RISK. SAVINGS. INVESTMENT MANAGEMENT. LEGAL & GENERAL GROUP PLC ANNUAL REPORT AND ACCOUNTS 2010 BUILDING. Creating solid foundations on which to grow for the future.

Welcome message from author
This document is posted to help you gain knowledge. Please leave a comment to let me know what you think about it! Share it to your friends and learn new things together.
Transcript

RISK. SAVINGS.INVESTMENT MANAGEMENT.
LEGAL & GENERAL GROUP PLC ANNUAL REPORT AND ACCOUNTS 2010
BUILDING.Creating solid foundations on which to grow for the future.
LEG
AL &
GEN
ER
AL G
RO
UP
PLC
AN
NU
AL R
EPOR
T AN
D A
CC
OU
NTS
2010
Registered offi ce: One Coleman Street, London EC2R 5AAT 020 3124 2000 F 020 3124 2500
We are authorised and regulated by the Financial Services Authority. We are members of the Association of British Insurers.
Designed and produced by Addison www.addison.co.uk
Printed on 9lives 55 Silk paper and 9lives Offset paper. These papers have been independently certifi ed according to the rules of the Forest Stewardship Council® (FSC). The inks used are all vegetable oil based.
Printed at Pureprint Group, ISO14001.
FSC® certifi ed and CarbonNeutral®.
legalandgeneralgroup.com
9484_L&G_AR_2010_Cover&Spine_210311_JR.indd 1 25/03/2011 11:06

CONTENTS
OUR GROUP*01 Highlights02 What we do: our businesses04 How we are structured06 Chairman’s statement08 Group Chief Executive’s review10 Market environment12 Strategic overview14 Risk Management
OUR PERFORMANCE*18 Group results24 Risk businesses28 Savings32 Investment management36 International
OUR PURPOSE40 Our purpose42 People and operational resources*44 CSR/Sustainability
GOVERNANCE*48 Board of Directors50 Chairman’s Letter51 Corporate Governance Statement55 Engagement Matters56 Nominations Committee Report57 Audit Committee Report60 Group Risk Committee Report62 Directors’ Report on Remuneration80 Other statutory and regulatory information
FINANCIAL STATEMENTS85 Contents of the Financial Statements87 Group Consolidated Financial Statements195 Supplementary Financial Statements
– European Embedded Value Basis217 Company Financial Statements
OTHER INFORMATION228 Shareholder information230 Glossary
* These sections make up the Directors’ Report. This section of the Annual Report sets out information on the Group’s principal activities together with a review of the development and performance of the Group, including fi nancial performance, in accordance with Section 417 Companies Act 2006.
WE COMBINE STRATEGIC CLARITY, OPERATIONAL EXCELLENCE AND FINANCIAL STRENGTH TO DELIVER SUSTAINABLE BENEFITS FOR CUSTOMERS, BUSINESS PARTNERS, SHAREHOLDERS AND EMPLOYEES.
For more information visit our website:legalandgeneralgroup.com
9484_L&G_AR_2010_Cover&Spine_210311_JR.indd 2 25/03/2011 11:06
AppleMac2
Distance Measurement
121.04 mm
AppleMac2
Distance Measurement
210.07 mm
AppleMac2
Distance Measurement
5.36 mm
AppleMac2
Distance Measurement
5.03 mm
AppleMac2
Distance Measurement
220.96 mm
AppleMac2
Distance Measurement
211.23 mm
AppleMac2
Distance Measurement
208.21 mm
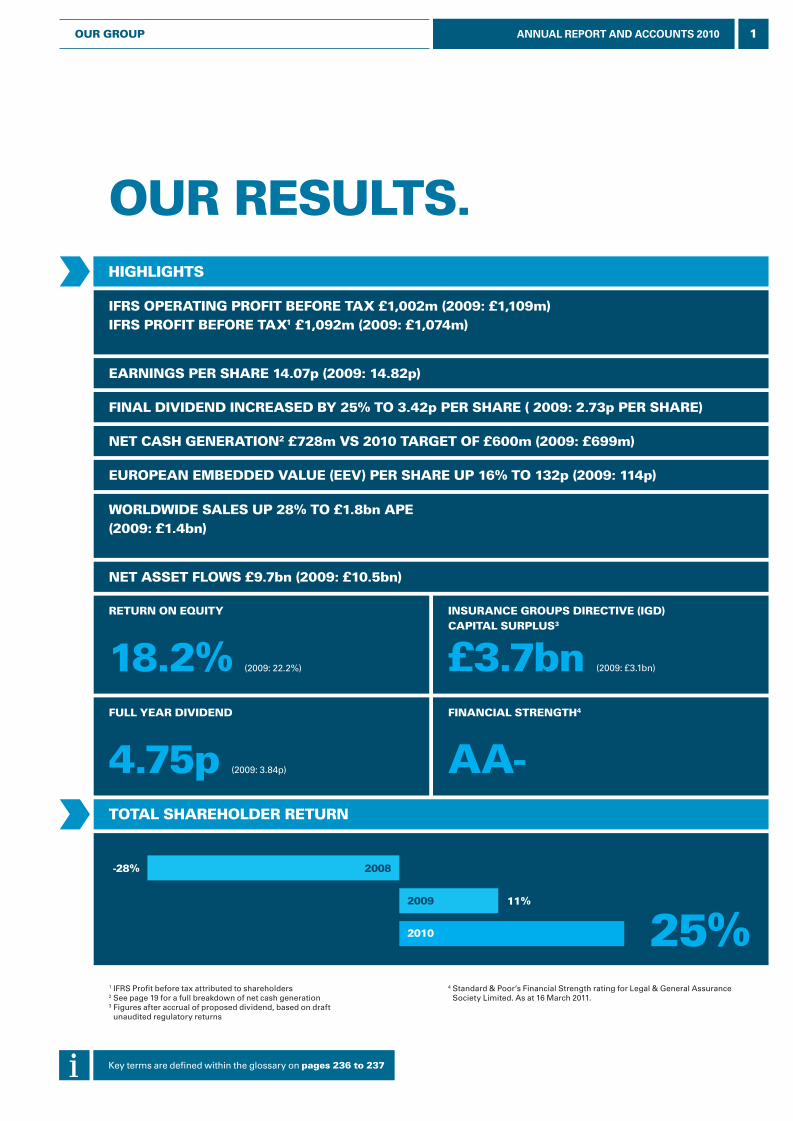
-28%
11%
25%
2008
2009
2010
1 IFRS Profi t before tax attributed to shareholders2 See page 19 for a full breakdown of net cash generation3 Figures after accrual of proposed dividend, based on draft
unaudited regulatory returns
FinanCial StREngth4
aa-Full yEaR DiViDEnD
4.75p (2009: 3.84p)
highlightS
inSuRanCE gROuPS DiRECtiVE (igD) CaPital SuRPluS3
£3.7bn (2009: £3.1bn)
nEt CaSh gEnERatiOn2 £728m VS 2010 taRgEt OF £600m (2009: £699m)
nEt aSSEt FlOWS £9.7bn (2009: £10.5bn)
EuROPEan EmBEDDED ValuE (EEV) PER ShaRE uP 16% tO 132p (2009: 114p)
EaRningS PER ShaRE 14.07p (2009: 14.82p)
Final DiViDEnD inCREaSED By 25% tO 3.42p PER ShaRE ( 2009: 2.73p PER ShaRE)
WORlDWiDE SalES uP 28% tO £1.8bn aPE(2009: £1.4bn)
iFRS OPERating PROFit BEFORE tax £1,002m (2009: £1,109m)iFRS PROFit BEFORE tax1 £1,092m (2009: £1,074m)
Key terms are defi ned within the glossary on pages 236 to 237
REtuRn On Equity
18.2% (2009: 22.2%)
OuR RESultS.
tOtal ShaREhOlDER REtuRn
25%4 Standard & Poor’s Financial Strength rating for Legal & General Assurance
Society Limited. As at 16 March 2011.
1ANNUAL REPORT AND ACCOUNTS 2010OuR gROuP
L&G_AR10_01_p1-9_230311_AT.indd 1 25/03/2011 11:07
Our purpose is to help make financial security easier to achieve.
Our risk products help protect individuals and businesses against the financial consequences of a wide range of risks. By reducing the financial impact of these events, we allow people to bear risks with greater peace of mind and reduce their potential reliance on the state.
Our savings and investment products provide individuals and businesses with access to a broad range of good value investment solutions. By helping our customers grow their assets we are helping them to become more financially secure.
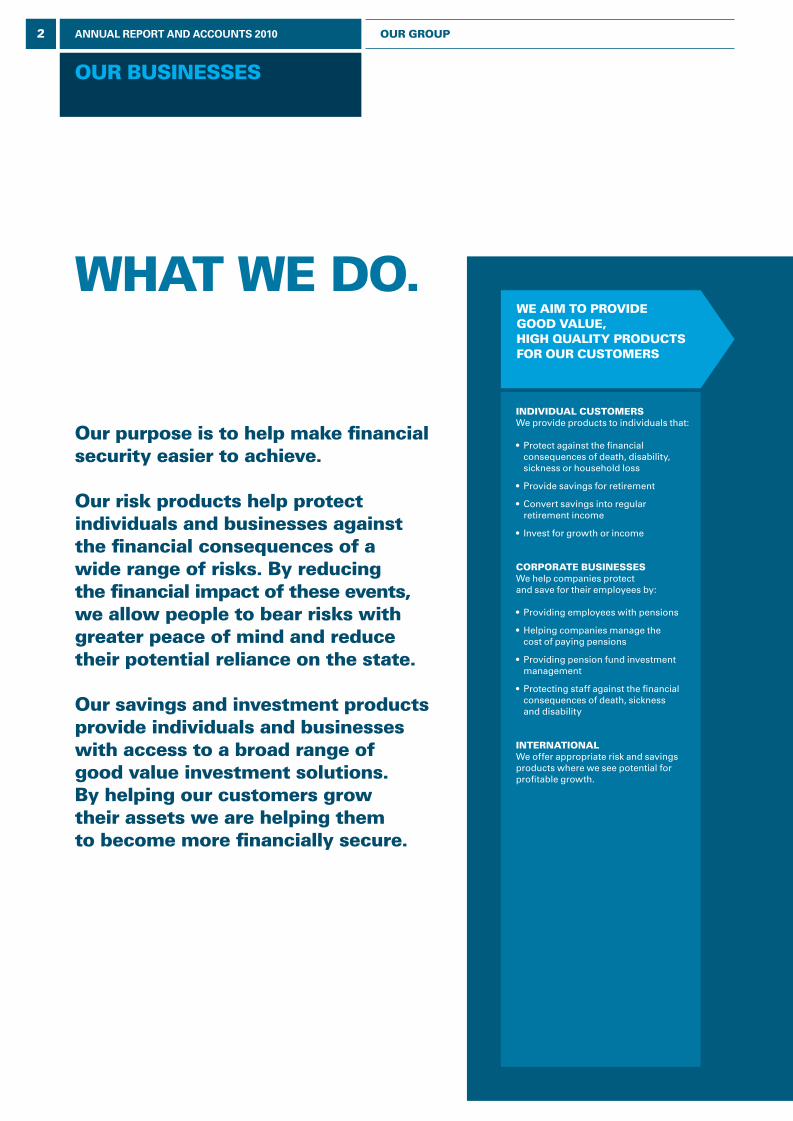
WE aim tO PROViDE gOOD ValuE, high quality PRODuCtS FOR OuR CuStOmERS
inDiViDual CuStOmERSWe provide products to individuals that:
• Protect against the financial consequences of death, disability, sickness or household loss
• Provide savings for retirement
• Convert savings into regular retirement income
• Invest for growth or income
CORPORatE BuSinESSESWe help companies protect and save for their employees by:
• Providing employees with pensions
• Helping companies manage the cost of paying pensions
• Providing pension fund investment management
• Protecting staff against the financial consequences of death, sickness and disability
intERnatiOnalWe offer appropriate risk and savings products where we see potential for profitable growth.
OuR BuSinESSES
What WE DO.
2 ANNUAL REPORT AND ACCOUNTS 2010 OuR gROuP
L&G_AR10_01_p1-9_230311_AT.indd 2 25/03/2011 11:07
5
4
3
2
1
45
3
21
5
4
3
2
1
45
3
21
WE managE OuR CuStOmERS’ RiSKS anD thEiR inVEStmEntS
WE aRE gOOD StEWaRDS FOR OuR CuStOmERS anD ShaREhOlDERS
CuStOmERS Buy PRODuCtS thROugh thEiR ChOSEn DiStRiButiOn ChannEl
inVEStmEnt ExPERtSOur ability to make investments for our customers, including pension funds, private investors, companies, charities, life companies, friendly societies and subsidiaries within the Group, is a crucial part of what we do.
£354bnlgim FunDS unDER managEmEnt (2009: £315bn)
3,300numBER OF CORPORatE PEnSiOn SChEmES WE managE
50% OF FtSE 100numBER OF COmPaniES With PEnSiOn FunDS managED By lgim
lOngEVity anD mORtality ExPERtSWe are recognised as an industry expert in the understanding and underwriting of protection and annuity products and services. We are committed continually to develop this expertise. We are pleased to be associated with a number of external longevity science initiatives, including being a founder member of the Life & Longevity Markets Association (LLMA), as well as supporting an independent panel of leading authorities who are experts on longevity issues, the Longevity Science Advisory Panel.
For more information on our financial model please see page 19.
£3.7bnigD CaPital SuRPluS (2009: £3.1bn)
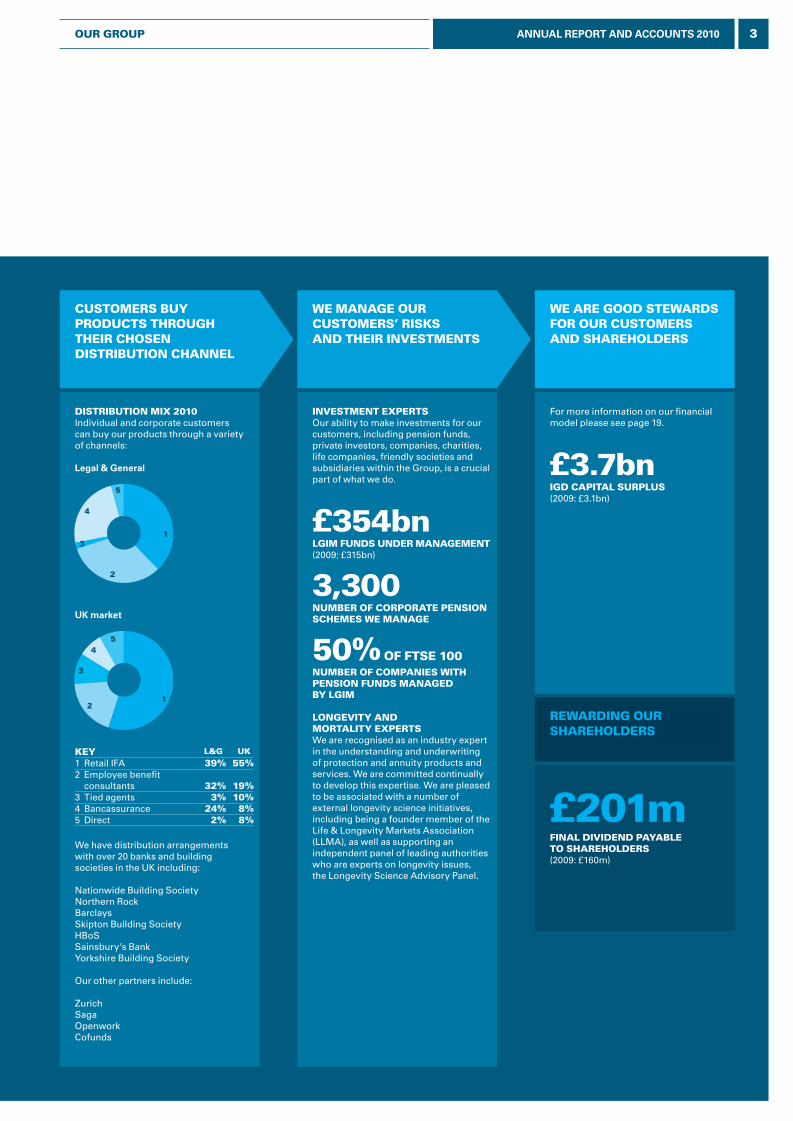
DiStRiButiOn mix 2010Individual and corporate customers can buy our products through a variety of channels:
Legal & General
UK market
£201mFinal DiViDEnD PayaBlE tO ShaREhOlDERS (2009: £160m)
REWaRDing OuR ShaREhOlDERS
KEy l&g uK
1 Retail IFA 39% 55%2 Employee benefit
consultants 32% 19%3 Tied agents 3% 10%4 Bancassurance 24% 8%5 Direct 2% 8%
We have distribution arrangements with over 20 banks and building societies in the UK including:
Nationwide Building SocietyNorthern RockBarclaysSkipton Building SocietyHBoSSainsbury’s BankYorkshire Building Society
Our other partners include:
ZurichSagaOpenworkCofunds
3ANNUAL REPORT AND ACCOUNTS 2010OuR gROuP
L&G_AR10_01_p1-9_230311_AT.indd 3 25/03/2011 11:07
54
3
2
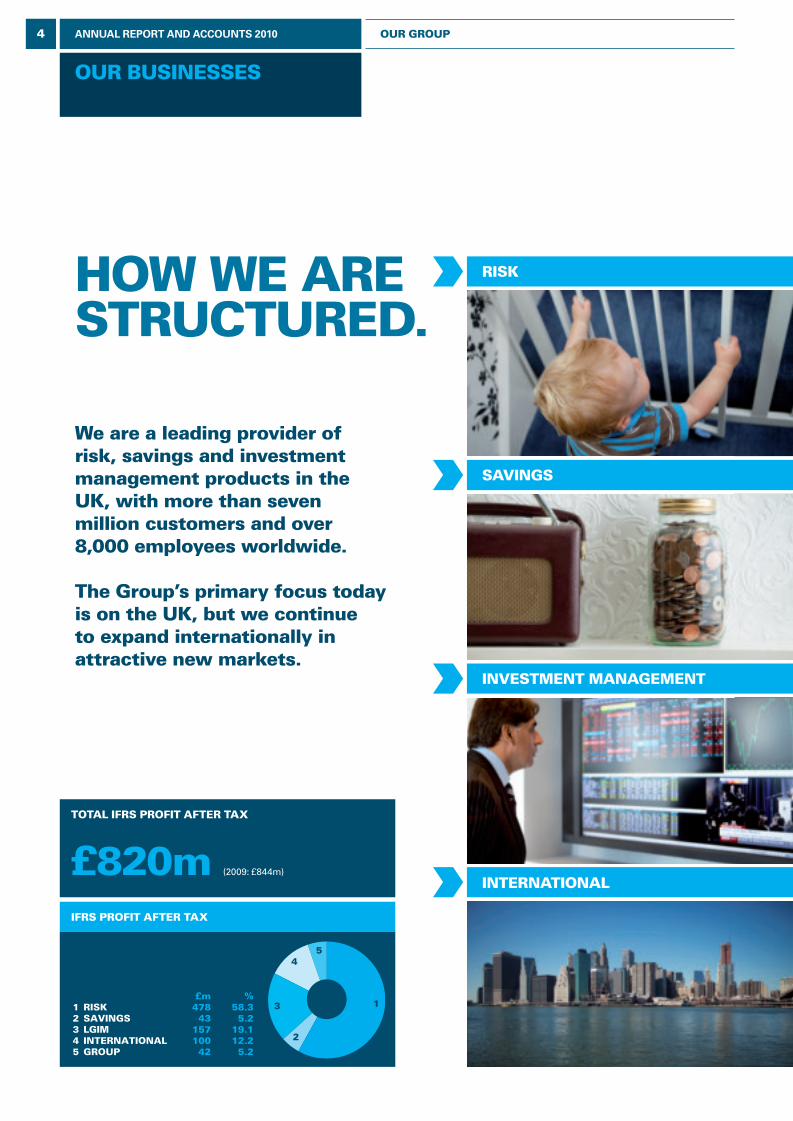
1 £m %1 RISK 478 58.32 SAVINGS 43 5.23 LGIM 157 19.14 INTERNATIONAL 100 12.25 GROUP 42 5.2
RiSK
SaVingS
inVEStmEnt managEmEnt
intERnatiOnal
We are a leading provider of risk, savings and investment management products in the uK, with more than seven million customers and over 8,000 employees worldwide.
the group’s primary focus today is on the uK, but we continue to expand internationally in attractive new markets.
iFRS PROFit aFtER tax
tOtal iFRS PROFit aFtER tax
£820m (2009: £844m)
OuR BuSinESSES
hOW WE aRE StRuCtuRED.
4 ANNUAL REPORT AND ACCOUNTS 2010 OuR gROuP
L&G_AR10_01_p1-9_230311_AT.indd 4 25/03/2011 11:07
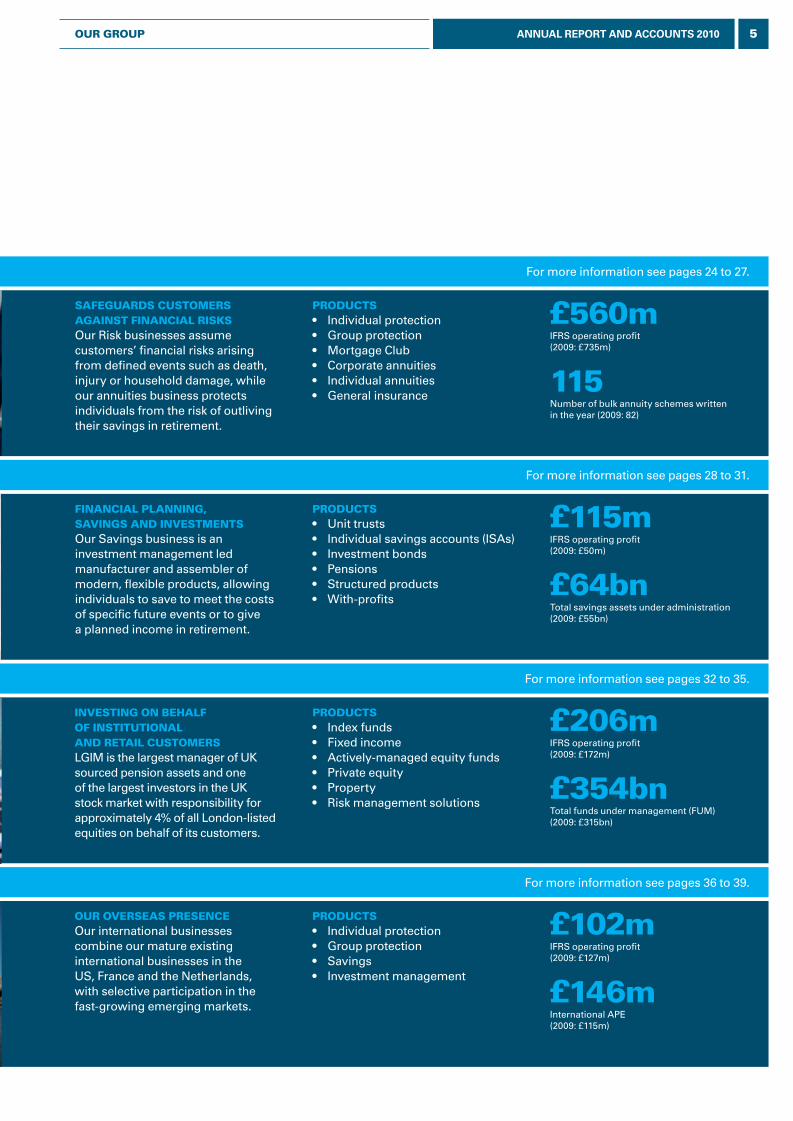
For more information see pages 28 to 31.
For more information see pages 32 to 35.
For more information see pages 36 to 39.
SaFEguaRDS CuStOmERS againSt FinanCial RiSKSOur Risk businesses assume customers’ financial risks arising from defined events such as death, injury or household damage, while our annuities business protects individuals from the risk of outliving their savings in retirement.
FinanCial Planning, SaVingS anD inVEStmEntSOur Savings business is an investment management led manufacturer and assembler of modern, flexible products, allowing individuals to save to meet the costs of specific future events or to give a planned income in retirement.
inVESting On BEhalF OF inStitutiOnal anD REtail CuStOmERSLGIM is the largest manager of UK sourced pension assets and one of the largest investors in the UK stock market with responsibility for approximately 4% of all London-listed equities on behalf of its customers.
OuR OVERSEaS PRESEnCEOur international businesses combine our mature existing international businesses in the US, France and the Netherlands, with selective participation in the fast-growing emerging markets.
PRODuCtS• Individual protection• Group protection• Mortgage Club• Corporate annuities• Individual annuities• General insurance
PRODuCtS• Unit trusts• Individual savings accounts (ISAs)• Investment bonds• Pensions• Structured products • With-profits
PRODuCtS• Index funds• Fixed income• Actively-managed equity funds• Private equity• Property• Risk management solutions
PRODuCtS• Individual protection• Group protection• Savings • Investment management
£560mIFRS operating profit (2009: £735m)
£115mIFRS operating profit (2009: £50m)
£206mIFRS operating profit (2009: £172m)
£102mIFRS operating profit (2009: £127m)
115Number of bulk annuity schemes written in the year (2009: 82)
£64bnTotal savings assets under administration(2009: £55bn)
£354bnTotal funds under management (FUM)(2009: £315bn)
£146mInternational APE(2009: £115m)
For more information see pages 24 to 27.RiSK
SaVingS
inVEStmEnt managEmEnt
intERnatiOnal
5ANNUAL REPORT AND ACCOUNTS 2010OuR gROuP
L&G_AR10_01_p1-9_230311_AT.indd 5 25/03/2011 11:07
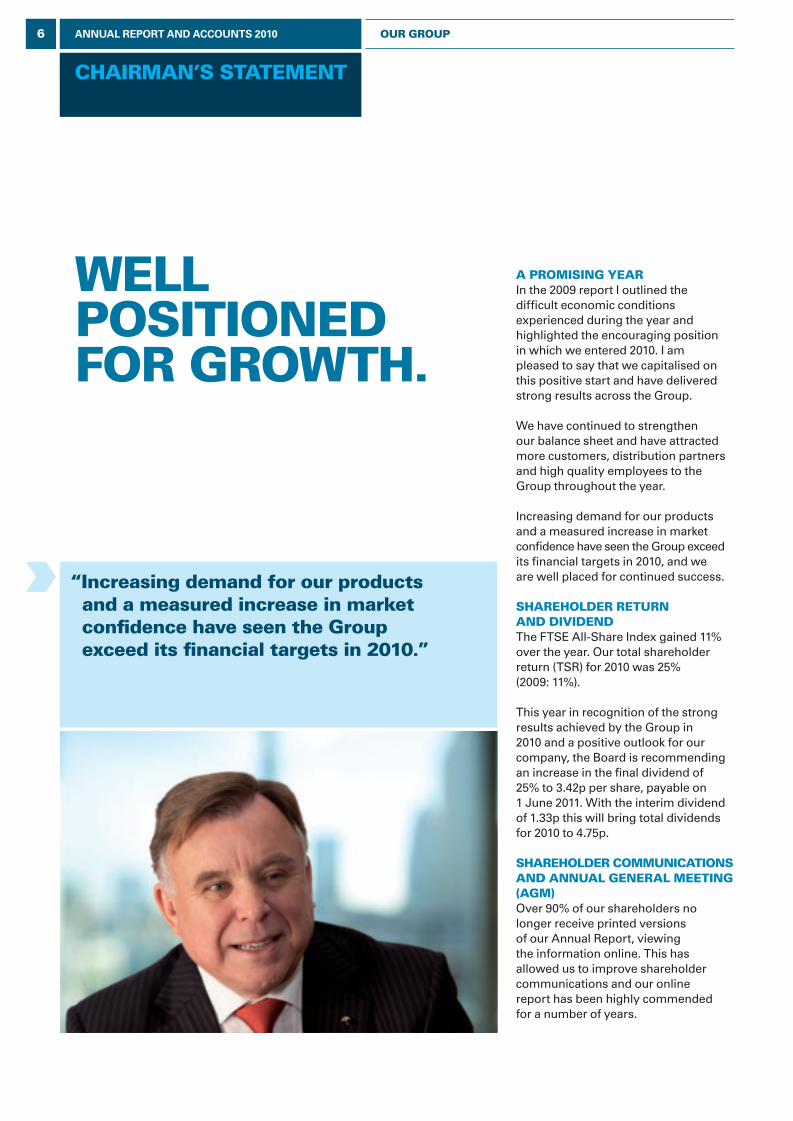
“ increasing demand for our products and a measured increase in market confidence have seen the group exceed its financial targets in 2010.”
a PROmiSing yEaRIn the 2009 report I outlined the difficult economic conditions experienced during the year and highlighted the encouraging position in which we entered 2010. I am pleased to say that we capitalised on this positive start and have delivered strong results across the Group.
We have continued to strengthen our balance sheet and have attracted more customers, distribution partners and high quality employees to the Group throughout the year.
Increasing demand for our products and a measured increase in market confidence have seen the Group exceed its financial targets in 2010, and we are well placed for continued success.
ShaREhOlDER REtuRn anD DiViDEnDThe FTSE All-Share Index gained 11% over the year. Our total shareholder return (TSR) for 2010 was 25% (2009: 11%).
This year in recognition of the strong results achieved by the Group in 2010 and a positive outlook for our company, the Board is recommending an increase in the final dividend of 25% to 3.42p per share, payable on 1 June 2011. With the interim dividend of 1.33p this will bring total dividends for 2010 to 4.75p.
ShaREhOlDER COmmuniCatiOnS anD annual gEnERal mEEting (agm) Over 90% of our shareholders no longer receive printed versions of our Annual Report, viewing the information online. This has allowed us to improve shareholder communications and our online report has been highly commended for a number of years.
WEll POSitiOnED FOR gROWth.
ChaiRman’S StatEmEnt
6 ANNUAL REPORT AND ACCOUNTS 2010 OuR gROuP
L&G_AR10_01_p1-9_230311_AT.indd 6 25/03/2011 11:07
This year’s AGM will be held at 2.30pm on Wednesday 25 May 2011 at The Honourable Artillery Company, City Road, London EC1Y 2BQ.
BOaRD ChangESAt the start of 2010 I took over from Sir Rob Margetts as Chairman of your Company. Two long-serving members of the Board, Frances Heaton and Ronaldo Schmitz also left during the year and I would like to thank them both for their contribution to the Company’s success.
I would also like to take this opportunity to thank our Vice Chairman, Sir David Walker, as he will be retiring from the Board after this year’s AGM, having served on the Board for nine years.
In November, Nick Prettejohn, formerly CEO of Lloyd’s of London and chief executive of Prudential UK and Europe, joined the Board as a non-executive director of the Group. I would like formally to welcome Nick to Legal & General.
Full details of all changes can be found on page 51 of the report.
managEmEnt OF RiSKRisk management is one of our core competencies and we ensure continuous improvement in this area by regularly reviewing our policies and practices. During 2010 we upgraded our risk management processes in two ways.
In July we appointed Andrea Blance as our first Group Chief Risk Officer. This appointment reflects our continued commitment to strong risk management. Andrea will support the Group Risk Committee in ensuring that our risk appetite is both clearly
defined and communicated. She will also provide assurance that the most material risks have been identified and ensure that our risk management framework is upgraded where required, and prepared for the forthcoming Solvency II capital regime.
We also reviewed our Group Risk Committee and decided that membership should consist of non-executive directors.
OuR StaFFOur employees drive Legal & General’s strong performance and are the owners of our customer service ethic.
This year I hosted the Making a Difference awards for employees and I was both touched and impressed at the level of dedication shown to charities and communities. There is much talk of the Big Society in the media at present and I am proud to say that this attitude appears to be thriving already across our offices.
OutlOOKAlthough we expect UK economic growth to remain subdued in 2011 we are seeing increasing opportunities in our markets.
We have carried strong business momentum into 2011 which, together with increasing consolidation in a number of our markets, underpins our confidence in the continued success of the Group going forward.
jOhn StEWaRtChaiRman
Full yEaR DiViDEnD
4.75p(2009: 3.84p)
iFRS OPERating PROFit
£1,002m(2009: £1,109m)
nEt CaSh gEnERatiOn
£728m(2009: £699m)
7ANNUAL REPORT AND ACCOUNTS 2010OuR gROuP
L&G_AR10_01_p1-9_230311_AT.indd 7 25/03/2011 11:07

We are successfully executing our strategy of growing the business, controlling operational costs and deploying our capital more effectively. Our results for 2010 demonstrate that we are able to deliver both improvements in cash generation and growth in sales. The Group achieved £728m of net cash generation in 2010, above that delivered in 2009 (£699m) and well ahead of the target set for the year. Meanwhile, worldwide sales of £1.8bn exceeded the figure achieved last year by 28%.
In Risk, we broadened our reach with several new or extended distribution partnerships for our protection and annuity products. We have also increased levels of direct sales and seen an increase in our market share of intermediated mortgage distribution. Our expertise in pricing and underwriting has enabled further growth in the scale and profitability of this business.
We have built a modern Savings business with a lower structural cost base. Increasing numbers of customers are placing their savings with Legal & General for increasing periods of time. As assets under administration grow, the business is also driving margin improvements.
“ Our results for 2010 demonstrate that we are successfully delivering both improvements to cash generation and growth in sales.”
WORlDWiDE SalES (aPE)
£1.8bn(2009: £1.4bn)
Final DiViDEnD PayaBlE
£201m(2009: £160m)
DEliVERing On OuR StRatEgy.
gROuP ChiEF ExECutiVE’S REViEW
8 ANNUAL REPORT AND ACCOUNTS 2010 OuR gROuP
L&G_AR10_01_p1-9_230311_AT.indd 8 25/03/2011 11:07
Legal & General Investment Management (LGIM) has grown to be amongst the top 30 fund management groups in the world measured by assets under management.
LGIM’s strategy is to build on its position as the largest manager of assets for UK pension funds and grow its low cost, high service, low investment risk model into other markets with successes already in the US, the Middle East and mainland Europe.
Our International businesses delivered more cash to the Group through increased dividends, and we made changes in the US to deploy capital more effectively through the execution of the first phase of our US capital management programme. Our joint venture in India is progressing well.
Our diversified distribution platform continues to thrive. Only 39% of UK new business was written through retail Independent Financial Advisers (IFAs) and within that segment we are increasing our focus on IFAs who have evolved their model to maximise the opportunities offered by the FSA Retail Distribution Review (RDR).
Bancassurance partners delivered 24% of new business in the UK where we continue to build relationships across the banking sector. Fee-based employee benefit consultants provided 32% of new business in the period and tied and direct distribution accounted for 5% of sales. Our distribution model remains well diversified and is a source of strength and differentiation for the Group.
BalanCE ShEEt anD CaPitalThe Group continues to benefit from a robust balance sheet. The estimated Insurance Groups Directive (IGD) capital surplus increased to £3.7bn from £3.1bn after accrual of £201m for the 2010 final dividend. This increase was primarily due to net cash
generated of £0.7bn coupled with the IGD benefit of the US capital management programme which amounted to £0.1bn. The IGD coverage ratio stood at 226% at the end of 2010 (2009: 224%).
REgulatORy ChangESBy the end of next year, UK insurers will need to be ready for a new European capital regime under Solvency II. This will deliver a dramatically altered regulatory capital approach in the UK and Europe. The late delivery of the new regulations, and the lack of clarity surrounding them, will present the UK insurance industry with considerable challenges and we remain closely engaged with this process.
The introduction of automatic enrolment into pension schemes and the removal of the compulsion for individuals to annuitise at age 75 will significantly change the pensions landscape in the UK.
Additionally, the radical reform to the way people buy financial advice following the RDR will go live in the UK in 2012. Customers should benefit from improved transparency on charges and increased adviser professionalism.
The Court of Justice of the European Union has reached a decision that
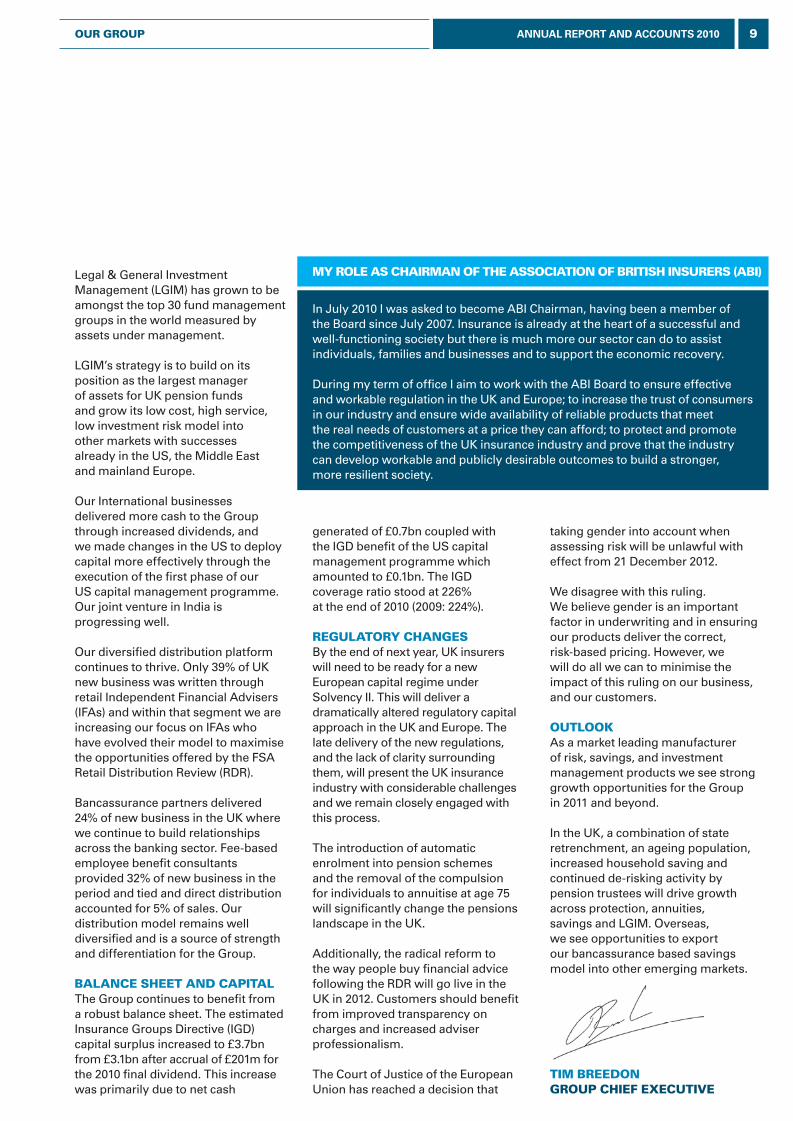
In July 2010 I was asked to become ABI Chairman, having been a member of the Board since July 2007. Insurance is already at the heart of a successful and well-functioning society but there is much more our sector can do to assist individuals, families and businesses and to support the economic recovery.
During my term of office I aim to work with the ABI Board to ensure effective and workable regulation in the UK and Europe; to increase the trust of consumers in our industry and ensure wide availability of reliable products that meet the real needs of customers at a price they can afford; to protect and promote the competitiveness of the UK insurance industry and prove that the industry can develop workable and publicly desirable outcomes to build a stronger, more resilient society.
taking gender into account when assessing risk will be unlawful with effect from 21 December 2012.
We disagree with this ruling. We believe gender is an important factor in underwriting and in ensuring our products deliver the correct, risk-based pricing. However, we will do all we can to minimise the impact of this ruling on our business, and our customers.
OutlOOKAs a market leading manufacturer of risk, savings, and investment management products we see strong growth opportunities for the Group in 2011 and beyond. In the UK, a combination of state retrenchment, an ageing population, increased household saving and continued de-risking activity by pension trustees will drive growth across protection, annuities, savings and LGIM. Overseas, we see opportunities to export our bancassurance based savings model into other emerging markets.
tim BREEDOngROuP ChiEF ExECutiVE
my ROlE aS ChaiRman OF thE aSSOCiatiOn OF BRitiSh inSuRERS (aBi)
9ANNUAL REPORT AND ACCOUNTS 2010OuR gROuP
L&G_AR10_01_p1-9_230311_AT.indd 9 25/03/2011 11:07
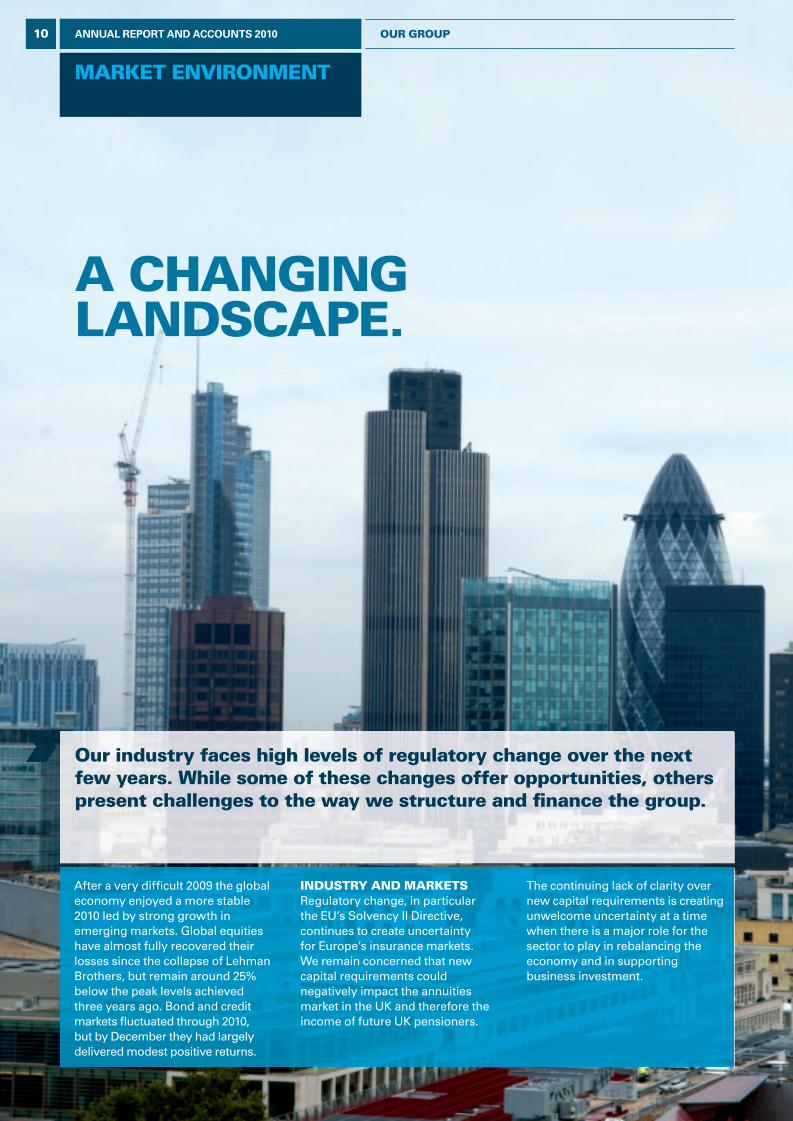
marKet environment
a changing landscape.
our industry faces high levels of regulatory change over the next few years. while some of these changes offer opportunities, others present challenges to the way we structure and fi nance the group.
After a very diffi cult 2009 the global economy enjoyed a more stable 2010 led by strong growth in emerging markets. Global equities have almost fully recovered their losses since the collapse of Lehman Brothers, but remain around 25% below the peak levels achieved three years ago. Bond and credit markets fl uctuated through 2010, but by December they had largely delivered modest positive returns.
industry and marKetsRegulatory change, in particular the EU’s Solvency II Directive, continues to create uncertainty for Europe’s insurance markets. We remain concerned that new capital requirements could negatively impact the annuities market in the UK and therefore the income of future UK pensioners.
The continuing lack of clarity over new capital requirements is creating unwelcome uncertainty at a time when there is a major role for the sector to play in rebalancing the economy and in supporting business investment.
10 ANNUAL REPORT AND ACCOUNTS 2010 our group
L&G_AR10_02_p10-17_230311_AT.indd 10 25/03/2011 11:09
political environmentThe UK general election in May was followed by a month of uncertainty as the Conservatives worked to form a coalition and then produce their June emergency Budget to achieve necessary deficit reduction.
The budget saw tax increases for all but the lowest paid. Capital gains tax was, however, maintained at a maximum of 28% for higher rate taxpayers rather than being brought into line with marginal income tax rates as predicted by many.
Pension tax relief has been reduced with the annual limit for tax relieved pension contributions being cut from £255,000 to £50,000 from April 2011 and the lifetime allowance to be reduced from £1.8m to £1.5m.
We responded to over 60 official consultation papers during the year including several on proposals for changes to the pension, welfare, and regulatory systems.
This high level of engagement has been important at a time of extensive, rapid change under a new administration.
insurance business environmentDuring 2010 we saw continued consolidation and selective exits from our markets. An unprecedented amount of the change including RDR, the Mortgage Market Review and the implementation of the recent European Court of Justice Gender Directive will have a material impact on housing and protection markets with the potential for further change in the way products are priced and distributed to consumers.
We also anticipate that the FSA’s RDR will impact the landscape of the marketplace. While consumers should benefit, one unintended consequence could be a reduction of access to financial advice for some groups of consumers.
We believe that RDR will accelerate change in financial services in the UK and expect more customers to purchase products without advice or through workplace schemes such as Company ISAs.
More information on our response to the RDR can be found on page 29 of the report.
interest ratesHomebuyers have had another year of record low mortgage rates. The Bank base rate has now been at 0.5% since March 2009. This should have enabled many to reduce their mortgage or pay off expensive credit card and overdraft borrowing.
Low interest rates, however, reduce returns for savers. At the end of 2010 inflation as measured by the Retail Prices Index (RPI) was 4.8% making it impossible for savers with cash deposits to keep pace with inflation. This has a particularly negative impact on pensioners who rely on savings for income.
outlooK As we head into 2011, there is uncertainty about whether the policy measures taken by central banks will be sufficient to generate economic recovery. We expect economic growth to slow as the Government embarks on one of the greatest periods of fiscal tightening since the Second World War. We expect to see continued consolidation across our markets as providers without sufficient scale struggle to compete. Additionally, providers dependent on high commission distribution strategies are likely to be negatively impacted by the RDR.
total investments the uK insurance industry is responsible for
£1.6tn(Representing 24% of the UK’s total worth). Source: Association of British Insurers (ABI).
investment assets managed in the uK
£3.9tnSource: Investment Management Association (IMA).
uK share of global insurance premiums
8%The UK is the world’s third largest insurance market. Source: ABI.
11ANNUAL REPORT AND ACCOUNTS 2010our group
L&G_AR10_02_p10-17_230311_AT.indd 11 25/03/2011 11:09
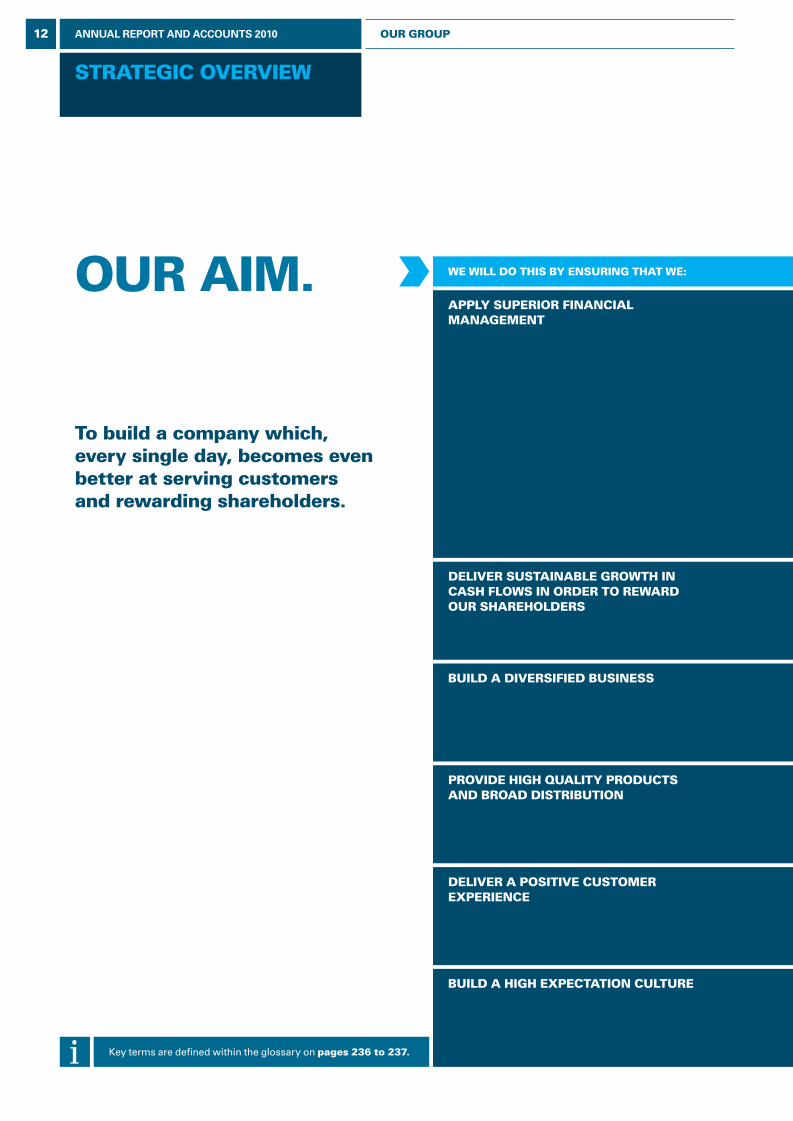
strategic overview
our aim.
to build a company which, every single day, becomes even better at serving customers and rewarding shareholders.
we will do this by ensuring that we:
apply superior financial management
deliver sustainable growth in cash flows in order to reward our shareholders
build a diversified business
provide high quality products and broad distribution
deliver a positive customer experience
build a high expectation culture
Key terms are defined within the glossary on pages 236 to 237.
12 ANNUAL REPORT AND ACCOUNTS 2010 our group
L&G_AR10_02_p10-17_230311_AT.indd 12 25/03/2011 11:09
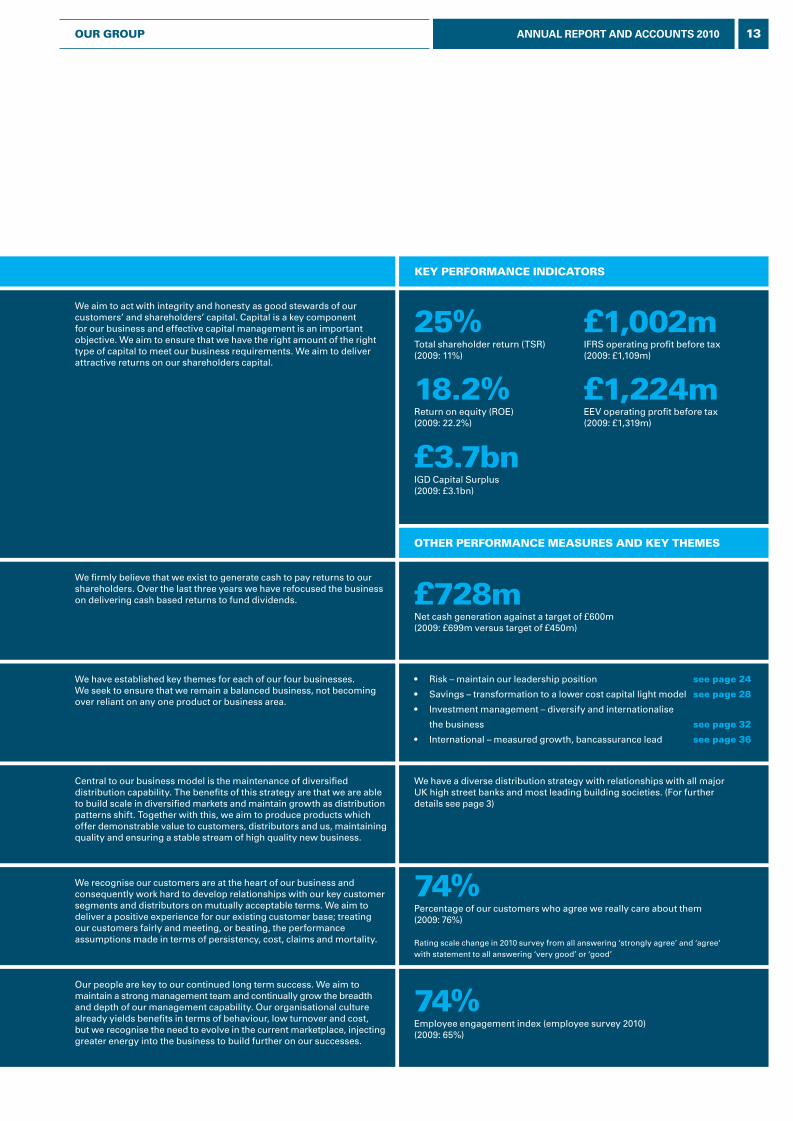
other performance measures and Key themes
We aim to act with integrity and honesty as good stewards of our customers’ and shareholders’ capital. Capital is a key component for our business and effective capital management is an important objective. We aim to ensure that we have the right amount of the right type of capital to meet our business requirements. We aim to deliver attractive returns on our shareholders capital.
We firmly believe that we exist to generate cash to pay returns to our shareholders. Over the last three years we have refocused the business on delivering cash based returns to fund dividends.
We have established key themes for each of our four businesses. We seek to ensure that we remain a balanced business, not becoming over reliant on any one product or business area.
Central to our business model is the maintenance of diversified distribution capability. The benefits of this strategy are that we are able to build scale in diversified markets and maintain growth as distribution patterns shift. Together with this, we aim to produce products which offer demonstrable value to customers, distributors and us, maintaining quality and ensuring a stable stream of high quality new business.
We recognise our customers are at the heart of our business and consequently work hard to develop relationships with our key customer segments and distributors on mutually acceptable terms. We aim to deliver a positive experience for our existing customer base; treating our customers fairly and meeting, or beating, the performance assumptions made in terms of persistency, cost, claims and mortality.
Our people are key to our continued long term success. We aim to maintain a strong management team and continually grow the breadth and depth of our management capability. Our organisational culture already yields benefits in terms of behaviour, low turnover and cost, but we recognise the need to evolve in the current marketplace, injecting greater energy into the business to build further on our successes.
• Risk – maintain our leadership position see page 24
• Savings – transformation to a lower cost capital light model see page 28
• Investment management – diversify and internationalise
the business see page 32
• International – measured growth, bancassurance lead see page 36
25%Total shareholder return (TSR)(2009: 11%)
£728mNet cash generation against a target of £600m(2009: £699m versus target of £450m)
We have a diverse distribution strategy with relationships with all major UK high street banks and most leading building societies. (For further details see page 3)
74%Percentage of our customers who agree we really care about them (2009: 76%) Rating scale change in 2010 survey from all answering ‘strongly agree’ and ‘agree‘ with statement to all answering ‘very good’ or ‘good’
74%Employee engagement index (employee survey 2010)(2009: 65%)
18.2%Return on equity (ROE)(2009: 22.2%)
£3.7bnIGD Capital Surplus (2009: £3.1bn)
£1,002mIFRS operating profit before tax(2009: £1,109m)
£1,224mEEV operating profit before tax(2009: £1,319m)
Key performance indicators
13ANNUAL REPORT AND ACCOUNTS 2010our group
L&G_AR10_02_p10-17_230311_AT.indd 13 25/03/2011 11:09
risK management
how we manage risK.letter from andrea blance
As Group Chief Risk Officer it is my role to provide risk management assurance to the Board and to challenge and direct the way we deal with risks.
We have successfully built a portfolio of risk businesses at Legal & General and we accept risk in the normal day to day running of our business providing it is consistent with the delivery of our strategic objectives. Good quality risk management is critical to our success and we have developed systems to ensure that risk management is an integral part of the way we run our business.
We have a very strong tradition of embedding risk management deep into the business. Our policy is to ensure that wherever possible, risks are identified and managed directly by operational management.
Managing Directors of business areas are therefore directly responsible for ensuring that risks are identified promptly and controlled effectively while also delivering against financial performance targets.
As a provider of risk products, including general insurance, we recognise that the management of risk lies at the heart of our business. As a result, effective risk management capabilities are an area where we can gain real competitive advantage.
We manage the Group’s capital and the risks to which it is exposed, with the aim that we would remain financially strong even following a shock to the markets we operate in.
The Group’s risk management framework seeks to ensure that the Group is only exposed to those residual elements of risk that are within our risk appetite, and that risk adjusted capital in respect of residual risk is accurately calculated. The framework includes structured risk identification and assessment procedures, minimum standards of control defined within formal risk management policies, and mandatory risk reporting requirements.
Our risk appetite sets out our tolerance to risk exposures as well as our approach to risk management and return optimisation. We monitor our risk profile continuously against agreed limits.
We operate a continuous risk identification and assessment process under which all our businesses consider the profile of their risks and potential changes as the business develops and markets change. Identified risks are recorded and responsibility is allocated to an owner to assess and manage the risk within agreed tolerances.
Risk mitigation plans are developed and implemented to manage or respond to risks. These plans are kept under regular review to ensure that they remain robust and appropriate as the nature, probability or impact of risks may change over time.
The Group’s approach to the identification, assessment and management of risk is underpinned by a Group-wide programme of stress and scenario tests. These tests aim to demonstrate the resilience of our balance sheet to a range of alternative stresses and scenarios and to ensure that we maintain the target level of capital that we wish to hold above our solvency requirements.
Recent stress tests have included consideration of the impact of recessionary conditions, sovereign debt crisis and the effects of inflation. The range of stress tests performed include reverse stress tests.
andrea blance group chief risK officer
14 ANNUAL REPORT AND ACCOUNTS 2010 our group
L&G_AR10_02_p10-17_230311_AT.indd 14 25/03/2011 11:09
The effective management of risk is essential to delivery of the Group’s strategy and the generation of shareholder value.
risK governance:• Responsibility for risk management is embedded
within the Group’s business divisions• Challenge and oversight of the effectiveness of risk
management is provided by Group functions and formal Group level risk committees
• Independent assurance on the effectiveness of both business risk management, and the Group level oversight and challenge processes, is provided by Internal Audit
group oversight functions: • Group Chief Risk Officer• Group Actuarial• Group Regulatory Risk & Compliance• Group Legal & Governance
committee oversight: • Key indicators monitor actual risk exposures
to target positions• Risk mitigation programmes are established where
risk exposures are outside tolerance or more effective use of capital can be achieved
risK management at a glanceRegular reporting of risks and the mitigation strategies occurs through individual business level risk committees to the executive level risk committees, and ultimately to the Board committees.
The operation of the Group’s risk management framework is overseen by the Group Risk Committee (see page 60). Oversight of the management of the Group’s exposures to market, insurance, counterparty credit, operational, liquidity and group risk are set out in the table below.
Note 48 on page 172 describes the risks to which our core product lines are exposed and our approach to managing those risks so as to ensure that the residual risk exposures are within acceptable tolerances agreed by the Board, together with sensitivity analysis setting out how changes in a range of risk factors may impact our results. We set out overleaf an analysis of the current principal risks and uncertainties.
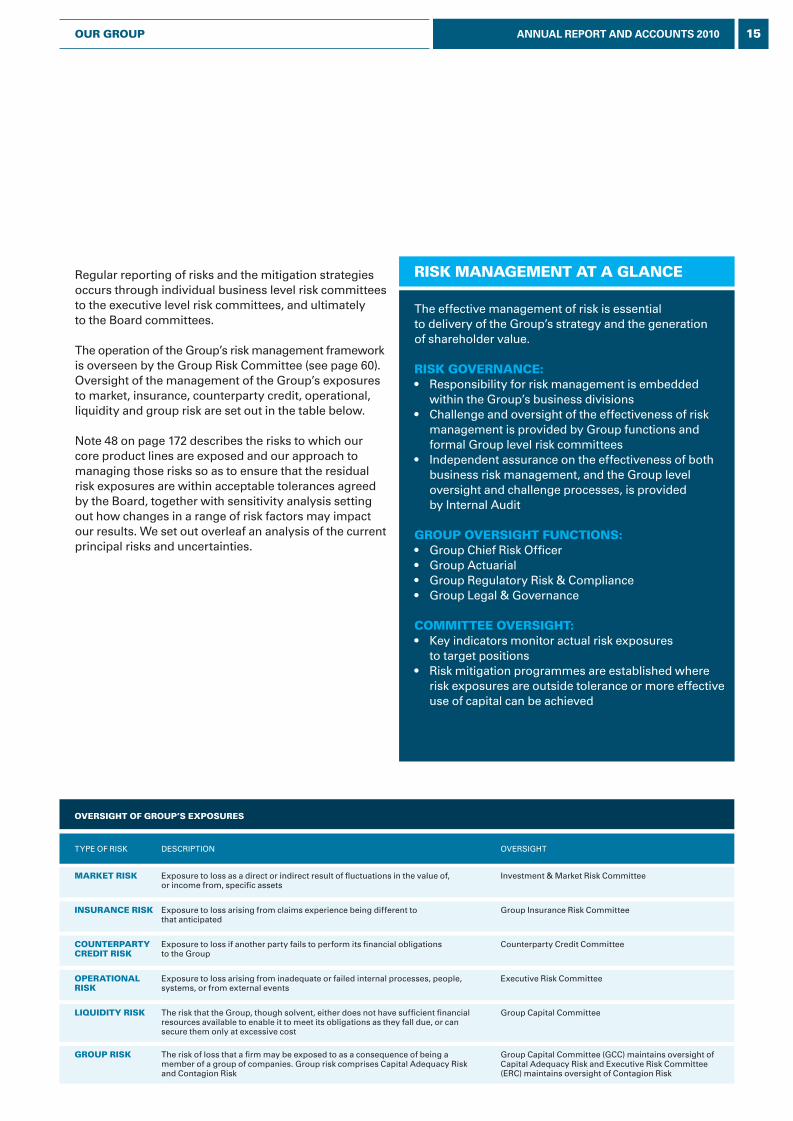
oversight of group’s exposures
TYPE OF RISK DESCRIPTION OVERSIGHT
marKet risK Exposure to loss as a direct or indirect result of fluctuations in the value of, or income from, specific assets
Investment & Market Risk Committee
insurance risK Exposure to loss arising from claims experience being different to that anticipated
Group Insurance Risk Committee
counterparty credit risK
Exposure to loss if another party fails to perform its financial obligations to the Group
Counterparty Credit Committee
operational risK
Exposure to loss arising from inadequate or failed internal processes, people, systems, or from external events
Executive Risk Committee
liquidity risK The risk that the Group, though solvent, either does not have sufficient financial resources available to enable it to meet its obligations as they fall due, or can secure them only at excessive cost
Group Capital Committee
group risK The risk of loss that a firm may be exposed to as a consequence of being a member of a group of companies. Group risk comprises Capital Adequacy Risk and Contagion Risk
Group Capital Committee (GCC) maintains oversight of Capital Adequacy Risk and Executive Risk Committee (ERC) maintains oversight of Contagion Risk
15ANNUAL REPORT AND ACCOUNTS 2010our group
L&G_AR10_02_p10-17_230311_AT.indd 15 25/03/2011 11:09

risK management
RISK NAME KEY RISK PRINCIPAL UNCERTANTIESPOTENTIAL IMPACT ON LEGAL & GENERAL
MITIGATION
legislation and regulation
Changes in regulation or legislation may have a detrimental effect on our strategy or profitability
Legislation and government fiscal policy can influence our product design, the retention of existing business and our required reserves for future liabilities. Regulation defines the overall framework for the design, marketing and distribution of our products; and the prudential capital that we hold. The nature of long term business can result in certain regulatory changes having a retrospective effect.
Solvency II, which is scheduled for full implementation in 2013, will lead to a fundamental change in the way that insurance companies are required to calculate their prudential capital. While the high level regulation is defined, detailed capital requirements and implementation rules have not been finalised.
There remain a number of areas of considerable uncertainty in proposed Solvency II regulation. Solvency II will also coincide with a change in the determination of taxable profits for UK insurance companies, creating a potential for volatility in the amount of tax payable. For certain business segments, such as annuities, Solvency II proposals may require firms to hold a disproportionate amount of capital relative to the risk exposure. While transitional arrangements are expected to apply, the scope and duration of these remain undecided.
The Group is actively participating with Government and regulatory bodies in the UK and Europe to ensure capital requirements accurately reflect the risks implicit in insurance products. Further details are set out at page 11. We are also engaged with HM Treasury working groups in the development of the tax regime. We are actively looking at innovative capital management solutions to mitigate unintended effects of Solvency II.
The International Accounting Standards Board’s (IASB’s) project on accounting for insurance contracts, which seeks to improve and ensure consistency in accounting, is targeted for completion in mid 2011, with possible implementation between 2013 and 2015.
Whilst we support the need for clear and consistent financial reporting, the proposals of the latest exposure draft would result in a significant change in the timing of profit recognition, inconsistencies with capital measurement under Solvency II and increased complexity for users of accounts.
We are working with the IASB, the European CFO forum and the ABI to ensure that the IASB proposals are appropriate to the insurance sector and meet the needs of investors.
The Retail Distribution Review (RDR), the rules for which come into force in 2012, will change the regulations for the provision of sales advice for retail investment products and the relationship between advisers and manufacturers of these products.
RDR will require significant changes to our products and distribution processes, particularly for our savings business. Poor execution of change would impact our earnings and profitability. Other factors that could hinder successful transition include consumers failing to understand the change and the exiting of financial advisers from the market.
As set out on page 29 we have undertaken significant activity during the year to implement the requirements of the RDR, covering both the commercial and regulatory changes to our business. We are also committed to helping our customers and business partners transition to the new framework.
The FSA has recently published proposals to amend existing rules on the operation of with-profits funds, with further proposals to be published later in 2011.
Effective governance of With Profits business and the fair treatment of policyholders is sound business practice. However, the differing interpretation and application of regulation over time, may have a detrimental effect on our strategy and profitability.
As a continuing provider of With Profit based products, we will actively engage with the FSA to assist in the evaluation of proposed rule changes on the operators of with profit funds that remain open to new business, and their stakeholders.
financial marKet and economic conditions
Investment market performance or conditions in the broader economy may adversely impact our earnings and profitability
The performance and liquidity of investment markets, interest rate movements and inflation can impact the value of investment assets we hold to meet the obligations arising from insurance business as well as the value of the obligations themselves, resulting in mismatches in the profile of cash flows of our assets and liabilities. Significant falls in investment values can also impact the fee income of our investment management business. Broader economic conditions can impact the timing of the purchase and retention of retail financial services products.
2010 saw further recovery of major investment markets, which has continued into 2011. However, the outlook for the broader economy remains uncertain with potential for a rise in inflation and increases in interest rates.
A prolonged period of economic uncertainty or a return to recession may result in increased levels of consumer saving benefiting our retail savings business. However, other product segments such as protection may experience reduced demand, impacting our new business volumes and our earnings.
We model our business plans across a broad range of economic scenarios and take account of alternative projected economic conditions within our overall business strategy. As part of our medium term plan we have sought to ensure focus upon those market segments that will be resilient in projected conditions. Details of our business strategy are set out on pages 12 to 13.
As well as presenting macro-economic risks, the ongoing potential for a eurozone-based sovereign debt crisis presents the risk of falls in investment asset values and significant disruption and illiquidity in global financial markets.
Disruption from a major Sovereign debt event may impact our ability to execute hedging strategies that ensure the profile of cash flows of our assets and liabilities are appropriately matched. Falls in investment values may impact the value of and income from our Shareholder cash flows.
Over the last 18 months we have reviewed our risk management and hedging strategies to ensure that they remain effective across a broad range of financial conditions. We have also refined our Shareholders’ fund investment strategy. Sensitivities to interest rate mismatches, exposures to worldwide equity markets and currencies, changes in credit spreads are set out on pages 175 to 190.
16 ANNUAL REPORT AND ACCOUNTS 2010 our group
L&G_AR10_02_p10-17_230311_AT.indd 16 25/03/2011 11:09
RISK NAME KEY RISK PRINCIPAL UNCERTANTIESPOTENTIAL IMPACT ON LEGAL & GENERAL
MITIGATION
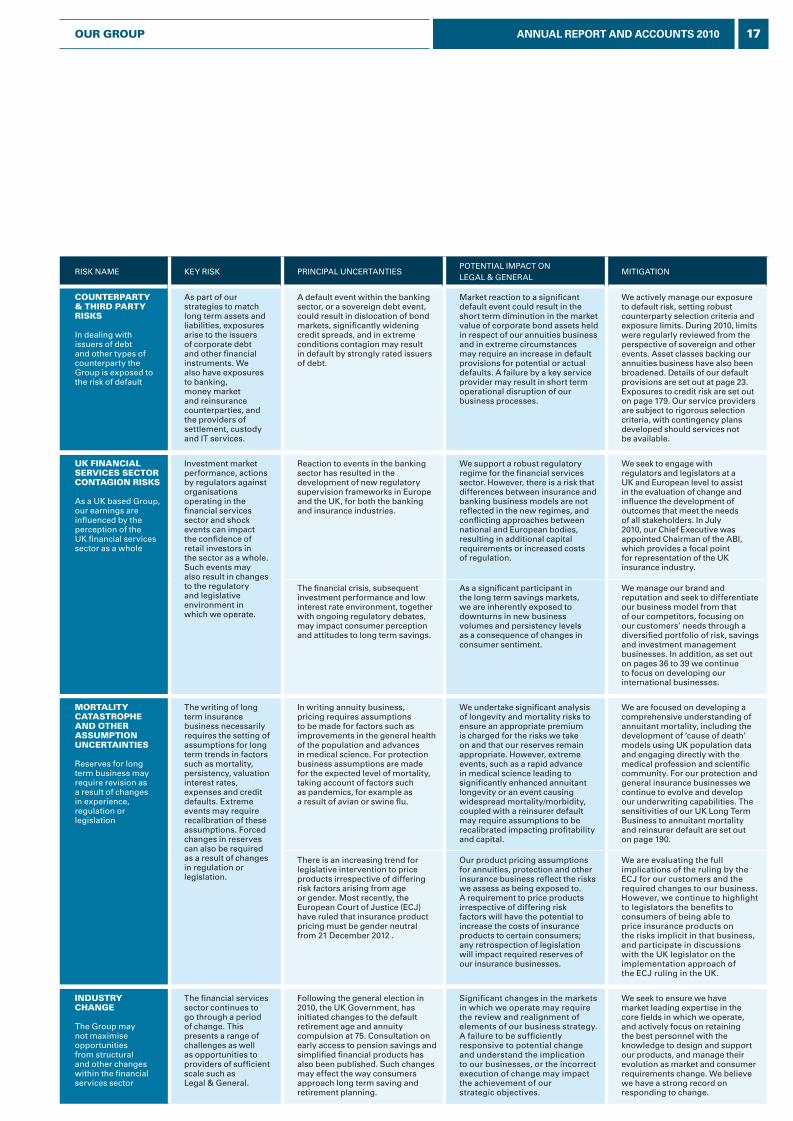
counterparty & third party risKs
In dealing with issuers of debt and other types of counterparty the Group is exposed to the risk of default
As part of our strategies to match long term assets and liabilities, exposures arise to the issuers of corporate debt and other financial instruments. We also have exposures to banking, money market and reinsurance counterparties, and the providers of settlement, custody and IT services.
A default event within the banking sector, or a sovereign debt event, could result in dislocation of bond markets, significantly widening credit spreads, and in extreme conditions contagion may result in default by strongly rated issuers of debt.
Market reaction to a significant default event could result in the short term diminution in the market value of corporate bond assets held in respect of our annuities business and in extreme circumstances may require an increase in default provisions for potential or actual defaults. A failure by a key service provider may result in short term operational disruption of our business processes.
We actively manage our exposure to default risk, setting robust counterparty selection criteria and exposure limits. During 2010, limits were regularly reviewed from the perspective of sovereign and other events. Asset classes backing our annuities business have also been broadened. Details of our default provisions are set out at page 23. Exposures to credit risk are set out on page 179. Our service providers are subject to rigorous selection criteria, with contingency plans developed should services not be available.
uK financial services sector contagion risKs
As a UK based Group, our earnings are influenced by the perception of the UK financial services sector as a whole
Investment market performance, actions by regulators against organisations operating in the financial services sector and shock events can impact the confidence of retail investors in the sector as a whole. Such events may also result in changes to the regulatory and legislative environment in which we operate.
Reaction to events in the banking sector has resulted in the development of new regulatory supervision frameworks in Europe and the UK, for both the banking and insurance industries.
We support a robust regulatory regime for the financial services sector. However, there is a risk that differences between insurance and banking business models are not reflected in the new regimes, and conflicting approaches between national and European bodies, resulting in additional capital requirements or increased costs of regulation.
We seek to engage with regulators and legislators at a UK and European level to assist in the evaluation of change and influence the development of outcomes that meet the needs of all stakeholders. In July 2010, our Chief Executive was appointed Chairman of the ABI, which provides a focal point for representation of the UK insurance industry.
The financial crisis, subsequent investment performance and low interest rate environment, together with ongoing regulatory debates, may impact consumer perception and attitudes to long term savings.
As a significant participant in the long term savings markets, we are inherently exposed to downturns in new business volumes and persistency levels as a consequence of changes in consumer sentiment.
We manage our brand and reputation and seek to differentiate our business model from that of our competitors, focusing on our customers’ needs through a diversified portfolio of risk, savings and investment management businesses. In addition, as set out on pages 36 to 39 we continue to focus on developing our international businesses.
mortality catastrophe and other assumption uncertainties
Reserves for long term business may require revision as a result of changes in experience, regulation or legislation
The writing of long term insurance business necessarily requires the setting of assumptions for long term trends in factors such as mortality, persistency, valuation interest rates, expenses and credit defaults. Extreme events may require recalibration of these assumptions. Forced changes in reserves can also be required as a result of changes in regulation or legislation.
In writing annuity business, pricing requires assumptions to be made for factors such as improvements in the general health of the population and advances in medical science. For protection business assumptions are made for the expected level of mortality, taking account of factors such as pandemics, for example as a result of avian or swine flu.
We undertake significant analysis of longevity and mortality risks to ensure an appropriate premium is charged for the risks we take on and that our reserves remain appropriate. However, extreme events, such as a rapid advance in medical science leading to significantly enhanced annuitant longevity or an event causing widespread mortality/morbidity, coupled with a reinsurer default may require assumptions to be recalibrated impacting profitability and capital.
We are focused on developing a comprehensive understanding of annuitant mortality, including the development of ‘cause of death’ models using UK population data and engaging directly with the medical profession and scientific community. For our protection and general insurance businesses we continue to evolve and develop our underwriting capabilities. The sensitivities of our UK Long Term Business to annuitant mortality and reinsurer default are set out on page 190.
There is an increasing trend for legislative intervention to price products irrespective of differing risk factors arising from age or gender. Most recently, the European Court of Justice (ECJ) have ruled that insurance product pricing must be gender neutral from 21 December 2012 .
Our product pricing assumptions for annuities, protection and other insurance business reflect the risks we assess as being exposed to. A requirement to price products irrespective of differing risk factors will have the potential to increase the costs of insurance products to certain consumers; any retrospection of legislation will impact required reserves of our insurance businesses.
We are evaluating the full implications of the ruling by the ECJ for our customers and the required changes to our business. However, we continue to highlight to legislators the benefits to consumers of being able to price insurance products on the risks implicit in that business, and participate in discussions with the UK legislator on the implementation approach of the ECJ ruling in the UK.
industry change
The Group may not maximise opportunities from structural and other changes within the financial services sector
The financial services sector continues to go through a period of change. This presents a range of challenges as well as opportunities to providers of sufficient scale such as Legal & General.
Following the general election in 2010, the UK Government, has initiated changes to the default retirement age and annuity compulsion at 75. Consultation on early access to pension savings and simplified financial products has also been published. Such changes may effect the way consumers approach long term saving and retirement planning.
Significant changes in the markets in which we operate may require the review and realignment of elements of our business strategy. A failure to be sufficiently responsive to potential change and understand the implication to our businesses, or the incorrect execution of change may impact the achievement of our strategic objectives.
We seek to ensure we have market leading expertise in the core fields in which we operate, and actively focus on retaining the best personnel with the knowledge to design and support our products, and manage their evolution as market and consumer requirements change. We believe we have a strong record on responding to change.
17ANNUAL REPORT AND ACCOUNTS 2010our group
L&G_AR10_02_p10-17_230311_AT.indd 17 25/03/2011 11:09
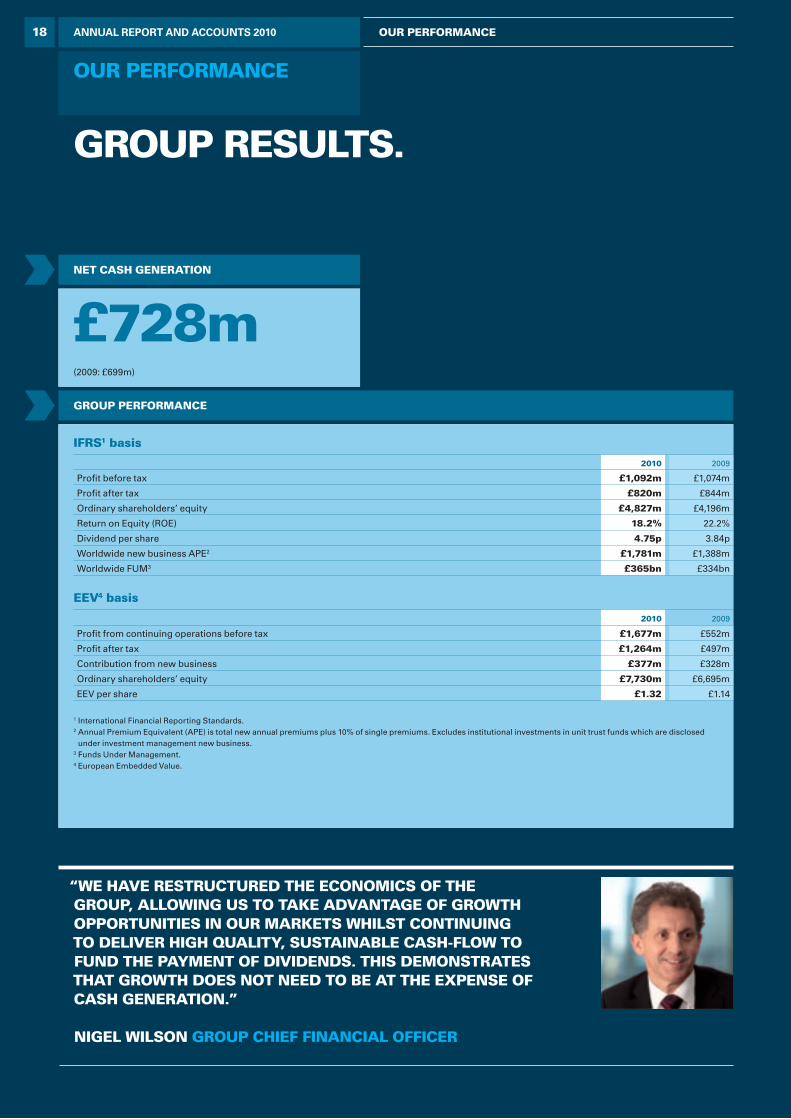
Group results.
our performance
£728m(2009: £699m)
ifrs1 basis
2010 2009
Profi t before tax £1,092m £1,074m
Profi t after tax £820m £844m
Ordinary shareholders’ equity £4,827m £4,196m
Return on Equity (ROE) 18.2% 22.2%
Dividend per share 4.75p 3.84p
Worldwide new business APE2 £1,781m £1,388m
Worldwide FUM3 £365bn £334bn
eev4 basis
2010 2009
Profi t from continuing operations before tax £1,677m £552m
Profi t after tax £1,264m £497m
Contribution from new business £377m £328m
Ordinary shareholders’ equity £7,730m £6,695m
EEV per share £1.32 £1.14
1 International Financial Reporting Standards.2 Annual Premium Equivalent (APE) is total new annual premiums plus 10% of single premiums. Excludes institutional investments in unit trust funds which are disclosed
under investment management new business.3 Funds Under Management.4 European Embedded Value.
“we Have restructureD tHe economics of tHe Group, allowinG us to taKe aDvantaGe of GrowtH opportunities in our marKets wHilst continuinG to Deliver HiGH quality, sustainable casH-flow to funD tHe payment of DiviDenDs. tHis Demonstrates tHat GrowtH Does not neeD to be at tHe expense of casH Generation.”
niGel wilson Group cHief financial officer
Group performance
net casH Generation
ANNUAL REPORT AND ACCOUNTS 2010 our performance18
L&G_AR10_03_p18-27_230311_AT.indd 18 25/03/2011 11:14
RISK £439m
INVESTMENT MANAGEMENT £162m
INTERNATIONAL £44m
SAVINGS £138m
CAPITATAT L STOCK
2009 B/B/B F: £3.1£3.1£ bnCASH POOL: £0.4bn
CAPITATAT L: £0.2bn2010: £3.7bn
CASH POOL
NEW BUSINESSSTRAIN £(80)m
OTHER £25m
REINVESTMENT
DIVIDEND£(279)m
1
INVESTOR RETURNS
£449m449m4
OPERATIONAL CASH GENERATION£808m
INCREASE IN CAPITATAT L £300m DECREASE IN CAPITATAT L (£150m)
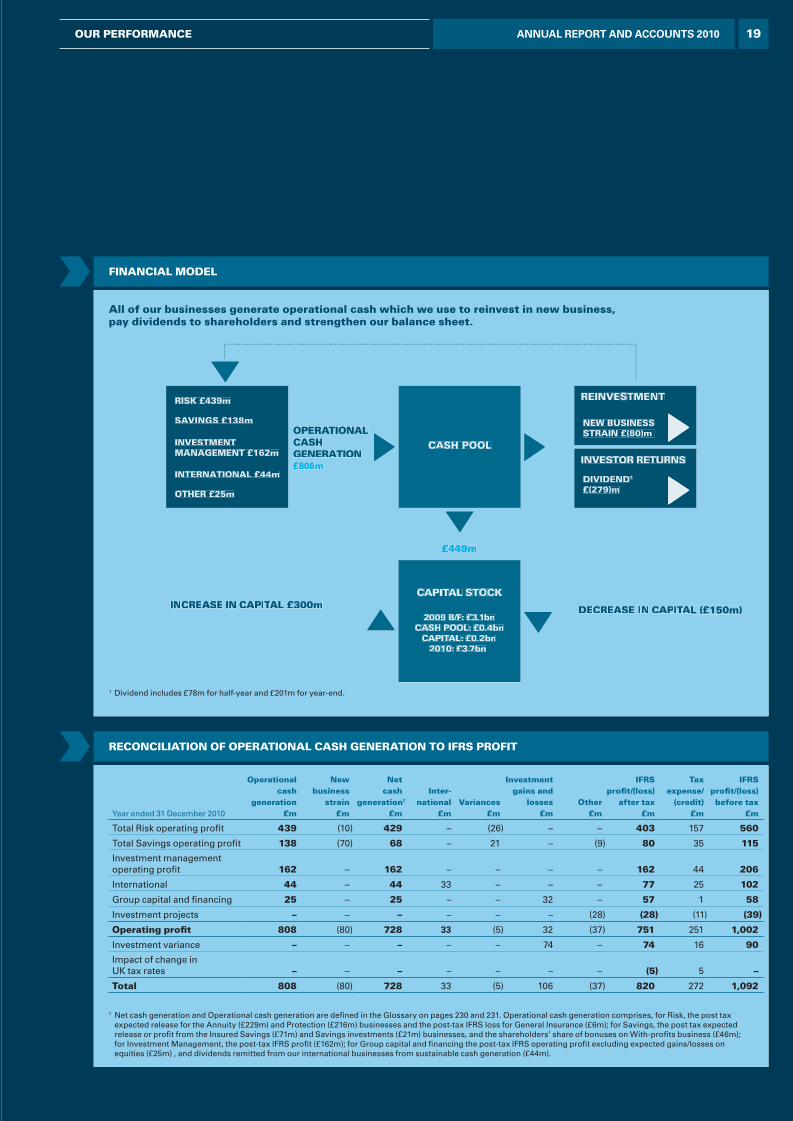
all of our businesses generate operational cash which we use to reinvest in new business, pay dividends to shareholders and strengthen our balance sheet.
financial moDel
reconciliation of operational casH Generation to ifrs profit
Year ended 31 December 2010
operationalcash
generation£m
newbusiness
strain£m
net cash
generation†
£m
inter-national
£mvariances
£m
investment gains and
losses£m
other£m
ifrsprofi t/(loss)
after tax£m
tax expense/
(credit)£m
ifrs profi t/(loss) before tax
£m
Total Risk operating profi t 439 (10) 429 – (26) – – 403 157 560
Total Savings operating profi t 138 (70) 68 – 21 – (9) 80 35 115
Investment management operating profi t 162 – 162 – – – – 162 44 206
International 44 – 44 33 – – – 77 25 102
Group capital and fi nancing 25 – 25 – – 32 – 57 1 58
Investment projects – – – – – – (28) (28) (11) (39)
operating profi t 808 (80) 728 33 (5) 32 (37) 751 251 1,002
Investment variance – – – – – 74 – 74 16 90
Impact of change in UK tax rates – – – – – – – (5) 5 –
total 808 (80) 728 33 (5) 106 (37) 820 272 1,092
† Net cash generation and Operational cash generation are defi ned in the Glossary on pages 230 and 231. Operational cash generation comprises, for Risk, the post tax expected release for the Annuity (£229m) and Protection (£216m) businesses and the post-tax IFRS loss for General Insurance (£6m); for Savings, the post tax expected release or profi t from the Insured Savings (£71m) and Savings investments (£21m) businesses, and the shareholders’ share of bonuses on With-profi ts business (£46m); for Investment Management, the post-tax IFRS profi t (£162m); for Group capital and fi nancing the post-tax IFRS operating profi t excluding expected gains/losses on equities (£25m) , and dividends remitted from our international businesses from sustainable cash generation (£44m).
1 Dividend includes £78m for half-year and £201m for year-end.
ANNUAL REPORT AND ACCOUNTS 2010our performance 19
L&G_AR10_03_p18-27_230311_AT.indd 19 25/03/2011 11:14
400
500
600
700
800
900
2007 2008 2009 2010
£580m
£654m
£726m
£808m
£m
DiviDenD policyContinued, strong operational cash and net cash generation, coupled with the Board’s confidence in the prospects for further growth in cash generation underpins the decision to recommend an 25% increase in the final dividend to 3.42p (2009: 2.73p) per share at a cost of £201m (2009: £160m).
As economic and regulatory uncertainty recede, the Board intends to reduce cash coverage of the dividend towards two times over the medium term.
monetisation of worlDwiDe value in force (vif) A growing and sustainable VIF profile provides a solid foundation for future sustainable cash generation. The following table demonstrates how the VIF is being replaced by the new business written in the period and illustrates the movements between the opening and closing UK long term Risk and Savings VIF. The contribution to VIF from new business written in 2010 and the unwind of the discount rate from business written in previous periods more than covers the expected releases from the non-profit and with-profits businesses. Experience variances, investment variances and assumption changes have been positive overall.
Reconciliation of UK long term Risk and Savings VIF
Discounted £bn
Undiscounted£bn
Opening VIF at 1 January 2010 3.68 7.9
Contribution from new business 0.32 0.7
Unwind of discount rate 0.30 n/a
Expected release from non-profit and with-profits businesses1
(0.57)
(0.6)
Closing operational VIF at 31 December 2010
3.73 8.0
Experience variances/ assumption changes
(0.03) (0.1)
Investment variance/economic assumption changes
0.19 0.1
Closing VIF at 31 December 2010 3.89 8.0
1 Comprises the expected release from non-profit business of £522m and With-profits transfer of £46m.
The contribution from long term Risk and Savings new business has grown the VIF on both a discounted and undiscounted basis in 2010. In every year since 2005, when we first published the analysis of the embedded value, the discounted and undiscounted operational VIF has increased; i.e. the contribution from new business written in the period and the unwind of the discount rate on business written in previous periods has exceeded the cash released in the period.
the Group results clearly demonstrate the progress we have made in focusing our businesses on delivering sustainable cash flows.
Group results.
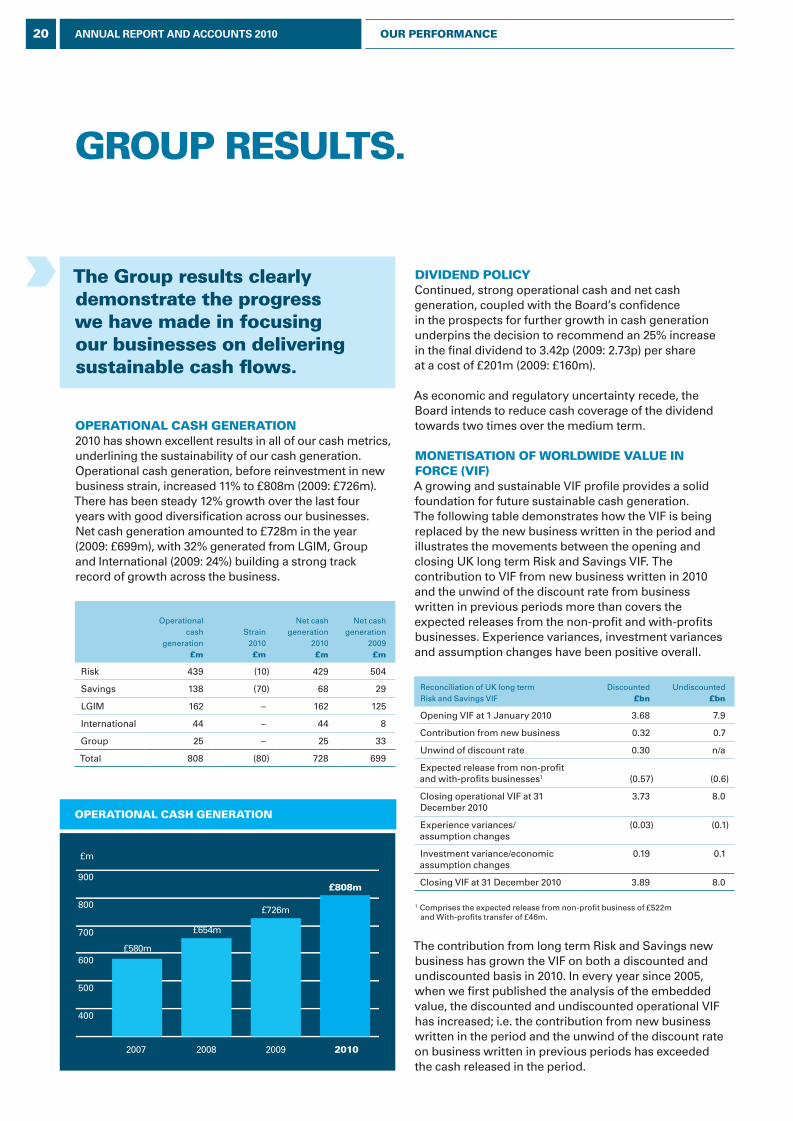
operational casH Generation
operational casH Generation2010 has shown excellent results in all of our cash metrics, underlining the sustainability of our cash generation. Operational cash generation, before reinvestment in new business strain, increased 11% to £808m (2009: £726m). There has been steady 12% growth over the last four years with good diversification across our businesses. Net cash generation amounted to £728m in the year (2009: £699m), with 32% generated from LGIM, Group and International (2009: 24%) building a strong track record of growth across the business.
Operational
cash generation
£m
Strain 2010£m
Net cash
generation 2010£m
Net cash
generation 2009£m
Risk 439 (10) 429 504
Savings 138 (70) 68 29
LGIM 162 – 162 125
International 44 – 44 8
Group 25 – 25 33
Total 808 (80) 728 699
20 ANNUAL REPORT AND ACCOUNTS 2010 our performance
L&G_AR10_03_p18-27_230311_AT.indd 20 25/03/2011 11:14
The operational VIF is largely dependent on sales of annuity, protection and workplace pensions products. Shrinking corporate pension deficits and an ageing UK population will stimulate growth in the Annuities market in which we remain a market leading competitor. In the Protection business, new business sales are resilient and have become less reliant on the housing market. Market growth is likely to be slow but we are set to continue to maintain and increase our market share as these markets consolidate. The Workplace pensions market is set to benefit from auto-enrolment and an expansion of our targeted fee-based market when the Retail Distribution Review (RDR) is implemented. Growth in the scale of the Annuity, Protection and Workplace pensions businesses will benefit the generation of VIF in future years.
In the Savings business, the strategy of selling more capital light products such as mutual funds resulted in growth of 38% in 2010 new business. Sales of Pensions and Bonds are included in the VIF; however sales of unit trusts and ISAs are included in Investments savings on an IFRS basis.
In 2011, £690m of VIF is expected to monetise and come through into surplus. This comprises:
• The expected flows from the UK non profit business. These flows represent the operational cash generation of the UK non profit Risk and Savings business and are broadly equivalent to the release of profit using best estimate assumptions. In 2011, these are anticipated to be £550m;
• the UK with-profits transfer of £70m of which approximately £50m, depending on market conditions, is included in operational cash generation; and
• the modelled one-off short term capital releases of £90m in 2011 which is expected to manifest itself in experience and/or investment variances and augment the IGD surplus. These items primarily relate to the modelled benefit of brought forward tax losses in Legal & General Assurance Society (LGAS) and, over time, should reduce to zero.
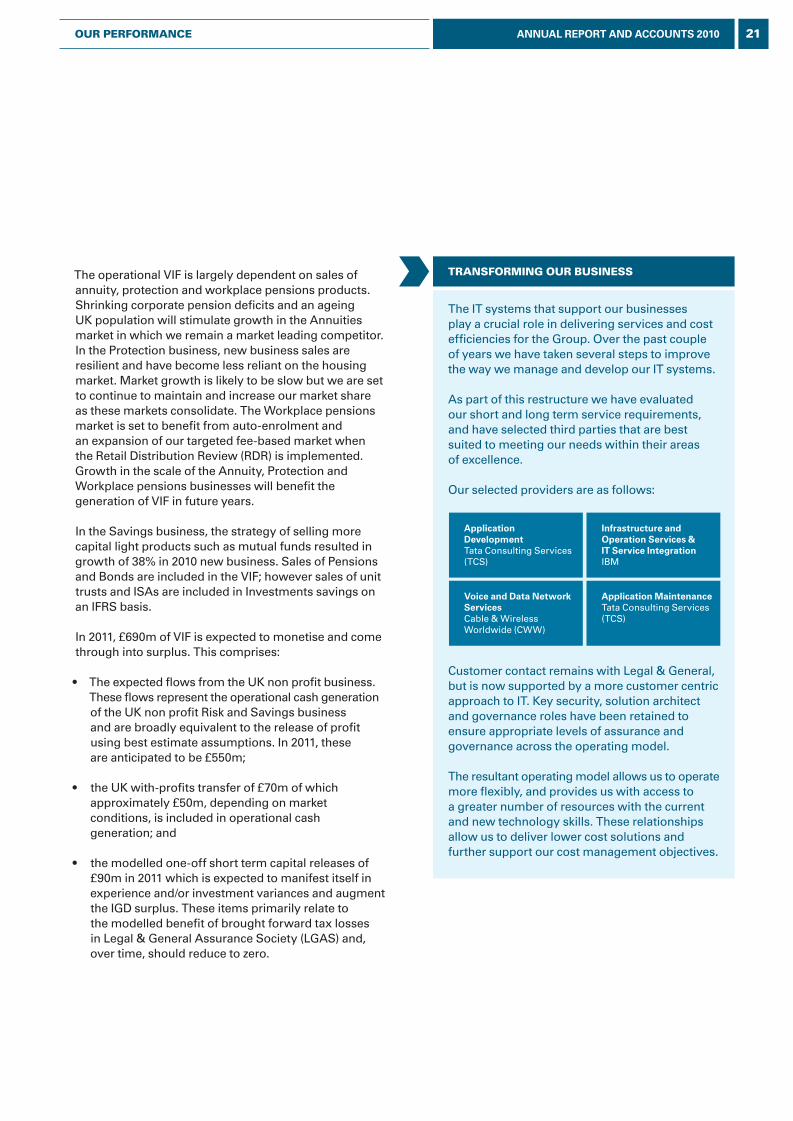
transforminG our business
The IT systems that support our businesses play a crucial role in delivering services and cost efficiencies for the Group. Over the past couple of years we have taken several steps to improve the way we manage and develop our IT systems.
As part of this restructure we have evaluated our short and long term service requirements, and have selected third parties that are best suited to meeting our needs within their areas of excellence.
Our selected providers are as follows:
Customer contact remains with Legal & General, but is now supported by a more customer centric approach to IT. Key security, solution architect and governance roles have been retained to ensure appropriate levels of assurance and governance across the operating model.
The resultant operating model allows us to operate more flexibly, and provides us with access to a greater number of resources with the current and new technology skills. These relationships allow us to deliver lower cost solutions and further support our cost management objectives.
Infrastructure and Operation Services & IT Service IntegrationIBM
Application DevelopmentTata Consulting Services (TCS)
Application MaintenanceTata Consulting Services (TCS)
Voice and Data Network ServicesCable & Wireless Worldwide (CWW)
21ANNUAL REPORT AND ACCOUNTS 2010our performance
L&G_AR10_03_p18-27_230311_AT.indd 21 25/03/2011 11:14
The Group continues to benefit from a strong and robust balance sheet. The estimated IGD surplus increased £0.6bn or 19% to £3.7bn after accruing for the 2010 final dividend. This increase was primarily due to net cash generated coupled with the IGD benefit of the US capital management programme. The IGD coverage ratio stood at 226% at the end of 2010 (2009: 224%).
asset qualityWorldwide assets under management at 31 December 2010 were £365bn of which shareholders have direct exposure to 9% or £34.4bn.
The majority of this shareholder exposure relates to £25.1bn of assets backing our annuity business in Legal & General Pensions Limited (LGPL). These assets also represent the majority of the Group’s fixed interest exposure. At the end of 2010, LGPL’s fixed interest portfolio comprised 98% investment grade bonds and was diversified by geography and by sector. LGPL’s exposure to sovereign debt from Portugal, Ireland, Greece and Spain amounted to less than £30m or 0.1% of the total portfolio.
creDit Default reserveDespite continued market volatility in 2010, the asset portfolio backing the annuity business remains of high quality and experienced no credit defaults. Although in 2010 the corporate default provisions were reduced due to some portfolio de-risking the impact was at least partially offset by new business written in the year plus market movements.
As a consequence, the total credit default provision remains unchanged from year end 2009 at £1.5bn. This represents 64 bps (2009: 68 bps) over the lifetime of the credit held per annum.
liquiDityLegal & General has a limited appetite for liquidity risk and maintains at Group level sufficient liquid assets and standby facilities to meet a prudent estimate of the Group’s cash outflows over a period of two years, as identified through annual planning processes and taking into account the provision of facilities to operational businesses to accommodate their liquidity requirements in extreme stressed scenarios, e.g. pandemic and adverse weather events.
new businessGroup APE for 2010 demonstrated a strong recovery at £1.8bn, 28% up on 2009. Our Risk division maintained strong market positions in individual protection, group protection and annuities. Individual Annuities had a strong 19% growth this year with the increase in normal retirement age and our vesting annuities deal with Zurich. The transformation of our Savings business continued with sales up 38%, within this figure savings investments are up 46% in the year and now account for over half of our capital light sales. Strain as a percentage of Savings PVNBP continued to fall in 2010 to 2.8% (2009: 4.2%).
creDit ratinGs Our current ratings are:
our credit ratings as at 16 march 2011 are:
Rating typeStandard& Poor’s1 Moody’s1 AM Best1 Fitch1,2
Financial strength rating* AA- Aa3 A+ AA-
Long term debt rating A A3 a A
Short term debt rating A-1 P2 n/a n/a
Subordinated debt rating BBB+ Baa1 a- BBB
* For Legal & General Assurance Society (Legal & General Assurance Society is the principal operating company of the Group). All other ratings for Legal & General Group Plc/Legal & General Finance PLC (guaranteed by Legal & General Group Plc).
1 Stable outlook. 2 Based on public information only.
capital strenGtH The principal movements in the estimated Insurance Groups Directive (IGD) surplus during 2010 were:
£bn
iGD capital surplus as at 31.12.09 3.1
Net cash generated 0.7
Profit after tax less net cash 0.1
Dividends (0.3)
US capital management programme 0.1
iGD capital surplus as at 31.12.10 3.7
Group results.
22 ANNUAL REPORT AND ACCOUNTS 2010 our performance
L&G_AR10_03_p18-27_230311_AT.indd 22 25/03/2011 11:14
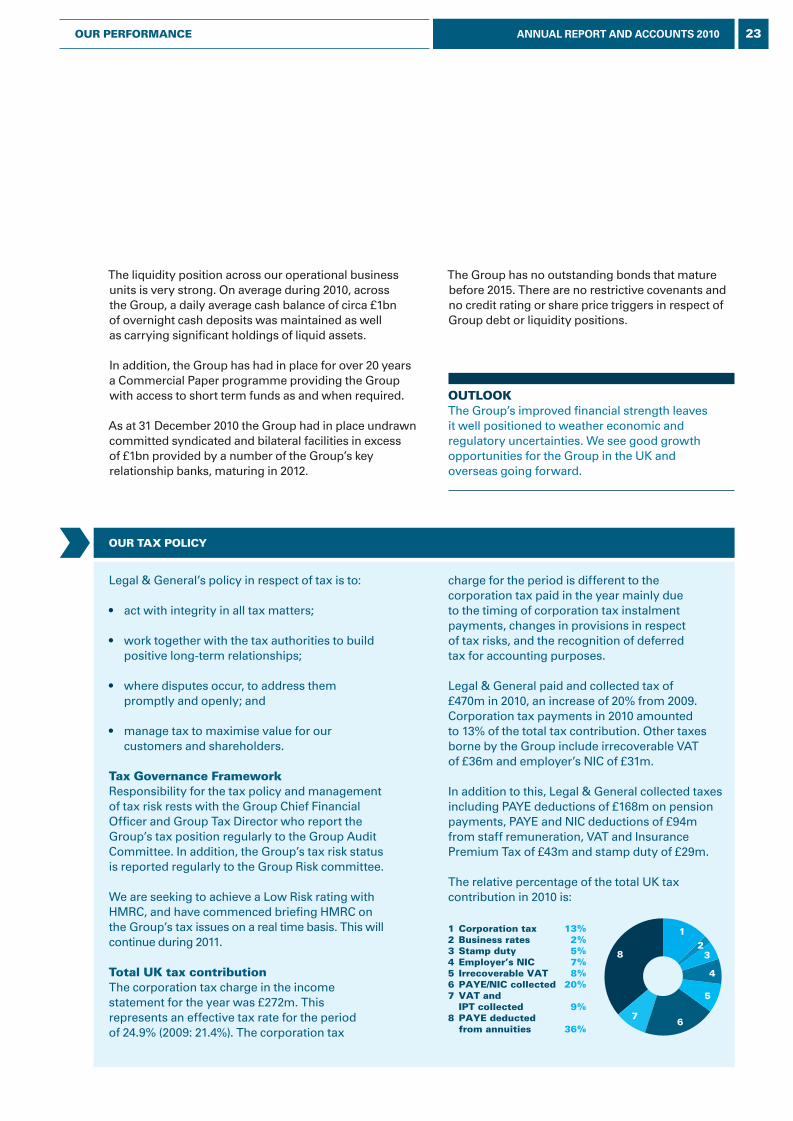
1 Corporation tax 13%2 Business rates 2%3 Stamp duty 5%4 Employer’s NIC 7%5 Irrecoverable VAT 8%6 PAYE/NIC collected 20%7 VAT and IPT collected 9%8 PAYE deducted from annuities 36%
5
67
8
4
32
1
our tax policy
The Group has no outstanding bonds that mature before 2015. There are no restrictive covenants and no credit rating or share price triggers in respect of Group debt or liquidity positions.
The liquidity position across our operational business units is very strong. On average during 2010, across the Group, a daily average cash balance of circa £1bn of overnight cash deposits was maintained as well as carrying significant holdings of liquid assets.
In addition, the Group has had in place for over 20 years a Commercial Paper programme providing the Group with access to short term funds as and when required.
As at 31 December 2010 the Group had in place undrawn committed syndicated and bilateral facilities in excess of £1bn provided by a number of the Group’s key relationship banks, maturing in 2012.
Legal & General’s policy in respect of tax is to:
• act with integrity in all tax matters;
• work together with the tax authorities to build positive long-term relationships;
• where disputes occur, to address them promptly and openly; and
• manage tax to maximise value for our customers and shareholders.
tax Governance frameworkResponsibility for the tax policy and management of tax risk rests with the Group Chief Financial Officer and Group Tax Director who report the Group’s tax position regularly to the Group Audit Committee. In addition, the Group’s tax risk status is reported regularly to the Group Risk committee.
We are seeking to achieve a Low Risk rating with HMRC, and have commenced briefing HMRC on the Group’s tax issues on a real time basis. This will continue during 2011.
total uK tax contributionThe corporation tax charge in the income statement for the year was £272m. This represents an effective tax rate for the period of 24.9% (2009: 21.4%). The corporation tax
charge for the period is different to the corporation tax paid in the year mainly due to the timing of corporation tax instalment payments, changes in provisions in respect of tax risks, and the recognition of deferred tax for accounting purposes.
Legal & General paid and collected tax of £470m in 2010, an increase of 20% from 2009. Corporation tax payments in 2010 amounted to 13% of the total tax contribution. Other taxes borne by the Group include irrecoverable VAT of £36m and employer’s NIC of £31m.
In addition to this, Legal & General collected taxes including PAYE deductions of £168m on pension payments, PAYE and NIC deductions of £94m from staff remuneration, VAT and Insurance Premium Tax of £43m and stamp duty of £29m.
The relative percentage of the total UK tax contribution in 2010 is:
outlooK The Group’s improved financial strength leaves it well positioned to weather economic and regulatory uncertainties. We see good growth opportunities for the Group in the UK and overseas going forward.
23ANNUAL REPORT AND ACCOUNTS 2010our performance
L&G_AR10_03_p18-27_230311_AT.indd 23 25/03/2011 11:14
individual protectionCovers individuals or families against fi nancial losses arising from defi ned events such as death, disability or critical illness.
Group protectionProducts which are designed for employers to offer as a benefi t to their employees. They protect employers, employees and their families by assuming the risks and associated costs of an employee falling ill or dying while in employment.
annuitiesBought by people converting a lump sum (money saved in a pension scheme) into a lifelong income.
bulk purchase annuities (bpas) or pension buyoutsBPAs are offered to pension trustees and companies wishing to transfer all or part of their pension obligations and risk from company pension schemes to an insurance company for a negotiated price.
General insurance (Gi)Focusing on the household sector, we insure the fabric of properties and their contents.
network and mortgage clubOur network of mortgage advisers provides a link with mortgage lenders, sourcing mortgages for clients and facilitating sales of mortgage linked protection products.
our proDucts
risK businesses.
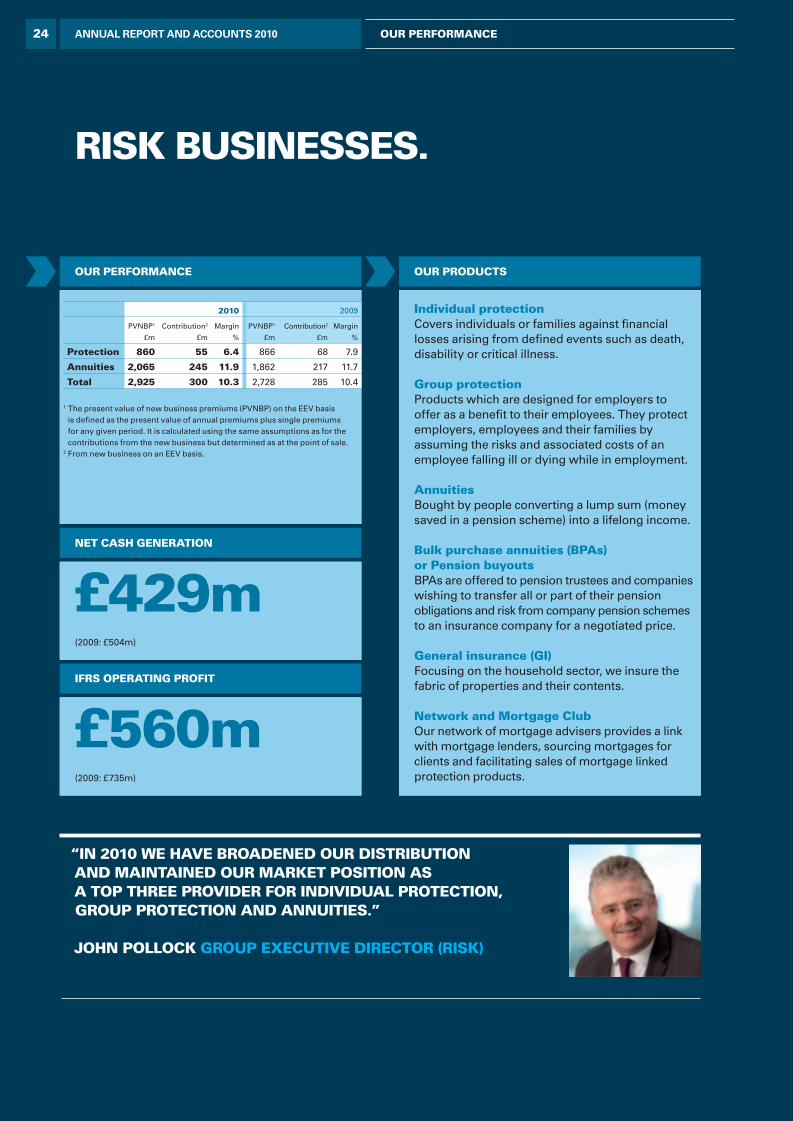
“in 2010 we Have broaDeneD our Distribution anD maintaineD our marKet position as a top tHree proviDer for inDiviDual protection, Group protection anD annuities.”
JoHn pollocK Group executive Director (risK)
£429m(2009: £504m)
£560m(2009: £735m)
net casH Generation
ifrs operatinG profit
our performance
2010 2009
PVNBP1
£m
Contribution2
£m
Margin
%
PVNBP1
£m
Contribution2
£m
Margin
%
protection 860 55 6.4 866 68 7.9
annuities 2,065 245 11.9 1,862 217 11.7
total 2,925 300 10.3 2,728 285 10.4
1 The present value of new business premiums (PVNBP) on the EEV basis is defi ned as the present value of annual premiums plus single premiums for any given period. It is calculated using the same assumptions as for the contributions from the new business but determined as at the point of sale.
2 From new business on an EEV basis.
24 ANNUAL REPORT AND ACCOUNTS 2010 our performance
L&G_AR10_03_p18-27_230311_AT.indd 24 25/03/2011 11:14
Awards won by our Risk businesses in 2010 include:
• Money Marketing: Best Life Protection Provider
• Moneywise Customer Services Awards: Most trusted Income Provider
• Financial Adviser Life & Pensions Awards: Term Assurance Provider of the Year
• Financial Adviser Life & Pensions Awards: Critical Illness Provider
• Life & Pensions Moneyfacts Awards: Most Competitive IFA Provider
• Personal Touch Financial Services Awards: Product Provider of the Year award
• Personal Touch Financial Services Awards: Best Protection Provider
• Cover Excellence Awards: Group Life Provider
• Cover Excellence Awards: Group Critical Illness Provider
• Cover Excellence Awards: Individual Critical Illness Provider
• Mortgage Strategy: Best Strategic Partner
• Mortgage Strategy: Best Mortgage Distributor
• British Mortgage Awards: Best Mortgage Club
manaGinG lonGevity risK Longevity risk is a primary insurance risk within an annuity business. Until recently there has been a very limited secondary market for hedging this risk and we have therefore retained and managed longevity risk in-house.
The Annuity business has built up a considerable amount of expertise in analysing current mortality trends using our large database of past experience. Future longevity trends will be impacted by a range of inter-connected factors, including developments in medical science, lifestyle trends, economic and government policies. It is impossible to predict the ultimate outcome, but insight can be gained to the range of possible outcomes, their likelihood and impact. We employ a variety of actuaries, statisticians, demographers and epidemiologists, and have strong links with the medical profession and relevant organisations through our links with UCL and the Longevity Science Advisory panel.
We are closely involved in the growing secondary market for reinsuring longevity which gives the opportunity to selectively manage longevity exposure, giving us the ability to reinsure risks where pricing looks attractive.
The Annuity business is also taking a leading role in the Life & Longevity Markets Association (LLMA), which aims to develop wider capital markets participation in longevity risk.
focus on risK manaGementawarDs anD acHievements
tHe leGal & General networK
We have created the Legal & General Network as a single in-house distribution entity to deliver market outperformance, especially in the mortgage and protection sectors. We have a unique set of competencies which can be leveraged to support the mortgage and housing led intermediary market where we expect advice to remain important to the majority of UK consumers.
Legal & General has a 14.7% (2009: 12.1%) share of the intermediated lending market. The Legal & General Mortgage Club is a leading mortgage
distributor in the market and in 2010 eight new lenders chose to partner with Legal & General.
We are well positioned for the Mortgage Market Review, which is proposing changes to the FSA regulatory regime and with two years to go before full implementation of the Retail Distribution Review.
The pace of consolidation of distribution continues to increase and we will be examining ways to profi t from this by growing our share in a diffi cult market.
ANNUAL REPORT AND ACCOUNTS 2010our performance 25
L&G_AR10_03_p18-27_230311_AT.indd 25 25/03/2011 11:14
2010 saw the continued growth of the successful partnership with Nationwide Building Society, sustained volumes from Legal & General Network and a new panel arrangement with Openwork. Direct business increased to 6% of total APE, reflecting an increase in marketing activity on the Over 50s product and the development of our affinity partnership with Bounty.
We have increased the maximum expiry age for our individual critical illness cover (CIC) from age 65 to age 70, reflecting developments in employment trends caused by changes such as the removal of the default retirement age and the increase in the state pension age. We have also increased the maximum sum assured for CIC, meeting the needs of more high net worth customers who need a higher level of cover. Both our income protection and CIC products now have a Defaqto 5 star rating.
In November, we successfully moved Nationwide Building Society, our largest tied protection partner, to our core protection system OLP Connect. This has enabled processing efficiencies for both companies and delivers an improved customer experience. Over 90% of applications are now received online through OLPC.
Group protectionIn group protection, traditional corporate markets continue to be adversely impacted by falling staff numbers and wage freezes. However, volumes have been maintained against this backdrop with APE of £57m (2009: £57m) through successful distribution, product innovation and continued investment in systems improvements such as the policy administration platform Elixir.
We have developed an Ill Health Liability Insurance product which allows UK Councils to manage their exposure to workers’ early retirement pensions when diagnosed with long-term illness. We were the first provider in the group market to provide employers with an income protection product allowing them to cover all of their employees, whatever their age, following the removal of the default retirement age.
Our group protection business was the first in the group market to offer tele-underwriting and the first to provide a free Employee Assistance Programme (EAP) to all group life members. We have expanded into the multinational pooling market in order to offer a global solution to corporate customers and have developed superior service and risk-assessment capabilities that have enabled us to grow our business by 40% in the last five years, with 88% of our customers staying year on year.
we continue to improve tHe proDucts across our risK businesses ensurinG tHat customer fairness is at tHe centre of our business moDel.
business volumes increaseD by 4% on 2009 Despite a cHallenGinG environment wHere volumes fell across tHe inDustry Due to fallinG payrolls, reDuceD mortGaGe funDs anD activity anD consoliDation in tHe marKetplace.
risK businesses.
Risk products are distributed through bank and building society partners, IFAs and consultants, direct sales and the Legal & General Network.
In 2010, the Risk division achieved £439m of operational cash generation (2009: £454m). Net cash generation was £429m (2009: £504m) as positive new business strain arising from exceptional pricing conditions in annuities receded. Operating profit was £560m (2009: £735m) but IFRS profit before tax was up 28% to £662m following the reversal of negative investment variances seen in 2009. IFRS operating profit at £560m (2009: £735m) was well ahead of target, although down on the previous year due to one off events such as exceptional annuities pricing in 2009.
inDiviDual protectionIn individual protection, the weak housing market continues to depress demand although intermediaries within the protection market are replacing the loss of income from mortgage business with other protection sales. New Business APE remained strong at 96% of that achieved in 2009. During the year, competitors have withdrawn from the market and there has been some consolidation.
26 ANNUAL REPORT AND ACCOUNTS 2010 our performance
L&G_AR10_03_p18-27_230311_AT.indd 26 25/03/2011 11:14
Our group life business paid out £196 million in claims to help relieve the financial suffering of over 2,000 dependants in 2010 and our group critical illness product has been improved with the addition of more conditions, the inclusion of a shorter survival period and a substantial increase in the free limit.
annuitiesOverall APE for annuities was 11% higher than in 2009 at £207m (2009: £186m). The overall annuities profit (including investment variance) stands at £458m (2009: £348m).
Individual Annuities delivered record volumes of more than £1.1bn in 2010 and full year APE grew by 19% (2009: £979m). Individual Annuities benefited from increased direct business and higher volumes through our relationship with SAGA; additionally there was a one off uplift as the minimum retirement age increased to 55. There was also growth in the enhanced annuities market where sophisticated pricing increased market share.
We expect to continue to grow in this area having entered into an annuity partnership deal with Zurich Financial Services to provide annuities for their pension customers from October.
In the bulk annuity market we continued to focus on small schemes, writing 115 schemes during the year (2009: 82 schemes) worth £900m of premium. We continue to be highly selective in the large bulk annuity market writing only one scheme in excess of £100m premiums.
General insuranceIn general insurance, gross written premiums of £281m are slightly up on 2009 (2009: £273m) and new business is ahead of 2009 with a new banking distribution deal signed in the period. Operating expenses have been controlled in line with business growth.
An IFRS operating loss of £(8)m reflects two periods of severe cold weather in the year. In January claims reached £14m and at the end of the year, during what the Meteorological Office has reported as the coldest December in the last 100 years, claims are estimated to be in excess of £30m. This experience is expected to be in line with the market and, despite the volume of December claims, action has been taken to protect customer service levels and good progress has been made around initial loss assessment visits.
outlooK Demand for protection products is likely to increase as the UK economy comes out of recession. Regulatory and state benefit changes will continue to drive product and distribution innovation. In particular, the ECJ ruling with respect to gender discrimination will affect underwriting and pricing in individual protection. Low annuity rates and the removal of compulsion to annuitise will encourage the more wealthy to look for alternative retirement income methods, and could lead to increased deferral of annuitisation across the market. In the BPA market, reinsurance will increasingly be used to limit the risk and capital required to support both new and existing businesses as the impact of pension liabilities on companies’ balance sheets continues to be exposed. We expect competition consolidation to continue in the protection markets and distribution arrangements to be impacted by the changes the Retail Distribution Review (RDR) will bring to this landscape.
DistributionIn the IFA market, we have consolidated our position by agreeing a panel arrangement with Sesame, the largest network in the market. We also gained a key position on the Openwork panel, which should provide new APE of £2m.
In the banks and building societies arena we continue to maximise scale from the large volume distributors such as Nationwide Building Society and Barclays while working with partners such as Sainsbury’s Bank to deliver more innovation.
The Legal & General Network had another strong year in 2010, maintaining distribution capacity in contrast to the general reduction of advisers in the market as a whole. The Legal & General Network is well placed, with significant strategic advantages, to outperform in the intermediary market.
We have taken steps to enhance future distribution through a number of strategic investments in additional technological solutions and platforms.
27ANNUAL REPORT AND ACCOUNTS 2010our performance
L&G_AR10_03_p18-27_230311_AT.indd 27 25/03/2011 11:14
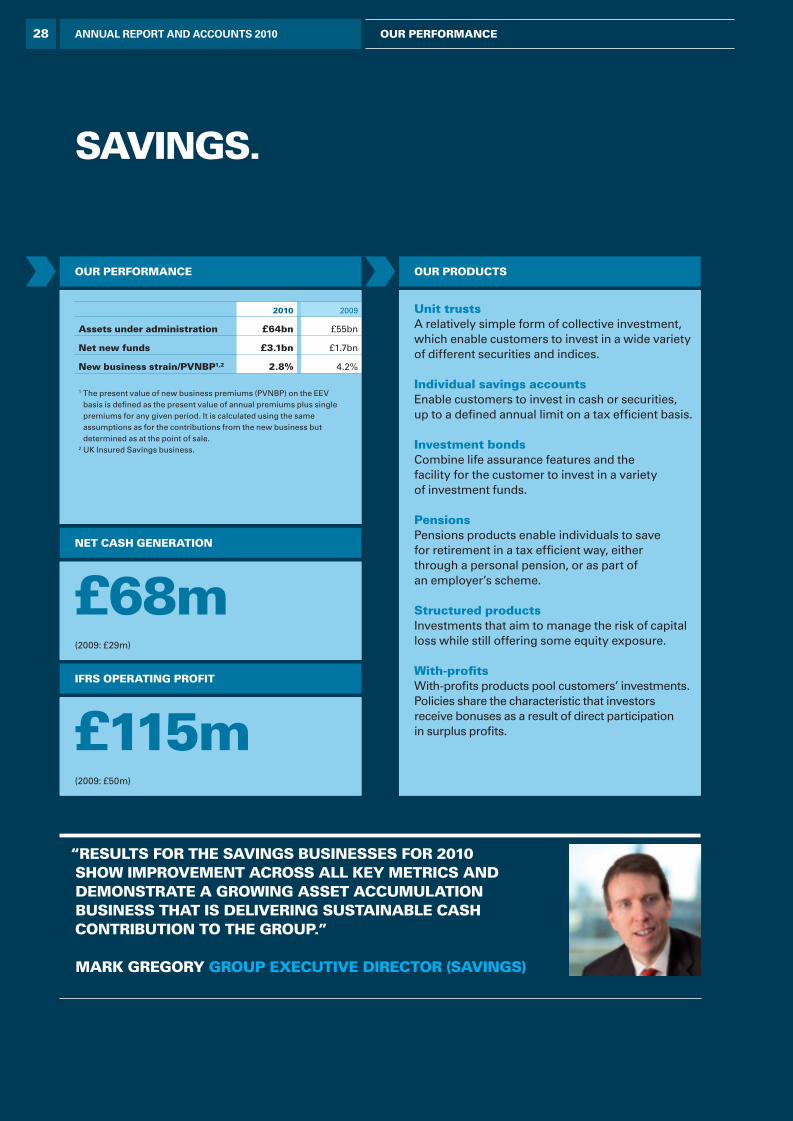
unit trustsA relatively simple form of collective investment, which enable customers to invest in a wide variety of different securities and indices.
individual savings accountsEnable customers to invest in cash or securities, up to a defi ned annual limit on a tax effi cient basis.
investment bondsCombine life assurance features and the facility for the customer to invest in a variety of investment funds.
pensionsPensions products enable individuals to save for retirement in a tax effi cient way, either through a personal pension, or as part of an employer’s scheme.
structured productsInvestments that aim to manage the risk of capital loss while still offering some equity exposure.
with-profi tsWith-profi ts products pool customers’ investments. Policies share the characteristic that investors receive bonuses as a result of direct participation in surplus profi ts.
our products
“results for the savings businesses for 2010 show improvement across all key metrics and demonstrate a growing asset accumulation business that is delivering sustainable cash contribution to the group.”
mark gregory group executive director (savings)
£68m(2009: £29m)
£115m(2009: £50m)
net cash generation
ifrs operating profit
our performance
savings.
2010 2009
assets under administration £64bn £55bn
net new funds £3.1bn £1.7bn
new business strain/pvnbp1,2 2.8% 4.2%
1 The present value of new business premiums (PVNBP) on the EEV basis is defi ned as the present value of annual premiums plus single premiums for any given period. It is calculated using the same assumptions as for the contributions from the new business but determined as at the point of sale.
2 UK Insured Savings business.
ANNUAL REPORT AND ACCOUNTS 2010 our performance28
L&G_AR10_04_p28-39_230311_AT.indd 28 25/03/2011 11:15
• Technology, Administration and Service Awards: Insured Hybrid SIPP and Group Pensions Provider of the year 2010
• Technology, Administration and Service Awards: Income drawdown and phased retirement provider for 2010 (Suffolk Life)
• Pensions and Investments Provider for Group SIPP 2010
• Defaqto 5 star rating for the MasterSIPP in 2011 (Suffolk Life)
• Investor in Customers 2 star ‘Outstanding’ Award 2010 (Suffolk Life)
preparing for the retail distribution review (rdr)Legal & General has set up a Group wide programme to assess the potential impacts of the RDR and ensure that we are well positioned to continue to operate successfully after implementation of these changes.
The key challenges are to predict what the distribution landscape will look like post-RDR, the changing shape of consumer demand and the impact this has on product providers operating in the retail fi nancial services market.
We believe there are four key requirements for fi rms to be successful:
strong engagement with customers
effi cient processes underpinned with good quality technology
scale in mass market products
a wide product range capable of supporting customer needs.
Our strategy and investment business case has been agreed by the Board and we are now moving from the strategy and planning phase into implementation. Initial focus will be on ensuring compliance with the RDR rules, preparing to facilitate the payment of adviser charges and developing an extended proposition for partners.
focus on risk managementawards and achievements
workplace savings
We were the fi rst company to launch a workplace ISA, an effective low cost, high penetration distribution method to encourage increased levels of savings.
A Company ISA (CISA) provides employees with the same tax effi ciency as a personal ISA, but with the added benefi ts for employees of much lower management charges and the convenience of making payments from payroll deductions. For employers it brings greater employee engagement from providing relevant benefi ts, heralding a new dimension of added convenience in workplace saving.
Barratt, the biggest house builder by volume in Britain, selected Legal & General to provide the UK’s fi rst CISA plan for employees, the Barratt ISA. The Barratt ISA, which is a stock and shares ISA, has an annual allowance of £10,200 for the 2010/2011 tax year. It has no income tax or capital gains tax, enabling employees to potentially increase investment returns.
This plan could be used to help employees to build up mid to long term savings in addition to their pension contributions and could be switched to their pension fund at a later date if required.
ANNUAL REPORT AND ACCOUNTS 2010our performance 29
L&G_AR10_04_p28-39_230311_AT.indd 29 25/03/2011 11:15
savings.
The 2010 Savings results show improvement across all key metrics. There has been continued improvement in financial management across our Savings businesses; reducing commissions paid to intermediaries, increasing fees on some products and withdrawing products which had high reserving costs.
As anticipated, the steps taken to reduce reliance on products with high levels of commission and long payback periods has resulted in a reduction in sales of stakeholder pensions and with-profits products.
Net cash generation saw an increase of 134% to £68m and IFRS operating profit at £115m (2009: £50m) delivered a 130% improvement on the previous year. New business APE increased 38% on 2009 to £1,253m (2009: £907m). Overall, net new funds increased £3.1bn versus £1.7bn in 2009, with Assets under Administration growth of 16% to £64bn (2009: £55bn). individual savingsThe scale of our structured products business continues to grow through our extended distribution agreement with Nationwide Building Society. This business has been further diversified with the addition of distribution partners including HSBC and RBS which has led to APE growing 85% to £183m.
Structured Products have benefited from the low interest rate environment experienced over the last two years and investors have taken the opportunity to seek higher returns with limited exposure to loss. We have a proven ability to manufacture structured products in a timely basis and we anticipate future opportunities in the market.
Changes to the tax regime continue to impact the savings landscape. The reduction in tax allowance on yearly pension contributions to £50,000 will encourage high earners to look for more flexible, tax efficient solutions for their long term savings needs. In response to this we launched a new Portfolio Regular Investment Plan (PRIP) in October to assist high net worth individuals with inheritance tax and retirement planning.
Offshore Bond sales delivered record APE growth of 463%, rising to £45m (2009: £8m) with particular success through the banks and building society distribution channels.
Re-engineering of the Self-Invested Personal Pension (SIPP) product, and the development of a combined high net worth (HNW) offering with LGII should help to build volume of this product.
during 2010 we have continued to implement the strategy outlined in 2009. our focus continues to be on building an asset accumulation and servicing business which makes an increasing cash contribution to group profitability. product mix has shifted towards modern, less capital intensive products to achieve this objective.
the overall number of customers for the savings business has increased by 7%, with an increase of 36% in the number of workplace schemes in force to 102 (2009: 75).
Savings products are distributed through bank and building society partners, IFAs and direct sales.
30 ANNUAL REPORT AND ACCOUNTS 2010 our performance
L&G_AR10_04_p28-39_230311_AT.indd 30 25/03/2011 11:15
individual investments In the Unit Trust market we continue to work on building our brand recognition, increase our range of funds and improve our fund capability.
We are the market leaders in retail index funds, a concept that is broadly expected to grow in usage after the Retail Distribution Review (RDR) implementation. In 2010, five of our funds had market share of gross industry sales exceeding 5% of their IMA sector.
Strong performance was shown by a range of other funds including the UK Alpha fund, the three multi-manager funds, the new Absolute Return fund and our three Corporate Bond funds.
There has been continued growth of 32% in the L&G Investments (UTM) business reflecting the success in the IFA sector to £263m (2009: £199m) and the strong investment performance in 2010 has delivered an investment platform on which to build sustained growth.
workplace savingsWe have made a number of product and proposition enhancements to our Worksave platform in 2010 and continue to win mandates with large blue-chip organisations to provide their employees with worksave schemes. The target plan volumes for 2010 were comfortably exceeded with the successful completion of major scheme acquisitions including Alliance Boots, BAM and AstraZeneca. We now have pension scheme relationships with 15% of the FTSE 100 companies.
The introduction of pension scheme auto-enrolment from 2012 is likely to expand the marketplace for workplace pensions, with increased activity on tenders and employers looking to minimise costs. In addition, there will be opportunities to drive further growth from the inforce book as membership of existing schemes increases.
Two new initiatives have been launched which are designed to meet the auto-enrolment challenges facing employers: Worksave choice, which is designed to manage the process for enrolling or opting out of auto-enrolment into a trust-based qualifying pension scheme, and Worksave Pension Trust which provides a qualifying pension scheme that can offer refunds of contributions for short service leavers.
distributionPlans are well under way to prepare our product range for the post-RDR world. The renewal of our distribution deal with Nationwide Building Society to provide RDR compliant investment products and services until 2016 is an important aspect of this preparation.
We also have retail savings relationships with the majority of Banks and Building Societies in the UK, including Barclays, Lloyds Banking Group, RBS, HSBC and Yorkshire Building Society.
Investment platforms are set to benefit from the changes that RDR will bring, with key IFAs expected to align with a platform of choice. We retain our 25% shareholding in Cofunds. However, we have removed the remaining exclusivity provisions so that we can work with advisers and distributors that have selected other platforms.
Our own platform, Investor Portfolio Service (IPS), is growing in scale amongst our tied distribution and banking partners, and is aligned to our strategy of continuing to increase customer numbers and build asset growth by deepening relationships with existing customers. Our WorkSave platform will continue to benefit from the emerging trend towards holistic workplace savings propositions.
outlook Significant changes to the Savings landscape over the coming few years, including RDR and auto-enrolment, should provide real opportunities for growth. The implementation of RDR from 2012 should favour asset management products including structured products and unit trusts, which have been a strong growth story within Savings during 2010. The recently signed contract extension with Nationwide Building Society will serve to enforce this position. Our overall focus in 2011 will be to drive continued cash generation from the investments business, through improved scaIe and operating model efficiency gains, while continuing to invest at appropriate levels. Cost efficiencies and servicing options will further reduce operating costs and improve profitability.
31ANNUAL REPORT AND ACCOUNTS 2010our performance
L&G_AR10_04_p28-39_230311_AT.indd 31 25/03/2011 11:15
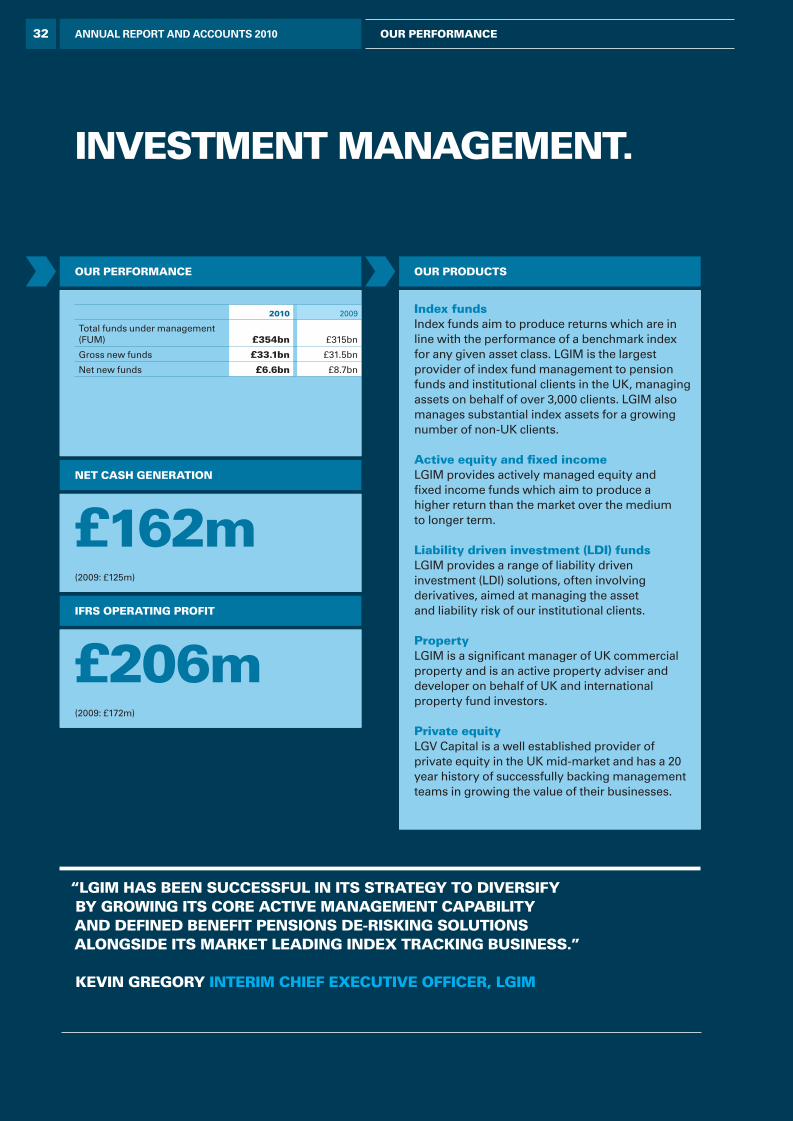
2010 2009
Total funds under management (FUM) £354bn £315bn
Gross new funds £33.1bn £31.5bn
Net new funds £6.6bn £8.7bn
index fundsIndex funds aim to produce returns which are in line with the performance of a benchmark index for any given asset class. LGIM is the largest provider of index fund management to pension funds and institutional clients in the UK, managing assets on behalf of over 3,000 clients. LGIM also manages substantial index assets for a growing number of non-UK clients.
active equity and fi xed incomeLGIM provides actively managed equity and fi xed income funds which aim to produce a higher return than the market over the medium to longer term.
liability driven investment (ldi) fundsLGIM provides a range of liability driven investment (LDI) solutions, often involving derivatives, aimed at managing the asset and liability risk of our institutional clients.
propertyLGIM is a signifi cant manager of UK commercial property and is an active property adviser and developer on behalf of UK and international property fund investors.
private equityLGV Capital is a well established provider of private equity in the UK mid-market and has a 20 year history of successfully backing management teams in growing the value of their businesses.
£162m(2009: £125m)
£206m(2009: £172m)
net cash generation
our products
“lgim has been successful in its strategy to diversify by growing its core active management capability and defined benefit pensions de-risking solutions alongside its market leading index tracking business.”
kevin gregory interim chief executive officer, lgim
investment management.
ifrs operating profit
our performance
ANNUAL REPORT AND ACCOUNTS 2010 our performance32
L&G_AR10_04_p28-39_230311_AT.indd 32 25/03/2011 11:15
2010 awards, achievements, recognition
• Engaged Investor Awards: Best Client Service by an Investment Manager
• Financial News Awards for Excellence in Institutional Client Service – Europe 2010: Best DC Member Support
• UK Professional Pensions Awards: DC Investment Only Provider of the Year
• Mayor of London Green Awards 2010: Green Portfolio Award
• Mayor of London Green Awards 2010: Building Improver Award – 99 Gresham Street
• Property Awards 2010: Property Fund Manager of the Year
investmentsRisk management is an essential building block of LGIM’s approach to management.
As one of the UK’s largest investment management groups, our fund managers have a long history of managing risk within fund and client guidelines. From consistently replicating market indices through our index funds to managing the effects of the credit crisis within our range of active fi xed income portfolios, we are experts in adapting to a changing marketplace.
Risk management is critical for our business and of utmost importance to our investors. In order to ensure different types of risks are given an explicit focus, independent oversight is given to market, credit, liquidity, operational, regulatory and legal risks. These risk management activities have separate reporting lines to our investment teams and are overseen by a governance framework of senior committees and ultimately the Board.
While our size allows us to deploy signifi cant resource behind understanding and managing the legal, regulatory and operating environment, it is the proven processes, experience and skill of our teams which we believe is critical to ensuring risk is managed effectively.
focus on risk managementawards and achievements
united nations principles for responsible investment
During 2010, LGIM expanded its long-established UK corporate governance and voting activities to the major international equity markets. LGIM has now signed up to the United Nations’ Principles of Responsible Investment (UNPRI). This is an initiative to encourage asset managers, asset owners and advisory companies around the world to incorporate environmental, social and governance issues into their investment analysis, develop engagement policies and seek appropriate disclosures from the companies in which they invest.
This is signifi cant both for LGIM and the global investment community as LGIM is one of the largest index tracking managers to be participating in the scheme worldwide. Signatories to the scheme commit to six fundamental principles of responsible ownership and governance and must complete an annual survey on which they are assessed on how effectively they have integrated the principles into their business.
ANNUAL REPORT AND ACCOUNTS 2010our performance 33
L&G_AR10_04_p28-39_230311_AT.indd 33 25/03/2011 11:15
lgim is one of the largest investors in the uk stock market and the largest manager of uk sourced pension assets. over 4% of the uk equity market is held by lgim on behalf of its clients.
lgim offers a full range of passive and active fund management for pension and institutional clients across a range of asset classes.
investment management.
A key theme in the index fund market has been the provision of passive fund management across alternatively weighted funds. This has extended our range of index tracking products.
internationalisationLGIM’s international distribution strategy has led to a 177% increase in gross inflows from overseas clients of £6.1bn (2009: £2.2bn).
2010 saw the successful launch of the first in a series of new pooled funds structured as an Open Ended Investment Company (OEIC) which meets the requirements of European Institutional investors. This builds on our evolving euro credit capabilities with mandates won this year in Scandinavia, Germany and Holland.
We are growing our ability to service international markets such as the Middle East and continue to expand in the US with mandate wins in Liability Driven Investment and Active Fixed Income.
index fundsIndex fund management remains a core part of LGIM’s business. As at the end of December 2010, total passive assets under management were £229bn (2009: £208bn) and gross new business amounted to £23.7bn in 2010 (2009: £23.9bn). Our flagship funds continued to consistently track their indices, producing returns with a healthy, positive bias versus their benchmarks while remaining within their target tracking tolerances. The size and stability of the client base within our market leading index tracking business has resulted in high persistency and good quality earnings.
liability driven investment (ldi)The de-risking of defined benefit pension schemes continues across our client base in the UK and increasingly in the US. LGIM and L&G are uniquely positioned as the provider that can help clients with all their risk management needs from defined benefit de-risking including moving to insured solutions to replacing with a flexible defined contribution or workplace savings arrangement. By the end of 2010, LDI funds assets under management for our UK pension clients had grown to £40.8bn from £29.9bn at the end of 2009 (growth of 36%).
The pipeline for LDI business remains strong from the largest clients who require a full integrated asset liability management service to the smallest clients who require flexible pooled solutions. LGIM remains dedicated to providing a leading service to all our clients.
Legal & General Investment Management (LGIM) delivered record IFRS operating profit of £206m in 2010, an increase of 20% over 2009 (2009: £172m). New business volumes of £33.1bn in 2010 were up 5% on the same period last year (2009: £31.5bn). Funds under management at the end of the year were £354bn, a 12% increase from £315bn at the end of 2009.
The increase in funds under management is across all asset classes and can be attributed to the recovery of markets and strong new business flows.
As the largest manager of UK sourced pension assets, we continue to strengthen our services for Defined Contribution (DC) corporate pension funds. In 2010 we introduced mid-day priced funds aimed at the DC platform market. We will further bolster this offering with the introduction of a multi-manager and blending capability.
LGIM clients include pension funds, institutional investors, corporates, charities and life companies
34 ANNUAL REPORT AND ACCOUNTS 2010 our performance
L&G_AR10_04_p28-39_230311_AT.indd 34 25/03/2011 11:15
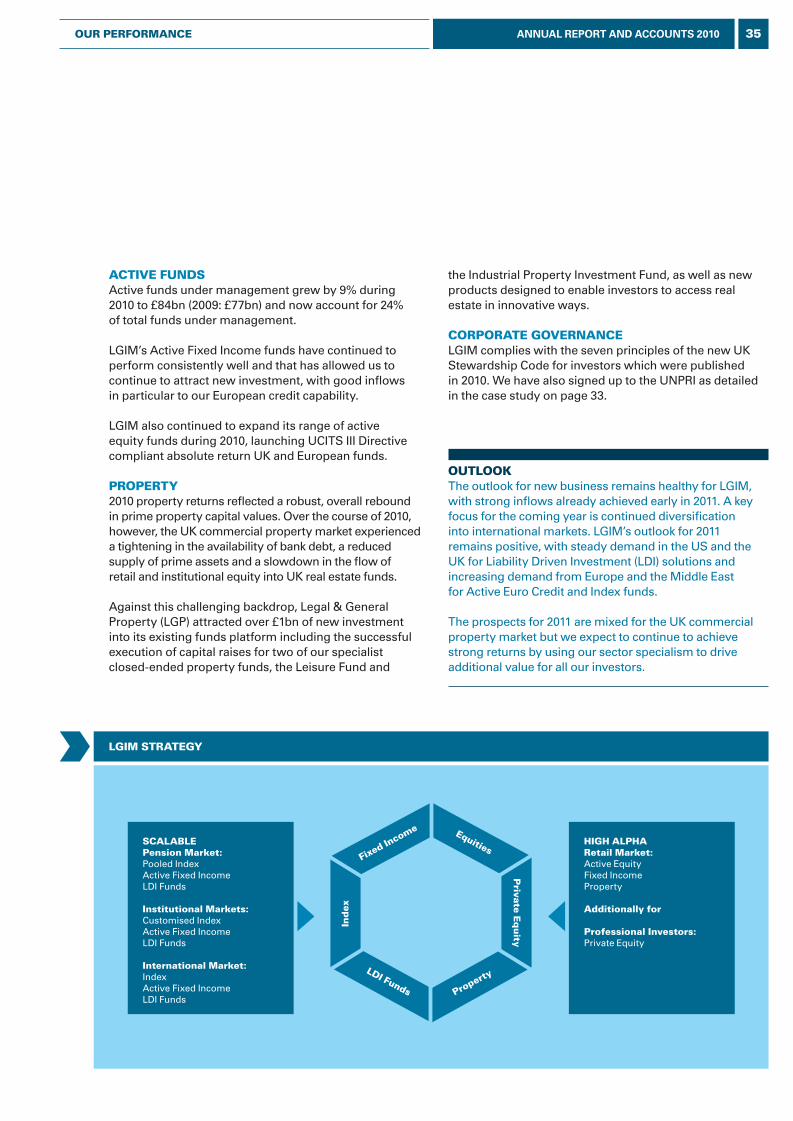
fixed income
ind
ex
private e
quity
equities
ldi funds property
scalablepension market:Pooled IndexActive Fixed IncomeLDI Funds
institutional markets:Customised Index Active Fixed Income LDI Funds
international market:IndexActive Fixed Income LDI Funds
high alpharetail market:Active EquityFixed IncomeProperty
additionally for
professional investors:Private Equity
the Industrial Property Investment Fund, as well as new products designed to enable investors to access real estate in innovative ways.
corporate governanceLGIM complies with the seven principles of the new UK Stewardship Code for investors which were published in 2010. We have also signed up to the UNPRI as detailed in the case study on page 33.
outlook The outlook for new business remains healthy for LGIM, with strong inflows already achieved early in 2011. A key focus for the coming year is continued diversification into international markets. LGIM’s outlook for 2011 remains positive, with steady demand in the US and the UK for Liability Driven Investment (LDI) solutions and increasing demand from Europe and the Middle East for Active Euro Credit and Index funds.
The prospects for 2011 are mixed for the UK commercial property market but we expect to continue to achieve strong returns by using our sector specialism to drive additional value for all our investors.
active fundsActive funds under management grew by 9% during 2010 to £84bn (2009: £77bn) and now account for 24% of total funds under management.
LGIM’s Active Fixed Income funds have continued to perform consistently well and that has allowed us to continue to attract new investment, with good inflows in particular to our European credit capability.
LGIM also continued to expand its range of active equity funds during 2010, launching UCITS III Directive compliant absolute return UK and European funds.
property2010 property returns reflected a robust, overall rebound in prime property capital values. Over the course of 2010, however, the UK commercial property market experienced a tightening in the availability of bank debt, a reduced supply of prime assets and a slowdown in the flow of retail and institutional equity into UK real estate funds.
Against this challenging backdrop, Legal & General Property (LGP) attracted over £1bn of new investment into its existing funds platform including the successful execution of capital raises for two of our specialist closed-ended property funds, the Leisure Fund and
lgim strategy
35ANNUAL REPORT AND ACCOUNTS 2010our performance
L&G_AR10_04_p28-39_230311_AT.indd 35 25/03/2011 11:15
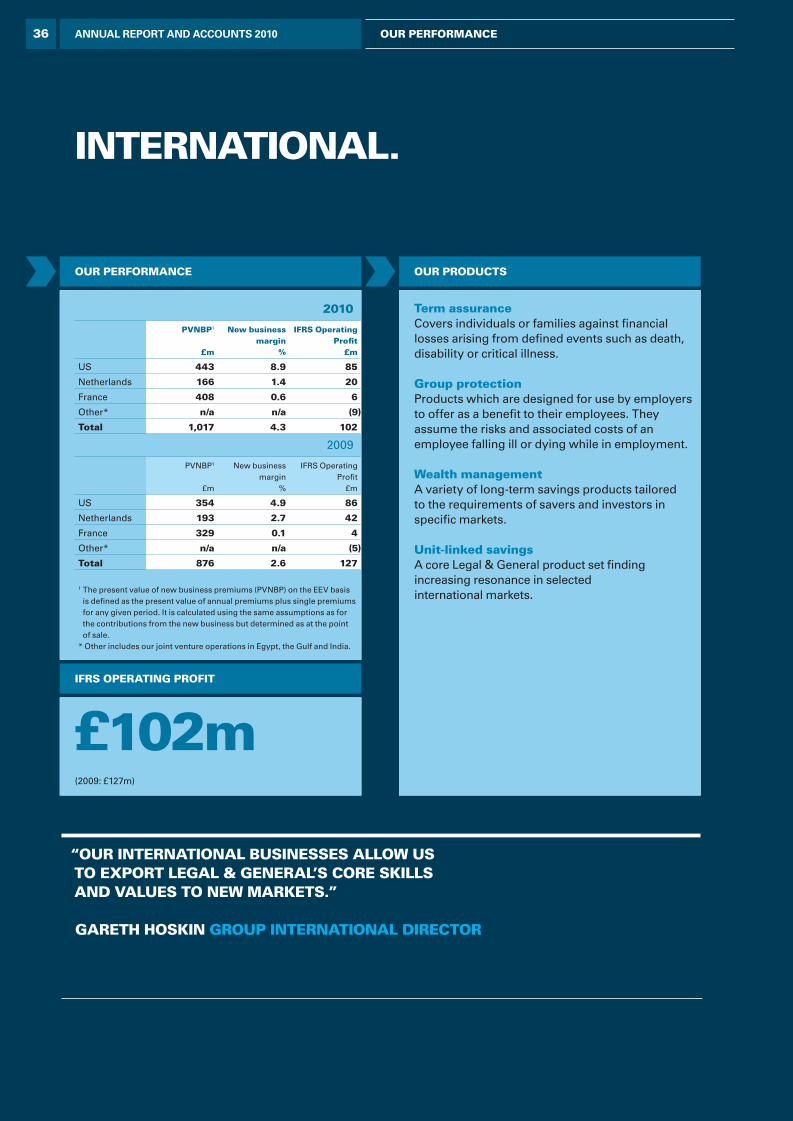
our products
“our international businesses allow us to export legal & general’s core skills and values to new markets.”
gareth hoskin group international director
£102m(2009: £127m)
ifrs operating profit
our performance
international.
2010
pvnbp1
£m
new businessmargin
%
ifrs operatingprofi t
£m
US 443 8.9 85
Netherlands 166 1.4 20
France 408 0.6 6
Other* n/a n/a (9)
total 1,017 4.3 102
2009
PVNBP1
£m
New businessmargin
%
IFRS OperatingProfi t
£m
US 354 4.9 86
Netherlands 193 2.7 42
France 329 0.1 4
Other* n/a n/a (5)
total 876 2.6 127
1 The present value of new business premiums (PVNBP) on the EEV basis is defi ned as the present value of annual premiums plus single premiums for any given period. It is calculated using the same assumptions as for the contributions from the new business but determined as at the point of sale.
* Other includes our joint venture operations in Egypt, the Gulf and India.
term assuranceCovers individuals or families against fi nancial losses arising from defi ned events such as death, disability or critical illness.
group protectionProducts which are designed for use by employers to offer as a benefi t to their employees. They assume the risks and associated costs of an employee falling ill or dying while in employment.
wealth managementA variety of long-term savings products tailored to the requirements of savers and investors in specifi c markets.
unit-linked savingsA core Legal & General product set fi nding increasing resonance in selected international markets.
ANNUAL REPORT AND ACCOUNTS 2010 our performance36
L&G_AR10_04_p28-39_230311_AT.indd 36 25/03/2011 11:15
awards and achievements in 2010 include:IndiaFirst was acclaimed as the fastest growing start-up in the Indian Life insurance market, due to the speed at which it sold its fi rst 100,000 policies.
An innovative capital solution has been developed in co-operation with L&G America and Legal & General Assurance Society (see adjacent column).
legal & general (france) were awarded:
• Golden Trophy for ‘quality services’ from the ‘association of insurance brokers’
• Golden Trophy for ‘best Life Insurance contract’ from Le Revenu Financial Magazine
• Golden Trophy for ‘best range of sector funds over 3 years’ from Le Revenu Financial Magazine
During 2010, Legal & General America (LGA) completed the fi rst phase of its capital management programme. This saw the repurchase at a discount to par of a further $440m of externally fi nanced debt. This had been issued as part of the funding of Triple X reserves on portions of business written prior to 2005.
In December 2010, this business was reinsured from LGA to Legal & General Assurance Society (LGAS) and assets were posted from LGAS to US trusts.
This transaction benefi ts both our US and UK businesses. Overall, IGD surplus is enhanced by $129m (£82m), embedded value is increased by $155m (£100m) and the annual external funding costs are reduced by an estimated $12m (£8m).
The new internal reinsurance solution also demonstrates the potential for further capital and profi t enhancing transactions from our US capital management programme.
returning capital to the groupawards and achievements
supporting the mumbai medicare van
Dr P. Nandagopal, Managing Director and CEO, IndiaFirst, said: “Mumbai is one of the world’s most densely populated cities where the not-so-rich segments of society struggle hard for their daily survival. Availability of proper living accommodation, good sanitation, safe drinking water – the key ingredients for basic health are missing in this city.”
We have been supporting the vehicle since January 2010 and in one year, the MMU has provided just under 30,000 basic healthcare treatments to people aged 60 and above.
Along with our partners at IndiaFirst Life Insurance Company Ltd, we are continuing to support HelpAge India (sister organisation to AgeUK) to run a Mobile Medicare Unit (MMU) in Mumbai, India.
The MMU is a vehicle that can move about the city providing a doctor, social worker, driver and basic medicines, which give essential primary medical support. The vehicle helps vulnerable elderly people living in the slums of Mumbai, who would otherwise not be able to access these services.
ANNUAL REPORT AND ACCOUNTS 2010our performance 37
L&G_AR10_04_p28-39_230311_AT.indd 37 25/03/2011 11:15
our international businesses are comprised of wholly owned subsidiaries in established markets such as the us and france and joint ventures with local partners in emerging markets such as india and the middle east.
international.
Strong new business growth of 27% was driven by encouraging performances in our emerging markets joint ventures. Over 16% of total international sales now come from our share of new joint venture operations in India and the Middle East. Net cash generation for the international division was £44m (2009: £8m) including dividends of US$53m from Legal & General America and €10m from our Dutch business.
Our US operation generated a strong sales recovery in term assurance in the second half of the year, and L&G France made significant progress in developing its Group business during the year.
As recently announced, the first stage of work on capital restructuring in the US has been successfully completed, using an internal reinsurance solution. Over the last two years, this has generated £46m of US non-operating profits, an increase in the Group’s EEV of £100m and increased the Group’s regulatory surplus by £82m. Going forward, it will increase the Group’s profitability by £8m per year due to lower funding costs.
International operating profits were £102m (2009 £127m), taking into account increased investments in our emerging markets business. As expected, investment profits in the Netherlands have fallen as bond yields recovered later in the year. New business margins rose in 2010, particularly in the US, as a consequence of increasing reinvestment yields and the impact of improving new business levels on expense recovery.
Our international businesses contribute to Group cash flow through the return of dividends.
38 ANNUAL REPORT AND ACCOUNTS 2010 our performance
L&G_AR10_04_p28-39_230311_AT.indd 38 25/03/2011 11:15
operational cash generation and ifrs operating profitIn addition to the effects of capital restructuring, underlying dividend flows are expected to continue and grow.
US operating profits of £85m (2009: £86m) are marginally below last year in local currency terms, with good investment returns offsetting mortality experience which was not as strong as in 2009.
In Europe, profits were £26m (2009: £46m). Dutch profits in 2009 and early 2010 benefited significantly from falls in Dutch bond yields, an element of which was recorded in investment fluctuations and excluded from operating profit.
We have taken action to lock in a substantial element of the profit from these market movements and protect the strong solvency position and dividend paying capacity of the business. In the last three years alone, L&G Netherlands has contributed more in dividends than it has received in capital in its entire history.
Profits in France have improved. Investment margins on savings business doubled. Claims experience on the growing Group portfolio held steady, but profits were diluted by the adverse effects of the mix of claims on reinsurance recoveries and the effect of an increase in the state retirement age on disability reserving.
new businessNew business volumes in the US, principally high value term business supported by specialist underwriting techniques, were £52m (2009: £49m), 5% up on 2009 in local currency terms, reflecting a strong recovery in the second half of the year.
outlook In 2011, the International businesses will continue their focus on increasing return on equity through tight capital management, preserving and growing the flow of dividends back to the Group Centre. The US operation will be central to this. Elsewhere, management in France is looking at growth options, and our Dutch operation aims to re-energise its core term offering while developing its non-insurance business and entering the small corporate pension market.
New business in France totalled £52m of APE (2009: £44m), representing 32% growth in local currency terms. This was principally driven by an increase of over 80% in the levels of Group new business, which consists of life, health and disability products.
New business in the Netherlands was £18m (2009: £22m), with sales of unit linked products slowing in line with the local market, although higher margin term business was less affected.
Our bancassurance joint venture in India, IndiaFirst, had a strong first full year of operation, selling over 130,000 policies during the year. These generated £53m APE, of which the Legal & General share was £14m.
opportunitiesWe continue to look for opportunities in selected new markets using our Indian joint venture as a preferred template. We have established a representative office in China, and also see opportunities in other markets which we believe have the potential to be large-scale insurance markets of the future.
39ANNUAL REPORT AND ACCOUNTS 2010our performance
L&G_AR10_04_p28-39_230311_AT.indd 39 25/03/2011 11:15

OUr SOCiaL rOLEInsurance products help to protect individuals and businesses against the fi nancial consequences of a wide range of risks – everything from poor health and natural disasters to the risk of outliving savings in old age. By reducing the impact of these problems, the insurance industry allows people to bear risks with greater peace of mind and reduces potential reliance on the state.
Finance plays a role in everybody’s life, and good fi nancial companies are those which connect with customers’ lives accordingly. They facilitate household budgeting and long term saving, enable people to get through the fi nancial consequences of unfortunate or catastrophic events and are there for customers when they are needed.
Our core purpose as an industry is to provide our customers with
‘safety in numbers’, enabling the pooling of premiums and sharing of risks to spread the fi nancial impact of the negative events that will inevitably happen to some of them.
Without our industry each of those individuals would have to provide for their own future independently, without the benefi ts of sharing the burden of the risk with others. For the majority, this just would not be possible.
OUr PUrPOSE
Our product range is designed to refl ect the risk, savings and investment needs of our customers at various key stages of their lives. in return, we provide benefi ts to our customers and wider society as a whole.
PrOviding PEaCE OF mind.
40 ANNUAL REPORT AND ACCOUNTS 2010 OUr PUrPOSE
L&G_AR10_05_p40-47_230311_AT.indd 40 25/03/2011 11:17
The IIWG report (July 2009), jointly written by Alistair Darling and industry leaders, suggested that if the public sector transferred 5% of its risk to the insurance industry, taxpayers could save roughly £17bn a year.2
More recently, the publication of 21st Century Welfare made clear the Secretary of State, Iain Duncan Smith’s determination to focus welfare resources on those in most need, and his ambition to improve the quality and variety of service provision.3 We believe that the debate about how best to allocate risk between the state and private sector is a valuable opportunity to save taxpayers’ money and improve services.
The insurance industry has the expertise and the capacity to help the state increase the quality of welfare provision and save money by growing a complementary private sector safety net with well-designed tax incentives and simpler regulations. One example would be to focus on the potential to maximise the benefits of Group Protection, but the broader principles of risk-sharing also apply to pensions and potentially long-term care.
Legal & General has been providing income replacement and other social protection products since 1836. We believe that our skills in rehabilitation and enabling individuals to return to work could help the DWP to provide more effective services at reduced expense. Put simply, if we can help a family keep most of their income when times are hard, they are less likely to need to rely on the welfare system.
Our industry already assists people in planning for their retirement. This is another area that has seen much focus from Government in recent months. We have responded to a number of consultation papers on proposed changes to the pension system and continue to work with government departments to help inform improvements to the system such as the removal of the default retirement age and the compulsion for individuals to annuitise at age 75.
In addition to delivering returns for our shareholders and customers we believe that as a business, we have a responsibility to take a position of leadership in broader society. We aim to ensure that we relate to the day-to-day lives and concerns of our customers, and as a shareholder we aim to set new and higher standards of stewardship and engagement with the businesses in which we invest.
Not enough people in Britain are privately insured against accidents, ill health or loss of income. People expect the Government to provide them with some level of financial protection against these events and this is wholly appropriate. The private sector can, however, provide advanced welfare services that can help families long before they might need to become a client of Jobcentre Plus or other services.
In 2009, the Insurance Industry Working Group (IIWG) highlighted the importance of partnership between the state and the private sector in the provision of cover for what is known as ‘addressable risk’ in the UK. This means each side picks up its part of the costs of ill health, healthcare, unemployment and pensions.
At present, the Government is responsible for some 65% of all addressable risk through its various benefit systems while 35% is covered by the insurance industry through the products provided to clients.
This idea of risk transfer from the state to the private sector was given greater impetus by the Chancellor’s Emergency budget in which he specifically identified the welfare budget as somewhere he was looking for additional cuts.1
1 George Osborne, 22 June 2010, Budget speech. “Clearly, if we can find any additional savings to social security and welfare beyond those which I will shortly outline, then that will greatly relieve the pressure on these departments and that 25% figure.”
2 Vision for the Insurance Industry 2020, p.21.3 21st Century Welfare, DWP consultation, July 2010.
OUTLOOK The country’s economic position has led to a review of the costs of state provision in several areas of welfare. Responsibility is shifting to individuals to protect themselves against risks that the state would previously have carried. The insurance sector is well positioned to help with this transfer of risk.
41ANNUAL REPORT AND ACCOUNTS 2010OUr PUrPOSE
L&G_AR10_05_p40-47_230311_AT.indd 41 25/03/2011 11:17

We have also made improvements to performance management systems and the way we align reward and achievement across the Group.
We have successfully outsourced our IT operations as detailed on page 21 of this report. This gives us additional fl exibility in ensuring we have the appropriate resource for business needs.
EmPLOyEE EngagEmEnTIn 2009 we outlined our intention to improve engagement with our employees and increase their understanding of the Company strategy and the vision for the business. In our 2010 employee survey we achieved our highest ever response rate at 85% and the employee engagement index increased by nine points to 74%. This is the highest score achieved since we have measured engagement.
The 2010 survey results also showed signifi cant improvements in employees’ understanding of the strategic direction of the business. This was achieved through increased face to face communications as well as electronic communications.
This year has been a year of re-engaging with our employees as the employment landscape stabilised after the changes and reduction in employee numbers in 2009.
ThE PEOPLE ThaT maTTEr.
PEOPLE and OPEraTiOnaL rESOUrCES
42 ANNUAL REPORT AND ACCOUNTS 2010 OUr PUrPOSE
L&G_AR10_05_p40-47_230311_AT.indd 42 25/03/2011 11:17
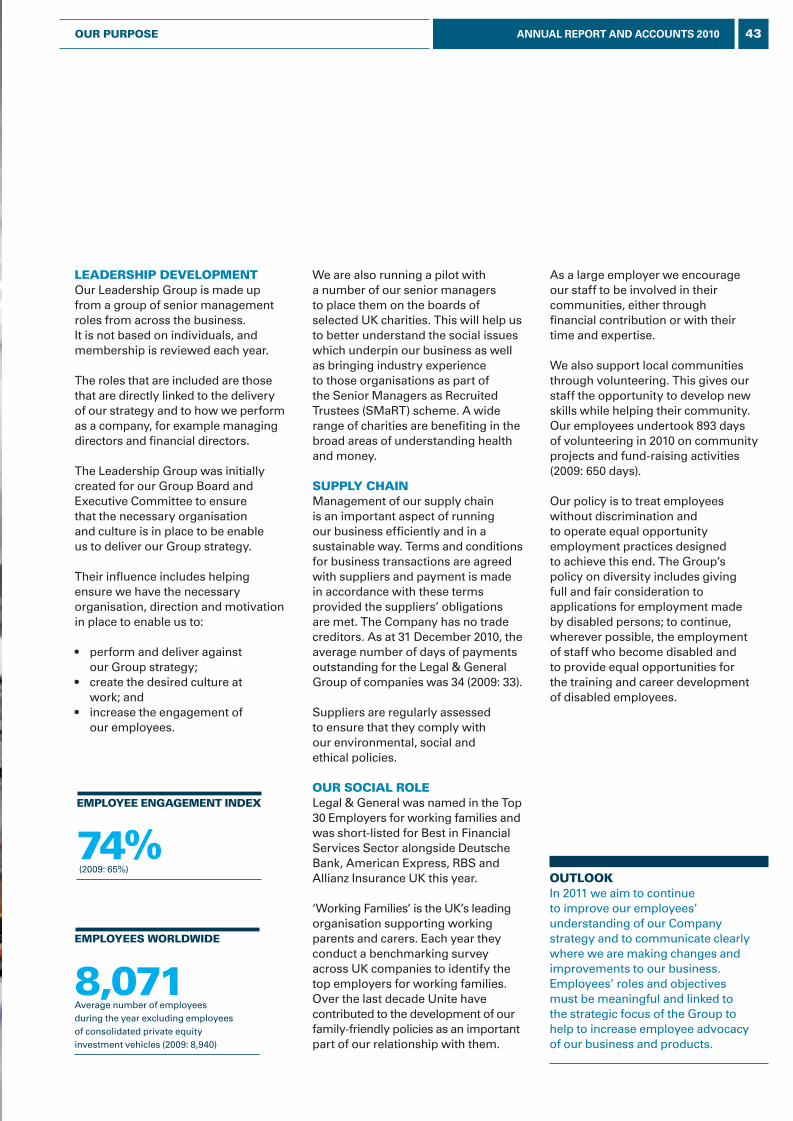
As a large employer we encourage our staff to be involved in their communities, either through financial contribution or with their time and expertise.
We also support local communities through volunteering. This gives our staff the opportunity to develop new skills while helping their community. Our employees undertook 893 days of volunteering in 2010 on community projects and fund-raising activities (2009: 650 days).
Our policy is to treat employees without discrimination and to operate equal opportunity employment practices designed to achieve this end. The Group’s policy on diversity includes giving full and fair consideration to applications for employment made by disabled persons; to continue, wherever possible, the employment of staff who become disabled and to provide equal opportunities for the training and career development of disabled employees.
We are also running a pilot with a number of our senior managers to place them on the boards of selected UK charities. This will help us to better understand the social issues which underpin our business as well as bringing industry experience to those organisations as part of the Senior Managers as Recruited Trustees (SMaRT) scheme. A wide range of charities are benefiting in the broad areas of understanding health and money.
SUPPLy ChainManagement of our supply chain is an important aspect of running our business efficiently and in a sustainable way. Terms and conditions for business transactions are agreed with suppliers and payment is made in accordance with these terms provided the suppliers’ obligations are met. The Company has no trade creditors. As at 31 December 2010, the average number of days of payments outstanding for the Legal & General Group of companies was 34 (2009: 33).
Suppliers are regularly assessed to ensure that they comply with our environmental, social and ethical policies.
OUr SOCiaL rOLELegal & General was named in the Top 30 Employers for working families and was short-listed for Best in Financial Services Sector alongside Deutsche Bank, American Express, RBS and Allianz Insurance UK this year.
‘Working Families’ is the UK’s leading organisation supporting working parents and carers. Each year they conduct a benchmarking survey across UK companies to identify the top employers for working families. Over the last decade Unite have contributed to the development of our family-friendly policies as an important part of our relationship with them.
LEadErShiP dEvELOPmEnTOur Leadership Group is made up from a group of senior management roles from across the business. It is not based on individuals, and membership is reviewed each year.
The roles that are included are those that are directly linked to the delivery of our strategy and to how we perform as a company, for example managing directors and financial directors.
The Leadership Group was initially created for our Group Board and Executive Committee to ensure that the necessary organisation and culture is in place to be enable us to deliver our Group strategy.
Their influence includes helping ensure we have the necessary organisation, direction and motivation in place to enable us to:
• perform and deliver against our Group strategy;
• create the desired culture at work; and
• increase the engagement of our employees.
EmPLOyEES wOrLdwidE
8,071Average number of employees during the year excluding employees of consolidated private equity investment vehicles (2009: 8,940)
EmPLOyEE EngagEmEnT indEx
74% (2009: 65%)
OUTLOOK In 2011 we aim to continue to improve our employees’ understanding of our Company strategy and to communicate clearly where we are making changes and improvements to our business. Employees’ roles and objectives must be meaningful and linked to the strategic focus of the Group to help to increase employee advocacy of our business and products.
43ANNUAL REPORT AND ACCOUNTS 2010OUr PUrPOSE
L&G_AR10_05_p40-47_230311_AT.indd 43 25/03/2011 11:17
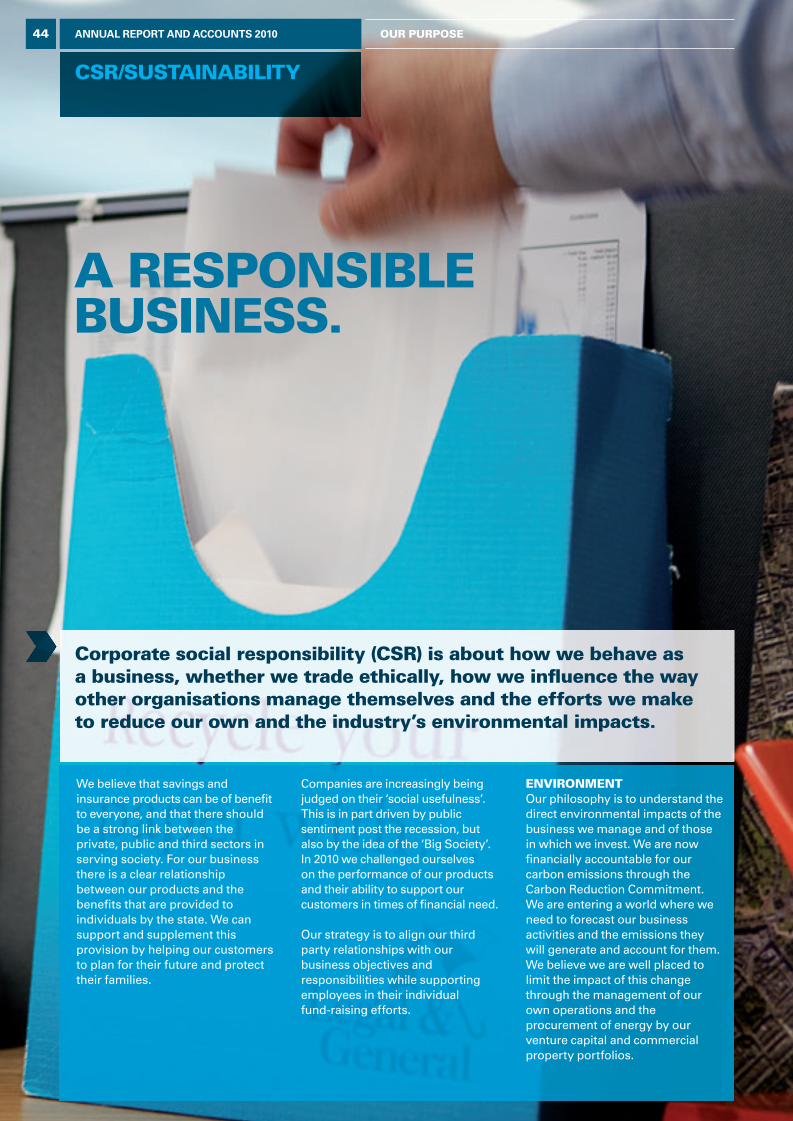
We believe that savings and insurance products can be of benefi t to everyone, and that there should be a strong link between the private, public and third sectors in serving society. For our business there is a clear relationship between our products and the benefi ts that are provided to individuals by the state. We can support and supplement this provision by helping our customers to plan for their future and protect their families.
Companies are increasingly being judged on their ‘social usefulness’. This is in part driven by public sentiment post the recession, but also by the idea of the ‘Big Society’. In 2010 we challenged ourselves on the performance of our products and their ability to support our customers in times of fi nancial need.
Our strategy is to align our third party relationships with our business objectives and responsibilities while supporting employees in their individual fund-raising efforts.
EnvirOnmEnTOur philosophy is to understand the direct environmental impacts of the business we manage and of those in which we invest. We are now fi nancially accountable for our carbon emissions through the Carbon Reduction Commitment. We are entering a world where we need to forecast our business activities and the emissions they will generate and account for them. We believe we are well placed to limit the impact of this change through the management of our own operations and the procurement of energy by our venture capital and commercial property portfolios.
a rESPOnSiBLE BUSinESS.
Corporate social responsibility (CSr) is about how we behave as a business, whether we trade ethically, how we infl uence the way other organisations manage themselves and the efforts we make to reduce our own and the industry’s environmental impacts.
CSr/SUSTainaBiLiTy
44 ANNUAL REPORT AND ACCOUNTS 2010 OUr PUrPOSE
L&G_AR10_05_p40-47_230311_AT.indd 44 25/03/2011 11:17
Our employees continue to engage in the Company’s core CSR programmes and engagement scores in our business have risen. We have seen a rise in the number of employees who regard Legal & General as an ethical company. We have also maintained our gold mark from the Charities Aid Foundation (CAF).
OUr PEOPLEThe SMaRT scheme initiative we have been involved in with an organisation called Charity People has seen a number of our senior managers recruited as trustees with not-for profit organisations. The scheme was developed with the aim of creating long lasting relationships between commercial and third sector organisations, essentially providing a vehicle to bring the skills of talented senior managers and directors onto the boards of not-for-profit organisations as Trustees.
UK dOnaTiOnSDuring 2010, charitable donations totalling over £3.2m (2009: £2.8m) were made by the Company and by employees through approved schemes. No political donations were made during the year.
Legal & General Property continue to lead the field with their ability to deliver commercial and environmental value for both investors and occupiers. We believe this approach can also help to provide sustainable returns.
Our involvement in the leadership team at ClimateWise means that we are at the centre of shaping the insurance sector’s global approach to environmental risk. In 2010 we scored 94% in ClimateWise’s global rating principles up from 82% in 2009.
STaKEhOLdEr OPiniOn2010 has seen an increase in external stakeholders asking for information on the way we run our business. We continue to be rated highly by external agencies and have seen further increases in our scores in relevant indices in 2010.
OUr PUrPOSE
ExTErnaL rECOgniTiOn
Our product range is designed to reflect the risk, savings and investment needs of our customers at various key stages of their lives. In return, we provide benefits to our customers and wider society as a whole. Our third party relationships reflect our business needs and objectives.
CUSTOmErS BUSinESSES PrOdUCTS BEnEFiTS TO CUSTOmErS PUBLiC POLiCy BEnEFiT
individUaLS and COrPOraTES
riSK – SAFEGUARDING CUSTOMERS AGAINST FINANCIAL RISKS
Customers pay up front premiums in return for insurance, individual protection and annuities.
Deliver on our promise to customers and pay all valid claims that enable individuals to cope with the financial consequences of unforeseen events, such as bereavement, illness, damage to property and running out of savings in old age.
The provision of these benefits reduces the likelihood of people having to fall back on the state as a result of loss of income, homelessness or poverty in retirement. This in turn benefits society by reducing pressure on strained public finances.
SavingS – FINANCIAL PLANNING, SAVINGS AND INVESTMENTS
invESTmEnT managEmEnT – INVESTING ON BEhALF OF INSTITUTIONAL AND RETAIL CUSTOMERS
Customers invest funds through unit trusts, ISAs, investment funds, pensions, index funds and other savings products.
Our products enable people to save for the medium and long term, either individually or through employer schemes, and to build funds to provide a secure income in retirement. We act as a steward of our customers’ money.
45ANNUAL REPORT AND ACCOUNTS 2010OUr PUrPOSE
L&G_AR10_05_p40-47_230311_AT.indd 45 25/03/2011 11:17
CSr/SUSTainaBiLiTy
Our group protection business has worked with the British heart Foundation (BhF) for several years, concentrating on the promotion of workplace health. Our partnership helps us understand longevity and health issues that could affect future customers.
Our group protection business is also working with Macmillan to increase our understanding of how people affected by cancer cope fi nancially.
MEND is a childhood obesity charity which helps young people and their families become fi tter, healthier and happier by offering free healthy living programmes in the local community. They are helping our Risk business to understand health and longevity issues caused by childhood obesity.
We believe that basic numeracy is key to understanding and managing fi nances. This is why we have been supporting a programme to help Maths teachers encourage their students to take more of an interest in the subject.
We are working with Credit Unions and A4e to help to improve understanding of fi nancial products and managing personal fi nances and budgets.
As a fi nancial services organisation, we believe we should help prevent fi nancial crime. We have supported Crimestoppers in the development of various community programmes including educating young people about crime.
We are working with Age UK on a number of projects across the UK to help to alleviate pensioner poverty.
For more information on CSR and for more case studies and interviews:legalandgeneralgroup.com
OUr CSr ParTnErShiPS gOvErnanCELegal & General’s CSR Committee is chaired by Tim Breedon, Group Chief Executive. The CSR Committee is supported by the following sub-committees:
• Group health and Safety Committee • Group Environment Committee• Sustainable Property Committee • Group Ethics Committee.
COrPOraTE gOvErnanCE OF CSrThe CSR Committee governs the strategy and implementation of our public targets and meets at least four times a year as a governing body.
The responsibilities of the Committee are:
• to develop and review the Group CSR strategy and policies in relation to Group-wide Environmental, Social and Governance (ESG) risks and opportunities identifi ed through engaging with the Company’s stakeholders;
• to manage the Group stakeholder engagement process and ensure that results are incorporated into the decision-making process;
• to monitor progress of the CSR sub-committees;
• to monitor results of external benchmarking surveys; and
• to ensure the CSR programme is communicated appropriately to internal and external stakeholders and in particular to review and approve the annual CSR Report.
46 ANNUAL REPORT AND ACCOUNTS 2010 OUr PUrPOSE
L&G_AR10_05_p40-47_230311_AT.indd 46 25/03/2011 11:17
GUIDING PRINCIPLES AND COMMITMENTS 2011 2011 TARGETS GOVERNED By
OUr CUSTOmErS• To provide customers with clear information so that
they can understand our products, allowing them to make informed decisions about which products are suitable for them
• To manage our products to ensure customer expectations are met: – manage customers’ investments – provide timely and accurate services – pay out valid claims promptly
• To seek, listen and act promptly upon customer feedback about our products, communications and services
• To be easy to do business with
Publish a quarterly scorecard showing our commitment to delivering our core responsibility to customers.
Group Ethics Committee
OUr invESTOrSTo promote responsible Environmental, Social and Governance (ESG) business practices in the companies in which we invest to create long term value for investors.
Company engagement – engage 200 companies on ESG issues (at least 20% of which to include topics on environment and/or social issues).
Group CSR Committee
To promote the sustainable management of our investment property portfolio, whatever our mandate, in the belief that enhanced investor returns will be delivered.
Energy efficiency: Continue to seek reductions in energy use focusing on properties which use the most energy and therefore where most impact can be made. About 20 properties account for 80% of energy consumed where a further reduction of 3% below 2010 levels will be our target.Waste management: We will seek to eliminate waste direct to landfill wherever LGP is responsible for waste management, targeting the ten largest waste producing sites to reduce the proportion of waste to landfill to 20% below 2010 levels.Leadership: Demonstrate leadership in the property industry, advancing the debate and by continuing to contribute to standard setting. Specifically to Chair a leading sustainability organisation and to publish, or present at seminars, four thought leadership papers.Climate change risks: Sustainability will be considered as part of the due diligence undertaken when evaluating the purchase of all new investment property assets. Over three years we will review all assets for climate change risks and develop asset specific strategies.
Sustainable Property Investment Committee
OUr PEOPLE• To work in close partnership with our recognised trades
union Unite and Management Consultative Forum, when making key decisions.
• To adopt policies and practices which encourage an appropriate work/life balance.
• To apply open and fair processes in major decisions affecting recruitment, promotions, outsourcing and downsizing.
• To ensure our employees understand and implement correct ethical behaviours.
• To promote and implement our Company values. • To provide a flexible, supportive, healthy and safe
working environment.
As an employer: We will monitor the trends on ethnicity and gender to ensure that the organisation is recruiting and retaining an appropriately diverse workforce.For employees: For employees with perceived or actual disabilities within our organisation, we aim to increase the positive response to ‘reasonable adjustments’ score from the current 76% rating in the 2011 employee survey. As an employer: Provide a minimum of 20 work placements for people with disabilities. This will provide opportunities for the community and for our employees and will help to provide us with feedback as an employer on the way that we reasonably adjust our offices and work practices.For employees with families: We aim to improve on our top 30 position in the ‘Top Employers for Working Families’ Awards 2011.
Group Equalities Committee Group health and Safety Committee
OUr SUPPLiErS • To ensure our ‘key’ suppliers comply with our
sustainable procurement policy at all times.• To support suppliers who do not comply with our
‘CSR standards for suppliers’ to facilitate improvements.
• Ensure that 90% of our ‘key’ suppliers are compliant with Legal & General’s CSR standards for suppliers by December 2012.
• 90% of paper purchased to have a recycled content or approved environmental credentials (by tonnage) by the end of 2011.
Group CSR CommitteeGroup Environment Committee
OUr EnvirOnmEnT • To reduce rather than offset our impact on
the environment.• To integrate environmental legislation across
our business.
• Reduce total direct CO2 emissions by 5% by 2012 and reduce total waste production by 10% by 2012.
• Integrate Environmental Carbon Data Disclosure into public reporting across the Group in line with Carbon Reduction Commitment regulations.
Group Environment Committee
OUr COmmUniTiES• To support the community as a whole, especially
on issues where we feel we can make a difference in key programmes.
• To partner with third sector organisations to campaign for the issues that matter to our markets and businesses.
• To support and encourage employee involvement in charitable giving, volunteering and in utilising the resources available to them.
• To manage appropriate international CSR programmes to address ESG risks and threats to reputation in those marketplaces.
• Following independent benchmarking of Legal & General America, Netherlands and France by Business in the Community, where a 30% average performance level was achieved, we will improve our disclosure of these businesses in our yearly reporting cycle and improve the BITC Ratings for these businesses by 2012 in line with expected Group performance.
• Deliver 1000 working days of volunteering using Legal & General people’s skills in the communities in which we operate in the UK and overseas.
• Continue to invest at least £2.5m into the third sector as a result of employee, business and community activities.
Group Charity Committee
gUiding PrinCiPLES and TargETS
47ANNUAL REPORT AND ACCOUNTS 2010OUr PUrPOSE
L&G_AR10_05_p40-47_230311_AT.indd 47 25/03/2011 11:17

governance
1. nigel WilSon, GROUP CHIEF FINANCIAL OFFICER. Nigel was appointed to the Board on 1 September 2009. Prior to joining Legal & General, Nigel was Chief Financial Offi cer of United Business Media Limited (from 2001) and appointed Deputy Chief Executive in 2008. Nigel was appointed as a non-executive director of The Capita Group plc in 2010 and will remain a non-executive director of Halfords Group Plc until 31 March 2011. Previous appointments include Group Finance Director at Waste Management International Plc, Chief Executive, Corporate, Guinness Peat Aviation (G.P.A.), Head of Corporate Finance and Group Commercial Director of Dixons Group Plc, Managing Director of Stanhope Properties Plc and a consultant at McKinsey & Co.
2. John SteWart, CHAIRMAN. John was appointed Chairman of the Company on 1 March 2010. He is a member of the Court of the Bank of England and a non-executive director of Telstra Corporation. He is also Chairman of Southern Cross Stud. Former roles include: Chief Executive of Woolwich (1996-2000), Deputy CEO of Barclays (2000-2003) and Chief Executive of National Australia Bank
(2004-2008). He was also a director of the Business Council Australia, a Member of the Australian Prime Minister’s Task Group on Emissions Trading, a member of the Australian Federal Attorney General Business – Government Advisory Group on National Security, and a member of Scottish Enterprise’s International Advisory Board.2, 3,4
3. tim BreeDon, GROUP CHIEF EXECUTIVE. Tim was appointed to the Board in January 2002 as Group Director (Investments) and became Group Chief Executive in January 2006. He joined Legal & General in 1987 and former roles include Managing Director (Index Funds). Tim was appointed Chairman of the Association of British Insurers in 2010, having been a director since 2007. Former directorships include the Investment Management Association and the Financial Reporting Council.
4. Sir DaviD WalKer, VICE CHAIRMAN AND SENIOR INDEPENDENT NON-EXECUTIVE DIRECTOR. Sir David was appointed to the Board in March 2002. He is a senior adviser to Morgan Stanley International Limited, a member of the Advisory Board of the National Bank of Kuwait, and a trustee of
Ciceley Saunders International. Former roles include: Chairman and Chief Executive of Morgan Stanley International Limited; executive director of the Bank of England; Chairman of the London Investment Banking Association; Chairman of the Securities and Investments Board and Deputy Chairman of Lloyds Bank.2, 3
5. ruDY marKham, INDEPENDENT NON-EXECUTIVE DIRECTOR. Rudy was appointed to the Board in October 2006. He is Chairman of Moorfi elds Eye Hospital NHS Foundation Trust, a non-executive director of Standard Chartered Plc and Chair of its Audit Committee, a non-executive director of the Financial Reporting Council, United Parcel Service Inc, UCL Partners Ltd and AstraZeneca Plc and was appointed a director of CSM in January 2011. He is also a non-executive director of the board of the UK Foreign and Commonwealth Offi ce and is a member of the Leverhulme Trust board. Former roles include: Chief Financial Offi cer, Director of Strategy and Technology and Treasurer of Unilever Plc; Chair and CEO of Unilever Japan, and Chair of Unilever Australia.2, 3, 4
6. marK gregorY, GROUP EXECUTIVE DIRECTOR (SAVINGS). Mark was appointed to the Board in January 2009. He joined Legal & General in 1998 and has held a variety of divisional fi nance director roles and served as Group Financial Controller, Communications and Resources Director, Resources and International Director and UK Service Operations Director. From 2006, he was Managing Director, With-Profi ts. Prior to joining Legal & General, he had worked in senior fi nancial and business development roles at companies including Kingfi sher Plc and ASDA.
7. John pollocK, GROUP EXECUTIVE DIRECTOR (RISK). John was appointed to the Board in December 2003, having joined Legal & General in 1980. John’s former roles include: Director, UK Operations; Managing Director, Legal & General Asia and various posts in Product Management, Sales, Customer Services and IT.
8. JameS Strachan, INDEPENDENT NON-EXECUTIVE DIRECTOR. James was appointed to the Board in December 2003. He is a non-executive director of the Financial Services Authority (FSA),
BoarD oF DirectorS.
4
10 11 1 3
5 9 2
48 ANNUAL REPORT AND ACCOUNTS 2010 governance
L&G_AR10_06_p48-54_230311_AT.indd 48 25/03/2011 11:18

Board structureThe Board currently comprises:
– A non-executive Chairman.
– A non-executive vice Chairman who is also the Senior Independent Director.
– Five other non-executive directors.
– Four executive directors.
Board changes during 2010 are detailed on page 51.
The Board met nine times during the year and participated in a two day off-site strategy event.
governance principlesDuring 2010, the Board resolved to develop a Corporate Governance handbook made up of the Company’s corporate governance policies, refl ecting the commitment of the Board to good corporate governance.
The Board also decided that all Board members would submit themselves for re-election at this year’s Annual General Meeting (AGM) in accordance with the new UK Corporate Governance Code.
This Governance report describes how the Company has applied the principles of the Combined Code (the Code).
Each of the non-executive directors is considered to be independent for the purposes of the Code.
geoffrey timmsCompany Secretary
KeY to committee memBerShip1 Member of the Audit Committee2 Member of the Nominations Committee3 Member of the Remuneration Committee4 Member of the Group Risk Committee
governance matterS
Welsh Water Limited, Sarasin & Partners LLP, JPMorgan Asian Investment Trust plc and Social Finance Limited, and a visiting senior fellow in risk and regulation at the London School of Economics. Former roles include: Member of the Court of Directors of the Bank of England, Chairman of the Audit Commission, Managing Director of Merrill Lynch, Trustee of Somerset House, a non-executive director of Care UK Plc and Chairman of RNID.1, 2, 4
9. Dame clara FurSe, INDEPENDENT NON-EXECUTIVE DIRECTOR. Clara was appointed to the Board in June 2009. She is a non-executive director of Nomura Holdings Inc. and a number of its FSA regulated subsidiaries, and Amadeus IT Holdings S.A. Former roles and directorships include: Chief Executive of London Stock Exchange (2001-2009); during this period, Clara was also a director of Euroclear plc, LCH Clearnet Group Ltd, Fortis and a member of the Shanghai International Financial Advisory Council.2, 4
10. nicholaS pretteJohn, INDEPENDENT NON-EXECUTIVE DIRECTOR. Nick was appointed to the Board in November 2010. Nick’s former roles include positions with
NFC Plc, Apax Partners and Bain & Company, and Chief Executive of Lloyd’s of London. More recently between 2006-2009 he was Chief Executive of Prudential UK & Europe responsible for UK Life and Pensions Business. Nick is also Chairman of the Britten-Pears Foundation and a trustee of the Royal Opera House Covent Garden.1, 2, 3, 4
11. henrY Staunton, INDEPENDENT NON-EXECUTIVE DIRECTOR. Henry was appointed to the Board in May 2004. He is a non-executive director of Standard Bank plc and The Merchants Trust plc and was appointed as a non-executive director of WH Smith PLC and Capital & Counties Properties plc in 2010. Former roles include: Finance Director of ITV Plc and Granada Group Plc; Chairman of Ashtead Group Plc and non-executive director of EMAP Plc, Independent Television News Limited, Ladbrokes Plc, New Look Retail Group Ltd and Vector Hospitality Plc.1, 2, 4
8 7 6
49ANNUAL REPORT AND ACCOUNTS 2010governance
L&G_AR10_06_p48-54_230311_AT.indd 49 25/03/2011 11:18

governance matterS.
chairman’S letter
During 2010, corporate governance has continued to evolve apace. The Board of Legal & General has again this year dedicated time to considering emerging corporate governance practice in line with our belief that good corporate governance underpins the long term success of the Company.
In November, the Board carried out a review of the Company’s corporate governance framework. This included the annual review of a number of corporate governance policies such as the Matters Reserved for the Board and Terms of Reference for each of the Board’s committees. As well as assisting the Board in being able to confi rm compliance with the principles and provisions of the Combined Code for 2010, the Board determined as a result of the review to develop a Corporate Governance handbook bringing all Company corporate governance policies into one reference document. I believe this refl ects the commitment of the Board to good corporate governance and to ensuring that good corporate governance practice underpins the day to day activities of the Board. The Board closely followed the debate on the annual re-election of directors and believes that annual re-election promotes our accountability to you, our shareholders. All Board members will therefore offer themselves for re-election at this year’s AGM.
The success of the Board as an effective steward of the Company depends on the right balance of skills and experience being in place. During 2010, two of our non-executive directors, Frances Heaton and Dr Ronaldo Schmitz, retired from the Board and Nick Prettejohn joined the Board in November as a non-executive director bringing recent executive experience to the Board, in particular experience in the life insurance sector. Sir David Walker will retire from the Board this year and we thank him for his outstanding contribution to the Board.
Each year the Board participates in a formal evaluation of its performance. This year our evaluation was undertaken by an external facilitator, Tracy Long of Boardroom Review. Tracy is an experienced consultant
whose only interest with Legal & General is her work with the Board. The evaluation process included the facilitator interviewing each of the directors and obtaining their views on how the Board and its committees work. Feedback on Board performance was then presented to a meeting of the Board which discussed what it believed were the relevant issues and agreed the recommendations arising and the actions to be taken in 2011 as a result. With regards to information on personal performance, I meet with each director individually and provide feedback on a one to one basis and agree any particular business education requirements for the year ahead. Feedback on my performance in chairing the Board is provided by the Senior Independent Director following discussions between him and the other Board members. Overall, I am satisfi ed that the Board operates well.
This year we have continued our work in promoting greater and more effective engagement with our shareholders. On behalf of the Board, the Group Chief Executive, Group Chief Financial Offi cer and I, supported by the Investor Relations department, regularly met with institutional investors and analysts throughout the year. The Board also received regular reports from the Investor Relations department on its activities, and in particular the feedback being received from investors and analysts. The Board is committed to ensuring that the direction of the Company is aligned with our shareholders’ interests. Ongoing engagement, supported by clear communication, is key and will remain a focus for the Board in 2011.
The AGM is an important opportunity for us as a Board to engage with the Company’s private investors. All Board members will attend the AGM and be available to meet and speak with shareholders. We would like our investors to fi nd attending our AGM an interesting and rewarding experience; to hear about the performance of the Company over the last year and have the opportunity to meet members of the Board. I encourage as many shareholders as possible to attend on 25 May 2011 and I look forward to sharing with you in person the successes of the Company during 2010.
John SteWart chairman
50 ANNUAL REPORT AND ACCOUNTS 2010 governance
L&G_AR10_06_p48-54_230311_AT.indd 50 25/03/2011 11:18
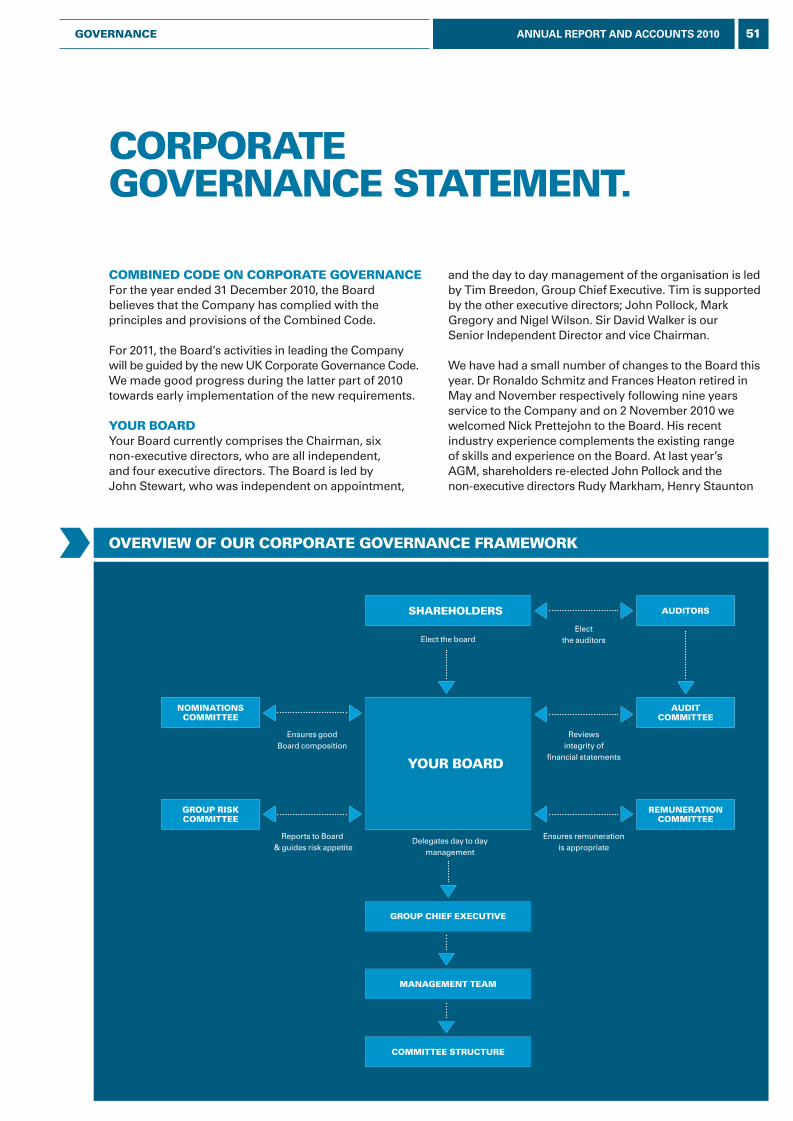
comBineD coDe on corporate governance For the year ended 31 December 2010, the Board believes that the Company has complied with the principles and provisions of the Combined Code.
For 2011, the Board’s activities in leading the Company will be guided by the new UK Corporate Governance Code. We made good progress during the latter part of 2010 towards early implementation of the new requirements.
Your BoarDYour Board currently comprises the Chairman, six non-executive directors, who are all independent, and four executive directors. The Board is led by John Stewart, who was independent on appointment,
and the day to day management of the organisation is led by Tim Breedon, Group Chief Executive. Tim is supported by the other executive directors; John Pollock, Mark Gregory and Nigel Wilson. Sir David Walker is our Senior Independent Director and vice Chairman.
We have had a small number of changes to the Board this year. Dr Ronaldo Schmitz and Frances Heaton retired in May and November respectively following nine years service to the Company and on 2 November 2010 we welcomed Nick Prettejohn to the Board. His recent industry experience complements the existing range of skills and experience on the Board. At last year’s AGM, shareholders re-elected John Pollock and the non-executive directors Rudy Markham, Henry Staunton
corporate governance Statement.
overvieW oF our corporate governance FrameWorK
Reviews integrity of
fi nancial statements
Ensures remuneration is appropriate
Elect the board
Delegates day to day management
Ensures good Board composition
Your BoarD
nominationScommittee
management team
committee Structure
remunerationcommittee
group riSKcommittee
auDitcommittee
group chieF executive
ShareholDerS auDitorS
Elect the auditors
Reports to Board & guides risk appetite
51ANNUAL REPORT AND ACCOUNTS 2010governance
L&G_AR10_06_p48-54_230311_AT.indd 51 25/03/2011 11:18
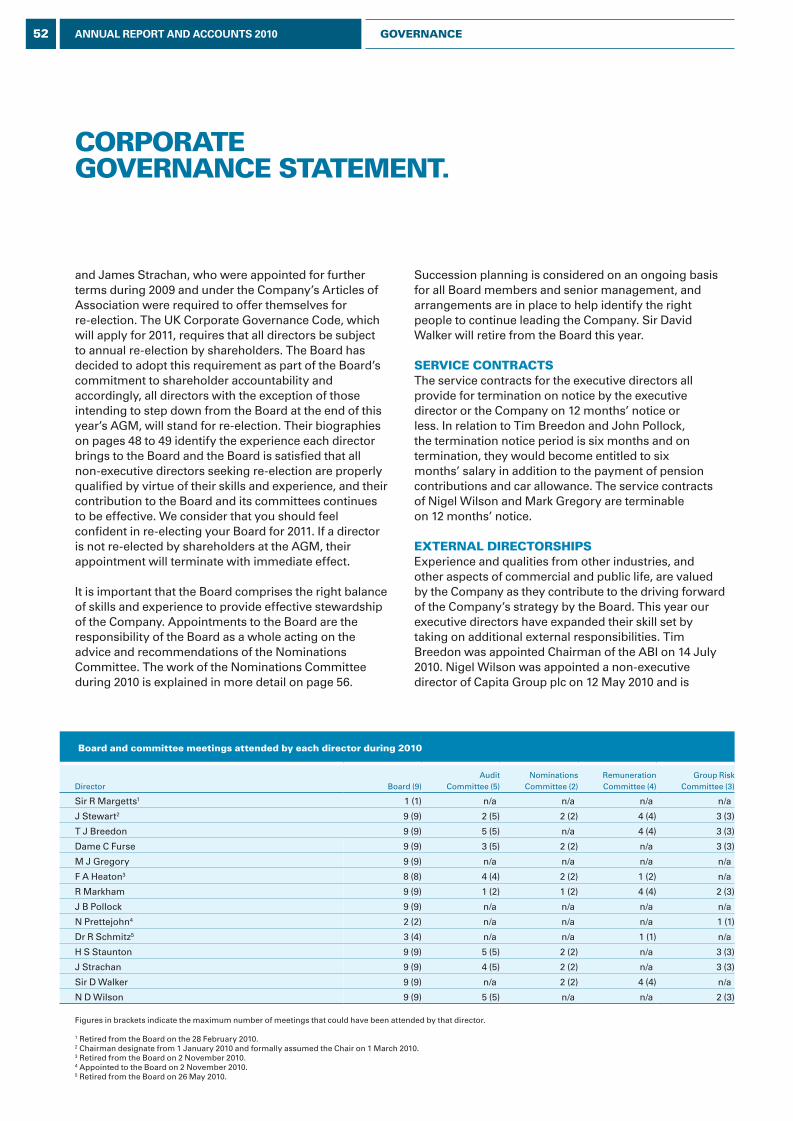
Succession planning is considered on an ongoing basis for all Board members and senior management, and arrangements are in place to help identify the right people to continue leading the Company. Sir David Walker will retire from the Board this year.
Service contractSThe service contracts for the executive directors all provide for termination on notice by the executive director or the Company on 12 months’ notice or less. In relation to Tim Breedon and John Pollock, the termination notice period is six months and on termination, they would become entitled to six months’ salary in addition to the payment of pension contributions and car allowance. The service contracts of Nigel Wilson and Mark Gregory are terminable on 12 months’ notice.
external DirectorShipSExperience and qualities from other industries, and other aspects of commercial and public life, are valued by the Company as they contribute to the driving forward of the Company’s strategy by the Board. This year our executive directors have expanded their skill set by taking on additional external responsibilities. Tim Breedon was appointed Chairman of the ABI on 14 July 2010. Nigel Wilson was appointed a non-executive director of Capita Group plc on 12 May 2010 and is
corporate governance Statement.
and James Strachan, who were appointed for further terms during 2009 and under the Company’s Articles of Association were required to offer themselves for re-election. The UK Corporate Governance Code, which will apply for 2011, requires that all directors be subject to annual re-election by shareholders. The Board has decided to adopt this requirement as part of the Board’s commitment to shareholder accountability and accordingly, all directors with the exception of those intending to step down from the Board at the end of this year’s AGM, will stand for re-election. Their biographies on pages 48 to 49 identify the experience each director brings to the Board and the Board is satisfied that all non-executive directors seeking re-election are properly qualified by virtue of their skills and experience, and their contribution to the Board and its committees continues to be effective. We consider that you should feel confident in re-electing your Board for 2011. If a director is not re-elected by shareholders at the AGM, their appointment will terminate with immediate effect.
It is important that the Board comprises the right balance of skills and experience to provide effective stewardship of the Company. Appointments to the Board are the responsibility of the Board as a whole acting on the advice and recommendations of the Nominations Committee. The work of the Nominations Committee during 2010 is explained in more detail on page 56.
Board and committee meetings attended by each director during 2010
Director Board (9)Audit
Committee (5)Nominations
Committee (2)RemunerationCommittee (4)
Group RiskCommittee (3)
Sir R Margetts1 1 (1) n/a n/a n/a n/a
J Stewart2 9 (9) 2 (5) 2 (2) 4 (4) 3 (3)
T J Breedon 9 (9) 5 (5) n/a 4 (4) 3 (3)
Dame C Furse 9 (9) 3 (5) 2 (2) n/a 3 (3)
M J Gregory 9 (9) n/a n/a n/a n/a
F A Heaton3 8 (8) 4 (4) 2 (2) 1 (2) n/a
R Markham 9 (9) 1 (2) 1 (2) 4 (4) 2 (3)
J B Pollock 9 (9) n/a n/a n/a n/a
N Prettejohn4 2 (2) n/a n/a n/a 1 (1)
Dr R Schmitz5 3 (4) n/a n/a 1 (1) n/a
H S Staunton 9 (9) 5 (5) 2 (2) n/a 3 (3)
J Strachan 9 (9) 4 (5) 2 (2) n/a 3 (3)
Sir D Walker 9 (9) n/a 2 (2) 4 (4) n/a
N D Wilson 9 (9) 5 (5) n/a n/a 2 (3)
Figures in brackets indicate the maximum number of meetings that could have been attended by that director.
1 Retired from the Board on the 28 February 2010.2 Chairman designate from 1 January 2010 and formally assumed the Chair on 1 March 2010.3 Retired from the Board on 2 November 2010.4 Appointed to the Board on 2 November 2010.5 Retired from the Board on 26 May 2010.
52 ANNUAL REPORT AND ACCOUNTS 2010 governance
L&G_AR10_06_p48-54_230311_AT.indd 52 25/03/2011 11:18
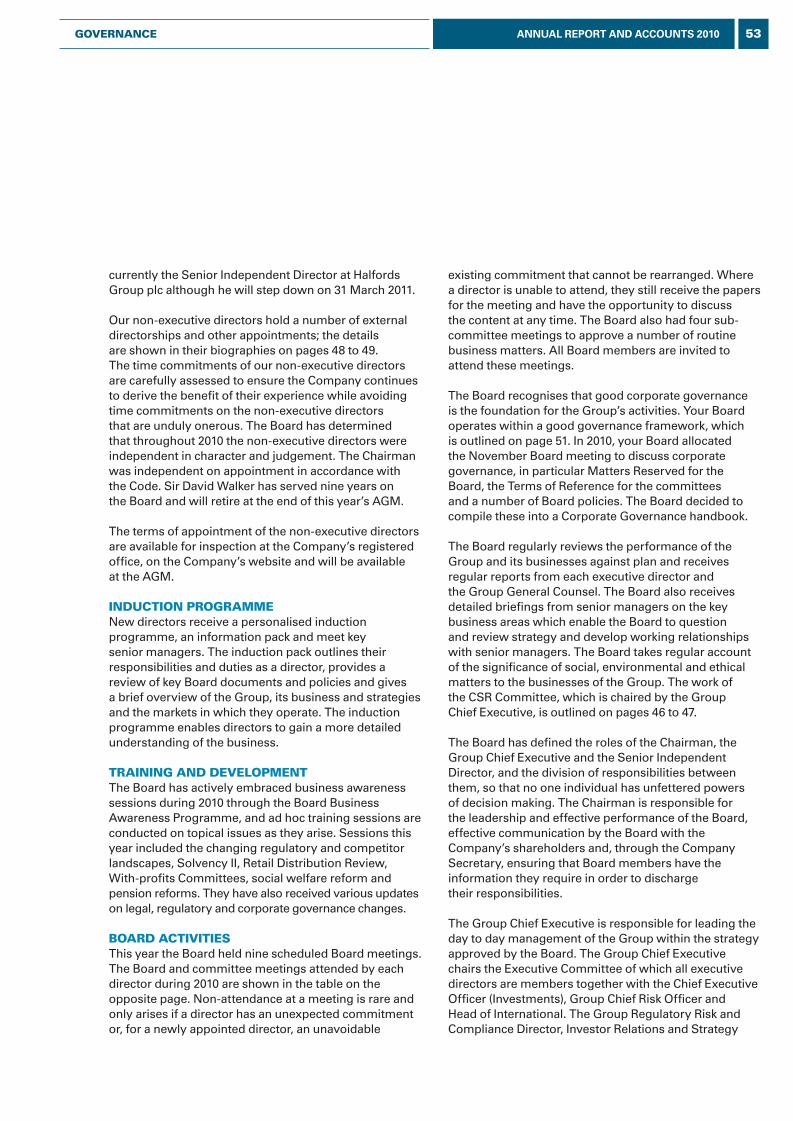
currently the Senior Independent Director at Halfords Group plc although he will step down on 31 March 2011.
Our non-executive directors hold a number of external directorships and other appointments; the details are shown in their biographies on pages 48 to 49. The time commitments of our non-executive directors are carefully assessed to ensure the Company continues to derive the benefit of their experience while avoiding time commitments on the non-executive directors that are unduly onerous. The Board has determined that throughout 2010 the non-executive directors were independent in character and judgement. The Chairman was independent on appointment in accordance with the Code. Sir David Walker has served nine years on the Board and will retire at the end of this year’s AGM.
The terms of appointment of the non-executive directors are available for inspection at the Company’s registered office, on the Company’s website and will be available at the AGM.
inDuction programmeNew directors receive a personalised induction programme, an information pack and meet key senior managers. The induction pack outlines their responsibilities and duties as a director, provides a review of key Board documents and policies and gives a brief overview of the Group, its business and strategies and the markets in which they operate. The induction programme enables directors to gain a more detailed understanding of the business.
training anD DevelopmentThe Board has actively embraced business awareness sessions during 2010 through the Board Business Awareness Programme, and ad hoc training sessions are conducted on topical issues as they arise. Sessions this year included the changing regulatory and competitor landscapes, Solvency II, Retail Distribution Review, With-profits Committees, social welfare reform and pension reforms. They have also received various updates on legal, regulatory and corporate governance changes.
BoarD activitieSThis year the Board held nine scheduled Board meetings. The Board and committee meetings attended by each director during 2010 are shown in the table on the opposite page. Non-attendance at a meeting is rare and only arises if a director has an unexpected commitment or, for a newly appointed director, an unavoidable
existing commitment that cannot be rearranged. Where a director is unable to attend, they still receive the papers for the meeting and have the opportunity to discuss the content at any time. The Board also had four sub-committee meetings to approve a number of routine business matters. All Board members are invited to attend these meetings.
The Board recognises that good corporate governance is the foundation for the Group’s activities. Your Board operates within a good governance framework, which is outlined on page 51. In 2010, your Board allocated the November Board meeting to discuss corporate governance, in particular Matters Reserved for the Board, the Terms of Reference for the committees and a number of Board policies. The Board decided to compile these into a Corporate Governance handbook.
The Board regularly reviews the performance of the Group and its businesses against plan and receives regular reports from each executive director and the Group General Counsel. The Board also receives detailed briefings from senior managers on the key business areas which enable the Board to question and review strategy and develop working relationships with senior managers. The Board takes regular account of the significance of social, environmental and ethical matters to the businesses of the Group. The work of the CSR Committee, which is chaired by the Group Chief Executive, is outlined on pages 46 to 47.
The Board has defined the roles of the Chairman, the Group Chief Executive and the Senior Independent Director, and the division of responsibilities between them, so that no one individual has unfettered powers of decision making. The Chairman is responsible for the leadership and effective performance of the Board, effective communication by the Board with the Company’s shareholders and, through the Company Secretary, ensuring that Board members have the information they require in order to discharge their responsibilities.
The Group Chief Executive is responsible for leading the day to day management of the Group within the strategy approved by the Board. The Group Chief Executive chairs the Executive Committee of which all executive directors are members together with the Chief Executive Officer (Investments), Group Chief Risk Officer and Head of International. The Group Regulatory Risk and Compliance Director, Investor Relations and Strategy
53ANNUAL REPORT AND ACCOUNTS 2010governance
L&G_AR10_06_p48-54_230311_AT.indd 53 25/03/2011 11:18
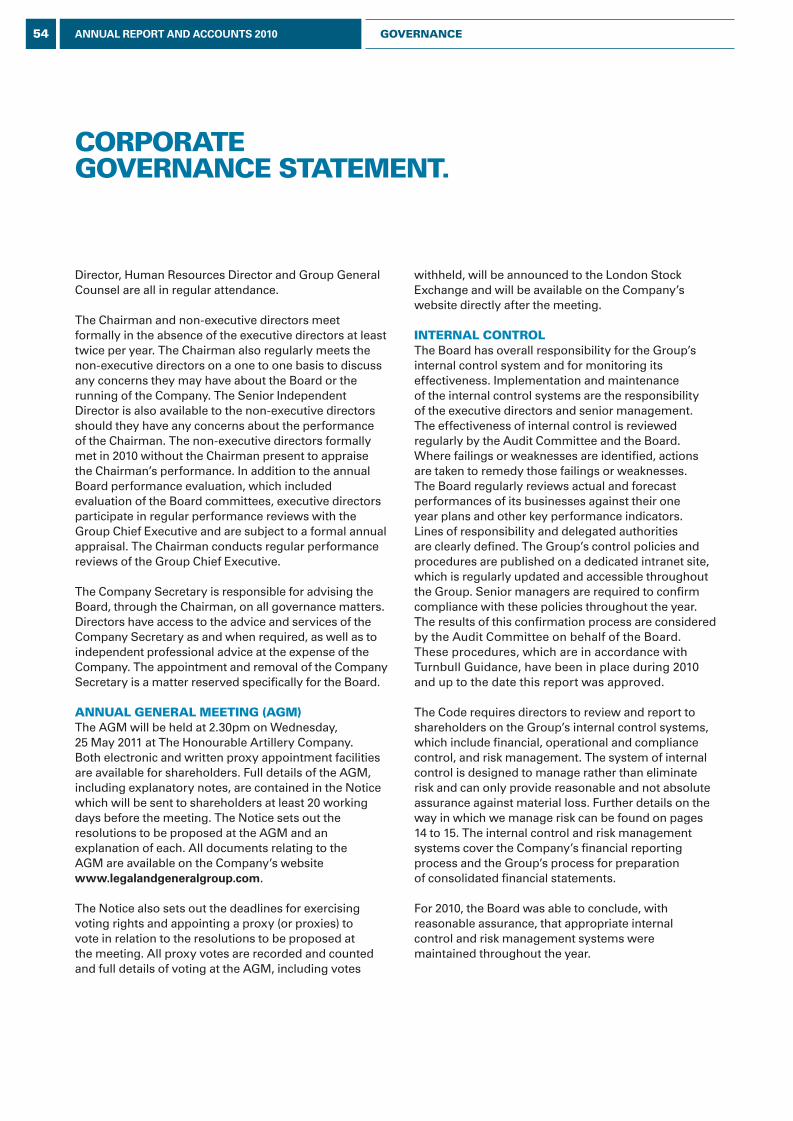
Director, Human Resources Director and Group General Counsel are all in regular attendance.
The Chairman and non-executive directors meet formally in the absence of the executive directors at least twice per year. The Chairman also regularly meets the non-executive directors on a one to one basis to discuss any concerns they may have about the Board or the running of the Company. The Senior Independent Director is also available to the non-executive directors should they have any concerns about the performance of the Chairman. The non-executive directors formally met in 2010 without the Chairman present to appraise the Chairman’s performance. In addition to the annual Board performance evaluation, which included evaluation of the Board committees, executive directors participate in regular performance reviews with the Group Chief Executive and are subject to a formal annual appraisal. The Chairman conducts regular performance reviews of the Group Chief Executive.
The Company Secretary is responsible for advising the Board, through the Chairman, on all governance matters. Directors have access to the advice and services of the Company Secretary as and when required, as well as to independent professional advice at the expense of the Company. The appointment and removal of the Company Secretary is a matter reserved specifically for the Board.
annual general meeting (agm)The AGM will be held at 2.30pm on Wednesday, 25 May 2011 at The Honourable Artillery Company. Both electronic and written proxy appointment facilities are available for shareholders. Full details of the AGM, including explanatory notes, are contained in the Notice which will be sent to shareholders at least 20 working days before the meeting. The Notice sets out the resolutions to be proposed at the AGM and an explanation of each. All documents relating to the AGM are available on the Company’s website www.legalandgeneralgroup.com.
The Notice also sets out the deadlines for exercising voting rights and appointing a proxy (or proxies) to vote in relation to the resolutions to be proposed at the meeting. All proxy votes are recorded and counted and full details of voting at the AGM, including votes
withheld, will be announced to the London Stock Exchange and will be available on the Company’s website directly after the meeting.
internal controlThe Board has overall responsibility for the Group’s internal control system and for monitoring its effectiveness. Implementation and maintenance of the internal control systems are the responsibility of the executive directors and senior management. The effectiveness of internal control is reviewed regularly by the Audit Committee and the Board. Where failings or weaknesses are identified, actions are taken to remedy those failings or weaknesses. The Board regularly reviews actual and forecast performances of its businesses against their one year plans and other key performance indicators. Lines of responsibility and delegated authorities are clearly defined. The Group’s control policies and procedures are published on a dedicated intranet site, which is regularly updated and accessible throughout the Group. Senior managers are required to confirm compliance with these policies throughout the year. The results of this confirmation process are considered by the Audit Committee on behalf of the Board. These procedures, which are in accordance with Turnbull Guidance, have been in place during 2010 and up to the date this report was approved.
The Code requires directors to review and report to shareholders on the Group’s internal control systems, which include financial, operational and compliance control, and risk management. The system of internal control is designed to manage rather than eliminate risk and can only provide reasonable and not absolute assurance against material loss. Further details on the way in which we manage risk can be found on pages 14 to 15. The internal control and risk management systems cover the Company’s financial reporting process and the Group’s process for preparation of consolidated financial statements.
For 2010, the Board was able to conclude, with reasonable assurance, that appropriate internal control and risk management systems were maintained throughout the year.
corporate governance Statement.
54 ANNUAL REPORT AND ACCOUNTS 2010 governance
L&G_AR10_06_p48-54_230311_AT.indd 54 25/03/2011 11:18
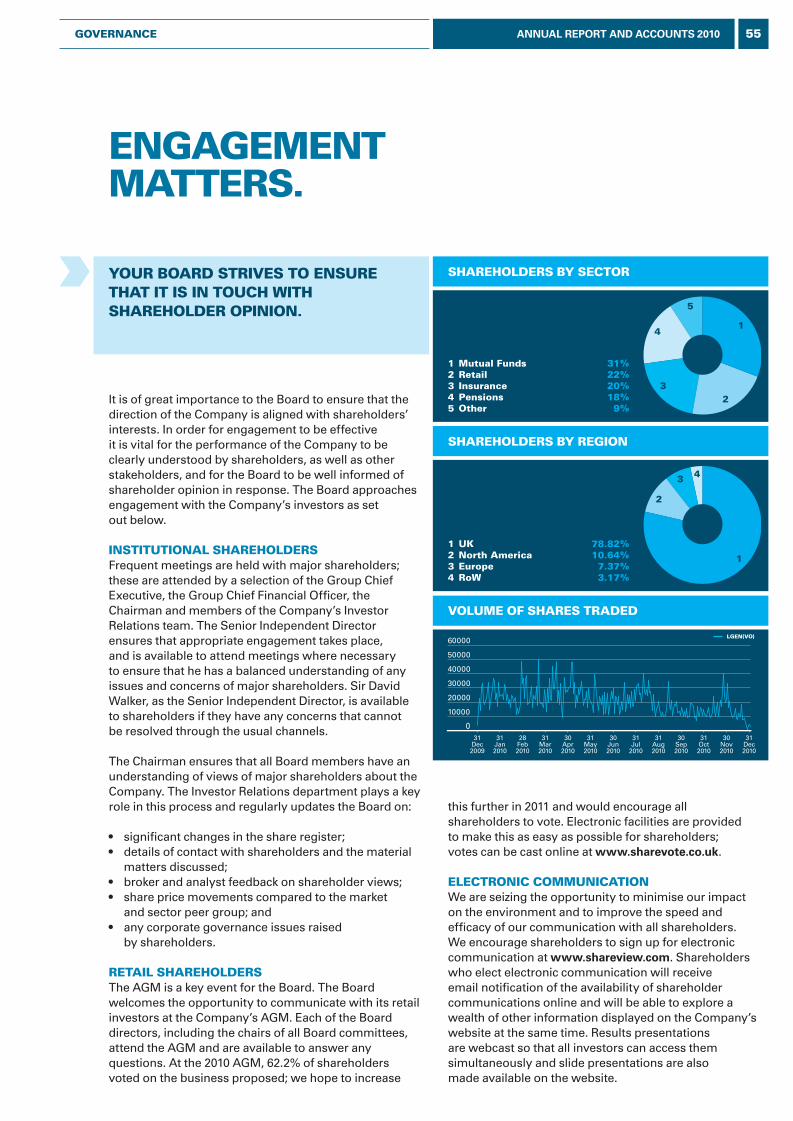
1 Mutual Funds 31%2 Retail 22%3 Insurance 20%4 Pensions 18%5 Other 9%
5
4
32
1
1 UK 78.82%2 North America 10.64%3 Europe 7.37%4 RoW 3.17%
43
2
1
31Dec2009
31Jan2010
28Feb2010
31Mar2010
30Apr2010
31May2010
30Jun2010
31Jul
2010
31Aug2010
30Sep2010
31Oct2010
30Nov2010
31Dec2010
0
10000
20000
30000
40000
50000
60000LGEN(VO)
SHAREHOLDERS BY SECTOR
SHAREHOLDERS BY REGION
VOLUME OF SHARES TRADED
ENGAGEMENT MATTERS.
YOUR BOARD STRIVES TO ENSURE THAT IT IS IN TOUCH wITH SHAREHOLDER OpINION.
this further in 2011 and would encourage all shareholders to vote. Electronic facilities are provided to make this as easy as possible for shareholders; votes can be cast online at www.sharevote.co.uk.
ELECTRONIC COMMUNICATIONWe are seizing the opportunity to minimise our impact on the environment and to improve the speed and efficacy of our communication with all shareholders. We encourage shareholders to sign up for electronic communication at www.shareview.com. Shareholders who elect electronic communication will receive email notification of the availability of shareholder communications online and will be able to explore a wealth of other information displayed on the Company’s website at the same time. Results presentations are webcast so that all investors can access them simultaneously and slide presentations are also made available on the website.
It is of great importance to the Board to ensure that the direction of the Company is aligned with shareholders’ interests. In order for engagement to be effective it is vital for the performance of the Company to be clearly understood by shareholders, as well as other stakeholders, and for the Board to be well informed of shareholder opinion in response. The Board approaches engagement with the Company’s investors as set out below.
INSTITUTIONAL SHAREHOLDERS Frequent meetings are held with major shareholders; these are attended by a selection of the Group Chief Executive, the Group Chief Financial Officer, the Chairman and members of the Company’s Investor Relations team. The Senior Independent Director ensures that appropriate engagement takes place, and is available to attend meetings where necessary to ensure that he has a balanced understanding of any issues and concerns of major shareholders. Sir David Walker, as the Senior Independent Director, is available to shareholders if they have any concerns that cannot be resolved through the usual channels.
The Chairman ensures that all Board members have an understanding of views of major shareholders about the Company. The Investor Relations department plays a key role in this process and regularly updates the Board on:
• significant changes in the share register;• details of contact with shareholders and the material
matters discussed;• broker and analyst feedback on shareholder views;• share price movements compared to the market
and sector peer group; and• any corporate governance issues raised
by shareholders.
RETAIL SHAREHOLDERSThe AGM is a key event for the Board. The Board welcomes the opportunity to communicate with its retail investors at the Company’s AGM. Each of the Board directors, including the chairs of all Board committees, attend the AGM and are available to answer any questions. At the 2010 AGM, 62.2% of shareholders voted on the business proposed; we hope to increase
55ANNUAL REPORT AND ACCOUNTS 2010GOVERNANCE
L&G_AR10_07_p55-61_230311_AT.indd 55 25/03/2011 11:19
NOMINATIONS COMMITTEE REpORT.
THE COMMITTEEThe Nominations Committee leads the process for the appointment of new directors to the Board and reviews on a regular basis whether the Chairman and the non-executive directors continue to be able to meet their commitments to the Company.
Members
John Stewart Dr Ronaldo Schmitz (until 26 May)
Dame Clara Furse Henry Staunton
Frances Heaton (until 2 November) James Strachan
Rudy Markham Sir David Walker
Nick Prettejohn (from 2 November)
The Committee is chaired by the Chairman, and all non-executive directors are members of the Committee. Both Frances Heaton and Dr Ronaldo Schmitz were members of the Committee prior to their resignation. Nick Prettejohn joined the Committee on the date of his appointment. The executive directors, as well as the Group General Counsel and Group HR Director, may attend meetings by invitation. The Committee is chaired by the vice Chairman when it is considering matters relating to the Chairman.
The Committee meets formally twice a year to review the succession plans in place for the executive directors and key senior management, Board composition and to consider the suitability of the directors standing for re-election at the AGM. Otherwise the Committee meets periodically when required.
All directors may serve on a number of other boards, provided they can demonstrate that any such appointment will not interfere with their time commitment to the Company and that they obtain the agreement of the Chairman to the appointment before accepting. Executive directors must also obtain the permission of the Group Chief Executive. This ensures that any potential conflicts of interest or any other concerns around the proposed appointment are considered and addressed. The major commitments of our non-executive directors are outlined in their biographies on pages 48 to 49. Currently, non-executive directors are expected to commit up to 25 days per year. The Committee remains satisfied that all non-executive directors have sufficient time to meet their commitments to the Company. The role and contribution of the non-executive directors who have served for six years or more were closely reviewed by the Committee. All of the non-executive directors are considered to be
independent and the Chairman was considered independent on appointment. The Committee was also satisfied that during 2010 the Chairman’s other commitments did not interfere with the day to day performance of his duties for the Company.
During 2010, the Committee was active in the appointment of a new non-executive director. Early in 2010, based on an assessment of the size of the Board and the balance of its composition, the Board decided to seek an additional non-executive director. The balance of skills, knowledge and experience on the Board was evaluated, and the Committee developed an appointment specification. The specification included a desire for the appointee to have recent executive experience. The Committee instructed external advisers to assist in the identification and shortlisting of potential candidates. All Committee members and the Group Chief Executive met the short listed candidates and unanimously resolved in November 2010 to recommend to the Board that Nick Prettejohn be appointed. Nick Prettejohn formally joined the Board as a non-executive director on 2 November.
RESpONSIBILITIES
• Regularly review the structure, size and composition of the Board and make recommendations to the Board on any changes.
• In relation to new appointments to the Board, lead the process for the identification and nomination of candidates to fill Board vacancies. The Committee considers potential candidates on merit and against objective criteria, and also considers a candidate’s ability to devote sufficient time to the job.
• Review the time commitment required from non-executive directors.
• Consider succession planning for directors and senior management to ensure the continued ability of the Company to implement its strategy and compete effectively in the markets in which it operates.
The terms of reference can be viewed on our website.
56 ANNUAL REPORT AND ACCOUNTS 2010 GOVERNANCE
L&G_AR10_07_p55-61_230311_AT.indd 56 25/03/2011 11:19
THE COMMITTEE
Members
Henry Staunton
Dame Clara Furse (until 2 January 2011)
Frances Heaton (until 2 November 2010)
Rudy Markham (until 26 May 2010)
Nick Prettejohn (from 15 March 2011)
James Strachan
Sir David Walker (15 February 2011 only)
Membership of the Audit Committee currently comprises two non-executive directors and myself as Chairman. The Combined Code requires at least one financially qualified member (as recognised by the Consultative Committee of Accountancy Bodies). Currently, membership of the Committee fulfils this requirement. All members of the Committee are required to be financially literate and to have relevant corporate finance experience. New Committee members participate in training upon joining the Committee, which covers the role of the Committee, its terms of reference and key current issues relevant to the matters considered by the Committee.
The Committee invites the Group Chairman, Group Chief Executive, Group Chief Financial Officer, Group Chief Risk Officer, Group Financial Controller, Group Chief Internal Auditor, UK Actuary and representatives of the external auditors, PricewaterhouseCoopers LLP, to attend all of its meetings, although it reserves the right to request that they withdraw at any time during the meeting. Other senior management are invited to present reports as required by the Committee to discharge its duties. The Committee regularly holds
AUDIT COMMITTEE REpORT.
IN 2010 THE wORk OF THE AUDIT COMMITTEE HAS BEEN CLOSELY LINkED wITH THAT OF THE GROUp RISk COMMITTEE.
private meetings with the Group Chief Internal Auditor and representatives of the external auditors.
The Committee met five times during 2010. Agendas for meetings are linked to events in the Group’s financial calendar.
The Committee operates under formal terms of reference and these are reviewed annually. The Committee’s terms of reference include all matters required by the Combined Code.
The work of the Committee is closely linked with that of the Group Risk Committee. The Chairman of the Committee is also a member of the Group Risk Committee.
The Chairman of the Committee reports back to the Board on the outcome of meetings, and the Board receives the minutes of all Committee meetings.
ACTIVITIESA principal responsibility of the Committee is to monitor the integrity of the Group’s financial statements. As part of this, the Committee reviewed the areas requiring judgement as part of the preparation of the Group’s financial statements during 2010. These areas change over time. With input from the Group’s external auditors, including their assessment of the Group’s financial reporting and control risks, the Committee reviewed the significant financial reporting issues and judgements as well as the key disclosures to be included in the financial statements published during the course of 2010. The market announcements which accompanied the financial statements were also reviewed to ensure consistency with the contents of the financial statements.
A sound system of internal control is essential for reliable financial reporting and for the effective management of the Group. To assess the quality of the control environment of the Group, the Committee received regular reports during the year from the external auditors, as well as from the Internal Audit department, following their work in reviewing and auditing the Group’s control environment. The Committee also invited senior managers from business areas across the Group to report to the Committee on the quality of the controls in their business area. This was usually linked to a report from the Group’s external auditors or the Internal Audit department on their findings on the control framework in that business area. In this way, the Committee obtains the fullest picture possible to enable it to be satisfied with the effectiveness of the Group’s internal control environment.
HENRY STAUNTONCHAIRMAN OF THE AUDIT COMMITTEE
57ANNUAL REPORT AND ACCOUNTS 2010GOVERNANCE
L&G_AR10_07_p55-61_230311_AT.indd 57 25/03/2011 11:19
The Committee is responsible for monitoring the Group’s relationship with its external auditors including their effectiveness and independence. The Committee reviewed and agreed the audit plan for 2010, and any variations to this that were proposed during the year;
robustness of representatives of the external auditors through their reports to the Committee and their participation in discussion at Committee meetings. The Committee also reviewed and agreed the fees payable to the auditors for their audit work. On the basis of this review, the Committee has recommended to the Board that it recommend that shareholders support the reappointment of PricewaterhouseCoopers LLP as the Group’s external auditors at this year’s AGM.
The Committee regularly reviews the amount and nature of non-audit work undertaken by the auditors and the associated fees, and did so in 2010. The Group has adopted a policy setting out the types of non-audit work that may and may not be provided to the Group by the auditors. This policy requires the Committee to approve the engagement of the auditors to undertake non-audit work. Non-audit work in excess of £250,000 must be subject to competitive tender. If the auditors are selected, the Committee is responsible for agreeing the fees for the work. The policy also restricts the employment by the Group of former staff of the external auditors, and precludes the employment of any audit partner if that partner was involved in providing audit services to the Group in the last three years.
The Group’s Internal Audit function makes an important contribution to the Committee in the discharge of its responsibilities. The Committee reviewed and agreed the internal audit plan for 2010 and evaluated the function’s performance through the quality of reports provided to the Committee, management response to audit findings and the timeliness of the implementation of recommendations. The level of skills and expertise of the individuals in the Internal Audit function and the resources available to the Internal Audit department, including staff numbers, were also reviewed.
• Advise the Board on external financial reporting matters including significant financial reporting issues and judgements and the Group’s accounting principles and policies, and any changes to them.
• Review the half year and annual financial statements prior to publication including related market announcements.
• Advise the Board on the effectiveness of the Group’s internal control environment and risk management systems.
• Consider and make recommendations to the Board on the appointment of external auditors.
• Monitor the relationship with the Group’s external auditors including audit expertise and effectiveness, terms of engagement, fees and their independence.
• Review the extent of non-audit services provided by the external auditors.
• Monitor the role and effectiveness of the Internal Audit function including resourcing, annual internal audit plans, key findings and management response.
The full terms of reference for the Committee can be found on our website.
RESpONSIBILITIES
AUDIT COMMITTEE REpORT.
58 ANNUAL REPORT AND ACCOUNTS 2010 GOVERNANCE
L&G_AR10_07_p55-61_230311_AT.indd 58 25/03/2011 11:19
it also evaluated the quality of input, perceptiveness and
• Reviewed the financial statements in the 2009 Annual Report and Accounts and 2010 Half Year results, and received reports from the external auditors on those statements.
• Reviewed the basis for the preparation of the Group’s accounts on a going concern basis.
• Reviewed the significant disclosures contained in the financial statements.
• Reviewed the effectiveness of the Group’s internal controls based on reports received from management, Internal Audit and the external auditors and reviewed the proposed disclosures for the 2009 Annual Report and Accounts, including the Principal Risks and Uncertainties disclosed in the 2009 Annual Report and Accounts and 2010 Half Year results.
• Reviewed the market announcements which accompanied the 2009 Annual Report and Accounts and the 2010 Half Year results.
• Agreed the scope of audit work to be undertaken by the Group’s external auditors and the fees to be paid to the auditors for this audit work. Reviewed the non-audit work undertaken by the external auditors during the year and the non-audit fees paid to the auditors.
• Undertook a comprehensive review of the external auditors’ performance.
• Received quarterly reports from the Group Chief Internal Auditor on internal audit work undertaken, key findings, management response and the implementation of recommended actions.
• Reviewed the terms of reference for Internal Audit and evaluated the performance of the Internal Audit function.
• Received annual reports from the Group Tax Director and Group Treasurer.
• Reviewed the Committee’s terms of reference.
• Received regular updates on developments in accounting and financial reporting matters.
SUMMARY OF wORk OVER THE LAST 12 MONTHS
59ANNUAL REPORT AND ACCOUNTS 2010GOVERNANCE
L&G_AR10_07_p55-61_230311_AT.indd 59 25/03/2011 11:19
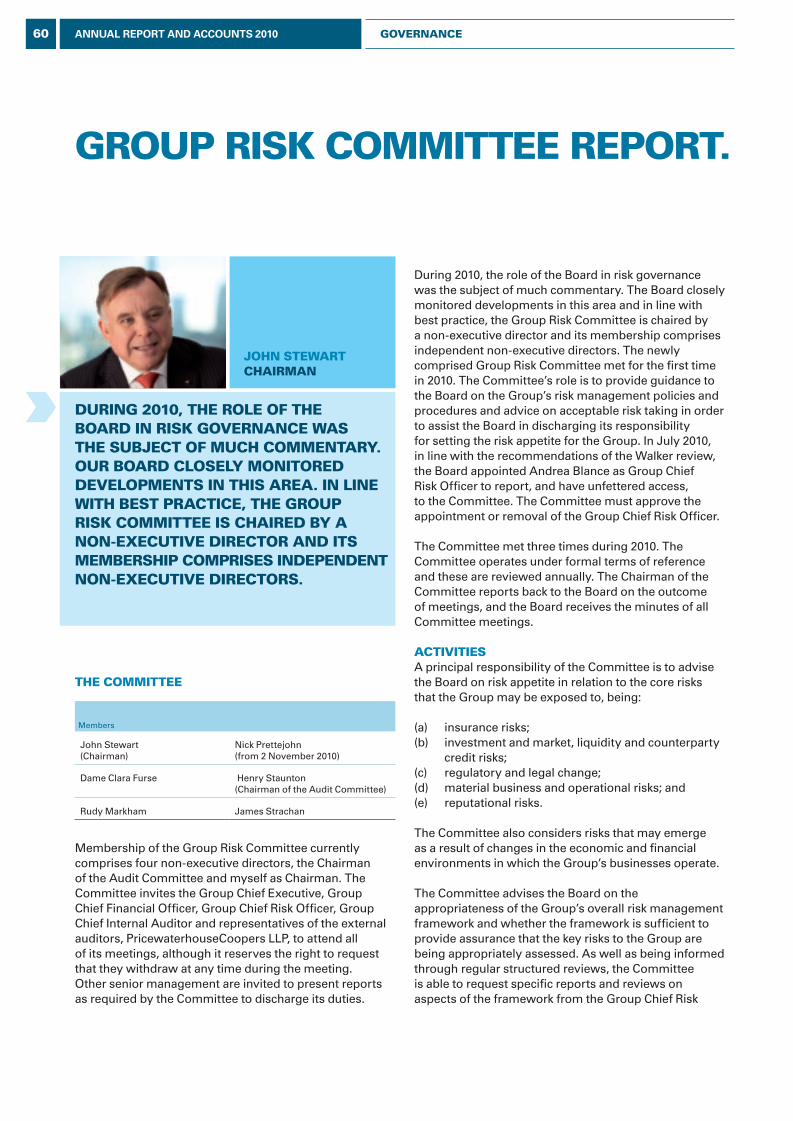
GROUp RISk COMMITTEE REpORT.
During 2010, the role of the Board in risk governance was the subject of much commentary. The Board closely monitored developments in this area and in line with best practice, the Group Risk Committee is chaired by a non-executive director and its membership comprises independent non-executive directors. The newly comprised Group Risk Committee met for the first time in 2010. The Committee’s role is to provide guidance to the Board on the Group’s risk management policies and procedures and advice on acceptable risk taking in order to assist the Board in discharging its responsibility for setting the risk appetite for the Group. In July 2010, in line with the recommendations of the Walker review, the Board appointed Andrea Blance as Group Chief Risk Officer to report, and have unfettered access, to the Committee. The Committee must approve the appointment or removal of the Group Chief Risk Officer.
The Committee met three times during 2010. The Committee operates under formal terms of reference and these are reviewed annually. The Chairman of the Committee reports back to the Board on the outcome of meetings, and the Board receives the minutes of all Committee meetings.
ACTIVITIESA principal responsibility of the Committee is to advise the Board on risk appetite in relation to the core risks that the Group may be exposed to, being:
(a) insurance risks;(b) investment and market, liquidity and counterparty
credit risks;(c) regulatory and legal change;(d) material business and operational risks; and (e) reputational risks.
The Committee also considers risks that may emerge as a result of changes in the economic and financial environments in which the Group’s businesses operate.
The Committee advises the Board on the appropriateness of the Group’s overall risk management framework and whether the framework is sufficient to provide assurance that the key risks to the Group are being appropriately assessed. As well as being informed through regular structured reviews, the Committee is able to request specific reports and reviews on aspects of the framework from the Group Chief Risk
DURING 2010, THE ROLE OF THE BOARD IN RISk GOVERNANCE wAS THE SUBJECT OF MUCH COMMENTARY. OUR BOARD CLOSELY MONITORED DEVELOpMENTS IN THIS AREA. IN LINE wITH BEST pRACTICE, THE GROUp RISk COMMITTEE IS CHAIRED BY A NON-EXECUTIVE DIRECTOR AND ITS MEMBERSHIp COMpRISES INDEpENDENT NON-EXECUTIVE DIRECTORS.
THE COMMITTEE
Members
John Stewart (Chairman)
Nick Prettejohn (from 2 November 2010)
Dame Clara Furse Henry Staunton (Chairman of the Audit Committee)
Rudy Markham James Strachan
Membership of the Group Risk Committee currently comprises four non-executive directors, the Chairman of the Audit Committee and myself as Chairman. The Committee invites the Group Chief Executive, Group Chief Financial Officer, Group Chief Risk Officer, Group Chief Internal Auditor and representatives of the external auditors, PricewaterhouseCoopers LLP, to attend all of its meetings, although it reserves the right to request that they withdraw at any time during the meeting. Other senior management are invited to present reports as required by the Committee to discharge its duties.
JOHN STEwART CHAIRMAN
60 ANNUAL REPORT AND ACCOUNTS 2010 GOVERNANCE
L&G_AR10_07_p55-61_230311_AT.indd 60 25/03/2011 11:19
RESpONSIBILITIESOfficer. The inaugural meeting of the Committee received a detailed presentation on the components and overall operation of the framework. The Committee will also receive an annual report from the Group Regulatory Risk and Compliance Director on regulatory compliance matters and the Company’s relationship with its regulator, the Financial Services Authority.
The Committee discharges its responsibilities through the receipt of reports from the Group Chief Risk Officer and a rolling programme of reviews considering the business and macro risks for specific aspects of the Group’s activities. Reports cover both changes to the profile of risks arising from the pursuit of the Group’s strategy, as well as changes in external markets, regulation and legislation. During 2010, focused reviews by the Committee included the risks associated with the Group’s annuities business, the fiscal environment in which the Group operates and the implications of sovereign debt events. The Committee also considered the Group’s programme of stress and scenario tests and the implications of the results to the Group. The Committee’s work is closely linked to that of the Audit Committee, and the membership of the Chairman of the Audit Committee in addition to the regular attendance of the Group Chief Internal Auditor and a representative of the external auditors promotes a consistent and coherent approach to the oversight of risk on behalf of the Board.
The Risk Management section of this Annual Report and Accounts was reviewed and recommended to the Board by the Committee.
• Advise the Board on the Group’s overall risk appetite for each of the categories of risk to which the Group may be exposed.
• Oversee the management of those risks.
• Monitor the impact of the principal risks on the Group’s strategy and consider changes arising as a consequence of the Group’s strategy, or market and regulatory events.
• Advise the Board on the adequacy of the Group’s overall risk framework and recommend any necessary changes to the Board.
• Review the Risk Management section to be included in the Group’s Annual Report and Accounts and to make a recommendation to the Board regarding its acceptance.
The full terms of reference for the Committee can be found on our website.
61ANNUAL REPORT AND ACCOUNTS 2010GOVERNANCE
L&G_AR10_07_p55-61_230311_AT.indd 61 25/03/2011 11:19
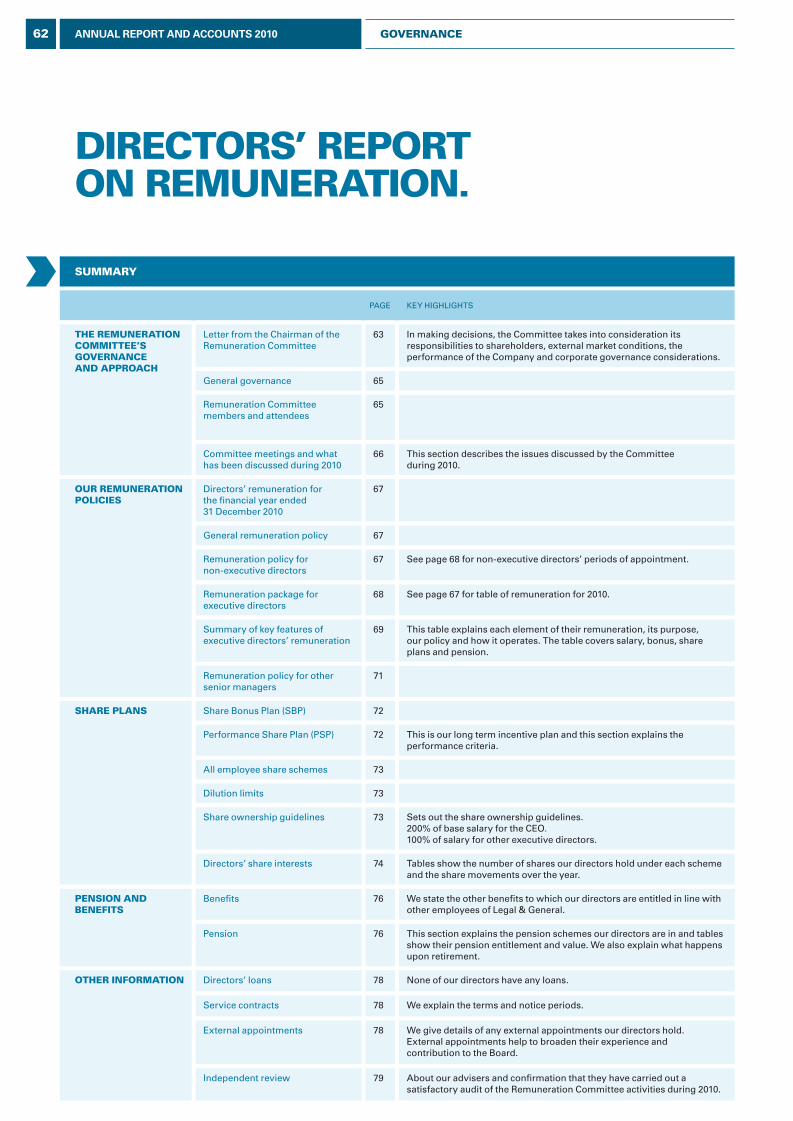
summary
page key highlights
THE rEmuNEraTION COmmITTEE’s GOVErNaNCE aND aPPrOaCH
letter from the Chairman of the Remuneration Committee
63 in making decisions, the Committee takes into consideration its responsibilities to shareholders, external market conditions, the performance of the Company and corporate governance considerations.
general governance 65
Remuneration Committee members and attendees
65
Committee meetings and what has been discussed during 2010
66 this section describes the issues discussed by the Committee during 2010.
Our rEmuNEraTION POlICIEs
Directors’ remuneration for the financial year ended 31 December 2010
67
general remuneration policy 67
Remuneration policy for non-executive directors
67 see page 68 for non-executive directors’ periods of appointment.
Remuneration package for executive directors
68 see page 67 for table of remuneration for 2010.
summary of key features of executive directors’ remuneration
69 this table explains each element of their remuneration, its purpose, our policy and how it operates. the table covers salary, bonus, share plans and pension.
Remuneration policy for other senior managers
71
sHarE PlaNs share Bonus plan (sBp) 72
performance share plan (psp) 72 this is our long term incentive plan and this section explains the performance criteria.
all employee share schemes 73
Dilution limits 73
share ownership guidelines 73 sets out the share ownership guidelines.200% of base salary for the CeO.100% of salary for other executive directors.
Directors’ share interests 74 tables show the number of shares our directors hold under each scheme and the share movements over the year.
PENsION aND bENEfITs
Benefits 76 We state the other benefits to which our directors are entitled in line with other employees of legal & general.
pension 76 this section explains the pension schemes our directors are in and tables show their pension entitlement and value. We also explain what happens upon retirement.
OTHEr INfOrmaTION Directors’ loans 78 None of our directors have any loans.
service contracts 78 We explain the terms and notice periods.
external appointments 78 We give details of any external appointments our directors hold. external appointments help to broaden their experience and contribution to the Board.
independent review 79 about our advisers and confirmation that they have carried out a satisfactory audit of the Remuneration Committee activities during 2010.
DIrECTOrs’ rEPOrT ON rEmuNEraTION.
62 ANNUAL REPORT AND ACCOUNTS 2010 GOVErNaNCE
L&G_AR10_08-p62-79_230311_AT.indd 62 25/03/2011 11:19
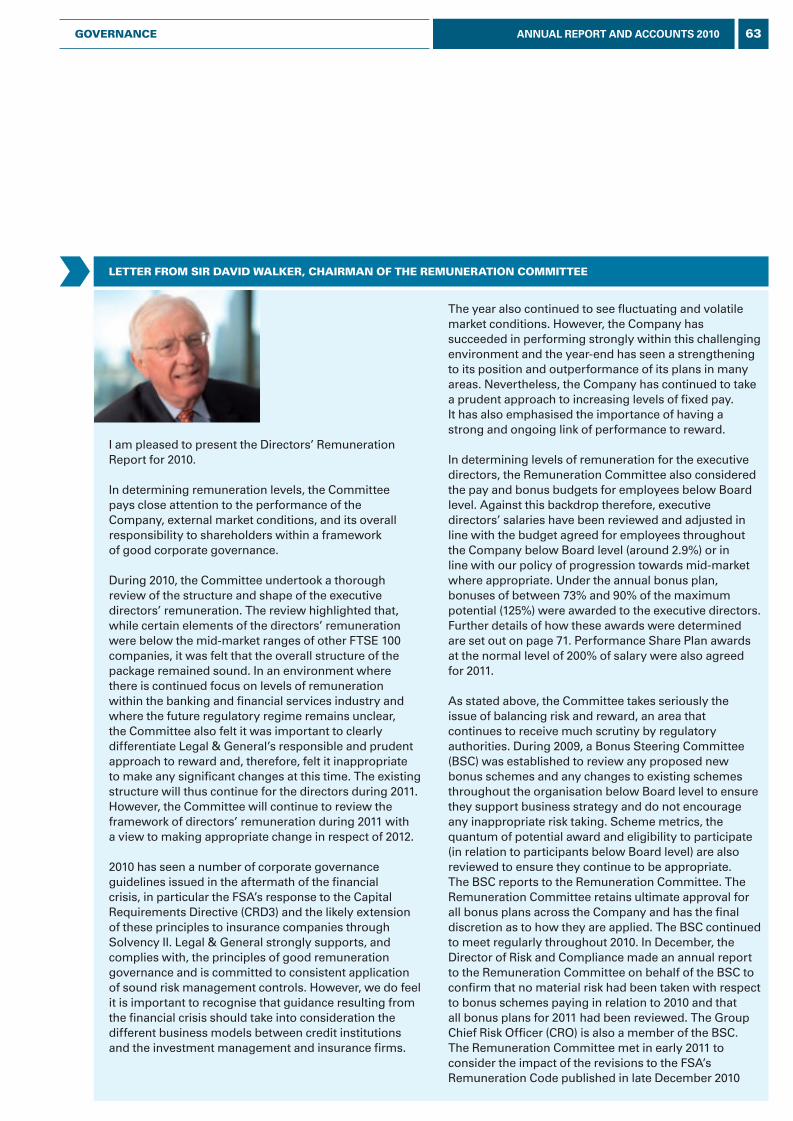
lETTEr frOm sIr DaVID WalKEr, CHaIrmaN Of THE rEmuNEraTION COmmITTEE
i am pleased to present the Directors’ Remuneration Report for 2010.
in determining remuneration levels, the Committee pays close attention to the performance of the Company, external market conditions, and its overall responsibility to shareholders within a framework of good corporate governance.
During 2010, the Committee undertook a thorough review of the structure and shape of the executive directors’ remuneration. the review highlighted that, while certain elements of the directors’ remuneration were below the mid-market ranges of other Ftse 100 companies, it was felt that the overall structure of the package remained sound. in an environment where there is continued focus on levels of remuneration within the banking and financial services industry and where the future regulatory regime remains unclear, the Committee also felt it was important to clearly differentiate legal & general’s responsible and prudent approach to reward and, therefore, felt it inappropriate to make any significant changes at this time. the existing structure will thus continue for the directors during 2011. however, the Committee will continue to review the framework of directors’ remuneration during 2011 with a view to making appropriate change in respect of 2012.
2010 has seen a number of corporate governance guidelines issued in the aftermath of the financial crisis, in particular the Fsa’s response to the Capital Requirements Directive (CRD3) and the likely extension of these principles to insurance companies through solvency ii. legal & general strongly supports, and complies with, the principles of good remuneration governance and is committed to consistent application of sound risk management controls. however, we do feel it is important to recognise that guidance resulting from the financial crisis should take into consideration the different business models between credit institutions and the investment management and insurance firms.
the year also continued to see fluctuating and volatile market conditions. however, the Company has succeeded in performing strongly within this challenging environment and the year-end has seen a strengthening to its position and outperformance of its plans in many areas. Nevertheless, the Company has continued to take a prudent approach to increasing levels of fixed pay. it has also emphasised the importance of having a strong and ongoing link of performance to reward.
in determining levels of remuneration for the executive directors, the Remuneration Committee also considered the pay and bonus budgets for employees below Board level. against this backdrop therefore, executive directors’ salaries have been reviewed and adjusted in line with the budget agreed for employees throughout the Company below Board level (around 2.9%) or in line with our policy of progression towards mid-market where appropriate. Under the annual bonus plan, bonuses of between 73% and 90% of the maximum potential (125%) were awarded to the executive directors. Further details of how these awards were determined are set out on page 71. performance share plan awards at the normal level of 200% of salary were also agreed for 2011.
as stated above, the Committee takes seriously the issue of balancing risk and reward, an area that continues to receive much scrutiny by regulatory authorities. During 2009, a Bonus steering Committee (BsC) was established to review any proposed new bonus schemes and any changes to existing schemes throughout the organisation below Board level to ensure they support business strategy and do not encourage any inappropriate risk taking. scheme metrics, the quantum of potential award and eligibility to participate (in relation to participants below Board level) are also reviewed to ensure they continue to be appropriate. the BsC reports to the Remuneration Committee. the Remuneration Committee retains ultimate approval for all bonus plans across the Company and has the final discretion as to how they are applied. the BsC continued to meet regularly throughout 2010. in December, the Director of Risk and Compliance made an annual report to the Remuneration Committee on behalf of the BsC to confirm that no material risk had been taken with respect to bonus schemes paying in relation to 2010 and that all bonus plans for 2011 had been reviewed. the group Chief Risk Officer (CRO) is also a member of the BsC.the Remuneration Committee met in early 2011 to consider the impact of the revisions to the Fsa’s Remuneration Code published in late December 2010
63ANNUAL REPORT AND ACCOUNTS 2010GOVErNaNCE
L&G_AR10_08-p62-79_230311_AT.indd 63 25/03/2011 11:19
DIrECTOrs’ rEPOrT ON rEmuNEraTION.
and which took effect on 1 January 2011. the Committee has concluded that, although insurance businesses are not caught, the group’s asset management business (lgiM) and retail investment business are categorised as tier 4 firms. the Committee has identified all group companies affected by the Code and identified those staff who are within its ambit (Code staff). the Committee has extended its terms of reference to include these individuals.
the Committee is satisfied that no significant changes to remuneration practices will be necessary and is considering how best to meet the new disclosure obligations.
the Company also appointed a group Chief Risk Officer (CRO) in July 2010. the Remuneration Committee felt that while the CRO should continue to participate in the long term incentive plans, with vesting a function of the long term performance of the group, eligibility for short term bonus should be determined by reference to performance against personal objectives set to underpin the independence of the CRO from day to day business pursuit. performance against these objectives will be reviewed by the Chairman of the group Risk Committee. this will form a key input to the final decision on reward that will be made by the Remuneration Committee. the same approach to bonus will be applied to the head of internal audit, whose objectives and performance will be reviewed by the Chairman of the audit Committee, and the Director of Regulatory Risk and Compliance, whose objectives and performance will be reviewed by the group Chairman. the principle of only looking at personal objectives will also cascade to their teams.
Following the government’s review of pensions legislation in relation to the annual allowance and lifetime allowance, the Remuneration Committee considered the impact on the small number immediately affected by the legislation. the Company does not compensate for legislative changes but the Committee endeavours to provide employees with as much information as possible to make informed choices and decisions. No special compensation is being offered to directors or any other employees who are affected by the tax changes but should any impacted employee wish to leave their pension scheme, a cash alternative equivalent to the current level of contribution given under the Company’s Defined Contribution pension scheme will be offered. in line with government
legislation, no changes will be made to those directors (tim Breedon and John pollock) who took protection under the a-Day legislation.
in my letter introducing the 2008 Remuneration Report, i mentioned that the table of pension entitlements in that year’s report showed a larger increase than may have been expected as a result of changes in actuarial assumptions. this year’s report actually shows a negative number. Neither arise from any change in policy or the underlying benefits but demonstrate the volatility associated with the assumptions we are required to use.
the Remuneration Committee’s remit extends beyond the executive Board members. it reviews the ongoing pay and bonus decisions on an individual basis for any employees who earn a base salary of £100,000 or more. it also reviews the overall pay and bonus decisions in relation to the oversight functions (Risk, Compliance and internal audit), and also Finance and human Resources to ensure that decisions are not biased depending on reporting lines to either the business or functional head. an equal pay audit is conducted before, during and after each pay review and looks at pay and bonus decisions by gender, ethnicity, age and full time versus part time employees across the Company. the results of this audit are reviewed by both the equalities Committee and the Remuneration Committee. pay and bonus budgets for all employees are approved at the Remuneration Committee and the Committee is mindful of these in determining pay and bonus for directors.
the Committee strongly supports the Company’s stance on linking performance to reward and is pleased to see the introduction of more specific performance ratings to all staff (in addition to managers) during 2010. For 2011, the performance cycle for all employees has been aligned to the annual business performance cycle to more closely link objectives and performance with group results. a resolution to vote for this Directors’ Remuneration Report (pages 62 to 79) will be put to the agM. i hope that you will support this resolution.
sIr DaVID WalKErCHaIrmaN Of THE rEmuNEraTION COmmITTEE
64 ANNUAL REPORT AND ACCOUNTS 2010 GOVErNaNCE
L&G_AR10_08-p62-79_230311_AT.indd 64 25/03/2011 11:19
Terms of referencethe Committee’s terms of reference are available on our website or on request. the terms of reference were reviewed during 2010 to ensure they continued to accurately reflect the remit of the Committee which embraces the remuneration strategy and policy for the whole Company as well as the executive directors. Further changes were made following the year end to include express references to the new Fsa Remuneration Code. the Committee has appointed hewitt New Bridge street (hNBs) as its independent adviser and the terms of agreement between the Company and hNBs are available on request. hNBs is a signatory to the Remuneration Consultants group Code of Conduct in relation to executive Remuneration Consulting in the Uk.
rEmuNEraTION COmmITTEE mEETINGsthe Committee met four times during 2010 and the main issues discussed are shown on page 66.
THE rEmuNEraTION COmmITTEE’s GOVErNaNCE aND aPPrOaCH
GENEral GOVErNaNCEthe Directors’ Remuneration report has been prepared in accordance with the requirements of the Companies act 2006 and schedule 8 of the large and Medium sized Companies and groups (accounts and Reports) Regulations 2008. it also describes the group’s compliance with the Combined Code on Corporate governance in relation to remuneration. the Company is an active member of the aBi and the Committee, consistent with its approach of operating within the highest standards of corporate governance, takes significant account of guidelines issued by the aBi and shareholder bodies (such as the NapF) when setting the remuneration strategy for the Company. it also seeks to maintain an active and productive dialogue with investors on developments in the remuneration aspects of corporate governance generally and any changes to the Company’s executive pay arrangements in particular.
remuneration Committee members and attendees
Remuneration Committee Member position Comments
sir David Walker Chairman of Remuneration Committee independent
John stewart Chairman of the Company and Member independent upon appointment on 1 March 2010
Rudy Markham Member independent
Dr Ronaldo schmitz Member stood down from the Committee on 28 May 2010
James strachan Member stood down from the Committee on 28 May 2010
Nick prettejohn Member independent – joined the Committee on 2 November 2010
Remuneration Committee attendee position Comments
tim Breedon group Chief executive attends by invitation
elaine Maclean group hR Director attends as an executive responsible for advising on the remuneration policy
Rosemary lemon group head of Reward and executive Remuneration
attends as an executive responsible for advising on the remuneration policy
John lee hewitt New Bridge street (hNBs) attends by invitation as the Committee’s independent adviser
Note : the august meeting was attended by Frances heaton (independent) and henry staunton (independent) as temporary members to discuss remuneration strategy.
No person is present during any discussion relating to their own remuneration.
65ANNUAL REPORT AND ACCOUNTS 2010GOVErNaNCE
L&G_AR10_08-p62-79_230311_AT.indd 65 25/03/2011 11:19
DIrECTOrs’ rEPOrT ON rEmuNEraTION.
remuneration Committee meetings
marCHthe March meeting mainly focused on remuneration issues relating to the previous and forthcoming year.
key agenda items• Recommendations to the Board in respect
of the executive directors’ salaries.
• setting annual bonus targets for the executive directors for 2010 and determining bonuses to be paid for 2009.
• Determining the 2010 performance share plan (psp) awards and performance conditions for the executive directors and approving proposed psp awards granted to senior executives within the group. the Committee also measured the performance condition applying to the 2007 psp awards. this award did not vest.
• performing an oversight role on remuneration for other senior executives within the group. the Committee reviews all pay, bonus and share award recommendations for employees whose salaries are £100,000 or above. it also reviews the remuneration for the ‘oversight departments’ that is, the employees in Risk, Compliance and internal audit as well as human Resources and Finance.
• Review and approval of new bonus plans or amendments to existing schemes.
• approving the 2009 Directors’ Report on Remuneration.
• approval to grant any performance related shares (previously known as Freeshares) under an hM Revenue & Customs approved scheme to employees based on Company performance.
• approval of any share grants under the share Bonus plan (sBp).
• Regular items include the review of any bonus plans and share grants for new joiners and termination arrangements for leavers.
items discussed in addition to the standard agenda• the Committee paid careful attention to
the external market, Company performance, return to shareholders and individual performance in assessing the bonus outcomes for the executive directors.
• group performance related shares were previously awarded twice a year. in 2010 it was determined to discuss these once a year after the annual results are known to tie any award more closely to overall Company performance. at the March meeting it was decided to grant 700 shares to each employee.
auGusTthe august meeting mainly focused on the strategic direction of reward.
key agenda items• the annual review of the remuneration
strategy, policy and approach for all staff. the Committee considers the policy in relation to senior executive remuneration in the context of remuneration structures across the group as a whole.
• Regular items include the review of any bonus plans and share grants for new joiners and termination arrangements for leavers.
items discussed in addition to the standard agenda• the august meeting focused on an in-depth
review of the remuneration policies for the executive directors including:
− salary policy
− balance of short term versus long term incentives
− performance metrics
− levels of deferment
− benchmarking
− remuneration governance guidelines (an initial overview of the draft Fsa guidance was reviewed)
− overall philosophy.
• in addition the meeting looked at the remuneration structure for the new group Chief Risk Officer and agreed the same approach should be extended to the head of internal audit.
• it determined that forfeiture of deferred bonus should also be considered in the event of personal misconduct as well as if the performance which led to a bonus being paid is found to be incorrect.
NOVEmbErthe November meeting was called to follow up remuneration policy issues discussed at the august review.
key agenda items• this was an additional meeting to continue
the discussion around remuneration structure for 2011.
• Regular items include the review of any bonus plans and share grants for new joiners and termination arrangements for leavers.
items discussed in addition to the standard agenda• the meeting agreed that, notwithstanding
the pay of executive directors falling below the Company’s mid-market positioning, given the regulatory uncertainty and the current focus on pay restraint across the Uk economy, it was not appropriate to change the pay structure at this time. this would be kept under review.
• the meeting agreed to extend the remuneration structure for the group CRO and head of internal audit to the Director of Regulatory Risk and Compliance.
DECEmbErthe December meeting focused on the pay review budgets and the approval of bonus plans for the forthcoming year.
key agenda items• Review of proposed pay, bonus and share
scheme budgets for the managers’ and staff pay review.
• Review of bonus schemes.
• Regular items include the review of any bonus plans and share grants for new joiners and termination arrangements for leavers.
• Review of terms of Reference of the Committee.
items discussed in addition to the standard agenda• the Director of Risk and Compliance
reported on the bonus schemes operated during 2010 and those approved for 2011. actions from the 2009 review had been implemented and the number of schemes in operation had been reduced. it was confirmed that no undue risk prevented payment of the 2010 schemes and that those plans intended for operation during 2011 had been reviewed by group Risk and Compliance and sanctioned at the Bonus steering Committee (BsC).
66 ANNUAL REPORT AND ACCOUNTS 2010 GOVErNaNCE
L&G_AR10_08-p62-79_230311_AT.indd 66 25/03/2011 11:19
Our rEmuNEraTION POlICIEs
1) GENEral rEmuNEraTION POlICythe group’s remuneration policy is broadly consistent for all employees and is designed to support recruitment, motivation and retention as well as reward high performance in the context of appropriate risk management. Remuneration is considered within the overall context of the group’s sector and the markets in which the divisions operate. the policy for the majority of employees continues to be to pay around the relevant mid-market range with a package designed to align the interests of employees with those of shareholders, with an appropriate proportion of total remuneration dependent upon performance. Management seeks to ensure that our pay policies and practices are free from unfair bias. this is monitored by an annual equal pay audit that reviews pay and bonus decisions by gender, ethnicity, age and full time versus part time working. in addition, it considers the pay of the oversight departments (Risk, Compliance and internal audit)
as well as Finance and human Resources and looks at decisions for employees who report directly to the business versus those who report to the function head.
the policy for directors is described in more detail on the following pages.
2) rEmuNEraTION POlICy fOr NON-ExECuTIVE DIrECTOrs (NEDs)appointment letters are currently for three years but NeDs will be subject to annual re-election going forward. appointments may be terminated by either party without notice. Fees for the non-executive directors are determined by the Board, based on a range of external information and advice set within the aggregate limits contained in the articles of association. the current aggregate limit for fees paid to NeDs is £1,500,000, increased from £1,000,000 at the 2010 agM.
Directors’ remuneration for financial year ended 31 December 2010
annual bonus total
salary/fees £’000
Benefits6
£’000
Cash in lieu of pension
£’000Cash £’000
Deferred £’000
2010 £’000
2009 £’000
Executive:
tim Breedon 785 20 173 552 331 1,861 1,729
Nigel Wilson 536 20 – 366 219 1,141 338
John pollock 400 20 88 229 137 874 764
Mark gregory 360 20 – 229 137 746 554
2,081 80 261 1,376 824 4622 3,385
Non-executive:
John stewart1 325 – – – – 325 –
sir David Walker 110 – – – – 110 110
henry staunton 90 – – – – 90 90
James strachan 65 – – – – 65 65
Rudy Markham 65 – – – – 65 65
Dame Clara Furse 65 – – – – 65 38
Nick prettejohn2 11 – – – – 11 –
Dr Ronaldo schmitz3 27 – – – – 27 82
Frances heaton4 54 – – – – 54 66
sir Rob Margetts5 54 – – – – 54 328
866 – – – – 866 844
Total 2,947 80 261 1,376 824 5,488 4,229
1 John stewart was appointed to the Board on 1 January 2010 as a non-executive director and Chairman designate. his fee at appointment was £325,000 pa. he became Chairman on 1 March 2010.
2 Nick prettejohn was appointed to the Board on 2 November 2010 and his fee represents the period 2 November 2010 to 31 December 2010.3 Dr Ronaldo schmitz stepped down from the Board on 26 May 2010. his fee represents the period 1 January 2010 to 26 May 2010.4 Frances heaton stood down from the Board on 2 November 2010 and her fee reflects the period 1 January 2010 to 2 November 2010.5 sir Rob Margetts stood down from the Board on 1 March 2010. his fee was £325,000 pa and his fee above reflects the period 1 January 2010 to 1 March 2010.6 Benefits include car allowances and medical insurance.
the information in this table has been audited by the independent auditors, pricewaterhouseCoopers llp.
67ANNUAL REPORT AND ACCOUNTS 2010GOVErNaNCE
L&G_AR10_08-p62-79_230311_AT.indd 67 25/03/2011 11:19
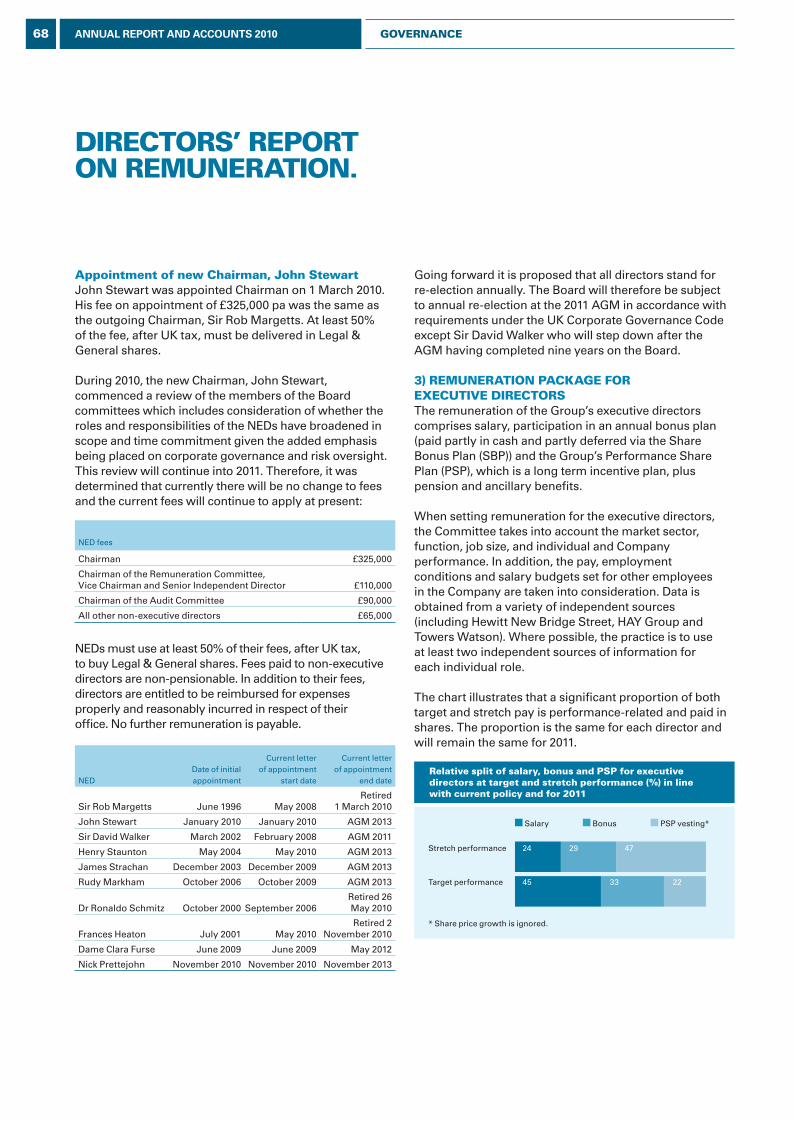
472924
45 33 22
Stretch performance
Target performance
* Share price growth is ignored.
Salary Bonus PSP vesting*
DIrECTOrs’ rEPOrT ON rEmuNEraTION.
appointment of new Chairman, John stewartJohn stewart was appointed Chairman on 1 March 2010. his fee on appointment of £325,000 pa was the same as the outgoing Chairman, sir Rob Margetts. at least 50% of the fee, after Uk tax, must be delivered in legal & general shares.
During 2010, the new Chairman, John stewart, commenced a review of the members of the Board committees which includes consideration of whether the roles and responsibilities of the NeDs have broadened in scope and time commitment given the added emphasis being placed on corporate governance and risk oversight. this review will continue into 2011. therefore, it was determined that currently there will be no change to fees and the current fees will continue to apply at present:
NeD fees
Chairman £325,000
Chairman of the Remuneration Committee, Vice Chairman and senior independent Director
£110,000
Chairman of the audit Committee £90,000
all other non-executive directors £65,000
NeDs must use at least 50% of their fees, after Uk tax, to buy legal & general shares. Fees paid to non-executive directors are non-pensionable. in addition to their fees, directors are entitled to be reimbursed for expenses properly and reasonably incurred in respect of their office. No further remuneration is payable.
NeDDate of initial appointment
Current letter of appointment
start date
Current letter of appointment
end date
sir Rob Margetts June 1996 May 2008Retired
1 March 2010
John stewart January 2010 January 2010 agM 2013
sir David Walker March 2002 February 2008 agM 2011
henry staunton May 2004 May 2010 agM 2013
James strachan December 2003 December 2009 agM 2013
Rudy Markham October 2006 October 2009 agM 2013
Dr Ronaldo schmitz October 2000 september 2006Retired 26 May 2010
Frances heaton July 2001 May 2010Retired 2
November 2010
Dame Clara Furse June 2009 June 2009 May 2012
Nick prettejohn November 2010 November 2010 November 2013
going forward it is proposed that all directors stand for re-election annually. the Board will therefore be subject to annual re-election at the 2011 agM in accordance with requirements under the Uk Corporate governance Code except sir David Walker who will step down after the agM having completed nine years on the Board.
3) rEmuNEraTION PaCKaGE fOrExECuTIVE DIrECTOrsthe remuneration of the group’s executive directors comprises salary, participation in an annual bonus plan (paid partly in cash and partly deferred via the share Bonus plan (sBp)) and the group’s performance share plan (psp), which is a long term incentive plan, plus pension and ancillary benefits.
When setting remuneration for the executive directors, the Committee takes into account the market sector, function, job size, and individual and Company performance. in addition, the pay, employment conditions and salary budgets set for other employees in the Company are taken into consideration. Data is obtained from a variety of independent sources (including hewitt New Bridge street, hay group and towers Watson). Where possible, the practice is to use at least two independent sources of information for each individual role.
the chart illustrates that a significant proportion of both target and stretch pay is performance-related and paid in shares. the proportion is the same for each director and will remain the same for 2011.
relative split of salary, bonus and PsP for executive directors at target and stretch performance (%) in line with current policy and for 2011
68 ANNUAL REPORT AND ACCOUNTS 2010 GOVErNaNCE
L&G_AR10_08-p62-79_230311_AT.indd 68 25/03/2011 11:19
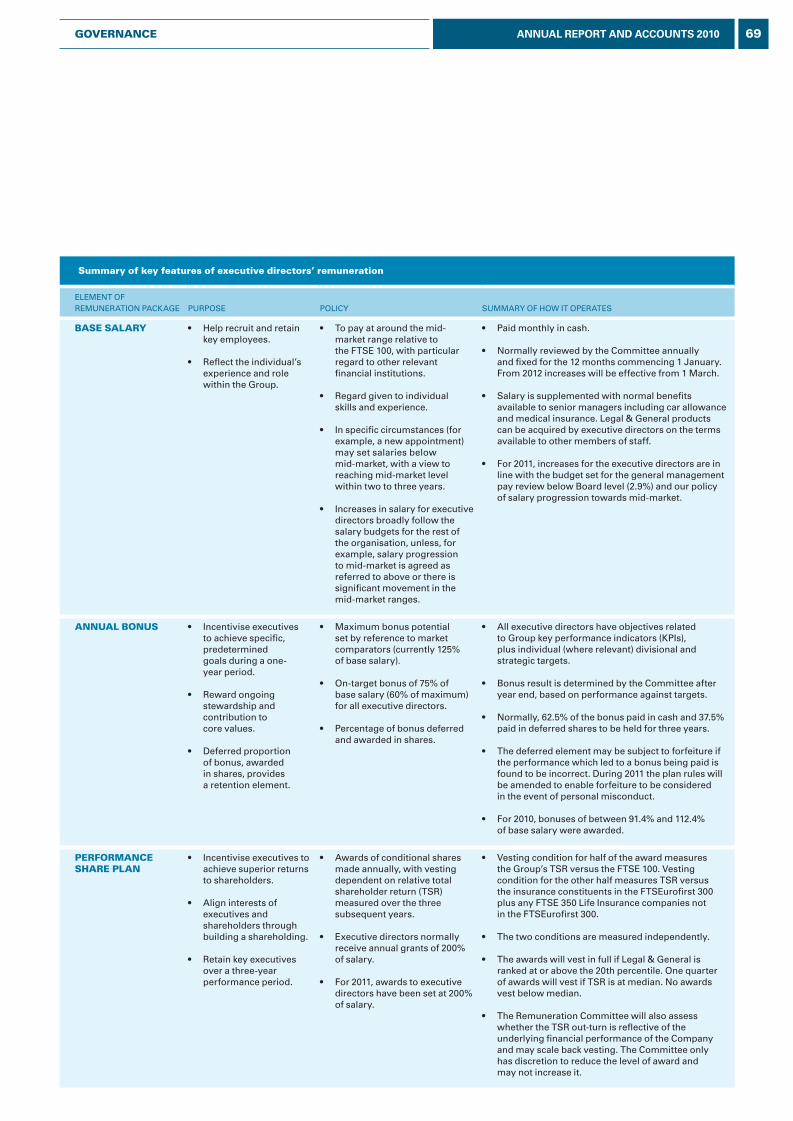
summary of key features of executive directors’ remuneration
eleMeNt OF ReMUNeRatiON paCkage pURpOse pOliCy sUMMaRy OF hOW it OpeRates
basE salary • help recruit and retain key employees.
• Reflect the individual’s experience and role within the group.
• to pay at around the mid-market range relative to the Ftse 100, with particular regard to other relevant financial institutions.
• Regard given to individual skills and experience.
• in specific circumstances (for example, a new appointment) may set salaries below mid-market, with a view to reaching mid-market level within two to three years.
• increases in salary for executive directors broadly follow the salary budgets for the rest of the organisation, unless, for example, salary progression to mid-market is agreed as referred to above or there is significant movement in the mid-market ranges.
• paid monthly in cash.
• Normally reviewed by the Committee annually and fixed for the 12 months commencing 1 January. From 2012 increases will be effective from 1 March.
• salary is supplemented with normal benefits available to senior managers including car allowance and medical insurance. legal & general products can be acquired by executive directors on the terms available to other members of staff.
• For 2011, increases for the executive directors are in line with the budget set for the general management pay review below Board level (2.9%) and our policy of salary progression towards mid-market.
aNNual bONus • incentivise executives to achieve specific, predetermined goals during a one- year period.
• Reward ongoing stewardship and contribution to core values.
• Deferred proportion of bonus, awarded in shares, provides a retention element.
• Maximum bonus potential set by reference to market comparators (currently 125% of base salary).
• On-target bonus of 75% of base salary (60% of maximum) for all executive directors.
• percentage of bonus deferred and awarded in shares.
• all executive directors have objectives related to group key performance indicators (kpis), plus individual (where relevant) divisional and strategic targets.
• Bonus result is determined by the Committee after year end, based on performance against targets.
• Normally, 62.5% of the bonus paid in cash and 37.5% paid in deferred shares to be held for three years.
• the deferred element may be subject to forfeiture if the performance which led to a bonus being paid is found to be incorrect. During 2011 the plan rules will be amended to enable forfeiture to be considered in the event of personal misconduct.
• For 2010, bonuses of between 91.4% and 112.4% of base salary were awarded.
PErfOrmaNCE sHarE PlaN
• incentivise executives to achieve superior returns to shareholders.
• align interests of executives and shareholders through building a shareholding.
• Retain key executives over a three-year performance period.
• awards of conditional shares made annually, with vesting dependent on relative total shareholder return (tsR) measured over the three subsequent years.
• executive directors normally receive annual grants of 200% of salary.
• For 2011, awards to executive directors have been set at 200% of salary.
• Vesting condition for half of the award measures the group’s tsR versus the Ftse 100. Vesting condition for the other half measures tsR versus the insurance constituents in the Ftseurofirst 300 plus any Ftse 350 life insurance companies not in the Ftseurofirst 300.
• the two conditions are measured independently.
• the awards will vest in full if legal & general is ranked at or above the 20th percentile. One quarter of awards will vest if tsR is at median. No awards vest below median.
• the Remuneration Committee will also assess whether the tsR out-turn is reflective of the underlying financial performance of the Company and may scale back vesting. the Committee only has discretion to reduce the level of award and may not increase it.
69ANNUAL REPORT AND ACCOUNTS 2010GOVErNaNCE
L&G_AR10_08-p62-79_230311_AT.indd 69 25/03/2011 11:19
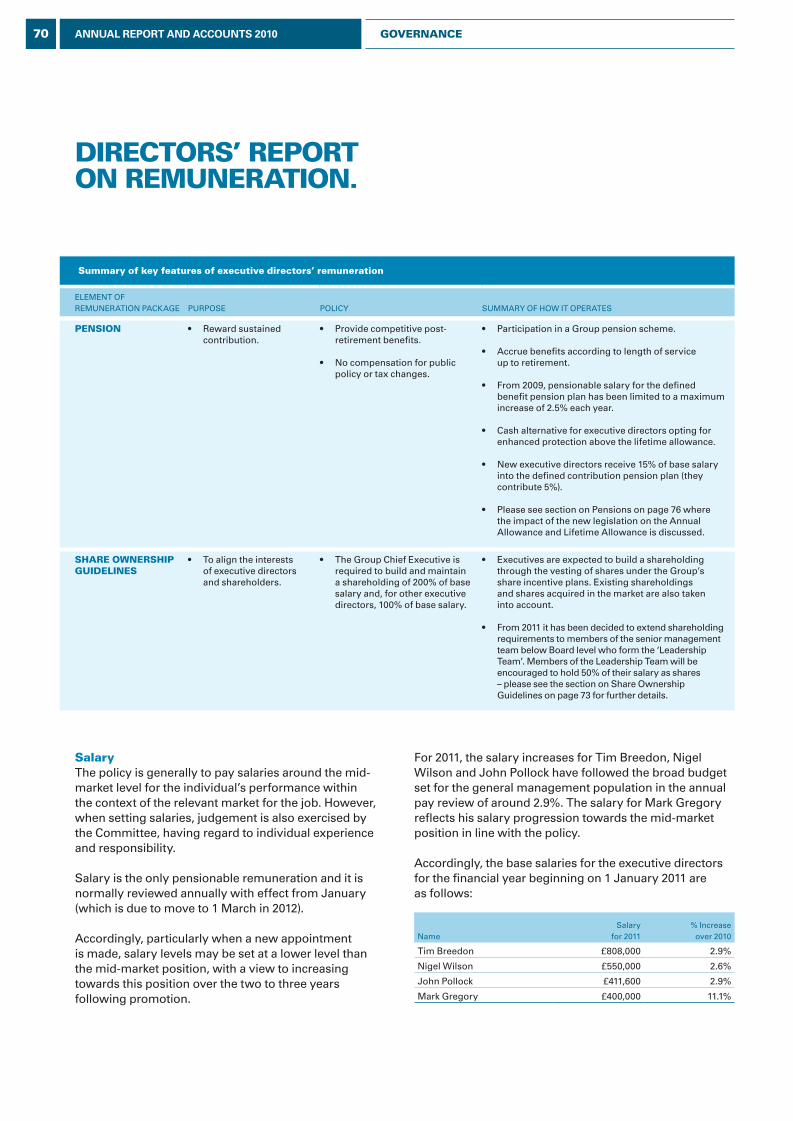
DIrECTOrs’ rEPOrT ON rEmuNEraTION.
summary of key features of executive directors’ remuneration
eleMeNt OF ReMUNeRatiON paCkage pURpOse pOliCy sUMMaRy OF hOW it OpeRates
PENsION • Reward sustained contribution.
• provide competitive post-retirement benefits.
• No compensation for public policy or tax changes.
• participation in a group pension scheme.
• accrue benefits according to length of service up to retirement.
• From 2009, pensionable salary for the defined benefit pension plan has been limited to a maximum increase of 2.5% each year.
• Cash alternative for executive directors opting for enhanced protection above the lifetime allowance.
• New executive directors receive 15% of base salary into the defined contribution pension plan (they contribute 5%).
• please see section on pensions on page 76 where the impact of the new legislation on the annual allowance and lifetime allowance is discussed.
sHarE OWNErsHIP GuIDElINEs
• to align the interests of executive directors and shareholders.
• the group Chief executive is required to build and maintain a shareholding of 200% of base salary and, for other executive directors, 100% of base salary.
• executives are expected to build a shareholding through the vesting of shares under the group’s share incentive plans. existing shareholdings and shares acquired in the market are also taken into account.
• From 2011 it has been decided to extend shareholding requirements to members of the senior management team below Board level who form the ‘leadership team’. Members of the leadership team will be encouraged to hold 50% of their salary as shares – please see the section on share Ownership guidelines on page 73 for further details.
For 2011, the salary increases for tim Breedon, Nigel Wilson and John pollock have followed the broad budget set for the general management population in the annual pay review of around 2.9%. the salary for Mark gregory reflects his salary progression towards the mid-market position in line with the policy.
accordingly, the base salaries for the executive directors for the financial year beginning on 1 January 2011 are as follows:
Namesalary
for 2011 % increase
over 2010
tim Breedon £808,000 2.9%
Nigel Wilson £550,000 2.6%
John pollock £411,600 2.9%
Mark gregory £400,000 11.1%
salarythe policy is generally to pay salaries around the mid-market level for the individual’s performance within the context of the relevant market for the job. however, when setting salaries, judgement is also exercised by the Committee, having regard to individual experience and responsibility.
salary is the only pensionable remuneration and it is normally reviewed annually with effect from January (which is due to move to 1 March in 2012).
accordingly, particularly when a new appointment is made, salary levels may be set at a lower level than the mid-market position, with a view to increasing towards this position over the two to three years following promotion.
70 ANNUAL REPORT AND ACCOUNTS 2010 GOVErNaNCE
L&G_AR10_08-p62-79_230311_AT.indd 70 25/03/2011 11:19
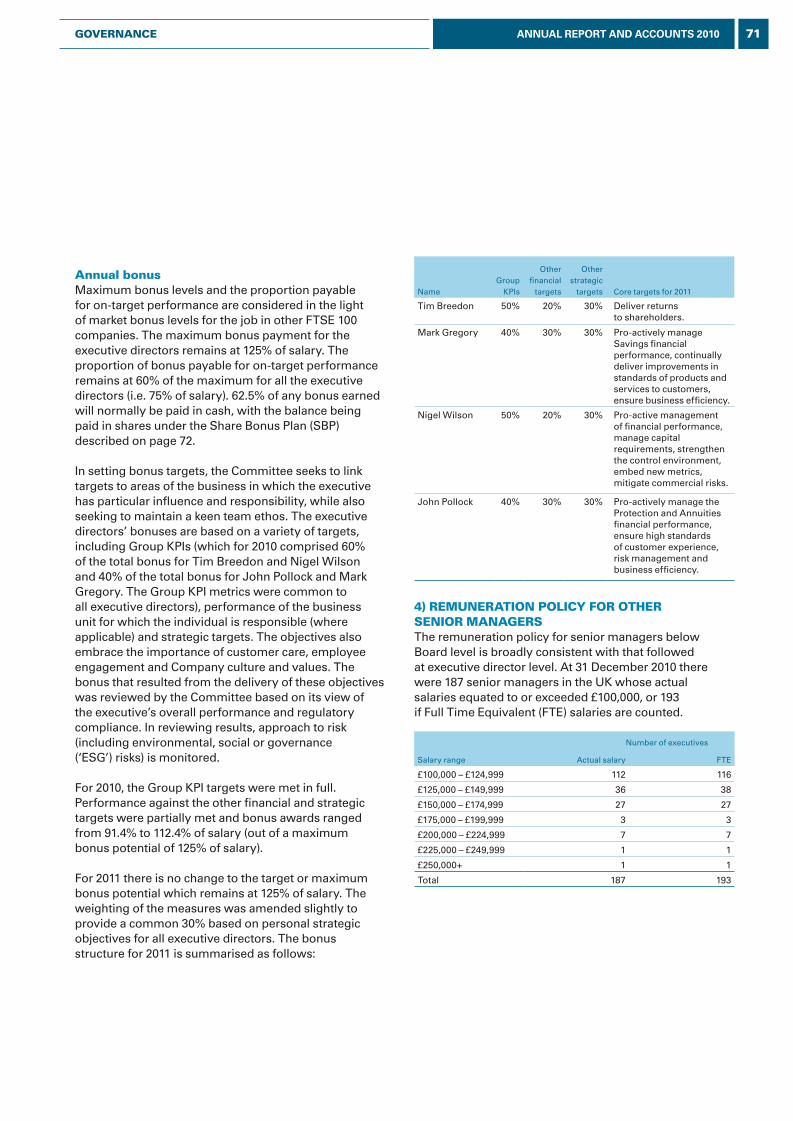
annual bonusMaximum bonus levels and the proportion payable for on-target performance are considered in the light of market bonus levels for the job in other Ftse 100 companies. the maximum bonus payment for the executive directors remains at 125% of salary. the proportion of bonus payable for on-target performance remains at 60% of the maximum for all the executive directors (i.e. 75% of salary). 62.5% of any bonus earned will normally be paid in cash, with the balance being paid in shares under the share Bonus plan (sBp) described on page 72.
in setting bonus targets, the Committee seeks to link targets to areas of the business in which the executive has particular influence and responsibility, while also seeking to maintain a keen team ethos. the executive directors’ bonuses are based on a variety of targets, including group kpis (which for 2010 comprised 60% of the total bonus for tim Breedon and Nigel Wilson and 40% of the total bonus for John pollock and Mark gregory. the group kpi metrics were common to all executive directors), performance of the business unit for which the individual is responsible (where applicable) and strategic targets. the objectives also embrace the importance of customer care, employee engagement and Company culture and values. the bonus that resulted from the delivery of these objectives was reviewed by the Committee based on its view of the executive’s overall performance and regulatory compliance. in reviewing results, approach to risk (including environmental, social or governance (‘esg’) risks) is monitored.
For 2010, the group kpi targets were met in full. performance against the other financial and strategic targets were partially met and bonus awards ranged from 91.4% to 112.4% of salary (out of a maximum bonus potential of 125% of salary).
For 2011 there is no change to the target or maximum bonus potential which remains at 125% of salary. the weighting of the measures was amended slightly to provide a common 30% based on personal strategic objectives for all executive directors. the bonus structure for 2011 is summarised as follows:
Namegroup
kpis
Other financial
targets
Other strategic
targets Core targets for 2011
tim Breedon 50% 20% 30% Deliver returns to shareholders.
Mark gregory 40% 30% 30% pro-actively manage savings financial performance, continually deliver improvements in standards of products and services to customers, ensure business efficiency.
Nigel Wilson 50% 20% 30% pro-active management of financial performance, manage capital requirements, strengthen the control environment, embed new metrics, mitigate commercial risks.
John pollock 40% 30% 30% pro-actively manage the protection and annuities financial performance, ensure high standards of customer experience, risk management and business efficiency.
4) rEmuNEraTION POlICy fOr OTHEr sENIOr maNaGErsthe remuneration policy for senior managers below Board level is broadly consistent with that followed at executive director level. at 31 December 2010 there were 187 senior managers in the Uk whose actual salaries equated to or exceeded £100,000, or 193 if Full time equivalent (Fte) salaries are counted.
Number of executives
salary range actual salary Fte
£100,000 – £124,999 112 116
£125,000 – £149,999 36 38
£150,000 – £174,999 27 27
£175,000 – £199,999 3 3
£200,000 – £224,999 7 7
£225,000 – £249,999 1 1
£250,000+ 1 1
total 187 193
71ANNUAL REPORT AND ACCOUNTS 2010GOVErNaNCE
L&G_AR10_08-p62-79_230311_AT.indd 71 25/03/2011 11:19
sHarE PlaNs
DIrECTOrs’ rEPOrT ON rEmuNEraTION.
sHarE bONus PlaN (sbP)as stated above, 37.5% of any bonus earned is normally deferred into shares under the sBp, under which restricted shares are awarded and held in a trust for three years. the release of shares is not subject to further performance conditions; however, executives are normally required to remain in employment during the three-year vesting period. as the shares have been earned prior to award, any dividends occurring on these shares are paid to the executives during the vesting period. the value of the shares awarded to directors is reported in the year of performance and shown in the directors’ remuneration table on page 67.
For bonus awarded in 2010, a choice was given to executive directors and employees below Board level to receive their deferred bonus in one of three ways:
– shares under the share Bonus plan (sBp), as described above;
– a combination of shares under the sBp and approved options under the Company share Option plan (CsOp); or
– a combination of unapproved nil cost options under the sBp and approved options under the CsOp.
this choice allowed some minor tax efficiency, at no cost to the group, or flexibility in choosing when an award vests once the initial three-year holding period ends.
this choice was consistent with our approach of ensuring that the overall benefits of reward are maximised and valued by employees.
should the performance which led to the payment of a bonus subsequently be found to be misstated, the Committee has discretion to withhold some or all of the sBp awards paid to executive directors relating to the relevant year’s performance. During 2011, this withholding discretion will also be extended to issues surrounding any personal misconduct.
PErfOrmaNCE sHarE PlaN (PsP)executive directors are entitled to participate in the group’s psp. the psp was approved by shareholders in 2004. in March 2007 the Committee approved the introduction of a specific long term incentive plan for lgiM senior executives (none of whom are executive directors). the psp remains the sole long term incentive arrangement for all other senior executives.
Under the psp, awards of conditional shares are made to top managers. the Committee reviews the quantum of awards made each year to ensure that it is in line with the market. the maximum annual award possible in 2011 remains at 200% of salary and, as reported last year, the Company awarded 200% to each executive director in 2010 and has done so again in 2011. however, when making awards, it will also consider wider factors such as company performance in determining whether to grant at this normal policy level.
the number of shares that vest is dependent on legal & general’s relative tsR performance over a three-year period as follows:
legal & general’s tsR relative to the comparator group at the end of the performance period
percentage of award which vests
Below median 0%
Median 25%
Between median and 20th percentile 25%-100%
20th percentile or above 100%
Until 2007, performance was measured solely in relation to the constituents of the Ftse 100. For the awards made in 2008 onwards, two distinct performance measures are used: half is measured relative to the Ftse 100 constituents (as set at a date shortly prior to the grant date), with the balance being measured against the insurance constituents of the Ftseurofirst 300 plus any Ftse 350 life insurers not in the Ftseurofirst 300, in sterling terms. performance under the two elements is assessed independently.
the Committee reviews the measures prior to each award. it continues to believe that the current measures and targets remain appropriate. they endorse consistency in the remuneration policy and provide a clear alignment of interests with shareholders. in addition they ensure a degree of risk management as tsR (through share price) reflects both underlying financial performance and the market’s assessment of the quality and sustainability of those earnings.
additionally, the Committee assesses whether the underlying performance of the Company is reflective of the tsR out-turn. the Committee may exercise its discretion to scale back the vesting of awards if it was felt that the Company’s financial performance did not justify the level of vesting (the Committee may not increase the award). the parameters which the
72 ANNUAL REPORT AND ACCOUNTS 2010 GOVErNaNCE
L&G_AR10_08-p62-79_230311_AT.indd 72 25/03/2011 11:19
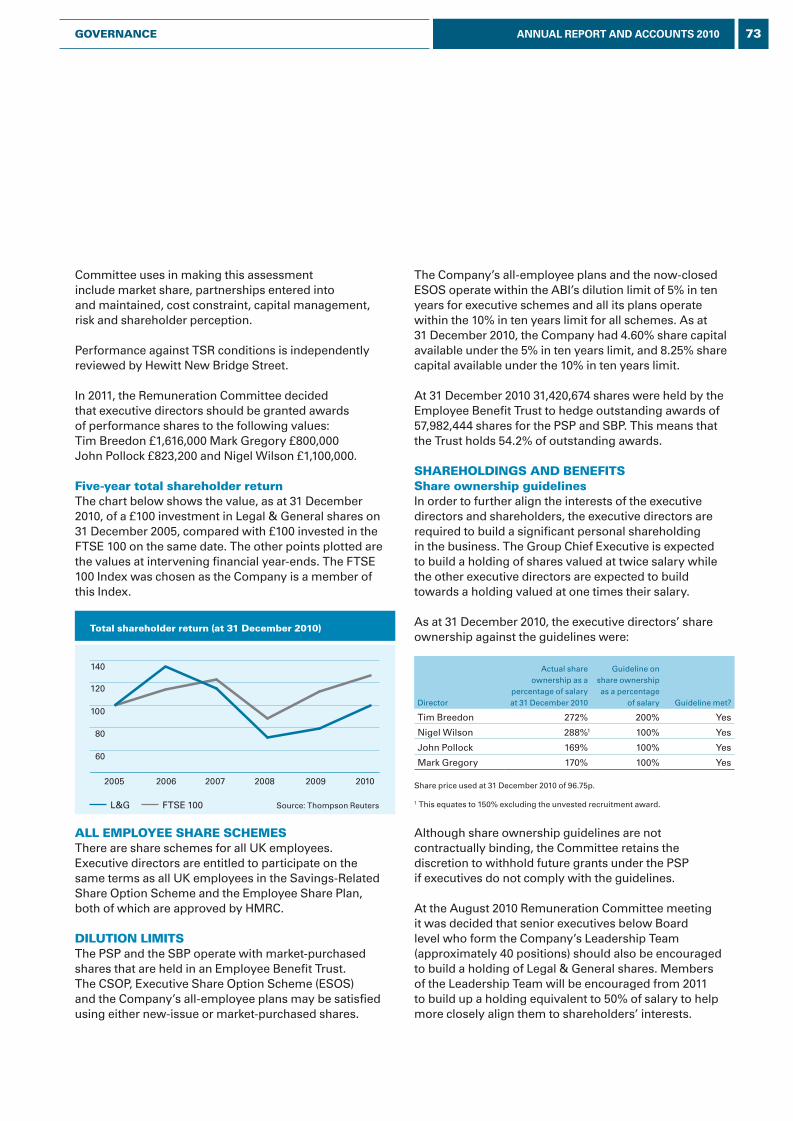
60
80
100
120
140
201020092008200720062005
l&g Ftse 100 source: thompson Reuters
the Company’s all-employee plans and the now-closed esOs operate within the aBi’s dilution limit of 5% in ten years for executive schemes and all its plans operate within the 10% in ten years limit for all schemes. as at 31 December 2010, the Company had 4.60% share capital available under the 5% in ten years limit, and 8.25% share capital available under the 10% in ten years limit.
at 31 December 2010 31,420,674 shares were held by the employee Benefit trust to hedge outstanding awards of 57,982,444 shares for the psp and sBp. this means that the trust holds 54.2% of outstanding awards.
sHarEHOlDINGs aND bENEfITsshare ownership guidelinesin order to further align the interests of the executive directors and shareholders, the executive directors are required to build a significant personal shareholding in the business. the group Chief executive is expected to build a holding of shares valued at twice salary while the other executive directors are expected to build towards a holding valued at one times their salary.
as at 31 December 2010, the executive directors’ share ownership against the guidelines were:
Director
actual share ownership as a
percentage of salary at 31 December 2010
guideline on share ownership as a percentage
of salary guideline met?
tim Breedon 272% 200% yes
Nigel Wilson 288%1 100% yes
John pollock 169% 100% yes
Mark gregory 170% 100% yes
share price used at 31 December 2010 of 96.75p.
1 this equates to 150% excluding the unvested recruitment award.
although share ownership guidelines are not contractually binding, the Committee retains the discretion to withhold future grants under the psp if executives do not comply with the guidelines.
at the august 2010 Remuneration Committee meeting it was decided that senior executives below Board level who form the Company’s leadership team (approximately 40 positions) should also be encouraged to build a holding of legal & general shares. Members of the leadership team will be encouraged from 2011 to build up a holding equivalent to 50% of salary to help more closely align them to shareholders’ interests.
Committee uses in making this assessment include market share, partnerships entered into and maintained, cost constraint, capital management, risk and shareholder perception.
performance against tsR conditions is independently reviewed by hewitt New Bridge street.
in 2011, the Remuneration Committee decided that executive directors should be granted awards of performance shares to the following values: tim Breedon £1,616,000 Mark gregory £800,000 John pollock £823,200 and Nigel Wilson £1,100,000.
five-year total shareholder return the chart below shows the value, as at 31 December 2010, of a £100 investment in legal & general shares on 31 December 2005, compared with £100 invested in the Ftse 100 on the same date. the other points plotted are the values at intervening financial year-ends. the Ftse 100 index was chosen as the Company is a member of this index.
all EmPlOyEE sHarE sCHEmEsthere are share schemes for all Uk employees. executive directors are entitled to participate on the same terms as all Uk employees in the savings-Related share Option scheme and the employee share plan, both of which are approved by hMRC.
DIluTION lImITsthe psp and the sBp operate with market-purchased shares that are held in an employee Benefit trust. the CsOp, executive share Option scheme (esOs) and the Company’s all-employee plans may be satisfied using either new-issue or market-purchased shares.
Total shareholder return (at 31 December 2010)
73ANNUAL REPORT AND ACCOUNTS 2010GOVErNaNCE
L&G_AR10_08-p62-79_230311_AT.indd 73 25/03/2011 11:19
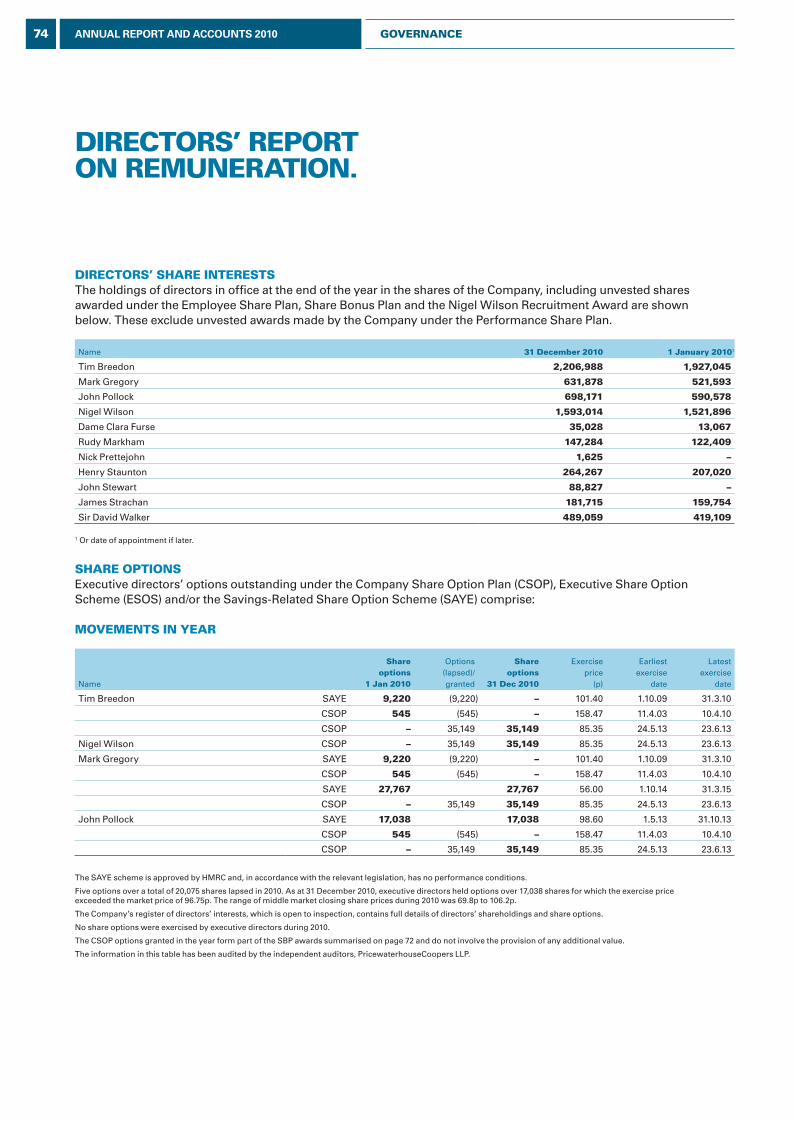
DIrECTOrs’ rEPOrT ON rEmuNEraTION.
DIrECTOrs’ sHarE INTErEsTsthe holdings of directors in office at the end of the year in the shares of the Company, including unvested shares awarded under the employee share plan, share Bonus plan and the Nigel Wilson Recruitment award are shown below. these exclude unvested awards made by the Company under the performance share plan.
Name 31 December 2010 1 January 20101
tim Breedon 2,206,988 1,927,045
Mark gregory 631,878 521,593
John pollock 698,171 590,578
Nigel Wilson 1,593,014 1,521,896
Dame Clara Furse 35,028 13,067
Rudy Markham 147,284 122,409
Nick prettejohn 1,625 –
henry staunton 264,267 207,020
John stewart 88,827 –
James strachan 181,715 159,754
sir David Walker 489,059 419,109
1 Or date of appointment if later.
sHarE OPTIONsexecutive directors’ options outstanding under the Company share Option plan (CsOp), executive share Option scheme (esOs) and/or the savings-Related share Option scheme (saye) comprise:
mOVEmENTs IN yEar
Name
share options
1 Jan 2010
Options (lapsed)/ granted
share options
31 Dec 2010
exercise price
(p)
earliest exercise
date
latest exercise
date
tim Breedon saye 9,220 (9,220) – 101.40 1.10.09 31.3.10
CsOp 545 (545) – 158.47 11.4.03 10.4.10
CsOp – 35,149 35,149 85.35 24.5.13 23.6.13
Nigel Wilson CsOp – 35,149 35,149 85.35 24.5.13 23.6.13
Mark gregory saye 9,220 (9,220) – 101.40 1.10.09 31.3.10
CsOp 545 (545) – 158.47 11.4.03 10.4.10
saye 27,767 27,767 56.00 1.10.14 31.3.15
CsOp – 35,149 35,149 85.35 24.5.13 23.6.13
John pollock saye 17,038 17,038 98.60 1.5.13 31.10.13
CsOp 545 (545) – 158.47 11.4.03 10.4.10
CsOp – 35,149 35,149 85.35 24.5.13 23.6.13
the saye scheme is approved by hMRC and, in accordance with the relevant legislation, has no performance conditions.
Five options over a total of 20,075 shares lapsed in 2010. as at 31 December 2010, executive directors held options over 17,038 shares for which the exercise price exceeded the market price of 96.75p. the range of middle market closing share prices during 2010 was 69.8p to 106.2p.
the Company’s register of directors’ interests, which is open to inspection, contains full details of directors’ shareholdings and share options.
No share options were exercised by executive directors during 2010.
the CsOp options granted in the year form part of the sBp awards summarised on page 72 and do not involve the provision of any additional value.
the information in this table has been audited by the independent auditors, pricewaterhouseCoopers llp.
74 ANNUAL REPORT AND ACCOUNTS 2010 GOVErNaNCE
L&G_AR10_08-p62-79_230311_AT.indd 74 25/03/2011 11:19
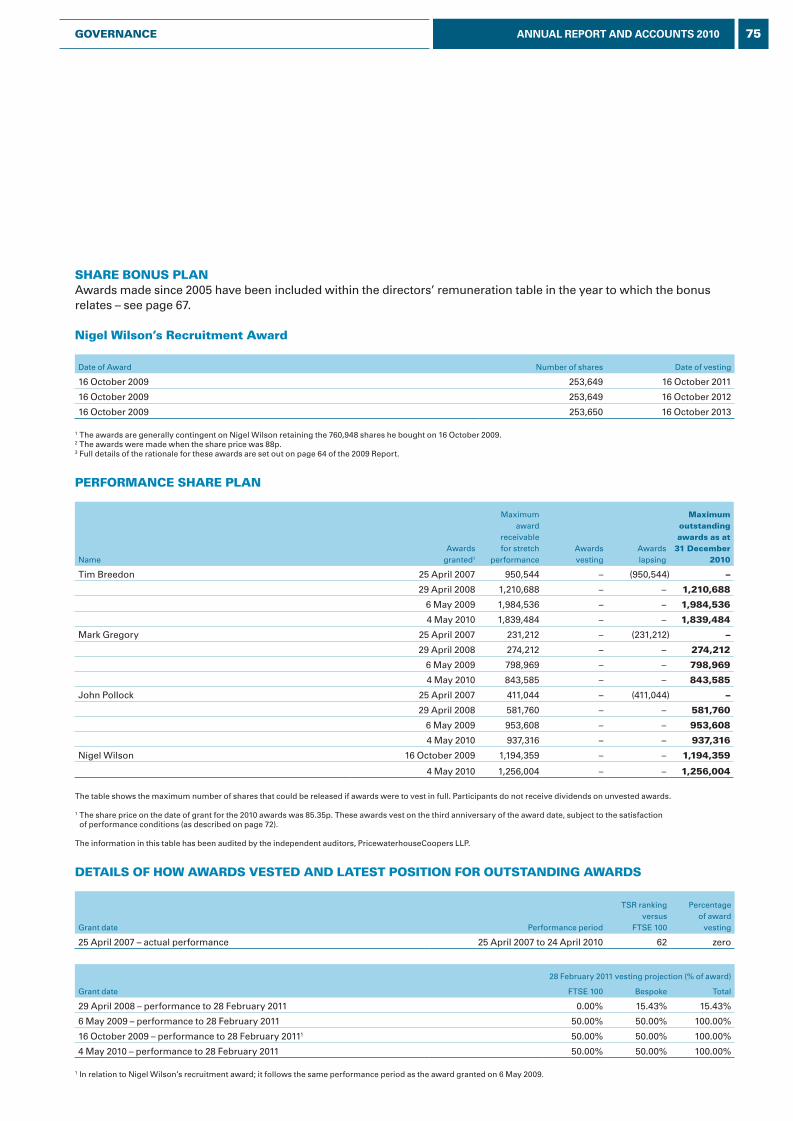
sHarE bONus PlaN awards made since 2005 have been included within the directors’ remuneration table in the year to which the bonus relates – see page 67.
Nigel Wilson’s recruitment award
Date of award Number of shares Date of vesting
16 October 2009 253,649 16 October 2011
16 October 2009 253,649 16 October 2012
16 October 2009 253,650 16 October 2013
1 the awards are generally contingent on Nigel Wilson retaining the 760,948 shares he bought on 16 October 2009. 2 the awards were made when the share price was 88p.3 Full details of the rationale for these awards are set out on page 64 of the 2009 Report.
PErfOrmaNCE sHarE PlaN
Nameawards
granted1
Maximum award
receivable for stretch
performanceawards vesting
awards lapsing
maximumoutstandingawards as at
31 December 2010
tim Breedon 25 april 2007 950,544 – (950,544) –
29 april 2008 1,210,688 – – 1,210,688
6 May 2009 1,984,536 – – 1,984,536
4 May 2010 1,839,484 – – 1,839,484
Mark gregory 25 april 2007 231,212 – (231,212) –
29 april 2008 274,212 – – 274,212
6 May 2009 798,969 – – 798,969
4 May 2010 843,585 – – 843,585
John pollock 25 april 2007 411,044 – (411,044) –
29 april 2008 581,760 – – 581,760
6 May 2009 953,608 – – 953,608
4 May 2010 937,316 – – 937,316
Nigel Wilson 16 October 2009 1,194,359 – – 1,194,359
4 May 2010 1,256,004 – – 1,256,004
the table shows the maximum number of shares that could be released if awards were to vest in full. participants do not receive dividends on unvested awards.
1 the share price on the date of grant for the 2010 awards was 85.35p. these awards vest on the third anniversary of the award date, subject to the satisfaction of performance conditions (as described on page 72).
the information in this table has been audited by the independent auditors, pricewaterhouseCoopers llp.
DETaIls Of HOW aWarDs VEsTED aND laTEsT POsITION fOr OuTsTaNDING aWarDs
grant date performance period
tsR ranking versus
Ftse 100
percentage of award
vesting
25 april 2007 – actual performance 25 april 2007 to 24 april 2010 62 zero
28 February 2011 vesting projection (% of award)
grant date Ftse 100 Bespoke total
29 april 2008 – performance to 28 February 2011 0.00% 15.43% 15.43%
6 May 2009 – performance to 28 February 2011 50.00% 50.00% 100.00%
16 October 2009 – performance to 28 February 20111 50.00% 50.00% 100.00%
4 May 2010 – performance to 28 February 2011 50.00% 50.00% 100.00%
1 in relation to Nigel Wilson’s recruitment award; it follows the same performance period as the award granted on 6 May 2009.
75ANNUAL REPORT AND ACCOUNTS 2010GOVErNaNCE
L&G_AR10_08-p62-79_230311_AT.indd 75 25/03/2011 11:19
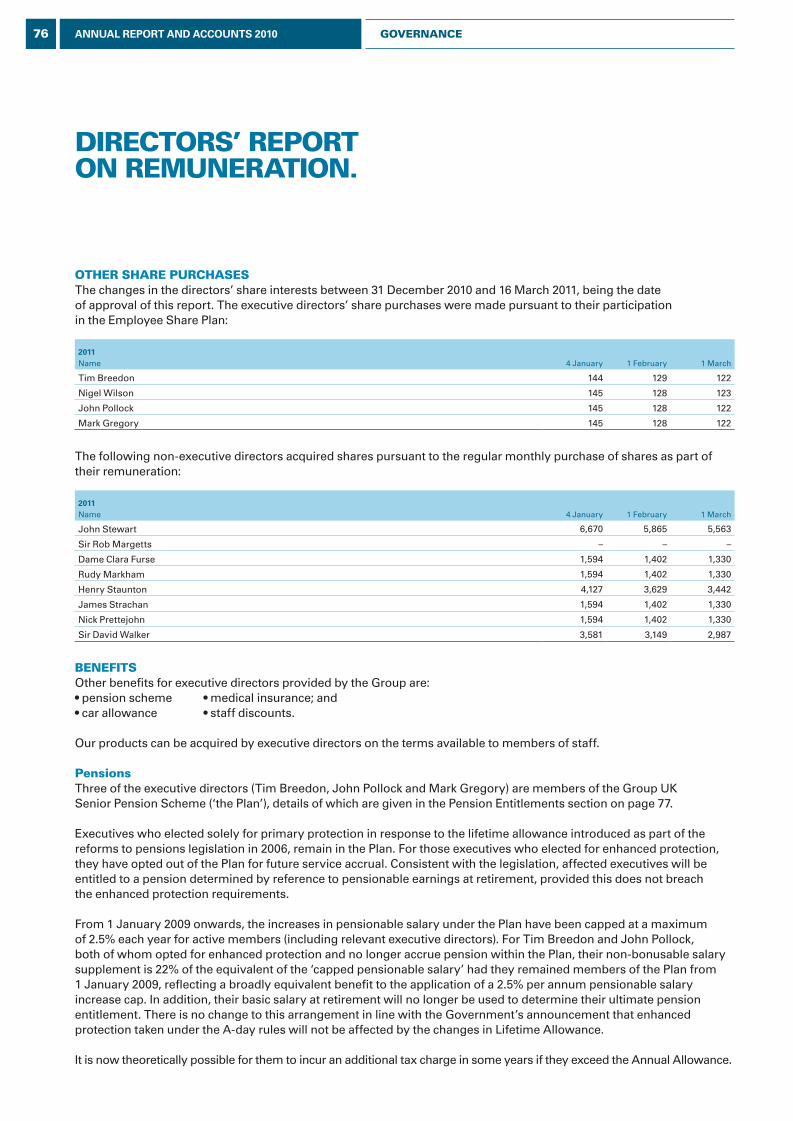
DIrECTOrs’ rEPOrT ON rEmuNEraTION.
OTHEr sHarE PurCHasEsthe changes in the directors’ share interests between 31 December 2010 and 16 March 2011, being the date of approval of this report. the executive directors’ share purchases were made pursuant to their participation in the employee share plan:
2011Name 4 January 1 February 1 March
tim Breedon 144 129 122
Nigel Wilson 145 128 123
John pollock 145 128 122
Mark gregory 145 128 122
the following non-executive directors acquired shares pursuant to the regular monthly purchase of shares as part of their remuneration:
2011Name 4 January 1 February 1 March
John stewart 6,670 5,865 5,563
sir Rob Margetts – – –
Dame Clara Furse 1,594 1,402 1,330
Rudy Markham 1,594 1,402 1,330
henry staunton 4,127 3,629 3,442
James strachan 1,594 1,402 1,330
Nick prettejohn 1,594 1,402 1,330
sir David Walker 3,581 3,149 2,987
bENEfITsOther benefits for executive directors provided by the group are:• pension scheme • medical insurance; and• car allowance • staff discounts.
Our products can be acquired by executive directors on the terms available to members of staff.
Pensionsthree of the executive directors (tim Breedon, John pollock and Mark gregory) are members of the group Uk senior pension scheme (‘the plan’), details of which are given in the pension entitlements section on page 77.
executives who elected solely for primary protection in response to the lifetime allowance introduced as part of the reforms to pensions legislation in 2006, remain in the plan. For those executives who elected for enhanced protection, they have opted out of the plan for future service accrual. Consistent with the legislation, affected executives will be entitled to a pension determined by reference to pensionable earnings at retirement, provided this does not breach the enhanced protection requirements.
From 1 January 2009 onwards, the increases in pensionable salary under the plan have been capped at a maximum of 2.5% each year for active members (including relevant executive directors). For tim Breedon and John pollock, both of whom opted for enhanced protection and no longer accrue pension within the plan, their non-bonusable salary supplement is 22% of the equivalent of the ‘capped pensionable salary’ had they remained members of the plan from 1 January 2009, reflecting a broadly equivalent benefit to the application of a 2.5% per annum pensionable salary increase cap. in addition, their basic salary at retirement will no longer be used to determine their ultimate pension entitlement. there is no change to this arrangement in line with the government’s announcement that enhanced protection taken under the a-day rules will not be affected by the changes in lifetime allowance.
it is now theoretically possible for them to incur an additional tax charge in some years if they exceed the annual allowance.
76 ANNUAL REPORT AND ACCOUNTS 2010 GOVErNaNCE
L&G_AR10_08-p62-79_230311_AT.indd 76 25/03/2011 11:19
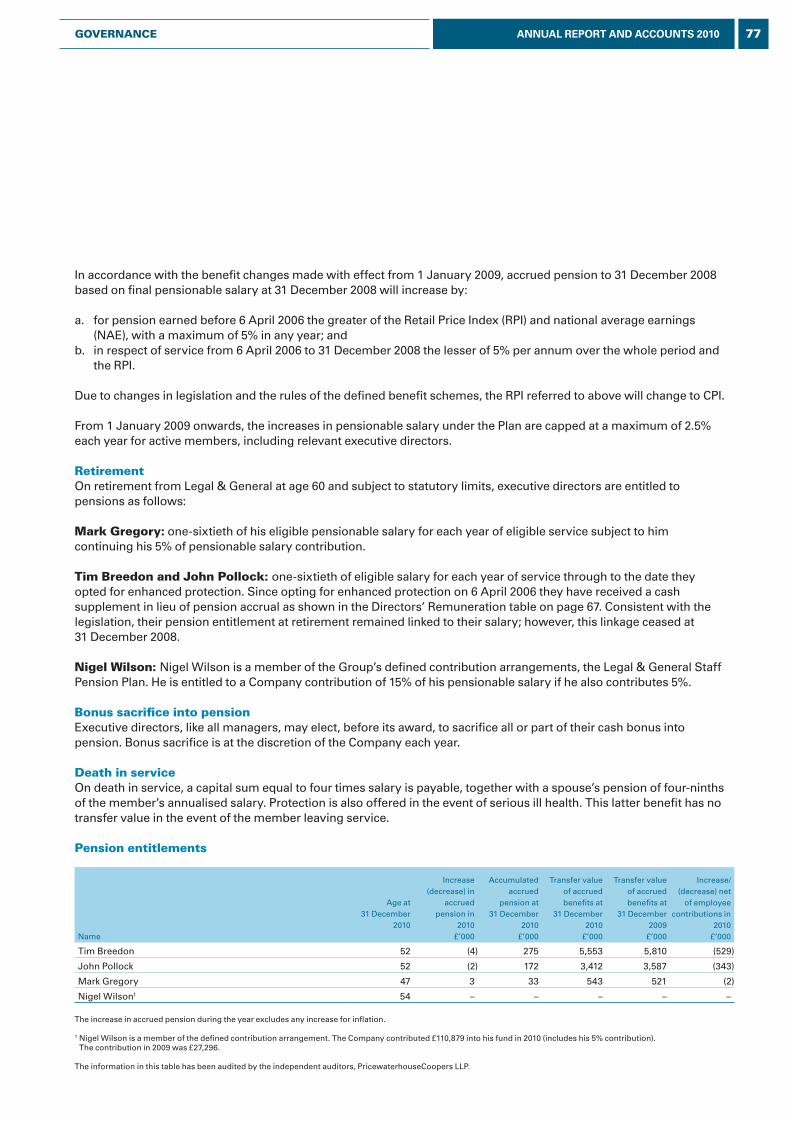
in accordance with the benefit changes made with effect from 1 January 2009, accrued pension to 31 December 2008 based on final pensionable salary at 31 December 2008 will increase by:
a. for pension earned before 6 april 2006 the greater of the Retail price index (Rpi) and national average earnings (Nae), with a maximum of 5% in any year; and
b. in respect of service from 6 april 2006 to 31 December 2008 the lesser of 5% per annum over the whole period and the Rpi.
Due to changes in legislation and the rules of the defined benefit schemes, the Rpi referred to above will change to Cpi.
From 1 January 2009 onwards, the increases in pensionable salary under the plan are capped at a maximum of 2.5% each year for active members, including relevant executive directors.
retirementOn retirement from legal & general at age 60 and subject to statutory limits, executive directors are entitled to pensions as follows:
mark Gregory: one-sixtieth of his eligible pensionable salary for each year of eligible service subject to him continuing his 5% of pensionable salary contribution.
Tim breedon and John Pollock: one-sixtieth of eligible salary for each year of service through to the date they opted for enhanced protection. since opting for enhanced protection on 6 april 2006 they have received a cash supplement in lieu of pension accrual as shown in the Directors’ Remuneration table on page 67. Consistent with the legislation, their pension entitlement at retirement remained linked to their salary; however, this linkage ceased at 31 December 2008.
Nigel Wilson: Nigel Wilson is a member of the group’s defined contribution arrangements, the legal & general staff pension plan. he is entitled to a Company contribution of 15% of his pensionable salary if he also contributes 5%.
bonus sacrifice into pensionexecutive directors, like all managers, may elect, before its award, to sacrifice all or part of their cash bonus into pension. Bonus sacrifice is at the discretion of the Company each year.
Death in serviceOn death in service, a capital sum equal to four times salary is payable, together with a spouse’s pension of four-ninths of the member’s annualised salary. protection is also offered in the event of serious ill health. this latter benefit has no transfer value in the event of the member leaving service.
Pension entitlements
Name
age at 31 December
2010
increase (decrease) in
accrued pension in
2010 £’000
accumulated accrued
pension at 31 December
2010 £’000
transfer value of accrued benefits at
31 December 2010
£’000
transfer value of accrued benefits at
31 December 2009
£’000
increase/ (decrease) net
of employee contributions in
2010£’000
tim Breedon 52 (4) 275 5,553 5,810 (529)
John pollock 52 (2) 172 3,412 3,587 (343)
Mark gregory 47 3 33 543 521 (2)
Nigel Wilson1 54 – – – – –
the increase in accrued pension during the year excludes any increase for inflation.
1 Nigel Wilson is a member of the defined contribution arrangement. the Company contributed £110,879 into his fund in 2010 (includes his 5% contribution). the contribution in 2009 was £27,296.
the information in this table has been audited by the independent auditors, pricewaterhouseCoopers llp.
77ANNUAL REPORT AND ACCOUNTS 2010GOVErNaNCE
L&G_AR10_08-p62-79_230311_AT.indd 77 25/03/2011 11:19
the defined benefit pensions accrued for tim Breedon and John pollock are based on service to the date of cessation of accrual, and revalued to the accounting date using published revaluation factors. as these factors are published in arrears, the factor for the last nine months’ revaluation is always an assumed one. this year the actual revaluation factor was much lower than that assumed, and so, as there is no further accrual of defined benefit pension, the pension disclosed has reduced.
DIrECTOrs’ lOaNsat 31 December 2010 there were no outstanding loans made to directors.
sErVICE CONTraCTs
executive DirectorContract Commencement
DateContinuous Employment
Date
tim Breedon January 2002 september 1987
Nigel Wilson september 2009 september 2009
John pollock November 2003 september 1980
Mark gregory January 2009 august 1998
tim Breedon and John pollock have a notice period of six months on either side and on termination they would be entitled to an additional six months’ salary, pension and car allowance entitlement.
Mark gregory and Nigel Wilson have notice periods of 12 months. however, they have no entitlement to any additional contractual payment on termination of employment. any payment in lieu of notice will consist solely of base salary and the cost of providing benefits for the outstanding notice period and will be subject to deductions for income tax and national insurance as appropriate.
Copies of the executive directors’ service contracts are available for inspection at the Company’s registered office.
ExTErNal aPPOINTmENTsthe Company considers that certain external appointments can help to broaden the experience and contribution to the Board of the executive directors. any such appointments are subject to annual agreement by the Company and must not be with competing companies. subject to the Company’s agreement, any fees may be retained by the individual. tim Breedon is chairman and an unpaid Board member of the aBi. he is also an ex officio (aBi) member of the takeover panel. Nigel Wilson is a non-executive director of halfords group plc and receives a fee of £66,000 p.a. he will step down in March 2011. he is also a non-executive director of Capita and received a fee of £44,722 for 2010. Mark gregory is an unpaid Director of Westdown park Management Company ltd.
the Directors’ Report on Remuneration was approved by the directors on 16 March 2011.
sIr DaVID WalKErCHaIrmaN Of THE rEmuNEraTION COmmITTEE
DIrECTOrs’ rEPOrT ON rEmuNEraTION.
78 ANNUAL REPORT AND ACCOUNTS 2010 GOVErNaNCE
L&G_AR10_08-p62-79_230311_AT.indd 78 25/03/2011 11:19
INDEPENDENT VErIfICaTION rEVIEWhewitt New Bridge street (hNBs) (part of hewitt associates) act as advisers to the Remuneration Committee. in October 2010, hewitt associates was acquired by aon Corporation. hewitt associates was merged with aon Consulting to form aon hewitt. aon hewitt is one of three distinct business divisions under aon Corporation, the others being aon Risk solutions and aon Benfield. these latter divisions provide corporate insurance broking services to legal & general. the Remuneration Committee therefore reviewed hNBs’s continuing independence to ensure there was no conflict of interest. the Committee was satisfied that no conflict arose out of the new structure and received assurance from aon Corporation that the governance structures within the organisation were in place to preserve the provision of objective and independent advice.
hNBs therefore continue to be the independent advisers to the Remuneration Committee and were asked to verify that the 2010 remuneration practice for executive directors followed the Remuneration policy put to the 2010 agM. in conducting this work, hNBs reviewed the elements of executive director remuneration during 2010, as detailed in the policy statements of the Directors’ Report on Remuneration 2009 (DRR 2009). they confirmed that they were satisfied that the remuneration practice during 2010 had been in line with the stated policy set out in the DRR 2009.
79ANNUAL REPORT AND ACCOUNTS 2010GOVErNaNCE
L&G_AR10_08-p62-79_230311_AT.indd 79 25/03/2011 11:19
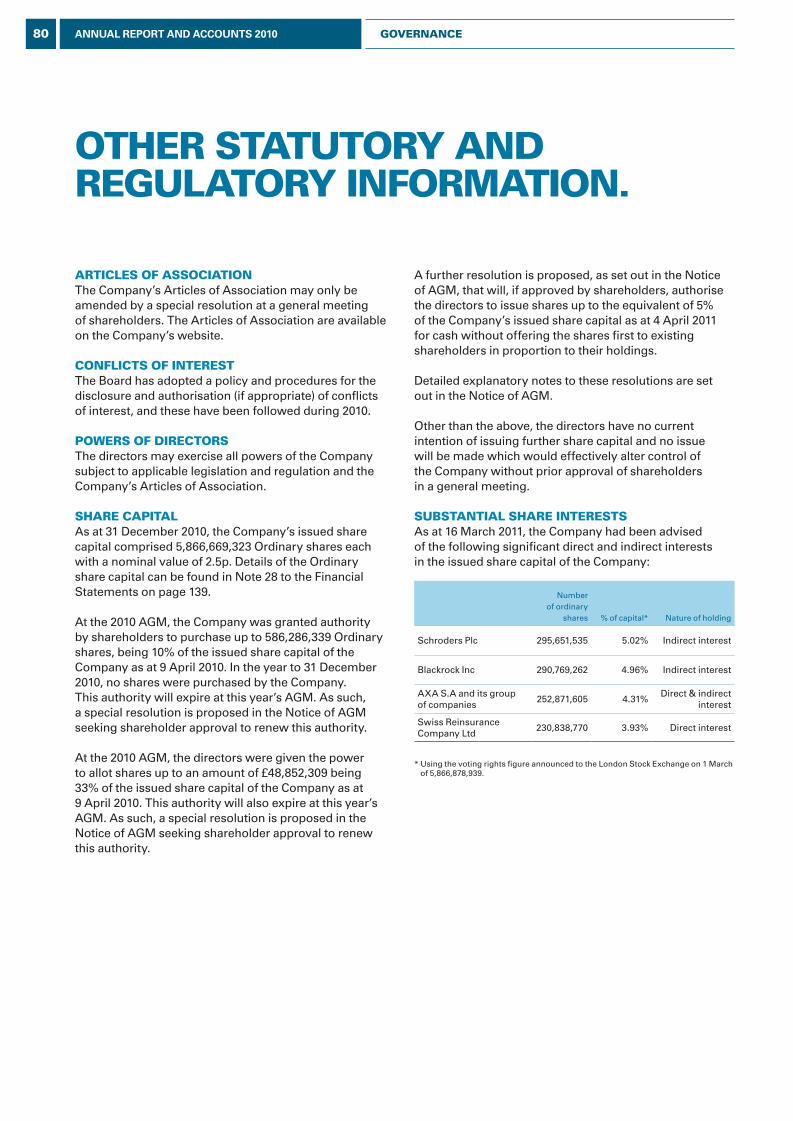
Articles of AssociAtionThe Company’s Articles of Association may only be amended by a special resolution at a general meeting of shareholders. The Articles of Association are available on the Company’s website.
conflicts of interestThe Board has adopted a policy and procedures for the disclosure and authorisation (if appropriate) of conflicts of interest, and these have been followed during 2010.
Powers of directorsThe directors may exercise all powers of the Company subject to applicable legislation and regulation and the Company’s Articles of Association.
shAre cAPitAlAs at 31 December 2010, the Company’s issued share capital comprised 5,866,669,323 Ordinary shares each with a nominal value of 2.5p. Details of the Ordinary share capital can be found in Note 28 to the Financial Statements on page 139.
At the 2010 AGM, the Company was granted authority by shareholders to purchase up to 586,286,339 Ordinary shares, being 10% of the issued share capital of the Company as at 9 April 2010. In the year to 31 December 2010, no shares were purchased by the Company. This authority will expire at this year’s AGM. As such, a special resolution is proposed in the Notice of AGM seeking shareholder approval to renew this authority.
At the 2010 AGM, the directors were given the power to allot shares up to an amount of £48,852,309 being 33% of the issued share capital of the Company as at 9 April 2010. This authority will also expire at this year’s AGM. As such, a special resolution is proposed in the Notice of AGM seeking shareholder approval to renew this authority.
A further resolution is proposed, as set out in the Notice of AGM, that will, if approved by shareholders, authorise the directors to issue shares up to the equivalent of 5% of the Company’s issued share capital as at 4 April 2011 for cash without offering the shares first to existing shareholders in proportion to their holdings.
Detailed explanatory notes to these resolutions are set out in the Notice of AGM.
Other than the above, the directors have no current intention of issuing further share capital and no issue will be made which would effectively alter control of the Company without prior approval of shareholders in a general meeting.
substAntiAl shAre interests As at 16 March 2011, the Company had been advised of the following significant direct and indirect interests in the issued share capital of the Company:
Number of ordinary
shares % of capital* Nature of holding
Schroders Plc 295,651,535 5.02% Indirect interest
Blackrock Inc 290,769,262 4.96% Indirect interest
AXA S.A and its group of companies
252,871,605 4.31%Direct & indirect
interest
Swiss Reinsurance Company Ltd
230,838,770 3.93% Direct interest
* Using the voting rights figure announced to the London Stock Exchange on 1 March of 5,866,878,939.
other stAtutorY And reGulAtorY inforMAtion.
80 ANNUAL REPORT AND ACCOUNTS 2010 GoVernAnce
L&G_AR10_09-p80-84_230311_AT.indd 80 25/03/2011 11:24
diVidendThe Company may, by ordinary resolution in a general meeting, declare dividends in accordance with the respective rights of the members, but no dividend can exceed the amount recommended by the Board. An interim dividend of 1.33p per share was paid on 1 October 2010. The directors propose a final dividend of 3.42p per Ordinary share. Subject to shareholder approval, the final dividend will be paid on 1 June 2011 to shareholders on the share register on 26 April 2011.
relAted PArtY trAnsActions Details of related party transactions are set out in Note 40 to the Financial Statements on page 158.
riGhts And obliGAtions AttAchinG to shAres The rights and obligations relating to the Company’s Ordinary shares are set out in the Articles of Association. A copy of the Articles of Association can be requested from the Company Secretary at the Company’s registered office.
Holders of Ordinary shares are entitled to attend, speak and vote at general meetings. In a vote on a show of hands, every member present in person or every proxy present, who has been duly appointed by a member, will have one vote and on a poll every member present in person or by proxy shall have one vote for every Ordinary share held. These rights are subject to any special terms as to voting upon which any shares may be issued or may at the relevant time be held and to any other provisions of the Company’s Articles of Association. Under the Companies Act 2006 and the Articles of Association, directors have the power to suspend voting rights and, in certain circumstances, the right to receive dividends in respect of shares where the holder of those shares fails to comply with a notice issued under section 793 of the Companies Act 2006.
The Board can decline to register a transfer of any share which is not a fully paid share. In addition, registration
of a transfer of an uncertificated share may be refused in the circumstances set out in the uncertificated securities rules and where the number of joint holders exceeds four. The Board may also refuse to register the transfer of a certificated share unless:
(a) the instrument of transfer is duly stamped and is left at the Company’s registered office or such other place as the Board may from time to time determine accompanied by the certificate for the share to which it relates and such evidence as the Board may reasonably require to show the right of the transferor to make the transfer;
(b) the instrument of transfer is in respect of only one class of share; and
(c) the number of joint holders does not exceed four.
Subject to the provisions of the Companies Act, all or any of the rights attaching to an existing class of shares may be varied from time to time either with the consent in writing of the holders of not less than three-fourths in nominal value of the issued shares of that class (excluding any treasury shares) or with the sanction of a special resolution passed at a separate general meeting of the holders of those shares.
Shares acquired through the employee share schemes rank equally with all other Ordinary shares in issue. Barclays Private Bank & Trust (Isle of Man) Limited, as trustee of the Legal & General Employees’ Share Ownership Trust, holds 0.52% of the issued share capital of the Company as at 16 March 2011 in trust for the benefit of the executive directors, senior executives and managers of the Group. This includes shares held as nominee on behalf of Legal & General Share Scheme Trustees Limited, as trustee of the Legal & General Employee Share Trust, which is in the process of being wound up. The voting rights in relation to these shares are exercised by the trustee. The trustee may vote or abstain from voting, or accept or reject any offer relating to shares, in any way it sees fit, without incurring any liability and without being required to give reasons for its decision.
81ANNUAL REPORT AND ACCOUNTS 2010GoVernAnce
L&G_AR10_09-p80-84_230311_AT.indd 81 25/03/2011 11:24
Under the rules of the Legal & General Group Employee Share Plan (Plan), eligible employees are entitled to acquire shares in the Company. Plan shares are held in trust for participants by Equiniti Share Plan Trustees Limited, which holds 0.45% of the issued share capital of the Company as at 16 March 2011. Voting rights are exercised by the trustees on receipt of the participants’ instructions. If a participant does not submit an instruction to the trustees, no vote is registered. In addition, the trustees do not vote on any unawarded shares held under the Plan as surplus assets.
The Company is not aware of any agreements between shareholders which may result in restrictions on the transfer of securities and/or voting rights.
chAnGe of controlThere are no agreements between the Company and its directors or employees for compensation providing for loss of office or employment (whether through resignation, purported redundancy or otherwise) in the event of a takeover bid, except for those relating to normal notice periods. The rules of the Company’s share plans contain provisions under which options and awards to participants, including executive directors, may vest on a takeover or change of control of the Company or transfer of undertakings.
The Company has a committed circa £1bn bank syndicated credit facility which is terminable if revised terms cannot be agreed with the syndicate of banks in a 30 day period following a change of control. As at 16 March 2011, the Company has no borrowings under this facility.
There are no change of control conditions in the terms of any of the Company’s outstanding debt securities. The terms of the Company’s agreements with its banking counterparties, under which derivative transactions are undertaken, include the provision for termination of transactions upon takeover/merger if the resulting
merged entity has a credit rating materially weaker than the Company. There are no other committed banking arrangements either drawn or undrawn that incorporate any change of control conditions.
use of finAnciAl instruMentsInformation on the Group’s risk management process is set out on pages 14 to 15. More details on risk management and the financial instruments used are set out in Note 48 of the Financial Statements on page 172.
indeMnitiesThe Company has agreed to indemnify, to the extent permitted by law, each of the directors against any liability incurred by a director in respect of acts or omissions arising in the course of their office. Qualifying pension scheme indemnities (as defined in section 235 of the Companies Act 2006) have been granted, to the extent permitted by law, to certain trustees of the Company’s pension schemes. The indemnities were in force throughout 2010 and remain so. Copies of the deeds of indemnity are available for inspection at the Company’s registered office.
chAritAble donAtionsDuring the period, the Group made UK charitable donations amounting to £3.2 million. Details of the Company’s charitable activities are set out on pages 44 to 47.
PoliticAl donAtionsNo political donations were made during 2010.
forwArd-lookinG stAteMents The Directors’ Report is prepared for the members of the Company and should not be relied upon by any other party or for any other purpose. Where the Directors’ Report includes forward-looking statements, these are made by the directors in good faith based on the information available to them at the time of their approval of this report. Such statements should be treated with caution due to the inherent uncertainties underlying such forward-looking statements.
other stAtutorY And reGulAtorY inforMAtion.
82 ANNUAL REPORT AND ACCOUNTS 2010 GoVernAnce
L&G_AR10_09-p80-84_230311_AT.indd 82 25/03/2011 11:24

insurAnce The Company has arranged appropriate Directors’ and Officers’ Liability insurance for directors. This is reviewed annually.
indePendent AuditorsThe Company’s auditors have expressed their willingness to continue in office and the Audit Committee has recommended their reappointment to the Board. Resolutions to reappoint PricewaterhouseCoopers LLP as auditors to the Company and to authorise the directors to determine their remuneration are proposed for the forthcoming AGM.
directors’ interestsThe Directors’ Report on Remuneration on pages 62 to 79 provides details of the interests of each director, including details of current incentive schemes and long term incentive schemes, the interests of directors in the share capital of the Company and details of their share options, as at 31 December 2010 and the changes in those interests that have occurred between 1 January 2011 and 16 March 2011 (being the date of approval of the Directors’ Report on Remuneration).
disclosure of inforMAtion to Auditors Each of the directors who held office at the date of approval of this Directors’ Report confirms that, so far as they are each aware, there is no relevant audit information of which the Company’s auditors are unaware and each of the directors have taken all reasonable steps they ought to have taken as directors to ascertain any relevant audit information and to ensure that the Company’s auditors are aware of such information. This confirmation is given in accordance with section 418(2) of the Companies Act 2006.
GoinG concern stAteMentThe Group’s business activities, together with the factors likely to affect its future development, performance and position in the current economic climate are set out in the Directors’ Report on pages 1 to 39, 42 to 43 and 48 to 83.
The financial position of the Group, its cash flows, liquidity position and borrowing facilities are described in the Group Results on page 23. Principal risks are detailed on pages 16 to 17. In addition, the financial statements include, amongst other things, notes on the Group’s objectives, policies and processes for managing its capital (Note 46, page 164), its financial risk management objectives (Note 48, page 172), details of its financial instruments and hedging activities (Notes 21 and 22, pages 125 to 135) and its exposures to credit risk (Note 48, page 178) and liquidity risk (Note 48, page 183).
The 2011 economic climate remains uncertain. However, based on the available information on the future, the directors consider that the Group has the plans and resources to manage its business risks successfully, as it has a diverse range of businesses and remains financially strong.
After making enquiries, the directors have a reasonable expectation that the Company and the Group have adequate resources to continue their operations for the foreseeable future. For that reason, they continue to adopt the going concern basis in preparing the accounts.
stAteMent of directors’ resPonsibilitiesThe directors are responsible for preparing the Directors’ Report, including the Directors’ Remuneration Report, and the Group and parent company financial statements in accordance with applicable law and regulations.
Company law requires the directors to prepare financial statements for each financial year. Under that law, the directors have prepared the Group financial statements in accordance with International Financial Reporting Standards (IFRS) as adopted by the EU and the parent company financial statements in accordance with UK Accounting Standards (UK Generally Accepted Accounting Principles) and applicable law. In preparing the Group financial statements, the directors have also elected to comply with IFRS issued by the International Accounting Standards Board (IASB).
83ANNUAL REPORT AND ACCOUNTS 2010GoVernAnce
L&G_AR10_09-p80-84_230311_AT.indd 83 25/03/2011 11:24
other stAtutorY And reGulAtorY inforMAtion.
Under company law, the directors must not approve the financial statements unless they are satisfied that they give a true and fair view of the state of affairs of the Company and the Group and of the profit or loss of the Group for that period. In preparing these financial statements, the directors are required to:
• select suitable accounting policies and then apply them consistently;
• make judgements and estimates that are reasonable and prudent;
• state that the Group financial statements comply with IFRS as adopted by the EU and IFRS issued by the IASB, and with regard to the parent company financial statements, that applicable UK Accounting Standards have been followed, subject to any material departures disclosed and explained in the financial statements; and
• prepare the Group and parent company financial statements on the going concern basis unless it is inappropriate to presume that the Group and parent company will continue in business, in which case there should be supporting assumptions or qualifications as necessary.
The directors are responsible for keeping proper accounting records that are sufficient to show and explain the Group and Company’s transactions and disclose with reasonable accuracy at any time the financial position of the Group and parent company and enable them to ensure that the Directors’ Remuneration Report and the financial statements comply with the Companies Act 2006 and, as regards the Group financial statements, Article 4 of the IAS Regulation. They are also responsible for safeguarding the assets of the Group and for taking such reasonable steps to prevent and detect fraud and other irregularities.
The directors are responsible for the maintenance and integrity of the information included on the Group’s website. Legislation in the UK governing the preparation and dissemination of financial statements may differ from legislation in other jurisdictions.
resPonsibilitY stAteMentEach of the directors listed on pages 48 and 49 confirms that to the best of their knowledge:
(a) the financial statements, prepared in accordance with the applicable set of accounting standards, give a true and fair view of the assets, liabilities, financial position and profit or loss of the Company and the Group as a whole; and
(b) the Directors’ Report includes a fair review of the development and performance of the business and the position of the Company and Group as a whole, together with a description of the principal risks and uncertainties that they face.
By order of the Board
G J tiMMscoMPAnY secretArY16 March 2011
84 ANNUAL REPORT AND ACCOUNTS 2010 GoVernAnce
L&G_AR10_09-p80-84_230311_AT.indd 84 25/03/2011 11:24

86 Independentauditors’report87 Consolidatedincomestatement88 Consolidatedstatementofcomprehensiveincome89 Consolidatedbalancesheet90 Consolidatedstatementofchangesinequity92 Consolidatedcashflowstatement93 Notestothefinancialstatements93 1. Accountingpolicies102 2. Supplementaryoperatingprofitinformation110 3. Segmentalanalysis114 4. Newbusiness(grossofreinsurance)115 5. Investmentreturn115 6. Netclaimsandchangeininsuranceliabilities115 7. Otherexpenses116 8. Auditors’remuneration116 9. Employeeinformation116 10. Foreignexchangeandexchangerates117 11. Incometaxexpense118 12. Dividends118 13. Earningspershare118 14. Disclosureoftaxeffectsrelatingtoeach
componentofothercomprehensiveincome119 15. Share-basedpayments122 16. Acquisitionsbyconsolidatedprivateequity
investmentvehicles123 17. Purchasedinterestinlongtermbusinesses
(PILTB)andotherintangibleassets123 18. Deferredacquisitioncosts124 19. Plantandequipment124 20. Investmentproperty125 21. Financialinvestments133 22. Derivativeassetsandliabilities136 23. Reinsurers’shareofcontractliabilities136 24. Deferredtaxasset/(liabilities)137 25. Incometax138 26. Otherassets138 27. Cashandcashequivalents139 28. Sharecapital,sharepremiumandemployee
schemetreasuryshares140 29. Non-controllinginterests140 30. Insurancecontractliabilities143 31. Investmentcontractliabilities145 32. Unallocateddivisiblesurplus145 33. Valueofin-forcenon-participatingcontracts146 34. Longterminsurancevaluationassumptions151 35. Borrowings154 36. Provisions157 37. Payablesandotherfinancialliabilities157 38. Otherliabilities158 39. Netassetvalueattributabletounitholders158 40. Relatedpartytransactions159 41. Contingentliabilities,guarantees
andindemnities159 42. Commitments160 43. Subsidiaries162 44. Associatesandjointventures163 45. Goodwillresultingfromacquisitions164 46. Managementofcapitalresources170 47. Assetsanalysis172 48. Riskmanagementandcontrol
195 Consolidatedincomestatement196 Consolidatedstatementofcomprehensiveincome197 Consolidatedbalancesheet198 Notestothesupplementaryfinancialstatements216 Independentauditors’report
217 Independentauditors’report218 Companybalancesheet219 Companystatementoftotalrecognised
gainsandlosses219 Companyreconciliationofmovements
intotalshareholders’funds220 NotestotheCompanyfinancialstatements
GROUP CONSOLIDATED FINANCIAL STATEMENTS SUPPLEMENTARY FINANCIAL STATEMENTS – EUROPEAN EMBEDDED VALUE BASIS
COMPANY FINANCIAL STATEMENTS
8585ANNUAL REPORT AND ACCOUNTS 2010GROUP FINANCIAL STATEMENTSGROUP FINANCIAL STATEMENTS
L&G_AR10_10-Fins_intro_p85-86_240311_AT.indd 85 25/03/2011 11:25
INDEPENDENT AUDITORS’ REPORT
TotheMembersofLegal&GeneralGroupPlc
WehaveauditedthegroupfinancialstatementsofLegal&GeneralGroupPlcfortheyearended31December2010whichcomprisetheConsolidatedIncomeStatement,ConsolidatedStatementofComprehensiveIncome,ConsolidatedBalanceSheet,ConsolidatedStatementofChangesinEquity,ConsolidatedCashFlowStatementandtherelatednotes.ThefinancialreportingframeworkthathasbeenappliedintheirpreparationisapplicablelawandInternationalFinancialReportingStandards(IFRSs)asadoptedbytheEuropeanUnion.
Respective responsibilities of directors and auditorsAsexplainedmorefullyintheDirectors’ResponsibilitiesStatement,thedirectorsareresponsibleforthepreparationofthegroupfinancialstatementsandforbeingsatisfiedthattheygiveatrueandfairview.OurresponsibilityistoauditandexpressanopiniononthegroupfinancialstatementsinaccordancewithapplicablelawandInternationalStandardsonAuditing(UKandIreland).ThosestandardsrequireustocomplywiththeAuditingPracticesBoard’sEthicalStandardsforAuditors.
Thisreport,includingtheopinions,hasbeenpreparedforandonlyforthecompany’smembersasabodyinaccordancewithChapter3ofPart16oftheCompaniesAct2006andfornootherpurpose.Wedonot,ingivingtheseopinions,acceptorassumeresponsibilityforanyotherpurposeortoanyotherpersontowhomthisreportisshownorintowhosehandsitmaycomesavewhereexpresslyagreedbyourpriorconsentinwriting.
Scope of the audit of the financial statements Anauditinvolvesobtainingevidenceabouttheamountsanddisclosuresinthefinancialstatementssufficienttogivereasonableassurancethatthefinancialstatementsarefreefrommaterialmisstatement,whethercausedbyfraudorerror.Thisincludesanassessmentof:whethertheaccountingpoliciesareappropriatetothegroup’scircumstancesandhavebeenconsistentlyappliedandadequatelydisclosed;thereasonablenessofsignificantaccountingestimatesmadebythedirectors;andtheoverallpresentationofthefinancialstatements.
Opinion on financial statementsInouropinionthegroupfinancialstatements:• giveatrueandfairviewofthestateofthegroup’saffairs
asat31December2010andofitsprofitandcashflowsfortheyearthenended;
• havebeenproperlypreparedinaccordancewithIFRSsasadoptedbytheEuropeanUnion;and
• havebeenpreparedinaccordancewiththerequirementsoftheCompaniesAct2006andArticle4ofthelASRegulation.
Separate opinion in relation to IFRSs as issued by the IASBAsexplainedinnote1tothegroupfinancialstatements,thegroupinadditiontocomplyingwithitslegalobligationtoapplyIFRSsasadoptedbytheEuropeanUnion,hasalsoappliedIFRSsasissuedbytheInternationalAccountingStandardsBoard(IASB).
InouropinionthegroupfinancialstatementscomplywithIFRSsasissuedbytheIASB.
Opinion on other matter prescribed by the Companies Act 2006Inouropinion,theinformationgivenintheDirectors’Reportforthefinancialyearforwhichthegroupfinancialstatementsarepreparedisconsistentwiththegroupfinancialstatements.
Matters on which we are required to report by exceptionWehavenothingtoreportinrespectofthefollowing:
UndertheCompaniesAct2006wearerequiredtoreporttoyouif,inouropinion:• certaindisclosuresofdirectors’remunerationspecifiedbylaw
arenotmade;or• wehavenotreceivedalltheinformationandexplanations
werequireforouraudit.
UndertheListingRuleswearerequiredtoreview:• thedirectors’statementongoingconcernincludedinthe
CorporateGovernanceStatement;and• thepartoftheCorporateGovernanceStatementrelating
tothecompany’scompliancewiththenineprovisionsoftheJune2008CombinedCodespecifiedforourreview;and
• certainelementsofthereporttoshareholdersbytheBoardondirectors’remuneration.
Other matter WehavereportedseparatelyontheparentcompanyfinancialstatementsofLegal&GeneralGroupPlcfortheyearended31December2010andontheinformationintheDirectors’RemunerationReportthatisdescribedashavingbeenaudited.
Richard Keers(SeniorStatutoryAuditor)forandonbehalfofPricewaterhouseCoopersLLPCharteredAccountantsandStatutoryAuditorsLondon16March2011
Notes:a) ThefinancialstatementsarepublishedonthewebsiteofLegal&GeneralGroupPlc,
legalandgeneralgroup.com.ThemaintenanceandintegrityoftheLegal&GeneralGroupPlcwebsiteistheresponsibilityofthedirectors;theworkcarriedoutbytheauditorsdoesnotinvolveconsiderationofthesemattersand,accordingly,theauditorsacceptnoresponsibilityforanychangesthatmayhaveoccurredtothefinancialstatementssincetheywereinitiallypresentedonthewebsite.
b)LegislationintheUnitedKingdomgoverningthepreparationanddisseminationoffinancialstatementsmaydifferfromlegislationinotherjurisdictions.
86 ANNUAL REPORT AND ACCOUNTS 2010 GROUP FINANCIAL STATEMENTS
L&G_AR10_10-Fins_intro_p85-86_240311_AT.indd 86 25/03/2011 11:25
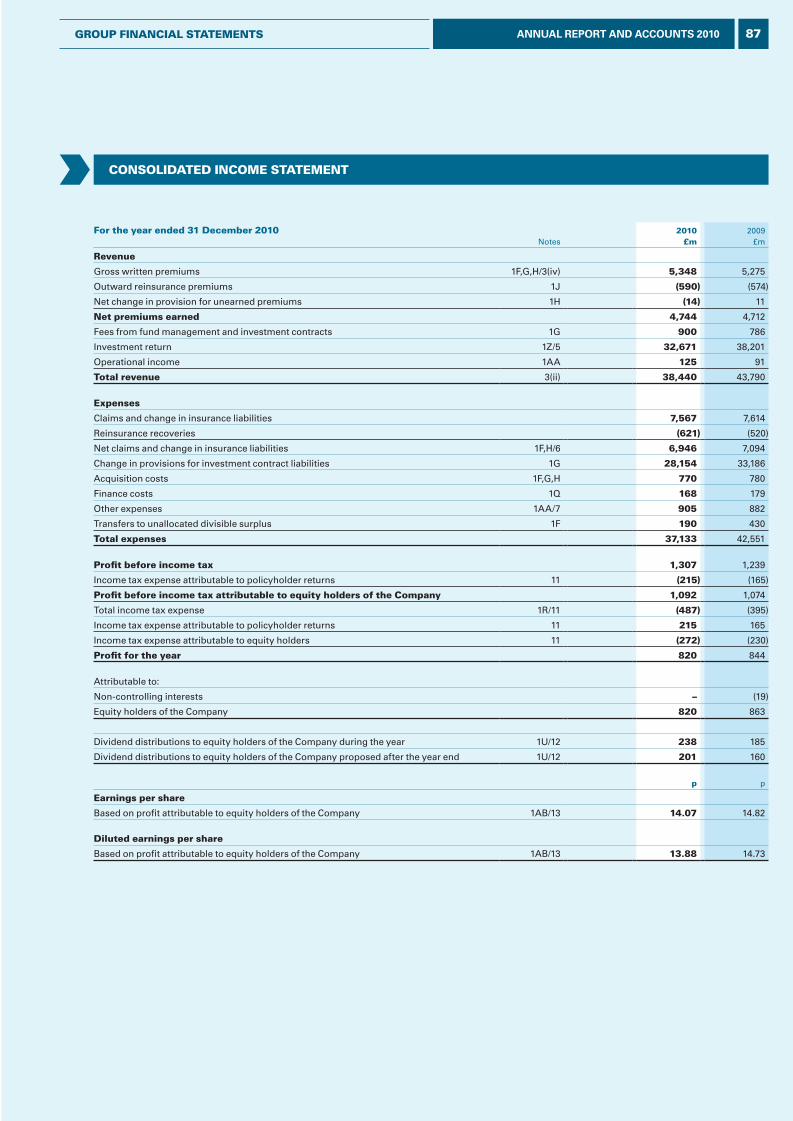
For the year ended 31 December 2010 Notes
2010£m
2009£m
Revenue
Gross written premiums 1F,G,H/3(iv) 5,348 5,275
Outward reinsurance premiums 1J (590) (574)
Net change in provision for unearned premiums 1H (14) 11
Net premiums earned 4,744 4,712
Fees from fund management and investment contracts 1G 900 786
Investment return 1Z/5 32,671 38,201
Operational income 1AA 125 91
Total revenue 3(ii) 38,440 43,790
Expenses
Claims and change in insurance liabilities 7,567 7,614
Reinsurance recoveries (621) (520)
Net claims and change in insurance liabilities 1F,H/6 6,946 7,094
Change in provisions for investment contract liabilities 1G 28,154 33,186
Acquisition costs 1F,G,H 770 780
Finance costs 1Q 168 179
Other expenses 1AA/7 905 882
Transfers to unallocated divisible surplus 1F 190 430
Total expenses 37,133 42,551
Profit before income tax 1,307 1,239
Income tax expense attributable to policyholder returns 11 (215) (165)
Profit before income tax attributable to equity holders of the Company 1,092 1,074
Total income tax expense 1R/11 (487) (395)
Income tax expense attributable to policyholder returns 11 215 165
Income tax expense attributable to equity holders 11 (272) (230)
Profit for the year 820 844
Attributable to:
Non-controlling interests – (19)
Equity holders of the Company 820 863
Dividend distributions to equity holders of the Company during the year 1U/12 238 185
Dividend distributions to equity holders of the Company proposed after the year end 1U/12 201 160
p p
Earnings per share
Based on profit attributable to equity holders of the Company 1AB/13 14.07 14.82
Diluted earnings per share
Based on profit attributable to equity holders of the Company 1AB/13 13.88 14.73
CONSOLIDATED INCOME STATEMENT
87ANNUAL REPORT AND ACCOUNTS 2010GROUP FINANCIAL STATEMENTS
L&G_AR10_11-PrimaryStmts_p87-92_230311_AT.indd 87 25/03/2011 11:25
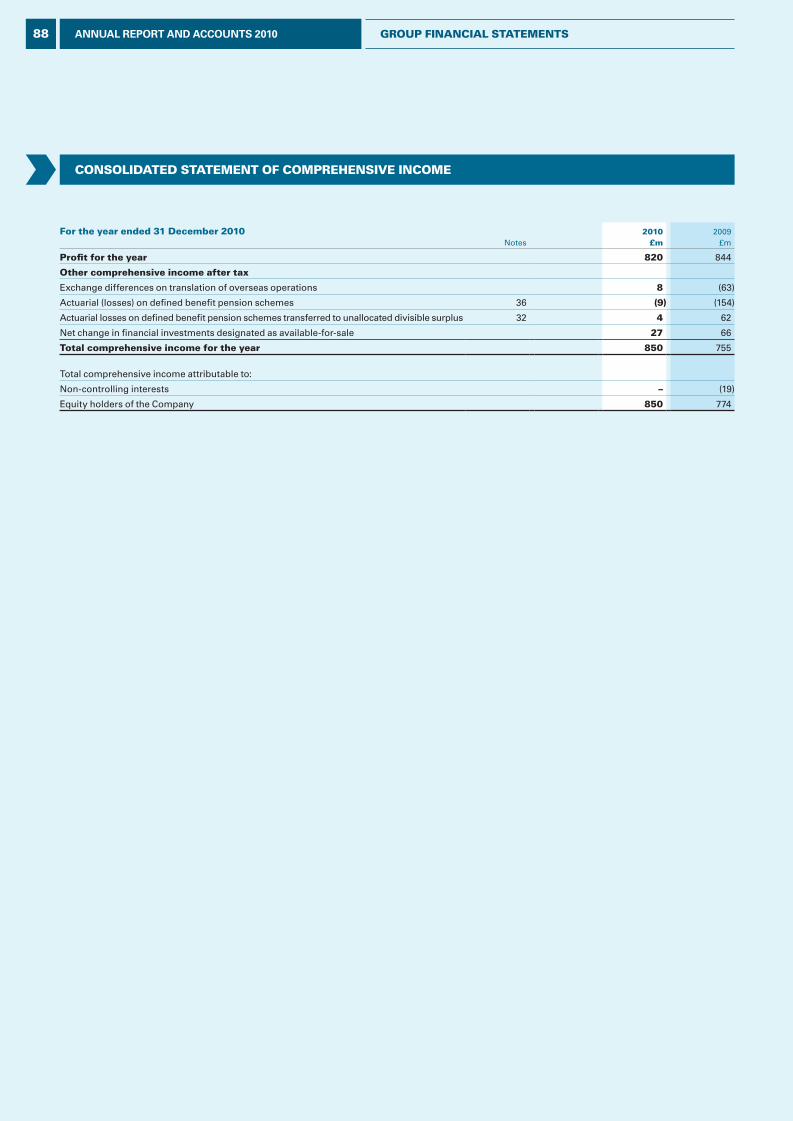
For the year ended 31 December 2010 Notes
2010£m
2009£m
Profit for the year 820 844
Other comprehensive income after tax
Exchange differences on translation of overseas operations 8 (63)
Actuarial (losses) on defined benefit pension schemes 36 (9) (154)
Actuarial losses on defined benefit pension schemes transferred to unallocated divisible surplus 32 4 62
Net change in financial investments designated as available-for-sale 27 66
Total comprehensive income for the year 850 755
Total comprehensive income attributable to:
Non-controlling interests – (19)
Equity holders of the Company 850 774
CONSOLIDATED STATEMENT OF COMPREhENSIvE INCOME
88 ANNUAL REPORT AND ACCOUNTS 2010 GROUP FINANCIAL STATEMENTS
L&G_AR10_11-PrimaryStmts_p87-92_230311_AT.indd 88 25/03/2011 11:25
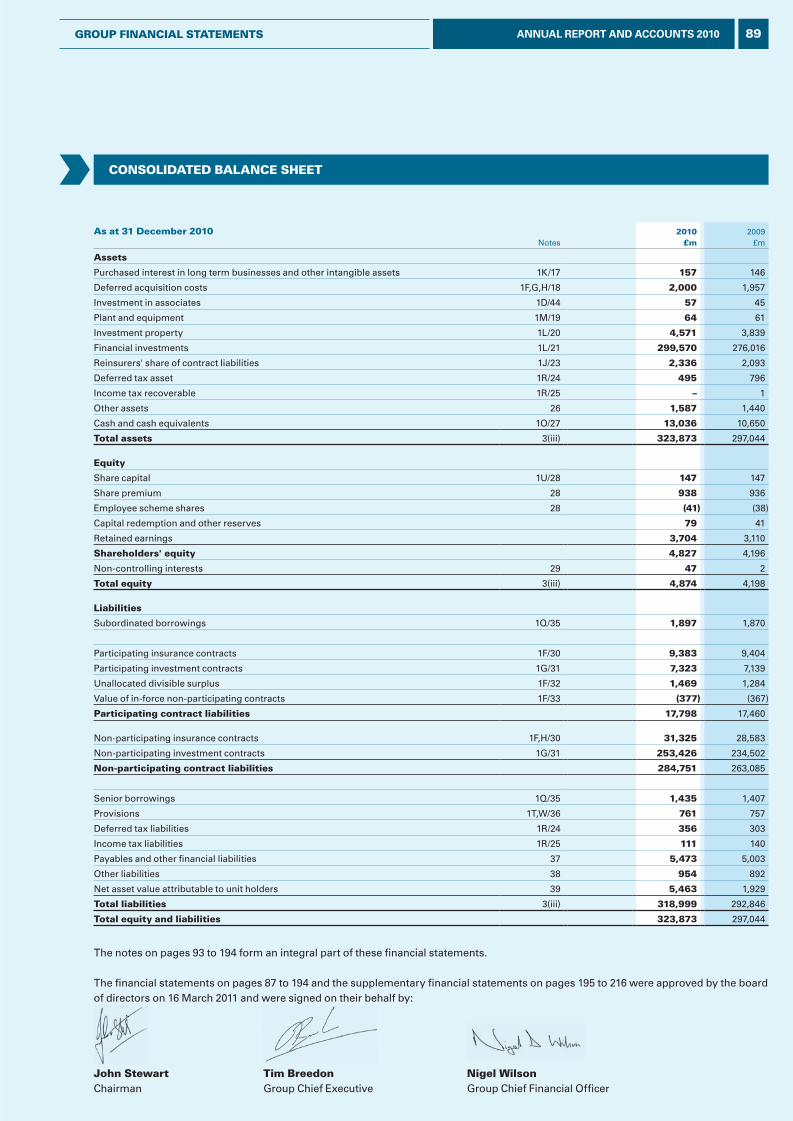
As at 31 December 2010Notes
2010£m
2009£m
Assets
Purchased interest in long term businesses and other intangible assets 1K/17 157 146
Deferred acquisition costs 1F,G,H/18 2,000 1,957
Investment in associates 1D/44 57 45
Plant and equipment 1M/19 64 61
Investment property 1L/20 4,571 3,839
Financial investments 1L/21 299,570 276,016
Reinsurers' share of contract liabilities 1J/23 2,336 2,093
Deferred tax asset 1R/24 495 796
Income tax recoverable 1R/25 – 1
Other assets 26 1,587 1,440
Cash and cash equivalents 1O/27 13,036 10,650
Total assets 3(iii) 323,873 297,044
Equity
Share capital 1U/28 147 147
Share premium 28 938 936
Employee scheme shares 28 (41) (38)
Capital redemption and other reserves 79 41
Retained earnings 3,704 3,110
Shareholders' equity 4,827 4,196
Non-controlling interests 29 47 2
Total equity 3(iii) 4,874 4,198
Liabilities
Subordinated borrowings 1Q/35 1,897 1,870
Participating insurance contracts 1F/30 9,383 9,404
Participating investment contracts 1G/31 7,323 7,139
Unallocated divisible surplus 1F/32 1,469 1,284
Value of in-force non-participating contracts 1F/33 (377) (367)
Participating contract liabilities 17,798 17,460
Non-participating insurance contracts 1F,H/30 31,325 28,583
Non-participating investment contracts 1G/31 253,426 234,502
Non-participating contract liabilities 284,751 263,085
Senior borrowings 1Q/35 1,435 1,407
Provisions 1T,W/36 761 757
Deferred tax liabilities 1R/24 356 303
Income tax liabilities 1R/25 111 140
Payables and other fi nancial liabilities 37 5,473 5,003
Other liabilities 38 954 892
Net asset value attributable to unit holders 39 5,463 1,929
Total liabilities 3(iii) 318,999 292,846
Total equity and liabilities 323,873 297,044
The notes on pages 93 to 194 form an integral part of these fi nancial statements.
The fi nancial statements on pages 87 to 194 and the supplementary fi nancial statements on pages 195 to 216 were approved by the board of directors on 16 March 2011 and were signed on their behalf by:
John Stewart Tim Breedon Nigel WilsonChairman Group Chief Executive Group Chief Financial Offi cer
CONSOLIDATED BALANCE ShEET
89ANNUAL REPORT AND ACCOUNTS 2010GROUP FINANCIAL STATEMENTS
L&G_AR10_11-PrimaryStmts_p87-92_230311_AT.indd 89 25/03/2011 11:25
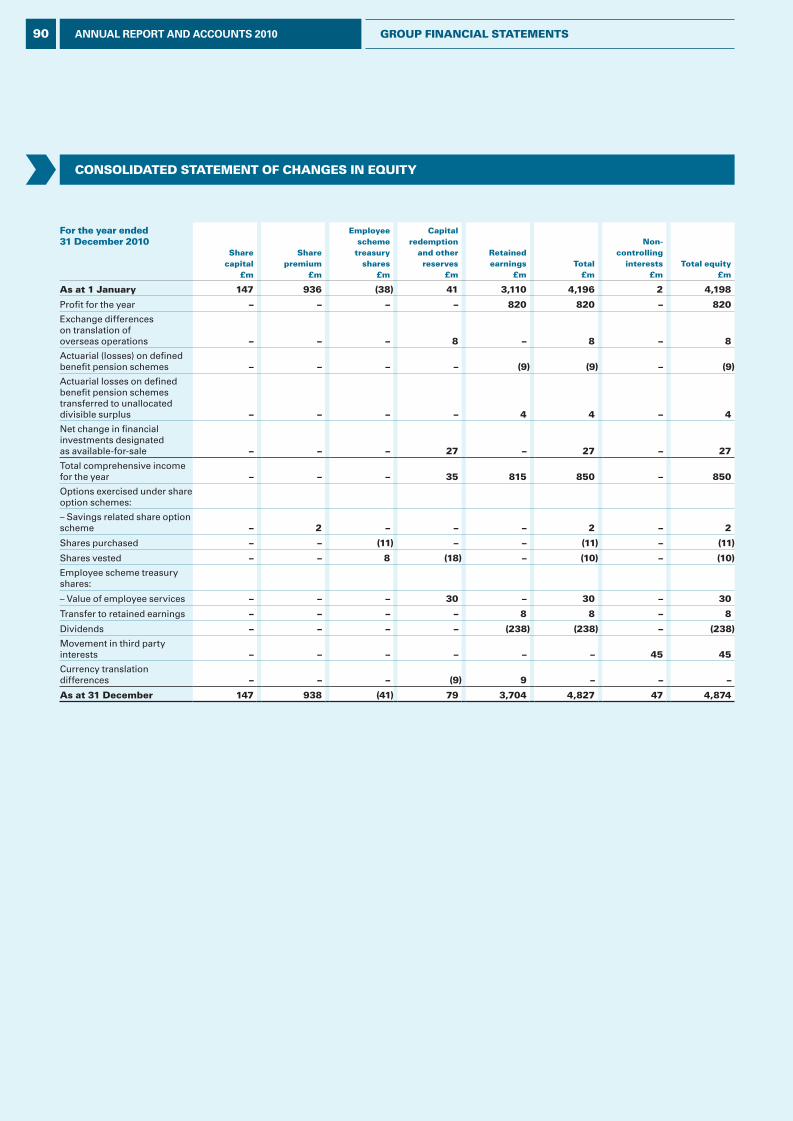
For the year ended 31 December 2010
Share capital
£m
Share premium
£m
Employee scheme
treasury shares
£m
Capital redemption
and other reserves
£m
Retained earnings
£mTotal
£m
Non-controlling
interests £m
Total equity £m
As at 1 January 147 936 (38) 41 3,110 4,196 2 4,198
Profit for the year – – – – 820 820 – 820
Exchange differences on translation of overseas operations – – – 8 – 8 – 8
Actuarial (losses) on defined benefit pension schemes – – – – (9) (9) – (9)
Actuarial losses on defined benefit pension schemes transferred to unallocated divisible surplus – – – – 4 4 – 4
Net change in financial investments designated as available-for-sale – – – 27 – 27 – 27
Total comprehensive income for the year – – – 35 815 850 – 850
Options exercised under share option schemes:
– Savings related share option scheme – 2 – – – 2 – 2
Shares purchased – – (11) – – (11) – (11)
Shares vested – – 8 (18) – (10) – (10)
Employee scheme treasury shares:
– Value of employee services – – – 30 – 30 – 30
Transfer to retained earnings – – – – 8 8 – 8
Dividends – – – – (238) (238) – (238)
Movement in third party interests – – – – – – 45 45
Currency translation differences – – – (9) 9 – – –
As at 31 December 147 938 (41) 79 3,704 4,827 47 4,874
CONSOLIDATED STATEMENT OF ChANGES IN EqUITy
90 ANNUAL REPORT AND ACCOUNTS 2010 GROUP FINANCIAL STATEMENTS
L&G_AR10_11-PrimaryStmts_p87-92_230311_AT.indd 90 25/03/2011 11:25
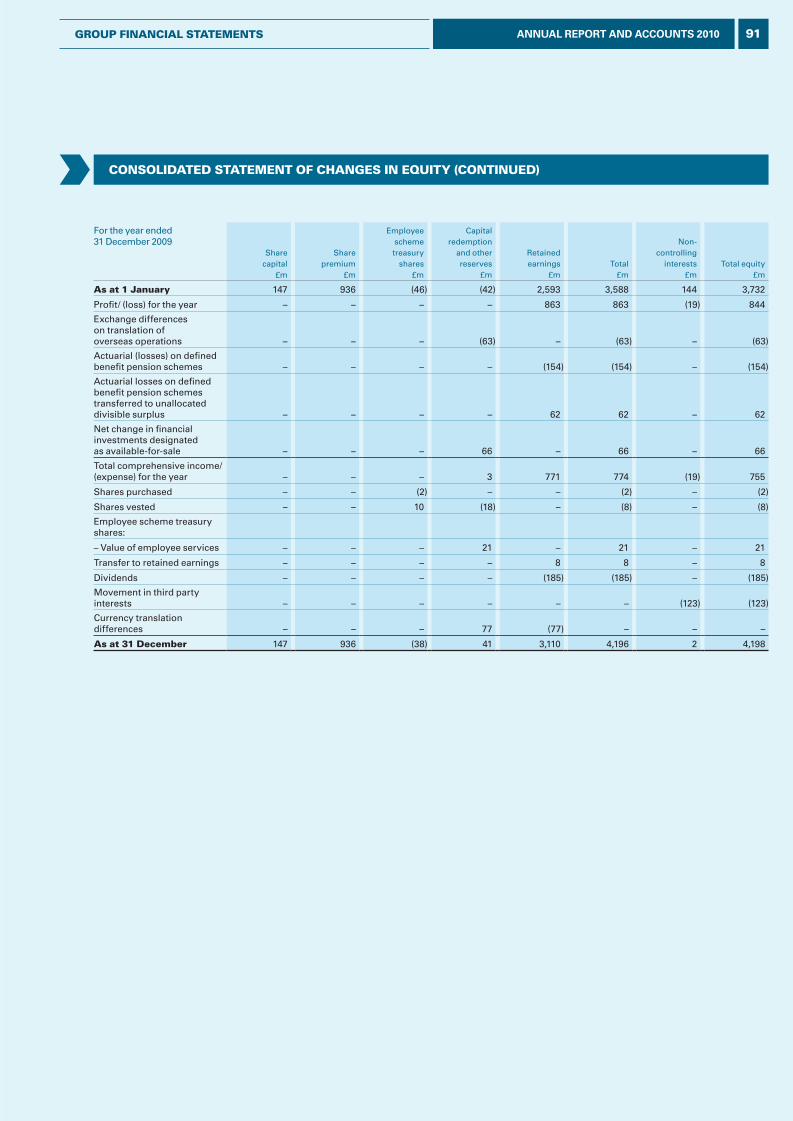
For the year ended 31 December 2009
Share capital
£m
Share premium
£m
Employee scheme treasury
shares £m
Capital redemption
and other reserves
£m
Retained earnings
£mTotal
£m
Non- controlling
interests £m
Total equity £m
As at 1 January 147 936 (46) (42) 2,593 3,588 144 3,732
Profit/ (loss) for the year – – – – 863 863 (19) 844
Exchange differences on translation of overseas operations – – – (63) – (63) – (63)
Actuarial (losses) on defined benefit pension schemes – – – – (154) (154) – (154)
Actuarial losses on defined benefit pension schemes transferred to unallocated divisible surplus – – – – 62 62 – 62
Net change in financial investments designated as available-for-sale – – – 66 – 66 – 66
Total comprehensive income/(expense) for the year – – – 3 771 774 (19) 755
Shares purchased – – (2) – – (2) – (2)
Shares vested – – 10 (18) – (8) – (8)
Employee scheme treasury shares:
– Value of employee services – – – 21 – 21 – 21
Transfer to retained earnings – – – – 8 8 – 8
Dividends – – – – (185) (185) – (185)
Movement in third party interests – – – – – – (123) (123)
Currency translation differences – – – 77 (77) – – –
As at 31 December 147 936 (38) 41 3,110 4,196 2 4,198
CONSOLIDATED STATEMENT OF ChANGES IN EqUITy (CONTINUED)
91ANNUAL REPORT AND ACCOUNTS 2010GROUP FINANCIAL STATEMENTS
L&G_AR10_11-PrimaryStmts_p87-92_230311_AT.indd 91 25/03/2011 11:25
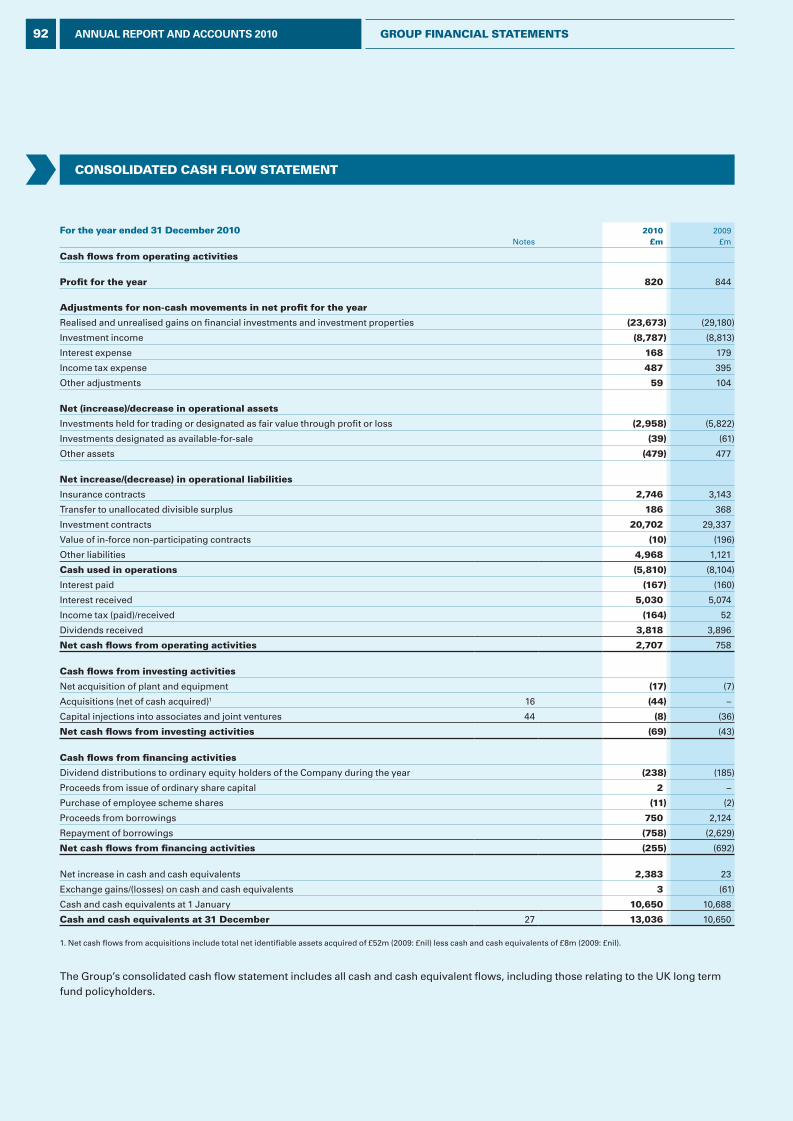
For the year ended 31 December 2010 Notes
2010 £m
2009 £m
Cash flows from operating activities
Profit for the year 820 844
Adjustme nts for non-cash movements in net profit for the year
Realised and unrealised gains on financial investments and investment properties (23,673) (29,180)
Investment income (8,787) (8,813)
Interest expense 168 179
Income tax expense 487 395
Other adjustments 59 104
Net (increase)/decrease in operational assets
Investments held for trading or designated as fair value through profit or loss (2,958) (5,822)
Investments designated as available-for-sale (39) (61)
Other assets (479) 477
Net increase/(decrease) in operational liabilities
Insurance contracts 2,746 3,143
Transfer to unallocated divisible surplus 186 368
Investment contracts 20,702 29,337
Value of in-force non-participating contracts (10) (196)
Other liabilities 4,968 1,121
Cash used in operations (5,810) (8,104)
Interest paid (167) (160)
Interest received 5,030 5,074
Income tax (paid)/received (164) 52
Dividends received 3,818 3,896
Net cash flows from operating activities 2,707 758
Cash flows from investing activities
Net acquisition of plant and equipment (17) (7)
Acquisitions (net of cash acquired)1 16 (44) –
Capital injections into associates and joint ventures 44 (8) (36)
Net cash flows from investing activities (69) (43)
Cash flows from financing activities
Dividend distributions to ordinary equity holders of the Company during the year (238) (185)
Proceeds from issue of ordinary share capital 2 –
Purchase of employee scheme shares (11) (2)
Proceeds from borrowings 750 2,124
Repayment of borrowings (758) (2,629)
Net cash flows from financing activities (255) (692)
Net increase in cash and cash equivalents 2,383 23
Exchange gains/(losses) on cash and cash equivalents 3 (61)
Cash and cash equivalents at 1 January 10,650 10,688
Cash and cash equivalents at 31 December 27 13,036 10,650
1. Net cash flows from acquisitions include total net identifiable assets acquired of £52m (2009: £nil) less cash and cash equivalents of £8m (2009: £nil).
The Group’s consolidated cash flow statement includes all cash and cash equivalent flows, including those relating to the UK long term fund policyholders.
CONSOLIDATED CASh FLOW STATEMENT
92 ANNUAL REPORT AND ACCOUNTS 2010 GROUP FINANCIAL STATEMENTS
L&G_AR10_11-PrimaryStmts_p87-92_230311_AT.indd 92 25/03/2011 11:25
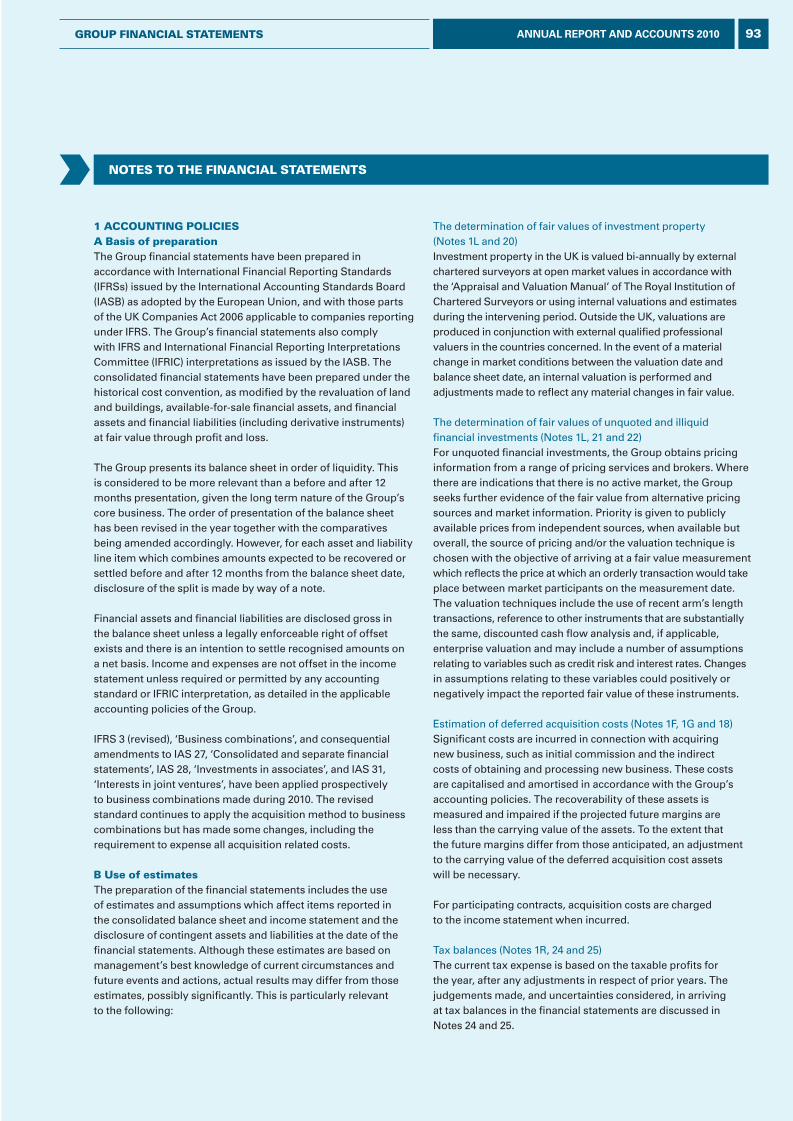
NOTES TO THE FINANCIAL STATEMENTS
1 ACCOuNTINg pOLICIESA Basis of preparationThe Group financial statements have been prepared in accordance with International Financial Reporting Standards (IFRSs) issued by the International Accounting Standards Board (IASB) as adopted by the European Union, and with those parts of the UK Companies Act 2006 applicable to companies reporting under IFRS. The Group’s financial statements also comply with IFRS and International Financial Reporting Interpretations Committee (IFRIC) interpretations as issued by the IASB. The consolidated financial statements have been prepared under the historical cost convention, as modified by the revaluation of land and buildings, available-for-sale financial assets, and financial assets and financial liabilities (including derivative instruments) at fair value through profit and loss.
The Group presents its balance sheet in order of liquidity. This is considered to be more relevant than a before and after 12 months presentation, given the long term nature of the Group’s core business. The order of presentation of the balance sheet has been revised in the year together with the comparatives being amended accordingly. However, for each asset and liability line item which combines amounts expected to be recovered or settled before and after 12 months from the balance sheet date, disclosure of the split is made by way of a note.
Financial assets and financial liabilities are disclosed gross in the balance sheet unless a legally enforceable right of offset exists and there is an intention to settle recognised amounts on a net basis. Income and expenses are not offset in the income statement unless required or permitted by any accounting standard or IFRIC interpretation, as detailed in the applicable accounting policies of the Group.
IFRS 3 (revised), ‘Business combinations’, and consequential amendments to IAS 27, ‘Consolidated and separate financial statements’, IAS 28, ‘Investments in associates’, and IAS 31, ‘Interests in joint ventures’, have been applied prospectively to business combinations made during 2010. The revised standard continues to apply the acquisition method to business combinations but has made some changes, including the requirement to expense all acquisition related costs.
B use of estimates The preparation of the financial statements includes the use of estimates and assumptions which affect items reported in the consolidated balance sheet and income statement and the disclosure of contingent assets and liabilities at the date of the financial statements. Although these estimates are based on management’s best knowledge of current circumstances and future events and actions, actual results may differ from those estimates, possibly significantly. This is particularly relevant to the following:
The determination of fair values of investment property (Notes 1L and 20)Investment property in the UK is valued bi-annually by external chartered surveyors at open market values in accordance with the ‘Appraisal and Valuation Manual’ of The Royal Institution of Chartered Surveyors or using internal valuations and estimates during the intervening period. Outside the UK, valuations are produced in conjunction with external qualified professional valuers in the countries concerned. In the event of a material change in market conditions between the valuation date and balance sheet date, an internal valuation is performed and adjustments made to reflect any material changes in fair value.
The determination of fair values of unquoted and illiquid financial investments (Notes 1L, 21 and 22)For unquoted financial investments, the Group obtains pricing information from a range of pricing services and brokers. Where there are indications that there is no active market, the Group seeks further evidence of the fair value from alternative pricing sources and market information. Priority is given to publicly available prices from independent sources, when available but overall, the source of pricing and/or the valuation technique is chosen with the objective of arriving at a fair value measurement which reflects the price at which an orderly transaction would take place between market participants on the measurement date. The valuation techniques include the use of recent arm’s length transactions, reference to other instruments that are substantially the same, discounted cash flow analysis and, if applicable, enterprise valuation and may include a number of assumptions relating to variables such as credit risk and interest rates. Changes in assumptions relating to these variables could positively or negatively impact the reported fair value of these instruments.
Estimation of deferred acquisition costs (Notes 1F, 1G and 18)Significant costs are incurred in connection with acquiring new business, such as initial commission and the indirect costs of obtaining and processing new business. These costs are capitalised and amortised in accordance with the Group’s accounting policies. The recoverability of these assets is measured and impaired if the projected future margins are less than the carrying value of the assets. To the extent that the future margins differ from those anticipated, an adjustment to the carrying value of the deferred acquisition cost assets will be necessary.
For participating contracts, acquisition costs are charged to the income statement when incurred.
Tax balances (Notes 1R, 24 and 25)The current tax expense is based on the taxable profits for the year, after any adjustments in respect of prior years. The judgements made, and uncertainties considered, in arriving at tax balances in the financial statements are discussed in Notes 24 and 25.
93ANNUAL REPORT AND ACCOUNTS 2010gROup FINANCIAL STATEMENTS
L&G_AR10_12-AccPolicies_p93-101_230311_AT.indd 93 25/03/2011 11:25
NOTES TO THE FINANCIAL STATEMENTS (CONTINuEd)
1 ACCOuNTINg pOLICIES (CONTINuEd)B use of estimates (continued)Insurance and investment contract liabilities (Notes 1F, 1G, 30 and 31) and associated balancesLong term business liabilities can never be definitive as to their timing or the amount of claims and are therefore subject to regular reassessment. The significant estimates and assumptions used in calculating insurance liabilities are disclosed in Note 34.
C Summary of significant accounting policiesThe Group has selected accounting policies which fairly state its financial position and financial performance for a reporting period. The accounting policies have been consistently applied to all years presented, unless otherwise stated.
The principal accounting policies adopted in preparing these financial statements are set out below.
d Consolidation principlesSubsidiary undertakings The consolidated financial statements incorporate the assets, liabilities, equity, revenues, expenses and cash flows of the Company and of its subsidiary undertakings drawn up to 31 December each year. All intra-group balances, transactions, income and expenses are eliminated in full. Subsidiaries are those entities (including special purpose entities, mutual funds and unit trusts) over which the Group directly or indirectly has the power to govern the operating and financial policies in order to gain economic benefits (Note 43). Profits or losses of subsidiary undertakings sold or acquired during the period are included in the consolidated results up to the date of disposal or from the date of gaining control. The interests of parties, other than the Group, in investment vehicles, such as unit trusts, are classified as liabilities and appear as ‘Net asset value attributable to unit holders’ in the consolidated balance sheet.
AcquisitionsThe Group applies the purchase method in its accounting for the acquisition of subsidiaries. The cost of an acquisition is measured as the fair value of the assets transferred, equity instruments issued, liabilities and contingent liabilities incurred or assumed at the date of exchange. The excess of the cost of acquisition over the fair value of the Group’s share of the net assets acquired is recorded as goodwill. If the cost of acquisition is less than the fair value of the Group’s share of the net assets of the subsidiary acquired, the difference is recognised directly in the income statement. All Group subsidiaries apply consistent accounting policies. Acquisition related costs are expensed as incurred.
Associates and joint ventures Associates are entities over which the Group has significant influence but which it does not control. Consistent with IAS 28, ‘Investments in associates’, it is presumed that the Group has significant influence where it has between 20% and 50% of the voting rights in the investee. Joint ventures are entities where the Group and other parties undertake an activity which is subject to joint control.
The Group has interests in associates and joint ventures which form part of an investment portfolio held through private equity partnerships, mutual funds, unit trusts and similar entities. In accordance with the choices permitted by IAS 28 and IAS 31, ‘Interests in joint ventures’, these interests have been classified as fair value through profit or loss and measured at fair value within financial investments, with changes in fair value recognised in the income statement.
Associates which do not form part of an investment portfolio are initially recognised in the balance sheet at cost. The carrying amount of the associate is increased or decreased to reflect the Group’s share of the profit or loss after the date of the acquisition.
E product classificationThe Group’s products are classified for accounting purposes as either insurance contracts (participating and non-participating) or investment contracts (participating and non-participating). Insurance contracts are contracts which transfer significant insurance risk to the insurer at the inception of the contract. Contracts which do not transfer significant insurance risk to the insurer are classified as investment contracts. Hybrid contract types, containing both insurance and investment features, have been treated as investment contracts when accounting for premiums, claims and other revenue.
A number of insurance and investment contracts contain discretionary participating features (DPF) which entitle the policyholders to receive guaranteed benefits as well as additional benefits:
• the amount or timing of which is contractually at the discretion of the Group; and
• which are contractually based on: − the performance of a specified pool of contracts
or a specified type of contract; − realised and/or unrealised investment returns on
a specified pool of assets held by the issuer; or − the profit or loss of the Company, fund or other entity
which issues the contract.
Contracts with DPF are referred to as participating contracts. With-profits contracts in the UK and most Garantie Long Terme contracts in France are classified as participating.
F Long term insurance contractsPremium income Premiums are recognised as revenue when due for payment.
ClaimsDeath claims are accounted for on notification of death. Surrenders for non-linked policies are accounted for when payment is made. Critical illness claims are accounted for when admitted. All other claims and surrenders are accounted for when payment is due. Claims payable include the direct costs of settlement.
94 ANNUAL REPORT AND ACCOUNTS 2010 gROup FINANCIAL STATEMENTS
L&G_AR10_12-AccPolicies_p93-101_230311_AT.indd 94 25/03/2011 11:25
NOTES TO THE FINANCIAL STATEMENTS (CONTINuEd)
Acquisition costsAcquisition costs comprise direct costs, such as initial commission, and the indirect costs of obtaining and processing new business. Acquisition costs relating to non-participating insurance contracts written outside the with-profits part of the UK Long Term Funds (LTFs) which are incurred during a financial year are deferred by use of an asset which is amortised over the period during which the costs are expected to be recoverable, and in accordance with the expected incidence of future related margins. For participating contracts, acquisition costs are charged to the income statement when incurred.
Insurance contract liabilities Under current IFRS requirements, insurance contract liabilities are measured using local Generally Accepted Accounting Principles (GAAP), as permitted by IFRS 4, ‘Insurance contracts’.
UKIn the UK, insurance contract liabilities are determined following an annual investigation of the LTFs in accordance with regulatory requirements.
For non-participating insurance contracts, the liabilities are calculated on the basis of current information using the gross premium valuation method. This brings into account the full premiums receivable under contracts written, having prudent regard to expected lapses and surrenders, estimated renewal and maintenance costs and contractually guaranteed benefits. For unit linked insurance contract liabilities the provision is based on the fund value together with an allowance for any excess of future expenses over charges where appropriate.
For participating contracts, the liabilities to policyholders are determined on a realistic basis in accordance with Financial Reporting Standard (FRS) 27, ‘Life assurance’. This includes an assessment of the cost of any future options and guarantees granted to policyholders valued on a market consistent basis. The calculation also takes account of bonus decisions which are consistent with Legal & General Assurance Society Limited’s (Society’s) Principles and Practices of Financial Management (PPFM). The shareholders’ share of the future cost of bonuses is excluded from the assessment of the realistic liability.
In determining the realistic value of liabilities for participating contracts, the value of future profits on non-participating business written in the with-profits part of the fund is accounted for as part of the calculation. The present value of future profits (VIF) for this business is separately determined and its value is deducted from the sum of the liabilities for participating contracts and the unallocated divisible surplus.
Unitised liabilities are recognised when premiums are received and non-unitised liabilities are recognised when premiums are due.
OverseasThe long term insurance contract liabilities for business transacted by overseas subsidiaries are determined on the basis of recognised actuarial methods which reflect local supervisory principles or, in the case of the US, on the basis of US GAAP.
Unallocated divisible surplus The nature of benefits for participating contracts is such that the allocation of surpluses between ordinary equity holders and participating policyholders is uncertain. The amount of surplus which has not been allocated at the balance sheet date is classified within liabilities as the unallocated divisible surplus. Adjustments made to comply with FRS 27 are charged to the unallocated divisible surplus.
g Investment contractsPremium income For investment contracts, amounts collected as premiums are not included in the income statement but are reported as contributions to investment contract liabilities in the balance sheet.
Revenue from investment contractsFees charged for investment management services are recognised as revenue as the services are provided. Initial fees, which exceed the level of recurring fees and relate to the future provision of services, are deferred and amortised over the anticipated period in which the services will be provided.
Fees charged for investment management services for institutional and retail fund management are also recognised on this basis.
ClaimsClaims are not included in the income statement but are deducted from investment contract liabilities. The movement in investment contract liabilities consists of claims incurred in the period less the corresponding elimination of the policyholder liability originally recognised in the balance sheet and the investment return credited to policyholders.
Acquisition costsFor participating investment contracts, acquisition costs comprise direct costs such as initial commission and the indirect costs of obtaining and processing new business. These costs are charged to the income statement when incurred.
For non-participating investment contracts, only directly related acquisition costs relating to investment management services which vary with, and are related to, securing new contracts and renewing existing contracts, are capitalised as an intangible asset and amortised over the period during which the costs are expected to be recoverable from future revenue. All other costs are recognised as expenses when incurred.
95ANNUAL REPORT AND ACCOUNTS 2010gROup FINANCIAL STATEMENTS
L&G_AR10_12-AccPolicies_p93-101_230311_AT.indd 95 25/03/2011 11:25
NOTES TO THE FINANCIAL STATEMENTS (CONTINuEd)
1 ACCOuNTINg pOLICIES (CONTINuEd)g Investment contracts (continued)Trail commissionThe Group operates distribution agreements with intermediaries where further commission costs are payable in each period in which a relevant policy remains in-force. For relevant non-participating investment contracts, a liability for the present value of this future commission cost is recognised in the balance sheet on inception of the contract. The present value of future commission costs is deferred as an asset and amortised over the period during which the related revenue will be recognised. At each subsequent reporting date, the liability is re-measured to fair value because this financial liability is part of a portfolio of unit linked assets and liabilities whose performance is evaluated on a fair value basis. Any increase in the liability is recognised as an additional deferred cost. Any change in lapse assumptions or revisions to the underlying assumptions for future cash flows will be reflected in the fair value movement for a period. If the future commission liability decreases, a corresponding adjustment is made to the amortisation of the asset.
Investment contract liabilities Under current IFRS requirements, participating investment contract liabilities are measured using local GAAP, as permitted by IFRS 4 (see above for insurance contract liabilities). In the UK, participating investment contract liabilities are determined in accordance with FRS 27, including a value for guarantees, in the same way as insurance contracts.
Non-participating investment contracts are unit linked contracts. Unit linked liabilities are measured at fair value by reference to the value of the underlying net asset values of the Group’s unitised investment funds at the balance sheet date.
Unitised liabilities are recognised when premiums are received and non-unitised liabilities are recognised when premiums are due.
H general insurance businessResults for the General insurance business are determined after taking account of unearned premiums, outstanding claims and unexpired risks using the annual basis of accounting.
Premium incomePremiums are accounted for in the period in which the risk commences. Estimates are included for premiums not notified by the year end and provision is made for the anticipated lapse of renewals not yet confirmed. Those proportions of premiums written in a year which relate to periods of risk extending beyond the end of the year are carried forward as unearned premiums.
Acquisition costsA proportion of commission and other acquisition costs relating to unearned premiums is carried forward as deferred acquisition costs or, in respect of reinsurance outwards, as deferred income.
Technical liabilitiesLiabilities, together with related reinsurance recoveries, are established on the basis of current information. Such liabilities can never be definitive as to their timing or the amount of claims and are therefore subject to subsequent reassessment on a regular basis.
Claims and related reinsurance recoveries are accounted for in respect of all incidents up to the year end. Provision is made on the basis of available information for the estimated ultimate cost, including claims settlement expenses, claims reported but not yet settled and claims incurred but not yet reported. An unexpired risk provision is made for any overall excess of expected claims and deferred acquisition costs over unearned premiums and after taking account of investment return.
I Liability adequacy testsThe Group performs liability adequacy testing on its insurance liabilities to ensure that the carrying amount of liabilities (less related deferred acquisition costs) is sufficient to cover current estimates of future cash flows. When performing the liability adequacy test, the Group discounts all contractual cash flows and compares this amount with the carrying value of the liability. Any deficiency is immediately charged to the income statement, initially reducing deferred acquisition costs and then by establishing a provision for losses.
J ReinsuranceThe Group’s insurance subsidiaries cede insurance premiums and risk in the normal course of business in order to limit the potential for losses and to provide financing. Outwards reinsurance premiums are accounted for in the same accounting period as the related premiums for the direct or inwards reinsurance business being reinsured. Reinsurance assets include balances due from reinsurers for paid and unpaid losses and loss adjustment expenses, ceded unearned premiums and ceded future life policy benefits. Amounts recoverable from reinsurers are estimated in a manner consistent with the claim liability associated with the reinsured policy. Reinsurance is recorded as an asset in the consolidated balance sheet unless a right of offset exists, in which case the associated liabilities are reduced commensurately.
K Intangible assetsGoodwillGoodwill on the acquisition of subsidiaries prior to 1998 has been charged directly to reserves. On disposal, goodwill held in reserves is transferred directly to retained earnings. From 1998, the Group’s policy is to recognise goodwill on the balance sheet as an intangible asset, measured at cost less any accumulated impairment losses.
96 ANNUAL REPORT AND ACCOUNTS 2010 gROup FINANCIAL STATEMENTS
L&G_AR10_12-AccPolicies_p93-101_230311_AT.indd 96 25/03/2011 11:25
NOTES TO THE FINANCIAL STATEMENTS (CONTINuEd)
Purchased interest in long term businesses and other intangible assetsPortfolios of in-force insurance or investment contracts acquired either directly or through the acquisition of a subsidiary undertaking are capitalised at fair value. The value of business acquired represents the present value of anticipated future profits in acquired contracts. These amounts are amortised over the anticipated lives of the related contracts in the portfolio. Other intangible assets acquired via business combinations, such as the value of customer relationships, are recognised at fair value and are subsequently amortised over their useful life in line with the expected emergence of profit from the business. Where acquired intangibles are deemed to have indefinite lives these are not amortised, but are subject to an annual test for impairment.
L Investments Investment propertyInvestment property comprises land and buildings which are held for long term rental yields and capital growth. It is carried at fair value with changes in fair value recognised in the income statement within investment return.
Financial investmentsThe Group classifies its financial investments on initial recognition as held for trading (HFT), designated at fair value through profit or loss (FVTPL), available-for-sale (AFS) or loans and receivables. Initial recognition of financial investments is on the trade date.
The Group’s policy is to measure investments at FVTPL except for certain overseas assets where the related liability is valued on a passive basis (not using current information), in which case investments are classified as AFS. All derivatives other than those designated as hedges are classified as HFT.
Certain financial investments held by the Group are designated as FVTPL as their performance is evaluated on a total return basis, consistent with asset performance reporting to the Group Investment and Market Risk Committee and the Group’s investment strategy. Assets designated as FVTPL include debt securities and equity instruments which would otherwise have been classified as AFS under IAS 39, ‘Financial instruments: recognition and measurement’. Assets backing participating and non-participating policyholder liabilities outside the US are designated as FVTPL. For participating contracts the assets are managed on a fair value basis to maximise the total return to policyholders over the contract life. The Group’s non-participating investment contract liabilities outside of the US are measured on the basis of current information and are designated as FVTPL to avoid an accounting mismatch in the income statement.
The fair values of quoted financial investments are based on current bid prices. If the market for a financial investment is not active, the Group establishes fair value by using valuation techniques such as recent arm’s length transactions, consensus market pricing, reference to similar listed investments, discounted cash flow models or option pricing models.
Private equity investments are valued in accordance with the International Private Equity and Venture Capital Valuation Guidelines, which represent current best practice, developed by the Association Français des Investisseurs en Capital, the British Venture Capital Association and the European Private Equity and Venture Capital Association. The techniques used for determining fair value include earnings multiples, the price of a recent investment or a net asset basis.
Financial investments classified as HFT and FVTPL are measured at fair value with gains and losses reflected in the income statement. Transaction costs are expensed as incurred.
Financial investments classified as AFS are measured at fair value with unrealised gains and losses recognised in a separate reserve within equity. Realised gains and losses, impairment losses, dividends, interest and foreign exchange movements on non-equity instruments are reflected in the income statement. Directly attributable transaction costs are included in the initial measurement of the investment.
Loans and receivables are initially measured at fair value plus acquisition costs, and subsequently measured at amortised cost using the effective interest method.
M plant and equipmentThe initial cost of an item of plant or equipment is capitalised where it is probable that future economic benefits associated with the item will flow to the Group and the cost of the item can be measured reliably. The cost is then depreciated on a straight line basis over the item’s estimated useful working life.
N Impairment policyThe Group reviews the carrying value of its financial assets (other than those held at FVTPL) at each balance sheet date. If the carrying value of a financial asset is impaired, the carrying value is reduced through a charge to the income statement. There must be objective evidence of impairment as a result of one or more events which have occurred after the initial recognition of the asset. Impairment is only recognised if the loss event has an impact on the estimated future cash flows of assets held at amortised cost or fair value of assets classified as AFS.
Assets which are subject to amortisation are reviewed for impairment whenever events or changes in circumstances indicate that the carrying amount may not be recoverable. The recoverable amount is the higher of an asset’s fair value less costs to sell and value in use.
O Cash and cash equivalentsCash and cash equivalents include cash in hand, deposits held at call with banks, treasury bills and other short term highly liquid investments with original maturities of three months or less.
97ANNUAL REPORT AND ACCOUNTS 2010gROup FINANCIAL STATEMENTS
L&G_AR10_12-AccPolicies_p93-101_230311_AT.indd 97 25/03/2011 11:25
NOTES TO THE FINANCIAL STATEMENTS (CONTINuEd)
1 ACCOuNTINg pOLICIES (CONTINuEd)p derivative financial instruments and hedge accountingThe Group’s activities expose it to the financial risks of changes in foreign exchange rates and interest rates. The Group uses derivatives such as foreign exchange forward contracts and interest rate swap contracts to hedge these exposures. The Group uses hedge accounting, provided the prescribed criteria in IAS 39 are met, to recognise the offsetting effects of changes in the fair value or cash flow of the derivative instrument and the hedged item. The Group’s principal uses of hedge accounting are to: (i) recognise in shareholders’ equity the changes in the fair
value of derivatives designated as hedges of a net investment in a foreign operation. Any cumulative gains and/or losses are recognised in the income statement on disposal of the foreign operation;
(ii) defer in equity the changes in the fair value of derivatives designated as the hedge of a future cash flow attributable to a recognised asset or liability, a highly probable forecast transaction, or a firm commitment until the period in which the future transaction affects profit or loss or is no longer expected to occur; and
(iii) hedge the fair value movements in loans due to interest rate and exchange rate fluctuations. Any gain or loss from remeasuring the hedging instrument at fair value is recognised immediately in the income statement. Any gain or loss on the hedged item attributable to the hedged risk is adjusted against the carrying amount of the hedged item and recognised in the income statement.
The relationship between the hedging instrument and the hedged item, together with the risk management objective and strategy for undertaking the hedge transaction, are documented at the inception of the transaction. The effectiveness of the hedge is documented and monitored on an ongoing basis. Hedge accounting is only applied for highly effective hedges (between 80% and 125% effectiveness) with any ineffective portion of the gain or loss recognised in the income statement, within other expenses, in the current period.
Certain derivative instruments do not qualify for hedge accounting. Changes in the fair value of any derivative instruments which do not qualify for hedge accounting are recognised immediately in the income statement.
Where the risks and characteristics of derivatives embedded in other contracts are not closely related to those of the host contract and the whole contract is not carried at fair value, the derivative is separated from that host contract and measured at fair value, with fair value movements reflected within investment return, unless the embedded derivative itself meets the definition of an insurance contract.
Q Borrowings Borrowings are recognised initially at fair value, net of transaction costs. Borrowings classified as liabilities are subsequently stated at amortised cost. The difference between the net proceeds and the redemption value is recognised in the income statement over the borrowing period using the effective interest method.
Borrowings comprise unsecured subordinated debt such as tier 1 and tier 2 bond issues, short and long term unsecured senior debt such as long dated bond issues, commercial paper issuance and bank borrowings under both committed and uncommitted debt facilities including bank overdrafts. Borrowings raised from individual banks, syndicated banks and capital markets secured on specific assets/cash flows such as Triple X securitisations and property partnership assets are included as non recourse borrowings, as are mortgage loans raised by SIPP clients secured on those properties invested in their portfolio of linked SIPP investments which we manage on their behalf.
R Income taxes Income taxIncome tax comprises current and deferred tax. Income tax is recognised in the income statement except where it relates to an item which is recognised in other comprehensive income.
Current tax is the expected tax payable on the taxable profit for the period and any adjustment to the tax payable in respect of previous periods.
The total income tax expense for the period includes income tax paid by Society in respect of UK life policyholder returns, which is not related to profits earned by equity holders for the period. The income tax charge in the income statement has therefore been apportioned between the element attributable to policyholder returns and the element attributable to equity holders’ profits (equity holder tax).
Deferred income taxDeferred income tax is provided in full, using the balance sheet liability method, on temporary differences between the carrying amounts of assets and liabilities for financial reporting purposes and the amounts used for tax purposes. Deferred tax is measured using tax rates expected to apply when the related deferred income tax asset is realised or the deferred income tax liability is settled, based on tax rates and law which have been enacted or substantively enacted at the balance sheet date.
Deferred income tax assets are recognised to the extent that it is probable that future taxable profits will be available against which the temporary differences can be utilised.
Deferred tax assets and liabilities are not discounted.
98 ANNUAL REPORT AND ACCOUNTS 2010 gROup FINANCIAL STATEMENTS
L&G_AR10_12-AccPolicies_p93-101_230311_AT.indd 98 25/03/2011 11:25
NOTES TO THE FINANCIAL STATEMENTS (CONTINuEd)
Deferred income tax is provided on temporary differences arising on investments in subsidiaries and associates, except where the Group controls the timing of the reversal of the temporary difference and it is probable that the temporary difference will not reverse in the foreseeable future (or if it will, then it will not generate any incremental tax liability for the Group).
S LeasesWhere a significant proportion of the risks and rewards of ownership is retained by the lessor, leases are classified as operating leases. Payments made as lessees under operating leases (net of any incentives from the lessor) are charged to the income statement on a straight line basis over the period of the lease.
T Employee benefitsPension obligationsThe Group operates a number of defined benefit and defined contribution pension schemes in the UK and overseas. The assets of all UK defined benefit schemes are held in separate trustee administered funds which are subject to regular actuarial valuation every three years, updated by formal reviews at reporting dates.
The liability recognised in the balance sheet in respect of defined benefit pension schemes is the present value of the defined benefit obligation at the balance sheet date less the fair value of plan assets. Plan assets exclude any insurance contracts issued by the Group. The defined benefit obligation is calculated actuarially each year using the projected unit credit method. The present value of the defined benefit obligation is determined by discounting the estimated future cash outflows. The discount rate is based on market yields of high quality corporate bonds which are denominated in the currency in which the benefits will be paid, and that have terms to maturity which approximate to those of the related pension liability.
Where the unallocated divisible surplus or equity holders’ funds are affected as a result of actuarial gains and losses on the defined benefit pension scheme, the charge or credit is not recognised in the income statement but through the statement of comprehensive income.
The Group pays contractual contributions in respect of defined contribution schemes. The Group has no further payment obligations once the contributions have been paid. The contributions are recognised as employee benefit expenses when they are due. Prepaid contributions are recognised as an asset to the extent that a cash refund or a reduction in future payments is available. Obligations under defined benefit pension schemes are included within provisions.
Share-based payments The Group operates a number of share-based payment schemes. The fair value at the date of grant of the equity instrument is recognised as an expense, spread over the vesting period of the instrument. The total amount to be expensed is determined by reference to the fair value of the awards, excluding the impact of any non-market vesting conditions. At each balance sheet date, the Group revises its estimate of the number of equity instruments which are expected to become exercisable. It recognises the impact of the revision of original estimates, if any, in the income statement, and a corresponding adjustment is made to equity. On vesting or exercise, the difference between the expense charged to the income statement and the actual cost to the Group is transferred to retained earnings. Where new shares are issued, the proceeds received are credited to share capital and share premium. u Share capital and employee scheme shares Equity instrumentsAn equity instrument is any contract which evidences a residual interest in the net assets of an entity. It follows that a financial instrument is treated as equity if:
• there is no contractual obligation to deliver cash or other financial assets or to exchange financial assets or liabilities on unfavourable terms; and
• the instrument is either a non-derivative which contains no contractual obligation to deliver a variable number of own equity instruments, or is a derivative which will be settled only by the Group exchanging a fixed amount of cash or other financial assets, for a fixed number of its own equity instruments.
Share issue costsIncremental costs directly attributable to the issue of new shares are shown in equity as a deduction, net of tax, from the proceeds. An incremental share issue cost is one which would not have arisen if shares had not been issued.
Legal & General sharesWhere any Group entity purchases the Company’s equity share capital, the consideration paid, including any directly attributable incremental costs (net of income taxes), is deducted from equity attributable to shareholders. Where such shares are subsequently sold, reissued or otherwise disposed of, any consideration received is included in equity attributable to shareholders, net of any directly attributable incremental transaction costs and the related income tax effects. Shares held on behalf of employee share schemes are disclosed as such on the balance sheet.
Dividend recognitionA dividend distribution to the Company’s shareholders is recognised as a liability in the period in which the dividends are authorised and are no longer at the discretion of the Company. Final dividends are accrued when approved by the Company’s shareholders at a general meeting and interim dividends are recognised when paid.
99ANNUAL REPORT AND ACCOUNTS 2010gROup FINANCIAL STATEMENTS
L&G_AR10_12-AccPolicies_p93-101_230311_AT.indd 99 25/03/2011 11:25
NOTES TO THE FINANCIAL STATEMENTS (CONTINuEd)
1 ACCOuNTINg pOLICIES (CONTINuEd)V Fiduciary activitiesAssets associated with fiduciary activities and the income arising from those assets, together with associated commitments to return such assets to customers, are not included in these financial statements. Where the Group acts in a fiduciary capacity, for instance as a trustee or agent, it has no contractual rights over the assets concerned.
W provisionsProvisions are recognised when the Group has a present legal or constructive obligation as a result of past events, it is probable that an outflow of resources embodying economic benefits will be required to settle the obligation and a reliable estimate of the amount of the obligation can be made. Where the Group expects a provision to be reimbursed, for example under an insurance contract, the reimbursement is recognised as a separate asset but only when the reimbursement is virtually certain. The Group recognises a provision for onerous contracts when the expected benefits to be derived from a contract are less than the unavoidable costs of meeting the obligations under the contract.
X payables and other financial liabilitiesPayables and other financial liabilities comprise derivative liabilities, collateral received from banks and other liabilities. The derivative liabilities comprise a variety of exchange traded and over-the-counter derivative financial instruments, including futures, options, forward currency contracts and swaps such as interest rate swaps, cross-currency swaps and credit default swaps measured at fair value.
Y Foreign currency translationForeign currency transactions Foreign currency transactions are translated into the functional currency using the exchange rate prevailing at the date of the transactions. The functional currency of the Group’s foreign operations is the currency of the primary economic environment in which these entities operate. Foreign exchange gains and losses are recognised in the income statement, except when recognised in equity as qualifying cash flow or net investment hedges.
Overseas subsidiaries The assets and liabilities of all of the Group’s foreign operations are translated into sterling, the Group’s presentational currency, at the closing rate at the date of the balance sheet. The income and expenses for each income statement are translated at average exchange rates. On consolidation, exchange differences arising from the translation of the net investment in foreign entities, and of borrowings and other currency instruments designated as hedges of such investments, are taken to a separate component of shareholders’ equity.
Z Investment returnThe reporting of investment return comprises investment income, unrealised gains and losses from financial investments held at FVTPL and realised gains and losses from all financial assets.
Investment income includes dividends, interest and rent. Dividends are accrued on an ex-dividend basis. Interest and rent are included on an accruals basis. Interest income for financial assets which are not classified as FVTPL is recognised using the effective interest method.
AA Operational income and expensesOperational income comprises fee income from estate agency operations, agency fee income relating to distribution services and revenue from consolidated private equity investments. Operational income is accounted for when due.
Other expenses comprise primarily the expenses incurred in estate agency operations, institutional fund management and retail investment business, together with unallocated corporate expenses. Other costs are accounted for as they arise.
AB Earnings per shareEarnings per shareEarnings per share is calculated by dividing net income attributable to ordinary equity holders by the weighted average number of ordinary shares in issue during the year, excluding employee scheme shares and shares acquired under the share buyback programme prior to cancellation. For this purpose, net income is defined as the profit after tax derived from continuing operations, or as the profit after tax derived from both continuing and discontinued operations.
Diluted earnings per shareFor diluted earnings per share, the weighted average number of ordinary shares in issue, excluding employee scheme shares, is adjusted to assume conversion of all dilutive potential ordinary shares, such as share options granted to employees. Potential or contingent share issuances are treated as dilutive when their conversion to shares would decrease net earnings per share.
AC Segmental reportingUnder the requirements of IFRS 8, ‘Operating segments’, operating and reportable segments are presented in a manner consistent with the internal reporting provided to the chief operating decision maker, which has been identified as the Board of Legal & General Group Plc.
100 ANNUAL REPORT AND ACCOUNTS 2010 gROup FINANCIAL STATEMENTS
L&G_AR10_12-AccPolicies_p93-101_230311_AT.indd 100 25/03/2011 11:26
NOTES TO THE FINANCIAL STATEMENTS (CONTINuEd)
Ad Standards, interpretations and amendments to published standards that are not yet effective Certain new standards, amendments and interpretations to existing standards have been published which are mandatory for the Group’s accounting periods beginning on or after 1 January 2011 or later periods but which the Group has not adopted early, as follows:
• There are various amendments resulting from the IASB’s annual improvements project issued in May 2010 (effective for annual periods commencing on or after 1 January 2011). These are unlikely to have a material impact on the Group accounts.
• IFRS 9, ‘Financial instruments’ on classification and measurement, issued in November 2009 (effective for annual periods commencing on or after 1 January 2013). This is the first part of a new standard on classification and measurement of financial assets that will replace IAS 39. IFRS 9 has two measurement categories: amortised cost and fair value. All equity instruments are measured at fair value. A debt instrument is at amortised cost only if the entity is holding it to collect contractual cash flows and the cash flows represent principal and interest, otherwise it must be measured at fair value through profit or loss. The Group does not intend to early-adopt this standard.
• Amendment to IAS 12, ‘Income Taxes’ issued in December 2010 (expected to come into force for annual periods commencing on or after 1 January 2011). The amendment provides an exception to the general principles of IAS 12 for investment properties measured using the fair value model in IAS 40 ‘Investment Property’, which requires the measurement of deferred tax assets and liabilities to reflect the tax consequences that would follow from the manner in which the entity expects to recover the carrying amount of an asset. The amendment is not expected to have a material impact on the Group accounts.
• Amended IAS 24 (revised), ‘Related party disclosures’, issued in November 2009. It supersedes IAS 24, ‘Related party disclosures’, issued in 2003. IAS 24 (revised) is mandatory for periods beginning on or after 1 January 2011. The revised standard clarifies and simplifies the definition of a related party and removes the requirement for government-related entities to disclose details of all transactions with the government and other government-related entities.
• IFRIC 19, ‘Extinguishing financial liabilities with equity instruments’, issued in November 2009 (effective for annual periods commencing on or after 1 July 2010). This IFRIC clarifies the accounting when an entity renegotiates the terms of its debt with the result that the liability is extinguished through the issuing of its own equity instruments to the creditor. This interpretation is not expected to have any impact on the Group.
101ANNUAL REPORT AND ACCOUNTS 2010gROup FINANCIAL STATEMENTS
L&G_AR10_12-AccPolicies_p93-101_230311_AT.indd 101 25/03/2011 11:26
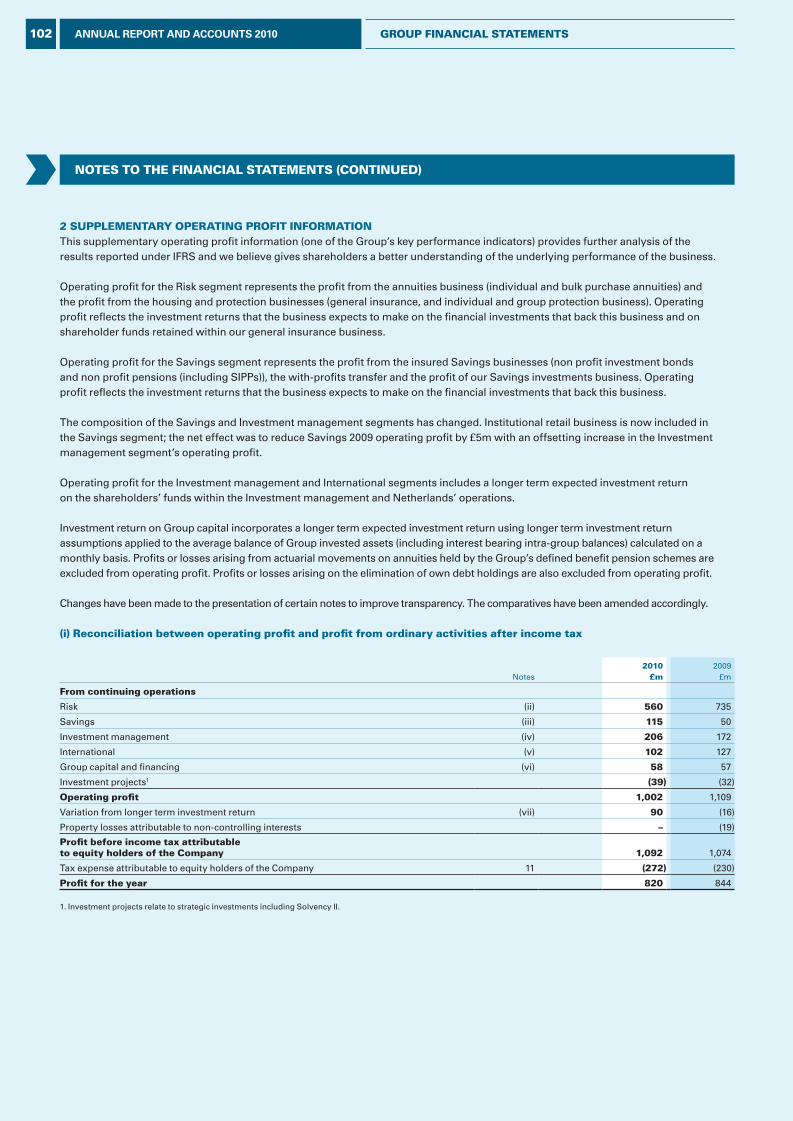
NOTES TO THE FINANCIAL STATEMENTS (CONTINuEd)
2 SuppLEMENTAry OpErATINg prOFIT INFOrMATIONThis supplementary operating profit information (one of the Group’s key performance indicators) provides further analysis of the results reported under IFRS and we believe gives shareholders a better understanding of the underlying performance of the business.
Operating profit for the Risk segment represents the profit from the annuities business (individual and bulk purchase annuities) and the profit from the housing and protection businesses (general insurance, and individual and group protection business). Operating profit reflects the investment returns that the business expects to make on the financial investments that back this business and on shareholder funds retained within our general insurance business.
Operating profit for the Savings segment represents the profit from the insured Savings businesses (non profit investment bonds and non profit pensions (including SIPPs)), the with-profits transfer and the profit of our Savings investments business. Operating profit reflects the investment returns that the business expects to make on the financial investments that back this business.
The composition of the Savings and Investment management segments has changed. Institutional retail business is now included in the Savings segment; the net effect was to reduce Savings 2009 operating profit by £5m with an offsetting increase in the Investment management segment’s operating profit.
Operating profit for the Investment management and International segments includes a longer term expected investment return on the shareholders’ funds within the Investment management and Netherlands’ operations.
Investment return on Group capital incorporates a longer term expected investment return using longer term investment return assumptions applied to the average balance of Group invested assets (including interest bearing intra-group balances) calculated on a monthly basis. Profits or losses arising from actuarial movements on annuities held by the Group’s defined benefit pension schemes are excluded from operating profit. Profits or losses arising on the elimination of own debt holdings are also excluded from operating profit. Changes have been made to the presentation of certain notes to improve transparency. The comparatives have been amended accordingly.
(i) reconciliation between operating profit and profit from ordinary activities after income tax
Notes2010
£m2009
£m
From continuing operations
Risk (ii) 560 735
Savings (iii) 115 50
Investment management (iv) 206 172
International (v) 102 127
Group capital and financing (vi) 58 57
Investment projects1 (39) (32)
Operating profit 1,002 1,109
Variation from longer term investment return (vii) 90 (16)
Property losses attributable to non-controlling interests – (19)
profit before income tax attributable to equity holders of the Company 1,092 1,074
Tax expense attributable to equity holders of the Company 11 (272) (230)
profit for the year 820 844
1. Investment projects relate to strategic investments including Solvency II.
102 ANNUAL REPORT AND ACCOUNTS 2010 grOup FINANCIAL STATEMENTS
L&G_AR10_13-Notes2-4_p102-114_230311_AT.indd 102 25/03/2011 11:26
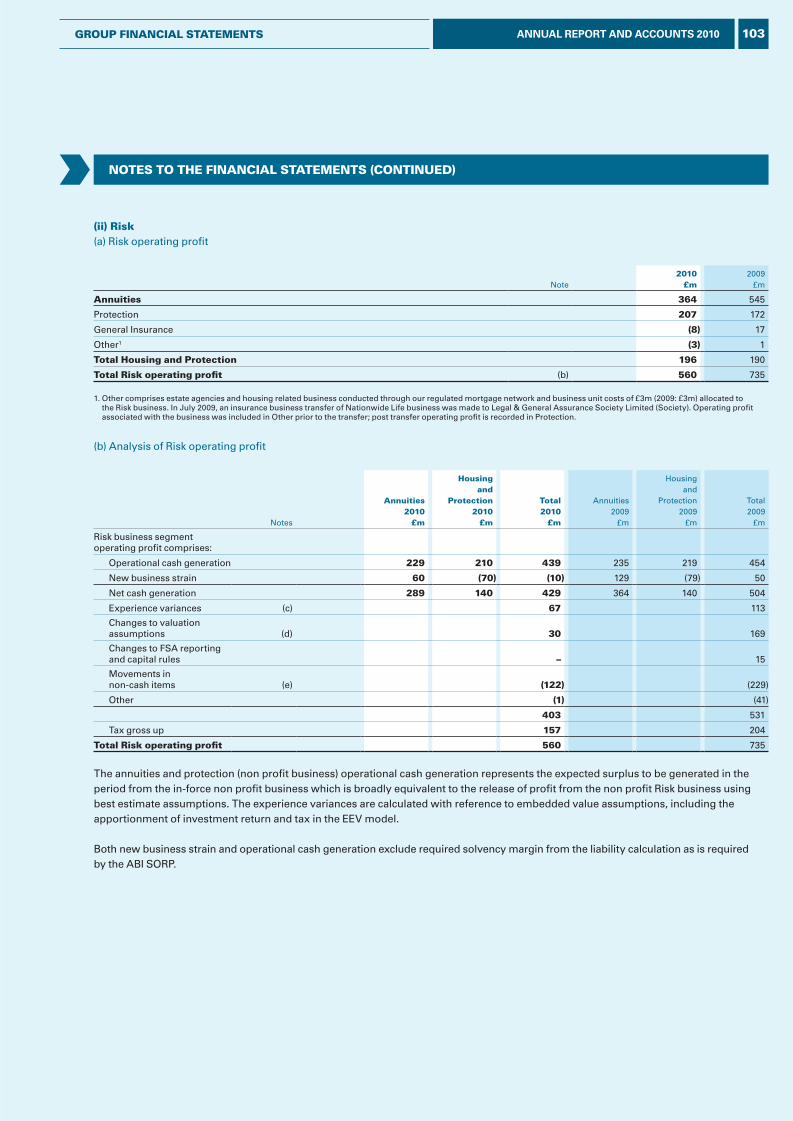
NOTES TO THE FINANCIAL STATEMENTS (CONTINuEd)
(ii) risk(a) Risk operating profit
Note2010
£m2009
£m
Annuities 364 545
Protection 207 172
General Insurance (8) 17
Other1 (3) 1
Total Housing and protection 196 190
Total risk operating profit (b) 560 735
1. Other comprises estate agencies and housing related business conducted through our regulated mortgage network and business unit costs of £3m (2009: £3m) allocated to the Risk business. In July 2009, an insurance business transfer of Nationwide Life business was made to Legal & General Assurance Society Limited (Society). Operating profit associated with the business was included in Other prior to the transfer; post transfer operating profit is recorded in Protection.
(b) Analysis of Risk operating profit
Notes
Annuities 2010
£m
Housing and
protection 2010
£m
Total 2010
£m
Annuities 2009
£m
Housing and
Protection 2009
£m
Total 2009
£m
Risk business segment operating profit comprises:
Operational cash generation 229 210 439 235 219 454
New business strain 60 (70) (10) 129 (79) 50
Net cash generation 289 140 429 364 140 504
Experience variances (c) 67 113
Changes to valuation assumptions (d) 30 169
Changes to FSA reporting and capital rules – 15
Movements in non-cash items (e) (122) (229)
Other (1) (41)
403 531
Tax gross up 157 204
Total risk operating profit 560 735
The annuities and protection (non profit business) operational cash generation represents the expected surplus to be generated in the period from the in-force non profit business which is broadly equivalent to the release of profit from the non profit Risk business using best estimate assumptions. The experience variances are calculated with reference to embedded value assumptions, including the apportionment of investment return and tax in the EEV model.
Both new business strain and operational cash generation exclude required solvency margin from the liability calculation as is required by the ABI SORP.
103ANNUAL REPORT AND ACCOUNTS 2010grOup FINANCIAL STATEMENTS
L&G_AR10_13-Notes2-4_p102-114_230311_AT.indd 103 25/03/2011 11:26
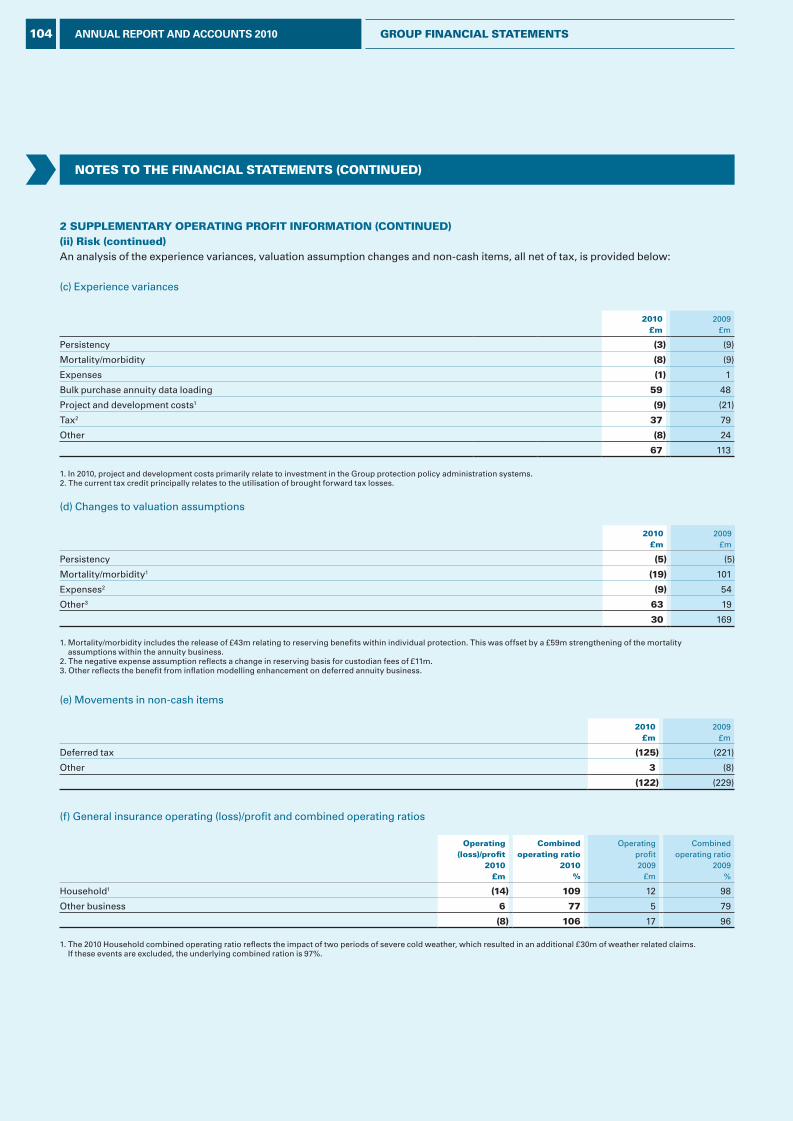
NOTES TO THE FINANCIAL STATEMENTS (CONTINuEd)
2 SuppLEMENTAry OpErATINg prOFIT INFOrMATION (CONTINuEd)(ii) risk (continued)An analysis of the experience variances, valuation assumption changes and non-cash items, all net of tax, is provided below:
(c) Experience variances
2010 £m
2009 £m
Persistency (3) (9)
Mortality/morbidity (8) (9)
Expenses (1) 1
Bulk purchase annuity data loading 59 48
Project and development costs1 (9) (21)
Tax2 37 79
Other (8) 24
67 113
1. In 2010, project and development costs primarily relate to investment in the Group protection policy administration systems.2. The current tax credit principally relates to the utilisation of brought forward tax losses.
(d) Changes to valuation assumptions
2010£m
2009£m
Persistency (5) (5)
Mortality/morbidity1 (19) 101
Expenses2 (9) 54
Other3 63 19
30 169
1. Mortality/morbidity includes the release of £43m relating to reserving benefits within individual protection. This was offset by a £59m strengthening of the mortality assumptions within the annuity business.
2. The negative expense assumption reflects a change in reserving basis for custodian fees of £11m.3. Other reflects the benefit from inflation modelling enhancement on deferred annuity business.
(e) Movements in non-cash items
2010£m
2009£m
Deferred tax (125) (221)
Other 3 (8)
(122) (229)
(f) General insurance operating (loss)/profit and combined operating ratios
Operating (loss)/profit
2010£m
Combinedoperating ratio
2010%
Operating profit2009
£m
Combinedoperating ratio
2009%
Household1 (14) 109 12 98
Other business 6 77 5 79
(8) 106 17 96
1. The 2010 Household combined operating ratio reflects the impact of two periods of severe cold weather, which resulted in an additional £30m of weather related claims. If these events are excluded, the underlying combined ration is 97%.
104 ANNUAL REPORT AND ACCOUNTS 2010 grOup FINANCIAL STATEMENTS
L&G_AR10_13-Notes2-4_p102-114_230311_AT.indd 104 25/03/2011 11:26
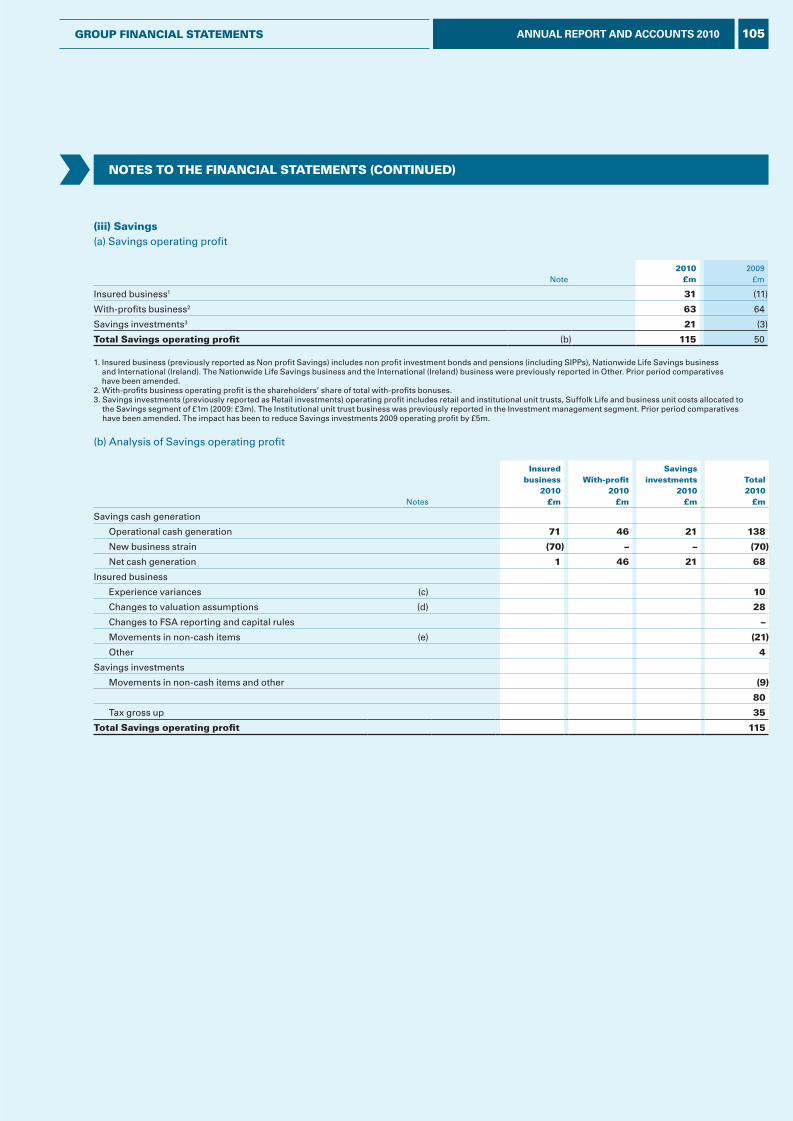
NOTES TO THE FINANCIAL STATEMENTS (CONTINuEd)
(iii) Savings(a) Savings operating profit
Note2010
£m2009
£m
Insured business1 31 (11)
With-profits business2 63 64
Savings investments3 21 (3)
Total Savings operating profit (b) 115 50
1. Insured business (previously reported as Non profit Savings) includes non profit investment bonds and pensions (including SIPPs), Nationwide Life Savings business and International (Ireland). The Nationwide Life Savings business and the International (Ireland) business were previously reported in Other. Prior period comparatives have been amended.
2. With-profits business operating profit is the shareholders’ share of total with-profits bonuses.3. Savings investments (previously reported as Retail investments) operating profit includes retail and institutional unit trusts, Suffolk Life and business unit costs allocated to
the Savings segment of £1m (2009: £3m). The Institutional unit trust business was previously reported in the Investment management segment. Prior period comparatives have been amended. The impact has been to reduce Savings investments 2009 operating profit by £5m.
(b) Analysis of Savings operating profit
Notes
Insuredbusiness
2010£m
With-profit2010
£m
Savingsinvestments
2010£m
Total2010
£m
Savings cash generation
Operational cash generation 71 46 21 138
New business strain (70) – – (70)
Net cash generation 1 46 21 68
Insured business
Experience variances (c) 10
Changes to valuation assumptions (d) 28
Changes to FSA reporting and capital rules –
Movements in non-cash items (e) (21)
Other 4
Savings investments
Movements in non-cash items and other (9)
80
Tax gross up 35
Total Savings operating profit 115
105ANNUAL REPORT AND ACCOUNTS 2010grOup FINANCIAL STATEMENTS
L&G_AR10_13-Notes2-4_p102-114_230311_AT.indd 105 25/03/2011 11:26
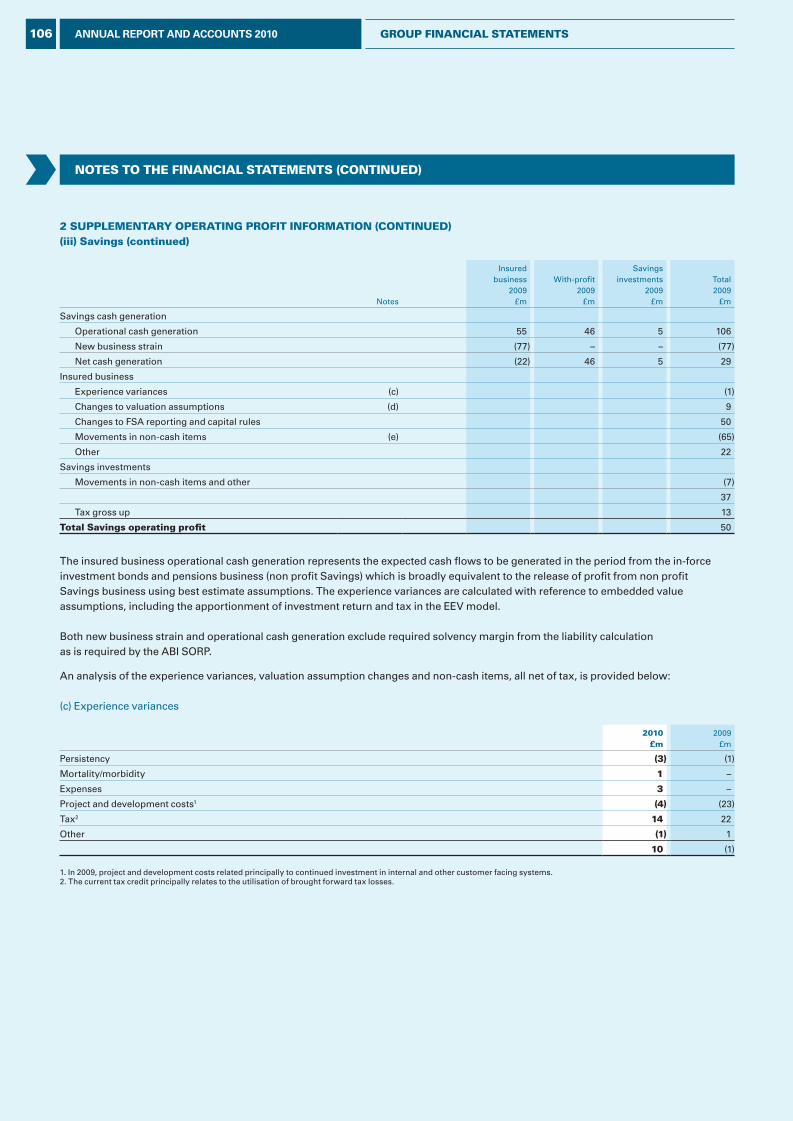
NOTES TO THE FINANCIAL STATEMENTS (CONTINuEd)
2 SuppLEMENTAry OpErATINg prOFIT INFOrMATION (CONTINuEd)(iii) Savings (continued)
Notes
Insuredbusiness
2009£m
With-profit2009
£m
Savings investments
2009£m
Total2009
£m
Savings cash generation
Operational cash generation 55 46 5 106
New business strain (77) – – (77)
Net cash generation (22) 46 5 29
Insured business
Experience variances (c) (1)
Changes to valuation assumptions (d) 9
Changes to FSA reporting and capital rules 50
Movements in non-cash items (e) (65)
Other 22
Savings investments
Movements in non-cash items and other (7)
37
Tax gross up 13
Total Savings operating profit 50
The insured business operational cash generation represents the expected cash flows to be generated in the period from the in-force investment bonds and pensions business (non profit Savings) which is broadly equivalent to the release of profit from non profit Savings business using best estimate assumptions. The experience variances are calculated with reference to embedded value assumptions, including the apportionment of investment return and tax in the EEV model.
Both new business strain and operational cash generation exclude required solvency margin from the liability calculation as is required by the ABI SORP.
An analysis of the experience variances, valuation assumption changes and non-cash items, all net of tax, is provided below:
(c) Experience variances
2010£m
2009£m
Persistency (3) (1)
Mortality/morbidity 1 –
Expenses 3 –
Project and development costs1 (4) (23)
Tax2 14 22
Other (1) 1
10 (1)
1. In 2009, project and development costs related principally to continued investment in internal and other customer facing systems.2. The current tax credit principally relates to the utilisation of brought forward tax losses.
106 ANNUAL REPORT AND ACCOUNTS 2010 grOup FINANCIAL STATEMENTS
L&G_AR10_13-Notes2-4_p102-114_230311_AT.indd 106 25/03/2011 11:26
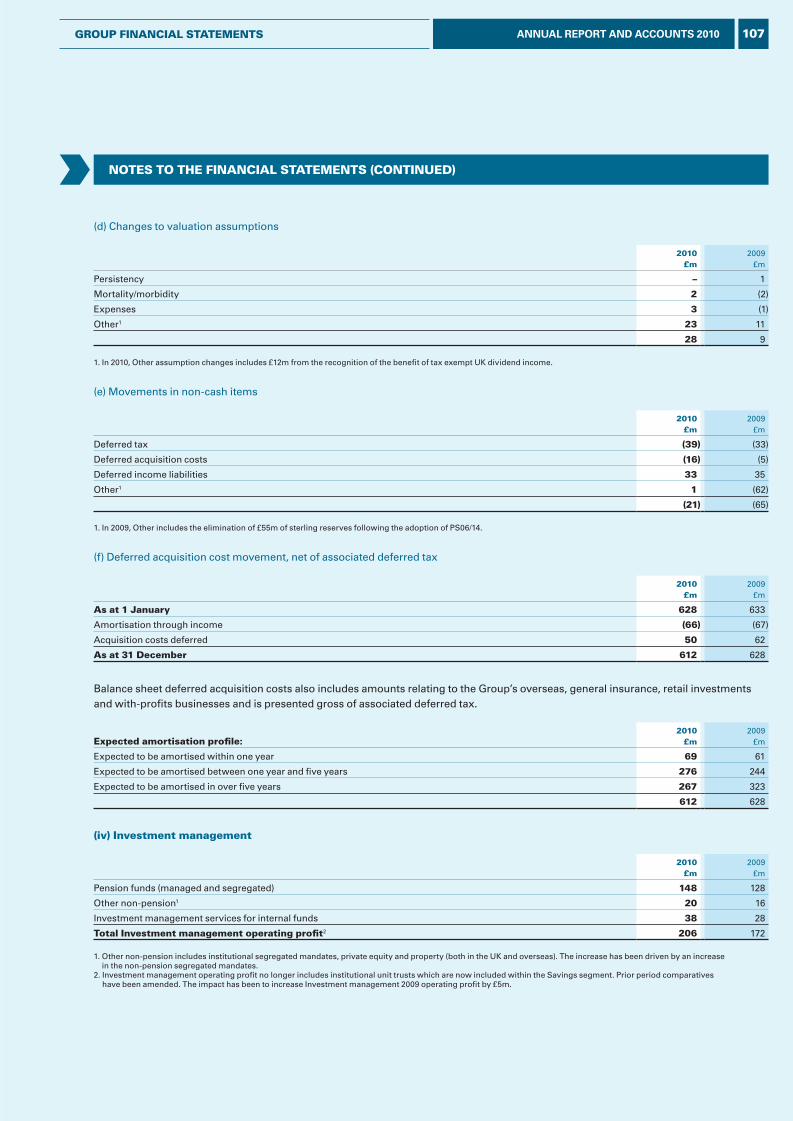
NOTES TO THE FINANCIAL STATEMENTS (CONTINuEd)
(d) Changes to valuation assumptions
2010£m
2009£m
Persistency – 1
Mortality/morbidity 2 (2)
Expenses 3 (1)
Other1 23 11
28 9
1. In 2010, Other assumption changes includes £12m from the recognition of the benefit of tax exempt UK dividend income.
(e) Movements in non-cash items
2010£m
2009£m
Deferred tax (39) (33)
Deferred acquisition costs (16) (5)
Deferred income liabilities 33 35
Other1 1 (62)
(21) (65)
1. In 2009, Other includes the elimination of £55m of sterling reserves following the adoption of PS06/14.
(f) Deferred acquisition cost movement, net of associated deferred tax
2010£m
2009£m
As at 1 January 628 633
Amortisation through income (66) (67)
Acquisition costs deferred 50 62
As at 31 december 612 628
Balance sheet deferred acquisition costs also includes amounts relating to the Group’s overseas, general insurance, retail investments and with-profits businesses and is presented gross of associated deferred tax.
Expected amortisation profile:2010
£m2009
£m
Expected to be amortised within one year 69 61
Expected to be amortised between one year and five years 276 244
Expected to be amortised in over five years 267 323
612 628
(iv) Investment management
2010£m
2009£m
Pension funds (managed and segregated) 148 128
Other non-pension1 20 16
Investment management services for internal funds 38 28
Total Investment management operating profit2 206 172
1. Other non-pension includes institutional segregated mandates, private equity and property (both in the UK and overseas). The increase has been driven by an increase in the non-pension segregated mandates.
2. Investment management operating profit no longer includes institutional unit trusts which are now included within the Savings segment. Prior period comparatives have been amended. The impact has been to increase Investment management 2009 operating profit by £5m.
107ANNUAL REPORT AND ACCOUNTS 2010grOup FINANCIAL STATEMENTS
L&G_AR10_13-Notes2-4_p102-114_230311_AT.indd 107 25/03/2011 11:26
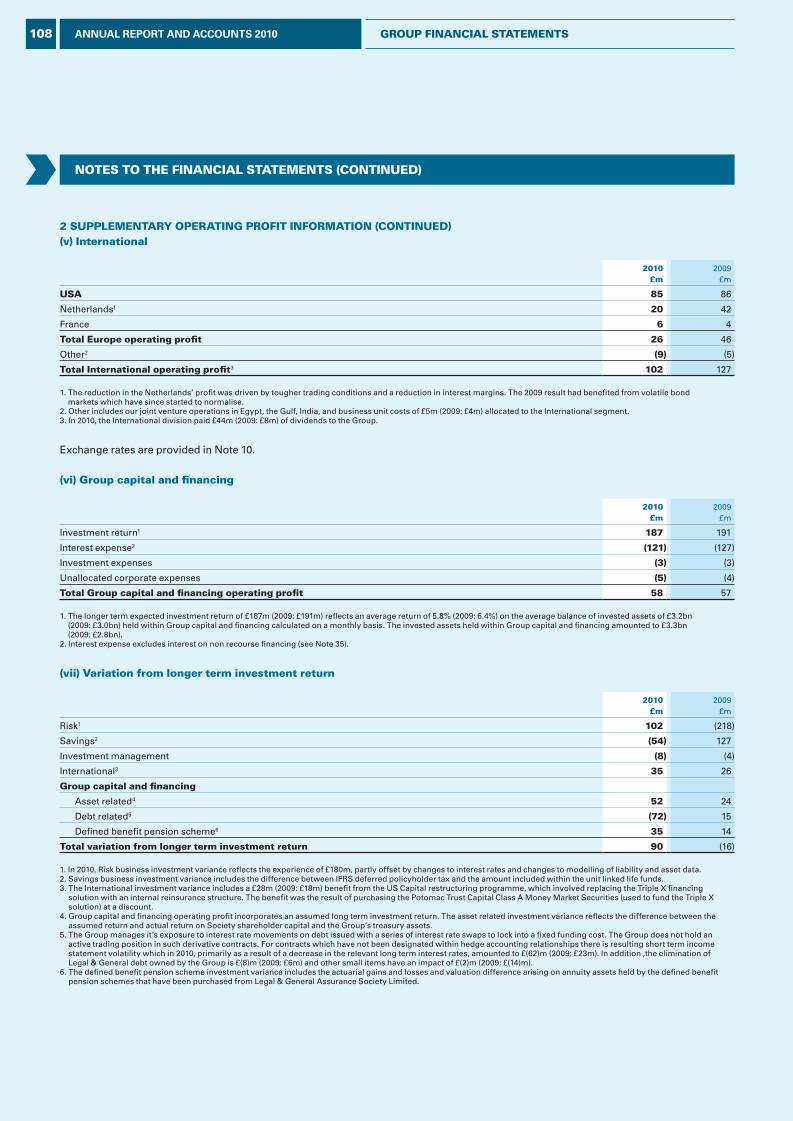
NOTES TO THE FINANCIAL STATEMENTS (CONTINuEd)
2 SuppLEMENTAry OpErATINg prOFIT INFOrMATION (CONTINuEd)(v) International
2010£m
2009£m
uSA 85 86
Netherlands1 20 42
France 6 4
Total Europe operating profit 26 46
Other2 (9) (5)
Total International operating profit3 102 127
1. The reduction in the Netherlands’ profit was driven by tougher trading conditions and a reduction in interest margins. The 2009 result had benefited from volatile bond markets which have since started to normalise.
2. Other includes our joint venture operations in Egypt, the Gulf, India, and business unit costs of £5m (2009: £4m) allocated to the International segment.3. In 2010, the International division paid £44m (2009: £8m) of dividends to the Group.
Exchange rates are provided in Note 10.
(vi) group capital and financing
2010£m
2009£m
Investment return1 187 191
Interest expense2 (121) (127)
Investment expenses (3) (3)
Unallocated corporate expenses (5) (4)
Total group capital and financing operating profit 58 57
1. The longer term expected investment return of £187m (2009: £191m) reflects an average return of 5.8% (2009: 6.4%) on the average balance of invested assets of £3.2bn (2009: £3.0bn) held within Group capital and financing calculated on a monthly basis. The invested assets held within Group capital and financing amounted to £3.3bn (2009: £2.8bn).
2. Interest expense excludes interest on non recourse financing (see Note 35).
(vii) Variation from longer term investment return
2010£m
2009£m
Risk1 102 (218)
Savings2 (54) 127
Investment management (8) (4)
International3 35 26
group capital and financing
Asset related4 52 24
Debt related5 (72) 15
Defined benefit pension scheme6 35 14
Total variation from longer term investment return 90 (16)
1. In 2010, Risk business investment variance reflects the experience of £180m, partly offset by changes to interest rates and changes to modelling of liability and asset data.2. Savings business investment variance includes the difference between IFRS deferred policyholder tax and the amount included within the unit linked life funds.3. The International investment variance includes a £28m (2009: £18m) benefit from the US Capital restructuring programme, which involved replacing the Triple X financing
solution with an internal reinsurance structure. The benefit was the result of purchasing the Potomac Trust Capital Class A Money Market Securities (used to fund the Triple X solution) at a discount.
4. Group capital and financing operating profit incorporates an assumed long term investment return. The asset related investment variance reflects the difference between the assumed return and actual return on Society shareholder capital and the Group’s treasury assets.
5. The Group manages it’s exposure to interest rate movements on debt issued with a series of interest rate swaps to lock into a fixed funding cost. The Group does not hold an active trading position in such derivative contracts. For contracts which have not been designated within hedge accounting relationships there is resulting short term income statement volatility which in 2010, primarily as a result of a decrease in the relevant long term interest rates, amounted to £(62)m (2009: £23m). In addition ,the elimination of Legal & General debt owned by the Group is £(8)m (2009: £6m) and other small items have an impact of £(2)m (2009: £(14)m).
6. The defined benefit pension scheme investment variance includes the actuarial gains and losses and valuation difference arising on annuity assets held by the defined benefit pension schemes that have been purchased from Legal & General Assurance Society Limited.
108 ANNUAL REPORT AND ACCOUNTS 2010 grOup FINANCIAL STATEMENTS
L&G_AR10_13-Notes2-4_p102-114_230311_AT.indd 108 25/03/2011 11:26
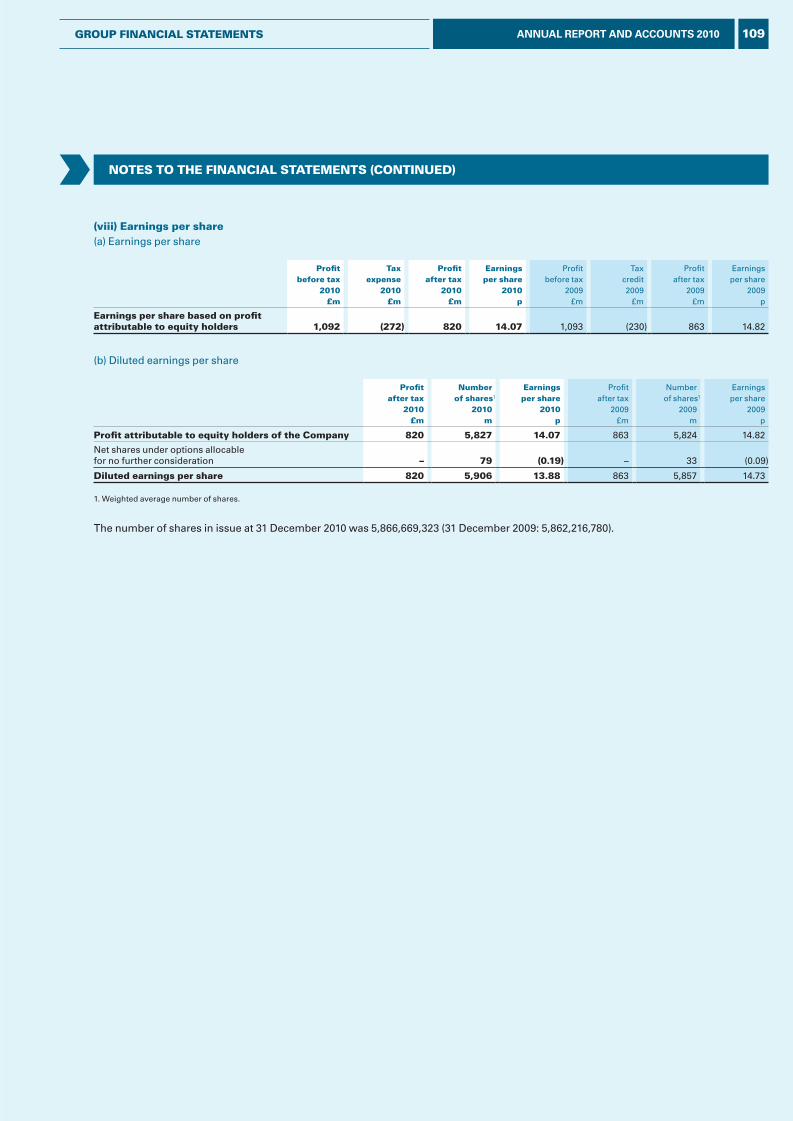
NOTES TO THE FINANCIAL STATEMENTS (CONTINuEd)
(viii) Earnings per share(a) Earnings per share
profitbefore tax
2010£m
Taxexpense
2010£m
profitafter tax
2010£m
Earningsper share
2010p
Profitbefore tax
2009£m
Taxcredit2009
£m
Profitafter tax
2009£m
Earningsper share
2009p
Earnings per share based on profit attributable to equity holders 1,092 (272) 820 14.07 1,093 (230) 863 14.82
(b) Diluted earnings per share
profitafter tax
2010£m
Numberof shares1
2010m
Earningsper share
2010p
Profitafter tax
2009£m
Numberof shares1
2009m
Earningsper share
2009p
profit attributable to equity holders of the Company 820 5,827 14.07 863 5,824 14.82
Net shares under options allocable for no further consideration – 79 (0.19) – 33 (0.09)
diluted earnings per share 820 5,906 13.88 863 5,857 14.73
1. Weighted average number of shares.
The number of shares in issue at 31 December 2010 was 5,866,669,323 (31 December 2009: 5,862,216,780).
109ANNUAL REPORT AND ACCOUNTS 2010grOup FINANCIAL STATEMENTS
L&G_AR10_13-Notes2-4_p102-114_230311_AT.indd 109 25/03/2011 11:26

NOTES TO THE FINANCIAL STATEMENTS (CONTINuEd)
3 SEgMENTAL ANALySISThe Group has five reporting segments comprising Risk, Savings, Investment management, International, and Group capital and financing.
The composition of the Savings and Investment management segments changed in 2010, with institutional retail investment business now included in Savings investments. Previously this was reported in the Investment management segment. Comparative information has been amended to reflect the change.
The Risk segment comprises individual and group protection, individual and bulk purchase annuities, and general insurance, together with estate agencies and the housing related business conducted through our regulated mortgage network.
The Savings segment comprises non profit investment bonds, non profit pensions (including SIPPs), ISAs, retail unit trusts, and all with-profits products.
The Investment management segment comprises institutional fund management business.
The International segment comprises businesses in the United States, France, the Netherlands and emerging markets.
Shareholders’ equity supporting the non profit Risk and Savings businesses is held within Legal & General Assurance Society Limited and Legal & General Pensions Limited and is managed on a groupwide basis within Group capital and financing. This also includes capital within the Group’s treasury function, and unit trust funds and property partnerships, which are managed on behalf of clients but are required to be consolidated under IFRS, which do not constitute a separately reportable segment.
Transactions between reportable segments are on normal commercial terms, and are included within the reported segments.
The Group assesses performance and allocates resources on the basis of supplementary operating profit before tax (set out in Note 2). Segmental IFRS operating profit before tax is reconciled to the consolidated profit from continuing operations before tax attributable to equity holders and consolidated profit from ordinary activities after income tax.
The Group considers additional performance measures in assessing the performance of the segments. These include new business levels (Note 4) and EEV reporting (Supplementary Financial Statements).
110 ANNUAL REPORT AND ACCOUNTS 2010 grOup FINANCIAL STATEMENTS
L&G_AR10_13-Notes2-4_p102-114_230311_AT.indd 110 25/03/2011 11:26
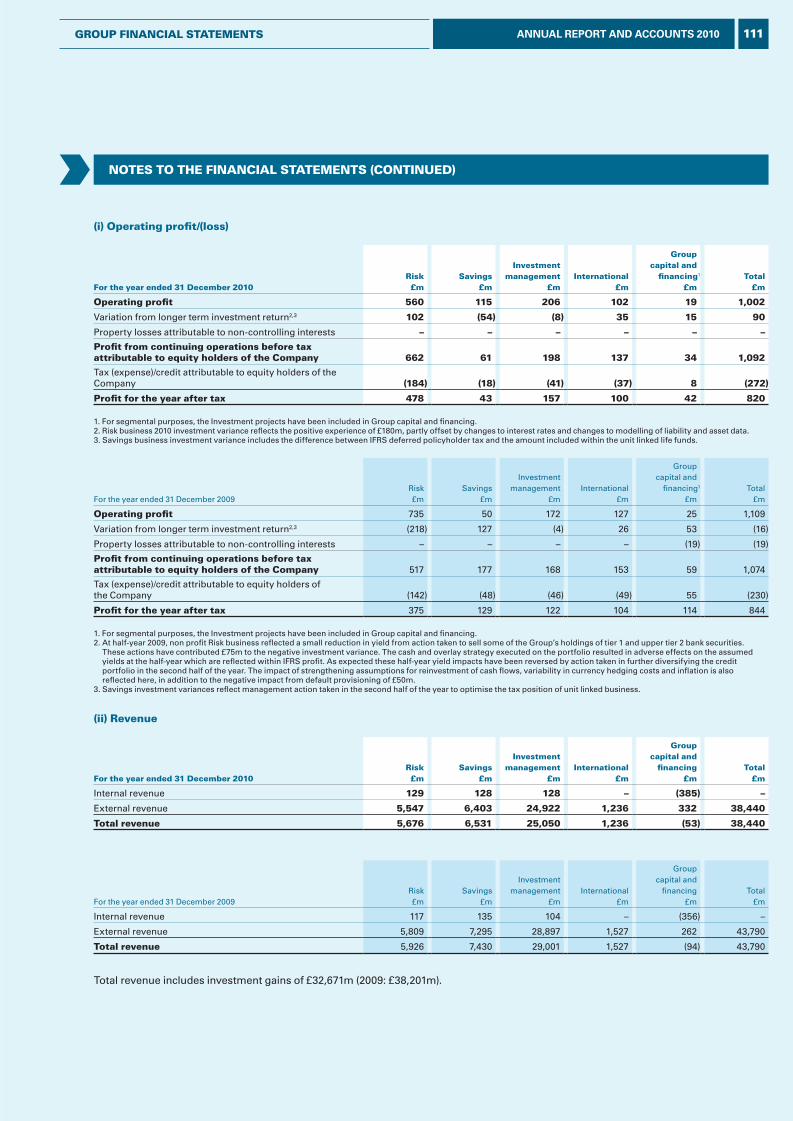
NOTES TO THE FINANCIAL STATEMENTS (CONTINuEd)
(i) Operating profit/(loss)
For the year ended 31 december 2010risk£m
Savings£m
Investmentmanagement
£mInternational
£m
groupcapital and
financing1
£mTotal
£m
Operating profit 560 115 206 102 19 1,002
Variation from longer term investment return2,3 102 (54) (8) 35 15 90
Property losses attributable to non-controlling interests – – – – – –
profit from continuing operations before tax attributable to equity holders of the Company 662 61 198 137 34 1,092
Tax (expense)/credit attributable to equity holders of the Company (184) (18) (41) (37) 8 (272)
profit for the year after tax 478 43 157 100 42 820
1. For segmental purposes, the Investment projects have been included in Group capital and financing.2. Risk business 2010 investment variance reflects the positive experience of £180m, partly offset by changes to interest rates and changes to modelling of liability and asset data.3. Savings business investment variance includes the difference between IFRS deferred policyholder tax and the amount included within the unit linked life funds.
For the year ended 31 December 2009Risk£m
Savings£m
Investmentmanagement
£mInternational
£m
Groupcapital and
financing1
£mTotal
£m
Operating profit 735 50 172 127 25 1,109
Variation from longer term investment return2,3 (218) 127 (4) 26 53 (16)
Property losses attributable to non-controlling interests – – – – (19) (19)
profit from continuing operations before taxattributable to equity holders of the Company 517 177 168 153 59 1,074
Tax (expense)/credit attributable to equity holders of the Company (142) (48) (46) (49) 55 (230)
profit for the year after tax 375 129 122 104 114 844
1. For segmental purposes, the Investment projects have been included in Group capital and financing.2. At half-year 2009, non profit Risk business reflected a small reduction in yield from action taken to sell some of the Group’s holdings of tier 1 and upper tier 2 bank securities.
These actions have contributed £75m to the negative investment variance. The cash and overlay strategy executed on the portfolio resulted in adverse effects on the assumed yields at the half-year which are reflected within IFRS profit. As expected these half-year yield impacts have been reversed by action taken in further diversifying the credit portfolio in the second half of the year. The impact of strengthening assumptions for reinvestment of cash flows, variability in currency hedging costs and inflation is also reflected here, in addition to the negative impact from default provisioning of £50m.
3. Savings investment variances reflect management action taken in the second half of the year to optimise the tax position of unit linked business.
(ii) revenue
For the year ended 31 december 2010risk£m
Savings£m
Investmentmanagement
£mInternational
£m
groupcapital and
financing£m
Total£m
Internal revenue 129 128 128 – (385) –
External revenue 5,547 6,403 24,922 1,236 332 38,440
Total revenue 5,676 6,531 25,050 1,236 (53) 38,440
For the year ended 31 December 2009Risk£m
Savings£m
Investmentmanagement
£mInternational
£m
Groupcapital and
financing£m
Total£m
Internal revenue 117 135 104 – (356) –
External revenue 5,809 7,295 28,897 1,527 262 43,790
Total revenue 5,926 7,430 29,001 1,527 (94) 43,790
Total revenue includes investment gains of £32,671m (2009: £38,201m).
111ANNUAL REPORT AND ACCOUNTS 2010grOup FINANCIAL STATEMENTS
L&G_AR10_13-Notes2-4_p102-114_230311_AT.indd 111 25/03/2011 11:26
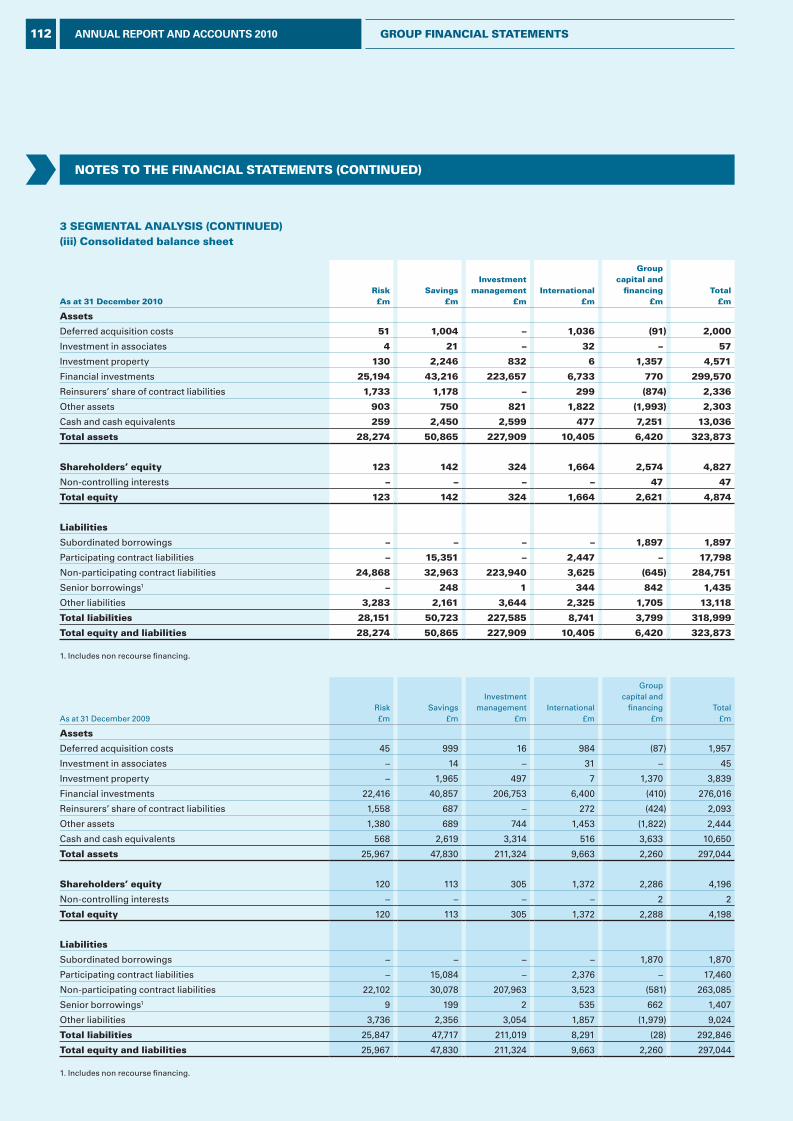
NOTES TO THE FINANCIAL STATEMENTS (CONTINuEd)
3 SEgMENTAL ANALySIS (CONTINuEd)(iii) Consolidated balance sheet
As at 31 december 2010risk£m
Savings£m
Investmentmanagement
£mInternational
£m
groupcapital and
financing£m
Total£m
Assets
Deferred acquisition costs 51 1,004 – 1,036 (91) 2,000
Investment in associates 4 21 – 32 – 57
Investment property 130 2,246 832 6 1,357 4,571
Financial investments 25,194 43,216 223,657 6,733 770 299,570
Reinsurers’ share of contract liabilities 1,733 1,178 – 299 (874) 2,336
Other assets 903 750 821 1,822 (1,993) 2,303
Cash and cash equivalents 259 2,450 2,599 477 7,251 13,036
Total assets 28,274 50,865 227,909 10,405 6,420 323,873
Shareholders’ equity 123 142 324 1,664 2,574 4,827
Non-controlling interests – – – – 47 47
Total equity 123 142 324 1,664 2,621 4,874
Liabilities
Subordinated borrowings – – – – 1,897 1,897
Participating contract liabilities – 15,351 – 2,447 – 17,798
Non-participating contract liabilities 24,868 32,963 223,940 3,625 (645) 284,751
Senior borrowings1 – 248 1 344 842 1,435
Other liabilities 3,283 2,161 3,644 2,325 1,705 13,118
Total liabilities 28,151 50,723 227,585 8,741 3,799 318,999
Total equity and liabilities 28,274 50,865 227,909 10,405 6,420 323,873
1. Includes non recourse financing.
As at 31 December 2009Risk£m
Savings£m
Investmentmanagement
£mInternational
£m
Groupcapital and
financing£m
Total£m
Assets
Deferred acquisition costs 45 999 16 984 (87) 1,957
Investment in associates – 14 – 31 – 45
Investment property – 1,965 497 7 1,370 3,839
Financial investments 22,416 40,857 206,753 6,400 (410) 276,016
Reinsurers’ share of contract liabilities 1,558 687 – 272 (424) 2,093
Other assets 1,380 689 744 1,453 (1,822) 2,444
Cash and cash equivalents 568 2,619 3,314 516 3,633 10,650
Total assets 25,967 47,830 211,324 9,663 2,260 297,044
Shareholders’ equity 120 113 305 1,372 2,286 4,196
Non-controlling interests – – – – 2 2
Total equity 120 113 305 1,372 2,288 4,198
Liabilities
Subordinated borrowings – – – – 1,870 1,870
Participating contract liabilities – 15,084 – 2,376 – 17,460
Non-participating contract liabilities 22,102 30,078 207,963 3,523 (581) 263,085
Senior borrowings1 9 199 2 535 662 1,407
Other liabilities 3,736 2,356 3,054 1,857 (1,979) 9,024
Total liabilities 25,847 47,717 211,019 8,291 (28) 292,846
Total equity and liabilities 25,967 47,830 211,324 9,663 2,260 297,044
1. Includes non recourse financing.
112 ANNUAL REPORT AND ACCOUNTS 2010 grOup FINANCIAL STATEMENTS
L&G_AR10_13-Notes2-4_p102-114_230311_AT.indd 112 25/03/2011 11:26
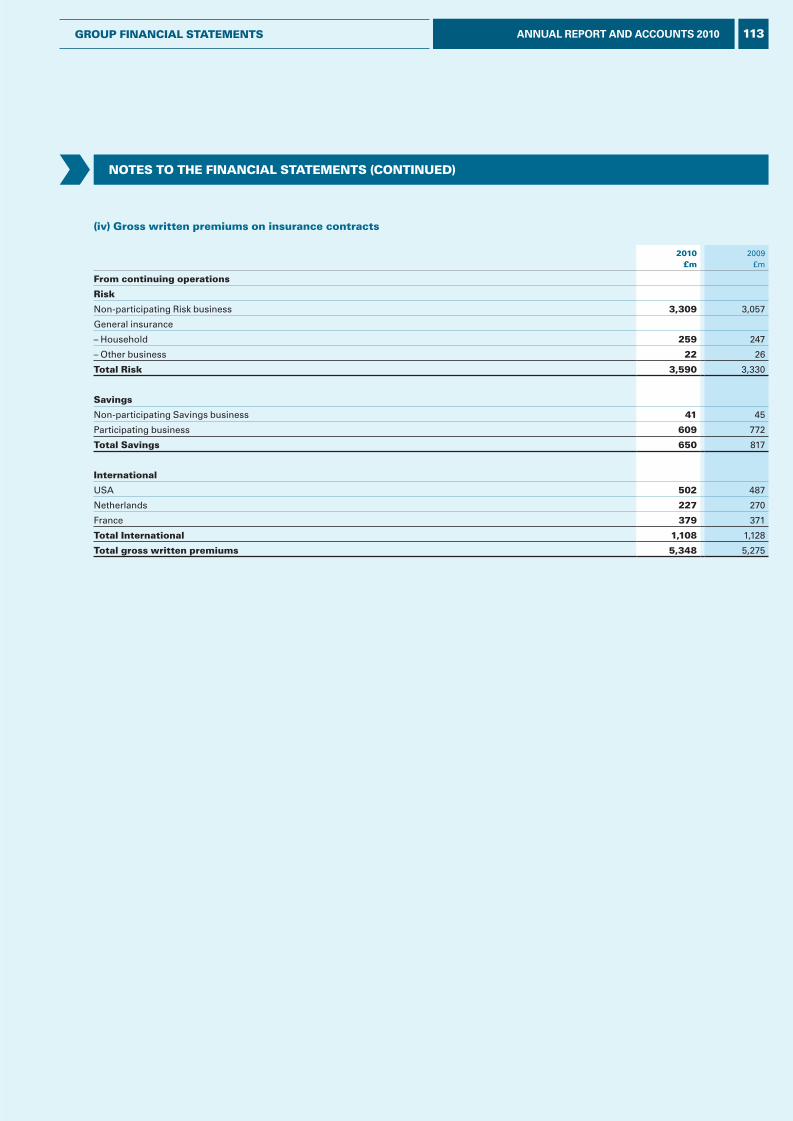
NOTES TO THE FINANCIAL STATEMENTS (CONTINuEd)
(iv) gross written premiums on insurance contracts
2010£m
2009£m
From continuing operations
risk
Non-participating Risk business 3,309 3,057
General insurance
– Household 259 247
– Other business 22 26
Total risk 3,590 3,330
Savings
Non-participating Savings business 41 45
Participating business 609 772
Total Savings 650 817
International
USA 502 487
Netherlands 227 270
France 379 371
Total International 1,108 1,128
Total gross written premiums 5,348 5,275
113ANNUAL REPORT AND ACCOUNTS 2010grOup FINANCIAL STATEMENTS
L&G_AR10_13-Notes2-4_p102-114_230311_AT.indd 113 25/03/2011 11:26
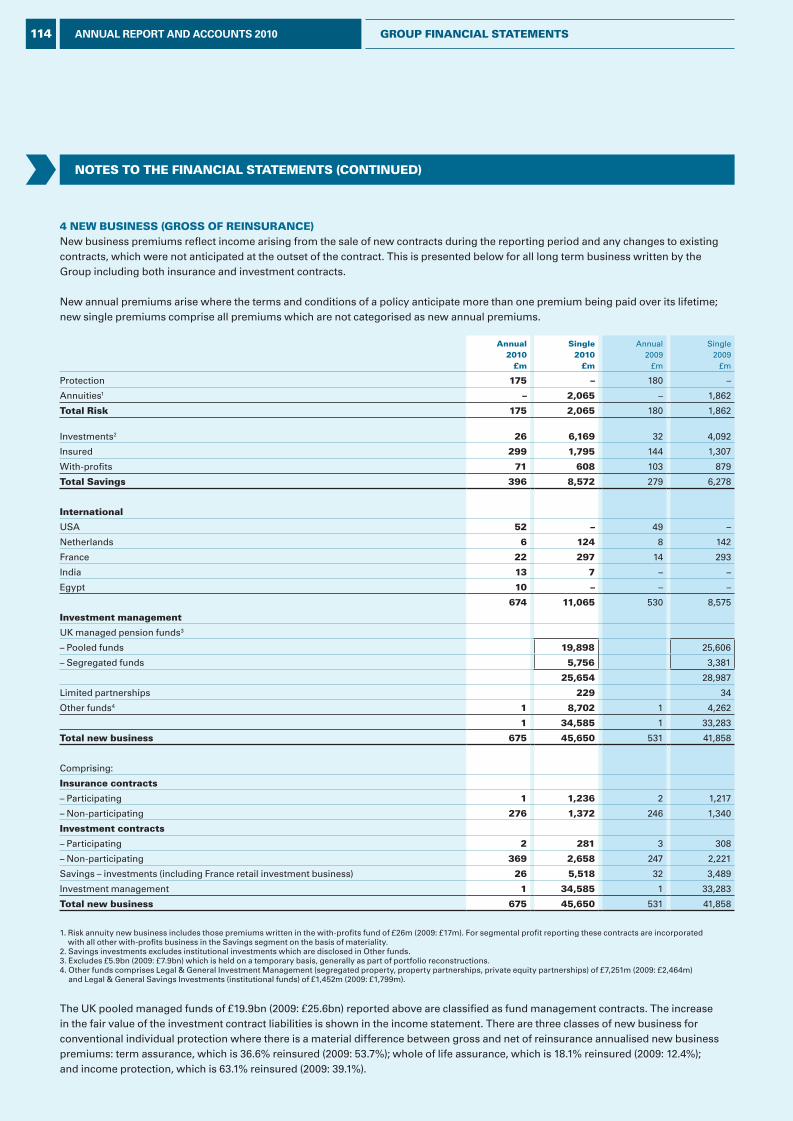
NOTES TO THE FINANCIAL STATEMENTS (CONTINuEd)
4 NEW buSINESS (grOSS OF rEINSurANCE)New business premiums reflect income arising from the sale of new contracts during the reporting period and any changes to existing contracts, which were not anticipated at the outset of the contract. This is presented below for all long term business written by the Group including both insurance and investment contracts.
New annual premiums arise where the terms and conditions of a policy anticipate more than one premium being paid over its lifetime; new single premiums comprise all premiums which are not categorised as new annual premiums.
Annual2010
£m
Single2010
£m
Annual 2009
£m
Single2009
£m
Protection 175 – 180 –
Annuities1 – 2,065 – 1,862
Total risk 175 2,065 180 1,862
Investments2 26 6,169 32 4,092
Insured 299 1,795 144 1,307
With-profits 71 608 103 879
Total Savings 396 8,572 279 6,278
International
USA 52 – 49 –
Netherlands 6 124 8 142
France 22 297 14 293
India 13 7 – –
Egypt 10 – – –
674 11,065 530 8,575
Investment management
UK managed pension funds3
– Pooled funds 19,898 25,606
– Segregated funds 5,756 3,381
25,654 28,987
Limited partnerships 229 34
Other funds4 1 8,702 1 4,262
1 34,585 1 33,283
Total new business 675 45,650 531 41,858
Comprising:
Insurance contracts
– Participating 1 1,236 2 1,217
– Non-participating 276 1,372 246 1,340
Investment contracts
– Participating 2 281 3 308
– Non-participating 369 2,658 247 2,221
Savings – investments (including France retail investment business) 26 5,518 32 3,489
Investment management 1 34,585 1 33,283
Total new business 675 45,650 531 41,858
1. Risk annuity new business includes those premiums written in the with-profits fund of £26m (2009: £17m). For segmental profit reporting these contracts are incorporated with all other with-profits business in the Savings segment on the basis of materiality.
2. Savings investments excludes institutional investments which are disclosed in Other funds.3. Excludes £5.9bn (2009: £7.9bn) which is held on a temporary basis, generally as part of portfolio reconstructions. 4. Other funds comprises Legal & General Investment Management (segregated property, property partnerships, private equity partnerships) of £7,251m (2009: £2,464m)
and Legal & General Savings Investments (institutional funds) of £1,452m (2009: £1,799m).
The UK pooled managed funds of £19.9bn (2009: £25.6bn) reported above are classified as fund management contracts. The increase in the fair value of the investment contract liabilities is shown in the income statement. There are three classes of new business for conventional individual protection where there is a material difference between gross and net of reinsurance annualised new business premiums: term assurance, which is 36.6% reinsured (2009: 53.7%); whole of life assurance, which is 18.1% reinsured (2009: 12.4%); and income protection, which is 63.1% reinsured (2009: 39.1%).
114 ANNUAL REPORT AND ACCOUNTS 2010 grOup FINANCIAL STATEMENTS
L&G_AR10_13-Notes2-4_p102-114_230311_AT.indd 114 25/03/2011 11:26
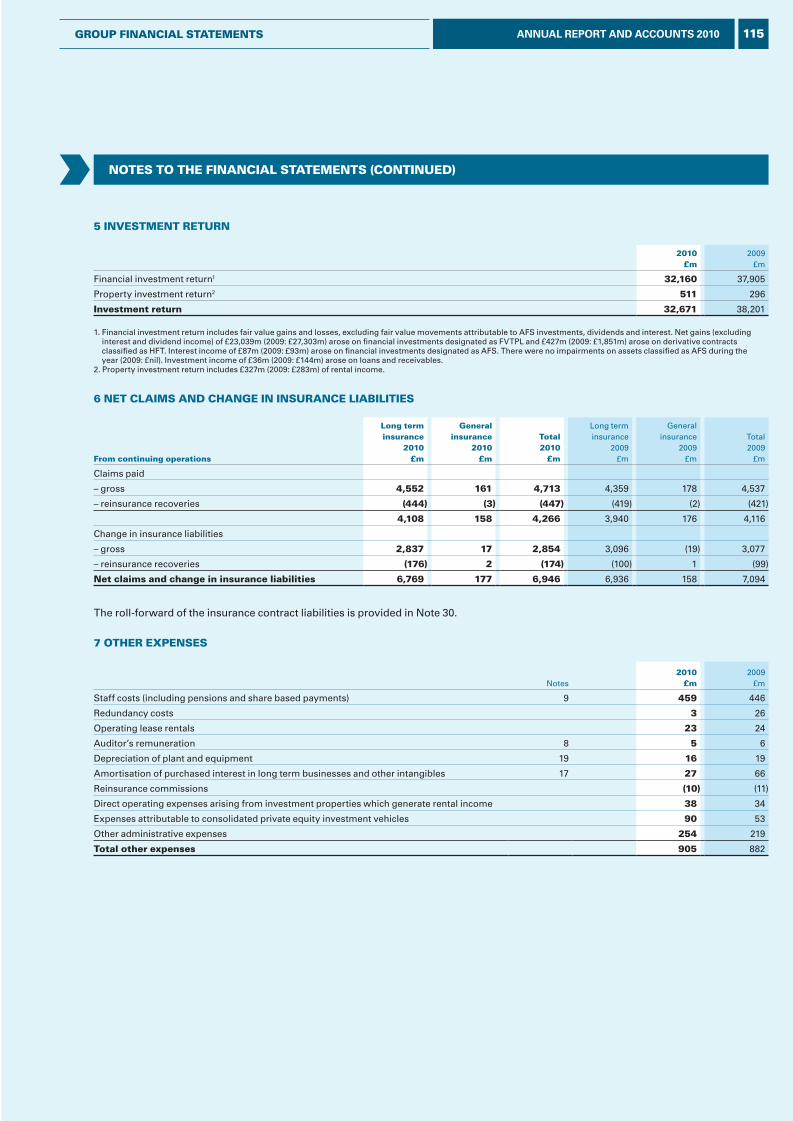
NOTES TO THE FINANCIAL STATEMENTS (CONTINuEd)
5 INvESTMENT rETurN
2010£m
2009£m
Financial investment return1 32,160 37,905
Property investment return2 511 296
Investment return 32,671 38,201
1. Financial investment return includes fair value gains and losses, excluding fair value movements attributable to AFS investments, dividends and interest. Net gains (excluding interest and dividend income) of £23,039m (2009: £27,303m) arose on financial investments designated as FVTPL and £427m (2009: £1,851m) arose on derivative contracts classified as HFT. Interest income of £87m (2009: £93m) arose on financial investments designated as AFS. There were no impairments on assets classified as AFS during the year (2009: £nil). Investment income of £36m (2009: £144m) arose on loans and receivables.
2. Property investment return includes £327m (2009: £283m) of rental income.
6 NET CLAIMS ANd CHANgE IN INSurANCE LIAbILITIES
From continuing operations
Long terminsurance
2010£m
generalinsurance
2010£m
Total2010
£m
Long terminsurance
2009£m
Generalinsurance
2009£m
Total2009
£m
Claims paid
– gross 4,552 161 4,713 4,359 178 4,537
– reinsurance recoveries (444) (3) (447) (419) (2) (421)
4,108 158 4,266 3,940 176 4,116
Change in insurance liabilities
– gross 2,837 17 2,854 3,096 (19) 3,077
– reinsurance recoveries (176) 2 (174) (100) 1 (99)
Net claims and change in insurance liabilities 6,769 177 6,946 6,936 158 7,094
The roll-forward of the insurance contract liabilities is provided in Note 30.
7 OTHEr ExpENSES
Notes2010
£m2009
£m
Staff costs (including pensions and share based payments) 9 459 446
Redundancy costs 3 26
Operating lease rentals 23 24
Auditor’s remuneration 8 5 6
Depreciation of plant and equipment 19 16 19
Amortisation of purchased interest in long term businesses and other intangibles 17 27 66
Reinsurance commissions (10) (11)
Direct operating expenses arising from investment properties which generate rental income 38 34
Expenses attributable to consolidated private equity investment vehicles 90 53
Other administrative expenses 254 219
Total other expenses 905 882
115ANNUAL REPORT AND ACCOUNTS 2010grOup FINANCIAL STATEMENTS
L&G_AR10_14-Notes5-14_p115-118_230311_AT.indd 115 25/03/2011 11:26
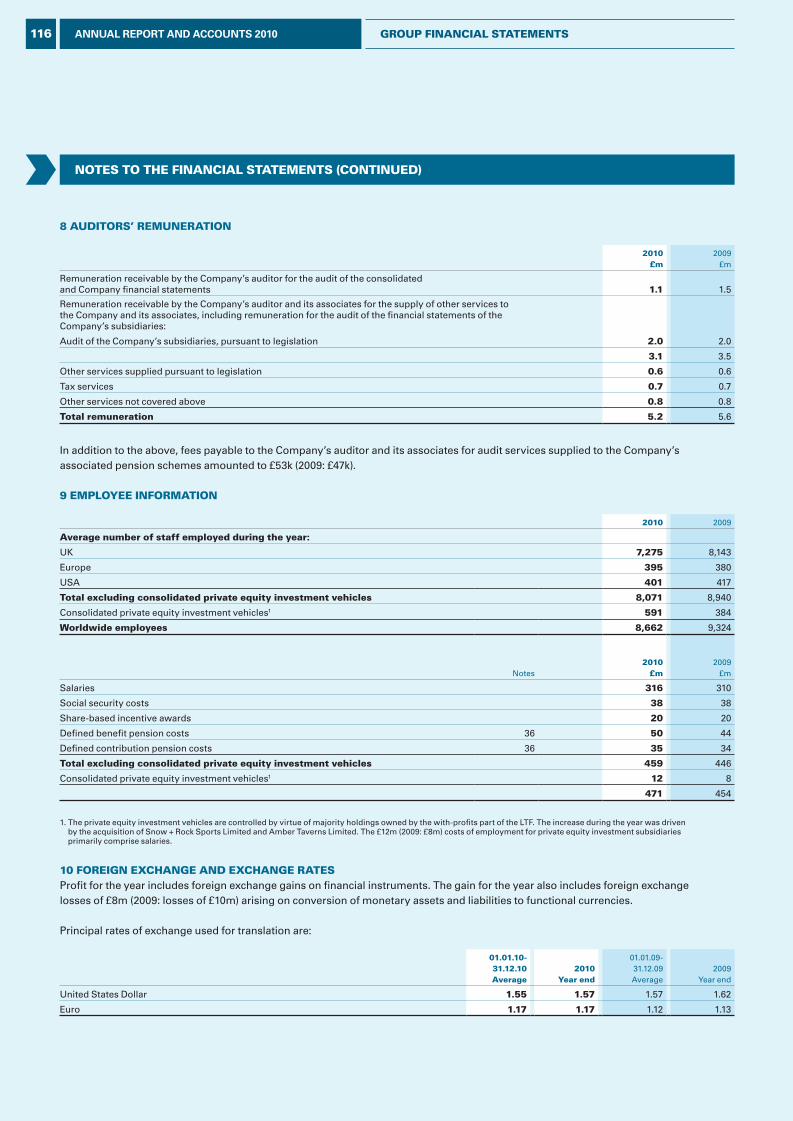
NOTES TO THE FINANCIAL STATEMENTS (CONTINuEd)
8 AudITOrS’ rEMuNErATION
2010£m
2009£m
Remuneration receivable by the Company’s auditor for the audit of the consolidated and Company financial statements 1.1 1.5
Remuneration receivable by the Company’s auditor and its associates for the supply of other services to the Company and its associates, including remuneration for the audit of the financial statements of the Company’s subsidiaries:
Audit of the Company’s subsidiaries, pursuant to legislation 2.0 2.0
3.1 3.5
Other services supplied pursuant to legislation 0.6 0.6
Tax services 0.7 0.7
Other services not covered above 0.8 0.8
Total remuneration 5.2 5.6
In addition to the above, fees payable to the Company’s auditor and its associates for audit services supplied to the Company’s associated pension schemes amounted to £53k (2009: £47k).
9 EMpLOyEE INFOrMATION
2010 2009
Average number of staff employed during the year:
UK 7,275 8,143
Europe 395 380
USA 401 417
Total excluding consolidated private equity investment vehicles 8,071 8,940
Consolidated private equity investment vehicles1 591 384
Worldwide employees 8,662 9,324
Notes2010
£m2009
£m
Salaries 316 310
Social security costs 38 38
Share-based incentive awards 20 20
Defined benefit pension costs 36 50 44
Defined contribution pension costs 36 35 34
Total excluding consolidated private equity investment vehicles 459 446
Consolidated private equity investment vehicles1 12 8
471 454
1. The private equity investment vehicles are controlled by virtue of majority holdings owned by the with-profits part of the LTF. The increase during the year was driven by the acquisition of Snow + Rock Sports Limited and Amber Taverns Limited. The £12m (2009: £8m) costs of employment for private equity investment subsidiaries primarily comprise salaries.
10 FOrEIgN ExCHANgE ANd ExCHANgE rATESProfit for the year includes foreign exchange gains on financial instruments. The gain for the year also includes foreign exchange losses of £8m (2009: losses of £10m) arising on conversion of monetary assets and liabilities to functional currencies.
Principal rates of exchange used for translation are:
01.01.10-31.12.10Average
2010year end
01.01.09-31.12.09Average
2009Year end
United States Dollar 1.55 1.57 1.57 1.62
Euro 1.17 1.17 1.12 1.13
116 ANNUAL REPORT AND ACCOUNTS 2010 grOup FINANCIAL STATEMENTS
L&G_AR10_14-Notes5-14_p115-118_230311_AT.indd 116 25/03/2011 11:26
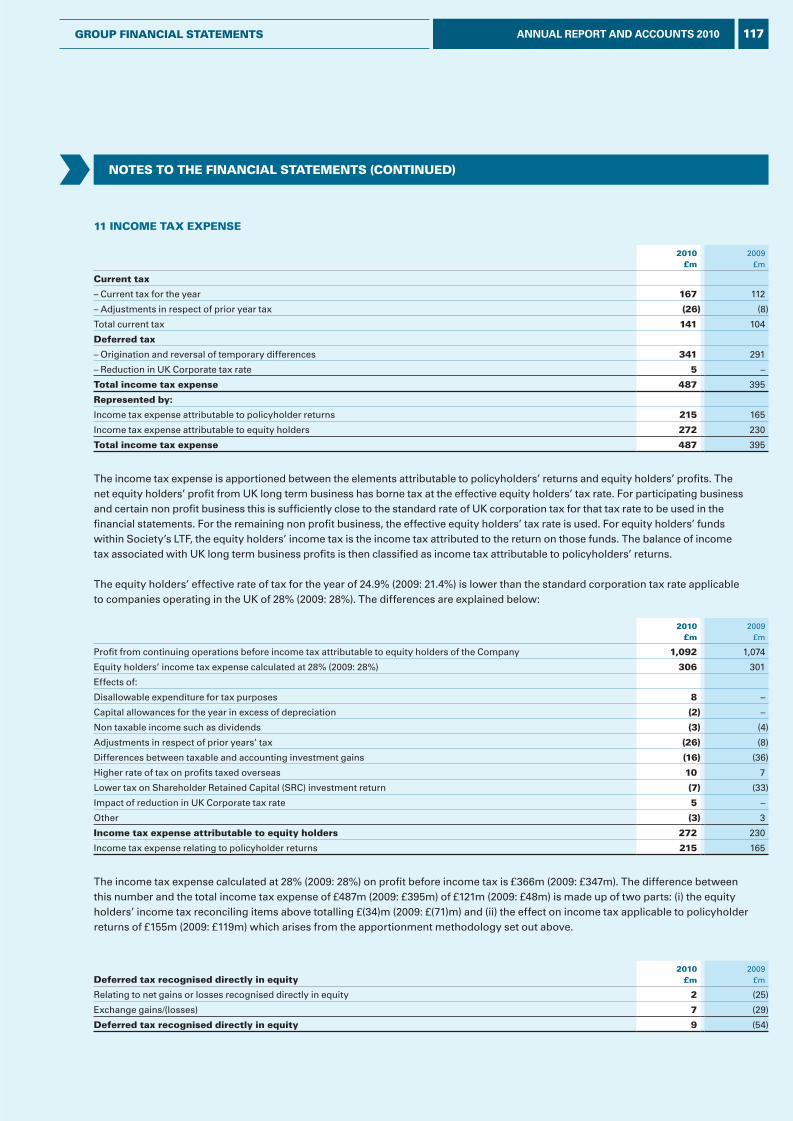
NOTES TO THE FINANCIAL STATEMENTS (CONTINuEd)
11 INCOME TAx ExpENSE
2010£m
2009£m
Current tax
– Current tax for the year 167 112
– Adjustments in respect of prior year tax (26) (8)
Total current tax 141 104
deferred tax
– Origination and reversal of temporary differences 341 291
– Reduction in UK Corporate tax rate 5 –
Total income tax expense 487 395
represented by:
Income tax expense attributable to policyholder returns 215 165
Income tax expense attributable to equity holders 272 230
Total income tax expense 487 395
The income tax expense is apportioned between the elements attributable to policyholders’ returns and equity holders’ profits. The net equity holders’ profit from UK long term business has borne tax at the effective equity holders’ tax rate. For participating business and certain non profit business this is sufficiently close to the standard rate of UK corporation tax for that tax rate to be used in the financial statements. For the remaining non profit business, the effective equity holders’ tax rate is used. For equity holders’ funds within Society’s LTF, the equity holders’ income tax is the income tax attributed to the return on those funds. The balance of income tax associated with UK long term business profits is then classified as income tax attributable to policyholders’ returns.
The equity holders’ effective rate of tax for the year of 24.9% (2009: 21.4%) is lower than the standard corporation tax rate applicable to companies operating in the UK of 28% (2009: 28%). The differences are explained below:
2010£m
2009£m
Profit from continuing operations before income tax attributable to equity holders of the Company 1,092 1,074
Equity holders’ income tax expense calculated at 28% (2009: 28%) 306 301
Effects of:
Disallowable expenditure for tax purposes 8 –
Capital allowances for the year in excess of depreciation (2) –
Non taxable income such as dividends (3) (4)
Adjustments in respect of prior years’ tax (26) (8)
Differences between taxable and accounting investment gains (16) (36)
Higher rate of tax on profits taxed overseas 10 7
Lower tax on Shareholder Retained Capital (SRC) investment return (7) (33)
Impact of reduction in UK Corporate tax rate 5 –
Other (3) 3
Income tax expense attributable to equity holders 272 230
Income tax expense relating to policyholder returns 215 165
The income tax expense calculated at 28% (2009: 28%) on profit before income tax is £366m (2009: £347m). The difference between this number and the total income tax expense of £487m (2009: £395m) of £121m (2009: £48m) is made up of two parts: (i) the equity holders’ income tax reconciling items above totalling £(34)m (2009: £(71)m) and (ii) the effect on income tax applicable to policyholder returns of £155m (2009: £119m) which arises from the apportionment methodology set out above.
deferred tax recognised directly in equity2010
£m2009
£m
Relating to net gains or losses recognised directly in equity 2 (25)
Exchange gains/(losses) 7 (29)
deferred tax recognised directly in equity 9 (54)
117ANNUAL REPORT AND ACCOUNTS 2010grOup FINANCIAL STATEMENTS
L&G_AR10_14-Notes5-14_p115-118_230311_AT.indd 117 25/03/2011 11:26
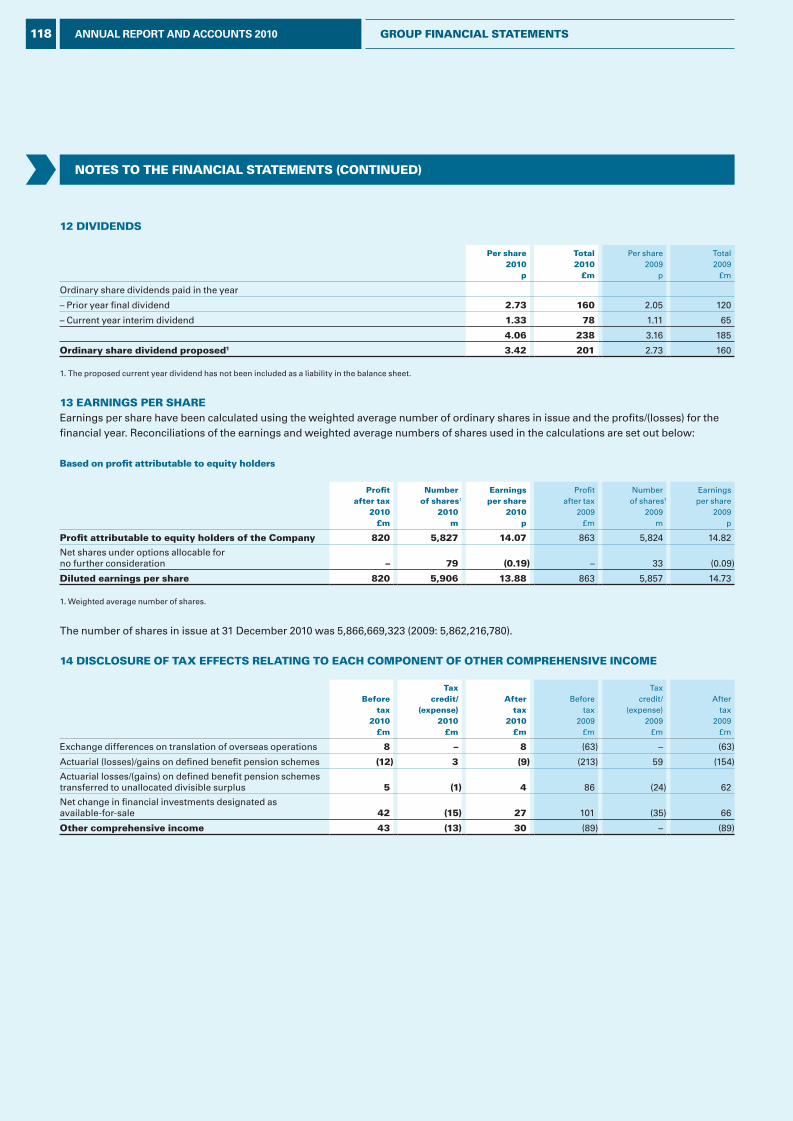
NOTES TO THE FINANCIAL STATEMENTS (CONTINuEd)
12 dIvIdENdS
per share2010
p
Total2010
£m
Per share2009
p
Total2009
£m
Ordinary share dividends paid in the year
– Prior year final dividend 2.73 160 2.05 120
– Current year interim dividend 1.33 78 1.11 65
4.06 238 3.16 185
Ordinary share dividend proposed1 3.42 201 2.73 160
1. The proposed current year dividend has not been included as a liability in the balance sheet.
13 EArNINgS pEr SHArEEarnings per share have been calculated using the weighted average number of ordinary shares in issue and the profits/(losses) for the financial year. Reconciliations of the earnings and weighted average numbers of shares used in the calculations are set out below:
based on profit attributable to equity holders
profitafter tax
2010£m
Numberof shares1
2010m
Earningsper share
2010p
Profitafter tax
2009£m
Numberof shares1
2009m
Earningsper share
2009p
profit attributable to equity holders of the Company 820 5,827 14.07 863 5,824 14.82
Net shares under options allocable for no further consideration – 79 (0.19) – 33 (0.09)
diluted earnings per share 820 5,906 13.88 863 5,857 14.73
1. Weighted average number of shares.
The number of shares in issue at 31 December 2010 was 5,866,669,323 (2009: 5,862,216,780).
14 dISCLOSurE OF TAx EFFECTS rELATINg TO EACH COMpONENT OF OTHEr COMprEHENSIvE INCOME
beforetax
2010£m
Taxcredit/
(expense)2010
£m
Aftertax
2010£m
Beforetax
2009£m
Taxcredit/
(expense)2009
£m
Aftertax
2009£m
Exchange differences on translation of overseas operations 8 – 8 (63) – (63)
Actuarial (losses)/gains on defined benefit pension schemes (12) 3 (9) (213) 59 (154)
Actuarial losses/(gains) on defined benefit pension schemes transferred to unallocated divisible surplus 5 (1) 4 86 (24) 62
Net change in financial investments designated as available-for-sale 42 (15) 27 101 (35) 66
Other comprehensive income 43 (13) 30 (89) – (89)
118 ANNUAL REPORT AND ACCOUNTS 2010 grOup FINANCIAL STATEMENTS
L&G_AR10_14-Notes5-14_p115-118_230311_AT.indd 118 25/03/2011 11:26
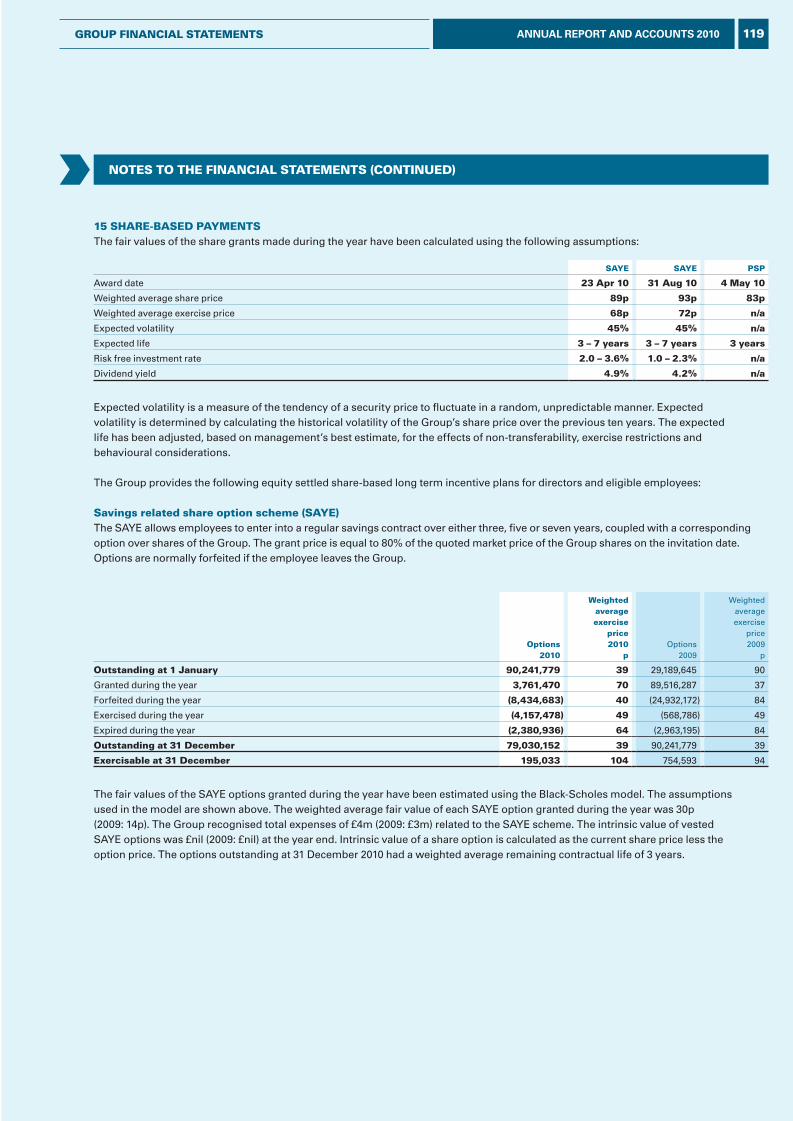
NOTES TO THE FINANCIAL STATEMENTS (CONTINuEd)
15 SHArE-bASEd pAyMENTSThe fair values of the share grants made during the year have been calculated using the following assumptions:
SAyE SAyE pSp
Award date 23 Apr 10 31 Aug 10 4 May 10
Weighted average share price 89p 93p 83p
Weighted average exercise price 68p 72p n/a
Expected volatility 45% 45% n/a
Expected life 3 – 7 years 3 – 7 years 3 years
Risk free investment rate 2.0 – 3.6% 1.0 – 2.3% n/a
Dividend yield 4.9% 4.2% n/a
Expected volatility is a measure of the tendency of a security price to fluctuate in a random, unpredictable manner. Expected volatility is determined by calculating the historical volatility of the Group’s share price over the previous ten years. The expected life has been adjusted, based on management’s best estimate, for the effects of non-transferability, exercise restrictions and behavioural considerations.
The Group provides the following equity settled share-based long term incentive plans for directors and eligible employees:
Savings related share option scheme (SAyE)The SAYE allows employees to enter into a regular savings contract over either three, five or seven years, coupled with a corresponding option over shares of the Group. The grant price is equal to 80% of the quoted market price of the Group shares on the invitation date. Options are normally forfeited if the employee leaves the Group.
Options2010
Weightedaverageexercise
price2010
pOptions
2009
Weightedaverageexercise
price2009
p
Outstanding at 1 January 90,241,779 39 29,189,645 90
Granted during the year 3,761,470 70 89,516,287 37
Forfeited during the year (8,434,683) 40 (24,932,172) 84
Exercised during the year (4,157,478) 49 (568,786) 49
Expired during the year (2,380,936) 64 (2,963,195) 84
Outstanding at 31 december 79,030,152 39 90,241,779 39
Exercisable at 31 december 195,033 104 754,593 94
The fair values of the SAYE options granted during the year have been estimated using the Black-Scholes model. The assumptions used in the model are shown above. The weighted average fair value of each SAYE option granted during the year was 30p (2009: 14p). The Group recognised total expenses of £4m (2009: £3m) related to the SAYE scheme. The intrinsic value of vested SAYE options was £nil (2009: £nil) at the year end. Intrinsic value of a share option is calculated as the current share price less the option price. The options outstanding at 31 December 2010 had a weighted average remaining contractual life of 3 years.
119ANNUAL REPORT AND ACCOUNTS 2010GrOup FINANCIAL STATEMENTS
L&G_AR10_15-Notes10-20_p119-124_230311_AT.indd 119 25/03/2011 11:26
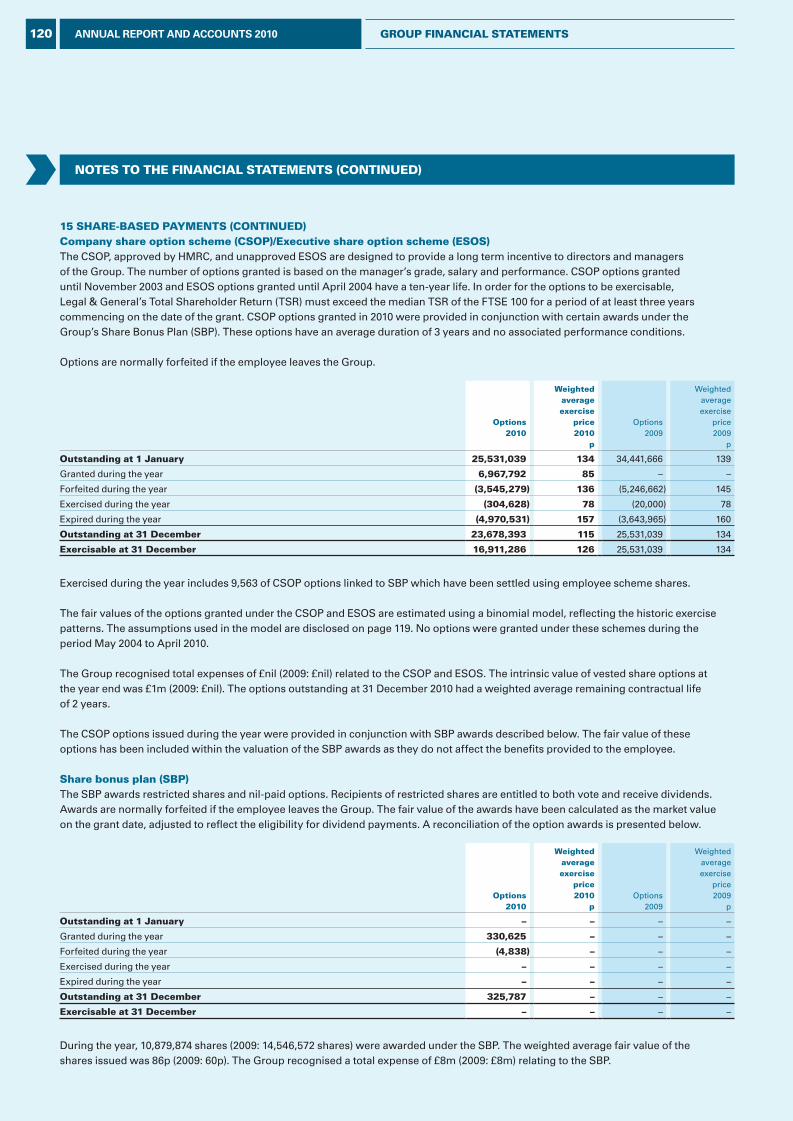
NOTES TO THE FINANCIAL STATEMENTS (CONTINuEd)
15 SHArE-bASEd pAyMENTS (CONTINuEd)Company share option scheme (CSOp)/Executive share option scheme (ESOS)The CSOP, approved by HMRC, and unapproved ESOS are designed to provide a long term incentive to directors and managers of the Group. The number of options granted is based on the manager’s grade, salary and performance. CSOP options granted until November 2003 and ESOS options granted until April 2004 have a ten-year life. In order for the options to be exercisable, Legal & General’s Total Shareholder Return (TSR) must exceed the median TSR of the FTSE 100 for a period of at least three years commencing on the date of the grant. CSOP options granted in 2010 were provided in conjunction with certain awards under the Group’s Share Bonus Plan (SBP). These options have an average duration of 3 years and no associated performance conditions.
Options are normally forfeited if the employee leaves the Group.
Options2010
Weightedaverageexercise
price2010
p
Options2009
Weightedaverageexercise
price2009
p
Outstanding at 1 January 25,531,039 134 34,441,666 139
Granted during the year 6,967,792 85 – –
Forfeited during the year (3,545,279) 136 (5,246,662) 145
Exercised during the year (304,628) 78 (20,000) 78
Expired during the year (4,970,531) 157 (3,643,965) 160
Outstanding at 31 december 23,678,393 115 25,531,039 134
Exercisable at 31 december 16,911,286 126 25,531,039 134
Exercised during the year includes 9,563 of CSOP options linked to SBP which have been settled using employee scheme shares.
The fair values of the options granted under the CSOP and ESOS are estimated using a binomial model, reflecting the historic exercise patterns. The assumptions used in the model are disclosed on page 119. No options were granted under these schemes during the period May 2004 to April 2010.
The Group recognised total expenses of £nil (2009: £nil) related to the CSOP and ESOS. The intrinsic value of vested share options at the year end was £1m (2009: £nil). The options outstanding at 31 December 2010 had a weighted average remaining contractual life of 2 years.
The CSOP options issued during the year were provided in conjunction with SBP awards described below. The fair value of these options has been included within the valuation of the SBP awards as they do not affect the benefits provided to the employee.
Share bonus plan (Sbp)The SBP awards restricted shares and nil-paid options. Recipients of restricted shares are entitled to both vote and receive dividends. Awards are normally forfeited if the employee leaves the Group. The fair value of the awards have been calculated as the market value on the grant date, adjusted to reflect the eligibility for dividend payments. A reconciliation of the option awards is presented below.
Options2010
Weightedaverageexercise
price2010
pOptions
2009
Weightedaverageexercise
price2009
p
Outstanding at 1 January – – – –
Granted during the year 330,625 – – –
Forfeited during the year (4,838) – – –
Exercised during the year – – – –
Expired during the year – – – –
Outstanding at 31 december 325,787 – – –
Exercisable at 31 december – – – –
During the year, 10,879,874 shares (2009: 14,546,572 shares) were awarded under the SBP. The weighted average fair value of the shares issued was 86p (2009: 60p). The Group recognised a total expense of £8m (2009: £8m) relating to the SBP.
120 ANNUAL REPORT AND ACCOUNTS 2010 GrOup FINANCIAL STATEMENTS
L&G_AR10_15-Notes10-20_p119-124_230311_AT.indd 120 25/03/2011 11:26
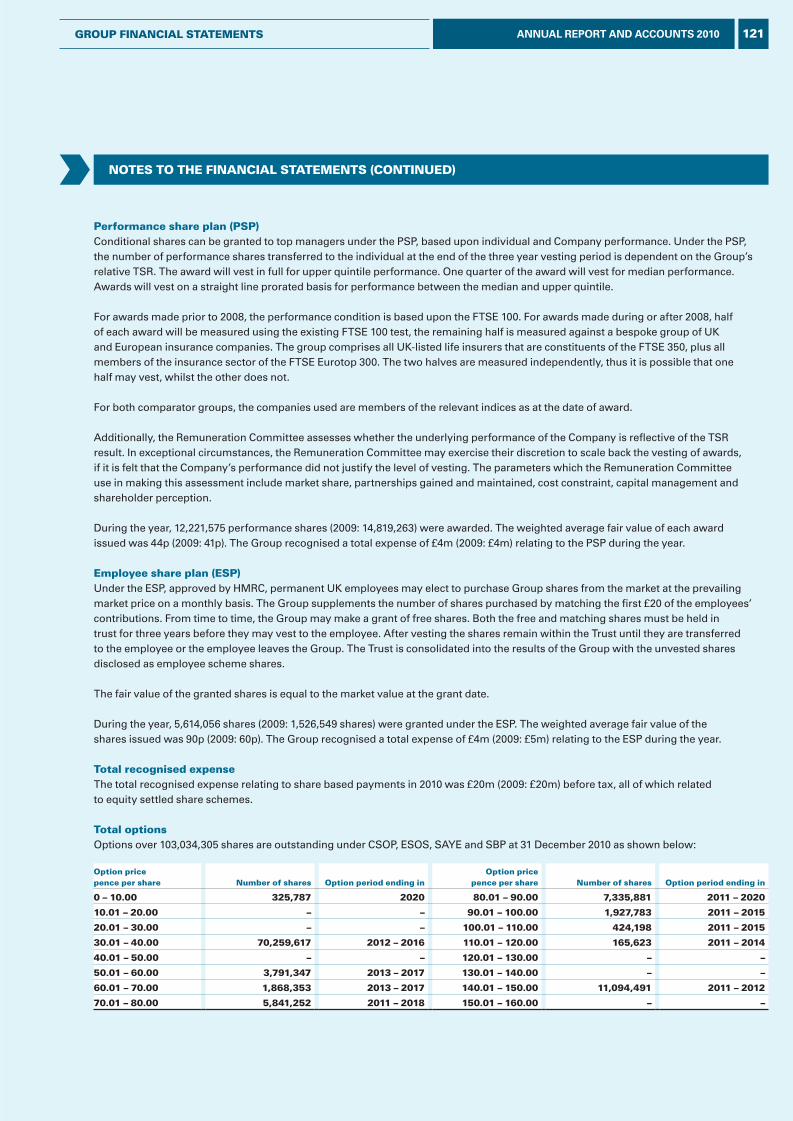
NOTES TO THE FINANCIAL STATEMENTS (CONTINuEd)
performance share plan (pSp)Conditional shares can be granted to top managers under the PSP, based upon individual and Company performance. Under the PSP, the number of performance shares transferred to the individual at the end of the three year vesting period is dependent on the Group’s relative TSR. The award will vest in full for upper quintile performance. One quarter of the award will vest for median performance. Awards will vest on a straight line prorated basis for performance between the median and upper quintile.
For awards made prior to 2008, the performance condition is based upon the FTSE 100. For awards made during or after 2008, half of each award will be measured using the existing FTSE 100 test, the remaining half is measured against a bespoke group of UK and European insurance companies. The group comprises all UK-listed life insurers that are constituents of the FTSE 350, plus all members of the insurance sector of the FTSE Eurotop 300. The two halves are measured independently, thus it is possible that one half may vest, whilst the other does not.
For both comparator groups, the companies used are members of the relevant indices as at the date of award.
Additionally, the Remuneration Committee assesses whether the underlying performance of the Company is reflective of the TSR result. In exceptional circumstances, the Remuneration Committee may exercise their discretion to scale back the vesting of awards, if it is felt that the Company’s performance did not justify the level of vesting. The parameters which the Remuneration Committee use in making this assessment include market share, partnerships gained and maintained, cost constraint, capital management and shareholder perception.
During the year, 12,221,575 performance shares (2009: 14,819,263) were awarded. The weighted average fair value of each award issued was 44p (2009: 41p). The Group recognised a total expense of £4m (2009: £4m) relating to the PSP during the year.
Employee share plan (ESp)Under the ESP, approved by HMRC, permanent UK employees may elect to purchase Group shares from the market at the prevailing market price on a monthly basis. The Group supplements the number of shares purchased by matching the first £20 of the employees’ contributions. From time to time, the Group may make a grant of free shares. Both the free and matching shares must be held in trust for three years before they may vest to the employee. After vesting the shares remain within the Trust until they are transferred to the employee or the employee leaves the Group. The Trust is consolidated into the results of the Group with the unvested shares disclosed as employee scheme shares.
The fair value of the granted shares is equal to the market value at the grant date.
During the year, 5,614,056 shares (2009: 1,526,549 shares) were granted under the ESP. The weighted average fair value of the shares issued was 90p (2009: 60p). The Group recognised a total expense of £4m (2009: £5m) relating to the ESP during the year.
Total recognised expenseThe total recognised expense relating to share based payments in 2010 was £20m (2009: £20m) before tax, all of which related to equity settled share schemes.
Total optionsOptions over 103,034,305 shares are outstanding under CSOP, ESOS, SAYE and SBP at 31 December 2010 as shown below:
Option price pence per share Number of shares Option period ending in
Option price pence per share Number of shares Option period ending in
0 – 10.00 325,787 2020 80.01 – 90.00 7,335,881 2011 – 2020
10.01 – 20.00 – – 90.01 – 100.00 1,927,783 2011 – 2015
20.01 – 30.00 – – 100.01 – 110.00 424,198 2011 – 2015
30.01 – 40.00 70,259,617 2012 – 2016 110.01 – 120.00 165,623 2011 – 2014
40.01 – 50.00 – – 120.01 – 130.00 – –
50.01 – 60.00 3,791,347 2013 – 2017 130.01 – 140.00 – –
60.01 – 70.00 1,868,353 2013 – 2017 140.01 – 150.00 11,094,491 2011 – 2012
70.01 – 80.00 5,841,252 2011 – 2018 150.01 – 160.00 – –
121ANNUAL REPORT AND ACCOUNTS 2010GrOup FINANCIAL STATEMENTS
L&G_AR10_15-Notes10-20_p119-124_230311_AT.indd 121 25/03/2011 11:26
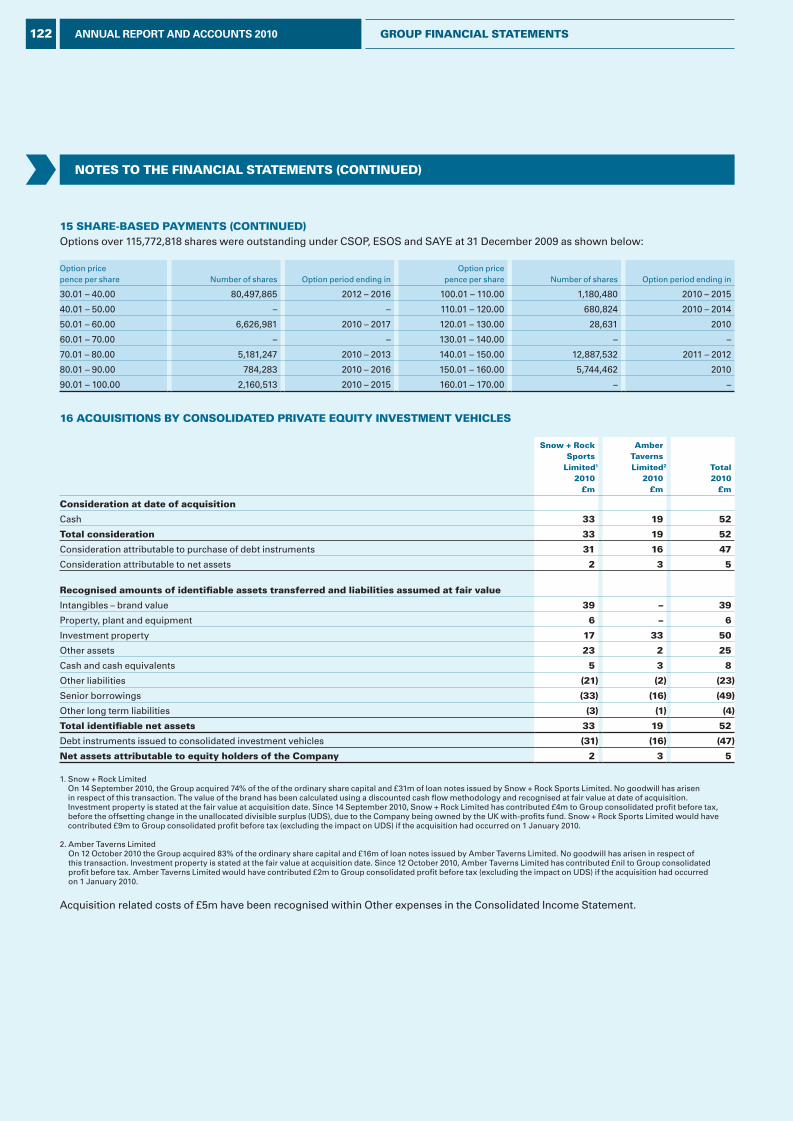
NOTES TO THE FINANCIAL STATEMENTS (CONTINuEd)
15 SHArE-bASEd pAyMENTS (CONTINuEd)Options over 115,772,818 shares were outstanding under CSOP, ESOS and SAYE at 31 December 2009 as shown below:
Option price pence per share Number of shares Option period ending in
Option price pence per share Number of shares Option period ending in
30.01 – 40.00 80,497,865 2012 – 2016 100.01 – 110.00 1,180,480 2010 – 2015
40.01 – 50.00 – – 110.01 – 120.00 680,824 2010 – 2014
50.01 – 60.00 6,626,981 2010 – 2017 120.01 – 130.00 28,631 2010
60.01 – 70.00 – – 130.01 – 140.00 – –
70.01 – 80.00 5,181,247 2010 – 2013 140.01 – 150.00 12,887,532 2011 – 2012
80.01 – 90.00 784,283 2010 – 2016 150.01 – 160.00 5,744,462 2010
90.01 – 100.00 2,160,513 2010 – 2015 160.01 – 170.00 – –
16 ACquISITIONS by CONSOLIdATEd prIvATE EquITy INvESTMENT vEHICLES
Snow + rock Sports
Limited1
2010£m
Amber Taverns Limited2
2010£m
Total2010
£m
Consideration at date of acquisition
Cash 33 19 52
Total consideration 33 19 52
Consideration attributable to purchase of debt instruments 31 16 47
Consideration attributable to net assets 2 3 5
recognised amounts of identifiable assets transferred and liabilities assumed at fair value
Intangibles – brand value 39 – 39
Property, plant and equipment 6 – 6
Investment property 17 33 50
Other assets 23 2 25
Cash and cash equivalents 5 3 8
Other liabilities (21) (2) (23)
Senior borrowings (33) (16) (49)
Other long term liabilities (3) (1) (4)
Total identifiable net assets 33 19 52
Debt instruments issued to consolidated investment vehicles (31) (16) (47)
Net assets attributable to equity holders of the Company 2 3 5
1. Snow + Rock Limited On 14 September 2010, the Group acquired 74% of the of the ordinary share capital and £31m of loan notes issued by Snow + Rock Sports Limited. No goodwill has arisen in respect of this transaction. The value of the brand has been calculated using a discounted cash flow methodology and recognised at fair value at date of acquisition. Investment property is stated at the fair value at acquisition date. Since 14 September 2010, Snow + Rock Limited has contributed £4m to Group consolidated profit before tax, before the offsetting change in the unallocated divisible surplus (UDS), due to the Company being owned by the UK with-profits fund. Snow + Rock Sports Limited would have contributed £9m to Group consolidated profit before tax (excluding the impact on UDS) if the acquisition had occurred on 1 January 2010.
2. Amber Taverns Limited On 12 October 2010 the Group acquired 83% of the ordinary share capital and £16m of loan notes issued by Amber Taverns Limited. No goodwill has arisen in respect of this transaction. Investment property is stated at the fair value at acquisition date. Since 12 October 2010, Amber Taverns Limited has contributed £nil to Group consolidated profit before tax. Amber Taverns Limited would have contributed £2m to Group consolidated profit before tax (excluding the impact on UDS) if the acquisition had occurred on 1 January 2010.
Acquisition related costs of £5m have been recognised within Other expenses in the Consolidated Income Statement.
122 ANNUAL REPORT AND ACCOUNTS 2010 GrOup FINANCIAL STATEMENTS
L&G_AR10_15-Notes10-20_p119-124_230311_AT.indd 122 25/03/2011 11:26
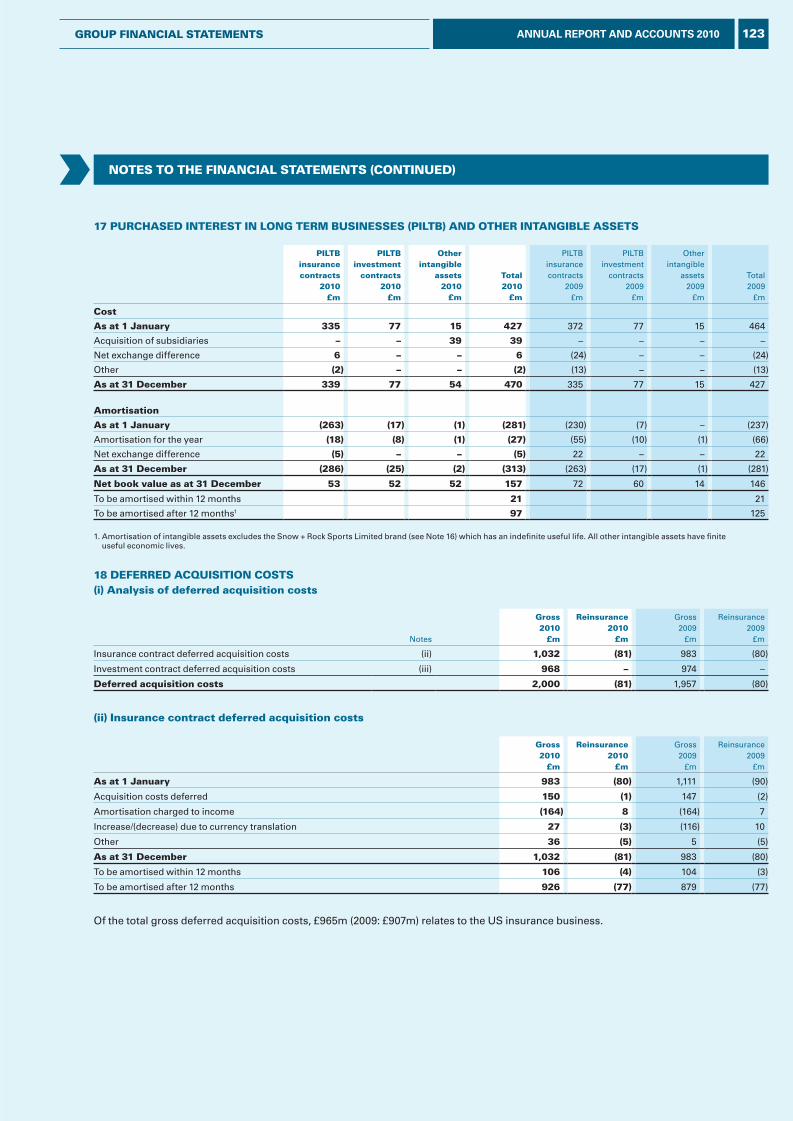
NOTES TO THE FINANCIAL STATEMENTS (CONTINuEd)
17 purCHASEd INTErEST IN LONG TErM buSINESSES (pILTb) ANd OTHEr INTANGIbLE ASSETS
pILTbinsurancecontracts
2010£m
pILTbinvestment
contracts2010
£m
Otherintangible
assets2010
£m
Total2010
£m
PILTBinsurancecontracts
2009£m
PILTBinvestment
contracts2009
£m
Otherintangible
assets2009
£m
Total2009
£m
Cost
As at 1 January 335 77 15 427 372 77 15 464
Acquisition of subsidiaries – – 39 39 – – – –
Net exchange difference 6 – – 6 (24) – – (24)
Other (2) – – (2) (13) – – (13)
As at 31 december 339 77 54 470 335 77 15 427
Amortisation
As at 1 January (263) (17) (1) (281) (230) (7) – (237)
Amortisation for the year (18) (8) (1) (27) (55) (10) (1) (66)
Net exchange difference (5) – – (5) 22 – – 22
As at 31 december (286) (25) (2) (313) (263) (17) (1) (281)
Net book value as at 31 december 53 52 52 157 72 60 14 146
To be amortised within 12 months 21 21
To be amortised after 12 months1 97 125
1. Amortisation of intangible assets excludes the Snow + Rock Sports Limited brand (see Note 16) which has an indefinite useful life. All other intangible assets have finite useful economic lives.
18 dEFErrEd ACquISITION COSTS(i) Analysis of deferred acquisition costs
Notes
Gross2010
£m
reinsurance2010
£m
Gross2009
£m
Reinsurance2009
£m
Insurance contract deferred acquisition costs (ii) 1,032 (81) 983 (80)
Investment contract deferred acquisition costs (iii) 968 – 974 –
deferred acquisition costs 2,000 (81) 1,957 (80)
(ii) Insurance contract deferred acquisition costs
Gross2010
£m
reinsurance2010
£m
Gross2009
£m
Reinsurance2009
£m
As at 1 January 983 (80) 1,111 (90)
Acquisition costs deferred 150 (1) 147 (2)
Amortisation charged to income (164) 8 (164) 7
Increase/(decrease) due to currency translation 27 (3) (116) 10
Other 36 (5) 5 (5)
As at 31 december 1,032 (81) 983 (80)
To be amortised within 12 months 106 (4) 104 (3)
To be amortised after 12 months 926 (77) 879 (77)
Of the total gross deferred acquisition costs, £965m (2009: £907m) relates to the US insurance business.
123ANNUAL REPORT AND ACCOUNTS 2010GrOup FINANCIAL STATEMENTS
L&G_AR10_15-Notes10-20_p119-124_230311_AT.indd 123 25/03/2011 11:26
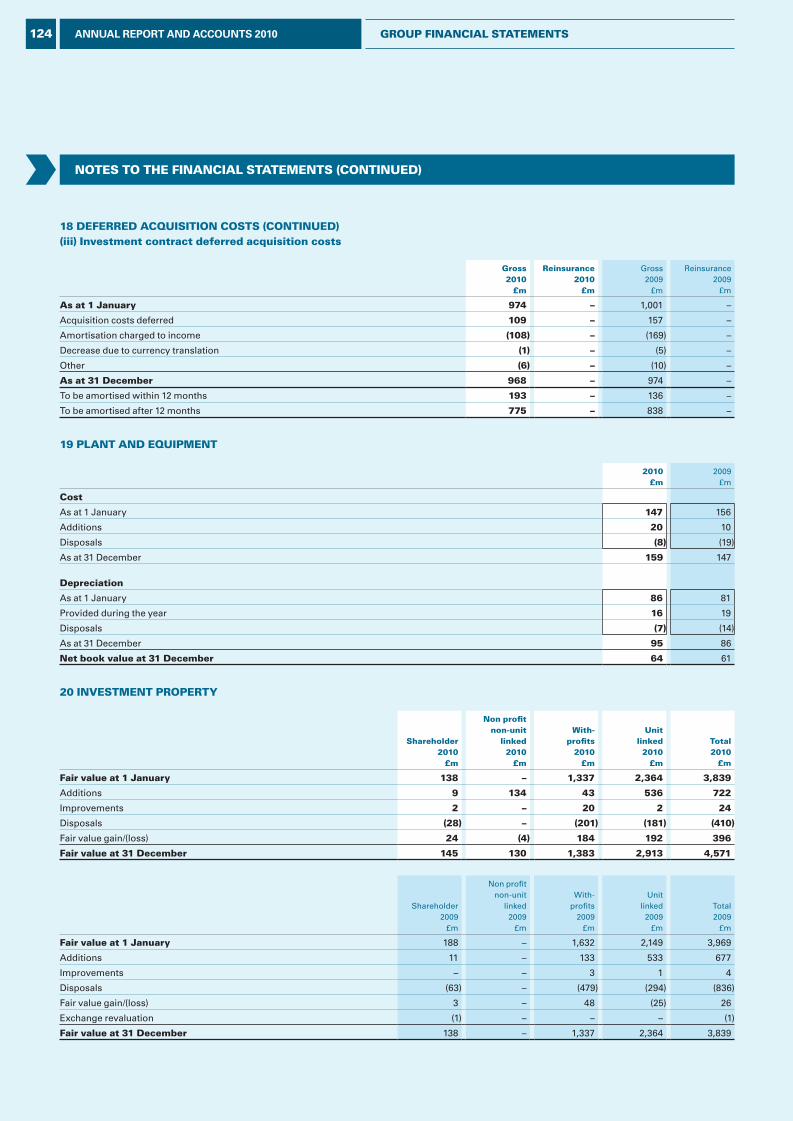
NOTES TO THE FINANCIAL STATEMENTS (CONTINuEd)
18 dEFErrEd ACquISITION COSTS (CONTINuEd)(iii) Investment contract deferred acquisition costs
Gross2010
£m
reinsurance2010
£m
Gross2009
£m
Reinsurance2009
£m
As at 1 January 974 – 1,001 –
Acquisition costs deferred 109 – 157 –
Amortisation charged to income (108) – (169) –
Decrease due to currency translation (1) – (5) –
Other (6) – (10) –
As at 31 december 968 – 974 –
To be amortised within 12 months 193 – 136 –
To be amortised after 12 months 775 – 838 –
19 pLANT ANd EquIpMENT
2010£m
2009£m
Cost
As at 1 January 147 156
Additions 20 10
Disposals (8) (19)
As at 31 December 159 147
depreciation
As at 1 January 86 81
Provided during the year 16 19
Disposals (7) (14)
As at 31 December 95 86
Net book value at 31 december 64 61
20 INvESTMENT prOpErTy
Shareholder2010
£m
Non profitnon-unit
linked2010
£m
With- profits
2010£m
unitlinked
2010£m
Total2010
£m
Fair value at 1 January 138 – 1,337 2,364 3,839
Additions 9 134 43 536 722
Improvements 2 – 20 2 24
Disposals (28) – (201) (181) (410)
Fair value gain/(loss) 24 (4) 184 192 396
Fair value at 31 december 145 130 1,383 2,913 4,571
Shareholder2009
£m
Non profitnon-unit
linked2009
£m
With-profits
2009£m
Unitlinked2009
£m
Total2009
£m
Fair value at 1 January 188 – 1,632 2,149 3,969
Additions 11 – 133 533 677
Improvements – – 3 1 4
Disposals (63) – (479) (294) (836)
Fair value gain/(loss) 3 – 48 (25) 26
Exchange revaluation (1) – – – (1)
Fair value at 31 december 138 – 1,337 2,364 3,839
124 ANNUAL REPORT AND ACCOUNTS 2010 GrOup FINANCIAL STATEMENTS
L&G_AR10_15-Notes10-20_p119-124_230311_AT.indd 124 25/03/2011 11:26
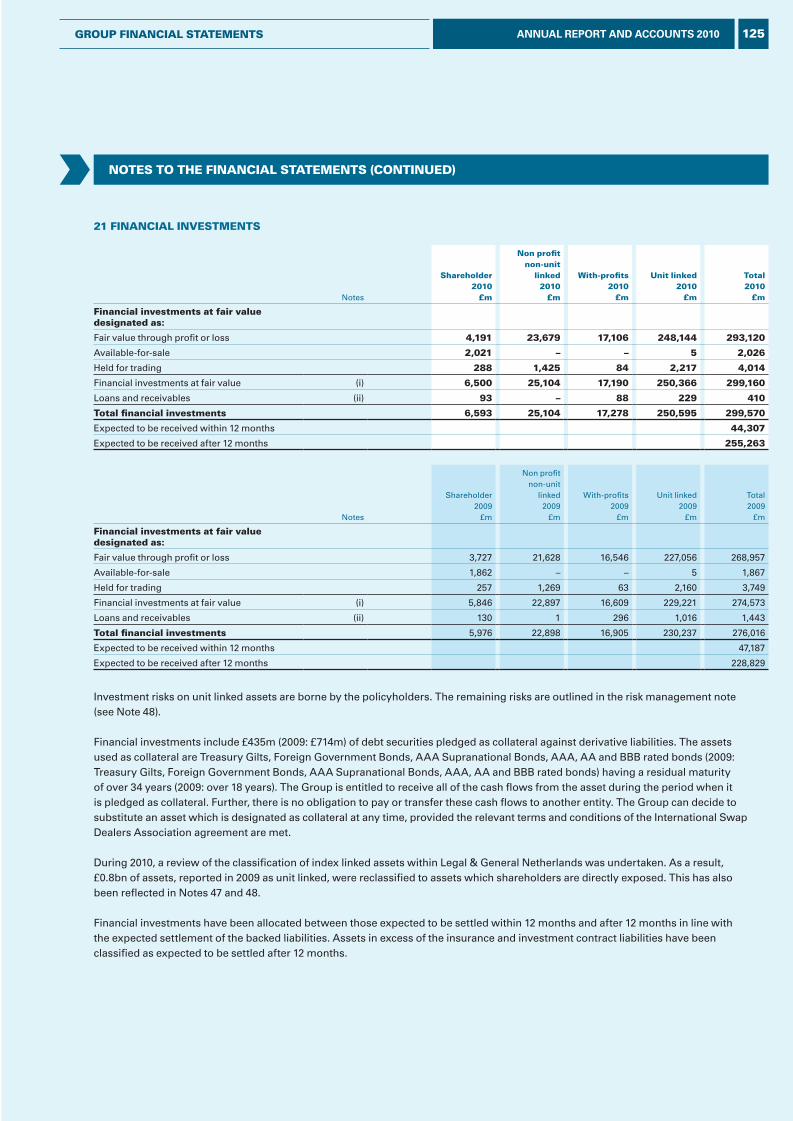
NOTES TO THE FINANCIAL STATEMENTS (CONTINuEd)
21 FINANCIAL INvESTMENTS
Notes
Shareholder2010
£m
Non profit non-unit
linked2010
£m
With-profits2010
£m
unit linked2010
£m
Total2010
£m
Financial investments at fair value designated as:
Fair value through profit or loss 4,191 23,679 17,106 248,144 293,120
Available-for-sale 2,021 – – 5 2,026
Held for trading 288 1,425 84 2,217 4,014
Financial investments at fair value (i) 6,500 25,104 17,190 250,366 299,160
Loans and receivables (ii) 93 – 88 229 410
Total financial investments 6,593 25,104 17,278 250,595 299,570
Expected to be received within 12 months 44,307
Expected to be received after 12 months 255,263
Notes
Shareholder2009
£m
Non profit non-unit
linked2009
£m
With-profits2009
£m
Unit linked2009
£m
Total2009
£m
Financial investments at fair value designated as:
Fair value through profit or loss 3,727 21,628 16,546 227,056 268,957
Available-for-sale 1,862 – – 5 1,867
Held for trading 257 1,269 63 2,160 3,749
Financial investments at fair value (i) 5,846 22,897 16,609 229,221 274,573
Loans and receivables (ii) 130 1 296 1,016 1,443
Total financial investments 5,976 22,898 16,905 230,237 276,016
Expected to be received within 12 months 47,187
Expected to be received after 12 months 228,829
Investment risks on unit linked assets are borne by the policyholders. The remaining risks are outlined in the risk management note (see Note 48).
Financial investments include £435m (2009: £714m) of debt securities pledged as collateral against derivative liabilities. The assets used as collateral are Treasury Gilts, Foreign Government Bonds, AAA Supranational Bonds, AAA, AA and BBB rated bonds (2009: Treasury Gilts, Foreign Government Bonds, AAA Supranational Bonds, AAA, AA and BBB rated bonds) having a residual maturity of over 34 years (2009: over 18 years). The Group is entitled to receive all of the cash flows from the asset during the period when it is pledged as collateral. Further, there is no obligation to pay or transfer these cash flows to another entity. The Group can decide to substitute an asset which is designated as collateral at any time, provided the relevant terms and conditions of the International Swap Dealers Association agreement are met.
During 2010, a review of the classification of index linked assets within Legal & General Netherlands was undertaken. As a result, £0.8bn of assets, reported in 2009 as unit linked, were reclassified to assets which shareholders are directly exposed. This has also been reflected in Notes 47 and 48.
Financial investments have been allocated between those expected to be settled within 12 months and after 12 months in line with the expected settlement of the backed liabilities. Assets in excess of the insurance and investment contract liabilities have been classified as expected to be settled after 12 months.
125ANNUAL REPORT AND ACCOUNTS 2010GROuP FINANCIAL STATEMENTS
L&G_AR10_16-Notes21-28_p125-139_230311_AT.indd 125 25/03/2011 11:27
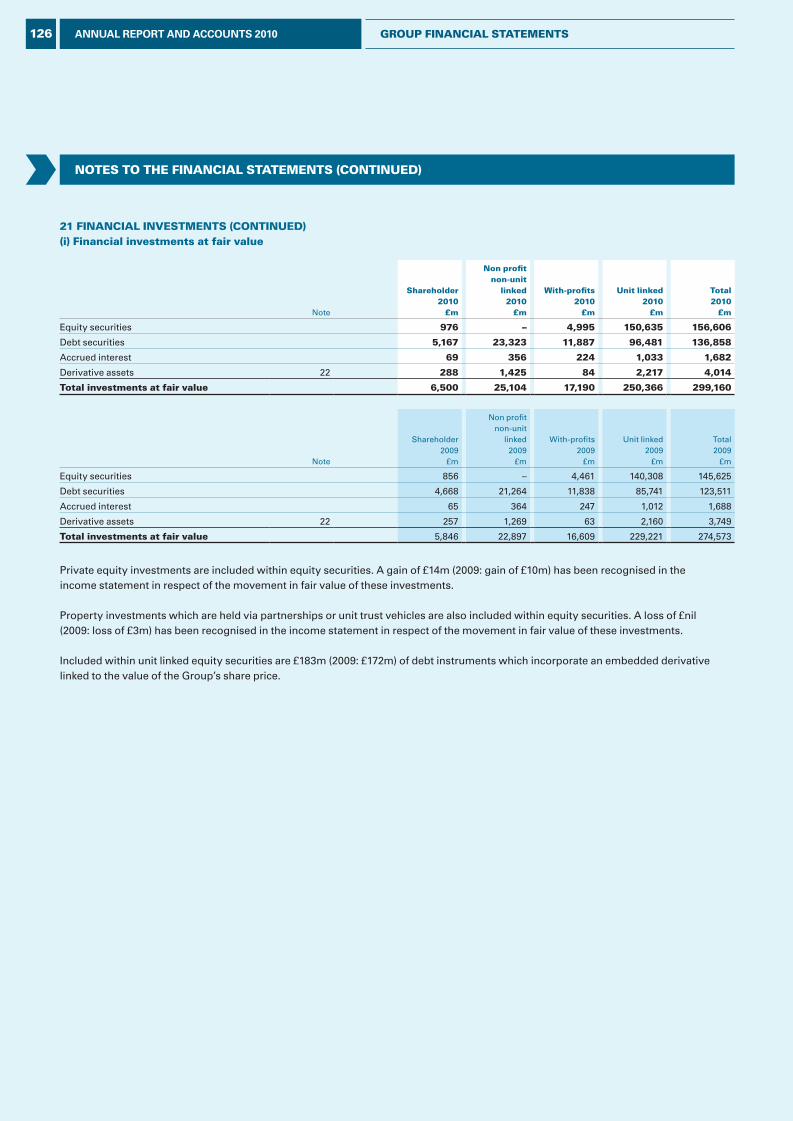
NOTES TO THE FINANCIAL STATEMENTS (CONTINuEd)
21 FINANCIAL INvESTMENTS (CONTINuEd)(i) Financial investments at fair value
Note
Shareholder2010
£m
Non profit non-unit
linked2010
£m
With-profits2010
£m
unit linked2010
£m
Total2010
£m
Equity securities 976 – 4,995 150,635 156,606
Debt securities 5,167 23,323 11,887 96,481 136,858
Accrued interest 69 356 224 1,033 1,682
Derivative assets 22 288 1,425 84 2,217 4,014
Total investments at fair value 6,500 25,104 17,190 250,366 299,160
Note
Shareholder2009
£m
Non profit non-unit
linked2009
£m
With-profits2009
£m
Unit linked2009
£m
Total2009
£m
Equity securities 856 – 4,461 140,308 145,625
Debt securities 4,668 21,264 11,838 85,741 123,511
Accrued interest 65 364 247 1,012 1,688
Derivative assets 22 257 1,269 63 2,160 3,749
Total investments at fair value 5,846 22,897 16,609 229,221 274,573
Private equity investments are included within equity securities. A gain of £14m (2009: gain of £10m) has been recognised in the income statement in respect of the movement in fair value of these investments.
Property investments which are held via partnerships or unit trust vehicles are also included within equity securities. A loss of £nil (2009: loss of £3m) has been recognised in the income statement in respect of the movement in fair value of these investments.
Included within unit linked equity securities are £183m (2009: £172m) of debt instruments which incorporate an embedded derivative linked to the value of the Group’s share price.
126 ANNUAL REPORT AND ACCOUNTS 2010 GROuP FINANCIAL STATEMENTS
L&G_AR10_16-Notes21-28_p125-139_230311_AT.indd 126 25/03/2011 11:27
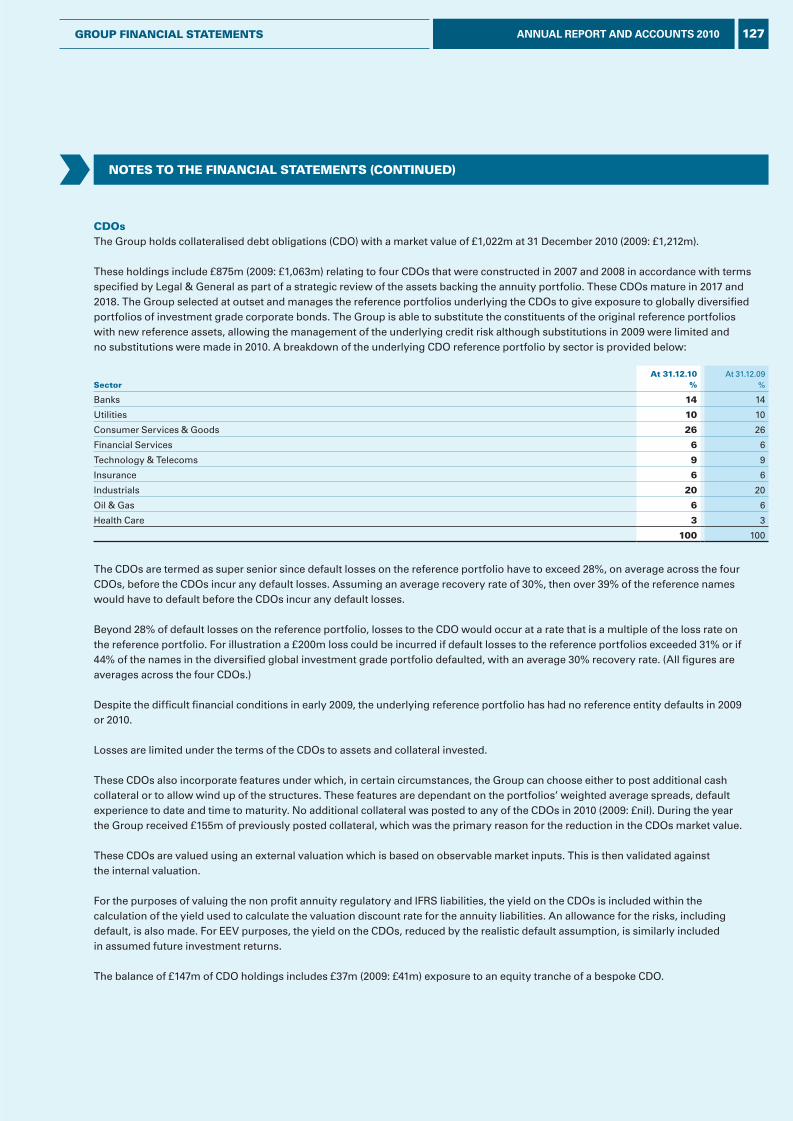
NOTES TO THE FINANCIAL STATEMENTS (CONTINuEd)
CdOsThe Group holds collateralised debt obligations (CDO) with a market value of £1,022m at 31 December 2010 (2009: £1,212m).
These holdings include £875m (2009: £1,063m) relating to four CDOs that were constructed in 2007 and 2008 in accordance with terms specified by Legal & General as part of a strategic review of the assets backing the annuity portfolio. These CDOs mature in 2017 and 2018. The Group selected at outset and manages the reference portfolios underlying the CDOs to give exposure to globally diversified portfolios of investment grade corporate bonds. The Group is able to substitute the constituents of the original reference portfolios with new reference assets, allowing the management of the underlying credit risk although substitutions in 2009 were limited and no substitutions were made in 2010. A breakdown of the underlying CDO reference portfolio by sector is provided below:
SectorAt 31.12.10
%At 31.12.09
%
Banks 14 14
Utilities 10 10
Consumer Services & Goods 26 26
Financial Services 6 6
Technology & Telecoms 9 9
Insurance 6 6
Industrials 20 20
Oil & Gas 6 6
Health Care 3 3
100 100
The CDOs are termed as super senior since default losses on the reference portfolio have to exceed 28%, on average across the four CDOs, before the CDOs incur any default losses. Assuming an average recovery rate of 30%, then over 39% of the reference names would have to default before the CDOs incur any default losses.
Beyond 28% of default losses on the reference portfolio, losses to the CDO would occur at a rate that is a multiple of the loss rate on the reference portfolio. For illustration a £200m loss could be incurred if default losses to the reference portfolios exceeded 31% or if 44% of the names in the diversified global investment grade portfolio defaulted, with an average 30% recovery rate. (All figures are averages across the four CDOs.)
Despite the difficult financial conditions in early 2009, the underlying reference portfolio has had no reference entity defaults in 2009 or 2010.
Losses are limited under the terms of the CDOs to assets and collateral invested.
These CDOs also incorporate features under which, in certain circumstances, the Group can choose either to post additional cash collateral or to allow wind up of the structures. These features are dependant on the portfolios’ weighted average spreads, default experience to date and time to maturity. No additional collateral was posted to any of the CDOs in 2010 (2009: £nil). During the year the Group received £155m of previously posted collateral, which was the primary reason for the reduction in the CDOs market value.
These CDOs are valued using an external valuation which is based on observable market inputs. This is then validated against the internal valuation.
For the purposes of valuing the non profit annuity regulatory and IFRS liabilities, the yield on the CDOs is included within the calculation of the yield used to calculate the valuation discount rate for the annuity liabilities. An allowance for the risks, including default, is also made. For EEV purposes, the yield on the CDOs, reduced by the realistic default assumption, is similarly included in assumed future investment returns.
The balance of £147m of CDO holdings includes £37m (2009: £41m) exposure to an equity tranche of a bespoke CDO.
127ANNUAL REPORT AND ACCOUNTS 2010GROuP FINANCIAL STATEMENTS
L&G_AR10_16-Notes21-28_p125-139_230311_AT.indd 127 25/03/2011 11:27
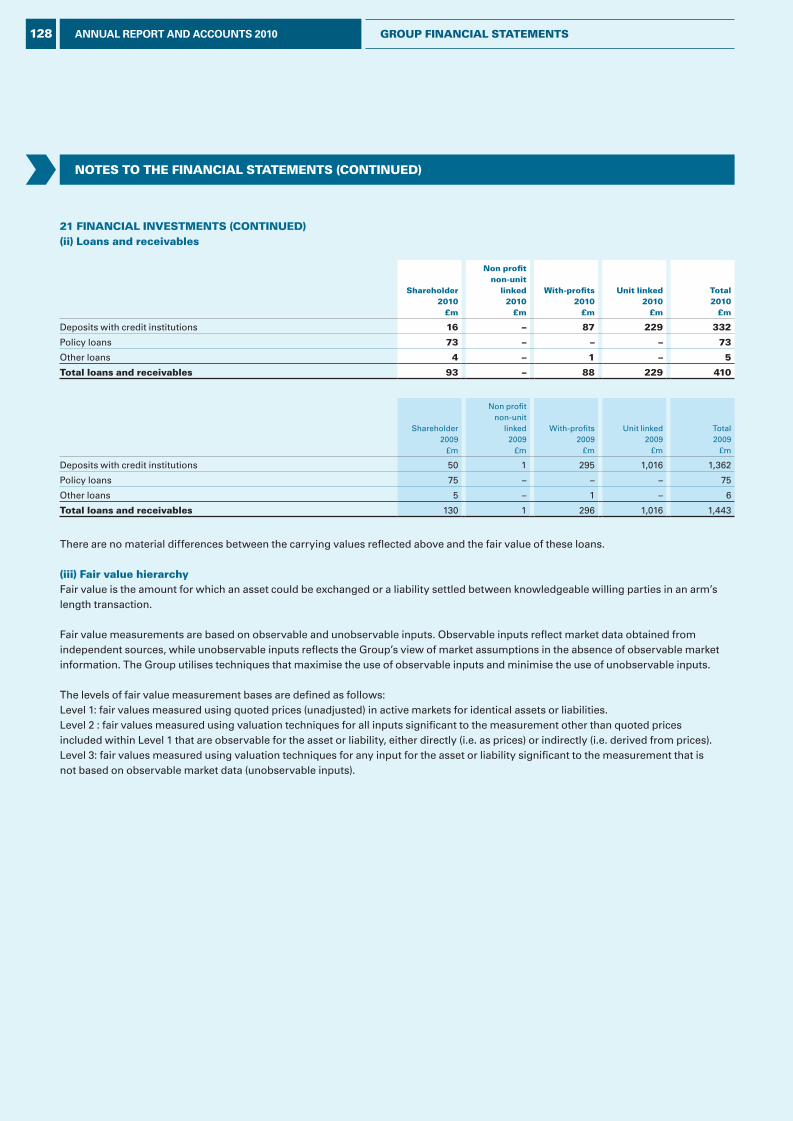
NOTES TO THE FINANCIAL STATEMENTS (CONTINuEd)
21 FINANCIAL INvESTMENTS (CONTINuEd)(ii) Loans and receivables
Shareholder2010
£m
Non profit non-unit
linked2010
£m
With-profits2010
£m
unit linked2010
£m
Total2010
£m
Deposits with credit institutions 16 – 87 229 332
Policy loans 73 – – – 73
Other loans 4 – 1 – 5
Total loans and receivables 93 – 88 229 410
Shareholder2009
£m
Non profit non-unit
linked2009
£m
With-profits2009
£m
Unit linked2009
£m
Total2009
£m
Deposits with credit institutions 50 1 295 1,016 1,362
Policy loans 75 – – – 75
Other loans 5 – 1 – 6
Total loans and receivables 130 1 296 1,016 1,443
There are no material differences between the carrying values reflected above and the fair value of these loans.
(iii) Fair value hierarchyFair value is the amount for which an asset could be exchanged or a liability settled between knowledgeable willing parties in an arm’s length transaction.
Fair value measurements are based on observable and unobservable inputs. Observable inputs reflect market data obtained from independent sources, while unobservable inputs reflects the Group’s view of market assumptions in the absence of observable market information. The Group utilises techniques that maximise the use of observable inputs and minimise the use of unobservable inputs.
The levels of fair value measurement bases are defined as follows:Level 1: fair values measured using quoted prices (unadjusted) in active markets for identical assets or liabilities.Level 2 : fair values measured using valuation techniques for all inputs significant to the measurement other than quoted prices included within Level 1 that are observable for the asset or liability, either directly (i.e. as prices) or indirectly (i.e. derived from prices).Level 3: fair values measured using valuation techniques for any input for the asset or liability significant to the measurement that is not based on observable market data (unobservable inputs).
128 ANNUAL REPORT AND ACCOUNTS 2010 GROuP FINANCIAL STATEMENTS
L&G_AR10_16-Notes21-28_p125-139_230311_AT.indd 128 25/03/2011 11:27
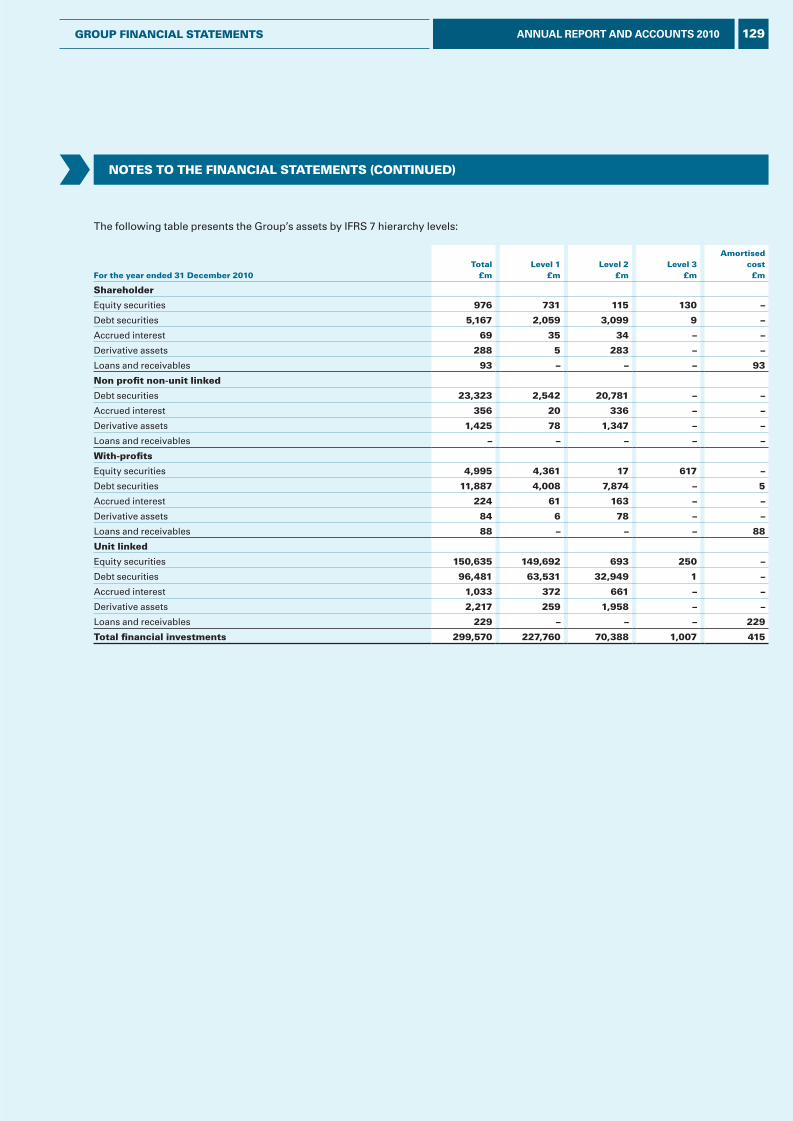
NOTES TO THE FINANCIAL STATEMENTS (CONTINuEd)
The following table presents the Group’s assets by IFRS 7 hierarchy levels:
For the year ended 31 december 2010Total
£mLevel 1
£mLevel 2
£mLevel 3
£m
Amortisedcost£m
Shareholder
Equity securities 976 731 115 130 –
Debt securities 5,167 2,059 3,099 9 –
Accrued interest 69 35 34 – –
Derivative assets 288 5 283 – –
Loans and receivables 93 – – – 93
Non profit non-unit linked
Debt securities 23,323 2,542 20,781 – –
Accrued interest 356 20 336 – –
Derivative assets 1,425 78 1,347 – –
Loans and receivables – – – – –
With-profits
Equity securities 4,995 4,361 17 617 –
Debt securities 11,887 4,008 7,874 – 5
Accrued interest 224 61 163 – –
Derivative assets 84 6 78 – –
Loans and receivables 88 – – – 88
unit linked
Equity securities 150,635 149,692 693 250 –
Debt securities 96,481 63,531 32,949 1 –
Accrued interest 1,033 372 661 – –
Derivative assets 2,217 259 1,958 – –
Loans and receivables 229 – – – 229
Total financial investments 299,570 227,760 70,388 1,007 415
129ANNUAL REPORT AND ACCOUNTS 2010GROuP FINANCIAL STATEMENTS
L&G_AR10_16-Notes21-28_p125-139_230311_AT.indd 129 25/03/2011 11:27
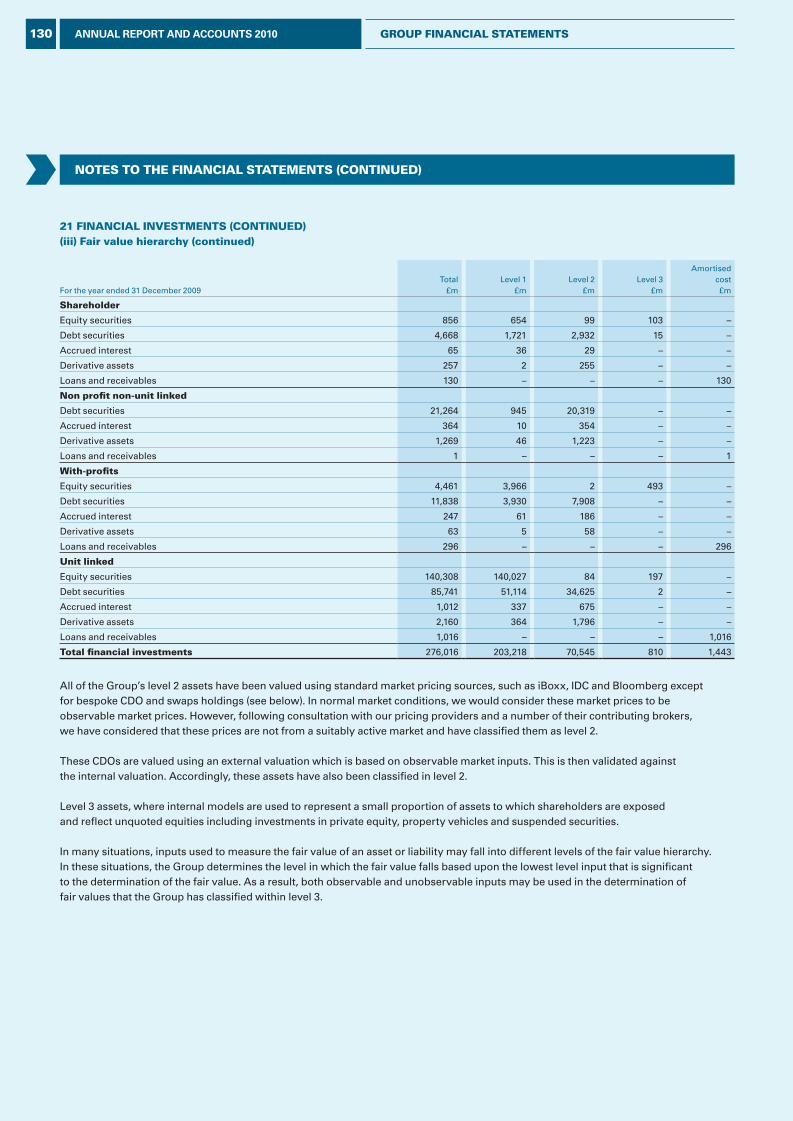
NOTES TO THE FINANCIAL STATEMENTS (CONTINuEd)
21 FINANCIAL INvESTMENTS (CONTINuEd)(iii) Fair value hierarchy (continued)
For the year ended 31 December 2009Total
£mLevel 1
£mLevel 2
£mLevel 3
£m
Amortisedcost£m
Shareholder
Equity securities 856 654 99 103 –
Debt securities 4,668 1,721 2,932 15 –
Accrued interest 65 36 29 – –
Derivative assets 257 2 255 – –
Loans and receivables 130 – – – 130
Non profit non-unit linked
Debt securities 21,264 945 20,319 – –
Accrued interest 364 10 354 – –
Derivative assets 1,269 46 1,223 – –
Loans and receivables 1 – – – 1
With-profits
Equity securities 4,461 3,966 2 493 –
Debt securities 11,838 3,930 7,908 – –
Accrued interest 247 61 186 – –
Derivative assets 63 5 58 – –
Loans and receivables 296 – – – 296
unit linked
Equity securities 140,308 140,027 84 197 –
Debt securities 85,741 51,114 34,625 2 –
Accrued interest 1,012 337 675 – –
Derivative assets 2,160 364 1,796 – –
Loans and receivables 1,016 – – – 1,016
Total financial investments 276,016 203,218 70,545 810 1,443
All of the Group’s level 2 assets have been valued using standard market pricing sources, such as iBoxx, IDC and Bloomberg except for bespoke CDO and swaps holdings (see below). In normal market conditions, we would consider these market prices to be observable market prices. However, following consultation with our pricing providers and a number of their contributing brokers, we have considered that these prices are not from a suitably active market and have classified them as level 2.
These CDOs are valued using an external valuation which is based on observable market inputs. This is then validated against the internal valuation. Accordingly, these assets have also been classified in level 2.
Level 3 assets, where internal models are used to represent a small proportion of assets to which shareholders are exposed and reflect unquoted equities including investments in private equity, property vehicles and suspended securities.
In many situations, inputs used to measure the fair value of an asset or liability may fall into different levels of the fair value hierarchy. In these situations, the Group determines the level in which the fair value falls based upon the lowest level input that is significant to the determination of the fair value. As a result, both observable and unobservable inputs may be used in the determination of fair values that the Group has classified within level 3.
130 ANNUAL REPORT AND ACCOUNTS 2010 GROuP FINANCIAL STATEMENTS
L&G_AR10_16-Notes21-28_p125-139_230311_AT.indd 130 25/03/2011 11:27
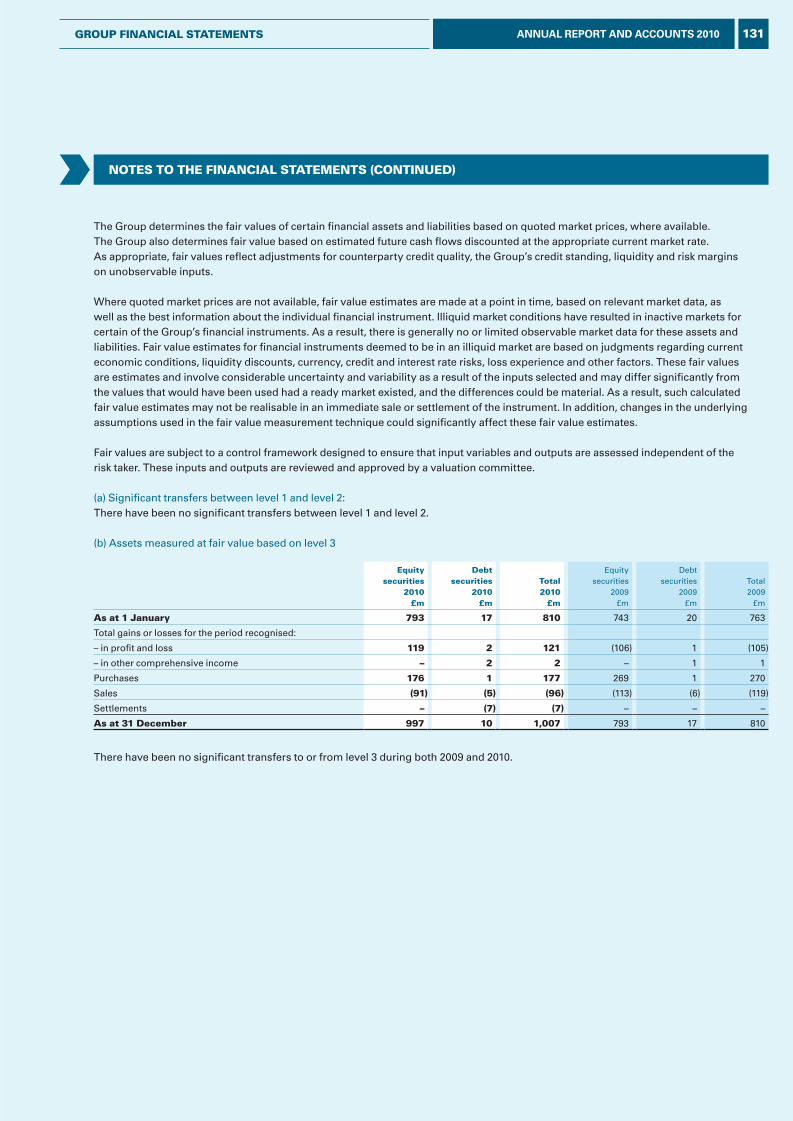
The Group determines the fair values of certain financial assets and liabilities based on quoted market prices, where available. The Group also determines fair value based on estimated future cash flows discounted at the appropriate current market rate. As appropriate, fair values reflect adjustments for counterparty credit quality, the Group’s credit standing, liquidity and risk margins on unobservable inputs.
Where quoted market prices are not available, fair value estimates are made at a point in time, based on relevant market data, as well as the best information about the individual financial instrument. Illiquid market conditions have resulted in inactive markets for certain of the Group’s financial instruments. As a result, there is generally no or limited observable market data for these assets and liabilities. Fair value estimates for financial instruments deemed to be in an illiquid market are based on judgments regarding current economic conditions, liquidity discounts, currency, credit and interest rate risks, loss experience and other factors. These fair values are estimates and involve considerable uncertainty and variability as a result of the inputs selected and may differ significantly from the values that would have been used had a ready market existed, and the differences could be material. As a result, such calculated fair value estimates may not be realisable in an immediate sale or settlement of the instrument. In addition, changes in the underlying assumptions used in the fair value measurement technique could significantly affect these fair value estimates.
Fair values are subject to a control framework designed to ensure that input variables and outputs are assessed independent of the risk taker. These inputs and outputs are reviewed and approved by a valuation committee.
(a) Significant transfers between level 1 and level 2:There have been no significant transfers between level 1 and level 2.
(b) Assets measured at fair value based on level 3
Equity securities
2010£m
debt securities
2010£m
Total2010
£m
Equity securities
2009£m
Debt securities
2009£m
Total2009
£m
As at 1 January 793 17 810 743 20 763
Total gains or losses for the period recognised:
– in profit and loss 119 2 121 (106) 1 (105)
– in other comprehensive income – 2 2 – 1 1
Purchases 176 1 177 269 1 270
Sales (91) (5) (96) (113) (6) (119)
Settlements – (7) (7) – – –
As at 31 december 997 10 1,007 793 17 810
There have been no significant transfers to or from level 3 during both 2009 and 2010.
NOTES TO THE FINANCIAL STATEMENTS (CONTINuEd)
131ANNUAL REPORT AND ACCOUNTS 2010GROuP FINANCIAL STATEMENTS
L&G_AR10_16-Notes21-28_p125-139_230311_AT.indd 131 25/03/2011 11:27
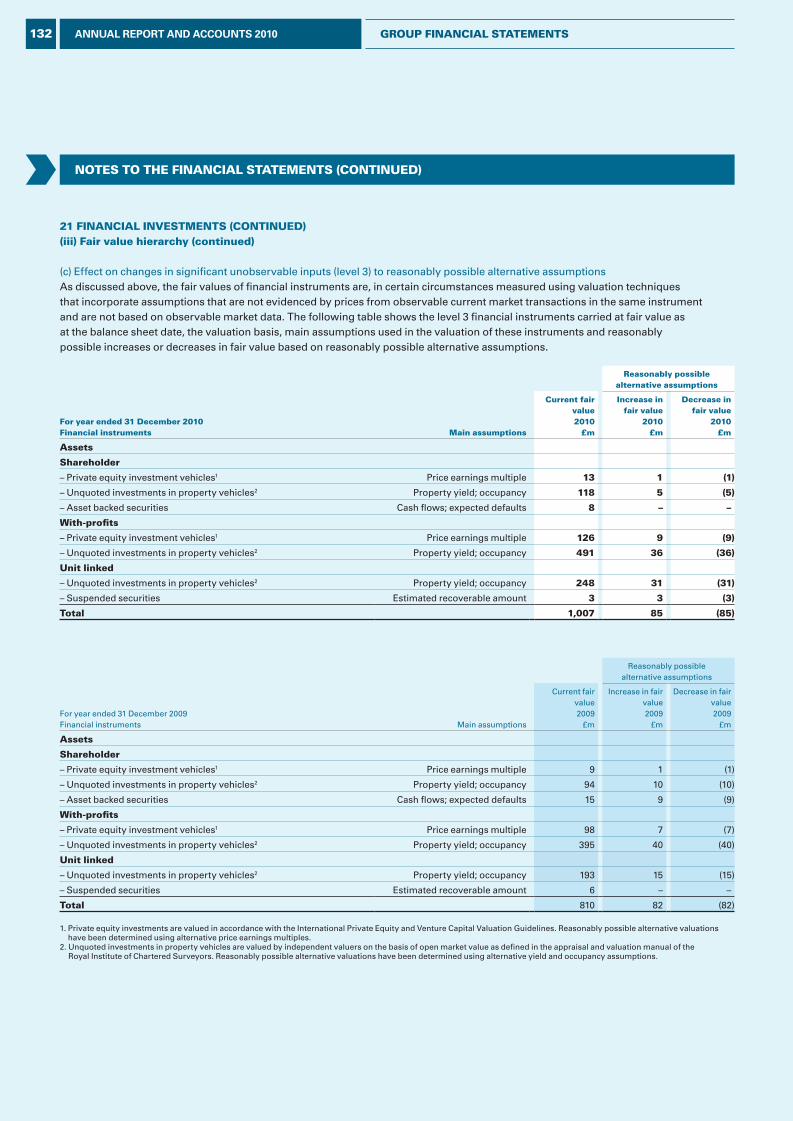
21 FINANCIAL INvESTMENTS (CONTINuEd)(iii) Fair value hierarchy (continued)
(c) Effect on changes in significant unobservable inputs (level 3) to reasonably possible alternative assumptionsAs discussed above, the fair values of financial instruments are, in certain circumstances measured using valuation techniques that incorporate assumptions that are not evidenced by prices from observable current market transactions in the same instrument and are not based on observable market data. The following table shows the level 3 financial instruments carried at fair value as at the balance sheet date, the valuation basis, main assumptions used in the valuation of these instruments and reasonably possible increases or decreases in fair value based on reasonably possible alternative assumptions.
Reasonably possible alternative assumptions
For year ended 31 december 2010Financial instruments Main assumptions
Current fair value2010
£m
Increase in fair value
2010£m
decrease in fair value
2010£m
Assets
Shareholder
– Private equity investment vehicles1 Price earnings multiple 13 1 (1)
– Unquoted investments in property vehicles2 Property yield; occupancy 118 5 (5)
– Asset backed securities Cash flows; expected defaults 8 – –
With-profits
– Private equity investment vehicles1 Price earnings multiple 126 9 (9)
– Unquoted investments in property vehicles2 Property yield; occupancy 491 36 (36)
unit linked
– Unquoted investments in property vehicles2 Property yield; occupancy 248 31 (31)
– Suspended securities Estimated recoverable amount 3 3 (3)
Total 1,007 85 (85)
Reasonably possible alternative assumptions
For year ended 31 December 2009Financial instruments Main assumptions
Current fairvalue2009
£m
Increase in fairvalue2009
£m
Decrease in fair value2009
£m
Assets
Shareholder
– Private equity investment vehicles1 Price earnings multiple 9 1 (1)
– Unquoted investments in property vehicles2 Property yield; occupancy 94 10 (10)
– Asset backed securities Cash flows; expected defaults 15 9 (9)
With-profits
– Private equity investment vehicles1 Price earnings multiple 98 7 (7)
– Unquoted investments in property vehicles2 Property yield; occupancy 395 40 (40)
unit linked
– Unquoted investments in property vehicles2 Property yield; occupancy 193 15 (15)
– Suspended securities Estimated recoverable amount 6 – –
Total 810 82 (82)
1. Private equity investments are valued in accordance with the International Private Equity and Venture Capital Valuation Guidelines. Reasonably possible alternative valuations have been determined using alternative price earnings multiples.
2. Unquoted investments in property vehicles are valued by independent valuers on the basis of open market value as defined in the appraisal and valuation manual of the Royal Institute of Chartered Surveyors. Reasonably possible alternative valuations have been determined using alternative yield and occupancy assumptions.
NOTES TO THE FINANCIAL STATEMENTS (CONTINuEd)
132 ANNUAL REPORT AND ACCOUNTS 2010 GROuP FINANCIAL STATEMENTS
L&G_AR10_16-Notes21-28_p125-139_230311_AT.indd 132 25/03/2011 11:27
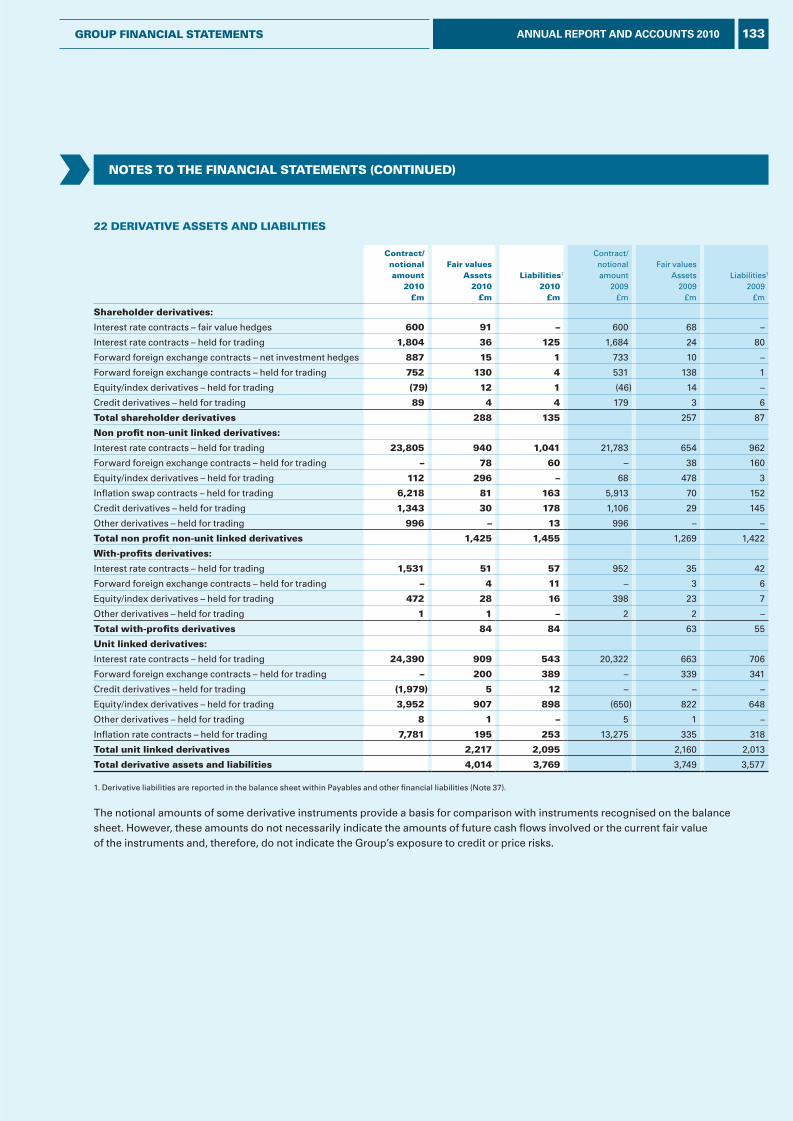
22 dERIvATIvE ASSETS ANd LIAbILITIES
Contract/ notional amount
2010£m
Fair values Assets
2010£m
Liabilities1
2010£m
Contract/ notional amount
2009£m
Fair values Assets
2009£m
Liabilities1
2009£m
Shareholder derivatives:
Interest rate contracts – fair value hedges 600 91 – 600 68 –
Interest rate contracts – held for trading 1,804 36 125 1,684 24 80
Forward foreign exchange contracts – net investment hedges 887 15 1 733 10 –
Forward foreign exchange contracts – held for trading 752 130 4 531 138 1
Equity/index derivatives – held for trading (79) 12 1 (46) 14 –
Credit derivatives – held for trading 89 4 4 179 3 6
Total shareholder derivatives 288 135 257 87
Non profit non-unit linked derivatives:
Interest rate contracts – held for trading 23,805 940 1,041 21,783 654 962
Forward foreign exchange contracts – held for trading – 78 60 – 38 160
Equity/index derivatives – held for trading 112 296 – 68 478 3
Inflation swap contracts – held for trading 6,218 81 163 5,913 70 152
Credit derivatives – held for trading 1,343 30 178 1,106 29 145
Other derivatives – held for trading 996 – 13 996 – –
Total non profit non-unit linked derivatives 1,425 1,455 1,269 1,422
With-profits derivatives:
Interest rate contracts – held for trading 1,531 51 57 952 35 42
Forward foreign exchange contracts – held for trading – 4 11 – 3 6
Equity/index derivatives – held for trading 472 28 16 398 23 7
Other derivatives – held for trading 1 1 – 2 2 –
Total with-profits derivatives 84 84 63 55
unit linked derivatives:
Interest rate contracts – held for trading 24,390 909 543 20,322 663 706
Forward foreign exchange contracts – held for trading – 200 389 – 339 341
Credit derivatives – held for trading (1,979) 5 12 – – –
Equity/index derivatives – held for trading 3,952 907 898 (650) 822 648
Other derivatives – held for trading 8 1 – 5 1 –
Inflation rate contracts – held for trading 7,781 195 253 13,275 335 318
Total unit linked derivatives 2,217 2,095 2,160 2,013
Total derivative assets and liabilities 4,014 3,769 3,749 3,577
1. Derivative liabilities are reported in the balance sheet within Payables and other financial liabilities (Note 37).
The notional amounts of some derivative instruments provide a basis for comparison with instruments recognised on the balance sheet. However, these amounts do not necessarily indicate the amounts of future cash flows involved or the current fair value of the instruments and, therefore, do not indicate the Group’s exposure to credit or price risks.
NOTES TO THE FINANCIAL STATEMENTS (CONTINuEd)
133ANNUAL REPORT AND ACCOUNTS 2010GROuP FINANCIAL STATEMENTS
L&G_AR10_16-Notes21-28_p125-139_230311_AT.indd 133 25/03/2011 11:27
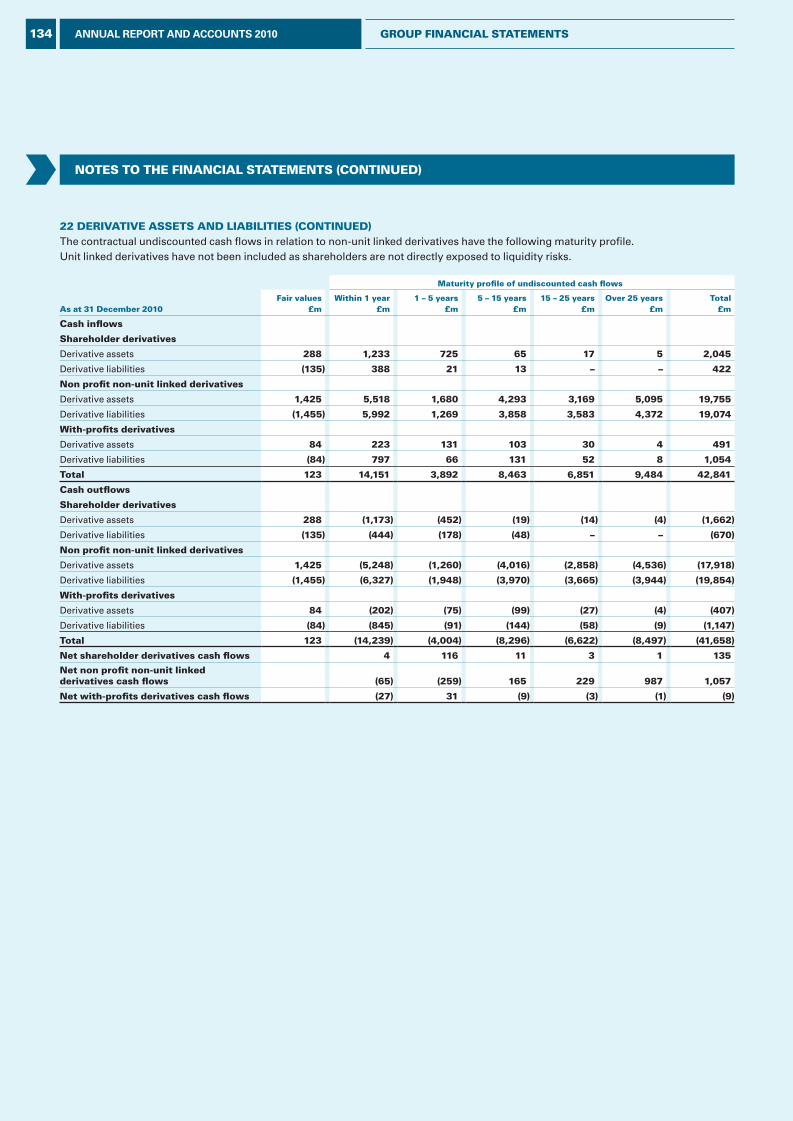
22 dERIvATIvE ASSETS ANd LIAbILITIES (CONTINuEd)The contractual undiscounted cash flows in relation to non-unit linked derivatives have the following maturity profile.Unit linked derivatives have not been included as shareholders are not directly exposed to liquidity risks.
Maturity profile of undiscounted cash flows
As at 31 december 2010Fair values
£mWithin 1 year
£m1 – 5 years
£m5 – 15 years
£m15 – 25 years
£mOver 25 years
£mTotal
£m
Cash inflows
Shareholder derivatives
Derivative assets 288 1,233 725 65 17 5 2,045
Derivative liabilities (135) 388 21 13 – – 422
Non profit non-unit linked derivatives
Derivative assets 1,425 5,518 1,680 4,293 3,169 5,095 19,755
Derivative liabilities (1,455) 5,992 1,269 3,858 3,583 4,372 19,074
With-profits derivatives
Derivative assets 84 223 131 103 30 4 491
Derivative liabilities (84) 797 66 131 52 8 1,054
Total 123 14,151 3,892 8,463 6,851 9,484 42,841
Cash outflows
Shareholder derivatives
Derivative assets 288 (1,173) (452) (19) (14) (4) (1,662)
Derivative liabilities (135) (444) (178) (48) – – (670)
Non profit non-unit linked derivatives
Derivative assets 1,425 (5,248) (1,260) (4,016) (2,858) (4,536) (17,918)
Derivative liabilities (1,455) (6,327) (1,948) (3,970) (3,665) (3,944) (19,854)
With-profits derivatives
Derivative assets 84 (202) (75) (99) (27) (4) (407)
Derivative liabilities (84) (845) (91) (144) (58) (9) (1,147)
Total 123 (14,239) (4,004) (8,296) (6,622) (8,497) (41,658)
Net shareholder derivatives cash flows 4 116 11 3 1 135
Net non profit non-unit linked derivatives cash flows (65) (259) 165 229 987 1,057
Net with-profits derivatives cash flows (27) 31 (9) (3) (1) (9)
NOTES TO THE FINANCIAL STATEMENTS (CONTINuEd)
134 ANNUAL REPORT AND ACCOUNTS 2010 GROuP FINANCIAL STATEMENTS
L&G_AR10_16-Notes21-28_p125-139_230311_AT.indd 134 25/03/2011 11:27
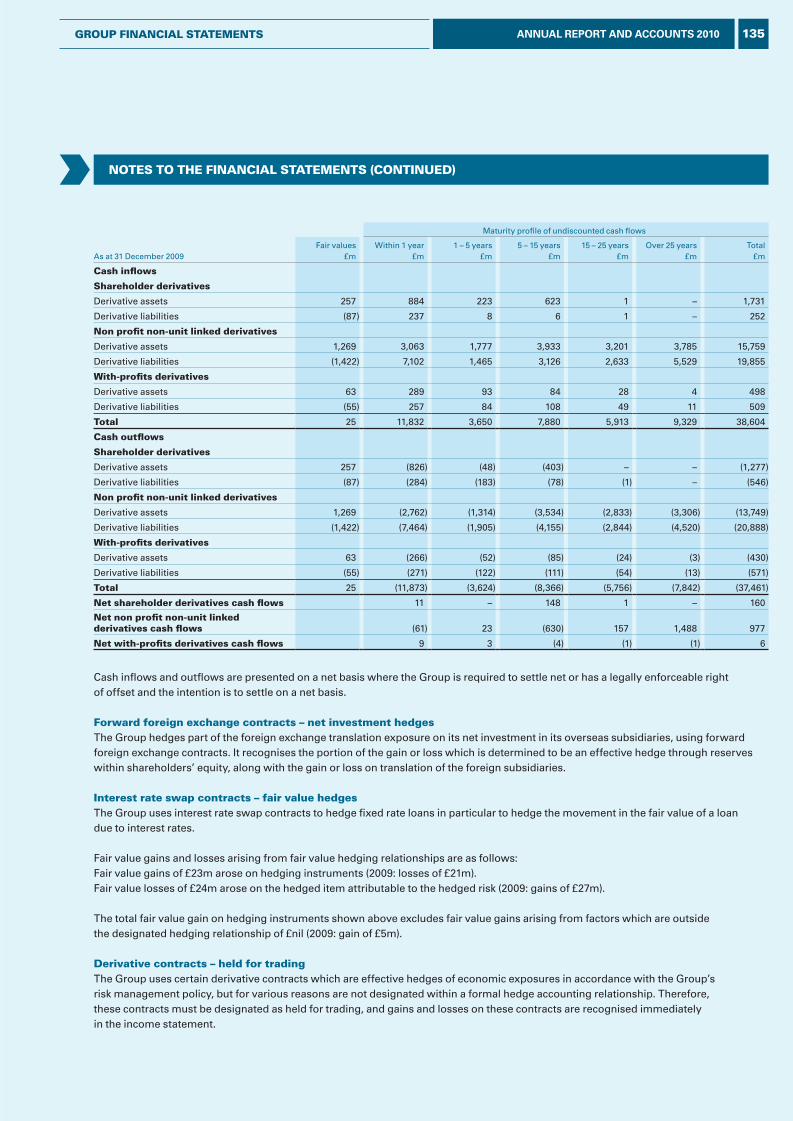
Maturity profile of undiscounted cash flows
As at 31 December 2009Fair values
£mWithin 1 year
£m1 – 5 years
£m5 – 15 years
£m15 – 25 years
£mOver 25 years
£mTotal
£m
Cash inflows
Shareholder derivatives
Derivative assets 257 884 223 623 1 – 1,731
Derivative liabilities (87) 237 8 6 1 – 252
Non profit non-unit linked derivatives
Derivative assets 1,269 3,063 1,777 3,933 3,201 3,785 15,759
Derivative liabilities (1,422) 7,102 1,465 3,126 2,633 5,529 19,855
With-profits derivatives
Derivative assets 63 289 93 84 28 4 498
Derivative liabilities (55) 257 84 108 49 11 509
Total 25 11,832 3,650 7,880 5,913 9,329 38,604
Cash outflows
Shareholder derivatives
Derivative assets 257 (826) (48) (403) – – (1,277)
Derivative liabilities (87) (284) (183) (78) (1) – (546)
Non profit non-unit linked derivatives
Derivative assets 1,269 (2,762) (1,314) (3,534) (2,833) (3,306) (13,749)
Derivative liabilities (1,422) (7,464) (1,905) (4,155) (2,844) (4,520) (20,888)
With-profits derivatives
Derivative assets 63 (266) (52) (85) (24) (3) (430)
Derivative liabilities (55) (271) (122) (111) (54) (13) (571)
Total 25 (11,873) (3,624) (8,366) (5,756) (7,842) (37,461)
Net shareholder derivatives cash flows 11 – 148 1 – 160
Net non profit non-unit linked derivatives cash flows (61) 23 (630) 157 1,488 977
Net with-profits derivatives cash flows 9 3 (4) (1) (1) 6
Cash inflows and outflows are presented on a net basis where the Group is required to settle net or has a legally enforceable right of offset and the intention is to settle on a net basis.
Forward foreign exchange contracts – net investment hedges The Group hedges part of the foreign exchange translation exposure on its net investment in its overseas subsidiaries, using forward foreign exchange contracts. It recognises the portion of the gain or loss which is determined to be an effective hedge through reserves within shareholders’ equity, along with the gain or loss on translation of the foreign subsidiaries.
Interest rate swap contracts – fair value hedges The Group uses interest rate swap contracts to hedge fixed rate loans in particular to hedge the movement in the fair value of a loan due to interest rates.
Fair value gains and losses arising from fair value hedging relationships are as follows:Fair value gains of £23m arose on hedging instruments (2009: losses of £21m).Fair value losses of £24m arose on the hedged item attributable to the hedged risk (2009: gains of £27m).
The total fair value gain on hedging instruments shown above excludes fair value gains arising from factors which are outside the designated hedging relationship of £nil (2009: gain of £5m).
derivative contracts – held for tradingThe Group uses certain derivative contracts which are effective hedges of economic exposures in accordance with the Group’s risk management policy, but for various reasons are not designated within a formal hedge accounting relationship. Therefore, these contracts must be designated as held for trading, and gains and losses on these contracts are recognised immediately in the income statement.
NOTES TO THE FINANCIAL STATEMENTS (CONTINuEd)
135ANNUAL REPORT AND ACCOUNTS 2010GROuP FINANCIAL STATEMENTS
L&G_AR10_16-Notes21-28_p125-139_230311_AT.indd 135 25/03/2011 11:27
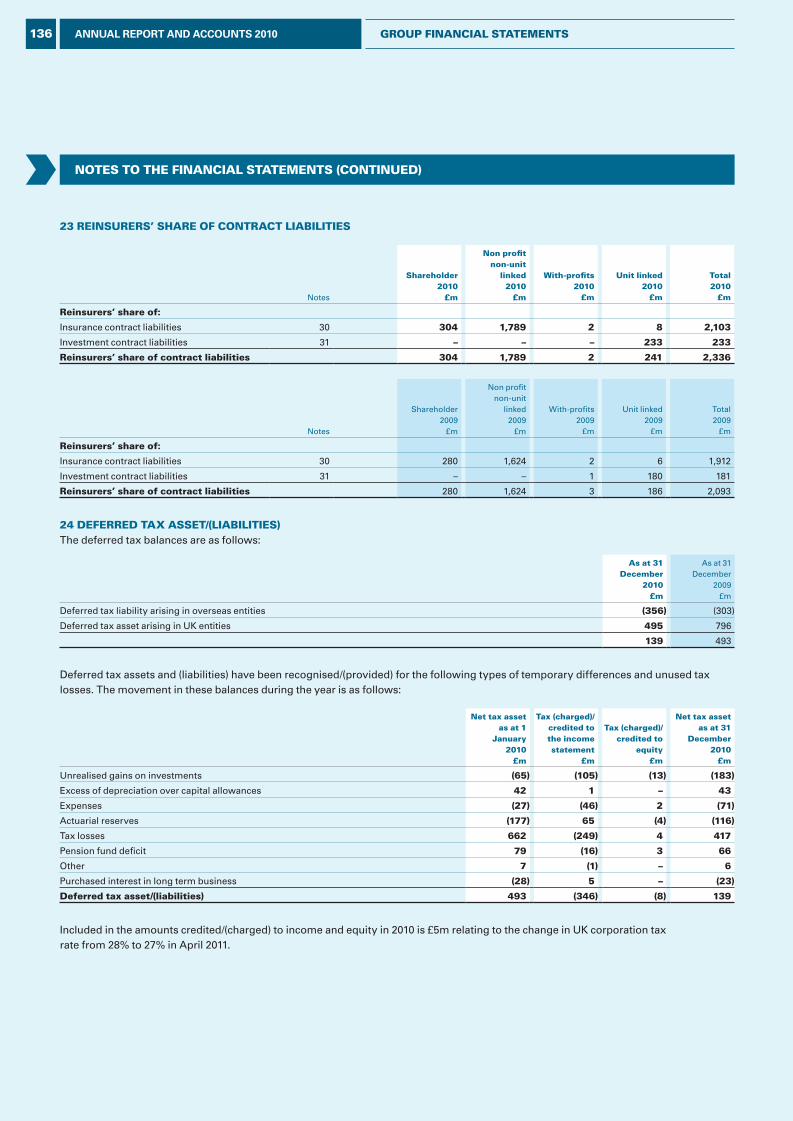
23 REINSuRERS’ SHARE OF CONTRACT LIAbILITIES
Notes
Shareholder2010
£m
Non profit non-unit
linked2010
£m
With-profits2010
£m
unit linked2010
£m
Total2010
£m
Reinsurers’ share of:
Insurance contract liabilities 30 304 1,789 2 8 2,103
Investment contract liabilities 31 – – – 233 233
Reinsurers’ share of contract liabilities 304 1,789 2 241 2,336
Notes
Shareholder2009
£m
Non profit non-unit
linked2009
£m
With-profits2009
£m
Unit linked2009
£m
Total2009
£m
Reinsurers’ share of:
Insurance contract liabilities 30 280 1,624 2 6 1,912
Investment contract liabilities 31 – – 1 180 181
Reinsurers’ share of contract liabilities 280 1,624 3 186 2,093
24 dEFERREd TAx ASSET/(LIAbILITIES)The deferred tax balances are as follows:
As at 31 december
2010£m
As at 31 December
2009£m
Deferred tax liability arising in overseas entities (356) (303)
Deferred tax asset arising in UK entities 495 796
139 493
Deferred tax assets and (liabilities) have been recognised/(provided) for the following types of temporary differences and unused tax losses. The movement in these balances during the year is as follows:
Net tax asset as at 1
January 2010
£m
Tax (charged)/ credited to the income statement
£m
Tax (charged)/ credited to
equity£m
Net tax asset as at 31
december 2010
£m
Unrealised gains on investments (65) (105) (13) (183)
Excess of depreciation over capital allowances 42 1 – 43
Expenses (27) (46) 2 (71)
Actuarial reserves (177) 65 (4) (116)
Tax losses 662 (249) 4 417
Pension fund deficit 79 (16) 3 66
Other 7 (1) – 6
Purchased interest in long term business (28) 5 – (23)
deferred tax asset/(liabilities) 493 (346) (8) 139
Included in the amounts credited/(charged) to income and equity in 2010 is £5m relating to the change in UK corporation taxrate from 28% to 27% in April 2011.
NOTES TO THE FINANCIAL STATEMENTS (CONTINuEd)
136 ANNUAL REPORT AND ACCOUNTS 2010 GROuP FINANCIAL STATEMENTS
L&G_AR10_16-Notes21-28_p125-139_230311_AT.indd 136 25/03/2011 11:27
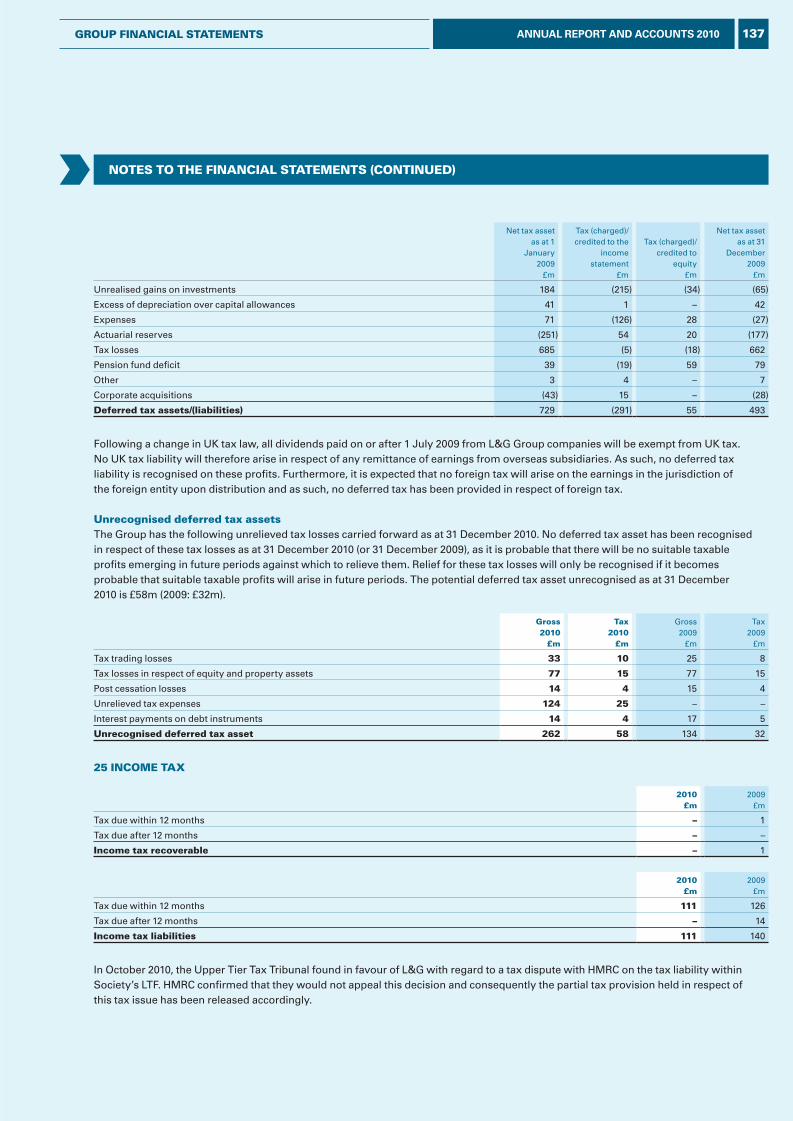
Net tax asset as at 1
January 2009
£m
Tax (charged)/credited to the
income statement
£m
Tax (charged)/ credited to
equity£m
Net tax asset as at 31
December 2009
£m
Unrealised gains on investments 184 (215) (34) (65)
Excess of depreciation over capital allowances 41 1 – 42
Expenses 71 (126) 28 (27)
Actuarial reserves (251) 54 20 (177)
Tax losses 685 (5) (18) 662
Pension fund deficit 39 (19) 59 79
Other 3 4 – 7
Corporate acquisitions (43) 15 – (28)
deferred tax assets/(liabilities) 729 (291) 55 493
Following a change in UK tax law, all dividends paid on or after 1 July 2009 from L&G Group companies will be exempt from UK tax. No UK tax liability will therefore arise in respect of any remittance of earnings from overseas subsidiaries. As such, no deferred tax liability is recognised on these profits. Furthermore, it is expected that no foreign tax will arise on the earnings in the jurisdiction of the foreign entity upon distribution and as such, no deferred tax has been provided in respect of foreign tax.
unrecognised deferred tax assetsThe Group has the following unrelieved tax losses carried forward as at 31 December 2010. No deferred tax asset has been recognised in respect of these tax losses as at 31 December 2010 (or 31 December 2009), as it is probable that there will be no suitable taxable profits emerging in future periods against which to relieve them. Relief for these tax losses will only be recognised if it becomes probable that suitable taxable profits will arise in future periods. The potential deferred tax asset unrecognised as at 31 December 2010 is £58m (2009: £32m).
Gross2010
£m
Tax2010
£m
Gross2009
£m
Tax2009
£m
Tax trading losses 33 10 25 8
Tax losses in respect of equity and property assets 77 15 77 15
Post cessation losses 14 4 15 4
Unrelieved tax expenses 124 25 – –
Interest payments on debt instruments 14 4 17 5
unrecognised deferred tax asset 262 58 134 32
25 INCOME TAx
2010£m
2009£m
Tax due within 12 months – 1
Tax due after 12 months – –
Income tax recoverable – 1
2010£m
2009£m
Tax due within 12 months 111 126
Tax due after 12 months – 14
Income tax liabilities 111 140
In October 2010, the Upper Tier Tax Tribunal found in favour of L&G with regard to a tax dispute with HMRC on the tax liability within Society’s LTF. HMRC confirmed that they would not appeal this decision and consequently the partial tax provision held in respect of this tax issue has been released accordingly.
NOTES TO THE FINANCIAL STATEMENTS (CONTINuEd)
137ANNUAL REPORT AND ACCOUNTS 2010GROuP FINANCIAL STATEMENTS
L&G_AR10_16-Notes21-28_p125-139_230311_AT.indd 137 25/03/2011 11:27
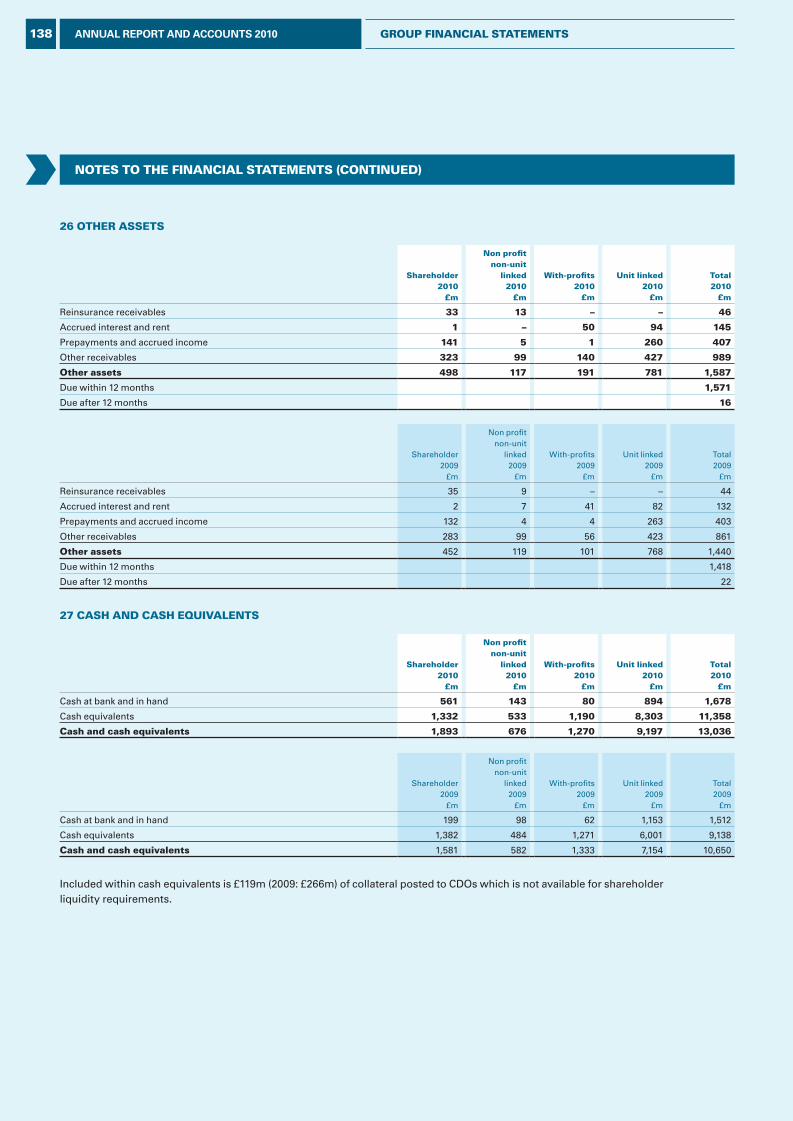
26 OTHER ASSETS
Shareholder2010
£m
Non profit non-unit
linked2010
£m
With-profits2010
£m
unit linked2010
£m
Total2010
£m
Reinsurance receivables 33 13 – – 46
Accrued interest and rent 1 – 50 94 145
Prepayments and accrued income 141 5 1 260 407
Other receivables 323 99 140 427 989
Other assets 498 117 191 781 1,587
Due within 12 months 1,571
Due after 12 months 16
Shareholder2009
£m
Non profit non-unit
linked2009
£m
With-profits2009
£m
Unit linked2009
£m
Total2009
£m
Reinsurance receivables 35 9 – – 44
Accrued interest and rent 2 7 41 82 132
Prepayments and accrued income 132 4 4 263 403
Other receivables 283 99 56 423 861
Other assets 452 119 101 768 1,440
Due within 12 months 1,418
Due after 12 months 22
27 CASH ANd CASH EquIvALENTS
Shareholder2010
£m
Non profit non-unit
linked2010
£m
With-profits2010
£m
unit linked2010
£m
Total2010
£m
Cash at bank and in hand 561 143 80 894 1,678
Cash equivalents 1,332 533 1,190 8,303 11,358
Cash and cash equivalents 1,893 676 1,270 9,197 13,036
Shareholder2009
£m
Non profit non-unit
linked2009
£m
With-profits2009
£m
Unit linked2009
£m
Total2009
£m
Cash at bank and in hand 199 98 62 1,153 1,512
Cash equivalents 1,382 484 1,271 6,001 9,138
Cash and cash equivalents 1,581 582 1,333 7,154 10,650
Included within cash equivalents is £119m (2009: £266m) of collateral posted to CDOs which is not available for shareholder liquidity requirements.
NOTES TO THE FINANCIAL STATEMENTS (CONTINuEd)
138 ANNUAL REPORT AND ACCOUNTS 2010 GROuP FINANCIAL STATEMENTS
L&G_AR10_16-Notes21-28_p125-139_230311_AT.indd 138 25/03/2011 11:27
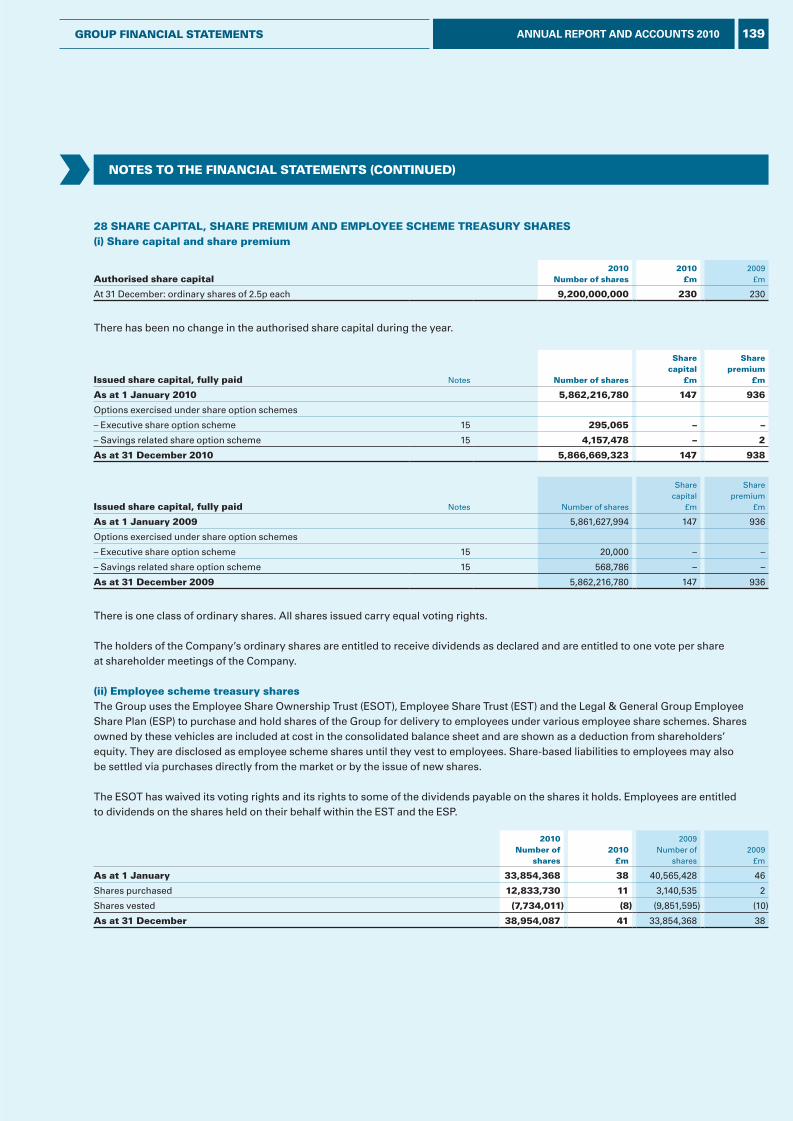
28 SHARE CAPITAL, SHARE PREMIuM ANd EMPLOyEE SCHEME TREASuRy SHARES(i) Share capital and share premium
Authorised share capital2010
Number of shares2010
£m2009
£m
At 31 December: ordinary shares of 2.5p each 9,200,000,000 230 230
There has been no change in the authorised share capital during the year.
Issued share capital, fully paid Notes Number of shares
Sharecapital
£m
Share premium
£m
As at 1 January 2010 5,862,216,780 147 936
Options exercised under share option schemes
– Executive share option scheme 15 295,065 – –
– Savings related share option scheme 15 4,157,478 – 2
As at 31 december 2010 5,866,669,323 147 938
Issued share capital, fully paid Notes Number of shares
Sharecapital
£m
Share premium
£m
As at 1 January 2009 5,861,627,994 147 936
Options exercised under share option schemes
– Executive share option scheme 15 20,000 – –
– Savings related share option scheme 15 568,786 – –
As at 31 december 2009 5,862,216,780 147 936
There is one class of ordinary shares. All shares issued carry equal voting rights.
The holders of the Company’s ordinary shares are entitled to receive dividends as declared and are entitled to one vote per share at shareholder meetings of the Company.
(ii) Employee scheme treasury sharesThe Group uses the Employee Share Ownership Trust (ESOT), Employee Share Trust (EST) and the Legal & General Group Employee Share Plan (ESP) to purchase and hold shares of the Group for delivery to employees under various employee share schemes. Shares owned by these vehicles are included at cost in the consolidated balance sheet and are shown as a deduction from shareholders’ equity. They are disclosed as employee scheme shares until they vest to employees. Share-based liabilities to employees may also be settled via purchases directly from the market or by the issue of new shares.
The ESOT has waived its voting rights and its rights to some of the dividends payable on the shares it holds. Employees are entitled to dividends on the shares held on their behalf within the EST and the ESP.
2010Number of
shares2010
£m
2009Number of
shares2009
£m
As at 1 January 33,854,368 38 40,565,428 46
Shares purchased 12,833,730 11 3,140,535 2
Shares vested (7,734,011) (8) (9,851,595) (10)
As at 31 december 38,954,087 41 33,854,368 38
NOTES TO THE FINANCIAL STATEMENTS (CONTINuEd)
139ANNUAL REPORT AND ACCOUNTS 2010GROuP FINANCIAL STATEMENTS
L&G_AR10_16-Notes21-28_p125-139_230311_AT.indd 139 25/03/2011 11:27
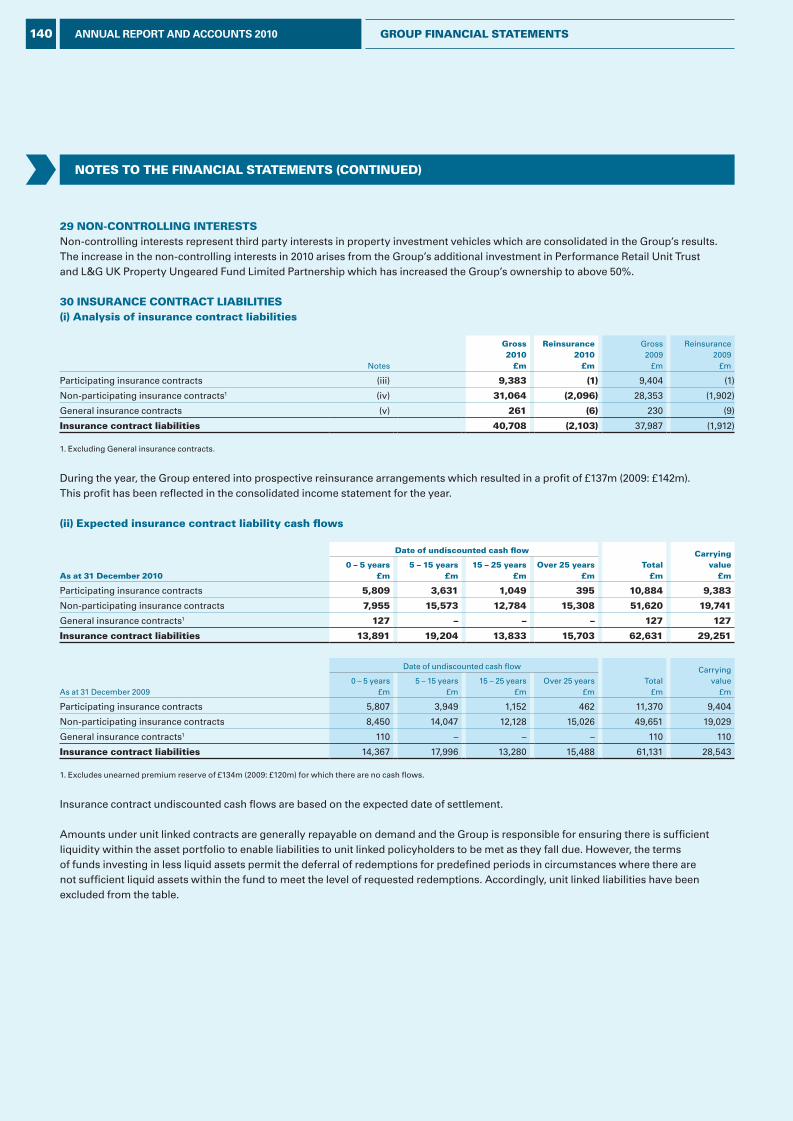
NOTES TO THE FINANCIAL STATEMENTS (CONTINuEd)
29 NON-CONTrOLLINg INTErESTSNon-controlling interests represent third party interests in property investment vehicles which are consolidated in the Group’s results. The increase in the non-controlling interests in 2010 arises from the Group’s additional investment in Performance Retail Unit Trust and L&G UK Property Ungeared Fund Limited Partnership which has increased the Group’s ownership to above 50%.
30 INSurANCE CONTrACT LIAbILITIES(i) Analysis of insurance contract liabilities
Notes
gross2010
£m
reinsurance2010
£m
Gross2009
£m
Reinsurance2009
£m
Participating insurance contracts (iii) 9,383 (1) 9,404 (1)
Non-participating insurance contracts1 (iv) 31,064 (2,096) 28,353 (1,902)
General insurance contracts (v) 261 (6) 230 (9)
Insurance contract liabilities 40,708 (2,103) 37,987 (1,912)
1. Excluding General insurance contracts.
During the year, the Group entered into prospective reinsurance arrangements which resulted in a profit of £137m (2009: £142m). This profit has been reflected in the consolidated income statement for the year.
(ii) Expected insurance contract liability cash flows
As at 31 december 2010
date of undiscounted cash flow
Total£m
Carrying value
£m0 – 5 years
£m5 – 15 years
£m15 – 25 years
£mOver 25 years
£m
Participating insurance contracts 5,809 3,631 1,049 395 10,884 9,383
Non-participating insurance contracts 7,955 15,573 12,784 15,308 51,620 19,741
General insurance contracts1 127 – – – 127 127
Insurance contract liabilities 13,891 19,204 13,833 15,703 62,631 29,251
As at 31 December 2009
Date of undiscounted cash flow
Total£m
Carrying value
£m0 – 5 years
£m5 – 15 years
£m15 – 25 years
£mOver 25 years
£m
Participating insurance contracts 5,807 3,949 1,152 462 11,370 9,404
Non-participating insurance contracts 8,450 14,047 12,128 15,026 49,651 19,029
General insurance contracts1 110 – – – 110 110
Insurance contract liabilities 14,367 17,996 13,280 15,488 61,131 28,543
1. Excludes unearned premium reserve of £134m (2009: £120m) for which there are no cash flows.
Insurance contract undiscounted cash flows are based on the expected date of settlement.
Amounts under unit linked contracts are generally repayable on demand and the Group is responsible for ensuring there is sufficient liquidity within the asset portfolio to enable liabilities to unit linked policyholders to be met as they fall due. However, the terms of funds investing in less liquid assets permit the deferral of redemptions for predefined periods in circumstances where there are not sufficient liquid assets within the fund to meet the level of requested redemptions. Accordingly, unit linked liabilities have been excluded from the table.
140 ANNUAL REPORT AND ACCOUNTS 2010 grOuP FINANCIAL STATEMENTS
L&G_AR10_17-Notes29-34_p140-150_230311_AT.indd 140 25/03/2011 11:27
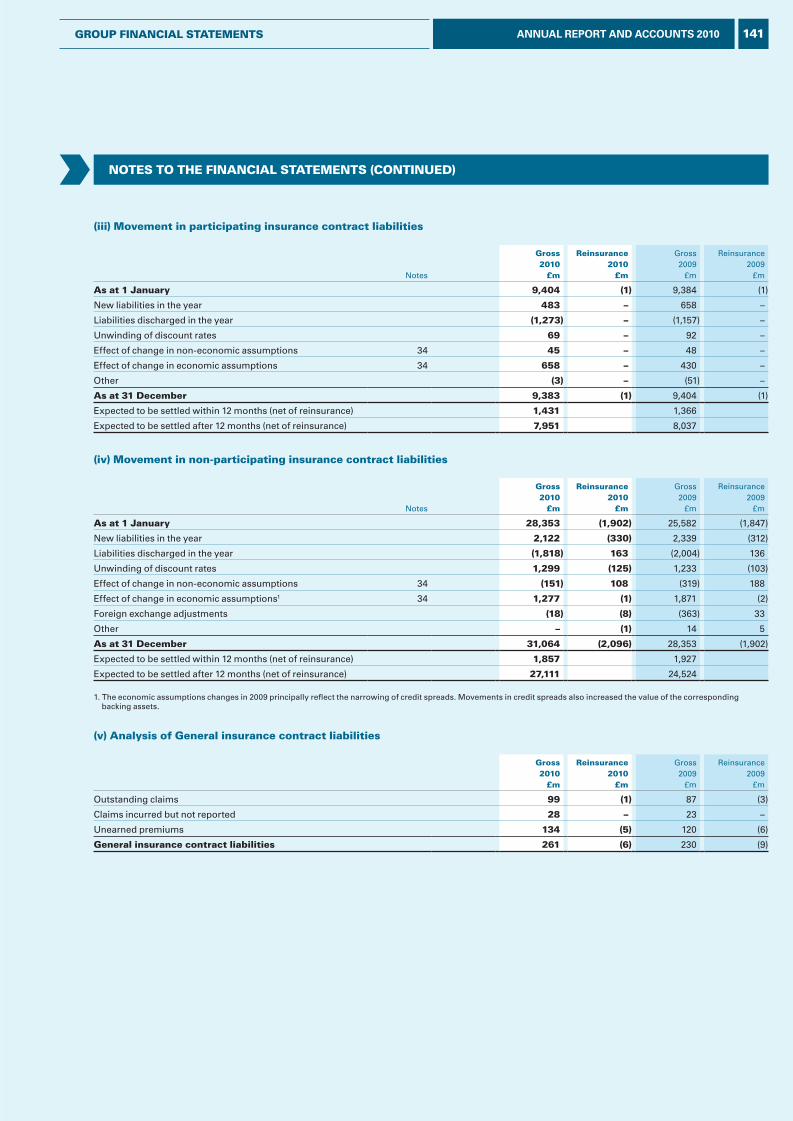
(iii) Movement in participating insurance contract liabilities
Notes
gross2010
£m
reinsurance2010
£m
Gross2009
£m
Reinsurance2009
£m
As at 1 January 9,404 (1) 9,384 (1)
New liabilities in the year 483 – 658 –
Liabilities discharged in the year (1,273) – (1,157) –
Unwinding of discount rates 69 – 92 –
Effect of change in non-economic assumptions 34 45 – 48 –
Effect of change in economic assumptions 34 658 – 430 –
Other (3) – (51) –
As at 31 december 9,383 (1) 9,404 (1)
Expected to be settled within 12 months (net of reinsurance) 1,431 1,366
Expected to be settled after 12 months (net of reinsurance) 7,951 8,037
(iv) Movement in non-participating insurance contract liabilities
Notes
gross2010
£m
reinsurance2010
£m
Gross2009
£m
Reinsurance2009
£m
As at 1 January 28,353 (1,902) 25,582 (1,847)
New liabilities in the year 2,122 (330) 2,339 (312)
Liabilities discharged in the year (1,818) 163 (2,004) 136
Unwinding of discount rates 1,299 (125) 1,233 (103)
Effect of change in non-economic assumptions 34 (151) 108 (319) 188
Effect of change in economic assumptions1 34 1,277 (1) 1,871 (2)
Foreign exchange adjustments (18) (8) (363) 33
Other – (1) 14 5
As at 31 december 31,064 (2,096) 28,353 (1,902)
Expected to be settled within 12 months (net of reinsurance) 1,857 1,927
Expected to be settled after 12 months (net of reinsurance) 27,111 24,524
1. The economic assumptions changes in 2009 principally reflect the narrowing of credit spreads. Movements in credit spreads also increased the value of the corresponding backing assets.
(v) Analysis of general insurance contract liabilities
gross2010
£m
reinsurance2010
£m
Gross2009
£m
Reinsurance2009
£m
Outstanding claims 99 (1) 87 (3)
Claims incurred but not reported 28 – 23 –
Unearned premiums 134 (5) 120 (6)
general insurance contract liabilities 261 (6) 230 (9)
NOTES TO THE FINANCIAL STATEMENTS (CONTINuEd)
141ANNUAL REPORT AND ACCOUNTS 2010grOuP FINANCIAL STATEMENTS
L&G_AR10_17-Notes29-34_p140-150_230311_AT.indd 141 25/03/2011 11:27
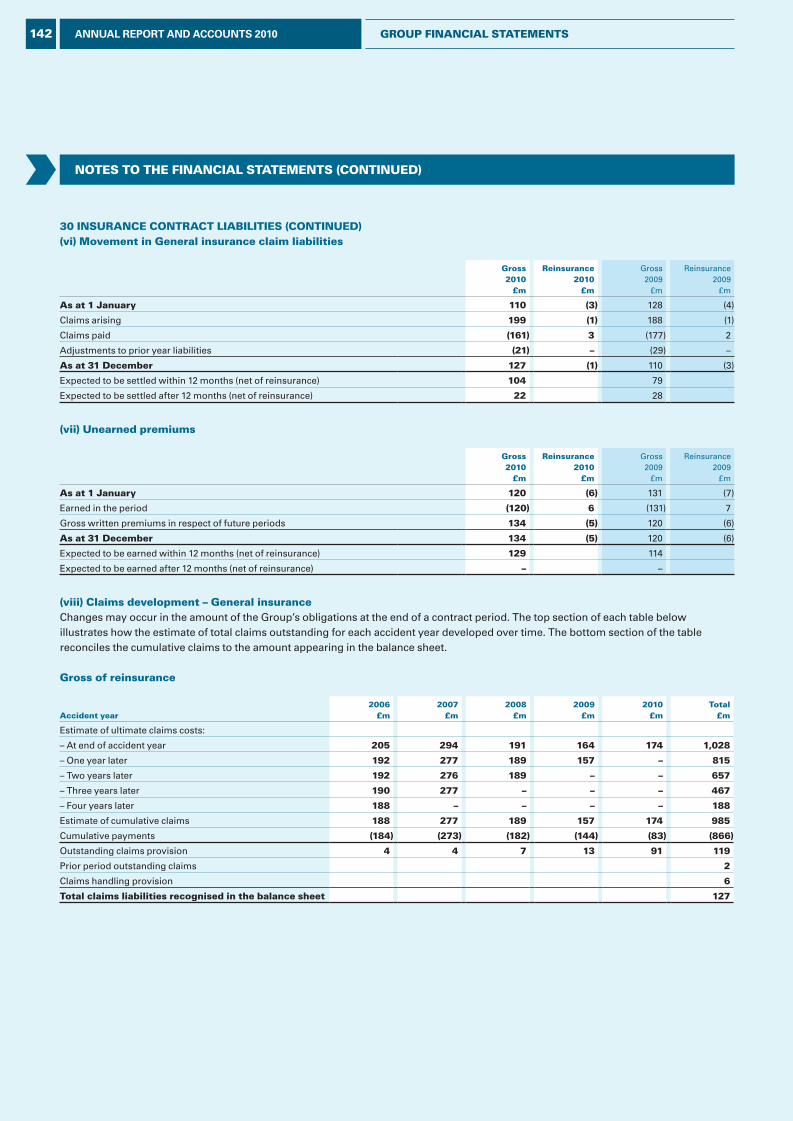
30 INSurANCE CONTrACT LIAbILITIES (CONTINuEd)(vi) Movement in general insurance claim liabilities
gross2010
£m
reinsurance2010
£m
Gross2009
£m
Reinsurance2009
£m
As at 1 January 110 (3) 128 (4)
Claims arising 199 (1) 188 (1)
Claims paid (161) 3 (177) 2
Adjustments to prior year liabilities (21) – (29) –
As at 31 december 127 (1) 110 (3)
Expected to be settled within 12 months (net of reinsurance) 104 79
Expected to be settled after 12 months (net of reinsurance) 22 28
(vii) unearned premiums
gross2010
£m
reinsurance2010
£m
Gross2009
£m
Reinsurance2009
£m
As at 1 January 120 (6) 131 (7)
Earned in the period (120) 6 (131) 7
Gross written premiums in respect of future periods 134 (5) 120 (6)
As at 31 december 134 (5) 120 (6)
Expected to be earned within 12 months (net of reinsurance) 129 114
Expected to be earned after 12 months (net of reinsurance) – –
(viii) Claims development – general insuranceChanges may occur in the amount of the Group’s obligations at the end of a contract period. The top section of each table below illustrates how the estimate of total claims outstanding for each accident year developed over time. The bottom section of the table reconciles the cumulative claims to the amount appearing in the balance sheet.
gross of reinsurance
Accident year2006
£m2007
£m2008
£m2009
£m2010
£mTotal
£m
Estimate of ultimate claims costs:
– At end of accident year 205 294 191 164 174 1,028
– One year later 192 277 189 157 – 815
– Two years later 192 276 189 – – 657
– Three years later 190 277 – – – 467
– Four years later 188 – – – – 188
Estimate of cumulative claims 188 277 189 157 174 985
Cumulative payments (184) (273) (182) (144) (83) (866)
Outstanding claims provision 4 4 7 13 91 119
Prior period outstanding claims 2
Claims handling provision 6
Total claims liabilities recognised in the balance sheet 127
NOTES TO THE FINANCIAL STATEMENTS (CONTINuEd)
142 ANNUAL REPORT AND ACCOUNTS 2010 grOuP FINANCIAL STATEMENTS
L&G_AR10_17-Notes29-34_p140-150_230311_AT.indd 142 25/03/2011 11:27
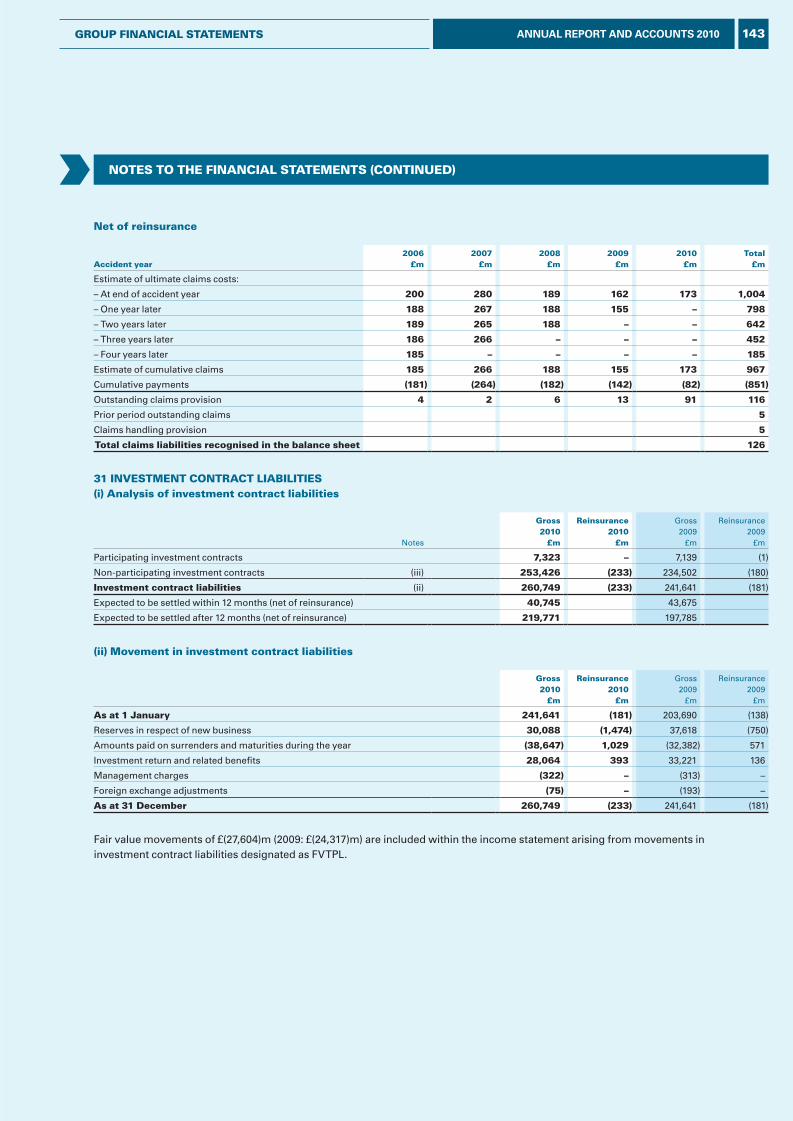
Net of reinsurance
Accident year2006
£m2007
£m2008
£m2009
£m2010
£mTotal
£m
Estimate of ultimate claims costs:
– At end of accident year 200 280 189 162 173 1,004
– One year later 188 267 188 155 – 798
– Two years later 189 265 188 – – 642
– Three years later 186 266 – – – 452
– Four years later 185 – – – – 185
Estimate of cumulative claims 185 266 188 155 173 967
Cumulative payments (181) (264) (182) (142) (82) (851)
Outstanding claims provision 4 2 6 13 91 116
Prior period outstanding claims 5
Claims handling provision 5
Total claims liabilities recognised in the balance sheet 126
31 INvESTMENT CONTrACT LIAbILITIES(i) Analysis of investment contract liabilities
Notes
gross2010
£m
reinsurance2010
£m
Gross2009
£m
Reinsurance2009
£m
Participating investment contracts 7,323 – 7,139 (1)
Non-participating investment contracts (iii) 253,426 (233) 234,502 (180)
Investment contract liabilities (ii) 260,749 (233) 241,641 (181)
Expected to be settled within 12 months (net of reinsurance) 40,745 43,675
Expected to be settled after 12 months (net of reinsurance) 219,771 197,785
(ii) Movement in investment contract liabilities
gross2010
£m
reinsurance2010
£m
Gross2009
£m
Reinsurance2009
£m
As at 1 January 241,641 (181) 203,690 (138)
Reserves in respect of new business 30,088 (1,474) 37,618 (750)
Amounts paid on surrenders and maturities during the year (38,647) 1,029 (32,382) 571
Investment return and related benefits 28,064 393 33,221 136
Management charges (322) – (313) –
Foreign exchange adjustments (75) – (193) –
As at 31 december 260,749 (233) 241,641 (181)
Fair value movements of £(27,604)m (2009: £(24,317)m) are included within the income statement arising from movements in investment contract liabilities designated as FVTPL.
NOTES TO THE FINANCIAL STATEMENTS (CONTINuEd)
143ANNUAL REPORT AND ACCOUNTS 2010grOuP FINANCIAL STATEMENTS
L&G_AR10_17-Notes29-34_p140-150_230311_AT.indd 143 25/03/2011 11:27
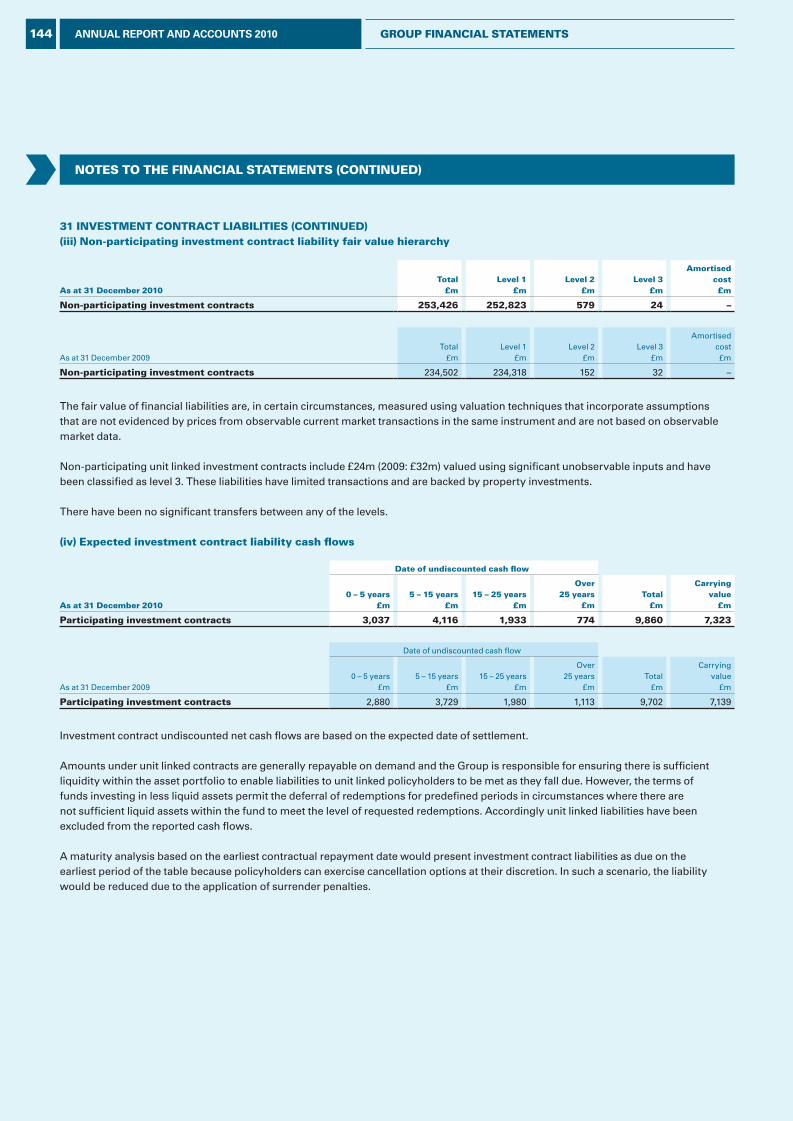
NOTES TO THE FINANCIAL STATEMENTS (CONTINuEd)
31 INvESTMENT CONTrACT LIAbILITIES (CONTINuEd)(iii) Non-participating investment contract liability fair value hierarchy
As at 31 december 2010Total
£mLevel 1
£mLevel 2
£mLevel 3
£m
Amortisedcost£m
Non-participating investment contracts 253,426 252,823 579 24 –
As at 31 December 2009Total
£mLevel 1
£mLevel 2
£mLevel 3
£m
Amortisedcost£m
Non-participating investment contracts 234,502 234,318 152 32 –
The fair value of financial liabilities are, in certain circumstances, measured using valuation techniques that incorporate assumptions that are not evidenced by prices from observable current market transactions in the same instrument and are not based on observable market data.
Non-participating unit linked investment contracts include £24m (2009: £32m) valued using significant unobservable inputs and have been classified as level 3. These liabilities have limited transactions and are backed by property investments.
There have been no significant transfers between any of the levels.
(iv) Expected investment contract liability cash flows
date of undiscounted cash flow
As at 31 december 20100 – 5 years
£m5 – 15 years
£m15 – 25 years
£m
Over 25 years
£mTotal
£m
Carryingvalue
£m
Participating investment contracts 3,037 4,116 1,933 774 9,860 7,323
Date of undiscounted cash flow
As at 31 December 20090 – 5 years
£m5 – 15 years
£m15 – 25 years
£m
Over25 years
£mTotal
£m
Carryingvalue
£m
Participating investment contracts 2,880 3,729 1,980 1,113 9,702 7,139
Investment contract undiscounted net cash flows are based on the expected date of settlement.
Amounts under unit linked contracts are generally repayable on demand and the Group is responsible for ensuring there is sufficient liquidity within the asset portfolio to enable liabilities to unit linked policyholders to be met as they fall due. However, the terms of funds investing in less liquid assets permit the deferral of redemptions for predefined periods in circumstances where there are not sufficient liquid assets within the fund to meet the level of requested redemptions. Accordingly unit linked liabilities have been excluded from the reported cash flows.
A maturity analysis based on the earliest contractual repayment date would present investment contract liabilities as due on the earliest period of the table because policyholders can exercise cancellation options at their discretion. In such a scenario, the liability would be reduced due to the application of surrender penalties.
144 ANNUAL REPORT AND ACCOUNTS 2010 grOuP FINANCIAL STATEMENTS
L&G_AR10_17-Notes29-34_p140-150_230311_AT.indd 144 25/03/2011 11:27
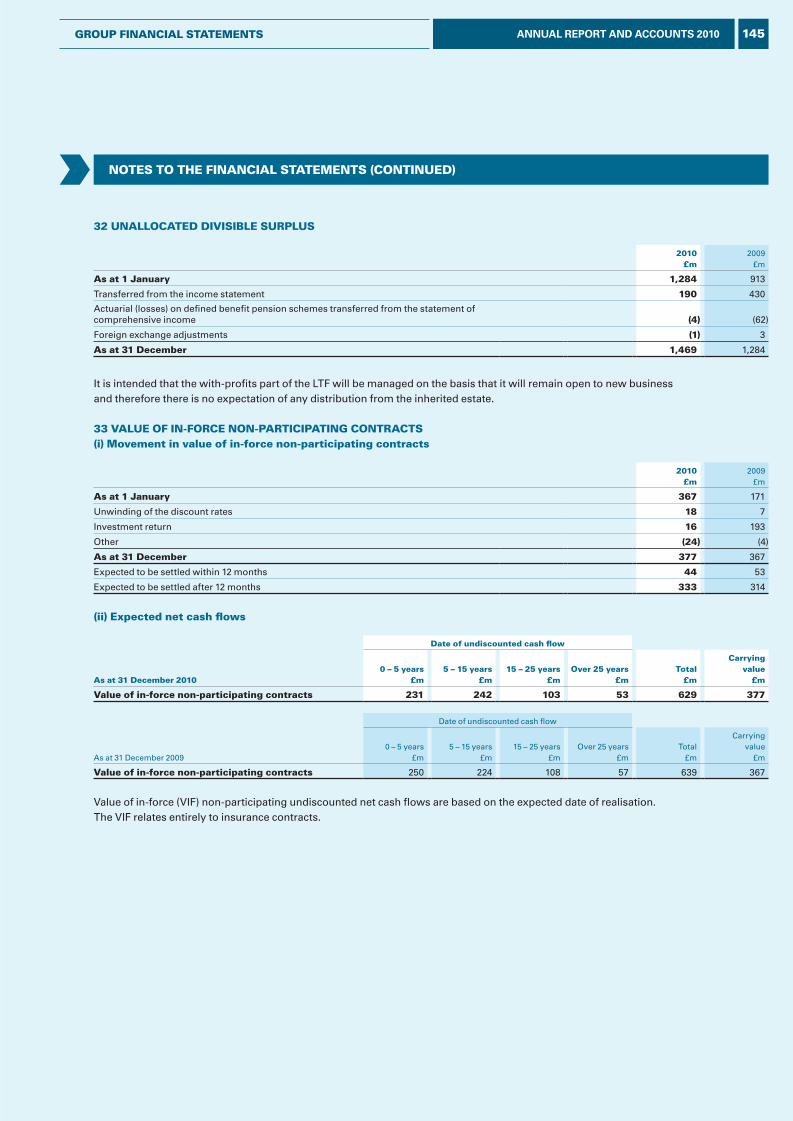
32 uNALLOCATEd dIvISIbLE SurPLuS
2010£m
2009£m
As at 1 January 1,284 913
Transferred from the income statement 190 430
Actuarial (losses) on defined benefit pension schemes transferred from the statement of comprehensive income (4) (62)
Foreign exchange adjustments (1) 3
As at 31 december 1,469 1,284
It is intended that the with-profits part of the LTF will be managed on the basis that it will remain open to new business and therefore there is no expectation of any distribution from the inherited estate.
33 vALuE OF IN-FOrCE NON-PArTICIPATINg CONTrACTS (i) Movement in value of in-force non-participating contracts
2010£m
2009£m
As at 1 January 367 171
Unwinding of the discount rates 18 7
Investment return 16 193
Other (24) (4)
As at 31 december 377 367
Expected to be settled within 12 months 44 53
Expected to be settled after 12 months 333 314
(ii) Expected net cash flows
date of undiscounted cash flow
As at 31 december 20100 – 5 years
£m5 – 15 years
£m15 – 25 years
£mOver 25 years
£mTotal
£m
Carrying value
£m
value of in-force non-participating contracts 231 242 103 53 629 377
Date of undiscounted cash flow
As at 31 December 20090 – 5 years
£m5 – 15 years
£m15 – 25 years
£mOver 25 years
£mTotal
£m
Carrying value
£m
value of in-force non-participating contracts 250 224 108 57 639 367
Value of in-force (VIF) non-participating undiscounted net cash flows are based on the expected date of realisation. The VIF relates entirely to insurance contracts.
NOTES TO THE FINANCIAL STATEMENTS (CONTINuEd)
145ANNUAL REPORT AND ACCOUNTS 2010grOuP FINANCIAL STATEMENTS
L&G_AR10_17-Notes29-34_p140-150_230311_AT.indd 145 25/03/2011 11:27
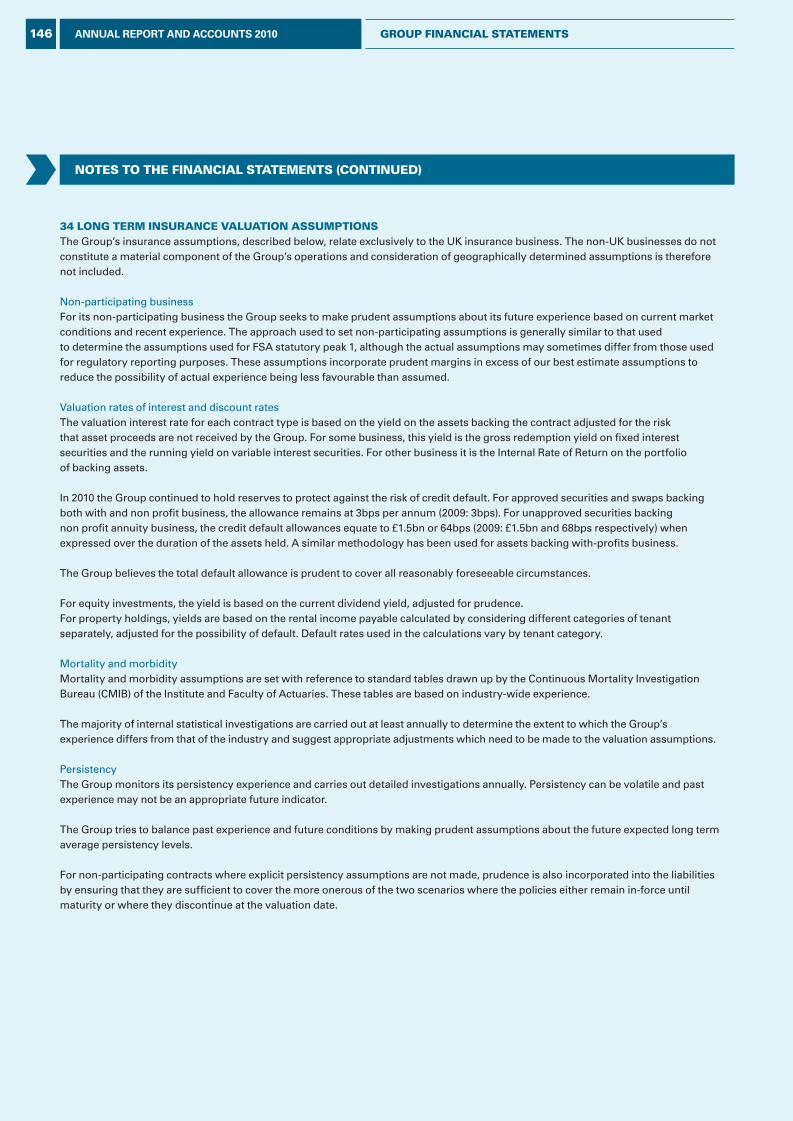
NOTES TO THE FINANCIAL STATEMENTS (CONTINuEd)
34 LONg TErM INSurANCE vALuATION ASSuMPTIONSThe Group’s insurance assumptions, described below, relate exclusively to the UK insurance business. The non-UK businesses do not constitute a material component of the Group’s operations and consideration of geographically determined assumptions is therefore not included.
Non-participating businessFor its non-participating business the Group seeks to make prudent assumptions about its future experience based on current market conditions and recent experience. The approach used to set non-participating assumptions is generally similar to that used to determine the assumptions used for FSA statutory peak 1, although the actual assumptions may sometimes differ from those used for regulatory reporting purposes. These assumptions incorporate prudent margins in excess of our best estimate assumptions to reduce the possibility of actual experience being less favourable than assumed.
Valuation rates of interest and discount ratesThe valuation interest rate for each contract type is based on the yield on the assets backing the contract adjusted for the risk that asset proceeds are not received by the Group. For some business, this yield is the gross redemption yield on fixed interest securities and the running yield on variable interest securities. For other business it is the Internal Rate of Return on the portfolio of backing assets.
In 2010 the Group continued to hold reserves to protect against the risk of credit default. For approved securities and swaps backing both with and non profit business, the allowance remains at 3bps per annum (2009: 3bps). For unapproved securities backing non profit annuity business, the credit default allowances equate to £1.5bn or 64bps (2009: £1.5bn and 68bps respectively) when expressed over the duration of the assets held. A similar methodology has been used for assets backing with-profits business.
The Group believes the total default allowance is prudent to cover all reasonably foreseeable circumstances.
For equity investments, the yield is based on the current dividend yield, adjusted for prudence. For property holdings, yields are based on the rental income payable calculated by considering different categories of tenant separately, adjusted for the possibility of default. Default rates used in the calculations vary by tenant category.
Mortality and morbidityMortality and morbidity assumptions are set with reference to standard tables drawn up by the Continuous Mortality Investigation Bureau (CMIB) of the Institute and Faculty of Actuaries. These tables are based on industry-wide experience.
The majority of internal statistical investigations are carried out at least annually to determine the extent to which the Group’s experience differs from that of the industry and suggest appropriate adjustments which need to be made to the valuation assumptions.
PersistencyThe Group monitors its persistency experience and carries out detailed investigations annually. Persistency can be volatile and past experience may not be an appropriate future indicator.
The Group tries to balance past experience and future conditions by making prudent assumptions about the future expected long term average persistency levels.
For non-participating contracts where explicit persistency assumptions are not made, prudence is also incorporated into the liabilities by ensuring that they are sufficient to cover the more onerous of the two scenarios where the policies either remain in-force until maturity or where they discontinue at the valuation date.
146 ANNUAL REPORT AND ACCOUNTS 2010 grOuP FINANCIAL STATEMENTS
L&G_AR10_17-Notes29-34_p140-150_230311_AT.indd 146 25/03/2011 11:27

NOTES TO THE FINANCIAL STATEMENTS (CONTINuEd)
ExpensesThe Group monitors its expense experience and carries out detailed investigations regularly to determine the expenses incurred in writing and administering the different products and classes of business. Adjustments may be made for known future changes in the administration processes, in line with the Group’s business plan. An allowance for expense inflation in the future is also made, taking account of both salary and price information.
Participating business For its participating business, the Group seeks to establish its liabilities at their realistic value in line with the requirements set out in FRS 27.
Non-economic assumptions are set to represent the Group’s best estimates of future experience.
Economic assumptionsThe FSA’s realistic reporting regime requires a market consistent economic model. The model is calibrated using market data from a variety of market sources. This enables assumptions to be determined for the term structure of risk free interest rates, property and equity volatility. Risk free interest rates are determined with reference to the gilt yield curve on the valuation date increased by ten basis points.
Property volatility is set with reference to historic variations in property prices. Equity volatility is set so that the model reproduces observed market prices of traded equity derivatives. Correlations between asset classes are based on historic data.
Each investment scenario contains a consistent set of assumptions for investment returns and inflation.
Future bonusesFuture reversionary and terminal bonuses are consistent with the bonus policies set out in Society’s Principles and Practices of Financial Management (PPFM).
Value of in-force non-participating contractsThe Group makes a reduction from the liabilities for the expected value of future profits arising on non-participating contracts written in the with-profits part of the Society LTF.
The economic assumptions used to calculate the value of these profits are consistent with those used to calculate liabilities for with-profits business, with the addition of a liquidity premium in respect of assets backing non-participating annuity business. Non-economic assumptions represent best estimates of expected future experience on this business.
Guaranteed annuity optionsThe guarantees are valued on a market consistent basis. The valuation methodology allows for the correlation between interest rates and the proportion of the policyholders who take up the option.
147ANNUAL REPORT AND ACCOUNTS 2010grOuP FINANCIAL STATEMENTS
L&G_AR10_17-Notes29-34_p140-150_230311_AT.indd 147 25/03/2011 11:27
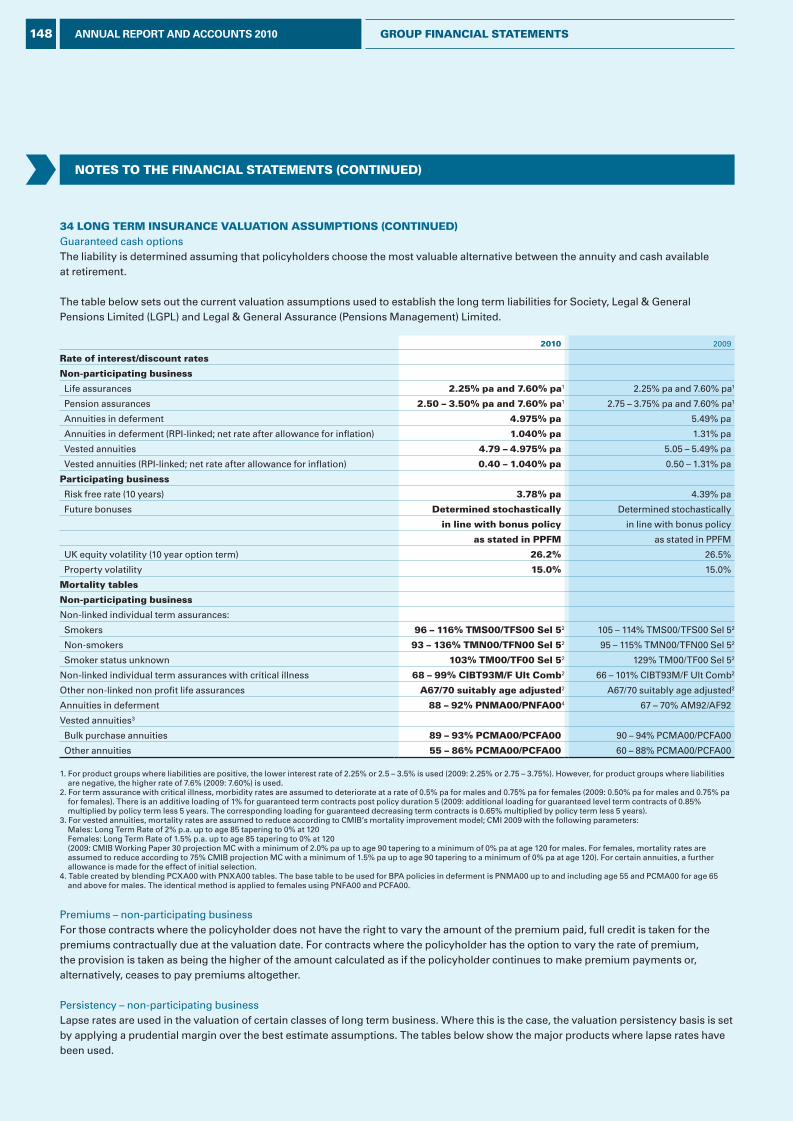
NOTES TO THE FINANCIAL STATEMENTS (CONTINuEd)
34 LONg TErM INSurANCE vALuATION ASSuMPTIONS (CONTINuEd)Guaranteed cash optionsThe liability is determined assuming that policyholders choose the most valuable alternative between the annuity and cash available at retirement.
The table below sets out the current valuation assumptions used to establish the long term liabilities for Society, Legal & General Pensions Limited (LGPL) and Legal & General Assurance (Pensions Management) Limited.
2010 2009
rate of interest/discount rates
Non-participating business
Life assurances 2.25% pa and 7.60% pa1 2.25% pa and 7.60% pa1
Pension assurances 2.50 – 3.50% pa and 7.60% pa1 2.75 – 3.75% pa and 7.60% pa1
Annuities in deferment 4.975% pa 5.49% pa
Annuities in deferment (RPI-linked; net rate after allowance for inflation) 1.040% pa 1.31% pa
Vested annuities 4.79 – 4.975% pa 5.05 – 5.49% pa
Vested annuities (RPI-linked; net rate after allowance for inflation) 0.40 – 1.040% pa 0.50 – 1.31% pa
Participating business
Risk free rate (10 years) 3.78% pa 4.39% pa
Future bonuses determined stochastically Determined stochastically
in line with bonus policy in line with bonus policy
as stated in PPFM as stated in PPFM
UK equity volatility (10 year option term) 26.2% 26.5%
Property volatility 15.0% 15.0%
Mortality tables
Non-participating business
Non-linked individual term assurances:
Smokers 96 – 116% TMS00/TFS00 Sel 52 105 – 114% TMS00/TFS00 Sel 52
Non-smokers 93 – 136% TMN00/TFN00 Sel 52 95 – 115% TMN00/TFN00 Sel 52
Smoker status unknown 103% TM00/TF00 Sel 52 129% TM00/TF00 Sel 52
Non-linked individual term assurances with critical illness 68 – 99% CIbT93M/F ult Comb2 66 – 101% CIBT93M/F Ult Comb2
Other non-linked non profit life assurances A67/70 suitably age adjusted2 A67/70 suitably age adjusted2
Annuities in deferment 88 – 92% PNMA00/PNFA004 67 – 70% AM92/AF92
Vested annuities3
Bulk purchase annuities 89 – 93% PCMA00/PCFA00 90 – 94% PCMA00/PCFA00
Other annuities 55 – 86% PCMA00/PCFA00 60 – 88% PCMA00/PCFA00
1. For product groups where liabilities are positive, the lower interest rate of 2.25% or 2.5 – 3.5% is used (2009: 2.25% or 2.75 – 3.75%). However, for product groups where liabilities are negative, the higher rate of 7.6% (2009: 7.60%) is used.
2. For term assurance with critical illness, morbidity rates are assumed to deteriorate at a rate of 0.5% pa for males and 0.75% pa for females (2009: 0.50% pa for males and 0.75% pa for females). There is an additive loading of 1% for guaranteed term contracts post policy duration 5 (2009: additional loading for guaranteed level term contracts of 0.85% multiplied by policy term less 5 years. The corresponding loading for guaranteed decreasing term contracts is 0.65% multiplied by policy term less 5 years).
3. For vested annuities, mortality rates are assumed to reduce according to CMIB’s mortality improvement model; CMI 2009 with the following parameters: Males: Long Term Rate of 2% p.a. up to age 85 tapering to 0% at 120 Females: Long Term Rate of 1.5% p.a. up to age 85 tapering to 0% at 120 (2009: CMIB Working Paper 30 projection MC with a minimum of 2.0% pa up to age 90 tapering to a minimum of 0% pa at age 120 for males. For females, mortality rates are assumed to reduce according to 75% CMIB projection MC with a minimum of 1.5% pa up to age 90 tapering to a minimum of 0% pa at age 120). For certain annuities, a further allowance is made for the effect of initial selection.
4. Table created by blending PCXA00 with PNXA00 tables. The base table to be used for BPA policies in deferment is PNMA00 up to and including age 55 and PCMA00 for age 65 and above for males. The identical method is applied to females using PNFA00 and PCFA00.
Premiums – non-participating businessFor those contracts where the policyholder does not have the right to vary the amount of the premium paid, full credit is taken for the premiums contractually due at the valuation date. For contracts where the policyholder has the option to vary the rate of premium, the provision is taken as being the higher of the amount calculated as if the policyholder continues to make premium payments or, alternatively, ceases to pay premiums altogether.
Persistency – non-participating business Lapse rates are used in the valuation of certain classes of long term business. Where this is the case, the valuation persistency basis is set by applying a prudential margin over the best estimate assumptions. The tables below show the major products where lapse rates have been used.
148 ANNUAL REPORT AND ACCOUNTS 2010 grOuP FINANCIAL STATEMENTS
L&G_AR10_17-Notes29-34_p140-150_230311_AT.indd 148 25/03/2011 11:27
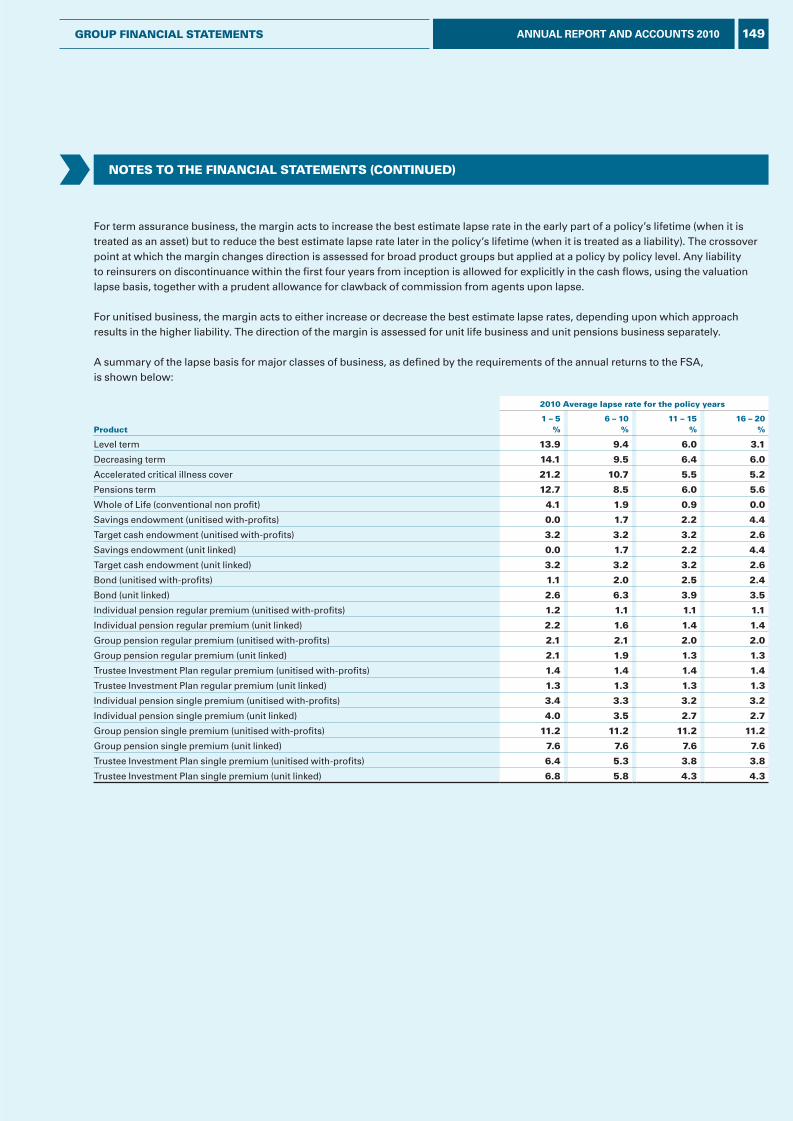
For term assurance business, the margin acts to increase the best estimate lapse rate in the early part of a policy’s lifetime (when it is treated as an asset) but to reduce the best estimate lapse rate later in the policy’s lifetime (when it is treated as a liability). The crossover point at which the margin changes direction is assessed for broad product groups but applied at a policy by policy level. Any liability to reinsurers on discontinuance within the first four years from inception is allowed for explicitly in the cash flows, using the valuation lapse basis, together with a prudent allowance for clawback of commission from agents upon lapse.
For unitised business, the margin acts to either increase or decrease the best estimate lapse rates, depending upon which approach results in the higher liability. The direction of the margin is assessed for unit life business and unit pensions business separately.
A summary of the lapse basis for major classes of business, as defined by the requirements of the annual returns to the FSA, is shown below:
2010 Average lapse rate for the policy years
Product1 – 5
%6 – 10
%11 – 15
%16 – 20
%
Level term 13.9 9.4 6.0 3.1
Decreasing term 14.1 9.5 6.4 6.0
Accelerated critical illness cover 21.2 10.7 5.5 5.2
Pensions term 12.7 8.5 6.0 5.6
Whole of Life (conventional non profit) 4.1 1.9 0.9 0.0
Savings endowment (unitised with-profits) 0.0 1.7 2.2 4.4
Target cash endowment (unitised with-profits) 3.2 3.2 3.2 2.6
Savings endowment (unit linked) 0.0 1.7 2.2 4.4
Target cash endowment (unit linked) 3.2 3.2 3.2 2.6
Bond (unitised with-profits) 1.1 2.0 2.5 2.4
Bond (unit linked) 2.6 6.3 3.9 3.5
Individual pension regular premium (unitised with-profits) 1.2 1.1 1.1 1.1
Individual pension regular premium (unit linked) 2.2 1.6 1.4 1.4
Group pension regular premium (unitised with-profits) 2.1 2.1 2.0 2.0
Group pension regular premium (unit linked) 2.1 1.9 1.3 1.3
Trustee Investment Plan regular premium (unitised with-profits) 1.4 1.4 1.4 1.4
Trustee Investment Plan regular premium (unit linked) 1.3 1.3 1.3 1.3
Individual pension single premium (unitised with-profits) 3.4 3.3 3.2 3.2
Individual pension single premium (unit linked) 4.0 3.5 2.7 2.7
Group pension single premium (unitised with-profits) 11.2 11.2 11.2 11.2
Group pension single premium (unit linked) 7.6 7.6 7.6 7.6
Trustee Investment Plan single premium (unitised with-profits) 6.4 5.3 3.8 3.8
Trustee Investment Plan single premium (unit linked) 6.8 5.8 4.3 4.3
NOTES TO THE FINANCIAL STATEMENTS (CONTINuEd)
149ANNUAL REPORT AND ACCOUNTS 2010grOuP FINANCIAL STATEMENTS
L&G_AR10_17-Notes29-34_p140-150_230311_AT.indd 149 25/03/2011 11:27
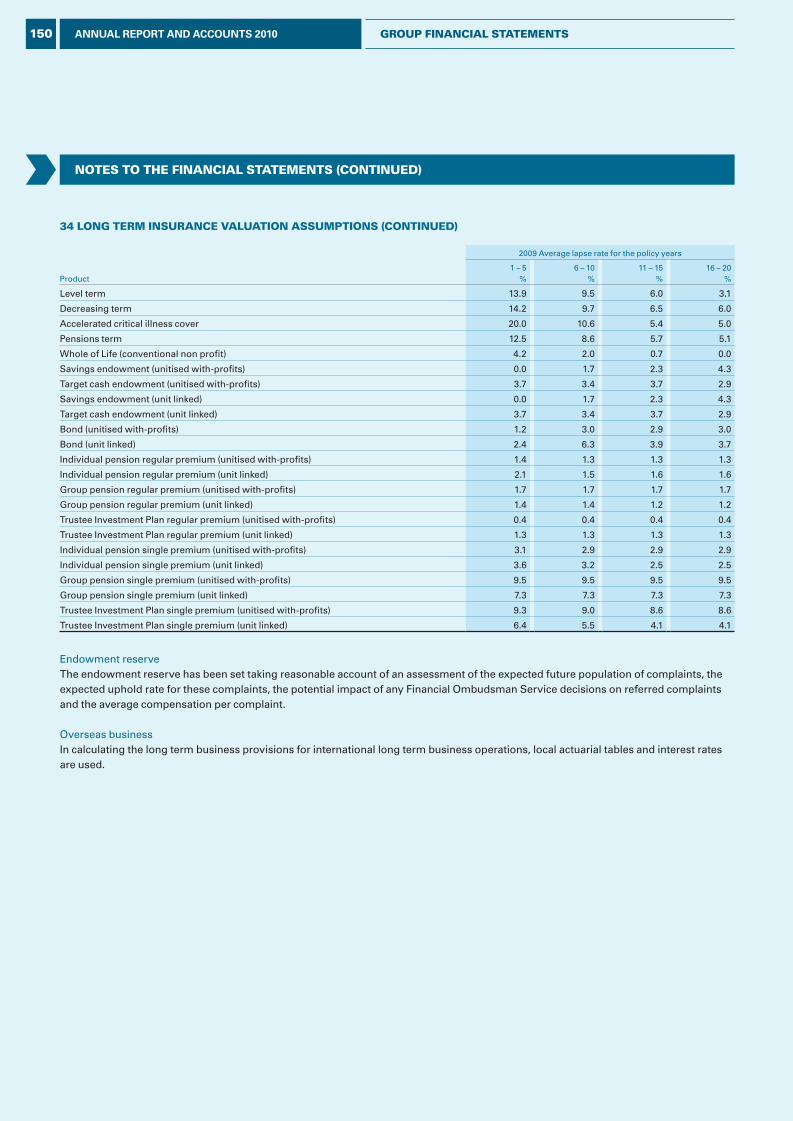
NOTES TO THE FINANCIAL STATEMENTS (CONTINuEd)
34 LONg TErM INSurANCE vALuATION ASSuMPTIONS (CONTINuEd)
2009 Average lapse rate for the policy years
Product1 – 5
%6 – 10
%11 – 15
%16 – 20
%
Level term 13.9 9.5 6.0 3.1
Decreasing term 14.2 9.7 6.5 6.0
Accelerated critical illness cover 20.0 10.6 5.4 5.0
Pensions term 12.5 8.6 5.7 5.1
Whole of Life (conventional non profit) 4.2 2.0 0.7 0.0
Savings endowment (unitised with-profits) 0.0 1.7 2.3 4.3
Target cash endowment (unitised with-profits) 3.7 3.4 3.7 2.9
Savings endowment (unit linked) 0.0 1.7 2.3 4.3
Target cash endowment (unit linked) 3.7 3.4 3.7 2.9
Bond (unitised with-profits) 1.2 3.0 2.9 3.0
Bond (unit linked) 2.4 6.3 3.9 3.7
Individual pension regular premium (unitised with-profits) 1.4 1.3 1.3 1.3
Individual pension regular premium (unit linked) 2.1 1.5 1.6 1.6
Group pension regular premium (unitised with-profits) 1.7 1.7 1.7 1.7
Group pension regular premium (unit linked) 1.4 1.4 1.2 1.2
Trustee Investment Plan regular premium (unitised with-profits) 0.4 0.4 0.4 0.4
Trustee Investment Plan regular premium (unit linked) 1.3 1.3 1.3 1.3
Individual pension single premium (unitised with-profits) 3.1 2.9 2.9 2.9
Individual pension single premium (unit linked) 3.6 3.2 2.5 2.5
Group pension single premium (unitised with-profits) 9.5 9.5 9.5 9.5
Group pension single premium (unit linked) 7.3 7.3 7.3 7.3
Trustee Investment Plan single premium (unitised with-profits) 9.3 9.0 8.6 8.6
Trustee Investment Plan single premium (unit linked) 6.4 5.5 4.1 4.1
Endowment reserveThe endowment reserve has been set taking reasonable account of an assessment of the expected future population of complaints, the expected uphold rate for these complaints, the potential impact of any Financial Ombudsman Service decisions on referred complaints and the average compensation per complaint.
Overseas businessIn calculating the long term business provisions for international long term business operations, local actuarial tables and interest rates are used.
150 ANNUAL REPORT AND ACCOUNTS 2010 grOuP FINANCIAL STATEMENTS
L&G_AR10_17-Notes29-34_p140-150_230311_AT.indd 150 25/03/2011 11:27
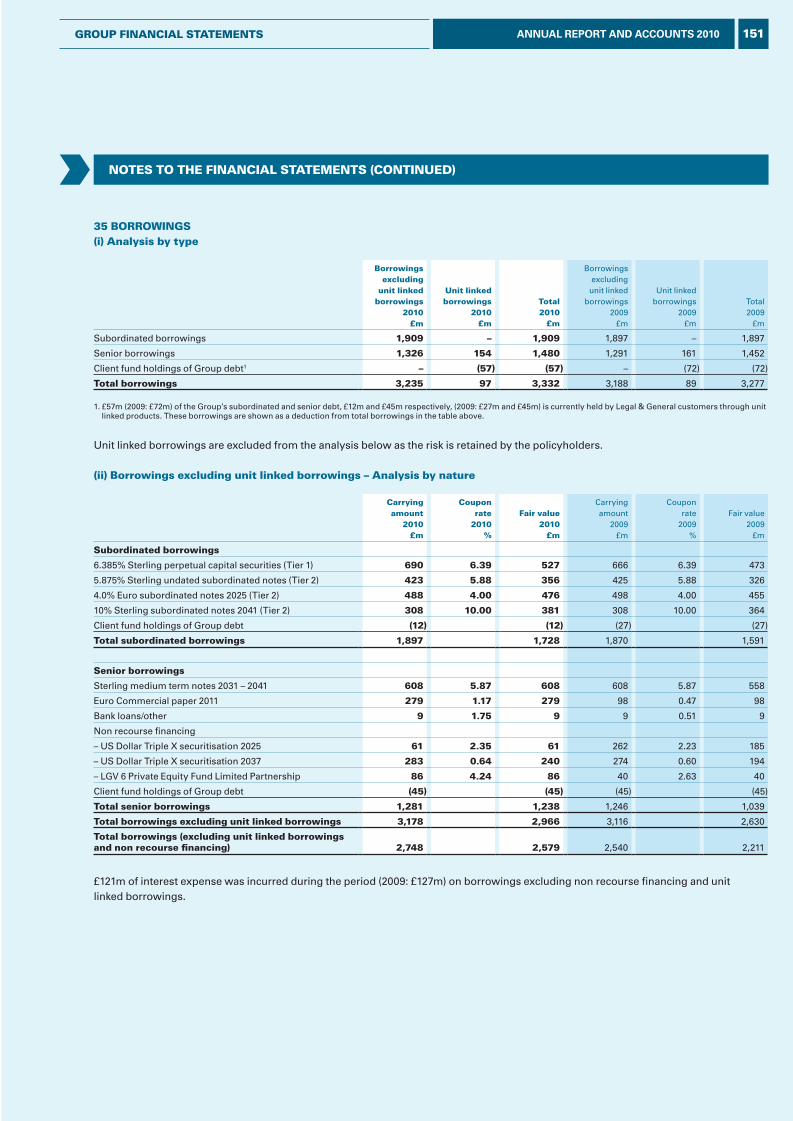
35 Borrowings (i) Analysis by type
Borrowings excluding
unit linked borrowings
2010£m
Unit linkedborrowings
2010£m
Total2010
£m
Borrowings excluding unit linked
borrowings2009
£m
Unit linked borrowings
2009£m
Total2009
£m
Subordinated borrowings 1,909 – 1,909 1,897 – 1,897
Senior borrowings 1,326 154 1,480 1,291 161 1,452
Client fund holdings of Group debt1 – (57) (57) – (72) (72)
Total borrowings 3,235 97 3,332 3,188 89 3,277
1. £57m (2009: £72m) of the Group’s subordinated and senior debt, £12m and £45m respectively, (2009: £27m and £45m) is currently held by Legal & General customers through unit linked products. These borrowings are shown as a deduction from total borrowings in the table above.
Unit linked borrowings are excluded from the analysis below as the risk is retained by the policyholders.
(ii) Borrowings excluding unit linked borrowings – Analysis by nature
Carryingamount
2010£m
Coupon rate
2010%
Fair value2010
£m
Carryingamount
2009£m
Coupon rate
2009%
Fair value2009
£m
subordinated borrowings
6.385% Sterling perpetual capital securities (Tier 1) 690 6.39 527 666 6.39 473
5.875% Sterling undated subordinated notes (Tier 2) 423 5.88 356 425 5.88 326
4.0% Euro subordinated notes 2025 (Tier 2) 488 4.00 476 498 4.00 455
10% Sterling subordinated notes 2041 (Tier 2) 308 10.00 381 308 10.00 364
Client fund holdings of Group debt (12) (12) (27) (27)
Total subordinated borrowings 1,897 1,728 1,870 1,591
senior borrowings
Sterling medium term notes 2031 – 2041 608 5.87 608 608 5.87 558
Euro Commercial paper 2011 279 1.17 279 98 0.47 98
Bank loans/other 9 1.75 9 9 0.51 9
Non recourse financing
– US Dollar Triple X securitisation 2025 61 2.35 61 262 2.23 185
– US Dollar Triple X securitisation 2037 283 0.64 240 274 0.60 194
– LGV 6 Private Equity Fund Limited Partnership 86 4.24 86 40 2.63 40
Client fund holdings of Group debt (45) (45) (45) (45)
Total senior borrowings 1,281 1,238 1,246 1,039
Total borrowings excluding unit linked borrowings 3,178 2,966 3,116 2,630
Total borrowings (excluding unit linked borrowings and non recourse financing)
2,748
2,579
2,540
2,211
£121m of interest expense was incurred during the period (2009: £127m) on borrowings excluding non recourse financing and unit linked borrowings.
noTEs To THE FinAnCiAL sTATEMEnTs (ConTinUEd)
151ANNUAL REPORT AND ACCOUNTS 2010groUP FinAnCiAL sTATEMEnTs
L&G_AR10_18-Notes35-44_p151-163_230311_AT.indd 151 25/03/2011 11:28
noTEs To THE FinAnCiAL sTATEMEnTs (ConTinUEd)
35 Borrowings (ConTinUEd)subordinated borrowings6.385% Sterling perpetual capital securitiesIn 2007, Legal & General Group Plc issued £600m of 6.385% Sterling perpetual capital securities. Simultaneous with the issuance, the fixed coupon was swapped into six month LIBOR plus 0.94% pa. These securities are callable at par on 2 May 2017 and every three months thereafter. If not called, the coupon from 2 May 2017 will be reset to three month LIBOR plus 1.93% pa. For regulatory purposes these securities are treated as innovative tier 1 capital. These securities have been classified as liabilities as the interest payments become mandatory in certain circumstances.
5.875% Sterling undated subordinated notesIn 2004, Legal & General Group Plc issued £400m of 5.875% Sterling undated subordinated notes. These notes are callable at par on 1 April 2019 and every five years thereafter. If not called, the coupon from 1 April 2019 will be reset to the prevailing five year benchmark gilt yield plus 2.33% pa. These notes are treated as upper tier 2 capital for regulatory purposes. These securities have been classified as liabilities as the interest payments become mandatory in certain circumstances.
4.0% Euro subordinated notes 2025In 2005, Legal & General Group Plc issued €600m of 4.0% Euro dated subordinated notes. The proceeds were swapped into sterling. The notes are callable at par on 8 June 2015 and each year thereafter. If not called, the coupon from 8 June 2015 will reset to a floating rate of interest based on prevailing three month Euribor plus 1.7% pa. These notes mature on 8 June 2025 and are treated as lower tier 2 capital for regulatory purposes.
10% Sterling subordinated notes 2041On 16 July 2009, Legal & General Group Plc issued £300m of 10% dated subordinated notes. The notes are callable at par on 23 July 2021 and every five years thereafter. If not called, the coupon from 23 July 2021 will be reset to the prevailing five year benchmark gilt yield plus 9.325% pa. These notes mature on 23 July 2041 and are treated as lower tier 2 capital for regulatory purposes.
non recourse financingUS Dollar Triple X securitisation 2025In 2004, a subsidiary of Legal & General America Inc issued US$550m of non recourse debt in the US capital markets to meet the Triple X reserve requirements of part of the US term insurance written up to 2005. It is secured on the cash flows related to that tranche of business. As at 31 December 2010, US$443m of the outstanding debt had been bought back.
US Dollar Triple X securitisation 2037In 2006, a subsidiary of Legal & General America Inc issued US$450m of non recourse debt in the US capital markets to meet the Triple X reserve requirements of part of the US term insurance written after 2005 and 2006. It is secured on the cash flows related to that tranche of business.
LGV 6 Private Equity Fund Limited PartnershipThese borrowings are non recourse bank borrowings.
152 ANNUAL REPORT AND ACCOUNTS 2010 groUP FinAnCiAL sTATEMEnTs
L&G_AR10_18-Notes35-44_p151-163_230311_AT.indd 152 25/03/2011 11:28
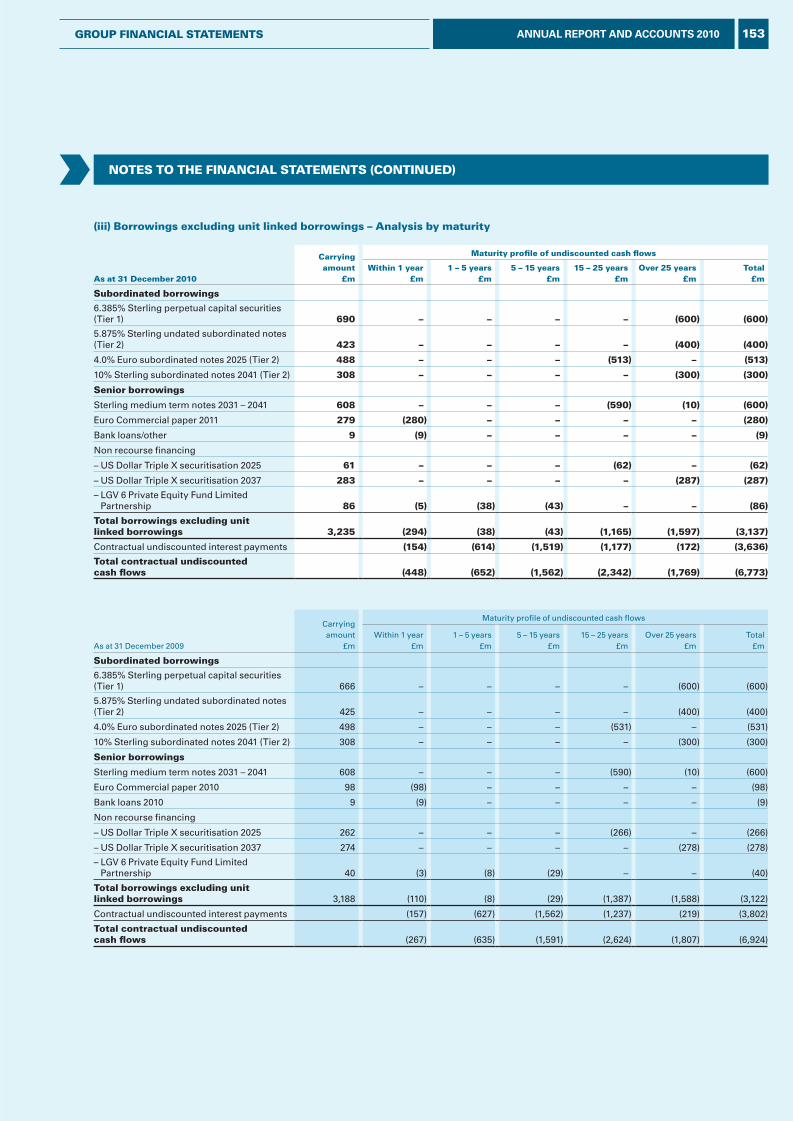
noTEs To THE FinAnCiAL sTATEMEnTs (ConTinUEd)
(iii) Borrowings excluding unit linked borrowings – Analysis by maturity
As at 31 december 2010
Carrying amount
£m
Maturity profile of undiscounted cash flows
within 1 year£m
1 – 5 years£m
5 – 15 years£m
15 – 25 years£m
over 25 years£m
Total£m
subordinated borrowings
6.385% Sterling perpetual capital securities (Tier 1) 690 – – – – (600) (600)
5.875% Sterling undated subordinated notes (Tier 2) 423 – – – – (400) (400)
4.0% Euro subordinated notes 2025 (Tier 2) 488 – – – (513) – (513)
10% Sterling subordinated notes 2041 (Tier 2) 308 – – – – (300) (300)
senior borrowings
Sterling medium term notes 2031 – 2041 608 – – – (590) (10) (600)
Euro Commercial paper 2011 279 (280) – – – – (280)
Bank loans/other 9 (9) – – – – (9)
Non recourse financing
– US Dollar Triple X securitisation 2025 61 – – – (62) – (62)
– US Dollar Triple X securitisation 2037 283 – – – – (287) (287)
– LGV 6 Private Equity Fund Limited Partnership 86 (5) (38) (43) – – (86)
Total borrowings excluding unit linked borrowings 3,235 (294) (38) (43) (1,165) (1,597) (3,137)
Contractual undiscounted interest payments (154) (614) (1,519) (1,177) (172) (3,636)
Total contractual undiscounted cash flows (448) (652) (1,562) (2,342) (1,769) (6,773)
As at 31 December 2009
Carryingamount
£m
Maturity profile of undiscounted cash flows
Within 1 year£m
1 – 5 years£m
5 – 15 years£m
15 – 25 years£m
Over 25 years£m
Total£m
subordinated borrowings
6.385% Sterling perpetual capital securities (Tier 1) 666 – – – – (600) (600)
5.875% Sterling undated subordinated notes (Tier 2) 425 – – – – (400) (400)
4.0% Euro subordinated notes 2025 (Tier 2) 498 – – – (531) – (531)
10% Sterling subordinated notes 2041 (Tier 2) 308 – – – – (300) (300)
senior borrowings
Sterling medium term notes 2031 – 2041 608 – – – (590) (10) (600)
Euro Commercial paper 2010 98 (98) – – – – (98)
Bank loans 2010 9 (9) – – – – (9)
Non recourse financing
– US Dollar Triple X securitisation 2025 262 – – – (266) – (266)
– US Dollar Triple X securitisation 2037 274 – – – – (278) (278)
– LGV 6 Private Equity Fund Limited Partnership 40 (3) (8) (29) – – (40)
Total borrowings excluding unit linked borrowings 3,188 (110) (8) (29) (1,387) (1,588) (3,122)
Contractual undiscounted interest payments (157) (627) (1,562) (1,237) (219) (3,802)
Total contractual undiscounted cash flows (267) (635) (1,591) (2,624) (1,807) (6,924)
153ANNUAL REPORT AND ACCOUNTS 2010groUP FinAnCiAL sTATEMEnTs
L&G_AR10_18-Notes35-44_p151-163_230311_AT.indd 153 25/03/2011 11:28
noTEs To THE FinAnCiAL sTATEMEnTs (ConTinUEd)
35 Borrowings (ConTinUEd)(iii) Borrowings excluding unit linked borrowings – Analysis by maturity (continued)As at 31 December 2010, the Group had in place a £960m syndicated committed revolving credit facility provided by a number of its key relationship banks, maturing in December 2012. The Group also had in place a £60m bilateral committed revolving credit facility from one of its key relationship banks also maturing in December 2012. No drawings were made under these facilities during 2010.
The maturity profile above is calculated on the basis that a facility to refinance a maturing loan is not recognised unless the facility and loan are related. If refinancing under the Group’s credit facilities was recognised, then all amounts shown as repayable within one year would be reclassified as repayable between one and five years.
Undiscounted interest payments are estimated based on the year end applicable interest rate and spot exchange rates.
Short term assets available at the holding company level exceeded the amount of short term borrowings of £288m (Euro Commercial Paper and Bank Loans).
36 Provisions(i) Analysis of provisions
Note2010
£m2009
£m
Retirement benefit obligations1 (ii) 748 746
Other provisions 13 11
761 757
1. Retirement benefit obligations are presented gross of £514m of annuity obligations insured by Society (2009: £465m).
(ii) retirement benefit obligationsdefined contribution plansThe Group operates the following defined contribution pension schemes in the UK and overseas:
– Legal & General Group Personal Pension Plan (UK).– Legal & General Staff Stakeholder Pension Scheme (UK).– Legal & General America Inc. Savings Plan (US).– Régime de Retraite Professionnel (France).– Legal & General Nederland Stichting Pensioenfonds (Netherlands).– Legal & General International (Ireland) Limited Retirement Solution Plan (Ireland).
Contributions of £35m (2009: £34m) were charged as expenses during the year in respect of defined contribution plans.
defined benefit plansThe Group operates the following defined benefit pension schemes in the UK and overseas:
– Legal & General Group UK Pension and Assurance Fund (the Fund). The Fund was closed to new members from January 1995; last full actuarial valuation as at 31 December 2009.
– Legal & General Group UK Senior Pension Scheme (the Scheme). The Scheme was, with a few exceptions (principally transfers from the Fund), closed to new members from August 2000 and finally closed to new members from April 2007; last full actuarial valuation as at 31 December 2009.
– Legal & General America Inc. Cash Balance Plan; last full actuarial valuation as at 31 December 2009.– Legal & General Nederland Stichting Pensioenfonds; last full actuarial valuation as at 31 December 2010.– Régime de Retraite à Prestations Définies de Legal & General (France); last full actuarial valuation as at 31 December 2010.
The benefits paid from the defined benefit schemes are based on percentages of the employees’ final pensionable salary for each year of credited service. The Group has no liability for retirement benefits other than for pensions, except for a small scheme in France (Indemnités de Fin de Carrière), which provides lump sum benefits on retirement. The Fund and Scheme account for all of the UK and over 97% of worldwide assets of the Group’s defined benefit schemes.
154 ANNUAL REPORT AND ACCOUNTS 2010 groUP FinAnCiAL sTATEMEnTs
L&G_AR10_18-Notes35-44_p151-163_230311_AT.indd 154 25/03/2011 11:28
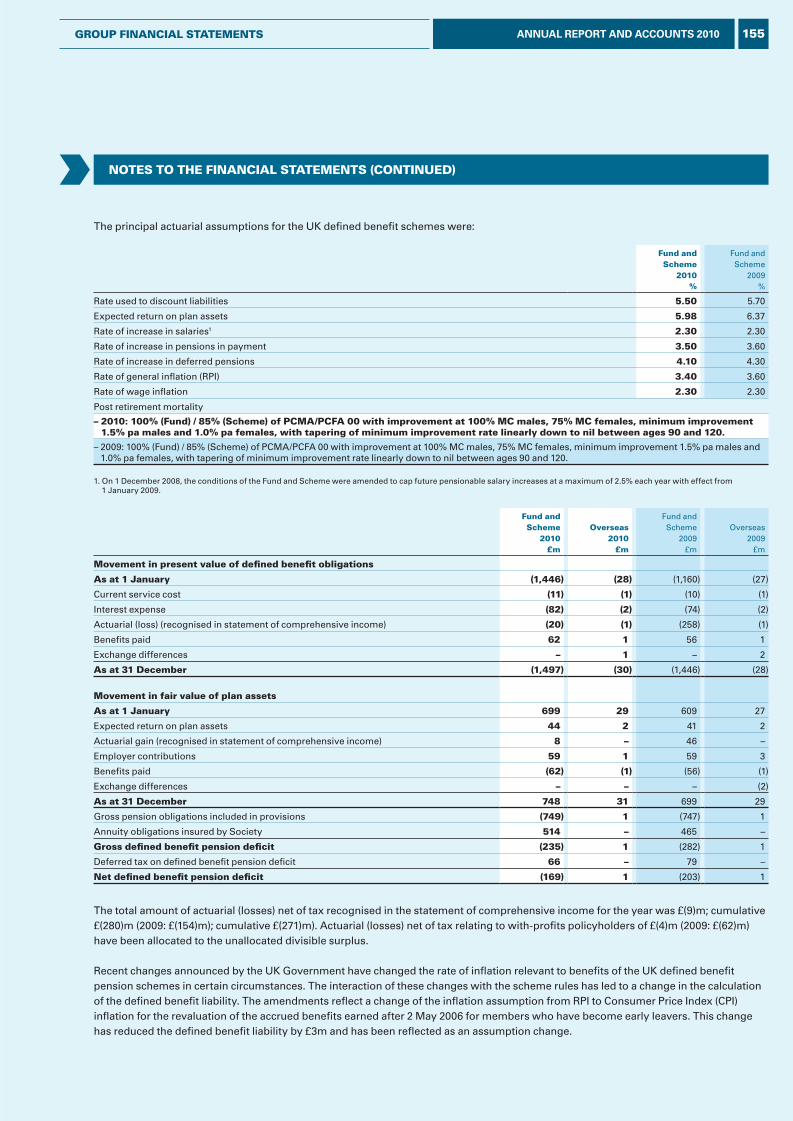
noTEs To THE FinAnCiAL sTATEMEnTs (ConTinUEd)
The principal actuarial assumptions for the UK defined benefit schemes were:
Fund and scheme
2010%
Fund and Scheme
2009%
Rate used to discount liabilities 5.50 5.70
Expected return on plan assets 5.98 6.37
Rate of increase in salaries1 2.30 2.30
Rate of increase in pensions in payment 3.50 3.60
Rate of increase in deferred pensions 4.10 4.30
Rate of general inflation (RPI) 3.40 3.60
Rate of wage inflation 2.30 2.30
Post retirement mortality
– 2010: 100% (Fund) / 85% (scheme) of PCMA/PCFA 00 with improvement at 100% MC males, 75% MC females, minimum improvement 1.5% pa males and 1.0% pa females, with tapering of minimum improvement rate linearly down to nil between ages 90 and 120.
– 2009: 100% (Fund) / 85% (Scheme) of PCMA/PCFA 00 with improvement at 100% MC males, 75% MC females, minimum improvement 1.5% pa males and 1.0% pa females, with tapering of minimum improvement rate linearly down to nil between ages 90 and 120.
1. On 1 December 2008, the conditions of the Fund and Scheme were amended to cap future pensionable salary increases at a maximum of 2.5% each year with effect from 1 January 2009.
Fund and scheme
2010£m
overseas2010
£m
Fund and Scheme
2009£m
Overseas2009
£m
Movement in present value of defined benefit obligations
As at 1 January (1,446) (28) (1,160) (27)
Current service cost (11) (1) (10) (1)
Interest expense (82) (2) (74) (2)
Actuarial (loss) (recognised in statement of comprehensive income) (20) (1) (258) (1)
Benefits paid 62 1 56 1
Exchange differences – 1 – 2
As at 31 december (1,497) (30) (1,446) (28)
Movement in fair value of plan assets
As at 1 January 699 29 609 27
Expected return on plan assets 44 2 41 2
Actuarial gain (recognised in statement of comprehensive income) 8 – 46 –
Employer contributions 59 1 59 3
Benefits paid (62) (1) (56) (1)
Exchange differences – – – (2)
As at 31 december 748 31 699 29
Gross pension obligations included in provisions (749) 1 (747) 1
Annuity obligations insured by Society 514 – 465 –
gross defined benefit pension deficit (235) 1 (282) 1
Deferred tax on defined benefit pension deficit 66 – 79 –
net defined benefit pension deficit (169) 1 (203) 1
The total amount of actuarial (losses) net of tax recognised in the statement of comprehensive income for the year was £(9)m; cumulative £(280)m (2009: £(154)m); cumulative £(271)m). Actuarial (losses) net of tax relating to with-profits policyholders of £(4)m (2009: £(62)m) have been allocated to the unallocated divisible surplus.
Recent changes announced by the UK Government have changed the rate of inflation relevant to benefits of the UK defined benefit pension schemes in certain circumstances. The interaction of these changes with the scheme rules has led to a change in the calculation of the defined benefit liability. The amendments reflect a change of the inflation assumption from RPI to Consumer Price Index (CPI) inflation for the revaluation of the accrued benefits earned after 2 May 2006 for members who have become early leavers. This change has reduced the defined benefit liability by £3m and has been reflected as an assumption change.
155ANNUAL REPORT AND ACCOUNTS 2010groUP FinAnCiAL sTATEMEnTs
L&G_AR10_18-Notes35-44_p151-163_230311_AT.indd 155 25/03/2011 11:28
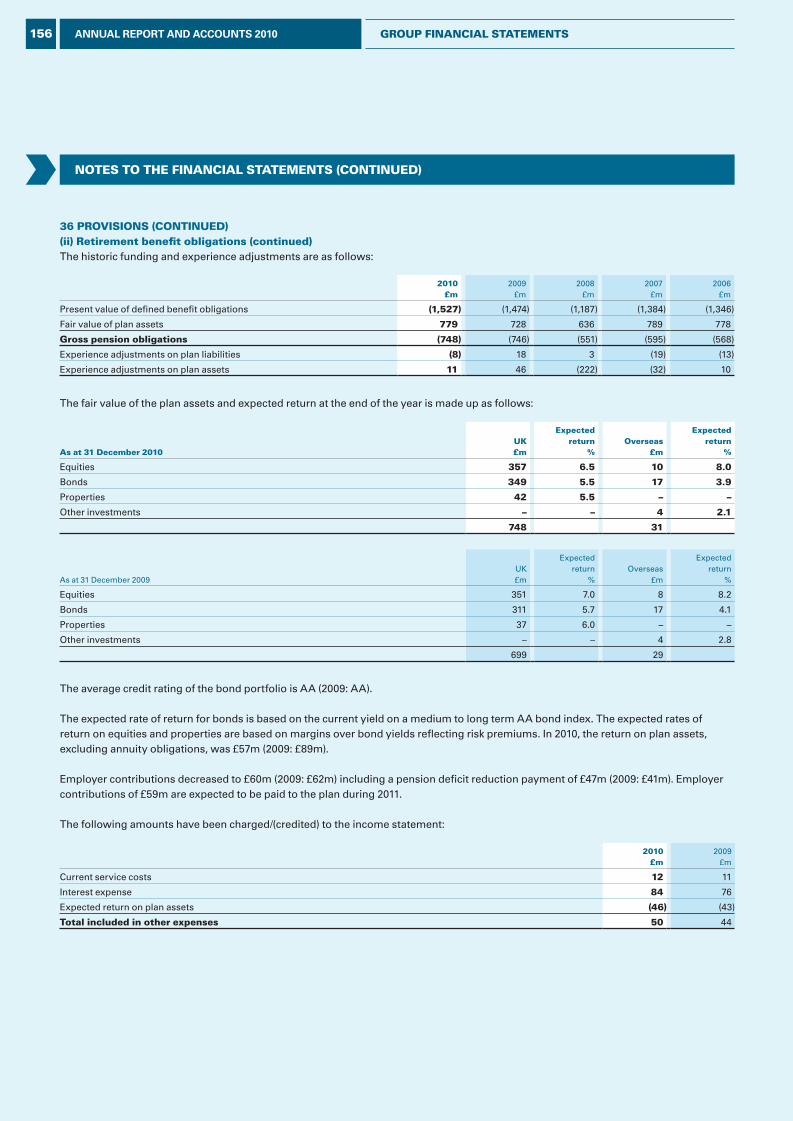
noTEs To THE FinAnCiAL sTATEMEnTs (ConTinUEd)
36 Provisions (ConTinUEd)(ii) retirement benefit obligations (continued)The historic funding and experience adjustments are as follows:
2010£m
2009£m
2008£m
2007£m
2006£m
Present value of defined benefit obligations (1,527) (1,474) (1,187) (1,384) (1,346)
Fair value of plan assets 779 728 636 789 778
gross pension obligations (748) (746) (551) (595) (568)
Experience adjustments on plan liabilities (8) 18 3 (19) (13)
Experience adjustments on plan assets 11 46 (222) (32) 10
The fair value of the plan assets and expected return at the end of the year is made up as follows:
As at 31 december 2010UK£m
Expected return
%overseas
£m
Expected return
%
Equities 357 6.5 10 8.0
Bonds 349 5.5 17 3.9
Properties 42 5.5 – –
Other investments – – 4 2.1
748 31
As at 31 December 2009UK£m
Expected return
%Overseas
£m
Expected return
%
Equities 351 7.0 8 8.2
Bonds 311 5.7 17 4.1
Properties 37 6.0 – –
Other investments – – 4 2.8
699 29
The average credit rating of the bond portfolio is AA (2009: AA).
The expected rate of return for bonds is based on the current yield on a medium to long term AA bond index. The expected rates of return on equities and properties are based on margins over bond yields reflecting risk premiums. In 2010, the return on plan assets, excluding annuity obligations, was £57m (2009: £89m).
Employer contributions decreased to £60m (2009: £62m) including a pension deficit reduction payment of £47m (2009: £41m). Employer contributions of £59m are expected to be paid to the plan during 2011.
The following amounts have been charged/(credited) to the income statement:
2010£m
2009 £m
Current service costs 12 11
Interest expense 84 76
Expected return on plan assets (46) (43)
Total included in other expenses 50 44
156 ANNUAL REPORT AND ACCOUNTS 2010 groUP FinAnCiAL sTATEMEnTs
L&G_AR10_18-Notes35-44_p151-163_230311_AT.indd 156 25/03/2011 11:28
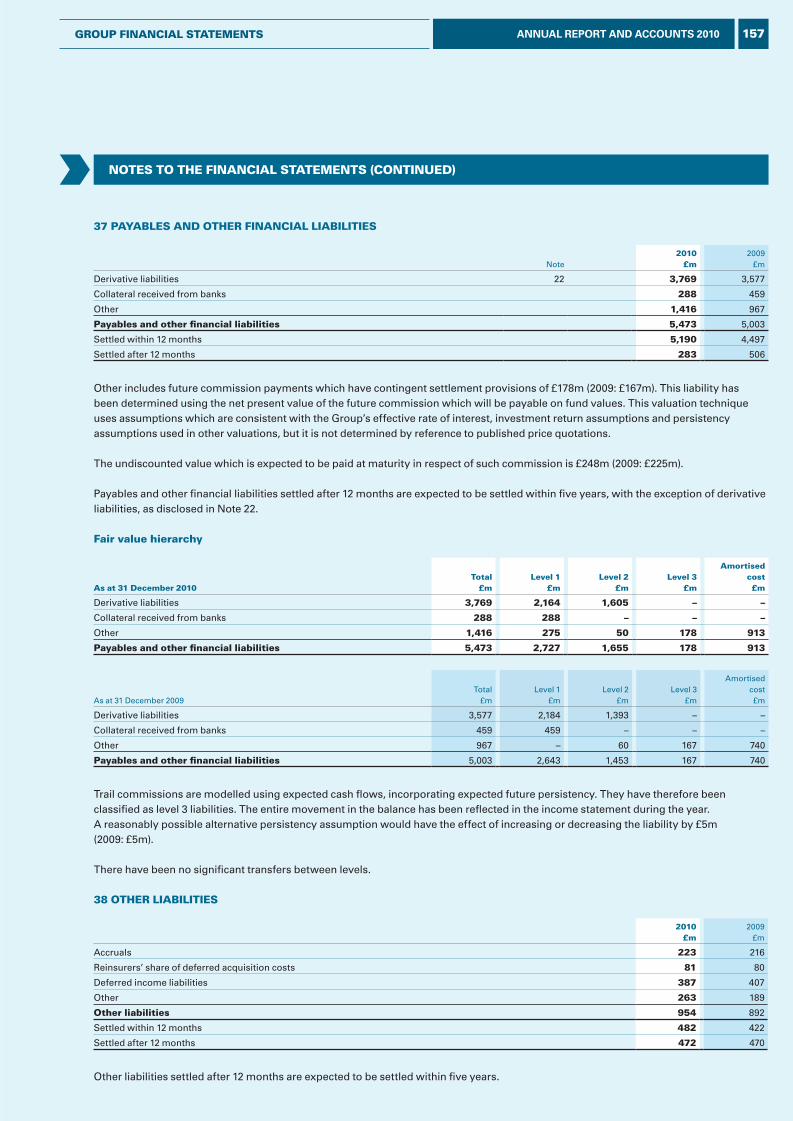
37 PAyABLEs And oTHEr FinAnCiAL LiABiLiTiEs
Note2010
£m2009
£m
Derivative liabilities 22 3,769 3,577
Collateral received from banks 288 459
Other 1,416 967
Payables and other financial liabilities 5,473 5,003
Settled within 12 months 5,190 4,497
Settled after 12 months 283 506
Other includes future commission payments which have contingent settlement provisions of £178m (2009: £167m). This liability has been determined using the net present value of the future commission which will be payable on fund values. This valuation technique uses assumptions which are consistent with the Group’s effective rate of interest, investment return assumptions and persistency assumptions used in other valuations, but it is not determined by reference to published price quotations.
The undiscounted value which is expected to be paid at maturity in respect of such commission is £248m (2009: £225m).
Payables and other financial liabilities settled after 12 months are expected to be settled within five years, with the exception of derivative liabilities, as disclosed in Note 22.
Fair value hierarchy
As at 31 december 2010Total
£mLevel 1
£mLevel 2
£mLevel 3
£m
Amortisedcost£m
Derivative liabilities 3,769 2,164 1,605 – –
Collateral received from banks 288 288 – – –
Other 1,416 275 50 178 913
Payables and other financial liabilities 5,473 2,727 1,655 178 913
As at 31 December 2009Total
£mLevel 1
£mLevel 2
£mLevel 3
£m
Amortisedcost£m
Derivative liabilities 3,577 2,184 1,393 – –
Collateral received from banks 459 459 – – –
Other 967 – 60 167 740
Payables and other financial liabilities 5,003 2,643 1,453 167 740
Trail commissions are modelled using expected cash flows, incorporating expected future persistency. They have therefore been classified as level 3 liabilities. The entire movement in the balance has been reflected in the income statement during the year. A reasonably possible alternative persistency assumption would have the effect of increasing or decreasing the liability by £5m (2009: £5m).
There have been no significant transfers between levels.
38 oTHEr LiABiLiTiEs
2010£m
2009£m
Accruals 223 216
Reinsurers’ share of deferred acquisition costs 81 80
Deferred income liabilities 387 407
Other 263 189
other liabilities 954 892
Settled within 12 months 482 422
Settled after 12 months 472 470
Other liabilities settled after 12 months are expected to be settled within five years.
noTEs To THE FinAnCiAL sTATEMEnTs (ConTinUEd)
157ANNUAL REPORT AND ACCOUNTS 2010groUP FinAnCiAL sTATEMEnTs
L&G_AR10_18-Notes35-44_p151-163_230311_AT.indd 157 25/03/2011 11:28
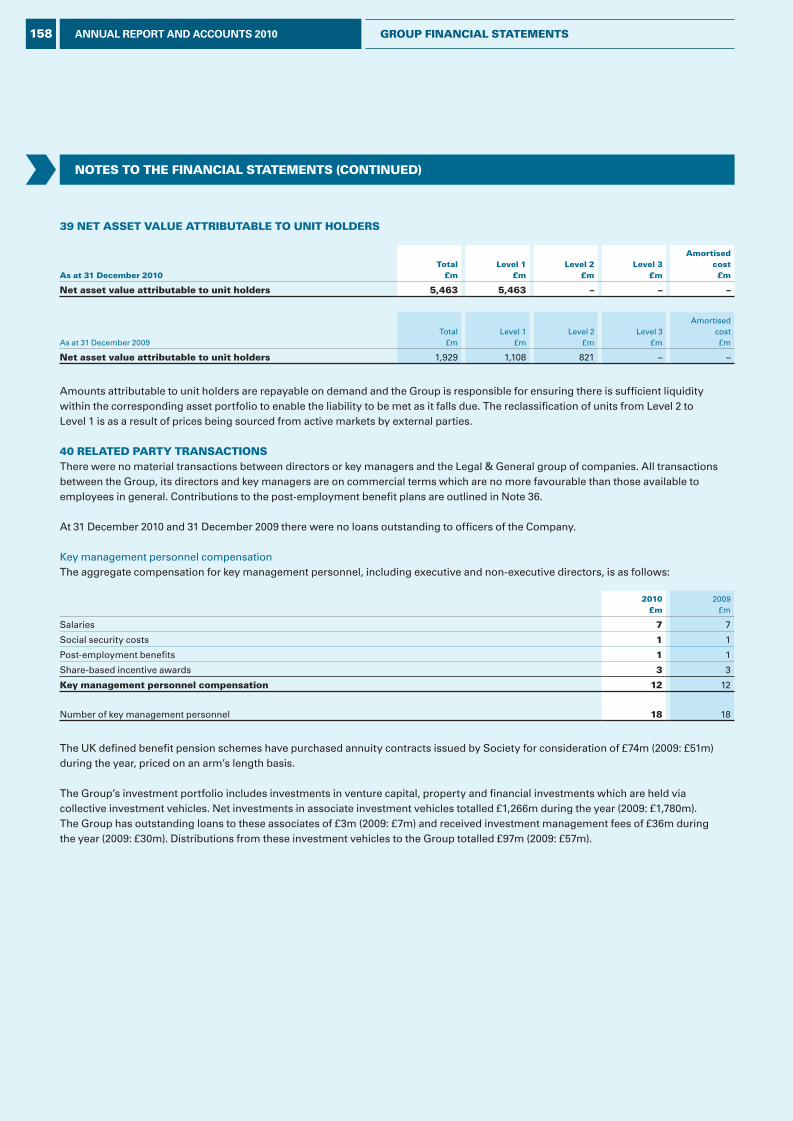
39 nET AssET vALUE ATTriBUTABLE To UniT HoLdErs
As at 31 december 2010Total
£mLevel 1
£mLevel 2
£mLevel 3
£m
Amortised cost£m
net asset value attributable to unit holders 5,463 5,463 – – –
As at 31 December 2009Total
£mLevel 1
£mLevel 2
£mLevel 3
£m
Amortised cost£m
net asset value attributable to unit holders 1,929 1,108 821 – –
Amounts attributable to unit holders are repayable on demand and the Group is responsible for ensuring there is sufficient liquidity within the corresponding asset portfolio to enable the liability to be met as it falls due. The reclassification of units from Level 2 to Level 1 is as a result of prices being sourced from active markets by external parties.
40 rELATEd PArTy TrAnsACTionsThere were no material transactions between directors or key managers and the Legal & General group of companies. All transactions between the Group, its directors and key managers are on commercial terms which are no more favourable than those available to employees in general. Contributions to the post-employment benefit plans are outlined in Note 36.
At 31 December 2010 and 31 December 2009 there were no loans outstanding to officers of the Company.
Key management personnel compensationThe aggregate compensation for key management personnel, including executive and non-executive directors, is as follows:
2010£m
2009£m
Salaries 7 7
Social security costs 1 1
Post-employment benefits 1 1
Share-based incentive awards 3 3
Key management personnel compensation 12 12
Number of key management personnel 18 18
The UK defined benefit pension schemes have purchased annuity contracts issued by Society for consideration of £74m (2009: £51m) during the year, priced on an arm’s length basis.
The Group’s investment portfolio includes investments in venture capital, property and financial investments which are held via collective investment vehicles. Net investments in associate investment vehicles totalled £1,266m during the year (2009: £1,780m). The Group has outstanding loans to these associates of £3m (2009: £7m) and received investment management fees of £36m during the year (2009: £30m). Distributions from these investment vehicles to the Group totalled £97m (2009: £57m).
noTEs To THE FinAnCiAL sTATEMEnTs (ConTinUEd)
158 ANNUAL REPORT AND ACCOUNTS 2010 groUP FinAnCiAL sTATEMEnTs
L&G_AR10_18-Notes35-44_p151-163_230311_AT.indd 158 25/03/2011 11:28
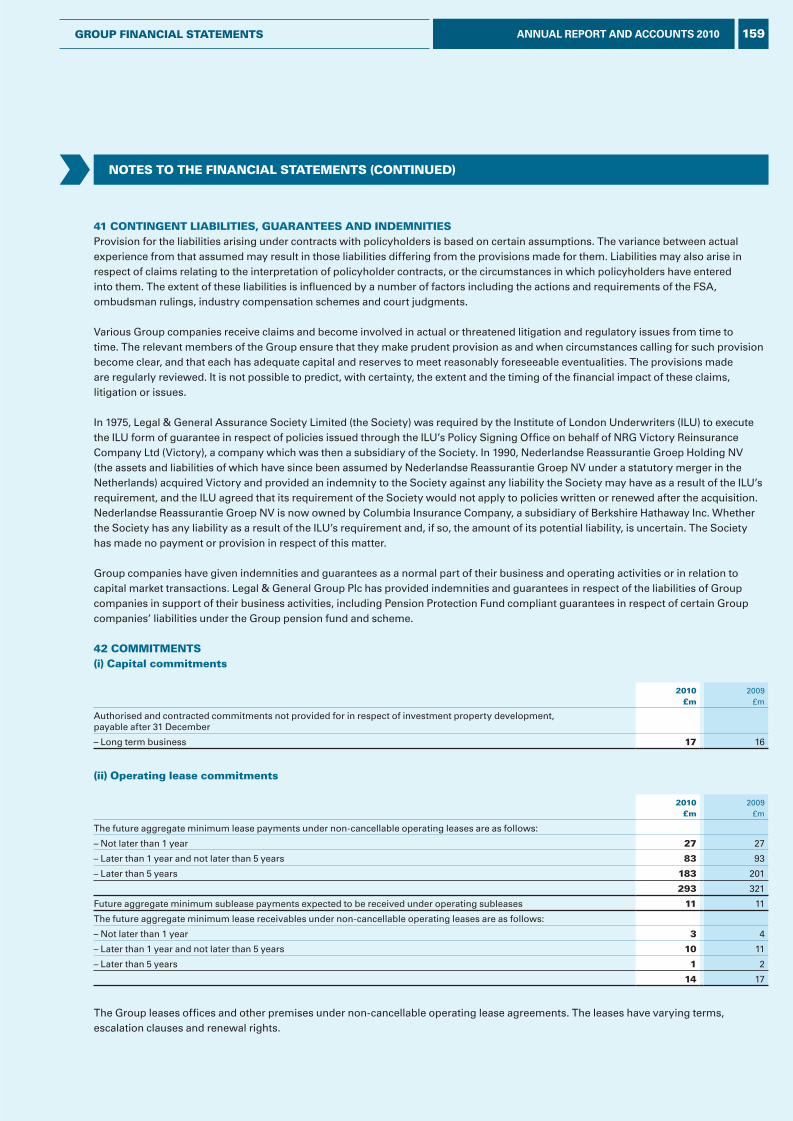
41 ConTingEnT LiABiLiTiEs, gUArAnTEEs And indEMniTiEsProvision for the liabilities arising under contracts with policyholders is based on certain assumptions. The variance between actual experience from that assumed may result in those liabilities differing from the provisions made for them. Liabilities may also arise in respect of claims relating to the interpretation of policyholder contracts, or the circumstances in which policyholders have entered into them. The extent of these liabilities is influenced by a number of factors including the actions and requirements of the FSA, ombudsman rulings, industry compensation schemes and court judgments.
Various Group companies receive claims and become involved in actual or threatened litigation and regulatory issues from time to time. The relevant members of the Group ensure that they make prudent provision as and when circumstances calling for such provision become clear, and that each has adequate capital and reserves to meet reasonably foreseeable eventualities. The provisions made are regularly reviewed. It is not possible to predict, with certainty, the extent and the timing of the financial impact of these claims, litigation or issues. In 1975, Legal & General Assurance Society Limited (the Society) was required by the Institute of London Underwriters (ILU) to execute the ILU form of guarantee in respect of policies issued through the ILU’s Policy Signing Office on behalf of NRG Victory Reinsurance Company Ltd (Victory), a company which was then a subsidiary of the Society. In 1990, Nederlandse Reassurantie Groep Holding NV (the assets and liabilities of which have since been assumed by Nederlandse Reassurantie Groep NV under a statutory merger in the Netherlands) acquired Victory and provided an indemnity to the Society against any liability the Society may have as a result of the ILU’s requirement, and the ILU agreed that its requirement of the Society would not apply to policies written or renewed after the acquisition. Nederlandse Reassurantie Groep NV is now owned by Columbia Insurance Company, a subsidiary of Berkshire Hathaway Inc. Whether the Society has any liability as a result of the ILU’s requirement and, if so, the amount of its potential liability, is uncertain. The Society has made no payment or provision in respect of this matter.
Group companies have given indemnities and guarantees as a normal part of their business and operating activities or in relation to capital market transactions. Legal & General Group Plc has provided indemnities and guarantees in respect of the liabilities of Group companies in support of their business activities, including Pension Protection Fund compliant guarantees in respect of certain Group companies’ liabilities under the Group pension fund and scheme.
42 CoMMiTMEnTs(i) Capital commitments
2010£m
2009£m
Authorised and contracted commitments not provided for in respect of investment property development, payable after 31 December
– Long term business 17 16
(ii) operating lease commitments
2010£m
2009£m
The future aggregate minimum lease payments under non-cancellable operating leases are as follows:
– Not later than 1 year 27 27
– Later than 1 year and not later than 5 years 83 93
– Later than 5 years 183 201
293 321
Future aggregate minimum sublease payments expected to be received under operating subleases 11 11
The future aggregate minimum lease receivables under non-cancellable operating leases are as follows:
– Not later than 1 year 3 4
– Later than 1 year and not later than 5 years 10 11
– Later than 5 years 1 2
14 17
The Group leases offices and other premises under non-cancellable operating lease agreements. The leases have varying terms, escalation clauses and renewal rights.
noTEs To THE FinAnCiAL sTATEMEnTs (ConTinUEd)
159ANNUAL REPORT AND ACCOUNTS 2010groUP FinAnCiAL sTATEMEnTs
L&G_AR10_18-Notes35-44_p151-163_230311_AT.indd 159 25/03/2011 11:28

noTEs To THE FinAnCiAL sTATEMEnTs (ConTinUEd)
43 sUBsidiAriEs(i) operating subsidiariesIn the opinion of the directors, the following subsidiaries principally affected the Company’s results as set out in the annual accounts and are consolidated in these financial statements. The information required to be provided under section 409 of the Companies Act 2006 is provided only in relation to these undertakings and the undertakings listed under notes 43(ii) and 44. A complete list of undertakings will be annexed to the Company’s next annual return which will be available from Companies House.
Company name nature of business Country of incorporation
Legal & general Finance Plc1 Treasury operations England and wales
Legal & general resources Limited1 Provision of services England and wales
Legal & general Assurance society Limited Long term and general insurance England and wales
Legal & general insurance Limited general insurance England and wales
Legal & general investment Management Limited institutional fund management England and wales
Legal & general Assurance (Pensions Management) Limited Long term business England and wales
Legal & general Pensions Limited reinsurance England and wales
Legal & general Partnership services Limited Provision of services England and wales
Legal & general (Portfolio Management services) Limited institutional fund management England and wales
Legal & general Property Limited Property management England and wales
Legal & general (Unit Trust Managers) Limited Unit trust management England and wales
nationwide Life Limited Long term business England and wales
suffolk Life Annuities Limited Long term business England and wales
suffolk Life Pensions Limited Long term business England and wales
Lgv Capital Limited Private equity England and wales
Legal & general (France) sA Long term business France
Legal & general Bank (France) sA Financial services France
Legal & general international (ireland) Limited Long term business ireland
Legal & general nederland Levensverzekering Maatschappij nv Long term business netherlands
Banner Life insurance Company inc Long term business UsA
william Penn Life insurance Company of new york inc Long term business UsA
Legal & general investment Management America inc institutional fund management UsA
First British American reinsurance Company reinsurance UsA
First British American reinsurance Company ii reinsurance UsA
First British Bermudan reinsurance Company reinsurance Bermuda
First British vermont reinsurance Company reinsurance UsA
1. Directly held by Legal & General Group Plc. All other subsidiaries are held through intermediate holding companies.
The main territory of operation of subsidiaries incorporated in England and Wales is the UK. For overseas subsidiaries the principal country of operation is the same as the country of incorporation. All operating subsidiaries have a 31 December year end reporting date and are 100% owned.
160 ANNUAL REPORT AND ACCOUNTS 2010 groUP FinAnCiAL sTATEMEnTs
L&G_AR10_18-Notes35-44_p151-163_230311_AT.indd 160 25/03/2011 11:28
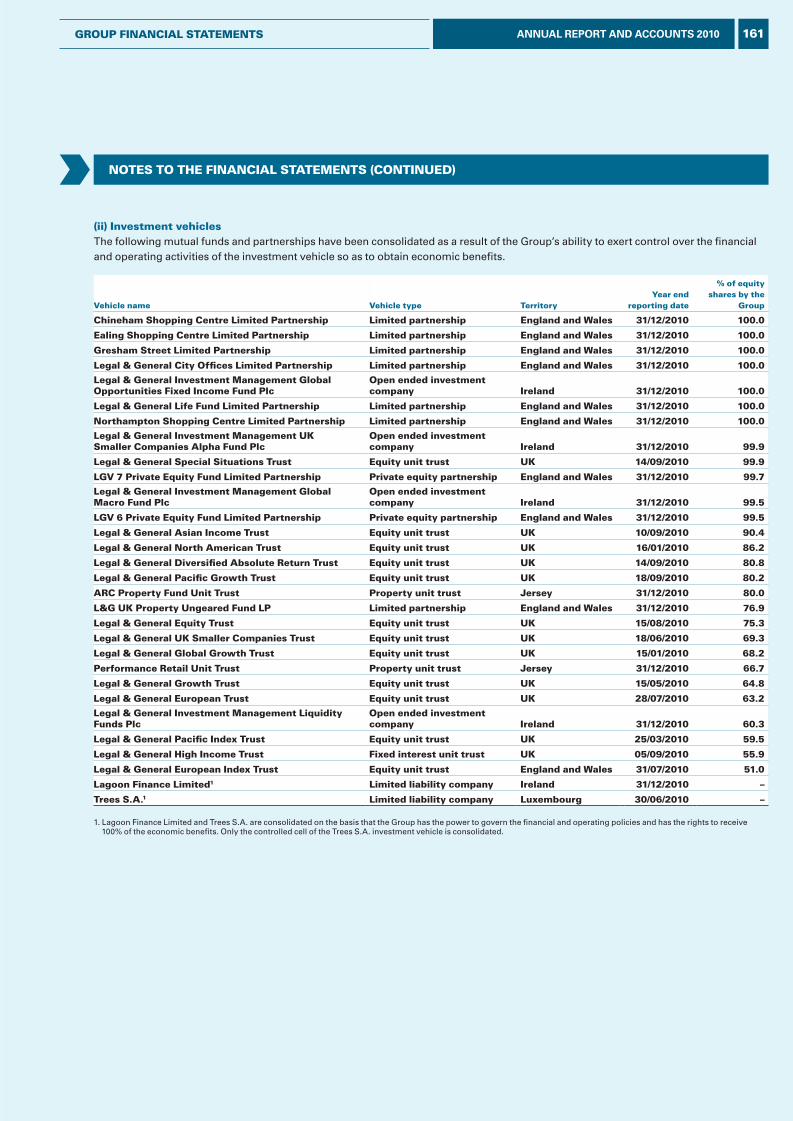
(ii) investment vehiclesThe following mutual funds and partnerships have been consolidated as a result of the Group’s ability to exert control over the financial and operating activities of the investment vehicle so as to obtain economic benefits.
vehicle name vehicle type Territoryyear end
reporting date
% of equity shares by the
group
Chineham shopping Centre Limited Partnership Limited partnership England and wales 31/12/2010 100.0
Ealing shopping Centre Limited Partnership Limited partnership England and wales 31/12/2010 100.0
gresham street Limited Partnership Limited partnership England and wales 31/12/2010 100.0
Legal & general City offices Limited Partnership Limited partnership England and wales 31/12/2010 100.0
Legal & general investment Management global opportunities Fixed income Fund Plc
open ended investment company ireland 31/12/2010 100.0
Legal & general Life Fund Limited Partnership Limited partnership England and wales 31/12/2010 100.0
northampton shopping Centre Limited Partnership Limited partnership England and wales 31/12/2010 100.0
Legal & general investment Management UK smaller Companies Alpha Fund Plc
open ended investment company ireland 31/12/2010 99.9
Legal & general special situations Trust Equity unit trust UK 14/09/2010 99.9
Lgv 7 Private Equity Fund Limited Partnership Private equity partnership England and wales 31/12/2010 99.7
Legal & general investment Management global Macro Fund Plc
open ended investment company ireland 31/12/2010 99.5
Lgv 6 Private Equity Fund Limited Partnership Private equity partnership England and wales 31/12/2010 99.5
Legal & general Asian income Trust Equity unit trust UK 10/09/2010 90.4
Legal & general north American Trust Equity unit trust UK 16/01/2010 86.2
Legal & general diversified Absolute return Trust Equity unit trust UK 14/09/2010 80.8
Legal & general Pacific growth Trust Equity unit trust UK 18/09/2010 80.2
ArC Property Fund Unit Trust Property unit trust Jersey 31/12/2010 80.0
L&g UK Property Ungeared Fund LP Limited partnership England and wales 31/12/2010 76.9
Legal & general Equity Trust Equity unit trust UK 15/08/2010 75.3
Legal & general UK smaller Companies Trust Equity unit trust UK 18/06/2010 69.3
Legal & general global growth Trust Equity unit trust UK 15/01/2010 68.2
Performance retail Unit Trust Property unit trust Jersey 31/12/2010 66.7
Legal & general growth Trust Equity unit trust UK 15/05/2010 64.8
Legal & general European Trust Equity unit trust UK 28/07/2010 63.2
Legal & general investment Management Liquidity Funds Plc
open ended investment company ireland 31/12/2010 60.3
Legal & general Pacific index Trust Equity unit trust UK 25/03/2010 59.5
Legal & general High income Trust Fixed interest unit trust UK 05/09/2010 55.9
Legal & general European index Trust Equity unit trust England and wales 31/07/2010 51.0
Lagoon Finance Limited1 Limited liability company ireland 31/12/2010 –
Trees s.A.1 Limited liability company Luxembourg 30/06/2010 –
1. Lagoon Finance Limited and Trees S.A. are consolidated on the basis that the Group has the power to govern the financial and operating policies and has the rights to receive 100% of the economic benefits. Only the controlled cell of the Trees S.A. investment vehicle is consolidated.
noTEs To THE FinAnCiAL sTATEMEnTs (ConTinUEd)
161ANNUAL REPORT AND ACCOUNTS 2010groUP FinAnCiAL sTATEMEnTs
L&G_AR10_18-Notes35-44_p151-163_230311_AT.indd 161 25/03/2011 11:28
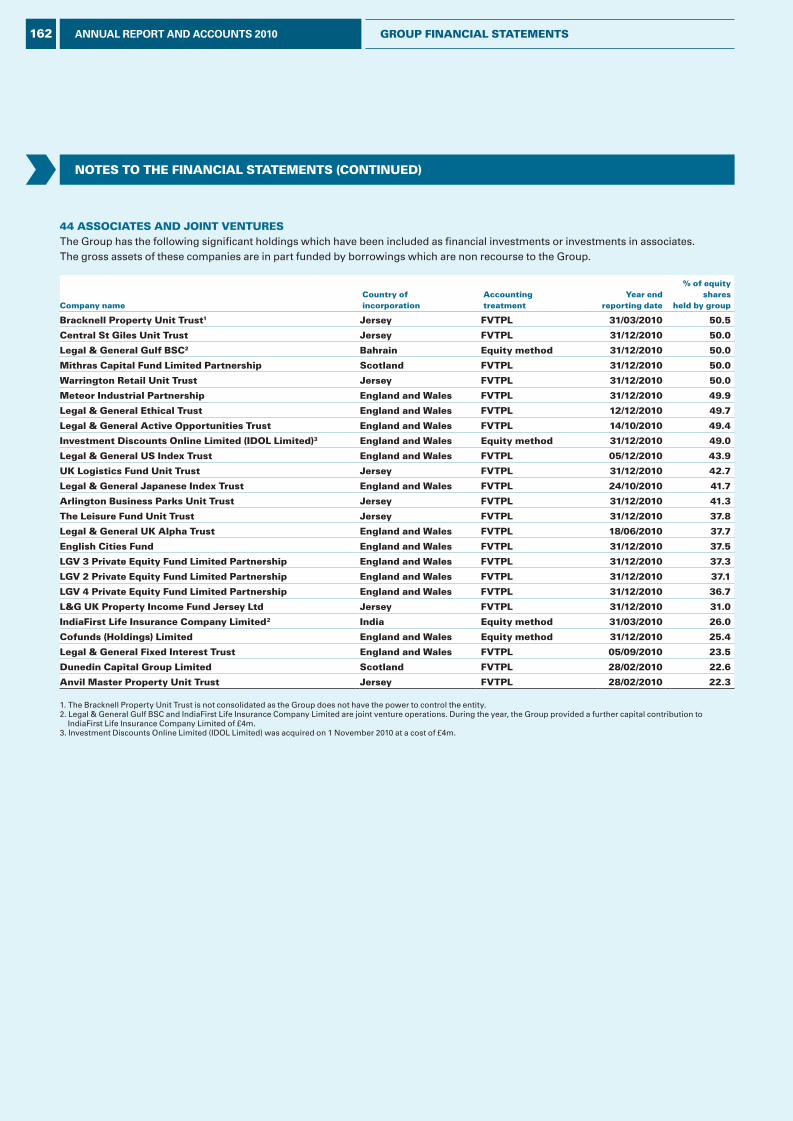
44 AssoCiATEs And JoinT vEnTUrEsThe Group has the following significant holdings which have been included as financial investments or investments in associates. The gross assets of these companies are in part funded by borrowings which are non recourse to the Group.
Company name Country of incorporation
Accounting treatment
year end reporting date
% of equity shares
held by group
Bracknell Property Unit Trust1 Jersey FvTPL 31/03/2010 50.5
Central st giles Unit Trust Jersey FvTPL 31/12/2010 50.0
Legal & general gulf BsC2 Bahrain Equity method 31/12/2010 50.0
Mithras Capital Fund Limited Partnership scotland FvTPL 31/12/2010 50.0
warrington retail Unit Trust Jersey FvTPL 31/12/2010 50.0
Meteor industrial Partnership England and wales FvTPL 31/12/2010 49.9
Legal & general Ethical Trust England and wales FvTPL 12/12/2010 49.7
Legal & general Active opportunities Trust England and wales FvTPL 14/10/2010 49.4
investment discounts online Limited (idoL Limited)3 England and wales Equity method 31/12/2010 49.0
Legal & general Us index Trust England and wales FvTPL 05/12/2010 43.9
UK Logistics Fund Unit Trust Jersey FvTPL 31/12/2010 42.7
Legal & general Japanese index Trust England and wales FvTPL 24/10/2010 41.7
Arlington Business Parks Unit Trust Jersey FvTPL 31/12/2010 41.3
The Leisure Fund Unit Trust Jersey FvTPL 31/12/2010 37.8
Legal & general UK Alpha Trust England and wales FvTPL 18/06/2010 37.7
English Cities Fund England and wales FvTPL 31/12/2010 37.5
Lgv 3 Private Equity Fund Limited Partnership England and wales FvTPL 31/12/2010 37.3
Lgv 2 Private Equity Fund Limited Partnership England and wales FvTPL 31/12/2010 37.1
Lgv 4 Private Equity Fund Limited Partnership England and wales FvTPL 31/12/2010 36.7
L&g UK Property income Fund Jersey Ltd Jersey FvTPL 31/12/2010 31.0
insurance Company Limited2 india Equity method 31/03/2010 26.0
Cofunds (Holdings) Limited England and wales Equity method 31/12/2010 25.4
Legal & general Fixed interest Trust England and wales FvTPL 05/09/2010 23.5
dunedin Capital group Limited scotland FvTPL 28/02/2010 22.6
Anvil Master Property Unit Trust Jersey FvTPL 28/02/2010 22.3
1. The Bracknell Property Unit Trust is not consolidated as the Group does not have the power to control the entity.2. Legal & General Gulf BSC and IndiaFirst Life Insurance Company Limited are joint venture operations. During the year, the Group provided a further capital contribution to
3. Investment Discounts Online Limited (IDOL Limited) was acquired on 1 November 2010 at a cost of £4m.
noTEs To THE FinAnCiAL sTATEMEnTs (ConTinUEd)
162 ANNUAL REPORT AND ACCOUNTS 2010 groUP FinAnCiAL sTATEMEnTs
L&G_AR10_18-Notes35-44_p151-163_230311_AT.indd 162 25/03/2011 11:28
indiaFirst Life
IndiaFirst Life Insurance Company Limited of £4m.
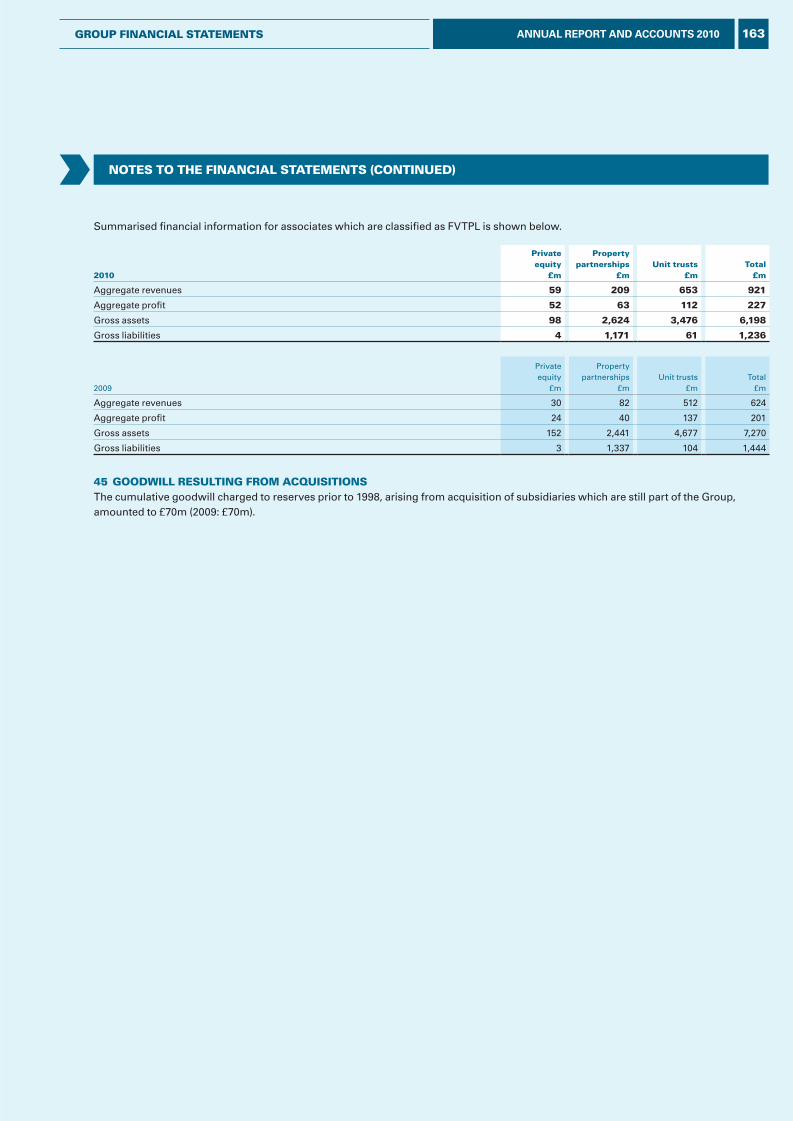
Summarised financial information for associates which are classified as FVTPL is shown below.
2010
Privateequity
£m
Propertypartnerships
£mUnit trusts
£mTotal
£m
Aggregate revenues 59 209 653 921
Aggregate profit 52 63 112 227
Gross assets 98 2,624 3,476 6,198
Gross liabilities 4 1,171 61 1,236
2009
Privateequity
£m
Propertypartnerships
£mUnit trusts
£mTotal
£m
Aggregate revenues 30 82 512 624
Aggregate profit 24 40 137 201
Gross assets 152 2,441 4,677 7,270
Gross liabilities 3 1,337 104 1,444
45 goodwiLL rEsULTing FroM ACqUisiTionsThe cumulative goodwill charged to reserves prior to 1998, arising from acquisition of subsidiaries which are still part of the Group, amounted to £70m (2009: £70m).
noTEs To THE FinAnCiAL sTATEMEnTs (ConTinUEd)
163ANNUAL REPORT AND ACCOUNTS 2010groUP FinAnCiAL sTATEMEnTs
L&G_AR10_18-Notes35-44_p151-163_230311_AT.indd 163 25/03/2011 11:28
NOTES TO THE FINANCIAL STATEMENTS (CONTINuEd)
46 MANAgEMENT OF CApITAL rESOurCESCapital structure The Group’s total capital resources of £8.1bn (2009: £7.3bn) on an IFRS basis comprise equity holders capital, £4.8bn (2009: £4.2bn), subordinated debt £1.8bn (2009: £1.8bn), and unallocated divisible surplus, £1.5bn (2009: £1.3bn).
From a regulatory perspective the Group is required to measure and monitor its capital resources on an ongoing basis and to comply with the minimum capital requirements of regulators in each territory in which we operate. At 31 December 2010, Legal & General’s unaudited Insurance Group Directive (IGD) capital resources were £3.7bn (2009: £3.1bn) in excess of capital requirements of £3.0bn (2009: £2.5bn), representing a solvency coverage ratio of 226% (2009: 224%). This surplus capital is after accruing for a 2010 final dividend of £201m (2009: £160m).
The Group writes a range of long term insurance and investment business in the long term fund (LTF) of its main operating insurance subsidiary, Legal & General Assurance Society Limited (Society). This fund is segregated from the Group’s other assets. The fund includes participating (with-profits) business where policyholders and shareholders share in the risks and rewards, and non-participating (non profit) business, where the shareholders receive profits or incur losses. Capital in excess of the amount required to cover the liabilities is currently held within Society. This capital provides support for new and existing non profit business within our UK non profit Risk and Savings businesses.
The non-linked, non profit pensions and annuity business of Society is ceded, on arm’s length terms, to a wholly owned Insurance Special Purpose Vehicle (ISPV), Legal & General Pensions Limited (LGPL). Whilst an ISPV is not required to segregate policyholder assets within a LTF, LGPL continues to manage policyholder and shareholder assets separately for internal purposes.
Managed pension fund business is written through Legal & General Assurance (Pensions Management) Limited (PMC), which is a life company writing predominantly non-participating group pension business effected by trustees of occupational schemes in the UK (or their equivalent overseas). The assets are held in a LTF and are separate from other assets within the Group.
In addition, the Group operates two UK long term insurance businesses acquired in 2008 (Nationwide Life Limited and Suffolk Life Annuities Limited). General insurance business is written in the UK by Legal & General Insurance Limited, and long term insurance business is also written by subsidiaries in America, the Netherlands and France.
Capital management policies and objectivesThe Group aims to manage its capital resources to maintain financial strength, policyholder security and relative external ratings advantage. The Group also seeks to maximise its financial flexibility by maintaining strong liquidity and by utilising a range of alternative sources of capital including equity, senior debt, subordinated debt and reinsurance.
Capital measuresThe Group measures its capital on a number of different bases, including those which comply with the regulatory frameworks within which the Group operates and those which the directors consider most appropriate for managing the business. The measures used by the Group include:
• Accounting bases Management use the primary financial statements prepared on an IFRS basis to manage capital and cash flow usage and to determine dividend paying capacity. In addition, the supplementary accounts prepared using EEV principles provide further insight into the value of the business to shareholders. Accordingly the Group’s net asset value and total capital employed are also analysed and measured on this basis.
• Regulatory bases The financial strength of the Group’s insurance subsidiaries is measured under various local regulatory requirements (see below). One of these regulatory measures, Individual Capital Assessment (ICA), measures capital using risk based stochastic techniques, and provides a measure of the level of economic capital required to run the Group’s business.
Basis of regulatory capital and corresponding regulatory capital requirementsIn each country in which the Group operates, the local insurance regulator specifies rules and guidance for the minimum amount and type of capital which must be held by long term insurance subsidiaries in excess of their insurance liabilities. The minimum required capital must be maintained at all times throughout the year. This helps to ensure that payments to policyholders can be made as they fall due.
164 ANNUAL REPORT AND ACCOUNTS 2010 grOup FINANCIAL STATEMENTS
L&G_AR10_19-Notes45-47_p164-171_230311_AT.indd 164 25/03/2011 11:28
NOTES TO THE FINANCIAL STATEMENTS (CONTINuEd)
The required capital is calculated by either assessing the additional assets which would be required to meet the insurance company’s liabilities in specified, stressed financial conditions, or by applying fixed percentages to the insurance company’s liabilities and risk exposures. The requirements in the different jurisdictions in which the Group operates are detailed below:
UK regulatory basisRequired capital for the life business is based on FSA rules. Society must hold assets in excess of the higher of two amounts, the first being calculated using the FSA rules specified by the Regulator (pillar 1), the second being an economic capital assessment by the Company which is reviewed by the FSA (pillar 2), otherwise known as ICA.
The public pillar 1 capital calculation is calculated by applying fixed percentages to liabilities and sums assured at risk or setting aside a proportion of expenses (Peak 1). There are further stress tests for participating business, as measured in the Realistic Balance Sheet (Peak 2), which may increase the required capital under Peak 1 calculations.
The private pillar 2 capital calculation is an assessment of the economic capital required to ensure that the Company can meet its liabilities, with a high likelihood, as they fall due. This is achieved by application of stochastic modelling and scenario testing. The result is reviewed and may be modified by the FSA.
Regulatory capital for the general insurance business is also calculated using FSA pillar 1 and pillar 2 requirements. The pillar 1 calculation applies fixed percentages to premiums and claims. Pillar 2 creates a higher capital requirement and is therefore applied in this business.
US regulatory basisRequired capital is determined to be the Company Action Level Risk Based Capital (RBC) based on the National Association of Insurance Commissioners RBC model. RBC is a method of measuring the minimum amount of capital appropriate for an insurance company to support its overall business operations, taking into account its size and risk profile. The calculation is based on applying factors to various asset, premium, claim, expense and reserve items, with higher factors used for those items with greater underlying risk and lower factors for less risky items.
French and Dutch regulatory basesThe minimum required capital is defined by the French Ministry of Finance’s ‘Code des Assurances’ and the ‘De Nederlandsche Bank N.V.’ (Dutch Supervisory Body) respectively. The basis of the calculation is a percentage of the liabilities plus a percentage of the sum assured at risk and, for some contracts, the premium. The percentages depend on the guarantees given and the amount of reinsurance cover.
Group regulatory basisIn addition to the regulatory capital calculations for the individual firms, the Group is required to comply with the requirements of the Insurance Group’s Directive (IGD).
Available regulatory capital resourcesCapital resources available to meet regulatory UK capital requirements are determined using FSA valuation rules. The asset valuation rules are based on UK GAAP, adjusted for admissibility, counterparty exposure limits and specific valuation differences.
The Group’s regulatory capital position statement in Table 1 sets out the different sources of capital held within the Group. The Group’s total available capital resources, based on unaudited FSA returns, are £5.9bn (2009: £5.1bn) of which £4.5bn (2009: £4.2bn) is held by the life businesses. The use of capital held by the UK and overseas life businesses is generally constrained by local regulatory requirements, and may not be available to provide funding for other businesses.
The total available capital resources of the Group’s with-profits business (with-profits estate) is determined in accordance with the Realistic Balance Sheet rules prescribed by the FSA.
At 31 December 2010, the realistic value of the UK participating liabilities was £15.3bn (2009: £15.3bn) under the FSA realistic capital regime. The excess of realistic assets over realistic liabilities was £1.0bn (2009: £0.8bn). The capital resources reflect the surplus in that part of the fund which is in excess of any constructive obligation to policyholders. The liabilities within the consolidated balance sheet do not include the amount representing the shareholders’ share of future bonuses.
165ANNUAL REPORT AND ACCOUNTS 2010grOup FINANCIAL STATEMENTS
L&G_AR10_19-Notes45-47_p164-171_230311_AT.indd 165 25/03/2011 11:28
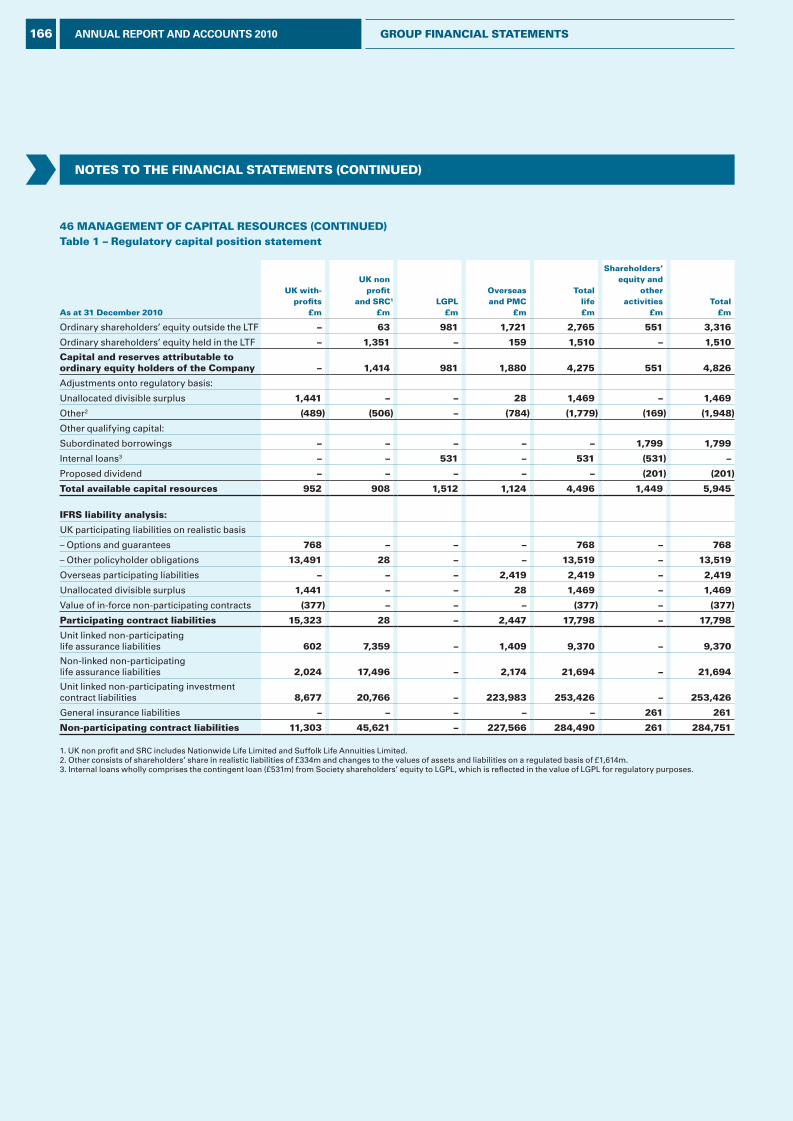
NOTES TO THE FINANCIAL STATEMENTS (CONTINuEd)
46 MANAgEMENT OF CApITAL rESOurCES (CONTINuEd) Table 1 – regulatory capital position statement
As at 31 december 2010
uK with-profits
£m
uK nonprofit
and SrC1
£mLgpL
£m
Overseasand pMC
£m
Totallife£m
Shareholders’equity and
otheractivities
£mTotal
£m
Ordinary shareholders’ equity outside the LTF – 63 981 1,721 2,765 551 3,316
Ordinary shareholders’ equity held in the LTF – 1,351 – 159 1,510 – 1,510
Capital and reserves attributable to ordinary equity holders of the Company – 1,414 981 1,880 4,275 551 4,826
Adjustments onto regulatory basis:
Unallocated divisible surplus 1,441 – – 28 1,469 – 1,469
Other2 (489) (506) – (784) (1,779) (169) (1,948)
Other qualifying capital:
Subordinated borrowings – – – – – 1,799 1,799
Internal loans3 – – 531 – 531 (531) –
Proposed dividend – – – – – (201) (201)
Total available capital resources 952 908 1,512 1,124 4,496 1,449 5,945
IFrS liability analysis:
UK participating liabilities on realistic basis
– Options and guarantees 768 – – – 768 – 768
– Other policyholder obligations 13,491 28 – – 13,519 – 13,519
Overseas participating liabilities – – – 2,419 2,419 – 2,419
Unallocated divisible surplus 1,441 – – 28 1,469 – 1,469
Value of in-force non-participating contracts (377) – – – (377) – (377)
participating contract liabilities 15,323 28 – 2,447 17,798 – 17,798
Unit linked non-participating life assurance liabilities 602 7,359 – 1,409 9,370 – 9,370
Non-linked non-participating life assurance liabilities 2,024 17,496 – 2,174 21,694 – 21,694
Unit linked non-participating investment contract liabilities 8,677 20,766 – 223,983 253,426 – 253,426
General insurance liabilities – – – – – 261 261
Non-participating contract liabilities 11,303 45,621 – 227,566 284,490 261 284,751
1. UK non profit and SRC includes Nationwide Life Limited and Suffolk Life Annuities Limited.2. Other consists of shareholders’ share in realistic liabilities of £334m and changes to the values of assets and liabilities on a regulated basis of £1,614m.3. Internal loans wholly comprises the contingent loan (£531m) from Society shareholders’ equity to LGPL, which is reflected in the value of LGPL for regulatory purposes.
166 ANNUAL REPORT AND ACCOUNTS 2010 grOup FINANCIAL STATEMENTS
L&G_AR10_19-Notes45-47_p164-171_230311_AT.indd 166 25/03/2011 11:28
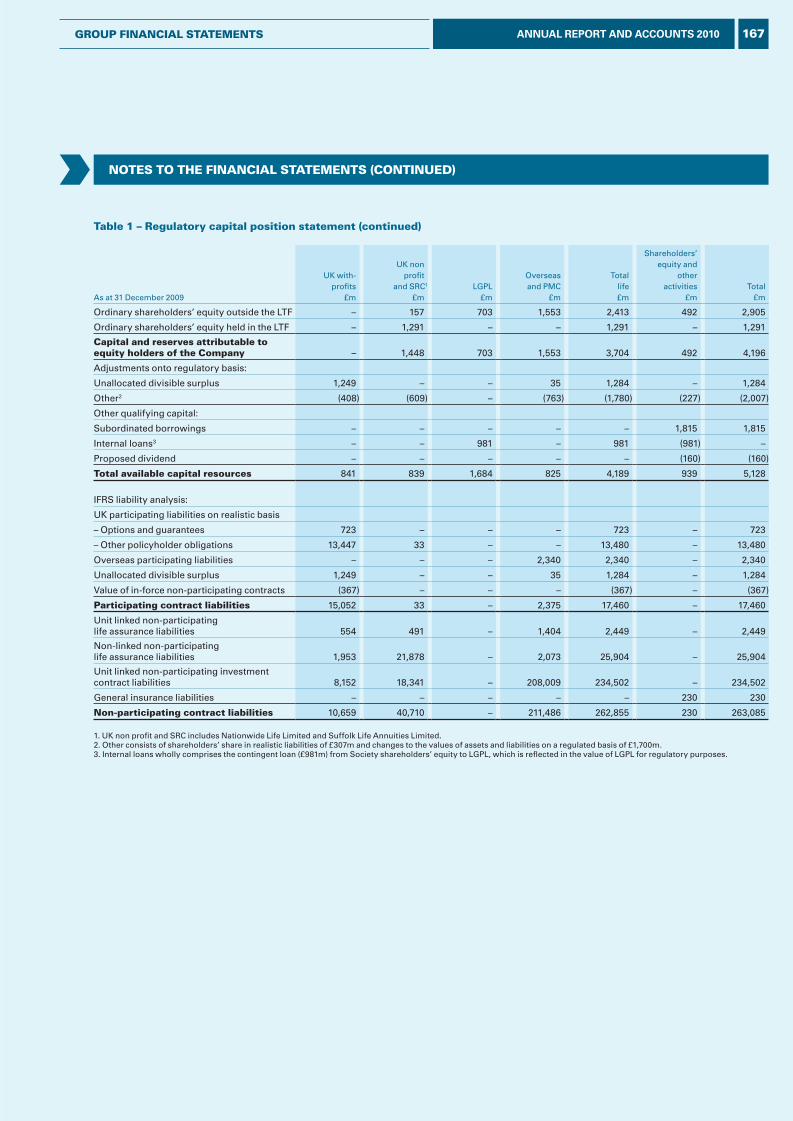
NOTES TO THE FINANCIAL STATEMENTS (CONTINuEd)
Table 1 – regulatory capital position statement (continued)
As at 31 December 2009
UK with-profits
£m
UK nonprofit
and SRC1
£mLGPL
£m
Overseasand PMC
£m
Totallife£m
Shareholders’equity and
otheractivities
£mTotal
£m
Ordinary shareholders’ equity outside the LTF – 157 703 1,553 2,413 492 2,905
Ordinary shareholders’ equity held in the LTF – 1,291 – – 1,291 – 1,291
Capital and reserves attributable to equity holders of the Company – 1,448 703 1,553 3,704 492 4,196
Adjustments onto regulatory basis:
Unallocated divisible surplus 1,249 – – 35 1,284 – 1,284
Other2 (408) (609) – (763) (1,780) (227) (2,007)
Other qualifying capital:
Subordinated borrowings – – – – – 1,815 1,815
Internal loans3 – – 981 – 981 (981) –
Proposed dividend – – – – – (160) (160)
Total available capital resources 841 839 1,684 825 4,189 939 5,128
IFRS liability analysis:
UK participating liabilities on realistic basis
– Options and guarantees 723 – – – 723 – 723
– Other policyholder obligations 13,447 33 – – 13,480 – 13,480
Overseas participating liabilities – – – 2,340 2,340 – 2,340
Unallocated divisible surplus 1,249 – – 35 1,284 – 1,284
Value of in-force non-participating contracts (367) – – – (367) – (367)
participating contract liabilities 15,052 33 – 2,375 17,460 – 17,460
Unit linked non-participating life assurance liabilities 554 491 – 1,404 2,449 – 2,449
Non-linked non-participating life assurance liabilities 1,953 21,878 – 2,073 25,904 – 25,904
Unit linked non-participating investment contract liabilities 8,152 18,341 – 208,009 234,502 – 234,502
General insurance liabilities – – – – – 230 230
Non-participating contract liabilities 10,659 40,710 – 211,486 262,855 230 263,085
1. UK non profit and SRC includes Nationwide Life Limited and Suffolk Life Annuities Limited.2. Other consists of shareholders’ share in realistic liabilities of £307m and changes to the values of assets and liabilities on a regulated basis of £1,700m.3. Internal loans wholly comprises the contingent loan (£981m) from Society shareholders’ equity to LGPL, which is reflected in the value of LGPL for regulatory purposes.
167ANNUAL REPORT AND ACCOUNTS 2010grOup FINANCIAL STATEMENTS
L&G_AR10_19-Notes45-47_p164-171_230311_AT.indd 167 25/03/2011 11:28
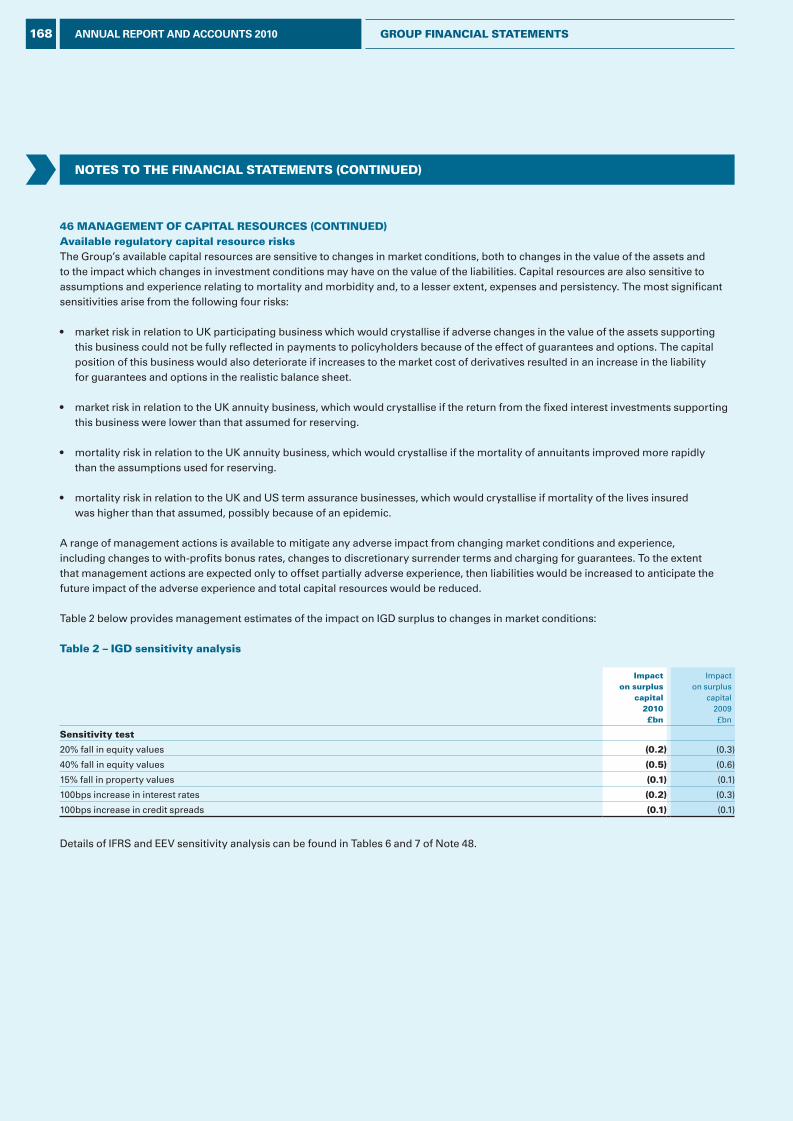
NOTES TO THE FINANCIAL STATEMENTS (CONTINuEd)
46 MANAgEMENT OF CApITAL rESOurCES (CONTINuEd)Available regulatory capital resource risksThe Group’s available capital resources are sensitive to changes in market conditions, both to changes in the value of the assets and to the impact which changes in investment conditions may have on the value of the liabilities. Capital resources are also sensitive to assumptions and experience relating to mortality and morbidity and, to a lesser extent, expenses and persistency. The most significant sensitivities arise from the following four risks:
• market risk in relation to UK participating business which would crystallise if adverse changes in the value of the assets supporting this business could not be fully reflected in payments to policyholders because of the effect of guarantees and options. The capital position of this business would also deteriorate if increases to the market cost of derivatives resulted in an increase in the liability for guarantees and options in the realistic balance sheet.
• market risk in relation to the UK annuity business, which would crystallise if the return from the fixed interest investments supporting this business were lower than that assumed for reserving.
• mortality risk in relation to the UK annuity business, which would crystallise if the mortality of annuitants improved more rapidly than the assumptions used for reserving.
• mortality risk in relation to the UK and US term assurance businesses, which would crystallise if mortality of the lives insured was higher than that assumed, possibly because of an epidemic.
A range of management actions is available to mitigate any adverse impact from changing market conditions and experience, including changes to with-profits bonus rates, changes to discretionary surrender terms and charging for guarantees. To the extent that management actions are expected only to offset partially adverse experience, then liabilities would be increased to anticipate the future impact of the adverse experience and total capital resources would be reduced.
Table 2 below provides management estimates of the impact on IGD surplus to changes in market conditions:
Table 2 – Igd sensitivity analysis
Impacton surplus
capital2010£bn
Impacton surplus
capital2009£bn
Sensitivity test
20% fall in equity values (0.2) (0.3)
40% fall in equity values (0.5) (0.6)
15% fall in property values (0.1) (0.1)
100bps increase in interest rates (0.2) (0.3)
100bps increase in credit spreads (0.1) (0.1)
Details of IFRS and EEV sensitivity analysis can be found in Tables 6 and 7 of Note 48.
168 ANNUAL REPORT AND ACCOUNTS 2010 grOup FINANCIAL STATEMENTS
L&G_AR10_19-Notes45-47_p164-171_230311_AT.indd 168 25/03/2011 11:28
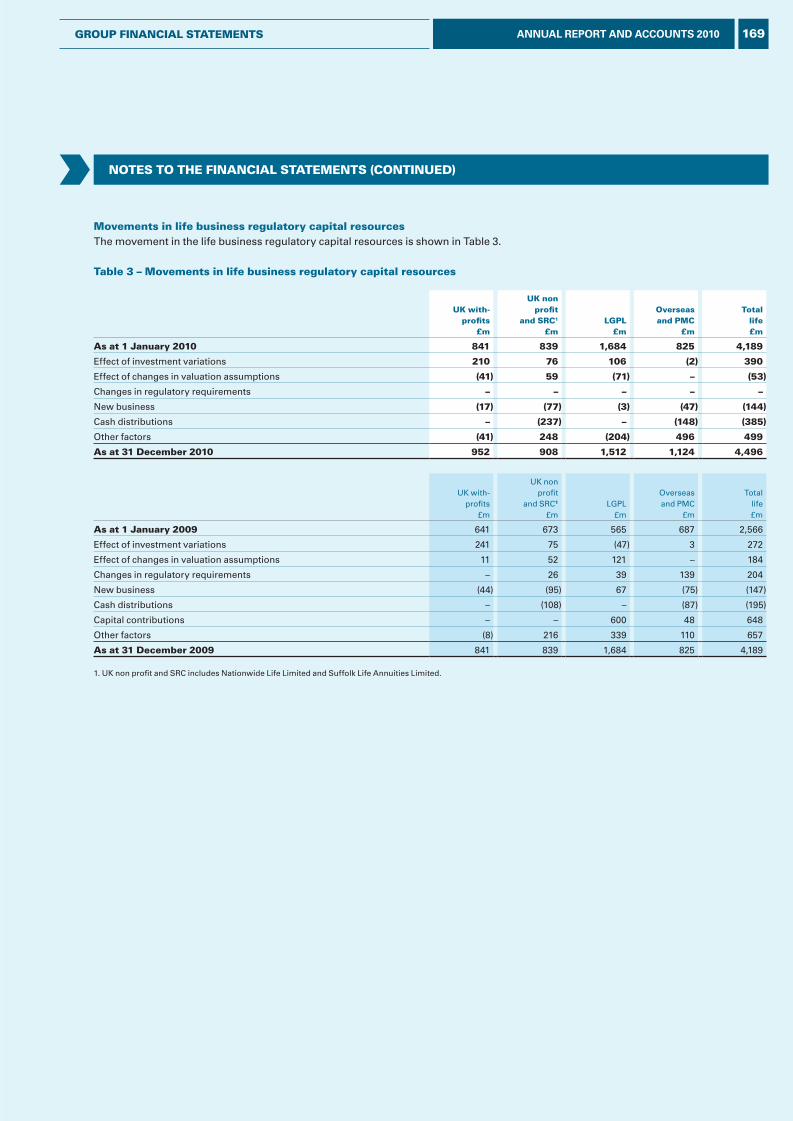
NOTES TO THE FINANCIAL STATEMENTS (CONTINuEd)
Movements in life business regulatory capital resourcesThe movement in the life business regulatory capital resources is shown in Table 3.
Table 3 – Movements in life business regulatory capital resources
uK with-profits
£m
uK nonprofit
and SrC1
£mLgpL
£m
Overseasand pMC
£m
Totallife£m
As at 1 January 2010 841 839 1,684 825 4,189
Effect of investment variations 210 76 106 (2) 390
Effect of changes in valuation assumptions (41) 59 (71) – (53)
Changes in regulatory requirements – – – – –
New business (17) (77) (3) (47) (144)
Cash distributions – (237) – (148) (385)
Other factors (41) 248 (204) 496 499
As at 31 december 2010 952 908 1,512 1,124 4,496
UK with-profits
£m
UK nonprofit
and SRC1
£mLGPL
£m
Overseasand PMC
£m
Totallife£m
As at 1 January 2009 641 673 565 687 2,566
Effect of investment variations 241 75 (47) 3 272
Effect of changes in valuation assumptions 11 52 121 – 184
Changes in regulatory requirements – 26 39 139 204
New business (44) (95) 67 (75) (147)
Cash distributions – (108) – (87) (195)
Capital contributions – – 600 48 648
Other factors (8) 216 339 110 657
As at 31 december 2009 841 839 1,684 825 4,189
1. UK non profit and SRC includes Nationwide Life Limited and Suffolk Life Annuities Limited.
169ANNUAL REPORT AND ACCOUNTS 2010grOup FINANCIAL STATEMENTS
L&G_AR10_19-Notes45-47_p164-171_230311_AT.indd 169 25/03/2011 11:28

NOTES TO THE FINANCIAL STATEMENTS (CONTINuEd)
47 ASSETS ANALySISThe Group has categorised its assets and liabilities in the following disclosure in accordance with the level of shareholder exposure to market and credit risks. The four categorisations presented are:
• unit linked For unit linked contracts, there is a direct link between the investments and the obligations. Unit linked business is written in both the Society LTF and in the LTF of PMC. The financial risk on these contracts is borne by the policyholders. The Group is, therefore, not directly exposed to any market risk, currency risk or credit risk for these contracts. Detailed risk disclosures have not been presented for unit linked assets and liabilities.
• With-profitsPolicyholders and shareholders share in the risks and returns of the with-profits part of the Society LTF. The return to shareholders on virtually all participating products is in the form of a transfer to shareholders’ equity, which is analogous to a dividend from the Society LTF and is dependent upon the bonuses credited or declared on policies in that year. The bonuses are broadly based on historic and current rates of return on equity, property and fixed income securities, as well as expectations of future investment returns. With-profits also includes participating business in the France operation which shares similar characteristics. The with-profits classification excludes unit linked contracts.
• Non profit non-unit linkedShareholders are exposed to the risk and rewards of ownership of assets backing non profit non-unit linked business held within UK LTFs.
• ShareholderAll other assets are classified as shareholder assets. Shareholders of the Group are directly exposed to market and credit risk on these assets. This includes the assets and liabilities of our overseas insurance operations.
The table overleaf presents an analysis of the balance sheet by category. All of the quantitative risk disclosures in Note 48 (Risk management and control) have been provided using this categorisation.
170 ANNUAL REPORT AND ACCOUNTS 2010 grOup FINANCIAL STATEMENTS
L&G_AR10_19-Notes45-47_p164-171_230311_AT.indd 170 25/03/2011 11:28
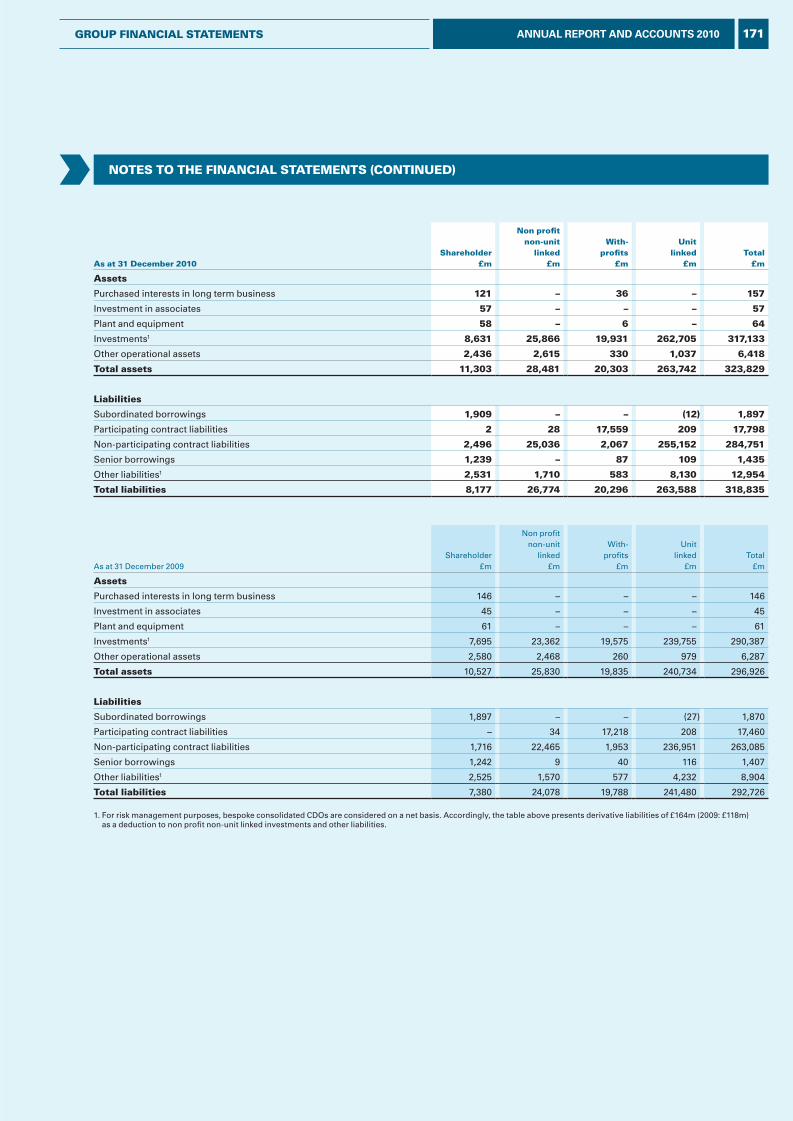
As at 31 december 2010Shareholder
£m
Non profitnon-unit
linked£m
With-profits
£m
unitlinked
£mTotal
£m
Assets
Purchased interests in long term business 121 – 36 – 157
Investment in associates 57 – – – 57
Plant and equipment 58 – 6 – 64
Investments1 8,631 25,866 19,931 262,705 317,133
Other operational assets 2,436 2,615 330 1,037 6,418
Total assets 11,303 28,481 20,303 263,742 323,829
Liabilities
Subordinated borrowings 1,909 – – (12) 1,897
Participating contract liabilities 2 28 17,559 209 17,798
Non-participating contract liabilities 2,496 25,036 2,067 255,152 284,751
Senior borrowings 1,239 – 87 109 1,435
Other liabilities1 2,531 1,710 583 8,130 12,954
Total liabilities 8,177 26,774 20,296 263,588 318,835
As at 31 December 2009Shareholder
£m
Non profitnon-unit
linked£m
With-profits
£m
Unitlinked
£mTotal
£m
Assets
Purchased interests in long term business 146 – – – 146
Investment in associates 45 – – – 45
Plant and equipment 61 – – – 61
Investments1 7,695 23,362 19,575 239,755 290,387
Other operational assets 2,580 2,468 260 979 6,287
Total assets 10,527 25,830 19,835 240,734 296,926
Liabilities
Subordinated borrowings 1,897 – – (27) 1,870
Participating contract liabilities – 34 17,218 208 17,460
Non-participating contract liabilities 1,716 22,465 1,953 236,951 263,085
Senior borrowings 1,242 9 40 116 1,407
Other liabilities1 2,525 1,570 577 4,232 8,904
Total liabilities 7,380 24,078 19,788 241,480 292,726
1. For risk management purposes, bespoke consolidated CDOs are considered on a net basis. Accordingly, the table above presents derivative liabilities of £164m (2009: £118m) as a deduction to non profit non-unit linked investments and other liabilities.
NOTES TO THE FINANCIAL STATEMENTS (CONTINuEd)
171ANNUAL REPORT AND ACCOUNTS 2010grOup FINANCIAL STATEMENTS
L&G_AR10_19-Notes45-47_p164-171_230311_AT.indd 171 25/03/2011 11:28
Notes to the FiNaNcial statemeNts (coNtiNued)
48 Risk maNagemeNt aNd coNtRolThis section describes the Group’s approach to risk management. It covers the overall approach that applies to all risks, and includes a detailed review of risks within the Group’s key businesses.
Risk management objectivesThe Group’s primary objective in undertaking risk management activity is to manage risk exposures in line with risk appetite, minimising its exposure to unexpected financial loss and limiting the potential for deviation from anticipated outcomes. In this respect, a framework of limits and qualitative statements, aligned with the Group’s risk appetite, is in place for material exposures.
Risk management approachA significant part of the Group’s business involves the acceptance and management of risk. The Group is exposed to insurance, market, credit, liquidity and operational risks and operates a formal risk management framework to ensure that all significant risks are identified and managed. The risk factors mentioned below should not be regarded as a complete and comprehensive statement of all potential risks and uncertainties.
Insurance risk: exposure to loss arising from claims experience being different to that anticipated.
Market risk: exposure to loss as a direct or indirect result of fluctuations in the value of, or income from, specific assets.
Credit risk: exposure to loss if another party fails to perform its financial obligations to the Group.
Liquidity risk: the risk that the Group, though solvent, either does not have sufficient financial resources available to enable it to meet its obligations as they fall due, or can secure them only at excessive cost.
Operational risk: exposure to loss arising from inadequate or failed internal processes, people, systems, or from external events.
Group risk: the risk of loss that a firm may be exposed to as a consequence of being a member of a group of companies. Group risk comprises Capital Adequacy Risk and Contagion Risk.
An explanation of the risk framework and the methods used to monitor and assess risk exposures can be found in pages 14 to 17.
management of risksThe Group seeks to manage its exposures to risk through control techniques which ensure that the residual risk exposures are within acceptable tolerances agreed by the Board. The key control techniques for the major categories of risk exposure are summarised in the following sections.
Insurance riskInsurance risk is implicit in the Group’s insurance business and arises as a consequence of the type and volume of business written and the concentration of risk in particular policies or groups of policies subject to the same risks. A detailed review of the Group’s inherent residual risks associated with insurance products is included on pages 186 to 191. Insurance risk is managed using the following techniques:
Policies and delegated authorities for underwriting, pricing and reinsuranceThe Group’s insurance risk policy sets out the overall framework for the management of insurance risk. As part of the framework, a structure of delegated pricing and underwriting authorities is in place. Pricing is based on assumptions, such as mortality and persistency, which have regard to past experience and to trends. Insurance exposures are limited through reinsurance. Overall, the Group seeks to be conservative in its acceptance of insurance risks by establishing strict underwriting criteria and limits. The underwriting policy is clearly documented, setting out risks which are unacceptable and the terms applicable for non-standard risks. Reinsurance is used to reduce potential loss to the Group from individual large risks and catastrophic events. It may also be used to manage capital or to provide access to specialist underwriting expertise. The Group makes extensive use of reinsurance for its UK individual protection business, placing a proportion of all risks meeting prescribed criteria.
The principal General insurance reinsurances are excess of loss catastrophe treaties, under which the cost of claims from a weather event, in excess of an agreed retention level, is recovered from insurers.
172 ANNUAL REPORT AND ACCOUNTS 2010 gRouP FiNaNcial statemeNts
L&G_AR10_20-Notes48_p172-194_230311_AT.indd 172 25/03/2011 11:29

Notes to the FiNaNcial statemeNts (coNtiNued)
Reserving policyAll subsidiaries writing insurance business have a documented reserving policy setting out the basis on which liabilities are to be determined using statistical analysis and actuarial experience. Policies for each subsidiary are in line with locally established actuarial techniques, relevant regulation and legislation. Further details of the assumption setting process are included in Note 34.
Market riskThe Group exposure to market risk is influenced by one or more external factors, including changes in specified interest rates, financial instrument prices, foreign exchange rates, and indices of prices or rates.
Significant areas where the Group is exposed to these risks are:• assets backing insurance and investment contracts other than unit linked contracts;• assets and liabilities denominated in foreign currencies; and• other financial assets and liabilities. The Group’s market risk policy sets out the overall framework for the management of market risk. The policy is reinforced by more granular investment policies for long term and other business, which have due regard to the nature of liabilities and guarantees and other embedded options given to policyholders. The Group manages market risk using the following methods:
Asset liability matchingThe Group manages its assets and liabilities in accordance with relevant regulatory requirements, reflecting the differing types of liabilities it has in each business.
For business such as immediate annuities, which is sensitive to interest rate risk, analysis of the liabilities is undertaken to create a portfolio of securities, the value of which changes in line with the value of liabilities when interest rates change. This type of analysis helps protect profits from changing interest rates. Interest rate risk cannot be completely eliminated, due to the nature of the liabilities and early redemption options contained in the assets. For businesses where a range of asset types, including equity and property, are held to meet liabilities, the Group uses stochastic models to assess the impact of a range of future return scenarios on investment values and associated liabilities. This allows the Group to devise an investment and with-profits policyholder bonus strategy which optimises returns to its policyholders over time, whilst limiting the capital requirements associated with these businesses. The Group uses this method extensively in connection with its UK with-profits business.
DerivativesThe Group uses derivatives to reduce market risk. The most widely used derivatives are exchange-traded equity futures and swaps. The Group may use futures to facilitate efficient asset allocation. In addition, derivatives are used to improve asset liability matching and to manage interest rate, foreign exchange and inflation risks. It is the Group’s policy that amounts at risk through derivative transactions are covered by cash or corresponding assets and that swaps are collateralised to reduce counterparty exposure.
Interest rate riskInterest rate risk is the risk that the Group is exposed to lower returns or loss as a direct or indirect result of fluctuations in the value of, or income from, specific assets and liabilities arising from changes in underlying interest rates.
The Group is exposed to interest rate risk on the investment portfolio it maintains to meet the obligations and commitments under its non-linked insurance and investment contracts, in that the proceeds from the assets may not be sufficient to meet the Group’s obligations to policyholders.
To mitigate the risk that guarantees and commitments are not met, the Group purchases financial instruments, which broadly match the expected non-participating policy benefits payable, by their nature and term. The composition of the investment portfolio is governed by the nature of the insurance or savings liabilities, the expected rate of return applicable on each class of asset and the capital available to meet the price fluctuations for each asset class, relative to the liabilities they support.
173ANNUAL REPORT AND ACCOUNTS 2010gRouP FiNaNcial statemeNts
L&G_AR10_20-Notes48_p172-194_230311_AT.indd 173 25/03/2011 11:29
Notes to the FiNaNcial statemeNts (coNtiNued)
48 Risk maNagemeNt aNd coNtRol (coNtiNued)Additionally, fluctuations in interest rates will vary the repayments on variable rate debt issued by the Group (Note 35).
Asset liability matching significantly reduces the Group’s exposure to interest rate risk. Sensitivity to interest rate changes is included in Table 2 of Note 46 and Tables 6 and 7 of Note 48.
Inflation risk Inflation risk is the potential for loss as a result of relative or absolute changes in inflation rates. The Group is exposed to inflation risk in two specific areas:• Certain non-linked contracts, such as annuities, may provide for future benefits to be paid taking account of changes in the level of
inflation. Contracts in payment may also include an annual adjustment for movements in prices indices, subject to an annual cap. The Group seeks to manage the risk of movements in price indices through an appropriate investment strategy including the use of inflation swaps; and
• In writing long term business, the Group makes assumptions regarding the future costs of product servicing. The assumptions take account of changes in price indices and the costs of employment, with stress testing evaluating the effect of significant deviations on the Group’s capital position.
Currency riskThe Group is potentially exposed to loss as a result of fluctuations in the value of, or income from, assets denominated in foreign currencies. The Group manages its currency risk exposure in the following way:• In respect of long term business assets and liabilities denominated in non-sterling currencies, the Group protects its exposure to
exchange rate fluctuations by backing obligations with investments in the same currency and through hedging using derivatives; and• Balance sheet foreign exchange currency translation exposure in respect of the Group’s international subsidiaries is actively
managed in accordance with a policy, agreed by the Group Board, which allows net foreign currency assets to be hedged through the use of derivatives.
As described in Note 47, the Group is not directly exposed to risks on unit linked contracts. Detailed risk disclosures have not been presented for unit linked assets and liabilities.
174 ANNUAL REPORT AND ACCOUNTS 2010 gRouP FiNaNcial statemeNts
L&G_AR10_20-Notes48_p172-194_230311_AT.indd 174 25/03/2011 11:29
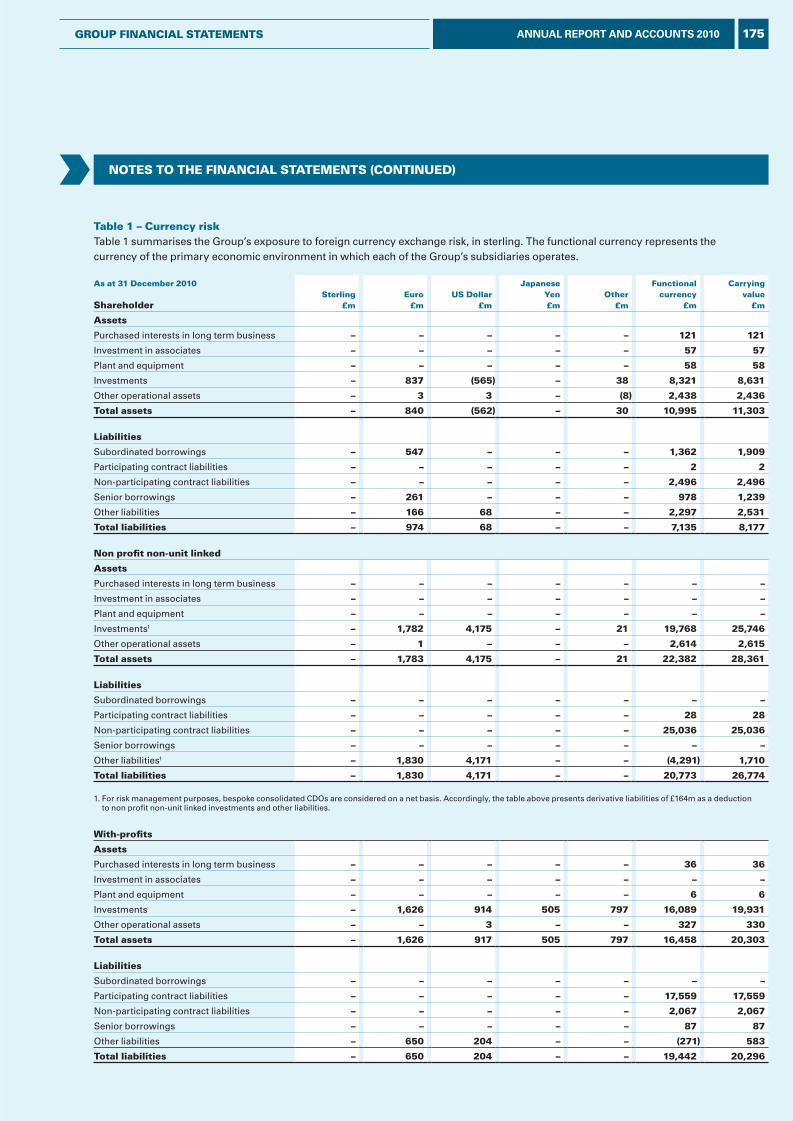
Notes to the FiNaNcial statemeNts (coNtiNued)
table 1 – currency risk Table 1 summarises the Group’s exposure to foreign currency exchange risk, in sterling. The functional currency represents the currency of the primary economic environment in which each of the Group’s subsidiaries operates.
as at 31 december 2010
shareholdersterling
£meuro
£mus dollar
£m
JapaneseYen£m
other£m
Functionalcurrency
£m
carryingvalue
£m
assets
Purchased interests in long term business – – – – – 121 121
Investment in associates – – – – – 57 57
Plant and equipment – – – – – 58 58
Investments – 837 (565) – 38 8,321 8,631
Other operational assets – 3 3 – (8) 2,438 2,436
total assets – 840 (562) – 30 10,995 11,303
liabilities
Subordinated borrowings – 547 – – – 1,362 1,909
Participating contract liabilities – – – – – 2 2
Non-participating contract liabilities – – – – – 2,496 2,496
Senior borrowings – 261 – – – 978 1,239
Other liabilities – 166 68 – – 2,297 2,531
total liabilities – 974 68 – – 7,135 8,177
Non profit non-unit linked
assets
Purchased interests in long term business – – – – – – –
Investment in associates – – – – – – –
Plant and equipment – – – – – – –
Investments1 – 1,782 4,175 – 21 19,768 25,746
Other operational assets – 1 – – – 2,614 2,615
total assets – 1,783 4,175 – 21 22,382 28,361
liabilities
Subordinated borrowings – – – – – – –
Participating contract liabilities – – – – – 28 28
Non-participating contract liabilities – – – – – 25,036 25,036
Senior borrowings – – – – – – –
Other liabilities1 – 1,830 4,171 – – (4,291) 1,710
total liabilities – 1,830 4,171 – – 20,773 26,774
1. For risk management purposes, bespoke consolidated CDOs are considered on a net basis. Accordingly, the table above presents derivative liabilities of £164m as a deduction to non profit non-unit linked investments and other liabilities.
With-profits
assets
Purchased interests in long term business – – – – – 36 36
Investment in associates – – – – – – –
Plant and equipment – – – – – 6 6
Investments – 1,626 914 505 797 16,089 19,931
Other operational assets – – 3 – – 327 330
total assets – 1,626 917 505 797 16,458 20,303
liabilities
Subordinated borrowings – – – – – – –
Participating contract liabilities – – – – – 17,559 17,559
Non-participating contract liabilities – – – – – 2,067 2,067
Senior borrowings – – – – – 87 87
Other liabilities – 650 204 – – (271) 583
total liabilities – 650 204 – – 19,442 20,296
175ANNUAL REPORT AND ACCOUNTS 2010gRouP FiNaNcial statemeNts
L&G_AR10_20-Notes48_p172-194_230311_AT.indd 175 25/03/2011 11:29
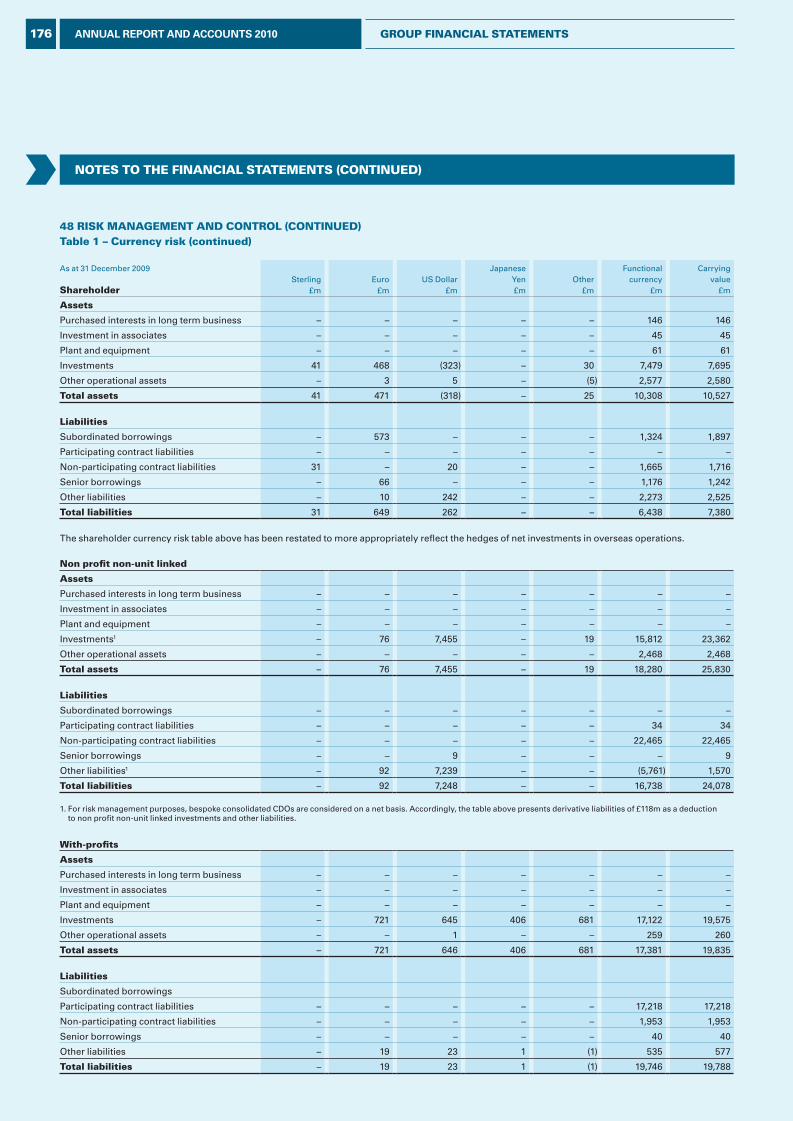
Notes to the FiNaNcial statemeNts (coNtiNued)
48 Risk maNagemeNt aNd coNtRol (coNtiNued)table 1 – currency risk (continued)
As at 31 December 2009
shareholderSterling
£mEuro
£mUS Dollar
£m
JapaneseYen£m
Other£m
Functionalcurrency
£m
Carryingvalue
£m
assets
Purchased interests in long term business – – – – – 146 146
Investment in associates – – – – – 45 45
Plant and equipment – – – – – 61 61
Investments 41 468 (323) – 30 7,479 7,695
Other operational assets – 3 5 – (5) 2,577 2,580
total assets 41 471 (318) – 25 10,308 10,527
liabilities
Subordinated borrowings – 573 – – – 1,324 1,897
Participating contract liabilities – – – – – – –
Non-participating contract liabilities 31 – 20 – – 1,665 1,716
Senior borrowings – 66 – – – 1,176 1,242
Other liabilities – 10 242 – – 2,273 2,525
total liabilities 31 649 262 – – 6,438 7,380
The shareholder currency risk table above has been restated to more appropriately reflect the hedges of net investments in overseas operations.
Non profit non-unit linked
assets
Purchased interests in long term business – – – – – – –
Investment in associates – – – – – – –
Plant and equipment – – – – – – –
Investments1 – 76 7,455 – 19 15,812 23,362
Other operational assets – – – – – 2,468 2,468
total assets – 76 7,455 – 19 18,280 25,830
liabilities
Subordinated borrowings – – – – – – –
Participating contract liabilities – – – – – 34 34
Non-participating contract liabilities – – – – – 22,465 22,465
Senior borrowings – – 9 – – – 9
Other liabilities1 – 92 7,239 – – (5,761) 1,570
total liabilities – 92 7,248 – – 16,738 24,078
1. For risk management purposes, bespoke consolidated CDOs are considered on a net basis. Accordingly, the table above presents derivative liabilities of £118m as a deduction to non profit non-unit linked investments and other liabilities.
With-profits
assets
Purchased interests in long term business – – – – – – –
Investment in associates – – – – – – –
Plant and equipment – – – – – – –
Investments – 721 645 406 681 17,122 19,575
Other operational assets – – 1 – – 259 260
total assets – 721 646 406 681 17,381 19,835
liabilities
Subordinated borrowings
Participating contract liabilities – – – – – 17,218 17,218
Non-participating contract liabilities – – – – – 1,953 1,953
Senior borrowings – – – – – 40 40
Other liabilities – 19 23 1 (1) 535 577
total liabilities – 19 23 1 (1) 19,746 19,788
176 ANNUAL REPORT AND ACCOUNTS 2010 gRouP FiNaNcial statemeNts
L&G_AR10_20-Notes48_p172-194_230311_AT.indd 176 25/03/2011 11:29

Notes to the FiNaNcial statemeNts (coNtiNued)
The Group’s management of currency risk reduces shareholders’ exposure to exchange rate fluctuations. The Group’s exposure to a 10% exchange movement in the US Dollar and Euro on an IFRS basis, net of hedging activities, is detailed in Table 2.
table 2 – currency sensitivity analysis
currency sensitivity test
impact onpre-tax
profit2010
£m
impact onequity
2010£m
Impact onpre-tax
profit2009
£m
Impact onequity
2009£m
10% Euro appreciation (18) (13) (19) (14)
10% US Dollar appreciation (63) (45) (37) (27)
The 2009 currency sensitivity analysis has been amended to more appropriately reflect the hedge of net investments in overseas operations.
Other price riskOther price risk is the risk that the fair value of future cash flows of a financial instrument will fluctuate because of changes in market prices, other than those arising from interest rate risk or currency risk. These changes may be as a result of features of the individual instrument, its issuer, or factors affecting all similar financial instruments traded in the market.
The Group controls its exposure to geographic price risks by using internal country credit ratings. These ratings are based on macroeconomic data and key qualitative indicators. The latter take into account economic, social and political environments. Table 3 indicates the Group’s exposure to different equity markets around the world. Unit linked equity investments are excluded from the table as the risk is retained by the policyholder.
table 3 – exposure to worldwide equity markets
shareholder2010
£m
Non profitnon-unit
linked2010
£m
With-profits
2010£m
total2010
£m
Shareholder2009
£m
Non profitnon-unit
linked2009
£m
With-profits
2009£m
Total2009
£m
UK 490 – 2,203 2,693 439 – 2,029 2,468
North America 30 – 425 455 26 – 369 395
Europe 127 – 743 870 27 – 676 703
Japan – – 492 492 – – 404 404
Asia Pacific 49 – 448 497 46 – 461 507
Other 11 – 143 154 3 – 57 60
listed equities 707 – 4,454 5,161 541 – 3,996 4,537
Unlisted UK equities 16 – 85 101 85 – 16 101
Holdings in unit trusts 253 – 456 709 230 – 449 679
total equities 976 – 4,995 5,971 856 – 4,461 5,317
The Group holds non-unit linked property investments totalling £145m (2009: £139m), of which £139m (2009: £132m) are located in the UK.
A 10% reduction in the value of listed UK equities would result in a reduction in pre-tax profit attributable to shareholders of £71m (2009: £54m). The impact on the with-profits fund has not been provided as the reduction would be offset by a change in the unallocated divisible surplus.
177ANNUAL REPORT AND ACCOUNTS 2010gRouP FiNaNcial statemeNts
L&G_AR10_20-Notes48_p172-194_230311_AT.indd 177 25/03/2011 11:29
Notes to the FiNaNcial statemeNts (coNtiNued)
48 Risk maNagemeNt aNd coNtRol (coNtiNued)Credit riskThe Group’s credit risk policy defines the overall framework for the management of credit risk. Significant areas where the Group is exposed to credit risk are:
• The Group holds corporate bonds to back part of its insurance liabilities. Significant exposures are managed by the application and regular review of concentration limits, with allowance being made in the actuarial valuation of the insurance liabilities for possible defaults; and
• The Group limits its exposure to insurance risk by ceding part of the risks it assumes to the reinsurance market. To limit the risk of reinsurer default the Group operates a credit rating policy when arranging cover. When selecting new reinsurance partners the Group considers only companies which have a minimum credit rating equivalent to A- from Standard & Poor’s. Exposure limits for new and existing reinsurers are determined based on credit ratings and projected exposure. Aggregate counterparty exposures are regularly monitored both at an individual subsidiary level and on a Groupwide basis.
The credit profile of the Group’s assets exposed to credit risk is shown in Table 4. The credit rating bands are provided by independent rating agencies. For unrated assets, the Group maintains internal ratings which are used to manage exposure to these counterparties. Unit linked assets have not been included as shareholders are not directly exposed to risk.
The carrying amount of non-unit linked assets included in the balance sheet represents the maximum credit exposure.
178 ANNUAL REPORT AND ACCOUNTS 2010 gRouP FiNaNcial statemeNts
L&G_AR10_20-Notes48_p172-194_230311_AT.indd 178 25/03/2011 11:29
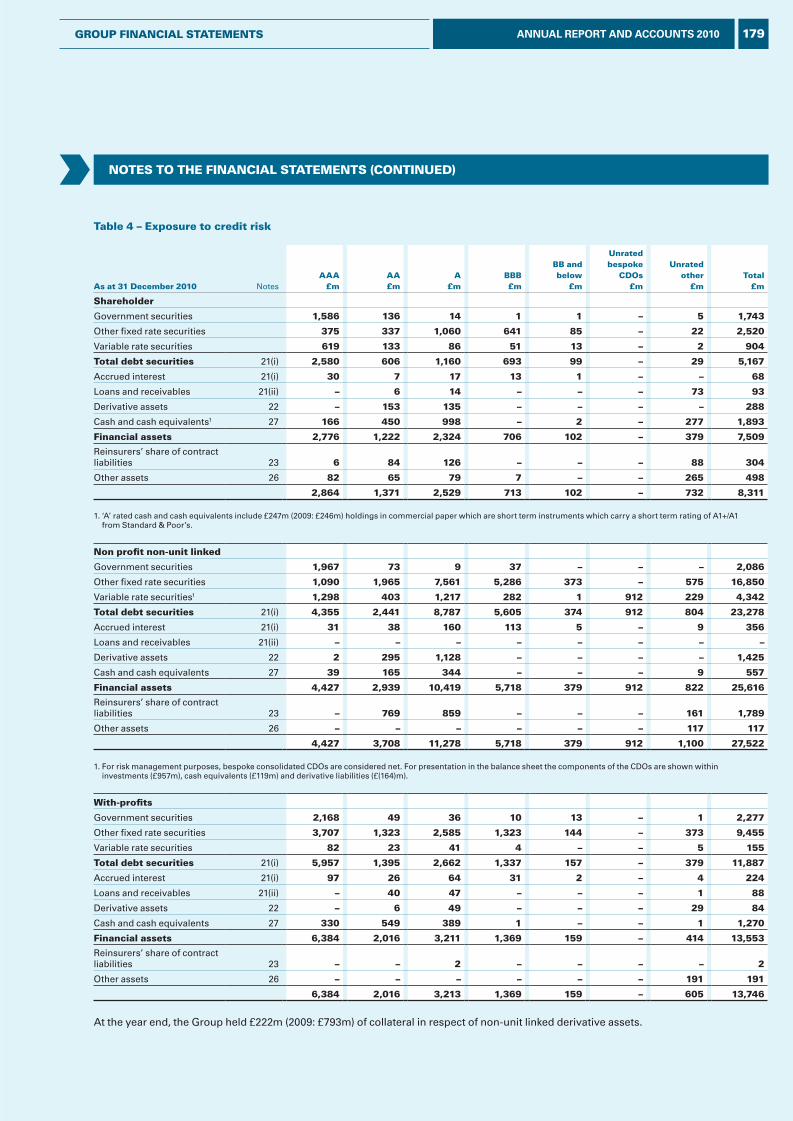
Notes to the FiNaNcial statemeNts (coNtiNued)
table 4 – exposure to credit risk
as at 31 december 2010 Notesaaa
£maa£m
a£m
BBB£m
BB andbelow
£m
unratedbespoke
cdos£m
unratedother
£mtotal
£m
shareholder
Government securities 1,586 136 14 1 1 – 5 1,743
Other fixed rate securities 375 337 1,060 641 85 – 22 2,520
Variable rate securities 619 133 86 51 13 – 2 904
total debt securities 21(i) 2,580 606 1,160 693 99 – 29 5,167
Accrued interest 21(i) 30 7 17 13 1 – – 68
Loans and receivables 21(ii) – 6 14 – – – 73 93
Derivative assets 22 – 153 135 – – – – 288
Cash and cash equivalents1 27 166 450 998 – 2 – 277 1,893
Financial assets 2,776 1,222 2,324 706 102 – 379 7,509
Reinsurers’ share of contract liabilities 23 6 84 126 – – – 88 304
Other assets 26 82 65 79 7 – – 265 498
2,864 1,371 2,529 713 102 – 732 8,311
1. ‘A’ rated cash and cash equivalents include £247m (2009: £246m) holdings in commercial paper which are short term instruments which carry a short term rating of A1+/A1 from Standard & Poor’s.
Non profit non-unit linked
Government securities 1,967 73 9 37 – – – 2,086
Other fixed rate securities 1,090 1,965 7,561 5,286 373 – 575 16,850
Variable rate securities1 1,298 403 1,217 282 1 912 229 4,342
total debt securities 21(i) 4,355 2,441 8,787 5,605 374 912 804 23,278
Accrued interest 21(i) 31 38 160 113 5 – 9 356
Loans and receivables 21(ii) – – – – – – – –
Derivative assets 22 2 295 1,128 – – – – 1,425
Cash and cash equivalents 27 39 165 344 – – – 9 557
Financial assets 4,427 2,939 10,419 5,718 379 912 822 25,616
Reinsurers’ share of contract liabilities 23 – 769 859 – – – 161 1,789
Other assets 26 – – – – – – 117 117
4,427 3,708 11,278 5,718 379 912 1,100 27,522
1. For risk management purposes, bespoke consolidated CDOs are considered net. For presentation in the balance sheet the components of the CDOs are shown within investments (£957m), cash equivalents (£119m) and derivative liabilities (£(164)m).
With-profits
Government securities 2,168 49 36 10 13 – 1 2,277
Other fixed rate securities 3,707 1,323 2,585 1,323 144 – 373 9,455
Variable rate securities 82 23 41 4 – – 5 155
total debt securities 21(i) 5,957 1,395 2,662 1,337 157 – 379 11,887
Accrued interest 21(i) 97 26 64 31 2 – 4 224
Loans and receivables 21(ii) – 40 47 – – – 1 88
Derivative assets 22 – 6 49 – – – 29 84
Cash and cash equivalents 27 330 549 389 1 – – 1 1,270
Financial assets 6,384 2,016 3,211 1,369 159 – 414 13,553
Reinsurers’ share of contract liabilities 23 – – 2 – – – – 2
Other assets 26 – – – – – – 191 191
6,384 2,016 3,213 1,369 159 – 605 13,746
At the year end, the Group held £222m (2009: £793m) of collateral in respect of non-unit linked derivative assets.
179ANNUAL REPORT AND ACCOUNTS 2010gRouP FiNaNcial statemeNts
L&G_AR10_20-Notes48_p172-194_230311_AT.indd 179 25/03/2011 11:29
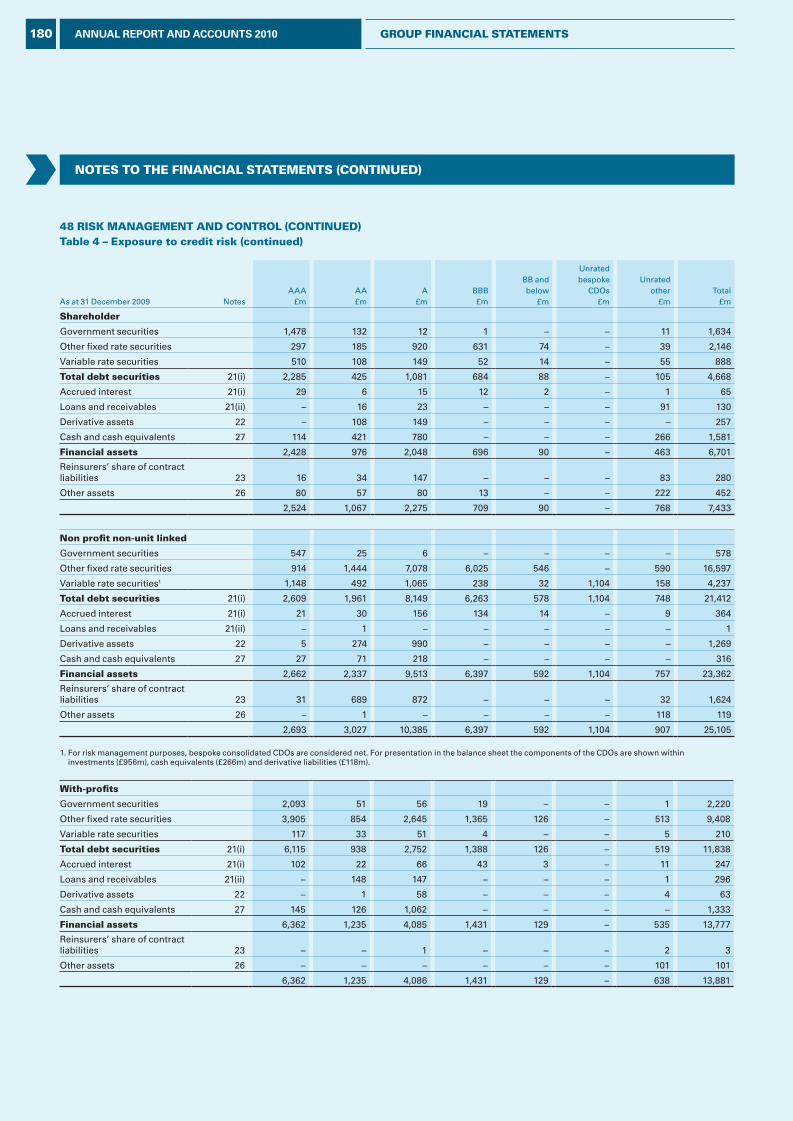
Notes to the FiNaNcial statemeNts (coNtiNued)
48 Risk maNagemeNt aNd coNtRol (coNtiNued)table 4 – exposure to credit risk (continued)
As at 31 December 2009 NotesAAA
£mAA£m
A£m
BBB£m
BB andbelow
£m
Unratedbespoke
CDOs£m
Unratedother
£mTotal
£m
shareholder
Government securities 1,478 132 12 1 – – 11 1,634
Other fixed rate securities 297 185 920 631 74 – 39 2,146
Variable rate securities 510 108 149 52 14 – 55 888
total debt securities 21(i) 2,285 425 1,081 684 88 – 105 4,668
Accrued interest 21(i) 29 6 15 12 2 – 1 65
Loans and receivables 21(ii) – 16 23 – – – 91 130
Derivative assets 22 – 108 149 – – – – 257
Cash and cash equivalents 27 114 421 780 – – – 266 1,581
Financial assets 2,428 976 2,048 696 90 – 463 6,701
Reinsurers’ share of contract liabilities 23 16 34 147 – – – 83 280
Other assets 26 80 57 80 13 – – 222 452
2,524 1,067 2,275 709 90 – 768 7,433
Non profit non-unit linked
Government securities 547 25 6 – – – – 578
Other fixed rate securities 914 1,444 7,078 6,025 546 – 590 16,597
Variable rate securities1 1,148 492 1,065 238 32 1,104 158 4,237
total debt securities 21(i) 2,609 1,961 8,149 6,263 578 1,104 748 21,412
Accrued interest 21(i) 21 30 156 134 14 – 9 364
Loans and receivables 21(ii) – 1 – – – – – 1
Derivative assets 22 5 274 990 – – – – 1,269
Cash and cash equivalents 27 27 71 218 – – – – 316
Financial assets 2,662 2,337 9,513 6,397 592 1,104 757 23,362
Reinsurers’ share of contract liabilities 23 31 689 872 – – – 32 1,624
Other assets 26 – 1 – – – – 118 119
2,693 3,027 10,385 6,397 592 1,104 907 25,105
1. For risk management purposes, bespoke consolidated CDOs are considered net. For presentation in the balance sheet the components of the CDOs are shown within investments (£956m), cash equivalents (£266m) and derivative liabilities (£118m).
With-profits
Government securities 2,093 51 56 19 – – 1 2,220
Other fixed rate securities 3,905 854 2,645 1,365 126 – 513 9,408
Variable rate securities 117 33 51 4 – – 5 210
total debt securities 21(i) 6,115 938 2,752 1,388 126 – 519 11,838
Accrued interest 21(i) 102 22 66 43 3 – 11 247
Loans and receivables 21(ii) – 148 147 – – – 1 296
Derivative assets 22 – 1 58 – – – 4 63
Cash and cash equivalents 27 145 126 1,062 – – – – 1,333
Financial assets 6,362 1,235 4,085 1,431 129 – 535 13,777
Reinsurers’ share of contract liabilities 23 – – 1 – – – 2 3
Other assets 26 – – – – – – 101 101
6,362 1,235 4,086 1,431 129 – 638 13,881
180 ANNUAL REPORT AND ACCOUNTS 2010 gRouP FiNaNcial statemeNts
L&G_AR10_20-Notes48_p172-194_230311_AT.indd 180 25/03/2011 11:29
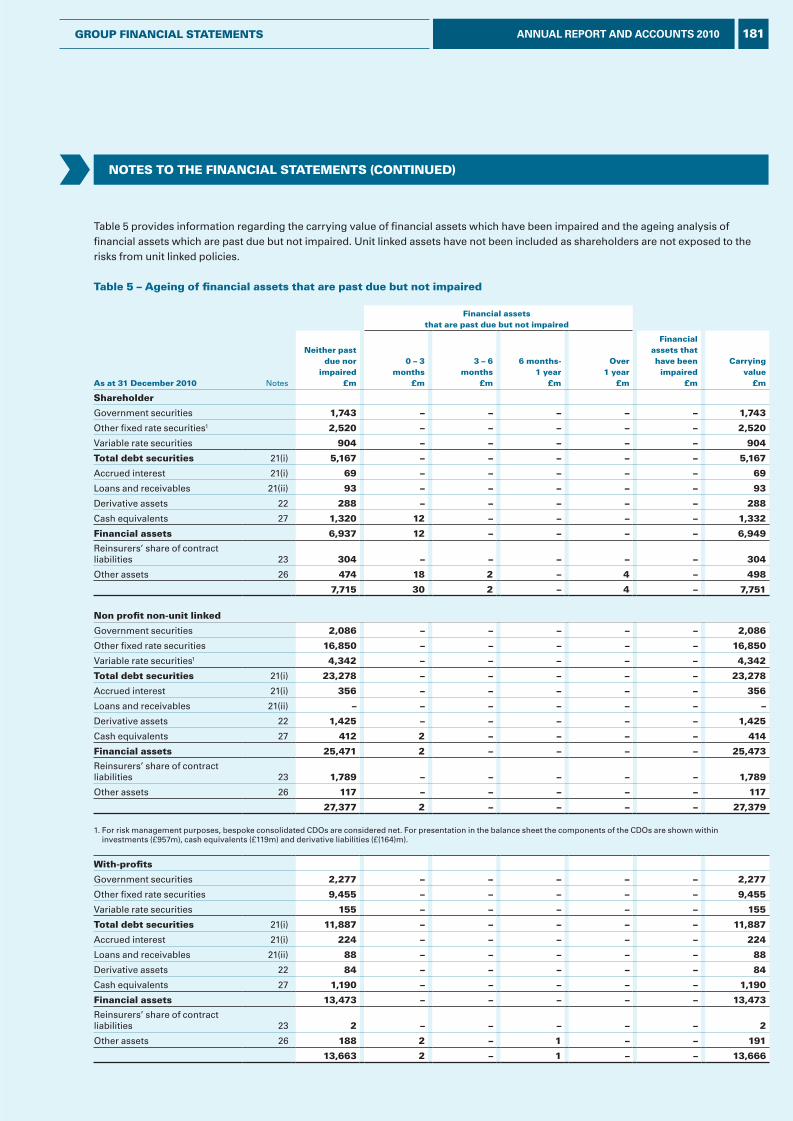
Notes to the FiNaNcial statemeNts (coNtiNued)
Table 5 provides information regarding the carrying value of financial assets which have been impaired and the ageing analysis of financial assets which are past due but not impaired. Unit linked assets have not been included as shareholders are not exposed to the risks from unit linked policies.
table 5 – ageing of financial assets that are past due but not impaired
Financial assetsthat are past due but not impaired
as at 31 december 2010 Notes
Neither pastdue nor
impaired£m
0 – 3months
£m
3 – 6months
£m
6 months-1 year
£m
over1 year
£m
Financialassets that have beenimpaired
£m
carryingvalue
£m
shareholder
Government securities 1,743 – – – – – 1,743
Other fixed rate securities1 2,520 – – – – – 2,520
Variable rate securities 904 – – – – – 904
total debt securities 21(i) 5,167 – – – – – 5,167
Accrued interest 21(i) 69 – – – – – 69
Loans and receivables 21(ii) 93 – – – – – 93
Derivative assets 22 288 – – – – – 288
Cash equivalents 27 1,320 12 – – – – 1,332
Financial assets 6,937 12 – – – – 6,949
Reinsurers’ share of contract liabilities 23 304 – – – – – 304
Other assets 26 474 18 2 – 4 – 498
7,715 30 2 – 4 – 7,751
Non profit non-unit linked
Government securities 2,086 – – – – – 2,086
Other fixed rate securities 16,850 – – – – – 16,850
Variable rate securities1 4,342 – – – – – 4,342
total debt securities 21(i) 23,278 – – – – – 23,278
Accrued interest 21(i) 356 – – – – – 356
Loans and receivables 21(ii) – – – – – – –
Derivative assets 22 1,425 – – – – – 1,425
Cash equivalents 27 412 2 – – – – 414
Financial assets 25,471 2 – – – – 25,473
Reinsurers’ share of contract liabilities 23 1,789 – – – – – 1,789
Other assets 26 117 – – – – – 117
27,377 2 – – – – 27,379
1. For risk management purposes, bespoke consolidated CDOs are considered net. For presentation in the balance sheet the components of the CDOs are shown within investments (£957m), cash equivalents (£119m) and derivative liabilities (£(164)m).
With-profits
Government securities 2,277 – – – – – 2,277
Other fixed rate securities 9,455 – – – – – 9,455
Variable rate securities 155 – – – – – 155
total debt securities 21(i) 11,887 – – – – – 11,887
Accrued interest 21(i) 224 – – – – – 224
Loans and receivables 21(ii) 88 – – – – – 88
Derivative assets 22 84 – – – – – 84
Cash equivalents 27 1,190 – – – – – 1,190
Financial assets 13,473 – – – – – 13,473
Reinsurers’ share of contract liabilities 23 2 – – – – – 2
Other assets 26 188 2 – 1 – – 191
13,663 2 – 1 – – 13,666
181ANNUAL REPORT AND ACCOUNTS 2010gRouP FiNaNcial statemeNts
L&G_AR10_20-Notes48_p172-194_230311_AT.indd 181 25/03/2011 11:29
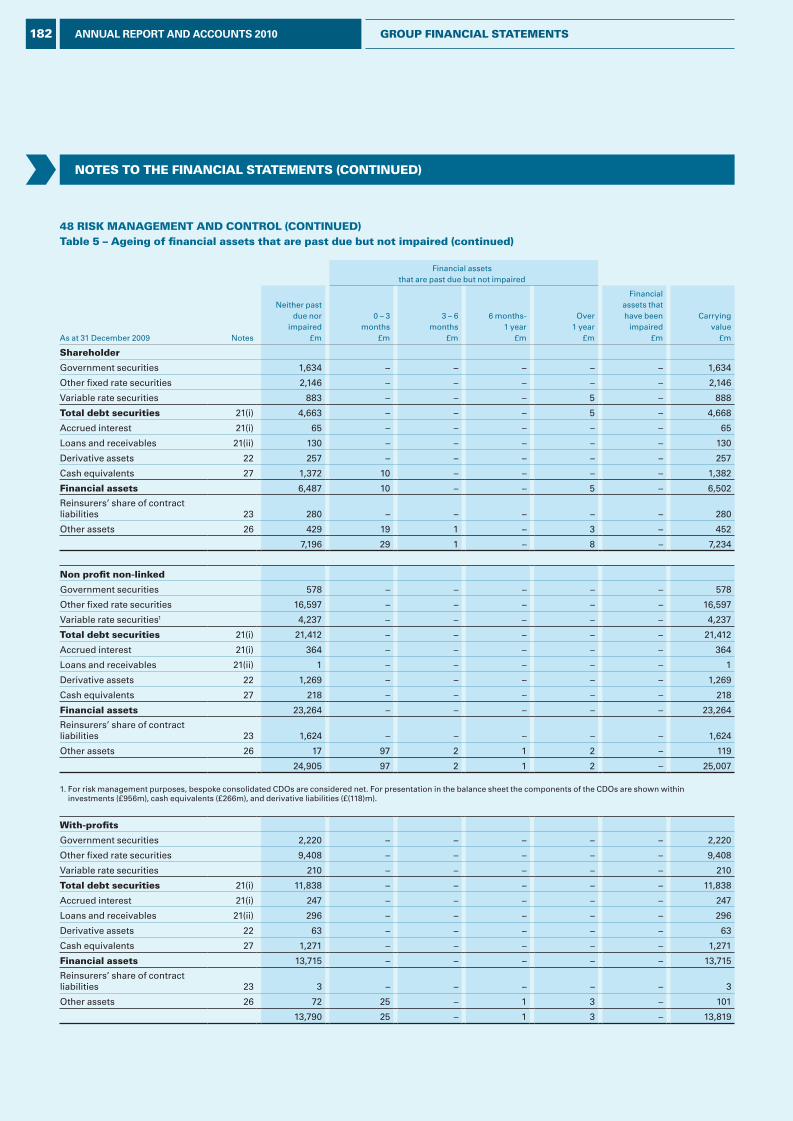
Notes to the FiNaNcial statemeNts (coNtiNued)
48 Risk maNagemeNt aNd coNtRol (coNtiNued)table 5 – ageing of financial assets that are past due but not impaired (continued)
Financial assetsthat are past due but not impaired
As at 31 December 2009 Notes
Neither pastdue nor
impaired£m
0 – 3months
£m
3 – 6months
£m
6 months-1 year
£m
Over1 year
£m
Financialassets thathave been
impaired£m
Carryingvalue
£m
shareholder
Government securities 1,634 – – – – – 1,634
Other fixed rate securities 2,146 – – – – – 2,146
Variable rate securities 883 – – – 5 – 888
total debt securities 21(i) 4,663 – – – 5 – 4,668
Accrued interest 21(i) 65 – – – – – 65
Loans and receivables 21(ii) 130 – – – – – 130
Derivative assets 22 257 – – – – – 257
Cash equivalents 27 1,372 10 – – – – 1,382
Financial assets 6,487 10 – – 5 – 6,502
Reinsurers’ share of contract liabilities 23 280 – – – – – 280
Other assets 26 429 19 1 – 3 – 452
7,196 29 1 – 8 – 7,234
Non profit non-linked
Government securities 578 – – – – – 578
Other fixed rate securities 16,597 – – – – – 16,597
Variable rate securities1 4,237 – – – – – 4,237
total debt securities 21(i) 21,412 – – – – – 21,412
Accrued interest 21(i) 364 – – – – – 364
Loans and receivables 21(ii) 1 – – – – – 1
Derivative assets 22 1,269 – – – – – 1,269
Cash equivalents 27 218 – – – – – 218
Financial assets 23,264 – – – – – 23,264
Reinsurers’ share of contract liabilities 23 1,624 – – – – – 1,624
Other assets 26 17 97 2 1 2 – 119
24,905 97 2 1 2 – 25,007
1. For risk management purposes, bespoke consolidated CDOs are considered net. For presentation in the balance sheet the components of the CDOs are shown within investments (£956m), cash equivalents (£266m), and derivative liabilities (£(118)m).
With-profits
Government securities 2,220 – – – – – 2,220
Other fixed rate securities 9,408 – – – – – 9,408
Variable rate securities 210 – – – – – 210
total debt securities 21(i) 11,838 – – – – – 11,838
Accrued interest 21(i) 247 – – – – – 247
Loans and receivables 21(ii) 296 – – – – – 296
Derivative assets 22 63 – – – – – 63
Cash equivalents 27 1,271 – – – – – 1,271
Financial assets 13,715 – – – – – 13,715
Reinsurers’ share of contract liabilities 23 3 – – – – – 3
Other assets 26 72 25 – 1 3 – 101
13,790 25 – 1 3 – 13,819
182 ANNUAL REPORT AND ACCOUNTS 2010 gRouP FiNaNcial statemeNts
L&G_AR10_20-Notes48_p172-194_230311_AT.indd 182 25/03/2011 11:29
Notes to the FiNaNcial statemeNts (coNtiNued)
Liquidity riskThe Group’s liquidity risk policy defines the overall framework for the management of liquidity risk. The Group does not seek exposure to liquidity risk in its own right, but recognises that exposure to liquidity risk can arise as a consequence of the markets in which it operates, the products that it writes and through the execution of investment management strategies.
The liquidity risks to which Legal & General’s insurance businesses may be exposed primarily stem from low probability events that if not adequately planned for may result in unanticipated liquidity requirements. Such events may include a flu pandemic or natural disaster leading to significantly higher levels of claims than would normally be expected and extreme market conditions impacting the timing of cash flows or the ability to realise investments at a given value within a specified timeframe. Collateral requirements for derivative/futures transactions and other types of financial instrument can also give rise to liquidity risk if sufficient cash or suitable alternative assets are not available to meet collateral calls when due. At a Group level, liquidity risk may arise in extreme market conditions, should the Group be unable to issue short term debt or commercial paper.
A limited level of contingent liquidity risk is an accepted element of writing contracts of insurance. However, the Group’s insurance businesses seek to maintain sufficient liquid assets and standby facilities to meet a prudent estimate of the cash outflows that may arise from contingent events. The level of required liquidity to be maintained by insurance funds is identified using techniques including cash flow analysis for ranges of extreme scenarios and stress tests for shock events.
To ensure an appropriate pool of liquid assets are maintained in line with a prudent estimate of cash outflows, the profile of investment assets held to meet future liabilities from writing insurance business are structured to include an appropriate proportion of cash and other readily realisable assets. The required profile is formally defined as part of asset benchmarks provided to the investment managers, with regular management information provided by the investment manager on the actual holding relative to the fund benchmarks. The level of insurance funds held in cash and other readily realisable assets at 31 December 2010 was £2.6bn (2009: £2.2bn).
In addition to each insurance fund maintaining a pool of liquid assets, the Group’s Treasury function provides formal facilities to the Group’s operating subsidiaries to cover contingent liquidity requirements arising from more extreme events and where investment assets may not be readily realisable. The facility available to each subsidiary is determined through analysis of potential shock events and the potential timing differences that may arise in cash flows.
Specific liquidity risks associated with the Group’s core product lines and the risk mitigation techniques are as follows:
Annuities: Potential for liquidity risk arises within two specific aspects of the Group’s annuity businesses – (i) changes in future pension commitments and (ii) collateral requirements for risk hedging strategies.
(i) Changes in future pension commitments – Once business has been written, cash outflows for pensions in payment are generally predictable, enabling the Group to structure the liquidity, income and maturity profile of investment assets backing long term liabilities to meet projected cash outflows. Although variations in longevity can alter the duration of cash outflows over the long term, trends are gradual, providing opportunity to respond with appropriate risk mitigation strategies.
(ii) Collateral requirements for risk hedging strategies – As part of the investment asset management strategy for the Group’s UK annuities business, financial instruments are utilised to manage exposure to fluctuations in interest rates, inflation and foreign currency, which may otherwise result in long term liabilities being unmatched. Financial instruments are also used to mitigate the impact of rating downgrades and defaults within corporate bond portfolios. The use of such financial instruments can require the posting of liquid collateral with counterparties, and as such an appropriate pool of the assets types specified by counterparties must either be held or readily available. In this context, the Group’s annuity portfolio held eligible assets worth 10 times the outstanding collateral as at 31 December 2010. Liquidity requirements in excess of the surplus assets would be met by funds held by the Group’s Treasury function.
Typically within the overall fund of investment assets held to meet the long term liabilities arising from annuity business, £350m is held in cash and other highly liquid investment types for general liquidity purposes.
Protection: Potential for liquidity risk within the Group’s protection businesses may arise should the rate of claims diverge significantly from that anticipated, typically as a consequence of an extreme event.
183ANNUAL REPORT AND ACCOUNTS 2010gRouP FiNaNcial statemeNts
L&G_AR10_20-Notes48_p172-194_230311_AT.indd 183 25/03/2011 11:29
Notes to the FiNaNcial statemeNts (coNtiNued)
48 Risk maNagemeNt aNd coNtRol (coNtiNued)The risk of being unable to settle claims as they fall due is actively managed with provision being made and cash pools maintained within investment portfolios for a prudent estimate of the potential claims that may arise from in-force business, taking account of extreme events. Such provisions are validated using stress tests. The use of reassurance also acts to mitigate liquidity, the effect of the treaties being to limit the Group’s liability for the overall sums assured, with a recovery being made from the reinsurance counterparty for that element of the claim covered by the treaty. Whilst timing differences can arise between the payment of claims and reimbursement by reinsurance counterparties, the Group seeks to ensure that these are accommodated from cash pools and intra-group facilities.
With-profits: Exposure to liquidity risk may arise if the profile of investment assets held to meet obligations to with-profits policyholders is not aligned with the maturity profile of policies, or the profile does not adequately take account of the rights of policyholders to exercise options or guarantees to specified early surrender terms or minimum rates of return.
Liquidity risk associated with with-profits business is managed through the analysis of the maturity profile of the fund taking account of projected future levels of bonus, policyholders reasonable expectations and projected early withdrawals, and ensuring that an appropriate proportion of the fund is held in cash or other readily realisable assets to meet each tranche of maturities and anticipated early withdrawals as they fall due. Where policyholders have discretion to require early payment of policy proceeds (for example by requesting a surrender value), appropriate contractual safeguards are in place to ensure that the fund and remaining policyholders are not disadvantaged should a material number of policyholders exercise this discretion.
Unit linked business: Investment risks associated with unit linked business, including those associated with liquidity, are generally borne by the holders of units in these funds. Liquidity risk specifically arises for unit holders in that certain asset classes in which the funds invest such as property in certain market conditions may not be readily realisable or only realisable in a specified timeframe at a diminution of value. Liquidity risks associated with these asset classes are documented and communicated to customers in point of sale product literature. Product terms & conditions also highlight that for certain product types that include asset classes that may be illiquid, the Group retains the right to defer the processing of fund withdrawal requests for up to six months, should underlying assets need to be realised to meet payment requests. To minimise the need to invoke these terms, the funds seek to maintain sufficient holdings in cash assets to meet foreseeable withdrawal activity.
The Group’s Treasury function manages the Group’s banking relationships, capital raising activities, overall cash and liquidity position and the payment of dividends. The Group seeks to manage its corporate funds and liquidity requirements on a pooled basis and to ensure the Group maintains sufficient liquid assets and standby facilities to meet a prudent estimate of its net cash outflows. In addition, it ensures that, even under adverse conditions, the Group has access to the funds necessary to cover surrenders, withdrawals and maturing liabilities. The Group has in place a £960m syndicated borrowing facility, expiring in 2012, which provides flexibility in the management of the Group’s liquidity. The Group also had in place a £60m bilateral committed revolving credit facility from one of its key relationship banks also maturing in December 2012. No drawings were made under these facilities during 2010.
Operational riskAll business managers are required to confirm regularly the adequacy of controls over operational risks to business unit Risk and Compliance Committees (RCCs), the Group Executive Risk Committee and the Group Audit Committee. Significant control issues which business areas identify are escalated to business unit RCCs, which oversee their resolution. There are a number of categories under which operational risk and its management across the Group can be considered, and these are outlined in the following paragraphs.
Internal process failureThe Group is potentially exposed to the risk of loss from failure of the internal processes with which it transacts its business. Each subsidiary is responsible for ensuring the adequacy of the controls over its processes and regular reviews are undertaken of their appropriateness and effectiveness.
PeopleThe Group is potentially exposed to the risk of loss from inappropriate actions by its staff. The risk is actively managed by business management and human resource (HR) functions. Recruitment is managed centrally by HR functions, and all new recruits undergo a formal induction programme. All employees have job descriptions setting out their accountabilities and reporting lines, and are appraised annually in accordance with agreed performance management frameworks. Employees in regulated subsidiaries are provided with appropriate training to enable them to meet the relevant regulatory requirements. Risks relating to health and safety and other legislation are managed through the provision of relevant training to all staff.
184 ANNUAL REPORT AND ACCOUNTS 2010 gRouP FiNaNcial statemeNts
L&G_AR10_20-Notes48_p172-194_230311_AT.indd 184 25/03/2011 11:29
Notes to the FiNaNcial statemeNts (coNtiNued)
OutsourcingThe Group is potentially exposed to the actions or failure of suppliers contracted to provide services on an outsourced basis. The required minimum standards of control for outsourced arrangements are set out in the Group’s outsourcing and critical supplier policy.
LegalLegal risk is the risk of loss from unclear or deficient product documentation; inadequate documentation in support of material contracts such as reassurance treaties; the incorrect interpretation of changes in legislation; employment related disputes and claims; and commercial disputes with suppliers. The risks are actively managed through the Group Legal Risk framework, which defines minimum standards of control to be applied to minimise the risk of loss.
ComplianceCompliance risk within the Group relates to the risk of non-adherence to legislative requirements, regulations and internal policies and procedures. Responsibility for ensuring adherence to relevant legal and regulatory requirements is vested in individual business managers. A Group Regulatory Risk and Compliance function has oversight of the Group’s compliance with conduct of business requirements and standards, providing policy advice and guidance and oversight of compliance arrangements and responsibilities.
EventEvent risk relates to the potential for loss arising from significant external events such as terrorism, financial crisis, major changes in fiscal systems or disaster. Typically, such events have a low likelihood of occurrence, a material impact and can be difficult to prevent. The Group’s risk mitigation focuses on minimising the business disruption and potential financial loss which may ensue from such an event. This includes maintaining a framework for the management of major incidents, the maintenance and regular testing of detailed business, technical and location recovery plans and the provision of insurance cover for the loss of buildings, contents and information technology systems and for the increased cost of working in the event of business disruption.
FraudThe Group is potentially exposed to the risk of internal fraud, claims-related fraud, and external action by third parties. The risk of internal fraud is managed through a number of processes including the screening of staff at recruitment, segregation of duties and management oversight. The activities of Internal Audit also act to counter the risk. Claims-related fraud is managed by ensuring business processes are designed to fully validate claims and ensure that only bona fide claims are settled. Anti-fraud techniques are regularly updated to mitigate risks and emerging threats. The Group’s approach to mitigating fraud and other dishonest acts is supported by promoting an open and honest culture in all dealings between employees, managers and those parties with which the Group has contact. A formal code of ethics sets out the Group’s expectations in this respect. Effective and honest communication is essential if malpractice is to be effectively dealt with. The Group has defined whistle blowing procedures to enable all employees and those who work with Legal & General to raise matters of concern relating to Legal & General in confidence. Personnel independent of the business reporting line act as designated whistle blowing contacts and include the heads of Internal Audit and Group Compliance. The Group also operates a hotline facility to report concerns, either in confidence or anonymously.
TechnologyThe Group places a high degree of reliance on IT in its business activities. The failure of IT systems could potentially expose the Group to significant business disruption and loss. To mitigate this risk, standards and methodologies for developing, testing and operating IT systems are maintained. Disaster recovery facilities enable IT operations to be conducted at remote locations in the event of the loss of computer facilities at a principal office site. All records are remotely backed up and computer suites are equipped with alternative power sources.
Group riskThe potential for contagion risk arises as a consequence of:• the use of a common brand across the majority of the Group; and• the provision of intra-group loans and indemnities.
The Group has defined policies and procedures for managing matters that may have reputational implications, to ensure that Legal & General’s position is correctly understood. The Group also has defined policies for the provision of guarantees, indemnities and letters of comfort.
185ANNUAL REPORT AND ACCOUNTS 2010gRouP FiNaNcial statemeNts
L&G_AR10_20-Notes48_p172-194_230311_AT.indd 185 25/03/2011 11:29
Notes to the FiNaNcial statemeNts (coNtiNued)
48 Risk maNagemeNt aNd coNtRol (coNtiNued)Concentration of riskAs part of the ongoing risk assessment processes the Group considers the concentration of risk. The Group seeks to manage concentrations by setting limits around the maximum exposure to loss that it can tolerate from a series of related events. Limits set include maximum exposures to single lives, geographic locations, financial instruments and reinsurance balances.
long term insurance risksUK long term insurance products are structured as either participating or non-participating. The level of shareholders’ interest in the value of policies and their share of the related profit or loss varies depending upon the contract structure.
Non-participating contractsNon-participating business is written mainly in the non profit part of the Society Long Term Fund (LTF). Profits accrue solely to shareholders. In addition, there is some non-participating business in the with-profits part of the Society LTF where the profits are shared, between participating policyholders and shareholders.
Protection business (individual and group)The Group offers protection products which provide mortality or morbidity benefits. They may include health, disability, critical illness and accident benefits; these additional benefits are commonly provided as supplements to main life policies but can also be sold separately. The benefit amounts would usually be specified in the policy terms. Some sickness benefits cover the policyholder’s mortgage repayments and are linked to the prevailing mortgage interest rates. In addition to these benefits, some contracts may guarantee premium rates, provide guaranteed insurability benefits and offer policyholders conversion options.
Life savings businessA range of contracts are offered in a variety of different forms to meet customers’ long term savings objectives. Policyholders may choose to include a number of protection benefits within their savings contracts. Typically, any guarantees under the contract would only apply on maturity or earlier death. On certain older contracts there may be provisions guaranteeing surrender benefits. Savings contracts may or may not guarantee policyholders an investment return. Where the return is guaranteed, the Group may be exposed to interest rate risk with respect to the backing assets.
Pensions (individual and corporate)These are long term savings contracts through which policyholders accumulate pension benefits. Some older contracts contain a basic guaranteed benefit expressed as an amount of pension payable or a guaranteed annuity option, which exposes the Group to interest rate and longevity risk. These guarantees become more costly during periods when interest rates are low or when annuitant mortality improves faster than expected. The ultimate cost will also depend on the take-up rate of any option and the final form of annuity selected by the policyholder.
Other options provided by these contracts include an open market option on maturity, early retirement and late retirement. The Group would generally have discretion over the terms on which these options are offered.
Annuities Deferred and immediate annuity contracts are offered. Immediate annuities provide a regular income stream to the policyholder, purchased with a lump sum investment, where the income stream starts immediately after the purchase. The income stream from a deferred annuity is delayed until a specified future date. Bulk annuities are also offered, where the Group accepts the assets and liabilities of a company pension scheme or a life fund.
Some non-participating deferred annuities sold by the Group contain guaranteed cash options predominately minimum factors for commuting part of the annuity income into cash at the date of vesting. The value of such guaranteed options are currently immaterial.
Annuity products provide guaranteed income for a specified time, usually the life of the policyholder, in exchange for a lump sum capital payment. No surrender value is available under any of these products. The primary risks to the Group from annuity products are therefore mortality improvements and investment performance.
186 ANNUAL REPORT AND ACCOUNTS 2010 gRouP FiNaNcial statemeNts
L&G_AR10_20-Notes48_p172-194_230311_AT.indd 186 25/03/2011 11:29
Notes to the FiNaNcial statemeNts (coNtiNued)
There is a block of immediate and deferred annuities within the UK non profit business with benefits linked to changes in the RPI, but with contractual maximum or minimum increases. In particular, most of these annuities have a provision that the annuity will not reduce if RPI becomes negative. The total of such annuities in payment at 31 December 2010 was £247m (2009: £242m). Thus, 1% negative inflation, which was reversed in the following year would result in a guarantee cost of approximately £2m (2009: £2m). Negative inflation sustained over a longer period would give rise to significantly greater guarantee costs. Some of these guarantee costs have been partially matched through the purchase of negative inflation hedges and limited price indexation swaps.
Key risk factors (a) Insurance risk(i) Mortality For contracts providing death benefits, higher mortality rates would lead to an increase in claims costs. For annuity contracts, the Group is exposed to the risk that mortality experience is lower than assumed; lower than expected mortality would require payments to be made for longer and increase the cost of benefits provided. The Group regularly reviews its mortality experience and industry projections of longevity and adjusts the valuation and pricing assumptions accordingly. The Group is exposed to mortality risk on protection and annuity business. For protection products, the Group has entered into reinsurance arrangements to mitigate this risk and provide financing.
(ii) PersistencyIn the early years of a policy, lapses and surrenders are likely to result in a loss to the Group, as the acquisition costs associated with the contract would not have been recovered from product margins. Some contracts include surrender deductions to mitigate this risk. In later periods, once the acquisition costs have been recouped, the effect of lapses and surrenders depends upon the relationship between the exit benefit, if any, and the liability for that contract. Exit benefits are not generally guaranteed and the Group has some discretion in determining the amount of the payment. As a result, the effect on profit in later periods is expected to be broadly neutral. Following the adoption of PS06/14 in 2006 the persistency assumption for non-participating protection business allows for the expected pattern of persistency, adjusted to incorporate a margin for adverse deviation. There is no persistency risk exposure for annuities in payment, and these contracts do not provide a lapse or surrender option.
(iii) Morbidity ratesThe cost of health related claims depends on both the incidence of policyholders becoming ill and the duration over which they remain ill. Higher than expected incidence or duration would increase costs over the level currently assumed in the calculation of liabilities.
(iv) Expense variancesHigher expenses and/or expense inflation will tend to increase the amount of the reserves required. The Group is exposed to the risk that its liabilities are not sufficient to cover future expenses.
(v) Geographic concentrations of riskInsurance risk may be concentrated in geographic regions, altering the risk profile of the Group. The most significant exposure of this type arises for the group protection business, where a single event could result in a large number of related claims. To reduce the overall exposure, current contracts include an ‘event limit’ which caps the total liability. Additionally, excess of loss reinsurance arrangements further mitigate the exposure.
(vi) EpidemicsThe spread of an epidemic could cause large aggregate claims across the Group’s portfolio. Quota share reinsurance contracts are used to manage this risk. The management of associated counterparty risks from the use of reinsurance is set out on page 178. Depending on the nature of an epidemic, mortality experience may lead to a reduction in the cost of claims for annuity business.
(vii) Accumulation of risksThere is limited potential for single incidents to give rise to a large number of claims across the different contract types written by the Group. In particular, there is little significant overlap between the long term and short term insurance business written by the Group. However, there are potentially material correlations of insurance risk with other types of risk exposure. These correlations are difficult to estimate though they would tend to be more acute as the underlying risk scenarios became more extreme. An example of the accumulation of risk is the correlation between reinsurer credit risk with mortality and morbidity exposures.
187ANNUAL REPORT AND ACCOUNTS 2010gRouP FiNaNcial statemeNts
L&G_AR10_20-Notes48_p172-194_230311_AT.indd 187 25/03/2011 11:29
Notes to the FiNaNcial statemeNts (coNtiNued)
48 Risk maNagemeNt aNd coNtRol (coNtiNued)(b) Market riskInvestment of the assets backing the Group liabilities reflects the nature of the liabilities being supported. For non-participating business, the strategy is to invest in fixed income securities of appropriate maturity dates. The risk of default on fixed interest securities is managed through diversified portfolios with exposure limits for individual economies, sectors and counterparties.
Interest rate risk is reduced by managing the duration and maturity structure of each investment portfolio in relation to the estimated cash flows of the liabilities it supports. A number of derivatives are held to enable the closer matching of assets and liabilities and to mitigate further exposure to interest rate movements, in particular, to limit the exposure to any options and guarantees in contracts.
In addition, the exposure to these risks is allowed for in the actuarial valuation of liabilities under these contracts.
Participating contractsParticipating contracts are supported by the with-profits part of the Society LTF. They offer policyholders the possibility of payment of benefits in addition to those guaranteed by the contract. The amount and timing of the additional benefits (usually called bonuses) are contractually at the discretion of the Group. Discretionary increases to benefits on participating contracts are allowed in one or both of annual and final bonus form. These bonuses are determined in accordance with the principles outlined in the Group’s PPFM for the management of the with-profits part of the Society LTF. The principles include:
• The with-profits part of the Society LTF will be managed with the objective of ensuring that its assets are sufficient to meet its liabilities without the need for additional capital;
• With-profits policies have no expectation of any distribution from the with-profits part of the Society LTF’s inherited estate. The inherited estate is the excess of assets held within the Society LTF over and above the amount required to meet liabilities, including those which arise from the regulatory duty to treat customers fairly in settling discretionary benefits; and
• Bonus rates will be smoothed so that some of the short term fluctuations in the value of the investments of the with-profits part of the Society LTF and the business results achieved in the with-profits part of the UK LTF are not immediately reflected in payments under with-profits policies.
At 30 June 2005 an assessment was made of the expected cost of guarantees and options to be paid in the future, and funds with the same value to meet these costs were allocated from the capital in the with-profits sub-fund. The value of the funds is regularly assessed and is reduced by the cost of guarantees and options paid since 1 July 2005. At each assessment point, if the value of the funds is lower than the expected cost of guarantees and options, it is possible to make deductions from asset shares to cover the difference. It is intended to limit deductions to no more than 0.75% each year, up to a maximum of 5% per policy.
Following the movement in the expected cost and the value of the associated funds up to 31 December 2010, and in accordance with the Group’s PPFM, a deduction of 0.2% was made to the asset shares. This followed a refund of 0.4% made in respect of the year to 31 December 2009. In the technical provisions, allowance was also made for future deductions in respect of the expected costs of meeting future guarantees and options not covered by the current year deduction. For policyholders who decide to surrender, a charge will generally be made in respect of the expected cost of guarantees and options not covered by the charge already taken. Some older participating contracts include a guaranteed minimum rate of roll up of the policyholder’s fund up to the date of retirement or maturity. The nature of the participating contracts written in the with-profits part of the Society LTF is that more emphasis can be placed on investing to maximise future investment returns. This results in a broader range of investments being held within the fund.
With-profits bonds These contracts provide an investment return to the policyholder which is determined by the attribution of regular and final bonuses over the duration of the contract. In addition, the contracts provide a death benefit, typically of 101% of the value of the units allocated to the policyholder.
Pension contractsThe Group has sold pension contracts containing guaranteed annuity options which expose the Group to both interest rate and longevity risk. The market consistent value of these guarantees carried in the balance sheet is £35m (2009: £31m).
188 ANNUAL REPORT AND ACCOUNTS 2010 gRouP FiNaNcial statemeNts
L&G_AR10_20-Notes48_p172-194_230311_AT.indd 188 25/03/2011 11:29

Notes to the FiNaNcial statemeNts (coNtiNued)
Deferred annuity contractsThe Group has written some deferred annuity contracts which guaranteed minimum pensions. These options expose the Groupto interest rate and longevity risk as the cost would be expected to increase with decreasing interest rates and improved longevity. The market consistent value of these guarantees carried in the balance sheet is £125m (2009: £111m).
Endowment contractsThese contracts provide a lump sum on maturity determined by the addition of annual and final bonuses over the duration of the contract. In addition, the contracts provide a minimum sum assured death benefit.
Key risk factorsThe insurance and market risk exposures for participating business are largely the same as those discussed for non-participating contracts. The main differences in the operation of these contracts are discussed below.
(a) Insurance risk – PersistencyAt early durations, the nature of the persistency risks on with-profits business is largely the same as for non-participating business and is influenced mainly by the ability to recover acquisition costs from product margins. At later durations, there is less scope for withdrawal to result in a loss for the Group as these contracts typically provide explicit allowances for market conditions. Allowance for future withdrawals is made in the assessment of participating contract liabilities. The Group is generally exposed to the risk that future withdrawals are lower than assumed, resulting in higher future guarantee costs.
(b) Market riskThe financial risk exposure for participating contracts is different from that for non-participating business. Greater emphasis is placed on investing to maximise future investment returns rather than matching assets to liabilities. This results in holding significant equity and property investments. Lower investment returns increase the costs associated with maturity and investment guarantees provided on these contracts. These risks are managed by maintaining capital sufficient to cover the consequences of mismatch under a number of adverse scenarios. In addition, different investment strategies are followed for assets backing policyholder asset shares and assets backing other participating liabilities and surplus. The former include significant equity and property holdings, whilst the latter are invested largely in fixed interest securities. The assets held are managed so as to provide a partial hedge to movements in fixed interest yields and equity markets. The methodology used to calculate the liabilities for participating contracts makes allowance for the possibility of adverse changes in investment markets on a basis consistent with the market cost of hedging the guarantees provided. The methodology also makes allowance for the cost of future discretionary benefits, guarantees and options. The value of future discretionary benefits depends on the return achieved on assets backing these contracts. The asset mix varies with investment conditions reflecting the Group’s investment policy, which aims to optimise returns to policyholders over time whilst limiting capital requirements for this business.
The distribution of surplus to shareholders depends upon the bonuses declared for the period. Typically, bonus rates are set having regard to investment returns, although the Group has some discretion setting rates and would normally smooth bonuses over time. The volatility of investment returns could impact the fund’s capital position and its ability to pay bonuses. If future investment conditions were less favourable than anticipated, the lower bonus levels resulting would also reduce future distributions to shareholders.
However, business which is written in the with-profits part of the Society LTF is managed to be self-supporting. The unallocated divisible surplus in the fund would normally be expected to absorb the impact of these investment risks. Only in extreme scenarios, where shareholders were required to provide capital support to the with-profits part of the Society LTF, would these risks affect equity. As part of the 2007 Society LTF restructure, the 1996 Sub-fund (£321m) was merged into the Shareholder Retained Capital (SRC). As a result, Society’s Board of Directors undertook to initially maintain £500m of assets within Society to support the with-profits business. The amount of the commitment reduced to £400m in 2010 and will then gradually reduce to zero over a period not exceeding eight years.
The Group’s approach to setting bonus rates is designed to treat customers fairly. The approach is set out in the Society’s PPFM for the with-profits part of the Society LTF. In addition, bonus declarations are also affected by FSA regulations relating to Treating Customers Fairly (TCF), which limit the discretion available when setting bonus rates. The Group’s approach to setting bonuses and meeting the FSA’s TCF regulations may increase the Group’s exposure to market risk should the ability to cut bonuses, during periods when investment returns are poor, be reduced.
189ANNUAL REPORT AND ACCOUNTS 2010gRouP FiNaNcial statemeNts
L&G_AR10_20-Notes48_p172-194_230311_AT.indd 189 25/03/2011 11:29
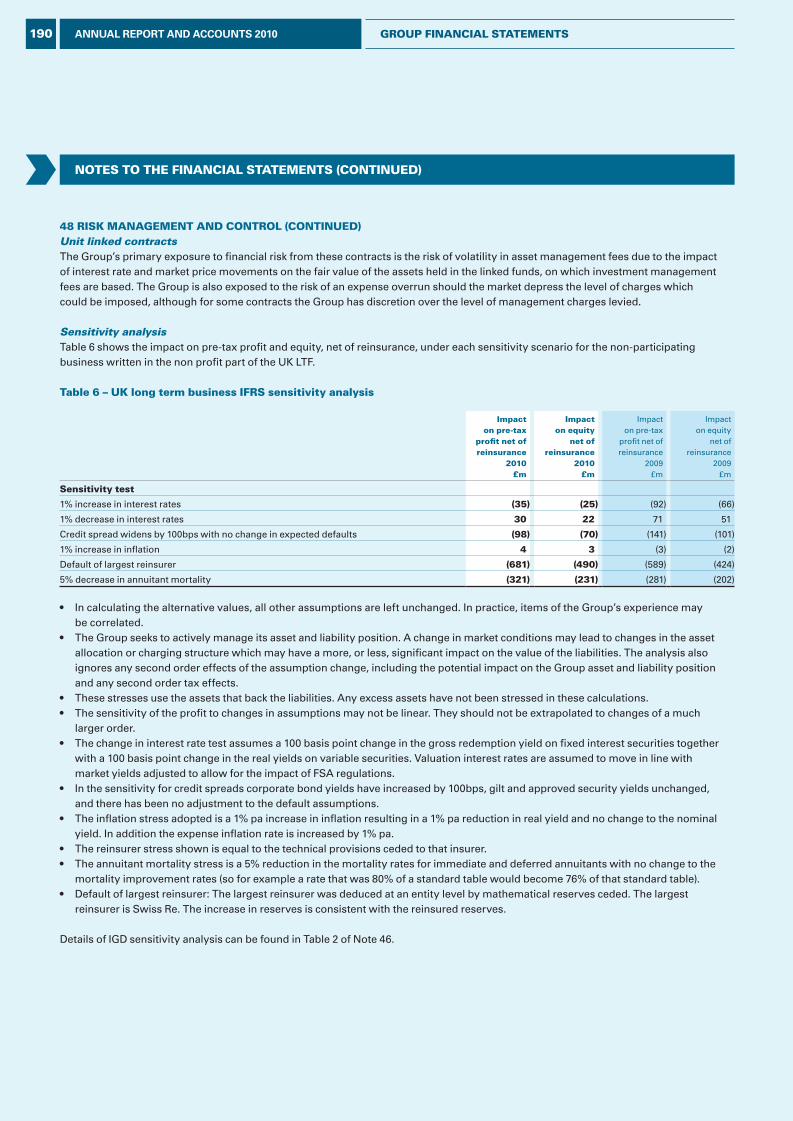
Notes to the FiNaNcial statemeNts (coNtiNued)
48 Risk maNagemeNt aNd coNtRol (coNtiNued)Unit linked contracts The Group’s primary exposure to financial risk from these contracts is the risk of volatility in asset management fees due to the impact of interest rate and market price movements on the fair value of the assets held in the linked funds, on which investment management fees are based. The Group is also exposed to the risk of an expense overrun should the market depress the level of charges which could be imposed, although for some contracts the Group has discretion over the level of management charges levied.
Sensitivity analysis Table 6 shows the impact on pre-tax profit and equity, net of reinsurance, under each sensitivity scenario for the non-participating business written in the non profit part of the UK LTF.
table 6 – uk long term business iFRs sensitivity analysis
impacton pre-tax
profit net ofreinsurance
2010£m
impacton equity
net ofreinsurance
2010£m
Impacton pre-tax
profit net ofreinsurance
2009£m
Impacton equity
net ofreinsurance
2009£m
sensitivity test
1% increase in interest rates (35) (25) (92) (66)
1% decrease in interest rates 30 22 71 51
Credit spread widens by 100bps with no change in expected defaults (98) (70) (141) (101)
1% increase in inflation 4 3 (3) (2)
Default of largest reinsurer (681) (490) (589) (424)
5% decrease in annuitant mortality (321) (231) (281) (202)
• In calculating the alternative values, all other assumptions are left unchanged. In practice, items of the Group’s experience may be correlated.
• The Group seeks to actively manage its asset and liability position. A change in market conditions may lead to changes in the asset allocation or charging structure which may have a more, or less, significant impact on the value of the liabilities. The analysis also ignores any second order effects of the assumption change, including the potential impact on the Group asset and liability position and any second order tax effects.
• These stresses use the assets that back the liabilities. Any excess assets have not been stressed in these calculations. • The sensitivity of the profit to changes in assumptions may not be linear. They should not be extrapolated to changes of a much
larger order. • The change in interest rate test assumes a 100 basis point change in the gross redemption yield on fixed interest securities together
with a 100 basis point change in the real yields on variable securities. Valuation interest rates are assumed to move in line with market yields adjusted to allow for the impact of FSA regulations.
• In the sensitivity for credit spreads corporate bond yields have increased by 100bps, gilt and approved security yields unchanged, and there has been no adjustment to the default assumptions.
• The inflation stress adopted is a 1% pa increase in inflation resulting in a 1% pa reduction in real yield and no change to the nominal yield. In addition the expense inflation rate is increased by 1% pa.
• The reinsurer stress shown is equal to the technical provisions ceded to that insurer. • The annuitant mortality stress is a 5% reduction in the mortality rates for immediate and deferred annuitants with no change to the
mortality improvement rates (so for example a rate that was 80% of a standard table would become 76% of that standard table). • Default of largest reinsurer: The largest reinsurer was deduced at an entity level by mathematical reserves ceded. The largest
reinsurer is Swiss Re. The increase in reserves is consistent with the reinsured reserves.
Details of IGD sensitivity analysis can be found in Table 2 of Note 46.
190 ANNUAL REPORT AND ACCOUNTS 2010 gRouP FiNaNcial statemeNts
L&G_AR10_20-Notes48_p172-194_230311_AT.indd 190 25/03/2011 11:29
Notes to the FiNaNcial statemeNts (coNtiNued)
international life and pensions Legal & General America (LGA)The principal products written by LGA are individual term assurance and universal life insurance. LGA also has smaller blocks of in-force deferred and immediate annuities. The individual term assurances provide death benefits over the medium to long term. The contracts have level premiums for an initial period with premiums increasing annually thereafter. During the initial period, there is generally an option to convert the contract to a universal life contract. After the initial period, the premium rates are not guaranteed, but cannot exceed the age related guaranteed premium. Reinsurance is used to reduce the insurance risk on this portfolio and manage liquidity risks, through the reinsurance commission received under quota share arrangements. Reinsurance and securitisation are used to provide regulatory solvency relief (including relief from regulation Triple X). These practices lead to the establishment of reinsurance assets on the Group’s balance sheet.
The universal life insurance and deferred annuities provide a savings component. In addition, the universal life contract provides substantial death benefits over the medium to long term. The savings element has a guaranteed minimum growth rate. LGA has exposure to loss in the event that interest rates decrease and it is unable to earn enough on the underlying assets to cover the guaranteed rate. LGA is also exposed to loss should interest rates increase, as the underlying market value of assets will generally fall without a change in the surrender value. The reserves for universal life and deferred annuities totalled $708m and $218m respectively at 31 December 2010 ($723m and $221m at 31 December 2009 respectively). The guaranteed interest rates associated with those reserves ranged from 0% to 5.5%, with the majority of the policies having guaranteed rates ranging from 3% to 4% (2009: 4%).
The deferred annuity contracts also contain a provision that, at maturity, a policyholder may move the account value into an immediate annuity, at rates which are either those currently in effect, or rates guaranteed in the contract. The other annuity contracts have similar risks to those in the UK.
Legal & General Netherlands (LGN)LGN principally writes non-participating Euro savings, individual term assurance and annuity business.
The Euro savings business includes an exposure to interest rate and credit risk; an active asset-liability management programme is in place. The individual term assurances provide death benefits over the medium to long term. Reinsurance is used to reduce the share of insurance risk. The annuity contracts have similar risks to those in the UK; however, the majority of annuity business has a term of three years or less.
Legal & General France (LGF)LGF writes a range of long term insurance and investment business through its subsidiaries. The principal products written are group protection, annuities, savings and open ended investment vehicles.
The group protection business consists of group term assurance, renewable on an annual basis, sickness and disability, and medical expenses assurance. The group sickness and disability and medical expenses policies integrate with social security benefits providing a level of top-up to those benefits. Reinsurance is used to manage exposure to large individual and group claims. The annuity contracts have similar risks to those in the UK.
Savings products include contracts that provide minimum guaranteed rates of return. The guarantee is aligned with current and projected rates of return from government securities. Investment risks associated with open ended investment vehicles are borne by unit holders of these funds.
191ANNUAL REPORT AND ACCOUNTS 2010gRouP FiNaNcial statemeNts
L&G_AR10_20-Notes48_p172-194_230311_AT.indd 191 25/03/2011 11:29
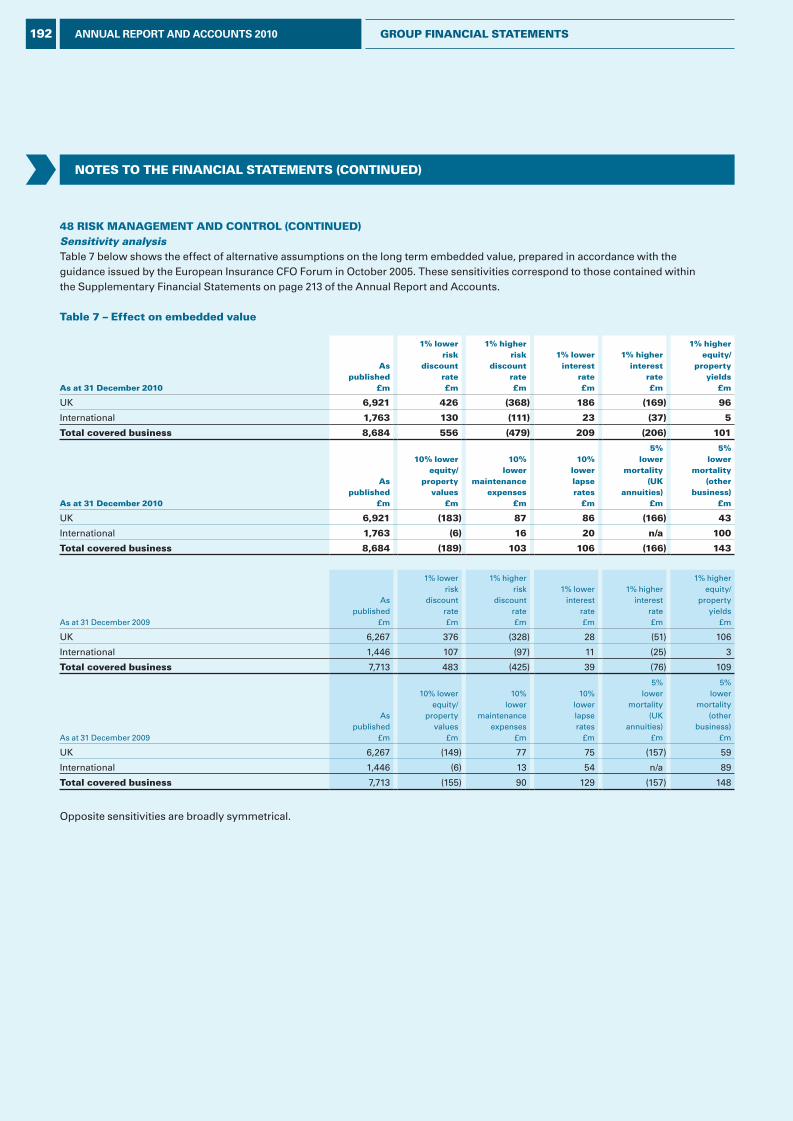
Notes to the FiNaNcial statemeNts (coNtiNued)
48 Risk maNagemeNt aNd coNtRol (coNtiNued)Sensitivity analysisTable 7 below shows the effect of alternative assumptions on the long term embedded value, prepared in accordance with the guidance issued by the European Insurance CFO Forum in October 2005. These sensitivities correspond to those contained within the Supplementary Financial Statements on page 213 of the Annual Report and Accounts.
table 7 – effect on embedded value
as at 31 december 2010
aspublished
£m
1% lowerrisk
discountrate£m
1% higherrisk
discountrate£m
1% lowerinterest
rate£m
1% higherinterest
rate£m
1% higherequity/
propertyyields
£m
UK 6,921 426 (368) 186 (169) 96
International 1,763 130 (111) 23 (37) 5
total covered business 8,684 556 (479) 209 (206) 101
as at 31 december 2010
aspublished
£m
10% lowerequity/
propertyvalues
£m
10%lower
maintenanceexpenses
£m
10%lowerlapserates
£m
5%lower
mortality(uk
annuities)£m
5%lower
mortality(other
business)£m
UK 6,921 (183) 87 86 (166) 43
International 1,763 (6) 16 20 n/a 100
total covered business 8,684 (189) 103 106 (166) 143
As at 31 December 2009
Aspublished
£m
1% lowerrisk
discountrate£m
1% higherrisk
discountrate£m
1% lowerinterest
rate£m
1% higherinterest
rate£m
1% higherequity/
propertyyields
£m
UK 6,267 376 (328) 28 (51) 106
International 1,446 107 (97) 11 (25) 3
total covered business 7,713 483 (425) 39 (76) 109
As at 31 December 2009
Aspublished
£m
10% lowerequity/
propertyvalues
£m
10%lower
maintenanceexpenses
£m
10%lowerlapserates
£m
5%lower
mortality(UK
annuities)£m
5%lower
mortality(other
business)£m
UK 6,267 (149) 77 75 (157) 59
International 1,446 (6) 13 54 n/a 89
total covered business 7,713 (155) 90 129 (157) 148
Opposite sensitivities are broadly symmetrical.
192 ANNUAL REPORT AND ACCOUNTS 2010 gRouP FiNaNcial statemeNts
L&G_AR10_20-Notes48_p172-194_230311_AT.indd 192 25/03/2011 11:29
Notes to the FiNaNcial statemeNts (coNtiNued)
The Group also uses embedded value (EV) financial information in addition to IFRS to manage and monitor performance, and to manage interdependencies between different aspects of financial risks, for example for market risk. This provides information about the value which is being created on the Group’s long term insurance contracts.
EV information is calculated for the Group’s life and pensions business (covered business). All other businesses are accounted for on the IFRS basis adopted in the primary financial statements.
The EV methodology requires assets of an insurance company, as reported in the primary financial statements, to be attributed between those supporting the covered business and the remainder. The method accounts for assets in the covered business on an EV basis and the remainder of the Group’s assets on the IFRS basis adopted in the primary financial statements. Sensitivities have been presented for covered business only. In this context the non-covered business is considered not to be material. Whilst EV sensitivities do not directly reflect the short term movements under IFRS, they more closely reflect the long term economic outturn.
Cash flow projections are determined using realistic assumptions for each component of cash flow and for each policy group. Future economic and investment return assumptions are based on conditions at the end of the financial year. Future investment returns are projected by one of two methods. The first method is based on an assumed investment return attributed to assets at their market value. The second, which is used in the US, where the investments of that subsidiary are substantially all fixed interest, projects the cash flows from the current portfolio of assets and assumes an investment return on reinvestment of surplus cash flows. The assumed discount and inflation rates are consistent with the investment return assumptions. The main assumptions are provided on page 214 in the Supplementary Financial Statements.
uk general insurance The principal products are:
• Household. These contracts provide cover in respect of policyholders’ homes, investment properties, contents, personal belongings and incidental liabilities which they may incur as a property owner, occupier and individual. Exposure is normally limited to the rebuilding cost of the home, the replacement cost of belongings and a policy limit in respect of liability claims. LGI uses reinsurance to manage the exposure to an accumulation of claims arising from any one incident, usually severe weather. The catastrophe cover runs from 1 July to 30 June and reinsures LGI for losses between £30m and £235m (2009/2010: £30m and £250m) for a single weather event.
• Accident, sickness and unemployment (ASU). These contracts provide cover in respect of continuing payment liabilities incurred by customers when they are unable to work as a result of accident, sickness or unemployment. They protect predominantly mortgage payments. Exposure is limited to the monthly payment level selected by the customer sufficient to cover the payment and associated costs, up to the duration limit specified in the policy, usually 12 months.
• Motor insurance (in run-off). These contracts provide cover in respect of customers’ private cars and their liability to third parties in respect of damage to property and injury. Exposure is normally limited to the replacement value of the vehicle, and a policy limit in respect of third party property damage. Exposure to third party bodily injury is unlimited in accordance with statutory requirements. The motor book continues in run-off, the final policy having expired in August 2007, but this is expected to take several years.
• Domestic mortgage indemnity (DMI). These contracts (primarily in run-off) protect a mortgage lender should an insured property be repossessed and subsequently sold at a loss. Since 1993, the contract has included a maximum period of cover of ten years, and a cap on the maximum claim. For business accepted prior to 1993, cover is unlimited and lasts until the insured property is remortgaged or redeemed.
Key risk factorsWeather eventsSignificant weather events such as windstorms, and coastal and river floods can lead to significant claims.
ConcentrationThe insurance of properties which are concentrated in high risk areas, or an above average market share in a particular region, can give rise to a concentration of insurance risk. This risk is managed by ensuring that the risk acceptance policy, terms and premiums both reflect the expected claim cost associated with the location and avoid adverse selection. Additionally, exposure and competitor activity is monitored by location to ensure that there is a geographic spread of business. Catastrophe reinsurance cover reduces the Group’s exposure to concentrations of risk. The catastrophe reinsurance is designed to protect against a modelled windstorm and coastal flood event with a return probability of 1 in 200 years.
193ANNUAL REPORT AND ACCOUNTS 2010gRouP FiNaNcial statemeNts
L&G_AR10_20-Notes48_p172-194_230311_AT.indd 193 25/03/2011 11:29
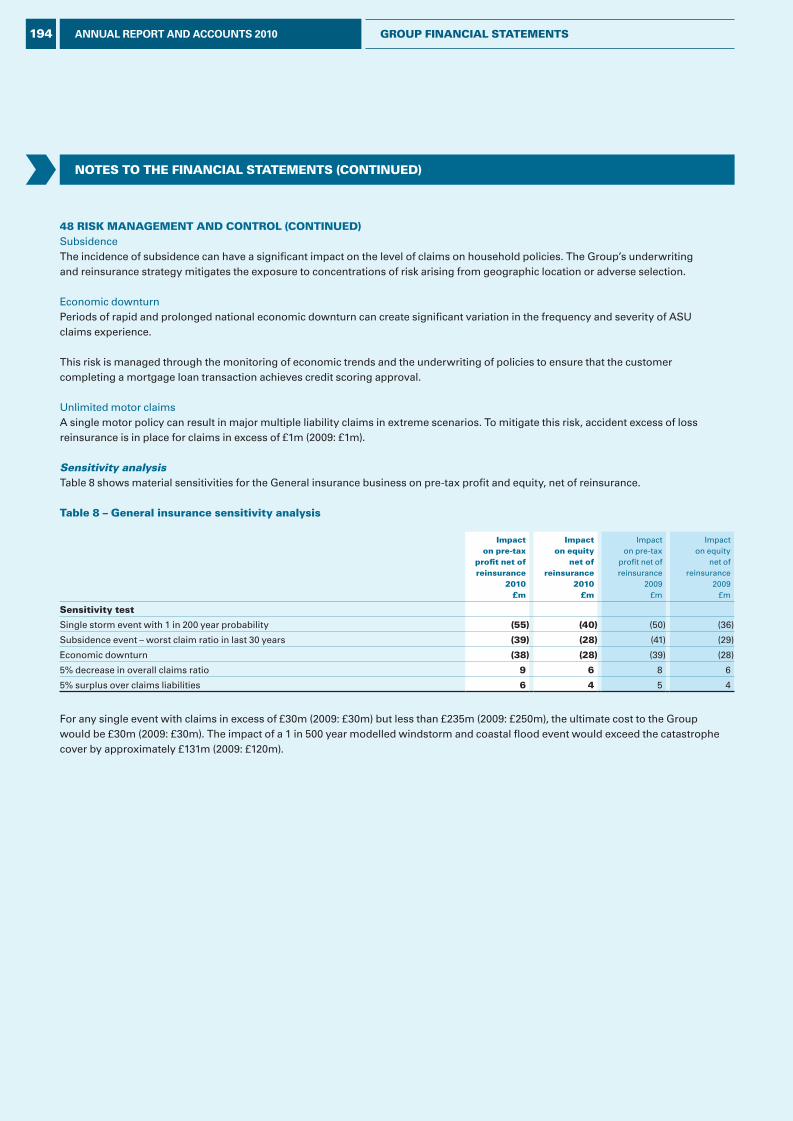
Notes to the FiNaNcial statemeNts (coNtiNued)
48 Risk maNagemeNt aNd coNtRol (coNtiNued)SubsidenceThe incidence of subsidence can have a significant impact on the level of claims on household policies. The Group’s underwriting and reinsurance strategy mitigates the exposure to concentrations of risk arising from geographic location or adverse selection.
Economic downturnPeriods of rapid and prolonged national economic downturn can create significant variation in the frequency and severity of ASU claims experience.
This risk is managed through the monitoring of economic trends and the underwriting of policies to ensure that the customer completing a mortgage loan transaction achieves credit scoring approval.
Unlimited motor claimsA single motor policy can result in major multiple liability claims in extreme scenarios. To mitigate this risk, accident excess of loss reinsurance is in place for claims in excess of £1m (2009: £1m).
Sensitivity analysis Table 8 shows material sensitivities for the General insurance business on pre-tax profit and equity, net of reinsurance.
table 8 – general insurance sensitivity analysis
impacton pre-tax
profit net ofreinsurance
2010£m
impacton equity
net ofreinsurance
2010£m
Impacton pre-tax
profit net ofreinsurance
2009£m
Impacton equity
net ofreinsurance
2009£m
sensitivity test
Single storm event with 1 in 200 year probability (55) (40) (50) (36)
Subsidence event – worst claim ratio in last 30 years (39) (28) (41) (29)
Economic downturn (38) (28) (39) (28)
5% decrease in overall claims ratio 9 6 8 6
5% surplus over claims liabilities 6 4 5 4
For any single event with claims in excess of £30m (2009: £30m) but less than £235m (2009: £250m), the ultimate cost to the Group would be £30m (2009: £30m). The impact of a 1 in 500 year modelled windstorm and coastal flood event would exceed the catastrophe cover by approximately £131m (2009: £120m).
194 ANNUAL REPORT AND ACCOUNTS 2010 gRouP FiNaNcial statemeNts
L&G_AR10_20-Notes48_p172-194_230311_AT.indd 194 25/03/2011 11:29
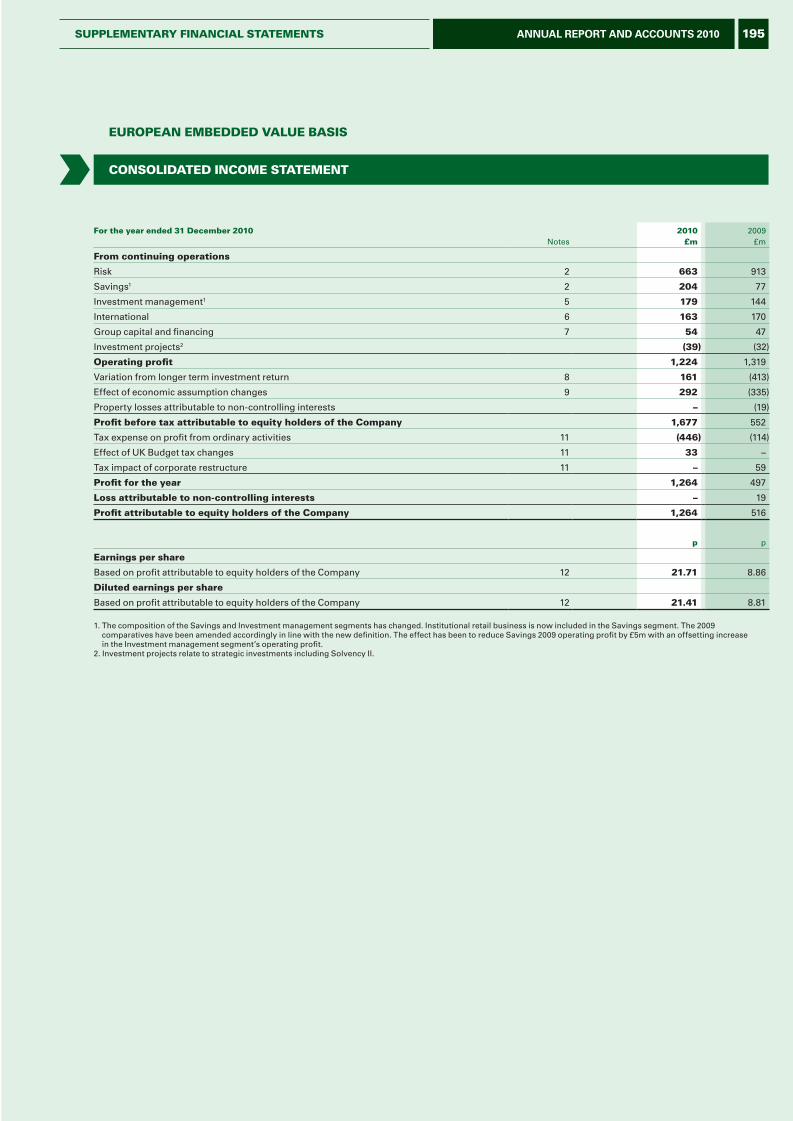
For the year ended 31 December 2010 Notes
2010£m
2009£m
From continuing operations
Risk 2 663 913
Savings1 2 204 77
Investment management1 5 179 144
International 6 163 170
Group capital and financing 7 54 47
Investment projects2 (39) (32)
Operating profit 1,224 1,319
Variation from longer term investment return 8 161 (413)
Effect of economic assumption changes 9 292 (335)
Property losses attributable to non-controlling interests – (19)
Profit before tax attributable to equity holders of the Company 1,677 552
Tax expense on profit from ordinary activities 11 (446) (114)
Effect of UK Budget tax changes 11 33 –
Tax impact of corporate restructure 11 – 59
Profit for the year 1,264 497
Loss attributable to non-controlling interests – 19
Profit attributable to equity holders of the Company 1,264 516
p p
Earnings per share
Based on profit attributable to equity holders of the Company 12 21.71 8.86
Diluted earnings per share
Based on profit attributable to equity holders of the Company 12 21.41 8.81
1. The composition of the Savings and Investment management segments has changed. Institutional retail business is now included in the Savings segment. The 2009 comparatives have been amended accordingly in line with the new definition. The effect has been to reduce Savings 2009 operating profit by £5m with an offsetting increase in the Investment management segment’s operating profit.
2. Investment projects relate to strategic investments including Solvency II.
COnsOLiDatED inCOmE statEmEnt
EurOPEan EmbEDDED vaLuE basis
195ANNUAL REPORT AND ACCOUNTS 2010suPPLEmEntary FinanCiaL statEmEnts
L&G_AR10_21-EEV_p195-216_230311_AT.indd 195 25/03/2011 11:30
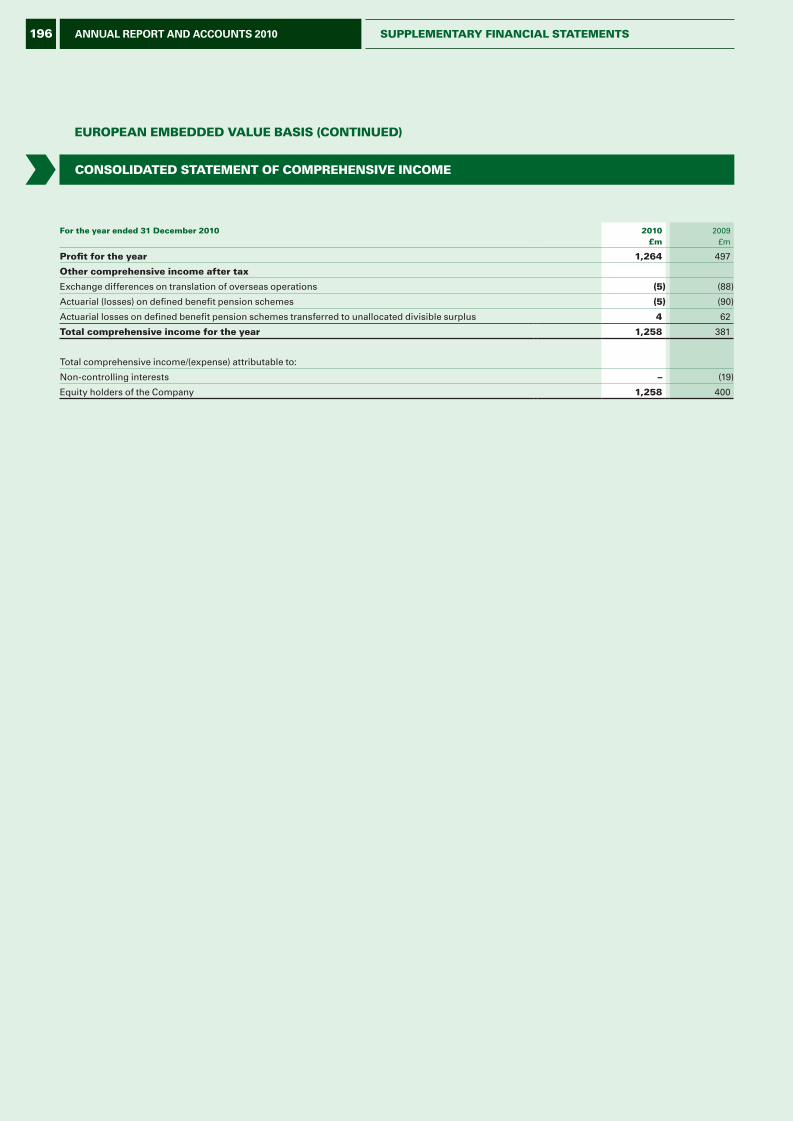
EurOPEan EmbEDDED vaLuE basis (COntinuED)
For the year ended 31 December 2010 2010£m
2009£m
Profit for the year 1,264 497
Other comprehensive income after tax
Exchange differences on translation of overseas operations (5) (88)
Actuarial (losses) on defined benefit pension schemes (5) (90)
Actuarial losses on defined benefit pension schemes transferred to unallocated divisible surplus 4 62
total comprehensive income for the year 1,258 381
Total comprehensive income/(expense) attributable to:
Non-controlling interests – (19)
Equity holders of the Company 1,258 400
COnsOLiDatED statEmEnt OF COmPrEhEnsivE inCOmE
196 ANNUAL REPORT AND ACCOUNTS 2010 suPPLEmEntary FinanCiaL statEmEnts
L&G_AR10_21-EEV_p195-216_230311_AT.indd 196 25/03/2011 11:30
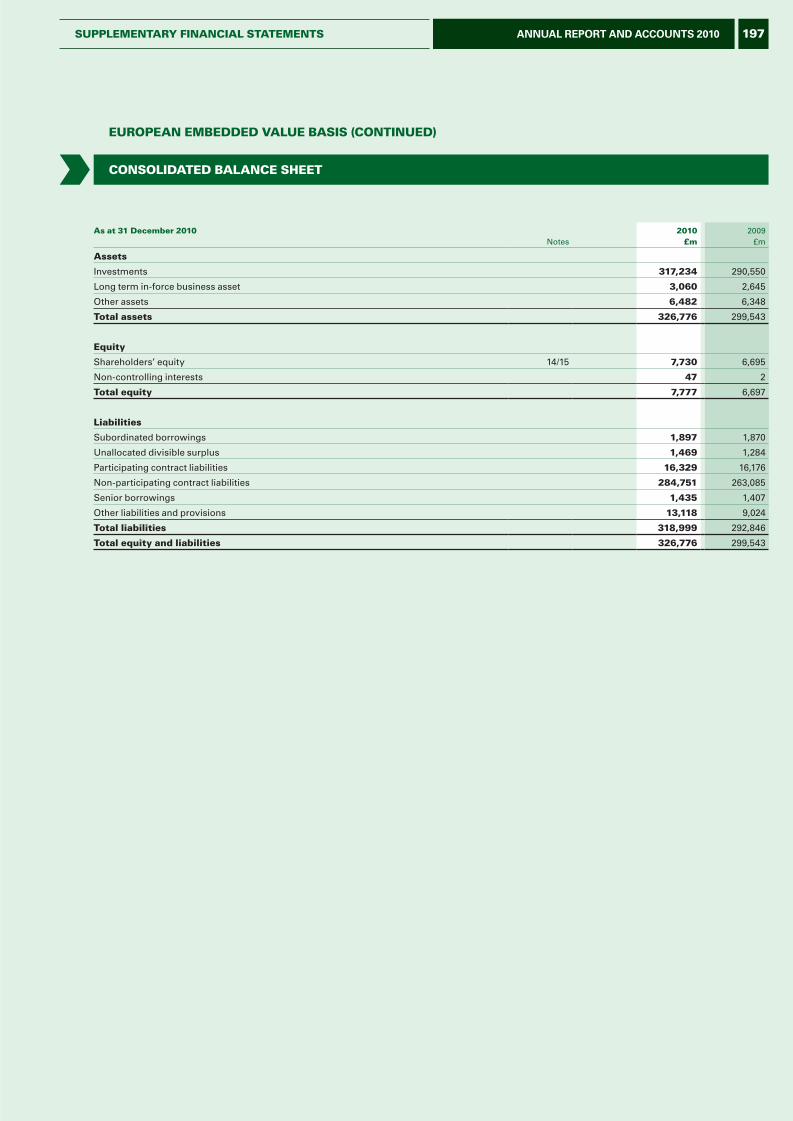
EurOPEan EmbEDDED vaLuE basis (COntinuED)
as at 31 December 2010 Notes
2010£m
2009£m
assets
Investments 317,234 290,550
Long term in-force business asset 3,060 2,645
Other assets 6,482 6,348
total assets 326,776 299,543
Equity
Shareholders’ equity 14/15 7,730 6,695
Non-controlling interests 47 2
total equity 7,777 6,697
Liabilities
Subordinated borrowings 1,897 1,870
Unallocated divisible surplus 1,469 1,284
Participating contract liabilities 16,329 16,176
Non-participating contract liabilities 284,751 263,085
Senior borrowings 1,435 1,407
Other liabilities and provisions 13,118 9,024
total liabilities 318,999 292,846
total equity and liabilities 326,776 299,543
COnsOLiDatED baLanCE shEEt
197ANNUAL REPORT AND ACCOUNTS 2010suPPLEmEntary FinanCiaL statEmEnts
L&G_AR10_21-EEV_p195-216_230311_AT.indd 197 25/03/2011 11:30
EurOPEan EmbEDDED vaLuE basis (COntinuED)
1 basis OF PrEParatiOnThe supplementary financial statements have been prepared in accordance with the European Embedded Value (EEV) Principles issued in May 2004 by the European Insurance CFO Forum.
These supplementary financial statements have been audited by PricewaterhouseCoopers LLP and prepared with assistance from our consulting actuaries; Towers Watson in the UK and Milliman in the USA.
Covered businessThe Group uses EEV methodology to value individual and group life assurance, pensions and annuity business written in the UK, Continental Europe and the US. The UK covered business also includes non-insured self invested personal pension (SIPP) business. The managed pension funds business has been excluded from covered business and is reported on an IFRS basis, as management believe IFRS to be the most appropriate reporting basis for the investment management business.
All other businesses are accounted for on the IFRS basis adopted in the primary financial statements.
There is no distinction made between insurance and investment contracts in our covered business as there is under IFRS.
Description of methodologyThe objective of EEV is to provide shareholders with realistic information on the financial position and current performance of the Group.
The methodology requires assets of an insurance company, as reported in the primary financial statements, to be attributed between those supporting the covered business and the remainder. The method accounts for assets in the covered business on an EEV basis and the remainder of the Group’s assets on the IFRS basis adopted in the primary financial statements.
The EEV methodology recognises profit from the covered business as the total of:i. cash transfers during the relevant period from the covered
business to the remainder of the Group’s assets; andii. the movement in the present value of future distributable
profits to shareholders arising from the covered business over the relevant reporting period.
Embedded valueShareholders’ equity on the EEV basis comprises the embedded value of the covered business plus the shareholders’ equity of other businesses, less the value included for purchased interests in long term business.
The embedded value is the sum of the shareholder net worth (SNW) and the value of the in-force business (VIF). SNW is defined as those amounts, within covered business (both within the long term fund and held outside the long term fund but used
to support long term business), which are regarded either as required capital or which represent free surplus.
The VIF is the present value of future shareholder profits arising from the covered business, projected using best estimate assumptions, less an appropriate deduction for the cost of holding the required level of capital and the time value of financial options and guarantees (FOGs).
service companiesAll services relating to the UK covered business are charged on a cost recovery basis, with the exception of investment management services provided to Legal & General Pensions Limited (LGPL) and to Legal & General Assurance Society Limited (Society). Profits arising on the provision of these services are valued on a look through basis.
As the EEV methodology incorporates the future capitalised cost of these internal investment management services, the equivalent IFRS profits have been removed from the Investment management segment and are instead included in the results of the Risk and Savings segments on an EEV basis.
The capitalised value of future profits emerging from internal investment management services are therefore included in the embedded value and new business contribution calculations for the Risk and Savings segments. However, the historical profits which have emerged continue to be reported in the shareholders’ equity of the Investment management segment on an IFRS basis. Since the look through into service companies includes only future profits and losses, current intra-group profits or losses must be eliminated from the closing embedded value and in order to reconcile the profits arising in the financial period within each segment with the net assets on the opening and closing balance sheet, a transfer of IFRS profits for the period from the UK SNW is deemed to occur. new businessNew business premiums reflect income arising from the sale of new contracts during the reporting period and any changes to existing contracts, which were not anticipated at the outset of the contract.
In-force business comprises previously written single premium, regular premium and recurrent single premium contracts.
Department of Work and Pensions rebates have not been treated as recurring and are included in single premium new business when received.
New business contribution arising from the new business premiums written during the reporting period has been calculated on the same economic and operating assumptions used in the embedded value at the end of the financial period. This has then been rolled forward to the end of the financial period using the risk discount rate applicable at the end of the reporting period.
nOtEs tO thE suPPLEmEntary FinanCiaL statEmEnts
198 ANNUAL REPORT AND ACCOUNTS 2010 suPPLEmEntary FinanCiaL statEmEnts
L&G_AR10_21-EEV_p195-216_230311_AT.indd 198 25/03/2011 11:30
EurOPEan EmbEDDED vaLuE basis (COntinuED)
nOtEs tO thE suPPLEmEntary FinanCiaL statEmEnts
The present value of new business premiums (PVNBP) has been calculated and expressed at the point of sale. The PVNBP is equivalent to the total single premiums plus the discounted value of regular premiums expected to be received over the term of the contracts using the same economic and operating assumptions used for the embedded value at the end of the financial period. The new business margin is defined as new business contribution at the end of the reporting period divided by the PVNBP. The premium volumes and projection assumptions used to calculate the PVNBP are the same as those used to calculate new business contribution.
Projection assumptionsCash flow projections are determined using best estimate assumptions for each component of cash flow and for each policy group. Future economic and investment return assumptions are based on conditions at the end of the financial period. Future investment returns are projected by one of two methods. The first method is based on an assumed investment return attributed to assets at their market value. The second, which is used in the US, where the investments of that subsidiary are substantially all fixed interest, projects the cash flows from the current portfolio of assets and assumes an investment return on reinvestment of surplus cash flows. The assumed discount and inflation rates are consistent with the investment return assumptions.
Detailed projection assumptions including mortality, morbidity, persistency and expenses reflect recent operating experience and are normally reviewed annually. Allowance is made for future improvements in annuitant mortality based on experience and externally published data. Favourable changes in operating experience are not anticipated until the improvement in experience has been observed.
All costs relating to the covered business, whether incurred in the covered business or elsewhere in the Group, are allocated to that business. The expense assumptions used for the cash flow projections therefore include the full cost of servicing this business.
taxThe projections take into account all tax which is expected to be paid, based on best estimate assumptions, applying current legislation and practice together with known future changes.
allowance for riskAggregate risks within the covered business are allowed for through the following principal mechanisms:i. setting required capital levels with reference to both
the Group’s internal risk based capital models, and an assessment of the strength of regulatory reserves in the covered business;
ii. allowing explicitly for the time value of financial options and guarantees within the Group’s products; and
iii. setting risk discount rates by deriving a Group level risk margin to be applied consistently to local risk free rates.
required capital and free surplusRegulatory capital for the Risk and Savings businesses is provided by assets backing the with-profits business or by the SNW. The SNW comprises all shareholders’ capital within Society, including those funds retained within the long term fund and the excess assets in LGPL (collectively Society shareholder capital).
Society shareholder capital is either required to cover EU solvency margin or is free surplus as its distribution to shareholders is not restricted.
For UK with-profits business, the required capital is covered by the surplus within the with-profits part of the fund and no effect is attributed to shareholders except for the burn-through cost, which is described later. This treatment is consistent with the Principles and Practices of Financial Management for this part of the fund.
For UK non profit business, the required capital will be maintained at no less than the level of the EU minimum solvency requirement. This level, together with the margins for adverse deviation in the regulatory reserves, is, in aggregate, in excess of internal capital targets assessed in conjunction with the Individual Capital Assessment (ICA) and the with-profits support account.
The initial strains relating to new non profit business, together with the related EU solvency margin, are supported by releases from existing non profit business and the Society shareholder capital. As a consequence, the writing of new business defers the release of capital to free surplus. The cost of holding required capital is defined as the difference between the value of the required capital and the present value of future releases of that capital. For new business, the cost of capital is taken as the difference in the value of that capital assuming it was available for release immediately and the present value of the future releases of that capital. As the investment return, net of tax, on that capital is less than the risk discount rate, there is a resulting cost of capital which is reflected in the value of new business.
For Legal & General America, the Company Action Level (CAL) of capital has been treated as required capital for modelling purposes. The CAL is the regulatory capital level at which the company would have to take prescribed action, such as submission of plans to the State insurance regulator, but would be able to continue operating on the existing basis. The CAL is currently twice the level of capital at which the regulator is permitted to take control of the business.
For Legal & General Netherlands, required capital has been set at 100% of EU minimum solvency margin for all products without FOGs. For those products with FOGs, capital of between 100% and 212% of the EU minimum solvency margin has been used. The level of capital has been determined using risk based capital techniques.
199ANNUAL REPORT AND ACCOUNTS 2010suPPLEmEntary FinanCiaL statEmEnts
L&G_AR10_21-EEV_p195-216_230311_AT.indd 199 25/03/2011 11:30
EurOPEan EmbEDDED vaLuE basis (COntinuED)
nOtEs tO thE suPPLEmEntary FinanCiaL statEmEnts (COntinuED)
For Legal & General France, 100% of EU minimum solvency margin has been used for EV modelling purposes for all products both with and without FOGs. The level of capital has been determined using risk based capital techniques.
The contribution from new business for our International businesses reflects an appropriate allowance for the cost of holding the required capital.
Financial options and guaranteesIn the UK, all financial options and guarantees (FOGs) are within the UK covered business.
Under the EEV Principles an allowance for time value of FOGs is required where a financial option exists which is exercisable at the discretion of the policyholder. These types of option principally arise within the with-profits part of the fund and their time value is recognised within the with-profits burn-through cost described below. Additional financial options for non profit business exist only for a small amount of deferred annuity business where guaranteed early retirement and cash commutation terms apply when the policyholders choose their actual retirement date.
Further financial guarantees exist for non profit business, in relation to index-linked annuities where capped or collared restrictions apply. Due to the nature of these restrictions and the manner in which they vary depending on the prevailing inflation conditions, they are also treated as FOGs and a time value cost recognised accordingly. The time value of FOGs has been calculated stochastically using a large number of real world economic scenarios derived from assumptions consistent with the deterministic EEV assumptions and allowing for appropriate management actions where applicable. The management action primarily relates to the setting of bonus rates. Future regular and terminal bonuses on participating business within the projections are set in a manner consistent with expected future returns available on assets deemed to back the policies within the stochastic scenarios.
In recognising the residual value of any projected surplus assets within the with-profits part of the fund in the deterministic projection, it is assumed that terminal bonuses are increased to exhaust all of the assets in the part of the fund over the future lifetime of the in-force with-profits policies. However, under stochastic modelling, there may be some extreme economic scenarios when the total projected assets within the with-profits part of the fund are insufficient to pay all projected policyholder claims and associated costs. The average additional shareholder cost arising from this shortfall has been included in the time value cost of options and guarantees and is referred to as the with-profits burn-through cost.
Economic scenarios have been used to assess the time value of the financial guarantees for non profit business by using the inflation rate generated in each scenario. The inflation
rate used to project index-linked annuities will be constrained in certain real world scenarios, for example, where negative inflation occurs but the annuity payments do not reduce below pre-existing levels. The time value cost of FOGs allows for the projected average cost of these constrained payments for the index-linked annuities. It also allows for the small additional cost of the guaranteed early retirement and cash commutation terms for the minority of deferred annuity business where such guarantees have been written.
In the US, FOGs relate to guaranteed minimum crediting rates and surrender values on a range of contracts. The guaranteed surrender value of the contract is based on the accumulated value of the contract including accrued interest. The crediting rates are discretionary but related to the accounting income for the amortising bond portfolio. The majority of the guaranteed minimum crediting rates are between 3% and 4%. The assets backing these contracts are invested in US Dollar denominated fixed interest securities.
In the Netherlands, there are two types of guarantees which have been separately provided for: interest rate guarantees and maturity guarantees. Certain contracts provide an interest rate guarantee where there is a minimum crediting rate based on the higher of 1-year Euribor and the policy guarantee rate. This guarantee applies on a monthly basis. Certain unit linked contracts provide a guaranteed minimum value at maturity where the maturity amount is the higher of the fund value and a guarantee amount. The fund values for both these contracts are invested in Euro denominated fixed interest securities.
In France, FOGs which have been separately provided for relate to guaranteed minimum crediting rates and surrender values on a range of contracts. The guaranteed surrender value of the contract is the accumulated value of the contract including accrued bonuses. The bonuses are based on the accounting income for the amortising bond portfolios plus income and releases from realised gains on any equity type investments. Policy liabilities equal guaranteed surrender values. Local statutory accounting rules require the establishment of a specific liability when the accounting income for a company is less than 125% of the guaranteed minimum credited returns, although this has never been required. In general, the guaranteed annual bonus rates are between 0% and 4.5%.
risk free rateThe risk free rate is set to reflect both the pattern of the emerging profits under EEV and the relevant duration of the liabilities where backing assets reflect this assumption (e.g. equity returns). Following a review, the risk free rate for 31 December 2010 is set by reference to the gross redemption yield on the 15 year gilt index. For 31 December 2009, a 20 year gilt index was referenced.
risk discount rateThe risk discount rate (RDR) is a combination of the risk free rate and a risk margin, which reflects the residual risks inherent in the
200 ANNUAL REPORT AND ACCOUNTS 2010 suPPLEmEntary FinanCiaL statEmEnts
L&G_AR10_21-EEV_p195-216_230311_AT.indd 200 25/03/2011 11:30
EurOPEan EmbEDDED vaLuE basis (COntinuED)
nOtEs tO thE suPPLEmEntary FinanCiaL statEmEnts (COntinuED)
Group’s covered businesses, after taking account of prudential margins in the statutory provisions, the required capital and the specific allowance for FOGs.
The risk margin has been determined based on an assessment of the Group’s weighted average cost of capital (WACC). This assessment incorporates a beta for the Group, which measures the correlation of movements in the Group’s share price to movements in a relevant index. Beta values therefore allow for the market’s assessment of the risks inherent in the business relative to other companies in the chosen index.
The WACC is derived from the Group’s cost of equity, cost of debt, and the proportion of equity to debt in the Group’s capital structure measured using market values. Each of these three parameters are forward looking, although informed by historic information. The cost of equity is calculated as the risk free rate plus the equity risk premium for the chosen index multiplied by the Company’s beta. Forward-looking or adjusted betas make allowance for the observed tendency for betas to revert to 1 and therefore a weighted average of the historic beta and 1 tends to be a better estimate of the Company’s beta for the future period. We have computed the WACC using an arithmetical average of forward-looking betas against the FTSE 100 Index.
The cost of debt used in the WACC calculations takes account of the actual locked-in rates for our senior and subordinated long term debt. All debt interest attracts tax relief at a rate of 27%.
Whilst the WACC approach is a relatively simple and transparent calculation to apply, subjectivity remains within a number of the assumptions. Management believes that the chosen margin, together with the levels of required capital, the inherent strength of the Group’s regulatory reserves and the explicit deduction for the cost of options and guarantees, is appropriate to reflect the risks within the covered business.
For the 2010 results, the risk margin was decreased to 3.3% (31 December 2009: 3.5%). analysis of profitOperating profit is identified at a level which reflects an assumed longer term level of investment return.
The contribution to operating profit in a period is attributed to four sources: i. new business; ii. the management of in-force business; iii. development costs; and iv. return on shareholder net worth.
Further profit contributions arise from actual investment returns differing from the assumed long term investment returns (investment return variances), and from the effect of economic assumption changes.
The contribution from new business represents the value recognised at the end of each period from new business written in that period, after allowing for the actual cost of acquiring the business and of establishing the required technical provisions and reserves and after making allowance for the cost of capital. New business contributions are calculated using closing assumptions.
The contribution from in-force business is calculated using opening assumptions and comprises:i. expected return – the discount earned from the value
of business in-force at the start of the year;ii. experience variances – the variance in the actual experience
over the reporting period from that assumed in the value of business in-force as at the start of the year; and
iii. operating assumption changes – the effects of changes in future assumptions, other than changes in economic assumptions from those used in valuing the business at the start of the year. These changes are made prospectively from the end of the year.
Development costs relate to investment in strategic systems and development capability.
The contribution from shareholder net worth comprises the increase in embedded value based on assumptions at the start of the year in respect of the expected investment return on the Society shareholder capital.
Further profit contributions arise from investment return variances and the effect of economic assumption changes.
Investment return variances represent the effect of actual investment performance and changes to investment policy on shareholder net worth and the value of in-force business from that assumed at the beginning of the period.
Economic assumption changes comprise the effect of changes in economic variables on shareholder net worth and the value of in-force business from that assumed at the beginning of the period, which are beyond the control of management, including associated changes to valuation bases to the extent that they are reflected in revised assumptions.
201ANNUAL REPORT AND ACCOUNTS 2010suPPLEmEntary FinanCiaL statEmEnts
L&G_AR10_21-EEV_p195-216_230311_AT.indd 201 25/03/2011 11:30
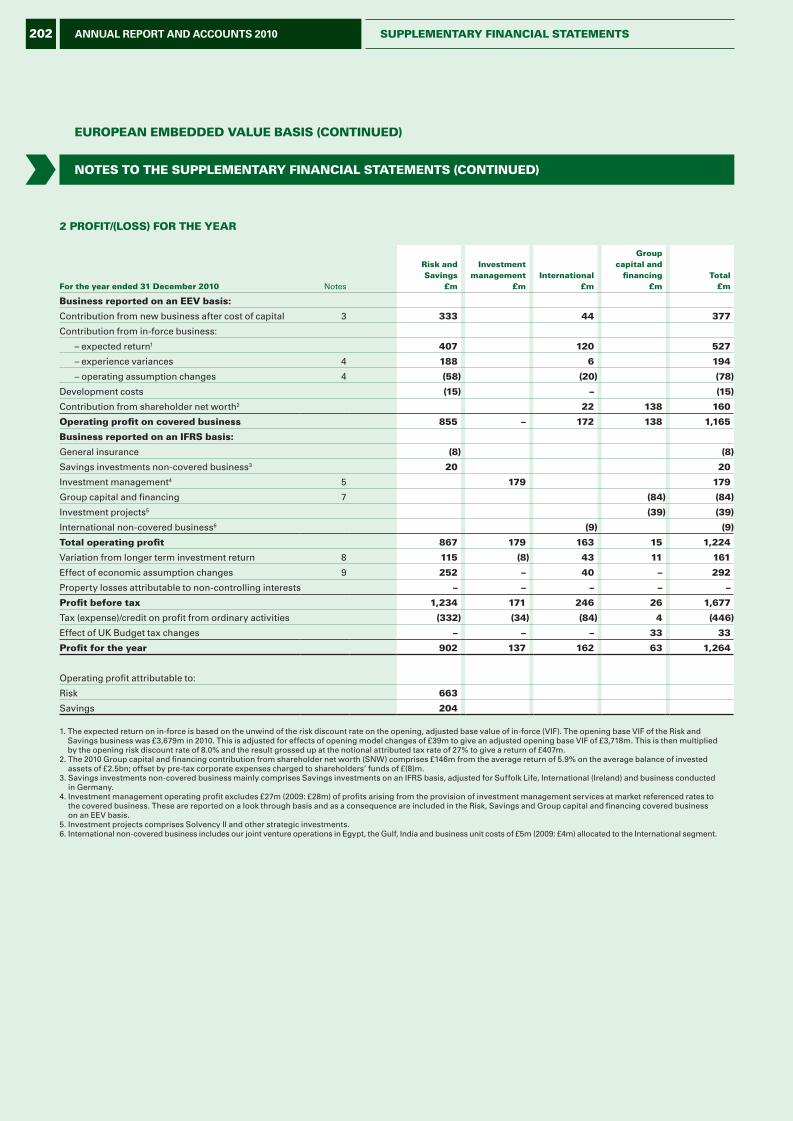
EurOPEan EmbEDDED vaLuE basis (COntinuED)
2 PrOFit/(LOss) FOr thE yEar
For the year ended 31 December 2010 Notes
risk andsavings
£m
investmentmanagement
£m international
£m
Groupcapital and
financing£m
total£m
business reported on an EEv basis:
Contribution from new business after cost of capital 3 333 44 377
Contribution from in-force business:
– expected return1 407 120 527
– experience variances 4 188 6 194
– operating assumption changes 4 (58) (20) (78)
Development costs (15) – (15)
Contribution from shareholder net worth2 22 138 160
Operating profit on covered business 855 – 172 138 1,165
business reported on an iFrs basis:
General insurance (8) (8)
Savings investments non-covered business3 20 20
Investment management4 5 179 179
Group capital and financing 7 (84) (84)
Investment projects5 (39) (39)
International non-covered business6 (9) (9)
total operating profit 867 179 163 15 1,224
Variation from longer term investment return 8 115 (8) 43 11 161
Effect of economic assumption changes 9 252 – 40 – 292
Property losses attributable to non-controlling interests – – – – –
Profit before tax 1,234 171 246 26 1,677
Tax (expense)/credit on profit from ordinary activities (332) (34) (84) 4 (446)
Effect of UK Budget tax changes – – – 33 33
Profit for the year 902 137 162 63 1,264
Operating profit attributable to:
Risk 663
Savings 204
1. The expected return on in-force is based on the unwind of the risk discount rate on the opening, adjusted base value of in-force (VIF). The opening base VIF of the Risk and Savings business was £3,679m in 2010. This is adjusted for effects of opening model changes of £39m to give an adjusted opening base VIF of £3,718m. This is then multiplied by the opening risk discount rate of 8.0% and the result grossed up at the notional attributed tax rate of 27% to give a return of £407m.
2. The 2010 Group capital and financing contribution from shareholder net worth (SNW) comprises £146m from the average return of 5.9% on the average balance of invested assets of £2.5bn; offset by pre-tax corporate expenses charged to shareholders’ funds of £(8)m.
3. Savings investments non-covered business mainly comprises Savings investments on an IFRS basis, adjusted for Suffolk Life, International (Ireland) and business conducted in Germany.
4. Investment management operating profit excludes £27m (2009: £28m) of profits arising from the provision of investment management services at market referenced rates to the covered business. These are reported on a look through basis and as a consequence are included in the Risk, Savings and Group capital and financing covered business on an EEV basis.
5. Investment projects comprises Solvency II and other strategic investments.6. International non-covered business includes our joint venture operations in Egypt, the Gulf, India and business unit costs of £5m (2009: £4m) allocated to the International segment.
nOtEs tO thE suPPLEmEntary FinanCiaL statEmEnts (COntinuED)
202 ANNUAL REPORT AND ACCOUNTS 2010 suPPLEmEntary FinanCiaL statEmEnts
L&G_AR10_21-EEV_p195-216_230311_AT.indd 202 25/03/2011 11:30
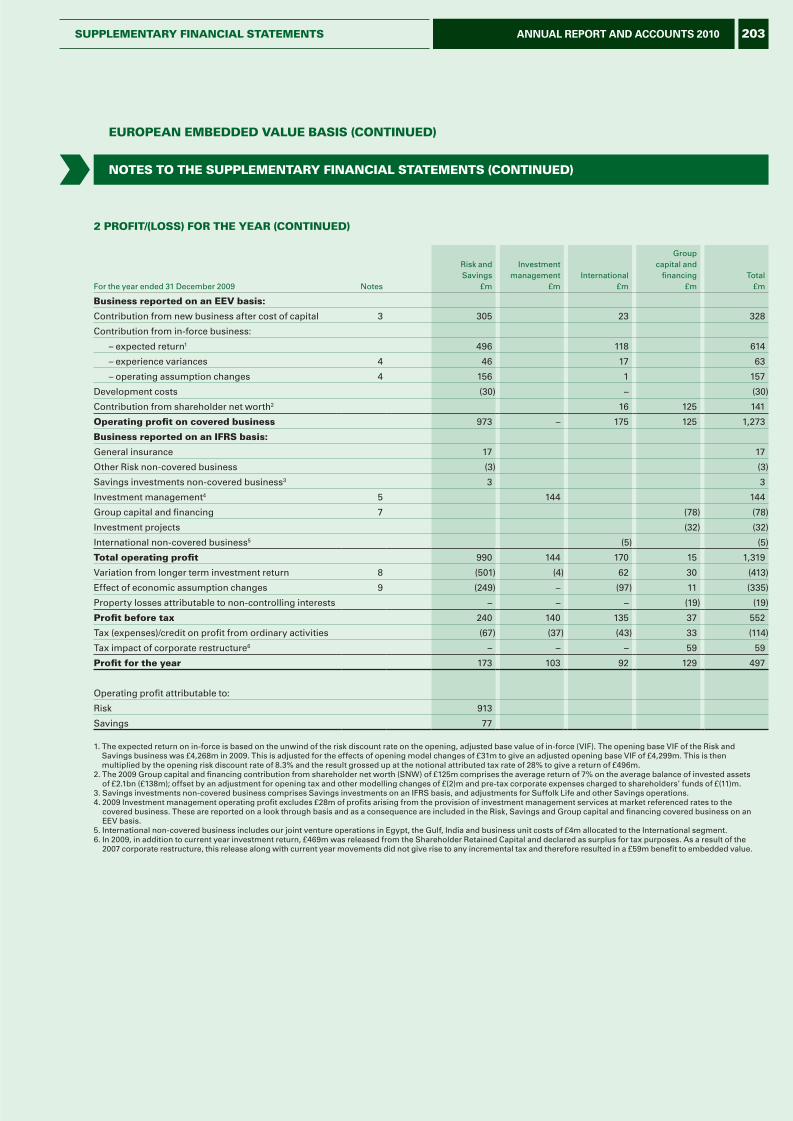
EurOPEan EmbEDDED vaLuE basis (COntinuED)
2 PrOFit/(LOss) FOr thE yEar (COntinuED)
For the year ended 31 December 2009 Notes
Risk andSavings
£m
Investmentmanagement
£m International
£m
Groupcapital and
financing£m
Total£m
business reported on an EEv basis:
Contribution from new business after cost of capital 3 305 23 328
Contribution from in-force business:
– expected return1 496 118 614
– experience variances 4 46 17 63
– operating assumption changes 4 156 1 157
Development costs (30) – (30)
Contribution from shareholder net worth2 16 125 141
Operating profit on covered business 973 – 175 125 1,273
business reported on an iFrs basis:
General insurance 17 17
Other Risk non-covered business (3) (3)
Savings investments non-covered business3 3 3
Investment management4 5 144 144
Group capital and financing 7 (78) (78)
Investment projects (32) (32)
International non-covered business5 (5) (5)
total operating profit 990 144 170 15 1,319
Variation from longer term investment return 8 (501) (4) 62 30 (413)
Effect of economic assumption changes 9 (249) – (97) 11 (335)
Property losses attributable to non-controlling interests – – – (19) (19)
Profit before tax 240 140 135 37 552
Tax (expenses)/credit on profit from ordinary activities (67) (37) (43) 33 (114)
Tax impact of corporate restructure6 – – – 59 59
Profit for the year 173 103 92 129 497
Operating profit attributable to:
Risk 913
Savings 77
1. The expected return on in-force is based on the unwind of the risk discount rate on the opening, adjusted base value of in-force (VIF). The opening base VIF of the Risk and Savings business was £4,268m in 2009. This is adjusted for the effects of opening model changes of £31m to give an adjusted opening base VIF of £4,299m. This is then multiplied by the opening risk discount rate of 8.3% and the result grossed up at the notional attributed tax rate of 28% to give a return of £496m.
2. The 2009 Group capital and financing contribution from shareholder net worth (SNW) of £125m comprises the average return of 7% on the average balance of invested assets of £2.1bn (£138m); offset by an adjustment for opening tax and other modelling changes of £(2)m and pre-tax corporate expenses charged to shareholders’ funds of £(11)m.
3. Savings investments non-covered business comprises Savings investments on an IFRS basis, and adjustments for Suffolk Life and other Savings operations. 4. 2009 Investment management operating profit excludes £28m of profits arising from the provision of investment management services at market referenced rates to the
covered business. These are reported on a look through basis and as a consequence are included in the Risk, Savings and Group capital and financing covered business on an EEV basis.
5. International non-covered business includes our joint venture operations in Egypt, the Gulf, India and business unit costs of £4m allocated to the International segment.6. In 2009, in addition to current year investment return, £469m was released from the Shareholder Retained Capital and declared as surplus for tax purposes. As a result of the
2007 corporate restructure, this release along with current year movements did not give rise to any incremental tax and therefore resulted in a £59m benefit to embedded value.
nOtEs tO thE suPPLEmEntary FinanCiaL statEmEnts (COntinuED)
203ANNUAL REPORT AND ACCOUNTS 2010suPPLEmEntary FinanCiaL statEmEnts
L&G_AR10_21-EEV_p195-216_230311_AT.indd 203 25/03/2011 11:30
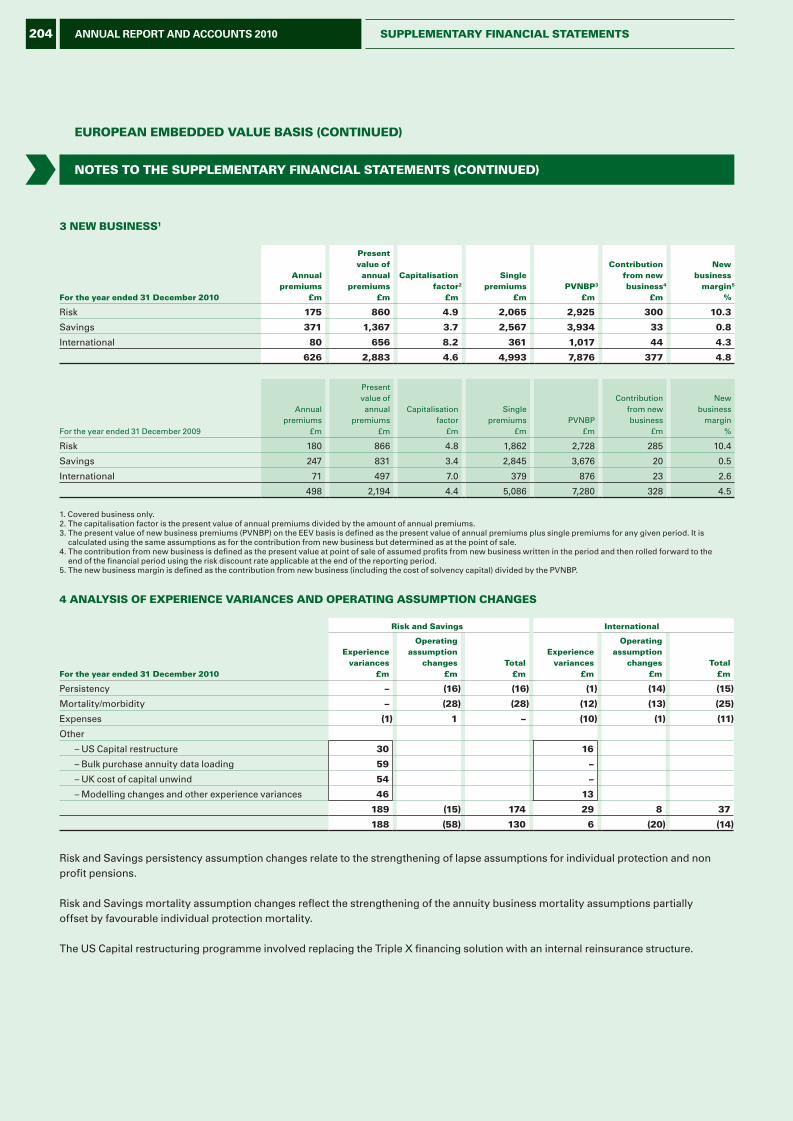
EurOPEan EmbEDDED vaLuE basis (COntinuED)
3 nEw businEss1
For the year ended 31 December 2010
annual premiums
£m
Present value of
annualpremiums
£m
Capitalisationfactor2
£m
singlepremiums
£m PvnbP3
£m
Contributionfrom newbusiness4
£m
newbusiness
margin5
%
Risk 175 860 4.9 2,065 2,925 300 10.3
Savings 371 1,367 3.7 2,567 3,934 33 0.8
International 80 656 8.2 361 1,017 44 4.3
626 2,883 4.6 4,993 7,876 377 4.8
For the year ended 31 December 2009
Annual premiums
£m
Present value of
annualpremiums
£m
Capitalisationfactor
£m
Singlepremiums
£m PVNBP
£m
Contributionfrom newbusiness
£m
Newbusiness
margin%
Risk 180 866 4.8 1,862 2,728 285 10.4
Savings 247 831 3.4 2,845 3,676 20 0.5
International 71 497 7.0 379 876 23 2.6
498 2,194 4.4 5,086 7,280 328 4.5
1. Covered business only.2. The capitalisation factor is the present value of annual premiums divided by the amount of annual premiums.3. The present value of new business premiums (PVNBP) on the EEV basis is defined as the present value of annual premiums plus single premiums for any given period. It is
calculated using the same assumptions as for the contribution from new business but determined as at the point of sale.4. The contribution from new business is defined as the present value at point of sale of assumed profits from new business written in the period and then rolled forward to the
end of the financial period using the risk discount rate applicable at the end of the reporting period.5. The new business margin is defined as the contribution from new business (including the cost of solvency capital) divided by the PVNBP.
4 anaLysis OF ExPEriEnCE varianCEs anD OPEratinG assumPtiOn ChanGEs
risk and savings international
For the year ended 31 December 2010
Experience variances
£m
Operating assumption
changes£m
total£m
Experience variances
£m
Operating assumption
changes£m
total£m
Persistency – (16) (16) (1) (14) (15)
Mortality/morbidity – (28) (28) (12) (13) (25)
Expenses (1) 1 – (10) (1) (11)
Other
– US Capital restructure 30 16
– Bulk purchase annuity data loading 59 –
– UK cost of capital unwind 54 –
– Modelling changes and other experience variances 46 13
189 (15) 174 29 8 37
188 (58) 130 6 (20) (14)
Risk and Savings persistency assumption changes relate to the strengthening of lapse assumptions for individual protection and non profit pensions.
Risk and Savings mortality assumption changes reflect the strengthening of the annuity business mortality assumptions partially offset by favourable individual protection mortality.
The US Capital restructuring programme involved replacing the Triple X financing solution with an internal reinsurance structure.
nOtEs tO thE suPPLEmEntary FinanCiaL statEmEnts (COntinuED)
204 ANNUAL REPORT AND ACCOUNTS 2010 suPPLEmEntary FinanCiaL statEmEnts
L&G_AR10_21-EEV_p195-216_230311_AT.indd 204 25/03/2011 11:30
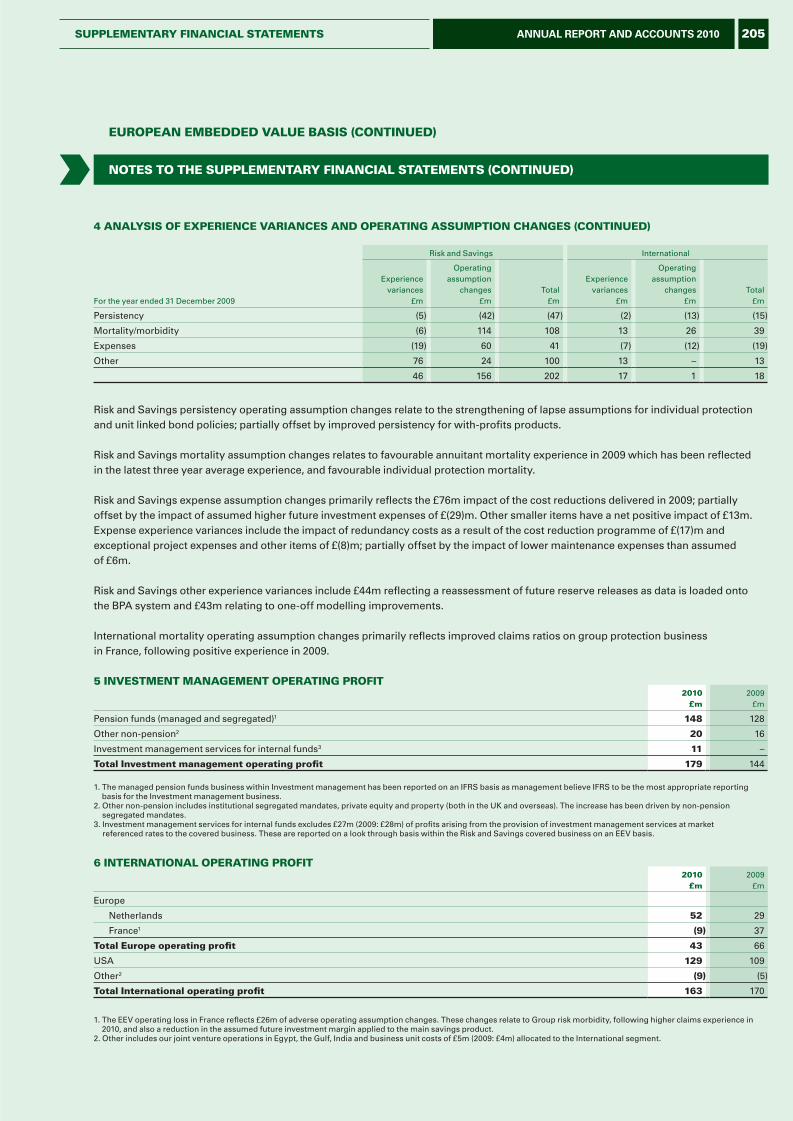
EurOPEan EmbEDDED vaLuE basis (COntinuED)
4 anaLysis OF ExPEriEnCE varianCEs anD OPEratinG assumPtiOn ChanGEs (COntinuED)
Risk and Savings International
For the year ended 31 December 2009
Experience variances
£m
Operating assumption
changes£m
Total£m
Experience variances
£m
Operating assumption
changes£m
Total£m
Persistency (5) (42) (47) (2) (13) (15)
Mortality/morbidity (6) 114 108 13 26 39
Expenses (19) 60 41 (7) (12) (19)
Other 76 24 100 13 – 13
46 156 202 17 1 18
Risk and Savings persistency operating assumption changes relate to the strengthening of lapse assumptions for individual protection and unit linked bond policies; partially offset by improved persistency for with-profits products.
Risk and Savings mortality assumption changes relates to favourable annuitant mortality experience in 2009 which has been reflected in the latest three year average experience, and favourable individual protection mortality.
Risk and Savings expense assumption changes primarily reflects the £76m impact of the cost reductions delivered in 2009; partially offset by the impact of assumed higher future investment expenses of £(29)m. Other smaller items have a net positive impact of £13m. Expense experience variances include the impact of redundancy costs as a result of the cost reduction programme of £(17)m and exceptional project expenses and other items of £(8)m; partially offset by the impact of lower maintenance expenses than assumed of £6m.
Risk and Savings other experience variances include £44m reflecting a reassessment of future reserve releases as data is loaded onto the BPA system and £43m relating to one-off modelling improvements.
International mortality operating assumption changes primarily reflects improved claims ratios on group protection business in France, following positive experience in 2009.
5 invEstmEnt manaGEmEnt OPEratinG PrOFit2010
£m2009
£m
Pension funds (managed and segregated)1 148 128
Other non-pension2 20 16
Investment management services for internal funds3 11 –
total investment management operating profit 179 144
1. The managed pension funds business within Investment management has been reported on an IFRS basis as management believe IFRS to be the most appropriate reporting basis for the Investment management business.
2. Other non-pension includes institutional segregated mandates, private equity and property (both in the UK and overseas). The increase has been driven by non-pension segregated mandates.
3. Investment management services for internal funds excludes £27m (2009: £28m) of profits arising from the provision of investment management services at market referenced rates to the covered business. These are reported on a look through basis within the Risk and Savings covered business on an EEV basis.
6 intErnatiOnaL OPEratinG PrOFit2010
£m2009
£m
Europe
Netherlands 52 29
France1 (9) 37
total Europe operating profit 43 66
USA 129 109
Other2 (9) (5)
total international operating profit 163 170
1. The EEV operating loss in France reflects £26m of adverse operating assumption changes. These changes relate to Group risk morbidity, following higher claims experience in 2010, and also a reduction in the assumed future investment margin applied to the main savings product.
2. Other includes our joint venture operations in Egypt, the Gulf, India and business unit costs of £5m (2009: £4m) allocated to the International segment.
nOtEs tO thE suPPLEmEntary FinanCiaL statEmEnts (COntinuED)
205ANNUAL REPORT AND ACCOUNTS 2010suPPLEmEntary FinanCiaL statEmEnts
L&G_AR10_21-EEV_p195-216_230311_AT.indd 205 25/03/2011 11:30
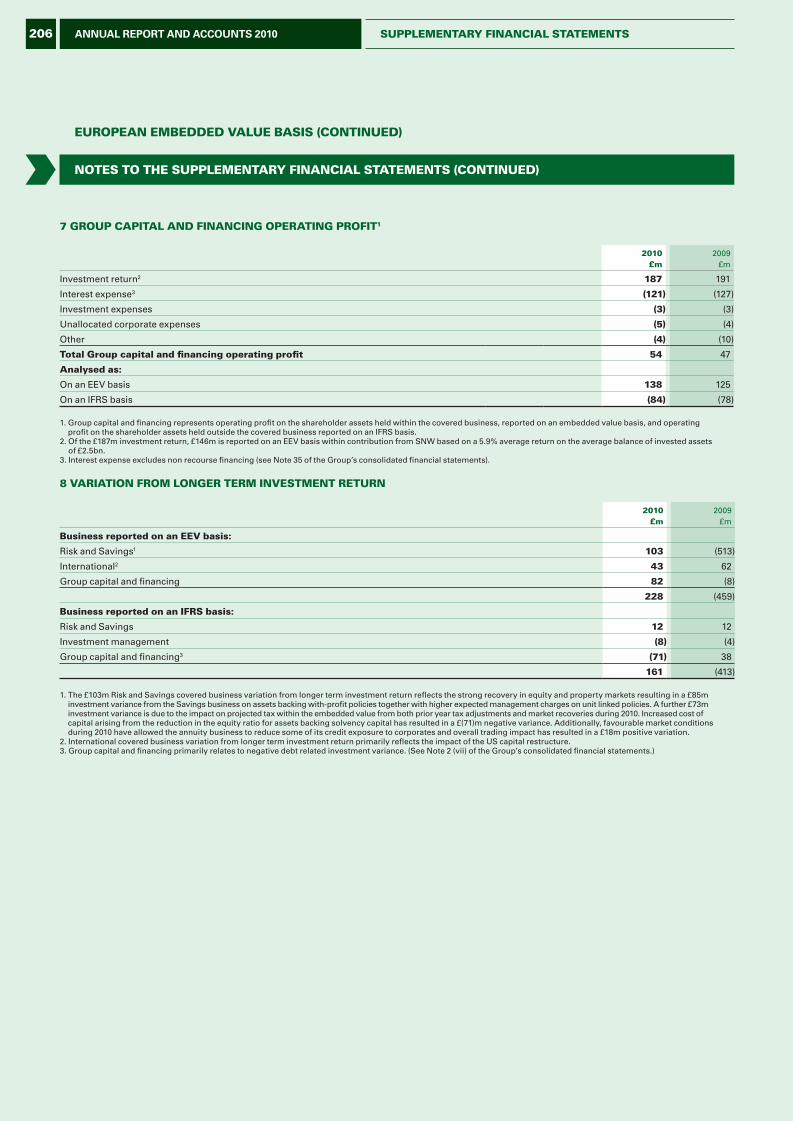
EurOPEan EmbEDDED vaLuE basis (COntinuED)
7 GrOuP CaPitaL anD FinanCinG OPEratinG PrOFit1
2010£m
2009£m
Investment return2 187 191
Interest expense3 (121) (127)
Investment expenses (3) (3)
Unallocated corporate expenses (5) (4)
Other (4) (10)
total Group capital and financing operating profit 54 47
analysed as:
On an EEV basis 138 125
On an IFRS basis (84) (78)
1. Group capital and financing represents operating profit on the shareholder assets held within the covered business, reported on an embedded value basis, and operating profit on the shareholder assets held outside the covered business reported on an IFRS basis.
2. Of the £187m investment return, £146m is reported on an EEV basis within contribution from SNW based on a 5.9% average return on the average balance of invested assets of £2.5bn.
3. Interest expense excludes non recourse financing (see Note 35 of the Group’s consolidated financial statements).
8 variatiOn FrOm LOnGEr tErm invEstmEnt rEturn
2010£m
2009£m
business reported on an EEv basis:
Risk and Savings1 103 (513)
International2 43 62
Group capital and financing 82 (8)
228 (459)
business reported on an iFrs basis:
Risk and Savings 12 12
Investment management (8) (4)
Group capital and financing3 (71) 38
161 (413)
1. The £103m Risk and Savings covered business variation from longer term investment return reflects the strong recovery in equity and property markets resulting in a £85m investment variance from the Savings business on assets backing with-profit policies together with higher expected management charges on unit linked policies. A further £73m investment variance is due to the impact on projected tax within the embedded value from both prior year tax adjustments and market recoveries during 2010. Increased cost of capital arising from the reduction in the equity ratio for assets backing solvency capital has resulted in a £(71)m negative variance. Additionally, favourable market conditions during 2010 have allowed the annuity business to reduce some of its credit exposure to corporates and overall trading impact has resulted in a £18m positive variation.
2. International covered business variation from longer term investment return primarily reflects the impact of the US capital restructure.3. Group capital and financing primarily relates to negative debt related investment variance. (See Note 2 (vii) of the Group’s consolidated financial statements.)
nOtEs tO thE suPPLEmEntary FinanCiaL statEmEnts (COntinuED)
206 ANNUAL REPORT AND ACCOUNTS 2010 suPPLEmEntary FinanCiaL statEmEnts
L&G_AR10_21-EEV_p195-216_230311_AT.indd 206 25/03/2011 11:30
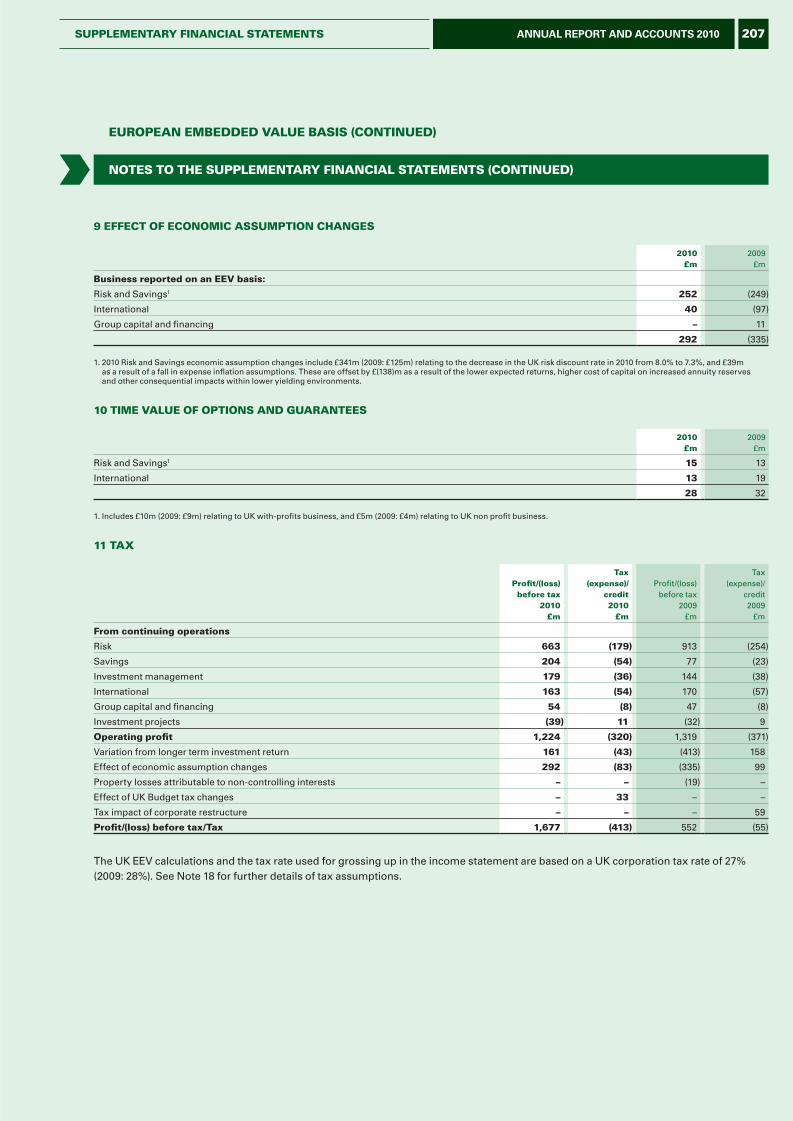
EurOPEan EmbEDDED vaLuE basis (COntinuED)
9 EFFECt OF ECOnOmiC assumPtiOn ChanGEs
2010£m
2009£m
business reported on an EEv basis:
Risk and Savings1 252 (249)
International 40 (97)
Group capital and financing – 11
292 (335)
1. 2010 Risk and Savings economic assumption changes include £341m (2009: £125m) relating to the decrease in the UK risk discount rate in 2010 from 8.0% to 7.3%, and £39m as a result of a fall in expense inflation assumptions. These are offset by £(138)m as a result of the lower expected returns, higher cost of capital on increased annuity reserves and other consequential impacts within lower yielding environments.
10 timE vaLuE OF OPtiOns anD GuarantEEs
2010£m
2009£m
Risk and Savings1 15 13
International 13 19
28 32
1. Includes £10m (2009: £9m) relating to UK with-profits business, and £5m (2009: £4m) relating to UK non profit business.
11 tax
Profit/(loss)before tax
2010£m
tax(expense)/
credit2010
£m
Profit/(loss)before tax
2009£m
Tax(expense)/
credit2009
£m
From continuing operations
Risk 663 (179) 913 (254)
Savings 204 (54) 77 (23)
Investment management 179 (36) 144 (38)
International 163 (54) 170 (57)
Group capital and financing 54 (8) 47 (8)
Investment projects (39) 11 (32) 9
Operating profit 1,224 (320) 1,319 (371)
Variation from longer term investment return 161 (43) (413) 158
Effect of economic assumption changes 292 (83) (335) 99
Property losses attributable to non-controlling interests – – (19) –
Effect of UK Budget tax changes – 33 – –
Tax impact of corporate restructure – – – 59
Profit/(loss) before tax/tax 1,677 (413) 552 (55)
The UK EEV calculations and the tax rate used for grossing up in the income statement are based on a UK corporation tax rate of 27% (2009: 28%). See Note 18 for further details of tax assumptions.
nOtEs tO thE suPPLEmEntary FinanCiaL statEmEnts (COntinuED)
207ANNUAL REPORT AND ACCOUNTS 2010suPPLEmEntary FinanCiaL statEmEnts
L&G_AR10_21-EEV_p195-216_230311_AT.indd 207 25/03/2011 11:30
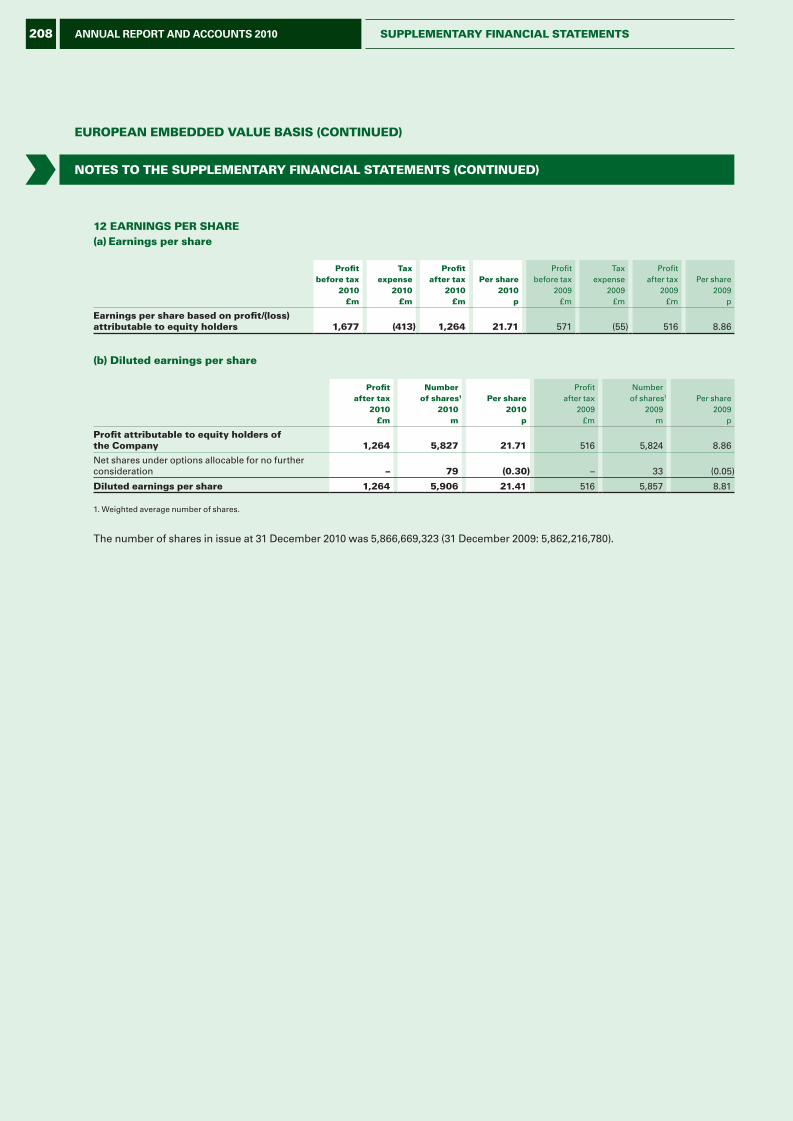
EurOPEan EmbEDDED vaLuE basis (COntinuED)
12 EarninGs PEr sharE(a) Earnings per share
Profitbefore tax
2010£m
taxexpense
2010£m
Profitafter tax
2010£m
Per share2010
p
Profitbefore tax
2009£m
Taxexpense
2009£m
Profitafter tax
2009£m
Per share2009
p
Earnings per share based on profit/(loss) attributable to equity holders 1,677 (413) 1,264 21.71 571 (55) 516 8.86
(b) Diluted earnings per share
Profitafter tax
2010£m
numberof shares1
2010m
Per share2010
p
Profitafter tax
2009£m
Numberof shares1
2009m
Per share2009
p
Profit attributable to equity holders of the Company 1,264 5,827 21.71 516 5,824 8.86
Net shares under options allocable for no further consideration – 79 (0.30) – 33 (0.05)
Diluted earnings per share 1,264 5,906 21.41 516 5,857 8.81
1. Weighted average number of shares.
The number of shares in issue at 31 December 2010 was 5,866,669,323 (31 December 2009: 5,862,216,780).
nOtEs tO thE suPPLEmEntary FinanCiaL statEmEnts (COntinuED)
208 ANNUAL REPORT AND ACCOUNTS 2010 suPPLEmEntary FinanCiaL statEmEnts
L&G_AR10_21-EEV_p195-216_230311_AT.indd 208 25/03/2011 11:30
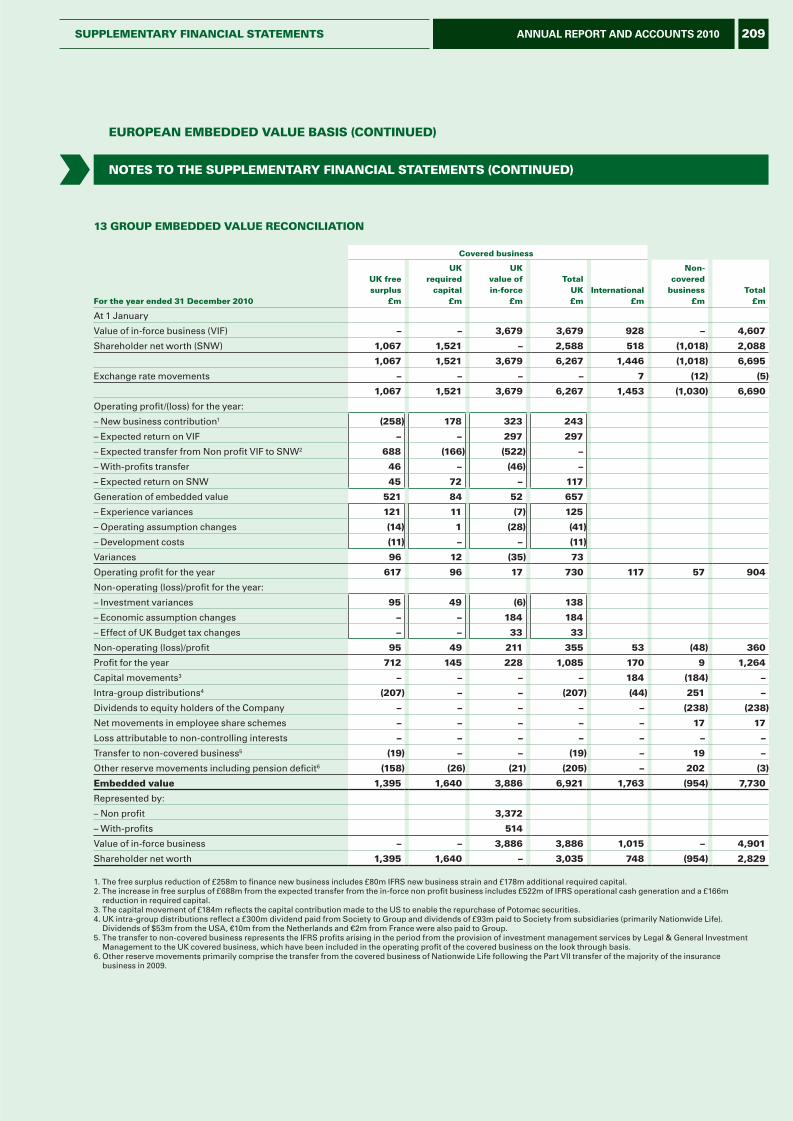
EurOPEan EmbEDDED vaLuE basis (COntinuED)
13 GrOuP EmbEDDED vaLuE rECOnCiLiatiOn
Covered business
For the year ended 31 December 2010
uK freesurplus
£m
uKrequired
capital£m
uKvalue ofin-force
£m
totaluK£m
international£m
non-covered
business£m
total £m
At 1 January
Value of in-force business (VIF) – – 3,679 3,679 928 – 4,607
Shareholder net worth (SNW) 1,067 1,521 – 2,588 518 (1,018) 2,088
1,067 1,521 3,679 6,267 1,446 (1,018) 6,695
Exchange rate movements – – – – 7 (12) (5)
1,067 1,521 3,679 6,267 1,453 (1,030) 6,690
Operating profit/(loss) for the year:
– New business contribution1 (258) 178 323 243
– Expected return on VIF – – 297 297
– Expected transfer from Non profit VIF to SNW2 688 (166) (522) –
– With-profits transfer 46 – (46) –
– Expected return on SNW 45 72 – 117
Generation of embedded value 521 84 52 657
– Experience variances 121 11 (7) 125
– Operating assumption changes (14) 1 (28) (41)
– Development costs (11) – – (11)
Variances 96 12 (35) 73
Operating profit for the year 617 96 17 730 117 57 904
Non-operating (loss)/profit for the year:
– Investment variances 95 49 (6) 138
– Economic assumption changes – – 184 184
– Effect of UK Budget tax changes – – 33 33
Non-operating (loss)/profit 95 49 211 355 53 (48) 360
Profit for the year 712 145 228 1,085 170 9 1,264
Capital movements3 – – – – 184 (184) –
Intra-group distributions4 (207) – – (207) (44) 251 –
Dividends to equity holders of the Company – – – – – (238) (238)
Net movements in employee share schemes – – – – – 17 17
Loss attributable to non-controlling interests – – – – – – –
Transfer to non-covered business5 (19) – – (19) – 19 –
Other reserve movements including pension deficit6 (158) (26) (21) (205) – 202 (3)
Embedded value 1,395 1,640 3,886 6,921 1,763 (954) 7,730
Represented by:
– Non profit 3,372
– With-profits 514
Value of in-force business – – 3,886 3,886 1,015 – 4,901
Shareholder net worth 1,395 1,640 – 3,035 748 (954) 2,829
1. The free surplus reduction of £258m to finance new business includes £80m IFRS new business strain and £178m additional required capital. 2. The increase in free surplus of £688m from the expected transfer from the in-force non profit business includes £522m of IFRS operational cash generation and a £166m
reduction in required capital. 3. The capital movement of £184m reflects the capital contribution made to the US to enable the repurchase of Potomac securities.4. UK intra-group distributions reflect a £300m dividend paid from Society to Group and dividends of £93m paid to Society from subsidiaries (primarily Nationwide Life).
Dividends of $53m from the USA, €10m from the Netherlands and €2m from France were also paid to Group.5. The transfer to non-covered business represents the IFRS profits arising in the period from the provision of investment management services by Legal & General Investment
Management to the UK covered business, which have been included in the operating profit of the covered business on the look through basis.6. Other reserve movements primarily comprise the transfer from the covered business of Nationwide Life following the Part VII transfer of the majority of the insurance
business in 2009.
nOtEs tO thE suPPLEmEntary FinanCiaL statEmEnts (COntinuED)
209ANNUAL REPORT AND ACCOUNTS 2010suPPLEmEntary FinanCiaL statEmEnts
L&G_AR10_21-EEV_p195-216_230311_AT.indd 209 25/03/2011 11:30
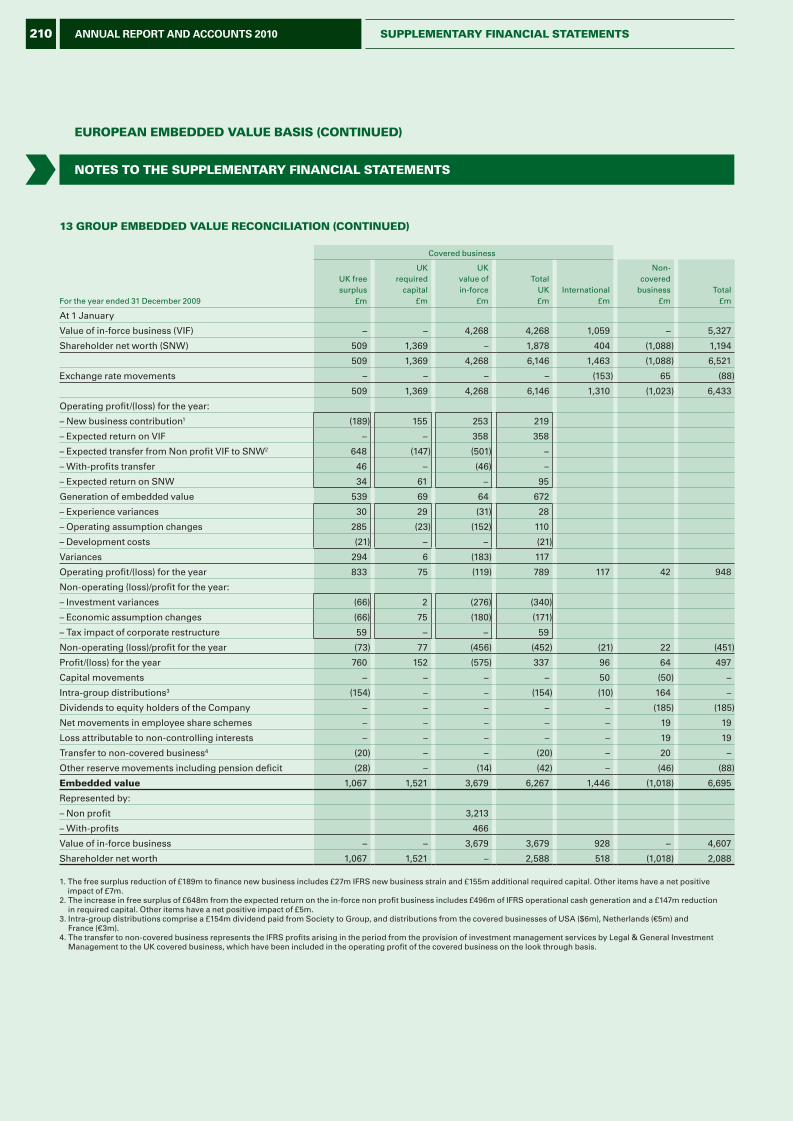
EurOPEan EmbEDDED vaLuE basis (COntinuED)
13 GrOuP EmbEDDED vaLuE rECOnCiLiatiOn (COntinuED)
Covered business
For the year ended 31 December 2009
UK freesurplus
£m
UKrequired
capital£m
UKvalue ofin-force
£m
TotalUK£m
International£m
Non- covered
business£m
Total £m
At 1 January
Value of in-force business (VIF) – – 4,268 4,268 1,059 – 5,327
Shareholder net worth (SNW) 509 1,369 – 1,878 404 (1,088) 1,194
509 1,369 4,268 6,146 1,463 (1,088) 6,521
Exchange rate movements – – – – (153) 65 (88)
509 1,369 4,268 6,146 1,310 (1,023) 6,433
Operating profit/(loss) for the year:
– New business contribution1 (189) 155 253 219
– Expected return on VIF – – 358 358
– Expected transfer from Non profit VIF to SNW2 648 (147) (501) –
– With-profits transfer 46 – (46) –
– Expected return on SNW 34 61 – 95
Generation of embedded value 539 69 64 672
– Experience variances 30 29 (31) 28
– Operating assumption changes 285 (23) (152) 110
– Development costs (21) – – (21)
Variances 294 6 (183) 117
Operating profit/(loss) for the year 833 75 (119) 789 117 42 948
Non-operating (loss)/profit for the year:
– Investment variances (66) 2 (276) (340)
– Economic assumption changes (66) 75 (180) (171)
– Tax impact of corporate restructure 59 – – 59
Non-operating (loss)/profit for the year (73) 77 (456) (452) (21) 22 (451)
Profit/(loss) for the year 760 152 (575) 337 96 64 497
Capital movements – – – – 50 (50) –
Intra-group distributions3 (154) – – (154) (10) 164 –
Dividends to equity holders of the Company – – – – – (185) (185)
Net movements in employee share schemes – – – – – 19 19
Loss attributable to non-controlling interests – – – – – 19 19
Transfer to non-covered business4 (20) – – (20) – 20 –
Other reserve movements including pension deficit (28) – (14) (42) – (46) (88)
Embedded value 1,067 1,521 3,679 6,267 1,446 (1,018) 6,695
Represented by:
– Non profit 3,213
– With-profits 466
Value of in-force business – – 3,679 3,679 928 – 4,607
Shareholder net worth 1,067 1,521 – 2,588 518 (1,018) 2,088
1. The free surplus reduction of £189m to finance new business includes £27m IFRS new business strain and £155m additional required capital. Other items have a net positive impact of £7m.
2. The increase in free surplus of £648m from the expected return on the in-force non profit business includes £496m of IFRS operational cash generation and a £147m reduction in required capital. Other items have a net positive impact of £5m.
3. Intra-group distributions comprise a £154m dividend paid from Society to Group, and distributions from the covered businesses of USA ($6m), Netherlands (€5m) and France (€3m).
4. The transfer to non-covered business represents the IFRS profits arising in the period from the provision of investment management services by Legal & General Investment Management to the UK covered business, which have been included in the operating profit of the covered business on the look through basis.
nOtEs tO thE suPPLEmEntary FinanCiaL statEmEnts
210 ANNUAL REPORT AND ACCOUNTS 2010 suPPLEmEntary FinanCiaL statEmEnts
L&G_AR10_21-EEV_p195-216_230311_AT.indd 210 25/03/2011 11:30
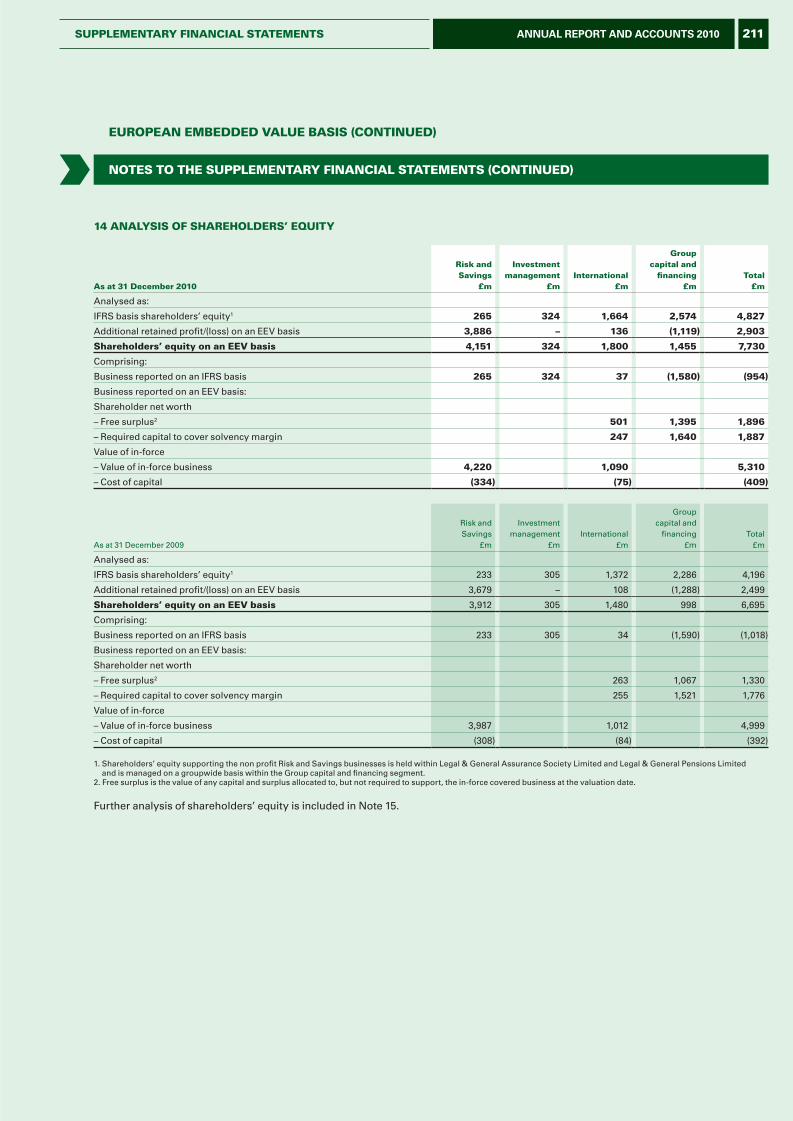
EurOPEan EmbEDDED vaLuE basis (COntinuED)
14 anaLysis OF sharEhOLDErs’ Equity
as at 31 December 2010
risk and savings
£m
investmentmanagement
£m international
£m
Groupcapital and
financing£m
total £m
Analysed as:
IFRS basis shareholders’ equity1 265 324 1,664 2,574 4,827
Additional retained profit/(loss) on an EEV basis 3,886 – 136 (1,119) 2,903
shareholders’ equity on an EEv basis 4,151 324 1,800 1,455 7,730
Comprising:
Business reported on an IFRS basis 265 324 37 (1,580) (954)
Business reported on an EEV basis:
Shareholder net worth
– Free surplus2 501 1,395 1,896
– Required capital to cover solvency margin 247 1,640 1,887
Value of in-force
– Value of in-force business 4,220 1,090 5,310
– Cost of capital (334) (75) (409)
As at 31 December 2009
Risk andSavings
£m
Investmentmanagement
£m International
£m
Groupcapital and
financing£m
Total £m
Analysed as:
IFRS basis shareholders’ equity1 233 305 1,372 2,286 4,196
Additional retained profit/(loss) on an EEV basis 3,679 – 108 (1,288) 2,499
shareholders’ equity on an EEv basis 3,912 305 1,480 998 6,695
Comprising:
Business reported on an IFRS basis 233 305 34 (1,590) (1,018)
Business reported on an EEV basis:
Shareholder net worth
– Free surplus2 263 1,067 1,330
– Required capital to cover solvency margin 255 1,521 1,776
Value of in-force
– Value of in-force business 3,987 1,012 4,999
– Cost of capital (308) (84) (392)
1. Shareholders’ equity supporting the non profit Risk and Savings businesses is held within Legal & General Assurance Society Limited and Legal & General Pensions Limited and is managed on a groupwide basis within the Group capital and financing segment.
2. Free surplus is the value of any capital and surplus allocated to, but not required to support, the in-force covered business at the valuation date.
Further analysis of shareholders’ equity is included in Note 15.
nOtEs tO thE suPPLEmEntary FinanCiaL statEmEnts (COntinuED)
211ANNUAL REPORT AND ACCOUNTS 2010suPPLEmEntary FinanCiaL statEmEnts
L&G_AR10_21-EEV_p195-216_230311_AT.indd 211 25/03/2011 11:30
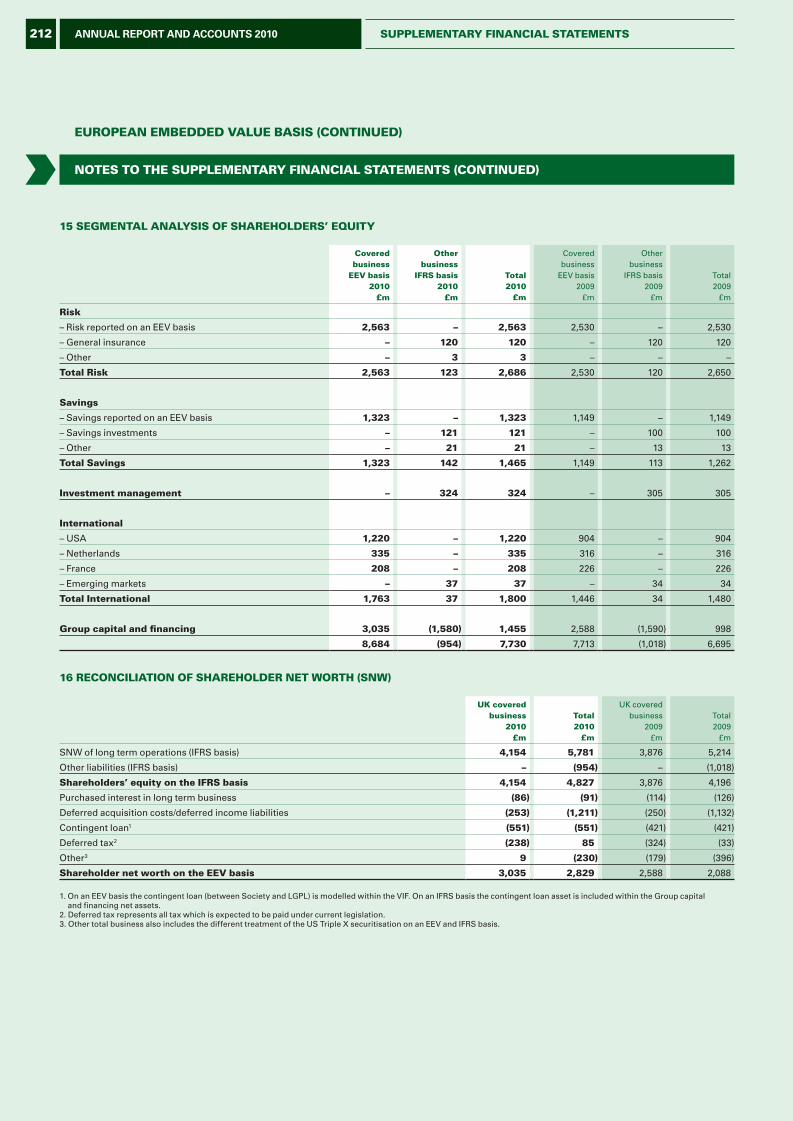
EurOPEan EmbEDDED vaLuE basis (COntinuED)
15 sEGmEntaL anaLysis OF sharEhOLDErs’ Equity
Coveredbusiness
EEv basis2010
£m
Otherbusiness
iFrs basis2010
£m
total2010
£m
Coveredbusiness
EEV basis2009
£m
Otherbusiness
IFRS basis2009
£m
Total2009
£m
risk
– Risk reported on an EEV basis 2,563 – 2,563 2,530 – 2,530
– General insurance – 120 120 – 120 120
– Other – 3 3 – – –
total risk 2,563 123 2,686 2,530 120 2,650
savings
– Savings reported on an EEV basis 1,323 – 1,323 1,149 – 1,149
– Savings investments – 121 121 – 100 100
– Other – 21 21 – 13 13
total savings 1,323 142 1,465 1,149 113 1,262
investment management – 324 324 – 305 305
international
– USA 1,220 – 1,220 904 – 904
– Netherlands 335 – 335 316 – 316
– France 208 – 208 226 – 226
– Emerging markets – 37 37 – 34 34
total international 1,763 37 1,800 1,446 34 1,480
Group capital and financing 3,035 (1,580) 1,455 2,588 (1,590) 998
8,684 (954) 7,730 7,713 (1,018) 6,695
16 rECOnCiLiatiOn OF sharEhOLDEr nEt wOrth (snw)
uK coveredbusiness
2010£m
total2010
£m
UK coveredbusiness
2009£m
Total 2009
£m
SNW of long term operations (IFRS basis) 4,154 5,781 3,876 5,214
Other liabilities (IFRS basis) – (954) – (1,018)
shareholders’ equity on the iFrs basis 4,154 4,827 3,876 4,196
Purchased interest in long term business (86) (91) (114) (126)
Deferred acquisition costs/deferred income liabilities (253) (1,211) (250) (1,132)
Contingent loan1 (551) (551) (421) (421)
Deferred tax2 (238) 85 (324) (33)
Other3 9 (230) (179) (396)
shareholder net worth on the EEv basis 3,035 2,829 2,588 2,088
1. On an EEV basis the contingent loan (between Society and LGPL) is modelled within the VIF. On an IFRS basis the contingent loan asset is included within the Group capital and financing net assets.
2. Deferred tax represents all tax which is expected to be paid under current legislation.3. Other total business also includes the different treatment of the US Triple X securitisation on an EEV and IFRS basis.
nOtEs tO thE suPPLEmEntary FinanCiaL statEmEnts (COntinuED)
212 ANNUAL REPORT AND ACCOUNTS 2010 suPPLEmEntary FinanCiaL statEmEnts
L&G_AR10_21-EEV_p195-216_230311_AT.indd 212 25/03/2011 11:30
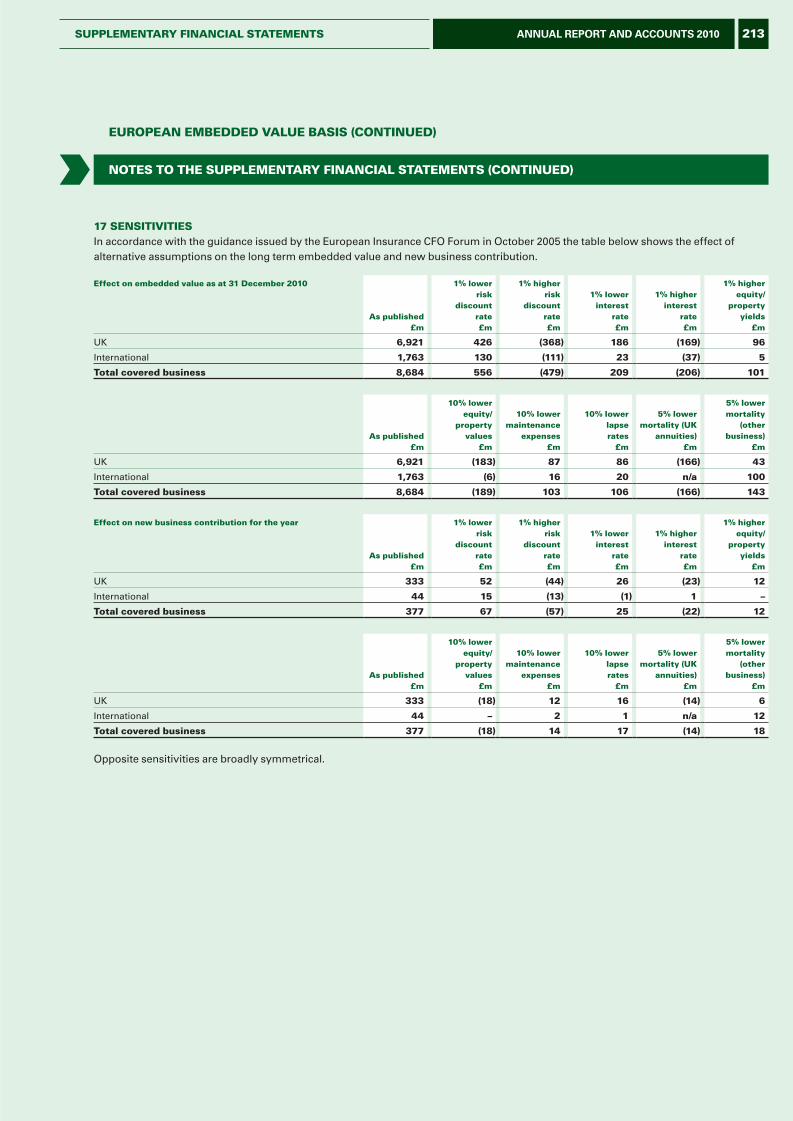
EurOPEan EmbEDDED vaLuE basis (COntinuED)
nOtEs tO thE suPPLEmEntary FinanCiaL statEmEnts (COntinuED)
17 sEnsitivitiEsIn accordance with the guidance issued by the European Insurance CFO Forum in October 2005 the table below shows the effect of alternative assumptions on the long term embedded value and new business contribution.
Effect on embedded value as at 31 December 2010
as published £m
1% lower risk
discount rate £m
1% higher risk
discount rate £m
1% lowerinterest
rate£m
1% higherinterest
rate£m
1% higher equity/
property yields
£m
UK 6,921 426 (368) 186 (169) 96
International 1,763 130 (111) 23 (37) 5
total covered business 8,684 556 (479) 209 (206) 101
as published £m
10% lower equity/
property values
£m
10% lowermaintenance
expenses£m
10% lower lapserates
£m
5% lower mortality (uK
annuities)£m
5% lower mortality
(otherbusiness)
£m
UK 6,921 (183) 87 86 (166) 43
International 1,763 (6) 16 20 n/a 100
total covered business 8,684 (189) 103 106 (166) 143
Effect on new business contribution for the year
as published £m
1% lower risk
discount rate £m
1% higher risk
discount rate £m
1% lowerinterest
rate£m
1% higherinterest
rate£m
1% higher equity/
property yields
£m
UK 333 52 (44) 26 (23) 12
International 44 15 (13) (1) 1 –
total covered business 377 67 (57) 25 (22) 12
as published £m
10% lower equity/
property values
£m
10% lowermaintenance
expenses£m
10% lower lapse rates
£m
5% lower mortality (uK
annuities)£m
5% lower mortality
(otherbusiness)
£m
UK 333 (18) 12 16 (14) 6
International 44 – 2 1 n/a 12
total covered business 377 (18) 14 17 (14) 18
Opposite sensitivities are broadly symmetrical.
213ANNUAL REPORT AND ACCOUNTS 2010suPPLEmEntary FinanCiaL statEmEnts
L&G_AR10_21-EEV_p195-216_230311_AT.indd 213 25/03/2011 11:30
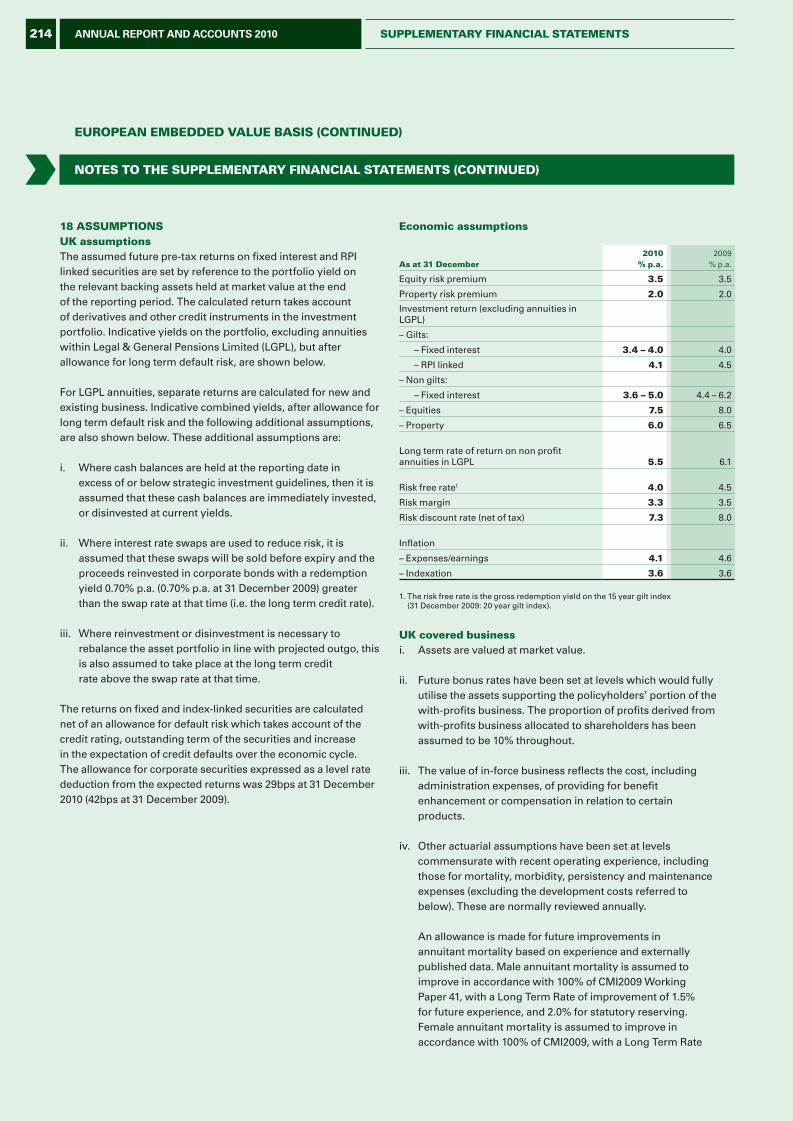
EurOPEan EmbEDDED vaLuE basis (COntinuED)
nOtEs tO thE suPPLEmEntary FinanCiaL statEmEnts (COntinuED)
18 assumPtiOnsuK assumptions The assumed future pre-tax returns on fixed interest and RPI linked securities are set by reference to the portfolio yield on the relevant backing assets held at market value at the end of the reporting period. The calculated return takes account of derivatives and other credit instruments in the investment portfolio. Indicative yields on the portfolio, excluding annuities within Legal & General Pensions Limited (LGPL), but after allowance for long term default risk, are shown below.
For LGPL annuities, separate returns are calculated for new and existing business. Indicative combined yields, after allowance for long term default risk and the following additional assumptions, are also shown below. These additional assumptions are:
i. Where cash balances are held at the reporting date in excess of or below strategic investment guidelines, then it is assumed that these cash balances are immediately invested, or disinvested at current yields.
ii. Where interest rate swaps are used to reduce risk, it is assumed that these swaps will be sold before expiry and the proceeds reinvested in corporate bonds with a redemption yield 0.70% p.a. (0.70% p.a. at 31 December 2009) greater than the swap rate at that time (i.e. the long term credit rate).
iii. Where reinvestment or disinvestment is necessary to rebalance the asset portfolio in line with projected outgo, this is also assumed to take place at the long term credit rate above the swap rate at that time.
The returns on fixed and index-linked securities are calculated net of an allowance for default risk which takes account of the credit rating, outstanding term of the securities and increase in the expectation of credit defaults over the economic cycle. The allowance for corporate securities expressed as a level rate deduction from the expected returns was 29bps at 31 December 2010 (42bps at 31 December 2009).
Economic assumptions
as at 31 December 2010
% p.a.2009
% p.a.
Equity risk premium 3.5 3.5
Property risk premium 2.0 2.0
Investment return (excluding annuities in LGPL)
– Gilts:
– Fixed interest 3.4 – 4.0 4.0
– RPI linked 4.1 4.5
– Non gilts:
– Fixed interest 3.6 – 5.0 4.4 – 6.2
– Equities 7.5 8.0
– Property 6.0 6.5
Long term rate of return on non profit annuities in LGPL 5.5 6.1
Risk free rate1 4.0 4.5
Risk margin 3.3 3.5
Risk discount rate (net of tax) 7.3 8.0
Inflation
– Expenses/earnings 4.1 4.6
– Indexation 3.6 3.6
1. The risk free rate is the gross redemption yield on the 15 year gilt index (31 December 2009: 20 year gilt index).
uK covered businessi. Assets are valued at market value.
ii. Future bonus rates have been set at levels which would fully utilise the assets supporting the policyholders’ portion of the with-profits business. The proportion of profits derived from with-profits business allocated to shareholders has been assumed to be 10% throughout.
iii. The value of in-force business reflects the cost, including administration expenses, of providing for benefit enhancement or compensation in relation to certain products.
iv. Other actuarial assumptions have been set at levels commensurate with recent operating experience, including those for mortality, morbidity, persistency and maintenance expenses (excluding the development costs referred to below). These are normally reviewed annually.
An allowance is made for future improvements in annuitant mortality based on experience and externally published data. Male annuitant mortality is assumed to improve in accordance with 100% of CMI2009 Working Paper 41, with a Long Term Rate of improvement of 1.5% for future experience, and 2.0% for statutory reserving. Female annuitant mortality is assumed to improve in accordance with 100% of CMI2009, with a Long Term Rate
214 ANNUAL REPORT AND ACCOUNTS 2010 suPPLEmEntary FinanCiaL statEmEnts
L&G_AR10_21-EEV_p195-216_230311_AT.indd 214 25/03/2011 11:30
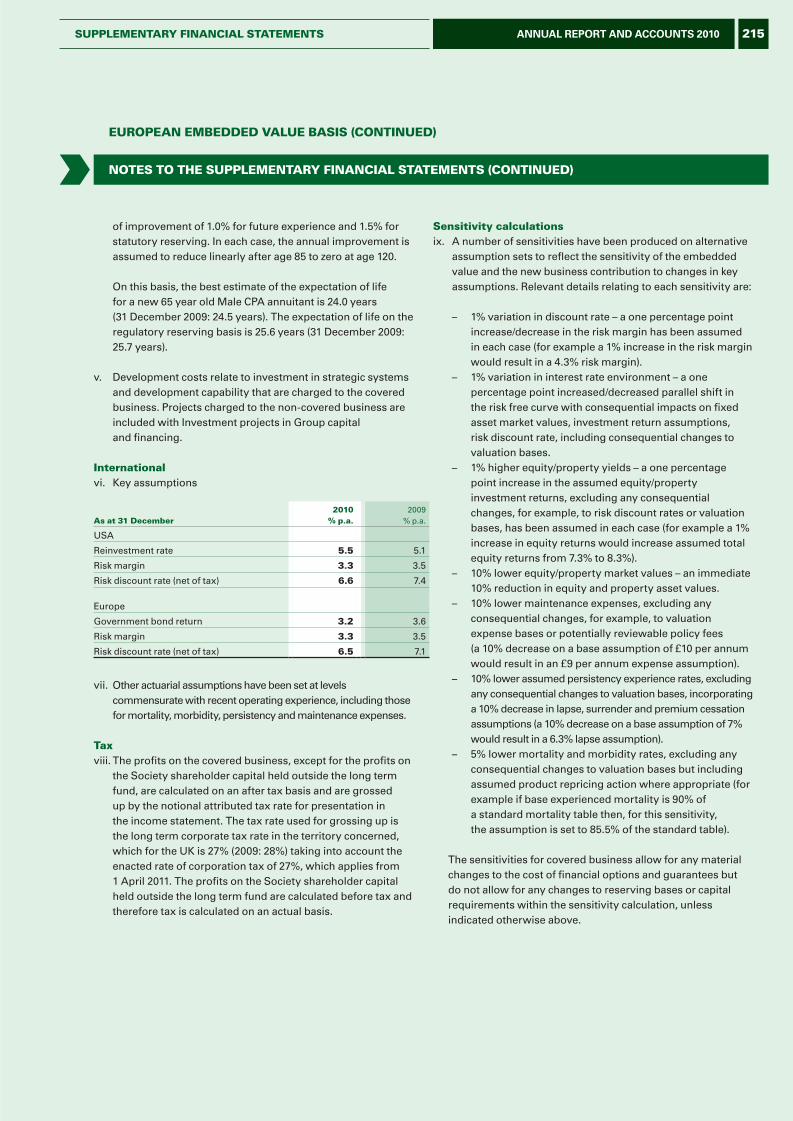
EurOPEan EmbEDDED vaLuE basis (COntinuED)
nOtEs tO thE suPPLEmEntary FinanCiaL statEmEnts (COntinuED)
of improvement of 1.0% for future experience and 1.5% for statutory reserving. In each case, the annual improvement is assumed to reduce linearly after age 85 to zero at age 120.
On this basis, the best estimate of the expectation of life for a new 65 year old Male CPA annuitant is 24.0 years (31 December 2009: 24.5 years). The expectation of life on the regulatory reserving basis is 25.6 years (31 December 2009: 25.7 years).
v. Development costs relate to investment in strategic systems and development capability that are charged to the covered business. Projects charged to the non-covered business are included with Investment projects in Group capital and financing.
internationalvi. Key assumptions
as at 31 December2010
% p.a.2009
% p.a.
USA
Reinvestment rate 5.5 5.1
Risk margin 3.3 3.5
Risk discount rate (net of tax) 6.6 7.4
Europe
Government bond return 3.2 3.6
Risk margin 3.3 3.5
Risk discount rate (net of tax) 6.5 7.1
vii. Other actuarial assumptions have been set at levels commensurate with recent operating experience, including those for mortality, morbidity, persistency and maintenance expenses.
taxviii. The profits on the covered business, except for the profits on
the Society shareholder capital held outside the long term fund, are calculated on an after tax basis and are grossed up by the notional attributed tax rate for presentation in the income statement. The tax rate used for grossing up is the long term corporate tax rate in the territory concerned, which for the UK is 27% (2009: 28%) taking into account the enacted rate of corporation tax of 27%, which applies from 1 April 2011. The profits on the Society shareholder capital held outside the long term fund are calculated before tax and therefore tax is calculated on an actual basis.
sensitivity calculationsix. A number of sensitivities have been produced on alternative
assumption sets to reflect the sensitivity of the embedded value and the new business contribution to changes in key assumptions. Relevant details relating to each sensitivity are:
– 1% variation in discount rate – a one percentage point increase/decrease in the risk margin has been assumed in each case (for example a 1% increase in the risk margin would result in a 4.3% risk margin).
– 1% variation in interest rate environment – a one percentage point increased/decreased parallel shift in the risk free curve with consequential impacts on fixed asset market values, investment return assumptions, risk discount rate, including consequential changes to valuation bases.
– 1% higher equity/property yields – a one percentage point increase in the assumed equity/property investment returns, excluding any consequential changes, for example, to risk discount rates or valuation bases, has been assumed in each case (for example a 1% increase in equity returns would increase assumed total equity returns from 7.3% to 8.3%).
– 10% lower equity/property market values – an immediate 10% reduction in equity and property asset values.
– 10% lower maintenance expenses, excluding any consequential changes, for example, to valuation expense bases or potentially reviewable policy fees (a 10% decrease on a base assumption of £10 per annum would result in an £9 per annum expense assumption).
– 10% lower assumed persistency experience rates, excluding any consequential changes to valuation bases, incorporating a 10% decrease in lapse, surrender and premium cessation assumptions (a 10% decrease on a base assumption of 7% would result in a 6.3% lapse assumption).
– 5% lower mortality and morbidity rates, excluding any consequential changes to valuation bases but including assumed product repricing action where appropriate (for example if base experienced mortality is 90% of a standard mortality table then, for this sensitivity, the assumption is set to 85.5% of the standard table).
The sensitivities for covered business allow for any material changes to the cost of financial options and guarantees but do not allow for any changes to reserving bases or capital requirements within the sensitivity calculation, unless indicated otherwise above.
215ANNUAL REPORT AND ACCOUNTS 2010suPPLEmEntary FinanCiaL statEmEnts
L&G_AR10_21-EEV_p195-216_230311_AT.indd 215 25/03/2011 11:30
EurOPEan EmbEDDED vaLuE basis (COntinuED)
inDEPEnDEnt auDitOrs’ rEPOrt
To the Directors of Legal & General Group Plc on the Supplementary Financial Statements
We have audited the Supplementary Financial Statements – European Embedded Value Basis of Legal & General Group Plc for the year ended 31 December 2010 which comprise the Consolidated Income Statement – European Embedded Value Basis, Consolidated Statement of Comprehensive Income – European Embedded Value Basis, Consolidated Balance Sheet – European Embedded Value Basis and the related notes (‘the supplementary financial statements’) which have been prepared in accordance with the European Embedded Value (‘EEV’) basis set out in Note 1 – Basis of Preparation and which should be read in conjunction with the Group’s financial statements.
respective responsibilities of directors and auditors The directors are responsible for preparing the supplementary financial statements on the EEV basis in accordance with the EEV basis set out in Note 1 – Basis of Preparation. Our responsibility, as set out in our letter of engagement agreed with you dated 15 November 2010 is to audit and express an opinion on the supplementary financial statements in accordance with applicable law and International Standards on Auditing (UK and Ireland). Those standards require us to comply with the Auditing Practices Board’s Ethical Standards for Auditors. This report, including the opinion, has been prepared for and only for the Company’s directors as a body in accordance with our letter of engagement dated 15 November 2010 and for no other purpose. We do not, in giving this opinion, accept or assume responsibility for any other purpose or to any other person to whom this report is shown or into whose hands it may come save where expressly agreed by our prior consent in writing.
scope of the audit of the supplementary financial statements An audit involves obtaining evidence about the amounts and disclosures in the supplementary financial statements sufficient to give reasonable assurance that the supplementary financial statements are free from material misstatement, whether caused by fraud or error. This includes an assessment of: whether the accounting policies are appropriate to the Group’s circumstances and have been consistently applied and adequately disclosed; the reasonableness of significant accounting estimates made by the directors; and the overall presentation of the supplementary financial statements.
Opinion on the supplementary financial statementsIn our opinion, the supplementary financial statements for the year ended 31 December 2010 have been properly prepared in all material respects in accordance with the European Embedded Value basis set out in Note 1 – Basis of Preparation.
PricewaterhouseCoopers LLPChartered AccountantsLondon16 March 2011
Notes:(a) The financial statements are published on the website of Legal & General Group
Plc, legalandgeneralgroup.com. The maintenance and integrity of the Legal & General Group Plc website is the responsibility of the directors; the work carried out by the auditors does not involve consideration of these matters and, accordingly, the auditors accept no responsibility for any changes that may have occurred to the financial statements since they were initially presented on the website.
(b) Legislation in the United Kingdom governing the preparation and dissemination of financial statements may differ from legislation in other jurisdictions.
216 ANNUAL REPORT AND ACCOUNTS 2010 suPPLEmEntary FinanCiaL statEmEnts
L&G_AR10_21-EEV_p195-216_230311_AT.indd 216 25/03/2011 11:30
Independent AudItors’ report
We have audited the parent company financial statements of Legal & General Group Plc for the year ended 31 December 2010 which comprise the Company Balance Sheet, the Company Statement of Total Recognised Gains and Losses, the Company Reconciliation of Movements in Total Shareholders’ Funds and the related notes. The financial reporting framework that has been applied in their preparation is applicable law and United Kingdom Accounting Standards (United Kingdom Generally Accepted Accounting Practice).
respective responsibilities of directors and auditorsAs explained more fully in the Statement of Directors’ Responsibilities, the directors are responsible for the preparation of the parent company financial statements and for being satisfied that they give a true and fair view. Our responsibility is to audit and express an opinion on the parent company financial statements in accordance with applicable law and International Standards on Auditing (UK and Ireland). Those standards require us to comply with the Auditing Practices Board’s Ethical Standards for Auditors.
This report, including the opinions, has been prepared for and only for the company’s members as a body in accordance with Chapter 3 of Part 16 of the Companies Act 2006 and for no other purpose. We do not, in giving these opinions, accept or assume responsibility for any other purpose or to any other person to whom this report is shown or into whose hands it may come save where expressly agreed by our prior consent in writing.
scope of the audit of the financial statementsAn audit involves obtaining evidence about the amounts and disclosures in the financial statements sufficient to give reasonable assurance that the financial statements are free from material misstatement, whether caused by fraud or error. This includes an assessment of: whether the accounting policies are appropriate to the parent company’s circumstances and have been consistently applied and adequately disclosed; the reasonableness of significant accounting estimates made by the directors; and the overall presentation of the financial statements.
opinion on financial statementsIn our opinion the parent company financial statements:
• give a true and fair view of the state of the company’s affairs as at 31 December 2010;
• have been properly prepared in accordance with the United Kingdom Generally Accepted Accounting Practice; and
• have been prepared in accordance with the requirements of the Companies Act 2006.
opinion on other matters prescribed by the Companies Act 2006In our opinion:
• the part of the Directors’ Report on Remuneration to be audited has been properly prepared in accordance with the Companies Act 2006; and
• the information given in the Directors’ Report for the financial year for which the parent company financial statements are prepared is consistent with the parent company financial statements.
Matters on which we are required to report by exceptionWe have nothing to report in respect of the following matters where the Companies Act 2006 requires us to report to you if, in our opinion:
• adequate accounting records have not been kept by the parent company, or returns adequate for our audit have not been received from branches not visited by us; or
• the parent company financial statements and the part of the Directors’ Report on Remuneration to be audited are not in agreement with the accounting records and returns; or
• certain disclosures of directors’ remuneration specified by law are not made; or
• we have not received all the information and explanations we require for our audit.
other mattersWe have reported separately on the group financial statements of Legal & General Group Plc for the year ended 31 December 2010.
richard Keers (senior statutory Auditor)For and on behalf of PricewaterhouseCoopers LLPChartered Accountants and Statutory AuditorsLondon 16 March 2011
(a) The financial statements are published on the website of Legal & General Group Plc, legalandgeneralgroup.com. The maintenance and integrity of the Legal & General Group Plc website is the responsibility of the directors; the work carried out by the auditors does not involve consideration of these matters and, accordingly, the auditors accept no responsibility for any changes that may have occurred to the financial statements since they were initially presented on the website.
(b) Legislation in the United Kingdom governing the preparation and dissemination of financial statements may differ from legislation in other jurisdictions.
To the Members of Legal & General Group Plc
217ANNUAL REPORT AND ACCOUNTS 2010CoMpAnY FInAnCIAL stAteMents
L&G_AR10_22-GroupPlc_p217-227_230311_AT.indd 217 25/03/2011 11:30
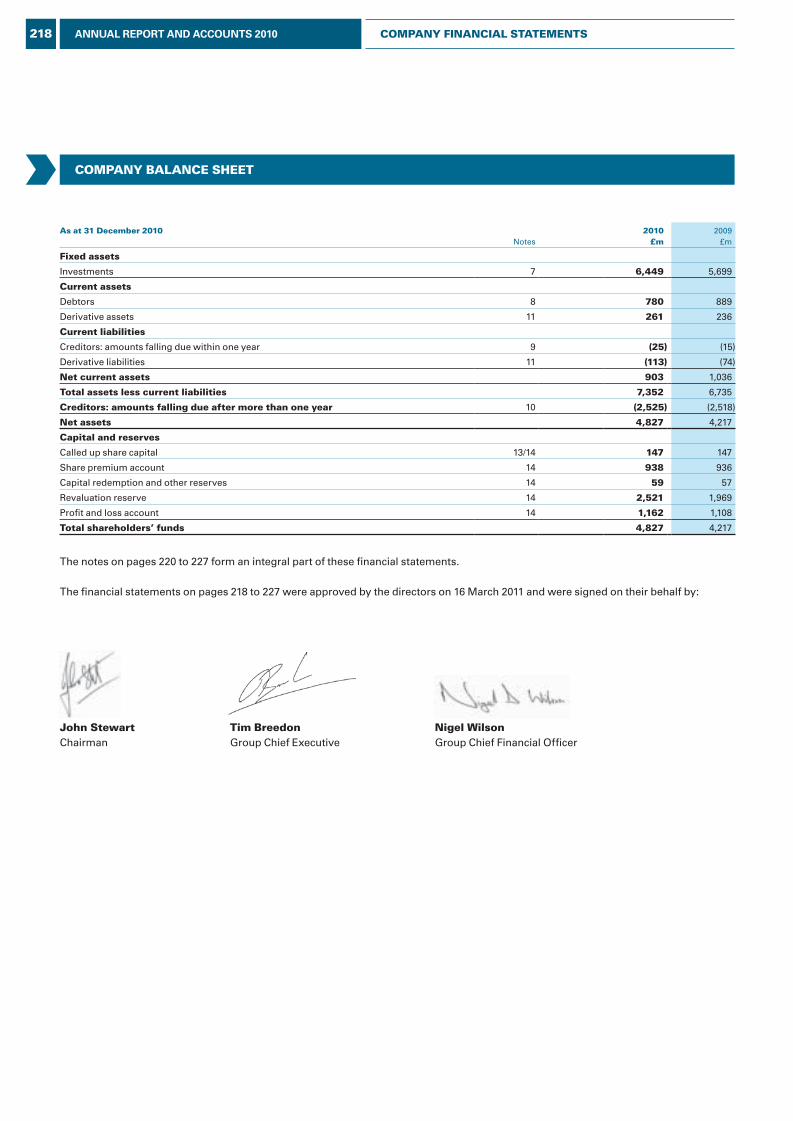
CoMpAnY BALAnCe sheet
As at 31 december 2010Notes
2010£m
2009£m
Fixed assets
Investments 7 6,449 5,699
Current assets
Debtors 8 780 889
Derivative assets 11 261 236
Current liabilities
Creditors: amounts falling due within one year 9 (25) (15)
Derivative liabilities 11 (113) (74)
net current assets 903 1,036
total assets less current liabilities 7,352 6,735
Creditors: amounts falling due after more than one year 10 (2,525) (2,518)
net assets 4,827 4,217
Capital and reserves
Called up share capital 13/14 147 147
Share premium account 14 938 936
Capital redemption and other reserves 14 59 57
Revaluation reserve 14 2,521 1,969
Profi t and loss account 14 1,162 1,108
total shareholders’ funds 4,827 4,217
The notes on pages 220 to 227 form an integral part of these fi nancial statements.
The fi nancial statements on pages 218 to 227 were approved by the directors on 16 March 2011 and were signed on their behalf by:
John stewart tim Breedon nigel WilsonChairman Group Chief Executive Group Chief Financial Offi cer
218 ANNUAL REPORT AND ACCOUNTS 2010 CoMpAnY FInAnCIAL stAteMents
L&G_AR10_22-GroupPlc_p217-227_230311_AT.indd 218 25/03/2011 11:30
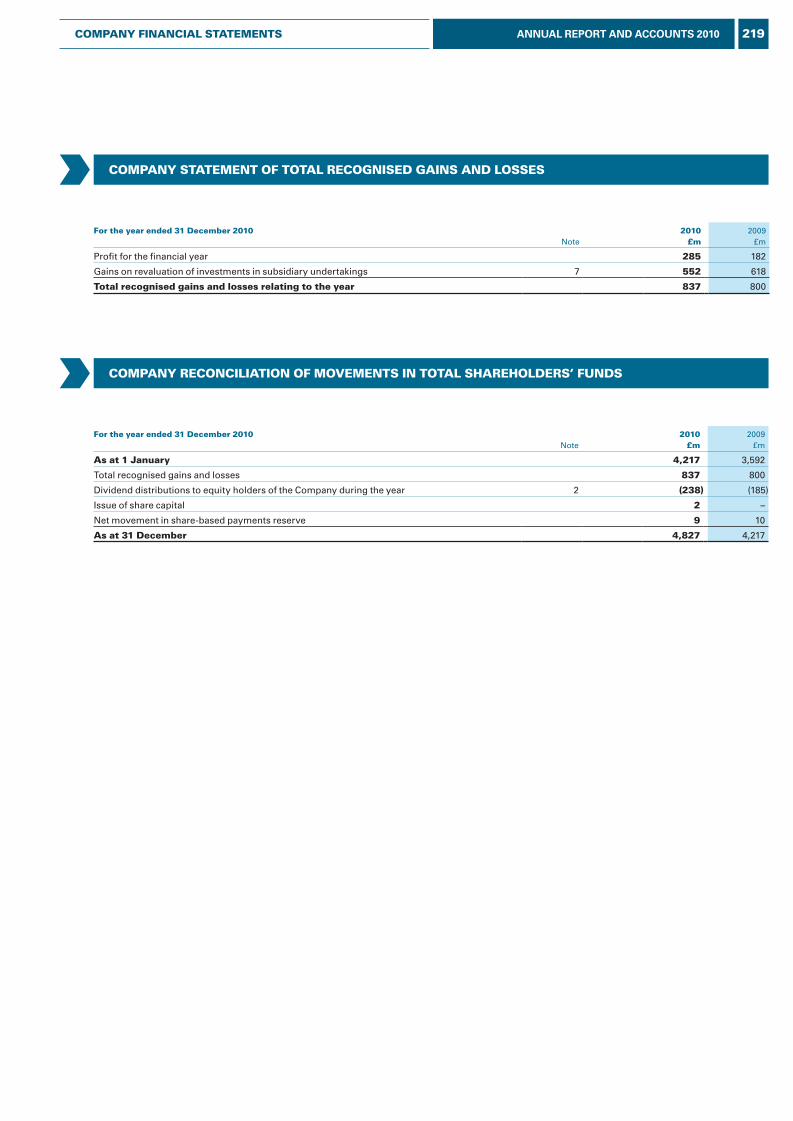
CoMpAnY stAteMent oF totAL reCognIsed gAIns And Losses
For the year ended 31 december 2010Note
2010£m
2009£m
Profit for the financial year 285 182
Gains on revaluation of investments in subsidiary undertakings 7 552 618
total recognised gains and losses relating to the year 837 800
CoMpAnY reConCILIAtIon oF MoveMents In totAL shArehoLders’ Funds
For the year ended 31 december 2010Note
2010£m
2009£m
As at 1 January 4,217 3,592
Total recognised gains and losses 837 800
Dividend distributions to equity holders of the Company during the year 2 (238) (185)
Issue of share capital 2 –
Net movement in share-based payments reserve 9 10
As at 31 december 4,827 4,217
219ANNUAL REPORT AND ACCOUNTS 2010CoMpAnY FInAnCIAL stAteMents
L&G_AR10_22-GroupPlc_p217-227_230311_AT.indd 219 25/03/2011 11:30
notes to the CoMpAnY FInAnCIAL stAteMents
1 ACCountIng poLICIesBasis of preparationThese financial statements are prepared on the going concern basis, under the historical cost convention, as modified by the revaluation of fixed asset investments and financial assets and financial liabilities (including derivative instruments) at fair value through profit or loss, and in accordance with the Companies Act 2006 and applicable accounting standards in the United Kingdom. The principal accounting policies, which have been applied consistently throughout the year, are set out below.
The Company’s financial statements have been prepared in compliance with Section 394 and 396 of the Companies Act 2006 adopting the exemption of omitting the profit and loss account conferred by Section 408 of that Act.
Investment incomeInvestment income includes dividends and interest. Dividends receivable from group companies are recognised in the period in which the dividends are declared and approved at the general meeting or paid. Interest income is recognised using the effective interest method.
distributionsDividend distribution to the Company’s shareholders is recognised as a liability in the period in which the dividends are authorised and are no longer at the discretion of the Company. Final dividends are accrued when approved by the Company’s shareholders at a general meeting and interim dividends are recognised when paid.
Interest expenseInterest expense reflects the underlying cost of borrowing, based on the effective interest method, and includes payments and receipts made under derivative instruments which are amortised over the interest period to which they relate.
Investment in subsidiary undertakingsShares in subsidiary undertakings are stated at current value. Unrealised gains or losses arising on investments in subsidiary undertakings are taken to the revaluation reserve.
Loans and receivablesLoans and receivables are held at amortised cost using the effective interest method.
derivative financial instruments and hedge accountingThe Company’s activities expose it to the financial risks of changes in foreign exchange rates and interest rates. The Company uses derivatives such as foreign exchange forward contracts and interest rate swap contracts to hedge these exposures. The Company uses hedge accounting, provided the prescribed criteria are met, to recognise the offsetting effects of changes in the fair value or cash flow of the derivative instrument
and the hedged item. The Company’s principal use of hedge accounting is to hedge the fair value movements in loans due to interest rate and exchange rate fluctuations. Any gain or loss from remeasuring the hedging instrument at fair value is recognised immediately in the profit and loss account. Any gain or loss on the hedged item attributable to the hedged risk is adjusted against the carrying amount of the hedged item and recognised in the profit and loss account.
Certain derivative instruments do not qualify for hedge accounting. Changes in the fair value of any derivative instruments which do not qualify for hedge accounting are recognised immediately in the profit and loss account.
BorrowingsBorrowings are recognised initially at fair value, net of transaction costs. Borrowings classified as liabilities are subsequently stated at amortised cost. The difference between the net proceeds and the redemption value is recognised in the profit and loss account over the borrowing period using the effective interest method.
deferred taxDeferred tax is recognised in respect of all timing differences that have originated but not reversed at the balance sheet date, where transactions or events that result in an obligation to pay more tax in the future or a right to pay less tax in the future have occurred at the balance sheet date.
A net deferred tax asset is recognised as recoverable and therefore recognised only when, on the basis of all available evidence, it can be regarded as more likely than not that there will be suitable taxable profits against which to recover carried forward tax losses and from which the future reversal of underlying timing differences can be deducted.
Deferred tax is measured at the average tax rates that are expected to apply in the periods in which the timing differences are expected to reverse, based on tax rates and laws that have been enacted or substantively enacted by the balance sheet date. Deferred tax is measured on an undiscounted basis.
Deferred tax is recognised in respect of the retained earnings of overseas subsidiaries only to the extent that, at the balance sheet date, dividends have been accrued as receivable or a binding agreement to distribute past earnings in future periods has been entered into by the subsidiary.
220 ANNUAL REPORT AND ACCOUNTS 2010 CoMpAnY FInAnCIAL stAteMents
L&G_AR10_22-GroupPlc_p217-227_230311_AT.indd 220 25/03/2011 11:30

Foreign currenciesTransactions denominated in foreign currencies are translated into sterling at the rates of exchange prevailing at the time of the transactions. Monetary assets and liabilities expressed in foreign currencies are translated into sterling at the rates of exchange ruling at the balance sheet date. Non-monetary items are maintained at historic rates. Exchange gains or losses are recognised in the profit and loss account, except those arising upon the revaluation of fixed assets, which are included in the revaluation reserve.
pension costsThe Company participates in multi-employer defined benefit schemes, within the meaning of FRS 17, ‘Retirement Benefits’, which, as its share of the underlying assets and liabilities cannot be identified, have been treated for reporting purposes as defined contribution schemes. In addition to these schemes the Company also contributes to defined contribution schemes. The Company charges the costs of its pension schemes against profit as incurred. Any difference between the cumulative amounts charged against profits and contribution amounts paid is included as a provision or prepayment in the balance sheet.
The assets of the defined benefit schemes and the defined contribution schemes are held in separate trustee administered funds, which have been subject to regular valuation every three years and updated by formal reviews at reporting dates by qualified actuaries who were employees of the Group.
related party transactionsThe Company has taken advantage of the exemptions of FRS 8, ‘Related Party Transactions’, not to disclose transactions with other group companies.
share-based paymentsThe Company operates a number of share-based payment plans on behalf of its subsidiaries. The fair value of the equity instruments granted is spread over the vesting period of the instrument and treated as a capital contribution to the respective subsidiary. The total capital contribution is determined by reference to the fair value of the awards, excluding the impact of any non-market vesting conditions. The capital contribution to the subsidiaries is accounted for as an increase in the investment in the parent company’s financial statements.
At each balance sheet date, the Company revises its estimate of the number of equity instruments which are expected to become exercisable. It recognises the impact of the revision of original estimate, if any, in the cost of the investment in the subsidiary and a corresponding adjustment is made to equity over the remaining vesting period. On vesting or exercise, the difference between the accumulated capital contribution and the actual cost to the Company is transferred to retained earnings. Where new shares are issued, the proceeds received are credited to share capital and share premium. Any capital contribution is subsequently recharged to the respective subsidiary as incurred and the corresponding cost of investment is reduced.
risk management The Company has taken advantage of the exemptions provided in FRS 29, ‘Financial Instruments: Disclosures’, which states that disclosure of financial instruments is not required in parent company financial statements where these are included in publicly available Consolidated Financial Statements.
notes to the CoMpAnY FInAnCIAL stAteMents (ContInued)
221ANNUAL REPORT AND ACCOUNTS 2010CoMpAnY FInAnCIAL stAteMents
L&G_AR10_22-GroupPlc_p217-227_230311_AT.indd 221 25/03/2011 11:30
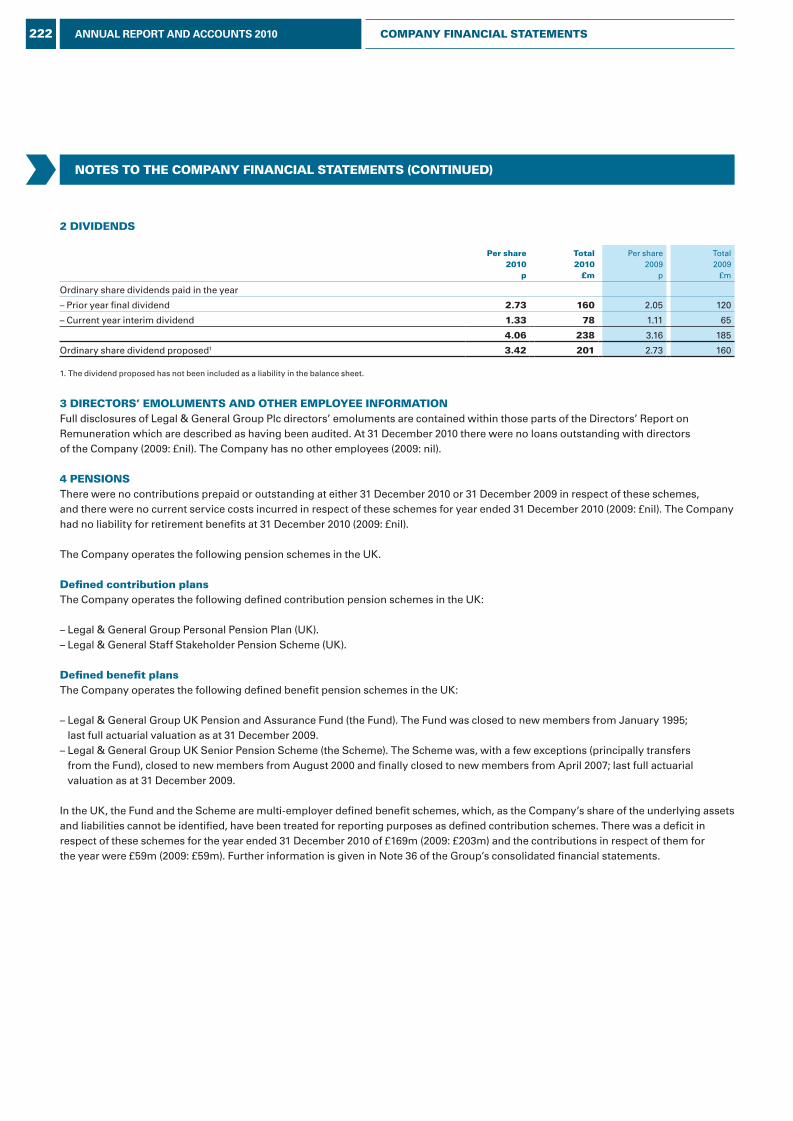
notes to the CoMpAnY FInAnCIAL stAteMents (ContInued)
2 dIvIdends
per share2010
p
total2010
£m
Per share2009
p
Total2009
£m
Ordinary share dividends paid in the year
– Prior year final dividend 2.73 160 2.05 120
– Current year interim dividend 1.33 78 1.11 65
4.06 238 3.16 185
Ordinary share dividend proposed1 3.42 201 2.73 160
1. The dividend proposed has not been included as a liability in the balance sheet.
3 dIreCtors’ eMoLuMents And other eMpLoYee InForMAtIonFull disclosures of Legal & General Group Plc directors’ emoluments are contained within those parts of the Directors’ Report on Remuneration which are described as having been audited. At 31 December 2010 there were no loans outstanding with directors of the Company (2009: £nil). The Company has no other employees (2009: nil).
4 pensIonsThere were no contributions prepaid or outstanding at either 31 December 2010 or 31 December 2009 in respect of these schemes, and there were no current service costs incurred in respect of these schemes for year ended 31 December 2010 (2009: £nil). The Company had no liability for retirement benefits at 31 December 2010 (2009: £nil).
The Company operates the following pension schemes in the UK.
defined contribution plansThe Company operates the following defined contribution pension schemes in the UK:
– Legal & General Group Personal Pension Plan (UK).– Legal & General Staff Stakeholder Pension Scheme (UK).
defined benefit plansThe Company operates the following defined benefit pension schemes in the UK:
– Legal & General Group UK Pension and Assurance Fund (the Fund). The Fund was closed to new members from January 1995; last full actuarial valuation as at 31 December 2009.
– Legal & General Group UK Senior Pension Scheme (the Scheme). The Scheme was, with a few exceptions (principally transfers from the Fund), closed to new members from August 2000 and finally closed to new members from April 2007; last full actuarial valuation as at 31 December 2009.
In the UK, the Fund and the Scheme are multi-employer defined benefit schemes, which, as the Company’s share of the underlying assets and liabilities cannot be identified, have been treated for reporting purposes as defined contribution schemes. There was a deficit in respect of these schemes for the year ended 31 December 2010 of £169m (2009: £203m) and the contributions in respect of them for the year were £59m (2009: £59m). Further information is given in Note 36 of the Group’s consolidated financial statements.
222 ANNUAL REPORT AND ACCOUNTS 2010 CoMpAnY FInAnCIAL stAteMents
L&G_AR10_22-GroupPlc_p217-227_230311_AT.indd 222 25/03/2011 11:30
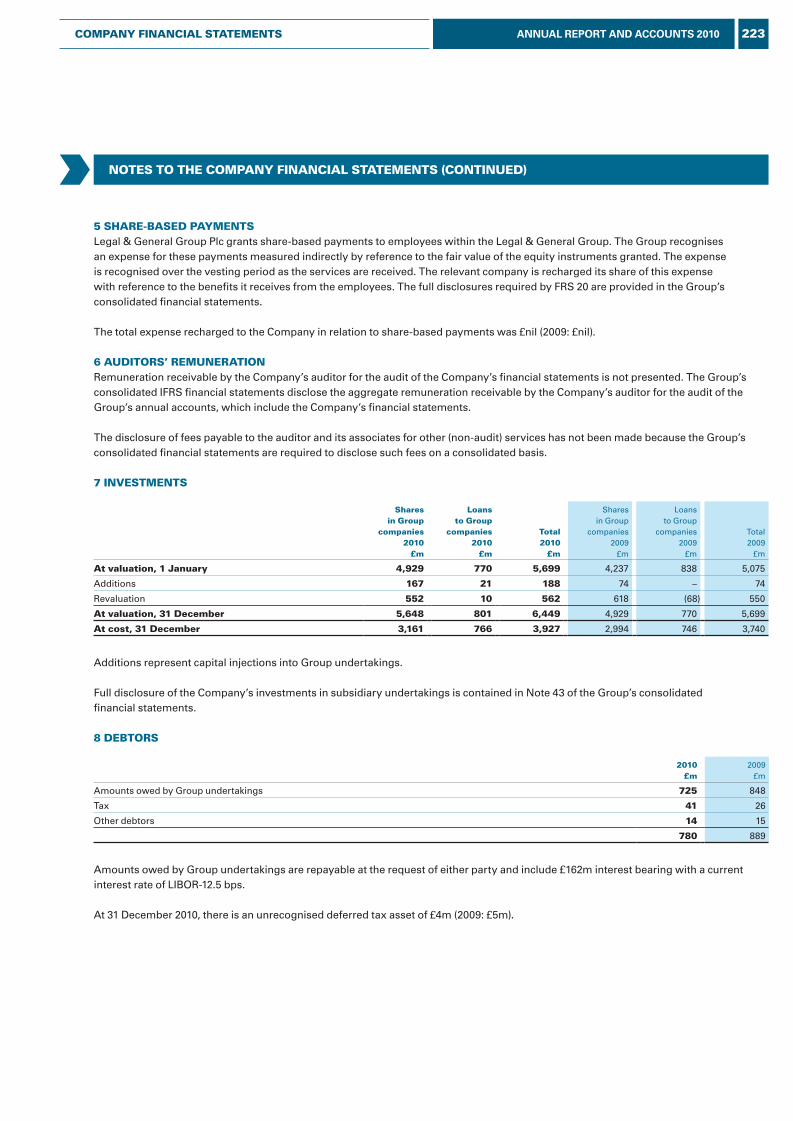
notes to the CoMpAnY FInAnCIAL stAteMents (ContInued)
5 shAre-BAsed pAYMentsLegal & General Group Plc grants share-based payments to employees within the Legal & General Group. The Group recognises an expense for these payments measured indirectly by reference to the fair value of the equity instruments granted. The expense is recognised over the vesting period as the services are received. The relevant company is recharged its share of this expense with reference to the benefits it receives from the employees. The full disclosures required by FRS 20 are provided in the Group’s consolidated financial statements.
The total expense recharged to the Company in relation to share-based payments was £nil (2009: £nil).
6 AudItors’ reMunerAtIonRemuneration receivable by the Company’s auditor for the audit of the Company’s financial statements is not presented. The Group’s consolidated IFRS financial statements disclose the aggregate remuneration receivable by the Company’s auditor for the audit of the Group’s annual accounts, which include the Company’s financial statements.
The disclosure of fees payable to the auditor and its associates for other (non-audit) services has not been made because the Group’s consolidated financial statements are required to disclose such fees on a consolidated basis.
7 InvestMents
sharesin group
companies2010
£m
Loansto group
companies2010
£m
total2010
£m
Shares in Group
companies2009
£m
Loansto Group
companies2009
£m
Total2009
£m
At valuation, 1 January 4,929 770 5,699 4,237 838 5,075
Additions 167 21 188 74 – 74
Revaluation 552 10 562 618 (68) 550
At valuation, 31 december 5,648 801 6,449 4,929 770 5,699
At cost, 31 december 3,161 766 3,927 2,994 746 3,740
Additions represent capital injections into Group undertakings.
Full disclosure of the Company’s investments in subsidiary undertakings is contained in Note 43 of the Group’s consolidated financial statements.
8 deBtors
2010£m
2009£m
Amounts owed by Group undertakings 725 848
Tax 41 26
Other debtors 14 15
780 889
Amounts owed by Group undertakings are repayable at the request of either party and include £162m interest bearing with a current interest rate of LIBOR-12.5 bps.
At 31 December 2010, there is an unrecognised deferred tax asset of £4m (2009: £5m).
223ANNUAL REPORT AND ACCOUNTS 2010CoMpAnY FInAnCIAL stAteMents
L&G_AR10_22-GroupPlc_p217-227_230311_AT.indd 223 25/03/2011 11:30
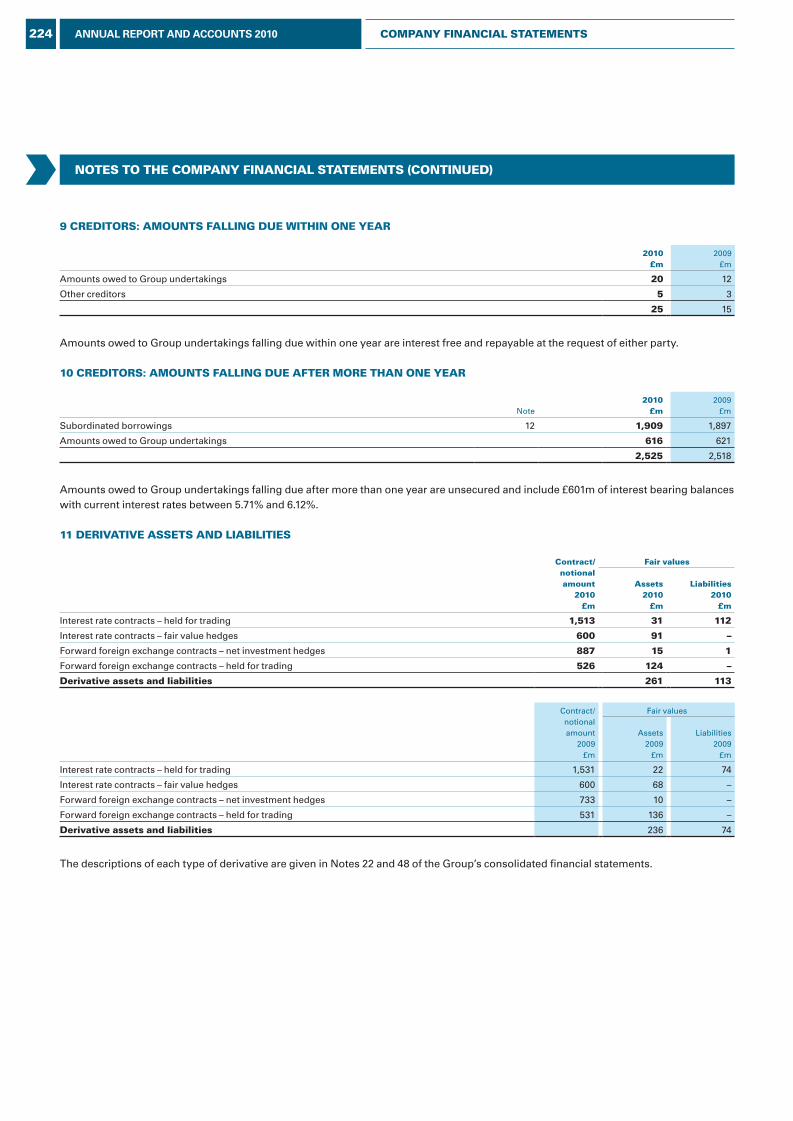
notes to the CoMpAnY FInAnCIAL stAteMents (ContInued)
9 CredItors: AMounts FALLIng due WIthIn one YeAr
2010£m
2009£m
Amounts owed to Group undertakings 20 12
Other creditors 5 3
25 15
Amounts owed to Group undertakings falling due within one year are interest free and repayable at the request of either party.
10 CredItors: AMounts FALLIng due AFter More thAn one YeAr
Note2010
£m2009
£m
Subordinated borrowings 12 1,909 1,897
Amounts owed to Group undertakings 616 621
2,525 2,518
Amounts owed to Group undertakings falling due after more than one year are unsecured and include £601m of interest bearing balances with current interest rates between 5.71% and 6.12%.
11 derIvAtIve Assets And LIABILItIes
Contract/notional amount
2010£m
Fair values
Assets2010
£m
Liabilities2010
£m
Interest rate contracts – held for trading 1,513 31 112
Interest rate contracts – fair value hedges 600 91 –
Forward foreign exchange contracts – net investment hedges 887 15 1
Forward foreign exchange contracts – held for trading 526 124 –
derivative assets and liabilities 261 113
Contract/notional amount
2009£m
Fair values
Assets2009
£m
Liabilities2009
£m
Interest rate contracts – held for trading 1,531 22 74
Interest rate contracts – fair value hedges 600 68 –
Forward foreign exchange contracts – net investment hedges 733 10 –
Forward foreign exchange contracts – held for trading 531 136 –
derivative assets and liabilities 236 74
The descriptions of each type of derivative are given in Notes 22 and 48 of the Group’s consolidated financial statements.
224 ANNUAL REPORT AND ACCOUNTS 2010 CoMpAnY FInAnCIAL stAteMents
L&G_AR10_22-GroupPlc_p217-227_230311_AT.indd 224 25/03/2011 11:30
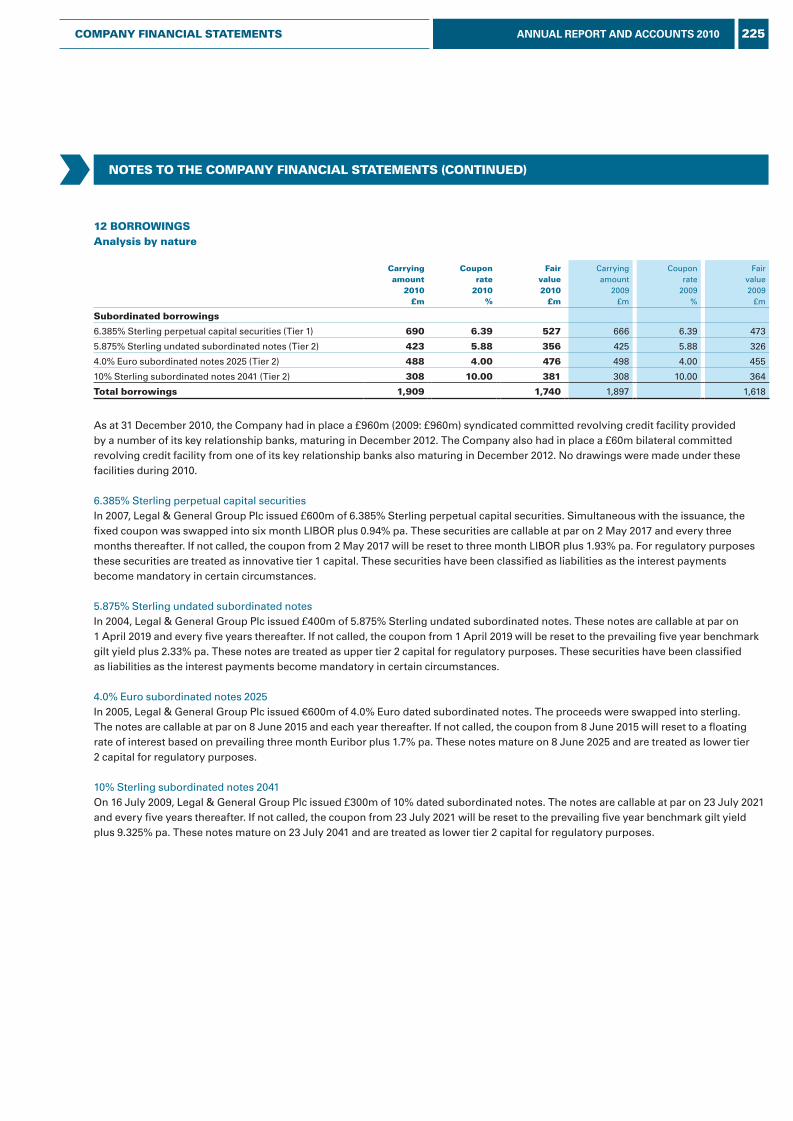
notes to the CoMpAnY FInAnCIAL stAteMents (ContInued)
12 BorroWIngsAnalysis by nature
Carryingamount
2010£m
Couponrate
2010%
Fairvalue2010
£m
Carryingamount
2009£m
Couponrate
2009%
Fairvalue2009
£m
subordinated borrowings
6.385% Sterling perpetual capital securities (Tier 1) 690 6.39 527 666 6.39 473
5.875% Sterling undated subordinated notes (Tier 2) 423 5.88 356 425 5.88 326
4.0% Euro subordinated notes 2025 (Tier 2) 488 4.00 476 498 4.00 455
10% Sterling subordinated notes 2041 (Tier 2) 308 10.00 381 308 10.00 364
total borrowings 1,909 1,740 1,897 1,618
As at 31 December 2010, the Company had in place a £960m (2009: £960m) syndicated committed revolving credit facility provided by a number of its key relationship banks, maturing in December 2012. The Company also had in place a £60m bilateral committed revolving credit facility from one of its key relationship banks also maturing in December 2012. No drawings were made under these facilities during 2010.
6.385% Sterling perpetual capital securitiesIn 2007, Legal & General Group Plc issued £600m of 6.385% Sterling perpetual capital securities. Simultaneous with the issuance, the fixed coupon was swapped into six month LIBOR plus 0.94% pa. These securities are callable at par on 2 May 2017 and every three months thereafter. If not called, the coupon from 2 May 2017 will be reset to three month LIBOR plus 1.93% pa. For regulatory purposes these securities are treated as innovative tier 1 capital. These securities have been classified as liabilities as the interest payments become mandatory in certain circumstances.
5.875% Sterling undated subordinated notesIn 2004, Legal & General Group Plc issued £400m of 5.875% Sterling undated subordinated notes. These notes are callable at par on 1 April 2019 and every five years thereafter. If not called, the coupon from 1 April 2019 will be reset to the prevailing five year benchmark gilt yield plus 2.33% pa. These notes are treated as upper tier 2 capital for regulatory purposes. These securities have been classified as liabilities as the interest payments become mandatory in certain circumstances.
4.0% Euro subordinated notes 2025In 2005, Legal & General Group Plc issued €600m of 4.0% Euro dated subordinated notes. The proceeds were swapped into sterling. The notes are callable at par on 8 June 2015 and each year thereafter. If not called, the coupon from 8 June 2015 will reset to a floating rate of interest based on prevailing three month Euribor plus 1.7% pa. These notes mature on 8 June 2025 and are treated as lower tier 2 capital for regulatory purposes.
10% Sterling subordinated notes 2041On 16 July 2009, Legal & General Group Plc issued £300m of 10% dated subordinated notes. The notes are callable at par on 23 July 2021 and every five years thereafter. If not called, the coupon from 23 July 2021 will be reset to the prevailing five year benchmark gilt yield plus 9.325% pa. These notes mature on 23 July 2041 and are treated as lower tier 2 capital for regulatory purposes.
225ANNUAL REPORT AND ACCOUNTS 2010CoMpAnY FInAnCIAL stAteMents
L&G_AR10_22-GroupPlc_p217-227_230311_AT.indd 225 25/03/2011 11:30
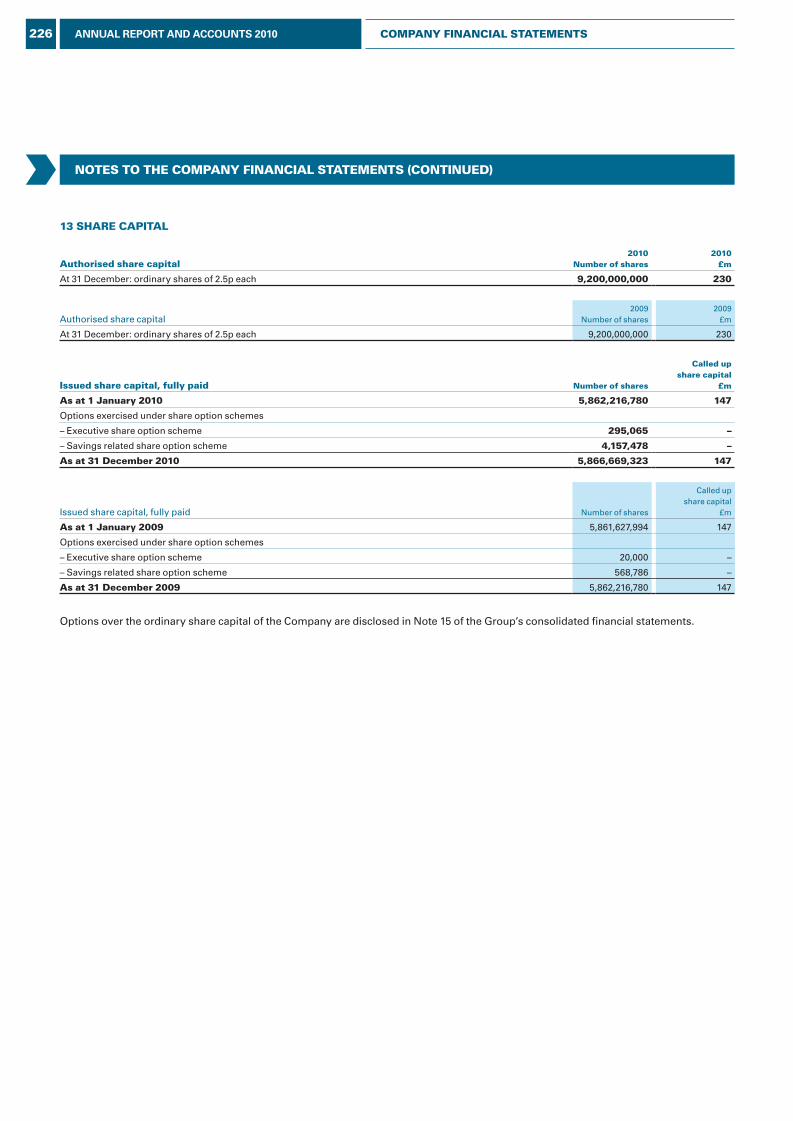
notes to the CoMpAnY FInAnCIAL stAteMents (ContInued)
13 shAre CApItAL
Authorised share capital2010
number of shares2010
£m
At 31 December: ordinary shares of 2.5p each 9,200,000,000 230
Authorised share capital2009
Number of shares2009
£m
At 31 December: ordinary shares of 2.5p each 9,200,000,000 230
Issued share capital, fully paid number of shares
Called upshare capital
£m
As at 1 January 2010 5,862,216,780 147
Options exercised under share option schemes
– Executive share option scheme 295,065 –
– Savings related share option scheme 4,157,478 –
As at 31 december 2010 5,866,669,323 147
Issued share capital, fully paid Number of shares
Called upshare capital
£m
As at 1 January 2009 5,861,627,994 147
Options exercised under share option schemes
– Executive share option scheme 20,000 –
– Savings related share option scheme 568,786 –
As at 31 december 2009 5,862,216,780 147
Options over the ordinary share capital of the Company are disclosed in Note 15 of the Group’s consolidated financial statements.
226 ANNUAL REPORT AND ACCOUNTS 2010 CoMpAnY FInAnCIAL stAteMents
L&G_AR10_22-GroupPlc_p217-227_230311_AT.indd 226 25/03/2011 11:30
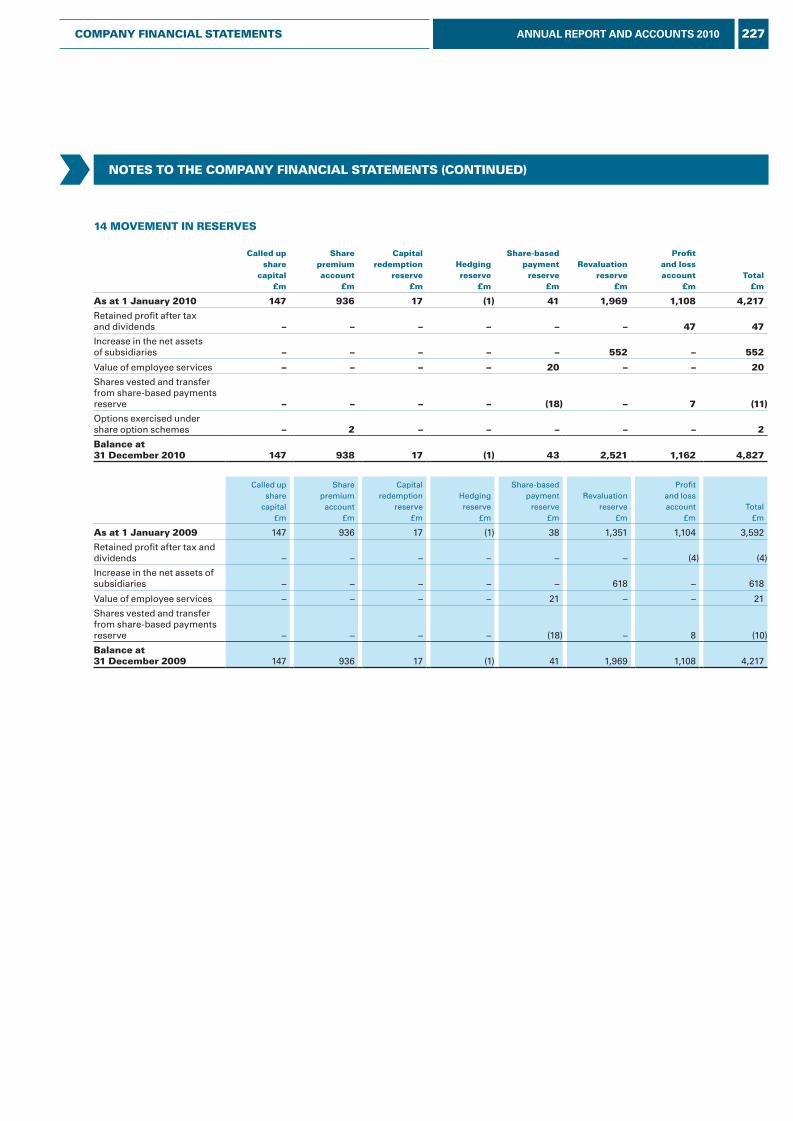
notes to the CoMpAnY FInAnCIAL stAteMents (ContInued)
14 MoveMent In reserves
Called upshare
capital£m
share premium account
£m
Capitalredemption
reserve£m
hedgingreserve
£m
share-basedpayment
reserve£m
revaluationreserve
£m
profitand lossaccount
£mtotal
£m
As at 1 January 2010 147 936 17 (1) 41 1,969 1,108 4,217
Retained profit after tax and dividends – – – – – – 47 47
Increase in the net assets of subsidiaries – – – – – 552 – 552
Value of employee services – – – – 20 – – 20
Shares vested and transfer from share-based payments reserve – – – – (18) – 7 (11)
Options exercised under share option schemes – 2 – – – – – 2
Balance at 31 december 2010 147 938 17 (1) 43 2,521 1,162 4,827
Called upshare
capital£m
Share premium
account£m
Capitalredemption
reserve£m
Hedgingreserve
£m
Share-basedpayment
reserve£m
Revaluationreserve
£m
Profitand lossaccount
£mTotal
£m
As at 1 January 2009 147 936 17 (1) 38 1,351 1,104 3,592
Retained profit after tax and dividends – – – – – – (4) (4)
Increase in the net assets of subsidiaries – – – – – 618 – 618
Value of employee services – – – – 21 – – 21
Shares vested and transfer from share-based payments reserve – – – – (18) – 8 (10)
Balance at 31 december 2009 147 936 17 (1) 41 1,969 1,108 4,217
227ANNUAL REPORT AND ACCOUNTS 2010CoMpAnY FInAnCIAL stAteMents
L&G_AR10_22-GroupPlc_p217-227_230311_AT.indd 227 25/03/2011 11:30
SHAREHOLDER INFORMATION
Annual General MeetingThe 2011 Annual General Meeting (AGM) will be held on Wednesday, 25 May 2011 at 2.30pm at The Honourable Artillery Company, Armoury House, City Road, London EC1Y 2BQ. The AGM provides Legal & General with the opportunity to meet its shareholders. The Board regards the AGM as an important opportunity to communicate directly with private investors. The Notice of Meeting and all other details for the AGM are available at legalandgeneralgroup.com (the website).
Pre-register your AGM questionIf you wish to raise a question at the AGM, you can pre-register your question on the website.
Dividend informationDividend per shareThis year the directors are recommending the payment of a final dividend of 3.42p per share. If you add this to your interim dividend of 1.33p per share, the total dividend recommended for 2010 will be 4.75p per share (2009: 3.84p per share). The key dates for the payment of dividends are set out in the Important Dates section on the next page.
Dividend paymentsLegal & General is keen to encourage all its shareholders to have their dividends paid directly into a Bank or Building Society Account. If you would like more details or a dividend mandate form, please contact our Registrar. Details of how to contact the Registrar can be found on the opposite page and on our website.
Dividend reinvestment planThe Legal & General Dividend Reinvestment Plan (DRIP) enables shareholders to use their cash dividends to purchase Legal & General Group Plc shares. If you would like more details, please contact our Registrar. Alternatively, the DRIP booklet and mandate form can be found in the Investors Section of the website.
The Board will be seeking shareholder approval at the 2011 AGM to operate a SCRIP dividend scheme.
CommunicationsInternetInformation about the Company including details of the current share price is available in the Investors Section of the website.
Investor relationsPrivate investors should contact the Registrar with any queries.
Institutional investors can contact the Investor Relations Team by telephone on: 020 3124 2345 or email: [email protected].
Over the last year many companies have become aware that their shareholders have received unsolicited phone calls or correspondence concerning investment matters which imply a connection to the company concerned. These are typically from overseas based ‘brokers’ who target UK shareholders offering to sell them what often turn out to be worthless or high risk shares in US or UK investments.
They can be very persistent and extremely persuasive. A 2006 survey by the Financial Services Authority (FSA) has reported that the average amount lost by investors is around £20,000. It is not just the novice investor that has been duped in this way; many of the victims had been successfully investing for several years. Shareholders are advised to be wary of any unsolicited advice, offers to buy shares at a discount or offers of free reports into the Company.
If you receive any unsolicited investment advice, make sure you get the correct name of the person and organisation and make a record of any other information they give you, e.g. telephone number, address etc. Check that they are properly authorised by the FSA before getting involved. You can check at fsa.gov.uk/register/.
The FSA also maintains on its website a list of unauthorised overseas firms who are targeting, or have targeted, UK investors and any approach from such organisations should be reported to the FSA so that this list can be kept up to date and any other appropriate action can be considered. If you deal with an unauthorised firm, you would not be eligible to receive payment under the Financial Services Compensation Scheme. The FSA can be contacted by completing an online form at fsa.gov.uk/pages/doing/regulated/law/alerts/form.shtml or, if you do not have access to the internet, on 0845 606 1234.
Inform our Registrar, Equiniti Limited, on 0871 384 2118. They are not able to investigate such incidents themselves but will record the details and pass them on to us and liaise with the FSA.
Details of any sharedealing facilities that the Company endorses will be included in Company mailings.
More detailed information on this or similar activity can be found on the FSA website fsa.gov.uk/pages/consumerinformation/.
228 ANNUAL REPORT AND ACCOUNTS 2010 SHAREHOLDER INFORMATION
L&G_AR10_23-OtherInfo_p228-232_230311_AT.indd 228 25/03/2011 11:32
SHAREHOLDER INFORMATION (CONTINUED)
Financial reportsLegal & General publishes an Annual Report and Accounts. These are available on the website.
The Annual Report and Accounts are sent to those shareholders who have elected to receive paper copies. Alternatively, shareholders may elect to receive notification by email by registering on shareview.co.uk. Copies of previous financial reports are available on the website.
If you receive more than one copy of our communications, it could be because you have more than one record on the share register. To avoid duplicate mailings, please contact the Registrar, who can arrange for your accounts to be amalgamated.
RegistrarYou can contact our Registrar, Equiniti Limited:
By post: Equiniti Limited, Aspect House, Spencer Road, Lancing, West Sussex BN99 6DA.By telephone: Shareholder Helpline: 0871 384 2118*.* Calls to this number are charged at 8p per minute from a BT landline.
Other telephone provider costs may vary.
All shareholder enquiries should be addressed to Equiniti.
The Registrar also provides the following services:
Electronic share serviceThe electronic share service allows you to hold shares in Legal & General without the need for a share certificate and enables you to benefit from shorter market settlement periods. Individual shareholders hold their Legal & General shares in a nominee holding registered in the name of Equiniti Corporate Nominees Limited.
To join, or obtain further information, contact the Registrar. They will send you a booklet, outlining the terms and conditions under which your shares will be held, together with the appropriate share transfer form. The booklet and the share transfer form are also available in the Investors Section of the website.
ShareviewShareview allows you to view your Legal & General shareholding on the internet. Registering is easy; simply log on to shareview.co.uk and follow the instructions. You will need your shareholder reference number, which can be found on your share certificate or a dividend statement. If you have any queries, please call the Shareholder Helpline.
Consolidation of share certificatesShareholders with more that one certificate may arrange to have them consolidated into one certificate by contacting the Registrar.
Individual Savings Account (ISA)Equiniti Financial Services Limited provide a Single Company ISA for Legal & General Group Plc shares. If you would like more information, please call 0871 384 2244*.* Calls to this number are charged at 8p per minute from a BT landline.
Other telephone provider costs may vary.
Share dealing serviceShareholders may buy or sell shares using the internet or telephone through a number of nominated providers. Details can be found on the website. General informationCapital gains tax: For the purpose of calculating UK capital gains tax, the market value on 31 March 1982 of each share was 7.996p, after adjusting for the 1986 capitalisation issue and the 1996 and 1999 sub-divisions, but not reflecting any rights taken up under the 2002 rights issue.
Close company provisions: The Company is not a close company within the terms of the Income and Corporation Taxes Act 1988.
Registered office: One Coleman Street, London EC2R 5AA. Registered in England and Wales, No. 1417162.
Shareholder offer line: For details of shareholder offers on Legal & General products call 0500 65 5555.
IMPORTANT DATES
17 March 2011 Final Results 2010
20 April 2011 Ex-dividend date (Final Dividend)
17 May 2011 Last day for DRIP elections
25 May 2011 Annual General Meeting
1 June 2011 Payment of Final Dividend for 2010 (to members registered on 26 April 2011)
3 August 2011 Half Year Results 2011
31 August 2011 Ex-dividend date (Interim Dividend)
Payment of Interim Dividend for 2011 (to members registered on 2 September 2011)
229ANNUAL REPORT AND ACCOUNTS 2010SHAREHOLDER INFORMATION
L&G_AR10_23-OtherInfo_p228-232_230311_AT.indd 229 25/03/2011 11:32
3 October 2011
GLOSSARY.
ANNUAL PREMIUM EqUIvALENT (APE)An industry measure of new business that is common in the UK. It is the total value of regular premiums, plus 10% of any new single premiums written for the fiscal year.
BULk PURCHASE ANNUITY (BPA) Bulk annuities are bought by firms that run final salary pension schemes to reduce their responsibilities by closing the schemes to new members and selling on the annuities to insurance providers.
DIvIDEND COvER Dividend cover measures how many times over the profits could have paid the dividend. For example, if the dividend cover is 3, this means that the firm’s profit attributable to shareholders was three times the amount of dividend paid out.
EARNINGS PER SHARE (EPS)EPS is a common financial metric which can be used to measure the profitability and strength of a company over time. It is the total earnings divided by the number of shares outstanding. Basic EPS uses a weighted average of shares outstanding during the year.
EUROPEAN EMBEDDED vALUE (EEv)The Embedded Value (EV) of a life insurance company is the value to equity shareholders of the net assets and expected future profits of the company. The European Embedded Value (EEV) is a variation of EV which allows for a more formalised method of choosing the parameters and doing the calculations to enable greater transparency and accountability.
EUROPEAN EMBEDDED vALUE OPERATING PROFIT (EEv OPERATING PROFIT) Legal & General provides supplementary financial statements prepared on the European Embedded Value (EEV) basis for long term insurance contracts. The EEV basis provides an assessment of the value which has been generated by the business during a period. Operating profit on the EEV basis reports the change in embedded value in a period, but excludes fluctuations from assumed longer term investment return. Purpose: In the Board’s opinion, EEV operating profit provides shareholders with a good understanding of the value which is being created on the Group’s long term insurance contracts.
FUNDS UNDER MANAGEMENT (FUM)The total amount of money investors have trusted to a fund manager to invest across all their investment products.
GENERALLY ACCEPTED ACCOUNTING PRINCIPLES (GAAP)These are a widely accepted collection of guidelines and principles, established by the International Accounting Standards Board, and used by the accounting community to report financial information.
INSURANCE GROUP DIRECTIvE SURPLUS (IGD SURPLUS) The IGD surplus is an FSA regulatory measure which calculates surplus capital within the Group. IGD surplus is defined as Group regulatory capital less the Group regulatory capital requirement. Surplus capital held within our Society Long Term Fund cannot be included in the IGD definition of capital employed. Purpose: IGD surplus is the Group level regulatory surplus capital measure. IGD surplus is after accrual of proposed dividend.
INTERNATIONAL FINANCIAL REPORTING STANDARDS (IFRS)These are accounting guidelines and rules that companies and organisations can follow when completing financial statements. The creation of international standards allows investors to compare financial statements with greater ease. These are the standards that all publicly listed groups in the European Union (EU) are required to use.
INTERNATIONAL FINANCIAL REPORTING STANDARDS (IFRS) OPERATING PROFIT The Group’s primary financial statements (see Financial Statements) are prepared on an International Financial Reporting Standards (IFRS) basis which all EU listed groups are required to follow. IFRS operating profit measures the pre-tax result using a smoothed longer term investment return. Any variance between actual and smoothed investment return is reported below operating profit.Purpose: IFRS operating profit gives an insight into the Group’s ability to generate cash flows to support dividends during a period.
kEY PERFORMANCE INDICATORS (kPIs)These are measures by which the development, performance or position of the business can be measured effectively.
LIABILITY DRIvEN INvESTMENT (LDI)A form of investing in which the main goal is to gain sufficient assets to meet all liabilities, both current and future. This form of investing is most prominent in final salary pension plans, whose liabilities can often reach into billions of pounds for the largest of plans.
230 ANNUAL REPORT AND ACCOUNTS 2010 SHAREHOLDER INFORMATION
L&G_AR10_23-OtherInfo_p228-232_230311_AT.indd 230 25/03/2011 11:32
NET CASH GENERATION Net cash generation is defined as operational cash generation less new business strain for the UK non profit Risk and Savings businesses.
OPERATIONAL CASH GENERATION Operational cash generation is defined as the expected release from in-force business for the UK non profit Risk and Savings businesses, the shareholder’s share of bonuses on With-profits business, the post-tax IFRS operating profit on other UK businesses, including an expected investment return (excluding expected gains/losses on equities) on Group Capital and Financing invested assets, and dividends remitted from our international businesses from sustainable cash generation.
PRESENT vALUE OF NEw BUSINESS PREMIUMS (PvNBP)The industry measure used to determine the value of new businesses. It is calculated as 100% of single premiums plus the expected present value of new regular premiums.
RETURN ON EqUITY (ROE) ROE measures the return earned by shareholders on shareholder capital retained within the business. ROE is calculated as IFRS profit after tax divided by average IFRS shareholder’s funds.Purpose: RoE provides a link between performance and balance sheet management and ensures that an appropriate balance is maintained between the two.
SELF INvESTED PERSONAL PENSIONS (SIPP)A self invested personal pension which provides the policyholder with greater choice and flexibility as to the range of investments made, how these investments are managed, and the administration of those assets and how retirement benefits are taken.
SOCIETYLegal & General Assurance Society Limited.
SOLvENCY IIA proposed EU-wide regulatory regime which intends to align solvency capital to an insurers risk profile. Expected to be implemented in 2012/13.
TOTAL SHAREHOLDER RETURN (TSR) TSR is a measure used to compare the performance of different companies’ stocks and shares over time. It combines the share price appreciation and dividends paid to show the total return to the shareholder. Purpose: TSR measures total return to shareholders over the medium term.
vALUE IN FORCE (vIF) The value of in-force business is the present value of expected future shareholder profits less the present value cost of holding capital required to support the in-force business.
Key Performance Indicators (KPIs) are denoted by the symbol throughout this glossary
231ANNUAL REPORT AND ACCOUNTS 2010SHAREHOLDER INFORMATION
L&G_AR10_23-OtherInfo_p228-232_230311_AT.indd 231 25/03/2011 11:32

NOTES
232 ANNUAL REPORT AND ACCOUNTS 2010
L&G_AR10_23-OtherInfo_p228-232_230311_AT.indd 232 25/03/2011 11:32

CONTENTS
OUR GROUP*01 Highlights02 What we do: our businesses04 How we are structured06 Chairman’s statement08 Group Chief Executive’s review10 Market environment12 Strategic overview14 Risk Management
OUR PERFORMANCE*18 Group results24 Risk businesses28 Savings32 Investment management36 International
OUR PURPOSE40 Our purpose42 People and operational resources*44 CSR/Sustainability
GOVERNANCE*48 Board of Directors50 Chairman’s Letter51 Corporate Governance Statement55 Engagement Matters56 Nominations Committee Report57 Audit Committee Report60 Group Risk Committee Report62 Directors’ Report on Remuneration80 Other statutory and regulatory information
FINANCIAL STATEMENTS85 Contents of the Financial Statements87 Group Consolidated Financial Statements195 Supplementary Financial Statements
– European Embedded Value Basis217 Company Financial Statements
OTHER INFORMATION228 Shareholder information230 Glossary
* These sections make up the Directors’ Report. This section of the Annual Report sets out information on the Group’s principal activities together with a review of the development and performance of the Group, including fi nancial performance, in accordance with Section 417 Companies Act 2006.
WE COMBINE STRATEGIC CLARITY, OPERATIONAL EXCELLENCE AND FINANCIAL STRENGTH TO DELIVER SUSTAINABLE BENEFITS FOR CUSTOMERS, BUSINESS PARTNERS, SHAREHOLDERS AND EMPLOYEES.
For more information visit our website:legalandgeneralgroup.com
9484_L&G_AR_2010_Cover&Spine_210311_JR.indd 2 25/03/2011 11:06
AppleMac2
Distance Measurement
121.04 mm
AppleMac2
Distance Measurement
210.07 mm
AppleMac2
Distance Measurement
5.36 mm
AppleMac2
Distance Measurement
5.03 mm
AppleMac2
Distance Measurement
220.96 mm
AppleMac2
Distance Measurement
211.23 mm
AppleMac2
Distance Measurement
208.21 mm

RISK. SAVINGS.INVESTMENT MANAGEMENT.
LEGAL & GENERAL GROUP PLC ANNUAL REPORT AND ACCOUNTS 2010
BUILDING.Creating solid foundations on which to grow for the future.
LEG
AL &
GEN
ER
AL G
RO
UP
PLC
AN
NU
AL R
EPOR
T AN
D A
CC
OU
NTS
2010
Registered offi ce: One Coleman Street, London EC2R 5AAT 020 3124 2000 F 020 3124 2500
We are authorised and regulated by the Financial Services Authority. We are members of the Association of British Insurers.
Designed and produced by Addison www.addison.co.uk
Printed on 9lives 55 Silk paper and 9lives Offset paper. These papers have been independently certifi ed according to the rules of the Forest Stewardship Council® (FSC). The inks used are all vegetable oil based.
Printed at Pureprint Group, ISO14001.
FSC® certifi ed and CarbonNeutral®.
legalandgeneralgroup.com
9484_L&G_AR_2010_Cover&Spine_210311_JR.indd 1 25/03/2011 11:06
Related Documents


