Budget 2014 - 2015 Joondalup City Centre image credit Greg Hocking

Welcome message from author
This document is posted to help you gain knowledge. Please leave a comment to let me know what you think about it! Share it to your friends and learn new things together.
Transcript
Budget2014 - 2015
Joondalup City Centre image credit Greg Hocking
2
CITY OF JOONDALUP
2014-15 BUDGET SUMMARY
EXECUTIVE REPORT
1) EXECUTIVE SUMMARY ................................................................................................. 3 2) INTRODUCTION ........................................................................................................... 4 3) BUDGET OVERVIEW .................................................................................................... 4 4) EXPENDITURE ............................................................................................................. 5 5) REVENUE ................................................................................................................... 8 6) EXPENDITURE AND SOURCES OF FUNDS .................................................................... 10 7) RESERVE ACCOUNTS ................................................................................................ 10 8) BORROWINGS ........................................................................................................... 11 9) CONCLUSION ............................................................................................................ 11
CITY OF JOONDALUP 2014-15 Annual Budget
3
1) Executive Summary The context for the City of Joondalup’s 2014-15 Budget is one of a heightened degree of economic uncertainty for the near future on the back of tough Federal and State budgets. Sources of revenue other than rates such as grant funds are being cut or increases being frozen and returns on investments remain subdued while the pressure on costs and the need to maintain and provide new infrastructure continues. The 2014-15 Budget preparation has been one of the most demanding in recent times. As part of the Budget preparation the City has undertaken an exhaustive and thorough review of its 20 Year Strategic Financial Plan to ensure that it is achievable and sustainable. Alignment to the City’s Strategic Community Plan, Joondalup 2022, has also been reviewed to ensure the City is delivering on the vision of “A global City: bold, creative and prosperous”. Every three years there is a general revaluation, for rating purposes, of all properties in the City of Joondalup. 2014-15 is a revaluation year with the revaluation undertaken by the Office of the Valuer General. The City is mindful of the potential impact of valuation changes. As has been the case for a number of years differential rating will be applied for 2014-15 ensuring that the City is able to equitably spread rate increases across the community. The differential rates proposed for residential, commercial and industrial property, both improved and unimproved, have been reviewed. The overall rate increase for 2014-15 is 3.9% which will generate general rate revenue of $86.1m excluding Specified Area Rates. This represents the City’s largest single source of funds and is essential for the City to deliver services and undertake planned works and projects. The 2014-15 expenditure program includes a number of significant projects and programs including:
$17.9m for a Multi Storey Car Park between Reid Promenade and Boas Avenue with
construction expected to commence by August 2014 $2.9m for a new community facility at Bramston Park $1.3m to commence the new hockey facility at Warwick Open Space including a
synthetic surface pitch $1.0m to commence the construction of a new car park next to the Marmion Angling
and Aquatic Club $0.6m to provide jetties at Ocean Reef Boat Harbour $0.7m for new basketball facilities at Arena Joondalup as an instalment on a total
contribution commitment of $4.0m $0.7m for extensions to Warwick Leisure Centre as an instalment on a total
contribution commitment of $2.3m $2.9m to advance the Ocean Reef Marina, Joondalup Performing Arts and Cultural
Facility and other significant projects $1.2m to complete streetscape and landscaping works on Shenton Avenue and the
streetscape renewal program $12.4m for various road construction, drainage and streetlight works including:
o Blackspot projects at Joondalup Drive and Shenton Avenue and Hepburn Avenue and Wanneroo Road
o Dualling of Ocean Reef Road from Marmion Avenue to Oceanside Promenade and Whitfords Avenue from Northshore Drive to Belrose Entrance
o Joondalup City Centre lighting o Road Preservation and resurfacing, local traffic treatments and blackspot
projects, stormwater drainage and other street lighting works
CITY OF JOONDALUP 2014-15 Annual Budget
4
$2.3m in other building works, facility upgrades and mini-makeovers $3.6m for parks equipment, playground equipment, shelters, barbecues and parks
reticulation refurbishments in accordance with Landscape Master plans or asset preservation plans
$1.8m on maintenance and capital for natural areas, landscaping and conservation including fencing, paths and firebreaks and management of dedicated bushland areas, bushland in developed parks and foreshores
$0.8m for new footpaths, shared use paths, bicycle parking facilities and slab path replacements
2) Introduction The City of Joondalup is one of the larger local governments in Western Australia based on population. The City has 17kms of stunning coastline stretching from Beach Road, Marmion in the south, to Burns Beach Road, Burns Beach in the north. Popular beaches with excellent facilities are located at Marmion, Sorrento, Hillarys, Pinnaroo, Whitfords, Mullaloo, Ocean Reef, Beaumaris and Burns Beach. Beachside leisure activities include boating, water skiing, snorkelling, fishing, windsurfing, animal exercise and dual use paths ideal for walking and cycling. The City provides a wide range of community services and excellent leisure and sporting facilities catering for junior and senior sporting and recreational pursuits. The City’s natural assets include the Yellagonga wetlands and the City works closely with CALM, the City of Wanneroo and a variety of community groups to manage the natural assets of the region. The City continues to work closely with regional stakeholders to develop cultural, educational and economic initiatives.
3) Budget Overview The 2014-15 Budget has been prepared in accordance with the requirements of the Local Government Act 1995 and the Local Government (Financial Management) Regulations 1996. The relevant Statutory Statements (shown on the grey sheets) within this document are:
Statement of Comprehensive Income by Nature or Type – Attachment 1a Statement of Comprehensive Income by Program – Attachment 1b Statement of Cash Flows – Attachment 2 Rate Setting Statement – Attachment 3 Rating Information Statement – Attachment 4
Additional supporting information is provided in Attachments 5 to 9. In summary:
Statement of Comprehensive Income shows a net surplus resulting from operations of $10.2m
CITY OF JOONDALUP 2014-15 Annual Budget
5
Capital Expenditure on projects, works and motor vehicle replacements amount to $52.1m
There will be Loan Borrowings of $13.0m - $10.0m for the Multi Storey Car Park between Reid Promenade and Boas Avenue, $1.7m for the new community facility at Bramston Park and $1.3m for the new hockey facility at Warwick Open Space
Net transfer from reserves during the budget year 2014-15 will be $6.6m
4) Expenditure Expenditure is categorised into operating and capital and these are described further below.
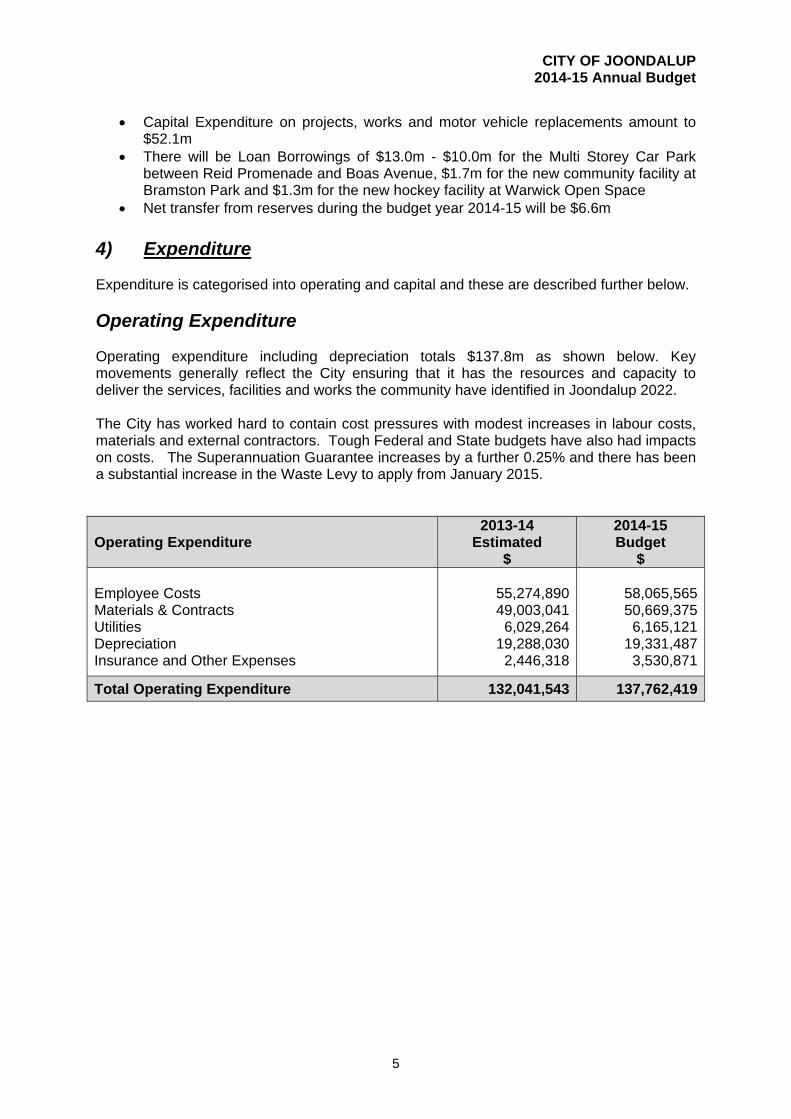
Operating Expenditure Operating expenditure including depreciation totals $137.8m as shown below. Key movements generally reflect the City ensuring that it has the resources and capacity to deliver the services, facilities and works the community have identified in Joondalup 2022. The City has worked hard to contain cost pressures with modest increases in labour costs, materials and external contractors. Tough Federal and State budgets have also had impacts on costs. The Superannuation Guarantee increases by a further 0.25% and there has been a substantial increase in the Waste Levy to apply from January 2015.
Operating Expenditure 2013-14
Estimated $
2014-15 Budget
$ Employee Costs Materials & Contracts Utilities Depreciation Insurance and Other Expenses
55,274,890 49,003,041
6,029,264 19,288,030
2,446,318
58,065,56550,669,375
6,165,12119,331,487
3,530,871
Total Operating Expenditure 132,041,543 137,762,419
CITY OF JOONDALUP 2014-15 Annual Budget
6
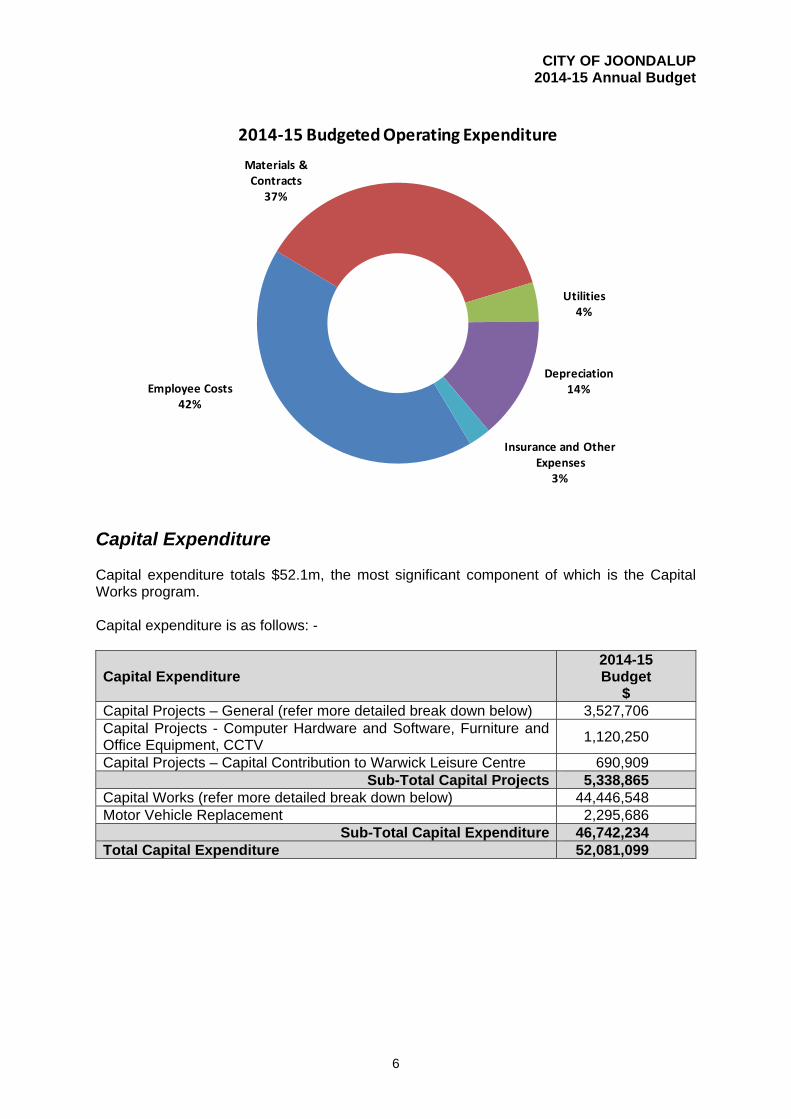
Capital Expenditure Capital expenditure totals $52.1m, the most significant component of which is the Capital Works program. Capital expenditure is as follows: -
Capital Expenditure 2014-15 Budget
$ Capital Projects – General (refer more detailed break down below) 3,527,706 Capital Projects - Computer Hardware and Software, Furniture and Office Equipment, CCTV
1,120,250
Capital Projects – Capital Contribution to Warwick Leisure Centre 690,909 Sub-Total Capital Projects 5,338,865
Capital Works (refer more detailed break down below) 44,446,548 Motor Vehicle Replacement 2,295,686
Sub-Total Capital Expenditure 46,742,234 Total Capital Expenditure 52,081,099
Employee Costs42%
Materials & Contracts
37%
Utilities 4%
Depreciation 14%
Insurance and Other Expenses
3%
2014‐15 Budgeted Operating Expenditure
CITY OF JOONDALUP 2014-15 Annual Budget
7
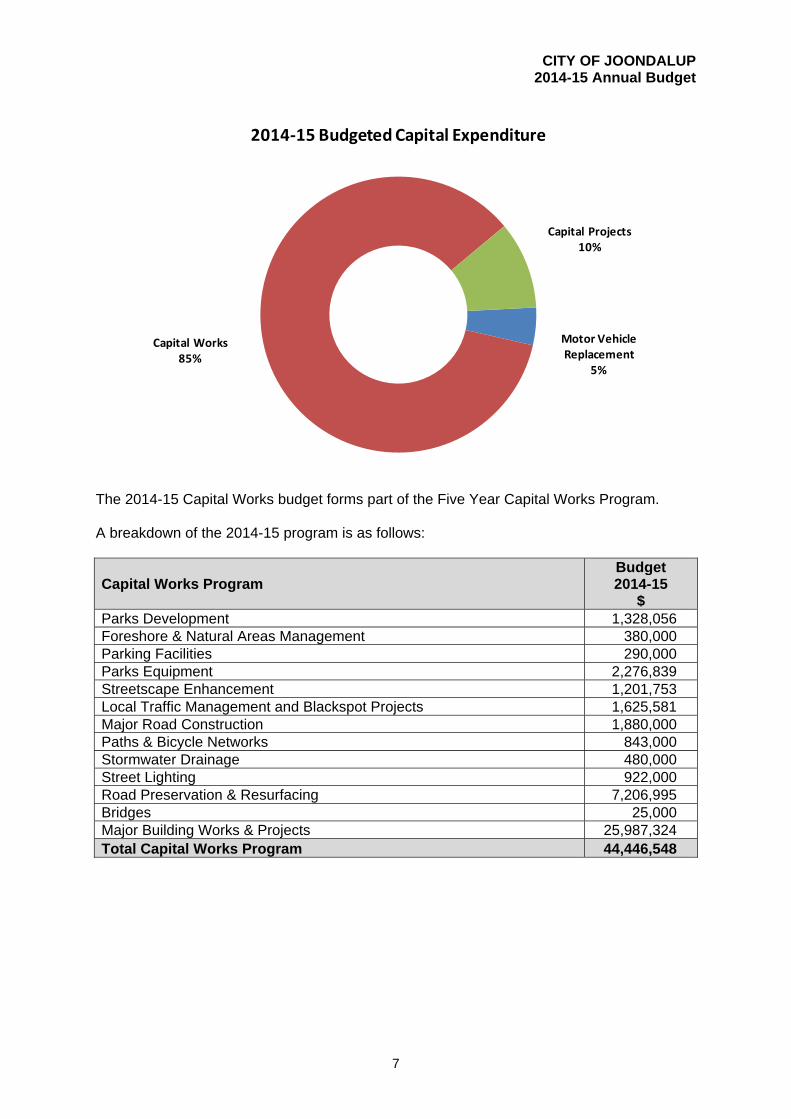
The 2014-15 Capital Works budget forms part of the Five Year Capital Works Program. A breakdown of the 2014-15 program is as follows:
Capital Works Program Budget 2014-15
$ Parks Development 1,328,056 Foreshore & Natural Areas Management 380,000 Parking Facilities 290,000 Parks Equipment 2,276,839 Streetscape Enhancement 1,201,753 Local Traffic Management and Blackspot Projects 1,625,581 Major Road Construction 1,880,000 Paths & Bicycle Networks 843,000 Stormwater Drainage 480,000 Street Lighting 922,000 Road Preservation & Resurfacing 7,206,995 Bridges 25,000 Major Building Works & Projects 25,987,324 Total Capital Works Program 44,446,548
Motor Vehicle Replacement
5%
Capital Works85%
Capital Projects10%
2014‐15 Budgeted Capital Expenditure
CITY OF JOONDALUP 2014-15 Annual Budget
8
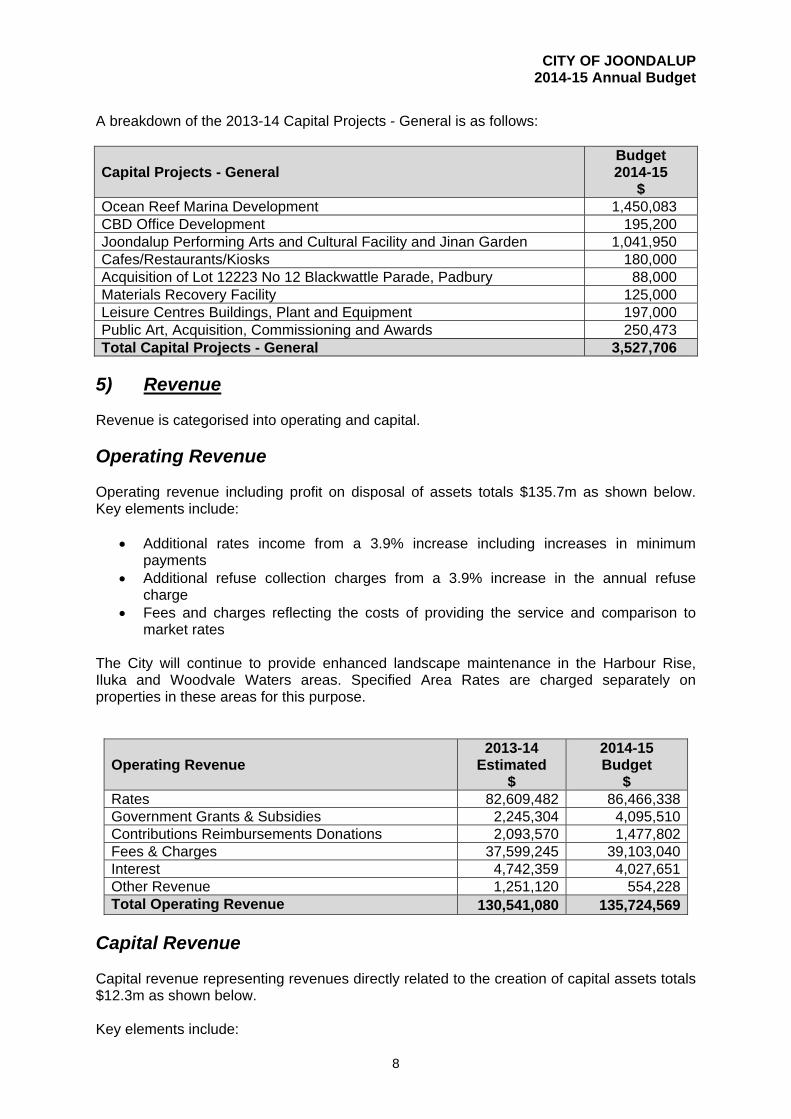
A breakdown of the 2013-14 Capital Projects - General is as follows:
Capital Projects - General Budget 2014-15
$ Ocean Reef Marina Development 1,450,083 CBD Office Development 195,200 Joondalup Performing Arts and Cultural Facility and Jinan Garden 1,041,950 Cafes/Restaurants/Kiosks 180,000 Acquisition of Lot 12223 No 12 Blackwattle Parade, Padbury 88,000 Materials Recovery Facility 125,000 Leisure Centres Buildings, Plant and Equipment 197,000 Public Art, Acquisition, Commissioning and Awards 250,473 Total Capital Projects - General 3,527,706
5) Revenue Revenue is categorised into operating and capital.
Operating Revenue Operating revenue including profit on disposal of assets totals $135.7m as shown below. Key elements include:
Additional rates income from a 3.9% increase including increases in minimum payments
Additional refuse collection charges from a 3.9% increase in the annual refuse charge
Fees and charges reflecting the costs of providing the service and comparison to market rates
The City will continue to provide enhanced landscape maintenance in the Harbour Rise, Iluka and Woodvale Waters areas. Specified Area Rates are charged separately on properties in these areas for this purpose.
Operating Revenue 2013-14
Estimated $
2014-15 Budget
$ Rates 82,609,482 86,466,338 Government Grants & Subsidies 2,245,304 4,095,510 Contributions Reimbursements Donations 2,093,570 1,477,802 Fees & Charges 37,599,245 39,103,040 Interest 4,742,359 4,027,651 Other Revenue 1,251,120 554,228Total Operating Revenue 130,541,080 135,724,569
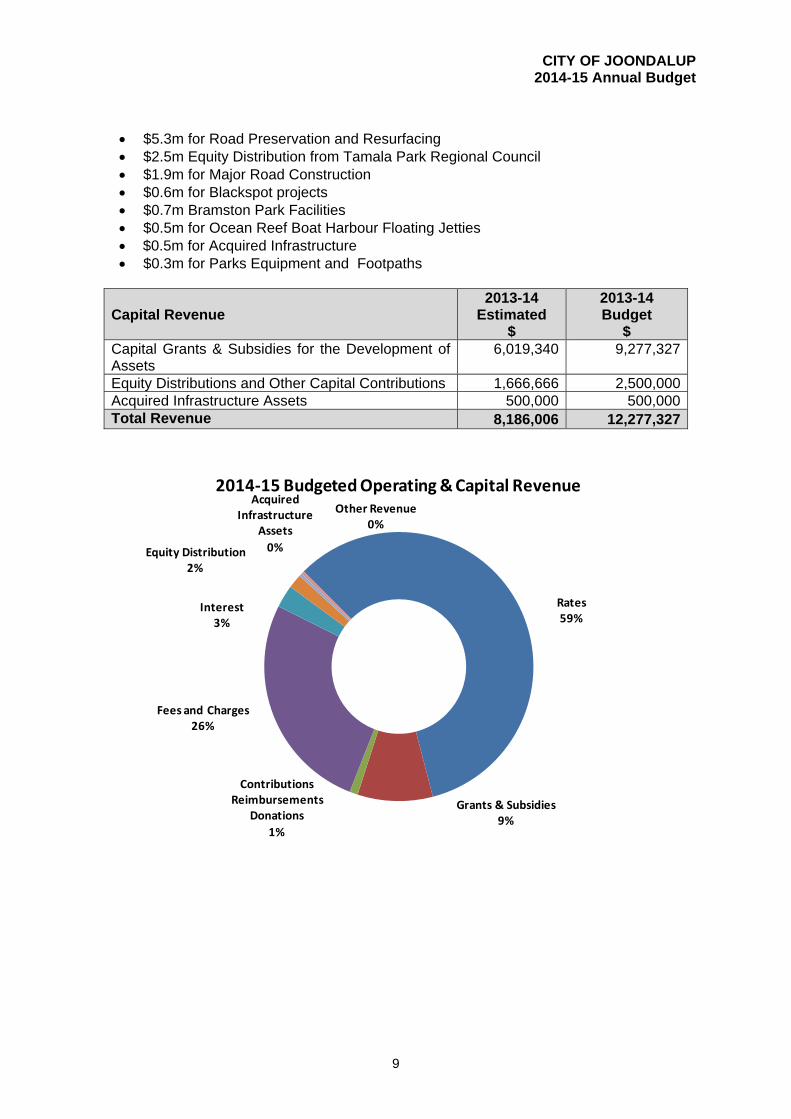
Capital Revenue Capital revenue representing revenues directly related to the creation of capital assets totals $12.3m as shown below. Key elements include:
CITY OF JOONDALUP 2014-15 Annual Budget
9
$5.3m for Road Preservation and Resurfacing $2.5m Equity Distribution from Tamala Park Regional Council $1.9m for Major Road Construction $0.6m for Blackspot projects $0.7m Bramston Park Facilities $0.5m for Ocean Reef Boat Harbour Floating Jetties $0.5m for Acquired Infrastructure $0.3m for Parks Equipment and Footpaths
Capital Revenue 2013-14
Estimated $
2013-14 Budget
$ Capital Grants & Subsidies for the Development of Assets
6,019,340 9,277,327
Equity Distributions and Other Capital Contributions 1,666,666 2,500,000Acquired Infrastructure Assets 500,000 500,000Total Revenue 8,186,006 12,277,327
Rates59%
Grants & Subsidies9%
Contributions Reimbursements
Donations
1%
Fees and Charges26%
Interest3%
Equity Distribution2%
Acquired Infrastructure
Assets
0%
Other Revenue0%
2014‐15 Budgeted Operating & Capital Revenue
CITY OF JOONDALUP 2014-15 Annual Budget
10
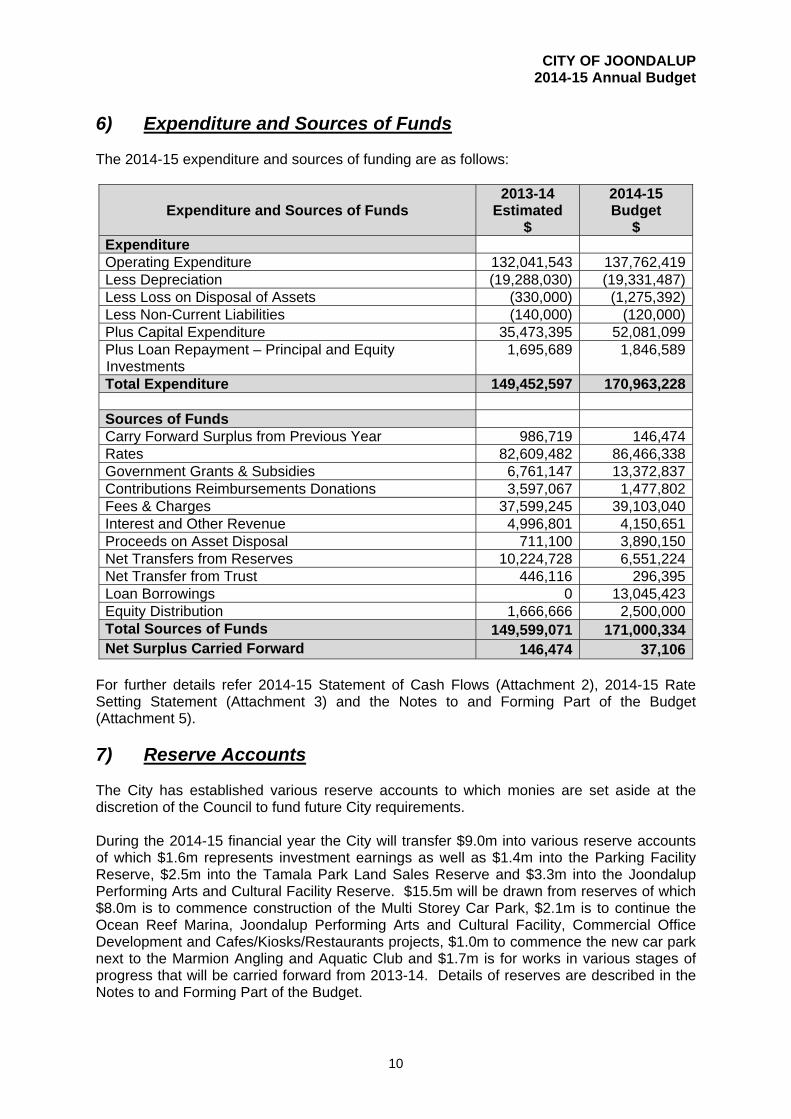
6) Expenditure and Sources of Funds The 2014-15 expenditure and sources of funding are as follows:
Expenditure and Sources of Funds 2013-14
Estimated $
2014-15 Budget
$ Expenditure Operating Expenditure 132,041,543 137,762,419Less Depreciation (19,288,030) (19,331,487)Less Loss on Disposal of Assets (330,000) (1,275,392)Less Non-Current Liabilities (140,000) (120,000)Plus Capital Expenditure 35,473,395 52,081,099Plus Loan Repayment – Principal and Equity Investments
1,695,689 1,846,589
Total Expenditure 149,452,597 170,963,228 Sources of Funds Carry Forward Surplus from Previous Year 986,719 146,474Rates 82,609,482 86,466,338Government Grants & Subsidies 6,761,147 13,372,837Contributions Reimbursements Donations 3,597,067 1,477,802Fees & Charges 37,599,245 39,103,040Interest and Other Revenue 4,996,801 4,150,651Proceeds on Asset Disposal 711,100 3,890,150Net Transfers from Reserves 10,224,728 6,551,224Net Transfer from Trust 446,116 296,395Loan Borrowings 0 13,045,423Equity Distribution 1,666,666 2,500,000Total Sources of Funds 149,599,071 171,000,334Net Surplus Carried Forward 146,474 37,106
For further details refer 2014-15 Statement of Cash Flows (Attachment 2), 2014-15 Rate Setting Statement (Attachment 3) and the Notes to and Forming Part of the Budget (Attachment 5).
7) Reserve Accounts The City has established various reserve accounts to which monies are set aside at the discretion of the Council to fund future City requirements. During the 2014-15 financial year the City will transfer $9.0m into various reserve accounts of which $1.6m represents investment earnings as well as $1.4m into the Parking Facility Reserve, $2.5m into the Tamala Park Land Sales Reserve and $3.3m into the Joondalup Performing Arts and Cultural Facility Reserve. $15.5m will be drawn from reserves of which $8.0m is to commence construction of the Multi Storey Car Park, $2.1m is to continue the Ocean Reef Marina, Joondalup Performing Arts and Cultural Facility, Commercial Office Development and Cafes/Kiosks/Restaurants projects, $1.0m to commence the new car park next to the Marmion Angling and Aquatic Club and $1.7m is for works in various stages of progress that will be carried forward from 2013-14. Details of reserves are described in the Notes to and Forming Part of the Budget.
Attachment 1.a
Budget Estimate Budget
2013-14 2013-14 2014-15
$ $ $
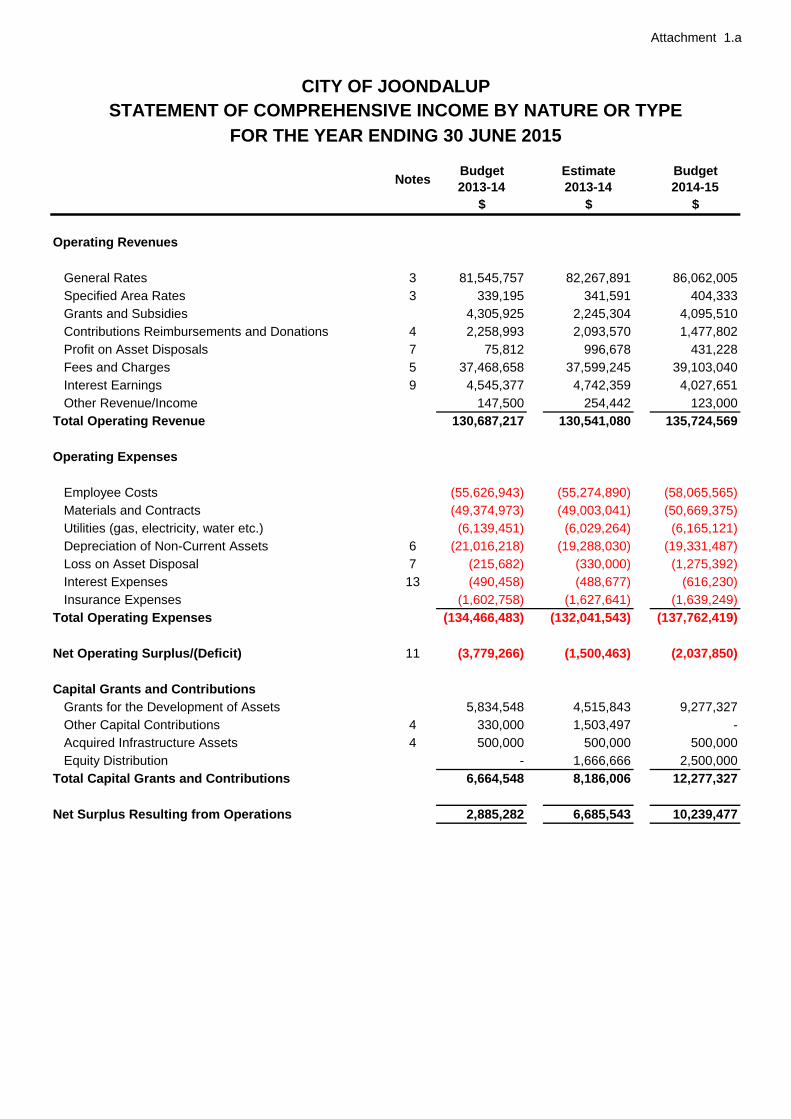
Operating Revenues
General Rates 3 81,545,757 82,267,891 86,062,005
Specified Area Rates 3 339,195 341,591 404,333
Grants and Subsidies 4,305,925 2,245,304 4,095,510
Contributions Reimbursements and Donations 4 2,258,993 2,093,570 1,477,802
Profit on Asset Disposals 7 75,812 996,678 431,228
Fees and Charges 5 37,468,658 37,599,245 39,103,040
Interest Earnings 9 4,545,377 4,742,359 4,027,651
Other Revenue/Income 147,500 254,442 123,000
Total Operating Revenue 130,687,217 130,541,080 135,724,569
Operating Expenses
Employee Costs (55,626,943) (55,274,890) (58,065,565)
Materials and Contracts (49,374,973) (49,003,041) (50,669,375)
Utilities (gas, electricity, water etc.) (6,139,451) (6,029,264) (6,165,121)
Depreciation of Non-Current Assets 6 (21,016,218) (19,288,030) (19,331,487)
Loss on Asset Disposal 7 (215,682) (330,000) (1,275,392)
Interest Expenses 13 (490,458) (488,677) (616,230)
Insurance Expenses (1,602,758) (1,627,641) (1,639,249)
Total Operating Expenses (134,466,483) (132,041,543) (137,762,419)
Net Operating Surplus/(Deficit) 11 (3,779,266) (1,500,463) (2,037,850)
Capital Grants and Contributions
Grants for the Development of Assets 5,834,548 4,515,843 9,277,327
Other Capital Contributions 4 330,000 1,503,497 -
Acquired Infrastructure Assets 4 500,000 500,000 500,000
Equity Distribution - 1,666,666 2,500,000
Total Capital Grants and Contributions 6,664,548 8,186,006 12,277,327
Net Surplus Resulting from Operations 2,885,282 6,685,543 10,239,477
Notes
CITY OF JOONDALUP
STATEMENT OF COMPREHENSIVE INCOME BY NATURE OR TYPE
FOR THE YEAR ENDING 30 JUNE 2015
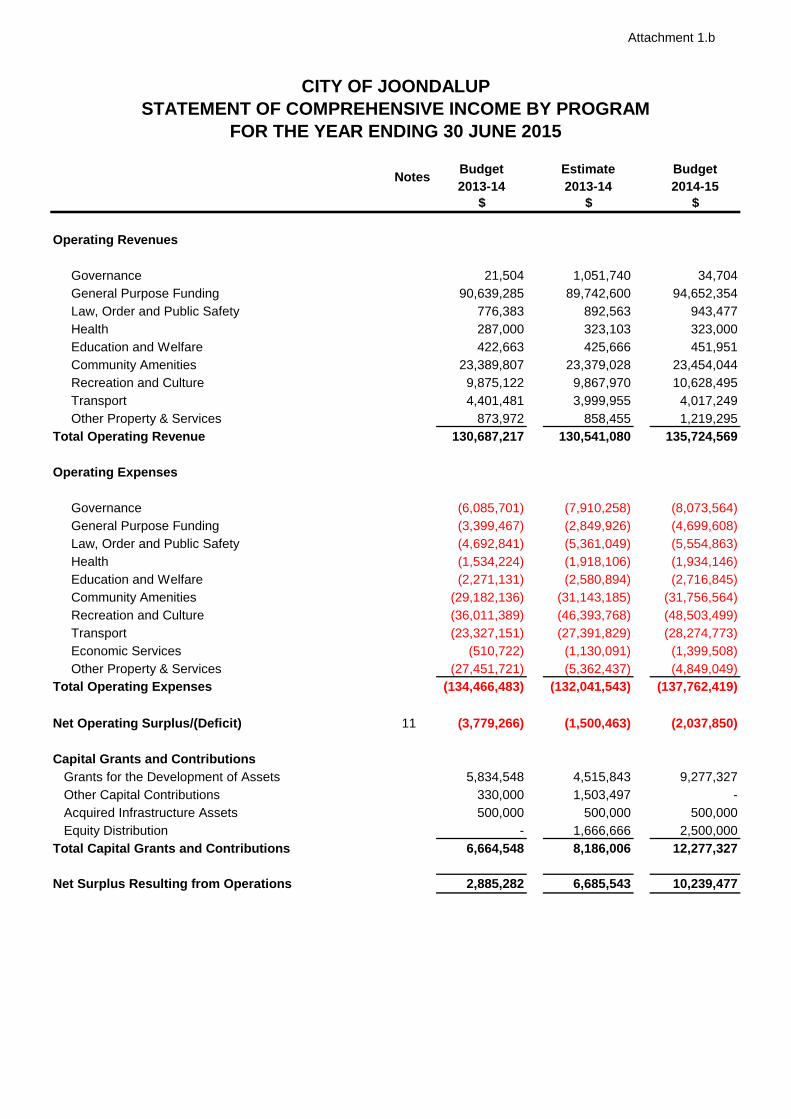
Attachment 1.b
Budget Estimate Budget
2013-14 2013-14 2014-15
$ $ $
Operating Revenues
Governance 21,504 1,051,740 34,704
General Purpose Funding 90,639,285 89,742,600 94,652,354
Law, Order and Public Safety 776,383 892,563 943,477
Health 287,000 323,103 323,000
Education and Welfare 422,663 425,666 451,951
Community Amenities 23,389,807 23,379,028 23,454,044
Recreation and Culture 9,875,122 9,867,970 10,628,495
Transport 4,401,481 3,999,955 4,017,249
Other Property & Services 873,972 858,455 1,219,295
Total Operating Revenue 130,687,217 130,541,080 135,724,569
Operating Expenses
Governance (6,085,701) (7,910,258) (8,073,564)
General Purpose Funding (3,399,467) (2,849,926) (4,699,608)
Law, Order and Public Safety (4,692,841) (5,361,049) (5,554,863)
Health (1,534,224) (1,918,106) (1,934,146)
Education and Welfare (2,271,131) (2,580,894) (2,716,845)
Community Amenities (29,182,136) (31,143,185) (31,756,564)
Recreation and Culture (36,011,389) (46,393,768) (48,503,499)
Transport (23,327,151) (27,391,829) (28,274,773)
Economic Services (510,722) (1,130,091) (1,399,508)
Other Property & Services (27,451,721) (5,362,437) (4,849,049)
Total Operating Expenses (134,466,483) (132,041,543) (137,762,419)
Net Operating Surplus/(Deficit) 11 (3,779,266) (1,500,463) (2,037,850)
Capital Grants and Contributions
Grants for the Development of Assets 5,834,548 4,515,843 9,277,327
Other Capital Contributions 330,000 1,503,497 -
Acquired Infrastructure Assets 500,000 500,000 500,000
Equity Distribution - 1,666,666 2,500,000
Total Capital Grants and Contributions 6,664,548 8,186,006 12,277,327
Net Surplus Resulting from Operations 2,885,282 6,685,543 10,239,477
Notes
CITY OF JOONDALUP
STATEMENT OF COMPREHENSIVE INCOME BY PROGRAM
FOR THE YEAR ENDING 30 JUNE 2015
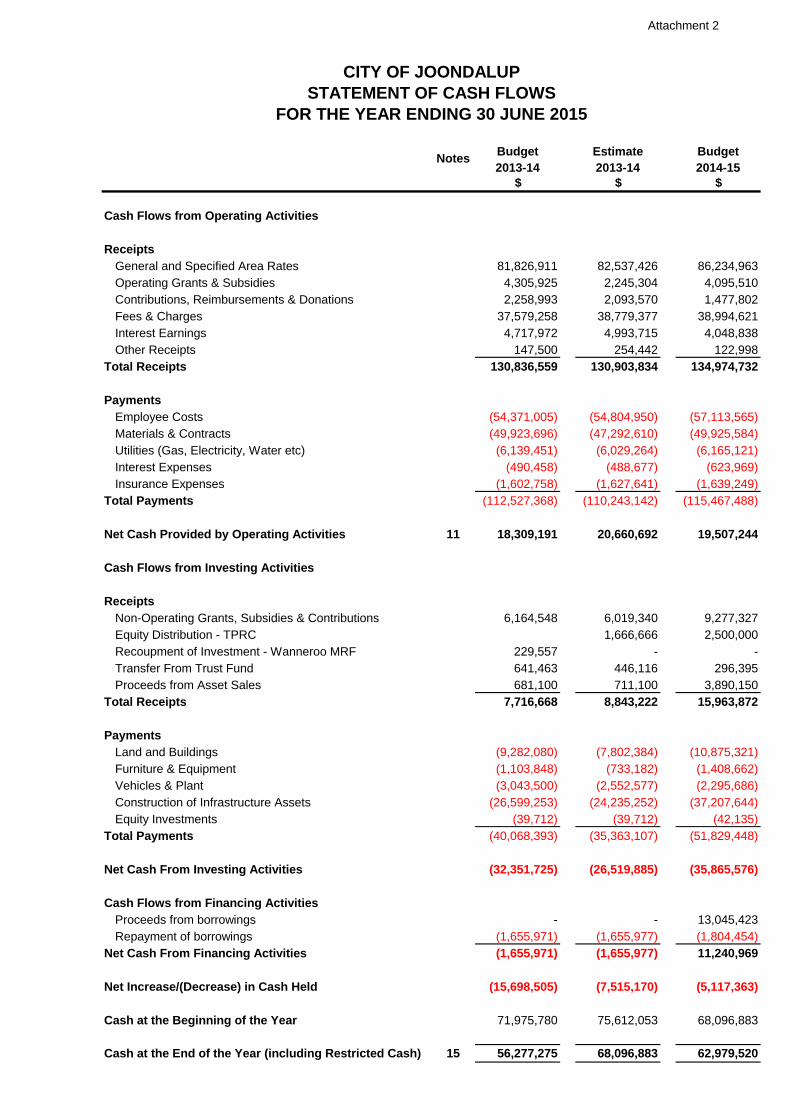
Attachment 2
CITY OF JOONDALUP
FOR THE YEAR ENDING 30 JUNE 2015
Budget Estimate Budget
2013-14 2013-14 2014-15
$ $ $
Cash Flows from Operating Activities
Receipts
General and Specified Area Rates 81,826,911 82,537,426 86,234,963
Operating Grants & Subsidies 4,305,925 2,245,304 4,095,510
Contributions, Reimbursements & Donations 2,258,993 2,093,570 1,477,802
Fees & Charges 37,579,258 38,779,377 38,994,621
Interest Earnings 4,717,972 4,993,715 4,048,838
Other Receipts 147,500 254,442 122,998
Total Receipts 130,836,559 130,903,834 134,974,732
Payments
Employee Costs (54,371,005) (54,804,950) (57,113,565)
Materials & Contracts (49,923,696) (47,292,610) (49,925,584)
Utilities (Gas, Electricity, Water etc) (6,139,451) (6,029,264) (6,165,121)
Interest Expenses (490,458) (488,677) (623,969)
Insurance Expenses (1,602,758) (1,627,641) (1,639,249)
Total Payments (112,527,368) (110,243,142) (115,467,488)
Net Cash Provided by Operating Activities 11 18,309,191 20,660,692 19,507,244
Cash Flows from Investing Activities
Receipts
Non-Operating Grants, Subsidies & Contributions 6,164,548 6,019,340 9,277,327
Equity Distribution - TPRC 1,666,666 2,500,000
Recoupment of Investment - Wanneroo MRF 229,557 - -
Transfer From Trust Fund 641,463 446,116 296,395
Proceeds from Asset Sales 681,100 711,100 3,890,150
Total Receipts 7,716,668 8,843,222 15,963,872
Payments
Land and Buildings (9,282,080) (7,802,384) (10,875,321)
Furniture & Equipment (1,103,848) (733,182) (1,408,662)
Vehicles & Plant (3,043,500) (2,552,577) (2,295,686)
Construction of Infrastructure Assets (26,599,253) (24,235,252) (37,207,644)
Equity Investments (39,712) (39,712) (42,135)
Total Payments (40,068,393) (35,363,107) (51,829,448)
Net Cash From Investing Activities (32,351,725) (26,519,885) (35,865,576)
Cash Flows from Financing Activities
Proceeds from borrowings - - 13,045,423
Repayment of borrowings (1,655,971) (1,655,977) (1,804,454)
Net Cash From Financing Activities (1,655,971) (1,655,977) 11,240,969
Net Increase/(Decrease) in Cash Held (15,698,505) (7,515,170) (5,117,363)
Cash at the Beginning of the Year 71,975,780 75,612,053 68,096,883
Cash at the End of the Year (including Restricted Cash) 15 56,277,275 68,096,883 62,979,520
Notes
STATEMENT OF CASH FLOWS
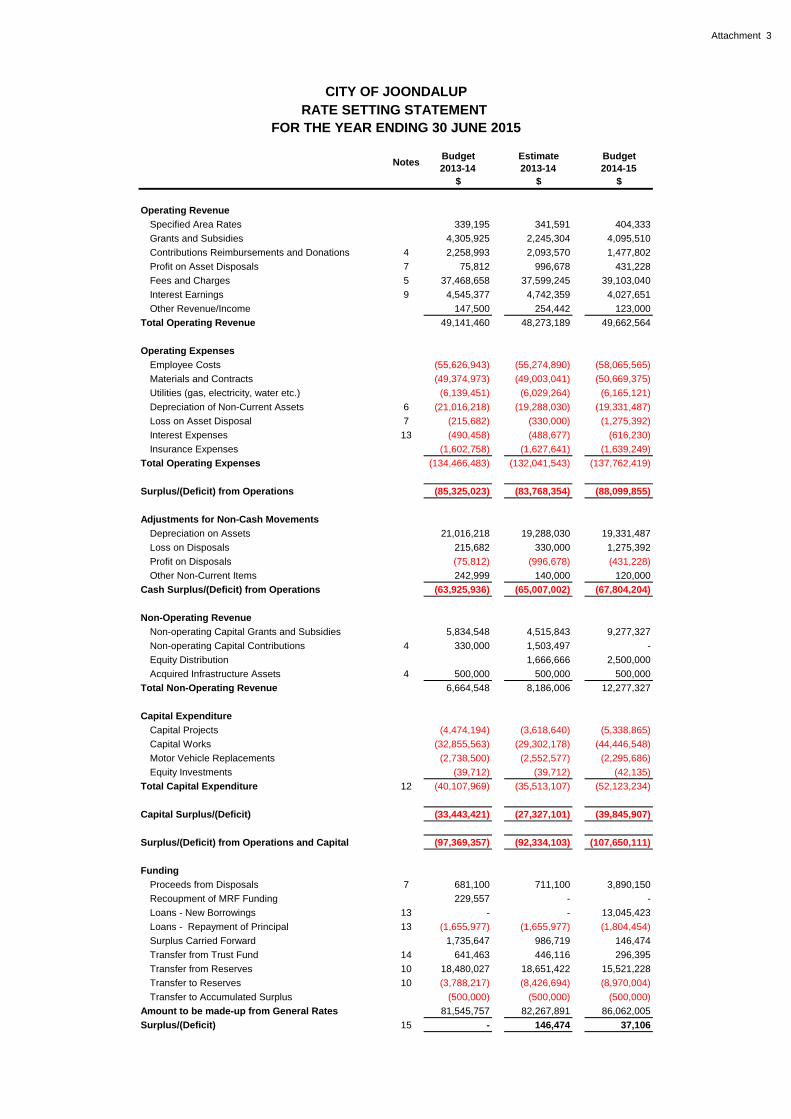
Attachment 3
CITY OF JOONDALUP
RATE SETTING STATEMENT
Budget Estimate Budget
2013-14 2013-14 2014-15
$ $ $
Operating Revenue
Specified Area Rates 339,195 341,591 404,333
Grants and Subsidies 4,305,925 2,245,304 4,095,510
Contributions Reimbursements and Donations 4 2,258,993 2,093,570 1,477,802
Profit on Asset Disposals 7 75,812 996,678 431,228
Fees and Charges 5 37,468,658 37,599,245 39,103,040
Interest Earnings 9 4,545,377 4,742,359 4,027,651
Other Revenue/Income 147,500 254,442 123,000
Total Operating Revenue 49,141,460 48,273,189 49,662,564
Operating Expenses
Employee Costs (55,626,943) (55,274,890) (58,065,565)
Materials and Contracts (49,374,973) (49,003,041) (50,669,375)
Utilities (gas, electricity, water etc.) (6,139,451) (6,029,264) (6,165,121)
Depreciation of Non-Current Assets 6 (21,016,218) (19,288,030) (19,331,487)
Loss on Asset Disposal 7 (215,682) (330,000) (1,275,392)
Interest Expenses 13 (490,458) (488,677) (616,230)
Insurance Expenses (1,602,758) (1,627,641) (1,639,249)
Total Operating Expenses (134,466,483) (132,041,543) (137,762,419)
Surplus/(Deficit) from Operations (85,325,023) (83,768,354) (88,099,855)
Adjustments for Non-Cash Movements
Depreciation on Assets 21,016,218 19,288,030 19,331,487
Loss on Disposals 215,682 330,000 1,275,392
Profit on Disposals (75,812) (996,678) (431,228)
Other Non-Current Items 242,999 140,000 120,000
Cash Surplus/(Deficit) from Operations (63,925,936) (65,007,002) (67,804,204)
Non-Operating Revenue
Non-operating Capital Grants and Subsidies 5,834,548 4,515,843 9,277,327
Non-operating Capital Contributions 4 330,000 1,503,497 -
Equity Distribution 1,666,666 2,500,000
Acquired Infrastructure Assets 4 500,000 500,000 500,000
Total Non-Operating Revenue 6,664,548 8,186,006 12,277,327
Capital Expenditure
Capital Projects (4,474,194) (3,618,640) (5,338,865)
Capital Works (32,855,563) (29,302,178) (44,446,548)
Motor Vehicle Replacements (2,738,500) (2,552,577) (2,295,686)
Equity Investments (39,712) (39,712) (42,135)
Total Capital Expenditure 12 (40,107,969) (35,513,107) (52,123,234)
Capital Surplus/(Deficit) (33,443,421) (27,327,101) (39,845,907)
Surplus/(Deficit) from Operations and Capital (97,369,357) (92,334,103) (107,650,111)
Funding
Proceeds from Disposals 7 681,100 711,100 3,890,150
Recoupment of MRF Funding 229,557 - -
Loans - New Borrowings 13 - - 13,045,423
Loans - Repayment of Principal 13 (1,655,977) (1,655,977) (1,804,454)
Surplus Carried Forward 1,735,647 986,719 146,474
Transfer from Trust Fund 14 641,463 446,116 296,395
Transfer from Reserves 10 18,480,027 18,651,422 15,521,228
Transfer to Reserves 10 (3,788,217) (8,426,694) (8,970,004)
Transfer to Accumulated Surplus (500,000) (500,000) (500,000)
Amount to be made-up from General Rates 81,545,757 82,267,891 86,062,005
Surplus/(Deficit) 15 - 146,474 37,106
Notes
FOR THE YEAR ENDING 30 JUNE 2015
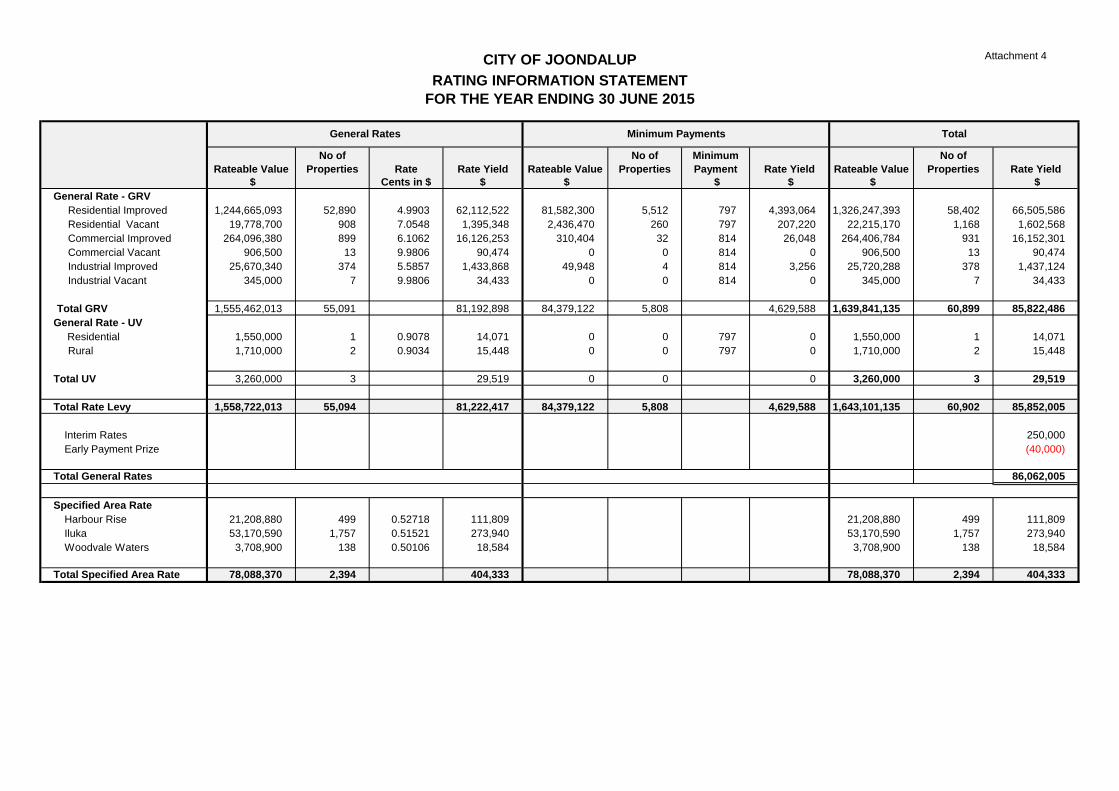
Attachment 4
Rateable Value
No of
Properties Rate Rate Yield Rateable Value
No of
Properties
Minimum
Payment Rate Yield Rateable Value
No of
Properties Rate Yield
$ Cents in $ $ $ $ $ $ $
General Rate - GRV
Residential Improved 1,244,665,093 52,890 4.9903 62,112,522 81,582,300 5,512 797 4,393,064 1,326,247,393 58,402 66,505,586
Residential Vacant 19,778,700 908 7.0548 1,395,348 2,436,470 260 797 207,220 22,215,170 1,168 1,602,568
Commercial Improved 264,096,380 899 6.1062 16,126,253 310,404 32 814 26,048 264,406,784 931 16,152,301
Commercial Vacant 906,500 13 9.9806 90,474 0 0 814 0 906,500 13 90,474
Industrial Improved 25,670,340 374 5.5857 1,433,868 49,948 4 814 3,256 25,720,288 378 1,437,124
Industrial Vacant 345,000 7 9.9806 34,433 0 0 814 0 345,000 7 34,433
Total GRV 1,555,462,013 55,091 81,192,898 84,379,122 5,808 4,629,588 1,639,841,135 60,899 85,822,486
General Rate - UV
Residential 1,550,000 1 0.9078 14,071 0 0 797 0 1,550,000 1 14,071
Rural 1,710,000 2 0.9034 15,448 0 0 797 0 1,710,000 2 15,448
Total UV 3,260,000 3 29,519 0 0 0 3,260,000 3 29,519
Total Rate Levy 1,558,722,013 55,094 81,222,417 84,379,122 5,808 4,629,588 1,643,101,135 60,902 85,852,005
Interim Rates 250,000
Early Payment Prize (40,000)
Total General Rates 86,062,005
Specified Area Rate
Harbour Rise 21,208,880 499 0.52718 111,809 21,208,880 499 111,809
Iluka 53,170,590 1,757 0.51521 273,940 53,170,590 1,757 273,940
Woodvale Waters 3,708,900 138 0.50106 18,584 3,708,900 138 18,584
Total Specified Area Rate 78,088,370 2,394 404,333 78,088,370 2,394 404,333
CITY OF JOONDALUP
General Rates Minimum Payments
RATING INFORMATION STATEMENT
FOR THE YEAR ENDING 30 JUNE 2015
Total
Attachment 5
1
NOTES TO AND FORMING PART OF THE BUDGET
1 Significant Accounting Policies ................................................................................... 1 2 Program Activities ...................................................................................................... 7 3 Rating and Valuations ................................................................................................ 9 4 Contributions, Reimbursements and Donations ........................................................ 16 5 Fees and Charges .................................................................................................... 17 6 Depreciation ............................................................................................................. 18 7 Profit / (Loss) on Disposals of Assets ....................................................................... 19 8 Members’ Fees and Allowances ............................................................................... 20 9 Interest Earnings ...................................................................................................... 21 10 Cash Backed Reserves ............................................................................................ 21 11 Reconciliation of Cash Provided by Operating Activity .............................................. 29 12 Capital Expenditure .................................................................................................. 30 13 Borrowings ............................................................................................................... 30 14 Trust Fund ................................................................................................................ 31 15 Determination of Opening Funds .............................................................................. 32 16 Major Land Transactions .......................................................................................... 33
Integrated Planning Framework
The City’s Integrated Planning Framework guides the organisation to deliver accountable and measurable linkages between community aspirations, financial capacity and practical service delivery. The City’s Strategic Community Plan outlines the vision, objectives and priorities of the City and its community, while the Corporate Business Plan translates the City’s strategic direction and priorities into an operational delivery program. Several key strategies also feed into this planning approach including the 20 Year Strategic Financial Plan to inform the resourcing requirements of the City.
The annual budget has been informed by this strategic planning process.
1 Significant Accounting Policies
The significant accounting policies which have been adopted in the preparation of the financial statements forming part of this budget are:
a) Basis of Preparation
The City’s financial report and budget constitute general purpose financial reports and have been prepared in accordance with the accounting and disclosure requirements of the Australian Accounting Standards (as they apply to local governments and not-for-profit entities), the Local Government Act 1995 (as amended) and the Local Government (Financial Management) Regulations 1996 (as amended). They have been prepared on the accrual basis under the convention of historical cost accounting modified, where applicable, by the measurement at fair value of certain classes of non-current assets, financial assets and liabilities.
b) The Local Government Reporting Entity
The City’s financial statements incorporate the Municipal Fund and the Reserve Fund under the control of the City.
In the process of reporting on the Local Government as a single entity, monies held by the City in the Trust Fund, of which the City has legal custody but is unable to deploy for its own purpose, are excluded from the consolidated financial statements and the cash position at the reporting date.
Attachment 5
2
c) Rounding off of Figures
All figures shown in the budget, other than a rate in the dollar, are rounded to the nearest dollar. This may cause variation between the financial statements and the notes.
d) Acquisition of Assets
Assets acquired during the year are recorded at the cost of acquisition, being the purchase consideration determined as at the date of acquisition plus costs incidental to the acquisition, subject to a capitalisation threshold applied to specific classes of assets as follows:
Furniture $ 5,000 Office Equipment $ 5,000 Motor Vehicles $ 5,000 Plant and Equipment $ 5,000 Computer Equipment $ 5,000 Computer Software $20,000 Infrastructure Assets $ 5,000
All other classes of assets are capitalised, regardless of the initial cost of acquisition.
In the event that settlement of all or part of the cash consideration given in the acquisition of an asset is deferred, the fair value of the purchase consideration is determined by discounting the amounts payable in the future to their present value as at the date of acquisition.
e) Property, Plant and Equipment
Recognition Property, plant and equipment are carried at cost less accumulated depreciation, except for land and buildings carried at fair value. Items of property, plant and equipment, including buildings but excluding freehold land and artworks are depreciated over their estimated useful lives on a straight-line basis. Depreciation has been charged to the Statement of Comprehensive Income. The estimated useful lives, residual values and depreciation method are reviewed at the end of each annual reporting period. Revaluation All asset classes may be revalued on a regular basis such that the carrying values are not materially different from fair value. Those assets carried at a revalued amount, being their fair value at the date of revaluation less any subsequent accumulated depreciation and accumulated impairment losses, are to be revalued with sufficient regularity to ensure that the carrying amount does not differ significantly from that determined using fair value at the reporting date.
f) Infrastructure Assets
Recognition Reserves and Engineering infrastructure assets acquired prior to 30 June 1997 were brought to account as non current assets at their estimated depreciated replacement cost at that time (deemed cost). Additions subsequent to 30 June 1997 are recorded at cost. Infrastructure assets acquired by the City from contributions by developers are recorded as additions to assets and the income recorded in the Statement of Comprehensive Income.
Attachment 5
3
Infrastructure assets acquired and constructed during the year are depreciated over their estimated useful lives on a straight-line basis from the commencement of the following financial year, subject to the capitalisation threshold. Depreciation has been charged to the Statement of Comprehensive Income.
Revaluation All infrastructure asset classes may be revalued on a regular basis such that the carrying values are not materially different from fair value. For infrastructure and other asset classes where no active market exists, fair value is determined to be the current replacement cost of an asset less, where applicable, accumulated depreciation calculated on a basis to reflect the already consumed or expired future economic benefits. Those assets carried at a revalued amount, being their fair value at the date of revaluation less any subsequent accumulated depreciation and accumulated impairment losses, are to be revalued with sufficient regularity to ensure the carrying amount does not differ significantly from that determined using fair value at reporting date.
Land under Roads Council has elected not to recognise the value of land under roads acquired before 1 July 2008 in accordance with AASB 1051. The City of Joondalup is required by Regulation 16 of the Local Government (Financial Management) Regulations 1996 not to recognise a value for land that is public thoroughfare.
g) Depreciation of Non-Current Assets
All non-current assets having a limited useful life are separately and systematically depreciated over their useful lives in a manner which reflects the consumption of the future economic benefits embodied in those assets. Property, plant and equipment are depreciated on a straight line basis from the date of acquisition or, in respect of internally constructed assets, from the time an asset is completed and ready for use. Infrastructure assets (roads, footpaths, drains, etc) are depreciated over their estimated useful lives on a straight-line basis effective from the commencement date of the next financial year following the year of acquisition / construction.
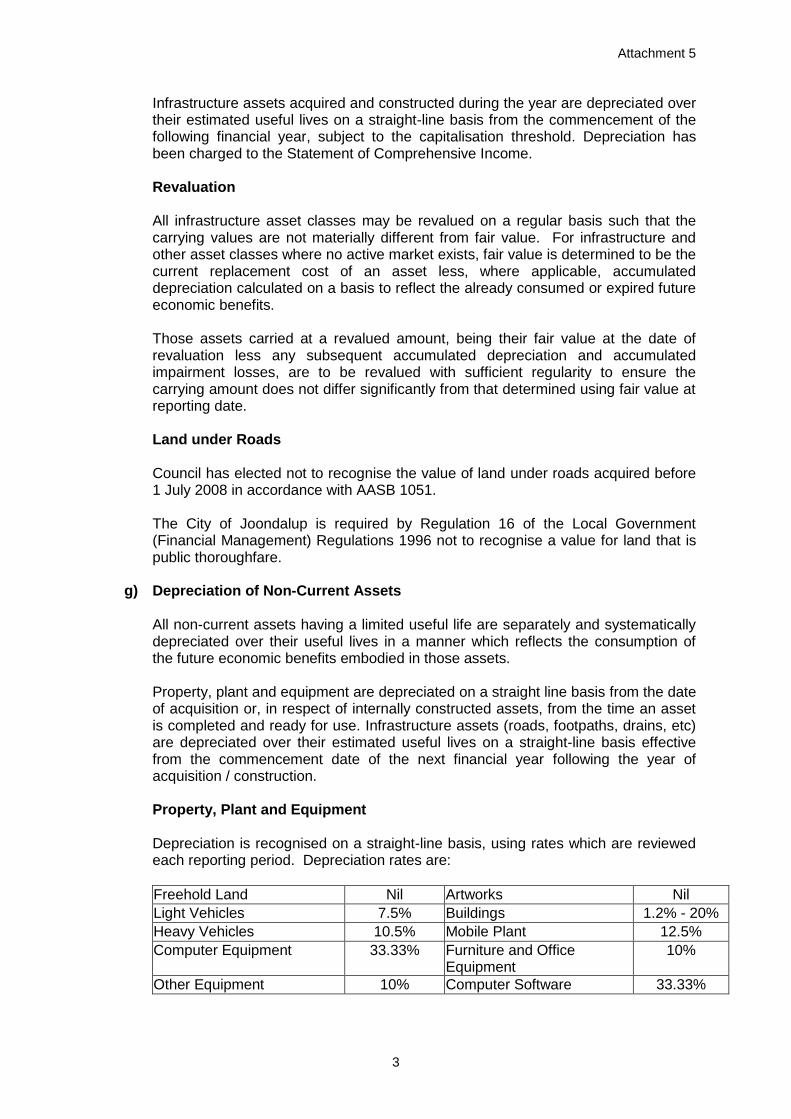
Property, Plant and Equipment Depreciation is recognised on a straight-line basis, using rates which are reviewed each reporting period. Depreciation rates are:
Freehold Land Nil Artworks Nil
Light Vehicles 7.5% Buildings 1.2% - 20%
Heavy Vehicles 10.5% Mobile Plant 12.5%
Computer Equipment 33.33% Furniture and Office Equipment
10%
Other Equipment 10% Computer Software 33.33%
Attachment 5
4
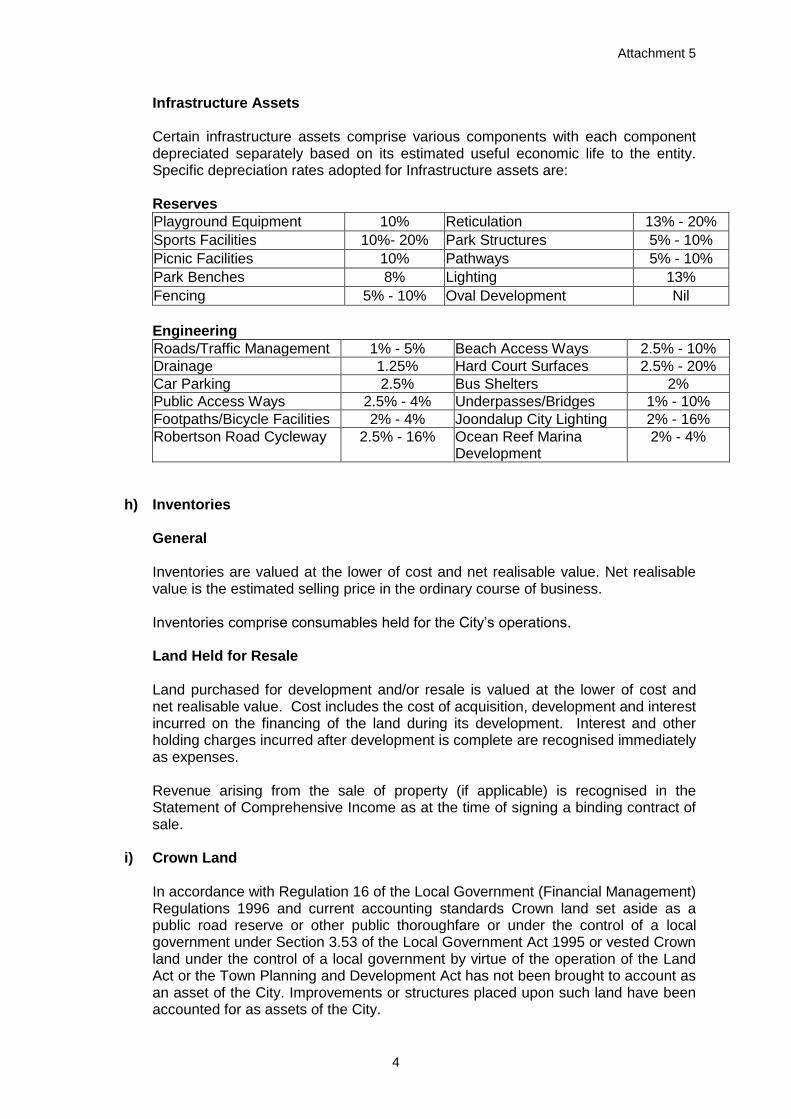
Infrastructure Assets Certain infrastructure assets comprise various components with each component depreciated separately based on its estimated useful economic life to the entity. Specific depreciation rates adopted for Infrastructure assets are:
Reserves
Playground Equipment 10% Reticulation 13% - 20%
Sports Facilities 10%- 20% Park Structures 5% - 10%
Picnic Facilities 10% Pathways 5% - 10%
Park Benches 8% Lighting 13%
Fencing 5% - 10% Oval Development Nil
Engineering
Roads/Traffic Management 1% - 5% Beach Access Ways 2.5% - 10%
Drainage 1.25% Hard Court Surfaces 2.5% - 20%
Car Parking 2.5% Bus Shelters 2%
Public Access Ways 2.5% - 4% Underpasses/Bridges 1% - 10%
Footpaths/Bicycle Facilities 2% - 4% Joondalup City Lighting 2% - 16%
Robertson Road Cycleway 2.5% - 16% Ocean Reef Marina Development
2% - 4%
h) Inventories
General Inventories are valued at the lower of cost and net realisable value. Net realisable value is the estimated selling price in the ordinary course of business. Inventories comprise consumables held for the City’s operations.
Land Held for Resale Land purchased for development and/or resale is valued at the lower of cost and net realisable value. Cost includes the cost of acquisition, development and interest incurred on the financing of the land during its development. Interest and other holding charges incurred after development is complete are recognised immediately as expenses. Revenue arising from the sale of property (if applicable) is recognised in the Statement of Comprehensive Income as at the time of signing a binding contract of sale.
i) Crown Land
In accordance with Regulation 16 of the Local Government (Financial Management) Regulations 1996 and current accounting standards Crown land set aside as a public road reserve or other public thoroughfare or under the control of a local government under Section 3.53 of the Local Government Act 1995 or vested Crown land under the control of a local government by virtue of the operation of the Land Act or the Town Planning and Development Act has not been brought to account as an asset of the City. Improvements or structures placed upon such land have been accounted for as assets of the City.
Attachment 5
5
j) Impairment
In accordance with Australian Accounting Standards the City’s assets, other than inventories, are assessed at each reporting date to determine whether there is any indication they may be impaired. Where such an indication exists, an estimate of the recoverable amount of the asset is made in accordance with AASB 136 “Impairment of Assets” and appropriate adjustments made. Impairment losses are recognised in the Comprehensive Income Statement whenever the carrying amount of an asset or its cash-generating unit exceeds its recoverable amount. For non-cash-generating assets, such as infrastructure, public buildings and the like, value in use is represented by the depreciated replacement cost of the asset. In adopting this budget, it is not possible to estimate the amount of impairment losses (if any) at 30 June 2015. In any event, an impairment loss is a non-cash transaction and consequently, has no net impact on the budget.
k) Rates
The rating and reporting periods coincide. All rates levied for the year are recognised as revenues. All outstanding rates are fully collectable and therefore no allowance has been made for doubtful debts. In accordance with the Rates and Charges (Rebates and Deferments) Act 1992, the City offers eligible pensioners and seniors the option to defer the payment of rates or to obtain a rebate from the Western Australian State Government. All eligible pensioners registered under the Rates and Charges (Rebates and Deferments) Act 1992 may obtain a rebate or defer their rates for full payment upon sale of their property. Pensioners who hold a Commonwealth Concession Card and a Pensioner Health Benefit Card, a State Concession Card, Seniors Card or a Commonwealth Seniors Health Card can apply to be eligible for this State scheme. There is no cost to the City under this scheme as interest is received from the State Government for pensioner deferred rates.
l) Grants, Donations and Other Contributions
All grants, donations and other contributions in respect of which the City is not required to make a reciprocal transfer of economic benefits are recognised as revenue when the City obtains control over the assets comprising the contribution. After being recognised as revenue, conditional grants and contributions are recognised as an expense and liability when the City fails to meet the specific conditions attached to a grant or contribution and becomes liable for its re-payment or refund. Capital grants unspent are treated as restricted assets and are deducted from the available funds in the determination of the Opening and Closing Funds for the purpose of the Rate Setting Statement incorporated in the City’s budget.
m) Employee Benefits
Provision is made for benefits accruing to employees in respect of annual leave and long service leave when it is probable that settlement will be required, and are capable of being measured reliably.
Attachment 5
6
Provisions made in respect of annual leave and long service leave, to be settled within twelve months, are measured at their nominal values. Provisions made in respect of long service leave which are not expected to be settled within 12 months are measured at their present value of the estimated future cash outflows to be made by the City in respect of services provided by employees up to the reporting date.
n) Borrowing Costs
Borrowing costs are recognised as an expense in the period in which they are incurred. Where the purpose of borrowings is to fund the acquisition or construction of assets, borrowing costs may be capitalised as part of the cost of the assets involved, offset by any interest earned on the borrowed fund before being spent. In accordance with the treatment permitted by Australian Accounting Standards, the City generally expenses borrowings costs as they are incurred, regardless of the purpose of the borrowing.
o) Investments
Investments in managed funds are marked to market and the resultant increase or decrease in value is reflected in the Statement of Comprehensive Income at the reporting date. Interest on money market investments is recognised as revenue when earned. Investments in short term deposits, or which are otherwise readily convertible to known amounts of cash, are treated as part of cash and cash equivalents.
p) Superannuation Fund
The City of Joondalup makes statutory contributions to the Local Government Superannuation Plan and other Funds as nominated by its employees. The expense relating to those contributions has been recognised in the Statement of Comprehensive Income.
q) Works in Progress
Major buildings, infrastructure and other assets that have not been completed at the reporting date will be reflected as works in progress.
r) Trade and Other Accounts Payable
Trade and other accounts payable are recognised when the City becomes liable to make future payments resulting from the purchase of goods and services. The amounts are unsecured and are generally settled within 30 days of recognition.
s) Trade and Other Accounts Receivable
Accounts receivable are recognised initially at fair value and subsequently measured at amortised cost for uncollectible amounts using the effective interest rate method, less any allowance. Collectibility of receivables is reviewed on an ongoing basis. Debts that are known to be uncollectible are written off when identified. An allowance for doubtful debts is raised when there is objective evidence that they may not be collectible.
Attachment 5
7
t) Goods and Services Tax
In accordance with recommended practice, revenues, expenses and assets capitalised are stated net of any GST recoverable. Receivables and payables in the Balance Sheet are stated inclusive of applicable GST. The net amount of GST recoverable from, or payable to, the Australian Taxation Office is included as part of current assets and current liabilities. Cash flows are included in the statement of cash flows on a gross basis. The GST component of cash flows arising from investing and financing activities which is recoverable from, or payable to, the taxation authority is classified as operating cash flow.
u) Cash and Cash Equivalents
Cash and cash equivalents comprise cash at bank and in-hand, deposits held at call and short term deposits with an original maturity of six months or less that are readily convertible to known amounts of cash and which are subject to an insignificant risk of changes in values. For the purpose of the Statement of Cash Flows, cash and cash equivalents consist of cash and cash equivalents as defined above, including bank overdrafts which form an integral part of the City’s cash management, and are repayable on demand.
v) Comparatives
Where required, comparative figures have been restated to conform to changes in presentation for the current year Annual Budget.
2 Program Activities
Statements of Comprehensive Income have been provided by program and by nature. Broad definitions of each program are as follows:
a) Governance
Governance relates to elected members costs and other costs that relate to the tasks of assisting elected members and ratepayers on matters which do not concern specific City services.
b) General Purpose Funding
Rates income and expenditure, Grants Commission and pensioner deferred rates interest.
c) Law, Order and Public Safety
Supervision and enforcement of various local laws relating to fire prevention, animal control and other aspects of public safety.
Attachment 5
8
d) Health
Prevention and treatment of human illnesses, including inspection of premises/food control, immunisation and child health services.
e) Education and Welfare
Provision, management and support services for families, children and the aged and disabled within the community, including pre-school playgroups, day and after school care, assistance to schools and senior citizens support groups. Provision of aged persons units and resident funded units.
f) Housing
Provision of housing and leased accommodation where the City acts as landlord.
g) Community Amenities
Town planning and development, rubbish collection services, stormwater drainage, the provision of public conveniences, bus shelters, roadside furniture and litter control.
h) Recreation and Culture
Provision of facilities and support for organisations concerned with leisure time activities and sport, support for the performing and creative arts. This includes maintenance of halls, aquatic centres, recreation and community centres, parks, gardens, sports grounds and the operation of libraries.
i) Transport
Construction, maintenance and cleaning of streets, roads, bridges, drainage works, footpaths, parking facilities, traffic signs and the City works operation centre, including development, plant purchase and maintenance.
j) Economic Services
Rural services, pest control and the implementation of building controls.
k) Other Property and Services
Private works, public works overheads, plant operations, materials and salaries and wages. With the exception of private works, the above activities listed are mainly summaries of costs that are allocated to all works and services undertaken by the City.

Attachment 5
9
3 Rating and Valuations
The following table summarises the Gross Rental Values and Unimproved Values used in calculating the rates revenue to be raised.
Budget 2013-14 Estimate 2013-14 Budget 2014-15
Gross Rental Values $ $ $
Residential Improved 1,084,757,464 1,089,639,470 1,326,247,393
Residential Not Improved 23,534,776 21,532,656 22,215,170
Commercial Improved 203,468,777 220,546,935 264,406,784
Commercial Not Improved 1,458,700 1,284,450 906,500
Industrial Improved 23,459,709 22,922,447 25,720,288
Industrial Not Improved 331,000 331,000 345,000
Total 1,337,010,426 1,356,256,958 1,639,841,135
Unimproved Values
Residential 2,750,000 2,750,000 1,550,000
Rural 1,710,000 1,710,000 1,710,000
Total 4,460,000 4,460,000 3,260,000
a) Gross Rental Values
The Valuer General at the Department of Land Information (Landgate) conducted a Triennial Revaluation which provided the City with both Gross Rental Values (GRV) and Unimproved Values (UV) for the purpose of calculating Rates for the ensuing year. The values supplied are effective from 1 July 2014 and will continue for three years from that date.
b) Differential Rates
The City of Joondalup has applied differential rates as empowered under Section 6.33 of the Local Government Act 1995. The differential rates are levied on all rateable land within the City according to the predominant purpose for which the land is held or used. Should the predominant land use forming the basis for the imposition of the differential rates change during the year, the City is not required to amend the assessment of rates payable on that land on account of that change. The proposed new rates are set at differential levels that provide, as far as is practically possible, a fair and equitable distribution of the rate burden to each category of land having regard to its demands on the City’s services. None of the differential rates are more than twice the lowest differential rate as applied in this budget.
A Rating Information Statement giving details of each respective category and their rates in the dollar, respective valuation totals and rates revenue raised is provided in Attachment 4 to the budget.
Attachment 5
10
The objects and reasons for the imposition of each differential rate are:
Object
The rates in the dollar for the various differential rates are calculated to provide the shortfall in income required to enable the City to provide necessary works and services in the 2014-15 Financial Year after taking into account all non-rate sources of income.
Reason – Gross Rental Value Based Differential Rates Residential Improved – the rate in the dollar has been set to ensure that the proportion of total rate revenue derived from residential property remains consistent with previous years. Residential Vacant – the rate in the dollar has been set to ensure that the proportion of total rate revenue derived from residential property remains consistent with previous years and is higher than residential improved property to recognise the different valuation method and in an effort to promote development of this category of property thereby stimulating growth and development in the community. Commercial Improved – the rate in the dollar has been set to ensure that the proportion of total rate revenue derived from commercial property remains consistent with previous years and recognises the higher demand on City infrastructure and services from the activity on commercial property. Commercial Vacant – the rate in the dollar has been set to ensure that the proportion of total rate revenue derived from commercial property remains consistent with previous years and is higher than commercial improved property in an effort to promote development of this category of property thereby stimulating growth and development in the community. Industrial Improved – the rate in the dollar has been set to ensure that the proportion of total rate revenue derived from industrial property remains consistent with previous years and recognises the higher demand on City infrastructure and services from the activity on industrial property. Industrial Vacant – the rate in the dollar has been set to ensure that the proportion of total rate revenue derived from industrial property remains consistent with previous years and is higher than industrial improved property in an effort to promote development of this category of property thereby stimulating growth and development in the community. Reason – Unimproved Value Based Differential Rates Residential – the rate in the dollar has been set to ensure that the proportion of total rate revenue derived from residential property remains consistent with previous years. Rural – the rate in the dollar has been set to ensure that the proportion of total rate revenue derived from rural property remains consistent with previous years.
Attachment 5
11
c) Minimum payments
A minimum payment of $797 is applied to Gross Rental Valued residential improved and vacant and Unimproved Valued residential and rural rate categories in recognition that every property receives some minimum level of benefit from works and services provided by the City. A minimum payment of $814 is applied to Gross Rental Valued commercial and industrial both improved and vacant rate categories in recognition that every property receives some minimum level of benefit from works and services provided and the higher minimum compared to other rate categories recognises the higher demand on City infrastructure and services from the activity on commercial and industrial property. The same minimum payments apply to interim valuations as and when they take effect.
d) Concessions, waivers
No concessions are provided for in this financial year.
e) Rates Early Payment Incentive Scheme
In accordance with the provisions of Section 6.46 of the Local Government Act 1995, a Local Government is empowered to offer a discount or other incentive for the early payment of rates. The City will purchase a vehicle to offer as an incentive prize for early payment of rates in addition to commercially sponsored prizes being offered. An allowance of $40,000 for the purchase of the vehicle is included in the Annual Budget. The City offers the early rate payment incentive prizes where: - Full payment of all current and arrears of rates, (including specified area rates), emergency services levy, domestic refuse charge and private swimming pool inspection fee is received within 28 days of the issue date of the annual rate notice. A computerised random selection process, the integrity of which has been authenticated by the City’s auditor, will choose the prize winners. The winners will be invited to attend a prize draw function during which the prizes will be allocated in a secondary draw process.
f) Rates Payment Options
The City in accordance with the provisions of section 6.45 of the Local Government Act 1995 offers the following payment options for the payment of rates (including specified area rates), emergency services levy, domestic refuse charges and private swimming pool inspection fees.
g) One Instalment
Payment in full (including all arrears) within 28 days of the issue date of the annual rate notice due on 15 August 2014 and be eligible to enter the rate incentive scheme for prizes.
Payment in full within 35 days of the issue date of the annual rate notice due on 22 August 2014.
Attachment 5
12
Two Instalments
The first instalment of 50% of the total current rates (including specified area rates), emergency services levy, domestic refuse charge, private swimming pool inspection fees, instalment charge, plus the total outstanding arrears payable within 35 days of the issue date of the annual rate notice and due on 22 August 2014. The second instalment of 50% of the total of the current rates, emergency services levy, domestic refuse charge, private swimming pool inspection fees and instalment charge, payable 63 days after due date of first instalment due on 24 October 2014.
Four Instalments
The first instalment of 25% of the total current rates (including specified area rates), emergency services levy, domestic refuse charge, private swimming pool inspection fees, instalment charge, plus the total outstanding arrears payable within 35 days of the issue date of the annual rate notice on 22 August 2014. The second, third and fourth instalments, each of 25% of the total current rates (including specified area rates), emergency services levy, domestic refuse charge, private swimming pool inspection fees, and instalment charge payable as follows:
2nd instalment – 63 days after due date of 1st instalment on 24 October 2014
3rd instalment – 63 days after due date of 2nd instalment on 26 December 2014
4th instalment – 63 days after due date of 3rd instalment on 27 February 2015.
h) Instalment Charges and Calculation of Interest
The instalment options are subject to an administration fee for each instalment, together with simple interest on the unpaid balance, as described below. A total of $371,850 is anticipated as interest revenue on instalment payments, which is calculated as follows:
Two Instalments
An administration fee of $12 for instalment two, together with an interest charge of 5.5% per annum, calculated on a simple interest basis on 50% of the total current general rate (including specified area rates), emergency services levy, domestic refuse charge and private swimming pool inspection fees calculated from the due date of the first instalment for 63 days until the due date of the second and final instalment.
Four Instalments
An administration fee of $12 for each of the second, third and fourth instalments, together with an interest charge of 5.5% per annum, calculated on a simple interest basis on: 75% of the total current general rate (including specified area rate), emergency services levy, and domestic refuse charge and private swimming
Attachment 5
13
pool inspection fees calculated from the due date of the first instalment for 63 days until the due date of the second instalment. 50% of the total current general rate (including specified area rate), emergency services levy, domestic refuse charge and private swimming pool inspection fees calculated from the due date of the second instalment to the due date of the third instalment; and 25% of the total current general rate (including specified area rate), emergency services levy, domestic refuse charge and private swimming pool inspection fees calculated from the due date of the third instalment to the due date of the fourth instalment.
i) Special Payment Arrangements
Special fortnightly, monthly or bimonthly payment arrangements can be made with the City for those ratepayers who may be unable to pay in full or according to the instalment plans offered. An administration fee of $34 if paid by Direct Debit (bank account only) or $52 if paid by another method is charged on each special payment arrangement and interest of 11.00% pa is applied to the outstanding balance effective from 23 August 2014 until the account is paid in full.
j) Late Payment Interest
The Council, in accordance with the provisions of Section 6.13 and Section 6.51 of the Local Government Act 1995 imposes interest on all current and arrears of rates (including specified area rate), current and arrears of domestic refuse charges and current and arrears of private swimming pool inspection fees at a rate of 11.00% per annum based on simple interest, calculated on arrears amounts that remain unpaid and current amounts that remain unpaid after 35 days from the issue date of the original rate notice, or the due date of the instalment as the case may be and continues until the outstanding amount payable is fully paid. Calculated interest is charged monthly in arrears. Deferred rates, instalment amounts not due under the two or four-payment options, registered pensioner portions and current government pensioner rebate amounts are excluded from late payment interest calculation. Deferred rates earn interest at stipulated rates, which is paid over to the City by the State Government. The 2014-15 Budget includes an amount of $191,000 to be generated from interest earned on outstanding rates and $42,000 from deferred rates.
k) Domestic Refuse Charges
In accordance with the provisions of the Waste Avoidance and Resource Recovery Act 2007 the City imposes the following domestic refuse charges for the 2014-15 financial year, which includes a charge for a recycling service to be provided to all ratepayers during the budget year.
$346 per service
Collection from within the property boundary $56
New refuse service – Cost of bin and delivery $65
Attachment 5
14
l) Private Swimming Pool Inspection Fee
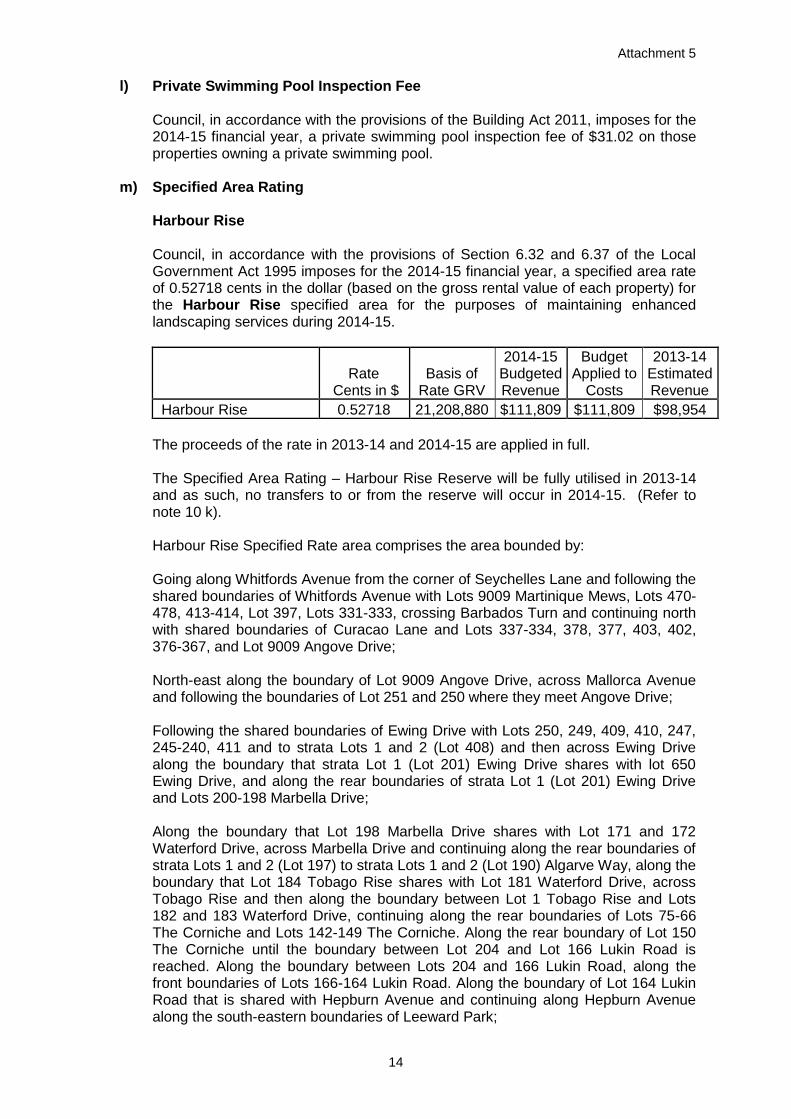
Council, in accordance with the provisions of the Building Act 2011, imposes for the 2014-15 financial year, a private swimming pool inspection fee of $31.02 on those properties owning a private swimming pool.
m) Specified Area Rating
Harbour Rise Council, in accordance with the provisions of Section 6.32 and 6.37 of the Local Government Act 1995 imposes for the 2014-15 financial year, a specified area rate of 0.52718 cents in the dollar (based on the gross rental value of each property) for the Harbour Rise specified area for the purposes of maintaining enhanced landscaping services during 2014-15.
Rate Cents in $
Basis of Rate GRV
2014-15 Budgeted Revenue
Budget Applied to
Costs
2013-14 Estimated Revenue
Harbour Rise 0.52718 21,208,880 $111,809 $111,809 $98,954
The proceeds of the rate in 2013-14 and 2014-15 are applied in full. The Specified Area Rating – Harbour Rise Reserve will be fully utilised in 2013-14 and as such, no transfers to or from the reserve will occur in 2014-15. (Refer to note 10 k). Harbour Rise Specified Rate area comprises the area bounded by: Going along Whitfords Avenue from the corner of Seychelles Lane and following the shared boundaries of Whitfords Avenue with Lots 9009 Martinique Mews, Lots 470-478, 413-414, Lot 397, Lots 331-333, crossing Barbados Turn and continuing north with shared boundaries of Curacao Lane and Lots 337-334, 378, 377, 403, 402, 376-367, and Lot 9009 Angove Drive; North-east along the boundary of Lot 9009 Angove Drive, across Mallorca Avenue and following the boundaries of Lot 251 and 250 where they meet Angove Drive; Following the shared boundaries of Ewing Drive with Lots 250, 249, 409, 410, 247, 245-240, 411 and to strata Lots 1 and 2 (Lot 408) and then across Ewing Drive along the boundary that strata Lot 1 (Lot 201) Ewing Drive shares with lot 650 Ewing Drive, and along the rear boundaries of strata Lot 1 (Lot 201) Ewing Drive and Lots 200-198 Marbella Drive; Along the boundary that Lot 198 Marbella Drive shares with Lot 171 and 172 Waterford Drive, across Marbella Drive and continuing along the rear boundaries of strata Lots 1 and 2 (Lot 197) to strata Lots 1 and 2 (Lot 190) Algarve Way, along the boundary that Lot 184 Tobago Rise shares with Lot 181 Waterford Drive, across Tobago Rise and then along the boundary between Lot 1 Tobago Rise and Lots 182 and 183 Waterford Drive, continuing along the rear boundaries of Lots 75-66 The Corniche and Lots 142-149 The Corniche. Along the rear boundary of Lot 150 The Corniche until the boundary between Lot 204 and Lot 166 Lukin Road is reached. Along the boundary between Lots 204 and 166 Lukin Road, along the front boundaries of Lots 166-164 Lukin Road. Along the boundary of Lot 164 Lukin Road that is shared with Hepburn Avenue and continuing along Hepburn Avenue along the south-eastern boundaries of Leeward Park;
Attachment 5
15
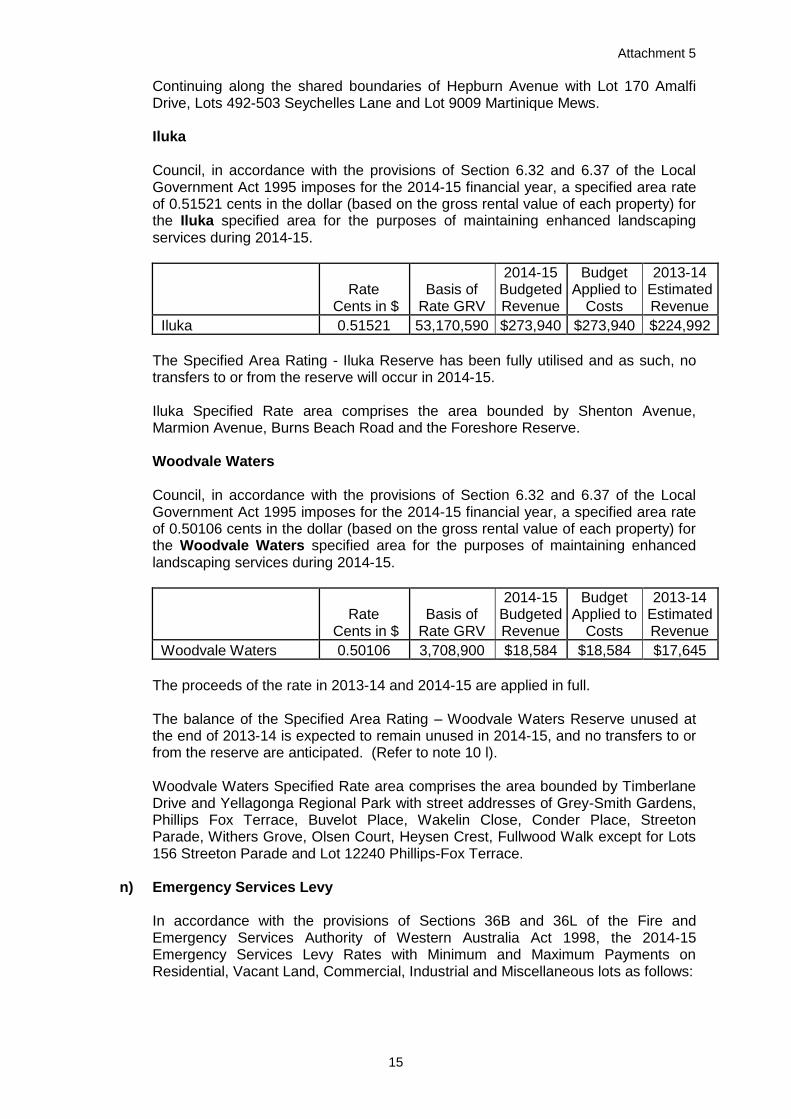
Continuing along the shared boundaries of Hepburn Avenue with Lot 170 Amalfi Drive, Lots 492-503 Seychelles Lane and Lot 9009 Martinique Mews. Iluka
Council, in accordance with the provisions of Section 6.32 and 6.37 of the Local Government Act 1995 imposes for the 2014-15 financial year, a specified area rate of 0.51521 cents in the dollar (based on the gross rental value of each property) for the Iluka specified area for the purposes of maintaining enhanced landscaping services during 2014-15.
Rate Cents in $
Basis of Rate GRV
2014-15 Budgeted Revenue
Budget Applied to
Costs
2013-14 Estimated Revenue
Iluka 0.51521 53,170,590 $273,940 $273,940 $224,992
The Specified Area Rating - Iluka Reserve has been fully utilised and as such, no transfers to or from the reserve will occur in 2014-15. Iluka Specified Rate area comprises the area bounded by Shenton Avenue, Marmion Avenue, Burns Beach Road and the Foreshore Reserve.
Woodvale Waters
Council, in accordance with the provisions of Section 6.32 and 6.37 of the Local Government Act 1995 imposes for the 2014-15 financial year, a specified area rate of 0.50106 cents in the dollar (based on the gross rental value of each property) for the Woodvale Waters specified area for the purposes of maintaining enhanced landscaping services during 2014-15.
Rate Cents in $
Basis of Rate GRV
2014-15 Budgeted Revenue
Budget Applied to
Costs
2013-14 Estimated Revenue
Woodvale Waters 0.50106 3,708,900 $18,584 $18,584 $17,645
The proceeds of the rate in 2013-14 and 2014-15 are applied in full. The balance of the Specified Area Rating – Woodvale Waters Reserve unused at the end of 2013-14 is expected to remain unused in 2014-15, and no transfers to or from the reserve are anticipated. (Refer to note 10 l). Woodvale Waters Specified Rate area comprises the area bounded by Timberlane Drive and Yellagonga Regional Park with street addresses of Grey-Smith Gardens, Phillips Fox Terrace, Buvelot Place, Wakelin Close, Conder Place, Streeton Parade, Withers Grove, Olsen Court, Heysen Crest, Fullwood Walk except for Lots 156 Streeton Parade and Lot 12240 Phillips-Fox Terrace.
n) Emergency Services Levy
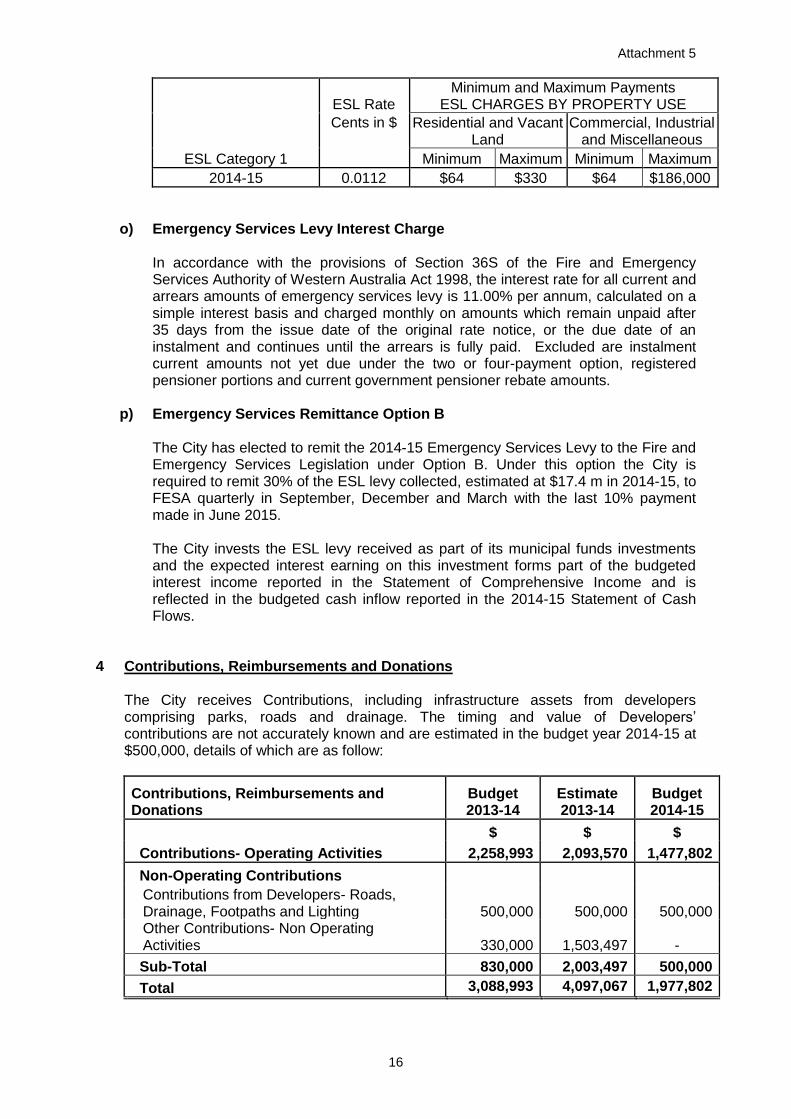
In accordance with the provisions of Sections 36B and 36L of the Fire and Emergency Services Authority of Western Australia Act 1998, the 2014-15 Emergency Services Levy Rates with Minimum and Maximum Payments on Residential, Vacant Land, Commercial, Industrial and Miscellaneous lots as follows:
Attachment 5
16
ESL Category 1
ESL Rate Minimum and Maximum Payments
ESL CHARGES BY PROPERTY USE
Cents in $ Residential and Vacant Land
Commercial, Industrial and Miscellaneous
Minimum Maximum Minimum Maximum
2014-15 0.0112 $64 $330 $64 $186,000
o) Emergency Services Levy Interest Charge
In accordance with the provisions of Section 36S of the Fire and Emergency Services Authority of Western Australia Act 1998, the interest rate for all current and arrears amounts of emergency services levy is 11.00% per annum, calculated on a simple interest basis and charged monthly on amounts which remain unpaid after 35 days from the issue date of the original rate notice, or the due date of an instalment and continues until the arrears is fully paid. Excluded are instalment current amounts not yet due under the two or four-payment option, registered pensioner portions and current government pensioner rebate amounts.
p) Emergency Services Remittance Option B
The City has elected to remit the 2014-15 Emergency Services Levy to the Fire and Emergency Services Legislation under Option B. Under this option the City is required to remit 30% of the ESL levy collected, estimated at $17.4 m in 2014-15, to FESA quarterly in September, December and March with the last 10% payment made in June 2015. The City invests the ESL levy received as part of its municipal funds investments and the expected interest earning on this investment forms part of the budgeted interest income reported in the Statement of Comprehensive Income and is reflected in the budgeted cash inflow reported in the 2014-15 Statement of Cash Flows.
4 Contributions, Reimbursements and Donations
The City receives Contributions, including infrastructure assets from developers comprising parks, roads and drainage. The timing and value of Developers’ contributions are not accurately known and are estimated in the budget year 2014-15 at $500,000, details of which are as follow:
Contributions, Reimbursements and Donations
Budget 2013-14
Estimate 2013-14
Budget 2014-15
$ $ $
Contributions- Operating Activities 2,258,993 2,093,570 1,477,802
Non-Operating Contributions Contributions from Developers- Roads,
Drainage, Footpaths and Lighting 500,000 500,000 500,000 Other Contributions- Non Operating Activities 330,000 1,503,497 -
Sub-Total 830,000 2,003,497 500,000
Total 3,088,993 4,097,067 1,977,802
Attachment 5
17
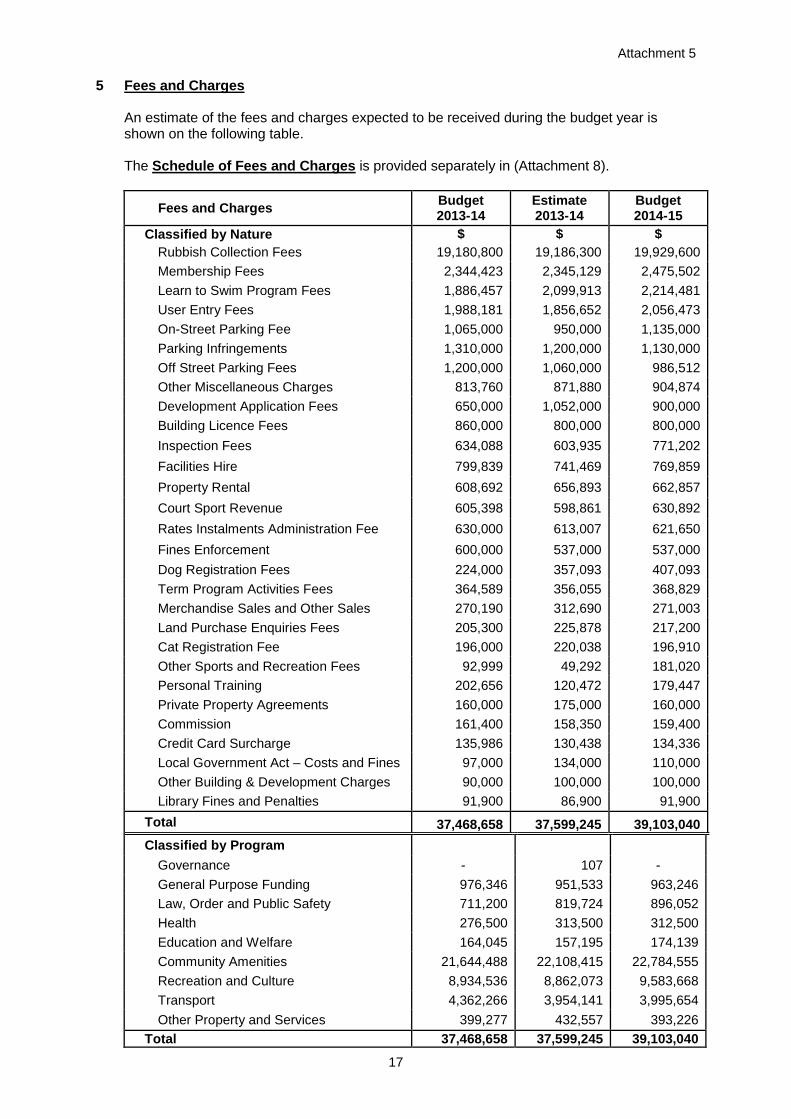
5 Fees and Charges
An estimate of the fees and charges expected to be received during the budget year is shown on the following table. The Schedule of Fees and Charges is provided separately in (Attachment 8).
Fees and Charges Budget 2013-14
Estimate 2013-14
Budget 2014-15
Classified by Nature $ $ $
Rubbish Collection Fees 19,180,800 19,186,300 19,929,600
Membership Fees 2,344,423 2,345,129 2,475,502
Learn to Swim Program Fees 1,886,457 2,099,913 2,214,481
User Entry Fees 1,988,181 1,856,652 2,056,473
On-Street Parking Fee 1,065,000 950,000 1,135,000
Parking Infringements 1,310,000 1,200,000 1,130,000
Off Street Parking Fees 1,200,000 1,060,000 986,512
Other Miscellaneous Charges 813,760 871,880 904,874
Development Application Fees 650,000 1,052,000 900,000
Building Licence Fees 860,000 800,000 800,000
Inspection Fees 634,088 603,935 771,202
Facilities Hire 799,839 741,469 769,859
Property Rental 608,692 656,893 662,857
Court Sport Revenue 605,398 598,861 630,892
Rates Instalments Administration Fee 630,000 613,007 621,650
Fines Enforcement 600,000 537,000 537,000
Dog Registration Fees 224,000 357,093 407,093
Term Program Activities Fees 364,589 356,055 368,829
Merchandise Sales and Other Sales 270,190 312,690 271,003
Land Purchase Enquiries Fees 205,300 225,878 217,200
Cat Registration Fee 196,000 220,038 196,910
Other Sports and Recreation Fees 92,999 49,292 181,020
Personal Training 202,656 120,472 179,447
Private Property Agreements 160,000 175,000 160,000
Commission 161,400 158,350 159,400
Credit Card Surcharge 135,986 130,438 134,336
Local Government Act – Costs and Fines 97,000 134,000 110,000
Other Building & Development Charges 90,000 100,000 100,000
Library Fines and Penalties 91,900 86,900 91,900
Total 37,468,658 37,599,245 39,103,040
Classified by Program
Governance - 107 -
General Purpose Funding 976,346 951,533 963,246
Law, Order and Public Safety 711,200 819,724 896,052
Health 276,500 313,500 312,500
Education and Welfare 164,045 157,195 174,139
Community Amenities 21,644,488 22,108,415 22,784,555
Recreation and Culture 8,934,536 8,862,073 9,583,668
Transport 4,362,266 3,954,141 3,995,654
Other Property and Services 399,277 432,557 393,226
Total 37,468,658 37,599,245 39,103,040
Attachment 5
18
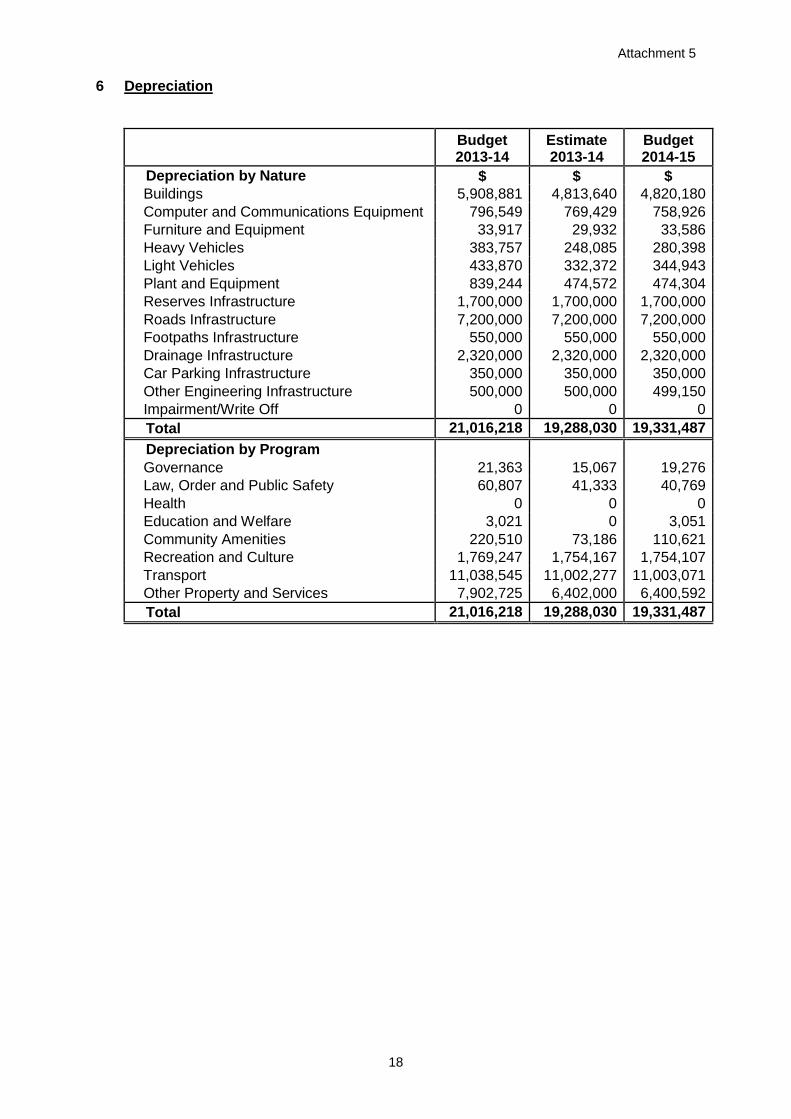
6 Depreciation
Budget 2013-14
Estimate 2013-14
Budget 2014-15
Depreciation by Nature $ $ $
Buildings 5,908,881 4,813,640 4,820,180
Computer and Communications Equipment 796,549 769,429 758,926
Furniture and Equipment 33,917 29,932 33,586
Heavy Vehicles 383,757 248,085 280,398
Light Vehicles 433,870 332,372 344,943
Plant and Equipment 839,244 474,572 474,304
Reserves Infrastructure 1,700,000 1,700,000 1,700,000
Roads Infrastructure 7,200,000 7,200,000 7,200,000
Footpaths Infrastructure 550,000 550,000 550,000
Drainage Infrastructure 2,320,000 2,320,000 2,320,000
Car Parking Infrastructure 350,000 350,000 350,000
Other Engineering Infrastructure 500,000 500,000 499,150
Impairment/Write Off 0 0 0
Total 21,016,218 19,288,030 19,331,487
Depreciation by Program
Governance 21,363 15,067 19,276
Law, Order and Public Safety 60,807 41,333 40,769
Health 0 0 0
Education and Welfare 3,021 0 3,051
Community Amenities 220,510 73,186 110,621
Recreation and Culture 1,769,247 1,754,167 1,754,107
Transport 11,038,545 11,002,277 11,003,071
Other Property and Services 7,902,725 6,402,000 6,400,592
Total 21,016,218 19,288,030 19,331,487
Attachment 5
19
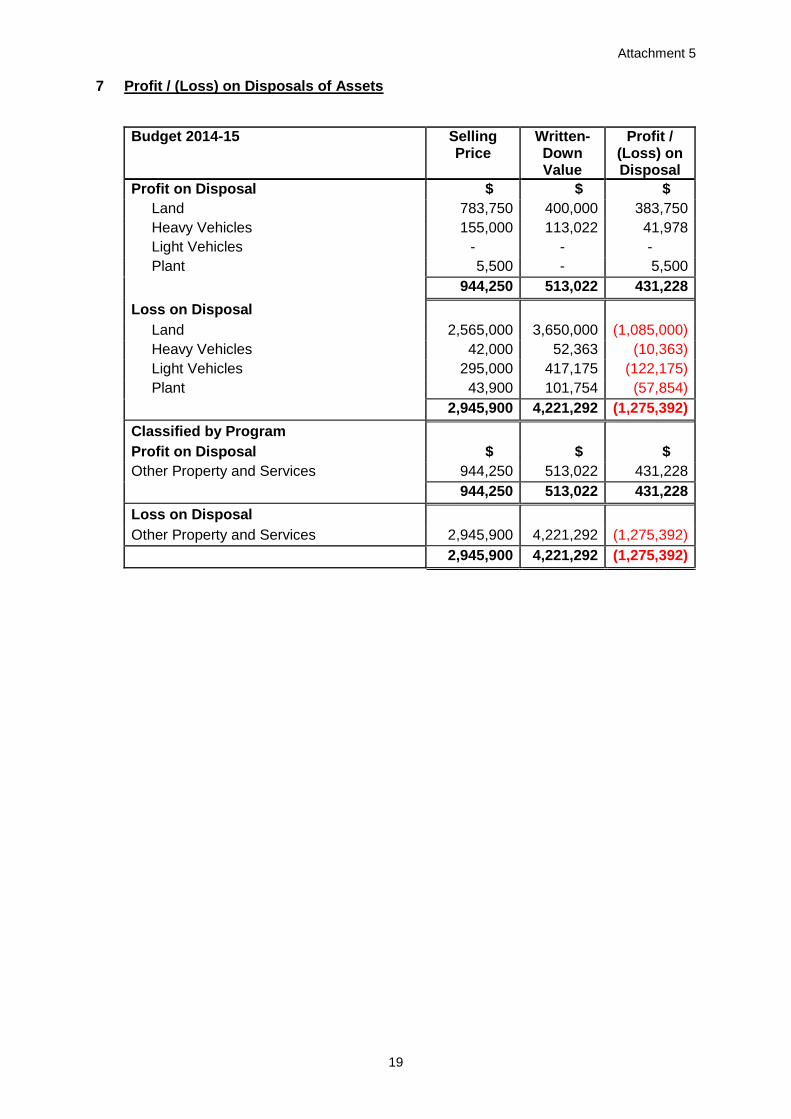
7 Profit / (Loss) on Disposals of Assets
Budget 2014-15 Selling Price
Written-Down Value
Profit / (Loss) on Disposal
Profit on Disposal $ $ $
Land 783,750 400,000 383,750
Heavy Vehicles 155,000 113,022 41,978
Light Vehicles - - -
Plant 5,500 - 5,500
944,250 513,022 431,228
Loss on Disposal
Land 2,565,000 3,650,000 (1,085,000)
Heavy Vehicles 42,000 52,363 (10,363)
Light Vehicles 295,000 417,175 (122,175)
Plant 43,900 101,754 (57,854)
2,945,900 4,221,292 (1,275,392)
Classified by Program
Profit on Disposal $ $ $
Other Property and Services 944,250 513,022 431,228
944,250 513,022 431,228
Loss on Disposal
Other Property and Services 2,945,900 4,221,292 (1,275,392)
2,945,900 4,221,292 (1,275,392)
Attachment 5
20
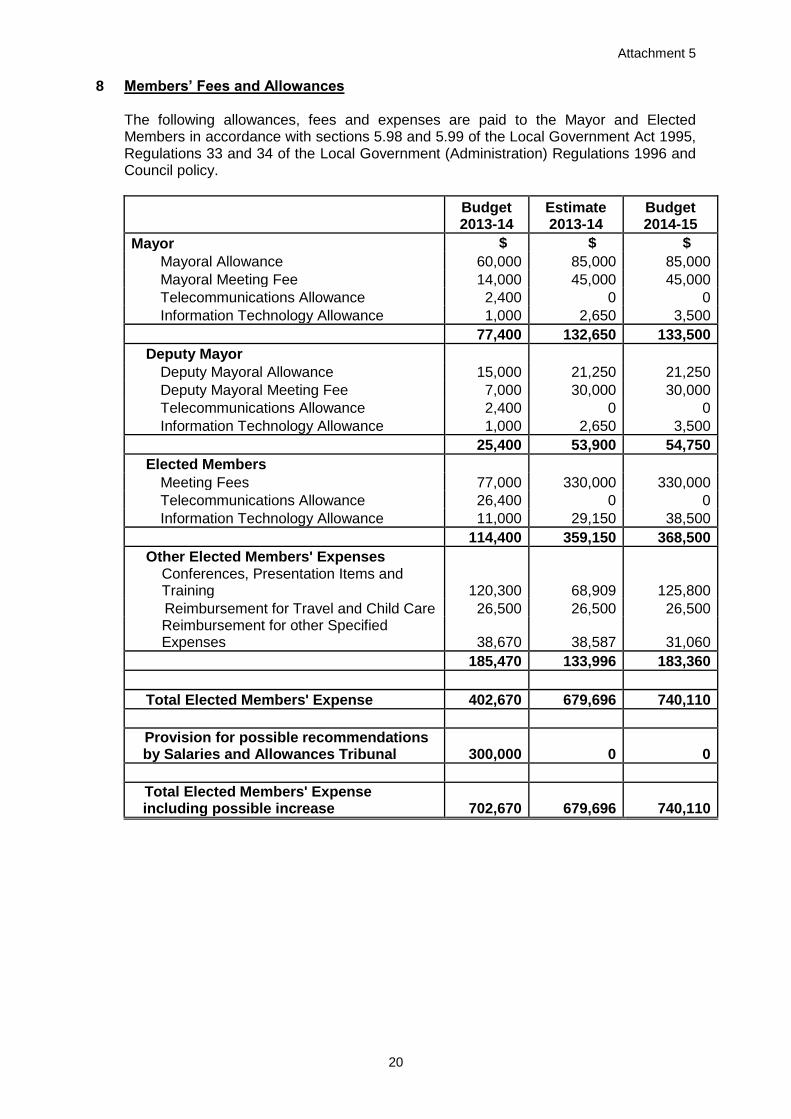
8 Members’ Fees and Allowances
The following allowances, fees and expenses are paid to the Mayor and Elected Members in accordance with sections 5.98 and 5.99 of the Local Government Act 1995, Regulations 33 and 34 of the Local Government (Administration) Regulations 1996 and Council policy.
Budget 2013-14
Estimate 2013-14
Budget 2014-15
Mayor $ $ $
Mayoral Allowance 60,000 85,000 85,000
Mayoral Meeting Fee 14,000 45,000 45,000
Telecommunications Allowance 2,400 0 0
Information Technology Allowance 1,000 2,650 3,500
77,400 132,650 133,500
Deputy Mayor Deputy Mayoral Allowance 15,000 21,250 21,250
Deputy Mayoral Meeting Fee 7,000 30,000 30,000
Telecommunications Allowance 2,400 0 0
Information Technology Allowance 1,000 2,650 3,500
25,400 53,900 54,750
Elected Members Meeting Fees 77,000 330,000 330,000
Telecommunications Allowance 26,400 0 0
Information Technology Allowance 11,000 29,150 38,500
114,400 359,150 368,500
Other Elected Members' Expenses Conferences, Presentation Items and
Training 120,300 68,909 125,800
Reimbursement for Travel and Child Care 26,500 26,500 26,500 Reimbursement for other Specified Expenses 38,670 38,587 31,060
185,470 133,996 183,360
Total Elected Members' Expense 402,670 679,696 740,110
Provision for possible recommendations by Salaries and Allowances Tribunal 300,000 0 0
Total Elected Members' Expense including possible increase 702,670 679,696 740,110
Attachment 5
21
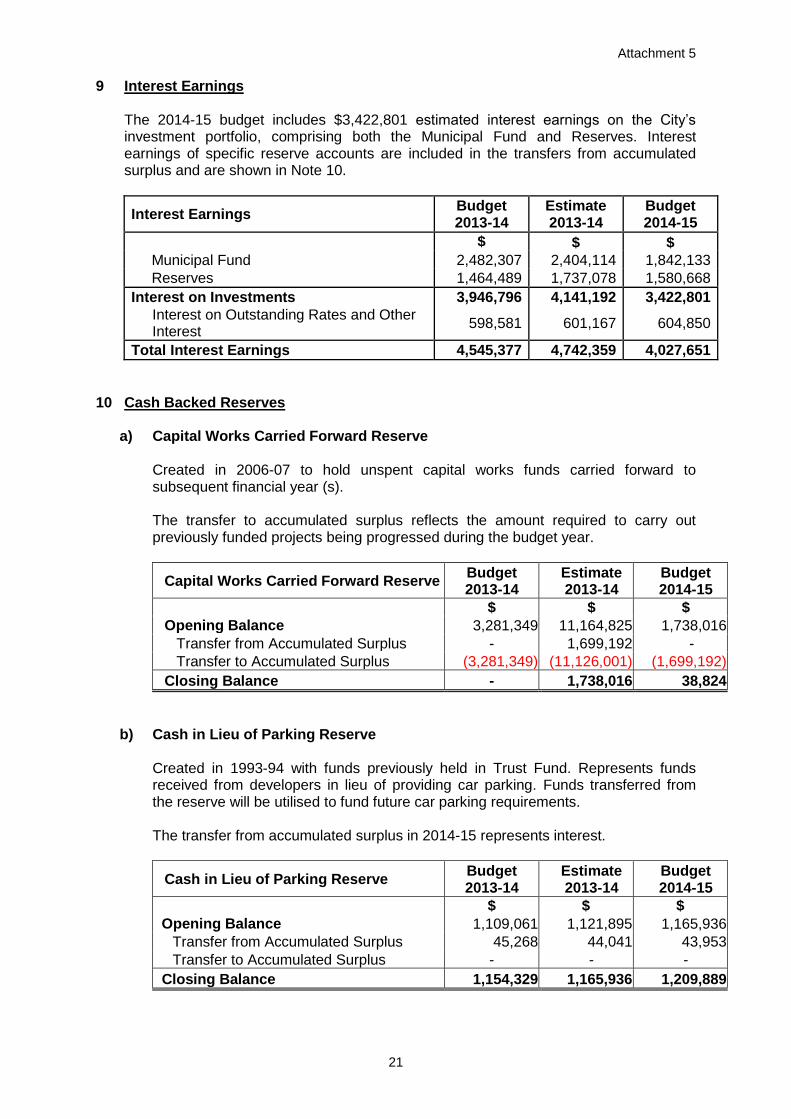
9 Interest Earnings
The 2014-15 budget includes $3,422,801 estimated interest earnings on the City’s investment portfolio, comprising both the Municipal Fund and Reserves. Interest earnings of specific reserve accounts are included in the transfers from accumulated surplus and are shown in Note 10.
Interest Earnings Budget 2013-14
Estimate 2013-14
Budget 2014-15
$ $ $
Municipal Fund 2,482,307 2,404,114 1,842,133
Reserves 1,464,489 1,737,078 1,580,668
Interest on Investments 3,946,796 4,141,192 3,422,801
Interest on Outstanding Rates and Other Interest
598,581 601,167 604,850
Total Interest Earnings 4,545,377 4,742,359 4,027,651
10 Cash Backed Reserves
a) Capital Works Carried Forward Reserve
Created in 2006-07 to hold unspent capital works funds carried forward to subsequent financial year (s). The transfer to accumulated surplus reflects the amount required to carry out previously funded projects being progressed during the budget year.
Capital Works Carried Forward Reserve Budget 2013-14
Estimate 2013-14
Budget 2014-15
$ $ $
Opening Balance 3,281,349 11,164,825 1,738,016
Transfer from Accumulated Surplus - 1,699,192 -
Transfer to Accumulated Surplus (3,281,349) (11,126,001) (1,699,192)
Closing Balance - 1,738,016 38,824
b) Cash in Lieu of Parking Reserve
Created in 1993-94 with funds previously held in Trust Fund. Represents funds received from developers in lieu of providing car parking. Funds transferred from the reserve will be utilised to fund future car parking requirements.
The transfer from accumulated surplus in 2014-15 represents interest.
Cash in Lieu of Parking Reserve Budget 2013-14
Estimate 2013-14
Budget 2014-15
$ $ $
Opening Balance 1,109,061 1,121,895 1,165,936
Transfer from Accumulated Surplus 45,268 44,041 43,953
Transfer to Accumulated Surplus - - -
Closing Balance 1,154,329 1,165,936 1,209,889
Attachment 5
22
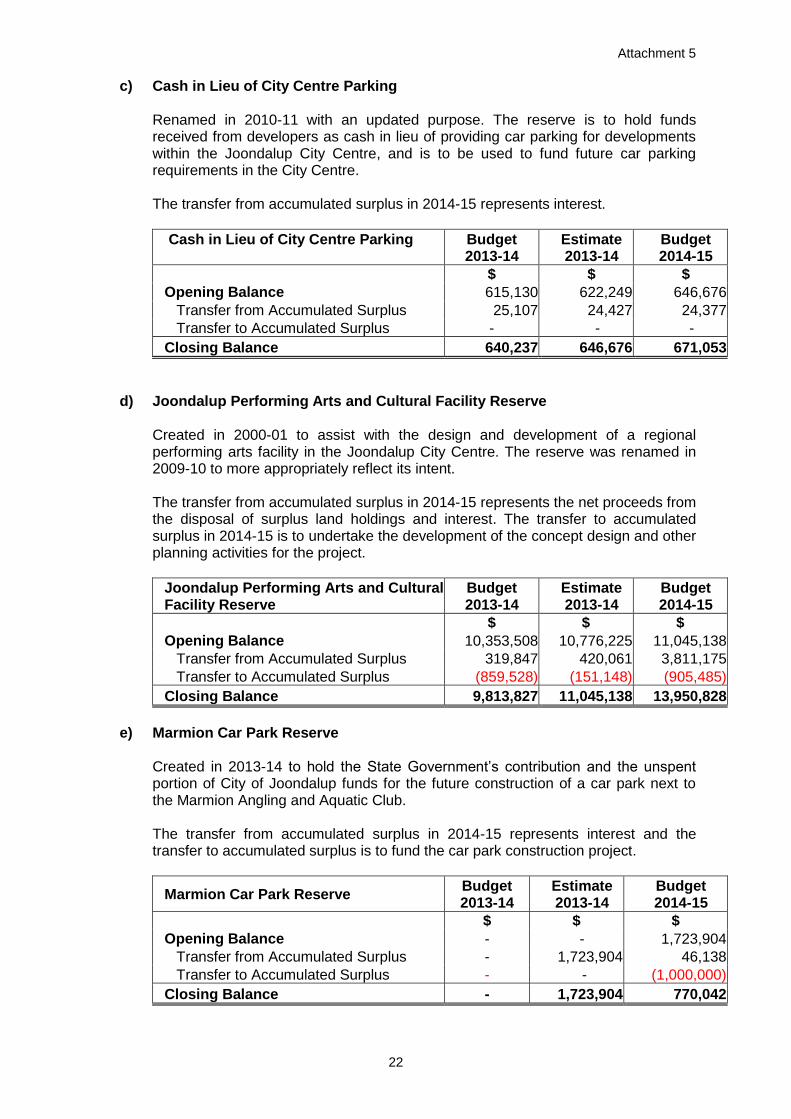
c) Cash in Lieu of City Centre Parking
Renamed in 2010-11 with an updated purpose. The reserve is to hold funds received from developers as cash in lieu of providing car parking for developments within the Joondalup City Centre, and is to be used to fund future car parking requirements in the City Centre. The transfer from accumulated surplus in 2014-15 represents interest.
Cash in Lieu of City Centre Parking
Budget 2013-14
Estimate 2013-14
Budget 2014-15
$ $ $
Opening Balance 615,130 622,249 646,676
Transfer from Accumulated Surplus 25,107 24,427 24,377
Transfer to Accumulated Surplus - - -
Closing Balance 640,237 646,676 671,053
d) Joondalup Performing Arts and Cultural Facility Reserve
Created in 2000-01 to assist with the design and development of a regional performing arts facility in the Joondalup City Centre. The reserve was renamed in 2009-10 to more appropriately reflect its intent. The transfer from accumulated surplus in 2014-15 represents the net proceeds from the disposal of surplus land holdings and interest. The transfer to accumulated surplus in 2014-15 is to undertake the development of the concept design and other planning activities for the project.
Joondalup Performing Arts and Cultural Facility Reserve
Budget 2013-14
Estimate 2013-14
Budget 2014-15
$ $ $
Opening Balance 10,353,508 10,776,225 11,045,138
Transfer from Accumulated Surplus 319,847 420,061 3,811,175
Transfer to Accumulated Surplus (859,528) (151,148) (905,485)
Closing Balance 9,813,827 11,045,138 13,950,828
e) Marmion Car Park Reserve
Created in 2013-14 to hold the State Government’s contribution and the unspent portion of City of Joondalup funds for the future construction of a car park next to the Marmion Angling and Aquatic Club. The transfer from accumulated surplus in 2014-15 represents interest and the transfer to accumulated surplus is to fund the car park construction project.
Marmion Car Park Reserve Budget 2013-14
Estimate 2013-14
Budget 2014-15
$ $ $
Opening Balance - - 1,723,904
Transfer from Accumulated Surplus - 1,723,904 46,138
Transfer to Accumulated Surplus - - (1,000,000)
Closing Balance - 1,723,904 770,042
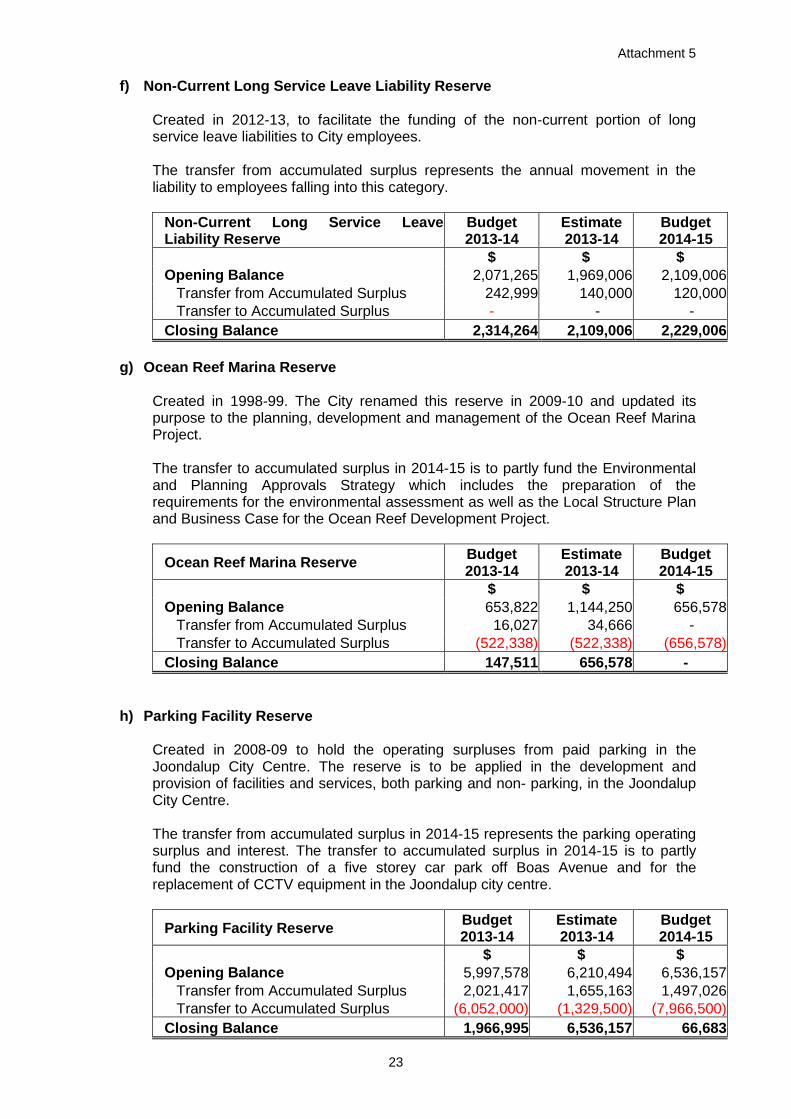
Attachment 5
23
f) Non-Current Long Service Leave Liability Reserve
Created in 2012-13, to facilitate the funding of the non-current portion of long service leave liabilities to City employees. The transfer from accumulated surplus represents the annual movement in the liability to employees falling into this category.
Non-Current Long Service Leave Liability Reserve
Budget 2013-14
Estimate 2013-14
Budget 2014-15
$ $ $
Opening Balance 2,071,265 1,969,006 2,109,006
Transfer from Accumulated Surplus 242,999 140,000 120,000
Transfer to Accumulated Surplus - - -
Closing Balance 2,314,264 2,109,006 2,229,006
g) Ocean Reef Marina Reserve
Created in 1998-99. The City renamed this reserve in 2009-10 and updated its purpose to the planning, development and management of the Ocean Reef Marina Project. The transfer to accumulated surplus in 2014-15 is to partly fund the Environmental and Planning Approvals Strategy which includes the preparation of the requirements for the environmental assessment as well as the Local Structure Plan and Business Case for the Ocean Reef Development Project.
Ocean Reef Marina Reserve Budget 2013-14
Estimate 2013-14
Budget 2014-15
$ $ $
Opening Balance 653,822 1,144,250 656,578
Transfer from Accumulated Surplus 16,027 34,666 -
Transfer to Accumulated Surplus (522,338) (522,338) (656,578)
Closing Balance 147,511 656,578 -
h) Parking Facility Reserve
Created in 2008-09 to hold the operating surpluses from paid parking in the Joondalup City Centre. The reserve is to be applied in the development and provision of facilities and services, both parking and non- parking, in the Joondalup City Centre. The transfer from accumulated surplus in 2014-15 represents the parking operating surplus and interest. The transfer to accumulated surplus in 2014-15 is to partly fund the construction of a five storey car park off Boas Avenue and for the replacement of CCTV equipment in the Joondalup city centre.
Parking Facility Reserve Budget 2013-14
Estimate 2013-14
Budget 2014-15
$ $ $
Opening Balance 5,997,578 6,210,494 6,536,157
Transfer from Accumulated Surplus 2,021,417 1,655,163 1,497,026
Transfer to Accumulated Surplus (6,052,000) (1,329,500) (7,966,500)
Closing Balance 1,966,995 6,536,157 66,683
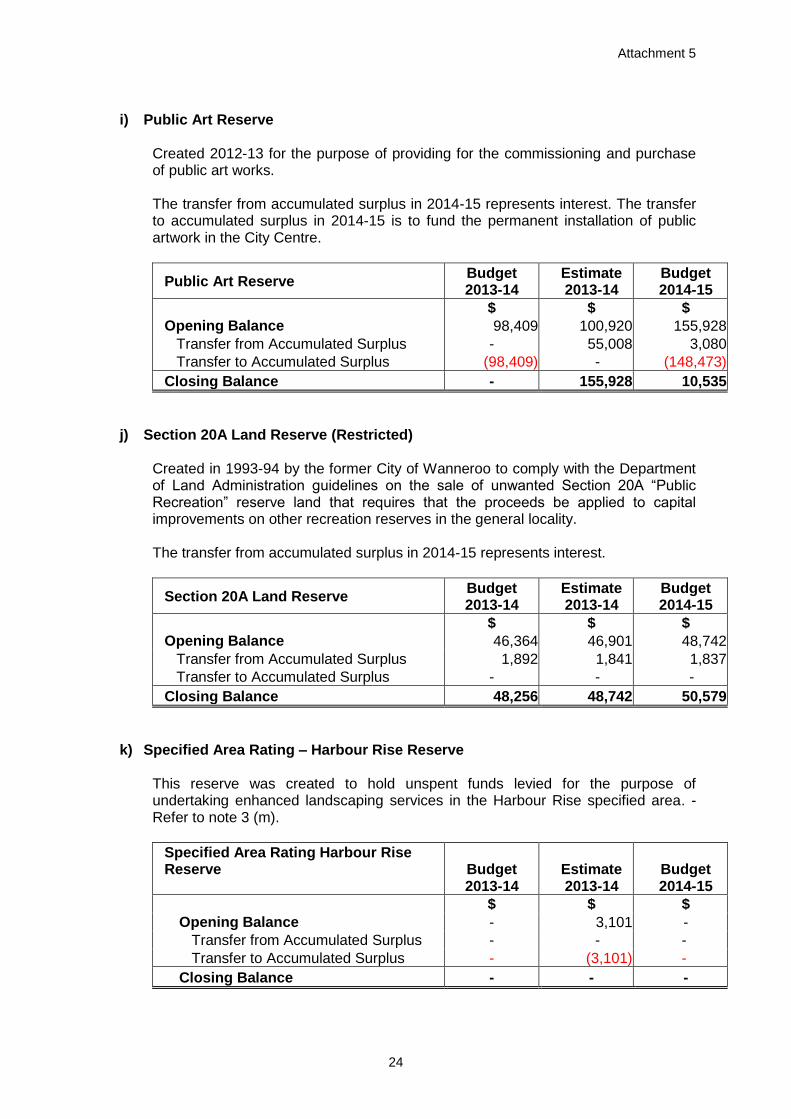
Attachment 5
24
i) Public Art Reserve
Created 2012-13 for the purpose of providing for the commissioning and purchase of public art works. The transfer from accumulated surplus in 2014-15 represents interest. The transfer to accumulated surplus in 2014-15 is to fund the permanent installation of public artwork in the City Centre.
Public Art Reserve Budget 2013-14
Estimate 2013-14
Budget 2014-15
$ $ $
Opening Balance 98,409 100,920 155,928
Transfer from Accumulated Surplus - 55,008 3,080
Transfer to Accumulated Surplus (98,409) - (148,473)
Closing Balance - 155,928 10,535
j) Section 20A Land Reserve (Restricted)
Created in 1993-94 by the former City of Wanneroo to comply with the Department of Land Administration guidelines on the sale of unwanted Section 20A “Public Recreation” reserve land that requires that the proceeds be applied to capital improvements on other recreation reserves in the general locality. The transfer from accumulated surplus in 2014-15 represents interest.
Section 20A Land Reserve Budget 2013-14
Estimate 2013-14
Budget 2014-15
$ $ $
Opening Balance 46,364 46,901 48,742
Transfer from Accumulated Surplus 1,892 1,841 1,837
Transfer to Accumulated Surplus - - -
Closing Balance 48,256 48,742 50,579
k) Specified Area Rating – Harbour Rise Reserve This reserve was created to hold unspent funds levied for the purpose of undertaking enhanced landscaping services in the Harbour Rise specified area. - Refer to note 3 (m).
Specified Area Rating Harbour Rise Reserve
Budget 2013-14
Estimate 2013-14
Budget 2014-15
$ $ $
Opening Balance - 3,101 -
Transfer from Accumulated Surplus - - -
Transfer to Accumulated Surplus - (3,101) -
Closing Balance - - -
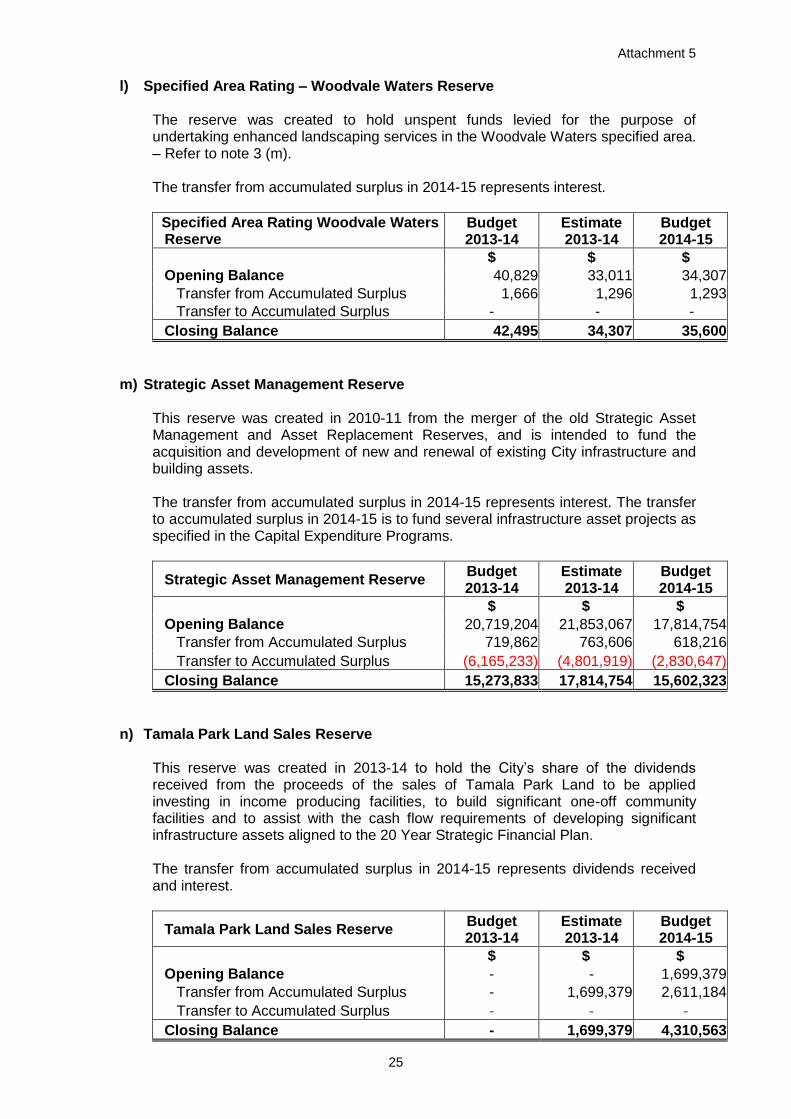
Attachment 5
25
l) Specified Area Rating – Woodvale Waters Reserve
The reserve was created to hold unspent funds levied for the purpose of undertaking enhanced landscaping services in the Woodvale Waters specified area. – Refer to note 3 (m). The transfer from accumulated surplus in 2014-15 represents interest.
Specified Area Rating Woodvale Waters Reserve
Budget 2013-14
Estimate 2013-14
Budget 2014-15
$ $ $
Opening Balance 40,829 33,011 34,307
Transfer from Accumulated Surplus 1,666 1,296 1,293
Transfer to Accumulated Surplus - - -
Closing Balance 42,495 34,307 35,600
m) Strategic Asset Management Reserve
This reserve was created in 2010-11 from the merger of the old Strategic Asset Management and Asset Replacement Reserves, and is intended to fund the acquisition and development of new and renewal of existing City infrastructure and building assets. The transfer from accumulated surplus in 2014-15 represents interest. The transfer to accumulated surplus in 2014-15 is to fund several infrastructure asset projects as specified in the Capital Expenditure Programs.
Strategic Asset Management Reserve Budget 2013-14
Estimate 2013-14
Budget 2014-15
$ $ $
Opening Balance 20,719,204 21,853,067 17,814,754
Transfer from Accumulated Surplus 719,862 763,606 618,216
Transfer to Accumulated Surplus (6,165,233) (4,801,919) (2,830,647)
Closing Balance 15,273,833 17,814,754 15,602,323
n) Tamala Park Land Sales Reserve
This reserve was created in 2013-14 to hold the City’s share of the dividends received from the proceeds of the sales of Tamala Park Land to be applied investing in income producing facilities, to build significant one-off community facilities and to assist with the cash flow requirements of developing significant infrastructure assets aligned to the 20 Year Strategic Financial Plan. The transfer from accumulated surplus in 2014-15 represents dividends received and interest.
Tamala Park Land Sales Reserve Budget 2013-14
Estimate 2013-14
Budget 2014-15
$ $ $
Opening Balance - - 1,699,379
Transfer from Accumulated Surplus - 1,699,379 2,611,184
Transfer to Accumulated Surplus - - -
Closing Balance - 1,699,379 4,310,563
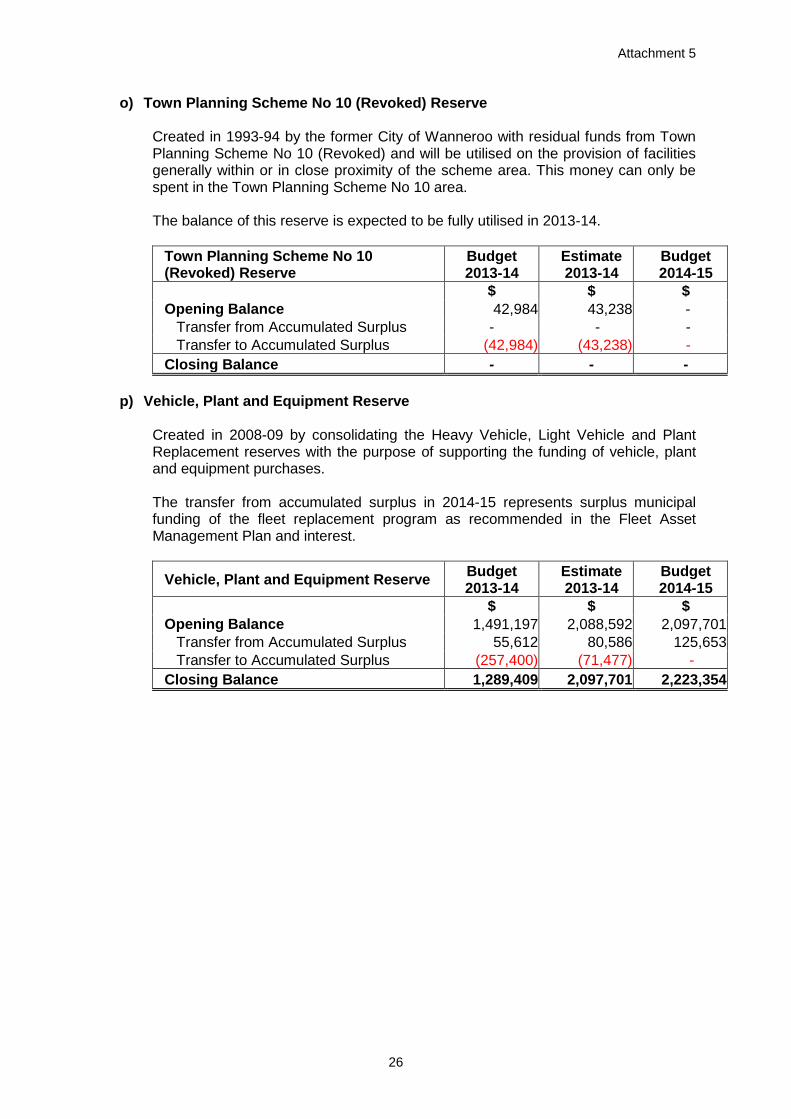
Attachment 5
26
o) Town Planning Scheme No 10 (Revoked) Reserve
Created in 1993-94 by the former City of Wanneroo with residual funds from Town Planning Scheme No 10 (Revoked) and will be utilised on the provision of facilities generally within or in close proximity of the scheme area. This money can only be spent in the Town Planning Scheme No 10 area. The balance of this reserve is expected to be fully utilised in 2013-14.
Town Planning Scheme No 10 (Revoked) Reserve
Budget 2013-14
Estimate 2013-14
Budget 2014-15
$ $ $
Opening Balance 42,984 43,238 -
Transfer from Accumulated Surplus - - -
Transfer to Accumulated Surplus (42,984) (43,238) -
Closing Balance - - -
p) Vehicle, Plant and Equipment Reserve
Created in 2008-09 by consolidating the Heavy Vehicle, Light Vehicle and Plant Replacement reserves with the purpose of supporting the funding of vehicle, plant and equipment purchases. The transfer from accumulated surplus in 2014-15 represents surplus municipal funding of the fleet replacement program as recommended in the Fleet Asset Management Plan and interest.
Vehicle, Plant and Equipment Reserve Budget 2013-14
Estimate 2013-14
Budget 2014-15
$ $ $
Opening Balance 1,491,197 2,088,592 2,097,701
Transfer from Accumulated Surplus 55,612 80,586 125,653
Transfer to Accumulated Surplus (257,400) (71,477) -
Closing Balance 1,289,409 2,097,701 2,223,354
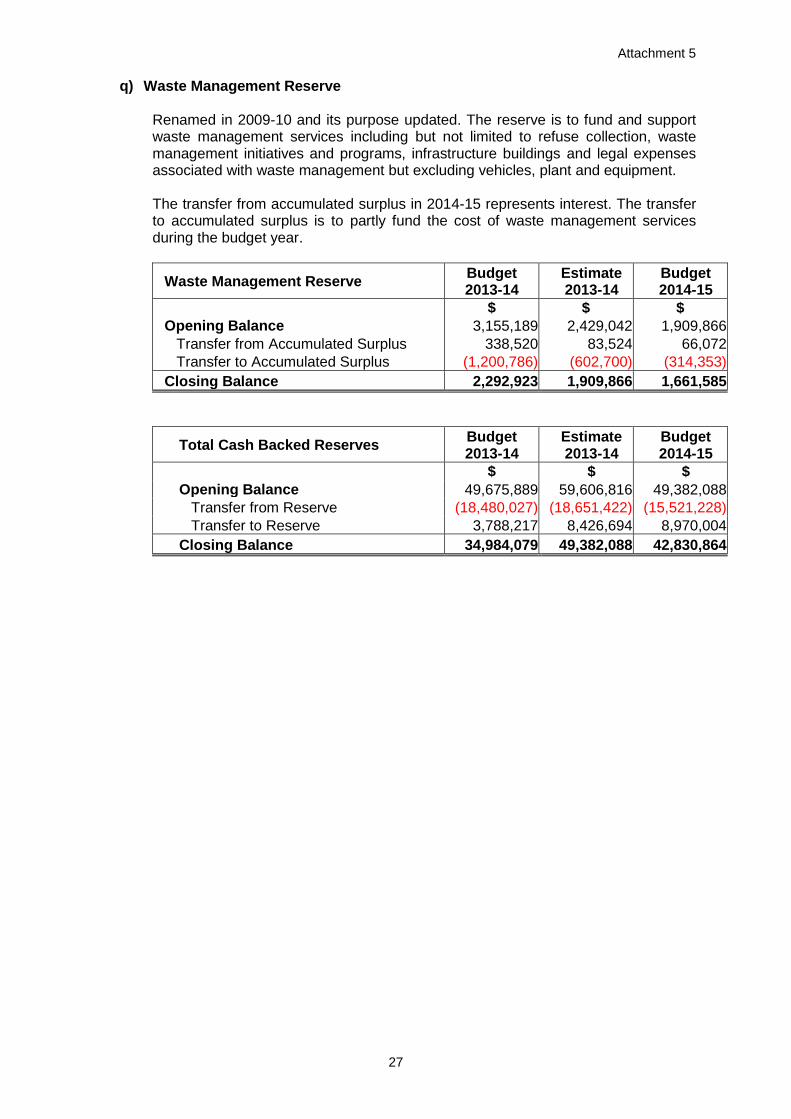
Attachment 5
27
q) Waste Management Reserve
Renamed in 2009-10 and its purpose updated. The reserve is to fund and support waste management services including but not limited to refuse collection, waste management initiatives and programs, infrastructure buildings and legal expenses associated with waste management but excluding vehicles, plant and equipment. The transfer from accumulated surplus in 2014-15 represents interest. The transfer to accumulated surplus is to partly fund the cost of waste management services during the budget year.
Waste Management Reserve Budget 2013-14
Estimate 2013-14
Budget 2014-15
$ $ $
Opening Balance 3,155,189 2,429,042 1,909,866
Transfer from Accumulated Surplus 338,520 83,524 66,072
Transfer to Accumulated Surplus (1,200,786) (602,700) (314,353)
Closing Balance 2,292,923 1,909,866 1,661,585
Total Cash Backed Reserves Budget 2013-14
Estimate 2013-14
Budget 2014-15
$ $ $
Opening Balance 49,675,889 59,606,816 49,382,088
Transfer from Reserve (18,480,027) (18,651,422) (15,521,228)
Transfer to Reserve 3,788,217 8,426,694 8,970,004
Closing Balance 34,984,079 49,382,088 42,830,864
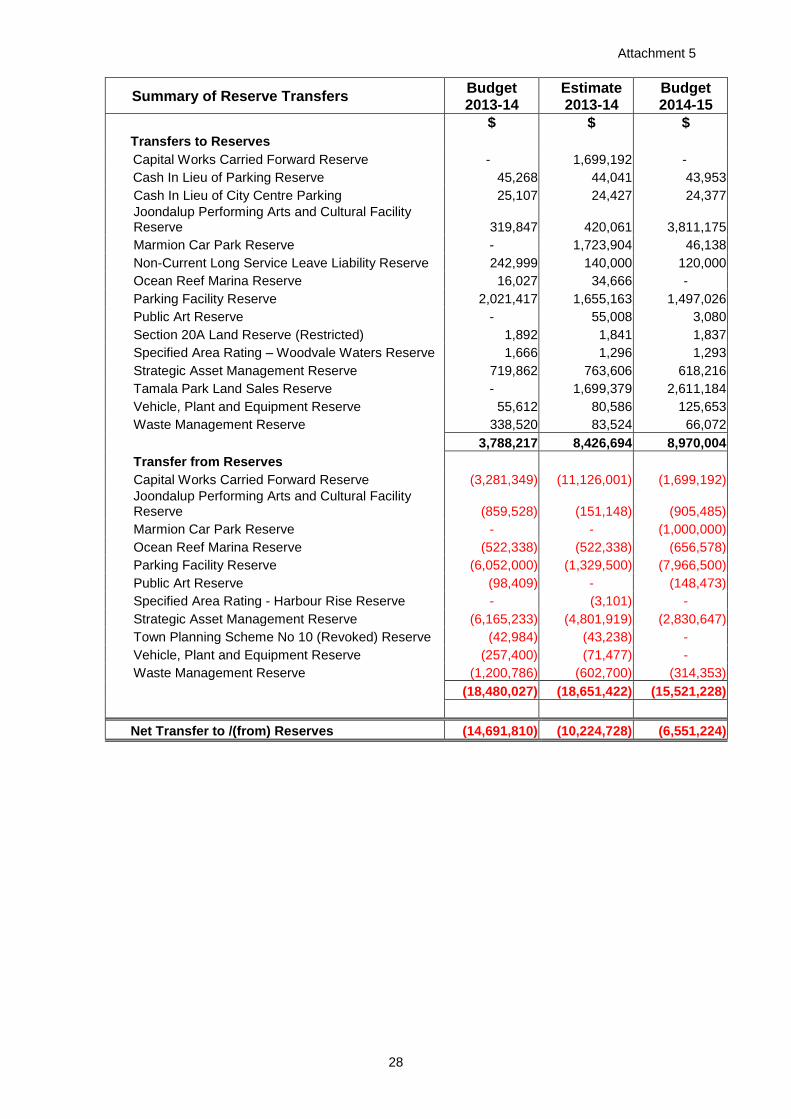
Attachment 5
28
Summary of Reserve Transfers Budget 2013-14
Estimate 2013-14
Budget 2014-15
$ $ $
Transfers to Reserves
Capital Works Carried Forward Reserve - 1,699,192 -
Cash In Lieu of Parking Reserve 45,268 44,041 43,953
Cash In Lieu of City Centre Parking 25,107 24,427 24,377
Joondalup Performing Arts and Cultural Facility Reserve 319,847 420,061 3,811,175
Marmion Car Park Reserve - 1,723,904 46,138
Non-Current Long Service Leave Liability Reserve 242,999 140,000 120,000
Ocean Reef Marina Reserve 16,027 34,666 -
Parking Facility Reserve 2,021,417 1,655,163 1,497,026
Public Art Reserve - 55,008 3,080
Section 20A Land Reserve (Restricted) 1,892 1,841 1,837
Specified Area Rating – Woodvale Waters Reserve 1,666 1,296 1,293
Strategic Asset Management Reserve 719,862 763,606 618,216
Tamala Park Land Sales Reserve - 1,699,379 2,611,184
Vehicle, Plant and Equipment Reserve 55,612 80,586 125,653
Waste Management Reserve 338,520 83,524 66,072
3,788,217 8,426,694 8,970,004
Transfer from Reserves
Capital Works Carried Forward Reserve (3,281,349) (11,126,001) (1,699,192)
Joondalup Performing Arts and Cultural Facility Reserve (859,528) (151,148) (905,485)
Marmion Car Park Reserve - - (1,000,000)
Ocean Reef Marina Reserve (522,338) (522,338) (656,578)
Parking Facility Reserve (6,052,000) (1,329,500) (7,966,500)
Public Art Reserve (98,409) - (148,473)
Specified Area Rating - Harbour Rise Reserve - (3,101) -
Strategic Asset Management Reserve (6,165,233) (4,801,919) (2,830,647)
Town Planning Scheme No 10 (Revoked) Reserve (42,984) (43,238) -
Vehicle, Plant and Equipment Reserve (257,400) (71,477) -
Waste Management Reserve (1,200,786) (602,700) (314,353)
(18,480,027) (18,651,422) (15,521,228)
Net Transfer to /(from) Reserves (14,691,810) (10,224,728) (6,551,224)
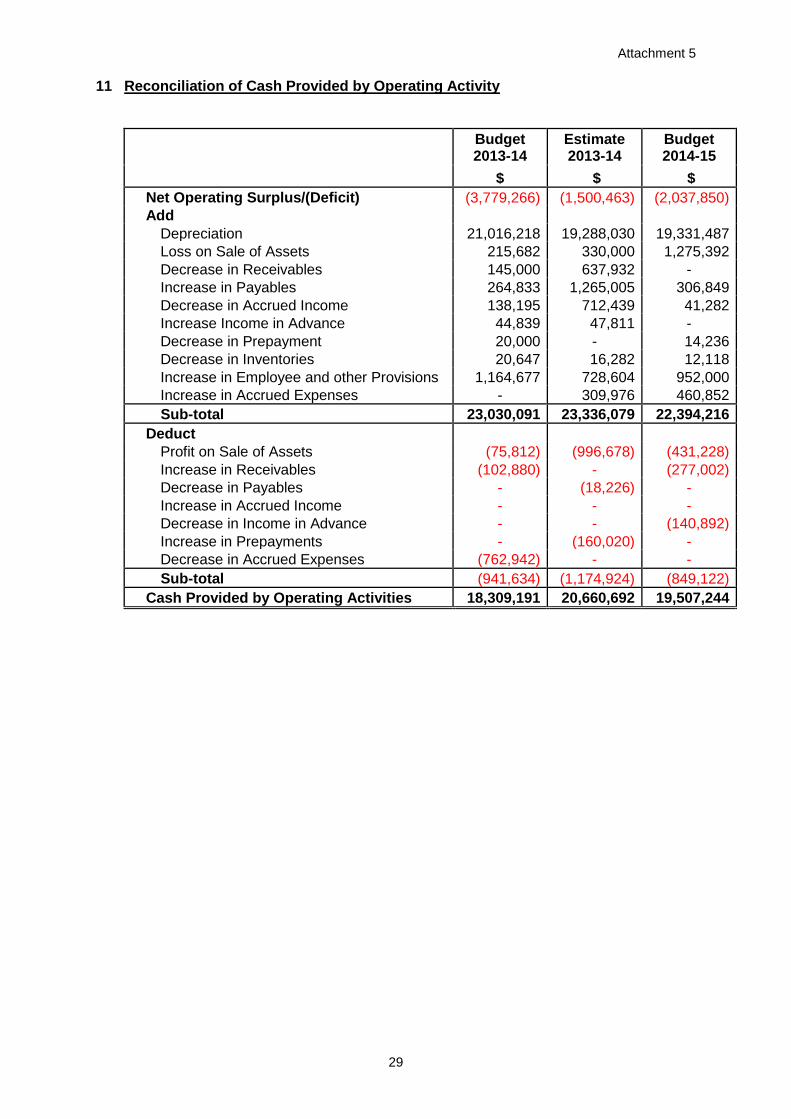
Attachment 5
29
11 Reconciliation of Cash Provided by Operating Activity
Budget 2013-14
Estimate 2013-14
Budget 2014-15
$ $ $
Net Operating Surplus/(Deficit) (3,779,266) (1,500,463) (2,037,850)
Add Depreciation 21,016,218 19,288,030 19,331,487
Loss on Sale of Assets 215,682 330,000 1,275,392
Decrease in Receivables 145,000 637,932 -
Increase in Payables 264,833 1,265,005 306,849
Decrease in Accrued Income 138,195 712,439 41,282
Increase Income in Advance 44,839 47,811 -
Decrease in Prepayment 20,000 - 14,236
Decrease in Inventories 20,647 16,282 12,118
Increase in Employee and other Provisions 1,164,677 728,604 952,000
Increase in Accrued Expenses - 309,976 460,852
Sub-total 23,030,091 23,336,079 22,394,216
Deduct
Profit on Sale of Assets (75,812) (996,678) (431,228)
Increase in Receivables (102,880) - (277,002)
Decrease in Payables - (18,226) -
Increase in Accrued Income - - -
Decrease in Income in Advance - - (140,892)
Increase in Prepayments - (160,020) -
Decrease in Accrued Expenses (762,942) - -
Sub-total (941,634) (1,174,924) (849,122)
Cash Provided by Operating Activities 18,309,191 20,660,692 19,507,244
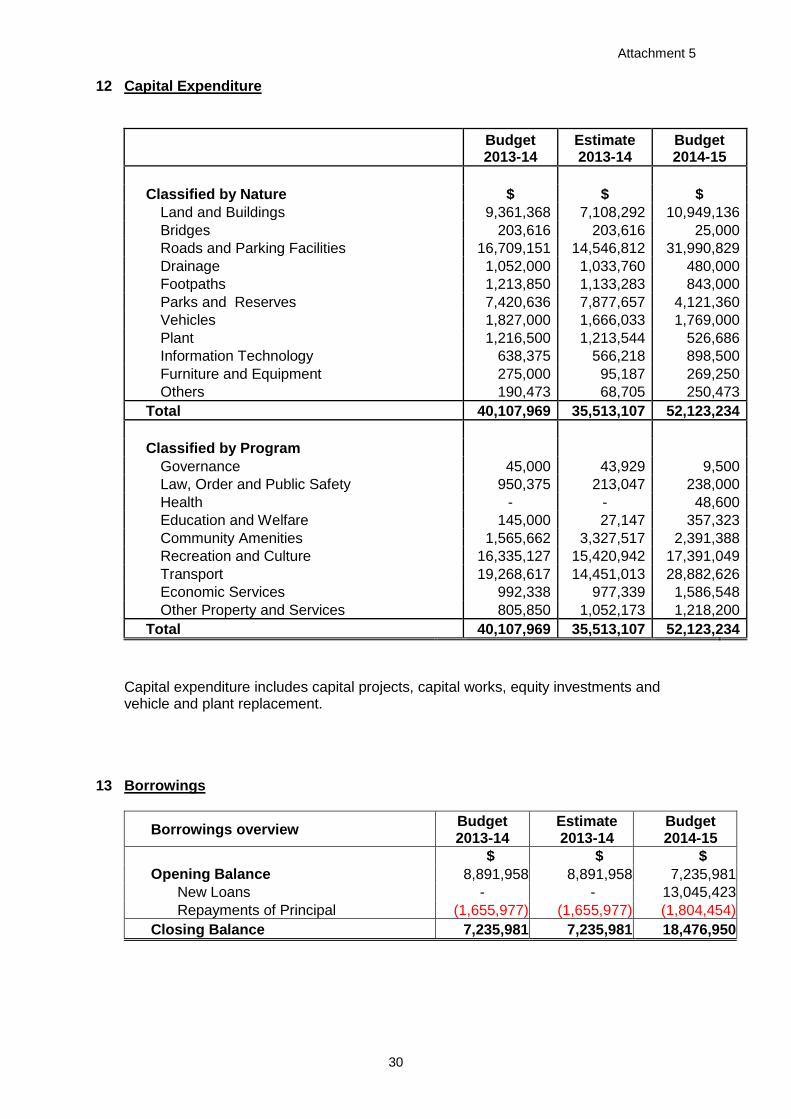
Attachment 5
30
12 Capital Expenditure
Budget 2013-14
Estimate 2013-14
Budget 2014-15
$ $ $ Classified by Nature
Land and Buildings 9,361,368 7,108,292 10,949,136
Bridges 203,616 203,616 25,000
Roads and Parking Facilities 16,709,151 14,546,812 31,990,829
Drainage 1,052,000 1,033,760 480,000
Footpaths 1,213,850 1,133,283 843,000
Parks and Reserves 7,420,636 7,877,657 4,121,360
Vehicles 1,827,000 1,666,033 1,769,000
Plant 1,216,500 1,213,544 526,686
Information Technology 638,375 566,218 898,500
Furniture and Equipment 275,000 95,187 269,250
Others 190,473 68,705 250,473
Total 40,107,969 35,513,107 52,123,234
Classified by Program
Governance 45,000 43,929 9,500
Law, Order and Public Safety 950,375 213,047 238,000
Health - - 48,600
Education and Welfare 145,000 27,147 357,323
Community Amenities 1,565,662 3,327,517 2,391,388
Recreation and Culture 16,335,127 15,420,942 17,391,049
Transport 19,268,617 14,451,013 28,882,626
Economic Services 992,338 977,339 1,586,548
Other Property and Services 805,850 1,052,173 1,218,200
Total 40,107,969 35,513,107 52,123,234
Capital expenditure includes capital projects, capital works, equity investments and vehicle and plant replacement.
13 Borrowings
Borrowings overview Budget 2013-14
Estimate 2013-14
Budget 2014-15
$ $ $
Opening Balance 8,891,958 8,891,958 7,235,981
New Loans - - 13,045,423
Repayments of Principal (1,655,977) (1,655,977) (1,804,454)
Closing Balance 7,235,981 7,235,981 18,476,950
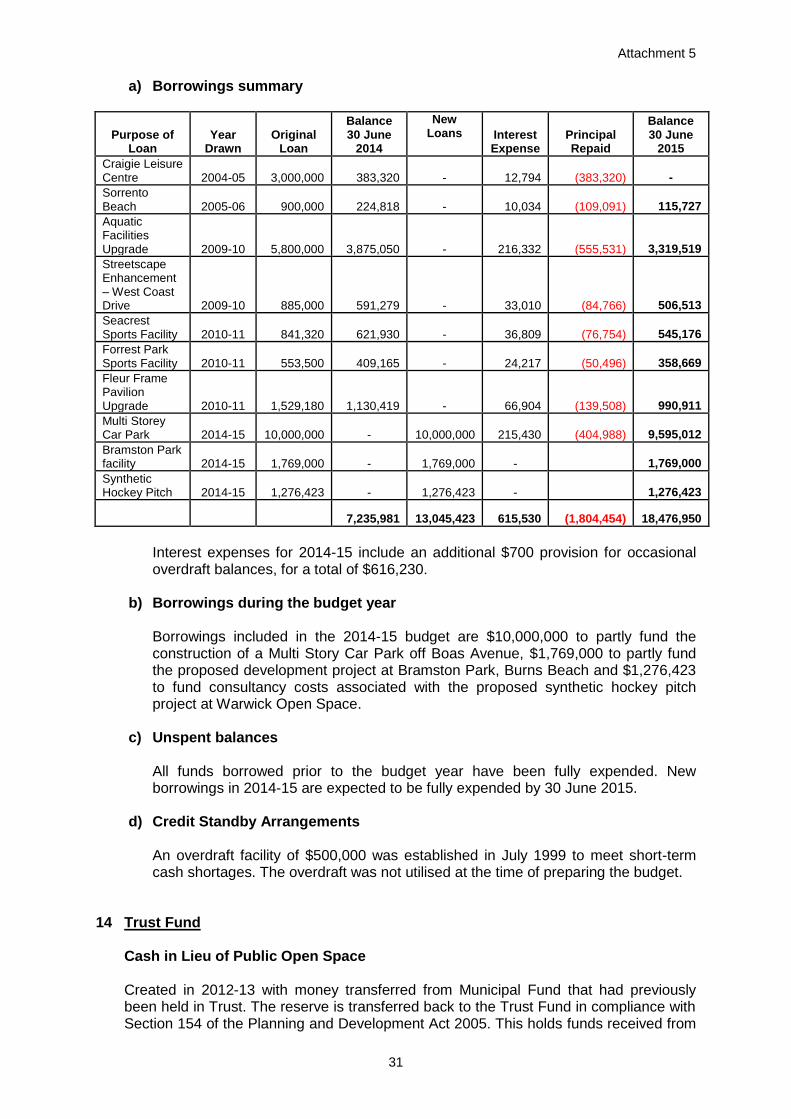
Attachment 5
31
a) Borrowings summary
Purpose of Loan
Year Drawn
Original Loan
Balance 30 June
2014
New Loans Interest
Expense Principal Repaid
Balance 30 June
2015
Craigie Leisure Centre 2004-05
3,000,000 383,320
- 12,794 (383,320) -
Sorrento Beach 2005-06
900,000
224,818
- 10,034 (109,091) 115,727
Aquatic Facilities Upgrade 2009-10
5,800,000
3,875,050
- 216,332 (555,531) 3,319,519
Streetscape Enhancement – West Coast Drive 2009-10
885,000
591,279
- 33,010 (84,766) 506,513
Seacrest Sports Facility 2010-11
841,320
621,930
- 36,809 (76,754) 545,176
Forrest Park Sports Facility 2010-11
553,500
409,165
- 24,217 (50,496) 358,669
Fleur Frame Pavilion Upgrade 2010-11
1,529,180
1,130,419
- 66,904 (139,508) 990,911
Multi Storey Car Park
2014-15
10,000,000 -
10,000,000 215,430 (404,988) 9,595,012
Bramston Park facility
2014-15
1,769,000 -
1,769,000 -
1,769,000
Synthetic Hockey Pitch
2014-15
1,276,423 -
1,276,423 -
1,276,423
7,235,981 13,045,423 615,530 (1,804,454) 18,476,950
Interest expenses for 2014-15 include an additional $700 provision for occasional overdraft balances, for a total of $616,230.
b) Borrowings during the budget year
Borrowings included in the 2014-15 budget are $10,000,000 to partly fund the construction of a Multi Story Car Park off Boas Avenue, $1,769,000 to partly fund the proposed development project at Bramston Park, Burns Beach and $1,276,423 to fund consultancy costs associated with the proposed synthetic hockey pitch project at Warwick Open Space.
c) Unspent balances
All funds borrowed prior to the budget year have been fully expended. New borrowings in 2014-15 are expected to be fully expended by 30 June 2015.
d) Credit Standby Arrangements
An overdraft facility of $500,000 was established in July 1999 to meet short-term cash shortages. The overdraft was not utilised at the time of preparing the budget.
14 Trust Fund
Cash in Lieu of Public Open Space
Created in 2012-13 with money transferred from Municipal Fund that had previously been held in Trust. The reserve is transferred back to the Trust Fund in compliance with Section 154 of the Planning and Development Act 2005. This holds funds received from
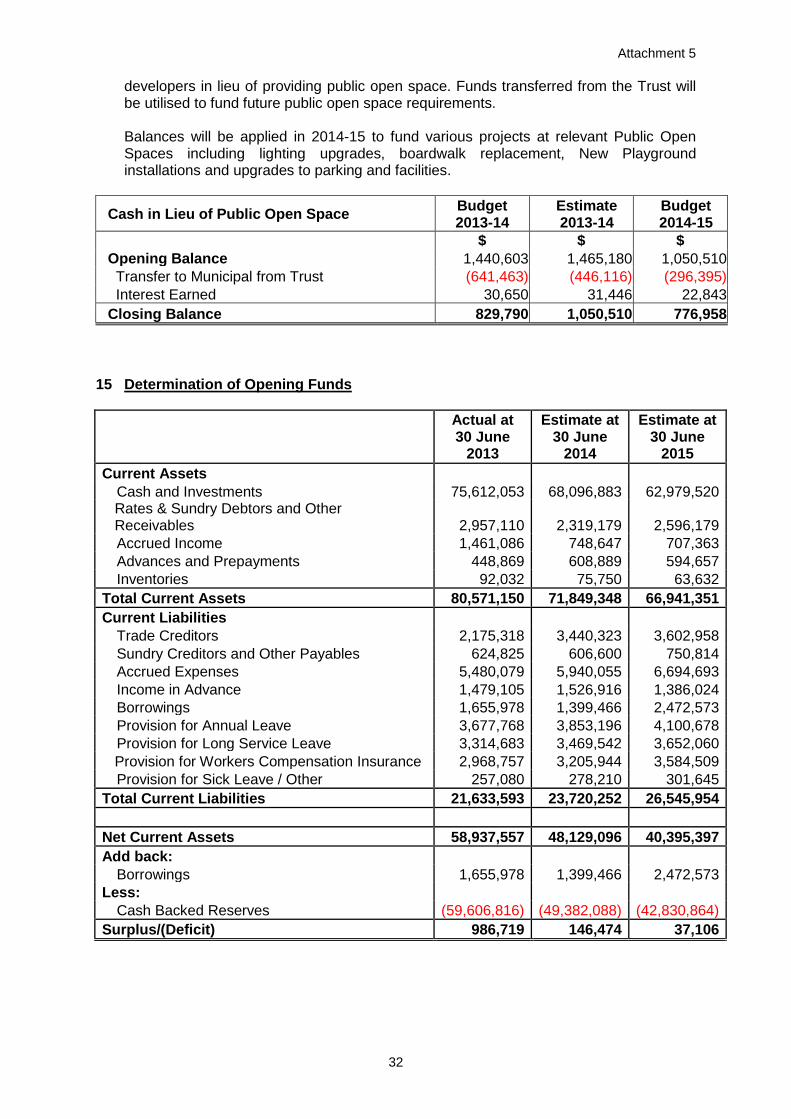
Attachment 5
32
developers in lieu of providing public open space. Funds transferred from the Trust will be utilised to fund future public open space requirements.
Balances will be applied in 2014-15 to fund various projects at relevant Public Open Spaces including lighting upgrades, boardwalk replacement, New Playground installations and upgrades to parking and facilities.
Cash in Lieu of Public Open Space Budget 2013-14
Estimate 2013-14
Budget 2014-15
$ $ $
Opening Balance 1,440,603 1,465,180 1,050,510
Transfer to Municipal from Trust (641,463) (446,116) (296,395)
Interest Earned 30,650 31,446 22,843
Closing Balance 829,790 1,050,510 776,958
15 Determination of Opening Funds
Actual at 30 June
2013
Estimate at 30 June
2014
Estimate at 30 June
2015
Current Assets
Cash and Investments 75,612,053 68,096,883 62,979,520 Rates & Sundry Debtors and Other Receivables 2,957,110 2,319,179 2,596,179
Accrued Income 1,461,086 748,647 707,363
Advances and Prepayments 448,869 608,889 594,657
Inventories 92,032 75,750 63,632
Total Current Assets 80,571,150 71,849,348 66,941,351
Current Liabilities Trade Creditors 2,175,318 3,440,323 3,602,958
Sundry Creditors and Other Payables 624,825 606,600 750,814
Accrued Expenses 5,480,079 5,940,055 6,694,693
Income in Advance 1,479,105 1,526,916 1,386,024
Borrowings 1,655,978 1,399,466 2,472,573
Provision for Annual Leave 3,677,768 3,853,196 4,100,678
Provision for Long Service Leave 3,314,683 3,469,542 3,652,060
Provision for Workers Compensation Insurance 2,968,757 3,205,944 3,584,509
Provision for Sick Leave / Other 257,080 278,210 301,645
Total Current Liabilities 21,633,593 23,720,252 26,545,954
Net Current Assets 58,937,557 48,129,096 40,395,397
Add back: Borrowings 1,655,978 1,399,466 2,472,573
Less: Cash Backed Reserves (59,606,816) (49,382,088) (42,830,864)
Surplus/(Deficit) 986,719 146,474 37,106
Attachment 5
33
16 Major Land Transactions
During the budget year the City intends to develop its land known as Lots 535 and 537 on Plan P19637 and create a multi-storey carpark facility at the site. The expenditure earmarked for the development amounts to $17,864,500 during the year. The development is not expected to be completed before the end of the budget year and no revenue is estimated from the project during the year. Planning for the development commenced in the previous financial year and the amount estimated to be spent on the project at 1 July 2014 is $759,500.
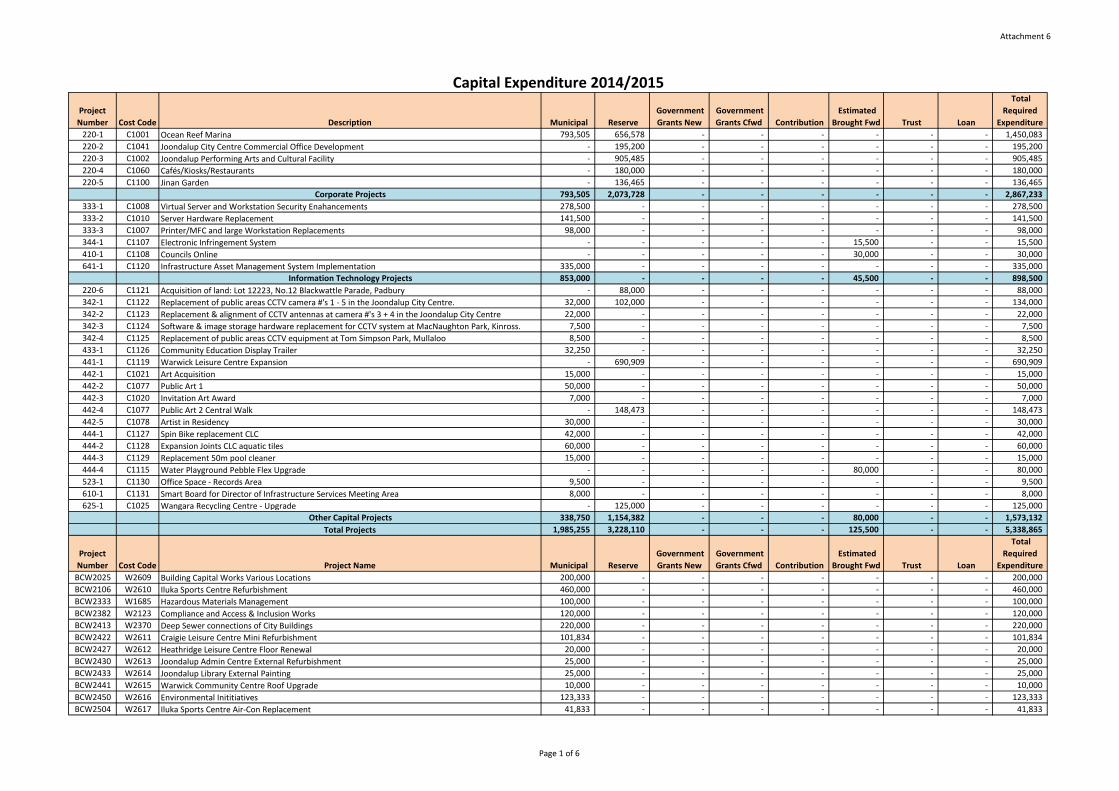
Attachment 6
Project
Number Cost Code Description Municipal Reserve
Government
Grants New
Government
Grants Cfwd Contribution
Estimated
Brought Fwd Trust Loan
Total
Required
Expenditure
220-1 C1001 Ocean Reef Marina 793,505 656,578 - - - - - - 1,450,083
220-2 C1041 Joondalup City Centre Commercial Office Development - 195,200 - - - - - - 195,200
220-3 C1002 Joondalup Performing Arts and Cultural Facility - 905,485 - - - - - - 905,485
220-4 C1060 Cafés/Kiosks/Restaurants - 180,000 - - - - - - 180,000
220-5 C1100 Jinan Garden - 136,465 - - - - - - 136,465
Corporate Projects 793,505 2,073,728 - - - - - - 2,867,233
333-1 C1008 Virtual Server and Workstation Security Enahancements 278,500 - - - - - - - 278,500
333-2 C1010 Server Hardware Replacement 141,500 - - - - - - - 141,500
333-3 C1007 Printer/MFC and large Workstation Replacements 98,000 - - - - - - - 98,000
344-1 C1107 Electronic Infringement System - - - - - 15,500 - - 15,500
410-1 C1108 Councils Online - - - - - 30,000 - - 30,000
641-1 C1120 Infrastructure Asset Management System Implementation 335,000 - - - - - - - 335,000
Information Technology Projects 853,000 - - - - 45,500 - - 898,500
220-6 C1121 Acquisition of land: Lot 12223, No.12 Blackwattle Parade, Padbury - 88,000 - - - - - - 88,000
342-1 C1122 Replacement of public areas CCTV camera #'s 1 - 5 in the Joondalup City Centre. 32,000 102,000 - - - - - - 134,000
342-2 C1123 Replacement & alignment of CCTV antennas at camera #'s 3 + 4 in the Joondalup City Centre 22,000 - - - - - - - 22,000
342-3 C1124 Software & image storage hardware replacement for CCTV system at MacNaughton Park, Kinross. 7,500 - - - - - - - 7,500
342-4 C1125 Replacement of public areas CCTV equipment at Tom Simpson Park, Mullaloo 8,500 - - - - - - - 8,500
433-1 C1126 Community Education Display Trailer 32,250 - - - - - - - 32,250
441-1 C1119 Warwick Leisure Centre Expansion - 690,909 - - - - - - 690,909
442-1 C1021 Art Acquisition 15,000 - - - - - - - 15,000
442-2 C1077 Public Art 1 50,000 - - - - - - - 50,000
442-3 C1020 Invitation Art Award 7,000 - - - - - - - 7,000
442-4 C1077 Public Art 2 Central Walk - 148,473 - - - - - - 148,473
442-5 C1078 Artist in Residency 30,000 - - - - - - - 30,000
444-1 C1127 Spin Bike replacement CLC 42,000 - - - - - - - 42,000
444-2 C1128 Expansion Joints CLC aquatic tiles 60,000 - - - - - - - 60,000
444-3 C1129 Replacement 50m pool cleaner 15,000 - - - - - - - 15,000
444-4 C1115 Water Playground Pebble Flex Upgrade - - - - - 80,000 - - 80,000
523-1 C1130 Office Space - Records Area 9,500 - - - - - - - 9,500
610-1 C1131 Smart Board for Director of Infrastructure Services Meeting Area 8,000 - - - - - - - 8,000
625-1 C1025 Wangara Recycling Centre - Upgrade - 125,000 - - - - - - 125,000
Other Capital Projects 338,750 1,154,382 - - - 80,000 - - 1,573,132
Total Projects 1,985,255 3,228,110 - - - 125,500 - - 5,338,865
Project
Number Cost Code Project Name Municipal Reserve
Government
Grants New
Government
Grants Cfwd Contribution
Estimated
Brought Fwd Trust Loan
Total
Required
Expenditure
BCW2025 W2609 Building Capital Works Various Locations 200,000 - - - - - - - 200,000
BCW2106 W2610 Iluka Sports Centre Refurbishment 460,000 - - - - - - - 460,000
BCW2333 W1685 Hazardous Materials Management 100,000 - - - - - - - 100,000
BCW2382 W2123 Compliance and Access & Inclusion Works 120,000 - - - - - - - 120,000
BCW2413 W2370 Deep Sewer connections of City Buildings 220,000 - - - - - - - 220,000
BCW2422 W2611 Craigie Leisure Centre Mini Refurbishment 101,834 - - - - - - - 101,834
BCW2427 W2612 Heathridge Leisure Centre Floor Renewal 20,000 - - - - - - - 20,000
BCW2430 W2613 Joondalup Admin Centre External Refurbishment 25,000 - - - - - - - 25,000
BCW2433 W2614 Joondalup Library External Painting 25,000 - - - - - - - 25,000
BCW2441 W2615 Warwick Community Centre Roof Upgrade 10,000 - - - - - - - 10,000
BCW2450 W2616 Environmental Inititiatives 123,333 - - - - - - - 123,333
BCW2504 W2617 Iluka Sports Centre Air-Con Replacement 41,833 - - - - - - - 41,833
Capital Expenditure 2014/2015
Page 1 of 6
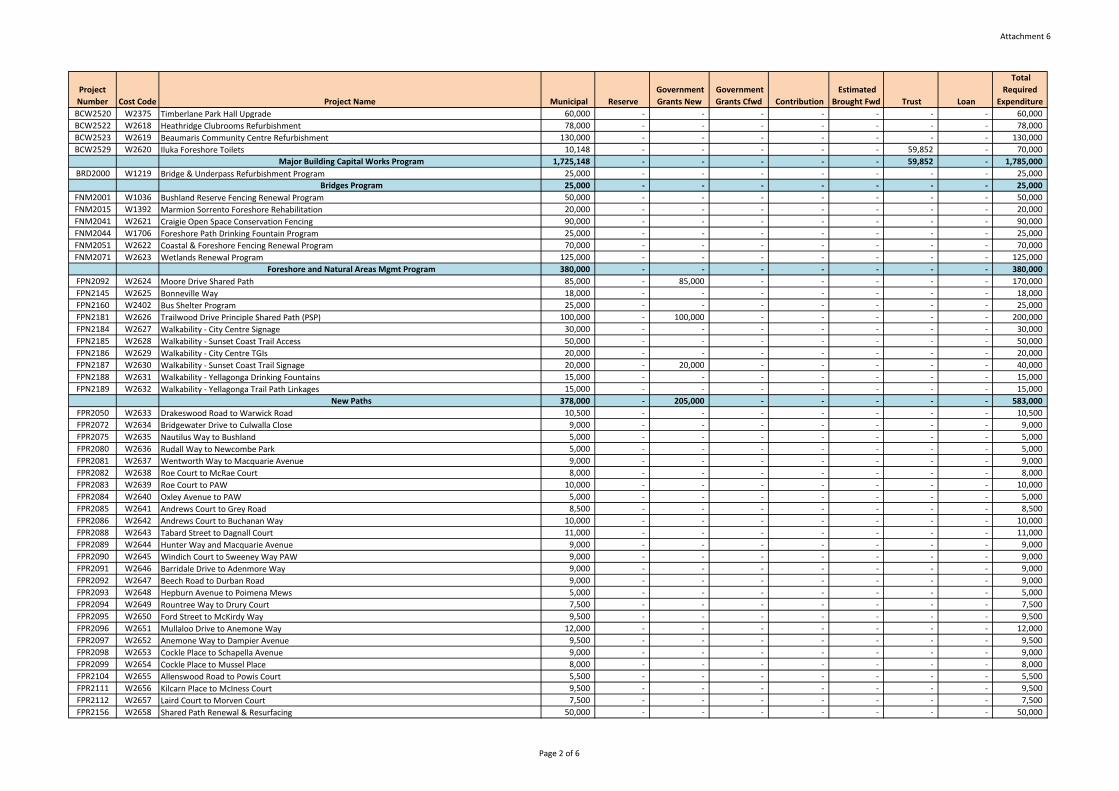
Attachment 6
Project
Number Cost Code Project Name Municipal Reserve
Government
Grants New
Government
Grants Cfwd Contribution
Estimated
Brought Fwd Trust Loan
Total
Required
Expenditure
BCW2520 W2375 Timberlane Park Hall Upgrade 60,000 - - - - - - - 60,000
BCW2522 W2618 Heathridge Clubrooms Refurbishment 78,000 - - - - - - - 78,000
BCW2523 W2619 Beaumaris Community Centre Refurbishment 130,000 - - - - - - - 130,000
BCW2529 W2620 Iluka Foreshore Toilets 10,148 - - - - - 59,852 - 70,000
Major Building Capital Works Program 1,725,148 - - - - - 59,852 - 1,785,000
BRD2000 W1219 Bridge & Underpass Refurbishment Program 25,000 - - - - - - - 25,000
Bridges Program 25,000 - - - - - - - 25,000
FNM2001 W1036 Bushland Reserve Fencing Renewal Program 50,000 - - - - - - - 50,000
FNM2015 W1392 Marmion Sorrento Foreshore Rehabilitation 20,000 - - - - - - - 20,000
FNM2041 W2621 Craigie Open Space Conservation Fencing 90,000 - - - - - - - 90,000
FNM2044 W1706 Foreshore Path Drinking Fountain Program 25,000 - - - - - - - 25,000
FNM2051 W2622 Coastal & Foreshore Fencing Renewal Program 70,000 - - - - - - - 70,000
FNM2071 W2623 Wetlands Renewal Program 125,000 - - - - - - - 125,000
Foreshore and Natural Areas Mgmt Program 380,000 - - - - - - - 380,000
FPN2092 W2624 Moore Drive Shared Path 85,000 - 85,000 - - - - - 170,000
FPN2145 W2625 Bonneville Way 18,000 - - - - - - - 18,000
FPN2160 W2402 Bus Shelter Program 25,000 - - - - - - - 25,000
FPN2181 W2626 Trailwood Drive Principle Shared Path (PSP) 100,000 - 100,000 - - - - - 200,000
FPN2184 W2627 Walkability - City Centre Signage 30,000 - - - - - - - 30,000
FPN2185 W2628 Walkability - Sunset Coast Trail Access 50,000 - - - - - - - 50,000
FPN2186 W2629 Walkability - City Centre TGIs 20,000 - - - - - - - 20,000
FPN2187 W2630 Walkability - Sunset Coast Trail Signage 20,000 - 20,000 - - - - - 40,000
FPN2188 W2631 Walkability - Yellagonga Drinking Fountains 15,000 - - - - - - - 15,000
FPN2189 W2632 Walkability - Yellagonga Trail Path Linkages 15,000 - - - - - - - 15,000
New Paths 378,000 - 205,000 - - - - - 583,000
FPR2050 W2633 Drakeswood Road to Warwick Road 10,500 - - - - - - - 10,500
FPR2072 W2634 Bridgewater Drive to Culwalla Close 9,000 - - - - - - - 9,000
FPR2075 W2635 Nautilus Way to Bushland 5,000 - - - - - - - 5,000
FPR2080 W2636 Rudall Way to Newcombe Park 5,000 - - - - - - - 5,000
FPR2081 W2637 Wentworth Way to Macquarie Avenue 9,000 - - - - - - - 9,000
FPR2082 W2638 Roe Court to McRae Court 8,000 - - - - - - - 8,000
FPR2083 W2639 Roe Court to PAW 10,000 - - - - - - - 10,000
FPR2084 W2640 Oxley Avenue to PAW 5,000 - - - - - - - 5,000
FPR2085 W2641 Andrews Court to Grey Road 8,500 - - - - - - - 8,500
FPR2086 W2642 Andrews Court to Buchanan Way 10,000 - - - - - - - 10,000
FPR2088 W2643 Tabard Street to Dagnall Court 11,000 - - - - - - - 11,000
FPR2089 W2644 Hunter Way and Macquarie Avenue 9,000 - - - - - - - 9,000
FPR2090 W2645 Windich Court to Sweeney Way PAW 9,000 - - - - - - - 9,000
FPR2091 W2646 Barridale Drive to Adenmore Way 9,000 - - - - - - - 9,000
FPR2092 W2647 Beech Road to Durban Road 9,000 - - - - - - - 9,000
FPR2093 W2648 Hepburn Avenue to Poimena Mews 5,000 - - - - - - - 5,000
FPR2094 W2649 Rountree Way to Drury Court 7,500 - - - - - - - 7,500
FPR2095 W2650 Ford Street to McKirdy Way 9,500 - - - - - - - 9,500
FPR2096 W2651 Mullaloo Drive to Anemone Way 12,000 - - - - - - - 12,000
FPR2097 W2652 Anemone Way to Dampier Avenue 9,500 - - - - - - - 9,500
FPR2098 W2653 Cockle Place to Schapella Avenue 9,000 - - - - - - - 9,000
FPR2099 W2654 Cockle Place to Mussel Place 8,000 - - - - - - - 8,000
FPR2104 W2655 Allenswood Road to Powis Court 5,500 - - - - - - - 5,500
FPR2111 W2656 Kilcarn Place to McIness Court 9,500 - - - - - - - 9,500
FPR2112 W2657 Laird Court to Morven Court 7,500 - - - - - - - 7,500
FPR2156 W2658 Shared Path Renewal & Resurfacing 50,000 - - - - - - - 50,000
Page 2 of 6
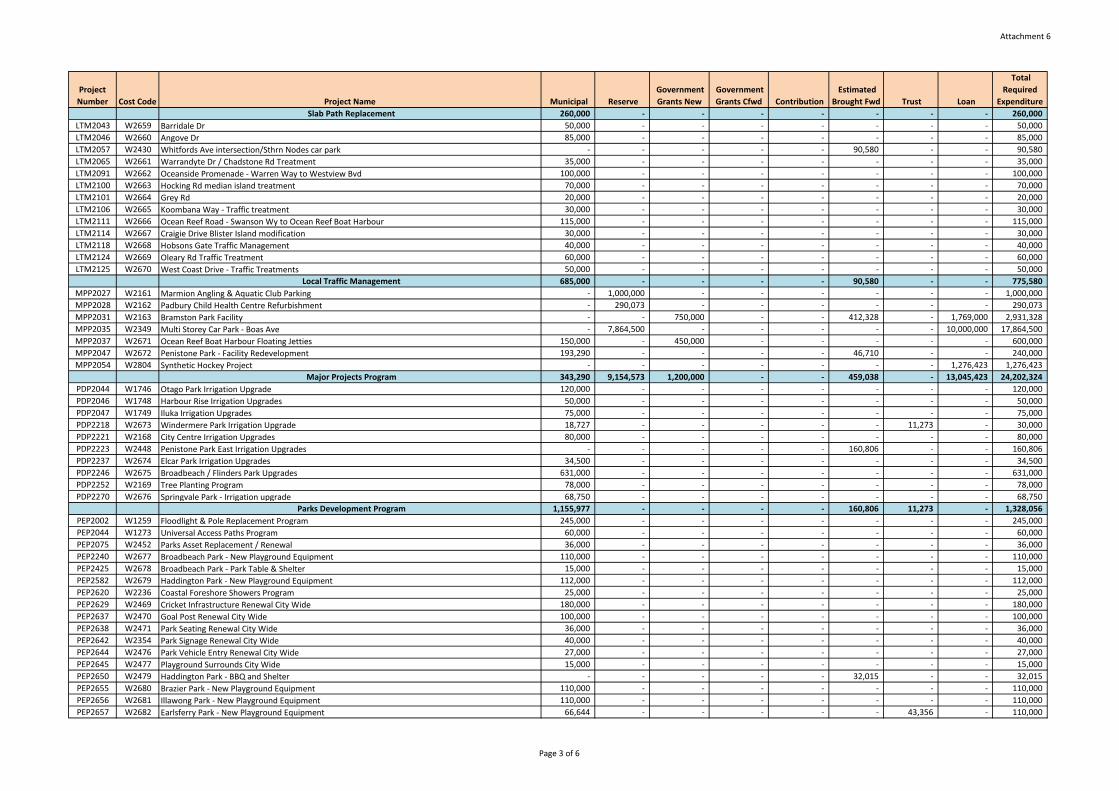
Attachment 6
Project
Number Cost Code Project Name Municipal Reserve
Government
Grants New
Government
Grants Cfwd Contribution
Estimated
Brought Fwd Trust Loan
Total
Required
Expenditure
Slab Path Replacement 260,000 - - - - - - - 260,000
LTM2043 W2659 Barridale Dr 50,000 - - - - - - - 50,000
LTM2046 W2660 Angove Dr 85,000 - - - - - - - 85,000
LTM2057 W2430 Whitfords Ave intersection/Sthrn Nodes car park - - - - - 90,580 - - 90,580
LTM2065 W2661 Warrandyte Dr / Chadstone Rd Treatment 35,000 - - - - - - - 35,000
LTM2091 W2662 Oceanside Promenade - Warren Way to Westview Bvd 100,000 - - - - - - - 100,000
LTM2100 W2663 Hocking Rd median island treatment 70,000 - - - - - - - 70,000
LTM2101 W2664 Grey Rd 20,000 - - - - - - - 20,000
LTM2106 W2665 Koombana Way - Traffic treatment 30,000 - - - - - - - 30,000
LTM2111 W2666 Ocean Reef Road - Swanson Wy to Ocean Reef Boat Harbour 115,000 - - - - - - - 115,000
LTM2114 W2667 Craigie Drive Blister Island modification 30,000 - - - - - - - 30,000
LTM2118 W2668 Hobsons Gate Traffic Management 40,000 - - - - - - - 40,000
LTM2124 W2669 Oleary Rd Traffic Treatment 60,000 - - - - - - - 60,000
LTM2125 W2670 West Coast Drive - Traffic Treatments 50,000 - - - - - - - 50,000
Local Traffic Management 685,000 - - - - 90,580 - - 775,580
MPP2027 W2161 Marmion Angling & Aquatic Club Parking - 1,000,000 - - - - - - 1,000,000
MPP2028 W2162 Padbury Child Health Centre Refurbishment - 290,073 - - - - - - 290,073
MPP2031 W2163 Bramston Park Facility - - 750,000 - - 412,328 - 1,769,000 2,931,328
MPP2035 W2349 Multi Storey Car Park - Boas Ave - 7,864,500 - - - - - 10,000,000 17,864,500
MPP2037 W2671 Ocean Reef Boat Harbour Floating Jetties 150,000 - 450,000 - - - - - 600,000
MPP2047 W2672 Penistone Park - Facility Redevelopment 193,290 - - - - 46,710 - - 240,000
MPP2054 W2804 Synthetic Hockey Project - - - - - - - 1,276,423 1,276,423
Major Projects Program 343,290 9,154,573 1,200,000 - - 459,038 - 13,045,423 24,202,324
PDP2044 W1746 Otago Park Irrigation Upgrade 120,000 - - - - - - - 120,000
PDP2046 W1748 Harbour Rise Irrigation Upgrades 50,000 - - - - - - - 50,000
PDP2047 W1749 Iluka Irrigation Upgrades 75,000 - - - - - - - 75,000
PDP2218 W2673 Windermere Park Irrigation Upgrade 18,727 - - - - - 11,273 - 30,000
PDP2221 W2168 City Centre Irrigation Upgrades 80,000 - - - - - - - 80,000
PDP2223 W2448 Penistone Park East Irrigation Upgrades - - - - - 160,806 - - 160,806
PDP2237 W2674 Elcar Park Irrigation Upgrades 34,500 - - - - - - - 34,500
PDP2246 W2675 Broadbeach / Flinders Park Upgrades 631,000 - - - - - - - 631,000
PDP2252 W2169 Tree Planting Program 78,000 - - - - - - - 78,000
PDP2270 W2676 Springvale Park - Irrigation upgrade 68,750 - - - - - - - 68,750
Parks Development Program 1,155,977 - - - - 160,806 11,273 - 1,328,056
PEP2002 W1259 Floodlight & Pole Replacement Program 245,000 - - - - - - - 245,000
PEP2044 W1273 Universal Access Paths Program 60,000 - - - - - - - 60,000
PEP2075 W2452 Parks Asset Replacement / Renewal 36,000 - - - - - - - 36,000
PEP2240 W2677 Broadbeach Park - New Playground Equipment 110,000 - - - - - - - 110,000
PEP2425 W2678 Broadbeach Park - Park Table & Shelter 15,000 - - - - - - - 15,000
PEP2582 W2679 Haddington Park - New Playground Equipment 112,000 - - - - - - - 112,000
PEP2620 W2236 Coastal Foreshore Showers Program 25,000 - - - - - - - 25,000
PEP2629 W2469 Cricket Infrastructure Renewal City Wide 180,000 - - - - - - - 180,000
PEP2637 W2470 Goal Post Renewal City Wide 100,000 - - - - - - - 100,000
PEP2638 W2471 Park Seating Renewal City Wide 36,000 - - - - - - - 36,000
PEP2642 W2354 Park Signage Renewal City Wide 40,000 - - - - - - - 40,000
PEP2644 W2476 Park Vehicle Entry Renewal City Wide 27,000 - - - - - - - 27,000
PEP2645 W2477 Playground Surrounds City Wide 15,000 - - - - - - - 15,000
PEP2650 W2479 Haddington Park - BBQ and Shelter - - - - - 32,015 - - 32,015
PEP2655 W2680 Brazier Park - New Playground Equipment 110,000 - - - - - - - 110,000
PEP2656 W2681 Illawong Park - New Playground Equipment 110,000 - - - - - - - 110,000
PEP2657 W2682 Earlsferry Park - New Playground Equipment 66,644 - - - - - 43,356 - 110,000
Page 3 of 6
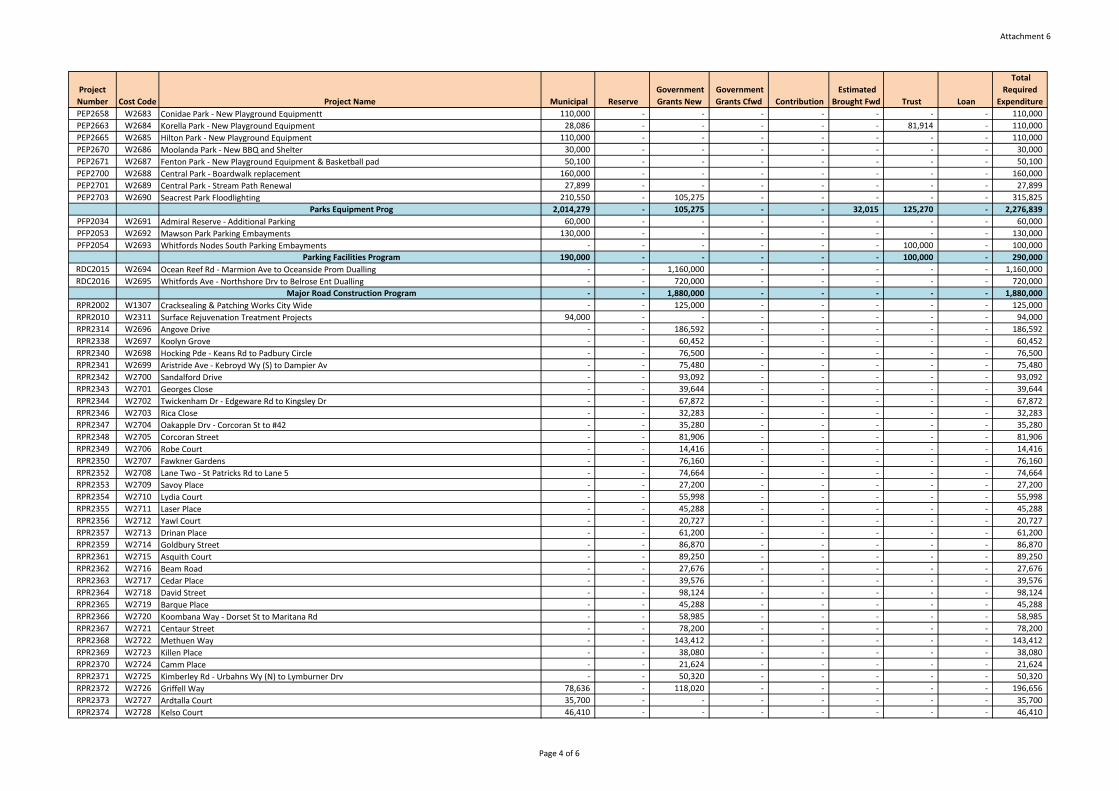
Attachment 6
Project
Number Cost Code Project Name Municipal Reserve
Government
Grants New
Government
Grants Cfwd Contribution
Estimated
Brought Fwd Trust Loan
Total
Required
Expenditure
PEP2658 W2683 Conidae Park - New Playground Equipmentt 110,000 - - - - - - - 110,000
PEP2663 W2684 Korella Park - New Playground Equipment 28,086 - - - - - 81,914 - 110,000
PEP2665 W2685 Hilton Park - New Playground Equipment 110,000 - - - - - - - 110,000
PEP2670 W2686 Moolanda Park - New BBQ and Shelter 30,000 - - - - - - - 30,000
PEP2671 W2687 Fenton Park - New Playground Equipment & Basketball pad 50,100 - - - - - - - 50,100
PEP2700 W2688 Central Park - Boardwalk replacement 160,000 - - - - - - - 160,000
PEP2701 W2689 Central Park - Stream Path Renewal 27,899 - - - - - - - 27,899
PEP2703 W2690 Seacrest Park Floodlighting 210,550 - 105,275 - - - - - 315,825
Parks Equipment Prog 2,014,279 - 105,275 - - 32,015 125,270 - 2,276,839
PFP2034 W2691 Admiral Reserve - Additional Parking 60,000 - - - - - - - 60,000
PFP2053 W2692 Mawson Park Parking Embayments 130,000 - - - - - - - 130,000
PFP2054 W2693 Whitfords Nodes South Parking Embayments - - - - - - 100,000 - 100,000
Parking Facilities Program 190,000 - - - - - 100,000 - 290,000
RDC2015 W2694 Ocean Reef Rd - Marmion Ave to Oceanside Prom Dualling - - 1,160,000 - - - - - 1,160,000
RDC2016 W2695 Whitfords Ave - Northshore Drv to Belrose Ent Dualling - - 720,000 - - - - - 720,000
Major Road Construction Program - - 1,880,000 - - - - - 1,880,000
RPR2002 W1307 Cracksealing & Patching Works City Wide - - 125,000 - - - - - 125,000
RPR2010 W2311 Surface Rejuvenation Treatment Projects 94,000 - - - - - - - 94,000
RPR2314 W2696 Angove Drive - - 186,592 - - - - - 186,592
RPR2338 W2697 Koolyn Grove - - 60,452 - - - - - 60,452
RPR2340 W2698 Hocking Pde - Keans Rd to Padbury Circle - - 76,500 - - - - - 76,500
RPR2341 W2699 Aristride Ave - Kebroyd Wy (S) to Dampier Av - - 75,480 - - - - - 75,480
RPR2342 W2700 Sandalford Drive - - 93,092 - - - - - 93,092
RPR2343 W2701 Georges Close - - 39,644 - - - - - 39,644
RPR2344 W2702 Twickenham Dr - Edgeware Rd to Kingsley Dr - - 67,872 - - - - - 67,872
RPR2346 W2703 Rica Close - - 32,283 - - - - - 32,283
RPR2347 W2704 Oakapple Drv - Corcoran St to #42 - - 35,280 - - - - - 35,280
RPR2348 W2705 Corcoran Street - - 81,906 - - - - - 81,906
RPR2349 W2706 Robe Court - - 14,416 - - - - - 14,416
RPR2350 W2707 Fawkner Gardens - - 76,160 - - - - - 76,160
RPR2352 W2708 Lane Two - St Patricks Rd to Lane 5 - - 74,664 - - - - - 74,664
RPR2353 W2709 Savoy Place - - 27,200 - - - - - 27,200
RPR2354 W2710 Lydia Court - - 55,998 - - - - - 55,998
RPR2355 W2711 Laser Place - - 45,288 - - - - - 45,288
RPR2356 W2712 Yawl Court - - 20,727 - - - - - 20,727
RPR2357 W2713 Drinan Place - - 61,200 - - - - - 61,200
RPR2359 W2714 Goldbury Street - - 86,870 - - - - - 86,870
RPR2361 W2715 Asquith Court - - 89,250 - - - - - 89,250
RPR2362 W2716 Beam Road - - 27,676 - - - - - 27,676
RPR2363 W2717 Cedar Place - - 39,576 - - - - - 39,576
RPR2364 W2718 David Street - - 98,124 - - - - - 98,124
RPR2365 W2719 Barque Place - - 45,288 - - - - - 45,288
RPR2366 W2720 Koombana Way - Dorset St to Maritana Rd - - 58,985 - - - - - 58,985
RPR2367 W2721 Centaur Street - - 78,200 - - - - - 78,200
RPR2368 W2722 Methuen Way - - 143,412 - - - - - 143,412
RPR2369 W2723 Killen Place - - 38,080 - - - - - 38,080
RPR2370 W2724 Camm Place - - 21,624 - - - - - 21,624
RPR2371 W2725 Kimberley Rd - Urbahns Wy (N) to Lymburner Drv - - 50,320 - - - - - 50,320
RPR2372 W2726 Griffell Way 78,636 - 118,020 - - - - - 196,656
RPR2373 W2727 Ardtalla Court 35,700 - - - - - - - 35,700
RPR2374 W2728 Kelso Court 46,410 - - - - - - - 46,410
Page 4 of 6
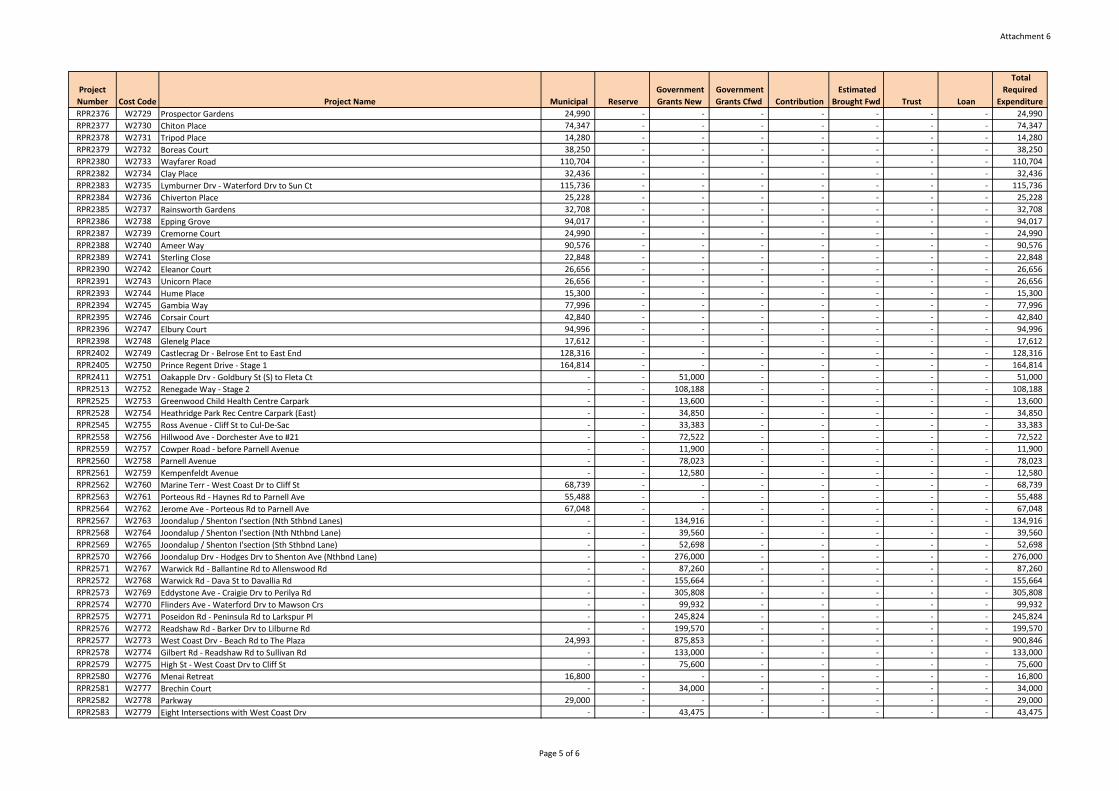
Attachment 6
Project
Number Cost Code Project Name Municipal Reserve
Government
Grants New
Government
Grants Cfwd Contribution
Estimated
Brought Fwd Trust Loan
Total
Required
Expenditure
RPR2376 W2729 Prospector Gardens 24,990 - - - - - - - 24,990
RPR2377 W2730 Chiton Place 74,347 - - - - - - - 74,347
RPR2378 W2731 Tripod Place 14,280 - - - - - - - 14,280
RPR2379 W2732 Boreas Court 38,250 - - - - - - - 38,250
RPR2380 W2733 Wayfarer Road 110,704 - - - - - - - 110,704
RPR2382 W2734 Clay Place 32,436 - - - - - - - 32,436
RPR2383 W2735 Lymburner Drv - Waterford Drv to Sun Ct 115,736 - - - - - - - 115,736
RPR2384 W2736 Chiverton Place 25,228 - - - - - - - 25,228
RPR2385 W2737 Rainsworth Gardens 32,708 - - - - - - - 32,708
RPR2386 W2738 Epping Grove 94,017 - - - - - - - 94,017
RPR2387 W2739 Cremorne Court 24,990 - - - - - - - 24,990
RPR2388 W2740 Ameer Way 90,576 - - - - - - - 90,576
RPR2389 W2741 Sterling Close 22,848 - - - - - - - 22,848
RPR2390 W2742 Eleanor Court 26,656 - - - - - - - 26,656
RPR2391 W2743 Unicorn Place 26,656 - - - - - - - 26,656
RPR2393 W2744 Hume Place 15,300 - - - - - - - 15,300
RPR2394 W2745 Gambia Way 77,996 - - - - - - - 77,996
RPR2395 W2746 Corsair Court 42,840 - - - - - - - 42,840
RPR2396 W2747 Elbury Court 94,996 - - - - - - - 94,996
RPR2398 W2748 Glenelg Place 17,612 - - - - - - - 17,612
RPR2402 W2749 Castlecrag Dr - Belrose Ent to East End 128,316 - - - - - - - 128,316
RPR2405 W2750 Prince Regent Drive - Stage 1 164,814 - - - - - - - 164,814
RPR2411 W2751 Oakapple Drv - Goldbury St (S) to Fleta Ct - - 51,000 - - - - - 51,000
RPR2513 W2752 Renegade Way - Stage 2 - - 108,188 - - - - - 108,188
RPR2525 W2753 Greenwood Child Health Centre Carpark - - 13,600 - - - - - 13,600
RPR2528 W2754 Heathridge Park Rec Centre Carpark (East) - - 34,850 - - - - - 34,850
RPR2545 W2755 Ross Avenue - Cliff St to Cul-De-Sac - - 33,383 - - - - - 33,383
RPR2558 W2756 Hillwood Ave - Dorchester Ave to #21 - - 72,522 - - - - - 72,522
RPR2559 W2757 Cowper Road - before Parnell Avenue - - 11,900 - - - - - 11,900
RPR2560 W2758 Parnell Avenue - - 78,023 - - - - - 78,023
RPR2561 W2759 Kempenfeldt Avenue - - 12,580 - - - - - 12,580
RPR2562 W2760 Marine Terr - West Coast Dr to Cliff St 68,739 - - - - - - - 68,739
RPR2563 W2761 Porteous Rd - Haynes Rd to Parnell Ave 55,488 - - - - - - - 55,488
RPR2564 W2762 Jerome Ave - Porteous Rd to Parnell Ave 67,048 - - - - - - - 67,048
RPR2567 W2763 Joondalup / Shenton I'section (Nth Sthbnd Lanes) - - 134,916 - - - - - 134,916
RPR2568 W2764 Joondalup / Shenton I'section (Nth Nthbnd Lane) - - 39,560 - - - - - 39,560
RPR2569 W2765 Joondalup / Shenton I'section (Sth Sthbnd Lane) - - 52,698 - - - - - 52,698
RPR2570 W2766 Joondalup Drv - Hodges Drv to Shenton Ave (Nthbnd Lane) - - 276,000 - - - - - 276,000
RPR2571 W2767 Warwick Rd - Ballantine Rd to Allenswood Rd - - 87,260 - - - - - 87,260
RPR2572 W2768 Warwick Rd - Dava St to Davallia Rd - - 155,664 - - - - - 155,664
RPR2573 W2769 Eddystone Ave - Craigie Drv to Perilya Rd - - 305,808 - - - - - 305,808
RPR2574 W2770 Flinders Ave - Waterford Drv to Mawson Crs - - 99,932 - - - - - 99,932
RPR2575 W2771 Poseidon Rd - Peninsula Rd to Larkspur Pl - - 245,824 - - - - - 245,824
RPR2576 W2772 Readshaw Rd - Barker Drv to Lilburne Rd - - 199,570 - - - - - 199,570
RPR2577 W2773 West Coast Drv - Beach Rd to The Plaza 24,993 - 875,853 - - - - - 900,846
RPR2578 W2774 Gilbert Rd - Readshaw Rd to Sullivan Rd - - 133,000 - - - - - 133,000
RPR2579 W2775 High St - West Coast Drv to Cliff St - - 75,600 - - - - - 75,600
RPR2580 W2776 Menai Retreat 16,800 - - - - - - - 16,800
RPR2581 W2777 Brechin Court - - 34,000 - - - - - 34,000
RPR2582 W2778 Parkway 29,000 - - - - - - - 29,000
RPR2583 W2779 Eight Intersections with West Coast Drv - - 43,475 - - - - - 43,475
Page 5 of 6
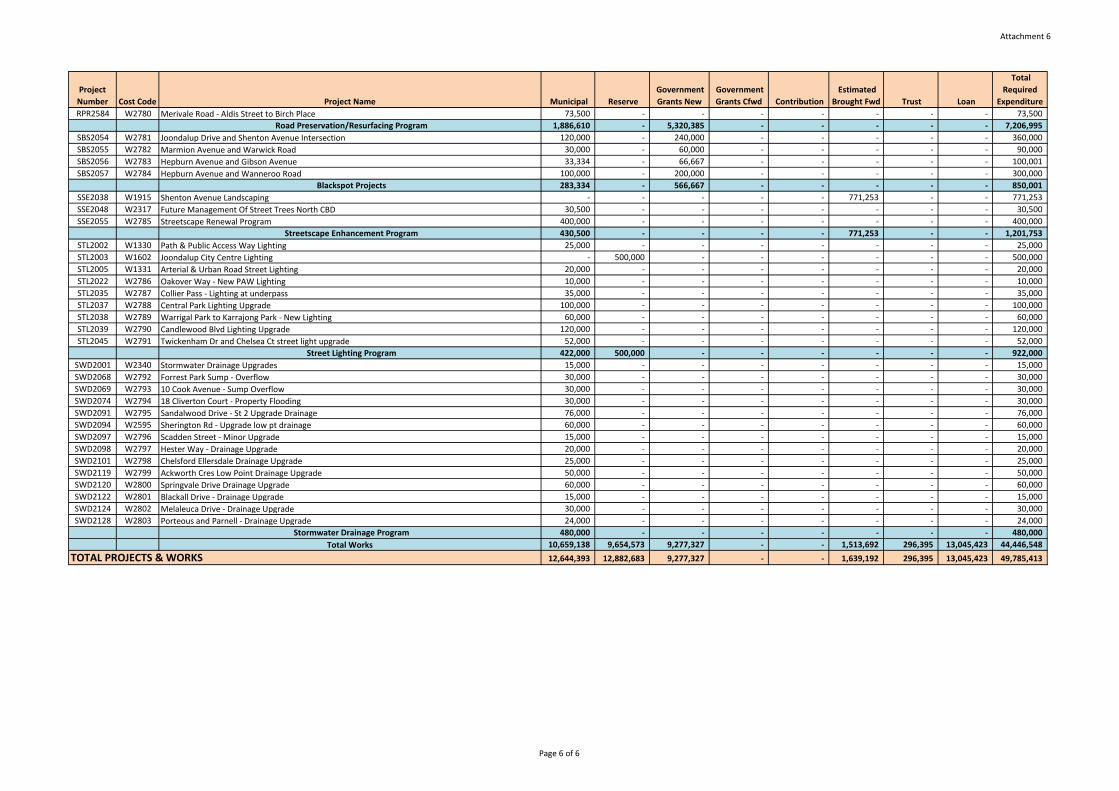
Attachment 6
Project
Number Cost Code Project Name Municipal Reserve
Government
Grants New
Government
Grants Cfwd Contribution
Estimated
Brought Fwd Trust Loan
Total
Required
Expenditure
RPR2584 W2780 Merivale Road - Aldis Street to Birch Place 73,500 - - - - - - - 73,500
Road Preservation/Resurfacing Program 1,886,610 - 5,320,385 - - - - - 7,206,995
SBS2054 W2781 Joondalup Drive and Shenton Avenue Intersection 120,000 - 240,000 - - - - - 360,000
SBS2055 W2782 Marmion Avenue and Warwick Road 30,000 - 60,000 - - - - - 90,000
SBS2056 W2783 Hepburn Avenue and Gibson Avenue 33,334 - 66,667 - - - - - 100,001
SBS2057 W2784 Hepburn Avenue and Wanneroo Road 100,000 - 200,000 - - - - - 300,000
Blackspot Projects 283,334 - 566,667 - - - - - 850,001
SSE2038 W1915 Shenton Avenue Landscaping - - - - - 771,253 - - 771,253
SSE2048 W2317 Future Management Of Street Trees North CBD 30,500 - - - - - - - 30,500
SSE2055 W2785 Streetscape Renewal Program 400,000 - - - - - - - 400,000
Streetscape Enhancement Program 430,500 - - - - 771,253 - - 1,201,753
STL2002 W1330 Path & Public Access Way Lighting 25,000 - - - - - - - 25,000
STL2003 W1602 Joondalup City Centre Lighting - 500,000 - - - - - - 500,000
STL2005 W1331 Arterial & Urban Road Street Lighting 20,000 - - - - - - - 20,000
STL2022 W2786 Oakover Way - New PAW Lighting 10,000 - - - - - - - 10,000
STL2035 W2787 Collier Pass - Lighting at underpass 35,000 - - - - - - - 35,000
STL2037 W2788 Central Park Lighting Upgrade 100,000 - - - - - - - 100,000
STL2038 W2789 Warrigal Park to Karrajong Park - New Lighting 60,000 - - - - - - - 60,000
STL2039 W2790 Candlewood Blvd Lighting Upgrade 120,000 - - - - - - - 120,000
STL2045 W2791 Twickenham Dr and Chelsea Ct street light upgrade 52,000 - - - - - - - 52,000
Street Lighting Program 422,000 500,000 - - - - - - 922,000
SWD2001 W2340 Stormwater Drainage Upgrades 15,000 - - - - - - - 15,000
SWD2068 W2792 Forrest Park Sump - Overflow 30,000 - - - - - - - 30,000
SWD2069 W2793 10 Cook Avenue - Sump Overflow 30,000 - - - - - - - 30,000
SWD2074 W2794 18 Cliverton Court - Property Flooding 30,000 - - - - - - - 30,000
SWD2091 W2795 Sandalwood Drive - St 2 Upgrade Drainage 76,000 - - - - - - - 76,000
SWD2094 W2595 Sherington Rd - Upgrade low pt drainage 60,000 - - - - - - - 60,000
SWD2097 W2796 Scadden Street - Minor Upgrade 15,000 - - - - - - - 15,000
SWD2098 W2797 Hester Way - Drainage Upgrade 20,000 - - - - - - - 20,000
SWD2101 W2798 Chelsford Ellersdale Drainage Upgrade 25,000 - - - - - - - 25,000
SWD2119 W2799 Ackworth Cres Low Point Drainage Upgrade 50,000 - - - - - - - 50,000
SWD2120 W2800 Springvale Drive Drainage Upgrade 60,000 - - - - - - - 60,000
SWD2122 W2801 Blackall Drive - Drainage Upgrade 15,000 - - - - - - - 15,000
SWD2124 W2802 Melaleuca Drive - Drainage Upgrade 30,000 - - - - - - - 30,000
SWD2128 W2803 Porteous and Parnell - Drainage Upgrade 24,000 - - - - - - - 24,000
Stormwater Drainage Program 480,000 - - - - - - - 480,000
Total Works 10,659,138 9,654,573 9,277,327 - - 1,513,692 296,395 13,045,423 44,446,548
TOTAL PROJECTS & WORKS 12,644,393 12,882,683 9,277,327 - - 1,639,192 296,395 13,045,423 49,785,413
Page 6 of 6
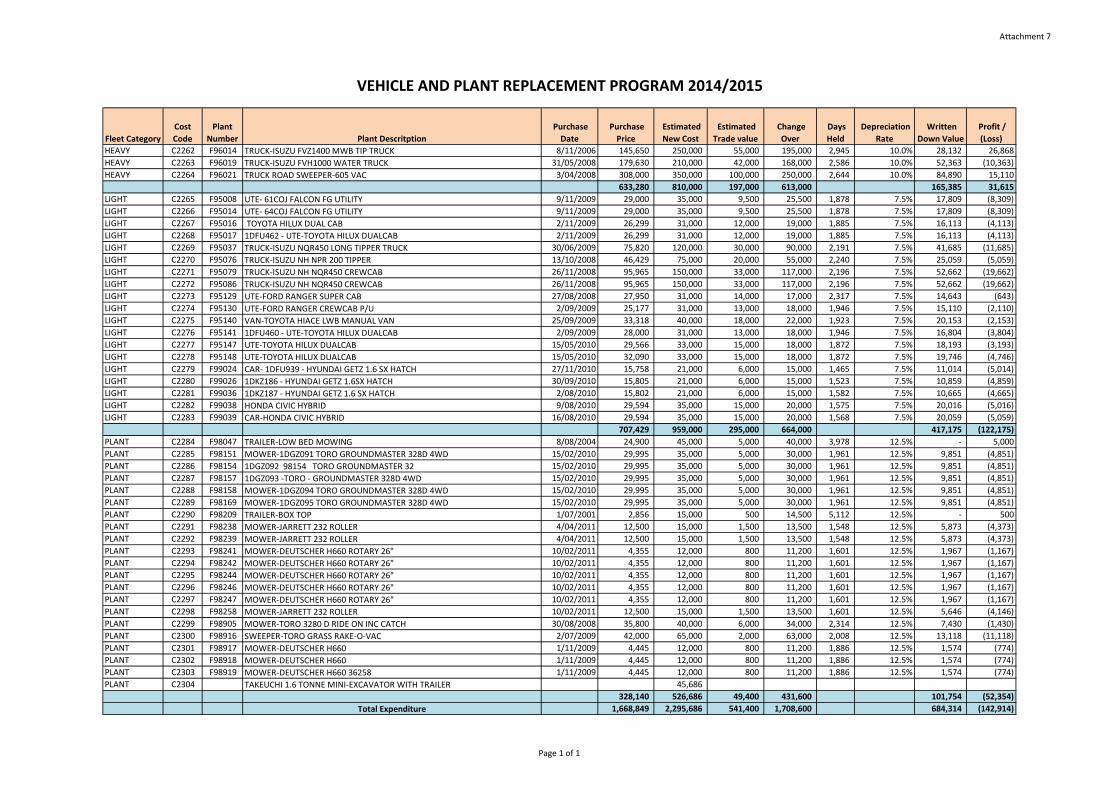
Attachment 7
Fleet Category
Cost
Code
Plant
Number Plant Descritption
Purchase
Date
Purchase
Price
Estimated
New Cost
Estimated
Trade value
Change
Over
Days
Held
Depreciation
Rate
Written
Down Value
Profit /
(Loss)
HEAVY C2262 F96014 TRUCK-ISUZU FVZ1400 MWB TIP TRUCK 8/11/2006 145,650 250,000 55,000 195,000 2,945 10.0% 28,132 26,868
HEAVY C2263 F96019 TRUCK-ISUZU FVH1000 WATER TRUCK 31/05/2008 179,630 210,000 42,000 168,000 2,586 10.0% 52,363 (10,363)
HEAVY C2264 F96021 TRUCK ROAD SWEEPER-605 VAC 3/04/2008 308,000 350,000 100,000 250,000 2,644 10.0% 84,890 15,110
633,280 810,000 197,000 613,000 165,385 31,615
LIGHT C2265 F95008 UTE- 61COJ FALCON FG UTILITY 9/11/2009 29,000 35,000 9,500 25,500 1,878 7.5% 17,809 (8,309)
LIGHT C2266 F95014 UTE- 64COJ FALCON FG UTILITY 9/11/2009 29,000 35,000 9,500 25,500 1,878 7.5% 17,809 (8,309)
LIGHT C2267 F95016 TOYOTA HILUX DUAL CAB 2/11/2009 26,299 31,000 12,000 19,000 1,885 7.5% 16,113 (4,113)
LIGHT C2268 F95017 1DFU462 - UTE-TOYOTA HILUX DUALCAB 2/11/2009 26,299 31,000 12,000 19,000 1,885 7.5% 16,113 (4,113)
LIGHT C2269 F95037 TRUCK-ISUZU NQR450 LONG TIPPER TRUCK 30/06/2009 75,820 120,000 30,000 90,000 2,191 7.5% 41,685 (11,685)
LIGHT C2270 F95076 TRUCK-ISUZU NH NPR 200 TIPPER 13/10/2008 46,429 75,000 20,000 55,000 2,240 7.5% 25,059 (5,059)
LIGHT C2271 F95079 TRUCK-ISUZU NH NQR450 CREWCAB 26/11/2008 95,965 150,000 33,000 117,000 2,196 7.5% 52,662 (19,662)
LIGHT C2272 F95086 TRUCK-ISUZU NH NQR450 CREWCAB 26/11/2008 95,965 150,000 33,000 117,000 2,196 7.5% 52,662 (19,662)
LIGHT C2273 F95129 UTE-FORD RANGER SUPER CAB 27/08/2008 27,950 31,000 14,000 17,000 2,317 7.5% 14,643 (643)
LIGHT C2274 F95130 UTE-FORD RANGER CREWCAB P/U 2/09/2009 25,177 31,000 13,000 18,000 1,946 7.5% 15,110 (2,110)
LIGHT C2275 F95140 VAN-TOYOTA HIACE LWB MANUAL VAN 25/09/2009 33,318 40,000 18,000 22,000 1,923 7.5% 20,153 (2,153)
LIGHT C2276 F95141 1DFU460 - UTE-TOYOTA HILUX DUALCAB 2/09/2009 28,000 31,000 13,000 18,000 1,946 7.5% 16,804 (3,804)
LIGHT C2277 F95147 UTE-TOYOTA HILUX DUALCAB 15/05/2010 29,566 33,000 15,000 18,000 1,872 7.5% 18,193 (3,193)
LIGHT C2278 F95148 UTE-TOYOTA HILUX DUALCAB 15/05/2010 32,090 33,000 15,000 18,000 1,872 7.5% 19,746 (4,746)
LIGHT C2279 F99024 CAR- 1DFU939 - HYUNDAI GETZ 1.6 SX HATCH 27/11/2010 15,758 21,000 6,000 15,000 1,465 7.5% 11,014 (5,014)
LIGHT C2280 F99026 1DKZ186 - HYUNDAI GETZ 1.6SX HATCH 30/09/2010 15,805 21,000 6,000 15,000 1,523 7.5% 10,859 (4,859)
LIGHT C2281 F99036 1DKZ187 - HYUNDAI GETZ 1.6 SX HATCH 2/08/2010 15,802 21,000 6,000 15,000 1,582 7.5% 10,665 (4,665)
LIGHT C2282 F99038 HONDA CIVIC HYBRID 9/08/2010 29,594 35,000 15,000 20,000 1,575 7.5% 20,016 (5,016)
LIGHT C2283 F99039 CAR-HONDA CIVIC HYBRID 16/08/2010 29,594 35,000 15,000 20,000 1,568 7.5% 20,059 (5,059)
707,429 959,000 295,000 664,000 417,175 (122,175)
PLANT C2284 F98047 TRAILER-LOW BED MOWING 8/08/2004 24,900 45,000 5,000 40,000 3,978 12.5% - 5,000
PLANT C2285 F98151 MOWER-1DGZ091 TORO GROUNDMASTER 328D 4WD 15/02/2010 29,995 35,000 5,000 30,000 1,961 12.5% 9,851 (4,851)
PLANT C2286 F98154 1DGZ092 98154 TORO GROUNDMASTER 32 15/02/2010 29,995 35,000 5,000 30,000 1,961 12.5% 9,851 (4,851)
PLANT C2287 F98157 1DGZ093 -TORO - GROUNDMASTER 328D 4WD 15/02/2010 29,995 35,000 5,000 30,000 1,961 12.5% 9,851 (4,851)
PLANT C2288 F98158 MOWER-1DGZ094 TORO GROUNDMASTER 328D 4WD 15/02/2010 29,995 35,000 5,000 30,000 1,961 12.5% 9,851 (4,851)
PLANT C2289 F98169 MOWER-1DGZ095 TORO GROUNDMASTER 328D 4WD 15/02/2010 29,995 35,000 5,000 30,000 1,961 12.5% 9,851 (4,851)
PLANT C2290 F98209 TRAILER-BOX TOP 1/07/2001 2,856 15,000 500 14,500 5,112 12.5% - 500
PLANT C2291 F98238 MOWER-JARRETT 232 ROLLER 4/04/2011 12,500 15,000 1,500 13,500 1,548 12.5% 5,873 (4,373)
PLANT C2292 F98239 MOWER-JARRETT 232 ROLLER 4/04/2011 12,500 15,000 1,500 13,500 1,548 12.5% 5,873 (4,373)
PLANT C2293 F98241 MOWER-DEUTSCHER H660 ROTARY 26" 10/02/2011 4,355 12,000 800 11,200 1,601 12.5% 1,967 (1,167)
PLANT C2294 F98242 MOWER-DEUTSCHER H660 ROTARY 26" 10/02/2011 4,355 12,000 800 11,200 1,601 12.5% 1,967 (1,167)
PLANT C2295 F98244 MOWER-DEUTSCHER H660 ROTARY 26" 10/02/2011 4,355 12,000 800 11,200 1,601 12.5% 1,967 (1,167)
PLANT C2296 F98246 MOWER-DEUTSCHER H660 ROTARY 26" 10/02/2011 4,355 12,000 800 11,200 1,601 12.5% 1,967 (1,167)
PLANT C2297 F98247 MOWER-DEUTSCHER H660 ROTARY 26" 10/02/2011 4,355 12,000 800 11,200 1,601 12.5% 1,967 (1,167)
PLANT C2298 F98258 MOWER-JARRETT 232 ROLLER 10/02/2011 12,500 15,000 1,500 13,500 1,601 12.5% 5,646 (4,146)
PLANT C2299 F98905 MOWER-TORO 3280 D RIDE ON INC CATCH 30/08/2008 35,800 40,000 6,000 34,000 2,314 12.5% 7,430 (1,430)
PLANT C2300 F98916 SWEEPER-TORO GRASS RAKE-O-VAC 2/07/2009 42,000 65,000 2,000 63,000 2,008 12.5% 13,118 (11,118)
PLANT C2301 F98917 MOWER-DEUTSCHER H660 1/11/2009 4,445 12,000 800 11,200 1,886 12.5% 1,574 (774)
PLANT C2302 F98918 MOWER-DEUTSCHER H660 1/11/2009 4,445 12,000 800 11,200 1,886 12.5% 1,574 (774)
PLANT C2303 F98919 MOWER-DEUTSCHER H660 36258 1/11/2009 4,445 12,000 800 11,200 1,886 12.5% 1,574 (774)
PLANT C2304 TAKEUCHI 1.6 TONNE MINI-EXCAVATOR WITH TRAILER 45,686
328,140 526,686 49,400 431,600 101,754 (52,354)
Total Expenditure 1,668,849 2,295,686 541,400 1,708,600 684,314 (142,914)
VEHICLE AND PLANT REPLACEMENT PROGRAM 2014/2015
Page 1 of 1
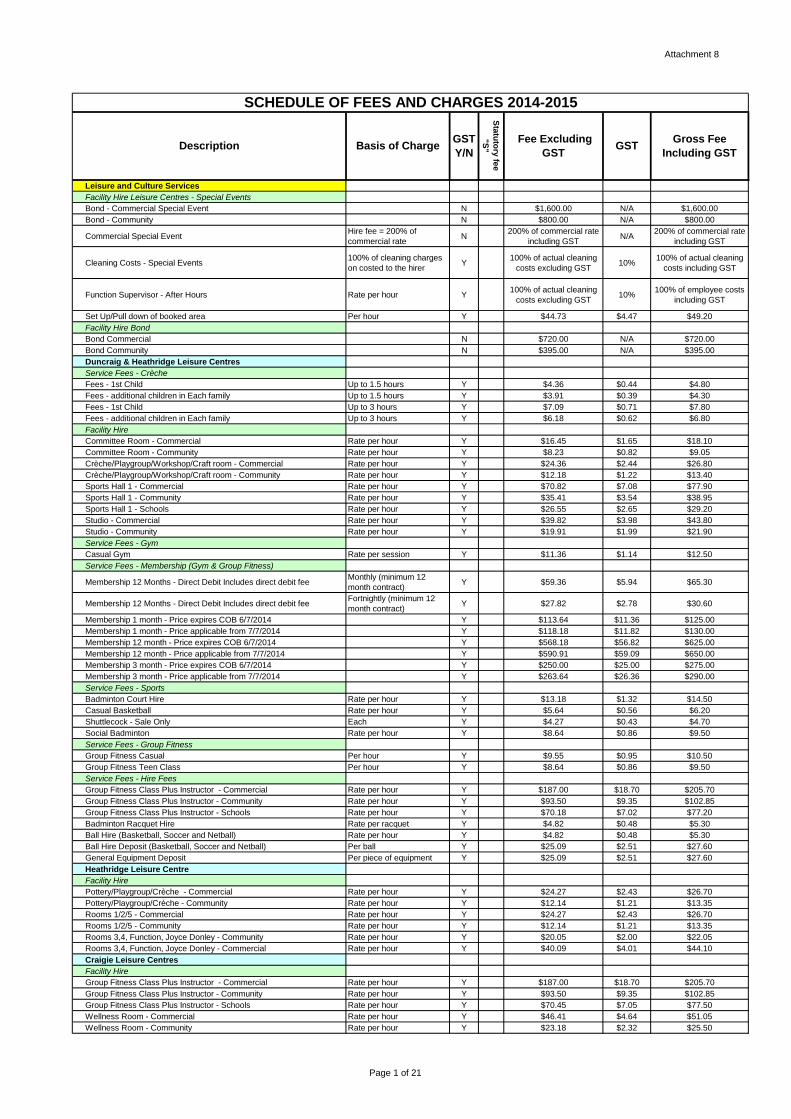
Attachment 8
Leisure and Culture Services
Facility Hire Leisure Centres - Special Events
Bond - Commercial Special Event N $1,600.00 N/A $1,600.00
Bond - Community N $800.00 N/A $800.00
Commercial Special EventHire fee = 200% of
commercial rateN
200% of commercial rate
including GSTN/A
200% of commercial rate
including GST
Cleaning Costs - Special Events100% of cleaning charges
on costed to the hirerY
100% of actual cleaning
costs excluding GST10%
100% of actual cleaning
costs including GST
Function Supervisor - After Hours Rate per hour Y100% of actual cleaning
costs excluding GST10%
100% of employee costs
including GST
Set Up/Pull down of booked area Per hour Y $44.73 $4.47 $49.20
Facility Hire Bond
Bond Commercial N $720.00 N/A $720.00
Bond Community N $395.00 N/A $395.00
Duncraig & Heathridge Leisure Centres
Service Fees - Crèche
Fees - 1st Child Up to 1.5 hours Y $4.36 $0.44 $4.80
Fees - additional children in Each family Up to 1.5 hours Y $3.91 $0.39 $4.30
Fees - 1st Child Up to 3 hours Y $7.09 $0.71 $7.80
Fees - additional children in Each family Up to 3 hours Y $6.18 $0.62 $6.80
Facility Hire
Committee Room - Commercial Rate per hour Y $16.45 $1.65 $18.10
Committee Room - Community Rate per hour Y $8.23 $0.82 $9.05
Crèche/Playgroup/Workshop/Craft room - Commercial Rate per hour Y $24.36 $2.44 $26.80
Crèche/Playgroup/Workshop/Craft room - Community Rate per hour Y $12.18 $1.22 $13.40
Sports Hall 1 - Commercial Rate per hour Y $70.82 $7.08 $77.90
Sports Hall 1 - Community Rate per hour Y $35.41 $3.54 $38.95
Sports Hall 1 - Schools Rate per hour Y $26.55 $2.65 $29.20
Studio - Commercial Rate per hour Y $39.82 $3.98 $43.80
Studio - Community Rate per hour Y $19.91 $1.99 $21.90
Service Fees - Gym
Casual Gym Rate per session Y $11.36 $1.14 $12.50
Service Fees - Membership (Gym & Group Fitness)
Membership 12 Months - Direct Debit Includes direct debit feeMonthly (minimum 12
month contract)Y $59.36 $5.94 $65.30
Membership 12 Months - Direct Debit Includes direct debit feeFortnightly (minimum 12
month contract)Y $27.82 $2.78 $30.60
Membership 1 month - Price expires COB 6/7/2014 Y $113.64 $11.36 $125.00
Membership 1 month - Price applicable from 7/7/2014 Y $118.18 $11.82 $130.00
Membership 12 month - Price expires COB 6/7/2014 Y $568.18 $56.82 $625.00
Membership 12 month - Price applicable from 7/7/2014 Y $590.91 $59.09 $650.00
Membership 3 month - Price expires COB 6/7/2014 Y $250.00 $25.00 $275.00
Membership 3 month - Price applicable from 7/7/2014 Y $263.64 $26.36 $290.00
Service Fees - Sports
Badminton Court Hire Rate per hour Y $13.18 $1.32 $14.50
Casual Basketball Rate per hour Y $5.64 $0.56 $6.20
Shuttlecock - Sale Only Each Y $4.27 $0.43 $4.70
Social Badminton Rate per hour Y $8.64 $0.86 $9.50
Service Fees - Group Fitness
Group Fitness Casual Per hour Y $9.55 $0.95 $10.50
Group Fitness Teen Class Per hour Y $8.64 $0.86 $9.50
Service Fees - Hire Fees
Group Fitness Class Plus Instructor - Commercial Rate per hour Y $187.00 $18.70 $205.70
Group Fitness Class Plus Instructor - Community Rate per hour Y $93.50 $9.35 $102.85
Group Fitness Class Plus Instructor - Schools Rate per hour Y $70.18 $7.02 $77.20
Badminton Racquet Hire Rate per racquet Y $4.82 $0.48 $5.30
Ball Hire (Basketball, Soccer and Netball) Rate per hour Y $4.82 $0.48 $5.30
Ball Hire Deposit (Basketball, Soccer and Netball) Per ball Y $25.09 $2.51 $27.60
General Equipment Deposit Per piece of equipment Y $25.09 $2.51 $27.60
Heathridge Leisure Centre
Facility Hire
Pottery/Playgroup/Crèche - Commercial Rate per hour Y $24.27 $2.43 $26.70
Pottery/Playgroup/Crèche - Community Rate per hour Y $12.14 $1.21 $13.35
Rooms 1/2/5 - Commercial Rate per hour Y $24.27 $2.43 $26.70
Rooms 1/2/5 - Community Rate per hour Y $12.14 $1.21 $13.35
Rooms 3,4, Function, Joyce Donley - Community Rate per hour Y $20.05 $2.00 $22.05
Rooms 3,4, Function, Joyce Donley - Commercial Rate per hour Y $40.09 $4.01 $44.10
Craigie Leisure Centres
Facility Hire
Group Fitness Class Plus Instructor - Commercial Rate per hour Y $187.00 $18.70 $205.70
Group Fitness Class Plus Instructor - Community Rate per hour Y $93.50 $9.35 $102.85
Group Fitness Class Plus Instructor - Schools Rate per hour Y $70.45 $7.05 $77.50
Wellness Room - Commercial Rate per hour Y $46.41 $4.64 $51.05
Wellness Room - Community Rate per hour Y $23.18 $2.32 $25.50
SCHEDULE OF FEES AND CHARGES 2014-2015
Description Basis of ChargeGST
Y/N
Sta
tuto
ry fe
e
"S
"
Fee Excluding
GSTGST
Gross Fee
Including GST
Page 1 of 21
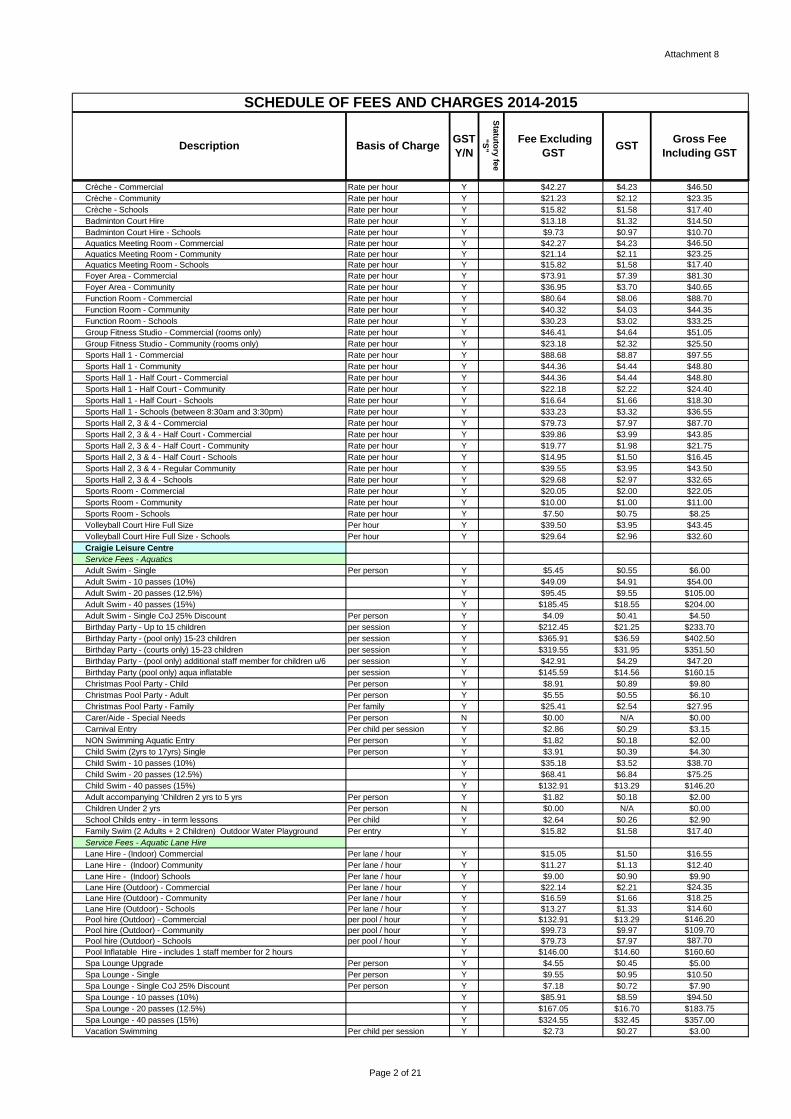
Attachment 8
SCHEDULE OF FEES AND CHARGES 2014-2015
Description Basis of ChargeGST
Y/N
Sta
tuto
ry fe
e
"S
"
Fee Excluding
GSTGST
Gross Fee
Including GST
Crèche - Commercial Rate per hour Y $42.27 $4.23 $46.50
Crèche - Community Rate per hour Y $21.23 $2.12 $23.35
Crèche - Schools Rate per hour Y $15.82 $1.58 $17.40
Badminton Court Hire Rate per hour Y $13.18 $1.32 $14.50
Badminton Court Hire - Schools Rate per hour Y $9.73 $0.97 $10.70
Aquatics Meeting Room - Commercial Rate per hour Y $42.27 $4.23 $46.50
Aquatics Meeting Room - Community Rate per hour Y $21.14 $2.11 $23.25
Aquatics Meeting Room - Schools Rate per hour Y $15.82 $1.58 $17.40
Foyer Area - Commercial Rate per hour Y $73.91 $7.39 $81.30
Foyer Area - Community Rate per hour Y $36.95 $3.70 $40.65
Function Room - Commercial Rate per hour Y $80.64 $8.06 $88.70
Function Room - Community Rate per hour Y $40.32 $4.03 $44.35
Function Room - Schools Rate per hour Y $30.23 $3.02 $33.25
Group Fitness Studio - Commercial (rooms only) Rate per hour Y $46.41 $4.64 $51.05
Group Fitness Studio - Community (rooms only) Rate per hour Y $23.18 $2.32 $25.50
Sports Hall 1 - Commercial Rate per hour Y $88.68 $8.87 $97.55
Sports Hall 1 - Community Rate per hour Y $44.36 $4.44 $48.80
Sports Hall 1 - Half Court - Commercial Rate per hour Y $44.36 $4.44 $48.80
Sports Hall 1 - Half Court - Community Rate per hour Y $22.18 $2.22 $24.40
Sports Hall 1 - Half Court - Schools Rate per hour Y $16.64 $1.66 $18.30
Sports Hall 1 - Schools (between 8:30am and 3:30pm) Rate per hour Y $33.23 $3.32 $36.55
Sports Hall 2, 3 & 4 - Commercial Rate per hour Y $79.73 $7.97 $87.70
Sports Hall 2, 3 & 4 - Half Court - Commercial Rate per hour Y $39.86 $3.99 $43.85
Sports Hall 2, 3 & 4 - Half Court - Community Rate per hour Y $19.77 $1.98 $21.75
Sports Hall 2, 3 & 4 - Half Court - Schools Rate per hour Y $14.95 $1.50 $16.45
Sports Hall 2, 3 & 4 - Regular Community Rate per hour Y $39.55 $3.95 $43.50
Sports Hall 2, 3 & 4 - Schools Rate per hour Y $29.68 $2.97 $32.65
Sports Room - Commercial Rate per hour Y $20.05 $2.00 $22.05
Sports Room - Community Rate per hour Y $10.00 $1.00 $11.00
Sports Room - Schools Rate per hour Y $7.50 $0.75 $8.25
Volleyball Court Hire Full Size Per hour Y $39.50 $3.95 $43.45
Volleyball Court Hire Full Size - Schools Per hour Y $29.64 $2.96 $32.60
Craigie Leisure Centre
Service Fees - Aquatics
Adult Swim - Single Per person Y $5.45 $0.55 $6.00
Adult Swim - 10 passes (10%) Y $49.09 $4.91 $54.00
Adult Swim - 20 passes (12.5%) Y $95.45 $9.55 $105.00
Adult Swim - 40 passes (15%) Y $185.45 $18.55 $204.00
Adult Swim - Single CoJ 25% Discount Per person Y $4.09 $0.41 $4.50
Birthday Party - Up to 15 children per session Y $212.45 $21.25 $233.70
Birthday Party - (pool only) 15-23 children per session Y $365.91 $36.59 $402.50
Birthday Party - (courts only) 15-23 children per session Y $319.55 $31.95 $351.50
Birthday Party - (pool only) additional staff member for children u/6 per session Y $42.91 $4.29 $47.20
Birthday Party (pool only) aqua inflatable per session Y $145.59 $14.56 $160.15
Christmas Pool Party - Child Per person Y $8.91 $0.89 $9.80
Christmas Pool Party - Adult Per person Y $5.55 $0.55 $6.10
Christmas Pool Party - Family Per family Y $25.41 $2.54 $27.95
Carer/Aide - Special Needs Per person N $0.00 N/A $0.00
Carnival Entry Per child per session Y $2.86 $0.29 $3.15
NON Swimming Aquatic Entry Per person Y $1.82 $0.18 $2.00
Child Swim (2yrs to 17yrs) Single Per person Y $3.91 $0.39 $4.30
Child Swim - 10 passes (10%) Y $35.18 $3.52 $38.70
Child Swim - 20 passes (12.5%) Y $68.41 $6.84 $75.25
Child Swim - 40 passes (15%) Y $132.91 $13.29 $146.20
Adult accompanying 'Children 2 yrs to 5 yrs Per person Y $1.82 $0.18 $2.00
Children Under 2 yrs Per person N $0.00 N/A $0.00
School Childs entry - in term lessons Per child Y $2.64 $0.26 $2.90
Family Swim (2 Adults + 2 Children) Outdoor Water Playground Per entry Y $15.82 $1.58 $17.40
Service Fees - Aquatic Lane Hire
Lane Hire - (Indoor) Commercial Per lane / hour Y $15.05 $1.50 $16.55
Lane Hire - (Indoor) Community Per lane / hour Y $11.27 $1.13 $12.40
Lane Hire - (Indoor) Schools Per lane / hour Y $9.00 $0.90 $9.90
Lane Hire (Outdoor) - Commercial Per lane / hour Y $22.14 $2.21 $24.35
Lane Hire (Outdoor) - Community Per lane / hour Y $16.59 $1.66 $18.25
Lane Hire (Outdoor) - Schools Per lane / hour Y $13.27 $1.33 $14.60
Pool hire (Outdoor) - Commercial per pool / hour Y $132.91 $13.29 $146.20
Pool hire (Outdoor) - Community per pool / hour Y $99.73 $9.97 $109.70
Pool hire (Outdoor) - Schools per pool / hour Y $79.73 $7.97 $87.70
Pool Inflatable Hire - includes 1 staff member for 2 hours Y $146.00 $14.60 $160.60
Spa Lounge Upgrade Per person Y $4.55 $0.45 $5.00
Spa Lounge - Single Per person Y $9.55 $0.95 $10.50
Spa Lounge - Single CoJ 25% Discount Per person Y $7.18 $0.72 $7.90
Spa Lounge - 10 passes (10%) Y $85.91 $8.59 $94.50
Spa Lounge - 20 passes (12.5%) Y $167.05 $16.70 $183.75
Spa Lounge - 40 passes (15%) Y $324.55 $32.45 $357.00
Vacation Swimming Per child per session Y $2.73 $0.27 $3.00
Page 2 of 21
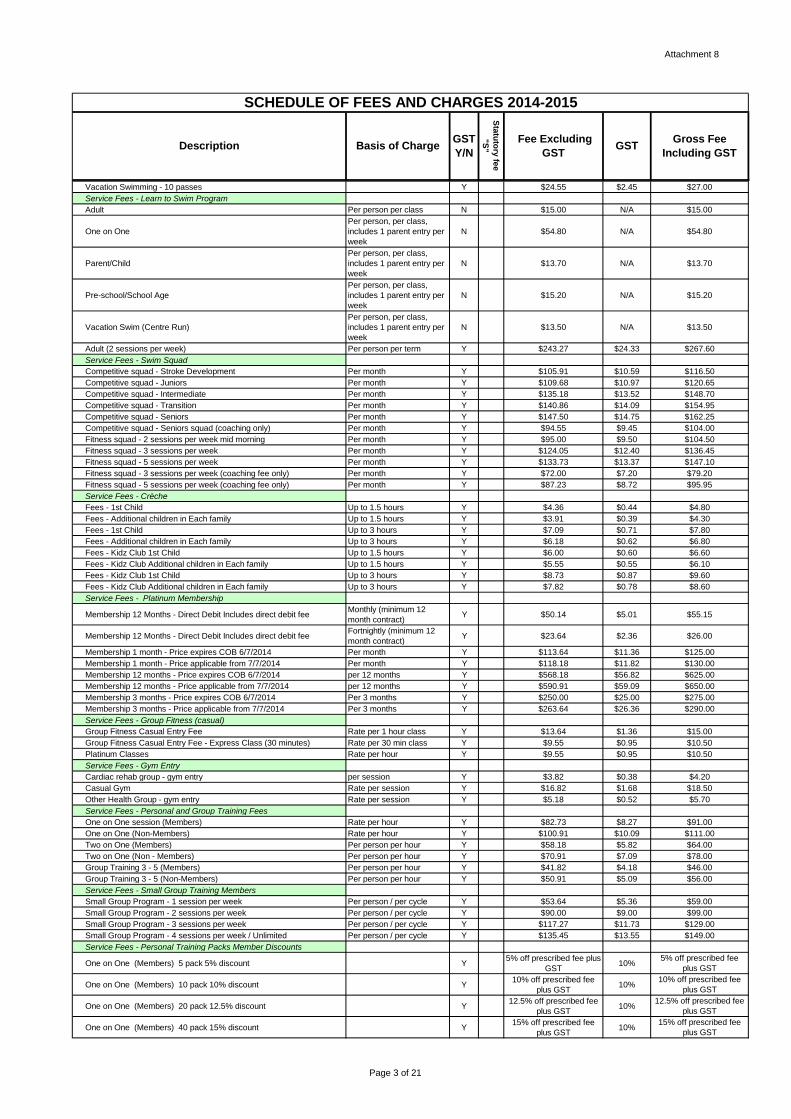
Attachment 8
SCHEDULE OF FEES AND CHARGES 2014-2015
Description Basis of ChargeGST
Y/N
Sta
tuto
ry fe
e
"S
"
Fee Excluding
GSTGST
Gross Fee
Including GST
Vacation Swimming - 10 passes Y $24.55 $2.45 $27.00
Service Fees - Learn to Swim Program
Adult Per person per class N $15.00 N/A $15.00
One on One
Per person, per class,
includes 1 parent entry per
week
N $54.80 N/A $54.80
Parent/Child
Per person, per class,
includes 1 parent entry per
week
N $13.70 N/A $13.70
Pre-school/School Age
Per person, per class,
includes 1 parent entry per
week
N $15.20 N/A $15.20
Vacation Swim (Centre Run)
Per person, per class,
includes 1 parent entry per
week
N $13.50 N/A $13.50
Adult (2 sessions per week) Per person per term Y $243.27 $24.33 $267.60
Service Fees - Swim Squad
Competitive squad - Stroke Development Per month Y $105.91 $10.59 $116.50
Competitive squad - Juniors Per month Y $109.68 $10.97 $120.65
Competitive squad - Intermediate Per month Y $135.18 $13.52 $148.70
Competitive squad - Transition Per month Y $140.86 $14.09 $154.95
Competitive squad - Seniors Per month Y $147.50 $14.75 $162.25
Competitive squad - Seniors squad (coaching only) Per month Y $94.55 $9.45 $104.00
Fitness squad - 2 sessions per week mid morning Per month Y $95.00 $9.50 $104.50
Fitness squad - 3 sessions per week Per month Y $124.05 $12.40 $136.45
Fitness squad - 5 sessions per week Per month Y $133.73 $13.37 $147.10
Fitness squad - 3 sessions per week (coaching fee only) Per month Y $72.00 $7.20 $79.20
Fitness squad - 5 sessions per week (coaching fee only) Per month Y $87.23 $8.72 $95.95
Service Fees - Crèche
Fees - 1st Child Up to 1.5 hours Y $4.36 $0.44 $4.80
Fees - Additional children in Each family Up to 1.5 hours Y $3.91 $0.39 $4.30
Fees - 1st Child Up to 3 hours Y $7.09 $0.71 $7.80
Fees - Additional children in Each family Up to 3 hours Y $6.18 $0.62 $6.80
Fees - Kidz Club 1st Child Up to 1.5 hours Y $6.00 $0.60 $6.60
Fees - Kidz Club Additional children in Each family Up to 1.5 hours Y $5.55 $0.55 $6.10
Fees - Kidz Club 1st Child Up to 3 hours Y $8.73 $0.87 $9.60
Fees - Kidz Club Additional children in Each family Up to 3 hours Y $7.82 $0.78 $8.60
Service Fees - Platinum Membership
Membership 12 Months - Direct Debit Includes direct debit feeMonthly (minimum 12
month contract)Y $50.14 $5.01 $55.15
Membership 12 Months - Direct Debit Includes direct debit feeFortnightly (minimum 12
month contract)Y $23.64 $2.36 $26.00
Membership 1 month - Price expires COB 6/7/2014 Per month Y $113.64 $11.36 $125.00
Membership 1 month - Price applicable from 7/7/2014 Per month Y $118.18 $11.82 $130.00
Membership 12 months - Price expires COB 6/7/2014 per 12 months Y $568.18 $56.82 $625.00
Membership 12 months - Price applicable from 7/7/2014 per 12 months Y $590.91 $59.09 $650.00
Membership 3 months - Price expires COB 6/7/2014 Per 3 months Y $250.00 $25.00 $275.00
Membership 3 months - Price applicable from 7/7/2014 Per 3 months Y $263.64 $26.36 $290.00
Service Fees - Group Fitness (casual)
Group Fitness Casual Entry Fee Rate per 1 hour class Y $13.64 $1.36 $15.00
Group Fitness Casual Entry Fee - Express Class (30 minutes) Rate per 30 min class Y $9.55 $0.95 $10.50
Platinum Classes Rate per hour Y $9.55 $0.95 $10.50
Service Fees - Gym Entry
Cardiac rehab group - gym entry per session Y $3.82 $0.38 $4.20
Casual Gym Rate per session Y $16.82 $1.68 $18.50
Other Health Group - gym entry Rate per session Y $5.18 $0.52 $5.70
Service Fees - Personal and Group Training Fees
One on One session (Members) Rate per hour Y $82.73 $8.27 $91.00
One on One (Non-Members) Rate per hour Y $100.91 $10.09 $111.00
Two on One (Members) Per person per hour Y $58.18 $5.82 $64.00
Two on One (Non - Members) Per person per hour Y $70.91 $7.09 $78.00
Group Training 3 - 5 (Members) Per person per hour Y $41.82 $4.18 $46.00
Group Training 3 - 5 (Non-Members) Per person per hour Y $50.91 $5.09 $56.00
Service Fees - Small Group Training Members
Small Group Program - 1 session per week Per person / per cycle Y $53.64 $5.36 $59.00
Small Group Program - 2 sessions per week Per person / per cycle Y $90.00 $9.00 $99.00
Small Group Program - 3 sessions per week Per person / per cycle Y $117.27 $11.73 $129.00
Small Group Program - 4 sessions per week / Unlimited Per person / per cycle Y $135.45 $13.55 $149.00
Service Fees - Personal Training Packs Member Discounts
One on One (Members) 5 pack 5% discount Y5% off prescribed fee plus
GST10%
5% off prescribed fee
plus GST
One on One (Members) 10 pack 10% discount Y10% off prescribed fee
plus GST10%
10% off prescribed fee
plus GST
One on One (Members) 20 pack 12.5% discount Y12.5% off prescribed fee
plus GST10%
12.5% off prescribed fee
plus GST
One on One (Members) 40 pack 15% discount Y15% off prescribed fee
plus GST10%
15% off prescribed fee
plus GST
Page 3 of 21
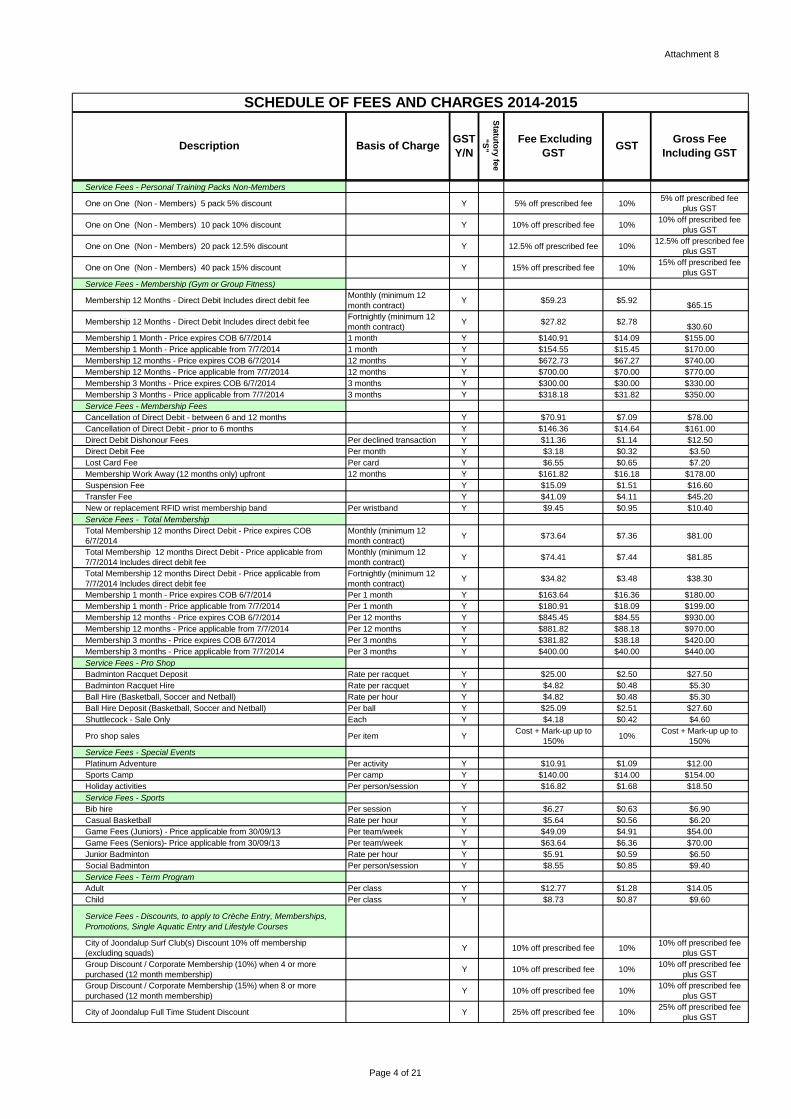
Attachment 8
SCHEDULE OF FEES AND CHARGES 2014-2015
Description Basis of ChargeGST
Y/N
Sta
tuto
ry fe
e
"S
"
Fee Excluding
GSTGST
Gross Fee
Including GST
Service Fees - Personal Training Packs Non-Members
One on One (Non - Members) 5 pack 5% discount Y 5% off prescribed fee 10%5% off prescribed fee
plus GST
One on One (Non - Members) 10 pack 10% discount Y 10% off prescribed fee 10%10% off prescribed fee
plus GST
One on One (Non - Members) 20 pack 12.5% discount Y 12.5% off prescribed fee 10%12.5% off prescribed fee
plus GST
One on One (Non - Members) 40 pack 15% discount Y 15% off prescribed fee 10%15% off prescribed fee
plus GST
Service Fees - Membership (Gym or Group Fitness)
Membership 12 Months - Direct Debit Includes direct debit feeMonthly (minimum 12
month contract)Y $59.23 $5.92
$65.15
Membership 12 Months - Direct Debit Includes direct debit feeFortnightly (minimum 12
month contract)Y $27.82 $2.78
$30.60
Membership 1 Month - Price expires COB 6/7/2014 1 month Y $140.91 $14.09 $155.00
Membership 1 Month - Price applicable from 7/7/2014 1 month Y $154.55 $15.45 $170.00
Membership 12 months - Price expires COB 6/7/2014 12 months Y $672.73 $67.27 $740.00
Membership 12 Months - Price applicable from 7/7/2014 12 months Y $700.00 $70.00 $770.00
Membership 3 Months - Price expires COB 6/7/2014 3 months Y $300.00 $30.00 $330.00
Membership 3 Months - Price applicable from 7/7/2014 3 months Y $318.18 $31.82 $350.00
Service Fees - Membership Fees
Cancellation of Direct Debit - between 6 and 12 months Y $70.91 $7.09 $78.00
Cancellation of Direct Debit - prior to 6 months Y $146.36 $14.64 $161.00
Direct Debit Dishonour Fees Per declined transaction Y $11.36 $1.14 $12.50
Direct Debit Fee Per month Y $3.18 $0.32 $3.50
Lost Card Fee Per card Y $6.55 $0.65 $7.20
Membership Work Away (12 months only) upfront 12 months Y $161.82 $16.18 $178.00
Suspension Fee Y $15.09 $1.51 $16.60
Transfer Fee Y $41.09 $4.11 $45.20
New or replacement RFID wrist membership band Per wristband Y $9.45 $0.95 $10.40
Service Fees - Total Membership
Total Membership 12 months Direct Debit - Price expires COB
6/7/2014
Monthly (minimum 12
month contract)Y $73.64 $7.36 $81.00
Total Membership 12 months Direct Debit - Price applicable from
7/7/2014 Includes direct debit fee
Monthly (minimum 12
month contract)Y $74.41 $7.44 $81.85
Total Membership 12 months Direct Debit - Price applicable from
7/7/2014 Includes direct debit fee
Fortnightly (minimum 12
month contract)Y $34.82 $3.48 $38.30
Membership 1 month - Price expires COB 6/7/2014 Per 1 month Y $163.64 $16.36 $180.00
Membership 1 month - Price applicable from 7/7/2014 Per 1 month Y $180.91 $18.09 $199.00
Membership 12 months - Price expires COB 6/7/2014 Per 12 months Y $845.45 $84.55 $930.00
Membership 12 months - Price applicable from 7/7/2014 Per 12 months Y $881.82 $88.18 $970.00
Membership 3 months - Price expires COB 6/7/2014 Per 3 months Y $381.82 $38.18 $420.00
Membership 3 months - Price applicable from 7/7/2014 Per 3 months Y $400.00 $40.00 $440.00
Service Fees - Pro Shop
Badminton Racquet Deposit Rate per racquet Y $25.00 $2.50 $27.50
Badminton Racquet Hire Rate per racquet Y $4.82 $0.48 $5.30
Ball Hire (Basketball, Soccer and Netball) Rate per hour Y $4.82 $0.48 $5.30
Ball Hire Deposit (Basketball, Soccer and Netball) Per ball Y $25.09 $2.51 $27.60
Shuttlecock - Sale Only Each Y $4.18 $0.42 $4.60
Pro shop sales Per item YCost + Mark-up up to
150%10%
Cost + Mark-up up to
150%
Service Fees - Special Events
Platinum Adventure Per activity Y $10.91 $1.09 $12.00
Sports Camp Per camp Y $140.00 $14.00 $154.00
Holiday activities Per person/session Y $16.82 $1.68 $18.50
Service Fees - Sports
Bib hire Per session Y $6.27 $0.63 $6.90
Casual Basketball Rate per hour Y $5.64 $0.56 $6.20
Game Fees (Juniors) - Price applicable from 30/09/13 Per team/week Y $49.09 $4.91 $54.00
Game Fees (Seniors)- Price applicable from 30/09/13 Per team/week Y $63.64 $6.36 $70.00
Junior Badminton Rate per hour Y $5.91 $0.59 $6.50
Social Badminton Per person/session Y $8.55 $0.85 $9.40
Service Fees - Term Program
Adult Per class Y $12.77 $1.28 $14.05
Child Per class Y $8.73 $0.87 $9.60
Service Fees - Discounts, to apply to Crèche Entry, Memberships,
Promotions, Single Aquatic Entry and Lifestyle Courses
City of Joondalup Surf Club(s) Discount 10% off membership
(excluding squads)Y 10% off prescribed fee 10%
10% off prescribed fee
plus GST
Group Discount / Corporate Membership (10%) when 4 or more
purchased (12 month membership)Y 10% off prescribed fee 10%
10% off prescribed fee
plus GST
Group Discount / Corporate Membership (15%) when 8 or more
purchased (12 month membership)Y 10% off prescribed fee 10%
10% off prescribed fee
plus GST
City of Joondalup Full Time Student Discount Y 25% off prescribed fee 10%25% off prescribed fee
plus GST
Page 4 of 21
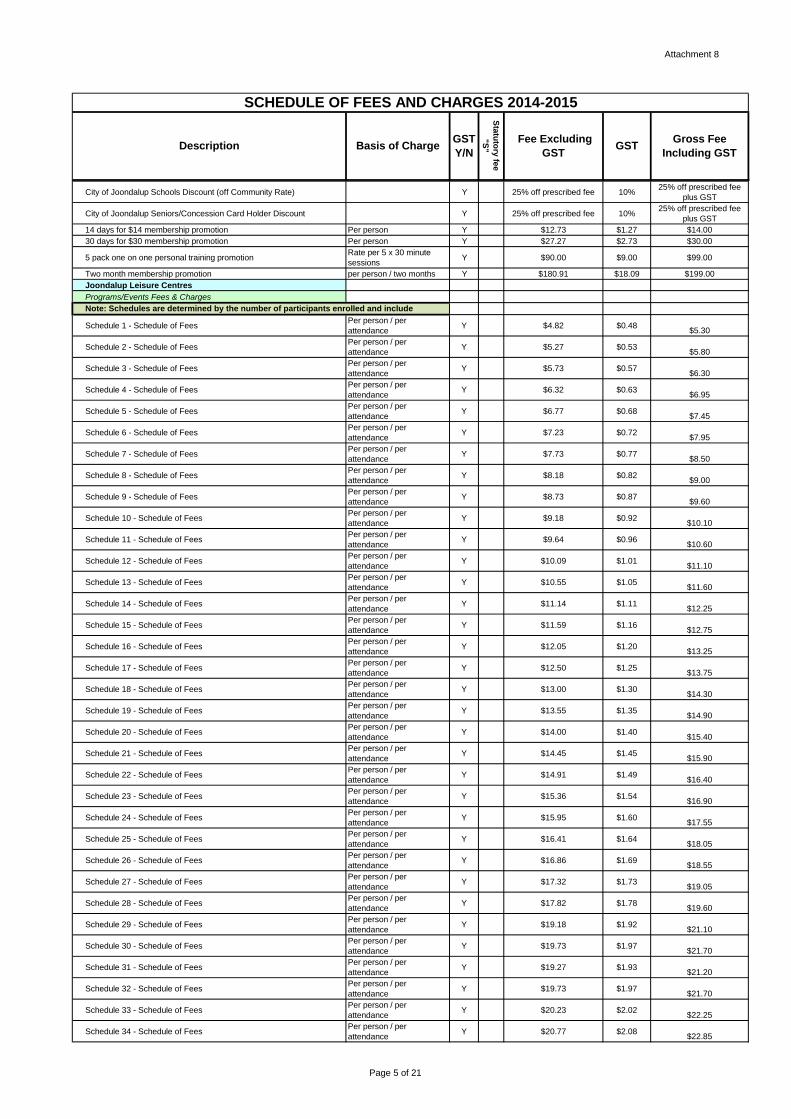
Attachment 8
SCHEDULE OF FEES AND CHARGES 2014-2015
Description Basis of ChargeGST
Y/N
Sta
tuto
ry fe
e
"S
"
Fee Excluding
GSTGST
Gross Fee
Including GST
City of Joondalup Schools Discount (off Community Rate) Y 25% off prescribed fee 10%25% off prescribed fee
plus GST
City of Joondalup Seniors/Concession Card Holder Discount Y 25% off prescribed fee 10%25% off prescribed fee
plus GST
14 days for $14 membership promotion Per person Y $12.73 $1.27 $14.00
30 days for $30 membership promotion Per person Y $27.27 $2.73 $30.00
5 pack one on one personal training promotion Rate per 5 x 30 minute
sessionsY $90.00 $9.00 $99.00
Two month membership promotion per person / two months Y $180.91 $18.09 $199.00
Joondalup Leisure Centres
Programs/Events Fees & Charges
Schedule 1 - Schedule of FeesPer person / per
attendanceY $4.82 $0.48
$5.30
Schedule 2 - Schedule of FeesPer person / per
attendanceY $5.27 $0.53
$5.80
Schedule 3 - Schedule of FeesPer person / per
attendanceY $5.73 $0.57
$6.30
Schedule 4 - Schedule of FeesPer person / per
attendanceY $6.32 $0.63
$6.95
Schedule 5 - Schedule of FeesPer person / per
attendanceY $6.77 $0.68
$7.45
Schedule 6 - Schedule of FeesPer person / per
attendanceY $7.23 $0.72
$7.95
Schedule 7 - Schedule of FeesPer person / per
attendanceY $7.73 $0.77
$8.50
Schedule 8 - Schedule of FeesPer person / per
attendanceY $8.18 $0.82
$9.00
Schedule 9 - Schedule of FeesPer person / per
attendanceY $8.73 $0.87
$9.60
Schedule 10 - Schedule of FeesPer person / per
attendanceY $9.18 $0.92
$10.10
Schedule 11 - Schedule of FeesPer person / per
attendanceY $9.64 $0.96
$10.60
Schedule 12 - Schedule of FeesPer person / per
attendanceY $10.09 $1.01
$11.10
Schedule 13 - Schedule of FeesPer person / per
attendanceY $10.55 $1.05
$11.60
Schedule 14 - Schedule of FeesPer person / per
attendanceY $11.14 $1.11
$12.25
Schedule 15 - Schedule of FeesPer person / per
attendanceY $11.59 $1.16
$12.75
Schedule 16 - Schedule of FeesPer person / per
attendanceY $12.05 $1.20
$13.25
Schedule 17 - Schedule of FeesPer person / per
attendanceY $12.50 $1.25
$13.75
Schedule 18 - Schedule of FeesPer person / per
attendanceY $13.00 $1.30
$14.30
Schedule 19 - Schedule of FeesPer person / per
attendanceY $13.55 $1.35
$14.90
Schedule 20 - Schedule of FeesPer person / per
attendanceY $14.00 $1.40
$15.40
Schedule 21 - Schedule of FeesPer person / per
attendanceY $14.45 $1.45
$15.90
Schedule 22 - Schedule of FeesPer person / per
attendanceY $14.91 $1.49
$16.40
Schedule 23 - Schedule of FeesPer person / per
attendanceY $15.36 $1.54
$16.90
Schedule 24 - Schedule of FeesPer person / per
attendanceY $15.95 $1.60
$17.55
Schedule 25 - Schedule of FeesPer person / per
attendanceY $16.41 $1.64
$18.05
Schedule 26 - Schedule of FeesPer person / per
attendanceY $16.86 $1.69
$18.55
Schedule 27 - Schedule of FeesPer person / per
attendanceY $17.32 $1.73
$19.05
Schedule 28 - Schedule of FeesPer person / per
attendanceY $17.82 $1.78
$19.60
Schedule 29 - Schedule of FeesPer person / per
attendanceY $19.18 $1.92
$21.10
Schedule 30 - Schedule of FeesPer person / per
attendanceY $19.73 $1.97
$21.70
Schedule 31 - Schedule of FeesPer person / per
attendanceY $19.27 $1.93
$21.20
Schedule 32 - Schedule of FeesPer person / per
attendanceY $19.73 $1.97
$21.70
Schedule 33 - Schedule of FeesPer person / per
attendanceY $20.23 $2.02
$22.25
Schedule 34 - Schedule of FeesPer person / per
attendanceY $20.77 $2.08
$22.85
Note: Schedules are determined by the number of participants enrolled and include
Page 5 of 21
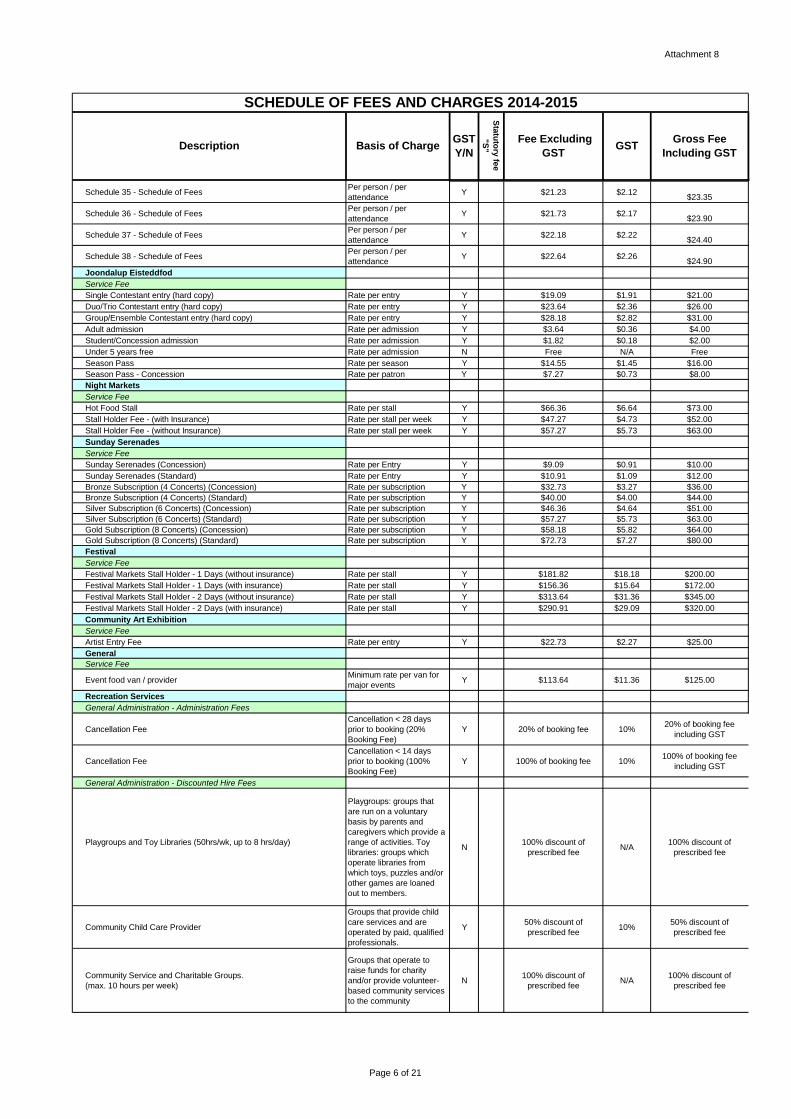
Attachment 8
SCHEDULE OF FEES AND CHARGES 2014-2015
Description Basis of ChargeGST
Y/N
Sta
tuto
ry fe
e
"S
"
Fee Excluding
GSTGST
Gross Fee
Including GST
Schedule 35 - Schedule of FeesPer person / per
attendanceY $21.23 $2.12
$23.35
Schedule 36 - Schedule of FeesPer person / per
attendanceY $21.73 $2.17
$23.90
Schedule 37 - Schedule of FeesPer person / per
attendanceY $22.18 $2.22
$24.40
Schedule 38 - Schedule of FeesPer person / per
attendanceY $22.64 $2.26
$24.90
Joondalup Eisteddfod
Service Fee
Single Contestant entry (hard copy) Rate per entry Y $19.09 $1.91 $21.00
Duo/Trio Contestant entry (hard copy) Rate per entry Y $23.64 $2.36 $26.00
Group/Ensemble Contestant entry (hard copy) Rate per entry Y $28.18 $2.82 $31.00
Adult admission Rate per admission Y $3.64 $0.36 $4.00
Student/Concession admission Rate per admission Y $1.82 $0.18 $2.00
Under 5 years free Rate per admission N Free N/A Free
Season Pass Rate per season Y $14.55 $1.45 $16.00
Season Pass - Concession Rate per patron Y $7.27 $0.73 $8.00
Night Markets
Service Fee
Hot Food Stall Rate per stall Y $66.36 $6.64 $73.00
Stall Holder Fee - (with Insurance) Rate per stall per week Y $47.27 $4.73 $52.00
Stall Holder Fee - (without Insurance) Rate per stall per week Y $57.27 $5.73 $63.00
Sunday Serenades
Service Fee
Sunday Serenades (Concession) Rate per Entry Y $9.09 $0.91 $10.00
Sunday Serenades (Standard) Rate per Entry Y $10.91 $1.09 $12.00
Bronze Subscription (4 Concerts) (Concession) Rate per subscription Y $32.73 $3.27 $36.00
Bronze Subscription (4 Concerts) (Standard) Rate per subscription Y $40.00 $4.00 $44.00
Silver Subscription (6 Concerts) (Concession) Rate per subscription Y $46.36 $4.64 $51.00
Silver Subscription (6 Concerts) (Standard) Rate per subscription Y $57.27 $5.73 $63.00
Gold Subscription (8 Concerts) (Concession) Rate per subscription Y $58.18 $5.82 $64.00
Gold Subscription (8 Concerts) (Standard) Rate per subscription Y $72.73 $7.27 $80.00
Festival
Service Fee
Festival Markets Stall Holder - 1 Days (without insurance) Rate per stall Y $181.82 $18.18 $200.00
Festival Markets Stall Holder - 1 Days (with insurance) Rate per stall Y $156.36 $15.64 $172.00
Festival Markets Stall Holder - 2 Days (without insurance) Rate per stall Y $313.64 $31.36 $345.00
Festival Markets Stall Holder - 2 Days (with insurance) Rate per stall Y $290.91 $29.09 $320.00
Community Art Exhibition
Service Fee
Artist Entry Fee Rate per entry Y $22.73 $2.27 $25.00
General
Service Fee
Event food van / providerMinimum rate per van for
major eventsY $113.64 $11.36 $125.00
Recreation Services
General Administration - Administration Fees
Cancellation Fee
Cancellation < 28 days
prior to booking (20%
Booking Fee)
Y 20% of booking fee 10%20% of booking fee
including GST
Cancellation Fee
Cancellation < 14 days
prior to booking (100%
Booking Fee)
Y 100% of booking fee 10%100% of booking fee
including GST
General Administration - Discounted Hire Fees
Playgroups and Toy Libraries (50hrs/wk, up to 8 hrs/day)
Playgroups: groups that
are run on a voluntary
basis by parents and
caregivers which provide a
range of activities. Toy
libraries: groups which
operate libraries from
which toys, puzzles and/or
other games are loaned
out to members.
N100% discount of
prescribed feeN/A
100% discount of
prescribed fee
Community Child Care Provider
Groups that provide child
care services and are
operated by paid, qualified
professionals.
Y50% discount of
prescribed fee10%
50% discount of
prescribed fee
Community Service and Charitable Groups.
(max. 10 hours per week)
Groups that operate to
raise funds for charity
and/or provide volunteer-
based community services
to the community
N100% discount of
prescribed feeN/A
100% discount of
prescribed fee
Page 6 of 21
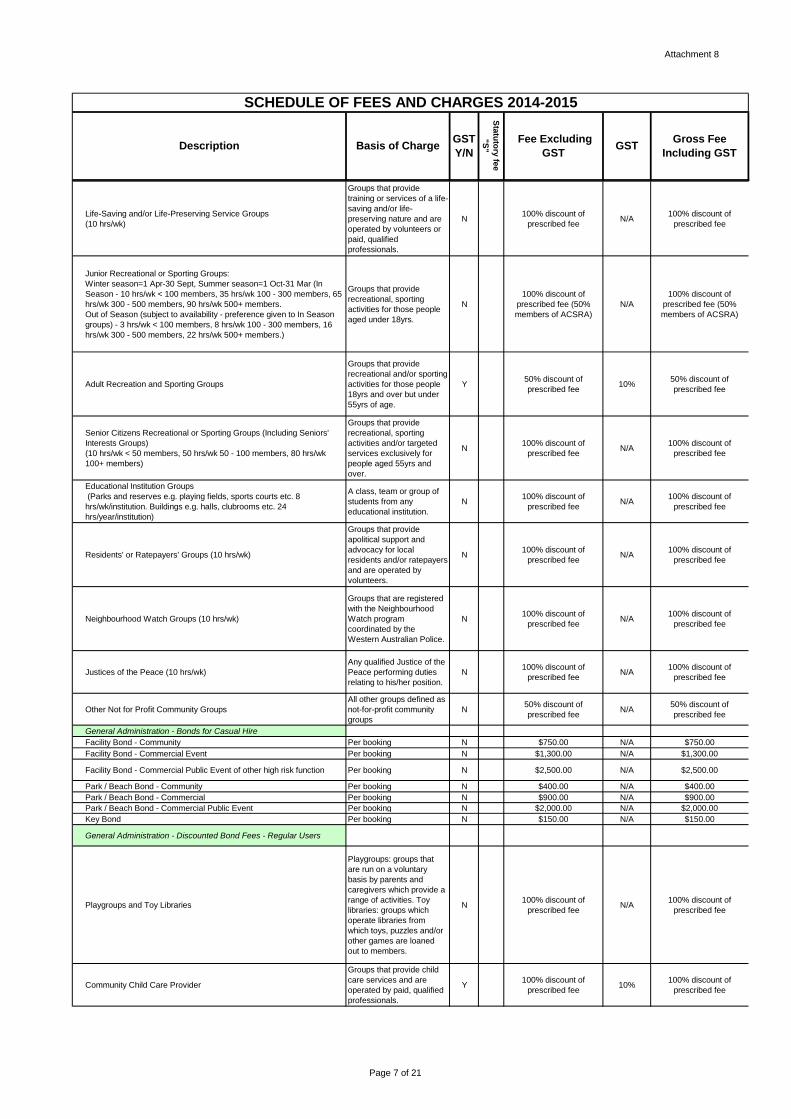
Attachment 8
SCHEDULE OF FEES AND CHARGES 2014-2015
Description Basis of ChargeGST
Y/N
Sta
tuto
ry fe
e
"S
"
Fee Excluding
GSTGST
Gross Fee
Including GST
Life-Saving and/or Life-Preserving Service Groups
(10 hrs/wk)
Groups that provide
training or services of a life-
saving and/or life-
preserving nature and are
operated by volunteers or
paid, qualified
professionals.
N100% discount of
prescribed feeN/A
100% discount of
prescribed fee
Junior Recreational or Sporting Groups:
Winter season=1 Apr-30 Sept, Summer season=1 Oct-31 Mar (In
Season - 10 hrs/wk < 100 members, 35 hrs/wk 100 - 300 members, 65
hrs/wk 300 - 500 members, 90 hrs/wk 500+ members.
Out of Season (subject to availability - preference given to In Season
groups) - 3 hrs/wk < 100 members, 8 hrs/wk 100 - 300 members, 16
hrs/wk 300 - 500 members, 22 hrs/wk 500+ members.)
Groups that provide
recreational, sporting
activities for those people
aged under 18yrs.
N
100% discount of
prescribed fee (50%
members of ACSRA)
N/A
100% discount of
prescribed fee (50%
members of ACSRA)
Adult Recreation and Sporting Groups
Groups that provide
recreational and/or sporting
activities for those people
18yrs and over but under
55yrs of age.
Y50% discount of
prescribed fee10%
50% discount of
prescribed fee
Senior Citizens Recreational or Sporting Groups (Including Seniors'
Interests Groups)
(10 hrs/wk < 50 members, 50 hrs/wk 50 - 100 members, 80 hrs/wk
100+ members)
Groups that provide
recreational, sporting
activities and/or targeted
services exclusively for
people aged 55yrs and
over.
N100% discount of
prescribed feeN/A
100% discount of
prescribed fee
Educational Institution Groups
(Parks and reserves e.g. playing fields, sports courts etc. 8
hrs/wk/institution. Buildings e.g. halls, clubrooms etc. 24
hrs/year/institution)
A class, team or group of
students from any
educational institution.
N100% discount of
prescribed feeN/A
100% discount of
prescribed fee
Residents' or Ratepayers' Groups (10 hrs/wk)
Groups that provide
apolitical support and
advocacy for local
residents and/or ratepayers
and are operated by
volunteers.
N100% discount of
prescribed feeN/A
100% discount of
prescribed fee
Neighbourhood Watch Groups (10 hrs/wk)
Groups that are registered
with the Neighbourhood
Watch program
coordinated by the
Western Australian Police.
N100% discount of
prescribed feeN/A
100% discount of
prescribed fee
Justices of the Peace (10 hrs/wk)
Any qualified Justice of the
Peace performing duties
relating to his/her position.
N100% discount of
prescribed feeN/A
100% discount of
prescribed fee
Other Not for Profit Community Groups
All other groups defined as
not-for-profit community
groups
N50% discount of
prescribed feeN/A
50% discount of
prescribed fee
General Administration - Bonds for Casual Hire
Facility Bond - Community Per booking N $750.00 N/A $750.00
Facility Bond - Commercial Event Per booking N $1,300.00 N/A $1,300.00
Facility Bond - Commercial Public Event of other high risk function Per booking N $2,500.00 N/A $2,500.00
Park / Beach Bond - Community Per booking N $400.00 N/A $400.00
Park / Beach Bond - Commercial Per booking N $900.00 N/A $900.00
Park / Beach Bond - Commercial Public Event Per booking N $2,000.00 N/A $2,000.00
Key Bond Per booking N $150.00 N/A $150.00
General Administration - Discounted Bond Fees - Regular Users
Playgroups and Toy Libraries
Playgroups: groups that
are run on a voluntary
basis by parents and
caregivers which provide a
range of activities. Toy
libraries: groups which
operate libraries from
which toys, puzzles and/or
other games are loaned
out to members.
N100% discount of
prescribed feeN/A
100% discount of
prescribed fee
Community Child Care Provider
Groups that provide child
care services and are
operated by paid, qualified
professionals.
Y100% discount of
prescribed fee10%
100% discount of
prescribed fee
Page 7 of 21
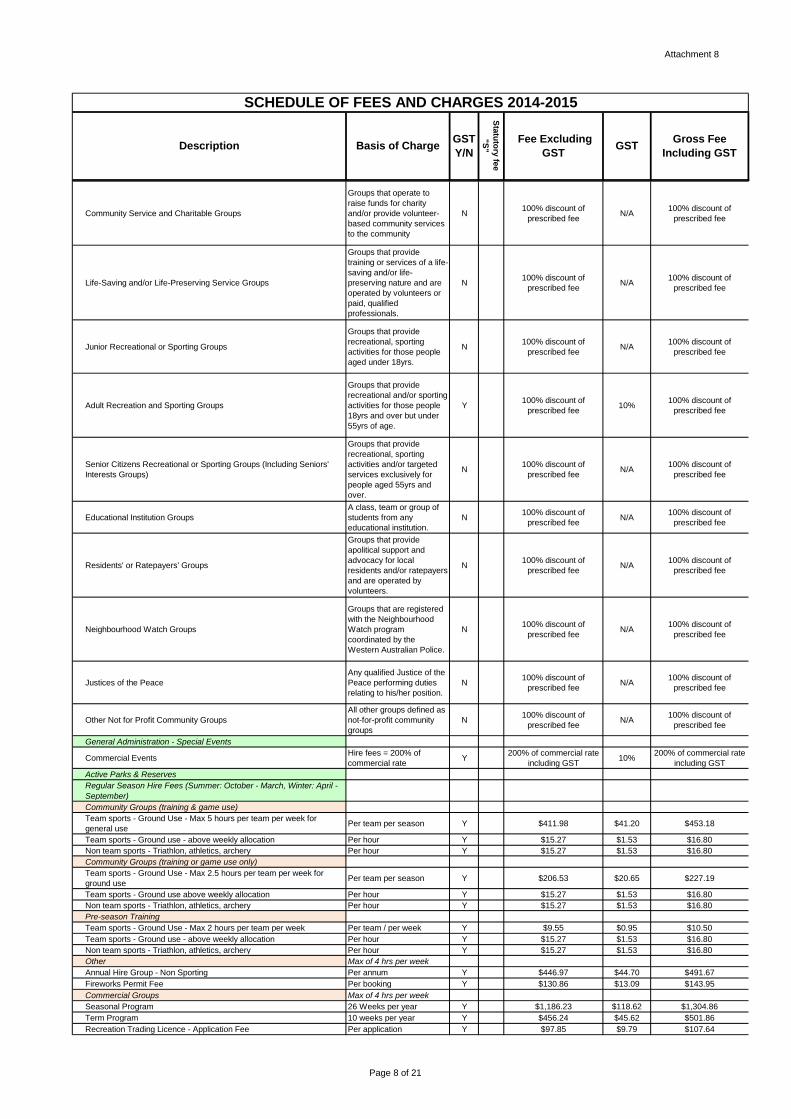
Attachment 8
SCHEDULE OF FEES AND CHARGES 2014-2015
Description Basis of ChargeGST
Y/N
Sta
tuto
ry fe
e
"S
"
Fee Excluding
GSTGST
Gross Fee
Including GST
Community Service and Charitable Groups
Groups that operate to
raise funds for charity
and/or provide volunteer-
based community services
to the community
N100% discount of
prescribed feeN/A
100% discount of
prescribed fee
Life-Saving and/or Life-Preserving Service Groups
Groups that provide
training or services of a life-
saving and/or life-
preserving nature and are
operated by volunteers or
paid, qualified
professionals.
N100% discount of
prescribed feeN/A
100% discount of
prescribed fee
Junior Recreational or Sporting Groups
Groups that provide
recreational, sporting
activities for those people
aged under 18yrs.
N100% discount of
prescribed feeN/A
100% discount of
prescribed fee
Adult Recreation and Sporting Groups
Groups that provide
recreational and/or sporting
activities for those people
18yrs and over but under
55yrs of age.
Y100% discount of
prescribed fee10%
100% discount of
prescribed fee
Senior Citizens Recreational or Sporting Groups (Including Seniors'
Interests Groups)
Groups that provide
recreational, sporting
activities and/or targeted
services exclusively for
people aged 55yrs and
over.
N100% discount of
prescribed feeN/A
100% discount of
prescribed fee
Educational Institution Groups
A class, team or group of
students from any
educational institution.
N100% discount of
prescribed feeN/A
100% discount of
prescribed fee
Residents' or Ratepayers' Groups
Groups that provide
apolitical support and
advocacy for local
residents and/or ratepayers
and are operated by
volunteers.
N100% discount of
prescribed feeN/A
100% discount of
prescribed fee
Neighbourhood Watch Groups
Groups that are registered
with the Neighbourhood
Watch program
coordinated by the
Western Australian Police.
N100% discount of
prescribed feeN/A
100% discount of
prescribed fee
Justices of the Peace
Any qualified Justice of the
Peace performing duties
relating to his/her position.
N100% discount of
prescribed feeN/A
100% discount of
prescribed fee
Other Not for Profit Community Groups
All other groups defined as
not-for-profit community
groups
N100% discount of
prescribed feeN/A
100% discount of
prescribed fee
General Administration - Special Events
Commercial EventsHire fees = 200% of
commercial rateY
200% of commercial rate
including GST10%
200% of commercial rate
including GST
Active Parks & Reserves
Regular Season Hire Fees (Summer: October - March, Winter: April -
September)
Community Groups (training & game use)
Team sports - Ground Use - Max 5 hours per team per week for
general usePer team per season Y $411.98 $41.20 $453.18
Team sports - Ground use - above weekly allocation Per hour Y $15.27 $1.53 $16.80
Non team sports - Triathlon, athletics, archery Per hour Y $15.27 $1.53 $16.80
Community Groups (training or game use only)
Team sports - Ground Use - Max 2.5 hours per team per week for
ground usePer team per season Y $206.53 $20.65 $227.19
Team sports - Ground use above weekly allocation Per hour Y $15.27 $1.53 $16.80
Non team sports - Triathlon, athletics, archery Per hour Y $15.27 $1.53 $16.80
Pre-season Training
Team sports - Ground Use - Max 2 hours per team per week Per team / per week Y $9.55 $0.95 $10.50
Team sports - Ground use - above weekly allocation Per hour Y $15.27 $1.53 $16.80
Non team sports - Triathlon, athletics, archery Per hour Y $15.27 $1.53 $16.80
Other Max of 4 hrs per week
Annual Hire Group - Non Sporting Per annum Y $446.97 $44.70 $491.67
Fireworks Permit Fee Per booking Y $130.86 $13.09 $143.95
Commercial Groups Max of 4 hrs per week
Seasonal Program 26 Weeks per year Y $1,186.23 $118.62 $1,304.86
Term Program 10 weeks per year Y $456.24 $45.62 $501.86
Recreation Trading Licence - Application Fee Per application Y $97.85 $9.79 $107.64
Page 8 of 21
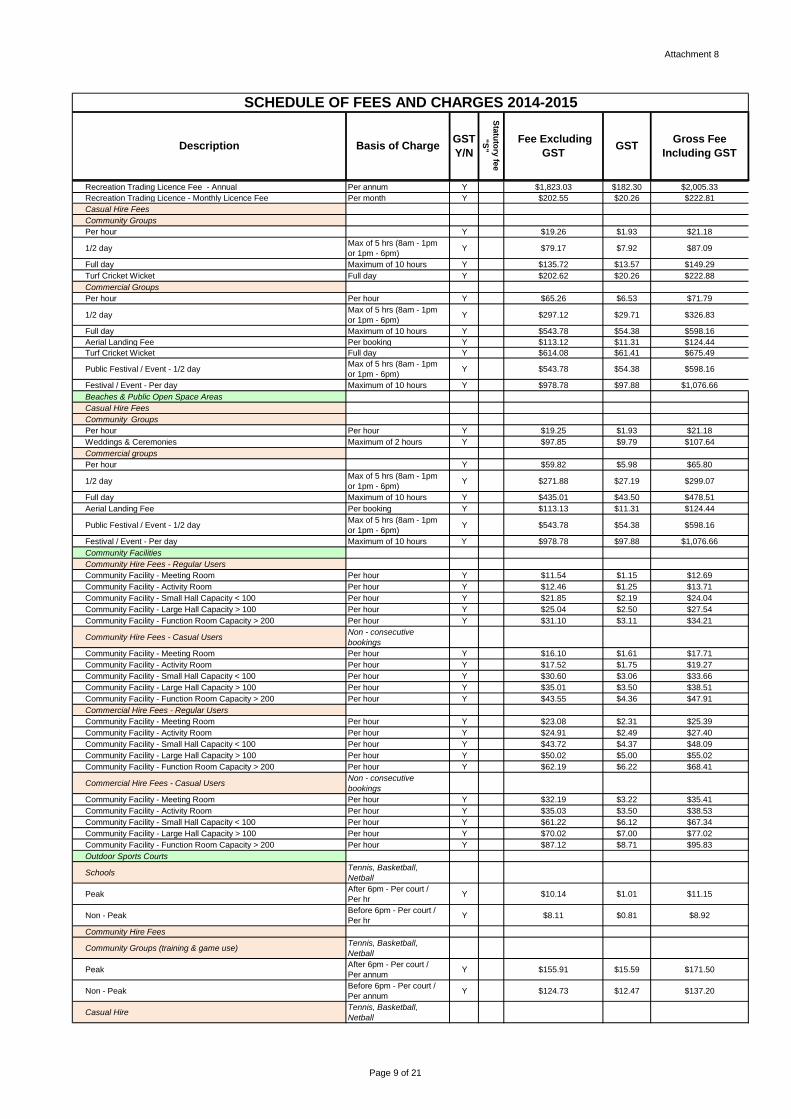
Attachment 8
SCHEDULE OF FEES AND CHARGES 2014-2015
Description Basis of ChargeGST
Y/N
Sta
tuto
ry fe
e
"S
"
Fee Excluding
GSTGST
Gross Fee
Including GST
Recreation Trading Licence Fee - Annual Per annum Y $1,823.03 $182.30 $2,005.33
Recreation Trading Licence - Monthly Licence Fee Per month Y $202.55 $20.26 $222.81
Casual Hire Fees
Community Groups
Per hour Y $19.26 $1.93 $21.18
1/2 dayMax of 5 hrs (8am - 1pm
or 1pm - 6pm)Y $79.17 $7.92 $87.09
Full day Maximum of 10 hours Y $135.72 $13.57 $149.29
Turf Cricket Wicket Full day Y $202.62 $20.26 $222.88
Commercial Groups
Per hour Per hour Y $65.26 $6.53 $71.79
1/2 dayMax of 5 hrs (8am - 1pm
or 1pm - 6pm)Y $297.12 $29.71 $326.83
Full day Maximum of 10 hours Y $543.78 $54.38 $598.16
Aerial Landing Fee Per booking Y $113.12 $11.31 $124.44
Turf Cricket Wicket Full day Y $614.08 $61.41 $675.49
Public Festival / Event - 1/2 dayMax of 5 hrs (8am - 1pm
or 1pm - 6pm)Y $543.78 $54.38 $598.16
Festival / Event - Per day Maximum of 10 hours Y $978.78 $97.88 $1,076.66
Beaches & Public Open Space Areas
Casual Hire Fees
Community Groups
Per hour Per hour Y $19.25 $1.93 $21.18
Weddings & Ceremonies Maximum of 2 hours Y $97.85 $9.79 $107.64
Commercial groups
Per hour Y $59.82 $5.98 $65.80
1/2 dayMax of 5 hrs (8am - 1pm
or 1pm - 6pm)Y $271.88 $27.19 $299.07
Full day Maximum of 10 hours Y $435.01 $43.50 $478.51
Aerial Landing Fee Per booking Y $113.13 $11.31 $124.44
Public Festival / Event - 1/2 dayMax of 5 hrs (8am - 1pm
or 1pm - 6pm)Y $543.78 $54.38 $598.16
Festival / Event - Per day Maximum of 10 hours Y $978.78 $97.88 $1,076.66
Community Facilities
Community Hire Fees - Regular Users
Community Facility - Meeting Room Per hour Y $11.54 $1.15 $12.69
Community Facility - Activity Room Per hour Y $12.46 $1.25 $13.71
Community Facility - Small Hall Capacity < 100 Per hour Y $21.85 $2.19 $24.04
Community Facility - Large Hall Capacity > 100 Per hour Y $25.04 $2.50 $27.54
Community Facility - Function Room Capacity > 200 Per hour Y $31.10 $3.11 $34.21
Community Hire Fees - Casual UsersNon - consecutive
bookings
Community Facility - Meeting Room Per hour Y $16.10 $1.61 $17.71
Community Facility - Activity Room Per hour Y $17.52 $1.75 $19.27
Community Facility - Small Hall Capacity < 100 Per hour Y $30.60 $3.06 $33.66
Community Facility - Large Hall Capacity > 100 Per hour Y $35.01 $3.50 $38.51
Community Facility - Function Room Capacity > 200 Per hour Y $43.55 $4.36 $47.91
Commercial Hire Fees - Regular Users
Community Facility - Meeting Room Per hour Y $23.08 $2.31 $25.39
Community Facility - Activity Room Per hour Y $24.91 $2.49 $27.40
Community Facility - Small Hall Capacity < 100 Per hour Y $43.72 $4.37 $48.09
Community Facility - Large Hall Capacity > 100 Per hour Y $50.02 $5.00 $55.02
Community Facility - Function Room Capacity > 200 Per hour Y $62.19 $6.22 $68.41
Commercial Hire Fees - Casual UsersNon - consecutive
bookings
Community Facility - Meeting Room Per hour Y $32.19 $3.22 $35.41
Community Facility - Activity Room Per hour Y $35.03 $3.50 $38.53
Community Facility - Small Hall Capacity < 100 Per hour Y $61.22 $6.12 $67.34
Community Facility - Large Hall Capacity > 100 Per hour Y $70.02 $7.00 $77.02
Community Facility - Function Room Capacity > 200 Per hour Y $87.12 $8.71 $95.83
Outdoor Sports Courts
SchoolsTennis, Basketball,
Netball
Peak After 6pm - Per court /
Per hrY $10.14 $1.01 $11.15
Non - PeakBefore 6pm - Per court /
Per hrY $8.11 $0.81 $8.92
Community Hire Fees
Community Groups (training & game use)Tennis, Basketball,
Netball
PeakAfter 6pm - Per court /
Per annumY $155.91 $15.59 $171.50
Non - PeakBefore 6pm - Per court /
Per annumY $124.73 $12.47 $137.20
Casual HireTennis, Basketball,
Netball
Page 9 of 21

Attachment 8
SCHEDULE OF FEES AND CHARGES 2014-2015
Description Basis of ChargeGST
Y/N
Sta
tuto
ry fe
e
"S
"
Fee Excluding
GSTGST
Gross Fee
Including GST
PeakAfter 6pm - Per hour /
Per courtY $14.65 $1.47 $16.12
Non - PeakBefore 6pm - Per hour /
Per courtY $11.82 $1.18 $13.00
Seniors (over 60 years)Tennis, Basketball,
Netball
PeakAfter 6pm - Per hour /
Per courtY $10.87 $1.09 $11.96
Non - PeakBefore 6pm - Per hour /
Per courtY $8.51 $0.85 $9.36
Commercial Hire FeesTennis, Basketball,
Netball
PeakAfter 6pm - Per hour /
Per courtY $23.17 $2.32 $25.49
Non - PeakBefore 6pm - Per hour /
Per courtY $18.54 $1.85 $20.39
Governance
Administration Fees - Freedom of Information
Delivery, Packaging and Postage Y Actual Cost before GST 10% Actual Cost+ GST
Duplicating a Tape, Film or Computer Information Y Actual Cost before GST 10% Actual Cost+ GST
Decision Making on Access Per hour / Pro rata N $30.00 N/A $30.00
Staff Time Supervising Access
Per hour / Pro rata (Plus
actual cost for hire of
facilities or equipment)
N $30.00 N/A $30.00
Transcription Staff time for Transcribing Information from Tape or Other
DevicePer hour / Pro rata N $30.00 N/A $30.00
Application Fee - Non Personal Information Only Per application N $30.00 N/A $30.00
Council Publications - Council Proceedings
CD Cost of CD Y $27.27 $2.73 $30.00
Council Publications - Electoral Rolls
Electoral Roll per CD (Subject to statutory declaration to prevent
commercial use)Cost of CD Y $27.27 $2.73 $30.00
Customer Service Fees
Service Fees - Computer Printing
Colour A3 Per page Y $1.82 $0.18 $2.00
Colour A4 Per page Y $0.91 $0.09 $1.00
Black & White A3 Per page Y $0.36 $0.04 $0.40
Black & White A4 Per page Y $0.18 $0.02 $0.20
Service Fees - Photocopies
Black and White Photocopier - > 1000 Each A3 Y $0.18 $0.02 $0.20
Black and White Photocopier - >1000 Each A4 Y $0.09 $0.01 $0.10
Black and White Photocopier - 100-1000 Each A4 Y $0.18 $0.02 $0.20
Black and White Photocopier - 100 -1000 Each A3 Y $0.27 $0.03 $0.30
Black and White Photocopier - 1-100 Each A3 Y $0.36 $0.04 $0.40
Black and White Photocopier - 1-100 Each A4 Y $0.18 $0.02 $0.20
Colour Photocopier Each A3 Y $1.82 $0.18 $2.00
Colour Photocopier Each A4 Y $0.91 $0.09 $1.00
Infrastructure Management
Service Fees - Administration Charge
Charge applicable for admin of private works Y 5% of Total Works 10%5% of Total Works
Including GST
Service Fees - Lighting
Service Charge for Shade for Street Light (minimum of $310 plus GST) Y $310.00 $31.00 $341.00
Service Fees - Subdivision Supervision Fees
Engineering Supervision fee per Subdivision (Construct and Drain
Street)
Without Consulting
Engineer and Clerk of
Works
Y3% of Total construction
costs10%
3% of Total construction
costs including GST
Engineering Supervision fee per Subdivision (Construct and Drain
Street)
With Consulting Engineer
and Clerk of WorksY
1.5% of Total construction
costs10%
1.5% of Total
construction costs
including GST
Defects Liability Bond for Subdivision Civil Works N5% of Civil Contract
ValueN/A
5% of Civil Contract
Value
Waste Management
Rated Residential Properties Service Fees - Refuse Collection
Refuse Collection - Collection from within property boundary N $56.00 N/A $56.00
Refuse Collection - Existing Service Per annum N $346.00 N/A $346.00
Refuse Collection - Full and Part Pensioners N $346.00 N/A $346.00
New or additional Refuse Bin (240 Ltr) Establishment fee N $65.00 N/A $65.00
Bins - Functions/Events Per bin Y $13.00 $1.30 $14.30
Refuse Collection - Additional service Per annum N $346.00 N/A $346.00
Operations Services
Service Fees - Access
Remove and Replace Grab RailsCharge to individuals
requesting removalY $430.00 $43.00 $473.00
Service Fees - Standard Vehicle Crossing Subsidy
Standard Vehicle Crossing Subsidy Subsidy to Owner N $275.00 N/A $275.00
Service Fees - Verge Protection Device
Page 10 of 21
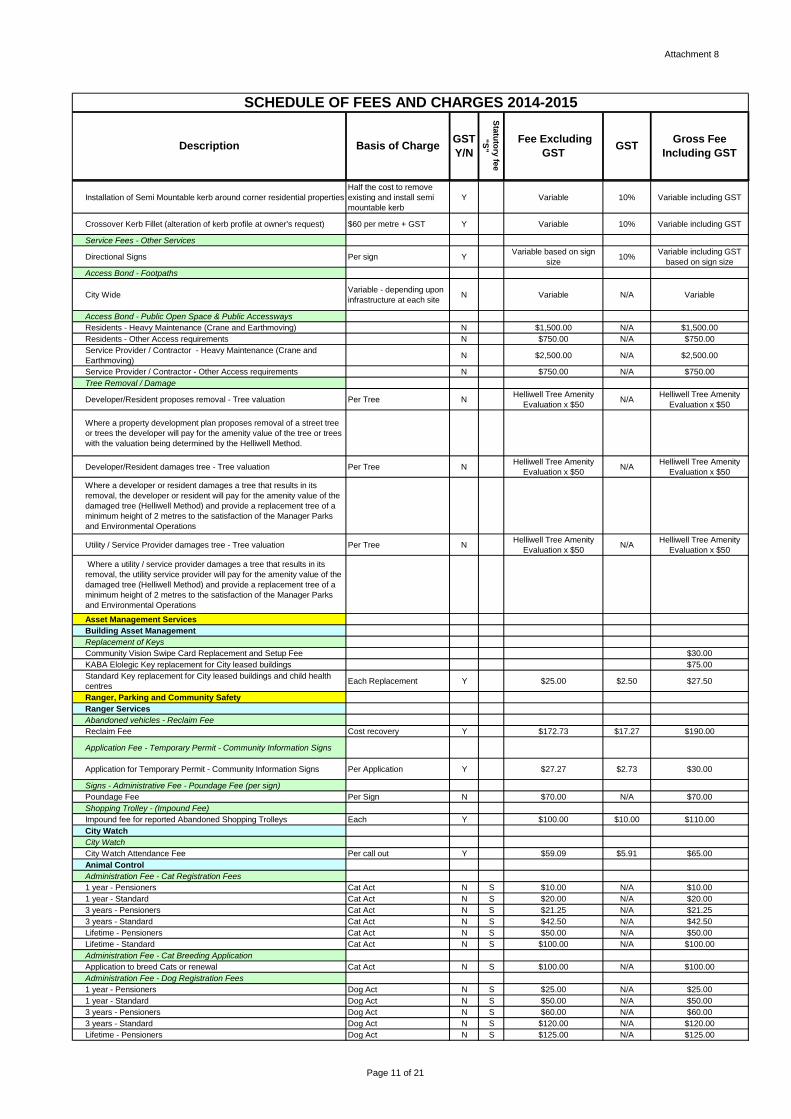
Attachment 8
SCHEDULE OF FEES AND CHARGES 2014-2015
Description Basis of ChargeGST
Y/N
Sta
tuto
ry fe
e
"S
"
Fee Excluding
GSTGST
Gross Fee
Including GST
Installation of Semi Mountable kerb around corner residential properties
Half the cost to remove
existing and install semi
mountable kerb
Y Variable 10% Variable including GST
Crossover Kerb Fillet (alteration of kerb profile at owner's request) $60 per metre + GST Y Variable 10% Variable including GST
Service Fees - Other Services
Directional Signs Per sign YVariable based on sign
size10%
Variable including GST
based on sign size
Access Bond - Footpaths
City WideVariable - depending upon
infrastructure at each siteN Variable N/A Variable
Access Bond - Public Open Space & Public Accessways
Residents - Heavy Maintenance (Crane and Earthmoving) N $1,500.00 N/A $1,500.00
Residents - Other Access requirements N $750.00 N/A $750.00
Service Provider / Contractor - Heavy Maintenance (Crane and
Earthmoving)N $2,500.00 N/A $2,500.00
Service Provider / Contractor - Other Access requirements N $750.00 N/A $750.00
Tree Removal / Damage
Developer/Resident proposes removal - Tree valuation Per Tree NHelliwell Tree Amenity
Evaluation x $50N/A
Helliwell Tree Amenity
Evaluation x $50
Where a property development plan proposes removal of a street tree
or trees the developer will pay for the amenity value of the tree or trees
with the valuation being determined by the Helliwell Method.
Developer/Resident damages tree - Tree valuation Per Tree NHelliwell Tree Amenity
Evaluation x $50N/A
Helliwell Tree Amenity
Evaluation x $50
Where a developer or resident damages a tree that results in its
removal, the developer or resident will pay for the amenity value of the
damaged tree (Helliwell Method) and provide a replacement tree of a
minimum height of 2 metres to the satisfaction of the Manager Parks
and Environmental Operations
Utility / Service Provider damages tree - Tree valuation Per Tree NHelliwell Tree Amenity
Evaluation x $50N/A
Helliwell Tree Amenity
Evaluation x $50
Where a utility / service provider damages a tree that results in its
removal, the utility service provider will pay for the amenity value of the
damaged tree (Helliwell Method) and provide a replacement tree of a
minimum height of 2 metres to the satisfaction of the Manager Parks
and Environmental Operations
Asset Management Services
Building Asset Management
Replacement of Keys
Community Vision Swipe Card Replacement and Setup Fee $30.00
KABA Elolegic Key replacement for City leased buildings $75.00
Standard Key replacement for City leased buildings and child health
centresEach Replacement Y $25.00 $2.50 $27.50
Ranger, Parking and Community Safety
Ranger Services
Abandoned vehicles - Reclaim Fee
Reclaim Fee Cost recovery Y $172.73 $17.27 $190.00
Application Fee - Temporary Permit - Community Information Signs
Application for Temporary Permit - Community Information Signs Per Application Y $27.27 $2.73 $30.00
Signs - Administrative Fee - Poundage Fee (per sign)
Poundage Fee Per Sign N $70.00 N/A $70.00
Shopping Trolley - (Impound Fee)
Impound fee for reported Abandoned Shopping Trolleys Each Y $100.00 $10.00 $110.00
City Watch
City Watch
City Watch Attendance Fee Per call out Y $59.09 $5.91 $65.00
Animal Control
Administration Fee - Cat Registration Fees
1 year - Pensioners Cat Act N S $10.00 N/A $10.00
1 year - Standard Cat Act N S $20.00 N/A $20.00
3 years - Pensioners Cat Act N S $21.25 N/A $21.25
3 years - Standard Cat Act N S $42.50 N/A $42.50
Lifetime - Pensioners Cat Act N S $50.00 N/A $50.00
Lifetime - Standard Cat Act N S $100.00 N/A $100.00
Administration Fee - Cat Breeding Application
Application to breed Cats or renewal Cat Act N S $100.00 N/A $100.00
Administration Fee - Dog Registration Fees
1 year - Pensioners Dog Act N S $25.00 N/A $25.00
1 year - Standard Dog Act N S $50.00 N/A $50.00
3 years - Pensioners Dog Act N S $60.00 N/A $60.00
3 years - Standard Dog Act N S $120.00 N/A $120.00
Lifetime - Pensioners Dog Act N S $125.00 N/A $125.00
Page 11 of 21
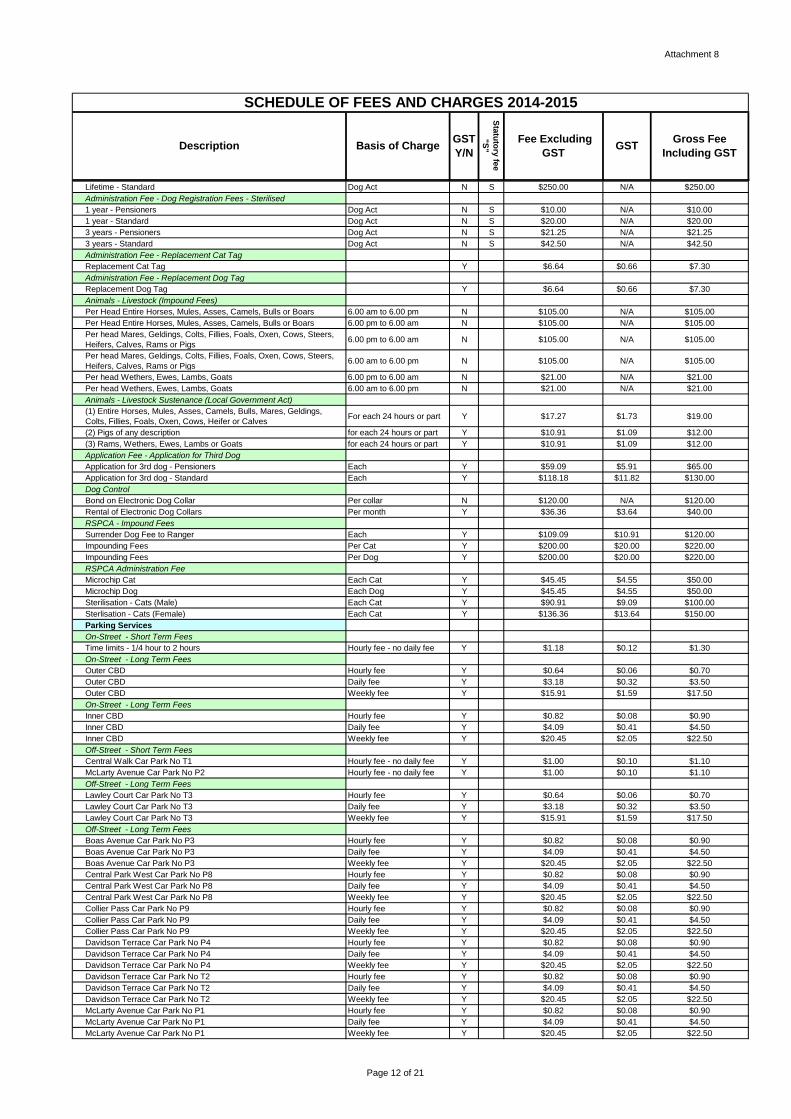
Attachment 8
SCHEDULE OF FEES AND CHARGES 2014-2015
Description Basis of ChargeGST
Y/N
Sta
tuto
ry fe
e
"S
"
Fee Excluding
GSTGST
Gross Fee
Including GST
Lifetime - Standard Dog Act N S $250.00 N/A $250.00
Administration Fee - Dog Registration Fees - Sterilised
1 year - Pensioners Dog Act N S $10.00 N/A $10.00
1 year - Standard Dog Act N S $20.00 N/A $20.00
3 years - Pensioners Dog Act N S $21.25 N/A $21.25
3 years - Standard Dog Act N S $42.50 N/A $42.50
Administration Fee - Replacement Cat Tag
Replacement Cat Tag Y $6.64 $0.66 $7.30
Administration Fee - Replacement Dog Tag
Replacement Dog Tag Y $6.64 $0.66 $7.30
Animals - Livestock (Impound Fees)
Per Head Entire Horses, Mules, Asses, Camels, Bulls or Boars 6.00 am to 6.00 pm N $105.00 N/A $105.00
Per Head Entire Horses, Mules, Asses, Camels, Bulls or Boars 6.00 pm to 6.00 am N $105.00 N/A $105.00
Per head Mares, Geldings, Colts, Fillies, Foals, Oxen, Cows, Steers,
Heifers, Calves, Rams or Pigs6.00 pm to 6.00 am N $105.00 N/A $105.00
Per head Mares, Geldings, Colts, Fillies, Foals, Oxen, Cows, Steers,
Heifers, Calves, Rams or Pigs6.00 am to 6.00 pm N $105.00 N/A $105.00
Per head Wethers, Ewes, Lambs, Goats 6.00 pm to 6.00 am N $21.00 N/A $21.00
Per head Wethers, Ewes, Lambs, Goats 6.00 am to 6.00 pm N $21.00 N/A $21.00
Animals - Livestock Sustenance (Local Government Act)
(1) Entire Horses, Mules, Asses, Camels, Bulls, Mares, Geldings,
Colts, Fillies, Foals, Oxen, Cows, Heifer or CalvesFor each 24 hours or part Y $17.27 $1.73 $19.00
(2) Pigs of any description for each 24 hours or part Y $10.91 $1.09 $12.00
(3) Rams, Wethers, Ewes, Lambs or Goats for each 24 hours or part Y $10.91 $1.09 $12.00
Application Fee - Application for Third Dog
Application for 3rd dog - Pensioners Each Y $59.09 $5.91 $65.00
Application for 3rd dog - Standard Each Y $118.18 $11.82 $130.00
Dog Control
Bond on Electronic Dog Collar Per collar N $120.00 N/A $120.00
Rental of Electronic Dog Collars Per month Y $36.36 $3.64 $40.00
RSPCA - Impound Fees
Surrender Dog Fee to Ranger Each Y $109.09 $10.91 $120.00
Impounding Fees Per Cat Y $200.00 $20.00 $220.00
Impounding Fees Per Dog Y $200.00 $20.00 $220.00
RSPCA Administration Fee
Microchip Cat Each Cat Y $45.45 $4.55 $50.00
Microchip Dog Each Dog Y $45.45 $4.55 $50.00
Sterilisation - Cats (Male) Each Cat Y $90.91 $9.09 $100.00
Sterlisation - Cats (Female) Each Cat Y $136.36 $13.64 $150.00
Parking Services
On-Street - Short Term Fees
Time limits - 1/4 hour to 2 hours Hourly fee - no daily fee Y $1.18 $0.12 $1.30
On-Street - Long Term Fees
Outer CBD Hourly fee Y $0.64 $0.06 $0.70
Outer CBD Daily fee Y $3.18 $0.32 $3.50
Outer CBD Weekly fee Y $15.91 $1.59 $17.50
On-Street - Long Term Fees
Inner CBD Hourly fee Y $0.82 $0.08 $0.90
Inner CBD Daily fee Y $4.09 $0.41 $4.50
Inner CBD Weekly fee Y $20.45 $2.05 $22.50
Off-Street - Short Term Fees
Central Walk Car Park No T1 Hourly fee - no daily fee Y $1.00 $0.10 $1.10
McLarty Avenue Car Park No P2 Hourly fee - no daily fee Y $1.00 $0.10 $1.10
Off-Street - Long Term Fees
Lawley Court Car Park No T3 Hourly fee Y $0.64 $0.06 $0.70
Lawley Court Car Park No T3 Daily fee Y $3.18 $0.32 $3.50
Lawley Court Car Park No T3 Weekly fee Y $15.91 $1.59 $17.50
Off-Street - Long Term Fees
Boas Avenue Car Park No P3 Hourly fee Y $0.82 $0.08 $0.90
Boas Avenue Car Park No P3 Daily fee Y $4.09 $0.41 $4.50
Boas Avenue Car Park No P3 Weekly fee Y $20.45 $2.05 $22.50
Central Park West Car Park No P8 Hourly fee Y $0.82 $0.08 $0.90
Central Park West Car Park No P8 Daily fee Y $4.09 $0.41 $4.50
Central Park West Car Park No P8 Weekly fee Y $20.45 $2.05 $22.50
Collier Pass Car Park No P9 Hourly fee Y $0.82 $0.08 $0.90
Collier Pass Car Park No P9 Daily fee Y $4.09 $0.41 $4.50
Collier Pass Car Park No P9 Weekly fee Y $20.45 $2.05 $22.50
Davidson Terrace Car Park No P4 Hourly fee Y $0.82 $0.08 $0.90
Davidson Terrace Car Park No P4 Daily fee Y $4.09 $0.41 $4.50
Davidson Terrace Car Park No P4 Weekly fee Y $20.45 $2.05 $22.50
Davidson Terrace Car Park No T2 Hourly fee Y $0.82 $0.08 $0.90
Davidson Terrace Car Park No T2 Daily fee Y $4.09 $0.41 $4.50
Davidson Terrace Car Park No T2 Weekly fee Y $20.45 $2.05 $22.50
McLarty Avenue Car Park No P1 Hourly fee Y $0.82 $0.08 $0.90
McLarty Avenue Car Park No P1 Daily fee Y $4.09 $0.41 $4.50
McLarty Avenue Car Park No P1 Weekly fee Y $20.45 $2.05 $22.50
Page 12 of 21
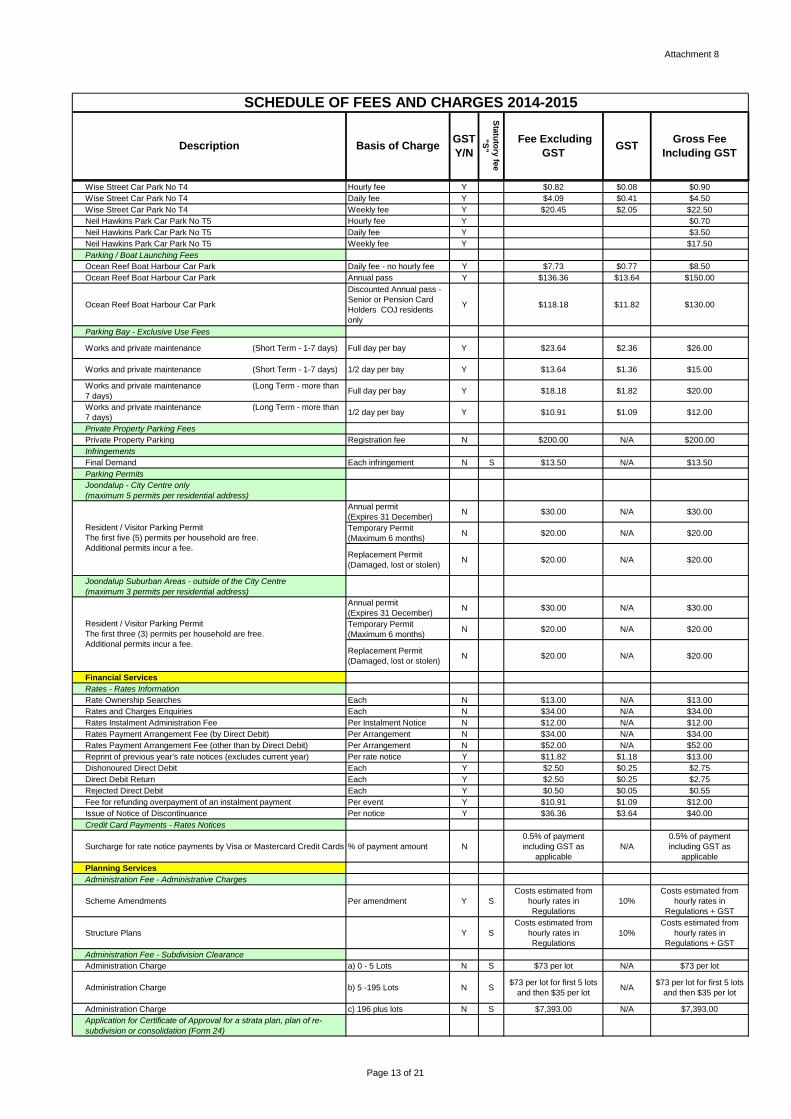
Attachment 8
SCHEDULE OF FEES AND CHARGES 2014-2015
Description Basis of ChargeGST
Y/N
Sta
tuto
ry fe
e
"S
"
Fee Excluding
GSTGST
Gross Fee
Including GST
Wise Street Car Park No T4 Hourly fee Y $0.82 $0.08 $0.90
Wise Street Car Park No T4 Daily fee Y $4.09 $0.41 $4.50
Wise Street Car Park No T4 Weekly fee Y $20.45 $2.05 $22.50
Neil Hawkins Park Car Park No T5 Hourly fee Y $0.70
Neil Hawkins Park Car Park No T5 Daily fee Y $3.50
Neil Hawkins Park Car Park No T5 Weekly fee Y $17.50
Parking / Boat Launching Fees
Ocean Reef Boat Harbour Car Park Daily fee - no hourly fee Y $7.73 $0.77 $8.50
Ocean Reef Boat Harbour Car Park Annual pass Y $136.36 $13.64 $150.00
Ocean Reef Boat Harbour Car Park
Discounted Annual pass -
Senior or Pension Card
Holders COJ residents
only
Y $118.18 $11.82 $130.00
Parking Bay - Exclusive Use Fees
Works and private maintenance (Short Term - 1-7 days) Full day per bay Y $23.64 $2.36 $26.00
Works and private maintenance (Short Term - 1-7 days) 1/2 day per bay Y $13.64 $1.36 $15.00
Works and private maintenance (Long Term - more than
7 days)Full day per bay Y $18.18 $1.82 $20.00
Works and private maintenance (Long Term - more than
7 days)1/2 day per bay Y $10.91 $1.09 $12.00
Private Property Parking Fees
Private Property Parking Registration fee N $200.00 N/A $200.00
Infringements
Final Demand Each infringement N S $13.50 N/A $13.50
Parking Permits
Joondalup - City Centre only
(maximum 5 permits per residential address)
Annual permit
(Expires 31 December)N $30.00 N/A $30.00
Temporary Permit
(Maximum 6 months)N $20.00 N/A $20.00
Replacement Permit
(Damaged, lost or stolen)N $20.00 N/A $20.00
Joondalup Suburban Areas - outside of the City Centre
(maximum 3 permits per residential address)
Annual permit
(Expires 31 December)N $30.00 N/A $30.00
Temporary Permit
(Maximum 6 months)N $20.00 N/A $20.00
Replacement Permit
(Damaged, lost or stolen)N $20.00 N/A $20.00
Financial Services
Rates - Rates Information
Rate Ownership Searches Each N $13.00 N/A $13.00
Rates and Charges Enquiries Each N $34.00 N/A $34.00
Rates Instalment Administration Fee Per Instalment Notice N $12.00 N/A $12.00
Rates Payment Arrangement Fee (by Direct Debit) Per Arrangement N $34.00 N/A $34.00
Rates Payment Arrangement Fee (other than by Direct Debit) Per Arrangement N $52.00 N/A $52.00
Reprint of previous year's rate notices (excludes current year) Per rate notice Y $11.82 $1.18 $13.00
Dishonoured Direct Debit Each Y $2.50 $0.25 $2.75
Direct Debit Return Each Y $2.50 $0.25 $2.75
Rejected Direct Debit Each Y $0.50 $0.05 $0.55
Fee for refunding overpayment of an instalment payment Per event Y $10.91 $1.09 $12.00
Issue of Notice of Discontinuance Per notice Y $36.36 $3.64 $40.00
Credit Card Payments - Rates Notices
Surcharge for rate notice payments by Visa or Mastercard Credit Cards % of payment amount N
0.5% of payment
including GST as
applicable
N/A
0.5% of payment
including GST as
applicable
Planning Services
Administration Fee - Administrative Charges
Scheme Amendments Per amendment Y S
Costs estimated from
hourly rates in
Regulations
10%
Costs estimated from
hourly rates in
Regulations + GST
Structure Plans Y S
Costs estimated from
hourly rates in
Regulations
10%
Costs estimated from
hourly rates in
Regulations + GST
Administration Fee - Subdivision Clearance
Administration Charge a) 0 - 5 Lots N S $73 per lot N/A $73 per lot
Administration Charge b) 5 -195 Lots N S$73 per lot for first 5 lots
and then $35 per lotN/A
$73 per lot for first 5 lots
and then $35 per lot
Administration Charge c) 196 plus lots N S $7,393.00 N/A $7,393.00
Application for Certificate of Approval for a strata plan, plan of re-
subdivision or consolidation (Form 24)
Resident / Visitor Parking Permit
The first five (5) permits per household are free.
Additional permits incur a fee.
Resident / Visitor Parking Permit
The first three (3) permits per household are free.
Additional permits incur a fee.
Page 13 of 21
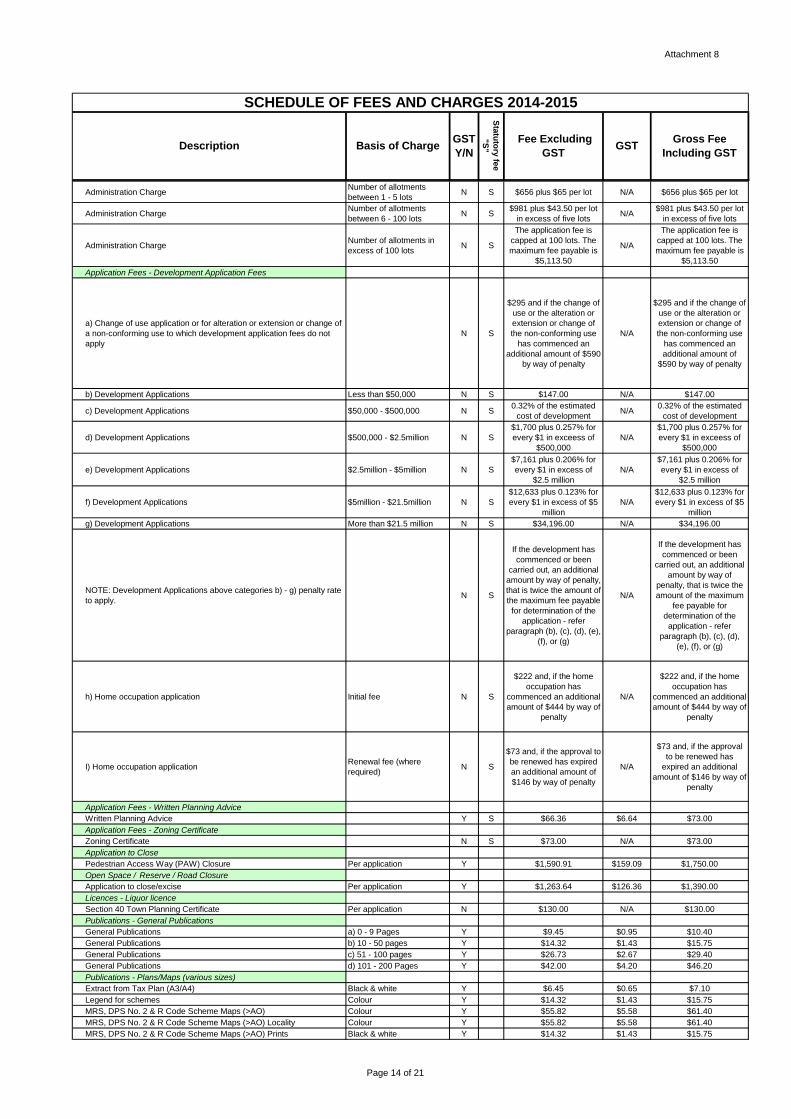
Attachment 8
SCHEDULE OF FEES AND CHARGES 2014-2015
Description Basis of ChargeGST
Y/N
Sta
tuto
ry fe
e
"S
"
Fee Excluding
GSTGST
Gross Fee
Including GST
Administration ChargeNumber of allotments
between 1 - 5 lotsN S $656 plus $65 per lot N/A $656 plus $65 per lot
Administration ChargeNumber of allotments
between 6 - 100 lotsN S
$981 plus $43.50 per lot
in excess of five lotsN/A
$981 plus $43.50 per lot
in excess of five lots
Administration ChargeNumber of allotments in
excess of 100 lotsN S
The application fee is
capped at 100 lots. The
maximum fee payable is
$5,113.50
N/A
The application fee is
capped at 100 lots. The
maximum fee payable is
$5,113.50
Application Fees - Development Application Fees
a) Change of use application or for alteration or extension or change of
a non-conforming use to which development application fees do not
apply
N S
$295 and if the change of
use or the alteration or
extension or change of
the non-conforming use
has commenced an
additional amount of $590
by way of penalty
N/A
$295 and if the change of
use or the alteration or
extension or change of
the non-conforming use
has commenced an
additional amount of
$590 by way of penalty
b) Development Applications Less than $50,000 N S $147.00 N/A $147.00
c) Development Applications $50,000 - $500,000 N S0.32% of the estimated
cost of developmentN/A
0.32% of the estimated
cost of development
d) Development Applications $500,000 - $2.5million N S
$1,700 plus 0.257% for
every $1 in exceess of
$500,000
N/A
$1,700 plus 0.257% for
every $1 in exceess of
$500,000
e) Development Applications $2.5million - $5million N S
$7,161 plus 0.206% for
every $1 in excess of
$2.5 million
N/A
$7,161 plus 0.206% for
every $1 in excess of
$2.5 million
f) Development Applications $5million - $21.5million N S
$12,633 plus 0.123% for
every $1 in excess of $5
million
N/A
$12,633 plus 0.123% for
every $1 in excess of $5
million
g) Development Applications More than $21.5 million N S $34,196.00 N/A $34,196.00
NOTE: Development Applications above categories b) - g) penalty rate
to apply.N S
If the development has
commenced or been
carried out, an additional
amount by way of penalty,
that is twice the amount of
the maximum fee payable
for determination of the
application - refer
paragraph (b), (c), (d), (e),
(f), or (g)
N/A
If the development has
commenced or been
carried out, an additional
amount by way of
penalty, that is twice the
amount of the maximum
fee payable for
determination of the
application - refer
paragraph (b), (c), (d),
(e), (f), or (g)
h) Home occupation application Initial fee N S
$222 and, if the home
occupation has
commenced an additional
amount of $444 by way of
penalty
N/A
$222 and, if the home
occupation has
commenced an additional
amount of $444 by way of
penalty
I) Home occupation applicationRenewal fee (where
required)N S
$73 and, if the approval to
be renewed has expired
an additional amount of
$146 by way of penalty
N/A
$73 and, if the approval
to be renewed has
expired an additional
amount of $146 by way of
penalty
Application Fees - Written Planning Advice
Written Planning Advice Y S $66.36 $6.64 $73.00
Application Fees - Zoning Certificate
Zoning Certificate N S $73.00 N/A $73.00
Application to Close
Pedestrian Access Way (PAW) Closure Per application Y $1,590.91 $159.09 $1,750.00
Open Space / Reserve / Road Closure
Application to close/excise Per application Y $1,263.64 $126.36 $1,390.00
Licences - Liquor licence
Section 40 Town Planning Certificate Per application N $130.00 N/A $130.00
Publications - General Publications
General Publications a) 0 - 9 Pages Y $9.45 $0.95 $10.40
General Publications b) 10 - 50 pages Y $14.32 $1.43 $15.75
General Publications c) 51 - 100 pages Y $26.73 $2.67 $29.40
General Publications d) 101 - 200 Pages Y $42.00 $4.20 $46.20
Publications - Plans/Maps (various sizes)
Extract from Tax Plan (A3/A4) Black & white Y $6.45 $0.65 $7.10
Legend for schemes Colour Y $14.32 $1.43 $15.75
MRS, DPS No. 2 & R Code Scheme Maps (>AO) Colour Y $55.82 $5.58 $61.40
MRS, DPS No. 2 & R Code Scheme Maps (>AO) Locality Colour Y $55.82 $5.58 $61.40
MRS, DPS No. 2 & R Code Scheme Maps (>AO) Prints Black & white Y $14.32 $1.43 $15.75
Page 14 of 21
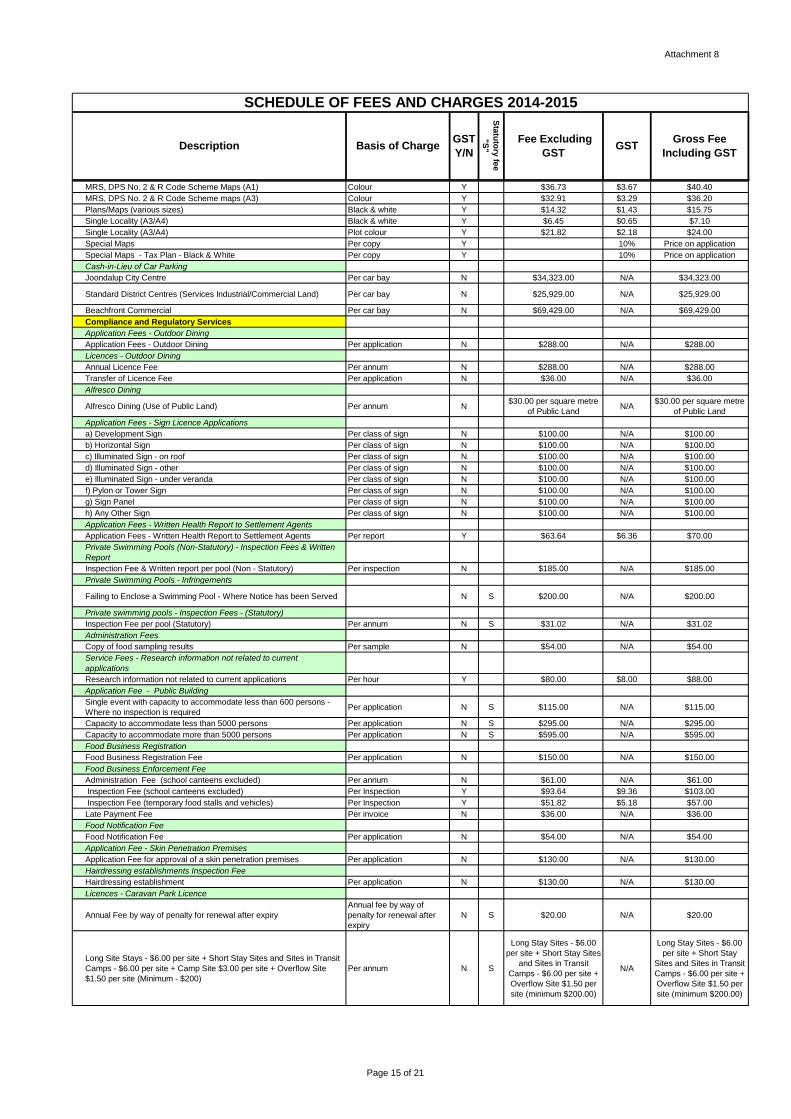
Attachment 8
SCHEDULE OF FEES AND CHARGES 2014-2015
Description Basis of ChargeGST
Y/N
Sta
tuto
ry fe
e
"S
"
Fee Excluding
GSTGST
Gross Fee
Including GST
MRS, DPS No. 2 & R Code Scheme Maps (A1) Colour Y $36.73 $3.67 $40.40
MRS, DPS No. 2 & R Code Scheme maps (A3) Colour Y $32.91 $3.29 $36.20
Plans/Maps (various sizes) Black & white Y $14.32 $1.43 $15.75
Single Locality (A3/A4) Black & white Y $6.45 $0.65 $7.10
Single Locality (A3/A4) Plot colour Y $21.82 $2.18 $24.00
Special Maps Per copy Y 10% Price on application
Special Maps - Tax Plan - Black & White Per copy Y 10% Price on application
Cash-in-Lieu of Car Parking
Joondalup City Centre Per car bay N $34,323.00 N/A $34,323.00
Standard District Centres (Services Industrial/Commercial Land) Per car bay N $25,929.00 N/A $25,929.00
Beachfront Commercial Per car bay N $69,429.00 N/A $69,429.00
Compliance and Regulatory Services
Application Fees - Outdoor Dining
Application Fees - Outdoor Dining Per application N $288.00 N/A $288.00
Licences - Outdoor Dining
Annual Licence Fee Per annum N $288.00 N/A $288.00
Transfer of Licence Fee Per application N $36.00 N/A $36.00
Alfresco Dining
Alfresco Dining (Use of Public Land) Per annum N$30.00 per square metre
of Public LandN/A
$30.00 per square metre
of Public Land
Application Fees - Sign Licence Applications
a) Development Sign Per class of sign N $100.00 N/A $100.00
b) Horizontal Sign Per class of sign N $100.00 N/A $100.00
c) Illuminated Sign - on roof Per class of sign N $100.00 N/A $100.00
d) Illuminated Sign - other Per class of sign N $100.00 N/A $100.00
e) Illuminated Sign - under veranda Per class of sign N $100.00 N/A $100.00
f) Pylon or Tower Sign Per class of sign N $100.00 N/A $100.00
g) Sign Panel Per class of sign N $100.00 N/A $100.00
h) Any Other Sign Per class of sign N $100.00 N/A $100.00
Application Fees - Written Health Report to Settlement Agents
Application Fees - Written Health Report to Settlement Agents Per report Y $63.64 $6.36 $70.00
Private Swimming Pools (Non-Statutory) - Inspection Fees & Written
Report
Inspection Fee & Written report per pool (Non - Statutory) Per inspection N $185.00 N/A $185.00
Private Swimming Pools - Infringements
Failing to Enclose a Swimming Pool - Where Notice has been Served N S $200.00 N/A $200.00
Private swimming pools - Inspection Fees - (Statutory)
Inspection Fee per pool (Statutory) Per annum N S $31.02 N/A $31.02
Administration Fees
Copy of food sampling results Per sample N $54.00 N/A $54.00
Service Fees - Research information not related to current
applications
Research information not related to current applications Per hour Y $80.00 $8.00 $88.00
Application Fee - Public Building
Single event with capacity to accommodate less than 600 persons -
Where no inspection is requiredPer application N S $115.00 N/A $115.00
Capacity to accommodate less than 5000 persons Per application N S $295.00 N/A $295.00
Capacity to accommodate more than 5000 persons Per application N S $595.00 N/A $595.00
Food Business Registration
Food Business Registration Fee Per application N $150.00 N/A $150.00
Food Business Enforcement Fee
Administration Fee (school canteens excluded) Per annum N $61.00 N/A $61.00
Inspection Fee (school canteens excluded) Per Inspection Y $93.64 $9.36 $103.00
Inspection Fee (temporary food stalls and vehicles) Per Inspection Y $51.82 $5.18 $57.00
Late Payment Fee Per invoice N $36.00 N/A $36.00
Food Notification Fee
Food Notification Fee Per application N $54.00 N/A $54.00
Application Fee - Skin Penetration Premises
Application Fee for approval of a skin penetration premises Per application N $130.00 N/A $130.00
Hairdressing establishments Inspection Fee
Hairdressing establishment Per application N $130.00 N/A $130.00
Licences - Caravan Park Licence
Annual Fee by way of penalty for renewal after expiry
Annual fee by way of
penalty for renewal after
expiry
N S $20.00 N/A $20.00
Long Site Stays - $6.00 per site + Short Stay Sites and Sites in Transit
Camps - $6.00 per site + Camp Site $3.00 per site + Overflow Site
$1.50 per site (Minimum - $200)
Per annum N S
Long Stay Sites - $6.00
per site + Short Stay Sites
and Sites in Transit
Camps - $6.00 per site +
Overflow Site $1.50 per
site (minimum $200.00)
N/A
Long Stay Sites - $6.00
per site + Short Stay
Sites and Sites in Transit
Camps - $6.00 per site +
Overflow Site $1.50 per
site (minimum $200.00)
Page 15 of 21
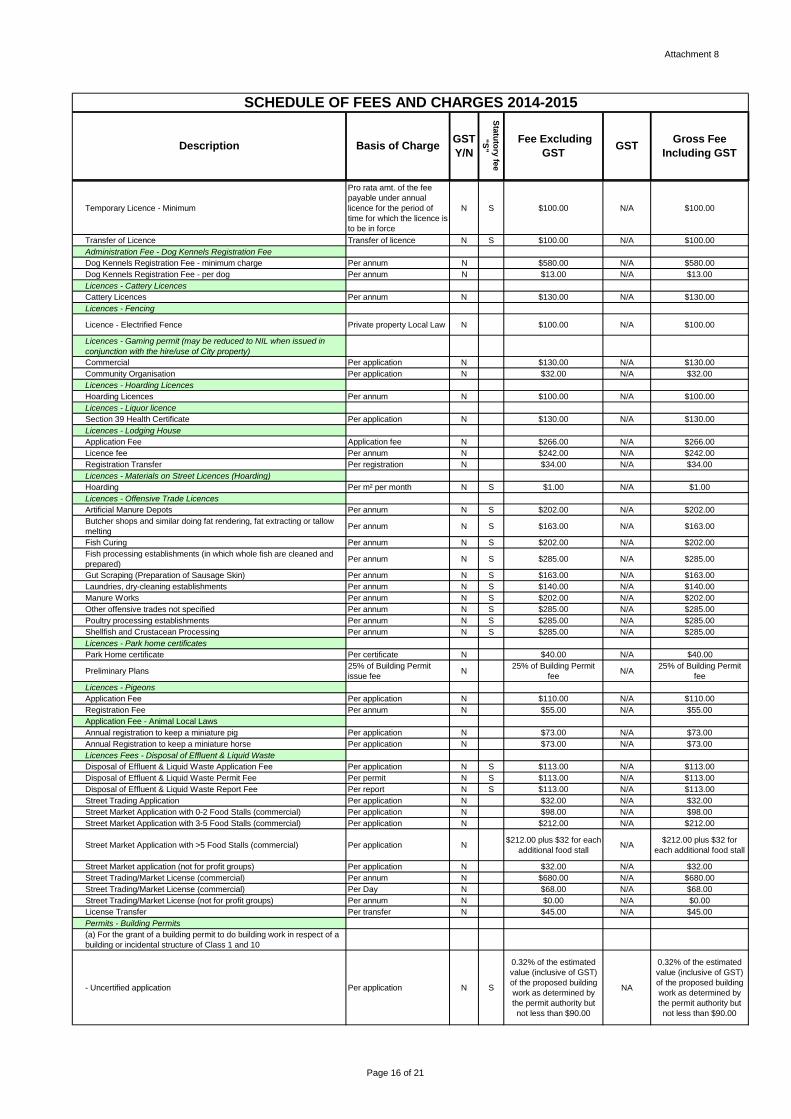
Attachment 8
SCHEDULE OF FEES AND CHARGES 2014-2015
Description Basis of ChargeGST
Y/N
Sta
tuto
ry fe
e
"S
"
Fee Excluding
GSTGST
Gross Fee
Including GST
Temporary Licence - Minimum
Pro rata amt. of the fee
payable under annual
licence for the period of
time for which the licence is
to be in force
N S $100.00 N/A $100.00
Transfer of Licence Transfer of licence N S $100.00 N/A $100.00
Administration Fee - Dog Kennels Registration Fee
Dog Kennels Registration Fee - minimum charge Per annum N $580.00 N/A $580.00
Dog Kennels Registration Fee - per dog Per annum N $13.00 N/A $13.00
Licences - Cattery Licences
Cattery Licences Per annum N $130.00 N/A $130.00
Licences - Fencing
Licence - Electrified Fence Private property Local Law N $100.00 N/A $100.00
Licences - Gaming permit (may be reduced to NIL when issued in
conjunction with the hire/use of City property)
Commercial Per application N $130.00 N/A $130.00
Community Organisation Per application N $32.00 N/A $32.00
Licences - Hoarding Licences
Hoarding Licences Per annum N $100.00 N/A $100.00
Licences - Liquor licence
Section 39 Health Certificate Per application N $130.00 N/A $130.00
Licences - Lodging House
Application Fee Application fee N $266.00 N/A $266.00
Licence fee Per annum N $242.00 N/A $242.00
Registration Transfer Per registration N $34.00 N/A $34.00
Licences - Materials on Street Licences (Hoarding)
Hoarding Per m² per month N S $1.00 N/A $1.00
Licences - Offensive Trade Licences
Artificial Manure Depots Per annum N S $202.00 N/A $202.00
Butcher shops and similar doing fat rendering, fat extracting or tallow
meltingPer annum N S $163.00 N/A $163.00
Fish Curing Per annum N S $202.00 N/A $202.00
Fish processing establishments (in which whole fish are cleaned and
prepared)Per annum N S $285.00 N/A $285.00
Gut Scraping (Preparation of Sausage Skin) Per annum N S $163.00 N/A $163.00
Laundries, dry-cleaning establishments Per annum N S $140.00 N/A $140.00
Manure Works Per annum N S $202.00 N/A $202.00
Other offensive trades not specified Per annum N S $285.00 N/A $285.00
Poultry processing establishments Per annum N S $285.00 N/A $285.00
Shellfish and Crustacean Processing Per annum N S $285.00 N/A $285.00
Licences - Park home certificates
Park Home certificate Per certificate N $40.00 N/A $40.00
Preliminary Plans25% of Building Permit
issue feeN
25% of Building Permit
fee N/A
25% of Building Permit
fee
Licences - Pigeons
Application Fee Per application N $110.00 N/A $110.00
Registration Fee Per annum N $55.00 N/A $55.00
Application Fee - Animal Local Laws
Annual registration to keep a miniature pig Per application N $73.00 N/A $73.00
Annual Registration to keep a miniature horse Per application N $73.00 N/A $73.00
Licences Fees - Disposal of Effluent & Liquid Waste
Disposal of Effluent & Liquid Waste Application Fee Per application N S $113.00 N/A $113.00
Disposal of Effluent & Liquid Waste Permit Fee Per permit N S $113.00 N/A $113.00
Disposal of Effluent & Liquid Waste Report Fee Per report N S $113.00 N/A $113.00
Street Trading Application Per application N $32.00 N/A $32.00
Street Market Application with 0-2 Food Stalls (commercial) Per application N $98.00 N/A $98.00
Street Market Application with 3-5 Food Stalls (commercial) Per application N $212.00 N/A $212.00
Street Market Application with >5 Food Stalls (commercial) Per application N$212.00 plus $32 for each
additional food stallN/A
$212.00 plus $32 for
each additional food stall
Street Market application (not for profit groups) Per application N $32.00 N/A $32.00
Street Trading/Market License (commercial) Per annum N $680.00 N/A $680.00
Street Trading/Market License (commercial) Per Day N $68.00 N/A $68.00
Street Trading/Market License (not for profit groups) Per annum N $0.00 N/A $0.00
License Transfer Per transfer N $45.00 N/A $45.00
Permits - Building Permits
(a) For the grant of a building permit to do building work in respect of a
building or incidental structure of Class 1 and 10
- Uncertified application Per application N S
0.32% of the estimated
value (inclusive of GST)
of the proposed building
work as determined by
the permit authority but
not less than $90.00
NA
0.32% of the estimated
value (inclusive of GST)
of the proposed building
work as determined by
the permit authority but
not less than $90.00
Page 16 of 21
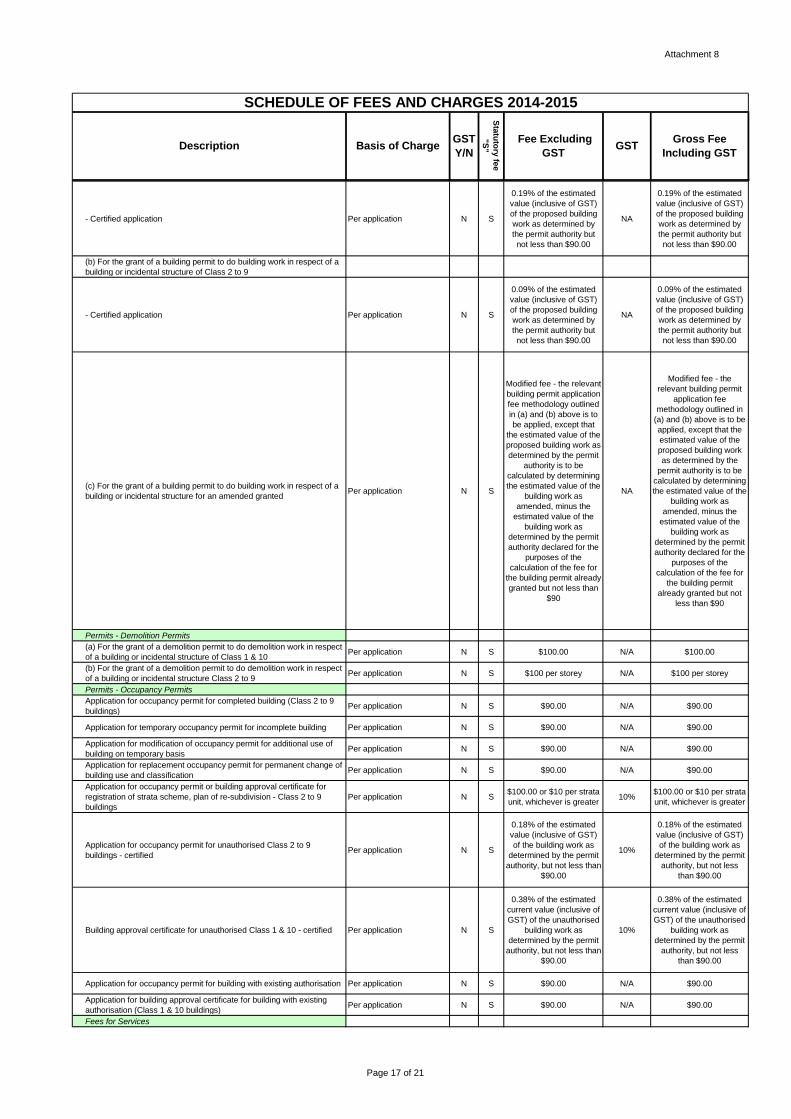
Attachment 8
SCHEDULE OF FEES AND CHARGES 2014-2015
Description Basis of ChargeGST
Y/N
Sta
tuto
ry fe
e
"S
"
Fee Excluding
GSTGST
Gross Fee
Including GST
- Certified application Per application N S
0.19% of the estimated
value (inclusive of GST)
of the proposed building
work as determined by
the permit authority but
not less than $90.00
NA
0.19% of the estimated
value (inclusive of GST)
of the proposed building
work as determined by
the permit authority but
not less than $90.00
(b) For the grant of a building permit to do building work in respect of a
building or incidental structure of Class 2 to 9
- Certified application Per application N S
0.09% of the estimated
value (inclusive of GST)
of the proposed building
work as determined by
the permit authority but
not less than $90.00
NA
0.09% of the estimated
value (inclusive of GST)
of the proposed building
work as determined by
the permit authority but
not less than $90.00
(c) For the grant of a building permit to do building work in respect of a
building or incidental structure for an amended grantedPer application N S
Modified fee - the relevant
building permit application
fee methodology outlined
in (a) and (b) above is to
be applied, except that
the estimated value of the
proposed building work as
determined by the permit
authority is to be
calculated by determining
the estimated value of the
building work as
amended, minus the
estimated value of the
building work as
determined by the permit
authority declared for the
purposes of the
calculation of the fee for
the building permit already
granted but not less than
$90
NA
Modified fee - the
relevant building permit
application fee
methodology outlined in
(a) and (b) above is to be
applied, except that the
estimated value of the
proposed building work
as determined by the
permit authority is to be
calculated by determining
the estimated value of the
building work as
amended, minus the
estimated value of the
building work as
determined by the permit
authority declared for the
purposes of the
calculation of the fee for
the building permit
already granted but not
less than $90
Permits - Demolition Permits
(a) For the grant of a demolition permit to do demolition work in respect
of a building or incidental structure of Class 1 & 10Per application N S $100.00 N/A $100.00
(b) For the grant of a demolition permit to do demolition work in respect
of a building or incidental structure Class 2 to 9Per application N S $100 per storey N/A $100 per storey
Permits - Occupancy Permits
Application for occupancy permit for completed building (Class 2 to 9
buildings)Per application N S $90.00 N/A $90.00
Application for temporary occupancy permit for incomplete building Per application N S $90.00 N/A $90.00
Application for modification of occupancy permit for additional use of
building on temporary basisPer application N S $90.00 N/A $90.00
Application for replacement occupancy permit for permanent change of
building use and classificationPer application N S $90.00 N/A $90.00
Application for occupancy permit or building approval certificate for
registration of strata scheme, plan of re-subdivision - Class 2 to 9
buildings
Per application N S$100.00 or $10 per strata
unit, whichever is greater10%
$100.00 or $10 per strata
unit, whichever is greater
Application for occupancy permit for unauthorised Class 2 to 9
buildings - certifiedPer application N S
0.18% of the estimated
value (inclusive of GST)
of the building work as
determined by the permit
authority, but not less than
$90.00
10%
0.18% of the estimated
value (inclusive of GST)
of the building work as
determined by the permit
authority, but not less
than $90.00
Building approval certificate for unauthorised Class 1 & 10 - certified Per application N S
0.38% of the estimated
current value (inclusive of
GST) of the unauthorised
building work as
determined by the permit
authority, but not less than
$90.00
10%
0.38% of the estimated
current value (inclusive of
GST) of the unauthorised
building work as
determined by the permit
authority, but not less
than $90.00
Application for occupancy permit for building with existing authorisation Per application N S $90.00 N/A $90.00
Application for building approval certificate for building with existing
authorisation (Class 1 & 10 buildings)Per application N S $90.00 N/A $90.00
Fees for Services
Page 17 of 21
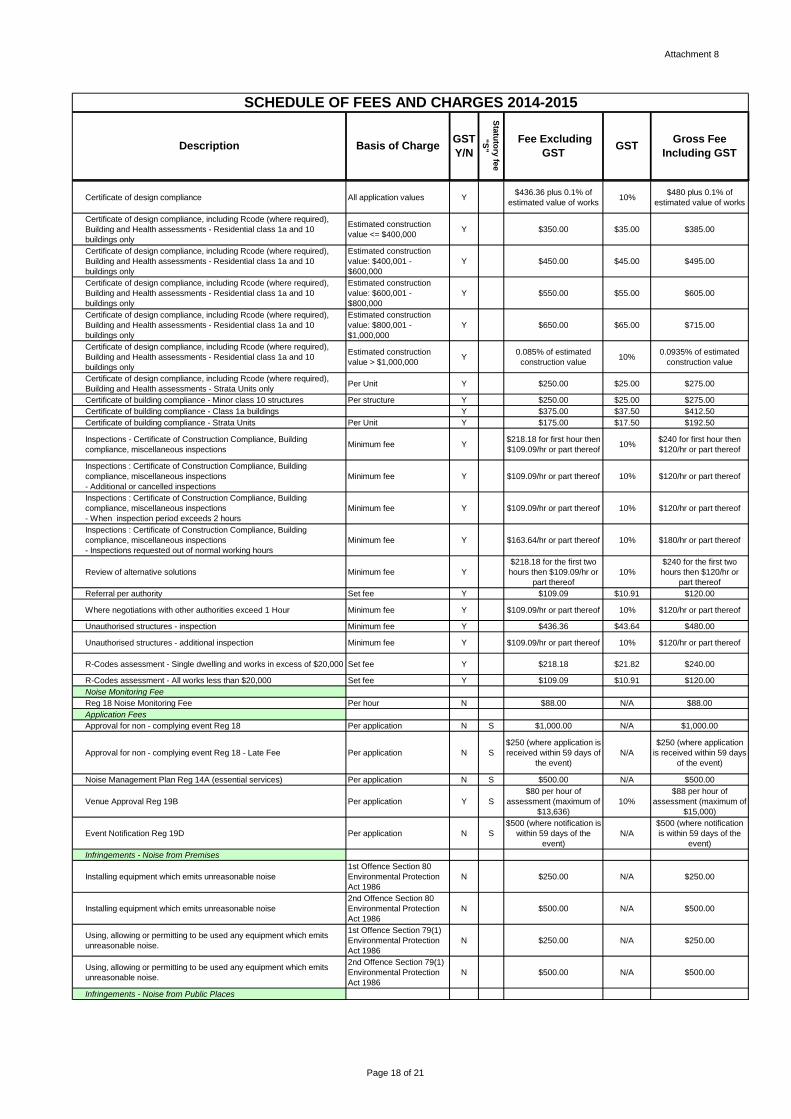
Attachment 8
SCHEDULE OF FEES AND CHARGES 2014-2015
Description Basis of ChargeGST
Y/N
Sta
tuto
ry fe
e
"S
"
Fee Excluding
GSTGST
Gross Fee
Including GST
Certificate of design compliance All application values Y$436.36 plus 0.1% of
estimated value of works10%
$480 plus 0.1% of
estimated value of works
Certificate of design compliance, including Rcode (where required),
Building and Health assessments - Residential class 1a and 10
buildings only
Estimated construction
value <= $400,000Y $350.00 $35.00 $385.00
Certificate of design compliance, including Rcode (where required),
Building and Health assessments - Residential class 1a and 10
buildings only
Estimated construction
value: $400,001 -
$600,000
Y $450.00 $45.00 $495.00
Certificate of design compliance, including Rcode (where required),
Building and Health assessments - Residential class 1a and 10
buildings only
Estimated construction
value: $600,001 -
$800,000
Y $550.00 $55.00 $605.00
Certificate of design compliance, including Rcode (where required),
Building and Health assessments - Residential class 1a and 10
buildings only
Estimated construction
value: $800,001 -
$1,000,000
Y $650.00 $65.00 $715.00
Certificate of design compliance, including Rcode (where required),
Building and Health assessments - Residential class 1a and 10
buildings only
Estimated construction
value > $1,000,000Y
0.085% of estimated
construction value10%
0.0935% of estimated
construction value
Certificate of design compliance, including Rcode (where required),
Building and Health assessments - Strata Units onlyPer Unit Y $250.00 $25.00 $275.00
Certificate of building compliance - Minor class 10 structures Per structure Y $250.00 $25.00 $275.00
Certificate of building compliance - Class 1a buildings Y $375.00 $37.50 $412.50
Certificate of building compliance - Strata Units Per Unit Y $175.00 $17.50 $192.50
Inspections - Certificate of Construction Compliance, Building
compliance, miscellaneous inspectionsMinimum fee Y
$218.18 for first hour then
$109.09/hr or part thereof10%
$240 for first hour then
$120/hr or part thereof
Inspections : Certificate of Construction Compliance, Building
compliance, miscellaneous inspections
- Additional or cancelled inspections
Minimum fee Y $109.09/hr or part thereof 10% $120/hr or part thereof
Inspections : Certificate of Construction Compliance, Building
compliance, miscellaneous inspections
- When inspection period exceeds 2 hours
Minimum fee Y $109.09/hr or part thereof 10% $120/hr or part thereof
Inspections : Certificate of Construction Compliance, Building
compliance, miscellaneous inspections
- Inspections requested out of normal working hours
Minimum fee Y $163.64/hr or part thereof 10% $180/hr or part thereof
Review of alternative solutions Minimum fee Y
$218.18 for the first two
hours then $109.09/hr or
part thereof
10%
$240 for the first two
hours then $120/hr or
part thereof
Referral per authority Set fee Y $109.09 $10.91 $120.00
Where negotiations with other authorities exceed 1 Hour Minimum fee Y $109.09/hr or part thereof 10% $120/hr or part thereof
Unauthorised structures - inspection Minimum fee Y $436.36 $43.64 $480.00
Unauthorised structures - additional inspection Minimum fee Y $109.09/hr or part thereof 10% $120/hr or part thereof
R-Codes assessment - Single dwelling and works in excess of $20,000 Set fee Y $218.18 $21.82 $240.00
R-Codes assessment - All works less than $20,000 Set fee Y $109.09 $10.91 $120.00
Noise Monitoring Fee
Reg 18 Noise Monitoring Fee Per hour N $88.00 N/A $88.00
Application Fees
Approval for non - complying event Reg 18 Per application N S $1,000.00 N/A $1,000.00
Approval for non - complying event Reg 18 - Late Fee Per application N S
$250 (where application is
received within 59 days of
the event)
N/A
$250 (where application
is received within 59 days
of the event)
Noise Management Plan Reg 14A (essential services) Per application N S $500.00 N/A $500.00
Venue Approval Reg 19B Per application Y S
$80 per hour of
assessment (maximum of
$13,636)
10%
$88 per hour of
assessment (maximum of
$15,000)
Event Notification Reg 19D Per application N S
$500 (where notification is
within 59 days of the
event)
N/A
$500 (where notification
is within 59 days of the
event)
Infringements - Noise from Premises
Installing equipment which emits unreasonable noise
1st Offence Section 80
Environmental Protection
Act 1986
N $250.00 N/A $250.00
Installing equipment which emits unreasonable noise
2nd Offence Section 80
Environmental Protection
Act 1986
N $500.00 N/A $500.00
Using, allowing or permitting to be used any equipment which emits
unreasonable noise.
1st Offence Section 79(1)
Environmental Protection
Act 1986
N $250.00 N/A $250.00
Using, allowing or permitting to be used any equipment which emits
unreasonable noise.
2nd Offence Section 79(1)
Environmental Protection
Act 1986
N $500.00 N/A $500.00
Infringements - Noise from Public Places
Page 18 of 21
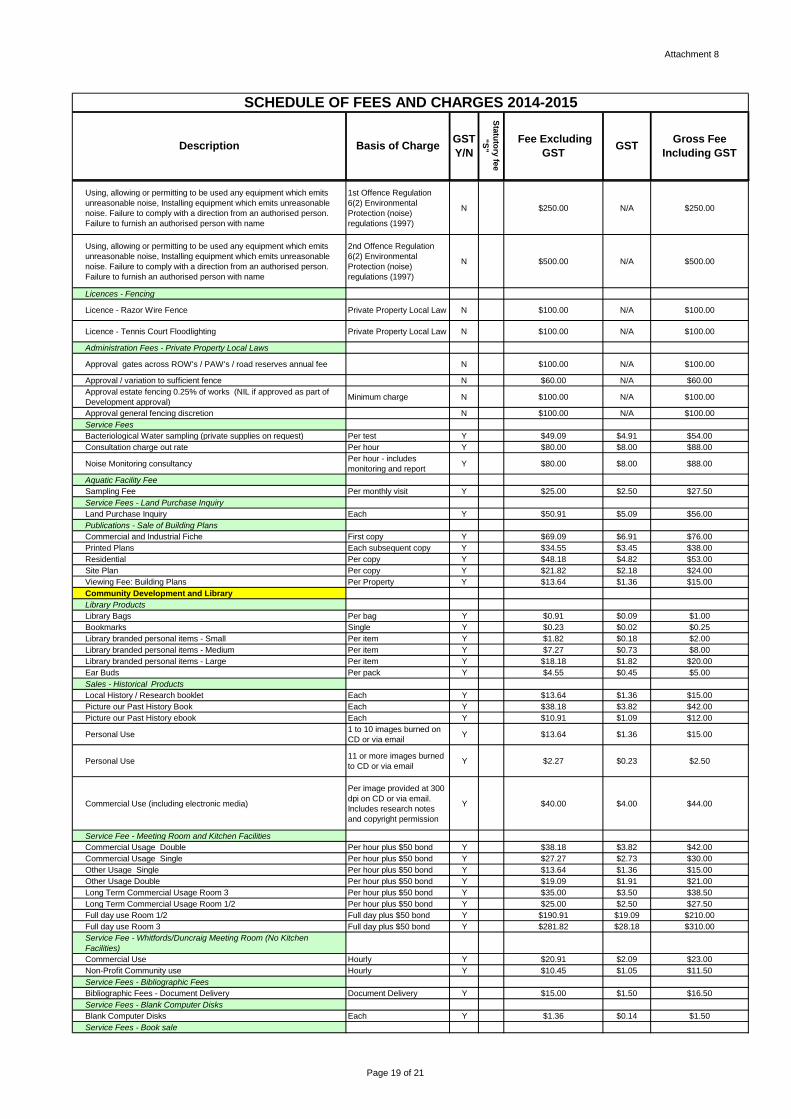
Attachment 8
SCHEDULE OF FEES AND CHARGES 2014-2015
Description Basis of ChargeGST
Y/N
Sta
tuto
ry fe
e
"S
"
Fee Excluding
GSTGST
Gross Fee
Including GST
Using, allowing or permitting to be used any equipment which emits
unreasonable noise, Installing equipment which emits unreasonable
noise. Failure to comply with a direction from an authorised person.
Failure to furnish an authorised person with name
1st Offence Regulation
6(2) Environmental
Protection (noise)
regulations (1997)
N $250.00 N/A $250.00
Using, allowing or permitting to be used any equipment which emits
unreasonable noise, Installing equipment which emits unreasonable
noise. Failure to comply with a direction from an authorised person.
Failure to furnish an authorised person with name
2nd Offence Regulation
6(2) Environmental
Protection (noise)
regulations (1997)
N $500.00 N/A $500.00
Licences - Fencing
Licence - Razor Wire Fence Private Property Local Law N $100.00 N/A $100.00
Licence - Tennis Court Floodlighting Private Property Local Law N $100.00 N/A $100.00
Administration Fees - Private Property Local Laws
Approval gates across ROW's / PAW's / road reserves annual fee N $100.00 N/A $100.00
Approval / variation to sufficient fence N $60.00 N/A $60.00
Approval estate fencing 0.25% of works (NIL if approved as part of
Development approval)Minimum charge N $100.00 N/A $100.00
Approval general fencing discretion N $100.00 N/A $100.00
Service Fees
Bacteriological Water sampling (private supplies on request) Per test Y $49.09 $4.91 $54.00
Consultation charge out rate Per hour Y $80.00 $8.00 $88.00
Noise Monitoring consultancyPer hour - includes
monitoring and reportY $80.00 $8.00 $88.00
Aquatic Facility Fee
Sampling Fee Per monthly visit Y $25.00 $2.50 $27.50
Service Fees - Land Purchase Inquiry
Land Purchase Inquiry Each Y $50.91 $5.09 $56.00
Publications - Sale of Building Plans
Commercial and Industrial Fiche First copy Y $69.09 $6.91 $76.00
Printed Plans Each subsequent copy Y $34.55 $3.45 $38.00
Residential Per copy Y $48.18 $4.82 $53.00
Site Plan Per copy Y $21.82 $2.18 $24.00
Viewing Fee: Building Plans Per Property Y $13.64 $1.36 $15.00
Community Development and Library
Library Products
Library Bags Per bag Y $0.91 $0.09 $1.00
Bookmarks Single Y $0.23 $0.02 $0.25
Library branded personal items - Small Per item Y $1.82 $0.18 $2.00
Library branded personal items - Medium Per item Y $7.27 $0.73 $8.00
Library branded personal items - Large Per item Y $18.18 $1.82 $20.00
Ear Buds Per pack Y $4.55 $0.45 $5.00
Sales - Historical Products
Local History / Research booklet Each Y $13.64 $1.36 $15.00
Picture our Past History Book Each Y $38.18 $3.82 $42.00
Picture our Past History ebook Each Y $10.91 $1.09 $12.00
Personal Use1 to 10 images burned on
CD or via emailY $13.64 $1.36 $15.00
Personal Use11 or more images burned
to CD or via emailY $2.27 $0.23 $2.50
Commercial Use (including electronic media)
Per image provided at 300
dpi on CD or via email.
Includes research notes
and copyright permission
Y $40.00 $4.00 $44.00
Service Fee - Meeting Room and Kitchen Facilities
Commercial Usage Double Per hour plus $50 bond Y $38.18 $3.82 $42.00
Commercial Usage Single Per hour plus $50 bond Y $27.27 $2.73 $30.00
Other Usage Single Per hour plus $50 bond Y $13.64 $1.36 $15.00
Other Usage Double Per hour plus $50 bond Y $19.09 $1.91 $21.00
Long Term Commercial Usage Room 3 Per hour plus $50 bond Y $35.00 $3.50 $38.50
Long Term Commercial Usage Room 1/2 Per hour plus $50 bond Y $25.00 $2.50 $27.50
Full day use Room 1/2 Full day plus $50 bond Y $190.91 $19.09 $210.00
Full day use Room 3 Full day plus $50 bond Y $281.82 $28.18 $310.00
Service Fee - Whitfords/Duncraig Meeting Room (No Kitchen
Facilities)
Commercial Use Hourly Y $20.91 $2.09 $23.00
Non-Profit Community use Hourly Y $10.45 $1.05 $11.50
Service Fees - Bibliographic Fees
Bibliographic Fees - Document Delivery Document Delivery Y $15.00 $1.50 $16.50
Service Fees - Blank Computer Disks
Blank Computer Disks Each Y $1.36 $0.14 $1.50
Service Fees - Book sale
Page 19 of 21
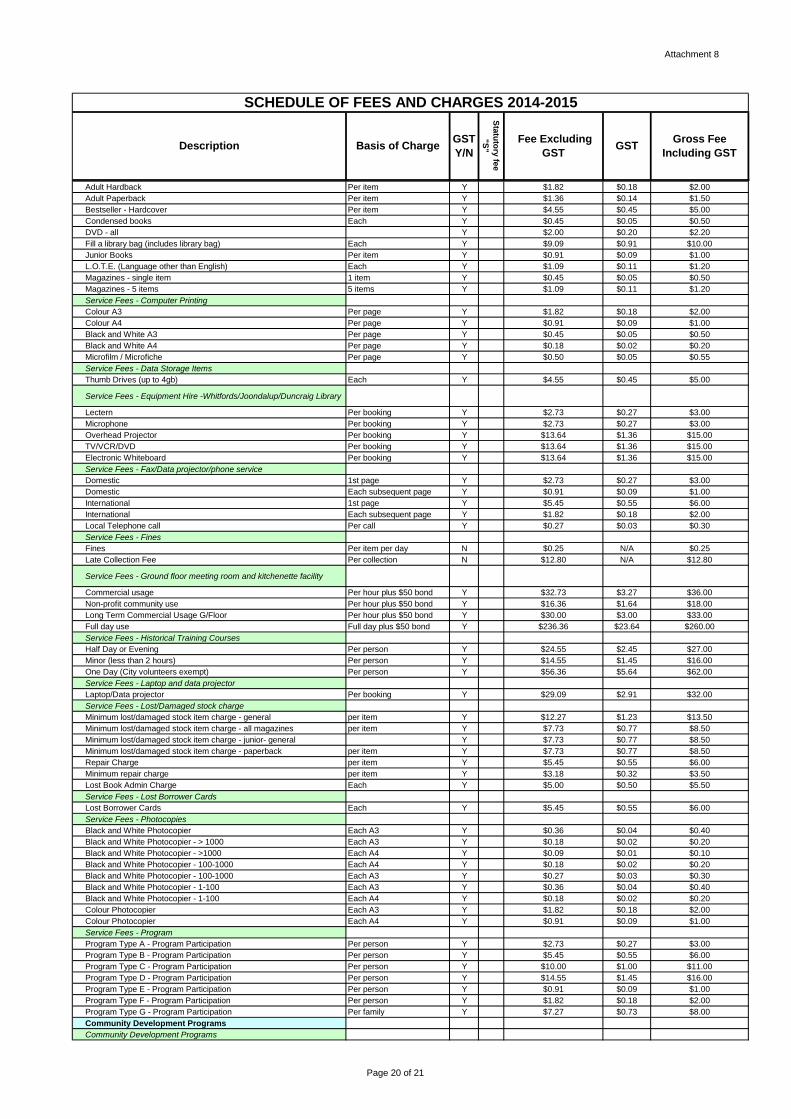
Attachment 8
SCHEDULE OF FEES AND CHARGES 2014-2015
Description Basis of ChargeGST
Y/N
Sta
tuto
ry fe
e
"S
"
Fee Excluding
GSTGST
Gross Fee
Including GST
Adult Hardback Per item Y $1.82 $0.18 $2.00
Adult Paperback Per item Y $1.36 $0.14 $1.50
Bestseller - Hardcover Per item Y $4.55 $0.45 $5.00
Condensed books Each Y $0.45 $0.05 $0.50
DVD - all Y $2.00 $0.20 $2.20
Fill a library bag (includes library bag) Each Y $9.09 $0.91 $10.00
Junior Books Per item Y $0.91 $0.09 $1.00
L.O.T.E. (Language other than English) Each Y $1.09 $0.11 $1.20
Magazines - single item 1 item Y $0.45 $0.05 $0.50
Magazines - 5 items 5 items Y $1.09 $0.11 $1.20
Service Fees - Computer Printing
Colour A3 Per page Y $1.82 $0.18 $2.00
Colour A4 Per page Y $0.91 $0.09 $1.00
Black and White A3 Per page Y $0.45 $0.05 $0.50
Black and White A4 Per page Y $0.18 $0.02 $0.20
Microfilm / Microfiche Per page Y $0.50 $0.05 $0.55
Service Fees - Data Storage Items
Thumb Drives (up to 4gb) Each Y $4.55 $0.45 $5.00
Service Fees - Equipment Hire -Whitfords/Joondalup/Duncraig Library
Lectern Per booking Y $2.73 $0.27 $3.00
Microphone Per booking Y $2.73 $0.27 $3.00
Overhead Projector Per booking Y $13.64 $1.36 $15.00
TV/VCR/DVD Per booking Y $13.64 $1.36 $15.00
Electronic Whiteboard Per booking Y $13.64 $1.36 $15.00
Service Fees - Fax/Data projector/phone service
Domestic 1st page Y $2.73 $0.27 $3.00
Domestic Each subsequent page Y $0.91 $0.09 $1.00
International 1st page Y $5.45 $0.55 $6.00
International Each subsequent page Y $1.82 $0.18 $2.00
Local Telephone call Per call Y $0.27 $0.03 $0.30
Service Fees - Fines
Fines Per item per day N $0.25 N/A $0.25
Late Collection Fee Per collection N $12.80 N/A $12.80
Service Fees - Ground floor meeting room and kitchenette facility
Commercial usage Per hour plus $50 bond Y $32.73 $3.27 $36.00
Non-profit community use Per hour plus $50 bond Y $16.36 $1.64 $18.00
Long Term Commercial Usage G/Floor Per hour plus $50 bond Y $30.00 $3.00 $33.00
Full day use Full day plus $50 bond Y $236.36 $23.64 $260.00
Service Fees - Historical Training Courses
Half Day or Evening Per person Y $24.55 $2.45 $27.00
Minor (less than 2 hours) Per person Y $14.55 $1.45 $16.00
One Day (City volunteers exempt) Per person Y $56.36 $5.64 $62.00
Service Fees - Laptop and data projector
Laptop/Data projector Per booking Y $29.09 $2.91 $32.00
Service Fees - Lost/Damaged stock charge
Minimum lost/damaged stock item charge - general per item Y $12.27 $1.23 $13.50
Minimum lost/damaged stock item charge - all magazines per item Y $7.73 $0.77 $8.50
Minimum lost/damaged stock item charge - junior- general Y $7.73 $0.77 $8.50
Minimum lost/damaged stock item charge - paperback per item Y $7.73 $0.77 $8.50
Repair Charge per item Y $5.45 $0.55 $6.00
Minimum repair charge per item Y $3.18 $0.32 $3.50
Lost Book Admin Charge Each Y $5.00 $0.50 $5.50
Service Fees - Lost Borrower Cards
Lost Borrower Cards Each Y $5.45 $0.55 $6.00
Service Fees - Photocopies
Black and White Photocopier Each A3 Y $0.36 $0.04 $0.40
Black and White Photocopier - > 1000 Each A3 Y $0.18 $0.02 $0.20
Black and White Photocopier - >1000 Each A4 Y $0.09 $0.01 $0.10
Black and White Photocopier - 100-1000 Each A4 Y $0.18 $0.02 $0.20
Black and White Photocopier - 100-1000 Each A3 Y $0.27 $0.03 $0.30
Black and White Photocopier - 1-100 Each A3 Y $0.36 $0.04 $0.40
Black and White Photocopier - 1-100 Each A4 Y $0.18 $0.02 $0.20
Colour Photocopier Each A3 Y $1.82 $0.18 $2.00
Colour Photocopier Each A4 Y $0.91 $0.09 $1.00
Service Fees - Program
Program Type A - Program Participation Per person Y $2.73 $0.27 $3.00
Program Type B - Program Participation Per person Y $5.45 $0.55 $6.00
Program Type C - Program Participation Per person Y $10.00 $1.00 $11.00
Program Type D - Program Participation Per person Y $14.55 $1.45 $16.00
Program Type E - Program Participation Per person Y $0.91 $0.09 $1.00
Program Type F - Program Participation Per person Y $1.82 $0.18 $2.00
Program Type G - Program Participation Per family Y $7.27 $0.73 $8.00
Community Development Programs
Community Development Programs
Page 20 of 21
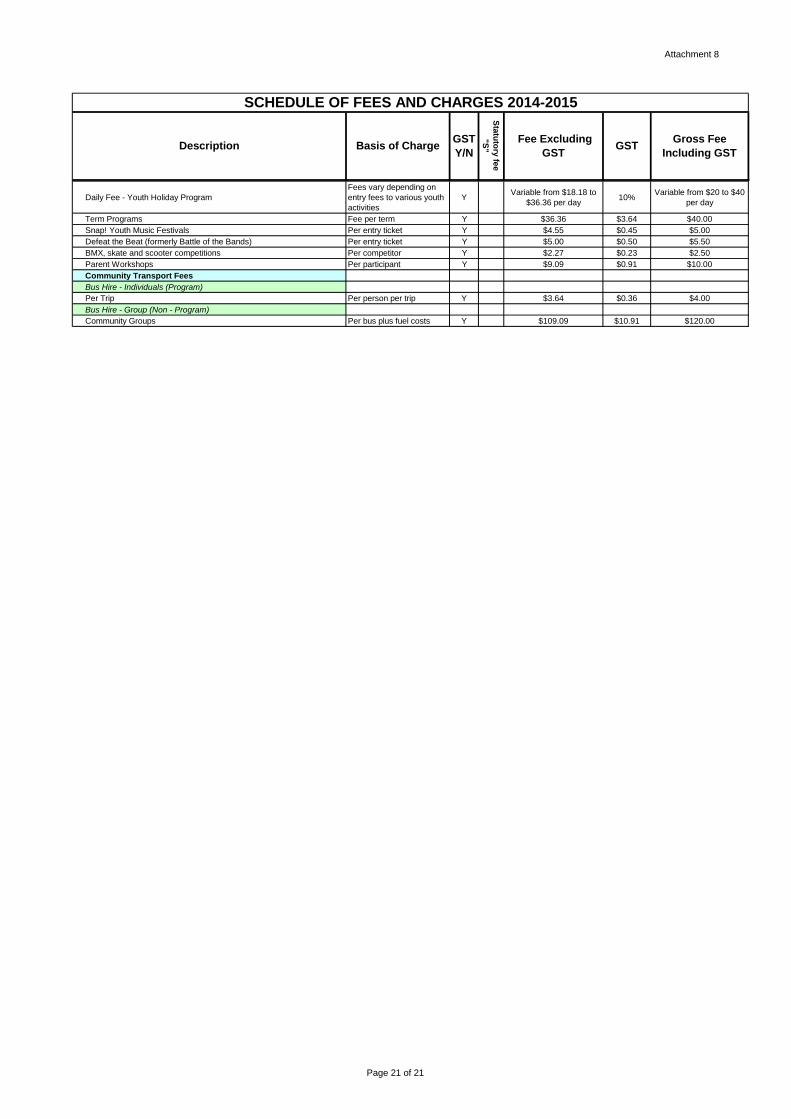
Attachment 8
SCHEDULE OF FEES AND CHARGES 2014-2015
Description Basis of ChargeGST
Y/N
Sta
tuto
ry fe
e
"S
"
Fee Excluding
GSTGST
Gross Fee
Including GST
Daily Fee - Youth Holiday Program
Fees vary depending on
entry fees to various youth
activities
YVariable from $18.18 to
$36.36 per day10%
Variable from $20 to $40
per day
Term Programs Fee per term Y $36.36 $3.64 $40.00
Snap! Youth Music Festivals Per entry ticket Y $4.55 $0.45 $5.00
Defeat the Beat (formerly Battle of the Bands) Per entry ticket Y $5.00 $0.50 $5.50
BMX, skate and scooter competitions Per competitor Y $2.27 $0.23 $2.50
Parent Workshops Per participant Y $9.09 $0.91 $10.00
Community Transport Fees
Bus Hire - Individuals (Program)
Per Trip Per person per trip Y $3.64 $0.36 $4.00
Bus Hire - Group (Non - Program)
Community Groups Per bus plus fuel costs Y $109.09 $10.91 $120.00
Page 21 of 21
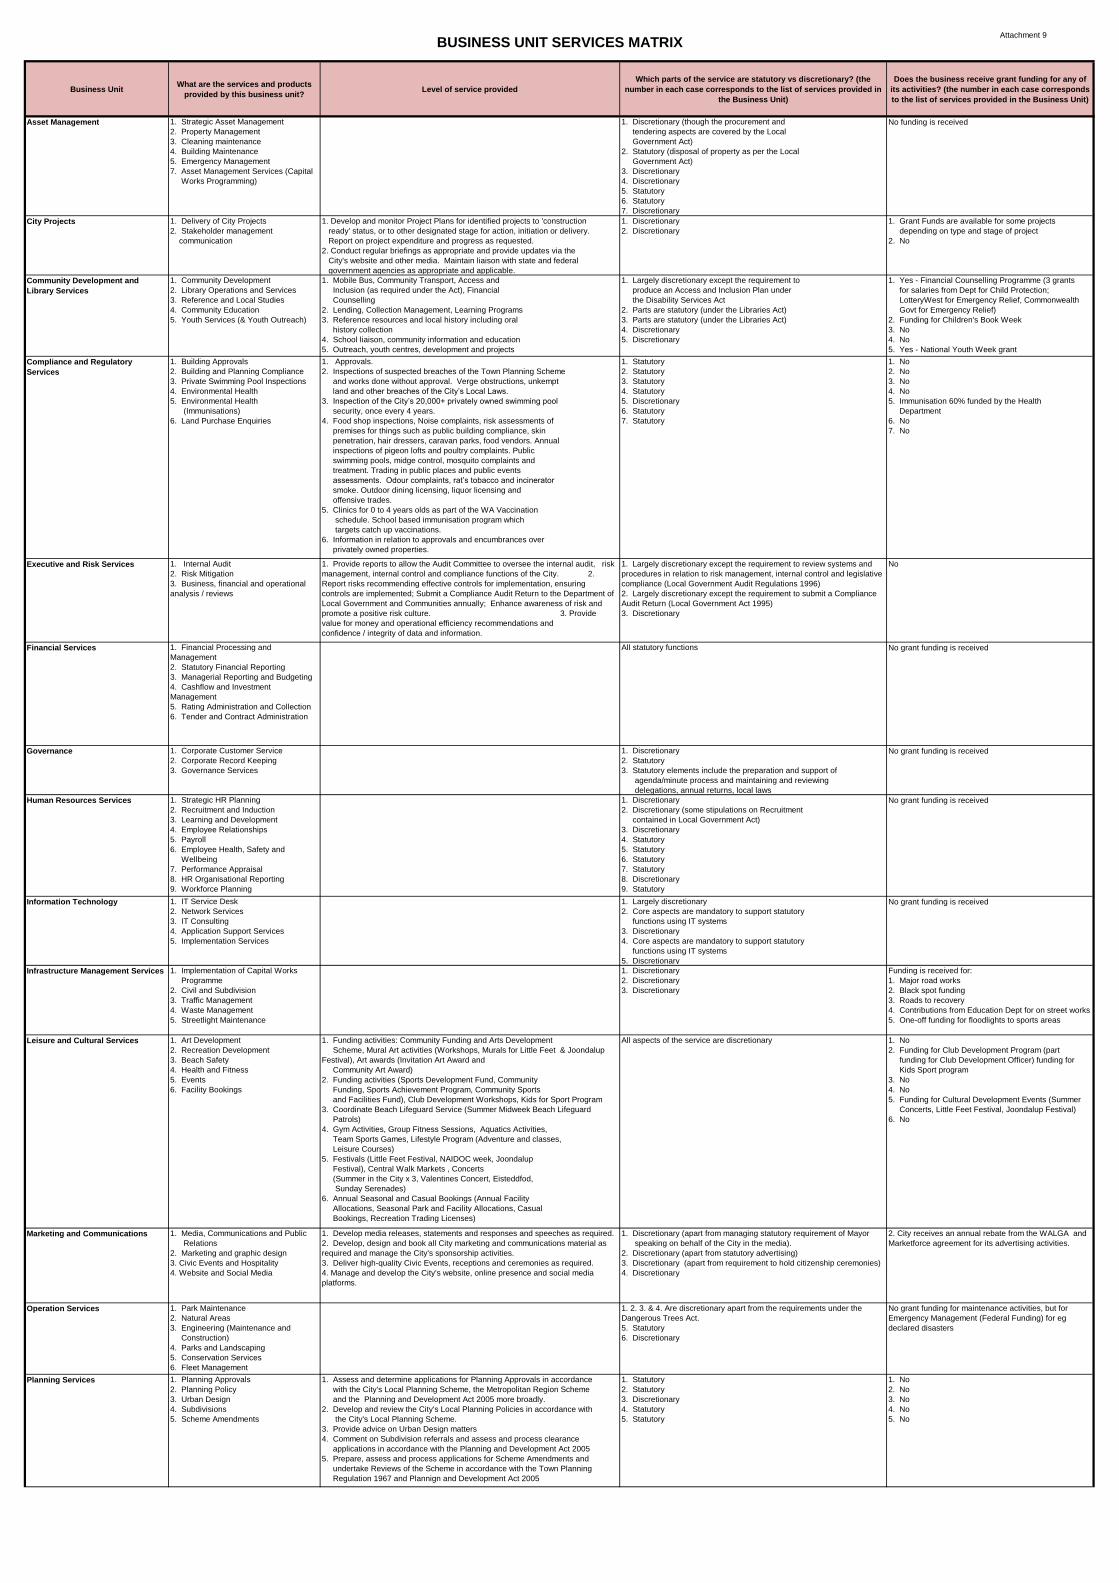
Attachment 9
Business UnitWhat are the services and products
provided by this business unit?Level of service provided
Which parts of the service are statutory vs discretionary? (the
number in each case corresponds to the list of services provided in
the Business Unit)
Does the business receive grant funding for any of
its activities? (the number in each case corresponds
to the list of services provided in the Business Unit)
Asset Management 1. Strategic Asset Management
2. Property Management
3. Cleaning maintenance
4. Building Maintenance
5. Emergency Management
7. Asset Management Services (Capital
Works Programming)
1. Discretionary (though the procurement and
tendering aspects are covered by the Local
Government Act)
2. Statutory (disposal of property as per the Local
Government Act)
3. Discretionary
4. Discretionary
5. Statutory
6. Statutory
7. Discretionary
No funding is received
City Projects 1. Delivery of City Projects
2. Stakeholder management
communication
1. Develop and monitor Project Plans for identified projects to 'construction
ready' status, or to other designated stage for action, initiation or delivery.
Report on project expenditure and progress as requested.
2. Conduct regular briefings as appropriate and provide updates via the
City's website and other media. Maintain liaison with state and federal
government agencies as appropriate and applicable.
1. Discretionary
2. Discretionary
1. Grant Funds are available for some projects
depending on type and stage of project
2. No
Community Development and
Library Services
1. Community Development
2. Library Operations and Services
3. Reference and Local Studies
4. Community Education
5. Youth Services (& Youth Outreach)
1. Mobile Bus, Community Transport, Access and
Inclusion (as required under the Act), Financial
Counselling
2. Lending, Collection Management, Learning Programs
3. Reference resources and local history including oral
history collection
4. School liaison, community information and education
5. Outreach, youth centres, development and projects
1. Largely discretionary except the requirement to
produce an Access and Inclusion Plan under
the Disability Services Act
2. Parts are statutory (under the Libraries Act)
3. Parts are statutory (under the Libraries Act)
4. Discretionary
5. Discretionary
1. Yes - Financial Counselling Programme (3 grants
for salaries from Dept for Child Protection;
LotteryWest for Emergency Relief, Commonwealth
Govt for Emergency Relief)
2. Funding for Children's Book Week
3. No
4. No
5. Yes - National Youth Week grant
Compliance and Regulatory
Services
1. Building Approvals
2. Building and Planning Compliance
3. Private Swimming Pool Inspections
4. Environmental Health
5. Environmental Health
(Immunisations)
6. Land Purchase Enquiries
1. Approvals.
2. Inspections of suspected breaches of the Town Planning Scheme
and works done without approval. Verge obstructions, unkempt
land and other breaches of the City’s Local Laws.
3. Inspection of the City’s 20,000+ privately owned swimming pool
security, once every 4 years.
4. Food shop inspections, Noise complaints, risk assessments of
premises for things such as public building compliance, skin
penetration, hair dressers, caravan parks, food vendors. Annual
inspections of pigeon lofts and poultry complaints. Public
swimming pools, midge control, mosquito complaints and
treatment. Trading in public places and public events
assessments. Odour complaints, rat’s tobacco and incinerator
smoke. Outdoor dining licensing, liquor licensing and
offensive trades.
5. Clinics for 0 to 4 years olds as part of the WA Vaccination
schedule. School based immunisation program which
targets catch up vaccinations.
6. Information in relation to approvals and encumbrances over
privately owned properties.
1. Statutory
2. Statutory
3. Statutory
4. Statutory
5. Discretionary
6. Statutory
7. Statutory
1. No
2. No
3. No
4. No
5. Immunisation 60% funded by the Health
Department
6. No
7. No
Executive and Risk Services 1. Internal Audit
2. Risk Mitigation
3. Business, financial and operational
analysis / reviews
1. Provide reports to allow the Audit Committee to oversee the internal audit, risk
management, internal control and compliance functions of the City. 2.
Report risks recommending effective controls for implementation, ensuring
controls are implemented; Submit a Compliance Audit Return to the Department of
Local Government and Communities annually; Enhance awareness of risk and
promote a positive risk culture. 3. Provide
value for money and operational efficiency recommendations and
confidence / integrity of data and information.
1. Largely discretionary except the requirement to review systems and
procedures in relation to risk management, internal control and legislative
compliance (Local Government Audit Regulations 1996)
2. Largely discretionary except the requirement to submit a Compliance
Audit Return (Local Government Act 1995)
3. Discretionary
No
Financial Services 1. Financial Processing and
Management
2. Statutory Financial Reporting
3. Managerial Reporting and Budgeting
4. Cashflow and Investment
Management
5. Rating Administration and Collection
6. Tender and Contract Administration
All statutory functions No grant funding is received
Governance 1. Corporate Customer Service
2. Corporate Record Keeping
3. Governance Services
1. Discretionary
2. Statutory
3. Statutory elements include the preparation and support of
agenda/minute process and maintaining and reviewing
delegations, annual returns, local laws
No grant funding is received
Human Resources Services 1. Strategic HR Planning
2. Recruitment and Induction
3. Learning and Development
4. Employee Relationships
5. Payroll
6. Employee Health, Safety and
Wellbeing
7. Performance Appraisal
8. HR Organisational Reporting
9. Workforce Planning
1. Discretionary
2. Discretionary (some stipulations on Recruitment
contained in Local Government Act)
3. Discretionary
4. Statutory
5. Statutory
6. Statutory
7. Statutory
8. Discretionary
9. Statutory
No grant funding is received
Information Technology 1. IT Service Desk
2. Network Services
3. IT Consulting
4. Application Support Services
5. Implementation Services
1. Largely discretionary
2. Core aspects are mandatory to support statutory
functions using IT systems
3. Discretionary
4. Core aspects are mandatory to support statutory
functions using IT systems
5. Discretionary
No grant funding is received
Infrastructure Management Services 1. Implementation of Capital Works
Programme
2. Civil and Subdivision
3. Traffic Management
4. Waste Management
5. Streetlight Maintenance
1. Discretionary
2. Discretionary
3. Discretionary
Funding is received for:
1. Major road works
2. Black spot funding
3. Roads to recovery
4. Contributions from Education Dept for on street works
5. One-off funding for floodlights to sports areas
Leisure and Cultural Services 1. Art Development
2. Recreation Development
3. Beach Safety
4. Health and Fitness
5. Events
6. Facility Bookings
1. Funding activities: Community Funding and Arts Development
Scheme, Mural Art activities (Workshops, Murals for Little Feet & Joondalup
Festival), Art awards (Invitation Art Award and
Community Art Award)
2. Funding activities (Sports Development Fund, Community
Funding, Sports Achievement Program, Community Sports
and Facilities Fund), Club Development Workshops, Kids for Sport Program
3. Coordinate Beach Lifeguard Service (Summer Midweek Beach Lifeguard
Patrols)
4. Gym Activities, Group Fitness Sessions, Aquatics Activities,
Team Sports Games, Lifestyle Program (Adventure and classes,
Leisure Courses)
5. Festivals (Little Feet Festival, NAIDOC week, Joondalup
Festival), Central Walk Markets , Concerts
(Summer in the City x 3, Valentines Concert, Eisteddfod,
Sunday Serenades)
6. Annual Seasonal and Casual Bookings (Annual Facility
Allocations, Seasonal Park and Facility Allocations, Casual
Bookings, Recreation Trading Licenses)
All aspects of the service are discretionary 1. No
2. Funding for Club Development Program (part
funding for Club Development Officer) funding for
Kids Sport program
3. No
4. No
5. Funding for Cultural Development Events (Summer
Concerts, Little Feet Festival, Joondalup Festival)
6. No
Marketing and Communications 1. Media, Communications and Public
Relations
2. Marketing and graphic design
3. Civic Events and Hospitality
4. Website and Social Media
1. Develop media releases, statements and responses and speeches as required.
2. Develop, design and book all City marketing and communications material as
required and manage the City's sponsorship activities.
3. Deliver high-quality Civic Events, receptions and ceremonies as required.
4. Manage and develop the City's website, online presence and social media
platforms.
1. Discretionary (apart from managing statutory requirement of Mayor
speaking on behalf of the City in the media).
2. Discretionary (apart from statutory advertising)
3. Discretionary (apart from requirement to hold citizenship ceremonies)
4. Discretionary
2. City receives an annual rebate from the WALGA and
Marketforce agreement for its advertising activities.
Operation Services 1. Park Maintenance
2. Natural Areas
3. Engineering (Maintenance and
Construction)
4. Parks and Landscaping
5. Conservation Services
6. Fleet Management
1. 2. 3. & 4. Are discretionary apart from the requirements under the
Dangerous Trees Act.
5. Statutory
6. Discretionary
No grant funding for maintenance activities, but for
Emergency Management (Federal Funding) for eg
declared disasters
Planning Services 1. Planning Approvals
2. Planning Policy
3. Urban Design
4. Subdivisions
5. Scheme Amendments
1. Assess and determine applications for Planning Approvals in accordance
with the City's Local Planning Scheme, the Metropolitan Region Scheme
and the Planning and Development Act 2005 more broadly.
2. Develop and review the City's Local Planning Policies in accordance with
the City's Local Planning Scheme.
3. Provide advice on Urban Design matters
4. Comment on Subdivision referrals and assess and process clearance
applications in accordance with the Planning and Development Act 2005
5. Prepare, assess and process applications for Scheme Amendments and
undertake Reviews of the Scheme in accordance with the Town Planning
Regulation 1967 and Plannign and Development Act 2005
1. Statutory
2. Statutory
3. Discretionary
4. Statutory
5. Statutory
1. No
2. No
3. No
4. No
5. No
BUSINESS UNIT SERVICES MATRIX
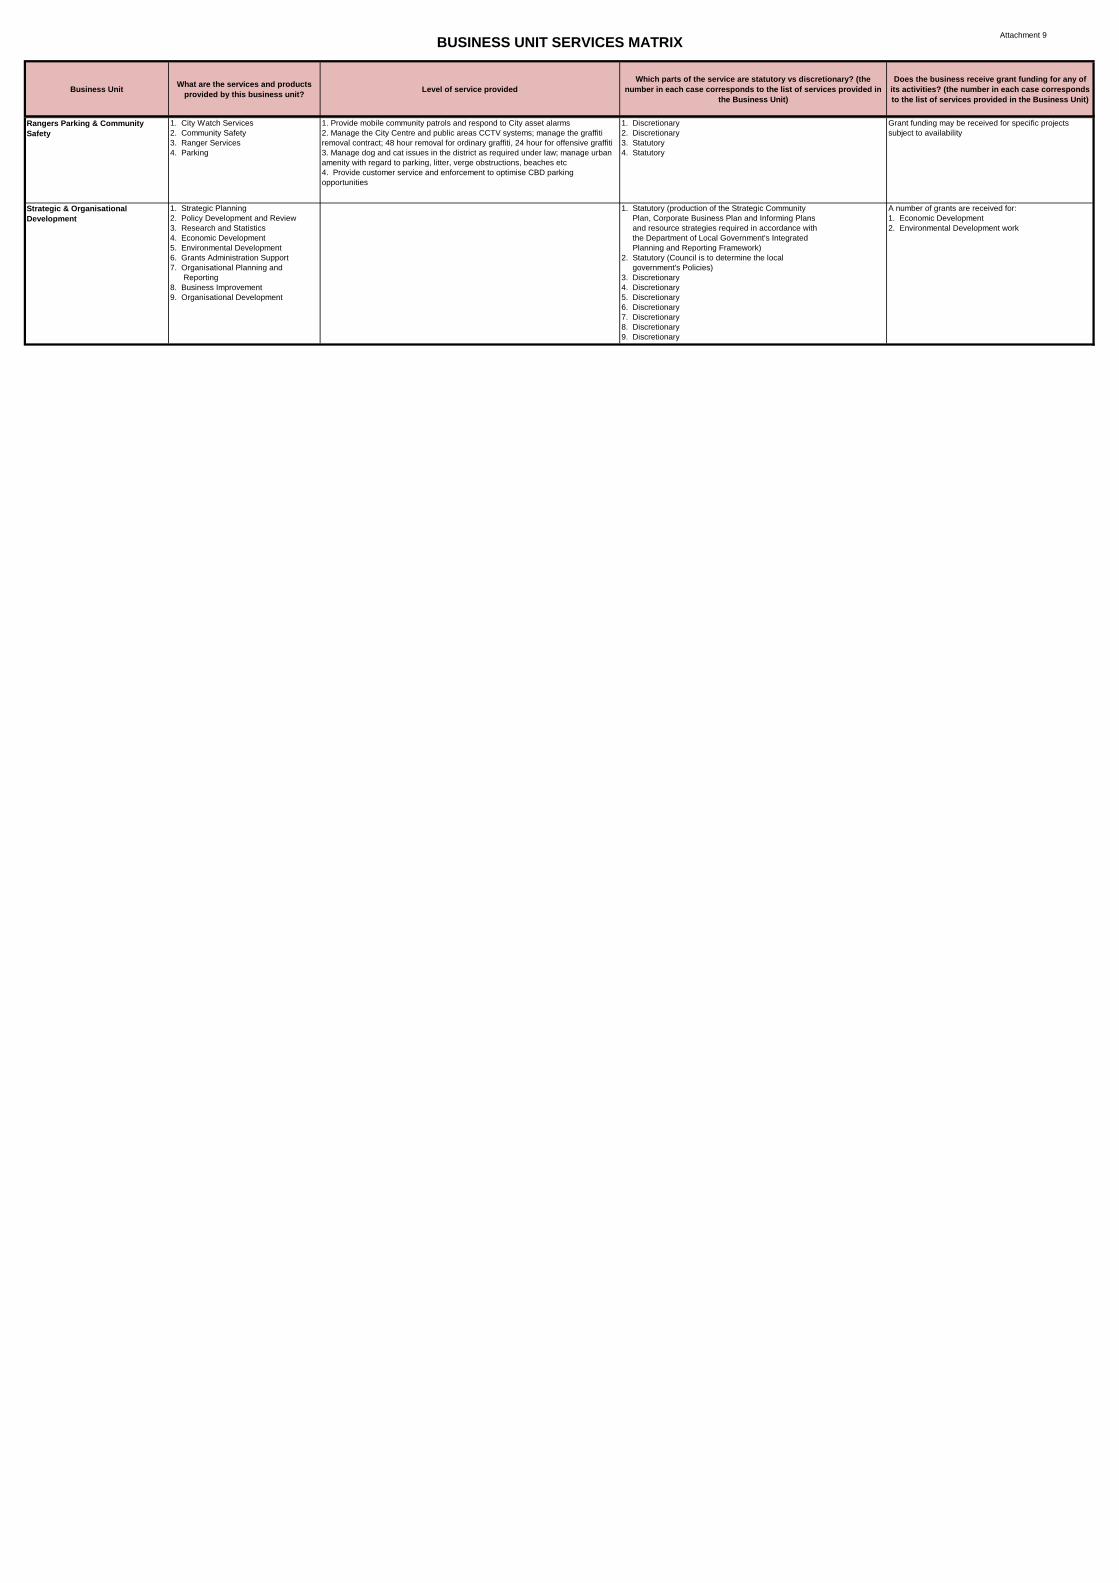
Attachment 9
Business UnitWhat are the services and products
provided by this business unit?Level of service provided
Which parts of the service are statutory vs discretionary? (the
number in each case corresponds to the list of services provided in
the Business Unit)
Does the business receive grant funding for any of
its activities? (the number in each case corresponds
to the list of services provided in the Business Unit)
BUSINESS UNIT SERVICES MATRIX
Rangers Parking & Community
Safety
1. City Watch Services
2. Community Safety
3. Ranger Services
4. Parking
1. Provide mobile community patrols and respond to City asset alarms
2. Manage the City Centre and public areas CCTV systems; manage the graffiti
removal contract; 48 hour removal for ordinary graffiti, 24 hour for offensive graffiti
3. Manage dog and cat issues in the district as required under law; manage urban
amenity with regard to parking, litter, verge obstructions, beaches etc
4. Provide customer service and enforcement to optimise CBD parking
opportunities
1. Discretionary
2. Discretionary
3. Statutory
4. Statutory
Grant funding may be received for specific projects
subject to availability
Strategic & Organisational
Development
1. Strategic Planning
2. Policy Development and Review
3. Research and Statistics
4. Economic Development
5. Environmental Development
6. Grants Administration Support
7. Organisational Planning and
Reporting
8. Business Improvement
9. Organisational Development
1. Statutory (production of the Strategic Community
Plan, Corporate Business Plan and Informing Plans
and resource strategies required in accordance with
the Department of Local Government's Integrated
Planning and Reporting Framework)
2. Statutory (Council is to determine the local
government's Policies)
3. Discretionary
4. Discretionary
5. Discretionary
6. Discretionary
7. Discretionary
8. Discretionary
9. Discretionary
A number of grants are received for:
1. Economic Development
2. Environmental Development work
Related Documents