B. SCI. Dissertation CuO nanostructures and its physical and electrochemical properties Author Bai Jie A0105679W Supervisor M V Venkatashamy Reddy Department of Physics Faculty of Science National University of Singapore April 2016

Welcome message from author
This document is posted to help you gain knowledge. Please leave a comment to let me know what you think about it! Share it to your friends and learn new things together.
Transcript

B. SCI. Dissertation
CuO nanostructures and its physical and electrochemical
properties
Author
Bai Jie �A0105679W�
Supervisor
MVVenkatashamy Reddy
Department of Physics
Faculty of Science
National University of Singapore
April 2016

Content1. Abstract......................................................................................................................................1
2. Introduction............................................................................................................................... 1
3. Synthesis of Copper Oxide and Cell Fabrication................................................................... 5
3.1 Preparation of macron-size CuO via molten salt method................................................5
3.2 Preparation of macron-size CuO via precipitation method............................................. 5
3.3 Preparation of macron-size CuO via thermal annealing method.................................... 6
3.4 Fabrication of batteries.......................................................................................................7
4. Characterization techniques..................................................................................................... 8
4.1 X-ray Diffraction analysis �XRD� ....................................................................................8
4.2 Scanning Electron Microscopy �SEM�............................................................................10
4.3 X-ray Photoelectron Spectroscopy �XPS� .....................................................................11
4.4 Battery performance characterization..............................................................................11
5. Result and discussions............................................................................................................12
5.1 Structure and morphology .............................................................................................. 12
5.2Chemical composition study............................................................................................ 16
6. Electrochemical studies on Li-ion Batteries......................................................................... 18
6.1 Galvanostatic Cycling �GC�............................................................................................. 18
7. Conclusion...............................................................................................................................23
8. Acknowledgements.................................................................................................................24
9. Reference.................................................................................................................................24
10. Appendix..................................................................................................................................26

1
1. AbstractConversion reaction says that normally, the stable lithium oxide, Li2O, is
electrochemically inactive and cannot be decomposed to the metal and oxygen.
However, in the presence of nanosize transition metal particles, which may or may
not be electrochemically generated, it can be decomposed, as exemplified by the now
well-known reaction:
nano-CuO + 2Li ↔ nano-Cu + Li2O.
Thus, at suitable potentials, depending on the nature of the metal, Li cycling can occur,
giving rise to large and reversible capacities, stable over a large number of discharge−
charge cycles. [1] Therefore, the hypothesis of this study is that CuO nanosucture
exhibits higher discharge capacity and charge capacity as compared to CuO bulk
structure lithium battery.
Therefore, in this report, the main objective is to study electrochemical properties and
nanostructures of Copper Oxide �CuO�. CuO nanoparticles is one of the anode
materials that gains considerable attentions due to its good electrical and chemical
properties. It shows excellent performance comparing the bulk or macron-sized
counterpart, with theoretical reversible capacity of 647 mAh g-1. Besides, it is also
very cheap and environmentally friendly due to its low toxicity. We report the
synthesis of CuO nanostructure material by both precipitation method and thermal
annealing method. Copper chloride was chosen as the precursors in precipitation
method and copper thin film was thermally annealed in static air in thermal annealing
method. The structural properties of the prepared CuO materials were then analyzed
by scanning eletron microscopy �SEM� and X-ray diffractrometer �XRD�. The
electrochemical properties were characterized galvanostatic cycling �GC� studies. GC
studies show that for the bulk material, continuous capacity fading was significantly
less than that of nanostructure copper oxide.
2. IntroductionLithium ion batteries�LIBs� are one of the most promising energy source for portable

2
electronic devices such as cell phones, laptops, cameras and etc due to their higher
energy density, light weight and durability. Studies of lithium-ion batteries can be
traced back to early 1910s, however, the first non-rechargeable lithium batteries only
became commercially available until late 1970s. In 1991, the Sony Corporation
developed the first modern commercial lithium-ion battery, where graphite �C� was
used as the anode �negative electrode� and LiCoO2 was used as cathode �positive
electrode�. Graphite material have two major issues as the anode material. Firstly,
when the charge current rate is high, it suffers from a safety problem. The main reason
is that the operating potential of the lithiated-graphite electrode is close to that of
metallic lithium, which causes growth of Lithium-dendrite and electrical shorting.
Secondly, in the current world, there is an upward shift in demand for portable devices
such as cellphones and laptops in many highly populated countries. Most of portable
devices are equipped with faster processors that requires batteries with high
volumetric capacity and low capacity fading. According to Moore’s law, the
processing capabilities of hardware doubles every 18 months, however, current
batteries are not able to keep pace with these developments. In fact, the performance
of lithium ion batteries strongly relies on properties of electrode material, therefore, a
suitable choice of electrodes based on their electrochemical properties are essential to
meet the demanding requirements of these applications. Therefore, since then it began
to gain considerable attention and research groups from all over the world tried to
improve its overall performance by finding a replacement for graphite as the anode
material. �see e.g. [1]�. The anode material should satisfy the several requirements so
as to be used as an electrode in lithium ion batteries. Firstly, the ideal anode must have
a low redox potential �graphite: 0.1-0.2V vs Li� and must be stable and not be soluble
in electrolyte. Secondly, the host lattice of anode material must be able to
accommodate large numbers of lithium particles per unit volume to yield a high
specific capacity and should be an intercalation host where Li can be inserted and
deinserted without disrupting the host structure. Thirdly, the gravimetric and
volumetric energy density of the anode material must be high so that the mass and

3
volume of the material can be reduced in lithium ion battery. Lastly, the anode
material must be cost-effective and easy to synthesize for large scale manufacture and
must be environmentally friendly.
In 2000, the conversion reaction mechanism of simple binary oxide �Co3O4� was
found by the Tarascon group [2]. Such simple binary oxides have high theoretical
capacity and high reversibility and meets the requirements of an ideal anode.[3]
Extensive research has been conducted to investigate other relevant properties.
Generally, the stable lithium oxide, Li2O is electrochemically stable thus cannot be
decomposed to metal and oxygen.
However, decomposition can happen in the presence of nanosize transition of metal
particle, which may or may not be electrochemically generated. [4] The reactions
involved in the entire synthesis can be summarized as the following:
MO + 2Li+ + 2e-⇌ M + Li2O
�M = Mn, Fe, Co, Ni, Cu�
In our case, M = Cu. During discharge reaction, Li metal crystal structure is
destructed �amorphization of lattice�, which is followed by the formation of
nanoparticles of metal embedded into the Li2O matrix. During charge reaction, the
re-formation of CuO is deemed as a consequence of decomposition of Li2O [5]
Nowadays, the lithium-ion batteries have high energy densities, meaning they have
greater power for longer time in a smaller package. They can provide higher voltage
which allows it to power complex mechanical devices. The shelf life of lithium-ion
batteries is long, with less than 5% self discharge loss per month. The production is
pollution free. There is no mercury, cadmium and etc involved. Lithium-ion batteries
now is a billion dollar industry and have been applied to every possible electronic
devices ranging from mobile phones to laptops and electric vehicles.
In this paper, we evaluate the electrochemical performance of cupper oxide materials

4
in the so-called ‘half-cell’ configuration, where the oxide practically serves as the
“cathode” and Lithium metal serves as the anode. Lithium metal acts as the reference
electrode whose voltage is arbitrarily taken to be zero. Therefore, in our configuration,
the process of Li being inserted into the oxide or composite is deemed as the
discharge reaction, whereas the process of Li being extracted from the oxide or
composite is deemed as the charge reaction. However, in commercial Lithium-ion
battery, which is the ‘full cell’ configuration, Li containing oxide, such as LiCoO2,
forms the cathode and an oxide material �or graphite� form the anode, hence, the
processes are named in the reverse way. Therefore, in full cell configuration, the
process of Li being extracted from the oxide �or graphite� anode, and the
corresponding Li of being inserted into the cathode, such as Li1−xCoO2, is deemed as
“discharge reaction”. Reversely, the process where Li being inserted in the oxide or
graphite, and the corresponding Li being inserted into the cathode, such as Li1−xCoO2,
is deemed as “charge reaction”. The reactions involved in the entire charge and
discharge process of can be summarized as the following:
Charging process:
Cathode: LiCoO2 Li1-xCoO2 + x Li+ + xe-
Anode: C + x Li+ + x e- LixC
Discharging process:
Cathode: Li1-xCoO2 + x Li+ + x e- LiCoO2
Anode: LixC x e- + x Li+ + C
The overall reaction is
LiCoO2 + C Li1-xCoO2 + LixC ; x=0.5

5
3. Synthesis of Copper Oxide and Cell FabricationIn this research project we first synthesized macron size CuO via the typical
experimental method -- molten salt method. In the electrochemical property study, we
used the macron size CuO sample as the control group to compare with its battery
performance with nano size CuO sample group. Subsequently, we synthesized nano
size CuO via precipitation method and thermal annealing method. We expected
different morphology of sample synthesized via these two method. The purpose to
prepared CuO sample via two different method is to study whether morphology of
CuO would have effect on its electrochemical property.
3.1 Preparation of macron-size CuO via molten salt method
In the first part of the experiment, we prepared the bulk CuO powder by Solid state
method where Cu�NO3�2·3H2O was heated in alumina crucible at 350 oC in air for 3h .
Next, we mixed the CuO sample with Super P Carbon dark �ENSACO, MMM Super
p�, which served as binder with a weight ratio of 70:15:15 that can improve the
conductivity and Polyvinylidene fluoride. Next ,we dispersed these mixtures were in
N-methyl pyrrolidone �NMP, Alfa Aesar� solvent to form viscous slurry, which was
then coated on a copper sheet by using Doctor Blade technique. Next, the coated
copper sheet sample was placed in the oven and dried for 12 hours at the temperature
of 70oC. Next, we pressed the copper sheet in between twin rollers and cut them into
circular disks with a diameter of 16mm, which were later used as electrodes to
fabricate batteries. The fabrication of cell is demonstrated in [3.2].
3.2 Preparation of CuO nanoparticles via precipitation method
We synthesized the CuO in nanostructure via precipitation method using copper
chloride �CuCl2�. We follow the typical experimental procedure, where we first

6
weighed 2g of PVP and 2g of copper chloride CuCl2 poured it into separate
volumetric flasks. Next, we added a total 100 mL distilled water to bring the solution
volumes to 100 mL. The solutions were added to a round-bottomed evaporating dish
and stirred using magnetic stirrer and heated for one hour. The resulting mixture color
was bright green. We added NaOH to the solution to adjust the pH, and kept the
solutions at 60 oC for 1 h. A large amount of black precipitates were obtained. After
being cooled to room temperature, the particles were repeatedly washed with distilled
water in order to remove impurities, and dried in an oven at 80 oC for 16 h. The
reactions involved in the entire synthesis can be summarized as the following
CuCl2+ 2NaOH →Cu�OH�2+2NaCl2
Cu�OH�2 →CuO +H2O
3.3 Preparation of CuO nanoparticle via thermal annealing method
In second part �B� of the experiment, copper oxide nanoparticles have been
synthesized by thermal annealing of copper thin films on aluminum bowl at constant
temperature of 650 oC. Thermal annealing of copper thin film in static air can produce
large-area, uniform, but not well vertically aligned CuO nanoparticles along the thin
film surface. When copper is oxidized in air, the major Cu is converted into Cu2O, and
CuO is then formed slowly through a second step of oxidation. In this case, Cu2O
served as a precursor to CuO. The reactions involved in the entire synthesis can be
summarized as the following:
4Cu + O2 = 2Cu2O
2Cu2O + O2= 4CuO
Therefore, we expected that sample prepared via this method could be a mixture of
CuO and Cu2O.

7
3.4 Fabrication of batteries
The bulk and nanostructure CuO were prepared as described above respectively. And
we fabricated the cell in an argon filled glove box �MBraun, Germany� which
maintains <1ppm of H2O and O2 so that metallic Lithium can remain chemically
stable. We first placed the CuO was on a commercial stainless steel cup, which serves
as the positive terminal and on top of it, we covered it with a polymeric separator. The
polymeric separator is electronically non-conducting, however, Lithium ions are
permeable to penetrate freely. Thus the separator can prevent direct contact of the two
electrodes with opposite polarity. Next, we placed a few drop of electrolyte �1 M
LiPF6 in mixture of ethylene carbonate �EC�: dimethyl carbonate �DMC��1: 1 by
volume�� on the polymeric separator. Next we placed a piece of circular lithium metal
on the top of the polymeric separator. The metallic lithium has diameter of 13mm and
thickness of 0.6mm. Next we again dropped a few electrolyte on top of the metallic
lithium. Next, we placed a lid fitted with a plastic ring, which serves as the negative
terminal, on top of the metallic lithium. Lastly, the coin cell was sealed by using a
coin cell crimper to press the whole cell.
The assembled cells were have a diameter of 16mm and height of 2.0mm after proper
sealing. then transferred out of the glove box and placed in the for more than 10 hours
until it was entirely chemically stable before we conducted any subsequent
experiment.
Figure 1 shows the full component and sequence of assembling a lithium-ion coin
cell.

8
Figure 1. Component of Lithium-ion coin cells.
4. Characterization techniques
4.1 X-ray Diffraction analysis
XRD technique, which relies on the theory of Bragg’s diffraction law, is a common
characterization technique that is used to determines information of crystal structure
of unknown materials. XRD diffraction patterns �constructive interference� will be
observed when the monochromatic X-ray λ beam is incident at angles θ with respect
to the sample. The relationship is given by
nλ = 2dsin θ
where d is the distance between two adjacent atomic planes and n is the order of
diffraction.

9
Figure 2. Simple illustration of Bragg’s law
In the this study, XRD patterns were obtained by using Siemens D5005 diffractometer
with Cu-Kα X-rays with a wavelength λ = 1.54 Å. With this technique, the
information about the crystallographic structure of the unknown samples can be
identified by matching the pattern with the literature value.
The original crystal structure of CuO was first determined by Tunnel in 1933 and was
then refined by single-crystal X-ray methods in 1970 [6]. The CuO crystal has
monoclinic structure with the Cu2+ ions are at centers of inversion symmetry in a
single fourfold site 4c �1/4,1/4,0�, and the oxygen ions occupy site 4e �0,y,1/4� with y
= 0.416�2� as illustrated figure 2. The structural parameters of CuO as summarized
above by Meyer et al.[7] are presented in Table 1.
Space group C 2/c �No.15�Unit cell a �� = 4.6837
b �Å� = 3.4226c �Å� = 5.1288beta �o� = 99.54oα, γ = 90o
Cell volume 81.08 ÅCell content 4 [CuO]Distances Cu–O 1.96 Å
O–O 2.62 ÅCu–Cu 2.90
Table 1. Structural parameters of CuO
10
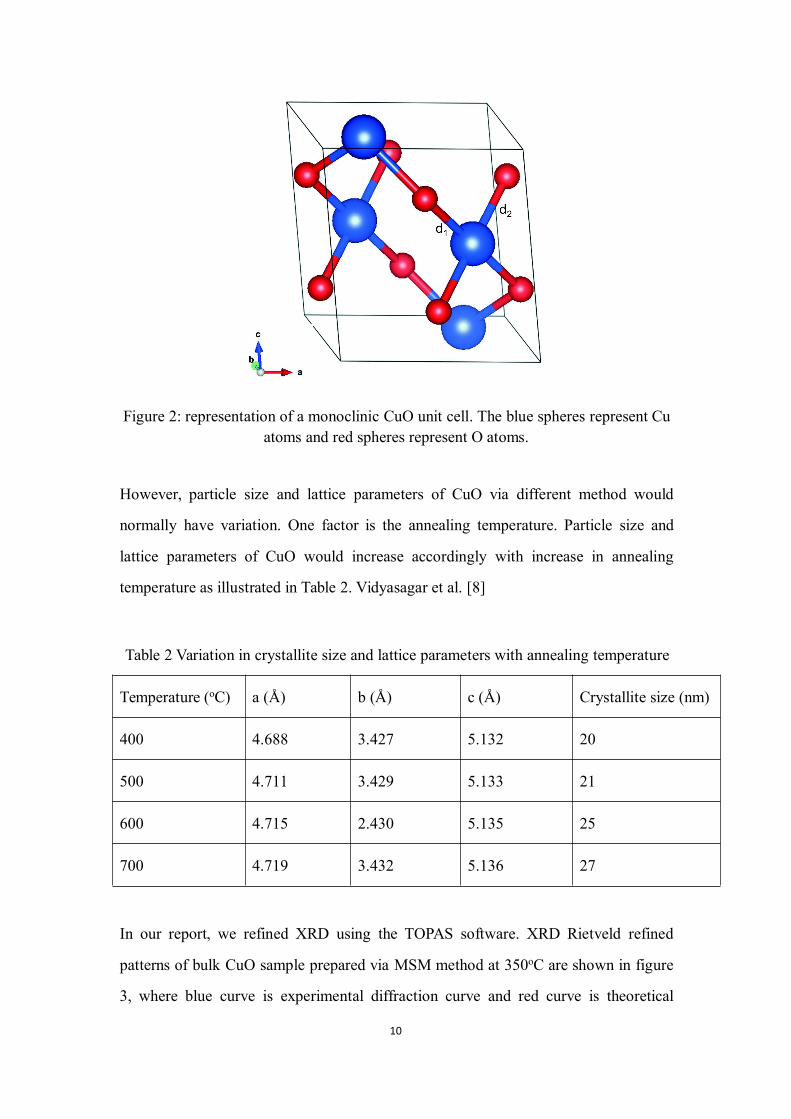
Figure 2: representation of a monoclinic CuO unit cell. The blue spheres represent Cuatoms and red spheres represent O atoms.
However, particle size and lattice parameters of CuO via different method would
normally have variation. One factor is the annealing temperature. Particle size and
lattice parameters of CuO would increase accordingly with increase in annealing
temperature as illustrated in Table 2. Vidyasagar et al. [8]
Table 2 Variation in crystallite size and lattice parameters with annealing temperature
Temperature �oC� a �� b �� c �� Crystallite size �nm�
400 4.688 3.427 5.132 20
500 4.711 3.429 5.133 21
600 4.715 2.430 5.135 25
700 4.719 3.432 5.136 27
In our report, we refined XRD using the TOPAS software. XRD Rietveld refined
patterns of bulk CuO sample prepared via MSM method at 350oC are shown in figure
3, where blue curve is experimental diffraction curve and red curve is theoretical

11
refined diffraction curve. The continuous line is fitted with theoretical refined
diffraction curve and differences pattern are shown.
4.2 Scanning Electron Microscopy
SEM is a common technique that is used in the study of surface topography of
morphology of solid samples where images of near surface structure of solids can be
provided by scanning it with a focused beam of emitted electrons, which would
interact with those within the surface of the sample, during which X-rays and
secondary electrons would be ejected and scattered. Detectors would collect these
secondary electrons and transfer them into a signal on a screen, by which the images
of near surface structure of sample and information such as particle size, shape and
structure, are formed.
4.3 X-ray Photoelectron Spectroscopy
XPS is one extensively-used surface-sensitive quantitative spectroscopic technique to
measure the elemental composition, empirical formula and chemical state of the
elements existing within a sample material.
When a beam of X-rays are irradiated to a material, the kinetic energy and number of
electrons that escaped are simultaneously being measured. As the energy of an X-ray
with particular wavelength is known, and the kinetic energies of emitted electrons are
measured, the electron binding energy of each of the emitted electrons can be
determined by applying the conservation of energy equation:
Ebinding = Ephoton - � Ekinetic+ κ �
Where Ebinding is the binding energy of the electron, Ephoton is the energy of the
irradiating X-ray photons, Ekinetic is the kinetic energy of the emitted electron
measured by the instrument and κ, which is an adjustable instrumental correction

12
factor that rarely needs to be adjusted in practice, is the work function dependent on
both the spectrometer and the material.
4.4 Battery performance characterization
The electrochemical properties of CuO are characterized Galvanostatic Cycling �GC�
tests. All GC tests carried out at the range of voltage between 0.005V and 3.0V vs
Lithium and at current rate of 60mAhg-1 and 240mAhg-1, respectively. Cyclic
voltammetry is an commonly used technique in electrochemistry studies to obtain
quantitative and qualitative information regarding to redox potentials, cell reversibility,
phase transitions and etc. Unfortunately, the experimental instrument for Cyclic
Voltammetry �CV� in Advance Batteries Lab 2, Physics Department, National
University of Singapore, is not working. Thus we cannot conduct CV studied during
the research project.
5. Result and discussions
5.1 Structure and morphology
We characterized the structures of the CuO synthesized via the molten salt method
and thermal annealing method by the powder X-ray Diffraction �XRD� technique to
identify and quantify the crystalline phases formed.
First we can observe that the experimental Rietveld refined XRD patterns for macron
size CuO prepared via MSM matches well with the reported value in literature, which
indicates the purity of CuO sample was very high. The Rietveld refined XRD patterns
show the lines with characteristic of monoclinic structure. The fitted lattice
parameters are a=4.692Å, b=3.431Å, c=5.137Å, which are very close to data obtained
by Meyer et al �a=4.684 Å, b=3.423 Å, c= 5.129 Å�[5].The Cell Volume is 81.556 Å3.
The structural parameters of the macron size CuO as summarized above are presented
in Table 3. The corresponding Retveld refined XRD patterns are shown in Figure 3.

13
Space group C 2/c �No.15�Unit cell a �� = 4.692
b �Å� = 3.431c �Å� = 5.137beta �o� = 99.54oα, γ = 90o
Cell volume 81.18487ÅCell content 4 [CuO]
Table 3. Structural parameters of experimental Rietveld refined XRD patterns for
macron size CuO prepared via MSM matches
Figure 3. XRD Rietveld refined patterns of bulk CuO samples prepared via MSM
method at 350oC
The XRD patterns for CuO samples prepared via Thermal annealing method is shown
below in Figure 4. We did not conduct Rietveld analysis on nano size CuO because
with smaller particle size, less signals are observed so that it is not easy to refine them
accurately. For nano sized CuO, very broad peaks are observed and some small peaks
are merged into a single peak. Besides, we can observe that the sample is a mixture of
(2,2,0)(1,1,0)
(1,-1,-1) (1,1,1)
(2,0,-2) (2,0,2)(0,2,0)
(1,-1,-3)(0,2,2)bulk

14
CuO and Cu2O as we can observe that the XRD characteristic peak for both CuO and
Cu2O coexist in the XRD graph. This is due to the growth mechanism: When copper
is oxidized in air, the major Cu is converted into Cu2O, and CuO is then formed
slowly through a second step of oxidation. In this case, Cu2O served as a precursor to
CuO. The reactions involved in the entire synthesis can be summarized as the
following:
4Cu + O2 = 2Cu2O
2Cu2O + O2= 4CuO
Figure 4. XRD patterns of nano size CuO samples prepared via thermal annealing
method at constant temperature of 650 oC
Due to the low concentration of CuO of the sample prepared via precipitation method,
we will not investigate the XRD pattern here, however, it is expected that the nano
size CuO prepared via different method should have very similar XRD pattern and the
intensity of XRD peaks of macron size CuO should be sharper than that of nano size
CuO as the particle size is bigger.

15
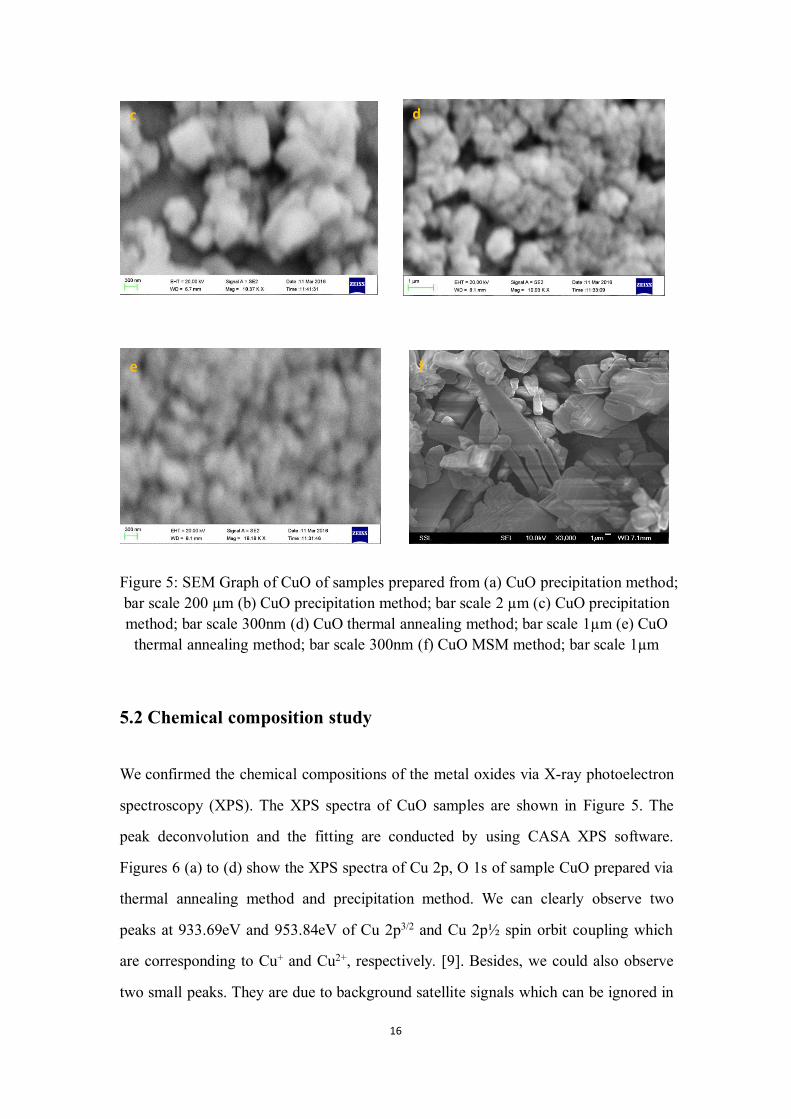
Next, We further investigate the morphology of the CuO prepared via all method by
scanning electron microscopy �SEM�. Before conducting SEM, in order to get clear
image, we heated the sample to 80°C to remove moisture from the sample as SEM is
carried out in vacuum conditions and uses electrons to form an image. The resulting
images are shown in Figure 5. The SEM images evidently exhibit different
morphologies and properties of architectures of CuO particles synthesized via
different method. However, we do not fully understand the exact chemical mechanism
behind the formation of these nanostructures. We can observe the macron size of
Nickel mesh in Figure 5�a� clearly. In figure 5�b�, we can observe that three
dimensional submicro-spherical structures a diameter in the range between 2 to 8 µm
are formed on the surface of Nickel mesh. Unfortunately, the image in figure 4 �c� to
�e� have low resolution and contrast so that we cannot see any clear nanostructure of
CuO. SEM image of CuO prepared via MSM method are shown in figure 5�e�. As
shown in figures, particle sizes of prepared samples are in micron size range and
showed irregular cauliflower-like shape.
a bc
16
Figure 5: SEM Graph of CuO of samples prepared from �a� CuO precipitation method;bar scale 200 µm �b� CuO precipitation method; bar scale 2 µm �c� CuO precipitationmethod; bar scale 300nm �d� CuO thermal annealing method; bar scale 1µm �e� CuOthermal annealing method; bar scale 300nm �f� CuO MSM method; bar scale 1µm
5.2 Chemical composition study
We confirmed the chemical compositions of the metal oxides via X-ray photoelectron
spectroscopy �XPS�. The XPS spectra of CuO samples are shown in Figure 5. The
peak deconvolution and the fitting are conducted by using CASA XPS software.
Figures 6 �a� to �d� show the XPS spectra of Cu 2p, O 1s of sample CuO prepared via
thermal annealing method and precipitation method. We can clearly observe two
peaks at 933.69eV and 953.84eV of Cu 2p3/2 and Cu 2p½ spin orbit coupling which
are corresponding to Cu+ and Cu2+, respectively. [9]. Besides, we could also observe
two small peaks. They are due to background satellite signals which can be ignored in
f
c d
e

17
this study. Furthermore, XPS studies also provide the information on binding energy
and oxidation state of O 1s, where we can observe two peaks. The first peak at 529.4
eV which is corresponding to oxidation sate of O 1s. [10] The second peak is
corresponding to the surface oxygen of the sample, which could be due to surface
moisture. We can conclude that CuO have been successfully synthesized. Furthermore,
CuO and Cu2O are confirmed to coexist in our sample prepare via thermal annealing
method as expected. The binding energy of 933.69 ev corresponds to Cu2+ and 529.4
eV corresponds to O 1s in CuO.
a b
c d

18
Figure 6: XPS Graph of CuO samples prepared via CuO thermal annealing method �a�Cu2p �b� O1s, XPS Graph of CuO of samples prepared via thermal annealing
method �c� Cu2p �d� O1s,
6. Electrochemical studies on Li-ion Batteries
6.1 Galvanostatic Cycling (GC)
We further study the electrochemical property of CuO samples prepared via all
method by investigating the performance of the cell which are characterized by
Galvanostatic Cycling study. Galvanostatic cycling requires the cell to be charged and
discharged at a constant current rate and the corresponding cell voltage, which varies
as a function of the discharge or charge state, is plotted as a function of step time.
Therefore, fundamentally, galvanostatic cycling explores the relationship between
time and voltage of an electrochemical cell. We can determine the suitability of
nanostructure CuO as the anode for the lithium ion battery by analyzing and
comparing its galvanostatic response in terms of achievable capacities and cyclability
with the theoretical values. The galvanostatic cycling was carried out in the voltage
range of 0.005V to 3V at current rate of 60 mAg-1 and 240 mAg-1, respectively.
The data collected was first plotted as a function of voltage vs the specific capacity.
To calculate the specific theoretical capacity, we can use the following formula:
e

19
Specific capacity = �Step Time x Current� / �Active Material Mass × 3600�
The voltage vs specific capacity of prepared via all methods in 1st, 2nd, 10th, 20th and
40th cycles plotted with current rate of 60 mAg-1 and 240 mAg-1 are shown in Figure 6
and specific capacity vs cycle number plots are shown in Figure 7. We can observe
that during the 1st discharge cycle, there was a sharp decrease in voltage of all the
CuO samples from 3.0V to somewhere between 1.25-1.5V. By comparing the 1st
charge-discharge curve with the 2nd charge-discharge curve, we can calculate the
irreversible capacity loss �ICL� of the cell, which is shown in table three.
As showed in Figure. 7, the specific capacity for macron size CuO samples prepared
via solid state method is significantly less than that of the nano size CuO samples.
We next study and compare the coin cell performance with CuO nanostructure and
CuO bulk structures as cathode for low current rate �60mAg-1�. We can observe
significantly different features in charge and discharge process for nanostructure
samples prepared by both precipitation and thermal annealing method and bulk CuO
prepared via MSM method. The former has a significantly higher overall capacity.
The irreversible capacity loss of CuO nanostructure samples was around 30%, which
is significantly less that of the CuO bulk structure samples. From 2nd cycle onwards,
we found out that the capacity fading of nanostructure CuO is much lower than that of
bulk CuO. CuO nanostructure samples exhibit very low reversible capacity loss
�between 10-15%� up to 40th cycle, comparing that of CuO bulk structures, which
was 66.9%. Therefore, we may conclude that, compared with nanostructures CuO,
discharge capacity of bulk CuO at the same current rate were lower and less stable.
To study effect of current rate on battery performance, we raised the current rate to
240mAg-1 and compare the coin cell performance with CuO nanostructure for low
current rate �60mAg-1� and high current rate �240mAg-1�. We can observe significantly
different features in charge and discharge process for nanostructure samples for low

20
current rate �60mAg-1� and high current rate �240mAg-1�. The former has a
significantly higher overall capacity. The irreversible capacity loss of CuO
nanostructure samples was around 30%, which is similar with that of the CuO bulk
structure samples. From 2nd cycle onwards, we observed that the reversible capacity
fading of CuO nanostructure for low current rate �60mAg-1� was significantly less
than that for high current rate �240mAg-1�. Therefore, we may conclude that,
compared with low current rate, discharge capacity of CuO at higher current rate were
lower and less stable.
We can observe a universal sharp decrease of capacity between the 1st and 2nd cycle of
all samples. This is due the formation of solid-electrolyte interphase �SEI� at the
electrode surface, which, in general, results from irreversible electrochemical
decomposition of the electrolyte or side reactions between lithium and electrolyte. In
our case of Li-ion batteries, the SEI is formed at the negative electrode, which is
lithium metal. It is easily imaged that if SEI formation were continued throughout
each charge and discharge cycle, Li-ion batteries would be unusable due to the
continual loss of lithium. However, the fact that batteries can operate is due to that
fact that SEI is not electron conductable, and is nearly impenetrable to any electrolyte
molecules. Therefore, once the initial SEI layer has formed, it would disable
electrolyte molecules to penetrate to further react with the lithium on the surface.
Thus the battery can actually experience many charge discharge cycles with minimum
additional formation of SEI layer. [11].
For clarity, we listed all information of discharge and charge capacity for all samples
in Table 3.

21
Sample Dischargecapacity at1st cycle�mAh g-1�
Chargecapacity at 1st
cycle �mAhg-1�
Dischargecapacity at2nd cycle�mAh g-1�
Dischargecapacity at10th cycle�mAh g-1�
Dischargecapacity at40th cycle�mAh g-1�
Reversiblecapacity Fading
from 2-40cycle �%�
Irreversiblecapacityloss�%�
CuO- 60 mAg-1MSM method
1180 395 390 325 280 28.2 66.9
CuO- 60 mAg-1Thin film 650oC
1100 710 695 650 620 10.8 35.5
CuO- 240mAg-1Thin film 650oC
980 680 660 570 480 27.2 32.7
CuO- 60 mAg-1precipitationmethod
920 620 595 570 505 15.1 35.3
CuO- 240mAg-1precipitationmethod
970 600 580 520 450 23.4 40.2
Table 3: 1stdischarge, 1st charge, 2nd charge, 10th charge and 40th charge capacity,irreversible capacity loss, and reversible capacity fading of samples prepared by allmethods

22
Fig. 6: Voltage �0.005-3.0V� vs specific Capacity of sample CuO prepared by �a� CuO60 mAg-1 MSM method 350 oC �b� CuO 60 mAg-1 Thin film 650oC �c� CuO 240mAg-1 Thin film 650oC �d� CuO 60 mAg-1 precipitation method �e� CuO 240 mAg-1precipitation met

23
Figure. 7: Specific capacity vs Cycle number of CuO prepared by �a� CuO 60 mAg-1MSM method 350 oC �b� CuO 60 mAg-1Thin film 650oC �c� CuO 240 mAg-1Thin
film 650oC
7. ConclusionsWe have successfully verified the hypothesis that CuO nanosucture exhibits higher
discharge capacity and charge capacity as compared to CuO bulk structure lithium
battery. Furthermore, we also proved that the morphology of CuO would influence on
its electrochemical properties. First, we synthesized bulk and nanostructure of CuO
via various methods including molten salt method, precipitation method and thermal
annealing method. Nanostructure and physical properties of CuO samples were
characterized and analyzed through X-Ray Diffraction �XRD�, Scanning Electron
Microscopy �SEM� and X-ray Photoelectron Spectroscopy �XPS�. Electrochemical
properties of CuO were examined and characterized via galvanostatic cycling �GC�
studies on Lithium-ion coin cell where CuO samples are used as cathode.
Galvanostatic cycling of CuO nanostructures prepared by precipitation and thermal
annealing methods shows a high and stable reversible capacity at current rate of
60mA/g within the voltage range of 0.005-3V compared with CuO macron-sized
structure prepared via MSM method. Besides, Galvanostatic cycling of CuO
nanostructures prepared by precipitation and thermal annealing methods shows a high
and stable reversible capacity at current rate of 60mA/g within the voltage range of
0.005-3V compared with current rate of 240mA/g within the voltage range of
0.005-3V.

24
8. AcknowledgmentI would like to express my most sincere gratitude to my mentor Dr M.V. Reddy,
Advanced Batteries Lab, Department of Physics, National University of Singapore,
for his utmost patience and guidance throughout my final year project journey.
Furthermore, I would like to thank technical staff of Advanced Batteries Lab,
Department of Physics, National University of Singapore. Lastly, I would like to
thank Ministry of Education �MOE� and National University of Singapore for
providing me with the opportunity to be involved in the honor year project.
9. Reference1. Guyomard, D., et al., New amorphous oxides as high capacity negative
electrodes for lithium batteries: the LixMVO4 (M = Ni, Co, Cd, Zn; 1 < x ≤
8) series. Journal of Power Sources, 1997. 68�2�: p. 692-697.
2. Poizot, P., et al., Nano-sized transition-metal oxides as negative-electrode
materials for lithium-ion batteries. Nature, 2000. 407�6803�: p. 496-499.
3. Sharma, Y., et al., Nanophase ZnCo2O4 as a High Performance Anode
Material for Li‐Ion Batteries. Advanced Functional Materials, 2007.
17(15):p.2855-2861.
4. Reddy, M.V., G.V. Subba Rao, and B.V.R. Chowdari, Metal oxides and
oxysalts as anode materials for Li ion batteries. Chemical Reviews, 2013.
113�7�: p. 5364-5457.
5. Laurent S, Forge D, Port M, Roch A, Robic C, Elst L, et al. Magnetic iron
oxide nanoparticles: synthesis, stabilization, vectorization, physicochemical
characterizations, and biological applications. Chem Rev 2008;108:2064–110.
6. Amin G. ZnO and CuO nanostructures: low temperature growth,
characterization, their optoelectronic and sensing applications. 1st ed.
LiU-Tryck: Norrköping �Sweden�; 2012 [SE-601 74]

25
7. Meyer B, Polity A, Reppin D, Becker M, Hering P, Klar P, et al. Binary copper
oxide semiconductors: from materials towards devices. Phys Status Solidi �b�
2012;249:1487–509.
8. Vidyasagar C, Arthoba Naik Y, Venkatesha T, Viswanatha R. Solid-state
synthesis and effect of temperature on optical properties of CuO nanoparticles.
Nano-Micro Lett 2012;4:73–7.
9. Anisimov VI, Zaanen J, Andersen OK. Band theory and Mott insulators:
Hubbard U instead of Stoner I. Phys Rev B 1991;44:943–54.
10. Anisimov V, Aryasetiawan F, Lichtenstein A. First-principles calculations of
the electronic structure and spectra of strongly correlated systems: the LDA+
U method. J Phys: Condens Matter 1997;9:767–808.
11. 21. P. Verma, P. Maire and P. Novák, Electrochimica Acta, 55, 6332 �2010�.

26
10. Appendix
Macron size CuO Rietveld refinement pattern
2Theta (Degrees)8070605040302010
Inte
nsity (
Co
un
ts) 80,000
60,000
40,000
20,000
0
-20,000
Tenorite 100.00 %
Analysis Report
Global R-Values
Rexp : 1.32 Rwp : 6.35 Rp : 4.08 GOF : 4.81
Rexp`: 3.79 Rwp`: 18.25 Rp` : 21.29 DW : 0.18
Range Number : 1
R-Values
Rexp : 1.32 Rwp : 6.35 Rp : 4.08 GOF : 4.81
Rexp`: 3.79 Rwp`: 18.25 Rp` : 21.29 DW : 0.18
Quantitative Analysis - RietveldPhase 1 : Tenorite 100.000 %
BackgroundChebychev polynomial, Coefficient 0 4867.283
1 -653.3883
2 511.1321
3 -310.869

27
4 173.5312
InstrumentPrimary radius (mm) 217.5
Secondary radius (mm) 217.5
CorrectionsCylindrical sample 2Th correction uR 0.8662125
LP Factor 24
Structure 1Phase name Tenorite
R-Bragg 3.040
Spacegroup C12/c1
Scale 0.0425493182
Cell Mass 318.183
Cell Volume (Å^3) 81.55658
Wt% - Rietveld 100.000
Crystallite Size
Cry Size Lorentzian (nm) 83.0
Crystal Linear Absorption Coeff. (1/cm) 283.338
Crystal Density (g/cm^3) 6.478
Lattice parameters
a (Å) 4.6915405
b (Å) 3.4311787
c (Å) 5.1374587
beta (°) 99.54
Site Np x y z Atom Occ Beq
Cu1 4 0.25000 0.25000 0.00000 Cu+2 1 1
O1 4 0.00000 0.41840 0.25000 O-2 1 1
Related Documents