British Journal of Science 21 November 2011, Vol. 2 (1) © 2011 British Journals ISSN 2047-3745 Relationship between Petrography and Uniaxial Compressive Strength of Some Crystalline Basement Complex Rocks of some Areas in Southwestern Nigeria Ademeso, Odunyemi Anthony Adekunle Ajasin University, Akungba-Akoko Adekoya, Adeyinka John The Federal University of Technology, Akure Abstract The petrography and uniaxial compressive strength of six crystalline basement complex rocks of Akure and Igarra areas were studied, analyzed and correlated. The outcrops of porphyritic biotite granite, biotite granite and lamprophyre (in Igarra) as well as gneiss, granite gneiss and charnockitic rocks (in Akure) were examined and sampled. Thin sections were prepared from the samples and investigated for the petrographic characteristics. Photomicrographs were taken and analyzed with the aid of “ImageJ”. The UCS of the rock types was determined with aid of Instron Universal tester “3369”. The Schmidt rebound hammer was also used to estimate the UCS. The average modal compositions of the major minerals range from 16 to 29% (quartz), 19 to 36% (plagioclase), 5 to 41% (biotite) and 4 to 37% (microcline). The petrography further showed that some of the rocks types particularly charnockitic rocks possessed micro-structures (micro- cracks, bent lamellae, distorted/deformed twinning and undulose extinction). The UCS of the rock types are 171MPa (lamprophyre), 149MPa (granite gneiss), 117MPa (biotite granite), 101MPa (gneiss), 82MPa (charnockitic rocks) and 56MPa (porphyritic biotite granite). The correlation coefficient (r) of the relationship between the mineral content and the UCS evaluated the highest value of 0.6229 for quartz. Textural and micro-structural characteristics of the rock types were discovered to have more influence on the UCS than the mineral content. Keywords: Petrography, UCS, ImageJ, micro-cracks, Schmidt hammer. 1. Introduction Uniaxial compressive strength was recommended as the best compressive strength test that could be carried out on rocks (Quick, 2002). The test is tedious, time consuming and expensive to carry-out (Teme, 1983; Aydin & Basu, 2005). This strength characteristic is believed to be affected by some factors which include petrography (mineral content, texture and microstructures) of the rock being tested (Liu et al. 2005, Mendes et al. 1966, Merriam et al. 1970, Onodera & Asoka 1980, Tug rul & Zarif, 1999). The basement complex of Nigeria has been various classified by workers which include Rahaman (1976, 1988); Odeyemi (1988) and Adekoya et al. (2003). Adekoya et al. (2003) classified the complex as follows: (i) Gneiss-migmatite-quartzite complex, (ii) The schist belts which are low to medium grade supracrustal and meta-igneous rocks; (iii) The Pan African granitoids (older granites) and other related rocks such as charnockitic rocks and syenites, and (iv) Minor felsic and mafic intrusives. The rocks that were tested in this research were from the Igarra and Akure in the southwestern part of Nigeria (Fig. 1) and fall into categories (i) and (iii) of the aforementioned classification.

Welcome message from author
This document is posted to help you gain knowledge. Please leave a comment to let me know what you think about it! Share it to your friends and learn new things together.
Transcript

British Journal of Science 21
November 2011, Vol. 2 (1)
© 2011 British Journals ISSN 2047-3745
Relationship between Petrography and Uniaxial Compressive Strength of Some Crystalline Basement
Complex Rocks of some Areas in Southwestern Nigeria
Ademeso, Odunyemi Anthony
Adekunle Ajasin University, Akungba-Akoko
Adekoya, Adeyinka John
The Federal University of Technology, Akure
Abstract
The petrography and uniaxial compressive strength of six crystalline basement complex rocks of Akure and
Igarra areas were studied, analyzed and correlated. The outcrops of porphyritic biotite granite, biotite granite
and lamprophyre (in Igarra) as well as gneiss, granite gneiss and charnockitic rocks (in Akure) were
examined and sampled. Thin sections were prepared from the samples and investigated for the petrographic
characteristics. Photomicrographs were taken and analyzed with the aid of “ImageJ”. The UCS of the rock
types was determined with aid of Instron Universal tester “3369”. The Schmidt rebound hammer was also
used to estimate the UCS. The average modal compositions of the major minerals range from 16 to 29%
(quartz), 19 to 36% (plagioclase), 5 to 41% (biotite) and 4 to 37% (microcline). The petrography further
showed that some of the rocks types particularly charnockitic rocks possessed micro-structures (micro-
cracks, bent lamellae, distorted/deformed twinning and undulose extinction). The UCS of the rock types are
171MPa (lamprophyre), 149MPa (granite gneiss), 117MPa (biotite granite), 101MPa (gneiss), 82MPa
(charnockitic rocks) and 56MPa (porphyritic biotite granite). The correlation coefficient (r) of the
relationship between the mineral content and the UCS evaluated the highest value of 0.6229 for quartz.
Textural and micro-structural characteristics of the rock types were discovered to have more influence on the
UCS than the mineral content.
Keywords: Petrography, UCS, ImageJ, micro-cracks, Schmidt hammer.
1. Introduction
Uniaxial compressive strength was recommended as the best compressive strength test that could be
carried out on rocks (Quick, 2002). The test is tedious, time consuming and expensive to carry-out (Teme,
1983; Aydin & Basu, 2005). This strength characteristic is believed to be affected by some factors which
include petrography (mineral content, texture and microstructures) of the rock being tested (Liu et al. 2005,
Mendes et al. 1966, Merriam et al. 1970, Onodera & Asoka 1980, Tug rul & Zarif, 1999).
The basement complex of Nigeria has been various classified by workers which include Rahaman (1976,
1988); Odeyemi (1988) and Adekoya et al. (2003). Adekoya et al. (2003) classified the complex as follows:
(i) Gneiss-migmatite-quartzite complex,
(ii) The schist belts which are low to medium grade supracrustal and meta-igneous rocks;
(iii) The Pan African granitoids (older granites) and other related rocks such as charnockitic rocks
and syenites, and
(iv) Minor felsic and mafic intrusives.
The rocks that were tested in this research were from the Igarra and Akure in the southwestern part of
Nigeria (Fig. 1) and fall into categories (i) and (iii) of the aforementioned classification.

British Journal of Science 22
November 2011, Vol. 2 (1)
© 2011 British Journals ISSN 2047-3745
The following rock types were selected for the research (a) from Akure: (i) gneiss, (ii) granite gneiss
and (iii) charnockitic rock and (b) from Igarra: (i) biotite granite, (ii) porphyritic biotite granite and (iii)
lamprophyre.
2. Materials and Methods
2.1 Field study: The rock types were selected to reflect varieties. The selected rock types were studied in the
field for their relationships, texture, mineralogy and structures. They were sampled for laboratory studies.
The samples were labeled Ak001 for gneiss, Ak002 for granite gneiss, Ak003 for charnockitic rock,
Ig001 for porphyritic biotite granite, Ig002 for biotite granite and Ig003 for lamprophyre.
The Schmidt rebound hammer was used to acquire rebound values which was converted to UCS with the
Deere & Miller graph (Ademeso, 2008).
2.2 Laboratory Study: Thin sections were prepared from the samples and the thin sections were studied
under the petrographic microscope with the photomicrographs of significant features taken. The modal
composition was carried out with the aid of “ImageJ” (Ademeso, 2010).
The UCS of the rock types was determined with the Instron Universal Tester. Specimens of the rock
types were prepared in line with ISRM (1979). The graph plotted by the computer was subjected to post
failure characteristics (PFC) test (Hoek & Brown, 1997). The yield strength column of the table of values
generated by the computer was also inspected to confirm if the tests got to the yield point without which
the results were unacceptable.

British Journal of Science 23
November 2011, Vol. 2 (1)
© 2011 British Journals ISSN 2047-3745
Fig. 1: Geoogical Map of Southwestern Nigeria Showing Study Areas.
2.3 In converting rebound values to UCS, the mean of at least 10 single impact readings were calculated and
the values that deviated from the mean by more than seven units were discarded and the remaining values
considered for further treatment in accordance with ASTM (2001).
The data collected from different tests were treated statictically with Microsoft Office Excel 2007.
3. Results
3.1 Field Characteristics and Petrography
The field characteristics and petrography of the rock types are presented as follow:

British Journal of Science 24
November 2011, Vol. 2 (1)
© 2011 British Journals ISSN 2047-3745
(a) Gneiss occurs as inselberg and hills. The gneissic component is essentially dark-coloured while the
pegmatitic part is generally light-coloured. Petrographically, the rock is medium to coarse grained and it
contains plagioclase, quartz, biotite, hornblende, and orthoclase as major minerals while hypersthene,
muscovite, pyroxene and mymerkite form the accessory. The modal content of the minerals is 36%, 25%,
21%, 7%, 6%, 3%, 1%, 1%, and 0.3% respectively.
(b) The granite gneiss occurs as domes, hills and pavement outcrops and is in contact with other rock
types of the gneiss-migmatite-quartzite complex. Macroscopically, the weakly foliated rock is medium
grained with biotite flakes forming alignment that imparts a gneissose structure to the rock. Microscopically,
quartz, biotite, plagioclase, microcline and hornblende constitute the major minerals in thin section of the
rock while mymerkite occurs sporadically. The modal analysis of the rock gives 29%, 23%, 21%, 18%, 8%
and 1%.
(c) The charnockitic rocks occur as small hills and pavement outcrops within the gneiss-migmatite-
quartzite complex. Plagioclase, biotite, quartz, hypersthene, hornblende, muscovite and orthoclase are the
major minerals while opaque minerals (probably iron oxide) and zircon are the accessories identified in the
thin section of the rock. The modal analysis of the rock gives 32%, 16%, 16%, 16%, 11%, 4%, 3%, 1% and
1% respectively. The petrography further revealed (i) undulose extinction in quartz and plagioclase; (ii)
distorted twinning in plagioclase; (iii) bent lamellae in plagioclase; (iv) compressed plane of carlsbad twin of
orthoclase; and (iv) micro-cracks in virtually all minerals of the rock (Ademeso, 2009).
(d) The porphyritic biotite granite occurs as pavement outcrops, small hills and inselbergs in the area.
The rock is essentially light coloured with large greyish feldspar phenocrysts. The groundmass of quartz,
biotite and feldspar, although medium to coarse grained, is generally finer than the phenocrysts giving the
rock a porphyritic texture. Xenoliths of phyllite and metaconglomerate occur in the outcrops. Biotite,
plagioclase, quartz, microcline and hornblende are the major minerals in the thin section of the rock while
mymerkite and zircon constitute accessories. The result of the modal analysis of the rock is 31%, 30%, 23%,
10%, 4%, 3% and 1%, respectively.
(e) Granite occurs as small hills and boulders (some of which rest precariously on the top of the hills).
The rock which was well exposed at a road cut along Ibillo-Igarra road is characterized by pavement and
craggy outcrops. It is generally light coloured (leucocratic) with medium to coarse grained texture. The
occurrence of microcline, plagioclase and quartz as major minerals with biotite and hornblende as accessory
is revealed from the microscopic examination of the thin sections of the rock. The result of the modal
analysis of the rock is 37%, 30%, 27%, 5% and 1%, respectively.
(f) The Lamprophyre intrusives occur as dykes within the quartz-biotite-schist and gneiss complex. The
road-cut along Igarra-Auchi road reveals the rock as a dyke with an E-W trend, having a width of about 60m.
Some outcrops of the rock occur as N-S trending dykes of about 50 to 75cm width. Generally the contacts
with the host rocks are sharp. Biotite, quartz, plagioclase, hornblende, microcline and opaque minerals are
the major minerals identified in the thin section of the rock while zircon is the accessory. The result of the
modal analysis is 41%, 23%, 21%, 6%, 5%, 5% and 0.5% respectively.
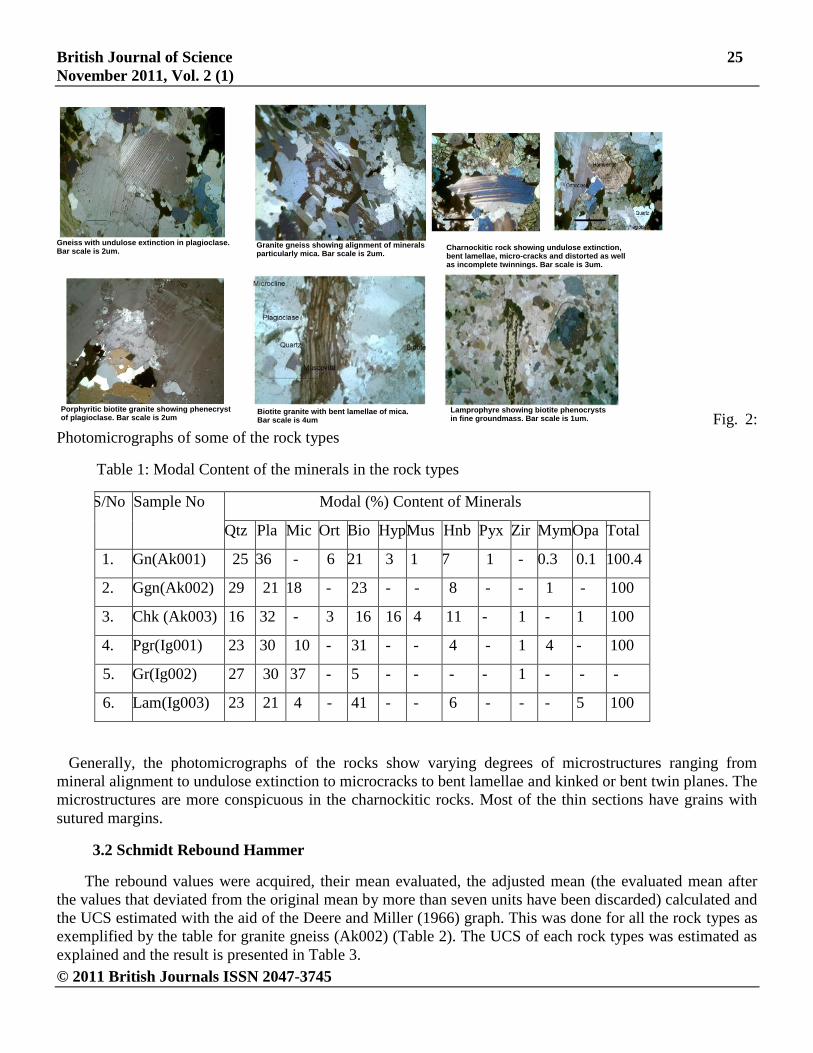
The photomicrographs and the modal composition of the rock types are presented in Fig. 2 and Table 1
respectively.
British Journal of Science 25
November 2011, Vol. 2 (1)
© 2011 British Journals ISSN 2047-3745
Gneiss with undulose extinction in plagioclase. Bar scale is 2um.
Granite gneiss showing alignment of minerals particularly mica. Bar scale is 2um.
Charnockitic rock showing undulose extinction, bent lamellae, micro-cracks and distorted as well as incomplete twinnings. Bar scale is 3um.
Porphyritic biotite granite showing phenecryst of plagioclase. Bar scale is 2um
Biotite granite with bent lamellae of mica. Bar scale is 4um
Lamprophyre showing biotite phenocrysts in fine groundmass. Bar scale is 1um. Fig. 2:
Photomicrographs of some of the rock types
Table 1: Modal Content of the minerals in the rock types
S/No Sample No Modal (%) Content of Minerals
Qtz Pla Mic Ort Bio Hyp Mus Hnb Pyx Zir Mym Opa Total
1. Gn(Ak001) 25 36 - 6 21 3 1 7 1 - 0.3 0.1 100.4
2. Ggn(Ak002) 29 21 18 - 23 - - 8 - - 1 - 100
3. Chk (Ak003) 16 32 - 3 16 16 4 11 - 1 - 1 100
4. Pgr(Ig001) 23 30 10 - 31 - - 4 - 1 4 - 100
5. Gr(Ig002) 27 30 37 - 5 - - - - 1 - - -
6. Lam(Ig003) 23 21 4 - 41 - - 6 - - - 5 100
Generally, the photomicrographs of the rocks show varying degrees of microstructures ranging from
mineral alignment to undulose extinction to microcracks to bent lamellae and kinked or bent twin planes. The
microstructures are more conspicuous in the charnockitic rocks. Most of the thin sections have grains with
sutured margins.
3.2 Schmidt Rebound Hammer
The rebound values were acquired, their mean evaluated, the adjusted mean (the evaluated mean after
the values that deviated from the original mean by more than seven units have been discarded) calculated and
the UCS estimated with the aid of the Deere and Miller (1966) graph. This was done for all the rock types as
exemplified by the table for granite gneiss (Ak002) (Table 2). The UCS of each rock types was estimated as
explained and the result is presented in Table 3.
British Journal of Science 26
November 2011, Vol. 2 (1)
© 2011 British Journals ISSN 2047-3745
Table 2: Conversion of rebound values of granite gneiss (Ak002) to UCS using Deere and Miller
(1966) Graph
S/No G.P.S.
Reading Rebound Values Mean Adjusted
Mean
Density
(g/cc)
UCS
(MPa)
1
48, 48, 54, 53, 45, 54, 46, 46, 52, 54. 50 50 2.67 150
2 53, 48, 50, 52, 55, 52, 56, 55, 50, 52. 52 52 2.67 163
3 48, 50, 53, 49, 51, 52, 54, 46, 53, 50. 51 51 2.67 156
4 005⁰13'46''E
07⁰ 14' 03"N
51, 48, 49, 52, 55, 50, 48, 54, 53, 45. 51 51 2.67 156
5 46, 54, 49, 45, 53, 54, 55, 45, 53, 48 50 50 2.67 150
6
50, 47, 55, 53, 45, 53, 48, 51, 49, 41. 45 47 2.67 131
7 42, 45, 53, 55, 50, 46, 48, 53, 51, 50. 49 49 2.67 146
8
55, 44, 50, 51, 49, 53, 45, 51, 46, 46. 49 49 2.67 146
9 53, 46, 52, 46, 55, 45, 50, 49, 49, 50 50 50 2.67 150
10
45, 46, 45, 54, 48, 51, 47, 49, 53, 50. 49 49 2.67 146
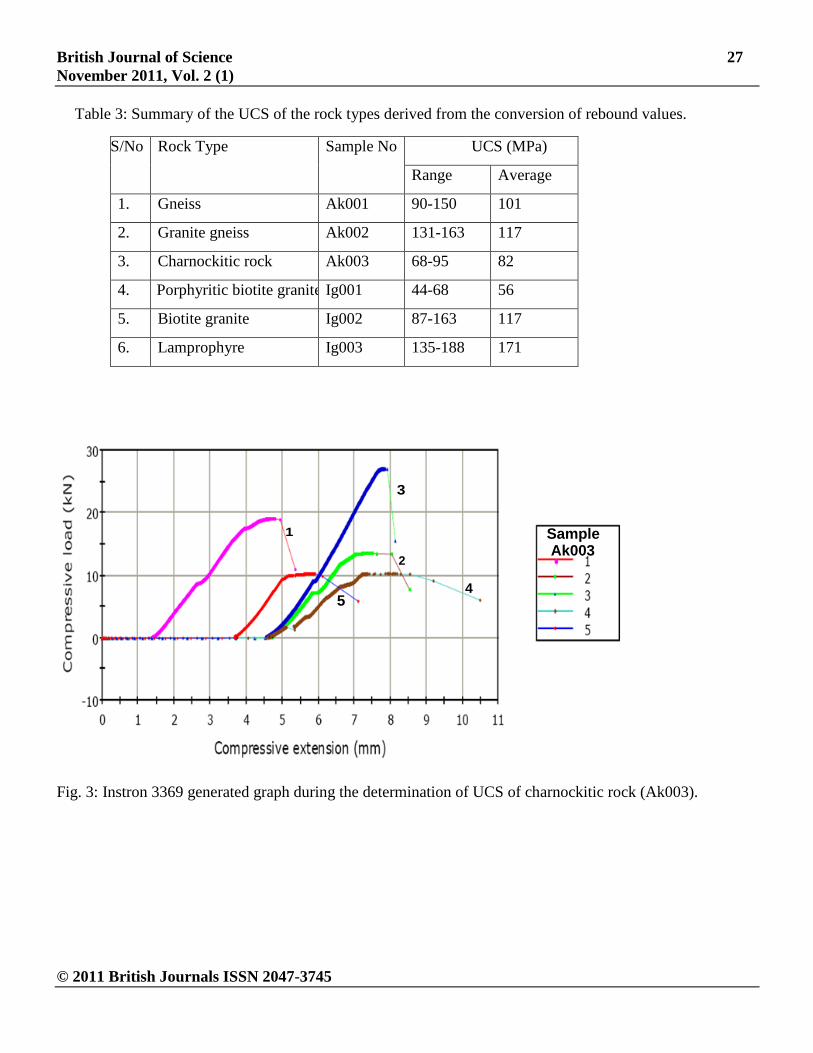
3.3 UCS Determination with “Instron Universal Tester 3369”
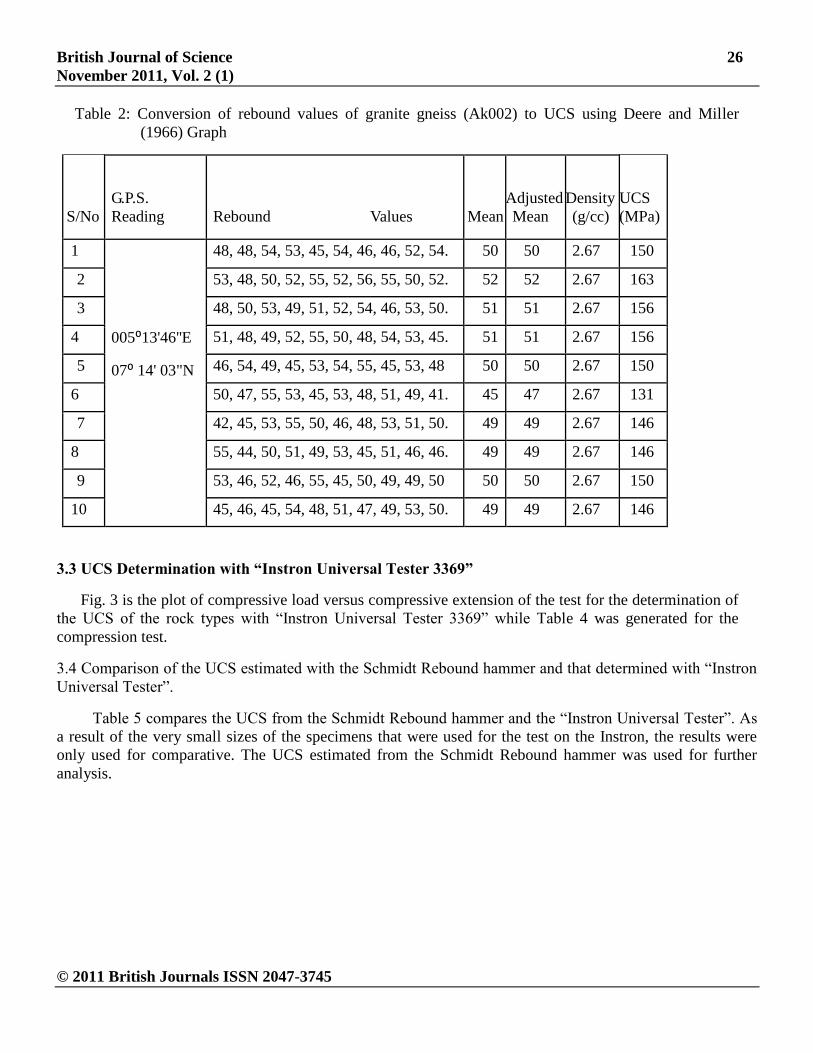
Fig. 3 is the plot of compressive load versus compressive extension of the test for the determination of
the UCS of the rock types with “Instron Universal Tester 3369” while Table 4 was generated for the
compression test.
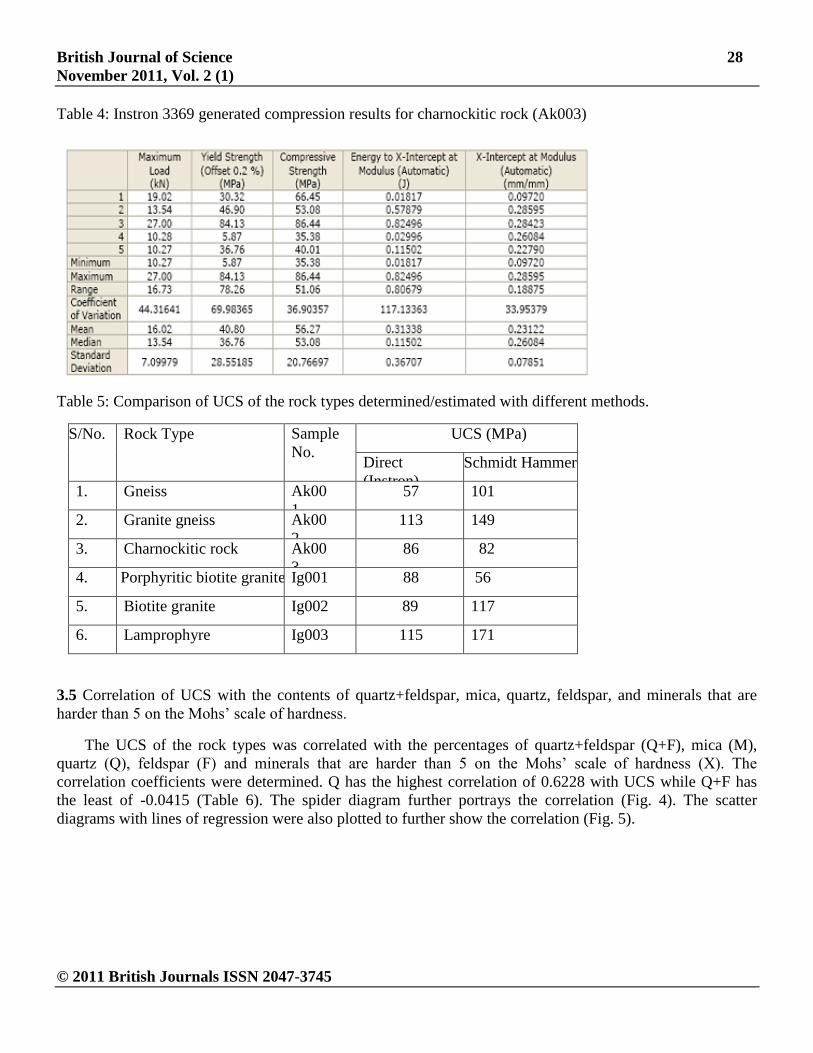
3.4 Comparison of the UCS estimated with the Schmidt Rebound hammer and that determined with “Instron
Universal Tester”.
Table 5 compares the UCS from the Schmidt Rebound hammer and the “Instron Universal Tester”. As
a result of the very small sizes of the specimens that were used for the test on the Instron, the results were
only used for comparative. The UCS estimated from the Schmidt Rebound hammer was used for further
analysis.
British Journal of Science 27
November 2011, Vol. 2 (1)
© 2011 British Journals ISSN 2047-3745
Table 3: Summary of the UCS of the rock types derived from the conversion of rebound values.
S/No Rock Type Sample No UCS (MPa)
Range Average
1. Gneiss Ak001 90-150 101
2. Granite gneiss Ak002 131-163 117
3. Charnockitic rock Ak003 68-95 82
4. Porphyritic biotite granite Ig001 44-68 56
5. Biotite granite Ig002 87-163 117
6. Lamprophyre Ig003 135-188 171
Sample Ak003
1
2
3
45
Fig. 3: Instron 3369 generated graph during the determination of UCS of charnockitic rock (Ak003).
British Journal of Science 28
November 2011, Vol. 2 (1)
© 2011 British Journals ISSN 2047-3745
Table 4: Instron 3369 generated compression results for charnockitic rock (Ak003)
Table 5: Comparison of UCS of the rock types determined/estimated with different methods.
S/No. Rock Type Sample
No.
UCS (MPa)
Direct
(Instron)
Schmidt Hammer
1. Gneiss Ak00
1
57 101
2. Granite gneiss Ak00
2
113 149
3. Charnockitic rock Ak00
3
86 82
4. Porphyritic biotite granite Ig001 88 56
5. Biotite granite Ig002 89 117
6. Lamprophyre Ig003 115 171
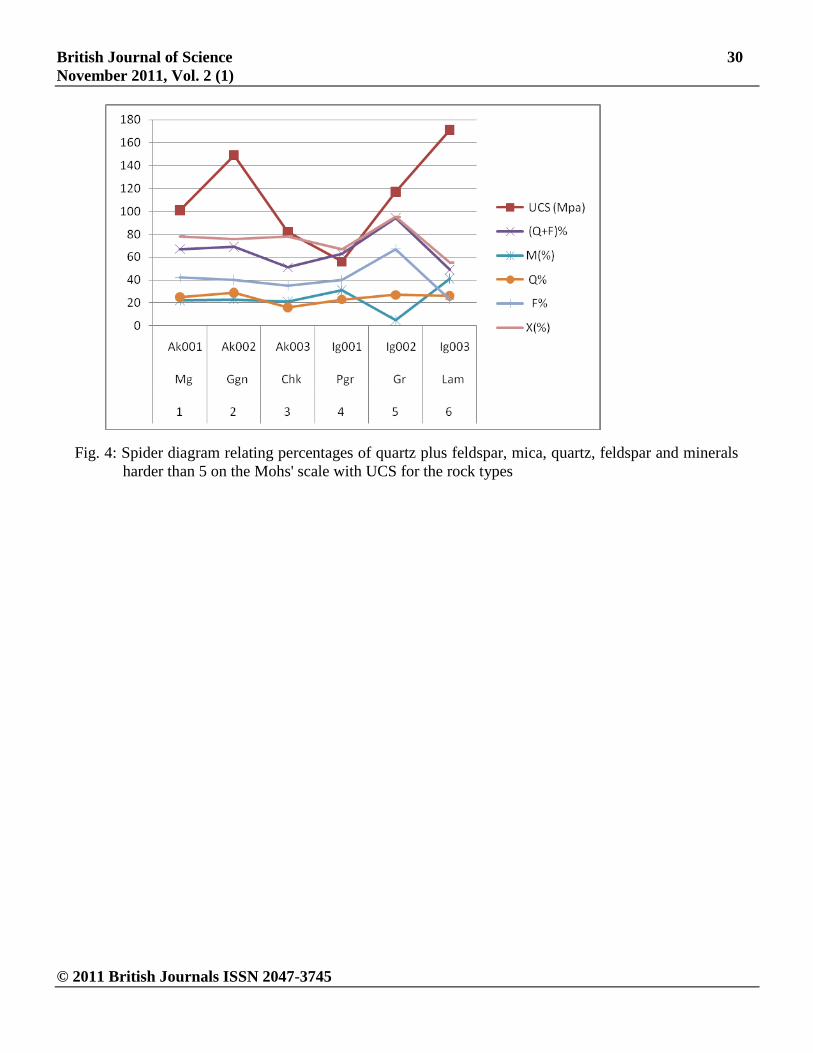
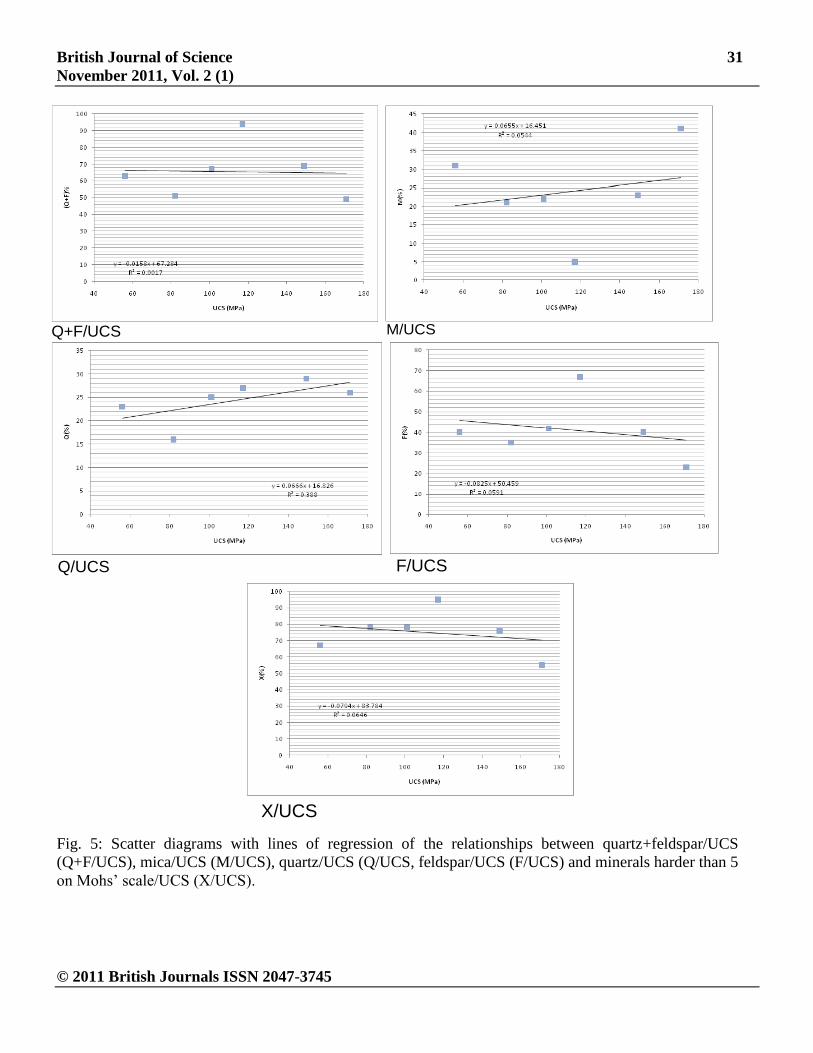
3.5 Correlation of UCS with the contents of quartz+feldspar, mica, quartz, feldspar, and minerals that are
harder than 5 on the Mohs’ scale of hardness.
The UCS of the rock types was correlated with the percentages of quartz+feldspar (Q+F), mica (M),
quartz (Q), feldspar (F) and minerals that are harder than 5 on the Mohs’ scale of hardness (X). The
correlation coefficients were determined. Q has the highest correlation of 0.6228 with UCS while Q+F has
the least of -0.0415 (Table 6). The spider diagram further portrays the correlation (Fig. 4). The scatter
diagrams with lines of regression were also plotted to further show the correlation (Fig. 5).

British Journal of Science 29
November 2011, Vol. 2 (1)
© 2011 British Journals ISSN 2047-3745
Table 6: The correlation of UCS with percentages of Q+F, M, Q, F and X for the rock types.
(A)
S/N
o
Rock
Type Sample No
UCS(MP
a)
(Q+F)
% M(%)
Q%
F%
X(%
)
1 Gn Ak001 101 67 22 25 42 78
2 Ggn Ak002 149 69 23 29 40 76
3 Chk Ak003 82 51 21 16 35 78
4 Pgr Ig001 56 63 31 23 40 67
5 Gr Ig002 117 94 5 27 67 95
6 Lam Ig003 171 49 41 26 23 55
(B)
UCS R2 r
(Q+F)% 0.0017 -0.0415
M(%) 0.0544 0.2332
Q(%)
0.3880
0.6228
F(%) 0.0591 -0.2431
X(%) 0.0646 -0.2541
Note: (1) Gn = gneiss, Ggn = granite gneiss, Ch = charnockitic rock, Gr = biotite granite, Pgr =
porphyritic biotite granite and Lam = lamprophyre.
(2) UCS {Y(MPa)} = the uniaxial compressive strength of the rock types, Q+F = quartz plus
feldspar, M = mica, Q = quartz, F = feldspar and X = minerals harder than 5 on the Mohs’ scale
of hardness.
(3) (i) R2 = the square of Pearson product moment correlation coefficient. (ii)
r returns the correlation coefficients between two sets of data.
(4) (A) is the table of values and (B) is the table of correlation (R2 and r).
British Journal of Science 30
November 2011, Vol. 2 (1)
© 2011 British Journals ISSN 2047-3745
Fig. 4: Spider diagram relating percentages of quartz plus feldspar, mica, quartz, feldspar and minerals
harder than 5 on the Mohs' scale with UCS for the rock types
British Journal of Science 31
November 2011, Vol. 2 (1)
© 2011 British Journals ISSN 2047-3745
Q+F/UCS M/UCS
Q/UCS F/UCS
X/UCS
Fig. 5: Scatter diagrams with lines of regression of the relationships between quartz+feldspar/UCS
(Q+F/UCS), mica/UCS (M/UCS), quartz/UCS (Q/UCS, feldspar/UCS (F/UCS) and minerals harder than 5
on Mohs’ scale/UCS (X/UCS).
British Journal of Science 32
November 2011, Vol. 2 (1)
© 2011 British Journals ISSN 2047-3745
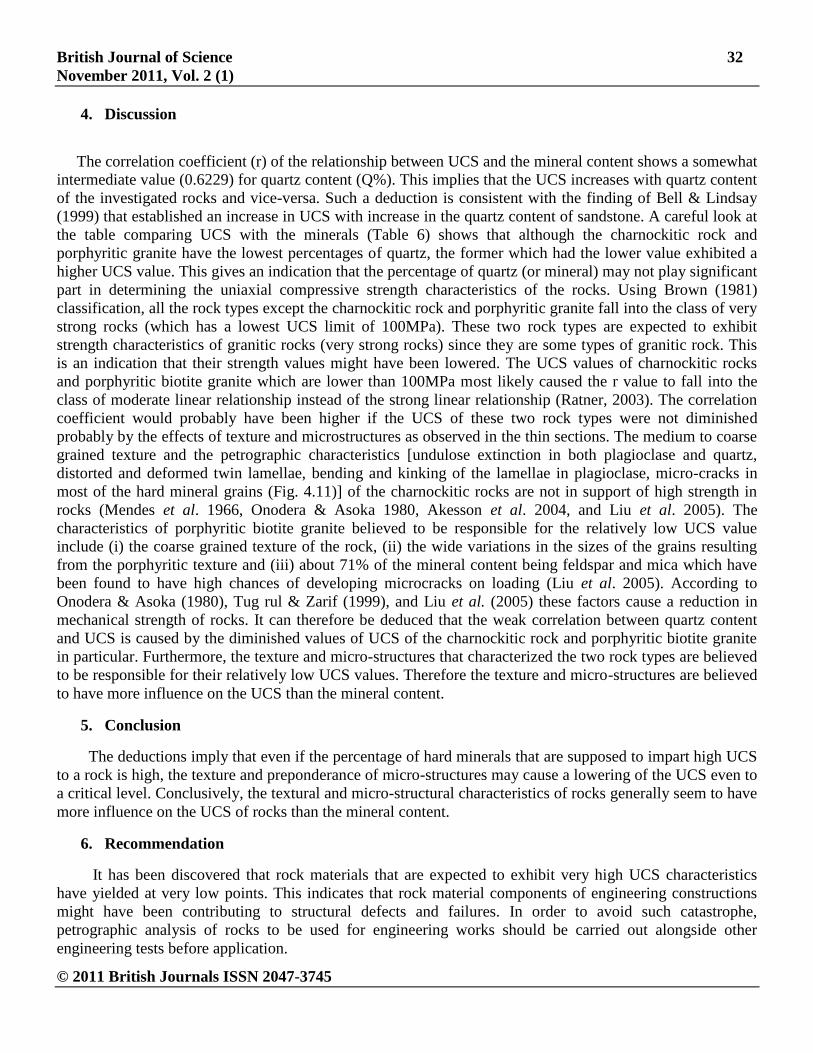
4. Discussion
The correlation coefficient (r) of the relationship between UCS and the mineral content shows a somewhat
intermediate value (0.6229) for quartz content (Q%). This implies that the UCS increases with quartz content
of the investigated rocks and vice-versa. Such a deduction is consistent with the finding of Bell & Lindsay
(1999) that established an increase in UCS with increase in the quartz content of sandstone. A careful look at
the table comparing UCS with the minerals (Table 6) shows that although the charnockitic rock and
porphyritic granite have the lowest percentages of quartz, the former which had the lower value exhibited a
higher UCS value. This gives an indication that the percentage of quartz (or mineral) may not play significant
part in determining the uniaxial compressive strength characteristics of the rocks. Using Brown (1981)
classification, all the rock types except the charnockitic rock and porphyritic granite fall into the class of very
strong rocks (which has a lowest UCS limit of 100MPa). These two rock types are expected to exhibit
strength characteristics of granitic rocks (very strong rocks) since they are some types of granitic rock. This
is an indication that their strength values might have been lowered. The UCS values of charnockitic rocks
and porphyritic biotite granite which are lower than 100MPa most likely caused the r value to fall into the
class of moderate linear relationship instead of the strong linear relationship (Ratner, 2003). The correlation
coefficient would probably have been higher if the UCS of these two rock types were not diminished
probably by the effects of texture and microstructures as observed in the thin sections. The medium to coarse
grained texture and the petrographic characteristics [undulose extinction in both plagioclase and quartz,
distorted and deformed twin lamellae, bending and kinking of the lamellae in plagioclase, micro-cracks in
most of the hard mineral grains (Fig. 4.11)] of the charnockitic rocks are not in support of high strength in
rocks (Mendes et al. 1966, Onodera & Asoka 1980, Akesson et al. 2004, and Liu et al. 2005). The
characteristics of porphyritic biotite granite believed to be responsible for the relatively low UCS value
include (i) the coarse grained texture of the rock, (ii) the wide variations in the sizes of the grains resulting
from the porphyritic texture and (iii) about 71% of the mineral content being feldspar and mica which have
been found to have high chances of developing microcracks on loading (Liu et al. 2005). According to
Onodera & Asoka (1980), Tug rul & Zarif (1999), and Liu et al. (2005) these factors cause a reduction in
mechanical strength of rocks. It can therefore be deduced that the weak correlation between quartz content
and UCS is caused by the diminished values of UCS of the charnockitic rock and porphyritic biotite granite
in particular. Furthermore, the texture and micro-structures that characterized the two rock types are believed
to be responsible for their relatively low UCS values. Therefore the texture and micro-structures are believed
to have more influence on the UCS than the mineral content.
5. Conclusion
The deductions imply that even if the percentage of hard minerals that are supposed to impart high UCS
to a rock is high, the texture and preponderance of micro-structures may cause a lowering of the UCS even to
a critical level. Conclusively, the textural and micro-structural characteristics of rocks generally seem to have
more influence on the UCS of rocks than the mineral content.
6. Recommendation
It has been discovered that rock materials that are expected to exhibit very high UCS characteristics
have yielded at very low points. This indicates that rock material components of engineering constructions
might have been contributing to structural defects and failures. In order to avoid such catastrophe,
petrographic analysis of rocks to be used for engineering works should be carried out alongside other
engineering tests before application.

British Journal of Science 33
November 2011, Vol. 2 (1)
© 2011 British Journals ISSN 2047-3745
Acknowledgement
We sincerely appreciate the staff of Engineering Materials Development Institute, Akure, Nigeria for the use
of “Instron Universal Tester”. Dr M.A. Saliu is also highly appreciated for making the Schmidt Rebound
hammer available for the work.
References
Adekoya, J. A., Kehinde Phillips, and Odukoya, A. M. (2003) Geological distribution of mineral resources in
southwest Nigeria. In: Prospects for investment in mineral resources of Southwestern Nigeria. A. A. Elueze
(Ed.) pp 1-13.
Ademeso, O.A. (2009) Deformation traits in the charnockitic rocks of Akure area, southwestern Nigeria.
Asian Journal of Earth Sciences 2(4), pp 113-120.
Ademeso, O.A.; Anifowose, A.Y.B. and Saliu, M.A. (2008) Reliability of the Schmidt rebound hammer in
estimating Uniaxial Compressive Strength of rocks, Science Research Annals, Vol. 4 No.2, pp 47-60.
Ademeso, O.A. (2010) Field and Petrographic Relationship between the Charnockitic and Associated
Granitic rock, Akure Area, Southwestern Nigeria. World Academy of Science, Engineering and Technology,
71, pp 986-991.
Akesson, Urban; Hanson, Jan and Stigh, Jimmy (2004) Characterisation of micro-cracks in the Bohus biotite
granite, western Sweden, caused by uniaxial cyclic loading. Engineering Geology 72, Issues 1-2 pp 131-142.
ASTM (2001) Standard test method for determination of rock hardness by rebound hammer method. ASTM
Stand. 04.09 (D 5873-00).
Aydin, A. and Basu, A. (2005) The Schmidt hammer in rock material characterization. Engineering Geology,
66, p.211-219.
Bell, F.G., and Lindsay, P. (1999) The petrographic and geomechanical properties of sandstones from the
Newspaper Member of the Natal Group near Durban, South Africa. Engineering Geology 53, 57– 81.
Brown E.T. (1981) Rock characterization, testing and monitoring - ISRM suggested methods, 113-116.
Pergamon Press. Pp201
Deere, D.U. and Miller, R.P. (1966) Engineering classification and index properties of intact rock. Tech.
Rept No AFWL-TR-65-116, Air Force Weapons Lab., Kirtland Air Force Weapons Base, New Mexico.
Hoek, E. and Brown, E.T. (1997) Practical estimates of rock mass strength. International Journal of Rock
Mechanics and Mining Sciences, Vol 34, No 8, pages 1165-1186.
ISRM (1979) Suggested methods for determining the uniaxial compressive strength and deformability of
rock. Int. Jour. Rock Mech. Min. Sci. & Geomech.Abstr. 16 (2) pp 135-140
Liu, Hongyuan; Shaoquan, Kou; Per-Arne, Lindqvist; Jan Erik, Lindqvist and Urban Åkesson (2005)
Microscope Rock Texture Characterization and Simulation of Rock Aggregate Properties. Report of project
60-1362/2004, Geological Survey of Sweden. Pp 94.
Mendes, F.M.; Aires-Barros, L. and Rodrigues, F.P. (1966) The use of modal analysis in the mechanical
characterization of rock masses. In: Proc 1st Int. Cong. Rock Mech. Lisbon, Vol 1, pp. 217-223.
Merriam, Richard, Herman H. Rieke III and Young C. Kim., (1970) Tensile strength related to mineralogy
and texture of some granitic rocks, Engineering Geology, vol. 4, Issuue 2, pp 155-160.
Odeyemi, I.B. (1988) Lithostratigraphy and structural relationship of the Upper Precambrian metasediments
in Igarra area, South-Western Nigeria. Precambrian Geology of Nigeria. Geological Survey of Nigeria.
Kaduna, Nigeria. pp111-125. Onodera T.F. and Asoka K.H.M. (1980)
Relationship between texture and mechanical properties of crystalline rocks. Bull. Int. Assoc. Eng. Geol. 22
pp 173-177.

British Journal of Science 34
November 2011, Vol. 2 (1)
© 2011 British Journals ISSN 2047-3745
Rahaman, M. A. (1976) A review of the basement geology of Southwestern Nigeria. Geology of Nigeria,
C.A., Kogbe (Ed.), Elizabethan Publ. Co., Lagos pp 4-58.
Rahaman, M. A. (1988) Recent advances in the study of the basement complex of Nigeria. In: Precam. Geol.
Nig., GSN Publication, pp11-43.
Ratner Bruce (2003) Statistical Modeling and Analysis for Database Marketing: Effective Techniques for
Mining Big Data, CRC, NY. pp 400. Teme, S. Clifford (1983) The
Engineering Geological Significance of the Point-Load Index Tests in Rock Material Strength Evaluation.
Nigerian Journal of Mining and Geology, vol. 20 (1&2) 87-93.
Tug rul, A. and I. H. Zarif (1999) Correlation of mineralogical and textural characteristics with engineering
properties of selected granitic rocks from Turkey. Engineering Geology vol. 51 issue 4 pp 303-317.
Quick, G. W. (2002) Selected guide to specification of dimension stone; Discovering stone, 1(1), pp 8-21.
Bio Profile of Authors
Ademeso, Odunyemi Anthony Department of Geology, Adekunle Ajasin University, Akungba-Akoko,
Ondo State, Nigeria. +2348034738470; +2348052279196. E-mail: [email protected]
Adekoya, Adeyinka John Department of Applied Geology, Federal University of Technology, Akure, Ondo
State, Nigeria.E-mail: [email protected]
Related Documents


