Eyre Peninsula Farming Systems 2014 Summary 59 Break Crops Section Editor: Amanda Cook SARDI, Minnipa Agricultural Centre Section 2 Lower Eyre Peninsula Upper Eyre Peninsula Variety 2014 2010-2014 2014 2010-2014 Lock Yeelanna % Site mean Trial # Minnipa % Site Mean Trial # Kaspa 86 86 92 10 98 105 4 Parafield 85 8 87 4 PBA Coogee** 73 73 91 6 84 2 PBA Gunyah 96 96 93 10 108 105 4 PBA Oura 110 100 106 10 101 99 4 PBA Pearl 115 111 123 10 70 102 4 PBA Percy 89 89 104 10 93 101 4 PBA Twilight 104 91 87 10 113 103 4 PBA Wharton 98 102 94 10 139 98 4 Sturt 93 4 Yarrum 105 4 Site mean yield (t/ha) 1.96 2.12 1.90 1.89 1.82 LSD (P=0.05) 11 15 18 Date sown 12/05 20/05 5/5 Soil type S/SL S/SL L Previous crop Wheat Wheat Barley Rainfall (mm) J-M/A-O 63/210 80/318 102/290 pH (water) 8 8.4 8.6 Site stress factors wl,we bs SA field pea variety trial yield performance 2014 (as a % of site mean) and long term (2010-2014) average across sites (as % of site mean) Soil Types: S=sand, L=loam, / = over Site stress factors: wl=waterlogging, bs=black spot, we=weed competition high Data source: SARDI/GRDC, PBA & NVT (long term data based on weighted analysis of sites and courtesy National Statistics Program). ** = Dual purpose type (hay production, or green/brown manuring) Peas Canola Lupins Vetch Beans Chickpeas Western EP 4,500 6,000 1,000 400 0 0 Eastern EP 3,300 9,000 5,000 500 200 100 Lower EP 6,500 63,000 32,000 1,500 7,000 250 Crop estimates by district (tonnes produced) in 2014 Source: PIRSA, January 2015, Crop and Pasture Report, South Australia Break Crops

Welcome message from author
This document is posted to help you gain knowledge. Please leave a comment to let me know what you think about it! Share it to your friends and learn new things together.
Transcript
Eyre Peninsula Farming Systems 2014 Summary 59
Break Crops
Section Editor:Amanda CookSARDI, Minnipa Agricultural Centre
Section
2
Lower Eyre Peninsula Upper Eyre Peninsula
Variety 2014 2010-2014 2014 2010-2014
Lock Yeelanna % Sitemean
Trial#
Minnipa % Site Mean
Trial#
Kaspa 86 86 92 10 98 105 4
Parafield 85 8 87 4
PBA Coogee** 73 73 91 6 84 2
PBA Gunyah 96 96 93 10 108 105 4
PBA Oura 110 100 106 10 101 99 4
PBA Pearl 115 111 123 10 70 102 4
PBA Percy 89 89 104 10 93 101 4
PBA Twilight 104 91 87 10 113 103 4
PBA Wharton 98 102 94 10 139 98 4
Sturt 93 4
Yarrum 105 4
Site mean yield (t/ha) 1.96 2.12 1.90 1.89 1.82
LSD (P=0.05) 11 15 18
Date sown 12/05 20/05 5/5
Soil type S/SL S/SL L
Previous crop Wheat Wheat Barley
Rainfall (mm) J-M/A-O 63/210 80/318 102/290
pH (water) 8 8.4 8.6
Site stress factors wl,we bs
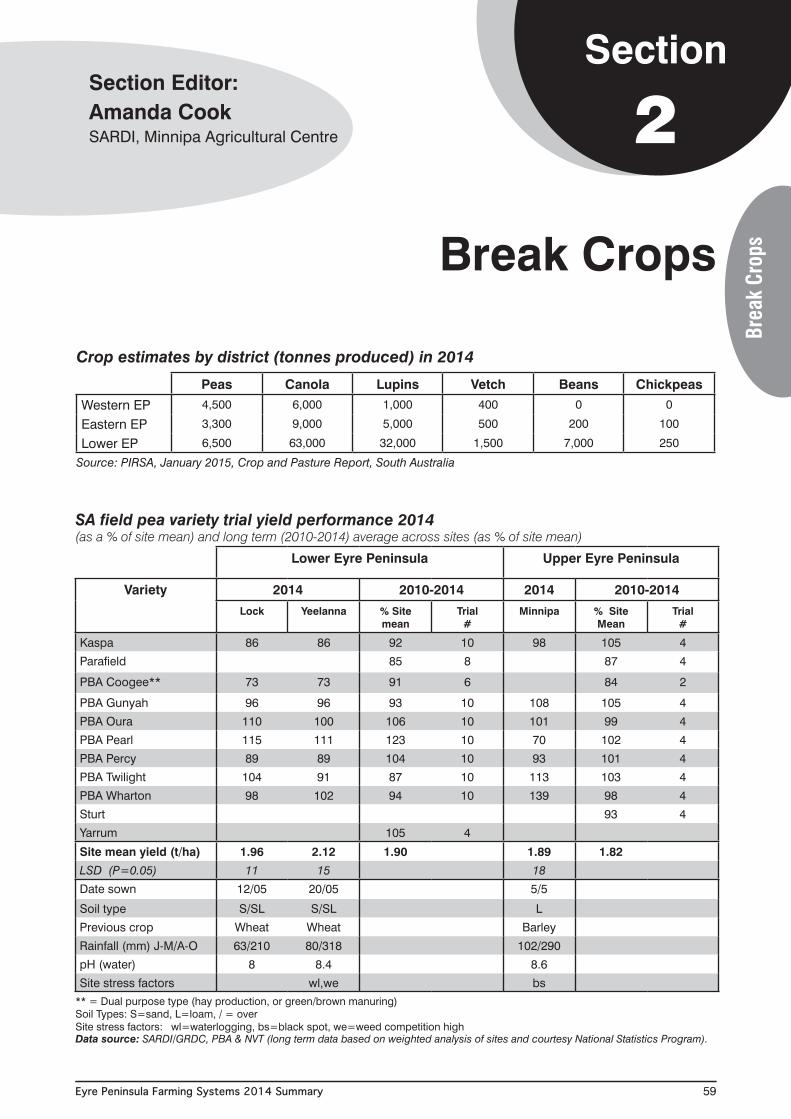
SA field pea variety trial yield performance 2014(as a % of site mean) and long term (2010-2014) average across sites (as % of site mean)
Soil Types: S=sand, L=loam, / = overSite stress factors: wl=waterlogging, bs=black spot, we=weed competition highData source: SARDI/GRDC, PBA & NVT (long term data based on weighted analysis of sites and courtesy National Statistics Program).
** = Dual purpose type (hay production, or green/brown manuring)
Peas Canola Lupins Vetch Beans Chickpeas
Western EP 4,500 6,000 1,000 400 0 0
Eastern EP 3,300 9,000 5,000 500 200 100
Lower EP 6,500 63,000 32,000 1,500 7,000 250
Crop estimates by district (tonnes produced) in 2014
Source: PIRSA, January 2015, Crop and Pasture Report, South Australia
Brea
k Cr
ops
Eyre Peninsula Farming Systems 2014 Summary60
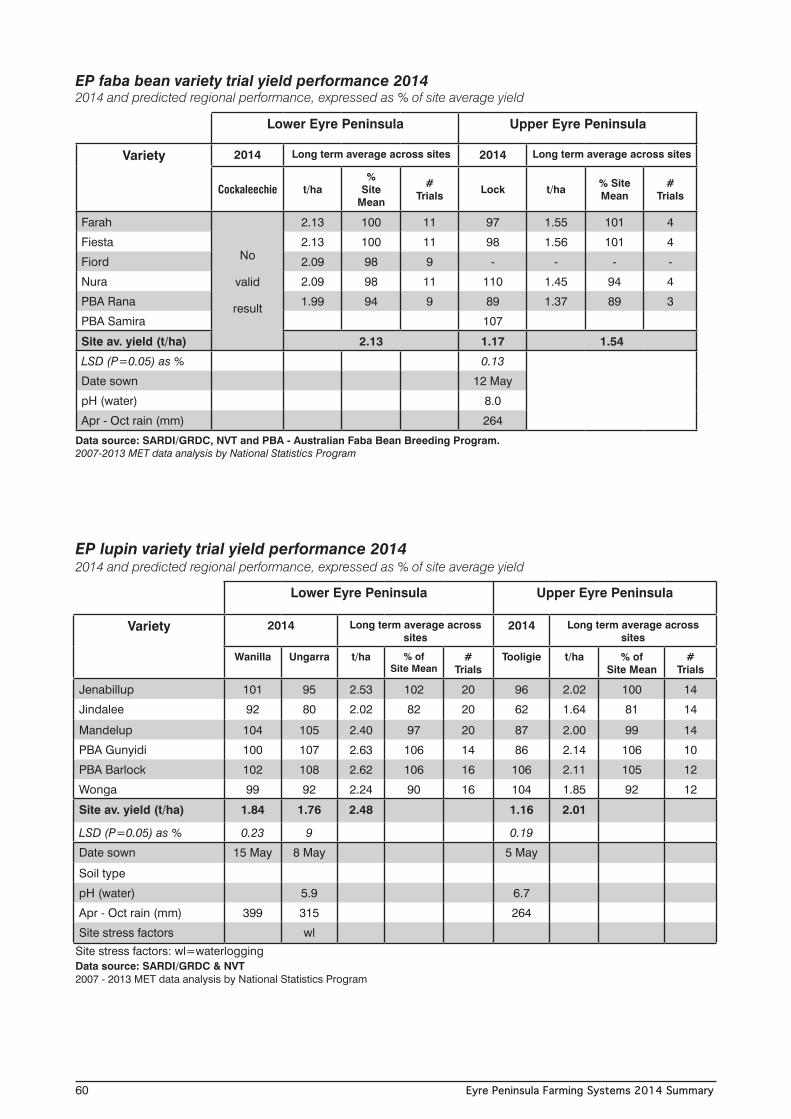
EP faba bean variety trial yield performance 20142014 and predicted regional performance, expressed as % of site average yield
Data source: SARDI/GRDC, NVT and PBA - Australian Faba Bean Breeding Program. 2007-2013 MET data analysis by National Statistics Program
Lower Eyre Peninsula Upper Eyre Peninsula
Variety 2014 Long term average across sites 2014 Long term average across sites
Cockaleechie t/ha%
Site Mean
#Trials Lock t/ha % Site
Mean#
Trials
Farah
No
valid
result
2.13 100 11 97 1.55 101 4
Fiesta 2.13 100 11 98 1.56 101 4
Fiord 2.09 98 9 - - - -
Nura 2.09 98 11 110 1.45 94 4
PBA Rana 1.99 94 9 89 1.37 89 3
PBA Samira 107
Site av. yield (t/ha) 2.13 1.17 1.54
LSD (P=0.05) as % 0.13
Date sown 12 May
pH (water) 8.0
Apr - Oct rain (mm) 264
Lower Eyre Peninsula Upper Eyre Peninsula
Variety 2014 Long term average across sites
2014 Long term average across sites
Wanilla Ungarra t/ha % ofSite Mean
#Trials
Tooligie t/ha % of Site Mean
#Trials
Jenabillup 101 95 2.53 102 20 96 2.02 100 14
Jindalee 92 80 2.02 82 20 62 1.64 81 14
Mandelup 104 105 2.40 97 20 87 2.00 99 14
PBA Gunyidi 100 107 2.63 106 14 86 2.14 106 10
PBA Barlock 102 108 2.62 106 16 106 2.11 105 12
Wonga 99 92 2.24 90 16 104 1.85 92 12
Site av. yield (t/ha) 1.84 1.76 2.48 1.16 2.01
LSD (P=0.05) as % 0.23 9 0.19
Date sown 15 May 8 May 5 May
Soil type
pH (water) 5.9 6.7
Apr - Oct rain (mm) 399 315 264
Site stress factors wl
EP lupin variety trial yield performance 20142014 and predicted regional performance, expressed as % of site average yield
Site stress factors: wl=waterloggingData source: SARDI/GRDC & NVT 2007 - 2013 MET data analysis by National Statistics Program
Eyre Peninsula Farming Systems 2014 Summary 61
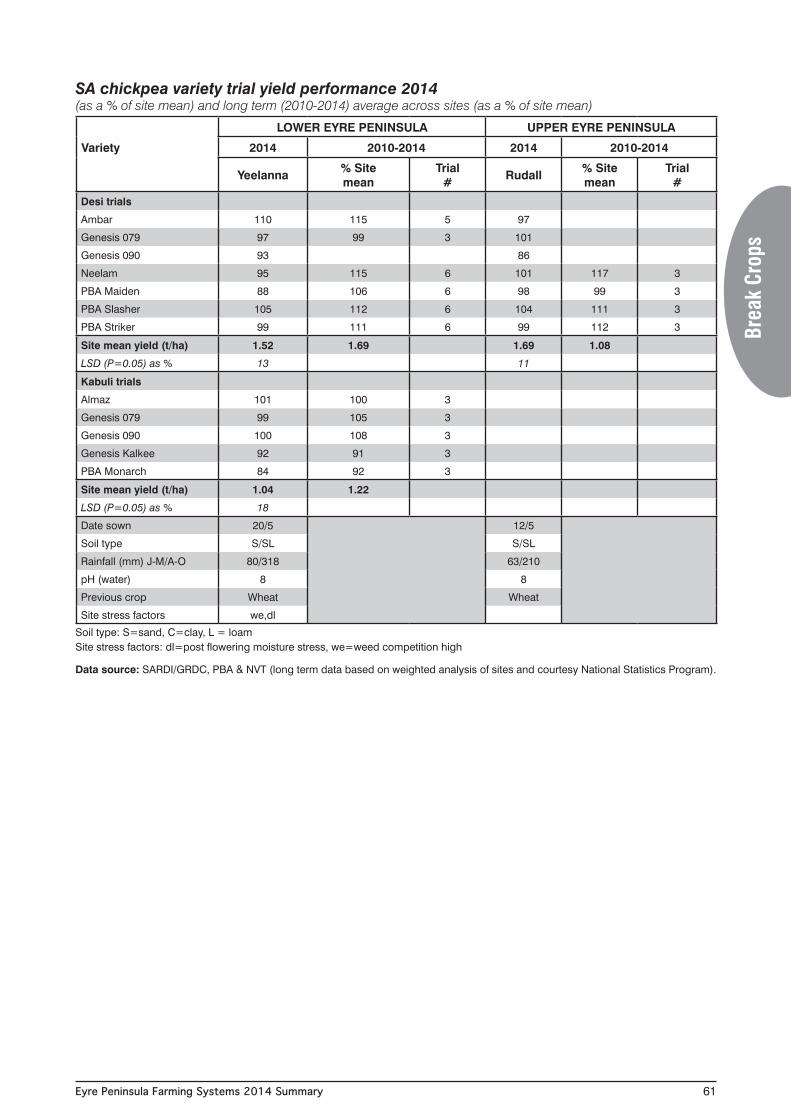
SA chickpea variety trial yield performance 2014(as a % of site mean) and long term (2010-2014) average across sites (as a % of site mean)
LOWER EYRE PENINSULA UPPER EYRE PENINSULA
Variety 2014 2010-2014 2014 2010-2014
Yeelanna % Site mean
Trial # Rudall % Site
meanTrial
#
Desi trials
Ambar 110 115 5 97
Genesis 079 97 99 3 101
Genesis 090 93 86
Neelam 95 115 6 101 117 3
PBA Maiden 88 106 6 98 99 3
PBA Slasher 105 112 6 104 111 3
PBA Striker 99 111 6 99 112 3
Site mean yield (t/ha) 1.52 1.69 1.69 1.08
LSD (P=0.05) as % 13 11
Kabuli trials
Almaz 101 100 3
Genesis 079 99 105 3
Genesis 090 100 108 3
Genesis Kalkee 92 91 3
PBA Monarch 84 92 3
Site mean yield (t/ha) 1.04 1.22
LSD (P=0.05) as % 18
Date sown 20/5 12/5
Soil type S/SL S/SL
Rainfall (mm) J-M/A-O 80/318 63/210
pH (water) 8 8
Previous crop Wheat Wheat
Site stress factors we,dl
Soil type: S=sand, C=clay, L = loamSite stress factors: dl=post flowering moisture stress, we=weed competition high
Data source: SARDI/GRDC, PBA & NVT (long term data based on weighted analysis of sites and courtesy National Statistics Program).
Brea
k Cr
ops
Eyre Peninsula Farming Systems 2014 Summary62
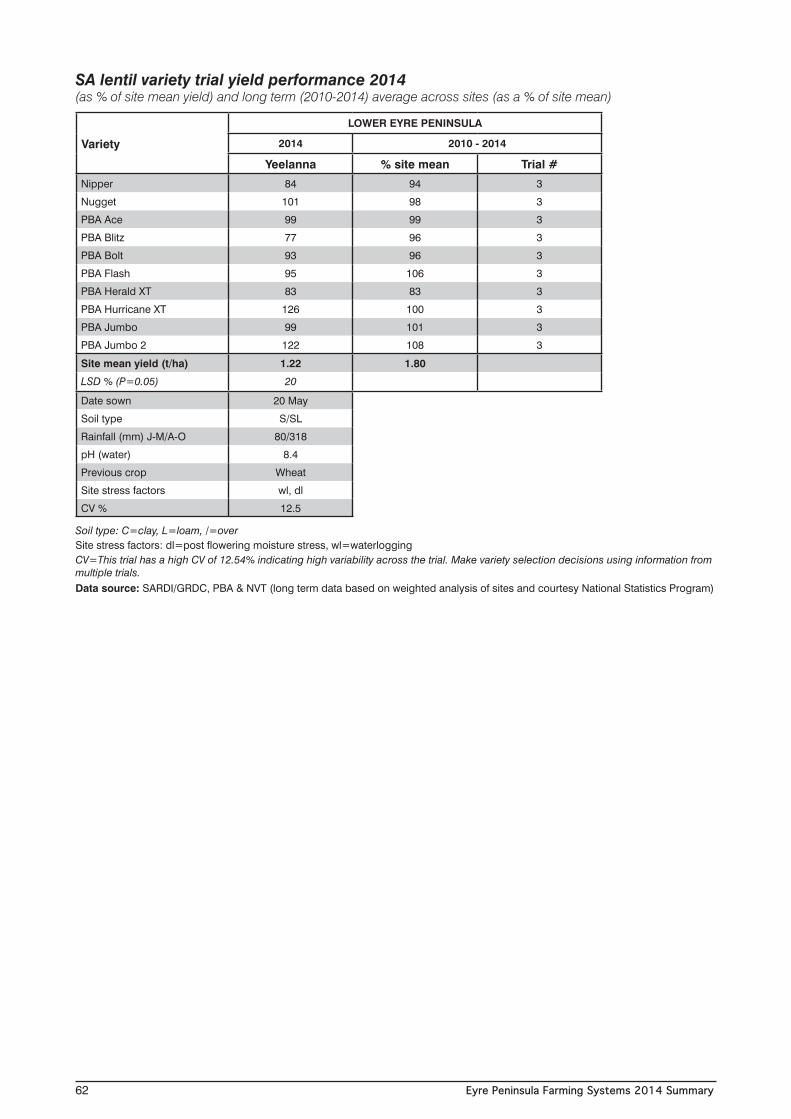
SA lentil variety trial yield performance 2014(as % of site mean yield) and long term (2010-2014) average across sites (as a % of site mean)
LOWER EYRE PENINSULA
Variety 2014 2010 - 2014
Yeelanna % site mean Trial #
Nipper 84 94 3
Nugget 101 98 3
PBA Ace 99 99 3
PBA Blitz 77 96 3
PBA Bolt 93 96 3
PBA Flash 95 106 3
PBA Herald XT 83 83 3
PBA Hurricane XT 126 100 3
PBA Jumbo 99 101 3
PBA Jumbo 2 122 108 3
Site mean yield (t/ha) 1.22 1.80
LSD % (P=0.05) 20
Date sown 20 May
Soil type S/SL
Rainfall (mm) J-M/A-O 80/318
pH (water) 8.4
Previous crop Wheat
Site stress factors wl, dl
CV % 12.5
Soil type: C=clay, L=loam, /=overSite stress factors: dl=post flowering moisture stress, wl=waterloggingCV=This trial has a high CV of 12.54% indicating high variability across the trial. Make variety selection decisions using information from multiple trials. Data source: SARDI/GRDC, PBA & NVT (long term data based on weighted analysis of sites and courtesy National Statistics Program)
Eyre Peninsula Farming Systems 2014 Summary 63
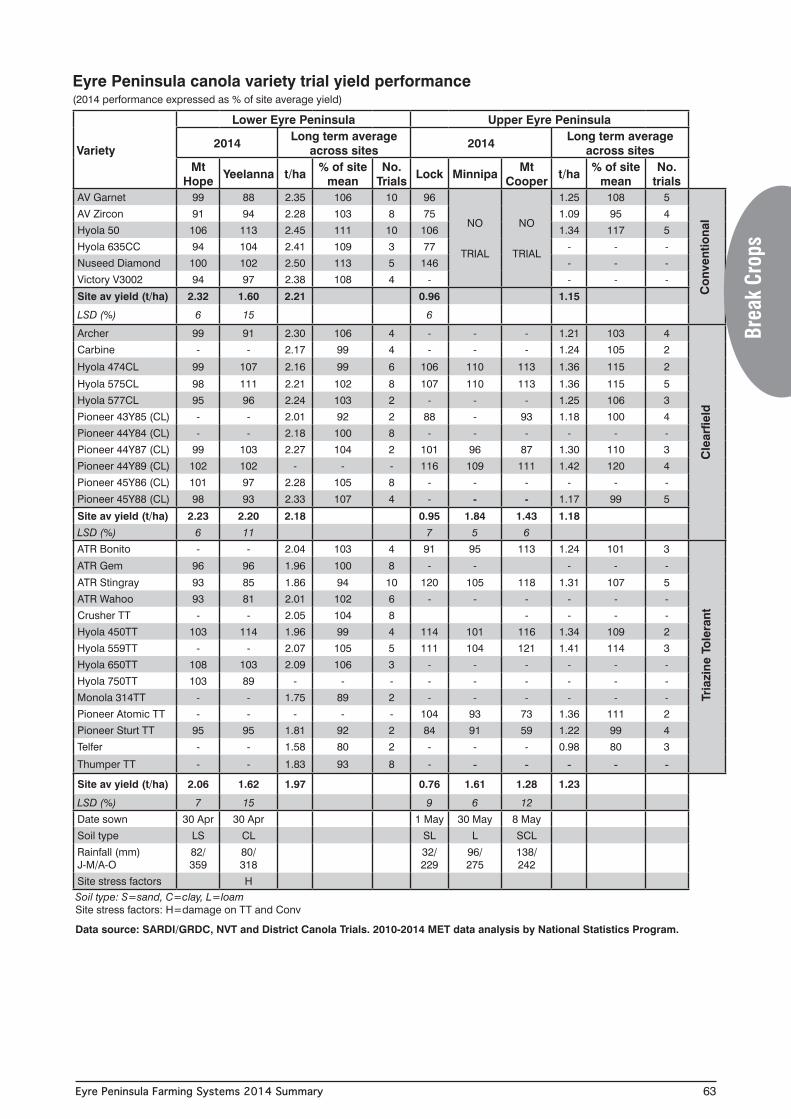
Eyre Peninsula canola variety trial yield performance(2014 performance expressed as % of site average yield)
Variety
Lower Eyre Peninsula Upper Eyre Peninsula
2014 Long term average across sites 2014 Long term average
across sitesMt
Hope Yeelanna t/ha % of site mean
No. Trials Lock Minnipa Mt
Cooper t/ha % of site mean
No. trials
AV Garnet 99 88 2.35 106 10 96
NO
TRIAL
NO
TRIAL
1.25 108 5
AV Zircon 91 94 2.28 103 8 75 1.09 95 4
Hyola 50 106 113 2.45 111 10 106 1.34 117 5
Hyola 635CC 94 104 2.41 109 3 77 - - -
Nuseed Diamond 100 102 2.50 113 5 146 - - -
Victory V3002 94 97 2.38 108 4 - - - -
Site av yield (t/ha) 2.32 1.60 2.21 0.96 1.15
LSD (%) 6 15 6
Archer 99 91 2.30 106 4 - - - 1.21 103 4
Carbine - - 2.17 99 4 - - - 1.24 105 2
Hyola 474CL 99 107 2.16 99 6 106 110 113 1.36 115 2
Hyola 575CL 98 111 2.21 102 8 107 110 113 1.36 115 5
Hyola 577CL 95 96 2.24 103 2 - - - 1.25 106 3
Pioneer 43Y85 (CL) - - 2.01 92 2 88 - 93 1.18 100 4
Pioneer 44Y84 (CL) - - 2.18 100 8 - - - - - -
Pioneer 44Y87 (CL) 99 103 2.27 104 2 101 96 87 1.30 110 3
Pioneer 44Y89 (CL) 102 102 - - - 116 109 111 1.42 120 4
Pioneer 45Y86 (CL) 101 97 2.28 105 8 - - - - - -
Pioneer 45Y88 (CL) 98 93 2.33 107 4 - - - 1.17 99 5
Site av yield (t/ha) 2.23 2.20 2.18 0.95 1.84 1.43 1.18
LSD (%) 6 11 7 5 6
ATR Bonito - - 2.04 103 4 91 95 113 1.24 101 3
ATR Gem 96 96 1.96 100 8 - - - - -
ATR Stingray 93 85 1.86 94 10 120 105 118 1.31 107 5
ATR Wahoo 93 81 2.01 102 6 - - - - - -
Crusher TT - - 2.05 104 8 - - - -
Hyola 450TT 103 114 1.96 99 4 114 101 116 1.34 109 2
Hyola 559TT - - 2.07 105 5 111 104 121 1.41 114 3
Hyola 650TT 108 103 2.09 106 3 - - - - - -
Hyola 750TT 103 89 - - - - - - - - -
Monola 314TT - - 1.75 89 2 - - - - - -
Pioneer Atomic TT - - - - - 104 93 73 1.36 111 2
Pioneer Sturt TT 95 95 1.81 92 2 84 91 59 1.22 99 4
Telfer - - 1.58 80 2 - - - 0.98 80 3
Thumper TT - - 1.83 93 8 - - - - - -Site av yield (t/ha) 2.06 1.62 1.97 0.76 1.61 1.28 1.23
LSD (%) 7 15 9 6 12
Date sown 30 Apr 30 Apr 1 May 30 May 8 May
Soil type LS CL SL L SCL
Rainfall (mm) J-M/A-O
82/359
80/318
32/229
96/275
138/242
Site stress factors H
Co
nven
tiona
lC
lear
field
Tria
zine
To
lera
nt
Soil type: S=sand, C=clay, L=loamSite stress factors: H=damage on TT and Conv
Data source: SARDI/GRDC, NVT and District Canola Trials. 2010-2014 MET data analysis by National Statistics Program.
Brea
k Cr
ops
Eyre Peninsula Farming Systems 2014 Summary64
Key messages• Early sowing (15 April)
had the largest positive impact on canola yield when comparing a range of treatments trialled in 2014, similar to results observed in 2013. Sowing on 15 April improved yields up to 45%, depending on variety, compared to 13 May sowing date.
• Good seeding depth and the correct seed rate proved important in maximising canola yield at the sites trialled in 2014, but not to the same extent as time of sowing. Sowing at 4.5 kg/ha at a 2 cm depth gave a 13% yield improvement over sowing at 1.5 kg/ha at 1 cm depth.
• Achieving approximately 50 plants/m2 of triazine tolerant varieties and 40 plants/m2 of Clearfield tolerant varieties was needed to maximise canola yields in trials conducted at Minnipa Agricultural Centre in 2014.
• Using farmer retained open pollinated seed did not cause a yield penalty when compared to commercially purchased seed in trials conducted at Minnipa in 2014.
Why do the trial?This is a South Australian Grains Industry Trust (SAGIT) funded project. It aims to maximise canola productivity through creating soil specific management strategies that improve canola yields, profitability and establishment in field trials on lower and upper Eyre Peninsula (EP).
In 2014, ten separate trials were conducted as part of this project at Minnipa Agricultural Centre, and Piednippie on upper EP. Four trials will be reported in this article but only from Minnipa Ag Centre trials, as the Piednippie trial site was too variable. Further trials were conducted on lower EP and will be reported in the LEADA results booklet.
How was it done? Trial 1 – Time of Sowing (Minnipa Agricultural Centre)Aim: To evaluate the effect of four different sowing times, in combination with two different seeding depths and two different seeding rates has on canola emergence and yield of two triazine tolerant varieties on Minnipa Agricultural Centre.
Treatments: Sowing dates: Time of Sowing (TOS) 1: 15 April 2014, TOS2: 30 April 2014, TOS3: 13 May 2014, TOS4: 29 May 2014. Two varieties were sown each time: ATR Stingray (open pollinated) and Hyola 559TT (hybrid). Sowing depths of, Normal (2 cm) and Deep (4 cm). Sowing rates: 40 plants/m2 (equivalent to 1.8 kg/ha Stingray and 1.7 kg/ha Hyola 559TT) and 60 plants/m2 (equivalent to 2.7 kg/ha Stingray and 2.6 kg/ha Hyola 559TT). Seed size: Stingray = 0.32 g/100 seeds and Hyola559TT = 0.37 g/100 seeds.
Management: The trial received a total of 71 kg/ha 19:13:0 S9% + 63 kg/ha Urea fertiliser, applied at seeding and a further 81 kg/ha of Urea and 168 kg/ha Sulphate of Ammonia (SOA) broadcast during the season (total of 113 kg/ha of nitrogen). 1 L/ha Atrazine (500g/L a.i), 250 ml/ha Select, 250 ml/ha Targa and 1% Kwicken was applied to control weeds. Multiple products were used during the season to control insects, which included aphids and diamond back moth.
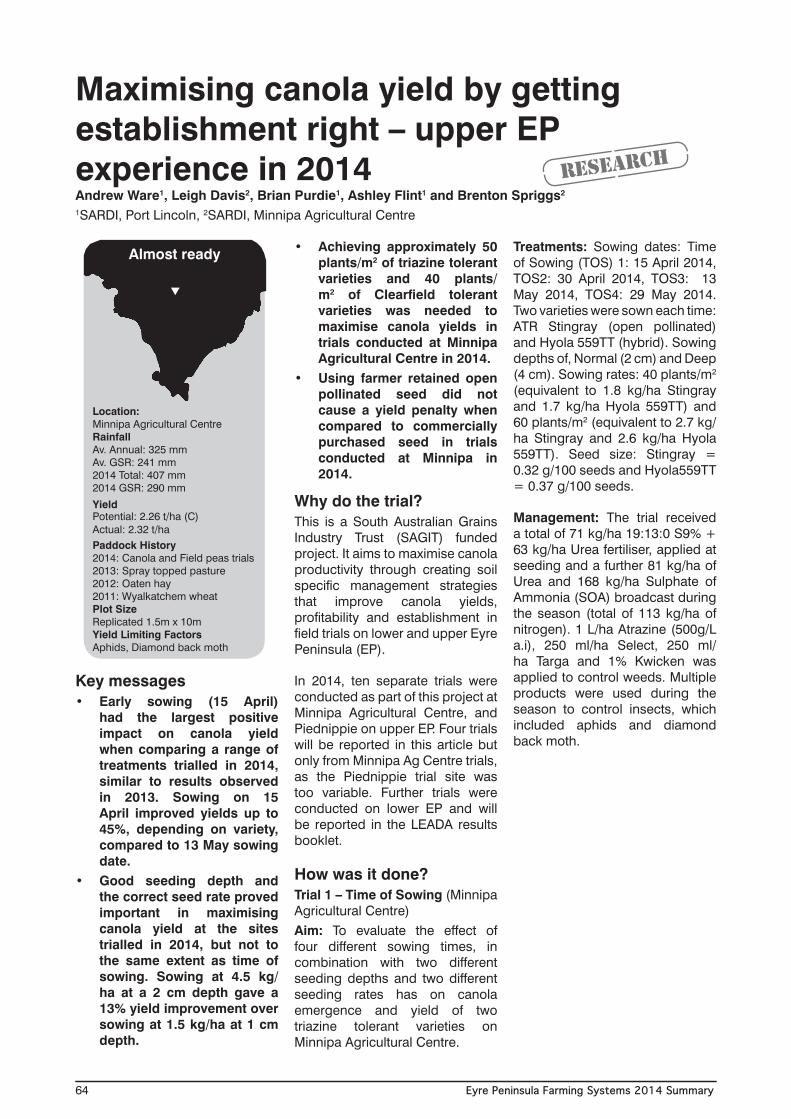
Maximising canola yield by getting establishment right – upper EP experience in 2014Andrew Ware1, Leigh Davis2, Brian Purdie1, Ashley Flint1 and Brenton Spriggs2 1SARDI, Port Lincoln, 2SARDI, Minnipa Agricultural Centre
Research
t
Location: Minnipa Agricultural CentreRainfallAv. Annual: 325 mmAv. GSR: 241 mm2014 Total: 407 mm2014 GSR: 290 mm
YieldPotential: 2.26 t/ha (C)Actual: 2.32 t/haPaddock History2014: Canola and Field peas trials2013: Spray topped pasture2012: Oaten hay2011: Wyalkatchem wheatPlot SizeReplicated 1.5m x 10mYield Limiting FactorsAphids, Diamond back moth
Almost ready
Eyre Peninsula Farming Systems 2014 Summary 65
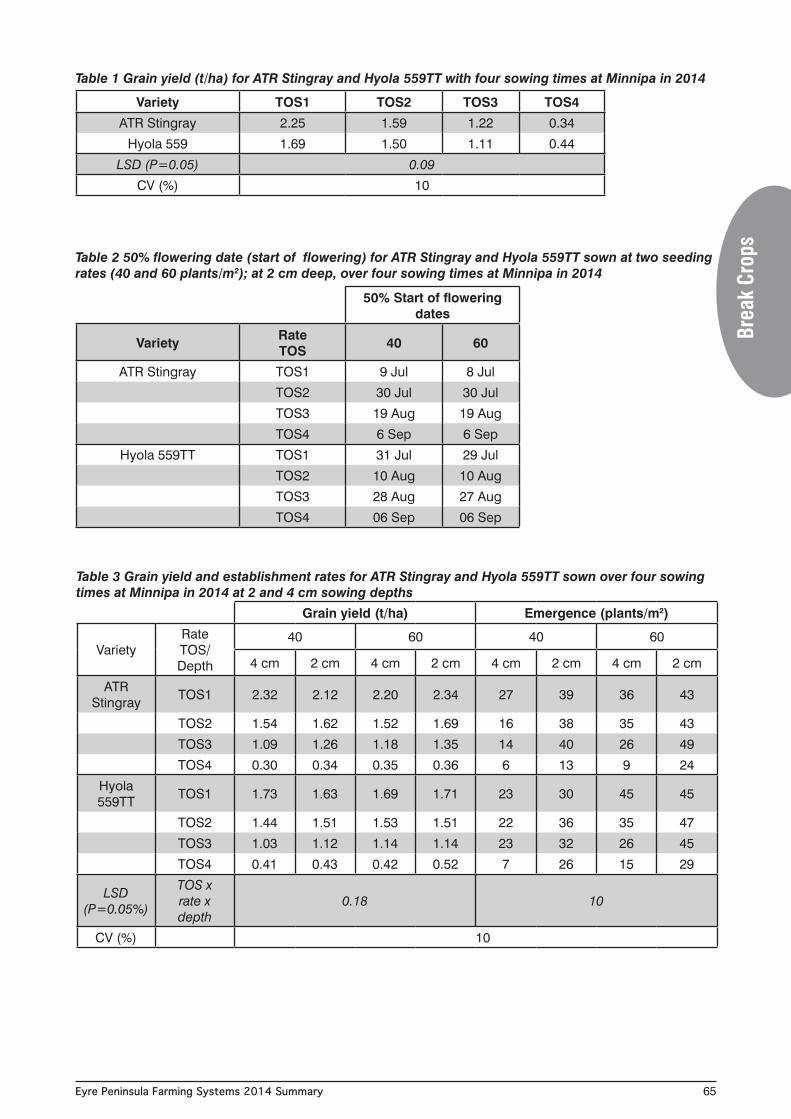
Table 1 Grain yield (t/ha) for ATR Stingray and Hyola 559TT with four sowing times at Minnipa in 2014
Table 3 Grain yield and establishment rates for ATR Stingray and Hyola 559TT sown over four sowing times at Minnipa in 2014 at 2 and 4 cm sowing depths
Variety TOS1 TOS2 TOS3 TOS4
ATR Stingray 2.25 1.59 1.22 0.34
Hyola 559 1.69 1.50 1.11 0.44
LSD (P=0.05) 0.09
CV (%) 10
Table 2 50% flowering date (start of flowering) for ATR Stingray and Hyola 559TT sown at two seeding rates (40 and 60 plants/m2); at 2 cm deep, over four sowing times at Minnipa in 2014
50% Start of flowering dates
Variety RateTOS 40 60
ATR Stingray TOS1 9 Jul 8 Jul
TOS2 30 Jul 30 Jul
TOS3 19 Aug 19 Aug
TOS4 6 Sep 6 Sep
Hyola 559TT TOS1 31 Jul 29 Jul
TOS2 10 Aug 10 Aug
TOS3 28 Aug 27 Aug
TOS4 06 Sep 06 Sep
Grain yield (t/ha) Emergence (plants/m2)
VarietyRateTOS/ Depth
40 60 40 60
4 cm 2 cm 4 cm 2 cm 4 cm 2 cm 4 cm 2 cm
ATR Stingray
TOS1 2.32 2.12 2.20 2.34 27 39 36 43
TOS2 1.54 1.62 1.52 1.69 16 38 35 43
TOS3 1.09 1.26 1.18 1.35 14 40 26 49
TOS4 0.30 0.34 0.35 0.36 6 13 9 24
Hyola 559TT
TOS1 1.73 1.63 1.69 1.71 23 30 45 45
TOS2 1.44 1.51 1.53 1.51 22 36 35 47
TOS3 1.03 1.12 1.14 1.14 23 32 26 45
TOS4 0.41 0.43 0.42 0.52 7 26 15 29
LSD (P=0.05%)
TOS x rate x depth
0.18 10
CV (%) 10
Brea
k Cr
ops
Eyre Peninsula Farming Systems 2014 Summary66
What does this mean? • Time of sowing had a large
impact on yield, where the earliest sowing time produced the highest yield and each subsequent time of sowing producing significantly lower yields.
• There was no penalty from seeding an early maturing variety such as ATR-Stingray in mid-April in 2014 i.e. it managed to utilise the soil moisture available very effectively, and didn’t appear to be affected too greatly by early season frosts.
• The first three times of sowing had similar establishment rates (TOS1: 36, TOS2: 34, and TOS3: 32 plants/m2, irrespective of variety, sowing depth and seeding rate), but establishment was almost reduced by half (TOS4: 16 plants/ m2) for the final time of sowing.
• From this it can be deduced that while establishment can be significantly affected by time of sowing (TOS4 and data collected from a similar trial in
2013) for the majority of the 2014 seeding window (mid-April – mid-May) conditions were suitable to achieve good establishment rates and that the differences observed in yields from different seeding dates were more due to factors other than establishment, such as physiological development.
• Other treatments such as sowing depth and seeding rate while significantly affecting establishment, did not in general terms significantly affect grain yield within the same time of sowing (i.e. all treatments sown on the same day, regardless of sowing rate and sowing depth didn’t yield significantly different to each other.)
• A similar trial was established in the high rainfall zone of lower EP, near Wanilla, and similar results were achieved.
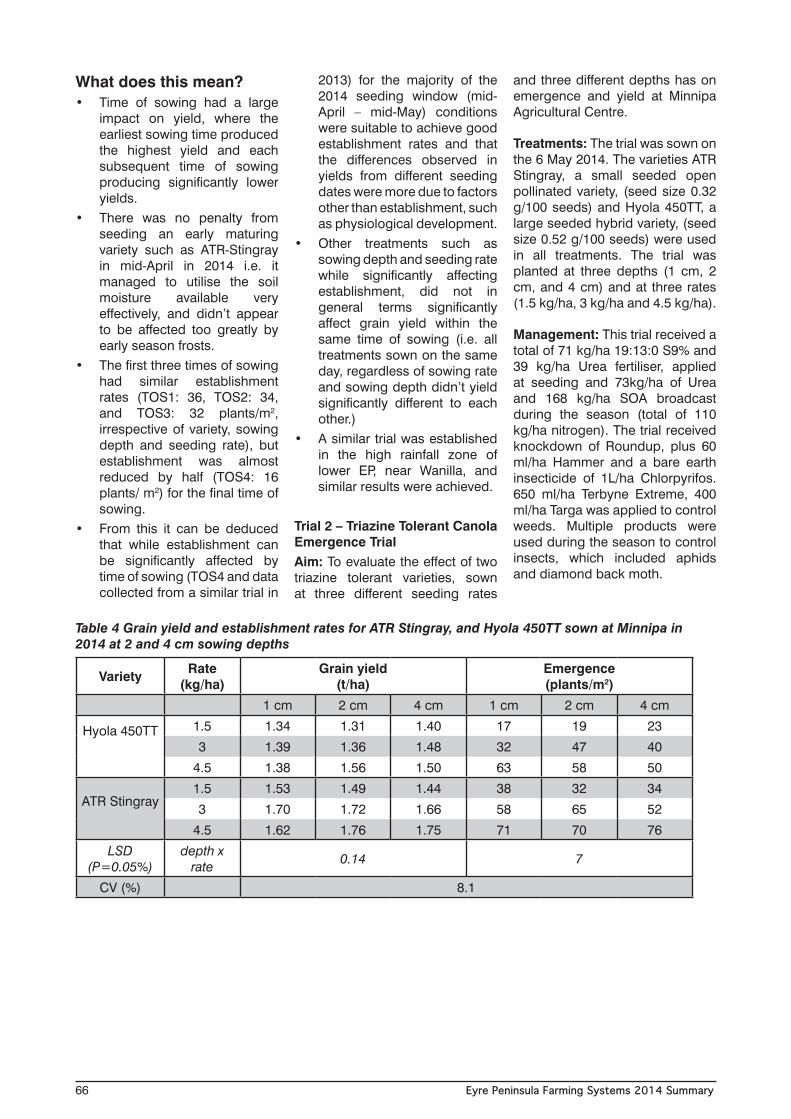
Trial 2 – Triazine Tolerant Canola Emergence TrialAim: To evaluate the effect of two triazine tolerant varieties, sown at three different seeding rates
and three different depths has on emergence and yield at Minnipa Agricultural Centre.
Treatments: The trial was sown on the 6 May 2014. The varieties ATR Stingray, a small seeded open pollinated variety, (seed size 0.32 g/100 seeds) and Hyola 450TT, a large seeded hybrid variety, (seed size 0.52 g/100 seeds) were used in all treatments. The trial was planted at three depths (1 cm, 2 cm, and 4 cm) and at three rates (1.5 kg/ha, 3 kg/ha and 4.5 kg/ha).
Management: This trial received a total of 71 kg/ha 19:13:0 S9% and 39 kg/ha Urea fertiliser, applied at seeding and 73kg/ha of Urea and 168 kg/ha SOA broadcast during the season (total of 110 kg/ha nitrogen). The trial received knockdown of Roundup, plus 60 ml/ha Hammer and a bare earth insecticide of 1L/ha Chlorpyrifos. 650 ml/ha Terbyne Extreme, 400 ml/ha Targa was applied to control weeds. Multiple products were used during the season to control insects, which included aphids and diamond back moth.
Table 4 Grain yield and establishment rates for ATR Stingray, and Hyola 450TT sown at Minnipa in 2014 at 2 and 4 cm sowing depths
Variety Rate (kg/ha)
Grain yield (t/ha)
Emergence (plants/m2)
1 cm 2 cm 4 cm 1 cm 2 cm 4 cm
Hyola 450TT
1.5 1.34 1.31 1.40 17 19 23
3 1.39 1.36 1.48 32 47 40
4.5 1.38 1.56 1.50 63 58 50
ATR Stingray
1.5 1.53 1.49 1.44 38 32 34
3 1.70 1.72 1.66 58 65 52
4.5 1.62 1.76 1.75 71 70 76
LSD (P=0.05%)
depth x rate 0.14 7
CV (%) 8.1
Eyre Peninsula Farming Systems 2014 Summary 67
What does this mean? • The highest yielding
treatments were sown at 3 and 4.5 kg/ha, this gave significantly higher yields than treatments sown at 1.5 kg/ha.
• Sowing depth (seed sown at 1 cm, 2 cm or 4 cm) did not have a significant effect on yield Minnipa in 2014.
• Results from both of these trials indicate that low plant numbers can have a significant detrimental effect on yield and also suggests that growers should target an establishment rate of at least 50 plants/m2 to maximise yield.
• Results from similar trials sown on sandier soils (Piednippie and Wanilla) conducted in
2014, but not reported here, show that seed placement is more important on sandier soils. Sowing at 4 cm deep significantly reduced yields compared to 2 cm.
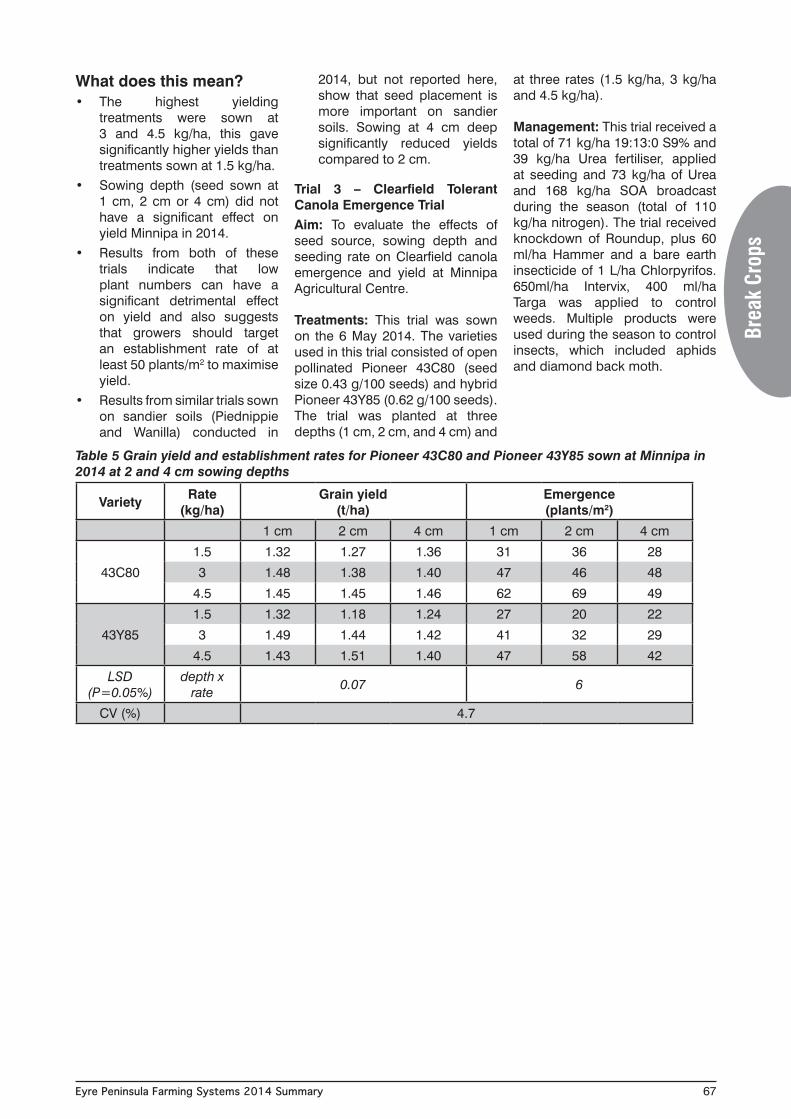
Trial 3 – Clearfield Tolerant Canola Emergence TrialAim: To evaluate the effects of seed source, sowing depth and seeding rate on Clearfield canola emergence and yield at Minnipa Agricultural Centre.
Treatments: This trial was sown on the 6 May 2014. The varieties used in this trial consisted of open pollinated Pioneer 43C80 (seed size 0.43 g/100 seeds) and hybrid Pioneer 43Y85 (0.62 g/100 seeds). The trial was planted at three depths (1 cm, 2 cm, and 4 cm) and
at three rates (1.5 kg/ha, 3 kg/ha and 4.5 kg/ha).
Management: This trial received a total of 71 kg/ha 19:13:0 S9% and 39 kg/ha Urea fertiliser, applied at seeding and 73 kg/ha of Urea and 168 kg/ha SOA broadcast during the season (total of 110 kg/ha nitrogen). The trial received knockdown of Roundup, plus 60 ml/ha Hammer and a bare earth insecticide of 1 L/ha Chlorpyrifos. 650ml/ha Intervix, 400 ml/ha Targa was applied to control weeds. Multiple products were used during the season to control insects, which included aphids and diamond back moth.
Table 5 Grain yield and establishment rates for Pioneer 43C80 and Pioneer 43Y85 sown at Minnipa in 2014 at 2 and 4 cm sowing depths
Variety Rate (kg/ha)
Grain yield (t/ha)
Emergence (plants/m2)
1 cm 2 cm 4 cm 1 cm 2 cm 4 cm
43C80
1.5 1.32 1.27 1.36 31 36 28
3 1.48 1.38 1.40 47 46 48
4.5 1.45 1.45 1.46 62 69 49
43Y85
1.5 1.32 1.18 1.24 27 20 22
3 1.49 1.44 1.42 41 32 29
4.5 1.43 1.51 1.40 47 58 42
LSD (P=0.05%)
depth x rate 0.07 6
CV (%) 4.7
Brea
k Cr
ops
Eyre Peninsula Farming Systems 2014 Summary68
What does this mean? • The lightest seeding rate
(1.5 kg/ha) yielded lower than the heavier rates (3 and 4.5 k/ha) for both varieties. Establishment rates were significantly lower in these treatments.
• Sowing depth (seed sown at 1, 2 or 4 cm) did not have a significant effect on yield Minnipa in 2014.
• Results from this trial indicates that sowing canola too thin can have a significant detrimental effect on yield and also suggests that growers should target an establishment rate of at least 40 plants/m2 to maximise yield.
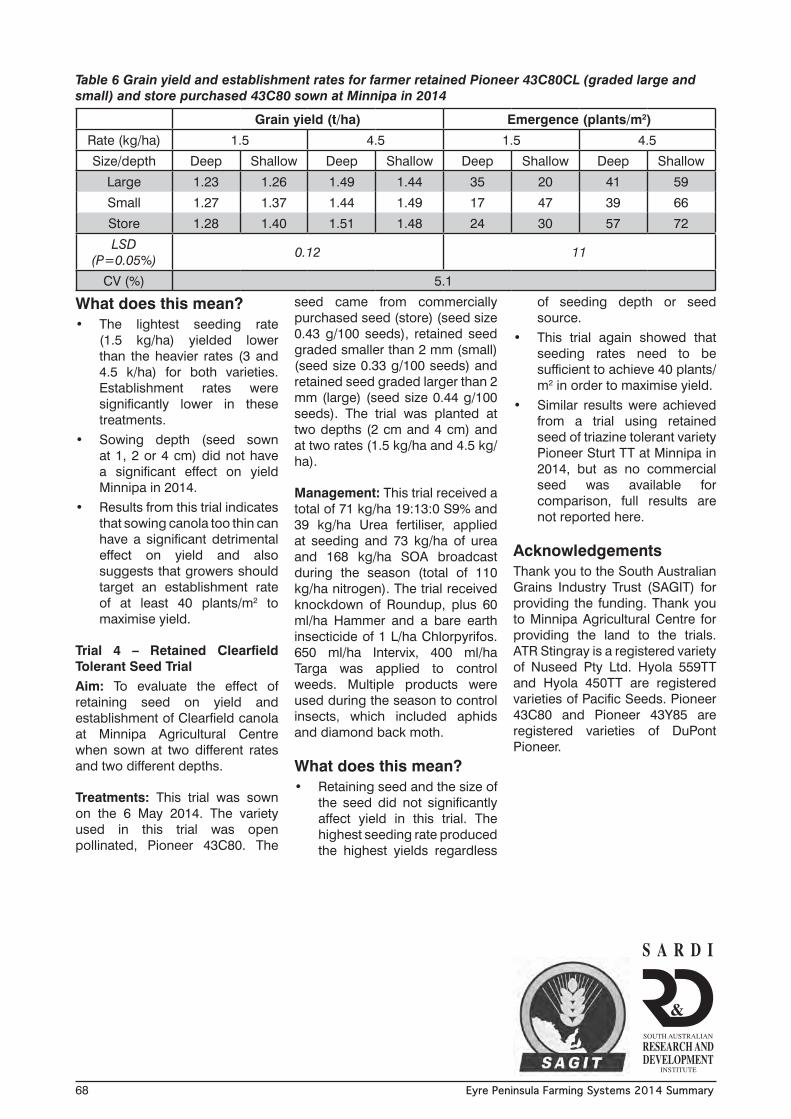
Trial 4 – Retained Clearfield Tolerant Seed TrialAim: To evaluate the effect of retaining seed on yield and establishment of Clearfield canola at Minnipa Agricultural Centre when sown at two different rates and two different depths.
Treatments: This trial was sown on the 6 May 2014. The variety used in this trial was open pollinated, Pioneer 43C80. The
seed came from commercially purchased seed (store) (seed size 0.43 g/100 seeds), retained seed graded smaller than 2 mm (small) (seed size 0.33 g/100 seeds) and retained seed graded larger than 2 mm (large) (seed size 0.44 g/100 seeds). The trial was planted at two depths (2 cm and 4 cm) and at two rates (1.5 kg/ha and 4.5 kg/ha).
Management: This trial received a total of 71 kg/ha 19:13:0 S9% and 39 kg/ha Urea fertiliser, applied at seeding and 73 kg/ha of urea and 168 kg/ha SOA broadcast during the season (total of 110 kg/ha nitrogen). The trial received knockdown of Roundup, plus 60 ml/ha Hammer and a bare earth insecticide of 1 L/ha Chlorpyrifos. 650 ml/ha Intervix, 400 ml/ha Targa was applied to control weeds. Multiple products were used during the season to control insects, which included aphids and diamond back moth.
What does this mean? • Retaining seed and the size of
the seed did not significantly affect yield in this trial. The highest seeding rate produced the highest yields regardless
of seeding depth or seed source.
• This trial again showed that seeding rates need to be sufficient to achieve 40 plants/m2 in order to maximise yield.
• Similar results were achieved from a trial using retained seed of triazine tolerant variety Pioneer Sturt TT at Minnipa in 2014, but as no commercial seed was available for comparison, full results are not reported here.
Acknowledgements Thank you to the South Australian Grains Industry Trust (SAGIT) for providing the funding. Thank you to Minnipa Agricultural Centre for providing the land to the trials. ATR Stingray is a registered variety of Nuseed Pty Ltd. Hyola 559TT and Hyola 450TT are registered varieties of Pacific Seeds. Pioneer 43C80 and Pioneer 43Y85 are registered varieties of DuPont Pioneer.
Table 6 Grain yield and establishment rates for farmer retained Pioneer 43C80CL (graded large and small) and store purchased 43C80 sown at Minnipa in 2014
Grain yield (t/ha) Emergence (plants/m2)
Rate (kg/ha) 1.5 4.5 1.5 4.5
Size/depth Deep Shallow Deep Shallow Deep Shallow Deep Shallow
Large 1.23 1.26 1.49 1.44 35 20 41 59
Small 1.27 1.37 1.44 1.49 17 47 39 66
Store 1.28 1.40 1.51 1.48 24 30 57 72
LSD (P=0.05%) 0.12 11
CV (%) 5.1
Eyre Peninsula Farming Systems 2014 Summary 69
Key messages• Work conducted in low
and medium rainfall environments indicate that N2O emissions are low from an overall national perspective.
• Results showed that there was no clear response of N2O emissions to nitrogen applied at sowing and post sowing.
• High pre-sowing soil mineral nitrogen raises the possibility of higher N2O losses over the fallow period following significant rainfall.
Why do the trial?Agricultural soils are the main source of emission of the greenhouse gas (GHG) nitrous oxide (N2O) to the atmosphere. N2O is a potent GHG which lasts in the atmosphere for 114 years and has a global warming potential of approximately 300 times greater than that of carbon dioxide over a 100 year timescale. Agriculture accounts for 16% of Australia’s greenhouse gas emissions but produces 80% of Australia’s N2O emissions.
This project seeks to measure and quantify N2O emissions from wheat grown in rotation with canola, pulses and legume pastures at two sites in low and medium/high rainfall farming systems of the Eyre Peninsula, while assessing best management practices that local farmers can adopt to reduce the risk of N2O losses and ultimately improve the paddock’s crop productivity and gross margin.
How was it done?During the first year of the trial, the plots were sown to canola, legume pasture (annual medic/ sub clover) and pulses (lupins/peas)
and the data was presented in the Eyre Peninsula Farming Systems (EPFS) Summary 2013, p75. In 2014 (Table 1), both trial sites were sown to Mace wheat; 1Minnipa Agricultural Centre (MAC) on 12 May 2014 and 2Beaumont (near Wanilla) on 11 May 2014.
All treatments were replicated 3 times. Diammonium phosphate fertilizer (DAP) was applied at sowing; 50 kg/ha at MAC and 80 kg/ha at Beaumont. 21 units of nitrogen (N) were applied on the canola-wheat high input plots at MAC at growth stage 31 (15 July) and 56 units of N were applied at Beaumont on the canola-wheat high input treatment (28 units at sowing and 28 units at growth stage 31on 18 July).
N2O gas sampling was done 5 times at MAC (11 and 14 April; 14 May; 14 and 18 July). At Beaumont sampling was done 5 times; on 30 April, 2 and 13 May, 10 and 21 July). Associated measurements collected at the time of gas sampling included:• 0-10 cm and 10–30 cm soil
water content (mm)• Live crop biomass and stubble
biomass (t/ha)• Soil temperature (5 cm)• 0–10 cm and 10–30 cm soil
samples for mineral nitrogen (NH4 and NO3) analysis.
MAC trial was harvested on 5 November 2014 and Beaumont, on 25 November 2014.
Nitrous oxide emission levels in response to alternative crop rotationsBrian Dzoma1 and Roy Latta2
1SARDI, Minnipa Agricultural Centre, 2Dodgshun Medlin, Swan Hill, Victoria research
Location: Minnipa Ag Centre, Airport paddockRainfallAv. Annual: 325 mmAv. GSR: 241 mm2014 Total: 407 mm 2014 GSR: 290 mmPaddock History2013: Wheat (Mace)2012: Wheat (Kord)Soil TypeCalcareous red sandy loamPlot Size10m x 3m x 3 reps
Location: Wanilla: David GiddingsRainfallAv. Annual: 550 mmAv. GSR: 400 mm2014 Total: 437 mm 2014 GSR: 368 mmPaddock History2013: Canola2012: Wheat Soil TypeDuplex sand over loamPlot Size10m x 3m x 3 reps
Searching for answers
t
t
Table 1 Trial treatments and rotation crops
Year 1 crop Year 2 crop Treatment
1 canola-high input wheat Recommended yield potential rate of N
2 canola-low input wheat Recommended rate of N, nothing post seeding
31annual medic,
2sub cloverwheat Recommended rate of N, nothing post seeding
4 1field peas, 2lupins wheat Recommended rate of N, nothing post seeding
Brea
k Cr
ops
Eyre Peninsula Farming Systems 2014 Summary70
What happened?2013 N2O fluxes ranged from 0–38.9g N2O-N/ha/day (MAC) and 1.1–129.9 g N2O-N/ha/day (Beaumont). However the N2O fluxes for 2014 at both sites were much lower, ranging from 0.3–11.1 g N2O-N/ha/day at Beaumont and 0–4.7 g N2O-N/ha/day at MAC. The highest N2O fluxes occurred on the canola-wheat high input treatments. Mean N2O emissions were significantly higher on the canola-wheat high input treatment at Beaumont, but no significant differences in mean emissions were observed at MAC on all treatments (Table 2).
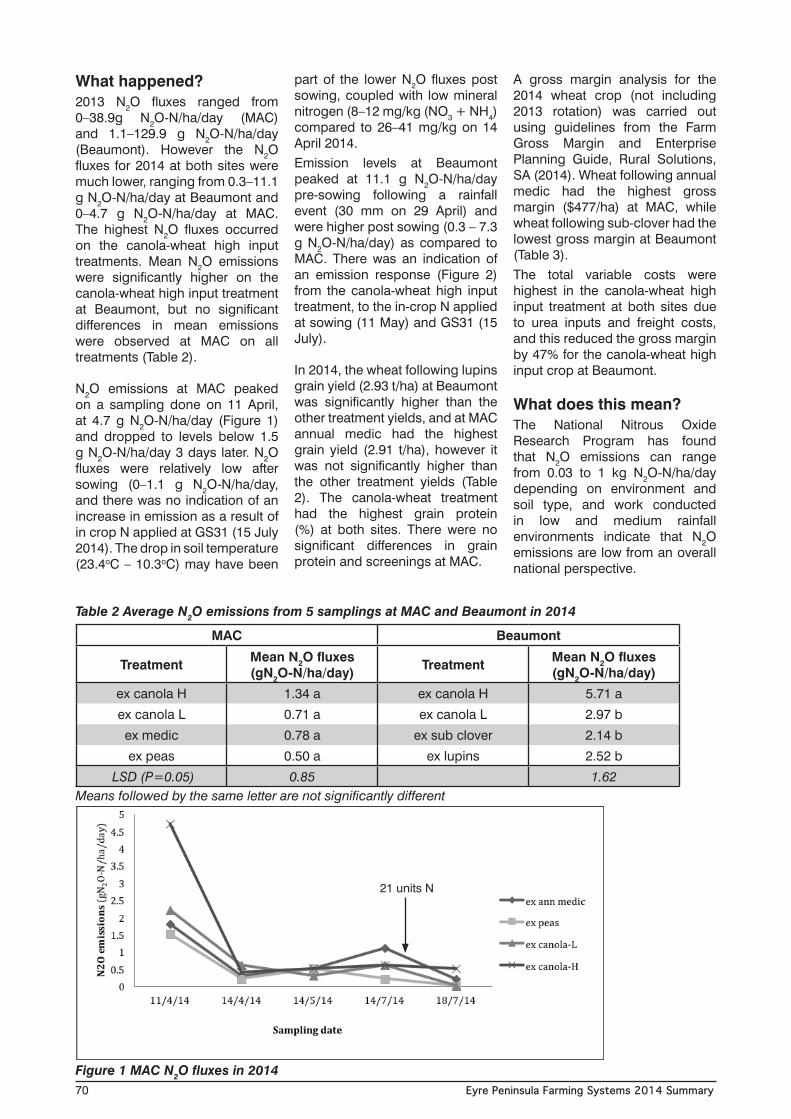
N2O emissions at MAC peaked on a sampling done on 11 April, at 4.7 g N2O-N/ha/day (Figure 1) and dropped to levels below 1.5 g N2O-N/ha/day 3 days later. N2O fluxes were relatively low after sowing (0–1.1 g N2O-N/ha/day, and there was no indication of an increase in emission as a result of in crop N applied at GS31 (15 July 2014). The drop in soil temperature (23.4oC – 10.3oC) may have been
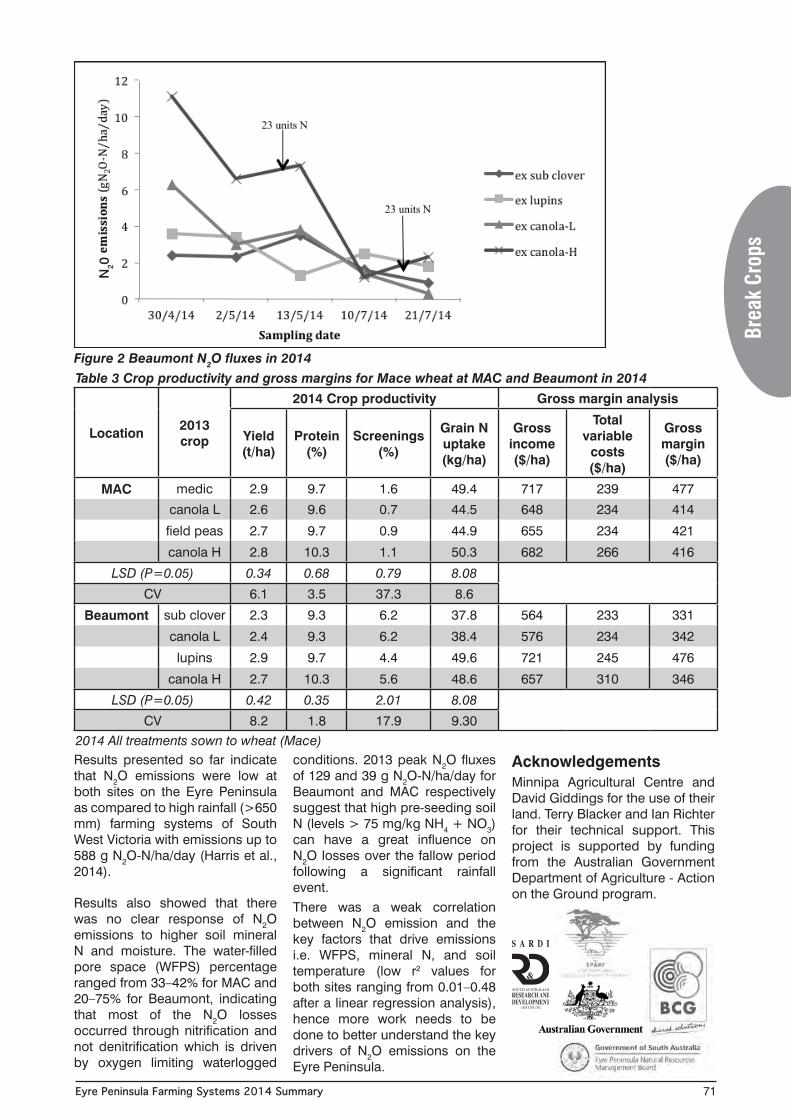
part of the lower N2O fluxes post sowing, coupled with low mineral nitrogen (8–12 mg/kg (NO3 + NH4) compared to 26–41 mg/kg on 14 April 2014.Emission levels at Beaumont peaked at 11.1 g N2O-N/ha/day pre-sowing following a rainfall event (30 mm on 29 April) and were higher post sowing (0.3 – 7.3 g N2O-N/ha/day) as compared to MAC. There was an indication of an emission response (Figure 2) from the canola-wheat high input treatment, to the in-crop N applied at sowing (11 May) and GS31 (15 July).
In 2014, the wheat following lupins grain yield (2.93 t/ha) at Beaumont was significantly higher than the other treatment yields, and at MAC annual medic had the highest grain yield (2.91 t/ha), however it was not significantly higher than the other treatment yields (Table 2). The canola-wheat treatment had the highest grain protein (%) at both sites. There were no significant differences in grain protein and screenings at MAC.
A gross margin analysis for the 2014 wheat crop (not including 2013 rotation) was carried out using guidelines from the Farm Gross Margin and Enterprise Planning Guide, Rural Solutions, SA (2014). Wheat following annual medic had the highest gross margin ($477/ha) at MAC, while wheat following sub-clover had the lowest gross margin at Beaumont (Table 3).The total variable costs were highest in the canola-wheat high input treatment at both sites due to urea inputs and freight costs, and this reduced the gross margin by 47% for the canola-wheat high input crop at Beaumont.
What does this mean?The National Nitrous Oxide Research Program has found that N2O emissions can range from 0.03 to 1 kg N2O-N/ha/day depending on environment and soil type, and work conducted in low and medium rainfall environments indicate that N2O emissions are low from an overall national perspective.
Table 2 Average N2O emissions from 5 samplings at MAC and Beaumont in 2014
MAC Beaumont
Treatment Mean N2O fluxes(gN2O-N/ha/day) Treatment Mean N2O fluxes
(gN2O-N/ha/day)
ex canola H 1.34 a ex canola H 5.71 a
ex canola L 0.71 a ex canola L 2.97 b
ex medic 0.78 a ex sub clover 2.14 b
ex peas 0.50 a ex lupins 2.52 b
LSD (P=0.05) 0.85 1.62Means followed by the same letter are not significantly different
Figure 1 MAC N2O fluxes in 2014
21 units N
Eyre Peninsula Farming Systems 2014 Summary 71
Results presented so far indicate that N2O emissions were low at both sites on the Eyre Peninsula as compared to high rainfall (>650 mm) farming systems of South West Victoria with emissions up to 588 g N2O-N/ha/day (Harris et al., 2014).
Results also showed that there was no clear response of N2O emissions to higher soil mineral N and moisture. The water-filled pore space (WFPS) percentage ranged from 33–42% for MAC and 20–75% for Beaumont, indicating that most of the N2O losses occurred through nitrification and not denitrification which is driven by oxygen limiting waterlogged
conditions. 2013 peak N2O fluxes of 129 and 39 g N2O-N/ha/day for Beaumont and MAC respectively suggest that high pre-seeding soil N (levels > 75 mg/kg NH4 + NO3) can have a great influence on N2O losses over the fallow period following a significant rainfall event.There was a weak correlation between N2O emission and the key factors that drive emissions i.e. WFPS, mineral N, and soil temperature (low r2 values for both sites ranging from 0.01–0.48 after a linear regression analysis), hence more work needs to be done to better understand the key drivers of N2O emissions on the Eyre Peninsula.
Acknowledgements Minnipa Agricultural Centre and David Giddings for the use of their land. Terry Blacker and Ian Richter for their technical support. This project is supported by funding from the Australian Government Department of Agriculture - Action on the Ground program.
Figure 2 Beaumont N2O fluxes in 2014Table 3 Crop productivity and gross margins for Mace wheat at MAC and Beaumont in 2014
Location 2013 crop
2014 Crop productivity Gross margin analysis
Yield (t/ha)
Protein (%)
Screenings (%)
Grain N uptake (kg/ha)
Gross income ($/ha)
Total variable
costs ($/ha)
Gross margin ($/ha)
MAC medic 2.9 9.7 1.6 49.4 717 239 477
canola L 2.6 9.6 0.7 44.5 648 234 414
field peas 2.7 9.7 0.9 44.9 655 234 421
canola H 2.8 10.3 1.1 50.3 682 266 416
LSD (P=0.05) 0.34 0.68 0.79 8.08
CV 6.1 3.5 37.3 8.6
Beaumont sub clover 2.3 9.3 6.2 37.8 564 233 331
canola L 2.4 9.3 6.2 38.4 576 234 342
lupins 2.9 9.7 4.4 49.6 721 245 476
canola H 2.7 10.3 5.6 48.6 657 310 346
LSD (P=0.05) 0.42 0.35 2.01 8.08
CV 8.2 1.8 17.9 9.302014 All treatments sown to wheat (Mace)
N20
Brea
k Cr
ops
Eyre Peninsula Farming Systems 2014 Summary72
Forage peas – a potential new break crop option for SA?Larn McMurray1, Leigh Davis2 and Michael Lines1
1SARDI, Clare, 2SARDI, Minnipa Agricultural Centre
RESEARCH
Key messages• The new forage field pea,
PBA Hayman performed poorly under high blackspot disease pressure in 2014. It appears to be less suited to conditions at Minnipa than it is to other parts of SA such as the Mid North, where it has shown higher biomass production potential than alternative field pea varieties (up to 70%), however it is more susceptible to black spot and has lower grain yields.
• Vetch varieties produced greater biomass than field peas at Minnipa over two years of evaluation, but field peas had equal or higher grain yields.
• Dual purpose field pea varieties offer the flexibility of a “forage” option if grain
yield is affected by seasonal stresses such as frost, and more established grain markets than vetch if taken through to harvest.
• Blackspot significantly reduced biomass production and most likely grain yield of field peas in 2014, particularly in PBA Hayman. Sowing dates of field peas in these environments need to be as early as possible around safe “black spot manager” predictions to avoid heavy disease infections in wet years.
• Kaspa and Morgan had similar biomass production levels to PBA Coogee but equal or higher grain yields, however PBA Coogee remains a dual purpose field pea option in disease prone areas due to improved resistance to bacterial blight and resistance to powdery mildew.
• Where sowing of field peas was delayed, biomass was maximised by increasing sowing densities above 50 plants/m2 with little negative effect on grain yield.
Why do the trial? These trials form part of a SAGIT funded project which aims to assess the potential of the newly released forage (PBA Hayman) and dual purpose (PBA Coogee) field pea varieties as alternatives to vetch and grain field peas. Outcomes from these trials and similar trials at Lameroo, Hart and Tarlee will be used to develop agronomic management guidelines to allow the successful production of these varieties in SA.
How was it done?Two forage experiments were undertaken at Minnipa in 2014 following on from similar trials held
in 2013. The first experiment aimed to compare field pea and vetch varieties for biomass and grain yield potential, and the second to determine optimum sowing dates and sowing densities for maximising biomass production of field pea varieties. In the first trial, four field pea varieties (Kaspa, Morgan, PBA Coogee and PBA Hayman) and four vetch varieties (Morava, Rasina, Capello and Volga) were sown at two sowing dates (5 May and 3 June). The second trial included the four field pea varieties sown at four plant densities (25, 50, 75 and 100 plants/m2) sown on the same dates. In both trials biomass measurements were taken during flowering and at maturity. Cuts during flowering were timed to correlate with early pod development (1-2 flat pods per plant, approximately 10-14 days after commencement of flowering). Final grain yield was also recorded.
All trials were sown with 59 kg/ha of DAP (18:20:0:0) and weeds and pests were controlled as required in line with standard field pea management.
What happened?Early growing season conditions at Minnipa were similar to those in 2013. Above average rainfall and warm temperatures favoured rapid early plant growth but also high levels of disease pressure. The ‘Blackspot Manager’ disease prediction for Minnipa at the early sowing date was for a medium risk level indicating that a yield loss in field peas of 20-35% could occur. Growing season rainfall (290 mm) and annual rainfall (407 mm) were both around 50 mm above average with almost all of this falling by the end of July. Moderate to high levels of early season black spot disease infection did occur and restricted early vegetative growth.
Location: Minnipa Ag CentreRainfallAv. Annual: 325 mmAv. GSR: 241 mm2014 Total: 407 mm 2014 GSR: 290 mmYieldPotential: Pulses 2.7 t/haActual: Peas 1.5 - 2.1 t/haPaddock History2013: Spray topped cereal2012: Barley2011: WheatSoil TypeRed loamPlot Size1.5m x 10m x 3 repsYield Limiting FactorsHigh black spot infection, late season moisture stress
Searching for answers
t
Eyre Peninsula Farming Systems 2014 Summary 73
Table 1 Flowering dates of field pea and vetch varieties, Minnipa 2014
Field PeaVariety Kaspa Morgan PBA Coogee PBA Hayman
5 May 17 Aug 18 Aug 11 Aug 5 Sep3 June 15 Sep 10 Sep 6 Sep 22 Sep
VetchVariety Morava Rasina Volga Capello5 May 11 Sep 4 Sep 4 Sep 13 Sep3 June 18 Sep 11 Sep 15 Sep 16 Sep
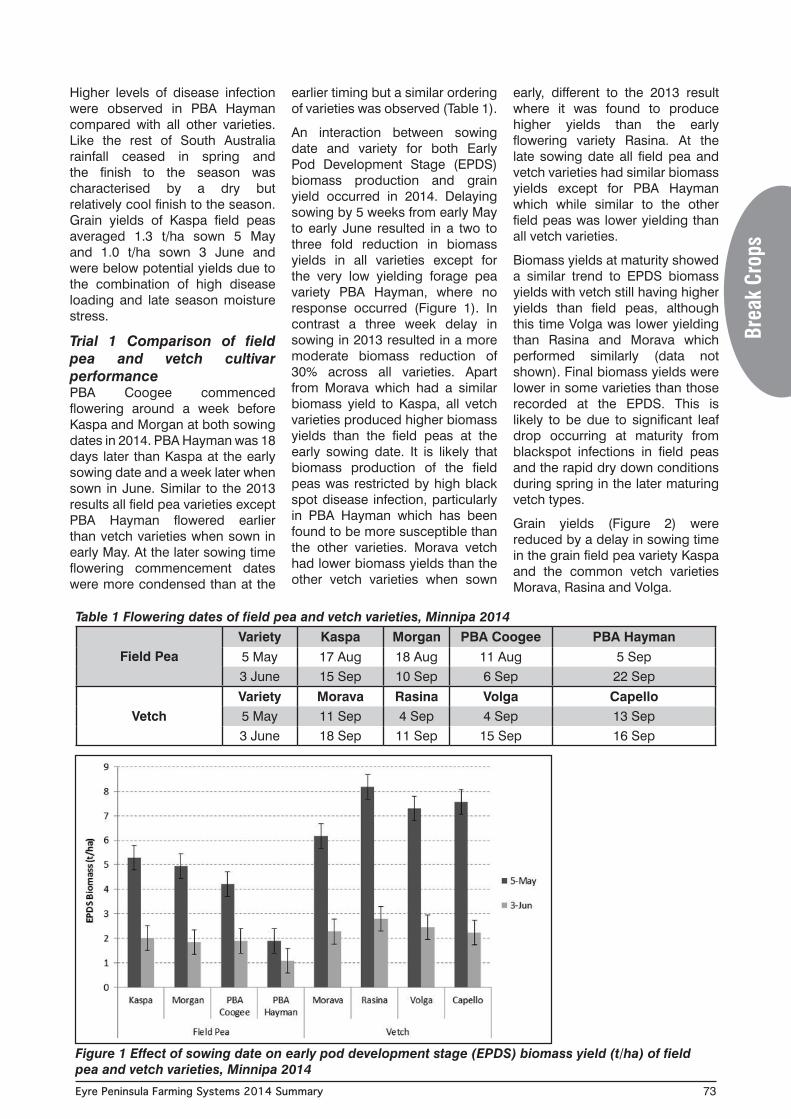
Higher levels of disease infection were observed in PBA Hayman compared with all other varieties. Like the rest of South Australia rainfall ceased in spring and the finish to the season was characterised by a dry but relatively cool finish to the season. Grain yields of Kaspa field peas averaged 1.3 t/ha sown 5 May and 1.0 t/ha sown 3 June and were below potential yields due to the combination of high disease loading and late season moisture stress.
Trial 1 Comparison of field pea and vetch cultivar performancePBA Coogee commenced flowering around a week before Kaspa and Morgan at both sowing dates in 2014. PBA Hayman was 18 days later than Kaspa at the early sowing date and a week later when sown in June. Similar to the 2013 results all field pea varieties except PBA Hayman flowered earlier than vetch varieties when sown in early May. At the later sowing time flowering commencement dates were more condensed than at the
earlier timing but a similar ordering of varieties was observed (Table 1).
An interaction between sowing date and variety for both Early Pod Development Stage (EPDS) biomass production and grain yield occurred in 2014. Delaying sowing by 5 weeks from early May to early June resulted in a two to three fold reduction in biomass yields in all varieties except for the very low yielding forage pea variety PBA Hayman, where no response occurred (Figure 1). In contrast a three week delay in sowing in 2013 resulted in a more moderate biomass reduction of 30% across all varieties. Apart from Morava which had a similar biomass yield to Kaspa, all vetch varieties produced higher biomass yields than the field peas at the early sowing date. It is likely that biomass production of the field peas was restricted by high black spot disease infection, particularly in PBA Hayman which has been found to be more susceptible than the other varieties. Morava vetch had lower biomass yields than the other vetch varieties when sown
early, different to the 2013 result where it was found to produce higher yields than the early flowering variety Rasina. At the late sowing date all field pea and vetch varieties had similar biomass yields except for PBA Hayman which while similar to the other field peas was lower yielding than all vetch varieties.
Biomass yields at maturity showed a similar trend to EPDS biomass yields with vetch still having higher yields than field peas, although this time Volga was lower yielding than Rasina and Morava which performed similarly (data not shown). Final biomass yields were lower in some varieties than those recorded at the EPDS. This is likely to be due to significant leaf drop occurring at maturity from blackspot infections in field peas and the rapid dry down conditions during spring in the later maturing vetch types.
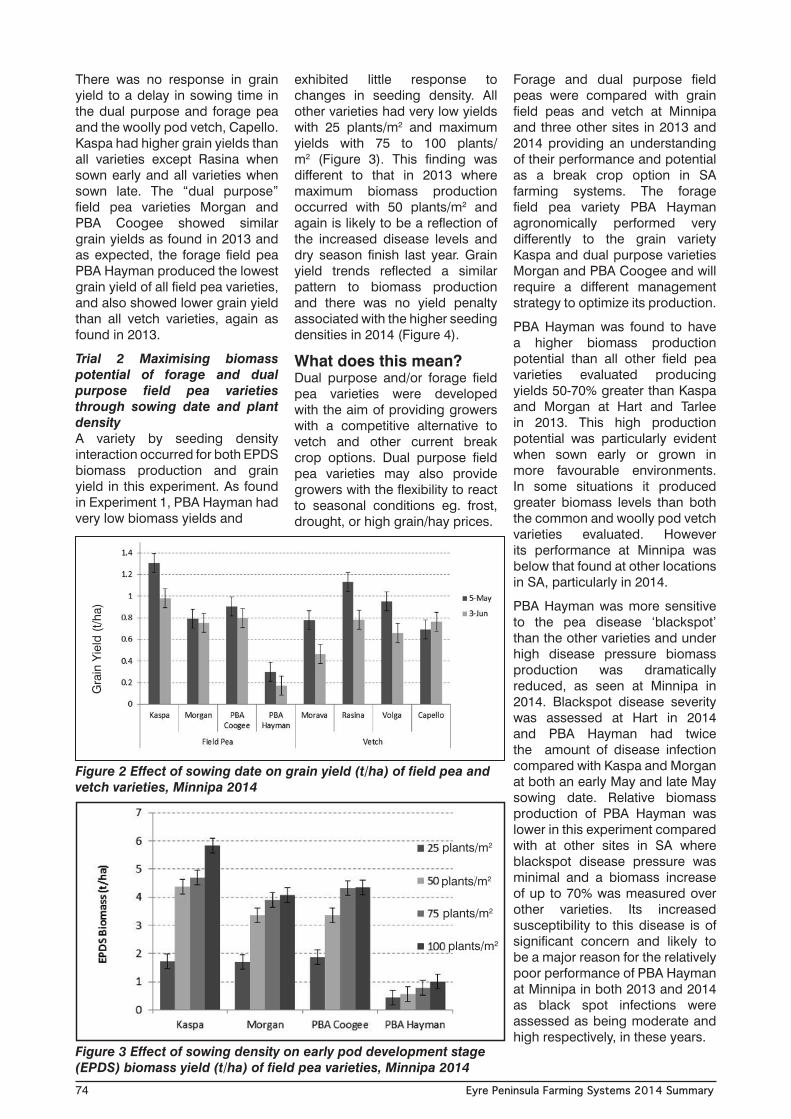
Grain yields (Figure 2) were reduced by a delay in sowing time in the grain field pea variety Kaspa and the common vetch varieties Morava, Rasina and Volga.
Figure 1 Effect of sowing date on early pod development stage (EPDS) biomass yield (t/ha) of field pea and vetch varieties, Minnipa 2014
Brea
k Cr
ops
Eyre Peninsula Farming Systems 2014 Summary74
There was no response in grain yield to a delay in sowing time in the dual purpose and forage pea and the woolly pod vetch, Capello. Kaspa had higher grain yields than all varieties except Rasina when sown early and all varieties when sown late. The “dual purpose” field pea varieties Morgan and PBA Coogee showed similar grain yields as found in 2013 and as expected, the forage field pea PBA Hayman produced the lowest grain yield of all field pea varieties, and also showed lower grain yield than all vetch varieties, again as found in 2013.
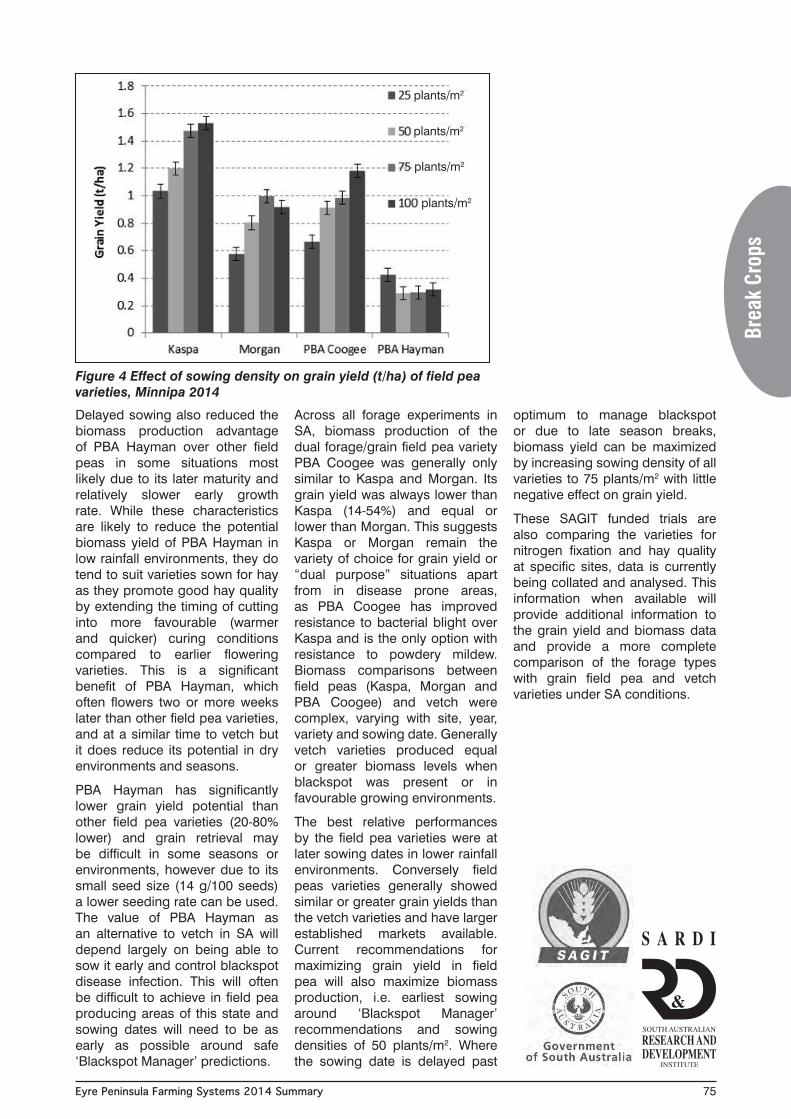
Trial 2 Maximising biomass potential of forage and dual purpose field pea varieties through sowing date and plant densityA variety by seeding density interaction occurred for both EPDS biomass production and grain yield in this experiment. As found in Experiment 1, PBA Hayman had very low biomass yields and
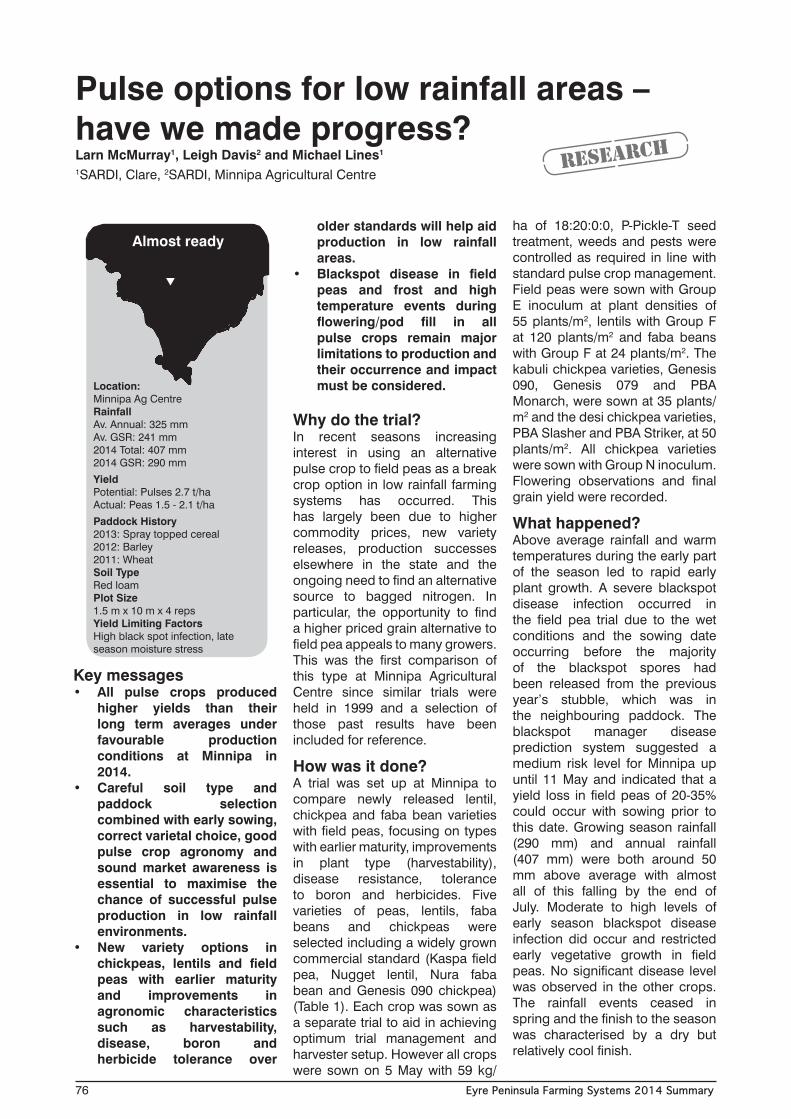
exhibited little response to changes in seeding density. All other varieties had very low yields with 25 plants/m2 and maximum yields with 75 to 100 plants/m2 (Figure 3). This finding was different to that in 2013 where maximum biomass production occurred with 50 plants/m2 and again is likely to be a reflection of the increased disease levels and dry season finish last year. Grain yield trends reflected a similar pattern to biomass production and there was no yield penalty associated with the higher seeding densities in 2014 (Figure 4).
What does this mean?Dual purpose and/or forage field pea varieties were developed with the aim of providing growers with a competitive alternative to vetch and other current break crop options. Dual purpose field pea varieties may also provide growers with the flexibility to react to seasonal conditions eg. frost, drought, or high grain/hay prices.
Forage and dual purpose field peas were compared with grain field peas and vetch at Minnipa and three other sites in 2013 and 2014 providing an understanding of their performance and potential as a break crop option in SA farming systems. The forage field pea variety PBA Hayman agronomically performed very differently to the grain variety Kaspa and dual purpose varieties Morgan and PBA Coogee and will require a different management strategy to optimize its production.
PBA Hayman was found to have a higher biomass production potential than all other field pea varieties evaluated producing yields 50-70% greater than Kaspa and Morgan at Hart and Tarlee in 2013. This high production potential was particularly evident when sown early or grown in more favourable environments. In some situations it produced greater biomass levels than both the common and woolly pod vetch varieties evaluated. However its performance at Minnipa was below that found at other locations in SA, particularly in 2014.
PBA Hayman was more sensitive to the pea disease ‘blackspot’ than the other varieties and under high disease pressure biomass production was dramatically reduced, as seen at Minnipa in 2014. Blackspot disease severity was assessed at Hart in 2014 and PBA Hayman had twice the amount of disease infection compared with Kaspa and Morgan at both an early May and late May sowing date. Relative biomass production of PBA Hayman was lower in this experiment compared with at other sites in SA where blackspot disease pressure was minimal and a biomass increase of up to 70% was measured over other varieties. Its increased susceptibility to this disease is of significant concern and likely to be a major reason for the relatively poor performance of PBA Hayman at Minnipa in both 2013 and 2014 as black spot infections were assessed as being moderate and high respectively, in these years.
Figure 2 Effect of sowing date on grain yield (t/ha) of field pea and vetch varieties, Minnipa 2014
Figure 3 Effect of sowing density on early pod development stage (EPDS) biomass yield (t/ha) of field pea varieties, Minnipa 2014
Gra
in Y
ield
(t/h
a)
plants/m2
plants/m2
plants/m2
plants/m2
Eyre Peninsula Farming Systems 2014 Summary 75
Figure 4 Effect of sowing density on grain yield (t/ha) of field pea varieties, Minnipa 2014
Delayed sowing also reduced the biomass production advantage of PBA Hayman over other field peas in some situations most likely due to its later maturity and relatively slower early growth rate. While these characteristics are likely to reduce the potential biomass yield of PBA Hayman in low rainfall environments, they do tend to suit varieties sown for hay as they promote good hay quality by extending the timing of cutting into more favourable (warmer and quicker) curing conditions compared to earlier flowering varieties. This is a significant benefit of PBA Hayman, which often flowers two or more weeks later than other field pea varieties, and at a similar time to vetch but it does reduce its potential in dry environments and seasons.
PBA Hayman has significantly lower grain yield potential than other field pea varieties (20-80% lower) and grain retrieval may be difficult in some seasons or environments, however due to its small seed size (14 g/100 seeds) a lower seeding rate can be used. The value of PBA Hayman as an alternative to vetch in SA will depend largely on being able to sow it early and control blackspot disease infection. This will often be difficult to achieve in field pea producing areas of this state and sowing dates will need to be as early as possible around safe ‘Blackspot Manager’ predictions.
Across all forage experiments in SA, biomass production of the dual forage/grain field pea variety PBA Coogee was generally only similar to Kaspa and Morgan. Its grain yield was always lower than Kaspa (14-54%) and equal or lower than Morgan. This suggests Kaspa or Morgan remain the variety of choice for grain yield or “dual purpose” situations apart from in disease prone areas, as PBA Coogee has improved resistance to bacterial blight over Kaspa and is the only option with resistance to powdery mildew. Biomass comparisons between field peas (Kaspa, Morgan and PBA Coogee) and vetch were complex, varying with site, year, variety and sowing date. Generally vetch varieties produced equal or greater biomass levels when blackspot was present or in favourable growing environments.
The best relative performances by the field pea varieties were at later sowing dates in lower rainfall environments. Conversely field peas varieties generally showed similar or greater grain yields than the vetch varieties and have larger established markets available. Current recommendations for maximizing grain yield in field pea will also maximize biomass production, i.e. earliest sowing around ‘Blackspot Manager’ recommendations and sowing densities of 50 plants/m2. Where the sowing date is delayed past
optimum to manage blackspot or due to late season breaks, biomass yield can be maximized by increasing sowing density of all varieties to 75 plants/m2 with little negative effect on grain yield.
These SAGIT funded trials are also comparing the varieties for nitrogen fixation and hay quality at specific sites, data is currently being collated and analysed. This information when available will provide additional information to the grain yield and biomass data and provide a more complete comparison of the forage types with grain field pea and vetch varieties under SA conditions.
plants/m2
plants/m2
plants/m2
plants/m2
Brea
k Cr
ops
Eyre Peninsula Farming Systems 2014 Summary76
Key messages • All pulse crops produced
higher yields than their long term averages under favourable production conditions at Minnipa in 2014.
• Careful soil type and paddock selection combined with early sowing, correct varietal choice, good pulse crop agronomy and sound market awareness is essential to maximise the chance of successful pulse production in low rainfall environments.
• New variety options in chickpeas, lentils and field peas with earlier maturity and improvements in agronomic characteristics such as harvestability, disease, boron and herbicide tolerance over
older standards will help aid production in low rainfall areas.
• Blackspot disease in field peas and frost and high temperature events during flowering/pod fill in all pulse crops remain major limitations to production and their occurrence and impact must be considered.
Why do the trial? In recent seasons increasing interest in using an alternative pulse crop to field peas as a break crop option in low rainfall farming systems has occurred. This has largely been due to higher commodity prices, new variety releases, production successes elsewhere in the state and the ongoing need to find an alternative source to bagged nitrogen. In particular, the opportunity to find a higher priced grain alternative to field pea appeals to many growers. This was the first comparison of this type at Minnipa Agricultural Centre since similar trials were held in 1999 and a selection of those past results have been included for reference.
How was it done?A trial was set up at Minnipa to compare newly released lentil, chickpea and faba bean varieties with field peas, focusing on types with earlier maturity, improvements in plant type (harvestability), disease resistance, tolerance to boron and herbicides. Five varieties of peas, lentils, faba beans and chickpeas were selected including a widely grown commercial standard (Kaspa field pea, Nugget lentil, Nura faba bean and Genesis 090 chickpea) (Table 1). Each crop was sown as a separate trial to aid in achieving optimum trial management and harvester setup. However all crops were sown on 5 May with 59 kg/
ha of 18:20:0:0, P-Pickle-T seed treatment, weeds and pests were controlled as required in line with standard pulse crop management. Field peas were sown with Group E inoculum at plant densities of 55 plants/m2, lentils with Group F at 120 plants/m2 and faba beans with Group F at 24 plants/m2. The kabuli chickpea varieties, Genesis 090, Genesis 079 and PBA Monarch, were sown at 35 plants/m2 and the desi chickpea varieties, PBA Slasher and PBA Striker, at 50 plants/m2. All chickpea varieties were sown with Group N inoculum. Flowering observations and final grain yield were recorded.
What happened?Above average rainfall and warm temperatures during the early part of the season led to rapid early plant growth. A severe blackspot disease infection occurred in the field pea trial due to the wet conditions and the sowing date occurring before the majority of the blackspot spores had been released from the previous year’s stubble, which was in the neighbouring paddock. The blackspot manager disease prediction system suggested a medium risk level for Minnipa up until 11 May and indicated that a yield loss in field peas of 20-35% could occur with sowing prior to this date. Growing season rainfall (290 mm) and annual rainfall (407 mm) were both around 50 mm above average with almost all of this falling by the end of July. Moderate to high levels of early season blackspot disease infection did occur and restricted early vegetative growth in field peas. No significant disease level was observed in the other crops. The rainfall events ceased in spring and the finish to the season was characterised by a dry but relatively cool finish.
Pulse options for low rainfall areas – have we made progress?Larn McMurray1, Leigh Davis2 and Michael Lines1
1SARDI, Clare, 2SARDI, Minnipa Agricultural CentreResearch
Location: Minnipa Ag CentreRainfallAv. Annual: 325 mmAv. GSR: 241 mm2014 Total: 407 mm2014 GSR: 290 mm
YieldPotential: Pulses 2.7 t/haActual: Peas 1.5 - 2.1 t/ha
Paddock History2013: Spray topped cereal2012: Barley2011: WheatSoil TypeRed loamPlot Size1.5 m x 10 m x 4 repsYield Limiting FactorsHigh black spot infection, late season moisture stress
Almost ready
t
Eyre Peninsula Farming Systems 2014 Summary 77
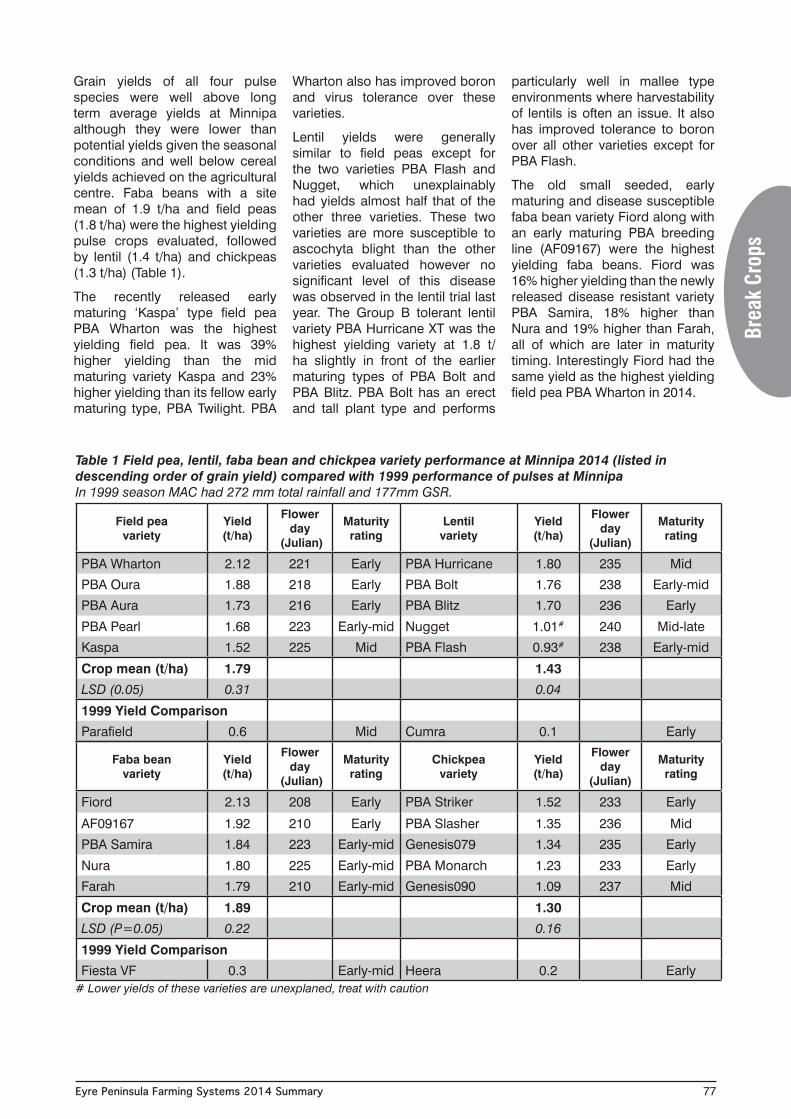
Grain yields of all four pulse species were well above long term average yields at Minnipa although they were lower than potential yields given the seasonal conditions and well below cereal yields achieved on the agricultural centre. Faba beans with a site mean of 1.9 t/ha and field peas (1.8 t/ha) were the highest yielding pulse crops evaluated, followed by lentil (1.4 t/ha) and chickpeas (1.3 t/ha) (Table 1).
The recently released early maturing ‘Kaspa’ type field pea PBA Wharton was the highest yielding field pea. It was 39% higher yielding than the mid maturing variety Kaspa and 23% higher yielding than its fellow early maturing type, PBA Twilight. PBA
Wharton also has improved boron and virus tolerance over these varieties.
Lentil yields were generally similar to field peas except for the two varieties PBA Flash and Nugget, which unexplainably had yields almost half that of the other three varieties. These two varieties are more susceptible to ascochyta blight than the other varieties evaluated however no significant level of this disease was observed in the lentil trial last year. The Group B tolerant lentil variety PBA Hurricane XT was the highest yielding variety at 1.8 t/ha slightly in front of the earlier maturing types of PBA Bolt and PBA Blitz. PBA Bolt has an erect and tall plant type and performs
particularly well in mallee type environments where harvestability of lentils is often an issue. It also has improved tolerance to boron over all other varieties except for PBA Flash.
The old small seeded, early maturing and disease susceptible faba bean variety Fiord along with an early maturing PBA breeding line (AF09167) were the highest yielding faba beans. Fiord was 16% higher yielding than the newly released disease resistant variety PBA Samira, 18% higher than Nura and 19% higher than Farah, all of which are later in maturity timing. Interestingly Fiord had the same yield as the highest yielding field pea PBA Wharton in 2014.
Field peavariety
Yield (t/ha)
Flower day
(Julian)
Maturity rating
Lentilvariety
Yield (t/ha)
Flower day
(Julian)
Maturity rating
PBA Wharton 2.12 221 Early PBA Hurricane 1.80 235 Mid
PBA Oura 1.88 218 Early PBA Bolt 1.76 238 Early-mid
PBA Aura 1.73 216 Early PBA Blitz 1.70 236 Early
PBA Pearl 1.68 223 Early-mid Nugget 1.01# 240 Mid-late
Kaspa 1.52 225 Mid PBA Flash 0.93# 238 Early-mid
Crop mean (t/ha) 1.79 1.43
LSD (0.05) 0.31 0.04
1999 Yield Comparison
Parafield 0.6 Mid Cumra 0.1 Early
Brea
k Cr
ops
Table 1 Field pea, lentil, faba bean and chickpea variety performance at Minnipa 2014 (listed in descending order of grain yield) compared with 1999 performance of pulses at MinnipaIn 1999 season MAC had 272 mm total rainfall and 177mm GSR.
Faba beanvariety
Yield (t/ha)
Flower day
(Julian)
Maturity rating
Chickpeavariety
Yield (t/ha)
Flower day
(Julian)
Maturity rating
Fiord 2.13 208 Early PBA Striker 1.52 233 Early
AF09167 1.92 210 Early PBA Slasher 1.35 236 Mid
PBA Samira 1.84 223 Early-mid Genesis079 1.34 235 Early
Nura 1.80 225 Early-mid PBA Monarch 1.23 233 Early
Farah 1.79 210 Early-mid Genesis090 1.09 237 Mid
Crop mean (t/ha) 1.89 1.30
LSD (P=0.05) 0.22 0.16
1999 Yield Comparison
Fiesta VF 0.3 Early-mid Heera 0.2 Early# Lower yields of these varieties are unexplaned, treat with caution
Eyre Peninsula Farming Systems 2014 Summary78
Chickpeas were the lowest yielding of the four crops evaluated and also have the latest maturity timing. The early maturing desi variety PBA Striker was the highest yielding variety some 13% higher yielding than the mid maturing desi type PBA Slasher. The small seeded early maturing kabuli Genesis 079 and the medium seeded early maturing kabuli type PBA Monarch yielded similarly and higher than the mid maturing small seeded ascochyta blight resistant type Genesis 090.
What does this mean?Grain yields of all pulses evaluated in 2014 were very much higher than their long term averages and also than those achieved in 1999, the last time these four pulse types were compared at Minnipa. The higher yields achieved last year are largely a result of the more favourable season that occurred in 2014 compared with 1999. The growing season rainfall was 85 mm higher in 2014 and annual rainfall 144 mm higher than 1999. Another major factor was the earlier sowing date in 2014 (5 May) compared with 28 May in 1999. Previous studies on upper Eyre Peninsula have shown that field pea yield is reduced by between 0.1–0.2 t/ha for every week sowing is delayed. The other critical seasonal difference in 2014 was the absence of hot days during the flowering and grain fill period. In 1999 a severe hot day in early September (330C) drove crops rapidly towards premature maturity, the absence of these types of events in 2014 allowed crops to finish last year despite the lack of significant rainfall after July.
Under favourable conditions there was little separation in grain yield between the pulse types in 2014. Field pea yields are likely to have been reduced by the high disease infection that occurred last year while the later maturing chickpeas were lower yielding than all other crops. Generally earlier maturing varieties yielded higher than those maturing later across all crops and this reflected the dry finish to the season. Apart from in faba beans recent early maturing variety releases (PBA Wharton & PBA
Oura field peas, PBA Blitz, PBA Bolt & PBA Hurricane lentils and PBA Striker and PBA Monarch chickpea) were all higher yielding than the older standard later maturing varieties (Kaspa field peas, Nugget lentils and Genesis 090 chickpeas). This reflects recent good progress being made by the relevant PBA breeding programs particularly when considering that a number of these varieties also contain agronomic improvements such as boron tolerance, disease resistance, harvestability and in the case of PBA Hurricane XT, herbicide tolerance. The PBA faba bean program is targeting medium to higher rainfall production areas with a large emphasis on improving disease resistance and seed quality and recent releases have not been aimed at low rainfall environments.
In previous years PBA Wharton has generally performed similar to PBA Twilight and Kaspa at Minnipa, however it was the highest yielding variety last year. It also was high yielding at many other sites in SA in 2014 most likely due to it being well suited to ‘favourable’ short season environments due to its early maturity and slightly lower biomass production than Kaspa. Its suitability to years with lower winter rainfall levels is still questionable and requires further evaluation on the upper Eyre Peninsula. Its combination of early maturity, boron tolerance and virus resistance makes it well suited to the lower rainfall regions and it has performed well in the Victorian mallee over a number of years.
Clearly the results in Table 1 show that successful and potentially profitable pulse crops can be grown in some regions of the low rainfall zone given favourable season conditions. Despite only similar yields to other crops in 2014, field pea remains the best adapted pulse to these regions, particularly in lower rainfall seasons due to their higher levels of winter biomass production and broader soil type adaptation. Pulses are not suited to all soil types in the low rainfall regions and should be targeted at the better loamy soil
types free of herbicide residues, sticks and stones. Early sowing dates are also critical to maximise success but as seen in 2014 consideration of black spot risk is required with field peas particularly in the more reliable production areas and where sown in close proximity to the previous year’s pea stubble. Frost risk also needs careful consideration. Faba beans are the least susceptible to frost but still incur yield loss and the other three pulse options are all susceptible. Delayed sowing does not guarantee frost avoidance and areas prone to regular frost events should be avoided. Dual purpose field peas, forage peas or vetch all provide alternative options to the straight grain crops for these areas. Lentil, faba bean and chickpea despite varietal improvements and a similar performance to field pea at Minnipa in 2014 remain suited to the better soil types and more reliable production areas of Eyre Peninsula. Outside of this they are at best opportunistic options in years with early season breaks and favourable seasonal outlooks. Where they are grown, correct varietal choice will be critical to success. Earlier maturing varieties with improvements in disease, boron and in particular improved height and lodging resistance to aid harvestability will all help to increase the chances of success and should be used where available. Timely insect control and harvest is critical to maximise yield and reduce seed quality down grading. Growers also need to be aware of the specific market requirements for pulses including limitations with market access, often on farm storage will be required until the appropriate market is secured.
Eyre Peninsula Farming Systems 2014 Summary 79
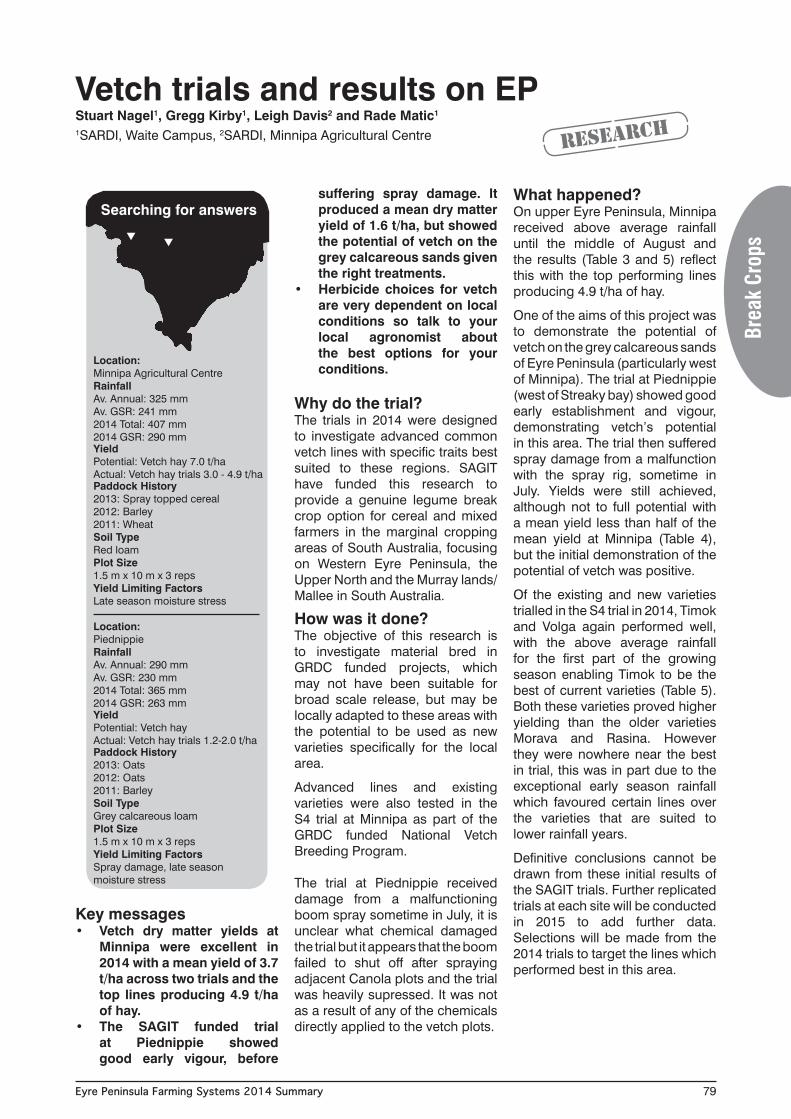
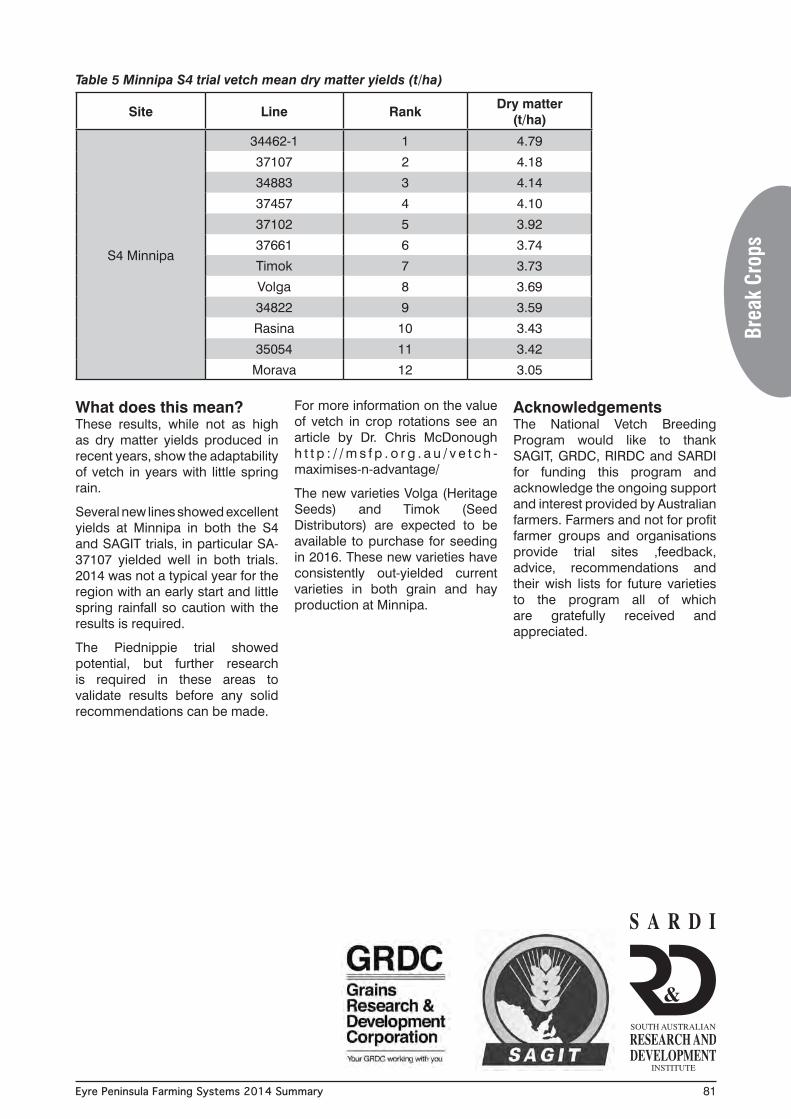
Key messages • Vetch dry matter yields at
Minnipa were excellent in 2014 with a mean yield of 3.7 t/ha across two trials and the top lines producing 4.9 t/ha of hay.
• The SAGIT funded trial at Piednippie showed good early vigour, before
suffering spray damage. It produced a mean dry matter yield of 1.6 t/ha, but showed the potential of vetch on the grey calcareous sands given the right treatments.
• Herbicide choices for vetch are very dependent on local conditions so talk to your local agronomist about the best options for your conditions.
Why do the trial?The trials in 2014 were designed to investigate advanced common vetch lines with specific traits best suited to these regions. SAGIT have funded this research to provide a genuine legume break crop option for cereal and mixed farmers in the marginal cropping areas of South Australia, focusing on Western Eyre Peninsula, the Upper North and the Murray lands/ Mallee in South Australia.
How was it done?The objective of this research is to investigate material bred in GRDC funded projects, which may not have been suitable for broad scale release, but may be locally adapted to these areas with the potential to be used as new varieties specifically for the local area.
Advanced lines and existing varieties were also tested in the S4 trial at Minnipa as part of the GRDC funded National Vetch Breeding Program.
The trial at Piednippie received damage from a malfunctioning boom spray sometime in July, it is unclear what chemical damaged the trial but it appears that the boom failed to shut off after spraying adjacent Canola plots and the trial was heavily supressed. It was not as a result of any of the chemicals directly applied to the vetch plots.
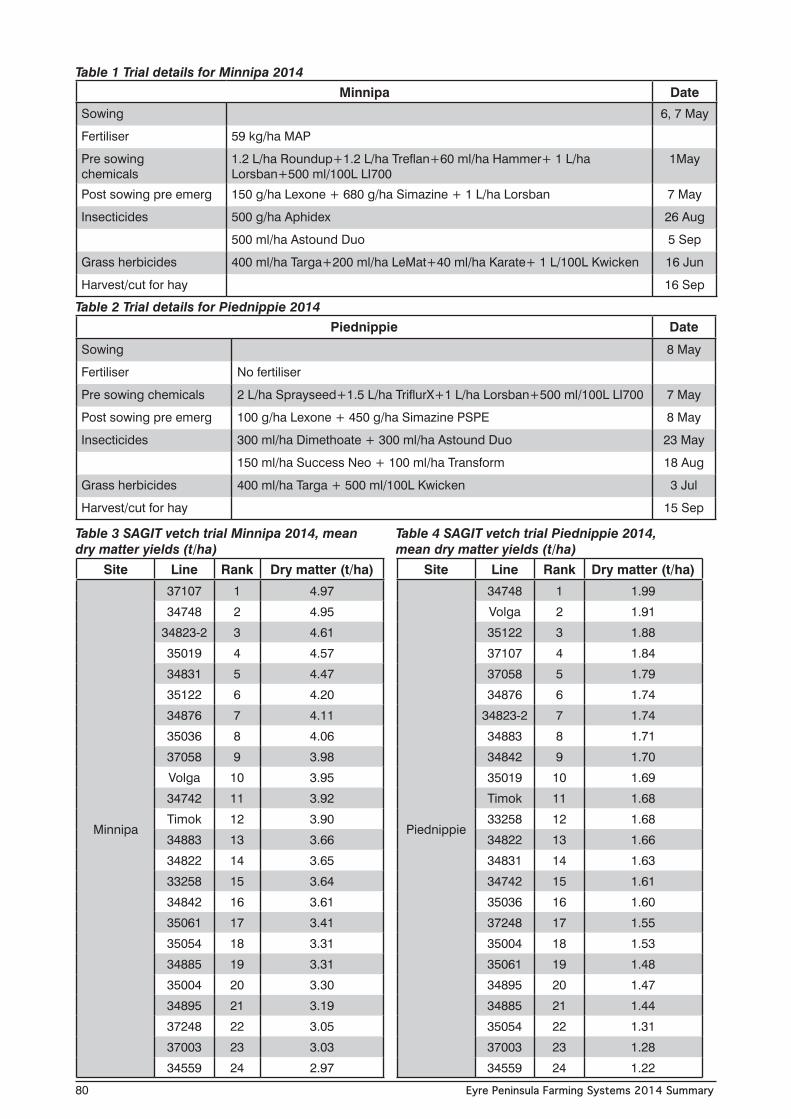
What happened?On upper Eyre Peninsula, Minnipa received above average rainfall until the middle of August and the results (Table 3 and 5) reflect this with the top performing lines producing 4.9 t/ha of hay.
One of the aims of this project was to demonstrate the potential of vetch on the grey calcareous sands of Eyre Peninsula (particularly west of Minnipa). The trial at Piednippie (west of Streaky bay) showed good early establishment and vigour, demonstrating vetch’s potential in this area. The trial then suffered spray damage from a malfunction with the spray rig, sometime in July. Yields were still achieved, although not to full potential with a mean yield less than half of the mean yield at Minnipa (Table 4), but the initial demonstration of the potential of vetch was positive.
Of the existing and new varieties trialled in the S4 trial in 2014, Timok and Volga again performed well, with the above average rainfall for the first part of the growing season enabling Timok to be the best of current varieties (Table 5). Both these varieties proved higher yielding than the older varieties Morava and Rasina. However they were nowhere near the best in trial, this was in part due to the exceptional early season rainfall which favoured certain lines over the varieties that are suited to lower rainfall years.
Definitive conclusions cannot be drawn from these initial results of the SAGIT trials. Further replicated trials at each site will be conducted in 2015 to add further data. Selections will be made from the 2014 trials to target the lines which performed best in this area.
Vetch trials and results on EP Stuart Nagel1, Gregg Kirby1, Leigh Davis2 and Rade Matic1
1SARDI, Waite Campus, 2SARDI, Minnipa Agricultural Centre Research
Location: Minnipa Agricultural CentreRainfallAv. Annual: 325 mmAv. GSR: 241 mm2014 Total: 407 mm2014 GSR: 290 mmYieldPotential: Vetch hay 7.0 t/haActual: Vetch hay trials 3.0 - 4.9 t/haPaddock History2013: Spray topped cereal2012: Barley2011: WheatSoil TypeRed loamPlot Size1.5 m x 10 m x 3 repsYield Limiting FactorsLate season moisture stress
Location: PiednippieRainfallAv. Annual: 290 mmAv. GSR: 230 mm2014 Total: 365 mm2014 GSR: 263 mmYieldPotential: Vetch hayActual: Vetch hay trials 1.2-2.0 t/haPaddock History2013: Oats2012: Oats2011: BarleySoil TypeGrey calcareous loamPlot Size1.5 m x 10 m x 3 repsYield Limiting FactorsSpray damage, late season moisture stress
Searching for answers
tt
Brea
k Cr
ops
Eyre Peninsula Farming Systems 2014 Summary80
Minnipa Date
Sowing 6, 7 May
Fertiliser 59 kg/ha MAP
Pre sowing chemicals
1.2 L/ha Roundup+1.2 L/ha Treflan+60 ml/ha Hammer+ 1 L/ha Lorsban+500 ml/100L LI700
1May
Post sowing pre emerg 150 g/ha Lexone + 680 g/ha Simazine + 1 L/ha Lorsban 7 May
Insecticides 500 g/ha Aphidex 26 Aug
500 ml/ha Astound Duo 5 Sep
Grass herbicides 400 ml/ha Targa+200 ml/ha LeMat+40 ml/ha Karate+ 1 L/100L Kwicken 16 Jun
Harvest/cut for hay 16 Sep
Table 1 Trial details for Minnipa 2014
Table 2 Trial details for Piednippie 2014Piednippie Date
Sowing 8 May
Fertiliser No fertiliser
Pre sowing chemicals 2 L/ha Sprayseed+1.5 L/ha TriflurX+1 L/ha Lorsban+500 ml/100L LI700 7 May
Post sowing pre emerg 100 g/ha Lexone + 450 g/ha Simazine PSPE 8 May
Insecticides 300 ml/ha Dimethoate + 300 ml/ha Astound Duo 23 May
150 ml/ha Success Neo + 100 ml/ha Transform 18 Aug
Grass herbicides 400 ml/ha Targa + 500 ml/100L Kwicken 3 Jul
Harvest/cut for hay 15 Sep
Table 3 SAGIT vetch trial Minnipa 2014, mean dry matter yields (t/ha)
Site Line Rank Dry matter (t/ha)
Minnipa
37107 1 4.97
34748 2 4.95
34823-2 3 4.61
35019 4 4.57
34831 5 4.47
35122 6 4.20
34876 7 4.11
35036 8 4.06
37058 9 3.98
Volga 10 3.95
34742 11 3.92
Timok 12 3.90
34883 13 3.66
34822 14 3.65
33258 15 3.64
34842 16 3.61
35061 17 3.41
35054 18 3.31
34885 19 3.31
35004 20 3.30
34895 21 3.19
37248 22 3.05
37003 23 3.03
34559 24 2.97
Table 4 SAGIT vetch trial Piednippie 2014, mean dry matter yields (t/ha)
Site Line Rank Dry matter (t/ha)
Piednippie
34748 1 1.99
Volga 2 1.91
35122 3 1.88
37107 4 1.84
37058 5 1.79
34876 6 1.74
34823-2 7 1.74
34883 8 1.71
34842 9 1.70
35019 10 1.69
Timok 11 1.68
33258 12 1.68
34822 13 1.66
34831 14 1.63
34742 15 1.61
35036 16 1.60
37248 17 1.55
35004 18 1.53
35061 19 1.48
34895 20 1.47
34885 21 1.44
35054 22 1.31
37003 23 1.28
34559 24 1.22
Eyre Peninsula Farming Systems 2014 Summary 81
Site Line Rank Dry matter (t/ha)
S4 Minnipa
34462-1 1 4.79
37107 2 4.18
34883 3 4.14
37457 4 4.10
37102 5 3.92
37661 6 3.74
Timok 7 3.73
Volga 8 3.69
34822 9 3.59
Rasina 10 3.43
35054 11 3.42
Morava 12 3.05
What does this mean?These results, while not as high as dry matter yields produced in recent years, show the adaptability of vetch in years with little spring rain.
Several new lines showed excellent yields at Minnipa in both the S4 and SAGIT trials, in particular SA-37107 yielded well in both trials. 2014 was not a typical year for the region with an early start and little spring rainfall so caution with the results is required.
The Piednippie trial showed potential, but further research is required in these areas to validate results before any solid recommendations can be made.
For more information on the value of vetch in crop rotations see an article by Dr. Chris McDonough h t t p : / / m s f p . o r g . a u / v e t c h -maximises-n-advantage/
The new varieties Volga (Heritage Seeds) and Timok (Seed Distributors) are expected to be available to purchase for seeding in 2016. These new varieties have consistently out-yielded current varieties in both grain and hay production at Minnipa.
Acknowledgements The National Vetch Breeding Program would like to thank SAGIT, GRDC, RIRDC and SARDI for funding this program and acknowledge the ongoing support and interest provided by Australian farmers. Farmers and not for profit farmer groups and organisations provide trial sites ,feedback, advice, recommendations and their wish lists for future varieties to the program all of which are gratefully received and appreciated.
Table 5 Minnipa S4 trial vetch mean dry matter yields (t/ha)
Brea
k Cr
ops
Eyre Peninsula Farming Systems 2014 Summary82
Key messages • Grain legume growers
are urged to take plant samples in late winter/early springtime to assess root nodulation by nitrogen-fixing bacteria.
• Guidelines, including photos, are available online as a resource at http://w w w. a g w i n e . a d e l a i d e .edu.au/research/farming/legumes-nitrogen/legume-inoculation/.
Why do this work?• To get some preliminary
information on grain legume nodulation in the area.
• Poor nodulation is often not obvious above ground, and if no or few nodules are present then little nitrogen will be fixed.
• Assessment of nodulation success is a useful exercise to guide future decision making about inoculation.
• For inoculated legumes, it is worth checking to see if the inoculation has worked well or not.
• For uninoculated crops, it is worth checking to see whether or not they should be inoculated in the future.
• While checking the root
systems, you can also see if they are generally healthy. Has there been disease damage? For example, you may see a lot of Rhizoctonia “spear tips”, depending on crop, season and paddock history.
How was it done?Nodulation of grain legumes was assessed on three properties near Verran in September 2014. Two chickpea crops and one lentil crop were sampled. All had been inoculated with root nodule bacteria at sowing. At each paddock, three sets of 10 plants were carefully dug up at approximately 50 metre intervals, starting 20 m from the edge of the paddock to avoid the headlands.
After sampling, root systems were washed carefully and individual plants were scored as having “adequate” or “inadequate” nodulation compared to a set of photos (nodulation assessment guide, found at http://www.agwine.adelaide.edu.au/research/f a r m i n g / l e g u m e s - n i t r o g e n /legume-inoculation/). The % of plants with adequate nodulation was calculated for each sample location and the numbers were averaged across the three sample locations. Overall nodulation was considered good if the average nodulation scores were at least 70% “adequate”.
What happened?Property 1 Crop details: Chickpea after oats (2013), medic pasture (2012) and wheat (2011); soil alkaline. Chickpea ‘Genesis 090’ (kabuli type), inoculated with group N rhizobia as a peat slurry. Fertilizer (DAP) @ 80kg/ha. Herbicides: knockdown glyphosate; pre-emergence Treflan; post-emergence Balance at sowing. Insecticide: Dimethoate.
Nodulation assessment: 43% of plants rated as good. This is below expectation for an inoculated crop (Figure 1). Note that many plants had Rhizoctonia damage (roots with spear tips, blackened collar) which may have contributed to the low nodulation result. Yield: not satisfactory at 0.6 t/ha.Troubleshooting: grower suspects herbicide (there was obvious chemical damage on sandier soils). Note also that high nitrogen fertiliser at sowing needs to be used cautiously. When combined with soil nitrate levels, this may reduce nodulation.
Property 2Crop details: Lentil after 3 years wheat, soil pH 8.5. Lentil ‘Blitz’ inoculated with TagTeam (N fixing and P solubilizing).Fertilizer single super applied @ 75 kg/ha, placed alongside seed. Herbicides: knockdown glyphosate; pre-emergence Diuron, Simazine, Treflan; post-emergence Select, Targa. Nodulation assessment: 42% of plants rated as good. This is below expectation for an inoculated crop (Figure 2A, compared to Figure 2B). Note that some root systems had apparent Rhizoctonia damage, but many plants had healthy roots (i.e. variable root health, mostly good, healthy). Result: the crop yielded 1 t/ha on only 250 mm growing season rainfall. The grower plans to sow lentils again in future and to sow early. The nodulation result may have been improved by using a double rate of inoculant as it was the first time lentils had been grown in that paddock.
Preliminary assessment of grain legume nodulation on upper Eyre PeninsulaMaarten Ryder1, Matt Denton1 and Ross Ballard2
1University of Adelaide, 2SARDI, Waite Research
Location: VerranRainfallAv. Annual: 340 mmAv. GSR: 254 mm2014 Total: 347 mm2014 GSR: 252 mm
Try this yourself now
t
Eyre Peninsula Farming Systems 2014 Summary 83
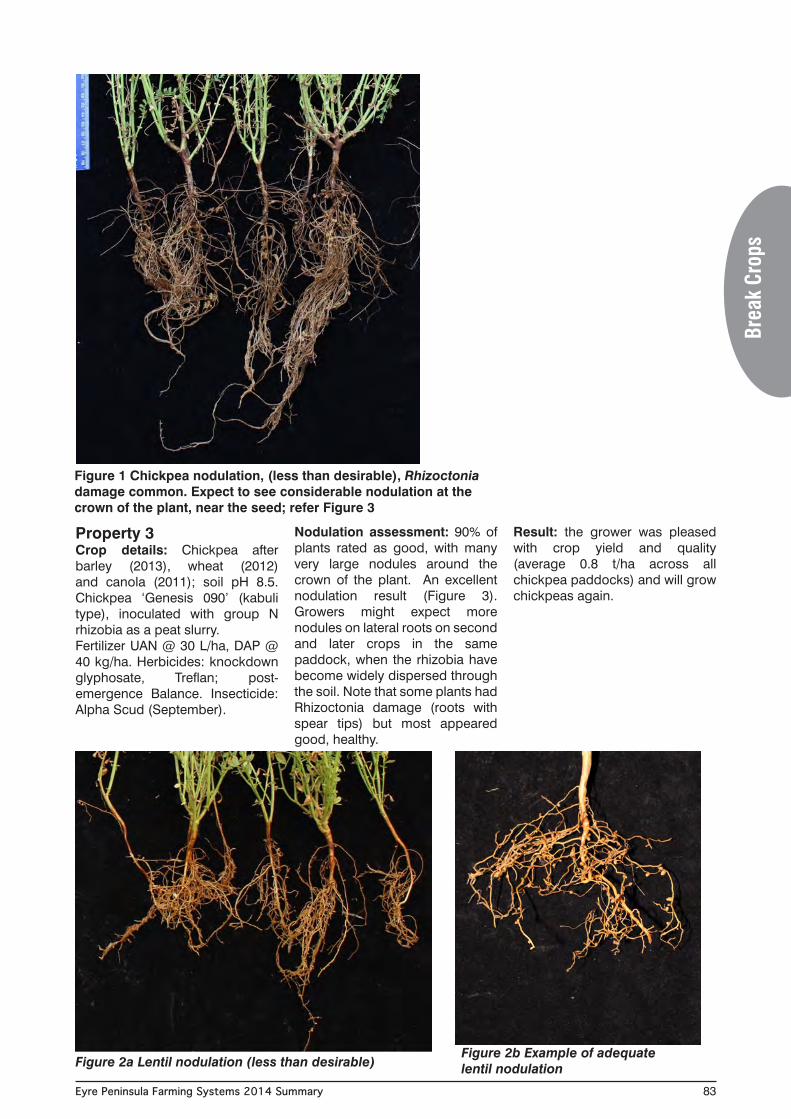
Figure 1 Chickpea nodulation, (less than desirable), Rhizoctonia damage common. Expect to see considerable nodulation at the crown of the plant, near the seed; refer Figure 3
Property 3Crop details: Chickpea after barley (2013), wheat (2012) and canola (2011); soil pH 8.5. Chickpea ‘Genesis 090’ (kabuli type), inoculated with group N rhizobia as a peat slurry. Fertilizer UAN @ 30 L/ha, DAP @ 40 kg/ha. Herbicides: knockdown glyphosate, Treflan; post-emergence Balance. Insecticide: Alpha Scud (September).
Nodulation assessment: 90% of plants rated as good, with many very large nodules around the crown of the plant. An excellent nodulation result (Figure 3). Growers might expect more nodules on lateral roots on second and later crops in the same paddock, when the rhizobia have become widely dispersed through the soil. Note that some plants had Rhizoctonia damage (roots with spear tips) but most appeared good, healthy.
Result: the grower was pleased with crop yield and quality (average 0.8 t/ha across all chickpea paddocks) and will grow chickpeas again.
Figure 2b Example of adequate lentil nodulation
Brea
k Cr
ops
Figure 2a Lentil nodulation (less than desirable)
Eyre Peninsula Farming Systems 2014 Summary84
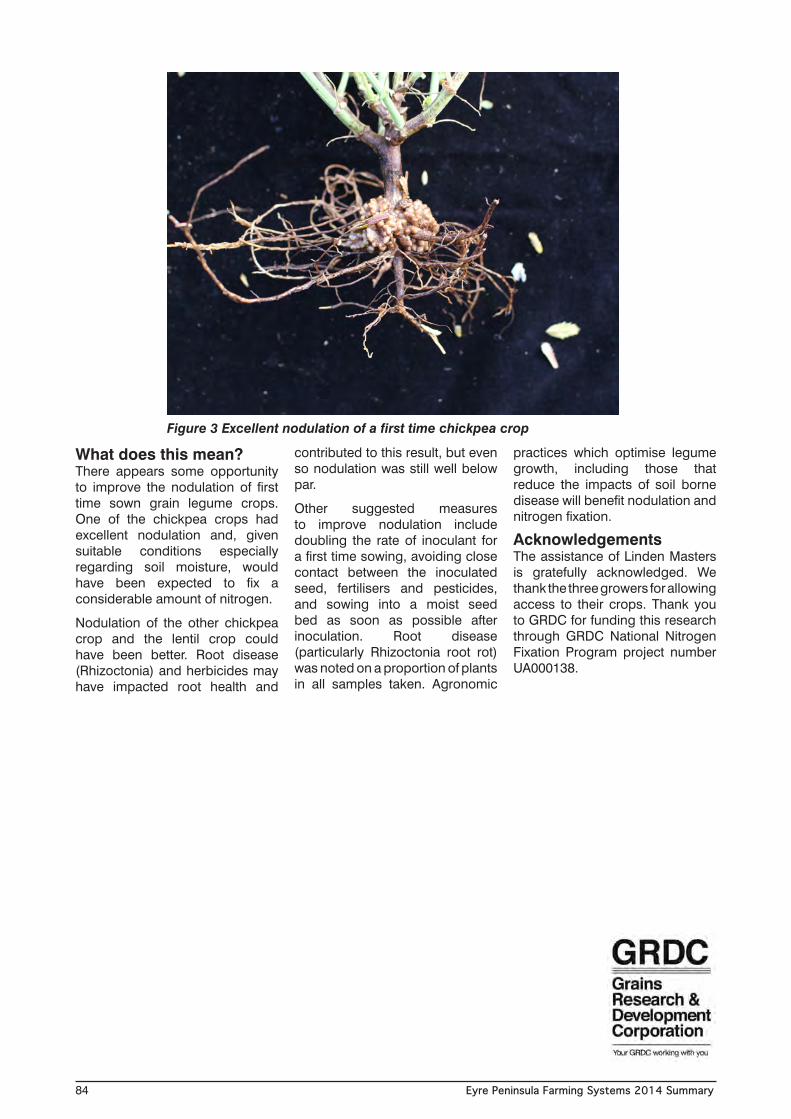
What does this mean?There appears some opportunity to improve the nodulation of first time sown grain legume crops. One of the chickpea crops had excellent nodulation and, given suitable conditions especially regarding soil moisture, would have been expected to fix a considerable amount of nitrogen.
Nodulation of the other chickpea crop and the lentil crop could have been better. Root disease (Rhizoctonia) and herbicides may have impacted root health and
contributed to this result, but even so nodulation was still well below par.
Other suggested measures to improve nodulation include doubling the rate of inoculant for a first time sowing, avoiding close contact between the inoculated seed, fertilisers and pesticides, and sowing into a moist seed bed as soon as possible after inoculation. Root disease (particularly Rhizoctonia root rot) was noted on a proportion of plants in all samples taken. Agronomic
practices which optimise legume growth, including those that reduce the impacts of soil borne disease will benefit nodulation and nitrogen fixation.
AcknowledgementsThe assistance of Linden Masters is gratefully acknowledged. We thank the three growers for allowing access to their crops. Thank you to GRDC for funding this research through GRDC National Nitrogen Fixation Program project number UA000138.
Figure 3 Excellent nodulation of a first time chickpea crop
Related Documents