Brazilian airport concessions: lessons learned and challenges

Welcome message from author
This document is posted to help you gain knowledge. Please leave a comment to let me know what you think about it! Share it to your friends and learn new things together.
Transcript
Brazilian airport concessions:
lessons learned and challenges
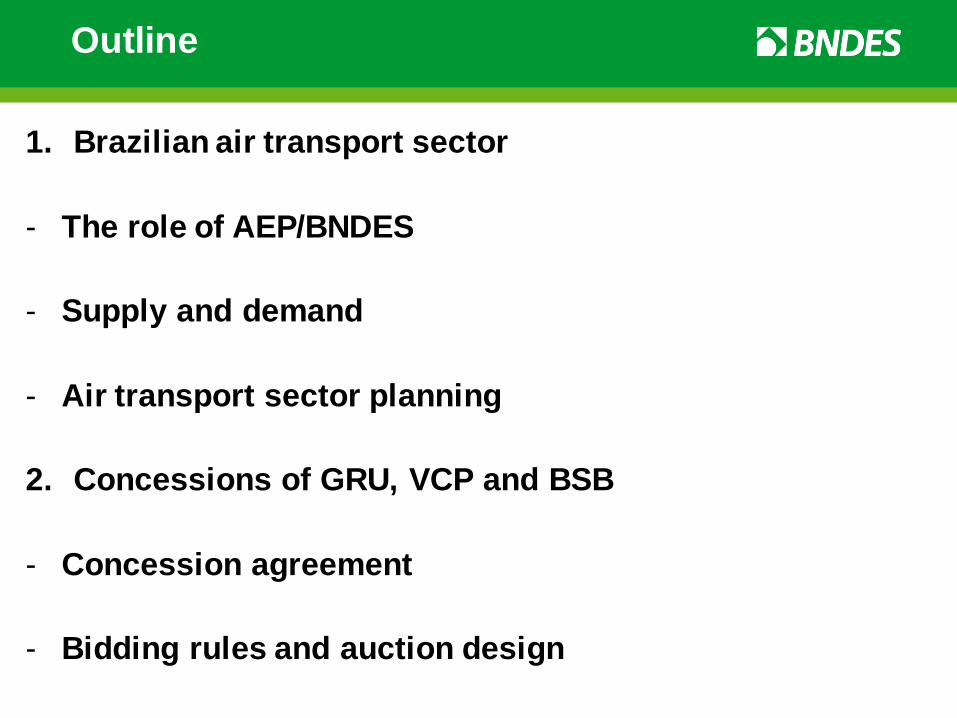
Outline
1. Brazilian air transport sector
- The role of AEP/BNDES
- Supply and demand
- Air transport sector planning
2. Concessions of GRU, VCP and BSB
- Concession agreement
- Bidding rules and auction design
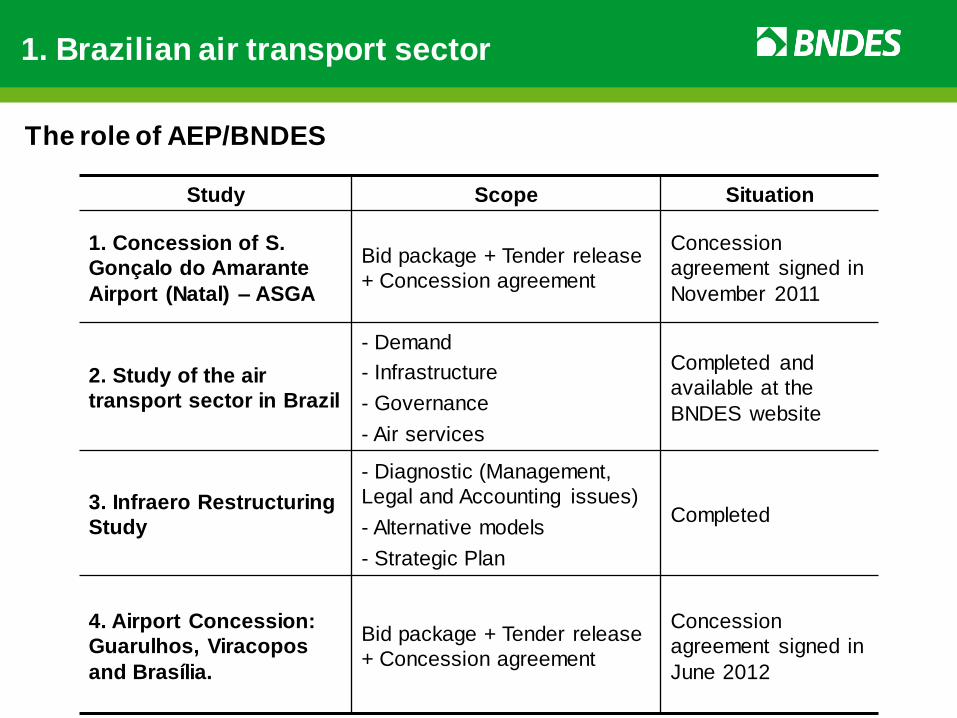
Study Scope Situation
1. Concession of S.
Gonçalo do Amarante
Airport (Natal) – ASGA
Bid package + Tender release
+ Concession agreement
Concession
agreement signed in
November 2011
2. Study of the air
transport sector in Brazil
- Demand
- Infrastructure
- Governance
- Air services
Completed and
available at the
BNDES website
3. Infraero Restructuring
Study
- Diagnostic (Management,
Legal and Accounting issues)
- Alternative models
- Strategic Plan
Completed
4. Airport Concession:
Guarulhos, Viracopos
and Brasília.
Bid package + Tender release
+ Concession agreement
Concession
agreement signed in
June 2012
The role of AEP/BNDES
1. Brazilian air transport sector
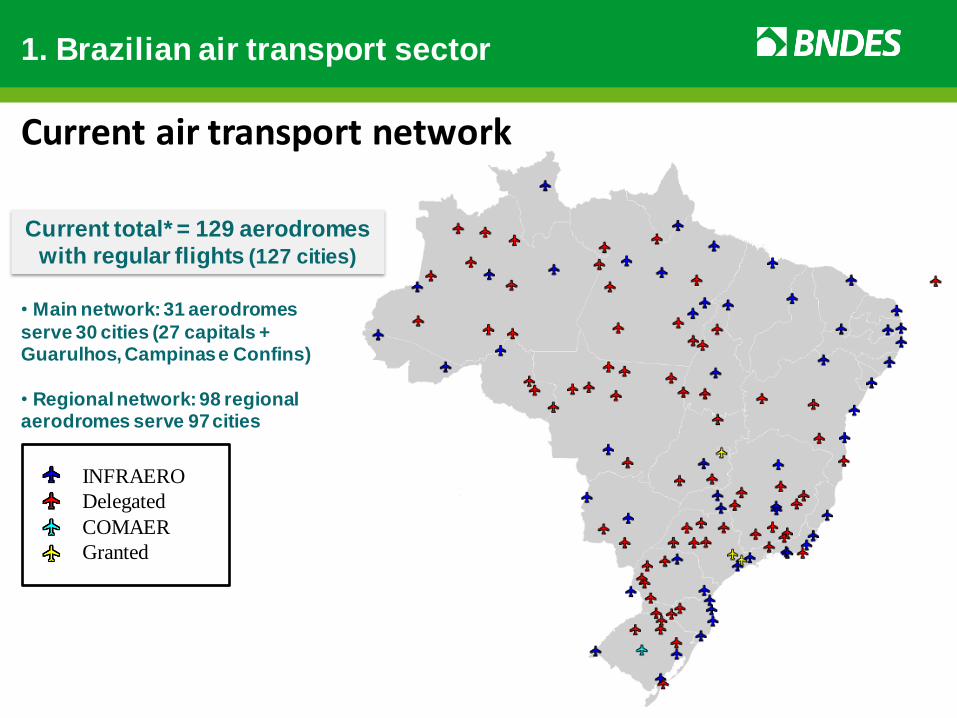
Current total* = 129 aerodromes
with regular flights (127 cities)
• Main network: 31 aerodromes
serve 30 cities (27 capitals + Guarulhos, Campinas e Confins)
• Regional network: 98 regional aerodromes serve 97 cities
INFRAERO
Delegated
COMAER
Granted
Current air transport network
1. Brazilian air transport sector
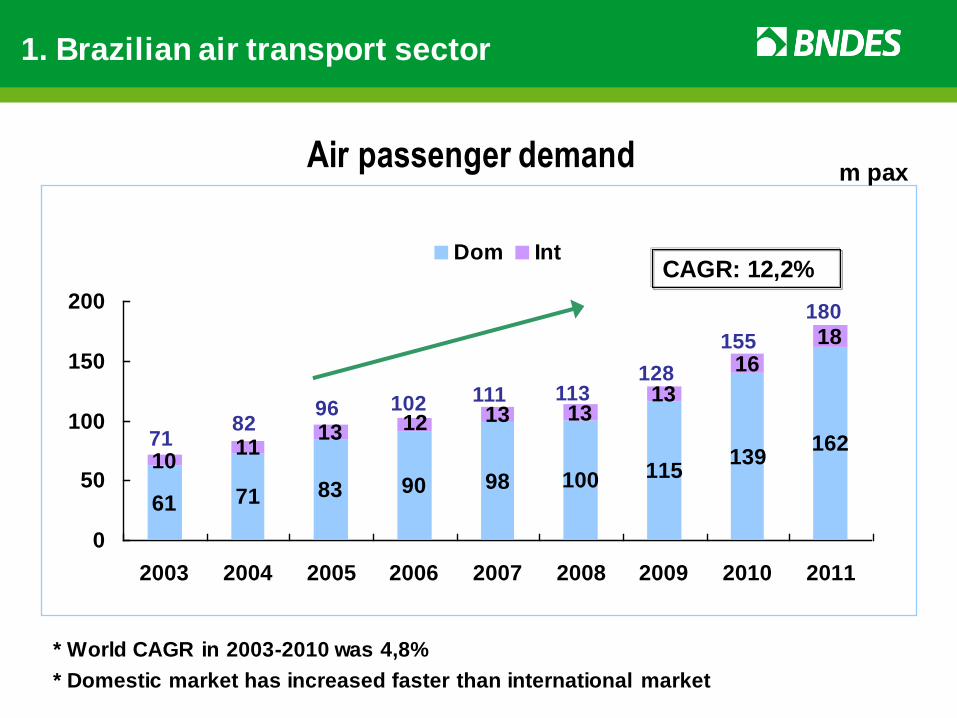
61 71 83 90 98 100 115139
16210
1113
13 1313
16
18
12
0
50
100
150
200
2003 2004 2005 2006 2007 2008 2009 2010 2011
Dom Int
1. Brazilian air transport sector
Air passenger demand
CAGR: 12,2%
71 82
96 102 111 113 128
155
180
* World CAGR in 2003-2010 was 4,8%
* Domestic market has increased faster than international market
m pax
1. Brazilian air transport sector
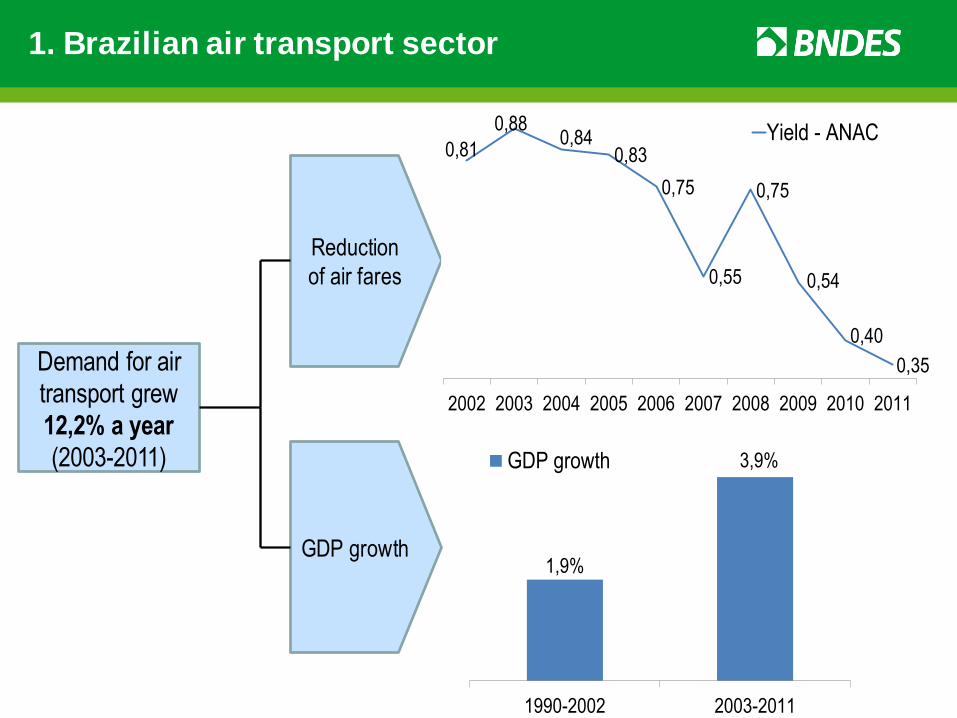
Reduction
of air fares
0,81
0,880,84
0,83
0,75
0,55
0,75
0,54
0,40
0,35
2002 2003 2004 2005 2006 2007 2008 2009 2010 2011
Yield - ANAC
1,9%
3,9%
1990-2002 2003-2011
GDP growth
GDP growth
Demand for air
transport grew
12,2% a year
(2003-2011)
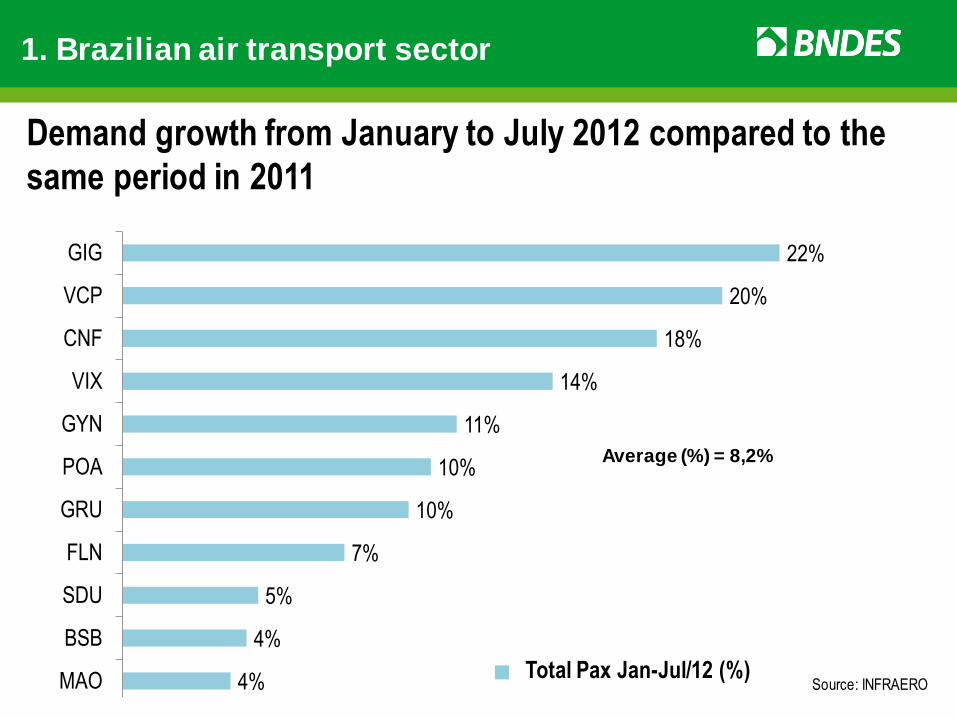
4%
4%
5%
7%
10%
10%
11%
14%
18%
20%
22%
0% 5% 10% 15% 20% 25%
MAO
BSB
SDU
FLN
GRU
POA
GYN
VIX
CNF
VCP
GIG
Pax Tot jan-jul 12 (%)Source: INFRAERO
Average (%) = 8,2%
Demand growth from January to July 2012 compared to the
same period in 2011
1. Brazilian air transport sector
Total Pax Jan-Jul/12 (%)
1. Brazilian air transport sector
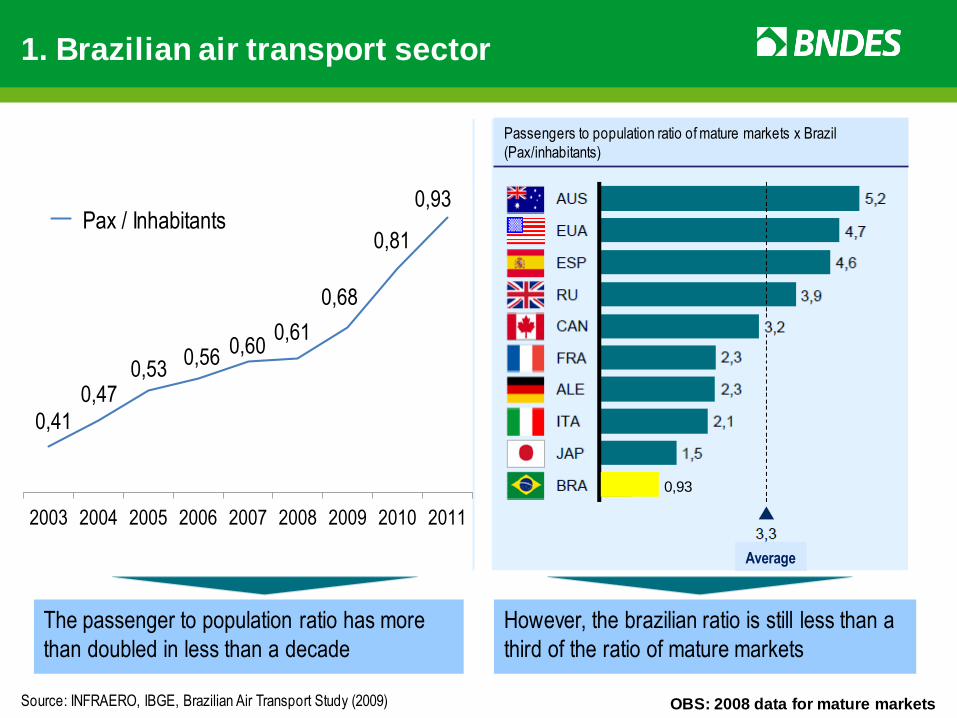
OBS: 2008 data for mature markets
0,41
0,470,53
0,560,60
0,61
0,68
0,81
0,93
2003 2004 2005 2006 2007 2008 2009 2010 2011
Pax / Hab
The passenger to population ratio has more
than doubled in less than a decade
However, the brazilian ratio is still less than a
third of the ratio of mature markets
Source: INFRAERO, IBGE, Brazilian Air Transport Study (2009)
Pax / Inhabitants
Passengers to population ratio of mature markets x Brazil
(Pax/inhabitants)
Average
0,93
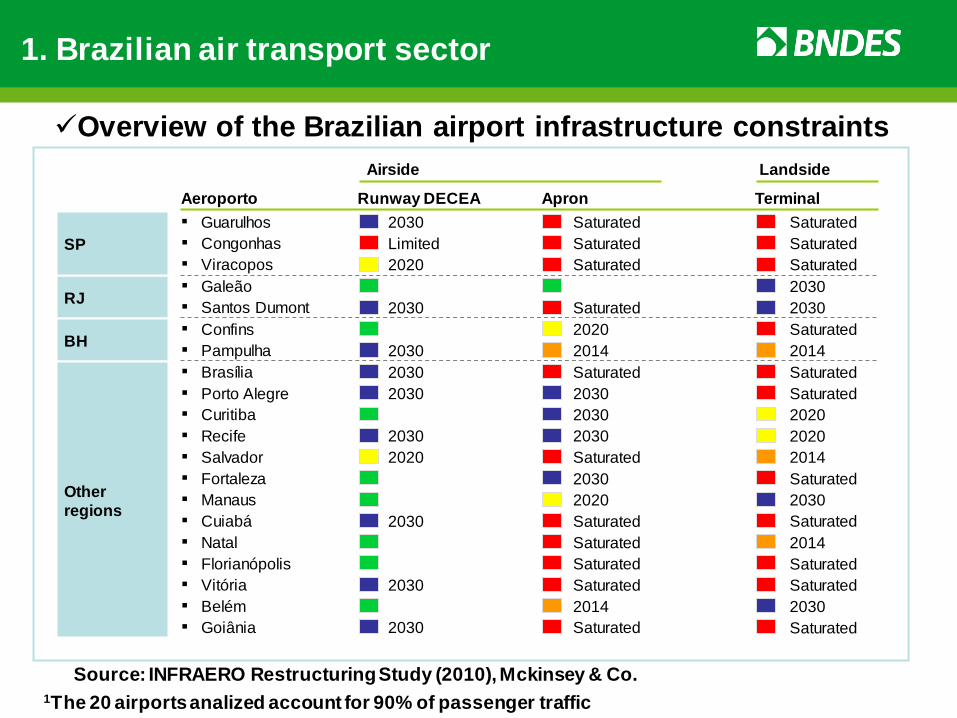
Airside Landside
RJ
BH
Other
regions
SP
2030
2030
2030
2030
2030
2030
Limited
2020
2030
2030
2030
2020
Saturated
2030
2030
Saturated
Saturated
2014
2030
2030
2020
Saturated
Saturated
Saturated
Saturated
Saturated
2014
Saturated
Saturated
Apron Runway DECEA
Saturated
Aeroporto
▪ Porto Alegre
▪ Curitiba
▪ Salvador
▪ Galeão
▪ Santos Dumont
▪ Confins
▪ Pampulha
▪ Recife
▪ Fortaleza
▪ Manaus
▪ Natal
▪ Cuiabá
▪ Congonhas
▪ Brasília
▪ Goiânia
▪ Belém
▪ Vitória
▪ Florianópolis
Terminal
Saturated
Saturated
Saturated
2020
2014
2030
2030
2014
2020
Saturated
2030
2014
Saturated
Saturated
Saturated
Saturated
2030
Saturated
Saturated
▪ Viracopos
▪ Guarulhos Saturated
2020
Overview of the Brazilian airport infrastructure constraints
1The 20 airports analized account for 90% of passenger traffic
Source: INFRAERO Restructuring Study (2010), Mckinsey & Co.
1. Brazilian air transport sector
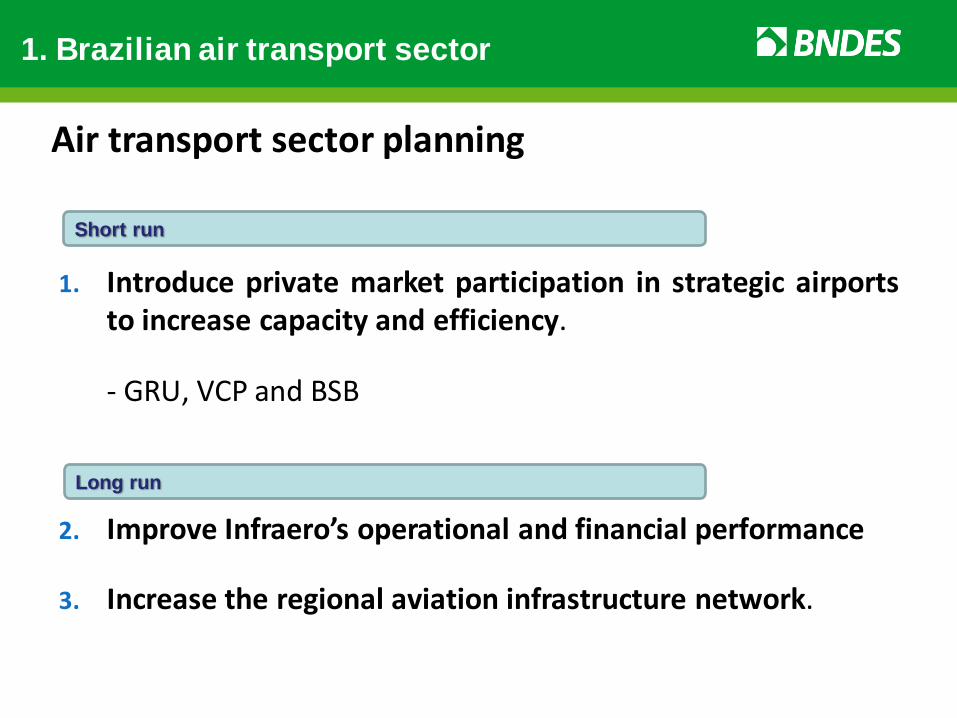
Air transport sector planning
1. Introduce private market participation in strategic airports to increase capacity and efficiency.
- GRU, VCP and BSB
1. Brazilian air transport sector
2. Improve Infraero’s operational and financial performance
3. Increase the regional aviation infrastructure network.
Short run
Long run
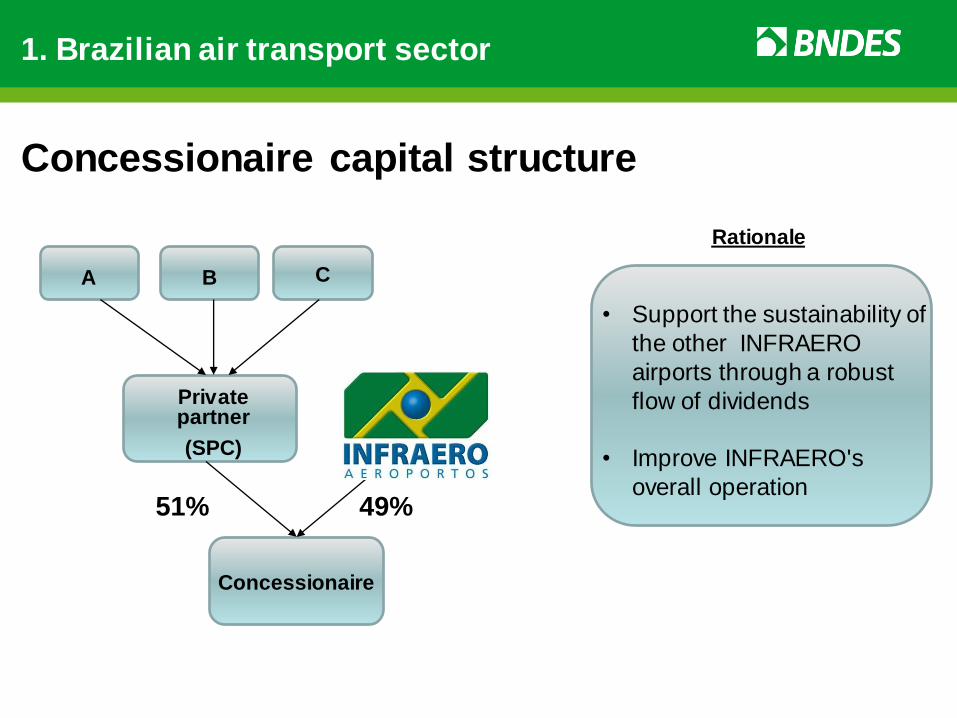
A
Private partner
(SPC)
B C
Concessionaire
51% 49%
Rationale
• Support the sustainability of
the other INFRAERO
airports through a robust
flow of dividends
• Improve INFRAERO's
overall operation
Concessionaire capital structure
1. Brazilian air transport sector
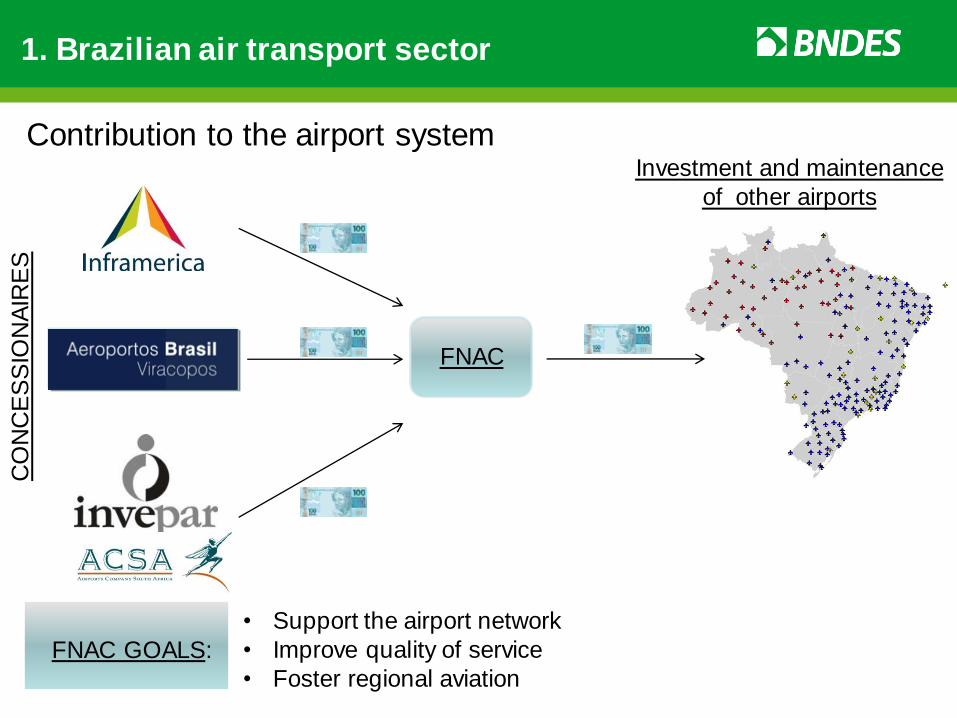
• Support the airport network
• Improve quality of service
• Foster regional aviation
CO
NC
ES
SIO
NA
IRE
S
FNAC
Investment and maintenance
of other airports
FNAC GOALS:
Contribution to the airport system
1. Brazilian air transport sector
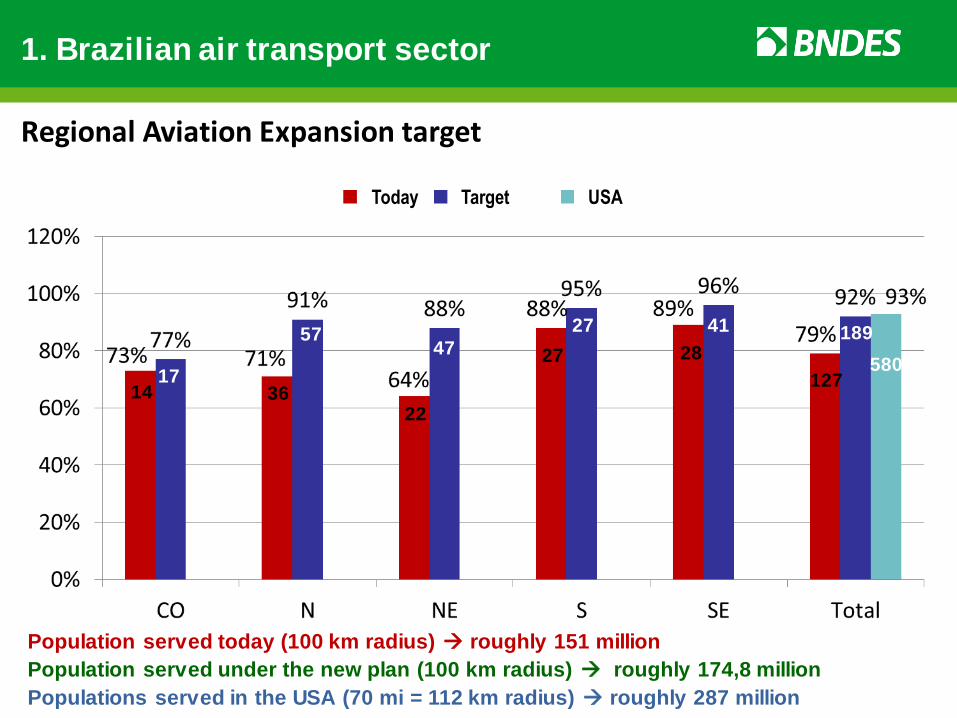
36 22
27 28
127
189
580 17
57 41 27
47
Population served today (100 km radius) roughly 151 million
Population served under the new plan (100 km radius) roughly 174,8 million
Populations served in the USA (70 mi = 112 km radius) roughly 287 million
14
Regional Aviation Expansion target
Today Target USA
1. Brazilian air transport sector
14
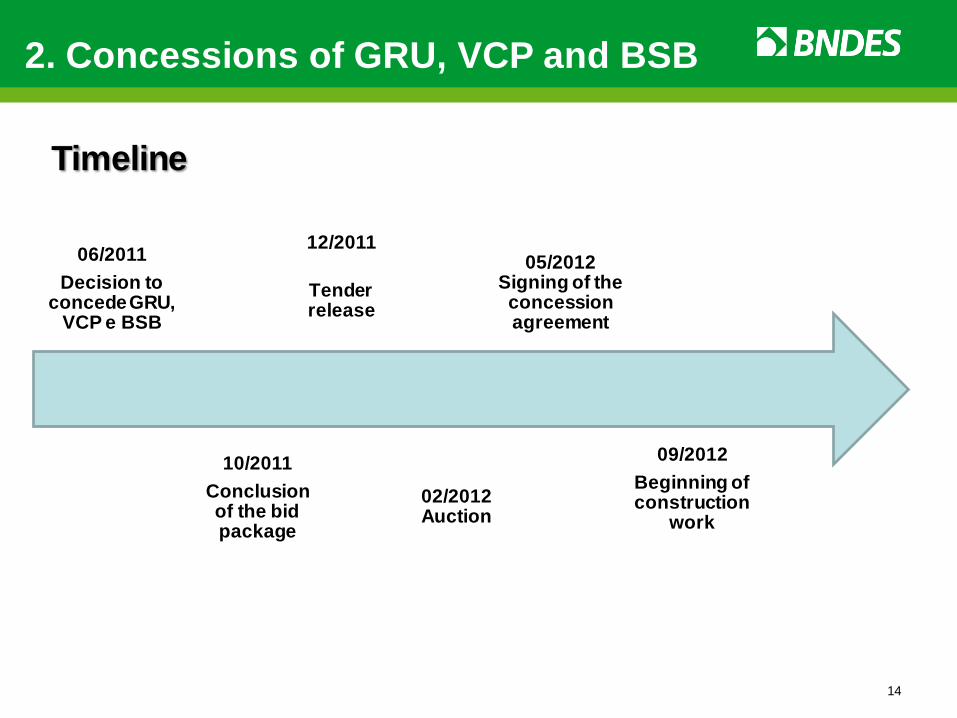
06/2011
Decision to concede GRU,
VCP e BSB
10/2011
Conclusion of the bid package
12/2011
Tender release
02/2012 Auction
05/2012 Signing of the concession agreement
09/2012
Beginning of construction
work
Timeline
2. Concessions of GRU, VCP and BSB
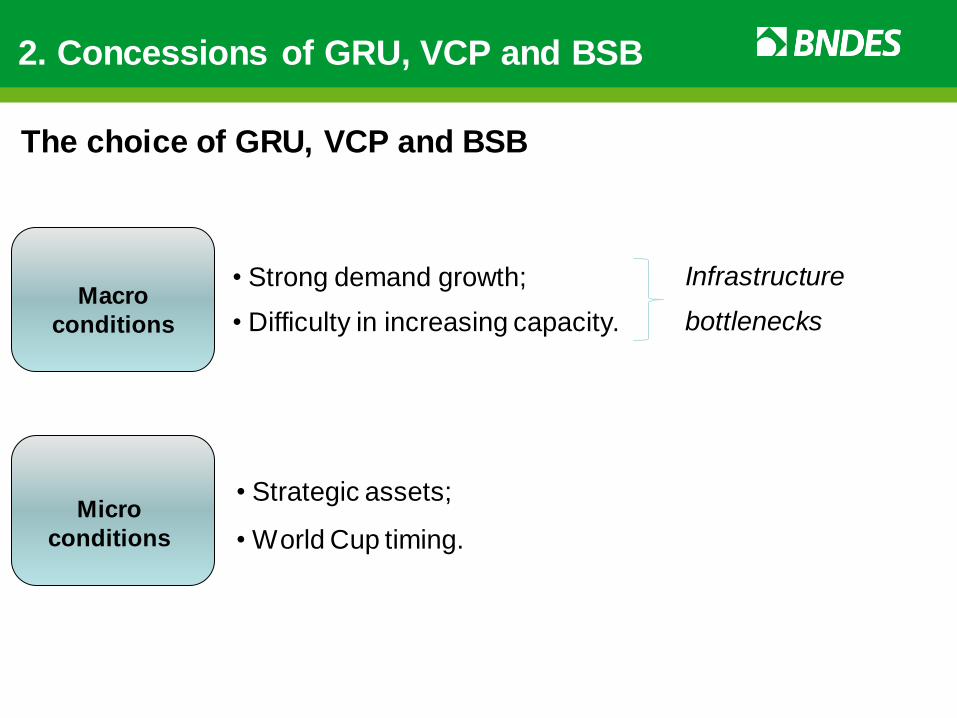
Macro
conditions
2. Concessions of GRU, VCP and BSB
• Strong demand growth;
• Difficulty in increasing capacity.
Micro
conditions
• Strategic assets;
• World Cup timing.
The choice of GRU, VCP and BSB
Infrastructure
bottlenecks
2. Concessions of GRU, VCP and BSB
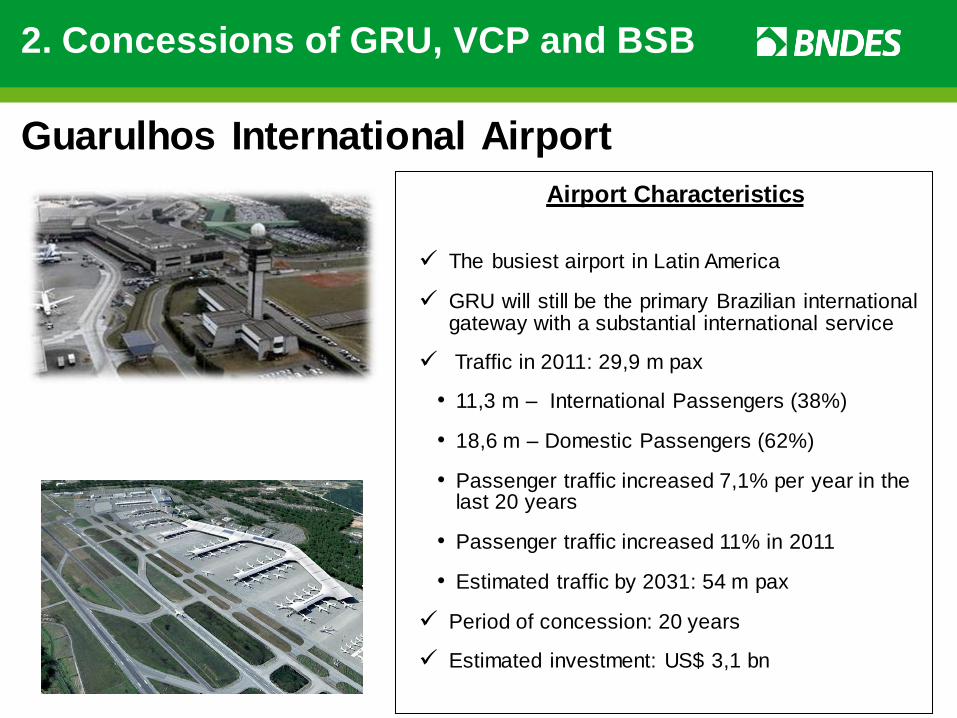
Airport Characteristics
The busiest airport in Latin America
GRU will still be the primary Brazilian international gateway with a substantial international service
Traffic in 2011: 29,9 m pax
• 11,3 m – International Passengers (38%)
• 18,6 m – Domestic Passengers (62%)
• Passenger traffic increased 7,1% per year in the last 20 years
• Passenger traffic increased 11% in 2011
• Estimated traffic by 2031: 54 m pax
Period of concession: 20 years
Estimated investment: US$ 3,1 bn
Guarulhos International Airport
2. Concessions of GRU, VCP and BSB
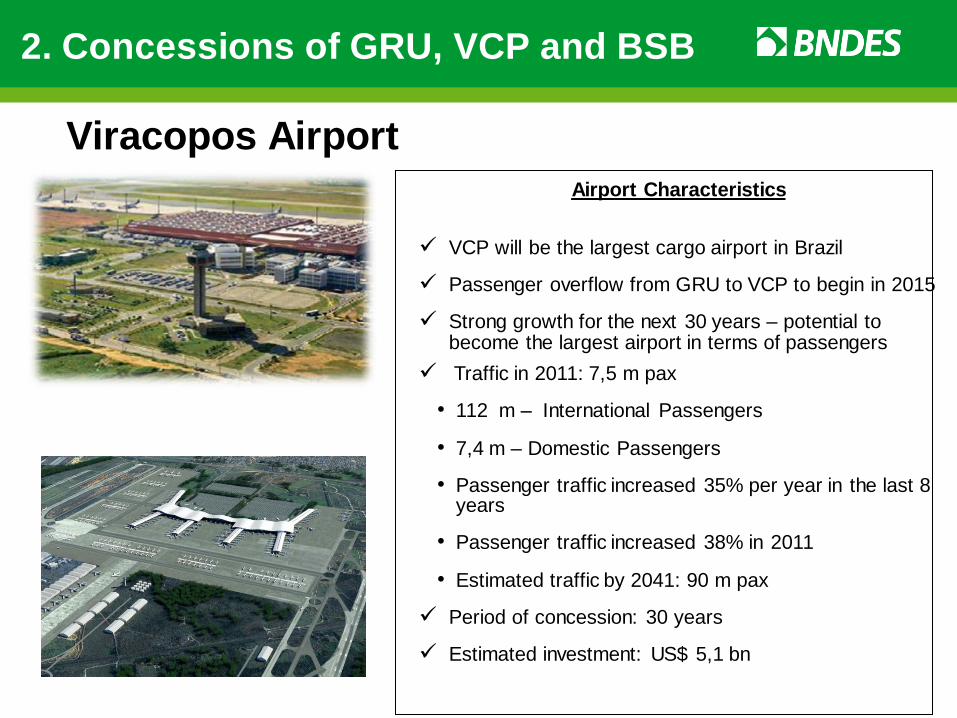
Airport Characteristics
VCP will be the largest cargo airport in Brazil
Passenger overflow from GRU to VCP to begin in 2015
Strong growth for the next 30 years – potential to become the largest airport in terms of passengers
Traffic in 2011: 7,5 m pax
• 112 m – International Passengers
• 7,4 m – Domestic Passengers
• Passenger traffic increased 35% per year in the last 8 years
• Passenger traffic increased 38% in 2011
• Estimated traffic by 2041: 90 m pax
Period of concession: 30 years
Estimated investment: US$ 5,1 bn
Viracopos Airport
2. Concessions of GRU, VCP and BSB
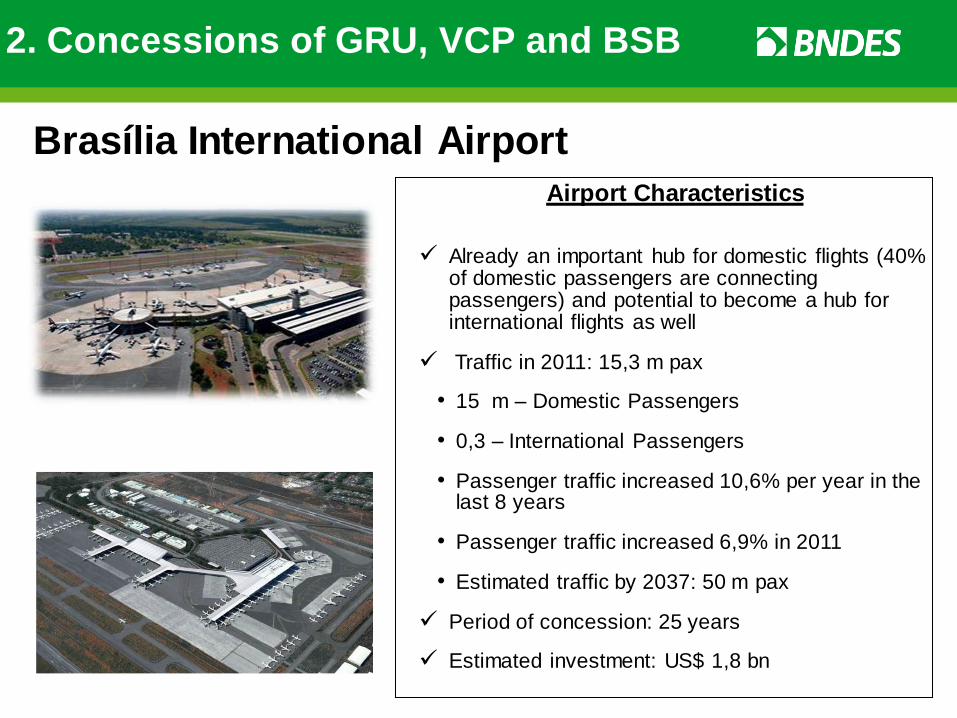
Airport Characteristics
Already an important hub for domestic flights (40% of domestic passengers are connecting passengers) and potential to become a hub for international flights as well
Traffic in 2011: 15,3 m pax
• 15 m – Domestic Passengers
• 0,3 – International Passengers
• Passenger traffic increased 10,6% per year in the last 8 years
• Passenger traffic increased 6,9% in 2011
• Estimated traffic by 2037: 50 m pax
Period of concession: 25 years
Estimated investment: US$ 1,8 bn
Brasília International Airport
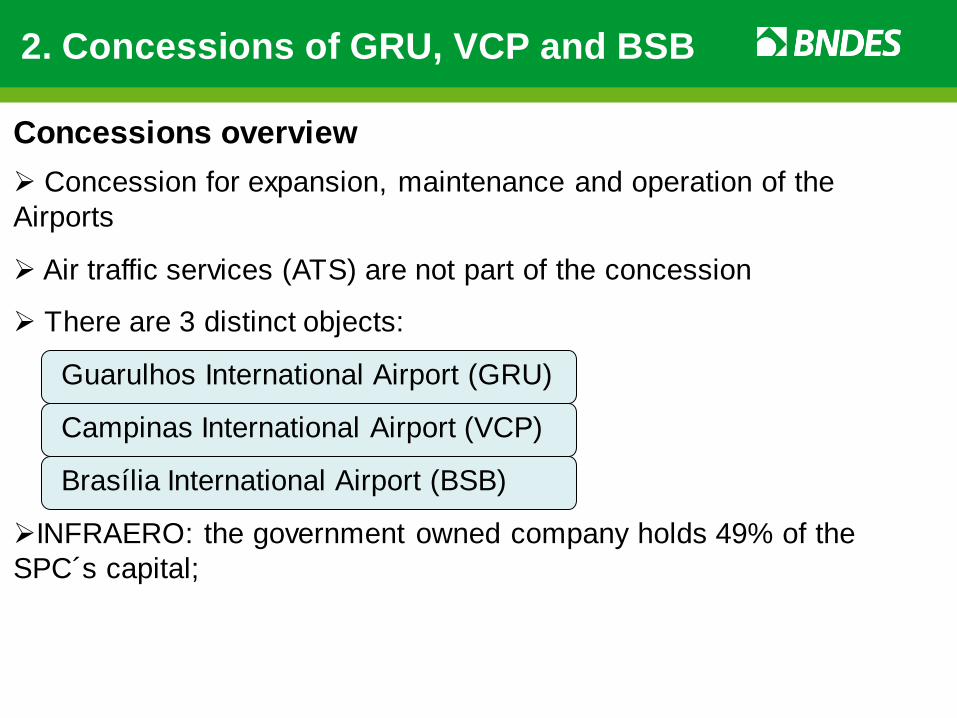
Concession for expansion, maintenance and operation of the
Airports
Air traffic services (ATS) are not part of the concession
There are 3 distinct objects:
Guarulhos International Airport (GRU)
Campinas International Airport (VCP)
Brasília International Airport (BSB)
INFRAERO: the government owned company holds 49% of the
SPC´s capital;
2. Concessions of GRU, VCP and BSB
Concessions overview
2. Concessions of GRU, VCP and BSB
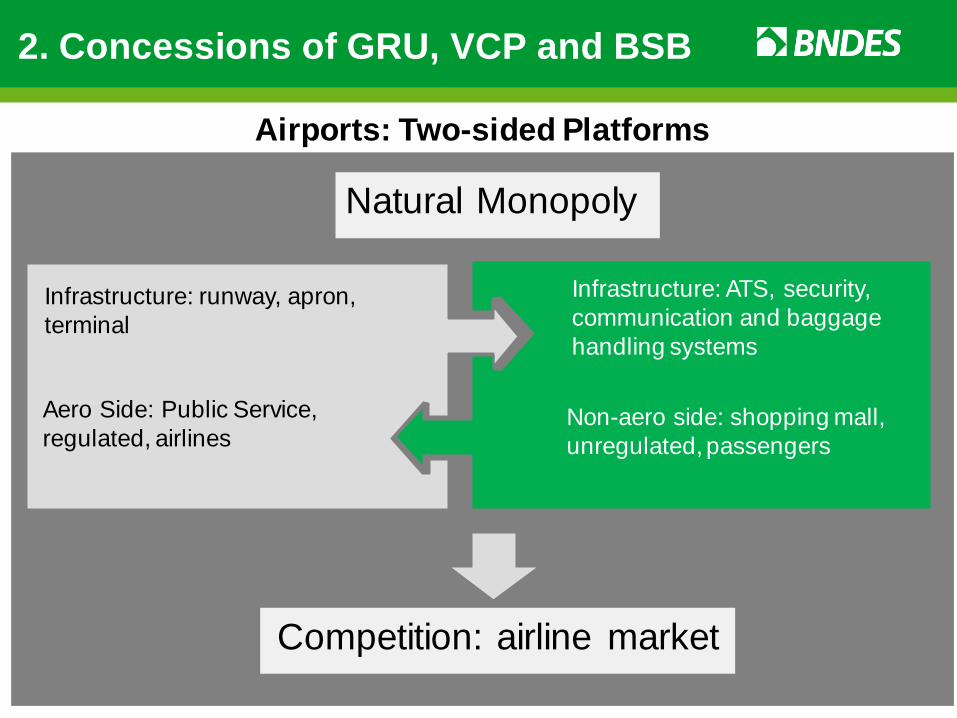
Infrastructure: runway, apron,
terminal
Airports: Two-sided Platforms
Non-aero side: shopping mall,
unregulated, passengers
Aero Side: Public Service,
regulated, airlines
Infrastructure: ATS, security,
communication and baggage
handling systems
Natural Monopoly
Competition: airline market
2. Concessions of GRU, VCP and BSB
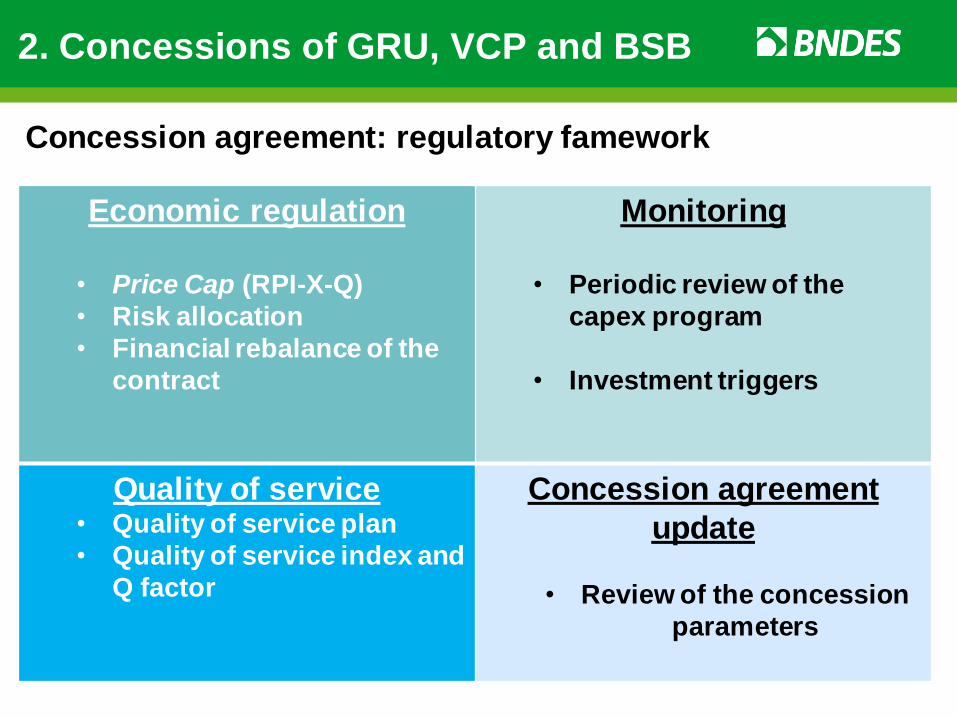
Economic regulation
• Price Cap (RPI-X-Q)
• Risk allocation
• Financial rebalance of the
contract
Monitoring
• Periodic review of the
capex program
• Investment triggers
Quality of service • Quality of service plan
• Quality of service index and
Q factor
Concession agreement
update
• Review of the concession
parameters
Concession agreement: regulatory famework
2.1 Economic Regulation
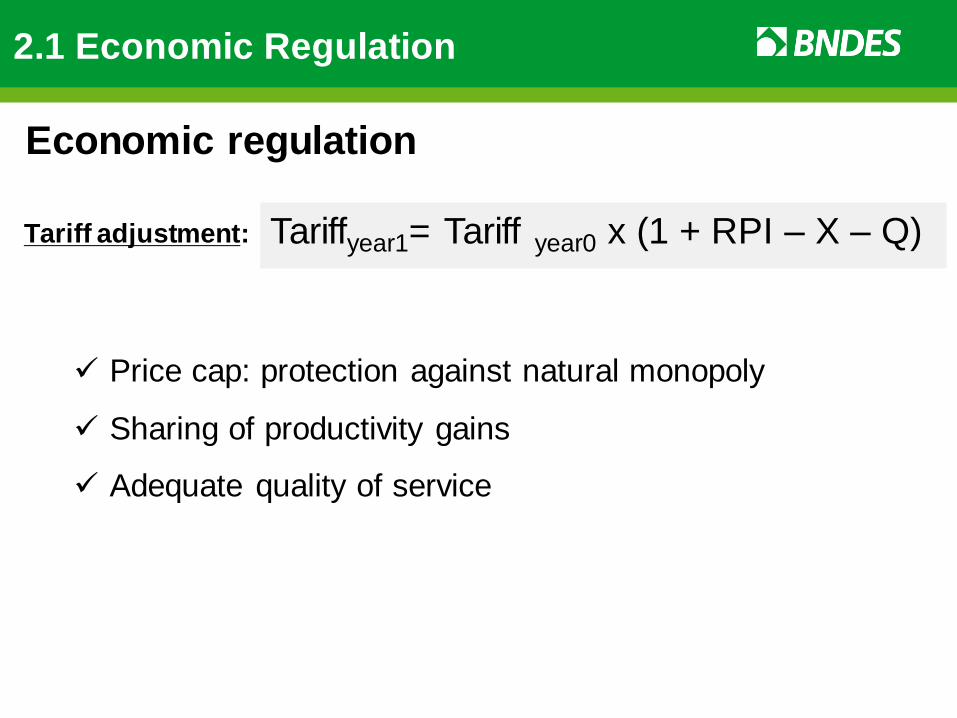
Tariff adjustment: Tariffyear1= Tariff year0 x (1 + RPI – X – Q)
Price cap: protection against natural monopoly
Sharing of productivity gains
Adequate quality of service
Economic regulation

Revenues
Aero revenues
• Price caps: (i) boarding, (ii) connection, (iii) landing and parking, (iv)
cargo
• The Concessionaire will be able to give tariff discounts on a
transparent and non-discriminatory basis
Non-aero revenues
• Commercial revenues from restaurants, duty free, car parking, internet,
etc
• Rents are freely negotiated
2.1 Economic Regulation
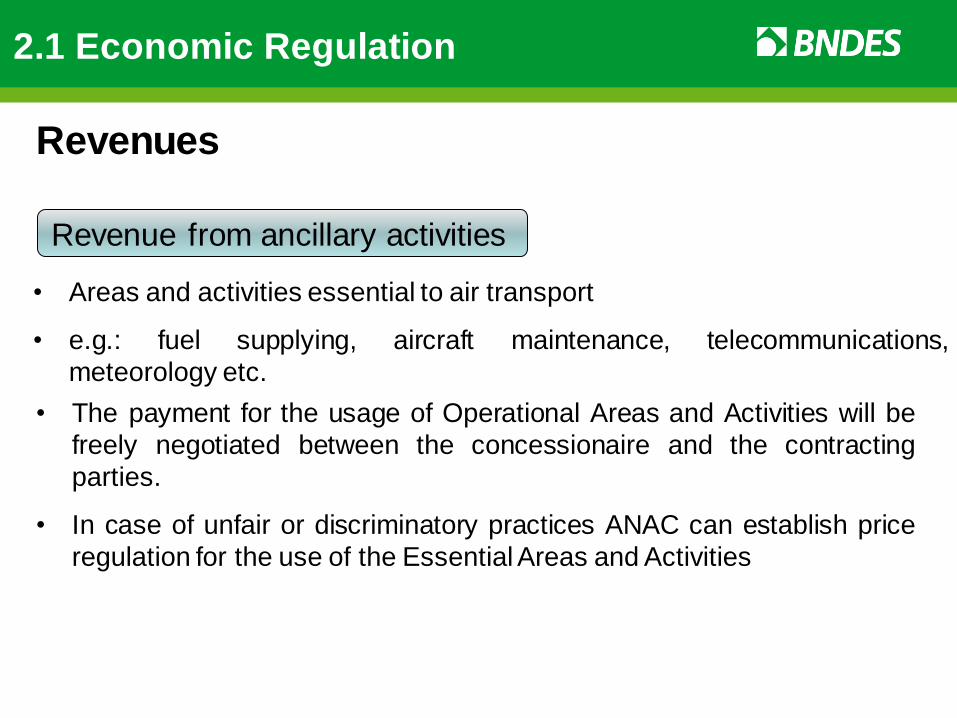
Revenue from ancillary activities
• Areas and activities essential to air transport
• e.g.: fuel supplying, aircraft maintenance, telecommunications,
meteorology etc.
• The payment for the usage of Operational Areas and Activities will be
freely negotiated between the concessionaire and the contracting
parties.
• In case of unfair or discriminatory practices ANAC can establish price
regulation for the use of the Essential Areas and Activities
Revenues
2.1 Economic Regulation
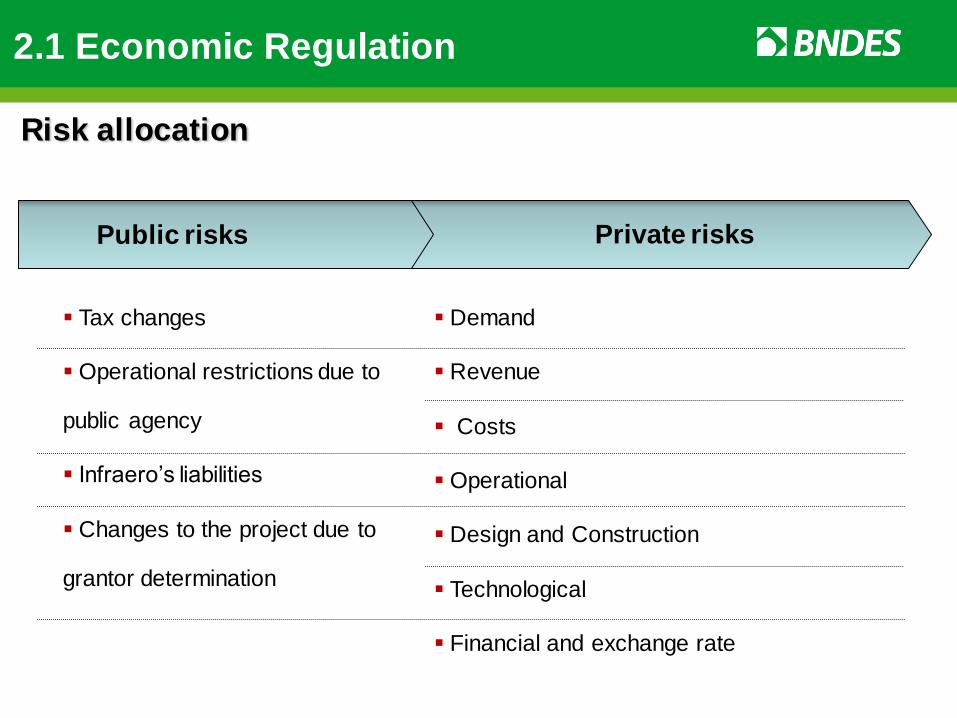
Public risks
Tax changes
Operational restrictions due to
public agency
Infraero’s liabilities
Changes to the project due to
grantor determination
Private risks
Demand
Revenue
Costs
Operational
Design and Construction
Technological
Financial and exchange rate
Risk allocation
2.1 Economic Regulation
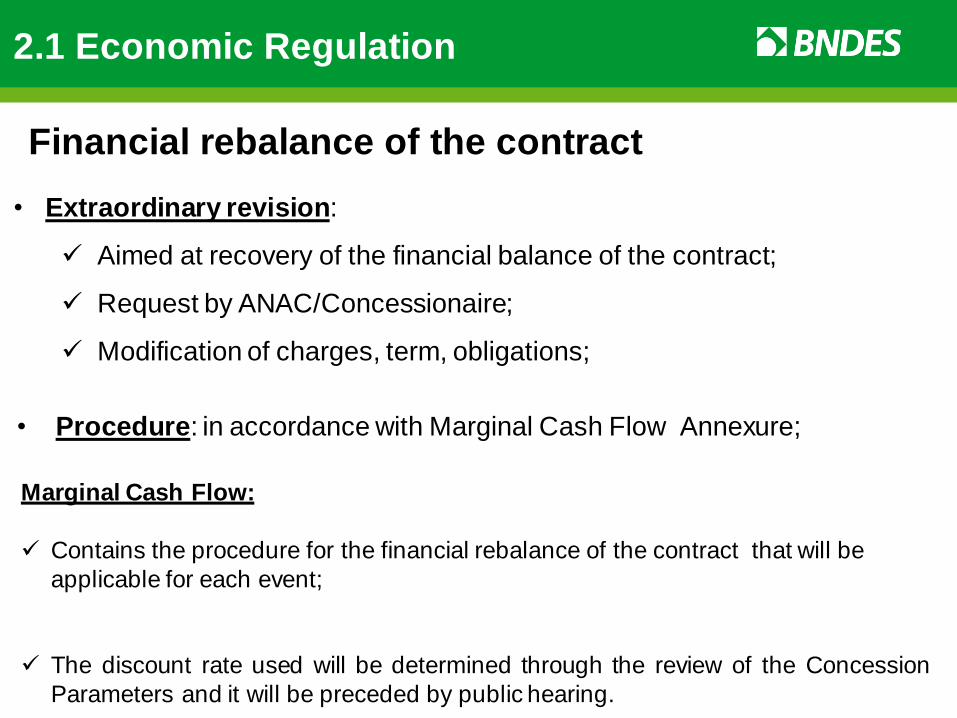
• Extraordinary revision:
Aimed at recovery of the financial balance of the contract;
Request by ANAC/Concessionaire;
Modification of charges, term, obligations;
• Procedure: in accordance with Marginal Cash Flow Annexure;
Marginal Cash Flow:
Contains the procedure for the financial rebalance of the contract that will be
applicable for each event;
The discount rate used will be determined through the review of the Concession
Parameters and it will be preceded by public hearing.
Financial rebalance of the contract
2.1 Economic Regulation

Level of service Flow Delay Comfort Examples
A Free Not existent Excelent • New Doha
• Incheon • Narita T2 • Taipei T2
• Singapore T3
B Stable Very few High
C Stable Acceptable Good
• New York T4
• San Francisco (int) • Deli T3 • Heathrow T5
• Toronto and Vancouver • Brisbane and Sydney
D Unstable Tolerable Adequate • Miami (several
terminals)
E Unstable Unacceptable Inadequate • Guarulhos
• Bogota
2.2 Quality of Service
Based on International Air Transport Association (IATA) level C
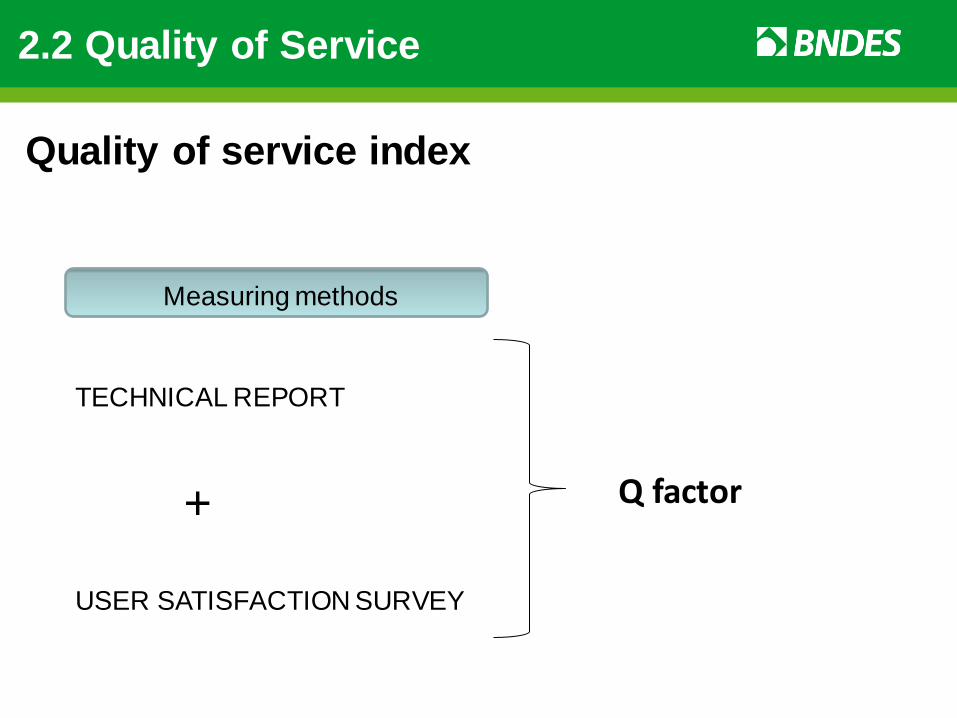
Measuring methods
TECHNICAL REPORT
USER SATISFACTION SURVEY
Q factor +
Quality of service index
2.2 Quality of Service
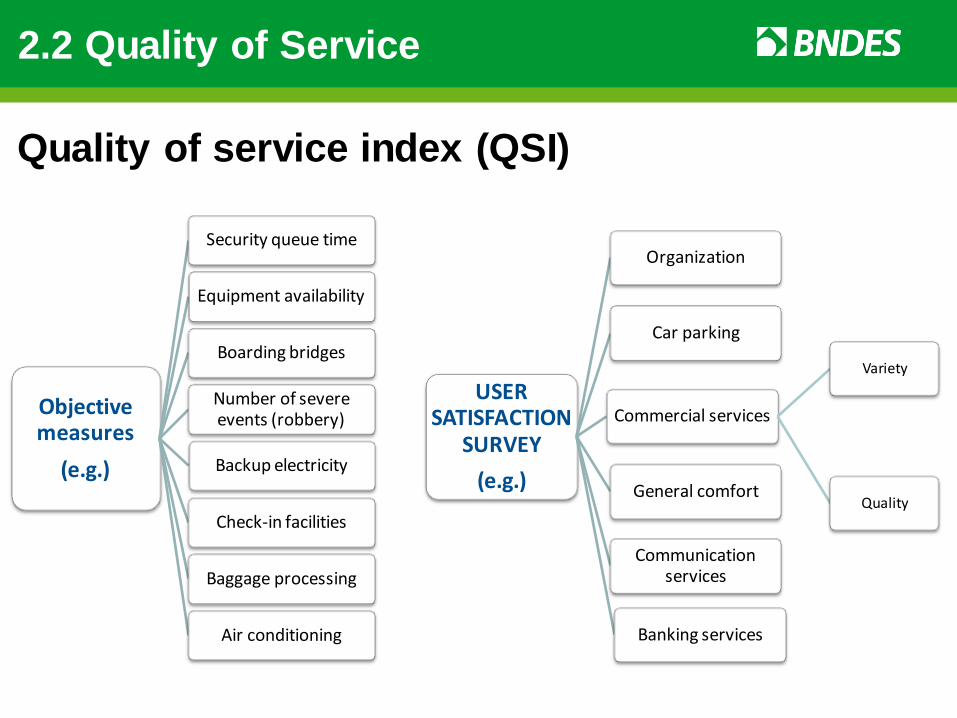
USER SATISFACTION
SURVEY
(e.g.)
Organization
Car parking
General comfort
Commercial services
Variety
Quality
Communication services
Banking services
Objective measures
(e.g.)
Security queue time
Equipment availability
Boarding bridges
Number of severe events (robbery)
Backup electricity
Check-in facilities
Baggage processing
Air conditioning
Quality of service index (QSI)
2.2 Quality of Service
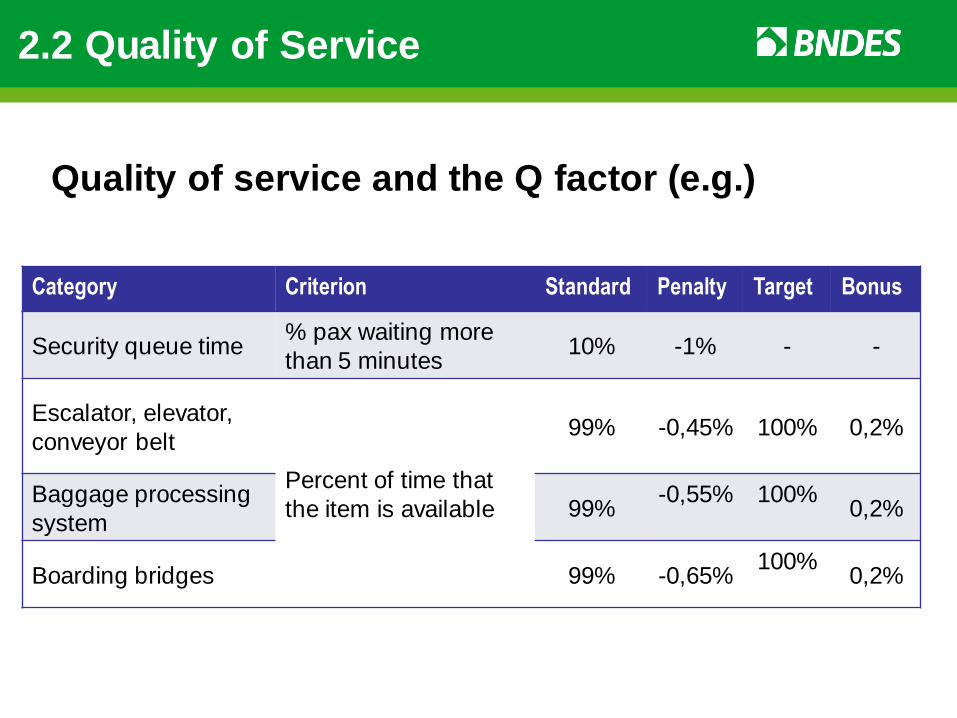
Quality of service and the Q factor (e.g.)
Category Criterion Standard Penalty Target Bonus
Security queue time % pax waiting more
than 5 minutes 10% -1% - -
Escalator, elevator,
conveyor belt
Percent of time that
the item is available
99% -0,45% 100% 0,2%
Baggage processing
system 99%
-0,55%
100%
0,2%
Boarding bridges 99% -0,65% 100%
0,2%
2.2 Quality of Service
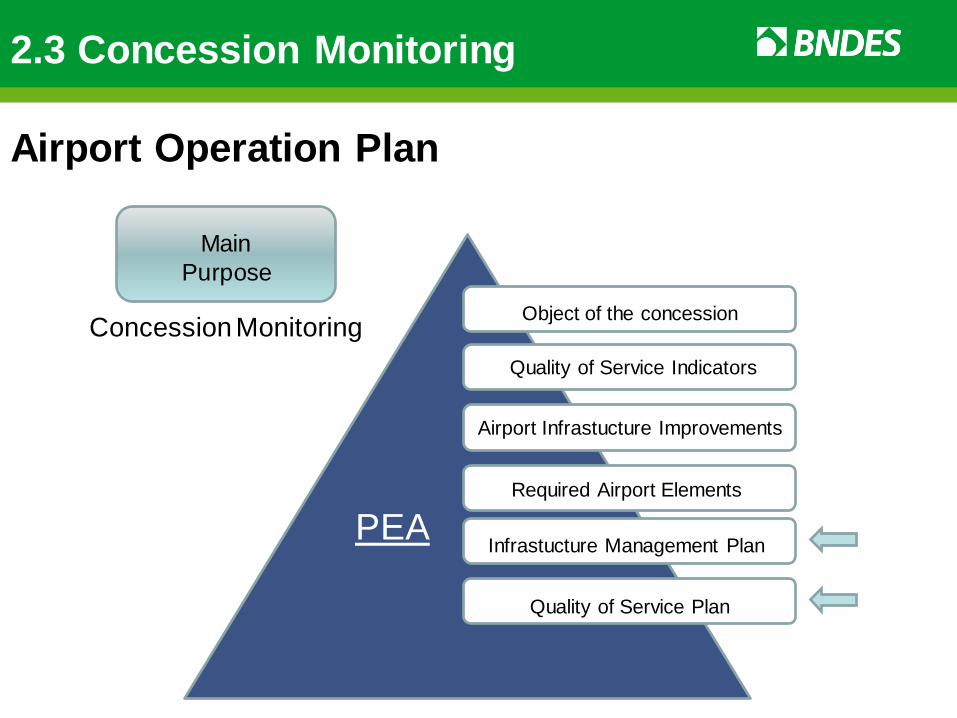
2.3 Concession Monitoring
PEA
Object of the concession
Quality of Service Indicators
Airport Infrastucture Improvements
Required Airport Elements
Infrastucture Management Plan
Quality of Service Plan
Concession Monitoring
Main
Purpose
Airport Operation Plan
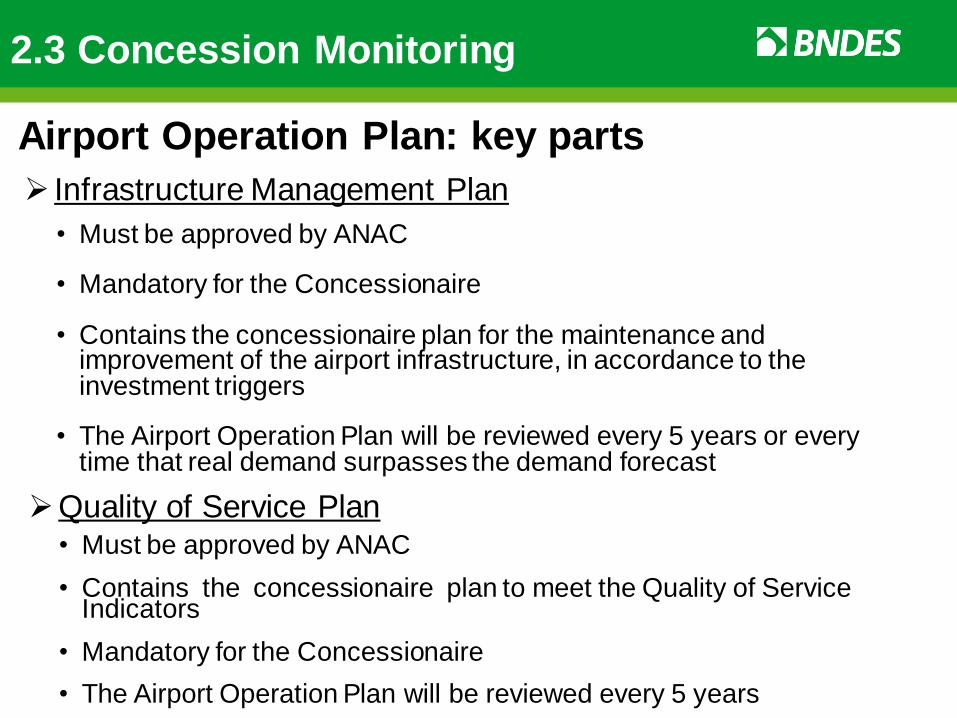
• Must be approved by ANAC
• Mandatory for the Concessionaire
• Contains the concessionaire plan for the maintenance and
improvement of the airport infrastructure, in accordance to the investment triggers
• The Airport Operation Plan will be reviewed every 5 years or every time that real demand surpasses the demand forecast
Infrastructure Management Plan
Quality of Service Plan • Must be approved by ANAC
• Contains the concessionaire plan to meet the Quality of Service
Indicators
• Mandatory for the Concessionaire
• The Airport Operation Plan will be reviewed every 5 years
Airport Operation Plan: key parts
2.3 Concession Monitoring
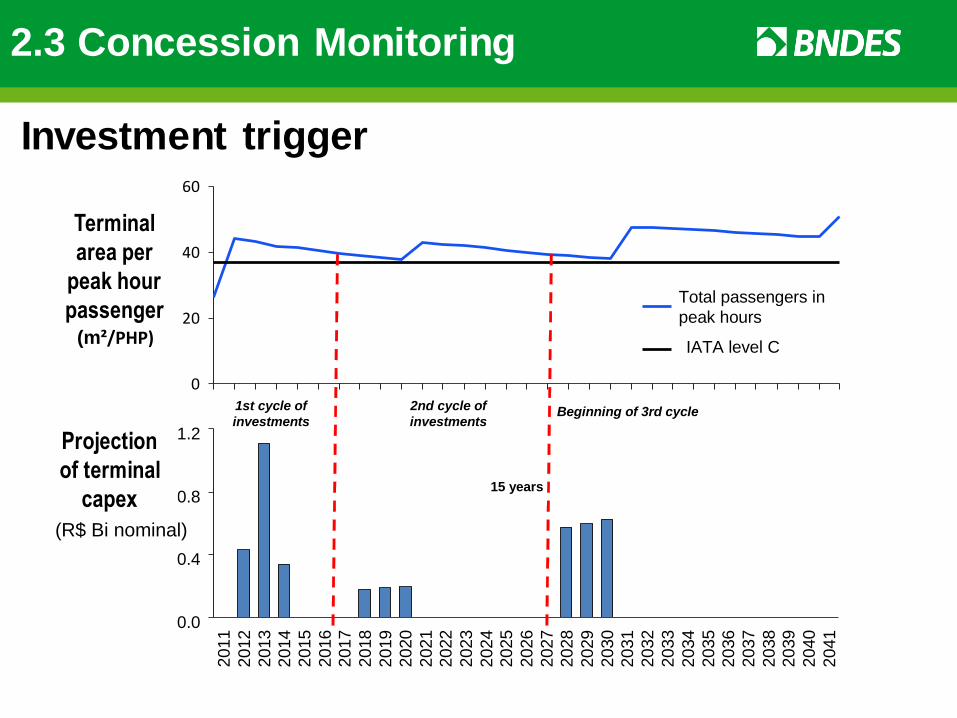
Projeção do
Capex para
TPS
(R$ Bi nominal)
Área do
Terminal por
passageiros
na hora-pico(m²/PHP)
1st cycle of
investments
0
20
40
60
2021
2020
2019
2018
2017
2016
2015
2014
2013
2012
2011
2033
2032
2031
2030
2029
2028
2027
2026
2025
2024
2023
2022
0.8
0.4
0.0
2041
2040
2039
2038
2037
2036
2035
2034
1.2
IATA level C
Total passengers in
peak hours
2nd cycle of
investmentsBeginning of 3rd cycle
15 years
Investment trigger
Terminal
area per
peak hour
passenger
Projection
of terminal
capex
2.3 Concession Monitoring
Rationale:
• Long Term Agreements;
• The uncertainty of future technical and economic scenarios;
• Public Utilities.
Concession Parameters Revision (every 5 years):
• Preceded by Public Hearing
• X Factor
• IQS / Q Factor
• WACC to MCF
Revision of the Concession Parameters
2.4 Concession Agreement Update
Minimum experience of 5 years operating airports; and
Over the last ten years must have operated airport that has
processed at least 5 million passengers/year, including boarding,
landing and connecting passengers.
Rationale:
- Concessionaire has the incentive to partner up with top operators
or hire globally recognized experts in master planning and
operation
- Technical expertise easily found in the market:
- Major operators: investments in equity, management
contracts and consultancy contracts
- Several high quality consultancy firms: master planning and
operation
Technical Qualification:
2.5 Bidding rules and auction design
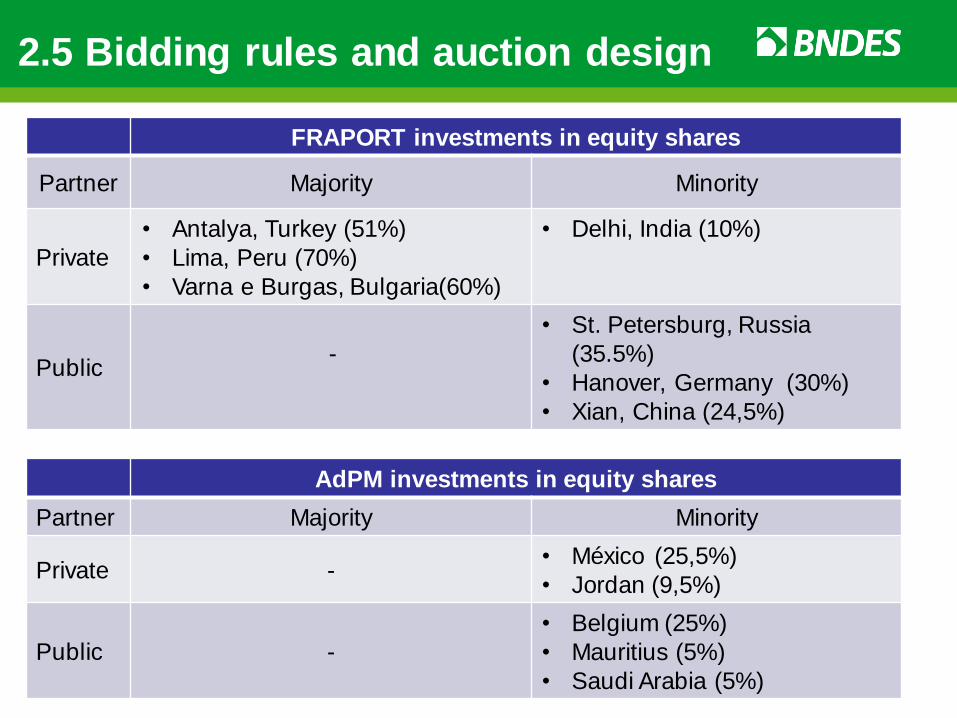
FRAPORT investments in equity shares
Partner Majority Minority
Private
• Antalya, Turkey (51%)
• Lima, Peru (70%)
• Varna e Burgas, Bulgaria(60%)
• Delhi, India (10%)
Public
-
• St. Petersburg, Russia
(35.5%)
• Hanover, Germany (30%)
• Xian, China (24,5%)
AdPM investments in equity shares
Partner Majority Minority
Private - • México (25,5%)
• Jordan (9,5%)
Public -
• Belgium (25%)
• Mauritius (5%)
• Saudi Arabia (5%)
2.5 Bidding rules and auction design
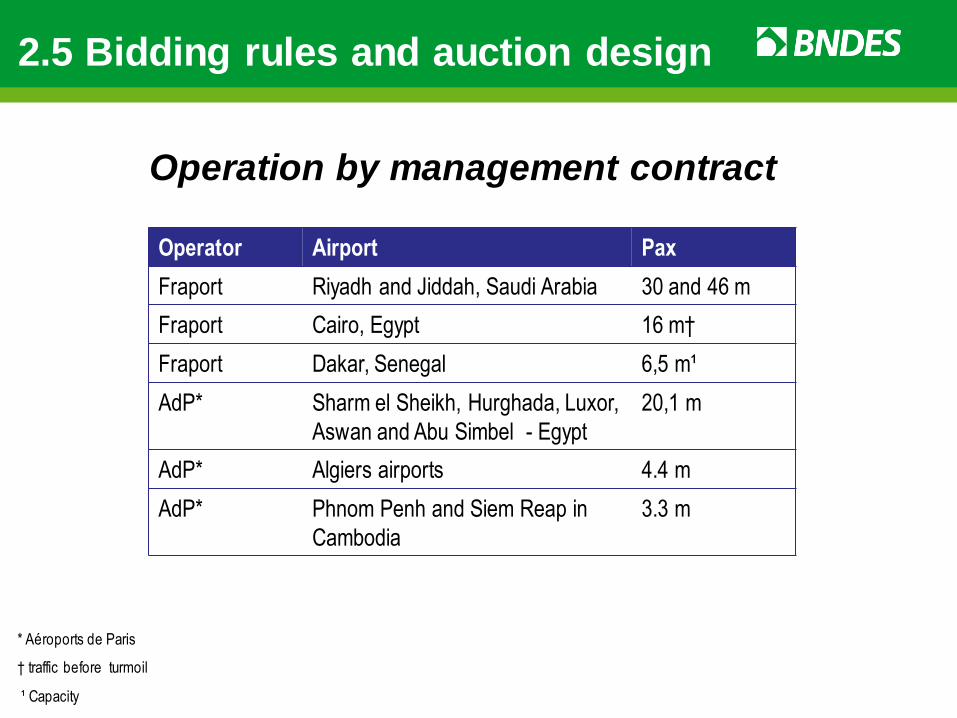
Operator Airport Pax
Fraport Riyadh and Jiddah, Saudi Arabia 30 and 46 m
Fraport Cairo, Egypt 16 m†
Fraport Dakar, Senegal 6,5 m¹
AdP* Sharm el Sheikh, Hurghada, Luxor,
Aswan and Abu Simbel - Egypt
20,1 m
AdP* Algiers airports 4.4 m
AdP* Phnom Penh and Siem Reap in
Cambodia
3.3 m
Operation by management contract
* Aéroports de Paris
† traffic before turmoil
¹ Capacity
2.5 Bidding rules and auction design
Source: PPP in Airport Infrastructure Business
Dead Sea – Jordan - June 6th & 7th, 2010 38
2.5 Bidding rules and auction design
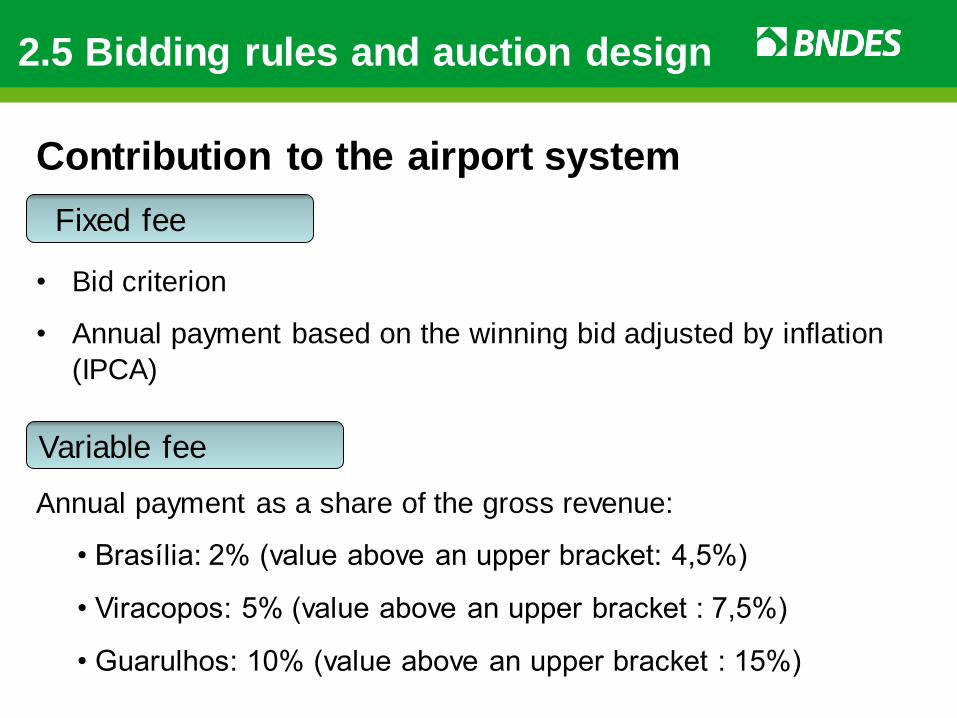
Variable fee
Fixed fee
• Bid criterion
• Annual payment based on the winning bid adjusted by inflation
(IPCA)
Annual payment as a share of the gross revenue:
• Brasília: 2% (value above an upper bracket: 4,5%)
• Viracopos: 5% (value above an upper bracket : 7,5%)
• Guarulhos: 10% (value above an upper bracket : 15%)
Contribution to the airport system
2.5 Bidding rules and auction design
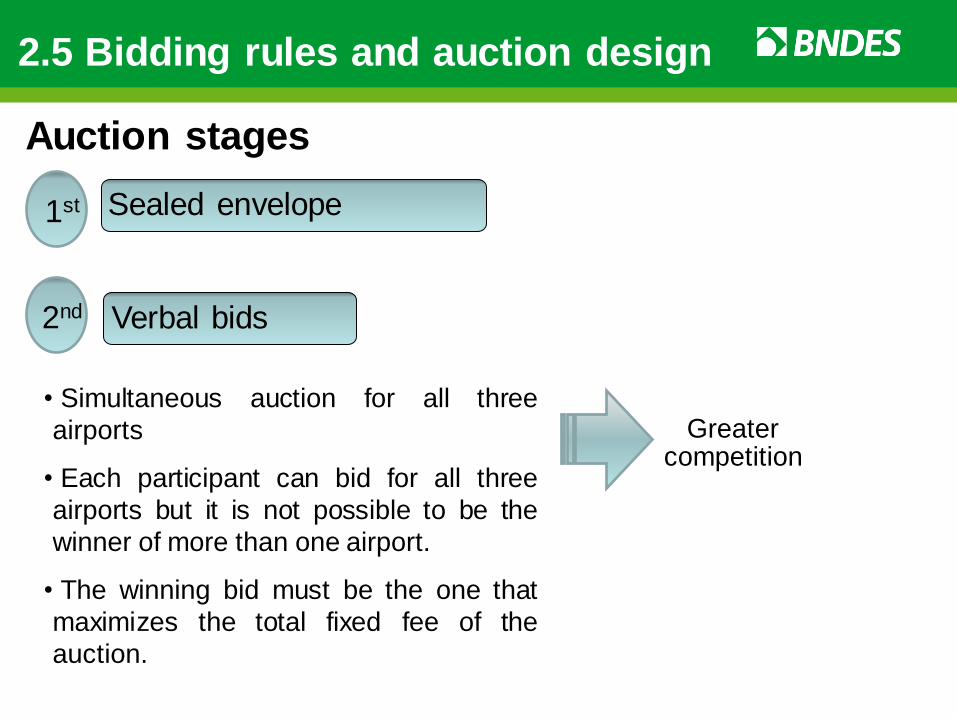
Verbal bids
Sealed envelope
• Simultaneous auction for all three
airports
• Each participant can bid for all three
airports but it is not possible to be the
winner of more than one airport.
• The winning bid must be the one that
maximizes the total fixed fee of the
auction.
1st
2nd
Greater competition
Auction stages
2.5 Bidding rules and auction design
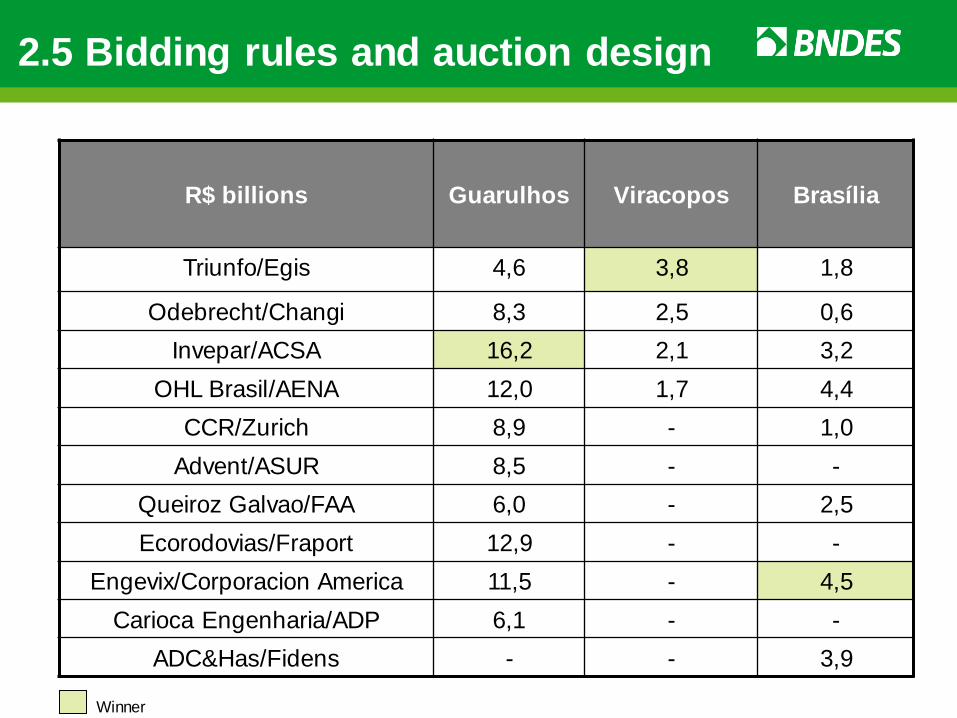
R$ billions
Guarulhos
Viracopos
Brasília
Triunfo/Egis 4,6 3,8 1,8
Odebrecht/Changi 8,3 2,5 0,6
Invepar/ACSA 16,2 2,1 3,2
OHL Brasil/AENA 12,0 1,7 4,4
CCR/Zurich 8,9 - 1,0
Advent/ASUR 8,5 - -
Queiroz Galvao/FAA 6,0 - 2,5
Ecorodovias/Fraport 12,9 - -
Engevix/Corporacion America 11,5 - 4,5
Carioca Engenharia/ADP 6,1 - -
ADC&Has/Fidens - - 3,9
Winner
2.5 Bidding rules and auction design
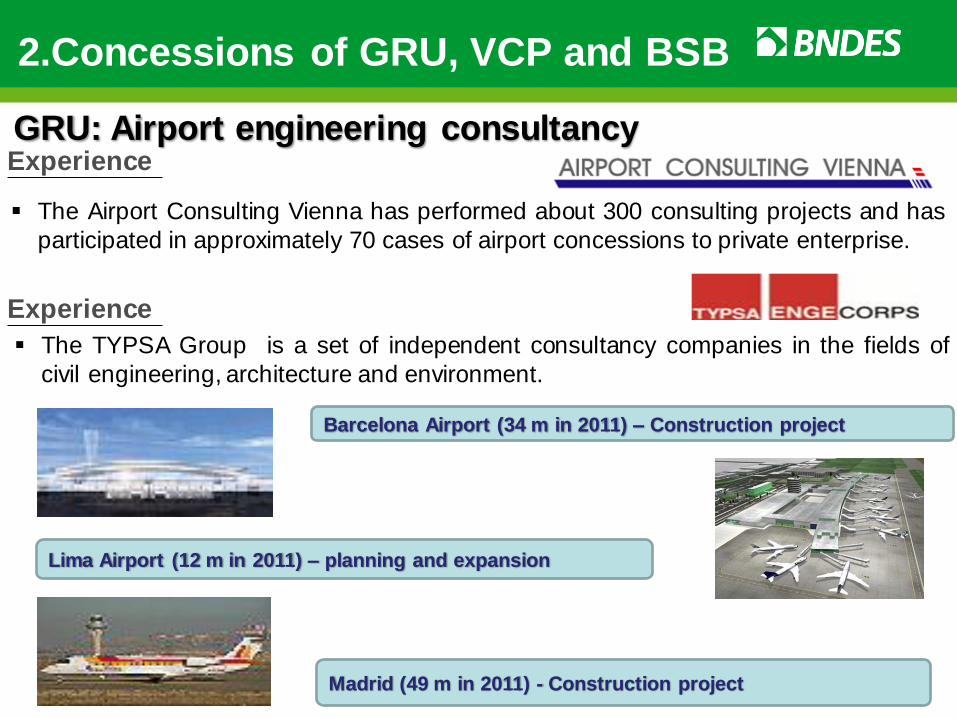
Experience GRU: Airport engineering consultancy
The Airport Consulting Vienna has performed about 300 consulting projects and has
participated in approximately 70 cases of airport concessions to private enterprise.
The TYPSA Group is a set of independent consultancy companies in the fields of
civil engineering, architecture and environment.
Experience
Barcelona Airport (34 m in 2011) – Construction project
Lima Airport (12 m in 2011) – planning and expansion
Madrid (49 m in 2011) - Construction project
2.Concessions of GRU, VCP and BSB
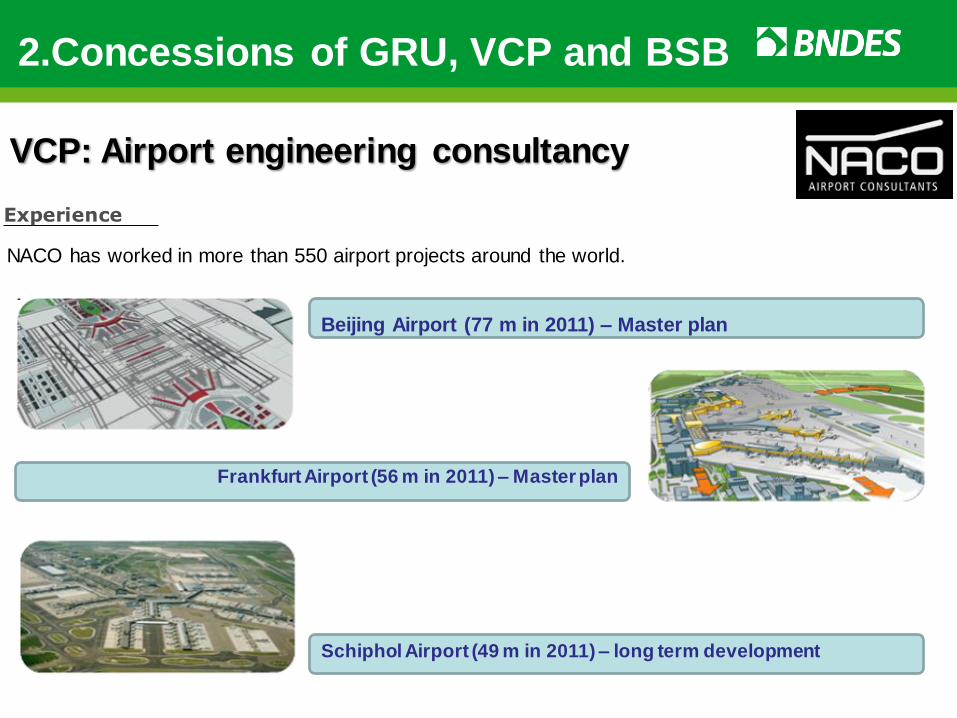
Experience
NACO has worked in more than 550 airport projects around the world.
Beijing Airport (77 m in 2011) – Master plan
Schiphol Airport (49 m in 2011) – long term development
Frankfurt Airport (56 m in 2011) – Master plan
VCP: Airport engineering consultancy
2.Concessions of GRU, VCP and BSB
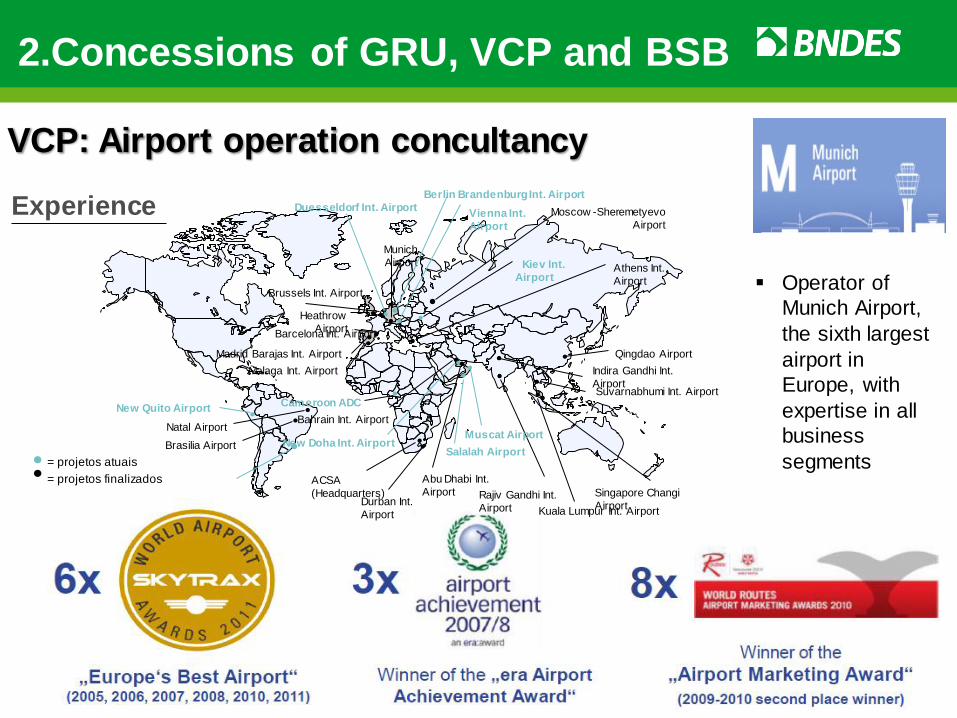
Experience
VCP: Airport operation concultancy
Operator of
Munich Airport,
the sixth largest
airport in
Europe, with
expertise in all
business
segments
Qingdao Airport
Natal Airport
Brasilia Airport
Heathrow
Airport
Durban Int.
Airport
Moscow -Sheremetyevo
Airport
Munich
Airport
Berlin Brandenburg Int. Airport
Madrid Barajas Int. Airport
Malaga Int. Airport
Duesseldorf Int. Airport
Brussels Int. Airport
Barcelona Int. Airport
Vienna Int.
Airport
Indira Gandhi Int.
Airport
Rajiv Gandhi Int.
Airport
Athens Int.
Airport
Kuala Lumpur Int. Airport
Suvarnabhumi Int. Airport
Abu Dhabi Int.
Airport Singapore Changi
Airport
New Doha Int. Airport
Bahrain Int. Airport
Salalah Airport
Muscat Airport
= projetos atuais
= projetos finalizados ACSA
(Headquarters)
Kiev Int.
Airport
New Quito Airport Cameroon ADC
2.Concessions of GRU, VCP and BSB
Experience
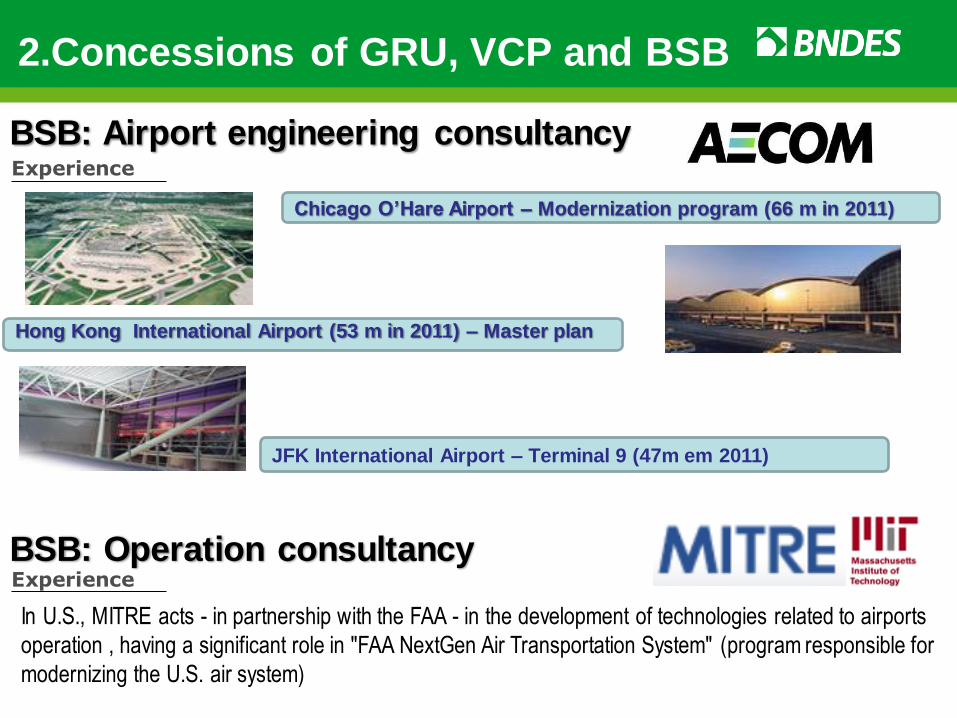
BSB: Airport engineering consultancy
Chicago O’Hare Airport – Modernization program (66 m in 2011)
Hong Kong International Airport (53 m in 2011) – Master plan
JFK International Airport – Terminal 9 (47m em 2011)
BSB: Operation consultancy
In U.S., MITRE acts - in partnership with the FAA - in the development of technologies related to airports
operation , having a significant role in "FAA NextGen Air Transportation System" (program responsible for
modernizing the U.S. air system)
Experience
2.Concessions of GRU, VCP and BSB
Contact us
www.bndes.gov.br
Thank you
Henrique Amarante Costa Pinto
Deputy Director

Back up
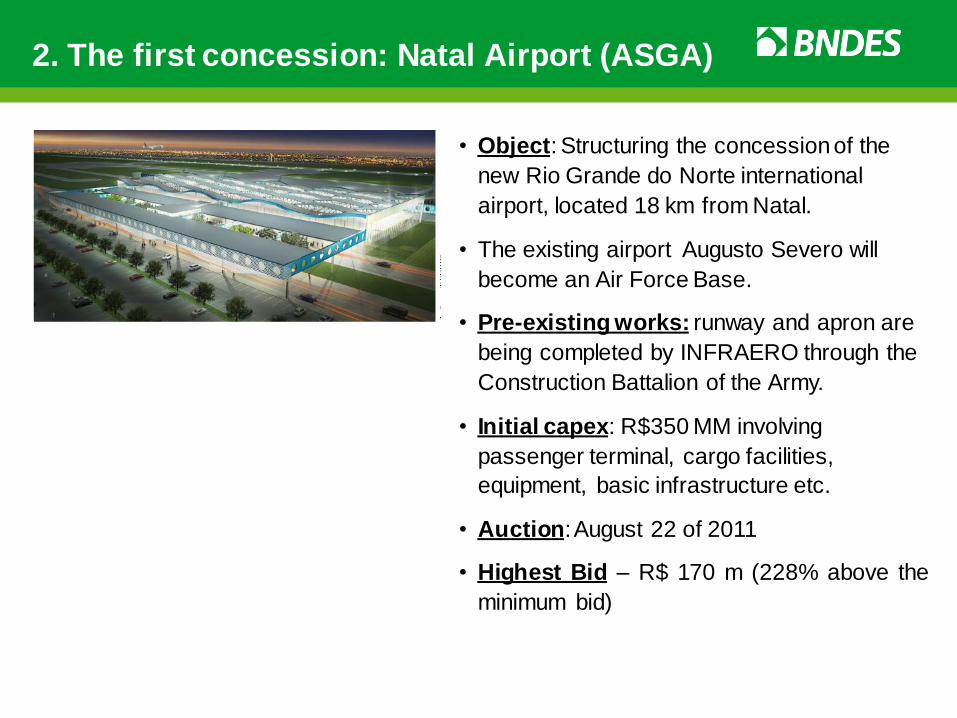
2. The first concession: Natal Airport (ASGA)
• Object: Structuring the concession of the
new Rio Grande do Norte international
airport, located 18 km from Natal.
• The existing airport Augusto Severo will
become an Air Force Base.
• Pre-existing works: runway and apron are
being completed by INFRAERO through the
Construction Battalion of the Army.
• Initial capex: R$350 MM involving
passenger terminal, cargo facilities,
equipment, basic infrastructure etc.
• Auction: August 22 of 2011
• Highest Bid – R$ 170 m (228% above the
minimum bid)
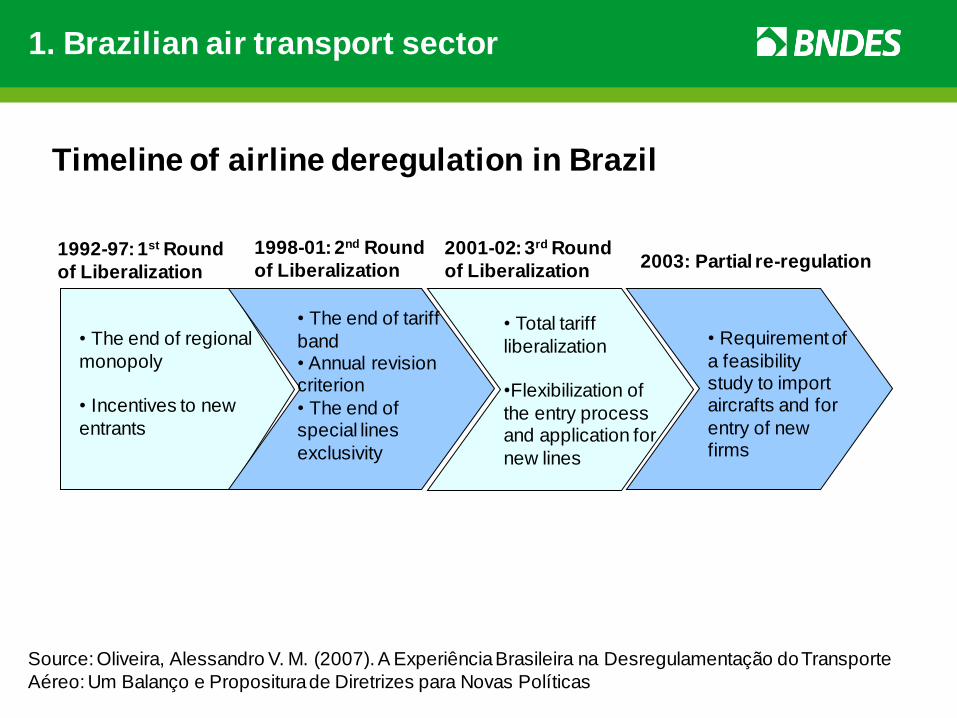
Timeline of airline deregulation in Brazil
• The end of regional
monopoly
• Incentives to new
entrants
1992-97: 1st Round
of Liberalization
1998-01: 2nd Round
of Liberalization
2001-02: 3rd Round
of Liberalization
• The end of tariff
band • Annual revision criterion
• The end of special lines
exclusivity
• Total tariff
liberalization •Flexibilization of
the entry process and application for
new lines
• Requirement of
a feasibility study to import aircrafts and for
entry of new firms
2003: Partial re-regulation
Source: Oliveira, Alessandro V. M. (2007). A Experiência Brasileira na Desregulamentação do Transporte
Aéreo: Um Balanço e Propositura de Diretrizes para Novas Políticas
1. Brazilian air transport sector
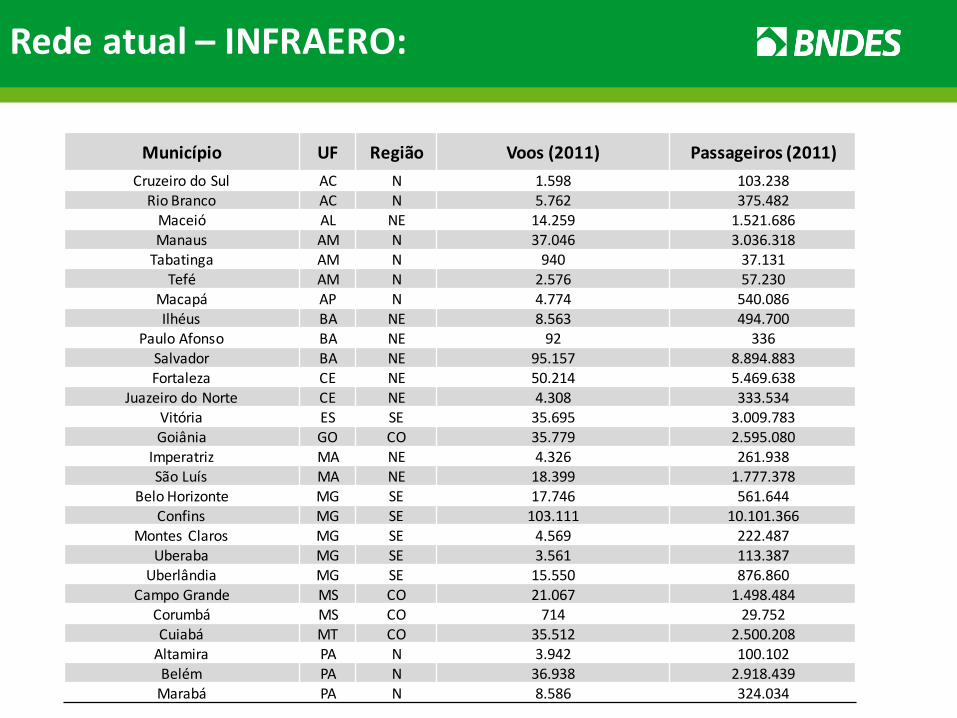
Município UF Região Voos (2011) Passageiros (2011)
Cruzeiro do Sul AC N 1.598 103.238 Rio Branco AC N 5.762 375.482
Maceió AL NE 14.259 1.521.686 Manaus AM N 37.046 3.036.318
Tabatinga AM N 940 37.131 Tefé AM N 2.576 57.230
Macapá AP N 4.774 540.086 Ilhéus BA NE 8.563 494.700
Paulo Afonso BA NE 92 336 Salvador BA NE 95.157 8.894.883 Fortaleza CE NE 50.214 5.469.638
Juazeiro do Norte CE NE 4.308 333.534 Vitória ES SE 35.695 3.009.783 Goiânia GO CO 35.779 2.595.080
Imperatriz MA NE 4.326 261.938 São Luís MA NE 18.399 1.777.378
Belo Horizonte MG SE 17.746 561.644 Confins MG SE 103.111 10.101.366
Montes Claros MG SE 4.569 222.487 Uberaba MG SE 3.561 113.387
Uberlândia MG SE 15.550 876.860 Campo Grande MS CO 21.067 1.498.484
Corumbá MS CO 714 29.752 Cuiabá MT CO 35.512 2.500.208
Altamira PA N 3.942 100.102 Belém PA N 36.938 2.918.439
Marabá PA N 8.586 324.034
Rede atual – INFRAERO:

Município UF Região Voos (2011) Passageiros (2011)
Parauapebas PA N 3.395 85.525 Santarém PA N 8.674 443.426
Campina Grande PB NE 1.351 94.179 João Pessoa PB NE 10.345 1.135.271
Petrolina PE NE 5.453 368.383 Recife PE NE 64.856 6.263.951
Teresina PI NE 11.433 1.026.165 Curitiba PR S 82.748 6.929.976
Foz do Iguaçu PR S 15.346 1.655.868 Londrina PR S 12.938 954.961
Campos dos Goytacazes RJ SE 1.534 15.657 Macaé RJ SE 2.176 23.999
Rio de Janeiro – GIG RJ SE 114.240 14.946.918 Rio de Janeiro – SDU RJ SE 99.601 8.635.485
Natal RN NE 23.681 2.498.868 Porto Velho RO N 13.783 987.783 Boa Vista RR N 3.098 318.491 Pelotas RS S 1.792 5.244
Porto Alegre RS S 77.054 7.637.188 Uruguaiana RS S 476 2.868
Florianópolis SC S 33.575 2.971.070 Itajaí SC S 12.846 1.104.926
Joinville SC S 6.718 487.013 Aracaju SE NE 13.367 1.055.894
São José dos Campos SP SE 3.947 190.162 São Paulo – CGH SP SE 159.932 17.292.266
Palmas TO N 7.107 490.198
Rede atual – INFRAERO
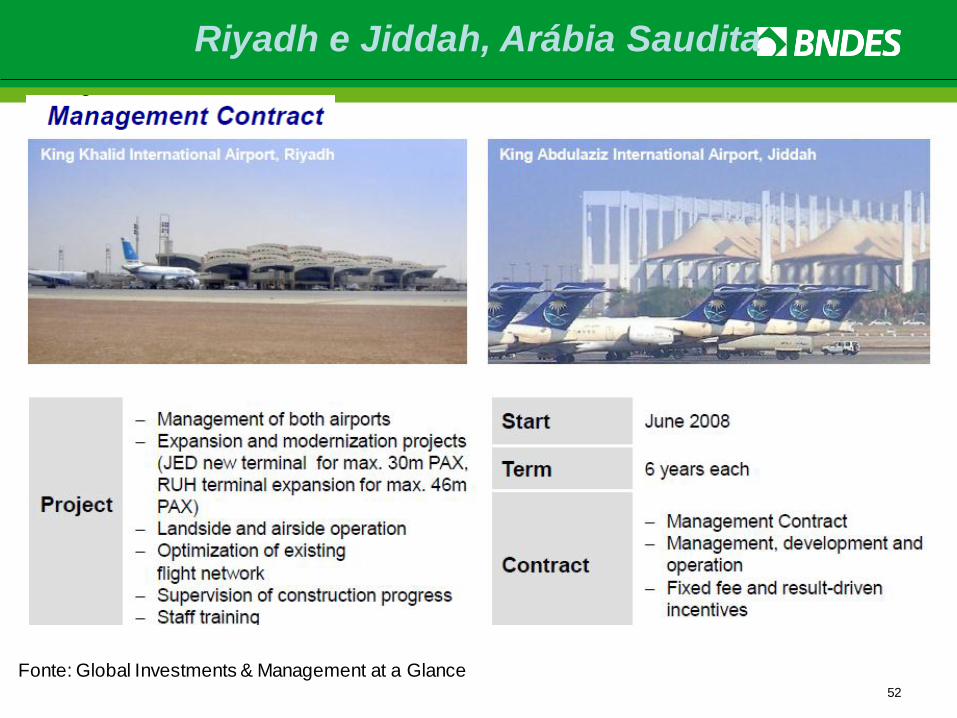
Fonte: Global Investments & Management at a Glance 52
Riyadh e Jiddah, Arábia Saudita
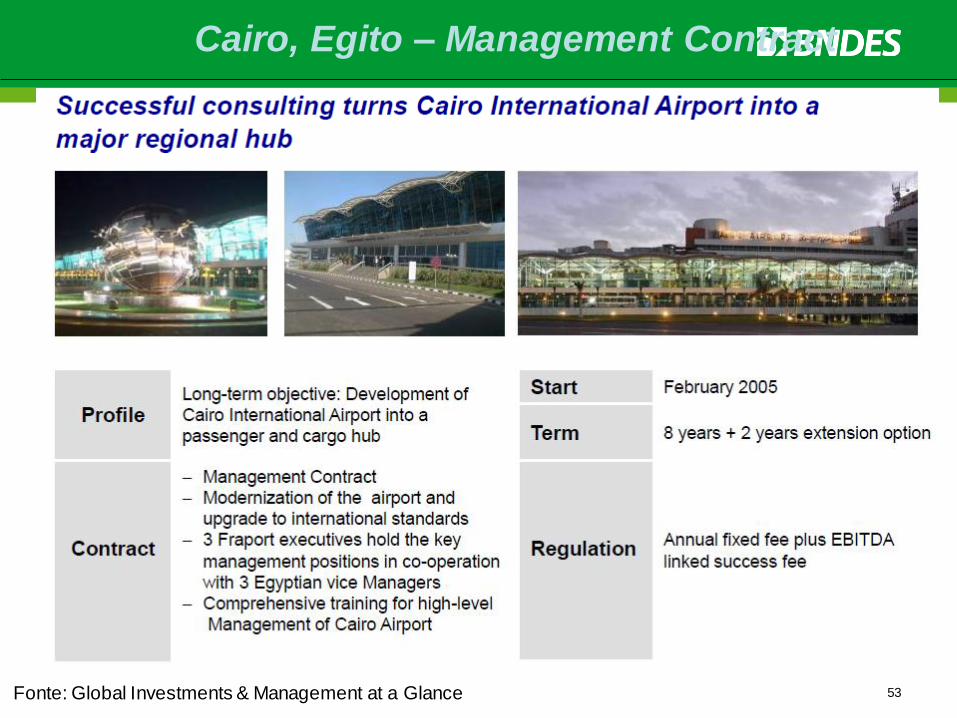
Fonte: Global Investments & Management at a Glance 53
Cairo, Egito – Management Contract
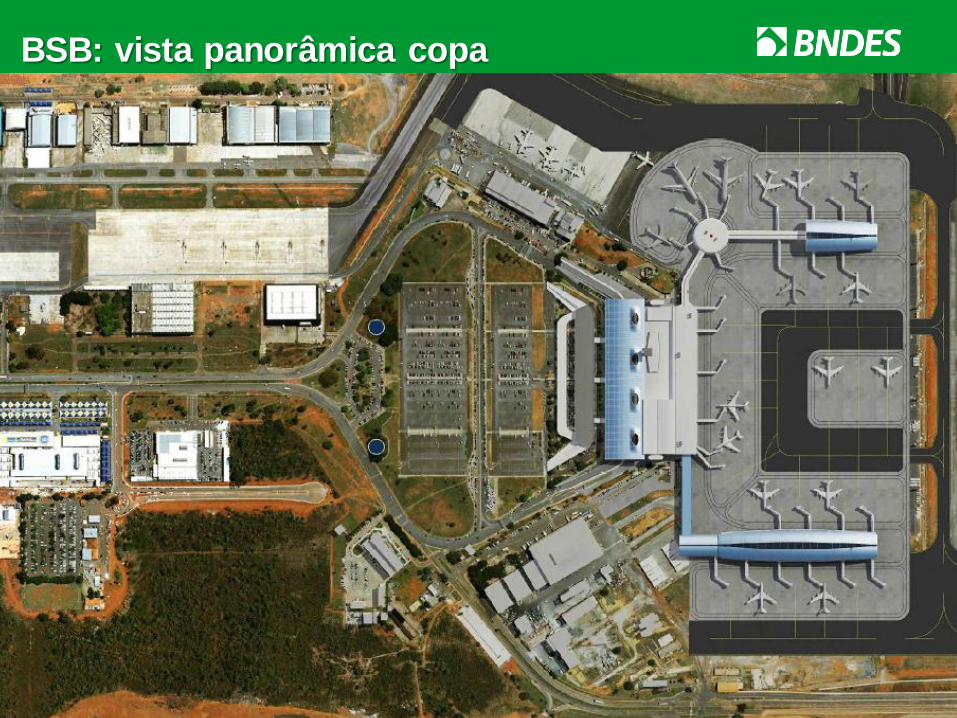
BSB: vista panorâmica copa
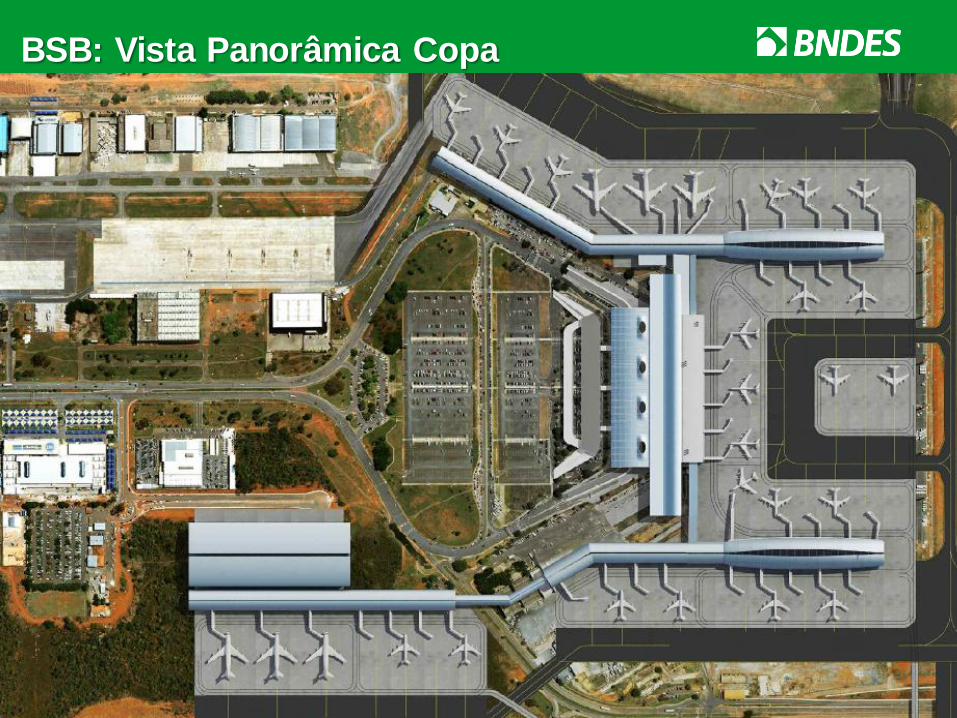
BSB: Vista Panorâmica Copa
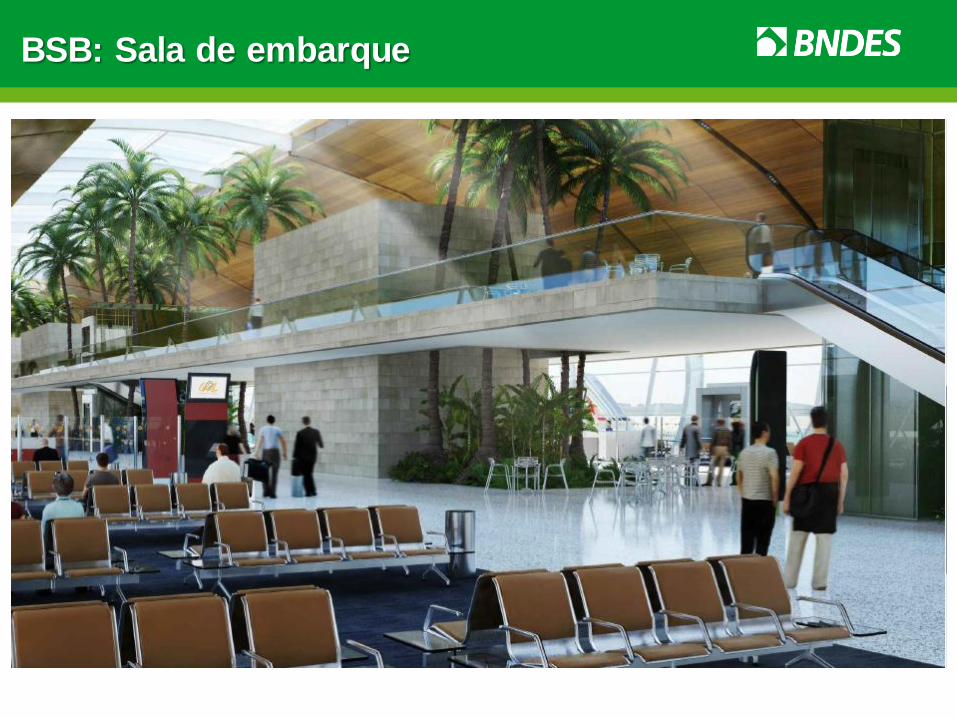
BSB: Sala de embarque
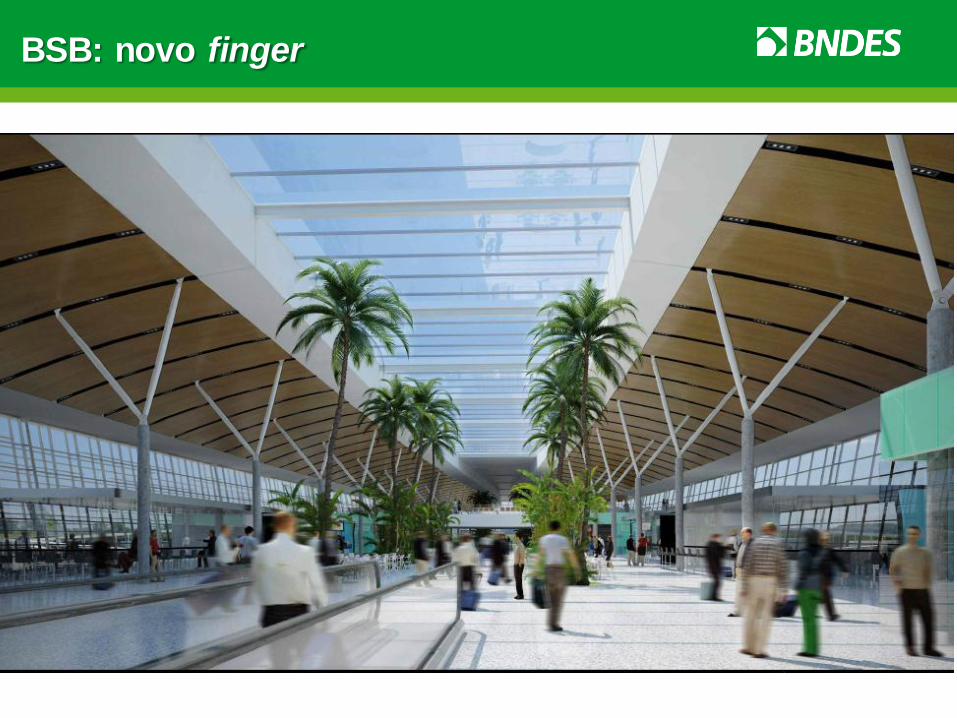
BSB: novo finger
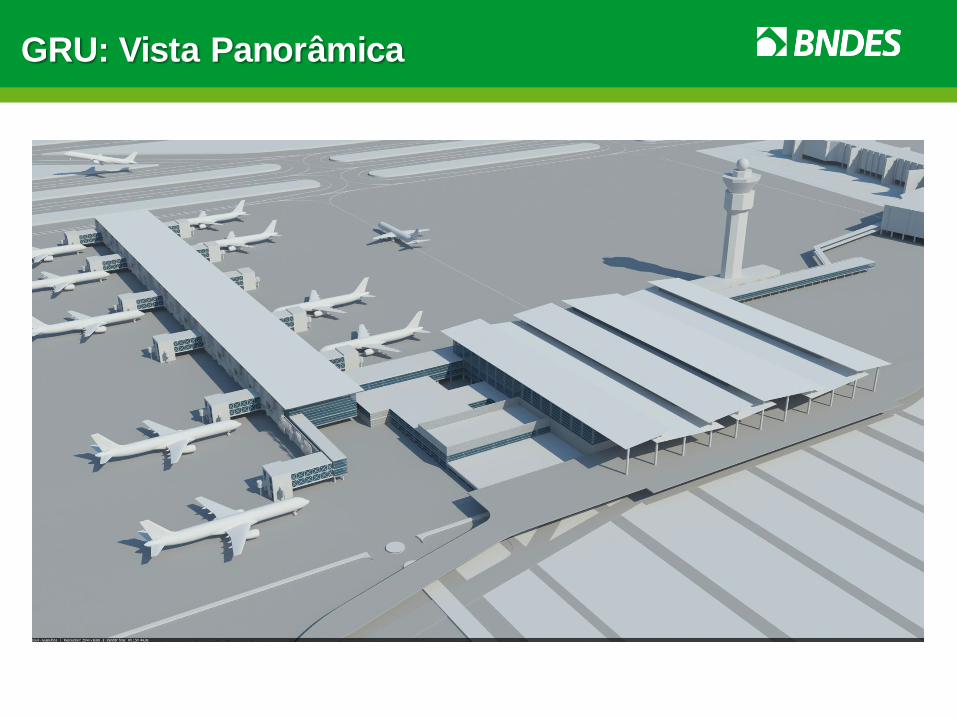
GRU: Vista Panorâmica
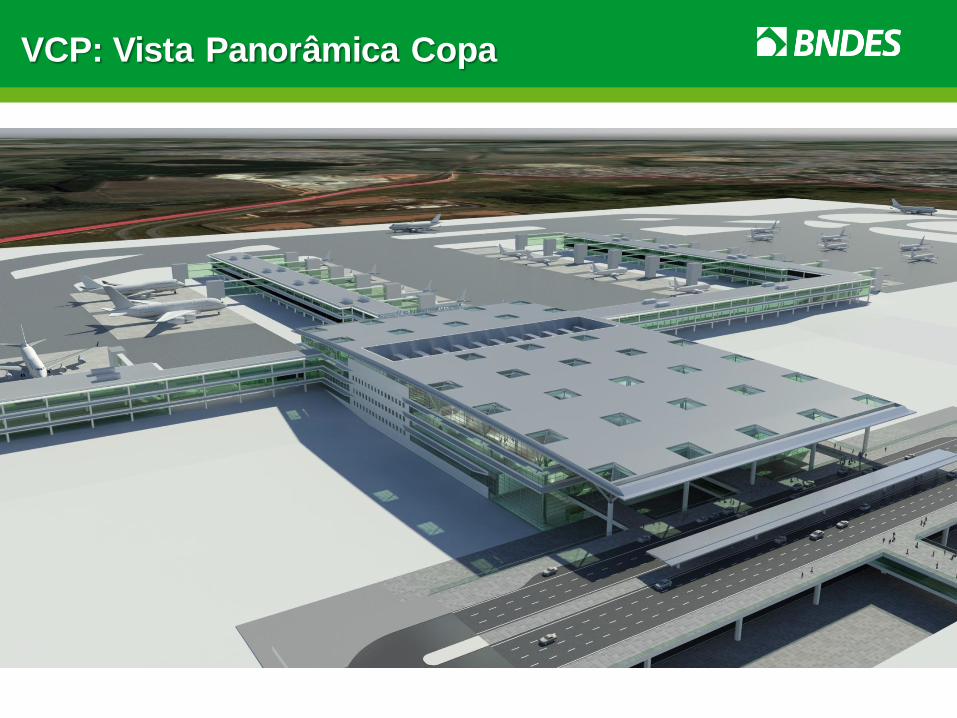
VCP: Vista Panorâmica Copa
Related Documents