Brands as Signals: A Cross-Country Validation Study Tülin Erdem Haas School of Business, University of California, Berkeley, CA 94720-1900. [email protected] , Tel: 1 510 642 4632, Fax: 1 510 643 1420 Joffre Swait Advanis Inc. and University of Alberta [email protected] , Tel: 1 352 372 7373 Ana Valenzuela Zicklin School of Business, Baruch College ana [email protected] , Tel: 1 646 312 3273 January 2005 Acknowledgments: We thank the many colleagues who assisted us with data collection: Esra Gençtürk at Koç University in Istanbul, Turkey; Monica Gomez at Universidad Autonoma de Madrid, Nora Lado at Universidad Carlos III de Madrid; Shrilekha Parikh at College of Commerce and Economics of the University of Mumbai, India; Oliver Heil at University of Mainz, Germany; Adele Diederich, Universität Oldenburg, Germany; Miyuri Shirai at Yokohama National University, Japan; André Menck at the Universidade Federal de Uberlândia and Cláudio Barbieri da Cunha at the Escola Politécnica of the Universidade de São Paulo, Brazil. This project was partially funded by the research fund SEJ 2004-00672/ECON granted by the Spanish Ministry of Science and Education.

Welcome message from author
This document is posted to help you gain knowledge. Please leave a comment to let me know what you think about it! Share it to your friends and learn new things together.
Transcript

Brands as Signals: A Cross-Country Validation Study
Tülin Erdem
Haas School of Business, University of California, Berkeley, CA 94720-1900.
[email protected], Tel: 1 510 642 4632, Fax: 1 510 643 1420
Joffre Swait
Advanis Inc. and University of Alberta
[email protected], Tel: 1 352 372 7373
Ana Valenzuela
Zicklin School of Business, Baruch College
ana [email protected], Tel: 1 646 312 3273
January 2005
Acknowledgments: We thank the many colleagues who assisted us with data collection: Esra
Gençtürk at Koç University in Istanbul, Turkey; Monica Gomez at Universidad Autonoma de
Madrid, Nora Lado at Universidad Carlos III de Madrid; Shrilekha Parikh at College of
Commerce and Economics of the University of Mumbai, India; Oliver Heil at University of
Mainz, Germany; Adele Diederich, Universität Oldenburg, Germany; Miyuri Shirai at
Yokohama National University, Japan; André Menck at the Universidade Federal de Uberlândia
and Cláudio Barbieri da Cunha at the Escola Politécnica of the Universidade de São Paulo,
Brazil. This project was partially funded by the research fund SEJ 2004-00672/ECON granted by
the Spanish Ministry of Science and Education.

1
Brands as Signals: A Cross-Country Validation Study
Abstract
This paper tests how well the information-economics view of brand equity explains
consumer brand choice in countries that represent different cultural dimensions. Empirical
analysis use survey and experimental data on orange juice and personal computer collected from
subjects in Brazil, Germany, India, Japan, Spain, Turkey, and the United States. The results
obtained provide strong empirical evidence across countries for the role of brands as signals of
product positions. Additionally, the positive effect of brand credibility on choice is larger in the
case of consumers that rate high on either uncertainty avoidance or collectivism. Credible
brands provide more value to collectivist consumers because of being perceived as of higher
quality (i.e. reinforcing group identity), while they do so to high uncertainty avoidance
consumers because of lowering perceived risk and information costs.
2
Introduction
A brand (understood to be “a name, term, sign, symbol or design, or a combination of
them which is intended to identify the goods and services of one seller or a group of sellers and
to differentiate them from those of competitors”, Kotler 1997, pp. 443) can potentially play many
roles in consumer decision-making and choice behavior. Underlying many of the brand effects is
consumer uncertainty about product attributes and/or benefits. This uncertainty arises from the
imperfect and asymmetric information state that characterizes most product markets (i.e., firms
are more informed about their own products than consumers).
The many roles brands play in consumer decision-making may materialize through
multiple mechanisms such as psychological (e.g., associative network memory), sociological
(e.g., brand communities) and economic processes (e.g., brands as signals under uncertainty)
(Keller 2002). Earlier work on brands as signals under uncertainty (e.g., Erdem and Swait 1998;
Wernerfelt, 1988) focused on the influence of imperfect and asymmetric information on
consumer choice processes. Specifically, Erdem and Swait (1998) suggested that the clarity and
credibility of brands as signals of product positions increase perceived quality, decrease
consumer perceived risk and information costs, and hence increase consumer expected utility.
They also discussed the antecedents to credibility and clarity. In this framework, the key
characteristic of a brand signal is its credibility. Brand credibility (the credibility of a brand as a
signal) is defined as the believability of the product position information contained in a brand,
which depends on the willingness and ability of firms to deliver what is promised.
Most previous work utilizing information economics frameworks to explain brand
credibility and brand equity focused on the United States only. The validity of existing
frameworks in predicting consumer behavior in regard to brands as signals and outcomes outside

3
of the US is not clear. With the growing trend in the globalization of marketing activities, as well
as the importance of brands in accomplishing many of these activities, there is a pressing need to
explicitly address whether existing frameworks are compatible with consumer behavior outside
of the US, and if not, to delimit their scope of application. Despite this practical impetus and
growing theoretical interest, relatively little work examines the use of signals or extrinsic cues to
judge quality across countries and/or cultures.
The purpose of this paper is two-fold. First, the paper tests how well the information
economics view of brand equity explains consumer brand choice and brand equity formation in
different countries. Specifically, this paper assesses the applicability of the framework proposed
by Erdem and Swait (1998)i across countries representing different cultural dimensions. Second,
we aim to highlight some differences across countries. More specifically, we attempt to explore
differences in the way brands as signals operate across countries and link any such differences to
consumers’ cultural orientation. We believe that three of Hofstede’s (1980) cultural dimensions
(individual-collectivism, uncertainty avoidance and power distance) may particularly affect the
way consumers use and think about brands as signals.
We conducted our analysis using survey and experimental data on orange juice and
personal computers. Data on consumer brand perceptions, choices and cultural dimensions were
collected from subjects in Brazil, Germany, India, Japan, Spain, Turkey, and the United States.
We chose these countries to represent a wide range of Hofstede’s (1980) cultural dimensions. All
subjects were undergraduates in business schools (except for about half of the Brazilian sample,
who were undergraduate engineering students) that participated in exchange for course credit.
The results obtained provide strong empirical evidence for brands as signals of product positions,
in general, and for Erdem and Swait (1998) framework, in particular, across countries that vary
4
along the cultural dimensions mentioned above. However, some interesting differences emerge
in terms of both total credibility effects on choice, as well as the mechanisms through which
brand credibility effects on utility operate.
The rest of the paper is organized as follows. The next section covers the relevant
literature review and discusses the conceptual framework. We then develop a number of
hypotheses to be tested and describe the empirical approach and the data collection. The last
section outlines the implications of our findings and discusses future research avenues.
Literature Review and Conceptual Framework
Brands under Uncertainty
The effect of uncertainty about brand attributes (more generally, a brand’s position in the
attribute space) on consumer choice has been the focal point of economics approaches to brand
effects. Uncertainty affects consumer perceived brand attributes, the variance of their attribute
beliefs, as well as their information costs. The literature both in economics and marketing has
focused on quality uncertainty, where quality is conceptualized and measured as a multi-
dimensional construct (as a summary statistic of a brand’s position in the space for attributes that
are imperfectly observable). Aaker (1991) suggested that strong brands are associated with
higher perceived quality, ceteris paribus, which refers to mean beliefs about quality. Uncertainty
about quality also implies that there is variance of consumer beliefs of quality for a given
consumer (if consumers knew quality exactly or thought they knew it exactly, this variance
would be zero). This creates consumer perceived risk, while consumers tend to be risk-averse in
most contexts. Risk aversion affects consumers’ decision making in various ways (e.g., Rao and
Bergen 1992; Shimp and Bearden 1982). Risk-averse consumers feel threatened by ambiguous
and uncertain product assessments. In this context, the literature has suggested that brands can
5
reduce perceived risk by becoming credible and consistent symbols of product quality (Erdem
and Swait 1998, Montgomery and Wernerfelt 1988).
When there is quality uncertainty, and especially in the presence of risk-aversion,
consumers tend to search for more information regarding product quality before making a
decision (Shimp and Bearden 1982; Money, Gilly and Graham 1998).ii However, such
information may often not be available, not credible even if available, or even if available and
credible, consumers may not be willing to bear large information costs, since utility decreases
with increasing information costs. Consequently, consumers may resort to extrinsic cues, such as
price, advertising or channel choice to infer product quality (Zeithaml 1988). For example, brand
as a cue of quality could be particularly useful in countries (e.g., India) where the quality of the
products may vary widely in a given product category (Maxwell 2001).
The signaling literature in economics focuses on which conditions make these cues into
credible signals (i.e., manipulable attributes or activities of economic agents to convey
information about their characteristics; see, e.g., Spence 1974). A firm can use various marketing
mix elements to signal product quality: for example, charging a high price, offering a certain
warranty or distributing via certain channels. Each of these actions may or may not be credible
depending on market conditions, including competitive conditions and consumer behavior.
However, what sets brands apart from the individual marketing mix elements as credible signals
is that the former embody the cumulative effect of past marketing mix strategies and activities.
This historical notion that credibility is based on the sum of past behaviors has been referred to
as reputation in the information economics literature (see Herbig and Milewicz 1995).
Credibility is broadly defined as the believability of an entity’s intentions at a particular
time and is posited to have two main components: trustworthiness and expertise (Wernerfelt
6
1988; Rao and Ruekkert 1994). Thus, brand credibility is defined as the believability of the
product information contained in a brand, which requires that consumers perceive that the brand
have the ability (i.e., expertise) and willingness (i.e., trustworthiness) to continuously deliver
what has been promised (in fact, brands can function as signals since − if and when they do not
deliver what is promised − their brand equity will erode). The credibility of a brand has been
shown to be higher for brands with higher marketing mix consistency over time and higher brand
investments, ceteris paribus (Erdem and Swait 1998). Consistency refers to the degree of
harmony and convergence among the marketing mix elements and the stability of marketing mix
strategies and attribute levels over time. Brand investments, on the other hand, are resources that
firms spend on brands to (1) assure consumers that brand promises will be kept and (2)
demonstrate longer-term commitment to brands (Klein and Leffler 1981). Furthermore, it has
also been shown that the clarity (i.e., lack of ambiguity) of the product information contained in
a brand is an antecedent to brand credibility (Erdem and Swait 1998).
As also suggested by Aaker (1991), higher perceived (or expected) quality, lower
information costs and lower risks associated with credible brands may increase consumer
evaluations of brands. Indeed, Erdem and Swait (1998) have shown, using structural equation
models, that expected utility increases with perceived quality, and decreases with perceived risk
and information costs; these, in turn, are anteceded by brand credibility.
Brand Effects across Countries and Cultural Dimensions
Few previous papers studied the use of signals or extrinsic cues to judge quality across
countries and/or cultures. Dawar and Parker (1994) found that there are few differences in the
use of price to signify quality for a highly homogeneous segment of consumers across both
Western countries and Japan. McGowan and Sternquist (1998) compared Japanese and US
7
consumers in terms of their price-quality schema, prestige sensitivity and value consciousness.
Results suggested that price-inference behaviors may be market-universal. These studies,
however, have focused on comparing consumer price-quality perceptions across developed
markets. In inefficient markets, such as less-developed countries, consumers may believe in the
price-quality relationship to a lesser extent because price information is less credible (Zhou, Su
and Bao 2002). As a result, consumers in such markets may need to rely more on certain other
signals to infer quality because other product information is less available or less reliable.
Past research has also attempted to link brand choice to a number of cultural dimensions
(e.g., Trompennars and Hampden-Turner 1997, Cray and Mallory 1998; Voich 1995).
Particularly, Hofstede’s (1980, 1984) influential work on cross-cultural value systems identifies
three aspects of cultures that can be related to brand choice: collectivism/individualism,
uncertainty avoidance and power distance.iii
Although Hofstede’s research was conducted in
organizational settings, the values he identifies have often been associated with consumer
behavior. For example, Hofstede’s values have been associated with consumer’s tipping
behavior (Lynn, Zinkhan and Harris 1993), country-of-origin effects on product evaluations
(Gurhan-Canli and Maheswaran 2000), value-attitude relations (Gregory, Munch and Peterson
2002), persuasion effects (Aaker and Maheswaran 1997), consumer innovativeness (Steenkamp,
Hofstede and Wedel 1999) and behavioral intention models (Lee and Green 1991).
The marketing literature has been particularly keen in examining the cultural dimensions
of individualism and collectivism. The individualism-collectivism dimension relates brand usage
to social motivations (Hofstede 1980). Cultures high in individualism tend to seek variety and
hedonistic experiences, whereas cultures high in collectivism correlate more with conformity and
group behavior. Roth (1995) found support for the hypotheses that collectivist cultures find
8
brands that reinforce group membership and affiliation more attractive, whereas individualistic
cultures favor brands that reinforce their independence and provide individual gratification.
Besides, collectivist societies value consensus and that makes them loyal to the dominant brand
(Robinson 1996). Furthermore, research into the symbolic meaning of brands indicates that
brand names are a much more important symbol of group identity in collectivistic societies
(Johansson, Ronkainen and Czinkota 1994). Finally, previous literature found that the degree in
which other people influence the consumer purchase decision is a factor that may affect brand
attitudes across national cultures. Particularly, Nicholls et al. (1997) showed that a collectivist
sub-culture (Hispanic consumers in the U.S.) tended to be more susceptible to social influence
than an individualistic sub-culture (their Anglo counterparts). For example, collectivist
consumers considered the influence of friends in the choice of favored brand very important.
In this research paper, given our focus on brands as signals, it is likely that the most
relevant cultural mechanism is uncertainty avoidance. Uncertainty avoidance refers to “the extent
to which people feel threatened by ambiguous situations and create beliefs and institutions that
try to avoid these” (Hofstede and Bond 1984, p.418). This concept captures the cultural pattern
of seeking stability, predictability, and low risk rather than change and new experiences
(Hofstede 1984). As a consequence, consumers in cultures high in uncertainty avoidance tend to
favor credible and consistent brands (Robinson 1996; Dawar and Parker 1994).
Another cultural dimension, power distance, describes the extent to which a culture
fosters social inequality. Cultures high in power distance tend to emphasize prestige and wealth
in shaping boundaries or vertical relationships between social and economic classes such as rich
and poor, superiors and subordinates (Hofstede 1984, Inkeles 1960). If one relates the aspects of
cultural power distance to consumer needs, then it appears that social brand images should be the
9
best fit for high power distance cultures. Past research confirms that consumers in high power
distance cultures attach more importance to products’ brand names than those in low power
distance cultures (Bristow and Asquith 1999; Roth 1995; Robinson 1996). However, when
power distance is high, consumers are also found to “distrust” authority (Hofstede 1980). More
distrust of authority may diminish brand credibility effects, counterbalancing the stronger
positive impact of the relationship between social status and brand names.
Applicability of Information Economics Perspective to Brand Effects across Countries and
Cross-cultural Differences in the Use of Brands as Signals
Erdem and Swait 1998 have shown that brand credibility 1) increases perceived quality,
2) decreases perceived risk, and 3) decreases information costs; all three of which 4) increase
consumer (expected) utility. We expect these main relationships to hold across countries but be
moderated by cultural dimensions. Uncertainty avoidance is the cultural dimension that most
clearly relates to brand effects as signals. Consumers from high uncertainty avoidance cultures
are more likely risk averse and should have lower tolerance for ambiguity. This type of consumer
tends to perceive more risk from product consumption and therefore adheres to historically tested
patterns of behavior (Verhage, Yava and Green 1991). Therefore, as already indicated in the
paper, consumers from high uncertainty avoidance cultures may use brands as signals more than
consumers from low uncertainty avoidance cultures. Also, perceived risk may be a relatively
more important source of the brand signaling effect in such cultures. Specifically, we would
expect the impact of brand credibility through perceived risk on consumer utility to be higher in
cultures with higher uncertainty avoidance (Douglas and Craig 1997). However, one would also
expect that higher uncertainty avoidance would decrease sensitivity to information costs and
increase willingness to collect information. Consequently, we expect
10
H1: Brand credibility’s impact on consumer utility through perceived risk and
information costs saved would be larger than through perceived quality under high
uncertainty avoidance than under low uncertainty avoidance.
H2: Brand credibility’s overall impact on consumer brand choice will increase with
uncertainty avoidance.
The collectivist/individualist distinction is a more complex phenomenon in regard to its
possible moderating effects on brand signals. Collectivist societies subordinate individual goals
to the goals of a few large in-groups (Triandis and Gelfand 1998). In individualistic societies, the
social fabric and group norms are much looser. Collectivism should result in more reliance on
the brand choice of the group as a whole. Therefore, reliance on brands, epically in forming
quality perceptions, may be more important in highly collectivist societies, ceteris paribus, since
the positive impact of credibility on perceived quality and the impact of perceived quality on
choice could become an element enhancing belonging to the group. However, culture conditions
the way consumers search for product information (Dawar, Parker and Price 1996). Collectivist
cultures tend to exhibit more information search than individualist cultures but rely more on
interpersonal information exchange or word-of-mouth (Money, Gilly and Graham 1998), which
reduces the impact of information costs. This may have two consequences: 1) dampening of the
total credibility effects; 2) brand credibility effects operating more strongly through perceived
quality than perceived risk and information costs.
We expect brand credibility’s role in enhancing quality perceptions and hence
belongingness to the group to dominate the dampening impact of reliance on interpersonal
information exchange. We believe this will be the net effect because the importance of belonging
to a group is very much the driver of behavior in collectivist societies. Consequently, we expect

11
H3: Brand credibility’s impact on consumer utility through perceived quality will be
more pronounced than its impact through perceived risk and information costs in
high collectivism than in low collectivism.
H4: Brand credibility’s overall impact on consumer brand choice will increase with
collectivism.
In regard to power distance, cultures high on power distance tend to be hierarchic in their
interpersonal relationships and decision-making, whereas those low on power distance tend to be
egalitarian. Power distance influences active opinion leadership behaviors by making consumers
distrust others (Dawar, Parker and Price 1996). Equally, power distance should make consumers
distrust brands. In this sense, enhancements on brand credibility and clarity could have a relative
lower effect on perceived quality, perceived risk and information costs saved. However, cultures
high in power distance tend to emphasize the importance of prestige and wealth in vertical
relationships between social classes (Hofstede 1980). If one relates this aspect of cultural power
distance to consumer needs, then it appears that brand as signals of brand positions that relate to
social status should be most important in high power distance cultures because people are highly
motivated by status and affiliation norms (Roth 1995). In this case, brands as signals may have a
larger effect on perceived quality, perceived risk and information costs saved compared to
cultures with low power distance. Given the counter-acting factors determining the impact of
power distance on brand credibility effects, power distance may be found not to have an effect
on how brand credibility impacts choice or if one of the two major mechanisms (distrust versus
importance of authority) dominates, it may decrease or increase total brand credibility effects.
Consequently, we do not propose any hypotheses about the directionality of the moderating
effects of power distance and leave the open empirical question to analyze further.
12
Empirical Investigation of Brand Signaling Across Cultures
As mentioned before, Erdem and Swait (1998) (henceforth, E&S) established the validity
of brand signaling (specifically, via brand credibility) as the basis for positive brand effects on
product evaluations, using a sample of United States university students. We have argued above
that certain of the basic relationships postulated by E&S would be moderated across different
cultures, particularly in terms of three important cross-cultural constructs: uncertainty avoidance
(UA), collectivism/individualism (C/I) and power distance (PD).
We collected comparable samples of respondents in seven different countries, specifically
chosen to differ across these cultural constructs. To that respect, Sekaran (1983) identifies two
primary ways to achieve sample comparability: Drawing nationally representative samples or
selecting matched samples on the basis of some set of characteristics of interest. Due to
budgetary constraints that prevented representative sampling, we matched samples by recruiting
undergraduate business student respondents in all countries (in Brazil, due to recruitment
difficulties, engineering undergraduates were employed for about half of that sample). While this
is a potential limitation to the generalizability of our results, E&S model was first tested using
undergraduate student samples, and, therefore, cross-cultural generalizability will be best
established using samples with similar characteristics. We also expect that differences in age,
socio-demographics, relative income, and so forth, to be small when we use undergraduate
students’ samples, making possible a clearer attribution of substantive theoretical differences
between countries to cultural differences. Finally, the use of student samples constitutes a very
conservative test of the impact of cultural constructs. University students is one of the most
globally homogeneous segment of consumers and, thus, any cultural difference may be amplified
if data is collected using a more inclusive group of respondents.
13
Cross-country comparisons are made in two ways: first, country-level structural equation
models (SEMs) are estimated and compared; second, Mixed MNL choice models based on an
experimental design are used to test the role of brand and cultural constructs in the choice
process. Two product classes were selected for testing the robustness of brand signaling across
cultures: orange juice is used to represent low-involvement/low-cost product categories, while
personal computers are used for high-involvement/high-price categories.
The Structural Model
Figure 1 presents our SEM. With the exception of the Relative Price construct, this is
basically the same model as implemented in E&S. Brand credibility (Cr) is postulated to increase
Perceived Quality (PQ), to increase Information Costs Saved (ICS) and to decrease Perceived
Risk (or conversely, increase its complement, Lower Perceived Risk − LPR); in turn, these latter
constructs are expected to increase product Consideration and Purchase (C&P).
--- Insert Figure 1 about here. ---
In addition to E&S’s brand constructs, the model includes a Relative Price (RP)
construct. This was included for two reasons: firstly, E&S did not include price in any form in
the SEM, and it was felt that its addition would be an interesting extension of their work to
control for purely economic impacts on Consumption and Purchase (C&P); secondly, rather than
price itself, since this would be country- and time-specific, we opted to use RP to capture the
relative price positioning of the brands in each country. The RP positioning is likely to be a
function of brand credibility because the firm is likely to be perceived by consumers to be
charging a premium if their brand is strong and visible in the market; this leads to our
expectation that the path from Cr to RP will be positive. The effect of RP on C&P, however, is
expected to be negative: The greater the relative price of the brand, the less the brand should be

14
considered and the less attractive it should be.
The Measurement Model
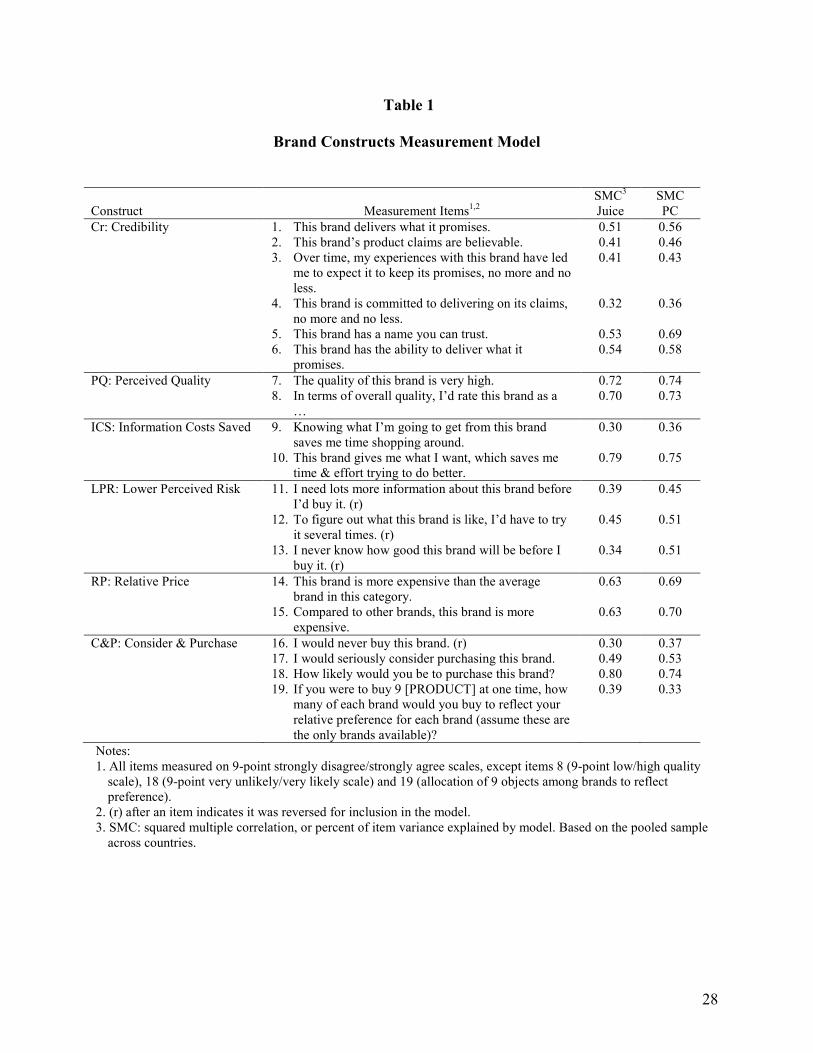
A total of 19 items, shown in Table 1, were used to implement the measurement model
that supports the SEM in Figure 1. We refer the reader to E&S for the items of all constructs
except RP, which were specifically formulated for this study.
--- Insert Table 1 about here. ---
Convergent and discriminant validity was established using Anderson and Gerbing’s
(1988) procedures. For convergent validity, pooling data across countries and product categories
to yield a sample of 882 respondents and 5292 brand evaluations, as required by their procedure,
it is found that the construct coefficients in all item equations are statistically significant at the
95% level. This is reflected in Table 1 via the appreciable squared multiple correlation (SMC)
levels for all items. In terms of discriminant validity, it is found that the hypothesis that the
correlation between every pair of constructs is equal to one (i.e. there is no discrimination
between the constructs in question) is rejected for all pairs of constructs in Figure 1 at the 95% or
higher level. The smallest chi-squared statistic is 34.1 (1 degree of freedom), and occurs between
Cr and ICS, for which the estimated correlation is 0.91 with a standard error of 0.014. Hence, we
established both convergent and discriminant validity at the pooled level.
Cultural Constructs
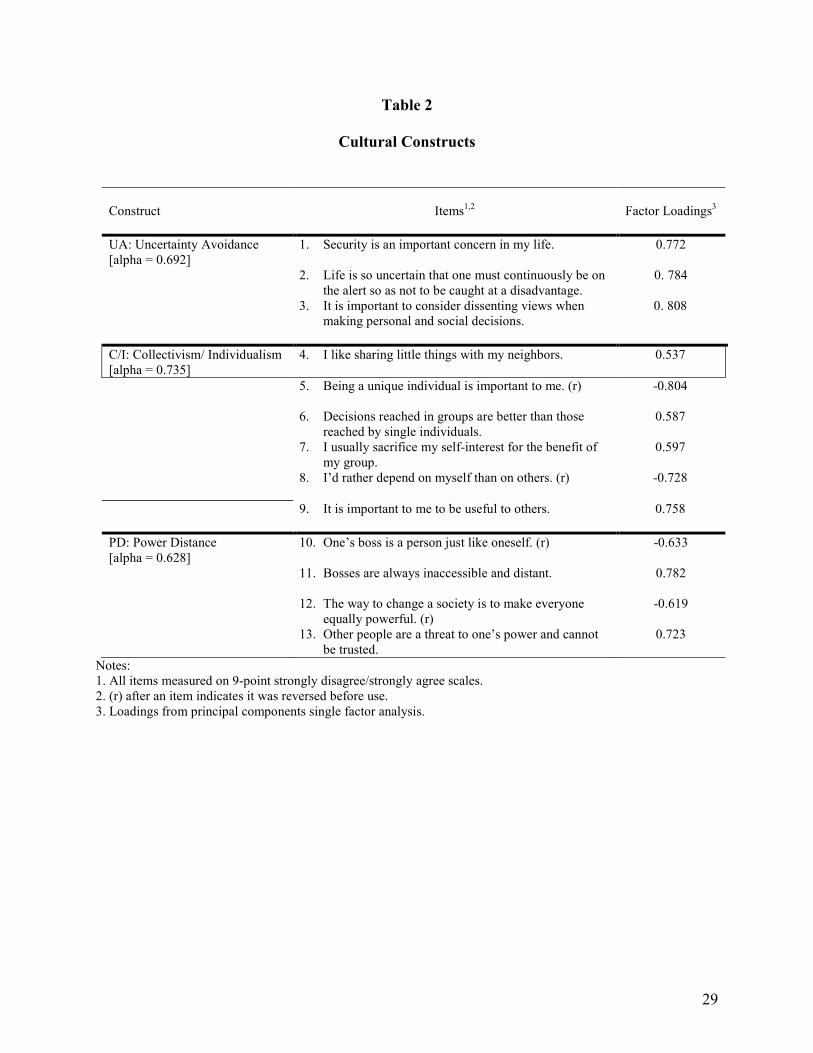
The 13 items in Table 2 were used to characterize the four cultural constructs of interest:
uncertainty avoidance (UA), collectivism/individualism (C/I) and power distance (PD)
(Hofstede, 1980). We developed these items using the following procedure: we used Hofstede’s
(1980) original organizational values survey items and Triandis’ (1995) horizontal and vertical
individualism/collectivism items slightly modified to improve their applicability to a general
15
consumer context. Once cultural identity data by country was collected from our sample, we ran
confirmatory factor analyses for each country to identify if any item did not load high enough
(our cutting point was factor loadings larger than 0.50) on a single factor. There were minimal
discrepancies in the factor structure by country. Final cultural construct specification excluded a
total of 5 items from the original set (1 in the power distance construct, 2 in the uncertainty
avoidance construct and 2 in the collectivism /individualism construct) that did not load high
overall on the specific cultural construct. This procedure ensured reasonable levels of scale
reliability both at the overall level as well as country by country (all Cronbach alphas > 0.60).
Table 2 shows final factor loadings and reliability coefficients using data at the aggregate level.
--- Insert Table 2 about here. ---
From this point forth, whenever we refer to these constructs in terms of inclusion in a
statistical model, it should be understood that we operationalized the cultural constructs as the
simple average of the respective item responses for each individual respondent.
Data Collection Methodology
The survey administered to the respondents has several sections: (1) elicitation of the
measurement model items (1 - 9 Strongly Disagree/Strongly Agree; Table 1) for three brands
within each of two product classes; (2) elicitation of the degree of confidence (1 - 7 Very
Low/Very High Confidence) in evaluating a new brand in each product class; (3) an association
task linking (yes/no scale) product class to items describing familiarity, risks of purchasing,
benefits offered, involvement levels, etc. (Erdem, Swait and Louviere 2002); (4) a brand/price
experimental choice task for each product class, involving 17 choice sets each that elicited
choice among 3 brands and a no choice alternative (the experimental design employed all brands
present in every choice set with the same four levels of price applied to all brands – this is the

16
same design employed by Erdem, Swait and Louviere 2002); (5) elicitation of the cultural
constructs (1 - 9 Strongly Disagree/Strongly Agree; Table 2); and (6) some simple demographics
(age, gender, household income, citizenship status and number of times traveled abroad).
Originally developed and tested in US English, the final survey instrument was then
translated and back-translated into Spanish, Portuguese, Japanese, Turkish and German for
respondents in Spain, Brazil, Japan, Turkey and Germany to ensure comparability across
countries (see the Appendix for a description of cross-country experimental controls).
Respondents in the US and India were given the original US English survey, duly customized for
local conditions (e.g. brands, prices). In the case of India, the survey was examined by our
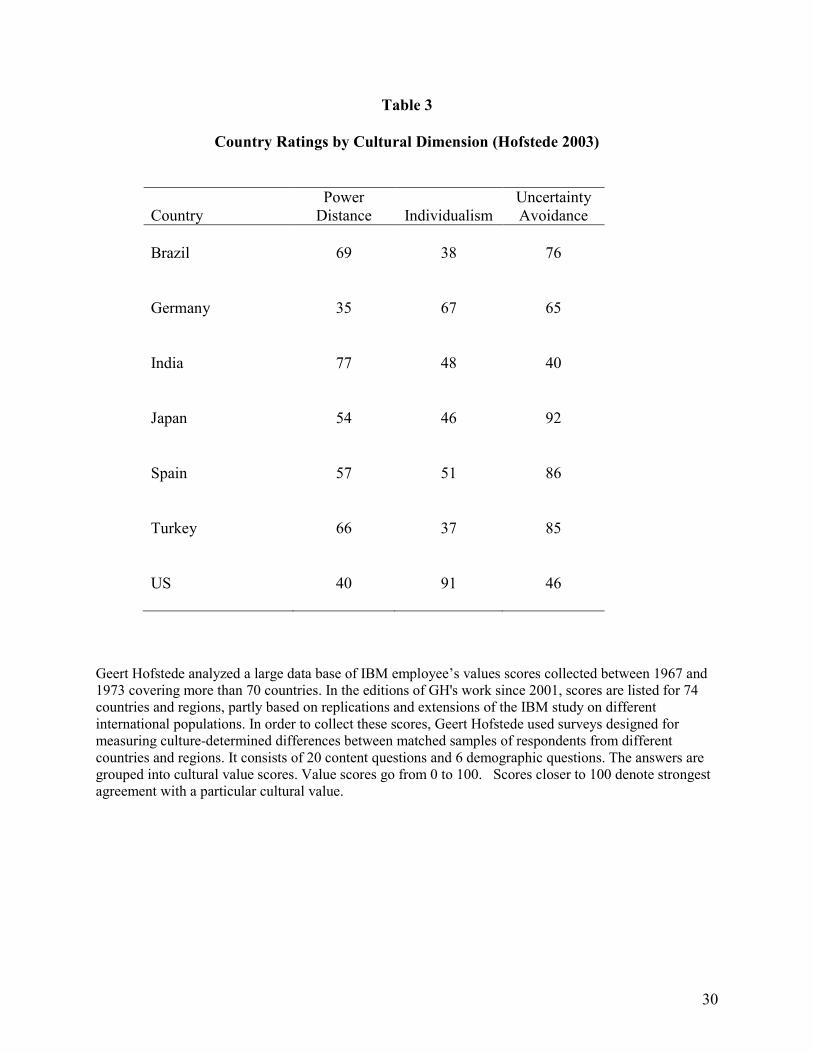
recruiter for understandability. These countries were selected to represent a wide range of
uncertainty avoidance, power distance and individualism/collectivism dimensions (Hofstede
2003). Table 3 shows Hofstede’s original country ratings by dimension for these countries.
--- Insert Table 3 about here. ---
In each country, three brands within each product class (orange juice and personal
computers) were selected to represent different levels of market power and price/quality
positioning.iv
All brands selected were required to enjoy high levels of consumer brand
recognition. We also made sure to always include at least one local brand and at least one
regional or global brand. Thus, the brands used in the study could be local, regional, national or
multinational/global, but to the extent possible they were selected to cover the spectrum of
market share (lower, average, higher), thus introducing greater potential heterogeneity in the
brand constructs of interest. Price levels used in the choice experiments were, of course, country-
and product-specific and expressed in the local currency. Average price levels across stores were
established using price audits by country with the cooperation of our recruiters.

17
The surveys were then programmed for execution on the Internet, which ensured method
invariance. Recruiters at each institution of higher learning were given a list of identifiers and
corresponding passwords (to enhance survey security), which they provided to their students for
voluntary participation in the survey. These recruiters were generally instructors of
undergraduate business courses, except in Brazil, where both business and engineering
undergraduates were used due to recruitment difficulties. The respondents have similar
demographic profiles: they are young (average age varies from 18 in India to 25 in Germany;
79% of all respondents are 22 or younger) and mainly middle-class. The gender split varies
somewhat more than age: the male to female split is about even in the US and India, about 40%
males/ 60% females in Germany, Spain and Turkey, and about 55% males/45% females in Brazil
and Japan. Foreign exchange students were excluded from the sample. Students were given
course credit for survey completion and were urged to complete the survey in one sitting
(approximately 30 minutes); however, if the session was interrupted, respondents could
subsequently resume the survey at the point of interruption.
Data collection occurred from October 2002 to April 2003, depending upon the country.
This extended data collection period was necessary to obtain reasonable sample sizes for our
statistical tests. Despite our best efforts, sample sizes by country vary significantly due to factors
outside our control: Brazil (126 respondents), Germany (57), India (161), Japan (114), Spain
(155), Turkey (126) and US (143).
Country-Specific Structural Equation Models
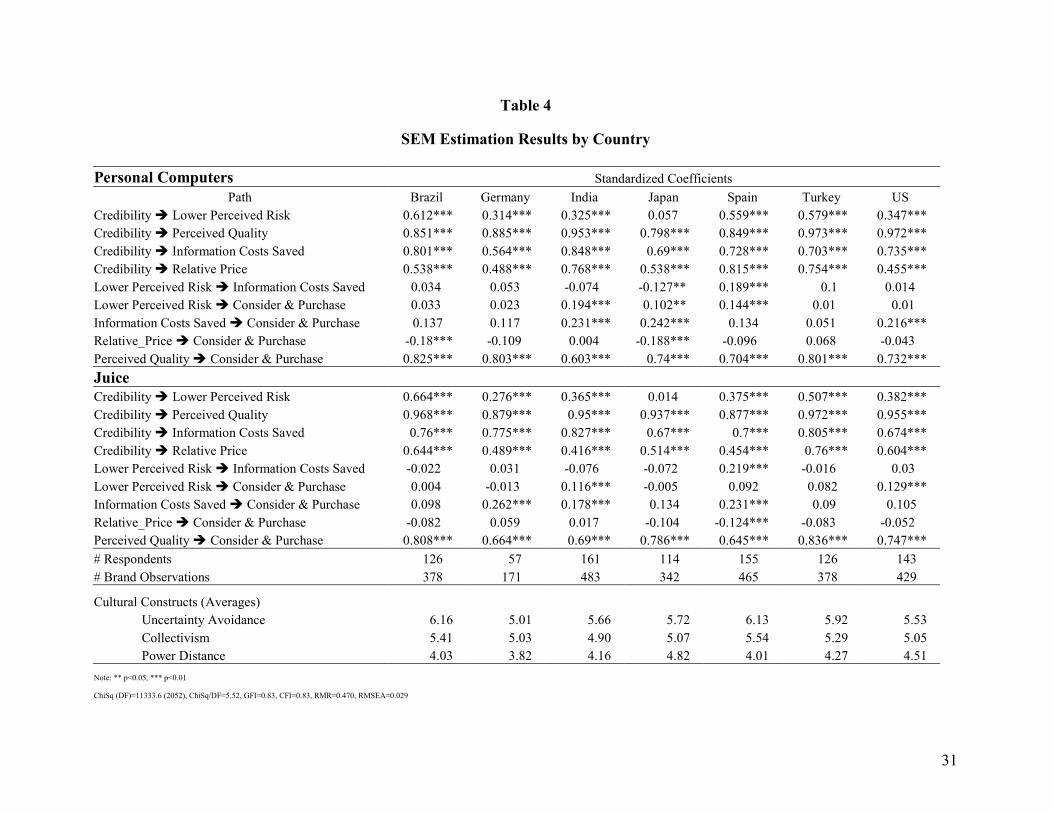
Table 4 presents the standardized SEM coefficients for each country and product class, as
well as the averages of cultural constructs for each country. The Amos 5 software program was
used to obtain model estimates (Byrne 2001). Overall, the models display a modest, though
18
certainly acceptable, level of goodness-of-fit (see Table 4 for details). All statistically significant
coefficients in both product classes are in the expected direction, with a single exception: the
LPR�ICS path, expected to have a positive coefficient, has a negative and statistically
significant effect in Japan for PC’s. Otherwise, it seems that the model structure from Figure 1
holds generally across the different countries.
--- Insert Table 4 about here. ---
That is not to say that the countries are homogenous in terms of the path coefficients. In
the Juice category, for instance, the impact of brand Credibility on Consideration and Purchase is
through the Perceived Quality construct in Brazil and Turkey. In Spain, however, the ICS and
LPR constructs are also mediators in the impact of Cr on C&P, indicating that Spanish
respondents displayed a more nuanced response to brand in the evaluation of product utility,
considering the role of brand in risk reduction and information acquisition as enhancements to
the utility of the brand. India, the US, and to a lesser extent, Germany, are more similar to Spain
than to Brazil and Turkey in overall structure in the juice category. Note that the Relative Price
(RP) construct is generally not statistically significant at the 95% significance level in this
product category, with the sole exception of Spain. In the PC category, PQ is again the main
mediator between Cr and C&P for Brazil, Germany and Turkey; the impact of Cr on C&P in
India, Japan, Spain and the US additionally occurs through paths involving LPR and ICS.
The total impact of Cr on C&P, as estimated through the SEMs in Table 4, is remarkably
consistent across countries: Brazil (0.806, 0.738 for juice and PC, respectively); Germany (0.815,
0.732); India (0.847, 0.831); Japan (0.773, 0.66); Spain (0.724, 0.712); Turkey (0.862, 0.880);
US (0.803, 0.855). The smallest impact for juice is found in Spain, and for PCs in Japan; in both
categories, Turkey displays the largest impact of Cr on C&P (and India is a close second in both

19
categories). As we’ve pointed out above, however, these effects and their magnitudes come
about through different pathways in Figure 1.
To undertake a more systematic exploration of between-country differences in the path
coefficients, we plotted the estimated coefficients as a function of cultural identity constructs.
The averages of cultural constructs (see bottom of Table 4) suggest that Germany (M = 5.31)
scores lowest on Uncertainty Avoidance, whereas Brazil (M = 6.72) and Spain (M = 6.57) score
highest. Among the seven countries we studied, Spain (M = 5.18) and Brazil (M = 5.22) scored
highest on collectivism, whereas India (M = 4.55) and US (M = 4.69) scored lowest. Power
distance seems to be lowest in Germany (M = 3.88) and highest in Japan (M = 4.99). These
ratings are consistent with Hofstede’s original findings (see Table 3) except for India and
Turkey, which seem to rate more moderately in our current data than in Hofstede’s work. A
possible reason for this divergence is that we collected these cultural values using university
students, which are more likely to have an international mindset, and therefore ratings may tend
to equalize those of reference countries in the Western world such as the U.S. and Europe.
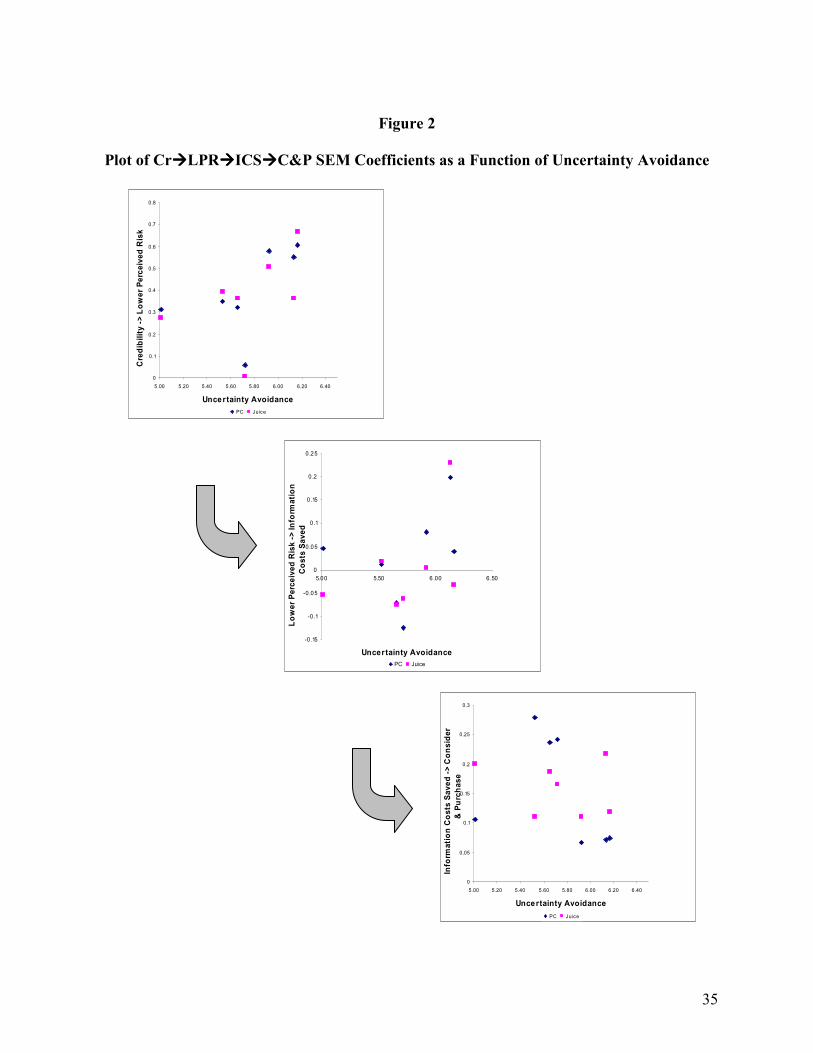
Figure 2 shows three plots, depicting the coefficient estimates for the
Cr�LPR�ICS�C&P paths as a function of Uncertainty Avoidance (UA) averages for each
country. These paths are shown because they depict relatively clearly UA’s moderating pattern:
the higher the country on the UA scale, the stronger the first two paths become. This implies that
as UA increases, brand credibility lowers risk perceptions more strongly and leads to more
information cost savings. This impact on risk is mitigated in part by the decreased reliance on the
brand to save on information costs in decision-making, as evidenced by the downward trend in
the strength of the ICS�C&P path as a function of increased UA (since uncertainty avoidance
decreases sensitivity to information costs). Furthermore, the PQ�C&P path strength does not

20
vary systematically with UA. These combined results suggest that the moderating role of UA in
regard to the impact of Cr on C&P is more through the LPR and ICS paths than the PQ path.
Thus, we find evidence for Hypothesis 1.
--- Insert Figure 2 about here. ---
Figure 3 shows two plots of the coefficient estimates for the Cr�PQ�C&P paths as a
function of the Collectivism/Individualism (C/I) construct. These paths depict a different
moderating pattern for C/I. Although Cr�PQ path coefficients do not change significantly, there
is a clearly discernible positive trend in PQ�C&P path coefficients with increasing collectivism
(Spain is an exception to this pattern). On the other hand, the sequence of paths
Cr�LPR�ICS�C&P is also found to be a function of the C/I construct. The higher a country
scores on the C/I scale (implying a more collectivist culture), the bigger the standardized
coefficients for Cr�LPR and LPR�ICS, and the smaller the ICS�C&P path coefficient, with
an almost null overall effect. These results suggest that in collectivist countries brand credibility
seems to make its impact felt more directly through the perceived quality route than through the
information acquisition route (perceived risk and information costs saved). This seems intuitive,
since it is reasonable that in collectivist cultures sources of information such as word-of-mouth
may be more easily available and more often used. Thus, we find evidence for Hypothesis 3.
--- Insert Figure 3 about here. ---
Notably, the last cultural construct under study (power distance) does not seem to explain
any of the differences between path coefficients.
Evidence from the Choice Modeling Results
To analyze the overall impact of credibility on choice in various countries (while
controlling for price effects) and to test Hypotheses 2 and 4, we also estimated brand choice

21
models. These final statistical results we present are based on Mixed MNL (McFadden and Train
2000) specifications, using the experimental choice data we mentioned earlier. These data
resulted from eliciting 17 choices for each product class. Three brands in each country and
product category were always presented, along with a No Choice alternative; each brand was
associated with a 4-level price variable, which had the same range for all brands in the same
country and product class. It will be noted that 17 choice sets are more than minimally necessary
for identification of parameters but was done to maintain compatibility and comparability with
prior studies (especially Erdem, Swait and Louviere 2002).
Our intent in this section is to examine whether the impact of credibility on preference
differs in magnitude between countries, or more specifically, whether the impact of brand
credibility on choice is moderated by the cultural constructs used in the previous two sections.
To this end we calibrate two Mixed MNL models, one per product category, which allow for
stochastic heterogeneity of brand and price effects at the country level. The utility function also
includes the Brand Credibility (Cr) construct, as well as its interactions with uncertainty
avoidance (UA), collectivism/individualism (C/I) and power distance (PD). Precisely, the utility
functions are given by the following expressionv:
Uicn=αicn+βicn·LN(pic)+δ·Cricn+γ1·UAicn· Cricn+γ2· (C/I)icn· Cricn+ γ3·PDicn· Cricn+εicn
(1)
where i, c, n are respectively index brand, country and respondent; pic is a country-specific price
for the good in question; εicn is the brand-country-person stochastic utility, which is assumed to
be independent and identically Gumbel distributed across brands and respondents within country,
but allowed to have different scale/variance by country (Swait and Louviere 1994); α, β, δ and γ
are parameter vectors; and all other quantities have been previously defined. Note that the α and

22
β parameter vectors are subscripted by respondent, reflecting the fact that these coefficients will
be allowed to have stochastic distributions (more details given with results in Table 5).
The coefficient vectors for the Cr and its cultural construct interactions were not given
stochastic distributions, and are assumed comparable across countries. To support this
specification, we established that the Cr construct has partial metric invariance across countries
at the 95% confidence level using Steenkamp and Baumgartner’s (1998) test; this result holds for
both product categories. Construct Cr has six measurement items in total; we establish partial
metric invariance with at most two items being country-specific. This test shows the construct
is quite homogenous and robust across the countries tested (for orange juice, chisq=26.0, DF=18,
p=0.10; for PC’s, chisq=34.4, DF=23, p=0.06). This also implies that comparing credibility
scores across country is empirically supported in our data, so making the γ and δ parameters in
(1) to be equal across countries is consistent with empirical evidence.
The resulting product class models are presented in Table 5. First, it is important to point
out that there is strong support for Erdem and Swait’s (1998) contention that brand credibility
increases product attractiveness/utility: across all countries, there is a positive and significant
main effect impact of Cr in both product classes. This result is quite robust, since we allow for
substantial country- and respondent-level differences via brands, prices and stochastic taste
distributions at the country level. Note that due to scale differences (i.e. error variance
differences) across product classes, it is not appropriate to directly compare juice and PC
coefficients; only parameter ratios or elasticities should be compared. The coefficients of
substantive interest to us are the interactions of Cr with cultural constructs (i.e. δ, γ1, …, γ4). In
both product classes it is found that Power Distance has no substantive impact on the main effect
of Cr on utility since γ3 and γ4 are not significantly different from zero at the 95% significance

23
level; this is in essential agreement with prior analyses reported above, but based on SEMs. Of
greater interest is the consistent finding across both product classes that Uncertainty Avoidance
(UA) increases the impact of brand credibility in both juice and PC’s (coefficient γ1 in both
categories), as argued beforehand. The marginal impact of UA is relatively greater in PC’s than
in juice, as would seem reasonable, but it is statistically significant and increasing in both. Thus,
we found evidence for Hypothesis 2 both in the PC and juice categories. Finally, increasing
Collectivism/Individualism (C/I) also leads to the increased importance of Cr, but only in the
juice category (see coefficients γ2 in the table). A possible reason for this finding is that brands as
symbols of collective behavior are more often embraced in high frequency/low involvement
purchases where decision time pressure is high and the financial risk of making a wrong choice
is low. Thus, we find evidence for Hypothesis 4 in the juice category only. It is interesting to
note that the impact of C/I is significantly greater than that of UA in the juice category. It is
difficult to discern the relative importance of these two cultural constructs across product classes
since they are subject to different error term scales.
--- Insert Table 5 about here. ---
Discussion, Conclusions and Future Research
In this paper, we investigated the effects of brand credibility on consumer choice through
perceived quality, perceived risk and information cost saved across seven countries in Asia,
Europe and North and South America. These countries have been shown to vary across cultural
dimensions such as uncertainty avoidance, collectivism and power distance (Hofstede 1980). We
found strong support for the Erdem and Swait (1998) framework of brand effects on choice
under consumer uncertainty. More specifically, brand credibility, the key construct in
information economics based approaches to brand equity, has been shown to affect consumer

24
choice in all the countries we studied. Although the paths through which credibility operated
differed somewhat across countries, the general framework of brand credibility effects was found
to be empirically very robust across the countries studied.
To explore whether cultural constructs that have been linked to consumer choice behavior
and brand effects in previous research moderated these effects, we investigated if uncertainty
avoidance, collectivism and power distance explain any differences across the countries in regard
to mechanisms through which brand credibility effects on consumer brand choice materialize.
We expected that uncertainty avoidance and collectivism would increase total credibility
impacts, which our results confirmed. Given counterbalancing considerations in the case of
power distance, we deemed its net effect to be an empirical question; we did not find any
moderating effects of this construct in either analysis undertaken (SEM and choice model). We
should note that this does not mean that this construct does not influence brand credibility
effects. It merely suggests that given that many factors are at play in confounding directions,
these factors may cancel out and it may not be possible to observe any total net effect. Indeed,
one necessary future research area is to more carefully map out these different factors by
measuring and testing them separately; for example, with the inclusion of a new construct that
denotes brand perceived prestige (Steenkamp, Batra and Alden 2003).
The results obtained through the choice models we estimated suggest uncertainty
avoidance amplifies the net effect of credibility on choice. The effect has been found to be
stronger in PC than in juice, which is to be expected since PC is a more complex, higher-
involvement product category than juice. Collectivism was found to amplify the brand credibility
effects as well, but only in juice. This might be due to the conspicuous consumption nature of
juice, a more frequently purchased/low-ticket item for which a brand’s value as a group identity

25
symbol would be more important than for PCs, for which functional features prevail.
The results obtained through the structural equation models suggested that as uncertainty
avoidance increases, brand credibility lowers risk perceptions and increases information costs
saved. However, it also decreases the reliance on the brand to save on information costs. The
same pattern of influence is true as collectivist tendencies increase. We believe that uncertainty
avoidance and collectivism decrease the impact of information costs on consumer choice due to
the increased willingness of consumers to engage in active search (in case of uncertainty
avoidance) and the ability to use other low costs information sources such as word-of-mouth (in
the case of collectivism). On the other hand, increasing collectivism leads to a stronger path for
the effect of perceived quality on brand consideration and purchase. This is consistent with the
fact that collectivist consumers perceive and prefer credible brands as better quality because they
reinforce their belongingness to the group. Overall, these findings suggest that collectivism
moderates the impact of brand credibility on consumer utility (consideration and purchase) by
increasing the effect of perceived quality while uncertainty avoidance makes the credibility
impact operate mainly through the reduction of perceived risk and information costs.
These findings have important managerial implications. First of all, returns on a
company’s efforts to establish brand credibility depend on consumers’ cultural values.
Establishing a brand’s credibility seems to be especially effective when consumers have more
aversion to risky choices and, thus, look at brands as a way to choose “the sure thing”; and when
consumers strongly need to reinforce their belonging to a group through the consumption of
symbols that reflect such identity. Additionally, companies could take advantage of cultural
differences in brand equity formation in many ways. For example, companies could work with
product positionings that match cultural values; for example, emphasizing brand attributes that
26
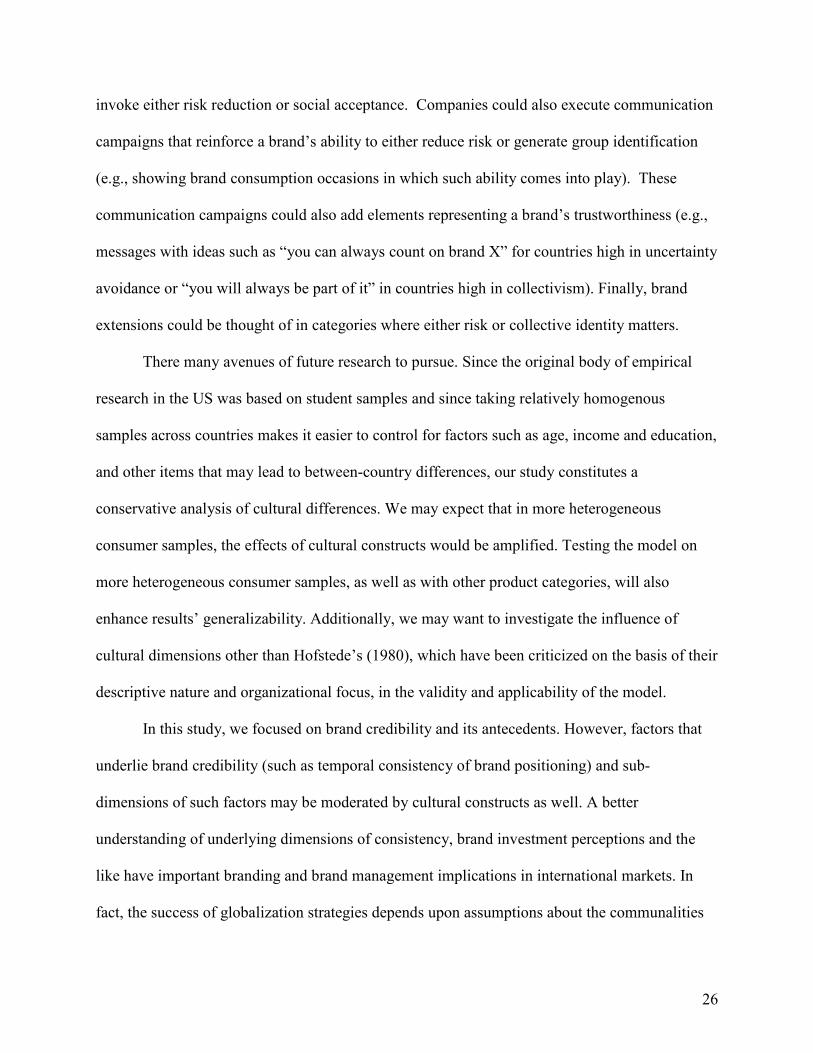
invoke either risk reduction or social acceptance. Companies could also execute communication
campaigns that reinforce a brand’s ability to either reduce risk or generate group identification
(e.g., showing brand consumption occasions in which such ability comes into play). These
communication campaigns could also add elements representing a brand’s trustworthiness (e.g.,
messages with ideas such as “you can always count on brand X” for countries high in uncertainty
avoidance or “you will always be part of it” in countries high in collectivism). Finally, brand
extensions could be thought of in categories where either risk or collective identity matters.
There many avenues of future research to pursue. Since the original body of empirical
research in the US was based on student samples and since taking relatively homogenous
samples across countries makes it easier to control for factors such as age, income and education,
and other items that may lead to between-country differences, our study constitutes a
conservative analysis of cultural differences. We may expect that in more heterogeneous
consumer samples, the effects of cultural constructs would be amplified. Testing the model on
more heterogeneous consumer samples, as well as with other product categories, will also
enhance results’ generalizability. Additionally, we may want to investigate the influence of
cultural dimensions other than Hofstede’s (1980), which have been criticized on the basis of their
descriptive nature and organizational focus, in the validity and applicability of the model.
In this study, we focused on brand credibility and its antecedents. However, factors that
underlie brand credibility (such as temporal consistency of brand positioning) and sub-
dimensions of such factors may be moderated by cultural constructs as well. A better
understanding of underlying dimensions of consistency, brand investment perceptions and the
like have important branding and brand management implications in international markets. In
fact, the success of globalization strategies depends upon assumptions about the communalities

27
in mechanisms whereby brands impact consumers, no matter what their cultural identity.
28
Table 1
Brand Constructs Measurement Model
Construct
Measurement Items1,2
SMC3
Juice
SMC
PC
Cr: Credibility 1. This brand delivers what it promises. 0.51 0.56
2. This brand’s product claims are believable. 0.41 0.46
3. Over time, my experiences with this brand have led
me to expect it to keep its promises, no more and no
less.
0.41 0.43
4. This brand is committed to delivering on its claims,
no more and no less.
0.32 0.36
5. This brand has a name you can trust. 0.53 0.69
6. This brand has the ability to deliver what it
promises.
0.54 0.58
PQ: Perceived Quality 7. The quality of this brand is very high. 0.72 0.74
8. In terms of overall quality, I’d rate this brand as a
…
0.70 0.73
ICS: Information Costs Saved 9. Knowing what I’m going to get from this brand
saves me time shopping around.
0.30 0.36
10. This brand gives me what I want, which saves me
time & effort trying to do better.
0.79 0.75
LPR: Lower Perceived Risk 11. I need lots more information about this brand before
I’d buy it. (r)
0.39 0.45
12. To figure out what this brand is like, I’d have to try
it several times. (r)
0.45 0.51
13. I never know how good this brand will be before I
buy it. (r)
0.34 0.51
RP: Relative Price 14. This brand is more expensive than the average
brand in this category.
0.63 0.69
15. Compared to other brands, this brand is more
expensive.
0.63 0.70
C&P: Consider & Purchase 16. I would never buy this brand. (r) 0.30 0.37
17. I would seriously consider purchasing this brand. 0.49 0.53
18. How likely would you be to purchase this brand? 0.80 0.74
19. If you were to buy 9 [PRODUCT] at one time, how
many of each brand would you buy to reflect your
relative preference for each brand (assume these are
the only brands available)?
0.39 0.33
Notes:
1. All items measured on 9-point strongly disagree/strongly agree scales, except items 8 (9-point low/high quality
scale), 18 (9-point very unlikely/very likely scale) and 19 (allocation of 9 objects among brands to reflect
preference).
2. (r) after an item indicates it was reversed for inclusion in the model.
3. SMC: squared multiple correlation, or percent of item variance explained by model. Based on the pooled sample
across countries.
29
Table 2
Cultural Constructs
Construct
Items1,2
Factor Loadings3
UA: Uncertainty Avoidance
[alpha = 0.692]
1. Security is an important concern in my life. 0.772
2. Life is so uncertain that one must continuously be on
the alert so as not to be caught at a disadvantage.
0. 784
3. It is important to consider dissenting views when
making personal and social decisions.
0. 808
C/I: Collectivism/ Individualism
[alpha = 0.735]
4. I like sharing little things with my neighbors. 0.537
5. Being a unique individual is important to me. (r) -0.804
6. Decisions reached in groups are better than those
reached by single individuals.
0.587
7. I usually sacrifice my self-interest for the benefit of
my group.
0.597
8. I’d rather depend on myself than on others. (r)
-0.728
9. It is important to me to be useful to others.
0.758
PD: Power Distance
[alpha = 0.628]
10. One’s boss is a person just like oneself. (r) -0.633
11. Bosses are always inaccessible and distant. 0.782
12. The way to change a society is to make everyone
equally powerful. (r)
-0.619
13. Other people are a threat to one’s power and cannot
be trusted.
0.723
Notes:
1. All items measured on 9-point strongly disagree/strongly agree scales.
2. (r) after an item indicates it was reversed before use.
3. Loadings from principal components single factor analysis.
30
Table 3
Country Ratings by Cultural Dimension (Hofstede 2003)
Country
Power
Distance
Individualism
Uncertainty
Avoidance
Brazil
69
38
76
Germany
35
67
65
India
77
48
40
Japan
54
46
92
Spain
57
51
86
Turkey
66
37
85
US
40
91
46
Geert Hofstede analyzed a large data base of IBM employee’s values scores collected between 1967 and
1973 covering more than 70 countries. In the editions of GH's work since 2001, scores are listed for 74
countries and regions, partly based on replications and extensions of the IBM study on different
international populations. In order to collect these scores, Geert Hofstede used surveys designed for
measuring culture-determined differences between matched samples of respondents from different
countries and regions. It consists of 20 content questions and 6 demographic questions. The answers are
grouped into cultural value scores. Value scores go from 0 to 100. Scores closer to 100 denote strongest
agreement with a particular cultural value.
31
Table 4
SEM Estimation Results by Country
Personal Computers Standardized Coefficients
Path Brazil Germany India Japan Spain Turkey US
Credibility � Lower Perceived Risk 0.612*** 0.314*** 0.325*** 0.057 0.559*** 0.579*** 0.347***
Credibility � Perceived Quality 0.851*** 0.885*** 0.953*** 0.798*** 0.849*** 0.973*** 0.972***
Credibility � Information Costs Saved 0.801*** 0.564*** 0.848*** 0.69*** 0.728*** 0.703*** 0.735***
Credibility � Relative Price 0.538*** 0.488*** 0.768*** 0.538*** 0.815*** 0.754*** 0.455***
Lower Perceived Risk � Information Costs Saved 0.034 0.053 -0.074 -0.127** 0.189*** 0.1 0.014
Lower Perceived Risk � Consider & Purchase 0.033 0.023 0.194*** 0.102** 0.144*** 0.01 0.01
Information Costs Saved � Consider & Purchase 0.137 0.117 0.231*** 0.242*** 0.134 0.051 0.216***
Relative_Price � Consider & Purchase -0.18*** -0.109 0.004 -0.188*** -0.096 0.068 -0.043
Perceived Quality � Consider & Purchase 0.825*** 0.803*** 0.603*** 0.74*** 0.704*** 0.801*** 0.732***
Juice
Credibility � Lower Perceived Risk 0.664*** 0.276*** 0.365*** 0.014 0.375*** 0.507*** 0.382***
Credibility � Perceived Quality 0.968*** 0.879*** 0.95*** 0.937*** 0.877*** 0.972*** 0.955***
Credibility � Information Costs Saved 0.76*** 0.775*** 0.827*** 0.67*** 0.7*** 0.805*** 0.674***
Credibility � Relative Price 0.644*** 0.489*** 0.416*** 0.514*** 0.454*** 0.76*** 0.604***
Lower Perceived Risk � Information Costs Saved -0.022 0.031 -0.076 -0.072 0.219*** -0.016 0.03
Lower Perceived Risk � Consider & Purchase 0.004 -0.013 0.116*** -0.005 0.092 0.082 0.129***
Information Costs Saved � Consider & Purchase 0.098 0.262*** 0.178*** 0.134 0.231*** 0.09 0.105
Relative_Price � Consider & Purchase -0.082 0.059 0.017 -0.104 -0.124*** -0.083 -0.052
Perceived Quality � Consider & Purchase 0.808*** 0.664*** 0.69*** 0.786*** 0.645*** 0.836*** 0.747***
# Respondents 126 57 161 114 155 126 143
# Brand Observations 378 171 483 342 465 378 429
Cultural Constructs (Averages)
Uncertainty Avoidance 6.16 5.01 5.66 5.72 6.13 5.92 5.53
Collectivism 5.41 5.03 4.90 5.07 5.54 5.29 5.05
Power Distance 4.03 3.82 4.16 4.82 4.01 4.27 4.51
Note: ** p<0.05, *** p<0.01
ChiSq (DF)=11333.6 (2052), ChiSq/DF=5.52, GFI=0.83, CFI=0.83, RMR=0.470, RMSEA=0.029

32
Table 5
Mixed M6L Parameter Estimates
Utility Function3
Juice
(asympt. t-stats)1
Personal Computers
(asympt. t-stats)2
Brazil Brand 1 -2.73 (-14.9) | 3.643 (6.96) 44.569 (12.66) | 0.201 (5.47)
Brand 2 -0.571 (-2.78) | 0.789 (5.26) 44.223 (12.67) | 0.201 (---)
Brand 3 -3.241 (-16.61) | 4.727 (6.42) 43.246 (12.67) | 1.718 (6.03)
-LN(Price) 1.784 (27.03) | 0.371 (10.73)
LN(Price) -5.875 (-12.87) | 0.049 (5.15)
Germany Brand 1 -36.172 (-1.23) | 1739.369 (0.56) 44.449 (57.78) | 4.6 (6.27)
Brand 2 3.723 (0.63) | 234.583 (0.55) 46.086 (58.38) | 2.706 (5.66)
Brand 3 -46.155 (-1.22) | 641.065 (0.55) 43.053 (57.02) | 4.853 (3.72)
-LN(Price) 3.815 (4.23) | 0.996 (6.66)
LN(Price) -5.952 (-60.46) | 0.053 (2.41)
India Brand 1 4.881 (13.28) | 1.155 (6.18) 29.546 (10.78) | 3.007 (5.03)
Brand 2 6.106 (13.83) | 1.673 (9.06) 31.852 (10.78) | 0.391 (5.21)
Brand 3 6.189 (13.61) | 0.117 (3.83) 31.211 (10.77) | 0.391 (---)
-LN(Price) 1.188 (21.93) | 0.067 (15.27)
LN(Price) -3.586 (-11.21) | 0.09 (4.95)
Japan Brand 1 1.188 (21.93) | 0.067 (15.27) 22.384 (12.85) | 0.122 (4.97)
Brand 2 26.54 (17.74) | 0.067 (---) 22.036 (12.84) | 0.432 (5.52)
Brand 3 26.066 (17.73) | 1.766 (8.42) 22.22 (12.87) | 0.234 (5.13)
-LN(Price) 1.881 (36.1) | 0.004 (12.84)
LN(Price) -3.439 (-13.25) | 0.037 (5.82)
Spain Brand 1 7.482 (14.47) | 0.356 (6.87) 8.605 (6.96) | 0.118 (2.42)
Brand 2 6.863 (14.01) | 2.934 (7.17) 7.444 (6.27) | 2.125 (4.18)
Brand 3 7.974 (15.12) | 0.356 (---) 8.736 (6.96) | 0.023 (1.01)
-LN(Price) 0.886 (16.55) | 0.049 (11.03)
LN(Price) -1.198 (-7.85) | 0.056 (2.88)
Turkey Brand 1 64.338 (31.79) | 0.204 (2.91) 22.577 (56.94) | 0.095 (3.74)
Brand 2 65.109 (31.79) | 0.886 (11.48) 24.321 (54.12) | 0.095 (---)
Brand 3 64.384 (31.6) | 0.114 (2.97) 24.499 (53.09) | 0.36 (6.67)
-LN(Price) 1.484 (54.48) | 0.262 (8.36)
LN(Price) -2.581 (-37.19) | 1.398 (13.06)
US Brand 1 -0.664 (-2.56) | 1.607 (5.84) 13.147 (10.79) | 0.467 (3.82)
Brand 2 -1.188 (-5.47) | 1.055 (4.95) 13.374 (10.73) | 0.374 (4.82)
Brand 3 -0.398 (-1.47) | 0.409 (3.86) 13.318 (10.65) | 0.149 (3.09)
-LN(Price) 1.716 (23.2) | 0.529 (10.46)
LN(Price) -2.148 (-11.92) | 0.045 (4.26)
Cred (δ) 0.438 (6.47) 0.448 (5.4)
Cred*Uncertainty Avoidance (γ1) 0.009 (2.03) 0.025 (5.28)
Cred*Collectivism (γ2) 0.064 (7.84) 0.000 (0.03)
Cred*Power Distance (γ3) -0.002 (-0.41) -0.006 (-1.02)
(Cont.)

33
Table 5 (Cont.)
Utility Function3
Juice
(asympt. t-stats)1
Personal Computers
(asympt. t-stats)2
L6(Scale Function)
Brazil -0.193 (-3.12) 0.581 (7.31)
Germany -1.498 (-1.68) 0 (---)
India -0.125 (-2.49) -0.115 (-1.3)
Japan 0.238 (4.45) 0.661 (8.7)
Spain 0.087 (1.66) 0.164 (1.71)
Turkey 0 (---) 0 (---)
US 0.862 (12.32) 0.813 (9.76)
Goodness-of-Fit
Log Likelihood at 0 -20786.1 -20758.4
Log Likelihood at Conv. -10339.1 -11985.0
Rho-Squared 0.5026 0.4226
Number of Subjects 882 881
Number of Choices 14994 14974
Notes:
1. Heterogeneity Specification: Independent normal distributions for brand effects, and independent log
normal distributions for prices. For brand effects, presentation format is mean|variance of distributions,
with t-stats in parentheses; for price effects, mean|variance of the normal distribution of the natural
logarithm of taste coefficients is presented, with t-stats in parentheses. To use the latter coefficients in the
utility function, note that the taste coefficients will multiply the negative of price. The log normal
distribution was used for this category’s price coefficients because the specification led to higher goodness-
of-fit than the normal distribution.
2. Heterogeneity Specification: Independent Normal distributions for brand and price effects. Presentation
format is mean|variance of distributions, with t-stats in parentheses.
3. Prices are given in currency of respective country.
4. One hundred Halton quasi-random numbers used for simulation estimator.

34
Figure 1
The Structural Equation Model Relating Brand Credibility to Product Utility
Credibility
Lower
Perceived
Risk
Information
Costs
Saved
Perceived
Quality
Consider &
Purchase
Relative
Price
+
+
+
+
+
+
+
+
−
35
Figure 2
Plot of Cr����LPR����ICS����C&P SEM Coefficients as a Function of Uncertainty Avoidance
-0.15
-0.1
-0.05
0
0.05
0.1
0.15
0 .2
0.25
5.00 5.50 6 .00 6 .50
Uncertainty Avoidance
Lo
we
r P
erc
eiv
ed
Ris
k -
> I
nfo
rma
tio
n
Co
sts
Sa
ve
d
PC Juice
0
0.05
0.1
0.15
0.2
0.25
0.3
5.00 5.20 5.40 5.60 5.80 6.00 6.20 6.40
Uncertainty Avoidance
Info
rma
tio
n C
os
ts S
av
ed
->
Co
ns
ide
r
& P
urc
ha
se
PC Juice
0
0.1
0.2
0.3
0.4
0.5
0.6
0.7
0.8
5.00 5.20 5.40 5.60 5.80 6.00 6.20 6.40
Uncertainty Avoidance
Cre
dib
ilit
y -
> L
ow
er
Pe
rce
ive
d R
isk
PC Juice

36
Figure 3
Plot of Cr����PQ����C&P SEM Coefficients as a Function of Collectivism (except Spain)
0.6
0.65
0.7
0.75
0.8
0.85
0.9
0.95
1
4.80 4.90 5.00 5.10 5.20 5.30 5.40 5.50 5.60
Collectivism
Cre
dib
ilit
y -
> P
erc
eiv
ed
Qu
ality
PC Juice
0.6
0.65
0.7
0.75
0.8
0.85
0.9
0.95
4.80 4.90 5.00 5.10 5.20 5.30 5.40 5.50 5.60
Collectivism
Perc
eiv
ed
Qu
ality
-> C
on
sid
er
&
Pu
rch
ase
PC Juice
37
Appendix - Cross-country Experimental Controls
Functional Equivalence (Sekaran 1983) To control for functional equivalence, our
survey requested responses to similar
problems in every culture. There was a
comparable context or work-setting in
every country.
Survey Instrumentalization (Steenkamp,
Hofstede and Wedel 1999)
We used back-translation to control for
vocabulary equivalence, idiomatic
equivalence and grammatical and
syntactical equivalence in our survey.
Conceptual equivalence (Adler 1983) To control for conceptual equivalence, we
pre-tested equivalence of the brands
selected for the analysis and chose product
categories purchased often, equally
available and have the same function for
consumers in each country of interest.
Construct equivalence (Steenkamp and
Baumgartner 1998)
Though not presented in the paper due to
space limitations, partial metric invariance
was established using MULTIPLE GROUP
SEMs for a subset of countries. This
suggests cross-country comparability of
path coefficients.
Response equivalence (Adler 1983) We controlled for response equivalence by
having uniform data collection procedures
(Internet collection) and identical
instructions.
Subject pool equivalence (Alden,
Stennkamp and Batra 1991)
We controlled for the equivalence in
educational background in three ways:
First, the universities chosen were all top
tier universities in their countries. Second,
participants were all students in business or
engineering. Third, sample characteristics
were analyzed to verify the match in terms
of age, sex and social class.
Currency equivalence (Roth et al. 1991) We controlled for currency equivalence by
using organic prices in each country, that
is, current price averages across retail
stores.
38
References
Aaker, David A. (1991), Managing Brand Equity, New York: The Free Press.
Aaker, Jennifer L. and Durairaj Maheswaran (1997), “The Effect of Cultural Orientation on
Persuasion,” Journal of Consumer Research, 24(4), 315-328.
Alden, D.L., Steenkamp, J.E.M. and R. Batra (1999), “Brand Positioning through Advertising in
Asia, North America and Europe: The Role of Global Consumer Culture”, Journal of
Marketing, 63(1), 75-87.
Anderson, J. and D. Gerbing (1988), “Structural Equation Modeling in Practice: A Review and
Recommended Two-Step Approach,” Psychological Bulletin, 103(3), 411-423.
Bristow, Dennis N. and Jo Ann L. Asquith (1999), “What's in a name? An intra-cultural
investigation of Hispanic and Anglo consumer preferences and the importance of brand
name,” Journal of Product and Brand Management, 8(3), 185 -197.
Byrne, Barbara M. (2001), Structural Equation Modeling With Amos: Basic Concepts,
Applications, and Programming. Mahwah, NJ: Lawrence Erlbaum Assoc, 2nd
Edition.
Cray, David and Geoffrey R. Mallory (1998), Making Sense of Managing Culture. London,
U.K: International Thomson Business Press.
Dawar, Niraj, and Philip Parker (1994), “Marketing Universals: Consumers' Use of Brand Name,
Price, Physical Appearance, and Retailer Reputation as Signals of Product Quality,”
Journal of Marketing, 58(2), 81-96.
__________________________and Lydia M. Price, (1996), “A cross-cultural study of
interpersonal information exchange,” Journal of International Business Studies, 27(3),
497-517.
Douglas, S.P. and C.S. Craig (1997), “The Changing Dynamic of Consumer Behavior:

39
Implications for Cross-Cultural Research,” International Journal of Research in
Marketing, 14, 379-395.
Erdem, Tülin and Joffre Swait (1998), “Brand Equity as a Signaling Phenomenon,” Journal of
Consumer Psychology, 7 (April), 131-157.
________, _______and Jordan Louviere (2002), “The Impact of Brand Credibility on Consumer
Price Sensitivity,” International Journal of Research in Marketing, 19(1), 1-19.
Gregory, Gary D., Munch, James M. and Mark Peterson (2002), “Attitude functions in consumer
research: Comparing value-attitude relations in individualist and collectivist cultures,”
Journal of Business Research, 55(11), 933-945.
Gurhan-Canli, Zeynep and Durairaj Maheswaran (2000), “Cultural variations in country of
origin effects,” Journal of Marketing Research, 37(3), 309-318.
Hofstede, Geert (1980), Culture's consequences: International differences in work-related
values. Newbury Park, CA: Sage.
______________ (1984), “The cultural relativity of the quality of life concept,” The Academy of
Management Review, 9 (3), 389-399
______________ and Michael Harris Bond (1984), “"Hofstede's Cultural Dimensions: An
Independent Validation Using Rokeach's Value Survey, “ Journal of Cross Cultural
Psychology; 15 (4), 417-433.
______________ (2003), Culture's Consequences, Comparing Values, Behaviors, Institutions,
and Organizations Across -ations. Newbury Park, CA: Sage Publications; Second
Edition.
Herbig, Paul and John Milewicz (1995), “The Relationship of Reputation And Credibility To
Brand Success,” Journal of Consumer Marketing, 14 (4), 5-10.
40
Inkeles, Alex (1960), “Industrial Man: The Relation of Status to Experience, Perception, and
Value,” American Journal of Sociology, 75, 208-225.
Johansson, J.K, Ronkainen, I.A. and M.R. Czinkota (1994), “Negative Country-of-origin Effects:
The Case of the New Russia,” Journal of International Business Studies, 25(10), 157-
176.
Keller, K. L. (2002), Strategic Brand Management: building, measuring and managing brand
equity (2nd ed.) Upper Saddle River, NJ: Prentice Hall.
Klein, Benjamin and Keith B. Leffler (1981), “The Role of Market Forces in Assuring
Contractual Performance,” Journal of Political Economy, 89(3), 615-639.
Kotler, Philip (1997), Marketing Management (7th edition). Englewood Cliffs, NJ: Prentice Hall.
Lee, C. and R. T. Green (1991), “Cross-cultural Examination of the Fishbein Behavioral
Intentions Model,” Journal of International Business Studies, 2nd
Quarter, 293-305.
Lynn, Michael, Zinkhan, George M. and Judy Harris (1993), “Consumer tipping: A cross-
country study,” Journal of Consumer Research, 20(3), 478-489.
Maxwell, Sarah (2001), “An expanded price/brand effect model: A demonstration of
heterogeneity in global consumption,” International Marketing Review, 18 (3), 325-44.
McGowan, Karen M. and Brenda J. Sternquist (1998), “Dimensions of price as a marketing
universal: A Comparison of Japanese and U.S. consumers,” Journal of International
Marketing, 6(4), 49-66.
McFadden, D. and K. Train (2000), “Mixed MNL Models for Discrete Response,” Journal of
Applied Econometrics, 15:447-470.
Money, Bruce R., Gilly, Mary C. and John L. Graham (1998), “Explorations of national culture
and word-of-mouth referral behavior in the purchase of industrial services in the United
States and Japan,” Journal of Marketing, 62(4), 76-78.

41
Montgomery, Cynthia A. and Birger Wernerfelt (1992), “Risk Reduction and Umbrella
Branding,” Journal of Business, 65(1), 31-51.
Nicholls, J.A.F., Roslow, S. and S. Dublish (1997), “Time and companionship: Key Factors in
Hispanic Shopping Behavior,” Journal of Consumer Marketing, 14(2-3), 194-205.
Rao, Akshay and Mark Bergen (1992), “Price Premium Variations as a Consequence of Buyers'
Lack of Information,” Journal of Consumer Research, 19(3), 412-424.
__________ and Robert W. Ruekkert (1994), “Brand Alliances as Signals of Product Quality,”
Sloan Management Review, Fall, 87-97.
Robinson, Chris (1996), “Asian culture: The marketing consequences,” Journal of the Market
Research Society, 38(1), 55-63.
Roth, Martin S. (1995), “The effects of culture and socioeconomics on the performance,”
Journal of Marketing Research, 32(2), 163-176.
Roth, A.E., Prasnikar, V., Okuno-Fujiwara, M. and S. Zamir (1991), “Bargaining and market
behavior in Jerusalem, Ljubljana, Pittsburgh and Tokio: An experimental study,” The
American Economic Review, 81(5), 1068-1095.
Sekaran, U. (1983), “Methodological and Thoretical Issues and Advancements in Cross-Cultural
Research”, Journal of International Business Studies, Fall, 61-73.
Shimp, Terence A. and William O. Bearden (1982), “The Use of Extrinsic Cues to Facilitate
Product Adoption,” Journal of Marketing Research, 19(2), 229-240.
Spence, Michael (1974), Market Signaling: Informational Transfer in Hiring and Related
Screening Processes, Cambridge, MA: Harvard University Press.
Steenkamp, J.E.M. and H. Baumgartner (1998), “Assessing Measurement Invariance in Cross-
National, Consumer Research”, Journal of Consumer Research, 25(3), 78-90.
________________, Hofstede, F.T. and M. Wedel (1999),”A Cross-National Investigation into

42
the Individual and National Cultural Antecedents of Consumer Innovativeness”, Journal
of Marketing, 63(2), 55-69.
________________, Batra, R. and D. L. Alden (2003), “How Perceived Brand Globalness
Creates Brand Value,” Journal of International Business Studies, 34, 53-65.
Swait, Joffre and Jordan Louviere (1993), "The Role of the Scale Parameter in the Estimation
and Comparison of Multinomial Logit Models," Journal of Marketing Research, 30:305-
314.
Triandis, Harry C. (1995), Individualism and Collectivism. Boulder, CO: Westview Press.
_____________ and Michele J. Gelfand (1998), “Converging measurement of horizontal and
vertical individualism and collectivism,” Journal of Personality and Social Psychology,
74(1), 118-129.
Verhage, B.J., Yavas, U. and R. T. Green (1991), “Perceived Risk: A Cross-Cultural
Phenomenon”, International Journal of Research in Marketing, 7, 297-303.
Voich, Dan (1995), Comparative empirical analysis of cultural values and perceptions of
political economy issues. Westport, Connecticut: Praeger.
Wernerfelt, Birger (1988), “Umbrella Branding As A Signal Of New Product Quality: An
Example Of Signalling By Posting A Bond,” Rand Journal of Economics, 19 (Autumn),
458-466.
Zeithaml, Valarie (1988), “A Consumer’s Perceptions of Price, Quality, and Value: A Means
End Model and Synthesis of Evidence,” Journal of Marketing, 52 (3), 2-22
Zhou, Kevin Z., Su, Chenting and Yeqing Bao (2002), “A paradox of price-quality and market
efficiency: A comparative study of the US and China markets,” International Journal of
Research in Marketing, 19 (4), 349-364.
43
i We should note that Erdem and Swait (1998) collected survey data on consumer self-reports in regard to consumer
perceptions and purchase intentions, and estimated on these survey data a SEM model to assess the impact of brands
as signals on expected utility, omitting price effects. In this paper, we collect via surveys both consumer self-reports
in regard to consumer perceptions, as well as experimental data about their choices, then estimate both SEM models
and brand choice models, the latter incorporating also price effects.
ii Specifically in cross-cultural contexts, consumers in cultures rating high in collectivism and uncertainty avoidance
have been shown to use personal information sources more often that those rating low in these two cultural
dimensions (Dawar, Parker and Price 1996).
iii Hofstede had a fourth dimension, “masculinity”, and later added also “time orientation” as a fifth dimension. We
chose not to focus on masculinity since the scale he developed combines two separate (although related)
components: 1) attitudes towards gender roles and 2) attitudes towards quality of life. No straightforward
expectations can be generated about how these might impact brand credibility effects. We pre-tested the impact of
time orientation. However, there was not enough variation across countries on this dimension to further study it.
iv We also controlled for the fact that certain brands may communicate more individualistic values while others may
communicate social values. Additionally, we believe such discrepancy is not as prevalent in the two product
categories under study.
v We should note that an alternative utility specification would include the successors of credibility only (that is,
perceived quality, perceived risk and information costs saved). Previous research has shown that credibility does not
have a direct effect on utility and its effects are mediated through these three antecedents (Erdem and Swait, 2003).
Therefore, there is no need to put credibility and the antecedents together in the utility function. We decided to put
credibility rather than its antecedents in the utility to assess the total impact of brand credibility on choice and get a
clearer and simpler picture of total credibility effects across countries.
Related Documents