Single Family, Condominiums, and Multifamily Homes Year End 2014 Boston, Massachusetts Market Report

Boston Real Estate Market Data - Dwell360
Apr 07, 2016
Dwell360 has published this report on the residential real estate market statistics for 2014, 2013, 2012, 2011, 2010, 2009, 2008, 2007, 2006, and 2005 for Boston, Massachusetts. The market statistics include residential sales averages for single family, condominium, and multifamily homes. Review the information presented by the Massachusetts boutique real estate brokerage Dwell360 based in Newton.
Welcome message from author
This document is posted to help you gain knowledge. Please leave a comment to let me know what you think about it! Share it to your friends and learn new things together.
Transcript

Single Family, Condominiums, and Multifamily Homes
Year End 2014
Boston, Massachusetts
Market Repor t
2

3
Table of contents
[email protected] | 617-299-1854
CoNTENTS Back Bay 4 Beacon Hill 10 Charlestown 16 South End 22 South Boston 28 Dorchester 34 Allston 40 Brighton 46 Jamaica Plain 52 Roslindale 58 West Roxbury 64
4
Range
Number of
Listing Sold
Days on
the Market
Average
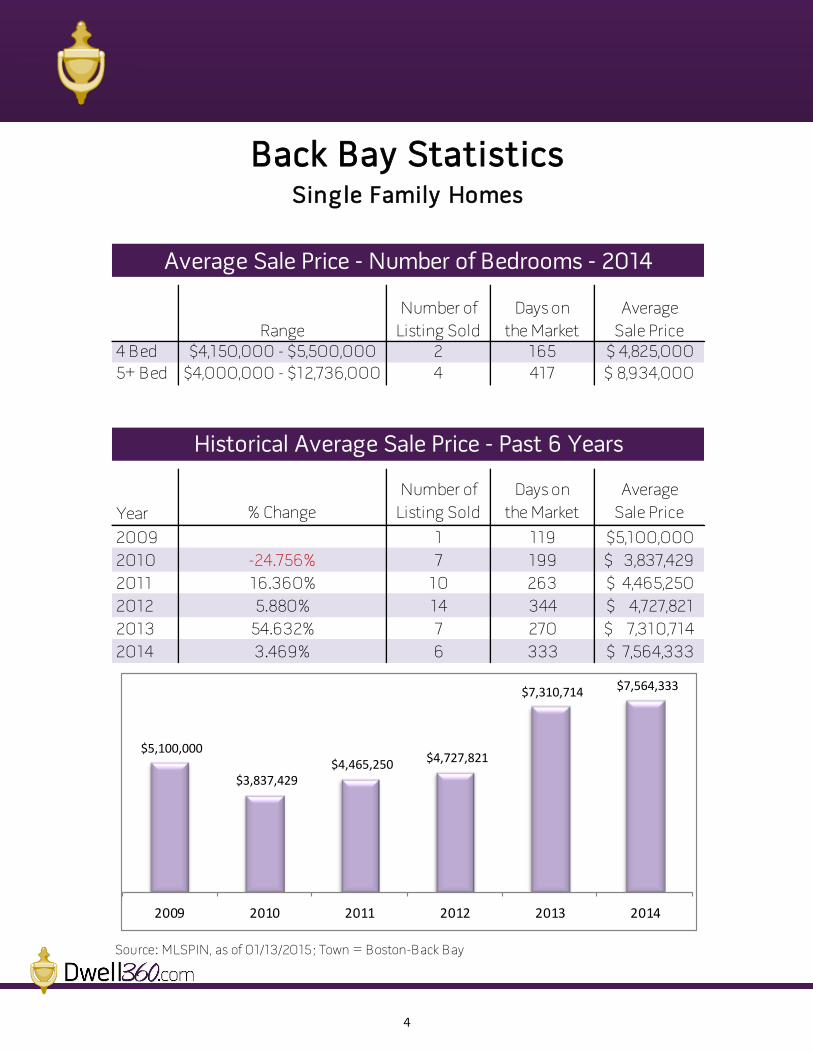
Sale Price4 Bed $4,150,000 - $5,500,000 2 165 4,825,000$
5+ Bed $4,000,000 - $12,736,000 4 417 8,934,000$
Year % Change
Number of
Listing Sold
Days on
the Market
Average
Sale Price
2009 1 119 5,100,000$
2010 -24.756% 7 199 3,837,429$
2011 16.360% 10 263 4,465,250$
2012 5.880% 14 344 4,727,821$
2013 54.632% 7 270 7,310,714$
2014 3.469% 6 333 7,564,333$
Source: MLSPIN, as of 01/13/2015; Town = Boston-Back Bay
Back Bay Statistics
Average Sale Price - Number of Bedrooms - 2014
Historical Average Sale Price - Past 6 Years
Single Family Homes
$5,100,000
$3,837,429 $4,465,250 $4,727,821
$7,310,714 $7,564,333
2009 2010 2011 2012 2013 2014

5
Market stat ist ics
[email protected] | 617-299-1854
Total Sold - Back BaySingle Family Homes, Town = Boston-Back Bay, 1/1/2014 - 12/31/2014
# of Avg. Days Average Average SP:LP Average SP:OP
Listings
on
Market Sale Price List Price Ratio Orig Price Ratio
$4,000,000 - $4,999,999 2 162 $4,075,000 $4,225,000 96 $4,097,500 100
$5,000,000 - $9,999,999 3 355 $8,166,667 $8,916,667 93 $9,500,000 90
$10,000,000 - $99,999,999 1 611 $12,736,000 $14,995,000 85 $14,995,000 85
Total Properties 6 333 $7,564,333 $8,365,833 93 $8,615,000 92
Source: MLSPIN, as of 01/13/2015
Price Range

6
Range
Number of
Listing Sold
Days on
the Market
Average
Sale Price
0 Bed $249,000 - $630,000 20 54 423,125$
1 Bed $279,000 - $1,499,999 129 40 601,311$
2 Bed $500,000 - $8,500,000 152 61 1,452,502$
3 Bed $906,500 - $11,950,000 63 93 3,229,072$
4-5 Bed $2,025,000 - $9,200,000 9 57 4,864,444$
Year % Change
Number of
Listing Sold
Days on
the Market
Average
Sale Price
2009 360 118 978,955$
2010 24.715% 448 132 1,220,908$
2011 -7.668% 433 131 1,127,283$
2012 4.862% 543 105 1,182,096$
2013 3.721% 475 59 1,226,083$
2014 21.143% 373 59 1,485,318$
Source: MLSPIN, as of 01/13/2015; Town = Boston-Back Bay
Back Bay StatisticsCondominiums
Average Sale Price - Number of Bedrooms - 2014
Historical Average Sale Price - Past 6 Years
$978,955
$1,220,908 $1,127,283
$1,182,096 $1,226,083
$1,485,318
2009 2010 2011 2012 2013 2014
7
Market stat ist ics
[email protected] | 617-299-1854
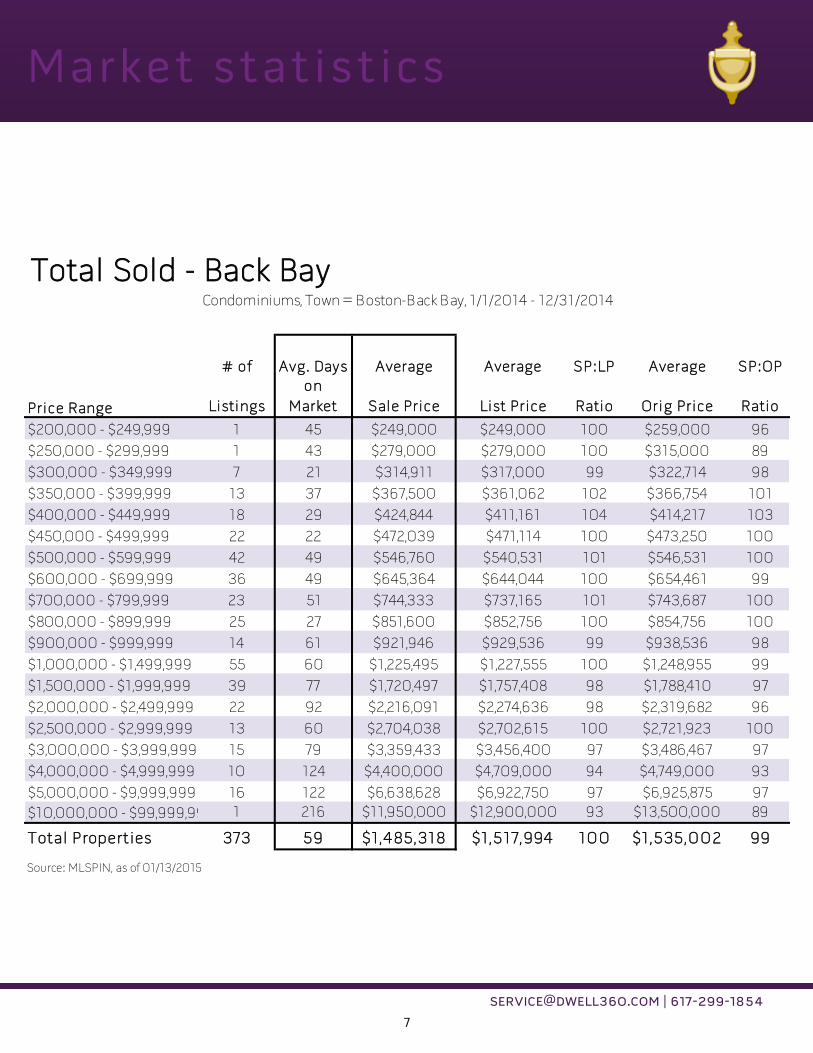
Total Sold - Back BayCondominiums, Town = Boston-Back Bay, 1/1/2014 - 12/31/2014
# of Avg. Days Average Average SP:LP Average SP:OP
Listings
on
Market Sale Price List Price Ratio Orig Price Ratio
$200,000 - $249,999 1 45 $249,000 $249,000 100 $259,000 96
$250,000 - $299,999 1 43 $279,000 $279,000 100 $315,000 89
$300,000 - $349,999 7 21 $314,911 $317,000 99 $322,714 98
$350,000 - $399,999 13 37 $367,500 $361,062 102 $366,754 101
$400,000 - $449,999 18 29 $424,844 $411,161 104 $414,217 103
$450,000 - $499,999 22 22 $472,039 $471,114 100 $473,250 100
$500,000 - $599,999 42 49 $546,760 $540,531 101 $546,531 100
$600,000 - $699,999 36 49 $645,364 $644,044 100 $654,461 99
$700,000 - $799,999 23 51 $744,333 $737,165 101 $743,687 100
$800,000 - $899,999 25 27 $851,600 $852,756 100 $854,756 100
$900,000 - $999,999 14 61 $921,946 $929,536 99 $938,536 98
$1,000,000 - $1,499,999 55 60 $1,225,495 $1,227,555 100 $1,248,955 99
$1,500,000 - $1,999,999 39 77 $1,720,497 $1,757,408 98 $1,788,410 97
$2,000,000 - $2,499,999 22 92 $2,216,091 $2,274,636 98 $2,319,682 96
$2,500,000 - $2,999,999 13 60 $2,704,038 $2,702,615 100 $2,721,923 100
$3,000,000 - $3,999,999 15 79 $3,359,433 $3,456,400 97 $3,486,467 97
$4,000,000 - $4,999,999 10 124 $4,400,000 $4,709,000 94 $4,749,000 93
$5,000,000 - $9,999,999 16 122 $6,638,628 $6,922,750 97 $6,925,875 97
$10,000,000 - $99,999,999 1 216 $11,950,000 $12,900,000 93 $13,500,000 89
Total Properties 373 59 $1,485,318 $1,517,994 100 $1,535,002 99
Source: MLSPIN, as of 01/13/2015
Price Range

8
Range
Number of
Listing Sold
Days on
the Market
Average
Sale Price
3-5 Units $5,100,000 - $5,100,000 1 1 5,100,000$
6+ Units $4,152,260 - $7,750,000 2 53 5,951,130$
Year % Change
Number of
Listing Sold
Days on
the Market
Average
Sale Price
2009 1 7 800,000$
2010 163.583% 3 54 2,108,667$
2011 37.587% 4 21 2,901,250$
2012 6.161% 5 76 3,080,000$
2013 89.715% 7 100 5,843,214$
2014 -3.009% 3 35 5,667,420$
Source: MLSPIN, as of 01/13/2015; Town = Boston-Back Bay
Back Bay StatisticsMultifamily Homes
Average Sale Price - Number of Units in Building - 2014
Historical Average Sale Price - Past 6 Years
$800,000
$2,108,667
$2,901,250 $3,080,000
$5,843,214 $5,667,420
2009 2010 2011 2012 2013 2014

9
Market stat ist ics
[email protected] | 617-299-1854
Multifamily Homes, Town = Boston-Back Bay, 1/1/2014 - 12/31/2014
# of Avg. Days Average Average SP:LP Average SP:OP
Listings
on
Market Sale Price List Price Ratio Orig Price Ratio
$4,000,000 - $4,999,999 1 84 $4,152,260 $3,950,000 105 $3,950,000 105
$5,000,000 - $9,999,999 2 11 $6,425,000 $5,697,500 112 $5,697,500 112
Total Properties 3 35 $5,667,420 $5,115,000 110 $5,115,000 110
Source: MLSPIN, as of 01/13/2015
Total Sold - Back Bay
Price Range
10
Range
Number of
Listing Sold
Days on
the Market
Average
Sale Price
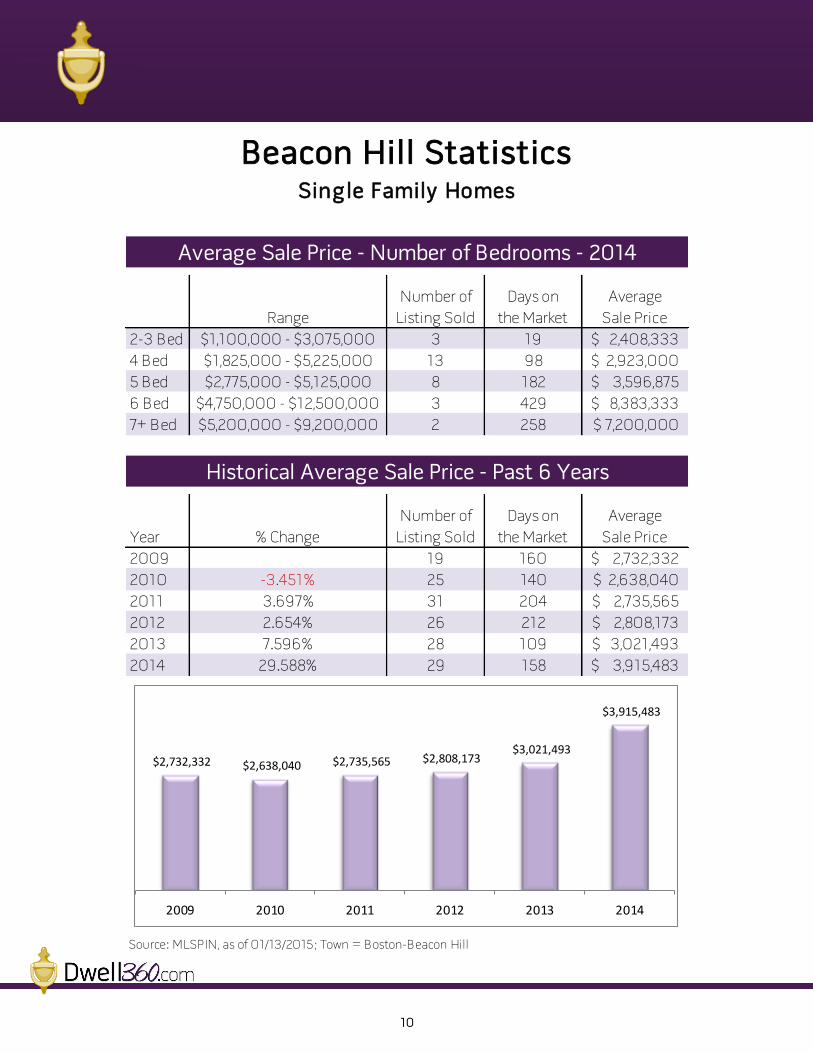
2-3 Bed $1,100,000 - $3,075,000 3 19 2,408,333$
4 Bed $1,825,000 - $5,225,000 13 98 2,923,000$
5 Bed $2,775,000 - $5,125,000 8 182 3,596,875$
6 Bed $4,750,000 - $12,500,000 3 429 8,383,333$
7+ Bed $5,200,000 - $9,200,000 2 258 7,200,000$
Year % Change
Number of
Listing Sold
Days on
the Market
Average
Sale Price
2009 19 160 2,732,332$
2010 -3.451% 25 140 2,638,040$
2011 3.697% 31 204 2,735,565$
2012 2.654% 26 212 2,808,173$
2013 7.596% 28 109 3,021,493$
2014 29.588% 29 158 3,915,483$
Source: MLSPIN, as of 01/13/2015; Town = Boston-Beacon Hill
Beacon Hill Statistics
Average Sale Price - Number of Bedrooms - 2014
Historical Average Sale Price - Past 6 Years
Single Family Homes
$2,732,332 $2,638,040 $2,735,565 $2,808,173 $3,021,493
$3,915,483
2009 2010 2011 2012 2013 2014

11
Market stat ist ics
[email protected] | 617-299-1854
Total Sold - Beacon HillSingle Family Homes, Town = Boston-Beacon Hill, 1/1/2014 - 12/31/2014
# of Avg. Days Average Average SP:LP Average SP:OP
Listings
on
Market Sale Price List Price Ratio Orig Price Ratio
$1,000,000 - $1,499,999 1 29 $1,100,000 $1,200,000 92 $1,200,000 92
$1,500,000 - $1,999,999 2 161 $1,895,000 $2,175,000 88 $2,175,000 88
$2,000,000 - $2,499,999 4 95 $2,267,500 $2,453,250 93 $2,509,500 90
$2,500,000 - $2,999,999 4 92 $2,762,500 $2,880,000 96 $2,880,000 96
$3,000,000 - $3,999,999 9 133 $3,309,889 $3,341,000 99 $3,396,556 98
$4,000,000 - $4,999,999 3 300 $4,533,333 $4,829,667 94 $5,121,667 89
$5,000,000 - $9,999,999 5 237 $6,530,000 $7,250,000 91 $5,680,000 231
$10,000,000 - $99,999,999 1 213 $12,500,000 $13,950,000 90 $13,950,000 90
Total Properties 29 158 $3,915,483 $4,194,517 95 $3,979,034 118
Source: MLSPIN, as of 01/13/2015
Price Range

12
Range
Number of
Listing Sold
Days on
the Market
Average
Sale Price
2 Bed $390,000 - $2,175,000 68 56 957,002$
3 Bed $1,070,000 - $4,389,000 11 62 1,883,182$
4-5 Bed $1,800,000 - $6,500,000 3 308 3,741,667$
Year % Change
Number of
Listing Sold
Days on
the Market
Average
Sale Price
2009 141 116 731,129$
2010 1.299% 136 111 740,626$
2011 3.505% 165 109 766,582$
2012 5.298% 189 85 807,196$
2013 9.430% 140 60 883,316$
2014* -1.977% 144 57 865,856$
Source: MLSPIN, as of 01/13/2015; Town = Boston-Beacon Hill
*2014 Data includes condominiums sold for greater than $100,000
Beacon Hill StatisticsCondominiums
Average Sale Price - Number of Bedrooms - 2014*
Historical Average Sale Price - Past 6 Years
$731,129 $740,626 $766,582 $807,196
$883,316 $865,856
2009 2010 2011 2012 2013 2014*

13
Market stat ist ics
[email protected] | 617-299-1854
Total Sold - Beacon HillCondominiums*, Town = Boston-Beacon Hill, 1/1/2014 - 12/31/2014
# of Avg. Days Average Average SP:LP Average SP:OP
Listings
on
Market Sale Price List Price Ratio Orig Price Ratio
$200,000 - $249,999 1 139 $211,000 $239,617 88 $269,617 78
$250,000 - $299,999 5 53 $268,380 $274,180 98 $283,180 95
$300,000 - $349,999 8 34 $327,250 $328,625 100 $330,500 99
$350,000 - $399,999 9 29 $385,576 $384,433 100 $388,433 100
$400,000 - $449,999 15 66 $421,700 $415,800 102 $421,067 101
$450,000 - $499,999 12 16 $474,250 $477,317 99 $477,317 99
$500,000 - $599,999 16 40 $555,172 $549,313 102 $557,188 101
$600,000 - $699,999 15 58 $657,928 $649,133 102 $650,733 101
$700,000 - $799,999 11 29 $744,450 $741,173 101 $745,355 100
$800,000 - $899,999 10 100 $864,800 $862,800 100 $887,800 98
$900,000 - $999,999 3 39 $926,667 $919,667 101 $936,333 99
$1,000,000 - $1,499,999 21 61 $1,233,524 $1,230,667 100 $1,238,000 100
$1,500,000 - $1,999,999 12 78 $1,691,167 $1,743,250 97 $1,832,417 94
$2,000,000 - $2,499,999 3 28 $2,215,000 $2,006,667 110 $2,006,667 110
$2,500,000 - $2,999,999 1 417 $2,925,000 $3,200,000 91 $3,450,000 85
$3,000,000 - $3,999,999 0 0 $0 $0 0 $0 0
$4,000,000 - $4,999,999 1 21 $4,389,000 $4,399,000 100 $4,399,000 100
$5,000,000 - $9,999,999 1 346 $6,500,000 $6,950,000 94 $7,250,000 90
Total Properties 144 57 $865,856 $868,487 100 $885,674 99
Source: MLSPIN, as of 01/13/2015
Price Range
*Condominium Data includes properties sold for greater than $100,000

14
Range
Number of
Listing Sold
Days on
the Market
Average
Sale Price
8-9 Units $3,535,000 - $4,500,000 2 42 4,017,500$
10+ Units $11,500,000 - $23,600,000 2 190 17,550,000$
Year % Change
Number of
Listing Sold
Days on
the Market
Average
Sale Price
2009 6 39 1,778,750$
2010 57.253% 7 108 2,797,143$
2011 -61.389% 1 11 1,080,000$
2012 106.019% 1 10 2,225,000$
2013 159.551% 2 103 5,775,000$
2014 86.732% 4 116 10,783,750$
Source: MLSPIN, as of 01/13/2015; Town = Boston-Beacon Hill
Beacon Hill StatisticsMultifamily Homes
Average Sale Price - Number of Units in Building - 2014
Historical Average Sale Price - Past 6 Years
$1,778,750
$2,797,143
$1,080,000
$2,225,000
$5,775,000
$10,783,750
2009 2010 2011 2012 2013 2014
15
Market stat ist ics
[email protected] | 617-299-1854
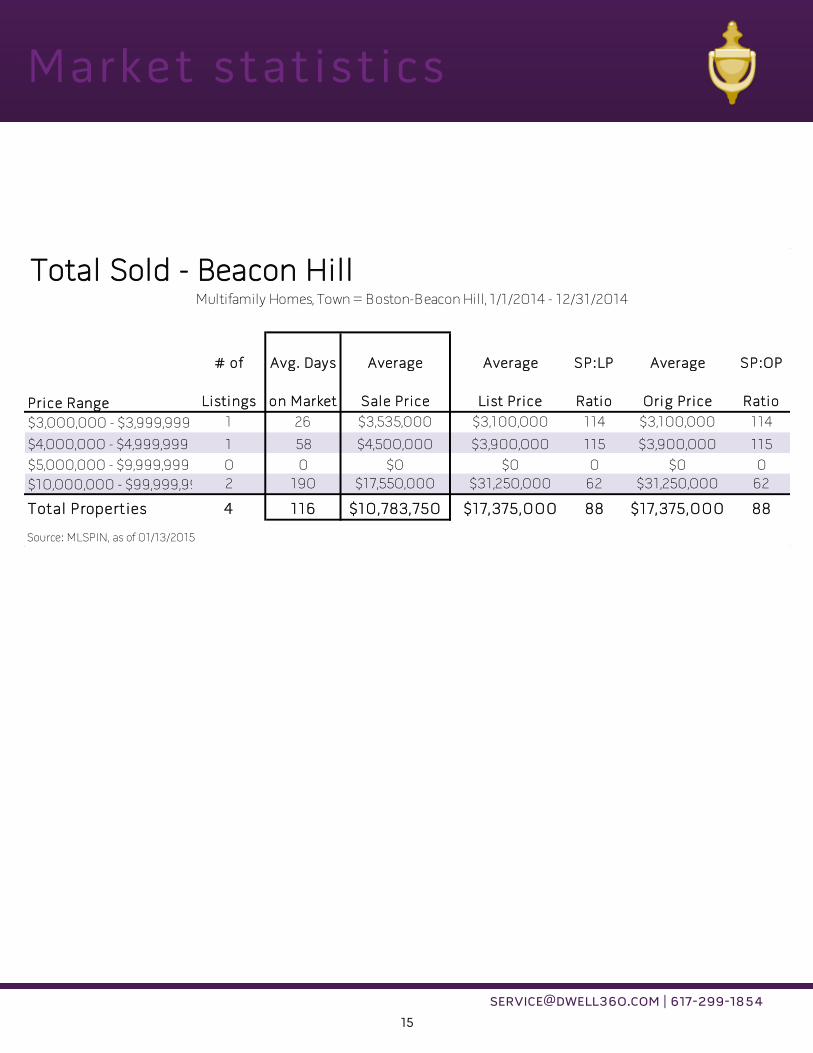
Multifamily Homes, Town = Boston-Beacon Hill, 1/1/2014 - 12/31/2014
# of Avg. Days Average Average SP:LP Average SP:OP
Listings on Market Sale Price List Price Ratio Orig Price Ratio
$3,000,000 - $3,999,999 1 26 $3,535,000 $3,100,000 114 $3,100,000 114
$4,000,000 - $4,999,999 1 58 $4,500,000 $3,900,000 115 $3,900,000 115
$5,000,000 - $9,999,999 0 0 $0 $0 0 $0 0
$10,000,000 - $99,999,999 2 190 $17,550,000 $31,250,000 62 $31,250,000 62
Total Properties 4 116 $10,783,750 $17,375,000 88 $17,375,000 88
Source: MLSPIN, as of 01/13/2015
Total Sold - Beacon Hill
Price Range

16
Range
Number of
Listing Sold
Days on
the Market
Average
Sale Price
1 Bed $365,625 - $715,000 2 24 540,313$
2 Bed $399,000 - $893,000 15 28 579,300$
3 Bed $441,000 - $1,279,000 32 38 811,122$
4 Bed $425,000 - $2,750,000 18 88 1,090,056$
5+ Bed $1,250,000 - $2,210,000 3 19 1,587,208$
Year % Change
Number of
Listing Sold
Days on
the Market
Average
Sale Price
2005 57 82 685,554$
2006 5.083% 34 141 720,403$
2007 -6.212% 51 130 675,648$
2008 -0.828% 61 99 670,053$
2009 -14.056% 47 140 575,870$
2010 27.076% 64 113 731,795$
2011 -10.290% 50 97 656,494$
2012 10.875% 76 94 727,888$
2013 5.757% 68 45 769,789$
2014 11.549% 70 48 858,695$
Source: MLSPIN, as of 01/28/2015; Zip Code 02129
Charlestown Statistics
Average Sale Price - Number of Bedrooms - 2014
Historical Average Sale Price - Past 10 Years
Single Family Homes
$685,554 $720,403
$675,648 $670,053
$575,870
$731,795 $656,494
$727,888 $769,789
$858,695
2005 2006 2007 2008 2009 2010 2011 2012 2013 2014

17
Market stat ist ics
[email protected] | 617-299-1854
Total Sold - CharlestownSingle Family Homes, Zip Code 02129, 1/1/2014 - 12/31/2014
# of Avg. Days Average Average SP:LP Average SP:OP
Listings
on
Market Sale Price List Price Ratio Orig Price Ratio
$350,000 - $399,999 2 31 $382,313 $399,000 96 $399,000 96
$400,000 - $449,999 4 20 $433,500 $439,475 99 $456,975 95
$450,000 - $499,999 5 21 $472,200 $460,200 103 $460,200 103
$500,000 - $599,999 6 43 $544,833 $523,633 104 $523,633 104
$600,000 - $699,999 12 46 $644,792 $645,982 100 $656,732 99
$700,000 - $799,999 8 41 $747,063 $748,500 100 $773,500 98
$800,000 - $899,999 10 35 $872,600 $867,880 101 $871,880 100
$900,000 - $999,999 4 42 $925,000 $872,750 106 $872,750 106
$1,000,000 - $1,499,999 16 39 $1,189,314 $1,174,500 102 $1,188,250 101
$1,500,000 - $1,999,999 1 12 $1,851,000 $1,699,000 109 $1,699,000 109
$2,000,000 - $2,499,999 1 21 $2,210,000 $1,995,000 111 $1,995,000 111
$2,500,000 - $2,999,999 1 782 $2,750,000 $2,750,000 100 $2,750,000 100
Total Properties 70 48 $858,695 $844,918 102 $854,333 101
Source: MLSPIN, as of 01/28/2015
Price Range

18
Range
Number of
Listing Sold
Days on
the Market
Average
Sale Price
0-1 Bed $240,000 - $639,000 72 36 414,860$
2 Bed $253,000 - $1,649,000 141 39 608,010$
3 Bed $505,000 - $1,599,000 45 50 831,191$
4 Bed $810,000 - $1,380,000 4 40 1,074,250$
Year % Change
Number of
Listing Sold
Days on
the Market
Average
Sale Price
2005 264 87 499,947$
2006 -4.127% 221 122 479,315$
2007 4.133% 304 117 499,124$
2008 -5.452% 227 122 471,910$
2009 -5.643% 219 116 445,280$
2010 5.027% 230 118 467,666$
2011 -1.228% 232 108 461,922$
2012 2.006% 334 87 471,187$
2013 21.444% 379 43 572,228$
2014 4.920% 262 40 600,382$
Source: MLSPIN, as of 01/15/2015; Zip Code 02129
Charlestown StatisticsCondominiums
Average Sale Price - Number of Bedrooms - 2014
Historical Average Sale Price - Past 10 Years
$499,947 $479,315 $499,124 $471,910
$445,280 $467,666 $461,922 $471,187
$572,228 $600,382
2005 2006 2007 2008 2009 2010 2011 2012 2013 2014

19
Market stat ist ics
[email protected] | 617-299-1854
Total Sold - CharlestownCondominiums, Zip Code 02129, 1/1/2014 - 12/31/2014
# of Avg. Days Average Average SP:LP Average SP:OP
Listings
on
Market Sale Price List Price Ratio Orig Price Ratio
$200,000 - $249,999 1 6 $240,000 $249,900 96 $249,900 96
$250,000 - $299,999 4 34 $272,725 $272,200 100 $275,950 99
$300,000 - $349,999 11 49 $322,997 $324,819 100 $332,365 97
$350,000 - $399,999 28 32 $377,613 $375,621 101 $377,343 100
$400,000 - $449,999 33 40 $422,650 $415,513 102 $417,910 101
$450,000 - $499,999 27 38 $471,463 $468,100 101 $471,218 100
$500,000 - $599,999 42 38 $545,757 $537,857 102 $542,062 101
$600,000 - $699,999 53 43 $646,160 $641,840 101 $646,934 100
$700,000 - $799,999 29 40 $738,651 $721,686 103 $723,583 102
$800,000 - $899,999 11 43 $829,909 $820,991 101 $824,627 101
$900,000 - $999,999 6 35 $955,417 $946,000 101 $950,167 101
$1,000,000 - $1,499,999 14 66 $1,208,379 $1,212,571 100 $1,216,143 100
$1,500,000 - $1,999,999 3 15 $1,599,333 $1,582,333 101 $1,582,333 101
Total Properties 262 40 $600,382 $594,451 101 $597,985 101
Source: MLSPIN, as of 01/15/2015
Price Range

20
Range
Number of
Listing Sold
Days on
the Market
Average
Sale Price
2 Units $630,000 - $1,135,000 7 19 812,843$
3-4 Units $639,999 - $1,295,000 5 20 959,000$
Year % Change
Number of
Listing Sold
Days on
the Market
Average
Sale Price
2005 21 52 750,291$
2006 26.289% 10 84 947,533$
2007 -28.272% 14 94 679,643$
2008 -23.747% 8 173 518,250$
2009 12.266% 11 188 581,818$
2010 -1.357% 8 41 573,925$
2011 6.034% 9 58 608,553$
2012 67.874% 5 75 1,021,600$
2013* -8.218% 11 65 937,650$
2014 -6.816% 12 19 873,742$
Source: MLSPIN, as of 01/15/2015; Zip Code 02129
*2013 data includes only multifamily properties that had 2 or more units in the building.
Charlestown StatisticsMultifamily Homes
Average Sale Price - Number of Units in Building - 2014
Historical Average Sale Price - Past 10 Years
$750,291
$947,533
$679,643
$518,250 $581,818 $573,925 $608,553
$1,021,600 $937,650
$873,742
2005 2006 2007 2008 2009 2010 2011 2012 2013* 2014
21
Market stat ist ics
[email protected] | 617-299-1854
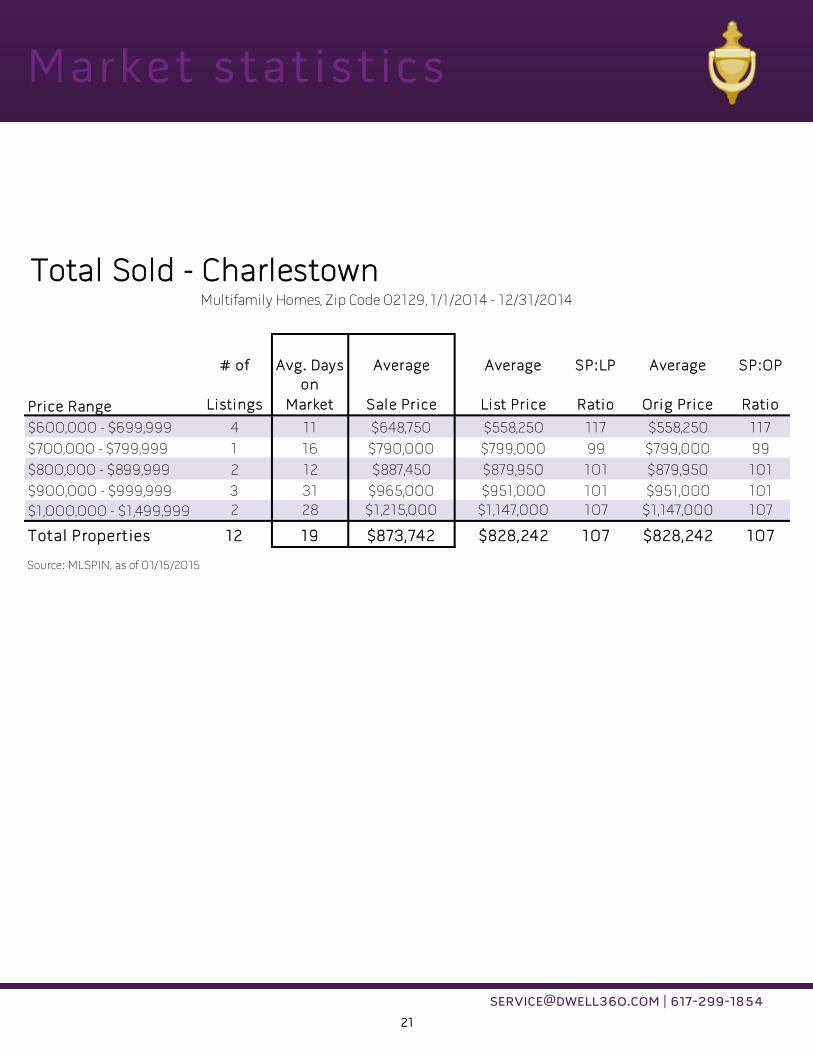
Multifamily Homes, Zip Code 02129, 1/1/2014 - 12/31/2014
# of Avg. Days Average Average SP:LP Average SP:OP
Listings
on
Market Sale Price List Price Ratio Orig Price Ratio
$600,000 - $699,999 4 11 $648,750 $558,250 117 $558,250 117
$700,000 - $799,999 1 16 $790,000 $799,000 99 $799,000 99
$800,000 - $899,999 2 12 $887,450 $879,950 101 $879,950 101
$900,000 - $999,999 3 31 $965,000 $951,000 101 $951,000 101
$1,000,000 - $1,499,999 2 28 $1,215,000 $1,147,000 107 $1,147,000 107
Total Properties 12 19 $873,742 $828,242 107 $828,242 107
Source: MLSPIN, as of 01/15/2015
Total Sold - Charlestown
Price Range

22
Range
Number of
Listing Sold
Days on
the Market
Average
Sale Price
3 Bed $551,000 - $2,499,000 4 21 1,648,750$
4 Bed $1,350,000 - $2,670,000 11 43 2,427,727$
5 Bed $2,135,000 - $4,240,000 9 149 3,014,111$
Year % Change
Number of
Listing Sold
Days on
the Market
Average
Sale Price
2009 22 201 1,593,305$
2010 4.236% 28 190 1,660,804$
2011 16.587% 38 108 1,936,280$
2012 0.930% 27 84 1,954,278$
2013 8.703% 39 49 2,124,357$
2014 18.520% 24 79 2,517,792$
Source: MLSPIN, as of 01/13/2015; Town = Boston-South End
South End Statistics
Average Sale Price - Number of Bedrooms - 2014
Historical Average Sale Price - Past 6 Years
Single Family Homes
$1,593,305 $1,660,804
$1,936,280 $1,954,278 $2,124,357
$2,517,792
2009 2010 2011 2012 2013 2014
23
Market stat ist ics
[email protected] | 617-299-1854
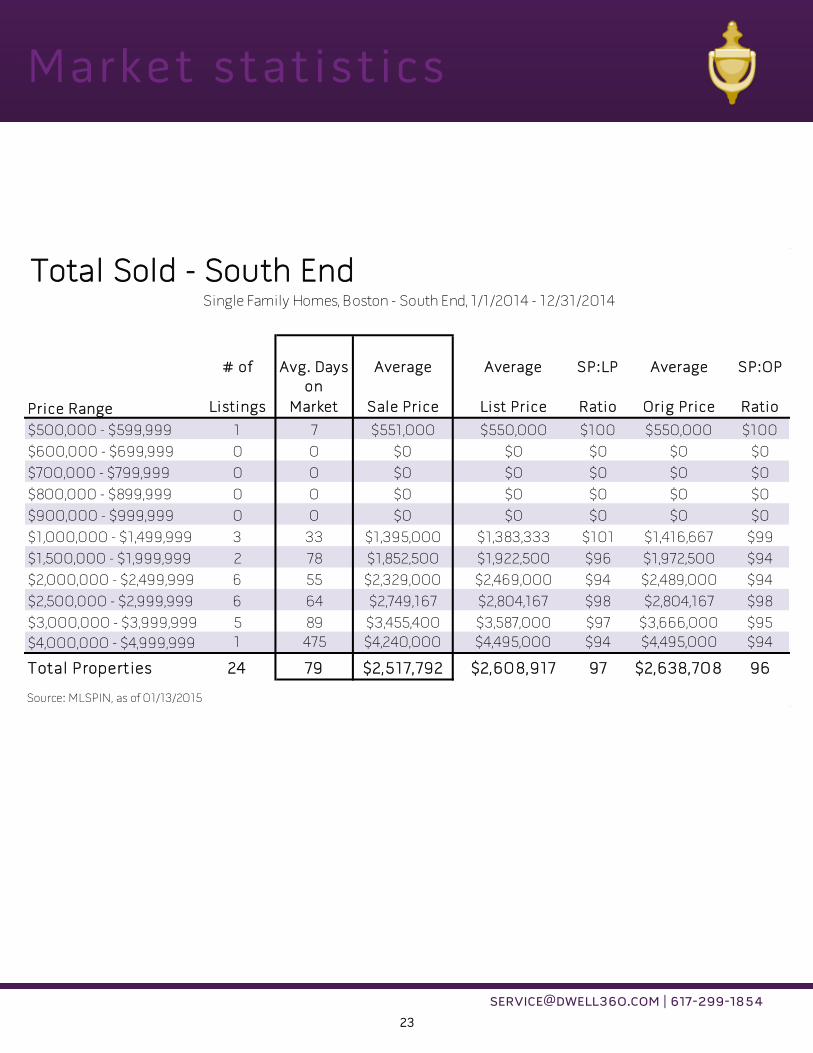
Total Sold - South EndSingle Family Homes, Boston - South End, 1/1/2014 - 12/31/2014
# of Avg. Days Average Average SP:LP Average SP:OP
Listings
on
Market Sale Price List Price Ratio Orig Price Ratio
$500,000 - $599,999 1 7 $551,000 $550,000 $100 $550,000 $100
$600,000 - $699,999 0 0 $0 $0 $0 $0 $0
$700,000 - $799,999 0 0 $0 $0 $0 $0 $0
$800,000 - $899,999 0 0 $0 $0 $0 $0 $0
$900,000 - $999,999 0 0 $0 $0 $0 $0 $0
$1,000,000 - $1,499,999 3 33 $1,395,000 $1,383,333 $101 $1,416,667 $99
$1,500,000 - $1,999,999 2 78 $1,852,500 $1,922,500 $96 $1,972,500 $94
$2,000,000 - $2,499,999 6 55 $2,329,000 $2,469,000 $94 $2,489,000 $94
$2,500,000 - $2,999,999 6 64 $2,749,167 $2,804,167 $98 $2,804,167 $98
$3,000,000 - $3,999,999 5 89 $3,455,400 $3,587,000 $97 $3,666,000 $95
$4,000,000 - $4,999,999 1 475 $4,240,000 $4,495,000 $94 $4,495,000 $94
Total Properties 24 79 $2,517,792 $2,608,917 97 $2,638,708 96
Source: MLSPIN, as of 01/13/2015
Price Range

24
Range
Number of
Listing Sold
Days on
the Market
Average
Sale Price
0 Bed $215,000 - $410,000 15 33 320,767$
1 Bed $215,000 - $1,100,000 166 34 547,943$
2 Bed $261,726 - $2,700,000 269 30 870,956$
3 Bed $559,900 - $2,700,000 70 43 1,590,963$
4 Bed $840,500 - $2,209,000 4 35 1,696,125$
Year % Change
Number of
Listing Sold
Days on
the Market
Average
Sale Price
2009 456 95 645,268$
2010 -0.468% 502 94 642,250$
2011 3.373% 497 85 663,910$
2012 6.118% 547 67 704,527$
2013 14.072% 583 33 803,669$
2014 6.432% 524 33 855,361$
Source: MLSPIN, as of 3/11/2014; Town = Boston-South End
South End StatisticsCondominiums
Average Sale Price - Number of Bedrooms - 2014
Historical Average Sale Price - Past 6 Years
$645,268 $642,250 $663,910 $704,527
$803,669 $855,361
2009 2010 2011 2012 2013 2014
25
Market stat ist ics
[email protected] | 617-299-1854
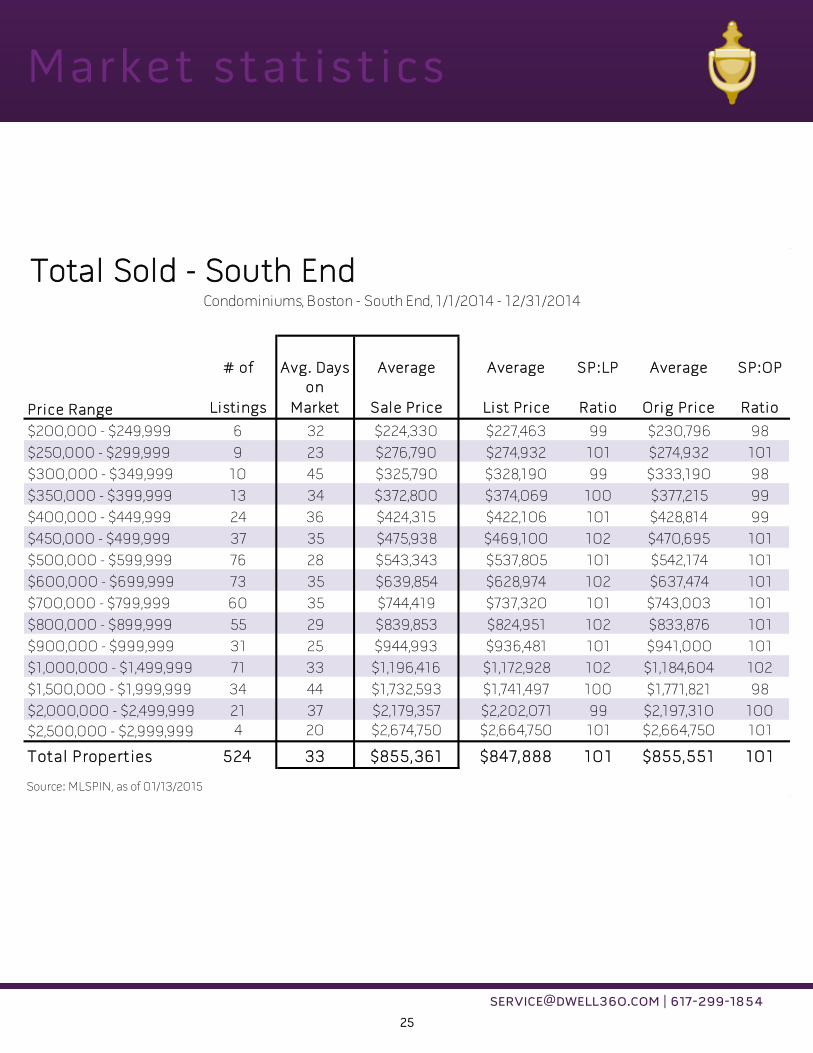
Total Sold - South EndCondominiums, Boston - South End, 1/1/2014 - 12/31/2014
# of Avg. Days Average Average SP:LP Average SP:OP
Listings
on
Market Sale Price List Price Ratio Orig Price Ratio
$200,000 - $249,999 6 32 $224,330 $227,463 99 $230,796 98
$250,000 - $299,999 9 23 $276,790 $274,932 101 $274,932 101
$300,000 - $349,999 10 45 $325,790 $328,190 99 $333,190 98
$350,000 - $399,999 13 34 $372,800 $374,069 100 $377,215 99
$400,000 - $449,999 24 36 $424,315 $422,106 101 $428,814 99
$450,000 - $499,999 37 35 $475,938 $469,100 102 $470,695 101
$500,000 - $599,999 76 28 $543,343 $537,805 101 $542,174 101
$600,000 - $699,999 73 35 $639,854 $628,974 102 $637,474 101
$700,000 - $799,999 60 35 $744,419 $737,320 101 $743,003 101
$800,000 - $899,999 55 29 $839,853 $824,951 102 $833,876 101
$900,000 - $999,999 31 25 $944,993 $936,481 101 $941,000 101
$1,000,000 - $1,499,999 71 33 $1,196,416 $1,172,928 102 $1,184,604 102
$1,500,000 - $1,999,999 34 44 $1,732,593 $1,741,497 100 $1,771,821 98
$2,000,000 - $2,499,999 21 37 $2,179,357 $2,202,071 99 $2,197,310 100
$2,500,000 - $2,999,999 4 20 $2,674,750 $2,664,750 101 $2,664,750 101
Total Properties 524 33 $855,361 $847,888 101 $855,551 101
Source: MLSPIN, as of 01/13/2015
Price Range

26
Range
Number of
Listing Sold
Days on
the Market
Average
Sale Price
2 Units $1,800,000 - $2,800,000 2 164 2,300,000$
3-5 Units $1,950,000 - $2,750,000 6 64 2,275,833$
Year % Change
Number of
Listing Sold
Days on
the Market
Average
Sale Price
2009 13 102 1,341,770$
2010 11.027% 14 187 1,489,732$
2011 -0.093% 14 70 1,488,348$
2012 1.743% 14 39 1,514,286$
2013 23.047% 13 20 1,863,285$
2014 22.465% 8 89 2,281,875$
Source: MLSPIN, as of 01/13/2015; Boston - South End
South End StatisticsMultifamily Homes
Average Sale Price - Number of Units in Building - 2014
Historical Average Sale Price - Past 6 Years
$1,341,770 $1,489,732 $1,488,348 $1,514,286
$1,863,285
$2,281,875
2009 2010 2011 2012 2013 2014

27
Market stat ist ics
[email protected] | 617-299-1854
Multifamily Homes, Boston - South End, 1/1/2014 - 12/31/2014
# of Avg. Days Average Average SP:LP Average SP:OP
Listings
on
Market Sale Price List Price Ratio Orig Price Ratio
$1,500,000 - $1,999,999 2 115 $1,875,000 $2,174,500 88 $2,399,500 78
$2,000,000 - $2,499,999 4 86 $2,238,750 $2,287,475 98 $2,287,475 98
$2,500,000 - $2,999,999 2 71 $2,775,000 $2,872,500 97 $2,872,500 97
Total Properties 8 89 $2,281,875 $2,405,488 95 $2,461,738 93
Source: MLSPIN, as of 01/13/2015
Total Sold - South End
Price Range

28
Range
Number of
Listing Sold
Days on
the Market
Average
Sale Price
1 Bed $382,000 - $405,000 3 44 392,333$
2 Bed $339,000 - $631,000 16 38 484,100$
3 Bed $353,000 - $1,040,000 25 56 616,760$
4 Bed $435,000 - $825,000 14 51 625,700$
5 Bed $695,000 - $867,750 2 14 781,375$
Year % Change
Number of
Listing Sold
Days on
the Market
Average
Sale Price
2009 46 87 351,304$
2010 25.321% 46 53 440,258$
2011 -6.012% 56 100 413,789$
2012 23.168% 45 65 509,657$
2013 13.174% 59 27 576,798$
2014 0.163% 60 48 577,736$
Source: MLSPIN, as of 01/13/2015; Boston-South Boston
South Boston Statistics
Average Sale Price - Number of Bedrooms - 2014
Historical Average Sale Price - Past 6 Years
Single Family Homes
$351,304
$440,258 $413,789
$509,657
$576,798 $577,736
2009 2010 2011 2012 2013 2014

29
Market stat ist ics
[email protected] | 617-299-1854
Total Sold - South BostonSingle Family Homes, Boston - South Boston, 1/1/2014 - 12/31/2014
# of Avg. Days Average Average SP:LP Average SP:OP
Listings
on
Market Sale Price List Price Ratio Orig Price Ratio
$300,000 - $349,999 1 23 $339,000 $349,000 $97 $349,000 $97
$350,000 - $399,999 5 61 $383,800 $392,480 $98 $402,660 $96
$400,000 - $449,999 9 58 $426,333 $441,889 $97 $459,667 $94
$450,000 - $499,999 7 38 $483,143 $490,571 $99 $497,714 $97
$500,000 - $599,999 16 54 $549,381 $555,544 $99 $567,675 $97
$600,000 - $699,999 10 30 $641,430 $640,300 $100 $651,100 $99
$700,000 - $799,999 4 65 $760,000 $789,000 $96 $789,000 $96
$800,000 - $899,999 6 40 $833,792 $819,000 $102 $839,000 $100
$900,000 - $999,999 1 85 $900,000 $949,000 $95 $949,000 $95
$1,000,000 - $1,499,999 1 16 $1,040,000 $1,100,000 $95 $1,100,000 $95
Total Properties 60 48 $577,736 $585,552 99 $596,935 97
Source: MLSPIN, as of 01/13/2015
Price Range

30
Range
Number of
Listing Sold
Days on
the Market
Average
Sale Price
0 Bed $220,000 - $437,500 5 41 296,900$
1 Bed $189,000 - $660,900 107 37 350,477$
2 Bed $208,000 - $1,210,000 386 52 537,392$
3 Bed $245,113 - $1,300,000 91 73 679,309$
4 Bed $821,750 - $1,500,000 2 26 1,160,875$
Year % Change
Number of
Listing Sold
Days on
the Market
Average
Sale Price
2009 457 114 356,240$
2010 2.905% 487 95 366,588$
2011 4.292% 466 102 382,323$
2012 10.689% 589 71 423,189$
2013 10.537% 637 32 467,780$
2014 12.334% 591 52 525,478$
Source: MLSPIN, as of 01/13/2015; Boston - South Boston
South Boston StatisticsCondominiums
Average Sale Price - Number of Bedrooms - 2014
Historical Average Sale Price - Past 6 Years
$356,240 $366,588 $382,323 $423,189
$467,780
$525,478
2009 2010 2011 2012 2013 2014

31
Market stat ist ics
[email protected] | 617-299-1854
Total Sold - South BostonCondominiums, Boston - South Boston, 1/1/2014 - 12/31/2014
# of Avg. Days Average Average SP:LP Average SP:OP
Listings
on
Market Sale Price List Price Ratio Orig Price Ratio
$150,000 - $199,999 1 28 $189,000 $199,000 95 $199,000 95
$200,000 - $249,999 11 66 $223,238 $236,897 95 $239,079 94
$250,000 - $299,999 22 43 $277,983 $282,799 98 $287,179 97
$300,000 - $349,999 47 38 $325,298 $325,453 100 $328,368 99
$350,000 - $399,999 75 37 $375,120 $371,324 101 $374,139 101
$400,000 - $449,999 62 45 $423,875 $421,803 101 $426,944 100
$450,000 - $499,999 75 49 $471,285 $469,699 101 $478,692 99
$500,000 - $599,999 125 58 $542,108 $544,939 100 $553,939 98
$600,000 - $699,999 88 57 $653,137 $657,853 99 $662,779 99
$700,000 - $799,999 40 58 $744,724 $750,200 99 $755,200 99
$800,000 - $899,999 29 99 $856,647 $863,821 99 $864,341 99
$900,000 - $999,999 10 59 $953,150 $956,600 100 $956,600 100
$1,000,000 - $1,499,999 5 38 $1,169,000 $1,168,600 100 $1,168,600 100
$1,500,000 - $1,999,999 1 2 $1,500,000 $1,500,000 100 $1,500,000 100
Total Properties 591 52 $525,478 $527,119 100 $532,594 99
Source: MLSPIN, as of 01/13/2015
Price Range

32
Range
Number of
Listing Sold
Days on
the Market
Average
Sale Price
1-2 Units $540,000 - $1,150,000 13 46 730,077$
3 Units $611,000 - $1,400,000 18 26 963,471$
4 Units $1,800,000 - $1,800,000 1 1 1,800,000$
Year % Change
Number of
Listing Sold
Days on
the Market
Average
Sale Price
2009 47 53 503,764$
2010 20.654% 40 30 607,811$
2011 -2.676% 34 50 591,544$
2012 7.944% 21 73 638,536$
2013 14.003% 39 37 727,949$
2014 22.920% 32 34 894,796$
Source: MLSPIN, as of 01/13/2015; Boston - South Boston
South Boston StatisticsMultifamily Homes
Average Sale Price - Number of Units in Building - 2014
Historical Average Sale Price - Past 6 Years
$503,764
$607,811 $591,544 $638,536
$727,949
$894,796
2009 2010 2011 2012 2013 2014

33
Market stat ist ics
[email protected] | 617-299-1854
Multifamily Homes, Boston - South Boston, 1/1/2014 - 12/31/2014
# of Avg. Days Average Average SP:LP Average SP:OP
Listings
on
Market Sale Price List Price Ratio Orig Price Ratio
$500,000 - $599,999 4 54 $573,500 $604,250 95 $604,250 95
$600,000 - $699,999 6 55 $632,333 $658,333 96 $694,167 92
$700,000 - $799,999 7 18 $724,140 $752,971 96 $752,971 96
$800,000 - $899,999 0 0 $0 $0 0 $0 0
$900,000 - $999,999 5 45 $959,500 $970,780 99 $970,780 99
$1,000,000 - $1,499,999 9 20 $1,208,778 $1,249,444 98 $1,256,111 98
$1,500,000 - $1,999,999 1 1 $1,800,000 $1,800,000 100 $1,800,000 100
Total Properties 32 34 $894,796 $923,022 97 $931,616 96
Source: MLSPIN, as of 01/13/2015
Total Sold - South Boston
Price Range

34
Range
Number of
Listing Sold
Days on
the Market
Average
Sale Price
2 Bed $185,000 - $489,000 11 59 296,657$
3 Bed $150,000 - $610,000 51 69 351,229$
4 Bed $150,000 - $709,000 35 51 396,594$
5 Bed $195,000 - $820,000 29 69 455,791$
6 Bed $185,000 - $850,000 21 68 428,190$
7 Bed $365,000 - $365,000 1 167 365,000$
Year % Change
Number of
Listing Sold
Days on
the Market
Average
Sale Price
2005 163 79 384,550$
2006 -6.891% 153 115 358,050$
2007 -5.369% 140 105 338,825$
2008 -13.015% 164 135 294,726$
2009 -8.604% 143 125 269,367$
2010 -2.760% 125 87 261,933$
2011 7.910% 101 92 282,653$
2012 3.702% 125 97 293,116$
2013 15.920% 123 67 339,779$
2014 14.605% 148 65 389,403$
Source: MLSPIN, as of 01/15/2015; Zip Codes 02121, 02122, 02124, 02125
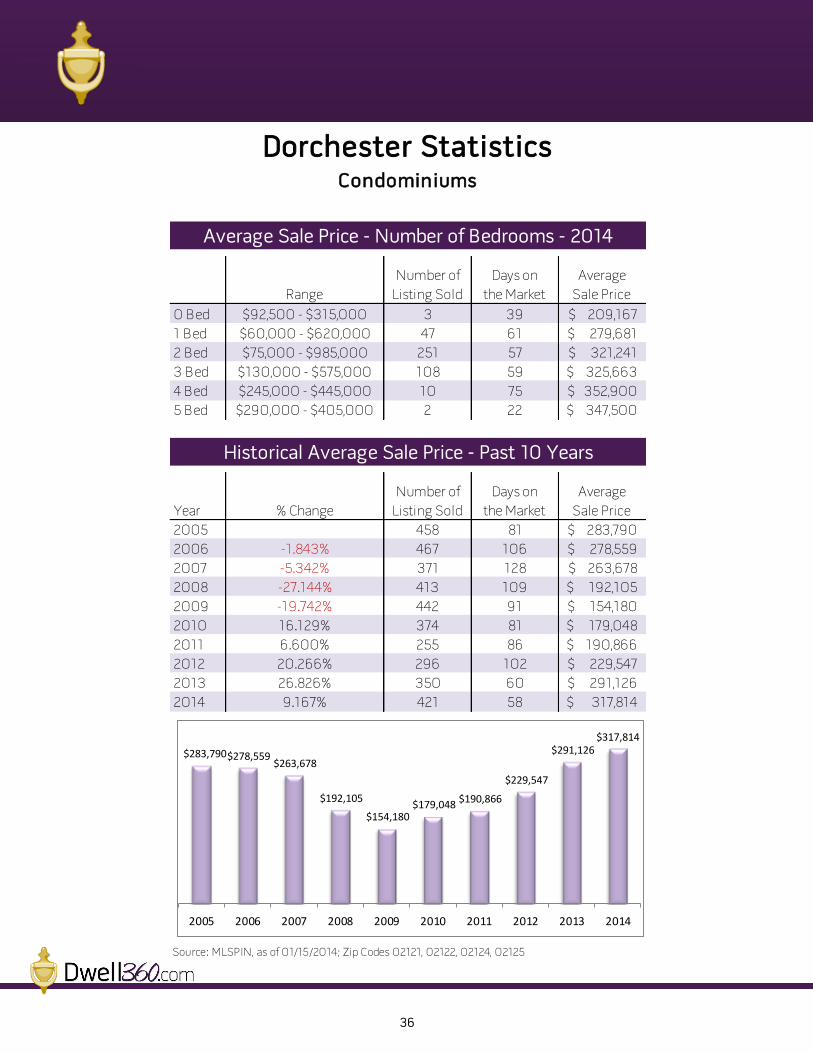
Dorchester Statistics
Average Sale Price - Number of Bedrooms - 2014
Historical Average Sale Price - Past 10 Years
Single Family Homes
$384,550 $358,050
$338,825
$294,726 $269,367 $261,933
$282,653 $293,116
$339,779
$389,403
2005 2006 2007 2008 2009 2010 2011 2012 2013 2014

35
Market stat ist ics
[email protected] | 617-299-1854
Total Sold - DorchesterSingle Family Homes, Zip Codes 02121, 02122, 02124, 02125 1/1/2014 - 12/31/2014
# of Avg. Days Average Average SP:LP Average SP:OP
Listings
on
Market Sale Price List Price Ratio Orig Price Ratio
$150,000 - $199,999 7 103 $174,228 $173,014 106 $197,657 98
$200,000 - $249,999 15 84 $228,435 $232,240 99 $239,433 97
$250,000 - $299,999 18 55 $277,138 $292,567 95 $301,017 94
$300,000 - $349,999 16 48 $321,344 $327,241 98 $329,785 98
$350,000 - $399,999 29 73 $371,308 $377,559 98 $381,262 98
$400,000 - $449,999 21 37 $418,804 $427,238 98 $424,814 99
$450,000 - $499,999 18 116 $474,875 $496,361 96 $506,033 95
$500,000 - $599,999 11 46 $547,341 $546,173 100 $546,173 100
$600,000 - $699,999 10 31 $634,520 $652,300 98 $670,200 95
$700,000 - $799,999 1 20 $709,000 $690,000 103 $690,000 103
$800,000 - $899,999 2 13 $835,000 $860,000 97 $860,000 97
Total Properties 148 65 $389,403 $398,604 98 $404,569 97
Source: MLSPIN, as of 01/15/2015
Price Range
36
Range
Number of
Listing Sold
Days on
the Market
Average
Sale Price
0 Bed $92,500 - $315,000 3 39 209,167$
1 Bed $60,000 - $620,000 47 61 279,681$
2 Bed $75,000 - $985,000 251 57 321,241$
3 Bed $130,000 - $575,000 108 59 325,663$
4 Bed $245,000 - $445,000 10 75 352,900$
5 Bed $290,000 - $405,000 2 22 347,500$
Year % Change
Number of
Listing Sold
Days on
the Market
Average
Sale Price
2005 458 81 283,790$
2006 -1.843% 467 106 278,559$
2007 -5.342% 371 128 263,678$
2008 -27.144% 413 109 192,105$
2009 -19.742% 442 91 154,180$
2010 16.129% 374 81 179,048$
2011 6.600% 255 86 190,866$
2012 20.266% 296 102 229,547$
2013 26.826% 350 60 291,126$
2014 9.167% 421 58 317,814$
Source: MLSPIN, as of 01/15/2014; Zip Codes 02121, 02122, 02124, 02125
Dorchester StatisticsCondominiums
Average Sale Price - Number of Bedrooms - 2014
Historical Average Sale Price - Past 10 Years
$283,790 $278,559 $263,678
$192,105
$154,180 $179,048 $190,866
$229,547
$291,126 $317,814
2005 2006 2007 2008 2009 2010 2011 2012 2013 2014

37
Market stat ist ics
[email protected] | 617-299-1854
Total Sold - DorchesterCondominums, Zip Codes 02121, 02122, 02124, 02125 1/1/2014 - 12/31/2014
# of
Avg.
Days Average Average SP:LP Average SP:OP
Listings
on
Market Sale Price List Price Ratio Orig Price Ratio
$50,000 - $99,999 4 42 $78,875 $90,700 86 $99,725 81
$100,000 - $149,999 26 77 $130,477 $134,431 98 $134,851 99
$150,000 - $199,999 36 86 $176,032 $183,164 96 $188,925 94
$200,000 - $249,999 42 97 $227,633 $232,921 98 $243,888 95
$250,000 - $299,999 80 54 $275,720 $278,706 99 $284,688 97
$300,000 - $349,999 90 48 $324,903 $325,519 100 $329,204 99
$350,000 - $399,999 56 59 $371,407 $371,687 100 $374,275 99
$400,000 - $449,999 40 39 $423,745 $424,345 100 $426,495 100
$450,000 - $499,999 25 39 $472,988 $477,180 99 $478,416 99
$500,000 - $599,999 14 27 $536,307 $533,186 101 $532,821 101
$600,000 - $699,999 5 3 $645,680 $645,980 100 $645,980 100
$700,000 - $799,999 1 2 $760,000 $760,000 100 $760,000 100
$800,000 - $899,999 1 89 $840,000 $849,900 99 $849,900 99
$900,000 - $999,999 1 9 $985,000 $1,000,000 99 $1,000,000 99
Total Properties 421 58 $317,814 $320,309 99 $324,541 98
Source: MLSPIN, as of 01/15/2015
Price Range

38
Range
Number of
Listing Sold
Days on
the Market
Average
Sale Price
0-2 Units $180,000 - $704,000 99 61 414,478$
3 Units $265,259 - $751,000 153 57 498,569$
4-6 Units $725,000 - $1,250,000 6 96 938,750$
7+ Units $875,000 - $2,675,000 3 96 1,515,000$
Year % Change
Number of
Listing Sold
Days on
the Market
Average
Sale Price
2005 538 65 520,106$
2006 -4.990% 381 85 494,155$
2007 -14.441% 269 114 422,794$
2008 -33.864% 367 132 279,620$
2009 -10.255% 355 111 250,944$
2010 16.995% 305 68 293,593$
2011 9.013% 243 64 320,056$
2012 8.718% 279 71 347,959$
2013 21.634% 295 57 423,236$
2014 15.414% 261 60 488,474$
Source: MLSPIN, as of 01/30/2015; Zip Codes 02121, 02122, 02124, 02125
Dorchester StatisticsMultifamily Homes
Average Sale Price - Number of Units in Building - 2014
Historical Average Sale Price - Past 10 Years
$520,106 $494,155
$422,794
$279,620 $250,944
$293,593 $320,056
$347,959
$423,236
$488,474
2005 2006 2007 2008 2009 2010 2011 2012 2013 2014

39
Market stat ist ics
[email protected] | 617-299-1854
Total Sold - DorchesterMultifamily Homes, Zip Codes 02121, 02122, 02124, 02125 1/1/2014 - 12/31/2014
# of
Avg.
Days Average Average SP:LP Average SP:OP
Listings
on
Market Sale Price List Price Ratio Orig Price Ratio
$150,000 - $199,999 1 42 $180,000 $195,000 92 $195,000 92
$200,000 - $249,999 6 51 $219,983 $231,283 97 $224,100 102
$250,000 - $299,999 15 64 $273,719 $277,100 102 $292,367 98
$300,000 - $349,999 15 70 $329,532 $310,687 108 $316,053 107
$350,000 - $399,999 32 76 $376,481 $391,175 96 $405,091 94
$400,000 - $449,999 31 57 $420,974 $432,795 98 $439,082 96
$450,000 - $499,999 56 84 $474,126 $477,710 99 $496,107 99
$500,000 - $599,999 63 39 $534,790 $536,141 100 $538,159 100
$600,000 - $699,999 27 38 $632,897 $613,880 104 $617,954 103
$700,000 - $799,999 9 43 $734,111 $699,933 106 $705,044 105
$800,000 - $899,999 1 176 $875,000 $1,009,999 87 $1,009,999 87
$900,000 - $999,999 2 71 $953,750 $972,450 98 $972,450 98
$1,000,000 - $1,499,999 2 72 $1,225,000 $1,300,000 94 $1,300,000 94
$1,500,000 - $1,999,999 0 0 $0 $0 0 $0 0
$2,000,000 - $2,499,999 0 0 $0 $0 0 $0 0
$2,500,000 - $2,999,999 1 106 $2,675,000 $2,999,000 89 $3,200,000 84
Total Properties 261 60 $488,474 $491,534 100 $500,810 99
Source: MLSPIN, as of 01/30/2015
Price Range

40
Range
Number of
Listing Sold
Days on
the Market
Average
Sale Price
3-4 Bed $425,000 - $600,000 6 32 521,833$
5+ Bed $480,000 - $700,000 7 46 557,857$
Year % Change
Number of
Listing Sold
Days on
the Market
Average
Sale Price
2005 18 55 484,609$
2006 -5.845% 7 44 456,286$
2007 11.986% 4 80 510,975$
2008 -28.103% 8 103 367,375$
2009 18.997% 3 88 437,167$
2010 2.635% 8 78 448,688$
2011 -5.037% 14 97 426,087$
2012 9.852% 9 71 468,067$
2013 12.191% 8 33 525,130$
2014 3.066% 13 40 541,231$
Source: MLSPIN, as of 01/15/2015; Zip Code 02134
Allston Statistics
Average Sale Price - Number of Bedrooms - 2014
Historical Average Sale Price - Past 10 Years
Single Family Homes
$484,609 $456,286
$510,975
$367,375
$437,167 $448,688 $426,087
$468,067
$525,130 $541,231
2005 2006 2007 2008 2009 2010 2011 2012 2013 2014

41
Market stat ist ics
[email protected] | 617-299-1854
Total Sold - AllstonSingle Family Homes, Zip Code 02134, 1/1/2014 - 12/31/2014
# of Avg. Days Average Average SP:LP Average SP:OP
Listings
on
Market Sale Price List Price Ratio Orig Price Ratio
$400,000 - $449,999 1 52 $425,000 $439,000 97 $439,000 97
$450,000 - $499,999 2 32 $467,000 $457,500 102 $457,500 102
$500,000 - $599,999 8 33 $547,125 $555,563 99 $569,313 97
$600,000 - $699,999 1 36 $600,000 $575,000 104 $575,000 104
$700,000 - $799,999 1 99 $700,000 $775,000 90 $800,000 88
Total Properties 13 40 $541,231 $549,885 99 $560,269 98
Source: MLSPIN, as of 01/15/2015
Price Range

42
Range
Number of
Listing Sold
Days on
the Market
Average
Sale Price
0 Bed $125,000 - $185,000 3 109 158,333$
1 Bed $163,000 - $450,000 29 46 293,186$
2 Bed $244,320 - $540,000 38 42 375,730$
3+ Bed $309,000 - $493,850 9 45 373,539$
Year % Change
Number of
Listing Sold
Days on
the Market
Average
Sale Price
2005 148 46 298,585$
2006 0.067% 112 123 298,784$
2007 -3.663% 109 83 287,840$
2008 8.145% 80 79 311,285$
2009 -2.130% 83 98 304,655$
2010 -16.176% 76 89 255,375$
2011 13.409% 74 71 289,618$
2012 -8.827% 80 58 264,053$
2013 19.209% 85 27 314,776$
2014 7.036% 79 47 336,924$
Source: MLSPIN, as of 01/15/2015; Zip Code 02134
Allston StatisticsCondominiums
Average Sale Price - Number of Bedrooms - 2014
Historical Average Sale Price - Past 10 Years
$298,585 $298,784 $287,840 $311,285 $304,655
$255,375
$289,618 $264,053
$314,776 $336,924
2005 2006 2007 2008 2009 2010 2011 2012 2013 2014
43
Market stat ist ics
[email protected] | 617-299-1854
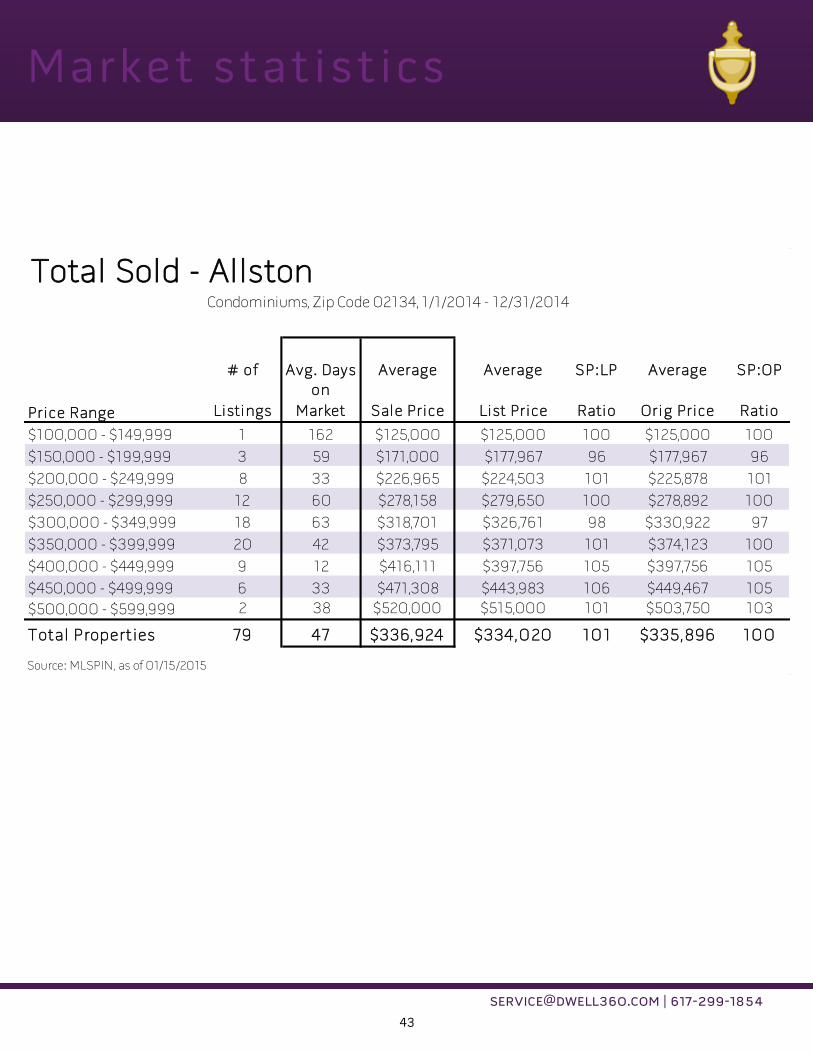
Total Sold - AllstonCondominiums, Zip Code 02134, 1/1/2014 - 12/31/2014
# of Avg. Days Average Average SP:LP Average SP:OP
Listings
on
Market Sale Price List Price Ratio Orig Price Ratio
$100,000 - $149,999 1 162 $125,000 $125,000 100 $125,000 100
$150,000 - $199,999 3 59 $171,000 $177,967 96 $177,967 96
$200,000 - $249,999 8 33 $226,965 $224,503 101 $225,878 101
$250,000 - $299,999 12 60 $278,158 $279,650 100 $278,892 100
$300,000 - $349,999 18 63 $318,701 $326,761 98 $330,922 97
$350,000 - $399,999 20 42 $373,795 $371,073 101 $374,123 100
$400,000 - $449,999 9 12 $416,111 $397,756 105 $397,756 105
$450,000 - $499,999 6 33 $471,308 $443,983 106 $449,467 105
$500,000 - $599,999 2 38 $520,000 $515,000 101 $503,750 103
Total Properties 79 47 $336,924 $334,020 101 $335,896 100
Source: MLSPIN, as of 01/15/2015
Price Range

44
Range
Number of
Listing Sold
Days on
the Market
Average
Sale Price
2 Units $490,000 - $1,650,000 9 24 821,333$
3 Units $600,000 - $1,005,000 4 24 875,000$
Year % Change
Number of
Listing Sold
Days on
the Market
Average
Sale Price
2005 32 45 767,875$
2006 -18.210% 27 84 628,046$
2007 3.181% 19 82 648,026$
2008 8.671% 11 70 704,218$
2009 -1.742% 20 69 691,950$
2010 -26.509% 17 158 508,524$
2011 35.709% 18 53 690,111$
2012* 1.748% 20 48 702,175$
2013 5.145% 20 19 738,300$
2014 13.483% 13 24 837,846$
Source: MLSPIN, as of 01/29/2014; Zip Code 02134
*2012 data includes only multifamily properties that sold for $3,000,000 or less.
Allston StatisticsMultifamily Homes
Average Sale Price - Number of Units in Building - 2014
Historical Average Sale Price - Past 10 Years
$767,875
$628,046 $648,026 $704,218 $691,950
$508,524
$690,111 $702,175 $738,300
$837,846
2005 2006 2007 2008 2009 2010 2011 2012* 2013 2014

45
Market stat ist ics
[email protected] | 617-299-1854
Total Sold - AllstonMultifamily Homes, Zip Code 02134, 1/1/2014 - 12/31/2014
# of Avg. Days Average Average SP:LP Average SP:OP
Listings
on
Market Sale Price List Price Ratio Orig Price Ratio
$450,000 - $499,999 1 20 $490,000 $499,000 98 $499,000 98
$500,000 - $599,999 1 5 $562,000 $499,500 113 $499,500 113
$600,000 - $699,999 3 52 $629,333 $619,767 102 $619,767 102
$700,000 - $799,999 2 7 $736,000 $649,950 114 $649,950 114
$800,000 - $899,999 1 24 $830,000 $899,900 92 $899,900 92
$900,000 - $999,999 2 34 $947,500 $957,400 99 $957,400 99
$1,000,000 - $1,499,999 2 4 $1,052,500 $1,100,000 96 $1,100,000 96
$1,500,000 - $1,999,999 1 16 $1,650,000 $1,790,000 92 $1,790,000 92
Total Properties 13 24 $837,846 $843,262 101 $843,262 101
Source: MLSPIN, as of 01/29/2015
Price Range

46
Range
Number of
Listing Sold
Days on
the Market
Average
Sale Price
2-3 Bed $360,000 - $719,000 21 63 502,148$
4 Bed $517,000 - $850,000 8 51 608,363$
5 Bed $505,500 - $740,000 3 97 593,500$
Year % Change
Number of
Listing Sold
Days on
the Market
Average
Sale Price
2005 54 79 508,689$
2006 -10.146% 36 74 457,075$
2007 4.169% 43 99 476,130$
2008 0.259% 22 91 477,364$
2009 -12.940% 30 54 415,594$
2010 1.133% 28 97 420,304$
2011 -4.926% 23 87 399,600$
2012 16.309% 33 44 464,770$
2013 9.665% 37 35 509,691$
2014 5.410% 32 63 537,266$
Source: MLSPIN, as of 01/15/2015; Zip Code 02135
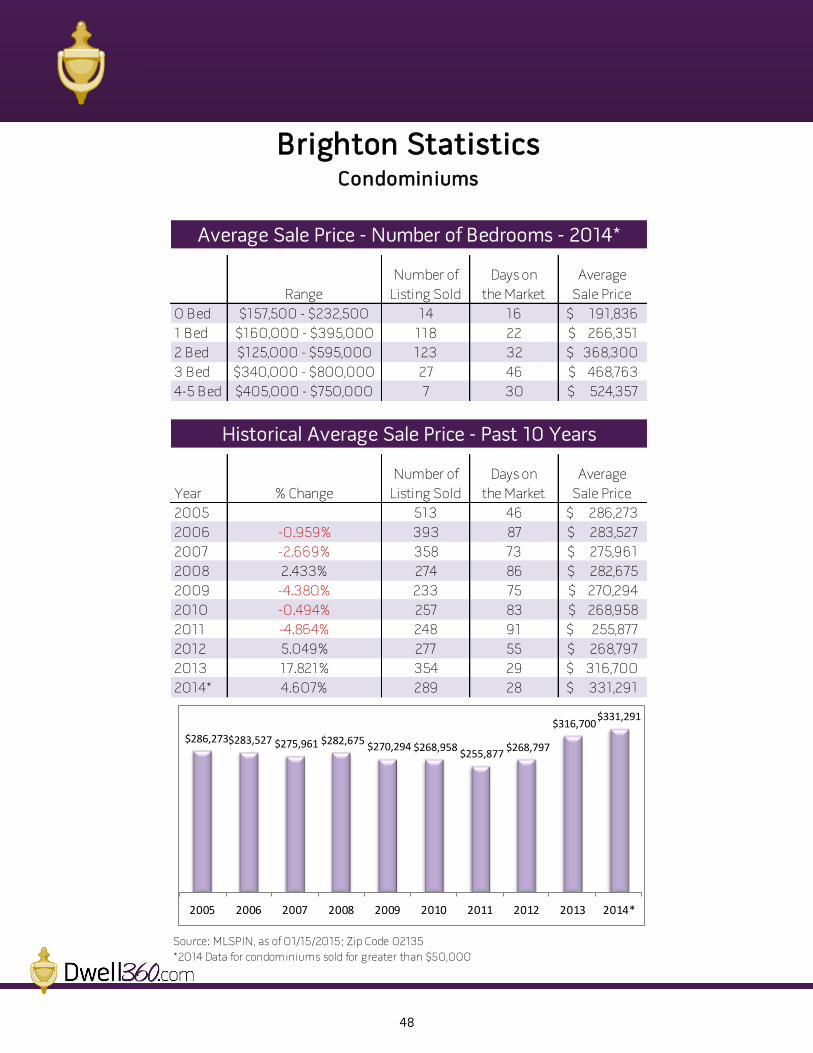
Brighton Statistics
Average Sale Price - Number of Bedrooms - 2014
Historical Average Sale Price - Past 10 Years
Single Family Homes
$508,689
$457,075 $476,130 $477,364
$415,594 $420,304 $399,600
$464,770 $509,691
$537,266
2005 2006 2007 2008 2009 2010 2011 2012 2013 2014

47
Market stat ist ics
[email protected] | 617-299-1854
Total Sold - BrightonSingle Family Homes, Zip Code 02135, 1/1/2014 - 12/31/2014
# of Avg. Days Average Average SP:LP Average SP:OP
Listings
on
Market Sale Price List Price Ratio Orig Price Ratio
$350,000 - $399,999 1 219 $360,000 $385,000 94 $385,000 94
$400,000 - $449,999 5 64 $429,500 $431,800 100 $454,800 96
$450,000 - $499,999 5 75 $472,420 $481,580 98 $505,560 94
$500,000 - $599,999 15 66 $542,093 $549,699 99 $561,306 98
$600,000 - $699,999 3 27 $627,500 $607,667 104 $646,333 98
$700,000 - $799,999 2 15 $729,500 $709,450 103 $709,450 103
$800,000 - $899,999 1 7 $850,000 $699,000 122 $699,000 122
Total Properties 32 63 $537,266 $535,572 100 $551,978 98
Source: MLSPIN, as of 01/15/2015
Price Range
48
Range
Number of
Listing Sold
Days on
the Market
Average
Sale Price
0 Bed $157,500 - $232,500 14 16 191,836$
1 Bed $160,000 - $395,000 118 22 266,351$
2 Bed $125,000 - $595,000 123 32 368,300$
3 Bed $340,000 - $800,000 27 46 468,763$
4-5 Bed $405,000 - $750,000 7 30 524,357$
Year % Change
Number of
Listing Sold
Days on
the Market
Average
Sale Price
2005 513 46 286,273$
2006 -0.959% 393 87 283,527$
2007 -2.669% 358 73 275,961$
2008 2.433% 274 86 282,675$
2009 -4.380% 233 75 270,294$
2010 -0.494% 257 83 268,958$
2011 -4.864% 248 91 255,877$
2012 5.049% 277 55 268,797$
2013 17.821% 354 29 316,700$
2014* 4.607% 289 28 331,291$
Source: MLSPIN, as of 01/15/2015; Zip Code 02135
*2014 Data for condominiums sold for greater than $50,000
Brighton StatisticsCondominiums
Average Sale Price - Number of Bedrooms - 2014*
Historical Average Sale Price - Past 10 Years
$286,273 $283,527 $275,961 $282,675 $270,294 $268,958
$255,877 $268,797
$316,700 $331,291
2005 2006 2007 2008 2009 2010 2011 2012 2013 2014*
49
Market stat ist ics
[email protected] | 617-299-1854
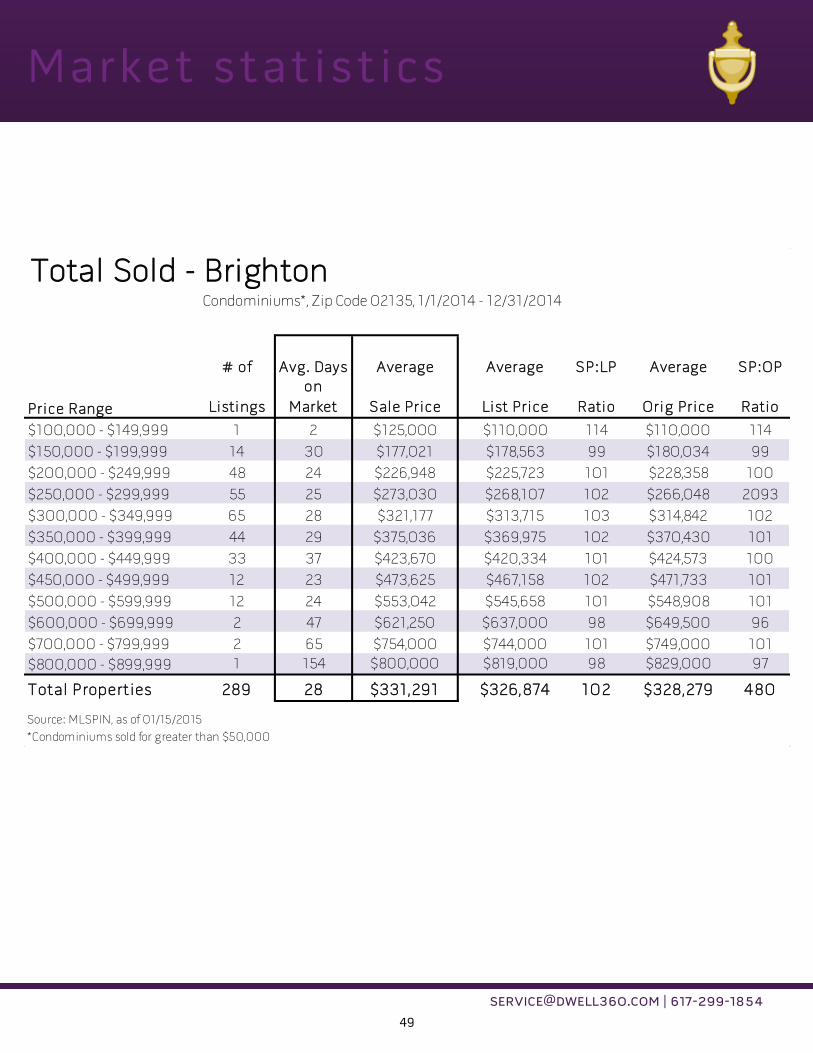
Total Sold - BrightonCondominiums*, Zip Code 02135, 1/1/2014 - 12/31/2014
# of Avg. Days Average Average SP:LP Average SP:OP
Listings
on
Market Sale Price List Price Ratio Orig Price Ratio
$100,000 - $149,999 1 2 $125,000 $110,000 114 $110,000 114
$150,000 - $199,999 14 30 $177,021 $178,563 99 $180,034 99
$200,000 - $249,999 48 24 $226,948 $225,723 101 $228,358 100
$250,000 - $299,999 55 25 $273,030 $268,107 102 $266,048 2093
$300,000 - $349,999 65 28 $321,177 $313,715 103 $314,842 102
$350,000 - $399,999 44 29 $375,036 $369,975 102 $370,430 101
$400,000 - $449,999 33 37 $423,670 $420,334 101 $424,573 100
$450,000 - $499,999 12 23 $473,625 $467,158 102 $471,733 101
$500,000 - $599,999 12 24 $553,042 $545,658 101 $548,908 101
$600,000 - $699,999 2 47 $621,250 $637,000 98 $649,500 96
$700,000 - $799,999 2 65 $754,000 $744,000 101 $749,000 101
$800,000 - $899,999 1 154 $800,000 $819,000 98 $829,000 97
Total Properties 289 28 $331,291 $326,874 102 $328,279 480
Source: MLSPIN, as of 01/15/2015
Price Range
*Condominiums sold for greater than $50,000

50
Range
Number of
Listing Sold
Days on
the Market
Average
Sale Price
2 Units $550,000 - $1,700,000 31 43 774,508$
3 Units $699,000 - $1,050,000 3 24 908,000$
4-5 Units $1,300,000 - $1,300,000 1 5 1,300,000$
6+ Units $1,480,000 - $1,545,000 2 57 1,512,500$
Year % Change
Number of
Listing Sold
Days on
the Market
Average
Sale Price
2005 72 51 705,921$
2006 -8.698% 70 83 644,519$
2007 2.339% 40 88 659,594$
2008 -3.364% 38 98 637,405$
2009 -9.272% 28 73 578,307$
2010 3.362% 40 60 597,748$
2011 13.534% 29 89 678,649$
2012 4.676% 52 42 710,383$
2013 11.543% 42 31 792,384$
2014 5.937% 37 41 839,426$
Source: MLSPIN, as of 01/29/2015; Zip Code 02135
Brighton StatisticsMultifamily Homes
Average Sale Price - Number of Units in Building - 2014
Historical Average Sale Price - Past 10 Years
$705,921 $644,519 $659,594 $637,405
$578,307 $597,748
$678,649 $710,383
$792,384 $839,426
2005 2006 2007 2008 2009 2010 2011 2012 2013 2014
51
Market stat ist ics
[email protected] | 617-299-1854
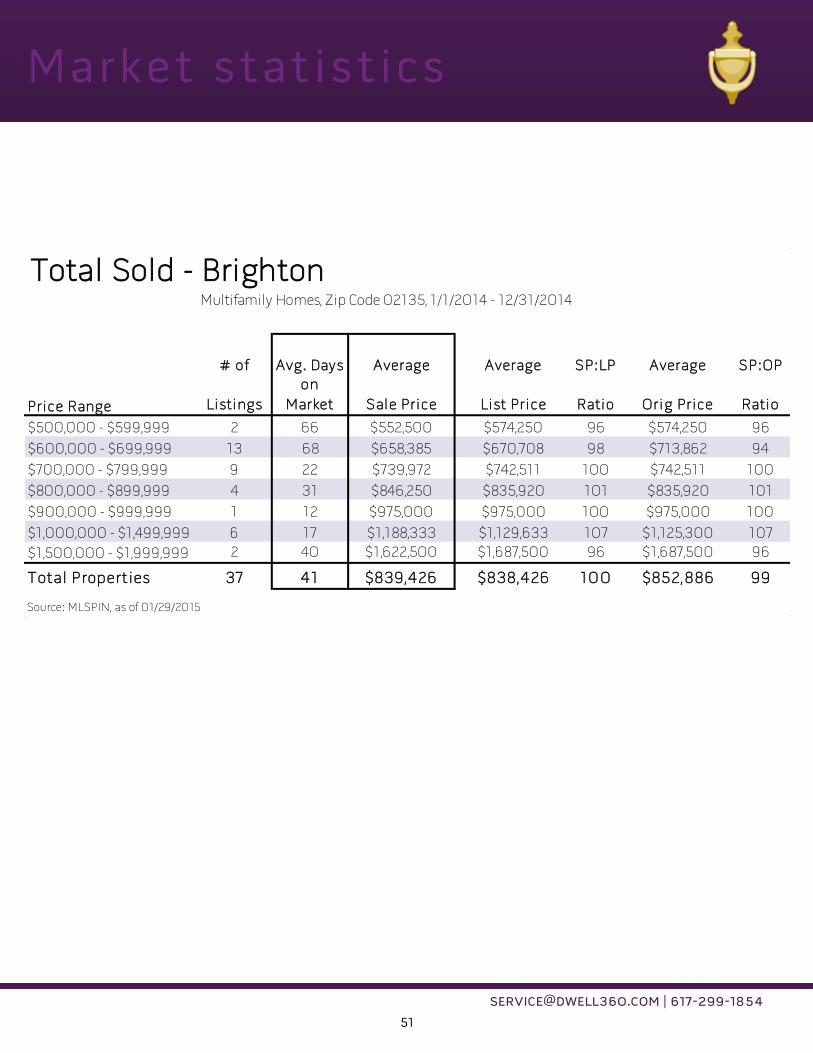
Total Sold - BrightonMultifamily Homes, Zip Code 02135, 1/1/2014 - 12/31/2014
# of Avg. Days Average Average SP:LP Average SP:OP
Listings
on
Market Sale Price List Price Ratio Orig Price Ratio
$500,000 - $599,999 2 66 $552,500 $574,250 96 $574,250 96
$600,000 - $699,999 13 68 $658,385 $670,708 98 $713,862 94
$700,000 - $799,999 9 22 $739,972 $742,511 100 $742,511 100
$800,000 - $899,999 4 31 $846,250 $835,920 101 $835,920 101
$900,000 - $999,999 1 12 $975,000 $975,000 100 $975,000 100
$1,000,000 - $1,499,999 6 17 $1,188,333 $1,129,633 107 $1,125,300 107
$1,500,000 - $1,999,999 2 40 $1,622,500 $1,687,500 96 $1,687,500 96
Total Properties 37 41 $839,426 $838,426 100 $852,886 99
Source: MLSPIN, as of 01/29/2015
Price Range

52
Range
Number of
Listing Sold
Days on
the Market
Average
Sale Price
2 Bed $420,000 - $619,000 4 12 474,250$
3 Bed $381,000 - $1,325,000 25 28 720,260$
4 Bed $435,000 - $1,407,000 21 33 859,721$
5 Bed $829,000 - $2,375,000 5 44 1,443,800$
6+ Bed $743,000 - $1,426,000 5 69 962,950$
Year % Change
Number of
Listing Sold
Days on
the Market
Average
Sale Price
2005 80 61 586,098$
2006 -0.450% 84 97 583,463$
2007 -4.277% 76 88 558,507$
2008 5.100% 60 78 586,992$
2009 -4.130% 73 74 562,748$
2010 6.190% 61 72 597,584$
2011 6.143% 49 91 634,296$
2012 -5.972% 70 49 596,419$
2013 19.999% 74 49 715,695$
2014 16.417% 60 34 833,190$
Source: MLSPIN, as of 01/15/2015; Zip Code 02130
Jamaica Plain Statistics
Average Sale Price - Number of Bedrooms - 2014
Historical Average Sale Price - Past 10 Years
Single Family Homes
$586,098 $583,463 $558,507 $586,992 $562,748 $597,584
$634,296 $596,419
$715,695
$833,190
2005 2006 2007 2008 2009 2010 2011 2012 2013 2014

53
Market stat ist ics
[email protected] | 617-299-1854
Total Sold - Jamaica PlainSingle Family Homes, Zip Code 02130, 1/1/2014 - 12/31/2014
# of Avg. Days Average Average SP:LP Average SP:OP
Listings
on
Market Sale Price List Price Ratio Orig Price Ratio
$350,000 - $399,999 1 6 $381,000 $224,900 169 $224,900 169
$400,000 - $449,999 4 15 $428,250 $424,675 101 $432,175 99
$450,000 - $499,999 1 14 $481,000 $429,000 112 $429,000 112
$500,000 - $599,999 6 41 $564,833 $561,317 101 $567,983 100
$600,000 - $699,999 15 25 $643,501 $637,047 102 $639,313 101
$700,000 - $799,999 8 63 $755,000 $754,488 101 $769,488 99
$800,000 - $899,999 6 11 $839,583 $801,917 105 $801,917 105
$900,000 - $999,999 6 49 $949,292 $906,983 105 $910,317 104
$1,000,000 - $1,499,999 11 37 $1,238,786 $1,205,809 103 $1,213,082 103
$1,500,000 - $1,999,999 1 6 $1,600,000 $1,599,000 100 $1,599,000 100
$2,000,000 - $2,499,999 1 22 $2,375,000 $2,475,000 96 $2,475,000 96
Total Properties 60 34 $833,190 $815,057 103 $820,457 103
Source: MLSPIN, as of 01/15/2015
Price Range
54
Range
Number of
Listing Sold
Days on
the Market
Average
Sale Price
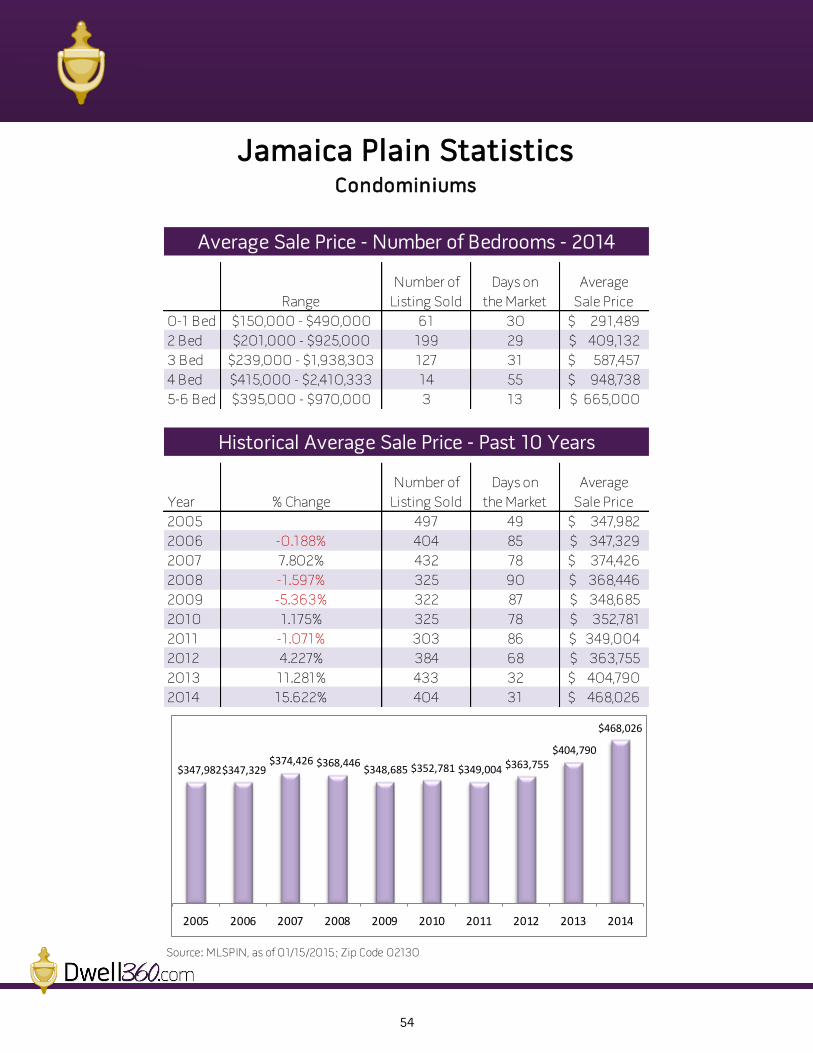
0-1 Bed $150,000 - $490,000 61 30 291,489$
2 Bed $201,000 - $925,000 199 29 409,132$
3 Bed $239,000 - $1,938,303 127 31 587,457$
4 Bed $415,000 - $2,410,333 14 55 948,738$
5-6 Bed $395,000 - $970,000 3 13 665,000$
Year % Change
Number of
Listing Sold
Days on
the Market
Average
Sale Price
2005 497 49 347,982$
2006 -0.188% 404 85 347,329$
2007 7.802% 432 78 374,426$
2008 -1.597% 325 90 368,446$
2009 -5.363% 322 87 348,685$
2010 1.175% 325 78 352,781$
2011 -1.071% 303 86 349,004$
2012 4.227% 384 68 363,755$
2013 11.281% 433 32 404,790$
2014 15.622% 404 31 468,026$
Source: MLSPIN, as of 01/15/2015; Zip Code 02130
Jamaica Plain StatisticsCondominiums
Average Sale Price - Number of Bedrooms - 2014
Historical Average Sale Price - Past 10 Years
$347,982 $347,329 $374,426 $368,446
$348,685 $352,781 $349,004 $363,755 $404,790
$468,026
2005 2006 2007 2008 2009 2010 2011 2012 2013 2014

55
Market stat ist ics
[email protected] | 617-299-1854
Total Sold - Jamaica PlainCondominiums, Zip Code 02130, 1/1/2014 - 12/31/2014
# of Avg. Days Average Average SP:LP Average SP:OP
Listings
on
Market Sale Price List Price Ratio Orig Price Ratio
$150,000 - $199,999 4 38 $171,500 $170,250 101 $170,250 101
$200,000 - $249,999 26 33 $229,306 $231,336 99 $236,371 98
$250,000 - $299,999 42 40 $280,427 $281,455 100 $285,860 98
$300,000 - $349,999 54 42 $324,994 $320,491 102 $325,146 101
$350,000 - $399,999 65 24 $371,578 $359,440 104 $361,532 103
$400,000 - $449,999 38 27 $421,491 $406,534 104 $407,903 104
$450,000 - $499,999 40 25 $473,616 $464,080 102 $466,408 102
$500,000 - $599,999 58 30 $540,085 $523,688 104 $527,897 103
$600,000 - $699,999 26 19 $633,463 $608,715 105 $613,331 104
$700,000 - $799,999 26 27 $742,727 $720,596 104 $722,904 103
$800,000 - $899,999 11 21 $847,727 $834,273 102 $834,273 102
$900,000 - $999,999 7 29 $939,571 $936,429 100 $936,429 100
$1,000,000 - $1,499,999 4 19 $1,121,650 $1,043,250 108 $1,043,250 108
$1,500,000 - $1,999,999 1 49 $1,938,303 $1,895,000 102 $1,895,000 102
$2,000,000 - $2,499,999 2 181 $2,280,167 $2,375,000 96 $2,375,000 96
Total Properties 404 31 $468,026 $457,140 102 $460,289 102
Source: MLSPIN, as of 01/15/2015
Price Range

56
Range
Number of
Listing Sold
Days on
the Market
Average
Sale Price
2 Units $460,000 - $1,005,000 20 34 723,875$
3 Units $685,000 - $1,157,500 22 25 830,136$
4 Units $815,000 - $1,075,000 3 25 910,333$
5 Units $1,367,000 - $1,367,000 1 6 1,367,000$
Year % Change
Number of
Listing Sold
Days on
the Market
Average
Sale Price
2005 63 51 609,254$
2006 13.027% 48 78 688,620$
2007 -13.726% 53 81 594,103$
2008 -11.500% 42 81 525,779$
2009 -10.308% 27 113 471,584$
2010 15.842% 31 49 546,290$
2011 12.780% 32 44 616,106$
2012 5.852% 53 54 652,163$
2013 28.044% 49 23 835,053$
2014 -4.097% 46 28 800,837$
Source: MLSPIN, as of 01/13/2015; Zip Code 02132
Jamaica Plain StatisticsMultifamily Homes
Average Sale Price - Number of Units in Building - 2014
Historical Average Sale Price - Past 10 Years
$609,254
$688,620
$594,103 $525,779
$471,584 $546,290
$616,106 $652,163
$835,053 $800,837
2005 2006 2007 2008 2009 2010 2011 2012 2013 2014
57
Market stat ist ics
[email protected] | 617-299-1854
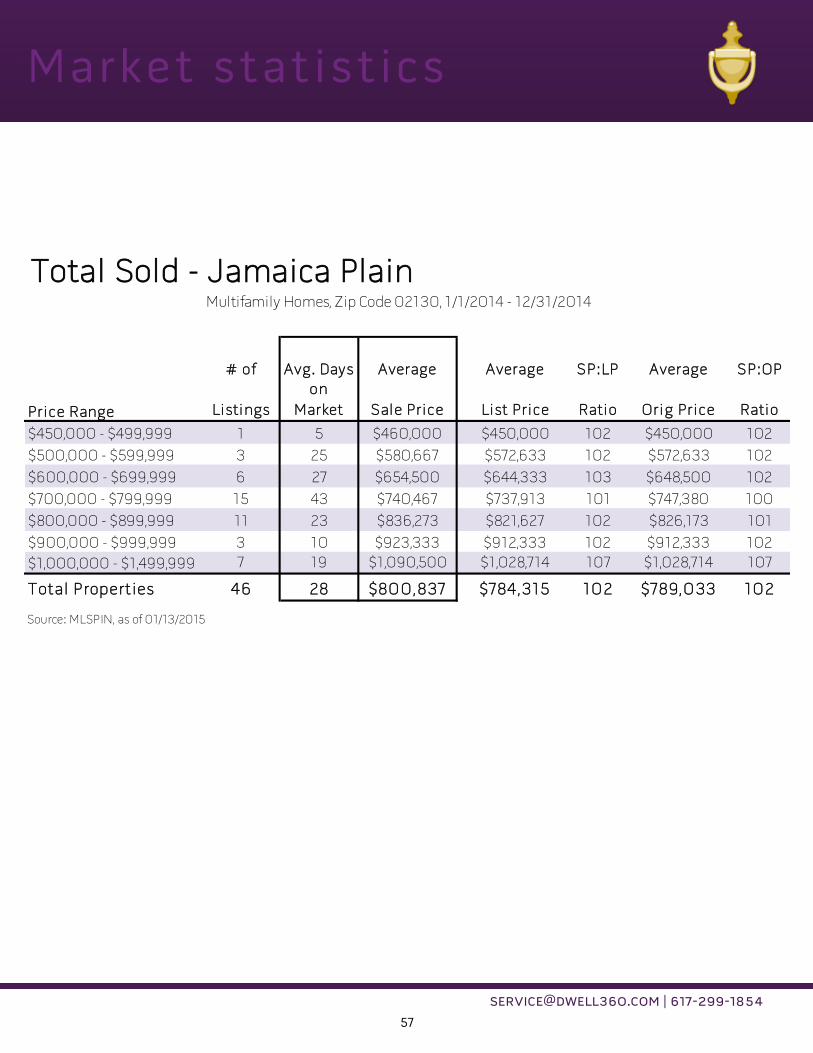
Multifamily Homes, Zip Code 02130, 1/1/2014 - 12/31/2014
# of Avg. Days Average Average SP:LP Average SP:OP
Listings
on
Market Sale Price List Price Ratio Orig Price Ratio
$450,000 - $499,999 1 5 $460,000 $450,000 102 $450,000 102
$500,000 - $599,999 3 25 $580,667 $572,633 102 $572,633 102
$600,000 - $699,999 6 27 $654,500 $644,333 103 $648,500 102
$700,000 - $799,999 15 43 $740,467 $737,913 101 $747,380 100
$800,000 - $899,999 11 23 $836,273 $821,627 102 $826,173 101
$900,000 - $999,999 3 10 $923,333 $912,333 102 $912,333 102
$1,000,000 - $1,499,999 7 19 $1,090,500 $1,028,714 107 $1,028,714 107
Total Properties 46 28 $800,837 $784,315 102 $789,033 102
Source: MLSPIN, as of 01/13/2015
Total Sold - Jamaica Plain
Price Range

58
Range
Number of
Listing Sold
Days on
the Market
Average
Sale Price
0-2 Bed $140,000 - $450,000 19 40 292,684$
3 Bed $204,855 - $642,000 57 54 417,647$
4 Bed $310,000 - $790,000 40 42 486,385$
5 Bed $287,000 - $784,000 14 36 488,100$
6 Bed $350,000 - $375,000 2 69 362,500$
Year % Change
Number of
Listing Sold
Days on
the Market
Average
Sale Price
2005 153 53 395,621$
2006 -3.157% 126 86 383,131$
2007 1.088% 140 103 387,301$
2008 -5.086% 101 91 367,601$
2009 -8.377% 96 72 336,808$
2010 0.453% 105 83 338,335$
2011 -1.891% 87 99 331,938$
2012 23.341% 128 44 409,416$
2013 1.617% 117 45 416,036$
2014 2.666% 132 47 427,126$
Source: MLSPIN, as of 01/15/2015; Zip Code 02131
Roslindale Statistics
Average Sale Price - Number of Bedrooms - 2014
Historical Average Sale Price - Past 10 Years
Single Family Homes
$395,621 $383,131 $387,301 $367,601
$336,808 $338,335 $331,938
$409,416 $416,036 $427,126
2005 2006 2007 2008 2009 2010 2011 2012 2013 2014

59
Market stat ist ics
[email protected] | 617-299-1854
Total Sold - RoslindaleSingle Family Homes, Zip Code 02131, 1/1/2014 - 12/31/2014
# of Avg. Days Average Average SP:LP Average SP:OP
Listings
on
Market Sale Price List Price Ratio Orig Price Ratio
$100,000 - $149,999 1 14 $140,000 $149,900 93 $149,900 93
$150,000 - $199,999 1 25 $165,000 $175,000 94 $175,000 94
$200,000 - $249,999 5 29 $215,271 $205,780 107 $207,780 106
$250,000 - $299,999 9 139 $275,022 $286,311 96 $292,544 94
$300,000 - $349,999 20 51 $331,700 $336,221 99 $343,221 97
$350,000 - $399,999 22 55 $370,905 $372,923 100 $377,695 99
$400,000 - $449,999 24 32 $426,204 $425,058 100 $433,558 99
$450,000 - $499,999 16 34 $465,031 $459,906 101 $463,225 101
$500,000 - $599,999 20 42 $536,170 $529,204 102 $529,204 102
$600,000 - $699,999 10 20 $632,700 $605,880 105 $605,880 105
$700,000 - $799,999 4 47 $752,597 $744,675 101 $744,675 101
Total Properties 132 47 $427,126 $424,551 101 $428,856 100
Source: MLSPIN, as of 01/15/2015
Price Range

60
Range
Number of
Listing Sold
Days on
the Market
Average
Sale Price
1 Bed $85,000 - $277,400 13 49 219,531$
2 Bed $114,400 - $457,000 82 45 308,861$
3 Bed $199,900 - $550,000 54 55 358,570$
4+ Bed $355,000 - $499,000 8 57 422,031$
Year % Change
Number of
Listing Sold
Days on
the Market
Average
Sale Price
2005 172 66 308,641$
2006 -9.943% 137 99 277,953$
2007 8.718% 105 94 302,186$
2008 -11.803% 97 103 266,519$
2009 -7.021% 131 101 247,806$
2010 2.964% 105 91 255,151$
2011 0.256% 95 120 255,803$
2012 -3.564% 91 93 246,687$
2013 18.616% 152 57 292,611$
2014 10.839% 157 49 324,328$
Source: MLSPIN, as of 01/14/2015; Zip Code 02131
Roslindale StatisticsCondominiums
Average Sale Price - Number of Bedrooms - 2014
Historical Average Sale Price - Past 10 Years
$308,641
$277,953 $302,186
$266,519 $247,806 $255,151 $255,803 $246,687
$292,611
$324,328
2005 2006 2007 2008 2009 2010 2011 2012 2013 2014

61
Market stat ist ics
[email protected] | 617-299-1854
Total Sold - RoslindaleCondominiums, Zip Code 02131, 1/1/2014 - 12/31/2014
# of Avg. Days Average Average SP:LP Average SP:OP
Listings
on
Market Sale Price List Price Ratio Orig Price Ratio
$50,000 - $99,999 1 133 $85,000 $112,500 76 $115,000 74
$100,000 - $149,999 2 171 $126,700 $135,825 94 $163,950 77
$150,000 - $199,999 4 59 $184,925 $185,925 99 $193,425 96
$200,000 - $249,999 17 54 $229,194 $232,835 99 $235,776 97
$250,000 - $299,999 31 47 $279,358 $279,545 100 $283,122 99
$300,000 - $349,999 54 41 $326,052 $324,563 101 $329,028 99
$350,000 - $399,999 25 43 $367,180 $364,780 101 $365,980 101
$400,000 - $449,999 10 56 $426,975 $418,780 102 $425,870 101
$450,000 - $499,999 11 63 $468,545 $463,518 101 $464,973 101
$500,000 - $599,999 2 61 $537,500 $534,450 101 $549,450 99
Total Properties 157 49 $324,328 $323,269 100 $327,330 99
Source: MLSPIN, as of 01/15/2015
Price Range

62
Range
Number of
Listing Sold
Days on
the Market
Average
Sale Price
2 Units $290,000 - $700,000 42 53 480,132$
3 Units $455,000 - $720,000 14 85 579,396$
Year % Change
Number of
Listing Sold
Days on
the Market
Average
Sale Price
2005 78 53 529,287$
2006 -5.281% 59 64 501,334$
2007 -6.899% 48 100 466,746$
2008 -23.412% 47 137 357,470$
2009 -5.506% 44 73 337,788$
2010 10.128% 37 57 372,000$
2011 -1.740% 37 64 365,528$
2012 9.950% 43 82 401,898$
2013 29.448% 34 41 520,247$
2014 -2.941% 56 61 504,948$
Source: MLSPIN, as of 01/13/2015; Zip Code 02131
Roslindale StatisticsMultifamily Homes
Average Sale Price - Number of Units in Building - 2014
Historical Average Sale Price - Past 10 Years
$529,287 $501,334
$466,746
$357,470 $337,788 $372,000 $365,528
$401,898
$520,247 $504,948
2005 2006 2007 2008 2009 2010 2011 2012 2013 2014

63
Market stat ist ics
[email protected] | 617-299-1854
Multifamily Homes, Zip Code 02131, 1/1/2014 - 12/31/2014
# of Avg. Days Average Average SP:LP Average SP:OP
Listings
on
Market Sale Price List Price Ratio Orig Price Ratio
$250,000 - $299,999 1 86 $290,000 $325,000 $89 $325,000 $89
$300,000 - $349,999 4 55 $321,500 $323,450 $100 $325,038 $100
$350,000 - $399,999 0 0 $0 $0 $0 $0 $0
$400,000 - $449,999 8 60 $427,750 $434,713 $99 $452,588 $95
$450,000 - $499,999 17 64 $470,871 $490,318 $96 $505,035 $94
$500,000 - $599,999 19 41 $552,174 $557,542 $99 $616,279 $96
$600,000 - $699,999 2 119 $616,500 $629,500 $98 $689,500 $90
$700,000 - $799,999 5 104 $710,000 $721,200 $99 $741,380 $97
Total Properties 56 61 $504,948 $515,896 98 $546,904 95
Source: MLSPIN, as of 01/29/2015
Total Sold - Roslindale
Price Range

64
Range
Number of
Listing Sold
Days on
the Market
Average
Sale Price
1-2 Bed $188,000 - $542,500 20 41 352,350$
3 Bed $304,900 - $850,000 103 36 457,640$
4 Bed $350,000 - $1,037,500 59 57 585,653$
5-6 Bed $417,000 - $887,500 14 65 696,554$
Year % Change
Number of
Listing Sold
Days on
the Market
Average
Sale Price
2005 215 65 481,866$
2006 -11.732% 220 94 425,332$
2007 2.946% 239 92 437,864$
2008 -6.773% 183 79 408,207$
2009 -1.191% 197 84 403,344$
2010 7.386% 195 80 433,135$
2011 -4.317% 189 80 414,437$
2012 0.794% 238 86 417,728$
2013 5.277% 251 51 439,773$
2014 14.263% 196 45 502,496$
Source: MLSPIN, as of 01/29/2015; Zip Code 02132
West Roxbury Statistics
Average Sale Price - Number of Bedrooms - 2014
Historical Average Sale Price - Past 10 Years
Single Family Homes
$481,866
$425,332 $437,864 $408,207 $403,344
$433,135 $414,437 $417,728 $439,773
$502,496
2005 2006 2007 2008 2009 2010 2011 2012 2013 2014
65
Market stat ist ics
[email protected] | 617-299-1854
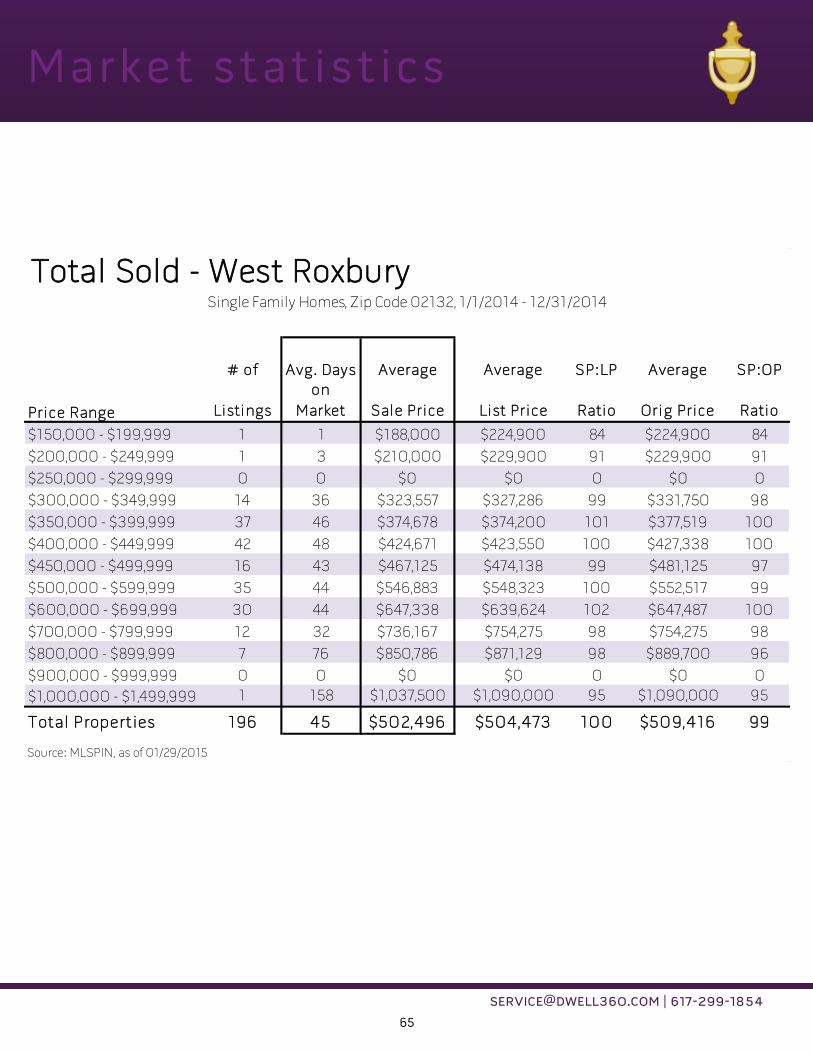
Total Sold - West RoxburySingle Family Homes, Zip Code 02132, 1/1/2014 - 12/31/2014
# of Avg. Days Average Average SP:LP Average SP:OP
Listings
on
Market Sale Price List Price Ratio Orig Price Ratio
$150,000 - $199,999 1 1 $188,000 $224,900 84 $224,900 84
$200,000 - $249,999 1 3 $210,000 $229,900 91 $229,900 91
$250,000 - $299,999 0 0 $0 $0 0 $0 0
$300,000 - $349,999 14 36 $323,557 $327,286 99 $331,750 98
$350,000 - $399,999 37 46 $374,678 $374,200 101 $377,519 100
$400,000 - $449,999 42 48 $424,671 $423,550 100 $427,338 100
$450,000 - $499,999 16 43 $467,125 $474,138 99 $481,125 97
$500,000 - $599,999 35 44 $546,883 $548,323 100 $552,517 99
$600,000 - $699,999 30 44 $647,338 $639,624 102 $647,487 100
$700,000 - $799,999 12 32 $736,167 $754,275 98 $754,275 98
$800,000 - $899,999 7 76 $850,786 $871,129 98 $889,700 96
$900,000 - $999,999 0 0 $0 $0 0 $0 0
$1,000,000 - $1,499,999 1 158 $1,037,500 $1,090,000 95 $1,090,000 95
Total Properties 196 45 $502,496 $504,473 100 $509,416 99
Source: MLSPIN, as of 01/29/2015
Price Range
66
Range
Number of
Listing Sold
Days on
the Market
Average
Sale Price
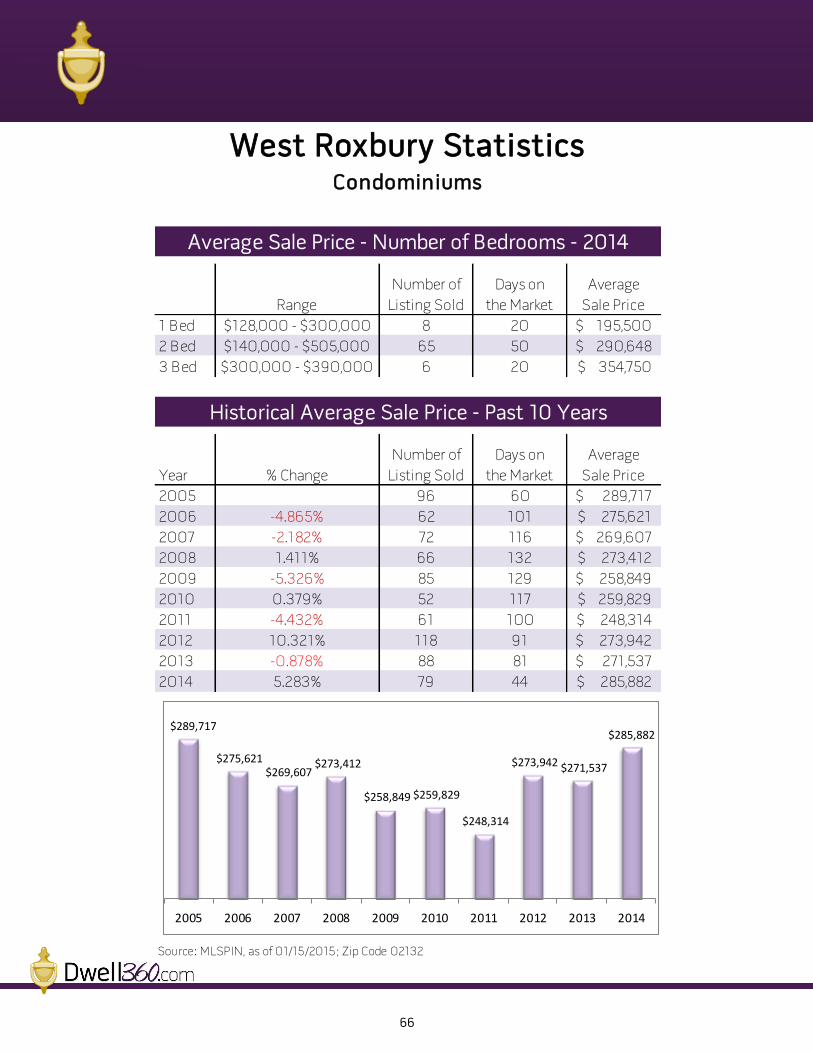
1 Bed $128,000 - $300,000 8 20 195,500$
2 Bed $140,000 - $505,000 65 50 290,648$
3 Bed $300,000 - $390,000 6 20 354,750$
Year % Change
Number of
Listing Sold
Days on
the Market
Average
Sale Price
2005 96 60 289,717$
2006 -4.865% 62 101 275,621$
2007 -2.182% 72 116 269,607$
2008 1.411% 66 132 273,412$
2009 -5.326% 85 129 258,849$
2010 0.379% 52 117 259,829$
2011 -4.432% 61 100 248,314$
2012 10.321% 118 91 273,942$
2013 -0.878% 88 81 271,537$
2014 5.283% 79 44 285,882$
Source: MLSPIN, as of 01/15/2015; Zip Code 02132
West Roxbury StatisticsCondominiums
Average Sale Price - Number of Bedrooms - 2014
Historical Average Sale Price - Past 10 Years
$289,717
$275,621 $269,607
$273,412
$258,849 $259,829
$248,314
$273,942 $271,537
$285,882
2005 2006 2007 2008 2009 2010 2011 2012 2013 2014

67
Market stat ist ics
[email protected] | 617-299-1854
Total Sold - West RoxburyCondominiums, Zip Code 02132, 1/1/2014 - 12/31/2014
# of Avg. Days Average Average SP:LP Average SP:OP
Listings
on
Market Sale Price List Price Ratio Orig Price Ratio
$100,000 - $149,999 3 21 $138,000 $129,966 106 $129,966 106
$150,000 - $199,999 11 36 $178,445 $171,664 105 $330,664 97
$200,000 - $249,999 17 27 $221,714 $221,079 100 $223,132 100
$250,000 - $299,999 11 96 $271,882 $277,864 98 $285,509 96
$300,000 - $349,999 14 64 $323,207 $323,714 100 $325,929 99
$350,000 - $399,999 16 32 $364,375 $360,850 101 $362,413 101
$400,000 - $449,999 5 23 $420,600 $404,200 104 $409,400 103
$450,000 - $499,999 1 7 $485,000 $449,000 108 $449,000 108
$500,000 - $599,999 1 3 $505,000 $489,000 103 $489,000 103
Total Properties 79 44 $285,882 $283,008 101 $307,692 99
Source: MLSPIN, as of 01/15/2015
Price Range

68
Range
Number of
Listing Sold
Days on
the Market
Average
Sale Price
2 Units $300,000 - $825,000 21 58 526,571$
3 Units $528,000 - $575,000 4 59 548,238$
Year % Change
Number of
Listing Sold
Days on
the Market
Average
Sale Price
2005 40 59 557,964$
2006 -7.937% 30 79 513,681$
2007 -3.914% 24 99 493,578$
2008 -10.247% 14 119 443,000$
2009 -4.325% 18 115 423,839$
2010 9.181% 20 92 462,750$
2011 -7.230% 18 72 429,294$
2012 1.595% 22 68 436,142$
2013 15.748% 21 65 504,827$
2014 4.994% 25 58 530,038$
Source: MLSPIN, as of 01/15/2015; Zip Code 02132
West Roxbury StatisticsMultifamily Homes
Average Sale Price - Number of Units in Building - 2014
Historical Average Sale Price - Past 10 Years
$557,964 $513,681 $493,578
$443,000 $423,839 $462,750
$429,294 $436,142
$504,827 $530,038
2005 2006 2007 2008 2009 2010 2011 2012 2013 2014

69
Market stat ist ics
[email protected] | 617-299-1854
Multifamily Homes, Zip Code 02132, 1/1/2014 - 12/31/2014
# of Avg. Days Average Average SP:LP Average SP:OP
Listings
on
Market Sale Price List Price Ratio Orig Price Ratio
$300,000 - $349,999 1 63 $300,000 $369,900 $81 $369,900 $81
$350,000 - $399,999 1 103 $360,000 $389,000 $93 $399,000 $90
$400,000 - $449,999 0 0 $0 $0 $0 $0 $0
$450,000 - $499,999 6 95 $479,333 $492,967 $97 $492,967 $97
$500,000 - $599,999 13 42 $540,765 $554,154 $98 $558,954 $97
$600,000 - $699,999 3 37 $620,000 $617,967 $100 $617,967 $100
$700,000 - $799,999 0 0 $0 $0 $0 $0 $0
$800,000 - $899,999 1 60 $825,000 $799,000 $103 $799,000 $103
Total Properties 25 58 $530,038 $542,944 97 $545,840 97
Source: MLSPIN, as of 01/15/2015
Total Sold - West Roxbury
Price Range

70
www.Dwell360.com [email protected]
617-299-1854
Dwell360 46 Austin Street Suite 302 Newton, MA 02460
Trust. Knowledge. Experience.
You want an agent who cares – We are experienced real estate agents who use professional marketing tools. We have neighborhood insight and are current with local market conditions. We know the inventory, have opinions about each property, are confident negotiators, and care about our clients – because buying and selling a home is a big deal!
Related Documents