Single Family Homes and Condominiums Year End 2013 Arlington, Massachusetts Market Report

Arlington Massachusetts Real Estate Market Data - Dwell360
Mar 22, 2016
Dwell360 has published this report on the residential real estate market statistics for 2013, 2012, 2011, 2010, 2009, 2008, 2007, 2006, 2005, 2004, and 2003 for Arlington, Massachusetts. The market statistics include residential sales averages for single family homes, condominiums, and multifamily homes. Review the information presented by the Massachusetts boutique real estate brokerage Dwell360 based in Newton.
Welcome message from author
This document is posted to help you gain knowledge. Please leave a comment to let me know what you think about it! Share it to your friends and learn new things together.
Transcript
Single Family Homes and Condominiums
Year End 2013
Arlington, Massachusetts
Market Repor t

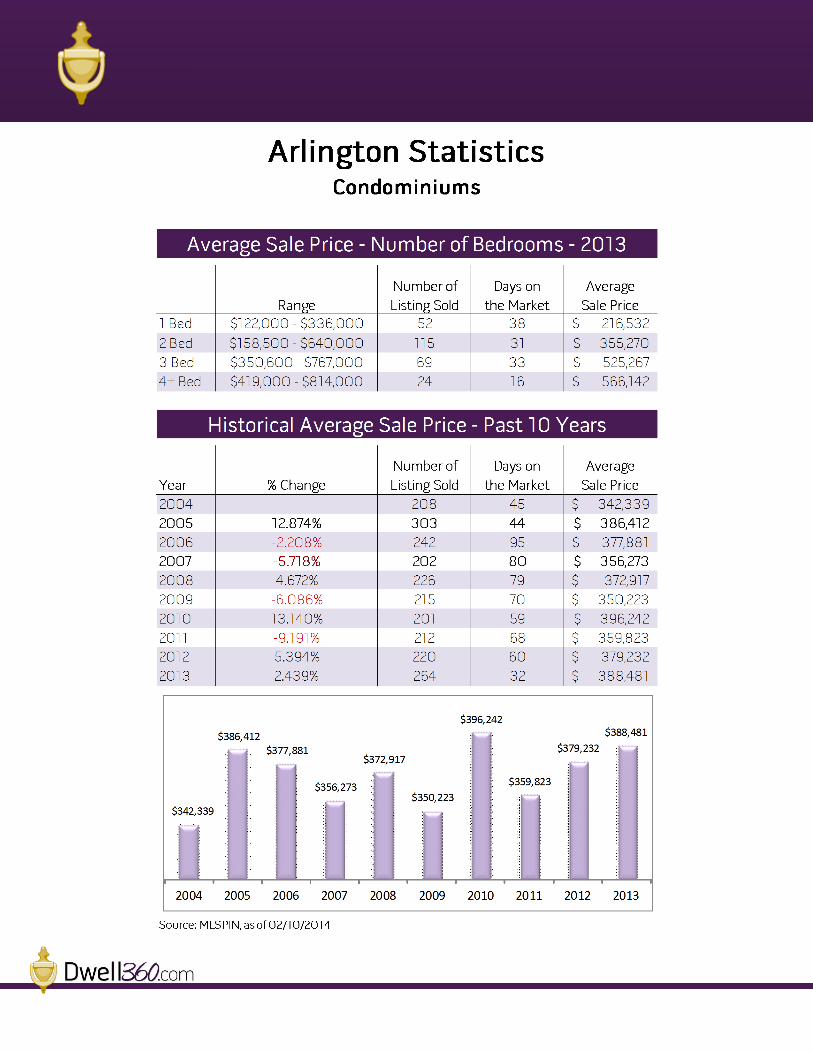
Range
Number of
Listing Sold
Days on
the Market
Average
Sale Price
2 Bed $300,000 - $820,400 34 32 434,747$
3 Bed $344,000 - $885,000 142 21 547,052$
4 Bed $350,814 - $1,550,000 83 35 698,108$
5 Bed $530,000 - $1,298,000 14 27 862,557$
Year % Change
Number of
Listing Sold
Days on
the Market
Average
Sale Price
2004 311 43 508,581$
2005 5.598% 253 41 537,053$
2006 -1.971% 314 65 526,467$
2007 -2.448% 291 69 513,578$
2008 -0.498% 218 49 511,018$
2009 -0.204% 248 52 509,975$
2010 5.399% 277 49 537,511$
2011 1.680% 264 62 546,539$
2012 1.144% 292 41 552,794$
2013 7.666% 273 27 595,171$
Source: MLSPIN, as of 02/07/2014
Arlington Statistics
Average Sale Price - Number of Bedrooms - 2013
Historical Average Sale Price - Past 10 Years
Single Family Homes
$508,581
$537,053 $526,467
$513,578 $511,018 $509,975
$537,511 $546,539
$552,794
$595,171
2004 2005 2006 2007 2008 2009 2010 2011 2012 2013
Market stat ist ics
[email protected] | 617-299-1854
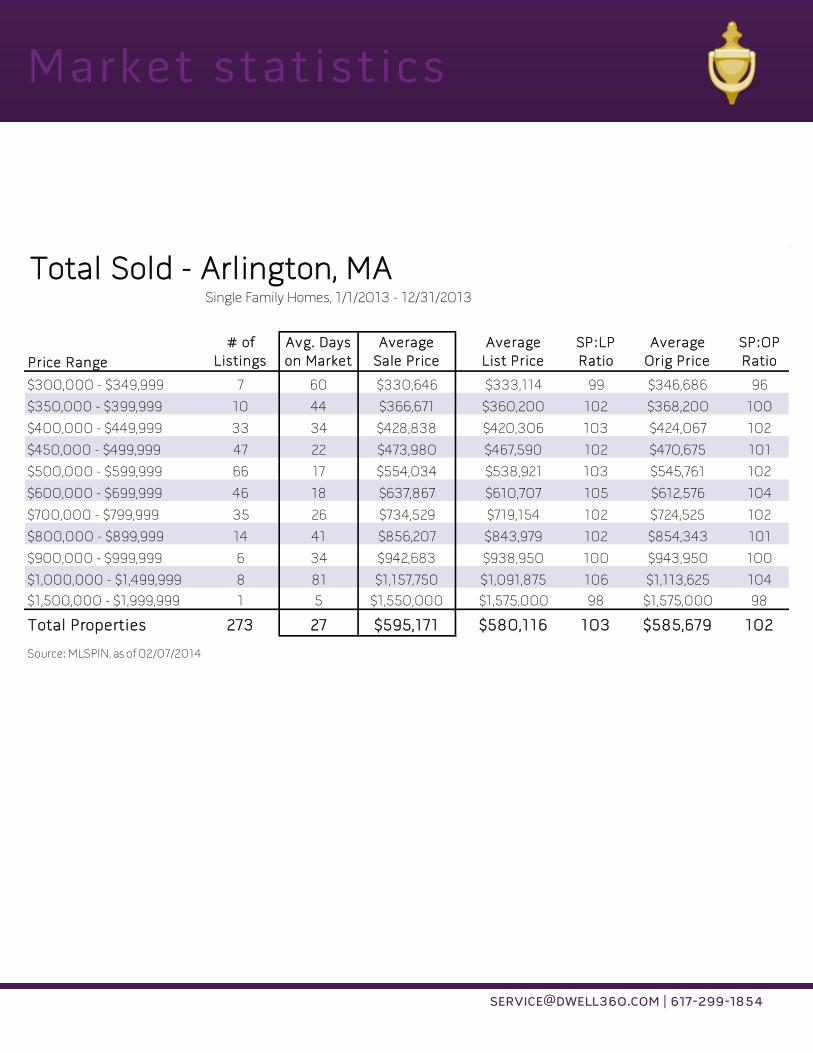
Single Family Homes, 1/1/2013 - 12/31/2013
# of Avg. Days Average Average SP:LP Average SP:OP
Listings on Market Sale Price List Price Ratio Orig Price Ratio
$300,000 - $349,999 7 60 $330,646 $333,114 99 $346,686 96
$350,000 - $399,999 10 44 $366,671 $360,200 102 $368,200 100
$400,000 - $449,999 33 34 $428,838 $420,306 103 $424,067 102
$450,000 - $499,999 47 22 $473,980 $467,590 102 $470,675 101
$500,000 - $599,999 66 17 $554,034 $538,921 103 $545,761 102
$600,000 - $699,999 46 18 $637,867 $610,707 105 $612,576 104
$700,000 - $799,999 35 26 $734,529 $719,154 102 $724,525 102
$800,000 - $899,999 14 41 $856,207 $843,979 102 $854,343 101
$900,000 - $999,999 6 34 $942,683 $938,950 100 $943,950 100
$1,000,000 - $1,499,999 8 81 $1,157,750 $1,091,875 106 $1,113,625 104
$1,500,000 - $1,999,999 1 5 $1,550,000 $1,575,000 98 $1,575,000 98
Total Properties 273 27 $595,171 $580,116 103 $585,679 102
Source: MLSPIN, as of 02/07/2014
Price Range
Total Sold - Arlington, MA
Market stat ist ics
[email protected] | 617-299-1854
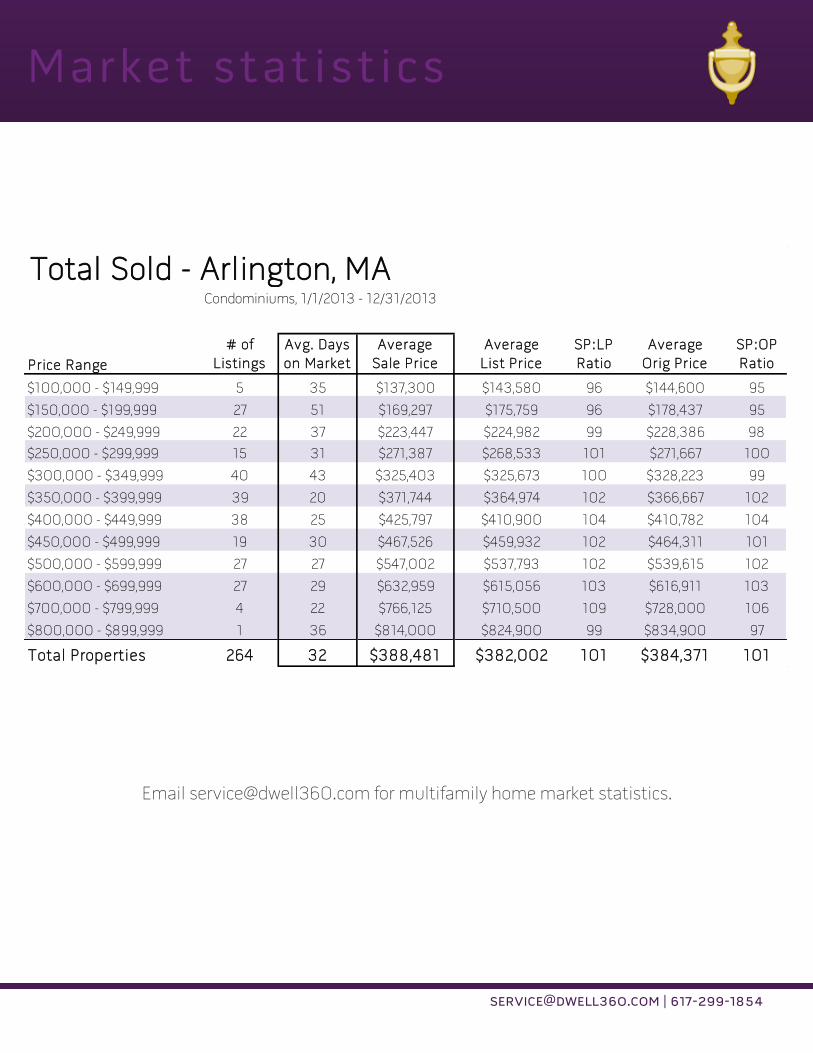
Email [email protected] for multifamily home market statistics.
Condominiums, 1/1/2013 - 12/31/2013
# of Avg. Days Average Average SP:LP Average SP:OP
Listings on Market Sale Price List Price Ratio Orig Price Ratio
$100,000 - $149,999 5 35 $137,300 $143,580 96 $144,600 95
$150,000 - $199,999 27 51 $169,297 $175,759 96 $178,437 95
$200,000 - $249,999 22 37 $223,447 $224,982 99 $228,386 98
$250,000 - $299,999 15 31 $271,387 $268,533 101 $271,667 100
$300,000 - $349,999 40 43 $325,403 $325,673 100 $328,223 99
$350,000 - $399,999 39 20 $371,744 $364,974 102 $366,667 102
$400,000 - $449,999 38 25 $425,797 $410,900 104 $410,782 104
$450,000 - $499,999 19 30 $467,526 $459,932 102 $464,311 101
$500,000 - $599,999 27 27 $547,002 $537,793 102 $539,615 102
$600,000 - $699,999 27 29 $632,959 $615,056 103 $616,911 103
$700,000 - $799,999 4 22 $766,125 $710,500 109 $728,000 106
$800,000 - $899,999 1 36 $814,000 $824,900 99 $834,900 97
Total Properties 264 32 $388,481 $382,002 101 $384,371 101
Price Range
Total Sold - Arlington, MA

www.Dwell360.com [email protected]
617-299-1854
Dwell360 46 Austin Street Suite 302 Newton, MA 02460
Trust. Knowledge. Experience.
You want an agent who cares – We are experienced real estate agents who use professional marketing tools. We have neighborhood insight and are current with local market conditions. We know the inventory, have opinions about each property, are confident negotiators, and care about our clients – because buying and selling a home is a big deal!
Related Documents