Blueprint for Active Living Communities: Innovative Solutions James Sallis University of California, San Diego For IOM PA Workshop. April 15, 2015

Welcome message from author
This document is posted to help you gain knowledge. Please leave a comment to let me know what you think about it! Share it to your friends and learn new things together.
Transcript
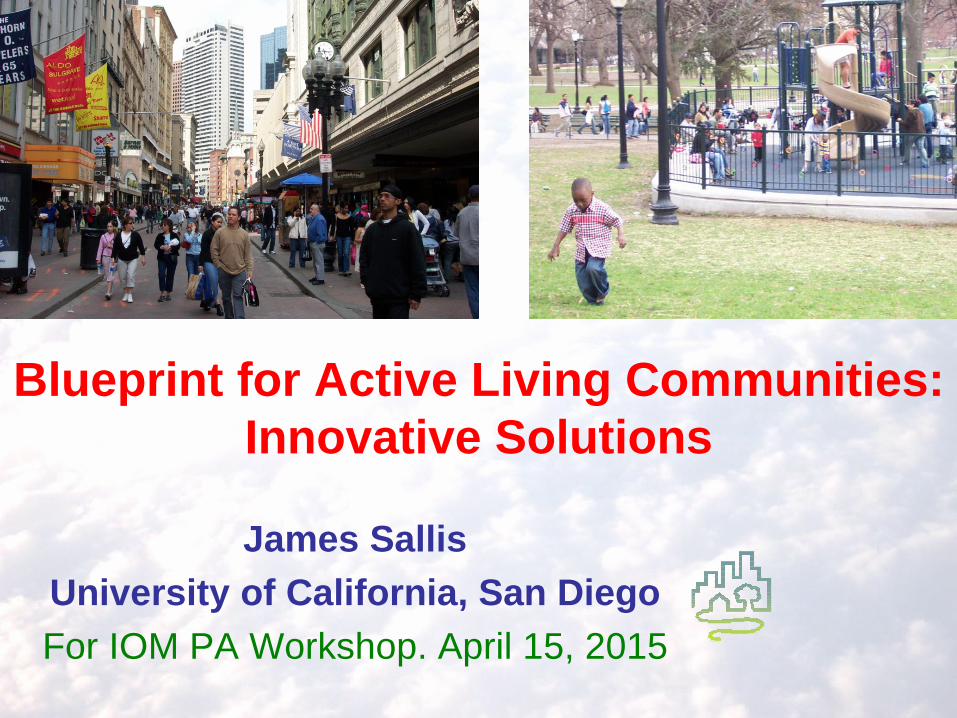
Blueprint for Active Living Communities: Innovative Solutions
James Sallis University of California, San Diego For IOM PA Workshop. April 15, 2015

Outline of Talk • Do built environments matter? • Progress in research and policy
– Designing walkable communities – Designing streetscapes for people: details matter – Re-engineering active commuting to school – Designing active parks
• Disparities in activity-friendly environments • Co-benefits of activity-friendly communities • Resources

Land Use and Transport Decisions Are Significant and Affect Health

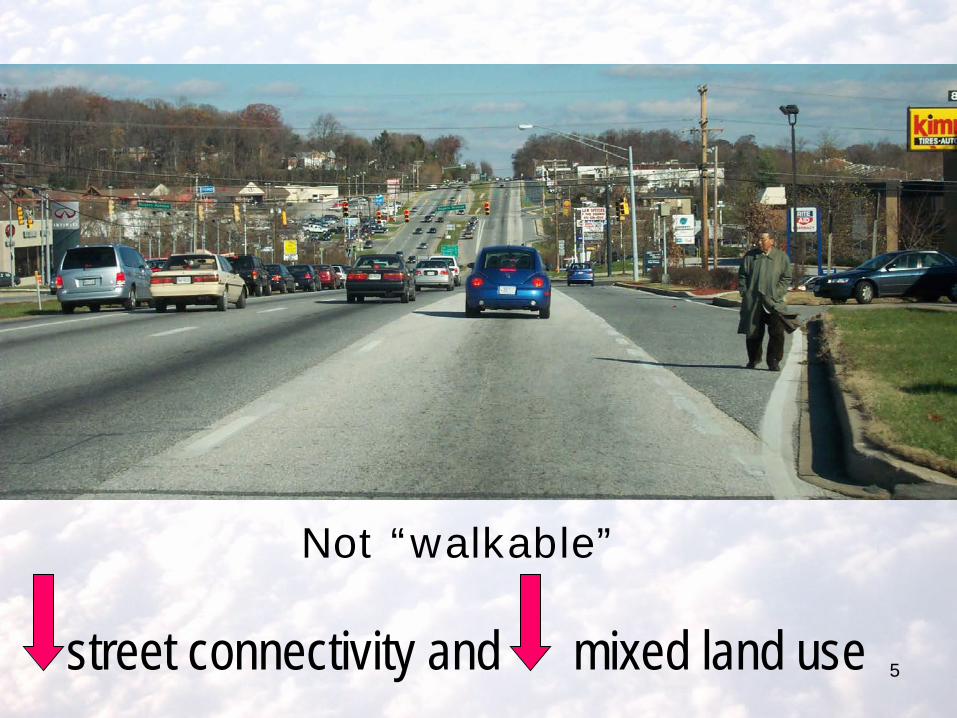
4 “Walkable”: Mixed use, connected, dense
5
Not “walkable”
street connectivity and mixed land use
The Neighborhood Quality of Life Study of Adults (NQLS)
Seattle, WA and Baltimore, MD regions
Sallis et al. Social Science & Medicine, 2009
Evidence of the link between community design and health
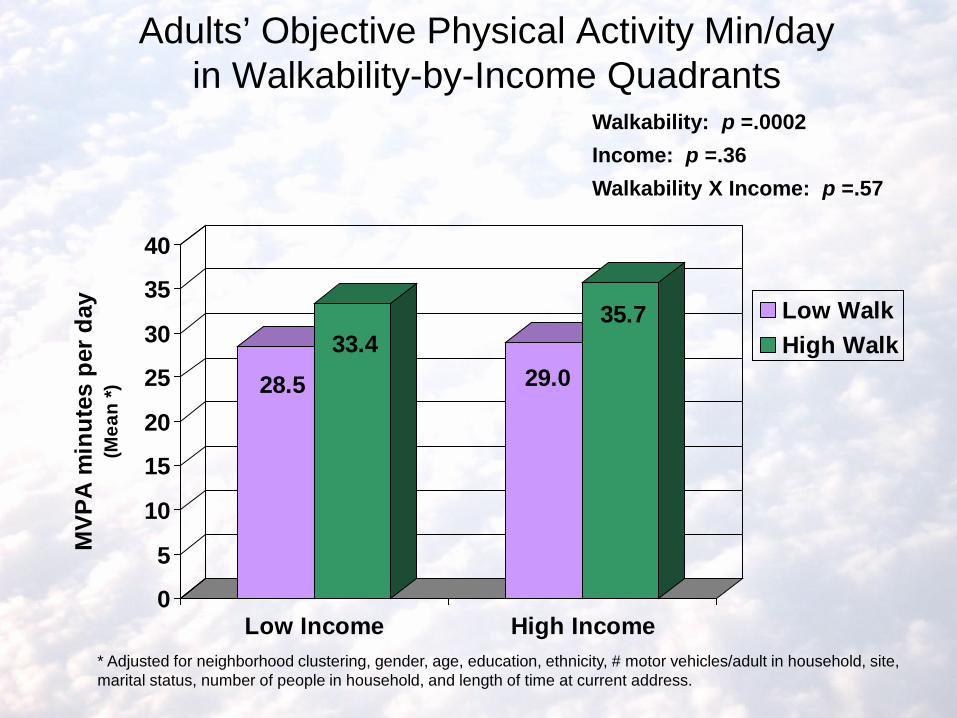
Adults’ Objective Physical Activity Min/day in Walkability-by-Income Quadrants
28.533.4
29.0
35.7
0
5
10
15
20
25
30
35
40
MVP
A m
inut
es p
er d
ay(M
ean
*)
Low Income High Income
Low WalkHigh Walk
Walkability: p =.0002 Income: p =.36 Walkability X Income: p =.57
* Adjusted for neighborhood clustering, gender, age, education, ethnicity, # motor vehicles/adult in household, site, marital status, number of people in household, and length of time at current address.
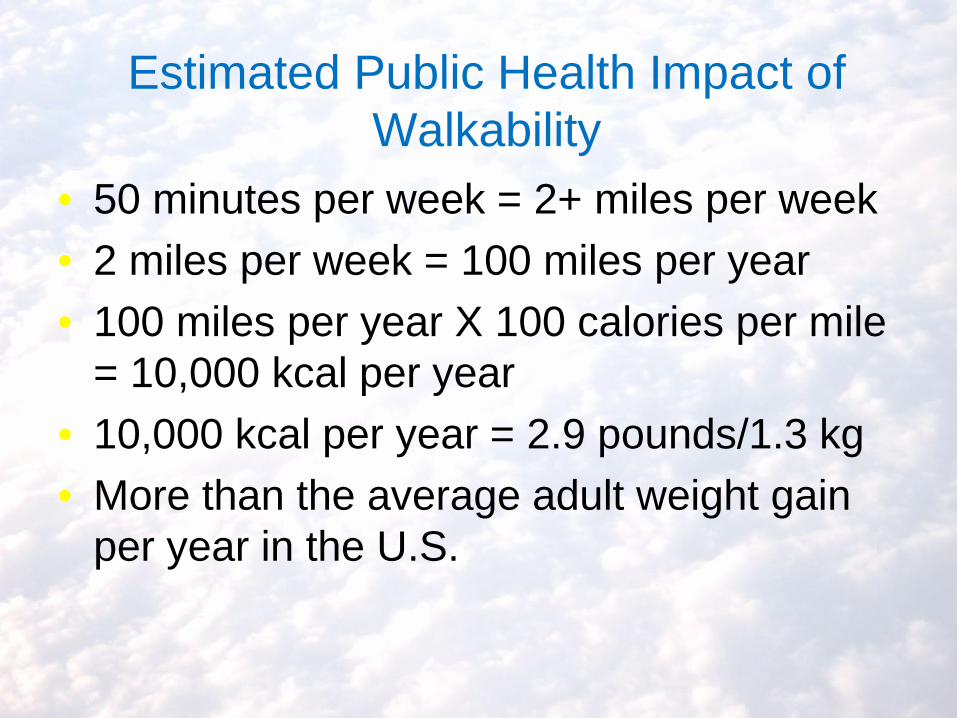
Estimated Public Health Impact of Walkability
• 50 minutes per week = 2+ miles per week • 2 miles per week = 100 miles per year • 100 miles per year X 100 calories per mile
= 10,000 kcal per year • 10,000 kcal per year = 2.9 pounds/1.3 kg • More than the average adult weight gain
per year in the U.S.

Adults’ Percent Overweight or Obese (BMI>25) in Walkability-by-Income Quadrants
63.156.8
60.4
48.2
0
10
20
30
40
50
60
70
% O
verw
eigh
t or O
bese
Low Income High Income
Low WalkHigh Walk
Walkability: p =.007 Income: p =.081 Walkability X Income: p =.26
* Adjusted for neighborhood clustering, gender, age, education, ethnicity, # motor vehicles/adult in household, site, marital status, number of people in household, and length of time at current address.

Policy Bright Spot: Form-Based Codes
http://www.placemakers.com/how-we-teach/codes-study/
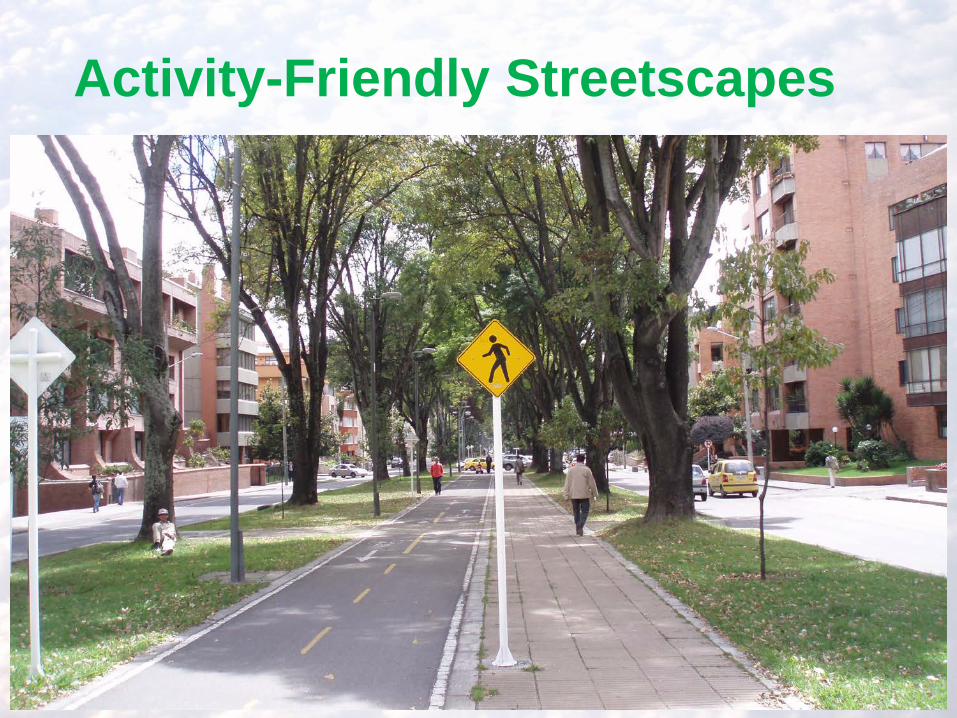
Activity-Friendly Streetscapes
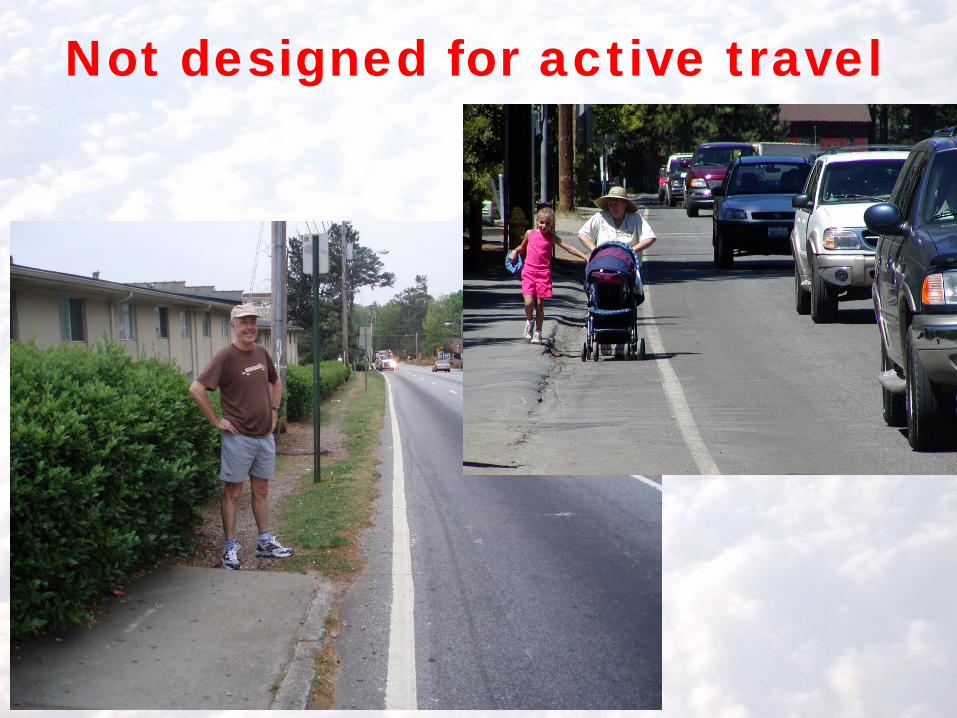
Not designed for active travel

Getting the Details Right:
Micro-Scale Features

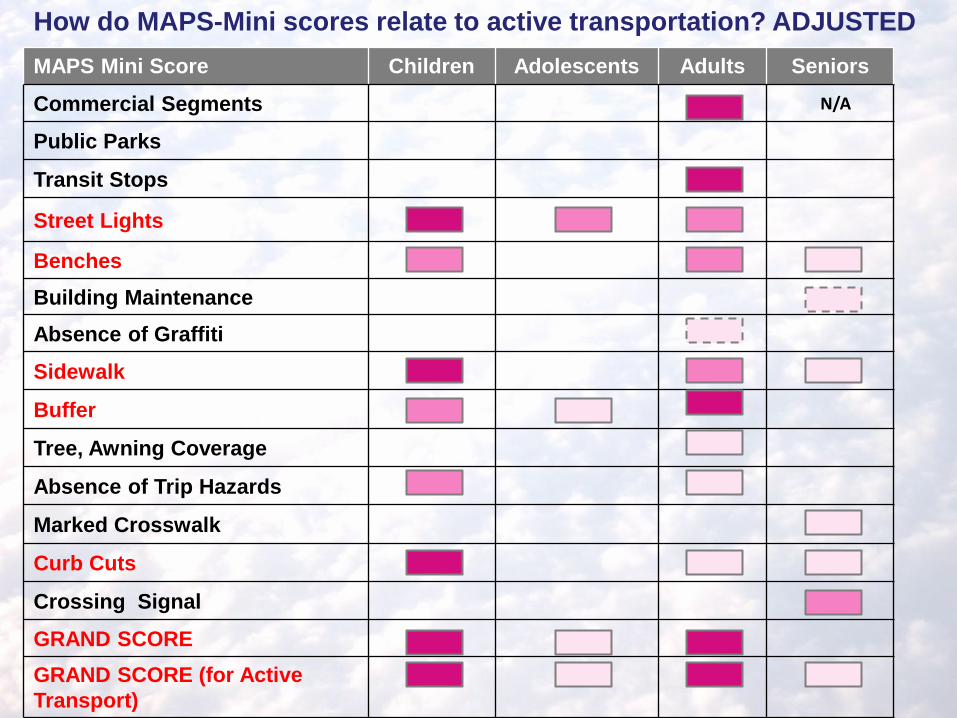
MAPS Mini: Assessing the Details
• 15-item MAPS-Mini was designed for practitioners and advocates – Reduced from 120 items
• Items were selected based on – Correlations with physical activity – Guidelines and recommendations – Modifiability
• Evaluated for validity in 3677 children, teens, adults, older adults – 3 regions
MAPS Mini Score Children Adolescents Adults Seniors
Commercial Segments N/A
Public Parks
Transit Stops
Street Lights
Benches Building Maintenance Absence of Graffiti
Sidewalk
Buffer
Tree, Awning Coverage
Absence of Trip Hazards
Marked Crosswalk
Curb Cuts
Crossing Signal
GRAND SCORE GRAND SCORE (for Active Transport)
How do MAPS-Mini scores relate to active transportation? ADJUSTED

0.00
0.20
0.40
0.60
0.80
1.00
1.20
1.40
1.60
1.80
2.00
Activ
e Tr
ansp
ort D
ays
per w
eek
Grand Score (% of total possible)
MAPS-Mini Grand Score & Active Transport: Adults
222% difference

Policy Bright Spot: Complete Street Adoptions
(Smart Growth America)
2004 2005 2006 2007 2008 2009 2010 2011 2012 2013 20140
100
200
300
400
500
600
700
Figure A: Number of Complete Streets Policies by Year (as of 2013)
Year
# of
Com
plet
e St
reet
s P
olic
ies
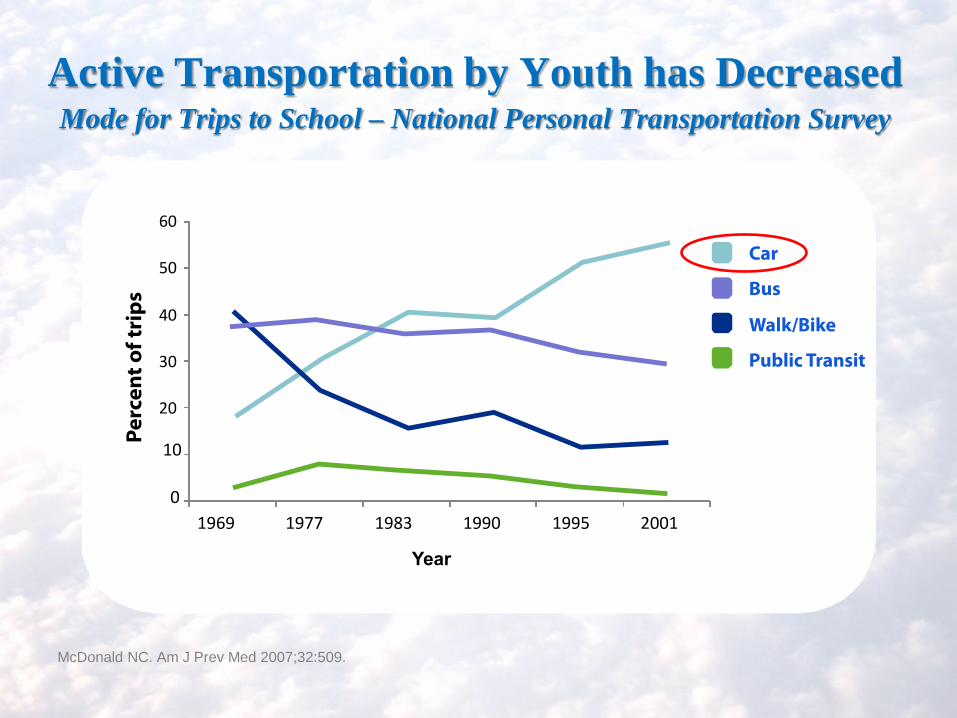
Active Transportation by Youth has Decreased Mode for Trips to School – National Personal Transportation Survey
McDonald NC. Am J Prev Med 2007;32:509.

Østergaard L. et al. Cycling to School Is Associated With Lower BMI and Lower Odds of Being Overweight or Obese in a Large Population-Based Study of Danish Adolescents. Journal of Physical Activity and Health 2012, 9: 617-625.
1
0.47
0.63
0
0.2
0.4
0.6
0.8
1
1.2
Passive(Reference)
Walking Cycling
Walking and Biking to School Reduces Odds of Being Overweight A Danish study found that adolescents (N=3847) who walked or cycled to school were less likely to be overweight than those who rode to school in motor vehicles (passive transport).
Odd
s R
atio

Step 1: Site schools where the students are

Step 2: Create Safe Routes to School
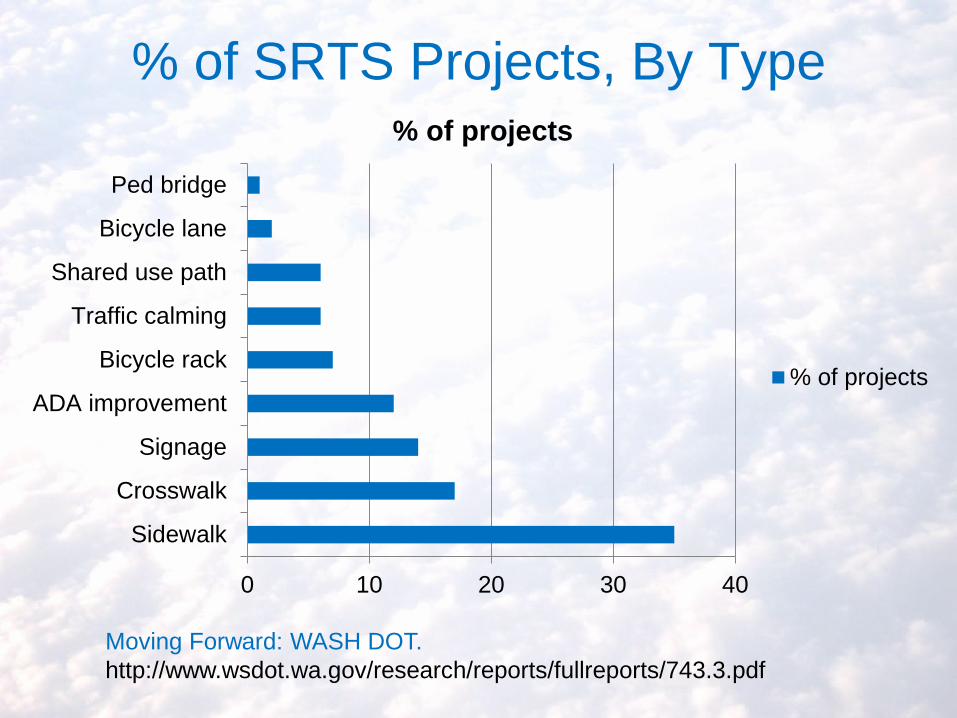
% of SRTS Projects, By Type
0 10 20 30 40
Sidewalk
Crosswalk
Signage
ADA improvement
Bicycle rack
Traffic calming
Shared use path
Bicycle lane
Ped bridge
% of projects
% of projects
Moving Forward: WASH DOT. http://www.wsdot.wa.gov/research/reports/fullreports/743.3.pdf

Walking & Cycling to School Pre & Post SRTS Projects in 5 States
0
2
4
6
8
10
12
14
16
% Walking % Bicycling
Pre-projectPost-project
Moving Forward: WASH DOT. http://www.wsdot.wa.gov/research/reports/fullreports/743.3.pdf .
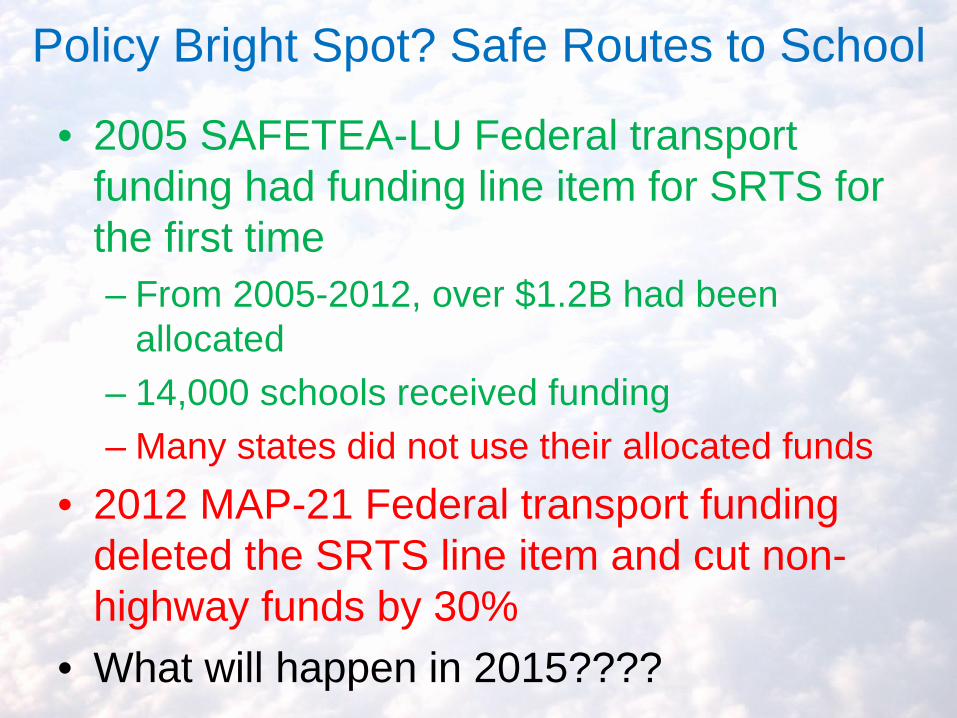
Policy Bright Spot? Safe Routes to School
• 2005 SAFETEA-LU Federal transport funding had funding line item for SRTS for the first time – From 2005-2012, over $1.2B had been
allocated – 14,000 schools received funding – Many states did not use their allocated funds
• 2012 MAP-21 Federal transport funding deleted the SRTS line item and cut non-highway funds by 30%
• What will happen in 2015????
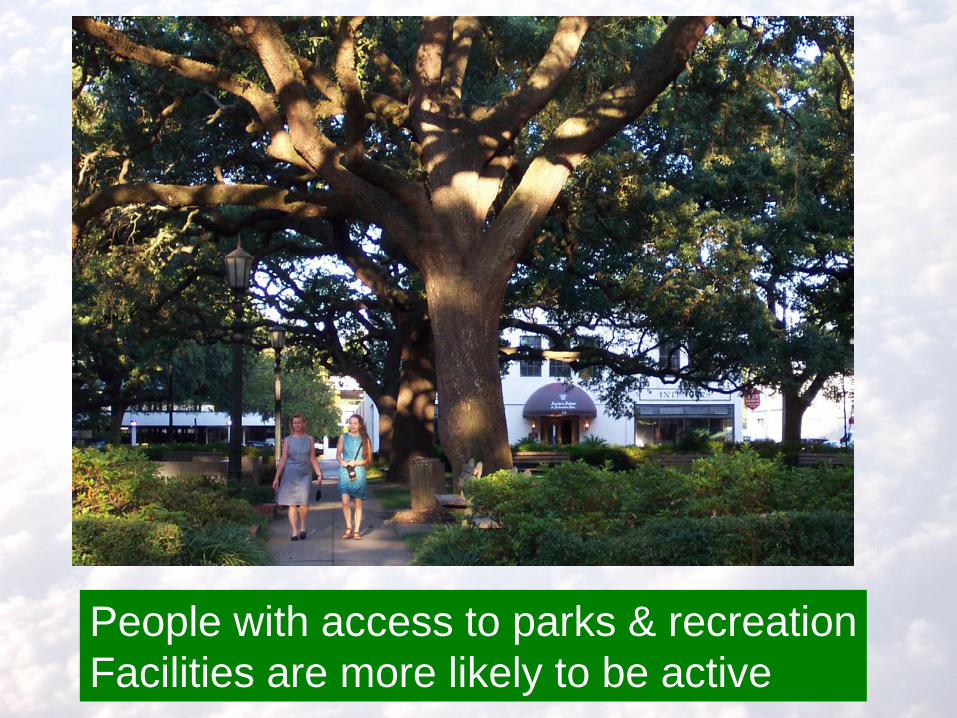
People with access to parks & recreation Facilities are more likely to be active
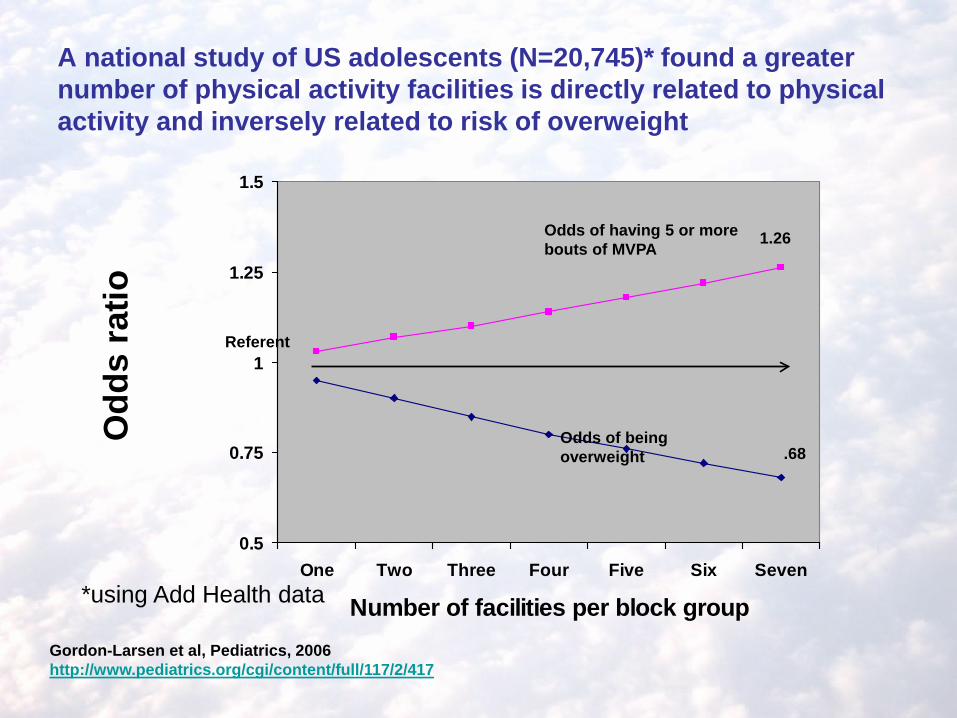
A national study of US adolescents (N=20,745)* found a greater number of physical activity facilities is directly related to physical activity and inversely related to risk of overweight
Gordon-Larsen et al, Pediatrics, 2006 http://www.pediatrics.org/cgi/content/full/117/2/417
*using Add Health data
0.5
0.75
1
1.25
1.5
One Two Three Four Five Six Seven
Number of facilities per block group
Odd
s ra
tio
Odds of having 5 or more bouts of MVPA
Odds of being overweight
1.26
.68
Referent
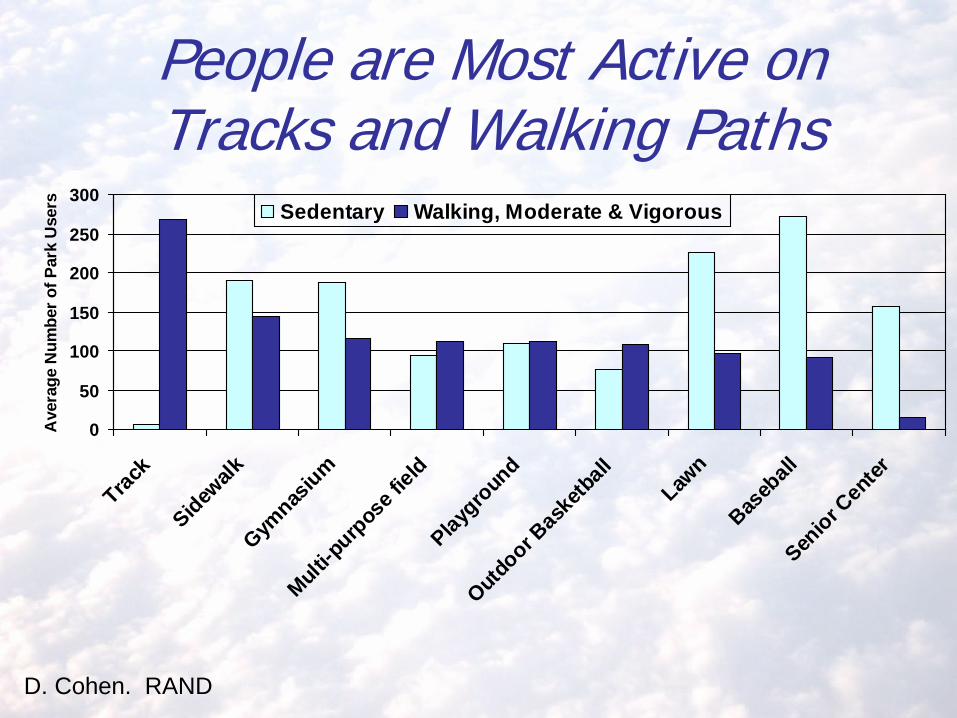
People are Most Active on Tracks and Walking Paths
0
50
100
150
200
250
300
Track
Sidewalk
Gymnas
ium
Multi-p
urpos
e fiel
d
Playgro
und
Outdoor B
aske
tball
Lawn
Baseb
all
Senior C
enter
Ave
rage
Num
ber o
f Par
k U
sers Sedentary Walking, Moderate & Vigorous
D. Cohen. RAND
Policy Bright Spot: Rails to Trails Conservancy
• This group lobbied to use US transportation funds to convert unused rails to trails
• 1991 ISTEA Federal transport law allowed these conversions
• Rail-trails have increased from 250 miles to 21,000+ miles

Before and after renovation of Denver schoolyards in low-income neighborhoods. Youth were more active AFTER.
BEF
OR
E AF
TER
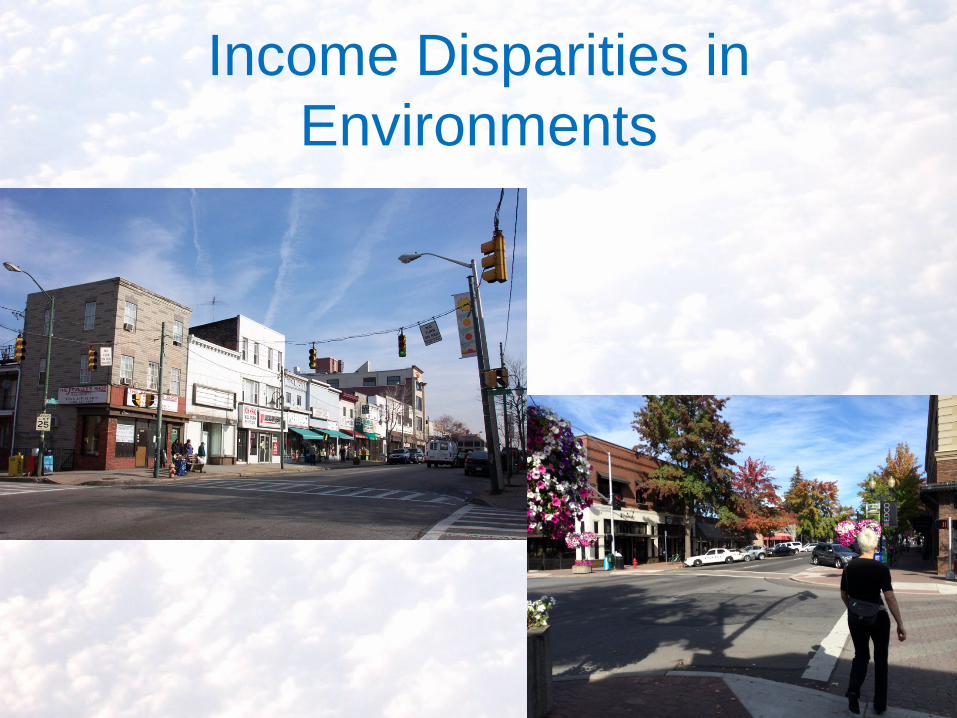
Income Disparities in Environments

Based on observations of 10,777 street segments in 154 communities across the US
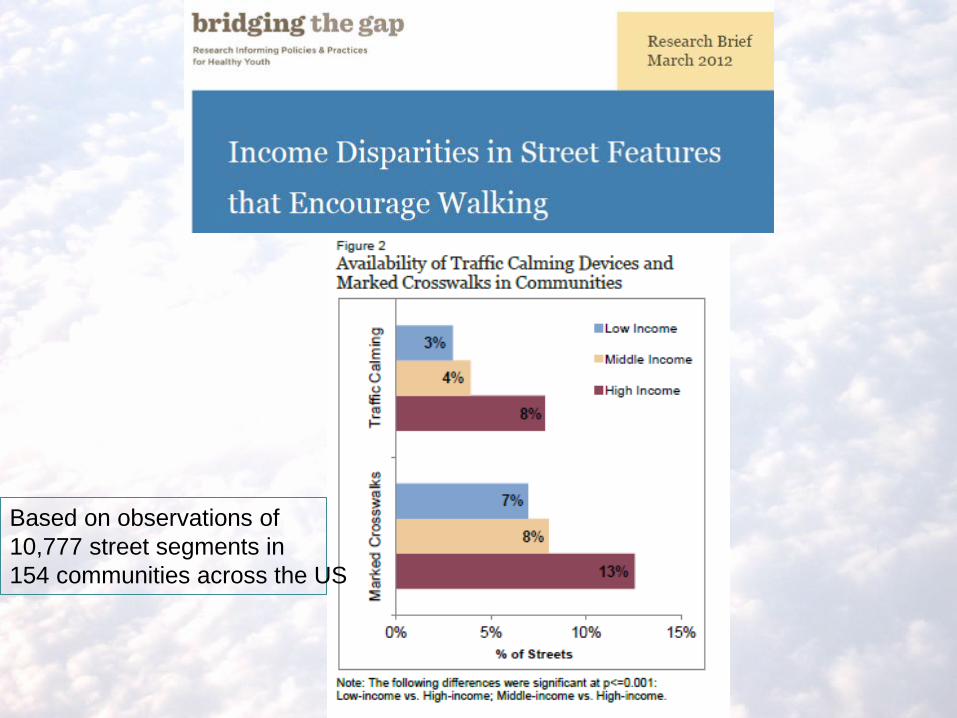
Based on observations of 10,777 street segments in 154 communities across the US
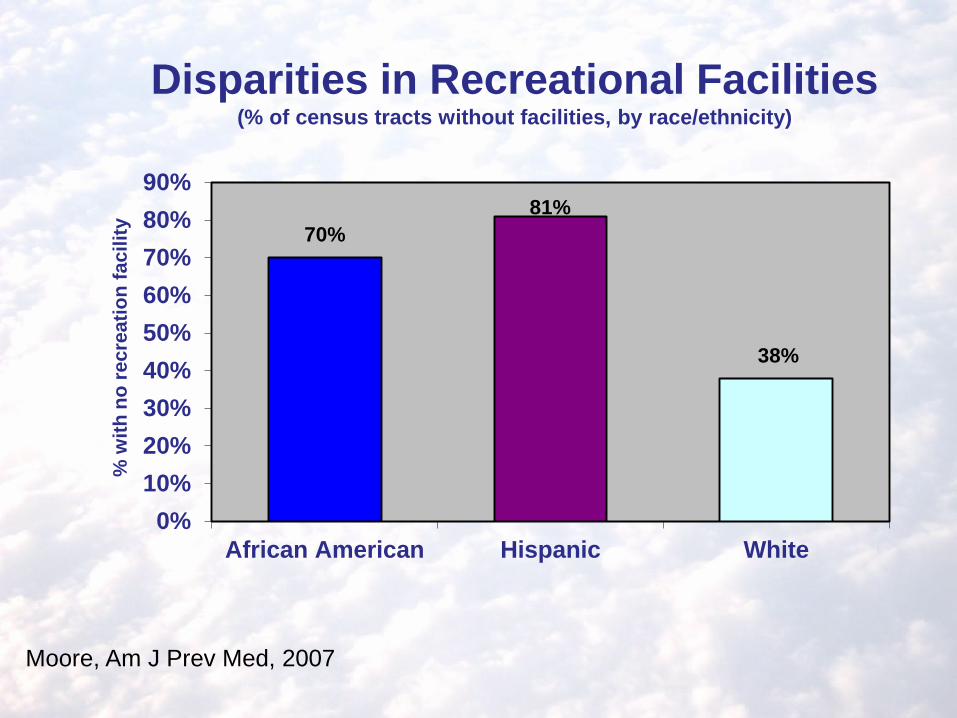
70% 81%
38%
0%10%20%30%40%50%60%70%80%90%
African American Hispanic White
% w
ith n
o re
crea
tion
faci
lity
Moore, Am J Prev Med, 2007
Disparities in Recreational Facilities (% of census tracts without facilities, by race/ethnicity)
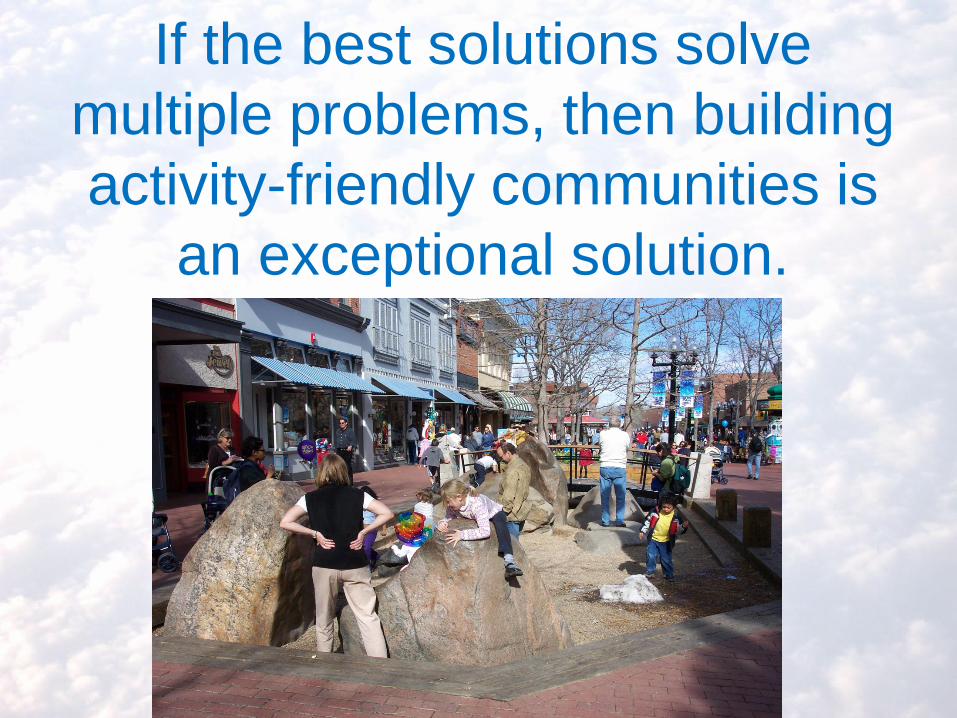
If the best solutions solve multiple problems, then building activity-friendly communities is
an exceptional solution.
Physical Health
Mental Health
Social Benefits
Environmental Sustainability
Safety / Injury
Prevention
Economic Benefits
Open spaces / Parks / Trails
57.5+
3.5(0) 93+ 42.5+
4(0) 20+
4(0) 23+ 19+
4(0)
Urban Design
105+
54(0) 19-
31+
4- 80.5+
29(0) 265.5+
45.5(0) 3.5-
13.5(0) 18.5-
69+
10.5(0) 4-
Transport Systems
7+
3.5- 3+
3.5(0) 23+ 70+
21(0) 3-
67+
14(0) 4-
56+
3.5(0) 4-
Schools 19.5+
3.5(0) 21+ 11+ 21.5+ 4+
3- 15+
Workplaces / Buildings
55+
3.5(0) 18.5+
4- 20.5+ 48+
3.5(0)
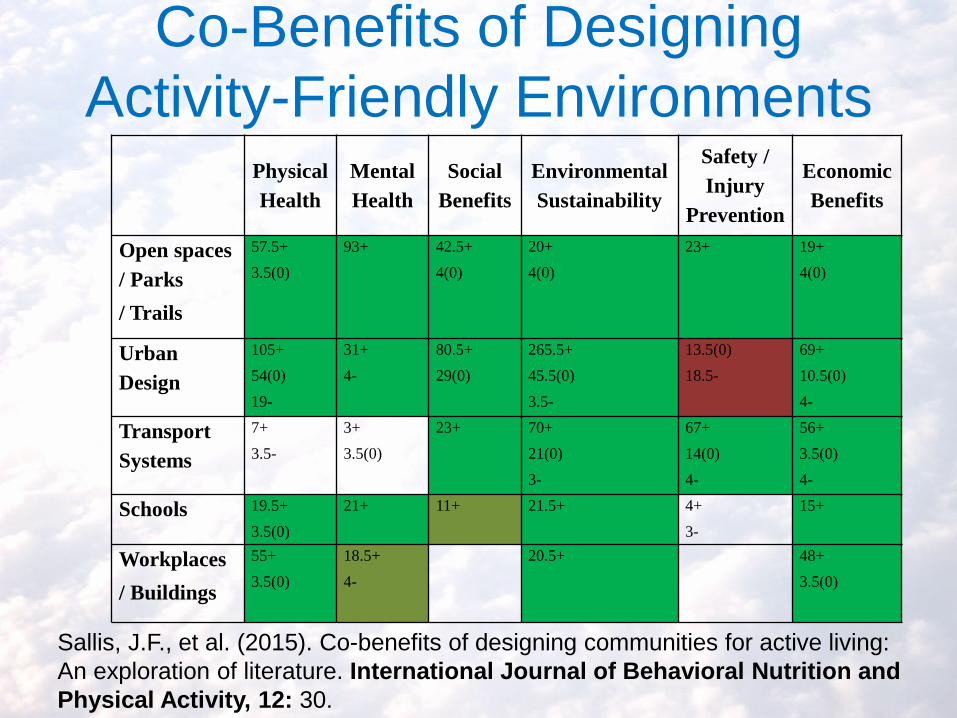
Co-Benefits of Designing Activity-Friendly Environments
Sallis, J.F., et al. (2015). Co-benefits of designing communities for active living: An exploration of literature. International Journal of Behavioral Nutrition and Physical Activity, 12: 30.

Resources at www.activelivingresearch.org
Related Documents