May 2015 BCOM <GO> [email protected] www.bloombergindexes.com Commentary 02 Performance Tables 04 Performance Charts 06 Commitment of Traders Report (COT) 11 Inventory & Sales Data 12 BCOM Constituent Weights 13 Commodity Price Forecasts 14 Top Ranked Commodity Forecasters 15 Commodity ETP Fund Flows 16 Term Structures 17 Bloomberg Commodity Event Calendar 20 Bloomberg Intelligence: Commodity Dashboards 21 Historical Performance, Volatility & Correlation Charts 22 Bloomberg Professional Commodity Cheatsheet 29 TABLES & CHARTS COMMODITY INDEX (BCOM) BLOOMBERG

Welcome message from author
This document is posted to help you gain knowledge. Please leave a comment to let me know what you think about it! Share it to your friends and learn new things together.
Transcript
May 2015
BCOM <GO> [email protected] www.bloombergindexes.com
Commentary 02Performance Tables 04Performance Charts 06
Commitment of Traders Report (COT) 11Inventory & Sales Data 12
BCOM Constituent Weights 13Commodity Price Forecasts 14
Top Ranked Commodity Forecasters 15Commodity ETP Fund Flows 16
Term Structures 17Bloomberg Commodity Event Calendar 20
Bloomberg Intelligence: Commodity Dashboards 21 Historical Performance, Volatility & Correlation Charts 22
Bloomberg Professional Commodity Cheatsheet 29
TABLES & CHARTSCOMMODITY INDEX (BCOM)BLOOMBERG

Bloomberg Commodity Index (BCOM) Dropped 2.7% in May, Softs and Industrial Metals Lag
• BCOM dropped 2.7% in May, trailing US equities, US treasuries (BUSY Index <GO>) and the US dollar (BDXY <GO>). • 15 out of 22 BCOM constituents traded lower in May. • Broad based commodity ETPs saw inflows of $284 million, about 3.7% of market cap. • Softs (including Sugar, Coffee) and Industrial Metals (including Aluminum, Nickel) were the worst performing BCOM groups in May, down 7.9% and 7.7% respectively. • BCOM Excess Return Index (BCOM Index <GO>) underperformed BCOM Spot Index (BCOMSP Index <GO>) by 0.11% in May.
The spectacular decline of oil prices, increasing geopolitical tension, and the sluggish rate of growth of the global economy dominated discussions at the Bloomberg sponsored “The Commodity Debate”, on May 14 in New York. Set against the backdrop of investment banks exiting the commodities business, fewer commodity hedge funds and underinvestment by pension plans, prospects for commodity investing still appear high. Bloomberg will continue to engage leading commodity investors and produce educational events. Our next commodity events are being held in Zurich on June 2 and in Paris on June 3.
Grains (20.2% weight in BCOM)
The Bloomberg Grains Index (BCOMGR Index GP W <GO>) continued to be beaten up, and is down 14.7% YTD. Good weather (WETR <GO>) is helping grain production from the European Union to North Africa and China, boosting the EU forecast for global output to about 2% from an all-time high. Farmers worldwide will gather 1.97 billion metric tons of grain in the 2015-16 seasons that starts July 1, the IGC said on May 28. That’s 1.1% more than last month’s forecast. However, the London-based group also said that world consumption will reach a record, citing increased demand for animal-feed.
Across the Midwest, the weather’s been dry enough to get fieldwork done, with enough showers to help seeds germinate and emerge. CBOT-listed wheat and corn futures tumbled more than 14% this year as bumper global harvests added to a glut, driving food costs (FAOFOODI Index <GO>) to the lowest since 2010. China’s demand for soybeans will dominate trading in the crop, leading to record global volumes, according to the IGC’s report.
Good growing conditions prompted the International Grains Council last week to say that global production will be even bigger than previously estimated. Bountiful supplies (BMAP AGPX SOYBEAN PRICE HEATMAP <GO>) mean that money managers last week almost doubled their bets on falling crop prices.
Energy (36.5% weight in BCOM)
Although WTI rose for an 11th week, the longest winning streak since futures started trading in New York in 1983, the price recovery from a six-year low in January is slowing amid speculation a global glut will persist. Saudi Arabia maintained crude output at a record in May. OPEC (OPEC <GO>), which pumps 40% of the world’s crude, is seen sticking with its strategy of favoring market share over supporting prices, while U.S. supply remains near a record (DOESCRUD Index GP <GO>). Saudi Arabia and Iraq are producing 1.1 million barrels a day more than at the last OPEC meeting. OPEC output increased 67,000 barrels to 31.579 million a day in May, according to a Bloomberg survey of oil companies, producers and analysts. Production from Iraq, the second-biggest of the group’s 12 members, accelerated by 197,000 barrels a day to a record 3.87 million, the survey showed. OPEC exceeded its collective target for a 12th consecutive month in May.
Crude paced gains in gasoline after the Environmental Protection Agency (EPA) proposed lowering the mandate for corn ethanol this year and next. After delaying rules for using ethanol, biodiesel and cellulosic fuels for more than a year, the EPA said corn ethanol levels should be set at 13.4 billion gallons this year and 14 billion gallons for 2016. The quota for biodiesel would increase to 1.7 billion gallons this year and 1.8 billion gallons next. This rule may increase refinery demand for oil and be supportive for gasoline.
Futures extended their advance after drillers idled oil rigs for the 25th straight week (RIG<GO>). Baker Hughes Inc. said on May 29 that the number of active oil rigs slipped by a further 13 to 646, down from 1,482 at the start of the year. Crude inventories (DOESCRUD Index HCP <GO>) fell for a fourth week, the longest series of declines since September 2014, according to the Energy Information Administration (EIA). Crude stockpiles in the U.S., the world’s biggest consumer, fell by 2.8 million barrels to 479.4 million in the week ended May 22. Supplies are, however, still almost 100 million barrels above the five-year average for this time of the year (DOESCRUD Index SEAG <GO>). Production (DOETCRUD Index GP <GO>) rose by 304,000 barrels a day to 9.57 million, according to the EIA. That’s the highest level since January 1983.
BCOM: TABLES & CHARTS - MAY 2015 ///////////////////////////////////////////////////////////////////////////////////////////////////////////////////////////////////////////////////////////////////////////////////////////////////////////////////////////////////////////////////
2

Industrial Metals (16% weight in BCOM)
While the Bloomberg Industrial Metals Index (BCOMIN Index) dropped 7.7% in May, investors are buying into industrial-metal funds at a faster pace than any other commodity, underscoring optimism about the health of the global economy. U.S. ETPs backed by the metals attracted $71.1 million in May, putting flows on track for the biggest monthly increase since 2012, according to data compiled by Bloomberg as of May 27. The extra funds represent a 22% increase in market value, more than other commodity groups.
Money managers are betting that China’s efforts to kickstart its slowing economy, including three interest-rate cuts in six months, will succeed in increasing demand for raw materials. The country, the biggest consumer of industrial metals, is expected to lower rates (PBOC <GO>) this year by the most since the global financial crisis, a Bloomberg survey of economists in May showed. China has been responsible for the growth in demand for copper globally over the past 10 years, but for the past year, the figure for demand growth has been flat.
Bloomberg surveyed 12 copper traders and analysts in the last week of May, showing that the majority are bearish on prices. Supply disruptions and shutdowns at mines around the world could support the bullish case for metals. Violent protests against Peru’s Tia Maria mine project in the past two months threaten the nation’s goal of becoming a significant copper producer. Zinc mines in Australia and Ireland are scheduled to close later this year, while Indonesia has banned nickel ore exports.
Precious Metals (15.9% weight in BCOM)
Gold traders should get ready for a change of pace in their markets. Prices have seesawed for the past two months, leaving the metal trapped in the tightest trading range in two years (XAU Curncy GPMA <GO>). That’s historically a sign of more volatility to come. When similar periods of calm blanketed the market, the metal swings 3.3% on average in the five days after breaking out of the band, almost twice the usual weekly change.
Gold moved around $1,200 an ounce as bullish catalysts, such as signs of faster inflation (ILBE <GO>), were offset by speculation the Fed will soon raise interest rates. While the weaker dollar usually draws buyers to gold, there’s also less demand for haven assets with equities near all-time highs.
Livestock (5% weight in BCOM)
The Bloomberg Livestock Index (BCOMLI) had a positive May, gaining 2.3%. The cost of beef is now more than three times as much as pork, compared with an average of 2.2 times in the past decade, according to USDA data. After a virus killed millions of piglets last year, farmers expanded herds and took advantage of lower grain prices to fatten animals. That drove hog prices 33% lower in the past 12 months. Retail pork-chop prices fell 8.6% from a record reached in October, while bacon dropped 15% from its peak in June. Hedge funds are now betting the slump won’t last as the lure of lower-cost meat stimulates demand (BIL 1091 <GO>).
Softs (6.4% weight in BCOM)
There’s nothing sweet in the sugar market for bulls these days. The Bloomberg Sugar Index (BCOMSB Index) was dragged lower as prices tumbled to a six-year low on May 27 as Brazil, the world’s biggest producer and exporter, saw the real extend a slump against the dollar. The commodity recorded a third monthly loss since January, crumbling under the pressure of the weaker South American currency that’s cutting costs for growers and adding to concern the global glut will keep expanding. World production is set to exceed demand for a fifth straight season, the International Sugar Organization said in May, increasing its outlook for the surplus. Farmers in Brazil’s main growing region are poised to collect a bigger cane crop as rains revive plants after a drought last year. Futures have tumbled 30% in the past 12 months, the biggest loss among non-energy materials tracked by the Bloomberg Commodity Index (BCOM). Even though prices have fallen, Brazil’s farmers are anxious to increase exports that are priced in dollars. Hedge funds are betting the slump in prices will continue. Money managers held a net-bearish position of 32,025 futures and options contracts as of May 19, the latest U.S. government data show. The investors have been net-short for 16 straight weeks.
Arabica-coffee futures fell to the lowest in more than a year amid signs of increasing global supplies and improved crop prospects for Brazil, the world’s biggest producer. In 2014, parched Brazilian crops sent arabica futures surging 50% in New York, the biggest gain among 22 raw materials tracked by BCOM. Arabica, favored by specialty roasters such as Starbucks, is the worst performer in the index this year, as ample rains boost the outlook for South American harvests.
BCOM: TABLES & CHARTS - MAY 2015 ///////////////////////////////////////////////////////////////////////////////////////////////////////////////////////////////////////////////////////////////////////////////////////////////////////////////////////////////////////////////////
3
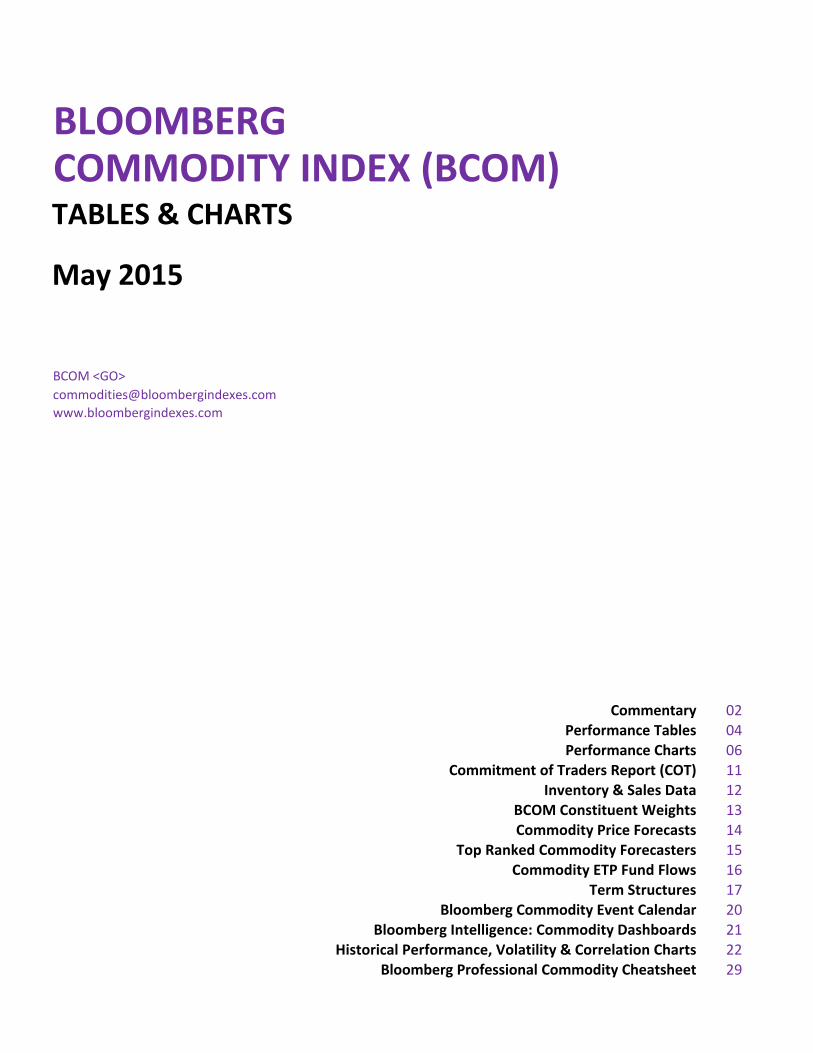
BCOM Composite Indices
May Apr Mar YTD 1-Year 3-Year 5-Year 10-Year 20-YearBloomberg Commodity Index BCOM -2.70% 5.73% -5.14% -3.24% -24.57% -21.37% -19.48% -33.03% 4.76%
Bloomberg Commodity TR Index BCOMTR -2.70% 5.73% -5.14% -3.23% -24.55% -21.24% -19.21% -23.38% 74.94%Bloomberg Commodity Spot Index BCOMSP -2.59% 6.87% -4.75% -0.10% -22.04% -16.04% -1.74% 60.17% 209.19%
Bloomberg Roll Select BCOMRS -3.04% 4.83% -4.86% -3.90% -23.22% -20.02% -12.80% 8.22% 130.63%1 Month Forward BCOMF1 -2.88% 5.54% -4.97% -3.21% -23.22% -18.88% -14.10% -13.84% 89.88% 2 Month Forward BCOMF2 -2.91% 5.17% -5.00% -3.66% -23.10% -20.74% -15.73% -4.06% 111.66% 3 Month Forward BCOMF3 -2.89% 4.93% -4.87% -3.63% -22.24% -19.39% -13.56% 4.60% 120.01% 4 Month Forward BCOMF4 -2.89% 4.85% -4.70% -3.47% -21.62% -18.38% -10.45% 16.80% 5 Month Forward BCOMF5 -2.88% 4.73% -4.63% -3.36% -21.62% -19.54% -10.84% 20.01% 6 Month Forward BCOMF6 -2.89% 4.54% -4.58% -3.48% -21.27% -19.26% -10.43% 23.89%
Energy BCOMEN -2.13% 13.84% -9.22% 2.27% -41.81% -29.19% -47.68% -82.24% -26.33%Petroleum BCOMPE -1.08% 17.87% -10.65% 6.72% -41.03% -30.41% -23.81% -53.11% 128.49%Agriculture BCOMAG -3.51% -0.53% -5.37% -12.49% -29.02% -23.69% -0.93% -15.27% -47.11%
Softs BCOMSO -7.94% 7.79% -8.97% -14.37% -33.55% -38.16% -16.95% -42.34% -63.50%Grains BCOMGR -3.07% -4.07% -3.56% -14.63% -29.81% -22.69% 1.07% -17.83% -53.27%
Industrial Metals BCOMIN -7.70% 7.80% -1.07% -5.79% -13.12% -20.54% -26.47% 14.97% 16.59%Precious Metals BCOMPR 1.29% -0.84% -1.82% 1.74% -6.58% -29.80% -5.99% 120.90% 89.12%
Livestock BCOMLI 2.34% 1.73% 1.31% -6.08% -6.64% 2.46% 0.00% -51.36% -63.10%Ex-Energy BCOMXE -3.02% 1.64% -2.98% -7.12% -18.65% -21.86% -7.97% 9.96% -10.40%
Ex-Petroleum BCOMXPE -3.33% 1.69% -3.17% -8.03% -22.60% -22.16% -22.44% -33.56%Ex-Agriculture BCOMXAG -2.40% 8.23% -5.04% 0.47% -23.33% -21.49% -28.28% -42.76%
Ex-Softs BCOMXSO -2.32% 5.58% -4.85% -2.51% -23.99% -20.14% -20.23% -33.21%Ex-Grains BCOMXGR -2.63% 7.69% -5.45% -0.89% -23.68% -22.02% -24.99% -39.51%
Ex-Industrial Metals BCOMXIM -1.69% 5.32% -5.91% -2.67% -26.82% -21.64% -18.19% -44.82%Ex-Precious Metals BCOMXPM -3.42% 7.01% -5.77% -4.30% -27.68% -20.54% -22.35% -42.98%
Ex-Livestock BCOMXLI -2.95% 5.94% -5.46% -3.04% -25.62% -22.65% -20.54% -31.40%Ex-Agriculture & Livestock BCOMXAL -2.74% 8.72% -5.49% 1.06% -24.91% -23.51% -30.55% -42.06%
BCOM Single Commodity Indices
May Apr Mar YTD 1-Year 3-Year 5-Year 10-Year 20-YearNatural Gas BCOMNG -5.70% 1.93% -4.73% -14.48% -48.53% -32.69% -81.68% -98.64% -98.79%WTI Crude BCOMCL -0.68% 20.82% -8.71% 2.17% -44.56% -34.60% -37.44% -65.86% 79.98%
Brent Crude BCOMCO -2.74% 18.17% -12.28% 4.26% -45.41% -34.84% -10.54% -27.81% 400.63%ULS Diesel BCOMHO -1.83% 15.17% -11.69% 8.10% -31.39% -25.61% -8.98% -38.01% 138.14%
Unleaded Gasoline BCOMRB 1.65% 14.94% -10.17% 18.01% -35.36% -17.31% 20.56% -8.28% 327.74%Corn BCOMCN -4.03% -4.61% -4.32% -15.03% -31.58% -29.40% -1.04% -38.07% -82.94%
Soybeans BCOMSY -4.30% -0.18% -5.67% -9.61% -27.69% 6.27% 50.09% 62.52% 157.62%Wheat BCOMWH 0.63% -7.06% -0.24% -18.83% -28.30% -39.23% -41.34% -65.66% -93.14%
Soybean Oil BCOMBO 5.31% 3.51% -7.77% 2.40% -16.31% -38.62% -28.54% -24.01% -60.19%Soybean Meal BCOMSM -3.29% -3.29% -4.56% -10.20% -21.39% 44.03% 122.12% 215.18% 790.49%HRW Wheat BCOMKW -0.05% -11.46% 3.66% -21.30% -33.89% -35.47% -25.62% -37.06% -70.63%
Copper BCOMHG -5.49% 5.27% 1.80% -3.51% -12.90% -21.08% -17.95% 85.41% 127.56%Alumnium BCOMAL -10.73% 7.62% -1.92% -7.95% -9.93% -29.10% -37.55% -44.80% -64.09%
Zinc BCOMZS -7.15% 12.88% 0.74% -0.26% 4.19% 3.65% -7.10% 22.32% -12.49%Nickel BCOMNI -9.70% 12.48% -12.23% -17.27% -35.67% -26.12% -44.87% -21.86% 74.09%Gold BCOMGC 0.54% -0.07% -2.55% 0.23% -4.92% -25.12% -5.09% 129.58% 79.38%Silver BCOMSI 3.39% -2.94% 0.24% 6.50% -11.84% -42.02% -14.10% 76.90% 74.84%Sugar BCOMSB -9.10% 11.32% -13.36% -16.64% -42.59% -54.95% -18.03% -38.61% -33.18%Coffee BCOMKC -8.22% 1.47% -5.41% -26.97% -35.54% -41.21% -37.28% -62.87% -82.81%Cotton BCOMCT -5.20% 7.36% -2.82% 6.11% -16.53% 1.17% 20.32% -31.08% -86.35%
Lean Hogs BCOMLH 2.78% 7.42% -6.51% -15.79% -32.92% -20.15% -30.81% -76.69% -89.91%Live Cattle BCOMLC 2.05% -1.72% 6.14% -0.40% 12.67% 17.18% 22.81% -26.39% -25.17%
Index Name Ticker
Index Name Ticker
PERFORMANCE: Bloomberg Commodity Indices
2015
2015
BCOM: TABLES & CHARTS - MAY 2015 ///////////////////////////////////////////////////////////////////////////////////////////////////////////////////////////////////////////////////////////////////////////////////////////////////////////////////////////////////////////////////
4

BCOM Composite Roll Select Indices
May Apr Mar YTD 1-Year 3-Year 5-Year 10-Year 20-YearBCOM Roll Select BCOMRS -3.04% 4.83% -4.86% -3.90% -23.22% -20.02% -12.80% 8.22% 130.63%
Roll Select Agriculture BCOMRAG -3.89% -0.91% -5.22% -13.40% -28.42% -22.48% 5.45% 22.29% -4.45%Roll Select Ex-Ags & Livestock BBURXAL -3.02% 7.62% -5.17% 0.44% -23.37% -22.42% -24.51% -6.35%
Roll Select Grains BCOMRGR -3.45% -4.15% -3.31% -14.67% -29.80% -23.15% 5.27% 22.03% -14.27%Roll Select Softs BCOMRSO -8.10% 6.53% -8.95% -17.09% -32.42% -34.49% -6.95% -16.27% -33.26%
Roll Select Livestock BCOMRLI 1.67% 0.29% 2.08% -4.95% -2.41% 8.35% 20.37% 6.48%Roll Select Energy BCOMREN -2.86% 11.64% -8.50% 1.32% -38.98% -27.64% -38.52% -58.03%
Roll Select Ex-Energy BCOMRXE -3.15% 1.32% -2.87% -7.45% -17.91% -20.57% -3.04% 51.85%Roll Select Petroleum BCOMRPE -2.10% 15.08% -10.26% 4.14% -39.10% -27.62% -16.22% -6.07% 578.84%
Roll Select Industrial Metals BCOMRIN -7.28% 7.60% -1.08% -5.61% -12.54% -18.94% -23.68% 49.62% 79.74%Roll Select Precious Metals BCOMRPR 1.29% -0.83% -1.81% 1.81% -6.47% -29.67% -5.52% 123.98% 94.59%
BCOM Single Commodity Roll Select Indices
May Apr Mar YTD 1-Year 3-Year 5-Year 10-Year 20-YearNatural Gas RS BCOMRNG -5.41% 1.51% -2.93% -9.87% -42.24% -31.29% -71.66% -94.33% -74.39%WTI Crude RS BCOMRCL -2.52% 15.04% -8.77% -1.15% -44.20% -33.03% -27.39% -14.59% 667.64%
Brent Crude RS BCOMRCO -2.69% 14.32% -10.82% 2.96% -39.85% -29.37% -9.24% 9.11% 727.62%ULS Diesel RS BCOMRHO -1.83% 15.17% -11.69% 8.10% -32.05% -27.10% -12.06% -9.47% 337.32%
Unleaded Gasoline RS BCOMRRB -0.30% 16.61% -10.86% 13.22% -33.19% -11.26% 17.00% 14.21% 530.44%Corn RS BCOMRCN -4.44% -4.62% -3.98% -14.25% -30.90% -34.04% -1.24% -9.31% -69.67%
Soybeans RS BCOMRSY -4.88% -0.31% -5.25% -10.35% -26.87% 10.49% 58.49% 105.42% 199.82%Wheat RS BCOMRWH 0.63% -7.06% -0.28% -19.58% -30.83% -38.55% -34.31% -30.15% -66.39%
Soybean Oil RS BCOMRBO 4.47% 3.87% -7.68% 1.95% -17.10% -36.89% -23.05% -4.14% -32.58%Soybean Meal RS BCOMRSM -3.84% -4.21% -4.56% -11.56% -20.82% 54.96% 132.69% 271.72% 961.14%HRW Wheat RS BCOMRKW -0.05% -11.46% 3.30% -21.49% -34.07% -34.61% -21.46% 6.33% -30.39%
Copper RS BCOMRHG -5.59% 5.28% 1.80% -3.60% -12.85% -21.08% -16.55% 125.13% 230.36%Alumnium RS BCOMRAL -9.12% 7.04% -1.85% -6.98% -8.67% -25.50% -33.06% -25.84% -42.10%
Zinc RS BCOMRZS -7.15% 12.57% 0.54% -0.74% 4.49% 6.25% -4.34% 65.25% 40.28%Nickel RS BCOMRNI -9.68% 12.32% -12.12% -17.20% -34.96% -25.02% -42.64% 8.07% 198.63%Gold RS BCOMRGC 0.54% -0.07% -2.55% 0.25% -4.90% -25.16% -5.01% 128.86% 80.19%Silver RS BCOMRSI 3.37% -2.88% 0.27% 6.71% -11.44% -41.42% -12.53% 88.42% 93.79%Sugar RS BCOMRSB -9.24% 9.29% -13.60% -21.85% -40.08% -48.86% -12.44% 7.88% 25.62%Coffee RS BCOMRKC -8.39% 0.74% -4.85% -25.88% -33.69% -39.54% -30.26% -54.01% -71.82%Cotton RS BCOMRCT -5.20% 7.36% -2.82% 5.37% -19.07% -0.56% 34.44% -7.92% -75.11%
Lean Hogs RS BCOMRLH 1.04% 3.94% -4.16% -10.37% -20.87% 0.04% 2.41% -3.57% 6.37%Live Cattle RS BCOMRLC 2.05% -1.72% 5.89% -1.38% 9.91% 12.21% 29.70% 6.42% 62.05%
PERFORMANCE: Bloomberg Commodity Roll Select Indices
Index Name Ticker 2015
Index Name Ticker 2015
BCOM: TABLES & CHARTS - MAY 2015 ///////////////////////////////////////////////////////////////////////////////////////////////////////////////////////////////////////////////////////////////////////////////////////////////////////////////////////////////////////////////////
5

Commodities vs. Equities vs. Bond vs. USD
PERFORMANCE: Bloomberg Commodity IndicesFigure 1: Return
Figure 3: Return
Figure 5: Correlation (Realized, 60 days)
Figure 2: Volatility (Realized, 60 days)
Figure 4: Volatility (Realized, 60 days)
BCOM was positively correlated with U.S. large cap stocks and US Treasuries, and was negatively correlated with the U.S. dollar throughout May.
The Bloomberg Commodity Indices were down in May. The 60-day moving volatilities for the main BCOM family have come down.
Commodities underperformed equities, bonds and the U.S. dollar in May. The 60-day moving volatility for commodities remained higher than equities, bonds and the dollar throughout the quarter.
-5%
-4%
-3%
-2%
-1%
0%
1%
2%
3%
Apr-2015 May-2015
Bloomberg CommodityIndex
Bloomberg Roll SelectCommodity Index
Bloomberg CommodityIndex 3 Month Forward
Bloomberg Commodityex-Ags & LivestockIndex
12%
13%
14%
15%
16%
17%
18%
19%
20%
21%
Apr-2015 May-2015
BloombergCommodity Index
Bloomberg RollSelect CommodityIndexBloombergCommodity Index 3Month ForwardBloombergCommodity ex-Ags &Livestock Index
-4%
-3%
-2%
-1%
0%
1%
2%
3%
Apr-2015 May-2015
BloombergCommodity Index
S&P 500 Index
Bloomberg USTreasury Bond Index
Bloomberg DollarSpot Index 0%
2%4%6%8%
10%12%14%16%18%
Apr-2015 May-2015
BloombergCommodity Index
S&P 500 Index
Bloomberg USTreasury Bond Index
Bloomberg DollarSpot Index
-70%-60%-50%-40%-30%-20%-10%
0%10%20%30%40%
Apr-2015 May-2015
BCOM - S&P 500Index
BCOM - BloombergUS Treasury BondIndex
BCOM - BloombergDollar Spot Index
BCOM: TABLES & CHARTS - MAY 2015 ///////////////////////////////////////////////////////////////////////////////////////////////////////////////////////////////////////////////////////////////////////////////////////////////////////////////////////////////////////////////////
6

Figure 8: Return vs. Previous Quarters
PERFORMANCE: BCOM SubgroupsFigure 6: Return Figure 7: Volatility (Realized, 60 days)
Figure 9: Volatility vs. Previous Quarters
Figure 10: Correlation Between Energy and GroupsEnergy was positively correlated with Grains, Industrial Metals, Precious Metals, Softs and Livestock during May.
Figure 11: Correlation (1-year Daily Returns)
-10%
-8%
-6%
-4%
-2%
0%
2%
4%
6%
8%
Apr-2015 May-2015
Energy
Grains
Industrial Metals
Precious Metals
Softs
Livestock10%
15%
20%
25%
30%
35%
40%
Apr-2015 May-2015
Energy
Grains
Industrial Metals
Precious Metals
Softs
Livestock
-40%
-30%
-20%
-10%
0%
10%
20%
Energy Grains IndustrialMetals
PreciousMetals
Softs Livestock BCOM
May '15 Apr '15 1Q15 4Q14 3Q14
0%
5%
10%
15%
20%
25%
30%
35%
40%
45%
Energy Grains IndustrialMetals
PreciousMetals
Softs Livestock BCOM
May '15 Apr '15 1Q15 4Q14 3Q14
-10%
0%
10%
20%
30%
40%
50%
60%
Energy-Grains Energy-Industrial
Metals
Energy-PreciousMetals
Energy-Softs Energy-Livestock
May '15 Apr '15 1Q15 4Q14 3Q14
Jun 2014 - May 2015 Energy Grains Industrial Metals
Precious Metals
Softs Livestock
Energy 100%
Grains 15% 100%
Industrial Metals 19% 16% 100%
Precious Metals 17% 14% 24% 100%
Softs 9% 21% 23% 17% 100%
Livestock 16% 6% 17% 15% 19% 100%
S&P 500 Index 12% 13% 16% -11% -1% 2%
Bloomberg US Treasury Bond Index
-10% -4% -12% 21% 2% -3%
Bloomberg Dollar Spot Index
-31% -20% -8% -35% -29% -14%
BCOM: TABLES & CHARTS - MAY 2015 ///////////////////////////////////////////////////////////////////////////////////////////////////////////////////////////////////////////////////////////////////////////////////////////////////////////////////////////////////////////////////
7

PERFORMANCE: BCOM Single Commodity IndicesFigure 13: Return
Figure 14: Volatility
Figure 15: Correlation
-12%
-10%
-8%
-6%
-4%
-2%
0%
2%
4%
6%
8%
0%5%
10%15%20%25%30%35%40%45%
Jun '14 to May '15 daily returns
Nat
ural
Gas
WTI
Cru
de
Bren
t Cru
de
ULS
Die
sel
Unl
eade
d Ga
solin
e
Corn
Soyb
eans
Whe
at
Soyb
ean
Oil
Soyb
ean
Mea
l
HRW
Whe
at
Copp
er
Alum
nium
Zinc
Nick
el
Gold
Silv
er
Suga
r
Coff
ee
Cott
on
Lean
Hog
s
Live
Catt
le
Natural Gas 100%WTI Crude 22% 100%Brent Crude 21% 94% 100%ULS Diesel 22% 89% 97% 100%Unleaded Gasoline 22% 88% 94% 93% 100%Corn 3% 16% 15% 16% 13% 100%Soybeans 2% 18% 17% 18% 18% 64% 100%Wheat 4% 5% 6% 7% 4% 59% 34% 100%Soybean Oil 17% 36% 36% 37% 37% 38% 58% 18% 100%Soybean Meal -2% 7% 7% 8% 8% 58% 89% 31% 25% 100%HRW Wheat 6% 7% 8% 9% 6% 56% 30% 93% 17% 27% 100%Copper -7% 26% 24% 23% 19% 18% 16% 7% 15% 9% 4% 100%Alumnium 7% 25% 23% 23% 22% 15% 12% 2% 16% 7% 1% 51% 100%Zinc -9% 21% 19% 18% 17% 13% 13% -1% 20% 5% -3% 65% 67% 100%Nickel -5% 13% 11% 10% 14% 8% 10% 1% 13% 2% 0% 46% 46% 51% 100%Gold -8% 19% 16% 21% 20% 14% 8% 7% 19% 1% 6% 19% 12% 14% 8% 100%Silver 5% 26% 24% 29% 28% 16% 16% 9% 26% 8% 7% 34% 20% 24% 16% 83% 100%Sugar -1% 10% 7% 8% 5% 18% 22% 16% 17% 17% 13% 21% 23% 27% 23% 10% 13% 100%Coffee 3% 8% 4% 5% 6% 6% 12% 4% 13% 9% 3% 4% 3% 10% 9% 11% 17% 22% 100%Cotton 0% 18% 21% 23% 18% 11% 24% 6% 23% 17% 3% 18% 10% 8% 17% 7% 12% 20% 5% 100%Lean Hogs 6% 14% 11% 10% 11% -5% -2% -7% 2% -3% -6% 13% 11% 18% 5% 4% 10% 6% 12% 9% 100%Live Cattle 6% 16% 14% 12% 14% 15% 8% 12% 17% 3% 10% 12% 12% 12% 9% 13% 20% 15% 10% 14% 28% 100%
S&P 500 Index 2% 14% 17% 13% 12% 10% 11% 13% 7% 9% 12% 15% 14% 10% 7% -15% -4% 4% -9% 18% 3% 0%
Bloomberg US Treasury Bond Index
-3% -12% -12% -8% -8% -1% -7% -4% -9% -6% 0% -10% -14% -12% -2% 26% 10% 0% 1% 7% -5% 0%
Bloomberg Dollar Spot Index
-8% -35% -32% -34% -28% -18% -16% -13% -19% -10% -15% -10% -6% -2% -6% -37% -28% -21% -18% -28% -13% -10%
LivestockEnergy Grains Industrial Metals Precious Softs
BCOM: TABLES & CHARTS - MAY 2015 ///////////////////////////////////////////////////////////////////////////////////////////////////////////////////////////////////////////////////////////////////////////////////////////////////////////////////////////////////////////////////
8

PERFORMANCE: Single Commodity IndiciesENERGY GROUP
GRAINS GROUPFigure 19: Volatility (Realized, 60 days)
INDUSTRIAL METALS GROUPFigure 21: Volatility (Realized, 60 days)
PRECIOUS METALS GROUP
Figure 16: Return
Figure 22: Return
Figure 20: Return
Figure 17: Volatility (Realized, 60 days)
Figure 23: Volatility (Realized, 60 days)
Figure 18: Return
-50%
-40%
-30%
-20%
-10%
0%
10%
20%
30%
Natural Gas WTI Crude Brent Crude ULS Diesel UnleadedGasoline
May '15 Apr '15 1Q15 4Q14 3Q14
-30%
-20%
-10%
0%
10%
20%
30%
Corn Soybeans Wheat Soybean Oil SoybeanMeal
HRW Wheat
May '15 Apr '15 1Q15 4Q14 3Q14
-25%-20%-15%-10%
-5%0%5%
10%15%
Copper Alumnium Zinc Nickel
May '15 Apr '15 1Q15 4Q14 3Q14
0%
5%
10%
15%
20%
25%
30%
35%
40%
Gold Silver
May '15 Apr '15 1Q15 4Q14 3Q14
0%
5%
10%
15%
20%
25%
30%
35%
Copper Alumnium Zinc Nickel
May '15 Apr '15 1Q15 4Q14 3Q14
0%
10%
20%
30%
40%
50%
60%
Natural Gas WTI Crude Brent Crude ULS Diesel UnleadedGasoline
May '15 Apr '15 1Q15 4Q14 3Q14
0%
5%
10%
15%
20%
25%
30%
35%
40%
Corn Soybeans Wheat Soybean Oil SoybeanMeal
HRW Wheat
May '15 Apr '15 1Q15 4Q14 3Q14
-25%
-20%
-15%
-10%
-5%
0%
5%
10%
Gold Silver
May '15 Apr '15 1Q15 4Q14 3Q14
BCOM: TABLES & CHARTS - MAY 2015 ///////////////////////////////////////////////////////////////////////////////////////////////////////////////////////////////////////////////////////////////////////////////////////////////////////////////////////////////////////////////////
9
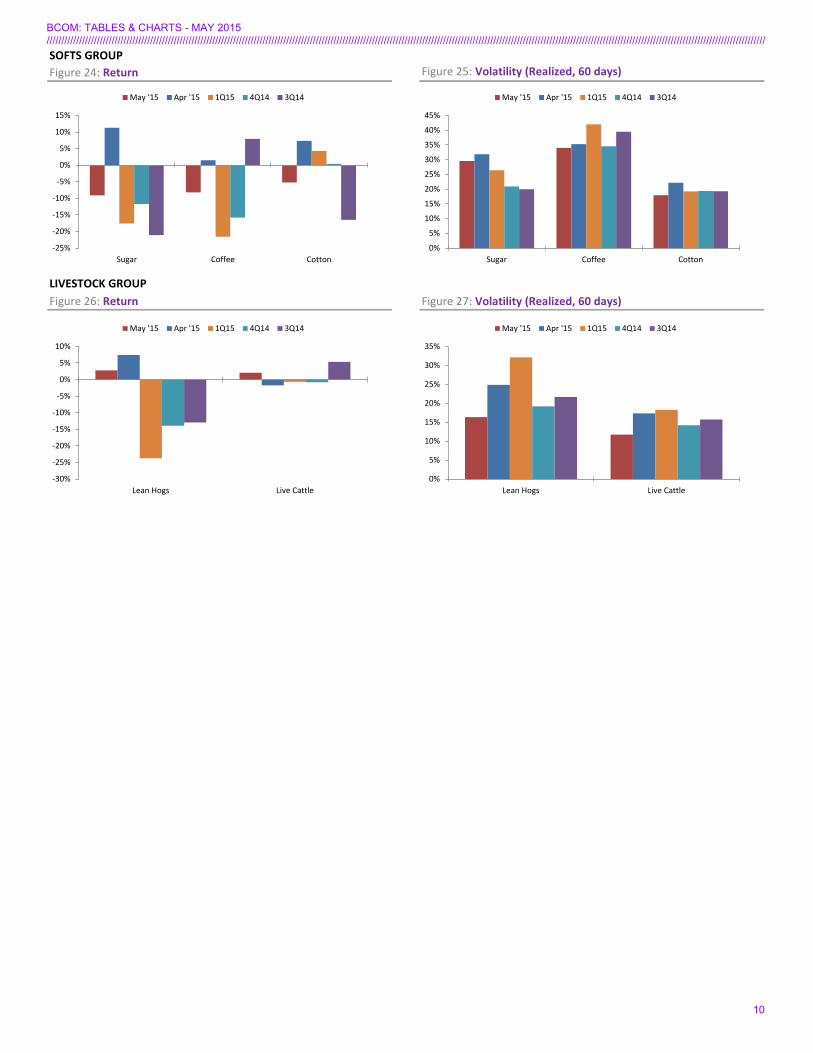
SOFTS GROUPFigure 25: Volatility (Realized, 60 days)
LIVESTOCK GROUPFigure 27: Volatility (Realized, 60 days)
Figure 24: Return
Figure 26: Return
-25%
-20%
-15%
-10%
-5%
0%
5%
10%
15%
Sugar Coffee Cotton
May '15 Apr '15 1Q15 4Q14 3Q14
-30%
-25%
-20%
-15%
-10%
-5%
0%
5%
10%
Lean Hogs Live Cattle
May '15 Apr '15 1Q15 4Q14 3Q14
0%
5%
10%
15%
20%
25%
30%
35%
40%
45%
Sugar Coffee Cotton
May '15 Apr '15 1Q15 4Q14 3Q14
0%
5%
10%
15%
20%
25%
30%
35%
Lean Hogs Live Cattle
May '15 Apr '15 1Q15 4Q14 3Q14
BCOM: TABLES & CHARTS - MAY 2015 ///////////////////////////////////////////////////////////////////////////////////////////////////////////////////////////////////////////////////////////////////////////////////////////////////////////////////////////////////////////////////
10
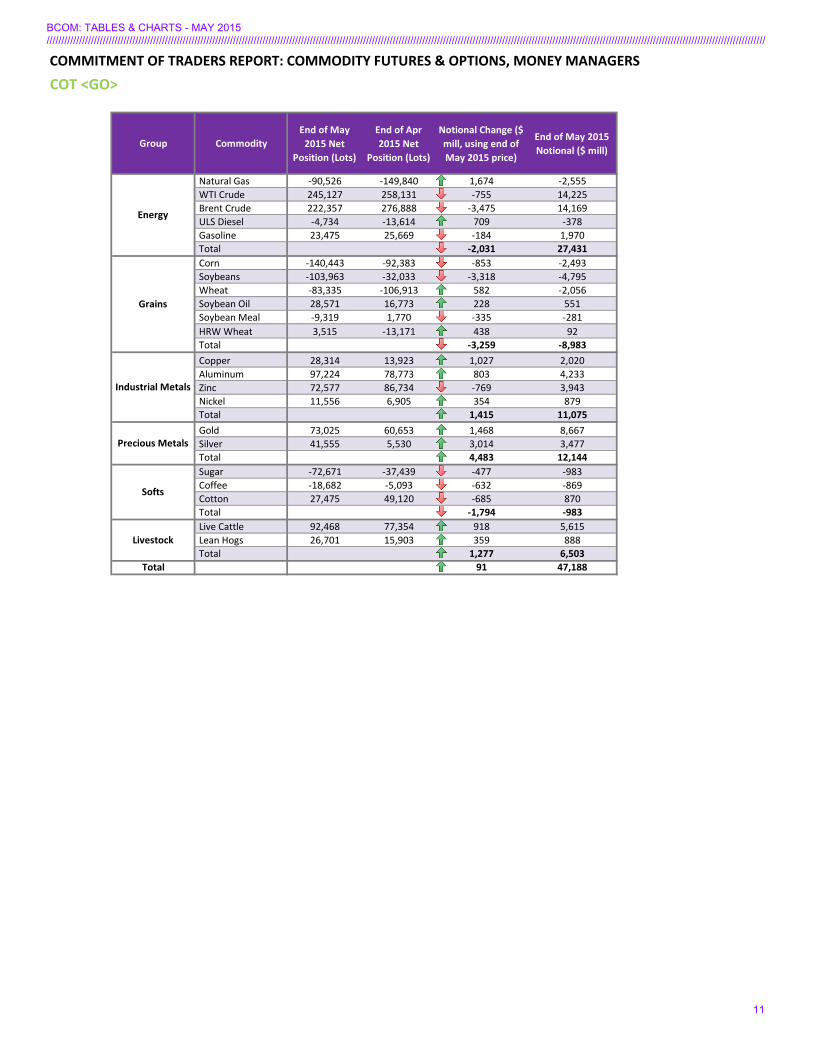
COMMITMENT OF TRADERS REPORT: COMMODITY FUTURES & OPTIONS, MONEY MANAGERS COT <GO>
Group CommodityEnd of May
2015 Net Position (Lots)
End of Apr 2015 Net
Position (Lots)
Notional Change ($ mill, using end of May 2015 price)
End of May 2015 Notional ($ mill)
Natural Gas -90,526 -149,840 1,674 -2,555 WTI Crude 245,127 258,131 -755 14,225 Brent Crude 222,357 276,888 -3,475 14,169 ULS Diesel -4,734 -13,614 709 -378 Gasoline 23,475 25,669 -184 1,970 Total -2,031 27,431 Corn -140,443 -92,383 -853 -2,493 Soybeans -103,963 -32,033 -3,318 -4,795 Wheat -83,335 -106,913 582 -2,056 Soybean Oil 28,571 16,773 228 551 Soybean Meal -9,319 1,770 -335 -281 HRW Wheat 3,515 -13,171 438 92 Total -3,259 -8,983 Copper 28,314 13,923 1,027 2,020 Aluminum 97,224 78,773 803 4,233 Zinc 72,577 86,734 -769 3,943 Nickel 11,556 6,905 354 879 Total 1,415 11,075 Gold 73,025 60,653 1,468 8,667 Silver 41,555 5,530 3,014 3,477 Total 4,483 12,144 Sugar -72,671 -37,439 -477 -983 Coffee -18,682 -5,093 -632 -869 Cotton 27,475 49,120 -685 870 Total -1,794 -983 Live Cattle 92,468 77,354 918 5,615 Lean Hogs 26,701 15,903 359 888 Total 1,277 6,503
Total 91 47,188
Livestock
Energy
Grains
Industrial Metals
Precious Metals
Softs
BCOM: TABLES & CHARTS - MAY 2015 ///////////////////////////////////////////////////////////////////////////////////////////////////////////////////////////////////////////////////////////////////////////////////////////////////////////////////////////////////////////////////
11

GLOBAL COMMODITIES INVENTORIES AND SALES DATAECO17 <GO>
Group Inventory/SalesRelated
CommoditiesUnit
End of May 2015
End of Apr 2014
Change (%)
DOE Natural Gas Total Inventory Natural Gas bcf 2,101 1,710 23%DOE Crude Oil Total Inventory WTI, Brent mm barrels 479 491 -2%DOE Cushing Oklahoma Crude Oil Total Stocks WTI, Brent mm barrels 60 62 -3%DOE Distillate Fuel Oil Total Inventory ULS Diesel mm barrels 129 129 0%DOE Motor Gasoline Total Inventory Gasoline mm barrels 221 227 -3%USDA Corn Total Export Sales Corn thousand MT 648 946 -31%USDA Soybeans Total Export Sales Soybeans thousand MT 378 315 20%USDA All Wheat Total Export Sales Wheat, HRW Wheat thousand MT 296 404 -27%USDA Soybean Oil Total Export Sales Soybean Oil thousand MT 9 32 -71%USDA Soybean Cake Meal Total Export Sales Soybean Meal thousand MT 244 137 78%Comex Copper Total Inventory Copper thousand short ton 23 24 -5%LME Copper Total Inventory Copper mm MT 6 7 -5%LME Primary Aluminum Total Inventory Aluminum mm MT 75 76 -2%LME Zinc Total Inventory Zinc mm MT 9 9 -3%LME Nickel Total Inventory Nickel mm MT 9 9 4%Comex Gold Total Inventory Gold mm ounces 8 8 1%Comex Silver Total Inventory Silver mm ounces 179 174 3%
Softs USDA All Upland Cotton Total Export Sales Cotton thousand bales 175 167 5%USDA Cattle Slaughter Estimates Daily Live Cattle thousand heads 115 115 0%USDA Hogs Slaughter Estimates Daily Lean Hogs thousand heads 422 425 -1%
Livestock
Energy
Grains
Industrial Metals
Precious Metals
BCOM: TABLES & CHARTS - MAY 2015 ///////////////////////////////////////////////////////////////////////////////////////////////////////////////////////////////////////////////////////////////////////////////////////////////////////////////////////////////////////////////////
12
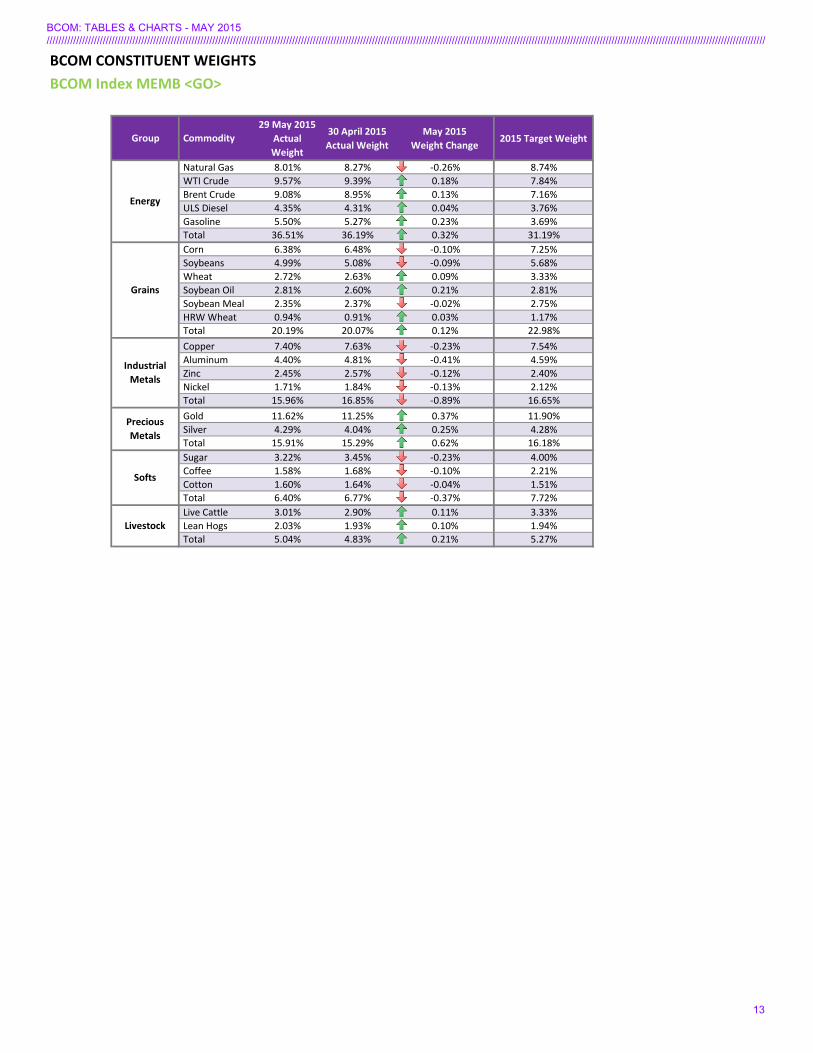
BCOM CONSTITUENT WEIGHTSBCOM Index MEMB <GO>
Group Commodity29 May 2015
Actual Weight
30 April 2015 Actual Weight
May 2015 Weight Change
2015 Target Weight
Natural Gas 8.01% 8.27% -0.26% 8.74% WTI Crude 9.57% 9.39% 0.18% 7.84% Brent Crude 9.08% 8.95% 0.13% 7.16% ULS Diesel 4.35% 4.31% 0.04% 3.76% Gasoline 5.50% 5.27% 0.23% 3.69% Total 36.51% 36.19% 0.32% 31.19% Corn 6.38% 6.48% -0.10% 7.25% Soybeans 4.99% 5.08% -0.09% 5.68% Wheat 2.72% 2.63% 0.09% 3.33% Soybean Oil 2.81% 2.60% 0.21% 2.81% Soybean Meal 2.35% 2.37% -0.02% 2.75% HRW Wheat 0.94% 0.91% 0.03% 1.17% Total 20.19% 20.07% 0.12% 22.98% Copper 7.40% 7.63% -0.23% 7.54% Aluminum 4.40% 4.81% -0.41% 4.59% Zinc 2.45% 2.57% -0.12% 2.40% Nickel 1.71% 1.84% -0.13% 2.12% Total 15.96% 16.85% -0.89% 16.65% Gold 11.62% 11.25% 0.37% 11.90% Silver 4.29% 4.04% 0.25% 4.28% Total 15.91% 15.29% 0.62% 16.18% Sugar 3.22% 3.45% -0.23% 4.00% Coffee 1.58% 1.68% -0.10% 2.21% Cotton 1.60% 1.64% -0.04% 1.51% Total 6.40% 6.77% -0.37% 7.72% Live Cattle 3.01% 2.90% 0.11% 3.33% Lean Hogs 2.03% 1.93% 0.10% 1.94% Total 5.04% 4.83% 0.21% 5.27%
Energy
Livestock
Softs
Precious Metals
Industrial Metals
Grains
BCOM: TABLES & CHARTS - MAY 2015 ///////////////////////////////////////////////////////////////////////////////////////////////////////////////////////////////////////////////////////////////////////////////////////////////////////////////////////////////////////////////////
13

COMMODITY PRICE FORECASTSCPFC <GO>
Group Commodity Q2 15 Q3 15 Q4 15 Q1 16
Forward 2.69 2.69 2.99 3.04Forecast 2.70 2.93 3.40 3.56Forward 58.14 60.85 61.59 62.22Forecast 55.00 59.00 65.00 68.00Forward 64.22 66.80 67.92 68.82Forecast 60.00 65.00 69.40 71.50Forward 191.73 196.97 200.95 203.59Forecast 180.00 186.00 205.00 211.00Forward 199.71 195.24 176.86 184.07Forecast 190.00 180.00 190.00 200.00Forward 361.44 358.46 369.97 379.88Forecast 373.00 385.50 402.50 419.50Forward 954.04 915.20 909.25 916.49Forecast 960.00 926.50 950.00 969.00Forward 489.38 484.28 499.72 513.27Forecast 520.00 540.00 540.50 548.00Forward 6,109 6,015 6,023 6,028Forecast 6,150 6,400 6,500 6,488Forward 1,774 1,741 1,765 1,777Forecast 1,874 1,900 1,940 1,950Forward 2,223 2,188 2,197 2,201Forecast 2,205 2,294 2,341 2,400Forward 12,960 12,622 12,665 12,705Forecast 15,180 16,000 17,578 18,594Forward 1,196 1,190 1,191 1,193Forecast 1,193 1,190 1,220 1,250Forward 16.61 16.73 16.79 16.82Forecast 16.55 17.00 17.30 18.00Forward 12.53 12.28 13.59 13.62Forecast 13.26 14.13 14.80 14.30Forward 132.06 128.53 132.75 136.18Forecast 145.00 156.00 155.00 170.00Forward 64.84 65.21 64.70 64.74Forecast 63.00 63.00 65.00 66.00
Softs
Bloomberg survey of commodity analysts
Energy
Grains
Industrial Metals
Precious Metals
Natural Gas
WTI Crude
Brent Crude
ULS Diesel
Gasoline
Corn
Soybeans
Wheat
Copper
Aluminum
Coffee
Cotton
Zinc
Nickel
Gold
Silver
Sugar
BCOM: TABLES & CHARTS - MAY 2015 ///////////////////////////////////////////////////////////////////////////////////////////////////////////////////////////////////////////////////////////////////////////////////////////////////////////////////////////////////////////////////
14
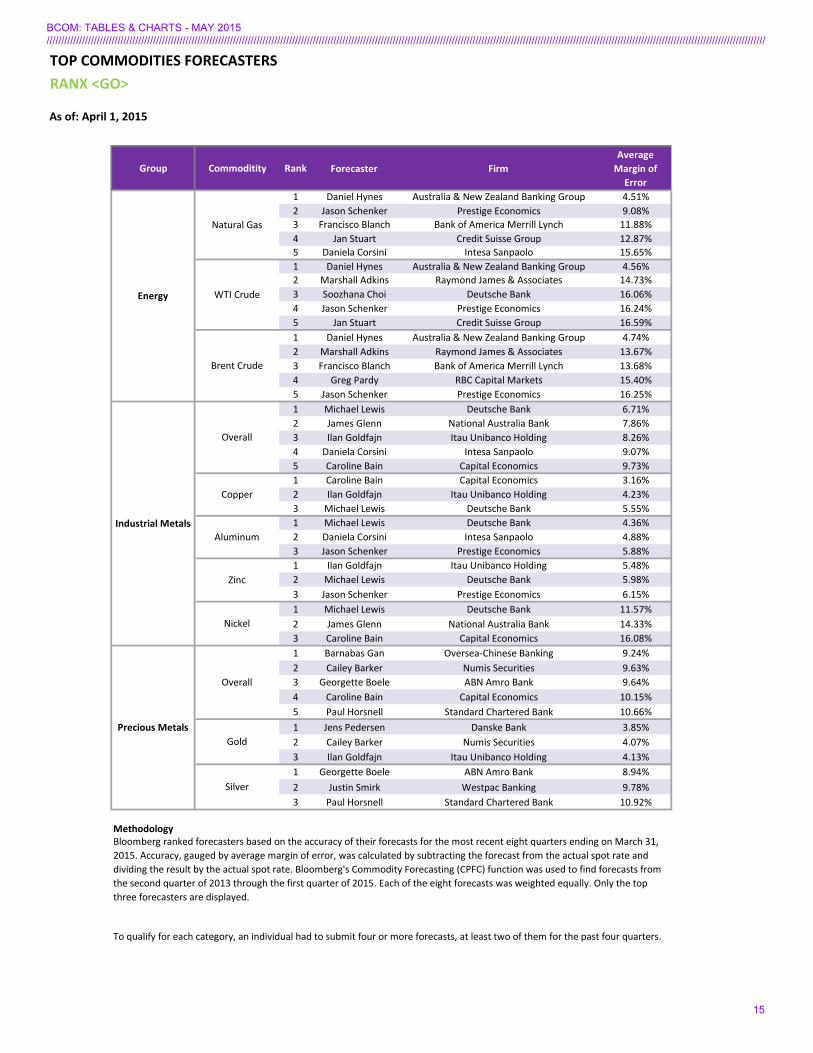
TOP COMMODITIES FORECASTERSRANX <GO>
Group Commoditity Rank Forecaster FirmAverage
Margin of Error
1 Daniel Hynes Australia & New Zealand Banking Group 4.51%2 Jason Schenker Prestige Economics 9.08%3 Francisco Blanch Bank of America Merrill Lynch 11.88%4 Jan Stuart Credit Suisse Group 12.87%5 Daniela Corsini Intesa Sanpaolo 15.65%1 Daniel Hynes Australia & New Zealand Banking Group 4.56%2 Marshall Adkins Raymond James & Associates 14.73%3 Soozhana Choi Deutsche Bank 16.06%4 Jason Schenker Prestige Economics 16.24%5 Jan Stuart Credit Suisse Group 16.59%1 Daniel Hynes Australia & New Zealand Banking Group 4.74%2 Marshall Adkins Raymond James & Associates 13.67%3 Francisco Blanch Bank of America Merrill Lynch 13.68%4 Greg Pardy RBC Capital Markets 15.40%5 Jason Schenker Prestige Economics 16.25%1 Michael Lewis Deutsche Bank 6.71%2 James Glenn National Australia Bank 7.86%3 Ilan Goldfajn Itau Unibanco Holding 8.26%4 Daniela Corsini Intesa Sanpaolo 9.07%5 Caroline Bain Capital Economics 9.73%1 Caroline Bain Capital Economics 3.16%2 Ilan Goldfajn Itau Unibanco Holding 4.23%3 Michael Lewis Deutsche Bank 5.55%1 Michael Lewis Deutsche Bank 4.36%2 Daniela Corsini Intesa Sanpaolo 4.88%3 Jason Schenker Prestige Economics 5.88%1 Ilan Goldfajn Itau Unibanco Holding 5.48%2 Michael Lewis Deutsche Bank 5.98%3 Jason Schenker Prestige Economics 6.15%1 Michael Lewis Deutsche Bank 11.57%2 James Glenn National Australia Bank 14.33%3 Caroline Bain Capital Economics 16.08%1 Barnabas Gan Oversea-Chinese Banking 9.24%2 Cailey Barker Numis Securities 9.63%3 Georgette Boele ABN Amro Bank 9.64%4 Caroline Bain Capital Economics 10.15%5 Paul Horsnell Standard Chartered Bank 10.66%1 Jens Pedersen Danske Bank 3.85%2 Cailey Barker Numis Securities 4.07%3 Ilan Goldfajn Itau Unibanco Holding 4.13%1 Georgette Boele ABN Amro Bank 8.94%2 Justin Smirk Westpac Banking 9.78%3 Paul Horsnell Standard Chartered Bank 10.92%
MethodologyBloomberg ranked forecasters based on the accuracy of their forecasts for the most recent eight quarters ending on March 31, 2015. Accuracy, gauged by average margin of error, was calculated by subtracting the forecast from the actual spot rate and dividing the result by the actual spot rate. Bloomberg's Commodity Forecasting (CPFC) function was used to find forecasts from the second quarter of 2013 through the first quarter of 2015. Each of the eight forecasts was weighted equally. Only the top three forecasters are displayed.
To qualify for each category, an individual had to submit four or more forecasts, at least two of them for the past four quarters.
As of: April 1, 2015
Energy
Industrial Metals
Precious Metals
Natural Gas
WTI Crude
Brent Crude
Overall
Copper
Aluminum
Zinc
Nickel
Overall
Gold
Silver
BCOM: TABLES & CHARTS - MAY 2015 ///////////////////////////////////////////////////////////////////////////////////////////////////////////////////////////////////////////////////////////////////////////////////////////////////////////////////////////////////////////////////
15

COMMODITY FUND FLOWS FOR US-LISTED ETPsXLTP FLOW <GO>
Report Period:4/30/2015 - 5/29/2015
Net Flows ($ mill)
Beginning Fund Market Cap
($ mill)
% of Funds Market Cap
283.87 7,767.86 3.65%-509.64 8,937.18 -5.70%89.17 1,510.75 5.90%-0.11 30.74 -0.34%71.13 321.78 22.10%
-1,043.25 44,314.68 -2.35%-1,108.83 62,882.98 -1.76%
All Commodities Sector: Top 10 Creations
Ticker Name Net Flows ($ mill)
Beginning Fund Market Cap
($ mill)
% of Funds Market Cap
DBC US PowerShares DB Commodity Index 132.26 3,121.80 4.24%UWTI US VelocityShares 3x Long Crude ETN 110.70 813.58 13.61%FTGC US First Trust Global Tactical Co 71.96 227.40 31.65%DBB US PowerShares DB Base Metals Fund 69.85 204.93 34.08%DGAZ US VelocityShares 3x Inverse Natural Gas ETN 44.01 48.82 90.14%DJP US iPath Bloomberg Commodity Index 41.16 1,305.18 3.15%IAU US iShares Gold Trust 40.57 6,407.24 0.63%DBA US PowerShares DB Agriculture Fund 35.98 863.87 4.17%JO US iPath Bloomberg Coffee Subindex 26.53 82.80 32.04%USCI US United States Commodity Index 25.78 532.34 4.84%
All Commodities Sector: Top 10 Redemptions
Ticker Name Net Flows ($ mill)
Beginning Fund Market Cap
($ mill)
% of Funds Market Cap
GLD US SPDR Gold Shares -891.27 28,600.30 -3.12%USO US United States Oil Fund LP -265.85 2,742.36 -9.69%SLV US iShares Silver Trust -177.21 5,416.51 -3.27%UNG US United States Natural Gas Fund -116.62 684.58 -17.04%OIL US iPath Goldman Sachs Crude Oil -63.19 1,146.91 -5.51%DBO US PowerShares DB Oil Fund -59.85 696.93 -8.59%UGAZ US VelocityShares 3x Long Natural Gas ETN -57.77 495.89 -11.65%UCO US ProShares Ultra Bloomberg Crude -33.78 1,093.83 -3.09%DWTI US eVelocityShares 3x Inverse Crud -33.32 199.70 -16.68%SCO US ProShares UltraShort Bloomberg Crude Oil -19.68 280.09 -7.03%
Sector
LivestockIndustrial MetalsPrecious Metals
Total
Broad BasedEnergy
Agriculture
BCOM: TABLES & CHARTS - MAY 2015 ///////////////////////////////////////////////////////////////////////////////////////////////////////////////////////////////////////////////////////////////////////////////////////////////////////////////////////////////////////////////////
16

COMMODITY FUTURES TERM STRUCTUREENERGY GROUP
GRAINS GROUP
2.5
3.5
4.5
5.5
JUN
15
DEC
15JU
N 1
6DE
C 16
JUN
17
DEC
17JU
N 1
8DE
C 18
JUN
19
DEC
19JU
N 2
0DE
C 20
JUN
21
DEC
21JU
N 2
2DE
C 22
JUN
23
DEC
23JU
N 2
4DE
C 24
JUN
25
DEC
25JU
N 2
6DE
C 26
JUN
27
Natural Gas
30-Apr-2015 29-May-2015
40
50
60
70
JUN
15
SEP
15DE
C 15
MAR
16
JUN
16
SEP
16DE
C 16
MAR
17
JUN
17
SEP
17DE
C 17
MAR
18
JUN
18
SEP
18DE
C 18
MAR
19
JUN
19
SEP
19DE
C 19
MAR
20
JUN
20
SEP
20DE
C 20
WTI Crude
30-Apr-2015 29-May-2015
5060708090
JUN
15
OCT
15
FEB
16
JUN
16
OCT
16
FEB
17
JUN
17
OCT
17
FEB
18
JUN
18
OCT
18
FEB
19
JUN
19
OCT
19
FEB
20
JUN
20
OCT
20
FEB
21
JUN
21
OCT
21
FEB
22
Brent Crude
30-Apr-2015 29-May-2015
150170190210230
MAY
15
JUL
15
SEP
15
NO
V 15
JAN
16
MAR
16
MAY
16
JUL
16
SEP
16
NO
V 16
JAN
17
MAR
17
MAY
17
JUL
17
SEP
17
NO
V 17
JAN
18
MAR
18
MAY
18
JUL
18
ULS Diesel
30-Apr-2015 29-May-2015
140
160
180
200
MAY
15
JUL
15
SEP
15
NO
V 15
JAN
16
MAR
16
MAY
16
JUL
16
SEP
16
NO
V 16
JAN
17
MAR
17
MAY
17
JUL
17
SEP
17
NO
V 17
JAN
18
MAR
18
Unleaded Gasoline
30-Apr-2015 29-May-2015
450
500
550
600
MAY
15
JUL
15
SEP
15
DEC
15
MAR
16
MAY
16
JUL
16
SEP
16
DEC
16
MAR
17
MAY
17
JUL
17
#N/A
Inva
lidSe
curit
y
Wheat
30-Apr-2015 29-May-2015
3030.5
3131.5
3232.5
3333.5
3434.5
MAY
15
JUL
15AU
G 15
SEP
15O
CT 1
5DE
C 15
JAN
16
MAR
16
MAY
16
JUL
16AU
G 16
SEP
16O
CT 1
6DE
C 16
JAN
17
MAR
17
MAY
17
JUL
17AU
G 17
SEP
17O
CT 1
7
Soybean Oil
30-Apr-2015 29-May-2015
300
350
400
450
MAY
15
JUL
15
SEP
15
DEC
15
MAR
16
MAY
16
JUL
16
SEP
16
DEC
16
MAR
17
MAY
17
JUL
17
SEP
17
Corn
30-Apr-2015 29-May-2015
850
900
950
1000
1050
MAY
15
JUL
15
AUG
15
SEP
15
NO
V 15
JAN
16
MAR
16
MAY
16
JUL
16
AUG
16
SEP
16
NO
V 16
JAN
17
MAR
17
MAY
17
JUL
17
AUG
17
Soybeans
30-Apr-2015 29-May-2015
BCOM: TABLES & CHARTS - MAY 2015 ///////////////////////////////////////////////////////////////////////////////////////////////////////////////////////////////////////////////////////////////////////////////////////////////////////////////////////////////////////////////////
17

COMMODITY FUTURES TERM STRUCTURE
INDUSTRIAL METALS GROUP
PRECIOUS METALS GROUP
280
290
300
310
320
330
MAY
15
JUL
15AU
G 15
SEP
15O
CT 1
5DE
C 15
JAN
16
MAR
16
MAY
16
JUL
16AU
G 16
SEP
16O
CT 1
6DE
C 16
JAN
17
MAR
17
MAY
17
JUL
17AU
G 17
SEP
17O
CT 1
7
Soybean Meal
30-Apr-2015 29-May-2015
460480500520540560580600
MAY
15
JUL
15
SEP
15
DEC
15
MAR
16
MAY
16
JUL
16
SEP
16
DEC
16
MAR
17
MAY
17
JUL
17
#N/A
Inva
lid…
#N/A
Inva
lid…
#N/A
Inva
lid…
HRW Wheat
30-Apr-2015 29-May-2015
250255260265270275280285290295
MAY
15
JUL
15
SEP
15
NO
V 15
JAN
16
MAR
16
MAY
16
JUL
16
SEP
16
NO
V 16
JAN
17
MAR
17
MAY
17
SEP
17
MAR
18
JUL
18
DEC
18
MAY
19
SEP
19
MAR
20
Copper
30-Apr-2015 29-May-2015
170018001900200021002200230024002500
MAY
15
OCT
15
MAR
16
AUG
16JA
N 1
7JU
N 1
7N
OV
17AP
R 18
SEP
18FE
B 19
JUL
19DE
C 19
MAY
20
OCT
20
MAR
21
AUG
21JA
N 2
2JU
N 2
2N
OV
22AP
R 23
SEP
23FE
B 24
JUL
24DE
C 24
MAY
25
Aluminum
30-Apr-2015 29-May-2015
11501170119012101230125012701290
MAY
15
JUN
15
JUL
15AU
G 15
OCT
15
DEC
15FE
B 16
APR
16JU
N 1
6AU
G 16
OCT
16
DEC
16FE
B 17
JUN
17
DEC
17JU
N 1
8DE
C 18
JUN
19
DEC
19JU
N 2
0DE
C 20
Gold
30-Apr-2015 29-May-2015
1515.5
1616.5
1717.5
1818.5
MAY
15
JUN
15
JUL
15
SEP
15
DEC
15
JAN
16
MAR
16
MAY
16
JUL
16
SEP
16
DEC
16
JAN
17
MAR
17
JUL
17
DEC
17
JUL
18
DEC
18
JUL
19
DEC
19
Silver
30-Apr-2015 29-May-2015
20502100215022002250230023502400
MAY
15
AUG
15N
OV
15FE
B 16
MAY
16
AUG
16N
OV
16FE
B 17
MAY
17
AUG
17N
OV
17FE
B 18
MAY
18
AUG
18N
OV
18FE
B 19
MAY
19
AUG
19N
OV
19FE
B 20
MAY
20
Zinc
30-Apr-2015 29-May-2015
1100011500120001250013000135001400014500
MAY
15
AUG
15N
OV
15FE
B 16
MAY
16
AUG
16N
OV
16FE
B 17
MAY
17
AUG
17N
OV
17FE
B 18
MAY
18
AUG
18N
OV
18FE
B 19
MAY
19
AUG
19N
OV
19FE
B 20
MAY
20
AUG
20
Nickel
30-Apr-2015 29-May-2015
BCOM: TABLES & CHARTS - MAY 2015 ///////////////////////////////////////////////////////////////////////////////////////////////////////////////////////////////////////////////////////////////////////////////////////////////////////////////////////////////////////////////////
18

COMMODITY FUTURES TERM STRUCTURESOFTS GROUP
LIVESTOCK GROUP
10
11
12
13
14
15
16
MAY
15
JUL
15
OCT
15
MAR
16
MAY
16
JUL
16
OCT
16
MAR
17
MAY
17
JUL
17
OCT
17
MAR
18
Sugar
30-Apr-2015 29-May-2015
120125130135140145150155160165
MAY
15
JUL
15
SEP
15
DEC
15
MAR
16
MAY
16
JUL
16
SEP
16
DEC
16
MAR
17
MAY
17
JUL
17
SEP
17
DEC
17
MAR
18
Coffee
30-Apr-2015 29-May-2015
60616263646566676869
MAY
15
JUL
15
OCT
15
DEC
15
MAR
16
MAY
16
JUL
16
OCT
16
DEC
16
MAR
17
MAY
17
JUL
17
OCT
17
DEC
17Cotton
30-Apr-2015 29-May-2015
505560657075808590
MAY
15
JUN
15
JUL
15
AUG
15
OCT
15
DEC
15
FEB
16
APR
16
MAY
16
JUN
16
JUL
16
Lean Hogs
30-Apr-2015 29-May-2015
130135140145150155160165
APR
15
JUN
15
AUG
15
OCT
15
DEC
15
FEB
16
APR
16
JUN
16
AUG
16
Live Cattle
30-Apr-2015 29-May-2015
BCOM: TABLES & CHARTS - MAY 2015 ///////////////////////////////////////////////////////////////////////////////////////////////////////////////////////////////////////////////////////////////////////////////////////////////////////////////////////////////////////////////////
19
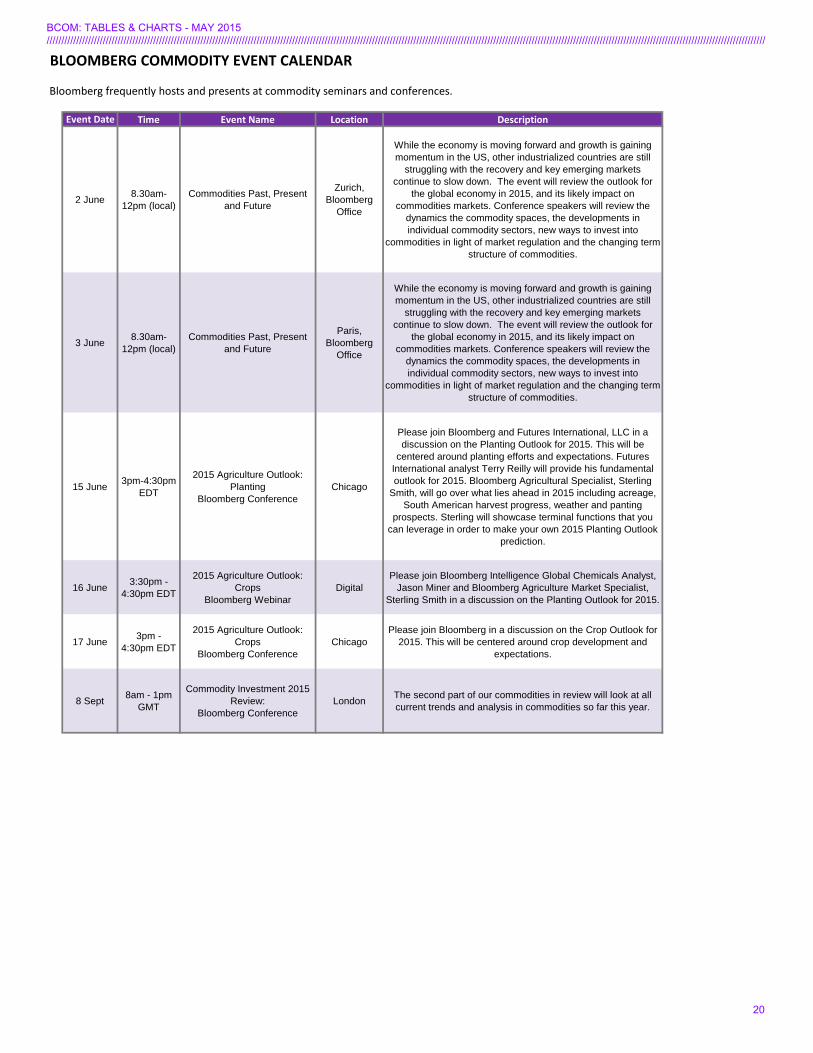
BLOOMBERG COMMODITY EVENT CALENDAR
Bloomberg frequently hosts and presents at commodity seminars and conferences.
Event Date Time Event Name Location Description
2 June 8.30am-12pm (local)
Commodities Past, Present and Future
Zurich, Bloomberg
Office
While the economy is moving forward and growth is gaining momentum in the US, other industrialized countries are still
struggling with the recovery and key emerging markets continue to slow down. The event will review the outlook for
the global economy in 2015, and its likely impact on commodities markets. Conference speakers will review the
dynamics the commodity spaces, the developments in individual commodity sectors, new ways to invest into
commodities in light of market regulation and the changing term structure of commodities.
3 June 8.30am-12pm (local)
Commodities Past, Present and Future
Paris, Bloomberg
Office
While the economy is moving forward and growth is gaining momentum in the US, other industrialized countries are still
struggling with the recovery and key emerging markets continue to slow down. The event will review the outlook for
the global economy in 2015, and its likely impact on commodities markets. Conference speakers will review the
dynamics the commodity spaces, the developments in individual commodity sectors, new ways to invest into
commodities in light of market regulation and the changing term structure of commodities.
15 June 3pm-4:30pm EDT
2015 Agriculture Outlook: Planting
Bloomberg ConferenceChicago
Please join Bloomberg and Futures International, LLC in a discussion on the Planting Outlook for 2015. This will be
centered around planting efforts and expectations. Futures International analyst Terry Reilly will provide his fundamental outlook for 2015. Bloomberg Agricultural Specialist, Sterling
Smith, will go over what lies ahead in 2015 including acreage, South American harvest progress, weather and panting
prospects. Sterling will showcase terminal functions that you can leverage in order to make your own 2015 Planting Outlook
prediction.
16 June 3:30pm - 4:30pm EDT
2015 Agriculture Outlook: Crops
Bloomberg WebinarDigital
Please join Bloomberg Intelligence Global Chemicals Analyst, Jason Miner and Bloomberg Agriculture Market Specialist,
Sterling Smith in a discussion on the Planting Outlook for 2015.
17 June 3pm - 4:30pm EDT
2015 Agriculture Outlook: Crops
Bloomberg ConferenceChicago
Please join Bloomberg in a discussion on the Crop Outlook for 2015. This will be centered around crop development and
expectations.
8 Sept 8am - 1pm GMT
Commodity Investment 2015 Review:
Bloomberg ConferenceLondon The second part of our commodities in review will look at all
current trends and analysis in commodities so far this year.
BCOM: TABLES & CHARTS - MAY 2015 ///////////////////////////////////////////////////////////////////////////////////////////////////////////////////////////////////////////////////////////////////////////////////////////////////////////////////////////////////////////////////
20

BLOOMBERG INTELLIGENCE: COMMODITY DASHBOARDS BI <GO>
Crude Oil Production: BI OILS <GO> Natural Gas Production: BI NGAS <GO>
Precious Metal Mining: BI PMET <GO> Agricultural Chemicals: BI AGCH <GO>
Copper: BI COPP <GO> Aluminum: BI ALUM <GO>
BI provides analysis on several key drivers of BCOM performance; industrial and precious metals mining, oil and natural gas production, and agricultural chemicals. The dashboards include key macro data libraries and interactive charting and commentary from analysts with an average of seventeen years of experience.
BCOM: TABLES & CHARTS - MAY 2015 ///////////////////////////////////////////////////////////////////////////////////////////////////////////////////////////////////////////////////////////////////////////////////////////////////////////////////////////////////////////////////
21

Return
Realized Vol (252 days)
HISTORICAL PERFORMANCE: Bloomberg Commodity Indices
-50%
0%
50%
100%
150%
200%
250%
300%
350%
400%
1991 1992 1993 1994 1995 1996 1997 1998 1999 2000 2001 2002 2003 2004 2005 2006 2007 2008 2009 2010 2011 2012 2013 2014 2015
Bloomberg Commodity Index Bloomberg Roll Select Commodity Index Bloomberg Commodity Index 3 Month Forward
0%
5%
10%
15%
20%
25%
30%
35%
1992 1993 1994 1995 1996 1997 1998 1999 2000 2001 2002 2003 2004 2005 2006 2007 2008 2009 2010 2011 2012 2013 2014 2015
Bloomberg Commodity Index Bloomberg Roll Select Commodity Index Bloomberg Commodity Index 3 Month Forward
BCOM: TABLES & CHARTS - MAY 2015 ///////////////////////////////////////////////////////////////////////////////////////////////////////////////////////////////////////////////////////////////////////////////////////////////////////////////////////////////////////////////////
22
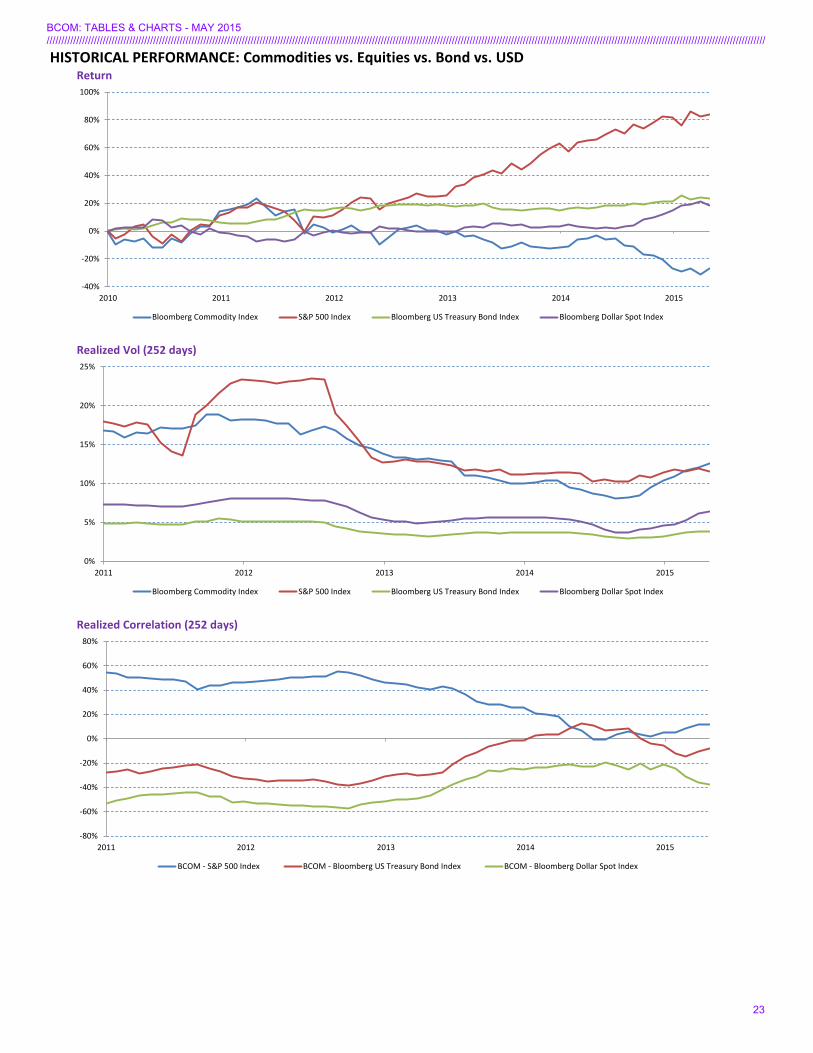
HISTORICAL PERFORMANCE: Commodities vs. Equities vs. Bond vs. USDReturn
Realized Vol (252 days)
Realized Correlation (252 days)
-40%
-20%
0%
20%
40%
60%
80%
100%
2010 2011 2012 2013 2014 2015
Bloomberg Commodity Index S&P 500 Index Bloomberg US Treasury Bond Index Bloomberg Dollar Spot Index
0%
5%
10%
15%
20%
25%
2011 2012 2013 2014 2015
Bloomberg Commodity Index S&P 500 Index Bloomberg US Treasury Bond Index Bloomberg Dollar Spot Index
-80%
-60%
-40%
-20%
0%
20%
40%
60%
80%
2011 2012 2013 2014 2015
BCOM - S&P 500 Index BCOM - Bloomberg US Treasury Bond Index BCOM - Bloomberg Dollar Spot Index
BCOM: TABLES & CHARTS - MAY 2015 ///////////////////////////////////////////////////////////////////////////////////////////////////////////////////////////////////////////////////////////////////////////////////////////////////////////////////////////////////////////////////
23

HISTORICAL PERFORMANCE: BCOM SubgroupsReturn
Realized Vol (252 days)
Realized Correlation (252 days)
-100%
0%
100%
200%
300%
400%
500%
1991 1992 1993 1994 1995 1996 1997 1998 1999 2000 2001 2002 2003 2004 2005 2006 2007 2008 2009 2010 2011 2012 2013 2014 2015
Energy Grains Industrial Metals Precious Metals Softs Livestock
0%
10%
20%
30%
40%
50%
60%
1992 1993 1994 1995 1996 1997 1998 1999 2000 2001 2002 2003 2004 2005 2006 2007 2008 2009 2010 2011 2012 2013 2014 2015
Energy Grains Industrial Metals Precious Metals Softs Livestock
-30%
-20%
-10%
0%
10%
20%
30%
40%
50%
60%
70%
1992 1993 1994 1995 1996 1997 1998 1999 2000 2001 2002 2003 2004 2005 2006 2007 2008 2009 2010 2011 2012 2013 2014 2015
Energy - Grains Energy - Industrial Metals Energy - Precious Metals Energy - Softs Energy - Livestock
BCOM: TABLES & CHARTS - MAY 2015 ///////////////////////////////////////////////////////////////////////////////////////////////////////////////////////////////////////////////////////////////////////////////////////////////////////////////////////////////////////////////////
24
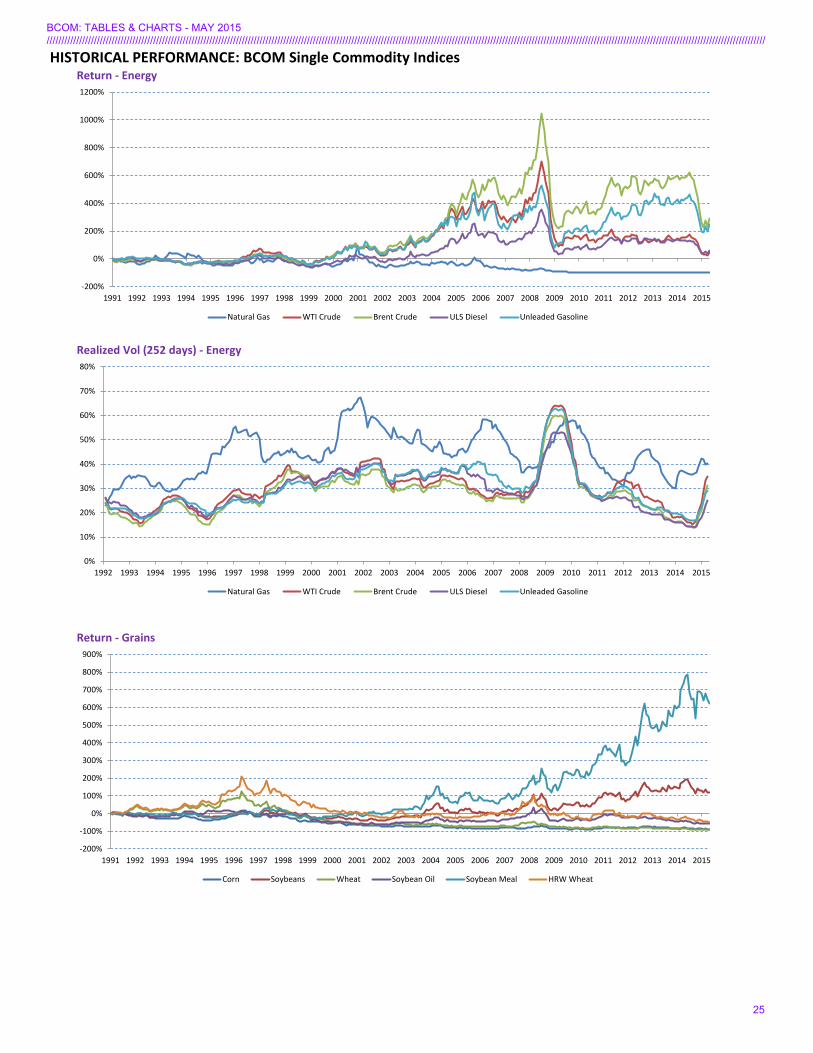
HISTORICAL PERFORMANCE: BCOM Single Commodity IndicesReturn - Energy
Realized Vol (252 days) - Energy
Return - Grains
-200%
0%
200%
400%
600%
800%
1000%
1200%
1991 1992 1993 1994 1995 1996 1997 1998 1999 2000 2001 2002 2003 2004 2005 2006 2007 2008 2009 2010 2011 2012 2013 2014 2015
Natural Gas WTI Crude Brent Crude ULS Diesel Unleaded Gasoline
0%
10%
20%
30%
40%
50%
60%
70%
80%
1992 1993 1994 1995 1996 1997 1998 1999 2000 2001 2002 2003 2004 2005 2006 2007 2008 2009 2010 2011 2012 2013 2014 2015
Natural Gas WTI Crude Brent Crude ULS Diesel Unleaded Gasoline
-200%
-100%
0%
100%
200%
300%
400%
500%
600%
700%
800%
900%
1991 1992 1993 1994 1995 1996 1997 1998 1999 2000 2001 2002 2003 2004 2005 2006 2007 2008 2009 2010 2011 2012 2013 2014 2015
Corn Soybeans Wheat Soybean Oil Soybean Meal HRW Wheat
BCOM: TABLES & CHARTS - MAY 2015 ///////////////////////////////////////////////////////////////////////////////////////////////////////////////////////////////////////////////////////////////////////////////////////////////////////////////////////////////////////////////////
25

HISTORICAL PERFORMANCE: BCOM Single Commodity IndicesRealized Vol (252 days) - Grains
Return - Industrial Metals
Realized Vol (252 days) - Industrial Metals
0%
10%
20%
30%
40%
50%
60%
1992 1993 1994 1995 1996 1997 1998 1999 2000 2001 2002 2003 2004 2005 2006 2007 2008 2009 2010 2011 2012 2013 2014 2015
Corn Soybeans Wheat Soybean Oil Soybean Meal HRW Wheat
-100%
0%
100%
200%
300%
400%
500%
600%
1991 1992 1993 1994 1995 1996 1997 1998 1999 2000 2001 2002 2003 2004 2005 2006 2007 2008 2009 2010 2011 2012 2013 2014 2015
Copper Alumnium Zinc Nickel
0%
10%
20%
30%
40%
50%
60%
70%
1992 1993 1994 1995 1996 1997 1998 1999 2000 2001 2002 2003 2004 2005 2006 2007 2008 2009 2010 2011 2012 2013 2014 2015
Copper Alumnium Zinc Nickel
BCOM: TABLES & CHARTS - MAY 2015 ///////////////////////////////////////////////////////////////////////////////////////////////////////////////////////////////////////////////////////////////////////////////////////////////////////////////////////////////////////////////////
26

HISTORICAL PERFORMANCE: BCOM Single Commodity IndicesReturn - Precious Metals
Realized Vol (252 days) - Precious Metals
Return - Softs
-100%
0%
100%
200%
300%
400%
500%
1991 1992 1993 1994 1995 1996 1997 1998 1999 2000 2001 2002 2003 2004 2005 2006 2007 2008 2009 2010 2011 2012 2013 2014 2015
Gold Silver
0%
10%
20%
30%
40%
50%
60%
1992 1993 1994 1995 1996 1997 1998 1999 2000 2001 2002 2003 2004 2005 2006 2007 2008 2009 2010 2011 2012 2013 2014 2015
Gold Silver
-150%
-100%
-50%
0%
50%
100%
150%
200%
250%
1991 1992 1993 1994 1995 1996 1997 1998 1999 2000 2001 2002 2003 2004 2005 2006 2007 2008 2009 2010 2011 2012 2013 2014 2015
Sugar Coffee Cotton
BCOM: TABLES & CHARTS - MAY 2015 ///////////////////////////////////////////////////////////////////////////////////////////////////////////////////////////////////////////////////////////////////////////////////////////////////////////////////////////////////////////////////
27
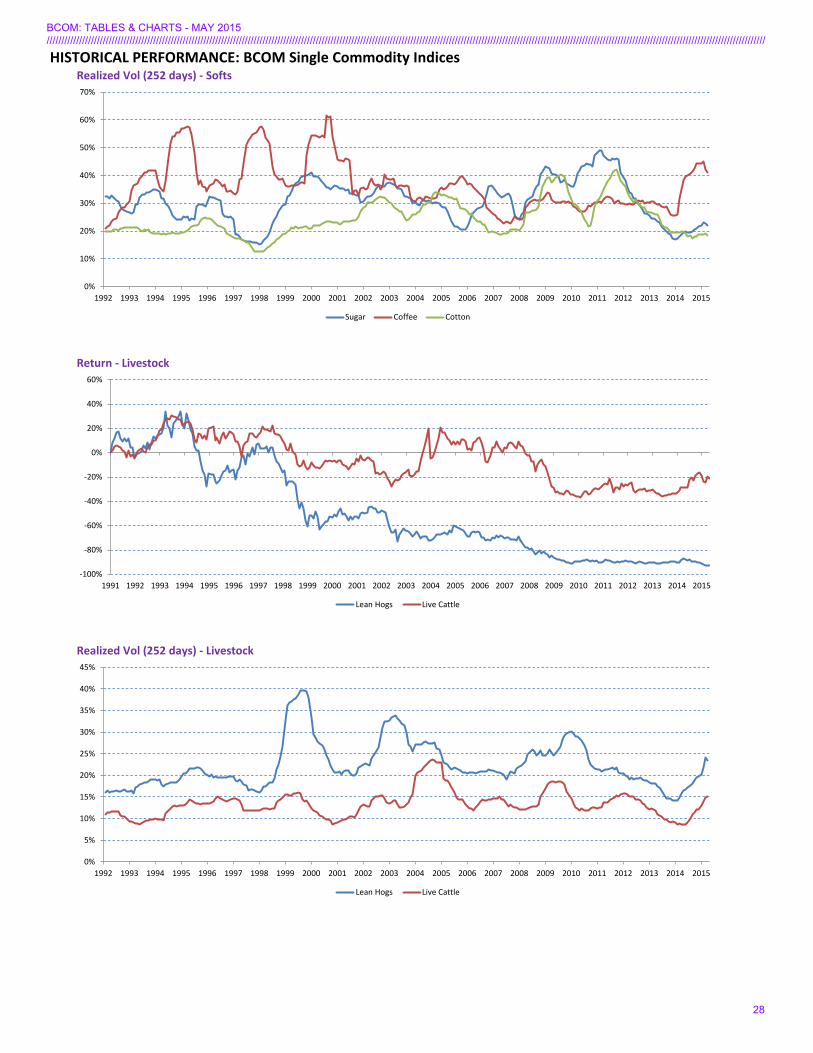
HISTORICAL PERFORMANCE: BCOM Single Commodity IndicesRealized Vol (252 days) - Softs
Return - Livestock
Realized Vol (252 days) - Livestock
0%
10%
20%
30%
40%
50%
60%
70%
1992 1993 1994 1995 1996 1997 1998 1999 2000 2001 2002 2003 2004 2005 2006 2007 2008 2009 2010 2011 2012 2013 2014 2015
Sugar Coffee Cotton
-100%
-80%
-60%
-40%
-20%
0%
20%
40%
60%
1991 1992 1993 1994 1995 1996 1997 1998 1999 2000 2001 2002 2003 2004 2005 2006 2007 2008 2009 2010 2011 2012 2013 2014 2015
Lean Hogs Live Cattle
0%
5%
10%
15%
20%
25%
30%
35%
40%
45%
1992 1993 1994 1995 1996 1997 1998 1999 2000 2001 2002 2003 2004 2005 2006 2007 2008 2009 2010 2011 2012 2013 2014 2015
Lean Hogs Live Cattle
BCOM: TABLES & CHARTS - MAY 2015 ///////////////////////////////////////////////////////////////////////////////////////////////////////////////////////////////////////////////////////////////////////////////////////////////////////////////////////////////////////////////////
28

COMMODITY CHEATSHEET FOR THE BLOOMBERG PROFESSIONAL® SERVICE
Broad Commodities EnergyTop commodity news CTOP Top energy news ETOPCommodity markets menu <COMDTY> F9 Top oil news OTOP Global commodity prices GLCO Crude Oil Production Dashboard BI OILSCommodity playbook CPLY First Word oil NI BFWOIL Commitments of traders report COT News on oil inventories TNI OIL INV Calendar of commodity events ECO17 Oil Buyer's Guide newsletter NI OBGBRIEFCommodity arbitrage calculator CARC Pipes & Wires newsletter NI PAWSBRIEFCommodity fundamental data explorer FDM Oil market analysis BOILCommodity futures overview CMBQ Nat gas spot prices BGASSecurity finder SECF Forward European utility markets EUMCommodity data contributors & broker CDAT News on oil markets NI OILMARKET Contract table menu CTM News on OPEC NI OPEC Seasonality chart SEAG OPEC production and prices OPECCommodity curve analysis CCRV Oil markets menu OIL Commodity fair values CFVL Crude stored in tankers NOONCommodity price forecasts CPFC Refinery outages REFOCommitments of Traders Report COT Oil’s decline EXT5 Commodity maps BMAP Oil versus inflation expectations SWIFCommodity options monitor OMON Commodities charts COSY MetalsCommodity Investors menu CMNV Top metal news METT US exchange traded product fund flows ETF Precious metal dashboard BI PMETG
Base metals dashboard BI BMETCommodity Indices Metals prices and data MINE Index description BCOM Index DES Precious metals prices and rates MTL Index constituent weights BCOM Index MEMB Metals Bulletin MB Listed index futures BCOM Index CT COMEX inventories COMX Option volatility surface BCOM Index OVDV LME monitor LME Seasonality chart BCOMNG Index SEAG LME implied volatilities LMIV Commodity index futures movers FMV LME warehouse inventories LMEI Commodity index ranked returns CRR
AgricultureWeather Top agriculture news YTOP Global weather database WETR Agriculture calendar AGRI US snow monitor SNOW Agriculture spot prices AGGPEU weather & utility models EUMM Agriculture supply & demand AGSD
Crop calendar CCAL
BCOM QUICK FACTS
Weighting Bias 2/3 market liquidity and 1/3 world production No. of Commodities 20 Re-balancing Frequency Annual Roll Schedule Monthly (5 day roll) Caps/Limits Single commodity: max 15%
Single commodity and its derivatives: max 25%Related commodity groups: max 33%
First Value Date 30 December 1990
The data provided in this report can be easily accessed on the Bloomberg Professional® service along with numerous news and analytical tools to help you stay on top of the commodity markets.
BCOM: TABLES & CHARTS - MAY 2015 ///////////////////////////////////////////////////////////////////////////////////////////////////////////////////////////////////////////////////////////////////////////////////////////////////////////////////////////////////////////////////
29
Related Documents