FEMS Microbiology Ecology, 91, 2015, fiv017 doi: 10.1093/femsec/fiv017 Advance Access Publication Date: 11 February 2015 Research Article RESEARCH ARTICLE Biotic and abiotic effects on CO 2 sequestration during microbially-induced calcium carbonate precipitation Tugba Onal Okyay and Debora F. Rodrigues ∗ Department of Civil and Environmental Engineering, University of Houston, Houston, TX 77204-4003, USA ∗ Corresponding author: Department of Civil and Environmental Engineering, University of Houston, N136, Engineering Bldg 1, 4800 Calhoun Rd, Houston, TX 77204, USA. Tel: +1-713-743-1495; Fax: +1-713-743-4260; E-mail: [email protected] One sentence summary: Microbially-induced calcium carbonate precipitation can promote CO2 sequestration through biotic and abiotic mechanisms. Editor: Riks Laanbroek ABSTRACT In this study, CO 2 sequestration was investigated through the microbially-induced calcium carbonate precipitation (MICP) process with isolates obtained from a cave called ‘Cave Without A Name’ (Boerne, TX, USA) and the Pamukkale travertines (Denizli, Turkey). The majority of the bacterial isolates obtained from these habitats belonged to the genera Sporosarcina, Brevundimonas, Sphingobacterium and Acinetobacter. The isolates were investigated for their capability to precipitate calcium carbonate and sequester CO 2 . Biotic and abiotic effects of CO 2 sequestration during MICP were also investigated. In the biotic effect, we observed that the rate and concentration of CO 2 sequestered was dependent on the species or strains. The main abiotic factors affecting CO 2 sequestration during MICP were the pH and medium components. The increase in pH led to enhanced CO 2 sequestration by the growth medium. The growth medium components, on the other hand, were shown to affect both the urease activity and CO 2 sequestration. Through the Plackett–Burman experimental design, the most important growth medium component involved in CO 2 sequestration was determined to be urea. The optimized medium composition by the Plackett–Burman design for each isolate led to a statistically significant increase, of up to 148.9%, in CO 2 uptake through calcification mechanisms. Keywords: ureolysis; calcium carbonate; cave; travertine; CO 2 sequestration; calcification INTRODUCTION Carbon sequestration consists in transferring and storing atmo- spheric carbon dioxide (CO 2 ) into other forms of carbon or by injecting into non-atmospheric reservoirs (e.g. depleted oil and gas reservoirs, non-mineable coal seams, deep saline formations and Deep Ocean). The conversion of CO 2 into other forms of carbon is a process that can occur through natural and anthro- pogenic processes (Lal 2008). For many years, plants and photo- synthetic microorganisms were considered to be the only natu- ral sinks for CO 2 . More recently, researchers have identified some microor- ganisms capable of sequestering CO 2 through carbonate pre- cipitation process, which has been called biomineralization or ‘microbially-induced carbonate precipitation (MICP)’ (Okwadha and Li 2010; Gray and Engel 2013). Researchers suggest that MICP occurs as a by-product of urea hydrolysis with urease enzymes produced by ureolytic bacteria (Douglas and Beveridge 1998; Castanier, Le M´ etayer-Levrel and Perthuisot 1999; De Muynck, De Belie and Verstraete 2010; DeJong et al. 2010; Salek et al. 2013). The suggested chemical reactions for MICP through ureolysis for CO 2 sequestration are presented below (Mitchell et al. 2010): Ureolysis: CO(NH 2 ) 2 + 2H 2 O → 2NH + 4 + CO 2− 3 (1) Received: 16 December 2014; Accepted: 3 February 2015 C FEMS 2015. All rights reserved. For permissions, please e-mail: [email protected] 1

Welcome message from author
This document is posted to help you gain knowledge. Please leave a comment to let me know what you think about it! Share it to your friends and learn new things together.
Transcript

FEMS Microbiology Ecology, 91, 2015, fiv017
doi: 10.1093/femsec/fiv017Advance Access Publication Date: 11 February 2015Research Article
RESEARCH ARTICLE
Biotic and abiotic effects on CO2 sequestration duringmicrobially-induced calcium carbonate precipitationTugba Onal Okyay and Debora F. Rodrigues∗
Department of Civil and Environmental Engineering, University of Houston, Houston, TX 77204-4003, USA∗Corresponding author: Department of Civil and Environmental Engineering, University of Houston, N136, Engineering Bldg 1, 4800 Calhoun Rd,Houston, TX 77204, USA. Tel: +1-713-743-1495; Fax: +1-713-743-4260; E-mail: [email protected] sentence summary: Microbially-induced calcium carbonate precipitation can promote CO2 sequestration through biotic and abiotic mechanisms.Editor: Riks Laanbroek
ABSTRACT
In this study, CO2 sequestration was investigated through the microbially-induced calcium carbonate precipitation (MICP)process with isolates obtained from a cave called ‘Cave Without A Name’ (Boerne, TX, USA) and the Pamukkale travertines(Denizli, Turkey). The majority of the bacterial isolates obtained from these habitats belonged to the genera Sporosarcina,Brevundimonas, Sphingobacterium and Acinetobacter. The isolates were investigated for their capability to precipitate calciumcarbonate and sequester CO2. Biotic and abiotic effects of CO2 sequestration during MICP were also investigated. In thebiotic effect, we observed that the rate and concentration of CO2 sequestered was dependent on the species or strains. Themain abiotic factors affecting CO2 sequestration during MICP were the pH and medium components. The increase in pH ledto enhanced CO2 sequestration by the growth medium. The growth medium components, on the other hand, were shownto affect both the urease activity and CO2 sequestration. Through the Plackett–Burman experimental design, the mostimportant growth medium component involved in CO2 sequestration was determined to be urea. The optimized mediumcomposition by the Plackett–Burman design for each isolate led to a statistically significant increase, of up to 148.9%, in CO2
uptake through calcification mechanisms.
Keywords: ureolysis; calcium carbonate; cave; travertine; CO2 sequestration; calcification
INTRODUCTION
Carbon sequestration consists in transferring and storing atmo-spheric carbon dioxide (CO2) into other forms of carbon or byinjecting into non-atmospheric reservoirs (e.g. depleted oil andgas reservoirs, non-mineable coal seams, deep saline formationsand Deep Ocean). The conversion of CO2 into other forms ofcarbon is a process that can occur through natural and anthro-pogenic processes (Lal 2008). For many years, plants and photo-synthetic microorganisms were considered to be the only natu-ral sinks for CO2.
More recently, researchers have identified some microor-ganisms capable of sequestering CO2 through carbonate pre-
cipitation process, which has been called biomineralization or‘microbially-induced carbonate precipitation (MICP)’ (Okwadhaand Li 2010; Gray and Engel 2013). Researchers suggest thatMICPoccurs as a by-product of urea hydrolysis with urease enzymesproduced by ureolytic bacteria (Douglas and Beveridge 1998;Castanier, Le Metayer-Levrel and Perthuisot 1999; De Muynck,De Belie and Verstraete 2010; DeJong et al. 2010; Salek et al. 2013).The suggested chemical reactions forMICP through ureolysis forCO2 sequestration are presented below (Mitchell et al. 2010):
Ureolysis:
CO(NH2)2 + 2H2O → 2NH+4 + CO2−
3 (1)
Received: 16 December 2014; Accepted: 3 February 2015C© FEMS 2015. All rights reserved. For permissions, please e-mail: [email protected]
1

2 FEMS Microbiology Ecology, 2015, Vol. 91, No. 3
CO2 dissolution in aquatic systems:
CO2 + H2O �H2CO3 (2)
H2CO3 �HCO3− + H+ (3)
HCO3− �CO2−3 + H+ (4)
Overall ureolysis and CaCO3 precipitation:
NH2CONH2 + 2H2O + Ca2+ → 2NH+4 + CaCO3 (5)
In the ureolysis reaction, urea is degraded by ureolytic mi-croorganisms, resulting in the production of ammonium (NH4
+),dissolved inorganic carbon and increasing in pH (Equation 1),which will favor CaCO3 precipitation in the presence of calciumions (Equation 5). At alkaline pH values generated by the ammo-nium production during ureolysis, the CO2 from the air will dis-solve in water and get converted to carbonates (Equations 2–4).These carbonates can, then, react with calcium ions and precip-itate as calcium carbonates.
In the MICP process, there are two possible CO2 sources forthe calcification reaction to happen: (i) CO2 from the air and(ii) CO2 from the bacterial ureolysis and respiration. However,little is known about how much of the CO2 can really be se-questered by these ureolytic microorganisms in aquatic envi-ronments and what are the real roles of microorganisms in theCO2 sequestration during MICP. Studies investigating MICP havebeen done mostly with microorganisms from soil. In soils, sev-eral species have been described to be able to performMICP, suchas Sporosarcina pasteurii (Meyer et al. 2011), Pseudomonas calcis(Boquet, Boronate and Ramos-Cormenzana 1973), Bacillus sp.VS1 (Chu, Stabnikov and Ivanov 2012) and P. denitrificans (Ham-dan 2011). However, the presence of these microorganisms inpristine aquatic environments, such as caves and travertines, aswell as their roles in calcification and CO2 sequestration has notbeen fully investigated.
Recent studies suggested that the formation of stalactitesand stalagmites in natural karst landscapes, such as cavesand travertines, could involve microorganisms active in MICP(Banks et al. 2010). In such habitats, it has been hypothesizedthat the presence of CO2, high calcium concentrations and thepresence of urea provide optimal environmental conditions forbiomineralization and therefore formation of stalactites and sta-lagmites and CO2 sequestration (Liu et al. 2010). The fact thatthese formations have been in these karstic environments forseveral thousands of years and continue to grow every year, sug-gest that, if MICP is truly involved in the production of these for-mations, it could be a very promising natural long-term carbonsequestration process.
In these karstic environments, calcium comes originallyfrom the rocks and surrounding soils (Kumaresan et al. 2014).Urea, on the other hand, is brought into caves and travertinesthrough different sources: in the case of caves, urea is fre-quently introduced throughmammals’ urine (Johnston,Muenchand Banks 2012), such as bats, and from seasonal or continu-ous water infiltration from the surface (Jameson and Alexan-der 1994; Baker and Fairchild 2012; Ortiz et al. 2013). Comparedto caves, travertines are outdoors, more prone to urea contam-ination from diverse sources, such as recreational human ac-tivities, animal excretions, municipal or agricultural wastewa-ter infiltration (Amundson and Kelly 1987; Kacaroglu 1999). Thefact that urea and calcium are present in these habitats allowsus to hypothesize that microorganisms involved in MICP couldalso be present in these aquatic environments and be playing
an important role in calcium carbonate precipitation and carbonsequestration.
Vis-a-vis the importance of ureolytic microorganisms in theMICP process and the fact that 10% of the Earth’s surface is occu-pied by karst landscapes, the presence of ureolytic microorgan-isms was investigated in two natural karstic environments, thePamukkale travertines in Denizli, Turkey and the ‘Cave WithoutA Name’ in Texas, USA. In this study, we isolated and identifiedureolyticmicroorganisms and determined their role inMICP andCO2 sequestration. The effects of growth conditions on the car-bon sequestration by these microorganisms were also investi-gated to better understand their physiology and roles in carbonsequestration during MICP.
MATERIALS AND METHODSSample collection and characterization
Water samples were collected aseptically in sterile 1L polyethy-lene containers from the Pamukkale travertine ponds in Denizli,Turkey (37◦54′59′′ N, 29◦07′02′′ E), and a pond in the ‘CaveWithoutAName’ in Boerne, TX, USA (29◦47′40′′ N, 98◦43′55′′ W) in Decem-ber 2011 and March 2012, respectively. The samples were keptat 4◦C until they were processed. The physicochemical charac-teristics of the water samples were measured in triplicate ac-cording to the standard methods of water analysis (APHA 2005)and presented in Table S1 (Supporting Information). Water sam-ples were stored at 4◦C until brought to the laboratory for furtheranalyses.
Growth conditions for enrichment and isolation ofcalcifying bacteria
Well-mixed aliquots of the water samples were inoculated (10%,v/v) in 13 different growth media as described in Table S2(Supporting Information), and incubated aerobically at 150 rpm(INNOVA 44, New Brunswick Scientific Co., USA) for 3 d at 28 and20◦C for travertine and cave samples, respectively. These tem-peratures were based on the local temperatures during sam-pling. For the bacterial isolation, serial dilutions were done inphosphate buffer solution (PBS, 0.01M, pH = 7.4), and sampleswere plated in triplicates onto agar plates prepared with 15g L−1
of agarwith their respective original growth broth (Table S2, Sup-porting Information). The plates were incubated for 24h at 28and 20◦C for the travertine and cave samples, respectively. Dif-ferent colonies in each plate were selected based on colonymor-phology. The selected colonieswere streaked at least three timesunder the same conditions to ensure purity.
The isolates were then investigated for urease activity us-ing the Stuart’s broth and the Christensen’s agar plates. TheStuart’s broth contained 0.1 g L−1 yeast extract, 9.1 g L−1 KH2PO4,9.5 g L−1 K2HPO4, 20 g L−1 urea and 0.01 g L−1 phenol red (Stu-art, Stratum and Rustigian 1945). The Christensen’s agar platescontained 1gL−1 peptone, 1 g L−1 dextrose, 5 g L−1 NaCl, 2 g L−1
KH2PO4, 20 g L−1 urea, 0.012 g L−1 phenol red and 16gL−1 agar(Christensen 1946). All the urease-positive isolates were alsoinvestigated for calcium carbonate precipitation, according toHammes, Boon and de Villiers (2003). All the calcifying isolateswere stored in 50% glycerol (v/v) and kept at −80◦C as stockcultures for future experiments. In all experiments, unless in-dicated otherwise, the travertine and cave isolates were grownin their specific isolation medium, as described in Table S2(Supporting Information), under 150 rpm at 28 and 20◦C,respectively.
Okyay and Rodrigues 3
DNA extraction and amplified ribosomal DNArestriction analysis (ARDRA)
The total DNA of each isolate was extracted with the DNeasy R©
Blood and Tissue Kit as described by the manufacturer (Qiagen2006). DNA quantification (O.D. 260) and quality (ratio A260/A280)were determined with the Take3 plate of the Synergy MX Mi-crotiter plate reader (BioTek, USA). Total DNA extracted fromeach isolate was stored at −20◦C until further analyses.
The ARDRA experiment was performed with the univer-sal eubacterial primers for the 16S rRNA genes. The primerswere 27f (5′-AGAGTTTGATCMTGGCTCAG-3′) and 1401r (5′-CGGTGTGTACAAGACCC-3′) (Rodrigues et al. 2009). Triplicate PCRreactions of 50μL for each isolate were performed using 1X Am-pliTaq Gold R© Fast PCR Master Mix (Applied Biosystems), 0.2μMof each primer and 50ngμL−1 of the DNA template in the Ap-plied Biosystems VeritiTM thermal cycler. The PCR amplificationconditions were performed as previously described (Rodrigueset al. 2009). All replicate experiments contained negative con-trols without DNA and positive controls containing DNA fromEscherichia coli.
In order to verify the successful PCR amplification, aliquotsof 10μL of the PCR products were mixed with 5μL of loadingdye (Thermo Scientific), and loaded onto 1% agarose gel (Om-nipur Agarose, EMD Millipore) containing SYBR Safe DNA gelstain (Invitrogen) (5μL SYBR Safe stain per 50 mL TAE buffer),using 1X TAE buffer (Fermentas) as the running buffer. Theagarose gel electrophoresis was run at 150 V for 30 min. TheDNA in the gel was visualized and photographed with a Com-pact Digimage System UVDI, Major Science. The DNA fragmentsizes were estimated using a 100 bp DNA ladder (Thermo Scien-tific). The remaining 40μL of amplified PCR products were pu-rified for further analyses using the QIAquick PCR PurificationKit (Qiagen), as described by the manufacturer (Qiagen 2008).The triplicate products for each isolate were combined in a sin-gle tube for purification. The purified products were quantifiedand their concentrations were adjusted to 100ngμL−1 using theTake3 plate.
The 16S rRNA gene amplicons were then digested with HhaI(GCG’C) andMspI (C’CGG) (New England Biolabs). Briefly, for eachisolate, 10μL of the purified PCR products was digested individ-ually with each restriction enzyme in a reaction mixture con-taining 1μL of restriction enzyme (20μM), 2μL of Buffer-4 (NewEngland Biolabs), 6.8μL of nuclease free water (Thermo Scien-tific) and 0.2μL of bovine serum albumin (Thermo Scientific).All digestions were incubated at 37◦C for 3 h, followed by a de-naturation step at 65◦C for 20 min. The restriction fragmentswere separated by electrophoresis in 3% (w/v) agarose gel at60 V for 4h and visualized as previously described (Pourshafie,Vahdani and Popoff 2005). ARDRA patterns were analyzed us-ing the PyElph1.3 software that automatically extracts the datafrom the gel images, computes the molecular weights and com-pares the DNA patterns using the neighbor-joining method todetermine the percent similarity among the isolates (Pavel andVasile 2012).
16S rRNA phylogenetic analyses
The purified PCR fragments were sequenced by the MD An-derson Genetic Laboratories (Houston, TX, USA). Both the for-ward and reverse primers were used to sequence the wholelength of the PCR products. The sequences were assembled us-ing MEGA 5.1 software. The sequences obtained were comparedto similar sequences available at theNational Center for Biotech-
nology Information (NCBI) using BLASTn (Altschul et al. 1990).Similar sequences to the isolates were retrieved from GenBankand aligned against the DNA sequences of the isolates usingMEGA 5.1 (Tamura et al. 2011). A phylogenetic tree was also con-structed using MEGA 5.1 through the neighbor-joining method(Saitou and Nei 1987). Bootstrap analysis based on 500 repli-cations of the neighbor-joining dataset was also obtained. Thenucleotide sequences determined in this study were depositedin the NCBI database under accession numbers KM009125 toKM009137.
Determination of physiological properties of calcifyingisolates
Physiological properties of the isolateswere determined bymea-suring the growth rate of each isolate at different pH values andtemperatures in their specific isolation medium. A plate readerwas used to obtain the microbial growth rates in each experi-ment by measuring the absorbance at 600 nm for 24h in eachwell. To determine the pH range that isolates were able to grow,96-well plates were prepared for each isolate containing 300μLof its specific growth medium in triplicate with pH values of 2,3, 4, 5, 6, 7, 8, 9, 10, 11 and 12. For the pH experiments, the in-cubation temperature was kept at 28 and 20◦C for the traver-tine and cave isolates, respectively. For the temperature experi-ments, each isolate was grown in its specific isolation media at15, 20, 25, 30, 35 and 40◦C. The pHwas kept at 7 ± 0.3 for the tem-perature experiments. All conditions were performed in tripli-cate. The growth rates for each condition and isolate were cal-culated as previously described (Onal Okyay and Frigi Rodrigues2014). The growth rate results were used to determine the opti-mum pH and temperature for each isolate. The triplicate resultswere averaged and the standard deviations were also calculated.
Determination of urease activity, calcification and CO2
sequestration
Urease activities of calcifying isolates were determined as pre-viously described (Onal Okyay and Frigi Rodrigues 2013). Briefly,color change in the Stuart’s broth was measured at 560 nm ev-ery 30 min for 24h using the 96-well plate reader. At the end ofthe incubation, the color change rates (h−1) were calculated foreach isolate. A standard curve with the purified Jack Bean ureaseenzyme was used to determine the enzymatic activity (U mL−1)of each isolate. One unit of urease activity corresponds to theamount of enzyme that hydrolyzes 1 μM of urea per min.
The rates of calcification and CO2 sequestration were deter-mined with five environmental isolates. Among these five iso-lates, three of them presented the highest urease activities (TR1,TR3 and TR20), while the other two showed the lowest ureaseactivities (TR12 and CV1). TR and CV abbreviations correspondto travertine and cave isolates, respectively. For the calcifica-tion assay, these five isolates were incubated in their respec-tive isolationmedium supplementedwith 6.9 g L−1 calcium chlo-ride, which was found to be the optimum calcium concentrationfor calcification in S. pasteurii ATCC 11859 (Onal Okyay and FrigiRodrigues 2014). The remaining calcium ions in the medium,after calcification, were measured by atomic absorption spec-troscopy (Perkin Elmer AAnalystTM 200) after centrifuging at10 000 rpm for 10 min and filtering the supernatant through0.2μm syringe filters. Negative controls, which had no bac-terium, were used to determine whether there were non-biological calcite precipitations throughout the experiment.

4 FEMS Microbiology Ecology, 2015, Vol. 91, No. 3
In order to confirm the CO2 sequestration, headspace CO2
concentrations were measured in sealed serum bottles usinga gas analyzer containing a non-dispersive infrared CO2 sen-sor (Columbus Instruments Model 180C Gas Analyzer, Colum-bus, OH, USA). For this experiment, overnight grown cultureswere centrifuged at 10 000 rpm for 10 min, and cells were col-lected, washed with sterile PBS and the absorbance of the cellsuspensions was adjusted to 0.5 at 600 nm. Subsequently, 39 mLserum bottles containing 9 mL of growth medium (with or with-out 6.9 g L−1 CaCl2) were inoculated with 10% of the washed cellsuspensions. The bottles were capped with butyl rubber stop-pers and aluminum seals. Pure CO2 gas was injected into eachserum bottle to obtain 10% of CO2 gas in the headspace. Theserumbottleswere then incubated in the dark for 24h at 150 rpmand 20 or 28◦C, depending on the isolate origin. After 1, 3.5, 6.5,9, 21.5 and 24 h, duplicate serum bottles were analyzed for CO2
concentration in the headspace. All experiments were repeatedthree times in three different days to take into considerationdaily variations. Abiotic controls, which had no cells, were in-cluded in each experiment as negative controls. All results wereaveraged out and their respective standard deviations were alsocalculated.
Abiotic effects of pH on CO2 sequestration
Since bacteria can change the pH during growth, the abiotic ef-fect of pH on calcium carbonate precipitation and CO2 seques-tration was also determined in growth medium with adjustedpH and without bacteria (Table S11, Supporting Information).Briefly, similarly to the bacterial CO2 sequestration experiment,9 mL of non-inoculated growth medium was placed into 39 mLserum bottles. The pH of the different growthmedia used in thisinvestigation were adjusted to 7.3, 8.3, 8.9, 9.2 and 9.3. The se-lection of the pH to do the abiotic experiment in each growthmedium depended on the final pH after growing the bacteria intheir specific growth medium (see Table 2). After adjusting thepH, all the bottles were capped, sealed, injected with CO2 andincubated as described in the previous section. After 24h incu-bation, CO2 concentrations in the headspace and the final pH ofthe solutions were measured.
In order to determine whether the CO2 in the air was con-verted to carbonate and/or bicarbonate ions in the differentgrowth media at different pH values, titrations of the mediawere done according to the standard methods (APHA 2005)(Table S10, Supporting Information). Before starting the incu-bations, the prepared growth media were titrated with 0.1 NH2SO4 with the help of phenolphthalein and methyl orangeto determine the initial concentrations of the carbonate ionsin the solution. At the end of the incubation periods with orwithout bacteria, the media were titrated again. These exper-iments allowed us to distinguish the biotic (i.e. bacteria) andabiotic (i.e. pH) effects on the CO2 sequestration. All exper-iments were performed in triplicate in three different days.The results were averaged and the standard deviations werecalculated.
Determination of dry cell weight
In order to normalize the CO2 sequestration results by dry cellbiomass, dry cell weights were determined for the five iso-lates (TR1, TR3, TR20, TR12 and CV1). Each isolate was grownovernight under its specific growth conditions, and a volumeof 10 mL from each suspension was filtered through 0.2μmpore-size sterile filters (Whatman). After filtration, the filter
membranes containing the bacteria were dried at 60◦C for 24hand kept in the desiccator until measured. The dried biomasswas determined by calculating the difference in the filter massbefore and after filtering the cells in the filter membranes.Experiments for each isolate were conducted in triplicate andthe average biomass of dried cells per filter was compared withthe control filter membranes after filtration of the media with-out bacteria. This procedure allowed us to determine any masschange in the filter caused by the media constituents retainedin the filter membranes.
Scanning electron microscopy and energy dispersiveX-ray spectroscopy
The calcification was confirmed using scanning electron mi-croscopy (SEM) and energy dispersive X-ray spectroscopy (EDS)analyses (JEOL JSM-6010LA). The five isolates (TR1, TR3, TR20,TR12 and CV1) were incubated for 96hwith sterile glass slides intheir original isolation medium (Table S2, Supporting Informa-tion) with 6.9 g L−1 calcium. At the end of the incubation time,the glass slides were removed with a sterile spatula and washedwith sterile distilled water to remove dissolved salts and looselyattached cells. The glass slides were dried at 60◦C overnight andsputter coated (Denton Desk V) with gold at 5 mA for 30 s us-ing 0.00 016 mbar Argon prior to the SEM-EDS analysis. All ex-periments were done in triplicates and repeated three times indifferent days.
Growth medium components affecting the CO2
sequestration
The growth medium components affecting microbial CO2 se-questration were investigated following the Plackett–Burman(PB) design using the Design Expert software (Khambhaty et al.2007). In the design, a total of 11 components commonly foundin the medium for MICP microorganisms (tryptone, yeast ex-tract, tricine, ammonium sulfate, glutamic acid, urea, meat ex-tract, peptone, sodium chloride, nickel (II) chloride and glucose)were selected for the CO2 sequestration investigation. The ex-perimental design is shown in Table S3 (Supporting Informa-tion), where each row represents one experiment and each col-umn represents an independent variable.
In all the PB design experiments, 6.9 g L−1 calcium chloridewas added to the media. The analysis of variance was used todetermine the statistical significance of the results. The qual-ity of the experiments was determined statistically by the co-efficient of determination R2 and the F-test. These results deter-mined the optimum concentrations of themedium constituentsto enhance the CO2 sequestration for the five isolates (TR1, TR3,TR20, TR12 and CV1). In order to confirm the CO2 sequestrationoptimization results, experimental assays were performed un-der the optimum conditions determined by the Design Expertsoftware and CO2 sequestration yields were calculated. All ex-periments were performed in triplicate and the results were av-eraged out and standard deviations were calculated.
RESULTSIsolation of calcifying bacteria
In this study, 13 different media (Table S2, Supporting Infor-mation), commonly used in MICP studies, were used for thefirst time to obtain calcifying microorganisms from water sam-ples collected in Pamukkale travertines from Turkey and ‘A Cave

Okyay and Rodrigues 5
Without a Name’ from the United States. The different mediayielded different numbers of isolates with distinct morphologi-cal characteristics, such as size, shape and color. It is important,however, to point out that some growth media did not allow thegrowth of any microorganisms from these habitats, this obser-vation was especially true for the cave sample. For instance, thenutrient-rich media did not allow isolation of microorganismsfrom the cave sample. In total, 6 and 28 isolates from the caveand the travertine pond, respectively, were obtained. After iso-lation, the microorganisms were investigated for urease activityand calcification, and it was determined that all these isolateswere capable of MICP.
Genetic fingerprinting and phylogenetic classificationof isolates
The isolates were further investigated for identical band pat-terns by digestion with HhaI and MspI restriction enzymesof the amplified 16S rRNA genes. The different band patternswere then subjected to cluster analysis. The ARDRA results withthe HhaI and MspI enzymes could distinguish 17 (Fig. S1, Sup-porting Information) and 13 (Fig. 1) different strains, respec-tively. These results showed that the MspI enzyme was morestringent than HhaI in this study. The isolates presenting 100%identical band patterns were considered to be clonal isolatesandwere no further investigated. The isolates (four isolates fromcave and nine isolates from travertine) presenting distinct bandpatterns for MspI with a similarity lower than 60% (Fig. 1) werefurther sequenced for identification.
The sequencing results (Fig. 2) showed that the majority ofthe isolates belonged to two genera, Sporosarcina and Sphingob-acterium. The isolates with high similarity to Sporosarcina wereCV1 (92%), TR1 (92%), TR20 (91%) and TR3 (91%), while CV4(87%), CV3 (88%) and CV2 (83%) had high similarity to Sphingob-acterium. The isolates TR11 (99%), TR6 (96%), TR28 (94%), TR9(94%), TR12 (96%) and TR16 (99%) presented high similarity toBacillus, Brevundimonas, Chryseobacterium, Alcaligenes, Acinetobac-ter and Stenotrophomonas, respectively (Fig. 2). Based on these re-sults, wewere able to isolatemore diverseMICPmicroorganisms
Figure 1. ARDRA dendrogram of calcifying isolates from the Pamukkaletravertines (Denizli, Turkey) and the Cave Without a Name (Boerne, TX, USA) af-ter digestion of the 16S rRNA geneswithMspI enzyme. The dendrogramwas con-
structed using the PyElph 1.3 software based on the neighbor-joining method.
in the travertine samples than in the cave. It is possible, however,that other types of medium, not investigated in this study, couldhave been more appropriate for the isolation of a more diversemicrobial population in the cave.
The comparison of the results obtained in Figs 1 and 2showed that the ARDRA dendrogram obtained with theMspI en-zyme is very similar to the 16S rRNA phylogenetic tree. There-fore, it can be concluded that MspI seems to be a better re-striction enzyme to identify and cluster calcifying isolates thanHhaI. Additionally, the phylogenetic results (Fig. 2) showed thatsome isolates, even though they had different band patternsin the ARDRA results (Fig. 1), still presented 99% similarity intheir 16S rRNA gene sequences. This was the case for someisolates, such as TR6 and TR11, TR1, TR28, CV4 and TR 20.The 16S rRNA phylogenetic tree also showed that the isolateswere clustered in six different classes: Bacilli (CV1, TR1, TR20,TR3, TR11), α-Proteobacteria (TR6), Flavobacteria (TR28), Sphingob-acteria (CV4, CV3, CV2), γ -Proteobacteria (TR16, TR12) and β-Proteobacteria (TR9). In this study, themost abundant and diversenumber of isolates belonged to Bacilli.
Effect of growth media on bacterial isolation
In the present study, rich and mineral media were investigated.The different types of media used allowed the isolation of di-verse microorganisms in the two sites. In the case of the cave,isolates were only obtained in more oligotrophic media, such astheM2medium (minimalmedium) and the 10X diluted-richme-dia. In the case of the travertine, isolates were obtained fromboth types of media. The rich media, however, allowed the iso-lation of five distinct bacteria, while eight distinct bacteria wereobtained in themineral or diluted-richmedia. Among themediainvestigated, ATCC-1832-10Xmediumwas the best to obtain thehighest number of isolates from the travertine (Table S2, Sup-porting Information).
Physiological properties of the calcifying isolates
The physiology of these microorganisms was determined bymeasuring their pH and temperature growth ranges, as well astheir optimum temperature and pH for growth. The results showthat the isolates were able to grow in a wide range of pH valuesand presented optimumpH values between 6 and 9 (Table 1). It isimportant to point out that the isolates (TR1, TR3 and TR20) pre-senting the highest urease activities among the isolates (Fig. 3)preferred alkaline conditions for growth. In contrast, the isolateswith optimum growth at pH values equal or below 7 presentedlower urease activities.
In the case of the temperature, the average annual tempera-ture in our sampling cave is nearly 20◦C (Cave 2014). Hence, allthe cave isolates were able to grow at this temperature; how-ever, only the isolate CV2 showed an optimum growth at 20◦C,the others all had higher optimum growth temperatures. Con-sidering that Texas has very warm temperatures, it is possi-ble that the isolates could have come from an external sourceother than the cave, which would have explained the preferenceof these isolates for higher temperatures than the normal cavetemperature.
In the Pamukkale travertines, the average annual tempera-ture is 35◦C at the exit point, where the spring water comes fromthe underground (Pamukkale 2014). Our sampling site was, how-ever, far from the spring point. Therefore, thewater temperaturewas around 28◦C. The different water temperatures at differentpoints in the travertine would explain the different optimum

6 FEMS Microbiology Ecology, 2015, Vol. 91, No. 3
S p o r o sa r c in a g in se n g iso li g i1 6 3 7 1 6 5 3 5 S p o r o sa r c in a so li g i3 4 3 2 0 3 0 1 1 C V 1 .2 7 F T R I.2 7 F S p o r o sa r c in a ko r e e n sis g i3 4 3 2 0 3 0 1 0 S p o r o sa r c in a ko r e e n sis g i3 5 9 8 0 3 6 5 5 u n cu ltu r e d b a cte r iu m g i2 9 7 0 2 2 7 0 6 T R 2 0 .2 7 F S p o r o sa r c in a so li g i2 9 0 7 9 6 5 1 2 u n cu ltu r e d b a cte r iu m g i3 0 2 7 3 4 6 7 4 T R 3 .2 7 F S p o r o sa r c in a p a ste u r ii W J - 5 g i4 4 4 8 9 8 1 6 4 B a cillu s ce r e u s L H 5 g i4 4 2 5 3 9 3 6 6 T R 1 1 .2 7 F B a cillu s sp . S C 6 5 g i3 0 0 9 5 3 4 4 8 B r e vu n d im o n a s d im in u ta g i1 9 7 1 1 4 1 3 5 T R 6 .2 7 F B r e vu n d im o n a s sp . T M 2 g i4 2 9 8 4 4 7 8 1
T R 2 8 .2 7 F C h r yse o b a cte r iu m sp . T S 3 g i3 4 3 7 8 8 3 4 6 C h r yse o b a cte r iu m je ju e n se g i3 4 3 2 0 5 8 4 5 C V 4 .2 7 F S p h in g o b a cte r iu m sp . A g 8 g i3 4 3 1 9 8 4 0 3 S p h in g o b a cte r iu m sp . P F - 1 1 g i2 1 1 9 4 0 0 7 4 S p h in g o b a cte r iu m sp . K M S Z P III g i3 3 3 3 8 4 8 3 5 S p h in g o b a cte r iu m m u lt ivo r u m g i3 5 9 8 0 3 2 7 8 C V 3 .2 7 F S p h in g o b a cte r iu m d e te r g e n s g i3 7 5 1 5 1 8 5 2 C V 2 .2 7 F S p h in g o b a cte r iu m d e te r g e n s 6 .2 S g i3 7 5 1 5 1 8 5 2
P se u d o m o n a s g e n icu la ta g i3 1 2 3 0 6 2 4 8 T R 1 6 .2 7 F S te n o tr o p h o m o n a s m a lto p h ilia g i3 9 8 0 2 6 4 4 9
T R 1 2 .2 7 F A cin e to b a cte r ta n d o ii g i4 2 9 5 3 4 1 6 1 A cin e to b a cte r sp . D u 6 g i2 6 0 1 5 9 5 9 9
T R 9 .2 7 F A lca lig e n e s sp . x- 1 g i3 2 6 3 1 4 7 6 2
u n cu ltu r e d b a cte r iu m g i2 4 2 1 1 8 2 7 0 D e su lfu r isp ir illu m in d icu m
9 89 8
9 9
6 5
9 1
9 1
8 9
8 2
6 6
9 96 2
8 29 9
9 89 9
9 7
9 88 9
9 7
5 4
5 0
0 . 0 5
Figure 2. Phylogenetic tree based on 16S rRNA gene sequences showing the relationship among calcifying isolates obtained from the Pamukkale travertines and the‘Cave Without a Name’ with their closest relatives according to NCBI. Tree was constructed by the maximum likelihood method using MEGA 5.1. Bootstrap valuesabove 40% (based on 500 replications) are shown at each node. Bar at the bottom correspond to the fixed nucleotide substitutions per sequence position.
Table 1. The pH and temperatures at which the isolates are able to grow, and their optimum values.
Isolate Isolation growth media pH range of growth Optimum pH Temperature range (◦C) Optimum growth temperature (◦C)
TR1 ATCC 1832 3–11 9 15–40 35TR3 NB3 3–12 8 15–40 30TR6 ATCC 1832–10X 3–12 7 15–40 35TR9 NB 4–12 7 15–40 35TR11 NB3 3–12 7 15–40 30TR12 ATCC 1832–10X 4–12 7 15–30 25TR16 ATCC 1832–10X 4–12 8 15–40 25TR20 NB 2–12 9 25–40 30TR28 ATCC 1832–10X 4–11 7 30–40 35CV1 NB-10X 4–11 6 15–35 35CV2 NB3–10X 4–12 7 15–25 20CV3 M220–10X 4–11 7 15–30 30CV4 M2 4–11 8 15–35 35
temperature preferences of the isolates. In all cases, however,the travertine isolates had optimum growth temperatures in therange of the temperatures found at the site.
Besides investigating the optimum pH and the temperaturefor the growth of the isolates, we also investigated their ure-ase activities; the 13 isolates showed different urease activities
ranging between 8 and 0.2 U mL−1 (Fig. 3). The top three per-forming isolates, TR20, TR1 and TR3, having 8, 3.6 and 3.5 UmL−1 urease activities, respectively; and the two worst perform-ing isolates, TR12 and CV1, having 0.22 and 0.18 U mL−1 ureaseactivity, respectively, were selected for the calcification investi-gations and CO2 sequestration. In these investigations, the goal

Okyay and Rodrigues 7
Figure 3. Urease activities of travertine (TR) and cave (CV) isolates. All isolateswere cultured in their specific growth conditions. All experiments were done in
triplicate and the error bars correspond to standard deviations.
Figure 4. The calcium concentrations in the growth media during microbialgrowth.
was to determine whether the urease activity was linked to cal-cification and CO2 sequestration; and then determine whetherchanges in the medium concentration components would allowthe enhancement of the CO2 sequestration even by the worstureolytic microorganisms.
In the calcification assays, we determined the amount of cal-cium left in the medium (Fig. 4) and analyzed all the precipi-tates formed during the microbial growth. The quantificationsof the calcium ions left in the bacterial media showed that eachisolate had different calcification capabilities (Fig. 4). The iso-late presenting the highest calcium carbonate precipitation wasTR20, which precipitated almost 100% of the calcium carbonatewithin 6 h. The isolates TR1 and TR3, on the other hand, pre-cipitated 69 and 87% of calcium carbonate, respectively, in thesame period of time (Fig. 4). No changes in the calcium ions inthe medium were observed in the control samples, which hadno bacteria.
In order to further confirm that the precipitates in themedium were made of calcium, SEM and EDS analyses of theprecipitates were performed. The results showed that the par-ticles precipitated by the microorganisms during MICP wereCaCO3 mineral precipitates. In Fig. 5A, the SEM results demon-strated that the precipitates are composed mostly by calciteand a few vaterites (Banks et al. 2010). Elemental analysis ofthe precipitates with EDS (Fig. 5B) confirmed the presenceof CaCO3.
Effects of pH on biotic and abiotic CO2 sequestration
In aquatic environments, the carbonate system plays an essen-tial role in the abiotic CO2 sequestration (Lal 2008). The carbon-ate system is also directly linked to pH,which can lead to the for-mation of carbonate and/or bicarbonate in the water or growthmedium (Bustos-Serrano 2010). Microorganisms also play an im-portant role in changing the pH of their surrounding environ-ment and producing CO2 during growth. At the same time, MICPmicroorganisms have also been described to facilitate calciteprecipitation to store CO2 (Okwadha and Li 2010). However, nostudy so far has done a systematic investigation to determinehow much of the CO2 sequestration during the MICP process isreally biotic or abiotic.
In thiswork, the abiotic CO2 uptakewas determined by quan-tifying the CO2 in the headspace of the serum bottles by a gasanalyzer and by titration of themedia to determine the amountsof carbonate (CO3
2−) and bicarbonate (HCO3−) ions present in
the growth media. In this investigation, sterile growth media
Figure 5. (A) Representative SEM image of precipitated CaCO3 particles of Sporosarcina sp. TR20 on a glass slide. (B) EDS result of precipitated calcium carbonate. Scale
bar: 20μm.
8 FEMS Microbiology Ecology, 2015, Vol. 91, No. 3
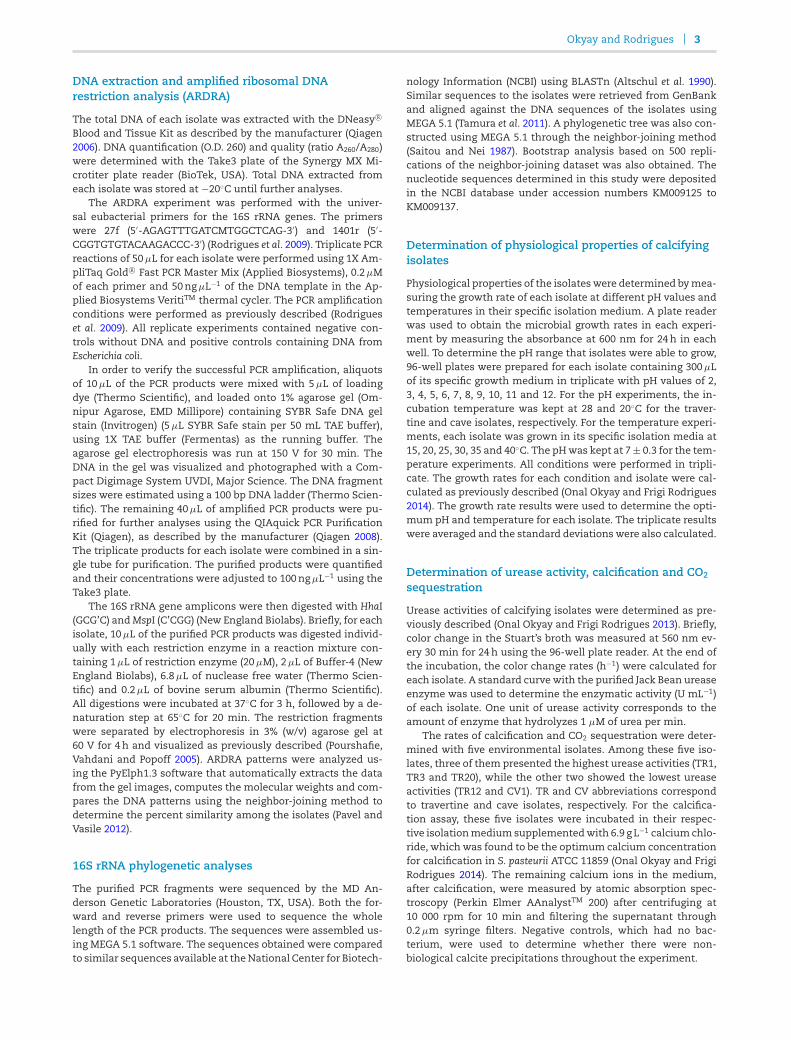
Table 2. The changes of CO2 concentration in headspace and pH of growth media after 24h incubation with and without bacterial cells todetermine biotic and abiotic CO2 sequestration.
Initial CO2 in the Initial Final CO2 in the pH after 24h CO2 (%) inMedium (with bacterial cells) headspace (%) pH headspace (%) incubation abiotic bottles∗
TR1 in ATCC 1832 10 7.6 2.1 8.9 4.6TR3 in NB3 10 7.5 2.6 9.2 6.1TR20 in NB 10 7.3 3.6 9.3 6.1CV1 in NB-10X 10 7.3 6.4 8.3 9.1TR12 in ATCC 1832–10X 10 7.3 6 7.3 9.1
∗Abiotic bottles had no cells and their pH were adjusted to the same pH as the biotic experiments after 24h incubation.
had their pH adjusted to the same final pH of the media thattypically the microorganisms induce after growth for 24h (Ta-ble 2). The goal was to determine whether the 10% CO2 in theheadspace got dissolved in the growth media at the specificpH generated by the bacteria through abiotic processes. The re-sults (Table 2) showed that the medium NB-10X had the low-est abiotic CO2 uptake from the headspace (0.9%). The mediumATCC 1832, on the other hand, had the highest abiotic CO2
uptake (5.4%).The biotic uptake by the MICP process was also determined
by growing the isolates in their respective growth medium andmeasuring the amount of CO2 left in the headspace. The resultsfrom the abiotic assayswere subtracted from the assayswith thebacteria to determine the biotic CO2 uptake by the microorgan-isms. The results showed that all isolates were able to sequesterCO2. The isolates that showed the highest and the lowest bioticCO2 uptake were TR3 and TR1 with a capability of sequestering3.5 and 2.4% of CO2, respectively (Table 2).
In summary, in the MICP process, we were able to observetwo CO2 sequestration phenomena happening: abiotic and bi-otic CO2 uptake. Briefly, most of the isolates increased the pH ofthe media, which led to an increase in abiotic CO2 uptake by thegrowth media, but also the cells induced the calcite precipita-tion, which also led to CO2 sequestration. It is worth point out,that if no cells were grown in the media, there would not be anypH increase and therefore no CO2 removal from the headspace.But, if we changed the pH chemically or biologically to a pHhigher than 7, we started to observe CO2 sequestration when weonly had excess amounts of CO2 (10%) in the serum bottles (seeTable S2, Supporting Information).
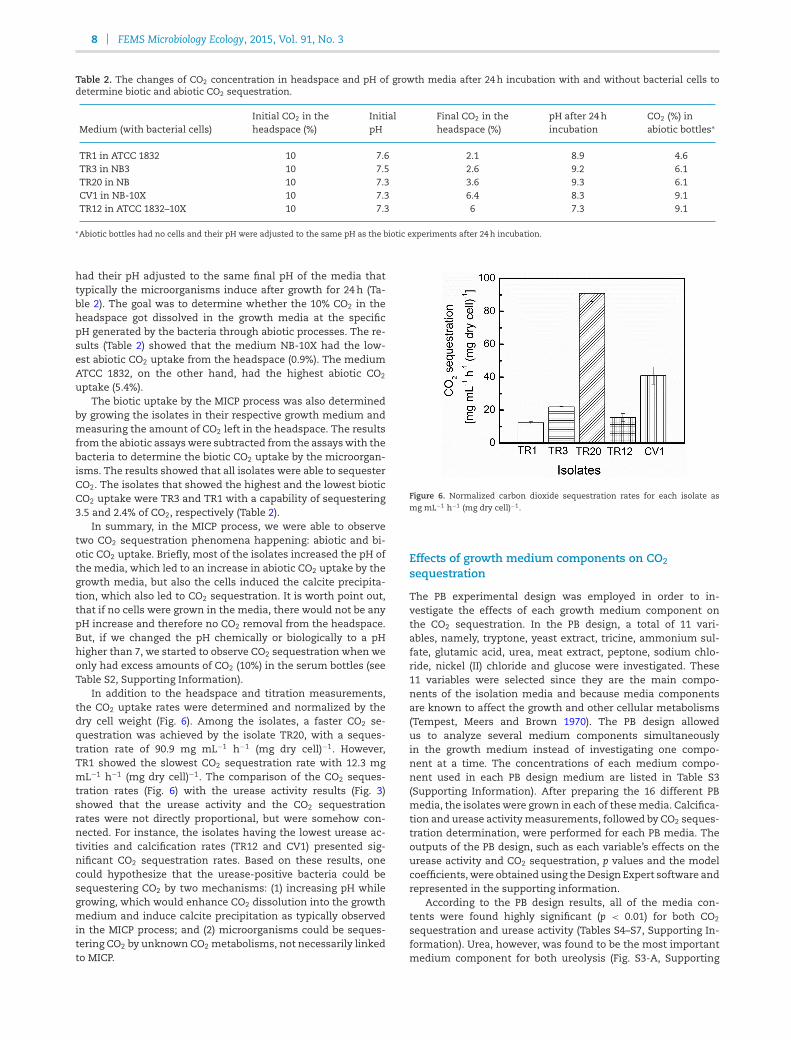
In addition to the headspace and titration measurements,the CO2 uptake rates were determined and normalized by thedry cell weight (Fig. 6). Among the isolates, a faster CO2 se-questration was achieved by the isolate TR20, with a seques-tration rate of 90.9 mg mL−1 h−1 (mg dry cell)−1. However,TR1 showed the slowest CO2 sequestration rate with 12.3 mgmL−1 h−1 (mg dry cell)−1. The comparison of the CO2 seques-tration rates (Fig. 6) with the urease activity results (Fig. 3)showed that the urease activity and the CO2 sequestrationrates were not directly proportional, but were somehow con-nected. For instance, the isolates having the lowest urease ac-tivities and calcification rates (TR12 and CV1) presented sig-nificant CO2 sequestration rates. Based on these results, onecould hypothesize that the urease-positive bacteria could besequestering CO2 by two mechanisms: (1) increasing pH whilegrowing, which would enhance CO2 dissolution into the growthmedium and induce calcite precipitation as typically observedin the MICP process; and (2) microorganisms could be seques-tering CO2 by unknown CO2 metabolisms, not necessarily linkedto MICP.
Figure 6. Normalized carbon dioxide sequestration rates for each isolate asmg mL−1 h−1 (mg dry cell)−1.
Effects of growth medium components on CO2
sequestration
The PB experimental design was employed in order to in-vestigate the effects of each growth medium component onthe CO2 sequestration. In the PB design, a total of 11 vari-ables, namely, tryptone, yeast extract, tricine, ammonium sul-fate, glutamic acid, urea, meat extract, peptone, sodium chlo-ride, nickel (II) chloride and glucose were investigated. These11 variables were selected since they are the main compo-nents of the isolation media and because media componentsare known to affect the growth and other cellular metabolisms(Tempest, Meers and Brown 1970). The PB design allowedus to analyze several medium components simultaneouslyin the growth medium instead of investigating one compo-nent at a time. The concentrations of each medium compo-nent used in each PB design medium are listed in Table S3(Supporting Information). After preparing the 16 different PBmedia, the isolates were grown in each of thesemedia. Calcifica-tion and urease activitymeasurements, followed by CO2 seques-tration determination, were performed for each PB media. Theoutputs of the PB design, such as each variable’s effects on theurease activity and CO2 sequestration, p values and the modelcoefficients, were obtained using theDesign Expert software andrepresented in the supporting information.
According to the PB design results, all of the media con-tents were found highly significant (p < 0.01) for both CO2
sequestration and urease activity (Tables S4–S7, Supporting In-formation). Urea, however, was found to be the most importantmedium component for both ureolysis (Fig. S3-A, Supporting
Okyay and Rodrigues 9
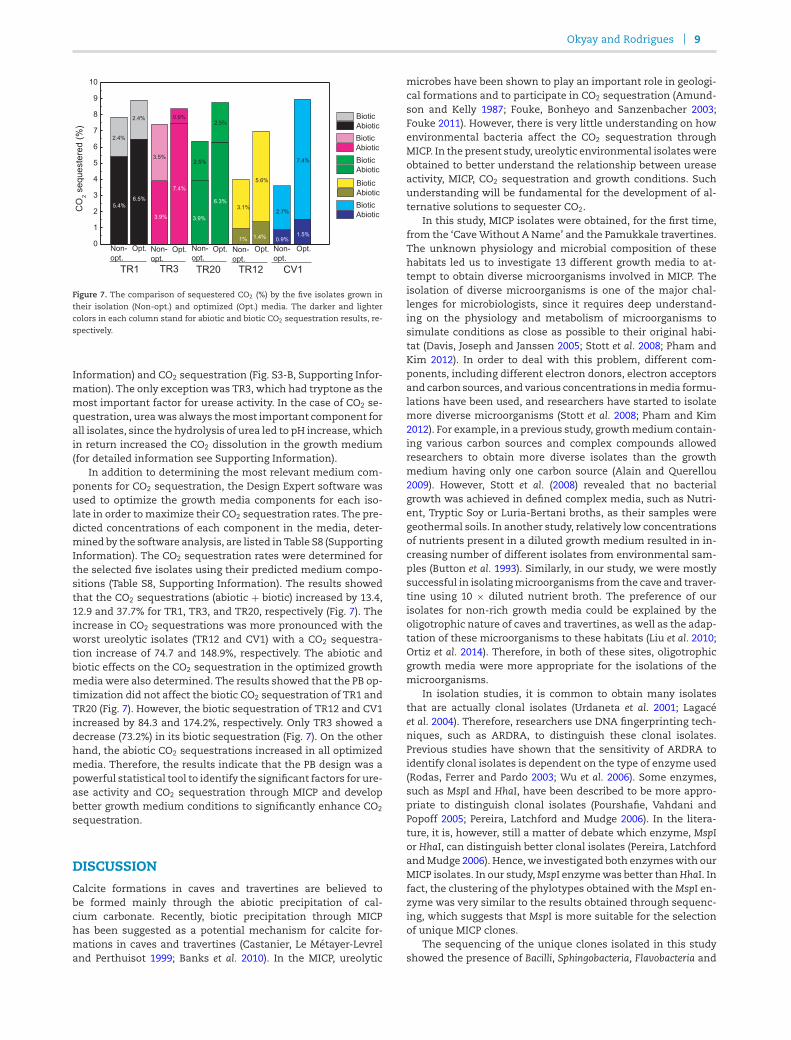
Figure 7. The comparison of sequestered CO2 (%) by the five isolates grown in
their isolation (Non-opt.) and optimized (Opt.) media. The darker and lightercolors in each column stand for abiotic and biotic CO2 sequestration results, re-spectively.
Information) and CO2 sequestration (Fig. S3-B, Supporting Infor-mation). The only exception was TR3, which had tryptone as themost important factor for urease activity. In the case of CO2 se-questration, ureawas always themost important component forall isolates, since the hydrolysis of urea led to pH increase, whichin return increased the CO2 dissolution in the growth medium(for detailed information see Supporting Information).
In addition to determining the most relevant medium com-ponents for CO2 sequestration, the Design Expert software wasused to optimize the growth media components for each iso-late in order tomaximize their CO2 sequestration rates. The pre-dicted concentrations of each component in the media, deter-mined by the software analysis, are listed in Table S8 (SupportingInformation). The CO2 sequestration rates were determined forthe selected five isolates using their predicted medium compo-sitions (Table S8, Supporting Information). The results showedthat the CO2 sequestrations (abiotic + biotic) increased by 13.4,12.9 and 37.7% for TR1, TR3, and TR20, respectively (Fig. 7). Theincrease in CO2 sequestrations was more pronounced with theworst ureolytic isolates (TR12 and CV1) with a CO2 sequestra-tion increase of 74.7 and 148.9%, respectively. The abiotic andbiotic effects on the CO2 sequestration in the optimized growthmedia were also determined. The results showed that the PB op-timization did not affect the biotic CO2 sequestration of TR1 andTR20 (Fig. 7). However, the biotic sequestration of TR12 and CV1increased by 84.3 and 174.2%, respectively. Only TR3 showed adecrease (73.2%) in its biotic sequestration (Fig. 7). On the otherhand, the abiotic CO2 sequestrations increased in all optimizedmedia. Therefore, the results indicate that the PB design was apowerful statistical tool to identify the significant factors for ure-ase activity and CO2 sequestration through MICP and developbetter growth medium conditions to significantly enhance CO2
sequestration.
DISCUSSION
Calcite formations in caves and travertines are believed tobe formed mainly through the abiotic precipitation of cal-cium carbonate. Recently, biotic precipitation through MICPhas been suggested as a potential mechanism for calcite for-mations in caves and travertines (Castanier, Le Metayer-Levreland Perthuisot 1999; Banks et al. 2010). In the MICP, ureolytic
microbes have been shown to play an important role in geologi-cal formations and to participate in CO2 sequestration (Amund-son and Kelly 1987; Fouke, Bonheyo and Sanzenbacher 2003;Fouke 2011). However, there is very little understanding on howenvironmental bacteria affect the CO2 sequestration throughMICP. In the present study, ureolytic environmental isolateswereobtained to better understand the relationship between ureaseactivity, MICP, CO2 sequestration and growth conditions. Suchunderstanding will be fundamental for the development of al-ternative solutions to sequester CO2.
In this study, MICP isolates were obtained, for the first time,from the ‘CaveWithout A Name’ and the Pamukkale travertines.The unknown physiology and microbial composition of thesehabitats led us to investigate 13 different growth media to at-tempt to obtain diverse microorganisms involved in MICP. Theisolation of diverse microorganisms is one of the major chal-lenges for microbiologists, since it requires deep understand-ing on the physiology and metabolism of microorganisms tosimulate conditions as close as possible to their original habi-tat (Davis, Joseph and Janssen 2005; Stott et al. 2008; Pham andKim 2012). In order to deal with this problem, different com-ponents, including different electron donors, electron acceptorsand carbon sources, and various concentrations inmedia formu-lations have been used, and researchers have started to isolatemore diverse microorganisms (Stott et al. 2008; Pham and Kim2012). For example, in a previous study, growthmedium contain-ing various carbon sources and complex compounds allowedresearchers to obtain more diverse isolates than the growthmedium having only one carbon source (Alain and Querellou2009). However, Stott et al. (2008) revealed that no bacterialgrowth was achieved in defined complex media, such as Nutri-ent, Tryptic Soy or Luria-Bertani broths, as their samples weregeothermal soils. In another study, relatively low concentrationsof nutrients present in a diluted growth medium resulted in in-creasing number of different isolates from environmental sam-ples (Button et al. 1993). Similarly, in our study, we were mostlysuccessful in isolatingmicroorganisms from the cave and traver-tine using 10 × diluted nutrient broth. The preference of ourisolates for non-rich growth media could be explained by theoligotrophic nature of caves and travertines, as well as the adap-tation of these microorganisms to these habitats (Liu et al. 2010;Ortiz et al. 2014). Therefore, in both of these sites, oligotrophicgrowth media were more appropriate for the isolations of themicroorganisms.
In isolation studies, it is common to obtain many isolatesthat are actually clonal isolates (Urdaneta et al. 2001; Lagaceet al. 2004). Therefore, researchers use DNA fingerprinting tech-niques, such as ARDRA, to distinguish these clonal isolates.Previous studies have shown that the sensitivity of ARDRA toidentify clonal isolates is dependent on the type of enzyme used(Rodas, Ferrer and Pardo 2003; Wu et al. 2006). Some enzymes,such as MspI and HhaI, have been described to be more appro-priate to distinguish clonal isolates (Pourshafie, Vahdani andPopoff 2005; Pereira, Latchford and Mudge 2006). In the litera-ture, it is, however, still a matter of debate which enzyme, MspIor HhaI, can distinguish better clonal isolates (Pereira, LatchfordandMudge 2006). Hence, we investigated both enzymeswith ourMICP isolates. In our study,MspI enzymewas better thanHhaI. Infact, the clustering of the phylotypes obtained with theMspI en-zyme was very similar to the results obtained through sequenc-ing, which suggests that MspI is more suitable for the selectionof unique MICP clones.
The sequencing of the unique clones isolated in this studyshowed the presence of Bacilli, Sphingobacteria, Flavobacteria and
10 FEMS Microbiology Ecology, 2015, Vol. 91, No. 3
α-, β-, and γ -Proteobacteria in these habitats. Similar observa-tions were also made by previous researchers working withkarstic samples (Fouke, Bonheyo and Sanzenbacher 2003; Bankset al. 2010; Fouke 2011). Interestingly, the Sporosarcina genus,which was the predominant genus in our study, was not ob-served by these researchers in their karstic samples. How-ever, other researchers were able to isolate several Sporosarcinaspecies from soil samples using different isolation media con-taining urea (Yoon et al. 2001; Hammes, Boon and de Villiers2003) or not (Claus et al. 1983; Reddy, Matsumoto and Shivaji2003; Zhang et al. 2010; Bafana 2011).
Based on our findings, it is possible that the addition of ureain all growth media used in this study led to the selection ofspecies having higher urease activities. This finding is also con-sistent with the conclusions of Hammes, Boon and de Villiers(2003) who observed that urea, when added to the medium forbacterial isolation, led to the selection of ureolytic microorgan-isms. In fact, we observed that the isolates presenting higherurease activity belonged to the Sporosarcina genus, except for thecave isolate CV1. It is, however, not surprising to see thatmost ofthe Sporosarcina isolates presented higher urease activities, sincethis genus is well known to be ureolytic (Tobler et al. 2011).
Another interesting observation about these isolates withhigh urease activity was that they had a preference for alkalinepH. This preference for high pH values is typically observed incalcifying microorganisms (Mortensen et al. 2011). This micro-bial adaptation of ureolytic microorganism to alkaline environ-ments can be explained by the degradation of urea and produc-tion of ammonia as a by-product. The production of ammonialeads to pH increase in the surrounding environment. The re-sults obtained are consistent with previous studies that showedthat ureolytic bacteria tend to be alkaliphilic microorganisms,with optimum growth at pH values between 8 and 9 (Okwadhaand Li 2010). It is important to point out, however, that eventhough the pH of the original travertine and the cave water sam-ples were 7 and 7.4, respectively, the presence of these microor-ganisms in sampling sites can be explained by the tolerance ofthese microbes to wide pH ranges as shown in Table 1. To re-late these findings to the environmental samples, in the traver-tine water sample, we found higher ammonia concentrationsthan the cave (Table S1, Supporting Information), which wouldexplain the larger number of MICP isolates obtained from thetravertine than the cave.
Further investigation of the urease andMICP activities by theisolates determined that microorganisms from the same genus,such as Sporosarcina sp. TR1 and Sporosarcina sp. CV1 or Sphin-gobacterium sp. CV2 and Sphingobacterium sp. CV4 had differenturease and MICP activities. This finding contradicts a previousreport that suggested that the urease activity or the rate of MICPwas dependent on the genus of the microorganisms (Hammes,Boon and de Villiers 2003). In the calcification and CO2 uptakeexperiments during MICP, we observed that calcium carbonateprecipitation and the CO2 uptake by the isolates were completedwithin 5–10 h, which were mostly in the exponential phases ofthesemicroorganisms. The calcite precipitation in the exponen-tial phase has also been previously observed in another study(Castanier, Le Metayer-Levrel and Perthuisot 1999). In fact, thecalcification process has been described to correlate well withthe CO2 uptake as the amount of calcite precipitated was pre-viously described to be directly proportional to the CO2 seques-trated (Okwadha and Li 2010).
The stoichiometric reaction of ureolysis in the calcium car-bonate formation shows that 1 mol of urea hydrolyzed will se-quester 1 mol of CO2 to form 1 mol of calcium carbonate, which
precipitates in the medium (Banks et al. 2010; Okwadha and Li2010), therefore the number of moles of CO2 sequestered shouldbe equal to the number of moles of calcium carbonate precip-itated. This could potentially be true in soils, but is certainlynot accurate in aquatic systems, since the CO2 in the air tendto dissolve in the water or in the growth medium, and depend-ing on the pH of the water, the CO2 can be converted to carbon-ates (Weiss 1974; Lee, Kim and Mahanty 2014). Additionally, itis important to point out that bacterial cells release CO2 due torespiration and can change the pH of the growthmedium,whichwould also affect the carbonate system (Millero 1995). These fac-tors should be taken into consideration in order to clarify thetrue biotic role of the MICP process in the CO2 sequestration ofaquatic systems.
In order to better understand the biotic and abiotic CO2 se-questration processes during MICP, we compared the CO2 con-centrations in the headspaces in the growth medium with dif-ferent pH values (abiotic results), and in the growth medium atthe end of the MICP assays (abiotic + biotic results) (Table 2). Assuggested by Lee and collaborators, the pH played an importantrole in the abiotic uptake. For instance, in the abiotic assay (with-out bacterial cells), the ATCC 1832 medium was able to serve asa CO2 sink and, hence, decreased the CO2 content present in theheadspace by 5.4%. In the presence of cells (biotic and abioticprocess together), however, the CO2 decreased by 7.8%. Theseresults suggest that the biotic CO2 uptake was 2.4%. In the caseof the NB3 medium, the CO2 decreased by 3.9 and 3.5% in theabiotic and biotic processes, respectively. In themediumNB, theabiotic and biotic processes were able to sequester 3.9 and 2.5%,respectively. For the isolates TR12 and CV1, their growth mediashowed almost no effect on the abiotic uptake of CO2 and thecells were able to sequestered 2.7 and 3.1% of CO2, respectively.Based on our findings, the five isolates investigated were able tosequester different amounts of CO2. The results suggested thatCO2 sequestration through MICP is strain-specific and dependson the environmental factors, such as pH.
When we take into consideration the amount of calcium car-bonate formed by MICP and the CO2 dissolved in each medium,we observed that stoichiometrically more CO2 is being se-questered than we can account for. The conversion of CO2 se-questered by TR1, TR3, TR20, CV1 and TR12 to moles showsthat 0.054, 0.051, 0.043, 0.025 and 0.027 moles of CO2 is beingsequestered, respectively. In addition, when we calculate thenumber of moles of CO2 in the CaCO3 precipitate and carbon-ates in the growth medium for each isolate, we get 6.4 × 10−4,6.9 × 10−4, 6.9 × 10⁻⁴, 2.6 × 10⁻⁴ and 1.8 × 10⁻⁴ moles,respectively. Hence, when comparing these two sequestrationresults, it is clear that the MICP is not the only CO2 sequestra-tion mechanism. It is possible that besides the uptake mech-anisms observed in this study, there might be other possibleCO2 fixing mechanisms being performed by these microorgan-isms, such as the Calvin–Benson reductive pentose phosphatecycle, the reductive citric acid (Arnon-Buchanan) cycle, thereductive acetyl-CoA (Wood-Ljungdahl) pathway, the hydrox-ypropionate (Fuchs-Holo) bi-cycle, the 3-hydroxypropionate/4-hydroxybutyrate and dicarboxylate/ 4-hydroxybutyrate cycles,as previously described (Ketjinda, Sinchaipanid and Limsuwan2011). In fact, Ortiz et al. (2014) came across some of the genesinvolved in these CO2 fixation pathways when investigating acave ecosystem.
In this study, for the different isolates, we used differentgrowth medium, which could explain the different urease ac-tivities, calcification rates and CO2 sequestration capabilitiesof these isolates. In order to investigate the effects of the

Okyay and Rodrigues 11
different medium components on the CO2 sequestrationthrough MICP, we used the PB experimental design. PB designis a well-established and widely used optimization techniquethat allows the identification of environmental factors play-ing significant roles on microbial metabolisms (Stocks-Fischer,Galinat and Bang 1999; Bachmeier et al. 2002; Hammes, Boonand de Villiers 2003; Whiffin 2004; Sanchez-Roman et al. 2007;De Muynck, De Belie and Verstraete 2010; Chou et al. 2011; Zam-belli et al. 2011; Onal Okyay and Frigi Rodrigues 2014). In thisstudy, the PB design allowed us to identify the significance ofeach medium component for each isolate and also assisted onthe selection of the appropriate concentrations of each com-ponent to enhance CO2 sequestration by each isolate. The PBresults showed that urea was the most important componentin all isolates’ growth media, which makes sense since ureais a key factor in ureolysis and all these isolates are ureolytic(Lee, Kim and Mahanty 2014). The PB results also allowed theenhancement of CO2 sequestration, by the two worst ureolyticisolates, TR12 and CV1. These results suggested that CO2 se-questration throughMICP depends on themicrobe itself and themicrobial growth conditions. Further analyses of the biotic andabiotic effects on the CO2 sequestration on these optimized me-dia demonstrated that the optimization helped the microorgan-isms (TR12 and CV1) increase their CO2 uptake metabolism toallow the enhancement of the biotic CO2 uptake. Moreover, thechange in the composition of the media led to higher abioticCO2 sequestrations in certain growth media. This higher abi-otic sequestration was observed with growth media with morenutrients (or higher concentrations). This could be explainedby the CO2 diffusivity, which is dependent on the viscosity ofthe medium and temperature (Wilke and Chang 1955; McCabe,Maguire and Lintell 2005). Moreover, CO2 solubility has been de-scribed to depend on environmental factors such as pH, temper-ature and pressure, and on intrinsic parameters such as salinity,sugar, fat and protein contents (Chaix, Guillaume and Guillard2014). Hence, it is likely that by changing the medium compo-sition, the viscosity of the medium changed and led to higherCO2 uptake.
CONCLUSIONS
This study suggests that caves and travertines contain microor-ganisms involved on calcification processes and CO2 seques-tration. These findings also suggest that caves and travertinescould be potential natural carbon sinks. Furthermore, calcify-ing bacteria were found to induce CO2 removal from the atmo-sphere through two possible mechanisms: (a) biotic sequestra-tion through MICP and (b) abiotic sequestration by changing theenvironment pH. In both cases, cells play significant roles in theCO2 sequestration: first, they can act as nucleation sites for cal-cite precipitation; second, they can potentially sequester CO2
by their fixation metabolisms; and third, they can increase thesurrounding environmental pH, which would allow increasingatmospheric CO2 dissolution in aquatic systems and calcite pre-cipitation, when calcium is present. In this study, when consid-ering the biotic and abiotic CO2 sequestration mechanisms byMICP, the isolates, TR1, TR3, TR20, CV1 and TR12, were able toassist in the CO2 sequestration by 78.6, 74.1, 63.6, 36 and 40%respectively, in their isolation media. Moreover, the PB designshowed to be a powerful tool to determine the components andconcentrations of each growth medium to significantly increasethe abiotic CO2 sequestrations for each isolate, and biotic CO2
sequestrations for the isolates TR12 and CV1.
SUPPLEMENTARY DATA
Supplementary data is available at FEMSEC online.
ACKNOWLEDGEMENTS
We thank the Turkish Ministry of National Education for sup-porting Tugba Onal Okyay with a Graduate Research Fellow-ship. We would like to acknowledge the University of HoustonGrants to Enhance and Advance Research for the support of thisresearch.
Conflict of interest. None declared.
REFERENCES
Alain K, Querellou J. Cultivating the uncultured: limits, advancesand future challenges. Extremophiles 2009;13:583–94.
Altschul SF, Gish W, Miller W, et al. Basic local alignment searchtool. J Mol Biol 1990;215:403–10.
Amundson R, Kelly E. The chemistry and mineralogy of a CO2-rich travertine depositing spring in the California CoastRange. Geochim Cosmochim Ac 1987;51:2883–90.
APHA. Standart Methods for the Examination of Water and Wastew-ater. Washington, DC: American Public Health Association,2005.
Bachmeier KL,Williams AE,Warmington JR, et al.Urease activityinmicrobiologically-induced calcite precipitation. J Biotechnol2002;93:171–81.
Bafana A. Mercury resistance in Sporosarcina sp. G3. BioMetals2011;24:301–9.
Baker A, Fairchild IJ. Drip water hydrology and speleothems.Nature Education Knowledge 2012;3:16.
Banks ED, Taylor NM, Gulley J, et al. Bacterial calcium carbon-ate precipitation in cave environments: a function of calciumhomeostasis. Geomicrobiol J 2010;27:444–54.
Boquet E, Boronate A, Ramos-Cormenzana A. Production of cal-cite (calcium carbonate) crystals by soil bacteria is a generalphenomenon. Nature 1973;246:527–9.
Bustos-Serrano H. The carbonate system in natural waters.Thesis. University of Miami, 2010.
Button DK, Schut F, Quang P, et al. Viability and isolation of ma-rine bacteria by dilution culture: theory, procedures, and ini-tial results. Appl Environ Microb 1993;59:881–91.
Castanier S, Le Metayer-Levrel G, Perthuisot J-P. Ca-carbonatesprecipitation and limestone genesis—the microbiogeologistpoint of view. Sediment Geol 1999;126:9–23.
Cave. Cave Without A Name’s Annual Temperature, 2014. Availableonline at: http://www.cavewithoutaname.com/tours.htm.
Chaix E, GuillaumeC, Guillard V. Oxygen and carbon dioxide sol-ubility and diffusivity in solid food matrices: a review of pastand current knowledge. Compr Rev Food Sci F 2014;13:261–86.
Chou C, Seagren E, Aydilek A, et al. Biocalcification of sandthrough ureolysis. J Geotech Geoenviron 2011;137:1179–89.
Christensen WB. Urea decomposition as a means of differenti-ating proteus and paracolon cultures from each other andfrom salmonella and shigella types. J Bacteriol 1946;52:461–6.
Chu J, Stabnikov V, Ivanov V. Microbially induced calciumcarbonate precipitation on surface or in the bulk of soil.Geomicrobiol J 2012;29:544–9.
Claus D, Fahmy F, Rolf HJ, et al. Sporosarcina halophila sp. nov.,an obligate, slightly halophilic bacterium from salt marshsoils. Syst Appl Microbiol 1983;4:496–506.

12 FEMS Microbiology Ecology, 2015, Vol. 91, No. 3
Davis KER, Joseph SJ, Janssen PH. Effects of growth medium, in-oculum size, and incubation time on culturability and isola-tion of soil bacteria. Appl Environ Microb 2005;71:826–34.
De Muynck W, De Belie N, Verstraete W. Microbial carbonateprecipitation in construction materials: a review. Ecol Eng2010;36:118–36.
DeJong JT, Mortensen BM, Martinez BC, et al. Bio-mediated soilimprovement. Ecol Eng 2010;36:197–210.
Douglas S, Beveridge TJ. Mineral formation by bacteria in naturalmicrobial communities. FEMS Microbiol Ecol 1998;26:79–88.
Fouke BW. Hot-spring Systems Geobiology: abiotic and biotic in-fluences on travertine formation at Mammoth Hot Springs,Yellowstone National Park, USA. Sedimentology 2011;58:170–219.
Fouke BW, Bonheyo GT, Sanzenbacher B, et al. Partitioning ofbacterial communities between travertine depositional fa-cies at Mammoth Hot Springs, Yellowstone National Park,U.S.A. Can J Earth Sci 2003;40:1531–48.
Gray CJ, Engel AS. Microbial diversity and impact on carbonategeochemistry across a changing geochemical gradient in akarst aquifer. ISME J 2013;7:325–37.
Hamdan N. Carbonate mineral precipitation for soil improve-ment throughmicrobial denitrification. Thesis. Arizona StateUniversity, 2011.
Hammes F, BoonN, deVilliers J, et al. Strain-specific ureolyticmi-crobial calcium carbonate precipitation. Appl Environ Microb2003;69:4901–9.
Jameson RA, Boyer DG, Alexander Jr EC. Nitrogen isotope anal-ysis of high-nitrate and other karst waters and leached sed-iments at Friar’s Hole Cave, West Virginia. In: Sasowsky ID,Palmer MV (eds). Breakthroughs in karst geomicrobiology and re-dox geochemistry: abstracts and Field-trip guide for the symposiumheld February 16 through 19, 1994, Colorado Springs, Colorado.Spec Pub 1. Charles Town, WV: Karst Waters Institute, Inc.,1994, p. 36–37.
Johnston M, Muench B, Banks E, et al. Human urine inLechuguilla Cave: the microbiological impact and potentialfor bioremediation. J Cave Karst Stud 2012;74:278–91.
Kacaroglu F. Review of groundwater pollution and protection inKarst areas. Int J Environ Pollut 1999;113:337–56.
Ketjinda W, Sinchaipanid N, Limsuwan P, et al. Development ofpush-pull osmotic tablets using chitosan-poly(acrylic acid)interpolymer complex as an osmopolymer. AAPS Pharm-SciTech 2011;12:132–40.
Khambhaty Y, Mody K, Jha B, et al. Statistical optimization ofmedium components for κ-carrageenase production by Pseu-domonas elongata. Enzyme Microb Tech 2007;40:813–22.
Kumaresan D, Wischer D, Stephenson J, et al. Microbiology ofmovile cave—a chemolithoautotrophic ecosystem. Geomicro-biol J 2014;31:186–93.
Lagace L, Pitre M, Jacques M, et al. Identification of the bacterialcommunity of maple sap by using amplified ribosomal DNA(rDNA) restriction analysis and rDNA sequencing. Appl Envi-ron Microb 2004;70:2052–60.
Lal R. Carbon sequestration. Philo T R Soc B 2008;363:815–30.Lee J, Kim C, Mahanty B. Mineralization of gaseous CO2 by Bacil-
lus megaterium in close environment system. Water Air SoilPoll 2014;225:1–8.
Liu Q, Wang H, Zhao R, et al. Bacteria isolated from dripping wa-ter in the oligotrophic Heshang cave in Central China. J EarthSci 2010;21:325–8.
McCabe M, Maguire D, Lintell N. The anomalous einstein-stokes behaviour of oxygen and other low molecular weightdiffusants. In: Okunieff P, Williams J, Chen Y (eds). Oxy-
gen Transport to Tissue XXVI, Vol. 566, US: Springer, 2005,143–9.
Meyer F, Bang S, Min S, Stetler L, Bang S, et al. Microbiologically-Induced Soil Stabilization: Application of Sporosarcina pas-teurii for Fugitive Dust Control. Geo-Frontiers 2011;4002–11.doi:10.1061/41165(397)409.
Millero FJ. Thermodynamics of the carbon dioxide system in theoceans. Geochim Cosmochim Ac 1995;59:661–77.
Mitchell AC, Dideriksen K, Spangler LH, et al. Microbially en-hanced carbon capture and storage by mineral-trapping andsolubility-trapping. Environ Sci Technol 2010;44:5270–6.
Mortensen BM, Haber MJ, DeJong JT, et al. Effects of environmen-tal factors on microbial induced calcium carbonate precipi-tation. J Appl Microbiol 2011;111:338–49.
Okwadha GDO, Li J. Optimumconditions formicrobial carbonateprecipitation. Chemosphere 2010;81:1143–8.
Onal Okyay T, Frigi Rodrigues D. High throughput colorimetricassay for rapid urease activity quantification. J Microbiol Meth2013;95:324–6.
Onal Okyay T, Frigi Rodrigues D. Optimized carbonate micro-particle production by Sporosarcina pasteurii using responsesurface methodology. Ecol Eng 2014;62:168–74.
Ortiz M, Legatzki A, Neilson JW, et al.Making a livingwhile starv-ing in the dark: metagenomic insights into the energy dy-namics of a carbonate cave. ISME J 2014;8:478–91.
Ortiz M, Neilson J, Nelson W, et al. profiling bacterial diver-sity and taxonomic composition on speleothem surfaces inKartchner Caverns, AZ. Microb Ecol 2013;65:371–83.
Pamukkale. Pamukkale Travertines’ Annual Temperature. Denizli,Turkey:Provincial Directorate of Culture and Tourism, 2014.
Pavel AB, Vasile CI. PyElph—a software tool for gel images anal-ysis and phylogenetics. BMC Bioinformatics 2012;13:9.
PereiraMG, Latchford JW,Mudge SM. The use of terminal restric-tion fragment length polymorphism (T-RFLP) for the char-acterisation of microbial communities in marine sediments.Geomicrobiol J 2006;23:247–51.
Pham VHT, Kim J. Cultivation of unculturable soil bacteria.Trends Biotechnol 2012;30:475–84.
Pourshafie M, Vahdani P, Popoff M. Genotyping Clostridium bo-tulinum toxinotype A isolates from patients using amplifiedrDNA restriction analysis. J Med Microbiol 2005;54:933–6.
Qiagen.DNeasy R© Blood & Tissue Handbook, USA: Qiagen Inc., 2006.Qiagen. QIAquick R© Spin Handbook, USA: Qiagen Inc., 2008.Reddy GSN, Matsumoto GI, Shivaji S. Sporosarcina macmur-
doensis sp. nov., from a cyanobacterial mat sample from apond in the McMurdo Dry Valleys, Antarctica. Int J Syst EvolMicr 2003;53:1363–7.
Rodas AM, Ferrer S, Pardo I. 16S-ARDRA, a tool for identificationof lactic acid bacteria isolated from grape must and wine.Syst Appl Microbiol 2003;26:412–22.
Rodrigues DF, Sakata SK, Comasseto JV, et al. Diversity ofhydrocarbon-degrading Klebsiella strains isolated fromhydrocarbon-contaminated estuaries. J Appl Microbiol2009;106:1304–14.
SaitouN, NeiM. The neighbor-joiningmethod: a newmethod forreconstructing phylogenetic trees. Mol Biol Evol 1987;4:406–25.
Salek SS, Kleerebezem R, Jonkers HM, et al. Mineral CO2 seques-tration by environmental biotechnological processes. TrendsBiotechnol 2013;31:139–46.
Sanchez-Roman M, Rivadeneyra MA, Vasconcelos C, et al.Biomineralization of carbonate and phosphate by moder-ately halophilic bacteria. FEMS Microbiol Ecol 2007;61:273–84.
Okyay and Rodrigues 13
Stocks-Fischer S, Galinat JK, Bang SS. Microbiological precipita-tion of CaCO3. Soil Biol Biochem 1999;31:1563–71.
Stott MB, Crowe MA, Mountain BW, et al. Isolation of novel bac-teria, including a candidate division, from geothermal soilsin New Zealand. Environ Microbiol 2008;10:2030–41.
Stuart CA, Stratum EV, Rustigian R. Further studies on ure-ase production by proteus and related organisms. J Bacteriol1945;49:437–44.
Tamura K, Peterson D, Peterson N, et al. MEGA5: molecular evo-lutionary genetics analysis using maximum likelihood, evo-lutionary distance, and maximum parsimony methods. MolBiol Evol 2011;28:2731–9.
Tempest DW, Meers JL, Brown CM. Influence of environ-ment on the content and composition of microbialfree amino acid pools. J Gen Microbiol 1970;64:171–85.
Tobler DJ, Cuthbert MO, Greswell RB, et al. Comparison of ratesof ureolysis between Sporosarcina pasteurii and an indige-nous groundwater community under conditions required toprecipitate large volumes of calcite. Geochim Cosmochim Ac2011;75:3290–301.
Urdaneta L, Lal A, Barnabe C, et al. Evidence for clonalpropagation in natural isolates of Plasmodium fal-ciparum from Venezuela. P Natl Acad Sci 2001;98:6725–9.
Weiss RF. Carbon dioxide in water and seawater: the solubilityof a non-ideal gas. Mar Chem 1974;2:203–15.
Whiffin VS. Microbial CaCO3 precipitation for the production ofbiocement. Thesis. Murdoch University, 2004.
Wilke CR, Chang P. Correlation of diffusion coefficients in dilutesolutions. AIChE J 1955;1:264–70.
Wu X-Y, Walker MJ, Hornitzky M, et al. Development of a group-specific PCR combined with ARDRA for the identificationof Bacillus species of environmental significance. J MicrobiolMeth 2006;64:107–19.
Yoon JH, Lee KC, Weiss N, et al. Sporosarcina aquimarina sp.nov., a bacterium isolated from seawater in Korea, and trans-fer of Bacillus globisporus (Larkin and Stokes 1967), Bacil-lus psychrophilus (Nakamura 1984) and Bacillus pasteurii(Chester 1898) to the genus Sporosarcina as Sporosarcina glo-bispora comb. nov., Sporosarcina psychrophila comb. nov.and Sporosarcina pasteurii comb. nov., and emended de-scription of th. Int J Syst Evol Micr 2001;51:1079–86.
Zambelli B, Musiani F, Benini S, et al. Chemistry of Ni2+ in ure-ase: sensing, trafficking, and catalysis. Accounts Chem Res2011;44:520–30.
Zhang Z, Srichuwong S, Kobayashi T, et al. Bioconversion of l-arabinose and other carbohydrates from plant cell walls to α-glucan by a soil bacterium, Sporosarcina sp. N52. BioresourceTechnol 2010;101:9734–41.
Related Documents