Biopharmaceutical Sector Update on the Financing and Deal Environment October 2020 © 2020. All rights reserved. Securities offered in the United States are offered through Torreya Capital LLC, Member FINRA/SIPC. In Europe such services are offered through Torreya Partners (Europe) LLP, which is authorized and regulated by the UK Financial Conduct Authority.

Welcome message from author
This document is posted to help you gain knowledge. Please leave a comment to let me know what you think about it! Share it to your friends and learn new things together.
Transcript
Biopharmaceutical SectorUpdate on the Financing and Deal Environment
October 2020
© 2020. All rights reserved. Securities offered in the United States are offered through Torreya Capital LLC, Member FINRA/SIPC. In Europe such services are offered through Torreya Partners (Europe) LLP, which is authorized and regulated by the UK Financial Conduct Authority.

Table of Contents
COVID-19 Update – October 2020 5The Public Biopharma Stock Markets 8
Public Equity Offering 15SPAC Offerings 23
The Private Capital Markets Environment 29The M&A Environment 37Japanese Licensing and M&A 44Chinese Licensing and M&A 48About Torreya 53

3
COVID-19 Situation Update: October 2020
We Remain in a COVID-19 Pandemic
4Source: European Center for Disease Prevention and Control
• The number of worldwide cases of COVID-19 infection exceeds 2 million according to the World Health Organization.
• It is likely that the number of cases is substantially underreported given the lack of widespread testing.
• New case growth went negative in the week ended April 17th, 2020.
0
50,000
100,000
150,000
200,000
250,000
300,000
350,000
400,000
450,000
2020
-03-
0820
20-0
3-13
2020
-03-
1820
20-0
3-23
2020
-03-
2820
20-0
4-02
2020
-04-
0720
20-0
4-12
2020
-04-
1720
20-0
4-22
2020
-04-
2720
20-0
5-02
2020
-05-
0720
20-0
5-12
2020
-05-
1720
20-0
5-22
2020
-05-
2720
20-0
6-01
2020
-06-
0620
20-0
6-11
2020
-06-
1620
20-0
6-21
2020
-06-
2620
20-0
7-01
2020
-07-
0620
20-0
7-11
2020
-07-
1620
20-0
7-21
2020
-07-
2620
20-0
7-31
2020
-08-
0520
20-0
8-10
2020
-08-
1520
20-0
8-20
2020
-08-
2520
20-0
8-30
2020
-09-
0420
20-0
9-09
2020
-09-
1420
20-0
9-19
2020
-09-
2420
20-0
9-29
2020
-10-
0420
20-1
0-09
2020
-10-
1420
20-1
0-19
2020
-10-
24
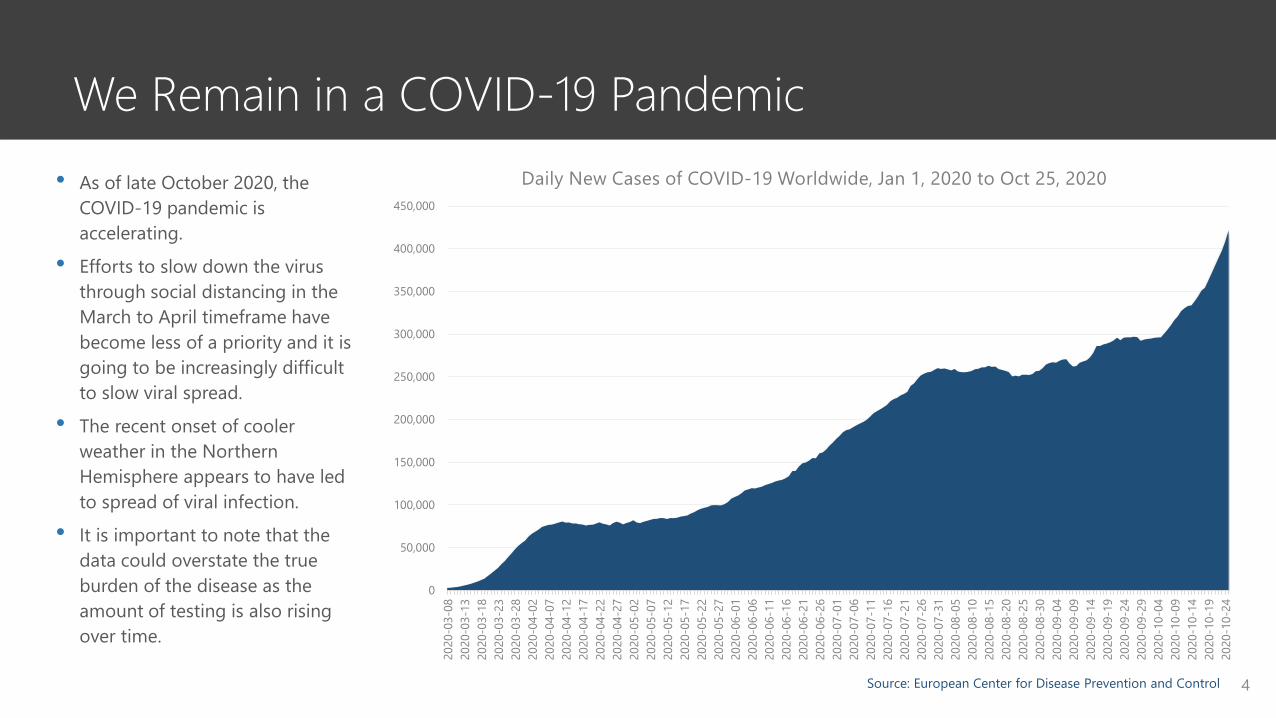
Daily New Cases of COVID-19 Worldwide, Jan 1, 2020 to Oct 25, 2020• As of late October 2020, the COVID-19 pandemic is accelerating.
• Efforts to slow down the virus through social distancing in the March to April timeframe have become less of a priority and it is going to be increasingly difficult to slow viral spread.
• The recent onset of cooler weather in the Northern Hemisphere appears to have led to spread of viral infection.
• It is important to note that the data could overstate the true burden of the disease as the amount of testing is also rising over time.
4
Lethality of COVID-19 is Dropping
5Source: European Center for Disease Prevention and Control
• The number of worldwide cases of COVID-19 infection exceeds 2 million according to the World Health Organization.
• It is likely that the number of cases is substantially underreported given the lack of widespread testing.
• New case growth went negative in the week ended April 17th, 2020.
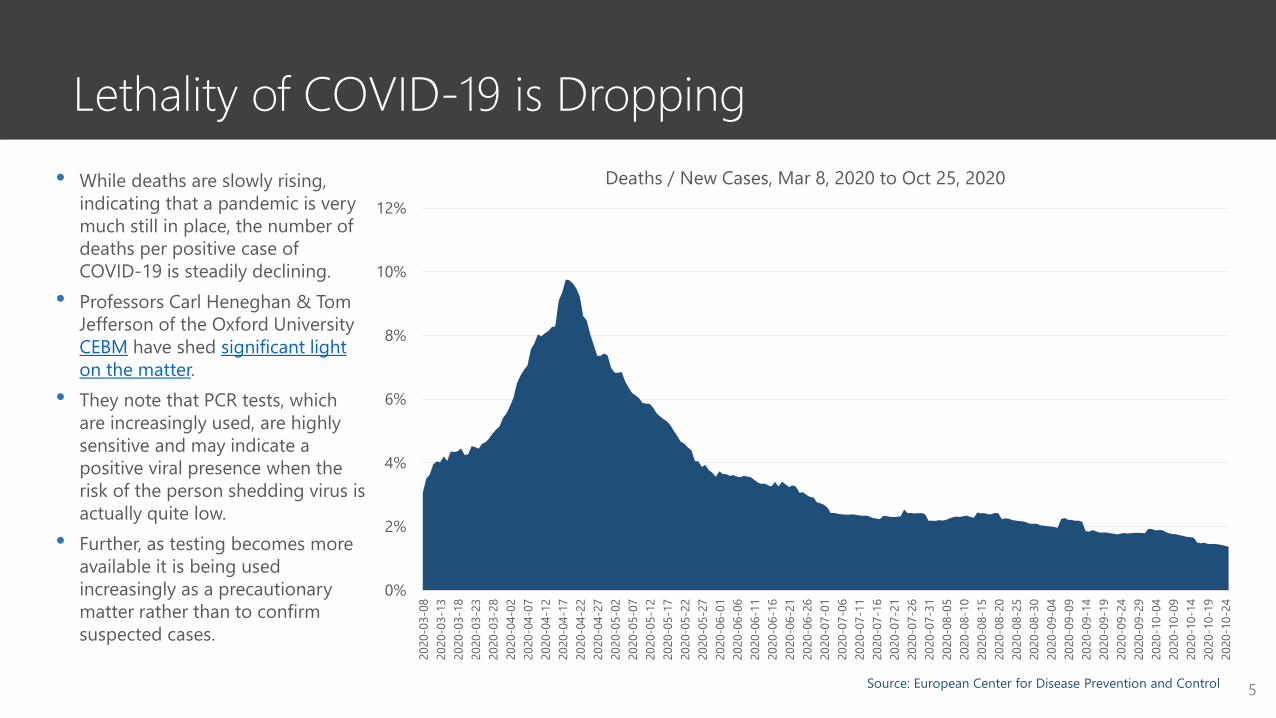
• While deaths are slowly rising, indicating that a pandemic is very much still in place, the number of deaths per positive case of COVID-19 is steadily declining.
• Professors Carl Heneghan & Tom Jefferson of the Oxford University CEBM have shed significant light on the matter.
• They note that PCR tests, which are increasingly used, are highly sensitive and may indicate a positive viral presence when the risk of the person shedding virus is actually quite low.
• Further, as testing becomes more available it is being used increasingly as a precautionary matter rather than to confirm suspected cases.
0%
2%
4%
6%
8%
10%
12%
2020
-03-
0820
20-0
3-13
2020
-03-
1820
20-0
3-23
2020
-03-
2820
20-0
4-02
2020
-04-
0720
20-0
4-12
2020
-04-
1720
20-0
4-22
2020
-04-
2720
20-0
5-02
2020
-05-
0720
20-0
5-12
2020
-05-
1720
20-0
5-22
2020
-05-
2720
20-0
6-01
2020
-06-
0620
20-0
6-11
2020
-06-
1620
20-0
6-21
2020
-06-
2620
20-0
7-01
2020
-07-
0620
20-0
7-11
2020
-07-
1620
20-0
7-21
2020
-07-
2620
20-0
7-31
2020
-08-
0520
20-0
8-10
2020
-08-
1520
20-0
8-20
2020
-08-
2520
20-0
8-30
2020
-09-
0420
20-0
9-09
2020
-09-
1420
20-0
9-19
2020
-09-
2420
20-0
9-29
2020
-10-
0420
20-1
0-09
2020
-10-
1420
20-1
0-19
2020
-10-
24
Deaths / New Cases, Mar 8, 2020 to Oct 25, 2020
5
Some Semblance of a “New Normal” Appears Likely:Vaccines Progressing Towards Approval
6
• The number of worldwide cases of COVID-19 infection exceeds 2 million according to the World Health Organization.
• It is likely that the number of cases is substantially underreported given the lack of widespread testing.
• New case growth went negative in the week ended April 17th, 2020.
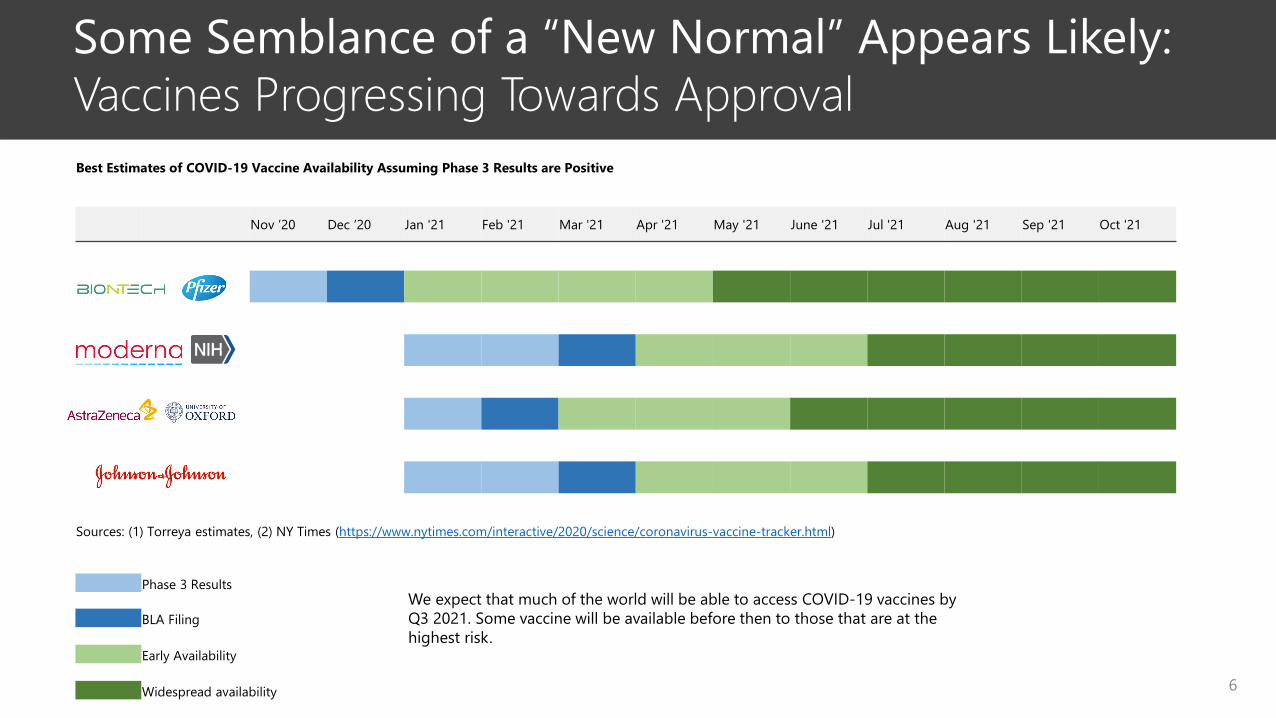
Best Estimates of COVID-19 Vaccine Availability Assuming Phase 3 Results are Positive
Nov ’20 Dec ’20 Jan '21 Feb '21 Mar '21 Apr '21 May '21 June '21 Jul '21 Aug '21 Sep '21 Oct '21
Sources: (1) Torreya estimates, (2) NY Times (https://www.nytimes.com/interactive/2020/science/coronavirus-vaccine-tracker.html)
Phase 3 Results
BLA Filing
Early Availability
Widespread availability
We expect that much of the world will be able to access COVID-19 vaccines by Q3 2021. Some vaccine will be available before then to those that are at the highest risk.
6
Some Semblance of a “New Normal” Appears Likely:Rapid PCR Tests
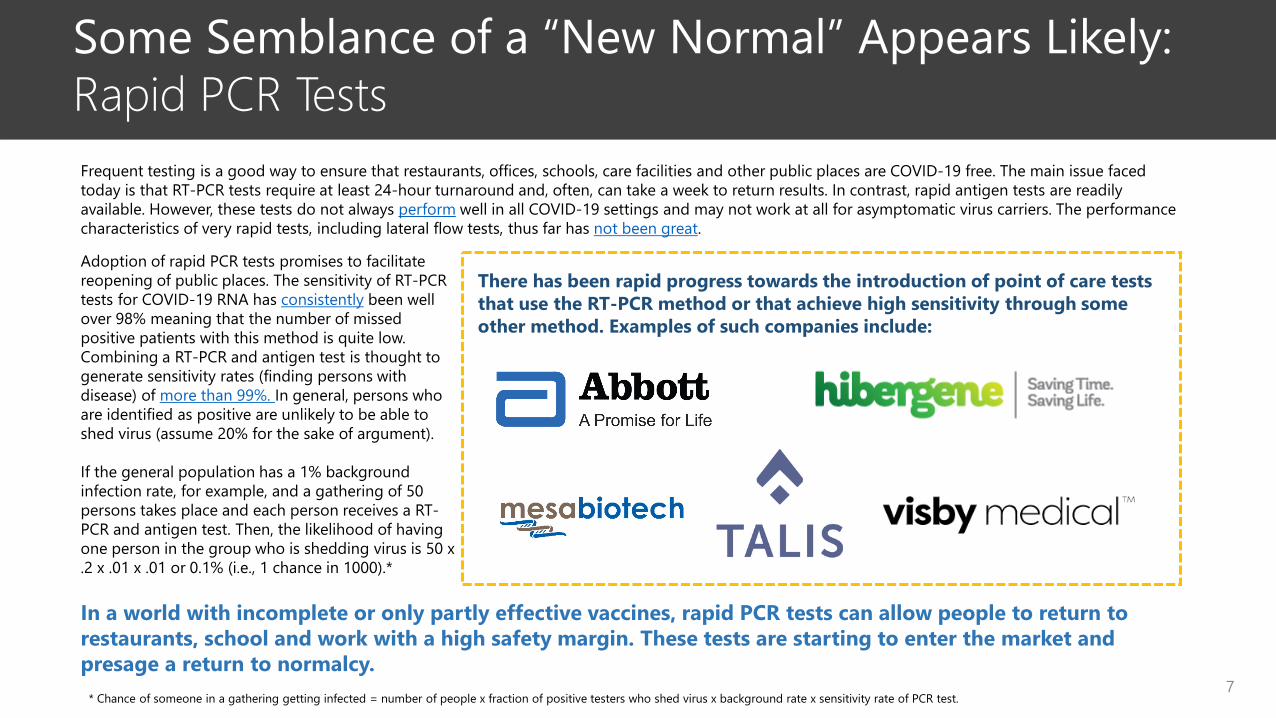
There has been rapid progress towards the introduction of point of care tests that use the RT-PCR method or that achieve high sensitivity through some other method. Examples of such companies include:
Frequent testing is a good way to ensure that restaurants, offices, schools, care facilities and other public places are COVID-19 free. The main issue faced today is that RT-PCR tests require at least 24-hour turnaround and, often, can take a week to return results. In contrast, rapid antigen tests are readily available. However, these tests do not always perform well in all COVID-19 settings and may not work at all for asymptomatic virus carriers. The performance characteristics of very rapid tests, including lateral flow tests, thus far has not been great.
Adoption of rapid PCR tests promises to facilitate reopening of public places. The sensitivity of RT-PCR tests for COVID-19 RNA has consistently been well over 98% meaning that the number of missed positive patients with this method is quite low. Combining a RT-PCR and antigen test is thought to generate sensitivity rates (finding persons with disease) of more than 99%. In general, persons who are identified as positive are unlikely to be able to shed virus (assume 20% for the sake of argument).
If the general population has a 1% background infection rate, for example, and a gathering of 50 persons takes place and each person receives a RT-PCR and antigen test. Then, the likelihood of having one person in the group who is shedding virus is 50 x .2 x .01 x .01 or 0.1% (i.e., 1 chance in 1000).*
In a world with incomplete or only partly effective vaccines, rapid PCR tests can allow people to return to restaurants, school and work with a high safety margin. These tests are starting to enter the market and presage a return to normalcy.
7* Chance of someone in a gathering getting infected = number of people x fraction of positive testers who shed virus x background rate x sensitivity rate of PCR test.

8
The Public Biopharma Stock Markets
0
500
1000
1500
2000
2500
3000
3500
4000
4500
5000
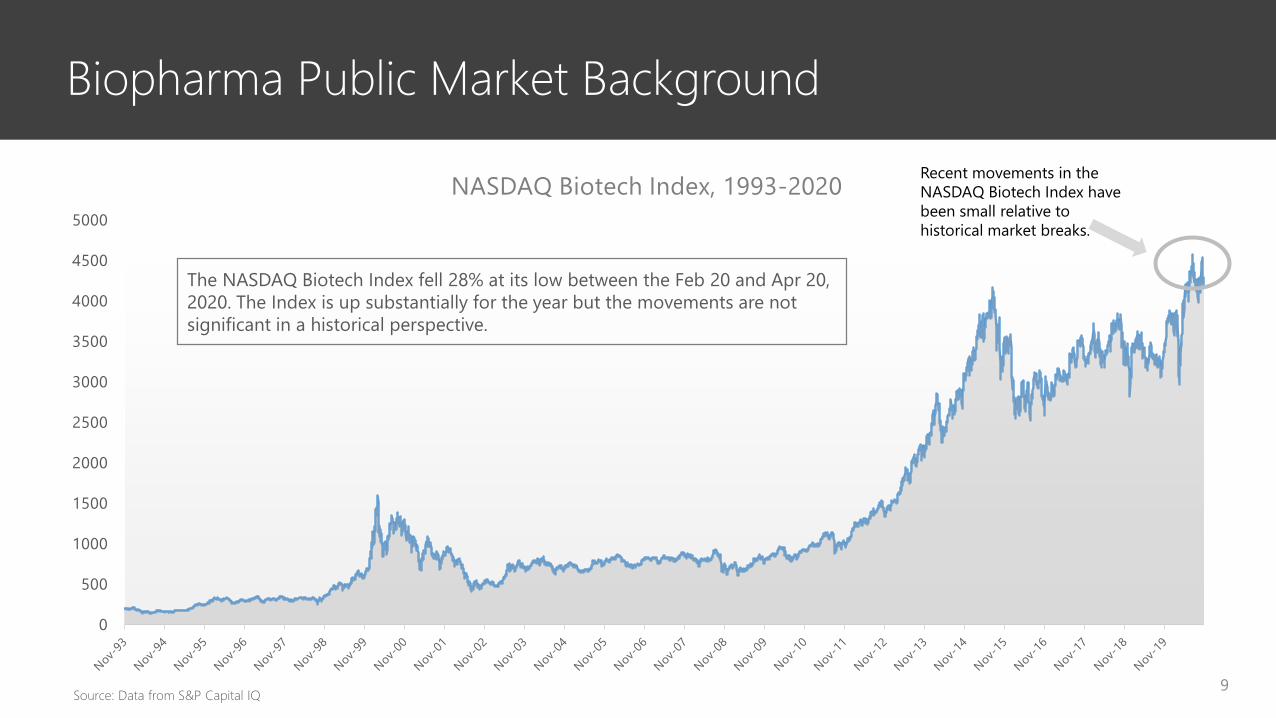
NASDAQ Biotech Index, 1993-2020
9
Recent movements in the NASDAQ Biotech Index have been small relative to historical market breaks.
Biopharma Public Market Background
The NASDAQ Biotech Index fell 28% at its low between the Feb 20 and Apr 20, 2020. The Index is up substantially for the year but the movements are not significant in a historical perspective.
Source: Data from S&P Capital IQ
3000
3200
3400
3600
3800
4000
4200
4400
4600
Apr-
20
Apr-
20
Apr-
20
Apr-
20
Apr-
20
May
-20
May
-20
May
-20
May
-20
Jun-
20
Jun-
20
Jun-
20
Jun-
20
Jul-2
0
Jul-2
0
Jul-2
0
Jul-2
0
Jul-2
0
Aug-
20
Aug-
20
Aug-
20
Aug-
20
Sep-
20
Sep-
20
Sep-
20
Sep-
20
Sep-
20
Oct
-20
Oct
-20
Oct
-20
Oct
-20
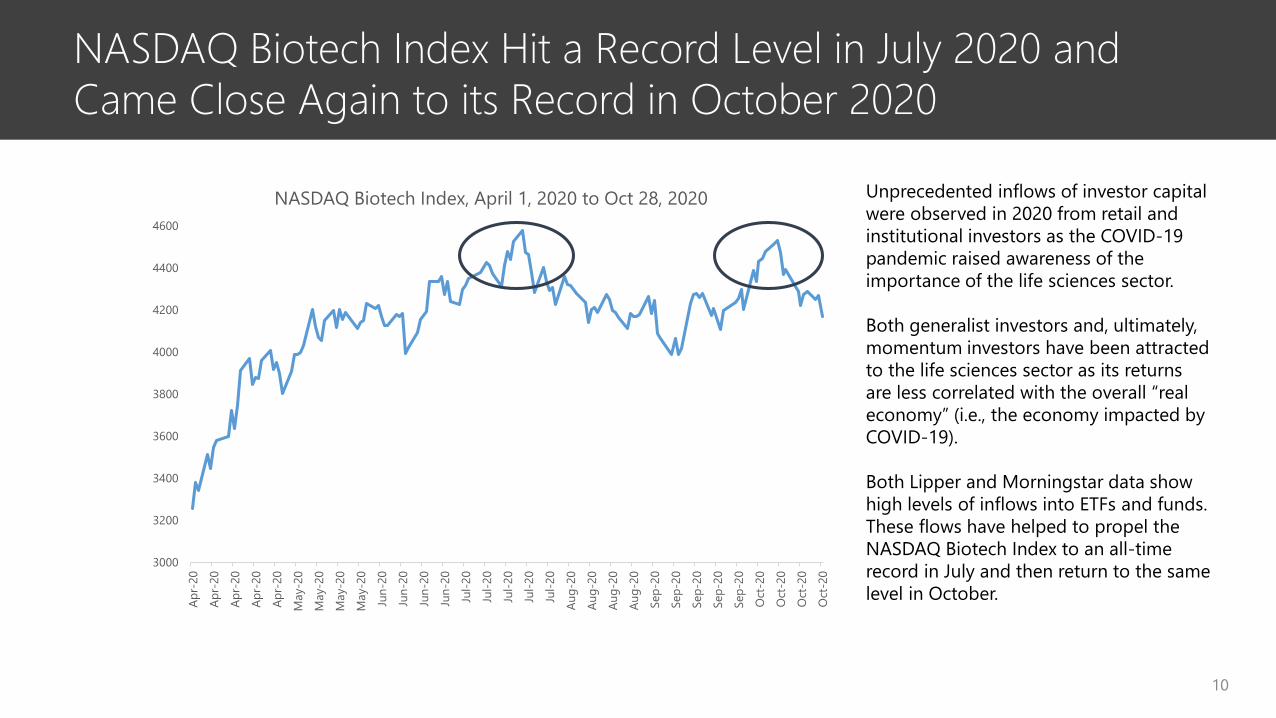
NASDAQ Biotech Index, April 1, 2020 to Oct 28, 2020
NASDAQ Biotech Index Hit a Record Level in July 2020 and Came Close Again to its Record in October 2020
10
Unprecedented inflows of investor capital were observed in 2020 from retail and institutional investors as the COVID-19 pandemic raised awareness of the importance of the life sciences sector.
Both generalist investors and, ultimately, momentum investors have been attracted to the life sciences sector as its returns are less correlated with the overall “real economy” (i.e., the economy impacted by COVID-19).
Both Lipper and Morningstar data show high levels of inflows into ETFs and funds. These flows have helped to propel the NASDAQ Biotech Index to an all-time record in July and then return to the same level in October.

Understanding the NASDAQ Biotech Index Returns
11
The NASDAQ Biotech Index is a market weighted index of 201 life sciences stocks, mainly in biopharma.
We looked at the returns on each of the constituents from Jan 1, 2020 to Oct 23, 2020
The index overall was up by 13.2% in this period.
We found that if two stocks were omitted from the index, the returns would have been cut by 40%.
The stocks were Moderna and Regeneron. Both companies have had outstanding returns due to their potential development of COVID-19 therapies in recent months.
It’s important to note that the median return on the components of the Index was negative from the beginning of the year.
Index returns can give a distorted view of what is actually going on in the market.
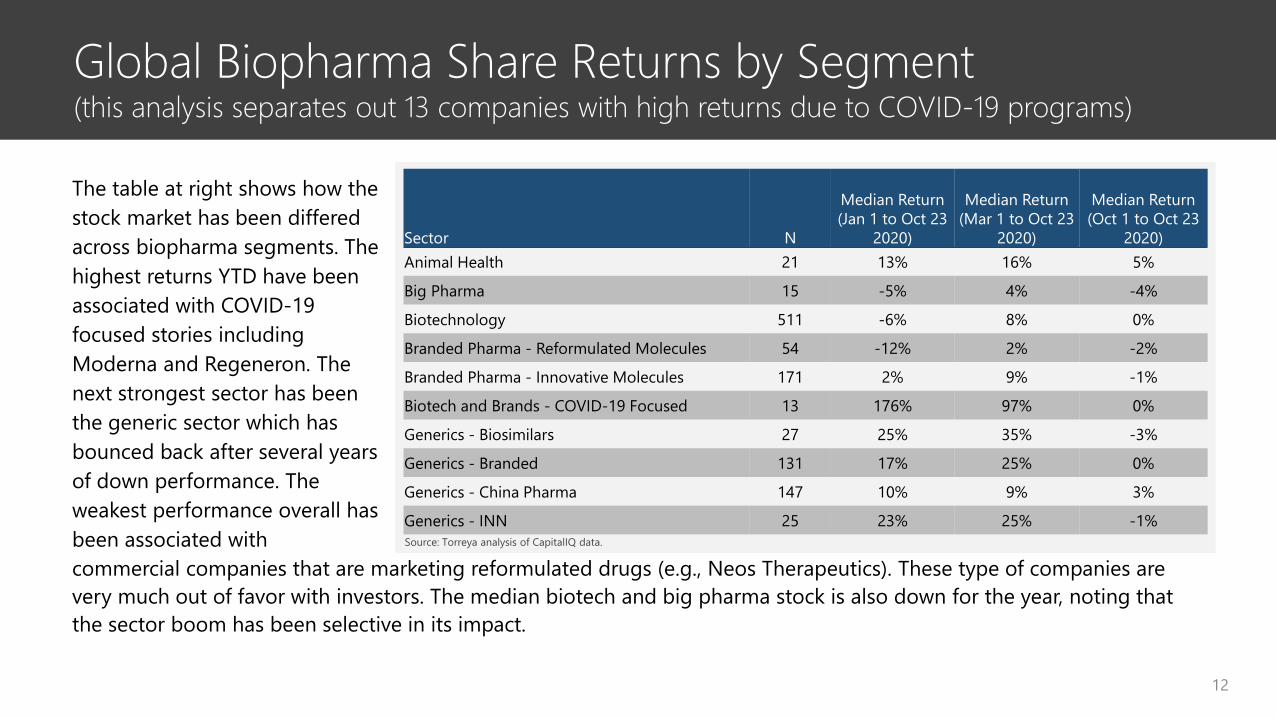
Global Biopharma Share Returns by Segment(this analysis separates out 13 companies with high returns due to COVID-19 programs)
12
Sector N
Median Return (Jan 1 to Oct 23
2020)
Median Return (Mar 1 to Oct 23
2020)
Median Return (Oct 1 to Oct 23
2020)Animal Health 21 13% 16% 5%
Big Pharma 15 -5% 4% -4%
Biotechnology 511 -6% 8% 0%
Branded Pharma - Reformulated Molecules 54 -12% 2% -2%
Branded Pharma - Innovative Molecules 171 2% 9% -1%
Biotech and Brands - COVID-19 Focused 13 176% 97% 0%
Generics - Biosimilars 27 25% 35% -3%
Generics - Branded 131 17% 25% 0%
Generics - China Pharma 147 10% 9% 3%
Generics - INN 25 23% 25% -1%
The table at right shows how the stock market has been differed across biopharma segments. The highest returns YTD have been associated with COVID-19 focused stories including Moderna and Regeneron. The next strongest sector has been the generic sector which has bounced back after several years of down performance. The weakest performance overall has been associated withcommercial companies that are marketing reformulated drugs (e.g., Neos Therapeutics). These type of companies are very much out of favor with investors. The median biotech and big pharma stock is also down for the year, noting that the sector boom has been selective in its impact.
Source: Torreya analysis of CapitalIQ data.
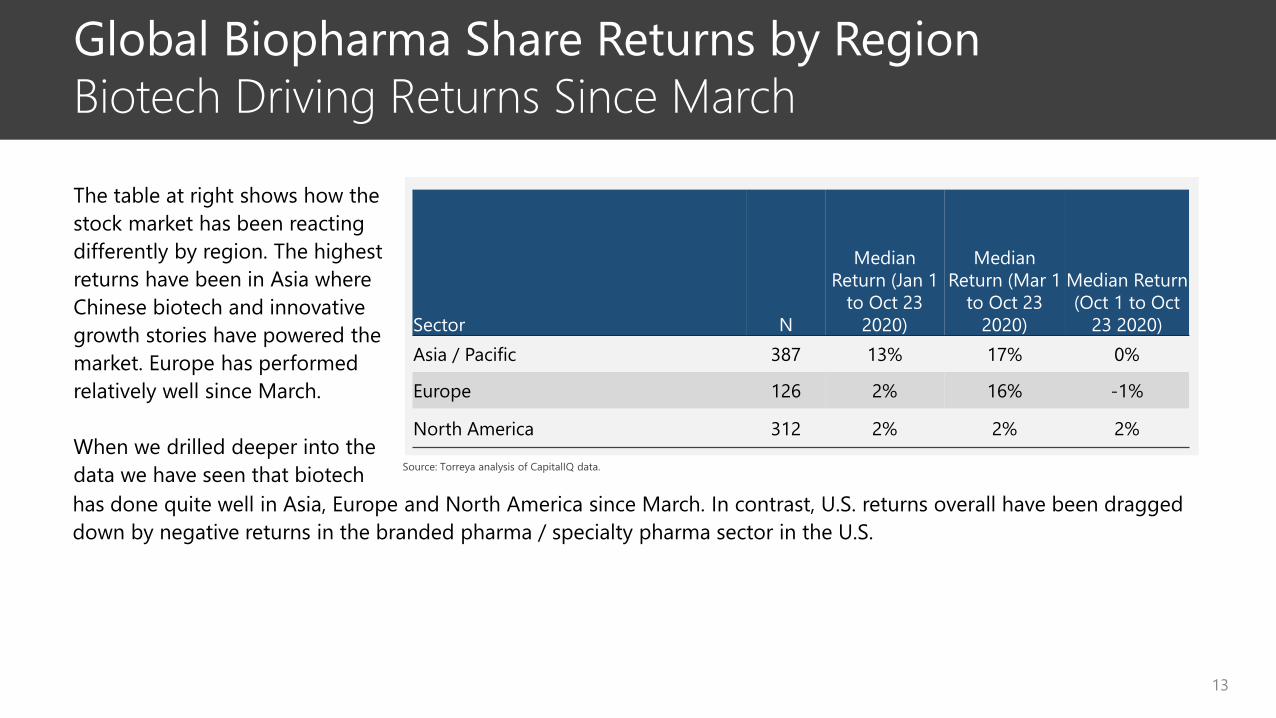
Global Biopharma Share Returns by RegionBiotech Driving Returns Since March
13
The table at right shows how the stock market has been reacting differently by region. The highest returns have been in Asia where Chinese biotech and innovative growth stories have powered the market. Europe has performed relatively well since March.
When we drilled deeper into the data we have seen that biotech
Sector N
Median Return (Jan 1
to Oct 23 2020)
Median Return (Mar 1
to Oct 23 2020)
Median Return (Oct 1 to Oct
23 2020)Asia / Pacific 387 13% 17% 0%
Europe 126 2% 16% -1%
North America 312 2% 2% 2%
has done quite well in Asia, Europe and North America since March. In contrast, U.S. returns overall have been dragged down by negative returns in the branded pharma / specialty pharma sector in the U.S.
Source: Torreya analysis of CapitalIQ data.
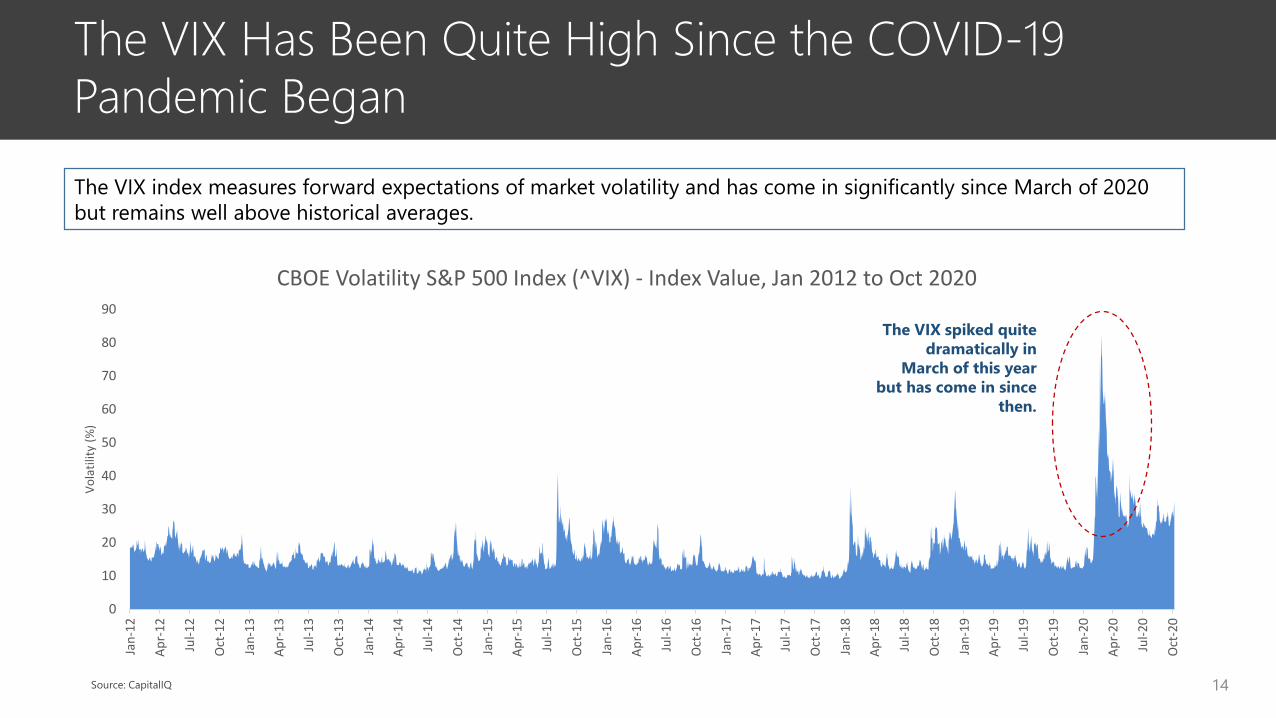
The VIX Has Been Quite High Since the COVID-19 Pandemic Began
14
The VIX index measures forward expectations of market volatility and has come in significantly since March of 2020 but remains well above historical averages.
0
10
20
30
40
50
60
70
80
90
Jan-
12
Apr-
12
Jul-1
2
Oct
-12
Jan-
13
Apr-
13
Jul-1
3
Oct
-13
Jan-
14
Apr-
14
Jul-1
4
Oct
-14
Jan-
15
Apr-
15
Jul-1
5
Oct
-15
Jan-
16
Apr-
16
Jul-1
6
Oct
-16
Jan-
17
Apr-
17
Jul-1
7
Oct
-17
Jan-
18
Apr-
18
Jul-1
8
Oct
-18
Jan-
19
Apr-
19
Jul-1
9
Oct
-19
Jan-
20
Apr-
20
Jul-2
0
Oct
-20
Vola
tility
(%)
CBOE Volatility S&P 500 Index (^VIX) - Index Value, Jan 2012 to Oct 2020
The VIX spiked quite dramatically in
March of this year but has come in since
then.
Source: CapitalIQ

Public Equity Offerings
15

2020 Setting an All Time Record for Equity Raises in the Biopharmaceutical Sector.
16
$0
$10,000
$20,000
$30,000
$40,000
$50,000
$60,000
$70,000
$80,000
$90,000
1995 1996 1997 1998 1999 2000 2001 2002 2003 2004 2005 2006 2007 2008 2009 2010 2011 2012 2013 2014 2015 2016 2017 2018 2019 2020
$ M
illio
ns (T
otal
Offe
ring
Volu
me)
Global Public Equity Issuance, Biopharmaceutical Sector, 1995-2020
Ex-US - Follow-Ons Ex-US - IPOs US - Follow-Ons US - IPOs
Source: CapitalIQ
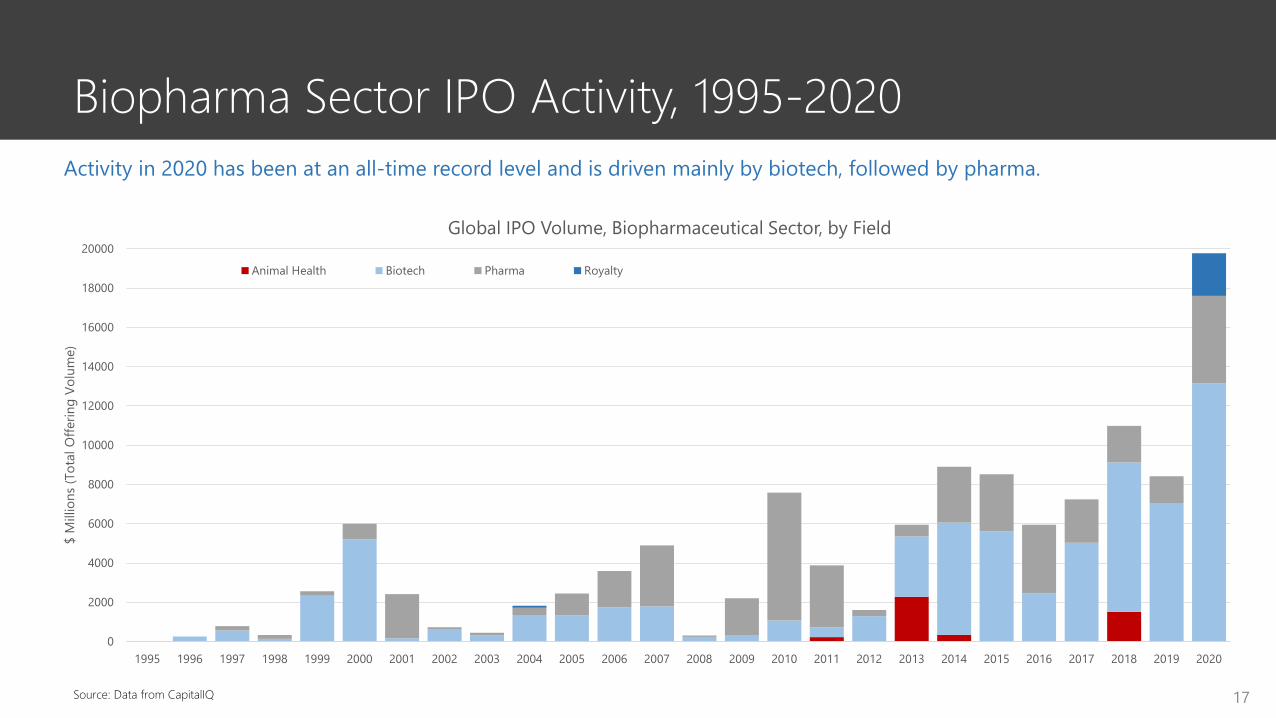
Biopharma Sector IPO Activity, 1995-2020
17
Activity in 2020 has been at an all-time record level and is driven mainly by biotech, followed by pharma.
Source: Data from CapitalIQ
0
2000
4000
6000
8000
10000
12000
14000
16000
18000
20000
1995 1996 1997 1998 1999 2000 2001 2002 2003 2004 2005 2006 2007 2008 2009 2010 2011 2012 2013 2014 2015 2016 2017 2018 2019 2020
$ M
illio
ns (T
otal
Offe
ring
Volu
me)
Global IPO Volume, Biopharmaceutical Sector, by Field
Animal Health Biotech Pharma Royalty
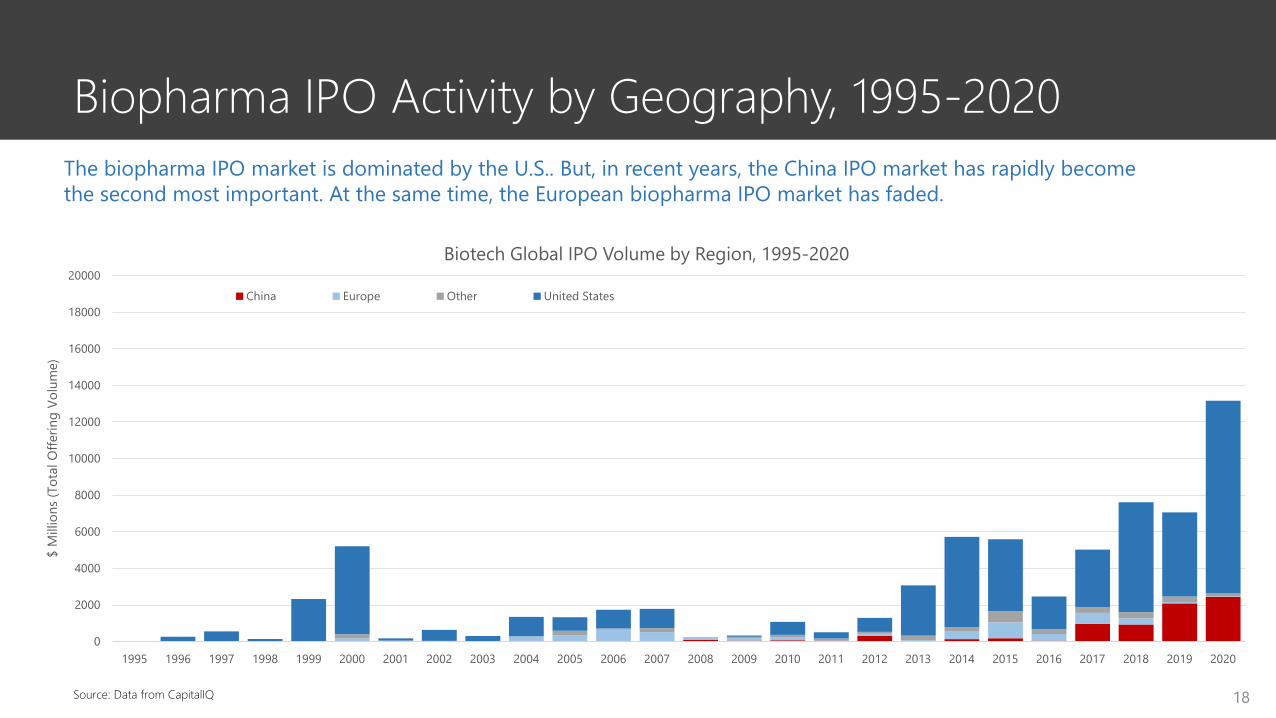
Biopharma IPO Activity by Geography, 1995-2020
18
The biopharma IPO market is dominated by the U.S.. But, in recent years, the China IPO market has rapidly become the second most important. At the same time, the European biopharma IPO market has faded.
Source: Data from CapitalIQ
0
2000
4000
6000
8000
10000
12000
14000
16000
18000
20000
1995 1996 1997 1998 1999 2000 2001 2002 2003 2004 2005 2006 2007 2008 2009 2010 2011 2012 2013 2014 2015 2016 2017 2018 2019 2020
$ M
illio
ns (T
otal
Offe
ring
Volu
me)
Biotech Global IPO Volume by Region, 1995-2020
China Europe Other United States
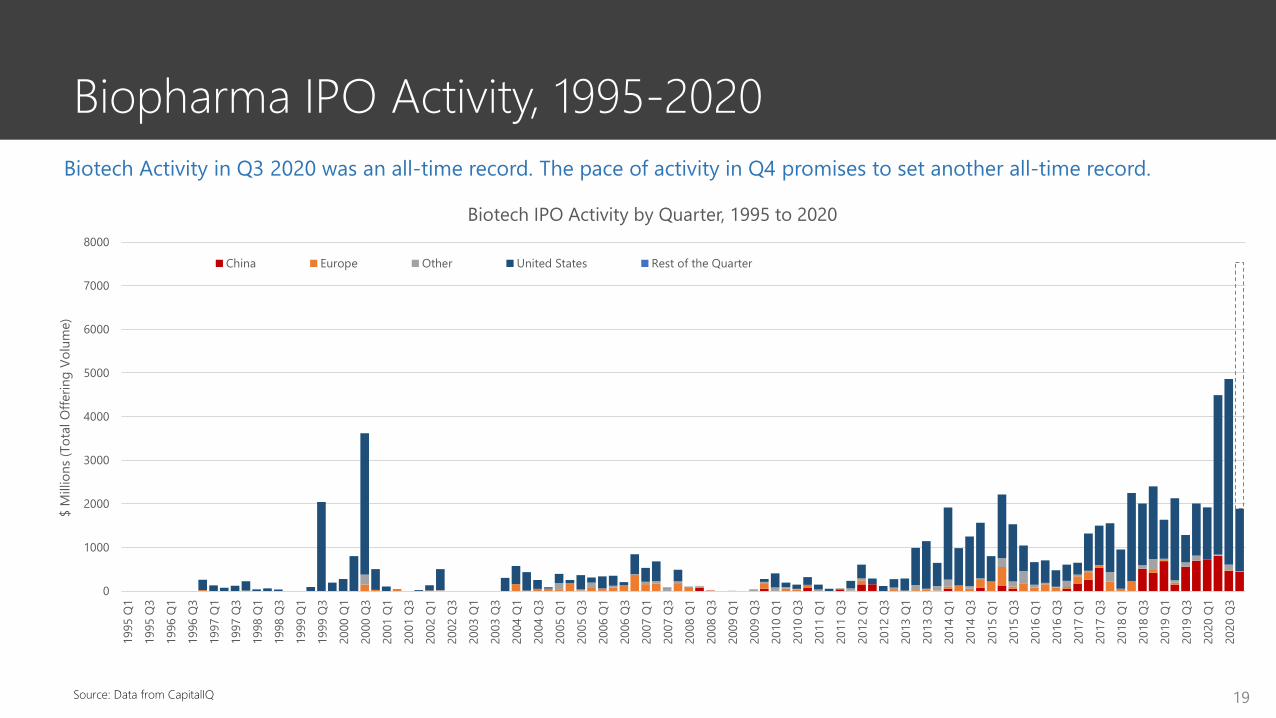
Biopharma IPO Activity, 1995-2020
19
Biotech Activity in Q3 2020 was an all-time record. The pace of activity in Q4 promises to set another all-time record.
Source: Data from CapitalIQ
0
1000
2000
3000
4000
5000
6000
7000
8000
1995
Q1
1995
Q3
1996
Q1
1996
Q3
1997
Q1
1997
Q3
1998
Q1
1998
Q3
1999
Q1
1999
Q3
2000
Q1
2000
Q3
2001
Q1
2001
Q3
2002
Q1
2002
Q3
2003
Q1
2003
Q3
2004
Q1
2004
Q3
2005
Q1
2005
Q3
2006
Q1
2006
Q3
2007
Q1
2007
Q3
2008
Q1
2008
Q3
2009
Q1
2009
Q3
2010
Q1
2010
Q3
2011
Q1
2011
Q3
2012
Q1
2012
Q3
2013
Q1
2013
Q3
2014
Q1
2014
Q3
2015
Q1
2015
Q3
2016
Q1
2016
Q3
2017
Q1
2017
Q3
2018
Q1
2018
Q3
2019
Q1
2019
Q3
2020
Q1
2020
Q3
$ M
illio
ns (T
otal
Offe
ring
Volu
me)
Biotech IPO Activity by Quarter, 1995 to 2020
China Europe Other United States Rest of the Quarter
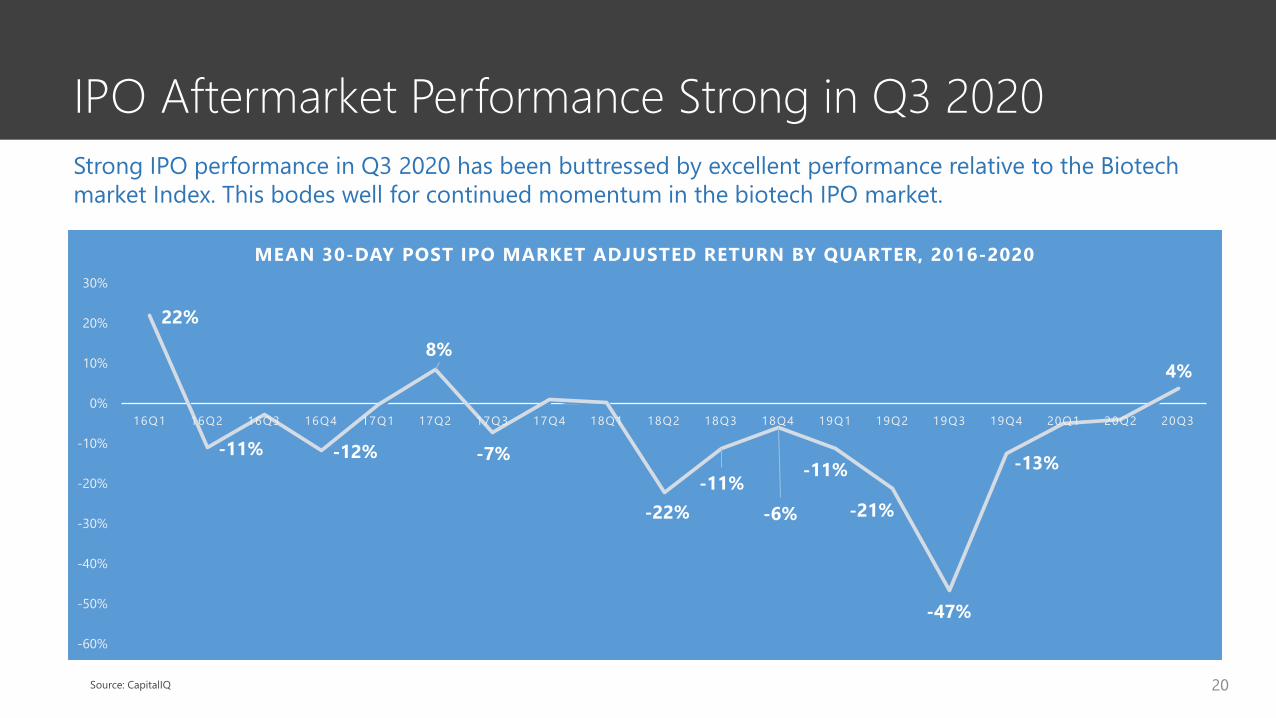
IPO Aftermarket Performance Strong in Q3 2020
20
22%
-11% -12%
8%
-7%
-22%-11%
-6%
-11%
-21%
-47%
-13%
4%
-60%
-50%
-40%
-30%
-20%
-10%
0%
10%
20%
30%
16Q1 16Q2 16Q3 16Q4 17Q1 17Q2 17Q3 17Q4 18Q1 18Q2 18Q3 18Q4 19Q1 19Q2 19Q3 19Q4 20Q1 20Q2 20Q3
MEAN 30-DAY POST IPO MARKET ADJUSTED RETURN BY QUARTER, 2016-2020
Strong IPO performance in Q3 2020 has been buttressed by excellent performance relative to the Biotech market Index. This bodes well for continued momentum in the biotech IPO market.
Source: CapitalIQ

Biopharma Follow-On Equity Activity, 2013-2020
21
The volume of equity follow-on offering activity has been at a record level in 2020, led by activity on U.S. exchanges.
Source: Data from CapitalIQ
0
10000
20000
30000
40000
50000
60000
70000
1995 1996 1997 1998 1999 2000 2001 2002 2003 2004 2005 2006 2007 2008 2009 2010 2011 2012 2013 2014 2015 2016 2017 2018 2019 2020
$ M
illio
ns (T
otal
Offe
ring
Volu
me)
Global Follow-on Volume, Biopharmaceutical Sector, by Exchange Region
China Europe Other US

Biotech Dominating the Follow-On Market in 2020
22
0
10000
20000
30000
40000
50000
60000
70000
1995 1996 1997 1998 1999 2000 2001 2002 2003 2004 2005 2006 2007 2008 2009 2010 2011 2012 2013 2014 2015 2016 2017 2018 2019 2020
$ M
illio
ns (T
otal
Offe
ring
Volu
me)
Global Follow-On Equity Offering Volume, Biopharmaceutical Sector, by Field
Animal Health Royalty Biotech Pharma
Source: CapitalIQ

SPAC Offerings
23
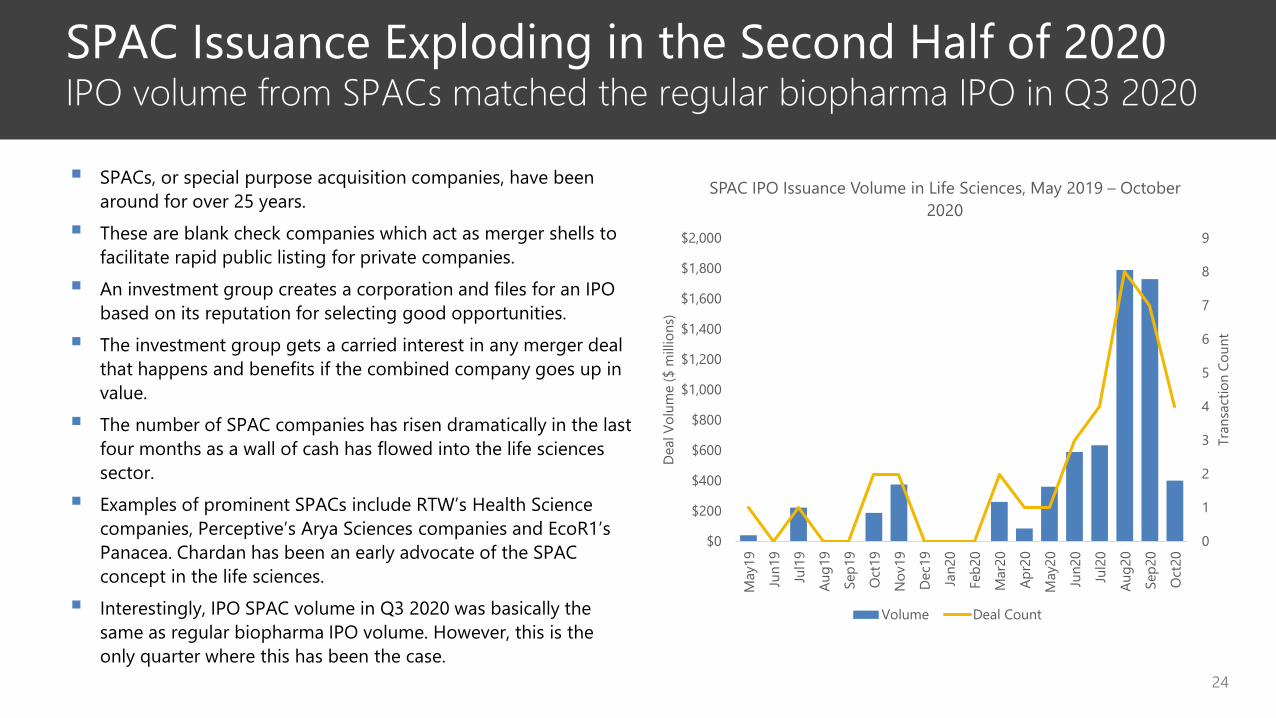
SPAC Issuance Exploding in the Second Half of 2020IPO volume from SPACs matched the regular biopharma IPO in Q3 2020
SPACs, or special purpose acquisition companies, have been around for over 25 years.
These are blank check companies which act as merger shells to facilitate rapid public listing for private companies.
An investment group creates a corporation and files for an IPO based on its reputation for selecting good opportunities.
The investment group gets a carried interest in any merger deal that happens and benefits if the combined company goes up in value.
The number of SPAC companies has risen dramatically in the last four months as a wall of cash has flowed into the life sciences sector.
Examples of prominent SPACs include RTW’s Health Science companies, Perceptive’s Arya Sciences companies and EcoR1’s Panacea. Chardan has been an early advocate of the SPAC concept in the life sciences.
Interestingly, IPO SPAC volume in Q3 2020 was basically the same as regular biopharma IPO volume. However, this is the only quarter where this has been the case.
0
1
2
3
4
5
6
7
8
9
$0
$200
$400
$600
$800
$1,000
$1,200
$1,400
$1,600
$1,800
$2,000
May
19
Jun1
9
Jul1
9
Aug1
9
Sep1
9
Oct
19
Nov
19
Dec1
9
Jan2
0
Feb2
0
Mar
20
Apr2
0
May
20
Jun2
0
Jul2
0
Aug2
0
Sep2
0
Oct
20
Tran
sact
ion
Coun
t
Dea
l Vol
ume
($ m
illio
ns)
SPAC IPO Issuance Volume in Life Sciences, May 2019 – October 2020
Volume Deal Count
24

25
Date Company Sponsor(s) Raise10/23/2020 Eucrates Biomedical Acquisition Stelios Papadopolous $100.010/22/2020 BCLS Acquisition Bain Capital $125.010/22/2020 Helix Acquisition Cormorant Capital $100.010/14/2020 LifeSci Acquisition II LifeSci Capital $75.09/30/2020 Sarissa Capital Acquisition Sarissa Capital $175.09/29/2020 SCP & CO Healthcare Acquisition SCP & Co. $200.09/28/2020 H.I.G. Acquisition H.I.G. Capital $450.09/18/2020 Nextgen Acquisition George Mattson $350.09/17/2020 Blue Water Joe Hernandez $40.09/10/2020 Vesper Healthcare Acquisition Brent Saunders $400.09/8/2020 Highcape Capital Acquisition Highscape $115.08/20/2020 Panacea Acquisition Corp. EcoR1 Capital $125.08/18/2020 Starboard Value Acquisition Starboard Value $300.08/14/2020 Brookline Capital Acquisition Brookline Capital Markets $50.08/14/2020 CM Life Sciences Casdin Capital $350.0
8/14/2020 Dragoneer Growth Opportunities Dragoneer Investment Group $600.0
8/12/2020 FS Development Corp Foresite Capital $105.08/4/2020 Alpha Healthcare Acquisition Constellation Alpha Holdings $100.08/4/2020 Health Sciences AC II RTW Investments $160.0
Most Recent Life Sciences SPAC IPOsDate Company Sponsor(s) Raise
7/21/2020 ARYA Sciences Acquisitions Corp III Perceptive Advisors $125.07/21/2020 Deerfield Healthcare Technology Deerfield Management $143.87/14/2020 Malacca Straits Acquisition Ark Pacific Capital $125.07/1/2020 Capstar Special Purpose Acquisition Capstar Partners $240.06/15/2020 Therapeutics Acquisition RA Capital $100.06/9/2020 Hudson Executive Investment Hudson Executive Capital $360.06/4/2020 ARYA Sciences Acquisition Corp II Perceptive Advisors $130.05/21/2020 Longview Acquisition Glenview Capital $360.04/23/2020 Chardan Healthcare Acquisition 2 Chardan Capital Markets $85.03/10/2020 DFP Healthcare Acquisitions Deerfield Management $200.03/6/2020 LifeSci Acquisition LifeSci Capital $60.011/22/2019 Amplitude Healthcare Acquisition Metalmark Capital $100.011/22/2019 CHP Merger Corp. Concord Health Partners $275.010/22/2019 Galileo Acquisitions Corp. Capital Dynamics $138.010/21/2019 GreenVision Acquisition Corp. GreenVision Capital Holdings $50.0
7/11/2019 SC Health Corporation SIN Capital Group $222.5
5/14/2019 AGBA Acquisition Limited Gordon Lee $40.08/6/2018 Tottenham Acquisition I Limited Jason Ma $46.0

Select SPAC Mergers in Biopharma
26
On Oct 21, 2020, Panacea announced a merger with Nuvation Bio to form a new oncology-focused public company. Led by David Hung, Nuvation will be focused on a pipeline of small molecule therapeutics in oncology. The deal brings in $850 million in cash resources to Nuvationincluding a concurrent $500mm raise. The combined company is expected to be valued at $1.5 billion.
Cerevel Therapeutics, dedicated to unraveling the mysteries of neuroscience, and Arya Sciences Acquisition Corp II, sponsored by Perceptive, announced a merger on July 30, 2020. In addition to the $150 million held in Arya II’s trust account an investor group committed to a PIPE of approximately $320 million. The combined company is expected to be valued at $1.3 billion.
Immunovant entered into a merger agreement with Health Sciences Acquisition Corporation, sponsored by RTW on October 2, 2020. Immunovantwas in Phase 2 studies of a subQ FcRnantagonist in a number of promising indications. The post-deal equity value was expected to be $556 million and Immunovant benefitted from a rapid close and a strong set of institutional investors dedicated to its story.
Has provided advisory services to Nuvation on this proposed transaction.
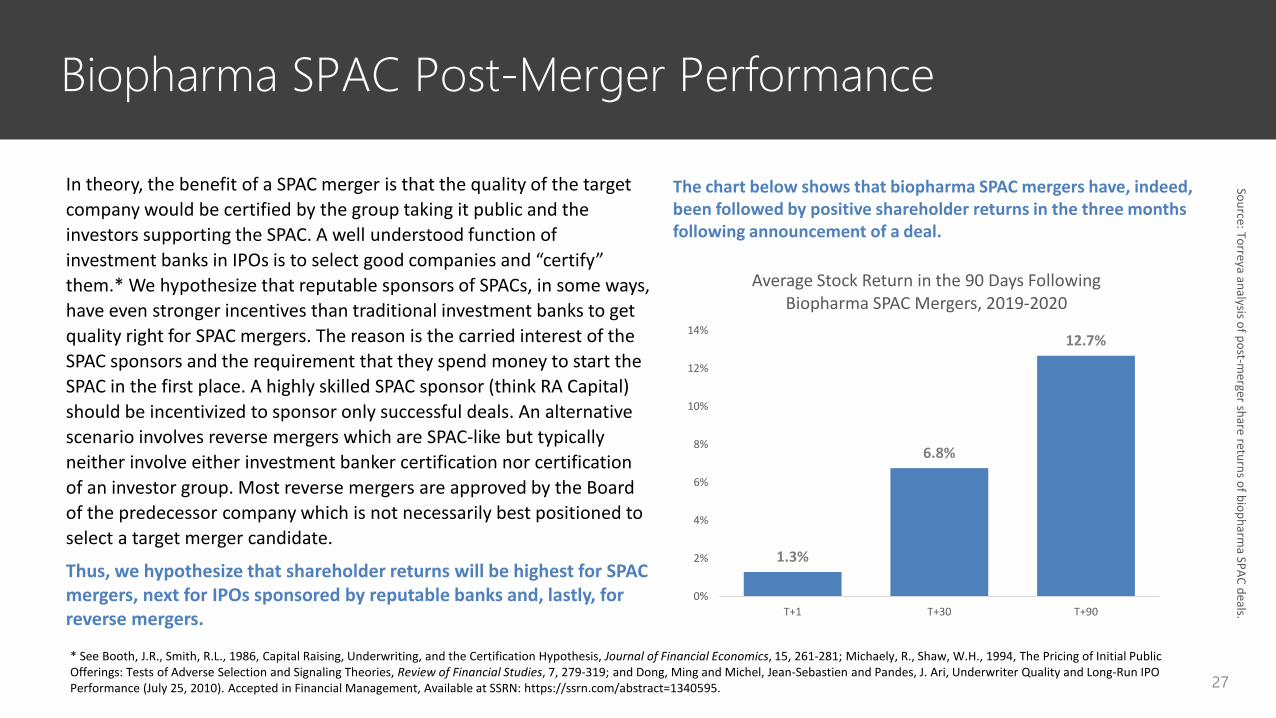
Biopharma SPAC Post-Merger Performance
27
1.3%
6.8%
12.7%
0%
2%
4%
6%
8%
10%
12%
14%
T+1 T+30 T+90
Average Stock Return in the 90 Days Following Biopharma SPAC Mergers, 2019-2020
In theory, the benefit of a SPAC merger is that the quality of the target company would be certified by the group taking it public and the investors supporting the SPAC. A well understood function of investment banks in IPOs is to select good companies and “certify” them.* We hypothesize that reputable sponsors of SPACs, in some ways, have even stronger incentives than traditional investment banks to get quality right for SPAC mergers. The reason is the carried interest of the SPAC sponsors and the requirement that they spend money to start the SPAC in the first place. A highly skilled SPAC sponsor (think RA Capital) should be incentivized to sponsor only successful deals. An alternative scenario involves reverse mergers which are SPAC-like but typically neither involve either investment banker certification nor certification of an investor group. Most reverse mergers are approved by the Board of the predecessor company which is not necessarily best positioned to select a target merger candidate.
Thus, we hypothesize that shareholder returns will be highest for SPAC mergers, next for IPOs sponsored by reputable banks and, lastly, for reverse mergers.
* See Booth, J.R., Smith, R.L., 1986, Capital Raising, Underwriting, and the Certification Hypothesis, Journal of Financial Economics, 15, 261-281; Michaely, R., Shaw, W.H., 1994, The Pricing of Initial Public Offerings: Tests of Adverse Selection and Signaling Theories, Review of Financial Studies, 7, 279-319; and Dong, Ming and Michel, Jean-Sebastien and Pandes, J. Ari, Underwriter Quality and Long-Run IPO Performance (July 25, 2010). Accepted in Financial Management, Available at SSRN: https://ssrn.com/abstract=1340595.
The chart below shows that biopharma SPAC mergers have, indeed, been followed by positive shareholder returns in the three months following announcement of a deal.
Source: Torreya analysis of post-merger share returns of biopharm
a SPAC deals.

Comparison Biopharma SPAC Long-Term Post-Merger Performance to IPOs and Reverse Mergers
28
96%
7%
-15%
-40%
-20%
0%
20%
40%
60%
80%
100%
120%
SPACs IPO Reverse Mergers
Average Market-Adjusted Returns in the One Year Period Following Going Public Announcement
The chart at left compares the average one year post-merger market-adjusted returns from biopharm SPACs in the 2018/2019 period to the same measure for IPOs and reverse mergers.
The average SPAC return after adjusting out for movements in the Nasdaq Biotech Index in the 12 months following deal announcement. Is 96%. This high return is driven mainly by outstanding performance of Immunovant after its merger with HSAC.
We looked at all 93 NASDAQ biotech IPOs in the 2018/2019 period. On average, they outperformed the NASDAQ Biotech Index by 7% over 365-day post deal period. We looked at 32 reverse mergers (2014-2018). These underperformed the market significantly.
The pattern here of SPAC outperformance is consistent with our hypothesis that certification is highly relevant to how companies go public. Ultimately, SPAC offerings could become significantly more important vis-à-vis traditionally underwritten IPOs.
* Computed as percentage change in share price of target company from event date to 365 days after the event date minus the percentage change in the IBB ETF in the same time period.

29
Private Capital Markets Environment
30
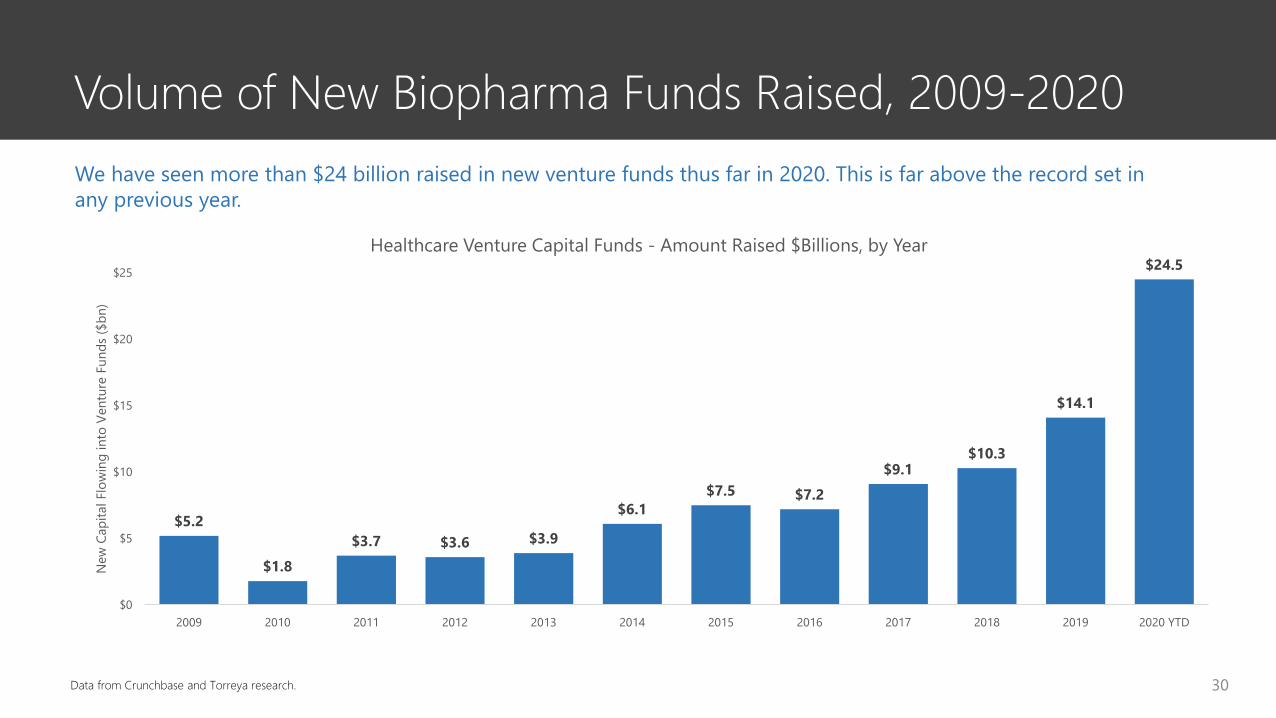
Volume of New Biopharma Funds Raised, 2009-2020
Data from Crunchbase and Torreya research.
We have seen more than $24 billion raised in new venture funds thus far in 2020. This is far above the record set in any previous year.
$5.2
$1.8$3.7 $3.6 $3.9
$6.1$7.5 $7.2
$9.1$10.3
$14.1
$24.5
$0
$5
$10
$15
$20
$25
2009 2010 2011 2012 2013 2014 2015 2016 2017 2018 2019 2020 YTD
New
Cap
ital F
low
ing
into
Ven
ture
Fun
ds ($
bn)
Healthcare Venture Capital Funds - Amount Raised $Billions, by Year
31
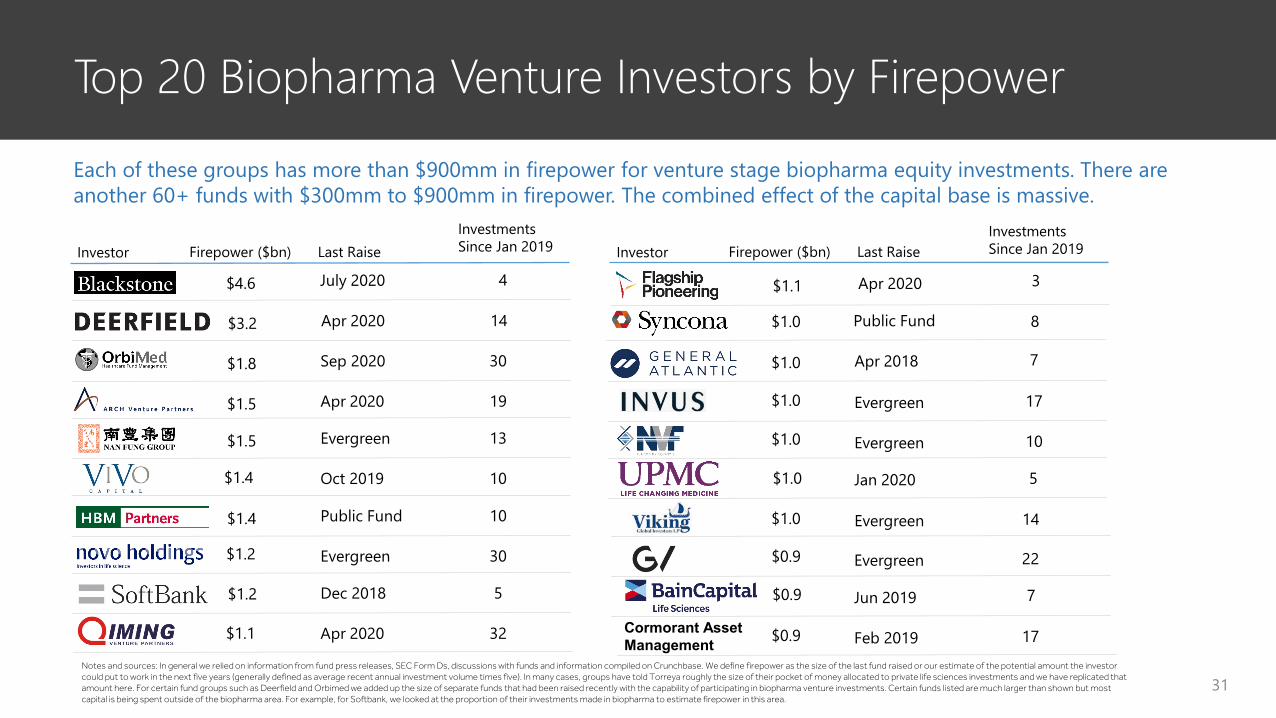
Top 20 Biopharma Venture Investors by Firepower
Notes and sources: In general we relied on information from fund press releases, SEC Form Ds, discussions with funds and information compiled on Crunchbase. We define firepower as the size of the last fund raised or our estimate of the potential amount the investor could put to work in the next five years (generally defined as average recent annual investment volume times five). In many cases, groups have told Torreya roughly the size of their pocket of money allocated to private life sciences investments and we have replicated that amount here. For certain fund groups such as Deerfield and Orbimed we added up the size of separate funds that had been raised recently with the capability of participating in biopharma venture investments. Certain funds listed are much larger than shown but most capital is being spent outside of the biopharma area. For example, for Softbank, we looked at the proportion of their investments made in biopharma to estimate firepower in this area.
Each of these groups has more than $900mm in firepower for venture stage biopharma equity investments. There are another 60+ funds with $300mm to $900mm in firepower. The combined effect of the capital base is massive.
Investor Firepower ($bn) Last Raise
$4.6 July 2020
Investments Since Jan 2019
4
$1.8 Sep 2020 30
$1.5 Apr 2020 19
$1.5 Evergreen 13
$1.4 Oct 2019 10
$1.4 Public Fund 10
$1.2 Evergreen 30
$1.2 Dec 2018 5
$1.1 Apr 2020 32
$1.1 Apr 2020 3
Investor Firepower ($bn) Last RaiseInvestments Since Jan 2019
$1.0 Apr 2018
$1.0 Evergreen 17
$1.0 Evergreen 10
$1.0 Jan 2020 5
$0.9 Evergreen 22
$0.9 Jun 2019 7
$0.9 Feb 2019 17
7
$1.0 Public Fund 8
$1.0 Evergreen 14
Cormorant AssetManagement
$3.2 Apr 2020 14

We have Seen Record Venture Financing Volume Since March 2020
32
$0
$500,000,000
$1,000,000,000
$1,500,000,000
$2,000,000,000
$2,500,000,000
$3,000,000,000
$3,500,000,000
$4,000,000,000
$4,500,000,000
Jan1
5Fe
b 15
Mar
15Ap
r15
May
15Ju
n15
Jul1
5Au
g15
Sep1
5O
ct15
Nov
15D
ec15
Jan1
6Fe
b16
Mar
16Ap
r16
May
16Ju
n16
Jul1
6Au
g16
Sep1
6O
ct16
Nov
16D
ec16
Jan1
7Fe
b 17
Mar
17Ap
r17
May
17Ju
n17
Jul1
7Au
g17
Sep1
7O
ct17
Nov
17D
ec17
Jan1
8Fe
b18
Mar
18Ap
r18
May
18Ju
n18
Jul1
8Au
g18
Sep1
8O
ct18
Nov
18D
ec18
Jan1
9Fe
b 19
Mar
19Ap
r19
May
19Ju
n19
Jul1
9Au
g19
Sep1
9O
ct19
Nov
19D
ec19
Jan2
0Fe
b20
Mar
20Ap
r20
May
20Ju
n20
Jul2
0Au
g20
Sep2
0O
ct20
Dolla
r Vol
ume
of C
apita
l Rai
sed
Biopharmaceutical Venture Equity Financing Volume by Month, Jan 2015 - Oct 2020
33
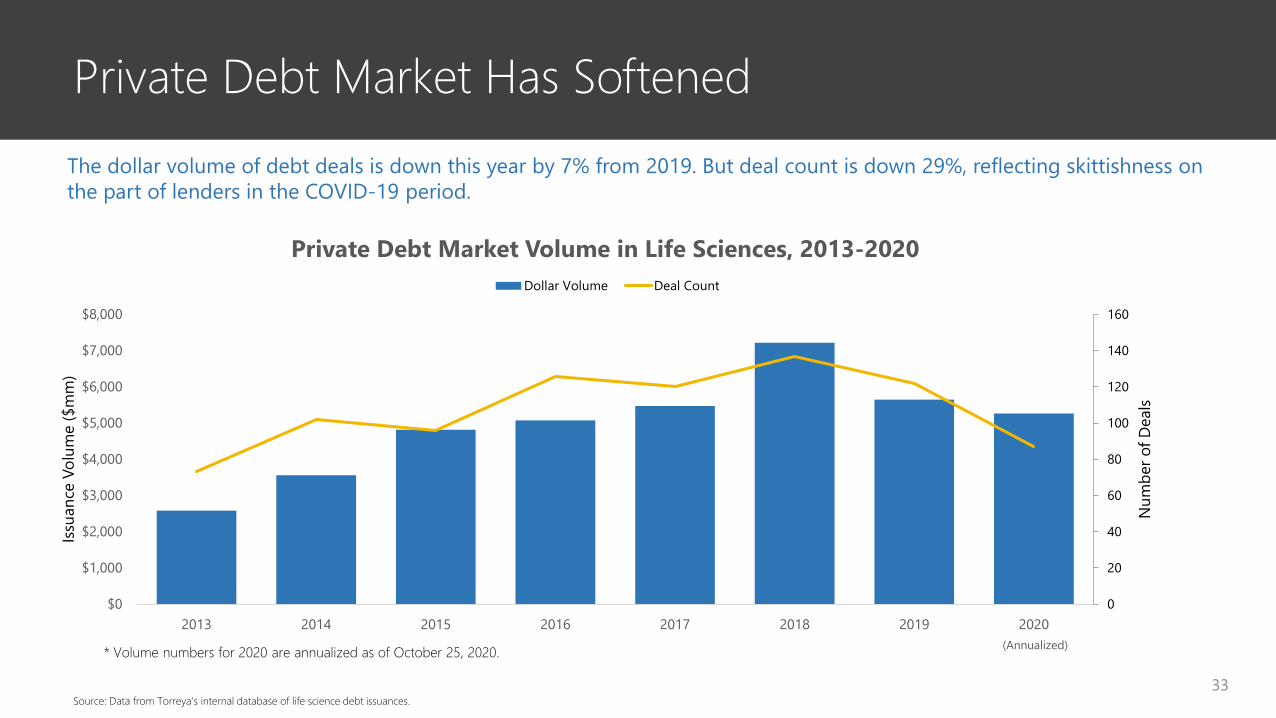
Private Debt Market Has Softened
* Volume numbers for 2020 are annualized as of October 25, 2020.
The dollar volume of debt deals is down this year by 7% from 2019. But deal count is down 29%, reflecting skittishness on the part of lenders in the COVID-19 period.
Source: Data from Torreya’s internal database of life science debt issuances.
(Annualized)
0
20
40
60
80
100
120
140
160
$0
$1,000
$2,000
$3,000
$4,000
$5,000
$6,000
$7,000
$8,000
2013 2014 2015 2016 2017 2018 2019 2020
Num
ber o
f Dea
ls
Issua
nce
Volu
me
($m
m)
Private Debt Market Volume in Life Sciences, 2013-2020Dollar Volume Deal Count
34
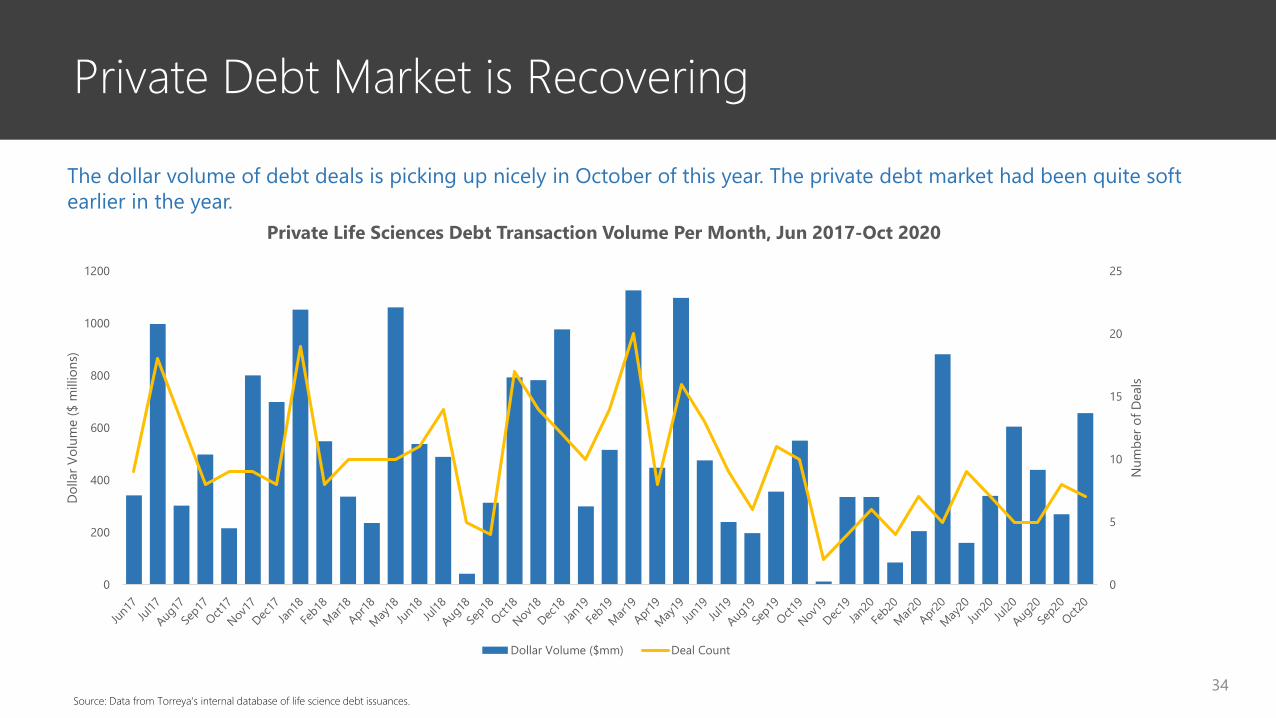
Private Debt Market is Recovering
The dollar volume of debt deals is picking up nicely in October of this year. The private debt market had been quite soft earlier in the year.
Source: Data from Torreya’s internal database of life science debt issuances.
0
5
10
15
20
25
0
200
400
600
800
1000
1200
Num
ber o
f Dea
ls
Dolla
r Vol
ume
($ m
illio
ns)
Private Life Sciences Debt Transaction Volume Per Month, Jun 2017-Oct 2020
Dollar Volume ($mm) Deal Count
Why Did the Debt Market Soften So Much?
35
Source: FRED Economic Data published by the St. Louis Fed. The blue chart represents the Option-Adjusted Spread (OAS) of the ICE BofAML US Corporate C Index, a subset of the ICE BofAML US High Yield Master II Index tracking the performance of US dollar denominated below investment grade rated corporate debt publically issued in the US domestic market. This subset includes all securities with a given investment grade rating CCC or below. The ICE BofAML OASs are the calculated spreads between a computed OAS index of all bonds in a given rating category and a spot Treasury curve.
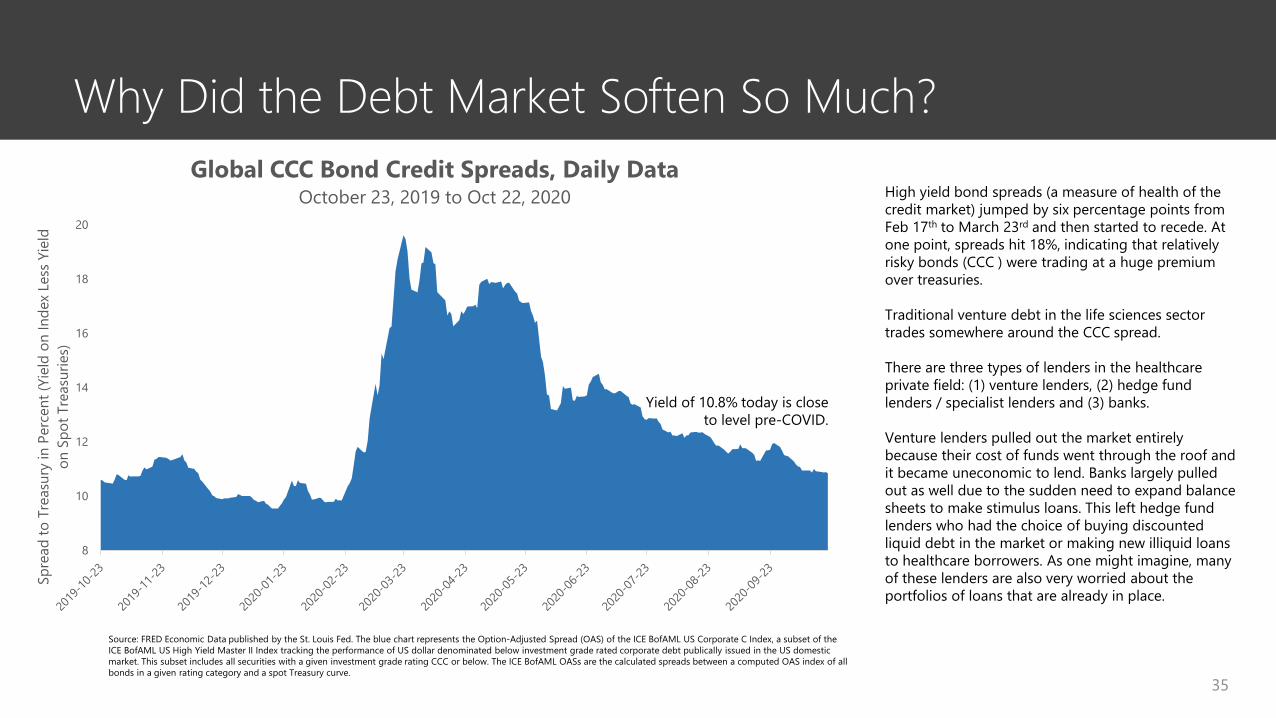
High yield bond spreads (a measure of health of the credit market) jumped by six percentage points from Feb 17th to March 23rd and then started to recede. At one point, spreads hit 18%, indicating that relatively risky bonds (CCC ) were trading at a huge premium over treasuries.
Traditional venture debt in the life sciences sector trades somewhere around the CCC spread.
There are three types of lenders in the healthcare private field: (1) venture lenders, (2) hedge fund lenders / specialist lenders and (3) banks.
Venture lenders pulled out the market entirely because their cost of funds went through the roof and it became uneconomic to lend. Banks largely pulled out as well due to the sudden need to expand balance sheets to make stimulus loans. This left hedge fund lenders who had the choice of buying discounted liquid debt in the market or making new illiquid loans to healthcare borrowers. As one might imagine, many of these lenders are also very worried about the portfolios of loans that are already in place.
8
10
12
14
16
18
20
Spre
ad to
Tre
asur
y in
Per
cent
(Yie
ld o
n In
dex
Less
Yie
ld
on S
pot T
reas
urie
s)
Global CCC Bond Credit Spreads, Daily Data October 23, 2019 to Oct 22, 2020
Yield of 10.8% today is closeto level pre-COVID.

0
2
4
6
8
10
12
14
16
18
20
$0
$500
$1,000
$1,500
$2,000
$2,500
$3,000
$3,500
$4,000
$4,500
2004 2005 2006 2007 2008 2009 2010 2011 2012 2013 2014 2015 2016 2017 2018 2019 2020
Num
ber o
f Dea
ls
Roya
lty M
onet
izatio
n Vo
lum
e ($
mm
)
Pharmaceutical Sector Royalty Monetization Volume in Life Sciences, 2011-2020
Total Deal Value Number of Deals
36
Royalty Monetization Market is Robust
Note: Volume numbers for 2020 are annualized as of Oct 25, 2020.
The pace of royalty monetizations is robust in 2020. This market is wide open and remains well funded.
Source: Data from Torreya’s internal database of royalty monetization transactions.
(Annualized)

37
The M&A Environment

Global Biopharma M&A Activity Recovering After COVID-19 Slowdown
38
0
10
20
30
40
50
60
$0
$20,000
$40,000
$60,000
$80,000
$100,000
$120,000
$140,000
Q12014
Q22014
Q32014
Q42014
Q12015
Q22015
Q32015
Q42015
Q12016
Q22016
Q32016
Q42016
Q12017
Q22017
Q32017
Q42017
Q12018
Q22018
Q32018
Q42018
Q12019
Q22019
Q32019
Q42019
Q12020
Q22020
Q32020
Q42020
Deal
Cou
nt
Qua
rter
ly M
&A
Volu
me
($ M
illio
ns)
Global Biopharmaceuticals M&A Volume, Q1 2014 to Q4 2020
Dollar Volume ($ millions) Deal Count
Source: CapitalIQ and Torreya analysis
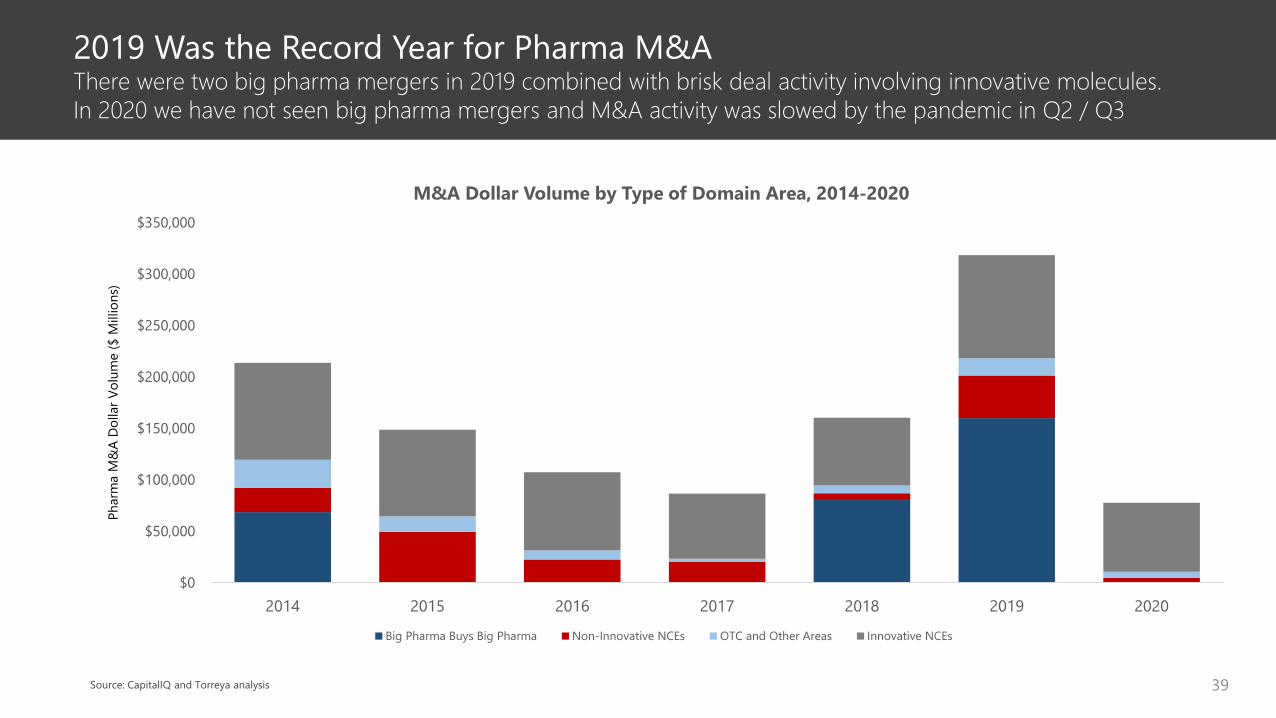
2019 Was the Record Year for Pharma M&AThere were two big pharma mergers in 2019 combined with brisk deal activity involving innovative molecules. In 2020 we have not seen big pharma mergers and M&A activity was slowed by the pandemic in Q2 / Q3
39
$0
$50,000
$100,000
$150,000
$200,000
$250,000
$300,000
$350,000
2014 2015 2016 2017 2018 2019 2020
Phar
ma
M&
A Do
llar V
olum
e ($
Mill
ions
)
M&A Dollar Volume by Type of Domain Area, 2014-2020
Big Pharma Buys Big Pharma Non-Innovative NCEs OTC and Other Areas Innovative NCEs
Source: CapitalIQ and Torreya analysis

Target Acquirer Transaction Value ($bn)
20.9
13.1
6.4
5.0
3.7
2.1
2.1
2.0
1.9
1.5
Top 20 Pharma and Biotech M&A Transactions 2020 YTD
40Source: Data from CapitalIQ
Target Acquirer Transaction Value ($bn)
1.4
1.1
1.0
NA
NA
0.7
0.6
0.6
0.5
0.4
The Evolving Pharma M&A Market
41
0%
10%
20%
30%
40%
50%
60%
70%
80%
90%
100%
2014 2015 2016 2017 2018 2019 2020
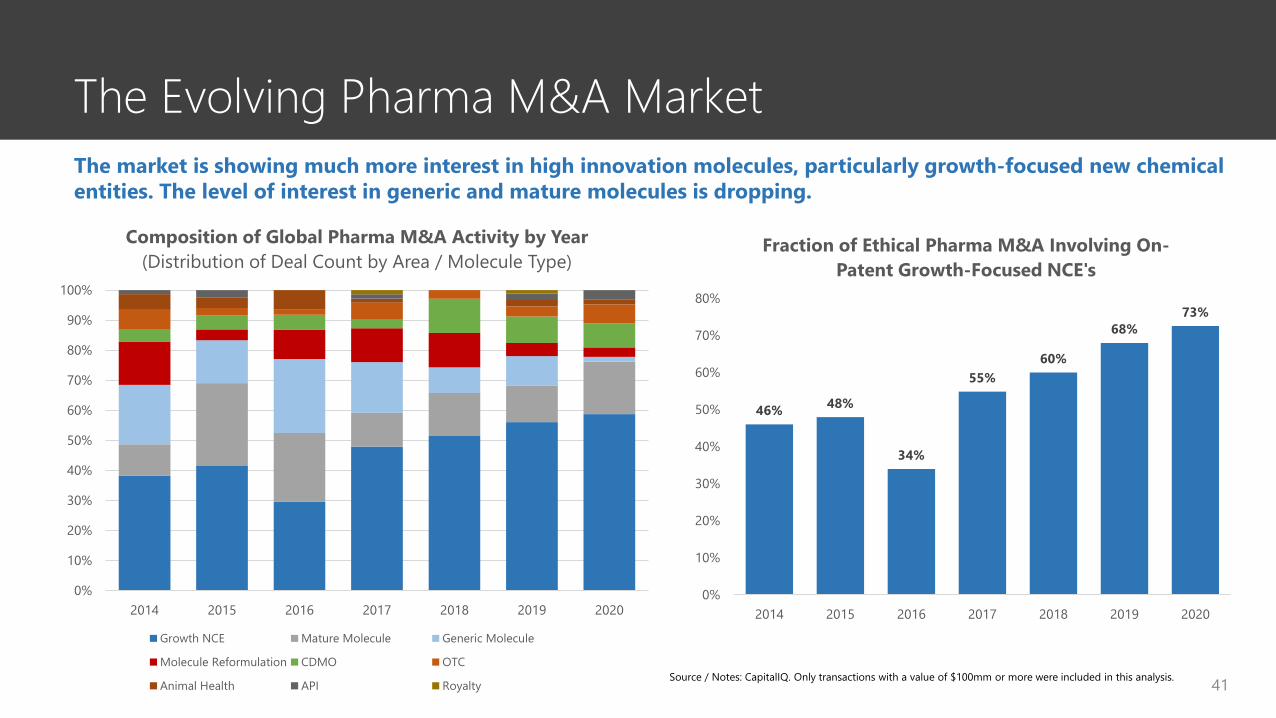
Composition of Global Pharma M&A Activity by Year(Distribution of Deal Count by Area / Molecule Type)
Growth NCE Mature Molecule Generic Molecule
Molecule Reformulation CDMO OTC
Animal Health API Royalty
46% 48%
34%
55%60%
68%73%
0%
10%
20%
30%
40%
50%
60%
70%
80%
2014 2015 2016 2017 2018 2019 2020
Fraction of Ethical Pharma M&A Involving On-Patent Growth-Focused NCE's
The market is showing much more interest in high innovation molecules, particularly growth-focused new chemical entities. The level of interest in generic and mature molecules is dropping.
Source / Notes: CapitalIQ. Only transactions with a value of $100mm or more were included in this analysis.

Composition of the Pharma M&A Market by Buyer Type
42
0
10
20
30
40
50
60
2014 2015 2016 2017 2018 2019 2020
Deal Count by Buyer Type, 2014-2020, Global Biopharma M&A Transactions
Big Pharma Biotech Generics Spec Pharma
Note: Excludes spin-off transactions, PE deals, CDMO deals, Asian buyers, animal health deals, asset swaps and deals cancelled subsequent to announcement. Based on private and public transactions over $100mm
Big pharma has been a very important buyer in the biopharma market over time. Their participation in the M&A market this year has been more limited than before. At the same time, specialty pharma buyers have been active in 2020. Biotech participation is up in 2020 and generic buyer participation has been quite limited as many of these companies struggle with high debt loads.
Source: CapitalIQ and Torreya analysis

M&A Likely to Accelerate in the Coming Months
43
Traditionally, there have been three drivers of Pharma M&A• Access to innovation• Portfolio realignment• Economies of scale / cost pressures
In the early days of pandemic, pharma companies were reluctant to engage in M&A as they focused on COVID solutions as well as the impact on their overall business
Going forward, however, we expect M&A demand to accelerate
The top 16 pharmas have a record of $381 billion in M&A firepower that is “relaxed” (3X debt / EBITDA) or $818 billion in firepower should they wish to stretch their balance sheets (5X debt / EBITDA).
$72
$67
$48
$41
$18
$30
$23
$16
$17
$18
$4 $0
$9
$0
$11
$6
$126$118
$84$79
$58$48 $47 $44 $42
$32$26 $25 $25 $23 $22 $20
$ BI
LLIO
NS
M&A FIREPOWER ($ BILLIONS, OCTOBER 2020)
Stretched Firepower Comfortable Firepower
Source: CapitalIQ, Torreya analysis. Note: Also see Jan Ascher and Ajay Dhankar, “A New Prescription for M&A in Pharma,” McKinsey, September 2020.

44
Japanese Licensing and M&A

45
Japan In-Licensing Deal Activity is Up in 2020
Source: Torreya Japan Deal Database, October 25, 2020
(Annualized)
0
5
10
15
20
25
30
35
40
0
100
200
300
400
500
600
1998 1999 2000 2001 2002 2003 2004 2005 2006 2007 2008 2009 2010 2011 2012 2013 2014 2015 2016 2017 2018 2019 2020
Num
ber o
f Dea
ls
Upfro
nt P
aym
ents
($ m
illio
ns)
Total Upfront Payments on Japan Rights In-License Deals, 1998-2020
Upfronts $mm Number of Deals

Comments from the Deal Front Lines in JapanWe speak with Japan pharma companies and investors as a normal part of business. We have summarized views heard from over two dozen business development professionals in the last 30 days in Japan.
Covid-19 Pandemic a concern but work activity has normalizedJapanese companies very focused on traditional workWidespread adoption of face-masksRealization that working in a distributed way can be acceptable
High interest in innovationJapanese companies are highly focused on innovationKey areas of interest include cell therapy, biologics and gene therapy
Focus on delivering modern medicines to the Japanese peopleIn-licensing activity for Japan has been brisk and reflects a desire to deliver medicines that matter to JapanKey areas of interest include cancer, immunology, rare disease, and renal disease
Japanese companies remain focused on global expansionWhile the Japan population is growing older it is not growing much as a wholeThis limits the market and a high ratio of debt to GDP limits the governments ability to afford domestic medicines. This has fueled global expansion
46

Japanese Pharma Cross-Border Deals in 2020
47
On Jul 27, 2020, AstraZeneca entered into a new global license agreement with Daiichi Sankyo for DS-1062, a TROP2 ADC for the treatment of cancer. AstraZeneca is paying DS $1bn in unconditional payments and additional possible $5bn in milestones. The companies will jointly commercialize DS-1062 except in Japan where Daiichi Sankyo will maintain exclusive rights.
In a move to enter the US pharma market and expand its global presence, Santen acquired EyevancePharmaceutical for $225 million in cash on Sep 17, 2020. Formed in 2017, Eyevance develops and commercializes topical ophthalmic products targeting the ocular surface and anterior segment. Eyevance’s US sales team targets ophthalmologists, optometrists, and allergists in the U.S.
Astellas Pharma acquired Iota Biosciences, Inc. on Oct 15, 2020. Astellas and iota previously entered into a Research and Development Agreement in August associated with iota’s ultrasonic-powered bioelectronicdevices (also known as “neural dust”) in a number of indications. Astellas paid $127.5mm upfront and agreed to milestones of $176.5mm. Astellascommitted to $125mm in R&D spend.
advised Santen on this deal invested in iota and supported the M&A deal.

48
China Licensing
49
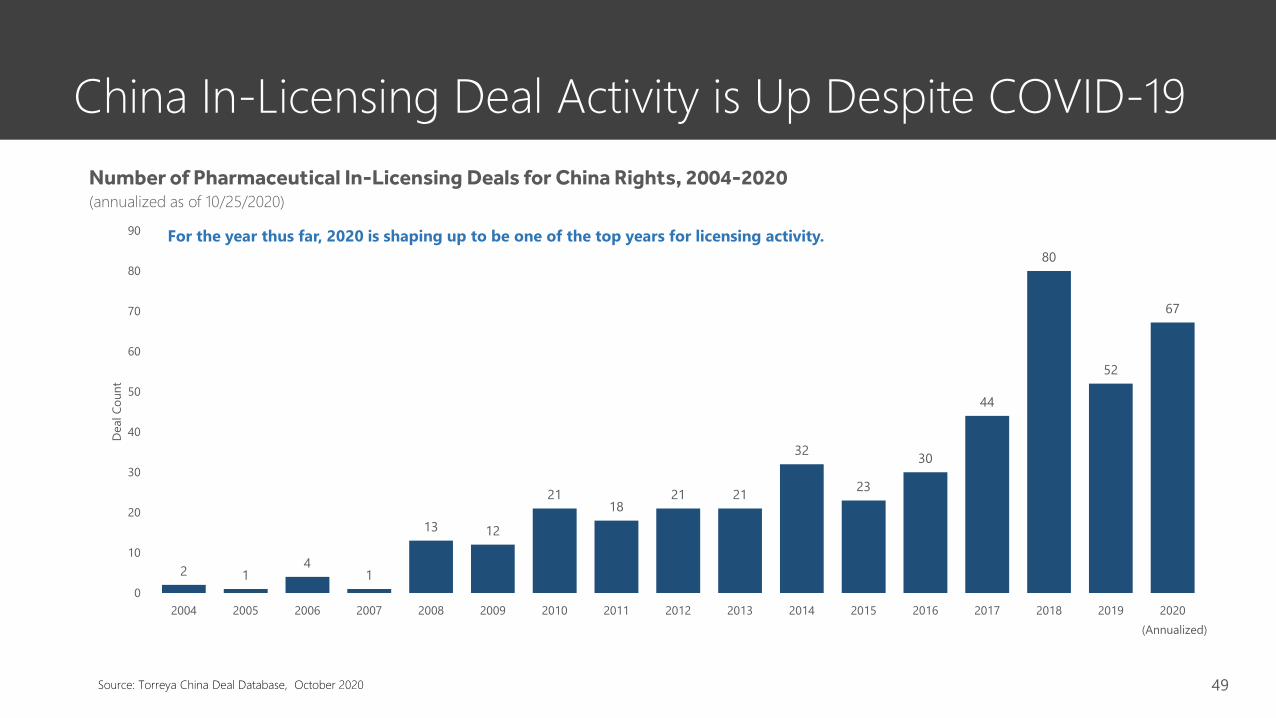
China In-Licensing Deal Activity is Up Despite COVID-19Number of Pharmaceutical In-Licensing Deals for China Rights, 2004-2020(annualized as of 10/25/2020)
Source: Torreya China Deal Database, October 2020
(Annualized)
2 14
1
13 12
2118
21 21
32
23
30
44
80
52
67
0
10
20
30
40
50
60
70
80
90
2004 2005 2006 2007 2008 2009 2010 2011 2012 2013 2014 2015 2016 2017 2018 2019 2020
Dea
l Cou
nt
For the year thus far, 2020 is shaping up to be one of the top years for licensing activity.
50
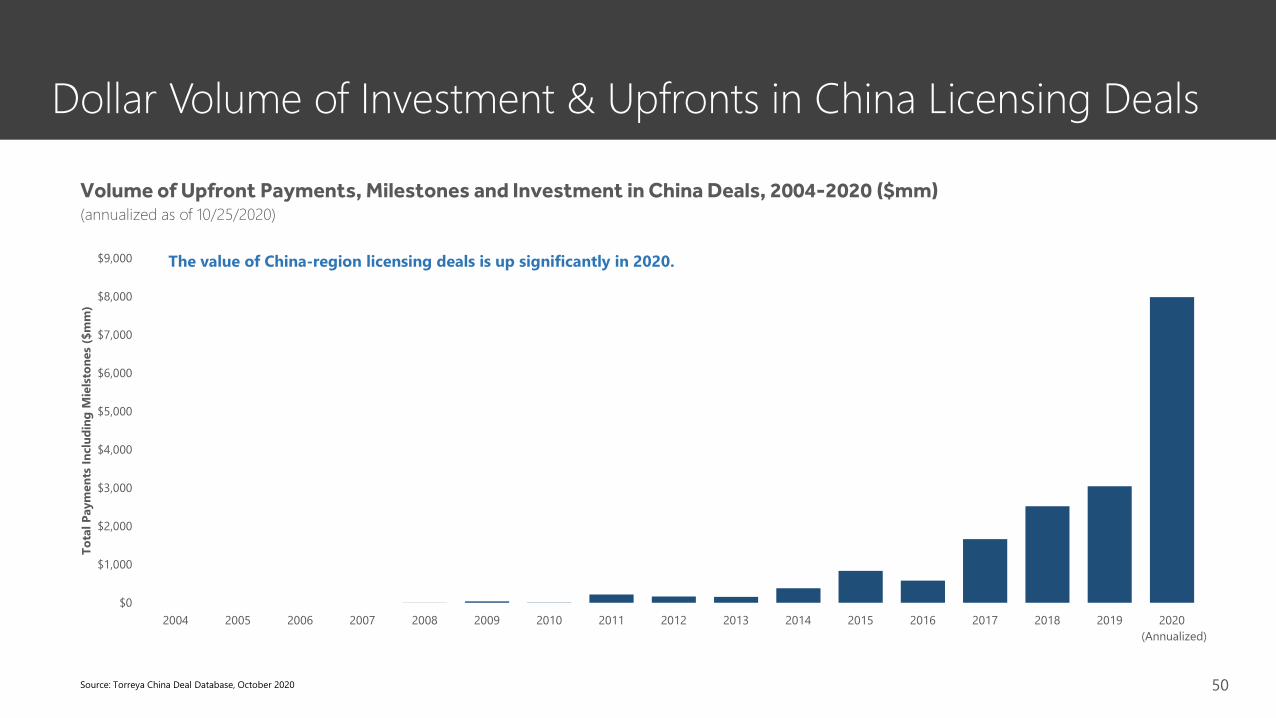
Dollar Volume of Investment & Upfronts in China Licensing Deals
Source: Torreya China Deal Database, October 2020
Volume of Upfront Payments, Milestones and Investment in China Deals, 2004-2020 ($mm)(annualized as of 10/25/2020)
(Annualized)
$0 $0 $0 $0 $5 $38 $7 $216 $162 $155 $379$837
$581
$1,666
$2,525$3,044
7985
$0
$1,000
$2,000
$3,000
$4,000
$5,000
$6,000
$7,000
$8,000
$9,000
2004 2005 2006 2007 2008 2009 2010 2011 2012 2013 2014 2015 2016 2017 2018 2019 2020
Tota
l Pay
men
ts In
clud
ing
Mie
lsto
nes
($m
m)
The value of China-region licensing deals is up significantly in 2020.
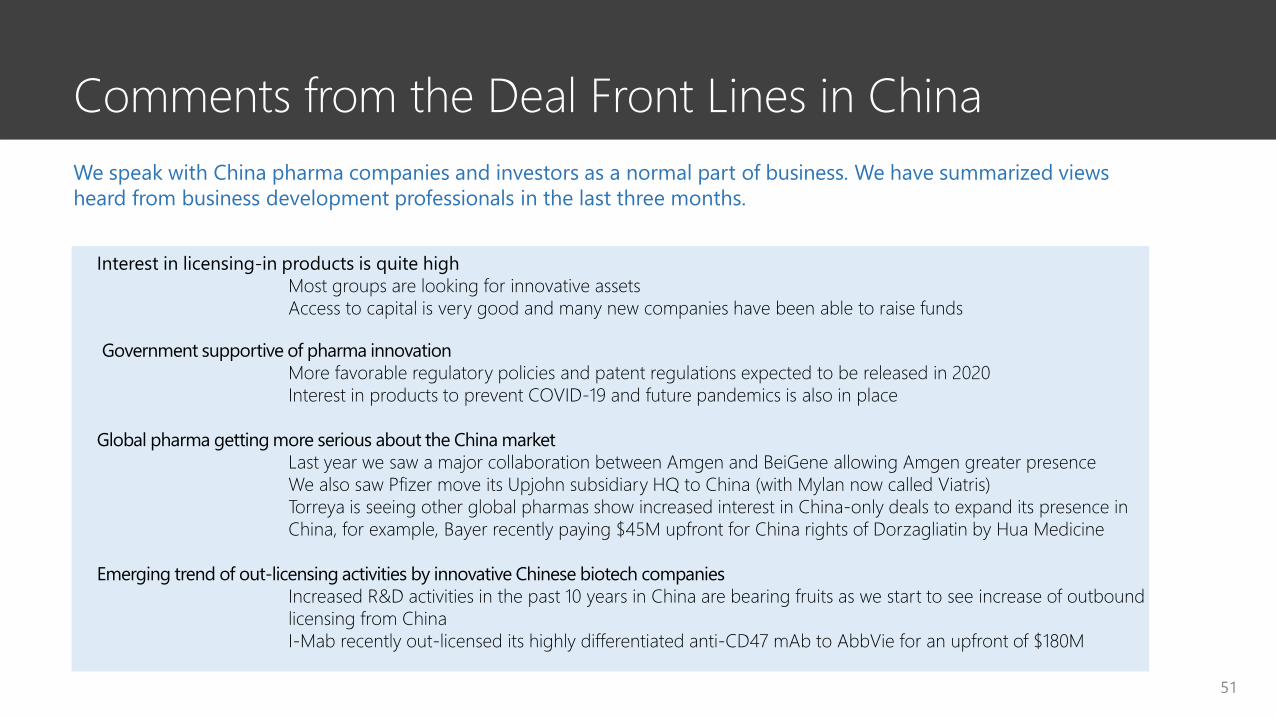
Comments from the Deal Front Lines in ChinaWe speak with China pharma companies and investors as a normal part of business. We have summarized views heard from business development professionals in the last three months.
Interest in licensing-in products is quite highMost groups are looking for innovative assetsAccess to capital is very good and many new companies have been able to raise funds
Government supportive of pharma innovationMore favorable regulatory policies and patent regulations expected to be released in 2020Interest in products to prevent COVID-19 and future pandemics is also in place
Global pharma getting more serious about the China marketLast year we saw a major collaboration between Amgen and BeiGene allowing Amgen greater presenceWe also saw Pfizer move its Upjohn subsidiary HQ to China (with Mylan now called Viatris)Torreya is seeing other global pharmas show increased interest in China-only deals to expand its presence in China, for example, Bayer recently paying $45M upfront for China rights of Dorzagliatin by Hua Medicine
Emerging trend of out-licensing activities by innovative Chinese biotech companiesIncreased R&D activities in the past 10 years in China are bearing fruits as we start to see increase of outbound licensing from ChinaI-Mab recently out-licensed its highly differentiated anti-CD47 mAb to AbbVie for an upfront of $180M
51
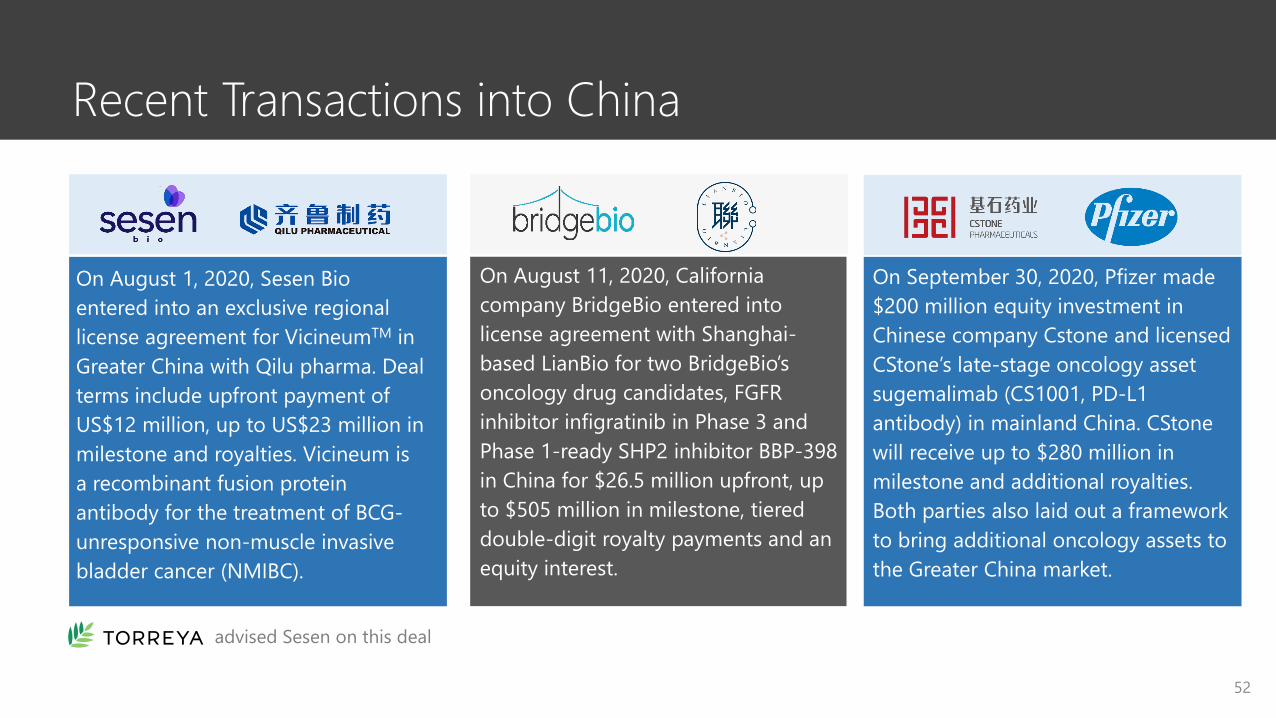
Recent Transactions into China
52
On August 1, 2020, Sesen Bio entered into an exclusive regional license agreement for VicineumTM in Greater China with Qilu pharma. Deal terms include upfront payment of US$12 million, up to US$23 million in milestone and royalties. Vicineum is a recombinant fusion protein antibody for the treatment of BCG-unresponsive non-muscle invasive bladder cancer (NMIBC).
On August 11, 2020, Californiacompany BridgeBio entered into license agreement with Shanghai-based LianBio for two BridgeBio’soncology drug candidates, FGFR inhibitor infigratinib in Phase 3 and Phase 1-ready SHP2 inhibitor BBP-398 in China for $26.5 million upfront, up to $505 million in milestone, tiered double-digit royalty payments and an equity interest.
On September 30, 2020, Pfizer made $200 million equity investment in Chinese company Cstone and licensed CStone’s late-stage oncology asset sugemalimab (CS1001, PD-L1 antibody) in mainland China. CStonewill receive up to $280 million in milestone and additional royalties. Both parties also laid out a framework to bring additional oncology assets to the Greater China market.
advised Sesen on this deal

About Torreya
53

Torreya is a Global Life Sciences Investment Bank
54
We are known for:
• Deep RelationshipsWe have strong personal relationships across the pharmaceutical and healthcare sectors.
• Operating PerspectiveMany of our senior colleagues come from industry and bring decades of experience.
• Deal ExcellenceTorreya is known as a firm that gets tough deals done. Our team is skilled in highly structured transactions.
• Healthcare FocusOur healthcare focus spans pharma, biotech, bioproduction, pharma services, physician services and HCIT.
$1.05 billionJune 2017
$658 millionJune 2014
Up to $470 millionJanuary 2015
$203 millionMarch 2017
Acquisition of generics business of Sale to
Sale of FXR program to Sale of Intrathecal business to
Generic Pharma Specialty Pharma
Asset Sale / Biotech Divestiture / Specialty Pharma
PE Recap / Bioproduction
Mergers & Acquisitions
Licensing, Asset Sales & JVs
Debt, Royalty Sales &Private Equity Deals
November 2019
Sale to
Specialty Pharma
$215 millionFebruary 2020
Option to be acquired by
Specialty Pharma
$30 millionFebruary 2020
Sale of majority stake to
Biotech
December 2019
License of NOV03 in North America to
Licensing / Biotech
Up to $306 millionJanuary 2020
License of Navicixizumab to
Licensing / Biotech
$50 MillionDecember 2018
JV Partnershipin China with
$125 millionApril 2019
$125 millionSeptember 2018
Sale of majority stake to
Debt recapitalization & acquisition of
NextWavePharmaceuticals from
PE Recap / Generics Debt / Specialty Pharma
$70 millionOctober 2019
Credit facility from
Debt / Healthcare Services
€44.5 millionOctober 2020
Private Equity Placement
Equity raise / Biotech
Representative Transaction Advisory Roles
$225 millionSeptember 2020
Purchase of
JV / China
• We cover Latin America, South Africa and parts of Asia through affiliate relationships
• 4 people cover the China market from a home base in the United States
55
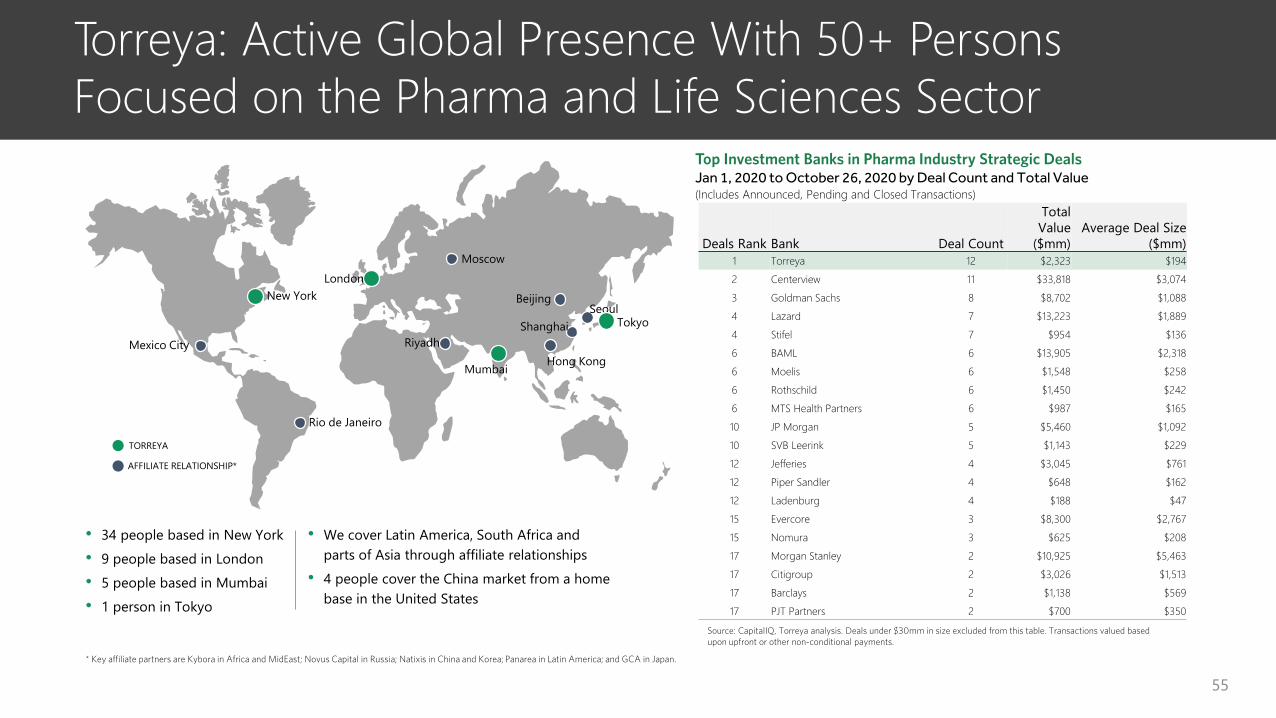
Torreya: Active Global Presence With 50+ Persons Focused on the Pharma and Life Sciences Sector
LondonNew York
Mexico City
Rio de Janeiro
RiyadhHong Kong
Tokyo
Mumbai
Shanghai
Beijing
Moscow
TORREYA
AFFILIATE RELATIONSHIP*
• 34 people based in New York• 9 people based in London• 5 people based in Mumbai• 1 person in Tokyo
* Key affiliate partners are Kybora in Africa and MidEast; Novus Capital in Russia; Natixis in China and Korea; Panarea in Latin America; and GCA in Japan.
Seoul
Top Investment Banks in Pharma Industry Strategic DealsJan 1, 2020 to October 26, 2020 by Deal Count and Total Value(Includes Announced, Pending and Closed Transactions)
Source: CapitalIQ, Torreya analysis. Deals under $30mm in size excluded from this table. Transactions valued based upon upfront or other non-conditional payments.
Deals Rank Bank Deal Count
Total Value
($mm)Average Deal Size
($mm)1 Torreya 12 $2,323 $1942 Centerview 11 $33,818 $3,0743 Goldman Sachs 8 $8,702 $1,0884 Lazard 7 $13,223 $1,8894 Stifel 7 $954 $1366 BAML 6 $13,905 $2,3186 Moelis 6 $1,548 $2586 Rothschild 6 $1,450 $2426 MTS Health Partners 6 $987 $16510 JP Morgan 5 $5,460 $1,09210 SVB Leerink 5 $1,143 $22912 Jefferies 4 $3,045 $76112 Piper Sandler 4 $648 $16212 Ladenburg 4 $188 $4715 Evercore 3 $8,300 $2,76715 Nomura 3 $625 $20817 Morgan Stanley 2 $10,925 $5,46317 Citigroup 2 $3,026 $1,51317 Barclays 2 $1,138 $56917 PJT Partners 2 $700 $350

Key Pharma Sector Contacts at Torreya
56
Tom BirdCo-Head Pharma Transactions New York [email protected]
Kelly CurtinManaging Director, PharmaLondon [email protected]
Masaki Doi, Ph.D.Director, Japan [email protected]
Peter Garrambone, Jr.Co-Head, Pharma TransactionsNew York [email protected]
Kylor HuaDirector, BiotechnologyNew York [email protected]
Leslie GautamDirector, Digital TherapeuticsNew York [email protected]
Benj GarrettManaging Director, Pharma M&ANew York [email protected]
Allen LefkowitzManaging Director, GenericsNew York [email protected]
Jie LiuManaging Director, ChinaNew York [email protected]
Stephanie LéouzonPartner, Head of EuropeLondon [email protected]
Nitin LathManaging Director, IndiaMumbai [email protected]
Tim Opler, Ph.D.Partner, PharmaceuticalsNew York [email protected]
Alan Selby, M.B.Ch.B.Director, Private EquityLondon [email protected]
Mark SimonPartner, BiotechnologyNew York [email protected]
Hetal VoraExecutive Director, IndiaMumbai [email protected]

Recent Transaction Work
57
$225 millionSeptember 2020
$80 millionMay 2020
Sale of majority of sponsor owned generic
pharma company
$68 millionMay 2020
Disposal of stake in
$120 millionJuly 2020
Sale of majorityequity stake to
U.S. based OTC business
Family Office
Acquisition of
$1.5 billionOctober 2020
Advisor to the Special Committee of the
Board of Directors in its merger with
$127 million upfront*(+$176mm CVRs)
October 2020
Sale to
$57.5 millionFebruary 2020
Debt financing by
€44.5 millionOctober 2020
Private Equity Placement
$30 millionFebruary 2020
Sale of majority stake to
$45 millionSeptember 2020
$15 millionAugust 2020
Registered Direct Common Equity
Offering
Sale of Noden to
$30 millionOctober 2020
Series C Private Equity Placement
September 2020February 2020
Sale of Ryaltris® to
February 2020
Distribution agreement with
$10 millionJune 2020
Acquisition of India business of
June 2020
License of Phase 1 drug candidate for
amyotrophic lateral sclerosis from Neugen
Pharma$35 million($12 million upfront)
July 2020
License of Vicineium in China to License of Triferic
in South Korea to
* Torreya acted as a principal in this transaction and provided extensive transaction support to iota.
Torreya has remained highly engaged with its clients during the COVID-19 pandemic period and is working across the spectrum of the global life sciences sector.

58
Thank You and Be Safe
Disclaimer
59
This presentation may not be used or relied upon for any purpose other than as specifically contemplated by a written agreement with Torreya. This publication has been prepared for general guidance on matters of interest only, and does not constitute professional advice. You should not act upon the Information contained in this publication without obtaining specific professional advice. The information used in preparing these materials was obtained from or through public sources. Torreya assumes no responsibility for independent verification of such information and has relied on such information being complete and accurate in all material respects. No representation, warranty or undertaking, express or implied, is made and no responsibility is accepted by Torreya as to or in relation to the accuracy or completeness or otherwise of these materials or as to the reasonableness of any other information made available in connection with these materials (whether in writing or orally) to any interested party (or its advisors). Torreya will not be liable for any direct, indirect, or consequential loss or damage suffered by any person as a result of relying on any statement contained in these materials or any such other information. None of these materials, the information contained in them or any other information supplied in connection with these materials, will form the basis of any contract. To the extent such information includes estimates and forecasts of future financial performance (including estimates of potential cost savings and synergies) prepared by or reviewed and discussed with the managements of the Company and/or other potential transaction participants or obtained from public sources, we have assumed that such estimates and forecasts have been reasonably prepared on bases reflecting the best currently available estimates and judgments of such managements (or, with respect to estimates and forecast obtained from public sources, represent reasonable estimates). There is no guarantee that any of these estimates and projections will be achieved. Actual results will vary from the projections and such variations may be material. Nothing contained herein is, or shall be relied upon as, a promise or representation as to the past or future. Torreya expressly disclaims any and all liability relating or resulting from the use of this presentation. Torreya assumes no obligation to update or otherwise review these materials. These materials have been prepared by Torreya and its affiliates and accordingly information reflected or incorporated into these materials may be shared with employees of Torreya and its affiliates and agents regardless of location. This presentation speaks only as of the date it is given, and the views expressed are subject to change based upon a number of factors, including market conditions.
Distribution of this presentation to any person other than the recipient is unauthorized. This material must not be copied, reproduced, distributed or passed to others at any time without the prior written consent of Torreya. This presentation has been prepared solely for informational purposes and is not to
be construed as a solicitation or an offer to buy or sell any securities or related financial instrument. You should not construe the contents of this presentation as legal, tax, accounting or investment advice or a recommendation. Torreya does not provide any tax advice. Any tax statement herein regarding any U.S. federal or other tax is not intended or written to be used, and cannot be used, by any taxpayer for the purpose of avoiding any penalties. Any such statement herein was written to support the marketing or promotion of the transaction(s) or matter(s) to which the statement related. Each taxpayer should seek advice based on the taxpayer's particular circumstances from an independent tax advisor. This presentation does not purport to be all-inclusive or to contain all of the information that the Company may require. No investment, divestment or other financial decisions or actions should be based solely on the information in this presentation.
The distribution of these materials in certain jurisdictions may be restricted by law and, accordingly, recipients represent that they are able to receive this memorandum without contravention of any unfulfilled registration requirements or other legal restrictions in the jurisdiction in which they reside or conduct business. By accepting these materials, the recipient agrees to be bound by the foregoing limitations. Insofar as these materials originate in the United Kingdom or are capable of having an effect in the United Kingdom (within the meaning of section 21 of the Financial Services and Markets Act 2000) they are directed only at classes of recipient at whom they may lawfully be directed without contravening that section or any applicable provisions of the Conduct of Business Sourcebook of the Financial Conduct Authority, including persons of a kind described in Article 19 (Investment professionals) or Article 49 (High net worth companies, unincorporated associations etc.) of the Financial Services and Markets Act 2000 (Financial Promotion) Order 2005 (as amended) and are not intended to be distributed or passed on, directly or indirectly, to or relied or acted on, by any other class of persons. Torreya (Europe) LLP, which is authorised and regulated in the United Kingdom by the Financial Conduct Authority, is not acting for you in connection with any potential transaction(s) described in these materials and thus will not be responsible for providing you the protections afforded to clients of Torreya (Europe) LLP or for advising you in connection with any potential transaction(s) as described in these materials except and unless subject to a subsequent specific written agreement relating to such potential transaction(s) between you and Torreya (Europe) LLP.Torreya (Europe) LLP is authorised and regulated by the Financial Conduct Authority. Securities offered in the United States are offered through Torreya Capital LLC, Member FINRA/SIPC.
Related Documents