Biology in primary school: Doing a big experiment and writing it up Dr. Peter Farrell EdD, MAppSc, GDipEd, PGCert Primary Mathematics Teaching, BAppSc(Hons) TeachingPrincipal Zeerust Primary School Zeerust, Victoria, Australia, 3634 CONTENTS INTRODUCTION 2 IT ALL BEGINS WITH A QUESTION 2 ANTICIPATING PROBLEMS 4 WHAT TO DO WHILE WAITING 5 AND NOW FOR SOMETHING COMPLETELY DIFFERENT (NUMERACY) 6 LET THE THINKING BEGIN [OR NOT] 8 SHARING PRACTICE 9 DISCUSSION 10 AUGMENTS MY PRACTICAL KNOWLEDGE 10 CHALLENGES MY PRACTICAL KNOWLEDGE 11 LEGITIMISES MY PRACTICAL KNOWLEDGE 11 CONCLUSION 12 ABOUT THE AUTHOR 12 REFERENCES 12 FURTHER INFORMATION 13

Welcome message from author
This document is posted to help you gain knowledge. Please leave a comment to let me know what you think about it! Share it to your friends and learn new things together.
Transcript
Biology in primary school: Doing a big experiment and writing it up Dr. Peter Farrell EdD, MAppSc, GDipEd, PGCert Primary Mathematics Teaching, BAppSc(Hons) Teaching-‐Principal Zeerust Primary School Zeerust, Victoria, Australia, 3634
CONTENTS INTRODUCTION 2 IT ALL BEGINS WITH A QUESTION 2 ANTICIPATING PROBLEMS 4 WHAT TO DO WHILE WAITING 5 AND NOW FOR SOMETHING COMPLETELY DIFFERENT (NUMERACY) 6 LET THE THINKING BEGIN [OR NOT] 8 SHARING PRACTICE 9 DISCUSSION 10 AUGMENTS MY PRACTICAL KNOWLEDGE 10 CHALLENGES MY PRACTICAL KNOWLEDGE 11 LEGITIMISES MY PRACTICAL KNOWLEDGE 11 CONCLUSION 12 ABOUT THE AUTHOR 12 REFERENCES 12 FURTHER INFORMATION 13

Peter Farrell – 16 November 14
2
Introduction I was sitting with a teaching colleague from another school watching a ‘science show’. After the show, which was very polished, I stated to this teacher that it seemed to me that primary school science is often trivialised into a series of tricks with a ‘fill-‐in-‐the-‐blanks’ worksheet at the end. I stated that this was a shame because science can be so much more than that. At the time I was being deliberately provocative because I knew that my colleague had put together a comprehensive science kit for her students, and that very term they had embarked on a series of unrelated ‘experiments’ culminating in the science show we had just watched with our students. The teacher asked me what I did with science. I replied that we did big science experiments at my school, and wrote it up as a science paper. After further discussion, she asked if I could send her something about what I did. An earlier draft of this essay was the result and it began: Doing a big science experiment and then writing it up is an ambitious undertaking for most primary school teachers and the children in their class, but it is a worthwhile thing to do, because it leads to such deep learning as student’s research, reason and retell what they know. In this essay I will share the work of my students as we worked through a big experiment over sixteen 50 to 60 minute sessions.
It all begins with a question For my class that question was simply this: What is a plant? As the students explored this question both on-‐line and in books, I acted as their scribe and created the following introduction to our science report:
There are some 300 000 species of plants on the earth (Wikipedia). Unlike animals, plants can create their own food. They do this through a process called photosynthesis (discussed below). All plants have leaves, roots and a stem. Some plants have branches and flowers. Some plants attract insects, birds and/or animals while some plants try to defend themselves against attack.
Plants draw nutrients like nitrogen, phosphorous, potassium and other trace elements up through their roots. The main root is the tap-‐root, and this will also draw water up to the plant stem and out through the leaves. Special passageways through the stem are called the xylem and phloem. The excess water exits via the stomates as vapour. These are small openings on the underside of the leaf; which are connected to vascular plant tissue. This process is called transpiration. Water gives the plant rigidity, rather like blowing up a modelling balloon with air. Plants lacking water wilt because they need to store more water. About 90% of the water that enters a plant is stored and used to provide rigidity, cool the plant down, and for later growth. Photosynthesis is the other significant process that plants are capable of. Occurring in the chloroplasts, which are found in the leaves, photosynthesis takes water, carbon dioxide, nutrients, and sunlight to create a glucose product; this is used for growth. The glucose finds its way into the cell walls of the plant and in the roots as starch. Chloroplasts are green because the plant does not absorb this wavelength of light. White light is made up of different wavelengths ranging from infrared to ultraviolet. The visible band of light falls between these two extremes. Plants prefer red and blue wavelengths.

Peter Farrell – 16 November 14
3
This took about two 50-‐minute sessions for us to create this introduction. My students discovered many great resources on-‐line as they did so; U-‐tube movies were particularly helpful. In addition to increasing my student’s understanding of plants, I wanted to model for them how complex ideas could be written down. I also wanted them to start thinking about an experiment. In a nutshell, primary school biology, where it is assessed, is concerned with form and function. In our introduction we had briefly described the form of a plant and we had touched on the importance of nutrition, and the processes of transpiration and photosynthesis. Could one of these factors form the basis of an experiment? The answer was yes, and the students and I initially worked on two questions. The first related to photosynthesis and the impact of filtered light upon plant growth and development. One of the students had seen an example of this experiment during our earlier research. The second experiment was about the impact of malnutrition and overcrowding. As it happens, because of the seasonality of plant growth, we never actually started the second experiment, because our candidate plant (rhubarb), chosen after much deliberation, was not then available from our local nursery, and we did not think anything else that was available would work quite as well. We did however spend a lot of time designing this experiment. Fortunately, the first experiment was completed and again, after much deliberation, the candidate plant was chosen, and an additional paragraph was inserted into our introduction:
Peas are an edible plant that climb. They are grown commercially worldwide and their seedpods and/or the seeds inside are eaten. Snow peas (Pisum sativum) are grown in late winter and early autumn and need eight to 10 days to germinate. It was for this reason they chosen as an experimental species. We wanted to find out what filtered light, effects the growth of the climbing pea? We anticipate that seeds planted under green light will not grow as well as seeds planted under red and blue filters.
There are two points to make here. The first is about writing an introduction while the second relates to scientific method. You will note that initially, our introduction
Scientific method is a formal process where problems are tackled in a particular way: 1. The scientist asks a question. 2. The scientist does background research. 3. The scientist constructs a hypothesis (this is an assumption about what is going on). 4. The scientist tests their hypothesis by doing an experiment (or making a model). 5. The scientist analyses their results and draws a conclusion that may include further experiments. 6. The scientist communicates the results in a transparent way. a. Experiments should be replicable – that is if other scientist do them then similar results will be seen. b. Peer-‐review is a process by which scientists working in the same field critically analyse the work of the author. c. Science is built upon the work of others. Remember steps 1 and 2 above.
Peter Farrell – 16 November 14
4
was broad in its scope before it narrowed down to very specific information about the snow pea, our experimental candidate. I often use the metaphor of funnel with my children to describe how they should structure their writing. The second point is that it is here, in this final paragraph of the introduction, that we presented our hypothesis as required by scientific method (see side bar). You will see that not only do we say what we want find out, we make a prediction (hypothesis), when we use the word ‘anticipate’ about what will happen.
Anticipating problems For me, as an ex-‐scientist, designing the experiment is one of the fun parts. And one of the problems I have with science done as a series of quick tricks, is that the students never engage in the process of solving the problems that go along with designing an experiment. In fact, I have already shared one problem-‐solving tale with you. You will recall that we had to choose appropriate plants as candidates for our experiments. This took a session to do, and then experiment 2 had to be abandoned because of a lack of supply. The problems we dealt with at this point of the experiment was how to filter the light, where to grow the plants, how to prepare the soil, how to choose the seeds, how we would we have a control to compare our treated plants with, when would we wrap the experiment up, what would we measure to show any differences, and what would we do while we waited for the plants to germinate and grow? In the write-‐up of a science experiment this is called the materials and method section. Literacy teachers will know this writing as procedural text. Once again I assisted the students with the writing but only to a preliminary draft stage. The intention was that each student in my grade 3-‐6 class would assume more and more responsibility for the writing to come. This is how it looked when they got copies of the report:
Materials and Method Light Experiment 16 x snow peas, 16x 1.25 litre clear plastic bottles, Coloured cellophane (green, red and blue), planter box with organically fertilised soil, watering regime (five days in seven), The bottles were washed and the labels removed. The bottom of the bottles was cut off and some bottles were wrapped in cellophane. Three bottles each were wrapped in blue, red and green cellophane respectively. The cellophane was held in place with sticky tape and elastic bands. The remaining seven bottles, the controls, were clear. It was intended that four of these would be sacrificed and examined. The soil in the box was turned over and weeded. 16 seeds, chosen for uniformity in size, were planted at 5cm into the soil. A bottle was place over the top and pushed into the soil about 2cm. The seeds were watered where a puddle formed over the top; this was the method used on five days out of seven.
Peter Farrell – 16 November 14
5
During the course of the experiment individual peas were examined under a dissecting microscope. These were whole, crushed, germinating, seedlings. Result At day six some seeds had germinated.
Conclusion
You will note that even at this point the headings for the results and conclusion are already ‘pencilled in’. The other thing to realise is that the procedures shown so far only describe the method used to prepare the soil and plant the seeds. The students were expected to complete the remainder of the section, with my assistance, later on. We had gone from full on modelling of writing to a shared writing approach, and from now on the writing examples will be provided by my students.
What to do while waiting Earlier I said that primary school biology, where it is assessed, is about form and function. We were about to deal with the latter, but what of the former. How do we teach the students about plant form? The answer is through scientific drawing. The week after we planted our experimental plants in the box outside, we also made use of the cut-‐off bottoms of the soft-‐drink bottles by putting layers of wet paper towel in the bottom and placing a single seed in each. During the same session we had a look at the seeds under a dissecting microscope we had been given by a local secondary college (it was old), and we also used magnifying glasses. Later, when these seeds germinated (we kept them in the classroom) we took them out and drew them. Scientific drawing is done with pencil and paper and includes a heading with the species name (in this case, Pisum sativum). Each part of the plant is labelled (we used the internet to do this) and the drawing is exactly what the student can see; artistic renderings are not acceptable. We spent three sessions working on this and the quality dramatically improved each time. The children gained an impressive understanding of the form of a snow pea seedling. These drawings did not form part of our experiment but are mentioned here as a worthwhile thing to do in a long biology experiment. Returning now to the materials and method section. Here is what, Lily, a grade 6 girl wrote, with my assistance and the assistance of other students in the class, continuing on from before:
During the course of the experiment individual peas were examined under a dissecting microscope. These were whole, crushed, germinating, seedlings. Seeds were germinated and examined using scientific drawing and labelling. This was conducted three times.
Peter Farrell – 16 November 14
6
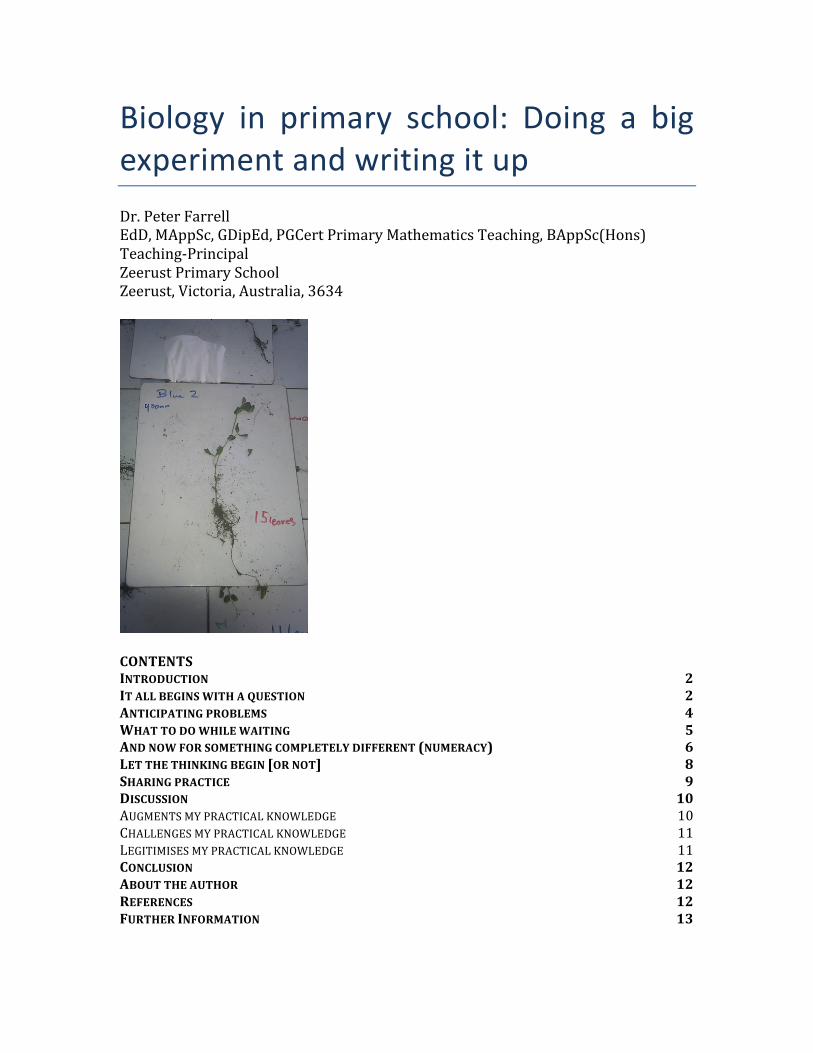
Some plants grew quickly and it was necessary to plug the top of the bottles with coloured cellophane. On the 10th of September the plants were retrieved from the soil, placed on labelled whiteboards (Red 1, Red 2 etc.). We measured the total length, counted the number of leaves, made a judgement about the condition of the leaves, the amount of secondary root growth, and the stem to root ratio. All test plants were compared and contrasted with the control group. The question asked went like this, ‘How are the red group plants similar to each other and different to the control group.’ This data was averaged and graphed.
Lily also modified the original materials section:
Table 1: Materials 16 snow pea seeds, 16 1.25l clear plastic bottles, coloured cellophane (green, red, blue), planter box with organically fertilised soil, watering regime (five in seven days), drawing pads, pencils, whiteboards, sticky tape, elastic bands
Lily has inadvertently included the materials and procedure used for scientific drawing. You should encourage your students to keep a laboratory notebook to record the happenings in the experiment as they do. This is why Lily was able to record the date of harvest so accurately. The retrieval and initial measurement and
counting processes took a whole session. We recorded leaf counts and average lengths as well as our judgements about relative condition.
And now for something completely different (numeracy) The results of a science experiment are usually analysed using
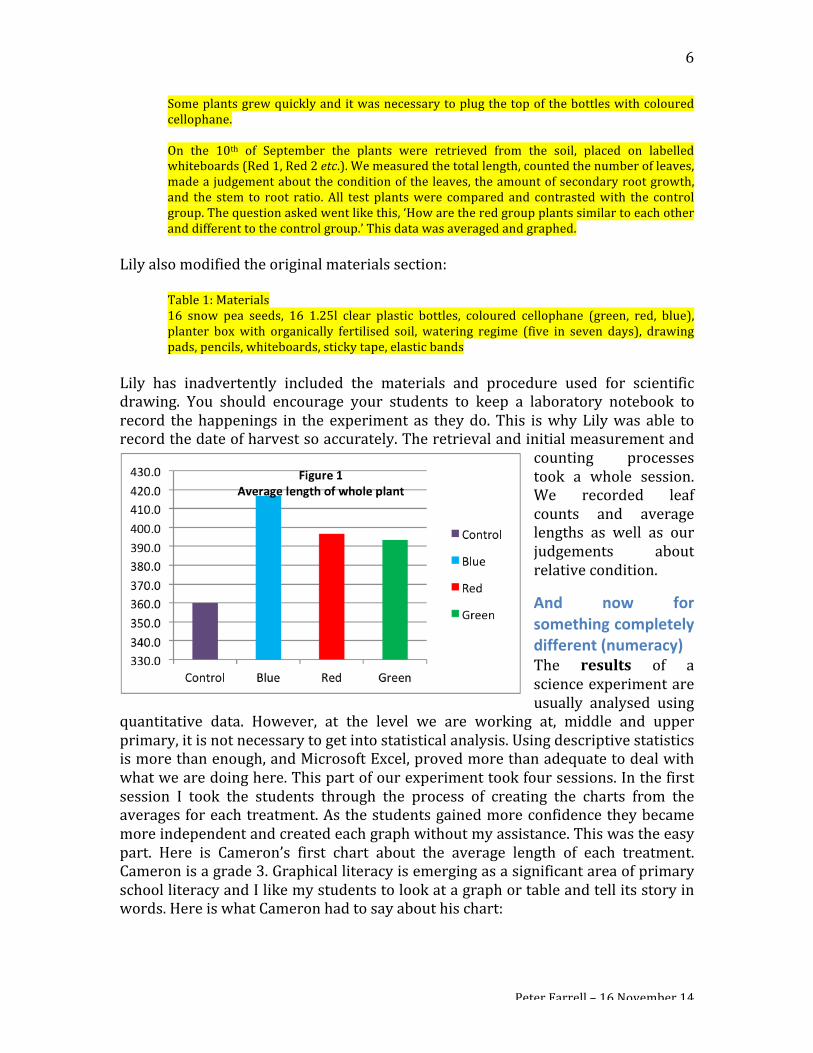
quantitative data. However, at the level we are working at, middle and upper primary, it is not necessary to get into statistical analysis. Using descriptive statistics is more than enough, and Microsoft Excel, proved more than adequate to deal with what we are doing here. This part of our experiment took four sessions. In the first session I took the students through the process of creating the charts from the averages for each treatment. As the students gained more confidence they became more independent and created each graph without my assistance. This was the easy part. Here is Cameron’s first chart about the average length of each treatment. Cameron is a grade 3. Graphical literacy is emerging as a significant area of primary school literacy and I like my students to look at a graph or table and tell its story in words. Here is what Cameron had to say about his chart:
Peter Farrell – 16 November 14
7
With the blue bottles getting the best average length, the red and green just about got the same length with red being taller by 3.4mm. It was surprising to see that the green went better than the control because our hypothesis was that the red and blue would do better than the green because the green would be reflecting the colour wavelengths.
Of course Cameron means that the plants getting the blue light treatment are growing best on average, this experiment is not about growing blue bottles. I note here that Cameron has also started to ‘reason’ as to why something has happened that is different to our hypothesis. Lily, our grade 6 student introduced earlier, had this to say about the data in the same chart:
Figure 1 shows the average length of the seedlings in mm. All coloured treatments grew more than the control (360mm). The blue treatment averaged about 417mm and about 20mm more than the red and green treatments which were similar to each other.
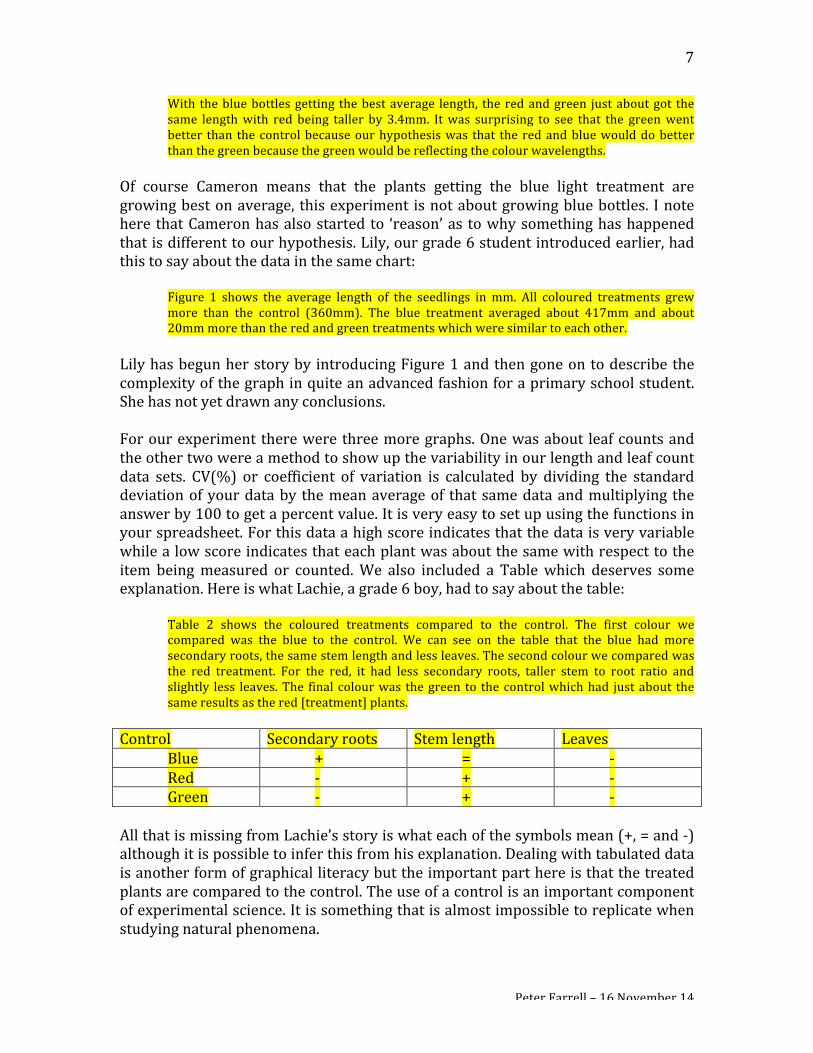
Lily has begun her story by introducing Figure 1 and then gone on to describe the complexity of the graph in quite an advanced fashion for a primary school student. She has not yet drawn any conclusions. For our experiment there were three more graphs. One was about leaf counts and the other two were a method to show up the variability in our length and leaf count data sets. CV(%) or coefficient of variation is calculated by dividing the standard deviation of your data by the mean average of that same data and multiplying the answer by 100 to get a percent value. It is very easy to set up using the functions in your spreadsheet. For this data a high score indicates that the data is very variable while a low score indicates that each plant was about the same with respect to the item being measured or counted. We also included a Table which deserves some explanation. Here is what Lachie, a grade 6 boy, had to say about the table:
Table 2 shows the coloured treatments compared to the control. The first colour we compared was the blue to the control. We can see on the table that the blue had more secondary roots, the same stem length and less leaves. The second colour we compared was the red treatment. For the red, it had less secondary roots, taller stem to root ratio and slightly less leaves. The final colour was the green to the control which had just about the same results as the red [treatment] plants.
Control Secondary roots Stem length Leaves
Blue + = -‐ Red -‐ + -‐ Green -‐ + -‐
All that is missing from Lachie’s story is what each of the symbols mean (+, = and -‐) although it is possible to infer this from his explanation. Dealing with tabulated data is another form of graphical literacy but the important part here is that the treated plants are compared to the control. The use of a control is an important component of experimental science. It is something that is almost impossible to replicate when studying natural phenomena.

Peter Farrell – 16 November 14
8
So as we come to the end of the results and each student, has, to a greater or lesser degree, told the story of each graph or table. Cameron is already wondering why our hypothesis is under threat but that should be saved for the report’s conclusion.
Let the thinking begin [or not] Even though each student wrote their own conclusion to our experiment I found, as their teacher, I could not remain silent as they did so. As certain phenomena in our experiment was explained by the eHow website, I could not help but draw conclusions of my own, or wonder, out aloud, about what it all meant. I am sure all of my students heard this thinking as they wrote. However, I did not assist the students with what they wrote. I think a decent conclusion should begin with an introductory paragraph introducing the overall theme of the results. Here is Georgie, a grade 5 girl, who made a pretty good effort to encapsulate the outcomes of our experiment:
All the plants reacted differently, and they survived in all weather. If someone was to do the same experiment they would hopefully get the same results. The threads in all the graphs are that green is nearly always 2nd, white [clear] is always all over the place and red and blue are near each other.
In an excellent conclusion to a scientific report you will find an attempt to compare and contrast the outcomes of the experiment with what the literature (in this case the web) has to say about the same phenomena. Emily, a grade 6 wrote the following:
eHow.com (2014) said that green light is harmful to plants and red light should encourage maturation. The green-‐treatments [in our experiment] did not show any signs of illness and we didn’t see maturation from the red-‐treatments. That could be possible if we had continued the experiment for longer.
A good conclusion will not incorporate the literature quite so well but it will use it to explain some phenomena. Here is Lachie:
Within Figure 1 you see that red and blue coloured treatments did as expected but the surprising twist was that the green went as well as both the red and the blue. That is because little hypocotyls in the plant react to the green light in the short term.
Lachie is almost right with his explanation except that there is only one hypocotyl. This is the part of a seedling that forms the transition between stem and root. A less well developed conclusion, which should be forgiven because the author is in grade 3, is this one by Jordan:
All of the plants did differently, depending on the colour of the plants filtered light they were under.
This statement is true enough and after some paragraphs that retell the stories of each of the graphs and the table, Jordan makes reference to the original hypothesis:
Peter Farrell – 16 November 14
9
Our hypothesis was that the plants with the red and blue filtered lighting would do better than all the plants [with green] filtered light.
I have inserted the two words that correctly state our hypothesis. Although Jordan referred to the hypothesis he did not draw a conclusion as to whether our hypothesis was proven or not. Jayk, a grade 5 boy, did better:
So all through the experiment we thought the red and the blue would do better than the rest. But the green was the same as the blue and the red on Figure 1. Then on the Figure 2 the red and the blue is not doing as well as the control and the green.
It should be noted that I have cherry-‐picked the above quotes from my seven students in order to make my point. I am indebted to Cameron, Emily, Georgie, Jayk, Jordan, Lachie and Lily for being such willing participants in this work. Writing the conclusion took six sessions and I used the writing block to get it done. As a minimum a conclusion to a science experiment should make reference to the original hypothesis (Jordan) and it should combine the evidence in the results indicating the hypothesis was proven or not (Jayk). Going one step better it should use other sources of information to explain what we have seen in our experiment (Lachie) and then suggesting how any issues encountered might be addressed by future experiments (Emily). Elsewhere I have written about the Six Rs which are reading, writing, ‘rithmatic, researching, reasoning and retelling. This big biology experiment and corresponding write up ticks every box. It is properly constituted integrated learning that offers support and differentiated expectation to the students involved.
Sharing practice An earlier draft of this essay was provided to my teaching colleague from another school and we arranged a meeting via Polycom ™ to discuss it. Polycom allowed our two schools to conduct a face-‐to-‐face meeting without the necessity of travel. As it happens both my teacher in my school where I am the principal, and the principal at my colleague’s school involved themselves in a discussion about what I had done and what my students had achieved. Everyone had read the essay first. What was apparent to me was that I was the only scientist in the discussion and that as generalist-‐teachers, my colleagues particularly appreciated the literacy-‐based approach provided by the science report format. The use of modelled writing in the introduction where the teacher acted as scribe resonated with them. They were familiar with the procedural text used in the materials and method section. The criteria writing a conclusion was welcome and they were impressed by the work of my students. However, it was apparent that the teachers at the other school were concerned about how the results had been made into charts using a spreadsheet – as they were
Peter Farrell – 16 November 14
10
unfamiliar with this process. Notwithstanding that, telling the story of a chart or table was an idea that they did understand.
Discussion I have advocated elsewhere that reflective teaching practice should make use of academic and professional literature, blogs and webpages to augment, challenge and legitimise practical knowledge (Farrell undated). With this in mind I have searched through Academia.edu, an online source of free academic and professional writings by authors from around the world and identified a number of papers about elementary/primary science teaching. After reading six papers I have settled on four for this discussion. The first is concerned with teaching physics via experiment and/or text, the second related to the importance of graphical literacy, the third is about writing and science, and the last paper is about using a laboratory notebook to underpin environmental enquiry.
Augments my practical knowledge Magnusson, Palincsar, Hapwood and Lomangino (2004) carried out an experiment teaching science in primary school where they looked at the interaction between primary and secondary investigations. A primary investigation is hands-‐on and engages the student with the materials, in this instance the use of a ramp or a table to investigate mass and force on the motion of objects. A secondary investigation is text-‐based and requires no experimentation. The authors had created a laboratory notebook as a learning artefact for children to learn from. The book was simplified for its intended audience (grade 4 students). Magnusson et al. (2004) developed their laboratory notes as the professional musings of a fictitious scientist named Lesley Park. By way of contrast we created our own science report. I can see how with some classes a pre-‐prepared notebook could be helpful but I am satisfied making our own artefact worked for us this time. Magnusson et al. (2004) determined that when primary and then secondary investigations work in interplay then good learning outcomes regarding the application of scientific reasoning are realised. As far as learning scientific content the order of delivery was not significant. Our own investigation started with on-‐line secondary sources (the introduction), then primary sources (designing and implementing the experiment), and then writing the conclusion (secondary sources found on-‐line). I think the interplay between secondary and primary methods of inquiry worked very well in our own investigation too and I could not teach science in a way where primary and secondary forms of inquiry were not combined. Nicolaou, Nicolaidou, Zacharia, and Constantinou (2007) wrote about the use of specialised software to create line-‐graphs in an experiment about states of matter in water. The important thing Nicolaou et al. (2007) learnt in their study was that the graphs produced should not be the end point in itself. Having your students apply graphical literacy techniques to their understanding of phenomena was particularly significant in improving student learning outcomes around science. The value of data loggers as used in this experiment is in the amount of time saved. There was a
Peter Farrell – 16 November 14
11
time cost for my students as they needed to be lead through the process of creating charts using Excel spread-‐sheets. Fortunately, I was able to provide that leadership. Students attending my colleague’s school would have found this step difficult. Data-‐loggers such as those used in the study by Nicolaou et al. (2007) would have circumvented this issue.
Challenges my practical knowledge Günel (2009) writes about two schools of thought around the use of writing in the science classroom. One, values how students learn proper technical language and the structure of scientific genre. The other believes that students should be able to use their own words and write in a variety of styles, in a way that is much closer to their own discourse level. I have not really thought about this before, I tend to promote scientific structure and language while at the same time realising that not all of my students will be capable of reproducing it yet. For example, Emily, is well on the way to expressing herself in scientific way whereas Jake is still using informal language. Günel (2009) suggests that science writing should have more than one dimension as topics, audiences, purposes, and genres can all vary; as can the method of text production. My own text production above deliberately moved from modelled, shared, guided and semi-‐independent writing. And while ostensibly a science report, each part of the report had a different purpose and thus adopted a different genre of writing. From a broad brushed explanation to a procedural text, back to an explanation (this time more fine-‐grained) and finally a discussion. However, the purpose was firmly embedded in writing like a scientist. Perhaps, in future I might consider having my students writing about scientific ideas but not necessarily in the guise of scientist.
Legitimises my practical knowledge Muthersbaugh, Kern, Pegg and Clark (2011) set out to deliberately combine science and literacy in their investigation into waste. Like my students the children in their study were encouraged to maintain a laboratory notebook and, in a similar intention to my own, Muthersbaugh et al. (2011) used this literacy-‐based form to facilitate learning. I had, in times past used this exact approach, but this time, my chosen vehicle to drive the learning of my children was the write up of the experiment. Both approaches pose a problem, develop a hypothesis, design and plan an experiment, collect data, make claims based on their findings, and write a conclusion. Muthersbaugh et al. (2011) suggest that this is the most important part but is often overlooked due to time constraints. For my class their conclusion was critical, it was the part I assessed and I allowed lots of time for this step. The similarities between my approach and that of Muthersbaugh et al. (2011) are hard to ignore even though this work was posited in environmental studies. The conclusion is that learning science can be underpinned by a hands-‐on, literacy-‐based approach.
Peter Farrell – 16 November 14
12
Conclusion Researchers operating out of the science-‐based tradition where research is about teachers and teaching may be surprised by the structure of this paper. My research paradigm follows the self-‐study model where reflection, reading and professional experimentation is performed in the practical-‐knowledge tradition. That is my research is for teachers and teaching, especially my own. This essay never was an experiment. It was simply a means to share a classroom practice with a colleague. However, once written, it could not be finished unless subject to a reflective process which involved interacting with other perspectives to augment, challenge and legitimise my practical knowledge.
About the author Peter Farrell teaches at a small rural school in country Victoria, Australia, where he is the principal. Peter has a science background and worked and trained as a scientist before becoming a teacher. Doing big science is a feature of Peter’s teaching and he has written about small school pedagogy and teaching science elsewhere (see: https://independent.academia.edu/PeterFarrell).
References Nicolaou, C.T, Nicolaidou, I.A., Zacharia, Z.C., and Constantinou, O.P. (2007) Enhancing fourth graders’ ability to interpret graphical representations through the use of microcomputer-‐based labs implemented within an inquiry-‐based activity sequence. Journal of Computers in Mathematics and Science Teaching, Vol. 26(1), 75-‐99 Farrell, P. (undated) The use of professional reflection and professional reading to challenge, legitimize and augment practitioner knowledge, values and attitudes. Retrieved from: https://www.academia.edu/7785311/The_use_of_professional_reflection_and_professional_reading_to_challenge_legitimize_and_augment_practitioner_knowledge_values_and_attitudes on Sunday 16 November 2014. Magnusson, S. J., Palincsar, A.S., Hapwood S., and Lomangino A. (2004) How should learning be structured in inquiry-‐based science instruction?: Investigating the interplay of 1st-‐ and 2nd-‐hand investigations. Retrieved from: https://www.academia.edu/4714932/How_Should_Learning_Be_Structured_in_Inquiry-‐based_Science_Instruction_Investigating_the_Interplay_of_1_st_-‐and_2_nd_-‐hand_Investigations on Sunday 16 November 2014 Günel, M. (2009) Writing as a cognitive process and learning tool in elementary science education. Elementary Education Online 8(1), 200-‐211. Retrieved from: https://www.academia.edu/4691886/Writing_as_a_Cognitive_Process_and_Learning_Tool_in_Elementary_Science_Education on Sunday 16 November 2014.
Peter Farrell – 16 November 14
13
Muthersbaugh, D., Kern, A.L., Pegg, J., and Clark, H.W. (2011) Science notebooks and a “Big Waste Problem”. The Earth Scientist, 27(4) 21-‐26. Retrieved from: https://www.academia.edu/7600678/Science_notebooks_and_a_Big_waste_problem_ on Sunday 16 November 2014.
Further Information http://artplantaetoday.com/2012/02/03/scientific-‐illustration-‐in-‐the-‐elementary-‐school-‐classroom/
Related Documents