IMPACT ASSESSMENT ON SELECTED POLICY OPTIONS FOR REVISION OF THE BATTERY DIRECTIVE FINAL REPORT JULY 2003 EUROPEAN COMMISSION DIRECTORATE GENERAL ENVIRONMENT Directorate General Environment A2 - Consumption, Production & Waste Contact BIO Intelligence Service Eric Labouze / Véronique MONIER 01 56 20 28 98 [email protected]; [email protected]

Welcome message from author
This document is posted to help you gain knowledge. Please leave a comment to let me know what you think about it! Share it to your friends and learn new things together.
Transcript
IIMMPPAACCTT AASSSSEESSSSMMEENNTT OONN SSEELLEECCTTEEDD
PPOOLLIICCYY OOPPTTIIOONNSS FFOORR RREEVVIISSIIOONN OOFF TTHHEE BBAATTTTEERRYY DDIIRREECCTTIIVVEE
FINAL REPORT
JULY 2003
EUROPEAN COMMISSION
DIRECTORATE GENERAL ENVIRONMENT
Directorate General Environment
A2 - Consumption, Production & Waste
Contact BIO Intelligence Service
Eric Labouze / Véronique MONIER
01 56 20 28 98
B I O I n t e l l i g e n c e S e r v i c e ________________________________________________ 2. IMPACT ASSESSMENT ON SELECTED POLICY OPTIONS FOR REVISION OF THE BATTERY DIRECTIVE
FF OO RR EE WW OO RR DD SS
The purpose of the study is to perform an analysis of economic, environmental and social impacts of different policy options about batteries and accumulators, in the framework of an extended impact assessment. The methodology developed is based on the guidelines recently published by the EC about extended impact assessment. But considering the time constraint of the present study which had to be performed in less than 3 months, we do not pretend having covered all the issues.
However, a considerable work was performed and trends and orders of magnitude presented in the report can be considered with good confidence.
We are grateful to the many experts who provided us with their help and comments at different key steps of the report’s preparation and for their reactivity and availability within a very short time period.

B I O I n t e l l i g e n c e S e r v i c e . IMPACT ASSESSMENT ON SELECTED POLICY OPTIONS FOR REVISION OF THE BATTERY DIRECTIVE
3
11 EEXXEECCUUTTIIVVEE SSUUMMMMAARRYY
CC OO NN TT EE NN TT
1 EXECUTIVE SUMMARY ____________________________________________________________ 3
1.1 CONTEXT AND OBJECTIVES OF THE PROJECT _______________________________________ 4
1.2 CURRENT SITUATION _________________________________________________________ 5
1.2.1 Batteries Segmentation _______________________________________________ 5
1.2.2 Definitions About Collection and Recycling Rates ___________________________ 5
1.2.3 Starter Batteries _____________________________________________________ 6
1.2.4 Industrial Batteries ___________________________________________________ 7
1.2.5 Portable Batteries ____________________________________________________ 8
1.2.6 Summary of the Current Situation in Europe ______________________________ 13
1.3 BASELINE SCENARIO ________________________________________________________ 15
1.4 SUMMARY OF THE IMPACTS OF POLICY OPTIONS ____________________________________ 17
1.4.1 Quantitative Policy Options About Total Batteries __________________________ 17
1.4.2 Quantitative Policy Options About Starter Batteries _________________________ 17
1.4.3 Policy Options About NiCd Batteries ____________________________________ 18 1.4.3.1 Quantitative Options About NiCd Batteries _________________________ 18 1.4.3.2 NiCd Batteries Ban Option______________________________________ 25
1.4.4 Policy Options About Stakeholders’ Responsibility__________________________ 27
1.5 LIMITS OF THE STUDY AND FURTHER RESEARCH WORK TO BE PERFORMED ________________ 28
B I O I n t e l l i g e n c e S e r v i c e . IMPACT ASSESSMENT ON SELECTED POLICY OPTIONS FOR REVISION OF THE BATTERY DIRECTIVE
4
11..11 CCOONNTTEEXXTT AANNDD OOBBJJEECCTTIIVVEESS OOFF TTHHEE PPRROOJJEECCTT
Directive 91/157/EEC on batteries and accumulators containing dangerous substances amended by Commission Directive 98/101/EC, as well as Commission Directive 93/86/EEC, harmonise the national laws of the Member States in the field of waste management and spent batteries and accumulators containing certain heavy metals.
In practice the Battery Directives have not fully realised these objectives, since:
The Battery Directives only cover the collection of batteries containing certain quantities of cadmium, mercury or lead, and this limited scope tends to reduce the effectiveness of waste management of batteries and has caused implementation problems within the Member States.
The Battery Directives only prohibit the marketing of batteries and accumulators containing more than 0.0005% mercury as from 1 January 2001. However, other spent batteries and accumulators are an important source of heavy metals (particularly lead and cadmium), which may constitute a significant source of environmental damage and risk to human health.
There is a significant disparity between the laws and administrative measures adopted by the Member States with regard to the collection and recycling systems as well as the results yielded by such systems.
In order to contribute to a proper functioning of the internal market and to establish a high level of environmental protection in the field of waste management of spent batteries and accumulators, the European Commission commissioned BIO Intelligence Service to analyse the positive and negative impacts of different policy options in view of revising the Battery directives.
An extended impact assessment was performed. The methodology developed in this study is based on recent guidelines published by the EC: ‘A Handbook for Impact Assessment in the Commission – How to Do an Impact Assessment’.
Remark: It should be noted that this impact assessment had to be performed in a very short time compared to the wide scope of the issue under consideration. The methodology had thus to be defined considering this time schedule constraint.
Different policy options are evaluated regarding their feasibility (from a practical point of view) as well as their economic, environmental and social impacts:
Different ranges of collection and recycling targets were studied for small, automotive and industrial batteries and accumulators.
A part of the study focused on the use of cadmium in batteries and its economic and environmental impacts.
All considerations were made taking into account the two following possible principles: producer responsibility or shared responsibility.

B I O I n t e l l i g e n c e S e r v i c e . IMPACT ASSESSMENT ON SELECTED POLICY OPTIONS FOR REVISION OF THE BATTERY DIRECTIVE
5
11..22 CCUURRRREENNTT SSIITTUUAATTIIOONN
11..22..11 BBaatttteerriieess SSeeggmmeennttaattiioonn
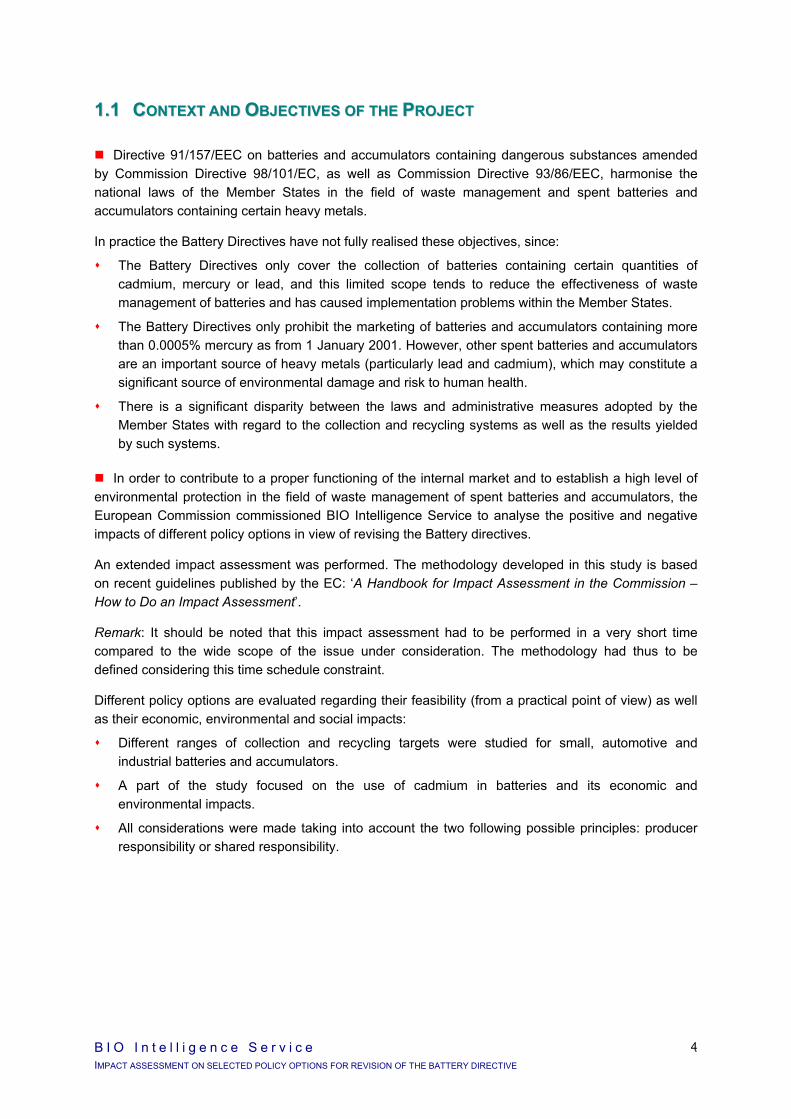
Batteries can be divided into primary (non rechargeable) and secondary (rechargeable) types. They can also be divided into 3 categories that we will keep all along the project:
portable batteries (used by households or professional users),
starter batteries for vehicles (large batteries used by households or professional users),
industrial batteries (large batteries used in the industry).
BBaatttteerriieess SSeeggmmeennttaattiioonn
In this report, the term ‘starter batteries’ stands for ‘starter lighting and ignition (SLI) batteries’, which are lead acid automotive batteries.
11..22..22 DDeeffiinniittiioonnss AAbboouutt CCoolllleeccttiioonn aanndd RReeccyycclliinngg RRaatteess
Spent batteries are split between:
Spent batteries available for collection,
Spent batteries not available for collection (because hoarded by end users, exported with equipments in which they are contained…).
Users Technology Typical Uses
General Purpose (alkaline manganese AlMn and zinc carbon ZnC)
Clocks, portable audio and devices, torches, toys and cameras
Lithium (Li) Photographic equipment, remote controls and electronics
Button cells (zinc air, silver oxide, manganese oxide and lithium) Watches, hearing aids, calculators
Nickel Cadmium (NiCd) Cordless phones, power tools and emergency lighting
Nickel Metal Hydride (NiMH) Cellular and cordless phones
Lithium Ion (Li-ion) Cellular phones, laptops and palms
Lead Acid Hobby applications
Lead Acid Automotive/MotorcycleStarter, Lighting and Ignition (SLI)
Starter batteries
Lead Acid StandbyAlarm systems, emergency back-up systems, e.g.rail and telecommunications applications
Lead Acid Traction Motive power sources, e.g. forklift trucks, milk floats
Industrial batteries
Nickel Cadmium (NiCd) standby Motive and standby applications, e.g.satellite and rail applications
Nickel Cadmium (NiCd) motive power Electrical vehicles
Nickel Metal Hydride (NiMH) Hybrid vehicles
Industrial
Households & Professional users
Type of batteries
Portable(<1 kg)
Non rechargeable
(primary)
Large (> 1 kg)
Rechargeable(secondary)

B I O I n t e l l i g e n c e S e r v i c e . IMPACT ASSESSMENT ON SELECTED POLICY OPTIONS FOR REVISION OF THE BATTERY DIRECTIVE
6
Collection rates (CR)
Because no definition is yet established about collection rates, we systematically assessed three collection rates in the study:
Collection rate as % of sales.
Collection rate as % of spent batteries, where spent batteries year N can be roughly estimated from sales for previous years by considering an appropriate hypothesis about lifespan for each applications.
Collection rate as % of spent batteries available for collection, where spent batteries available for collection = spent batteries x (1 – X%), X% depending on segment specificities (hoarding, exports…).
For instance in the case of portable batteries:
CR as % of spent batteries CR as % of spent batteries available for collection = (1 – % hoarded)
Remark: The higher the quantities collected, the higher the difference between these two collection rates. And the higher the % hoarded, the higher the difference between collection rates.
In case of markets where sales evolved regularly over the last years with a certain average growth rate, spent batteries year N can be roughly estimated from previous years sales:
Sales Year N Spent batteries Year N = (1 + average growth rate)lifespan and thus
CR as % of spent batteries = CR as % of sales x (1 + average growth rate)lifespan
Regarding recycling, the same ratio was assessed for all the batteries segment considered in the study: the recycling plant input, as the % of collected batteries sent to recycling.
11..22..33 SSttaarrtteerr BBaatttteerriieess
Definition about spent batteries available for collection
Two main categories of starter batteries are sold:
OEM (Original Equipment Manufacturer’s) batteries, sold in cars;
AM (After Market) batteries, sold to replace spent batteries.
A significant part of the OEM batteries are exported with cars and will then not become spent batteries in the country. Remaining OEM batteries, when spent, are replaced by the after market batteries, until the car is scrapped. Thus, the total sales, OEM + AM, does reflect the real quantities of spent batteries.
Spent starter batteries available for collection in 2002 = After market sales in 1997 + Batteries in scrapped cars in 2002

B I O I n t e l l i g e n c e S e r v i c e . IMPACT ASSESSMENT ON SELECTED POLICY OPTIONS FOR REVISION OF THE BATTERY DIRECTIVE
7
Starter batteries market and waste stream
In Western Europe in 2002, about 860 kt of starter batteries are estimated to be sold and 610 kt of spent batteries available for collection to arise, among which 15% from scrapped end-of-life vehicles (respectively 140 kt and 110 kt in Eastern and Central Europe).
Collection and recycling results for starter batteries
80-95% of spent starter batteries available for collection are believed to be collected and sent to recycling. No statistic exist at the EU level to confirm that situation.
Collection and recycling economics of starter batteries
Revenues from recycling (mostly sale of recovered lead and also of plastics) are generally sufficient to cover all of the collection and re-processing costs involved in the sector. However, lead batteries recycling economics is sensitive to the lead market price (LME) which can fluctuate significantly over years. But the industry has shown in the past that they can deal with that lead market fluctuation, using intermediate temporary storage as a hedging effect. This may explain that 5-10% of spent starter batteries available for collection are actually not collected. We found no information during the study which would indicate that this recycling activity is not durable at the European level. This may need some restructuring and collection optimisation, in some regions at least.
11..22..44 IInndduussttrriiaall BBaatttteerriieess
Definition about spent batteries available for collection
Two main categories of industrial batteries can be distinguished:
NiCd batteries, which are covered by the battery directive, for which statistics are available at both the EU and national levels,
Other industrial batteries, mostly lead acid batteries, for which statistics are available neither at the European level nor at the national level.
Spent batteries, which can theoretically be derived from sales of previous years by considering lifespans, are all collectable. However, spent batteries have very long lifespans which vary significantly with applications. And some hoarding behaviours by end users exist. Contrary to portable batteries, no data are available to assess the level of hoarding. As a consequence, spent batteries derived from sales and considered available for collection give a rough approximation of actual waste streams, without being able to quantify the uncertainty.
Industrial batteries market and waste stream
About 200 kt of batteries have been put on the market in 2002, 97% being lead acid batteries. This estimation about the total industrial batteries market is very uncertain. It is derived from 1995 data with an average 1% growth rate till 2002.
3.6 kt of large NiCd batteries have been sold in 2002, among which 83% for standby applications (3 kt) and 16% for electrical vehicles (0.6 kt).
Considering average lifespans, spent batteries available for collection are assessed to amount at 187 kt in 2002, among which 3.1 kt of NiCd.

B I O I n t e l l i g e n c e S e r v i c e . IMPACT ASSESSMENT ON SELECTED POLICY OPTIONS FOR REVISION OF THE BATTERY DIRECTIVE
8
Collection and recycling results for industrial batteries
No statistics are available about large lead acid batteries. Considering the well established recycling market of lead acid batteries, it is quite certain that all collected batteries are sent to a recycling plant.
As for NiCd, 2.8 kt were collected in 2002 at the EU level, representing 78% of 2002 sales and 90% of the spent batteries available for collection. 98% of NiCd batteries collected at the European level are declared to be sent to recycling.
Between 80-90% of total industrial batteries are then believed to be collected and sent to recycling.
From the nature of the product and their application, their collection and recycling is regulated by established industrial practices and supplier-customer regimes.
Collection and recycling economics of industrial batteries
For lead acid batteries, see starter batteries above.
For NiCd batteries sent to dedicated plants, recyclers bill between 0 to 300 Euros / t entering the plant depending on the proportion of metals recovered and metal market prices (nickel, cadmium and steel).
According to recyclers, NiCd recycling cost could decrease to a range of 0 – 200 Euros / t in the future (even positive value in some cases), in particular by increasing the recovery of ferro nickel by 10-15%.
11..22..55 PPoorrttaabbllee BBaatttteerriieess
Definition about spent batteries available for collection
Spent batteries available for collection = spent batteries x (1 –% hoarded).
In countries where data are available about batteries contained in municipal solid waste (MSW), we assessed the % of hoarding and obtained a very large range: from 27% to 62% according to countries.
At the EU level, we considered that 30% of non rechargeable batteries and 60% of rechargeable batteries are hoarded by households and professional users, resulting in an average of 37% all portable batteries together.
CR as % of spent batteries CR as % of spent batteries available for collection = 0.63
Beside, the equivalence formula with collection rate as % of sale is as follows: CR as % of spent batteries = CR as % of sales + 1 or 2 points for 1% average growth rate over last yrs CR as % of spent batteries = CR as % of sales + 2 or 3 points for 5% average growth rate over last yrs
Portable batteries market and waste stream
About 160 kt of batteries are sold in the EU in 2002, i.e. an average of 410 g / capita / year. The discrepancy between countries is important: between 250 and 425 g / capita / year according to country.
About 75% of portable batteries sold are non rechargeable batteries (general purpose, button cells and lithium), mainly general purpose batteries (alkaline manganese and zinc carbone). Button cells

B I O I n t e l l i g e n c e S e r v i c e . IMPACT ASSESSMENT ON SELECTED POLICY OPTIONS FOR REVISION OF THE BATTERY DIRECTIVE
9
(containing high mercury content) only represent 0.2%. NiCd technology represents one third of portable rechargeable batteries (7% of all portable batteries sold).
About 30% of portable batteries (45 kt) are estimated being sold in electric and electronic equipment (EEE). This concerns about 90% of rechargeable batteries and 10% of non rechargeable batteries.
About 150 kt of spent batteries are estimated to arise in the EU, i.e. an average of 380 g / capita / year (with an important discrepancy between countries as for sales: between 245 and 400 g / capita / year according to country). Spent NiCd batteries amounts to about 10.5 kt.
Only about 97 kt of spent batteries are estimated to be collectable in 2002 (i.e. available for collection), that is an average of 235 g / capita / year (between 140 and 285 g / capita / year according to country). Spent NiCd batteries available for collection are estimated at 4.1 kt.
An average of about 20% of spent batteries available for collection are estimated to be contained in WEEE.
Collection and recycling results for portable batteries
Separate collection of portable batteries is well or quite well developed in 8 MSs:
Separate collection focusing on NiCd (or all rechargeable according to country) batteries: Dk, Nw (other portable batteries remain in the MSW flow),
Separate collection of all portable batteries: A, B, F, D, NL and Sw.
According to information provided to BIO in the framework of the study, separate collection would not be well developed in accession countries.
About 27 kt of spent batteries are separately collected in the EU:
17% of current sales,
18% of spent batteries,
28% of spent batteries available for collection,
an average of 70 g / capita / year.
More than 80% of portable batteries collected are non rechargeable general purpose batteries and 8% are rechargeable NiCd batteries (2.1 kt).
The situation is very different from one country to another. Three categories of countries can be distinguished:
Countries where separate collection of all portable batteries is well developed (A, B, F, D, NL, Sw): 45 to about 85% of portable batteries available for collection are estimated to be collected according to countries.
Countries where separate collection of NiCd batteries is well developed (Dk, Nw): 40 to 50% of spent NiCd are collected.
Countries where separate collection is not developed: 0 to 15% of portable batteries available for collection are estimated to be collected according to countries.
Differences in the results reached in MSs may be explained by several parameters which differ among countries:
Starting date of separate collection: in some MSs, the system is more than 10 year old thus at a steady stage rather than in others, it is 2 year old, so still at a development stage.
B I O I n t e l l i g e n c e S e r v i c e . IMPACT ASSESSMENT ON SELECTED POLICY OPTIONS FOR REVISION OF THE BATTERY DIRECTIVE
10
Type and level of legal collection objectives set up at national level: from high mandatory targets to no quantified targets.
Collection schemes and communication programmes implemented: depending on the objectives to be reached (and the level of penalties included), more or less collection points have been setting up and more or less extensive communication and promotion programmes have been developed to encourage end users to first participate and secondly reduce their hoarding behaviours.
About 90% of total portable batteries collected is estimated to be recycled. This percentage aggregates different situations according to battery segments and countries:
NiCd batteries: about 100% of NiCd batteries collected are recycled.
General purpose batteries: the situation is very different among countries:
- Most of them send all portable collected batteries to a recycling plant.
- Others send 60-65% of portable collected batteries to a recycling plant (D, UK, Sw).
- Others have no estimation of quantities sent to recycling.
The limitation of recycling rate of general purpose batteries in some countries is motivated by different reasons according to countries:
Relatively high Hg-content general purpose batteries, put on the market before legislation entered into force in the EU1, are not all recycled in some countries, due to specific costly recycling processes2.
Non hazardous general purpose batteries (i.e. containing no Hg) are disposed of in landfill in some other countries.
Portable batteries are recycled in dedicated plants, smelting plants or electrical arc furnaces (EAF). About 32 dedicated recycling plants exist in the EU and are concentrated in certain countries (mainly France and Germany). Several plants dedicated to batteries recycling are still under used (up to half of their capacity seems to be available) thus there is an overcapacity of recycling. After collection, spent batteries are transported from countries where no recycling plant exist to over-capacity countries.
Collected batteries which are not recycled are disposed of in landfill, as hazardous waste or non hazardous waste according to their type.
Collection and recycling economics of portable batteries
Case studies were performed to gather updated cost data about existing collection and organisation schemes in countries where they are well or quite well developed. From these data, we were able to define ranges for the different cost items and discuss with experts about expected economies of scale.
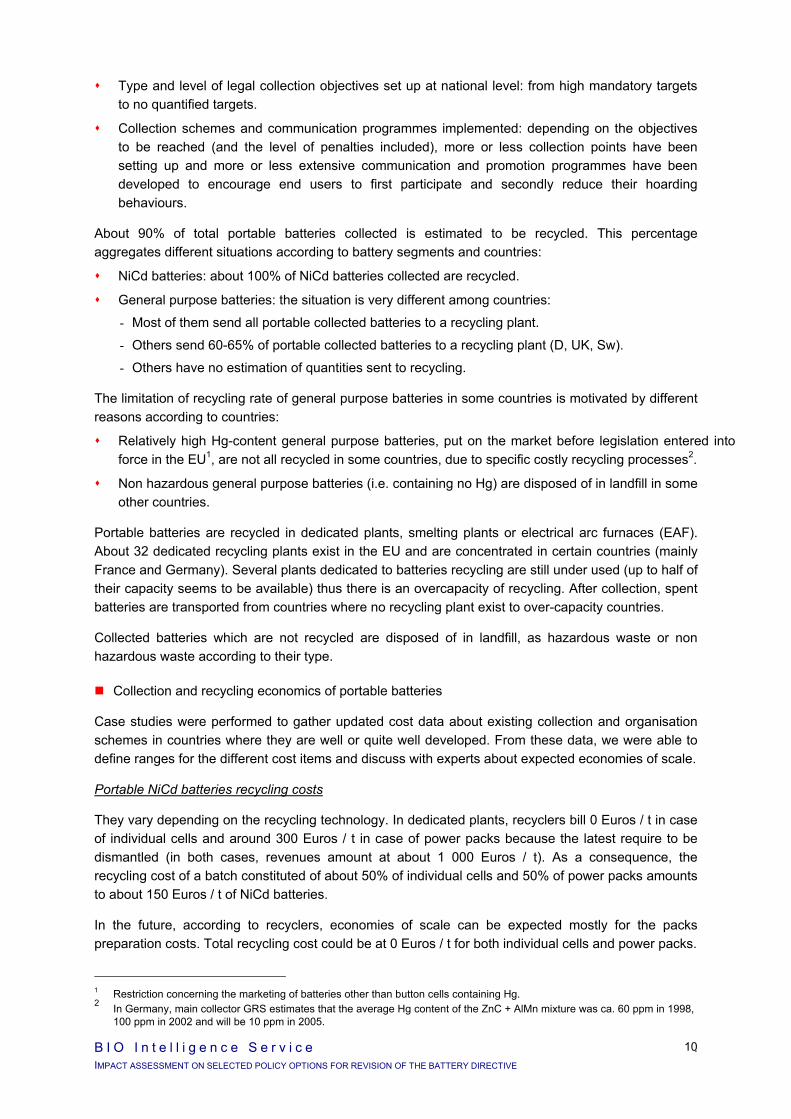
Portable NiCd batteries recycling costs
They vary depending on the recycling technology. In dedicated plants, recyclers bill 0 Euros / t in case of individual cells and around 300 Euros / t in case of power packs because the latest require to be dismantled (in both cases, revenues amount at about 1 000 Euros / t). As a consequence, the recycling cost of a batch constituted of about 50% of individual cells and 50% of power packs amounts to about 150 Euros / t of NiCd batteries.
In the future, according to recyclers, economies of scale can be expected mostly for the packs preparation costs. Total recycling cost could be at 0 Euros / t for both individual cells and power packs.
1 Restriction concerning the marketing of batteries other than button cells containing Hg. 2 In Germany, main collector GRS estimates that the average Hg content of the ZnC + AlMn mixture was ca. 60 ppm in 1998,
100 ppm in 2002 and will be 10 ppm in 2005.

B I O I n t e l l i g e n c e S e r v i c e . IMPACT ASSESSMENT ON SELECTED POLICY OPTIONS FOR REVISION OF THE BATTERY DIRECTIVE
11
In metal plants, recycling costs amounts to approximately 100 Euros / t of batteries. No major economies of scale can be expected in the future.
Portable NiCd batteries collection and recycling economics
Danish scheme concerns NiCd batteries collection and recycling. Total collection and recycling costs are estimated at about 2 830 Euros / t of NiCd collected.
For collection circuits dedicated to power tools containing NiCd batteries, collection and recycling costs vary between 1 300 and 1 750 Euros / t collected.
In both cases, collection rates reach about 40-50% of spent NiCd.
All portable batteries recycling costs
The average recycling cost (all types of portable flows together) vary in a quite large range: 400 to 900 Euros / t entering a recycling plants according to country.
PPoorrttaabbllee BBaatttteerriieess -- RReeccyycclliinngg CCoossttss IInnvveennttoorriieedd
Further investigation would be required to explain differences between different countries for portable lead acid and button cells batteries.
All portable batteries collection and recycling economics
The compilation of the different costs obtained in our analysis results in the following ranges.
PPoorrttaabbllee BBaatttteerriieess -- CCoossttss RRaannggeess FFoorr EExxiissttiinngg SScchheemmeess Euros / t of portable batteries collected
Variable costs Collection points (equipment) 50 - 150
Collection (logistic) 250 - 550 Sorting 150 - 250
Transport & Recycling (excl. disposal) 400 - 900 Fixed costs
Public relations & communication 50 - 1 700 Administration 125 - 900
Total 1 115 – 3 765
Euros / t entering a recycling plant
ZnC & Alk batteries about 900-1000 Euros / t in dedicated plants whatever Hg content (B, F)180 to 700 Euros / t in metal plants for limited Hg content (D)
Small lead acid batteries 1000 Euros / t (F)0 even negative costs (B)
Button cells 2600 Euros / t (F)4000 Euros / t (B)
NiMH batteries 0 Euros / t (B, F)
Li batteries 2000 Euros / t (F)
Li-ion batteries 1000 Euros / t (F)
B I O I n t e l l i g e n c e S e r v i c e . IMPACT ASSESSMENT ON SELECTED POLICY OPTIONS FOR REVISION OF THE BATTERY DIRECTIVE
12
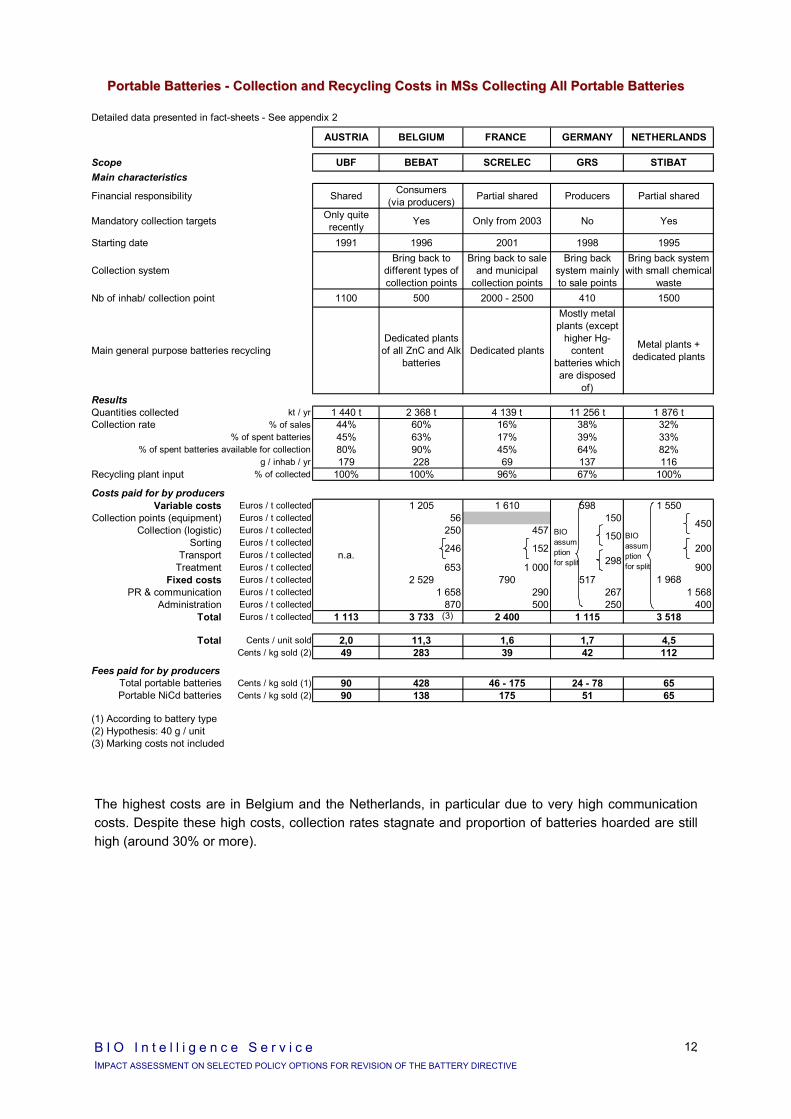
PPoorrttaabbllee BBaatttteerriieess -- CCoolllleeccttiioonn aanndd RReeccyycclliinngg CCoossttss iinn MMSSss CCoolllleeccttiinngg AAllll PPoorrttaabbllee BBaatttteerriieess
The highest costs are in Belgium and the Netherlands, in particular due to very high communication costs. Despite these high costs, collection rates stagnate and proportion of batteries hoarded are still high (around 30% or more).
Detailed data presented in fact-sheets - See appendix 2
AUSTRIA BELGIUM FRANCE. GERMANY NETHERLANDS
Scope UBF BEBAT SCRELEC GRS STIBATMain characteristics
Financial responsibility Shared Consumers (via producers) Partial shared Producers Partial shared
Mandatory collection targets Only quite recently Yes Only from 2003 No Yes
Starting date 1991 1996 2001 1998 1995
Collection systemBring back to
different types of collection points
Bring back to sale and municipal
collection points
Bring back system mainly to sale points
Bring back system with small chemical
wasteNb of inhab/ collection point 1100 500 2000 - 2500 410 1500
Main general purpose batteries recyclingDedicated plants
of all ZnC and Alk batteries
Dedicated plants
Mostly metal plants (except
higher Hg-content
batteries which are disposed
of)
Metal plants + dedicated plants
ResultsQuantities collected kt / yr 1 440 t 2 368 t 4 139 t 11 256 t 1 876 tCollection rate % of sales 44% 60% 16% 38% 32%
% of spent batteries 45% 63% 17% 39% 33%% of spent batteries available for collection 80% 90% 45% 64% 82%
g / inhab / yr 179 228 69 137 116Recycling plant input % of collected 100% 100% 96% 67% 100%
Costs paid for by producersVariable costs Euros / t collected 1 205 1 610 598 1 550
Collection points (equipment) Euros / t collected 56 150Collection (logistic) Euros / t collected 250 457
Sorting Euros / t collectedTransport Euros / t collected n.a.
Treatment Euros / t collected 653 1 000 900Fixed costs Euros / t collected 2 529 790 517 1 968
PR & communication Euros / t collected 1 658 290 267 1 568Administration Euros / t collected 870 500 250 400
Total Euros / t collected 1 113 3 733 2 400 1 115 3 518
Total Cents / unit sold 2,0 11,3 1,6 1,7 4,5Cents / kg sold (2) 49 283 39 42 112
Fees paid for by producersTotal portable batteries Cents / kg sold (1) 90 428 46 - 175 24 - 78 65Portable NiCd batteries Cents / kg sold (2) 90 138 175 51 65
(1) According to battery type(2) Hypothesis: 40 g / unit(3) Marking costs not included
450
200246150
152298
(3)
BIO assumptionfor split
BIO assumptionfor split
B I O I n t e l l i g e n c e S e r v i c e . IMPACT ASSESSMENT ON SELECTED POLICY OPTIONS FOR REVISION OF THE BATTERY DIRECTIVE
13
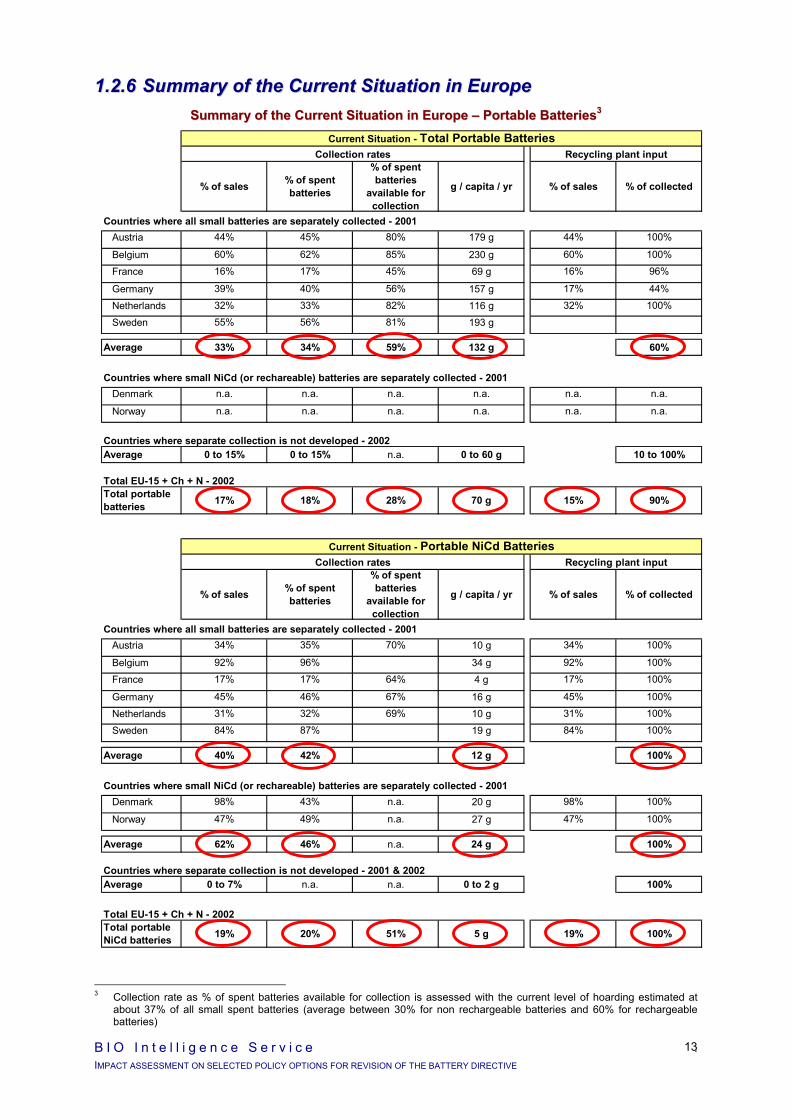
11..22..66 SSuummmmaarryy ooff tthhee CCuurrrreenntt SSiittuuaattiioonn iinn EEuurrooppee SSuummmmaarryy ooff tthhee CCuurrrreenntt SSiittuuaattiioonn iinn EEuurrooppee –– PPoorrttaabbllee BBaatttteerriieess33
3 Collection rate as % of spent batteries available for collection is assessed with the current level of hoarding estimated at
about 37% of all small spent batteries (average between 30% for non rechargeable batteries and 60% for rechargeable batteries)
Current Situation - Total Portable BatteriesCollection rates Recycling plant input
% of sales % of spent batteries
% of spent batteries
available for collection
g / capita / yr % of sales % of collected
Countries where all small batteries are separately collected - 2001Austria 44% 45% 80% 179 g 44% 100%
Belgium 60% 62% 85% 230 g 60% 100%
France 16% 17% 45% 69 g 16% 96%
Germany 39% 40% 56% 157 g 17% 44%
Netherlands 32% 33% 82% 116 g 32% 100%
Sweden 55% 56% 81% 193 g
Average 33% 34% 59% 132 g 60%
Countries where small NiCd (or rechareable) batteries are separately collected - 2001Denmark n.a. n.a. n.a. n.a. n.a. n.a.
Norway n.a. n.a. n.a. n.a. n.a. n.a.
Countries where separate collection is not developed - 2002Average 0 to 15% 0 to 15% n.a. 0 to 60 g 10 to 100%
Total EU-15 + Ch + N - 2002Total portable batteries 17% 18% 28% 70 g 15% 90%
Current Situation - Portable NiCd BatteriesCollection rates Recycling plant input
% of sales % of spent batteries
% of spent batteries
available for collection
g / capita / yr % of sales % of collected
Countries where all small batteries are separately collected - 2001Austria 34% 35% 70% 10 g 34% 100%
Belgium 92% 96% 34 g 92% 100%
France 17% 17% 64% 4 g 17% 100%
Germany 45% 46% 67% 16 g 45% 100%
Netherlands 31% 32% 69% 10 g 31% 100%
Sweden 84% 87% 19 g 84% 100%
Average 40% 42% 12 g 100%
Countries where small NiCd (or rechareable) batteries are separately collected - 2001Denmark 98% 43% n.a. 20 g 98% 100%
Norway 47% 49% n.a. 27 g 47% 100%
Average 62% 46% n.a. 24 g 100%
Countries where separate collection is not developed - 2001 & 2002Average 0 to 7% n.a. n.a. 0 to 2 g 100%
Total EU-15 + Ch + N - 2002Total portable NiCd batteries 19% 20% 51% 5 g 19% 100%

B I O I n t e l l i g e n c e S e r v i c e . IMPACT ASSESSMENT ON SELECTED POLICY OPTIONS FOR REVISION OF THE BATTERY DIRECTIVE
14
SSuummmmaarryy ooff tthhee CCuurrrreenntt SSiittuuaattiioonn iinn EEuurrooppee –– AAllll SSeeggmmeennttss
Spent batteries Current situation 2002 - Collection rates
kt of spent batteries and collection rates as % of spent batteries
Starter batteries segment
Industrial batteries segment
Portable batteries segment
Starter Batteries 611 kt
80-95% - -NiCd Batteries 3,1 kt 10,5 kt
- 80-90% 15-20%14 kt
30-35%Other batteries 184 kt 142 kt
- 80-90% 15-20%Total batteries 611 kt 187 kt 153 kt
80-95% 80-90% 15-20%950 kt
70-85%
Spent batteries available for collection
Current situation 2002 - Collection rates
kt of spent batteries available for collection and collection rates as % of spent batteries available for collection
Starter batteries segment
Industrial batteries segment
Portable batteries segment
Starter Batteries 611 kt
80-95% - -NiCd Batteries 3 kt 4 kt
- 80-90% 45-55%7 kt
60-70%Other batteries 184 kt 92 kt
- 80-90% 25-30%Total batteries 611 kt 187 kt 97 kt
80-95% 80-90% 25-30%894 kt
75-90%
Recycling plant inputs Current situation 2002 - Recycling plant inputs
kt of collected batteries and recycling plant input as % of collected batteries
Starter batteries segment
Industrial batteries segment
Portable batteries segment
Starter Batteries 490-590 kt
95-100% - -NiCd Batteries 2,8 kt 2,1 kt
- 98% 100%4,9 kt
100%Other batteries 145-165 kt 25 kt
- 95-100% 90%Total batteries 490-590 kt 148-168 kt 27 kt
95-100 95-100% 90%665-800 kt
95-100%(1) Hypothesis because no statistics available at the EU level; countries where data are available, 90% to 97% of spent batteries are collected and recycled
(3) Hypothesis about hoarding: 30% of spent non rechargeable batteries and 60% of rechargeable ones are considered being hoarded by households and professional users
(2) No statistics available at the EU level; in France, more than 90% of sales are collected; as an hypothesis, the same collection rate range as for industrial NiCd batteries is considered
(4) It is possible that the quantities collected declared by MSs include batteries not only from 4 wheel passengers cars but also from 2 and 3 wheel vehicles as well as from professional and industrial vehicles (agricultural vehicles, trucks, buses, military vehicles...), which are not necessarily included in batteries sales declared. In that case, this difference in scope of stakeholders would result in an overestimation of collection rate.
(3)
(3)
(1)
(1)
(4)
(4)
(2)
(2)

B I O I n t e l l i g e n c e S e r v i c e . IMPACT ASSESSMENT ON SELECTED POLICY OPTIONS FOR REVISION OF THE BATTERY DIRECTIVE
15
11..33 BBAASSEELLIINNEE SSCCEENNAARRIIOO
The baseline scenario aims at describing 2007 situation without any revision of the Batteries directives. The policy options to be analysed are compared to this baseline scenario.
Compared to the current situation, 2 main elements were taken into account:
For all segments: the assumption that existing separate collection systems dedicated to batteries will still exist and maybe develop.
For portable batteries: a 5 point increase in taken into account for collection rates following the WEEE directive implementation.
No major impacts are expected from the ELV directive since first most starter batteries are believed already collected and recycled and secondly ELV directive sets up no collection target; targets concern the % of each scrapped car which has to be recycled and batteries are one of spare parts already well recycled.
SSuummmmaarryy ooff tthhee BBaasseelliinnee SScceennaarriioo 22000077 –– PPoorrttaabbllee BBaatttteerriieess
Baseline Scenario 2007 - Total Portable BatteriesCollection rates Recycling plant input
% of sales % of spent batteries
% of spent batteries
available for collection
g / capita / yr % of collected
Countries where all portable batteries are separately collected in 2002
A, B, F, D, NL, Sw 30-65% 30-65% 60-85% 120-230 g 70-100%
Countries where portable NiCd (or rechargeable) batteries are separately collected in 2002Dk, Nw low ? low ? low ? low ?
Countries where separate collection is not developed in 2002Other countries 5-20% 5-20% n.a. 20-80 g 10-100%
Baseline Scenario 2007 - Portable NiCd BatteriesCollection rates Recycling plant input
% of sales % of spent batteries
% of spent batteries
available for collection
g / capita / yr % of collected
Countries where all portable batteries are separately collected in 2002
A, B, F, D, NL, Sw 35-95% 35-95% about 70% 10-35 g 100%
Countries where portable NiCd (or rechargeable) batteries are separately collected in 2002Denmark 98% 43% n.a. 20 g 100%
Norway 47% 49% n.a. 27 g 100%
Countries where separate collection is not developed - 2001 & 2002Other countries 5-10% 5-10% n.a. n.a. 100%
(1) Sales are radically decreasing since 1996
(1) (1)
B I O I n t e l l i g e n c e S e r v i c e . IMPACT ASSESSMENT ON SELECTED POLICY OPTIONS FOR REVISION OF THE BATTERY DIRECTIVE
16
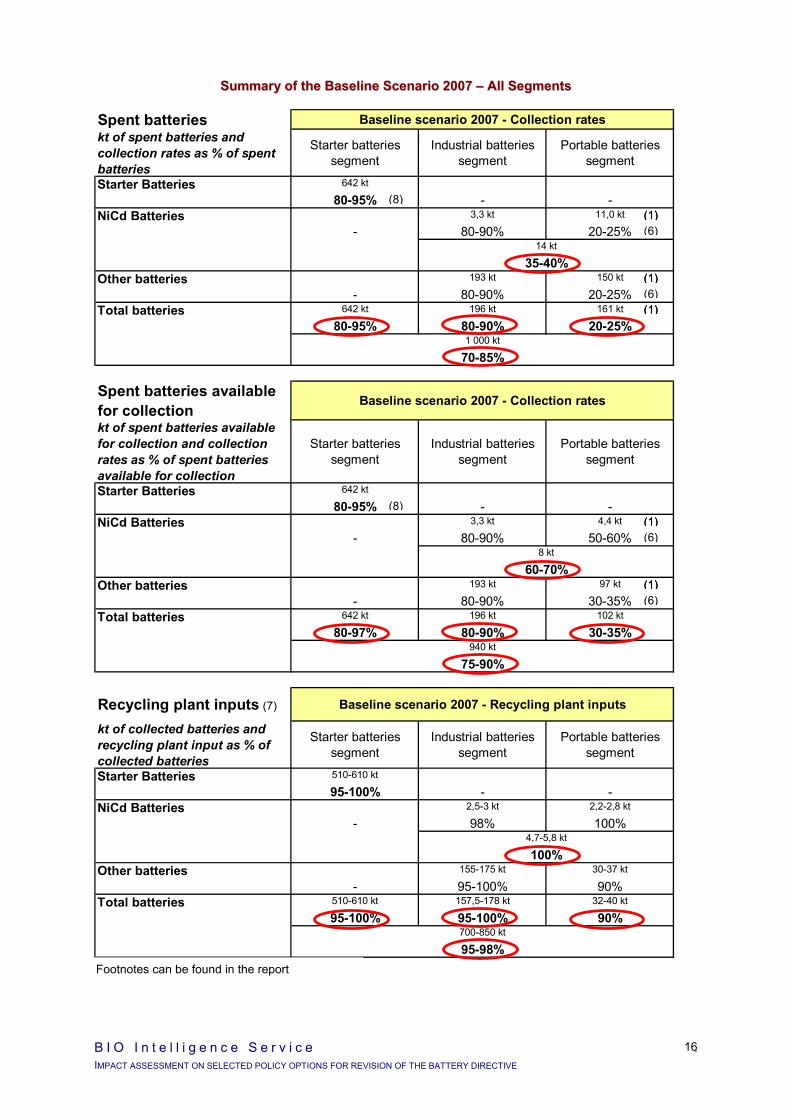
SSuummmmaarryy ooff tthhee BBaasseelliinnee SScceennaarriioo 22000077 –– AAllll SSeeggmmeennttss
Spent batteries Baseline scenario 2007 - Collection rateskt of spent batteries and collection rates as % of spent batteries
Starter batteries segment
Industrial batteries segment
Portable batteries segment
Starter Batteries 642 kt
80-95% - -NiCd Batteries 3,3 kt 11,0 kt
- 80-90% 20-25%14 kt
35-40%Other batteries 193 kt 150 kt
- 80-90% 20-25%Total batteries 642 kt 196 kt 161 kt
80-95% 80-90% 20-25%1 000 kt
70-85%
Spent batteries available for collection
Baseline scenario 2007 - Collection rates
kt of spent batteries available for collection and collection rates as % of spent batteries available for collection
Starter batteries segment
Industrial batteries segment
Portable batteries segment
Starter Batteries 642 kt
80-95% - -NiCd Batteries 3,3 kt 4,4 kt
- 80-90% 50-60%8 kt
60-70%Other batteries 193 kt 97 kt
- 80-90% 30-35%Total batteries 642 kt 196 kt 102 kt
80-97% 80-90% 30-35%940 kt
75-90%
Recycling plant inputs (7) Baseline scenario 2007 - Recycling plant inputs
kt of collected batteries and recycling plant input as % of collected batteries
Starter batteries segment
Industrial batteries segment
Portable batteries segment
Starter Batteries 510-610 kt
95-100% - -NiCd Batteries 2,5-3 kt 2,2-2,8 kt
- 98% 100%4,7-5,8 kt
100%Other batteries 155-175 kt 30-37 kt
- 95-100% 90%Total batteries 510-610 kt 157,5-178 kt 32-40 kt
95-100% 95-100% 90%700-850 kt
95-98%See footnotes next page
(1)
(1)
(1)
(1)(1)
(1)
(1)
(1)
(1)
(1)
(6)
(6)
(6)
(6)
(8)
(8)
Footnotes can be found in the report
B I O I n t e l l i g e n c e S e r v i c e . IMPACT ASSESSMENT ON SELECTED POLICY OPTIONS FOR REVISION OF THE BATTERY DIRECTIVE
17
11..44 SSUUMMMMAARRYY OOFF TTHHEE IIMMPPAACCTTSS OOFF PPOOLLIICCYY OOPPTTIIOONNSS
11..44..11 QQuuaannttiittaattiivvee PPoolliiccyy OOppttiioonnss AAbboouutt TToottaall BBaatttteerriieess
When considering the baseline scenario for 2007, the highest policy options to be studied for all spent batteries, a collection rate of 70-80% and a recycling plant input of 90%, are already reached due to the fact that:
80 to 95% of spent starter batteries, which represent about 65% of all spent batteries, are believed to be collected and more than 95% of them sent to a recycling plant,
80 to 90% of spent industrial batteries, which represent about 20% of all spent batteries, are believed to be collected and more than 95% of them sent to a recycling plant.
No major additional environmental impacts are thus expected for policy options about all batteries.
Regarding economic impacts, the setting up of mandatory targets will require to implement monitoring systems for all types of batteries, in particular starter batteries and industrial batteries where statistics do not exist at all in most countries today. This will generate costs, without being certain of the reliability of the measurements considering the high levels already reached.
As for social impacts, job would be created with the implementation of monitoring systems.
11..44..22 QQuuaannttiittaattiivvee PPoolliiccyy OOppttiioonnss AAbboouutt SSttaarrtteerr BBaatttteerriieess
In the baseline scenario for 2007, 80-95% of spent starter batteries are believed to be collected and more than 95% of them sent to a recycling plant. We would be between the 80-90% and 90-100% policy options to be studied for collection rate and above the highest policy options for recycling.
It should be noted that no statistics exist at the European level and in most countries. But where data are available, the highest values of the range are reached4. The lowest values are assumed to reflect the situation in countries where starter batteries collection would be less developed.
Economic impacts
Baseline scenario: lead recycling is financially self sufficient.
Economic impacts are mostly independent from the level of collection rate (for the recycling plant input considered 75%5). They are rather linked to their mandatory aspect: having mandatory targets will involve costs to monitor, without being certain of measurement reliability (because high results are believed to be already achieved).
Other additional costs are likely to be not significant, even for countries where starter batteries recycling is less developed (because lead recycling is financially balanced).
4 It is possible that the quantities collected declared by MSs include batteries not only from 4 wheel passengers cars but also
from 2 and 3 wheel vehicles as well as from professional and industrial vehicles (agricultural vehicles, trucks, buses, military vehicles...), which are not necessarily included in batteries sales declared. In that case, this difference in scope would result in an overestimation of collection rate.
5 If recycling targets higher than 90-95% of collection (i.e. higher than those considered here) would be considered, market efficiency could be hurt. As a matter of fact, this could oblige the industry to reduce the temporary storages they use as a hedging effect, which could affect their capacity to adjust when facing low lead prices. The risk is that lead recycling could become no more financially self sufficient, which would oblige producers to create a collective system to finance recycling.

B I O I n t e l l i g e n c e S e r v i c e . IMPACT ASSESSMENT ON SELECTED POLICY OPTIONS FOR REVISION OF THE BATTERY DIRECTIVE
18
Environmental impacts
Baseline scenario: - Positive consequences of recycling: most of lead (heavy metal) is already diverted from waste. - Negative consequences of recycling: environmental damages linked to collection, transport
and re-processing (in particular to air) are higher than benefits brought by virgin material savings.
Positive consequences of recycling increase with collection and recycling targets increase (the higher the collection and recycling targets, the higher the lead diverted from waste).
Negative consequences of recycling decrease with recycling targets increase (for a given collection target, the higher recycling target, the lower negative consequences of recycling: recycling benefits increase more than transport negative impacts).
Social impacts
As for economic impacts, social impacts are mostly independent from the level of collection rate. They are rather linked to their mandatory aspect: having mandatory targets will involve the creation of a monitoring system, with new jobs.
11..44..33 PPoolliiccyy OOppttiioonnss AAbboouutt NNiiCCdd BBaatttteerriieess
11..44..33..11 QQuuaannttiittaattiivvee OOppttiioonnss AAbboouutt NNiiCCdd BBaatttteerriieess
In the baseline scenario, industrial NiCd batteries already reach the highest collection target (80-90% of spent batteries).
But they only represent 1/5th of total spent NiCd batteries and collection rate of portable NiCd batteries is estimated at 20-25% in the baseline scenario.
To reach the total targets contemplated for NiCd batteries (60-70% or 70-80% or 80-90%), targets 10 points lower than for total spent NiCd batteries would be necessary for portable NiCd batteries (50-60%, 60-70%, 70-80%).
This is technically possible, but will require both:
current domestic hoarding behaviours to be reduced significantly,
refractory persons to participate to separate collection.
As a matter of fact, with current level of domestic hoarding (estimated at 60% of spent rechargeable batteries), collecting 50-60% of spent portable NiCd batteries means collecting more than what is assessed being available for collection.
In view of collecting portable NiCd batteries, the directive could either adopt collection and recycling targets focusing on portable NiCd batteries or on all portable batteries.
It is not easy to compare these scope options in terms of collection efficiency because results vary in a large range on the ground. Most of member states who launched a collection system following the current directive implementation decided to collect all portable batteries (A, B, D, F, NL, Sw). 17% to 62% of all spent portable batteries are collected according to country (systems more or less

B I O I n t e l l i g e n c e S e r v i c e . IMPACT ASSESSMENT ON SELECTED POLICY OPTIONS FOR REVISION OF THE BATTERY DIRECTIVE
19
developed, different stakeholders responsibility, different equipments…). Two others (Dk, Nw) focused on portable NiCd and collect 40-50% of spent portable NiCd batteries.
The question should be asked if schemes focusing on portable NiCd batteries can reach policy targets under consideration. As a matter of fact, despite very high financial incentives for collectors to collect since 1996, only 43% are collected in Denmark.
Economic, environmental and social impacts are worthwhile to assess for both scope options.
It is even necessary to distinguish between 3 schemes, because for a given scope option, countries have still different possibilities to implement the directive which will generate different impacts.
PPoossssiibbllee SSccooppee OOppttiioonnss ffoorr tthhee DDiirreeccttiivvee aanndd PPoossssiibbllee SScchheemmeess aatt NNaattiioonnaall LLeevveell
Possible schemes at national level
Possible scope options for the directive
Scheme 1 – Collection and recycling of
portable NiCd batteries
Scheme 2 – Collection and recycling of all portable batteries
Scheme 3 – Collection of all portable batteries and recycling of portable NiCd
Collection and recycling targets focusing on portable NiCd batteries or on all portable batteries
X
X
X
Collection and recycling targets covering all portable batteries
X
Economic impacts
Scheme 1 – Collection and recycling of portable NiCd batteries:
For countries which have already adopted this scheme (Dk, Nw) and for countries which have developed no scheme till now, it is not relevant to assess the additional costs because it is possible that this scheme does not allow to reach policy targets under consideration.
For countries which have already adopted scheme 2 (A, B, F, NL, Sw) or 3 (D6), - Some of them already reached the highest option (70-80% of spent batteries): no impacts are
expected. - For others, collection could develop with no major additional costs.
Scheme 2 – Collection and recycling of all portable batteries:
For countries which have already adopted this scheme, several of them are expected to reach the lowest target contemplated (50-60% - maybe some could be between 60-70%) (for some of them, the implementation of the WEEE directive which would give about 5 additional points could help).
For the others, they may still be at about 30% of spent batteries, with high domestic hoarding.
For countries which have adopted scheme 1 or no scheme, very low collection rate will be reached in 2007.
6 Germany is actually between scheme 2 and 3 since not only NiCd is recycled but also other small batteries, those whose
recycling cost is judged not being too high (67% of what is collected in 2003 is recycled)
B I O I n t e l l i g e n c e S e r v i c e . IMPACT ASSESSMENT ON SELECTED POLICY OPTIONS FOR REVISION OF THE BATTERY DIRECTIVE
20
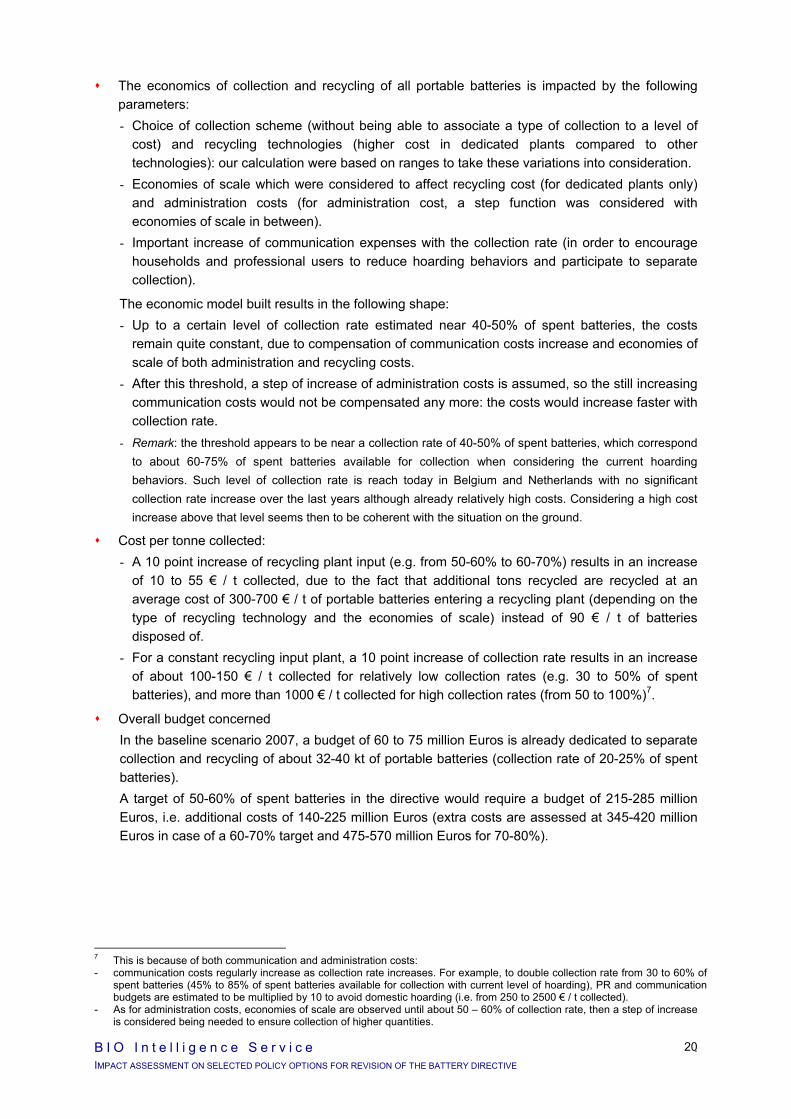
The economics of collection and recycling of all portable batteries is impacted by the following parameters: - Choice of collection scheme (without being able to associate a type of collection to a level of
cost) and recycling technologies (higher cost in dedicated plants compared to other technologies): our calculation were based on ranges to take these variations into consideration.
- Economies of scale which were considered to affect recycling cost (for dedicated plants only) and administration costs (for administration cost, a step function was considered with economies of scale in between).
- Important increase of communication expenses with the collection rate (in order to encourage households and professional users to reduce hoarding behaviors and participate to separate collection).
The economic model built results in the following shape: - Up to a certain level of collection rate estimated near 40-50% of spent batteries, the costs
remain quite constant, due to compensation of communication costs increase and economies of scale of both administration and recycling costs.
- After this threshold, a step of increase of administration costs is assumed, so the still increasing communication costs would not be compensated any more: the costs would increase faster with collection rate.
- Remark: the threshold appears to be near a collection rate of 40-50% of spent batteries, which correspond to about 60-75% of spent batteries available for collection when considering the current hoarding behaviors. Such level of collection rate is reach today in Belgium and Netherlands with no significant collection rate increase over the last years although already relatively high costs. Considering a high cost increase above that level seems then to be coherent with the situation on the ground.
Cost per tonne collected: - A 10 point increase of recycling plant input (e.g. from 50-60% to 60-70%) results in an increase
of 10 to 55 € / t collected, due to the fact that additional tons recycled are recycled at an average cost of 300-700 € / t of portable batteries entering a recycling plant (depending on the type of recycling technology and the economies of scale) instead of 90 € / t of batteries disposed of.
- For a constant recycling input plant, a 10 point increase of collection rate results in an increase of about 100-150 € / t collected for relatively low collection rates (e.g. 30 to 50% of spent batteries), and more than 1000 € / t collected for high collection rates (from 50 to 100%)7.
Overall budget concerned In the baseline scenario 2007, a budget of 60 to 75 million Euros is already dedicated to separate collection and recycling of about 32-40 kt of portable batteries (collection rate of 20-25% of spent batteries). A target of 50-60% of spent batteries in the directive would require a budget of 215-285 million Euros, i.e. additional costs of 140-225 million Euros (extra costs are assessed at 345-420 million Euros in case of a 60-70% target and 475-570 million Euros for 70-80%).
7 This is because of both communication and administration costs: - communication costs regularly increase as collection rate increases. For example, to double collection rate from 30 to 60% of
spent batteries (45% to 85% of spent batteries available for collection with current level of hoarding), PR and communication budgets are estimated to be multiplied by 10 to avoid domestic hoarding (i.e. from 250 to 2500 € / t collected).
- As for administration costs, economies of scale are observed until about 50 – 60% of collection rate, then a step of increase is considered being needed to ensure collection of higher quantities.
B I O I n t e l l i g e n c e S e r v i c e . IMPACT ASSESSMENT ON SELECTED POLICY OPTIONS FOR REVISION OF THE BATTERY DIRECTIVE
21
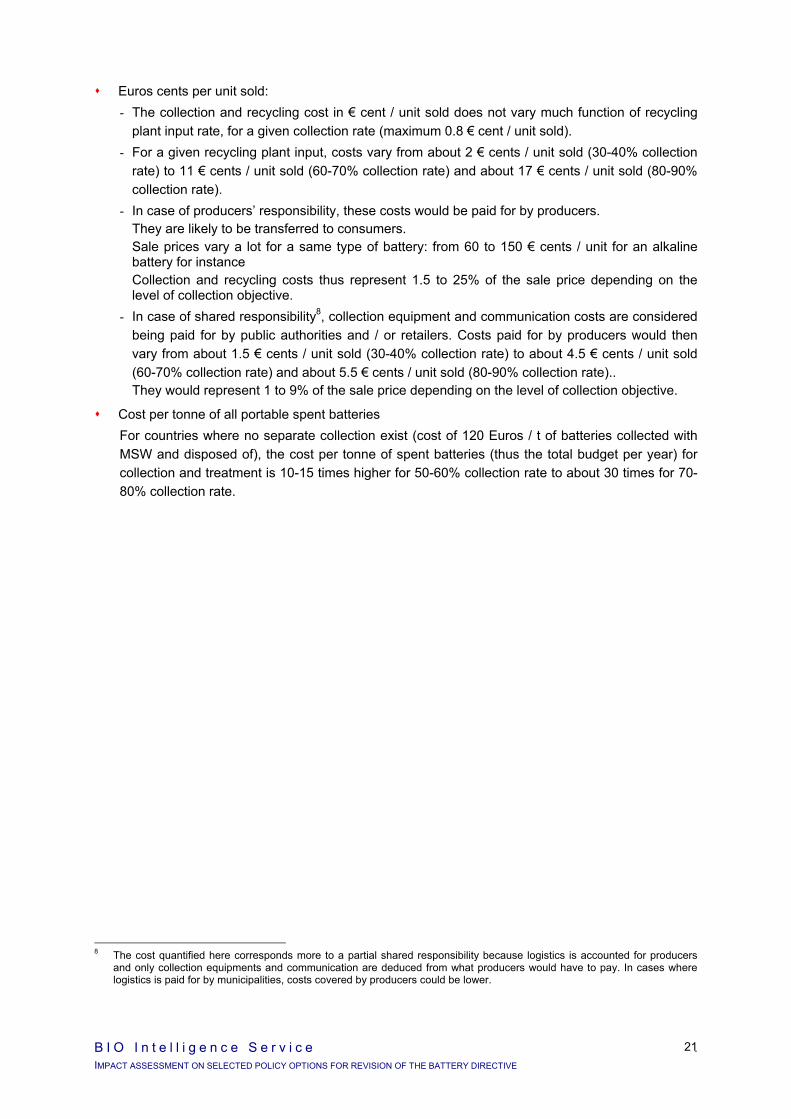
Euros cents per unit sold: - The collection and recycling cost in € cent / unit sold does not vary much function of recycling
plant input rate, for a given collection rate (maximum 0.8 € cent / unit sold). - For a given recycling plant input, costs vary from about 2 € cents / unit sold (30-40% collection
rate) to 11 € cents / unit sold (60-70% collection rate) and about 17 € cents / unit sold (80-90% collection rate).
- In case of producers’ responsibility, these costs would be paid for by producers. They are likely to be transferred to consumers. Sale prices vary a lot for a same type of battery: from 60 to 150 € cents / unit for an alkaline battery for instance Collection and recycling costs thus represent 1.5 to 25% of the sale price depending on the level of collection objective.
- In case of shared responsibility8, collection equipment and communication costs are considered being paid for by public authorities and / or retailers. Costs paid for by producers would then vary from about 1.5 € cents / unit sold (30-40% collection rate) to about 4.5 € cents / unit sold (60-70% collection rate) and about 5.5 € cents / unit sold (80-90% collection rate).. They would represent 1 to 9% of the sale price depending on the level of collection objective.
Cost per tonne of all portable spent batteries For countries where no separate collection exist (cost of 120 Euros / t of batteries collected with MSW and disposed of), the cost per tonne of spent batteries (thus the total budget per year) for collection and treatment is 10-15 times higher for 50-60% collection rate to about 30 times for 70-80% collection rate.
8 The cost quantified here corresponds more to a partial shared responsibility because logistics is accounted for producers
and only collection equipments and communication are deduced from what producers would have to pay. In cases where logistics is paid for by municipalities, costs covered by producers could be lower.

BIO
In
tell
ige
nc
e S
erv
ice
____
____
____
____
____
____
____
____
____
____
____
____
____
____
____
____
____
____
____
____
____
____
____
____
_
22.
I MP
AC
T A
SS
ES
SM
EN
T O
N S
ELE
CTE
D P
OLI
CY
OP
TIO
NS
FO
R R
EV
ISIO
N O
F TH
E B
ATT
ER
Y D
IRE
CTI
VE
Port
able
Bat
terie
s - T
otal
Col
lect
ion
and
Rec
yclin
g C
osts
Fun
ctio
n of
Col
lect
ion
Rat
e (o
rder
s of
mag
nitu
des)
Col
lect
ed b
atte
ries
sent
to re
cycl
ing:
90
- 10
0%
Tota
l col
lect
ion
and
recy
clin
g co
sts
(= c
osts
pai
d fo
r by
prod
ucer
s in
cas
e of
pro
duce
rs re
spon
sibi
lity)
Euro
s / t
of p
orta
ble
batte
ries
sep
arat
ely
colle
cted
in v
iew
of r
ecyc
ling
(unc
erta
inty
repr
esen
ted:
+/-1
0%)
Col
lect
ion
rate
10-2
0%20
-30%
30-4
0%40
-50%
50-6
0%60
-70%
70-8
0%80
-90%
90-1
00%
% o
f sal
es20
-25%
11-2
1%21
-31%
31-4
1%41
-51%
51-6
1%61
-71%
72-8
2%82
-92%
92-1
02%
% o
f spe
nt b
atte
ries
30-3
5%25
-35%
35-4
5%45
-60%
60-7
5%75
-85%
85-1
00%
100-
120%
110-
120%
120-
130%
% o
f spe
nt b
atte
ries
avai
labl
e fo
r col
lect
ion
(1)
82-1
03 g
40-8
080
-120
120-
160
160-
200
200-
240
240-
280
280-
320
320-
360
360-
400
g co
llect
ed /
inha
b / y
r (2)
32-4
0 kt
2541
5874
9110
712
414
015
7kt
col
lect
ed /
yr51
7810
613
728
449
963
176
793
4m
illio
n Eu
ros
/ yr -
max
2746
6898
213
422
549
694
857
mill
ion
Euro
s / y
r - m
in60
-75
mill
ion
Euro
s (3
)
Bas
elin
e sc
enar
io 2
007
(tota
l EU
)
Hig
h co
st c
omm
unic
atio
n pr
ogra
mm
es:
- to
redu
ce h
oard
ing
beha
vior
s in
ord
er to
incr
ease
sp
ent b
atte
ries
avai
labl
e fo
r col
lect
ion
- to
enco
urag
e re
fract
ory
pers
ons
to p
artic
ipat
e to
se
para
te c
olle
ctio
n
Bas
elin
e sc
enar
io- M
inim
um o
f 3%
of s
ales
col
lect
ed fo
llow
ing
the
impl
emen
tatio
n of
WEE
E di
rect
ive- A
vera
ge o
f 90
Eur
os /
t of b
atte
ries
disp
osed
of
Not
rele
vant
(s
pent
bat
terie
s <
sale
s)
Incr
ease
of c
omm
unic
atio
n co
sts
com
pens
ates
ec
onom
ies
of s
cale
for r
ecyc
ling
cost
s (o
nly
for
max
val
ues)
Euro
s / t
onne
col
lect
ed
1 74
61
615
1 58
41
642
2 97
1
4 48
5
4 93
6
5 34
5
5 83
5
1 08
81
110
1 18
21
326
2 35
3
3 93
5
4 43
5
4 94
7
5 46
7
0
1 00
0
2 00
0
3 00
0
4 00
0
5 00
0
6 00
0
Prod
ucer
sre
spon
sibi
lity
Prod
ucer
sre
spon
sibi
lity
Max
Min
(1) E
quiva
lenc
e be
twee
n co
llect
ion
rate
as
% o
f sal
es a
nd c
olle
ctio
n ra
te a
s %
of s
pent
bat
terie
s av
aila
ble
for c
olle
ctio
n ba
sed
on th
e cu
rren
t ave
rage
cur
rent
hoa
rdin
g be
havi
ors
of h
ouse
hold
s an
d pr
ofes
sion
al u
sers
in th
e EU
(2) B
ased
on
the
EU
ave
rage
situ
atio
n of
165
kt o
f sm
all b
atte
ries
sold
in 2
007
(158
kt i
n 20
02 +
1%
ave
rage
gro
wth
rate
per
ye
ar) a
nd 3
90 M
illion
s in
habi
tant
s(3
) Bas
ed o
n th
e av
erag
e co
st o
f 184
0 Eu
ros
/ t c
olle
cted
(cal
cula
ted
by w
eigh
ting
the
cost
of A
, B, F
, G, a
nd th
e N
L w
ith th
e qu
antit
ies
they
col
lect
ed in
200
1)
Eco
nom
ies
of s
cale
of
adm
inis
tratio
n co
sts
Incr
ease
of a
dmin
istra
tion
budg
et

B I O I n t e l l i g e n c e S e r v i c e . IMPACT ASSESSMENT ON SELECTED POLICY OPTIONS FOR REVISION OF THE BATTERY DIRECTIVE
23
Scheme 3 – Collection of all portable batteries and recycling of portable NiCd:
The difference considered here compared to scheme 2 is that only NiCd (and other batteries which can be recycled at a low cost, even a 0 cost) are recycled. It is considered that 15% of collected portable batteries are sent to recycling, at an average cost of 100 Euros / t9. Scheme 3 presents costs which are lower than scheme 2 of about 100-250 Euros /t collected.
For countries where no separate collection exist (cost of 120 Euros / t of batteries collected with MSW and disposed of), the cost per tonne of spent batteries (thus the total budget per year) for collection and treatment is about 11 times higher for 50-60% collection rate to 25 times for 70-80% collection rate.
Environmental impacts
Scheme 1 – Collection and recycling of portable NiCd batteries:
The separate collection and recycling of portable NiCd batteries has positive environmental consequences for all the environmental indicators examined (dissipative losses of Cd, CO2 emissions, SOx emissions, NOx emissions, primary energy consumption), irrespective of the collection and recycling rates. As collection and recycling rates increase, the predicted environmental benefits are maximised.
Remark: no data were available to assess the environmental consequences of other NiCd recycling technologies (metal plants, electric arc furnace…). They are likely to significantly differ from recycling in dedicated plants (different proportions of metals recovered, specific environmental advantages or disadvantages…).
Scheme 2 – Collection and recycling of all portable batteries:
It was not possible to assess the overall environmental balance of this scheme since there is no LCA data available to conclude if the environmental consequences of collection and recycling of portable batteries other than NiCd are positive or negative.
Scheme 3 – Collection of all portable batteries and recycling of portable NiCd:
The separate collection of portable batteries in view of recycling portable NiCd batteries only (other portable batteries are disposed of) has positive environmental consequences for all the environmental indicators examined except NOx emissions, irrespective of the collection and recycling rates.
For NOx emissions, the higher the collection rate and recycling plant input, the lower the damage (the environmental benefit of recycling increasing more than the NOx emissions due to transport).
Remark: no data were available to assess the environmental consequences of other NiCd recycling technologies (metal plants, electric arc furnace…) as mentioned above.
9 with economies of scale (recycling cost = 0 Euros / t for 50-60% collection rate and above)

B I O I n t e l l i g e n c e S e r v i c e . IMPACT ASSESSMENT ON SELECTED POLICY OPTIONS FOR REVISION OF THE BATTERY DIRECTIVE
24
Social impacts
Two indicators have the same tendencies whatever the scheme is:
Gender employment: waste management are not unfavorable to equal gender employment.
Modification of end users behaviors: the higher the collection objectives, the higher necessary hoarding decrease.
Scheme 1 – Collection and recycling of portable NiCd batteries:
Job creation at the EU level (if all countries would adopt this scheme): the current number of jobs would be multiplied by about 1.2 for 50-60% collection rate to about 2 for 70-80% collection rate (hypothesis: current level of employment is assessed being around 140-160 persons for collection and recycling of 20-25% of portable NiCd).
Perception of batteries by users: potential negative impact on the perception of batteries by consumers (‘some would be dangerous others not’).
Perception of waste management by end users: possible confusing message with other waste management policies10.
Scheme 2 – Collection and recycling of all portable batteries:
Job creation at the EU level (if all countries would adopt this scheme): the current number of jobs would be multiplied by about 1.2 for 50-60% collection rate to about 2 for 70-80% collection rate (hypothesis: current level of employment is assessed being around 2000-2400 persons for collection and recycling of 20-25% of portable NiCd).
Perception of batteries by users: No difference between batteries in the perception by users.
Perception of waste management by end users: Messages homogeneous with other waste management instructions to citizens11.
Scheme 3 – Collection of all portable batteries and recycling of portable NiCd:
Job creation at the EU level (if all countries would adopt this scheme): the current number of jobs would be multiplied by about 1.2 for 50-60% collection rate to about 2 for 70-80% collection rate (hypothesis: current level of employment is assessed being around 1600-2000 persons for collection and recycling of 20-25% of portable NiCd).
Perception of batteries by users: No difference between batteries in the perception by users.
Perception of waste management by end users: Messages homogeneous with other waste management instructions to citizens. But high risk to discourage end users from participating to waste separation12.
10 Contrary to other waste, in the battery sector, recycling would be justified only by level of hazard. 11 Similarly to other waste, in the battery sector, separate collection is promoted independently of the hazardous content of
waste. 12 when they realise that most of separately collected waste are disposed of instead of being recycled

B I O I n t e l l i g e n c e S e r v i c e . IMPACT ASSESSMENT ON SELECTED POLICY OPTIONS FOR REVISION OF THE BATTERY DIRECTIVE
25
11..44..33..22 NNiiCCdd BBaatttteerriieess BBaann OOppttiioonn
Environmental impacts
From a global risks point of view, a ban of NiCd batteries is not relevant to reduce total human cadmium exposure because NiCd batteries do not represent a significant source of cadmium emissions to the environment (Cd emissions come mainly from other anthropogenic emission sources: fertilizers, fossil fuels, iron and steel…). (TRAR conclusion)
As for local risks, there is no strong argument to support a ban on industrial NiCd batteries, because they do not represent a significant source of Cd emissions to the environment (local risks are primarily linked to incineration and landfilling and most of industrial NiCd batteries are believed to be collected and sent to recycling). (BIO conclusions from TRAR data)
On the contrary, as far as portable NiCd batteries and local risks are concerned, BIO calculation of characterisation risk factors from TRAR data does not permit to exclude the relevance of a ban on portable NiCd batteries (BIO conclusions from TRAR data):
- no risk assessment has been performed regarding air emissions,
- no conclusion can be drawn for additional risk in sediment compartment because existing cadmium concentration has already eco-toxicological effect,
- for the other compartments, the existence or absence of local risk depend on local characteristics: in particular, incineration and landfill facilities in conformity with EU regulations and applying existing risk reduction measures have no local risk whereas others have local risks for fresh water ecosystems.
On the other hand, a ban option will not necessarily result in a no risk situation because two flows of spent NiCd batteries will still have to be treated after the ban is into force: batteries which will become waste after the ban and batteries discarded after having been hoarded13.
High rate collection and recycling of portable NiCd batteries and / or enforcement of existing regulations about incinerators and landfill facilities are likely to be good alternatives to a ban with a view to reduce local risks.
Other environmental impacts of a ban can be mentioned. Because the life expectancy of NiMH batteries in terms of number of cycles is between one third and one half that of NiCd, the number of cells for disposal would double or triple. And for domestic tools, it is often necessary to replace the entire tool because it is a sealed unit and the battery cannot be removed.
Feasibility
A ban on batteries containing cadmium could be feasible for one market segment: households applications, except cordless power tools where significant negative technical impacts are expected. Other segments do not have viable substitutes other than lead-acid batteries.
Households applications other that cordless power tools represented 3 600 tonnes in 1999, i.e. about 30% (weight) of portable NiCd batteries and about 20% of total NiCd batteries.
13 60% of rechargeable batteries are assumed being hoarded today by end users.
B I O I n t e l l i g e n c e S e r v i c e . IMPACT ASSESSMENT ON SELECTED POLICY OPTIONS FOR REVISION OF THE BATTERY DIRECTIVE
26
Other impacts
Economic and social impacts are difficult to assess because first no factual information were available and secondly the effect of a ban on the market structure (mainly the four industrial stakeholders: producers, assemblers, incorporators, retailers) is difficult to predict:
Risk of side effect for the whole portable NiCd batteries industry
A ban on only one segment of NiCd rechargeable batteries is likely to be generalized to other NiCd segments, even if not required legally. Some actors may decide to anticipate a possible extension of the regulation or may simply misunderstand the actual scope of existing regulation. However, the existence of alternative technologies is a prerequisite for this generalization to arise.
Risk of domino effect
Through a domino effect, importers, assemblers and incorporators will be affected too. SMEs may be more sensitive to a ban, in case they can not switch to other technologies (if any).
Risk of market distortion
The difficulty to implement an efficient and reliable control system (to guarantee that no NiCd batteries are imported with household equipments other than power tools for instance) could benefit to non EU producers and result in competition distortion.
As for macroeconomic impacts:
Some of them were roughly quantified:
- Costs due to higher pricing of substitutes: based on current prices, a substitution by more expensive Ni-MH batteries could result in additional costs for consumers of 825 to 1 995 million Euros (this large range reflects two elements: first, NiMH selling price is today 10 to 30% higher than NiCd14 and NiMH life expectancy is one third to one half that of NiCd). Most likely, the market will adjust to a lower equilibrium.
- Costs due to more waste to be treated: the doubling or tripling of the number of cells for disposal15 would result in additional costs between 0 Euros (if enough recycling capacities exist with a zero cost as today) to 1.3 million Euros (in case of disposal of 10 800 tonnes at 120 Euros / t).
Others can be qualitatively mentioned, mostly:
- Costs due to more frequent equipment replacement: for domestic tools, it is often necessary to replace the entire tool when the battery is over because it is a sealed unit and the battery cannot be removed. The shorter life expectancy of NiMH batteries would then generate higher costs related to equipment purchase and WEEE management.
- Costs to implement and monitor a control system, in particular for importations of equipment containing rechargeable batteries (without being certain of its expected efficiency and reliability).
Concerning social impacts:
Employment:
- Jobs are likely to be created, first at the production stage since 2 to 3 times more substitutes are today necessary to replace NiCd (due to lower life expectancy) and also to control the system.
- Others could disappear at the different stages (production, assembling, incorporation, distribution) due to possible reorganisation of industrial and commercial activities.
14 Depending in particular on the country where it is produced; a 10% difference in selling price would be for NiMH produced in
China. 15 The life expectancy of NiMH batteries is between one third and one half that of NiCd as mentioned above for environmental
impacts.
B I O I n t e l l i g e n c e S e r v i c e . IMPACT ASSESSMENT ON SELECTED POLICY OPTIONS FOR REVISION OF THE BATTERY DIRECTIVE
27
- Indirect jobs are generally considered being impacted in the same proportion as direct jobs.
- As for new jobs location, the possibility of a foreign outsourcing for production, in favor to countries with lower labor costs (in particular China), at least for part of the jobs created, can not be excluded from information available.
Acceptability (homogeneity with other European policies): a ban on NiCd batteries in the Battery directive would be consistent with other recent directives (end-of life vehicles directives and directive on the use of certain hazardous substances in electrical and electronic equipment).
Perception by stakeholders: a ban on only one segment of NiCd rechargeable batteries would possibly constitute a confusing message for downstream industrial stakeholders (assemblers, incorporators, importers, retailers), who could easily generalized to other NiCd segments, even if not required legally.
11..44..44 PPoolliiccyy OOppttiioonnss AAbboouutt SSttaakkeehhoollddeerrss’’ RReessppoonnssiibbiilliittyy
If the directive defines only legal responsibilities, no major differences can be expected between producers’ and shared responsibility for the three categories of impacts considered (economic, environmental, social). As a matter of fact, impacts are more related to the financial responsibilities or the organisational responsibilities.
Compared to a producers’ organisational responsibility, a shared organisational responsibility:
is likely to allow more easily an optimisation of waste collection by municipalities and thus a reduction of total costs and of environmental impacts.
However, in case of partial shared financial responsibility where producers reimburse partly municipalities expenses, municipalities may have less incentive to optimise their costs and these benefits of shared responsibility principle may not exist.
is more favourable to local jobs creation (proximity principle).
Compared to a producers’ financial responsibility, a shared financial responsibility:
from the economic point of view, is more favourable to producers and less to municipalities and retailers of course, and more favourable to end users and less to tax payers (because all tax payers may pay, not only end users as consumers).
is more favourable to local jobs creation (proximity principle).
And a producers’ financial responsibility:
has no major economic impact on municipalities and on tax payers and is thus more favourable to the polluter-pays principle (end users will pay total costs as consumers),
is likely to be more favourable to the design of products more environmentally friendly because producers may try to design product integrating end-of-life considerations in view of reducing end-of-life costs),
is more favourable to the internalisation of waste management costs in purchasing price of products, as the integrated product policy developed at the EU level may give priority in the future.

B I O I n t e l l i g e n c e S e r v i c e . IMPACT ASSESSMENT ON SELECTED POLICY OPTIONS FOR REVISION OF THE BATTERY DIRECTIVE
28
11..55 LLIIMMIITTSS OOFF TTHHEE SSTTUUDDYY AANNDD FFUURRTTHHEERR RREESSEEAARRCCHH WWOORRKK TTOO BBEE PPEERRFFOORRMMEEDD
We encountered an important lack of statistics (sales, quantities collected, quantities recycled) mostly for starter batteries and industrial batteries other than NiCd.
Besides, choice between collection rate definitions still need to be made. The elaboration of methodologies to estimate them and monitor quantities arising may help to make the decision.
According to information provided to BIO in the framework of the study, separate collection would not be well developed in accession countries. But information received is very partial at that stage. Further investigation would be necessary in order to describe more accurately the situation in accession countries.
No system to accredit battery recycling facilities exists today. The analysis of the advantages and disadvantages of systems based on best available technology (BAT) principles and systems based on best available technology not entailing excessive costs (BATNEEC) principles would be necessary given that the different recycling technologies (mostly dedicated plants, metal plants, EAF) are likely to present different profile in terms of Recovery rate (proportion of metals which can be recovered), costs and environmental impacts and benefits.
Regarding environment impact assessment, the lack of LCA data about portable batteries other than NiCd do not allow to conclude about the environmental consequences of their recycling. LCA study has to be carried out.
For NiCd, LCA are only available for their recycling in dedicated plants. No data are available for other recycling technologies (metal plants, electric arc furnaces…) whose environmental profiles are likely to significantly differ from dedicated plants.
Monetarisation of environmental impacts
In this study, no monetarisation of environmental impacts was performed:
First, existing results from ERM study can not be used directly in the present study since we re-calculated environmental impacts.
Secondly, to monetarise environmental impacts, we should have had to select a set of cost-factors (no ready-for-use database about external cost factors exist today in such a macro-economic and LCA-context) and carry out calculation for the different battery segments and policy options under consideration (collection and recycling rates). This was not compatible with the short duration of the study.
Most importantly, the benefit to reduce cadmium dissipative losses through the implementation of a collection and recycling system would not have been monetarised by lack of data. A considerable biais would have been introduced and as a result, it would not have been of great help for decision makers.
Further research work are necessary in that area.
The conclusions we were able to draw from the TRAR encountered the same limits as those mentioned in the TRAR, in particular the lack of data about atmospheric toxicity of cadmium.

B I O I n t e l l i g e n c e S e r v i c e . IMPACT ASSESSMENT ON SELECTED POLICY OPTIONS FOR REVISION OF THE BATTERY DIRECTIVE
29
CC OO NN TT EE NN TT
1 CONTEXT AND OBJECTIVES OF THE PROJECT __________________________________________ 32
2 CURRENT SITUATION IN EUROPE ___________________________________________________ 33
2.1 BATTERIES SEGMENTATION ___________________________________________________ 33
2.2 STARTER BATTERIES SEGMENT ________________________________________________ 34
2.2.1 Discussion About Collection Rates For Starter Batteries Segment _____________ 34
2.2.2 Broad Overview of Starter Batteries Segment _____________________________ 34
2.2.3 European Market of Starter Batteries ____________________________________ 37
2.2.4 Waste Stream of Starter Batteries ______________________________________ 37
2.2.5 Collection of Spent Starter Batteries_____________________________________ 38
2.2.6 Recycling of Spent Starter Batteries_____________________________________ 38
2.2.7 Economics of Starter Batteries Collection and Recycling _____________________ 38
2.3 INDUSTRIAL BATTERIES SEGMENT ______________________________________________ 40
2.3.1 Broad Overview of Industrial Batteries Segment ___________________________ 40
2.3.2 European Market of Industrial Batteries __________________________________ 40
2.3.3 Waste Stream of Industrial Batteries ____________________________________ 40
2.3.4 Collection of Spent Industrial Batteries___________________________________ 43
2.3.5 Recycling of Spent Industrial Batteries ___________________________________ 43
2.3.6 Economics of Industrial Batteries Collection and Recycling ___________________ 43
2.4 PORTABLE BATTERIES SEGMENT _______________________________________________ 44
2.4.1 Discussion About Collection Rates For Portable Batteries Segment and Equivalence Formulas__________________________________________________________ 44
2.4.2 Broad Overview of Portable Batteries Segment ____________________________ 46
2.4.3 European Market of Portable Batteries___________________________________ 53
2.4.4 Waste Stream of Portable Batteries _____________________________________ 54
2.4.5 Collection of Spent Portable Batteries ___________________________________ 55
2.4.6 Recycling of Spent Portable Batteries ___________________________________ 56
2.4.7 Economics of Portable Batteries Collection and Recycling ___________________ 60 2.4.7.1 Costs Taken Into Account ______________________________________ 60 2.4.7.2 Economics of Portable NiCd Batteries Collection and Recycling_________ 62 2.4.7.3 Economics of All Portable Batteries Collection and Recycling___________ 65 2.4.7.4 Other Cost Data ______________________________________________ 66
2.5 SUMMARY OF THE CURRENT SITUATION IN EUROPE __________________________________ 67
B I O I n t e l l i g e n c e S e r v i c e . IMPACT ASSESSMENT ON SELECTED POLICY OPTIONS FOR REVISION OF THE BATTERY DIRECTIVE
30
3 IMPACT ASSESSMENT OF POLICY OPTIONS____________________________________________ 70
3.1 BASELINE SCENARIO ________________________________________________________ 70
3.2 OPTIONS STUDIED __________________________________________________________ 76
3.3 QUANTITATIVE OPTIONS ABOUT STARTER BATTERIES ________________________________ 79
3.3.1 Feasibility _________________________________________________________ 79
3.3.2 Economic Impacts __________________________________________________ 79
3.3.3 Environmental Impacts _______________________________________________ 80 3.3.3.1 Objective of This Section _______________________________________ 80 3.3.3.2 Previous Work and Derived Results ______________________________ 82
3.3.4 Social Impacts _____________________________________________________ 86
3.3.5 Summary of Starter Batteries Policy Options Impact Assessment ______________ 87
3.4 QUANTITATIVE OPTIONS ABOUT ALL BATTERIES ____________________________________ 88
3.5 QUANTITATIVE OPTIONS ABOUT NICD BATTERIES ___________________________________ 89
3.5.1 Feasibility _________________________________________________________ 89
3.5.2 Economic Impacts __________________________________________________ 89 3.5.2.1 Economic Impacts for Scheme 1 - Collection and Recycling of NiCd Only _ 90 3.5.2.2 Economic Impacts for Scheme 2 - Collection and Recycling of All Portable
Batteries____________________________________________________ 90 3.5.2.3 Economic Impacts for Scheme 3 - Collection of All Portable Batteries in View
of Recycling Primarily NiCd ____________________________________ 118
3.5.3 Environmental Impacts ______________________________________________ 121 3.5.3.1 Introduction ________________________________________________ 121 3.5.3.2 Methodology _______________________________________________ 125 3.5.3.3 Results____________________________________________________ 130 3.5.3.4 Conclusion About Environmental Impacts _________________________ 136
3.5.4 Social Impacts ____________________________________________________ 138
3.5.5 Summary of NiCd Quantitative Policy Options Impact Assessment ____________ 143
B I O I n t e l l i g e n c e S e r v i c e . IMPACT ASSESSMENT ON SELECTED POLICY OPTIONS FOR REVISION OF THE BATTERY DIRECTIVE
31
3.6 NICD BATTERIES BAN OPTION ________________________________________________ 144
3.6.1 Background Data __________________________________________________ 144 3.6.1.1 EU Policy Background ________________________________________ 144 3.6.1.2 Cadmium Market in Europe ____________________________________ 145
3.6.2 Environmental Impacts ______________________________________________ 148 3.6.2.1 Scientific Background on Hazard Associated with Cadmium___________ 148 3.6.2.2 Risk Assessment on the Use of Cadmium in Batteries _______________ 150 3.6.2.3 Conclusions About Environmental Impacts ________________________ 158
3.6.3 Feasibility ________________________________________________________ 159 3.6.3.1 Overview of the Battery Market _________________________________ 159 3.6.3.2 Possible Substitution of NiCd Batteries ___________________________ 169 3.6.3.3 Conclusion About Feasibility ___________________________________ 171
3.6.4 Other Impacts _____________________________________________________ 172 3.6.4.1 Market Structure ____________________________________________ 172 3.6.4.2 Economic Impacts ___________________________________________ 173 3.6.4.3 Social Impacts ______________________________________________ 175
3.6.5 Summary of NiCd Ban Option Impact Assessment ________________________ 176
3.7 OPTIONS ABOUT STAKEHOLDERS’ RESPONSIBILITY _________________________________ 178
4 CONCLUSION ________________________________________________________________ 183
4.1 SUMMARY OF THE IMPACTS OF POLICY OPTIONS ___________________________________ 183
4.1.1 Quantitative Policy Options About Total Batteries _________________________ 183
4.1.2 Quantitative Policy Options About Starter Batteries ________________________ 183
4.1.3 Policy Options About NiCd Batteries ___________________________________ 184 4.1.3.1 Quantitative Options About NiCd Batteries ________________________ 184 4.1.3.2 NiCd Batteries Ban Option_____________________________________ 191
4.1.4 Policy Options About Stakeholders’ Responsibility_________________________ 193
4.2 LIMITS OF THE STUDY AND FURTHER RESEARCH WORK TO BE PERFORMED _______________ 194
APPENDIX 1: CONTACT PERSONS ____________________________________________________ 196
APPENDIX 2: FACT-SHEETS ABOUT COLLECTION SCHEMES OF PORTABLE BATTERIES EXISTING IN EUROPE
__________________________________________________________________________ 198
APPENDIX 3: EU SECONDARY LEAD SMELTERS__________________________________________ 204

B I O I n t e l l i g e n c e S e r v i c e . IMPACT ASSESSMENT ON SELECTED POLICY OPTIONS FOR REVISION OF THE BATTERY DIRECTIVE
32
11 CCOONNTTEEXXTT AANNDD OOBBJJEECCTTIIVVEESS OOFF TTHHEE PPRROOJJEECCTT
Directive 91/157/EEC on batteries and accumulators containing dangerous substances amended by Commission Directive 98/101/EC, as well as Commission Directive 93/86/EEC, harmonise the national laws of the Member States in the field of waste management and spent batteries and accumulators containing certain heavy metals.
In practice the Battery Directives have not fully realised these objectives, since:
The Battery Directives only cover the collection of batteries containing certain quantities of cadmium, mercury or lead, and this limited scope tends to reduce the effectiveness of waste management of batteries and has caused implementation problems within the Member States.
The Battery Directives only prohibit the marketing of batteries and accumulators containing more than 0.0005% mercury as from 1 January 2001. However, other spent batteries and accumulators are an important source of heavy metals (particularly lead and cadmium), which may constitute a significant source of environmental damage and risk to human health.
There is a significant disparity between the laws and administrative measures adopted by the Member States with regard to the collection and recycling systems as well as the results yielded by such systems.
In order to contribute to a proper functioning of the internal market and to establish a high level of environmental protection in the field of waste management of spent batteries and accumulators, the European Commission commissioned BIO Intelligence Service to analyse the positive and negative impacts of different policy options in view of revising the Battery directives.
An extended impact assessment was performed. The methodology developed in this study is based on recent guidelines published by the EC: ‘A Handbook for Impact Assessment in the Commission – How to Do an Impact Assessment’.
Remark: It should be noted that this impact assessment had to be performed in a very short time compared to the wide scope of the issue under consideration. The methodology had thus to be defined considering this time schedule constraint.
Different policy options are evaluated regarding their feasibility (from a practical point of view) as well as their economic, environmental and social impacts:
Different ranges of collection and recycling targets were studied for small, automotive and industrial batteries and accumulators.
A part of the study focused on the use of cadmium in batteries and its economic and environmental impacts.
All considerations were made taking into account the two following possible principles: producer responsibility or shared responsibility.
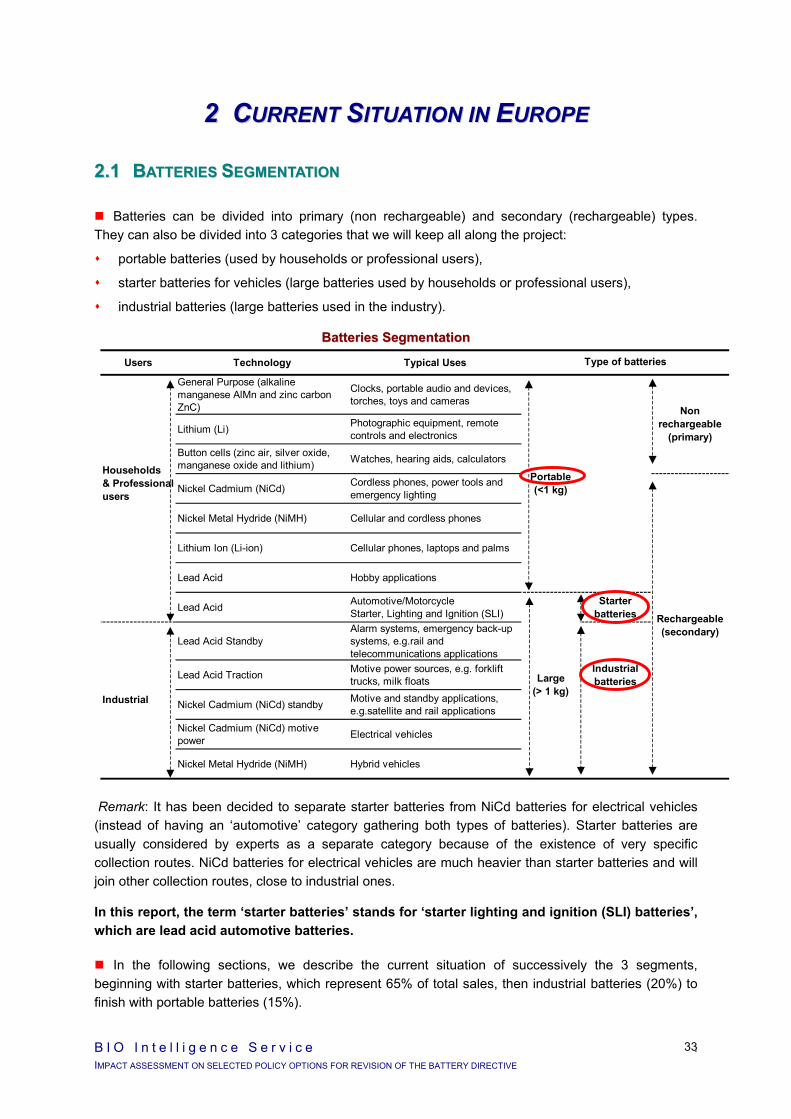
B I O I n t e l l i g e n c e S e r v i c e . IMPACT ASSESSMENT ON SELECTED POLICY OPTIONS FOR REVISION OF THE BATTERY DIRECTIVE
33
22 CCUURRRREENNTT SSIITTUUAATTIIOONN IINN EEUURROOPPEE
22..11 BBAATTTTEERRIIEESS SSEEGGMMEENNTTAATTIIOONN
Batteries can be divided into primary (non rechargeable) and secondary (rechargeable) types. They can also be divided into 3 categories that we will keep all along the project:
portable batteries (used by households or professional users),
starter batteries for vehicles (large batteries used by households or professional users),
industrial batteries (large batteries used in the industry).
BBaatttteerriieess SSeeggmmeennttaattiioonn
Remark: It has been decided to separate starter batteries from NiCd batteries for electrical vehicles (instead of having an ‘automotive’ category gathering both types of batteries). Starter batteries are usually considered by experts as a separate category because of the existence of very specific collection routes. NiCd batteries for electrical vehicles are much heavier than starter batteries and will join other collection routes, close to industrial ones.
In this report, the term ‘starter batteries’ stands for ‘starter lighting and ignition (SLI) batteries’, which are lead acid automotive batteries.
In the following sections, we describe the current situation of successively the 3 segments, beginning with starter batteries, which represent 65% of total sales, then industrial batteries (20%) to finish with portable batteries (15%).
Users Technology Typical Uses
General Purpose (alkaline manganese AlMn and zinc carbon ZnC)
Clocks, portable audio and devices, torches, toys and cameras
Lithium (Li) Photographic equipment, remote controls and electronics
Button cells (zinc air, silver oxide, manganese oxide and lithium) Watches, hearing aids, calculators
Nickel Cadmium (NiCd) Cordless phones, power tools and emergency lighting
Nickel Metal Hydride (NiMH) Cellular and cordless phones
Lithium Ion (Li-ion) Cellular phones, laptops and palms
Lead Acid Hobby applications
Lead Acid Automotive/MotorcycleStarter, Lighting and Ignition (SLI)
Starter batteries
Lead Acid StandbyAlarm systems, emergency back-up systems, e.g.rail and telecommunications applications
Lead Acid Traction Motive power sources, e.g. forklift trucks, milk floats
Industrial batteries
Nickel Cadmium (NiCd) standby Motive and standby applications, e.g.satellite and rail applications
Nickel Cadmium (NiCd) motive power Electrical vehicles
Nickel Metal Hydride (NiMH) Hybrid vehicles
Industrial
Households & Professional users
Type of batteries
Portable(<1 kg)
Non rechargeable
(primary)
Large (> 1 kg)
Rechargeable(secondary)
B I O I n t e l l i g e n c e S e r v i c e . IMPACT ASSESSMENT ON SELECTED POLICY OPTIONS FOR REVISION OF THE BATTERY DIRECTIVE
34
22..22 SSTTAARRTTEERR BBAATTTTEERRIIEESS SSEEGGMMEENNTT
22..22..11 DDiissccuussssiioonn AAbboouutt CCoolllleeccttiioonn RRaatteess FFoorr SSttaarrtteerr BBaatttteerriieess SSeeggmmeenntt
Two main categories of starter batteries are sold:
OEM (Original Equipment Manufacturer’s) batteries, sold in cars;
AM (After Market) batteries, sold to replace spent batteries.
A significant part of the OEM batteries are exported with cars and will then not become spent batteries in the country.
Remaining OEM batteries, when spent, are replaced by the after market batteries, until the car is scrapped.
Thus, the total sales, OEM + AM, does reflect the real quantities of spent batteries.
Spent starter batteries which can be collected can better be assessed from two sources:
After-market batteries which become spent during the year under consideration (they can be roughly estimated from AM batteries sold in the past, considering average lifespan);
Batteries removed from scrapped cars.
NB: a distinction has to be made between end-of-life vehicles (ELV) and scrapped cars, because only a part of ELV is actually sent to scrapping. Most of the remaining ELV are exported for a secondary use.
Spent batteries available for collection are thus only those contained in cars scrapped, and not in all ELV. An evaluation of batteries contained in scrapped cars has been made and is presented in table ‘Starter Batteries – Evaluation of batteries contained in scrapped passengers cars’ hereafter.
Two different collection rates are thus assessed in this report:
Collection rate as % of sales;
Collection rate as % of spent batteries available for collection where
Spent starter batteries available for collection in 2002 = AM sales in 1997 + Batteries in scrapped cars in 2002
22..22..22 BBrrooaadd OOvveerrvviieeww ooff SSttaarrtteerr BBaatttteerriieess SSeeggmmeenntt
The detailed table, ‘Starter Batteries – Current situation in Europe’, presents the overall picture of the starter batteries segment (sales, waste stream, collection and recycling). Comments are provided in following sections.
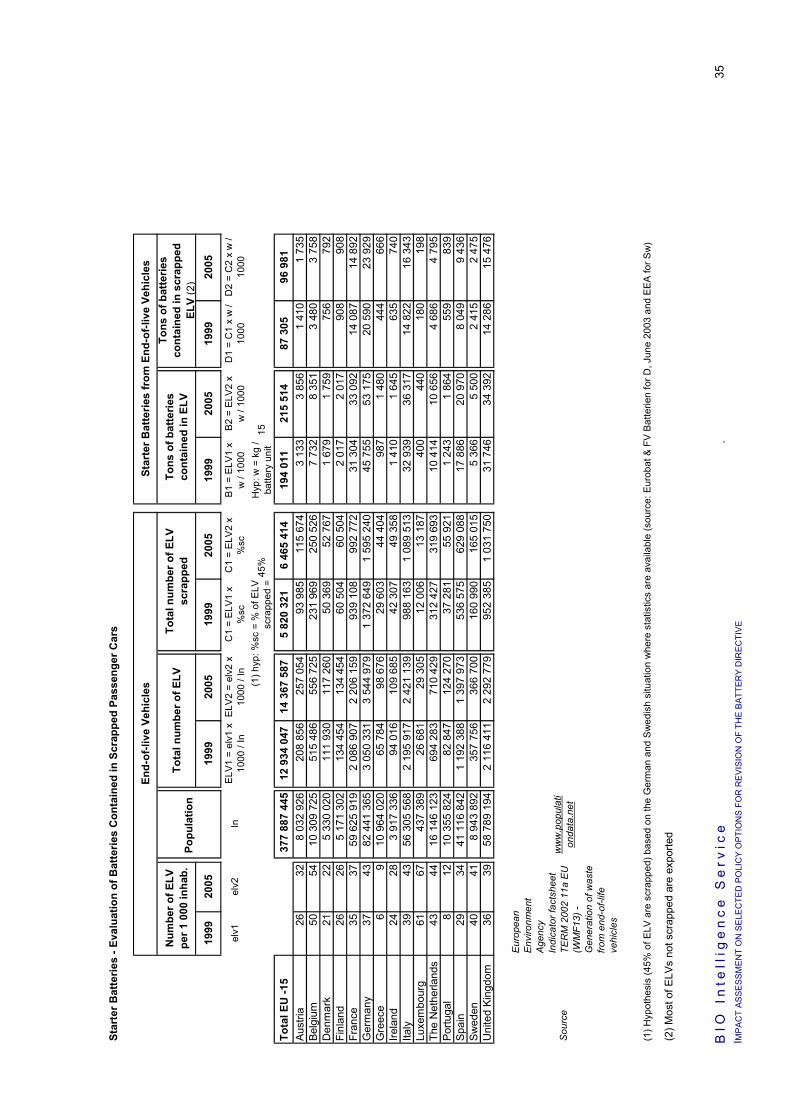
BIO
In
tell
ige
nc
e S
erv
ice
. I M
PA
CT
AS
SE
SS
ME
NT
ON
SE
LEC
TED
PO
LIC
Y O
PTI
ON
S F
OR
RE
VIS
ION
OF
THE
BA
TTE
RY
DIR
EC
TIV
E
35
Star
ter B
atte
ries
- Eva
luat
ion
of B
atte
ries
Con
tain
ed in
Scr
appe
d Pa
ssen
ger C
ars
End-
of-li
ve V
ehic
les
Star
ter B
atte
ries
from
End
-of-l
ive
Vehi
cles
Num
ber o
f ELV
pe
r 1 0
00 in
hab.
Tota
l num
ber o
f ELV
Tota
l num
ber o
f ELV
sc
rapp
edTo
ns o
f bat
terie
s co
ntai
ned
in E
LV
Tons
of b
atte
ries
cont
aine
d in
scr
appe
d EL
V (2
)19
9920
0519
9920
0519
9920
0519
9920
0519
9920
05
elv1
elv2
InE
LV1
= el
v1 x
10
00 /
InEL
V2 =
elv
2 x
1000
/ In
C1
= E
LV1
x %
scC
1 =
ELV
2 x
%sc
B1 =
ELV
1 x
w /
1000
B2
= EL
V2
x w
/ 10
00D
1 =
C1
x w
/ 10
00D
2 =
C2
x w
/ 10
00
45%
Hyp
: w =
kg
/ ba
ttery
uni
t15
Tota
l EU
-15
377
887
445
12 9
34 0
4714
367
587
5 82
0 32
16
465
414
194
011
215
514
87 3
0596
981
Aust
ria
2632
8 03
2 92
620
8 85
625
7 05
493
985
115
674
3 13
33
856
1 41
01
735
Belg
ium
5054
10 3
09 7
2551
5 48
655
6 72
523
1 96
925
0 52
67
732
8 35
13
480
3 75
8D
enm
ark
2122
5 33
0 02
011
1 93
011
7 26
050
369
52 7
671
679
1 75
975
679
2Fi
nlan
d 26
265
171
302
134
454
134
454
60 5
0460
504
2 01
72
017
908
908
Fran
ce
3537
59 6
25 9
192
086
907
2 20
6 15
993
9 10
899
2 77
231
304
33 0
9214
087
14 8
92G
erm
any
3743
82 4
41 3
653
050
331
3 54
4 97
91
372
649
1 59
5 24
045
755
53 1
7520
590
23 9
29G
reec
e6
910
964
020
65 7
8498
676
29 6
0344
404
987
1 48
044
466
6Ire
land
2428
3 91
7 33
694
016
109
685
42 3
0749
358
1 41
01
645
635
740
Italy
3943
56 3
05 5
682
195
917
2 42
1 13
998
8 16
31
089
513
32 9
3936
317
14 8
2216
343
Luxe
mbo
urg
6167
437
389
26 6
8129
305
12 0
0613
187
400
440
180
198
The
Net
herla
nds
4344
16 1
46 1
2369
4 28
371
0 42
931
2 42
731
9 69
310
414
10 6
564
686
4 79
5Po
rtuga
l8
1210
355
824
82 8
4712
4 27
037
281
55 9
211
243
1 86
455
983
9Sp
ain
2934
41 1
16 8
421
192
388
1 39
7 97
353
6 57
562
9 08
817
886
20 9
708
049
9 43
6Sw
eden
4041
8 94
3 89
235
7 75
636
6 70
016
0 99
016
5 01
55
366
5 50
02
415
2 47
5U
nite
d Ki
ngdo
m36
3958
789
194
2 11
6 41
12
292
779
952
385
1 03
1 75
031
746
34 3
9214
286
15 4
76
Sou
rce
ww
w.p
opul
ati
onda
ta.n
et
(2) M
ost o
f ELV
s no
t scr
appe
d ar
e ex
porte
d
Popu
latio
n
Eur
opea
n E
nviro
nmen
t A
genc
yIn
dica
tor f
acts
heet
TER
M 2
002
11a
EU
(W
MF1
3) -
Gen
erat
ion
of w
aste
fro
m e
nd-o
f-life
ve
hicl
es
(1) h
yp: %
sc =
% o
f ELV
sc
rapp
ed =
(1) H
ypot
hesi
s (4
5% o
f ELV
are
scr
appe
d) b
ased
on
the
Ger
man
and
Sw
edis
h si
tuat
ion
whe
re s
tatis
tics
are
avai
labl
e (s
ourc
e: E
urob
at &
FV
Bat
terie
n fo
r D, J
une
2003
and
EE
A fo
r Sw
)
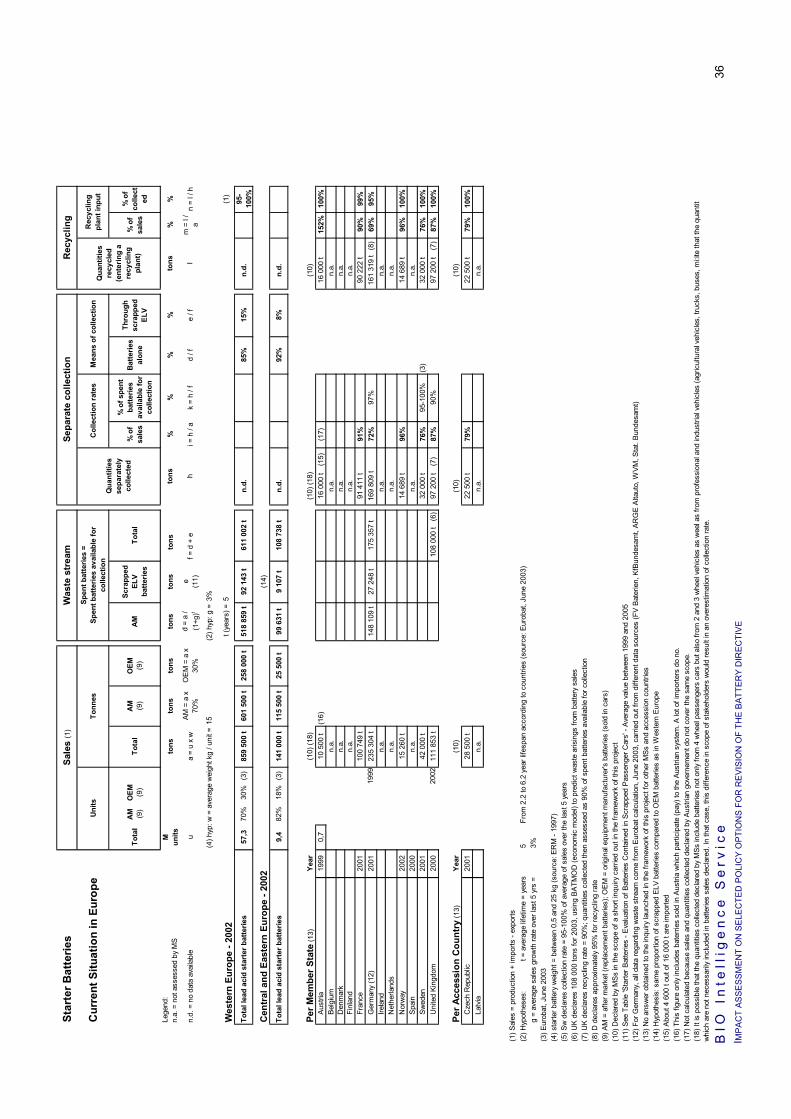
BIO
In
tell
ige
nc
e S
erv
ice
I MP
AC
T A
SS
ES
SM
EN
T O
N S
ELE
CTE
D P
OLI
CY
OP
TIO
NS
FO
R R
EV
ISIO
N O
F TH
E B
ATT
ER
Y D
IRE
CTI
VE
36
Star
ter B
atte
ries
Sale
s (1
)W
aste
str
eam
Sepa
rate
col
lect
ion
Rec
yclin
g
Cur
rent
Situ
atio
n in
Eur
ope
Uni
tsTo
nnes
Spen
t bat
terie
s =
Spen
t bat
terie
s av
aila
ble
for
colle
ctio
nC
olle
ctio
n ra
tes
Mea
ns o
f col
lect
ion
Rec
yclin
g pl
ant i
nput
Tota
lA
M
(9)
OEM
(9
)To
tal
AM
(9
)O
EM
(9)
AM
Scra
pped
EL
V ba
tterie
sTo
tal
% o
f sa
les
% o
f spe
nt
batte
ries
avai
labl
e fo
r co
llect
ion
Bat
terie
s al
one
Thro
ugh
scra
pped
EL
V
% o
f sa
les
% o
f co
llect
ed
M
units
tons
tons
tons
tons
tons
tons
%%
%%
%%
n.d.
= n
o da
ta a
vaila
ble
ua
= u
x w
AM =
a x
70
%O
EM
= a
x
30%
d =
a /
(1+g
)te (11)
f = d
+ e
i = h
/ a
k =
h / f
d / f
e / f
m =
l /
an
= l /
h
(4) h
yp: w
= a
vera
ge w
eigh
t kg
/ uni
t =15
(2) h
yp: g
=3%
Wes
tern
Eur
ope
- 200
2t (
year
s) =
5(1
)
Tota
l lea
d ac
id s
tart
er b
atte
ries
57,3
70%
30%
(3)
859
500
t60
1 50
0 t
258
000
t51
8 85
9 t
92 1
43 t
611
002
tn.
d.85
%15
%n.
d.95
-10
0%
Cen
tral
and
Eas
tern
Eur
ope
- 200
2(1
4)
Tota
l lea
d ac
id s
tart
er b
atte
ries
9,4
82%
18%
(3)
141
000
t11
5 50
0 t
25 5
00 t
99 6
31 t
9 10
7 t
108
738
tn.
d.92
%8%
n.d.
Per M
embe
r Sta
te (1
3)Y
ear
(10)
(18)
(10)
(18)
(10)
Aust
ria19
990,
710
500
t(1
6)16
000
t(1
5)(1
7)16
000
t15
2%10
0%Be
lgiu
mn.
a.n.
a.n.
a.D
enm
ark
n.a.
n.a.
n.a.
Finl
and
n.a.
n.a.
n.a.
Fran
ce20
0110
0 74
9 t
91 4
11 t
91%
90 2
22 t
90%
99%
Ger
man
y (1
2)20
0123
5 30
4 t
148
109
t27
248
t17
5 35
7 t
169
809
t72
%97
%16
1 31
9 t
(8)
69%
95%
Irela
ndn.
a.n.
a.n.
a.N
ethe
rland
sn.
a.n.
a.n.
a.N
orw
ay20
0215
260
t14
689
t96
%14
689
t96
%10
0%Sp
ain
2000
n.a.
n.a.
n.a.
Swed
en20
0142
000
t32
000
t76
%95
-100
%(3
)32
000
t76
%10
0%U
nite
d Ki
ngdo
m20
0011
1 85
3 t
108
000
t(6
)97
200
t(7
)87
%90
%97
200
t(7
)87
%10
0%
Per A
cces
sion
Cou
ntry
(13)
Yea
r(1
0)(1
0)(1
0)C
zech
Rep
ublic
2001
28 5
00 t
22 5
00 t
79%
22 5
00 t
79%
100%
Latv
ian.
a.n.
a.n.
a.
(1) S
ales
= p
rodu
ctio
n +
impo
rts -
expo
rts(2
) Hyp
othe
ses:
t =
ave
rage
life
time
= ye
ars
5Fr
om 2
.2 to
6.2
yea
r life
span
acc
ordi
ng to
cou
ntrie
s (s
ourc
e: E
urob
at, J
une
2003
)g
= av
erag
e sa
les
grow
th ra
te o
ver l
ast 5
yrs
=3%
(3) E
urob
at, J
une
2003
(4) s
tarte
r bat
tery
wei
ght =
bet
wee
n 0,
5 an
d 25
kg
(sou
rce:
ER
M -
1997
)(5
) Sw
dec
lare
s co
llect
ion
rate
= 9
5-10
0% o
f ave
rage
of s
ales
ove
r the
last
5 y
ears
(6) U
K d
ecla
res
108
000
tons
for 2
003,
usi
ng B
ATM
OD
(eco
nom
ic m
odel
) to
pred
ict w
aste
aris
ings
from
bat
tery
sal
es(7
) UK
dec
lare
s re
cycl
ing
rate
= 9
0%; q
uant
ities
col
lect
ed th
en a
sses
sed
as 9
0% o
f spe
nt b
atte
ries
avai
labl
e fo
r col
lect
ion
(8) D
dec
lare
s ap
prox
imat
ely
95%
for r
ecyc
ling
rate
(9) A
M =
afte
r mar
ket (
repl
acem
ent b
atte
ries)
; OEM
= o
rigin
al e
quip
men
t man
ufac
ture
r's b
atte
ries
(sol
d in
car
s)(1
0) D
ecla
red
by M
Ss
in th
e sc
ope
of a
sho
rt in
quiry
car
ried
out i
n th
e fra
mew
ork
of th
is p
roje
ct(1
1) S
ee T
able
'Sta
rter B
atte
ries
- Eva
luat
ion
of B
atte
ries
Con
tain
ed in
Scr
appe
d P
asse
nger
Car
s' -
Aver
age
valu
e be
twee
n 19
99 a
nd 2
005
(12)
For
Ger
man
y, a
ll da
ta re
gard
ing
was
te s
tream
com
e fro
m E
urob
at c
alcu
latio
n, J
une
2003
, car
ried
out f
rom
diff
eren
t dat
a so
urce
s (F
V B
ater
ien,
KfB
unde
sam
t, AR
GE
Alta
uto,
WV
M, S
tat.
Bund
esam
t)(1
3) N
o an
swer
obt
aine
d to
the
inqu
iry la
unch
ed in
the
fram
ewor
k of
this
pro
ject
for o
ther
MSs
and
acc
essi
on c
ount
ries
(14)
Hyp
othe
sis:
sam
e pr
opor
tion
of s
crap
ped
ELV
batte
ries
com
pare
d to
OE
M b
atte
ries
as in
Wes
tern
Eur
ope
(15)
Abo
ut 4
600
t ou
t of 1
6 00
0 t a
re im
porte
d(1
6) T
his
figur
e on
ly in
clud
es b
ater
ries
sold
in A
ustri
a w
hich
par
ticip
ate
(pay
) to
the
Aust
rian
syst
em. A
lot o
f im
porte
rs d
o no
.(1
7) N
ot c
alcu
late
d be
caus
e sa
les
and
quan
titie
s co
llect
ed d
ecla
red
by A
ustri
an g
over
nem
ent d
o no
t cov
er th
e sa
me
scop
e.(1
8) It
is p
ossi
ble
that
the
quan
titie
s co
llect
ed d
ecla
red
by M
Ss in
clud
e ba
tterie
s no
t onl
y fro
m 4
whe
el p
asse
nger
s ca
rs b
ut a
lso
from
2 a
nd 3
whe
el v
ehic
les
as w
eel a
s fro
m p
rofe
ssio
nal a
nd in
dust
rial v
ehic
les
(agr
icul
tura
l veh
icle
s, tr
ucks
, bus
es, m
i:ite
that
the
quan
titw
hich
are
not
nec
essa
rily
incl
uded
in b
atte
ries
sale
s de
clar
ed. I
n th
at c
ase,
this
diff
eren
ce in
sco
pe o
f sta
keho
lder
s w
ould
resu
lt in
an
over
estim
atio
n of
col
lect
ion
rate
.
Lege
nd:
n.a.
= n
ot a
sses
sed
by M
S
Qua
ntiti
es
sepa
rate
ly
colle
cted
1999
2002
l
Qua
ntiti
es
recy
cled
(e
nter
ing
a re
cycl
ing
plan
t)
h
tons
tons

B I O I n t e l l i g e n c e S e r v i c e _______________________________________________ 37. IMPACT ASSESSMENT ON SELECTED POLICY OPTIONS FOR REVISION OF THE BATTERY DIRECTIVE
22..22..33 EEuurrooppeeaann MMaarrkkeett ooff SSttaarrtteerr BBaatttteerriieess
About 860 kt of starter batteries are estimated to be sold in Western Europe in 2002, among which 70% (about 600 kt) for the after market (AM) and 30% (about 260 kt) as OEM batteries.
140 kt are estimated to be sold in Eastern and Central Europe in 2002.
22..22..44 WWaassttee SSttrreeaamm ooff SSttaarrtteerr BBaatttteerriieess
610 kt of spent batteries available for collection are estimated to arise in Western Europe in 2002. 85% are estimated coming from the “after market” segment and 15% from scrapped end-of-life vehicles.
Compared to 2002 sales (even if the comparison has no real signification because sales and waste arising the same year have no empirical relationship), spent batteries available for collection represent only 60% of sales.
This will introduce a significant difference between levels of collection rate assessed depending on the definition considered for collection rate (see next section).
Starter Batteries Estimation of Spent Batteries Available for Collection in 2002
AM batteries 100 kt
AM batteries 520 kt
Scrapped ELV batteries
10 kt
Scrapped ELV batteries
90 kt
Western Europe Eastern & Central Europe
610 kt
110 kt

B I O I n t e l l i g e n c e S e r v i c e IMPACT ASSESSMENT ON SELECTED POLICY OPTIONS FOR REVISION OF THE BATTERY DIRECTIVE
38
22..22..55 CCoolllleeccttiioonn ooff SSppeenntt SSttaarrtteerr BBaatttteerriieess
Battery collection is carried out by players belonging to two categories: Collecting resulting from work by dealers: the dealers collect used starter batteries and supply a
circuit of recyclers and wholesalers. Unbilled organised collecting and organised collecting with billing for services: multi-waste
collectors, certain refiners and certain manufacturers collect starter batteries.
Regarding collected quantities and collection rates, no statistics are available at the European level and for most of the European countries. When considering countries where statistics are available (D,F, Sw, UK, Cz for instance), 90 to 97% of spent batteries available for collection are collected, representing at least 70 to 90% of the same year sales. Remark: It is possible that the collected quantities declared by MSs include batteries not only from 4 wheel passengers cars but also from 2 and 3 wheel vehicles as well as from professional and industrial vehicles (agricultural vehicles, trucks, buses, military vehicles...), which are not necessarily included in batteries sales declared. In that case, this difference in scope of stakeholders would result in an overestimation of collection rate. Because the collection and recycling of starter batteries is economically self sufficient and market driven (see § 2.2.7 page 38), it is likely that the situation in these countries above mentioned reflect a much more generalised situation, without being able to quantify it.
22..22..66 RReeccyycclliinngg ooff SSppeenntt SSttaarrtteerr BBaatttteerriieess
Starter batteries are recycled in lead smelting plants, located in most of European countries (a list of EU secondary lead smelters is provided in appendix 3 on page 204). About 0.58 t of lead is recovered from 1 tonne of battery smelted (58% recovery rate).
22..22..77 EEccoonnoommiiccss ooff SSttaarrtteerr BBaatttteerriieess CCoolllleeccttiioonn aanndd RReeccyycclliinngg
The revenues from recycling (mostly sale of recovered lead and also of plastics) are generally sufficient to cover all of the collection and re-processing costs involved in the sector.
However, lead batteries recycling economics is sensitive to the lead market price (LME London Metal Exchange) which can fluctuate significantly over years. The following table and curves present the detail of the cost and revenues involved. They are based on a French study performed for ADEME where several collectors and all French smelters were audited in 2001. The collection cost varies between 40 and 120 €/t of battery collected, and the recycling cost is evaluated at 230 €/t collected. Revenues from lead sale varied in a 265-355 €/t collected range over the 1995-1999 period. With certain expensive collection systems, net revenues may then be negative certain years.
But the industry has shown in the past that they can deal with that lead market fluctuation, using intermediate temporary storage as a hedging effect. This may explain that 5-10% of spent starter batteries available for collection are actually not collected. We found no information during the study which would indicate that this recycling activity is not durable at the European level. This may need some restructuring and collection optimisation, in some regions at least.

B I O I n t e l l i g e n c e S e r v i c e IMPACT ASSESSMENT ON SELECTED POLICY OPTIONS FOR REVISION OF THE BATTERY DIRECTIVE
39
Starter Batteries - Economics of Lead Acid Starter Batteries Collection and Recycling
Euros / t of lead recovered
Euros / t of batteries collected
(1)
Costs (1999 data)
Collection (logistics / storage) a 40 to 120 according to collection system (3)
Lead smelting cost (2) b 395 229Raw material purchase (other
than Ld) 47
Grinding 40Reduction 122
Waste treatment 35Smelting 49
Waste water treatment 11Security-Health-Environment 9
S&G 83
Total cost C = a + b 270 to 350
Revenues (lead sale)
Lead sale r1 460 to 610 265 to 355 fluctuation with lead market price (LME)
Polypropylene sale r2 14 8Total revenues R = r1 + r2 273 to 363
Net revenues R - C - 77 to + 93
(1) Ratio: 0.58 tonne of lead recovered from 1 tonne of battery (58% recovery rate)(2) Average cost data for 4 refiners representing the entire refining capacity in France(3) Data derived from a sample of 11 collectors Source: Figures presented here result from BIO IS calculation based on data from 'Economic audit of lead batteries' gathering and recycling', carried out by Arthur Andersen for ADEME, 2001
0
100
200
300
400
500
600
700
1995 1996 1997 1998 1999
Lead
Mar
ket P
rice
(€/t
of le
ad)
-80
-60
-40
-20
0
20
40
60
80
100
Net
Rev
enue
s(€
/t of
bat
terie
s)
Lead market price (€/t of lead)Net revenues if low collection cost (€/t of battery)Net revenues if high collection cost (€/t of battery)

B I O I n t e l l i g e n c e S e r v i c e IMPACT ASSESSMENT ON SELECTED POLICY OPTIONS FOR REVISION OF THE BATTERY DIRECTIVE
40
22..33 IINNDDUUSSTTRRIIAALL BBAATTTTEERRIIEESS SSEEGGMMEENNTT
22..33..11 BBrrooaadd OOvveerrvviieeww ooff IInndduussttrriiaall BBaatttteerriieess SSeeggmmeenntt
Two main categories can be distinguished:
NiCd batteries, which are covered by the battery directive, for which statistics are available at both the EU and national levels;
Other industrial batteries, mostly lead acid batteries, for which statistics are available neither at the European level nor at the national level.
Spent batteries, which can theoretically be derived from sales of previous years by considering lifespans, are all collectable.
However, spent batteries have very long lifespans which vary significantly with applications. And some hoarding behaviours by end users exist. Contrary to portable batteries, no data are available to assess the level of hoarding.
As a consequence, spent batteries derived from sales and considered available for collection will give a rough approximation of actual waste streams, without being able to quantify the uncertainty.
Table ‘Industrial Batteries - Current Situation in Europe’ next page presents the overall picture of the industrial batteries segment (sales, waste stream, collection and recycling). Comments are provided in following sections.
22..33..22 EEuurrooppeeaann MMaarrkkeett ooff IInndduussttrriiaall BBaatttteerriieess
About 200 kt of batteries have been put on the market in 2002, 97% being lead acid batteries.
This estimation about the total industrial batteries market is very uncertain. It is derived from 1995 data with an average 1% growth rate till 2002
3.6 kt of large NiCd batteries have been sold in 2002, among which 83% for standby applications (3 kt) and 16% for electrical vehicles (0.6 kt).
22..33..33 WWaassttee SSttrreeaamm ooff IInndduussttrriiaall BBaatttteerriieess
Considering average lifespans, spent batteries available for collection are assessed to amount at 187 kt in 2002, among which 3.1 kt of NiCd.
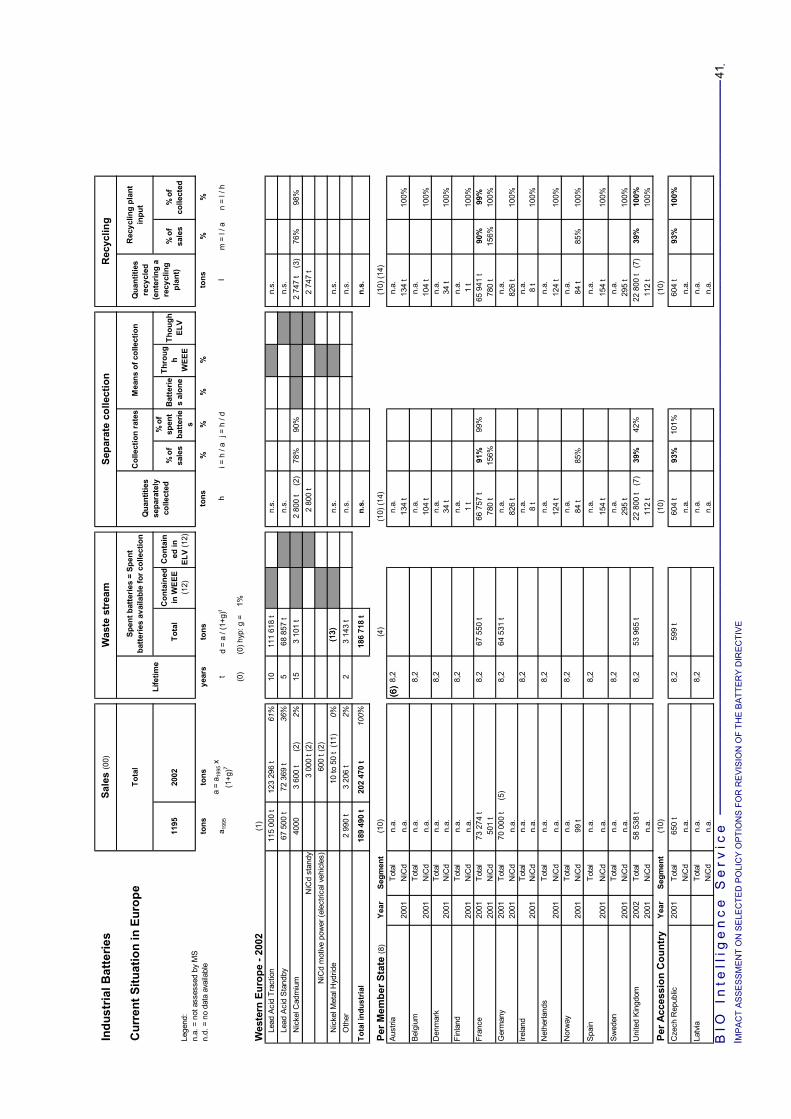
BIO
In
tell
ige
nc
e S
erv
ice
____
____
____
____
____
____
____
____
____
____
____
____
____
____
____
____
____
____
____
____
____
____
____
____
___
.
I MP
AC
T A
SS
ES
SM
EN
T O
N S
ELE
CTE
D P
OLI
CY
OP
TIO
NS
FO
R R
EV
ISIO
N O
F TH
E B
ATT
ER
Y D
IRE
CTI
VE
41
Indu
stria
l Bat
terie
sW
aste
str
eam
Sepa
rate
col
lect
ion
Rec
yclin
g
Cur
rent
Situ
atio
n in
Eur
ope
Tota
lSp
ent b
atte
ries
= Sp
ent
batte
ries
avai
labl
e fo
r col
lect
ion
Col
lect
ion
rate
sM
eans
of c
olle
ctio
nR
ecyc
ling
plan
t in
put
1195
2002
Tota
lC
onta
ined
in
WEE
E (1
2)
Con
tain
ed in
EL
V (1
2)
% o
f sa
les
% o
f sp
ent
batte
ries
Bat
terie
s al
one
Thro
ugh
WEE
E
Thou
gh
ELV
% o
f sa
les
% o
f co
llect
ed
tons
tons
year
sto
ns%
%%
%%
%
a 199
5a
= a 1
995 x
(1
+g)7
td
= a
/ (1+
g)t
i = h
/ a
j = h
/ d
m =
l / a
n =
l / h
(0)
(0) h
yp: g
=1%
Wes
tern
Eur
ope
- 200
2(1
)Le
ad A
cid
Trac
tion
115
000
t12
3 29
6 t
61%
1011
1 61
8 t
n.s.
n.s.
Lead
Aci
d S
tand
by67
500
t72
369
t36
%5
68 8
57 t
n.s.
n.s.
Nic
kel C
adm
ium
4000
3 60
0 t
(2)
2%15
3 10
1 t
2 80
0 t
(2)
78%
90%
2 74
7 t
(3)
76%
98%
NiC
d st
andy
3 00
0 t(
2)2
800
t2
747
tN
iCd
mot
ive p
ower
(ele
ctric
al v
ehic
les)
600
t(2)
Nic
kel M
etal
Hyd
ride
10 to
50
t (1
1)0%
n.s.
n.s.
Oth
er2
990
t3
206
t2%
23
143
tn.
s.n.
s.
Tota
l ind
ustr
ial
189
490
t20
2 47
0 t
100%
186
718
tn.
s.n.
s.
Per M
embe
r Sta
te (8
)Y
ear
Segm
ent
(10)
(4)
(10)
(14)
(10)
(14)
Aus
tria
Tota
ln.
a.8,
2n.
a.n.
a.20
01N
iCd
n.a.
134
t13
4 t
100%
Bel
gium
Tota
ln.
a.8,
2n.
a.n.
a.20
01N
iCd
n.a.
104
t10
4 t
100%
Den
mar
kTo
tal
n.a.
8,2
n.a.
n.a.
2001
NiC
dn.
a.34
t34
t10
0%Fi
nlan
dTo
tal
n.a.
8,2
n.a.
n.a.
2001
NiC
dn.
a.1
t1
t10
0%Fr
ance
2001
Tota
l73
274
t8,
267
550
t66
757
t91
%99
%65
941
t90
%99
%20
01N
iCd
501
t78
0 t
156%
780
t15
6%10
0%G
erm
any
2001
Tota
l70
000
t(5
)8,
264
531
tn.
a.n.
a.20
01N
iCd
n.a.
826
t82
6 t
100%
Irela
ndTo
tal
n.a.
8,2
n.a.
n.a.
2001
NiC
dn.
a.8
t8
t10
0%N
ethe
rland
sTo
tal
n.a.
8,2
n.a.
n.a.
2001
NiC
dn.
a.12
4 t
124
t10
0%N
orw
ayTo
tal
n.a.
8,2
n.a.
n.a.
2001
NiC
d99
t84
t85
%84
t85
%10
0%S
pain
Tota
ln.
a.8,
2n.
a.n.
a.20
01N
iCd
n.a.
154
t15
4 t
100%
Sw
eden
Tota
ln.
a.8,
2n.
a.n.
a.20
01N
iCd
n.a.
295
t29
5 t
100%
Uni
ted
Kin
gdom
2002
Tota
l58
538
t8,
253
965
t22
800
t(7
)39
%42
%22
800
t(7
)39
%10
0%20
01N
iCd
n.a.
112
t11
2 t
100%
Per A
cces
sion
Cou
ntry
Yea
rSe
gmen
t(1
0)(1
0)(1
0)
Cze
ch R
epub
lic20
01To
tal
650
t8,
259
9 t
604
t93
%10
1%60
4 t
93%
100%
NiC
dn.
a.n.
a.n.
a.La
tvia
Tota
ln.
a.8,
2n.
a.n.
a.N
iCd
n.a.
n.a.
n.a.
Lege
nd:
n.a.
= n
ot a
sses
sed
by M
Sn.
d. =
no
data
ava
ilabl
e
Qua
ntiti
es
sepa
rate
ly
colle
cted
l
Qua
ntiti
es
recy
cled
(e
nter
ing
a re
cycl
ing
plan
t)
h
Sale
s (0
0)
tons
Life
time
tons
(13)
(6)
(13)
(6)

BIO
In
tell
ige
nc
e S
erv
ice
I MP
AC
T A
SS
ES
SM
EN
T O
N S
ELE
CTE
D P
OLI
CY
OP
TIO
NS
FO
R R
EV
ISIO
N O
F TH
E B
ATT
ER
Y D
IRE
CTI
VE
42
(00)
Sal
es =
pro
duct
ion
+ im
ports
- ex
ports
(0) H
ypot
hese
s: t
= av
erag
e lif
etim
e (s
ourc
e: E
RM
repo
rt 19
97)
g =
ave
rage
sal
es g
row
th ra
te o
ver l
ast 3
yrs
=1%
(sou
rce:
ER
M re
port
1997
)(1
) ER
M re
port
1997
, 199
5 da
ta(2
) Col
lect
NiC
ad, J
une
2003
(3) C
olle
ctN
iCad
, est
. 200
0(4
) Ave
rage
life
time
cons
ider
ed (w
eigh
ting
of th
e di
ffere
nt li
fetim
es) =
8,2
year
s(5
) vag
ue e
stim
ate
for l
ead
batte
ries
only
(6) 1
5-ye
ar li
fetim
e co
nsid
ered
(7) U
K d
ecla
res
110-
130
kt o
f lar
ge b
atte
ries
colle
cted
and
recy
cled
; ind
ustri
al b
atte
ries
colle
cted
is a
sses
sed
as th
e di
ffere
nce
betw
een
120
kt a
nd th
ose
asse
ssed
for s
tarte
r bat
terie
s (9
7,2
kt -
see
tabl
e St
arte
r bat
terie
s)(8
) No
answ
er o
btai
ned
to th
e in
quiry
laun
ched
in th
e fra
mew
ork
of th
is p
roje
ct fo
r the
oth
er c
ount
ries
(10)
Dec
lare
d by
MSs
in th
e sc
ope
of a
sho
rt in
quiry
car
ried
out i
n th
e fra
mew
ork
of th
is p
roje
ct(1
1) S
aft,
June
200
3(1
2) o
nly
thos
e co
ncer
ned
by th
e W
EE
E di
rect
ive
and
the
ELV
dire
ctive
(13)
NiM
H is
use
d in
hyb
ride
vehi
cles
; one
mig
ht n
ot e
xpec
t mqa
ny to
be
avai
albl
e fo
r col
lect
ion
yet (
sour
ce: E
urob
at, J
une
2003
)(1
4) S
ourc
e fro
NiC
d da
ta: T
RA
R, R
isk
Ass
essm
ent T
arge
ted
Rep
ort -
Cad
miu
m (o
xide
) as
used
in b
atte
ries
- Dra
ft ve
rsio
n of
Feb
ruar
y 20
03

B I O I n t e l l i g e n c e S e r v i c e _______________________________________________ 43. IMPACT ASSESSMENT ON SELECTED POLICY OPTIONS FOR REVISION OF THE BATTERY DIRECTIVE
22..33..44 CCoolllleeccttiioonn ooff SSppeenntt IInndduussttrriiaall BBaatttteerriieess
No statistics are available about large lead acid batteries.
In France, where data are available, 91% of sales are declared being collected, which would represent 99% of spent batteries available for collection.
From the nature of the product and their application, their collection and recycling is regulated by established industrial practices and supplier-customer regimes.
As for NiCd, 2.8 kt were collected in 2002 at the EU level, representing 78% of 2002 sales.
It represents 90% of the spent batteries available for collection calculated from 1987 sales. The actual collection rate is likely to be a little bit lower, maybe somewhere between 80-90%, because landfilling still exist in some MSs.
Data about national situations can be derived from the TRAR (see table ‘NiCd Batteries Market, Collection, Recycling’ page 67).
22..33..55 RReeccyycclliinngg ooff SSppeenntt IInndduussttrriiaall BBaatttteerriieess
Considering the well established recycling market of lead acid batteries, it is quite certain that all collected batteries are sent to a recycling plant, even if no statistics are available. This is the case in France, according to MSs declaration.
As for NiCd, 98% of collected quantities at the European level are declared to be sent to recycling.
Most of industrial NiCd batteries are sent to dedicated recycling plants, as portable sealed NiCd batteries.
22..33..66 EEccoonnoommiiccss ooff IInndduussttrriiaall BBaatttteerriieess CCoolllleeccttiioonn aanndd RReeccyycclliinngg
For lead acid batteries, see section 2.2.7 page 38.
For NiCd batteries sent to dedicated plants, recyclers bill between 0 to 300 Euros / t entering the plant depending on the proportion of metals recovered and metal market prices (nickel, cadmium and steel). This is the same price range as for portable NiCd (see section 2.4.7.3.1 page 65).
According to recyclers, NiCd recycling cost could decrease to a range of 0 – 200 Euros / t in the future (even positive value in some cases), in particular by increasing the recovery of ferro nickel by 10-15%.

B I O I n t e l l i g e n c e S e r v i c e IMPACT ASSESSMENT ON SELECTED POLICY OPTIONS FOR REVISION OF THE BATTERY DIRECTIVE
44
22..44 PPOORRTTAABBLLEE BBAATTTTEERRIIEESS SSEEGGMMEENNTT
22..44..11 DDiissccuussssiioonn AAbboouutt CCoolllleeccttiioonn RRaatteess FFoorr PPoorrttaabbllee BBaatttteerriieess SSeeggmmeenntt aanndd EEqquuiivvaalleennccee FFoorrmmuullaass
The notion of ‘spent batteries’ is difficult to define and quantify because in the portable batteries segment, a significant part of batteries, spent or not spent yet, are hoarded by end-users, mostly in electric and electronic equipment (EEE) in which they are contained.
A stock in the economic sphere is actually constituted of batteries still in use as well as batteries hoarded by households and professional users (batteries no more used, being spent batteries or not yet).
The spent batteries collectable (i.e. available for collection) are spent batteries which are not hoarded by end users. The less batteries hoarded, the more spent batteries available for collection.
In this study, it was possible to estimate the quantities available for collection in 2002 and the collection rates reached compared to spent batteries collectable, for the current situation of domestic hoarding.
To increase collection rates up to a certain point, it is necessary to have end users to put their spent batteries hoarded till now in the waste management circuits.
Specific communication programmes are necessary, whose corresponding costs are estimated in the economic analysis of policy options (see section 3.5.2 page 89).
Four definitions of collection rates are possible for portable batteries. These different collection rates were quantified for the current situation and are presented in the next sections.
PPoossssiibbllee CCoolllleeccttiioonn RRaatteess ffoorr PPoorrttaabbllee BBaatttteerriieess
Collection rate Definition Comments
% of sales Quantities collected (kt) yr N
-------------------------------------------Sales (kt) yr N
As for other segments, this collection rate is the easiest to calculate because statistics exist for both numerator and denominator. But there is no empirical relationship between both of them so it does not reflect the efficiency of the collection scheme.
% of spent batteries
Quantities collected (kt) yr N -------------------------------------------
Spent batteries (kt) yr N
To reach high collection rate as % of spent batteries may be an objective which will need to have end users to cease or at least significantly reduce hoarding behaviours.
% of spent batteries available for collection
Quantities collected (kt) yr N -------------------------------------------
Spent batteries available for collection (kt) yr N
This collection rate takes into account actual domestic hoarding. The less hoarding, the closer % of spent batteries available for collection and % of spent batteries.
g collected / inhabitant / year
Quantities collected (kt) yr N -------------------------------------------
Inhabitants
This indicator reflects the actual level reached.
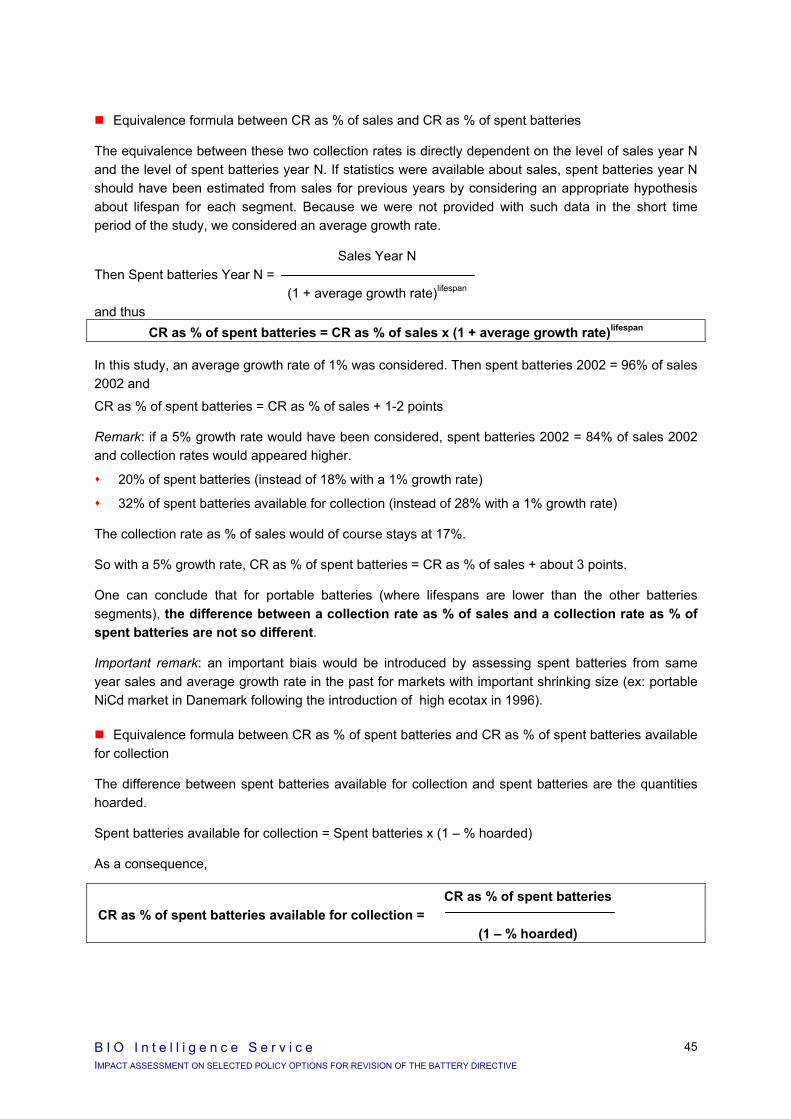
B I O I n t e l l i g e n c e S e r v i c e IMPACT ASSESSMENT ON SELECTED POLICY OPTIONS FOR REVISION OF THE BATTERY DIRECTIVE
45
Equivalence formula between CR as % of sales and CR as % of spent batteries
The equivalence between these two collection rates is directly dependent on the level of sales year N and the level of spent batteries year N. If statistics were available about sales, spent batteries year N should have been estimated from sales for previous years by considering an appropriate hypothesis about lifespan for each segment. Because we were not provided with such data in the short time period of the study, we considered an average growth rate.
Sales Year N Then Spent batteries Year N = (1 + average growth rate)lifespan and thus
CR as % of spent batteries = CR as % of sales x (1 + average growth rate)lifespan
In this study, an average growth rate of 1% was considered. Then spent batteries 2002 = 96% of sales 2002 and
CR as % of spent batteries = CR as % of sales + 1-2 points
Remark: if a 5% growth rate would have been considered, spent batteries 2002 = 84% of sales 2002 and collection rates would appeared higher.
20% of spent batteries (instead of 18% with a 1% growth rate)
32% of spent batteries available for collection (instead of 28% with a 1% growth rate)
The collection rate as % of sales would of course stays at 17%.
So with a 5% growth rate, CR as % of spent batteries = CR as % of sales + about 3 points.
One can conclude that for portable batteries (where lifespans are lower than the other batteries segments), the difference between a collection rate as % of sales and a collection rate as % of spent batteries are not so different.
Important remark: an important biais would be introduced by assessing spent batteries from same year sales and average growth rate in the past for markets with important shrinking size (ex: portable NiCd market in Danemark following the introduction of high ecotax in 1996).
Equivalence formula between CR as % of spent batteries and CR as % of spent batteries available for collection
The difference between spent batteries available for collection and spent batteries are the quantities hoarded.
Spent batteries available for collection = Spent batteries x (1 – % hoarded)
As a consequence,
CR as % of spent batteries CR as % of spent batteries available for collection = (1 – % hoarded)

B I O I n t e l l i g e n c e S e r v i c e IMPACT ASSESSMENT ON SELECTED POLICY OPTIONS FOR REVISION OF THE BATTERY DIRECTIVE
46
In this study, about 37% of portable batteries are assumed being hoarded, thus:
CR as % of spent batteries CR as % of spent batteries available for collection = 0.63
The higher the quantities collected, the higher the difference between collection rates. And the higher the % hoarded, the higher the difference between collection rates.
When considering the various situations in MSs, there is a 10-15 to 30 point difference between CR as % of spent batteries and CR as % of spent batteries available for collection, even a 50 point difference for some countries (see detailed data in section 2.4.5 page 55).
22..44..22 BBrrooaadd OOvveerrvviieeww ooff PPoorrttaabbllee BBaatttteerriieess SSeeggmmeenntt
The following diagram describes the different flows of portable batteries quantified in this report.
FFlloowwss ooff PPoorrttaabbllee BBaatttteerriieess QQuuaannttiiffiieedd1166
We combined different methods to assess batteries hoarded and batteries available for collection:
At the EU level: upstream method, from sales.
Hypotheses about % of hoarding were used to assess batteries hoarded. Spent batteries available for collection are then the difference between spent batteries and hoarded batteries.
For MSs where data were available (those where separate collection is developed): downstream method, by adding batteries collected separately and batteries contained in MSW (municipal solid waste).
The implementation of the upstream method as at the EU level with standardised hypotheses about % of hoarding proved to bring results incoherent at the national level. And indeed, from available data at national level, % of hoarding proved to be very different according to countries (see section 2.4.4 page 54).
In both cases, hypotheses about life spans were used to assess spent batteries.
16 Quantities of small batteries collected through professional collection systems were not assessed; however, according to
experts, only small quantities are concerned.
Previous years
Sales
Year
2002
Year 2002
Spent batteries available
for collection
Waste – 2002
Hoarded
Collected
separately
Collected – 2002 Treated – 2002
Collected through WEEE
Collected
with MSW
Recycling
Landfill or
incineration
Landfill Sold in EEE In
WEEEIn
WEEE

B I O I n t e l l i g e n c e S e r v i c e IMPACT ASSESSMENT ON SELECTED POLICY OPTIONS FOR REVISION OF THE BATTERY DIRECTIVE
47
Methodology and hypotheses used to quantify flows at EU level
As mentioned above, the methodology used to assess batteries hoarded and then batteries available for collection is an upstream method, from sales.
MMeetthhooddoollooggyy aanndd HHyyppootthheesseess ttoo QQuuaannttiiffyy PPoorrttaabbllee BBaatttteerriieess FFlloowwss aatt EEUU LLeevveell
The input data come from industry and concern:
sales,
quantities collected separately from MWS,
quantities recycled (entering a recycling plants).
Several hypotheses had to be made:
Average portable batteries lifetime = 3 or 5 or 7 years according to battery type.
Spent batteries Year 2002 = Sales Year 1999 or 1997 or 1995 according to battery type.
Domestic hoarding = 30% for non rechargeable batteries and 60% for rechargeable batteries (i.e. 30 or 60% of spent batteries are hoarded by households and professional users), given an average of 37% all portable batteries together.
Remark: No statistics exist at the EU level. These hypotheses seemed acceptable to some experts, others were not able to refute or to confirm.
In countries where data are available about batteries contained in MSW, we assessed the % of hoarding and obtained a very large range.
%% ooff PPoorrttaabbllee SSppeenntt BBaatttteerriieess HHooaarrddeedd
Source: BIO calculation from data provided by CollectNiCad, June 2003 (original sources: various studies performed at national level) (see Table ‘Portable Batteries – Current Situation in Some MSs’)
Spent batteries available for collection = 60% of non rechargeable spent batteries and 30% of rechargeable spent batteries only
2
1
Netherlands Sweden
43% 27% 62% 28% 60% 30%
Austria Belgium France Germany
Previous years
SalesSales
Year 2002
Sales
Year 2002
Spent batteries
Spent batteries available
for collection
Waste – 2002Waste – 2002
Hoarded
Separated from MSW
Collected – 2002Collected – 2002 Treated – 2002Treated – 2002
Collected through WEEE
Collected with MSW
Recycling
Landfill or incineration
Landfill
1
2
Sold in EEE In
WEEE
In WEEE
3
+
- +
-
+ -

B I O I n t e l l i g e n c e S e r v i c e IMPACT ASSESSMENT ON SELECTED POLICY OPTIONS FOR REVISION OF THE BATTERY DIRECTIVE
48
Spent batteries available for collection are either contained in WEEE or alone. Spent batteries ‘alone’ are mostly non rechargeable batteries after use collected separately from any EEE. Spent batteries contained in WEEE are mostly rechargeable batteries sold in EEE. Some of them are non rechargeable batteries: a part of those sold in EEE as well as batteries sold alone and used as safe batteries in EEE.
HHyyppootthheesseess AAbboouutt PPoorrttaabbllee BBaatttteerriieess CCoonnttaaiinneedd iinn WWEEEEEE
Remark: No statistics exist at the EU level. These hypotheses seemed acceptable to some experts, others were not able to refute or to confirm.
NB: these hypotheses do not affect the estimation of the current situation. They will be used in the baseline scenario to estimate the expected impact of the WEEE directive implementation (see section � page 76).
Methodology and hypotheses used to quantify flows at national level
As mentioned above, the methodology used to assess batteries available for collection and then batteries hoarded (for countries where data were available) is a downstream methodology, by adding batteries collected separately and batteries contained in MSW.
MMeetthhooddoollooggyy aanndd HHyyppootthheesseess ttoo QQuuaannttiiffyy PPoorrttaabbllee BBaatttteerriieess FFlloowwss aatt nnaattiioonnaall lleevveell
HypothesesBatteries sold in EEE in
2002 Spent batteries contained in WEEE in
2002 Rechargeable batteries sold in EEE 90 %
of rechargeable batteries sold90%
of rechargeable spent batteriesNon rechargeable batteries sold in EEE 10%
of non rechargeable batteries soldNon rechargeable batteries sold alone and
used in EEE as safe batteries
10% of non rechargeable spent batteries
Type of spent batteries contained in WEEE
0% of non rechargeable batteries sold
Spentbatteries available
for collection
Waste – 2002Waste – 2002
Separatedfrom MSW
Collected – 2002Collected – 2002 Treated – 2002Treated – 2002
CollectedthroughWEEE
Collectedwith MSW
Recycling
Landfill or incineration
Landfill
In WEEE3
2
Previousyears
SalesSales
Year 2002
Sales
Year 2002
Spentbatteries
1
Sold in EEE
In WEEE
Hoarded
+
-
+
+
3
B I O I n t e l l i g e n c e S e r v i c e IMPACT ASSESSMENT ON SELECTED POLICY OPTIONS FOR REVISION OF THE BATTERY DIRECTIVE
49
The input data come from industry, Member States and accession countries and concern:
Sales,
quantities collected separately from MSW,
quantities recycled (entering a recycling plants),
for MSs where data are available (countries where separate collection is developed): quantities contained in MSW.
Several hypotheses had to be made:
Same hypotheses as at the EU level for portable batteries lifetime and growth rates.
Hypothesis for MSs where data are available (countries where separate collection is developed): spent batteries remaining in MSW is extrapolated from national data about the content of batteries in MSW (between 100 and 370 ppm according to country) and the production of MSW per inhabitant (between 192 and 570 kg/capita/yr according to country).
Same hypotheses for batteries contained in WEEE as at the EU level.
The detailed table, ‘Portable Batteries – Current situation in Europe’, presents the overall picture of the portable batteries segment (sales, waste stream, collection and recycling).
The detailed table, ‘Portable Batteries – Current situation in Some MSs’, focuses on the 6 countries where separate collection of all portable batteries exist (see section 2.4.5 page 55).
Comments are provided in following sections.
1
2
3
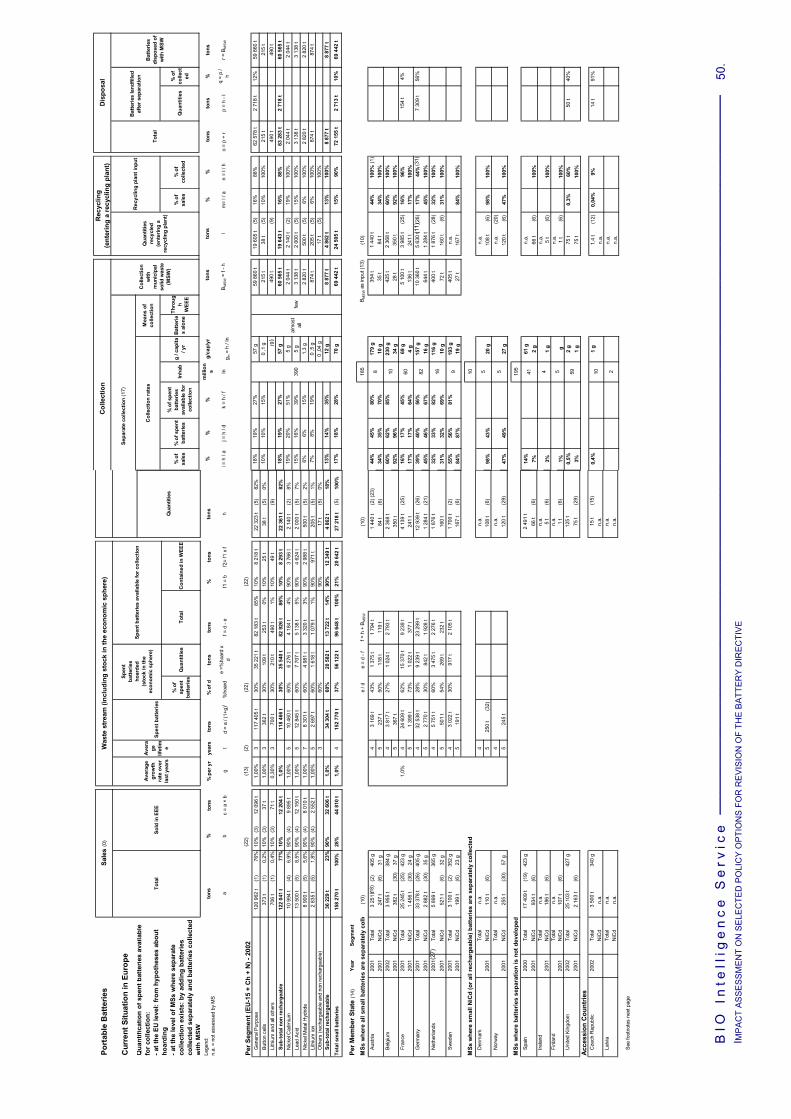
BIO
In
tell
ige
nc
e S
erv
ice
____
____
____
____
____
____
____
____
____
____
____
____
____
____
____
____
____
____
____
____
____
____
____
____
_
50.
I MP
AC
T A
SS
ES
SM
EN
T O
N S
ELE
CTE
D P
OLI
CY
OP
TIO
NS
FO
R R
EV
ISIO
N O
F TH
E B
ATT
ER
Y D
IRE
CTI
VE
Port
able
Bat
terie
sW
aste
str
eam
(inc
ludi
ng s
tock
in th
e ec
onom
ic s
pher
e)
Cur
rent
Situ
atio
n in
Eur
ope
% o
f sp
ent
batte
ries
Qua
ntiti
esTo
tal
Con
tain
ed in
WEE
E
Lege
nd:
n.a.
= n
ot a
sses
sed
by M
Sto
ns%
per
yr
year
sto
ns%
of d
tons
tons
%to
ns
c =
a ×
bg
td
= a
/ (1+
g)t
%ho
ard
e =%
hoar
d x
df =
d -
ef1
= b
f2=
f1 x
f
Per S
egm
ent (
EU-1
5 +
Ch
+ N
) - 2
002
(22)
(13)
(2
) (2
2)(2
2)
Gen
eral
Pur
pose
120
962
t(1
)76
%10
%(3
)12
096
t1,
00%
311
7 40
5 t
30%
35 2
21 t
82 1
83 t
85%
10%
8 21
8 t
22 3
23 t
(5)
82%
Butto
n ce
lls37
3 t
(1)
0,2%
10%
(3)
37 t
1,00
%3
362
t30
%10
9 t
253
t0%
10%
25 t
38 t
(5)
0%Li
thiu
m a
nd a
ll ot
hers
706
t(1
)0,
4%10
%(3
)71
t0,
30%
370
0 t
30%
210
t49
0 t
1%10
%49
t(9
)Su
b-to
tal n
on re
char
geab
le12
2 04
1 t
77%
10%
12 2
04 t
1,0%
118
466
t30
%35
540
t82
926
t86
%10
%8
293
t22
361
t82
%N
icke
l Cad
miu
m10
994
t(4
)6,
9%90
%(4
)9
895
t1,
00%
510
460
t60
%6
276
t4
184
t4%
90%
3 76
6 t
2 14
0 t
(2)
8%Le
ad A
cid
13 5
00 t
(5)
8,5%
90%
(4)
12 1
50 t
1,00
%5
12 8
45 t
60%
7 70
7 t
5 13
8 t
5%90
%4
624
t2
000
t(5
)7%
Nic
kel M
etal
Hyd
ride
8 90
0 t
(5)
5,6%
90%
(4)
8 01
0 t
1,00
%7
8 30
1 t
60%
4 98
1 t
3 32
0 t
3%90
%2
988
t50
0 t
(5)
2%Li
thiu
m io
n 2
835
t(5
)1,
8%90
%(4
)2
552
t1,
00%
52
697
t60
%1
618
t1
079
t1%
90%
971
t20
5 t
(5)
1%O
ther
s (re
char
geab
le a
nd n
on re
char
geab
le)
360
%90
%17
t(5
)0%
Sub-
tota
l rec
harg
eabl
e36
229
t23
%90
%32
606
t1,
0%34
304
t60
%20
582
t13
722
t14
%90
%12
349
t4
862
t18
%
Tota
l sm
all b
atte
ries
158
270
t10
0%28
%44
810
t1,
0%4
152
770
t37
%56
122
t96
648
t10
0%21
%20
642
t27
218
t(5
)10
0%
Per M
embe
r Sta
te (1
4)Y
ear
Segm
ent
MSs
whe
re a
ll sm
all b
atte
ries
are
sepa
rate
ly c
olle
(10)
e / d
e =
d - f
f = h
+ B
MS
W(1
0)
Aust
ria20
01To
tal
3 25
1 t
(2)
405
g4
3 16
9 t
43%
1 37
5 t
1 79
4 t
1 44
0 t
(2) (
23)
2001
NiC
d24
7 t
(6)
31 g
523
7 t
50%
118
t11
9 t
84 t
(6)
Belg
ium
2002
Tota
l3
955
t38
4 g
43
817
t27
%1
024
t2
793
t2
368
t20
01N
iCd
382
t(3
0)37
g5
367
t35
0 t
Fran
ce20
01To
tal
25 2
45 t
(25)
423
g1,
0%4
24 6
09 t
62%
15 3
70 t
9 23
9 t
4 13
9 t
(25)
2001
NiC
d1
456
t(3
0)24
g5
1 39
9 t
73%
1 02
2 t
377
t24
1 t
Ger
man
y20
01To
tal
33 3
78 t
(26)
405
g4
32 5
38 t
28%
9 23
9 t
23 2
99 t
12 9
39 t
(26)
2001
NiC
d2
882
t(3
0)35
g5
2 77
0 t
30%
842
t1
928
t1
284
t(2
1)N
ethe
rland
s20
01To
tal
5 89
9 t
365
g4
5 75
1 t
60%
3 47
5 t
2 27
6 t
1 87
6 t
2001
NiC
d52
1 t
(6)
32 g
550
1 t
54%
269
t23
2 t
160
tSw
eden
2001
Tota
l3
100
t(2
)35
2 g
43
022
t30
%91
7 t
2 10
5 t
1 70
0 t
(2)
2001
NiC
d19
9 t
(6)
23 g
519
1 t
167
t(6
)
MSs
whe
re s
mal
l NiC
d (o
r all
rech
arge
able
) bat
terie
s ar
e se
para
tely
col
lect
edD
enm
ark
Tota
ln.
a.4
n.a.
2001
NiC
d11
0 t
(6)
525
0 t
(32)
108
t(6
)N
orw
ayTo
tal
n.a.
4n.
a.20
01N
iCd
255
t(3
0)57
g5
245
t12
0 t
(29)
MSs
whe
re b
atte
ries
sepa
ratio
n is
not
dev
elop
edSp
ain
2000
Tota
l17
409
t(1
9)42
3 g
2 49
1 t
2001
NiC
d93
4 t
(6)
66 t
(6)
Irela
ndTo
tal
n.a.
n.a.
2001
NiC
d18
6 t
(6)
5 t
(6)
Finl
and
Tota
ln.
a.n.
a.20
01N
iCd
107
t(6
)1
t(6
)U
nite
d Ki
ngdo
m20
02To
tal
25 1
03 t
427
g12
5 t
2001
NiC
d2
163
t(6
)75
t(2
9)
Acce
ssio
n C
ount
ries
Cze
ch R
epub
lic20
02To
tal
3 50
0 t
340
g15
t(1
5)N
iCd
n.a.
n.a.
Latv
iaTo
tal
n.a.
n.a.
NiC
dn.
a.n.
a.
See
foot
note
s ne
xt p
age
Qua
ntifi
catio
n of
spe
nt b
atte
ries
avai
labl
e fo
r col
lect
ion:
- at t
he E
U le
vel:
from
hyp
othe
ses
abou
t ho
ardi
ng- a
t the
leve
l of M
Ss w
here
sep
arat
e co
llect
ion
exis
ts: b
y ad
ding
bat
terie
s co
llect
ed s
epar
atel
y an
d ba
tterie
s co
llect
ed
with
MSW
Qua
ntiti
es
Spen
t bat
terie
s av
aila
ble
for c
olle
ctio
n
%
Spen
t bat
terie
sTo
tal
Sold
in E
EE
Ave
rage
gr
owth
ra
te o
ver
last
yea
rs
Ave
rage
lif
etim e
Sale
s (0
)
tons
tons
ab
h
Spen
t ba
tterie
s ho
arde
d (s
tock
in th
e ec
onom
ic s
pher
e)
(18)
(27)
Col
lect
ion
Rec
yclin
g (e
nter
ing
a re
cycl
ing
plan
t)D
ispo
sal
Sepa
rate
col
lect
ion
(17)
Col
lect
ion
rate
sM
eans
of
colle
ctio
n
% o
f sa
les
% o
f spe
nt
batte
ries
% o
f spe
nt
batte
ries
avai
labl
e fo
r co
llect
ion
Inha
bg
/ cap
ita
/ yr
Batte
ries
alon
e
Thro
ugh
WEE
E
% o
f sa
les
% o
f co
llect
edQ
uant
ities
% o
f co
llect
ed
%%
%m
illio
ns
g/ca
p/yr
%%
tons
tons
%to
ns
i = h
/ a
j = h
/ d
k =
h / f
InB M
SW
= f
- hm
= l /
an
= l /
ho
= p
+ r
p =
h - l
q =
p /
hr =
BM
SW
18%
19%
27%
57 g
59 8
60 t
19 6
05 t
(5)
16%
88%
62 5
78 t
2 71
8 t
12%
59 8
60 t
10%
10%
15%
0 ,1
g21
5 t
38 t
(5)
10%
100%
215
t21
5 t
490
t(9
)49
0 t
490
t18
%19
%27
%57
g60
565
t19
643
t16
%88
%63
283
t2
718
t60
565
t19
%20
%51
%5
g2
044
t2
140
t(2
)19
%10
0%2
044
t2
044
t15
%16
%39
%5
g3
138
t2
000
t(5
)15
%10
0%3
138
t3
138
t6%
6%15
%1,
3 g
2 82
0 t
500
t(5
)6%
100%
2 82
0 t
2 82
0 t
7%8%
19%
0 ,5
g87
4 t
205
t(5
)6%
100%
874
t87
4 t
0 ,0
4 g
17 t
(5)
100%
13%
14%
35%
12 g
8 87
7 t
4 86
2 t
13%
100%
8 87
7 t
8 87
7 t
17%
18%
28%
70 g
69 4
42 t
24 5
05 t
15%
90%
72 1
55 t
2 71
3 t
10%
69 4
42 t
185
B MS
W a
s in
put (
13)
(10)
44%
45%
80%
179
g35
4 t
1 44
0 t
44%
100%
34%
35%
70%
10 g
35 t
84 t
34%
100%
60%
62%
85%
230
g42
5 t
2 36
8 t
60%
100%
92%
96%
34 g
28 t
350
t92
%10
0%16
%17
%45
%69
g5
100
t3
985
t(2
5)16
%96
%15
4 t
4%17
%17
%64
%4
g13
6 t
241
t17
%10
0%39
%40
%56
%15
7 g
10 3
60 t
5 63
0 t
(26)
17%
44%
7 30
9 t
56%
45%
46%
67%
16 g
644
t1
284
t45
%10
0%32
%33
%82
%11
6 g
400
t1
876
t(2
8)32
%10
0%31
%32
%69
%10
g72
t16
0 t
(6)
31%
100%
55%
56%
81%
193
g40
5 t
n.a.
84%
87%
19 g
27 t
167
t84
%10
0%
10
n.a.
98%
43%
20 g
108
t(6
)98
%10
0%n.
a.(2
0)47
%49
%27
g12
0 t
(6)
47%
100%
195
14%
61 g
n.a.
7%2
g66
t(6
)10
0%n.
a.3%
1 g
5 t
(6)
100%
n.a.
1% g
1 t
(6)
100%
0,5%
2 g
75 t
0,3%
60%
50 t
40%
3%1
g75
t10
0%
0,4%
1 g
1,4
t(1
2)0,
04%
9%14
t91
%n.
a.n.
a.n.
a.
49 5 59
Bat
terie
s di
spos
ed o
f w
ith M
SWTo
tal
alm
ost
all
few
Rec
yclin
g pl
ant i
nput
Bat
terie
s la
ndfil
led
afte
r sep
arat
ion
l
Qua
ntiti
es
recy
cled
(e
nter
ing
a re
cycl
ing
plan
t)
10 25 541
tons
tons
Col
lect
ion
with
m
unic
ipal
so
lid w
aste
(M
SW)
g In =
h /
In
390 8 10 60 82 16
(9)
(1)
(11)
(31)
BIO
In
tell
ige
nc
e S
erv
ice
I MP
AC
T A
SS
ES
SM
EN
T O
N S
ELE
CTE
D P
OLI
CY
OP
TIO
NS
FO
R R
EV
ISIO
N O
F TH
E B
ATT
ER
Y D
IRE
CTI
VE
51
(0) S
ales
= p
rodu
ctio
n +
impo
rts -
expo
rts(1
) EP
BA
, Jun
e 20
03 -
Wes
tern
Eur
ope
(2) C
olle
ctN
iCad
, Jun
e 20
03(3
) EB
RA
& E
PB
A, J
une
2003
(4) C
olle
ctN
iCad
, Jun
e 20
03(5
) EB
RA
, May
200
3(6
) Sou
rce:
TR
AR
, Ris
k A
sses
smen
t Tar
gete
d R
epor
t - C
adm
ium
(oxi
de) a
s us
ed in
bat
terie
s - D
raft
vers
ion
of F
ebru
ary
2003
(7) P
yrom
etal
lurg
y in
ded
icat
ed p
lant
s(8
) Pyr
omet
allu
rgy
in m
etal
pla
nts
(9) I
nclu
ded
in 'L
ithiu
m io
n (re
char
geab
le)'
(10)
Dec
lare
d by
MS
s in
the
scop
e of
a s
hort
inqu
iry c
arrie
d ou
t in
the
fram
ewor
k of
this
pro
ject
exc
ept w
hen
expl
icite
ly in
dica
ted
(12)
dec
isio
n no
t mad
e ye
t reg
ardi
ng th
e ex
porta
tion
of c
olle
cted
qua
ntiti
es to
be
recy
cled
abr
oad
(14)
No
answ
er o
btai
ned
to th
e in
quiry
laun
ched
in th
e fra
mew
ork
of th
is p
roje
ct fo
r the
oth
er M
Ss
and
acce
ssio
n co
untri
es.
(15)
Rec
ent i
mpl
emen
tatio
n of
take
bac
k ob
ligat
ion
(sin
ce 2
3.02
.200
2) m
ay e
xpla
in c
olle
cted
qua
ntiti
es s
till v
ery
low
(16)
Ave
rage
gro
wth
rate
for t
he la
st y
ears
- S
ourc
e: E
PB
A &
Col
lect
NiC
ad, J
une
2003
(17)
Incl
udin
g m
agne
tic s
epar
atio
n at
inci
nera
tion
plan
ts
(19)
Ass
umpt
ion:
sam
e sa
le p
er c
apita
as
Fran
ce(2
0) A
mon
g ge
nera
l pur
pose
bat
terie
s, N
w re
cycl
es th
ose
cont
aini
ng H
g an
d di
spos
es o
f the
non
haz
ardo
us o
nes
in la
ndfil
l(2
1) w
ould
be
950
kt a
ccor
ding
to C
olle
ctN
iCad
, whe
n in
dust
rial N
iCd
is n
ot a
ccou
nted
for
(22)
No
stat
istic
s ex
ist a
t the
EU
leve
l; hy
poth
eses
see
med
acc
epta
ble
to s
ome
indu
stria
l exp
erts
, oth
ers
wer
e no
t abl
e to
refu
te o
r to
conf
irm(2
3) 1
396
kt a
ccor
ding
to E
PB
A, J
une
2003
(cov
erin
g co
mm
on o
rgan
isat
ions
ope
ratin
g in
Aus
tria
but n
ot n
eces
saril
y al
l)(2
5) 2
002
data
for F
ranc
e (S
TIB
AT)
acc
ordi
ng to
EP
BA
, Jun
e 20
03: s
ales
= 2
2035
t; c
olle
cted
= 2
105
t; re
cycl
ed =
210
0 t (
99,8
% o
f col
lect
ed)
(27)
sam
e da
ta g
iven
by
EP
BA
, Jun
e 20
03, f
or 2
002
(28)
sou
rce:
EP
BA
, Jun
e 20
03, f
or 2
002
(31)
44%
is 2
001
aver
age
betw
een
54%
for G
RS
, 15%
for R
EB
AT
and
100%
for B
osch
; in
2002
, GR
S s
ent 6
7% o
f bat
terie
s co
llect
ed to
recy
clin
g
(30)
Oth
er d
ata
than
thos
e de
clar
ed b
y na
tiona
l gov
ernm
ents
can
be
foun
d in
TR
AR
(Ris
k A
sses
smen
t Tar
gete
d R
epor
t - C
adm
ium
(oxi
de) a
s us
ed in
bat
terie
s - D
raft
vers
ion
of M
ay 2
003)
for t
he fo
llow
ing
coun
tries
(with
out b
eing
abl
e to
exp
lain
diff
eren
ces)
: B
261
t; F
176
8 t;
D 1
808
t; N
w 1
00 t
(32)
Bec
ause
Dan
ish
porta
ble
NiC
d m
arke
t has
bee
n de
clin
ing
radi
cally
sin
ce 1
996
from
278
t in
199
6 to
110
t in
200
1 (s
ee C
OW
I rep
ort -
in
trodu
ctio
n of
a h
igh
tax
paid
for b
y pr
oduc
ers
aim
ing
at e
ncou
ragi
ng c
olle
ctio
n bu
t whi
ch d
isco
urag
ed s
ales
as
a si
de e
ffect
), sp
ent b
atte
ries
can
not b
e as
sess
ed fr
om 2
001
sale
s w
ithou
t int
rodu
cing
a c
onsi
dera
ble
biai
s. 1
997
sale
s ar
e co
nsid
ered
inst
ead,
ass
esse
d at
250
t.
(11)
AlM
n an
d Zn
C b
atte
ries
with
rela
tivel
y hi
gh m
ercu
ry c
onte
nt (p
ut o
n th
e m
arke
t bef
ore
legi
slat
ion
ente
red
into
forc
e) a
re n
ot a
ll re
cycl
ed b
ecau
se o
f rec
yclin
g di
fficu
lties
and
hig
h co
st; g
ener
al p
urpo
se b
atte
ries
with
no
Hg
are
recy
cled
(13)
see
tabl
e 'P
orta
ble
Bat
terie
s - C
urre
nt S
ituat
ion
in s
ome
MS
s' w
here
spe
nt b
atte
ries
avai
labl
e is
ass
esse
d by
add
ing
batte
ries
sepa
rate
ly c
olle
cted
and
bat
terie
s co
ntai
ned
in M
SW
(18)
270
0 kt
acc
ordi
ng to
EP
BA
, Jun
e 20
03 (c
over
ing
com
mon
org
anis
atio
ns o
pera
ting
in A
ustri
a bu
t not
nec
essa
rily
all),
i.e.
33
6 g
/ inh
ab /
yr; i
n th
is ta
ble,
we
deci
ded
to u
se C
olle
ctN
iCad
ass
umpt
ion,
i.e.
sam
e sa
le p
er in
hab
in A
ustri
a as
in G
erm
any:
(26)
dat
a he
re a
re th
ose
decl
ared
by
Ger
man
gov
ernm
ent f
or 2
001,
cov
erin
g G
RS
, RE
BA
T an
d B
osch
; 200
2 da
ta fo
r Ger
man
y (c
over
ing
GR
S o
nly)
acc
ordi
ng to
EP
BA
, Jun
e 20
03: s
ales
= 2
9982
t; c
olle
cted
= 1
1256
t; re
cycl
ed =
753
9 t (
66%
of c
olle
cted
)
(29)
Oth
er d
ata
than
thos
e de
clar
ed b
y na
tiona
l gov
ernm
ents
can
be
foun
d in
TR
AR
(Ris
k A
sses
smen
t Tar
gete
d R
epor
t - C
adm
ium
(oxi
de) a
s us
ed in
bat
terie
s - D
raft
vers
ion
of M
ay 2
003)
for t
he fo
llow
ing
coun
tries
(with
out b
eing
abl
e to
exp
lain
diff
eren
ces)
: 4
3 t,
UK
93
t

BIO
In
tell
ige
nc
e S
erv
ice
I MP
AC
T A
SS
ES
SM
EN
T O
N S
ELE
CTE
D P
OLI
CY
OP
TIO
NS
FO
R R
EV
ISIO
N O
F TH
E B
ATT
ER
Y D
IRE
CTI
VE
52
Port
able
Bat
terie
sW
aste
str
eam
(inc
ludi
ng s
tock
in th
e ec
onom
ic s
pher
e)C
olle
ctio
n
Cur
rent
Situ
atio
n in
som
e M
SsSe
para
te c
olle
ctio
n
Col
lect
ion
rate
s
Qua
ntiti
es%
of s
pent
ba
tterie
s%
of s
ales
% o
f spe
nt
batte
ries
avai
labl
e fo
r co
llect
ion
Inha
bg
/ cap
ita /
yr
% p
er y
rye
ars
tons
tons
% o
f dto
nskg
/ ca
p /
yr%
%m
illio
nsg/
cap/
yr
gt
d =
a / (
1+g)
te
= d
- fe
/ df =
h +
BM
SW
f / In
i = h
/ a
k =
h / f
In
Yea
rSe
gmen
t(3
)(3
)(3
)(3
)
Aust
ria20
01To
tal
3 25
1 t
1,0%
43
169
t1
375
t43
%1
794
t22
3 g
1 44
0 t
44%
80%
179
g
2001
NiC
d24
7 t
1,0%
523
7 t
118
t50
%11
9 t
15 g
84 t
34%
70%
10 g
Belg
ium
2002
Tota
l3
955
t1,
0%4
3 81
7 t
1 02
4 t
27%
2 79
3 t
271
g2
368
t60
%85
%23
0 g
2001
NiC
d38
2 t
1,0%
536
7 t
(2)
(2)
350
t92
%34
g
Fran
ce20
01To
tal
25 2
45 t
1,0%
424
609
t15
370
t62
%9
239
t15
5 g
4 13
9 t
16,4
%45
%69
g
2001
NiC
d1
456
t1,
0%5
1 39
9 t
1 02
2 t
73%
377
t6
g24
1 t
17%
64%
4 g
Ger
man
y20
01To
tal
33 3
78 t
1,0%
432
538
t9
239
t28
%23
299
t28
3 g
12 9
39 t
39%
56%
157
g
2001
NiC
d2
882
t1,
0%5
2 77
0 t
842
t30
%1
928
t23
g1
284
t45
%67
%16
g
Net
herla
nds
2001
Tota
l5
899
t1,
0%4
5 75
1 t
3 47
5 t
60%
2 27
6 t
141
g1
876
t32
%82
%11
6 g
2001
NiC
d52
1 t
1,0%
550
1 t
269
t54
%23
2 t
14 g
160
t31
%69
%10
g
Swed
en20
01To
tal
3 10
0 t
1,0%
43
022
t91
7 t
30%
2 10
5 t
239
g1
700
t55
%81
%19
3 g
2001
NiC
d19
9 t
1,0%
519
1 t
(2)
(2)
167
t84
%19
g
Tota
l74
828
t72
906
t31
399
t43
%41
507
t22
4 g
24 4
62 t
33%
59%
132
g
NiC
d5
687
t5
465
t46
%2
286
t40
%12
g
(1) C
olle
ctN
iCad
, Jun
e 20
03 -
Sour
ce: d
iffer
ent s
tudi
es p
erfo
rmed
at n
atio
nal l
evel
(2) m
aybe
not
repr
esen
tativ
e of
the
natio
nal s
ituat
ion,
like
ly to
be
over
estim
ated
at t
he n
atio
nal l
evel
; thu
s ca
lcul
atio
n re
sults
are
not
pre
sent
ed (q
uant
ities
col
lect
ed a
re h
ighe
r tha
n qu
antit
ies
avai
labl
e fo
r col
lect
ion
resu
lting
from
cal
cula
tion)
(3) S
ee T
able
'Por
tabl
e Ba
tterie
s - C
urre
nt S
ituat
ion
in E
urop
e'(4
) for
tota
l sm
all b
atte
ries,
0.0
15%
is c
onsi
dere
d in
stea
d of
0.0
10%
as
resu
lting
from
the
anal
ysis
per
form
ed in
Bel
gium
bec
ause
acc
ordi
ng to
BE
BAT
- Jun
e 20
03, 0
.010
% w
ould
not
be
repr
esen
tativ
e of
the
aver
age
Belg
ium
situ
atio
n(5
) ave
rage
for 4
cou
ntrie
s
9
Spen
t ba
tterie
s ho
arde
d (s
tock
in th
e ec
onom
ic
sphe
re)
Spen
t bat
terie
s av
aila
ble
for c
olle
ctio
n
8 82 16
Qua
ntiti
es
g In =
h /
In
Qua
ntifi
catio
n of
spe
nt
batte
ries
avai
labl
e fo
r col
lect
ion
from
ass
essm
ent o
f bat
terie
s co
ntai
ned
in M
SW
10 60
Tota
lA
vera
ge
lifet
ime
Ave
rage
gr
owth
rate
ov
er la
st
year
s
185
Ave
rage
situ
atio
n am
ong
the
6 co
untr
ies
whe
re s
epar
ate
colle
ctio
n sy
stem
exi
st
Sale
s
tons
tons
ah
Spen
t ba
tterie
s
(5)
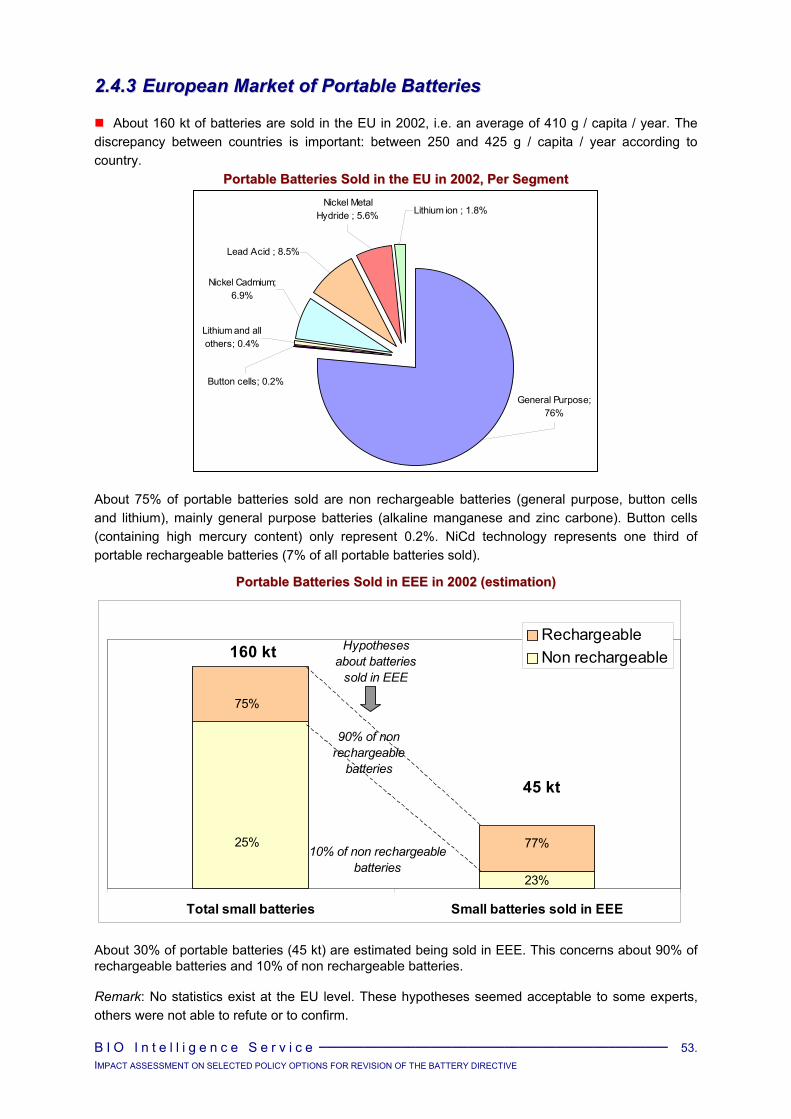
B I O I n t e l l i g e n c e S e r v i c e _______________________________________________ 53. IMPACT ASSESSMENT ON SELECTED POLICY OPTIONS FOR REVISION OF THE BATTERY DIRECTIVE
22..44..33 EEuurrooppeeaann MMaarrkkeett ooff PPoorrttaabbllee BBaatttteerriieess
About 160 kt of batteries are sold in the EU in 2002, i.e. an average of 410 g / capita / year. The discrepancy between countries is important: between 250 and 425 g / capita / year according to country.
PPoorrttaabbllee BBaatttteerriieess SSoolldd iinn tthhee EEUU iinn 22000022,, PPeerr SSeeggmmeenntt
Lithium ion ; 1.8%Nickel Metal
Hydride ; 5.6%
Lead Acid ; 8.5%
Nickel Cadmium; 6.9%
Lithium and all others; 0.4%
Button cells; 0.2%
General Purpose; 76%
About 75% of portable batteries sold are non rechargeable batteries (general purpose, button cells and lithium), mainly general purpose batteries (alkaline manganese and zinc carbone). Button cells (containing high mercury content) only represent 0.2%. NiCd technology represents one third of portable rechargeable batteries (7% of all portable batteries sold).
PPoorrttaabbllee BBaatttteerriieess SSoolldd iinn EEEEEE iinn 22000022 ((eessttiimmaattiioonn))
About 30% of portable batteries (45 kt) are estimated being sold in EEE. This concerns about 90% of rechargeable batteries and 10% of non rechargeable batteries.
Remark: No statistics exist at the EU level. These hypotheses seemed acceptable to some experts, others were not able to refute or to confirm.
Total small batteries Small batteries sold in EEE
RechargeableNon rechargeable
25%
75%
77%
23%
160 kt
45 kt
90% of non rechargeable
batteries
10% of non rechargeablebatteries
Hypotheses about batteries
sold in EEE

B I O I n t e l l i g e n c e S e r v i c e IMPACT ASSESSMENT ON SELECTED POLICY OPTIONS FOR REVISION OF THE BATTERY DIRECTIVE
54
22..44..44 WWaassttee SSttrreeaamm ooff PPoorrttaabbllee BBaatttteerriieess
The quantification of waste streams is based on several assumptions (lifespan, domestic hoarding, proportion contained in WEEE) described above in section � page 45. Figures regarding batteries waste streams are thus approximate estimates. This exercise (although time-consuming) proved to be very useful to be able to quantify collection rates according to more accurate definitions rather than collected quantities compared to sales.
About 150 kt of spent batteries are estimated to arise in the EU, i.e. an average of 380 g / capita / year (with an important discrepancy between countries as for sales: between 245 and 400 g / capita / year according to country).
Spent NiCd batteries amounts to about 10.5 kt.
Domestic hoarding is estimated at
30% for non rechargeable batteries (i.e. 30% of non rechargeable spent batteries are hoarded by households),
60% for rechargeable batteries.
Thus only about 97 kt of spent batteries are estimated to be collectable in 2002 (i.e. available for collection), that is an average of 235 g / capita / year (between 140 and 285 g / capita / year according to country).
Spent NiCd batteries available for collection are estimated at 4.1 kt.
An average of about 20% of spent batteries available for collection are estimated to be contained in WEEE.
EEssttiimmaattiioonn ooff WWaassttee SSttrreeaamm ooff PPoorrttaabbllee BBaatttteerriieess iinn 22000022
Waste stream (including stock in the economic sphere)
% of spent batteries Quantities Total Contained in
WEEE
EU-15 + Ch + N - 2002General Purpose 117 405 t 30% 35 221 t 82 183 t 85% 10% 8 218 tButton cells 362 t 30% 109 t 253 t 0% 10% 25 tLithium and all others 700 t 30% 210 t 490 t 1% 10% 49 tSub-total non rechargeable 118 466 t 30% 35 540 t 82 926 t 86% 10% 8 293 tNickel Cadmium 10 460 t 60% 6 276 t 4 184 t 4% 90% 3 766 tLead Acid 12 845 t 60% 7 707 t 5 138 t 5% 90% 4 624 tNickel Metal Hydride 8 301 t 60% 4 981 t 3 320 t 3% 90% 2 988 tLithium ion 2 697 t 60% 1 618 t 1 079 t 1% 90% 971 tSub-total rechargeable 34 304 t 60% 20 582 t 13 722 t 14% 90% 12 349 t
Total small batteries 152 770 t 37% 56 122 t 96 648 t 100% 21% 20 642 t
Spent batteries
Spent batteries hoarded (stock in the economic
sphere)
Spent batteries available for collection
See detailed table ‘Portable Batteries – Current Situation in Europe’ for further explanations.
B I O I n t e l l i g e n c e S e r v i c e IMPACT ASSESSMENT ON SELECTED POLICY OPTIONS FOR REVISION OF THE BATTERY DIRECTIVE
55
22..44..55 CCoolllleeccttiioonn ooff SSppeenntt PPoorrttaabbllee BBaatttteerriieess
Several collection schemes are possible to collect portable batteries in view of recycling:
separate collection of batteries ‘alone’, which is the most widespread scheme in countries where separate collection and recycling exist,
separate collection of WEEE containing batteries, which is not developed yet,
separate collection in professional circuits, which concerns only a small proportion of portable batteries separately collected according to experts,
collection mixed with MSW and magnetic separation in incineration plants, which is not developed yet but is under study in several MSs (e.g. NL and D). This solution presents low collection costs. On going R&D programmes includes the improvement of the efficiency of the magnetic separation.
As for separate collection of portable batteries ‘alone’, it is well or quite well developed in 8 MSs, which can be split into 2 categories according to the choice made in terms of flows collected:
Separate collection focusing on NiCd (or all rechargeable according to country) batteries: Dk, Nw (other portable batteries remain in the MSW flow),
Separate collection of all portable batteries: A, B, F, D, NL and Sw.
According to information provided to BIO in the framework of the study, separate collection would not be well developed in accession countries. But information received is very partial at that stage. Further investigation would be necessary in order to describe more accurately the situation in accession countries.
This quantification of quantities collected is based on the different data provided by European industry associations as well as MSs.
About 27 kt of spent batteries are separately collected in the EU, i.e. the collection rate reaches:
17% of current sales,
18% of spent batteries,
28% of spent batteries available for collection,
an average of 70 g / capita / year.
More than 80% of portable batteries collected are non rechargeable general purpose batteries and 8% are rechargeable NiCd batteries (2.1 kt).
The situation is very different from one country to another. Three categories of countries can be distinguished:
Countries where separate collection of all portable batteries is well developed (A, B, F, D, NL, Sw): 45 to about 85% of portable batteries available for collection are estimated to be collected according to countries.
Countries where separate collection of NiCd batteries is well developed (Dk, Nw): 40 to 50% of spent NiCd are collected.
Countries where separate collection is not developed: 0 to 15% of portable batteries available for collection are estimated to be collected according to countries.
A table in section 2.5 summarises the current situation.
B I O I n t e l l i g e n c e S e r v i c e IMPACT ASSESSMENT ON SELECTED POLICY OPTIONS FOR REVISION OF THE BATTERY DIRECTIVE
56
Differences in the results reached in MSs may be explained by several parameters which differ among countries:
Starting date of separate collection: in some MSs, the system is more than 10 year old thus at a steady stage rather than in others, it is 2 year old, so still at a development stage.
Type and level of legal collection objectives set up at national level: from high mandatory targets to no quantified targets.
Collection schemes and communication programmes implemented: depending on the objectives to be reached (and the level of penalties included), more or less collection points have been setting up and more or less extensive communication and promotion programmes have been developed to encourage end users to first participate and secondly reduce their hoarding behaviours.
Fact sheets are presented in appendix 2 for each main collection scheme. A summary is included in section 2.4.7 page 60 with related costs as well.
22..44..66 RReeccyycclliinngg ooff SSppeenntt PPoorrttaabbllee BBaatttteerriieess
About 90% of total portable batteries collected is estimated to be recycled. This percentage aggregates different situations according to battery segments and countries:
NiCd batteries: about 100% of NiCd batteries collected are recycled.
General purpose batteries: the situation is very different among countries:
- Most of them send all portable collected batteries to a recycling plant.
- Others send 60-65% of portable collected batteries to a recycling plant (D, UK, Sw).
- Others have no estimation of quantities sent to recycling.
The limitation of recycling rate of general purpose batteries in some countries is motivated by different reasons according to countries:
Relatively high Hg-content general purpose batteries, put on the market before legislation entered into force in the EU17, are not all recycled in some countries, due to specific costly recycling processes18.
- Smelting plants (not dedicated to batteries) can accept batches containing up to 5 ppm of mercury (even 500 ppm in certain cases according to experts).
- As for the plants dedicated to batteries, a demercurisation step must take place prior to the recycling process.
Non hazardous general purpose batteries (i.e. containing no Hg) are disposed of in landfill in some other countries.
Button cells and batteries containing up to 30% of Hg are recycled in specific plants (some of spent button cells have a positive market value (e.g. those containing Ag) others a negative value; the overall value would be negative according to experts).
As for lithium-ion batteries, the development of specific recycling processes is in progress because of the security required (fire and explosion risks at the battery production and recycling steps). Most of collected quantities today are stored waiting for recycling processes to be ready.
17 Restriction concerning the marketing of batteries other than button cells containing Hg. 18 In Germany, main collector GRS estimates that the average Hg content of the ZnC + AlMn mixture was ca. 60 ppm in 1998,
100 ppm in 2002 and will be 10 ppm in 2005.

B I O I n t e l l i g e n c e S e r v i c e IMPACT ASSESSMENT ON SELECTED POLICY OPTIONS FOR REVISION OF THE BATTERY DIRECTIVE
57
Other rechargeable or non rechargeable batteries (NiMH, lithium) are not always recycled yet, due to portable quantities.
Collected batteries which are not recycled are disposed of in landfill, as hazardous waste or non hazardous waste according to their type.
Sorting prior to recycling is necessary to separate main flows:
ZnC & Alkaline batteries,
NiCd batteries,
Portable lead acid batteries,
Button cells,
NiMH batteries,
Li batteries,
Li-ion batteries.
Dedicated sorting plants exist in all countries where separate collection is developed (1 to 3 plants according to the size of the country and the current development of separate collection i.e. the current quantities of batteries to be sorted).
As for recycling, batteries are recycled in dedicated plants, smelting plants or electrical arc furnaces (EAF).
Three recycling processes exist:
Hydrometallurgic process,
Pyrometallurgic process,
Thermal treatment. PPoorrttaabbllee BBaatttteerriieess –– RReeccyycclliinngg PPrroocceesssseess
About 32 dedicated recycling plants exist in the EU and are concentrated in certain countries (mainly France and Germany).
Several plants dedicated to batteries recycling are still under used (up to half of their capacity seems to be available) thus there is an overcapacity of recycling.
After collection, spent batteries are transported from countries where no recycling plant exist to over-capacity countries.
Process technology Hydrometallurgic Pyrometallurgic Thermal treatmentPrimary batteriesButton cells X X X
Alkaline Manganese X X X
Zinc Carbon X X X
Lithium Manganese X X
Zinc Air X
Secondary batteriesLead Acid X
Nickel Cadmium X
Nickel Metal Hydride X X
Lithium Ion X X
B I O I n t e l l i g e n c e S e r v i c e IMPACT ASSESSMENT ON SELECTED POLICY OPTIONS FOR REVISION OF THE BATTERY DIRECTIVE
58
It is not the purpose of this study to analyse in detail the different types of recycling (dedicated plants, smelting plant, EAF).
It can just be mentioned that they are likely to have different profiles in terms of:
Recovery rate (proportion of metals which can be recovered),
Costs,
Environmental impacts and benefits.
Some information will be given further in the report without pretending covering the whole issue.
Several stakeholders mentioned the usefulness to define a system to accredit battery recycling facilities.
A dedicated study would be necessary to cover that issue, in particular to analyse the advantages and disadvantages of systems based on best available technology (BAT) principles and systems based on best available technology not entailing excessive costs (BATNEEC) principles.
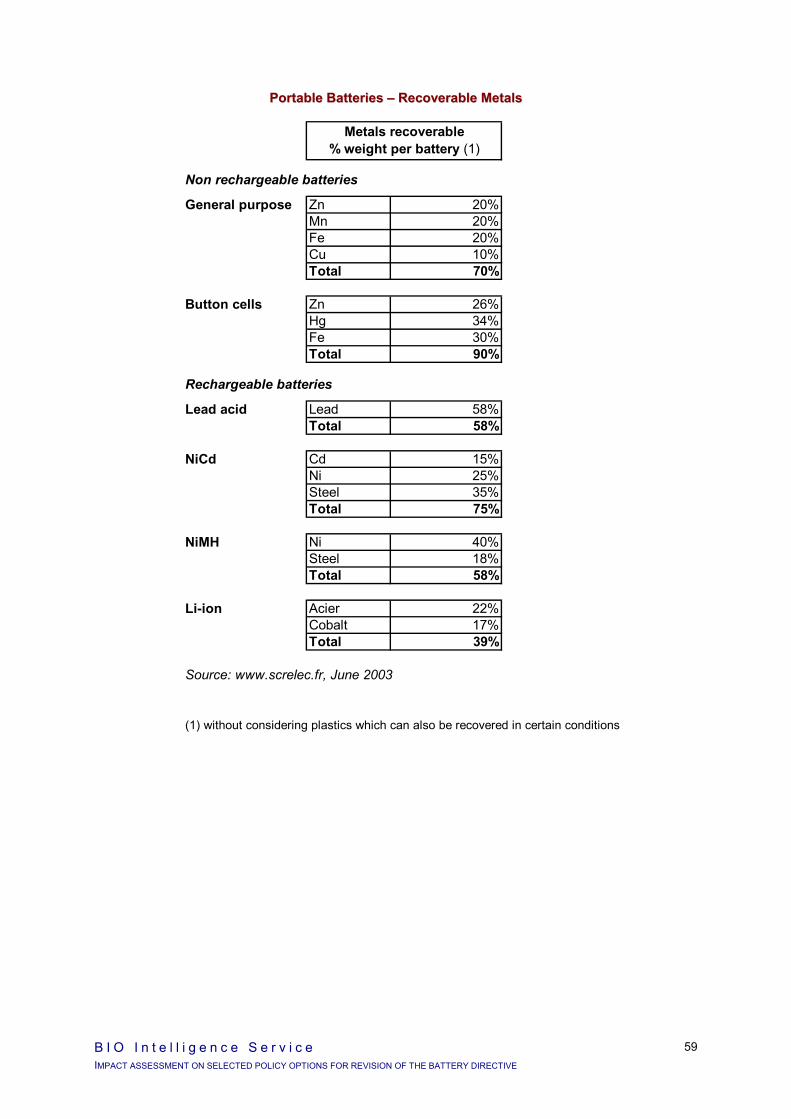
B I O I n t e l l i g e n c e S e r v i c e IMPACT ASSESSMENT ON SELECTED POLICY OPTIONS FOR REVISION OF THE BATTERY DIRECTIVE
59
PPoorrttaabbllee BBaatttteerriieess –– RReeccoovveerraabbllee MMeettaallss
Non rechargeable batteries
General purpose Zn 20%Mn 20%Fe 20%Cu 10%Total 70%
Button cells Zn 26%Hg 34%Fe 30%Total 90%
Rechargeable batteries
Lead acid Lead 58%Total 58%
NiCd Cd 15%Ni 25%Steel 35%Total 75%
NiMH Ni 40%Steel 18%Total 58%
Li-ion Acier 22%Cobalt 17%Total 39%
Source: www.screlec.fr, June 2003
(1) without considering plastics which can also be recovered in certain conditions
Metals recoverable % weight per battery (1)

B I O I n t e l l i g e n c e S e r v i c e IMPACT ASSESSMENT ON SELECTED POLICY OPTIONS FOR REVISION OF THE BATTERY DIRECTIVE
60
22..44..77 EEccoonnoommiiccss ooff PPoorrttaabbllee BBaatttteerriieess CCoolllleeccttiioonn aanndd RReeccyycclliinngg
Case studies were performed to gather updated cost data about existing collection and organisation schemes in countries where they are well or quite well developed.
From these data, we were able to define ranges for the different cost items and discuss with experts about expected economies of scale.
In this section, we successively consider:
Methodological aspects, including cost items taken into account,
Economics of collection and recycling of portable NiCd batteries,
Economics of collection and recycling of all portable batteries.
22..44..77..11 CCoossttss TTaakkeenn IInnttoo AAccccoouunntt
The following cost items are distinguished:
Variable costs
- Collection points (equipment)
- Collection (logistic)
- Sorting
- Transport
- Recycling
Fixed costs
- Public relations & communication
- Administration
Total
We quantified costs per tonne collected and per battery sold.
Costs paid for by producers are indicated and quantified. Those paid for by retailers and / or public authorities are mentioned if any but no data were available to quantify them.
For each collection and recycling scheme studied, a fact-sheet was elaborated based on a similar format summarising:
results reached,
stakeholders responsibility and organisation,
costs,
fees paid for by producers,
evolution of costs, in the past and in future.
Detailed fact-sheets are presented in appendix 2. Comments and a summary are included in the following sections.

B I O I n t e l l i g e n c e S e r v i c e IMPACT ASSESSMENT ON SELECTED POLICY OPTIONS FOR REVISION OF THE BATTERY DIRECTIVE
61
FFaacctt--SShheeeett FFoorrmmaatt -- EExxaammppllee ooff BBeellggiiuumm FFaacctt--SShheeeett
C.4 Expected costs evolution in the future
(1) Hypothesis: average weight of small batteries = g 40(2) slightlly negative if no sorting(3) Belgium is the only MS where consumers are legally in charge of the financial responsibility.
PR & communication expenses are planned to decrease because the maximum collection rate is considered to be reached; economies of scale are likely to happen for ZnC & alkaline batteries recycled in dedicated plants when more quantities arise in Europe (up to 600-700 Euros / t)
Portable BatteriesMain Characteristics
Collection: Bring back system to various collection points Country BelgiumFinancial responsibility: Consumer responsibility (3) Scope BEBAT, 2002
General purpose batteries recycling: Dedicated plants of all ZnC and Alk batteries
A/ Quantities and Results ReachedSales 3 955 tonsSpent batteries (assumption) 3 745 tonsSpent batteries available for collection (assumption) 2 632 tonsCollected quantities 2 368 tonsCollection rate 60% of sales
63% of spent batteries90% of spent batteries available for collection228 g/inhabitant/yr
Quantities entering a recycling plant 2 368 tonsRecycling plant input 100% of collected
B/ Responsibility and organisation
- Starting date of separate collection and recycling: 1996 (7 years old)
- Bulking up depot: 3 exist in Belgium- Sorting: 1 sorting plant (one of the 3 bulking up depots); a partial sorting is also performed in another bulking up depot- Sorted flows and destination
Recycling in dedicated 1 000 Euros / t
NiCd batteries Recycling, F 400 Euros / tSmall lead acid batteries Recycling, B 50 - 100 Euros / t (2)Button cells Recycling, B 4 000 Euros / tNiMH batteries Recycling, F nulLi & Li-ion batteries Storage, B -
C/ Costs Paid for by consumers (via producers)
C.1 2002 situation BudgetkEuros
Euros / tcollected
Variable costs 5 221 2 205 5,3Collection points (equipment) 132 56 0,1
Collection (logistic) 592 250 0,6Sorting
TransportRecycling 1 279 540 1,3 noneProvision 268 113 0,3
Marking cost 2 368 1 000 2,4Fixed costs 5 988 2 529 6,1
Distribution of plastic bags to households 1 206 509 1,2Other PR & communication 2 721 1 149 2,8
Administration 2 061 870 2,1Total 11 209 4 733 11,3
Cents / kg soldZnC & Alk batteries 12,39 428
NiCd batteries 12,39 138NB: BEBAT operates on a per unit basis Source: BEBAT, July 2003
C.3 Costs evolution in the past t collected Euros / t collected
BudgetkEuros
1998 1 562 5 055 7 8961999 1 834 5 092 9 3392000 2 105 4 872 10 2562001 2 325 3 806 8 8492002 2 368 3 733 8 841
Source: BEBAT, July 2003
C.2 Financial fees paid for by consumers (via producers) to BEBAT
Paid for by local
authorities or retailers
Approximative sorting, transport and recycling costs (Euros / ton entering a recycling plant)
- Collection points: a total of about 20 000 collection points (500 inhab / collection point); about 20% of collection points are located in super and hyper markets as well as schools and about 80% in municipal collection points; about 80% of quantities collected are collected with 20% of collection points available; 3 plastic bags per year are mailed by BEBAT to households they can use to store batteries and bring them back to collection points (they also allow to participate to a lotery).- Collection: about 5000 collection points are collected automatically with an optimised time schedule and the others are collected when they call BEBAT
ZnC & Alk batteries (high or no Hg content)
- At the begining, high mandatory targets to be reached quickly (collection rate = 75% of batteries sold; threat of a high penalty: 80 cents / unit not collected). Because they were not reached (and considered not reacheable), they were revised. New targets: 60% in 2002 and 65% in 2004
0,6
From 1998 to date:- communication expenses increased then stabilised,- collection expenses decreased due to the optimisation of collection circuits and time schedule, - quantities collected regularly increased.
582 246
Cents / battery sold
NB: the table presents total costs except marking costs (which correspond to the refund to producers of their expenses to mark batteries put on the market) because it is specific to Belgium
Cents / battery sold (1)

B I O I n t e l l i g e n c e S e r v i c e IMPACT ASSESSMENT ON SELECTED POLICY OPTIONS FOR REVISION OF THE BATTERY DIRECTIVE
62
22..44..77..22 EEccoonnoommiiccss ooff PPoorrttaabbllee NNiiCCdd BBaatttteerriieess CCoolllleeccttiioonn aanndd RReeccyycclliinngg
22..44..77..22..11 RReeccyycclliinngg CCoossttss ooff PPoorrttaabbllee NNiiCCdd bbaatttteerriieess
Portable NiCd recycling costs vary depending on the recycling technology.
In dedicated plants, recyclers bill 0 Euros / t in case of individual cells and around 300 Euros / t in case of power packs because the latest require to be dismantled (in both cases, revenues amount at about 1 000 Euros / t). As a consequence, the recycling cost of a batch constituted of about 50% of individual cells and 50% of power packs amounts to about 150 Euros / t of NiCd batteries.
In the future, according to recyclers, economies of scale can be expected mostly for the packs preparation costs. Total recycling cost could be at 0 Euros / t for both individual cells and power packs.
In metal plants, recycling costs amounts to approximately 100 Euros / t of batteries. No major economies of scale can be expected in the future.
22..44..77..22..22 CCoolllleeccttiioonn aanndd RReeccyycclliinngg CCoossttss ooff PPoorrttaabbllee NNiiCCdd bbaatttteerriieess ffoorr EExxiissttiinngg SScchheemmeess
We collected and compiled cost data to illustrate 2 cases:
Countries which focus on NiCd (or rechargeable) batteries collection and recycling (Dk, Nw),
Collection circuits dedicated to power tools containing NiCd batteries in countries where separate collection of all portable batteries exist (D, F for instance).
In Denmark, producers have to pay 81 cents / NiCd unit sold to cover collection and recycling costs. Total collection and recycling costs can then be estimated at about 2 830 Euros / t of NiCd collected. 43% of portable spent NiCd are assessed being collected and recycled.
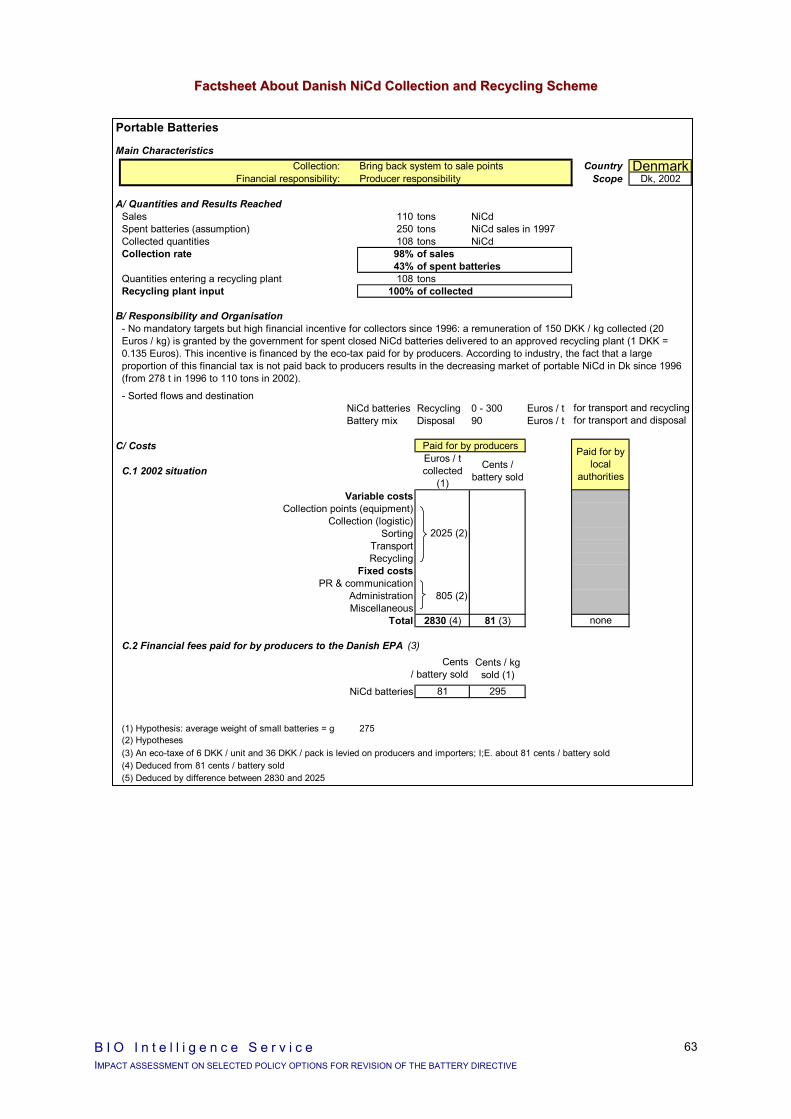
B I O I n t e l l i g e n c e S e r v i c e IMPACT ASSESSMENT ON SELECTED POLICY OPTIONS FOR REVISION OF THE BATTERY DIRECTIVE
63
FFaaccttsshheeeett AAbboouutt DDaanniisshh NNiiCCdd CCoolllleeccttiioonn aanndd RReeccyycclliinngg SScchheemmee
Portable Batteries
Main CharacteristicsCollection: Bring back system to sale points Country Denmark
Financial responsibility: Producer responsibility Scope Dk, 2002
A/ Quantities and Results ReachedSales 110 tons NiCdSpent batteries (assumption) 250 tons NiCd sales in 1997Collected quantities 108 tons NiCdCollection rate 98% of sales
43% of spent batteriesQuantities entering a recycling plant 108 tonsRecycling plant input 100% of collected
B/ Responsibility and Organisation
- Sorted flows and destinationNiCd batteries Recycling 0 - 300 Euros / tBattery mix Disposal 90 Euros / t
C/ Costs Paid for by producers
C.1 2002 situationEuros / t collected
(1)
Cents / battery sold
Variable costsCollection points (equipment)
Collection (logistic)Sorting
TransportRecycling
Fixed costsPR & communication
Administration 805 (2)Miscellaneous
Total 2830 (4) 81 (3)
C.2 Financial fees paid for by producers to the Danish EPA (3)
Cents / kg sold (1)
NiCd batteries 81 295
(1) Hypothesis: average weight of small batteries = g 275
(3) An eco-taxe of 6 DKK / unit and 36 DKK / pack is levied on producers and importers; I;E. about 81 cents / battery sold(4) Deduced from 81 cents / battery sold(5) Deduced by difference between 2830 and 2025
Cents / battery sold
(2) Hypotheses
2025 (2)
none
- No mandatory targets but high financial incentive for collectors since 1996: a remuneration of 150 DKK / kg collected (20 Euros / kg) is granted by the government for spent closed NiCd batteries delivered to an approved recycling plant (1 DKK = 0.135 Euros). This incentive is financed by the eco-tax paid for by producers. According to industry, the fact that a large proportion of this financial tax is not paid back to producers results in the decreasing market of portable NiCd in Dk since 1996 (from 278 t in 1996 to 110 tons in 2002).
for transport and recyclingfor transport and disposal
Paid for by local
authorities

B I O I n t e l l i g e n c e S e r v i c e IMPACT ASSESSMENT ON SELECTED POLICY OPTIONS FOR REVISION OF THE BATTERY DIRECTIVE
64
For NiCd power tools collection circuits, data were compiled for Bosh system in Germany and Ecovolt system in France.
Collection and recycling costs vary between 1 300 and 1 750 Euros / t collected with about 50% collection rates for batteries sold by producers involved.
FFaaccttsshheeeett AAbboouutt DDaanniisshh NNiiCCdd PPoowweerr TToooollss CCoolllleeccttiioonn CCiirrccuuiittss
Portable Batteries
Main CharacteristicsCollection: Bring back to sale points
Financial responsibility: Shared responsibility
Ecovolt, F Collected (t / year) 100 t 20-30 t
Sales of producers concerned (t) n.a. about 60 tCollection rate (% of sales) n.a. about 40%
Containers + reverse logistics
Parcels sent back
Costs
Euros / t
collected
Euros / t
collected
Cents / battery sold (1)
Variable costs 1 200 1 190Collection points (equipment)
Collection (logistic) 350 400Sorting 600 540
Transport 150 150Recycling (2) 100 100 2,8Fixed costs 130 130
PR & communication - - -Administration 130 130 -
Total 1 330 1 320 1 777 20,0 no data available
Source: EBRA, June 2003 BIO estimation from Ecovolt, June 2003
(1) Hypothesis: average weight of small NiCd batteries = g 275
Paid for by
retailers
(2) Hypothesis: 2/3 of NiCd on which 50% of individual cells at 0 Euro / t of batteries, and 50% of power packs at 300 Euros / t of batteries
Bosch, D
-
Paid for by producers
46,1
100
-
Euros / t
collected
1677
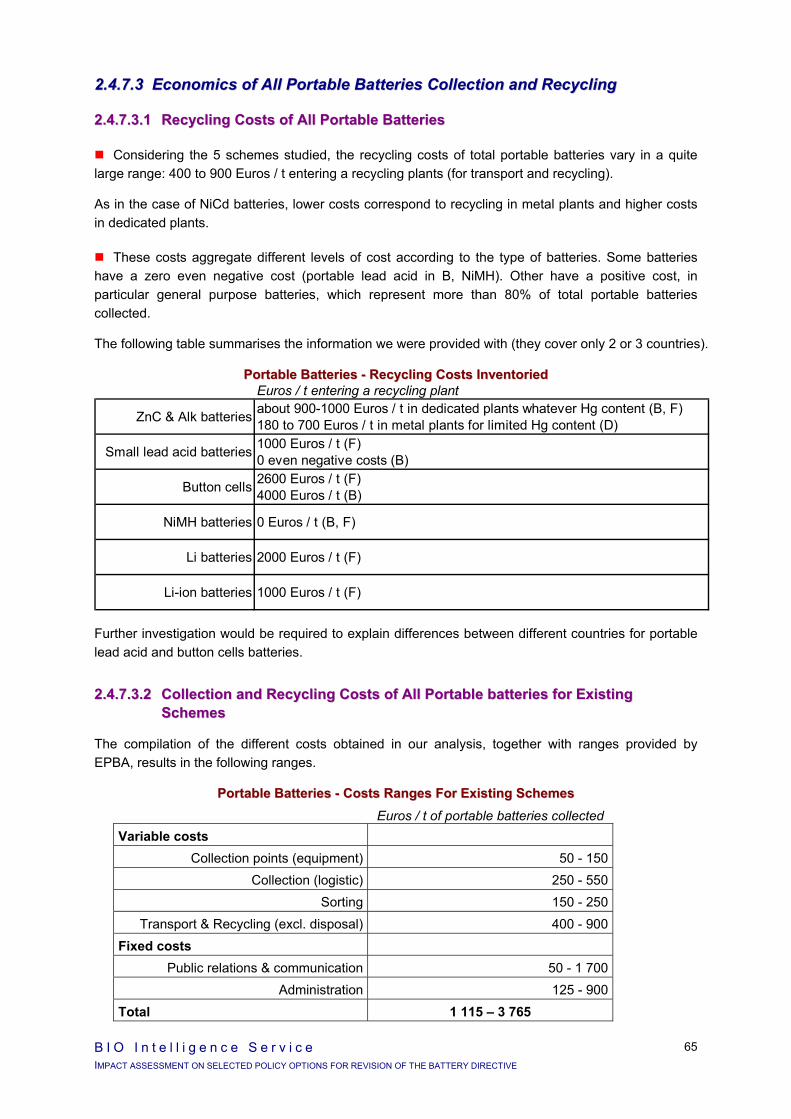
B I O I n t e l l i g e n c e S e r v i c e IMPACT ASSESSMENT ON SELECTED POLICY OPTIONS FOR REVISION OF THE BATTERY DIRECTIVE
65
22..44..77..33 EEccoonnoommiiccss ooff AAllll PPoorrttaabbllee BBaatttteerriieess CCoolllleeccttiioonn aanndd RReeccyycclliinngg
22..44..77..33..11 RReeccyycclliinngg CCoossttss ooff AAllll PPoorrttaabbllee BBaatttteerriieess
Considering the 5 schemes studied, the recycling costs of total portable batteries vary in a quite large range: 400 to 900 Euros / t entering a recycling plants (for transport and recycling).
As in the case of NiCd batteries, lower costs correspond to recycling in metal plants and higher costs in dedicated plants.
These costs aggregate different levels of cost according to the type of batteries. Some batteries have a zero even negative cost (portable lead acid in B, NiMH). Other have a positive cost, in particular general purpose batteries, which represent more than 80% of total portable batteries collected.
The following table summarises the information we were provided with (they cover only 2 or 3 countries).
PPoorrttaabbllee BBaatttteerriieess -- RReeccyycclliinngg CCoossttss IInnvveennttoorriieedd
Further investigation would be required to explain differences between different countries for portable lead acid and button cells batteries.
22..44..77..33..22 CCoolllleeccttiioonn aanndd RReeccyycclliinngg CCoossttss ooff AAllll PPoorrttaabbllee bbaatttteerriieess ffoorr EExxiissttiinngg SScchheemmeess
The compilation of the different costs obtained in our analysis, together with ranges provided by EPBA, results in the following ranges.
PPoorrttaabbllee BBaatttteerriieess -- CCoossttss RRaannggeess FFoorr EExxiissttiinngg SScchheemmeess Euros / t of portable batteries collected
Variable costs Collection points (equipment) 50 - 150
Collection (logistic) 250 - 550 Sorting 150 - 250
Transport & Recycling (excl. disposal) 400 - 900 Fixed costs
Public relations & communication 50 - 1 700 Administration 125 - 900
Total 1 115 – 3 765
Euros / t entering a recycling plant
ZnC & Alk batteries about 900-1000 Euros / t in dedicated plants whatever Hg content (B, F)180 to 700 Euros / t in metal plants for limited Hg content (D)
Small lead acid batteries 1000 Euros / t (F)0 even negative costs (B)
Button cells 2600 Euros / t (F)4000 Euros / t (B)
NiMH batteries 0 Euros / t (B, F)
Li batteries 2000 Euros / t (F)
Li-ion batteries 1000 Euros / t (F)
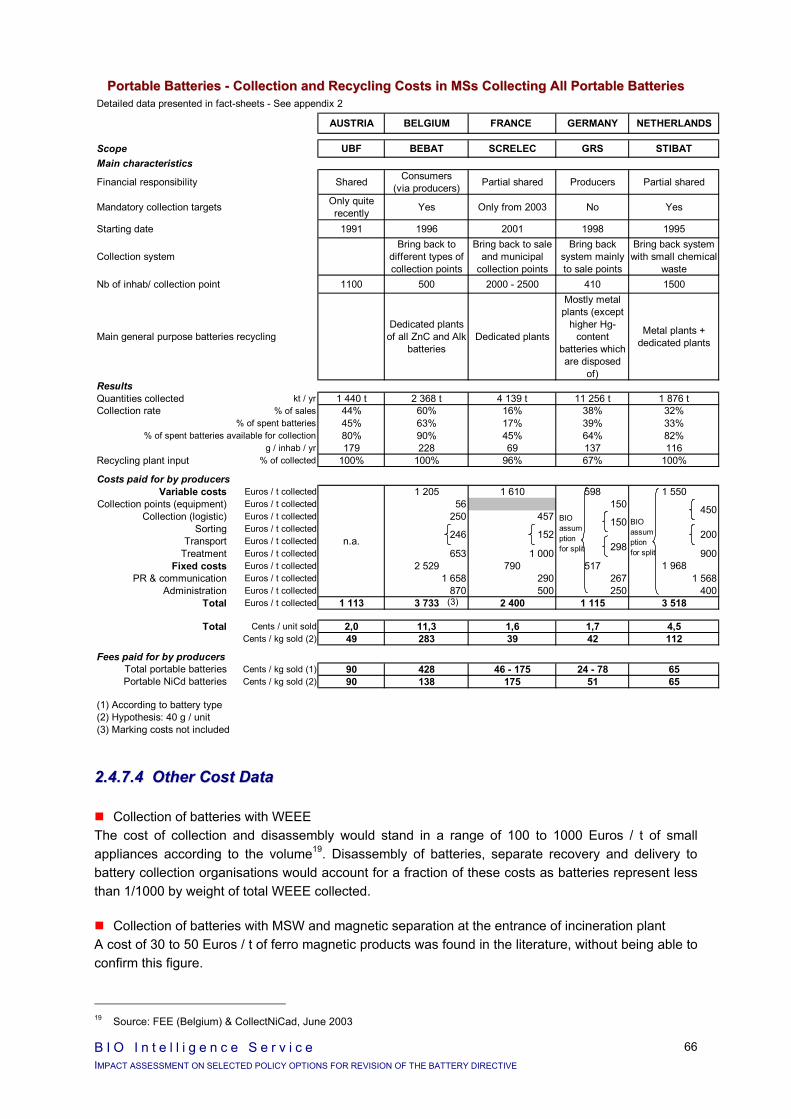
B I O I n t e l l i g e n c e S e r v i c e IMPACT ASSESSMENT ON SELECTED POLICY OPTIONS FOR REVISION OF THE BATTERY DIRECTIVE
66
PPoorrttaabbllee BBaatttteerriieess -- CCoolllleeccttiioonn aanndd RReeccyycclliinngg CCoossttss iinn MMSSss CCoolllleeccttiinngg AAllll PPoorrttaabbllee BBaatttteerriieess
22..44..77..44 OOtthheerr CCoosstt DDaattaa
Collection of batteries with WEEE The cost of collection and disassembly would stand in a range of 100 to 1000 Euros / t of small appliances according to the volume19. Disassembly of batteries, separate recovery and delivery to battery collection organisations would account for a fraction of these costs as batteries represent less than 1/1000 by weight of total WEEE collected.
Collection of batteries with MSW and magnetic separation at the entrance of incineration plant A cost of 30 to 50 Euros / t of ferro magnetic products was found in the literature, without being able to confirm this figure.
19 Source: FEE (Belgium) & CollectNiCad, June 2003
Detailed data presented in fact-sheets - See appendix 2
AUSTRIA BELGIUM FRANCE. GERMANY NETHERLANDS
Scope UBF BEBAT SCRELEC GRS STIBATMain characteristics
Financial responsibility Shared Consumers (via producers) Partial shared Producers Partial shared
Mandatory collection targets Only quite recently Yes Only from 2003 No Yes
Starting date 1991 1996 2001 1998 1995
Collection systemBring back to
different types of collection points
Bring back to sale and municipal
collection points
Bring back system mainly to sale points
Bring back system with small chemical
wasteNb of inhab/ collection point 1100 500 2000 - 2500 410 1500
Main general purpose batteries recyclingDedicated plants
of all ZnC and Alk batteries
Dedicated plants
Mostly metal plants (except
higher Hg-content
batteries which are disposed
of)
Metal plants + dedicated plants
ResultsQuantities collected kt / yr 1 440 t 2 368 t 4 139 t 11 256 t 1 876 tCollection rate % of sales 44% 60% 16% 38% 32%
% of spent batteries 45% 63% 17% 39% 33%% of spent batteries available for collection 80% 90% 45% 64% 82%
g / inhab / yr 179 228 69 137 116Recycling plant input % of collected 100% 100% 96% 67% 100%
Costs paid for by producersVariable costs Euros / t collected 1 205 1 610 598 1 550
Collection points (equipment) Euros / t collected 56 150Collection (logistic) Euros / t collected 250 457
Sorting Euros / t collectedTransport Euros / t collected n.a.
Treatment Euros / t collected 653 1 000 900Fixed costs Euros / t collected 2 529 790 517 1 968
PR & communication Euros / t collected 1 658 290 267 1 568Administration Euros / t collected 870 500 250 400
Total Euros / t collected 1 113 3 733 2 400 1 115 3 518
Total Cents / unit sold 2,0 11,3 1,6 1,7 4,5Cents / kg sold (2) 49 283 39 42 112
Fees paid for by producersTotal portable batteries Cents / kg sold (1) 90 428 46 - 175 24 - 78 65Portable NiCd batteries Cents / kg sold (2) 90 138 175 51 65
(1) According to battery type(2) Hypothesis: 40 g / unit(3) Marking costs not included
450
200246150
152298
(3)
BIO assumptionfor split
BIO assumptionfor split
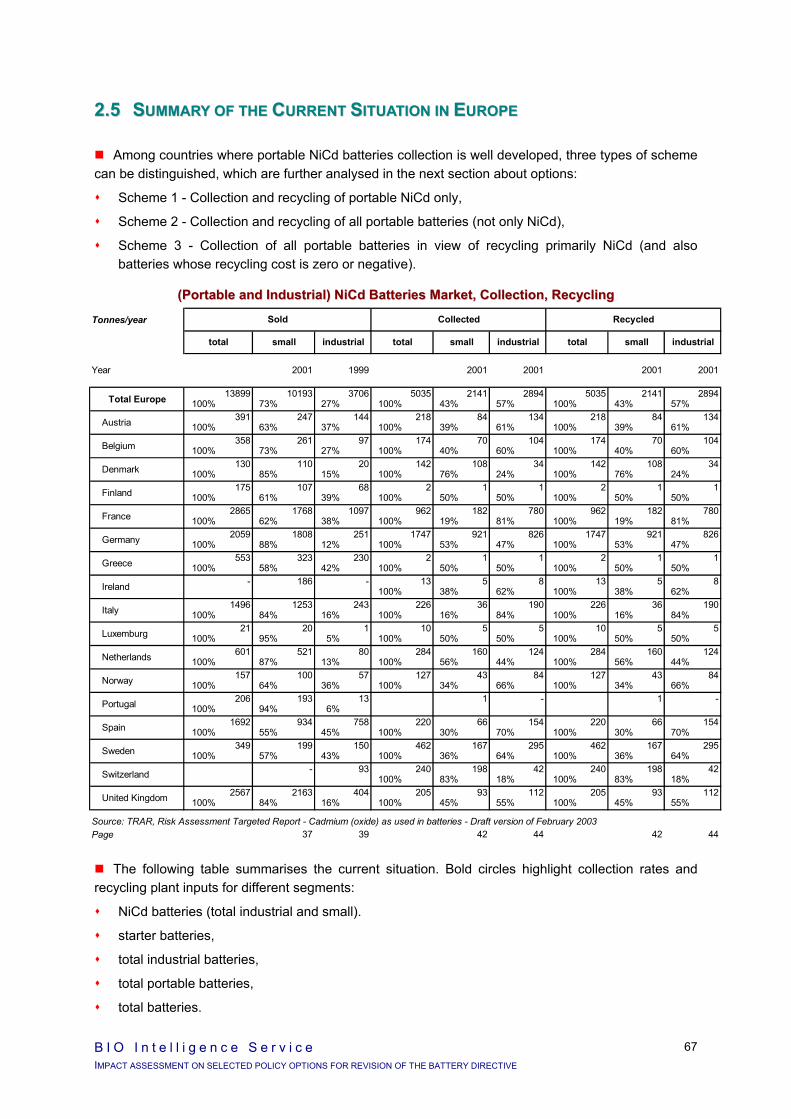
B I O I n t e l l i g e n c e S e r v i c e IMPACT ASSESSMENT ON SELECTED POLICY OPTIONS FOR REVISION OF THE BATTERY DIRECTIVE
67
22..55 SSUUMMMMAARRYY OOFF TTHHEE CCUURRRREENNTT SSIITTUUAATTIIOONN IINN EEUURROOPPEE
Among countries where portable NiCd batteries collection is well developed, three types of scheme can be distinguished, which are further analysed in the next section about options:
Scheme 1 - Collection and recycling of portable NiCd only,
Scheme 2 - Collection and recycling of all portable batteries (not only NiCd),
Scheme 3 - Collection of all portable batteries in view of recycling primarily NiCd (and also batteries whose recycling cost is zero or negative).
((PPoorrttaabbllee aanndd IInndduussttrriiaall)) NNiiCCdd BBaatttteerriieess MMaarrkkeett,, CCoolllleeccttiioonn,, RReeccyycclliinngg
The following table summarises the current situation. Bold circles highlight collection rates and recycling plant inputs for different segments:
NiCd batteries (total industrial and small).
starter batteries,
total industrial batteries,
total portable batteries,
total batteries.
Tonnes/year
Year 2001 1999 2001 2001 2001 2001
Total Europe 100%13899
73%10193
27%3706
100%5035
43%2141
57%2894
100%5035
43%2141
57%2894
Austria 100%391
63%247
37%144
100%218
39%84
61%134
100%218
39%84
61%134
Belgium 100%358
73%261
27%97
100%174
40%70
60%104
100%174
40%70
60%104
Denmark 100%130
85%110
15%20
100%142
76%108
24%34
100%142
76%108
24%34
Finland 100%175
61%107
39%68
100%2
50%1
50%1
100%2
50%1
50%1
France 100%2865
62%1768
38%1097
100%962
19%182
81%780
100%962
19%182
81%780
Germany 100%2059
88%1808
12%251
100%1747
53%921
47%826
100%1747
53%921
47%826
Greece 100%553
58%323
42%230
100%2
50%1
50%1
100%2
50%1
50%1
Ireland - 186 -100%
1338%
562%
8100%
1338%
562%
8
Italy 100%1496
84%1253
16%243
100%226
16%36
84%190
100%226
16%36
84%190
Luxemburg 100%21
95%20
5%1
100%10
50%5
50%5
100%10
50%5
50%5
Netherlands 100%601
87%521
13%80
100%284
56%160
44%124
100%284
56%160
44%124
Norway 100%157
64%100
36%57
100%127
34%43
66%84
100%127
34%43
66%84
Portugal 100%206
94%193
6%13 1 - 1 -
Spain 100%1692
55%934
45%758
100%220
30%66
70%154
100%220
30%66
70%154
Sweden 100%349
57%199
43%150
100%462
36%167
64%295
100%462
36%167
64%295
Switzerland - 93100%
24083%
19818%
42100%
24083%
19818%
42
United Kingdom 100%2567
84%2163
16%404
100%205
45%93
55%112
100%205
45%93
55%112
Source: TRAR, Risk Assessment Targeted Report - Cadmium (oxide) as used in batteries - Draft version of February 2003 Page 37 39 42 44 42 44
Collected Recycled
industrial total small industrialtotal small
Sold
total small industrial
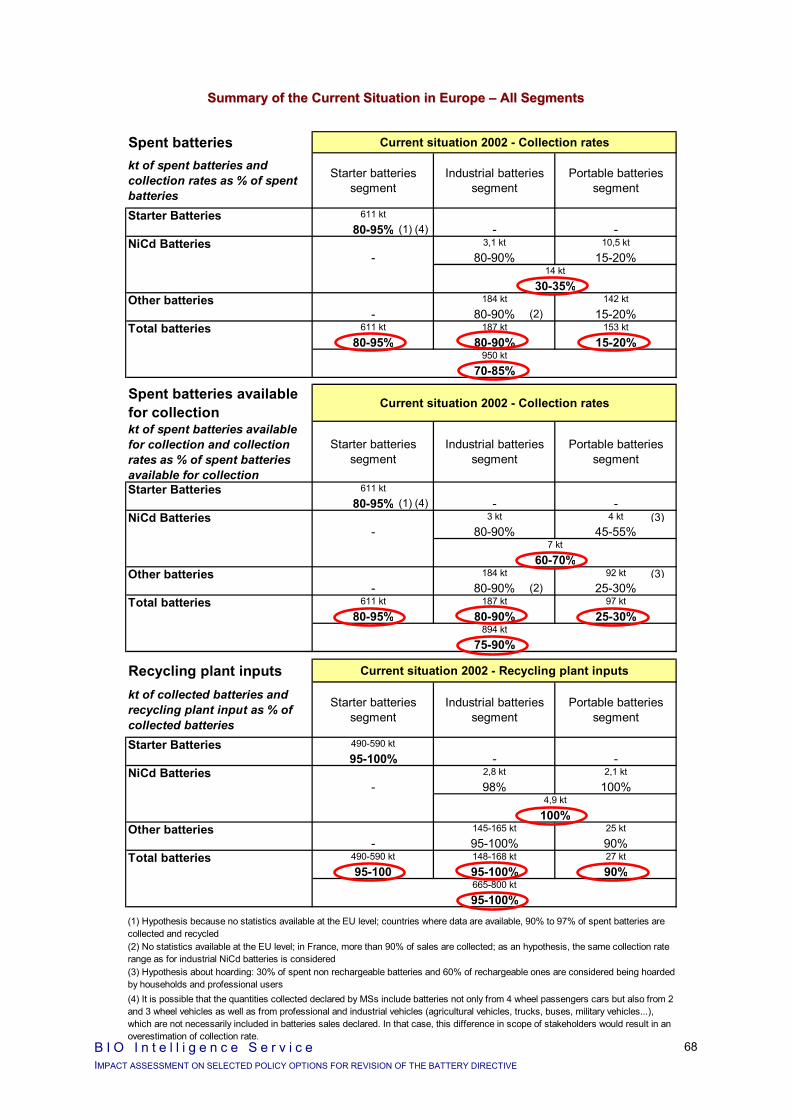
B I O I n t e l l i g e n c e S e r v i c e IMPACT ASSESSMENT ON SELECTED POLICY OPTIONS FOR REVISION OF THE BATTERY DIRECTIVE
68
SSuummmmaarryy ooff tthhee CCuurrrreenntt SSiittuuaattiioonn iinn EEuurrooppee –– AAllll SSeeggmmeennttss
Spent batteries Current situation 2002 - Collection rates
kt of spent batteries and collection rates as % of spent batteries
Starter batteries segment
Industrial batteries segment
Portable batteries segment
Starter Batteries 611 kt
80-95% - -NiCd Batteries 3,1 kt 10,5 kt
- 80-90% 15-20%14 kt
30-35%Other batteries 184 kt 142 kt
- 80-90% 15-20%Total batteries 611 kt 187 kt 153 kt
80-95% 80-90% 15-20%950 kt
70-85%
Spent batteries available for collection
Current situation 2002 - Collection rates
kt of spent batteries available for collection and collection rates as % of spent batteries available for collection
Starter batteries segment
Industrial batteries segment
Portable batteries segment
Starter Batteries 611 kt
80-95% - -NiCd Batteries 3 kt 4 kt
- 80-90% 45-55%7 kt
60-70%Other batteries 184 kt 92 kt
- 80-90% 25-30%Total batteries 611 kt 187 kt 97 kt
80-95% 80-90% 25-30%894 kt
75-90%
Recycling plant inputs Current situation 2002 - Recycling plant inputs
kt of collected batteries and recycling plant input as % of collected batteries
Starter batteries segment
Industrial batteries segment
Portable batteries segment
Starter Batteries 490-590 kt
95-100% - -NiCd Batteries 2,8 kt 2,1 kt
- 98% 100%4,9 kt
100%Other batteries 145-165 kt 25 kt
- 95-100% 90%Total batteries 490-590 kt 148-168 kt 27 kt
95-100 95-100% 90%665-800 kt
95-100%(1) Hypothesis because no statistics available at the EU level; countries where data are available, 90% to 97% of spent batteries are collected and recycled
(3) Hypothesis about hoarding: 30% of spent non rechargeable batteries and 60% of rechargeable ones are considered being hoarded by households and professional users
(2) No statistics available at the EU level; in France, more than 90% of sales are collected; as an hypothesis, the same collection rate range as for industrial NiCd batteries is considered
(4) It is possible that the quantities collected declared by MSs include batteries not only from 4 wheel passengers cars but also from 2 and 3 wheel vehicles as well as from professional and industrial vehicles (agricultural vehicles, trucks, buses, military vehicles...), which are not necessarily included in batteries sales declared. In that case, this difference in scope of stakeholders would result in an overestimation of collection rate.
(3)
(3)
(1)
(1)
(4)
(4)
(2)
(2)

B I O I n t e l l i g e n c e S e r v i c e IMPACT ASSESSMENT ON SELECTED POLICY OPTIONS FOR REVISION OF THE BATTERY DIRECTIVE
69
SSuummmmaarryy ooff tthhee CCuurrrreenntt SSiittuuaattiioonn iinn EEuurrooppee –– PPoorrttaabbllee BBaatttteerriieess2200 2211 2222
20 Collection rate as % of spent batteries available for collection is assessed with the current level of hoarding estimated at
about 37% of all small spent batteries (average between 30% for non rechargeable batteries and 60% for rechargeable batteries)
21 The proportion of collected batteries sent to a recycling plant increases in Germany: 44% in 2001 as mentioned here and 67% in 2002.
22 Recycling plant input is commented in the next section hereafter.
Current Situation - Total Portable BatteriesCollection rates Recycling plant input
% of sales % of spent batteries
% of spent batteries
available for collection
g / capita / yr % of sales % of collected
Countries where all small batteries are separately collected - 2001Austria 44% 45% 80% 179 g 44% 100%
Belgium 60% 62% 85% 230 g 60% 100%
France 16% 17% 45% 69 g 16% 96%
Germany 39% 40% 56% 157 g 17% 44%
Netherlands 32% 33% 82% 116 g 32% 100%
Sweden 55% 56% 81% 193 g
Average 33% 34% 59% 132 g 60%
Countries where small NiCd (or rechareable) batteries are separately collected - 2001Denmark n.a. n.a. n.a. n.a. n.a. n.a.
Norway n.a. n.a. n.a. n.a. n.a. n.a.
Countries where separate collection is not developed - 2002Average 0 to 15% 0 to 15% n.a. 0 to 60 g 10 to 100%
Total EU-15 + Ch + N - 2002Total portable batteries 17% 18% 28% 70 g 15% 90%
Current Situation - Portable NiCd BatteriesCollection rates Recycling plant input
% of sales % of spent batteries
% of spent batteries
available for collection
g / capita / yr % of sales % of collected
Countries where all small batteries are separately collected - 2001Austria 34% 35% 70% 10 g 34% 100%
Belgium 92% 96% 34 g 92% 100%
France 17% 17% 64% 4 g 17% 100%
Germany 45% 46% 67% 16 g 45% 100%
Netherlands 31% 32% 69% 10 g 31% 100%
Sweden 84% 87% 19 g 84% 100%
Average 40% 42% 12 g 100%
Countries where small NiCd (or rechareable) batteries are separately collected - 2001Denmark 98% 43% n.a. 20 g 98% 100%
Norway 47% 49% n.a. 27 g 47% 100%
Average 62% 46% n.a. 24 g 100%
Countries where separate collection is not developed - 2001 & 2002Average 0 to 7% n.a. n.a. 0 to 2 g 100%
Total EU-15 + Ch + N - 2002Total portable NiCd batteries 19% 20% 51% 5 g 19% 100%
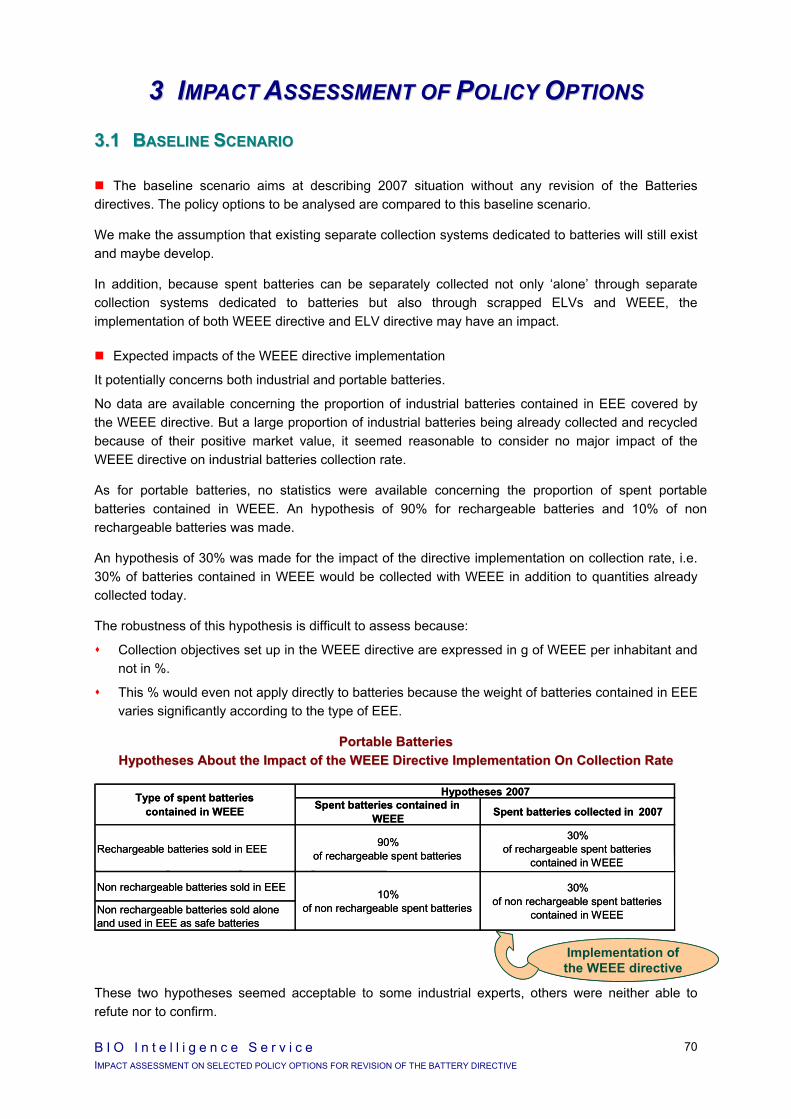
B I O I n t e l l i g e n c e S e r v i c e IMPACT ASSESSMENT ON SELECTED POLICY OPTIONS FOR REVISION OF THE BATTERY DIRECTIVE
70
33 IIMMPPAACCTT AASSSSEESSSSMMEENNTT OOFF PPOOLLIICCYY OOPPTTIIOONNSS
33..11 BBAASSEELLIINNEE SSCCEENNAARRIIOO
The baseline scenario aims at describing 2007 situation without any revision of the Batteries directives. The policy options to be analysed are compared to this baseline scenario.
We make the assumption that existing separate collection systems dedicated to batteries will still exist and maybe develop.
In addition, because spent batteries can be separately collected not only ‘alone’ through separate collection systems dedicated to batteries but also through scrapped ELVs and WEEE, the implementation of both WEEE directive and ELV directive may have an impact.
Expected impacts of the WEEE directive implementation
It potentially concerns both industrial and portable batteries.
No data are available concerning the proportion of industrial batteries contained in EEE covered by the WEEE directive. But a large proportion of industrial batteries being already collected and recycled because of their positive market value, it seemed reasonable to consider no major impact of the WEEE directive on industrial batteries collection rate.
As for portable batteries, no statistics were available concerning the proportion of spent portable batteries contained in WEEE. An hypothesis of 90% for rechargeable batteries and 10% of non rechargeable batteries was made.
An hypothesis of 30% was made for the impact of the directive implementation on collection rate, i.e. 30% of batteries contained in WEEE would be collected with WEEE in addition to quantities already collected today.
The robustness of this hypothesis is difficult to assess because:
Collection objectives set up in the WEEE directive are expressed in g of WEEE per inhabitant and not in %.
This % would even not apply directly to batteries because the weight of batteries contained in EEE varies significantly according to the type of EEE.
PPoorrttaabbllee BBaatttteerriieess HHyyppootthheesseess AAbboouutt tthhee IImmppaacctt ooff tthhee WWEEEEEE DDiirreeccttiivvee IImmpplleemmeennttaattiioonn OOnn CCoolllleeccttiioonn RRaattee
These two hypotheses seemed acceptable to some industrial experts, others were neither able to refute nor to confirm.
Hypotheses 2007Spent batteries contained in
WEEE Spent batteries collected in 2007
Rechargeable batteries sold in EEE 90% of rechargeable spent batteries
30% of rechargeable spent batteries
contained in WEEE
Non rechargeable batteries sold in EEE
Non rechargeable batteries sold aloneand used in EEE as safe batteries
Type of spent batteries contained in WEEE
30% of non rechargeable spent batteries
contained in WEEE
10% of non rechargeable spent batteries
Implementation of the WEEE directive

B I O I n t e l l i g e n c e S e r v i c e IMPACT ASSESSMENT ON SELECTED POLICY OPTIONS FOR REVISION OF THE BATTERY DIRECTIVE
71
As shown on the table next page, additional quantities collected through the WEEE directive would represent about 6% of spent portable NiCd batteries and 7% of other spent portable batteries (respectively 4 and 5% of spent batteries available for collection).
Regarding the impact on the recycling plant inputs, we have to consider that EEE producers are only responsible for WEEE collection and not for recycling of spare parts including batteries. Most likely this would impact countries differently depending on whether collection and recycling practice exists:
Countries where collection and recycling are not developed: it is assumed that only about 30% of batteries collected through WEEE would be recycled.
Countries where collection and recycling already exist: the current proportion of batteries collected which are sent to recycling is likely to be the same for additional batteries coming from WEEE.
Expected impacts of the ELV directive implementation
It potentially concerns lead acid starter batteries, NiCd batteries for electrical cars and NiMH batteries for hybrid vehicles.
No major impact can be expected for lead acid starter batteries. Most of starter batteries are already collected and recycled because of their positive market value. In addition, ELV directive sets up no collection target; targets concern the % of each scrapped car which has to be recycled and batteries are one of spare parts already well recycled.
About 20% of industrial NiCd batteries are used in electrical vehicles in 2002. Considering their high weight, they are expected to be collected and recycled independently from the ELV directive.
NiMH industrial batteries for hybrid vehicles represent portable quantities. Only marginal quantities if any are expected to come from end-of-life hybrid vehicles in 2007.
Remark: the ELV directive targets only part of the starter batteries market: batteries from M1 and N1 vehicles (passengers vehicles up to 8 seats and freight transport vehicles up to 3.5 tones). Are not covered: motorised bikes, buses above 9 seats, trucks above 3.5 tonnes, agricultural equipments, military vehicles… (20% in weight of total starter batteries?).
The tables hereafter give a summary of the baseline scenario.
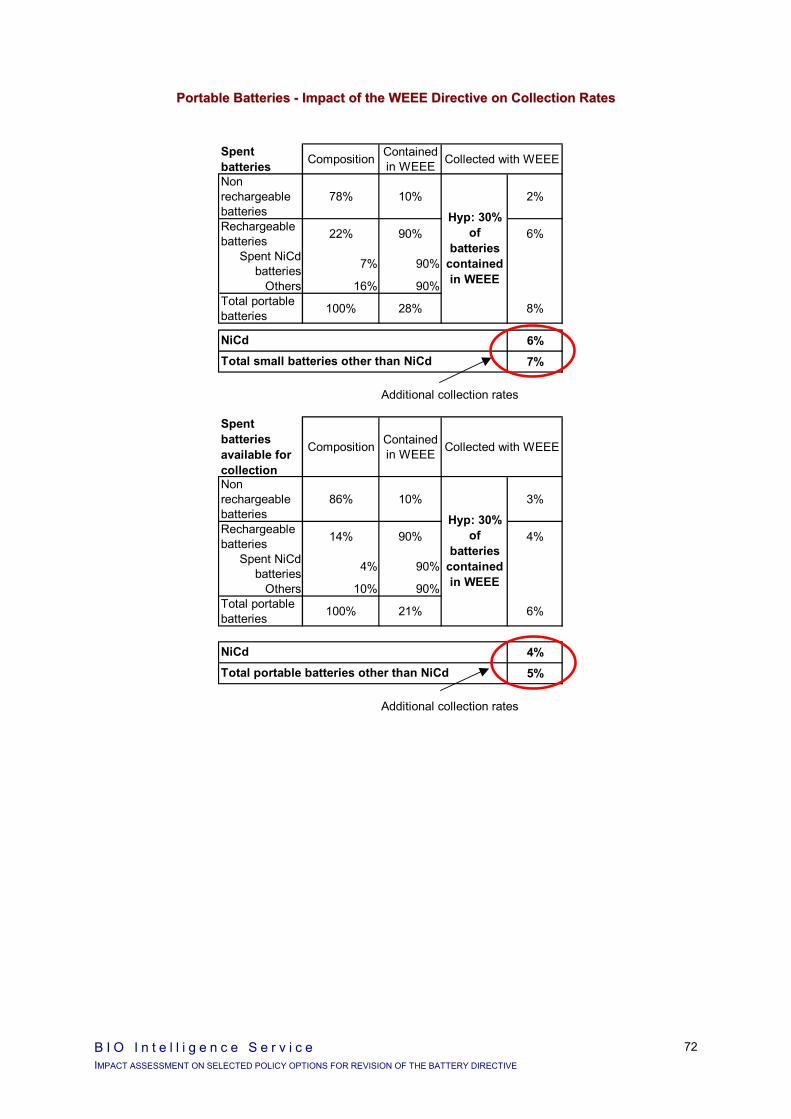
B I O I n t e l l i g e n c e S e r v i c e IMPACT ASSESSMENT ON SELECTED POLICY OPTIONS FOR REVISION OF THE BATTERY DIRECTIVE
72
PPoorrttaabbllee BBaatttteerriieess -- IImmppaacctt ooff tthhee WWEEEEEE DDiirreeccttiivvee oonn CCoolllleeccttiioonn RRaatteess
Spent batteries Composition Contained
in WEEE Collected with WEEE
Non rechargeable batteries
78% 10% 2%
Rechargeable batteries 22% 90% 6%
Spent NiCd batteries 7% 90%
Others 16% 90%Total portable batteries 100% 28% 8%
6%
7%
Additional collection rates
Spent batteries available for collection
Composition Contained in WEEE Collected with WEEE
Non rechargeable batteries
86% 10% 3%
Rechargeable batteries 14% 90% 4%
Spent NiCd batteries 4% 90%
Others 10% 90%Total portable batteries 100% 21% 6%
4%
5%
Additional collection rates
NiCd
Total portable batteries other than NiCd
Hyp: 30% of
batteries contained in WEEE
Hyp: 30% of
batteries contained in WEEE
NiCd
Total small batteries other than NiCd

B I O I n t e l l i g e n c e S e r v i c e IMPACT ASSESSMENT ON SELECTED POLICY OPTIONS FOR REVISION OF THE BATTERY DIRECTIVE
73
SSuummmmaarryy ooff tthhee BBaasseelliinnee SScceennaarriioo 22000077 –– AAllll SSeeggmmeennttss
Spent batteries Baseline scenario 2007 - Collection rateskt of spent batteries and collection rates as % of spent batteries
Starter batteries segment
Industrial batteries segment
Portable batteries segment
Starter Batteries 642 kt
80-95% - -NiCd Batteries 3,3 kt 11,0 kt
- 80-90% 20-25%14 kt
35-40%Other batteries 193 kt 150 kt
- 80-90% 20-25%Total batteries 642 kt 196 kt 161 kt
80-95% 80-90% 20-25%1 000 kt
70-85%
Spent batteries available for collection
Baseline scenario 2007 - Collection rates
kt of spent batteries available for collection and collection rates as % of spent batteries available for collection
Starter batteries segment
Industrial batteries segment
Portable batteries segment
Starter Batteries 642 kt
80-95% - -NiCd Batteries 3,3 kt 4,4 kt
- 80-90% 50-60%8 kt
60-70%Other batteries 193 kt 97 kt
- 80-90% 30-35%Total batteries 642 kt 196 kt 102 kt
80-97% 80-90% 30-35%940 kt
75-90%
Recycling plant inputs (7) Baseline scenario 2007 - Recycling plant inputs
kt of collected batteries and recycling plant input as % of collected batteries
Starter batteries segment
Industrial batteries segment
Portable batteries segment
Starter Batteries 510-610 kt
95-100% - -NiCd Batteries 2,5-3 kt 2,2-2,8 kt
- 98% 100%4,7-5,8 kt
100%Other batteries 155-175 kt 30-37 kt
- 95-100% 90%Total batteries 510-610 kt 157,5-178 kt 32-40 kt
95-100% 95-100% 90%700-850 kt
95-98%See footnotes next page
(1)
(1)
(1)
(1)(1)
(1)
(1)
(1)
(1)
(1)
(6)
(6)
(6)
(6)
(8)
(8)

B I O I n t e l l i g e n c e S e r v i c e IMPACT ASSESSMENT ON SELECTED POLICY OPTIONS FOR REVISION OF THE BATTERY DIRECTIVE
74
SSuummmmaarryy ooff tthhee BBaasseelliinnee SScceennaarriioo 22000077 –– AAllll SSeeggmmeennttss FFoooottnnootteess
(1) Hypothesis: 1% growth rate per year
(6) WEEE directive implementation:
- Spent portable batteries other than NiCd are composed of about 83% of non rechargeable batteries and 17% of rechargeable batteries
- Spent portable batteries available for collection other than NiCd are composed of about 88% of non rechargeable batteries and 12% of rechargeable batteries
(7) No major impact on quantities sent to recycling can be expected from WEEE & ELV directives
(8) It is likely that the high value of the range (95%) is overestimated since it is possible that the quantities collected declared by MSs include batteries not only from 4 wheel passengers cars but also from 2 and 3 wheel vehicles as well as from professional and industrial vehicles (agricultural vehicles, trucks, buses, military vehicles...), which are not necessarily included in batteries sales declared.
- Spent portable batteries contained in WEEE collected following the WEEE implementation: an hypothesis of 30% is made (i.e. 30% of batteries contained in WEEE would be collected with WEEE in addition to quantities already collected today); this hypothesis seemed acceptable to some industrial experts, others were able neither to refute nor to confirm
- Proportion of spent portable batteries contained in WEEE: no statistics were available; an hypothesis of 90% for rechargeable batteries and 10% of non rechargeable batteries is made; this hypothesis seemed acceptable to some industrial experts, others were able neither to refute nor to confirm
(2) ELV directive implementation: no major impact can be expected. Most of starter batteries are already collected and recycled because of their positive market value. In addition, ELV directive sets up no collection target; targets concern the % of each scrapped car which has to be recycled; batteries being one of spare parts already well recycled, no significant effect can be expected
(3) WEEE directive implementation: no data was available concerning the proportion of industrial batteries contained in EEE covered by the WEEE directive. In addition, targets in the WEEE are expressed as g / inhab / year, which make impossible to easily deduce a % of collection rate for batteries. But a large proportion of industrial batteries being already collected and recycled because of their positive market value, it was decided to consider no major impact of the WEEE directive
(5) ELV directive implementation: only NiMH industrial batteries for hybrid vehicles are concerned and marginal quantities if any are expected to come from end-of-life hybrid vehicles in 2007
(5) ELV directive implementation: about 20% of industrial NiCd batteries are used in electrical vehicles in 2002; considering their high weight, they are expected to be collected and recycled independently from the ELV directive

B I O I n t e l l i g e n c e S e r v i c e IMPACT ASSESSMENT ON SELECTED POLICY OPTIONS FOR REVISION OF THE BATTERY DIRECTIVE
75
SSuummmmaarryy ooff tthhee BBaasseelliinnee SScceennaarriioo 22000077 –– PPoorrttaabbllee BBaatttteerriieess2233
23 Compare to the current situation, 3 elements are taken into account: (i) a 5 point increase in taken into account for collection
rates following the WEEE directive implementation, (ii) the development of separate collection in France (which just begun 2 years ago), (iii) increase of recycling input plant in Germany (to about 70%; this is 67% in 2003 and was 44% in 2001)
Baseline Scenario 2007 - Total Portable BatteriesCollection rates Recycling plant input
% of sales % of spent batteries
% of spent batteries
available for collection
g / capita / yr % of collected
Countries where all portable batteries are separately collected in 2002
A, B, F, D, NL, Sw 30-65% 30-65% 60-85% 120-230 g 70-100%
Countries where portable NiCd (or rechargeable) batteries are separately collected in 2002Dk, Nw low ? low ? low ? low ?
Countries where separate collection is not developed in 2002Other countries 5-20% 5-20% n.a. 20-80 g 10-100%
Baseline Scenario 2007 - Portable NiCd BatteriesCollection rates Recycling plant input
% of sales % of spent batteries
% of spent batteries
available for collection
g / capita / yr % of collected
Countries where all portable batteries are separately collected in 2002
A, B, F, D, NL, Sw 35-95% 35-95% about 70% 10-35 g 100%
Countries where portable NiCd (or rechargeable) batteries are separately collected in 2002Denmark 98% 43% n.a. 20 g 100%
Norway 47% 49% n.a. 27 g 100%
Countries where separate collection is not developed - 2001 & 2002Other countries 5-10% 5-10% n.a. n.a. 100%
(1) Sales are radically decreasing since 1996
(1) (1)

B I O I n t e l l i g e n c e S e r v i c e IMPACT ASSESSMENT ON SELECTED POLICY OPTIONS FOR REVISION OF THE BATTERY DIRECTIVE
76
33..22 OOPPTTIIOONNSS SSTTUUDDIIEEDD
The different options contained in the terms of reference concern collection and recycling rates and, for NiCd, the ban option as well.
PPoolliiccyy OOppttiioonnss ttoo BBee SSttuuddiieedd
Collection rate Recycling plant input Scope
% of spent batteries
% of spent batteries
% of collected
Other options
All batteries 50-60% 60-70% 70-80%
45-55% 55-65% 65-75%
90%
All starter batteries
70-80% 80-90%
90-100%
50-60% 60-70% 70-80%
75%
All NiCd batteries 60-70% 70-80% 80-90%
50-60% 60-70% 70-80%
80%
Ban NiCd
For NiCd batteries, given that:
the highest target (80-90% of collection rate) is already reached for industrial NiCd batteries in the baseline scenario,
1/5th of total spent NiCd batteries are industrial batteries,
high collection rates will have to be reached by portable NiCd batteries.
For that reason, the impacts of the following options are also studied in the next sections.
PPoolliiccyy OOppttiioonnss SSttuuddiieedd ffoorr PPoorrttaabbllee NNiiCCdd
Collection rate Recycling plant Input Scope
% of spent batteries
% of spent batteries
% of collected
Portable NiCd batteries
50-60% 60-70% 70-80%
50-60% 60-70% 70-80%
80%
The collection rates for portable NiCd can be set up 10 points lower than for total NiCd batteries. Added to industrial NiCd already collected, the overall NiCd targets included in the terms of reference would be reached.
Stakeholders also proposed targets for total portable batteries. Data provided in this report can also help to assess related impacts.
In the tables next pages, quantities concerned by each option are estimated.
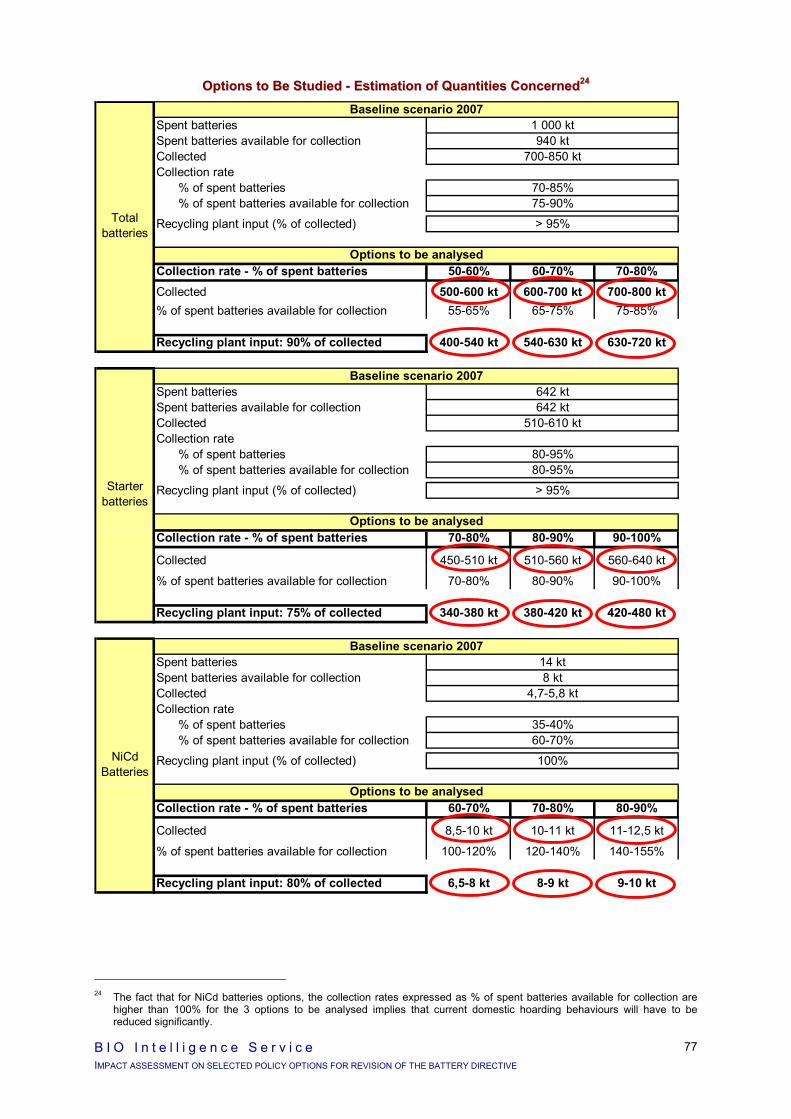
B I O I n t e l l i g e n c e S e r v i c e IMPACT ASSESSMENT ON SELECTED POLICY OPTIONS FOR REVISION OF THE BATTERY DIRECTIVE
77
OOppttiioonnss ttoo BBee SSttuuddiieedd -- EEssttiimmaattiioonn ooff QQuuaannttiittiieess CCoonncceerrnneedd2244
24 The fact that for NiCd batteries options, the collection rates expressed as % of spent batteries available for collection are
higher than 100% for the 3 options to be analysed implies that current domestic hoarding behaviours will have to be reduced significantly.
Baseline scenario 2007Spent batteries 1 000 ktSpent batteries available for collection 940 ktCollected 700-850 ktCollection rate
% of spent batteries 70-85%% of spent batteries available for collection 75-90%
Recycling plant input (% of collected) > 95%
Options to be analysedCollection rate - % of spent batteries 50-60% 60-70% 70-80%Collected 500-600 kt 600-700 kt 700-800 kt% of spent batteries available for collection 55-65% 65-75% 75-85%
Recycling plant input: 90% of collected 400-540 kt 540-630 kt 630-720 kt
Baseline scenario 2007Spent batteries 642 ktSpent batteries available for collection 642 ktCollected 510-610 ktCollection rate
% of spent batteries 80-95%% of spent batteries available for collection 80-95%
Recycling plant input (% of collected) > 95%
Options to be analysedCollection rate - % of spent batteries 70-80% 80-90% 90-100%
Collected 450-510 kt 510-560 kt 560-640 kt
% of spent batteries available for collection 70-80% 80-90% 90-100%
Recycling plant input: 75% of collected 340-380 kt 380-420 kt 420-480 kt
Baseline scenario 2007Spent batteries 14 ktSpent batteries available for collection 8 ktCollected 4,7-5,8 ktCollection rate
% of spent batteries 35-40%% of spent batteries available for collection 60-70%
Recycling plant input (% of collected) 100%
Options to be analysedCollection rate - % of spent batteries 60-70% 70-80% 80-90%
Collected 8,5-10 kt 10-11 kt 11-12,5 kt
% of spent batteries available for collection 100-120% 120-140% 140-155%
Recycling plant input: 80% of collected 6,5-8 kt 8-9 kt 9-10 kt
Total batteries
Starter batteries
NiCd Batteries

B I O I n t e l l i g e n c e S e r v i c e IMPACT ASSESSMENT ON SELECTED POLICY OPTIONS FOR REVISION OF THE BATTERY DIRECTIVE
78
OOppttiioonnss ttoo BBee SSttuuddiieedd -- PPoossssiibbllee OOppttiioonnss ffoorr PPoorrttaabbllee NNiiCCdd BBaatttteerriieess CCoonnssiiddeerriinngg TThhaatt HHiigghh CCoolllleeccttiioonn RRaatteess AArree AAllrreeaaddyy RReeaacchheedd ffoorr IInndduussttrriiaall NNiiCCdd BBaatttteerriieess2255
25 The fact that for small NiCd batteries options, the collection rates expressed as % of spent batteries available for collection
are higher than 100% for the 3 options to be analysed implies that current domestic hoarding behaviours will have to be reduced significantly.
Baseline scenario 2007Spent batteries 11 ktSpent batteries available for collection 4 ktCollected 2,2-2,8 ktCollection rate
% of spent batteries 20-25%% of spent batteries available for collection 50-60%
Recycling plant input (% of collected) 100%
Options to be analysedCollection rate - % of spent batteries 50-60% 60-70% 70-80%
Collected 5,5-6,5 kt 6,5-7,5 kt 7,5-9 kt
% of spent batteries available for collection 135-165% 165-190% 190-220%
Recycling plant input: 90% of collected 5-6 kt 6-7 kt 7-8 kt
Portable NiCd
Batteries

B I O I n t e l l i g e n c e S e r v i c e IMPACT ASSESSMENT ON SELECTED POLICY OPTIONS FOR REVISION OF THE BATTERY DIRECTIVE
79
33..33 QQUUAANNTTIITTAATTIIVVEE OOPPTTIIOONNSS AABBOOUUTT SSTTAARRTTEERR BBAATTTTEERRIIEESS
33..33..11 FFeeaassiibbiilliittyy
PPoolliiccyy OOppttiioonnss ttoo BBee SSttuuddiieedd ffoorr SSttaarrtteerr BBaatttteerriieess
Collection rate Recycling plant input Scope
% of spent batteries
% of spent batteries
% of collected
All starter batteries
70-80% 80-90%
90-100%
50-60% 60-70% 70-80%
75%
In the baseline scenario for 2007, 80-95% of spent starter batteries are collected and more than 95% of them are sent to a recycling plant.
We are between the 80-90% and 90-100% policy options to be studied for collection rate and above the highest policy options for recycling.
Remark: as stated above, it is likely that the high value of the range (95%) is overestimated since it is possible that the quantities collected declared by MSs include batteries not only from 4 wheel passengers cars but also from 2 and 3 wheel vehicles as well as from professional and industrial vehicles (agricultural vehicles, trucks, buses, military vehicles...), which are not necessarily included in batteries sales declared.
33..33..22 EEccoonnoommiicc IImmppaaccttss
As described in section 2.2.7 page 38, the revenues from recycling (mostly sale of recovered lead and also of plastics) are generally sufficient to cover all of the collection and re-processing costs involved in the sector. However, the economics is sensitive to the lead market price which can fluctuate significantly over years. But the industry has shown in the past that they can deal with that lead market fluctuation, using intermediate temporary storage as a hedging effect. This may explain that 5-10% of spent starter batteries available for collection are actually not collected and recycled.
The setting up of mandatory targets would require the implementation of a monitoring system which does not exist today in most countries. Costs will be involved, without being certain of the reliability of measurements at such high levels of collection and recycling targets.
Regarding the quantification of the economic impact of mandatory targets, only two sources of data were found.
Denmark has introduced fees for starter batteries. Producers have to pay fees to a collective scheme which amount to 875 000 Euros / year, i.e. about 80 Euros / t of spent batteries sold.
B I O I n t e l l i g e n c e S e r v i c e IMPACT ASSESSMENT ON SELECTED POLICY OPTIONS FOR REVISION OF THE BATTERY DIRECTIVE
80
In their report26, ERM estimated a cost of 133 to 171 Euros / t according to the level of mandatory collection rates (respectively 95% and 80%).
Other additional costs are likely to be not significant, even for countries where starter batteries recycling is less developed (because lead recycling is financially self sufficient).
On the contrary, market efficiency could be hurt by the setting up of 90-100% mandatory collection target with very high recycling plant input targets. As a matter of fact, this could oblige the industry to reduce the temporary storages they use as a hedging effect, which could affect their capacity to adjust when facing low lead prices.
The risk is that lead recycling could become no more financially self sufficient, which would oblige producers to create a collective system to finance recycling (for instance with a compensation fund fed when lead market price is high as it is done in some countries for packaging paper recycling).
However, this risk is likely to not exist in the case of 90-100% mandatory collection target with 75% recycling plant input target as considered here.
33..33..33 EEnnvviirroonnmmeennttaall IImmppaaccttss
33..33..33..11 OObbjjeeccttiivvee ooff TThhiiss SSeeccttiioonn
The purpose of this section is to give an overview of the environmental impacts related to the various policy options under study for starter batteries.
Generally speaking, the establishment of separate collection and recycling targets are expected to cause both positive and negative environmental consequences. The positive consequences are associated with the control of hazardous substances in batteries currently disposed of with mixed wastes, but also in connection with the use of recovered, rather than virgin, materials (which can therefore avoid the environmental impacts due to the production of virgin materials). However, these environmental benefits are expected to be at least partially compensated by environmental impacts due to additional activities required to separate, collect and recycle batteries, including, inter alia, the provision of containers, transport associated with collection and delivery to reprocessing facilities and the recycling processes themselves.
Thus, the control of hazardous substances, the principal objective which drives the policy options under study, will induce a change in the balance of environmental impacts due to additional recycling and collection activities.
Therefore, analysis and assessment have to be done through a life cycle approach. The life cycle assessment (LCA) methodology is fairly well developed and can reasonably well support comparisons of environmental benefits of various batteries disposal options. LCA is regarded by many as the most rigorous scientific approach available to quantify environmental impacts of a given 'system' (i.e. the activities to which the technique is applied).
ISO 14040 defines: "LCA studies the environmental aspects and potential impacts throughout a product's life (i.e. cradle-to-grave) from raw material acquisition through production use and disposal. The general categories or environmental impacts needing consideration include resource use, human health and ecological consequences".
26 Analysis of the Environmental Impact and Financial Costs of a Possible New European Directive on Batteries – November
2000
B I O I n t e l l i g e n c e S e r v i c e IMPACT ASSESSMENT ON SELECTED POLICY OPTIONS FOR REVISION OF THE BATTERY DIRECTIVE
81
The methodology of LCA is still under development, but a great part of standardisation has been achieved. Standards in the ISO 14040 series describe principles and framework and the four stages of an LCA : Goal and scope definition (ISO 14040 and 14041), Life cycle inventory analysis (ISO 14041), Impact assessment (ISO 14042) LC interpretation / improvement assessment (ISO 14043).

B I O I n t e l l i g e n c e S e r v i c e IMPACT ASSESSMENT ON SELECTED POLICY OPTIONS FOR REVISION OF THE BATTERY DIRECTIVE
82
33..33..33..22 PPrreevviioouuss WWoorrkk aanndd DDeerriivveedd RReessuullttss
The ERM study
In the ERM study (‘Analysis of the environmental impact and financial costs of a possible new European directive on batteries’, 2000), the environmental impacts of the lead-acid automotive battery collection and recycling scenarios in UK were predicted using a life cycle assessment (LCA) approach.
Nine scenarios were examined separately, each defined by collection and recycling targets (the overall recycling rate is the quantity of batteries entering reprocessing facilities divided by total spent batteries) :
Collection target (a)
Recycling target (defined as a percentage of
collected batteries) (b)
Overall recycling
target (a x b) 85% 68% 90% 72% 80% 95% 76% 85% 76.5% 90% 81% 90% 95% 85.5% 85% 80.8% 90% 85.5% 95% 95% 90.3%
With respect to collection of automotive batteries, it was assumed that lead acid batteries are collected by waste management companies and transported by trucks to the lead smelters, principally in UK, over a total distance of 275 km (75 km from a collecting point to a depot for storage/sorting, then 200 km to the recycling facility).
BIO was not able to obtain and manipulate background LCA data used by ERM, since the report is not transparent enough. Thus, it was not possible to review the reliability of the results.
Results are summarised in the following table (adapted from table 7.10 of the study, simply by dividing original results by the quantities of collected and recycled batteries as given in table 5.2 ).
Ld to total waste CO2 emissions NOx emissions Collection target (a)
Recycling target (b)
Overall recycling
target (a x b)
t of batteries recycled (a x b)
kg / t recycled
kg / t spent batt.
t / t recycled
t / t spent batt.
kg / t recycled
kg / t spent batt.
85% 68% 73 834 765 520 26.4 18.0 242 164 90% 72% 78 177 637 488 24.6 17.7 228 164 80% 95% 76% 82 520 599 455 23.0 17.5 215 164 85% 76.5% 83 063 595 455 25.8 19.8 241 184 90% 81% 87 949 502 406 24.1 19.5 227 184 90% 95% 85.5% 92 835 418 358 22.5 19.3 215 184 85% 80.8% 87 678 499 403 25.6 20.7 240 194 90% 85.5% 92 835 399 341 23.9 20.4 227 194 95% 95% 90.3% 97 993 310 280 22.3 20.1 214 194

B I O I n t e l l i g e n c e S e r v i c e IMPACT ASSESSMENT ON SELECTED POLICY OPTIONS FOR REVISION OF THE BATTERY DIRECTIVE
83
According to the authors, results indicate a complicated environmental trade-off in the scenarios. As collection and recycling rates increase, the heavy metals (lead) in batteries are progressively diverted from waste. Clearly this is most effective when the recycling rate is maximised and when batteries are not simply collected for separate disposal.
However, as collection rates increase, other environmental impacts examined, such as global warming, NOx and SOx emissions, etc., also increase. These impacts are claimed to be associated with the demands and activities of battery collection (eg transport), and are offset only to a limited extent by the avoided impacts associated with the recovery of materials through recycling.
CO2 emissions due to automotive battery collection & recycling
22,5
25,6
23,9
22,3
24,123
24,6
26,4 25,8
17
19
21
23
25
27
29
coll 80% -rec 85%
[68%]
coll 80% -rec 90%
[72%)
coll 80% -rec 95%
[76%]
coll 90% -rec 85%
[77%]
coll 90% -rec 90%
[81%]
coll 90% -rec 95%
[86%]
coll 95% -rec 85%
[81%]
coll 95% -rec 90%
[86%]
coll 95% -rec 95%
[90%]
Collection rate - Recycling rate [overall recycling rate]
CO
2 em
issi
ons
(t / t
recy
cled
)Pb to waste due to automotive battery collection & recycling
358403
341
280
406
455488
520
455
200
300
400
500
600
coll 80% -rec 85%
[68%]
coll 80% -rec 90%
[72%)
coll 80% -rec 95%
[76%]
coll 90% -rec 85%
[77%]
coll 90% -rec 90%
[81%]
coll 90% -rec 95%
[86%]
coll 95% -rec 85%
[81%]
coll 95% -rec 90%
[86%]
coll 95% -rec 95%
[90%]
Collection rate - Recycling rate [overall recycling rate]
Pb to
was
te (t
/ t s
pent
bat
t.)
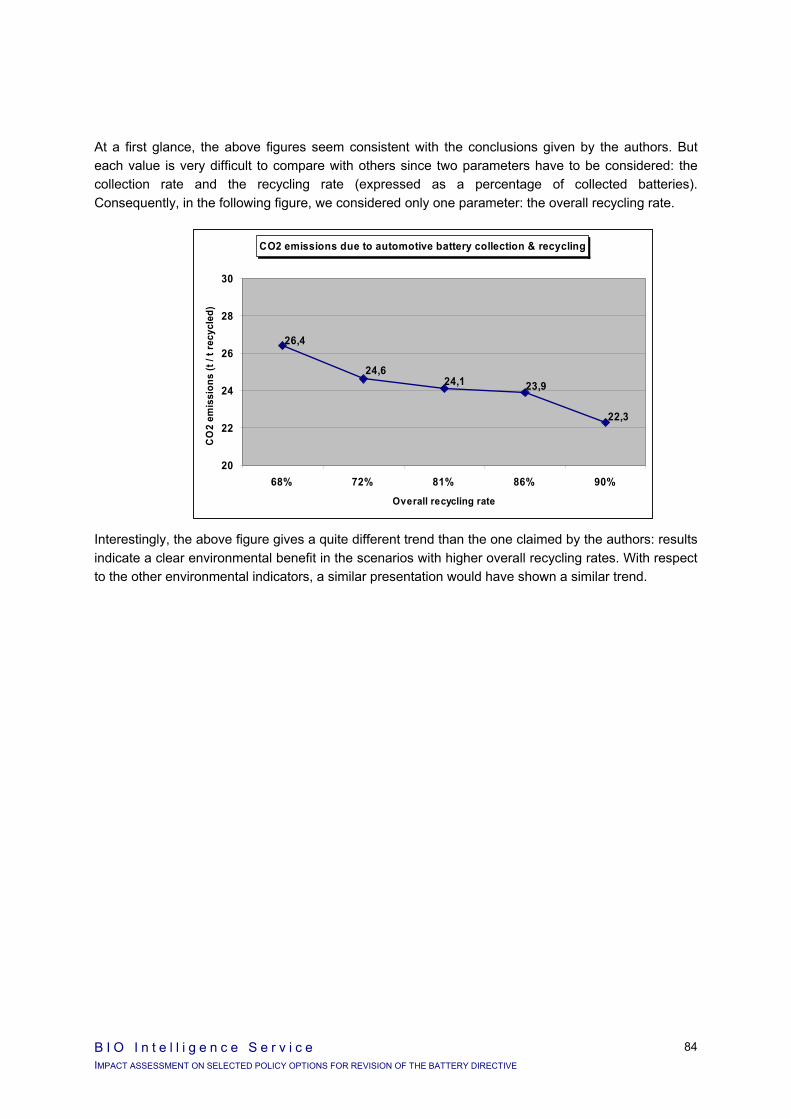
B I O I n t e l l i g e n c e S e r v i c e IMPACT ASSESSMENT ON SELECTED POLICY OPTIONS FOR REVISION OF THE BATTERY DIRECTIVE
84
At a first glance, the above figures seem consistent with the conclusions given by the authors. But each value is very difficult to compare with others since two parameters have to be considered: the collection rate and the recycling rate (expressed as a percentage of collected batteries). Consequently, in the following figure, we considered only one parameter: the overall recycling rate.
Interestingly, the above figure gives a quite different trend than the one claimed by the authors: results indicate a clear environmental benefit in the scenarios with higher overall recycling rates. With respect to the other environmental indicators, a similar presentation would have shown a similar trend.
CO2 emissions due to automotive battery collection & recycling
23,9
26,4
24,624,1
22,3
20
22
24
26
28
30
68% 72% 81% 86% 90%
Overall recycling rate
CO
2 em
issi
ons
(t / t
recy
cled
)

B I O I n t e l l i g e n c e S e r v i c e IMPACT ASSESSMENT ON SELECTED POLICY OPTIONS FOR REVISION OF THE BATTERY DIRECTIVE
85
LCA of Lead-acid batteries
During the present work, and due to the very short duration of the study, we were not able to find any other LCA study covering the scope of the present work. However, one useful study was considered27.
In this paper, a life cycle assessment approach was used to compare vanadium redox and lead-acid batteries for stationary energy storage. Two types of lead-acid batteries were considered: a lead-acid battery with 50% secondary (recycled) lead and one with 99% secondary lead. It is thus possible to derive from this paper some relevant conclusions with respect to the recycling of lead into batteries. Furthermore, the material composition of a lead-acid automotive battery is very similar to the one of a lead-acid batteries for stationary energy storage: in both types, lead represents around 60% in mass of the battery, and the other components are also the same. With the objective to derive from this paper results related to the comparison of the life cycle of a lead-acid automotive battery with 50% of secondary lead versus the life cycle of a lead-acid automotive battery with 99%, we modified the functional unit of the study and considered the life cycle of 1000 automotive batteries28. Results are given in the following figures.
The results of this environmental assessment indicate that the rate of re-use of secondary lead in new batteries is of major importance for the environmental impact.
As a conclusion, the larger quantity of recycled lead in a lead-acid battery, the less environmental damages of its life cycle.
27 Environmental assessment of vanadium redox and lead-acid batteries for stationary energy storage, C.J. Rydh, Journal of
Power Sources 80 (1999) 21-29 28 The original functional unit (FU) was defined as ‘an electricity storage system with a power rating of 50 kW, a storage
capacity of 450 kW and an average delivery of 150 kWh electricity energy per day for 20 years’. This FU corresponds to a mass of lead-acid batteries of 47 974 kg. Considering 14.7 kg for an average automotive battery, we recalculated results on this basis.
Primary energy for Lead-acid automotive batteries life cycle at different recycled rate
-
100
200
300
400
500
600
Lead-acid 50% secondary Pb Lead-acid 99% secondary Pb
Prim
ary
ener
gy (
MJ
/100
0 b
atte
ries)
Battery production
Recycling
Transport
Material
CO2 emissions for automotive batteries life cycle at different recycled rates
-
2
4
6
8
10
Lead-acid 50% secondary Pb Lead-acid 99% secondary Pb
CO
2 em
issi
ons
(t
/100
0 b
atte
ries
)
NOx emissions for Pb automotive batteries life cycle at different recycled rates
-
10
20
30
40
50
60
70
80
Lead-acid 50% secondary Pb Lead-acid 99% secondary Pb
NO
x em
issi
ons
(k
g /1
000
bat
teri
es)
SO2 emissions for Pb automotive batteries life cycle at different recycled rates
-
10
20
30
40
50
60
70
Lead-acid 50% secondary Pb Lead-acid 99% secondary Pb
SO2
emis
sion
s
(kg
/100
0 b
atte
ries
)

B I O I n t e l l i g e n c e S e r v i c e IMPACT ASSESSMENT ON SELECTED POLICY OPTIONS FOR REVISION OF THE BATTERY DIRECTIVE
86
33..33..44 SSoocciiaall IImmppaaccttss
No major additional social impacts are expected compared to the baseline scenario given that high collection and recycling rates are already reached.
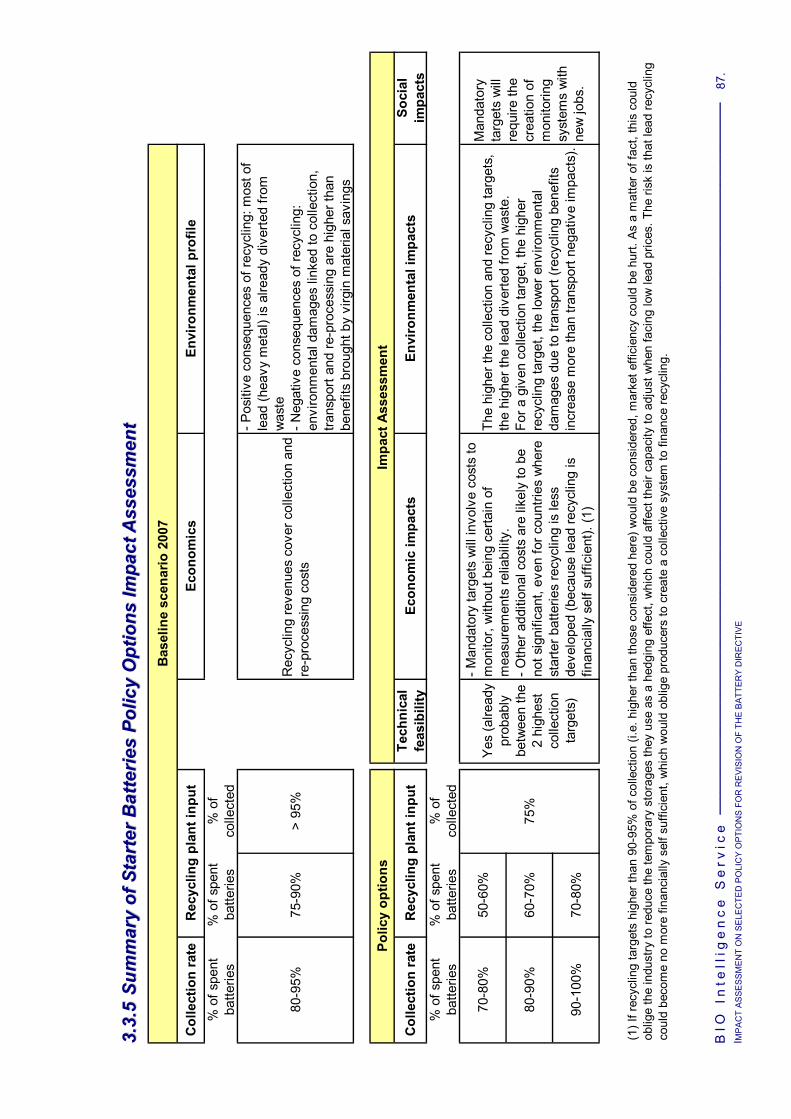
BIO
In
tell
ige
nc
e S
erv
ice
____
____
____
____
____
____
____
____
____
____
____
____
____
____
____
____
____
____
____
____
____
____
____
____
87
. I M
PA
CT
AS
SE
SS
ME
NT
ON
SE
LEC
TED
PO
LIC
Y O
PTI
ON
S F
OR
RE
VIS
ION
OF
THE
BA
TTE
RY
DIR
EC
TIV
E
33 ..33 ..
55 SS
uu mmmm
aa rryy
oo ff SS
tt aarr tt
ee rr BB
aa tttt ee
rr iiee ss
PPoo ll
ii ccyy
OOpp tt
ii oonn ss
II mmpp aa
cc tt AA
ss ssee ss
ss mmee nn
tt
Bas
elin
e sc
enar
io 2
007
Col
lect
ion
rate
Rec
yclin
g pl
ant i
nput
Ec
onom
ics
Envi
ronm
enta
l pro
file
% o
f spe
nt
batte
ries
% o
f spe
nt
batte
ries
% o
f co
llect
ed
80-9
5%75
-90%
> 95
%R
ecyc
ling
reve
nues
cov
er c
olle
ctio
n an
d re
-pro
cess
ing
cost
s
- Pos
itive
con
sequ
ence
s of
recy
clin
g: m
ost o
f le
ad (h
eavy
met
al) i
s al
read
y di
verte
d fro
m
was
te- N
egat
ive
cons
eque
nces
of r
ecyc
ling:
en
viro
nmen
tal d
amag
es li
nked
to c
olle
ctio
n,
trans
port
and
re-p
roce
ssin
g ar
e hi
gher
than
be
nefit
s br
ough
t by
virg
in m
ater
ial s
avin
gs
Polic
y op
tions
Impa
ct A
sses
smen
t
Col
lect
ion
rate
Rec
yclin
g pl
ant i
nput
Tech
nica
l fe
asib
ilit y
Econ
omic
impa
cts
Envi
ronm
enta
l im
pact
sSo
cial
im
pact
s%
of s
pent
ba
tterie
s%
of s
pent
ba
tterie
s%
of
colle
cted
70-8
0%50
-60%
80-9
0%60
-70%
75%
90-1
00%
70-8
0%
- Man
dato
ry ta
rget
s w
ill in
volv
e co
sts
to
mon
itor,
with
out b
eing
cer
tain
of
mea
sure
men
ts re
liabi
lity.
- Oth
er a
dditi
onal
cos
ts a
re li
kely
to b
e no
t sig
nific
ant,
even
for c
ount
ries
whe
re
star
ter b
atte
ries
recy
clin
g is
less
de
velo
ped
(bec
ause
lead
recy
clin
g is
fin
anci
ally
sel
f suf
ficie
nt).
(1)
Yes
(alre
ady
prob
ably
be
twee
n th
e 2
high
est
colle
ctio
n ta
rget
s)
(1) I
f rec
yclin
g ta
rget
s hi
gher
than
90-
95%
of c
olle
ctio
n (i.
e. h
ighe
r tha
n th
ose
cons
ider
ed h
ere)
wou
ld b
e co
nsid
ered
, mar
ket e
ffici
ency
cou
ld b
e hu
rt. A
s a
mat
ter o
f fac
t, th
is c
ould
ob
lige
the
indu
stry
to re
duce
the
tem
pora
ry s
tora
ges
they
use
as
a he
dgin
g ef
fect
, whi
ch c
ould
affe
ct th
eir c
apac
ity to
adj
ust w
hen
faci
ng lo
w le
ad p
rices
. The
risk
is th
at le
ad re
cycl
ing
coul
d be
com
e no
mor
e fin
anci
ally
sel
f suf
ficie
nt, w
hich
wou
ld o
blig
e pr
oduc
ers
to c
reat
e a
colle
ctiv
e sy
stem
to fi
nanc
e re
cycl
ing.
The
high
er th
e co
llect
ion
and
recy
clin
g ta
rget
s,
the
high
er th
e le
ad d
iver
ted
from
was
te.
For a
giv
en c
olle
ctio
n ta
rget
, the
hig
her
recy
clin
g ta
rget
, the
low
er e
nviro
nmen
tal
dam
ages
due
to tr
ansp
ort (
recy
clin
g be
nefit
s in
crea
se m
ore
than
tran
spor
t neg
ativ
e im
pact
s).
Man
dato
ry
targ
ets
will
re
quire
the
crea
tion
of
mon
itorin
g sy
stem
s w
ith
new
jobs
.

B I O I n t e l l i g e n c e S e r v i c e _______________________________________________ 88. IMPACT ASSESSMENT ON SELECTED POLICY OPTIONS FOR REVISION OF THE BATTERY DIRECTIVE
33..44 QQUUAANNTTIITTAATTIIVVEE OOPPTTIIOONNSS AABBOOUUTT AALLLL BBAATTTTEERRIIEESS
PPoolliiccyy OOppttiioonnss ttoo BBee SSttuuddiieedd ffoorr AAllll BBaatttteerriieess
Collection rate Recycling plant input Scope
% of spent batteries
% of spent batteries
% of collected
All batteries 50-60% 60-70% 70-80%
45-55% 55-65% 65-75%
90%
When considering the baseline scenario for 2007, the highest policy options to be studied for all spent batteries, a collection rate of 70-80%, is already reached due to the fact that:
80 to 95% of spent starter batteries, which represent about 65% of all spent batteries, are believed to be collected,
80 to 90% of spent industrial batteries, which represent about 20% of all spent batteries, are collected.
As far as policy options about recycling plant inputs is concerned, 95-98% of all spent batteries collected in 2007 will be sent to a recycling plant, for the same reason.
No major environmental impacts are thus expected for policy options about all batteries.
Regarding economic impacts, the setting up of mandatory targets will require to implement monitoring systems for all types of batteries, in particular starter batteries and industrial batteries where statistics do not exist at all in most countries today. This will generate costs (see section 3.3.2 page 79 for starter batteries), without being certain of the reliability of the measurements considering the high levels already reached.
As for social impacts, job would be created with the implementation of monitoring systems.

B I O I n t e l l i g e n c e S e r v i c e IMPACT ASSESSMENT ON SELECTED POLICY OPTIONS FOR REVISION OF THE BATTERY DIRECTIVE
89
33..55 QQUUAANNTTIITTAATTIIVVEE OOPPTTIIOONNSS AABBOOUUTT NNIICCDD BBAATTTTEERRIIEESS
33..55..11 FFeeaassiibbiilliittyy
As mentioned before, in the baseline scenario, industrial NiCd batteries are believed to already reach the highest collection target (80-90% of spent batteries).
But they only represent 1/5th of total spent NiCd batteries and collection rate of portable NiCd batteries is estimated at 20-25% in the baseline scenario.
To reach the total targets for NiCd batteries, targets no lower than 10 points would be necessary for portable NiCd batteries.
PPoolliiccyy OOppttiioonnss AAbboouutt NNiiCCdd BBaatttteerriieess
Policy options Collection rate
Policy options Collection rate
% of all spent NiCd batteries
80-90% of spent Industrial NiCd
batteries are already collected
% of spent portable NiCd
batteries
60-70% 70-80% 80-90%
50-60% 60-70% 70-80%
% of all spent NiCd batteries available for collection29
% of spent
portable NiCd batteries
available for collection
All NiCd batteries
100-120% 120-140% 140-155%
Portable NiCd batteries
135-165% 165-190% 190-220%
This is technically possible, but will require both:
current domestic hoarding behaviours to be reduced significantly,
refractory persons to participate to separate collection.
Corresponding costs are assessed in the next section.
33..55..22 EEccoonnoommiicc IImmppaaccttss
Among countries where portable NiCd batteries collection is well developed, three types of scheme can be distinguished:
Scheme 1 - Collection and recycling of NiCd only,
Scheme 2 - Collection and recycling all portable batteries,
29 Estimated with current hoarding behaviours of end users.

B I O I n t e l l i g e n c e S e r v i c e IMPACT ASSESSMENT ON SELECTED POLICY OPTIONS FOR REVISION OF THE BATTERY DIRECTIVE
90
Scheme 3 - Collection of all portable batteries in view of recycling primarily NiCd (and also batteries whose recycling cost is 0 or negative).
Because economic impacts are a priori different according to the type of scheme, we consider them separately hereafter.
33..55..22..11 EEccoonnoommiicc IImmppaaccttss ffoorr SScchheemmee 11 -- CCoolllleeccttiioonn aanndd RReeccyycclliinngg ooff NNiiCCdd OOnnllyy
The only costs available concern the Danish situation, where total collection and recycling costs amount at about 2 830 Euros / tonne collected, i.e. about 80 cents / battery sold. And 40-45% of spent portable NiCd batteries are collected and recycled.
As mentioned in section 2.4.7.2 page 62, economies of scale can be expected for NiCd power packs recycling cost. Recycling cost is then expected to decrease from an average of 150 Euros / tonne (for a mix of individual cells and power packs) today to zero Euros / t.
A total collection and recycling costs could then reach 2600-2700 Euros / tonne in a system as in Denmark, i.e. about 75 cents / battery sold.
Remark: these cots are likely to be influenced by the size of Denmark. It is not sure these costs are representative of what would cost this system in larger countries.
The question should be asked if such scheme focusing on NiCd could reach policy targets under consideration. As a matter of fact, despite very high financial incentives for collectors to collect since 1996, only 43% are collected.
33..55..22..22 EEccoonnoommiicc IImmppaaccttss ffoorr SScchheemmee 22 -- CCoolllleeccttiioonn aanndd RReeccyycclliinngg ooff AAllll PPoorrttaabbllee BBaatttteerriieess
33..55..22..22..11 EEccoonnoommiicc MMooddeell BBuuiilltt
An economic model was built to assess economic impacts. Hypotheses are based on the case studies analysed (see section 2.4.7.3 page 65).
Important remark about the purpose of the model: the main purpose of the economic model built is to try to estimate the level of costs to reach different levels of collection rate, with a specificity: the existence of hoarding behaviors. When considering countries advanced in batteries collection, it appears that hurdles exist which are difficult to overcome. The model does not aim at describing how costs would evolve in a given country with years (in that case, there could be collection cost optimisation for instance after a while... - we did not integrate these elements in the modelisation).
The following costs are estimated:
Variable costs: - Collection points (equipment) - Collection (logistic) - Transport - Sorting - Recycling or disposal - Miscellaneous

B I O I n t e l l i g e n c e S e r v i c e IMPACT ASSESSMENT ON SELECTED POLICY OPTIONS FOR REVISION OF THE BATTERY DIRECTIVE
91
Fixed costs: - Public relation and communication - Administration.
Remark about the terminology: We kept the common definition of ‘variable’ and ‘fixed’ costs terms which are meant to reflect how total expenses (yearly budget) evolve when collected quantities increase in a given system . Given that the purpose of the model differs, some cost qualified as ‘fixed cost’ are not necessarily considered fixed in the model.
To take into account the ranges in which actual costs vary, we considered two scenarii:
Scenario L – ‘Low costs’ scenario, corresponding to relatively low collection and recycling costs,
Scenario H – ‘High costs’ scenario, corresponding to relatively high collection and recycling costs.
For each scenario, we studied 3 ranges of recycling plant inputs:
50-60%,
60-70%,
90-100%.
The costs for any other ranges of recycling plant input can easily be calculated from the detailed data provided in the report.
PPoorrttaabbllee BBaatttteerriieess –– SScceennaarriiii AAnnaallyysseedd
A set of hypotheses was defined for one point of the curves: collection rate of 20-30% of sales (i.e. 21-31% of spent batteries), based on existing collection scheme costs.
Then hypotheses about evolution of costs with the collection rate targeted and economies of scale were introduced, as described in the following table.
Level of costs"Low costs"
Relatively low collection and recycling costs
"High costs" Relatively high collection and recycling costs
Scenario L50 - 60% Scenario H50 - 60%
Scenario L60 - 70%
Scenario L90 - 100%
Scenario H60 - 70%
Scenario H90 - 100%
Recycling plant input
(% of collected)
50-60%
60-70%
90-100%
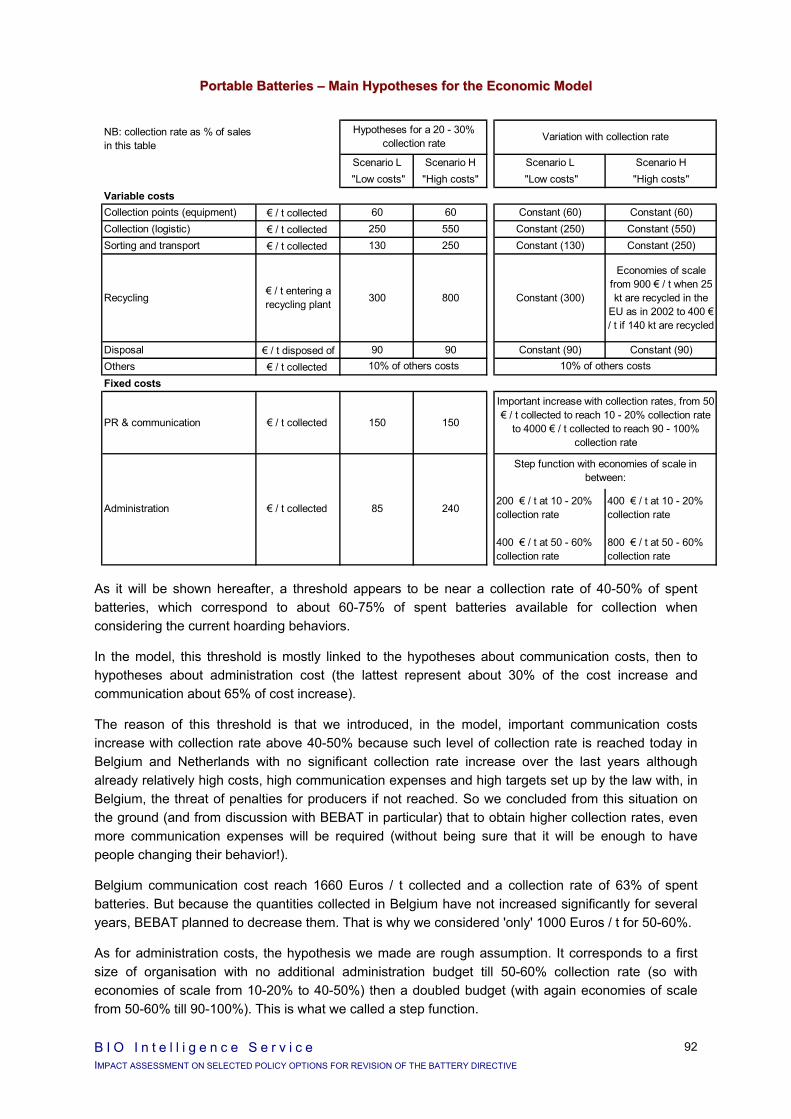
B I O I n t e l l i g e n c e S e r v i c e IMPACT ASSESSMENT ON SELECTED POLICY OPTIONS FOR REVISION OF THE BATTERY DIRECTIVE
92
PPoorrttaabbllee BBaatttteerriieess –– MMaaiinn HHyyppootthheesseess ffoorr tthhee EEccoonnoommiicc MMooddeell
As it will be shown hereafter, a threshold appears to be near a collection rate of 40-50% of spent batteries, which correspond to about 60-75% of spent batteries available for collection when considering the current hoarding behaviors.
In the model, this threshold is mostly linked to the hypotheses about communication costs, then to hypotheses about administration cost (the lattest represent about 30% of the cost increase and communication about 65% of cost increase).
The reason of this threshold is that we introduced, in the model, important communication costs increase with collection rate above 40-50% because such level of collection rate is reached today in Belgium and Netherlands with no significant collection rate increase over the last years although already relatively high costs, high communication expenses and high targets set up by the law with, in Belgium, the threat of penalties for producers if not reached. So we concluded from this situation on the ground (and from discussion with BEBAT in particular) that to obtain higher collection rates, even more communication expenses will be required (without being sure that it will be enough to have people changing their behavior!).
Belgium communication cost reach 1660 Euros / t collected and a collection rate of 63% of spent batteries. But because the quantities collected in Belgium have not increased significantly for several years, BEBAT planned to decrease them. That is why we considered 'only' 1000 Euros / t for 50-60%.
As for administration costs, the hypothesis we made are rough assumption. It corresponds to a first size of organisation with no additional administration budget till 50-60% collection rate (so with economies of scale from 10-20% to 40-50%) then a doubled budget (with again economies of scale from 50-60% till 90-100%). This is what we called a step function.
NB: collection rate as % of sales in this table
Scenario L Scenario H Scenario L Scenario H "Low costs" "High costs" "Low costs" "High costs"
Variable costsCollection points (equipment) € / t collected 60 60 Constant (60) Constant (60)Collection (logistic) € / t collected 250 550 Constant (250) Constant (550)Sorting and transport € / t collected 130 250 Constant (130) Constant (250)
Recycling€ / t entering a recycling plant 300 800 Constant (300)
Economies of scale from 900 € / t when 25 kt are recycled in the
EU as in 2002 to 400 € / t if 140 kt are recycled
Disposal € / t disposed of 90 90 Constant (90) Constant (90)Others € / t collected Fixed costs
PR & communication € / t collected 150 150
200 € / t at 10 - 20% collection rate
400 € / t at 10 - 20% collection rate
400 € / t at 50 - 60% collection rate
800 € / t at 50 - 60% collection rate
Important increase with collection rates, from 50 € / t collected to reach 10 - 20% collection rate
to 4000 € / t collected to reach 90 - 100% collection rate
Administration € / t collected 85 240
Step function with economies of scale in between:
10% of others costs 10% of others costs
Hypotheses for a 20 - 30% collection rate Variation with collection rate

B I O I n t e l l i g e n c e S e r v i c e IMPACT ASSESSMENT ON SELECTED POLICY OPTIONS FOR REVISION OF THE BATTERY DIRECTIVE
93
Remark: for a given collection rate, the scenarii for different recycling plant inputs differ on the proportions of spent batteries collected which are recycled (at a recycling cost assessed as described in the above-mentioned table) or disposed of (at a cost of 90 Euros / t disposed of). In order to not complicate to much the model, a simplification had thus been made; it concerns the fact that economies of scale for recycling are accounted for function of collection rate (and thus quantities collected) and not function of quantities actually sent to a recycling plant. Considering the prospective dimension of the approach, and the uncertainties associated independently from that simplification, it is likely not to introduce too big a biais.
For each scenario, 2 levels of costs paid for by producers are represented depending on their responsibility:
costs paid for by producers when a producer responsibility is introduced.
They give a good estimate of the total collection and recycling costs of the scheme.
costs paid for by producers when a shared responsibility is introduced.
The difference between the two costs give an order of magnitude of the costs taken in charge by public authorities and retailers.
Remark: the costs paid for by local authorities may even be lower because optimisation with other waste management scheme is possible.
33..55..22..22..22 DDeettaaiilleedd RReessuullttss
The detailed results are successively presented first for scenario L then for scenario H.
The following 8 pages present the curves and detailed data for each ‘low costs’ scenario L:
Scenario L50 – 60% :
- Graph: Total collection and recycling costs in € / tonne collected, function of the collection rate,
- Graph: Total collection and recycling costs in € cent / unit sold, function of the collection rate.
Scenario L60 – 70% :
- Graph: Total collection and recycling costs in € / tonne collected, function of the collection rate
- Graph: Total collection and recycling costs in € cent / unit sold, function of the collection rate.
Scenario L90 – 100% :
- Graph: Total collection and recycling costs in € / tonne collected, function of the collection rate
- Graph: Total collection and recycling costs in € cent / unit sold, function of the collection rate.
Two tables contain all detailed data used to build the curves, one in € / tonne collected and the other in cents / unit sold.

BIO
In
tell
ige
nc
e S
erv
ice
____
____
____
____
____
____
____
____
____
____
____
___
94
. I M
PA
CT
AS
SE
SS
ME
NT
ON
SE
LEC
TED
PO
LIC
Y O
PTI
ON
S F
OR
RE
VIS
ION
OF
THE
BA
TTE
RY
DIR
EC
TIV
E
Sm
all B
atte
ries
- Sce
nario
L50
- 60
%C
olle
ctio
n sy
stem
:Lo
w c
ost
Rec
yclin
g:Lo
w c
ost w
ith n
o ec
onom
ies
of s
cale
Col
lect
ed b
atte
ries
sent
to re
cycl
ing:
50
- 60
%
Tota
l col
lect
ion
and
recy
clin
g co
sts
paid
for b
y pr
oduc
ers
Col
lect
ion
rate
10-2
0%20
-30%
30-4
0%40
-50%
50-6
0%60
-70%
70-8
0%80
-90%
90-1
00%
% o
f sal
es11
-21%
21-3
1%31
-41%
41-5
1%51
-61%
61-7
1%72
-82%
82-9
2%92
-102
%%
of s
pent
bat
terie
s25
-35%
35-4
5%45
-60%
60-7
5%75
-85%
85-1
00%
100-
120%
110-
120%
120-
130%
% o
f spe
nt b
atte
ries
avai
labl
e fo
r col
lect
ion
(1)
40-8
080
-120
120-
160
160-
200
200-
240
240-
280
280-
320
320-
360
360-
400
g co
llect
ed /
inha
b / y
r (2)
Euro
s / t
of s
mal
l bat
terie
s s
epar
atel
y co
llect
ed in
vie
w o
f rec
yclin
g(u
ncer
tain
ty re
pres
ente
d: +
/-10%
)
Hig
h co
st c
omm
unic
atio
n pr
ogra
mm
es:
- to
redu
ce h
oard
ing
beha
vior
s in
ord
er to
incr
ease
sp
ent b
atte
ries
avai
labl
e fo
r col
lect
ion
- to
enco
urag
e re
fract
ory
pers
ons
to p
artic
ipat
e to
se
para
te c
olle
ctio
n
Bas
elin
e sc
enar
io- M
inim
um o
f 3%
of s
ales
col
lect
ed fo
llow
ing
the
impl
emen
tatio
n of
WE
EE
dire
ctiv
e- A
vera
ge o
f 90
Eur
os /
t of b
atte
ries
disp
osed
of
(1) E
quiv
alen
ce b
etw
een
colle
ctio
n ra
te a
s %
of s
ales
and
col
lect
ion
rate
as
% o
f spe
nt b
atte
ries
avai
labl
e fo
r col
lect
ion
base
d on
the
curre
nt a
vera
ge c
urre
nt h
oard
ing
beha
vior
s of
hou
seho
lds
and
prof
essi
onal
use
rs in
the
EU(2
) Bas
ed o
n th
e E
U a
vera
ge s
ituat
ion
of 1
65 k
t of s
mal
l bat
terie
s so
ld in
200
7 (1
58 k
t in
2002
+ 1
% a
vera
ge g
row
th
rate
per
yea
r) an
d 39
0 M
illio
ns in
habi
tant
s(3
) In
case
of s
hare
d re
spon
sibi
litie
s, th
e co
st d
iffer
ence
bet
wee
n th
e tw
o cu
rbs
is p
aid
for b
y pu
blic
aut
horit
ies
and/
or
reta
ilers
Not
rele
vant
(s
pent
bat
terie
s <
sale
s)
Incr
ease
of c
omm
unic
atio
n co
sts
com
pens
ates
eco
nom
ies
of s
cale
for r
ecyc
ling
cost
s
Euro
s / t
onne
col
lect
ed
1 00
41
026
1 09
81
242
2 26
9
3 85
1
4 35
1
4 86
3
5 38
3
894
816
788
782
1 20
91
291
1 29
11
303
1 32
3
0
1 00
0
2 00
0
3 00
0
4 00
0
5 00
0
6 00
0
Prod
ucer
sre
spon
sibi
lity
Shar
edre
spon
sibi
lity
(3)
90
Eco
nom
ies
of s
cale
of
adm
inis
tratio
n co
sts
Incr
ease
of
adm
inis
tratio
n bu
dget

BIO
In
tell
ige
nc
e S
erv
ice
I MP
AC
T A
SS
ES
SM
EN
T O
N S
ELE
CTE
D P
OLI
CY
OP
TIO
NS
FO
R R
EV
ISIO
N O
F TH
E B
ATT
ER
Y D
IRE
CTI
VE
95
Smal
l Bat
terie
s - S
cena
rio L
50 -
60%
Col
lect
ion
syst
em:
Low
cos
t R
ecyc
ling:
Low
cos
t with
no
econ
omie
s of
sca
leC
olle
cted
bat
terie
s se
nt to
recy
clin
g:
50 -
60%
Col
lect
ion
rate
10-2
0%20
-30%
30-4
0%40
-50%
50-6
0%60
-70%
70-8
0%80
-90%
90-1
00%
11-2
1%21
-31%
31-4
1%41
-51%
51-6
1%61
-71%
72-8
2%82
-92%
92-1
02%
% o
f sal
es25
-35%
35-4
5%45
-60%
60-7
5%75
-85%
85-1
00%
100-
120%
110-
120%
120-
130%
% o
f spe
nt b
atte
ries
40-8
080
-120
120-
160
160-
200
200-
240
240-
280
280-
320
320-
360
360-
400
% o
f spe
nt b
atte
ries
avai
labl
e fo
r col
lect
ion
(1)
g co
llect
ed /
inha
b / y
r (2)
(unc
erta
inty
repr
esen
ted:
+/-1
0%)
Euro
s ce
nts
/ uni
t sol
dTo
tal c
olle
ctio
n an
d re
cycl
ing
cost
s pa
id fo
r
Col
lect
ion
rate
Hig
h co
st c
omm
unic
atio
n pr
ogra
mm
es:
- to
redu
ce h
oard
ing
beha
vior
s in
ord
er to
incr
ease
sp
ent b
atte
ries
avai
labl
e fo
r col
lect
ion
- to
enco
urag
e re
fract
ory
pers
ons
to p
artic
ipat
e to
se
para
te c
olle
ctio
n
Bas
elin
e sc
enar
io- M
inim
um o
f 3%
of s
ales
col
lect
ed fo
llow
ing
the
impl
emen
tatio
n of
WE
EE
dire
ctiv
e- A
vera
ge o
f 90
Eur
os /
t of b
atte
ries
disp
osed
of
Not
rele
vant
(s
pent
bat
terie
s <
sale
s)Euro
s ce
nts
/ uni
t sol
d
0,6
1,0
1,5
2,2
5,0
10,0
13,1
16,5
20,5
0,5
0,8
1,1
1,4
2,7
3,4
3,9
5,0
4,4
0,0
5,0
10,0
15,0
20,0
Pro
duce
rsre
spon
sibi
lity
Sha
red
resp
onsi
bilit
y (3
)
(1) E
quiv
alen
ce b
etw
een
colle
ctio
n ra
te a
s %
of s
ales
and
col
lect
ion
rate
as
% o
f spe
nt b
atte
ries
avai
labl
e fo
r col
lect
ion
base
d on
the
curre
nt a
vera
ge c
urre
nt h
oard
ing
beha
vior
s of
hou
seho
lds
and
prof
essi
onal
use
rs in
the
EU
(2) B
ased
on
the
EU
ave
rage
situ
atio
n of
165
kt o
f sm
all b
atte
ries
sold
in 2
007
(158
kt i
n 20
02 +
1%
ave
rage
gro
wth
ra
te p
er y
ear)
and
390
Mill
ions
inha
bita
nts
(3) I
n ca
se o
f sha
red
resp
onsi
bilit
ies,
the
cost
diff
eren
ce b
etw
een
the
two
curb
s is
pai
d fo
r by
publ
ic a
utho
ritie
s an
d/or
re
taile
rs
0.36
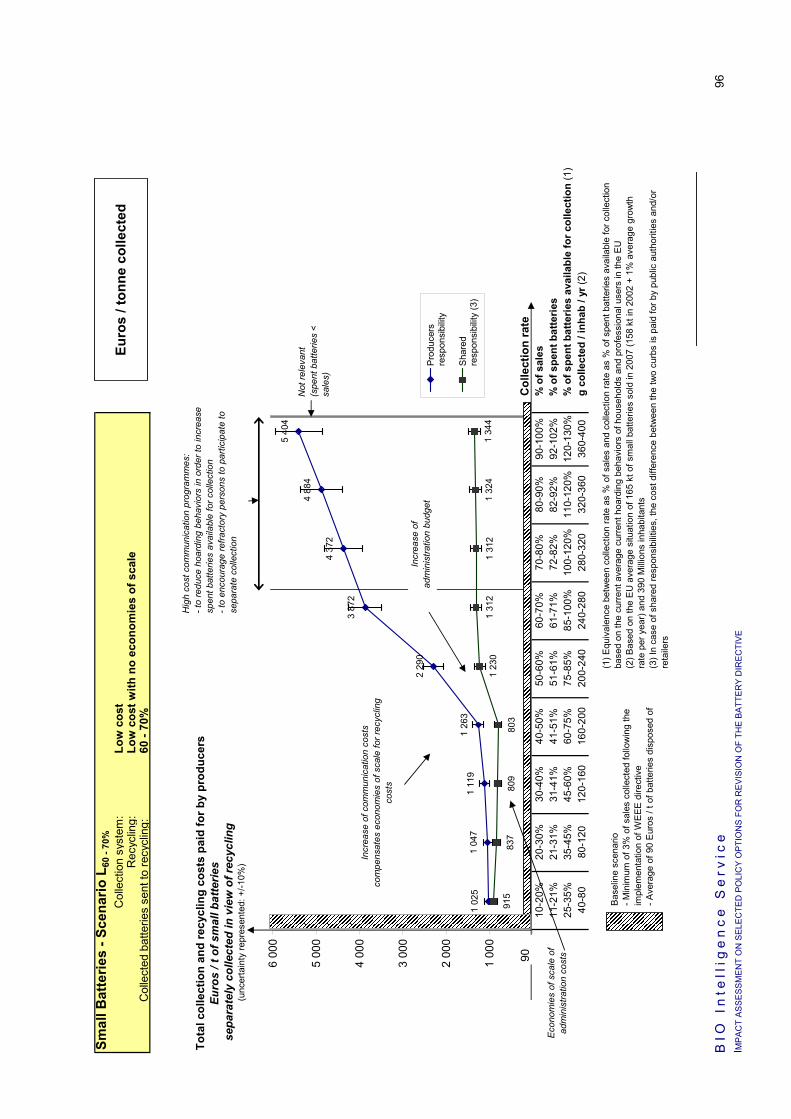
BIO
In
tell
ige
nc
e S
erv
ice
I MP
AC
T A
SS
ES
SM
EN
T O
N S
ELE
CTE
D P
OLI
CY
OP
TIO
NS
FO
R R
EV
ISIO
N O
F TH
E B
ATT
ER
Y D
IRE
CTI
VE
96
Smal
l Bat
terie
s - S
cena
rio L
60 -
70%
Col
lect
ion
syst
em:
Low
cos
t R
ecyc
ling:
Low
cos
t with
no
econ
omie
s of
sca
leC
olle
cted
bat
terie
s se
nt to
recy
clin
g:
60 -
70%
Tota
l col
lect
ion
and
recy
clin
g co
sts
paid
for b
y pr
oduc
ers
Col
lect
ion
rate
10-2
0%20
-30%
30-4
0%40
-50%
50-6
0%60
-70%
70-8
0%80
-90%
90-1
00%
% o
f sal
es11
-21%
21-3
1%31
-41%
41-5
1%51
-61%
61-7
1%72
-82%
82-9
2%92
-102
%%
of s
pent
bat
terie
s25
-35%
35-4
5%45
-60%
60-7
5%75
-85%
85-1
00%
100-
120%
110-
120%
120-
130%
% o
f spe
nt b
atte
ries
avai
labl
e fo
r col
lect
ion
(1)
40-8
080
-120
120-
160
160-
200
200-
240
240-
280
280-
320
320-
360
360-
400
g co
llect
ed /
inha
b / y
r (2)
Euro
s / t
of s
mal
l bat
terie
s s
epar
atel
y co
llect
ed in
vie
w o
f rec
yclin
g(u
ncer
tain
ty re
pres
ente
d: +
/-10%
)
Hig
h co
st c
omm
unic
atio
n pr
ogra
mm
es:
- to
redu
ce h
oard
ing
beha
vior
s in
ord
er to
incr
ease
sp
ent b
atte
ries
avai
labl
e fo
r col
lect
ion
- to
enco
urag
e re
fract
ory
pers
ons
to p
artic
ipat
e to
se
para
te c
olle
ctio
n
Bas
elin
e sc
enar
io- M
inim
um o
f 3%
of s
ales
col
lect
ed fo
llow
ing
the
impl
emen
tatio
n of
WE
EE
dire
ctiv
e- A
vera
ge o
f 90
Eur
os /
t of b
atte
ries
disp
osed
of
Not
rele
vant
(s
pent
bat
terie
s <
sale
s)
Incr
ease
of c
omm
unic
atio
n co
sts
com
pens
ates
eco
nom
ies
of s
cale
for r
ecyc
ling
cost
s
Euro
s / t
onne
col
lect
ed
1 02
51
047
1 11
91
263
2 29
0
3 87
2
4 37
2
4 88
4
5 40
4
915
837
809
803
1 23
01
312
1 31
21
324
1 34
4
0
1 00
0
2 00
0
3 00
0
4 00
0
5 00
0
6 00
0
Pro
duce
rsre
spon
sibi
lity
Sha
red
resp
onsi
bilit
y (3
)
90
(1) E
quiv
alen
ce b
etw
een
colle
ctio
n ra
te a
s %
of s
ales
and
col
lect
ion
rate
as
% o
f spe
nt b
atte
ries
avai
labl
e fo
r col
lect
ion
base
d on
the
curre
nt a
vera
ge c
urre
nt h
oard
ing
beha
vior
s of
hou
seho
lds
and
prof
essi
onal
use
rs in
the
EU(2
) Bas
ed o
n th
e E
U a
vera
ge s
ituat
ion
of 1
65 k
t of s
mal
l bat
terie
s so
ld in
200
7 (1
58 k
t in
2002
+ 1
% a
vera
ge g
row
th
rate
per
yea
r) an
d 39
0 M
illion
s in
habi
tant
s(3
) In
case
of s
hare
d re
spon
sibi
litie
s, th
e co
st d
iffer
ence
bet
wee
n th
e tw
o cu
rbs
is p
aid
for b
y pu
blic
aut
horit
ies
and/
or
reta
ilers
Eco
nom
ies
of s
cale
of
adm
inis
tratio
n co
sts
Incr
ease
of
adm
inis
tratio
n bu
dget

BIO
In
tell
ige
nc
e S
erv
ice
I MP
AC
T A
SS
ES
SM
EN
T O
N S
ELE
CTE
D P
OLI
CY
OP
TIO
NS
FO
R R
EV
ISIO
N O
F TH
E B
ATT
ER
Y D
IRE
CTI
VE
97
Smal
l Bat
terie
s - S
cena
rio L
60 -
70%
Col
lect
ion
syst
em:
Low
cos
t R
ecyc
ling:
Low
cos
t with
no
econ
omie
s of
sca
leC
olle
cted
bat
terie
s se
nt to
recy
clin
g:
60 -
70%
Col
lect
ion
rate
10-2
0%20
-30%
30-4
0%40
-50%
50-6
0%60
-70%
70-8
0%80
-90%
90-1
00%
11-2
1%21
-31%
31-4
1%41
-51%
51-6
1%61
-71%
72-8
2%82
-92%
92-1
02%
% o
f sal
es25
-35%
35-4
5%45
-60%
60-7
5%75
-85%
85-1
00%
100-
120%
110-
120%
120-
130%
% o
f spe
nt b
atte
ries
40-8
080
-120
120-
160
160-
200
200-
240
240-
280
280-
320
320-
360
360-
400
% o
f spe
nt b
atte
ries
avai
labl
e fo
r col
lect
ion
(1)
g co
llect
ed /
inha
b / y
r (2)
Euro
s ce
nts
/ uni
t sol
dTo
tal c
olle
ctio
n an
d re
cycl
ing
cost
s pa
id fo
r
(unc
erta
inty
repr
esen
ted:
+/-1
0%)
Col
lect
ion
rate
Hig
h co
st c
omm
unic
atio
n pr
ogra
mm
es:
- to
redu
ce h
oard
ing
beha
vior
s in
ord
er to
incr
ease
sp
ent b
atte
ries
avai
labl
e fo
r col
lect
ion
- to
enco
urag
e re
fract
ory
pers
ons
to p
artic
ipat
e to
se
para
te c
olle
ctio
n
Base
line
scen
ario
- Min
imum
of 3
% o
f sal
es c
olle
cted
follo
win
g th
e im
plem
enta
tion
of W
EEE
dire
ctiv
e- A
vera
ge o
f 90
Eur
os /
t of b
atte
ries
disp
osed
of
Not
rele
vant
(s
pent
bat
terie
s <
sale
s)
0,6
1,0
1,5
2,2
5,0
10,0
13,1
16,5
20,5
0,5
0,8
1,1
1,4
2,7
3,4
3,9
5,0
4,4
0,0
5,0
10,0
15,0
20,0
Pro
duce
rsre
spon
sibi
lity
Sha
red
resp
onsi
bilit
y (3
)
(1) E
quiv
alen
ce b
etw
een
colle
ctio
n ra
te a
s %
of s
ales
and
col
lect
ion
rate
as
% o
f spe
nt b
atte
ries
avai
labl
e fo
r col
lect
ion
base
d on
the
curre
nt a
vera
ge c
urre
nt h
oard
ing
beha
vior
s of
hou
seho
lds
and
prof
essi
onal
use
rs in
the
EU
(2) B
ased
on
the
EU
ave
rage
situ
atio
n of
165
kt o
f sm
all b
atte
ries
sold
in 2
007
(158
kt i
n 20
02 +
1%
ave
rage
gro
wth
ra
te p
er y
ear)
and
390
Mill
ions
inha
bita
nts
(3) I
n ca
se o
f sha
red
resp
onsi
bilit
ies,
the
cost
diff
eren
ce b
etw
een
the
two
curb
s is
pai
d fo
r by
publ
ic a
utho
ritie
s an
d/or
re
taile
rs
0.36
Euro
s ce
nts
/ uni
t sol
d

BIO
In
tell
ige
nc
e S
erv
ice
I MP
AC
T A
SS
ES
SM
EN
T O
N S
ELE
CTE
D P
OLI
CY
OP
TIO
NS
FO
R R
EV
ISIO
N O
F TH
E B
ATT
ER
Y D
IRE
CTI
VE
98
Smal
l Bat
terie
s - S
cena
rio L
90 -
100%
Col
lect
ion
syst
em:
Low
cos
t R
ecyc
ling:
Low
cos
t with
no
econ
omie
s of
sca
leC
olle
cted
bat
terie
s se
nt to
recy
clin
g:
90 -
100%
Tota
l col
lect
ion
and
recy
clin
g co
sts
paid
for b
y pr
oduc
ers
Col
lect
ion
rate
10-2
0%20
-30%
30-4
0%40
-50%
50-6
0%60
-70%
70-8
0%80
-90%
90-1
00%
% o
f sal
es11
-21%
21-3
1%31
-41%
41-5
1%51
-61%
61-7
1%72
-82%
82-9
2%92
-102
%%
of s
pent
bat
terie
s25
-35%
35-4
5%45
-60%
60-7
5%75
-85%
85-1
00%
100-
120%
110-
120%
120-
130%
% o
f spe
nt b
atte
ries
avai
labl
e fo
r col
lect
ion
(1)
40-8
080
-120
120-
160
160-
200
200-
240
240-
280
280-
320
320-
360
360-
400
g co
llect
ed /
inha
b / y
r (2)
sep
arat
ely
colle
cted
in v
iew
of r
ecyc
ling
(unc
erta
inty
repr
esen
ted:
+/-1
0%)
Euro
s / t
of s
mal
l bat
terie
s
Hig
h co
st c
omm
unic
atio
n pr
ogra
mm
es:
- to
redu
ce h
oard
ing
beha
vior
s in
ord
er to
incr
ease
sp
ent b
atte
ries
avai
labl
e fo
r col
lect
ion
- to
enco
urag
e re
fract
ory
pers
ons
to p
artic
ipat
e to
se
para
te c
olle
ctio
n
Bas
elin
e sc
enar
io- M
inim
um o
f 3%
of s
ales
col
lect
ed fo
llow
ing
the
impl
emen
tatio
n of
WE
EE
dire
ctiv
e- A
vera
ge o
f 90
Eur
os /
t of b
atte
ries
disp
osed
of
Not
rele
vant
(s
pent
bat
terie
s <
sale
s)
Incr
ease
of c
omm
unic
atio
n co
sts
com
pens
ates
eco
nom
ies
of s
cale
for r
ecyc
ling
cost
s
Euro
s / t
onne
col
lect
ed
1 08
81
110
1 18
21
326
2 35
3
3 93
5
4 43
5
4 94
7
5 46
7
978
900
872
866
1 29
31
375
1 37
51
387
1 40
7
0
1 00
0
2 00
0
3 00
0
4 00
0
5 00
0
6 00
0
Pro
duce
rsre
spon
sibi
lity
Sha
red
resp
onsi
bilit
y (3
)
(1) E
quiv
alen
ce b
etw
een
colle
ctio
n ra
te a
s %
of s
ales
and
col
lect
ion
rate
as
% o
f spe
nt b
atte
ries
avai
labl
e fo
r col
lect
ion
base
d on
the
curre
nt a
vera
ge c
urre
nt h
oard
ing
beha
vior
s of
hou
seho
lds
and
prof
essi
onal
use
rs in
the
EU(2
) Bas
ed o
n th
e E
U a
vera
ge s
ituat
ion
of 1
65 k
t of s
mal
l bat
terie
s so
ld in
200
7 (1
58 k
t in
2002
+ 1
% a
vera
ge g
row
th
rate
per
yea
r) an
d 39
0 M
illion
s in
habi
tant
s(3
) In
case
of s
hare
d re
spon
sibi
litie
s, th
e co
st d
iffer
ence
bet
wee
n th
e tw
o cu
rbs
is p
aid
for b
y pu
blic
aut
horit
ies
and/
or
reta
ilers
Eco
nom
ies
of s
cale
of
adm
inis
tratio
n co
sts
Incr
ease
of
adm
inis
tratio
n bu
dget
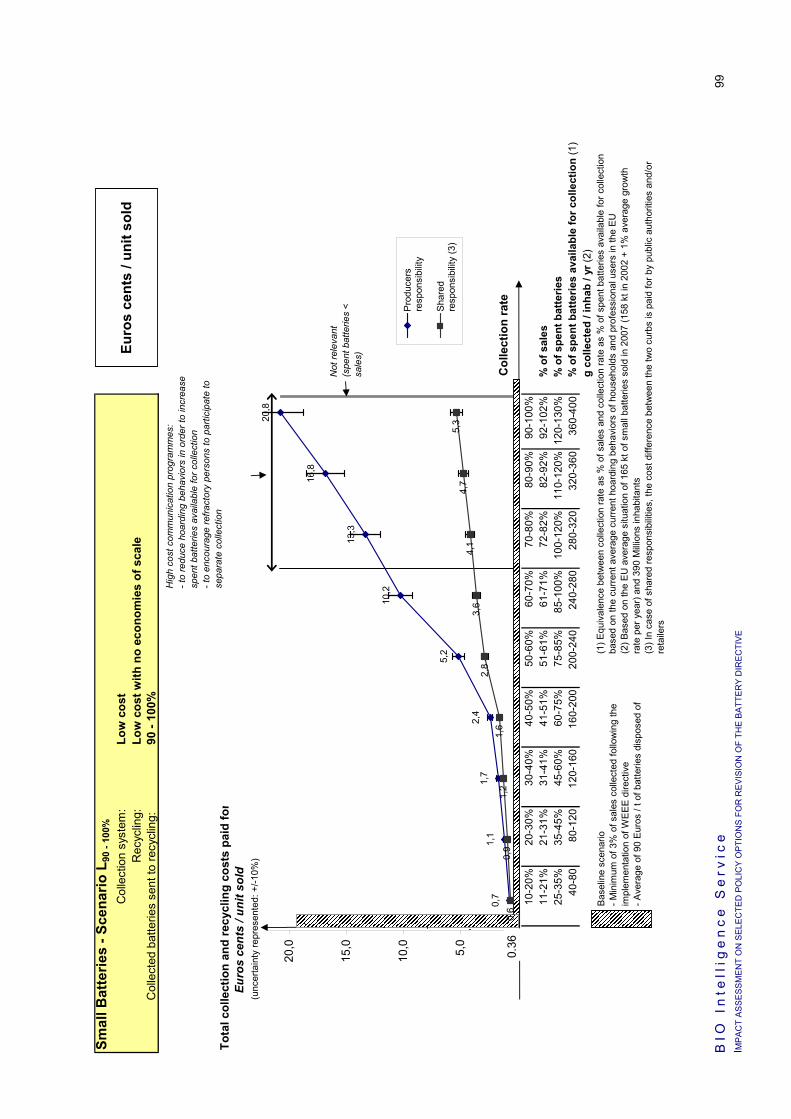
BIO
In
tell
ige
nc
e S
erv
ice
I MP
AC
T A
SS
ES
SM
EN
T O
N S
ELE
CTE
D P
OLI
CY
OP
TIO
NS
FO
R R
EV
ISIO
N O
F TH
E B
ATT
ER
Y D
IRE
CTI
VE
99
Smal
l Bat
terie
s - S
cena
rio L
90 -
100%
Col
lect
ion
syst
em:
Low
cos
t R
ecyc
ling:
Low
cos
t with
no
econ
omie
s of
sca
leC
olle
cted
bat
terie
s se
nt to
recy
clin
g:
90 -
100%
Col
lect
ion
rate
10-2
0%20
-30%
30-4
0%40
-50%
50-6
0%60
-70%
70-8
0%80
-90%
90-1
00%
11-2
1%21
-31%
31-4
1%41
-51%
51-6
1%61
-71%
72-8
2%82
-92%
92-1
02%
% o
f sal
es25
-35%
35-4
5%45
-60%
60-7
5%75
-85%
85-1
00%
100-
120%
110-
120%
120-
130%
% o
f spe
nt b
atte
ries
40-8
080
-120
120-
160
160-
200
200-
240
240-
280
280-
320
320-
360
360-
400
% o
f spe
nt b
atte
ries
avai
labl
e fo
r col
lect
ion
(1)
g co
llect
ed /
inha
b / y
r (2)
Tota
l col
lect
ion
and
recy
clin
g co
sts
paid
for
Euro
s ce
nts
/ uni
t sol
d(u
ncer
tain
ty re
pres
ente
d: +
/-10%
)
Col
lect
ion
rate
Euro
s ce
nts
/ uni
t sol
d
Hig
h co
st c
omm
unic
atio
n pr
ogra
mm
es:
- to
redu
ce h
oard
ing
beha
vior
s in
ord
er to
incr
ease
sp
ent b
atte
ries
avai
labl
e fo
r col
lect
ion
- to
enco
urag
e re
fract
ory
pers
ons
to p
artic
ipat
e to
se
para
te c
olle
ctio
n
Bas
elin
e sc
enar
io- M
inim
um o
f 3%
of s
ales
col
lect
ed fo
llow
ing
the
impl
emen
tatio
n of
WE
EE
dire
ctiv
e- A
vera
ge o
f 90
Eur
os /
t of b
atte
ries
disp
osed
of
Not
rele
vant
(s
pent
bat
terie
s <
sale
s)
0,7
1,1
1,7
2,4
5,2
10,2
13,3
16,8
20,8
0,6
0,9
1,2
1,6
2,8
3,6
4,1
4,7
5,3
0,0
5,0
10,0
15,0
20,0
Pro
duce
rsre
spon
sibi
lity
Sha
red
resp
onsi
bilit
y (3
)
(1) E
quiv
alen
ce b
etw
een
colle
ctio
n ra
te a
s %
of s
ales
and
col
lect
ion
rate
as
% o
f spe
nt b
atte
ries
avai
labl
e fo
r col
lect
ion
base
d on
the
curre
nt a
vera
ge c
urre
nt h
oard
ing
beha
vior
s of
hou
seho
lds
and
prof
essi
onal
use
rs in
the
EU(2
) Bas
ed o
n th
e E
U a
vera
ge s
ituat
ion
of 1
65 k
t of s
mal
l bat
terie
s so
ld in
200
7 (1
58 k
t in
2002
+ 1
% a
vera
ge g
row
th
rate
per
yea
r) an
d 39
0 M
illion
s in
habi
tant
s(3
) In
case
of s
hare
d re
spon
sibi
litie
s, th
e co
st d
iffer
ence
bet
wee
n th
e tw
o cu
rbs
is p
aid
for b
y pu
blic
aut
horit
ies
and/
or
reta
ilers
0.36

BIO
In
tell
ige
nc
e S
erv
ice
I MP
AC
T A
SS
ES
SM
EN
T O
N S
ELE
CTE
D P
OLI
CY
OP
TIO
NS
FO
R R
EV
ISIO
N O
F TH
E B
ATT
ER
Y D
IRE
CTI
VE
100
Smal
l bat
terie
s - B
asel
ine
scen
ario
200
7S
ales
a16
5kt
/ ye
arD
ispo
sal c
ost o
f bat
terie
s no
t rec
ycle
dd
90€
/ t o
f bat
terie
sb
3%%
of s
ales
d' =
d x
h0,
36€/
uni
t sol
dc
5%%
of s
pent
bat
terie
s av
aila
ble
for c
olle
ctio
n
Smal
l bat
terie
s - S
cena
rio L
Col
lect
ion
syst
em:
Low
cos
t R
ecyc
ling:
Low
cos
t with
no
econ
omie
s of
sca
le
Col
lect
ion
rate
e10
-20%
20-3
0%30
-40%
40-5
0%50
-60%
60-7
0%70
-80%
80-9
0%90
-100
%%
of s
ales
f15
%25
%35
%45
%55
%65
%75
%85
%95
%av
erag
e %
of s
ales
11-2
1%21
-31%
31-4
1%41
-51%
51-6
1%61
-71%
72-8
2%82
-92*
%92
-102
%%
of s
pent
bat
terie
s25
-35%
35-4
5%45
-60%
60-7
5%75
-85%
85-1
00%
100-
120%
110-
120%
120-
130%
% o
f spe
nt b
atte
ries
avai
labl
e fo
r col
lect
ion
(1)
40-8
080
-120
120-
160
160-
200
200-
240
240-
280
280-
320
320-
360
360-
400
g co
llect
ed /
inha
b / y
r (2)
Qua
ntiti
es c
olle
cted
g =
a x
f25
4158
7491
107
124
140
157
kt /
year
1. C
ost s
truc
ture
Varia
ble
cost
s fo
r 100
% re
cycl
edV=
v1->
v4 +
v684
885
085
787
096
31
107
1 15
21
199
1 24
6€
/ t c
olle
cted
C
olle
ctio
n po
ints
(equ
ipm
ent)
v160
6060
6060
6060
6060
€ / t
col
lect
ed
Col
lect
ion
(logi
stic
)v2
250
250
250
250
250
250
250
250
250
€ / t
col
lect
ed
Sor
ting
and
trans
port
v313
013
013
013
013
013
013
013
013
0€
/ t c
olle
cted
R
ecyc
ling
v430
030
030
030
030
030
030
030
030
0€
/ t e
nter
ing
a re
cycl
ing
plan
tD
ispo
sal
v590
9090
9090
9090
9090
€ / t
dis
pose
d of
Oth
ers
v610
811
011
713
022
336
741
245
950
6€
/ t c
olle
cted
Fi
xed
cost
sF=
f1+f
225
027
033
646
71
400
2 83
83
293
3 75
94
232
€ / t
col
lect
ed
PR
& c
omm
unic
atio
nf1
5015
025
040
01
000
2 50
03
000
3 50
04
000
€ / t
col
lect
ed
Adm
inis
tratio
nf2
200
120
8667
400
338
293
259
232
€ / t
col
lect
ed
k (3
): To
tal c
osts
for r
ecyc
ling
plan
t inp
ut
= 10
0% o
f col
lect
edT
(3)
1 09
81
120
1 19
21
336
2 36
33
945
4 44
64
958
5 47
8€
/ t c
olle
cted
1
Tota
l cos
ts fo
r rec
yclin
g pl
ant i
nput
=
50 -
60%
of c
olle
cted
T (3
)1
004
1 02
61
098
1 24
22
269
3 85
14
351
4 86
35
383
€ / t
col
lect
ed
0,55
Tota
l cos
ts fo
r rec
yclin
g pl
ant i
nput
=
60 -
70%
of c
olle
cted
T (3
)1
025
1 04
71
119
1 26
32
290
3 87
24
372
4 88
45
404
€ / t
col
lect
ed
0,65
Tota
l cos
ts fo
r rec
yclin
g pl
ant i
nput
=
90 -
100%
of c
olle
cted
T
(3)
1 08
81
110
1 18
21
326
2 35
33
935
4 43
54
947
5 46
7€
/ t c
olle
cted
0,
95
2. C
osts
pai
d fo
r by
prod
ucer
sP
rodu
cer r
espo
nsib
ility
T1
098
1 12
01
192
1 33
62
363
3 94
54
446
4 95
85
478
€ / t
col
lect
ed
Sha
red
resp
onsi
bilit
y (1
)T
- v1
- f1
988
910
882
876
1 30
31
385
1 38
61
398
1 41
8€
/ t c
olle
cted
P
rodu
cer r
espo
nsib
ility
T1
004
1 02
61
098
1 24
22
269
3 85
14
351
4 86
35
383
€ / t
col
lect
ed
Sha
red
resp
onsi
bilit
y (1
)T
- v1
- f1
894
816
788
782
1 20
91
291
1 29
11
303
1 32
3€
/ t c
olle
cted
P
rodu
cer r
espo
nsib
ility
T1
025
1 04
71
119
1 26
32
290
3 87
24
372
4 88
45
404
€ / t
col
lect
ed
Sha
red
resp
onsi
bilit
y (1
)T
- v1
- f1
915
837
809
803
1 23
01
312
1 31
21
324
1 34
4€
/ t c
olle
cted
P
rodu
cer r
espo
nsib
ility
T1
088
1 11
01
182
1 32
62
353
3 93
54
435
4 94
75
467
€ / t
col
lect
ed
Sha
red
resp
onsi
bilit
y (1
)T
- v1
- f1
978
900
872
866
1 29
31
375
1 37
51
387
1 40
7€
/ t c
olle
cted
(1) R
emai
ning
cos
ts a
re p
aid
for b
y pu
blic
aut
horit
ies
or re
taile
rs(3
) If
k=re
cycl
ing
inpu
t pla
nt ra
te, T
=v1+
v2+v
3+k*
v4+(
1-k)
*v5+
v6+F
(2) H
ypot
hesi
s:h
40g
/ uni
t
90 -
100%
50 -
60%
60 -
70%
Qua
ntiti
es c
olle
cted
follo
win
g th
e im
plem
enta
tion
of W
EE
E d
irect
ive
Rec
yclin
g pl
ant i
nput
100%
Euro
s / t
onne
col
lect
edD
etai
led
data
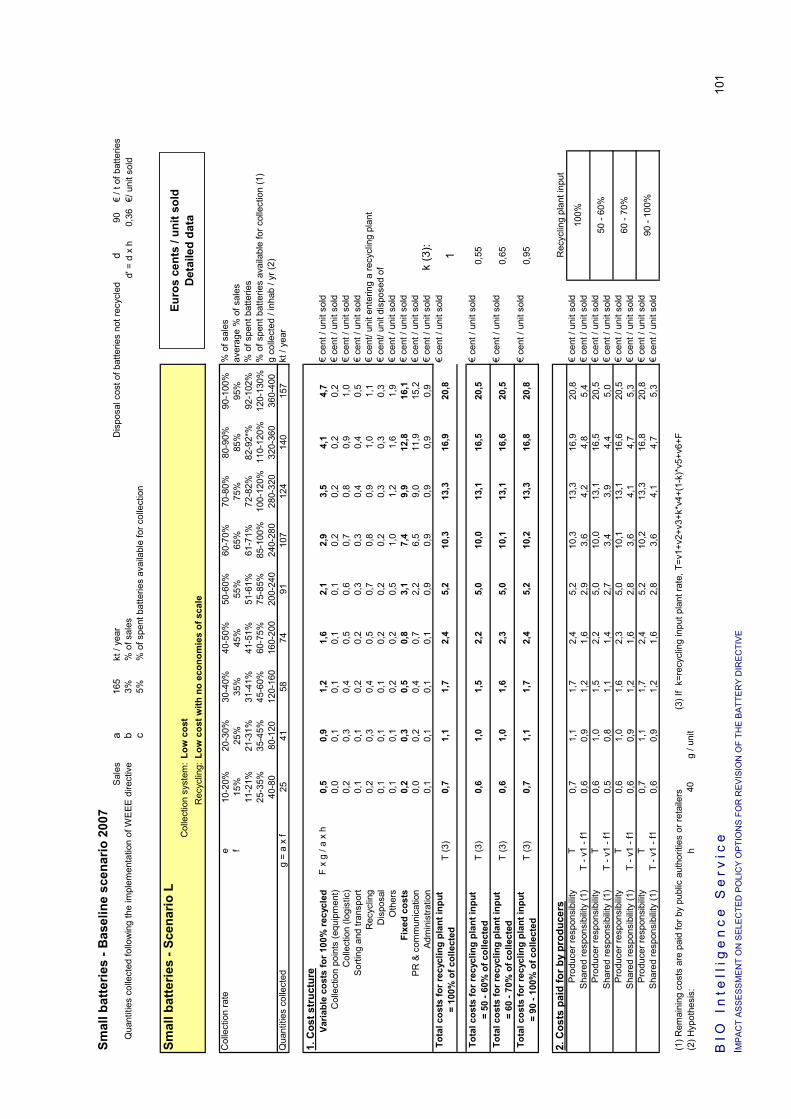
BIO
In
tell
ige
nc
e S
erv
ice
I MP
AC
T A
SS
ES
SM
EN
T O
N S
ELE
CTE
D P
OLI
CY
OP
TIO
NS
FO
R R
EV
ISIO
N O
F TH
E B
ATT
ER
Y D
IRE
CTI
VE
101
Smal
l bat
terie
s - B
asel
ine
scen
ario
200
7S
ales
a16
5kt
/ ye
arD
ispo
sal c
ost o
f bat
terie
s no
t rec
ycle
dd
90€
/ t o
f bat
terie
sb
3%%
of s
ales
d' =
d x
h0,
36€/
uni
t sol
dc
5%%
of s
pent
bat
terie
s av
aila
ble
for c
olle
ctio
n
Smal
l bat
terie
s - S
cena
rio L
Col
lect
ion
syst
em:
Low
cos
t R
ecyc
ling:
Low
cos
t with
no
econ
omie
s of
sca
le
Col
lect
ion
rate
e10
-20%
20-3
0%30
-40%
40-5
0%50
-60%
60-7
0%70
-80%
80-9
0%90
-100
%%
of s
ales
f15
%25
%35
%45
%55
%65
%75
%85
%95
%av
erag
e %
of s
ales
11-2
1%21
-31%
31-4
1%41
-51%
51-6
1%61
-71%
72-8
2%82
-92*
%92
-102
%%
of s
pent
bat
terie
s25
-35%
35-4
5%45
-60%
60-7
5%75
-85%
85-1
00%
100-
120%
110-
120%
120-
130%
% o
f spe
nt b
atte
ries
avai
labl
e fo
r col
lect
ion
(1)
40-8
080
-120
120-
160
160-
200
200-
240
240-
280
280-
320
320-
360
360-
400
g co
llect
ed /
inha
b / y
r (2)
Qua
ntiti
es c
olle
cted
g =
a x
f25
4158
7491
107
124
140
157
kt /
year
1. C
ost s
truc
ture
Varia
ble
cost
s fo
r 100
% re
cycl
edF
x g
/ a x
h0,
50,
91,
21,
62,
12,
93,
54,
14,
7€
cent
/ un
it so
ldC
olle
ctio
n po
ints
(equ
ipm
ent)
0,0
0,1
0,1
0,1
0,1
0,2
0,2
0,2
0,2
€ ce
nt /
unit
sold
Col
lect
ion
(logi
stic
)0,
20,
30,
40,
50,
60,
70,
80,
91,
0€
cent
/ un
it so
ldS
ortin
g an
d tra
nspo
rt0,
10,
10,
20,
20,
30,
30,
40,
40,
5€
cent
/ un
it so
ldR
ecyc
ling
0,2
0,3
0,4
0,5
0,7
0,8
0,9
1,0
1,1
€ ce
nt/ u
nit e
nter
ing
a re
cycl
ing
plan
tD
ispo
sal
0,1
0,1
0,1
0,2
0,2
0,2
0,3
0,3
0,3
€ ce
nt/ u
nit d
ispo
sed
ofO
ther
s0,
10,
10,
20,
20,
51,
01,
21,
61,
9€
cent
/ un
it so
ldFi
xed
cost
s0,
20,
30,
50,
83,
17,
49,
912
,816
,1€
cent
/ un
it so
ldPR
& c
omm
unic
atio
n0,
00,
20,
40,
72,
26,
59,
011
,915
,2€
cent
/ un
it so
ldAd
min
istra
tion
0,1
0,1
0,1
0,1
0,9
0,9
0,9
0,9
0,9
€ ce
nt /
unit
sold
k (3
): To
tal c
osts
for r
ecyc
ling
plan
t inp
ut
= 10
0% o
f col
lect
edT
(3)
0,7
1,1
1,7
2,4
5,2
10,3
13,3
16,9
20,8
€ ce
nt /
unit
sold
1
Tota
l cos
ts fo
r rec
yclin
g pl
ant i
nput
=
50 -
60%
of c
olle
cted
T (3
)0,
61,
01,
52,
25,
010
,013
,116
,520
,5€
cent
/ un
it so
ld0,
55
Tota
l cos
ts fo
r rec
yclin
g pl
ant i
nput
=
60 -
70%
of c
olle
cted
T (3
)0,
61,
01,
62,
35,
010
,113
,116
,620
,5€
cent
/ un
it so
ld0,
65
Tota
l cos
ts fo
r rec
yclin
g pl
ant i
nput
=
90 -
100%
of c
olle
cted
T
(3)
0,7
1,1
1,7
2,4
5,2
10,2
13,3
16,8
20,8
€ ce
nt /
unit
sold
0,95
2. C
osts
pai
d fo
r by
prod
ucer
sP
rodu
cer r
espo
nsib
ility
T0,
71,
11,
72,
45,
210
,313
,316
,920
,8€
cent
/ un
it so
ldS
hare
d re
spon
sibi
lity
(1)
T - v
1 - f
10,
60,
91,
21,
62,
93,
64,
24,
85,
4€
cent
/ un
it so
ldP
rodu
cer r
espo
nsib
ility
T0,
61,
01,
52,
25,
010
,013
,116
,520
,5€
cent
/ un
it so
ldS
hare
d re
spon
sibi
lity
(1)
T - v
1 - f
10,
50,
81,
11,
42,
73,
43,
94,
45,
0€
cent
/ un
it so
ldP
rodu
cer r
espo
nsib
ility
T0,
61,
01,
62,
35,
010
,113
,116
,620
,5€
cent
/ un
it so
ldS
hare
d re
spon
sibi
lity
(1)
T - v
1 - f
10,
60,
91,
21,
62,
83,
64,
14,
75,
3€
cent
/ un
it so
ldP
rodu
cer r
espo
nsib
ility
T0,
71,
11,
72,
45,
210
,213
,316
,820
,8€
cent
/ un
it so
ldS
hare
d re
spon
sibi
lity
(1)
T - v
1 - f
10,
60,
91,
21,
62,
83,
64,
14,
75,
3€
cent
/ un
it so
ld
(1) R
emai
ning
cos
ts a
re p
aid
for b
y pu
blic
aut
horit
ies
or re
taile
rs(3
) If
k=re
cycl
ing
inpu
t pla
nt ra
te, T
=v1+
v2+v
3+k*
v4+(
1-k)
*v5+
v6+F
(2) H
ypot
hesi
s:h
40g
/ uni
t
60 -
70%
90 -
100%
Qua
ntiti
es c
olle
cted
follo
win
g th
e im
plem
enta
tion
of W
EEE
dire
ctiv
e
Rec
yclin
g pl
ant i
nput
100%
50 -
60%
Euro
s ce
nts
/ uni
t sol
dD
etai
led
data

B I O I n t e l l i g e n c e S e r v i c e ______________________________________________ 102. IMPACT ASSESSMENT ON SELECTED POLICY OPTIONS FOR REVISION OF THE BATTERY DIRECTIVE
Short comments on the previous curves to facilitate the reading
The shapes and ranges of the different graphs are sensibly the same for the three recycling plant inputs examined here. This is because in this model, recycling and disposal costs remain constant whatever the collection rate is (there is no economies of scale for the low recycling cost). The only cost differences come from the ratio waste batteries entering a recycling plant / waste batteries disposed of. Indeed, the recycling cost is 300 € / tonne collected, whereas the disposal cost is only 90 € / tonne collected.
Up to a certain level of collection rate estimated near 40-50%, the costs remain quite constant, due to compensation of communication costs increase and economies of scale of administration costs.
After this threshold, a step of increase of administration costs is assumed, so the still increasing communication costs would not be compensated any more: the costs would increase faster with collection rate.
For each scenario, the same differences of shapes for the ‘Producers responsibility’ and ‘Shared responsibility’ curves are observed. In case of shared responsibility, collection equipment and communication costs are considered being paid for by public authorities and / or retailers. So the ‘Shared responsibility’ curve only follows the variations of administration costs, that is to say economies of scale until 40-50% of collection rate, then a step of increase, and economies of scale again.
Remark: the threshold appears to be near a collection rate of 40-50% of spent batteries, which correspond to about 60-75% of spent batteries available for collection when considering the current hoarding behaviours. Such level of collection rate is reach today in Belgium and Netherlands with no significant collection rate increase over the last years although already relatively high costs. Considering a high cost increase above that level is then coherent with the situation on the ground.
The following 8 pages present the curves and detailed data for each ‘high costs’ scenario H:
Scenario H50 – 60% :
- Graph: Total collection and recycling costs in € / tonne collected, function of the collection rate,
- Graph: Total collection and recycling costs in € cent / unit sold, function of the collection rate.
Scenario H60 – 70% :
- Graph: Total collection and recycling costs in € / tonne collected, function of the collection rate
- Graph: Total collection and recycling costs in € cent / unit sold, function of the collection rate.
Scenario H90 – 100% :
- Graph: Total collection and recycling costs in € / tonne collected, function of the collection rate
- Graph: Total collection and recycling costs in € cent / unit sold, function of the collection rate.
Two tables contain all detailed data used to build the curves, one in € / tonne collected and the other in cents / unit sold.

BIO
In
tell
ige
nc
e S
erv
ice
____
____
____
____
____
____
____
____
____
____
____
__
103.
I M
PA
CT
AS
SE
SS
ME
NT
ON
SE
LEC
TED
PO
LIC
Y O
PTI
ON
S F
OR
RE
VIS
ION
OF
THE
BA
TTE
RY
DIR
EC
TIV
E
Sm
all B
atte
ries
- Sce
nario
H50
- 60
%C
olle
ctio
n sy
stem
:H
igh
cost
R
ecyc
ling:
Hig
h co
st w
ith e
cono
mie
s of
sca
leC
olle
cted
bat
terie
s se
nt to
rec y
clin
g:50
- 60
%
Tota
l col
lect
ion
and
recy
clin
g co
sts
paid
for b
y pr
oduc
ers
Col
lect
ion
rate
10-2
0%20
-30%
30-4
0%40
-50%
50-6
0%60
-70%
70-8
0%80
-90%
90-1
00%
% o
f sal
es11
-21%
21-3
1%31
-41%
41-5
1%51
-61%
61-7
1%72
-82%
82-9
2%92
-102
%%
of s
pent
bat
terie
s25
-35%
35-4
5%45
-60%
60-7
5%75
-85%
85-1
00%
100-
120%
110-
120%
120-
130%
% o
f spe
nt b
atte
ries
avai
labl
e fo
r col
lect
ion
(1)
40-8
080
-120
120-
160
160-
200
200-
240
240-
280
280-
320
320-
360
360-
400
g co
llect
ed /
inha
b / y
r (2)
Euro
s / t
of s
mal
l bat
terie
s s
epar
atel
y co
llect
ed in
vie
w o
f rec
yclin
g(u
ncer
tain
ty re
pres
ente
d: +
/-10%
)
Hig
h co
st c
omm
unic
atio
n pr
ogra
mm
es:
- to
redu
ce h
oard
ing
beha
vior
s in
ord
er to
incr
ease
sp
ent b
atte
ries
avai
labl
e fo
r col
lect
ion
- to
enco
urag
e re
fract
ory
pers
ons
to p
artic
ipat
e to
se
para
te c
olle
ctio
n
Bas
elin
e sc
enar
io- M
inim
um o
f 3%
of s
ales
col
lect
ed fo
llow
ing
the
impl
emen
tatio
n of
WE
EE
dire
ctiv
e- A
vera
ge o
f 90
Eur
os /
t of b
atte
ries
disp
osed
of
Not
rele
vant
(s
pent
bat
terie
s <
sale
s)
Incr
ease
of c
omm
unic
atio
n co
sts
com
pens
ates
eco
nom
ies
of s
cale
for r
ecyc
ling
cost
s
Euro
s / t
onne
col
lect
ed
1 74
61
615
1 58
41
642
2 97
1
4 48
5
4 93
6
5 34
5
5 83
5
1 63
61
405
1 27
41
182
1 91
11
925
1 87
61
785
1 77
5
0
1 00
0
2 00
0
3 00
0
4 00
0
5 00
0
6 00
0
Prod
ucer
sre
spon
sibi
lity
Shar
edre
spon
sibi
lity
(3)
90
Eco
nom
ies
of s
cale
for r
ecyc
ling
and
adm
inis
tratio
n co
sts
Incr
ease
of a
dmin
istra
tion
budg
et
(1) E
quiv
alen
ce b
etw
een
colle
ctio
n ra
te a
s %
of s
ales
and
col
lect
ion
rate
as
% o
f spe
nt b
atte
ries
avai
labl
e fo
r col
lect
ion
base
d on
the
curre
nt a
vera
ge c
urre
nt h
oard
ing
beha
vior
s of
hou
seho
lds
and
prof
essi
onal
use
rs in
the
EU(2
) Bas
ed o
n th
e E
U a
vera
ge s
ituat
ion
of 1
65 k
t of s
mal
l bat
terie
s so
ld in
200
7 (1
58 k
t in
2002
+ 1
% a
vera
ge g
row
th
rate
per
yea
r) an
d 39
0 M
illion
s in
habi
tant
s(3
) In
case
of s
hare
d re
spon
sibi
litie
s, th
e co
st d
iffer
ence
bet
wee
n th
e tw
o cu
rbs
is p
aid
for b
y pu
blic
aut
horit
ies
and/
or
reta
ilers

BIO
In
tell
ige
nc
e S
erv
ice
I MP
AC
T A
SS
ES
SM
EN
T O
N S
ELE
CTE
D P
OLI
CY
OP
TIO
NS
FO
R R
EV
ISIO
N O
F TH
E B
ATT
ER
Y D
IRE
CTI
VE
104
Smal
l Bat
terie
s - S
cena
rio H
50 -
60%
Col
lect
ion
syst
em:
Hig
h co
st
Rec
yclin
g:H
igh
cost
with
eco
nom
ies
of s
cale
Col
lect
ed b
atte
ries
sent
to re
cycl
ing:
50
- 60
%
Col
lect
ion
rate
10-2
0%20
-30%
30-4
0%40
-50%
50-6
0%60
-70%
70-8
0%80
-90%
90-1
00%
11-2
1%21
-31%
31-4
1%41
-51%
51-6
1%61
-71%
72-8
2%82
-92%
92-1
02%
% o
f sal
es25
-35%
35-4
5%45
-60%
60-7
5%75
-85%
85-1
00%
100-
120%
110-
120%
120-
130%
% o
f spe
nt b
atte
ries
40-8
080
-120
120-
160
160-
200
200-
240
240-
280
280-
320
320-
360
360-
400
% o
f spe
nt b
atte
ries
avai
labl
e fo
r col
lect
ion
(1)
g co
llect
ed /
inha
b / y
r (2)
(unc
erta
inty
repr
esen
ted:
+/-1
0%)
Euro
s ce
nts
/ uni
t sol
dTo
tal c
olle
ctio
n an
d re
cycl
ing
cost
s pa
id fo
r
Col
lect
ion
rate
Bas
elin
e sc
enar
io- M
inim
um o
f 3%
of s
ales
col
lect
ed fo
llow
ing
the
impl
emen
tatio
n of
WE
EE
dire
ctiv
e- A
vera
ge o
f 90
Eur
os /
t of b
atte
ries
disp
osed
of
Not
rele
vant
(s
pent
bat
terie
s <
sale
s)Euro
s ce
nts
/ uni
t sol
d
1,0
1,6
2,2
3,0
6,5
11,7
14,8
18,2
22,2
1,0
1,4
1,8
2,1
4,2
5,0
5,6
6,1
6,7
0,0
5,0
10,0
15,0
20,0
25,0
Pro
duce
rsre
spon
sibi
lity
Sha
red
resp
onsi
bilit
y (3
)
Hig
h co
st c
omm
unic
atio
n pr
ogra
mm
es:
- to
redu
ce h
oard
ing
beha
vior
s in
ord
er to
incr
ease
sp
ent b
atte
ries
avai
labl
e fo
r col
lect
ion
- to
enco
urag
e re
fract
ory
pers
ons
to p
artic
ipat
e to
se
para
te c
olle
ctio
n
(1) E
quiv
alen
ce b
etw
een
colle
ctio
n ra
te a
s %
of s
ales
and
col
lect
ion
rate
as
% o
f spe
nt b
atte
ries
avai
labl
e fo
r col
lect
ion
base
d on
the
curre
nt a
vera
ge c
urre
nt h
oard
ing
beha
vior
s of
hou
seho
lds
and
prof
essi
onal
use
rs in
the
EU
(2) B
ased
on
the
EU a
vera
ge s
ituat
ion
of 1
65 k
t of s
mal
l bat
terie
s so
ld in
200
7 (1
58 k
t in
2002
+ 1
% a
vera
ge g
row
th
rate
per
yea
r) an
d 39
0 M
illio
ns in
habi
tant
s(3
) In
case
of s
hare
d re
spon
sibi
litie
s, th
e co
st d
iffer
ence
bet
wee
n th
e tw
o cu
rbs
is p
aid
for b
y pu
blic
aut
horit
ies
and/
or
reta
ilers
0.36
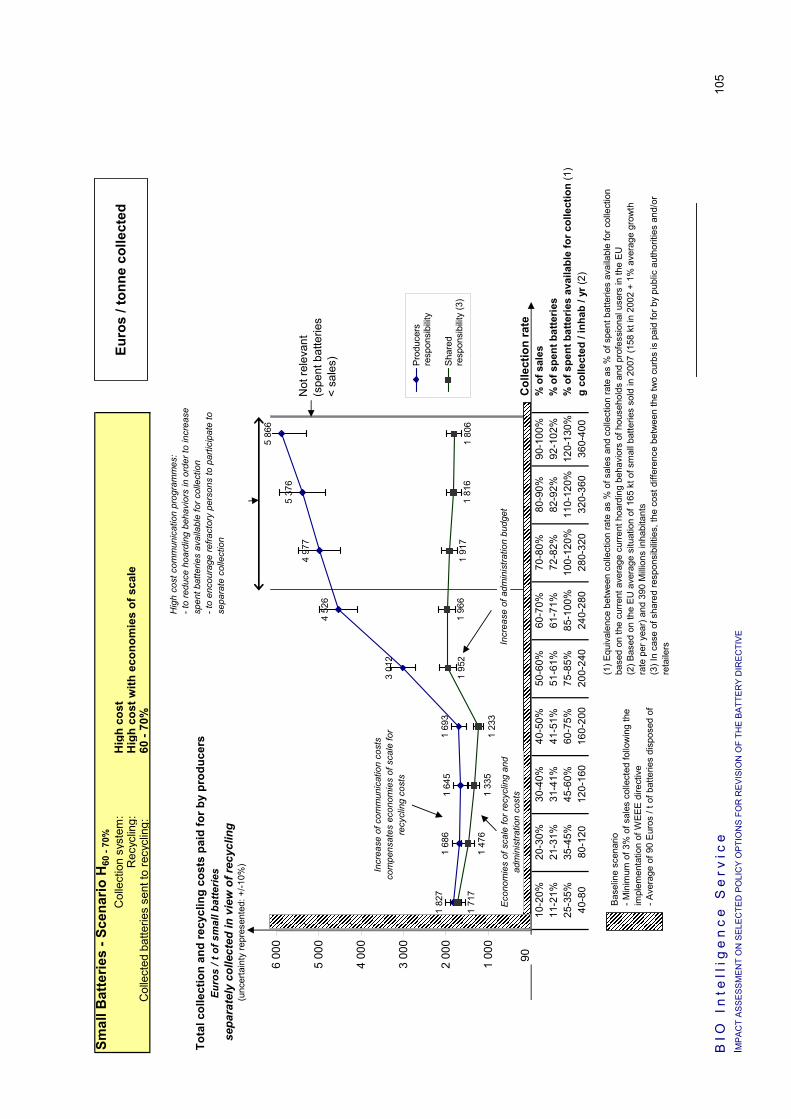
BIO
In
tell
ige
nc
e S
erv
ice
I MP
AC
T A
SS
ES
SM
EN
T O
N S
ELE
CTE
D P
OLI
CY
OP
TIO
NS
FO
R R
EV
ISIO
N O
F TH
E B
ATT
ER
Y D
IRE
CTI
VE
105
Smal
l Bat
terie
s - S
cena
rio H
60 -
70%
Col
lect
ion
syst
em:
Hig
h co
st
Rec
yclin
g:H
igh
cost
with
eco
nom
ies
of s
cale
Col
lect
ed b
atte
ries
sent
to re
c ycl
ing:
60
- 70
%
Tota
l col
lect
ion
and
recy
clin
g co
sts
paid
for b
y pr
oduc
ers
Col
lect
ion
rate
10-2
0%20
-30%
30-4
0%40
-50%
50-6
0%60
-70%
70-8
0%80
-90%
90-1
00%
% o
f sal
es11
-21%
21-3
1%31
-41%
41-5
1%51
-61%
61-7
1%72
-82%
82-9
2%92
-102
%%
of s
pent
bat
terie
s25
-35%
35-4
5%45
-60%
60-7
5%75
-85%
85-1
00%
100-
120%
110-
120%
120-
130%
% o
f spe
nt b
atte
ries
avai
labl
e fo
r col
lect
ion
(1)
40-8
080
-120
120-
160
160-
200
200-
240
240-
280
280-
320
320-
360
360-
400
g co
llect
ed /
inha
b / y
r (2)
Euro
s / t
of s
mal
l bat
terie
s s
epar
atel
y co
llect
ed in
vie
w o
f rec
yclin
g(u
ncer
tain
ty re
pres
ente
d: +
/-10%
)
Bas
elin
e sc
enar
io- M
inim
um o
f 3%
of s
ales
col
lect
ed fo
llow
ing
the
impl
emen
tatio
n of
WE
EE
dire
ctiv
e- A
vera
ge o
f 90
Eur
os /
t of b
atte
ries
disp
osed
of
Not
rele
vant
(s
pent
bat
terie
s <
sale
s)
Euro
s / t
onne
col
lect
ed
1 82
71
686
1 64
51
693
3 01
2
4 52
6
4 97
7
5 37
6
5 86
6
1 71
71
476
1 33
51
233
1 95
21
966
1 91
71
816
1 80
6
0
1 00
0
2 00
0
3 00
0
4 00
0
5 00
0
6 00
0
Pro
duce
rsre
spon
sibi
lity
Sha
red
resp
onsi
bilit
y (3
)
90
Incr
ease
of c
omm
unic
atio
n co
sts
com
pens
ates
eco
nom
ies
of s
cale
for
recy
clin
g co
sts
Eco
nom
ies
of s
cale
for r
ecyc
ling
and
adm
inis
tratio
n co
sts
Incr
ease
of a
dmin
istra
tion
budg
et
Hig
h co
st c
omm
unic
atio
n pr
ogra
mm
es:
- to
redu
ce h
oard
ing
beha
vior
s in
ord
er to
incr
ease
sp
ent b
atte
ries
avai
labl
e fo
r col
lect
ion
- to
enco
urag
e re
fract
ory
pers
ons
to p
artic
ipat
e to
se
para
te c
olle
ctio
n
(1) E
quiv
alen
ce b
etw
een
colle
ctio
n ra
te a
s %
of s
ales
and
col
lect
ion
rate
as
% o
f spe
nt b
atte
ries
avai
labl
e fo
r col
lect
ion
base
d on
the
curre
nt a
vera
ge c
urre
nt h
oard
ing
beha
vior
s of
hou
seho
lds
and
prof
essi
onal
use
rs in
the
EU
(2) B
ased
on
the
EU a
vera
ge s
ituat
ion
of 1
65 k
t of s
mal
l bat
terie
s so
ld in
200
7 (1
58 k
t in
2002
+ 1
% a
vera
ge g
row
th
rate
per
yea
r) an
d 39
0 M
illion
s in
habi
tant
s(3
) In
case
of s
hare
d re
spon
sibi
litie
s, th
e co
st d
iffer
ence
bet
wee
n th
e tw
o cu
rbs
is p
aid
for b
y pu
blic
aut
horit
ies
and/
or
reta
ilers
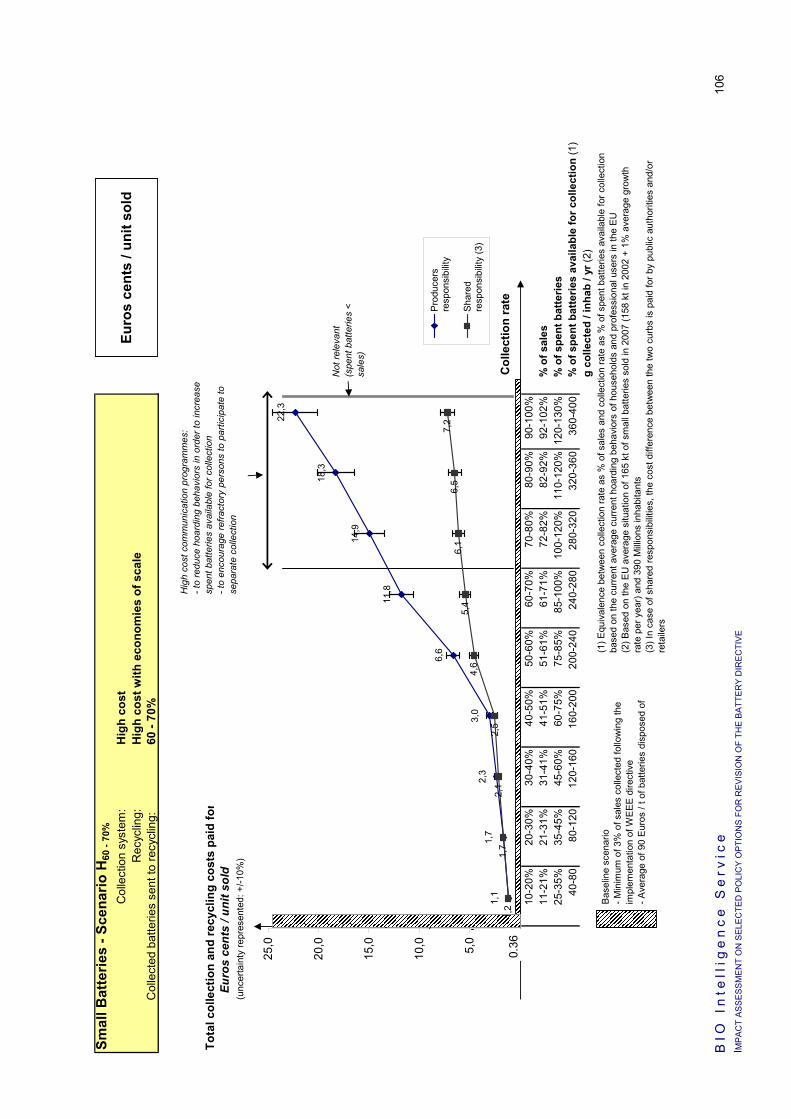
BIO
In
tell
ige
nc
e S
erv
ice
I MP
AC
T A
SS
ES
SM
EN
T O
N S
ELE
CTE
D P
OLI
CY
OP
TIO
NS
FO
R R
EV
ISIO
N O
F TH
E B
ATT
ER
Y D
IRE
CTI
VE
106
Smal
l Bat
terie
s - S
cena
rio H
60 -
70%
Col
lect
ion
syst
em:
Hig
h co
st
Rec
yclin
g:H
igh
cost
with
eco
nom
ies
of s
cale
Col
lect
ed b
atte
ries
sent
to re
cycl
ing:
60
- 70
%
Col
lect
ion
rate
10-2
0%20
-30%
30-4
0%40
-50%
50-6
0%60
-70%
70-8
0%80
-90%
90-1
00%
11-2
1%21
-31%
31-4
1%41
-51%
51-6
1%61
-71%
72-8
2%82
-92%
92-1
02%
% o
f sal
es25
-35%
35-4
5%45
-60%
60-7
5%75
-85%
85-1
00%
100-
120%
110-
120%
120-
130%
% o
f spe
nt b
atte
ries
40-8
080
-120
120-
160
160-
200
200-
240
240-
280
280-
320
320-
360
360-
400
% o
f spe
nt b
atte
ries
avai
labl
e fo
r col
lect
ion
(1)
g co
llect
ed /
inha
b / y
r (2)
Euro
s ce
nts
/ uni
t sol
dTo
tal c
olle
ctio
n an
d re
cycl
ing
cost
s pa
id fo
r
(unc
erta
inty
repr
esen
ted:
+/-1
0%)
Col
lect
ion
rate
Bas
elin
e sc
enar
io- M
inim
um o
f 3%
of s
ales
col
lect
ed fo
llow
ing
the
impl
emen
tatio
n of
WE
EE
dire
ctiv
e- A
vera
ge o
f 90
Eur
os /
t of b
atte
ries
disp
osed
of
Not
rele
vant
(s
pent
bat
terie
s <
sale
s)
1,1
1,7
2,3
3,0
6,6
11,8
14,9
18,3
22,3
1,2
1,7
2,1
2,5
4,6
5,4
6,1
7,2
6,5
0,0
5,0
10,0
15,0
20,0
25,0
Pro
duce
rsre
spon
sibi
lity
Sha
red
resp
onsi
bilit
y (3
)
Euro
s ce
nts
/ uni
t sol
d
Hig
h co
st c
omm
unic
atio
n pr
ogra
mm
es:
- to
redu
ce h
oard
ing
beha
vior
s in
ord
er to
incr
ease
sp
ent b
atte
ries
avai
labl
e fo
r col
lect
ion
- to
enco
urag
e re
fract
ory
pers
ons
to p
artic
ipat
e to
se
para
te c
olle
ctio
n
(1) E
quiv
alen
ce b
etw
een
colle
ctio
n ra
te a
s %
of s
ales
and
col
lect
ion
rate
as
% o
f spe
nt b
atte
ries
avai
labl
e fo
r col
lect
ion
base
d on
the
curre
nt a
vera
ge c
urre
nt h
oard
ing
beha
vior
s of
hou
seho
lds
and
prof
essi
onal
use
rs in
the
EU
(2) B
ased
on
the
EU a
vera
ge s
ituat
ion
of 1
65 k
t of s
mal
l bat
terie
s so
ld in
200
7 (1
58 k
t in
2002
+ 1
% a
vera
ge g
row
th
rate
per
yea
r) an
d 39
0 M
illio
ns in
habi
tant
s(3
) In
case
of s
hare
d re
spon
sibi
litie
s, th
e co
st d
iffer
ence
bet
wee
n th
e tw
o cu
rbs
is p
aid
for b
y pu
blic
aut
horit
ies
and/
or
reta
ilers
0.36

BIO
In
tell
ige
nc
e S
erv
ice
I MP
AC
T A
SS
ES
SM
EN
T O
N S
ELE
CTE
D P
OLI
CY
OP
TIO
NS
FO
R R
EV
ISIO
N O
F TH
E B
ATT
ER
Y D
IRE
CTI
VE
107
Smal
l Bat
terie
s - S
cena
rio H
90 -
100%
Col
lect
ion
syst
em:
Hig
h co
st
Rec
yclin
g:H
igh
cost
with
eco
nom
ies
of s
cale
Col
lect
ed b
atte
ries
sent
to re
c ycl
ing:
90 -
100%
Tota
l col
lect
ion
and
recy
clin
g co
sts
paid
for b
y pr
oduc
ers
Col
lect
ion
rate
10-2
0%20
-30%
30-4
0%40
-50%
50-6
0%60
-70%
70-8
0%80
-90%
90-1
00%
% o
f sal
es11
-21%
21-3
1%31
-41%
41-5
1%51
-61%
61-7
1%72
-82%
82-9
2%92
-102
%%
of s
pent
bat
terie
s25
-35%
35-4
5%45
-60%
60-7
5%75
-85%
85-1
00%
100-
120%
110-
120%
120-
130%
% o
f spe
nt b
atte
ries
avai
labl
e fo
r col
lect
ion
(1)
40-8
080
-120
120-
160
160-
200
200-
240
240-
280
280-
320
320-
360
360-
400
g co
llect
ed /
inha
b / y
r (2)
Euro
s / t
of s
mal
l bat
terie
s s
epar
atel
y co
llect
ed in
vie
w o
f rec
yclin
g(u
ncer
tain
ty re
pres
ente
d: +
/-10%
)
Bas
elin
e sc
enar
io- M
inim
um o
f 3%
of s
ales
col
lect
ed fo
llow
ing
the
impl
emen
tatio
n of
WE
EE
dire
ctiv
e- A
vera
ge o
f 90
Eur
os /
t of b
atte
ries
disp
osed
of
Not
rele
vant
(s
pent
bat
terie
s <
sale
s)
Euro
s / t
onne
col
lect
ed
2 07
01
899
1 82
81
846
3 13
5
4 64
9
5 10
05
469
5 95
9
1 96
01
689
1 51
81
386
2 07
52
089
2 04
01
909
1 89
9
0
1 00
0
2 00
0
3 00
0
4 00
0
5 00
0
6 00
0
Pro
duce
rsre
spon
sibi
lity
Sha
red
resp
onsi
bilit
y (3
)
Incr
ease
of a
dmin
istra
tion
budg
et
Incr
ease
of c
omm
unic
atio
n co
sts
com
pens
ates
eco
nom
ies
of s
cale
for r
ecyc
ling
cost
s
Eco
nom
ies
of s
cale
for r
ecyc
ling
and
adm
inis
tratio
n co
sts
Hig
h co
st c
omm
unic
atio
n pr
ogra
mm
es:
- to
redu
ce h
oard
ing
beha
vior
s in
ord
er to
incr
ease
sp
ent b
atte
ries
avai
labl
e fo
r col
lect
ion
- to
enco
urag
e re
fract
ory
pers
ons
to p
artic
ipat
e to
se
para
te c
olle
ctio
n
(1) E
quiv
alen
ce b
etw
een
colle
ctio
n ra
te a
s %
of s
ales
and
col
lect
ion
rate
as
% o
f spe
nt b
atte
ries
avai
labl
e fo
r col
lect
ion
base
d on
the
curre
nt a
vera
ge c
urre
nt h
oard
ing
beha
vior
s of
hou
seho
lds
and
prof
essi
onal
use
rs in
the
EU
(2) B
ased
on
the
EU a
vera
ge s
ituat
ion
of 1
65 k
t of s
mal
l bat
terie
s so
ld in
200
7 (1
58 k
t in
2002
+ 1
% a
vera
ge g
row
th
rate
per
yea
r) an
d 39
0 M
illion
s in
habi
tant
s(3
) In
case
of s
hare
d re
spon
sibi
litie
s, th
e co
st d
iffer
ence
bet
wee
n th
e tw
o cu
rbs
is p
aid
for b
y pu
blic
aut
horit
ies
and/
or
reta
ilers
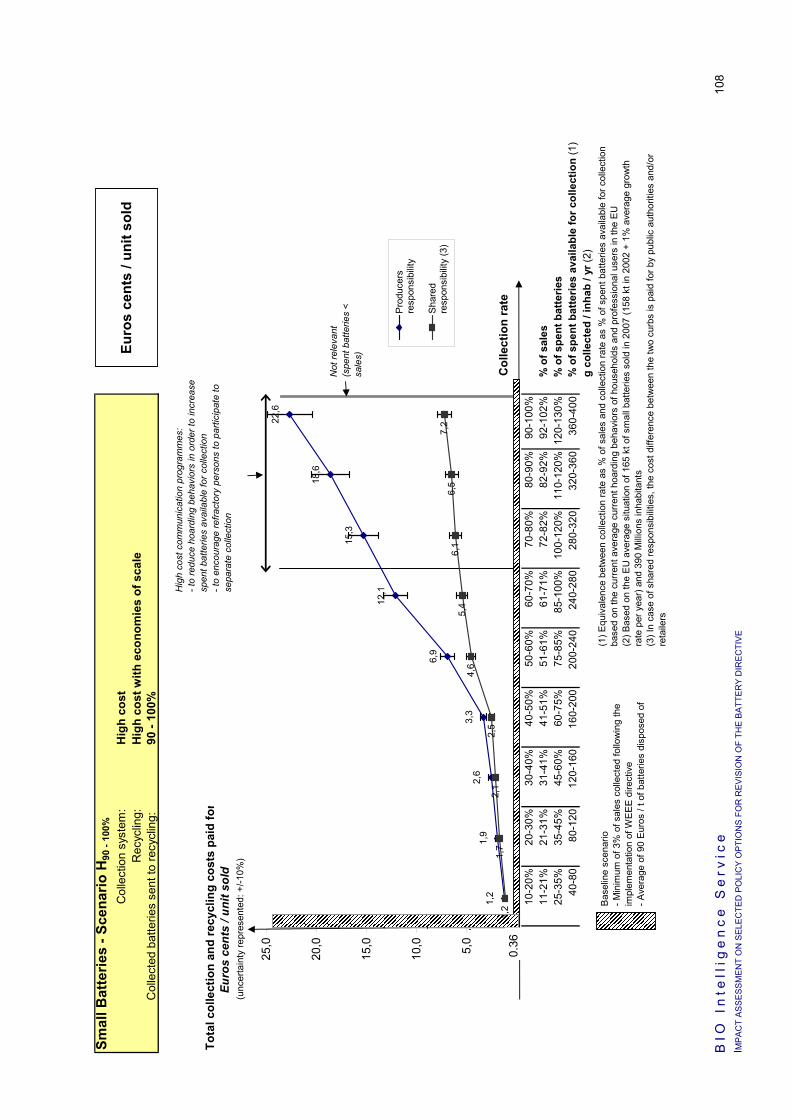
BIO
In
tell
ige
nc
e S
erv
ice
I MP
AC
T A
SS
ES
SM
EN
T O
N S
ELE
CTE
D P
OLI
CY
OP
TIO
NS
FO
R R
EV
ISIO
N O
F TH
E B
ATT
ER
Y D
IRE
CTI
VE
108
Smal
l Bat
terie
s - S
cena
rio H
90 -
100%
Col
lect
ion
syst
em:
Hig
h co
st
Rec
yclin
g:H
igh
cost
with
eco
nom
ies
of s
cale
Col
lect
ed b
atte
ries
sent
to re
cycl
ing:
90
- 10
0%
Col
lect
ion
rate
10-2
0%20
-30%
30-4
0%40
-50%
50-6
0%60
-70%
70-8
0%80
-90%
90-1
00%
11-2
1%21
-31%
31-4
1%41
-51%
51-6
1%61
-71%
72-8
2%82
-92%
92-1
02%
% o
f sal
es25
-35%
35-4
5%45
-60%
60-7
5%75
-85%
85-1
00%
100-
120%
110-
120%
120-
130%
% o
f spe
nt b
atte
ries
40-8
080
-120
120-
160
160-
200
200-
240
240-
280
280-
320
320-
360
360-
400
% o
f spe
nt b
atte
ries
avai
labl
e fo
r col
lect
ion
(1)
g co
llect
ed /
inha
b / y
r (2)
Euro
s ce
nts
/ uni
t sol
d(u
ncer
tain
ty re
pres
ente
d: +
/-10%
)
Tota
l col
lect
ion
and
recy
clin
g co
sts
paid
for
Col
lect
ion
rate
Euro
s ce
nts
/ uni
t sol
d
Bas
elin
e sc
enar
io- M
inim
um o
f 3%
of s
ales
col
lect
ed fo
llow
ing
the
impl
emen
tatio
n of
WE
EE
dire
ctiv
e- A
vera
ge o
f 90
Eur
os /
t of b
atte
ries
disp
osed
of
Not
rele
vant
(s
pent
bat
terie
s <
sale
s)
1,2
1,9
2,6
3,3
6,9
12,1
15,3
18,6
22,6
1,2
1,7
2,1
2,5
4,6
5,4
6,1
7,2
6,5
0,0
5,0
10,0
15,0
20,0
25,0
Pro
duce
rsre
spon
sibi
lity
Sha
red
resp
onsi
bilit
y (3
)
Hig
h co
st c
omm
unic
atio
n pr
ogra
mm
es:
- to
redu
ce h
oard
ing
beha
vior
s in
ord
er to
incr
ease
sp
ent b
atte
ries
avai
labl
e fo
r col
lect
ion
- to
enco
urag
e re
fract
ory
pers
ons
to p
artic
ipat
e to
se
para
te c
olle
ctio
n
(1) E
quiv
alen
ce b
etw
een
colle
ctio
n ra
te a
s %
of s
ales
and
col
lect
ion
rate
as
% o
f spe
nt b
atte
ries
avai
labl
e fo
r col
lect
ion
base
d on
the
curre
nt a
vera
ge c
urre
nt h
oard
ing
beha
vior
s of
hou
seho
lds
and
prof
essi
onal
use
rs in
the
EU(2
) Bas
ed o
n th
e E
U a
vera
ge s
ituat
ion
of 1
65 k
t of s
mal
l bat
terie
s so
ld in
200
7 (1
58 k
t in
2002
+ 1
% a
vera
ge g
row
th
rate
per
yea
r) an
d 39
0 M
illion
s in
habi
tant
s(3
) In
case
of s
hare
d re
spon
sibi
litie
s, th
e co
st d
iffer
ence
bet
wee
n th
e tw
o cu
rbs
is p
aid
for b
y pu
blic
aut
horit
ies
and/
or
reta
ilers
0.36

BIO
In
tell
ige
nc
e S
erv
ice
I MP
AC
T A
SS
ES
SM
EN
T O
N S
ELE
CTE
D P
OLI
CY
OP
TIO
NS
FO
R R
EV
ISIO
N O
F TH
E B
ATT
ER
Y D
IRE
CTI
VE
109
Smal
l bat
terie
s - B
asel
ine
scen
ario
200
7S
ales
a16
5kt
/ ye
arD
ispo
sal c
ost o
f bat
terie
s no
t rec
ycle
dd
90€
/ t o
f bat
terie
sb
3%%
of s
ales
d' =
d x
h0,
36€/
uni
t sol
dc
5%%
of s
pent
bat
terie
s av
aila
ble
for c
olle
ctio
n
Smal
l bat
terie
s - S
cena
rio H
Col
lect
ion
syst
em:
Hig
h co
st
Rec
yclin
g:H
i gh
cost
with
eco
nom
ies
of s
cale
Col
lect
ion
rate
e10
-20%
20-3
0%30
-40%
40-5
0%50
-60%
60-7
0%70
-80%
80-9
0%90
-100
%%
of s
ales
f15
%25
%35
%45
%55
%65
%75
%85
%95
%av
erag
e %
of s
ales
11-2
1%21
-31%
31-4
1%41
-51%
51-6
1%61
-71%
72-8
2%82
-92*
%92
-102
%%
of s
pent
bat
terie
s25
-35%
35-4
5%45
-60%
60-7
5%75
-85%
85-1
00%
100-
120%
110-
120%
120-
130%
% o
f spe
nt b
atte
ries
avai
labl
e fo
r col
lect
ion
(1)
40-8
080
-120
120-
160
160-
200
200-
240
240-
280
280-
320
320-
360
360-
400
g co
llect
ed /
inha
b / y
r (2)
Qua
ntiti
es c
olle
cted
g =
a x
f25
4158
7491
107
124
140
157
kt /
year
1. C
ost s
truc
ture
Varia
ble
cost
s fo
r 100
% re
cycl
edV=
v1->
v4 +
v61
660
1 54
41
437
1 33
81
355
1 49
31
534
1 46
71
511
€ / t
col
lect
ed
Col
lect
ion
poin
ts (e
quip
men
t)v1
6060
6060
6060
6060
60€
/ t c
olle
cted
C
olle
ctio
n (lo
gist
ic)
v225
025
025
025
025
025
025
025
025
0€
/ t c
olle
cted
S
ortin
g an
d tra
nspo
rtv3
250
250
250
250
250
250
250
250
250
€ / t
col
lect
ed
Rec
yclin
gv4
900
800
700
600
500
500
500
400
400
€ / t
ent
erin
g a
recy
clin
g pl
ant
Dis
posa
lv5
9090
9090
9090
9090
90€
/ t d
ispo
sed
ofO
ther
sv6
200
184
177
178
295
433
474
507
551
€ / t
col
lect
ed
Fixe
d co
sts
F=f1
+f2
450
390
421
533
1 80
03
177
3 58
74
018
4 46
3€
/ t c
olle
cted
P
R &
com
mun
icat
ion
f150
150
250
400
1 00
02
500
3 00
03
500
4 00
0€
/ t c
olle
cted
A
dmin
istra
tion
f240
024
017
113
380
067
758
751
846
3€
/ t c
olle
cted
k
(3):
Tota
l cos
ts fo
r rec
yclin
g pl
ant i
nput
=
100%
of c
olle
cted
T (3
)2
110
1 93
41
859
1 87
23
155
4 67
05
120
5 48
45
974
€ / t
col
lect
ed
1
Tota
l cos
ts fo
r rec
yclin
g pl
ant i
nput
=
50 -
60%
of c
olle
cted
T (3
)1
746
1 61
51
584
1 64
22
971
4 48
54
936
5 34
55
835
€ / t
col
lect
ed
0,55
Tota
l cos
ts fo
r rec
yclin
g pl
ant i
nput
=
60 -
70%
of c
olle
cted
T (3
)1
827
1 68
61
645
1 69
33
012
4 52
64
977
5 37
65
866
€ / t
col
lect
ed
0,65
Tota
l cos
ts fo
r rec
yclin
g pl
ant i
nput
=
90 -
100%
of c
olle
cted
T
(3)
2 07
01
899
1 82
81
846
3 13
54
649
5 10
05
469
5 95
9€
/ t c
olle
cted
0,
95
2. C
osts
pai
d fo
r by
prod
ucer
sP
rodu
cer r
espo
nsib
ility
T2
110
1 93
41
859
1 87
23
155
4 67
05
120
5 48
45
974
€ / t
col
lect
ed
Sha
red
resp
onsi
bilit
y (1
)T
- v1
- f1
2 00
01
724
1 54
91
412
2 09
52
110
2 06
01
924
1 91
4€
/ t c
olle
cted
P
rodu
cer r
espo
nsib
ility
T1
746
1 61
51
584
1 64
22
971
4 48
54
936
5 34
55
835
€ / t
col
lect
ed
Sha
red
resp
onsi
bilit
y (1
)T
- v1
- f1
1 63
61
405
1 27
41
182
1 91
11
925
1 87
61
785
1 77
5€
/ t c
olle
cted
P
rodu
cer r
espo
nsib
ility
T1
827
1 68
61
645
1 69
33
012
4 52
64
977
5 37
65
866
€ / t
col
lect
ed
Sha
red
resp
onsi
bilit
y (1
)T
- v1
- f1
1 71
71
476
1 33
51
233
1 95
21
966
1 91
71
816
1 80
6€
/ t c
olle
cted
P
rodu
cer r
espo
nsib
ility
T2
070
1 89
91
828
1 84
63
135
4 64
95
100
5 46
95
959
€ / t
col
lect
ed
Sha
red
resp
onsi
bilit
y (1
)T
- v1
- f1
1 96
01
689
1 51
81
386
2 07
52
089
2 04
01
909
1 89
9€
/ t c
olle
cted
(1) R
emai
ning
cos
ts a
re p
aid
for b
y pu
blic
aut
horit
ies
or re
taile
rs(3
) If
k=re
cycl
ing
inpu
t pla
nt ra
te, T
=v1+
v2+v
3+k*
v4+(
1-k)
*v5+
v6+F
(2) H
ypot
hesi
s:h
40g
/ uni
t
90 -
100%
50 -
60%
60 -
70%
Qua
ntiti
es c
olle
cted
follo
win
g th
e im
plem
enta
tion
of W
EE
E d
irect
ive
Rec
yclin
g pl
ant i
nput
100%
Euro
s / t
onne
col
lect
edD
etai
led
data

BIO
In
tell
ige
nc
e S
erv
ice
I MP
AC
T A
SS
ES
SM
EN
T O
N S
ELE
CTE
D P
OLI
CY
OP
TIO
NS
FO
R R
EV
ISIO
N O
F TH
E B
ATT
ER
Y D
IRE
CTI
VE
110
Smal
l bat
terie
s - B
asel
ine
scen
ario
200
7S
ales
a16
5kt
/ ye
arD
ispo
sal c
ost o
f bat
terie
s no
t rec
ycle
dd
90€
/ t o
f bat
terie
sb
3%%
of s
ales
d' =
d x
h0,
36€/
uni
t sol
dc
5%%
of s
pent
bat
terie
s av
aila
ble
for c
olle
ctio
n
Smal
l bat
terie
s - S
cena
rio H
Col
lect
ion
syst
em:
Hig
h co
st
Rec
yclin
g:H
igh
cost
with
eco
nom
ies
of s
cale
Col
lect
ion
rate
e10
-20%
20-3
0%30
-40%
40-5
0%50
-60%
60-7
0%70
-80%
80-9
0%90
-100
%%
of s
ales
f15
%25
%35
%45
%55
%65
%75
%85
%95
%av
erag
e %
of s
ales
11-2
1%21
-31%
31-4
1%41
-51%
51-6
1%61
-71%
72-8
2%82
-92*
%92
-102
%%
of s
pent
bat
terie
s25
-35%
35-4
5%45
-60%
60-7
5%75
-85%
85-1
00%
100-
120%
110-
120%
120-
130%
% o
f spe
nt b
atte
ries
avai
labl
e fo
r col
lect
ion
(1)
40-8
080
-120
120-
160
160-
200
200-
240
240-
280
280-
320
320-
360
360-
400
g co
llect
ed /
inha
b / y
r (2)
Qua
ntiti
es c
olle
cted
g =
a x
f25
4158
7491
107
124
140
157
kt /
year
1. C
ost s
truc
ture
Varia
ble
cost
s fo
r 100
% re
cycl
edF
x g
/ a x
h1,
01,
52,
02,
43,
03,
94,
65,
05,
7€
cent
/ un
it so
ldC
olle
ctio
n po
ints
(equ
ipm
ent)
0,0
0,1
0,1
0,1
0,1
0,2
0,2
0,2
0,2
€ ce
nt /
unit
sold
Col
lect
ion
(logi
stic
)0,
20,
30,
40,
50,
60,
70,
80,
91,
0€
cent
/ un
it so
ldS
ortin
g an
d tra
nspo
rt0,
20,
30,
40,
50,
60,
70,
80,
91,
0€
cent
/ un
it so
ldR
ecyc
ling
0,5
0,8
1,0
1,1
1,1
1,3
1,5
1,4
1,5
€ ce
nt/ u
nit e
nter
ing
a re
cycl
ing
plan
tD
ispo
sal
0,1
0,1
0,1
0,2
0,2
0,2
0,3
0,3
0,3
€ ce
nt/ u
nit d
ispo
sed
ofO
ther
s0,
10,
20,
20,
30,
61,
11,
41,
72,
1€
cent
/ un
it so
ldFi
xed
cost
s0,
30,
40,
61,
04,
08,
310
,813
,717
,0€
cent
/ un
it so
ldPR
& c
omm
unic
atio
n0,
00,
20,
40,
72,
26,
59,
011
,915
,2€
cent
/ un
it so
ldAd
min
istra
tion
0,2
0,2
0,2
0,2
1,8
1,8
1,8
1,8
1,8
€ ce
nt /
unit
sold
k (3
): To
tal c
osts
for r
ecyc
ling
plan
t inp
ut
= 10
0% o
f col
lect
edT
(3)
1,3
1,9
2,6
3,4
6,9
12,1
15,4
18,6
22,7
€ ce
nt /
unit
sold
1
Tota
l cos
ts fo
r rec
yclin
g pl
ant i
nput
=
50 -
60%
of c
olle
cted
T (3
)1,
01,
62,
23,
06,
511
,714
,818
,222
,2€
cent
/ un
it so
ld0,
55
Tota
l cos
ts fo
r rec
yclin
g pl
ant i
nput
=
60 -
70%
of c
olle
cted
T (3
)1,
11,
72,
33,
06,
611
,814
,918
,322
,3€
cent
/ un
it so
ld0,
65
Tota
l cos
ts fo
r rec
yclin
g pl
ant i
nput
=
90 -
100%
of c
olle
cted
T
(3)
1,2
1,9
2,6
3,3
6,9
12,1
15,3
18,6
22,6
€ ce
nt /
unit
sold
0,95
2. C
osts
pai
d fo
r by
prod
ucer
sP
rodu
cer r
espo
nsib
ility
T1,
31,
92,
63,
46,
912
,115
,418
,622
,7€
cent
/ un
it so
ldS
hare
d re
spon
sibi
lity
(1)
T - v
1 - f
11,
21,
72,
22,
54,
65,
56,
26,
57,
3€
cent
/ un
it so
ldP
rodu
cer r
espo
nsib
ility
T1,
01,
62,
23,
06,
511
,714
,818
,222
,2€
cent
/ un
it so
ldS
hare
d re
spon
sibi
lity
(1)
T - v
1 - f
11,
01,
41,
82,
14,
25,
05,
66,
16,
7€
cent
/ un
it so
ldP
rodu
cer r
espo
nsib
ility
T1,
11,
72,
33,
06,
611
,814
,918
,322
,3€
cent
/ un
it so
ldS
hare
d re
spon
sibi
lity
(1)
T - v
1 - f
11,
21,
72,
12,
54,
65,
46,
16,
57,
2€
cent
/ un
it so
ldP
rodu
cer r
espo
nsib
ility
T1,
21,
92,
63,
36,
912
,115
,318
,622
,6€
cent
/ un
it so
ldS
hare
d re
spon
sibi
lity
(1)
T - v
1 - f
11,
21,
72,
12,
54,
65,
46,
16,
57,
2€
cent
/ un
it so
ld
(1) R
emai
ning
cos
ts a
re p
aid
for b
y pu
blic
aut
horit
ies
or re
taile
rs(3
) If
k=re
cycl
ing
inpu
t pla
nt ra
te, T
=v1+
v2+v
3+k*
v4+(
1-k)
*v5+
v6+F
(2) H
ypot
hesi
s:h
40g
/ uni
t
60 -
70%
90 -
100%
Qua
ntiti
es c
olle
cted
follo
win
g th
e im
plem
enta
tion
of W
EEE
dire
ctiv
e
Rec
yclin
g pl
ant i
nput
100%
50 -
60%
Euro
s ce
nts
/ uni
t sol
dD
etai
led
data
B I O I n t e l l i g e n c e S e r v i c e ______________________________________________ 111. IMPACT ASSESSMENT ON SELECTED POLICY OPTIONS FOR REVISION OF THE BATTERY DIRECTIVE
Short comments on the previous curves to facilitate the reading
With this scenario again, the shapes and ranges of the graphs according to the different recycling plant inputs do not vary a lot.
Administration and communication costs are much higher than in the ‘Low costs’ scenarii, so do the total costs.
Contrary to scenario L, economies of scale of recycling costs are accounted for scenario H, which explains the slight decrease of total costs up to a certain of collection rate near 50%.
An increase in the slope of the graphs is then observed from that level of collection rate due to an increase of administration costs.
The same remarks as for the difference of shapes between the ‘Producers responsibility’ and ‘Shared responsibility’ in scenario L curves are worth for this scenario H too.
33..55..22..22..33 SSuummmmaarryy ooff tthhee RReessuullttss
The following graphs summarise the main results, for 90-100% recycling plant input.
Total collection and recycling costs are represented. They correspond to costs that producers would have to pay for in case of producer responsibility.
Yearly budget for separate collection and recycling of concerned spent batteries is also presented on the bottom of the page.
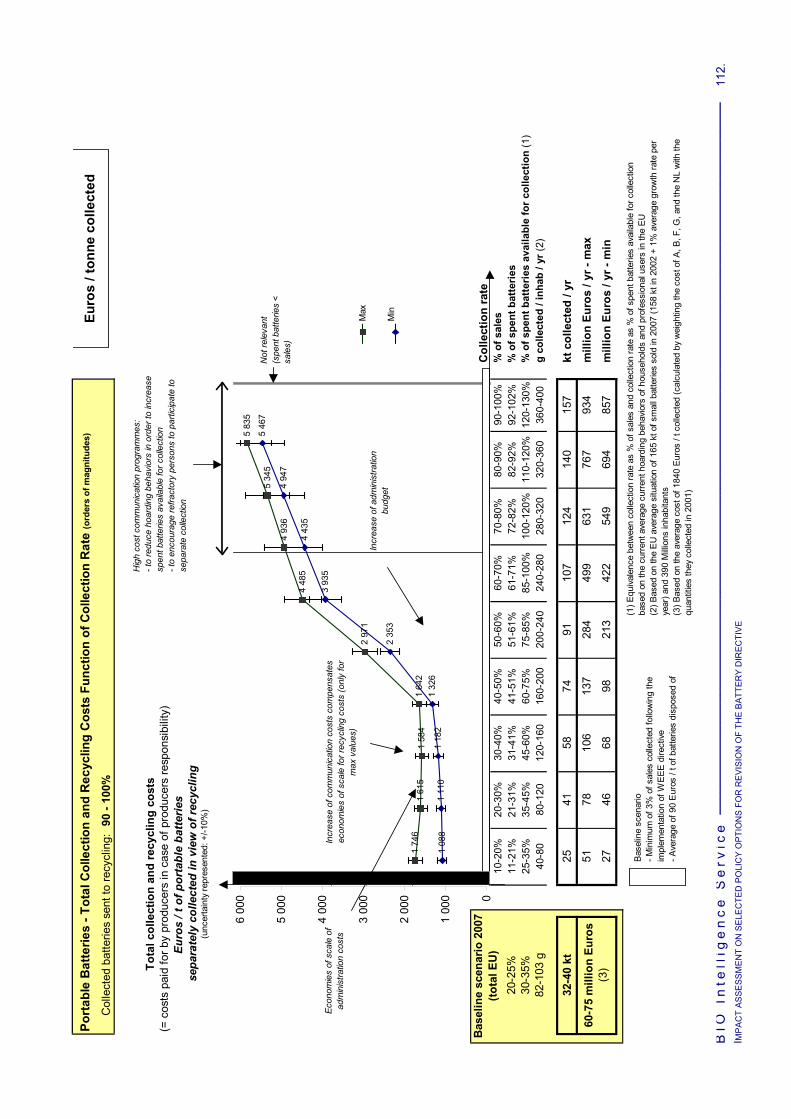
BIO
In
tell
ige
nc
e S
erv
ice
____
____
____
____
____
____
____
____
____
____
____
____
____
____
____
____
____
____
____
____
____
____
____
____
11
2.
I MP
AC
T A
SS
ES
SM
EN
T O
N S
ELE
CTE
D P
OLI
CY
OP
TIO
NS
FO
R R
EV
ISIO
N O
F TH
E B
ATT
ER
Y D
IRE
CTI
VE
Port
able
Bat
terie
s - T
otal
Col
lect
ion
and
Rec
yclin
g C
osts
Fun
ctio
n of
Col
lect
ion
Rat
e (o
rder
s of
mag
nitu
des)
Col
lect
ed b
atte
ries
sent
to re
cycl
ing:
90
- 10
0%
Tota
l col
lect
ion
and
recy
clin
g co
sts
(= c
osts
pai
d fo
r by
prod
ucer
s in
cas
e of
pro
duce
rs re
spon
sibi
lity)
Euro
s / t
of p
orta
ble
batte
ries
sep
arat
ely
colle
cted
in v
iew
of r
ecyc
ling
(unc
erta
inty
repr
esen
ted:
+/-1
0%)
Col
lect
ion
rate
10-2
0%20
-30%
30-4
0%40
-50%
50-6
0%60
-70%
70-8
0%80
-90%
90-1
00%
% o
f sal
es20
-25%
11-2
1%21
-31%
31-4
1%41
-51%
51-6
1%61
-71%
72-8
2%82
-92%
92-1
02%
% o
f spe
nt b
atte
ries
30-3
5%25
-35%
35-4
5%45
-60%
60-7
5%75
-85%
85-1
00%
100-
120%
110-
120%
120-
130%
% o
f spe
nt b
atte
ries
avai
labl
e fo
r col
lect
ion
(1)
82-1
03 g
40-8
080
-120
120-
160
160-
200
200-
240
240-
280
280-
320
320-
360
360-
400
g co
llect
ed /
inha
b / y
r (2)
32-4
0 kt
2541
5874
9110
712
414
015
7kt
col
lect
ed /
yr51
7810
613
728
449
963
176
793
4m
illio
n Eu
ros
/ yr -
max
2746
6898
213
422
549
694
857
mill
ion
Euro
s / y
r - m
in60
-75
mill
ion
Euro
s (3
)
Bas
elin
e sc
enar
io 2
007
(tota
l EU
)
Hig
h co
st c
omm
unic
atio
n pr
ogra
mm
es:
- to
redu
ce h
oard
ing
beha
vior
s in
ord
er to
incr
ease
sp
ent b
atte
ries
avai
labl
e fo
r col
lect
ion
- to
enco
urag
e re
fract
ory
pers
ons
to p
artic
ipat
e to
se
para
te c
olle
ctio
n
Bas
elin
e sc
enar
io- M
inim
um o
f 3%
of s
ales
col
lect
ed fo
llow
ing
the
impl
emen
tatio
n of
WEE
E di
rect
ive- A
vera
ge o
f 90
Eur
os /
t of b
atte
ries
disp
osed
of
Not
rele
vant
(s
pent
bat
terie
s <
sale
s)
Incr
ease
of c
omm
unic
atio
n co
sts
com
pens
ates
ec
onom
ies
of s
cale
for r
ecyc
ling
cost
s (o
nly
for
max
val
ues)
Euro
s / t
onne
col
lect
ed
1 74
61
615
1 58
41
642
2 97
1
4 48
5
4 93
6
5 34
5
5 83
5
1 08
81
110
1 18
21
326
2 35
3
3 93
5
4 43
5
4 94
7
5 46
7
0
1 00
0
2 00
0
3 00
0
4 00
0
5 00
0
6 00
0
Prod
ucer
sre
spon
sibi
lity
Prod
ucer
sre
spon
sibi
lity
Max
Min
(1) E
quiva
lenc
e be
twee
n co
llect
ion
rate
as
% o
f sal
es a
nd c
olle
ctio
n ra
te a
s %
of s
pent
bat
terie
s av
aila
ble
for c
olle
ctio
n ba
sed
on th
e cu
rren
t ave
rage
cur
rent
hoa
rdin
g be
havi
ors
of h
ouse
hold
s an
d pr
ofes
sion
al u
sers
in th
e EU
(2) B
ased
on
the
EU
ave
rage
situ
atio
n of
165
kt o
f sm
all b
atte
ries
sold
in 2
007
(158
kt i
n 20
02 +
1%
ave
rage
gro
wth
rate
per
ye
ar) a
nd 3
90 M
illion
s in
habi
tant
s(3
) Bas
ed o
n th
e av
erag
e co
st o
f 184
0 Eu
ros
/ t c
olle
cted
(cal
cula
ted
by w
eigh
ting
the
cost
of A
, B, F
, G, a
nd th
e N
L w
ith th
e qu
antit
ies
they
col
lect
ed in
200
1)
Eco
nom
ies
of s
cale
of
adm
inis
tratio
n co
sts
Incr
ease
of a
dmin
istra
tion
budg
et

B I O I n t e l l i g e n c e S e r v i c e ______________________________________________ 113. IMPACT ASSESSMENT ON SELECTED POLICY OPTIONS FOR REVISION OF THE BATTERY DIRECTIVE
SScchheemmee 22 -- CCoolllleeccttiioonn aanndd RReeccyycclliinngg ooff AAllll PPoorrttaabbllee BBaatttteerriieess EEssttiimmaattiioonn ooff TToottaall CCoolllleeccttiioonn aanndd RReeccyycclliinngg CCoossttss WWiitthh CCoolllleeccttiioonn RRaattee aanndd RReeccyycclliinngg PPllaanntt IInnppuutt
EEuurrooss // TToonnnnee CCoolllleecctteedd
Total collection and recycling costs paid for by producers
Collection rate40-50% 50-60% 60-70% 70 - 80% % of sales41-51% 51-61% 61-71% 72 - 82% % of spent batteries60-75% 75-85% 85-100% 100 -120% % of spent batteries available for collection (1)160-200 200-240 240-280 280 - 320 g collected / inhab / yr (2)
separately collectedin view of recyling
Euros / t of small batteries
0
1000
2000
3000
4000
5000
6000
Min costsMax costs
Recycling plant input = 50 - 60%
Total collection and recycling costs paid for by producers
Collection rate40-50% 50-60% 60-70% 70 - 80% % of sales41-51% 51-61% 61-71% 72 - 82% % of spent batteries60-75% 75-85% 85-100% 100 -120% % of spent batteries available for collection (1)160-200 200-240 240-280 280 - 320 g collected / inhab / yr (2)
Euros / t of small batteries separately collected
in view of recyling
0
1000
2000
3000
4000
5000
6000
Min costsMax costs
Recycling plant input = 60 - 70%
Total collection and recycling costs paid for by producers
Collection rate40-50% 50-60% 60-70% 70 - 80% % of sales41-51% 51-61% 61-71% 72 - 82% % of spent batteries60-75% 75-85% 85-100% 100 -120% % of spent batteries available for collection (1)160-200 200-240 240-280 280 - 320 g collected / inhab / yr (2)
separately collectedin view of recyling
Euros / t of small batteries
0
1000
2000
3000
4000
5000
6000
Min costsMax costs
(1) Equivalence between collection rate as % of sales and collection rate as % of spent batteries available for collection based on the current average current hoarding behaviors of households and professional users in the EU(2) Based on the EU average situation of 165 kt of small batteries sold in 2007 (158 kt in 2002 + 1% average growth rate per year) and 390 Millions inhabitants
Recycling plant input = 90 - 100%
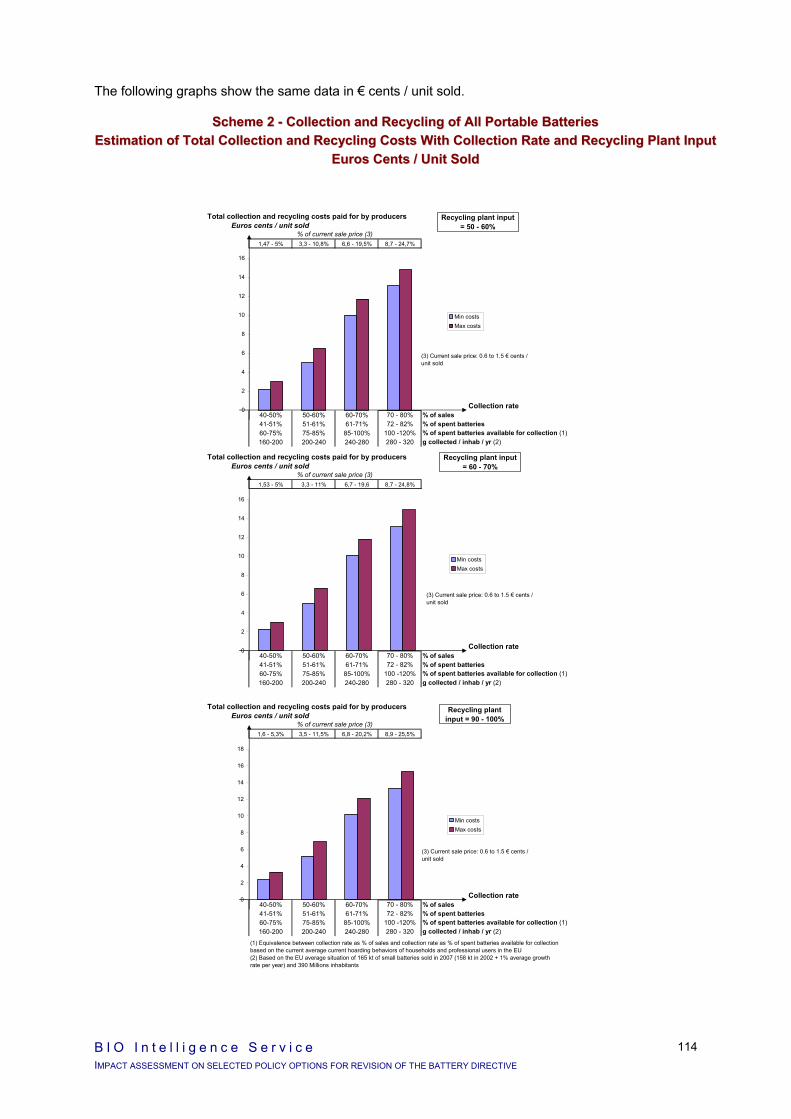
B I O I n t e l l i g e n c e S e r v i c e IMPACT ASSESSMENT ON SELECTED POLICY OPTIONS FOR REVISION OF THE BATTERY DIRECTIVE
114
The following graphs show the same data in € cents / unit sold.
SScchheemmee 22 -- CCoolllleeccttiioonn aanndd RReeccyycclliinngg ooff AAllll PPoorrttaabbllee BBaatttteerriieess EEssttiimmaattiioonn ooff TToottaall CCoolllleeccttiioonn aanndd RReeccyycclliinngg CCoossttss WWiitthh CCoolllleeccttiioonn RRaattee aanndd RReeccyycclliinngg PPllaanntt IInnppuutt
EEuurrooss CCeennttss // UUnniitt SSoolldd
Total collection and recycling costs paid for by producers
1,47 - 5% 3,3 - 10,8% 6,6 - 19,5% 8,7 - 24,7%
Collection rate40-50% 50-60% 60-70% 70 - 80% % of sales41-51% 51-61% 61-71% 72 - 82% % of spent batteries60-75% 75-85% 85-100% 100 -120% % of spent batteries available for collection (1)160-200 200-240 240-280 280 - 320 g collected / inhab / yr (2)
% of current sale price (3)Euros cents / unit sold
0
2
4
6
8
10
12
14
16
Min costsMax costs
Recycling plant input = 50 - 60%
(3) Current sale price: 0.6 to 1.5 € cents / unit sold
Total collection and recycling costs paid for by producers
1,53 - 5% 3,3 - 11% 6,7 - 19,6 8,7 - 24,8%
Collection rate40-50% 50-60% 60-70% 70 - 80% % of sales41-51% 51-61% 61-71% 72 - 82% % of spent batteries60-75% 75-85% 85-100% 100 -120% % of spent batteries available for collection (1)160-200 200-240 240-280 280 - 320 g collected / inhab / yr (2)
% of current sale price (3)Euros cents / unit sold
0
2
4
6
8
10
12
14
16
Min costsMax costs
Recycling plant input = 60 - 70%
(3) Current sale price: 0.6 to 1.5 € cents / unit sold
Total collection and recycling costs paid for by producers
1,6 - 5,3% 3,5 - 11,5% 6,8 - 20,2% 8,9 - 25,5%
Collection rate40-50% 50-60% 60-70% 70 - 80% % of sales41-51% 51-61% 61-71% 72 - 82% % of spent batteries60-75% 75-85% 85-100% 100 -120% % of spent batteries available for collection (1)160-200 200-240 240-280 280 - 320 g collected / inhab / yr (2)
% of current sale price (3)Euros cents / unit sold
0
2
4
6
8
10
12
14
16
18
Min costsMax costs
(1) Equivalence between collection rate as % of sales and collection rate as % of spent batteries available for collection based on the current average current hoarding behaviors of households and professional users in the EU(2) Based on the EU average situation of 165 kt of small batteries sold in 2007 (158 kt in 2002 + 1% average growth rate per year) and 390 Millions inhabitants
Recycling plant input = 90 - 100%
(3) Current sale price: 0.6 to 1.5 € cents / unit sold

B I O I n t e l l i g e n c e S e r v i c e IMPACT ASSESSMENT ON SELECTED POLICY OPTIONS FOR REVISION OF THE BATTERY DIRECTIVE
115
The following tables summarise total collection and recycling costs (min-max ranges) for the different policy options about collection rates (50-60%, 60-70%, 70-80% of spent portable batteries) and recycling plant input (40-50%, 50-60%, 60-70%, 70-80% of collected), with a reminder of the baseline scenarion. A collection rate of 40-50% is also included to better show cost evolution.
The 2 tables differ in the scope they cover:
The first table focuses on batteries separately collected, i.e. costs concern separate collection and recycling as well as the disposal of separately collected quantities which are not recycled depending in the recycling plant input considered.
These costs are those that producers would have to pay for in case of producer responsibility.
The second table covers all spent batteries, those separately collected with costs from the 1st table and the remaining fraction collected and disposed of with MSW (at a cost of 120 Euros / t).
They correspond to the total end-of-life cost of spent batteries.
The comparison with the baseline scenario is particularly appropriate.
NB: The figures presented are to be regarded as orders of magnitude and trends rather than absolute figures. Ranges correspond to the low and high costs assessed with scenario L and scenario H.
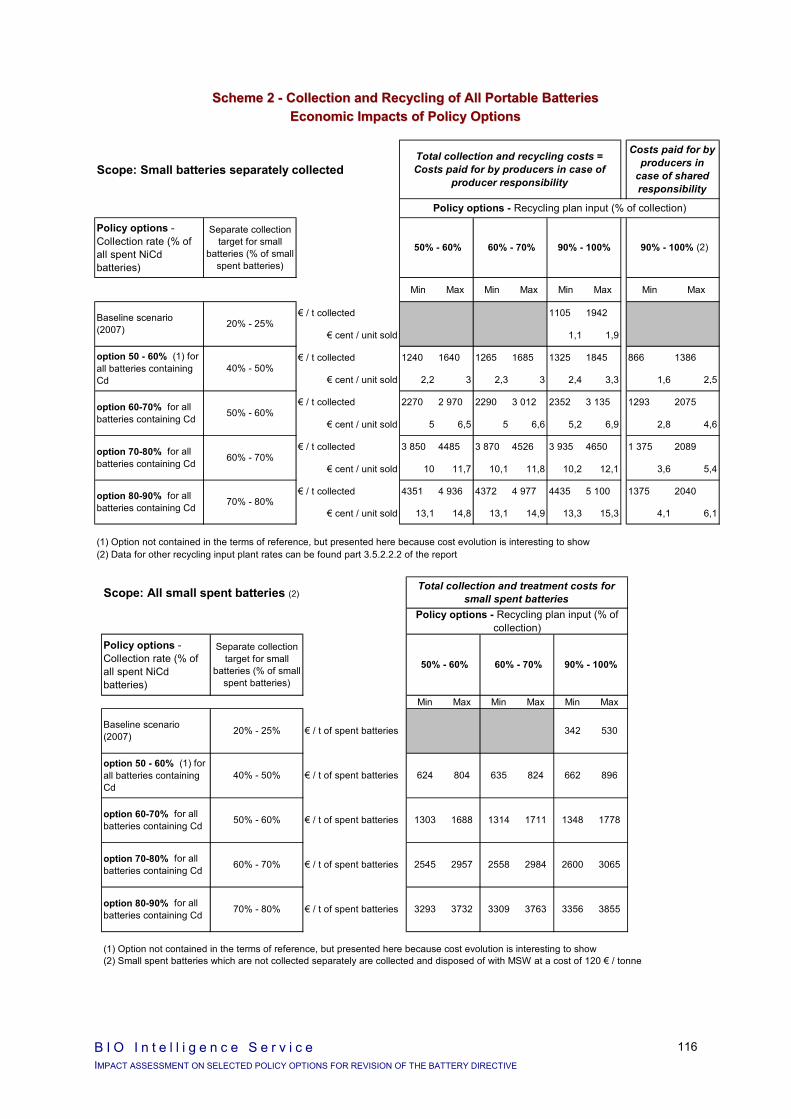
B I O I n t e l l i g e n c e S e r v i c e IMPACT ASSESSMENT ON SELECTED POLICY OPTIONS FOR REVISION OF THE BATTERY DIRECTIVE
116
SScchheemmee 22 -- CCoolllleeccttiioonn aanndd RReeccyycclliinngg ooff AAllll PPoorrttaabbllee BBaatttteerriieess EEccoonnoommiicc IImmppaaccttss ooff PPoolliiccyy OOppttiioonnss
Scope: Small batteries separately collected
Policy options - Collection rate (% of all spent NiCd batteries)
Separate collection target for small
batteries (% of small spent batteries)
Min Max Min Max Min Max Min Max
€ / t collected 1105 1942
€ cent / unit sold 1,1 1,9
€ / t collected 1240 1640 1265 1685 1325 1845 866 1386
€ cent / unit sold 2,2 3 2,3 3 2,4 3,3 1,6 2,5
€ / t collected 2270 2 970 2290 3 012 2352 3 135 1293 2075
€ cent / unit sold 5 6,5 5 6,6 5,2 6,9 2,8 4,6
€ / t collected 3 850 4485 3 870 4526 3 935 4650 1 375 2089
€ cent / unit sold 10 11,7 10,1 11,8 10,2 12,1 3,6 5,4
€ / t collected 4351 4 936 4372 4 977 4435 5 100 1375 2040
€ cent / unit sold 13,1 14,8 13,1 14,9 13,3 15,3 4,1 6,1
(2) Data for other recycling input plant rates can be found part 3.5.2.2.2 of the report
option 80-90% for all batteries containing Cd
90% - 100% (2)
Baseline scenario (2007)
option 50 - 60% (1) for all batteries containing Cd
70% - 80%
(1) Option not contained in the terms of reference, but presented here because cost evolution is interesting to show
Total collection and recycling costs = Costs paid for by producers in case of
producer responsibility
Costs paid for by producers in
case of shared responsibility
Policy options - Recycling plan input (% of collection)
60% - 70%
50% - 60% 60% - 70%
20% - 25%
90% - 100%
40% - 50%
50% - 60%option 60-70% for all batteries containing Cd
option 70-80% for all batteries containing Cd
Scope: All small spent batteries (2)
Policy options - Collection rate (% of all spent NiCd batteries)
Separate collection target for small
batteries (% of small spent batteries)
Min Max Min Max Min Max
(2) Small spent batteries which are not collected separately are collected and disposed of with MSW at a cost of 120 € / tonne
3293 3732
1303 1688
2545 2957
624 804 896662824635
50% - 60%
Policy options - Recycling plan input (% of collection)
60% - 70% 90% - 100%
3065
3855
1348 1778
2600
33563309
1711
2984
3763
option 70-80% for all batteries containing Cd 60% - 70%
1314
2558
50% - 60%
Baseline scenario (2007)
(1) Option not contained in the terms of reference, but presented here because cost evolution is interesting to show
€ / t of spent batteries
€ / t of spent batteries
€ / t of spent batteries
€ / t of spent batteries
€ / t of spent batteries
342 530
Total collection and treatment costs for small spent batteries
option 80-90% for all batteries containing Cd 70% - 80%
20% - 25%
option 50 - 60% (1) for all batteries containing Cd
40% - 50%
option 60-70% for all batteries containing Cd

B I O I n t e l l i g e n c e S e r v i c e IMPACT ASSESSMENT ON SELECTED POLICY OPTIONS FOR REVISION OF THE BATTERY DIRECTIVE
117
Main conclusions about the cost for separate collection and recycling of portable batteries
Euros / tonne collected:
A 10 point increase of recycling plant input (e.g. from 50-60% to 60-70%) results in an increase of 10 to 55 € / t collected, due to the fact that additional tons recycled are recycled at an average cost of 300-700 € / t of portable batteries entering a recycling plant (depending on the type of recycling technology and the economies of scale) instead of 90 € / t of batteries disposed of.
For a constant recycling input plant, a 10 point increase of collection rate results in an increase of about 100-150 € / t collected for relatively low collection rates (e.g. 30 to 50% of sales), and more than 1000 € / t collected for high collection rates (from 50 to 100%). This is because of both communication and administration costs: - communication costs regularly increase as collection rate targeted increases. For example, to
double collection rate from 30 to 60% of sales (45% to 85% of spent batteries available for collection with current level of hoarding), PR and communication budgets are estimated to be multiplied by 10 to avoid domestic hoarding (i.e. from 250 to 2500 € / t collected).
- As for administration costs, economies of scale are observed until about 50 – 60% of collection rate, then a step of increase is considered being needed to ensure collection of higher quantities.
Overall budget concerned:
In the baseline scenario 2007, a budget of 60 to 75 million Euros is already dedicated to separate collection and recycling of about 32-40 kt of portable batteries (collection rate of 20-25% of spent batteries).
A target of 50-60% of spent batteries in the directive would require a budget of 215-285 million Euros, i.e. additional costs of 140-225 million Euros (extra costs are assessed at 345-420 million Euros in case of a 60-70% target and 475-570 million Euros for 70-80%).
Euros cents / unit sold:
The collection and recycling cost in € cent / unit sold does not vary much function of recycling plant input rate, for a given collection rate (maximum 0.8 € cent / unit sold).
For a given recycling plant input, costs vary from about 2 € cents / unit sold (30-40% collection rate) to 11 € cents / unit sold (60-70% collection rate) and about 17 € cents / unit sold (80-90% collection rate).
Sale prices vary a lot for a same type of battery: from 0.6 to 1.5 € / unit for an alkaline battery for instance. Collection and recycling costs thus represent 1.5 to 25% of the sale price depending on the level of collection objective.
Main conclusions about the cost for portable spent batteries collection and treatment
Compared to the baseline scenario (340-530 Euros / t of spent batteries), the cost per tonne of spent batteries (thus the total budget per year) for collection and treatment is 2 times the baseline cost for 40-50% collection rate to more than 7 times for 70-80% collection rate.
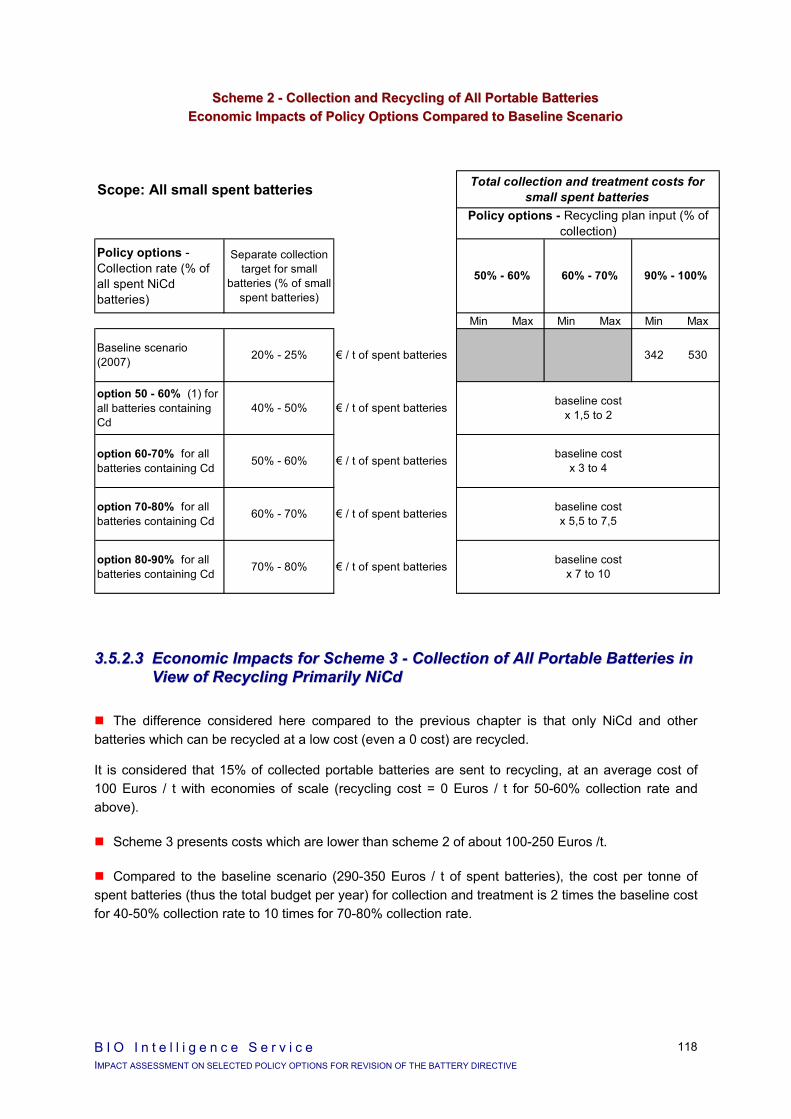
B I O I n t e l l i g e n c e S e r v i c e IMPACT ASSESSMENT ON SELECTED POLICY OPTIONS FOR REVISION OF THE BATTERY DIRECTIVE
118
SScchheemmee 22 -- CCoolllleeccttiioonn aanndd RReeccyycclliinngg ooff AAllll PPoorrttaabbllee BBaatttteerriieess EEccoonnoommiicc IImmppaaccttss ooff PPoolliiccyy OOppttiioonnss CCoommppaarreedd ttoo BBaasseelliinnee SScceennaarriioo
33..55..22..33 EEccoonnoommiicc IImmppaaccttss ffoorr SScchheemmee 33 -- CCoolllleeccttiioonn ooff AAllll PPoorrttaabbllee BBaatttteerriieess iinn VViieeww ooff RReeccyycclliinngg PPrriimmaarriillyy NNiiCCdd
The difference considered here compared to the previous chapter is that only NiCd and other batteries which can be recycled at a low cost (even a 0 cost) are recycled.
It is considered that 15% of collected portable batteries are sent to recycling, at an average cost of 100 Euros / t with economies of scale (recycling cost = 0 Euros / t for 50-60% collection rate and above).
Scheme 3 presents costs which are lower than scheme 2 of about 100-250 Euros /t.
Compared to the baseline scenario (290-350 Euros / t of spent batteries), the cost per tonne of spent batteries (thus the total budget per year) for collection and treatment is 2 times the baseline cost for 40-50% collection rate to 10 times for 70-80% collection rate.
Scope: All small spent batteries
Policy options - Collection rate (% of all spent NiCd batteries)
Separate collection target for small
batteries (% of small spent batteries)
Min Max Min Max Min Max
Total collection and treatment costs for small spent batteries
342
Policy options - Recycling plan input (% of collection)
50% - 60% 60% - 70% 90% - 100%
option 60-70% for all batteries containing Cd 50% - 60% € / t of spent batteries
530
option 50 - 60% (1) for all batteries containing Cd
40% - 50% € / t of spent batteries
Baseline scenario (2007) 20% - 25% € / t of spent batteries
option 80-90% for all batteries containing Cd 70% - 80% € / t of spent batteries
option 70-80% for all batteries containing Cd 60% - 70% € / t of spent batteries baseline cost
x 5,5 to 7,5
baseline cost x 7 to 10
baseline cost x 1,5 to 2
baseline cost x 3 to 4

B I O I n t e l l i g e n c e S e r v i c e IMPACT ASSESSMENT ON SELECTED POLICY OPTIONS FOR REVISION OF THE BATTERY DIRECTIVE
119
SScchheemmee 33 -- CCoolllleeccttiioonn ooff AAllll PPoorrttaabbllee BBaatttteerriieess iinn VViieeww ooff RReeccyycclliinngg PPrriimmaarriillyy NNiiCCdd EEccoonnoommiicc IImmppaaccttss ooff PPoolliiccyy OOppttiioonnss
Scope: Small batteries separately collected
Policy options - Collection rate (% of all spent NiCd batteries)
Separate collection target for small
batteries (% of small spent batteries)
Min Max
€ / t collected 890 1150
€ cent / unit sold 0,9 1,2
€ / t collected 1110 1310
€ cent / unit sold 2 2,4
€ / t collected 2110 2 680
€ cent / unit sold 4,6 5,8
€ / t collected 3 690 4200
€ cent / unit sold 9,5 10,8
€ / t collected 4190 4 650
€ cent / unit sold 12,5 13,8
option 70-80% for all batteries containing Cd 60% - 70%
20% - 25%
15% (2)
40% - 50%
50% - 60%
option 80-90% for all batteries containing Cd
Baseline scenario (2007)
option 50 - 60% (1) for all batteries containing Cd
70% - 80%
(1) Option not contained in the terms of reference, but presented here because cost evolution is
option 60-70% for all batteries containing Cd
Total collection and recycling costs =
Costs paid for by producers in case of
producer responsibility
Policy options - Recycling plan input (% of collection)
(2) Hypothesis: 15% of collected small batteries are NiCd and other batteries which can be recycled at an average cost of 100 Euros / t with economies of scale (recycling cost = 0 Euros / t for 50-60% collection rate and above)
Scope: All small spent batteries (2)
Policy options - Collection rate (% of all spent NiCd batteries)
Separate collection target for small
batteries (% of small spent batteries)
Min Max
(2) Small spent batteries which are not collected separately are collected and disposed of with MSW at a cost of 120 € / tonne
option 80-90% for all batteries containing Cd 70% - 80%
20% - 25%
option 50 - 60% (1) for all batteries containing Cd
40% - 50%
option 60-70% for all batteries containing Cd 50% - 60%
Baseline scenario (2007) (3)
(1) Option not contained in the terms of reference, but presented here because cost evolution is
€ / t of spent batteries
€ / t of spent batteries
€ / t of spent batteries
€ / t of spent batteries
€ / t of spent batteries
293 352
option 70-80% for all batteries containing Cd 60% - 70% 2772
3518
1215 1528
2441
3173
15% (2)
Total collection and treatment costs for small
spent batteries
656566
Policy options - Recycling plan input (% of collection)

B I O I n t e l l i g e n c e S e r v i c e IMPACT ASSESSMENT ON SELECTED POLICY OPTIONS FOR REVISION OF THE BATTERY DIRECTIVE
120
SScchheemmee 33 -- CCoolllleeccttiioonn ooff AAllll PPoorrttaabbllee BBaatttteerriieess iinn VViieeww ooff RReeccyycclliinngg PPrriimmaarriillyy NNiiCCdd EEccoonnoommiicc IImmppaaccttss ooff PPoolliiccyy OOppttiioonnss –– CCoommppaarriissoonn wwiitthh BBaasseelliinnee SScceennaarriioo
Scope: All small spent batteries
Policy options - Collection rate (% of all spent NiCd batteries)
Separate collection target for small
batteries (% of small spent batteries)
Min Max
15%
€ / t of spent batteries 293
Total collection and treatment costs for small
spent batteries
Policy options - Recycling plan input (% of collection)
352
option 50 - 60% for all batteries containing Cd 40% - 50% € / t of spent batteries
Baseline scenario (2007) 20% - 25%
option 60-70% for all batteries containing Cd 50% - 60% € / t of spent batteries
option 70-80% for all batteries containing Cd 60% - 70% € / t of spent batteries
option 80-90% for all batteries containing Cd 70% - 80% € / t of spent batteries
Baseline costs x 2
Baseline costs x 4
Baseline costs x 8
Baseline costs x 10

B I O I n t e l l i g e n c e S e r v i c e .
IMPACT ASSESSMENT ON SELECTED POLICY OPTIONS FOR REVISION OF THE BATTERY DIRECTIVE
121
33..55..33 EEnnvviirroonnmmeennttaall IImmppaaccttss
33..55..33..11 IInnttrroodduuccttiioonn
33..55..33..11..11 OObbjjeeccttiivvee ooff TThhiiss CChhaapptteerr
The purpose of this section is to give an overview of the environmental impacts related to the various policy options under study.
As already introduced in the chapter relative to lead-acid automotive batteries, the control of hazardous substances, the principal objective which drives the policy options under study, will induce a change in the balance of environmental impacts. This change is due to additional recycling and collection activities which generate burdens on the one hand, and avoided impacts due to the savings of extraction, transport and processing or raw materials which generate benefits on the other hand.
The environmental impact assessment related to various policy options must therefore be based on a life cycle approach, in order to assess the overall balance between additional burdens and savings.
33..55..33..11..22 PPrreevviioouuss WWoorrkk
LCA of Recycling Portable NiCd batteries
The aim of this study30 was to assess the environmental effects of recycling portable NiCd batteries in Sweden and to identify life cycle activities with significant environmental impacts. The assessment was made by varying recycling rates, using a life cycle inventory (LCI), which includes compiling an inventory of environmentally relevant inputs and outputs related to the functionality of a product. The functional unit of the study was defined as “a battery with an energy storage of 1.0 Wh electrical energy”. This corresponds to a cylindrical NiCd battery with a mass of 25 g (40 Wh/kg), containing 16.4 % (weight) of Cadmium and 20.5% of Nickel. Hereafter, some important results of this study are detailed, after BIO recalculation in order to present the values for 1 kg of portable NiCd battery.
Emissions and resources use in the user phase of the battery were excluded from the study since they do not influence the materials management of metals for the functional unit chosen. Various kinds of end-of-life treatment (recycling, landfill and incineration) were considered.
It was assumed that the NiCd batteries were manufactured in Germany and used in Sweden. Data on raw materials extraction and refining from cradle to gate are based on average data from manufacturers. Average transportation distances are estimated for materials production, collection and recycling of batteries in Sweden. Emissions from electricity generation (extraction, refining and combustion of duels) were calculated for base case based on country specific mix for electricity generation.
With respect to the collection stage, the transportation distances involved in collecting mixed household batteries from battery collection boxes and taking them to a central point within a municipality vary in the range 30 to 250 km (average 100 km) for the different municipalities in Sweden. After the sorting plant, the fraction of NiCd batteries is transported to cadmium recovery facility (AB SAFT) with an average distance of 600 km.
30 Environmental assessment of battery systems in life cycle management, C.J. Rydh, Chalmers University of Technology,
2001 (thesis + paper submitted to Resources, conservation and Recycling)

B I O I n t e l l i g e n c e S e r v i c e IMPACT ASSESSMENT ON SELECTED POLICY OPTIONS FOR REVISION OF THE BATTERY DIRECTIVE
122
Recoverable materials (76wt.% of NiCd battery) are cadmium and nickel-iron scrap. The cadmium recovered is used in the production of new industrial NiCd batteries at SAFT, and nickel-iron scrap is sent to smelters for use as alloying metal in the steel industry. However, in this study, it was assumed that the cadmium recovered is used in the production of new portable batteries to avoid the use of different allocation procedures, which must be applied when recycling materials in cascade. As for the MSW fraction of NiCd batteries, it was assumed that 60% is incinerated and 40% is landfilled.
The following results represent selected inventory data for the NiCd batteries life cycle (excluding user phase), with different recycling rates (from 0 to 100%) in Sweden.
As recycling rates increase, the heavy metals in batteries are progressively diverted from waste. Clearly, this is most effective when the recycling rate is maximised.
dissipative losses of Cd (total emissions) for NiCd battery life cycle (excl. user phase) at different recycling rates
164
-
82
20-
20
40
60
80
100
120
140
160
180
0% 25% 50% 75% 100%
Recycling rate (%)
tota
l em
issi
on o
f Cd
(g /
kg N
iCd
batt
ery)
CO2 emissions for NiCd battery life cycle (excl. user phase) at different recycling rates
16,4
13,1
9,7
-
2
4
6
8
10
12
14
16
18
0% 25% 50% 75% 100%
Recycling rate (%)
CO
2 em
issi
ons
(kg
/ kg
NiC
d ba
ttery
)
NOx emissions for NiCd battery life cycle (excl. user phase) at different recycling rates
22,4
17,5 18,6
13,8 15,1
0
5
10
15
20
25
0% 25% 50% 75% 100%
Recycling rate (%)
NO
x em
issi
ons
(g /
kg N
iCd
batte
ry)
SOx emissions for NiCd battery life cycle (excl. user phase) at different recycling rates
218
115
13 0
50
100
150
200
250
0% 25% 50% 75% 100%
Recycling rate (%)
SOx
emis
sion
s (g
/ kg
NiC
d ba
ttery
)
Primary energy for NiCd battery life cycle (excl. user phase) at different recycling rates
179
213
193
160
170
180
190
200
210
220
0% 25% 50% 75% 100%
Recycling rate (%)
Prim
ary
ener
gy(M
J / k
g N
iCd
batte
ry)
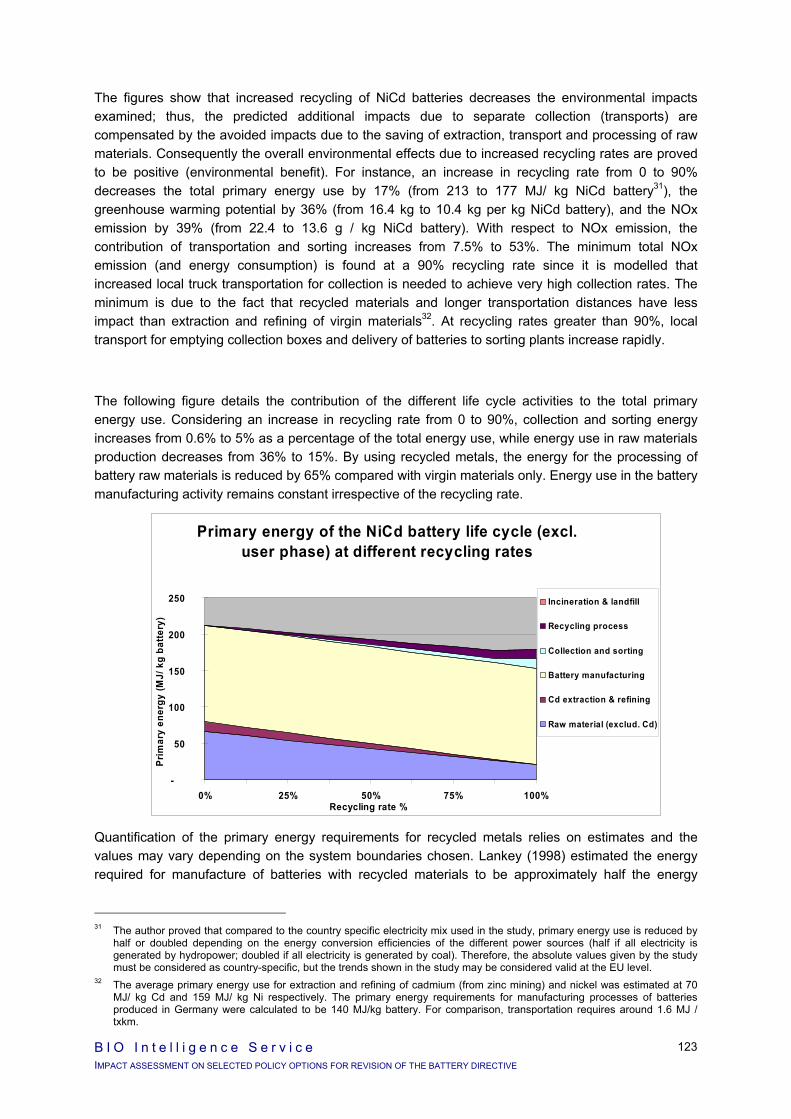
B I O I n t e l l i g e n c e S e r v i c e IMPACT ASSESSMENT ON SELECTED POLICY OPTIONS FOR REVISION OF THE BATTERY DIRECTIVE
123
The figures show that increased recycling of NiCd batteries decreases the environmental impacts examined; thus, the predicted additional impacts due to separate collection (transports) are compensated by the avoided impacts due to the saving of extraction, transport and processing of raw materials. Consequently the overall environmental effects due to increased recycling rates are proved to be positive (environmental benefit). For instance, an increase in recycling rate from 0 to 90% decreases the total primary energy use by 17% (from 213 to 177 MJ/ kg NiCd battery31), the greenhouse warming potential by 36% (from 16.4 kg to 10.4 kg per kg NiCd battery), and the NOx emission by 39% (from 22.4 to 13.6 g / kg NiCd battery). With respect to NOx emission, the contribution of transportation and sorting increases from 7.5% to 53%. The minimum total NOx emission (and energy consumption) is found at a 90% recycling rate since it is modelled that increased local truck transportation for collection is needed to achieve very high collection rates. The minimum is due to the fact that recycled materials and longer transportation distances have less impact than extraction and refining of virgin materials32. At recycling rates greater than 90%, local transport for emptying collection boxes and delivery of batteries to sorting plants increase rapidly.
The following figure details the contribution of the different life cycle activities to the total primary energy use. Considering an increase in recycling rate from 0 to 90%, collection and sorting energy increases from 0.6% to 5% as a percentage of the total energy use, while energy use in raw materials production decreases from 36% to 15%. By using recycled metals, the energy for the processing of battery raw materials is reduced by 65% compared with virgin materials only. Energy use in the battery manufacturing activity remains constant irrespective of the recycling rate.
Quantification of the primary energy requirements for recycled metals relies on estimates and the values may vary depending on the system boundaries chosen. Lankey (1998) estimated the energy required for manufacture of batteries with recycled materials to be approximately half the energy
31 The author proved that compared to the country specific electricity mix used in the study, primary energy use is reduced by
half or doubled depending on the energy conversion efficiencies of the different power sources (half if all electricity is generated by hydropower; doubled if all electricity is generated by coal). Therefore, the absolute values given by the study must be considered as country-specific, but the trends shown in the study may be considered valid at the EU level.
32 The average primary energy use for extraction and refining of cadmium (from zinc mining) and nickel was estimated at 70 MJ/ kg Cd and 159 MJ/ kg Ni respectively. The primary energy requirements for manufacturing processes of batteries produced in Germany were calculated to be 140 MJ/kg battery. For comparison, transportation requires around 1.6 MJ / txkm.
Primary energy of the NiCd battery life cycle (excl. user phase) at different recycling rates
-
50
100
150
200
250
0% 25% 50% 75% 100%Recycling rate %
Prim
ary
ener
gy (M
J/ k
g ba
ttery
)
Incineration & landfill
Recycling process
Collection and sorting
Battery manufacturing
Cd extraction & refining
Raw material (exclud. Cd)

B I O I n t e l l i g e n c e S e r v i c e IMPACT ASSESSMENT ON SELECTED POLICY OPTIONS FOR REVISION OF THE BATTERY DIRECTIVE
124
needed to manufacture batteries using only primary materials33. In this study, the energy reduction was calculated to be 16%.
Extrapolation at the EU level: uncertainties in the results depend on the choice of methodology and data source. Choices in methodology that could affect the results are modelling of cadmium and nickel as closed-loop recycling, recycling of steel, choice of model for electricity production. Uncertain data values include assumptions about load factor for trucks and transport distances. Sensitivity analyses have, however, shown that these parameters are of minor importance in the final result. The absolute values may be distorted by methodological choices and data values but the identified trends will remain the same.
The ERM studies
A study published by the Department of Trade & Industry (DTI) in November 2000 (“Analysis of the environmental impact and financial costs of a possible new European directive on batteries”), using Life Cycle Assessment (LCA) methodology, concluded, that the collection of all batteries would cause additional environmental impacts instead of improving the environmental situation. The reason for this is simply because the emissions due to collection and transportation would more than cancel out the positive environmental benefit from the recycling of batteries.
From a strictly LCA point of view such a conclusion is very singular, since all the LCA studies published hitherto with respect to a wide variety of products and waste management systems, have generally concluded that the environmental impacts due to transport are of second order by comparison with the other life cycle stages.
In addition to this point, we were not able to include the results of the ERM study in the own calculations we performed in this study because:
no life cycle inventory data (background data) were available in the report version we got,
no hypotheses about save ratio (i.e. the quantity of virgin material saved per kg of material recovered) were found,
not enough explanation about other main hypotheses were found..
Another ERM study was published by EPBA in August 2001 : “Assessment of the environmental impacts associated with the transport of waste batteries in Europe”. In this study, the LCA methodology was applied and background data and assumptions are transparent enough. Therefore, we have used hereafter the data presented in this study.
We were thus able to integrate some data from this study on our calculation.
Conclusion
The conclusions from the first ERM study are not suitable for the present work. It is thus necessary to perform new calculations, based on well sound data. Only two sources of data can be used:
Environmental assessment of battery systems in life cycle management, C.J. Rydh (2001)
Assessment of the environmental impacts associated with the transport of waste batteries in Europe, ERM for EPBA (august 2001).
33 Lankey (in Lankey R., 1998. Materials management and recycling for nickel-cadmium batteries. Ph.D thesis, Carnegie
Mellon University, Aug. Dept. Civil Envir. Engin.) claims that 190 MJ/kg is needed for virgin cadmium production and 22 MJ/kg for recycled cadmium. However, these data are uncertain since they are based on theoretical calculations and allocation principles, and the use of different energy carriers was not explained.
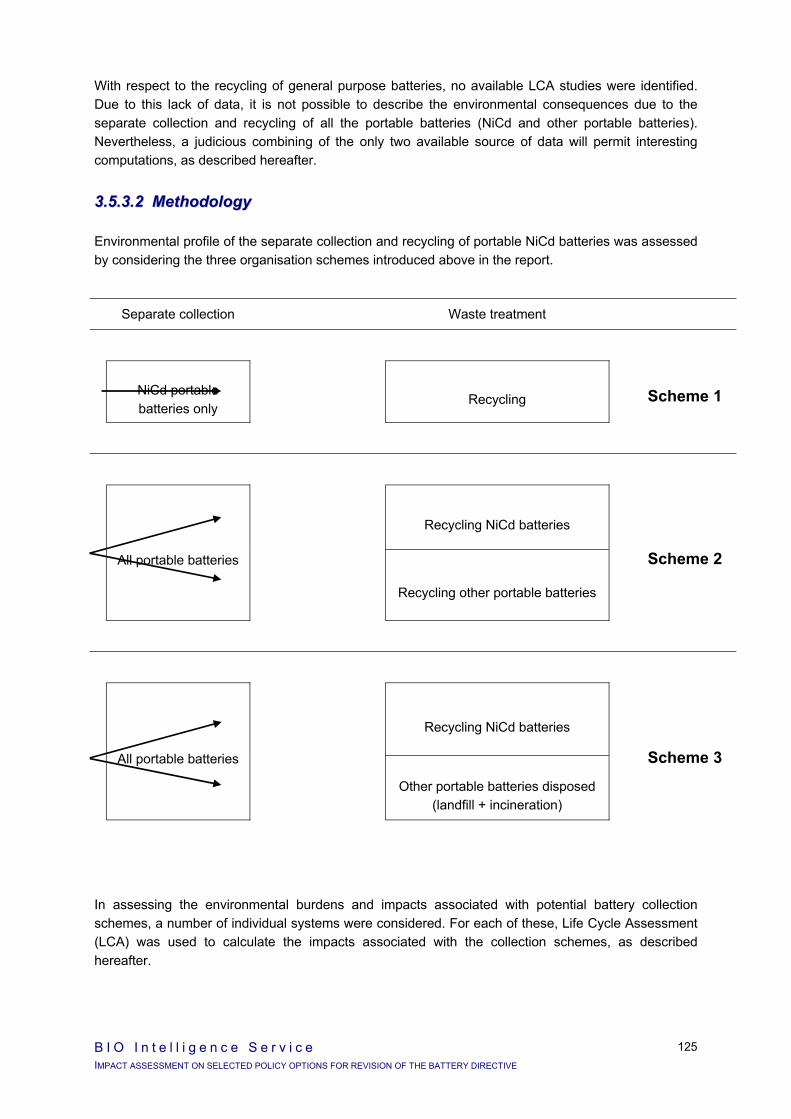
B I O I n t e l l i g e n c e S e r v i c e IMPACT ASSESSMENT ON SELECTED POLICY OPTIONS FOR REVISION OF THE BATTERY DIRECTIVE
125
With respect to the recycling of general purpose batteries, no available LCA studies were identified. Due to this lack of data, it is not possible to describe the environmental consequences due to the separate collection and recycling of all the portable batteries (NiCd and other portable batteries). Nevertheless, a judicious combining of the only two available source of data will permit interesting computations, as described hereafter.
33..55..33..22 MMeetthhooddoollooggyy
Environmental profile of the separate collection and recycling of portable NiCd batteries was assessed by considering the three organisation schemes introduced above in the report.
Separate collection Waste treatment
NiCd portable batteries only
Recycling
Scheme 1
Recycling NiCd batteries
All portable batteries
Recycling other portable batteries
Scheme 2
Recycling NiCd batteries
All portable batteries
Other portable batteries disposed
(landfill + incineration)
Scheme 3
In assessing the environmental burdens and impacts associated with potential battery collection schemes, a number of individual systems were considered. For each of these, Life Cycle Assessment (LCA) was used to calculate the impacts associated with the collection schemes, as described hereafter.

B I O I n t e l l i g e n c e S e r v i c e IMPACT ASSESSMENT ON SELECTED POLICY OPTIONS FOR REVISION OF THE BATTERY DIRECTIVE
126
The Model system
In the objective of calculating the environmental impacts associated with the separate collection and recycling of portable NiCd batteries only (e.g. all other portable batteries are collected with MSW then disposed), the following system was considered in a life cycle assessment approach.
A ‘differential’ approach was adopted between a baseline (system 2) in which there is no separate collection of portable NiCd batteries (and no recovery of materials from batteries) and a range of collection rates with associated recovery of materials (system 1). This approach enables the evaluation of the environmental impacts of the various policy options under study (by taking the corresponding value of y% in system 1), by comparison with a common system (system 2). As system 2 is the same in every scenario, it is therefore possible to compare the environmental impacts of the various policy options considered.
Data used for impact assessment
From the study : “Environmental assessment of battery systems in life cycle management”, (C.J. Rydh, 2001), we were able to directly derive the life cycle inventory of both system 1 (with recycling in dedicated plants ; no data available for recycling in metal plants) and system 2. We used the original data without any further modification.
We assumed that 100% of the batteries collected are recycled (i.e. recycling plant input is 100%).
Life cycle of x t small NiCd batteries with y% of spent batteries
separately collected and recycled
Life cycle of x t small NiCd batteries with 100% of spent batteries
collected with MSW (no recycling)
System 1 System 2
avoided impacts due to saving extraction, transport and
processing of raw materials (production of virgin material)
generated impacts due to separate collection
(transport to waste treatment facilities)
generated impacts due to sorting and recycling
(production of secondary material)
Ni-Cd batteries
NiCd system = System 1 - Systeme 2
Scheme 1 - CCOOLLLLEECCTTIIOONN AANNDD RREECCYYCCLLIINNGG OOFF NNIICCDD PPOORRTTAABBLLEE BBAATTTTEERRIIEESS OONNLLYY
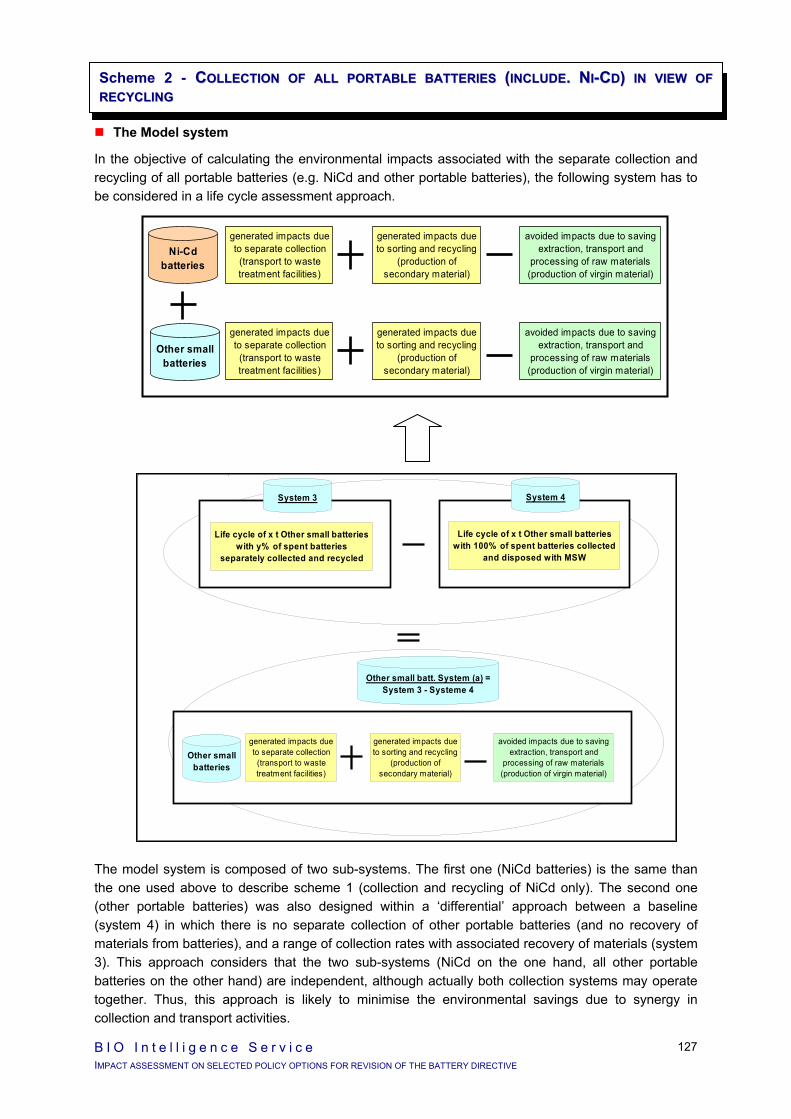
B I O I n t e l l i g e n c e S e r v i c e IMPACT ASSESSMENT ON SELECTED POLICY OPTIONS FOR REVISION OF THE BATTERY DIRECTIVE
127
The Model system
In the objective of calculating the environmental impacts associated with the separate collection and recycling of all portable batteries (e.g. NiCd and other portable batteries), the following system has to be considered in a life cycle assessment approach.
The model system is composed of two sub-systems. The first one (NiCd batteries) is the same than the one used above to describe scheme 1 (collection and recycling of NiCd only). The second one (other portable batteries) was also designed within a ‘differential’ approach between a baseline (system 4) in which there is no separate collection of other portable batteries (and no recovery of materials from batteries), and a range of collection rates with associated recovery of materials (system 3). This approach considers that the two sub-systems (NiCd on the one hand, all other portable batteries on the other hand) are independent, although actually both collection systems may operate together. Thus, this approach is likely to minimise the environmental savings due to synergy in collection and transport activities.
avoided impacts due to saving extraction, transport and
processing of raw materials (production of virgin material)
avoided impacts due to saving extraction, transport and
processing of raw materials (production of virgin material)
generated impacts due to separate collection
(transport to waste treatment facilities)
generated impacts due to sorting and recycling
(production of secondary material)
generated impacts due to separate collection
(transport to waste treatment facilities)
generated impacts due to sorting and recycling
(production of secondary material)
Ni-Cd batteries
Other small batteries
Life cycle of x t Other small batteries with y% of spent batteries
separately collected and recycled
Life cycle of x t Other small batteries with 100% of spent batteries collected
and disposed with MSW
System 3
Other small batt. System (a) = System 3 - Systeme 4
System 4
avoided impacts due to saving extraction, transport and
processing of raw materials (production of virgin material)
generated impacts due to separate collection
(transport to waste treatment facilities)
generated impacts due to sorting and recycling
(production of secondary material)
Other small batteries
Scheme 2 - CCOOLLLLEECCTTIIOONN OOFF AALLLL PPOORRTTAABBLLEE BBAATTTTEERRIIEESS ((IINNCCLLUUDDEE.. NNII--CCDD)) IINN VVIIEEWW OOFFRREECCYYCCLLIINNGG
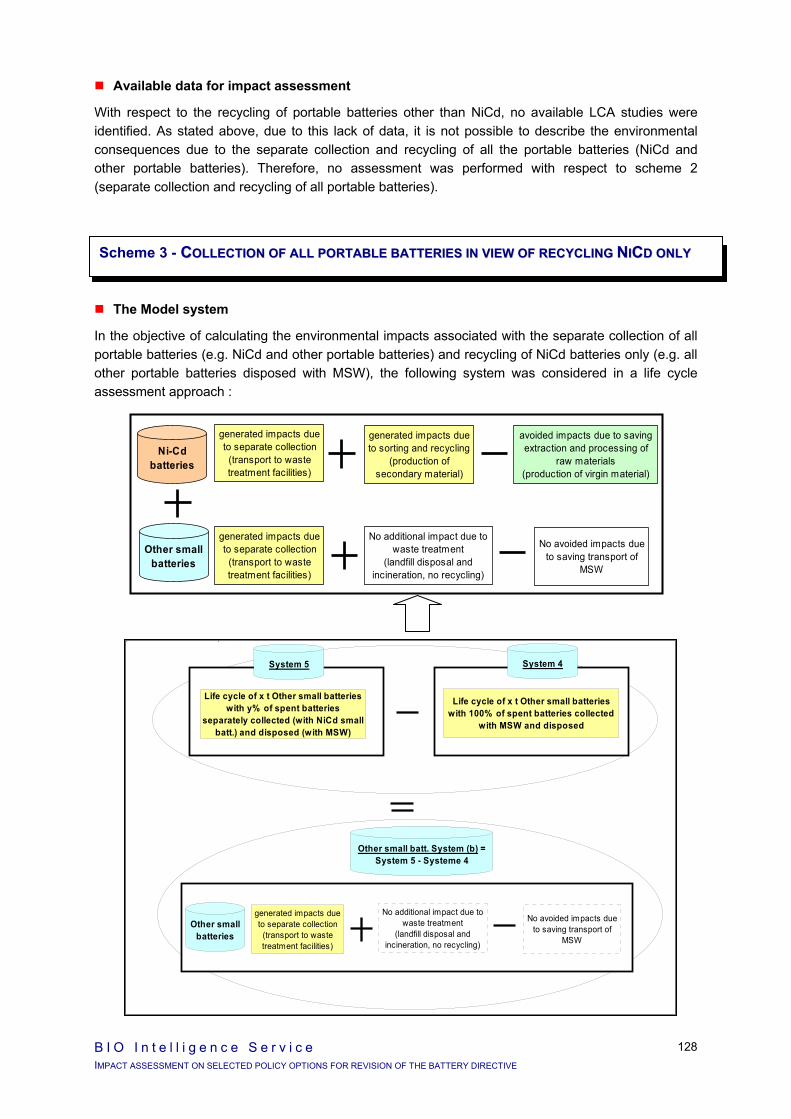
B I O I n t e l l i g e n c e S e r v i c e IMPACT ASSESSMENT ON SELECTED POLICY OPTIONS FOR REVISION OF THE BATTERY DIRECTIVE
128
Available data for impact assessment
With respect to the recycling of portable batteries other than NiCd, no available LCA studies were identified. As stated above, due to this lack of data, it is not possible to describe the environmental consequences due to the separate collection and recycling of all the portable batteries (NiCd and other portable batteries). Therefore, no assessment was performed with respect to scheme 2 (separate collection and recycling of all portable batteries).
The Model system
In the objective of calculating the environmental impacts associated with the separate collection of all portable batteries (e.g. NiCd and other portable batteries) and recycling of NiCd batteries only (e.g. all other portable batteries disposed with MSW), the following system was considered in a life cycle assessment approach :
avoided impacts due to saving extraction and processing of
raw materials (production of virgin material)
generated impacts due to separate collection
(transport to waste treatment facilities)
generated impacts due to sorting and recycling
(production of secondary material)
generated impacts due to separate collection
(transport to waste treatment facilities)
Ni-Cd batteries
Other small batteries
No additional impact due to waste treatment
(landfill disposal and incineration, no recycling)
No avoided impacts due to saving transport of
MSW
Life cycle of x t Other small batteries with y% of spent batteries
separately collected (with NiCd smallbatt.) and disposed (with MSW)
Life cycle of x t Other small batteries with 100% of spent batteries collected
with MSW and disposed
System 5
Other small batt. System (b) = System 5 - Systeme 4
System 4
generated impacts due to separate collection
(transport to waste treatment facilities)
Other small batteries
No additional impact due to waste treatment
(landfill disposal and incineration, no recycling)
No avoided impacts due to saving transport of
MSW
Scheme 3 - CCOOLLLLEECCTTIIOONN OOFF AALLLL PPOORRTTAABBLLEE BBAATTTTEERRIIEESS IINN VVIIEEWW OOFF RREECCYYCCLLIINNGG NNIICCDD OONNLLYY
B I O I n t e l l i g e n c e S e r v i c e IMPACT ASSESSMENT ON SELECTED POLICY OPTIONS FOR REVISION OF THE BATTERY DIRECTIVE
129
The model system is composed of two sub-systems. The first one (NiCd batteries) is the same than the one used above to describe scheme 1 (collection and recycling of NiCd only). The second one (other portable batteries) was also designed within a ‘differential’ approach between a baseline (system 4) in which there is no separate collection of other portable batteries and no recovery of materials from batteries, and a range of separate collection rates (and no recovery of materials from batteries) (system 5). As shown in the figure, the difference between system 5 and system 4 may be reduced to the separate collection of other portable batteries (no change neither in the waste treatment nor in the MSW transport since batteries represent less than 0,07% of the total mass of MSW). Consequently, the sub-system was assessed by using transport data from the ERM study.
This approach considers that the two sub-systems (NiCd on the one hand, all other portable batteries on the other hand) are independent, although actually both collection systems may operate together. Thus, this approach is likely to at least minimise environmental savings due to synergy in collection and transport activities.
Data used for impact assessment
Results from scheme 1 were used to assess the NiCd sub-system. From the study “Assessment of the environmental impacts associated with the transport of waste batteries in Europe” ( ERM for EPBA, august 2001), we directly derived the life cycle inventory of the other portable batteries sub-system (system 5 – system 4). Therefore, we used the original assumptions (transport distances with respect to the Europe Kerbside - 500 km scenario, emission factors related to 16 t truck) without any further modification. ). However, ERM data used for emission factors about transport are 5 times lower than data currently used by most of LCA studies. To obtain more reliable figures, further LCA work would be necessary.
We assumed that 100% of the batteries collected are recycled (i.e. recycling plant input is 100%).

B I O I n t e l l i g e n c e S e r v i c e IMPACT ASSESSMENT ON SELECTED POLICY OPTIONS FOR REVISION OF THE BATTERY DIRECTIVE
130
33..55..33..33 RReessuullttss
The following table gives results of the environment assessment of various policy options related to separate collection and recycling of portable NiCd batteries only (e.g. other portable batteries are collected with MSW then disposed), within a life cycle perspective. Negative values mean an avoided impact (i.e. environmental benefit) by comparison with the baseline system (system 2 above) with no recycling.
(hypothesis : 100% of the separately collected batteries are recycled)
All the values are negative, indicating that the separate collection and recycling of portable NiCd batteries has positive environmental consequences for all the environmental indicators examined, irrespective of the collection and recycling rates. As indicated in the following figures, as collection and recycling rates increase, the predicted environmental benefits are maximised.
Dissipative losses of cadmium
-250
-200
-150
-100
-50
0baseline 60-70% 70-80% 80-90%
collection rate
Dis
sipa
tive
loss
es o
f Cd
(t)
CO2 emissions
-60000
-50000
-40000
-30000
-20000
-10000
0baseline 60-70% 70-80% 80-90%
collection rate
CO
2 em
issi
ons
(t)
Scheme 1 - CCOOLLLLEECCTTIIOONN AANNDD RREECCYYCCLLIINNGG OOFF PPOORRTTAABBLLEE NNIICCDD BBAATTTTEERRIIEESS OONNLLYY
(Scheme 1)
Policy option - Collection rate (% of
spent batteries containing Cd)
separate collection
rate
Current situation Ni-Cd 10 500 t 15% - 20% (a)
1 575 t to 2 100 t
Baseline scenario (2007)
Ni-Cd 11 000 t 20% - 25% (a)
2 200 t to 2 750 t
option 60-70% for all batteries
containing Cd (=50-60% for small NiCd
batteries)
Ni-Cd 11 000 t 50% - 60% (b)
5 500 t to 6 600 t
option 70-80% for all batteries
containing Cd (=60-70% for small NiCd
batteries)
Ni-Cd 11 000 t 60% - 70% (b)
6 600 t to 7 700 t
option 80-90% for all batteries
containing Cd (=70-80% for small NiCd
batteries)
Ni-Cd 11 000 t 70% - 80% (b)
7 700 t to 8 800 t
(a) : actual separate collection rate; (b) separate collection target
NiCd small batteries separately collected
spent small batteries
Spent and separately collected Ni-Cd small batteries on the community market
-39 t to -52 t -1 575 t to -2 800 t -49 t to -86 t -2,3 t to -4,1 t -9 334 GJ to -16 595 GJ
-54 t to -68 t -2 933 t to -4 583 t -90 t to -141 t -4 t to -7 t -17 385 GJ to -27 164 GJ
-135 t to -162 t -18 333 t to -26 400 t -565 t to -813 t -27 t to -39 t -108 656 GJ to -156 464 GJ
-162 t to -189 t -26 400 t to -35 933 t -813 t to -1 107 t -39 t to -53 t -156 464 GJ to -212 965 GJ
-189 t to -216 t -35 933 t to -46 933 t -1 107 t to -1 265 t -53 t to -60 t -212 965 GJ to -278 158 GJ
SOx emissions NOx emissions
Primary energy consumption
dissipative losses of Cd CO2 emissions
Total environmental impacts of the waste management system (scheme 1) for spent Ni-Cd, at the UE level
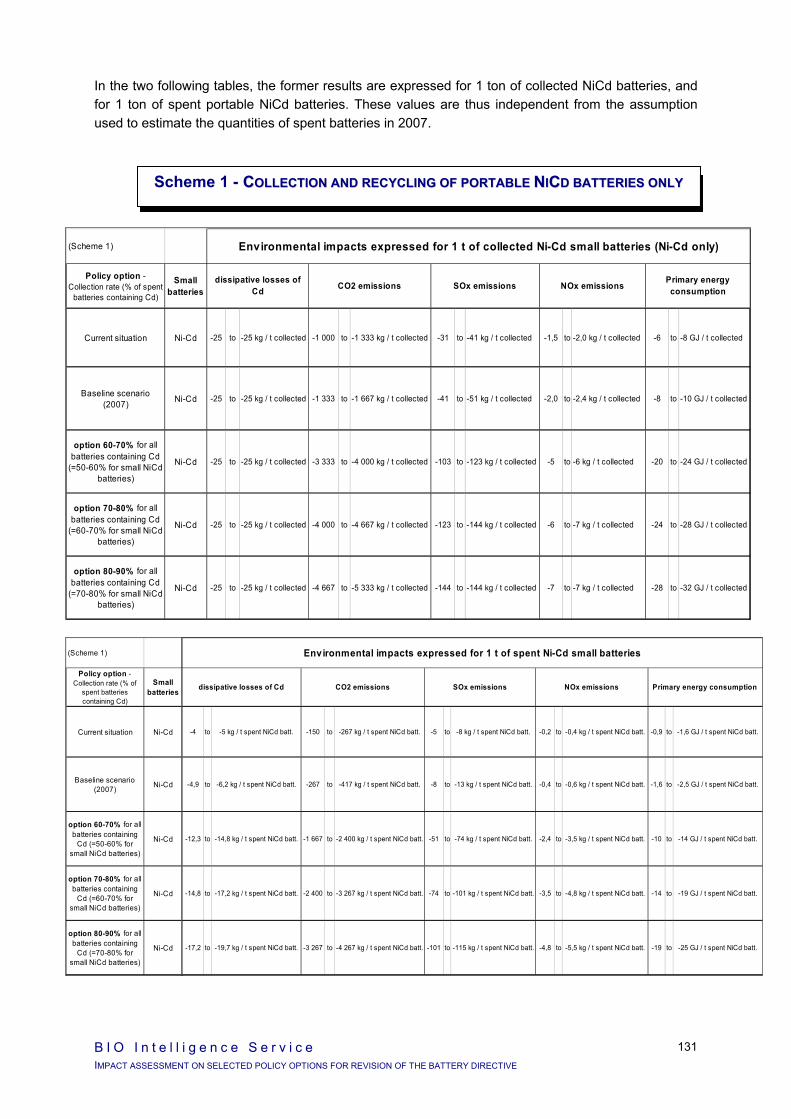
B I O I n t e l l i g e n c e S e r v i c e IMPACT ASSESSMENT ON SELECTED POLICY OPTIONS FOR REVISION OF THE BATTERY DIRECTIVE
131
In the two following tables, the former results are expressed for 1 ton of collected NiCd batteries, and for 1 ton of spent portable NiCd batteries. These values are thus independent from the assumption used to estimate the quantities of spent batteries in 2007.
Scheme 1 - CCOOLLLLEECCTTIIOONN AANNDD RREECCYYCCLLIINNGG OOFF PPOORRTTAABBLLEE NNIICCDD BBAATTTTEERRIIEESS OONNLLYY
(Scheme 1)
Policy option - Collection rate (% of spent
batteries containing Cd)
Small batteries
Current situation Ni-Cd -25 to -25 kg / t collected -1 000 to -1 333 kg / t collected -31 to -41 kg / t collected -1,5 to -2,0 kg / t collected -6 to -8 GJ / t collected
Baseline scenario (2007) Ni-Cd -25 to -25 kg / t collected -1 333 to -1 667 kg / t collected -41 to -51 kg / t collected -2,0 to -2,4 kg / t collected -8 to -10 GJ / t collected
option 60-70% for all batteries containing Cd
(=50-60% for small NiCd batteries)
Ni-Cd -25 to -25 kg / t collected -3 333 to -4 000 kg / t collected -103 to -123 kg / t collected -5 to -6 kg / t collected -20 to -24 GJ / t collected
option 70-80% for all batteries containing Cd
(=60-70% for small NiCd batteries)
Ni-Cd -25 to -25 kg / t collected -4 000 to -4 667 kg / t collected -123 to -144 kg / t collected -6 to -7 kg / t collected -24 to -28 GJ / t collected
option 80-90% for all batteries containing Cd
(=70-80% for small NiCd batteries)
Ni-Cd -25 to -25 kg / t collected -4 667 to -5 333 kg / t collected -144 to -144 kg / t collected -7 to -7 kg / t collected -28 to -32 GJ / t collected
dissipative losses of Cd
Primary energy consumptionNOx emissionsSOx emissionsCO2 emissions
Environmental impacts expressed for 1 t of collected Ni-Cd small batteries (Ni-Cd only)
(Scheme 1)
Policy option - Collection rate (% of
spent batteries containing Cd)
Small batteries
Current situation Ni-Cd
Baseline scenario (2007) Ni-Cd
option 60-70% for all batteries containing
Cd (=50-60% for small NiCd batteries)
Ni-Cd
option 70-80% for all batteries containing
Cd (=60-70% for small NiCd batteries)
Ni-Cd
option 80-90% for all batteries containing
Cd (=70-80% for small NiCd batteries)
Ni-Cd
-4 to -5 kg / t spent NiCd batt. -150 to -267 kg / t spent NiCd batt. -5 to -8 kg / t spent NiCd batt. -0,2 to -0,4 kg / t spent NiCd batt. -0,9 to -1,6 GJ / t spent NiCd batt.
-4,9 to -6,2 kg / t spent NiCd batt. -267 to -417 kg / t spent NiCd batt. -8 to -13 kg / t spent NiCd batt. -0,4 to -0,6 kg / t spent NiCd batt. -1,6 to -2,5 GJ / t spent NiCd batt.
-12,3 to -14,8 kg / t spent NiCd batt. -1 667 to -2 400 kg / t spent NiCd batt. -51 to -74 kg / t spent NiCd batt. -2,4 to -3,5 kg / t spent NiCd batt. -10 to -14 GJ / t spent NiCd batt.
-14,8 to -17,2 kg / t spent NiCd batt. -2 400 to -3 267 kg / t spent NiCd batt. -74 to -101 kg / t spent NiCd batt. -3,5 to -4,8 kg / t spent NiCd batt. -14 to -19 GJ / t spent NiCd batt.
-17,2 to -19,7 kg / t spent NiCd batt. -3 267 to -4 267 kg / t spent NiCd batt. -101 to -115 kg / t spent NiCd batt. -4,8 to -5,5 kg / t spent NiCd batt. -19 to -25 GJ / t spent NiCd batt.
dissipative losses of Cd Primary energy consumptionNOx emissionsSOx emissionsCO2 emissions
Environmental impacts expressed for 1 t of spent Ni-Cd small batteries

B I O I n t e l l i g e n c e S e r v i c e IMPACT ASSESSMENT ON SELECTED POLICY OPTIONS FOR REVISION OF THE BATTERY DIRECTIVE
132
The following table gives results of the life cycle assessment of various policy options related to the separate collection of all portable batteries and recycling of portable NiCd batteries only (e.g. other portable batteries are disposed of with MSW). For each policy option, three datasets are given: the first line details results for the NiCd batteries fraction; the second line details results for the other portable batteries fraction (separate collection and transport to landfill or incineration plant); the last line details overall results for all portable batteries (line 1 + line 2).
Reminder: negative values = avoided impacts = environmental benefit ; positive values = additional burdens = environmental damage
(hypothesis : 100% of the separately collected batteries are recycled)
With respect to all portable batteries, most values are negative, indicating that the separate collection of portable batteries in view of recycling portable NiCd batteries only (other portable batteries are disposed of) has positive environmental consequences for most of environmental indicators examined (CO2 emissions, SOx emissions, primary energy use), irrespective of the collection and recycling rates. However, positive values for NOx emission indicate an environmental damage due to the collection scheme; but as collection rate increases, the NOx emissions progressively decrease (because the avoided emissions due to the NiCd recycling compensate the generated emissions due to additional transport). As indicated in the following figures, as collection rate increases, the predicted environmental benefits are maximised.
Scheme 3 - CCOOLLLLEECCTTIIOONN OOFF AALLLL PPOORRTTAABBLLEE BBAATTTTEERRIIEESS IINN VVIIEEWW OOFF RREECCYYCCLLIINNGG NNIICCDD OONNLLYY
(scheme 3)
Policy option - Collection rate (% of
spent batteries containing Cd)
separate collection
rate
Ni-Cd 10 500 t 1 575 t to 2 100 t
Others 142 000 t 21 300 t to 28 400 t
Total 152 500 t 22 875 t to 30 500 t
Ni-Cd 11 000 t 2 200 t to 2 750 t
Others 150 000 t 30 000 t to 37 500 t
Total 161 000 t 32 200 t to 40 250 t
Ni-Cd 11 000 t 5 500 t to 6 600 t
Others 150 000 t 75 000 t to 90 000 t
Total 161 000 t 80 500 t to 96 600 t
Ni-Cd 11 000 t 6 600 t to 7 700 t
Others 150 000 t 90 000 t to 105 000 t
Total 161 000 t 96 600 t to 112 700 t
Ni-Cd 11 000 t 7 700 t to 8 800 t
Others 150 000 t 105 000 t to 120 000 t
Total 161 000 t 112 700 t to 128 800 t
option 60-70% for all batteries
containing Cd (=50-60% for small NiCd
batteries)
option 70-80% for all batteries
containing Cd (=60-70% for small NiCd
batteries)
option 80-90% for all batteries
containing Cd (=70-80% for small NiCd
batteries)
Spent and separately collected small batteries on the community market
small batteries separately collected
Current situation
20% - 25% (a)
15% - 20% (a)
Baseline scenario (2007)
spent small batteries
70% - 80% (b)
60% - 70% (b)
50% - 60% (b)
-39 t to -52 t -1 575 t to -2 800 t -49 t to -86 t -2,3 t to -4,1 t -9 334 GJ to -16 595 GJ
0 t to 0 t 535 t to 713 t 1,2 t to 2 t 13 t to 18 t 12 137 GJ to 16 182 GJ
-39 t to -52 t -1 040 t to -2 087 t -47 t to -85 t 11 t to 14 t 2 802 GJ to -412 GJ
-54 t to -68 t -2 933 t to -4 583 t -90 t to -141 t -4 t to -7 t -17 385 GJ to -27 164 GJ
0 t to 0 t 754 t to 942 t 2 t to 2 t 19 t to 23 t 17 094 GJ to 21 368 GJ
-54 t to -68 t -2 180 t to -3 641 t -89 t to -139 t 14 t to 17 t -291 GJ to -5 796 GJ
-135 t to -162 t -18 333 t to -26 400 t -565 t to -813 t -27 t to -39 t -108 656 GJ to -156 464 GJ
0 t to 0 t 1 884 t to 2 261 t 4 t to 5 t 47 t to 56 t 42 735 GJ to 51 282 GJ
-135 t to -162 t -16 449 t to -24 139 t -560 t to -808 t 20 t to 17 t -65 921 GJ to -105 182 GJ
-162 t to -189 t -26 400 t to -35 933 t -813 t to -1 107 t -39 t to -53 t -156 464 GJ to -212 965 GJ
0 t to 0 t 2 261 t to 2 638 t 5 t to 6 t 56 t to 65 t 51 282 GJ to 59 829 GJ
-162 t to -189 t -24 139 t to -33 295 t -808 t to -1 101 t 17 t to 13 t -105 182 GJ to -153 136 GJ
-189 t to -216 t -35 933 t to -46 933 t -1 107 t to -1 265 t -53 t to -60 t -212 965 GJ to -278 158 GJ
0 t to 0 t 2 638 t to 3 015 t 6 t to 7 t 65 t to 75 t 59 829 GJ to 68 376 GJ
-189 t to -216 t -33 295 t to -43 919 t -1 101 t to -1 258 t 13 t to 15 t -153 136 GJ to -209 782 GJ
Total environmental impacts of the waste management system for spent Ni-Cd and other small batteries, at the UE level
dissipative losses of Cd CO2 emissions SOx emissions NOx
emissionsPrimary energy
consumption

B I O I n t e l l i g e n c e S e r v i c e IMPACT ASSESSMENT ON SELECTED POLICY OPTIONS FOR REVISION OF THE BATTERY DIRECTIVE
133
Above figures show that conclusions about CO2 emissions are very robust: the absolute values for each sub-system (separate collection and recycling of NiCd batteries on the one hand, and separate collection and disposal of other portable batteries on the other hand) may be distorted by methodological choices and data values but the identified trends will remain the same (avoided impact due to NiCd recycling is more than ten fold higher than generated emissions caused by the transport of other portable batteries).
On the contrary, conclusions about NOx emission are less robust since avoided emissions due to recycling activities are of the same order of magnitude than additional emissions associated with battery collection.
CO2 emissions
-60000
-50000
-40000
-30000
-20000
-10000
0
10000baseline 60-70% 70-80% 80-90%
collection rate (Ni-Cd and other small batteries)
CO
2 em
issi
ons
(t)
Ni-Cd batteriesOther small batteriesAll small batteries
NOx emissions
-80
-60
-40
-20
0
20
40
60
80
100baseline 60-70% 70-80% 80-90%
collection rate (Ni-Cd and other small batteries)
NO
x em
issi
ons
(t) Ni-Cd batteriesOther small batteriesAll small batteries
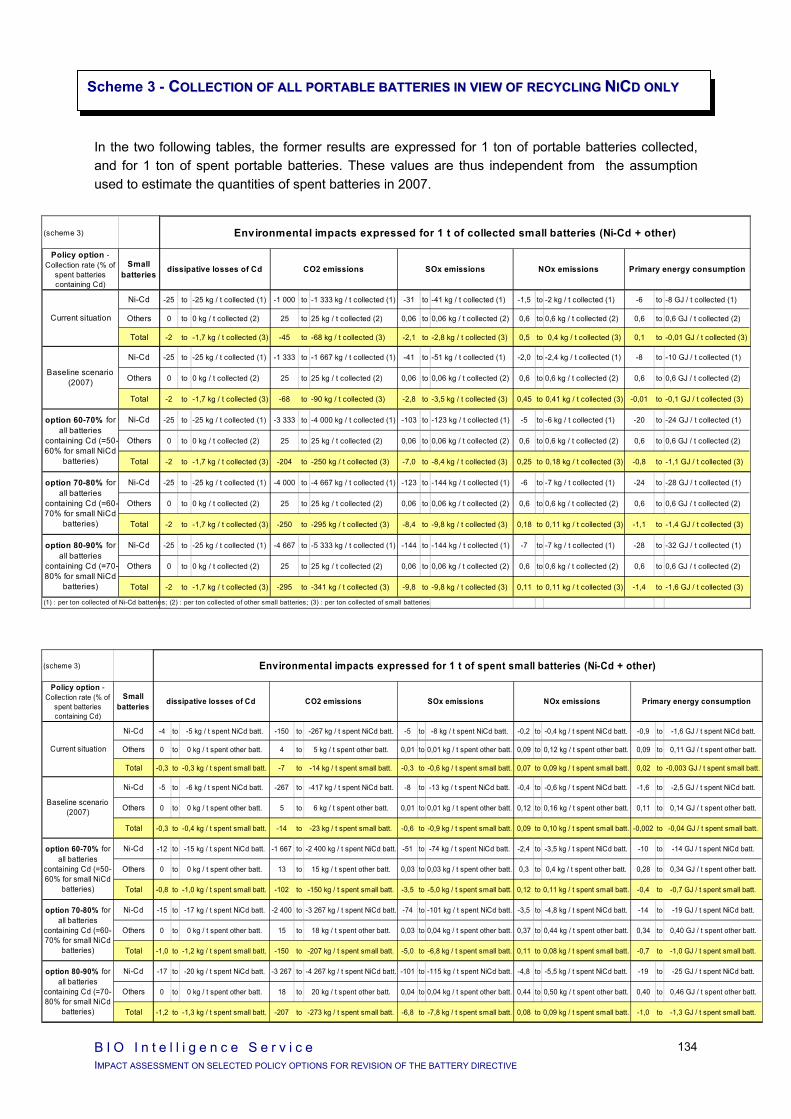
B I O I n t e l l i g e n c e S e r v i c e IMPACT ASSESSMENT ON SELECTED POLICY OPTIONS FOR REVISION OF THE BATTERY DIRECTIVE
134
In the two following tables, the former results are expressed for 1 ton of portable batteries collected, and for 1 ton of spent portable batteries. These values are thus independent from the assumption used to estimate the quantities of spent batteries in 2007.
Scheme 3 - CCOOLLLLEECCTTIIOONN OOFF AALLLL PPOORRTTAABBLLEE BBAATTTTEERRIIEESS IINN VVIIEEWW OOFF RREECCYYCCLLIINNGG NNIICCDD OONNLLYY
-25 to -25 kg / t collected (1) -1 000 to -1 333 kg / t collected (1) -31 to -41 kg / t collected (1) -1,5 to -2 kg / t collected (1) -6 to -8 GJ / t collected (1)
0 to 0 kg / t collected (2) 25 to 25 kg / t collected (2) 0,06 to 0,06 kg / t collected (2) 0,6 to 0,6 kg / t collected (2) 0,6 to 0,6 GJ / t collected (2)
-2 to -1,7 kg / t collected (3) -45 to -68 kg / t collected (3) -2,1 to -2,8 kg / t collected (3) 0,5 to 0,4 kg / t collected (3) 0,1 to -0,01 GJ / t collected (3)
-25 to -25 kg / t collected (1) -1 333 to -1 667 kg / t collected (1) -41 to -51 kg / t collected (1) -2,0 to -2,4 kg / t collected (1) -8 to -10 GJ / t collected (1)
0 to 0 kg / t collected (2) 25 to 25 kg / t collected (2) 0,06 to 0,06 kg / t collected (2) 0,6 to 0,6 kg / t collected (2) 0,6 to 0,6 GJ / t collected (2)
-2 to -1,7 kg / t collected (3) -68 to -90 kg / t collected (3) -2,8 to -3,5 kg / t collected (3) 0,45 to 0,41 kg / t collected (3) -0,01 to -0,1 GJ / t collected (3)
-25 to -25 kg / t collected (1) -3 333 to -4 000 kg / t collected (1) -103 to -123 kg / t collected (1) -5 to -6 kg / t collected (1) -20 to -24 GJ / t collected (1)
0 to 0 kg / t collected (2) 25 to 25 kg / t collected (2) 0,06 to 0,06 kg / t collected (2) 0,6 to 0,6 kg / t collected (2) 0,6 to 0,6 GJ / t collected (2)
-2 to -1,7 kg / t collected (3) -204 to -250 kg / t collected (3) -7,0 to -8,4 kg / t collected (3) 0,25 to 0,18 kg / t collected (3) -0,8 to -1,1 GJ / t collected (3)
-25 to -25 kg / t collected (1) -4 000 to -4 667 kg / t collected (1) -123 to -144 kg / t collected (1) -6 to -7 kg / t collected (1) -24 to -28 GJ / t collected (1)
0 to 0 kg / t collected (2) 25 to 25 kg / t collected (2) 0,06 to 0,06 kg / t collected (2) 0,6 to 0,6 kg / t collected (2) 0,6 to 0,6 GJ / t collected (2)
-2 to -1,7 kg / t collected (3) -250 to -295 kg / t collected (3) -8,4 to -9,8 kg / t collected (3) 0,18 to 0,11 kg / t collected (3) -1,1 to -1,4 GJ / t collected (3)
-25 to -25 kg / t collected (1) -4 667 to -5 333 kg / t collected (1) -144 to -144 kg / t collected (1) -7 to -7 kg / t collected (1) -28 to -32 GJ / t collected (1)
0 to 0 kg / t collected (2) 25 to 25 kg / t collected (2) 0,06 to 0,06 kg / t collected (2) 0,6 to 0,6 kg / t collected (2) 0,6 to 0,6 GJ / t collected (2)
-2 to -1,7 kg / t collected (3) -295 to -341 kg / t collected (3) -9,8 to -9,8 kg / t collected (3) 0,11 to 0,11 kg / t collected (3) -1,4 to -1,6 GJ / t collected (3)
es; (2) : per ton collected of other small batteries; (3) : per ton collected of small batteries
Environmental impacts expressed for 1 t of collected small batteries (Ni-Cd + other)
Primary energy consumptionNOx emissionsSOx emissionsCO2 emissionsdissipative losses of Cd
(scheme 3)
Policy option - Collection rate (% of
spent batteries containing Cd)
Small batteries
Ni-Cd
Others
Total
Ni-Cd
Others
Total
Ni-Cd
Others
Total
Ni-Cd
Others
Total
Ni-Cd
Others
Total
(1) : per ton collected of Ni-Cd batterie
Current situation
Baseline scenario (2007)
option 60-70% for all batteries
containing Cd (=50-60% for small NiCd
batteries)
option 70-80% for all batteries
containing Cd (=60-70% for small NiCd
batteries)
option 80-90% for all batteries
containing Cd (=70-80% for small NiCd
batteries)
-4 to -5 kg / t spent NiCd batt. -150 to -267 kg / t spent NiCd batt. -5 to -8 kg / t spent NiCd batt. -0,2 to -0,4 kg / t spent NiCd batt. -0,9 to -1,6 GJ / t spent NiCd batt.
0 to 0 kg / t spent other batt. 4 to 5 kg / t spent other batt. 0,01 to 0,01 kg / t spent other batt. 0,09 to 0,12 kg / t spent other batt. 0,09 to 0,11 GJ / t spent other batt.
-0,3 to -0,3 kg / t spent small batt. -7 to -14 kg / t spent small batt. -0,3 to -0,6 kg / t spent small batt. 0,07 to 0,09 kg / t spent small batt. 0,02 to -0,003 GJ / t spent small batt.
-5 to -6 kg / t spent NiCd batt. -267 to -417 kg / t spent NiCd batt. -8 to -13 kg / t spent NiCd batt. -0,4 to -0,6 kg / t spent NiCd batt. -1,6 to -2,5 GJ / t spent NiCd batt.
0 to 0 kg / t spent other batt. 5 to 6 kg / t spent other batt. 0,01 to 0,01 kg / t spent other batt. 0,12 to 0,16 kg / t spent other batt. 0,11 to 0,14 GJ / t spent other batt.
-0,3 to -0,4 kg / t spent small batt. -14 to -23 kg / t spent small batt. -0,6 to -0,9 kg / t spent small batt. 0,09 to 0,10 kg / t spent small batt. -0,002 to -0,04 GJ / t spent small batt.
-12 to -15 kg / t spent NiCd batt. -1 667 to -2 400 kg / t spent NiCd batt. -51 to -74 kg / t spent NiCd batt. -2,4 to -3,5 kg / t spent NiCd batt. -10 to -14 GJ / t spent NiCd batt.
0 to 0 kg / t spent other batt. 13 to 15 kg / t spent other batt. 0,03 to 0,03 kg / t spent other batt. 0,3 to 0,4 kg / t spent other batt. 0,28 to 0,34 GJ / t spent other batt.
-0,8 to -1,0 kg / t spent small batt. -102 to -150 kg / t spent small batt. -3,5 to -5,0 kg / t spent small batt. 0,12 to 0,11 kg / t spent small batt. -0,4 to -0,7 GJ / t spent small batt.
-15 to -17 kg / t spent NiCd batt. -2 400 to -3 267 kg / t spent NiCd batt. -74 to -101 kg / t spent NiCd batt. -3,5 to -4,8 kg / t spent NiCd batt. -14 to -19 GJ / t spent NiCd batt.
0 to 0 kg / t spent other batt. 15 to 18 kg / t spent other batt. 0,03 to 0,04 kg / t spent other batt. 0,37 to 0,44 kg / t spent other batt. 0,34 to 0,40 GJ / t spent other batt.
-1,0 to -1,2 kg / t spent small batt. -150 to -207 kg / t spent small batt. -5,0 to -6,8 kg / t spent small batt. 0,11 to 0,08 kg / t spent small batt. -0,7 to -1,0 GJ / t spent small batt.
-17 to -20 kg / t spent NiCd batt. -3 267 to -4 267 kg / t spent NiCd batt. -101 to -115 kg / t spent NiCd batt. -4,8 to -5,5 kg / t spent NiCd batt. -19 to -25 GJ / t spent NiCd batt.
0 to 0 kg / t spent other batt. 18 to 20 kg / t spent other batt. 0,04 to 0,04 kg / t spent other batt. 0,44 to 0,50 kg / t spent other batt. 0,40 to 0,46 GJ / t spent other batt.
-1,2 to -1,3 kg / t spent small batt. -207 to -273 kg / t spent small batt. -6,8 to -7,8 kg / t spent small batt. 0,08 to 0,09 kg / t spent small batt. -1,0 to -1,3 GJ / t spent small batt.
Environmental impacts expressed for 1 t of spent small batteries (Ni-Cd + other)
Primary energy consumptionNOx emissionsSOx emissionsCO2 emissionsdissipative losses of Cd
(scheme 3)
Policy option - Collection rate (% of
spent batteries containing Cd)
Small batteries
Ni-Cd
Others
Total
Ni-Cd
Others
Total
Ni-Cd
Others
Total
Ni-Cd
Others
Total
Ni-Cd
Others
Total
option 80-90% for all batteries
containing Cd (=70-80% for small NiCd
batteries)
option 70-80% for all batteries
containing Cd (=60-70% for small NiCd
batteries)
option 60-70% for all batteries
containing Cd (=50-60% for small NiCd
batteries)
Baseline scenario (2007)
Current situation
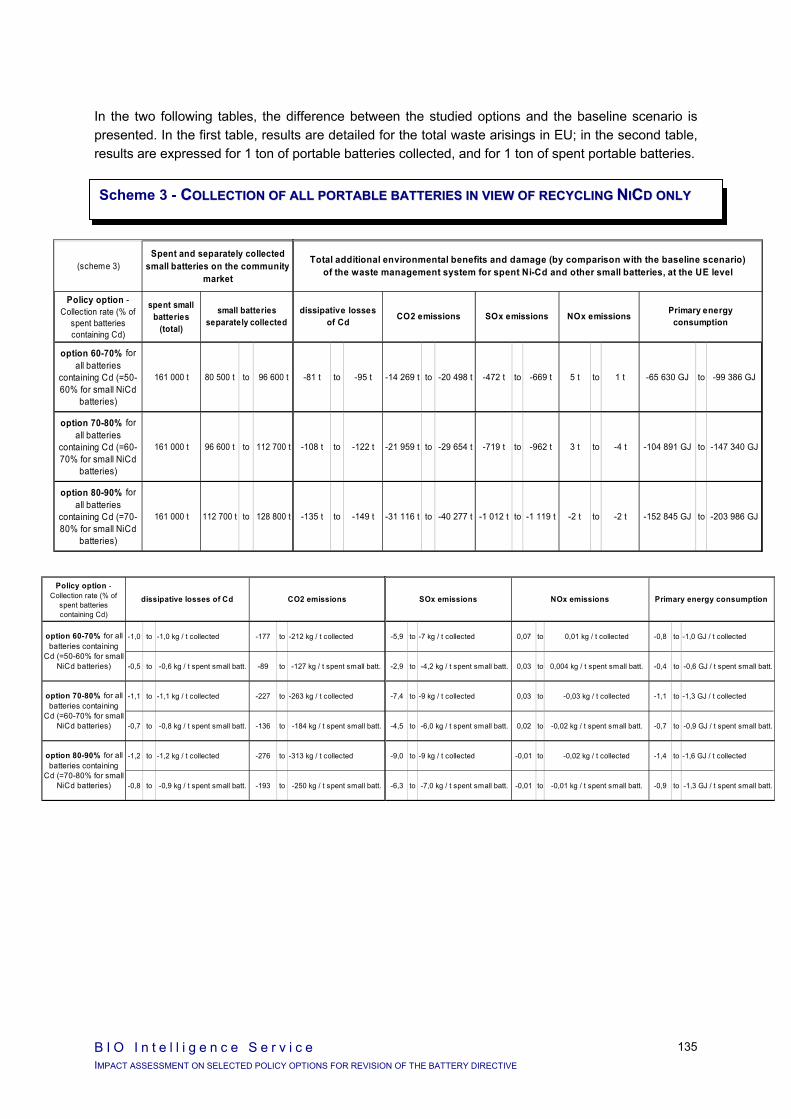
B I O I n t e l l i g e n c e S e r v i c e IMPACT ASSESSMENT ON SELECTED POLICY OPTIONS FOR REVISION OF THE BATTERY DIRECTIVE
135
In the two following tables, the difference between the studied options and the baseline scenario is presented. In the first table, results are detailed for the total waste arisings in EU; in the second table, results are expressed for 1 ton of portable batteries collected, and for 1 ton of spent portable batteries.
Scheme 3 - CCOOLLLLEECCTTIIOONN OOFF AALLLL PPOORRTTAABBLLEE BBAATTTTEERRIIEESS IINN VVIIEEWW OOFF RREECCYYCCLLIINNGG NNIICCDD OONNLLYY
(scheme 3)
Policy option - Collection rate (% of
spent batteries containing Cd)
spent small batteries
(total)
option 60-70% for all batteries
containing Cd (=50-60% for small NiCd
batteries)
161 000 t 80 500 t to 96 600 t
option 70-80% for all batteries
containing Cd (=60-70% for small NiCd
batteries)
161 000 t 96 600 t to 112 700 t
option 80-90% for all batteries
containing Cd (=70-80% for small NiCd
batteries)
161 000 t 112 700 t to 128 800 t
Spent and separately collected small batteries on the community
market
small batteries separately collected
-81 t to -95 t -14 269 t to -20 498 t -472 t to -669 t 5 t to 1 t -65 630 GJ to -99 386 GJ
-108 t to -122 t -21 959 t to -29 654 t -719 t to -962 t 3 t to -4 t -104 891 GJ to -147 340 GJ
-135 t to -149 t -31 116 t to -40 277 t -1 012 t to -1 119 t -2 t to -2 t -152 845 GJ to -203 986 GJ
Total additional environmental benefits and damage (by comparison with the baseline scenario)of the waste management system for spent Ni-Cd and other small batteries, at the UE level
dissipative losses of Cd CO2 emissions SOx emissions NOx emissions Primary energy
consumption
Policy option - Collection rate (% of
spent batteries containing Cd)
-1,0 to -1,0 kg / t collected -177 to -212 kg / t collected
-0,5 to -0,6 kg / t spent small batt. -89 to -127 kg / t spent small batt.
-1,1 to -1,1 kg / t collected -227 to -263 kg / t collected
-0,7 to -0,8 kg / t spent small batt. -136 to -184 kg / t spent small batt.
-1,2 to -1,2 kg / t collected -276 to -313 kg / t collected
-0,8 to -0,9 kg / t spent small batt. -193 to -250 kg / t spent small batt.
CO2 emissionsdissipative losses of Cd
option 60-70% for all batteries containing
Cd (=50-60% for small NiCd batteries)
option 70-80% for all batteries containing
Cd (=60-70% for small NiCd batteries)
option 80-90% for all batteries containing
Cd (=70-80% for small NiCd batteries)
-5,9 to -7 kg / t collected 0,07 to 0,01 kg / t collected -0,8 to -1,0 GJ / t collected
-2,9 to -4,2 kg / t spent small batt. 0,03 to 0,004 kg / t spent small batt. -0,4 to -0,6 GJ / t spent small batt.
-7,4 to -9 kg / t collected 0,03 to -0,03 kg / t collected -1,1 to -1,3 GJ / t collected
-4,5 to -6,0 kg / t spent small batt. 0,02 to -0,02 kg / t spent small batt. -0,7 to -0,9 GJ / t spent small batt.
-9,0 to -9 kg / t collected -0,01 to -0,02 kg / t collected -1,4 to -1,6 GJ / t collected
-6,3 to -7,0 kg / t spent small batt. -0,01 to -0,01 kg / t spent small batt. -0,9 to -1,3 GJ / t spent small batt.
Primary energy consumptionNOx emissionsSOx emissions

B I O I n t e l l i g e n c e S e r v i c e IMPACT ASSESSMENT ON SELECTED POLICY OPTIONS FOR REVISION OF THE BATTERY DIRECTIVE
136
33..55..33..44 CCoonncclluussiioonn AAbboouutt EEnnvviirroonnmmeennttaall IImmppaaccttss
Conclusions for scheme 1 The separate collection and recycling of portable NiCd batteries in dedicated plants has positive environmental consequences for all the environmental indicators examined, irrespective of the collection and recycling rates. As collection and recycling rates increase, the predicted environmental benefits are maximised.
No LCA data were available about NiCd recycling in metal plants.
Conclusions for scheme 2 With respect to the recycling of portable batteries (neither for dedicated plants nor for metal plants) other than NiCd, no available LCA studies were identified. Due to this lack of data, it was not possible to describe the environmental consequences due to the separate collection and recycling of all the portable batteries (NiCd and other portable batteries).
Conclusions for scheme 3 The separate collection of portable batteries in view of recycling portable NiCd batteries only in (dedicated plants) (other portable batteries are disposed of) has positive environmental consequences for all the environmental indicators examined except NOx emissions, irrespective of the collection and recycling rates.
avoided impacts due to saving extraction, transport and
processing of raw materials (production of virgin material)
generated impacts due to separate collection
(transport to waste treatment facilities)
generated impacts due to sorting and recycling
(production of secondary material)
Ni-Cd batteries
Scheme 1 - Collection and recycling of Ni-Cd only
Dissipative losses of hazardous
substances (Cd)
Other environmental
impacts (greenhouse effect,
…)
BENEFIT BENEFIT
avoided impacts due to saving extraction, transport and
processing of raw materials (production of virgin material)
avoided impacts due to saving extraction, transport and
processing of raw materials (production of virgin material)
generated impacts due to separate collection
(transport to waste treatment facilities)
generated impacts due to sorting and recycling
(production of secondary material)
generated impacts due to separate collection
(transport to waste treatment facilities)
generated impacts due to sorting and recycling
(production of secondary material)
?
Ni-Cd batteries
Other small batteries
Scheme 2 - Collection of all small batteries (includ. Ni-Cd) in view of recycling
Dissipative losses of hazardous
substances (Cd)
Other environmental
impacts (greenhouse effect,
…)
BENEFIT ?
Scheme 3 - Collection of all small batteries in view of recycling Ni-Cd only
Dissipative losses of hazardous
substances (Cd)
Other environmental
impacts (greenhouse effect,
…)
BENEFIT BENEFIT
avoided impacts due to saving extraction, transport and
processing of raw materials (production of virgin material)
generated impacts due to separate collection
(transport to waste treatment facilities)
generated impacts due to sorting and recycling
(production of secondary material)
generated impacts due to separate collection
(transport to waste treatment facilities)
Ni-Cd batteries
Other small batteries
No additional impact due to waste treatment
(landfill disposal and incineration, no recycling)
No avoided impacts due to saving transport of
MSW

B I O I n t e l l i g e n c e S e r v i c e IMPACT ASSESSMENT ON SELECTED POLICY OPTIONS FOR REVISION OF THE BATTERY DIRECTIVE
137
Regarding NOx emissions, the negative environmental consequence of the separate collection of all portable batteries may be compensated to a limited extent by the avoided impacts associated with the recovery of NiCd through recycling at rates above 80%. As collection and recycling rates increase, all other predicted environmental benefits are maximised. No LCA data are available about NiCd recycling in metal plants. The following tables summarise key results about first scheme 1 then scheme 3.
EEnnvviirroonnmmeennttaall IImmppaaccttss ooff SScchheemmee11 -- CCoolllleeccttiioonn aanndd RReeccyycclliinngg ooff PPoorrttaabbllee NNiiCCdd BBaatttteerriieess aanndd SScchheemmee 33 -- CCoolllleeccttiioonn ooff AAllll PPoorrttaabbllee BBaatttteerriieess aanndd RReeccyycclliinngg ooff NNiiCCdd BBaatttteerriieess OOnnllyy
Uncertainties in the results presented here depend on the choice of methodology and data sources. Choices in methodology that could affect the results are system boundary as described earlier. Uncertain data values include assumptions about load factor for trucks, transport distances and emission factors. However, as shown in the tables, large order of magnitude differentiate the studied policy options from the baseline scenario. It is likely that the absolute values may be distorted by methodological choices and data values but the identified trends would remain the same.
(Scheme 1)
Policy option - Collection rate (% of
spent batteries containing Cd)
separate collection target for small NiCd batteries
dissipative losses of Cd CO2 emissions Sox emissions NOx emissions Primary energy
consumption
Baseline scenario (2007)
20% - 25% benefit(a) (baseline)- 54 to - 68 t
benefit (baseline)- 2 933 to - 4 583 t
benefit (baseline)- 90 to - 141 t
benefit (baseline)- 4 to - 7 t
benefit (baseline)-17 385 to -27 164 GJ
option 60-70% for all batteries containing Cd
50% - 60% baseline benefit X 2.5
baseline benefit X 6
baseline benefit X 6
baseline benefit X 6 to 7
baseline benefit X 6
option 70-80% for all batteries containing Cd
60% - 70% baseline benefit X 2.8 to 3
baseline benefit X 8 to 9
baseline benefit X 8 to 9
baseline benefit X 8 to 10
baseline benefit X 8 to 9
option 80-90% for all batteries containing Cd
70% - 80% baseline benefit X 3 to 3<5
baseline benefit X 10 to 12
baseline benefit X 9 to 12
baseline benefit X 9 to 13
baseline benefit X 10 to 12
(a) : as compared with a no recycling situation
Environmental impacts of the waste management system for Ni-Cd spent small batteries (scheme 1), at the UE level
(scheme 3)
Policy option - Collection rate (% of
spent batteries containing Cd)
separate collection target for all small
batteries
dissipative losses of Cd CO2 emissions SOx emissions NOx emissions Primary energy
consumption
Baseline scenario (2007)
20% - 25% benefit(a) (baseline) : - 54 to - 68 t
benefit (baseline):- 2 180 to - 3 641 t
benefit (baseline):- 89 to - 139 t
damage (baseline)
+ 14 to +17 t
benefit (baseline):-291 to -5 796 GJ
option 60-70% for all batteries containing Cd
50% - 60% baseline benefitx 2.5
baseline benefitx 6.6 to 7.5
baseline benefitx 5.8 to 6.3
baseline damage+ 0 to 40%
baseline benefitx 18 to 226
option 70-80% for all batteries containing Cd
60% - 70% baseline benefitx 2.8 to 3
baseline benefitx 9 to 11
baseline benefitx 8 to 9
baseline damage- 20 to +20%
baseline benefitx 26 to 360
option 80-90% for all batteries containing Cd 70% - 80% baseline benefit
x 3.1 to 3.5baseline benefit
x 12 to 15baseline benefit
x 9 to 12baseline damage
- 10%baseline benefit
x 36 to 526
(a) : as compared with a no recycling situation
Environmental impacts of the waste management system for spent small batteries (Ni-Cd and other), at the UE level
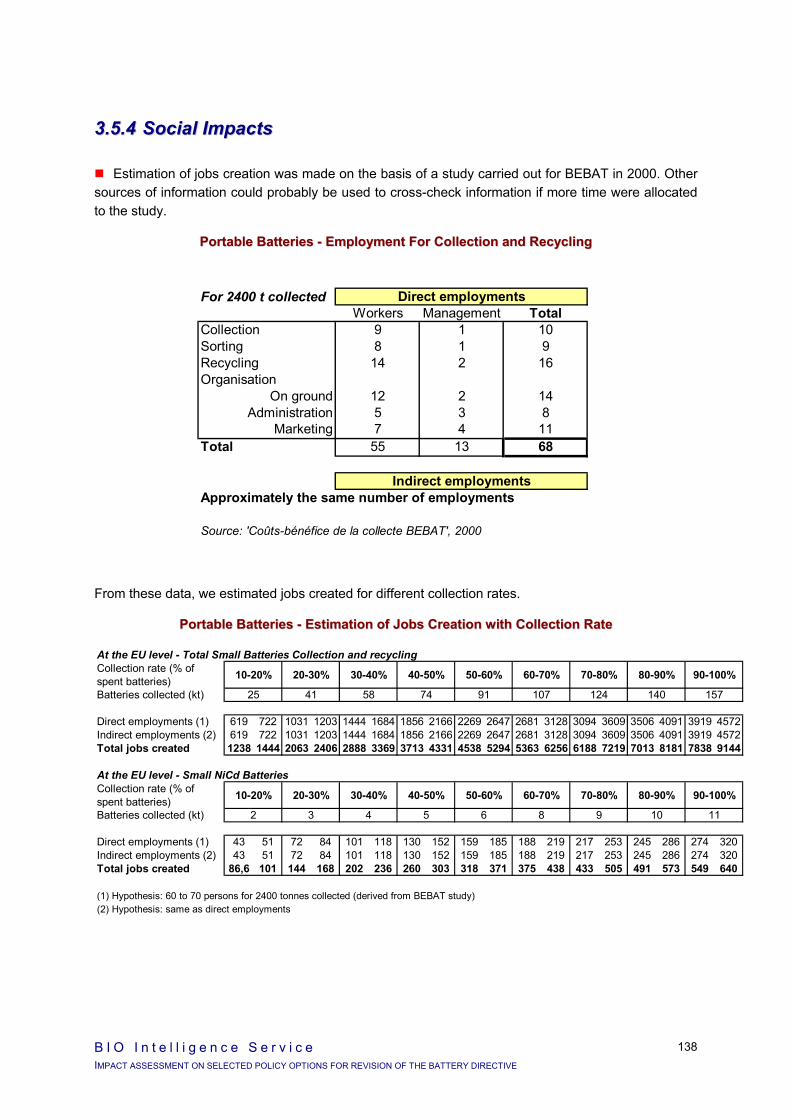
B I O I n t e l l i g e n c e S e r v i c e IMPACT ASSESSMENT ON SELECTED POLICY OPTIONS FOR REVISION OF THE BATTERY DIRECTIVE
138
33..55..44 SSoocciiaall IImmppaaccttss
Estimation of jobs creation was made on the basis of a study carried out for BEBAT in 2000. Other sources of information could probably be used to cross-check information if more time were allocated to the study.
PPoorrttaabbllee BBaatttteerriieess -- EEmmppllooyymmeenntt FFoorr CCoolllleeccttiioonn aanndd RReeccyycclliinngg
From these data, we estimated jobs created for different collection rates.
PPoorrttaabbllee BBaatttteerriieess -- EEssttiimmaattiioonn ooff JJoobbss CCrreeaattiioonn wwiitthh CCoolllleeccttiioonn RRaattee
For 2400 t collected Direct employmentsWorkers Management Total
Collection 9 1 10Sorting 8 1 9Recycling 14 2 16Organisation
On ground 12 2 14Administration 5 3 8
Marketing 7 4 11Total 55 13 68
Indirect employmentsApproximately the same number of employments
Source: 'Coûts-bénéfice de la collecte BEBAT', 2000
At the EU level - Total Small Batteries Collection and recycling Collection rate (% of spent batteries) 10-20% 20-30% 30-40% 40-50% 50-60% 60-70% 70-80% 80-90% 90-100%
Batteries collected (kt) 25 41 58 74 91 107 124 140 157
Direct employments (1) 619 722 1031 1203 1444 1684 1856 2166 2269 2647 2681 3128 3094 3609 3506 4091 3919 4572Indirect employments (2) 619 722 1031 1203 1444 1684 1856 2166 2269 2647 2681 3128 3094 3609 3506 4091 3919 4572Total jobs created 1238 1444 2063 2406 2888 3369 3713 4331 4538 5294 5363 6256 6188 7219 7013 8181 7838 9144
At the EU level - Small NiCd BatteriesCollection rate (% of spent batteries) 10-20% 20-30% 30-40% 40-50% 50-60% 60-70% 70-80% 80-90% 90-100%
Batteries collected (kt) 2 3 4 5 6 8 9 10 11
Direct employments (1) 43 51 72 84 101 118 130 152 159 185 188 219 217 253 245 286 274 320Indirect employments (2) 43 51 72 84 101 118 130 152 159 185 188 219 217 253 245 286 274 320Total jobs created 86,6 101 144 168 202 236 260 303 318 371 375 438 433 505 491 573 549 640
(1) Hypothesis: 60 to 70 persons for 2400 tonnes collected (derived from BEBAT study)(2) Hypothesis: same as direct employments

B I O I n t e l l i g e n c e S e r v i c e IMPACT ASSESSMENT ON SELECTED POLICY OPTIONS FOR REVISION OF THE BATTERY DIRECTIVE
139
Other indicators are considered here for social impacts:
Expected modification of end users behaviours (households and professional users),
Perception of batteries by end users, in particular households,
Perception of waste management by end users, in particular households,
Gender employment.
The same 3 schemes are distinguished as for economic and environmental impacts:
Scheme 1 - Collection and recycling of NiCd only,
Scheme 2 - Collection of all portable batteries in view of recycling (all portable batteries are recycled, not only NiCd),
Scheme 3 - Collection of all portable batteries in view of recycling primarily NiCd (and also batteries whose recycling cost is 0 or negative).
SSoocciiaall IImmppaaccttss ooff SScchheemmee 11 -- CCoolllleeccttiioonn aanndd RReeccyycclliinngg ooff PPoorrttaabbllee NNiiCCdd BBaatttteerriieess
Policy options about collection rate
Separate collection target for portable NiCd batteries
Modification of end users behaviours
Perception of batteries by end users
Perception of waste management by end users
Jobs created at the EU level
Gender employment
Baseline scenario (2007)
20-25% Hoarding = about 60% of portable NiCd batteries
Potential negative impact on the perception of batteries by consumers (‘some would be dangerous others not’)
Possible confusing message with other waste management policies (contrary to other waste, in the battery sector, recycling would be justified only by level of hazard)
About 140-160 (for NiCd only)
Sorting and recycling is not unfavourable to equal gender employment
Option 60-70% for all batteries containing Cd
50-60% About x 1.2
(+20%)
Option 70-80% for all batteries containing Cd
60-70% About x 1.6
(+60%)
Option 80-90% for all batteries containing Cd
70-80%
The higher the collection objective, the higher necessary hoarding decrease
Same potential negative impact compared to baseline scenario
Same potential negative impact compared to baseline scenario
About x 2
(+100%)
The higher the collection objective, the higher the potential for equal gender employment

B I O I n t e l l i g e n c e S e r v i c e IMPACT ASSESSMENT ON SELECTED POLICY OPTIONS FOR REVISION OF THE BATTERY DIRECTIVE
140
SSoocciiaall IImmppaaccttss ooff SScchheemmee 22 -- CCoolllleeccttiioonn aanndd RReeccyycclliinngg ooff AAllll PPoorrttaabbllee BBaatttteerriieess
Policy options about collection rate
Separate collection target for portable NiCd batteries
Modification of end users behaviours
Perception of batteries by end users
Perception of waste management by end users
Jobs created at the EU level
Gender employment
Baseline scenario (2007)
20-25% Hoarding = about 60% of portable NiCd batteries
No difference between batteries in the perception by end users
Messages homogeneous with other waste management instructions to citizens (similarly to other waste, in the battery sector, separate collection is promoted independently of the hazardous content of waste)
About 2000-2400 (for all portable batteries)
Sorting and recycling is not unfavourable to equal gender employment
Option 60-70% for all batteries containing Cd
50-60% About x 1.2
(+20%)
Option 70-80% for all batteries containing Cd
60-70% About x 1.6
(+60%)
Option 80-90% for all batteries containing Cd
70-80%
The higher the collection objective, the higher necessary hoarding decrease
- -
About x 2
(+100%)
The higher the collection objective, the higher the potential for equal gender employment

B I O I n t e l l i g e n c e S e r v i c e IMPACT ASSESSMENT ON SELECTED POLICY OPTIONS FOR REVISION OF THE BATTERY DIRECTIVE
141
SSoocciiaall IImmppaaccttss ooff SScchheemmee 33 -- CCoolllleeccttiioonn ooff AAllll PPoorrttaabbllee BBaatttteerriieess iinn VViieeww ooff RReeccyycclliinngg PPrriimmaarriillyy NNiiCCdd
Policy options about collection rate
Separate collection target for portable NiCd batteries
Modification of end users behaviours
Perception of batteries by end users
Perception of waste management by end users
Jobs created at the EU level
Gender employment
Baseline scenario (2007)
20-25% Hoarding = about 60% of portable NiCd batteries
No difference between batteries in the perception by end users
Messages homogeneous with other waste management instructions to citizens (similarly to other waste, in the battery sector, separate collection is promoted independently of the hazardous content of waste)
But high risk to discourage end-users from participating to waste separation at home when they realise that most of separately collected waste are disposed of instead of being recycled
About 1600-2000 (for all portable batteries collected and NiCd recycled – about 20% less jobs compared to scheme 2)
Sorting and recycling is not unfavourable to equal gender employment
Option 60-70% for all batteries containing Cd
50-60% About x 1.2 (+20%)
Option 70-80% for all batteries containing Cd
60-70% About x 1.6 (+60%)
Option 80-90% for all batteries containing Cd
70-80%
The higher the collection objective, the higher necessary hoarding decrease
- The higher the collection rate,
the higher the risk to discourage end
users
About x 2 (+100%)
The higher the collection objective, the higher the potential for equal gender employment

B I O I n t e l l i g e n c e S e r v i c e IMPACT ASSESSMENT ON SELECTED POLICY OPTIONS FOR REVISION OF THE BATTERY DIRECTIVE
142
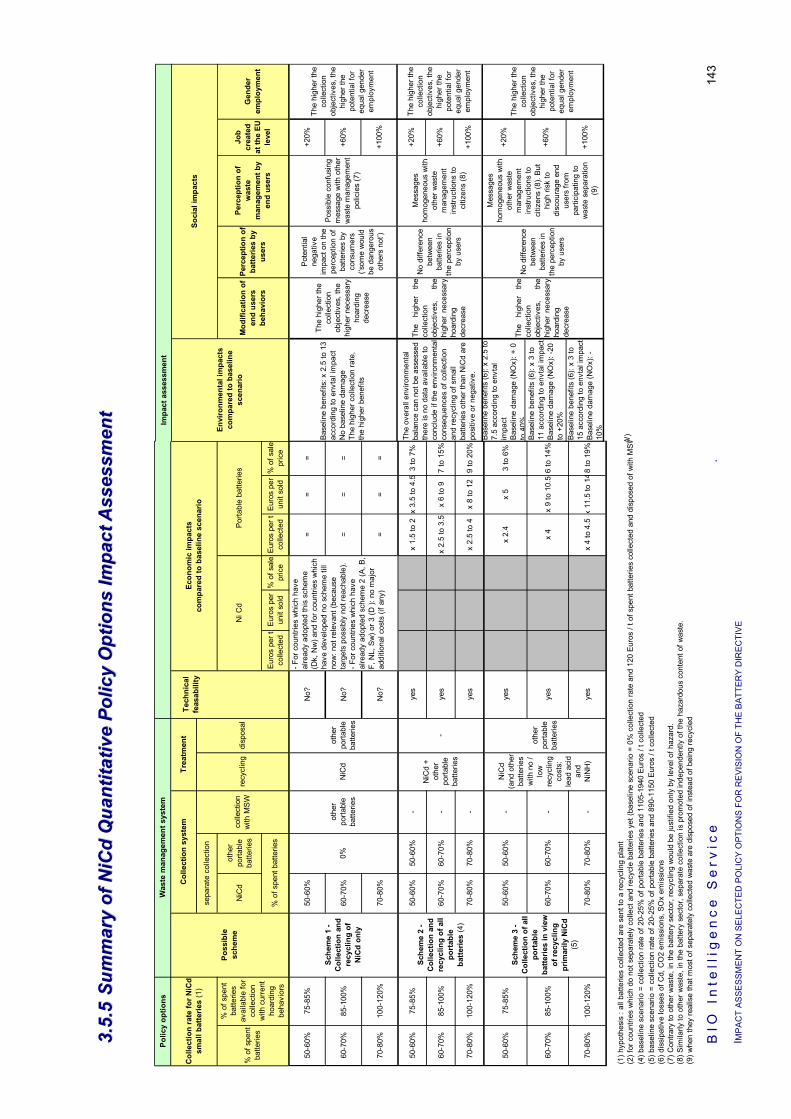
BIO
In
tell
ige
nc
e S
erv
ice
.
I MP
AC
T A
SS
ES
SM
EN
T O
N S
ELE
CTE
D P
OLI
CY
OP
TIO
NS
FO
R R
EV
ISIO
N O
F TH
E B
ATT
ER
Y D
IRE
CTI
VE
143
33 ..55 ..
55 SS
uu mmmm
aa rryy
oo ff NN
ii CCdd
QQuu aa
nn ttii tt aa
tt ii vvee
PPoo ll
ii ccyy
OOpp tt
ii oonn ss
II mmpp aa
cc tt AA
ss ssee ss
ss mmee nn
tt
Polic
y op
tions
NiC
dot
her
porta
ble
batte
ries
Euro
s pe
r t
colle
cted
Eur
os p
er
unit
sold
% o
f sal
e pr
ice
Euro
s pe
r t
colle
cted
Euro
s pe
r un
it so
ld%
of s
ale
pric
e
50-6
0%75
-85%
50-6
0%N
o?=
==
60-7
0%85
-100
%60
-70%
No?
==
=
70-8
0%10
0-12
0%70
-80%
No?
==
=
50-6
0%75
-85%
50-6
0%50
-60%
-ye
sx
1.5
to 2
x 3.
5 to
4. 5
3 to
7%
60-7
0%85
-100
%60
-70%
60-7
0%-
yes
x 2.
5 to
3.5
x 6
to 9
7 to
15%
70-8
0%10
0-12
0%70
-80%
70-8
0%-
yes
x 2.
5 to
4x
8 to
12
9 to
20%
50-6
0%75
-85%
50-6
0%50
-60%
-ye
sx
2.4
x 5
3 to
6%
60-7
0%85
-100
%60
-70%
60-7
0%-
yes
x 4
x 9
to 1
0.5
6 to
14%
70-8
0%10
0-12
0%70
-80%
70-8
0%-
yes
x 4
to 4
.5x
11.5
to 1
48
to 1
9%
(1) h
ypot
hesi
s : a
ll ba
tterie
s co
llect
ed a
re s
ent t
o a
recy
clin
g pl
ant
(2) f
or c
ount
ries
whi
ch d
o no
t sep
arat
ely
colle
ct a
nd re
cycl
e ba
tterie
s ye
t (ba
selin
e sc
enar
io =
0%
col
lect
ion
rate
and
120
Eur
os /
t of s
pent
bat
terie
s co
llect
ed a
nd d
ispo
sed
of w
ith M
SW
(4) b
asel
ine
scen
ario
= c
olle
ctio
n ra
te o
f 20-
25%
of p
orta
ble
batte
ries
and
1105
-194
0 Eu
ros
/ t c
olle
cted
(5) b
asel
ine
scen
ario
= c
olle
ctio
n ra
te o
f 20-
25%
of p
orta
ble
batte
ries
and
890-
1150
Eur
os /
t col
lect
ed(6
) dis
sipa
tive
loss
es o
f Cd,
CO
2 em
issi
ons,
SO
x em
issi
ons
(7) C
ontra
ry to
oth
er w
aste
, in
the
batte
ry s
ecto
r, re
cycl
ing
wou
ld b
e ju
stifi
ed o
nly
by le
vel o
f haz
ard.
(8) S
imila
rly to
oth
er w
aste
, in
the
batte
ry s
ecto
r, se
para
te c
olle
ctio
n is
pro
mot
ed in
depe
nden
tly o
f the
haz
ardo
us c
onte
nt o
f was
te.
(9) w
hen
they
real
ise
that
mos
t of s
epar
atel
y co
llect
ed w
aste
are
dis
pose
d of
inst
ead
of b
eing
recy
cled
Sche
me
2 -
Col
lect
ion
and
recy
clin
g of
all
port
able
ba
tterie
s (4
)
Was
te m
anag
emen
t sys
tem
% o
f spe
nt b
atte
ries
colle
ctio
n w
ith M
SW
sepa
rate
col
lect
ion
Trea
tmen
tTe
chni
cal
feas
abili
ty
-
Sche
me
3 -
Col
lect
ion
of a
ll po
rtab
le
batte
ries
in v
iew
of
recy
clin
g pr
imar
ily N
iCd
(5)
Ni C
d
Poss
ible
sc
hem
ere
cycl
ing
disp
osal
NiC
dot
her
porta
ble
batte
ries
NiC
d +
othe
r po
rtabl
e ba
tterie
s
Col
lect
ion
syst
emC
olle
ctio
n ra
te fo
r NiC
d sm
all b
atte
ries
(1)
% o
f spe
nt
batte
ries
% o
f spe
nt
batte
ries
avai
labl
e fo
r co
llect
ion
with
cur
rent
ho
ardi
ng
beha
vior
s
othe
r po
rtabl
e ba
tterie
s0%
Sche
me
1 -
Col
lect
ion
and
recy
clin
g of
N
iCd
only
NiC
d (a
nd o
ther
ba
tterie
s w
ith n
o /
low
re
cycl
ing
cost
s:
lead
aci
d an
d N
iNH
)
othe
r po
rtabl
e ba
tterie
s
Por
tabl
e ba
tterie
s
- For
cou
ntrie
s w
hich
hav
e al
read
y ad
opte
d th
is s
chem
e (D
k, N
w) a
nd fo
r cou
ntrie
s w
hich
ha
ve d
evel
oped
no
sche
me
till
now
: not
rele
vant
(bec
ause
ta
rget
s po
ssib
ly n
ot re
acha
ble)
. - F
or c
ount
ries
whi
ch h
ave
alre
ady
adop
ted
sche
me
2 (A
, B,
F, N
L, S
w) o
r 3 (D
): n
o m
ajor
ad
ditio
nal c
osts
(if a
ny)Ec
onom
ic im
pact
s co
mpa
red
to b
asel
ine
scen
ario
Impa
ct a
sses
smen
t
+20%
+60%
+100
%
+20%
+60%
+100
%
Bas
elin
e be
nefit
s (6
): x
2.5
to
7.5
acco
rdin
g to
env
tal
impa
ctB
asel
ine
dam
age
(NO
x): +
0
to40
%
+20%
Bas
elin
e be
nefit
s (6
): x
3 to
11
acc
ordi
ng to
env
tal i
mpa
ctB
asel
ine
dam
age
(NO
x): -
20
to +
20%
+60%
Bas
elin
e be
nefit
s (6
): x
3 to
15
acc
ordi
ng to
env
tal i
mpa
ctB
asel
ine
dam
age
(NO
x): -
10%
+100
%
W)
Pot
entia
l ne
gativ
e im
pact
on
the
perc
eptio
n of
ba
tterie
s by
co
nsum
ers
(‘som
e w
ould
be
dan
gero
us
othe
rs n
ot’)
Base
line
bene
fits:
x 2
.5 to
13
acco
rdin
g to
env
tal i
mpa
ctN
o ba
selin
e da
mag
eTh
e hi
gher
col
lect
ion
rate
, th
e hi
gher
ben
efits
Soci
al im
pact
s
Mes
sage
s ho
mog
eneo
us w
ith
othe
r was
te
man
agem
ent
inst
ruct
ions
to
citiz
ens
(8).
But
hi
gh ri
sk to
di
scou
rage
end
us
ers
from
pa
rtici
patin
g to
w
aste
sep
arat
ion
(9)
Perc
eptio
n of
ba
tterie
s by
us
ers
Perc
eptio
n of
w
aste
m
anag
emen
t by
end
user
s
The
high
er th
e co
llect
ion
obje
ctiv
es, t
he
high
er th
e po
tent
ial f
or
equa
l gen
der
empl
oym
ent
Job
crea
ted
at th
e EU
le
vel
The
high
erth
eco
llect
ion
obje
ctiv
es,
the
high
erne
cess
ary
hoar
ding
de
crea
se
No
diffe
renc
e be
twee
n ba
tterie
s in
th
e pe
rcep
tion
by u
sers
Pos
sibl
e co
nfus
ing
mes
sage
with
oth
er
was
te m
anag
emen
t po
licie
s (7
)
The
high
er th
e co
llect
ion
obje
ctiv
es, t
he
high
er th
e po
tent
ial f
or
equa
l gen
der
empl
oym
ent
Gen
der
empl
oym
ent
The
high
er th
e co
llect
ion
obje
ctiv
es, t
he
high
er n
eces
sary
ho
ardi
ng
decr
ease
Mod
ifica
tion
of
end
user
s be
havi
ors
No
diffe
renc
e be
twee
n ba
tterie
s in
th
e pe
rcep
tion
by u
sers
Mes
sage
s ho
mog
eneo
us w
ith
othe
r was
te
man
agem
ent
inst
ruct
ions
to
citiz
ens
(8)
The
high
er th
e co
llect
ion
obje
ctiv
es, t
he
high
er th
e po
tent
ial f
or
equa
l gen
der
empl
oym
ent
Envi
ronm
enta
l im
pact
sco
mpa
red
to b
asel
ine
scen
ario
The
over
all e
nviro
nmen
tal
bala
nce
can
not b
e as
sess
ed
ther
e is
no
data
ava
ilabl
e to
co
nclu
de if
the
envi
ronm
enta
l co
nseq
uenc
es o
f col
lect
ion
and
recy
clin
g of
sm
all
batte
ries
othe
r tha
n N
iCd
are
posi
tive
or n
egat
ive.
The
high
erth
eco
llect
ion
obje
ctiv
es,
the
high
erne
cess
ary
hoar
ding
de
crea
se
B I O I n t e l l i g e n c e S e r v i c e _____________________________________________ 144. IMPACT ASSESSMENT ON SELECTED POLICY OPTIONS FOR REVISION OF THE BATTERY DIRECTIVE
33..66 NNIICCDD BBAATTTTEERRIIEESS BBAANN OOPPTTIIOONN
The key objective of the battery directive is to prevent the release of hazardous substances to the environment. This can be achieved by substituting dangerous substances as much as possible or by establishing effective collection schemes.
The purpose of this chapter is to consider the policy option consisting in the introduction of a ban on the use of cadmium in batteries and accumulators placed on the Community market, where commercially viable substitutes are available.
33..66..11 BBaacckkggrroouunndd DDaattaa
33..66..11..11 EEUU PPoolliiccyy BBaacckkggrroouunndd
In January 1988 a Council resolution invited the Commission to pursue without delay the development of specific measures for a Community action program to combat environmental pollution by cadmium. The Resolution stressed that the use of cadmium should be limited to cases where suitable alternatives do not exist. However most industrial cadmium used is to produce portable rechargeable batteries, mainly used for portable consumer products.
In line with the approach on hazardous substances set out in the 6th Environmental Action Programme and in the Johannesburg Plan of Implementation and in accordance with the principles of substitution and precaution as set out in the Commission white paper on chemicals, which is the basis for the new chemicals legislation under development in Europe, the guiding principles for revision of the battery directive could be to phase out hazardous substances where suitable alternatives exist. These concerns are restricted to mercury, lead and cadmium.
EU has decided to phase out the use of mercury, lead and cadmium in the directives concerning end-of life vehicles (2000/53/EC, and the commission decision34 C(2002)2238 of 27 June 2002 amending annex II of Directive 2000/53/EC) and in the directive on the use of certain hazardous substances in electrical and electronic equipment (2002/95/EC). To be consistent with this policy the battery directive could have the same approach.
Mercury containing batteries are no longer a significant concern, following the implementation of Directive 98/101/EC. Due to the very high collection and recycling rates (close to 100%) of lead-acid automotive batteries in EU, a ban on lead containing batteries is not under discussion (lead emissions from landfill or MSW incinerators are not known to be a significant concern). As for cadmium, batteries are today the main use for cadmium, and cadmium from batteries accounts
34 According to this decision: “Cadmium in batteries for electrical vehicles should be exempted until 31 December 2005 since, in view of present scientific and technical evidence and the overall environmental assessment undertaken, by that date, substitutes will be available and the availability of electrical vehicles will be ensured. The progressive replacement of cadmium should, however, continue to be analysed, taking into account the availability of electrical vehicles. The Commission will publish its findings by 31 December 2004 at the latest and, if proven justified by the results of the analysis, may propose an extension of the expiry date for cadmium in batteries for electrical vehicles in accordance with Article 4(2)(b)of Directive 2000/53/EC”.
B I O I n t e l l i g e n c e S e r v i c e _____________________________________________ 145. IMPACT ASSESSMENT ON SELECTED POLICY OPTIONS FOR REVISION OF THE BATTERY DIRECTIVE
for at least 50% of the cadmium content found in landfills within Europe; batteries are also the principal source of cadmium emissions from MSW incinerators within the EU.
Some stakeholders consider this situation is not acceptable since suitable alternatives for many kinds of NiCd batteries are claimed to exist. For other stakeholders, a ban on cadmium should be considered only in the context of a scientifically sound risk assessment. Therefore, in the next sections we question the environmental justification for a market restriction, then we investigate the availability of commercially viable substitutes, before assessing economic and social impacts. First, we summarise the industrial uses of cadmium in Europe.
33..66..11..22 CCaaddmmiiuumm MMaarrkkeett iinn EEuurrooppee
Cadmium production and consumption
Based on the cadmium content in the zinc ore, between 18,000 and 21,000 tonnes of cadmium are produced per year in the world as a by-product of zinc refining35 36. Roughly 60% of that amount is produced by the world largest producers: Japan, Canada, China, Belgium, Germany, Kazakhstan and USA. Among these 7 countries, Japan and Canada together produce about 45% of the total worldwide production (roughly 25% each).
Approximately 85% of the worldwide production of Cd are consumed by the 5 largest consumer countries listed by the World Bureau of Metal Statistics i.e. Japan, Belgium, France, USA and Germany (50-55% by Japan and Belgium, the two leading Cd consumer countries)37. It should be noted that the “consumption” of cadmium in Belgium is, in fact, almost exclusively the conversion of cadmium metal to cadmium oxide which is then shipped to Japan for the NiCd battery industry usage. Thus, Japan is, by far, the world’s largest consumer of cadmium in addition to being one of its largest producers38.
The cadmium fraction which reaches the market (some of the cadmium is being stored) is transformed into products belonging mainly to five categories: batteries39, coatings, pigments, stabilizers and alloys. Consumption and use patterns are currently changing, as indicated by reduced industrial use of cadmium for plating, stabilizers and pigments in several countries as a result of regulations. However, a significant increase in percentage of use in cadmium-containing batteries have occurred, resulting globally in increasing trends for the total consumption and production40. In 1996, Ni-Cd batteries contained approximately 75% of the 2,630 tonnes of refined cadmium used in the EU41. It is also estimated that 80% of the cadmium consumed in NiCd batteries is for consumer batteries and 20% for industrial batteries,
35 World Bureau of Metal Statistics, 2000 36 Cadmium has this unique characteristic that it is not produced from its own specific ore but it is an inevitable by-
product of zinc primary production. 37 Japan, France, USA and Germany are the four largest producers of NiCd batteries 38 Japan, the country in the world with the largest production and consumption of cadmium in the last 15 years, is also
the country which has had the world’s worst disaster related to cadmium. In the 1950’s, there was a spillage of cadmium wastes from a smelter on to rice fields which resulted in the so-called Itai-Itai disease affecting hundreds of people in the general population. While this disease is not related to cadmium exposure alone, it is obvious that, after this disaster, Japan has been able to cope with environmental issues and risks posed by cadmium.
39 Cadmium has been used in some primary batteries in the past. There is no application of cadmium in primary batteries anymore.
40 Draft Risk Assessment Report, February 2003 – from Jensen and Bro-Ramussen, 1992; Wiaux, 2000 41 The production volume of cadmium in Europe in 1996 is estimated at 5,808 tonnes. Corrected with import/export,
5,528 tonnes/year is available for different applications (draft RAR Cd/CdO, 1999). Approximately 2,733 tonnes/year is used for battery manufacturing which represent approximately 47% of cadmium produced in Europe. European regional consumption of cadmium reaches the value of 2,638 tonnes, among which 75.2% for Ni-Cd batteries, 14.9% for pigments, 5% for stabilisers and 5% for alloys and plating (draft TRAR, February 2003).
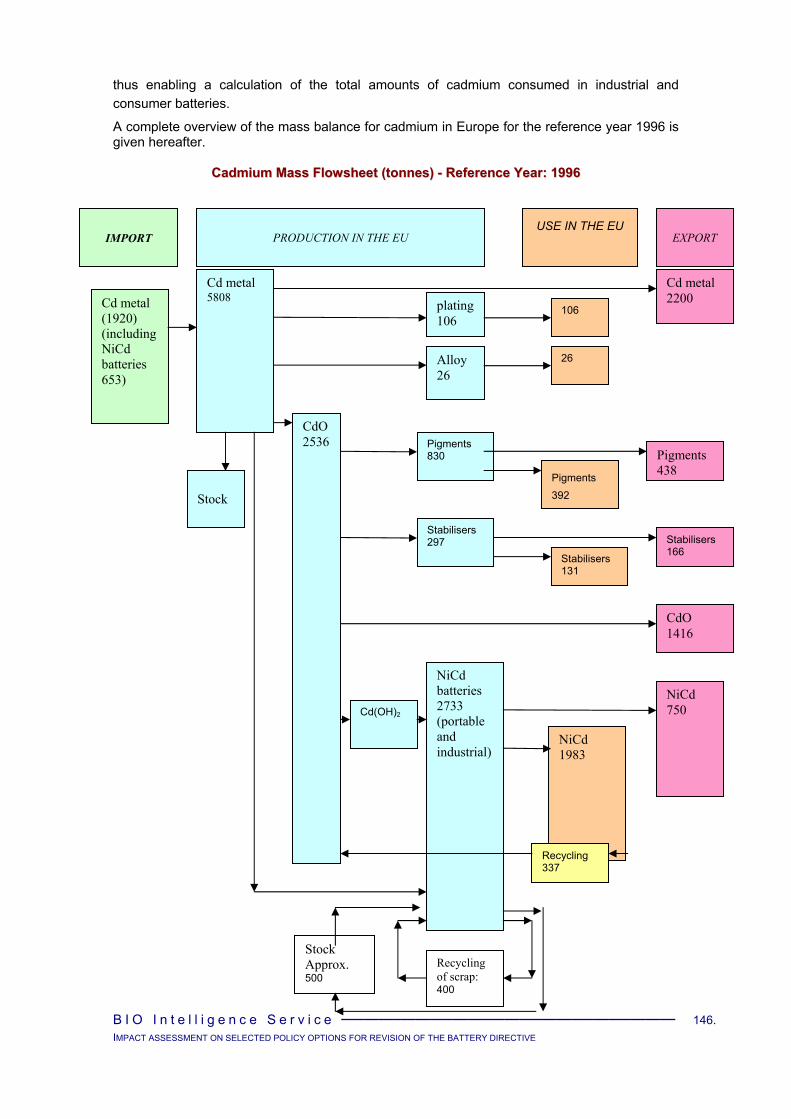
B I O I n t e l l i g e n c e S e r v i c e _____________________________________________ 146. IMPACT ASSESSMENT ON SELECTED POLICY OPTIONS FOR REVISION OF THE BATTERY DIRECTIVE
thus enabling a calculation of the total amounts of cadmium consumed in industrial and consumer batteries.
A complete overview of the mass balance for cadmium in Europe for the reference year 1996 is given hereafter.
CCaaddmmiiuumm MMaassss FFlloowwsshheeeett ((ttoonnnneess)) -- RReeffeerreennccee YYeeaarr:: 11999966
Cd metal (1920) (including NiCd batteries 653)
Cd metal 5808
CdO2536
plating106
106
Alloy 26
NiCd batteries 2733 (portable and industrial)
Cd metal 2200
26
NiCd 1983
NiCd 750
Stock
Pigments 830
Stabilisers 297
Pigments 392
Stabilisers 131
Pigments 438
Stabilisers 166
CdO 1416
Recycling 337
IMPORT PRODUCTION IN THE EU USE IN THE EU
EXPORT
Cd(OH)2
Recycling of scrap: 400
Stock Approx. 500
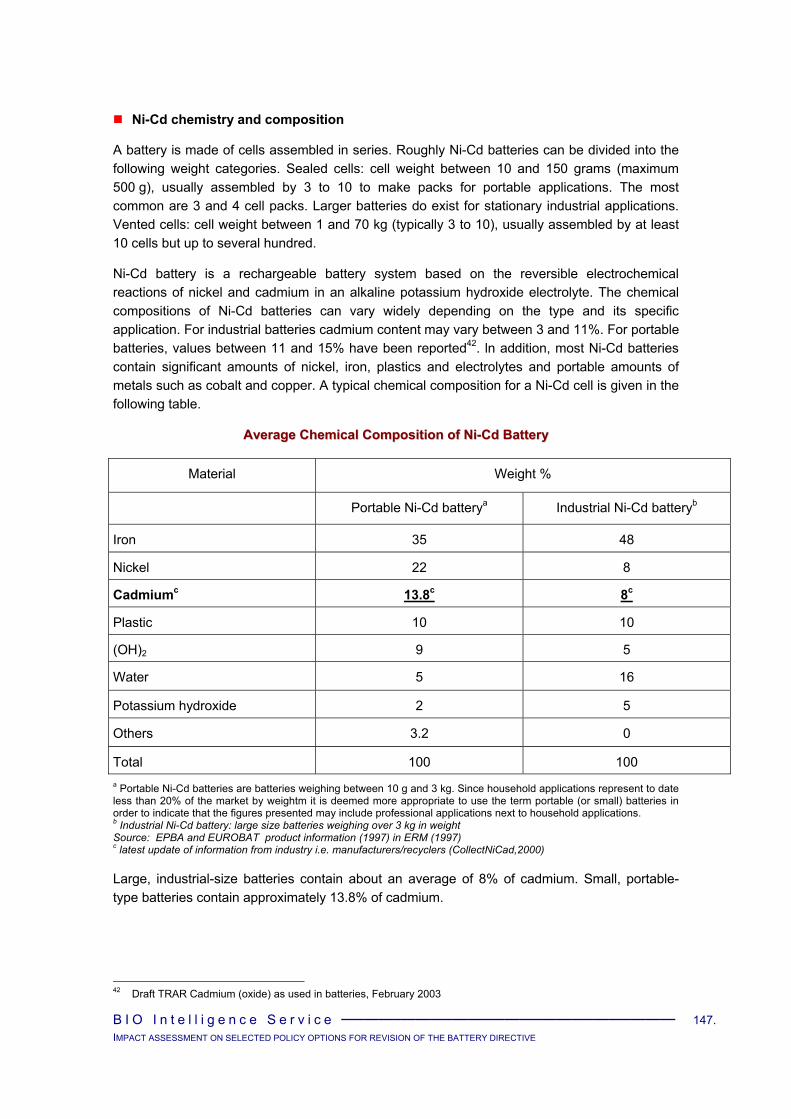
B I O I n t e l l i g e n c e S e r v i c e _____________________________________________ 147. IMPACT ASSESSMENT ON SELECTED POLICY OPTIONS FOR REVISION OF THE BATTERY DIRECTIVE
Ni-Cd chemistry and composition
A battery is made of cells assembled in series. Roughly Ni-Cd batteries can be divided into the following weight categories. Sealed cells: cell weight between 10 and 150 grams (maximum 500 g), usually assembled by 3 to 10 to make packs for portable applications. The most common are 3 and 4 cell packs. Larger batteries do exist for stationary industrial applications. Vented cells: cell weight between 1 and 70 kg (typically 3 to 10), usually assembled by at least 10 cells but up to several hundred.
Ni-Cd battery is a rechargeable battery system based on the reversible electrochemical reactions of nickel and cadmium in an alkaline potassium hydroxide electrolyte. The chemical compositions of Ni-Cd batteries can vary widely depending on the type and its specific application. For industrial batteries cadmium content may vary between 3 and 11%. For portable batteries, values between 11 and 15% have been reported42. ln addition, most Ni-Cd batteries contain significant amounts of nickel, iron, plastics and electrolytes and portable amounts of metals such as cobalt and copper. A typical chemical composition for a Ni-Cd cell is given in the following table.
AAvveerraaggee CChheemmiiccaall CCoommppoossiittiioonn ooff NNii--CCdd BBaatttteerryy
Material Weight %
Portable Ni-Cd batterya Industrial Ni-Cd batteryb
Iron 35 48
Nickel 22 8
Cadmiumc 13.8c 8c
Plastic 10 10
(OH)2 9 5
Water 5 16
Potassium hydroxide 2 5
Others 3.2 0
Total 100 100 a Portable Ni-Cd batteries are batteries weighing between 10 g and 3 kg. Since household applications represent to date less than 20% of the market by weightm it is deemed more appropriate to use the term portable (or small) batteries in order to indicate that the figures presented may include professional applications next to household applications. b Industrial Ni-Cd battery: large size batteries weighing over 3 kg in weight Source: EPBA and EUROBAT product information (1997) in ERM (1997) c latest update of information from industry i.e. manufacturers/recyclers (CollectNiCad,2000)
Large, industrial-size batteries contain about an average of 8% of cadmium. Small, portable-type batteries contain approximately 13.8% of cadmium.
42 Draft TRAR Cadmium (oxide) as used in batteries, February 2003
B I O I n t e l l i g e n c e S e r v i c e _____________________________________________ 148. IMPACT ASSESSMENT ON SELECTED POLICY OPTIONS FOR REVISION OF THE BATTERY DIRECTIVE
33..66..22 EEnnvviirroonnmmeennttaall IImmppaaccttss
33..66..22..11 SScciieennttiiffiicc BBaacckkggrroouunndd oonn HHaazzaarrdd AAssssoocciiaatteedd wwiitthh CCaaddmmiiuumm
Cadmium, in its elemental form, occurs naturally in the earth's crust. Pure cadmium is a soft, silver-white metal; however cadmium is not usually found in the environment as a metal but as a mineral combined with other elements such as oxygen (cadmium oxide), chlorine (cadmium chloride), or sulfur (cadmium sulfate, cadmium sulfide). These solid compounds are soluble in water. Cadmium has no definite odor or taste. Most cadmium is extracted during the production of other metals such as zinc, lead or copper.
Cadmium is a flammable powder. Toxic fumes are produced in a fire. Cadmium is highly persistent in water, with a half-life of higher than 200 days.
The largest source of cadmium release to the general environment is the burning of fossil fuels (such as coal or oil) or the incineration of municipal waste materials. Cadmium may also escape into the air from zinc, lead or copper smelters. It can enter water from disposal of waste water from households or industries. Fertilizers often contain some cadmium.
Cadmium is a heavy metal with a high toxicity even at very low exposure levels and has acute and chronic effects on health and environment. Cadmium is not degradable in nature and will thus, once released to the environment, stay in circulation.
Human health
As a conservative approach, and based on the limited human data and the studies in rats, the United States Department of Health and Human Services (DHHS) has determined that cadmium and cadmium compounds may reasonably be anticipated to be carcinogens. The International Agency for Research on Cancer (IARC) has determined that cadmium is carcinogenic to humans. The USEPA has determined that cadmium is a probable human carcinogen by inhalation.
Cadmium enters the food chain through contamination of soil (by leaching from landfills and inappropriate disposal of the substance, burning in incinerators, etc.). It accumulates in the human body through ingestion of contaminated substance. Bio-accumulation causes a serious health hazard. Its targeted organs are kidneys, liver, bones and blood.
Food and cigarette smoke are the largest potential sources of cadmium exposure for the general population. An average person ingests about 30 micrograms (µg) of cadmium from food each day. Smokers absorb an additional 1 to 3 µg per day from cigarettes. Average cadmium levels in cigarettes range from 1,000 to 3,000 ppb. Average cadmium levels in food range from 2 to 40 parts of cadmium per billion parts of food (ppb). The level of cadmium in most drinking water supplies is less than 1 ppb. Air levels normally range from 5 to 40 ng/m3.
Cadmium can enter the blood by absorption from the stomach or intestines after ingestion of food or water, or by absorption from the lungs after inhalation. Very little cadmium enters the body through the skin. Usually only about 1 to 5% of what is taken in by mouth is absorbed into the blood, while about 30 to 50% of what is inhaled is taken up into the blood. However, once cadmium enters the body, it is very strongly retained; therefore, even low doses may build up significant cadmium levels in the body if exposure continues for a long time.

B I O I n t e l l i g e n c e S e r v i c e _____________________________________________ 149. IMPACT ASSESSMENT ON SELECTED POLICY OPTIONS FOR REVISION OF THE BATTERY DIRECTIVE
The amount of cadmium needed to cause an adverse effect in an exposed person depends on the chemical and physical form of the element. In general, cadmium compounds that dissolve easily in water (e.g. cadmium chloride), or those that can be dissolved in the body (e.g. cadmium oxide), tend to be more toxic than compounds that are very hard to dissolve (e.g. cadmium sulfide).
By the inhalation route, airborne concentrations of 1 mg/m3 are associated with acute irritation to lungs, and long-term exposure to levels of 0.1 mg/m3 may increase the risk of lung disease. These same levels are also associated with development of kidney injury similar to that observed following oral exposure. Long-term exposure to a level of 0.02 mg/m3 is thought to pose relatively little risk of injury to lung or kidney. It has been estimated that lifelong inhalation of air containing 1 ug/m3 (0.001 mg/m3) of cadmium is associated with a risk of lung cancer of about 2 in 1,000. For soluble cadmium compounds, an oral dose of about 0.05 mg/kg (3.5 mg in an adult) is considered to be the minimum which causes irritation to the stomach. Long-term intake of up to about 0.005 mg/kg/day (0.35 mg/day in an adult) is believed to have relatively little risk of causing injury to the kidney or other tissues.
Cadmium that enters the human body remains in the liver and kidneys. Most of the cadmium is stored in a form that is not harmful, but too much cadmium can overload the kidneys' storage system and lead to health problems. High exposures can cause severe lung damage with shortness of breath, chest pain, cough, and even a buildup of fluid in the lungs. In severe casesm death or permanent lung damage occurs. Illness can be delayed for 4 to 8 hours, allowing overexposure without warning.
Non-lethal exposure to high levels of cadmium may cause nausea, salivation, vomiting, cramps, and diarrhea. During heating or grinding operations, cadmium can cause a flu like illness with chills, headache, aching and/or fever. Emphysema and/or lung scarring can occur from a single high exposure or repeated lower exposures. Long term exposure can cause anemia, loss of sense of smell, fatigue and/or yellow staining of teeth.
Kidney damage has been observed in people who are exposed to excess cadmium either through air or through the diet. This kidney disease is usually not life-threatening, but it can lead to the formation of kidney stones and effects on the skeleton that are equally painful and debilitating. It may also promote hypertension and heart disease.
Exposure to cadmium (especially cadmium oxide) may increase the risk of lung, prostate, and kidney cancer in humans. There may be no safe level of exposure to a cancer-causing agent.
Cadmium also affects the bones; causing bone and joint aches and pains, a syndrome, first described in Japan (1995), where it was termed the itai-itai ("ouch-ouch") disease. Symptoms of this disease include weak bones that lead to deformities, especially of the spine, or to more easily broken bones. It is often fatal. Cadmium may damage the testes (male reproductive glands) and may affect the female reproductive cycle. Cadmium appears to depress some immune functions, mainly by reducing host resistance to bacteria and viruses.
Cadmium levels in humans tend to increase with age (probably because of chronic subtle exposure), usually peaking at around age 50 and then leveling off. No cadmium is present in newborns; cadmium does not cross the placenta-fetal barrier nor the blood-brain barrier as lead and mercury do. Exposure during pregnancy may not be toxic to fetuses, nor does it cause the mental and brain symptoms of lead and mercury.
B I O I n t e l l i g e n c e S e r v i c e _____________________________________________ 150. IMPACT ASSESSMENT ON SELECTED POLICY OPTIONS FOR REVISION OF THE BATTERY DIRECTIVE
Animal health
Animals given cadmium in food or water show iron-poor blood, liver disease, and nerve or brain damage. Inhaling cadmium causes liver damage and changes in the immune system in rats and mice. Reproductive and developmental effects have been observed in rats and mice treated with cadmium. Cadmium has been shown to cause lung and testes cancer in animals. In rat studies, higher levels of cadmium are associated with an increase in heart size, higher blood pressure, progressive atherosclerosis, and reduced kidney function. Acute toxic effects may include the death of animals, birds, or fish, and death or low growth rate in plants.
Cadmium has high acute toxicity to aquatic life. The concentration of cadmium found in fish tissues is expected to be much higher than the average concentration of cadmium in the water from which the fish was taken.
33..66..22..22 RRiisskk AAsssseessssmmeenntt oonn tthhee UUssee ooff CCaaddmmiiuumm iinn BBaatttteerriieess
33..66..22..22..11 IInnttrroodduuccttiioonn aanndd WWaarrnniinngg
Facts above give an overview of intrinsic hazard of cadmium and cadmium compounds. They do not permit to justify a market restriction regarding NiCd batteries because they only consider one aspect of risk assessment: the hazard component. A ban on cadmium should be considered only in the context of a scientifically sound risk assessment (or risk characterisation) which integrates two components: the hazard and the exposure to that hazard.
A Targeted Risk Assessment on cadmium used in batteries is currently carrying out (in accordance with Council Regulation (EEC) 793/9343 on the evaluation and control of the risks of “existing” substances). The methods for carrying out an in-depth Risk Assessment at Community level are laid down in Commission Regulation (EC) 1488/9444 which is supported by a technical guidance document45.
Remark: The last draft of the Targeted Risk Assessment Report (TRAR) on the use of cadmium in nickel-cadmium batteries available when carrying the study was dated on February 2003. The May 2003 version was provided to BIO IS at the end of the project. Only a rapid overview of this last version was possible, which lead us to conclude that no significant modification was introduced that thus that the analysis presented below remains unchanged.
Caveats: The draft TRAR is currently under discussion in a final written procedure by the Competent Group of Member States’ experts with the aim of reaching consensus. In doing so, the scientific interpretation of the underlying information may change, more information may be included and even the results in this draft may change. Competent Group of Member State experts seek as wide a distribution of these drafts as possible, in order to assure as complete and accurate an information basis as possible. The information contained in this Draft Risk Assessment Report therefore does not necessarily provide a sound definitive basis for decision making regarding the hazards, exposures or the risks associated with the priority substance.
43 O.J. No L 084, 05/04/199 p. 0001 – 0075 - Regulation 793/93 provides a systematic framework for the evaluation of
the risks to human health and the environment of these substances if they are produced or imported into the Community in volumes above 10 tonnes per year.
44 O.J. No. L 161, 29/06/1994 p. 0003 – 0011 45 Technical Guidance Document, Part I-V, ISBN 92-827-801[1234]
B I O I n t e l l i g e n c e S e r v i c e _____________________________________________ 151. IMPACT ASSESSMENT ON SELECTED POLICY OPTIONS FOR REVISION OF THE BATTERY DIRECTIVE
33..66..22..22..22 EEnnvviirroonnmmeennttaall EExxppoossuurree aanndd RRiisskk CChhaarraacctteerriissaattiioonn
Concepts introduced and used in the TRAR
The draft TRAR gives an analysis of the environmental impact of the production, use and end of life management of nickel-cadmium batteries. It examines various scenarios related to the marketing of nickel-cadmium batteries accompanied by various collection and recycling programs. The toxicological and ecotoxicological aspects related to the impact of cadmium emissions from nickel-cadmium batteries are analysed.
The draft TRAR develops scenarios for current and predicted future emissions to the environment of cadmium from the production and end of life management of nickel-cadmium batteries. The local exposure assessment addressed in this TRAR is based on emissions from Ni-Cd batteries producing plants, Cd recyclers, MSW incineration plants and MSW landfills, in order to estimate the contribution from the Ni-Cd batteries life cycle to the overall regional exposure (all anthropogenic Cd emissions). The “Predicted environmental concentration” (PEC) has been taken as a basis for estimating the environmental exposure to cadmium: for a particular environmental compartment (water, air, soil), a PEC is defined as the predicted cadmium concentration in that compartment due to actual Cd concentrations in the environment (ambient concentrations) and Cd that is added to the environment all over the NiCd batteries life cycle (pollution due to NiCd batteries).
The “Predicted No Effect Concentration” (PNEC) for Cadmium derived for different environmental compartments has been taken as a basis for the risk characterisation: for a particular environmental compartment (water, air, soil), a PNEC is defined as the maximum cadmium concentration which induces no environmental effects.
For every environmental compartment (water, air, soil), predicted total concentrations (PEC) are then compared to the specific PNEC for risk characterisation. If PEC / PNEC is higher than 1, a risk is predicted (as the predicted exposure is higher than the no effect concentration); if PEC / PNEC is lower than 1, no risk is predicted.
B I O I n t e l l i g e n c e S e r v i c e _____________________________________________ 152. IMPACT ASSESSMENT ON SELECTED POLICY OPTIONS FOR REVISION OF THE BATTERY DIRECTIVE
What we did in the present study, based on the TRAR
The risk linked to NiCd batteries life cycle can be assessed at two levels:
risk at a global level,
risk at a local level.
For the global level analysis, we directly exploited TRAR data about environmental exposure (see section 3.6.2.2.3 hereafter).
For the local level:
we first drew conclusions from environmental exposure.
We then used the PEC/PNEC ratio for each different environmental compartments (water, air, soil) as a characterisation risk factor to assess local risk (either for human health or for ecosystems) arising from the different stages of nickel-cadmium batteries life cycle (production, use and end of life management).
We calculated a PEC/PNEC ratio for each life cycle stage and each environmental compartments by using TRAR values for PEC and PNEC obtained for the different scenarii analysed in the TRAR.
The results of our calculations and the conclusions drew are presented in section 3.6.2.2.4.
Remark: no conclusions about these local risk considerations were explicitly presented in the TRAR February version that is why we performed all the calculations presented hereafter and drew conclusions on our own.

B I O I n t e l l i g e n c e S e r v i c e _____________________________________________ 153. IMPACT ASSESSMENT ON SELECTED POLICY OPTIONS FOR REVISION OF THE BATTERY DIRECTIVE
33..66..22..22..33 CCoonncclluussiioonnss BBaasseedd oonn EEnnvviirroonnmmeennttaall EExxppoossuurree
Relevance to ban NiCd batteries from a global risk point of view
TRAR results
For all scenarios investigated in the TRAR, the added46 regional/continental concentrations of Cd calculated from Cd emissions during NiCd batteries life cycle are very small. Furthermore, under the worse case scenario, NiCd batteries contribute to less than 1% of the anthropogenic emission sources.
These findings are compatible with previous studies from the U.S. EPA studies, which indicate that fertilizers and fossil fuel combustion are the major sources of human and environmental cadmium exposure, and cadmium products life cycle represent only a very portable fraction of the total. Studies on the relative contributions of various sources to total human cadmium exposure (Van Assche 1998, Van Assche and Ciarletta 1992) have also clearly demonstrated that cadmium products contribute only to about 2% of total human cadmium exposure. These results are shown in the figure below.
SSoouurrcceess ooff TToottaall HHuummaann EExxppoossuurree ttoo CCaaddmmiiuumm
Source: Van Assche 1998 BIO conclusions
From a global risk point of view, a ban of NiCd batteries would have almost no effect on total human cadmium exposure, given that most of it is due to other anthropogenic Cd emission sources. It will then not represent an appropriate solution to reduce total human cadmium exposure.
Nevertheless, Cd emission sources can have a major impact on the Cd concentration at a local level. This issue is now considered.
46 Actual Cd concentrations in the environment (ambient concentrations) are determined by the natural background of
Cd (from geological origin or from natural processes) and Cd that was added to the environment in the past by man (historical pollution). Natural Cd and Cd from historical pollution determine background Cd concentrations in the environment.
1%2%2%
6%
8%
17%
22%
42%
Fertilizers
Fossil Fuels
Iron & Steel
Natural
Nonferrous
Cement
Applications
Incineration
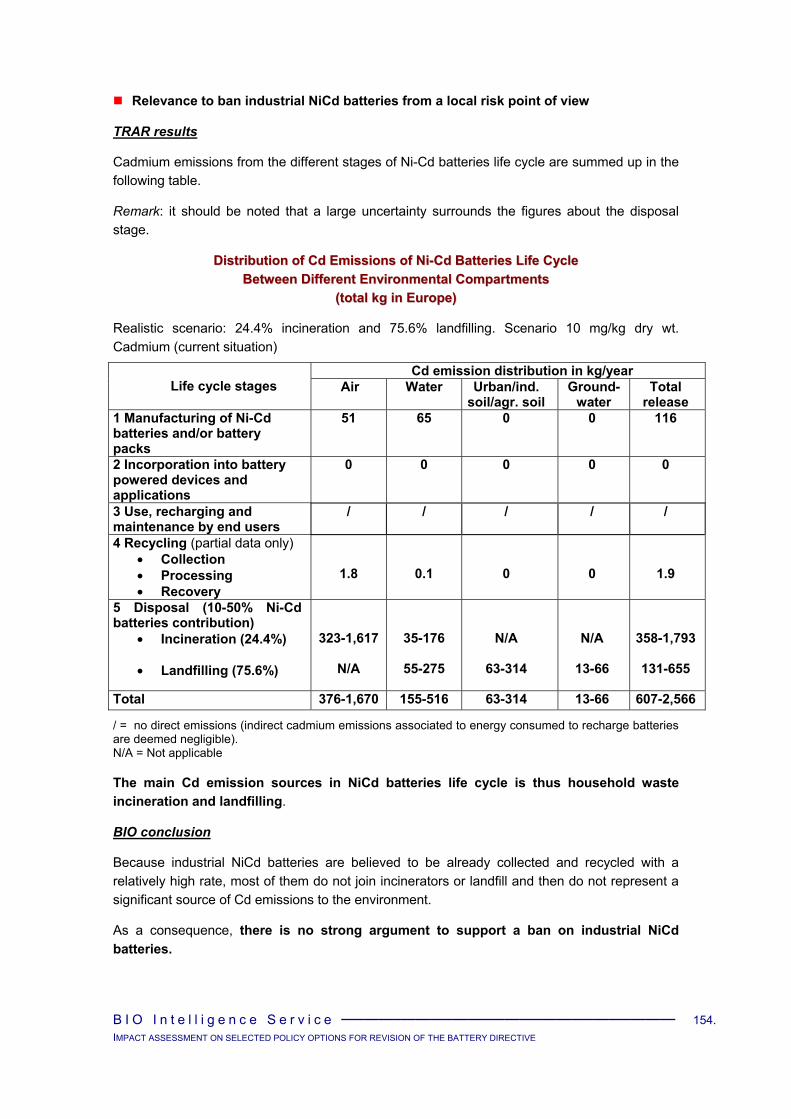
B I O I n t e l l i g e n c e S e r v i c e _____________________________________________ 154. IMPACT ASSESSMENT ON SELECTED POLICY OPTIONS FOR REVISION OF THE BATTERY DIRECTIVE
Relevance to ban industrial NiCd batteries from a local risk point of view
TRAR results
Cadmium emissions from the different stages of Ni-Cd batteries life cycle are summed up in the following table.
Remark: it should be noted that a large uncertainty surrounds the figures about the disposal stage.
DDiissttrriibbuuttiioonn ooff CCdd EEmmiissssiioonnss ooff NNii--CCdd BBaatttteerriieess LLiiffee CCyyccllee BBeettwweeeenn DDiiffffeerreenntt EEnnvviirroonnmmeennttaall CCoommppaarrttmmeennttss
((ttoottaall kkgg iinn EEuurrooppee))
Realistic scenario: 24.4% incineration and 75.6% landfilling. Scenario 10 mg/kg dry wt. Cadmium (current situation)
Cd emission distribution in kg/year Life cycle stages Air Water Urban/ind.
soil/agr. soil Ground-
water Total
release 1 Manufacturing of Ni-Cd batteries and/or battery packs
51 65 0 0 116
2 Incorporation into battery powered devices and applications
0 0 0
0 0
3 Use, recharging and maintenance by end users
/ / / / /
4 Recycling (partial data only) • Collection • Processing • Recovery
1.8
0.1
0
0
1.9
5 Disposal (10-50% Ni-Cd batteries contribution)
• Incineration (24.4%)
• Landfilling (75.6%)
323-1,617
N/A
35-176
55-275
N/A
63-314
N/A
13-66
358-1,793
131-655
Total 376-1,670 155-516 63-314 13-66 607-2,566
/ = no direct emissions (indirect cadmium emissions associated to energy consumed to recharge batteries are deemed negligible). N/A = Not applicable
The main Cd emission sources in NiCd batteries life cycle is thus household waste incineration and landfilling.
BIO conclusion
Because industrial NiCd batteries are believed to be already collected and recycled with a relatively high rate, most of them do not join incinerators or landfill and then do not represent a significant source of Cd emissions to the environment.
As a consequence, there is no strong argument to support a ban on industrial NiCd batteries.
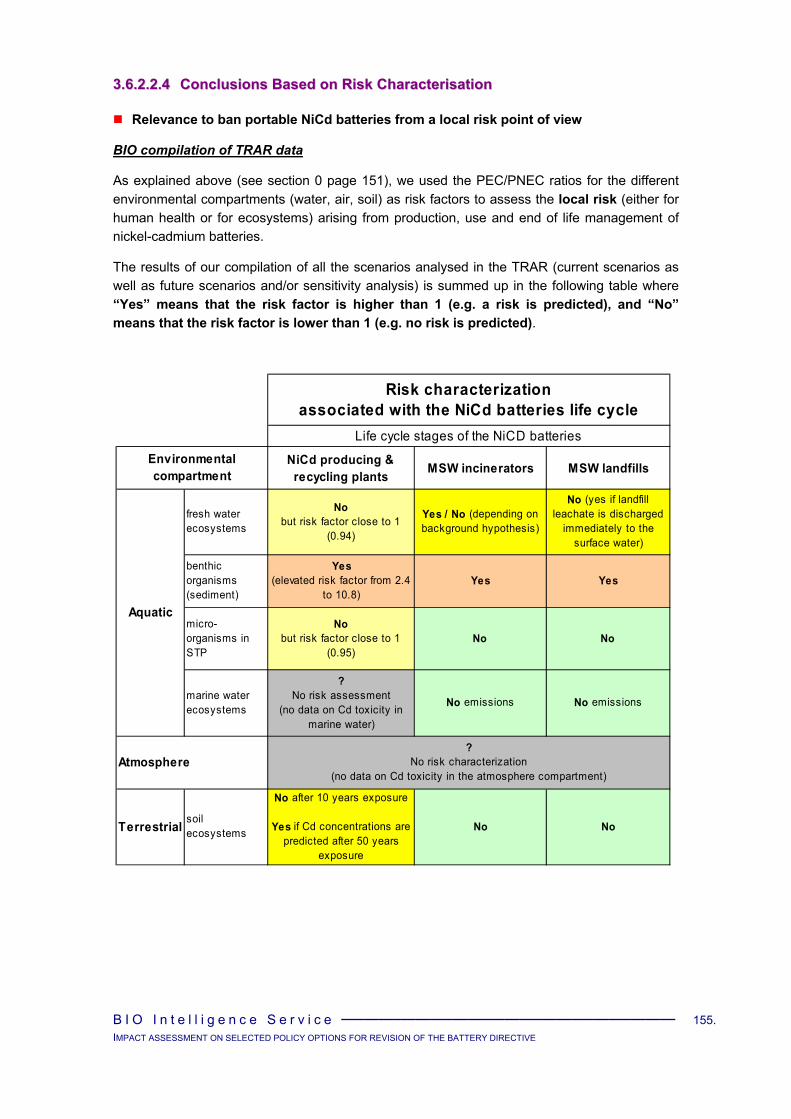
B I O I n t e l l i g e n c e S e r v i c e _____________________________________________ 155. IMPACT ASSESSMENT ON SELECTED POLICY OPTIONS FOR REVISION OF THE BATTERY DIRECTIVE
33..66..22..22..44 CCoonncclluussiioonnss BBaasseedd oonn RRiisskk CChhaarraacctteerriissaattiioonn
Relevance to ban portable NiCd batteries from a local risk point of view
BIO compilation of TRAR data
As explained above (see section 0 page 151), we used the PEC/PNEC ratios for the different environmental compartments (water, air, soil) as risk factors to assess the local risk (either for human health or for ecosystems) arising from production, use and end of life management of nickel-cadmium batteries.
The results of our compilation of all the scenarios analysed in the TRAR (current scenarios as well as future scenarios and/or sensitivity analysis) is summed up in the following table where “Yes” means that the risk factor is higher than 1 (e.g. a risk is predicted), and “No” means that the risk factor is lower than 1 (e.g. no risk is predicted).
NiCd producing & recycling plants MSW incinerators MSW landfills
fresh water ecosystems
No but risk factor close to 1
(0.94)
Yes / No (depending on background hypothesis)
No (yes if landfill leachate is discharged
immediately to the surface water)
benthic organisms (sediment)
Yes(elevated risk factor from 2.4
to 10.8)Yes Yes
micro-organisms in STP
Nobut risk factor close to 1
(0.95)No No
marine water ecosystems
? No risk assessment
(no data on Cd toxicity in marine water)
No emissions No emissions
Terrestrial soil ecosystems
No after 10 years exposure
Yes if Cd concentrations are predicted after 50 years
exposure
No No
Risk characterization associated with the NiCd batteries life cycle
Life cycle stages of the NiCD batteries
? No risk characterization
(no data on Cd toxicity in the atmosphere compartment)
Aquatic
Atmosphere
Environmental compartment

B I O I n t e l l i g e n c e S e r v i c e _____________________________________________ 156. IMPACT ASSESSMENT ON SELECTED POLICY OPTIONS FOR REVISION OF THE BATTERY DIRECTIVE
We can deduce that (conclusions coherent with the TRAR conclusions / results chapter contained in the May version):
For all environmental compartments assessed in the TRAR:
- If risk reduction measures and regulations which already exist are applied at all the life cycle stages and mainly incineration and landfill facilities, there is no local risk from Cd emissions except for local sediment compartment.
- If existing regulations are not applied (in particular for incineration and landfill facilities), local risks exist for fresh water ecosystems.
- For local sediment compartment, the background concentration is today already higher than the predicted no effect concentration (i.e. the existing Cd concentration in sediment has already eco-toxicological effect on benthic organisms).
No risk assessment has been performed regarding air emissions due to a lack of toxicity data of cadmium in the atmospheric compartment.
BIO conclusion
When considering local risks, the TRAR does not permit to definitively exclude the relevance of a ban on portable NiCd batteries because:
no risk assessment has been performed regarding air emissions,
no conclusion can be drawn for additional risk in sediment compartment because existing cadmium concentration has already eco-toxicological effect,
for the other compartments, the existence or absence of local risk depend on local characteristics: in particular, incineration and landfill facilities in conformity with EU regulations and applying existing risk reduction measures have no local risk whereas others have local risks for fresh water ecosystems.
On the other hand, a ban option will not necessarily result in a no risk situation because two flows of spent NiCd batteries will still have to be treated after the ban is into force: batteries which will become waste after the ban and batteries discarded after having been hoarded47.
High rate collection and recycling of NiCd batteries and / or enforcement of existing regulations about incinerators and landfill facilities are likely to be good alternatives to a ban with a view to reduce local risks.
47 60% of rechargeable batteries are assumed being hoarded today by end users.

B I O I n t e l l i g e n c e S e r v i c e _____________________________________________ 157. IMPACT ASSESSMENT ON SELECTED POLICY OPTIONS FOR REVISION OF THE BATTERY DIRECTIVE
Uncertainties and current limitations of the TRAR
The risk assessment as currently performed in the TRAR suffers from several limitations.
Release to the environment and environmental exposure
Some plants have not transmitted emission data, thus the distributions of Cd emissions (total kg in EU) to different environmental compartments during Ni-Cd batteries life cycle may be underestimated.
Cd and CdO producing plants are not addressed in this TRAR but have been incorporated in the overall RAR on Cd metal and CdO (2001).
Emissions from industrial NiCd batteries disposed of in industrial landfill are not addressed in this TRAR.
The emissions associated with landfilling of incineration products (ashes) have not been assessed. Thus, delayed emissions associated with landfilling of output fractions of MSW incinerators (particularly ash) are not addressed (whereas 24 to 120 tonnes per year of Cd contained in ash are landfilled or are reused in road construction)48.
Long term (above 500 years) water emissions associated with Cd disposed of in landfill are not taken into account, although release of pollutants from a landfill can occur over an indefinite period. Cadmium emissions out of landfill (within leachate49) are very uncertain (although Cd emission from landfill are reported to be the principal source of water release of Cd). Hence, the daily or annual release may result in a very portable PEC and does not reflect the long-term emissions of a landfill.
The impact of an increasing cadmium content in the MSW on leachate composition cannot be predicted on the basis of current knowledge since there is no direct relationship between the total content of Cd and the leachability of Cd. A 10% increase of total Cd content in MSW landfilled will not necessarily lead to a 10% increase in the leachable amount of Cd. The leachability will depend on the chemical nature of the cadmium and the leaching conditions.
In this TRAR, the cadmium concentration in the leachate originating from a fixed amount of cadmium being landfilled is assumed to be constant over time. The question arises whether or not it is reasonable to assume one constant leachate concentration since the conditions in landfills are changing during the different degradation phases in a landfill.
The environmental impacts after a hypothetical infinite time period has not been addressed in this TRAR since scientific knowledge on this issue is insufficient.
Risk characterisation
No toxicity data of cadmium in the atmospheric compartment have been found. Therefore no risk assessment has been performed regarding air emissions.
48 At present 8,333 kt of bottom ash and 1,095 kt of fly ash have to be disposed of on a yearly basis. The cadmium
concentrations in the bottom ash and fly ash are respectively 3.8 mg Cd/kg dry wt. and 192 mg Cd/kg dry wt. The re-use and/or landfilling of incineration residues may result in a long-term diffuse emission potentially contaminating groundwater, surface water and soil. The delayed cadmium emissions of the re-use of incineration residues have, however, not been quantified in this TRAR since the use of incineration residues is only allowed if the results of leaching tests are favourable.
49 Leachate is generated as a result of the expulsion of liquid from the waste due to its own weight or compaction loading (termed primary leachate) and the percolation of water through a landfill (termed secondary leachate). The source of percolating water could be precipitation, irrigation, groundwater or leachate recirculated through the landfill.

B I O I n t e l l i g e n c e S e r v i c e _____________________________________________ 158. IMPACT ASSESSMENT ON SELECTED POLICY OPTIONS FOR REVISION OF THE BATTERY DIRECTIVE
33..66..22..33 CCoonncclluussiioonnss AAbboouutt EEnnvviirroonnmmeennttaall IImmppaaccttss
Conclusions about toxic and ecotoxic risks based on TRAR data are the following:
From a global risks point of view, a ban of NiCd batteries is not relevant to reduce total human cadmium exposure because they do not represent a significant source of Cd emissions to the environment (they come mainly from other anthropogenic Cd emission sources: fertilizers, fossil fuels, iron and steel…). (TRAR conclusion)
As for local risks, there is no strong argument to support a ban on industrial NiCd batteries, because they do not represent a significant source of Cd emissions to the environment (local risks are primarily linked to incineration and landfilling and most of industrial NiCd batteries are believed to be collected and sent to recycling). (BIO conclusions from TRAR data)
On the contrary, as far as portable NiCd batteries and local risks are concerned, BIO calculation of characterisation risk factors from TRAR data does not permit to exclude the relevance of a ban on portable NiCd batteries (BIO conclusions from TRAR data):
- no risk assessment has been performed regarding air emissions, - no conclusion can be drawn for additional risk in sediment compartment because existing
cadmium concentration has already eco-toxicological effect, - for the other compartments, the existence or absence of local risk depend on local
characteristics: in particular, incineration and landfill facilities in conformity with EU regulations and applying existing risk reduction measures have no local risk whereas others have local risks for fresh water ecosystems.
On the other hand, a ban option will not necessarily result in a no risk situation because two flows of spent NiCd batteries will still have to be treated after the ban is into force: batteries which will become waste after the ban and batteries discarded after having been hoarded50.
High rate collection and recycling of portable NiCd batteries and / or enforcement of existing regulations about incinerators and landfill facilities are likely to be good alternatives to a ban with a view to reduce local risks.
Other environmental impacts can be mentioned.
Because the life expectancy of NiMH batteries in terms of number of cycles is between one third and one half that of NiCd, the number of cells for disposal would double or triple. And for domestic tools, it is often necessary to replace the entire tool because it is a sealed unit and the battery cannot be removed.
50 60% of rechargeable batteries are assumed being hoarded today by end users.
B I O I n t e l l i g e n c e S e r v i c e _____________________________________________ 159. IMPACT ASSESSMENT ON SELECTED POLICY OPTIONS FOR REVISION OF THE BATTERY DIRECTIVE
33..66..33 FFeeaassiibbiilliittyy
We now focus on the ban on portable NiCd batteries since the relevance to ban industrial batteries appear to be low from the TRAR. The first question, addressed in this chapter, is: do substitute exist to replace portable NiCd batteries in case of ban? The economic and social impacts are then analysed in the next chapter.
33..66..33..11 OOvveerrvviieeww ooff tthhee BBaatttteerryy MMaarrkkeett
33..66..33..11..11 RReecchhaarrggeeaabbllee BBaatttteerriieess TTeecchhnnoollooggiieess
There is no unique battery chemistry which can combine optimum performance under all operating conditions, i.e. high temperature, low temperature, mechanical abuse, light weight, low volume, high rate discharge, low rate discharge, long cycle life, low self discharge, reliability, low maintenance, etc.
Among rechargeable batteries, lead-acid batteries of various designs dominate the industrial market. The largest group is the automotive starting, lighting and ignition (SLI) battery. There are various types of SLI batteries depending on climate conditions and application types such as trucks, cars and boats. Both vented (open) and sealed types are available.
In cycling applications such as traction and vehicular propulsion for electric trucks and industrial vehicles for uses in mining, railroads or submarines, where long cycle life is required, lead-acid batteries of a different design than the SLI batteries are used. In stand-by applications such as telecommunication, computer backup, emergency lighting and power backup systems, various types of vented or valve-regulated (VRLA) lead-acid batteries are used depending on the specific application.
B I O I n t e l l i g e n c e S e r v i c e _____________________________________________ 160. IMPACT ASSESSMENT ON SELECTED POLICY OPTIONS FOR REVISION OF THE BATTERY DIRECTIVE
Vented or sealed industrial NiCd batteries with pocket, sintered, fiber, or plastic-bonded electrodes are used in applications where the batteries are exposed to:
temperature extremes,
mechanical abuse,
limited or no maintenance,
demand for long service life,
high reliability requirements.
Industrial NiCd batteries are used in railroad and mass transit applications due to their high durability and excellent resistance to mechanical and electrical abuse. Other applications for industrial NiCd batteries are for stationary installations where power reliability is the highest priority as life and great economic investments could be jeopardized by a power failure. Examples of such installations are hospital operating theaters, offshore oil rigs, backup power for large computer systems in banks and insurance companies, standby power in process industries, and emergency power systems in airports. Another important use for industrial NiCd batteries is in aviation applications where they are used mainly for aircraft starting and emergency power. Specialized uses in space and military applications are also important because of their high performance, long life and dependability.
Lead-acid batteries have always dominated the telecommunication market, particularly in large central station batteries. With the development of fiber optic systems and more decentralised distribution systems, the traditional valve regulated lead acid (VRLA) battery could not meet the demand requiring 99,9% reliability and long service life. The VRLA batteries therefore have been replaced by low maintenance, long life NiCd batteries of 80 and 125 Ampere-hours (Ah). It is interesting to note that, in this application, the industrial NiCd battery has been able to penetrate a traditional lead-acid market segment. The reason is that a NiCd battery was developed, which could meet the market demand of high reliability, low maintenance and long life in a wide temperature range, resulting in a cost per unit of performance that was superior to the lead-acid batteries being used.
The global market for consumer type rechargeable batteries has exploded during recent years as more and more electronic and portable devices are introduced in the market place. This rapid growth began in the 1980s with cordless devices such as shavers and phones and has now evolved into toys, household appliances, laptop and handheld computers, camcorders, cameras, memory back up, power tools, and, above all, cellular phones.
The consumer portable battery market has been dominated by sealed cylindrical NiCd batteries for many years. However, in applications where a high specific energy and low weight in a moderate temperature range are required, the NiMH battery is now the preferred battery chemistry. More recently, the Li-ion and, most recently, Li-polymer batteries are now penetrating this market segment, and will probably command a significant share of the rechargeable consumer battery market in the future. Sealed lead-acid batteries have only a portable market share of portable applications.
Sealed NiCd batteries still maintain their strong market position in applications which require:
high power drains and drain rates,
temperature extremes,
long life.
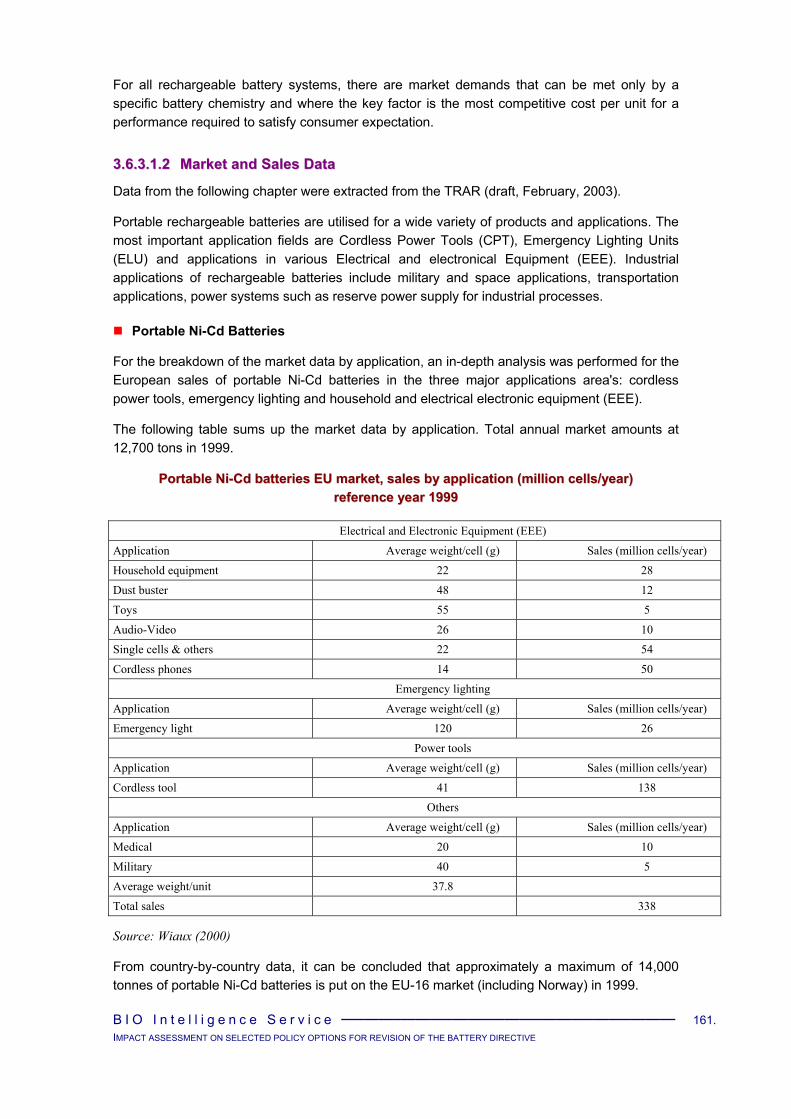
B I O I n t e l l i g e n c e S e r v i c e _____________________________________________ 161. IMPACT ASSESSMENT ON SELECTED POLICY OPTIONS FOR REVISION OF THE BATTERY DIRECTIVE
For all rechargeable battery systems, there are market demands that can be met only by a specific battery chemistry and where the key factor is the most competitive cost per unit for a performance required to satisfy consumer expectation.
33..66..33..11..22 MMaarrkkeett aanndd SSaalleess DDaattaa
Data from the following chapter were extracted from the TRAR (draft, February, 2003).
Portable rechargeable batteries are utilised for a wide variety of products and applications. The most important application fields are Cordless Power Tools (CPT), Emergency Lighting Units (ELU) and applications in various Electrical and electronical Equipment (EEE). Industrial applications of rechargeable batteries include military and space applications, transportation applications, power systems such as reserve power supply for industrial processes.
Portable Ni-Cd Batteries
For the breakdown of the market data by application, an in-depth analysis was performed for the European sales of portable Ni-Cd batteries in the three major applications area's: cordless power tools, emergency lighting and household and electrical electronic equipment (EEE).
The following table sums up the market data by application. Total annual market amounts at 12,700 tons in 1999.
PPoorrttaabbllee NNii--CCdd bbaatttteerriieess EEUU mmaarrkkeett,, ssaalleess bbyy aapppplliiccaattiioonn ((mmiilllliioonn cceellllss//yyeeaarr)) rreeffeerreennccee yyeeaarr 11999999
Electrical and Electronic Equipment (EEE)
Application Average weight/cell (g) Sales (million cells/year)
Household equipment 22 28
Dust buster 48 12
Toys 55 5
Audio-Video 26 10
Single cells & others 22 54
Cordless phones 14 50
Emergency lighting
Application Average weight/cell (g) Sales (million cells/year)
Emergency light 120 26
Power tools
Application Average weight/cell (g) Sales (million cells/year)
Cordless tool 41 138
Others
Application Average weight/cell (g) Sales (million cells/year)
Medical 20 10
Military 40 5
Average weight/unit 37.8
Total sales 338
Source: Wiaux (2000)
From country-by-country data, it can be concluded that approximately a maximum of 14,000 tonnes of portable Ni-Cd batteries is put on the EU-16 market (including Norway) in 1999.

B I O I n t e l l i g e n c e S e r v i c e _____________________________________________ 162. IMPACT ASSESSMENT ON SELECTED POLICY OPTIONS FOR REVISION OF THE BATTERY DIRECTIVE
Recent data given by industry indicate a decrease in the weight volume introduced on the market with respectively 11,930 and 10,995 tonnes/year for 2000 and 2001.
Industrial Ni-Cd Batteries
The European market for industrial batteries can be split into a number of well-defined sectors as follows: Standby, or stationary, applications: safety and back-up systems at airports, hospitals,
power stations, offshore installations, etc., Transportation: railways, metro cars, etc., Aviation: starting of engines, oil board safety systems, etc., Electric vehicles (EV).
The batteries within the two largest segments - standby and transportation - are used within specific country's infrastructures. The need for batteries for new installations is the largest during this infrastructure development phase. Batteries for standby applications are often purchased by equipment manufacturer (OEM) and delivered together with the equipment to the user. Many of these OEM's are situated in Western Europe while the users are situated in e.g. the Middle East and Far East. Thus, the batteries are purchased by and invoiced to a European customer, but they are very often re-exported to other parts of the world. In some of the Member states with important OEM'S, the re-export factor of standby batteries can be as high as 50 %.
Batteries for transportation and aviation purposes are to a higher extent delivered directly to the end user and the re-export factor is lower (15 %). The EV (Electric Vehicles) market is still at a low level. Main part of the EV nickel-cadmium is produced in the EU and is used within the EU.
The volumes of the different industrial Ni-Cd batteries for use within the EU market were estimated from data of the three major suppliers (representing more than 95 % of the market supply) with addition of an estimated volume of imported batteries (see following table).
IInndduussttrriiaall NNii--CCdd BBaatttteerriieess EEUU MMaarrkkeett SSaalleess ((ttoonnnneess//yyrr))
Year Industrial Ni-Cd battery (tonnes/year)
1995 3,242
1996 3,608
1997 3,625
1998 3,964
1999 3,697
2000 3,566
Sources: original references Saft, Exide and Hoppecke in Wiaux (2000, 2002)
From this table it is clear that the industrial batteries market have reached a stable level of 3,500 to 4,000 tons per year. Cross-validation with the ERM study shows the same magnitude (4,000 tons in 1995). About 3,700 tonnes of industrial Ni-Cd batteries is put on the EU-16 market (EU including Norway) in 1999.
B I O I n t e l l i g e n c e S e r v i c e _____________________________________________ 163. IMPACT ASSESSMENT ON SELECTED POLICY OPTIONS FOR REVISION OF THE BATTERY DIRECTIVE
33..66..33..11..33 MMaarrkkeett TTrreennddss Most of the data related to market evolution come from industry. No precise information was (made) available on how the Ni-Cd battery market is likely to evolve in the future.
Ni-Cd batteries can be classified into four lines of products according to their market applications: industrial batteries, Emergency Lighting units (ELU), Cordless Power Tools (CPT) and applications in numerous Electrical and Electronic Equipment (EEE).
The largest application field for Ni-Cd batteries and a growing market have become the CPT applications (separated between the Professionals and Consumer market). The ELU market is under a slight growth rate with higher market shares in countries like France, United Kingdom, Italy and Spain, by opposition to Germany where centralised units powered by lead-acid batteries are used. The EEE market, which has been the largest market segment for Ni-Cd batteries during the first half of the nineties, is declining. From 1995, Ni-Cd batteries have gradually being replaced on the market by other types of batteries like the Nickel-Metal Hydride, the Lithium-Ion and the Lithium-Polymer batteries. Industrial Ni-Cd batteries are continuously in competition with lead-acid batteries but forms a stable market. Market shares for the different applications for the years 1999 and 2000 are summed up in the following tables.
DDiissttrriibbuuttiioonn ((%% wweeiigghhtt)) ooff NNii--CCdd BBaatttteerriieess MMaarrkkeett SShhaarree bbyy AApppplliiccaattiioonn RReeffeerreennccee yyeeaarr 11999999
Industrial 22 % (Stable)
Portable CPT 35 % ( growing)
Portable ELU 18 % (Stable)
Portable EEE 25 % (Declining)
Source: Collect NiCad (2000)
DDiissttrriibbuuttiioonn ((%% wweeiigghhtt)) ooff NNii--CCdd BBaatttteerriieess MMaarrkkeett SShhaarree bbyy AApppplliiccaattiioonn RReeffeerreennccee yyeeaarr 22000000
Industrial 24 % (Stable)
Portable CPT 35 % (growing)
Portable ELU 19 % (Stable)
Portable EEE 16 % (Declining)
Specialities (Aviation, Industrial Comm. & Computing) 6 % and growing
Source: Collect NiCad (2002)
It can be concluded that the Ni-Cd market has increased significantly in the 80's to reach a more or less stable level in the late 1990's of around 13,500 tons/year for consumer/sealed portable nickel-cadmium batteries and 3,500 to 4,000 tons/year for the industrial nickel-cadmium battery market.
To date, no market projections are available for the amount of portable Ni-Cd batteries which will be put on the market in the future. The ERM study (2000) employed a positive common growth rate for all types of portable secondary batteries (+ 5-6%). However, since the market evolution is stated to be mainly technology driven and as there is confidential business implication, it is difficult to get any good specific estimate for the growth rate of Ni-Cd chemistry applications. Between 1996 and 1999, the portable Ni-Cd battery market in the EU seems to be oscillating around 13,000 -14,000 tonnes51. But recent figures for 2000 and 2001 indicate a decrease in sales. The industrial batteries remain at the level of 3,600 tonnes.
51 The reference year 1999 was chosen because this was the most recent year for which cross validation of the data
provided by industry with those provided by Member States was possible.

B I O I n t e l l i g e n c e S e r v i c e _____________________________________________ 164. IMPACT ASSESSMENT ON SELECTED POLICY OPTIONS FOR REVISION OF THE BATTERY DIRECTIVE
0%
20%
40%
60%
80%
100%
1990 1993 1996 1999
Pb-acid Ni-Cd Ni-MH Li-Ion Li-Polym
CollectNiCad
European Portable Rechargeable Battery Market Evolutionas a % of cells numbers introduced on the EU market
Cel
ls N
umbe
r Rat
i o
33..66..33..11..44 TTeecchhnnoollooggiiccaall EEvvoolluuttiioonn:: aa MMaarrkkeett RReeaalliittyy
During the nineties, the rechargeable battery industry invested up to 5% of its turnover into R&D for the development of alternative sources of portable electrical energy (Source: SAFT).
For industrial rechargeable batteries, the commercial systems in competition remained the Lead-acid battery and the Nickel-Cadmium batteries. Prototypes of Nickel-Metal hydrides batteries and of Li-Ion batteries were announced in the Electric Vehicle applications but they did not reached industrial scale and this is not foreseen before an undefined period of time52.
For portable rechargeable batteries, the commercial systems in competition are basically five: Lead-acid, Nickel-Cadmium, Nickel-Metal Hydride, Lithium-Ion and Lithium-Polymer.
MMaarrkkeett EEvvoolluuttiioonn ffoorr PPoorrttaabbllee RReecchhaarrggeeaabbllee bbaatttteerriieess iinn EEuurrooppee
Source: Collect NiCad
The data presented in this figure demonstrates that the rechargeable battery industry has been committed to very progressive technological development in which the offer to the end-user has been enlarged from two basic systems in 1990 (Lead-acid, Nickel-Cadmium) to five systems in the year 2000 (with the addition of Nickel-Metal Hydride, Lithium-Ion and Lithium-Polymer to the previously mentioned systems).
In the year 2000, the five systems are present on the market in a very competitive commercial context where each technology has found its own market share. It is important to realise that the most important actors in manufacturing rechargeable batteries are involved in the production of more than one type of system. This reality is presented in the next figure, where it can be observed that the manufacturing leaders, SAFT, VARTA, SANYO, MOLTECH, YUASA and PANASONIC are not only competing on the commercial scene but also internally to promote the best technology for a given application.
52 The Toyota RAV 4 has often been cited as an example of the electric vehicle powered by a NiMH rechargeable
battery (marketed principally in California and not on offer by Toyota in Europe), providing a suitable alternative to Ni(Cd powered electric vehicles. However, Toyota Motor Corporation has discontinued production of the RAV4 Electric Vehicle worldwide in spring 2003.

B I O I n t e l l i g e n c e S e r v i c e _____________________________________________ 165. IMPACT ASSESSMENT ON SELECTED POLICY OPTIONS FOR REVISION OF THE BATTERY DIRECTIVE
CollectNiCad
Industrial Ni-Cd Battery Market
Technological Innovation Actors Manufacturers of Industrial Rechargeable Batteries
Industrial Production (neither pilot nor research level) - EV Batteries Excluded
Companies Pb-Acid Ni-CdSAFT - YHOPPECKE Y Y VARTA Y - EXIDE Y Y FIAMM Y -HAWKER (Oldham - UK) Y -HONDA DENKI - YMARATHON (US) Y -FURUKAWA Y Y For Lead-Acid : OERLIKON, BANNER, YUASA, HITACHI...
Y:Manufacturer
PPrroodduucceerrss ooff PPoorrttaabbllee RReecchhaarrggeeaabbllee BBaatttteerriieess
Source: Collect NiCad
If the portable rechargeable battery industry would not have developed technical alternatives to Nickel-Cadmium batteries, the market of those batteries would probably be twice as large as it is during the year 2000 and even larger.
For industrial rechargeable batteries, the market has been distributed between two types, Lead-acid and Nickel-Cadmium, for the last ten years. In the following figure, the manufacturers of Industrial Rechargeable Batteries are presented.
PPrroodduucceerrss ooff IInndduussttrriiaall RReecchhaarrggeeaabbllee BBaatttteerriieess
Source: Collect NiCad
CollectNiCad
Portable Rechargeable Battery Market
Technological Innovation Actors Manufacturers of Portable Rechargeable Batteries
Companies Pb-Acid Ni-Cd Ni-MH Li-Ion Li-Polymer
SAFT - Y Y Y -VARTA Y Y Y Y -SANYO - Y Y Y YPANASONIC Y Y Y Y YYUASA Y Y Y Y YMOLTECH - Y Y Y YEMMERICH - Y - - -GP Battery - Y Y Y YBYD - Y Y Y YTOSHIBA - - Y Y YSONY - - - Y YGS Melcotech - - - Y YHITACHI Y Y Y Y Y
Y:Manufacturer
B I O I n t e l l i g e n c e S e r v i c e _____________________________________________ 166. IMPACT ASSESSMENT ON SELECTED POLICY OPTIONS FOR REVISION OF THE BATTERY DIRECTIVE
33..66..33..11..55 TTeecchhnniiccaall PPeerrffoorrmmaannccee:: aa BBrrooaadd AApppplliiccaattiioonn RRaannggee
It is a theoretical view of the problem to claim that battery performances can be compared only on a Wh/kg basis (energy density). The reality is quite different and in their day-to-day commercial activity, companies that are offering the best services to their clients are in fact offering a variety of technologies in the field of portable rechargeable batteries. A broad range of technical characteristics is satisfied when a battery system finds its application in a piece of equipment.
Table on next page details various parameters and technical characteristics that are considered before making the final choice for one or other of the rechargeable battery systems.
The following parameters are compared in relation to the different battery systems:
Energy density,
Impedance/Current drain,
Temperature range,
Charge storage,
Charge mode,
Lifetime,
Cycling capacity,
Production cost,
Production technology.
None of those parameters can be dissociated from the others. They all have an impact on the potentiality to apply a given battery technology in a selected application: costs versus performances are the parameters leading to the final selection.
The origin of this multi-criteria selection is found in the broad application ranges of electrical and electronic equipment satisfied by portable electrical energy sources. All these parameters such as energy, power, cycling capacity and others have to be evaluated simultaneously and not independently.
If one considers a mobile telephone, the lowest weight and the smallest size are desirable, but the current drain is characteristic of an electronic device (low current drain in the 10 milli-amperes range). In this application, Li-Ion batteries are replacing advantageously Ni-MH and Ni-Cd for technical and design reasons.
For a cordless power tool, the first obvious requirement is power or high current drain characteristic. In this application, the highest power delivery is critical. In addition, this high power has to be available several tens of hundreds of times. The amperage requirement for a power tool is in the 10 amperes range or 1000 times higher than that for a portable telephone. Consequently in this application, even if Li-Ion would be at the same price level as a Ni-Cd battery, the Li-Ion battery would not be selected. Energy is not the key factor here, but power.
Lastly, the most decisive argument for the industrial application of rechargeable batteries is still the reliability in safety applications where Nickel-Cadmium systems offer a full warranty on their performances.
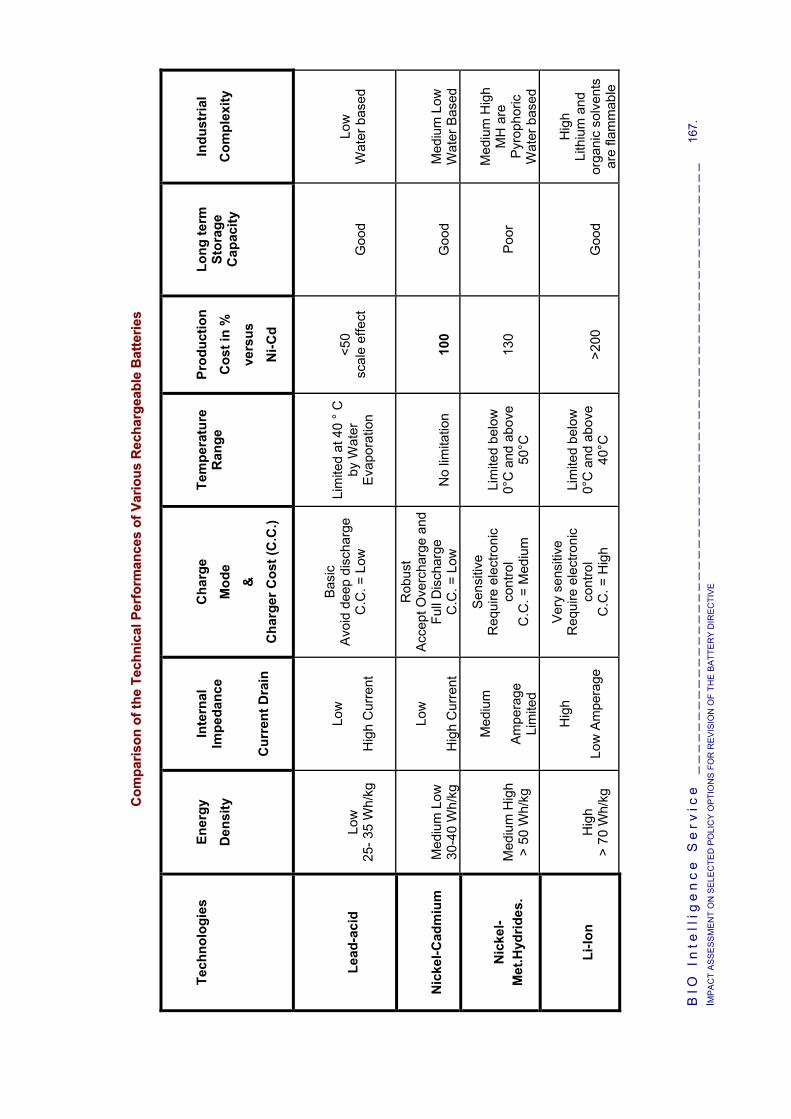
BIO
In
tell
ige
nc
e S
erv
ice
__
__
__
__
__
__
__
__
__
__
__
__
__
__
__
__
__
__
__
__
__
__
__
__
__
__
__
__
_
167.
IM
PA
CT
AS
SE
SS
ME
NT
ON
SE
LEC
TED
PO
LIC
Y O
PTI
ON
S F
OR
RE
VIS
ION
OF
THE
BA
TTE
RY
DIR
EC
TIV
E
CCoo mm
pp aarr ii
ss oonn
oo ff tt hh
ee TT ee
cc hhnn ii
cc aall PP
ee rrff oo
rr mmaa nn
cc eess
oo ff VV
aa rrii oo
uu ss RR
ee cchh aa
rr ggee aa
bb llee
BBaa tt
tt eerr ii
ee ss
Tech
nolo
gies
Ener
gy
Den
sity
Inte
rnal
Im
peda
nce
Cur
rent
Dra
in
Cha
rge
Mod
e
&
Cha
rger
Cos
t (C
.C.)
Tem
pera
ture
R
ange
Prod
uctio
n
Cos
t in
%
vers
us
Ni-C
d
Long
term
St
orag
e C
apac
ity
Indu
stria
l
Com
plex
ity
Lead
-aci
d
Lo
w
25- 3
5 W
h/kg
Lo
w
H
igh
Cur
rent
Basi
c Av
oid
deep
dis
char
ge
C.C
. = L
ow
Li
mite
d at
40
° C
by
Wat
er
Evap
orat
ion
<5
0 sc
ale
effe
ct
G
ood
Lo
w
Wat
er b
ased
Nic
kel-C
adm
ium
M
ediu
m L
ow
30-4
0 W
h/kg
Lo
w
H
igh
Cur
rent
Rob
ust
Acce
pt O
verc
harg
e an
d Fu
ll D
isch
arge
C
.C. =
Low
N
o lim
itatio
n
10
0
G
ood
M
ediu
m L
ow
Wat
er B
ased
Nic
kel-
Met
.Hyd
rides
.
M
ediu
m H
igh
> 50
Wh/
kg
M
ediu
m
Am
pera
ge
Lim
ited
Sens
itive
R
equi
re e
lect
roni
c co
ntro
l C
.C. =
Med
ium
Li
mite
d be
low
0°
C a
nd a
bove
50
°C
13
0
Poor
M
ediu
m H
igh
MH
are
P
yrop
horic
W
ater
bas
ed
Li-Io
n
H
igh
> 70
Wh/
kg
H
igh
Low
Am
pera
ge
Very
sen
sitiv
e R
equi
re e
lect
roni
c co
ntro
l C
.C. =
Hig
h
Li
mite
d be
low
0°
C a
nd a
bove
40
°C
>2
00
G
ood
H
igh
Lith
ium
and
or
gani
c so
lven
ts
are
flam
mab
le
B I O I n t e l l i g e n c e S e r v i c e .
IMPACT ASSESSMENT ON SELECTED POLICY OPTIONS FOR REVISION OF THE BATTERY DIRECTIVE
168
33..66..33..11..66 DDrriivviinngg FFoorrcceess ffoorr TTeecchhnnoollooggiiccaall EEvvoolluuttiioonn
In Communication Equipment, Office and Household Appliances
The requirements for lower current drain characteristics from new electronic devices, the decreasing size and volume of communication equipment, the high volumetric energy of Li-Ion for low current drain applications but also the higher added value of equipment are parameters influencing technological evolution.
The diversification of the mobile communication equipment, portable computers and visual communication equipment has required smaller sized rechargeable batteries.
In other areas where miniaturisation has not been critical, such as shavers, tooth-brushes and home mobile telephones, the Ni-Cd battery is still the preferred choice for its robustness in given operating conditions and basic technical requirements. Price plays an important role at this level of international competition.
A simple charger technology is required for Ni-Cd batteries. The charger technology for Ni-MH and Li-Ion is more sophisticated. It requires electronic control circuits to avoid overcharge and over-discharge.
In Cordless Power Tools
For high current drain applications, the cadmium electrode has proven to achieve optimum performances while the metal hydride electrode is more fragile.
The combination of optimum technical performances and price, offered to the end user, is critical. The wide range of power tool applications associated with safety aspects of a portable rechargeable battery is at the origin of the high market development rate of this application field which is satisfied at the best by the Ni-Cd system.
In Emergency Lighting Units
The Normalisation conditions for usage at low temperature (below minus 20°C) and high temperature (above 50°C) operating ranges make Ni-Cd batteries the preferred choice. In addition, a Ni-MH battery performs less well in permanent charge floating conditions except if it is equipped with a more sophisticated overcharge control system.
In Industrial Battery Applications
Wide range research and development work is underway to satisfy application programs in the uninterruptible power supply field as well as in areas such as safety for tunnels, transportation, industrial robots and electric vehicles…
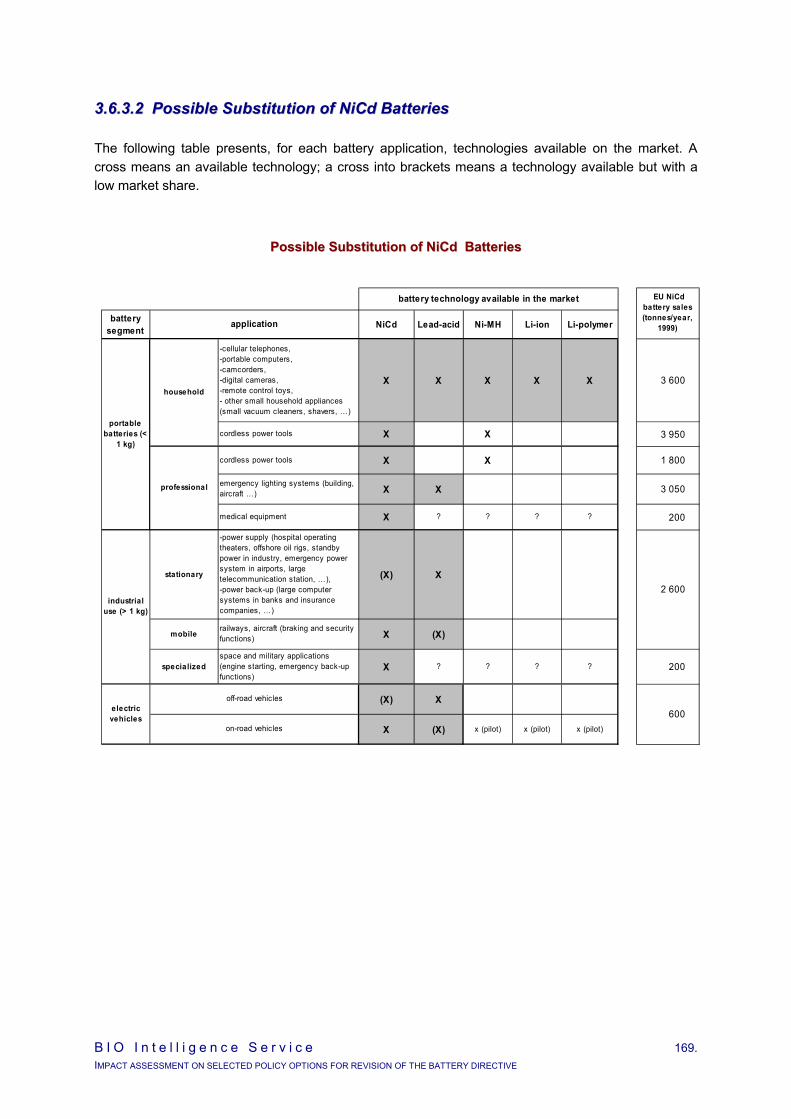
B I O I n t e l l i g e n c e S e r v i c e 169. IMPACT ASSESSMENT ON SELECTED POLICY OPTIONS FOR REVISION OF THE BATTERY DIRECTIVE
33..66..33..22 PPoossssiibbllee SSuubbssttiittuuttiioonn ooff NNiiCCdd BBaatttteerriieess
The following table presents, for each battery application, technologies available on the market. A cross means an available technology; a cross into brackets means a technology available but with a low market share.
PPoossssiibbllee SSuubbssttiittuuttiioonn ooff NNiiCCdd BBaatttteerriieess
battery segment NiCd Lead-acid Ni-MH Li-ion Li-polymer
-cellular telephones, -portable computers, -camcorders, -digital cameras, -remote control toys, - other small household appliances (small vacuum cleaners, shavers, …)
X X X X X 3 600
cordless power tools X X 3 950
cordless power tools X X 1 800
emergency lighting systems (building, aircraft …) X X 3 050
medical equipment X ? ? ? ? 200
stationary
-power supply (hospital operating theaters, offshore oil rigs, standby power in industry, emergency power system in airports, large telecommunication station, …), -power back-up (large computer systems in banks and insurance companies, …)
(X) X
mobilerailways, aircraft (braking and security functions) X (X)
specializedspace and military applications (engine starting, emergency back-up functions)
X ? ? ? ? 200
(X) X
X (X) x (pilot) x (pilot) x (pilot)
600
EU NiCd battery sales (tonnes/year,
1999)
electric vehicles
portable batteries (<
1 kg)
off-road vehicles
on-road vehicles
household
battery technology available in the market
professional
industrial use (> 1 kg)
application
2 600

B I O I n t e l l i g e n c e S e r v i c e 170. IMPACT ASSESSMENT ON SELECTED POLICY OPTIONS FOR REVISION OF THE BATTERY DIRECTIVE
In small-size batteries for consumers' applications (cellular phones, portable computers,…), five battery technologies are currently used; Lead-acid, Nickel-Cadmium, Nickel-Metal Hydride, Lithium-Ion and Lithium-Polymer. The last two, although the most expensive ones, have technical advantages and their place on the market is growing.
In small-size batteries for professional applications, there are only two current technologies: Lead-acid and Nickel-Cadmium.
For professional cordless power tools, the Nickel-Cadmium battery remains at the moment the only reliable technology; the TRAR indicates that lead-acid batteries are used in Germany, but we did not find no confirmation; Ni-MH batteries can be used but with severe technical53 and economical54 limitations.
For emergency lighting systems in buildings, Lead-acid can be used. It is of low cost but because it presents low performances and low reliability, Nickel-Cadmium is generally preferred55.
In emergency lighting systems in aircrafts, the Nickel-Cadmium battery is also preferred for its reliability and its specific energy.
For large-size batteries with industrial applications, the market is shared between Lead-acid and Nickel-Cadmium.
In stationary applications (power supply, power backup), Lead-acid is predominant due to its low cost. Nevertheless, the substitution by Nickel-Cadmium is under way, due to its higher performances. On the long term, the fuel cell would be a technology to take into account for stationary applications.
In mobile applications, in railways and in aircrafts, Nickel-Cadmium battery remains the preferred technology, especially in critical applications (emergency breaking, emergency starting).
The market of batteries for the electric vehicle is shared between Nickel-Cadmium and Lead-acid. Lead-acid is mainly used in off-road vehicles whereas the Nickel-Cadmium has a predominance for on-road vehicles, Nickel-Metal Hydride, Lithium-Ion and Lithium-Polymer are currently produced at a pilot-scale level and are tested in road conditions. Probably, Nickel-Metal Hydride batteries would never reach the industrial-scale production for economic reasons56. Lithium-Ion and Lithium-Polymer are the most promising technologies but have to be considered as long term candidates. Hybrid electric vehicles using fuel cells are currently evaluated but are not expected to reach the market before 10 to 20 years.
53 Ni-MH cells are less suitable than NiCd for portable power tools because Ni-MH cells, unlike NiCd, cannot simultaneously
be optimised to provide high capacity, high peak power and many deep discharges cycles. Moreover, Ni-MH batteries must be stored at a temperature between –10°C and 50°C, whereas NiCd may be stored at temperatures as low as –20°C (this may be important both for domestic users who often store tools in an unheated garage and professional users who store tools in vehicles).
54 The true cost of Ni-MH batteries would be between 30% and 40% higher than equivalent NiCd batteries. Furthermore, the through-life cost of Ni-MH batteries will also be much higher, because their life expectancy in terms of number of cycles is between one third and one half that of NiCd. Professional users will probably buy new battery packs (at a cost of typically 75 €); for domestic tools, it is often necessary to replace the entire tool because it is a sealed unit and the battery cannot be removed. It should be also noted that the shorter life cycle of Ni-MH cells would therefore double or triple the number of cells for disposal.
55 Emergency lighting systems are installed in building for the safety of people by providing adequate illumination on Escape ways, illuminating Safety signs, providing anti-panic lighting and lighting of high risk areas of power failure. A key consideration in choosing batteries for these self-contained emergency units is therefore reliability. At present time, the most reliable way to ensure that those criteria for emergency lighting units are met, is by using rechargeable batteries under permanent charge, which is not possible with either Ni-MH or Li-ion batteries. The limitations associated with lead-acid batteries are not well documented.
56 The Toyota RAV 4 has often been cited as an example of the electric vehicle powered by a NiMH rechargeable battery, (marketed principally in California and not on offer by Toyota in Europe), providing a suitable alternative to NiCad powered electric vehicles. However, Toyota Motor Corporation discontinued production of the RAV4 Electric Vehicle worldwide in spring 2003.
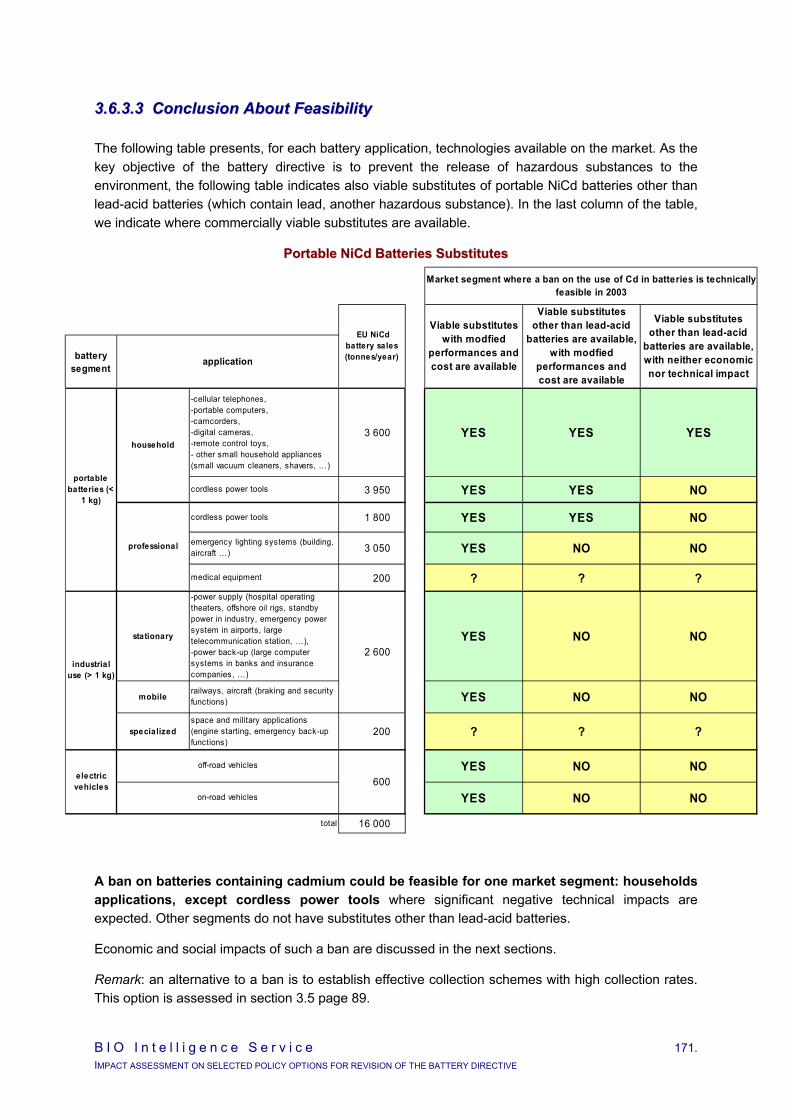
B I O I n t e l l i g e n c e S e r v i c e 171. IMPACT ASSESSMENT ON SELECTED POLICY OPTIONS FOR REVISION OF THE BATTERY DIRECTIVE
33..66..33..33 CCoonncclluussiioonn AAbboouutt FFeeaassiibbiilliittyy
The following table presents, for each battery application, technologies available on the market. As the key objective of the battery directive is to prevent the release of hazardous substances to the environment, the following table indicates also viable substitutes of portable NiCd batteries other than lead-acid batteries (which contain lead, another hazardous substance). In the last column of the table, we indicate where commercially viable substitutes are available.
PPoorrttaabbllee NNiiCCdd BBaatttteerriieess SSuubbssttiittuutteess
A ban on batteries containing cadmium could be feasible for one market segment: households applications, except cordless power tools where significant negative technical impacts are expected. Other segments do not have substitutes other than lead-acid batteries.
Economic and social impacts of such a ban are discussed in the next sections.
Remark: an alternative to a ban is to establish effective collection schemes with high collection rates. This option is assessed in section 3.5 page 89.
battery segment
-cellular telephones, -portable computers, -camcorders, -digital cameras, -remote control toys, - other small household appliances (small vacuum cleaners, shavers, …)
3 600 YES YES YES
cordless power tools 3 950 YES YES NO
cordless power tools 1 800 YES YES NO
emergency lighting systems (building, aircraft …) 3 050 YES NO NO
medical equipment 200 ? ? ?
stationary
-power supply (hospital operating theaters, offshore oil rigs, standby power in industry, emergency power system in airports, large telecommunication station, …), -power back-up (large computer systems in banks and insurance companies, …)
YES NO NO
mobilerailways, aircraft (braking and security functions) YES NO NO
specializedspace and military applications (engine starting, emergency back-up functions)
200 ? ? ?
YES NO NO
YES NO NO
total 16 000
Viable substitutes other than lead-acid
batteries are available, with modfied
performances and cost are available
Viable substitutes other than lead-acid
batteries are available, with neither economic nor technical impact
Market segment where a ban on the use of Cd in batteries is technically feasible in 2003
600
EU NiCd battery sales (tonnes/year)
electric vehicles
portable batteries (<
1 kg)
off-road vehicles
on-road vehicles
household
Viable substitutes with modfied
performances and cost are available
professional
industrial use (> 1 kg)
application
2 600

B I O I n t e l l i g e n c e S e r v i c e 172. IMPACT ASSESSMENT ON SELECTED POLICY OPTIONS FOR REVISION OF THE BATTERY DIRECTIVE
33..66..44 OOtthheerr IImmppaaccttss
Caveats: As no facts were available during the short time of this study, we gathered in this section qualitative information from industry sources and established first order assessment of economic and social impacts for the the NiCd batteries ban option, without pretending having covered the entire issue.
33..66..44..11 MMaarrkkeett SSttrruuccttuurree
Four types of industrial players are involved during the life of portable NiCd batteries:
NiCd cells producers,
assemblers of NiCd cells into packs,
incorporators of NiCd packs into equipments,
retailers.
NiCd cells producers
SAFT is the last European producer, with two plants producing both portable and industrial NiCd batteries, one in France and one in Sweden, and plants recently acquired producing industrial NiCd batteries in Spain and Germany.
According to industry sources, in France and Sweden, SAFT yearly sales are 600-700 million Euros, approximately 2/3 for industry batteries segment and 1/3 for portable batteries segment. To produce both industrial and portable batteries, 2000 to 3000 persons are employed by SAFT.
SAFT produces primarily NiCd batteries (more than 85% of its yearly sales according to industry sources). It also produces alternative technologies (NiMH and Li-ion), mostly for niche markets.
Other producers (Varta, Panasonic, Moltech… - see table in section 3.6.3.1.4 page 164) either produce outside Europe (mainly Asia) or import portable NiCd batteries produced with low costs in China for instance.
Other industrial players
No factual information were available during the study about other industry stakeholders.
However, it is likely that they consist of various profiles of companies for the assembling process such as SMEs and cells producers integrating the assembling stage (upstream integration).
The introduction of the ban on portable NiCd batteries for households applications except cordless power tools would affect about 30% (weight) of portable NiCd batteries (3 600 t out of 12 600 t in 1999) and about 22% of total NiCd batteries (3 600 t out of 16 000 t in 1999). Sales impacts are likely to be different as pricing differ.
It is not easy to predict what would be the effects on the market structure:
Risk of side effect for the whole portable NiCd batteries industry
A ban on only one segment of NiCd rechargeable batteries is likely to be generalized to other NiCd segments, even if not required legally. Some actors may decide to anticipate a possible extension of the regulation or may simply misunderstand the actual scope of existing regulation. However, the existence of alternative technologies is a prerequisite for this generalization to arise.

B I O I n t e l l i g e n c e S e r v i c e 173. IMPACT ASSESSMENT ON SELECTED POLICY OPTIONS FOR REVISION OF THE BATTERY DIRECTIVE
Risk of side effect for part of the whole rechargeable battery industry
The economic balance of some industrial players may be modified: some could be affected by a loss of profitability since NiCd batteries would bring comfortable margins, at least in some cases (their entire industrial activity could then be affected); others, producing primary batteries, could benefit from the opportunity that a ban of some rechargeable batteries could represent for primary batteries.
Risk of increase in outsourcing outside Europe
SAFT may decide to develop its NiMH and Li-ion market share on segments other than niches. But the competition with low price NiMH and Li-ion batteries coming from China in particular may make difficult to reach a good return on investment and brings SAFT to outsource production outside Europe or import rechargeable batteries as other producers.
Risk of domino effect
Through a domino effect, importers, assemblers and incorporators will be affected too. SMEs may be more sensitive to a ban, in case they can not switch to other technologies (if any).
Risk of market distortion
The difficulty to implement an efficient and reliable control system (to guarantee that no NiCd batteries are imported with household equipments other than power tools for instance) could benefit to non EU producers and result in competition distortion.
33..66..44..22 EEccoonnoommiicc IImmppaaccttss
Caveats: Considering the difficulty to predict the evolution that will affect the market, it is not possible to assess the overall economic impacts of a ban. Only partial data are provided below, focusing on macroeconomic impacts.
Costs due to higher pricing
Based on today pricing, a substitution of household portable NiCd batteries by other rechargeable technologies would result in an increase of the selling price per unit, due to the fact that Ni-MH and Li-ion batteries are more expensive than NiCd.
Furthermore, the through-life cost of Ni-MH batteries will also be much higher, because their life expectancy in terms of number of cycles is between one third and one half that of NiCd.

B I O I n t e l l i g e n c e S e r v i c e 174. IMPACT ASSESSMENT ON SELECTED POLICY OPTIONS FOR REVISION OF THE BATTERY DIRECTIVE
PPootteennttiiaall SSaalleess IImmppaacctt ooff aa BBaann ooff HHoouusseehhoolldd PPoorrttaabbllee BBaatttteerriieess ((OOtthheerr TThhaann PPoowweerr TToooollss))
NiCd batteries Example: NiMH batteries Assumptions Selling price (at current market structure)
4.2 Euros / unit 4.6 to 5.2 Euros / unit + 10 to 30%
Number of cycles X X / 3 to X / 2 Quantities Quantities replaced
3 600 tonnes / yr Replacing quantities
3 600 tonnes x 2 or 3 = 7 200 to 10 800 tonnes/ yr
Weight 22 g / unit 22 g / unit Calculation Sales 685 Million Euros / yr 1 510 to 2 680 Million Euros / yr
i.e. + 825 to 1 995 Million Euros / yr
to be paid for by consumers
A substitution by Ni-MH batteries, which selling price is today 10 to 30% higher than NiCd depending in particular on the country where it is produced (a 10% difference in selling price would be for NiMH produced in China) and whose life expectancy is less than half of NiCd, could result in additional costs for consumers of 825 to 1 995 million Euros.
This constitutes an upper bound estimate. Most likely, market will adjust to a lower equilibrium.
Costs due to more waste to be treated
Two types of additional waste will generate additional costs:
For batteries themselves: because the life expectancy of NiMH batteries in terms of number of cycles is between one third and one half that of NiCd, the number of cells for disposal would double or triple.
The corresponding cost has a range of 0 Euros (if enough recycling capacities exist with a zero cost as today) to 1.3 Million Euros (in case of disposal of 10 800 tonnes at 120 Euros / t).
For domestic tools: it is often necessary to replace the entire tool because it is a sealed unit and the battery cannot be removed.
Average selling price of domestic tools may be assessed at 50 – 60 Euros. No data are available to assess the overall additional cost at the EU level.
Other costs involved
Control system: the enforcement of the ban will require the creation of a control system, in particular for importation of equipment containing rechargeable batteries (without being sure of the efficiency and reliability of the control).
Recycling activities: portable NiCd batteries are recycled in the same plants as industrial NiCd batteries. Because most industrial batteries are today collected and recycled and because the ban would target about 30% of portable batteries on which 60% are assumed being hoarded (and thus not recycled), the total NiCd quantities recycled will not be significantly affected.
B I O I n t e l l i g e n c e S e r v i c e 175. IMPACT ASSESSMENT ON SELECTED POLICY OPTIONS FOR REVISION OF THE BATTERY DIRECTIVE
33..66..44..33 SSoocciiaall IImmppaaccttss
Job in the EU
Only qualitative inputs can be provided.
Some will be created to produce substitutes, as due to shorter life expectancy, more substitutes are necessary to replace a given number of NiCd batteries. New jobs could also be created to control the system.
Other jobs could disappear at the different stages (production, assembling, incorporation…).
As for location of new jobs, it is possible that a foreign outsourcing will occur for production, in favor to countries with lower labor costs (in particular China), at least for part of the jobs created.
In addition, it should be remembered that indirect jobs are generally considered being impacted in the same proportion as direct jobs.
Acceptability (homogeneity with other European policies)
EU has decided to phase out the use of mercury, lead and cadmium in the directives concerning end-of life vehicles (2000/53/EC, and the commission decision57 C(2002)2238 of 27 June 2002 amending annex II of Directive 2000/53/EC) and in the directive on the use of certain hazardous substances in electrical and electronic equipment (2002/95/EC).
A ban on NiCd batteries would be consistent with this policy.
Perception by stakeholders
A ban on only one segment of NiCd rechargeable batteries would possibly constitute a confusing message for downstream industrial stakeholders (assemblers, incorporators, importers, retailers), who could easily generalized to other NiCd segments, even if not required legally.
As stated above, some players may decide to anticipate a possible extension of the regulation or may simply misunderstand the actual scope of existing regulation. However, the existence of alternative technologies is a prerequisite for this generalization to arise.
57 According to this decision : “Cadmium in batteries for electrical vehicles should be exempt until 31 December 2005 since, in
view of present scientific and technical evidence and the overall environmental assessment undertaken, by that date, substitutes will be available and the availability of electrical vehicles will be ensured. The progressive replacement of cadmium should, however, continue to be analysed, taking into account the availability of electrical vehicles. The Commission will publish its findings by 31 December 2004 at the latest and, if proven justified by the results of the analysis, may propose an extension of the expiry date for cadmium in batteries for electrical vehicles in accordance with Article 4(2)(b)of Directive 2000/53/EC”.
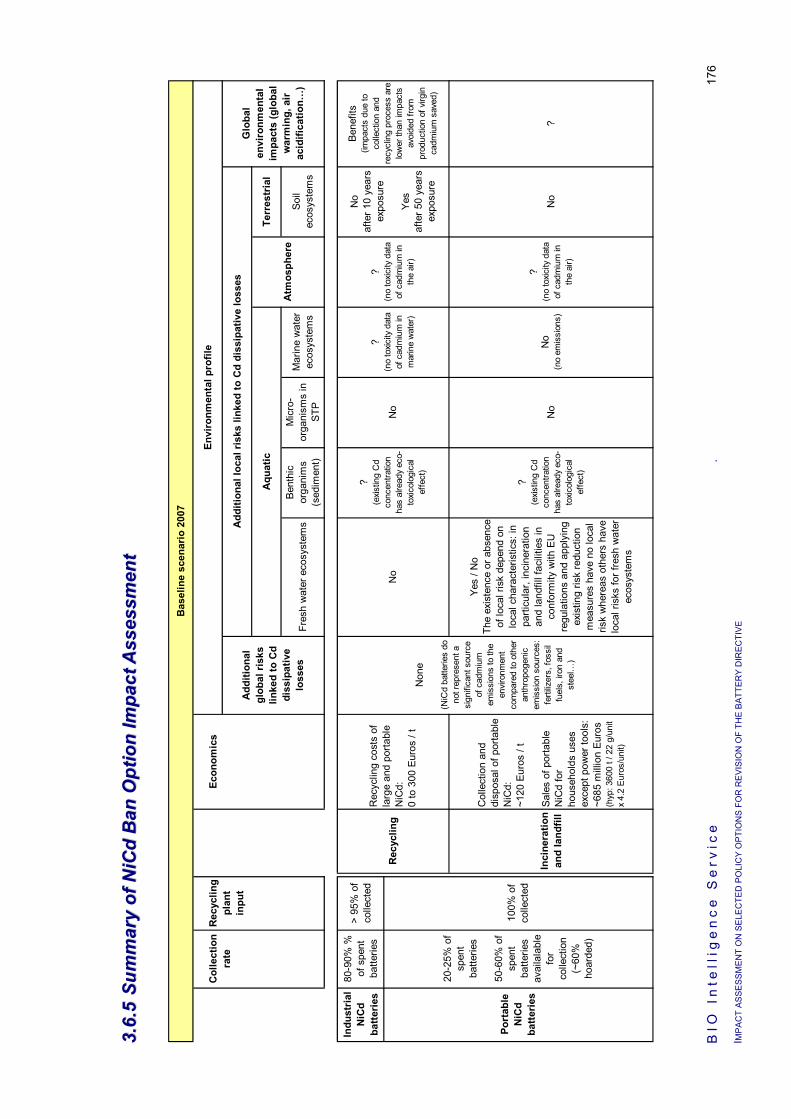
BIO
In
tell
ige
nc
e S
erv
ice
.
I MP
AC
T A
SS
ES
SM
EN
T O
N S
ELE
CTE
D P
OLI
CY
OP
TIO
NS
FO
R R
EV
ISIO
N O
F TH
E B
ATT
ER
Y D
IRE
CTI
VE
176
33 ..66 ..
55 SS
uu mmmm
aa rryy
oo ff NN
ii CCdd
BBaa nn
OOpp tt
ii oonn
II mmpp aa
cc tt AA
ss ssee ss
ss mmee nn
tt
Bas
elin
e sc
enar
io 2
007
Envi
ronm
enta
l pro
file
Add
ition
al lo
cal r
isks
link
ed to
Cd
diss
ipat
ive
loss
es
Aqu
atic
Terr
estr
ial
Fres
h w
ater
eco
syst
ems
Bent
hic
orga
nim
s (s
edim
ent)
Mic
ro-
orga
nism
s in
ST
P
Mar
ine
wat
er
ecos
yste
ms
Soil
ecos
yste
ms
Indu
stria
l N
iCd
batte
ries
80-9
0% %
of
spe
nt
batte
ries
> 95
% o
f co
llect
ed
Inci
nera
tion
and
land
fill
Col
lect
ion
and
disp
osal
of p
orta
ble
NiC
d:
~120
Eur
os /
t
Sale
s of
por
tabl
e N
iCd
for
hous
ehol
ds u
ses
exce
pt p
ower
tool
s:
~685
mill
ion
Euro
s (h
yp: 3
600
t / 2
2 g/
unit
x 4.
2 E
uros
/uni
t)
Yes
/ No
The
exis
tenc
e or
abs
ence
of
loca
l ris
k de
pend
on
loca
l cha
ract
eris
tics:
in
parti
cula
r, in
cine
ratio
n an
d la
ndfil
l fac
ilitie
s in
co
nfor
mity
with
EU
re
gula
tions
and
app
lyin
g ex
istin
g ris
k re
duct
ion
mea
sure
s ha
ve n
o lo
cal
risk
whe
reas
oth
ers
have
lo
cal r
isks
for f
resh
wat
er
ecos
yste
ms
? (e
xist
ing
Cd
conc
entra
tion
has
alre
ady
eco-
toxi
colo
gica
l ef
fect
)
No
No
(no
emis
sion
s)
? (n
o to
xicity
dat
a of
cad
miu
m in
th
e ai
r)
No
?
Col
lect
ion
rate
Rec
yclin
g pl
ant
inpu
t
Econ
omic
s
? (e
xist
ing
Cd
conc
entra
tion
has
alre
ady
eco-
toxi
colo
gica
l ef
fect
)
Glo
bal
envi
ronm
enta
l im
pact
s (g
loba
l w
arm
ing,
air
acid
ifica
tion…
)
Add
ition
al
glob
al ri
sks
linke
d to
Cd
diss
ipat
ive
loss
esA
tmos
pher
e
Bene
fits
(impa
cts
due
to
colle
ctio
n an
d re
cycl
ing
proc
ess
are
low
er th
an im
pact
s av
oide
d fro
m
prod
uctio
n of
virg
in
cadm
ium
sav
ed)
No
afte
r 10
year
s ex
posu
re
Yes
afte
r 50
year
s ex
posu
re
? (n
o to
xicity
dat
a of
cad
miu
m in
m
arin
e w
ater
)
? (n
o to
xicity
dat
a of
cad
miu
m in
th
e ai
r)
No
No
Non
e
(NiC
d ba
tterie
s do
no
t rep
rese
nt a
si
gnifi
cant
sou
rce
of c
adm
ium
em
issi
ons
to th
e en
viron
men
t co
mpa
red
to o
ther
an
thro
poge
nic
emis
sion
sou
rces
: fe
rtiliz
ers,
foss
il fu
els,
iron
and
st
eel…
)
Port
able
N
iCd
batte
ries
20-2
5% o
f sp
ent
batte
ries
50-6
0% o
f sp
ent
batte
ries
avai
lala
ble
for
colle
ctio
n (~
60%
ho
arde
d)
100%
of
colle
cted
Rec
yclin
g
Rec
yclin
g co
sts
of
larg
e an
d po
rtabl
e N
iCd:
0
to 3
00 E
uros
/ t
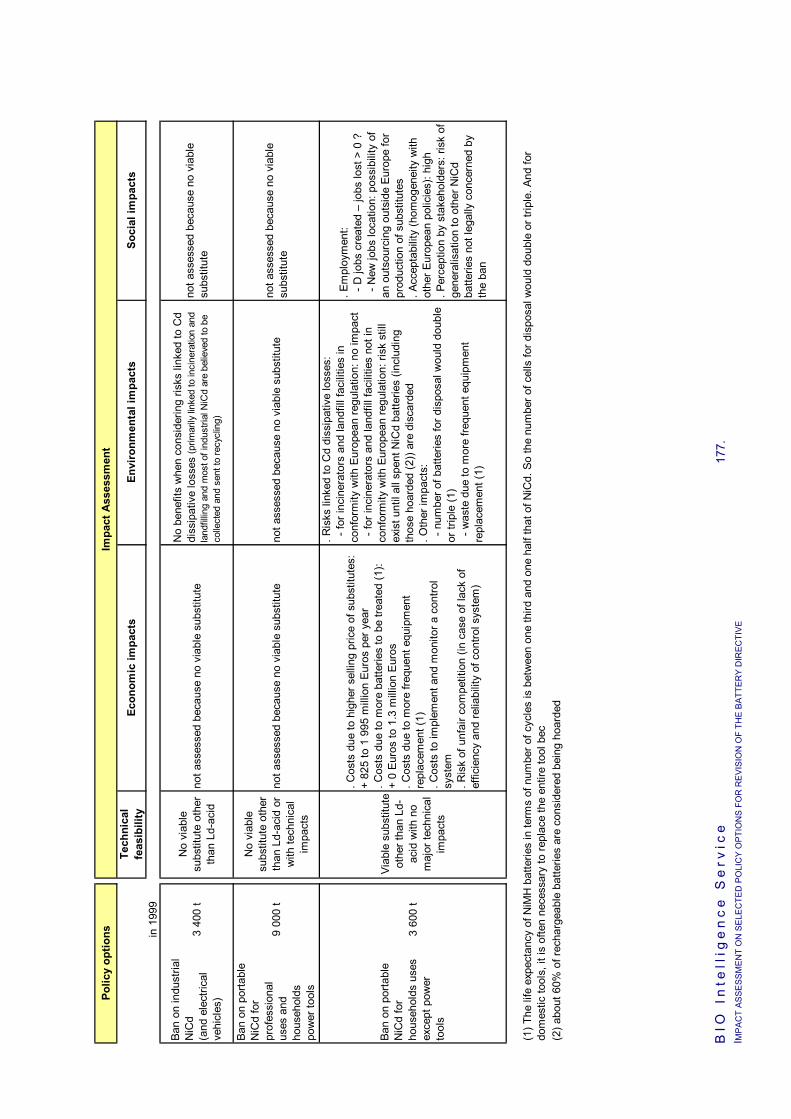
BIO
In
tell
ige
nc
e S
erv
ice
177.
I M
PA
CT
AS
SE
SS
ME
NT
ON
SE
LEC
TED
PO
LIC
Y O
PTI
ON
S F
OR
RE
VIS
ION
OF
THE
BA
TTE
RY
DIR
EC
TIV
E
Polic
y op
tions
Im
pact
Ass
essm
ent
Te
chni
cal
feas
ibili
tyEc
onom
ic im
pact
sEn
viro
nmen
tal i
mpa
cts
Soci
al im
pact
s
in 1
999
3 40
0 t
No
viab
le
subs
titut
e ot
her
than
Ld-
acid
not a
sses
sed
beca
use
no v
iabl
e su
bstit
ute
No
bene
fits
whe
n co
nsid
erin
g ris
ks li
nked
to C
d di
ssip
ativ
e lo
sses
(prim
arily
link
ed to
inci
nera
tion
and
land
fillin
g an
d m
ost o
f ind
ustri
al N
iCd
are
belie
ved
to b
e co
llect
ed a
nd s
ent t
o re
cycl
ing)
not a
sses
sed
beca
use
no v
iabl
e su
bstit
ute
9 00
0 t
No
viab
le
subs
titut
e ot
her
than
Ld-
acid
or
with
tech
nica
l im
pact
s
not a
sses
sed
beca
use
no v
iabl
e su
bstit
ute
not a
sses
sed
beca
use
no v
iabl
e su
bstit
ute
not a
sses
sed
beca
use
no v
iabl
e su
bstit
ute
3 60
0 t
Viab
le s
ubst
itute
ot
her t
han
Ld-
acid
with
no
maj
or te
chni
cal
impa
cts
. Cos
ts d
ue to
hig
her s
ellin
g pr
ice
of s
ubst
itute
s:
+ 82
5 to
1 9
95 m
illio
n Eu
ros
per y
ear
. Cos
ts d
ue to
mor
e ba
tterie
s to
be
treat
ed (1
): +
0 Eu
ros
to 1
.3 m
illio
n Eu
ros
. Cos
ts d
ue to
mor
e fre
quen
t equ
ipm
ent
repl
acem
ent (
1). C
osts
to im
plem
ent a
nd m
onito
r a c
ontro
l sy
stem
. Ris
k of
unf
air c
ompe
titio
n (in
cas
e of
lack
of
effic
ienc
y an
d re
liabi
lity
of c
ontro
l sys
tem
)
. Ris
ks li
nked
to C
d di
ssip
ativ
e lo
sses
: -
for i
ncin
erat
ors
and
land
fill f
acili
ties
in
conf
orm
ity w
ith E
urop
ean
regu
latio
n: n
o im
pact
- fo
r inc
iner
ator
s an
d la
ndfil
l fac
ilitie
s no
t in
conf
orm
ity w
ith E
urop
ean
regu
latio
n: ri
sk s
till
exis
t unt
il al
l spe
nt N
iCd
batte
ries
(incl
udin
g th
ose
hoar
ded
(2))
are
dis
card
ed
. Oth
er im
pact
s: -
num
ber o
f bat
terie
s fo
r dis
posa
l wou
ld d
oubl
e or
trip
le (1
) -
was
te d
ue to
mor
e fre
quen
t equ
ipm
ent
repl
acem
ent (
1)
. Em
ploy
men
t: -
D jo
bs c
reat
ed –
jobs
lost
> 0
? -
New
jobs
loca
tion:
pos
sibi
lity
of
an o
utso
urci
ng o
utsi
de E
urop
e fo
r pr
oduc
tion
of s
ubst
itute
s. A
ccep
tabi
lity
(hom
ogen
eity
with
ot
her E
urop
ean
polic
ies)
: hig
h. P
erce
ptio
n by
sta
keho
lder
s: ri
sk o
f ge
nera
lisat
ion
to o
ther
NiC
d ba
tterie
s no
t leg
ally
con
cern
ed b
y th
e ba
n
(2) a
bout
60%
of r
echa
rgea
ble
batte
ries
are
cons
ider
ed b
eing
hoa
rded
Ban
on in
dust
rial
NiC
d (a
nd e
lect
rical
ve
hicl
es)
Ban
on p
orta
ble
NiC
d fo
r pr
ofes
sion
al
uses
and
ho
useh
olds
po
wer
tool
s
Ban
on p
orta
ble
NiC
d fo
r ho
useh
olds
use
s ex
cept
pow
er
tool
s
(1) T
he li
fe e
xpec
tanc
y of
NiM
H b
atte
ries
in te
rms
of n
umbe
r of c
ycle
s is
bet
wee
n on
e th
ird a
nd o
ne h
alf t
hat o
f NiC
d. S
o th
e nu
mbe
r of c
ells
for d
ispo
sal w
ould
dou
ble
or tr
iple
. And
for
dom
estic
tool
s, it
is o
ften
nece
ssar
y to
repl
ace
the
entir
e to
ol b
ec

B I O I n t e l l i g e n c e S e r v i c e .
IMPACT ASSESSMENT ON SELECTED POLICY OPTIONS FOR REVISION OF THE BATTERY DIRECTIVE
178
33..77 OOPPTTIIOONNSS AABBOOUUTT SSTTAAKKEEHHOOLLDDEERRSS’’ RREESSPPOONNSSIIBBIILLIITTYY
Preliminary remark: we do not pretend to cover the entire issue about producers’ responsibility in this study. However, it seemed necessary to elaborate a little bit about the issue because different concepts are used by stakeholders and impacts to be assessed depend on the type of responsibility considered.
It seemed useful to first define the concept by distinguishing three types of responsibility:
Legal responsibility: who is legally responsible for reaching the targets set up in the directive?
Financial responsibility: who is responsible for covering the costs of collection, sorting and recycling?
Organisational responsibility: who is responsible for organising collection, sorting and recycling?
As a matter of fact:
A directive can define stakeholders’ responsibility either only at the legal level or both at the legal and financial level or even at the organisation level as well.
Remark: it should be noted that the more levels defined in the directive, the less the subsidiary principle respected.
The economic, environmental and social impact depend on the type of responsibility which is defined as shown hereafter.
For each type of responsibility, two main options exist:
Producers’ responsibility, where the obligation falls on producers,
Shared responsibility, where the obligation is shared between producers and other stakeholders (mainly municipalities and retailers).
We found worthwhile to add another options for both the financial and organisation responsibilities that we called ‘partial shared responsibility’ in order to be able to distinguish between to different levels of split possible between stakeholders. As a matter of fact, in a shared responsibility, the producers’ responsibility may begin at collection facilities or only later after sorting for instance. There are also cases where producers reimburse to municipalities part of their collection costs.

B I O I n t e l l i g e n c e S e r v i c e 179. IMPACT ASSESSMENT ON SELECTED POLICY OPTIONS FOR REVISION OF THE BATTERY DIRECTIVE
PPoossssiibbllee OOppttiioonnss ffoorr SSttaakkeehhoollddeerrss’’ RReessppoonnssiibbiilliittyy
Legal responsibility Financial responsibility (1) Organisational responsibility
Possible scopes for stakeholders' responsibility in the directivePolicy option 1: only about legal responsibility
Policy option 2: about legal and financial responsibility
Possible types of stakeholders' responsibility in a directive or in national implementationL1 - Producers' responsibility Obligation for producers to set up and operate a take back in view of recycling products they put on the market.
PC C T S R PC C T S R
PC C T S R PC C T S R
PC C T S R PC C T S R
(1) PC = pre-collection (containers…), C = collection, T = Transport, S = sorting, R = recycling
L2 - Shared responsibility Obligation for producers to take back and recycle what is collected by other stakeholders (municipalities, retailers).
NB: a large number of combinations between different types of legal responsibility, financial responsibility and organisational responsibility are theoritically possible and exist in the framework of other directives (see next table).
F1 - Producers' responsibilityProducers are fully responsible for covering all costs (they directly pay for them or reimburse total municipalities expenses).
O1 - Producers' responsibilityIt is likely to result in the creation of a collection system with its own logistic
ProducersOthers
Or Producers
ProducersOthers
O2 - Partial shared responsibilityMunicipalities (and retailers) take care of pre-collection and collection and producers of other stages.
Producers ProducersOthers Others
??
F3 - Shared responsibilityProducers cover costs for recycling (and maybe sorting).Municipalities (and retailers) cover other costs.
O3 - Shared responsibilityProducers take care of recycling (and maybe sorting) and municipalities (and retailers) of others.
Producers ? ProducersOthers ? Others
Others
F2 - Partial shared responsibilityProducers cover costs for recycling and- transport costs from collection facilities as well as sorting,- or reimburse part of their costs to other stakeholders.
??

B I O I n t e l l i g e n c e S e r v i c e 180. IMPACT ASSESSMENT ON SELECTED POLICY OPTIONS FOR REVISION OF THE BATTERY DIRECTIVE
SSttaakkeehhoollddeerrss’’ RReessppoonnssiibbiilliittyy –– EExxaammppllee ooff OOtthheerr DDiirreeccttiivveess
The following table attempts to summarise the economic, environmental and social impacts that can be expected for each option. These impacts do not concern only batteries but the analysis performed is relevant for other types of waste.
If a directive defines only legal responsibilities, no major differences can be expected between producers’ and shared responsibility for the three categories of impacts considered.
Some impacts are more related to the financial responsibilities and others to the organisational responsibilities.
Compared to a producers’ organisational responsibility, a shared organisational responsibility:
Is likely to allow more easily an optimisation of waste collection by municipalities and thus a reduction of total costs and of environmental impacts.
However, in case of partial shared financial responsibility where producers reimburse partly municipalities expenses, municipalities may have less incentive to optimise their costs and these benefits of shared responsibility principle may not exist.
is more favourable to local jobs creation (proximity principle).
Legal responsibility
Financial responsibility
Organisational responsibility
Example of existing directives
Scope for stakeholders' responsibility in directivePolicy option 1: only about legal Packaging directive
WEEE directiveELV directive
Types of stakeholders' responsibility in national implementation
O1 - Producers' responsibility Packaging directive: A, D
O2 - Partial shared responsibility Packaging directive: B
O3 - Shared responsibility WEEE directive: Sw (1)
O2 - Partial shared responsibility
Packaging directive: Dk, F, Fi, It, Sp…
O3 - Shared responsibility
Packaging directive: NL, UKWEEE directive: NL (1)
(1) prior to WEEE directive implementation
F2 - Partial shared responsibility
L1 - Producers' responsibility
L2 - Shared responsibility
F1 - Producers' responsibility
Policy option 2: about legal and financial responsibility
F3 - Shared responsibility
F2 - Partial shared responsibility

B I O I n t e l l i g e n c e S e r v i c e 181. IMPACT ASSESSMENT ON SELECTED POLICY OPTIONS FOR REVISION OF THE BATTERY DIRECTIVE
Compared to a producers’ financial responsibility, a shared financial responsibility:
from the economic point of view, is more favourable to producers and less to municipalities and retailers of course, and more favourable to end users and less to tax payers (because all tax payers may pay, not only end users as consumers).
is more favourable to local jobs creation (proximity principle).
And a producers’ financial responsibility:
has no major economic impact on municipalities and on tax payers and is thus more favourable to the polluter-pays principle (end users will pay total costs as consumers),
is likely to be more favourable to the design of products more environmentally friendly because producers may try to design product integrating end-of-life considerations in view of reducing end-of-life costs),
is more favourable to the internalisation of waste management costs in purchasing price of products, as the integrated product policy developed at the EU level may give priority in the future.
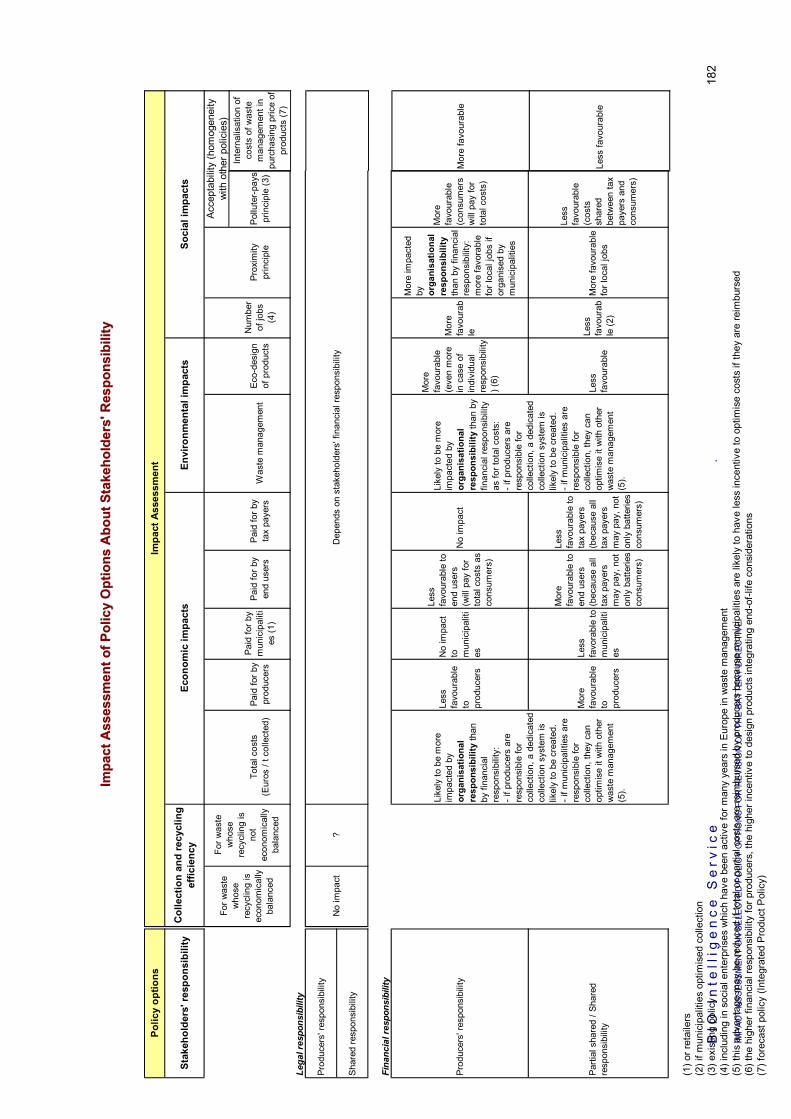
BIO
In
tell
ige
nc
e S
erv
ice
.
I MP
AC
T A
SS
ES
SM
EN
T O
N S
ELE
CTE
D P
OLI
CY
OP
TIO
NS
FO
R R
EV
ISIO
N O
F TH
E B
ATT
ER
Y D
IRE
CTI
VE
182
II mmpp aa
cc tt AA
ss ssee ss
ss mmee nn
tt ooff PP
oo llii cc
yy OO
pp ttii oo
nn ss AA
bb oouu tt
SStt aa
kk eehh oo
ll ddee rr
ss '' RR
ee sspp oo
nn ssii bb
ii ll iitt yy
Polic
y op
tions
Impa
ct A
sses
smen
t
Stak
ehol
ders
' res
pons
ibili
tyC
olle
ctio
n an
d re
cycl
ing
effic
ienc
yEc
onom
ic im
pact
sEn
viro
nmen
tal i
mpa
cts
Soci
al im
pact
s
Acce
ptab
iliw
ith o
t h
Tota
l cos
ts
(Eur
os /
t col
lect
ed)
Paid
for b
y pr
oduc
ers
Paid
for b
y m
unic
ipal
ities
(1)
Paid
for b
y en
d us
ers
Paid
for b
y ta
x pa
yers
Was
te m
anag
emen
tEc
o-de
sign
of
pro
duct
s
Num
ber
of jo
bs
(4)
Prox
imity
pr
inci
ple
Pollu
ter-
pays
pr
inci
ple
(3)
Lega
l res
pons
ibili
ty
Prod
ucer
s' re
spon
sibi
lity
Shar
ed re
spon
sibi
lity
Fina
ncia
l res
pons
ibili
ty
Prod
ucer
s' re
spon
sibi
lity
Less
fa
vour
able
to
pr
oduc
ers
No
impa
ct
to
mun
icip
aliti
es
Less
fa
vour
able
to
end
user
s (w
ill p
ay fo
r to
tal c
osts
as
cons
umer
s)
No
impa
ct
Mor
e fa
vour
able
(e
ven
mor
e in
cas
e of
in
divi
dual
re
spon
sibi
lity
) (6)
Mor
e fa
vour
able
Mor
e im
pact
ed
by
orga
nisa
tiona
l re
spon
sibi
lity
than
by
finan
cial
re
spon
sibi
lity:
m
ore
favo
rabl
e fo
r loc
al jo
bs if
or
gani
sed
by
mun
icip
aliti
es
Mor
e fa
vour
able
(c
onsu
mer
s w
ill p
ay fo
r to
tal c
osts
)
Parti
al s
hare
d / S
hare
d re
spon
sibi
lity
Mor
e fa
vour
able
to
pr
oduc
ers
Less
fa
vora
ble
to
mun
icip
aliti
es
Mor
e fa
vour
able
to
end
user
s (b
ecau
se a
ll ta
x pa
yers
m
ay p
ay, n
ot
only
bat
terie
s co
nsum
ers)
Less
fa
vour
able
to
tax
paye
rs
(bec
ause
all
tax
paye
rs
may
pay
, not
on
ly b
atte
ries
cons
umer
s)
Less
fa
vour
able
Less
fa
vour
able
(2)
Mor
e fa
vour
able
fo
r loc
al jo
bs
Less
fa
vour
able
(c
osts
sh
ared
be
twee
n ta
x pa
yers
and
co
nsum
ers)
(1) o
r ret
aile
rs(2
) if m
unic
ipal
ities
opt
imis
ed c
olle
ctio
n(3
) exi
stin
g po
licy
(4) i
nclu
ding
in s
ocia
l ent
erpr
ises
whi
ch h
ave
been
act
ive
for m
any
year
s in
Eur
ope
in w
aste
man
agem
ent
(5) t
his
adva
ntag
e m
ay b
e re
duce
d if
tota
l or p
artia
l cos
ts a
re re
imbu
rsed
by
prod
ucer
s be
caus
e m
unic
ipal
ities
are
like
ly to
hav
e le
ss in
cent
ive
to o
ptim
ise
cost
s if
they
are
reim
burs
ed(6
) the
hig
her f
inan
cial
resp
onsi
bilit
y fo
r pro
duce
rs, t
he h
ighe
r inc
entiv
e to
des
ign
prod
ucts
inte
grat
ing
end-
of-li
fe c
onsi
dera
tions
(7) f
orec
ast p
olic
y (In
tegr
ated
Pro
duct
Pol
icy)
Like
ly to
be
mor
e im
pact
ed b
y or
gani
satio
nal
resp
onsi
bilit
y th
an
by fi
nanc
ial
resp
onsi
bilit
y:- i
f pro
duce
rs a
re
resp
onsi
ble
for
colle
ctio
n, a
ded
icat
ed
colle
ctio
n sy
stem
is
likel
y to
be
crea
ted.
- if m
unic
ipal
ities
are
re
spon
sibl
e fo
r co
llect
ion,
they
can
op
timis
e it
with
oth
er
was
te m
anag
emen
t (5
).
?N
o im
pact
Dep
ends
on
stak
ehol
ders
' fin
anci
al re
spon
sibi
lity
Like
ly to
be
mor
e im
pact
ed b
y or
gani
satio
nal
resp
onsi
bilit
y th
an b
y fin
anci
al re
spon
sibi
lity
as fo
r tot
al c
osts
:- i
f pro
duce
rs a
re
resp
onsi
ble
for
colle
ctio
n, a
ded
icat
ed
colle
ctio
n sy
stem
is
likel
y to
be
crea
ted.
- if m
unic
ipal
ities
are
re
spon
sibl
e fo
r co
llect
ion,
they
can
op
timis
e it
with
oth
er
was
te m
anag
emen
t (5
).
For w
aste
w
hose
re
cycl
ing
is
econ
omic
ally
ba
lanc
ed
For w
aste
w
hose
re
cycl
ing
is
not
econ
omic
ally
ba
lanc
ed
ity (h
omog
enei
ty
her p
olic
ies)
Inte
rnal
isat
ion
of
cost
s of
was
te
man
agem
ent i
n pu
rcha
sing
pric
e of
pr
oduc
ts (7
)
Mor
e fa
vour
able
Less
favo
urab
le
B I O I n t e l l i g e n c e S e r v i c e ______________________________________________ 183. IMPACT ASSESSMENT ON SELECTED POLICY OPTIONS FOR REVISION OF THE BATTERY DIRECTIVE
44 CCOONNCCLLUUSSIIOONN
44..11 SSUUMMMMAARRYY OOFF TTHHEE IIMMPPAACCTTSS OOFF PPOOLLIICCYY OOPPTTIIOONNSS
44..11..11 QQuuaannttiittaattiivvee PPoolliiccyy OOppttiioonnss AAbboouutt TToottaall BBaatttteerriieess
When considering the baseline scenario for 2007, the highest policy options to be studied for all spent batteries, a collection rate of 70-80% and a recycling plant input of 90%, are already reached due to the fact that:
80 to 95% of spent starter batteries, which represent about 65% of all spent batteries, are believed to be collected and more than 95% of them sent to a recycling plant,
80 to 90% of spent industrial batteries, which represent about 20% of all spent batteries, are believed to be collected and more than 95% of them sent to a recycling plant.
No major additional environmental impacts are thus expected for policy options about all batteries.
Regarding economic impacts, the setting up of mandatory targets will require to implement monitoring systems for all types of batteries, in particular starter batteries and industrial batteries where statistics do not exist at all in most countries today. This will generate costs, without being certain of the reliability of the measurements considering the high levels already reached.
As for social impacts, job would be created with the implementation of monitoring systems.
44..11..22 QQuuaannttiittaattiivvee PPoolliiccyy OOppttiioonnss AAbboouutt SSttaarrtteerr BBaatttteerriieess
In the baseline scenario for 2007, 80-95% of spent starter batteries are believed to be collected and more than 95% of them sent to a recycling plant. We would be between the 80-90% and 90-100% policy options to be studied for collection rate and above the highest policy options for recycling.
It should be noted that no statistics exist at the European level and in most countries. But where data are available, the highest values of the range are reached58. The lowest values are assumed to reflect the situation in countries where starter batteries collection would be less developed.
Economic impacts
Baseline scenario: lead recycling is financially self sufficient.
Economic impacts are mostly independent from the level of collection rate (for the recycling plant input considered 75%59). They are rather linked to their mandatory aspect: having mandatory targets will involve costs to monitor, without being certain of measurement reliability (because high results are believed to be already achieved).
Other additional costs are likely to be not significant, even for countries where starter batteries recycling is less developed (because lead recycling is financially balanced).
58 It is possible that the quantities collected declared by MSs include batteries not only from 4 wheel passengers cars but also
from 2 and 3 wheel vehicles as well as from professional and industrial vehicles (agricultural vehicles, trucks, buses, military vehicles...), which are not necessarily included in batteries sales declared. In that case, this difference in scope would result in an overestimation of collection rate.
59 If recycling targets higher than 90-95% of collection (i.e. higher than those considered here) would be considered, market efficiency could be hurt. As a matter of fact, this could oblige the industry to reduce the temporary storages they use as a hedging effect, which could affect their capacity to adjust when facing low lead prices. The risk is that lead recycling could become no more financially self sufficient, which would oblige producers to create a collective system to finance recycling.
B I O I n t e l l i g e n c e S e r v i c e 184. IMPACT ASSESSMENT ON SELECTED POLICY OPTIONS FOR REVISION OF THE BATTERY DIRECTIVE
Environmental impacts
Baseline scenario: - Positive consequences of recycling: most of lead (heavy metal) is already diverted from waste. - Negative consequences of recycling: environmental damages linked to collection, transport
and re-processing (in particular to air) are higher than benefits brought by virgin material savings.
Positive consequences of recycling increase with collection and recycling targets increase (the higher the collection and recycling targets, the higher the lead diverted from waste).
Negative consequences of recycling decrease with recycling targets increase (for a given collection target, the higher recycling target, the lower negative consequences of recycling: recycling benefits increase more than transport negative impacts).
Social impacts
As for economic impacts, social impacts are mostly independent from the level of collection rate. They are rather linked to their mandatory aspect: having mandatory targets will involve the creation of a monitoring system, with new jobs.
44..11..33 PPoolliiccyy OOppttiioonnss AAbboouutt NNiiCCdd BBaatttteerriieess
44..11..33..11 QQuuaannttiittaattiivvee OOppttiioonnss AAbboouutt NNiiCCdd BBaatttteerriieess
In the baseline scenario, industrial NiCd batteries already reach the highest collection target (80-90% of spent batteries).
But they only represent 1/5th of total spent NiCd batteries and collection rate of portable NiCd batteries is estimated at 20-25% in the baseline scenario.
To reach the total targets contemplated for NiCd batteries (60-70% or 70-80% or 80-90%), targets 10 points lower than for total spent NiCd batteries would be necessary for portable NiCd batteries (50-60%, 60-70%, 70-80%).
This is technically possible, but will require both:
current domestic hoarding behaviours to be reduced significantly,
refractory persons to participate to separate collection.
As a matter of fact, with current level of domestic hoarding (estimated at 60% of spent rechargeable batteries), collecting 50-60% of spent portable NiCd batteries means collecting more than what is assessed being available for collection.
In view of collecting portable NiCd batteries, the directive could either adopt collection and recycling targets focusing on portable NiCd batteries or on all portable batteries.
It is not easy to compare these scope options in terms of collection efficiency because results vary in a large range on the ground. Most of member states who launched a collection system following the current directive implementation decided to collect all portable batteries (A, B, D, F, NL, Sw). 17% to 62% of all spent portable batteries are collected according to country (systems more or less

B I O I n t e l l i g e n c e S e r v i c e 185. IMPACT ASSESSMENT ON SELECTED POLICY OPTIONS FOR REVISION OF THE BATTERY DIRECTIVE
developed, different stakeholders responsibility, different equipments…). Two others (Dk, Nw) focused on portable NiCd and collect 40-50% of spent portable NiCd batteries.
The question should be asked if schemes focusing on portable NiCd batteries can reach policy targets under consideration. As a matter of fact, despite very high financial incentives for collectors to collect since 1996, only 43% are collected in Denmark.
Economic, environmental and social impacts are worthwhile to assess for both scope options.
It is even necessary to distinguish between 3 schemes, because for a given scope option, countries have still different possibilities to implement the directive which will generate different impacts.
PPoossssiibbllee SSccooppee OOppttiioonnss ffoorr tthhee DDiirreeccttiivvee aanndd PPoossssiibbllee SScchheemmeess aatt NNaattiioonnaall LLeevveell Possible schemes at national level
Possible scope options for the directive
Scheme 1 – Collection and recycling of
portable NiCd batteries
Scheme 2 – Collection and recycling of all portable batteries
Scheme 3 – Collection of all portable batteries and recycling of portable NiCd
Collection and recycling targets focusing on portable NiCd batteries or on all portable batteries
X
X
X
Collection and recycling targets covering all portable batteries
X
Economic impacts
Scheme 1 – Collection and recycling of portable NiCd batteries:
For countries which have already adopted this scheme (Dk, Nw) and for countries which have developed no scheme till now, it is not relevant to assess the additional costs because it is possible that this scheme does not allow to reach policy targets under consideration.
For countries which have already adopted scheme 2 (A, B, F, NL, Sw) or 3 (D60), - Some of them already reached the highest option (70-80% of spent batteries): no impacts are
expected. - For others, collection could develop with no major additional costs.
Scheme 2 – Collection and recycling of all portable batteries:
For countries which have already adopted this scheme, several of them are expected to reach the lowest target contemplated (50-60% - maybe some could be between 60-70%) (for some of them, the implementation of the WEEE directive which would give about 5 additional points could help).
For the others, they may still be at about 30% of spent batteries, with high domestic hoarding.
For countries which have adopted scheme 1 or no scheme, very low collection rate will be reached in 2007.
60 Germany is actually between scheme 2 and 3 since not only NiCd is recycled but also other small batteries, those whose
recycling cost is judged not being too high (67% of what is collected in 2003 is recycled)

B I O I n t e l l i g e n c e S e r v i c e 186. IMPACT ASSESSMENT ON SELECTED POLICY OPTIONS FOR REVISION OF THE BATTERY DIRECTIVE
The economics of collection and recycling of all portable batteries is impacted by the following parameters: - Choice of collection scheme (without being able to associate a type of collection to a level of
cost) and recycling technologies (higher cost in dedicated plants compared to other technologies): our calculation were based on ranges to take these variations into consideration.
- Economies of scale which were considered to affect recycling cost (for dedicated plants only) and administration costs (for administration cost, a step function was considered with economies of scale in between).
- Important increase of communication expenses with the collection rate (in order to encourage households and professional users to reduce hoarding behaviors and participate to separate collection).
The economic model built results in the following shape: - Up to a certain level of collection rate estimated near 40-50% of spent batteries, the costs
remain quite constant, due to compensation of communication costs increase and economies of scale of both administration and recycling costs.
- After this threshold, a step of increase of administration costs is assumed, so the still increasing communication costs would not be compensated any more: the costs would increase faster with collection rate.
- Remark: the threshold appears to be near a collection rate of 40-50% of spent batteries, which correspond to about 60-75% of spent batteries available for collection when considering the current hoarding behaviors. Such level of collection rate is reach today in Belgium and Netherlands with no significant collection rate increase over the last years although already relatively high costs. Considering a high cost increase above that level seems then to be coherent with the situation on the ground.
Cost per tonne collected: - A 10 point increase of recycling plant input (e.g. from 50-60% to 60-70%) results in an increase
of 10 to 55 € / t collected, due to the fact that additional tons recycled are recycled at an average cost of 300-700 € / t of portable batteries entering a recycling plant (depending on the type of recycling technology and the economies of scale) instead of 90 € / t of batteries disposed of.
- For a constant recycling input plant, a 10 point increase of collection rate results in an increase of about 100-150 € / t collected for relatively low collection rates (e.g. 30 to 50% of spent batteries), and more than 1000 € / t collected for high collection rates (from 50 to 100%)61.
Overall budget concerned In the baseline scenario 2007, a budget of 60 to 75 million Euros is already dedicated to separate collection and recycling of about 32-40 kt of portable batteries (collection rate of 20-25% of spent batteries). A target of 50-60% of spent batteries in the directive would require a budget of 215-285 million Euros, i.e. additional costs of 140-225 million Euros (extra costs are assessed at 345-420 million Euros in case of a 60-70% target and 475-570 million Euros for 70-80%).
61 This is because of both communication and administration costs: - communication costs regularly increase as collection rate increases. For example, to double collection rate from 30 to 60% of
spent batteries (45% to 85% of spent batteries available for collection with current level of hoarding), PR and communication budgets are estimated to be multiplied by 10 to avoid domestic hoarding (i.e. from 250 to 2500 € / t collected).
- As for administration costs, economies of scale are observed until about 50 – 60% of collection rate, then a step of increase is considered being needed to ensure collection of higher quantities.
B I O I n t e l l i g e n c e S e r v i c e 187. IMPACT ASSESSMENT ON SELECTED POLICY OPTIONS FOR REVISION OF THE BATTERY DIRECTIVE
Euros cents per unit sold: - The collection and recycling cost in € cent / unit sold does not vary much function of recycling
plant input rate, for a given collection rate (maximum 0.8 € cent / unit sold). - For a given recycling plant input, costs vary from about 2 € cents / unit sold (30-40% collection
rate) to 11 € cents / unit sold (60-70% collection rate) and about 17 € cents / unit sold (80-90% collection rate).
- In case of producers’ responsibility, these costs would be paid for by producers. They are likely to be transferred to consumers. Sale prices vary a lot for a same type of battery: from 60 to 150 € cents / unit for an alkaline battery for instance Collection and recycling costs thus represent 1.5 to 25% of the sale price depending on the level of collection objective.
- In case of shared responsibility62, collection equipment and communication costs are considered being paid for by public authorities and / or retailers. Costs paid for by producers would then vary from about 1.5 € cents / unit sold (30-40% collection rate) to about 4.5 € cents / unit sold (60-70% collection rate) and about 5.5 € cents / unit sold (80-90% collection rate).. They would represent 1 to 9% of the sale price depending on the level of collection objective.
Cost per tonne of all portable spent batteries For countries where no separate collection exist (cost of 120 Euros / t of batteries collected with MSW and disposed of), the cost per tonne of spent batteries (thus the total budget per year) for collection and treatment is 10-15 times higher for 50-60% collection rate to about 30 times for 70-80% collection rate.
62 The cost quantified here corresponds more to a partial shared responsibility because logistics is accounted for producers
and only collection equipments and communication are deduced from what producers would have to pay. In cases where logistics is paid for by municipalities, costs covered by producers could be lower.

BIO
In
tell
ige
nc
e S
erv
ice
____
____
____
____
____
____
____
____
____
____
____
____
____
____
____
____
____
____
____
____
____
____
____
____
18
8.
I MP
AC
T A
SS
ES
SM
EN
T O
N S
ELE
CTE
D P
OLI
CY
OP
TIO
NS
FO
R R
EV
ISIO
N O
F TH
E B
ATT
ER
Y D
IRE
CTI
VE
Port
able
Bat
terie
s - T
otal
Col
lect
ion
and
Rec
yclin
g C
osts
Fun
ctio
n of
Col
lect
ion
Rat
e (o
rder
s of
mag
nitu
des)
Col
lect
ed b
atte
ries
sent
to re
cycl
ing:
90
- 10
0%
Tota
l col
lect
ion
and
recy
clin
g co
sts
(= c
osts
pai
d fo
r by
prod
ucer
s in
cas
e of
pro
duce
rs re
spon
sibi
lity)
Euro
s / t
of p
orta
ble
batte
ries
sep
arat
ely
colle
cted
in v
iew
of r
ecyc
ling
(unc
erta
inty
repr
esen
ted:
+/-1
0%)
Col
lect
ion
rate
10-2
0%20
-30%
30-4
0%40
-50%
50-6
0%60
-70%
70-8
0%80
-90%
90-1
00%
% o
f sal
es20
-25%
11-2
1%21
-31%
31-4
1%41
-51%
51-6
1%61
-71%
72-8
2%82
-92%
92-1
02%
% o
f spe
nt b
atte
ries
30-3
5%25
-35%
35-4
5%45
-60%
60-7
5%75
-85%
85-1
00%
100-
120%
110-
120%
120-
130%
% o
f spe
nt b
atte
ries
avai
labl
e fo
r col
lect
ion
(1)
82-1
03 g
40-8
080
-120
120-
160
160-
200
200-
240
240-
280
280-
320
320-
360
360-
400
g co
llect
ed /
inha
b / y
r (2)
32-4
0 kt
2541
5874
9110
712
414
015
7kt
col
lect
ed /
yr51
7810
613
728
449
963
176
793
4m
illio
n Eu
ros
/ yr -
max
2746
6898
213
422
549
694
857
mill
ion
Euro
s / y
r - m
in60
-75
mill
ion
Euro
s (3
)
Bas
elin
e sc
enar
io 2
007
(tota
l EU
)
Hig
h co
st c
omm
unic
atio
n pr
ogra
mm
es:
- to
redu
ce h
oard
ing
beha
vior
s in
ord
er to
incr
ease
sp
ent b
atte
ries
avai
labl
e fo
r col
lect
ion
- to
enco
urag
e re
fract
ory
pers
ons
to p
artic
ipat
e to
se
para
te c
olle
ctio
n
Bas
elin
e sc
enar
io- M
inim
um o
f 3%
of s
ales
col
lect
ed fo
llow
ing
the
impl
emen
tatio
n of
WEE
E di
rect
ive- A
vera
ge o
f 90
Eur
os /
t of b
atte
ries
disp
osed
of
Not
rele
vant
(s
pent
bat
terie
s <
sale
s)
Incr
ease
of c
omm
unic
atio
n co
sts
com
pens
ates
ec
onom
ies
of s
cale
for r
ecyc
ling
cost
s (o
nly
for
max
val
ues)
Euro
s / t
onne
col
lect
ed
1 74
61
615
1 58
41
642
2 97
1
4 48
5
4 93
6
5 34
5
5 83
5
1 08
81
110
1 18
21
326
2 35
3
3 93
5
4 43
5
4 94
7
5 46
7
0
1 00
0
2 00
0
3 00
0
4 00
0
5 00
0
6 00
0
Prod
ucer
sre
spon
sibi
lity
Prod
ucer
sre
spon
sibi
lity
Max
Min
(1) E
quiva
lenc
e be
twee
n co
llect
ion
rate
as
% o
f sal
es a
nd c
olle
ctio
n ra
te a
s %
of s
pent
bat
terie
s av
aila
ble
for c
olle
ctio
n ba
sed
on th
e cu
rren
t ave
rage
cur
rent
hoa
rdin
g be
havi
ors
of h
ouse
hold
s an
d pr
ofes
sion
al u
sers
in th
e EU
(2) B
ased
on
the
EU
ave
rage
situ
atio
n of
165
kt o
f sm
all b
atte
ries
sold
in 2
007
(158
kt i
n 20
02 +
1%
ave
rage
gro
wth
rate
per
ye
ar) a
nd 3
90 M
illion
s in
habi
tant
s(3
) Bas
ed o
n th
e av
erag
e co
st o
f 184
0 Eu
ros
/ t c
olle
cted
(cal
cula
ted
by w
eigh
ting
the
cost
of A
, B, F
, G, a
nd th
e N
L w
ith th
e qu
antit
ies
they
col
lect
ed in
200
1)
Eco
nom
ies
of s
cale
of
adm
inis
tratio
n co
sts
Incr
ease
of a
dmin
istra
tion
budg
et
B I O I n t e l l i g e n c e S e r v i c e .
IMPACT ASSESSMENT ON SELECTED POLICY OPTIONS FOR REVISION OF THE BATTERY DIRECTIVE
189
Scheme 3 – Collection of all portable batteries and recycling of portable NiCd:
The difference considered here compared to scheme 2 is that only NiCd (and other batteries which can be recycled at a low cost, even a 0 cost) are recycled. It is considered that 15% of collected portable batteries are sent to recycling, at an average cost of 100 Euros / t63. Scheme 3 presents costs which are lower than scheme 2 of about 100-250 Euros /t collected.
For countries where no separate collection exist (cost of 120 Euros / t of batteries collected with MSW and disposed of), the cost per tonne of spent batteries (thus the total budget per year) for collection and treatment is about 11 times higher for 50-60% collection rate to 25 times for 70-80% collection rate.
Environmental impacts
Scheme 1 – Collection and recycling of portable NiCd batteries:
The separate collection and recycling of portable NiCd batteries has positive environmental consequences for all the environmental indicators examined (dissipative losses of Cd, CO2 emissions, SOx emissions, NOx emissions, primary energy consumption), irrespective of the collection and recycling rates. As collection and recycling rates increase, the predicted environmental benefits are maximised.
Remark: no data were available to assess the environmental consequences of other NiCd recycling technologies (metal plants, electric arc furnace…). They are likely to significantly differ from recycling in dedicated plants (different proportions of metals recovered, specific environmental advantages or disadvantages…).
Scheme 2 – Collection and recycling of all portable batteries:
It was not possible to assess the overall environmental balance of this scheme since there is no LCA data available to conclude if the environmental consequences of collection and recycling of portable batteries other than NiCd are positive or negative.
Scheme 3 – Collection of all portable batteries and recycling of portable NiCd:
The separate collection of portable batteries in view of recycling portable NiCd batteries only (other portable batteries are disposed of) has positive environmental consequences for all the environmental indicators examined except NOx emissions, irrespective of the collection and recycling rates.
For NOx emissions, the higher the collection rate and recycling plant input, the lower the damage (the environmental benefit of recycling increasing more than the NOx emissions due to transport).
Remark: no data were available to assess the environmental consequences of other NiCd recycling technologies (metal plants, electric arc furnace…) as mentioned above.
63 with economies of scale (recycling cost = 0 Euros / t for 50-60% collection rate and above)

B I O I n t e l l i g e n c e S e r v i c e 190. IMPACT ASSESSMENT ON SELECTED POLICY OPTIONS FOR REVISION OF THE BATTERY DIRECTIVE
Social impacts
Two indicators have the same tendencies whatever the scheme is:
Gender employment: waste management are not unfavorable to equal gender employment.
Modification of end users behaviors: the higher the collection objectives, the higher necessary hoarding decrease.
Scheme 1 – Collection and recycling of portable NiCd batteries:
Job creation at the EU level (if all countries would adopt this scheme): the current number of jobs would be multiplied by about 1.2 for 50-60% collection rate to about 2 for 70-80% collection rate (hypothesis: current level of employment is assessed being around 140-160 persons for collection and recycling of 20-25% of portable NiCd).
Perception of batteries by users: potential negative impact on the perception of batteries by consumers (‘some would be dangerous others not’).
Perception of waste management by end users: possible confusing message with other waste management policies64.
Scheme 2 – Collection and recycling of all portable batteries:
Job creation at the EU level (if all countries would adopt this scheme): the current number of jobs would be multiplied by about 1.2 for 50-60% collection rate to about 2 for 70-80% collection rate (hypothesis: current level of employment is assessed being around 2000-2400 persons for collection and recycling of 20-25% of portable NiCd).
Perception of batteries by users: No difference between batteries in the perception by users.
Perception of waste management by end users: Messages homogeneous with other waste management instructions to citizens65.
Scheme 3 – Collection of all portable batteries and recycling of portable NiCd:
Job creation at the EU level (if all countries would adopt this scheme): the current number of jobs would be multiplied by about 1.2 for 50-60% collection rate to about 2 for 70-80% collection rate (hypothesis: current level of employment is assessed being around 1600-2000 persons for collection and recycling of 20-25% of portable NiCd).
Perception of batteries by users: No difference between batteries in the perception by users.
Perception of waste management by end users: Messages homogeneous with other waste management instructions to citizens. But high risk to discourage end users from participating to waste separation66.
64 Contrary to other waste, in the battery sector, recycling would be justified only by level of hazard. 65 Similarly to other waste, in the battery sector, separate collection is promoted independently of the hazardous content of
waste. 66 when they realise that most of separately collected waste are disposed of instead of being recycled
B I O I n t e l l i g e n c e S e r v i c e 191. IMPACT ASSESSMENT ON SELECTED POLICY OPTIONS FOR REVISION OF THE BATTERY DIRECTIVE
44..11..33..22 NNiiCCdd BBaatttteerriieess BBaann OOppttiioonn
Environmental impacts
From a global risks point of view, a ban of NiCd batteries is not relevant to reduce total human cadmium exposure because NiCd batteries do not represent a significant source of cadmium emissions to the environment (Cd emissions come mainly from other anthropogenic emission sources: fertilizers, fossil fuels, iron and steel…). (TRAR conclusion)
As for local risks, there is no strong argument to support a ban on industrial NiCd batteries, because they do not represent a significant source of Cd emissions to the environment (local risks are primarily linked to incineration and landfilling and most of industrial NiCd batteries are believed to be collected and sent to recycling). (BIO conclusions from TRAR data)
On the contrary, as far as portable NiCd batteries and local risks are concerned, BIO calculation of characterisation risk factors from TRAR data does not permit to exclude the relevance of a ban on portable NiCd batteries (BIO conclusions from TRAR data):
- no risk assessment has been performed regarding air emissions,
- no conclusion can be drawn for additional risk in sediment compartment because existing cadmium concentration has already eco-toxicological effect,
- for the other compartments, the existence or absence of local risk depend on local characteristics: in particular, incineration and landfill facilities in conformity with EU regulations and applying existing risk reduction measures have no local risk whereas others have local risks for fresh water ecosystems.
On the other hand, a ban option will not necessarily result in a no risk situation because two flows of spent NiCd batteries will still have to be treated after the ban is into force: batteries which will become waste after the ban and batteries discarded after having been hoarded67.
High rate collection and recycling of portable NiCd batteries and / or enforcement of existing regulations about incinerators and landfill facilities are likely to be good alternatives to a ban with a view to reduce local risks.
Other environmental impacts of a ban can be mentioned. Because the life expectancy of NiMH batteries in terms of number of cycles is between one third and one half that of NiCd, the number of cells for disposal would double or triple. And for domestic tools, it is often necessary to replace the entire tool because it is a sealed unit and the battery cannot be removed.
Feasibility
A ban on batteries containing cadmium could be feasible for one market segment: households applications, except cordless power tools where significant negative technical impacts are expected. Other segments do not have viable substitutes other than lead-acid batteries.
Households applications other that cordless power tools represented 3 600 tonnes in 1999, i.e. about 30% (weight) of portable NiCd batteries and about 20% of total NiCd batteries.
67 60% of rechargeable batteries are assumed being hoarded today by end users.

B I O I n t e l l i g e n c e S e r v i c e 192. IMPACT ASSESSMENT ON SELECTED POLICY OPTIONS FOR REVISION OF THE BATTERY DIRECTIVE
Other impacts
Economic and social impacts are difficult to assess because first no factual information were available and secondly the effect of a ban on the market structure (mainly the four industrial stakeholders: producers, assemblers, incorporators, retailers) is difficult to predict:
Risk of side effect for the whole portable NiCd batteries industry
A ban on only one segment of NiCd rechargeable batteries is likely to be generalized to other NiCd segments, even if not required legally. Some actors may decide to anticipate a possible extension of the regulation or may simply misunderstand the actual scope of existing regulation. However, the existence of alternative technologies is a prerequisite for this generalization to arise.
Risk of domino effect
Through a domino effect, importers, assemblers and incorporators will be affected too. SMEs may be more sensitive to a ban, in case they can not switch to other technologies (if any).
Risk of market distortion
The difficulty to implement an efficient and reliable control system (to guarantee that no NiCd batteries are imported with household equipments other than power tools for instance) could benefit to non EU producers and result in competition distortion.
As for macroeconomic impacts:
Some of them were roughly quantified:
- Costs due to higher pricing of substitutes: based on current prices, a substitution by more expensive Ni-MH batteries could result in additional costs for consumers of 825 to 1 995 million Euros (this large range reflects two elements: first, NiMH selling price is today 10 to 30% higher than NiCd68 and NiMH life expectancy is one third to one half that of NiCd). Most likely, the market will adjust to a lower equilibrium.
- Costs due to more waste to be treated: the doubling or tripling of the number of cells for disposal69 would result in additional costs between 0 Euros (if enough recycling capacities exist with a zero cost as today) to 1.3 million Euros (in case of disposal of 10 800 tonnes at 120 Euros / t).
Others can be qualitatively mentioned, mostly:
- Costs due to more frequent equipment replacement: for domestic tools, it is often necessary to replace the entire tool when the battery is over because it is a sealed unit and the battery cannot be removed. The shorter life expectancy of NiMH batteries would then generate higher costs related to equipment purchase and WEEE management.
- Costs to implement and monitor a control system, in particular for importations of equipment containing rechargeable batteries (without being certain of its expected efficiency and reliability).
Concerning social impacts:
Employment:
- Jobs are likely to be created, first at the production stage since 2 to 3 times more substitutes are today necessary to replace NiCd (due to lower life expectancy) and also to control the system.
- Others could disappear at the different stages (production, assembling, incorporation, distribution) due to possible reorganisation of industrial and commercial activities.
68 Depending in particular on the country where it is produced; a 10% difference in selling price would be for NiMH produced in
China. 69 The life expectancy of NiMH batteries is between one third and one half that of NiCd as mentioned above for environmental
impacts.

B I O I n t e l l i g e n c e S e r v i c e 193. IMPACT ASSESSMENT ON SELECTED POLICY OPTIONS FOR REVISION OF THE BATTERY DIRECTIVE
- Indirect jobs are generally considered being impacted in the same proportion as direct jobs.
- As for new jobs location, the possibility of a foreign outsourcing for production, in favor to countries with lower labor costs (in particular China), at least for part of the jobs created, can not be excluded from information available.
Acceptability (homogeneity with other European policies): a ban on NiCd batteries in the Battery directive would be consistent with other recent directives (end-of life vehicles directives and directive on the use of certain hazardous substances in electrical and electronic equipment).
Perception by stakeholders: a ban on only one segment of NiCd rechargeable batteries would possibly constitute a confusing message for downstream industrial stakeholders (assemblers, incorporators, importers, retailers), who could easily generalized to other NiCd segments, even if not required legally.
44..11..44 PPoolliiccyy OOppttiioonnss AAbboouutt SSttaakkeehhoollddeerrss’’ RReessppoonnssiibbiilliittyy
If the directive defines only legal responsibilities, no major differences can be expected between producers’ and shared responsibility for the three categories of impacts considered (economic, environmental, social). As a matter of fact, impacts are more related to the financial responsibilities or the organisational responsibilities.
Compared to a producers’ organisational responsibility, a shared organisational responsibility:
is likely to allow more easily an optimisation of waste collection by municipalities and thus a reduction of total costs and of environmental impacts.
However, in case of partial shared financial responsibility where producers reimburse partly municipalities expenses, municipalities may have less incentive to optimise their costs and these benefits of shared responsibility principle may not exist.
is more favourable to local jobs creation (proximity principle).
Compared to a producers’ financial responsibility, a shared financial responsibility:
from the economic point of view, is more favourable to producers and less to municipalities and retailers of course, and more favourable to end users and less to tax payers (because all tax payers may pay, not only end users as consumers).
is more favourable to local jobs creation (proximity principle).
And a producers’ financial responsibility:
has no major economic impact on municipalities and on tax payers and is thus more favourable to the polluter-pays principle (end users will pay total costs as consumers),
is likely to be more favourable to the design of products more environmentally friendly because producers may try to design product integrating end-of-life considerations in view of reducing end-of-life costs),
is more favourable to the internalisation of waste management costs in purchasing price of products, as the integrated product policy developed at the EU level may give priority in the future.
B I O I n t e l l i g e n c e S e r v i c e 194. IMPACT ASSESSMENT ON SELECTED POLICY OPTIONS FOR REVISION OF THE BATTERY DIRECTIVE
44..22 LLIIMMIITTSS OOFF TTHHEE SSTTUUDDYY AANNDD FFUURRTTHHEERR RREESSEEAARRCCHH WWOORRKK TTOO BBEE PPEERRFFOORRMMEEDD
We encountered an important lack of statistics (sales, quantities collected, quantities recycled) mostly for starter batteries and industrial batteries other than NiCd.
Besides, choice between collection rate definitions still need to be made. The elaboration of methodologies to estimate them and monitor quantities arising may help to make the decision.
According to information provided to BIO in the framework of the study, separate collection would not be well developed in accession countries. But information received is very partial at that stage. Further investigation would be necessary in order to describe more accurately the situation in accession countries.
No system to accredit battery recycling facilities exists today. The analysis of the advantages and disadvantages of systems based on best available technology (BAT) principles and systems based on best available technology not entailing excessive costs (BATNEEC) principles would be necessary given that the different recycling technologies (mostly dedicated plants, metal plants, EAF) are likely to present different profile in terms of Recovery rate (proportion of metals which can be recovered), costs and environmental impacts and benefits.
Regarding environment impact assessment, the lack of LCA data about portable batteries other than NiCd do not allow to conclude about the environmental consequences of their recycling. LCA study has to be carried out.
For NiCd, LCA are only available for their recycling in dedicated plants. No data are available for other recycling technologies (metal plants, electric arc furnaces…) whose environmental profiles are likely to significantly differ from dedicated plants.
As for NiCd collection and recycling as well as collection step of other portable batteries, the simplified LCA performed in this study are based on data extracted from existing studies (ERM, 2000 and Environmental assessment of battery systems in life cycle management, C.J. Rydh, 2001). However, ERM data used for emission factors about transport are 5 times lower than data currently used by most of LCA studies. To obtain more reliable figures, further LCA work is necessary.
Monetarisation of environmental impacts
Externalities are the costs imposed on society and the environment that are not accounted for by the producers and consumers, i.e. that are not included in market prices. They include damage to the natural and built environment, such as effects of air pollution on health, buildings, crops, forests and global warming; occupational disease and accidents; and reduced amenity from visual intrusion of plant or emissions of noise.
In this study, no monetarisation of environmental impacts was performed:
First, existing results from ERM study can not be used directly in the present study since we re-calculated environmental impacts.
Secondly, to monetarise environmental impacts, we should have had to select a set of cost-factors (no ready-for-use database about external cost factors exist today in such a macro-economic and
B I O I n t e l l i g e n c e S e r v i c e 195. IMPACT ASSESSMENT ON SELECTED POLICY OPTIONS FOR REVISION OF THE BATTERY DIRECTIVE
LCA-context70) and carry out calculation for the different battery segments and policy options under consideration (collection and recycling rates). This was not compatible with the short duration of the study.
Most importantly, the benefit to reduce cadmium dissipative losses through the implementation of a collection and recycling system would not have been monetarised by lack of data. A considerable biais would have been introduced and as a result, it would not have been of great help for decision makers.
Further research work are necessary in that area.
The conclusions we were able to draw from the TRAR encountered the same limits as those mentioned in the TRAR, in particular the lack of data about atmospheric toxicity of cadmium.
70 Monetarisation methods have been developed for years (and until quite recently, independently from LCAs). See Bio
Intelligence Service study for recent results in that field: ‘Study on External Environmental Effects Related to the Life Cycle of Products and Services’, February 2003 , DG Environment
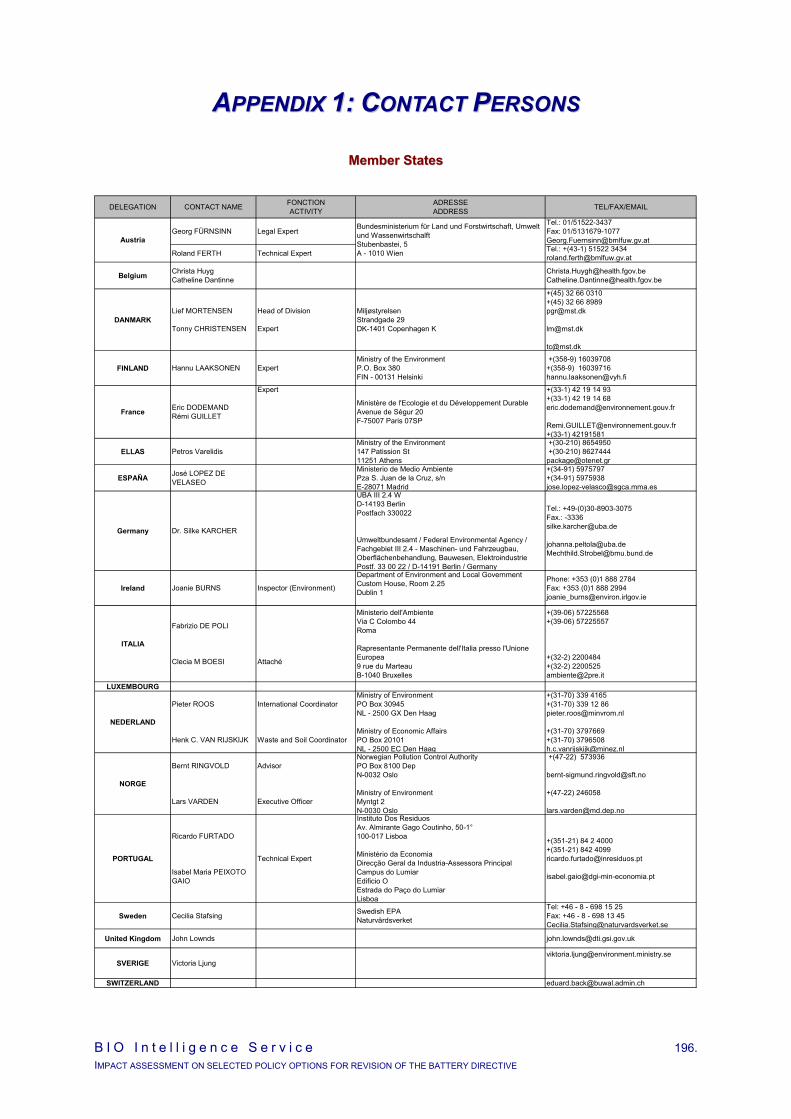
B I O I n t e l l i g e n c e S e r v i c e 196. IMPACT ASSESSMENT ON SELECTED POLICY OPTIONS FOR REVISION OF THE BATTERY DIRECTIVE
AAPPPPEENNDDIIXX 11:: CCOONNTTAACCTT PPEERRSSOONNSS
MMeemmbbeerr SSttaatteess
DELEGATION CONTACT NAME FONCTIONACTIVITY
ADRESSEADDRESS TEL/FAX/EMAIL
Georg FÜRNSINN Legal ExpertTel.: 01/51522-3437Fax: 01/[email protected]
Roland FERTH Technical Expert Tel.: +(43-1) 51522 [email protected]
Belgium Christa Huyg Catheline Dantinne
[email protected] [email protected]
DANMARKLief MORTENSEN
Tonny CHRISTENSEN
Head of Division
Expert
MiljøstyrelsenStrandgade 29DK-1401 Copenhagen K
+(45) 32 66 0310+(45) 32 66 [email protected]
FINLAND Hannu LAAKSONEN ExpertMinistry of the EnvironmentP.O. Box 380FIN - 00131 Helsinki
+(358-9) 16039708+(358-9) [email protected]
France Eric DODEMANDRémi GUILLET
Expert
Ministère de l'Ecologie et du Développement DurableAvenue de Ségur 20F-75007 Paris 07SP
+(33-1) 42 19 14 93+(33-1) 42 19 14 [email protected]
[email protected]+(33-1) 42191581
ELLAS Petros VarelidisMinistry of the Environment147 Patission St11251 Athens
+(30-210) 8654950 +(30-210) [email protected]
ESPAÑA José LOPEZ DE VELASEO
Ministerio de Medio AmbientePza S. Juan de la Cruz, s/nE-28071 Madrid
+(34-91) 5975797+(34-91) [email protected]
Germany Dr. Silke KARCHER
UBA III 2.4 WD-14193 BerlinPostfach 330022
Umweltbundesamt / Federal Environmental Agency / Fachgebiet III 2.4 - Maschinen- und Fahrzeugbau, Oberflächenbehandlung, Bauwesen, Elektroindustrie Postf. 33 00 22 / D-14191 Berlin / Germany
Tel.: +49-(0)30-8903-3075 Fax.: -3336 [email protected]
[email protected]@bmu.bund.de
Ireland Joanie BURNS Inspector (Environment)
Department of Environment and Local GovernmentCustom House, Room 2.25Dublin 1
Phone: +353 (0)1 888 2784Fax: +353 (0)1 888 [email protected]
ITALIA
Fabrizio DE POLI
Clecia M BOESI Attaché
Ministerio dell'AmbienteVia C Colombo 44Roma
Rapresentante Permanente dell'Italia presso l'Unione Europea9 rue du MarteauB-1040 Bruxelles
+(39-06) 57225568+(39-06) 57225557
+(32-2) 2200484+(32-2) [email protected]
LUXEMBOURG
NEDERLAND
Pieter ROOS
Henk C. VAN RIJSKIJK
International Coordinator
Waste and Soil Coordinator
Ministry of EnvironmentPO Box 30945NL - 2500 GX Den Haag
Ministry of Economic AffairsPO Box 20101NL - 2500 EC Den Haag
+(31-70) 339 4165+(31-70) 339 12 [email protected]
+(31-70) 3797669+(31-70) [email protected]
NORGE
Bernt RINGVOLD
Lars VARDEN
Advisor
Executive Officer
Norwegian Pollution Control AuthorityPO Box 8100 DepN-0032 Oslo
Ministry of EnvironmentMyntgt 2N-0030 Oslo
+(47-22) 573936
+(47-22) 246058
PORTUGAL
Ricardo FURTADO
Isabel Maria PEIXOTO GAIO
Technical Expert
Instituto Dos ResiduosAv. Almirante Gago Coutinho, 50-1°100-017 Lisboa
Ministério da EconomiaDirecção Geral da Industria-Assessora PrincipalCampus do LumiarEdificio OEstrada do Paço do LumiarLisboa
+(351-21) 84 2 4000+(351-21) 842 [email protected]
Sweden Cecilia Stafsing Swedish EPANaturvårdsverket
Tel: +46 - 8 - 698 15 25Fax: +46 - 8 - 698 13 [email protected]
United Kingdom John Lownds [email protected]
SVERIGE Victoria [email protected]
SWITZERLAND [email protected]
Austria
Bundesministerium für Land und Forstwirtschaft, Umwelt und WassenwirtschalftStubenbastei, 5A - 1010 Wien
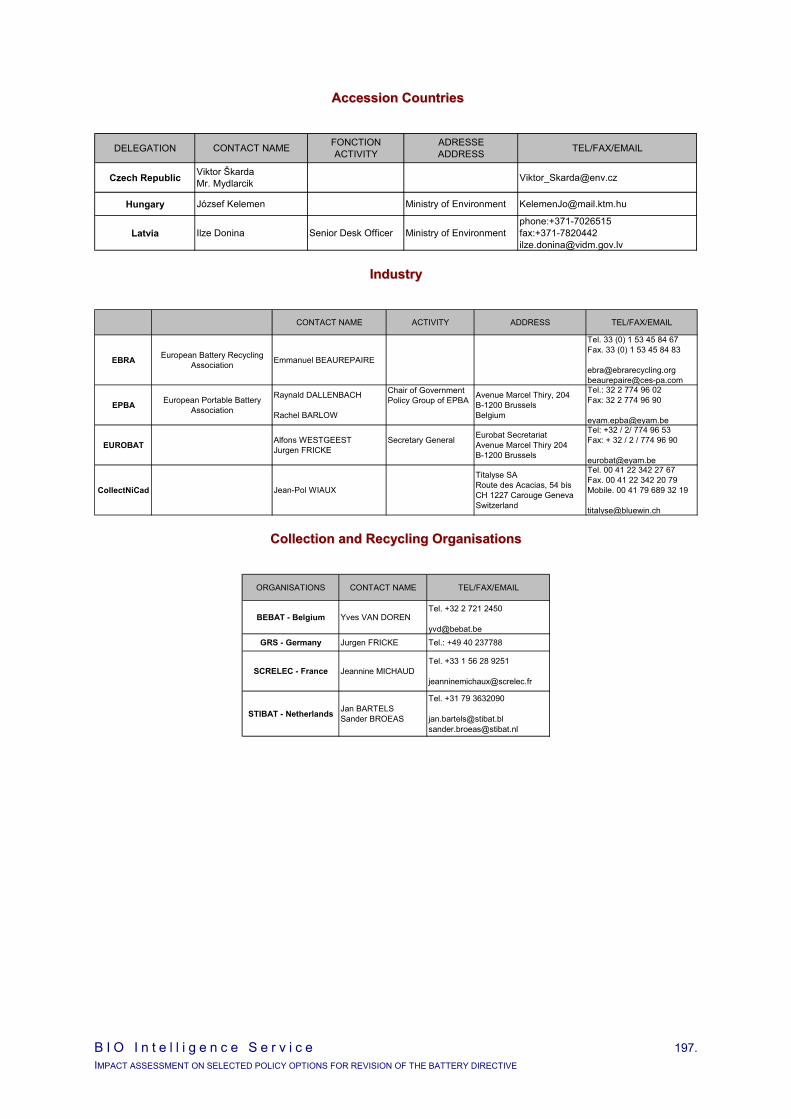
B I O I n t e l l i g e n c e S e r v i c e 197. IMPACT ASSESSMENT ON SELECTED POLICY OPTIONS FOR REVISION OF THE BATTERY DIRECTIVE
AAcccceessssiioonn CCoouunnttrriieess
DELEGATION CONTACT NAME FONCTIONACTIVITY
ADRESSEADDRESS TEL/FAX/EMAIL
Czech Republic Viktor ŠkardaMr. Mydlarcik [email protected]
Hungary József Kelemen Ministry of Environment [email protected]
Latvia Ilze Donina Senior Desk Officer Ministry of Environmentphone:+371-7026515 fax:+371-7820442 [email protected]
IInndduussttrryy
CONTACT NAME ACTIVITY ADDRESS TEL/FAX/EMAIL
EBRA European Battery Recycling Association Emmanuel BEAUREPAIRE
Tel. 33 (0) 1 53 45 84 67Fax. 33 (0) 1 53 45 84 83
[email protected]@ces-pa.com
EPBA European Portable Battery Association
Raynald DALLENBACH
Rachel BARLOW
Chair of Government Policy Group of EPBA Avenue Marcel Thiry, 204
B-1200 BrusselsBelgium
Tel.: 32 2 774 96 02Fax: 32 2 774 96 90
EUROBAT Alfons WESTGEESTJurgen FRICKE
Secretary General Eurobat SecretariatAvenue Marcel Thiry 204B-1200 Brussels
Tel: +32 / 2/ 774 96 53Fax: + 32 / 2 / 774 96 90
CollectNiCad Jean-Pol WIAUX
Titalyse SARoute des Acacias, 54 bisCH 1227 Carouge Geneva Switzerland
Tel. 00 41 22 342 27 67Fax. 00 41 22 342 20 79Mobile. 00 41 79 689 32 19
CCoolllleeccttiioonn aanndd RReeccyycclliinngg OOrrggaanniissaattiioonnss
ORGANISATIONS CONTACT NAME TEL/FAX/EMAIL
BEBAT - Belgium Yves VAN DORENTel. +32 2 721 2450
[email protected] - Germany Jurgen FRICKE Tel.: +49 40 237788
SCRELEC - France Jeannine MICHAUD Tel. +33 1 56 28 9251
STIBAT - Netherlands Jan BARTELS Sander BROEAS
Tel. +31 79 3632090
[email protected]@stibat.nl
B I O I n t e l l i g e n c e S e r v i c e 198. IMPACT ASSESSMENT ON SELECTED POLICY OPTIONS FOR REVISION OF THE BATTERY DIRECTIVE
AAPPPPEENNDDIIXX 22:: FFAACCTT--SSHHEEEETTSS AABBOOUUTT CCOOLLLLEECCTTIIOONN SSCCHHEEMMEESS OOFF PPOORRTTAABBLLEE BBAATTTTEERRIIEESS EEXXIISSTTIINNGG IINN
EEUURROOPPEE
The following fact-sheets are included:
Austria – UFB,
Belgium - BEBAT,
France – SCRELEC,
Germany – GRS,
Netherlands – STIBAT.

B I O I n t e l l i g e n c e S e r v i c e 199. IMPACT ASSESSMENT ON SELECTED POLICY OPTIONS FOR REVISION OF THE BATTERY DIRECTIVE
Portable BatteriesMain characteristics
Collection: Country AustriaFinancial responsibility: Shared responsibility Scope UFB, 2001
General purpose batteries recycling: Metal plants
A/ Quantities and Results ReachedSales 3 251 tonsSpent batteries (assumption) 3 169 tonsSpent batteries available for collection (assumption) 1 794 tonsCollected quantities 1 440 tonsCollection rate 44% of sales
45% of spent batteries80% of spent batteries available for collection179 g/inhabitant/yr
Quantities entering a recycling plant 1 440 tonsRecycling plant input 100% of collected
B/ Responsibility and Organisation- No mandatory targets at the begining; recent objectives: 65% of collection rate by 2005- Starting date of separate collection and recycling: 1991 (12 years old system)- Collection points: 7000 collection points (about 1100 inhab / collection point)
C/ Costs
C.1 2001 situation Euros / t collected
1113 2,0Source: EPBA, Nov 2001
C.2 Fees Cents / kg sold90
Source: CollectNiCad, June 2003
(1) Hypothesis: average weight of small batteries = g 40
Cents / battery sold (1)
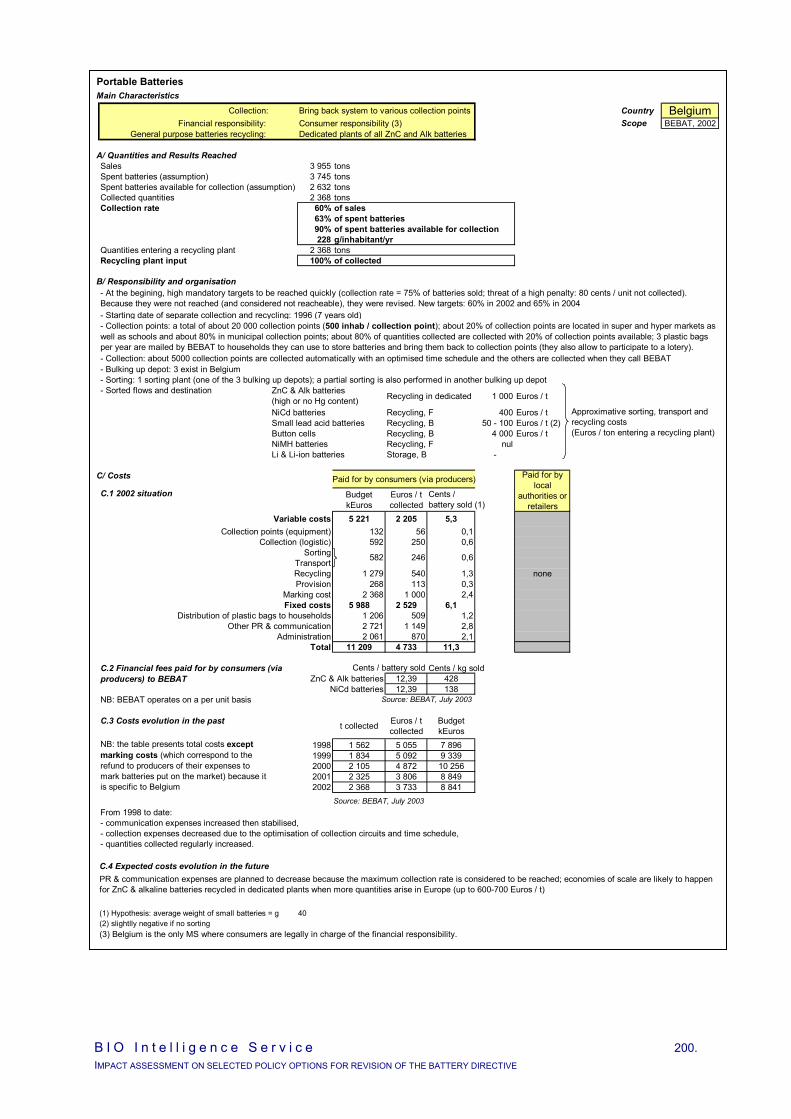
B I O I n t e l l i g e n c e S e r v i c e 200. IMPACT ASSESSMENT ON SELECTED POLICY OPTIONS FOR REVISION OF THE BATTERY DIRECTIVE
Portable BatteriesMain Characteristics
Collection: Bring back system to various collection points Country BelgiumFinancial responsibility: Consumer responsibility (3) Scope BEBAT, 2002
General purpose batteries recycling: Dedicated plants of all ZnC and Alk batteries
A/ Quantities and Results ReachedSales 3 955 tonsSpent batteries (assumption) 3 745 tonsSpent batteries available for collection (assumption) 2 632 tonsCollected quantities 2 368 tonsCollection rate 60% of sales
63% of spent batteries90% of spent batteries available for collection228 g/inhabitant/yr
Quantities entering a recycling plant 2 368 tonsRecycling plant input 100% of collected
B/ Responsibility and organisation
- Starting date of separate collection and recycling: 1996 (7 years old)
- Bulking up depot: 3 exist in Belgium- Sorting: 1 sorting plant (one of the 3 bulking up depots); a partial sorting is also performed in another bulking up depot- Sorted flows and destination
Recycling in dedicated 1 000 Euros / t
NiCd batteries Recycling, F 400 Euros / tSmall lead acid batteries Recycling, B 50 - 100 Euros / t (2)Button cells Recycling, B 4 000 Euros / tNiMH batteries Recycling, F nulLi & Li-ion batteries Storage, B -
C/ Costs Paid for by consumers (via producers)
C.1 2002 situation BudgetkEuros
Euros / tcollected
Variable costs 5 221 2 205 5,3Collection points (equipment) 132 56 0,1
Collection (logistic) 592 250 0,6Sorting
TransportRecycling 1 279 540 1,3 noneProvision 268 113 0,3
Marking cost 2 368 1 000 2,4Fixed costs 5 988 2 529 6,1
Distribution of plastic bags to households 1 206 509 1,2Other PR & communication 2 721 1 149 2,8
Administration 2 061 870 2,1Total 11 209 4 733 11,3
Cents / kg soldZnC & Alk batteries 12,39 428
NiCd batteries 12,39 138NB: BEBAT operates on a per unit basis Source: BEBAT, July 2003
C.3 Costs evolution in the past t collected Euros / t collected
BudgetkEuros
1998 1 562 5 055 7 8961999 1 834 5 092 9 3392000 2 105 4 872 10 2562001 2 325 3 806 8 8492002 2 368 3 733 8 841
Source: BEBAT, July 2003
C.2 Financial fees paid for by consumers (via producers) to BEBAT
Paid for by local
authorities or retailers
Approximative sorting, transport and recycling costs (Euros / ton entering a recycling plant)
- Collection points: a total of about 20 000 collection points (500 inhab / collection point); about 20% of collection points are located in super and hyper markets as well as schools and about 80% in municipal collection points; about 80% of quantities collected are collected with 20% of collection points available; 3 plastic bags per year are mailed by BEBAT to households they can use to store batteries and bring them back to collection points (they also allow to participate to a lotery).- Collection: about 5000 collection points are collected automatically with an optimised time schedule and the others are collected when they call BEBAT
ZnC & Alk batteries (high or no Hg content)
- At the begining, high mandatory targets to be reached quickly (collection rate = 75% of batteries sold; threat of a high penalty: 80 cents / unit not collected). Because they were not reached (and considered not reacheable), they were revised. New targets: 60% in 2002 and 65% in 2004
0,6
From 1998 to date:- communication expenses increased then stabilised,- collection expenses decreased due to the optimisation of collection circuits and time schedule, - quantities collected regularly increased.
582 246
Cents / battery sold
NB: the table presents total costs except marking costs (which correspond to the refund to producers of their expenses to mark batteries put on the market) because it is specific to Belgium
Cents / battery sold (1)
C.4 Expected costs evolution in the future
(1) Hypothesis: average weight of small batteries = g 40(2) slightlly negative if no sorting(3) Belgium is the only MS where consumers are legally in charge of the financial responsibility.
PR & communication expenses are planned to decrease because the maximum collection rate is considered to be reached; economies of scale are likely to happen for ZnC & alkaline batteries recycled in dedicated plants when more quantities arise in Europe (up to 600-700 Euros / t)
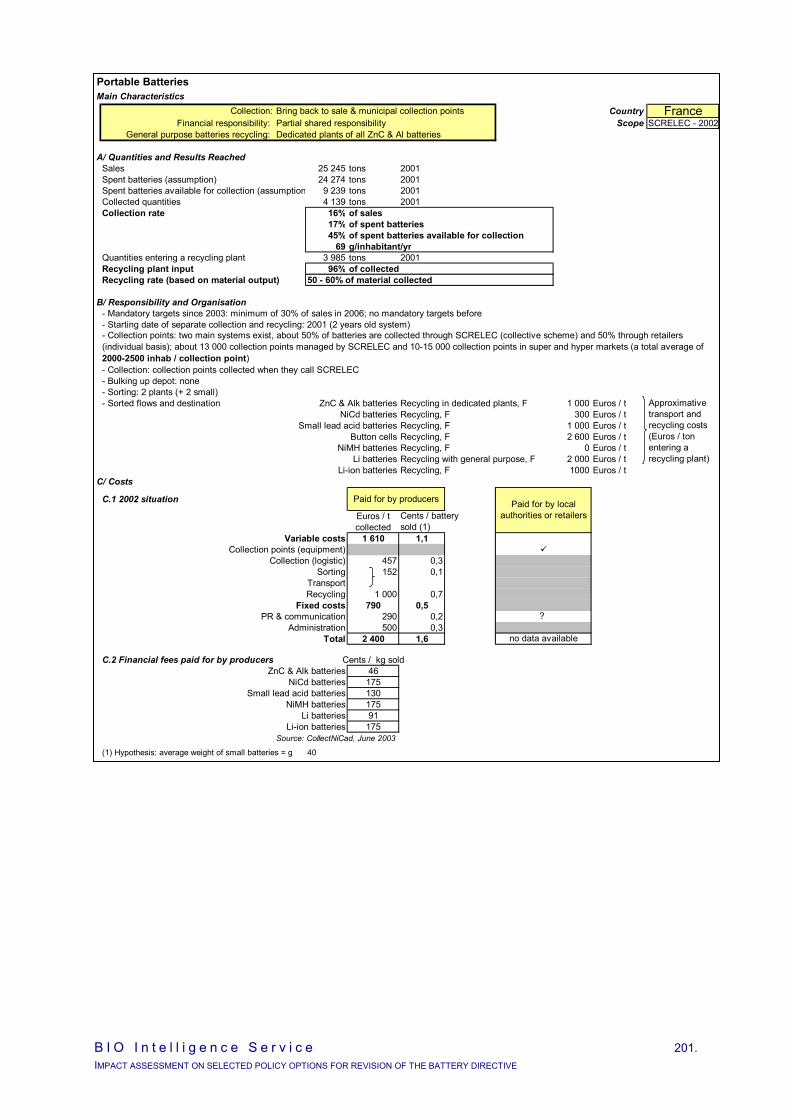
B I O I n t e l l i g e n c e S e r v i c e 201. IMPACT ASSESSMENT ON SELECTED POLICY OPTIONS FOR REVISION OF THE BATTERY DIRECTIVE
Portable BatteriesMain Characteristics
Collection: Bring back to sale & municipal collection points Country FranceFinancial responsibility: Partial shared responsibility Scope SCRELEC - 2002
General purpose batteries recycling: Dedicated plants of all ZnC & Al batteries
A/ Quantities and Results ReachedSales 25 245 tons 2001Spent batteries (assumption) 24 274 tons 2001Spent batteries available for collection (assumption 9 239 tons 2001Collected quantities 4 139 tons 2001Collection rate 16% of sales
17% of spent batteries45% of spent batteries available for collection
69 g/inhabitant/yrQuantities entering a recycling plant 3 985 tons 2001Recycling plant input 96% of collectedRecycling rate (based on material output) 50 - 60% of material collected
B/ Responsibility and Organisation- Mandatory targets since 2003: minimum of 30% of sales in 2006; no mandatory targets before- Starting date of separate collection and recycling: 2001 (2 years old system)
- Collection: collection points collected when they call SCRELEC- Bulking up depot: none- Sorting: 2 plants (+ 2 small)- Sorted flows and destination ZnC & Alk batteries Recycling in dedicated plants, F 1 000 Euros / t
NiCd batteries Recycling, F 300 Euros / tSmall lead acid batteries Recycling, F 1 000 Euros / t
Button cells Recycling, F 2 600 Euros / tNiMH batteries Recycling, F 0 Euros / t
Li batteries Recycling with general purpose, F 2 000 Euros / tLi-ion batteries Recycling, F 1000 Euros / t
C/ Costs
C.1 2002 situation Paid for by producers
Euros / t collected
Variable costs 1 610 1,1Collection points (equipment)
Collection (logistic) 457 0,3Sorting 152 0,1
TransportRecycling 1 000 0,7
Fixed costs 790 0,5PR & communication 290 0,2
Administration 500 0,3Total 2 400 1,6
C.2 Financial fees paid for by producers Cents / kg soldZnC & Alk batteries 46
NiCd batteries 175Small lead acid batteries 130
NiMH batteries 175Li batteries 91
Li-ion batteries 175Source: CollectNiCad, June 2003
(1) Hypothesis: average weight of small batteries = g 40
- Collection points: two main systems exist, about 50% of batteries are collected through SCRELEC (collective scheme) and 50% through retailers (individual basis); about 13 000 collection points managed by SCRELEC and 10-15 000 collection points in super and hyper markets (a total average of 2000-2500 inhab / collection point)
Approximative transport and recycling costs (Euros / ton entering a recycling plant)
Paid for by local authorities or retailersCents / battery
sold (1)
no data available
?
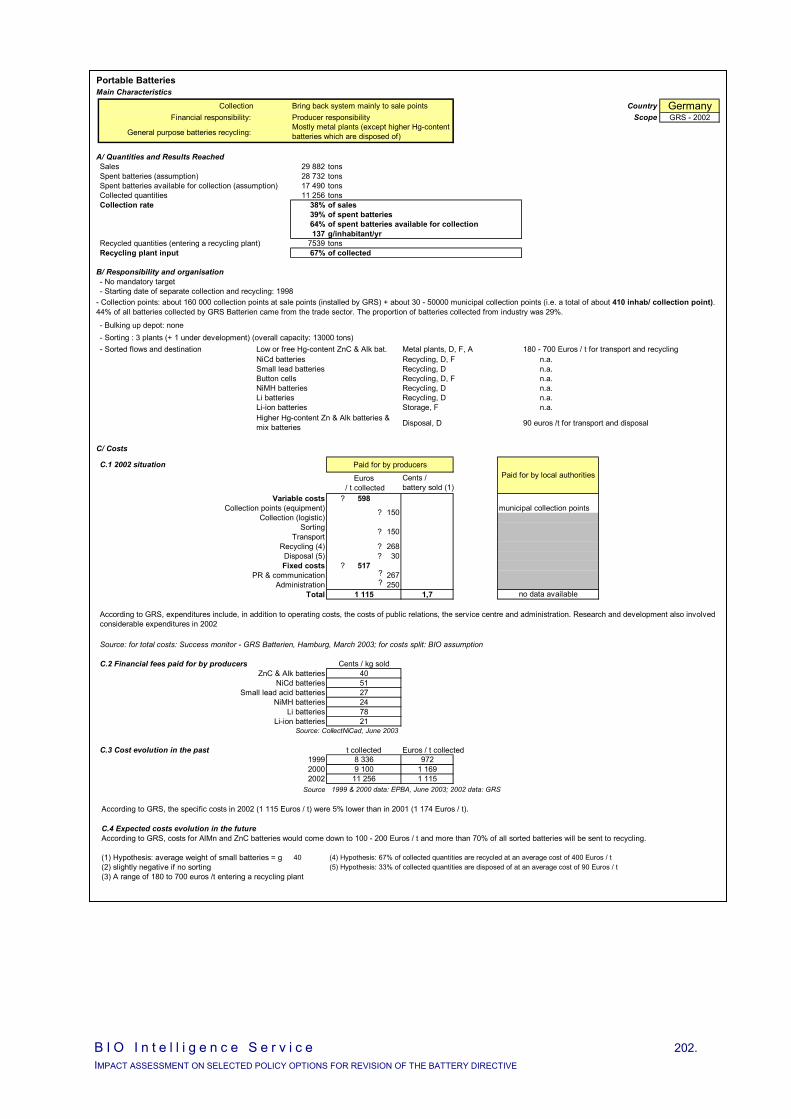
B I O I n t e l l i g e n c e S e r v i c e 202. IMPACT ASSESSMENT ON SELECTED POLICY OPTIONS FOR REVISION OF THE BATTERY DIRECTIVE
Portable BatteriesMain Characteristics
Collection Bring back system mainly to sale points Country GermanyFinancial responsibility: Producer responsibility Scope GRS - 2002
General purpose batteries recycling:
A/ Quantities and Results ReachedSales 29 882 tonsSpent batteries (assumption) 28 732 tonsSpent batteries available for collection (assumption) 17 490 tonsCollected quantities 11 256 tonsCollection rate 38% of sales
39% of spent batteries64% of spent batteries available for collection137 g/inhabitant/yr
Recycled quantities (entering a recycling plant) 7539 tonsRecycling plant input 67% of collected
B/ Responsibility and organisation- No mandatory target- Starting date of separate collection and recycling: 1998
- Bulking up depot: none
- Sorted flows and destination Low or free Hg-content ZnC & Alk bat. Metal plants, D, F, A 180 - 700 Euros / t for transport and recyclingNiCd batteries Recycling, D, F n.a.Small lead batteries Recycling, D n.a.Button cells Recycling, D, F n.a.NiMH batteries Recycling, D n.a.Li batteries Recycling, D n.a.Li-ion batteries Storage, F n.a.
Disposal, D 90 euros /t for transport and disposal
C/ Costs
C.1 2002 situation Paid for by producers
Euros / t collected
Variable costs 598Collection points (equipment) municipal collection points
Collection (logistic)Sorting
TransportRecycling (4) 268
Disposal (5) 30Fixed costs 517
PR & communication 267Administration 250
Total 1 115 1,7
Source: for total costs: Success monitor - GRS Batterien, Hamburg, March 2003; for costs split: BIO assumption
C.2 Financial fees paid for by producers Cents / kg soldZnC & Alk batteries 40
NiCd batteries 51Small lead acid batteries 27
NiMH batteries 24Li batteries 78
Li-ion batteries 21Source: CollectNiCad, June 2003
C.3 Cost evolution in the past t collected Euros / t collected1999 8 336 9722000 9 100 1 1692002 11 256 1 115
According to GRS, expenditures include, in addition to operating costs, the costs of public relations, the service centre and administration. Research and development also involved considerable expenditures in 2002
no data available
Paid for by local authoritiesCents / battery sold (1)
Mostly metal plants (except higher Hg-content batteries which are disposed of)
Higher Hg-content Zn & Alk batteries & mix batteries
150
150
- Collection points: about 160 000 collection points at sale points (installed by GRS) + about 30 - 50000 municipal collection points (i.e. a total of about 410 inhab/ collection point). 44% of all batteries collected by GRS Batterien came from the trade sector. The proportion of batteries collected from industry was 29%.
- Sorting : 3 plants (+ 1 under development) (overall capacity: 13000 tons)
?
?
?
??
?
??
Source 1999 & 2000 data: EPBA, June 2003; 2002 data: GRS
According to GRS, the specific costs in 2002 (1 115 Euros / t) were 5% lower than in 2001 (1 174 Euros / t).
C.4 Expected costs evolution in the futureAccording to GRS, costs for AlMn and ZnC batteries would come down to 100 - 200 Euros / t and more than 70% of all sorted batteries will be sent to recycling.
(1) Hypothesis: average weight of small batteries = g 40 (4) Hypothesis: 67% of collected quantities are recycled at an average cost of 400 Euros / t(2) slightly negative if no sorting (5) Hypothesis: 33% of collected quantities are disposed of at an average cost of 90 Euros / t(3) A range of 180 to 700 euros /t entering a recycling plant
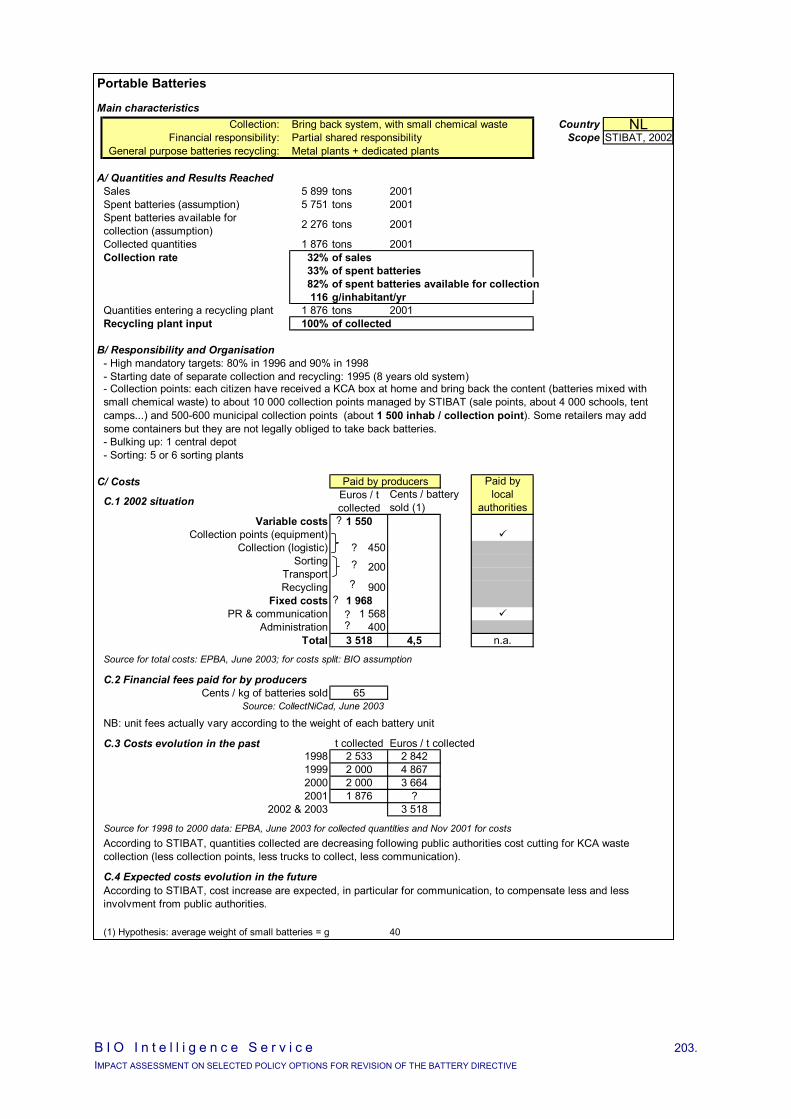
B I O I n t e l l i g e n c e S e r v i c e 203. IMPACT ASSESSMENT ON SELECTED POLICY OPTIONS FOR REVISION OF THE BATTERY DIRECTIVE
Portable Batteries
Main characteristicsCollection: Bring back system, with small chemical waste Country NL
Financial responsibility: Partial shared responsibility Scope STIBAT, 2002General purpose batteries recycling: Metal plants + dedicated plants
A/ Quantities and Results ReachedSales 5 899 tons 2001Spent batteries (assumption) 5 751 tons 2001Spent batteries available for collection (assumption) 2 276 tons 2001
Collected quantities 1 876 tons 2001Collection rate 32% of sales
33% of spent batteries82% of spent batteries available for collection116 g/inhabitant/yr
Quantities entering a recycling plant 1 876 tons 2001Recycling plant input 100% of collected
B/ Responsibility and Organisation- High mandatory targets: 80% in 1996 and 90% in 1998- Starting date of separate collection and recycling: 1995 (8 years old system)
- Bulking up: 1 central depot- Sorting: 5 or 6 sorting plants
C/ Costs Paid by producers
C.1 2002 situation Euros / t collected
Variable costs 1 550Collection points (equipment)
Collection (logistic) 450Sorting
TransportRecycling 900
Fixed costs 1 968PR & communication 1 568
Administration 400Total 3 518 4,5 n.a.
Source for total costs: EPBA, June 2003; for costs split: BIO assumption
C.2 Financial fees paid for by producersCents / kg of batteries sold 65
Source: CollectNiCad, June 2003
NB: unit fees actually vary according to the weight of each battery unit
C.3 Costs evolution in the past t collected Euros / t collected1998 2 533 2 8421999 2 000 4 8672000 2 000 3 6642001 1 876 ?
2002 & 2003 3 518
Source for 1998 to 2000 data: EPBA, June 2003 for collected quantities and Nov 2001 for costs
C.4 Expected costs evolution in the future
(1) Hypothesis: average weight of small batteries = g 40
- Collection points: each citizen have received a KCA box at home and bring back the content (batteries mixed with small chemical waste) to about 10 000 collection points managed by STIBAT (sale points, about 4 000 schools, tent camps...) and 500-600 municipal collection points (about 1 500 inhab / collection point). Some retailers may add some containers but they are not legally obliged to take back batteries.
According to STIBAT, quantities collected are decreasing following public authorities cost cutting for KCA waste collection (less collection points, less trucks to collect, less communication).
According to STIBAT, cost increase are expected, in particular for communication, to compensate less and less involvment from public authorities.
200
Paid by local
authoritiesCents / battery sold (1)
?
??
??
??

B I O I n t e l l i g e n c e S e r v i c e 204. IMPACT ASSESSMENT ON SELECTED POLICY OPTIONS FOR REVISION OF THE BATTERY DIRECTIVE
AAPPPPEENNDDIIXX 33:: EEUU SSEECCOONNDDAARRYY LLEEAADD SSMMEELLTTEERRSS
Country Secondary Smelter Lead capacity (t) Austria BMG Metall und Recycling 32,000 Belgium Campine
Fonderie et Manufacture de Metaux Umicore
45,000 15,000 200,000
France Affinerie de Pont Sainte Maxence Metal Blanc Societe de Traitements Chimique des Metaux Societe de Traitements Chimique des Metaux
45,000 23,000 20,000 30,000
Germany Berzelius Metall* BSB Recycling Metaleurop Weser* Metalhutten Hoppecke Muldenhutten Recycling und Umwelttechnik Varta Recycling
120,000 40,000 90,000 12,000 45,000 40,000
Italy EcoBat (Paderno Dugnano) EcoBat (Marcianise) Ecological Scrap Industry Me.Ca. Lead Recycling Piombifera Bresciana Piomboleghe
50,000 40,000 10,000 20,000 20,000 20,000
Portugal Sonalur 20,000 Spain Derivados de Minerales y Metales
Metalurgica de Gormaz Perdigones Azor Oxivolt
6,000 50,000 22,000 20,000
Sweden Boliden Bergsoe 50,000 United Kingdom Britannia Refined Metals
H J Enthoven 35,000 85,000
* These plants treat both primary and secondary feedstocks
Source: Eurobat, July 2003 – Primary source: “World Directory 2003: Primary and Secondary Lead Plants” published by the International Lead and Zinc Study Group, London – modified to reflect recent closures and additional data
Total number of smelters which process scrap batteries: 28
Total lead production capacity of the 28 plants: 1,210,000 mt

B I O I n t e l l i g e n c e S e r v i c e 205. IMPACT ASSESSMENT ON SELECTED POLICY OPTIONS FOR REVISION OF THE BATTERY DIRECTIVE
Related Documents