Running head: BIAM510_FINAL_EXAM_PROJECT_PFAEHLER_PAULA 1 BIAM510_Final_Exam_Project_Pfaehler_Paula Paula A. Pfaehler Capella Business Analytics II BIAM 510 Dr. Ware June 25, 2015

BIAM510_Final_Exam_Project_Pfaehler_Paula
Aug 17, 2015
Welcome message from author
This document is posted to help you gain knowledge. Please leave a comment to let me know what you think about it! Share it to your friends and learn new things together.
Transcript

Running head: BIAM510_FINAL_EXAM_PROJECT_PFAEHLER_PAULA 1
BIAM510_Final_Exam_Project_Pfaehler_Paula
Paula A. Pfaehler
Capella
Business Analytics II
BIAM 510
Dr. Ware
June 25, 2015

BIAM510_FINAL_EXAM_PROJECT_PFAEHLER_PAULA 2
BIAM510_Final_Exam_Project_Pfaehler_Paula
I. Management Section
1. Discuss the role of BI in each of the four stages of the customer life cycle.
As the authors Linoff, & Berry (2011) presented the four life cycles of the customers are
“Prospect, new customer, established customer, and former customer.” Business Intelligence
analyst can play part in each section of the customer life cycle. Starting with the prospect
portion of the customer life cycle, the BI analyst could uncover data through social media that
could help in targeting a market to grow and develop the customer base. New customers provide
a wealth of information through buying preference and cross sell information which could be
mined by the BI. Established customers play a key role in the heart of any business and a BI
could obtain a wealth of information for a corporation from these existing customers. First, why
does a customer stay, what does the profile of an ideal customer look like, what products are the
customers buying in addition to the products they are retaining. Also, the BI should be able to
determine the life of the existing customer which would help with forecasting revenue for a
corporation. Finally, why did a customer leave – what impact would it have on the company
especially if the customer was in the top 20% of the revenue generators? BI analysts would want
to determine how to prevent this type of customer from leaving in the future.
2. Describe the specific tools that might be appropriate for each and what questions or
issues they would address.
First is acquiring a customer through prospecting and the best way a BI can assist is
through building a “response model in which they answer the question of whether or not the
prospect can afford to become a customer and they will be profitable as customers.” (Linoff, et
al, 2011, p. 40). Secondly, a BI is able to assist in obtaining information from onboarding a new
BIAM510_FINAL_EXAM_PROJECT_PFAEHLER_PAULA 3
customer. For example, a BI can derive information using “customer activation which may be as
simple as a customer filling out a registration from on a website.” (Linoff, et al, 2011, p. 36).
This would answer the question of building a profile for a new customer to ascertain what type
of customer is buying the product. As discussed in the previous question, customer retention is
key to the profitability of the company. Therefore, data mining can play a huge part in retention.
“Predictive modeling is applied most often which answers the question as to why customer left
after a short time vs. customer who had long tenures.” (Linoff, et al, 2011, p. 39). Finally, why
does a customer leave – or can we win them back is the main question, however, BI analysts may
not be able to answer that question directly instead may complete a “data mining process in
customer service complaints and other behavioral data.” (Linoff, et al, 2011, p. 39).
3. Find at least one example of each from a web search.
Response Model https://teddykw1.files.wordpress.com/2010/02/model-cognitive-response2.png

BIAM510_FINAL_EXAM_PROJECT_PFAEHLER_PAULA 4
Customer Activation http://www.marketo.com/ebooks/customer-activation-marketing-with-a-
measurable-purpose/

BIAM510_FINAL_EXAM_PROJECT_PFAEHLER_PAULA 5
Predictive Analytics
http://www.sas.com/en_us/offers/sem/predictive-analytics-2248176/register.html?
utm_source=bing&utm_medium=cpc&utm_campaign=Analytics_Predictive_Analytics_conv&u
tm_term=predictive%20modelling

BIAM510_FINAL_EXAM_PROJECT_PFAEHLER_PAULA 6
Customer Complaint Data Mining
http://www.sciencedirect.com/science/article/pii/S0957417411010360

BIAM510_FINAL_EXAM_PROJECT_PFAEHLER_PAULA 7
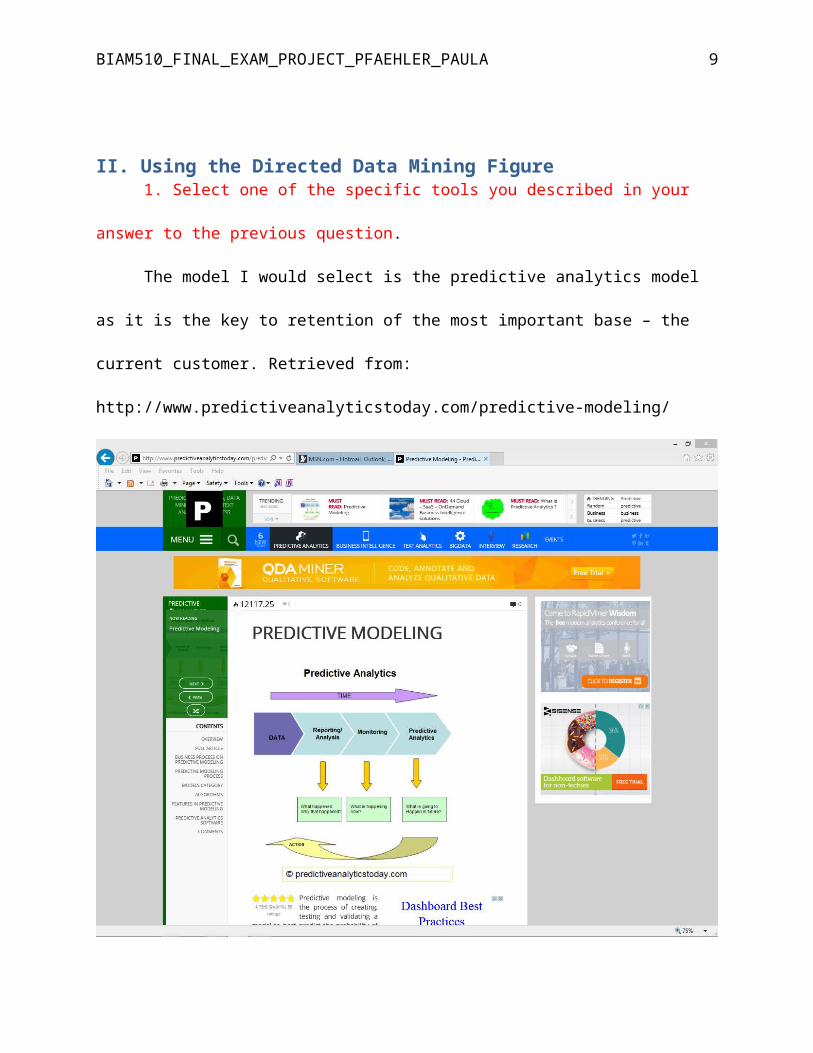
II. Using the Directed Data Mining Figure 1. Select one of the specific tools you described in your answer to the previous question.
The model I would select is the predictive analytics model as it is the key to retention of
the most important base – the current customer. Retrieved from:
http://www.predictiveanalyticstoday.com/predictive-modeling/

BIAM510_FINAL_EXAM_PROJECT_PFAEHLER_PAULA 8
BIAM510_FINAL_EXAM_PROJECT_PFAEHLER_PAULA 9

BIAM510_FINAL_EXAM_PROJECT_PFAEHLER_PAULA 10
2. Describe for each of the 11 component what you would to appropriately manage the
process: resources required; possible problems encountered and appropriate responses; measures
of project success or failure and descriptions of target input variables.
Each part of the project is as follows: (Lecture, Week 3)
C1 Translate the business problem into a data mining problem
The first issue is that customer retention is key to the challenges of ascertaining why a
customer stays and what products make them sticky. The BI would need to examine a very large
database of customers to find the top customer base and this could prove to be time consuming.
C2 Select Appropriate Data
In my opinion, the very first component would be to figure out the top 20% of customers
who make up 80% of the revenue. If it is a smaller company, then figure out if there is one
customer who makes up more than 10% of the revenue of the company. In each case losing one
customer would prove to significantly decrease the profitability of the company.
C3 Get to know the data
What makes a customer stay – ie what make them sticky. Questions that I would ask are
what makes up the profile of the profitable customer, what are the demographics, what is the
average life cycle of this customer, are there specific products that they are buying, what makes
them a repeat customer and what aren’t they buying. Lastly, are there products that they are
consistently not purchasing and what makes them leave the company. A good example provided
by the lecture is to review histograms of the data for “tells” to what the distribution of the data
looks over time or different set of variables.

BIAM510_FINAL_EXAM_PROJECT_PFAEHLER_PAULA 11
C4 Create a model set
Here in lies the difficulty of a predictive model – the resources required would be to
ensure that you have completed a full analysis of the correct variables ie data. The problems that
may be encountered is that the data may not prove out with any meaningful results so back to the
drawing board a BI must go. The measures of project success would only be proven in time and
would require consistent monitoring. Failure could result in cost of capital for the company and
loss of customers. The target would have to be at least a 95% confidence interval of data
analysis to ensure that the model chosen is able to give the prediction of behaviors with different
data set or newer data set to ensure the same results.
C5 Fix problems with the data
As the lecture for Week 3 states you want to look at the following:
“Discarding
Dividing the values into equal size ranges, such as defiles
Transforming the variables to reduce the range of values by standardizing the values.”
The possible problems with fixing the problems with the data “is imposing biasness into the
data” (week 3 lecture). As such, sorting through the data may result in the BI finding only what
they are looking for rather than what is the actual information being derived.
C6 Transform Data
To quote the lecture from week 3 you must “prepare data for analysis which often
requires adding derived fields, solving the problem outliers, binning numeric variables, grouping
classes for categorical variables, applying transformation such as logarithms, turning counts into
proportions and building models.” From a resource requirement, this portion would be the need
for time and the need for the removal of biasness from the analysis.

BIAM510_FINAL_EXAM_PROJECT_PFAEHLER_PAULA 12
C7 Build Models
Hopefully, the data selection was accurate and the data “scrubbing or transformation”
was thorough so that the model that is being built is true to the source and can answer the
questions that are being posed by the executives.
C8 Assess models
Here in lies the proving ground for the hard work that has already been performed. I
would ask “Does this model accurately predict the ideal customer and does it actually provide
real actionable solutions to retain the customer?” All of the aforementioned steps do fall in line
with the predictive modeling method that was picked for retention of the customers.
C9 Deploy Models
I like the week 3 lecture section in which the questions are askes as follows:
“What is the fixed cost of setting up to campaign in the model that supports it?
What is the cost per recipient of making the offer?
What is the cost per respondent of fulfilling the offer?
What is the value of a positive response?”
In other words, translating the model into a working model that has predictive values in true
costs to the company and a possible true profit to the company which gives the company an
ability to forecast future revenue.
C10 Assess Results
One question needs to be asked, did this obtain the results that the executives and
shareholders were ultimately looking for ie profits. Did the data modeling prove out with great
predictive modeling and retention of the top 20% customer base or was the predictive model
lacking in effectiveness? The resource required would be a full analysis of the results and the

BIAM510_FINAL_EXAM_PROJECT_PFAEHLER_PAULA 13
possible problems could be that issues were not detected in the previous tasks and may be
skewing the data analysis therefore, resulting in results that are not valid or not actionable.
C11 Begin Again
The first hope is to “get it right the first time” as starting over is a huge expense to a small
or large company just to try to solve the same problem. Yet, if the first model is a success, this
may prove to be a building block or a formula for the next problem to tackle. An example that
could prove out would be a call center that is trying to resolve who is the top customers yet is
constantly adding customers to their base. They could potentially begin again with this very
same model at a future date to ensure that at that point in time they have an accurate picture of
their top 20% customer base that makes up 80% of their revenue. Once again, they would want
to scrub the data however, they may not have to go directly to the drawing board for a starting
point.
III. Methods SectionsA. Decision Trees
1. Discuss in your own words how decision trees work.
I always think of decision trees as an “if then” statement that has another “if then”
statement attached. This may not be the correct way but the way a decision tree branches out is if
you have this then the data provides this and I have included a visual from Hill (2014) as an
example of how an if then or decision tree may work:

BIAM510_FINAL_EXAM_PROJECT_PFAEHLER_PAULA 14
2. What are the strengths of a decision tree approach?
I like the method as it provides a visual for the opportunity cost of making a decision
before you make a decision. You can actually plot out your choices and assign a cost to each
decision. The author Hill (2014) states that the benefits are:
“Clearly lay out the problem so that all options can be challenged.
Allow us to analyze fully the possible consequences of a decision
Provide a framework to quantify the values of outcomes and the probabilities of
achieving them.
Help us to make the best decisions on the basis of existing information and best guesses.”

BIAM510_FINAL_EXAM_PROJECT_PFAEHLER_PAULA 15
3. What are the weaknesses?
The most obvious is the actual decision making process. What if a possible outcome is
left out? What if the numbers associated with the decision tree are not correct? I have provided
an example that Hill (2014) provided as a positive, however, I could see the negatives from a
budgeting stand point.

BIAM510_FINAL_EXAM_PROJECT_PFAEHLER_PAULA 16
The cost value does not necessarily include a breakdown of cost of goods sold or
projected revenue, simply a simple approach of revenues minus costs. There could be a potential
of flunctuation of costs and changes in purchasing behavior.
4. When should they be used?
The author Hill (2014) sees the greatest benefit when a company is deciding to develop a
new product. Her comments are “by applying this technique we can see the best option is to
develop a new product. It is worth much more to us to take out time and get the product right,
than to rush the product to market. It is better to just to improve our existing products than to
botch a new product, even though it costs us less.” (p. 1). Decision trees in its simplest form
could be used for business decisions that may include opportunity costs even for clarity of
thought.
B. Survival Analysis
1. Discuss the role hazards play in survival analysis
Week 5 lecture presents that hazards are the “probability of the chance that someone who
has survived for a certain length of time is going to stop, cancel or expire before the next unit of
time.” The lecture from week 5 continues on with “given a set of hazards by time, survival can
be easily calculated in a spreadsheet or other tool.”
2. Describe how survival analysis would be used when trying to identify the
behavior of multiple groups of customers.
Both the authors Linoff, et al, (2011) and the Week 5 lecture review “Proportional
Hazards as a tool to show the effects of different groups of customers.” (p. 382). The best way I
understand it is there is a graphical layering of one customer group to another customer group

BIAM510_FINAL_EXAM_PROJECT_PFAEHLER_PAULA 17
and a visual comparison of the two groups to compare the expected survival rate of one customer
group to another group for decision making and analysis purposes.
3. Discuss the role of censoring in survival analysis
Linoff, et al, (2011) provides the discourses on censoring as “dropping some customers
from some of the hazard calculations-proves to be a very powerful part of the survival analysis.”
(p. 371). In essence, when calculating survival analysis there will be customers who have already
cancelled their service at the point in time that is being calculated and there are customers who
may still be customers for an unusually long time and may not fit the model. Therefore, those
customers are “dropped” or not included in the calculation. (Linoff, et al, 2011, p. 372).

BIAM510_FINAL_EXAM_PROJECT_PFAEHLER_PAULA 18
4. Provide specific examples of how survival analysis might be used to derive
customer value.
The author Linoff (2004) wrote a separate document dedicated to survival data mining
and in it he provided an excellent visual example of the use of Survival data mining. The above
graph is offered on page 3 of his body of work in which “charts the hazard probability of a
customer in a typical subscription business” (Linoff, 2004, p. 3). The graph provides a great
visual understanding of the effect of customer who do not pay, customer who agree to start but

BIAM510_FINAL_EXAM_PROJECT_PFAEHLER_PAULA 19
do not start the subscription and those who leave do to the end of the promotion. (Linoff, 2004,
p.3). As such, marketing executives would be able to utilize the graph for future promotions to
forecast life of a customer and the actual anticipated revenue from such promotions.
C. Market Basket Analysis
1. Describe the insights a market basket analysis might provide an organization.
In researching market basis analysis an unknown author (2014) provided good detail on the
Albion Research LTD website in regards to how the insights a market basket analysis might
provide an organization. For example, “market basket analysis can be used in deciding the
location and promotion of goods inside a store.” (p.1) Thus, increasing the product sale and
possibly having a bigger ticket per average customer.
2. Define the four measures of association rules and provide examples of each.
Actionable rules contain “actionable information for example Walmart’s discovery

BIAM510_FINAL_EXAM_PROJECT_PFAEHLER_PAULA 20
Reference

BIAM510_FINAL_EXAM_PROJECT_PFAEHLER_PAULA 21
Author unknown (2015) “Lecture 3 – Week 3 & Lecture 5- Week 5” Keller University.
http://frameset.next.ecollege.com/(NEXT(d402e2c3605949ccb5eea70e0d93ddd1))/Main/
AllMode/FramesetHybrid/FramesetFromPSHView.ed?ihm=11405118&returnUrl=http%
3a%2f%2fwww
Author unknown, (2014). “Market Basket Analysis” Albion Research LTD. Retrieved from:
http://www.albionresearch.com/data_mining/market_basket.php
Hill, R. (2013). “Decision Trees, Choosing by Projecting Expected Outcomes.” Mind Tools.
Retrieved from: http://www.mindtools.com/dectree.html
Imanuel, (2014). “Predictive Modeling” Predictive Analytics Today. Retrieved from:
http://www.predictiveanalyticstoday.com/predictive-modeling/
Linoff, G.S. (2004). “Survival Data Mining for Customer Insight.” Data-Miners.com.
Retrieved from: http://www.data-miners.com/resources/Customer-Insight-Article.pdf
Linoff, G.S., Berry, M.J.A. (2011). “Data Mining Techniques for Marketing, Sales, and
Customer Relationship Management.” Wiley Publishing Inc., Indianapolis: IN