http://jtlu.org Aic i P [Scheduled for JTLU 8.3 (2015)] pp. 1-30 Abstract: This paper presents a bi-level cellular agent-based model (ABM) framework, which incorporates a land cover change sub-model at the local level and a socioeconomic activity growth sub-model at the regional level. In the local sub-model, a land cell is set as an agent, of which the land-cover change decisions are mainly influenced by spatial mixed logit models. The regional sub-model is driven by fixed effects panel models, generating estimates of socioeconomic variables, thanks to the accessibility improvement and local land development. The regional outputs are also distributed into the local sub-models as their inputs. By inputting the historical data of the Lisbon Metropoli- tan Area (LMA) in 1991, a back-casting simulation was executed for validation. It compares the simulated outputs in 2011 with the actual reference data, based on multiple resolution goodness-of-fit (MRG) methods. Three scenarios are then designed to study the potential im- pacts of high-speed rail (HSR) on land-cover change in the LMA ac- cording to different proposals of HSR station locations. The scenarios indicate that without HSR the un-built lands in the LMA are likely to be largely developed if the annual GDP growth rate holds at 1.5 percent. With HSR the simulation suggests that land development is accelerated. The opening of an additional HSR station in Setúbal be- sides Lisbon-Oriente does not act as an obstacle to the urbanization process in the LMA, although it reduces HSR speed and the resulting regional accessibility. However, the contribution of the added station to the land-development process is also limited. Only a few areas are likely to benefit. Keywords: Agent-based model, high-speed rail, land-cover change, Lisbon Metropolitan Area Bi-level cellular agent-based model: Simulation of potential impacts of high-speed rail on land cover change in the Lisbon Metropolitan Area, Portugal Yu Shen Guineng Chen Universidade de Lisboa Portugal Universidade de Lisboa Portugal [email protected] [email protected] Luís Miguel Martínez João de Abreu e Silva Universidade de Lisboa Portugal Universidade de Lisboa Portugal [email protected] [email protected] Article History: Received: November 30, 2013 Received in revised form: August 30, 2014 Accepted: February 16, 2015 Available online: May 29, 2015 Copyright 2015 Yu Shen, Guineng Chen, Luís Miguel Martínez, & João de Abreu e Silva ISSN: 1938-7849 | Licensed under the Creative Commons Attribution – Noncommercial License 3.0 e Journal of Transport and Land Use is the official journal of the World Society for Transport and Land Use (WSTLUR) and is published and sponsored by the University of Minnesota Center for Transportation Studies. is paper and others from WSTLUR 2014 are also published with sponsorship from WSTLUR and the Institutes of Transportation Studies at University of California, Davis, and University of California, Berkeley.

Welcome message from author
This document is posted to help you gain knowledge. Please leave a comment to let me know what you think about it! Share it to your friends and learn new things together.
Transcript

http://jtlu.orgAic i P [Scheduled for JTLU 8.3 (2015)] pp. 1-30
Abstract: This paper presents a bi-level cellular agent-based model (ABM) framework, which incorporates a land cover change sub-model at the local level and a socioeconomic activity growth sub-model at the regional level. In the local sub-model, a land cell is set as an agent, of which the land-cover change decisions are mainly influenced by spatial mixed logit models. The regional sub-model is driven by fixed effects panel models, generating estimates of socioeconomic variables, thanks to the accessibility improvement and local land development. The regional outputs are also distributed into the local sub-models as their inputs. By inputting the historical data of the Lisbon Metropoli-tan Area (LMA) in 1991, a back-casting simulation was executed for validation. It compares the simulated outputs in 2011 with the actual reference data, based on multiple resolution goodness-of-fit (MRG) methods. Three scenarios are then designed to study the potential im-pacts of high-speed rail (HSR) on land-cover change in the LMA ac-cording to different proposals of HSR station locations. The scenarios indicate that without HSR the un-built lands in the LMA are likely to be largely developed if the annual GDP growth rate holds at 1.5 percent. With HSR the simulation suggests that land development is accelerated. The opening of an additional HSR station in Setúbal be-sides Lisbon-Oriente does not act as an obstacle to the urbanization process in the LMA, although it reduces HSR speed and the resulting regional accessibility. However, the contribution of the added station to the land-development process is also limited. Only a few areas are likely to benefit.Keywords: Agent-based model, high-speed rail, land-cover change, Lisbon Metropolitan Area
Bi-level cellular agent-based model: Simulation of potential impacts of high-speed rail on land cover change in the Lisbon Metropolitan Area, Portugal
Yu Shen Guineng ChenUniversidade de Lisboa Portugal Universidade de Lisboa [email protected] [email protected]
Luís Miguel Martínez João de Abreu e SilvaUniversidade de Lisboa Portugal Universidade de Lisboa [email protected] [email protected]
Article History:Received: November 30, 2013Received in revised form: August 30, 2014 Accepted: February 16, 2015Available online: May 29, 2015
Copyright 2015 Yu Shen, Guineng Chen, Luís Miguel Martínez, & João de Abreu e Silva
ISSN: 1938-7849 | Licensed under the Creative Commons Attribution – Noncommercial License 3.0
The Journal of Transport and Land Use is the official journal of the World Society for Transport and Land Use (WSTLUR) and is published and sponsored by the University of Minnesota Center for Transportation Studies. This paper and others from WSTLUR 2014 are also published with sponsorship from WSTLUR and the Institutes of Transportation Studies at University of California, Davis, and University of California, Berkeley.

2 JOURNAL OF TRANSPORT AND LAND USE : ARTICLE IN PRESS
1 Introduction
As commonly recognized by transportation modelers, transportation infrastructure is, in the long run, an important location factor for households and firms, indicating that better transportation infrastruc-ture reduces congestion costs, increases investment returns, and attracts new economic activities, allow-ing greater agglomerations and higher productivity (Guild 2000, Kessides 1993, Weisbrod and Weis-brod 1997). To model temporal and spatial transportation problems, the theory of cellular automata (CA), first developed by von Neumann (1951, 1966) and Ulam (1952) in the 1950s, is now extensively implemented. After the 1990s, due to developments in computer science, many new CA applications have been used to simulate the physical evolutions and behavior processes in urban and regional stud-ies (Al-Ahmadi et al. 2009, Batty, Xie, and Sun 1999, Clarke and Gaydos 1998, Clarke, Hoopen, and Gaydos 1997, Liu and Feng 2012, White and Engelen 1993, 2000). Besides CA methods, thanks to the prevalence of object-oriented programming, another individual-based modeling framework, agent-based modeling (ABM), has also emerged, largely to represent the heterogeneity within physical and human systems at a greatly disaggregated level (Batty et al. 2012). In short, compared to CA, ABM is a newer modeling system composed of autonomous, interacting agents with the consideration of their adaptation and emergence, which is widely applied in a variety of fields and disciplines (Macal and North 2010). In the applications of spatial studies, by integrating geographic information systems (GIS) technology, the combination of agent-based representations of decision makers with their impacts on land-use and land-cover changes on a cellular landscape, referred to as ABM/LUCC, becomes feasible (Parker 2005). These models not only simulate the transition of land parcels (Barros 2004), but they also focus on the decision-making processes of other individuals, e.g., households, residents, employ-ers, etc. (Brown and Robinson 2006, Loibl and Toetzer 2003, Otter, van der Veen, and Vriend 2001, Semboloni 2006).
Comparing CA models with ABMs, there are two critical features for CA: the location of automata cannot change, and the automata do not contain multiple attributes (Crooks and Heppenstall 2012). By contrast, the agents in ABMs are more flexible, and normally have the following four characteristics: 1) the perception of their environment or neighborhood, 2) a set of behaviors to interact with other agents, 3) the ability to memorize previous states and movements, and 4) recognition of the next movement or decision, based on the current and past situations (Abdou, Hamill, and Gilbert 2012). Regardless of the theoretical differences listed above, the structures of CA become more complex and comprehensive, drawing more features from ABM. As Birkin and Wu’s (2012) discussion, with the integration of GIS, the future path of these methodologies is to evolve toward a hybrid modeling approach.
Reviewing the CA practices over the last two decades, the intrinsic spatiality of CA offers an ex-cellent instrument for urban dynamic simulations, as the natural affinity with raster data in GIS and various urban morphologies can be easily interpreted as cells in simulation models (Iltanen 2012). Nev-ertheless, traditional CA models are limited by the design of transition potential of the cell’s states, while the object-oriented idea of ABM offers a more flexible setting of the behavior of an agent. Despite the great flexibility of agent design, the high computational requirement of ABM remains a limitation when modeling large-scale systems, although computing power is increasing rapidly (Parry and Bithell 2012).
In terms of the impacts HSR, at the regional level, some early works about the Japanese Shinkansen system reveal that HSR may impact the relocation of firms and households due to shorter travel time (Nakamura and Ueda 1989, Amano and Nakagawa 1990). After the success in Japan, similar benefits are also found in several European countries (Bonnafous 1987, Monzón, Ortega, and López 2013, Blum, Haynes, and Karlsson 1997, Haynes 1997, Vickerman and Ulied 2009). Nevertheless, the stud-ies about the local impacts of HSR are limited. Previous studies on local impacts of HSR majorly focus

3Bi-level cellular agent-based model in Lisbon Metropolitan Area, Portugal
on case studies on intermediate and small cities, with ex-post economic analysis methods (Chen and Hall 2011, Garmendia et al. 2008, Ureña, Memerault, and Garmendia 2009, Fröidh 2005), whereas the current urban CA or ABM models on land-use change rarely take into account the impacts of HSR, or other regional transport infrastructures or services. In recent years, some simulation-based studies in terms of the local HSR impacts were conducted, but those only model the impacts on small cities (Basse 2013, Shen, Martinez, and de Abreu e Silva 2014).
Therefore, to study the impacts of HSR at the local level, the creation of a nexus between regional economic models and urban simulation models becomes necessary. As in the classical studies reviewed above, the linkage between regional economic models and land-cover change models is often one-way. Until recently, several studies attempted to integrate socioeconomic models and land-use change models dynamically, by allowing a bi-directional interaction. Specifically, the socioeconomic models provide land-use demands based on demographic and economic developments to the land-use change model and also a feedback from the land-use model to the economic model (Britz, Verburg, and Leip 2010, Fontaine and Rounsevell 2009, van Delden et al. 2010).
However, the dynamic integrated models mentioned above have not yet been found in the assess-ment of transportation infrastructure impacts. In this study, benefited by applications in the field of ecology, e.g., the works of van Delden et al. (2010), we attempt to build a model considering the inter-action between regional impact models of HSR and local urban dynamic land-cover change models, to gain a more comprehensive understanding of the potential HSR impacts on the LMA spatial con-figuration. Specifically, a cellular ABM framework is proposed to simulate the potential urban growth of the LMA in Portugal, resulting from the future opening of a new HSR line. The model synthesizes the advantages of CA, i.e., less demanding in computation and intrinsic adaption for urban study, and ABM, i.e., great flexibility of agent design. In this study, an agent-based approach is introduced for land-cover change simulation.
The structure of this paper follows. Some key background features of the LMA, as well as the motivation of the present work, are introduced in the next section. Then, the modeling structure, with its sub-models, is described in Section 3. In Section 4, the input data applied for simulation are listed. Section 5 presents the back-casting validation of the ABM, ranging from 1991 to 2011. In Section 6, two scenarios are designed based on different configurations of HSR station locations in the LMA: 1) only one HSR station in Lisbon-Oriente; 2) two HSR stations respectively located in Lisbon-Oriente and Setúbal, between which the HSR speed is reduced by half. In the final section, some conclusions are drawn and the future developments for this work are also discussed.
2 Case study
The LMA, bisected by the Tagus River estuary, is the most populous and the economically strongest area in Portugal, with about one-fourth of the total population it creates more than one-third of the total Portuguese gross domestic product (GDP). The metropolitan area, as shown in Figure 1, comprises two EU NUTS III subdivisions1, i.e., Greater Lisbon and the Peninsula of Setúbal, and some areas along the Tagus Valley. The total area is approximately 3600 kilometers2.
From 1991 to 2011, the transportation network in the LMA changed quite substantially, with sev-eral new freeways being built. In 1998, a new Tagus-crossing bridge, Ponte Vasco da Gama, was opened. In the same year, a new railway station, Lisbon-Oriente, was also inaugurated. This new station became an important transit hub in Lisbon, with connections to the Lisbon Metro, as well as urban, suburban, and regional bus networks. In 1999, a new electric tilting rail service, Alfa Pendular (AP), started operat-ing, running from Faro (in the south) to Braga (north of Porto). As a result, the rail travel time was also
1 EU NUTS III: the third-level nomenclature of territorial units for statistics of the European Union.

4 JOURNAL OF TRANSPORT AND LAND USE : ARTICLE IN PRESS
reduced. During these two decades, the transit network in the LMA was also greatly expanded with new metro and suburban rail lines.
(a) High-speed rail planning in Portugal (b) Lisbon Metropolitan Area
Figure 1: Geographical location of the Lisbon Metrolitan Area and HSR planning in Portugal (Background: ESRI topo-graphic base map)
In 1996, under the European Commission Trans-European Transport Network Program (TEN-T), a Portuguese HSR project was developed. The maximum operation speed would be of 300 kilome-ters per hour. In terms of HSR planning, the decision of HSR station location is an essential issue, since the location determines the quality and the level of accessibility to the station, which further impacts the attractiveness of HSR (Brons, Givoni, and Rietveld 2009). In the planning of Portuguese HSR, many scholars focused on this issue based on various criteria. From the perspective of policymaking, besides accessibility, Mateus, Ferreira, and Carreira (2008) took into account other conditions, e.g., construc-tion, maintenance and operation cost, noise and vibration impacts, residential relocations, etc. From an operational point of view, Repolho, Antunes, and Church (2013) studied the optimal location and number of HSR stations along Lisbon-Porto HSR by maximizing the total travel cost savings. In terms of land-use impacts, a study of Aveiro, presented by Shen, Martinez, and de Abreu e Silva (2014), shows that a station located in the city center is relatively more attractive to the development of new urbanized land covers than a station located outside the urban perimeter. In the LMA, as illustrated in Figure 1(a), the Lisbon-Oriente railway station was designated as the main station, with connections to Madrid (Spain) and Porto. From this station eastward, before connecting to Évora and to Madrid, two differ-ent proposals are raised, as shown in Figure 1(b): the first one links Évora directly (Steer Davies Gleave 2007); and the other one firstly links to Setúbal on the southern bank of the Tagus River and then links to Évora. The latter station placement proposal is not an official plan of the Portuguese HSR network, but it has been mentioned in some EU documents (European Commission 2008).

5Bi-level cellular agent-based model in Lisbon Metropolitan Area, Portugal
3 Modeling description
The ABM simulation in this study is cellular based, meaning that the study area is latticed into square grid cells. Each cell, as an individual, represents a collectivity of population behaviors and economic activities on a piece of land. To capture the urbanization process and the potential land-cover impacts of HSR on the LMA as well as the regional effects on Portugal, two levels of grids are latticed. The LMA is divided into 13,652 cells with a cell size of 500×500 meters, whereas the whole country is divided into 3,822 cells with a cell size of 5×5 kilometers. The local land cell size is consistent with the spatial resolution for urban extent derived from MODIS data (Schneider, Friedl, and Potere 2009, 2010). The regional cells located in the LMA have a perfect overlap with the local cells, each of which contains up to 100 local cells.
As one of the largest differences from the cellular ABM to other traditional CA methods, each cell (i.e., agent) at local contains multiple states of attributes, consisting of land cover, population, number of firms, etc., while each regional cell also contains multiple attributes including land cover, population, GDP, and number of firms. The classification of land cover is regrouped based on CORINE land-cover nomenclature developed by the European Environment Agency (EEA), compiled based on the EU satellite maps in 1990, 2000, and 2006. In this model, four different land covers are classified, namely:
• Continuous urban fabric (CUF, code 1.1.1), where more than 80 percent of land is covered by buildings, roads, and artificially surfaced areas
• Discontinuous urban and recreational areas (DUR, code 1.1.2 and 1.4.x), where the surface is not only covered by buildings and roads, but also associated with green areas, parks, sports grounds, bare soils, etc.
• Commercial/industrial/transportation sites (CIT, code. 1.2.x), which represents industrial or commercial complexes, including transportation platforms (e.g., railway stations, airports, dockyards, etc.) and industrial and commercial centers
• Un-built surfaces (UBS, other codes), including construction and dump sites, cultivable lands, forests, water bodies, etc.
According to EEA, the most common land use in CUF and DUR is residential. However, com-mercial and retail activities may also be present in these areas, as CIT sites can only be identified if they are distinguishable from residential areas. Another essential state variable of each cell is the neighbor-hood situation, containing all state variables from its neighbor cells. Thus, the state of each cell is not only dependent on its previous states but also on its neighborhood state.
In the LMA, a number of areas are regulated by national planning regulations and environmental laws. The regulated areas are mainly the national environmental and agricultural reserves, i.e., water bodies, protected forests, and some fertile cultivable lands, which are indicated by Instituto do Ambiente (IA, Environment Agency) of Portugal. The model assumes that these areas (e.g., Atlantic Coast, Tagus River banks) are unchangeable, and therefore are excluded from the simulation. In addition to the na-tional regulated lands, the areas in the east of Setúbal NUTS III and the Tagus Valley are also excluded from the simulation, as these areas are majorly agricultural areas and forests, and the land cover has held the same for the past two decades. All the other cells, 7012 out of 13,652, could be developable, as the land-use regulation policies applied at other administrative levels in Portugal are quite loose (Carter and Nunes da Silva 2001).
The fundamental modeling framework is shown in Figure 2. The simulation follows a discrete time-based procedure, in which both regional and local cells update their states once per iteration, i.e., once per year. At both levels, the annual evolution of local and regional cells are simulated simultane-

6 JOURNAL OF TRANSPORT AND LAND USE : ARTICLE IN PRESS
ously. At the local level, the land-cover change is driven by the improvement of local and regional acces-sibility and the change in local population and number of firms, and it is also affected by its local neigh-borhoods. At the regional level each year, the population and number of firms in each regional cell are updated according to national GDP growth, improvement in regional accessibility, and new land-cover patterns derived from the local model. The generated regional values are distributed to its local cells, as a function of the previous shares of the corresponding values in each local cell. With the predicted and distributed socioeconomic values, the local cells are able to perform land-cover development. The details of accessibility measurement, local and regional sub-models are described in the following subsections, respectively.
Figure 2: Bi-level modeling framework
In this study, agents’ behaviors are coded in Java programming language in the AnyLogic simula-tion platform. The model is connected to MySQL database via JDBC (i.e., Java database connectivity) for accessibility calculation. In the GIS map, an ID number is assigned to each node in the transporta-tion network. For each link, its starting and ending points are also enumerated based on the ID of the nodes. From one link to its connected link, a turning cost, generalized into minutes, is also implemented to capture the time loss due to the interchange among different public transit routes in the LMA, includ-ing bus, metro, commuter rail, ferry, etc. The cost is estimated based on the service frequencies of each public transit service route. With the assigned ID numbers, the transportation networks of the LMA and Portugal are converted into abstract topology maps. The travel time between each origin-destination pair (OD pair) is thus estimated based on Dijkstra’s algorithm, coded in Java and stored in the MySQL database prior to ABM simulations.

7Bi-level cellular agent-based model in Lisbon Metropolitan Area, Portugal
3.1 Accessibility measures
3.1.1 Simulation framework
Figure 3: Measuring accessibility during simulation
As the study areas are divided into 13,652 local cells (in which 7012 cells are input for modeling) and 3822 regional cells, for each accessibility indicator, the sizes of OD matrices are 7012×7012 (for local car), 7012×7012 (for local public transit), 3822×3822 (regional), and 7012×3822 (hybrid). It is very demanding for the simulation to process so many data records at each iteration. Therefore, during the simulation, the accessibility indicators are computed directly in the SQL database based on the OD travel time matrices calculated beforehand.
The process is shown in Figure 3. The simulation platform and SQL database are bridged by JDBC. In each year, the simulation updates population at year t and sends it to the database. With the updated population, SQL queries are sent to the database for accessibility estimation, of which the measures are discussed in the following subsections. For every 10-year period, the simulation requests the database to update its OD travel time matrices. When the accessibility calculation is done, the simulation reads the results from the database.
3.1.2 Theoretical methodologies
As in Hansen’s (1959) pioneering work pointing out the causality between transportation accessibility and land-use change, in this model, the change of accessibility led by the expansion and upgrade of the transportation network is an essential factor. In short, the concept of accessibility depicts the “weighted moving average of access to target,” which can be expressed by various mathematical forms (Bhat et al. 2000, Geurs and van Wee 2004, Harris 2001). Commonly, to study the impacts of HSR, location-based accessibility indicators are implemented, including two major approaches, economic potential and weighted average travel time. The calculations of both of these approaches comprehend two parts, the activity function and the impendence function. In this study, the weighted average travel time ac-cessibility form is implemented as compared with economic potential form. This indicator can be easily interpreted by providing a value of travel time savings, and it also offers a clearer figure of geographical separation (Gutiérrez 2001, Gutiérrez, Gonzáles, and Gómez 1996, Gutiérrez and Urbano 1996). A general expression of weighted average travel time indicator is:
(1)Ait= ∑j=1(Tijt . Pjt )
∑j=1(Pjt )J
J

8 JOURNAL OF TRANSPORT AND LAND USE : ARTICLE IN PRESS
where: Pjt: population at local or regional destination j in year t; and Tijt: the travel time from origin i to destination j in year t.
Thanks to the population growth, roadway and public transit network expansion, as well as the implementation of new train service, the accessibility in the LMA varied substantially during the past two decades.
As in equation (1), to measure accessibility, the calculation of OD travel time becomes essential. In a previous study of local impacts of HSR on Madrid, three accessibility indicators, based on the ODs at different geographical levels, are defined, namely local accessibility, regional accessibility, and hybrid accessibility, in which hybrid accessibility accounts for the travel time from local origins to regional destinations by different means of transport (Shen, Martínez, and de Abreu e Silva 2013). In this study the same measures are adopted.
3.1.2.1. Local accessibility
The local accessibility is defined as the accessibility resulting from public transport and road network characteristics. To estimate local transit accessibility between each OD pair i,j at year t, the travel time is the shortest travel time from i to j between year period t and previous year period t-1, with the form as:
TT PT(or car) (i,j) = min [TT PT(or car) (i,j), TT PT(or car) (i,j)] (2)
This expression indicates that, from i to j, if the travel time via the new route by public transit (or by car) at year t is longer than the travel time by public transit (or by car) via the former route at year t-1, the former route is still taken.
For each OD pair at each year, the travel time by local public transit is:
(3)
where: TT PT (i,j) : total travel time from i to j by public transit; TT walk (i,Ei ) : walking time from i to the nearest public transport station Ei by pedestrian road
way network; TT PT,c (Ei,c , Ej,c ) : in-vehicle travel time of the c-th change of different public transit lines, from
station Ei,c to the station Ej,c; TT walk (Ej , j): walking time from the station Ej to the final destination j; and, τp: total time local for the expected waiting and transfer of each interchange c, depending on the
service frequencies.
TT car (i,j) = TT walk(i ,Ni ) + TT car (Ni , Nj ) + TT walk (Nj , j) (4)
where:TT car (i,j) : total travel time from origin i to destination j by car;TT walk(i ,Ni ) : walking time from i to the nearest road access node Ni; TT car (Ni , Nj ) : in-vehicle travel time from road node Ni to the node Nj, the closest one to j, which
is constrained by road types and traffic flows; and,TT walk (Nj , j) : the walking time from Nj to j.
tt-1t
TT PT (i,j) = TT walk (i, Ei ) + ∑ TT PT,c (Ei,c ,Ej,c ) + TTwalk(Ej , j) + τp
C
c = 1

9Bi-level cellular agent-based model in Lisbon Metropolitan Area, Portugal
3.1.2.2. Regional accessibility
Regional accessibility implemented in this study attempts to capture the geographic separation between each regional land cell in Portugal, measured by the minimal travel time between regional car travel time and regional railway travel time, weighted by population at the target regional cell. The regional travel time is formulated as:
TT(i,j) = min [TT rail (i,j), TT car (i,j)] (5)
Similar to the definitions in equation (3), the total travel time by rail at year t, TT rail (i,j) is the sum of travel time via roadway from regional origin proximity i to regional railway station Ei, regional railway travel time from station Ei to destination station Ej, the roadway travel time from Ej to final destination j, and time loss penalty Tloss, following the measurement applied by Monzón, Ortega, and López (2013):
TT rail (i,j) = TT car (i,Ei ) + TT rail (Ei , Ej ) + TT rail (Ej ,j) + Tloss,t (6)
where Tloss,t indicates the loss time budget due to the interchange of railway lines (Crozet 2005), formu-lated as, at year t:
Tloss,t = α exp (–βloss N train,t) (7)
where N train,t is the number of trains per day from the origin to the transfer railway station in correspond-ing year t.
3.1.2.3 Hybrid accessibility
The concept of “hybrid accessibility” is adopted to capture the accessibility from the proximity in each local origin cell to the whole country. The travel time is defined as the shortest travel time through either roadway or railway network from local to regional destinations. The travel time from each grid cell i to j in the rest of country, can be expressed as:
TT hyb (i,j ) = min [TT car (i,j ), (TT local (i,E ), TT regional (E,j ))] (8)
where:
TT car (i,j): personal vehicle travel time from origin i to destination j at year t; TT local (i,E): local travel time by car or public transit from i to railway station E at year t; TT regional (E,j): regional railway travel time from E to regional destination j at year t.
3.2 Local sub-model
The simulation procedures of the local sub-model are shown in Figure 4. When a cell has already devel-oped from un-built areas to artificial land cover, i.e., urban fabric or commercial area, it does not search for future land-use evolutions. What has to be noted is that, this setting discards the changes between commercial areas and residential urban areas, and from discontinuous to continuous urban fabrics. However, as the cell-by-cell land-cover transition matrix shown in Table A in Appendix A, in the LMA from 1991 to 2011, among 7012 cells, only 12 cells are developed from discontinuous to continuous
t t
t
t t t t
t
t
t

10 JOURNAL OF TRANSPORT AND LAND USE : ARTICLE IN PRESS
urban areas, and 10 cells change from DUR to CIT while another 10 cells change from CIT to DUR. Thus, due to a relatively small share of these types of changes, we believe that the simplification is worth-while since it may take a huge effort to ask the model to automatically distinguish these cells, whereas the share of these changes is very small. For the cells with urbanization potential, the simulation of land-cover change is first based on the spatial discrete choice module, in which the probability of evolving to a specific land cover is estimated based on the utility of each land cover, built as a function of accessibil-ity indicators at different geographical levels, socioeconomic variables, spatial effects, and a series of un-certainty. To measure the spatial impacts, a neighbor area is defined including the neighboring cells with a maximum Euclidean distance of 3.2 kilometers, as such distance is found as the threshold that the neighborhood effects start to become inconsequential (Zhou and Kockelman 2008). For land cell n at each year t, the choice procedure is repeated 1000 times. The most frequently occurring land cover is chosen. The parameters of the variables in spatial discrete choice model are estimated based on the past land-cover changes from 1991 to 2001 and to 2011. The spatial discrete choice model used in this study is discussed in Subsection 3.2.1. The parameters, as the sub-model inputs, estimated from this model, are listed and analyzed in Table A.2 in Appendix A.
Figure 4: Local sub-model
In the simulation, all cells follow the same land-cover choice procedure. However, the development speed may not be homogenous in all municipalities of the LMA. In some municipalities, the develop-ment speed simulated by the discrete choice procedure may be slower than the actual speed, which means that, in these areas, the data gathered by this study, i.e., the accessibility improvement and the growth of socioeconomic activities, may not be powerful enough to drive the land-development process in these municipalities. To calibrate the underestimation of development speed, a naïve land-cover tran-sition rule is additionally proposed for land-cover change in these municipalities, based on the neigh-borhood-based urban cellular automata theories (Batty 1998, Batty and Xie, 1997, Batty, Xie, and Sun 1999, White and Engelen 1993):
(9)
where:Probni (t+1): probability for land cell n at year t to develop to land cover i at the next year, t+1;ysi(t): dummy variable, which equals to 1 if neighbor cell s has land cover i at year t;dns: Euclidean distance between cell n and neighbor cell s; and,
Probni (t +1) = βn. ∑S
ysi (t) ∑S
1dns dns
2 2[ ]
11Bi-level cellular agent-based model in Lisbon Metropolitan Area, Portugal
βn: empirical land cover transition threshold for cell n.
As in equation (9), if the proportion of land cover i is higher, and the cells with land cover i are closer to land cell n, the probability for cell n developing to land cover i will also be higher.
3.2.1 Spatial mixed logit model
For land cell n, the development of land cover j at year t is the outcome of decisions made by households, developers, and planners under a fair amount of uncertainty. To model land-cover change, random util-ity theories can be used (Wang and Kockelman 2006). Specifically, the land cover of a cell is affected by accessibility improvement, growth of socioeconomic activities, spatial autocorrelations, etc. The form of spatial mixed logit model proposed by Mohammadian, Haider, and Kanaroglou (2005) is used. It is written as:
Uint = Vint + εint = αin + βinXint + Zint + εint (10)
where: αin is alternative specific constant, capturing the inherent preference of land cell n for land-cover alternative i and εint is the error term with Gumbel distribution. In the equation, Xint is a set of observed attributes, including local accessibility by transit and by private car, accessibility from local origin (i.e., local 500×500 meter cells) to regional destination (i.e., regional 5×5 kilometer cells), as well as several socioeconomic variables, i.e., population and number of firms, while βin is the vector of parameters to be estimated. The systematic component Zint captures spatial autocorrelation over space, expressed as the total impacts that the land covers of all other neighboring land cells have on land cell n:
Zint = ∑ ρsint ysit (11)
where S is the number of land cells that impact n, and ysit is binary that equals one if land cell s obtains land cover i in year t. In the equation, ρ represents the separation between two land cells with a negative exponential function, expressed as:
ρsint = λ exp [γ ∙ dns] (12)
where λ and γ are parameters to be estimated, and the separation between two cells is computed as the Euclidean distance dns from the centroid proximity of land cell n to the centroid proximity of land cell s. For land cell n, there are at maximum 128 neighbor cells. To relieve the calculation demand, for each cell, 20 neighbor cells are randomly drawn from the full neighbor set S.
Based on equation (10), the probability of land cell n evolving to land cover i in situation t is given as:
(13)
where, Iint equals 1 if there is at least one cell in the 3.2-kilometer neighborhood of land cell n having land cover i at year t; and equals 0 otherwise. According to Train (2009), the unconditional probability of choosing land cover i for a randomly selected land cell n is:
Pnt (i|θ) = ∫Pnt (i|β) f (β|θ) d β (14)
2
Pnt (i|βn )=Iint∙ exp (Vint )
∑[Ijnt∙ exp (Vjnt )]

12 JOURNAL OF TRANSPORT AND LAND USE : ARTICLE IN PRESS
As the integral of equation (14) cannot be analytically solved, the estimation must be simulated. Denote T as the number of land-cover occasions observed for land cell n, the likelihood function for land cell n’s observed sequence of choices, conditional on β, is:
Ln (β) = ∏ ∏ [Pnt(i|β)]yint (15)
where ynit equals 1 if the n-th cell evolves to land cover i on situation t, and zero otherwise. The uncon-ditional likelihood function is:
Ln(θ) = ∫Ln(β) f (β|θ) dθ (16)
For further explanations, refer to the works of Mohammadian and Kanaroglou (2003) and Moham-madian, Haider, and Kanaroglou (2005).
3.3 Regional sub-model
In the analysis of the impacts of transport infrastructure using panel data, many studies employ a fixed effects model to take explicit account of unobserved characteristics across jurisdictions, which makes it less likely to have omitted-variable biases comparing to the single-equation studies using cross-sectional data (Bollinger and Ihlanfeldt 2003, Canning and Fay 1993, Dalenberg, Partridge, and Rickman 1998, Holl 2004). As in Figure 5, the change of the regional cells’ states accords to two fixed effects panel models, which generate predicted values of regional population and number of firms. In this paper, the regional fixed effects are included in the empirical model to control for unobservable heterogeneity of population and number of firms across regions that may be persistent during the sample period. In the panel data literature, there are also two-way error component regression models, namely individual ef-fects and time effects. However, in our estimation, the fixed effects across year are found to be insignifi-cant compared to the location-specific fixed terms, which are as a result not included. The unobservable fixed effects of regional characteristics are important in regional economics. We thus use a fixed effects approach as well as the common intercept model with spatial correlation.
Figure 5: Regional sub-model
13Bi-level cellular agent-based model in Lisbon Metropolitan Area, Portugal
The formulation and notation of the fixed effects model follows Mutl and Pfaffermayr (2008),
ynt = α + λn + б ∑Wnsynt + Xnt β + εnt (17)
where:ynt: an n×1 vector containing the dependent variable of individual land cell n in year t; α: the constant;Xnt: an n×k matrix containing k explanatory variables of individual land cell n in year t; λn: an n×1 vector of individual specific fixed effects;б: spatial autoregressive coefficient; and,β: k×1 vector of the trend parameters.
To include the spatial correlation, the Spatial Durbin Model (SDM) is used, with which the autore-gression is in the independent variables. W is an n×k matrix of criteria for neighbor relations structure, Wns is an element of a spatial weights matrix. The spatial weights matrix determines the number of interactive neighboring regions for spatial correlation analysis. This involves the distance over which the effect is felt. The criterion to calculate the spatial matrix is the shortest travel time by car or by rail between the regional cell centroids, with up to 30 minutes (equivalent to the average commuting time in Portugal).
In the regional sub-models, regional population is formulated as a function of the neighboring population, number of firms, GDP, and the area of artificial land covers; and the number of firms in a regional cell is explained by the firms in the neighboring regions, the regional accessibility, GDP, and area of artificial land covers. The single equation models are written as:
Popnt = α + λn + б ∑ WnsPopst + βFirmFirmnt + βGDPGDPnt , (18)
+ βCUF AreaCUF + βDUR AreaDUR + βCIT AreaCIT + εnt
and
Firmnt = α + λn + б ∑ Wns Firmst + βAccAccnt + βGDPGDPnt , (19)
+ βCUF AreaCUF + βDUR AreaDUR + βCIT AreaCIT + εnt
The parameters of each fixed effects model are estimated based on the historical regional changes in 1991, 2001, and 2011, which are listed in Table A.3 in Appendix A. According to the modeling frame-work, during simulation, two variables externally trigger the growth, the GDP growth, and the accessi-bility improvement thanks to the opening of new transportation infrastructures. The GDP growth from 1991 to 2011 is based on the actual GDP changes in Portugal, and for growth from 2011 onward, the forecasts from the European Commission (2013) are used.
3.4 Cross-level interaction
In the context of the impacts of HSR, the regional benefits are revealed by classical regional economic models. In terms of the individual-based simulation for urban land development, it is not straightfor-ward to directly incorporate the regional impacts caused by HSR or other transport infrastructures into the urban model. In addition to the hybrid accessibility described in Subsection 3.1.2.3, the socioeco-nomic benefits at the regional level should also be taken into account. As the discussions of the local sub-

14 JOURNAL OF TRANSPORT AND LAND USE : ARTICLE IN PRESS
models, the potential causality proposed by this model is that land-cover change can be ascribed to the improvement of accessibility, increase of socioeconomic activities, and neighborhood effects. However, with only the local model, the counter-directional causality, i.e., the change of socioeconomic activities can also be the result of land-cover change (i.e., an increase in the urbanized areas), cannot be reflected. Therefore, by creating a bi-level structure, the model not only fits the regional nature of HSR, but also creates a loop that is able to model the bi-directional causality (i.e., land cover vs. socioeconomic activi-ties) simultaneously.
The cross-level interaction framework is demonstrated in Figure 6. Thanks to the object-oriented nature of Java programming language, a regional cell (as a Java object) has a Java collection including all matching local land cells (as Java object variables); and a local cell is also able to have an object variable linking to the corresponding regional cell. Before year t, the regional cells calculate the share of the population and number of firms for each local cell, based on the values at year t-1. During the t-th year iteration, local cells update its socioeconomic variables based on the share distributed by its regional cell and the numbers of regional population and firms generated by the regional sub-models. At year t, the local cells output the new land cover; and regional cells sum and update the area of each land cover. For instance, at year t, the land cover of a local cell is developed from un-built area to continuous urban fabric. For the matched regional cells, the area of un-built area thus declines by 0.25 kilometer2; and the area of continuous urban fabric increases by 0.25 kilometer2. To sum up, in the model, the land-cover change is affected by local socioeconomic activities and also influences the regional land-cover patterns, which plays an important role in the growth of regional population and firms. The increase of local so-cioeconomic activities is distributed by the regional values.
Figure 6: Cross-level interaction framework
4 Initialization and modeling inputs
Each simulation runs for a 20-year period. The simulation ranges from 1991 to 2011 for back-casting validation purposes, and executes from 2011 to 2031 to predict the future effects of HSR on land-cover change in the LMA. Thus, the historical data in 1991 are input into the model for validation, and the most recent data in 2011 is used for scenario analyses. The modeling parameters can be found in A.2 and A.3 of Appendix A, and this study hypothesizes that the future land-cover change and growth of socioeconomic activities in the LMA are consistent with the historical changes. The input data are cat-egorized as transportation network, land cover, socioeconomic variables, zoning restriction, etc. For each data category, a detailed description is written below.

15Bi-level cellular agent-based model in Lisbon Metropolitan Area, Portugal
4.1 Data processed before simulation
As discussed in Section 3.1, the sizes of OD matrices are quite huge. Thus, before ABM simulation, the OD travel time matrices at each geographical level have to be prepared. For OD travel time estimation, this study incorporates the following transportation network data.
• Local road network, obtained from NAVTEQ GPS data. The road network in the LMA con-tains over 50,000 links, with different highway opening years. The travel time of each road link is simulated by Aimsun Advanced V6.0, based on the OD demand between each parish in the LMA in 1991, 2001, and 2011.
• Local public transit network, provided by the Lisbon Institute of Mobility and Transport, includes all public transit operators in the LMA. The data contains over 41,000 links, including the information of all bus operators, metro, light rail, suburban rail, and ferry in the LMA. The change of public transit network from 1991 to 2011 is determined by the opening of new bus, metro, and light rail lines, as well as the technology upgrade for ferries crossing the Tagus River. In addition, as introduced in Section 3, the generalized turning costs due to the interchange of public transit routes are all tagged in the network, with more than 1 million records.
• Regional road network, based on the Portuguese 2000 National Roadway Plan (PRN2000), covers the expansion of regional road network in Portugal from 1991 to 2011, as well as the opening year of each highway.
• Regional rail network, based on the information from the Portuguese National Rail Company (CP), includes the rail links of Inter-City rail and AP tilting train. The rail travel time is repre-sented by the suggested travel time from CP.
• HSR network, from TEN-T program, is integrated into the conventional regional rail net-work. The HSR travel time is calculated based on the TEN-T suggested HSR speed.
For back-casting validation, the improvement of accessibility results from the expansion of roadway and railway networks at both the local and regional level from 1991 to 2011. For scenario analyses beginning in 2011, the local roadway and public transit OD travel time matrices are assumed to be constant, and the improvement of regional accessibility is mainly led by the inauguration of HSR.
4.2 Data as direct inputs of simulation
Besides the OD travel time matrices calculated based on the transportation networks in the LMA, all other variables can be directly input into the ABM simulation. The input data follow:
• Land cover, based on CORINE land-cover data from EEA, contains the land-cover data of 1991, 2001, and 2006. In this study, the CORINE land-cover data of 2006 is implemented as the land cover of 2011, as we hypothesize that, due to the recession, the land cover will not vary greatly during this five-year period. However, since economic growth is not the only factor that affects land-use changes, it has to be noted that this assumption is arbitrary. Due to the lack of land-cover information after 2006, the neglect of the five-year’s land-cover change might be one of the limitations in this study. In addition, till now, we could hardly find any published scientific evidence to either support or disprove this hypothesis.
• Population, shared by Statistics Portugal (INE), is at census tract level (i.e., BGRI in Portu-guese). The data is gathered from the demographic census in 1991, 2001, and 2011 for the whole country. The population data in each census tract are converted into the values in local and regional cells.
• Number of firms, shared by INE, is available at the civil parish level. The data is also assigned

16 JOURNAL OF TRANSPORT AND LAND USE : ARTICLE IN PRESS
into the local and regional land cells.• GDP, from INE, is for the municipality level, which is available for 1991, 2001, and 2011. The
GDP data is converted into the data of regional land cells.• Land reserves, from IA, are labeled based on the Environment Atlas of Portugal.
5 Back-casting validation
To assess the behaviors of the model proposed above, a back-casting simulation process is incorporated to test for acceptability and validity. The historical land-cover change from 1991 to 2011 is simulated to verify the model. The simulation is executed 100 times, and the results statistics are listed in Table 1. With 100 replications, the average numbers of simulated land covers are quite close to the actual num-bers, and are also within the maximum and minimum boundaries. The table shows that the model is able to reflect the historical land-development speed from 1991 to 2011.
In terms of the validation of spatial ABM models, conventional methods, e.g., confusion matrix or kappa statistic, estimate the output at a single resolution, which normally measures the goodness-of-fit based on the pixel-by-pixel comparison between two land-cover maps. However, these methods are unable to reflect the relationship between the measured pixel and its neighbors and fail to measure the accuracy of the spatial arrangement of the simulation outputs (Ngo and See 2012). As the study area of the LMA covers an area of more than 1750 kilometers2, it is almost impossible to ask the model to perfectly replicate the actual two decades’ land-cover change. The conventional validation methods at a single resolution tend to underestimate the performance of this model. For instance, if the land cover for cell n is simulated as i, while the actual land cover should be j, the single resolution measures label the output as unmatched. However, if the window size increases, in a larger scale, the share of simulated land cell j in the larger window could match the actual share of j even if land cell n fails to develop to j. For a single resolution method, such situations are unable to be tested. Thus, to study the performance of the model, the multiple resolution goodness-of-fit (MRG) method, proposed by Costanza (1989), is implemented. The MRG method estimates the land-cover patterns of the simulation output at various resolutions, which is quite relevant for the validation of land-use/land-cover change models (Turner, Costanza, and Skiar 1989). As the simulation is repeated 100 times, for land cell n, the final output is not a deterministic land cover, but a probability value of developing to each land cover. Therefore, MRG measurement procedure applied in this study is expressed as:
(20)where:
Table 1: Results statistics from the back-casting simulation (Unit: Number of cells)
Land cover1991 (Actual)
2011 (Actual)
2011 (Simulated)
Standard Deviation
Maximum Minimum
CUF 119 143 144.92 4.51 159 135DUR 1113 1624 1617.66 17.71 1667 1569CIT 251 411 409.59 17.94 463 372UBS 5529 4834 4839.83 24.86 4908 4780

17Bi-level cellular agent-based model in Lisbon Metropolitan Area, Portugal
w: window size, the square-root of total number of cells in a window;Fw: MRG at window size w;tw: total number of windows at size w;psi: probability for land cell s developing to land cover i;ysi: dummy variable, which equals 1 if actual land cover of cell n is i;I: total number of land covers; andS: total number of cells in window tw.
In this study, a window is defined as a square-shaped Moore neighborhood, consisting land cell n plus the cells in its Moore neighborhood with a range of (w–1)/2 . For instance, for windows with sizes 1, 3, and 5, the numbers of cells in each window are 1, 9, and 25, i.e., 1×1, 3×3, and 5×5, respectively. Based on the MRG values at each window size, the weighted average of all Fw values, denoted Ft, is calculated based on:
(21)
where N is the total number of Fw, and k is a weight coefficient. A value of k of 0 means that all window sizes have the same weight, while a value of 1 means that the smaller windows sizes are more relevant. Costanza (1989) offers an empirically value of k of 0.1.
The value of Fw at various sizes of windows is shown as in Figure 7. By aggregating the values of Fw with windows sizes from 1×1 to 25×25, the results of Ft is 0.909, indicating that the simulation model fits the historical data quite well. In addition, the MRG values at multiple resolutions of a stochastic model are also shown in Figure 7 for comparison. Theoretically, if the land-cover change process is random, the probability for a land cell of un-built surface developing to land cover i should be 0.25. For artificial land covers, the probability is 1 if the cell’s land cover holds the same in 2011, and is 0 if the land cover changes to other artificial land covers during the 20-year period, since this model holds the artificial land covers in 1991 unchanged. If the land-cover change process is purely stochastic, the value of Ft based on equation (20) and (21) should be 0.473. The Ft value of 0.909 shows the model improves largely from a stochastic model (Ft=0.473). At each window size, the values of Fw of ABM are significantly larger than the values of the random model. The differences of Fw between the two models become larger along with the increase of window size. Thus, through back-casting validation, we find that the model is explainable for the land-cover change process in the LMA study area. We conclude that the model is verified and is able to be implemented for the following scenario analyses.

18 JOURNAL OF TRANSPORT AND LAND USE : ARTICLE IN PRESS
Figure 7: Plots for MRG values for ABM and random model
6 Scenario analysis
As introduced in Section 2, between Lisbon and Évora, two arrangements of HSR routes are proposed, i.e., a direct link between Lisbon and Évora (representing the planned corridor), or a detour via Setúbal on the southern bank of the Tagus River in the LMA. As the decision of introducing HSR in Portugal is still under debate, in addition to the two proposals above, there is also a considerable chance that an HSR project might be indefinitely postponed. Hence, to study the land-cover changes in the LMA for the next 20 years, i.e., from 2011 to 2031, three scenarios are designed. The scenarios are: 1) baseline sce-nario, i.e., the HSR is not built; 2) nonstop scenario, i.e., the HSR is constructed from Lisbon-Oriente directly to Évora; 3) detour scenario, i.e., besides Lisbon and Évora, HSR also serves Setúbal. Under all these scenarios, the GDP growth follows a unique 1.5 percent increase from 2015 onward, according to European Commission (2013) forecasts. The HSR is assumed to be opened in 2021 in the latter two scenarios. For each scenario, the simulation is repeated 100 times, and the results are listed in Table 2, with the standard deviations of the total number of each land cover shown in parentheses.

19Bi-level cellular agent-based model in Lisbon Metropolitan Area, Portugal
(a) Initial land cover in 2011 (b) Baseline scenario in 2031
(c) Nonstop scenario in 2031 (d) Detour scenario in 2031
Figure 8: Land cover in the LMA under different scenarios(Background: ESRI topographic base map)

20 JOURNAL OF TRANSPORT AND LAND USE : ARTICLE IN PRESS
According to the simulation results from Table 2, the model shows that, independently of HSR, just by keeping the annual growth of GDP at the level of 1.5 percent, there will be about 228 kilometers2 of new lands to be developed into artificial land covers. With HSR (i.e., nonstop and detour scenarios), the results show that, in total, due to the shrink of weighted average regional travel time, the land de-velopment process in these two scenarios becomes faster than the process in the baseline scenario, with more than 30 kilometers2 of new artificial land covers. Under these two scenarios, the development of all types of artificial land covers becomes faster, in which the discontinuous urban and recreational areas (DUR) enjoy the fastest growth. Comparing the nonstop scenario (2) with the detour scenario (3), the number shows that, by placing two HSR stations, the overall development speed becomes slightly faster than in the second scenario. Statistically, more commercial/industrial/transportation sites (CIT) are newly developed under the detour scenario.
In addition to the statistical results, the most likely land-cover patterns of the three scenarios are shown in Figure 8. The initial land covers in 2011 with the names of municipalities are also shown in the figure. With an annual 1.5 percent increase in GDP, after a 20-year simulation, the figures present a large expansion of land cover in the municipalities surrounding Lisbon. For instance, in 2011, the artificial land covers in Oeiras, Amadora, and Odivelas are discrete, while in 2031 almost all pieces of land in these municipalities are built. On the southern bank of the Tagus River, the urban development process in Seixal is observable. In the scenarios with HSR, more artificial land covers are shown on the maps, these differences are difficult to distinguish. Comparing the nonstop scenario (in Figure 8c) with the detour scenario (in Figure 8d), the land-cover patterns are very similar. Hence, to study the impacts of the Setúbal HSR station, the simulation results are then grouped and compared by locations. As in Figure 8a, the study area contains 18 municipalities. For simplification, these municipalities are empiri-cally regrouped into five “supra-municipalities,” according to their geographical locations, which are:
• Lisbon supra-municipality, including Lisbon, Amadora, Oeiras, and Odivelas• Sintra supra-municipality, including Sintra, Cascais, and Mafra• Loures supra-municipality, including Loures and Vila Franca de Xira• Seixal supra-municipality, including Seixal, Almada, Barreiro, and Sesimbra• Setúbal supra-municipality, including Setúbal, Palmela, Alcochete, Montijo, and Moita
As in Figure 8a, the former three supra-municipalities are located on the northern bank of the Tagus River, and the latter two are in the southern bank. In each land-cover category, the average number of cells from the three scenarios are listed in Table 3, grouped by supra-municipality. For each number, the standard deviations are also listed in parentheses.
According to the results from Table 3, in all municipalities, after two decades of development, there is obvious growth in the number of artificial land cells. In Lisbon, Amadora, Oeiras, and Odivelas, most of areas have been urbanized in 2011, and the total area of un-built surfaces, in this year, is about 28 kilmeters2. After 20 years of development, the area of un-built surfaces, in the baseline scenario, declines to about 6 kilometers2. With HSR, even with the Lisbon-Oriente station located in the municipality of
Table 2. Comparison of simulation results (Unit: Number of cells)
Land coverContinuous urban fabric
Discontinuous urban and
recreational areas
Commercial/ industrial/
transportation sitesUnbuilt surfaces
Year 2011 (initial) 143.00 (0.00) 1624.00 (0.00) 411.00 (0.00) 4834.00 (0.00)Baseline 172.34 (4.55) 2267.27 (20.27) 689.27 (19.59) 3883.12 (23.20)Nonstop 178.91 (4.98) 2361.33 (20.36) 730.28 (18.91) 3741.48 (24.30)Detour 178.69 (5.27) 2360.42 (17.82) 738.03 (21.77) 3734.86 (25.87)

21Bi-level cellular agent-based model in Lisbon Metropolitan Area, Portugal
Lisbon, the total area of un-built surfaces only decreases by less than 1 kilometer2, because the potential of new land development in this area is very limited. Nevertheless, in other areas on the northern bank of the Tagus River, in addition to the “natural” development shown by the baseline scenario, the impacts of HSR on land-cover change are also distinguishable. In Cascais, Sintra, and Mafra, with HSR, about 38 un-built land cells are developed in addition to the baseline scenario, in which 29 cells become dis-continuous urban and recreational areas. Similarly, in Loures and Vila Franca de Xira, when compared with the baseline scenario, about 27 cells are likely to be additionally developed, including roughly 15 new DUR cells and 12 new CIT cells. In the southern side of the LMA, regardless of the placement of the HSR station in Setúbal, the land development speeds in both Seixal and Setúbal “supra-municipal-ities” are both accelerated. In Seixal, Almada, Barreiro, and Sesimbra, about 5 kilometers2 of area are further developed from un-built surfaces. By adding one more new HSR station in the south of the LMA, i.e., Setúbal, there is no change of land development speed in the Seixal “supra-municipality.” However, the “supra-municipality” of Setúbal is mostly benefited by adding one more HSR station in Setúbal. Without HSR, the baseline scenario indicates that the total area of un-built surfaces is likely to be reduced from 312 kilometers2 (1247 cells) to about 257 kilometers2 (1029.17 cells). If there is no HSR station in Setúbal, the total un-built area decreases to about 248 kilometers2 (990.87 cells). Under the detour scenario (3), the area of un-built surfaces keeps declining to less than 246 kilometers2 (983.09 cells), while the difference of 2 kilometers2 of area from the nonstop scenario (2) is added into the com-mercial/industrial/transportation sites.
Table 3: Results of land cover of different scenarios by “supra-municipality” (Unit: Number of cells)
Supra-municipality Land CoverScenario CUF DUR CIT UBS
Lisbon Initial (2011) 59.00 (0.00) 465.00 (0.00) 84.00 (0.00) 113.00 (0.00)Baseline (2031) 59.26 (0.50) 548.74 (3.47) 89.62 (1.75) 23.38 (3.29)Nonstop (2031) 59.87 (0.80) 552.82 (4.00) 89.96 (2.16) 18.35 (3.03)Detour (2031) 59.88 (0.83) 552.42 (3.76) 89.89 (2.13) 18.81 (3.22)
Sintra Initial (2011) 28.00 (0.00) 437.00 (0.00) 68.00 (0.00) 1586.00 (0.00)Baseline (2031) 53.63 (4.47) 643.44 (13.12) 131.17 (9.18) 1290.76 (14.69)Nonstop (2031) 58.53 (4.78) 672.49 (12.50) 135.93 (9.34) 1252.05 (14.07)Detour (2031) 58.50 (4.96) 672.88 (13.41) 136.24 (8.90) 1251.38 (14.34)
Loures Initial (2011) 7.00 (0.00) 185.00 (0.00) 79.00 (0.00) 955.00 (0.00)Baseline (2031) 7.04 (0.20) 277.31 (6.36) 126.21 (8.74) 815.44 (9.76)Nonstop (2031) 7.63 (0.56) 292.25 (6.51) 137.80 (7.99) 788.32 (9.07)Detour (2031) 7.46 (0.52) 292.03 (6.47) 137.37 (8.80) 789.14 (9.31)
Seixal Initial (2011) 28.00 (0.00) 354.00 (0.00) 63.00 (0.00) 805.00 (0.00)Baseline (2031) 28.00 (0.00) 512.67 (8.11) 109.17 (5.42) 600.16 (7.27)Nonstop (2031) 28.00 (0.00) 538.18 (8.03) 114.41 (5.86) 569.41 (6.76)Detour (2031) 28.00 (0.00) 537.77 (8.54) 113.71 (5.42) 570.52 (7.61)
Setúbal Initial (2011) 21.00 (0.00) 180.00 (0.00) 117.00 (0.00) 1247.00 (0.00)Baseline (2031) 24.41 (0.77) 282.11 (9.15) 229.31 (14.29) 1029.17 (15.39)Nonstop (2031) 24.88 (0.76) 302.59 (9.84) 246.66 (11.42) 990.87 (14.28)Detour (2031) 24.85 (0.73) 302.32 (8.86) 254.74 (15.29) 983.09 (18.33)

22 JOURNAL OF TRANSPORT AND LAND USE : ARTICLE IN PRESS
Summing up, the 20-year simulation shows that the un-built surfaces in the LMA are likely to be largely developed with a constant annual GDP growth of 1.5 percent even without the implementation of HSR. After the opening of HSR in Lisbon-Oriente, in both nonstop and detour scenarios, the land de-velopment speed is accelerated in addition to the baseline scenario. By adding one more HSR station in the municipality of Setúbal, despite the fact that regional average weighted travel time becomes longer, the overall land development process is still speeded up. In specific, Setúbal and the municipalities that are geographically closer to the Setúbal HSR station are likely to benefit by this additional station. How-ever, comparing the difference in the number of developed cells between nonstop and detour scenarios, the increase of artificial land cells is very small. The detour scenario (3) indicates that, the longer regional weighted average travel time due to one more HSR station does not create an obstacle to urbanization, whereas only a few areas are likely to benefit from the additional Setúbal HSR station.
7 Conclusions
To model the impacts of transportation infrastructures on land-cover change, socioeconomic variables are also essential. The interaction between land-cover change and the growth of socioeconomic activities is, by default, normally defined as unidirectional, i.e., accessibility and socioeconomic activities shift land cover. As in the spatial mixed logit model, presented in Subsection 3.2.1, the population and number of firms are set as independent variables, while various land covers are defined as the dependent variables. However, in the real world, the reverse interaction may also hold true, i.e., the development of new land may also lead to a change in socioeconomic activities. To reflect this bi-directional interaction, in this study, a bi-level cellular agent-based model was developed, which incorporates both local land-cover change sub-model and regional socioeconomic activity growth sub-model. Specifically, the local sub-model is CA-based, as this method greatly fits the context of urban land-cover change due to the nature of this technique. In the local sub-model, a land cell is set as an agent, which is able to make land-cover change decisions based on spatial mixed logit models. It is able to react based on the change of neighbor-hoods, it is also able to influence the cells at the regional level. The regional sub-model is mainly based on a fixed effects panel model, in which the growth of socioeconomic activities, i.e., population and number of firms, is the result of 1) accessibility improvement thanks to the improvement of transporta-tion infrastructure, 2) neighborhood impacts, and 3) the land-cover change from the local sub-model. Besides the cross-level interaction of land-cover change, the regional outputs of population and number of firms can also be distributed into the local sub-model as its inputs, according to the historical shares.
This model is applied to test the potential impacts of HSR on land-cover change. For a simulation model, a large amount of data inputs may always be an advantage. However, in Portugal, one of the difficulties faced to model land-use impacts of HSR is the limitation of data availability at the local level (Shen, Martínez, and de Abreu e Silva, 2014). By using the bi-level framework, more data can be input for modeling as the quantity of data in Portugal is more abundant at a regional level.
In this study, we first estimated the parameters of spatial mixed logit models at the local level and fixed effects panel models at the regional level based on historical data from 1991 to 2011. With the estimated parameters and the data of 1991 as initial inputs, a back-casting simulation is executed and calibrated according to the actual data in 2011 as the reference. The simulation is replicated 100 times, and the model is verified based on multiple resolution goodness-of-fit (MRG) methods with an overall fit value of 0.909. To test the potential impacts of HSR in the LMA of Portugal, three scenarios are designed according to different arrangements of HSR in the LMA. By running each scenario 100 times, the results indicate that, without HSR, the un-built lands in the LMA are likely to be largely developed if the annual growth rate of GDP holds at the level of 1.5 percent. With the arrival of HSR services, regardless of whether only the Lisbon-Oriente HSR station is placed or both Lisbon-Oriente

23Bi-level cellular agent-based model in Lisbon Metropolitan Area, Portugal
and Setúbal are used as HSR stations, the model suggests that the land-cover development is accelerated. If Setúbal station is added into the Portuguese HSR network, the total regional weighted average travel time becomes longer. However, it does not act as an obstacle to the urbanization process in the LMA. Nevertheless, the contribution of the additional HSR station to the land development process in Setúbal and its neighboring municipalities is also limited. In fact, only a few areas are likely to benefit from the additional Setúbal HSR station.
Despite the large amount of data input into this model, this study is still limited by data availability, which is one of the considerable future paths to improve this work. As mentioned in Subsection 4.2, since the land-cover patterns in 2011 are unavailable, this study has to use the land-cover data of 2006 to mimic the land cover of 2011, which may lead to a basis for underestimating the historical land-cover change process. Hence, for future works, several methods, for instance, calibrating the data by referenc-ing the roadway network of 2011, or applying land-use data from other sources, should be implemented to improve the land-cover data. Another limitation is the assumption of criteria to stop the simulation. As the land cover of a cell stops change if it is developed from un-built surfaces to any other urbanized land covers, the changes from commercial areas to urban fabrics and from discontinuous urban fabric to continuous urban fabric are discarded. Although the share of these changes in the LMA is very small, it still should be noted that the simplification of criteria to stop could weaken the capability of the model to predict land-use and socioeconomic activities. The other limitation is the lack of master plans at the local municipal or civil parish levels. Thus, although the input of a local cell is controlled by the regional cell’s output, the land-cover change at the local level is still spontaneous.
This study focuses on the land-cover change in the LMA. During the simulations, only land-cover data are output. However, as shown in Figure 2, the outputs of this model can also be population and number of firms at both the regional and local levels. Therefore, the potential of this model is not limited by presenting land-cover change. The authors need to further design this model with more features and to present more comprehensive relationships between the two levels. In addition to the LMA, more urban areas, i.e., other Portuguese cities along (or even distant from) the proposed HSR network, can be added into this model. By including more cities at various sizes and geographical locations, a more systematic picture for the potential impacts of HSR network in Portugal may be presented.
Last but not least, as White and Engelen (2000) argue, the bifurcation effect of a self-organizing system should not be discarded, meaning that such effects may lead the model moving to other possible trajectories, and eventually approaching various and quite different futures. Thus, the simulated patterns in the scenarios do not necessarily become the real land-use patterns in the LMA in 2031. However, we believe that the fundamental findings of this study are trustworthy and indicative of the scale and direc-tion of the expected impacts. In addition to GDP growth (and the increase in population and number of firms), the improvement of accessibility due to the opening of new Portuguese HSR is also an impor-tant factor influencing the potential land-cover change process in the LMA. In addition, the difference between placing either one or two HSR stations in this area is not significantly large.
Acknowledgments
This research was developed in the framework of the EXPRESS Research Project (MIT/SET/0023/2009) sponsored by the Portuguese National Research Funds through FCT/MCTES (PIDDAC) and co-financed by the European Regional Development Fund (ERDF) under the Operational Agenda for Competitiveness Factors—COMPETE. The authors acknowledge Marcos Correia for his help with data collection, and also thank Aleksandr Prodan for his help in proofreading.

24 JOURNAL OF TRANSPORT AND LAND USE : ARTICLE IN PRESS
References
Abdou, M., L. Hamill, and N. Gilbert. 2012. Designing and building an agent-based model. In Agent-Based Models of Geographical Systems, edited by A. J. Heppenstall, A. T., Crooks, L. M. See, and M. Batty. Dordrecht: Springer Netherlands.
Al-Ahmadi, K., A. J. Heppenstall, J. Hogg, and L. M. See. 2009. A fuzzy cellular automata urban growth model (FCAUGM) for the city of Riyadh, Saudi Arabia. Applied Spatial Analysis and Policy 2: 65¬–105.
Amano, K., and D. Nakagawa. Study on urbanization impacts by new stations of High Speed Railway. Conference of Korean Transportation Association, 1990, Dejeon City, South Korea.
Barros, J. 2004. Urban growth in Latin American cities: Exploring urban dynamics through agent-based simulation. PhD thesis. London: University College.
Basse, R. M. 2013. A constrained cellular automata model to simulate the potential effects of high-speed train stations on land-use dynamics in trans-border regions. Journal of Transport Geography 32: 23–37.
Batty, M. 1998. Urban evolution on the desktop: Simulation with the use of extended cellular automa-ta. Environment and Planning A 30: 1943–1967.
Batty, M., A. T. Crooks, L. M. See, and A. J. Heppenstall. 2012. Perspectives on agent-based models and geographical systems. In Agent-Based Models of Geographical Systems, edited by A. J. Heppenstall, A. T. Crooks, L. M. See, and M. Batty. Dordrecht: Springer Netherlands.
Batty, M., and Y. Xie. 1997. Possible urban automata. Environment and Planning B: Planning and De-sign 24: 175–192.
Batty, M., Y. Xie, and Z. Sun. 1999. Modeling urban dynamics through GIS-based cellular automata. Computers, Environment and Urban Systems 23: 205–233.
Bhat, C., S. L. Handy, K. Kockelman, H. Mahmassani, Q. Chen, and L. Westion. 2000. Urban Acces-sibility Index: Literature Review. Springfield, VA: Center of Transportation Research, University of Texas at Austin.
Bierlaire, M. BIOGEME: A free package for the estimation of discrete choice models. Third Swiss Transportation Research Conference, 2003, Ascona, Switzerland.
Birkin, M., and B. Wu. 2012. A review of microsimulation and hybrid agent-based approaches. In Agent-Based Models of Geographical Systems, edited by A. J. Heppenstall, A. T. Crooks, L. M. See, and M. Batty. Dordrecht: Springer Netherlands.
Blum, U., K. E. Haynes, and C. Karlsson. 1997. The regional and urban effects of high-speed trains. The Annals of Regional Science 31: 1–20.
Bollinger, C. R., and K. R. Ihlanfeldt. 2003. The intraurban spatial distribution of employment: Which government interventions make a difference? Journal of Urban Economics 53: 396–412.
Bonnafous, A. 1987. The regional impact of the TGV. Transportation 14: 127–137.Britz, W., P. H. Verburg, and A. Leip, A. 2010. Modeling of land cover and agricultural change in Eu-
rope: Combining the CLUE and CAPRI-Spat approaches. Agriculture, Ecosystems and Environment 142: 40–50.
Brons, M., M. Givoni, and P. Rietveld. 2009. Access to railway stations and its potential in increasing rail use. Transportation Research Part A: Policy and Practice 43: 136–149.
Brown, D. G., and D. T. Robinson. 2006. Effects of heterogeneity in residential preferences on an agent-based model of urban sprawl. Ecology and Society 11: 46–67.
Canning, D., and M. Fay. 1993. The effects of transportation networks on economic growth. Depart-ment of Economics Discussion Papers. New York: Department of Economics, Columbia University.

25Bi-level cellular agent-based model in Lisbon Metropolitan Area, Portugal
Carter, N., and F. Nunes da Silva. 2001. Recent changes in territorial planning and the system for con-trolling urban development in Portugal. The Town Planning Review 72: 341–370.
Chen, C.-L., and P. Hall. 2011. The wider spatial-economic impacts of high-speed trains: A compara-tive case study of Manchester and Lille sub-regions. Journal of Transport Geography 24: 89–110.
Clarke, K. C., and L. Gaydos. 1998. Loose-coupling a cellular automaton model and GIS: Long-term urban growth prediction for San Francisco and Washington/Baltimore. International Journal of Geo-graphical Information Science 12: 699–714.
Clarke, K. C., S. Hoopen, and L. Gaydos. 1997. A self-modifying cellular automaton model of histori-cal urbanization in the San Franciso Bay area. Environment and Planning B: Planning and Design, 24: 247–261.
Costanza, R. 1989. Model goodness of fit: A multiple resolution procedure. Ecological Modeling 47: 199–215.
Crooks, A. T., and A. J. Heppenstall. 2012. Introduction to Agent-Based Modeling. In Agent-Based Models of Geographical Systems, edited by A. J. Heppenstall, A. T. Crooks, L. M. See, and M. Batty, M. Dordrecht: Springer Netherlands.
Crozet, Y. 2005. Time and passenger transport. In Round Table 127: Time and Transport, edited by ECMT. Paris: ECMT Round Tables, No. 127, OECD Publishing.
Dalenberg, D. R., M. D. Partridge, and D. S. Rickman. 1998. Public infrastructure: Pork or jobs cre-ator? Public Finance Review 26: 24–52.
European Commission 2008. The south-west European high-speed rail link. Better transport links for Europe—Succeeding through coordination. Brussels, Belgium: Directorate-General for Energy and Transport.
European Commission 2013. European Economic Forecast Autumn 2013. European Economy series. Brussels, Belgium: Economc and Financial Affairs.
Fontaine, C. M., and M. D. A. Rounsevell. 2009. An agent-based approach to model future residential pressure on a regional landscape. Landscape Ecology 24: 1237–1254.
Fröidh, O. 2005. Market effects of regional high-speed trains of the Svealand line. Journal of Transport Geography 13: 352–361.
Garmendia, M., J. M. Ureña, C. Ribalaygua, J. Leal, and J. M. Coronado. 2008. Urban residential development in isolated small cities that are partially integrated in metropolitan areas by high-speed train. European Urban and Regional Studies 3: 265–280.
Geurs, K. T., and B. van Wee. 2004. Accessibility evaluation of land-use and transport strategies: Review and research directions. Journal of Transport Geography 12: 127–140.
Guild, R. L. 2000. Infrastructure investment and interregional development: Theory, evidence, and implications for planning. Public Works Management Policy 4: 274–285.
Gutiérrez, J. 2001. Location, economic potential and daily accessibility: an analysis of accessbility im-pact of high-speed line Madrid-Barcelona-French border. Journal of Transport Geography 9: 229–242.
Gutiérrez, J., González, R., and G. Gómez. 1996. The European high-speed train network: Predicted effects on accessibility patterns. Journal of Transport Geography 4: 227–238.
Gutiérrez, J., and P. Urbano. 1996. Accessibility in the European Union: the impact of the trans-Euro-pean road network. Journal of Transport Geography 4: 15–25.
Hansen, W. G. 1959. How accessibility shapes land use. Journal of the American Institute of Planners 25: 73–76.
Harris, B. 2001. Accessibility: Concepts and applications. Journal of Transportation and Statistics 4: 15–30.
26 JOURNAL OF TRANSPORT AND LAND USE : ARTICLE IN PRESS
Haynes, K. E. 1997. Labor markets and regional transportation improvements: The case of high-speed trains. The Annals of Regional Science 31: 57–76.
Holl, A. 2004. Manufacturing location and impacts of road transport infrastructure: Empirical evidence from Spain. Regional Science and Urban Economics 34: 341–363.
Iltanen, S. 2012. Cellular automata in urban spatial modeling. In Agent-Based Models of Geographical Systems, edited by A. J. Heppenstall, A. T. Crooks, L. M. See, and M. Batty. Dordrecht: Springer Netherlands.
Kessides, C. 1993. The Contributions of Infrastructure to Economic Development: A Review of Experience and Policy Implications. Washington DC: World Bank
Liu, Y., and Y. Feng. 2012. A logistic based cellular automata model for continuous urban growth simulation: A case study of the Gold Coast City, Australia. In Agent-Based Models of Geographical Systems, edited by A. J. Heppenstall, A. T. Crooks, L. M. See, and M. Batty. Dordrecht: Springer Netherlands.
Loibl, W., and T. Toetzer. 2003. Modeling growth and densification processes in suburban regions— simulation of landscape transition with spatial agents. Environmental Modeling and Software 18: 553–563.
Macal, C. M., and M. J. North. 2010. Tutorial on agent-based modeling and simulation. Journal of Simulation 4: 151–162.
Mateus, R., J. A. Ferreira, and J. Carreira. 2008. Multicriteria decision analysis (MCDA): Central Porto high-speed railway station. European Journal of Operation Research 187: 1–18.
Mohammadian, A., M. Haider, and P. S. Kanaroglou. 2005. Incorporating spatial dependencies in ran-dom parameter discrete choice models. 84th Annual Meeting of the Transportation Research Board. January 9–13, 2005, Washington, DC.
Mohammadian, A., and P. S. Kanaroglou. 2003. Applications of spatial multinomial logit model to transportation planning. The 10th International Conference on Travel Behaviour Research. August 10–15, Lucerne, Switzerland.
Monzón, A., E. Ortega, and E. López. 2013. Efficiency and spatial equity impacts of high-speed rail extensions in uran areas. Cities 30: 18–30.
Mutl, J., and M. Pfaffermayr. 2008. The spatial random effects and the spatial fixed effects model. The Hausman Test in a Cliff and Ord Panel Model. Economics Series. Vienna, Austria: Institute for Advanced Studies.
Nakamura, H., and T. Ueda,. The impacts of the Shinkansen on regional development. The 5th World Conference on Transport Research, July 10–14,1989, Yokohama, Japan.
Ngo, T. A., and L. M. See. 2012. Calibration and validation of agent-based models of land cover change. In Agent-Based Models of Geographical Systems, edited by A. J. Heppenstall, A. T. Crooks, L. M. See, and M. Batty. Dordrecht: Springer Netherlands.
Otter, H. S., A. van der Veen, and H. J. de Vriend. 2001. ABLOoM: Location behavior, spatial patterns, and agent-based modeling. Journal of Artificial Societies and Social Simulation 4: 1147–1152.
Parker, D. C. 2005. Integration of geographic information systems and agent-based models of land use: prospects and challenges. In GIS, Spatial Analysis, and Modeling, edited by D. J. Maguire,, M. F. Goodchild, and M. Batty. Redlands: ESRI Press.
Parry, H. R., and M. Bithell. 2012. Large scale agent-based modeling: A review and guidelines for model scaling. In Agent-Based Models of Geographical Systems, edited by A. J. Heppenstall, A. T. Crooks, L. M. See, and M. Batty. Dordrecht: Springer Netherlands. .
Repolho, H. M., A. P. Antunes, and R. L. Church. 2013. Optimal location of railway stations: The Lisbon-Porto High-speed Rail line. Transportation Science 47: 330–343.

27Bi-level cellular agent-based model in Lisbon Metropolitan Area, Portugal
Schneider, A., M. A. Friedl, and D. Potere. 2009. A new map of global urban extent from MODIS satellite data. Environmental Research Letters 4: 1–11.
Schneider, A., M. A. Friedl, and D. Potere. 2010. Mapping global urban areas using MODIS 500-m data: New methods and datasets based on urban ecoregions. Remote Sensing of Environment 114: 1733–1746.
Semboloni, F. 2006. The CityDev project: An interactive multi-agent urban model on the web. In Com-plex Artificial Environments, editd by J. Portugali. Springer Berlin Heidelberg.
Shen, Y., L. M. Martínez, and J. de Abreu e Silva. 2013. Impacts of short-term land use by high-speed rail on large metropolises: Case study of Madrid, Spain. Transportation Research Record 2374: 35–43.
Shen, Y., L. M. Martínez, and J. de Abreu e Silva, J. 2014. Cellular agent-based approach incorporating spatial discrete choice methods: Simulation of future land-use impacts of high-speed rail on Aveiro, Portugal. Transportation Research Record, forthcoming.
Steer Davies Gleave. 2007. Modelo integrado de procura de passageirosz—Relatório 2: Estimativas de procura de passageiros e receitas. Modelo Integrado de Procura de Passageiros da Rede Ferroviaria de Alta Velocidade. London: Elsevier.
Train, K. E. 2009. Discrete Choice Methods with Simulation. New York: Cambridge University Press.Turner, M. G., R. Costanza, R., and F. H. Skiar. 1989. Methods to evaluate the performance of spatial
simulation models. Ecological Modeling 48: 1–18.Ulam, S. 1952. Random processes and transformations. International Congress on Mathematics, 1950
2: 264–275.Ureña, J. M., P. Memerault, and M. Garmendia. 2009. The high-speed rail challenge for big intermedi-
ate cities: A national, regional and local perspective. Cities 26: 266–279.van Delden, H., T. Stuczynski, P. Ciaian, M. L. Paracchini, J. Hurkens, A. Lopatka, Y-e Shi, O. G. Pri-
eto, S. Calvo, J. van Vliet, and R. Vanhout. 2010. Integrated assessment of agricultural policies with dynamic land use change modeling. Ecological Modeling 22: 2153–2166.
Vickerman, R., and A. Ulied. 2009. Indirect and wider economic impacts of high speed rail. In Eco-nomic Analysis of High Speed Rail in Europe, edited by G. de Rus. Madrid: Fundación BBVA.
von Neumann, J. 1951. The general and logical theory of automata. In Cerebral Mechanisms in Behavior the Hixon Symposium, edited by L. A. Jeffress. New York: Wiley.
von Neumann, J. 1966. Theory of self-reproducing automata. Urbana, IL: University of Illinois Press.Wang, X., and K. M. Kockelman. 2006. Tracking land cover change in mixed logit model: Recognizing
temporal and spatial effects. Transportation Research Record 1977: 112–120.Weisbrod, G., and B. Weisbrod. 1997. Assessing the economic impact of transportation projects: How
to choose the appropriate technique for your project. Transportation Research Circular. Washington DC: Transportation Research Board.
White, R., and G. Engelen. 1993. Cellular automata and fractal urban form: A cellular modeling ap-proach to the evolution of urban land-use patterns. Environment and Planning A 25: 1175–1199.
White, R., and G. Engelen. 2000. High-resolution integrated modeling of the spatial dynamics of urban and regional systems. Computers, Environment and Urban Systems 24: 383–400.
Zhou, B., and K. M. Kockelman. 2008. Neighborhood impacts on land use change: A multinomial logit model of spatial relationships. The Annals of Regional Science 42: 321–340.

28 JOURNAL OF TRANSPORT AND LAND USE : ARTICLE IN PRESS
Appendix A. Auxiliary tables and parameters
A.1 Land cover transition matrix
Table A.1: Land cover transition matrix in the modeling area of LMA from 1991 to 2011
Land cover in 2011Total land
cover in 1991Land cover in 1991Continuous urban fabric
Discontinuous urban and recreational areas
Commercial/Industrial/ Transportation sites
Un-built surfaces
Continuous urban fabric 119 0 0 0 119
Discontinuous urban and recreational areas
12 1088 10 3 1113
Commercial/Industrial/ Transportation sites
0 10 241 0 251
Un-built surfaces 12 526 160 4831 5529
Total Land cover in 2011 143 1624 411 4834 7012
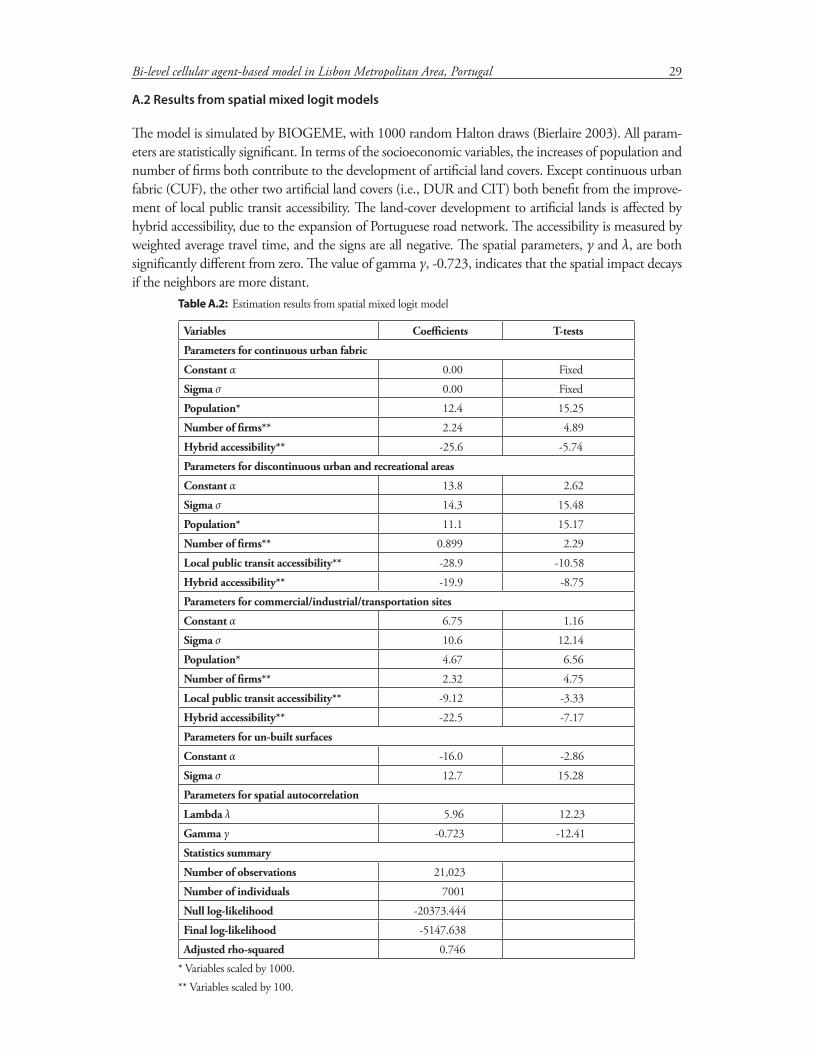
29Bi-level cellular agent-based model in Lisbon Metropolitan Area, Portugal
A.2 Results from spatial mixed logit models
The model is simulated by BIOGEME, with 1000 random Halton draws (Bierlaire 2003). All param-eters are statistically significant. In terms of the socioeconomic variables, the increases of population and number of firms both contribute to the development of artificial land covers. Except continuous urban fabric (CUF), the other two artificial land covers (i.e., DUR and CIT) both benefit from the improve-ment of local public transit accessibility. The land-cover development to artificial lands is affected by hybrid accessibility, due to the expansion of Portuguese road network. The accessibility is measured by weighted average travel time, and the signs are all negative. The spatial parameters, γ and λ, are both significantly different from zero. The value of gamma γ, -0.723, indicates that the spatial impact decays if the neighbors are more distant.
Table A.2: Estimation results from spatial mixed logit model
Variables Coefficients T-tests
Parameters for continuous urban fabric
Constant α 0.00 Fixed
Sigma σ 0.00 Fixed
Population* 12.4 15.25
Number of firms** 2.24 4.89
Hybrid accessibility** -25.6 -5.74
Parameters for discontinuous urban and recreational areas
Constant α 13.8 2.62
Sigma σ 14.3 15.48
Population* 11.1 15.17
Number of firms** 0.899 2.29
Local public transit accessibility** -28.9 -10.58
Hybrid accessibility** -19.9 -8.75
Parameters for commercial/industrial/transportation sites
Constant α 6.75 1.16
Sigma σ 10.6 12.14
Population* 4.67 6.56
Number of firms** 2.32 4.75
Local public transit accessibility** -9.12 -3.33
Hybrid accessibility** -22.5 -7.17
Parameters for un-built surfaces
Constant α -16.0 -2.86
Sigma σ 12.7 15.28
Parameters for spatial autocorrelation
Lambda λ 5.96 12.23
Gamma γ -0.723 -12.41
Statistics summary
Number of observations 21,023
Number of individuals 7001
Null log-likelihood -20373.444
Final log-likelihood -5147.638
Adjusted rho-squared 0.746* Variables scaled by 1000.** Variables scaled by 100.

30 JOURNAL OF TRANSPORT AND LAND USE : ARTICLE IN PRESS
A.3 Results from fixed effects modelsThe estimation results of the fixed effects panel models are listed in Table A.3, where, λn indicates the fixed effects for each regional land cell n. The estimation results show that at regional level, a higher number of firms and a greater GDP may attract the growth of population in this area, while the total population in its neighborhood also contributes to the population increase. Besides, within the same area, a continuous urban fabric land cover is able to lead to the greatest population growth than other land covers. In terms of the estimation for the number of firms, the results show that a shrink of regional travel time has positive impacts of the increase in firm numbers, and a greater value of total number of firms in the neighborhood and GDP may also result in an increase in the number of firms. In addition, a larger continuous urban fabric area can also positively impact the number of firms.
Table A.3: Estimation results from fixed effects models
Variables Coefficients T-tests
Regression model for population:
Constant α -15.38 -0.49
Number of firms 3.23 51.32
GDP (in thousand euros) 1.56 28.33
Total neighborhood population 0.0019 12.84
Area of continuous urban fabric
(in km2)
9525.70 62.81
Area of discontinuous urban and
recreational areas (in km2)
2038.90 61.71
Area of commercial/industrial/
transportation sites (in km2)
775.39 9.74
Mean of Lambda λn 1222.072 -
Standard deviation of Lambda λn 7160.701 -
Adjusted pseudo-R-squared 0.904
Regression model for number of firms:
Constant α 62.02 3.31
GDP (in thousand euros) 0.58 93.64
Regional accessibility (in min) -0.19 -2.08
Total number of firms in
neighborhood
0.0014 6.50
Area of continuous urban fabric
(in km2)
1692.86 105.62
Area of discontinuous urban and
recreational areas (in km2)
174.84 38.27
Area of commercial/industrial/
transportation sites (in km2)
28.84 2.44
Mean of Lambda λn -15.72 -
Standard deviation of Lambda λn 454.42 -
Adjusted pseudo-R-squared 0.829
Related Documents