WWW.NATURE.COM/NATURE | 1 SUPPLEMENTARY INFORMATION doi:10.1038/nature10539 Table S1. Frequency of the germline Mi-E318K (c.952G>A) substitution in controls and in patients with melanoma only, according to melanoma type Subjects Number of non-carriers Number of carriers* Total Frequency of Mi- E318K FET p-value OR [95%CI] Controls 1649 10 1659 0.003 - Reference Patients with melanoma only 586 17 603 0.014 7.8 x 10 -5 4.78 [2.05- 11.75] With family history 363 8 371 0.011 † 0.009 3.63[1.24- 10.29] Without family history 223 9 232 0.019 † 1.7x 10 -4 6.65 [2.36- 18.41 ] Patients with melanoma only 586 17 603 0.014 7.8 x 10 -5 4.78 [2.05- 11.75] Single melanoma 311 4 315 0.006 †† 0.26 2.12 [0.48- 7.40] Multiple melanomas 275 13 288 0.023 †† 3.91x10 -6 7.79 [3.12- 20.04] * All carriers are heterozygotes for Mi-E318K. FET is the Fisher’s exact test for the difference in Mi-E318K allele frequency between each group of patients and controls. OR (95% CI) is the odds-ratio (with 95% confidence interval) associated with the Mi-E318K carrier status. * Family history of melanoma and/or pancreatic cancer, FHM in Table S2; † The Mi-E318K allele frequency was not significantly different (p = 0.22; Fisher’s exact test) between patients with melanoma that did/did not have a family history. †† The Mi-E318K allele frequency was significantly different (p=0.02; Fisher’s exact test) between patients with a single melanoma and those with multiple primary melanomas, irrespective of family history.

Welcome message from author
This document is posted to help you gain knowledge. Please leave a comment to let me know what you think about it! Share it to your friends and learn new things together.
Transcript
w w w. n a t u r e . c o m / n a t u r e | 1
SuPPLementarY InFormatIondoi:10.1038/nature10539
4
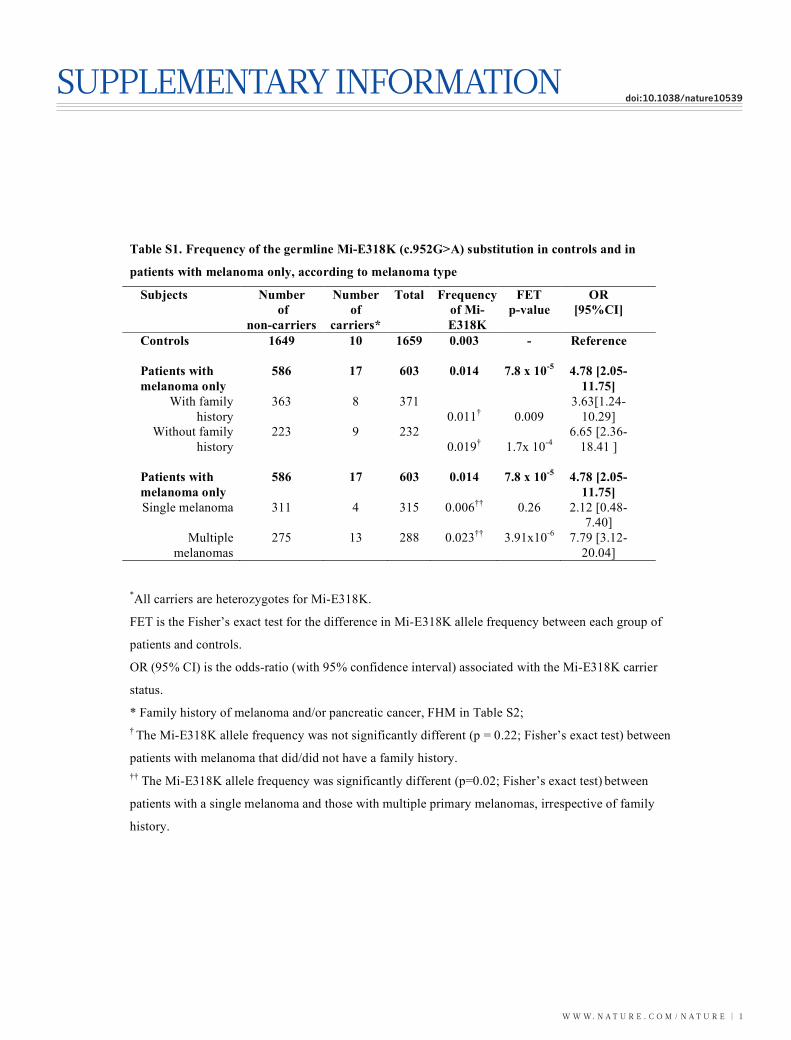
Table S1. Frequency of the germline Mi-E318K (c.952G>A) substitution in controls and in
patients with melanoma only, according to melanoma type
Subjects Number
of
non-carriers
Number
of
carriers*
Total Frequency
of Mi-
E318K
FET
p-value
OR
[95%CI]
Controls 1649 10 1659 0.003 - Reference
Patients with
melanoma only
586 17 603 0.014 7.8 x 10⁻⁵
4.78 [2.05-
11.75]
With family
history
363 8 371
0.011† 0.009
3.63[1.24-
10.29]
Without family
history
223 9 232
0.019† 1.7x 10
-4
6.65 [2.36-
18.41 ]
Patients with
melanoma only
586 17 603 0.014 7.8 x 10⁻⁵
4.78 [2.05-
11.75]
Single melanoma 311 4 315 0.006††
0.26 2.12 [0.48-
7.40]
Multiple
melanomas
275 13 288 0.023††
3.91x10⁻⁶
7.79 [3.12-
20.04]
*All carriers are heterozygotes for Mi-E318K.
FET is the Fisher’s exact test for the difference in Mi-E318K allele frequency between each group of
patients and controls.
OR (95% CI) is the odds-ratio (with 95% confidence interval) associated with the Mi-E318K carrier
status.
* Family history of melanoma and/or pancreatic cancer, FHM in Table S2;
† The Mi-E318K allele frequency was not significantly different (p = 0.22; Fisher’s exact test) between
patients with melanoma that did/did not have a family history.
†† The Mi-E318K allele frequency was significantly different (p=0.02; Fisher’s exact test)
between
patients with a single melanoma and those with multiple primary melanomas, irrespective of family
history.
SUPPLEMENTARY INFORMATION
2 | w w w. n a t u r e . c o m / n a t u r e
RESEARCH
5
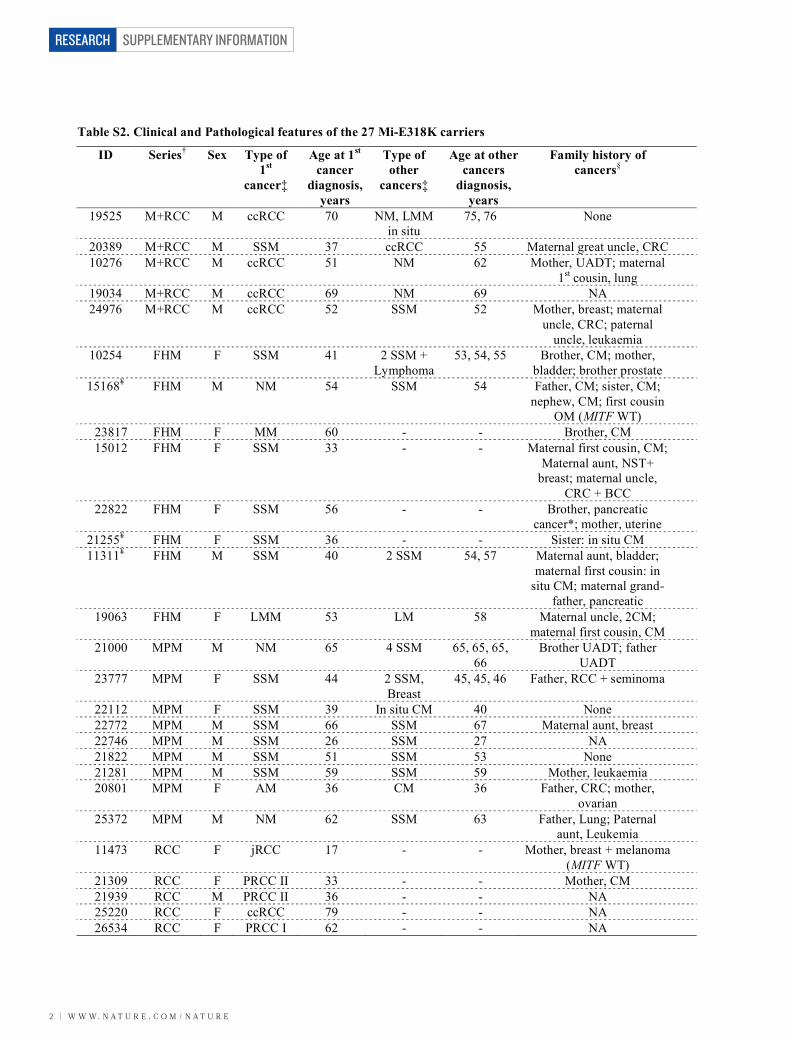
Table S2. Clinical and Pathological features of the 27 Mi-E318K carriers
ID Series† Sex Type of
1st
cancer‡
Age at 1st
cancer
diagnosis,
years
Type of
other
cancers‡
Age at other
cancers
diagnosis,
years
Family history of
cancers§
19525 M+RCC M ccRCC 70 NM, LMM
in situ
75, 76 None
20389 M+RCC M SSM 37 ccRCC 55 Maternal great uncle, CRC
10276 M+RCC M ccRCC 51 NM 62 Mother, UADT; maternal
1st cousin, lung
19034 M+RCC M ccRCC 69 NM 69 NA
24976 M+RCC M ccRCC 52 SSM 52 Mother, breast; maternal
uncle, CRC; paternal
uncle, leukaemia
10254 FHM F SSM 41 2 SSM +
Lymphoma
53, 54, 55 Brother, CM; mother,
bladder; brother prostate
15168¥ FHM M NM 54 SSM 54 Father, CM; sister, CM;
nephew, CM; first cousin
OM (MITF WT)
23817 FHM F MM 60 - - Brother, CM
15012 FHM F SSM 33 - - Maternal first cousin, CM;
Maternal aunt, NST+
breast; maternal uncle,
CRC + BCC
22822 FHM F SSM 56 - - Brother, pancreatic
cancer*; mother, uterine
21255¥ FHM F SSM 36 - - Sister: in situ CM
11311¥ FHM M SSM 40 2 SSM 54, 57 Maternal aunt, bladder;
maternal first cousin: in
situ CM; maternal grand-
father, pancreatic
19063 FHM F LMM 53 LM 58 Maternal uncle, 2CM;
maternal first cousin, CM
21000 MPM M NM 65 4 SSM 65, 65, 65,
66
Brother UADT; father
UADT
23777 MPM F SSM 44 2 SSM,
Breast
45, 45, 46 Father, RCC + seminoma
22112 MPM F SSM 39 In situ CM 40 None
22772 MPM M SSM 66 SSM 67 Maternal aunt, breast
22746 MPM M SSM 26 SSM 27 NA
21822 MPM M SSM 51 SSM 53 None
21281 MPM M SSM 59 SSM 59 Mother, leukaemia
20801 MPM F AM 36 CM 36 Father, CRC; mother,
ovarian
25372 MPM M NM 62 SSM 63 Father, Lung; Paternal
aunt, Leukemia
11473 RCC F jRCC 17 - - Mother, breast + melanoma
(MITF WT)
21309 RCC F PRCC II 33 - - Mother, CM
21939 RCC M PRCC II 36 - - NA
25220 RCC F ccRCC 79 - - NA
26534 RCC F PRCC I 62 - - NA

w w w. n a t u r e . c o m / n a t u r e | 3
SUPPLEMENTARY INFORMATION RESEARCH
6
¥ Pedigrees are shown in Figure S1a
† M, melanoma; RCC, renal cell carcinoma; FHM, melanoma with family history of melanoma and/or
pancreatic cancer (see Methods); MPM, multiple primary melanomas.
‡ ccRCC, clear cell RCC; SSM, superficial spreading melanoma; NM, nodular melanoma; LMM,
lentigo malignant melanoma; MM, mucosal melanoma; LM, lentigo maligna; jRCC, juvenile
carcinoma t(X;17)(p11;q25); AM, acral melanoma; PRCC, papillary renal cell carcinoma.
§
CRC, colorectal cancer; UADT, upper aero-digestive tumour; NST, nervous system tumour; BCC,
basal Cell Carcinoma; RCC, renal cell carcinoma; OM, ocular melanoma; NA, not available.
7
Table S3. Association analysis of Mi-E318K among patients with melanoma, renal cell
carcinoma (RCC), or both cancers, and controls, with and without adjusting for
principal components (PCs).
†All carriers were heterozygotes for Mi-E318K.
‡The Wald test is a test of the effect of Mi-E318K carrier status on cancer risk using
logistic regression, with and without adjusting for principal components (PCs). The PCs were
estimated by a principal components analysis of genome-wide SNP data.
§FET is the Fisher’s exact test for assessing whether the Mi-E318K allele frequency was
significantly different between each group of patients and controls (this test does not adjust
for principal components).
‼OR (95% CI) is the odds-ratio (with 95% confidence interval) associated with the Mi-
E318K carrier status. The odds-ratios were estimated by adjusting for principal components.
Subjects Number
of non-
carriers
Number
of
carriers†
Total Frequency
of
p.E.318K
Wald
test
p-value
(adjusti
ng for
PCs)‡
Wald test
p-value
(not
adjusting
for PCs)‡
FET
p-value§
OR [95 % CI]
‼
Controls 1380 9 1389 0.003 - - - Reference
Melanoma
and/or RCC
patients
517 19 536 0.018 4.3×10⁻⁵
2.2×10⁻⁵
1.2×10⁻⁵
5.41 [2.41-
12.18]
Melanoma
+ RCC
36 5 41 0.061 7.1×10⁻⁷
1.5×10⁻⁷
2.8×10⁻⁵
20.34 [6.19-
66.92]
Melanoma
only
424 11 435 0.013 4.1×10⁻³
2.3×10⁻³
2.6×10⁻³
3.75 [1.52-
9.24]
RCC only 57 3 60 0.025 2.6×10⁻³
2.1×10⁻³
0.01 8.15 [2.08-
31.96]
SUPPLEMENTARY INFORMATION
4 | w w w. n a t u r e . c o m / n a t u r e
RESEARCH
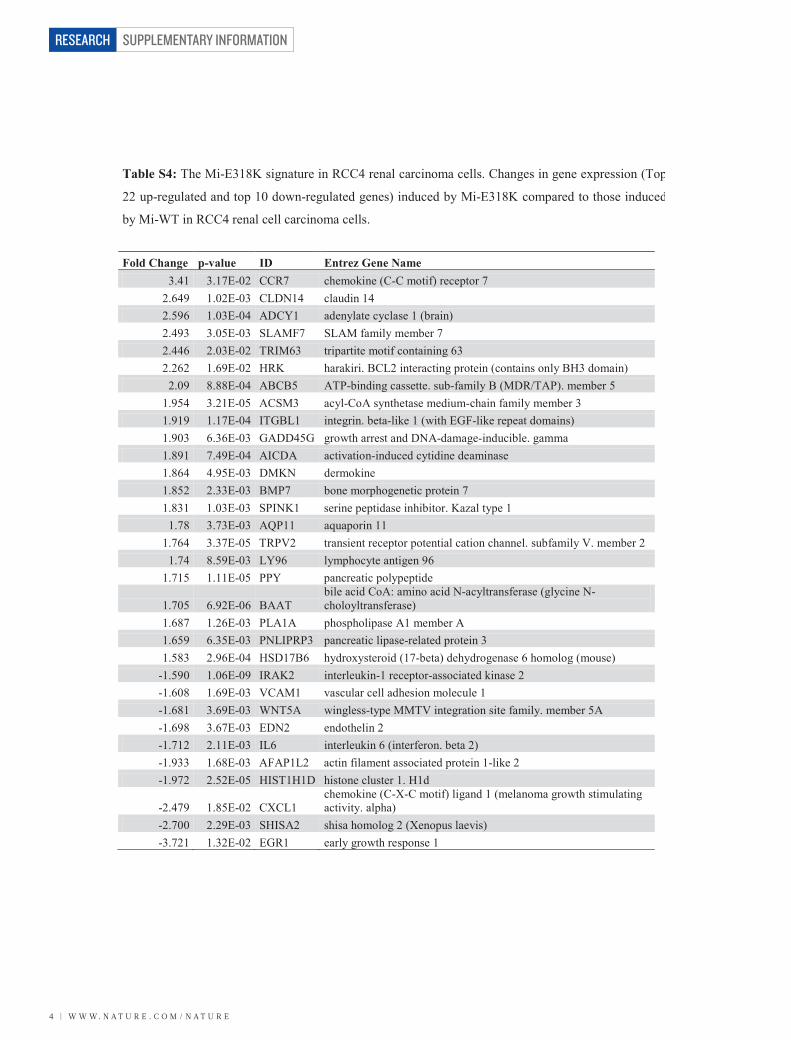
Table S4: The Mi-E318K signature in RCC4 renal carcinoma cells. Changes in gene expression (Top
22 up-regulated and top 10 down-regulated genes) induced by Mi-E318K compared to those induced
by Mi-WT in RCC4 renal cell carcinoma cells.
Fold Change p-value ID Entrez Gene Name 3.41 3.17E-02 CCR7 chemokine (C-C motif) receptor 7
2.649 1.02E-03 CLDN14 claudin 14 2.596 1.03E-04 ADCY1 adenylate cyclase 1 (brain) 2.493 3.05E-03 SLAMF7 SLAM family member 7 2.446 2.03E-02 TRIM63 tripartite motif containing 63 2.262 1.69E-02 HRK harakiri. BCL2 interacting protein (contains only BH3 domain)
2.09 8.88E-04 ABCB5 ATP-binding cassette. sub-family B (MDR/TAP). member 5 1.954 3.21E-05 ACSM3 acyl-CoA synthetase medium-chain family member 3 1.919 1.17E-04 ITGBL1 integrin. beta-like 1 (with EGF-like repeat domains) 1.903 6.36E-03 GADD45G growth arrest and DNA-damage-inducible. gamma 1.891 7.49E-04 AICDA activation-induced cytidine deaminase 1.864 4.95E-03 DMKN dermokine 1.852 2.33E-03 BMP7 bone morphogenetic protein 7 1.831 1.03E-03 SPINK1 serine peptidase inhibitor. Kazal type 1
1.78 3.73E-03 AQP11 aquaporin 11 1.764 3.37E-05 TRPV2 transient receptor potential cation channel. subfamily V. member 2
1.74 8.59E-03 LY96 lymphocyte antigen 96 1.715 1.11E-05 PPY pancreatic polypeptide
1.705 6.92E-06 BAAT bile acid CoA: amino acid N-acyltransferase (glycine N-choloyltransferase)
1.687 1.26E-03 PLA1A phospholipase A1 member A 1.659 6.35E-03 PNLIPRP3 pancreatic lipase-related protein 3 1.583 2.96E-04 HSD17B6 hydroxysteroid (17-beta) dehydrogenase 6 homolog (mouse)
-1.590 1.06E-09 IRAK2 interleukin-1 receptor-associated kinase 2 -1.608 1.69E-03 VCAM1 vascular cell adhesion molecule 1 -1.681 3.69E-03 WNT5A wingless-type MMTV integration site family. member 5A -1.698 3.67E-03 EDN2 endothelin 2 -1.712 2.11E-03 IL6 interleukin 6 (interferon. beta 2) -1.933 1.68E-03 AFAP1L2 actin filament associated protein 1-like 2 -1.972 2.52E-05 HIST1H1D histone cluster 1. H1d
-2.479 1.85E-02 CXCL1 chemokine (C-X-C motif) ligand 1 (melanoma growth stimulating activity. alpha)
-2.700 2.29E-03 SHISA2 shisa homolog 2 (Xenopus laevis) -3.721 1.32E-02 EGR1 early growth response 1
w w w. n a t u r e . c o m / n a t u r e | 5
SUPPLEMENTARY INFORMATION RESEARCH
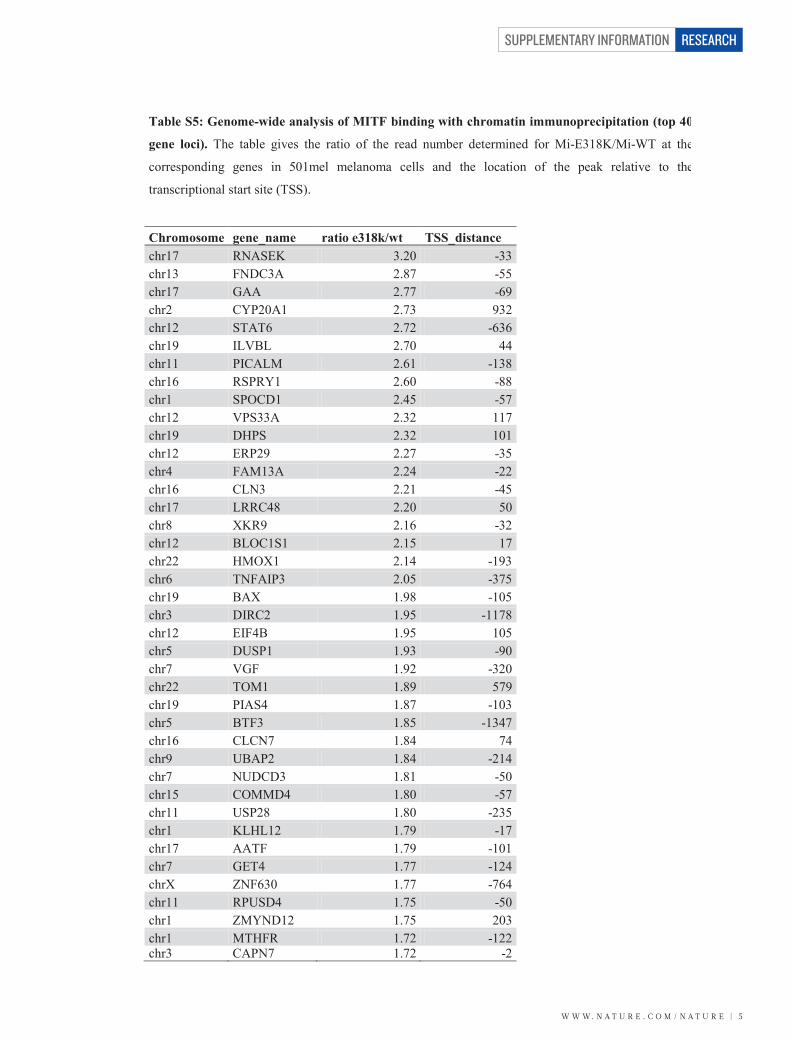
Table S5: Genome-wide analysis of MITF binding with chromatin immunoprecipitation (top 40
gene loci). The table gives the ratio of the read number determined for Mi-E318K/Mi-WT at the
corresponding genes in 501mel melanoma cells and the location of the peak relative to the
transcriptional start site (TSS).
Chromosome gene_name ratio e318k/wt TSS_distance chr17 RNASEK 3.20 -33chr13 FNDC3A 2.87 -55chr17 GAA 2.77 -69chr2 CYP20A1 2.73 932chr12 STAT6 2.72 -636chr19 ILVBL 2.70 44chr11 PICALM 2.61 -138chr16 RSPRY1 2.60 -88chr1 SPOCD1 2.45 -57chr12 VPS33A 2.32 117chr19 DHPS 2.32 101chr12 ERP29 2.27 -35chr4 FAM13A 2.24 -22chr16 CLN3 2.21 -45chr17 LRRC48 2.20 50chr8 XKR9 2.16 -32chr12 BLOC1S1 2.15 17chr22 HMOX1 2.14 -193chr6 TNFAIP3 2.05 -375chr19 BAX 1.98 -105chr3 DIRC2 1.95 -1178chr12 EIF4B 1.95 105chr5 DUSP1 1.93 -90chr7 VGF 1.92 -320chr22 TOM1 1.89 579chr19 PIAS4 1.87 -103chr5 BTF3 1.85 -1347chr16 CLCN7 1.84 74chr9 UBAP2 1.84 -214chr7 NUDCD3 1.81 -50chr15 COMMD4 1.80 -57chr11 USP28 1.80 -235chr1 KLHL12 1.79 -17chr17 AATF 1.79 -101chr7 GET4 1.77 -124chrX ZNF630 1.77 -764chr11 RPUSD4 1.75 -50chr1 ZMYND12 1.75 203chr1 MTHFR 1.72 -122chr3 CAPN7 1.72 -2
SUPPLEMENTARY INFORMATION
6 | w w w. n a t u r e . c o m / n a t u r e
RESEARCH
Co
mp
on
en
t 2
Component 1
Controls Melanoma only
Melanoma+RCC RCC only
Figure S1Family 1
ID15179, 31 yrsMi-E318K
Mi-E318K
ID151682 CM 54
ID15318Mi-WT
Mi-WT
ID15858OM 51
ID27708CM 54
CM < 37
CM
Mi-E318K
ID21256CM 44
Mi-E318K
Family 2
ID11311
CM 40,
54, 57
Family 3
Mi-E318KMi-E318K
ID11131
CM 57
Pancreaticcancer
Bladdercancer, 72
a
Mi-E318K
b
ID21255CM 36
1
Supplemental information
Figure legends
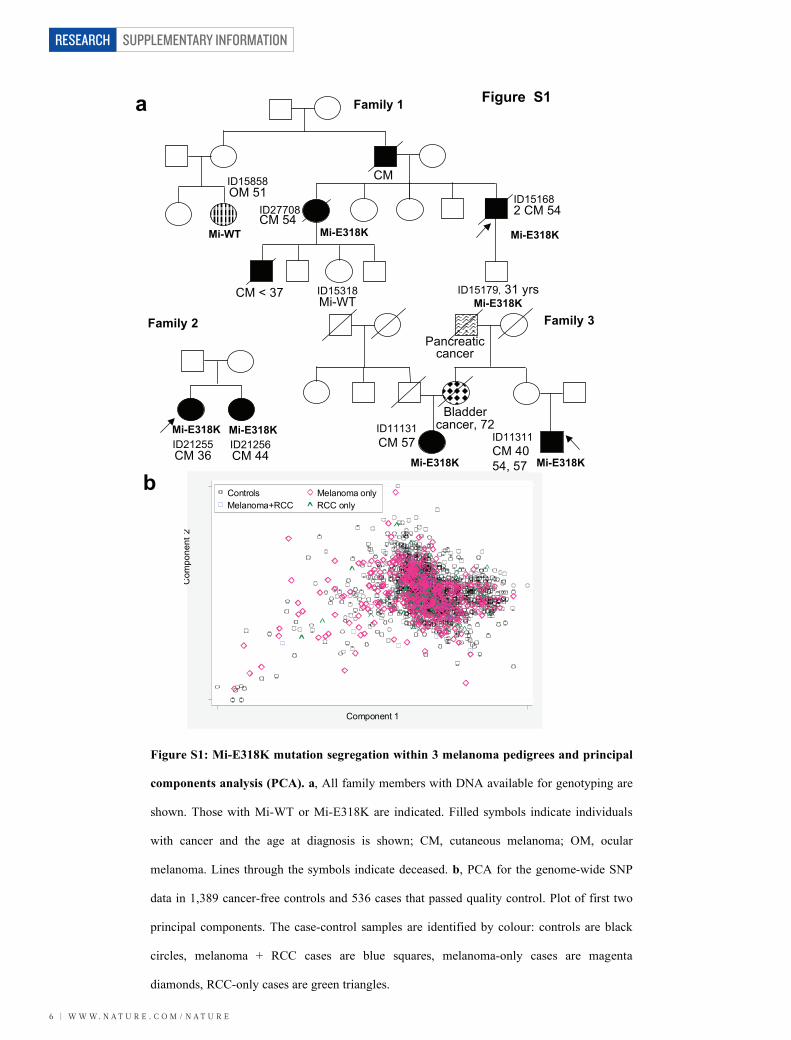
Figure S1: Mi-E318K mutation segregation within 3 melanoma pedigrees and principal
components analysis (PCA). a, All family members with DNA available for genotyping are
shown. Those with Mi-WT or Mi-E318K are indicated. Filled symbols indicate individuals
with cancer and the age at diagnosis is shown; CM, cutaneous melanoma; OM, ocular
melanoma. Lines through the symbols indicate deceased. b, PCA for the genome-wide SNP
data in 1,389 cancer-free controls and 536 cases that passed quality control. Plot of first two
principal components. The case-control samples are identified by colour: controls are black
circles, melanoma + RCC cases are blue squares, melanoma-only cases are magenta
diamonds, RCC-only cases are green triangles.
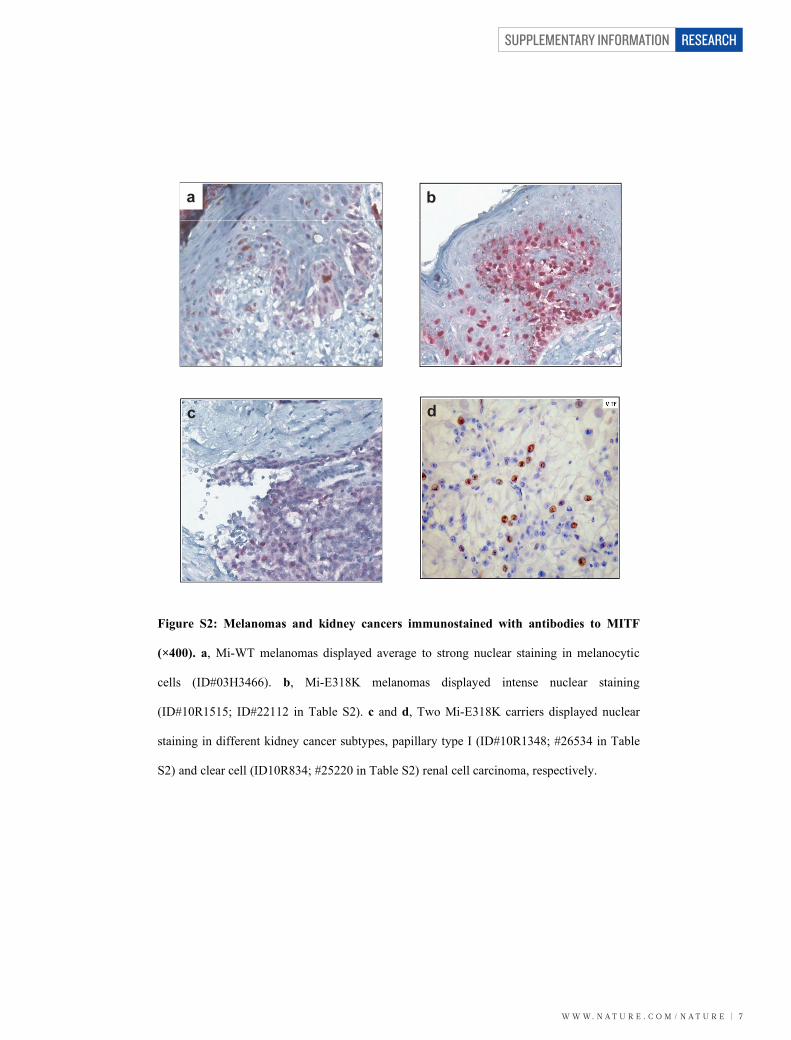
Figure S2: Melanomas and kidney cancers immunostained with antibodies to MITF
(×400). a, Mi-WT melanomas displayed average to strong nuclear staining in melanocytic
cells (ID#03H3466). b, Mi-E318K melanomas displayed intense nuclear staining
(ID#10R1515; ID#22112 in Table S2). c and d, Two Mi-E318K carriers displayed nuclear
staining in different kidney cancer subtypes, papillary type I (ID#10R1348; #26534 in Table
S2) and clear cell (ID10R834; #25220 in Table S2) renal cell carcinoma, respectively.
Figure S3: Mi-E318K alters a MITF SUMO binding site. a, Protein sequence alignment
from Human to Tetraodon shows that the ΨKXE sumoylation motif is highly conserved. b,
Schematization of the main structure-function domains and post-translational modification
sites that affect MITF activity. AD1, transactivation domain; bHLH-LZ, basic helix loop helix
w w w. n a t u r e . c o m / n a t u r e | 7
SUPPLEMENTARY INFORMATION RESEARCH
ba
dc
Figure S2
1
Supplemental information
Figure legends
Figure S1: Mi-E318K mutation segregation within 3 melanoma pedigrees and principal
components analysis (PCA). a, All family members with DNA available for genotyping are
shown. Those with Mi-WT or Mi-E318K are indicated. Filled symbols indicate individuals
with cancer and the age at diagnosis is shown; CM, cutaneous melanoma; OM, ocular
melanoma. Lines through the symbols indicate deceased. b, PCA for the genome-wide SNP
data in 1,389 cancer-free controls and 536 cases that passed quality control. Plot of first two
principal components. The case-control samples are identified by colour: controls are black
circles, melanoma + RCC cases are blue squares, melanoma-only cases are magenta
diamonds, RCC-only cases are green triangles.
Figure S2: Melanomas and kidney cancers immunostained with antibodies to MITF
(×400). a, Mi-WT melanomas displayed average to strong nuclear staining in melanocytic
cells (ID#03H3466). b, Mi-E318K melanomas displayed intense nuclear staining
(ID#10R1515; ID#22112 in Table S2). c and d, Two Mi-E318K carriers displayed nuclear
staining in different kidney cancer subtypes, papillary type I (ID#10R1348; #26534 in Table
S2) and clear cell (ID10R834; #25220 in Table S2) renal cell carcinoma, respectively.
Figure S3: Mi-E318K alters a MITF SUMO binding site. a, Protein sequence alignment
from Human to Tetraodon shows that the ΨKXE sumoylation motif is highly conserved. b,
Schematization of the main structure-function domains and post-translational modification
sites that affect MITF activity. AD1, transactivation domain; bHLH-LZ, basic helix loop helix

SUPPLEMENTARY INFORMATION
8 | w w w. n a t u r e . c o m / n a t u r e
RESEARCH
KXEE318K
a
S73 S298 S307 S409P P P P
b
1 419
K182 K201
AD1 bHLH-LZ
K316S U S
Fi S3Figure S3
1
Supplemental information
Figure legends
Figure S1: Mi-E318K mutation segregation within 3 melanoma pedigrees and principal
components analysis (PCA). a, All family members with DNA available for genotyping are
shown. Those with Mi-WT or Mi-E318K are indicated. Filled symbols indicate individuals
with cancer and the age at diagnosis is shown; CM, cutaneous melanoma; OM, ocular
melanoma. Lines through the symbols indicate deceased. b, PCA for the genome-wide SNP
data in 1,389 cancer-free controls and 536 cases that passed quality control. Plot of first two
principal components. The case-control samples are identified by colour: controls are black
circles, melanoma + RCC cases are blue squares, melanoma-only cases are magenta
diamonds, RCC-only cases are green triangles.
Figure S2: Melanomas and kidney cancers immunostained with antibodies to MITF
(×400). a, Mi-WT melanomas displayed average to strong nuclear staining in melanocytic
cells (ID#03H3466). b, Mi-E318K melanomas displayed intense nuclear staining
(ID#10R1515; ID#22112 in Table S2). c and d, Two Mi-E318K carriers displayed nuclear
staining in different kidney cancer subtypes, papillary type I (ID#10R1348; #26534 in Table
S2) and clear cell (ID10R834; #25220 in Table S2) renal cell carcinoma, respectively.
Figure S3: Mi-E318K alters a MITF SUMO binding site. a, Protein sequence alignment
from Human to Tetraodon shows that the ΨKXE sumoylation motif is highly conserved. b,
Schematization of the main structure-function domains and post-translational modification
sites that affect MITF activity. AD1, transactivation domain; bHLH-LZ, basic helix loop helix
2
leucine zipper domain, characteristic of the Myc super family of transcription factors; P,
phosphorylated site; S, sumoylated site; U, ubiquitinated site.
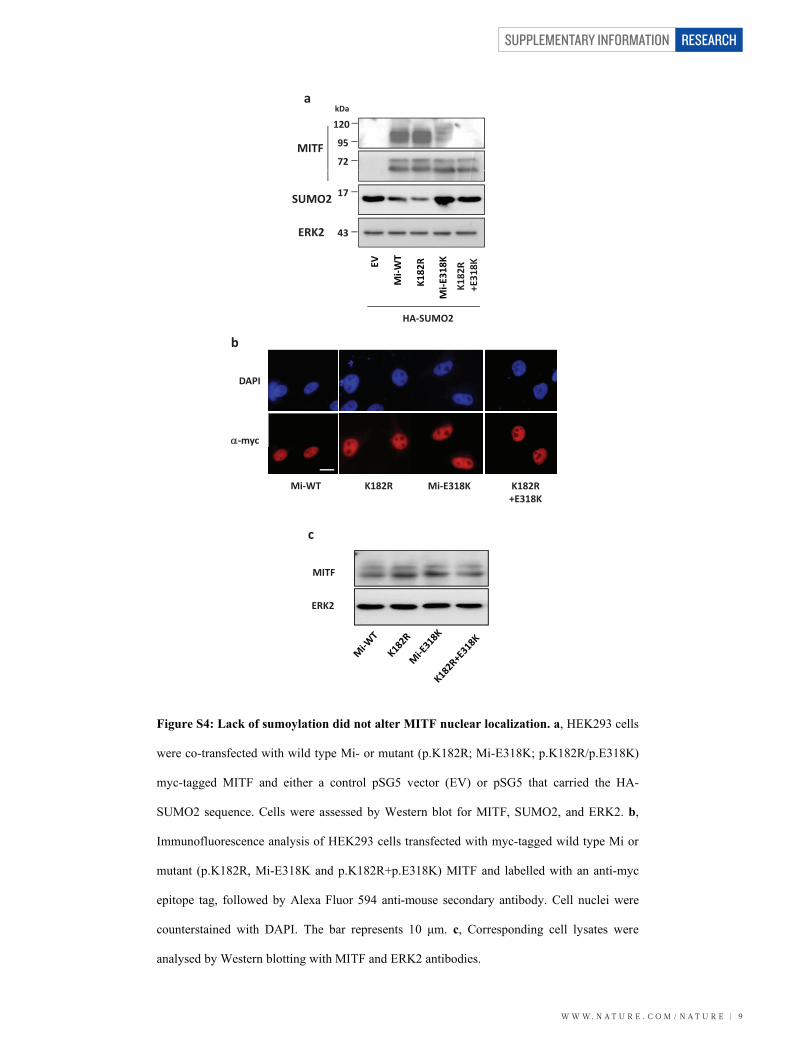
Figure S4: Lack of sumoylation did not alter MITF nuclear localization. a, HEK293 cells
were co-transfected with wild type Mi- or mutant (p.K182R; Mi-E318K; p.K182R/p.E318K)
myc-tagged MITF and either a control pSG5 vector (EV) or pSG5 that carried the HA-
SUMO2 sequence. Cells were assessed by Western blot for MITF, SUMO2, and ERK2. b,
Immunofluorescence analysis of HEK293 cells transfected with myc-tagged wild type Mi or
mutant (p.K182R, Mi-E318K and p.K182R+p.E318K) MITF and labelled with an anti-myc
epitope tag, followed by Alexa Fluor 594 anti-mouse secondary antibody. Cell nuclei were
counterstained with DAPI. The bar represents 10 µm. c, Corresponding cell lysates were
analysed by Western blotting with MITF and ERK2 antibodies.
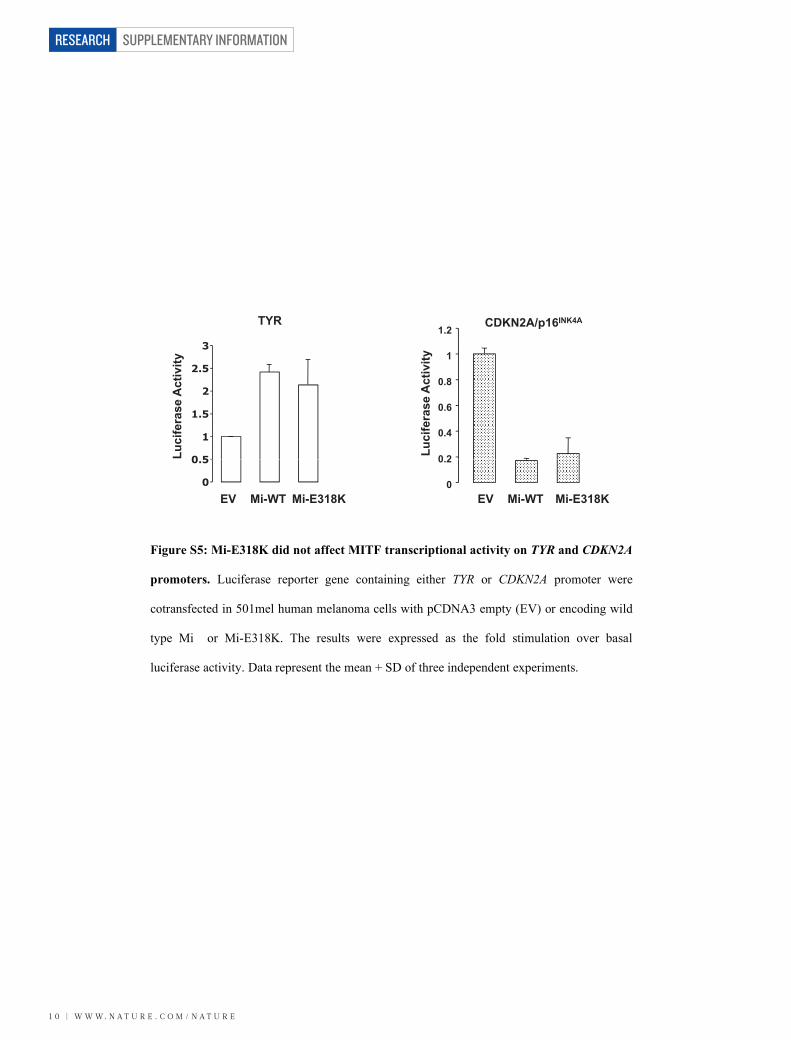
Figure S5: Mi-E318K did not affect MITF transcriptional activity on TYR and CDKN2A
promoters. Luciferase reporter gene containing either TYR or CDKN2A promoter were
cotransfected in 501mel human melanoma cells with pCDNA3 empty (EV) or encoding wild
type Mi or Mi-E318K. The results were expressed as the fold stimulation over basal
luciferase activity. Data represent the mean + SD of three independent experiments.
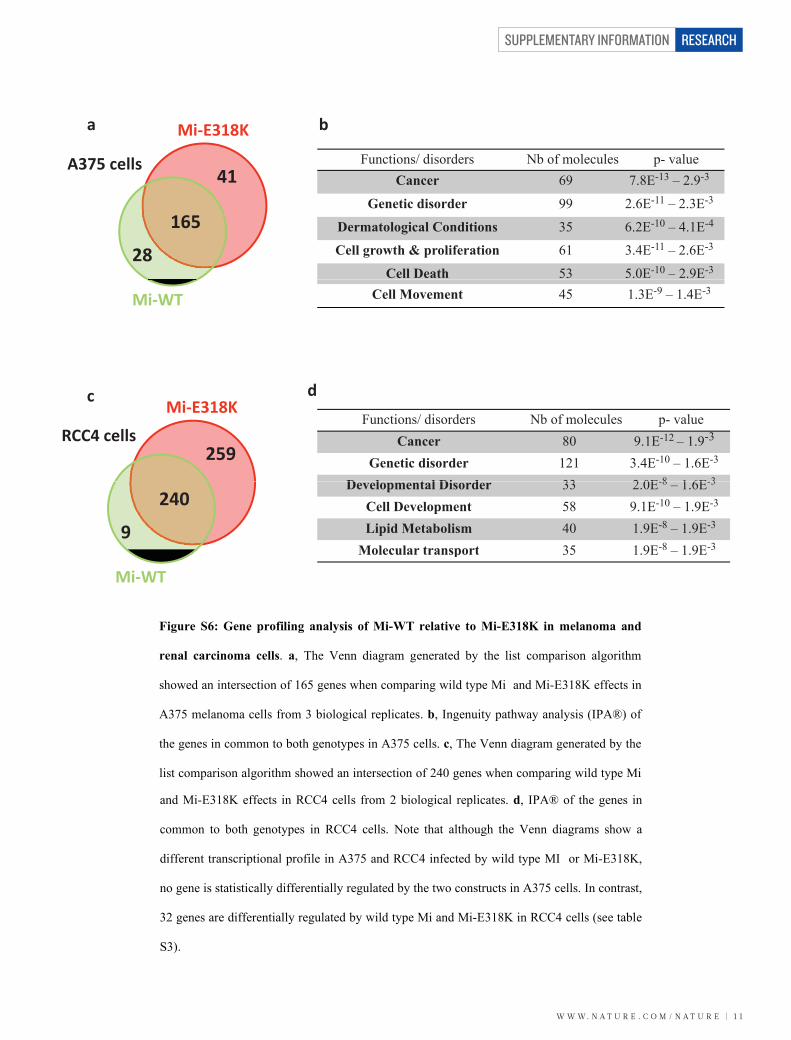
Figure S6: Gene profiling analysis of Mi-WT relative to Mi-E318K in melanoma and
renal carcinoma cells. a, The Venn diagram generated by the list comparison algorithm
showed an intersection of 165 genes when comparing wild type Mi and Mi-E318K effects in
A375 melanoma cells from 3 biological replicates. b, Ingenuity pathway analysis (IPA®) of
the genes in common to both genotypes in A375 cells. c, The Venn diagram generated by the
list comparison algorithm showed an intersection of 240 genes when comparing wild type Mi
w w w. n a t u r e . c o m / n a t u r e | 9
SUPPLEMENTARY INFORMATION RESEARCH
MITF
a
72
95
kDa
120
R K
ERK2 43
17SUMO2
K182R
+E31
8K
HA‐SUMO2
b
‐myc
DAPI
Mi‐E318KMi‐WT K182R+E318K
K182R
c
MITF
ERK2
Figure S4
2
leucine zipper domain, characteristic of the Myc super family of transcription factors; P,
phosphorylated site; S, sumoylated site; U, ubiquitinated site.
Figure S4: Lack of sumoylation did not alter MITF nuclear localization. a, HEK293 cells
were co-transfected with wild type Mi- or mutant (p.K182R; Mi-E318K; p.K182R/p.E318K)
myc-tagged MITF and either a control pSG5 vector (EV) or pSG5 that carried the HA-
SUMO2 sequence. Cells were assessed by Western blot for MITF, SUMO2, and ERK2. b,
Immunofluorescence analysis of HEK293 cells transfected with myc-tagged wild type Mi or
mutant (p.K182R, Mi-E318K and p.K182R+p.E318K) MITF and labelled with an anti-myc
epitope tag, followed by Alexa Fluor 594 anti-mouse secondary antibody. Cell nuclei were
counterstained with DAPI. The bar represents 10 µm. c, Corresponding cell lysates were
analysed by Western blotting with MITF and ERK2 antibodies.
Figure S5: Mi-E318K did not affect MITF transcriptional activity on TYR and CDKN2A
promoters. Luciferase reporter gene containing either TYR or CDKN2A promoter were
cotransfected in 501mel human melanoma cells with pCDNA3 empty (EV) or encoding wild
type Mi or Mi-E318K. The results were expressed as the fold stimulation over basal
luciferase activity. Data represent the mean + SD of three independent experiments.
Figure S6: Gene profiling analysis of Mi-WT relative to Mi-E318K in melanoma and
renal carcinoma cells. a, The Venn diagram generated by the list comparison algorithm
showed an intersection of 165 genes when comparing wild type Mi and Mi-E318K effects in
A375 melanoma cells from 3 biological replicates. b, Ingenuity pathway analysis (IPA®) of
the genes in common to both genotypes in A375 cells. c, The Venn diagram generated by the
list comparison algorithm showed an intersection of 240 genes when comparing wild type Mi
SUPPLEMENTARY INFORMATION
1 0 | w w w. n a t u r e . c o m / n a t u r e
RESEARCH
3
y
TYR
1
1.2
y
CDKN2A/p16INK4A
0 5
1
1.5
2
2.5
Luci
fera
se A
ctiv
ity
0 2
0.4
0.6
0.8
1
Luci
fera
se A
ctiv
it
0
0.5
0
0.2
EV Mi-WT Mi-E318KEV Mi-WT Mi-E318K
Figure S5
2
leucine zipper domain, characteristic of the Myc super family of transcription factors; P,
phosphorylated site; S, sumoylated site; U, ubiquitinated site.
Figure S4: Lack of sumoylation did not alter MITF nuclear localization. a, HEK293 cells
were co-transfected with wild type Mi- or mutant (p.K182R; Mi-E318K; p.K182R/p.E318K)
myc-tagged MITF and either a control pSG5 vector (EV) or pSG5 that carried the HA-
SUMO2 sequence. Cells were assessed by Western blot for MITF, SUMO2, and ERK2. b,
Immunofluorescence analysis of HEK293 cells transfected with myc-tagged wild type Mi or
mutant (p.K182R, Mi-E318K and p.K182R+p.E318K) MITF and labelled with an anti-myc
epitope tag, followed by Alexa Fluor 594 anti-mouse secondary antibody. Cell nuclei were
counterstained with DAPI. The bar represents 10 µm. c, Corresponding cell lysates were
analysed by Western blotting with MITF and ERK2 antibodies.
Figure S5: Mi-E318K did not affect MITF transcriptional activity on TYR and CDKN2A
promoters. Luciferase reporter gene containing either TYR or CDKN2A promoter were
cotransfected in 501mel human melanoma cells with pCDNA3 empty (EV) or encoding wild
type Mi or Mi-E318K. The results were expressed as the fold stimulation over basal
luciferase activity. Data represent the mean + SD of three independent experiments.
Figure S6: Gene profiling analysis of Mi-WT relative to Mi-E318K in melanoma and
renal carcinoma cells. a, The Venn diagram generated by the list comparison algorithm
showed an intersection of 165 genes when comparing wild type Mi and Mi-E318K effects in
A375 melanoma cells from 3 biological replicates. b, Ingenuity pathway analysis (IPA®) of
the genes in common to both genotypes in A375 cells. c, The Venn diagram generated by the
list comparison algorithm showed an intersection of 240 genes when comparing wild type Mi
w w w. n a t u r e . c o m / n a t u r e | 1 1
SUPPLEMENTARY INFORMATION RESEARCH
a Mi‐E318K b
41Functions/ disorders Nb of molecules p- value
Cancer 69 7.8E-13 – 2.9-3
Genetic disorder 99 2.6E-11 – 2.3E-3
A375 cells
165
28Dermatological Conditions 35 6.2E-10 – 4.1E-4
Cell growth & proliferation 61 3.4E-11 – 2.6E-3
Cell Death 53 5.0E-10 – 2.9E-3
Mi‐WT Cell Movement 45 1.3E-9 – 1.4E-3
c dMi‐E318K
i / di d b f l l l
259
Functions/ disorders Nb of molecules p- valueCancer 80 9.1E-12 – 1.9-3
Genetic disorder 121 3.4E-10 – 1.6E-3
D l t l Di d 33 2 0E-8 1 6E-3
RCC4 cells
240
9
Developmental Disorder 33 2.0E-8 – 1.6E-3
Cell Development 58 9.1E-10 – 1.9E-3
Lipid Metabolism 40 1.9E-8 – 1.9E-3
Molecular transport 35 1 9E-8 1 9E-3
Mi‐WTMolecular transport 35 1.9E 8 – 1.9E 3
Figure S6
2
leucine zipper domain, characteristic of the Myc super family of transcription factors; P,
phosphorylated site; S, sumoylated site; U, ubiquitinated site.
Figure S4: Lack of sumoylation did not alter MITF nuclear localization. a, HEK293 cells
were co-transfected with wild type Mi- or mutant (p.K182R; Mi-E318K; p.K182R/p.E318K)
myc-tagged MITF and either a control pSG5 vector (EV) or pSG5 that carried the HA-
SUMO2 sequence. Cells were assessed by Western blot for MITF, SUMO2, and ERK2. b,
Immunofluorescence analysis of HEK293 cells transfected with myc-tagged wild type Mi or
mutant (p.K182R, Mi-E318K and p.K182R+p.E318K) MITF and labelled with an anti-myc
epitope tag, followed by Alexa Fluor 594 anti-mouse secondary antibody. Cell nuclei were
counterstained with DAPI. The bar represents 10 µm. c, Corresponding cell lysates were
analysed by Western blotting with MITF and ERK2 antibodies.
Figure S5: Mi-E318K did not affect MITF transcriptional activity on TYR and CDKN2A
promoters. Luciferase reporter gene containing either TYR or CDKN2A promoter were
cotransfected in 501mel human melanoma cells with pCDNA3 empty (EV) or encoding wild
type Mi or Mi-E318K. The results were expressed as the fold stimulation over basal
luciferase activity. Data represent the mean + SD of three independent experiments.
Figure S6: Gene profiling analysis of Mi-WT relative to Mi-E318K in melanoma and
renal carcinoma cells. a, The Venn diagram generated by the list comparison algorithm
showed an intersection of 165 genes when comparing wild type Mi and Mi-E318K effects in
A375 melanoma cells from 3 biological replicates. b, Ingenuity pathway analysis (IPA®) of
the genes in common to both genotypes in A375 cells. c, The Venn diagram generated by the
list comparison algorithm showed an intersection of 240 genes when comparing wild type Mi
3
and Mi-E318K effects in RCC4 cells from 2 biological replicates. d, IPA® of the genes in
common to both genotypes in RCC4 cells. Note that although the Venn diagrams show a
different transcriptional profile in A375 and RCC4 infected by wild type MI or Mi-E318K,
no gene is statistically differentially regulated by the two constructs in A375 cells. In contrast,
32 genes are differentially regulated by wild type Mi and Mi-E318K in RCC4 cells (see table
S3).
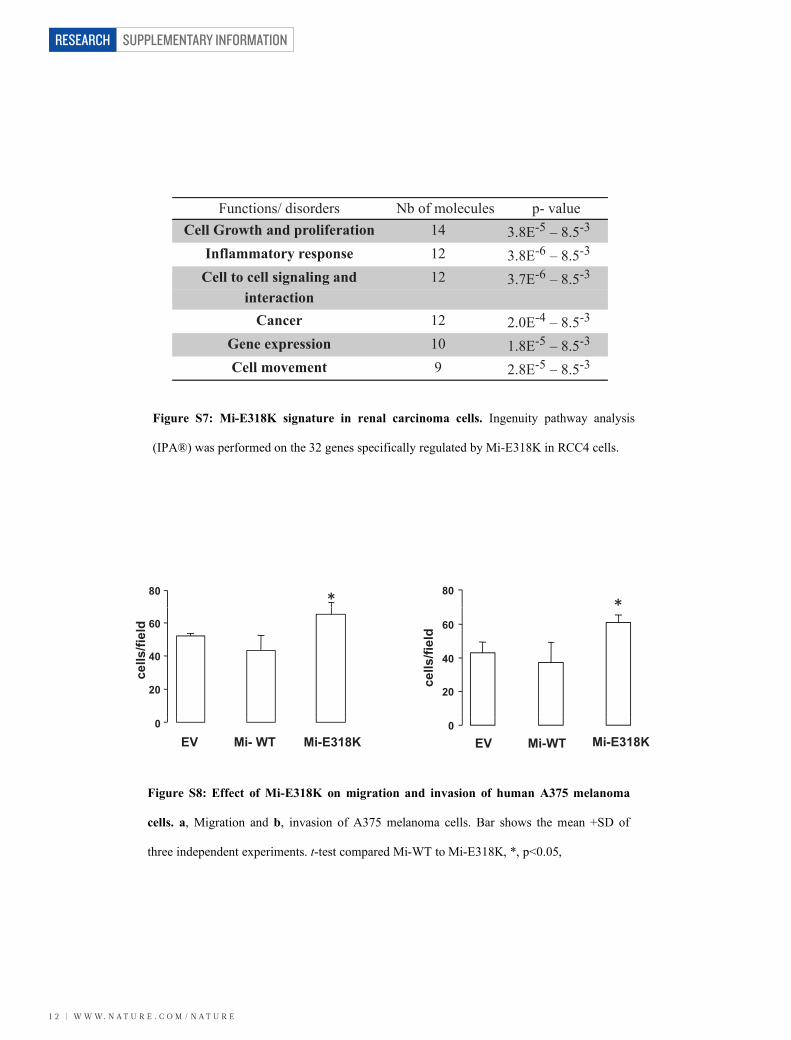
Figure S7: Mi-E318K signature in renal carcinoma cells. Ingenuity pathway analysis
(IPA®) was performed on the 32 genes specifically regulated by Mi-E318K in RCC4 cells.
Figure S8: Effect of Mi-E318K on migration and invasion of human A375 melanoma
cells. a, Migration and b, invasion of A375 melanoma cells. Bar shows the mean +SD of
three independent experiments. t-test compared Mi-WT to Mi-E318K, *, p<0.05,
SUPPLEMENTARY INFORMATION
1 2 | w w w. n a t u r e . c o m / n a t u r e
RESEARCH
Functions/ disorders Nb of molecules p- valueCell Growth and proliferation 14 3.8E-5 – 8.5-3
Inflammatory response 12 3.8E-6 – 8.5-3
Cell to cell signaling and 12 3.7E-6 – 8.5-3
interactionCancer 12 2.0E-4 – 8.5-3
Gene expression 10 1.8E-5 – 8.5-3
5 3Cell movement 9 2.8E-5 – 8.5-3
Figure S7Figure S7
3
and Mi-E318K effects in RCC4 cells from 2 biological replicates. d, IPA® of the genes in
common to both genotypes in RCC4 cells. Note that although the Venn diagrams show a
different transcriptional profile in A375 and RCC4 infected by wild type MI or Mi-E318K,
no gene is statistically differentially regulated by the two constructs in A375 cells. In contrast,
32 genes are differentially regulated by wild type Mi and Mi-E318K in RCC4 cells (see table
S3).
Figure S7: Mi-E318K signature in renal carcinoma cells. Ingenuity pathway analysis
(IPA®) was performed on the 32 genes specifically regulated by Mi-E318K in RCC4 cells.
Figure S8: Effect of Mi-E318K on migration and invasion of human A375 melanoma
cells. a, Migration and b, invasion of A375 melanoma cells. Bar shows the mean +SD of
three independent experiments. t-test compared Mi-WT to Mi-E318K, *, p<0.05,
80 80* *
20
40
60
20
40
60
cells
/fiel
d
cells
/fiel
d
0 0EV Mi- WT Mi-E318K EV Mi-WT Mi-E318K
Figure S8
3
and Mi-E318K effects in RCC4 cells from 2 biological replicates. d, IPA® of the genes in
common to both genotypes in RCC4 cells. Note that although the Venn diagrams show a
different transcriptional profile in A375 and RCC4 infected by wild type MI or Mi-E318K,
no gene is statistically differentially regulated by the two constructs in A375 cells. In contrast,
32 genes are differentially regulated by wild type Mi and Mi-E318K in RCC4 cells (see table
S3).
Figure S7: Mi-E318K signature in renal carcinoma cells. Ingenuity pathway analysis
(IPA®) was performed on the 32 genes specifically regulated by Mi-E318K in RCC4 cells.
Figure S8: Effect of Mi-E318K on migration and invasion of human A375 melanoma
cells. a, Migration and b, invasion of A375 melanoma cells. Bar shows the mean +SD of
three independent experiments. t-test compared Mi-WT to Mi-E318K, *, p<0.05,
Related Documents


