Managing Gap on Planning and Urban Development – An Indonesian Experience Bernardus Djonoputro President Indonesian Association of Urban & Regional Planners

Welcome message from author
This document is posted to help you gain knowledge. Please leave a comment to let me know what you think about it! Share it to your friends and learn new things together.
Transcript
Managing Gap on Planning and Urban Development – An Indonesian Experience
Bernardus Djonoputro President Indonesian Association of Urban & Regional Planners

• IAP is the sole organisation of urban and regional planning profesionals in Indonesia. It is the largest planning profesional institute in the Asean region.
• Branch offices in 25 provinces throughout Indonesia
• More than 4,000 members and 1,200 certified planners
• Planning Certification Board that is independent and fully accredited member of the National Certification Board
INDONESIAN ASSOCIATION OF URBAN & REGIONAL PLANNERS (IAP)

Indonesia has the 10th largest economy in the world, according to a recent report by the World Bank, with the country contributing 2.3 percent of global economic output and 30% of ASEAN’s.
Indonesia’s positioning in Global Economy

China 1,3 Bi
India 1,2 Bi
US 310 Mn
Indonesia 248 Mn
• Indonesia is the third fastest growing economy in Asia and the largest economy in Southeast Asia.
• Indonesia’s economy grew by 5.8% last year (2013) • Indonesia is the 4th most populous nation in the world, • Indonesia is the 3rd largest democracy nation in the world. • Indonesia is the largest moslem country in the world
Brazil
Of the 248 million people in Indonesia, over 60% of the population is under 39 years old, providing a dynamic workforce.
Age 100+
Age 0
Year 2010 Year 2030E Year 2050E


17,000 islands 248 million people
250 ethnic groups
300+ local languages All religions and denominations
1 language
GDP/Capita (US$ ‘000) 30%
urban
1950
51% urban
2008
60% urban
2030
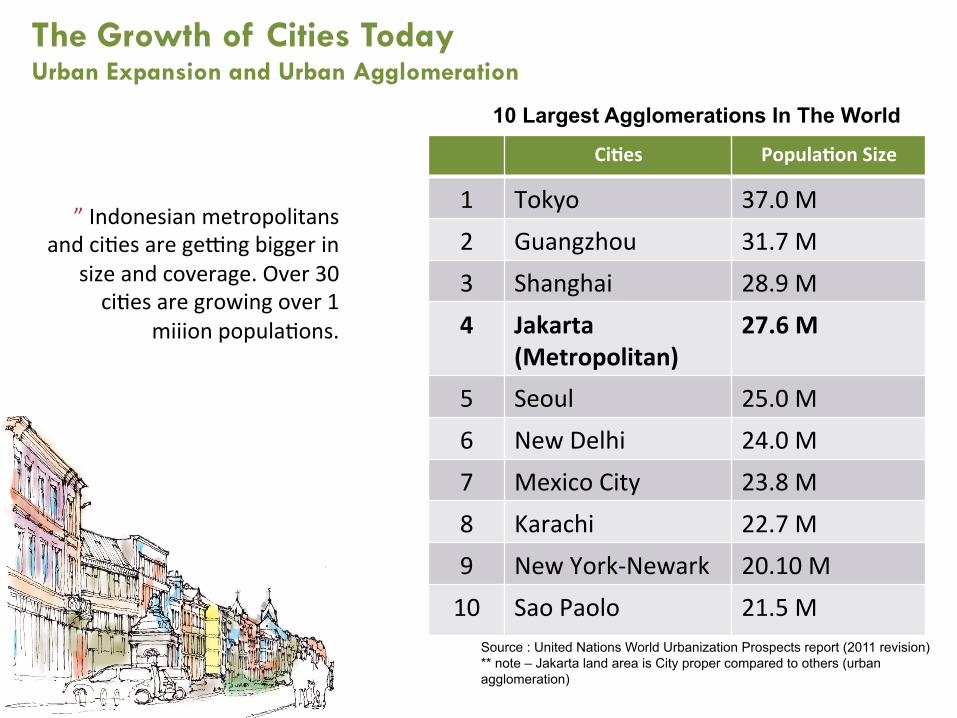
The Growth of Cities Today Urban Expansion and Urban Agglomeration
Ci#es Popula#on Size
1 Tokyo 37.0 M 2 Guangzhou 31.7 M 3 Shanghai 28.9 M 4 Jakarta
(Metropolitan) 27.6 M
5 Seoul 25.0 M 6 New Delhi 24.0 M 7 Mexico City 23.8 M 8 Karachi 22.7 M 9 New York-‐Newark 20.10 M 10 Sao Paolo 21.5 M
10 Largest Agglomerations In The World
” Indonesian metropolitans and ciOes are gePng bigger in
size and coverage. Over 30 ciOes are growing over 1
miiion populaOons.
Source : United Nations World Urbanization Prospects report (2011 revision) ** note – Jakarta land area is City proper compared to others (urban agglomeration)

8
JAKARTA AT A CROSSROAD Vibrant Ci#es


Local New Urbanism Intervention. New younger visionary Mayors.


Inclusivity

The Threats To Our CiOes Are Real
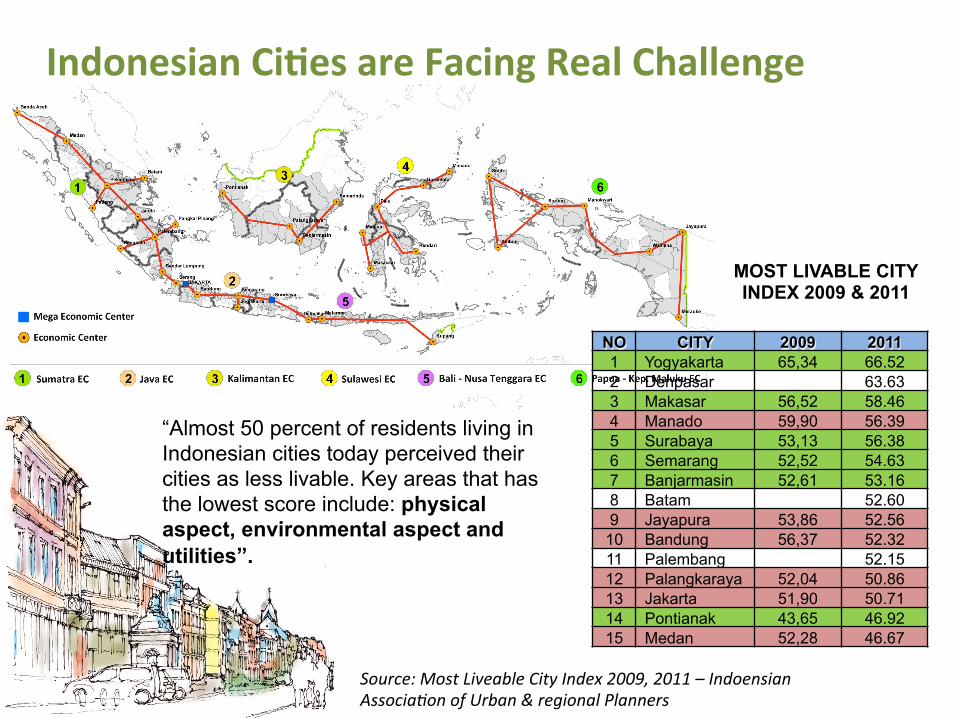
Indonesian Ci#es are Facing Real Challenge
NO CITY 2009 2011 1 Yogyakarta 65,34 66.52 2 Denpasar 63.63 3 Makasar 56,52 58.46 4 Manado 59,90 56.39 5 Surabaya 53,13 56.38 6 Semarang 52,52 54.63 7 Banjarmasin 52,61 53.16 8 Batam 52.60 9 Jayapura 53,86 52.56
10 Bandung 56,37 52.32 11 Palembang 52.15 12 Palangkaraya 52,04 50.86 13 Jakarta 51,90 50.71 14 Pontianak 43,65 46.92 15 Medan 52,28 46.67
MOST LIVABLE CITY INDEX 2009 & 2011
“Almost 50 percent of residents living in Indonesian cities today perceived their cities as less livable. Key areas that has the lowest score include: physical aspect, environmental aspect and utilities”.
Source: Most Liveable City Index 2009, 2011 – Indoensian Associa?on of Urban & regional Planners

15

16

Jakarta is projected to be the most at risk to the impact of climate change The coastal population in North Jakarta is highest risk of sea level rise
Jakarta Risk Map

18
SHORTAGE OF CAPACITY

More global. More connected. Instant. Real time.

The Threat is real!

Inclusive?


Known for its high intensity of floods incidence caused by high #des

Its topography resembles a bowl, where some area with lower al#tude are inundated by sea-‐water
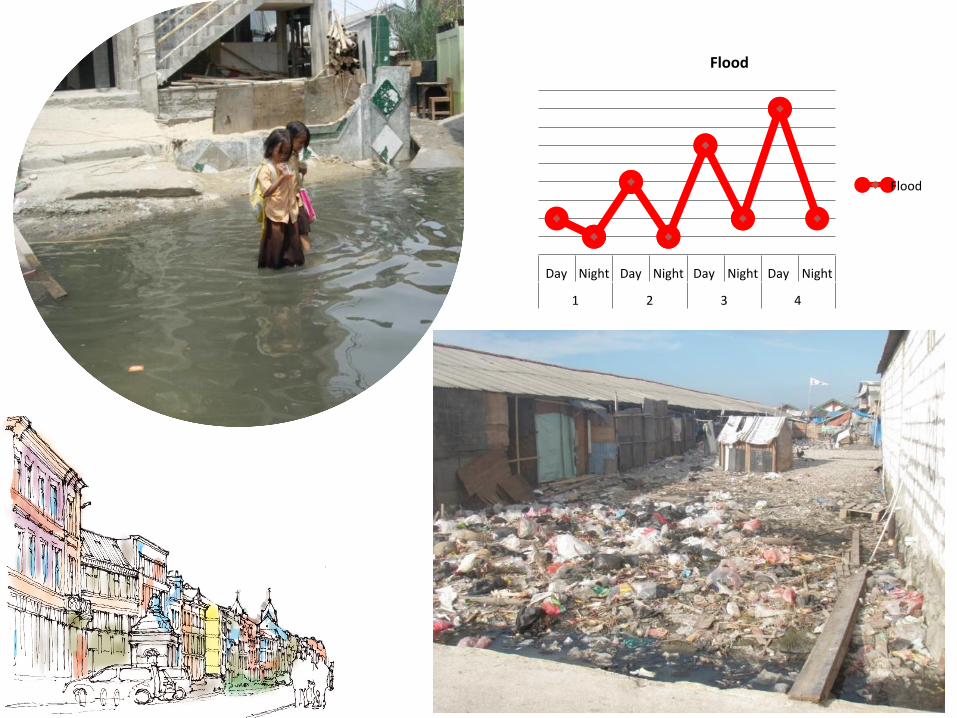
Day Night Day Night Day Night Day Night
1 2 3 4
Flood
Flood


Activity Patterns (12.00-18.00)
Evening (19.00-24.00)
Early morning (03.00-06.00)
Urat Nadi Ekonomi Warga: TPI

The Gap: Planning Process
Provision of Infrastructure

Findings: Elevated road à low-cost material, local and migrant culture; informal media sharing


Young Planners Local Planning
Agency NGO
Urban kampung is the most vulnerable
community
A dream to make a beWer livelihood area for the vulnerable groups
Involving Most Vulnerable community in Local Planning
Locally embedded adapta#on planning of
kampung
Special technique for flood plain zone within
kampung
Housing and seWlement guidelines for adap#ng
kampung


Lesson learnt

The Gap: Planning Process
Provision of Infrastructure
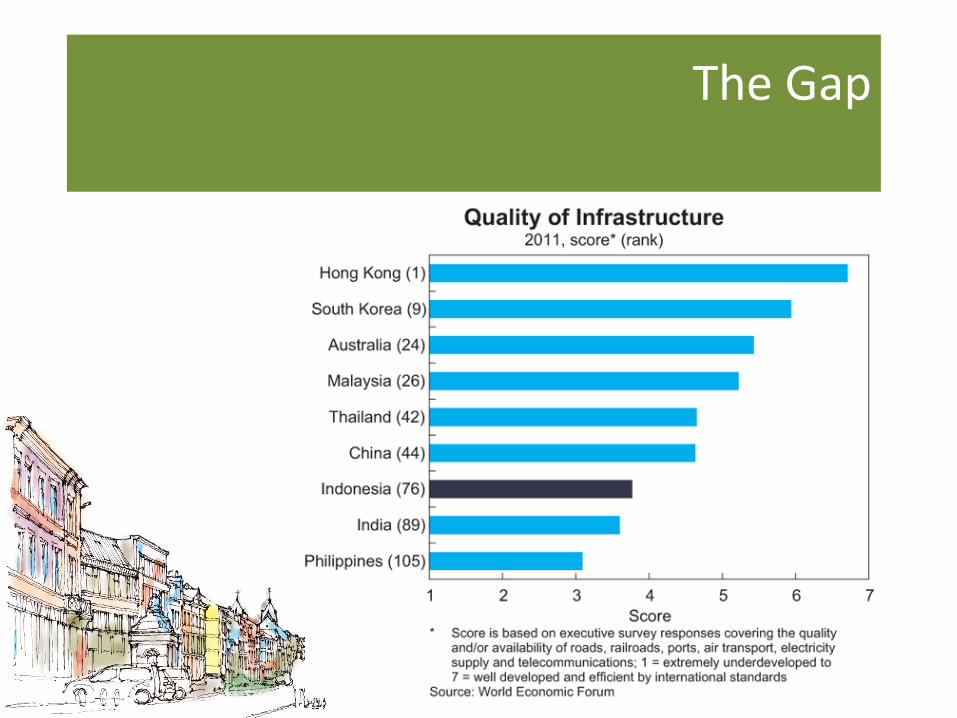
The Gap
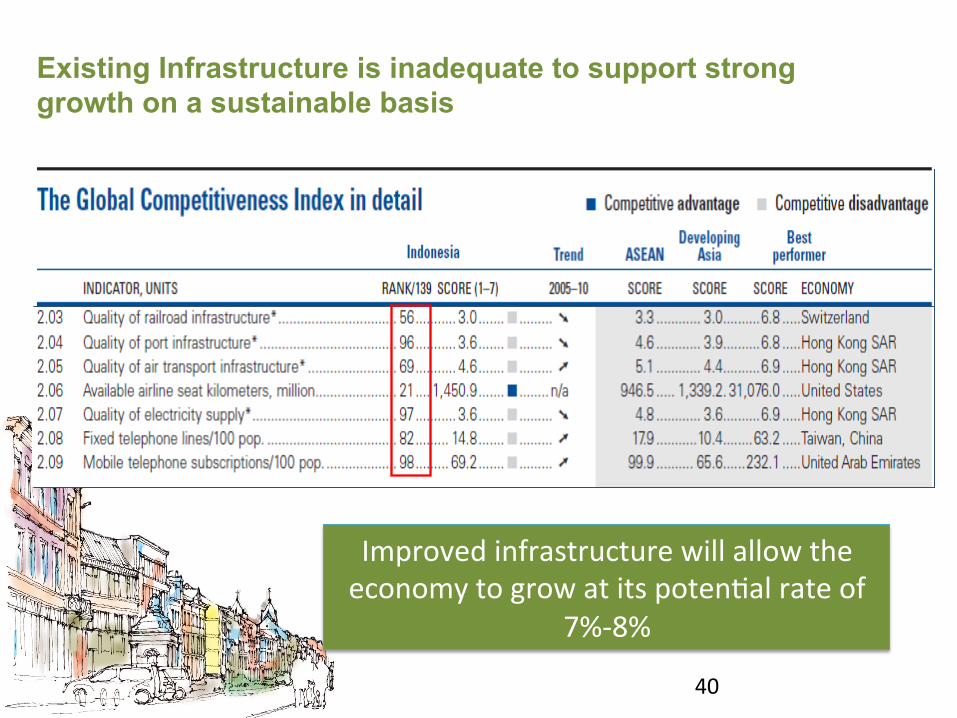
Existing Infrastructure is inadequate to support strong growth on a sustainable basis
40
Improved infrastructure will allow the economy to grow at its potenOal rate of
7%-‐8%

n Low road distance to square kilometer of area ratios in Southeast Asia
n Indonesia – 25%, Thailand – 41% and China 40%) n Government estimates that 3,088km of tolls roads are
needed, whereas existing toll roads have a total length of 738km
n Increasing trend of traffic congestion on existing toll roads
Toll Road
n Low Water service coverage for the increasing Indonesia population
n Current water service coverage only at 39% although targeted to increase to 70% by 2015
n Substantial demand for water services going forward Water

n Electrification rates at 66% n Projected 8% annual growth in electricity demand through
2018 underpins the growth in the electricity sector n Coal still expected to be the main driver for growth in the
power sector, though we see geothermal energy playing a more significant role in the future, along with supporting renewable power. Power
Water
n Existing seaport capacity lags behind despite geographical background as an archipelago country
n Seaport infrastructure critical as Indonesia’s economic growth will be driven by regional economic activities and infrastructure will need to be in place to cater to inter-island commercial growth
Seaport

43
Source: Government Medium Term Plan 2010-‐2014 and Bappenas
USD143bn
USD50bn
USD93bn
Infrastructure Investment Needs
State Budget Funding Gap
• The NaOonal Development Planning Board (“Bappenas”) has stated that around USD143 billion (or 3% of GDP) will be needed for infrastructure development in 2010-‐2014 in order to meet the country’s economic growth target of 6% -‐ 7% per annum.
Source: Pressures Mounting. Indonesia Economic Quarterly, March 2013, Figure 56, p. 41.
The Gap in Provision of Infrastructure
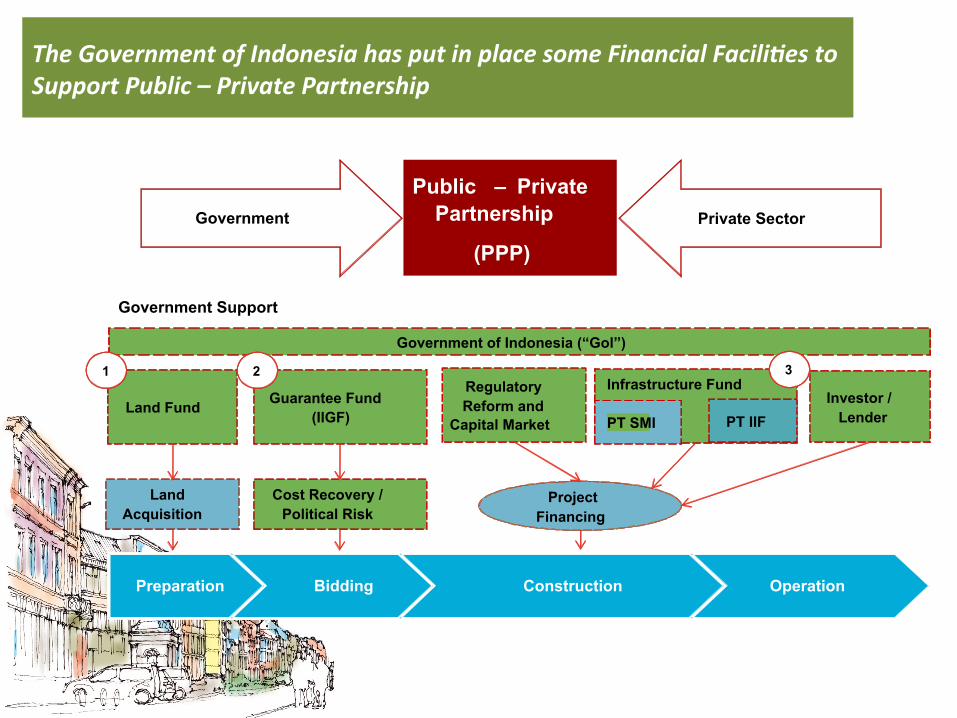
The Government of Indonesia has put in place some Financial Facili=es to Support Public – Private Partnership
Preparation Bidding Construction Operation
Land Fund
Land Acquisition
Cost Recovery / Political Risk
Guarantee Fund (IIGF)
Government of Indonesia (“Gol”)
Regulatory Reform and
Capital Market Investor /
Lender
Project Financing
Infrastructure Fund
PT SMI PT IIF
Public – Private Partnership
(PPP) Government Private Sector
Government Support
1 2 3

PPP Progress
Toll road Seaport Power Water
79 Projects USD 53.4 Bio
21 Projects USD 10.4 Bio
13 Projects USD 27.5 Bio
PPP Book List
Pra-Qualification /
Tender
Showcase/ Priority
24 Projects USD 1.7 Bio
6 Projects USD 350 Bio
6 Projects USD 350 Mio
6 Projects USD 4.8 Bio
2 Projects USD 2 Bio
6 Projects USD 4.8 Bio
6 Projects USD 4.1 Bio
2 Projects USD 1.2 Bio
2 Projects USD 1.2 Bio
22 Projects USD 35.7 Bio
17 Projects USD 8.2 Bio
2 Projects USD 25.7 Bio
Tender - - - - -

How cities and communities engage various different stakeholders in the provision of the needed urban infrastructure? How do we deliver Sustainable Benefits for all stakeholders? The interaction and participation of private and public in provision of urban infrastructure? How to realize better life-cycle economies of urban infrastructure investment, and improving the lack of accountability and responsibility for urban asset condition, use and performance?
So, what are the questions to ask?

What Do We Learn ?
• Involve our communities more. Connect our cities and regions.
• Enhance policy formation of infrastructure financing to encourage private sector investing in infrastructure to make our cities more livable.
• Appropriate incentives and accountability measures at all levels of government to better capture life-cycle economies in urban infrastructure investment.
• Greater use of decentralization tools and systems for a more engaged and incentivised role in local infrastructure service delivery.

Some Inputs For Our Governments …
• A more realistic approach to risk-sharing model to enable greater opportunities for the private sector in urban infrastructure service delivery.
• Mainstreaming of performance-based incentives into planning and delivery systems, including inter-government fiscal transfers, will greatly improve the efficiency and accountability of public investment in urban infrastructure.’
• Support the establishment of institutions that can champion PPPs, for the private sector to finance infrastructure development.
What Do We Learn ?

Innova#on, Planning and Determina#on in Managing Major Ci#es of The World
Towards Resilient and Smart Cities
World Congress
Jakarta 10-12 August 2014 www.earoph-indonesia.org
Related Documents