Morningstar Equity Research © Morningstar 2014. All Rights Reserved. Morningstar's Credit Ratings & Research is produced and offered by Morningstar, Inc., which is not registered with the U.S. Securities and Exchange Commission as a Nationally Recognized Statistical Rating Organization (“NRSRO”). Unless otherwise provided in a separate agreement, you may use this report only in the country in which its original distributor is based. The information, data, analyses and opinions presented herein do not constitute investment advice; are provided solely for informational purposes and therefore are not an offer to buy or sell a security; and are not warranted to be correct, complete or accurate. The opinions expressed are as of the date written and are subject to change without notice. Except as otherwise required by law, Morningstar shall not be responsible for any trading decisions, damages or other losses resulting from, or related to, the information, data, analyses or opinions or their use. The information contained herein is the proprietary property of Morningstar and may not be reproduced, in whole or in part, or used in any manner, without the prior written consent of Morningstar. To order reprints, call +1 312-696-6100. To license the research, call +1 312-696-6869. See last page for important disclosures. Last Price Fair Value Consider Buy Consider Sell Uncertainty Economic Moat™ Moat Trend™ Stewardship Morningstar Credit Rating Industry Group 136.25 USD 150.00 USD 105.00 USD 202.50 USD Medium Wide Stable Exemplary — Insurance Berkshire Hathaway Inc BRK.B (NYSE) | QQQ Market Cap (USD Mil) 318,104 52-Week High (USD) 136.82 52-Week Low (USD) 108.12 52-Week Total Return % 19.7 YTD Total Return % 14.9 Last Fiscal Year End 31 Dec 2013 5-Yr Forward Revenue CAGR % 5.8 5-Yr Forward EPS CAGR % 3.2 Price/Fair Value 0.91 2012 2013 2014(E) 2015(E) Price/Earnings 0.01 0.01 0.01 0.01 Price/Book 0.00 0.00 0.00 0.00 Price/Tangible Book 0.00 0.00 0.00 0.00 Price/Earned Premium 6.07 7.55 8.44 7.78 Dividend Yield % — — — — 2012 2013 2014(E) 2015(E) Earned Premium 34,545 36,684 37,676 40,906 Earned Premium YoY % 7.7 6.2 2.7 8.6 Investment Income 4,534 4,939 5,172 5,959 Investment Income YoY % -5.4 8.9 4.7 15.2 Net Income 5,049 8,210 6,558 7,453 Net Income YoY % 28.2 62.6 -20.1 13.7 Diluted EPS, adjusted NM NM NM NM Diluted EPS YoY %, adjusted 44.4 32.0 -16.7 7.8 Dividends Per Share — — — — Buffett Puts Berkshire's Cash Toward Helping Finance Burger King's Purchase of Tim Hortons See Page 2 for the full Analyst Note from 26 Aug 2014 Greggory Warren, CFA Senior Analyst [email protected] +1 (312) 384-4015 Research as of 26 Aug 2014 Estimates as of 29 Apr 2014 Pricing data through 26 Aug 2014 Rating updated as of 26 Aug 2014 Investment Thesis 29 Apr 2014 Our two biggest concerns about Berkshire Hathaway continue to be the firm's ability to expand the business (given its current size and the need to consistently find deals that not only add value but are large enough to be meaningful) and its planning for the day when Warren Buffett no longer runs the show (with Buffett turning 84 this year and Charlie Munger turning 90 at the start of 2014). While Berkshire is likely to continue to putting money to work in value-creating projects in the near to medium term, much as it has in the past, we think the huge sums of cash that it generates and maintains on its balance sheet will ultimately limit its ability to produce outsize returns. Despite spending more than $18 billion on acquisitions during 2013--including $12 billion for its stake in Heinz and $6 billion for NV Energy--Berkshire closed out the year with $43 billion in cash on its books, relatively unchanged from the end of 2012. While Buffett does like to keep $20 billion on hand as a backstop for the insurance business, which we believe is prudent, the firm is still carrying more than $20 billion in excess cash, earning relatively little in an environment of historically low interest rates. If the firm cannot find a better use for the cash, we believe Buffett should rethink his policy of retaining all of Berkshire's earnings and perhaps pay out a one-time dividend. As for the succession planning issues, we think the firm has alleviated some investor concerns, with Buffett saying he wants his three roles--chairman, CEO, and investment manager--to be split after his retirement from the firm. We continue to believe that Buffett's son, Howard Buffett, will serve as nonexecutive chairman and Ajit Jain, head of Berkshire Hathaway Reinsurance Group, will end up in the CEO role. Meanwhile, we've been impressed by the work that Buffett's two lieutenants--Ted Weschler and Todd Combs--have been doing on the investment side. Both are far more involved than we expected them to be this early in the transition, which we now expect to be a bit more seamless than we were willing to believe just a few years ago. Berkshire Hathaway is a holding company with a wide array of subsidiaries engaged in a number of diverse activities. The firm's core business is insurance, run primarily through Geico (auto insurance), General Re (reinsurance), Berkshire Hathaway Reinsurance Group, and Berkshire Hathaway Primary Group. The company's second-largest segment includes Burlington Northern Santa Fe (railroad) and MidAmerican Energy (utilities and energy distributors). The rest of its operations comprise finance, manufacturing, and retailing operations. Profile Vital Statistics Valuation Summary and Forecasts Financial Summary and Forecasts The primary analyst covering this company does not own its stock. Currency amounts expressed with "$" are in U.S. dollars (USD) unless otherwise denoted. Source for forecasts in the data tables above: Morningstar Estimates Analyst Note: Financial Statements reflect Insurance segment information only, EPS reflects consolidated operations. (USD Mil) Contents Investment Thesis Morningstar Analysis Analyst Note Valuation, Growth and Profitability Scenario Analysis Economic Moat Moat Trend Bulls Say/Bears Say Credit Analysis Financial Health Capital Structure Enterprise Risk Management & Ownership Analyst Note Archive Additional Information Morningstar Analyst Forecasts Comparable Company Analysis Methodology for Valuing Companies Fiscal Year: Fiscal Year: 1 2 2 3 3 6 9 10 10 11 13 15 - 25 28 29 Page 1 of 33

Welcome message from author
This document is posted to help you gain knowledge. Please leave a comment to let me know what you think about it! Share it to your friends and learn new things together.
Transcript

Morningstar Equity Research
© Morningstar 2014. All Rights Reserved. Morningstar's Credit Ratings & Research is produced and offered by Morningstar, Inc., which is not registered with the U.S. Securities and Exchange Commission as a Nationally Recognized Statistical Rating Organization(“NRSRO”). Unless otherwise provided in a separate agreement, you may use this report only in the country in which its original distributor is based. The information, data, analyses and opinions presented herein do not constitute investment advice; are providedsolely for informational purposes and therefore are not an offer to buy or sell a security; and are not warranted to be correct, complete or accurate. The opinions expressed are as of the date written and are subject to change without notice. Except as otherwiserequired by law, Morningstar shall not be responsible for any trading decisions, damages or other losses resulting from, or related to, the information, data, analyses or opinions or their use. The information contained herein is the proprietary property ofMorningstar and may not be reproduced, in whole or in part, or used in any manner, without the prior written consent of Morningstar. To order reprints, call +1 312-696-6100. To license the research, call +1 312-696-6869. See last page for important disclosures.
Last Price Fair Value Consider Buy Consider Sell Uncertainty Economic Moat™ Moat Trend™ Stewardship Morningstar Credit Rating Industry Group
136.25 USD 150.00 USD 105.00 USD 202.50 USD Medium Wide Stable Exemplary — Insurance
Berkshire Hathaway Inc BRK.B (NYSE) | QQQ
Market Cap (USD Mil) 318,104
52-Week High (USD) 136.82
52-Week Low (USD) 108.12
52-Week Total Return % 19.7
YTD Total Return % 14.9
Last Fiscal Year End 31 Dec 2013
5-Yr Forward Revenue CAGR % 5.8
5-Yr Forward EPS CAGR % 3.2
Price/Fair Value 0.91
2012 2013 2014(E) 2015(E)
Price/Earnings 0.01 0.01 0.01 0.01Price/Book 0.00 0.00 0.00 0.00Price/Tangible Book 0.00 0.00 0.00 0.00Price/Earned Premium 6.07 7.55 8.44 7.78Dividend Yield % — — — —
2012 2013 2014(E) 2015(E)
Earned Premium 34,545 36,684 37,676 40,906
Earned Premium YoY % 7.7 6.2 2.7 8.6
Investment Income 4,534 4,939 5,172 5,959
Investment Income YoY % -5.4 8.9 4.7 15.2
Net Income 5,049 8,210 6,558 7,453
Net Income YoY % 28.2 62.6 -20.1 13.7
Diluted EPS, adjusted NM NM NM NM
Diluted EPS YoY %, adjusted 44.4 32.0 -16.7 7.8
Dividends Per Share — — — —
Buffett Puts Berkshire's Cash Toward Helping Finance BurgerKing's Purchase of Tim HortonsSee Page 2 for the full Analyst Note from 26 Aug 2014
Greggory Warren, CFASenior [email protected]+1 (312) 384-4015
Research as of 26 Aug 2014Estimates as of 29 Apr 2014Pricing data through 26 Aug 2014Rating updated as of 26 Aug 2014
Investment Thesis 29 Apr 2014
Our two biggest concerns about Berkshire Hathaway continue to
be the firm's ability to expand the business (given its current size
and the need to consistently find deals that not only add value but
are large enough to be meaningful) and its planning for the day
when Warren Buffett no longer runs the show (with Buffett turning
84 this year and Charlie Munger turning 90 at the start of 2014).
While Berkshire is likely to continue to putting money to work in
value-creating projects in the near to medium term, much as it has
in the past, we think the huge sums of cash that it generates and
maintains on its balance sheet will ultimately limit its ability to
produce outsize returns. Despite spending more than $18 billion
on acquisitions during 2013--including $12 billion for its stake in
Heinz and $6 billion for NV Energy--Berkshire closed out the year
with $43 billion in cash on its books, relatively unchanged from the
end of 2012. While Buffett does like to keep $20 billion on hand
as a backstop for the insurance business, which we believe is
prudent, the firm is still carrying more than $20 billion in excess
cash, earning relatively little in an environment of historically low
interest rates. If the firm cannot find a better use for the cash, we
believe Buffett should rethink his policy of retaining all of
Berkshire's earnings and perhaps pay out a one-time dividend.
As for the succession planning issues, we think the firm has
alleviated some investor concerns, with Buffett saying he wants
his three roles--chairman, CEO, and investment manager--to be
split after his retirement from the firm. We continue to believe that
Buffett's son, Howard Buffett, will serve as nonexecutive chairman
and Ajit Jain, head of Berkshire Hathaway Reinsurance Group, will
end up in the CEO role. Meanwhile, we've been impressed by the
work that Buffett's two lieutenants--Ted Weschler and Todd
Combs--have been doing on the investment side. Both are far more
involved than we expected them to be this early in the transition,
which we now expect to be a bit more seamless than we were
willing to believe just a few years ago.
Berkshire Hathaway is a holding company with a wide array of subsidiariesengaged in a number of diverse activities. The firm's core business isinsurance, run primarily through Geico (auto insurance), General Re(reinsurance), Berkshire Hathaway Reinsurance Group, and BerkshireHathaway Primary Group. The company's second-largest segment includesBurlington Northern Santa Fe (railroad) and MidAmerican Energy (utilitiesand energy distributors). The rest of its operations comprise finance,manufacturing, and retailing operations.
Profile
Vital Statistics
Valuation Summary and Forecasts
Financial Summary and Forecasts
The primary analyst covering this companydoes not own its stock.
Currency amounts expressed with "$" are inU.S. dollars (USD) unless otherwise denoted.
Source for forecasts in the data tables above: Morningstar EstimatesAnalyst Note: Financial Statements reflect Insurance segment information only, EPS reflectsconsolidated operations.
(USD Mil)
Contents
Investment Thesis
Morningstar Analysis
Analyst Note
Valuation, Growth and Profitability
Scenario Analysis
Economic Moat
Moat Trend
Bulls Say/Bears Say
Credit Analysis
Financial Health
Capital Structure
Enterprise Risk
Management & Ownership
Analyst Note Archive
Additional Information
Morningstar Analyst Forecasts
Comparable Company Analysis
Methodology for Valuing Companies
Fiscal Year:
Fiscal Year:
1
2
2
3
3
6
9
10
10
11
13
15
-
25
28
29
Page 1 of 33

Morningstar Equity Research
© Morningstar 2014. All Rights Reserved. Morningstar's Credit Ratings & Research is produced and offered by Morningstar, Inc., which is not registered with the U.S. Securities and Exchange Commission as a Nationally Recognized Statistical Rating Organization(“NRSRO”). Unless otherwise provided in a separate agreement, you may use this report only in the country in which its original distributor is based. The information, data, analyses and opinions presented herein do not constitute investment advice; are providedsolely for informational purposes and therefore are not an offer to buy or sell a security; and are not warranted to be correct, complete or accurate. The opinions expressed are as of the date written and are subject to change without notice. Except as otherwiserequired by law, Morningstar shall not be responsible for any trading decisions, damages or other losses resulting from, or related to, the information, data, analyses or opinions or their use. The information contained herein is the proprietary property ofMorningstar and may not be reproduced, in whole or in part, or used in any manner, without the prior written consent of Morningstar. To order reprints, call +1 312-696-6100. To license the research, call +1 312-696-6869. See last page for important disclosures.
Last Price Fair Value Consider Buy Consider Sell Uncertainty Economic Moat™ Moat Trend™ Stewardship Morningstar Credit Rating Industry Group
136.25 USD 150.00 USD 105.00 USD 202.50 USD Medium Wide Stable Exemplary — Insurance
Berkshire Hathaway Inc BRK.B (NYSE) | QQQ
Morningstar Analysis
Buffett Puts Berkshire's Cash Toward Helping Finance
Burger King's Purchase of Tim Hortons 26 Aug 2014
It has been widely reported this morning that wide-moat-rated Berkshire Hathaway has agreed to provide aroundCAD 3 billion in financing for the proposed CAD 12.5 billionpurchase of Tim Hortons by Burger King. Though the dealdoes involve 3G Capital--the Brazilian private-equity firmthat owns about 70% of Burger King and joined Berkshirein a joint purchase of Heinz last year--it looks like WarrenBuffett is acting purely as a financier in this particulartransaction. While terms for Berkshire's preferredinvestment in a combined Burger King-Tim Hortons have notbeen released, Buffett did negotiate a 9% coupon for thecumulative compounding preferred stock that Berkshirereceived for its $8 billion cash infusion into the Heinz deal(with the insurer also taking 50% of the common equity foran additional $4.25 billion). Given that spreads have comedown some over the past year and a half, and the fact thatBerkshire is providing only about a quarter of the financingfor the transaction, we would expect the yield to be lowerfor these particular preferred securities. That said, we areencouraged to see Berkshire, which closed out the secondquarter of 2014 with more than $55 billion in cash on itsbooks, putting some cash to work, even if it is only CAD 3billion. It is also interesting to see Buffett teaming up againwith 3G Capital, with our expectation being that Berkshirewill continue to look for innovative ways to put its excesscapital to work. Our fair value estimate and moat rating forBerkshire remain unchanged.
Valuation, Growth and Profitability 29 Apr 2014
We've increased our fair value estimate for BerkshireHathaway's Class B shares to $150 per share from $143after updating our valuation model to reflect newassumptions about growth and profitability for the firm'sdifferent operating segments. This new fair value estimateis equivalent to 1.7 times Berkshire's reported book valueper Class B share of $90 at the end of 2013. With book value
per share expected to grow at a double-digit rate both thisyear and next, our fair value estimate is equivalent to 1.5times book value at the end of 2014 and 1.3 times bookvalue at the end of 2015.
We arrive at our overall fair value estimate using asum-of-the-parts methodology, which values the differentpieces of Berkshire's portfolio separately and then combinesthem to arrive at a total value for the firm. We estimate thatBerkshire's insurance operations are worth $66 per Class Bshare, down 8% from our previous forecast. While webelieve the firm will benefit from the continued growth ofGeico's operations, as well as from the launch of BHSI, weexpect results to be less robust in its reinsurance arms, giventhe impact that excess capacity in the industry, soft demandfor reinsurance overall, and increased oversight fromregulators will have on underwriting.
Our estimate for Berkshire's railroad, utilities, and energyoperations has improved to $45 per Class B share, up morethan 20% from our previous forecast, with changes in ourvaluation of BNSF having the biggest impact. Our forecastfor the railroad now includes stronger assumptions aboutlonger-term profitability, with BNSF continuing to benefitfrom increased rail volume and higher average revenue percar/unit. We also expect capital expenditures to be lowerthan in our original forecast. As for MEHC, we see theacquisition of NV Energy at the end of 2013 having a bigimpact on revenue and profitability this year, but expectthings to return to more normalized levels during theremainder of our five-year forecast.
Our fair value estimate for Berkshire's manufacturing,service, and retailing operations also improved to $33 perClass B share, up 9% from our previous forecast, as weincreased our projections for revenue growth andprofitability for some of the largest contributors to thesegment--including Marmon, Iscar, Lubrizol, and McLane.Our fair value estimate for Berkshire's finance and financial
Page 2 of 33

Morningstar Equity Research
© Morningstar 2014. All Rights Reserved. Morningstar's Credit Ratings & Research is produced and offered by Morningstar, Inc., which is not registered with the U.S. Securities and Exchange Commission as a Nationally Recognized Statistical Rating Organization(“NRSRO”). Unless otherwise provided in a separate agreement, you may use this report only in the country in which its original distributor is based. The information, data, analyses and opinions presented herein do not constitute investment advice; are providedsolely for informational purposes and therefore are not an offer to buy or sell a security; and are not warranted to be correct, complete or accurate. The opinions expressed are as of the date written and are subject to change without notice. Except as otherwiserequired by law, Morningstar shall not be responsible for any trading decisions, damages or other losses resulting from, or related to, the information, data, analyses or opinions or their use. The information contained herein is the proprietary property ofMorningstar and may not be reproduced, in whole or in part, or used in any manner, without the prior written consent of Morningstar. To order reprints, call +1 312-696-6100. To license the research, call +1 312-696-6869. See last page for important disclosures.
Last Price Fair Value Consider Buy Consider Sell Uncertainty Economic Moat™ Moat Trend™ Stewardship Morningstar Credit Rating Industry Group
136.25 USD 150.00 USD 105.00 USD 202.50 USD Medium Wide Stable Exemplary — Insurance
Berkshire Hathaway Inc BRK.B (NYSE) | QQQ
Morningstar Analysis
products division remains unchanged at $6 per Class Bshare.
Scenario Analysis
Our downside case leads to a fair value estimate of $100per Class B share. This scenario assumes that Berkshire'sinsurance segment does not perform as well as we areprojecting in our base case, with Geico struggling in a morecompetitive environment for auto insurance, BHSI takinglonger to gain traction with commercial clients, andimprovements in the firm's reinsurance business takinglonger to materialize. It also assumes that the improvementsseen in Berkshire's manufacturing, service, and retailingoperations stall after posting more than two years of solidgrowth in revenue and profitability. On top of that, ourdownside cases assumes a far less prosperous outlook forBerkshire's railroad, utilities, and energy division, with amoribund recovery in the U.S. economy and significantlyhigher fuel costs affecting the results for these moreeconomically sensitive businesses.
In our upside case, which results in a fair value estimate of$193 per Class B share, we assume that Berkshire's
insurance segment performs much more strongly than weare projecting in our base case, with premium growth andunderwriting profits exceeding our expectations throughoutour five-year forecast, as Geico continues to take share fromcompetitors, BHSI ramps up quickly to be a major player inthe commercial specialty insurance market, andimprovements in the firm's reinsurance business take muchless time to materialize. This scenario also assumes a morerobust recovery in the U.S. economy, with Berkshire's twomain noninsurance segments--manufacturing, service, andretailing and railroad, utilities, and energy--not only holdingon to revenue and profitability gains made since the 2008-09financial crisis, but also picking up pace over the next severalyears.
Economic Moat
Berkshire's wide economic moat is more than just a sum ofits parts. That said, the parts that make up the whole arefairly moaty in their own regard. The company's mostimportant business continues to be its insurance operations,comprising Geico, General Re, Berkshire HathawayReinsurance Group, Berkshire Hathaway Primary Group andBerkshire Hathaway Specialty Insurance Not only do thesebusinesses account for about a third of Berkshire's pretaxearnings (and more than 40% of our estimate of thecompany's fair value), but they generate low-cost float (thetemporary cash holdings that arise from premiums beingcollected well in advance of future claims)--a major sourceof funding for investments. While we can point to amultitude of advantages that Berkshire has in its insuranceoperations, we think the business overall benefits from nomore than a narrow economic moat. In general, we do notbelieve the insurance industry is all that conducive to thedevelopment of sustainable economic moats, as it is for themost part a commodity business where sustainable excessreturns are difficult for most firms to achieve. Whereeconomic moats have been carved out, it has been the resultof superior underwriting profitability (achieved through
Page 3 of 33

Morningstar Equity Research
© Morningstar 2014. All Rights Reserved. Morningstar's Credit Ratings & Research is produced and offered by Morningstar, Inc., which is not registered with the U.S. Securities and Exchange Commission as a Nationally Recognized Statistical Rating Organization(“NRSRO”). Unless otherwise provided in a separate agreement, you may use this report only in the country in which its original distributor is based. The information, data, analyses and opinions presented herein do not constitute investment advice; are providedsolely for informational purposes and therefore are not an offer to buy or sell a security; and are not warranted to be correct, complete or accurate. The opinions expressed are as of the date written and are subject to change without notice. Except as otherwiserequired by law, Morningstar shall not be responsible for any trading decisions, damages or other losses resulting from, or related to, the information, data, analyses or opinions or their use. The information contained herein is the proprietary property ofMorningstar and may not be reproduced, in whole or in part, or used in any manner, without the prior written consent of Morningstar. To order reprints, call +1 312-696-6100. To license the research, call +1 312-696-6869. See last page for important disclosures.
Last Price Fair Value Consider Buy Consider Sell Uncertainty Economic Moat™ Moat Trend™ Stewardship Morningstar Credit Rating Industry Group
136.25 USD 150.00 USD 105.00 USD 202.50 USD Medium Wide Stable Exemplary — Insurance
Berkshire Hathaway Inc BRK.B (NYSE) | QQQ
Morningstar Analysis
superior underwriting abilities and/or some sort of costadvantage) relative to the industry, rather than throughinvestment gains (even when those gains are the result ofthe investing prowess of someone like Buffett). We believeinsurers that consistently achieve positive underwritingprofitability are better bets in the long run, as insuranceprofitability, in most cases, is far more sustainable thaninvestment income.
While Geico has made strides with its direct-sellingoperations, moving from a position as the fifth-largestprivate auto insurer in the U.S. a decade ago to thesecond-largest underwriter last year, we think it benefitsfrom no more than a narrow economic moat around itsoperations. Much like its closest competitor, Progressive,Geico has set itself apart from the industry by its scale inthe direct response channel. While scaling is typicallydifficult for insurance companies, personal line insurers likeGeico and Progressive have been better at spreading fixedcosts over a wider base, as their business models do notrequire as much human capital and specialized underwritersas other insurance lines. This has been reflected in Geico'sexpense ratio, which over the past five years has averagedaround 18%, leaving it 700 basis points below the industryaverage and about 300 basis points better than Progressive.That said, Geico has trailed its closest peer on anunderwriting basis, with both firms generating combinedratios of around 94% on average during the past five years.Given the similarity in their operations, as well as the leveland consistency of their profitability, we think Geico, muchlike Progressive, has a narrow economic moat around itsoperations.
With regards to Berkshire's two other large insurancearms--General Re and BHRG--both are reinsurers, whichmeans that for a premium they will assume all or part of aninsurance or reinsurance policy written by another insurancecompany. While any insurance company can technically
write reinsurance, a handful of larger companies--MunichRe, Swiss Re, Hannover Re, Lloyd's, and BerkshireHathaway (through General RE and BHRG)--hold sway overthe lion's share of the global reinsurance market. Thepolicies underwritten by reinsurers often contain largelong-tail risks that few companies have the capacity toendure and, when priced appropriately, can generatefavorable long-term returns. That said, reinsurers competefor business on the basis of price and capital strength, andit is almost impossible to build a structural cost advantageas scale provides few advantages. More important, lossesin the reinsurance market are lumpy and may not be realizedfor years after a policy is written, magnifying the importanceof disciplined and accurate underwriting skills. WhileBerkshire's reinsurance arms are unique, in that they havethe luxury of walking away from business when anappropriate premium cannot be obtained--something thattheir peers cannot always do--their underwritingprofitability has been less consistent and much narrowerthan Berkshire's other insurance arms. The company stickswith reinsurance, though, because it generates asignificantly higher level of float that can be invested forlonger periods of time than short-tail lines like autoinsurance. While our standard view on reinsurance is thatthe publicly traded companies operating in thissegment--like Munich Re and Swiss Re--are unable to carveout economic moats, we think Berkshire's reinsurance armshave come closer than most to achieving this goal.
We believe BHPG, which has been Berkshire's mostconsistently profitable insurance business over the past 10years, benefits from a narrow economic moat around itsoperations. What is all the more remarkable about this isthe fact that BHPG is a conglomeration of multiple insuranceoperations--including National Indemnity's primary group,Medical Protective Company, U.S. Investment Corporation,and Applied Underwriters--that offer coverage as varied asworkers' compensation and commercial auto and property
Page 4 of 33

Morningstar Equity Research
© Morningstar 2014. All Rights Reserved. Morningstar's Credit Ratings & Research is produced and offered by Morningstar, Inc., which is not registered with the U.S. Securities and Exchange Commission as a Nationally Recognized Statistical Rating Organization(“NRSRO”). Unless otherwise provided in a separate agreement, you may use this report only in the country in which its original distributor is based. The information, data, analyses and opinions presented herein do not constitute investment advice; are providedsolely for informational purposes and therefore are not an offer to buy or sell a security; and are not warranted to be correct, complete or accurate. The opinions expressed are as of the date written and are subject to change without notice. Except as otherwiserequired by law, Morningstar shall not be responsible for any trading decisions, damages or other losses resulting from, or related to, the information, data, analyses or opinions or their use. The information contained herein is the proprietary property ofMorningstar and may not be reproduced, in whole or in part, or used in any manner, without the prior written consent of Morningstar. To order reprints, call +1 312-696-6100. To license the research, call +1 312-696-6869. See last page for important disclosures.
Last Price Fair Value Consider Buy Consider Sell Uncertainty Economic Moat™ Moat Trend™ Stewardship Morningstar Credit Rating Industry Group
136.25 USD 150.00 USD 105.00 USD 202.50 USD Medium Wide Stable Exemplary — Insurance
Berkshire Hathaway Inc BRK.B (NYSE) | QQQ
Morningstar Analysis
coverage. With regards to BHSI, which was just formed inJune 2013, it is too early, in our view, to assess theeconomics of this business let alone assign an economicmoat rating. That said, early indications are that BHSI isfocusing on U.S. excess and surplus lines, wanting to takeadvantage of the growing demand for tailored insurance,which is a net positive, in our view. We've long believedthat insurers that focus on the least commodified areas ofthe insurance market, such as excess and surplus lines, aremore likely to generate consistent underwriting profitability(which is a prerequisite for carving out an economic moat).
Of the more than 70 noninsurance businesses that make upBerkshire's remaining collection of operating subsidiaries,Burlington Northern Santa Fe and MidAmerican EnergyHoldings Company are the next two largest contributors toBerkshire's profitability and overall value, generating closeto one third of pretax earnings and accounting for 30% ofour fair value estimate for the firm. The most interestingthing about these two businesses is that neither one was amajor contributor to Berkshire's earnings a decade ago.Buffett's shift into such debt-heavy, capital-intensivebusinesses as railroads and utilities represented a markeddeparture from many of his other acquisitions over the years,which have tended to require less ongoing capitalinvestment and have had little to no debt on their books. Bydefinition, these higher-capital businesses will have lowerreturns than the low-capital businesses Berkshire hasacquired in the past, but with a lot of high-return, low- orno-capital businesses, Buffett needs to reinvest thecompany's excess cash flows into businesses that not onlyoffer a decent rate of return but absorb substantial amountsof capital. He has mentioned on several occasions that hewould be content to generate a 12% return on theseinvestments.
With BNSF, which was acquired in full in February 2010,Berkshire picked up a Class I railroad operator, which is an
industry designation for a large operator with an extensivesystem of interconnected rails, yards, terminals, andexpansive fleets of motive power and rolling stock. Webelieve that the North American Class I railroads benefitfrom colossal barriers to entry because of their established,practically impossible-to-replicate networks of rights of wayand continuously welded steel rail. Also, rail customers havefew choices and thus wield limited buyer power,highlighting the fact that most railroads operate as aduopoly in most markets, and that some may even be amonopoly supplier to the end client in many cases. Believingthat North American Class I railroads like BNSF will leveragetheir competitive advantages of low cost and efficient scaleto generate returns on invested capital in excess of theircost of capital over the long run, we have awarded themwide-moat ratings. As for MEHC, which Berkshire built upthrough investments in MidAmerican Energy (supplanting a76% equity stake taken in early 2000 with additionalpurchases that have raised its interest up to 89.8%),PacifiCorp (acquired by MEHC in full during 2005), and morerecently NV Energy (acquired at the end of last year), wethink the business overall is endowed with a narroweconomic moat. While MEHC has picked up some pipelineassets through the years, which can have wide-moatcharacteristics, the majority of its revenue and profitability(and ongoing capital investment) continues to be driven byits three main regulated utilities: MidAmerican Energy,PacifiCorp, and NV Energy. We think regulated utilities havehad a more difficult time establishing more than a narrowmoat around their businesses, even with theirdifficult-to-replicate networks of power generation,transmission, and distribution, given that their rates, as wellas their returns, are set by state and federal regulators.
While Berkshire's manufacturing, service, and retailingoperations are the next-largest contributor to pretaxearnings and our estimate of the overall value of the firm,they comprise a wide array of businesses operating in more
Page 5 of 33

Morningstar Equity Research
© Morningstar 2014. All Rights Reserved. Morningstar's Credit Ratings & Research is produced and offered by Morningstar, Inc., which is not registered with the U.S. Securities and Exchange Commission as a Nationally Recognized Statistical Rating Organization(“NRSRO”). Unless otherwise provided in a separate agreement, you may use this report only in the country in which its original distributor is based. The information, data, analyses and opinions presented herein do not constitute investment advice; are providedsolely for informational purposes and therefore are not an offer to buy or sell a security; and are not warranted to be correct, complete or accurate. The opinions expressed are as of the date written and are subject to change without notice. Except as otherwiserequired by law, Morningstar shall not be responsible for any trading decisions, damages or other losses resulting from, or related to, the information, data, analyses or opinions or their use. The information contained herein is the proprietary property ofMorningstar and may not be reproduced, in whole or in part, or used in any manner, without the prior written consent of Morningstar. To order reprints, call +1 312-696-6100. To license the research, call +1 312-696-6869. See last page for important disclosures.
Last Price Fair Value Consider Buy Consider Sell Uncertainty Economic Moat™ Moat Trend™ Stewardship Morningstar Credit Rating Industry Group
136.25 USD 150.00 USD 105.00 USD 202.50 USD Medium Wide Stable Exemplary — Insurance
Berkshire Hathaway Inc BRK.B (NYSE) | QQQ
Morningstar Analysis
than a handful of different industries. Unlike BNSF andMEHC, both of which file annual and quarterly reports withthe Securities and Exchange Commission, there is littlefinancial information available on the firms operating in thissegment. Given Buffett's penchant for acquiring companiesthat have consistent earnings power, generateabove-average returns on capital, have little debt, and arerun by solid management teams, we believe thesebusinesses are collectively endowed with a narroweconomic moat. The same could also be said for Berkshire'sfinance and financial product segment, which includesClayton Homes (manufactured housing and finance) andCORT Business Services (furniture rental). While thedisruption caused by the 2008-09 financial crisis and thecollapse of the housing market may have affected thesebusinesses, much as it did some of Berkshire's othersubsidiaries--like Benjamin Moore, Shaw, Acme, and JohnsManville--there are still solidly moaty characteristics inthese subsidiaries.
With Buffett running Berkshire on a decentralized basis, themanagers of these operating subsidiaries are empoweredto make their own business decisions. In most cases, thesemanagers are the same individuals who originally sold theirfirms to Buffett, leaving them with a vested interest in thebusinesses that they are running, such that barring a trulydisruptive event in their industries these firms are likely tocontinue to have the same advantages that attracted Buffettto them in the first place. That does not mean that therewon't be firms within Berkshire whose competitiveadvantages diminish (exemplified most ironically by thetextile manufacturer that Berkshire Hathaway derives itsown name from), it's just that the large collection of moatyfirms that reside in Berkshire's noninsurance/railroad/utilityoperations is more likely to maintain a narrow economicmoat in aggregate, even as a few firms along the waysuccumb to changing competitive dynamics within theirindustries.
Moat Trend
We believe Berkshire Hathaway's moat trend is stable.Much like its economic moat, which is derived from thecompetitive advantages ascribed to its different operatingsubsidiaries, the firm's moat trend is influenced by changesin the competitive dynamics for each of its main operatingsegments. With insurance having the single-largestinfluence on the firm's pretax profits (as well as our fairvalue estimate), changes in the moat trends for thesevarious operations will have a bigger influence on thecompany's moat trend rating. That said, the insuranceindustry is very mature, its basic structure is long defined,and it is not generally affected by technological changes.As a result, competitive positions are generally stable, andin determining trends, we find it important to ignore thenoise of the inherent volatility in near-term results, focusingmore on long-term trends. Insurance moat trends aretypically driven by changes in a company's cost structure,and moats predicated on focused scale or sticky customerscan strengthen or weaken over time, based on an insurer'sstrategy or industry dynamics.
With regards to Geico, while we believe that the shift fromthe agent channel to the direct response channel willcontinue as consumers become more aware of the costsavings afforded by these types of operations, we also thinkthis trend has contributed to the ongoing standardizationand commodification of auto insurance products. And whilewe also believe that scale advantages can be reinforcingas an insurer's business grows, we think that Geico, muchlike Progressive, has reached a point of maturity, and expectmany of the positive strides that it has made over the past5-10 years to moderate over time. As such, we assign astable moat trend to Geico (much as we do with Progressive).As for Berkshire's reinsurance operations, we believe themoat trend is stable for both General Re and BHRG eventhough the industry itself is currently flush with capital and
Page 6 of 33

Morningstar Equity Research
© Morningstar 2014. All Rights Reserved. Morningstar's Credit Ratings & Research is produced and offered by Morningstar, Inc., which is not registered with the U.S. Securities and Exchange Commission as a Nationally Recognized Statistical Rating Organization(“NRSRO”). Unless otherwise provided in a separate agreement, you may use this report only in the country in which its original distributor is based. The information, data, analyses and opinions presented herein do not constitute investment advice; are providedsolely for informational purposes and therefore are not an offer to buy or sell a security; and are not warranted to be correct, complete or accurate. The opinions expressed are as of the date written and are subject to change without notice. Except as otherwiserequired by law, Morningstar shall not be responsible for any trading decisions, damages or other losses resulting from, or related to, the information, data, analyses or opinions or their use. The information contained herein is the proprietary property ofMorningstar and may not be reproduced, in whole or in part, or used in any manner, without the prior written consent of Morningstar. To order reprints, call +1 312-696-6100. To license the research, call +1 312-696-6869. See last page for important disclosures.
Last Price Fair Value Consider Buy Consider Sell Uncertainty Economic Moat™ Moat Trend™ Stewardship Morningstar Credit Rating Industry Group
136.25 USD 150.00 USD 105.00 USD 202.50 USD Medium Wide Stable Exemplary — Insurance
Berkshire Hathaway Inc BRK.B (NYSE) | QQQ
Morningstar Analysis
regulatory oversight is increasing. We don't think thecompetitive environment will be dramatically altered in thenear to medium term, and we are comforted by theknowledge that the managers of Berkshire's reinsuranceoperations have the luxury of not underwriting policies whenthe pricing environment is unfavorable, much as it is rightnow. We also assign a stable moat trend to BHPG, whichhas been Berkshire's most consistently profitable insurancebusiness over the past 10 years, believing that thecommitment to underwriting discipline exemplified by theseoperations will continue in the near to medium term.
Looking more closely at Berkshire's railroad, utilities, andenergy segment, we consider BNSF's moat trend to bestable, much as we do the six publicly traded Class I railroadsthat are covered by Morningstar. While we expect the largeNorth American railroad operators to continue improvingtheir operations and raising rates, much as they have thepast decade, we think these cost advantage enhancementsare now routine practices for the industry and not a changein competitive dynamics; hence, the stable moat trendrating. We expect operating measures for the major ClassI railroads to converge during the next decade, with all railsdelivering margins slightly below what Canadian National,the highest-margin railroad in the industry, has achieved.With regards to MEHC, we have assigned a stable moattrend to the firm's consolidated operations. We do notexpect the regulatory structure for MidAmerican's regulatedutilities to change substantially in the near term, believingregulators will continue to uphold the implicit contract thatallows utilities to earn at least their cost of capital onaverage in the long run. The same holds for MidAmerican'spipelines unit, where the current policy of approving onlythose projects that demonstrate an economic need providethe firm some protection from competitors. We also do notexpect any near-term shift in natural gas supply or demandfundamentals that would erode its geographicalcompetitive advantage.
While Berkshire's remaining operating segments--manufacturing,service and retailing (which includes a wide variety of firmsfrom Marmon to Dairy Queen) and finance and financialproducts (which includes both Clayton Homes and CORTBusiness Services)--account for about a third of pretaxearnings and one fourth of our fair value estimate for thefirm, we have the same problem assessing their moat trendsas we do their economic moats. That said, many of thesefirms continue to be run by the same managers who soldtheir firms to Berkshire, leaving them with a vested interestin the businesses that they are running. Barring a trulydisruptive event in their industries, these firms are likely tocontinue to have the same advantages that attracted Buffettto them in the first place. That does not mean that therewon't be firms within these categories whose competitiveadvantages diminish, it's just that the moat trend for thegroup as a whole is likely to remain fairly stable even as afew firms along the way succumb to changing competitivedynamics within their industries.
As a result, we expect Berkshire's moat trend overall toremain fairly stable even as it faces two big longer-termhurdles: the company's ability to expand the business andits planning for the day when Warren Buffett no longer runsthe show. Although acquisitions and shrewd capitalallocation have nearly tripled the firm's book value per shareover the past decade, we think it will be difficult forBerkshire to replicate that kind of performance longer term,even with Buffett at the helm. That's not to say that the firmcan't continue to put money to work in value-creatingprojects, much as it has in the past--it's just that the largesums of cash that the company generates and maintains onits balance sheet are likely to serve an impediment to itsability to produce outsize returns. That said, with a muchlower cost of capital than most firms, the hurdle rate forgenerating excess returns is somewhat lower than onewould imagine, increasing the likelihood that Berkshire can
Page 7 of 33

Morningstar Equity Research
© Morningstar 2014. All Rights Reserved. Morningstar's Credit Ratings & Research is produced and offered by Morningstar, Inc., which is not registered with the U.S. Securities and Exchange Commission as a Nationally Recognized Statistical Rating Organization(“NRSRO”). Unless otherwise provided in a separate agreement, you may use this report only in the country in which its original distributor is based. The information, data, analyses and opinions presented herein do not constitute investment advice; are providedsolely for informational purposes and therefore are not an offer to buy or sell a security; and are not warranted to be correct, complete or accurate. The opinions expressed are as of the date written and are subject to change without notice. Except as otherwiserequired by law, Morningstar shall not be responsible for any trading decisions, damages or other losses resulting from, or related to, the information, data, analyses or opinions or their use. The information contained herein is the proprietary property ofMorningstar and may not be reproduced, in whole or in part, or used in any manner, without the prior written consent of Morningstar. To order reprints, call +1 312-696-6100. To license the research, call +1 312-696-6869. See last page for important disclosures.
Last Price Fair Value Consider Buy Consider Sell Uncertainty Economic Moat™ Moat Trend™ Stewardship Morningstar Credit Rating Industry Group
136.25 USD 150.00 USD 105.00 USD 202.50 USD Medium Wide Stable Exemplary — Insurance
Berkshire Hathaway Inc BRK.B (NYSE) | QQQ
Morningstar Analysis
continue to earn more than its cost of capital for an extendedperiod of time. While a big concern for investors is whetherBuffett's successors will be able to extract the sameadvantages from Berkshire's operations that he has over theyears, we think they may not need to as long as they continueto earn more than the firm's cost of capital with thebusinesses that make up the whole.
Page 8 of 33

Morningstar Equity Research
© Morningstar 2014. All Rights Reserved. Morningstar's Credit Ratings & Research is produced and offered by Morningstar, Inc., which is not registered with the U.S. Securities and Exchange Commission as a Nationally Recognized Statistical Rating Organization(“NRSRO”). Unless otherwise provided in a separate agreement, you may use this report only in the country in which its original distributor is based. The information, data, analyses and opinions presented herein do not constitute investment advice; are providedsolely for informational purposes and therefore are not an offer to buy or sell a security; and are not warranted to be correct, complete or accurate. The opinions expressed are as of the date written and are subject to change without notice. Except as otherwiserequired by law, Morningstar shall not be responsible for any trading decisions, damages or other losses resulting from, or related to, the information, data, analyses or opinions or their use. The information contained herein is the proprietary property ofMorningstar and may not be reproduced, in whole or in part, or used in any manner, without the prior written consent of Morningstar. To order reprints, call +1 312-696-6100. To license the research, call +1 312-696-6869. See last page for important disclosures.
Last Price Fair Value Consider Buy Consider Sell Uncertainty Economic Moat™ Moat Trend™ Stewardship Morningstar Credit Rating Industry Group
136.25 USD 150.00 USD 105.00 USD 202.50 USD Medium Wide Stable Exemplary — Insurance
Berkshire Hathaway Inc BRK.B (NYSE) | QQQ
Bulls Say/Bears Say
Bulls Say Bears Say
3 Book value per share, which is the best proxy formeasuring changes in Berkshire's intrinsic value,increased at a compound annual rate of 19.7% from1964 to 2013, compared with a 9.8% total return forthe S&P 500 TR Index.
3 Berkshire's long-term record has been fairlyconsistent, with the company reporting annualdeclines in book value per share in only two calendaryears: 2001 and 2008.
3 At the end of the fourth quarter of 2013, Berkshire had$77.2 billion in float from its insurance operations. Thecost of float has been negative for the past decade.
3 Given the size of its existing operations, the biggesthurdle facing Berkshire will be its ability toconsistently find deals that not only add value but alsoare large enough to be meaningful.
3 The other big issue facing the firm is the longevity ofchairman and CEO Warren Buffett (who is 83) andmanaging partner Charlie Munger (who is 90).
3 Berkshire's insurance operations face highlycompetitive and cyclical markets and occasionally willproduce large losses. It also has highly uncertainliabilities that could cost more than the firm has statedand/or reserved.
Page 9 of 33

Morningstar Equity Research
© Morningstar 2014. All Rights Reserved. Morningstar's Credit Ratings & Research is produced and offered by Morningstar, Inc., which is not registered with the U.S. Securities and Exchange Commission as a Nationally Recognized Statistical Rating Organization(“NRSRO”). Unless otherwise provided in a separate agreement, you may use this report only in the country in which its original distributor is based. The information, data, analyses and opinions presented herein do not constitute investment advice; are providedsolely for informational purposes and therefore are not an offer to buy or sell a security; and are not warranted to be correct, complete or accurate. The opinions expressed are as of the date written and are subject to change without notice. Except as otherwiserequired by law, Morningstar shall not be responsible for any trading decisions, damages or other losses resulting from, or related to, the information, data, analyses or opinions or their use. The information contained herein is the proprietary property ofMorningstar and may not be reproduced, in whole or in part, or used in any manner, without the prior written consent of Morningstar. To order reprints, call +1 312-696-6100. To license the research, call +1 312-696-6869. See last page for important disclosures.
Last Price Fair Value Consider Buy Consider Sell Uncertainty Economic Moat™ Moat Trend™ Stewardship Morningstar Credit Rating Industry Group
136.25 USD 150.00 USD 105.00 USD 202.50 USD Medium Wide Stable Exemplary — Insurance
Berkshire Hathaway Inc BRK.B (NYSE) | QQQ
Size (Assets in USD Mil) 240,154Economic Moat Rating WideEquity Uncertainty Rating (Uncertainty of Equity Residual) MediumManagement GradeUnderwriting Profitability % (7-Yr Average Modified Combined Ratio)Volatility of Underwriting Profitability % (7-Yr Range of Modified Combined Ratio)Overall Level of Underwriting RiskBusiness Risk Score
Reserves/Capital 0.7Earned Premium/Capital 0.3Debt/Capital 0.1Investment Portfolio Loss Rate % - Sensitivity Analysis —Capital Reduction % - Sensitivity Analysis —Financial Risk Score
Adjusted Balance Sheet Surplus 122,313Total Profitability Available for Debt Service 31,177Total Projected Surplus 153,490Debt Balance 8,730Total Debt Service 10,556Debt Cushion 14.5
Business Risk ScoreFinancial Risk Score Debt Cushion ScoreDistance to Default ScoreCredit Rating —
Business Risk Summary(USD Mil)
Credit Analysis
Financial Risk Summary
Debt Cushion Summary
Credit Rating Pillars
Financial Health & Capital Structure
Berkshire's strong balance sheet and liquidity are among itsmost enduring competitive advantages. The company'sinsurance operations are well capitalized and highly liquid,carrying greater levels of equity and cash relative to otherinsurers, which we believe should offset potential losses.Berkshire generates large amounts of free cash flow fromits operations and maintains significant levels of cash onits balance sheet, which amounted to $42.6 billion at theend of the fourth quarter of 2013. Buffett does, however,like to keep at least $20 billion in cash on hand as a backstopfor the firm's insurance business, with the remainderavailable for investment purposes and/or sharerepurchases.
Berkshire generally seeks to run its operating companiesand make ongoing investments without an overreliance ondebt. In instances when it is necessary to issue debt,Berkshire strives to do it on a long-term, fixed-rate basis.While consolidated debt levels have increased significantlyover the past five years, much of it is has been tied to twoof the firm's noninsurance subsidiaries--MEHC andBNSF--and is not explicitly guaranteed by Berkshire. Thatsaid, substantially all of these two subsidiaries' assets canbe pledged or encumbered to support or otherwise securethe debt.
Berkshire benefits from the float that is provided by itsinsurance operations. Collecting insurance premiums wellin advance of any potential future claims provides the firmwith plenty of low- to no-cost capital that can be used tofund its investment activities. While most property andcasualty insurers generate float, Berkshire tends to outstripits peers on an absolute basis, as well as in relation topremium volume. About three fourths of Berkshire's floattends to come from its reinsurance operations, which areable to underwrite policies that contain large tail risks thatfew companies (other than Berkshire, with its strong
Page 10 of 33
Morningstar Equity Research
© Morningstar 2014. All Rights Reserved. Morningstar's Credit Ratings & Research is produced and offered by Morningstar, Inc., which is not registered with the U.S. Securities and Exchange Commission as a Nationally Recognized Statistical Rating Organization(“NRSRO”). Unless otherwise provided in a separate agreement, you may use this report only in the country in which its original distributor is based. The information, data, analyses and opinions presented herein do not constitute investment advice; are providedsolely for informational purposes and therefore are not an offer to buy or sell a security; and are not warranted to be correct, complete or accurate. The opinions expressed are as of the date written and are subject to change without notice. Except as otherwiserequired by law, Morningstar shall not be responsible for any trading decisions, damages or other losses resulting from, or related to, the information, data, analyses or opinions or their use. The information contained herein is the proprietary property ofMorningstar and may not be reproduced, in whole or in part, or used in any manner, without the prior written consent of Morningstar. To order reprints, call +1 312-696-6100. To license the research, call +1 312-696-6869. See last page for important disclosures.
Last Price Fair Value Consider Buy Consider Sell Uncertainty Economic Moat™ Moat Trend™ Stewardship Morningstar Credit Rating Industry Group
136.25 USD 150.00 USD 105.00 USD 202.50 USD Medium Wide Stable Exemplary — Insurance
Berkshire Hathaway Inc BRK.B (NYSE) | QQQ
Credit Analysis
balance sheet) have the capacity to endure.
In most years, the firm's insurance operations generate anegative cost of float, which is a direct result of these sameoperations generating a net underwriting gain. In effect, thecompany is being paid to hold on to other people's moneyin those years when it generates negative cost of float. Itis also interesting to note that Berkshire has seen solidgrowth in its float, even as it sticks to a fairly rigorousunderwriting discipline. The firm's float, which stood at$77.2 billion at the end of 2013, has risen from $63.4 billionat the end of 2009 and $46.1 billion a decade ago.Berkshire's insurance float is unlikely to grow meaningfullyfrom here, though, as underwriting in its reinsurance armsis likely to be much less robust that it has been in past years(given the current pricing environment).
Berkshire does not pay a dividend on its shares. It did,however, authorize a share-repurchase program inSeptember 2011 aimed at buying back Class A and B sharesat prices no higher than a 10% premium to the firm's mostrecent book value per share. Berkshire altered the terms ofthe share-repurchase program in December 2012, allowingmanagement to repurchase Class A and Class B shares atprices no higher than a 20% premium to the firm's mostrecent book value per share (which stood at $134,973 perClass A share and $90 per Class B share at the end of thethird quarter of 2013). While Berkshire has been vague abouthow much it would spend on share repurchases, Buffett hasnoted that stock buybacks would not occur if they reducedthe firm's consolidated cash balance below $20 billion.
Berkshire spent $67 million on share repurchases during2011, purchasing 98 Class A shares (for about $10 million)and a little over 800,000 Class B Shares (for around $57million) during the last four months of that year. After making
no share repurchases during the first three quarters of 2012,the company bought back 9,200 of its Class A shares fromthe estate of a longtime shareholder (for a little more than$1 billion) after raising the price limit for share repurchasesto 120% of book value. No share repurchases were madeduring 2013. We continue to believe that Buffett hassuccessfully created a floor under Berkshire's stock price,as investors will now expect him to buy back shares at pricesbelow 120% of the firm's reported book value. Absent morelucrative investment opportunities, we believe sharerepurchases made in accordance with these guidelines area good use of shareholder capital.
Enterprise Risk
Berkshire is exposed to large potential losses through itsinsurance operations. While the company believes itssuper-catastrophe underwriting will generate solidlong-term results, the volatility of this particular line ofbusiness, which can subject the firm to especially largelosses, could be high. Berkshire maintains much highercapital levels than almost all other insurers, though, whichwe believe mitigates some of this risk.Several of the firm'skey businesses--insurance, energy generation anddistribution, and rail transport--operate in industries thatare subject to higher degrees of regulatory oversight, whichcould have an impact on future business combinations, aswell as the setting of rates charged to customers. Berkshireis also exposed to foreign currency, equity price, and creditdefault risk through its various investments and operatingcompanies. Its derivative contracts, in particular, can affectthe company's earnings and capital position, especiallyduring volatile markets, given that they are recorded at fairvalue (and are, therefore, updated periodically to reflectchanges in the value of these contracts). On top of that,many of the firm's noninsurance operations are exposed tothe cyclicality of the economy, with results typicallysuffering during economic slowdowns and recessions.Thecompany also depends heavily on two key employees,
Page 11 of 33

Morningstar Equity Research
© Morningstar 2014. All Rights Reserved. Morningstar's Credit Ratings & Research is produced and offered by Morningstar, Inc., which is not registered with the U.S. Securities and Exchange Commission as a Nationally Recognized Statistical Rating Organization(“NRSRO”). Unless otherwise provided in a separate agreement, you may use this report only in the country in which its original distributor is based. The information, data, analyses and opinions presented herein do not constitute investment advice; are providedsolely for informational purposes and therefore are not an offer to buy or sell a security; and are not warranted to be correct, complete or accurate. The opinions expressed are as of the date written and are subject to change without notice. Except as otherwiserequired by law, Morningstar shall not be responsible for any trading decisions, damages or other losses resulting from, or related to, the information, data, analyses or opinions or their use. The information contained herein is the proprietary property ofMorningstar and may not be reproduced, in whole or in part, or used in any manner, without the prior written consent of Morningstar. To order reprints, call +1 312-696-6100. To license the research, call +1 312-696-6869. See last page for important disclosures.
Last Price Fair Value Consider Buy Consider Sell Uncertainty Economic Moat™ Moat Trend™ Stewardship Morningstar Credit Rating Industry Group
136.25 USD 150.00 USD 105.00 USD 202.50 USD Medium Wide Stable Exemplary — Insurance
Berkshire Hathaway Inc BRK.B (NYSE) | QQQ
Credit Analysis
Warren Buffett and Charlie Munger, for almost all of itsinvestment and capital-allocation decisions. With Buffettturning 83 in August 2013 and Munger turning 90 at thebeginning of 2014, it has become increasingly likely that ourvaluation horizon will end up exceeding their expected lifespans, with the quality of investment returns and capitalallocation likely to deteriorate under new management.
Page 12 of 33

Morningstar Equity Research
© Morningstar 2014. All Rights Reserved. Morningstar's Credit Ratings & Research is produced and offered by Morningstar, Inc., which is not registered with the U.S. Securities and Exchange Commission as a Nationally Recognized Statistical Rating Organization(“NRSRO”). Unless otherwise provided in a separate agreement, you may use this report only in the country in which its original distributor is based. The information, data, analyses and opinions presented herein do not constitute investment advice; are providedsolely for informational purposes and therefore are not an offer to buy or sell a security; and are not warranted to be correct, complete or accurate. The opinions expressed are as of the date written and are subject to change without notice. Except as otherwiserequired by law, Morningstar shall not be responsible for any trading decisions, damages or other losses resulting from, or related to, the information, data, analyses or opinions or their use. The information contained herein is the proprietary property ofMorningstar and may not be reproduced, in whole or in part, or used in any manner, without the prior written consent of Morningstar. To order reprints, call +1 312-696-6100. To license the research, call +1 312-696-6869. See last page for important disclosures.
Last Price Fair Value Consider Buy Consider Sell Uncertainty Economic Moat™ Moat Trend™ Stewardship Morningstar Credit Rating Industry Group
136.25 USD 150.00 USD 105.00 USD 202.50 USD Medium Wide Stable Exemplary — Insurance
Berkshire Hathaway Inc BRK.B (NYSE) | QQQ
Name Position Shares Held Report Date* InsiderActivity
WARREN E. BUFFETT CEO/Chairman of the Board/Director,Director
2,105,640 02 Jul 2014 —
RONALD L. OLSON Director 2,500 31 Dec 2012 —THOMAS S. MURPHY Director 1,489 31 Dec 2013 —MR. CHARLES T. MUNGER Director 750 19 Feb 2014 —MS. SUSAN L. DECKER Director 125 05 May 2007 —DONALD R. KEOUGH Director 100 08 Aug 2011 —STEPHEN B BURKE Director 5 29 Dec 2009 —
Top Owners% of Shares
Held% of Fund
AssetsChange
(k) Portfolio Date
Vanguard Total Stock Mkt Idx 1.20 1.02 290 31 Jul 2014SPDR S&P 500 0.81 1.38 117 25 Aug 2014Vanguard Institutional Index Fund 0.74 1.23 241 31 Jul 2014Vanguard Five Hundred Index Fund 0.72 1.20 -44 31 Jul 2014Financial Select Sector SPDR® 0.53 8.54 17 25 Aug 2014
Concentrated Holders
Rx Premier Managers — 19.43 1 31 Jul 2014Midas Magic — 16.29 — 31 Jul 2014Boulder Total Return 0.02 15.35 — 31 Jul 2014RevenueShares Financials Sector Fund — 13.53 — 25 Aug 2014Integras Balance — 12.74 — 31 Jul 2014
Top 5 Buyers% of Shares
Held% of Fund
Assets
SharesBought/Sold (k) Portfolio Date
Cascade Investment Llc 3.55 — 83,057 11 Dec 2013Vanguard Group, Inc. 3.50 0.81 1,854 30 Jun 2014Fidelity Management and Research Company 0.62 0.26 1,512 30 Jun 2014GVO Asset Management Ltd 0.06 17.89 1,294 30 Jun 2014Government Pension Fund of Norway - Global 0.52 0.17 1,198 31 Dec 2011
Top 5 Sellers
Gates Bill & Melinda Foundation 3.09 45.66 -5,000 30 Jun 2014D. E. Shaw & Co LP 0.31 1.26 -1,429 30 Jun 2014American Century Inv Mgt, Inc. 0.04 0.12 -1,183 30 Jun 2014Scottish Widows PLC — 1.35 -888 30 Jun 2014BNY Mellon Asset Management Ltd. 0.27 0.98 -838 30 Jun 2014
Management 29 Apr 2014
Management & Ownership
Management Activity
Fund Ownership
Institutional Transactions
*Represents the date on which the owner’s name, position, and common shares held were reported by the holder or issuer.
Warren Buffett has been chairman and CEO of BerkshireHathaway since 1970. Charlie Munger has served as vicechairman since 1978. Berkshire has two classes of commonstock, with Class B shares holding 1/1,500th of the economicrights of Class A shares and only 1/10,000th of the votingrights. Buffett is Berkshire's largest shareholder, with a34.4% voting stake and 20.5% economic interest in the firm.He has been a strong steward of investor capital,consistently aligning his own interests with those ofshareholders, with Berkshire's wide economic moat derivedin part from the success that he has had in melding the firm'sfinancial strength and underwriting ability with his owninvestment acumen.
Buffett's stewardship has allowed Berkshire to increase itsbook value per share at a compound annual rate of 19.7%from 1965 to 2013, compared with a 9.8% total return forthe S&P 500 TR Index. While the 18.2% increase inBerkshire's book value per share during 2013 fell short ofthe 32.4% increase in the benchmark index (which includesdividends as well as price appreciation), it marked only the10th time in the past 49 years that this has happened. Itshould be noted, though, that in nine of those ten years theS&P 500 posted annual gains in excess of 15.0%. Before2013, the company had never had a five-year period ofunderperformance relative to the benchmark. That streakended last year, with book value per share growing at afive-year compound annual rate of 7.9% from the start of2009 to the end of 2013, compared with 13.9% for the S&P500 TR Index.
Given the impressive long-term record that Buffett has puttogether, it is even more important that his legacy remainsintact once he no longer runs the firm. Succession was notformally addressed by Berkshire until 2005, when the firmnoted that Buffett's three main jobs--chairman, chief
Page 13 of 33

Morningstar Equity Research
© Morningstar 2014. All Rights Reserved. Morningstar's Credit Ratings & Research is produced and offered by Morningstar, Inc., which is not registered with the U.S. Securities and Exchange Commission as a Nationally Recognized Statistical Rating Organization(“NRSRO”). Unless otherwise provided in a separate agreement, you may use this report only in the country in which its original distributor is based. The information, data, analyses and opinions presented herein do not constitute investment advice; are providedsolely for informational purposes and therefore are not an offer to buy or sell a security; and are not warranted to be correct, complete or accurate. The opinions expressed are as of the date written and are subject to change without notice. Except as otherwiserequired by law, Morningstar shall not be responsible for any trading decisions, damages or other losses resulting from, or related to, the information, data, analyses or opinions or their use. The information contained herein is the proprietary property ofMorningstar and may not be reproduced, in whole or in part, or used in any manner, without the prior written consent of Morningstar. To order reprints, call +1 312-696-6100. To license the research, call +1 312-696-6869. See last page for important disclosures.
Last Price Fair Value Consider Buy Consider Sell Uncertainty Economic Moat™ Moat Trend™ Stewardship Morningstar Credit Rating Industry Group
136.25 USD 150.00 USD 105.00 USD 202.50 USD Medium Wide Stable Exemplary — Insurance
Berkshire Hathaway Inc BRK.B (NYSE) | QQQ
executive, and chief investment officer--would be handledby one chairman (expected to be his son, Howard Buffett),one CEO (with one candidate already identified but notrevealed), and three or more external hires (reportingdirectly to the CEO) to manage the investment portfolio.While we have gained a little more clarity about the planfor the investment side of the business, with Todd Combsand Ted Weschler likely to be the only outside hires broughtin to take responsibility for the investment portfolio,questions linger over who will step into the CEO role.
At this point, our best guess is that Ajit Jain, who headsBerkshire Hathaway Reinsurance Group, will run thecompany once Buffett steps down. Not only does Jainunderstand risk better than just about anyone else atBerkshire, but Buffett has admitted on countless occasionsthat Jain has "probably made a lot more money" for the firmthan Buffett has over the period that Jain has been withBerkshire. While Jain's experience has primarily been onthe underwriting side of the business, his success there hasbeen built on his ability to avoid making "dumb decisions"rather than making "brilliant" ones--attributes that havekept him in good stead with Buffett over the years.
If the firm's next CEO is expected to do nothing more thanact as a caretaker for the business, tending to the needs ofthe managers that run the different subsidiaries, overseeingthe actions of the investment managers that handle thecompany's investment portfolio, and dealing with thecapital-allocation decisions and critical risk assessmentsthat need to be made in any given year, then we could notthink of a better candidate within Berkshire than Jain. Thatlast point is an important one, since Buffett has said on morethan a few occasions that it would be highly unlikely for thenext CEO at Berkshire to come from the outside. He has alsonoted that the board of directors would gladly support Jainas the company's next chief executive if he decided to seekthe post. The problem is that Jain has been on the record
several times saying that he does not want the job--whichis the main reason that speculation continues about whowill ultimately fill the CEO role.
Regardless of who takes the helm once Buffett has steppeddown, we think the next chief executive is going to feel farmore pressure from shareholders and analysts than Buffetthas ever been subjected to, especially with regards tocapital-allocation decisions and the firm's lack of a dividend.As such, the more important long-term question forinvestors is whether the individual who succeeds him canreplace the significant advantages that have come withhaving an investor of Buffett's caliber, with the knowledgeand connections he has acquired over the years, running theshow.
Page 14 of 33

Morningstar Equity Research
© Morningstar 2014. All Rights Reserved. Morningstar's Credit Ratings & Research is produced and offered by Morningstar, Inc., which is not registered with the U.S. Securities and Exchange Commission as a Nationally Recognized Statistical Rating Organization(“NRSRO”). Unless otherwise provided in a separate agreement, you may use this report only in the country in which its original distributor is based. The information, data, analyses and opinions presented herein do not constitute investment advice; are providedsolely for informational purposes and therefore are not an offer to buy or sell a security; and are not warranted to be correct, complete or accurate. The opinions expressed are as of the date written and are subject to change without notice. Except as otherwiserequired by law, Morningstar shall not be responsible for any trading decisions, damages or other losses resulting from, or related to, the information, data, analyses or opinions or their use. The information contained herein is the proprietary property ofMorningstar and may not be reproduced, in whole or in part, or used in any manner, without the prior written consent of Morningstar. To order reprints, call +1 312-696-6100. To license the research, call +1 312-696-6869. See last page for important disclosures.
Last Price Fair Value Consider Buy Consider Sell Uncertainty Economic Moat™ Moat Trend™ Stewardship Morningstar Credit Rating Industry Group
136.25 USD 150.00 USD 105.00 USD 202.50 USD Medium Wide Stable Exemplary — Insurance
Berkshire Hathaway Inc BRK.B (NYSE) | QQQ
Analyst Notes
Addition of Charter and Elimination of Starz the Most
Notable Changes in Berkshire's 2Q Portfolio 14 Aug 2014
While wide-moat Berkshire Hathaway's second-quarter 13-F filing reflected a bit more activity than we've seen in pastperiods, the overall impact on the portfolio was minimal.The company's 13-F equity holdings, which do not includeforeign investments held abroad like BYD and Tesco, werevalued at $107.6 billion at the end of the June quarter, withthe top five holdings--Wells Fargo (23%), Coke (16%),American Express (13%), IBM (12%), and Wal-Mart (4%)--accounting for more than two thirds of the portfolio.
The insurer's only new money purchase during the periodwas 2.3 million shares of Charter Communications for anestimated cost of $325 million. We believe this transactionwas initiated by Ted Weschler, the driving force behind themedia and communications names that have made theirway into the portfolio the past few years. Berkshire alsosunk another $340 million into IBM, $200 million intoVerizon, and anywhere between $100 million and $135million each into GM, Liberty Global, USG, and Suncor. Evensmaller amounts were added to holdings in Chicago Bridge& Iron, VeriSign, Wal-Mart, Visa, and US Bancorp. Thecompany also held 1.8 million shares of NOW, which wasspun off from National Oilwell Varco at the end of May.
As for the sales that took place during the period, the firmeliminated its stake in Starz (netting an estimated $60million), and unloaded 11.0 million shares of Directv ($900million), 9.7 million shares of ConocoPhillips ($750 million),3.2 million shares of Phillips 66 ($250 million), 1.3 millionshares of Liberty Media ($175 million), and 1.6 million sharesof National Oilwell Varco ($125 million), as well as smallamount of Precision Castparts. On top of that, Berkshireswapped out 1.6 million shares of Graham Holdings for fullcontrol of WPLG-TV, a Miami-based television station(worth an estimated $364 million), 2,107 Berkshire Class Ashares ($400 million), 1,278 Berkshire Class B shares
($162,500), and $328 million in cash.
Berkshire Posts Solid Second-Quarter Results; Book
Value per Class A Share Rises to $142,483 01 Aug 2014
Wide-moat-rated Berkshire Hathaway released results forthe second quarter of 2014 that were pretty much in linewith our expectations. Revenue increased 11% year overyear to $49.8 billion on improved operating results from eachof Berkshire's main segments. Excluding the impact ofinvestments and derivatives, revenue increased 8% yearover year. With expenses rising at a slower rate thanrevenue, and most of the gains from investments andderivatives falling straight to the bottom line, Berkshirereported a 29% increase in pretax earnings (to $8.9 billion)and a 41% increase in net earnings (to $6.4 billion). Strippingout the impact of investments and derivatives, operatingearnings increased 11% to $4.3 billion. Net earnings perClass A equivalent share were $3,889 (up from $2,763 duringthe second quarter of 2013). We do not expect to make anychanges to our $225,000 per Class A share ($150 per ClassB share) fair value estimate for the firm.
Book value per Class A equivalent share at the end of thesecond quarter was $142,483--up 16% year over year andless than 3% over the first quarter of 2014. This was in linewith our expectations, which had called for Berkshire's bookvalue per share to increase to $142,578 per Class A shareduring the period. The company closed out the secondquarter of 2014 with $55.5 billion in cash on its books, upfrom $48.9 billion at the end of March and $48.2 billion atthe beginning of the year. Berkshire did not buy back anyshares during the first six months of 2014, but did retire2,107 Class A shares and 1,278 Class B shares as part of itstransaction with Graham Holdings at the end of June. GivenBerkshire's current book value per share, the firm should bewilling to step in and buy back its common stock at pricesup to $170,980 per Class A share (or $114 per Class B share),
Page 15 of 33
Morningstar Equity Research
© Morningstar 2014. All Rights Reserved. Morningstar's Credit Ratings & Research is produced and offered by Morningstar, Inc., which is not registered with the U.S. Securities and Exchange Commission as a Nationally Recognized Statistical Rating Organization(“NRSRO”). Unless otherwise provided in a separate agreement, you may use this report only in the country in which its original distributor is based. The information, data, analyses and opinions presented herein do not constitute investment advice; are providedsolely for informational purposes and therefore are not an offer to buy or sell a security; and are not warranted to be correct, complete or accurate. The opinions expressed are as of the date written and are subject to change without notice. Except as otherwiserequired by law, Morningstar shall not be responsible for any trading decisions, damages or other losses resulting from, or related to, the information, data, analyses or opinions or their use. The information contained herein is the proprietary property ofMorningstar and may not be reproduced, in whole or in part, or used in any manner, without the prior written consent of Morningstar. To order reprints, call +1 312-696-6100. To license the research, call +1 312-696-6869. See last page for important disclosures.
Last Price Fair Value Consider Buy Consider Sell Uncertainty Economic Moat™ Moat Trend™ Stewardship Morningstar Credit Rating Industry Group
136.25 USD 150.00 USD 105.00 USD 202.50 USD Medium Wide Stable Exemplary — Insurance
Berkshire Hathaway Inc BRK.B (NYSE) | QQQ
Analyst Notes
implying a floor on the company's shares that is about 10%below where they are trading right now.
Looking more closely at Berkshire's insurance operations,three of the firm's four insurance lines--GEICO, General Re,and Berkshire Hathaway Primary Group--posted earnedpremium growth during the quarter (as well as on a year-to-date basis), with Berkshire Hathaway Reinsurance Groupseeing another decline in earned premiums as it continuesto be impacted by the runoff of its Swiss Re quota-sharecontract. While Berkshire remains committed to limiting thevolume of reinsurance that it is underwriting, given theexcess capacity that exists in the market and the fact thatpricing is not attractive enough to underwrite additionalbusiness, the firm did pick up $3 billion in additional floatlast month from Liberty Mutual Holding to backstop up to$6.5 billion of obligations tied to asbestos, environmental,and workers' compensation policies. The contract shouldhelp compensate for part of the lost premiums from theSwiss Re contract. This is similar to the deal that Berkshireminted with AIG and CNA back in 2011 and 2010,respectively, to assume the asbestos liabilities of those twofirms.
Operating trends at GEICO remain positive. Earnedpremiums for the low-cost auto insurer grew 11% to $5.1billion (and were up 11% to $10.0 billion on a year-to-datebasis), due to a 7% increase in policies-in-force and priceincreases. These results continued to reflect the company'sanalytic prowess and pricing discipline. Despite an uptickin claim frequencies for collision coverages and bodilyinjuries, as a result of a harsher than normal winter thisyear, GEICO produced a combined ratio of 97.2%. This was40 basis points better than the prior-year period's combinedratio of 97.6%. While we are impressed with these results,we think that further margin expansion will be harder tocome by, especially as competitors have stepped up theirefforts to become more price competitive with the low-cost
auto insurers. As a result, we would not be surprised to seeGEICO's margins remain flat, or even start to deteriorate,over the next several quarters.
From a profitability perspective, underwriting income wasdown 22% during the second quarter when compared withthe prior year's period (and was down 39% on a year-to-date basis), with underwriting profit declines at BHRG morethan offsetting positive results from GEICO and General Re.Pretax earnings for the insurance business overall weredown just 10% during the second quarter (and declined 20%on a year-to-date basis), as net investment income wasdown at a low-single-digit rate year over year in the secondquarter (and for the first half) of 2014. General Re benefitedfrom a fairly quiet quarter, with no significant catastropheevents. The division earned $61 million of pretaxunderwriting profits, compared with a loss of $34 million inthe year-ago period. As for GEICO, the auto insurer posteda 17% increase in underwriting profit, primarily due tosteady growth in policies-in-force.
Berkshire's insurance float increased to $79 billion from $77billion at the start of the year, reflective of a 2% increaseyear to date. Further gains in float are likely to be muchharder to come by, though, especially with Berkshire limitingthe amount of reinsurance business it underwrites (withmuch of the growth in the firm's float over the past decadecoming from its reinsurance operations). Going forward, wecontinue to expect GEICO and BHPG to be importantcontributors to earned premium growth, as well as thegrowth of float, with underwriting profitability in these twoarms likely to be among the most stable within Berkshire'sinsurance operations. That said, we continue to project moremeager results from the insurance operations overall duringthe next couple of years, as we expect results to be lessrobust in Berkshire's reinsurance arms.
Much as they have the past several years, Berkshire's
Page 16 of 33

Morningstar Equity Research
© Morningstar 2014. All Rights Reserved. Morningstar's Credit Ratings & Research is produced and offered by Morningstar, Inc., which is not registered with the U.S. Securities and Exchange Commission as a Nationally Recognized Statistical Rating Organization(“NRSRO”). Unless otherwise provided in a separate agreement, you may use this report only in the country in which its original distributor is based. The information, data, analyses and opinions presented herein do not constitute investment advice; are providedsolely for informational purposes and therefore are not an offer to buy or sell a security; and are not warranted to be correct, complete or accurate. The opinions expressed are as of the date written and are subject to change without notice. Except as otherwiserequired by law, Morningstar shall not be responsible for any trading decisions, damages or other losses resulting from, or related to, the information, data, analyses or opinions or their use. The information contained herein is the proprietary property ofMorningstar and may not be reproduced, in whole or in part, or used in any manner, without the prior written consent of Morningstar. To order reprints, call +1 312-696-6100. To license the research, call +1 312-696-6869. See last page for important disclosures.
Last Price Fair Value Consider Buy Consider Sell Uncertainty Economic Moat™ Moat Trend™ Stewardship Morningstar Credit Rating Industry Group
136.25 USD 150.00 USD 105.00 USD 202.50 USD Medium Wide Stable Exemplary — Insurance
Berkshire Hathaway Inc BRK.B (NYSE) | QQQ
Analyst Notes
noninsurance operations continue to be a source of stabilityfor the firm. BNSF, which contributes about half of the pretaxearnings of the company's so-called "Powerhouse Five"--Burlington Northern Santa Fe, Berkshire Hathaway Energy,Iscar, Lubrizol, and Marmon--reported an 8% increase insecond-quarter revenue and a 5% increase in pretax profits.For the first half of 2014, revenue increased 5%, but pretaxprofits declined 2%. The overall increase in year-to-daterevenue reflected a 3% increase in cars/units handled anda 2% increase in average revenue per car/unit.
Both figures remain somewhat lower than what we've seenfrom BNSF in past periods, but were to be expected giventhe above-average results that the railroad reported in thefirst half of 2013, and the impact that poor weatherconditions in much of the firm's territory had on itsoperations during the first quarter of 2014. The latter issuehad a negative impact on operating income as well, as costsfor equipment, materials, and other expenses increasedsubstantially during the first quarter. Compensation wasalso up over year-ago levels on increased employmentlevels, and to a lesser extent, wage inflation and higherovertime. We expect BNSF to continue to get past thenegative impact of the first quarter of 2014 as the yearprogresses.
Berkshire more than made up for the weakness at BNSF,with stronger results from Berkshire Hathaway Energy,which not only benefited from the NV Energy acquisition,but also saw stronger results from MidAmerican EnergyPipeline Group (due to system rebalancing activities andincreased natural gas rates and volumes), NorthernPowergrid (driven primarily by foreign currency gains,increased rates and favorable regulatory provisions), andthe firm's real estate brokerage unit (which has beenrebranded as Berkshire Hathaway HomeServices followinga bevy of acquisitions over the past two years). Second-quarter revenue increased 37% (and was up 38% year to
date) when including the NV Energy deal, and was up 11%(and 14%) when looking at results on a comparable basis.Pretax earnings were up 36% on a reported basis during thesecond quarter (and 25% on a year-to-date basis), but whenexcluding the NV Energy deal were up just 12% whencompared with the second quarter of 2013 (and 10% whencompared with the first half of last year).
With regards to Berkshire's manufacturing, service andretail operations, which include McLane, Iscar, and Lubrizol,the group overall recorded a 6% increase in second-quarterrevenue (and 4% gain in the top-line on a year-to-date basis),as stronger performance from the segment's manufacturing,service and retailing divisions were offset by weaker top-line growth at McLane. Pretax earnings increased 17%overall, though, when compared with the second quarter of2013, and were up 13% on a year-to-date basis, asBerkshire's higher-margin businesses more than compensatedfor the drag that the lower-margin businesses at McLanecaused.
Results for the firm's finance and financial products division,which includes Clayton Homes (manufactured housing andfinance), CORT Business Services (furniture rental), Marmon(rail car and other transportation equipment manufacturing,repair, and leasing) and XTRA (over-the-road trailer leasing),were also up year over year, but much of this was becauseof the reclassification of Marmon's businesses from themanufacturing, service, and retail operations. Pretaxearnings increased 19% during the second quarter whencompared with the prior year's period (and were up 22% ona year-to-date basis), with Clayton Homes seeing thebiggest improvement in overall earnings due to lower loanloss provisions on installment loan portfolios, lower interestexpense on borrowings, and improved manufacturingresults.Berkshire Hathaway Finalizes Its Asset Swap With
Graham Holdings; No Change to FVE 01 Jul 2014
Page 17 of 33

Morningstar Equity Research
© Morningstar 2014. All Rights Reserved. Morningstar's Credit Ratings & Research is produced and offered by Morningstar, Inc., which is not registered with the U.S. Securities and Exchange Commission as a Nationally Recognized Statistical Rating Organization(“NRSRO”). Unless otherwise provided in a separate agreement, you may use this report only in the country in which its original distributor is based. The information, data, analyses and opinions presented herein do not constitute investment advice; are providedsolely for informational purposes and therefore are not an offer to buy or sell a security; and are not warranted to be correct, complete or accurate. The opinions expressed are as of the date written and are subject to change without notice. Except as otherwiserequired by law, Morningstar shall not be responsible for any trading decisions, damages or other losses resulting from, or related to, the information, data, analyses or opinions or their use. The information contained herein is the proprietary property ofMorningstar and may not be reproduced, in whole or in part, or used in any manner, without the prior written consent of Morningstar. To order reprints, call +1 312-696-6100. To license the research, call +1 312-696-6869. See last page for important disclosures.
Last Price Fair Value Consider Buy Consider Sell Uncertainty Economic Moat™ Moat Trend™ Stewardship Morningstar Credit Rating Industry Group
136.25 USD 150.00 USD 105.00 USD 202.50 USD Medium Wide Stable Exemplary — Insurance
Berkshire Hathaway Inc BRK.B (NYSE) | QQQ
Analyst Notes
Wide-moat Berkshire Hathaway announced after the closeof trading on July 1 that it had completed its tax-efficient$1.1 billion share-swap deal with narrow-moat GrahamHoldings (formerly Washington Post). The final terms of thedeal, which was approved by the Federal CommunicationsCommission, have the insurer exchanging 1.62 million (ofthe 1.73 million) shares of Graham Holdings held in itsinvestment portfolio for full control of WPLG-TV, a Miami-based television station (estimated to be worth $364million), 2,107 Berkshire Class A shares (worth more than$400 million), 1,278 Berkshire Class B shares (worth$162,500), and $328 million worth of cash. With Berkshireeffectively swapping equity that it already owns in GrahamHoldings for these different assets, with a relatively smallnumber of its own shares coming back to it as part of thedeal, the transaction is unlikely to have a material impacton our fair value estimate for the firm.
Addition of Verizon and Trimming of GM Most Notable
Changes in Berkshire's 1Q Portfolio 15 May 2014
Wide-moat Berkshire Hathaway's first-quarter 13-F filing,which details the firm's equity holdings at the end of theMarch quarter, held relatively few surprises, with thebiggest change in the period being the addition of 11 millionshares of Verizon Holdings (for a cost of about $530 million).We believe that this transaction was most likely initiatedby Ted Weschler, who was far more active with investmentsin media and communications firms before joining Berkshireand has been the driving force behind names like DirecTV,Dish Network, Liberty Media, and Starz, which have madetheir way into the portfolio at one time or another over thepast few years. Berkshire also sank an additional $665million into Wal-Mart, increasing its stake in the retail giantby 17% and making it a top 5 holding for the firm. Much likewe saw during the fourth quarter, there was no change toBerkshire's stake in Wells Fargo, which Warren Buffett has
been buying with some regularity since the U.S. equitymarkets bottomed in March 2009.
The only other notable additions during the period was thepurchase of an additional 1.2 million shares of DaVita (for$75 million), 233,000 shares of IBM (for $45 million), 724,000shares of VeriSign (for $40 million), and 706,000 shares ofUS Bancorp (for $29 million). Berkshire also increased itsallocation in Liberty Global PLC Class A, which paid out aone-for-one stock dividend of Liberty Global PLC Class Cshares during the first quarter. As for sales during the period,the firm unloaded 2.6 million shares of Starz (netting $80million), 2.0 million shares of DirecTV (netting $145 million),and 10.0 million shares of General Motors (for what shouldhave been about $375 million). Berkshire also swapped out17.4 million shares of Phillips 66 during the period as partof its deal to acquire Phillips Specialty Products from the oiland gas firm.
Berkshire Starts out 2014 on Weaker Note; Book Value
per Class A Share Rises to $138,426 02 May 2014
Ahead of its annual meeting this weekend, wide-moat-ratedBerkshire Hathaway released results for the first quarter of2014 that were slightly disappointing when compared withthe prior-year period, but basically in line with our ownprojections. First-quarter revenue increased 4% year overyear to $45.5 billion, with the biggest contribution comingfrom Berkshire's railroad, utilities, and energy segment.Stripping out the impact of investments and derivatives,first-quarter revenue actually rose closer to 5% year overyear.
Just about every segment at Berkshire was dealing withelevated costs during the first quarter. As a result, pretaxearnings declined 10% year over year and after-taxoperating earnings were down 7% when compared with theprior-year period. Accounting for the impact of investments
Page 18 of 33

Morningstar Equity Research
© Morningstar 2014. All Rights Reserved. Morningstar's Credit Ratings & Research is produced and offered by Morningstar, Inc., which is not registered with the U.S. Securities and Exchange Commission as a Nationally Recognized Statistical Rating Organization(“NRSRO”). Unless otherwise provided in a separate agreement, you may use this report only in the country in which its original distributor is based. The information, data, analyses and opinions presented herein do not constitute investment advice; are providedsolely for informational purposes and therefore are not an offer to buy or sell a security; and are not warranted to be correct, complete or accurate. The opinions expressed are as of the date written and are subject to change without notice. Except as otherwiserequired by law, Morningstar shall not be responsible for any trading decisions, damages or other losses resulting from, or related to, the information, data, analyses or opinions or their use. The information contained herein is the proprietary property ofMorningstar and may not be reproduced, in whole or in part, or used in any manner, without the prior written consent of Morningstar. To order reprints, call +1 312-696-6100. To license the research, call +1 312-696-6869. See last page for important disclosures.
Last Price Fair Value Consider Buy Consider Sell Uncertainty Economic Moat™ Moat Trend™ Stewardship Morningstar Credit Rating Industry Group
136.25 USD 150.00 USD 105.00 USD 202.50 USD Medium Wide Stable Exemplary — Insurance
Berkshire Hathaway Inc BRK.B (NYSE) | QQQ
Analyst Notes
and derivatives, which tend to fall straight down to thebottom line, Berkshire reported only a 4% decline inoperating earnings. Net earnings per Class A equivalentshare were $2,862 for the quarter (down from $2,977 duringthe first quarter of 2013).
Book value per Class A equivalent share at the end of thefirst quarter was $138,426--up 15% year over year and lessthan 3% over the fourth quarter of 2013. This was in linewith our expectations, which had called for Berkshire's bookvalue per share to increase to $138,347 per Class A shareduring the period. The company closed out the first quarterof 2014 with $48.9 billion in cash on its books, up slightlyfrom $48.2 billion at the end of last year.
Berkshire did not buy back any shares during the first quarterof 2014. With the company's book value per Class A shareat $138,426 per Class A share (or $92 per Class B share),Buffett should now be willing to step in and buy back stockat prices up to $166,111 per Class A share (or $111 per ClassB share), implying a floor on the company's shares that isabout 15% below current prices.
Looking more closely at Berkshire's insurance operations,three of the firm's four insurance lines--Geico, General Re,and Berkshire Hathaway Primary Group--posted earnedpremium growth during the quarter, with BerkshireHathaway Reinsurance Group seeing another decline inearned premiums as the runoff of its Swiss Re quota-sharecontract continues to have an impact on it. The firm alsocontinues to constrain the volume of reinsurance that it isunderwriting, given the excess capacity that exists in themarket and the fact that pricing is not attractive enough tounderwrite additional business. From a profitabilityperspective, pretax earnings for the insurance businessdeclined 30% overall, as underwriting profit declines at bothGen Re and BHRG offset positive results from Geico andBHPG.
Berkshire’s insurance float increased to $78 billion from $73billion last year, reflective of a 7% increase year over year.Further gains in float are likely to be much harder to comeby, though, especially with Berkshire limiting the amount ofreinsurance business it underwrites (with much of thegrowth in the firm's float over the past decade coming fromits reinsurance operations). Going forward, we continue toexpect Geico to be an important contributor to earnedpremium growth, as well as to the growth of float, withunderwriting profitability likely to be among the most stableof Berkshire's insurance operations. BHPG should alsocontinue to be an important contributor, especiallyconsidering the growth potential that exists for the newlyformed Berkshire Hathaway Specialty Insurance unit. Wedo, however, continue to project more meager results fromthe company's insurance operations overall during the nextcouple of years, as we expect results to be far less robustin its reinsurance arms. Much as they have the past several years, Berkshire'snoninsurance operations continue to be a source of stabilityfor the firm. BNSF, which contributes about half of the pretaxearnings of the company's so-called "Powerhouse Five"--Burlington Northern Santa Fe, MidAmerican, Iscar, Lubrizol,and Marmon--reported a 3% increase in first-quarterrevenue and a 9% decline in pretax profits. The overallincrease in revenue reflected a 1% increase in cars/unitshandled and a 2% increase in average revenue per car/unit.Both figures were lower than what we've seen from BNSFin past periods, but were to be expected given the above-average results that the railroad reported in the first quarterof 2013, and the impact that poor weather conditions inmuch of the firm's territory had on its operations during themost recent period. The latter issue had a negative impacton operating income as well, as costs for equipment,materials, and other expenses increased 18% year over yearon higher crew transportation and travel expenses, and
Page 19 of 33

Morningstar Equity Research
© Morningstar 2014. All Rights Reserved. Morningstar's Credit Ratings & Research is produced and offered by Morningstar, Inc., which is not registered with the U.S. Securities and Exchange Commission as a Nationally Recognized Statistical Rating Organization(“NRSRO”). Unless otherwise provided in a separate agreement, you may use this report only in the country in which its original distributor is based. The information, data, analyses and opinions presented herein do not constitute investment advice; are providedsolely for informational purposes and therefore are not an offer to buy or sell a security; and are not warranted to be correct, complete or accurate. The opinions expressed are as of the date written and are subject to change without notice. Except as otherwiserequired by law, Morningstar shall not be responsible for any trading decisions, damages or other losses resulting from, or related to, the information, data, analyses or opinions or their use. The information contained herein is the proprietary property ofMorningstar and may not be reproduced, in whole or in part, or used in any manner, without the prior written consent of Morningstar. To order reprints, call +1 312-696-6100. To license the research, call +1 312-696-6869. See last page for important disclosures.
Last Price Fair Value Consider Buy Consider Sell Uncertainty Economic Moat™ Moat Trend™ Stewardship Morningstar Credit Rating Industry Group
136.25 USD 150.00 USD 105.00 USD 202.50 USD Medium Wide Stable Exemplary — Insurance
Berkshire Hathaway Inc BRK.B (NYSE) | QQQ
Analyst Notes
increased utilities and locomotive materials costs.Compensation also increased 7% year over year, becauseof increased employment levels, and to a lesser extent,wage inflation and higher overtime. We view much of thenegative revenue and profitability impact during the firstquarter to be one-time in nature, and expect BNSF to getback on track in the remaining three quarters of the year. Berkshire more than made up for the weakness at BNSF,with stronger results from MidAmerican, which not onlybenefited from the NV Energy acquisition, but also sawstronger results from MEC, MidAmerican Energy PipelineGroup, and the firm's real estate brokerage unit. First-quarter revenue increased 38% when including the NVEnergy deal, and was up 18% when looking at results on acomparable basis. Pretax earnings were up 16% on areported basis, but when excluding the NV Energy deal wereactually up 9% year over year, as increased energy costsand higher renewable energy generation expenses morethan offset the increase in first-quarter revenue. The otherbig news out of MidAmerican this week was theannouncement that the firm has made a $2.9 billion bid forAltaLink, a regulated transmission-only business in westernCanada. With Berkshire likely to make some cashcontribution to the bid, it is unlikely to make too big of adent in the insurer's large cash balances, as MidAmericanhas announced it will fund some of the purchase price withdebt. On a separate note, MidAmerican also announced thatits name has been changed to Berkshire Hathaway EnergyCompany. With regards to Berkshire's manufacturing, service andretail operations, which include McLane, Iscar and Lubrizol,the group overall recorded only a 2% increase in revenue,as better performance from the segments' manufacturingand service divisions were more than offset by weak top-line growth at McLane and the company's retail division.Pretax earnings increased 8% overall, though, when
compared with the first quarter of 2013, as the higher-margin manufacturing and service divisions more thancompensated for the drag caused by the lower-marginbusinesses at McLane and within Berkshire's retail division.That said, much of the poorer results from McLane andBerkshire's retail division were due to the timing of holidays,as well as the number of days during the period, some ofwhich should work its way out as we move through thesecond quarter. Meanwhile, the company's finance andfinancial products division expanded during the first quarterwith the inclusion of Marmon in the segment, which hastraditionally been centered on Clayton Homes (manufacturedhousing and finance) and Cort Business Services (furniturerental). Pretax earnings for the segment increased 26% yearover year, with Clayton Homes making the biggestcontribution to overall earnings. Improved Forecast for BNSF Lifts Our Berkshire
Hathaway Fair Value; Moat Trend Changes to Stable 29
Apr 2014
We've increased our fair value estimate for wide-moatBerkshire Hathaway to $225,000 per Class A share (or $150per Class B share) from $215,000 ($143) after updating ourvaluation model to reflect changes in our assumptions aboutgrowth and profitability for the firm's operating segments.In particular, we've reassessed our assumptions forBurlington Northern Santa Fe and MidAmerican, with thetotal value ascribed to these two subsidiaries increasingmore than 20% as a result (and changes in the assumptionsabout longer-term profitability and capital expenditures forBNSF having the biggest impact). The improved valuationfor Berkshire's railroad, utilities, and energy segment morethan offset our reduced valuation for Berkshire's insuranceoperations, which we expect to be less robust over thecourse of our five-year forecast as the firm's reinsurancearms stay disciplined and underwrite less business in amarket that is flush with capital and where regulatory
Page 20 of 33

Morningstar Equity Research
© Morningstar 2014. All Rights Reserved. Morningstar's Credit Ratings & Research is produced and offered by Morningstar, Inc., which is not registered with the U.S. Securities and Exchange Commission as a Nationally Recognized Statistical Rating Organization(“NRSRO”). Unless otherwise provided in a separate agreement, you may use this report only in the country in which its original distributor is based. The information, data, analyses and opinions presented herein do not constitute investment advice; are providedsolely for informational purposes and therefore are not an offer to buy or sell a security; and are not warranted to be correct, complete or accurate. The opinions expressed are as of the date written and are subject to change without notice. Except as otherwiserequired by law, Morningstar shall not be responsible for any trading decisions, damages or other losses resulting from, or related to, the information, data, analyses or opinions or their use. The information contained herein is the proprietary property ofMorningstar and may not be reproduced, in whole or in part, or used in any manner, without the prior written consent of Morningstar. To order reprints, call +1 312-696-6100. To license the research, call +1 312-696-6869. See last page for important disclosures.
Last Price Fair Value Consider Buy Consider Sell Uncertainty Economic Moat™ Moat Trend™ Stewardship Morningstar Credit Rating Industry Group
136.25 USD 150.00 USD 105.00 USD 202.50 USD Medium Wide Stable Exemplary — Insurance
Berkshire Hathaway Inc BRK.B (NYSE) | QQQ
Analyst Notes
oversight is increasing.
We've also changed our moat trend rating for Berkshire tostable from negative, bringing our assessment of the firm'seconomic moat and moat trend in line with our improvedmethodology for conglomerates. Our previous moat trendrating was based almost entirely on our two biggest long-term concerns about Berkshire: the firm's ability to expandthe business and its planning for the day when WarrenBuffett no longer runs the show. While we still considerthese negatives in our overall assessment, they are offsetby the stable nature of the competitive positions ofBerkshire's different operating segments. The rating alsoincorporates our improved outlook for the transition that willtake place once Buffett retires, as we believe that thecontribution we've seen so far from his two lieutenants--Ted Weschler and Todd Combs--is likely to make the shiftmore seamless than we were willing to project just a fewyears ago.
Berkshire Exchanges Legacy Washington Post Holdings
for Assets and Cash; No Change to FVE 12 Mar 2014
We were not too surprised to see wide-moat rated BerkshireHathaway announce this morning that it would beexchanging nearly all of the firm's remaining shares ofGraham Holdings (formerly Washington Post) for a Miami-based television station, a number of Class A and Class BBerkshire shares (that were held by Graham Holdings), andcash in what is expected to be a tax-free transfer for bothfirms. With Berkshire effectively swapping equity that italready owns in Graham Holdings for these different assets,with a relatively small number of its own shares comingback to it as part of the deal, we do not expect the transactionto have a material impact on our fair value estimate for thefirm.
News that a deal of this nature might be brokered between
the two companies emerged early last month, signaling tous that CEO Warren Buffett continues to think outside ofthe box when it came to dealing with some of the taximplications inherent in Berkshire's legacy holdings. Whilethe firm's holdings in Phillips 66 were relatively new to theequity portfolio (compared with Washington Post sharesthat were purchased by Berkshire four decades ago for lessthan $11 million), Buffett arranged for the swap of around19 million shares of the energy firm's common stock forPhillips Specialty Products, a business that makes chemicalsto improve the flow potential of pipelines, back at the endof 2013.
In this case, we see Berkshire exchanging what is expectedto be 1.6 million shares of Graham Holdings (worth around$1.1 billion) for the television station, Berkshire shares(worth more than $400 million) and cash (currentlyestimated to be around $327 million); although the exactnumber of shares transferred and cash paid to Berkshire willbe based on prevailing market prices when the deal iscompleted. Given Ted Weschler's affinity for media firms,we would expect him to be more intimately involved in theoperations of the Miami television station.
Berkshire Closes out 2013 on a Solid Note; Book Value
per Class A Share Hits $134,973 01 Mar 2014
There was little in wide-moat Berkshire Hathaway's fourth-quarter and full-year results that would alter our long-termview of the firm. We are leaving our fair value estimate inplace. Fourth-quarter aftertax operating earnings increased34.2% year over year, contributing to a 20.2% increase for2013. Including the impact of investment and derivativegains, Berkshire reported a 9.6% increase in fourth-quarternet earnings, with full-year earnings rising 31.4%. Resultsfor 2013 once again demonstrated the value of Berkshire'sdiversified portfolio, as solid and consistent results from thefirm's noninsurance operations helped smooth out some of
Page 21 of 33

Morningstar Equity Research
© Morningstar 2014. All Rights Reserved. Morningstar's Credit Ratings & Research is produced and offered by Morningstar, Inc., which is not registered with the U.S. Securities and Exchange Commission as a Nationally Recognized Statistical Rating Organization(“NRSRO”). Unless otherwise provided in a separate agreement, you may use this report only in the country in which its original distributor is based. The information, data, analyses and opinions presented herein do not constitute investment advice; are providedsolely for informational purposes and therefore are not an offer to buy or sell a security; and are not warranted to be correct, complete or accurate. The opinions expressed are as of the date written and are subject to change without notice. Except as otherwiserequired by law, Morningstar shall not be responsible for any trading decisions, damages or other losses resulting from, or related to, the information, data, analyses or opinions or their use. The information contained herein is the proprietary property ofMorningstar and may not be reproduced, in whole or in part, or used in any manner, without the prior written consent of Morningstar. To order reprints, call +1 312-696-6100. To license the research, call +1 312-696-6869. See last page for important disclosures.
Last Price Fair Value Consider Buy Consider Sell Uncertainty Economic Moat™ Moat Trend™ Stewardship Morningstar Credit Rating Industry Group
136.25 USD 150.00 USD 105.00 USD 202.50 USD Medium Wide Stable Exemplary — Insurance
Berkshire Hathaway Inc BRK.B (NYSE) | QQQ
Analyst Notes
the volatility seen in its insurance operations during the year.
Berkshire's book value per Class A equivalent share was$134,973 at the end of 2013--up 6.5% sequentially andreflective of an 18.2% increase year over year (higher thanour full-year forecast of a 15.0% gain). With the S&P 500TR Index up 32.4% during 2013, this marked just the 10thtime in the past 49 years that Berkshire has trailed thebenchmark. It also broke the company's long-standingstreak of never having a five-year period ofunderperformance relative to the benchmark. All told,though, Berkshire has increased its book value per share ata compound annual rate of 19.7% from 1965 to 2013,compared with a 9.8% annualized total return for the S&P500.
With Berkshire's common stock trading at prices above the1.2 times book value threshold required for stock buybacks,the company did not repurchase any shares during 2013.Berkshire closed out the year with a consolidated cashbalance of $42.6 billion, relatively unchanged from the thirdquarter of 2013 and from the end of 2012. Major acquisitionsduring the last year included Heinz (into which Berkshireinvested $8.0 billion for Heinz preferred stock and another$4.3 billion for a 50% equity stake in Heinz), and NV Energy(which closed in December 2013 at a cost of $5.6 billion).
Looking more closely at Berkshire's insurance operations,three of the firm's four insurance lines--GEICO, BerkshireHathaway Reinsurance, and Berkshire Hathaway PrimaryGroup--posted underwriting profits during 2013, despitesome of these operations posting higher claims experience(especially in the reinsurance side of the business) atdifferent times during the year. General Re was the onlyunderperformer, impacted by significantly lower underwritingprofits on the property/casualty side of the business as thereinsurer was negatively affected by catastrophe lossesattributable to a hailstorm and floods in Europe.
Berkshire's insurance float also increased to $77.2 billionfrom $73.1 billion last year, reflective of a 5.6% increaseyear over year. Further gains in float are likely to be muchharder to come by, though, especially with Berkshire likelyto limit the amount of reinsurance business it underwrites(given the poor pricing environment for the reinsurers rightnow). At the end of 2013, Berkshire Hathaway Reinsuranceaccounted for 48% of the company's total float, withGeneral Re at 26%, GEICO at 16%, and the remainingprimary insurance operations at 10%. Much of the growthin Berkshire's float over the past decade has come from itsreinsurance operations.
Geico is now the second-largest auto insurer in the UnitedStates, relying primarily on direct selling to consumers, amodel that has traditionally provided it with cost advantagesover some of its competitors. Premium growth was relativelystrong for the auto insurer during 2013, with premiumswritten increasing 11.4% year over year, and earnedpremiums rising 10.9% during the year. This growth wasdriven by a 7.8% increase in voluntary auto policies-in-forceand, to a lesser degree, higher average premiums perpolicy--trends that have been relatively healthy and in linewith our expectations. Although GEICO continues to postconsistently solid top-line growth, claims expenses haveticked up over the past year, with the firm's loss ratioincreasing to 76.7% in 2013 (compared with 75.9% in 2012).Even after this slight uptick in the loss ratio, GEICO continuedto maintain one of the best combined ratios in the industry,with pretax underwriting profit increasing 65.7% year overyear.
Looking more closely at Berkshire's reinsurance operations,underwriting profits at Berkshire Hathaway Reinsurancemore than tripled during 2013, despite that the firmcontinued to post losses in its retroactive insuranceoperations. The company also had a 20% quota-share
Page 22 of 33
Morningstar Equity Research
© Morningstar 2014. All Rights Reserved. Morningstar's Credit Ratings & Research is produced and offered by Morningstar, Inc., which is not registered with the U.S. Securities and Exchange Commission as a Nationally Recognized Statistical Rating Organization(“NRSRO”). Unless otherwise provided in a separate agreement, you may use this report only in the country in which its original distributor is based. The information, data, analyses and opinions presented herein do not constitute investment advice; are providedsolely for informational purposes and therefore are not an offer to buy or sell a security; and are not warranted to be correct, complete or accurate. The opinions expressed are as of the date written and are subject to change without notice. Except as otherwiserequired by law, Morningstar shall not be responsible for any trading decisions, damages or other losses resulting from, or related to, the information, data, analyses or opinions or their use. The information contained herein is the proprietary property ofMorningstar and may not be reproduced, in whole or in part, or used in any manner, without the prior written consent of Morningstar. To order reprints, call +1 312-696-6100. To license the research, call +1 312-696-6869. See last page for important disclosures.
Last Price Fair Value Consider Buy Consider Sell Uncertainty Economic Moat™ Moat Trend™ Stewardship Morningstar Credit Rating Industry Group
136.25 USD 150.00 USD 105.00 USD 202.50 USD Medium Wide Stable Exemplary — Insurance
Berkshire Hathaway Inc BRK.B (NYSE) | QQQ
Analyst Notes
contract with Swiss Re (covering substantially all of thatfirm's property/casualty risks) wind down during the year.That said, soft reinsurance pricing has dampened thedemand for new businesses, something that we expect tohave an impact on General Re as well in the year ahead.Berkshire Hathaway Primary Group, which is composed ofa wide collection of independently managed insurancebusinesses, had a good year as well, with pretaxunderwriting profits increasing 34.6% year over year.
Also of note was Warren Buffett's comments on Ajit Jain'slatest venture into commercial insurance, BerkshireHathaway Specialty Insurance, which is being run by PeterEastwood (formerly of AIG) and has been instantly acceptedby both major insurance brokers and corporate riskmanagers. The expectation is that this business will startbeing a major contributor to Berkshire's insuranceoperations in the next several years, generating volume inthe billions.
Much as they have the during past several years, Berkshire'snoninsurance operations continue to be a source of stabilityfor the firm, reporting a 10.4% increase year over year inpretax earnings during 2013. The company's so-called"Powerhouse Five"--Burlington Northern Santa Fe,MidAmerican, Iscar, Lubrizol, and Marmon--generated arecord $10.8 billion of pretax earnings last year, up 8.0%over 2012 levels. BNSF, which (at $5.9 billion) continues tobe one of the largest contributors to Berkshire's overallprofitability (outside of its insurance operations), reporteda 10.2% increase in pretax earnings during 2013. BNSFbenefited from increased rail volumes (especially inindustrial products, which include petroleum shipments,and consumer products) and slightly higher average revenueper car/unit, both of which are likely to continue in the nearterm. The company spent around $4 billion on capitalexpenditures during 2013, double its depreciation chargeand a single-year record for any railroad, with management
expecting to spend considerably more on capitalimprovements in 2014.
Berkshire also reported solid results for MidAmerican,which posted a 9.9% increase in pretax earnings for the fullyear. Weaker relative results from MidAmerican EnergyCompany (which handles MEHC's Midwestern operations),MidAmerican Pipeline Group, and Northern Powergrid weremore than offset by stronger performance from PacifiCorpand HomeServices of America (Berkshire's real estatebrokerage operations). PacifiCorp, which will benefit fromthe inclusion of NV Energy in its results during 2014, postedstronger results last year due to increased pricing and fewerone-time charges (tied to litigation, fire and other damageclaims during 2012). Excluding those charges, theimprovement in pretax earnings year over year wasrelatively modest at PacifiCorp. The same could not be saidfor HomeServices of America, which posted a 36.7%increase in full-year revenue and a 69.5% increase in pretaxearnings. While some of this was tied to acquisitions thatHomeServices has done over the past year, it also reflectsan increase in closed brokerage transactions and higheraverage home prices.
With regards to Berkshire's manufacturing, service andretail operations, which include Iscar, Lubrizol, and Marmon,the group overall saw a 10.0% increase in pretax earningsduring the year. Marmon, which had been a standoutperformer coming into 2013, struggled somewhat over thepast year because of its exposure to declining commodityprices. Despite posting a 2.7% decline in revenue last year,Marmon still managed to post a 3.4% increase on pretaxearnings due to an increasing focus on niche products andmarkets (which carry higher margins), and ongoing effortsto improve operating efficiency and productivity. WithMarmon facing slightly less onerous hurdles in 2014, weexpect the division to post stronger operating results in theyear ahead. Even though Berkshire includes Iscar and
Page 23 of 33

Morningstar Equity Research
© Morningstar 2014. All Rights Reserved. Morningstar's Credit Ratings & Research is produced and offered by Morningstar, Inc., which is not registered with the U.S. Securities and Exchange Commission as a Nationally Recognized Statistical Rating Organization(“NRSRO”). Unless otherwise provided in a separate agreement, you may use this report only in the country in which its original distributor is based. The information, data, analyses and opinions presented herein do not constitute investment advice; are providedsolely for informational purposes and therefore are not an offer to buy or sell a security; and are not warranted to be correct, complete or accurate. The opinions expressed are as of the date written and are subject to change without notice. Except as otherwiserequired by law, Morningstar shall not be responsible for any trading decisions, damages or other losses resulting from, or related to, the information, data, analyses or opinions or their use. The information contained herein is the proprietary property ofMorningstar and may not be reproduced, in whole or in part, or used in any manner, without the prior written consent of Morningstar. To order reprints, call +1 312-696-6100. To license the research, call +1 312-696-6869. See last page for important disclosures.
Last Price Fair Value Consider Buy Consider Sell Uncertainty Economic Moat™ Moat Trend™ Stewardship Morningstar Credit Rating Industry Group
136.25 USD 150.00 USD 105.00 USD 202.50 USD Medium Wide Stable Exemplary — Insurance
Berkshire Hathaway Inc BRK.B (NYSE) | QQQ
Analyst Notes
Lubrizol in its "Powerhouse Five" grouping, the firm isrelatively light with details on either firm. From what wecould gather from the annual report, pretax earnings at Iscarand Lubrizol were roughly unchanged from 2012, which issurprising given the number of bolt-on acquisitions in theseoperations over the last year.
This means that the weaker performance at Marmon, andthe relatively unchanged performance at Iscar and Lubrizol,have been offset by better results at McLane (Berkshire'swholesale distribution business), as well as from thecompany's other manufacturing, service, and retailoperations. McLane's business is extremely low-margin,and can be influenced heavily by fuel surcharges (whichtend to elevate revenue but get washed out at the operatingincome level). Full-year revenue for the wholesaler of $45.9billion represented a 22.7% increase year over year, drivenprimarily by price increases, the addition of new customers,and the acquisition of Meadowbrook Meat Company in late2012 (which added around $6 billion in annual revenue tothe firm). Pretax earnings of $486 million represented a20.6% increase year over year, most of which can beattributed to the Meadowbrook acquisition, and a gain onMcLane's sale of its Brazil-based logistics business.Berkshire also benefited from stronger pretax earningsgrowth in its other manufacturing businesses, particularlyfrom its recreational vehicles (Forest River), buildingproducts, and apparel businesses during the year.
The company's finance and financial products division alsoseems to be on better footing, with total pretax earningsrising 16.2% year over year on significantly betterperformance from Clayton Homes (Berkshire's manufacturedhousing and finance subsidiary), where pretax earningsincreased 63.1% year over year to $416 million, on improvedsales (with units sold up 9% year to date), lower loan lossprovisions (reflecting comparatively lower foreclosuresvolume and loss rates), and increased net interest income.
With the economy (and, more importantly, the job market)continuing to recover in fits and starts, it is encouraging tosee some of Berkshire's more economically sensitiveoperations still posting such solid results.
Page 24 of 33

Morningstar Equity Research
© Morningstar 2014. All Rights Reserved. Morningstar's Credit Ratings & Research is produced and offered by Morningstar, Inc., which is not registered with the U.S. Securities and Exchange Commission as a Nationally Recognized Statistical Rating Organization(“NRSRO”). Unless otherwise provided in a separate agreement, you may use this report only in the country in which its original distributor is based. The information, data, analyses and opinions presented herein do not constitute investment advice; are providedsolely for informational purposes and therefore are not an offer to buy or sell a security; and are not warranted to be correct, complete or accurate. The opinions expressed are as of the date written and are subject to change without notice. Except as otherwiserequired by law, Morningstar shall not be responsible for any trading decisions, damages or other losses resulting from, or related to, the information, data, analyses or opinions or their use. The information contained herein is the proprietary property ofMorningstar and may not be reproduced, in whole or in part, or used in any manner, without the prior written consent of Morningstar. To order reprints, call +1 312-696-6100. To license the research, call +1 312-696-6869. See last page for important disclosures.
Last Price Fair Value Consider Buy Consider Sell Uncertainty Economic Moat™ Moat Trend™ Stewardship Morningstar Credit Rating Industry Group
136.25 USD 150.00 USD 105.00 USD 202.50 USD Medium Wide Stable Exemplary — Insurance
Berkshire Hathaway Inc BRK.B (NYSE) | QQQ
Growth (% YoY)3-Year
Hist. CAGR 2011 2012 2013 2014 20155-Year
Proj. CAGR
Earned Premium 6.1 4.3 7.7 6.2 2.7 8.6 6.4Investment Income -1.8 -8.1 -5.4 8.9 4.7 15.2 13.3Total Revenue 6.2 -0.3 5.6 13.6 -1.6 9.0 5.8Total Expenses 5.3 10.8 3.4 2.1 4.6 7.7 7.0Diluted EPS, adjusted 14.3 -21.6 44.4 32.0 -16.7 7.8 3.2Operating Income 8.6 -34.4 17.1 66.6 -19.1 13.8 2.4Net Income 2.1 -49.0 28.2 62.6 -20.1 13.7 1.9
Profitability3-Year
Hist. Avg Dec 2011 Dec 2012 Dec 2013 Dec 2014 Dec 20155-Year
Proj. Avg
Loss Ratio % 75.0 80.2 73.0 71.8 72.3 71.8 73.2Expense Ratio % 20.4 19.1 22.3 19.8 21.0 20.8 21.3Combined Ratio % 95.4 99.2 95.3 91.6 93.3 92.5 94.4Profit Margin % 13.7 10.4 12.6 18.0 14.7 15.3 14.3ROE % 6.4 5.0 6.0 8.1 5.6 5.7 5.1ROE, Without Goodwill % 7.7 6.3 7.4 9.6 6.4 6.5 5.7ROA % 2.8 2.2 2.6 3.7 2.6 2.7 2.5
Leverage3-Year
Hist. Avg 2011 2012 2013 2014 20155-Year
Proj. Avg
Debt/Capital % 8.8 10.4 8.9 7.3 7.4 7.4 7.4Debt/Equity % 9.7 11.6 9.7 7.8 8.0 8.0 8.0Equity/Assets % 44.1 41.7 44.0 46.5 47.5 48.2 48.9
2012 2013 2014(E) 2015(E)
Price/Fair Value 0.82 0.83 — —Price/Earnings 0.0 0.0 0.0 0.0Price/Book 0.0 0.0 0.0 0.0Price/Tangible Book 0.0 0.0 0.0 0.0Price/Earned Premium 6.1 7.6 8.4 7.8Dividend Yield % — — — —
Cost of Equity % 10.0Average Forward ROE %, 5 Yr % 5.1Average Forward ROE %, 5 Yr, Excluding Goodwill % 5.7Long-Run Tax Rate % 30.0Stage 2 Net Income Growth Rate % 5.0Stage 2 Incremental ROE % 13.0Perpetuity Year 20
USD MilFirm Value
(%)Per Share
Value
Present Value Stage I 4,561 1.3 2,774.62Present Value Stage II 86,092 23.7 52,374.28Present Value of the Perpetuity 69,303 19.1 42,160.83Equity Value, Sub-Total 159,956 97,309.73
Other Adjustments 203,268 56.0 123,658.66Total Equity Value 363,223 225,000.00
Projected Shares Outstanding 2
Fair Value per Share 150.00
Morningstar Analyst Forecasts
Forecast
Financial Summary and Forecasts
Valuation Summary and Forecasts
Key Valuation Drivers
Discounted Cash Flow Valuation
Additional estimates and scenarios available for download at http://select.morningstar.com.
(USD)
Page 25 of 33
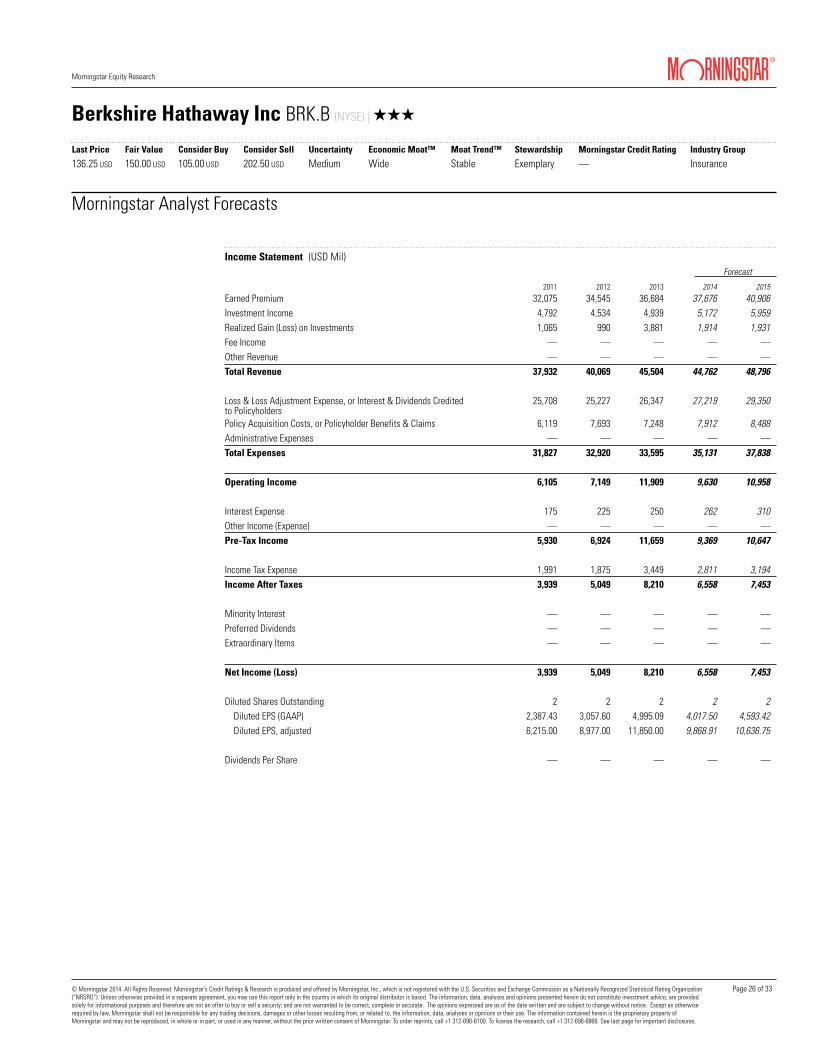
Morningstar Equity Research
© Morningstar 2014. All Rights Reserved. Morningstar's Credit Ratings & Research is produced and offered by Morningstar, Inc., which is not registered with the U.S. Securities and Exchange Commission as a Nationally Recognized Statistical Rating Organization(“NRSRO”). Unless otherwise provided in a separate agreement, you may use this report only in the country in which its original distributor is based. The information, data, analyses and opinions presented herein do not constitute investment advice; are providedsolely for informational purposes and therefore are not an offer to buy or sell a security; and are not warranted to be correct, complete or accurate. The opinions expressed are as of the date written and are subject to change without notice. Except as otherwiserequired by law, Morningstar shall not be responsible for any trading decisions, damages or other losses resulting from, or related to, the information, data, analyses or opinions or their use. The information contained herein is the proprietary property ofMorningstar and may not be reproduced, in whole or in part, or used in any manner, without the prior written consent of Morningstar. To order reprints, call +1 312-696-6100. To license the research, call +1 312-696-6869. See last page for important disclosures.
Last Price Fair Value Consider Buy Consider Sell Uncertainty Economic Moat™ Moat Trend™ Stewardship Morningstar Credit Rating Industry Group
136.25 USD 150.00 USD 105.00 USD 202.50 USD Medium Wide Stable Exemplary — Insurance
Berkshire Hathaway Inc BRK.B (NYSE) | QQQ
2011 2012 2013 2014 2015Earned Premium 32,075 34,545 36,684 37,676 40,906Investment Income 4,792 4,534 4,939 5,172 5,959Realized Gain (Loss) on Investments 1,065 990 3,881 1,914 1,931Fee Income — — — — —Other Revenue — — — — —Total Revenue 37,932 40,069 45,504 44,762 48,796
Loss & Loss Adjustment Expense, or Interest & Dividends Creditedto Policyholders
25,708 25,227 26,347 27,219 29,350
Policy Acquisition Costs, or Policyholder Benefits & Claims 6,119 7,693 7,248 7,912 8,488Administrative Expenses — — — — —Total Expenses 31,827 32,920 33,595 35,131 37,838
Operating Income 6,105 7,149 11,909 9,630 10,958
Interest Expense 175 225 250 262 310Other Income (Expense) — — — — —Pre-Tax Income 5,930 6,924 11,659 9,369 10,647
Income Tax Expense 1,991 1,875 3,449 2,811 3,194Income After Taxes 3,939 5,049 8,210 6,558 7,453
Minority Interest — — — — —Preferred Dividends — — — — —Extraordinary Items — — — — —
Net Income (Loss) 3,939 5,049 8,210 6,558 7,453
Diluted Shares Outstanding 2 2 2 2 2 Diluted EPS (GAAP) 2,387.43 3,057.60 4,995.09 4,017.50 4,593.42 Diluted EPS, adjusted 6,215.00 8,977.00 11,850.00 9,868.91 10,636.75
Dividends Per Share — — — — —
Morningstar Analyst Forecasts
Income Statement (USD Mil)Forecast
Page 26 of 33

Morningstar Equity Research
© Morningstar 2014. All Rights Reserved. Morningstar's Credit Ratings & Research is produced and offered by Morningstar, Inc., which is not registered with the U.S. Securities and Exchange Commission as a Nationally Recognized Statistical Rating Organization(“NRSRO”). Unless otherwise provided in a separate agreement, you may use this report only in the country in which its original distributor is based. The information, data, analyses and opinions presented herein do not constitute investment advice; are providedsolely for informational purposes and therefore are not an offer to buy or sell a security; and are not warranted to be correct, complete or accurate. The opinions expressed are as of the date written and are subject to change without notice. Except as otherwiserequired by law, Morningstar shall not be responsible for any trading decisions, damages or other losses resulting from, or related to, the information, data, analyses or opinions or their use. The information contained herein is the proprietary property ofMorningstar and may not be reproduced, in whole or in part, or used in any manner, without the prior written consent of Morningstar. To order reprints, call +1 312-696-6100. To license the research, call +1 312-696-6869. See last page for important disclosures.
Last Price Fair Value Consider Buy Consider Sell Uncertainty Economic Moat™ Moat Trend™ Stewardship Morningstar Credit Rating Industry Group
136.25 USD 150.00 USD 105.00 USD 202.50 USD Medium Wide Stable Exemplary — Insurance
Berkshire Hathaway Inc BRK.B (NYSE) | QQQ
Assets 2011 2012 2013 2014 2015
Investment Portfolio 120,396 133,973 168,694 188,834 211,425Cash & Equivalents 29,873 38,195 38,173 38,173 38,173Premiums Receivable 6,663 7,845 7,474 8,258 8,966Deferred Acquisition Costs — — — — —Accrued Investment Income — — — — —Prepaid Reinsurance Premiums — — — — —Reinsurance Recoverables 2,953 2,925 3,055 3,138 3,407
Goodwill & Other Intangibles 15,511 15,511 15,511 15,511 15,511Deferred Tax Assets — — — — —Other Assets 8,611 8,689 7,247 7,436 8,002Non-Operating Assets — — — — —Total Assets 184,007 207,138 240,154 261,350 285,483
Loss Reserves, or Policyholders' Account Balances 77,869 79,547 81,258 88,063 96,134Unearned Premiums, or Future Policy Benefits 8,910 10,237 10,770 11,061 12,010Accounts Payable 4,043 4,876 5,448 5,677 6,164Deferred Tax Liabilities 7,662 12,417 22,289 22,500 22,500Other Liabilities — — — — —Liabilities Sub-Total 98,484 107,077 119,765 127,301 136,808
Debt 8,859 8,867 8,730 9,930 11,013
Non-Operating Liabilities — — — — —Total Liabilities 107,343 115,944 128,495 137,231 147,821
Preferred Stock — — — — —Minority Interest — — — — —
Common Stock 4 4 4 4 4Additional Paid-In Capital 18,904 18,615 17,736 17,736 17,736Retained Earnings 44,516 51,950 60,900 67,458 74,911Treasury Stock — — — -2,148 -4,201Unrealized Gains (Losses) 13,241 20,625 33,019 41,069 49,213Other Equity — — — — —Total Shareholders' Equity 76,664 91,194 111,659 124,119 137,663Total Liabilities and Shareholders' Equity 184,007 207,138 240,154 261,350 285,483
Separate Account Assets — — — — —
Morningstar Analyst Forecasts
Balance Sheet (USD Mil)Forecast
Liabilities
Shareholders' Equity
Page 27 of 33

Morningstar Equity Research
© Morningstar 2014. All Rights Reserved. Morningstar's Credit Ratings & Research is produced and offered by Morningstar, Inc., which is not registered with the U.S. Securities and Exchange Commission as a Nationally Recognized Statistical Rating Organization(“NRSRO”). Unless otherwise provided in a separate agreement, you may use this report only in the country in which its original distributor is based. The information, data, analyses and opinions presented herein do not constitute investment advice; are providedsolely for informational purposes and therefore are not an offer to buy or sell a security; and are not warranted to be correct, complete or accurate. The opinions expressed are as of the date written and are subject to change without notice. Except as otherwiserequired by law, Morningstar shall not be responsible for any trading decisions, damages or other losses resulting from, or related to, the information, data, analyses or opinions or their use. The information contained herein is the proprietary property ofMorningstar and may not be reproduced, in whole or in part, or used in any manner, without the prior written consent of Morningstar. To order reprints, call +1 312-696-6100. To license the research, call +1 312-696-6869. See last page for important disclosures.
Last Price Fair Value Consider Buy Consider Sell Uncertainty Economic Moat™ Moat Trend™ Stewardship Morningstar Credit Rating Industry Group
136.25 USD 150.00 USD 105.00 USD 202.50 USD Medium Wide Stable Exemplary — Insurance
Berkshire Hathaway Inc BRK.B (NYSE) | QQQ
Company/Ticker Value 2013 2014(E) 2015(E) 2013 2014(E) 2015(E) 2013 2014(E) 2015(E) 2013 2014(E) 2015(E) 2013 2014(E) 2015(E)
Progressive Corp PGR USA 1.04 17.4 15.4 14.3 2.7 2.4 2.1 2.7 2.4 2.1 1.0 0.8 0.8 1.1 6.7 1.4RenaissanceRe Holdings Ltd RNR USA — 11.7 11.7 10.1 1.3 1.2 1.1 1.3 1.2 1.1 3.7 3.6 3.4 1.2 1.2 1.3Average 14.6 13.6 12.2 2.0 1.8 1.6 2.0 1.8 1.6 2.4 2.2 2.1 1.2 4.0 1.4Berkshire Hathaway Inc BRK.B US 0.91 0.0 0.0 0.0 0.0 0.0 0.0 0.0 0.0 0.0 7.6 8.4 7.8 — — —
Company/Ticker Net Income (Mil) 2013 2014(E) 2015(E) 2013 2014(E) 2015(E) 2013 2014(E) 2015(E) 2013 2014(E) 2015(E) 2013 2014(E) 2015(E)
Progressive Corp PGR USA 1,165 USD 19.1 18.0 17.1 19.1 18.0 17.1 5.0 4.6 4.4 93.5 93.9 94.0 6.4 5.9 5.5RenaissanceRe Holdings Ltd RNR USA 383 USD 12.0 11.2 12.2 12.0 11.3 12.2 4.7 4.5 4.9 72.0 77.0 77.0 29.2 27.3 29.5Average 15.6 14.6 14.7 15.6 14.7 14.7 4.9 4.6 4.7 82.8 85.5 85.5 17.8 16.6 17.5Berkshire Hathaway Inc BRK.B US 8,210 USD 8.1 5.6 5.7 9.6 6.4 6.5 3.7 2.6 2.7 91.6 93.3 92.5 18.0 14.7 15.3
Company/Ticker Total Debt (Mil) 2013 2014(E) 2015(E) 2013 2014(E) 2015(E) 2013 2014(E) 2015(E) 2013 2014(E) 2015(E) 2013 2014(E) 2015(E)
Progressive Corp PGR USA 1,861 USD 23.1 23.1 23.1 30.1 30.0 30.0 25.4 25.4 25.9 276.3 293.0 288.9 34.1 34.7 35.0RenaissanceRe Holdings Ltd RNR USA 330 USD 9.1 9.1 9.1 10.0 10.0 10.0 39.8 40.2 40.6 33.7 32.8 32.0 47.0 47.5 47.8Average 16.1 16.1 16.1 20.1 20.0 20.0 32.6 32.8 33.3 155.0 162.9 160.5 40.6 41.1 41.4Berkshire Hathaway Inc BRK.B US 8,730 USD 7.3 7.4 7.4 7.8 8.0 8.0 46.5 47.5 48.2 32.9 30.4 29.7 54.0 54.7 55.2
Comparable Company AnalysisThese companies are chosen by the analyst and the data are shown by nearest calendar year in descending market capitalization order.
Valuation Analysis
Profitability Analysis
Leverage Analysis
Price/Earnings Price/Book Price/Tangible Book Price/Earned Premium Dividend Yield %
ROE % ROE Without Goodwill % Return on Assets % Combined Ratio % Profit Margin %
Debt/Capital % Debt/Equity % Equity/Assets % Premium/Equity % Equity/Investment Portolio %
Last Historical Year
Last Historical Year
Price/Fair
Page 28 of 33

Morningstar Equity Research
Research Methodology for Valuing Companies
Components of OurMethodology
3 Economic Moat™ Rating
3 Moat Trend™ Rating
3 Moat Valuation
3 Three-Stage Discounted
Cash Flow
3 Weighted Average Cost
of Capital
3 Fair Value Estimate
3 Scenario Analysis
3 Uncertainty Ratings
3 Margin of Safety
3 Consider Buying/Selling
3 Stewardship Rating
The Morningstar Rating for stocks identifies companies trad-
ing at a discount or premium to our analysts’ assessment of
their fair value. A number of components drive this rating: (1)
our assessment of the firm’s economic moat, (2) our estimate
of the stock’s intrinsic value based on a discounted cash-flow
model, (3) the margin of safety bands we apply to our Fair
Value Estimate, and (4) the current stock price relative to our
fair value estimate.
The concept of the Morningstar Economic Moat™ Rating
plays a vital role not only in our qualitative assessment of a
firm’s investment potential, but also in our valuation process.
We assign three moat ratings—none, narrow, or wide—as
well as the Morningstar Moat Trend™ Rating—positive,
stable, or negative—to each company we cover. There are
two major requirements for firms to earn either a narrow or
wide moat rating: (1) the prospect of earning above-average
returns on capital; and (2) some competitive edge that pre-
vents these returns from quickly eroding. The assumptions
we make about a firm’s moat determine the length of “eco-
nomic outperformance” that we assume in the latter stages
of our valuation model. We also quantify the value of each
firm’s moat, which represents the difference between a firm’s
enterprise value and the value of the firm if no future net in-
vestment were to occur. Said differently, moat value identi-
fies the value generated by the firm as a result of any future
net new investment. Our Moat Trend Rating reflects our as-
sessment of whether each firm’s competitive advantage is
either getting stronger or weaker, since we think of moats as
dynamic, rather than static.
At the heart of our valuation system is a detailed projection
of a company’s future cash flows. The first stage of our three-
stage discounted cash flow model can last from 5 to 10 years
and contains numerous detailed assumptions about various
financial and operating items. The second stage of our mod-
el—where a firm’s return on new invested capital (RONIC)
and earnings growth rate implicitly fade until the perpetuity
year—can last anywhere from 0 years (for no-moat firms) to
20 years (for wide-moat companies). In our third stage, we
assume the firm’s RONIC equals its weighted average cost of
capital, and we calculate a continuing value using a standard
Morningstar Research Methodology for Valuing Companies
Analyst conducts company and industry research:
Financial statementanalysis
Channel checks
Trade-show visits
Industry and company reports and journals
Conference calls
Management andsite visits
3
3
3
3
3
3
Strength of competitive advantage is rated: None, Narrow, or Wide
Advantages that confer an economic moat:
High Switching Costs (Microsoft)
Cost advantage (Wal-Mart)
Intangible assets(Johnson & Johnson)
Network Effect(Mastercard)
Efficient Scale(Lockheed Martin)
Analyst considers past financial resultsand focuses on competitive position and future prospects to forecast future cash flows.
Assumptions areentered into Morningstar’s proprietary discounted cash-flow model.
The analyst then eval-uates the range of potential intrinsic values for the company and assigns an Uncertainty Rating: Low, Medium, High, Very High, or Extreme.
The Uncertainty Rating determines the margin of safety required before we would rec-ommend the stock.The higher the uncer-tainty, the wider the margin of safety.
Analyst uses adiscounted cash-flowmodel to develop a Fair Value Estimate, which serves as the foundation for the Morningstar Rating for stocks.
The current stock price relative to Morningstar’s Fair Value Estimate, adjusted for uncertainty, determines the Morningstar Rating for stocks.
The Morningstar Rating for stocks is updated each evening after the market closes.
QQQQQQQQQQQQQQQ
Fundamental Analysis
EconomicMoatTM Rating
CompanyValuation
Fair ValueEstimate
UncertaintyAssessment
@Morningstar 2014. All Rights Reserved. Morningstar's Credit Ratings & Research is produced and offered by Morningstar, Inc., which is not registered with the U.S. Securities and Exchange Commission as a Nationally Recognized Statistical Rating Organization(“NRSRO”). Unless otherwise provided in a separate agreement, you may use this report only in the country in which its original distributor is based. The information, data, analyses and opinions presented herein do not constitute investment advice; are providedsolely for informational purposes and therefore are not an offer to buy or sell a security; and are not warranted to be correct, complete or accurate. The opinions expressed are as of the date written and are subject to change without notice. Except as otherwiserequired by law, Morningstar shall not be responsible for any trading decisions, damages or other losses resulting from, or related to, the information, data, analyses or opinions or their use. The information contained herein is the proprietary property ofMorningstar and may not be reproduced, in whole or in part, or used in any manner, without the prior written consent of Morningstar. To order reprints, call +1 312-696-6100. To license the research, call +1 312-696-6869. See last page for important disclosures.
Page 29 of 33

Morningstar Equity Research
Research Methodology for Valuing Companies
Detailed MethodologyDocuments and Materials*
3 Comprehensive
Equity Research Methodology
3 Uncertainty Methodology
3 Cost of Equity Methodology
3 Morningstar DCF
Valuation Model
3 Stewardship Rating
Methodology
* Please contact a sales
representative for more
information.
perpetuity formula. In deciding on the rate at which to dis-
count future cash flows, we ignore stock-price volatility.
Instead, we rely on a system that measures the estimated
volatility of a firm’s underlying future free cash flows, tak-
ing into account fundamental factors such as the diversity of
revenue sources and the firm’s fixed cost structure.
We also employ a number of other tools to augment our valu-
ation process, including scenario analysis, where we assess
the likelihood and performance of a business under different
economic and firm-specific conditions. Our analysts typically
model three to five scenarios for each company we cover,
stress-testing the model and examining the distribution of
resulting fair values.
The Morningstar Uncertainty Rating captures the range of
these potential fair values, based on an assessment of a
company’s future sales range, the firm’s operating and fi-
nancial leverage, and any other contingent events that may
impact the business. Our analysts use this range to assign
an appropriate margin of safety—or the discount/premium
to a fair value we apply in setting our consider buying/con-
sider selling prices. Firms trading below our consider-buying
prices receive our highest rating of five stars, whereas firms
trading above our consider-selling prices receive our lowest
rating of one star.
Morningstar Margin of Safety and Star Rating Bands
Price/Fair Value
2.75
2.50
2.25
2.00
1.75
1.50
1.25
1.00
0.75
0.50
0.25
Low Medium High Very High*
* Occasionally a stock’s uncertainty will be too high for us to estimate, in which case we label it Extreme.
• 5 Star
• 4 Star
• 3 Star
• 2 Star
• 1 Star
Uncertainty Rating
— 125%
105% —
80% —— 95%
— 135%
110% —
70% —
— 90%
— 155%
115% —
60% —
— 85%
— 175%
125% —
50% —
— 80%
New Morningstar Margin of Safety and Star Rating Bands as of August 18th, 2011
Our corporate Stewardship Rating represents our assess-
ment of management's stewardship of shareholder capital,
with particular emphasis on capital allocation decisions.
Analysts consider companies' investment strategy and
valuation, financial leverage, dividend and share buyback
policies, execution, compensation, related party transac-
tions, and accounting practices. Corporate governance
practices are only considered if they've had a demonstrated
impact on shareholder value. Analysts assign one of three
ratings: "Exemplary," "Standard," and "Poor." Analysts judge
stewardship from an equity holder's perspective. Ratings
are determined on an absolute basis. Most companies will
receive a Standard rating, and this is the default rating in
the absence of evidence that managers have made
exceptionally strong or poor capital allocation decisions.
@Morningstar 2014. All Rights Reserved. Morningstar's Credit Ratings & Research is produced and offered by Morningstar, Inc., which is not registered with the U.S. Securities and Exchange Commission as a Nationally Recognized Statistical Rating Organization(“NRSRO”). Unless otherwise provided in a separate agreement, you may use this report only in the country in which its original distributor is based. The information, data, analyses and opinions presented herein do not constitute investment advice; are providedsolely for informational purposes and therefore are not an offer to buy or sell a security; and are not warranted to be correct, complete or accurate. The opinions expressed are as of the date written and are subject to change without notice. Except as otherwiserequired by law, Morningstar shall not be responsible for any trading decisions, damages or other losses resulting from, or related to, the information, data, analyses or opinions or their use. The information contained herein is the proprietary property ofMorningstar and may not be reproduced, in whole or in part, or used in any manner, without the prior written consent of Morningstar. To order reprints, call +1 312-696-6100. To license the research, call +1 312-696-6869. See last page for important disclosures.
Page 30 of 33

Morningstar Corporate Credit Rating
3 Offers a proprietary measure of the credit qual-ity of companies on our coverage list.
3 Encapsulates our in-depth modeling and quantitative work in one letter grade.
3 Allows investors to rank companies by each of the four underlying com- ponents of our credit ratings, including both analyst-driven and quantitative measures.
3 Provides access to all the underlying forecasts that go into the rating, available through our insti-tutional service.
MethodologyWe feel it’s important to perform credit analysis through different lenses—qualitative and quantitative, as well as fundamental and market-driven. We therefore evaluate each company in four broad categories.
Business RiskKey components of the business risk score include the Morningstar Economic Moat™ Rating and the Morningstar Uncertainty Rating. However, it also takes into consideration some insurance-specific factors: regulatory environment, the level and volatility of underwriting profitability, and overall level of underwriting risk.
Financial RiskThis score is a quantitative assessment of an insurer’s credit health based on three components: reserves leverage, financial leverage, and an investment portfolio sensitivity analysis. For this final measure, we estimate a one-standard deviation loss rate for each asset class in the company’ investment portfolio to assess the relative risk level of the investment portfolio and the balance sheet
3
3
3
3
3
3
PurposeThe Morningstar Corporate Credit Rating measures the ability of a firm to satisfy its debt and debt-like obligations. The higher the rating, the less likely we think the company is to default on these obligations.
The Morningstar Corporate Credit Rating builds on the modeling expertise of our securities research team. For each company, we publish:
Five years of detailed pro-forma financial statements
Annual estimates of free cash flow
Annual forecasts of return on invested capital
Scenario analyses, including upside and downside cases
Forecasts of leverage, coverage, and liquidity ratios for five years
Estimates of off balance sheet liabilities
These forecasts are key inputs into the Morningstar Corporate Credit Rating and are available to subscribers at select.morningstar.com.
Morningstar’s Credit Methodology for Insurance
Morningstar Research Methodology for Determining Corporate Credit Ratings
Competitive Analysis
Cash-Flow Forecasts
ScenarioAnalysis
Quantitative Checks
RatingCommittee
AAA
BBBC
D
BB
BCC
CCC
Analyst conducts company and industry research:
• Management interviews• Conference calls• Trade show visits• Competitor, supplier, distributor, and customer interviews• Assign Economic Moat™ Rating
Analyst considers company financial statements and competitive dynamics to forecast future free cash flows to the firm.
Analyst derives estimate of Debt Cushion.
Analysts run bull and bear cases through the model to derive alternate estimates of enterprise value.
Based on compet- itive analysis, cash-flow fore- casts, and scenario analysis, the analyst assigns Business Risk.
We gauge a firm’s health using quantitative tools supported by our own backtesting and academic research.
• Distance to Default
Senior personnel review each company to determine the appropriate final credit rating.
• Review modeling assumptions• Approve company-specific adjustments
AAA Extremely Low Default Risk AA Very Low Default Risk A Low Default Risk BBB Moderate Default Risk
BB Above Average Default Risk B High Default Risk CCC Currently Very High Default Risk CC Currently Extreme Default Risk
C Imminent Payment Default D Payment Default
UR Under Review UR+ Positive Credit Implication UR- Negative Credit Implication
AAA
@Morningstar 2014. All Rights Reserved. Morningstar's Credit Ratings & Research is produced and offered by Morningstar, Inc., which is not registered with the U.S. Securities and Exchange Commission as a Nationally Recognized Statistical Rating Organization(“NRSRO”). Unless otherwise provided in a separate agreement, you may use this report only in the country in which its original distributor is based. The information, data, analyses and opinions presented herein do not constitute investment advice; are providedsolely for informational purposes and therefore are not an offer to buy or sell a security; and are not warranted to be correct, complete or accurate. The opinions expressed are as of the date written and are subject to change without notice. Except as otherwiserequired by law, Morningstar shall not be responsible for any trading decisions, damages or other losses resulting from, or related to, the information, data, analyses or opinions or their use. The information contained herein is the proprietary property ofMorningstar and may not be reproduced, in whole or in part, or used in any manner, without the prior written consent of Morningstar. To order reprints, call +1 312-696-6100. To license the research, call +1 312-696-6869. See last page for important disclosures.
Page 31 of 33

Overall Credit RatingThe four component ratings roll up into a single prelim-inary credit rating. To determine the final credit rating, a credit committee of at least five senior research per-sonnel reviews each preliminary rating.
We review credit ratings on a regular basis and as events warrant. Any change in rating must be approved by the Credit Rating Committee.
Investor AccessMorningstar Corporate Credit Ratings are available on Morningstar.com. Our credit research, including detailed cash-flow models that contain all of the components of the Morningstar Corporate Credit Rating, is available to subscribers at select.morningstar.com.
leverage to potential investment losses.
Debt CushionOur debt cushion score is a corollary to the Cash Flow Cushion™ concept in the general credit rating methodology, measuring the insurer’s ability to cover its debt load and future interest payments with its balance sheet surplus and future profitability. We believe the debt cushion is a fairly robust measure as it is forward-looking and not only takes into account both earnings power and leverage, but also allows the components to be dissected and analyzed..
Distance to DefaultMorningstar’s quantitative Distance to Default measure ranks companies on the likelihood that they will tumble into financial distress. The measure is a linear model of the percentile of a firm’s leverage (ratio of Enterprise Value to Market Value), the percentile of a firm’s equity volatility relative to the rest of the universe and the interaction of these two percentiles. This is a proxy methodology for the common definition of Distance to Default which relies on option-based pricing models. The proxy has the benefit of increased breadth of coverage, greater simplicity of calculation, and more predictive power.
For each of these four categories, we assign a score, which we then translate into a descriptive rating along the scale of Very Good / Good / Fair / Poor / Very Poor.
Morningstar Corporate Credit Rating
Morningstar’s Credit Methodology for Insurance
@Morningstar 2014. All Rights Reserved. Morningstar's Credit Ratings & Research is produced and offered by Morningstar, Inc., which is not registered with the U.S. Securities and Exchange Commission as a Nationally Recognized Statistical Rating Organization(“NRSRO”). Unless otherwise provided in a separate agreement, you may use this report only in the country in which its original distributor is based. The information, data, analyses and opinions presented herein do not constitute investment advice; are providedsolely for informational purposes and therefore are not an offer to buy or sell a security; and are not warranted to be correct, complete or accurate. The opinions expressed are as of the date written and are subject to change without notice. Except as otherwiserequired by law, Morningstar shall not be responsible for any trading decisions, damages or other losses resulting from, or related to, the information, data, analyses or opinions or their use. The information contained herein is the proprietary property ofMorningstar and may not be reproduced, in whole or in part, or used in any manner, without the prior written consent of Morningstar. To order reprints, call +1 312-696-6100. To license the research, call +1 312-696-6869. See last page for important disclosures.
Page 32 of 33
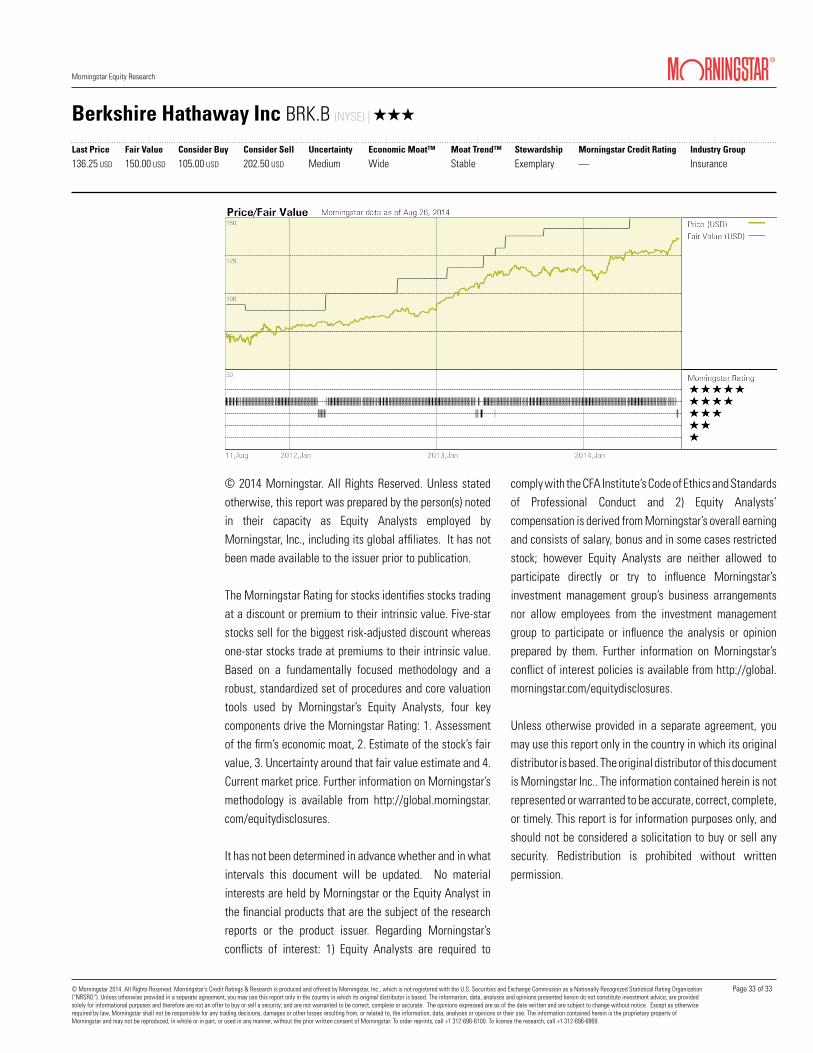
Morningstar Equity Research
© Morningstar 2014. All Rights Reserved. Morningstar's Credit Ratings & Research is produced and offered by Morningstar, Inc., which is not registered with the U.S. Securities and Exchange Commission as a Nationally Recognized Statistical Rating Organization(“NRSRO”). Unless otherwise provided in a separate agreement, you may use this report only in the country in which its original distributor is based. The information, data, analyses and opinions presented herein do not constitute investment advice; are providedsolely for informational purposes and therefore are not an offer to buy or sell a security; and are not warranted to be correct, complete or accurate. The opinions expressed are as of the date written and are subject to change without notice. Except as otherwiserequired by law, Morningstar shall not be responsible for any trading decisions, damages or other losses resulting from, or related to, the information, data, analyses or opinions or their use. The information contained herein is the proprietary property ofMorningstar and may not be reproduced, in whole or in part, or used in any manner, without the prior written consent of Morningstar. To order reprints, call +1 312-696-6100. To license the research, call +1 312-696-6869.
Last Price Fair Value Consider Buy Consider Sell Uncertainty Economic Moat™ Moat Trend™ Stewardship Morningstar Credit Rating Industry Group
136.25 USD 150.00 USD 105.00 USD 202.50 USD Medium Wide Stable Exemplary — Insurance
Berkshire Hathaway Inc BRK.B (NYSE) | QQQ
© 2014 Morningstar. All Rights Reserved. Unless statedotherwise, this report was prepared by the person(s) notedin their capacity as Equity Analysts employed byMorningstar, Inc., including its global affiliates. It has notbeen made available to the issuer prior to publication.
The Morningstar Rating for stocks identifies stocks tradingat a discount or premium to their intrinsic value. Five-starstocks sell for the biggest risk-adjusted discount whereasone-star stocks trade at premiums to their intrinsic value.Based on a fundamentally focused methodology and arobust, standardized set of procedures and core valuationtools used by Morningstar’s Equity Analysts, four keycomponents drive the Morningstar Rating: 1. Assessmentof the firm’s economic moat, 2. Estimate of the stock’s fairvalue, 3. Uncertainty around that fair value estimate and 4.Current market price. Further information on Morningstar’smethodology is available from http://global.morningstar.com/equitydisclosures.
It has not been determined in advance whether and in whatintervals this document will be updated. No materialinterests are held by Morningstar or the Equity Analyst inthe financial products that are the subject of the researchreports or the product issuer. Regarding Morningstar’sconflicts of interest: 1) Equity Analysts are required to
comply with the CFA Institute’s Code of Ethics and Standardsof Professional Conduct and 2) Equity Analysts’compensation is derived from Morningstar’s overall earningand consists of salary, bonus and in some cases restrictedstock; however Equity Analysts are neither allowed toparticipate directly or try to influence Morningstar’sinvestment management group’s business arrangementsnor allow employees from the investment managementgroup to participate or influence the analysis or opinionprepared by them. Further information on Morningstar’sconflict of interest policies is available from http://global.morningstar.com/equitydisclosures.
Unless otherwise provided in a separate agreement, youmay use this report only in the country in which its originaldistributor is based. The original distributor of this documentis Morningstar Inc.. The information contained herein is notrepresented or warranted to be accurate, correct, complete,or timely. This report is for information purposes only, andshould not be considered a solicitation to buy or sell anysecurity. Redistribution is prohibited without writtenpermission.
Page 33 of 33
Related Documents