UNITED STATES SECURITIES AND EXCHANGE COMMISSION Washington, D.C. 20549 FORM 10-Q (Mark One) For the quarterly period ended June 30, 2014 OR For the transition period from to Commission file number 001-14905 BERKSHIRE HATHAWAY INC. (Exact name of registrant as specified in its charter) 3555 Farnam Street, Omaha, Nebraska 68131 (Address of principal executive office) (Zip Code) (402) 346-1400 (Registrant’s telephone number, including area code) (Former name, former address and former fiscal year, if changed since last report) Indicate by check mark whether the registrant (1) has filed all reports required to be filed by Section 13 or 15(d) of the Securities Exchange Act of 1934 during the preceding 12 months and (2) has been subject to such filing requirements for the past 90 days. Yes No Indicate by check mark whether the registrant has submitted electronically and posted on its corporate Web site, if any, every Interactive Data File required to be submitted and posted pursuant to Rule 405 of Regulation S-T (§232.405 of this chapter) during the preceding 12 months (or for such shorter period that the registrant was required to submit and post such files). Yes No Indicate by check mark whether the registrant is a large accelerated filer, an accelerated filer, a non-accelerated filer or a smaller reporting company. See the definitions of “large accelerated filer,” “accelerated filer” and “smaller reporting company” in Rule 12b-2 of the Exchange Act. Indicate by check mark whether the registrant is a shell company (as defined in Rule 12b-2 of the Act). Yes No Number of shares of common stock outstanding as of July 25, 2014: QUARTERLY REPORT PURSUANT TO SECTION 13 OR 15(d) OF THE SECURITIES EXCHANGE ACT OF 1934 TRANSITION REPORT PURSUANT TO SECTION 13 OR 15(d) OF THE SECURITIES EXCHANGE ACT OF 1934 Delaware 47-0813844 (State or other jurisdiction of incorporation or organization) (I.R.S. Employer Identification Number) Large accelerated filer Accelerated filer Non-accelerated filer Smaller reporting company Class A — 835,607 Class B — 1,210,134,698

Welcome message from author
This document is posted to help you gain knowledge. Please leave a comment to let me know what you think about it! Share it to your friends and learn new things together.
Transcript

UNITED STATES SECURITIES AND EXCHANGE COMMISSION
Washington, D.C. 20549
FORM 10-Q
(Mark One)
For the quarterly period ended June 30, 2014
OR
For the transition period from to
Commission file number 001-14905
BERKSHIRE HATHAWAY INC. (Exact name of registrant as specified in its charter)
3555 Farnam Street, Omaha, Nebraska 68131 (Address of principal executive office)
(Zip Code)
(402) 346-1400 (Registrant’s telephone number, including area code)
(Former name, former address and former fiscal year, if changed since last report)
Indicate by check mark whether the registrant (1) has filed all reports required to be filed by Section 13 or 15(d) of the SecuritiesExchange Act of 1934 during the preceding 12 months and (2) has been subject to such filing requirements for the past 90days. Yes ⌧ No �
Indicate by check mark whether the registrant has submitted electronically and posted on its corporate Web site, if any, everyInteractive Data File required to be submitted and posted pursuant to Rule 405 of Regulation S-T (§232.405 of this chapter) during the preceding 12 months (or for such shorter period that the registrant was required to submit and post such files). Yes ⌧ No �
Indicate by check mark whether the registrant is a large accelerated filer, an accelerated filer, a non-accelerated filer or a smaller reporting company. See the definitions of “large accelerated filer,” “accelerated filer” and “smaller reporting company” in Rule 12b-2 of the Exchange Act.
Indicate by check mark whether the registrant is a shell company (as defined in Rule 12b-2 of the Act). Yes � No ⌧
Number of shares of common stock outstanding as of July 25, 2014:
⌧ QUARTERLY REPORT PURSUANT TO SECTION 13 OR 15(d) OF THE SECURITIESEXCHANGE ACT OF 1934
� TRANSITION REPORT PURSUANT TO SECTION 13 OR 15(d) OF THE SECURITIESEXCHANGE ACT OF 1934
Delaware 47-0813844(State or other jurisdiction of
incorporation or organization) (I.R.S. Employer
Identification Number)
Large accelerated filer ⌧ Accelerated filer �Non-accelerated filer � Smaller reporting company �
Class A — 835,607 Class B — 1,210,134,698
BERKSHIRE HATHAWAY INC.
1
Page No. Part I – Financial Information
Item 1. Financial Statements
Consolidated Balance Sheets— June 30, 2014 and December 31, 2013 2
Consolidated Statements of Earnings— Second Quarter and First Six Months 2014 and 2013 3
Consolidated Statements of Comprehensive Income—Second Quarter and First Six Months 2014 and 2013 4
Consolidated Statements of Changes in Shareholders’ Equity—First Six Months 2014 and 2013 4
Consolidated Statements of Cash Flows— First Six Months 2014 and 2013 5
Notes to Consolidated Financial Statements 6-23 Item 2. Management’s Discussion and Analysis of Financial Condition and Results of Operations 24-40 Item 3. Quantitative and Qualitative Disclosures About Market Risk 41 Item 4. Controls and Procedures 41
Part II – Other Information
Item 1. Legal Proceedings 42 Item 1A. Risk Factors 42 Item 2.
Unregistered Sales of Equity Securities and Use of Proceeds and Issuer Repurchases of Equity Securities 42
Item 3. Defaults Upon Senior Securities 42 Item 4. Mine Safety Disclosures 42 Item 5. Other Information 42 Item 6. Exhibits 42
Signature 43
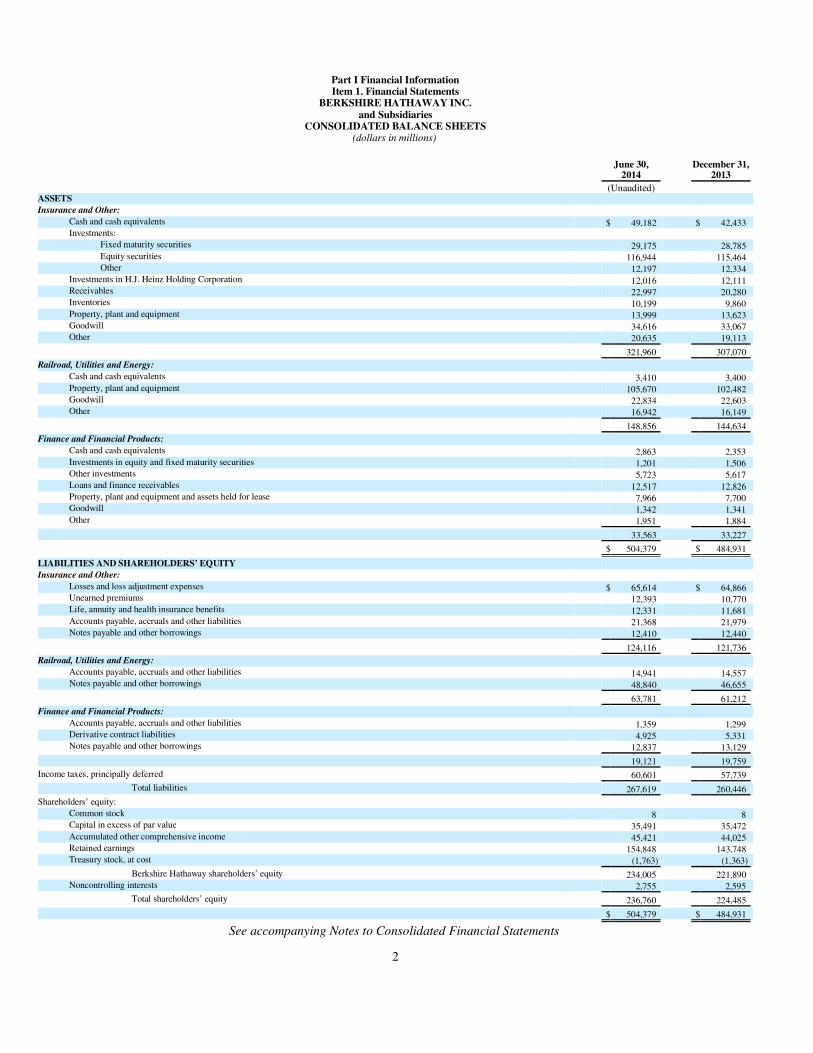
Part I Financial Information Item 1. Financial Statements
BERKSHIRE HATHAWAY INC. and Subsidiaries
CONSOLIDATED BALANCE SHEETS (dollars in millions)
See accompanying Notes to Consolidated Financial Statements
2
June 30,
2014 December 31,
2013 (Unaudited) ASSETS Insurance and Other:
Cash and cash equivalents $ 49,182 $ 42,433 Investments:
Fixed maturity securities 29,175 28,785 Equity securities 116,944 115,464 Other 12,197 12,334
Investments in H.J. Heinz Holding Corporation 12,016 12,111 Receivables 22,997 20,280 Inventories 10,199 9,860 Property, plant and equipment 13,999 13,623 Goodwill 34,616 33,067 Other 20,635 19,113
321,960 307,070
Railroad, Utilities and Energy: Cash and cash equivalents 3,410 3,400 Property, plant and equipment 105,670 102,482 Goodwill 22,834 22,603 Other 16,942 16,149
148,856 144,634
Finance and Financial Products: Cash and cash equivalents 2,863 2,353 Investments in equity and fixed maturity securities 1,201 1,506 Other investments 5,723 5,617 Loans and finance receivables 12,517 12,826 Property, plant and equipment and assets held for lease 7,966 7,700 Goodwill 1,342 1,341 Other 1,951 1,884
33,563 33,227
$ 504,379 $ 484,931
LIABILITIES AND SHAREHOLDERS’ EQUITY Insurance and Other:
Losses and loss adjustment expenses $ 65,614 $ 64,866 Unearned premiums 12,393 10,770 Life, annuity and health insurance benefits 12,331 11,681 Accounts payable, accruals and other liabilities 21,368 21,979 Notes payable and other borrowings 12,410 12,440
124,116 121,736
Railroad, Utilities and Energy: Accounts payable, accruals and other liabilities 14,941 14,557 Notes payable and other borrowings 48,840 46,655
63,781 61,212
Finance and Financial Products: Accounts payable, accruals and other liabilities 1,359 1,299 Derivative contract liabilities 4,925 5,331 Notes payable and other borrowings 12,837 13,129
19,121 19,759
Income taxes, principally deferred 60,601 57,739
Total liabilities 267,619 260,446
Shareholders’ equity: Common stock 8 8 Capital in excess of par value 35,491 35,472 Accumulated other comprehensive income 45,421 44,025 Retained earnings 154,848 143,748 Treasury stock, at cost (1,763) (1,363)
Berkshire Hathaway shareholders’ equity 234,005 221,890 Noncontrolling interests 2,755 2,595
Total shareholders’ equity 236,760 224,485
$ 504,379 $ 484,931

BERKSHIRE HATHAWAY INC. and Subsidiaries
CONSOLIDATED STATEMENTS OF EARNINGS (dollars in millions except per share amounts)
See accompanying Notes to Consolidated Financial Statements
3
Second Quarter First Six Months 2014 2013 2014 2013 (Unaudited) (Unaudited)Revenues: Insurance and Other:
Insurance premiums earned $ 9,323 $ 8,815 $ 18,739 $ 18,192 Sales and service revenues 24,846 23,412 47,174 45,408 Interest, dividend and other investment income 1,583 1,608 2,738 2,618 Investment gains/losses 2,366 455 3,425 889
38,118 34,290 72,076 67,107
Railroad, Utilities and Energy: Revenues 9,846 8,378 19,599 16,778
Finance and Financial Products: Sales and service revenues 1,314 1,183 2,410 2,214 Interest, dividend and other investment income 329 344 667 686 Investment gains/losses — 37 72 108 Derivative gains/losses 155 461 391 1,667
1,798 2,025 3,540 4,675
49,762 44,693 95,215 88,560
Costs and expenses: Insurance and Other:
Insurance losses and loss adjustment expenses 5,542 5,269 11,132 10,413 Life, annuity and health insurance benefits 1,279 1,063 2,489 2,324 Insurance underwriting expenses 1,864 1,657 3,765 3,240 Cost of sales and services 20,063 19,095 38,200 37,114 Selling, general and administrative expenses 2,966 2,878 5,854 5,692 Interest expense 116 98 214 191
31,830 30,060 61,654 58,974
Railroad, Utilities and Energy: Cost of sales and operating expenses 7,193 6,094 14,574 12,205 Interest expense 591 452 1,156 899
7,784 6,546 15,730 13,104
Finance and Financial Products: Cost of sales and services 692 648 1,281 1,206 Selling, general and administrative expenses 423 407 800 803 Interest expense 117 141 236 287
1,232 1,196 2,317 2,296
40,846 37,802 79,701 74,374
Earnings before income taxes 8,916 6,891 15,514 14,186 Income tax expense 2,458 2,279 4,283 4,557
Net earnings 6,458 4,612 11,231 9,629 Less: Earnings attributable to noncontrolling
interests 63 71 131 196
Net earnings attributable to Berkshire Hathaway $ 6,395 $ 4,541 $ 11,100 $ 9,433
Average common shares outstanding * 1,644,370 1,643,599 1,644,215 1,643,391 Net earnings per share attributable to Berkshire
Hathaway shareholders * $ 3,889 $ 2,763 $ 6,751 $ 5,740
* Average shares outstanding include average Class A common shares and average Class B common shares determined on anequivalent Class A common stock basis. Net earnings per common share attributable to Berkshire Hathaway shown aboverepresents net earnings per equivalent Class A common share. Net earnings per Class B common share is equal to one-fifteen-hundredth (1/1,500) of such amount.
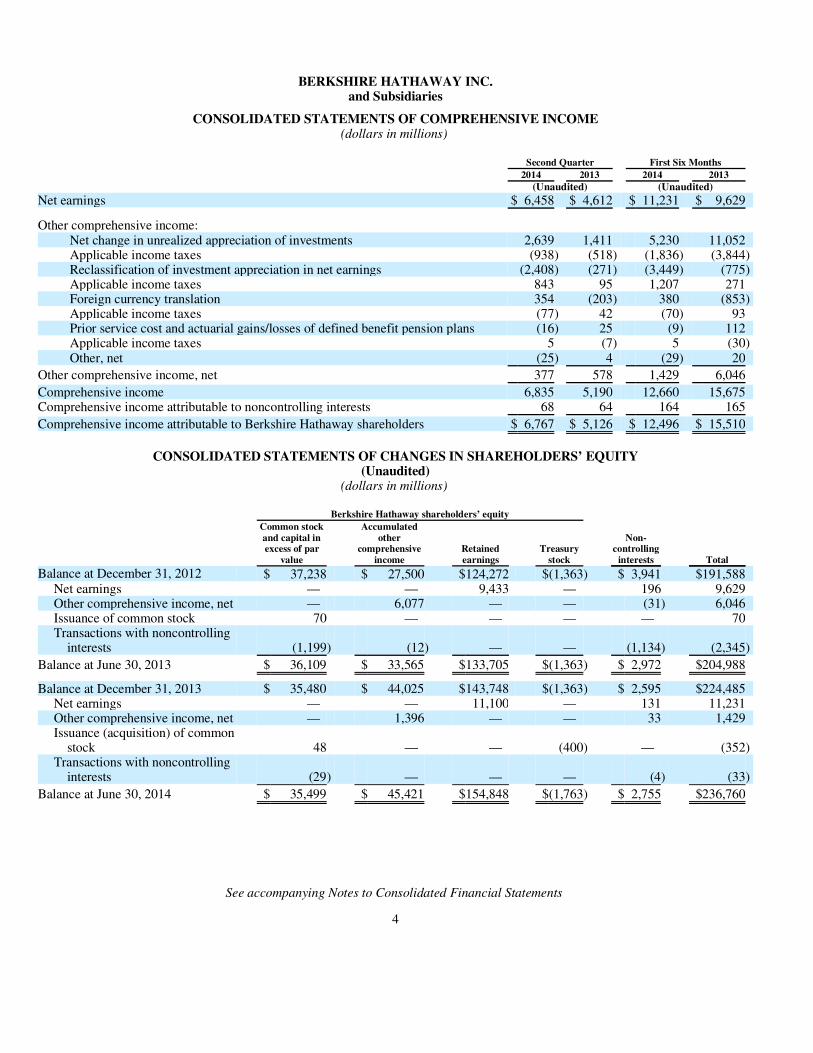
BERKSHIRE HATHAWAY INC. and Subsidiaries
CONSOLIDATED STATEMENTS OF COMPREHENSIVE INCOME (dollars in millions)
CONSOLIDATED STATEMENTS OF CHANGES IN SHAREHOLDERS’ EQUITY (Unaudited)
(dollars in millions)
See accompanying Notes to Consolidated Financial Statements
4
Second Quarter First Six Months 2014 2013 2014 2013 (Unaudited) (Unaudited) Net earnings $ 6,458 $ 4,612 $ 11,231 $ 9,629
Other comprehensive income: Net change in unrealized appreciation of investments 2,639 1,411 5,230 11,052 Applicable income taxes (938) (518) (1,836) (3,844) Reclassification of investment appreciation in net earnings (2,408) (271) (3,449) (775) Applicable income taxes 843 95 1,207 271 Foreign currency translation 354 (203) 380 (853) Applicable income taxes (77) 42 (70) 93 Prior service cost and actuarial gains/losses of defined benefit pension plans (16) 25 (9) 112 Applicable income taxes 5 (7) 5 (30) Other, net (25) 4 (29) 20
Other comprehensive income, net 377 578 1,429 6,046
Comprehensive income 6,835 5,190 12,660 15,675 Comprehensive income attributable to noncontrolling interests 68 64 164 165
Comprehensive income attributable to Berkshire Hathaway shareholders $ 6,767 $ 5,126 $ 12,496 $ 15,510
Berkshire Hathaway shareholders’ equity
Non- controlling
interests
Total
Common stock and capital in excess of par
value
Accumulatedother
comprehensiveincome
Retainedearnings
Treasury stock
Balance at December 31, 2012 $ 37,238 $ 27,500 $124,272 $(1,363) $ 3,941 $191,588 Net earnings — — 9,433 — 196 9,629 Other comprehensive income, net — 6,077 — — (31) 6,046 Issuance of common stock 70 — — — — 70 Transactions with noncontrolling
interests (1,199) (12) — — (1,134) (2,345)
Balance at June 30, 2013 $ 36,109 $ 33,565 $133,705 $(1,363) $ 2,972 $204,988
Balance at December 31, 2013 $ 35,480 $ 44,025 $143,748 $(1,363) $ 2,595 $224,485 Net earnings — — 11,100 — 131 11,231 Other comprehensive income, net — 1,396 — — 33 1,429 Issuance (acquisition) of common
stock 48 — — (400) — (352) Transactions with noncontrolling
interests (29) — — — (4) (33)
Balance at June 30, 2014 $ 35,499 $ 45,421 $154,848 $(1,763) $ 2,755 $236,760
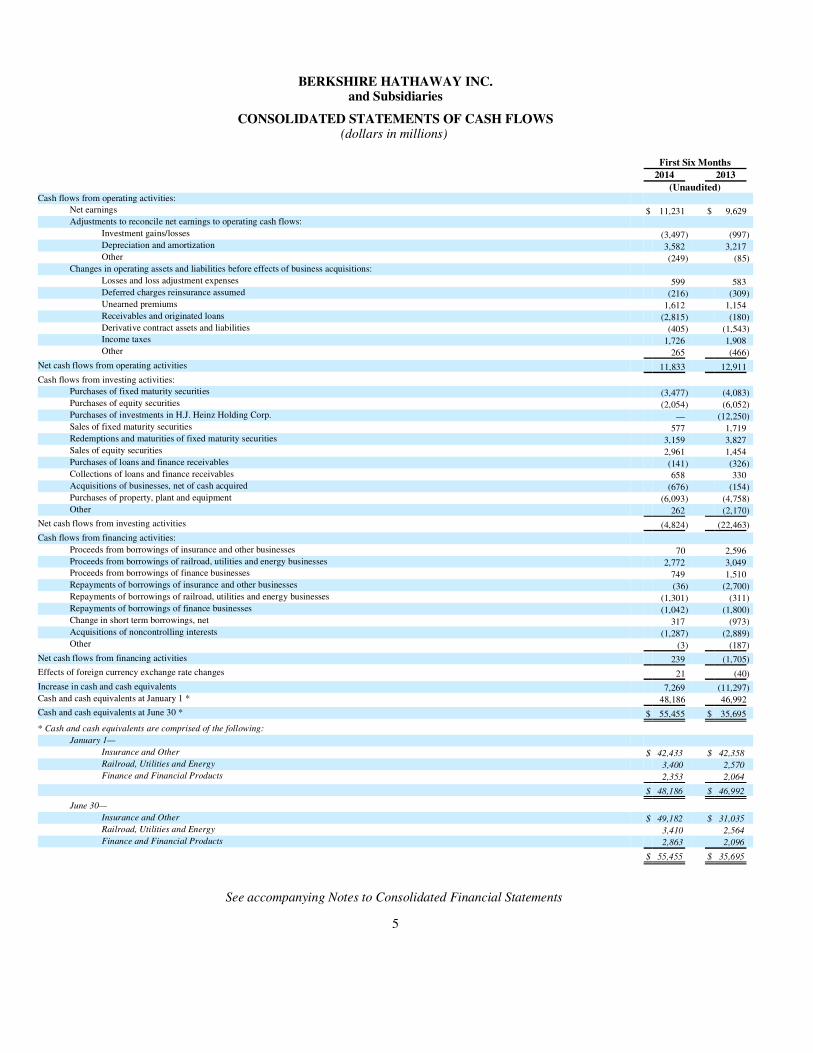
BERKSHIRE HATHAWAY INC. and Subsidiaries
CONSOLIDATED STATEMENTS OF CASH FLOWS (dollars in millions)
See accompanying Notes to Consolidated Financial Statements
5
First Six Months 2014 2013 (Unaudited) Cash flows from operating activities:
Net earnings $ 11,231 $ 9,629 Adjustments to reconcile net earnings to operating cash flows:
Investment gains/losses (3,497) (997) Depreciation and amortization 3,582 3,217 Other (249) (85)
Changes in operating assets and liabilities before effects of business acquisitions: Losses and loss adjustment expenses 599 583 Deferred charges reinsurance assumed (216) (309) Unearned premiums 1,612 1,154 Receivables and originated loans (2,815) (180) Derivative contract assets and liabilities (405) (1,543) Income taxes 1,726 1,908 Other 265 (466)
Net cash flows from operating activities 11,833 12,911
Cash flows from investing activities: Purchases of fixed maturity securities (3,477) (4,083) Purchases of equity securities (2,054) (6,052) Purchases of investments in H.J. Heinz Holding Corp. — (12,250) Sales of fixed maturity securities 577 1,719 Redemptions and maturities of fixed maturity securities 3,159 3,827 Sales of equity securities 2,961 1,454 Purchases of loans and finance receivables (141) (326) Collections of loans and finance receivables 658 330 Acquisitions of businesses, net of cash acquired (676) (154) Purchases of property, plant and equipment (6,093) (4,758) Other 262 (2,170)
Net cash flows from investing activities (4,824) (22,463)
Cash flows from financing activities: Proceeds from borrowings of insurance and other businesses 70 2,596 Proceeds from borrowings of railroad, utilities and energy businesses 2,772 3,049 Proceeds from borrowings of finance businesses 749 1,510 Repayments of borrowings of insurance and other businesses (36) (2,700) Repayments of borrowings of railroad, utilities and energy businesses (1,301) (311) Repayments of borrowings of finance businesses (1,042) (1,800) Change in short term borrowings, net 317 (973) Acquisitions of noncontrolling interests (1,287) (2,889) Other (3) (187)
Net cash flows from financing activities 239 (1,705)
Effects of foreign currency exchange rate changes 21 (40)
Increase in cash and cash equivalents 7,269 (11,297) Cash and cash equivalents at January 1 * 48,186 46,992
Cash and cash equivalents at June 30 * $ 55,455 $ 35,695
* Cash and cash equivalents are comprised of the following: January 1—
Insurance and Other $ 42,433 $ 42,358 Railroad, Utilities and Energy 3,400 2,570 Finance and Financial Products 2,353 2,064
$ 48,186 $ 46,992
June 30— Insurance and Other $ 49,182 $ 31,035 Railroad, Utilities and Energy 3,410 2,564 Finance and Financial Products 2,863 2,096
$ 55,455 $ 35,695

BERKSHIRE HATHAWAY INC. and Subsidiaries
NOTES TO CONSOLIDATED FINANCIAL STATEMENTS June 30, 2014
Note 1. General
The accompanying unaudited Consolidated Financial Statements include the accounts of Berkshire Hathaway Inc. (“Berkshire” or “Company”) consolidated with the accounts of all its subsidiaries and affiliates in which Berkshire holds controlling financial interestsas of the financial statement date. In these notes the terms “us,” “we,” or “our” refer to Berkshire and its consolidated subsidiaries. Reference is made to Berkshire’s most recently issued Annual Report on Form 10-K (“Annual Report”) which includes information necessary or useful to understanding Berkshire’s businesses and financial statement presentations. Our significant accounting policiesand practices were presented as Note 1 to the Consolidated Financial Statements included in the Annual Report. In our 2014 financialstatements, we are presenting Marmon’s transportation equipment manufacturing, repair and leasing businesses as a component offinance and financial products businesses. Prior period amounts in these financial statements have been reclassified to conform to thecurrent year presentation. On April 30, 2014, MidAmerican Energy Holdings Company’s name was changed to Berkshire Hathaway Energy Company (“BHE”).
Financial information in this Report reflects any adjustments (consisting only of normal recurring adjustments) that are, in theopinion of management, necessary to a fair statement of results for the interim periods in accordance with accounting principlesgenerally accepted in the United States (“GAAP”).
For a number of reasons, our results for interim periods are not normally indicative of results to be expected for the year. Thetiming and magnitude of catastrophe losses incurred by insurance subsidiaries and the estimation error inherent to the process ofdetermining liabilities for unpaid losses of insurance subsidiaries can be relatively more significant to results of interim periods than toresults for a full year. Variations in the amount and timing of investment gains/losses can cause significant variations in periodic netearnings. Investment gains/losses are recorded when investments are disposed or are other-than-temporarily impaired. In addition, changes in the fair value of derivative assets/liabilities associated with derivative contracts can cause significant variations in periodicnet earnings.
Note 2. New accounting pronouncements
In February 2013, the FASB issued ASU 2013-04 “Obligations Resulting from Joint and Several Liability Arrangements forWhich the Total Amount of the Obligation Is Fixed at the Reporting Date.” ASU 2013-04 requires an entity to measure obligations resulting from joint and several liability arrangements for which the total amount of the obligation is fixed at the reporting date as theamount the reporting entity agreed to pay plus additional amounts the reporting entity expects to pay on behalf of its co-obligors. ASU 2013-04 became effective as of January 1, 2014. In January 2014, the FASB issued ASU 2014-01 “Accounting for Investments inQualified Affordable Housing Tax Credits.” ASU 2014-01 permits an entity to elect the proportional amortization method of accountingfor limited liability investments in qualified affordable housing projects if certain criteria are met. Under the proportional amortizationmethod, the investment is amortized in proportion to the tax benefits received and the amortization charge is reported as a component ofincome tax expense. We adopted ASU 2014-01 for eligible investments as of January 1, 2014. The adoption of these accountingpronouncements had an immaterial effect on our Consolidated Financial Statements.
In April 2014, the FASB issued ASU 2014-08 “Reporting Discontinued Operations and Disclosures of Disposals of Componentsof an Entity.” ASU 2014-08 provides a narrower definition of discontinued operations than under existing U.S. GAAP. ASU 2014-08 requires that only disposals of components of an entity (or groups of components) that represent a strategic shift that has or will have amajor effect on the reporting entity’s operations are reported in the financial statements as discontinued operations. ASU 2014-08 also provides guidance on the financial statement presentations and disclosures of discontinued operations. ASU 2014-08 is effective prospectively for disposals (or classifications of businesses as held-for-sale) of components of an entity that occur in annual or interimperiods beginning after December 15, 2014.
In May 2014, the FASB issued ASU 2014-09 “Revenue from Contracts with Customers.” ASU 2014-09 applies to most contracts with customers. Insurance and leasing contracts are excluded from the scope of this pronouncement. ASU 2014-09 prescribes a five step framework in accounting for revenues from contracts within its scope, including (a) identification of the contract, (b) identification ofthe performance obligations under the contract, (c) determination of the transaction price, (d) allocation of the transaction price to theidentified performance obligations and (e) recognition of revenues as the identified performance obligations are satisfied. ASU 2014-09 also prescribes additional disclosures and financial statement presentations. ASU 2014-09 is effective for public entities in annual reporting periods beginning after December 15, 2016. Early application is not permitted. ASU 2014-09 may be adopted retrospectivelyor under a modified retrospective method where the cumulative effect is recognized at the date of initial application. We are currentlyevaluating the effect the adoption of this standard will have on our consolidated financial statements.
6

Notes to Consolidated Financial Statements (Continued) Note 3. Significant business acquisitions
Our long-held acquisition strategy is to acquire businesses at sensible prices that have consistent earning power, good returnson equity and able and honest management.
On December 19, 2013, BHE acquired NV Energy, Inc. (“NV Energy”) for cash consideration of approximately $5.6 billion. NV Energy is an energy holding company serving approximately 1.2 million retail electric customers and 0.2 million retail naturalgas customers in Nevada. NV Energy’s principal operating subsidiaries, Nevada Power Company and Sierra Pacific Power Company,are regulated utilities. We accounted for the acquisition pursuant to the acquisition method. NV Energy’s financial results are included in our Consolidated Financial Statements beginning on the acquisition date.
The preliminary values of NV Energy’s identified assets acquired and liabilities assumed and residual goodwill at the date ofacquisition are summarized as follows (in millions).
On January 1, 2014, we acquired the beverage dispensing equipment manufacturing and merchandising operations of Britishengineering company, IMI plc for approximately $1.12 billion. On February 25, 2014, we acquired 100% of the outstanding commonstock of Phillips Specialty Products Inc. (“PSPI”) in exchange for 17,422,615 shares of Phillips 66 (“PSX”) common stock with an aggregate fair value of $1.35 billion. PSPI, which has been renamed as Lubrizol Specialty Products Inc. (“LSPI”), provides flow improver products to customers worldwide. On June 30, 2014, we acquired WPLG, Inc. (“WPLG”), whose assets included a Miami,Florida, ABC affiliated television station, shares of Berkshire Hathaway Class A and Class B common stock and cash in exchange for1,620,190 shares of Graham Holding Company (“GHC”) common stock with an aggregate fair value of $1.13 billion. At theirrespective acquisition dates, the preliminary aggregate fair value of the identified net assets of IMI plc, LSPI and WPLG wasapproximately $2.1 billion and the residual goodwill was approximately $1.5 billion.
The following table sets forth certain unaudited pro forma consolidated earnings data for the first six months of 2013 (inmillions, except the per share amount).
7
December 19, 2013
Property, plant and equipment $ 9,550 Goodwill 2,362 Other assets, including cash and cash equivalents of $304 million 2,481
Assets acquired $ 14,393
Accounts payable, accruals and other liabilities $ 3,455 Notes payable and other borrowings 5,342
Liabilities assumed $ 8,797
Net assets acquired $ 5,596
Revenues $90,362 Net earnings attributable to Berkshire Hathaway shareholders 9,563 Net earnings per equivalent Class A common share attributable to Berkshire Hathaway shareholders 5,819

Notes to Consolidated Financial Statements (Continued) Note 4. Investments in fixed maturity securities
Investments in securities with fixed maturities as of June 30, 2014 and December 31, 2013 are summarized by type below(in millions).
Investments in fixed maturity securities are reflected in our Consolidated Balance Sheets as follows (in millions).
Investments in foreign government securities include securities issued by national and provincial government entities as well asinstruments that are unconditionally guaranteed by such entities. As of June 30, 2014, approximately 92% of foreign governmentholdings were rated AA or higher by at least one of the major rating agencies and securities issued or guaranteed by the UnitedKingdom, Germany, Australia, Canada and The Netherlands represented 76% of these investments. Unrealized losses on all fixedmaturity investments in a continuous unrealized loss position for more than twelve consecutive months were not significant.
The amortized cost and estimated fair value of securities with fixed maturities at June 30, 2014 are summarized below bycontractual maturity dates. Actual maturities will differ from contractual maturities because issuers of certain of the securities retainearly call or prepayment rights. Amounts are in millions.
8
Amortized
Cost Unrealized
Gains Unrealized
Losses Fair
Value Carrying
Value
June 30, 2014 Available for sale:
U.S. Treasury, U.S. government corporations and agencies $ 2,819 $ 16 $ (3) $ 2,832 $ 2,832
States, municipalities and political subdivisions 2,003 109 (1) 2,111 2,111 Foreign governments 12,485 307 (40) 12,752 12,752 Corporate bonds 7,923 1,268 (2) 9,189 9,189 Mortgage-backed securities 1,656 224 (4) 1,876 1,876
26,886 1,924 (50) 28,760 28,760 Held to maturity:
Wm. Wrigley Jr. Company notes 661 10 — 671 661
$27,547 $ 1,934 $ (50) $29,431 $29,421
December 31, 2013 Available for sale:
U.S. Treasury, U.S. government corporations and agencies $ 2,650 $ 16 $ (8) $ 2,658 $ 2,658
States, municipalities and political subdivisions 2,221 129 (5) 2,345 2,345 Foreign governments 11,001 182 (110) 11,073 11,073 Corporate bonds 9,383 1,190 (15) 10,558 10,558 Mortgage-backed securities 1,830 218 (8) 2,040 2,040
27,085 1,735 (146) 28,674 28,674 Held to maturity:
Wm. Wrigley Jr. Company notes 679 17 — 696 679
$27,764 $ 1,752 $ (146) $29,370 $29,353
June 30,
2014 December 31,
2013
Insurance and other $ 29,175 $28,785 Finance and financial products 246 568
$ 29,421 $29,353
Due in oneyear or less
Due after oneyear through
five years
Due after fiveyears through
ten years Due afterten years
Mortgage-backed
securities Total
Amortized cost $7,969 $12,639 $2,628 $2,655 $1,656 $27,547 Fair value 8,075 13,450 2,875 3,155 1,876 29,431

Notes to Consolidated Financial Statements (Continued) Note 5. Investments in equity securities
Investments in equity securities as of June 30, 2014 and December 31, 2013 are summarized based on the primary industry ofthe investee in the table below (in millions).
As of June 30, 2014 and December 31, 2013, we concluded that the unrealized losses shown in the tables above weretemporary. Our conclusions were based on: (a) our ability and intent to hold the securities to recovery; (b) our assessment that theunderlying business and financial condition of each of these issuers was favorable; (c) our opinion that the relative price declines werenot significant; and (d) our belief that market prices will increase to and exceed our cost. As of June 30, 2014 and December 31, 2013,unrealized losses on equity securities in a continuous unrealized loss position for more than twelve consecutive months were $61million and $52 million, respectively.
Investments in equity securities are reflected in our Consolidated Balance Sheets as follows (in millions).
Note 6. Other investments
Other investments include preferred stock of Wm. Wrigley Jr. Company (“Wrigley”), The Dow Chemical Company (“Dow”) and Bank of America Corporation (“BAC”) as well as warrants to purchase common stock of BAC. Information concerning each ofthese investments follows.
In 2008, we acquired $2.1 billion liquidation amount of Wrigley preferred stock in conjunction with Mars Incorporated’s acquisition of Wrigley. The Wrigley preferred stock is entitled to dividends at a rate of 5% per annum. This investment is held withinour Finance and Financial Products businesses.
9
Cost Basis Unrealized
Gains Unrealized
Losses Fair
Value
June 30, 2014 * Banks, insurance and finance $ 22,368 $ 32,190 $ — $ 54,558Consumer products 7,088 18,129 (1) 25,216Commercial, industrial and other 30,151 9,632 (365) 39,418
$ 59,607 $ 59,951 $ (366) $ 119,192
* As of June 30, 2014, approximately 58% of the aggregate fair value was concentrated in the equity securities of four companies(American Express Company – $14.4 billion; Wells Fargo & Company – $25.4 billion; International Business Machines Corporation – $12.7 billion; and The Coca-Cola Company – $16.9 billion).
Cost Basis Unrealized
Gains Unrealized
Losses Fair
Value
December 31, 2013 * Banks, insurance and finance $ 22,420 $ 28,021 $ — $ 50,441Consumer products 7,082 17,854 — 24,936Commercial, industrial and other 29,949 12,322 (143) 42,128
$ 59,451 $ 58,197 $ (143) $ 117,505
* As of December 31, 2013, approximately 55% of the aggregate fair value was concentrated in the equity securities of four
companies (American Express Company – $13.8 billion; Wells Fargo & Company – $21.9 billion; International Business Machines Corporation – $12.8 billion; and The Coca-Cola Company – $16.5 billion).
June 30,
2014 December 31,
2013
Insurance and other $ 116,944 $ 115,464 Railroad, utilities and energy * 1,293 1,103 Finance and financial products 955 938
$ 119,192 $ 117,505
* Included in other assets.

Notes to Consolidated Financial Statements (Continued)
Note 6. Other investments (Continued)
In 2009, we acquired 3,000,000 shares of Series A Cumulative Convertible Perpetual Preferred Stock of Dow (“Dow Preferred”) for a cost of $3 billion. Each share of the Dow Preferred is convertible into 24.201 shares of Dow common stock(equivalent to a conversion price of $41.32 per share). Beginning in April 2014, Dow has the option, to cause some or all of the DowPreferred to be converted into Dow common stock at the then applicable conversion rate, if the closing price on the New York StockExchange of Dow’s common stock price exceeds $53.72 per share for 20 trading days within any period of 30 consecutive tradingdays ending on the day before Dow exercises its option. The Dow Preferred is entitled to dividends at a rate of 8.5% per annum. TheDow Preferred is held by our insurance subsidiaries.
In 2011, we acquired 50,000 shares of 6% Perpetual Preferred Stock of BAC (“BAC Preferred”) and warrants to purchase 700,000,000 shares of common stock of BAC (“BAC Warrants”) for a combined cost of $5 billion. When issued, the BAC Preferredwas redeemable at any time by BAC at a price of $105,000 per share ($5.25 billion in aggregate) and dividends were payable on acumulative basis. At the end of 2013, Berkshire agreed to a proposed amendment to the BAC Preferred and on May 7, 2014, BACshareholders approved the amendment. Pursuant to the amendment, the BAC Preferred may not be redeemed at the option of BACbefore May 7, 2019 and dividends payable on the BAC Preferred are no longer cumulative. The BAC Warrants expire in 2021 and areexercisable for an aggregate cost of $5 billion ($7.142857/share). The BAC Preferred and BAC Warrants are held by our Insurancebusinesses (80%) and our Finance and Financial Products businesses (20%).
Our other investments are classified as available-for-sale and are carried at fair value. In the aggregate, the cost of theseinvestments was $10.0 billion and the fair value was approximately $17.9 billion at June 30, 2014 and December 31, 2013.
Note 7. Investments in H.J. Heinz Holding Corporation
On June 7, 2013, Berkshire and an affiliate of the global investment firm 3G Capital (such affiliate, “3G”), through a newly formed holding company, H.J. Heinz Holding Corporation (“Heinz Holding”), acquired H.J. Heinz Company (“Heinz”). Berkshire and 3G each made equity investments in Heinz Holding, which, together with debt financing obtained by Heinz Holding, was used toacquire all outstanding common stock of Heinz for approximately $23.25 billion in the aggregate.
Heinz is one of the world’s leading marketers and producers of healthy, convenient and affordable foods, specializing inketchup, sauces, meals, soups, snacks and infant nutrition. Heinz is a global family of leading branded products, including Heinz®
Ketchup, sauces, soups, beans, pasta, infant foods, Ore-Ida® potato products, Weight Watchers® Smart Ones® entrées and T.G.I. Friday’s® snacks.
Berkshire’s investments in Heinz Holding consist of 425 million shares of common stock, warrants to acquire approximately46 million additional shares of common stock, and cumulative compounding preferred stock (“Preferred Stock”) with a liquidation preference of $8 billion. The aggregate cost of these investments was $12.25 billion. 3G acquired 425 million shares of HeinzHolding common stock for $4.25 billion. In addition, Heinz Holding reserved 39.6 million shares of common stock for issuance understock options.
The Preferred Stock possesses no voting rights except as required by law or for certain matters specified in the Heinz Holdingcharter. The Preferred Stock is entitled to dividends at 9% per annum whether or not declared, is senior in priority to the commonstock and is callable after June 7, 2016 at the liquidation value plus an applicable premium and any accrued and unpaid dividends.Under the Heinz Holding charter and a shareholders’ agreement entered into as of the acquisition date (the “shareholders’agreement”), after June 7, 2021, Berkshire can cause Heinz Holding to attempt to sell shares of common stock through publicofferings or other issuances (“redemption offerings”), the proceeds of which would be required to be used to redeem any outstandingshares of Preferred Stock. The warrants are exercisable for one cent per share and expire on June 7, 2018.
Berkshire and 3G each currently own 50% of the outstanding shares of common stock and possess equal voting interests inHeinz Holding. Under the shareholders’ agreement, unless and until Heinz Holding engages in a public offering, Berkshire and 3Geach must approve all significant transactions and governance matters involving Heinz Holding and Heinz so long as Berkshire and3G each continue to hold at least 66% of their initial common stock investments, except for (i) the declaration and payment ofdividends on the Preferred Stock, and actions related to a Heinz Holding call of the Preferred Stock, for which Berkshire does nothave a vote or approval right, and (ii) redemption offerings and redemptions resulting therefrom, which may only be triggered byBerkshire. No dividends may be paid on the common stock if there are any unpaid dividends on the Preferred Stock.
10
Notes to Consolidated Financial Statements (Continued)
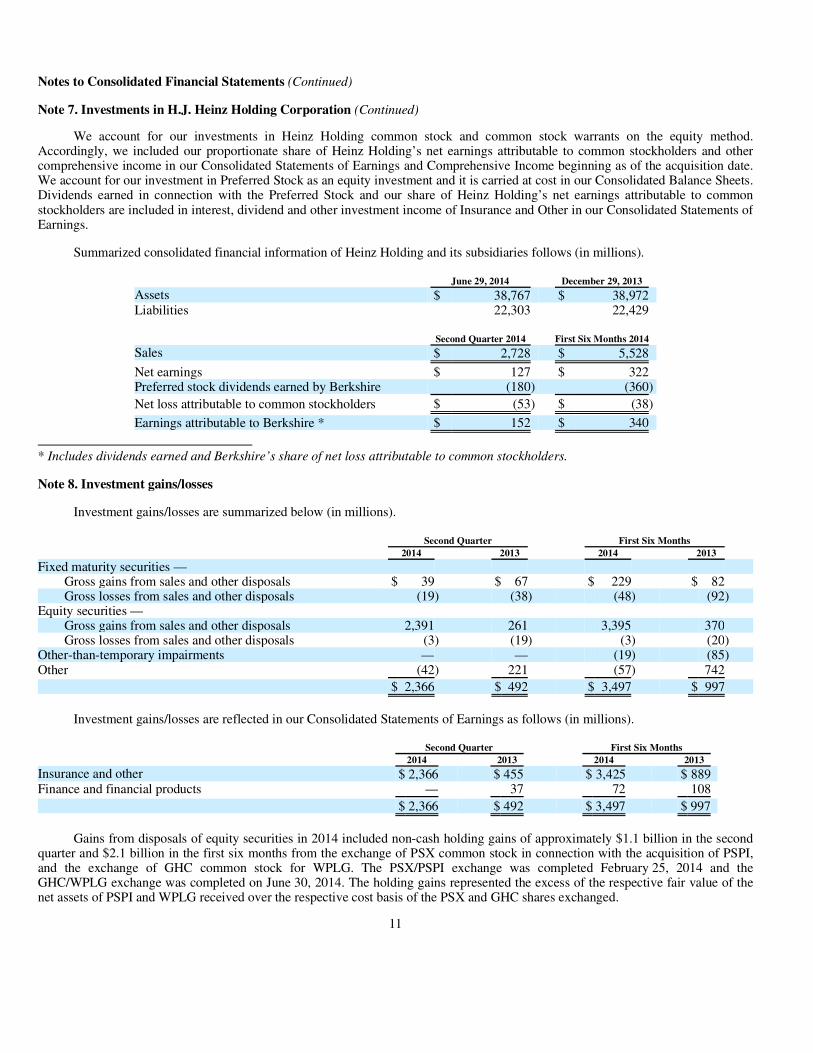
Note 7. Investments in H.J. Heinz Holding Corporation (Continued)
We account for our investments in Heinz Holding common stock and common stock warrants on the equity method.Accordingly, we included our proportionate share of Heinz Holding’s net earnings attributable to common stockholders and othercomprehensive income in our Consolidated Statements of Earnings and Comprehensive Income beginning as of the acquisition date.We account for our investment in Preferred Stock as an equity investment and it is carried at cost in our Consolidated Balance Sheets.Dividends earned in connection with the Preferred Stock and our share of Heinz Holding’s net earnings attributable to common stockholders are included in interest, dividend and other investment income of Insurance and Other in our Consolidated Statements ofEarnings.
Summarized consolidated financial information of Heinz Holding and its subsidiaries follows (in millions).
* Includes dividends earned and Berkshire’s share of net loss attributable to common stockholders.
Note 8. Investment gains/losses
Investment gains/losses are summarized below (in millions).
Investment gains/losses are reflected in our Consolidated Statements of Earnings as follows (in millions).
Gains from disposals of equity securities in 2014 included non-cash holding gains of approximately $1.1 billion in the secondquarter and $2.1 billion in the first six months from the exchange of PSX common stock in connection with the acquisition of PSPI,and the exchange of GHC common stock for WPLG. The PSX/PSPI exchange was completed February 25, 2014 and theGHC/WPLG exchange was completed on June 30, 2014. The holding gains represented the excess of the respective fair value of thenet assets of PSPI and WPLG received over the respective cost basis of the PSX and GHC shares exchanged.
11
June 29, 2014 December 29, 2013 Assets $ 38,767 $ 38,972 Liabilities 22,303 22,429
Second Quarter 2014 First Six Months 2014 Sales $ 2,728 $ 5,528
Net earnings $ 127 $ 322 Preferred stock dividends earned by Berkshire (180) (360)
Net loss attributable to common stockholders $ (53) $ (38)
Earnings attributable to Berkshire * $ 152 $ 340
Second Quarter First Six Months 2014 2013 2014 2013 Fixed maturity securities —
Gross gains from sales and other disposals $ 39 $ 67 $ 229 $ 82 Gross losses from sales and other disposals (19) (38) (48) (92)
Equity securities — Gross gains from sales and other disposals 2,391 261 3,395 370 Gross losses from sales and other disposals (3) (19) (3) (20)
Other-than-temporary impairments — — (19) (85) Other (42) 221 (57) 742
$ 2,366 $ 492 $ 3,497 $ 997
Second Quarter First Six Months 2014 2013 2014 2013
Insurance and other $ 2,366 $ 455 $ 3,425 $ 889 Finance and financial products — 37 72 108
$ 2,366 $ 492 $ 3,497 $ 997

Notes to Consolidated Financial Statements (Continued) Note 9. Receivables
Receivables of insurance and other businesses are comprised of the following (in millions).
Loans and finance receivables of finance and financial products businesses are comprised of the following (in millions).
Consumer installment loans represented approximately 97% and 95% of the aggregate consumer installment loans, commercialloans and finance receivables as of June 30, 2014 and December 31, 2013, respectively. Allowances for uncollectible loanspredominantly related to consumer installment loans. Provisions for loan losses for the first six months of 2014 and 2013 were$94 million and $128 million, respectively, and loan charge-offs, net of recoveries, were $102 million in 2014 and $151 million in2013. The carrying values of loans were net of unamortized acquisition discounts of $308 million at June 30, 2014 and $406 millionat December 31, 2013. At June 30, 2014, approximately 97% of the loan balances were evaluated collectively for impairment, and theremainder were evaluated individually for impairment. As a part of the evaluation process, credit quality indicators are reviewed andloans are designated as performing or non-performing. At June 30, 2014, approximately 98% of the loan balances were determined tobe performing and approximately 94% of those balances were current as to payment status.
Note 10. Inventories
Inventories are comprised of the following (in millions).
Note 11. Property, plant and equipment and assets held for lease
A summary of property, plant and equipment of our insurance and other businesses follows (in millions).
Depreciation expense attributable to assets of insurance and other businesses for the first six months of 2014 and 2013 was$797 million and $802 million, respectively.
12
June 30,
2014 December 31,
2013
Insurance premiums receivable $ 8,638 $ 7,474 Reinsurance recoverable on unpaid losses 3,233 3,055 Trade and other receivables 11,477 10,111 Allowances for uncollectible accounts (351) (360)
$ 22,997 $ 20,280
June 30,
2014 December 31,
2013
Consumer installment loans, commercial loans and finance receivables $ 12,853 $ 13,170 Allowances for uncollectible loans (336) (344)
$ 12,517 $ 12,826
June 30,
2014 December 31,
2013
Raw materials $ 1,889 $ 1,755 Work in process and other 900 842 Finished manufactured goods 3,447 3,206 Goods acquired for resale 3,963 4,057
$10,199 $ 9,860
Ranges of
estimated useful life June 30,
2014 December 31,
2013 Land — $ 1,125 $ 1,098 Buildings and improvements 2 – 40 years 6,415 6,244 Machinery and equipment 3 – 25 years 16,313 15,984 Furniture, fixtures and other 2 – 15 years 3,082 2,748
26,935 26,074 Accumulated depreciation (12,936) (12,451)
$ 13,999 $ 13,623
Notes to Consolidated Financial Statements (Continued)
Note 11. Property, plant and equipment and assets held for lease (Continued)
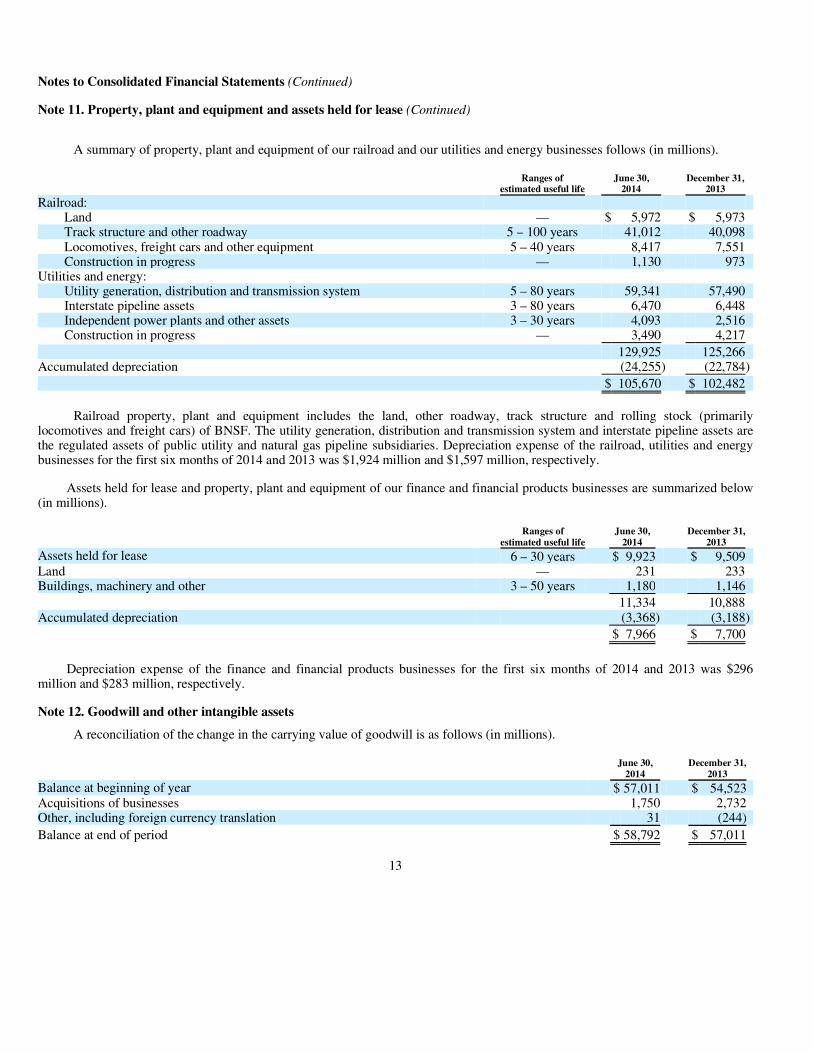
A summary of property, plant and equipment of our railroad and our utilities and energy businesses follows (in millions).
Railroad property, plant and equipment includes the land, other roadway, track structure and rolling stock (primarilylocomotives and freight cars) of BNSF. The utility generation, distribution and transmission system and interstate pipeline assets arethe regulated assets of public utility and natural gas pipeline subsidiaries. Depreciation expense of the railroad, utilities and energybusinesses for the first six months of 2014 and 2013 was $1,924 million and $1,597 million, respectively.
Assets held for lease and property, plant and equipment of our finance and financial products businesses are summarized below(in millions).
Depreciation expense of the finance and financial products businesses for the first six months of 2014 and 2013 was $296million and $283 million, respectively.
Note 12. Goodwill and other intangible assets
A reconciliation of the change in the carrying value of goodwill is as follows (in millions).
13
Ranges of
estimated useful life June 30,
2014 December 31,
2013
Railroad: Land — $ 5,972 $ 5,973 Track structure and other roadway 5 – 100 years 41,012 40,098 Locomotives, freight cars and other equipment 5 – 40 years 8,417 7,551 Construction in progress — 1,130 973
Utilities and energy: Utility generation, distribution and transmission system 5 – 80 years 59,341 57,490 Interstate pipeline assets 3 – 80 years 6,470 6,448 Independent power plants and other assets 3 – 30 years 4,093 2,516 Construction in progress — 3,490 4,217
129,925 125,266 Accumulated depreciation (24,255) (22,784)
$ 105,670 $ 102,482
Ranges of
estimated useful life June 30,
2014 December 31,
2013
Assets held for lease 6 – 30 years $ 9,923 $ 9,509 Land — 231 233 Buildings, machinery and other 3 – 50 years 1,180 1,146
11,334 10,888 Accumulated depreciation (3,368) (3,188)
$ 7,966 $ 7,700
June 30,
2014 December 31,
2013
Balance at beginning of year $ 57,011 $ 54,523 Acquisitions of businesses 1,750 2,732 Other, including foreign currency translation 31 (244)
Balance at end of period $ 58,792 $ 57,011

Notes to Consolidated Financial Statements (Continued)
Note 12. Goodwill and other intangible assets (Continued)
Intangible assets other than goodwill are included in other assets and are summarized as follows (in millions).
Amortization expense was $565 million for the first six months of 2014 and $535 million for the first six months of 2013.Intangible assets with indefinite lives as of June 30, 2014 and December 31, 2013 were $2,460 million and $2,221 million,respectively.
Note 13. Derivative contracts
Derivative contracts have been entered into primarily by our finance and financial products and our energy businesses.Substantially all of the derivative contracts of our finance and financial products businesses are not designated as hedges for financialreporting purposes. Changes in the fair values of such contracts are reported in earnings as derivative gains/losses. We entered intothese contracts with the expectation that the premiums received would exceed the amounts ultimately paid to counterparties. Asummary of derivative contracts of our finance and financial products businesses follows (in millions).
Derivative gains/losses of our finance and financial products businesses included in our Consolidated Statements of Earningswere as follows (in millions).
14
June 30, 2014 December 31, 2013
Gross carrying
amount Accumulatedamortization
Gross carryingamount
Accumulatedamortization
Insurance and other $ 12,882 $ 4,017 $ 11,923 $ 3,723 Railroad, utilities and energy 2,254 1,387 2,214 1,231
$ 15,136 $ 5,404 $ 14,137 $ 4,954
Trademarks and trade names $ 3,011 $ 392 $ 2,750 $ 340 Patents and technology 5,703 2,920 5,173 2,626 Customer relationships 4,786 1,587 4,690 1,518 Other 1,636 505 1,524 470
$ 15,136 $ 5,404 $ 14,137 $ 4,954
June 30, 2014 December 31, 2013
Assets Liabilities Notional
Value Assets Liabilities Notional
Value
Equity index put options $ — $ 4,734 $32,362(1) $ — $ 4,667 $32,095(1) Credit default — 191 7,792(2) — 648 7,792(2) Other, principally interest rate and foreign currency — — — 16
$ — $ 4,925 $ — $ 5,331
(1) Represents the aggregate undiscounted amount payable at the contract expiration dates assuming that the value of the relatedindex is zero at each contract’s expiration date.
(2) Represents the maximum undiscounted future value of losses payable under the contracts, if all underlying issuers default andthe residual value of the specified obligations is zero.
Second Quarter First Six Months 2014 2013 2014 2013
Equity index put options $ 65 $ 390 $ (67) $ 1,636 Credit default 84 99 457 85 Other, principally interest rate and foreign currency 6 (28) 1 (54)
$ 155 $ 461 $ 391 $ 1,667
Notes to Consolidated Financial Statements (Continued)
Note 13. Derivative contracts (Continued)
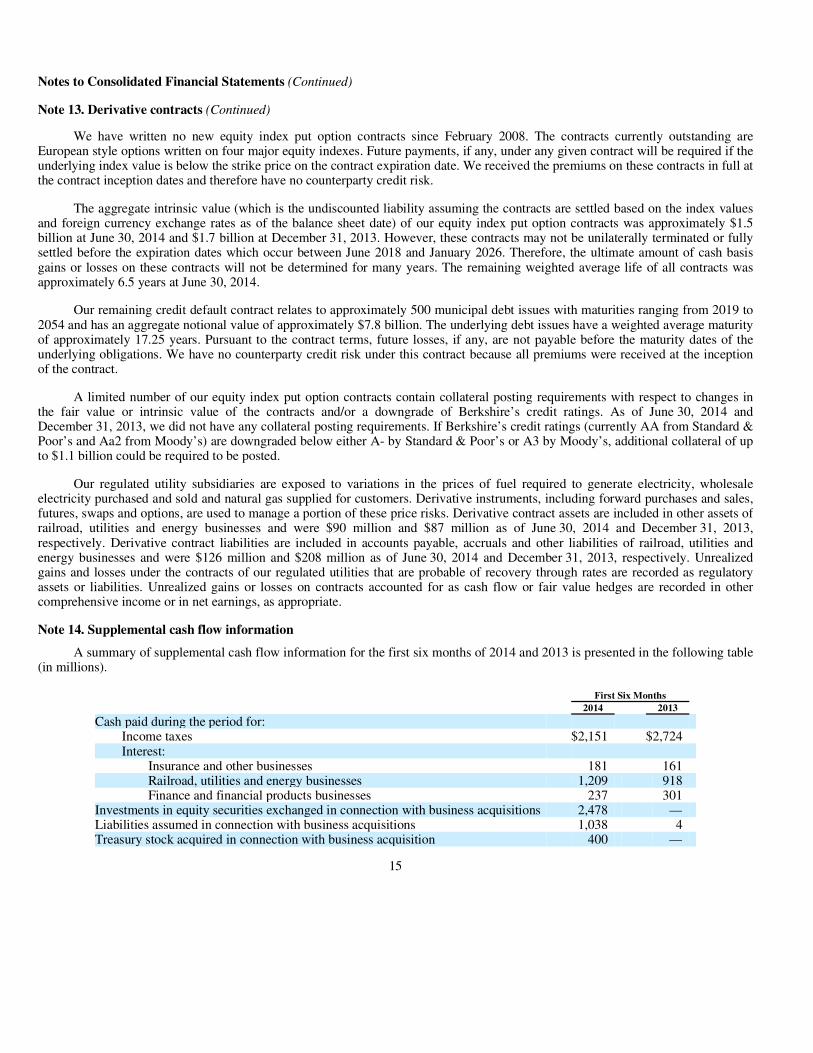
We have written no new equity index put option contracts since February 2008. The contracts currently outstanding areEuropean style options written on four major equity indexes. Future payments, if any, under any given contract will be required if theunderlying index value is below the strike price on the contract expiration date. We received the premiums on these contracts in full atthe contract inception dates and therefore have no counterparty credit risk.
The aggregate intrinsic value (which is the undiscounted liability assuming the contracts are settled based on the index valuesand foreign currency exchange rates as of the balance sheet date) of our equity index put option contracts was approximately $1.5billion at June 30, 2014 and $1.7 billion at December 31, 2013. However, these contracts may not be unilaterally terminated or fullysettled before the expiration dates which occur between June 2018 and January 2026. Therefore, the ultimate amount of cash basisgains or losses on these contracts will not be determined for many years. The remaining weighted average life of all contracts wasapproximately 6.5 years at June 30, 2014.
Our remaining credit default contract relates to approximately 500 municipal debt issues with maturities ranging from 2019 to2054 and has an aggregate notional value of approximately $7.8 billion. The underlying debt issues have a weighted average maturityof approximately 17.25 years. Pursuant to the contract terms, future losses, if any, are not payable before the maturity dates of theunderlying obligations. We have no counterparty credit risk under this contract because all premiums were received at the inceptionof the contract.
A limited number of our equity index put option contracts contain collateral posting requirements with respect to changes inthe fair value or intrinsic value of the contracts and/or a downgrade of Berkshire’s credit ratings. As of June 30, 2014 and December 31, 2013, we did not have any collateral posting requirements. If Berkshire’s credit ratings (currently AA from Standard & Poor’s and Aa2 from Moody’s) are downgraded below either A- by Standard & Poor’s or A3 by Moody’s, additional collateral of up to $1.1 billion could be required to be posted.
Our regulated utility subsidiaries are exposed to variations in the prices of fuel required to generate electricity, wholesaleelectricity purchased and sold and natural gas supplied for customers. Derivative instruments, including forward purchases and sales,futures, swaps and options, are used to manage a portion of these price risks. Derivative contract assets are included in other assets ofrailroad, utilities and energy businesses and were $90 million and $87 million as of June 30, 2014 and December 31, 2013,respectively. Derivative contract liabilities are included in accounts payable, accruals and other liabilities of railroad, utilities andenergy businesses and were $126 million and $208 million as of June 30, 2014 and December 31, 2013, respectively. Unrealizedgains and losses under the contracts of our regulated utilities that are probable of recovery through rates are recorded as regulatoryassets or liabilities. Unrealized gains or losses on contracts accounted for as cash flow or fair value hedges are recorded in othercomprehensive income or in net earnings, as appropriate.
Note 14. Supplemental cash flow information
A summary of supplemental cash flow information for the first six months of 2014 and 2013 is presented in the following table(in millions).
15
First Six Months 2014 2013 Cash paid during the period for:
Income taxes $2,151 $2,724 Interest:
Insurance and other businesses 181 161 Railroad, utilities and energy businesses 1,209 918 Finance and financial products businesses 237 301
Investments in equity securities exchanged in connection with business acquisitions 2,478 — Liabilities assumed in connection with business acquisitions 1,038 4 Treasury stock acquired in connection with business acquisition 400 —

Notes to Consolidated Financial Statements (Continued) Note 15. Notes payable and other borrowings
Notes payable and other borrowings are summarized below (in millions). The weighted average interest rates and maturity dateranges shown in the following tables are based on borrowings as of June 30, 2014.
BHE subsidiary debt represents amounts issued pursuant to separate financing agreements. All, or substantially all, of theassets of certain BHE subsidiaries are, or may be, pledged or encumbered to support or otherwise secure the debt. These borrowingarrangements generally contain various covenants including, but not limited to, leverage ratios, interest coverage ratios and debtservice coverage ratios. In the first six months of 2014, BHE subsidiaries issued term debt of $1,272 million.
In March 2014, BNSF issued $500 million of 3.75% debentures due in 2024 and $1.0 billion of 4.9% debentures due in 2044.BNSF’s borrowings are primarily unsecured. As of June 30, 2014, BNSF and BHE and their subsidiaries were in compliance with allapplicable debt covenants. Berkshire does not guarantee any debt, borrowings or lines of credit of BNSF, BHE or their subsidiaries.
The borrowings of BHFC, a wholly owned finance subsidiary of Berkshire, are fully and unconditionally guaranteed byBerkshire. In January 2014, $750 million of BHFC senior notes matured and BHFC issued $750 million of new senior notes toreplace maturing notes. The new senior notes consisted of $650 million of floating rate notes due in 2017 and $100 million of 2%notes due in 2018.
Our subsidiaries have unused lines of credit and commercial paper capacity aggregating approximately $7.2 billion at June 30,2014, to support short-term borrowing programs and provide additional liquidity. Such unused lines of credit included about $4.1 billion related to BHE and its subsidiaries. In addition to BHFC’s borrowings, Berkshire has guaranteed other subsidiary borrowings,aggregating approximately $3.9 billion at June 30, 2014. Generally, Berkshire’s guarantee of a subsidiary’s debt obligation is an absolute, unconditional and irrevocable guarantee for the full and prompt payment when due of all present and future paymentobligations.
16
Weighted Average
Interest Rate June 30,
2014 December 31,
2013
Insurance and other: Issued by Berkshire due 2014-2047 2.7% $ 8,357 $ 8,311 Short-term subsidiary borrowings 0.4% 890 949 Other subsidiary borrowings due 2014-2035 6.0% 3,163 3,180
$12,410 $ 12,440
Weighted Average
Interest Rate June 30,
2014 December 31,
2013 Railroad, utilities and energy:
Issued by Berkshire Hathaway Energy Company (“BHE”) and its subsidiaries: BHE senior unsecured debt due 2017-2043 5.7% $ 6,366 $ 6,616 Subsidiary and other debt due 2014-2054 5.2% 24,593 23,033
Issued by Burlington Northern Santa Fe LLC and its subsidiaries (“BNSF”) due 2014-2097 5.1% 17,881 17,006
$48,840 $ 46,655
Weighted Average
Interest Rate June 30,
2014 December 31,
2013
Finance and financial products: Issued by Berkshire Hathaway Finance Corporation (“BHFC”) due 2014-2043 3.3% $11,178 $ 11,178 Issued by other subsidiaries due 2014-2036 4.7% 1,659 1,951
$12,837 $ 13,129

Notes to Consolidated Financial Statements (Continued) Note 16. Fair value measurements
Our financial assets and liabilities are summarized below as of June 30, 2014 and December 31, 2013 with fair values shownaccording to the fair value hierarchy (in millions). The carrying values of cash and cash equivalents, accounts receivable and accountspayable, accruals and other liabilities are considered to be reasonable estimates of their fair values.
17
Carrying
Value Fair Value
QuotedPrices
(Level 1)
Significant Other Observable Inputs
(Level 2)
SignificantUnobservable Inputs
(Level 3)
June 30, 2014 Investments in fixed maturity securities:
U.S. Treasury, U.S. government corporations and agencies $ 2,832 $ 2,832 $ 2,270 $ 562 $ —
States, municipalities and political subdivisions 2,111 2,111 — 2,111 — Foreign governments 12,752 12,752 7,771 4,981 — Corporate bonds 9,850 9,860 — 8,875 985Mortgage-backed securities 1,876 1,876 — 1,876 —
Investments in equity securities 119,192 119,192 119,125 60 7Investment in Heinz Holding Preferred Stock 7,710 8,384 — — 8,384Other investments 17,920 17,920 — — 17,920Loans and finance receivables 12,517 11,589 — 48 11,541Derivative contract assets (1) 90 90 3 27 60Derivative contract liabilities:
Railroad, utilities and energy (1) 126 126 1 74 51Finance and financial products:
Equity index put options 4,734 4,734 — — 4,734Credit default 191 191 — — 191
Notes payable and other borrowings: Insurance and other 12,410 12,918 — 12,918 — Railroad, utilities and energy 48,840 54,539 — 54,539 — Finance and financial products 12,837 13,458 — 12,849 609
December 31, 2013 Investments in fixed maturity securities:
U.S. Treasury, U.S. government corporations and agencies $ 2,658 $ 2,658 $ 2,184 $ 473 $ 1
States, municipalities and political subdivisions 2,345 2,345 — 2,345 — Foreign governments 11,073 11,073 7,467 3,606 — Corporate bonds 11,237 11,254 — 10,187 1,067Mortgage-backed securities 2,040 2,040 — 2,040 —
Investments in equity securities 117,505 117,505 117,438 60 7Investment in Heinz Holding Preferred Stock 7,710 7,971 — — 7,971Other investments 17,951 17,951 — — 17,951Loans and finance receivables 12,826 12,002 — 454 11,548Derivative contract assets (1) 87 87 3 15 69Derivative contract liabilities:
Railroad, utilities and energy (1) 208 208 1 198 9Finance and financial products:
Equity index put options 4,667 4,667 — — 4,667Credit default 648 648 — — 648
Notes payable and other borrowings: Insurance and other 12,440 12,655 — 12,655 — Railroad, utilities and energy 46,655 49,879 — 49,879 — Finance and financial products 13,129 13,505 — 12,846 659
(1) Assets are included in other assets and liabilities are included in accounts payable, accruals and other liabilities.

Notes to Consolidated Financial Statements (Continued)
Note 16. Fair value measurements (Continued)
The fair values of substantially all of our financial instruments were measured using market or income approaches.Considerable judgment may be required in interpreting market data used to develop the estimates of fair value. Accordingly, the fairvalues presented are not necessarily indicative of the amounts that could be realized in an actual current market exchange. The use ofalternative market assumptions and/or estimation methodologies may have a material effect on the estimated fair value. The hierarchyfor measuring fair value consists of Levels 1 through 3, which are described below.
Level 1 – Inputs represent unadjusted quoted prices for identical assets or liabilities exchanged in active markets.
Level 2 – Inputs include directly or indirectly observable inputs (other than Level 1 inputs) such as quoted prices for similarassets or liabilities exchanged in active or inactive markets; quoted prices for identical assets or liabilities exchanged in inactivemarkets; other inputs that may be considered in fair value determinations of the assets or liabilities, such as interest rates andyield curves, volatilities, prepayment speeds, loss severities, credit risks and default rates; and inputs that are derivedprincipally from or corroborated by observable market data by correlation or other means. Pricing evaluations generally reflectdiscounted expected future cash flows, which incorporate yield curves for instruments with similar characteristics, such ascredit ratings, estimated durations and yields for other instruments of the issuer or entities in the same industry sector.
Level 3 – Inputs include unobservable inputs used in the measurement of assets and liabilities. Management is required to useits own assumptions regarding unobservable inputs because there is little, if any, market activity in the assets or liabilities andwe may be unable to corroborate the related observable inputs. Unobservable inputs require management to make certainprojections and assumptions about the information that would be used by market participants in pricing assets or liabilities.
Reconciliations of assets and liabilities measured and carried at fair value on a recurring basis with the use of significantunobservable inputs (Level 3) for the six months ending June 30, 2014 and 2013 follow (in millions).
In the second quarter of 2013, we transferred the fair value measurements of the Goldman Sachs Warrants and General ElectricWarrants from Level 3 to Level 2 because we concluded that the unobservable inputs were no longer significant.
18
Investmentsin fixed
maturitysecurities
Investmentsin equity securities and other
investments
Netderivativecontractliabilities
Six months ending June 30, 2014 Balance at December 31, 2013 $ 372 $17,958 $(5,255) Gains (losses) included in:
Earnings — — 369 Other comprehensive income — (31) 4 Regulatory assets and liabilities — — —
Dispositions and settlements (1) — 1 Transfers into (out of) Level 3 (56) — (35)
Balance at June 30, 2014 $ 315 $17,927 $(4,916)
Six months ending June 30, 2013 Balance at December 31, 2012 $ 652 $15,785 $(7,847) Gains (losses) included in:
Earnings — 523 1,715 Other comprehensive income (12) 722 (5) Regulatory assets and liabilities — — 2
Dispositions and settlements (8) (31) (45) Transfers into (out of) Level 3 — (1,495) —
Balance at June 30, 2013 $ 632 $15,504 $(6,180)

Notes to Consolidated Financial Statements (Continued)
Note 16. Fair value measurements (Continued)
Gains and losses recorded in earnings are reported as components of investment gains/losses, derivative gains/losses and otherrevenues, as appropriate and are primarily related to changes in the values of derivative contracts and settlement transactions. Gainsand losses recorded in other comprehensive income are reported as components of the net change in unrealized appreciation ofinvestments and the reclassification of investment appreciation in earnings, as appropriate in the Consolidated Statements ofComprehensive Income.
Quantitative information as of June 30, 2014, with respect to assets and liabilities measured and carried at fair value on arecurring basis with the use of significant unobservable inputs (Level 3) follows (in millions).
Other investments currently consist of investments that were acquired in a few relatively large private placement transactionsand include preferred stocks and common stock warrants. These investments are subject to contractual restrictions on transferabilityand/or provisions that prevent us from economically hedging the values of our investments. In applying discounted estimated cashflow techniques in valuing the perpetual preferred stocks, we made assumptions regarding the expected durations of the investments,as the issuers may have the right to redeem or convert these investments. We also made estimates regarding the impact ofsubordination, as the preferred stocks have a lower priority in liquidation than debt instruments of the issuers, which affected thediscount rates used. In valuing the common stock warrants, we used a warrant valuation model. While most of the inputs to the modelare observable, we are subject to the aforementioned contractual restrictions. We have applied discounts with respect to thecontractual restrictions. Increases or decreases to these inputs would result in decreases or increases to the fair values of theinvestments.
Our equity index put option and credit default contracts are not exchange traded and certain contract terms are not standard inderivatives markets. For example, we are not required to post collateral under most of our contracts and many contracts have longdurations, and otherwise are illiquid. For these and other reasons, we classified these contracts as Level 3. The methods we use tovalue these contracts are those that we believe market participants would use in determining exchange prices with respect to suchcontracts.
We value equity index put option contracts based on the Black-Scholes option valuation model. Inputs to this model includecurrent index price, contract duration, dividend and interest rate inputs (including a Berkshire non-performance input) which areobservable. However, we believe that the valuation of long-duration options using any model is inherently subjective, given the lackof observable transactions and prices, and acceptable values may be subject to wide ranges. Expected volatility inputs represent ourexpectations after considering the remaining duration of each contract and that the contracts will remain outstanding until theexpiration dates without offsetting transactions occurring in the interim. Increases or decreases in the volatility inputs will produceincreases or decreases in the fair values of the liabilities.
19
Fair
Value Principal Valuation
Techniques Unobservable Inputs WeightedAverage
Other investments: Preferred stocks $12,306 Discounted cash flow Expected duration 6 years
Discount for transferability restrictions and subordination 97 basis points
Common stock warrants
5,614
Warrant pricing model
Discount for transferability and hedging restrictions 9%
Net derivative liabilities: Equity index put options 4,734 Option pricing model Volatility 20%
Credit default-states/municipalities 191 Discounted cash flow Credit spreads 17 basis points

Notes to Consolidated Financial Statements (Continued) Note 17. Common stock
Changes in Berkshire’s issued and outstanding common stock during the first six months of 2014 are shown in the table below.
Each Class A common share is entitled to one vote per share. Class B common stock possesses dividend and distribution rightsequal to one-fifteen-hundredth (1/1,500) of such rights of Class A common stock. Each Class B common share possesses votingrights equivalent to one-ten-thousandth (1/10,000) of the voting rights of a Class A share. Unless otherwise required under DelawareGeneral Corporation Law, Class A and Class B common shares vote as a single class. Each share of Class A common stock isconvertible, at the option of the holder, into 1,500 shares of Class B common stock. Class B common stock is not convertible intoClass A common stock. On an equivalent Class A common stock basis, there were 1,642,335 shares outstanding as of June 30, 2014and 1,643,954 shares outstanding as of December 31, 2013. In addition to our common stock, 1,000,000 shares of preferred stock areauthorized, but none are issued and outstanding.
In September 2011, Berkshire’s Board of Directors (“Berkshire’s Board”) approved a common stock repurchase program under which Berkshire may repurchase its Class A and Class B shares at prices no higher than a 10% premium over the book value ofthe shares. In December 2012, Berkshire’s Board amended the repurchase program by raising the price limit to no higher than a 20%premium over book value. Berkshire may repurchase shares in the open market or through privately negotiated transactions.Berkshire’s Board authorization does not specify a maximum number of shares to be repurchased. However, repurchases will not bemade if they would reduce Berkshire’s consolidated cash equivalent holdings below $20 billion. The repurchase program is expectedto continue indefinitely and the amount of repurchases will depend entirely upon the level of cash available, the attractiveness ofinvestment and business opportunities either at hand or on the horizon, and the degree of discount of the market price relative tomanagement’s estimate of intrinsic value. The repurchase program does not obligate Berkshire to repurchase any dollar amount ornumber of Class A or Class B shares and there is no expiration date to the program. There were no share repurchases under theprogram in the first six months of 2014.
In addition, on June 30, 2014, we exchanged approximately 1.62 million shares of GHC common stock for WPLG whoseassets included 2,107 shares of Berkshire Hathaway Class A Common Stock and 1,278 shares of Class B Common Stock. Theseshares are reflected as treasury stock in our Consolidated Financial Statements. The value of the Berkshire shares received wasapproximately $400 million.
20
Class A, $5 Par Value
(1,650,000 shares authorized)Class B, $0.0033 Par Value
(3,225,000,000 shares authorized) Issued Treasury Outstanding Issued Treasury Outstanding
Balance at December 31, 2013 868,616 (9,573) 859,043 1,178,775,092 (1,408,484) 1,177,366,608 Conversions of Class A common stock to
Class B common stock and exercises of replacement stock options issued in a business acquisition (5,391) — (5,391) 8,819,007 — 8,819,007
Treasury shares acquired — (2,107) (2,107) — (1,278) (1,278)
Balance at June 30, 2014 863,225 (11,680) 851,545 1,187,594,099 (1,409,762) 1,186,184,337

Notes to Consolidated Financial Statements (Continued) Note 18. Accumulated other comprehensive income
A summary of the net changes in after-tax accumulated other comprehensive income attributable to Berkshire Hathawayshareholders and significant amounts reclassified out of accumulated other comprehensive income for the six months ending June 30,2014 and 2013 follows (in millions).
21
Unrealizedappreciation ofinvestments, net
Foreigncurrency
translation
Prior service and actuarial gains/losses of defined benefitpension plans Other
Accumulatedother
comprehensiveincome
Six months ending June 30, 2014 Balance at December 31, 2013 $44,042 $(146) $ 46 $ 83 $44,025
Other comprehensive income, net before reclassifications 3,378 247 (31) (3) 3,591
Amounts reclassified from accumulated other comprehensive income (2,242) 47 27 (27) (2,195)
1,136 294 (4) (30) 1,396
Balance at June 30, 2014 $45,178 $ 148 $ 42 $ 53 $45,421
Amounts reclassified from other comprehensive income into net earnings during 2014 are included on the following line items:
Investment gains/losses: Insurance and other $ (3,377) $ — $ — $ — $ (3,377)Finance and financial products (72) — — — (72)
Other — 47 36 (45) 38
Reclassifications before income taxes (3,449) 47 36 (45) (3,411)Applicable income taxes (1,207) — 9 (18) (1,216)
$ (2,242) $ 47 $ 27 $ (27) $ (2,195)
Six months ending June 30, 2013 Balance at December 31, 2012 $29,254 $(120) $(1,601) $ (33) $27,500
Other comprehensive income, net before reclassifications 7,196 (669) 17 4 6,548
Amounts reclassified from accumulated other comprehensive income (504) (29) 59 3 (471)
Transactions with noncontrolling interests — (12) — — (12)
6,692 (710) 76 7 6,065
Balance at June 30, 2013 $35,946 $(830) $(1,525) $ (26) $33,565
Amounts reclassified from other comprehensive income into net earnings during 2013 are included on the following line items:
Investment gains/losses: Insurance and other $ (707) $ — $ — $ — $ (707)Finance and financial products (68) — — — (68)
Other — (29) 83 7 61
Reclassifications before income taxes (775) (29) 83 7 (714)Applicable income taxes (271) — 24 4 (243)
$ (504) $ (29) $ 59 $ 3 $ (471)
Notes to Consolidated Financial Statements (Continued) Note 19. Contingencies and Commitments
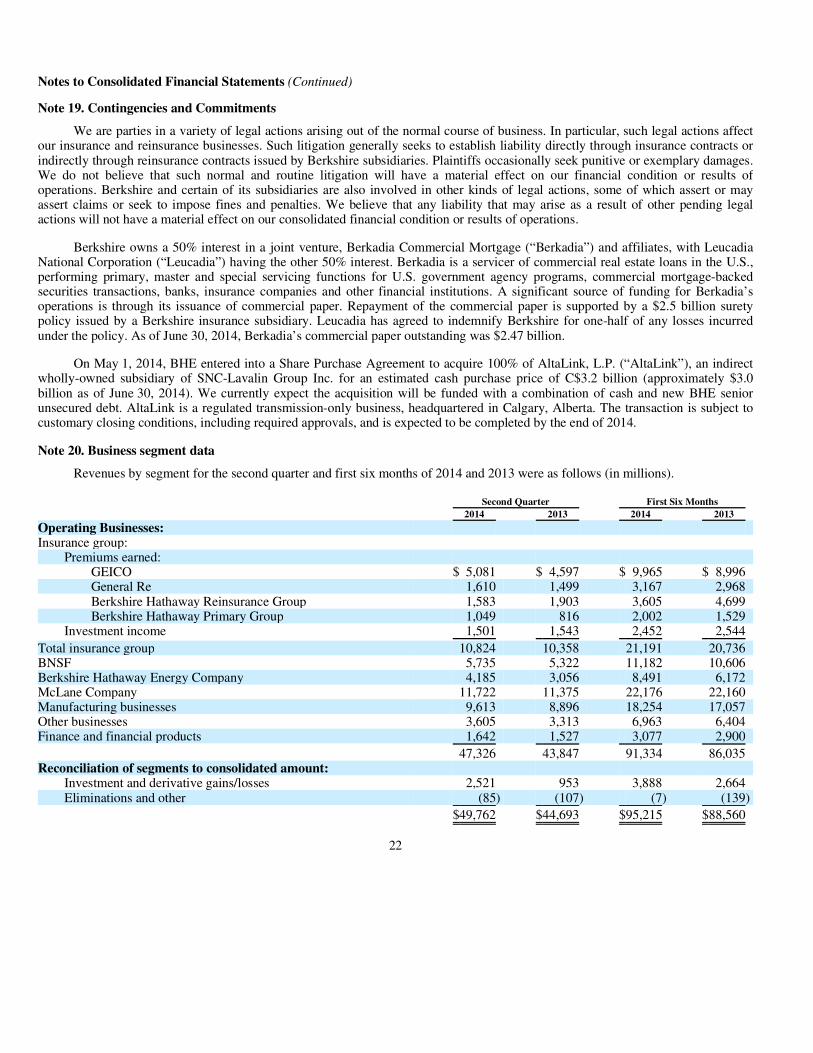
We are parties in a variety of legal actions arising out of the normal course of business. In particular, such legal actions affectour insurance and reinsurance businesses. Such litigation generally seeks to establish liability directly through insurance contracts orindirectly through reinsurance contracts issued by Berkshire subsidiaries. Plaintiffs occasionally seek punitive or exemplary damages.We do not believe that such normal and routine litigation will have a material effect on our financial condition or results ofoperations. Berkshire and certain of its subsidiaries are also involved in other kinds of legal actions, some of which assert or mayassert claims or seek to impose fines and penalties. We believe that any liability that may arise as a result of other pending legalactions will not have a material effect on our consolidated financial condition or results of operations.
Berkshire owns a 50% interest in a joint venture, Berkadia Commercial Mortgage (“Berkadia”) and affiliates, with Leucadia National Corporation (“Leucadia”) having the other 50% interest. Berkadia is a servicer of commercial real estate loans in the U.S.,performing primary, master and special servicing functions for U.S. government agency programs, commercial mortgage-backed securities transactions, banks, insurance companies and other financial institutions. A significant source of funding for Berkadia’s operations is through its issuance of commercial paper. Repayment of the commercial paper is supported by a $2.5 billion suretypolicy issued by a Berkshire insurance subsidiary. Leucadia has agreed to indemnify Berkshire for one-half of any losses incurred under the policy. As of June 30, 2014, Berkadia’s commercial paper outstanding was $2.47 billion.
On May 1, 2014, BHE entered into a Share Purchase Agreement to acquire 100% of AltaLink, L.P. (“AltaLink”), an indirect wholly-owned subsidiary of SNC-Lavalin Group Inc. for an estimated cash purchase price of C$3.2 billion (approximately $3.0billion as of June 30, 2014). We currently expect the acquisition will be funded with a combination of cash and new BHE seniorunsecured debt. AltaLink is a regulated transmission-only business, headquartered in Calgary, Alberta. The transaction is subject tocustomary closing conditions, including required approvals, and is expected to be completed by the end of 2014.
Note 20. Business segment data
Revenues by segment for the second quarter and first six months of 2014 and 2013 were as follows (in millions).
22
Second Quarter First Six Months 2014 2013 2014 2013
Operating Businesses: Insurance group:
Premiums earned: GEICO $ 5,081 $ 4,597 $ 9,965 $ 8,996 General Re 1,610 1,499 3,167 2,968 Berkshire Hathaway Reinsurance Group 1,583 1,903 3,605 4,699 Berkshire Hathaway Primary Group 1,049 816 2,002 1,529
Investment income 1,501 1,543 2,452 2,544
Total insurance group 10,824 10,358 21,191 20,736 BNSF 5,735 5,322 11,182 10,606 Berkshire Hathaway Energy Company 4,185 3,056 8,491 6,172 McLane Company 11,722 11,375 22,176 22,160 Manufacturing businesses 9,613 8,896 18,254 17,057 Other businesses 3,605 3,313 6,963 6,404 Finance and financial products 1,642 1,527 3,077 2,900
47,326 43,847 91,334 86,035 Reconciliation of segments to consolidated amount:
Investment and derivative gains/losses 2,521 953 3,888 2,664 Eliminations and other (85) (107) (7) (139)
$49,762 $44,693 $95,215 $88,560

Notes to Consolidated Financial Statements (Continued)
Note 20. Business segment data (Continued)
Earnings before income taxes by segment for the second quarter and first six months of 2014 and 2013 were as follows (inmillions).
23
Second Quarter First Six Months 2014 2013 2014 2013
Operating Businesses: Insurance group:
Underwriting gain (loss): GEICO $ 393 $ 336 $ 746 $ 602 General Re 116 24 196 119 Berkshire Hathaway Reinsurance Group (9) 391 174 1,365 Berkshire Hathaway Primary Group 137 75 236 129
Net investment income 1,498 1,535 2,444 2,531
Total insurance group 2,135 2,361 3,796 4,746 BNSF 1,472 1,397 2,641 2,686 Berkshire Hathaway Energy Company 578 435 1,197 988 McLane Company 126 114 241 246 Manufacturing businesses 1,369 1,151 2,437 2,099 Other businesses 453 400 740 682 Finance and financial products 422 355 794 651
6,555 6,213 11,846 12,098 Reconciliation of segments to consolidated amount:
Investment and derivative gains/losses 2,521 953 3,888 2,664 Interest expense, excluding interest allocated to operating
businesses (77) (74) (154) (146) Eliminations and other (83) (201) (66) (430)
$ 8,916 $ 6,891 $ 15,514 $ 14,186
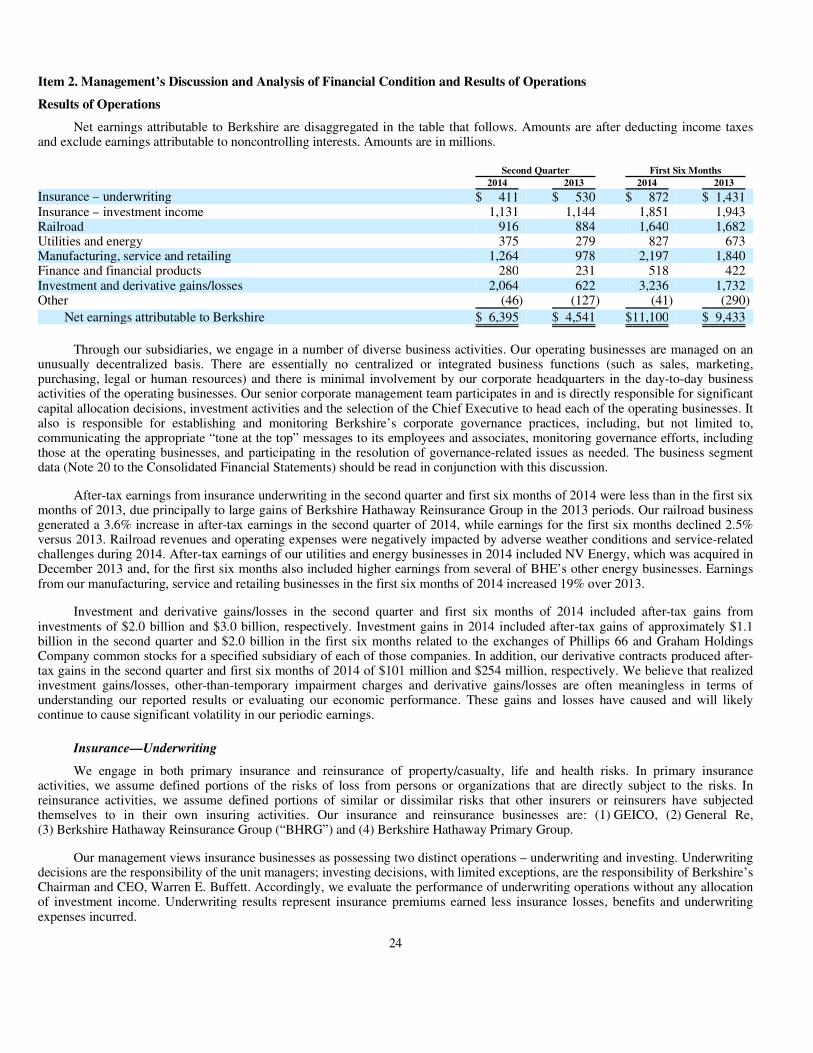
Item 2. Management’s Discussion and Analysis of Financial Condition and Results of Operations
Results of Operations
Net earnings attributable to Berkshire are disaggregated in the table that follows. Amounts are after deducting income taxesand exclude earnings attributable to noncontrolling interests. Amounts are in millions.
Through our subsidiaries, we engage in a number of diverse business activities. Our operating businesses are managed on anunusually decentralized basis. There are essentially no centralized or integrated business functions (such as sales, marketing,purchasing, legal or human resources) and there is minimal involvement by our corporate headquarters in the day-to-day business activities of the operating businesses. Our senior corporate management team participates in and is directly responsible for significantcapital allocation decisions, investment activities and the selection of the Chief Executive to head each of the operating businesses. Italso is responsible for establishing and monitoring Berkshire’s corporate governance practices, including, but not limited to,communicating the appropriate “tone at the top” messages to its employees and associates, monitoring governance efforts, includingthose at the operating businesses, and participating in the resolution of governance-related issues as needed. The business segment data (Note 20 to the Consolidated Financial Statements) should be read in conjunction with this discussion.
After-tax earnings from insurance underwriting in the second quarter and first six months of 2014 were less than in the first sixmonths of 2013, due principally to large gains of Berkshire Hathaway Reinsurance Group in the 2013 periods. Our railroad businessgenerated a 3.6% increase in after-tax earnings in the second quarter of 2014, while earnings for the first six months declined 2.5%versus 2013. Railroad revenues and operating expenses were negatively impacted by adverse weather conditions and service-related challenges during 2014. After-tax earnings of our utilities and energy businesses in 2014 included NV Energy, which was acquired inDecember 2013 and, for the first six months also included higher earnings from several of BHE’s other energy businesses. Earnings from our manufacturing, service and retailing businesses in the first six months of 2014 increased 19% over 2013.
Investment and derivative gains/losses in the second quarter and first six months of 2014 included after-tax gains from investments of $2.0 billion and $3.0 billion, respectively. Investment gains in 2014 included after-tax gains of approximately $1.1billion in the second quarter and $2.0 billion in the first six months related to the exchanges of Phillips 66 and Graham HoldingsCompany common stocks for a specified subsidiary of each of those companies. In addition, our derivative contracts produced after-tax gains in the second quarter and first six months of 2014 of $101 million and $254 million, respectively. We believe that realizedinvestment gains/losses, other-than-temporary impairment charges and derivative gains/losses are often meaningless in terms ofunderstanding our reported results or evaluating our economic performance. These gains and losses have caused and will likelycontinue to cause significant volatility in our periodic earnings.
Insurance—Underwriting
We engage in both primary insurance and reinsurance of property/casualty, life and health risks. In primary insuranceactivities, we assume defined portions of the risks of loss from persons or organizations that are directly subject to the risks. Inreinsurance activities, we assume defined portions of similar or dissimilar risks that other insurers or reinsurers have subjectedthemselves to in their own insuring activities. Our insurance and reinsurance businesses are: (1) GEICO, (2) General Re,(3) Berkshire Hathaway Reinsurance Group (“BHRG”) and (4) Berkshire Hathaway Primary Group.
Our management views insurance businesses as possessing two distinct operations – underwriting and investing. Underwriting decisions are the responsibility of the unit managers; investing decisions, with limited exceptions, are the responsibility of Berkshire’s Chairman and CEO, Warren E. Buffett. Accordingly, we evaluate the performance of underwriting operations without any allocationof investment income. Underwriting results represent insurance premiums earned less insurance losses, benefits and underwritingexpenses incurred.
24
Second Quarter First Six Months 2014 2013 2014 2013 Insurance – underwriting $ 411 $ 530 $ 872 $ 1,431 Insurance – investment income 1,131 1,144 1,851 1,943 Railroad 916 884 1,640 1,682 Utilities and energy 375 279 827 673 Manufacturing, service and retailing 1,264 978 2,197 1,840 Finance and financial products 280 231 518 422 Investment and derivative gains/losses 2,064 622 3,236 1,732 Other (46) (127) (41) (290)
Net earnings attributable to Berkshire $ 6,395 $ 4,541 $11,100 $ 9,433

Item 2. Management’s Discussion and Analysis of Financial Condition and Results of Operations (Continued)
Insurance—Underwriting (Continued)
The timing and amount of catastrophe losses can produce significant volatility in our periodic underwriting results, particularlywith respect to BHRG and General Re. For the purposes of this discussion, we categorize catastrophe losses as significant if the pre-tax losses incurred from a single event (or series of related events) exceed $100 million on a consolidated basis. In the first six monthsof 2014, there were no significant catastrophe events.
Our periodic underwriting results may be affected significantly by changes in estimates for unpaid losses and loss adjustmentexpenses, including amounts established for occurrences in prior years. Periodic underwriting results may also include significantforeign currency transaction gains and losses arising from the changes in the valuations of certain non-U.S. Dollar denominated reinsurance liabilities as a result of foreign currency exchange rate fluctuations. Historically, currency exchange rates have beenvolatile and the resulting impact on our periodic underwriting earnings has been relatively significant. These gains and losses areincluded in underwriting expenses. BHRG’s underwriting results included pre-tax foreign currency exchange rate losses of $139 million in the first six months of 2014. BHRG’s underwriting results in the first six months of 2013 included pre-tax gains from foreign currency exchange rate changes of $251 million, as well as a one-time pre-tax gain of $255 million arising from amendments to a life reinsurance contract.
A key marketing strategy followed by all of our insurance businesses is the maintenance of extraordinary capital strength.Statutory surplus of our insurance subsidiaries was approximately $129 billion at December 31, 2013. This superior capital strengthcreates opportunities, especially with respect to reinsurance activities, to negotiate and enter into insurance and reinsurance contractsspecially designed to meet the unique needs of insurance and reinsurance buyers.
A summary follows of underwriting results from our insurance businesses. Amounts are in millions.
GEICO
Through GEICO, we primarily write private passenger automobile insurance, offering coverages to insureds in all 50 states andthe District of Columbia. GEICO’s policies are marketed mainly by direct response methods in which customers apply for coveragedirectly to the company via the Internet or over the telephone. This is a significant element in our strategy to be a low-cost auto insurer. In addition, we strive to provide excellent customer service, with the goal of establishing long-term customer relationships. GEICO’s underwriting results are summarized below. Dollars are in millions.
Premiums written in the second quarter and first six months of 2014 were $5.0 billion and $10.3 billion, respectively,representing increases of 9.9% and 10.1%, respectively, over the corresponding 2013 periods. Premiums earned in the second quarterand first six months of 2014 increased $484 million (10.5%) and $969 million (10.8%), respectively, compared to premiums earned inthe same periods in 2013. The growth in premiums earned for voluntary auto was 10.7%, reflecting policies-in-force growth of 6.8%
25
Second Quarter First Six Months 2014 2013 2014 2013
Underwriting gain/loss attributable to: GEICO $ 393 $ 336 $ 746 $ 602 General Re 116 24 196 119 Berkshire Hathaway Reinsurance Group (9) 391 174 1,365 Berkshire Hathaway Primary Group 137 75 236 129
Pre-tax underwriting gain 637 826 1,352 2,215 Income taxes and noncontrolling interests 226 296 480 784
Net underwriting gain $ 411 $ 530 $ 872 $ 1,431
Second Quarter First Six Months 2014 2013 2014 2013 Amount % Amount % Amount % Amount %
Premiums earned $ 5,081 100.0 $ 4,597 100.0 $ 9,965 100.0 $ 8,996 100.0
Losses and loss adjustment expenses 3,881 76.4 3,515 76.5 7,582 76.1 6,868 76.3 Underwriting expenses 807 15.9 746 16.2 1,637 16.4 1,526 17.0
Total losses and expenses 4,688 92.3 4,261 92.7 9,219 92.5 8,394 93.3
Pre-tax underwriting gain $ 393 $ 336 $ 746 $ 602

Item 2. Management’s Discussion and Analysis of Financial Condition and Results of Operations (Continued)
Insurance—Underwriting (Continued)
GEICO (Continued) during the past twelve months and increased premiums per policy. Voluntary auto new business sales increased about 1.0% in the firstsix months of 2014 compared to the first six months of 2013. Voluntary auto policies-in-force at June 30, 2014 were approximately 505,000 greater than at December 31, 2013.
Losses and loss adjustment expenses incurred in the second quarter and first six months of 2014 increased $366 million(10.4%) and $714 million (10.4%), respectively, over the same periods of 2013. Our ratio of losses and loss adjustment expensesincurred to premiums earned (the “loss ratio”) was 76.1% in the first six months of 2014 compared to 76.3% in 2013. In the first sixmonths of 2014, claims frequencies for property damage and collision coverages increased in the five to six percent range due to moresevere winter weather in the first quarter as compared to 2013. Claims frequencies for bodily injury coverage increased in the one totwo percent range while frequencies for personal injury protection decreased two to three percent. Physical damage severities havebeen relatively flat and bodily injury severities decreased in the three to four percent range from 2013. Underwriting expenses in thesecond quarter and first six months of 2014 increased $61 million (8.2%) and $111 million (7.3%) over expenses in the prior yearperiods. The increases reflected the growth in policies-in-force.
General Re
Through General Re, we conduct a reinsurance business offering property and casualty and life and health coverages to clientsworldwide. We write property and casualty reinsurance in North America on a direct basis through General Reinsurance Corporationand internationally through Germany-based General Reinsurance AG and other wholly-owned affiliates. Property and casualty reinsurance is also written in broker markets through Faraday in London. Life and health reinsurance is written in North Americathrough General Re Life Corporation and internationally through General Reinsurance AG. General Re strives to generateunderwriting profits in all of its product lines. Our management does not evaluate underwriting performance based upon market shareand our underwriters are instructed to reject inadequately priced risks. General Re’s underwriting results are summarized in the following table. Amounts are in millions.
Property/casualty
Property/casualty premiums earned in the second quarter and first six months of 2014 increased $64 million (9%) and $94million (6%), respectively, compared to 2013. Adjusting for the differences in foreign currency exchange rates, premiums earned inthe first six months of 2014 increased $59 million (4%). Strong price competition in property and casualty markets persists. Ourunderwriters continue to exercise discipline by declining business where prices are deemed inadequate. We remain prepared toincrease premium volume when appropriate prices are attained relative to the risks assumed.
Our property/casualty business produced pre-tax underwriting gains in 2014 of $61 million in the second quarter and $157million in the first six months. In 2013, this business generated a pre-tax loss of $34 million in the second quarter and a pre-tax gain of $62 million in the first six months. In the first six months of 2014 and 2013, our property business generated pre-tax underwriting gains of $207 million and $74 million, respectively. Underwriting results in the 2014 periods reflected no significant catastropheevents, while results in the second quarter of 2013 included catastrophe losses of $124 million from floods in Europe. In the first sixmonths, property results also benefitted from reductions of estimated ultimate losses for prior years’ occurrences, which resulted inpre-tax underwriting gains of $80 million in 2014 and $114 million in 2013. The favorable development in each period was primarilyattributable to lower than expected losses reported from ceding companies. The timing and magnitude of catastrophe and largeindividual losses has produced and is expected to continue to produce significant volatility in periodic underwriting results.
26
Premiums earned Pre-tax underwriting gain (loss) Second Quarter First Six Months Second Quarter First Six Months 2014 2013 2014 2013 2014 2013 2014 2013 Property/casualty $ 799 $ 735 $ 1,587 $ 1,493 $ 61 $ (34) $ 157 $ 62 Life/health 811 764 1,580 1,475 55 58 39 57
$ 1,610 $ 1,499 $ 3,167 $ 2,968 $ 116 $ 24 $ 196 $ 119
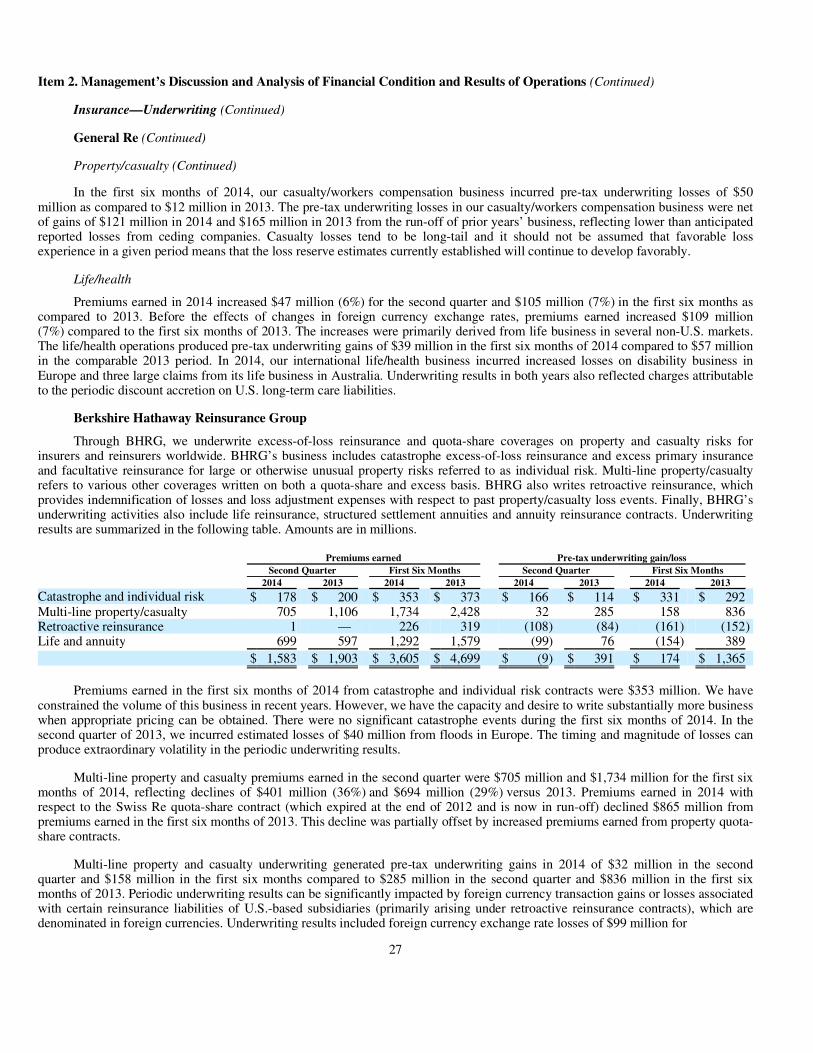
Item 2. Management’s Discussion and Analysis of Financial Condition and Results of Operations (Continued)
Insurance—Underwriting (Continued)
General Re (Continued)
Property/casualty (Continued)
In the first six months of 2014, our casualty/workers compensation business incurred pre-tax underwriting losses of $50million as compared to $12 million in 2013. The pre-tax underwriting losses in our casualty/workers compensation business were netof gains of $121 million in 2014 and $165 million in 2013 from the run-off of prior years’ business, reflecting lower than anticipated reported losses from ceding companies. Casualty losses tend to be long-tail and it should not be assumed that favorable loss experience in a given period means that the loss reserve estimates currently established will continue to develop favorably.
Life/health
Premiums earned in 2014 increased $47 million (6%) for the second quarter and $105 million (7%) in the first six months ascompared to 2013. Before the effects of changes in foreign currency exchange rates, premiums earned increased $109 million(7%) compared to the first six months of 2013. The increases were primarily derived from life business in several non-U.S. markets. The life/health operations produced pre-tax underwriting gains of $39 million in the first six months of 2014 compared to $57 millionin the comparable 2013 period. In 2014, our international life/health business incurred increased losses on disability business inEurope and three large claims from its life business in Australia. Underwriting results in both years also reflected charges attributableto the periodic discount accretion on U.S. long-term care liabilities.
Berkshire Hathaway Reinsurance Group
Through BHRG, we underwrite excess-of-loss reinsurance and quota-share coverages on property and casualty risks for insurers and reinsurers worldwide. BHRG’s business includes catastrophe excess-of-loss reinsurance and excess primary insurance and facultative reinsurance for large or otherwise unusual property risks referred to as individual risk. Multi-line property/casualty refers to various other coverages written on both a quota-share and excess basis. BHRG also writes retroactive reinsurance, whichprovides indemnification of losses and loss adjustment expenses with respect to past property/casualty loss events. Finally, BHRG’s underwriting activities also include life reinsurance, structured settlement annuities and annuity reinsurance contracts. Underwritingresults are summarized in the following table. Amounts are in millions.
Premiums earned in the first six months of 2014 from catastrophe and individual risk contracts were $353 million. We haveconstrained the volume of this business in recent years. However, we have the capacity and desire to write substantially more businesswhen appropriate pricing can be obtained. There were no significant catastrophe events during the first six months of 2014. In thesecond quarter of 2013, we incurred estimated losses of $40 million from floods in Europe. The timing and magnitude of losses canproduce extraordinary volatility in the periodic underwriting results.
Multi-line property and casualty premiums earned in the second quarter were $705 million and $1,734 million for the first sixmonths of 2014, reflecting declines of $401 million (36%) and $694 million (29%) versus 2013. Premiums earned in 2014 withrespect to the Swiss Re quota-share contract (which expired at the end of 2012 and is now in run-off) declined $865 million frompremiums earned in the first six months of 2013. This decline was partially offset by increased premiums earned from property quota-share contracts.
Multi-line property and casualty underwriting generated pre-tax underwriting gains in 2014 of $32 million in the secondquarter and $158 million in the first six months compared to $285 million in the second quarter and $836 million in the first sixmonths of 2013. Periodic underwriting results can be significantly impacted by foreign currency transaction gains or losses associatedwith certain reinsurance liabilities of U.S.-based subsidiaries (primarily arising under retroactive reinsurance contracts), which aredenominated in foreign currencies. Underwriting results included foreign currency exchange rate losses of $99 million for
27
Premiums earned Pre-tax underwriting gain/loss Second Quarter First Six Months Second Quarter First Six Months 2014 2013 2014 2013 2014 2013 2014 2013
Catastrophe and individual risk $ 178 $ 200 $ 353 $ 373 $ 166 $ 114 $ 331 $ 292 Multi-line property/casualty 705 1,106 1,734 2,428 32 285 158 836 Retroactive reinsurance 1 — 226 319 (108) (84) (161) (152) Life and annuity 699 597 1,292 1,579 (99) 76 (154) 389
$ 1,583 $ 1,903 $ 3,605 $ 4,699 $ (9) $ 391 $ 174 $ 1,365

Item 2. Management’s Discussion and Analysis of Financial Condition and Results of Operations (Continued)
Insurance—Underwriting (Continued)
Berkshire Hathaway Reinsurance Group (Continued) the first six months of 2014 compared to gains of $217 million in the first six months of 2013. In the first six months of 2014, theSwiss Re quota-share contract produced a pre-tax underwriting gain of $79 million compared to a gain of $362 million in 2013, whichwas primarily attributable to reductions in estimates of ultimate liabilities for prior years’ losses. There were no significant catastrophe loss events affecting multi-line contracts in the first six months of 2014, while results for the first six months of 2013included estimated losses of $25 million from floods in Europe during the second quarter.
Retroactive reinsurance policies provide indemnification of unpaid losses and loss adjustment expenses with respect to pastloss events, and related claims are generally expected to be paid over long periods of time. Premiums and limits of indemnificationare often very large in amount. At the inception of a contract, deferred charge assets are recorded for the excess, if any, of theestimated ultimate losses payable over the premiums earned. Deferred charges are subsequently amortized over the estimated claimspayment period using the interest method, which reflects estimates of the timing and amount of loss payments. The original estimatesof the timing and amount of loss payments are periodically analyzed against actual experience and revised based on an actuarialevaluation of the expected remaining losses. Amortization charges and deferred charge adjustments resulting from changes to theestimated timing and amount of future loss payments are included in earnings.
The underwriting losses from retroactive policies for the first six months of 2014 and 2013 were primarily attributable todeferred charge amortization. Gross unpaid losses from retroactive reinsurance contracts were approximately $17.9 billion as ofJune 30, 2014 and $17.7 billion at December 31, 2013. Unamortized deferred charges related to BHRG’s retroactive reinsurance contracts were approximately $4.48 billion at June 30, 2014 and $4.25 billion at December 31, 2013.
On July 17, 2014, National Indemnity Company (“NICO”), the lead insurance entity of BHRG, entered into a retroactivereinsurance agreement with Liberty Mutual Insurance Company (“LMIC”). The agreement provides that NICO reinsure substantially all of LMIC’s unpaid losses and allocated loss adjustment expense liabilities related to (a) asbestos and environmental from policiesincepting prior to 2005 and (b) workers compensation claims occurrences arising prior to January 1, 2014, in excess of an aggregateretention of approximately $12.5 billion and subject to an aggregate limit of $6.5 billion. Consideration paid to NICO with respect tothis contract was approximately $3.0 billion.
Life and annuity premiums earned in the second quarter of 2014 were $699 million, an increase of $102 million (17%) over2013, while premiums earned in the first six months of 2014 declined $287 million (18%) from the comparable 2013 period. In thefirst six months of 2014, premiums earned from annuity contracts were $514 million, an increase of $68 million (15%) over 2013.Premiums earned in the first quarter of 2013 included $1.7 billion from a single reinsurance contract providing guarantees ofminimum death benefits on variable annuity reinsurance contracts that have been in run-off for a number of years. Premiums earned in 2013 also included the reversal of premiums previously earned (approximately $1.3 billion) under a life reinsurance contract as aresult of contract amendments in the first quarter. The amendments essentially commuted coverage with respect to a number of theunderlying contracts in exchange for payments of $675 million.
In the second quarter and first six months of 2014, life and annuity business produced pre-tax underwriting losses of $99million and $154 million, respectively, compared to gains of $76 million and $389 million in the comparable 2013 periods. In 2013,underwriting results included a one-time pre-tax gain of $255 million related to the aforementioned amendments to a life reinsurancecontract. Underwriting results in the first six months of 2014 also included a pre-tax loss of approximately $35 million related to variable annuity guarantee contracts written in 2013 and 2014. These contracts produced a pre-tax gain of $110 million in the first six months of 2013. Periodic underwriting results from this business can be volatile reflecting changes in returns in investment markets,which impact the underlying insured exposures.
Underwriting results from life and annuity contracts in each period included the recurring impact of the accretion of discountedannuity liabilities, adjustments for mortality experience and changes in foreign currency exchange rates applicable to certain of thecontracts. Liabilities related to certain of these contracts are payable in foreign currencies and the changes in currency exchange ratesproduced a pre-tax loss of $40 million in the first six months of 2014 versus a pre-tax gain of $34 million in the first six months of 2013. At June 30, 2014 and December 31, 2013, our aggregate annuity liabilities were approximately $6.3 billion and $5.7 billion,respectively.
28
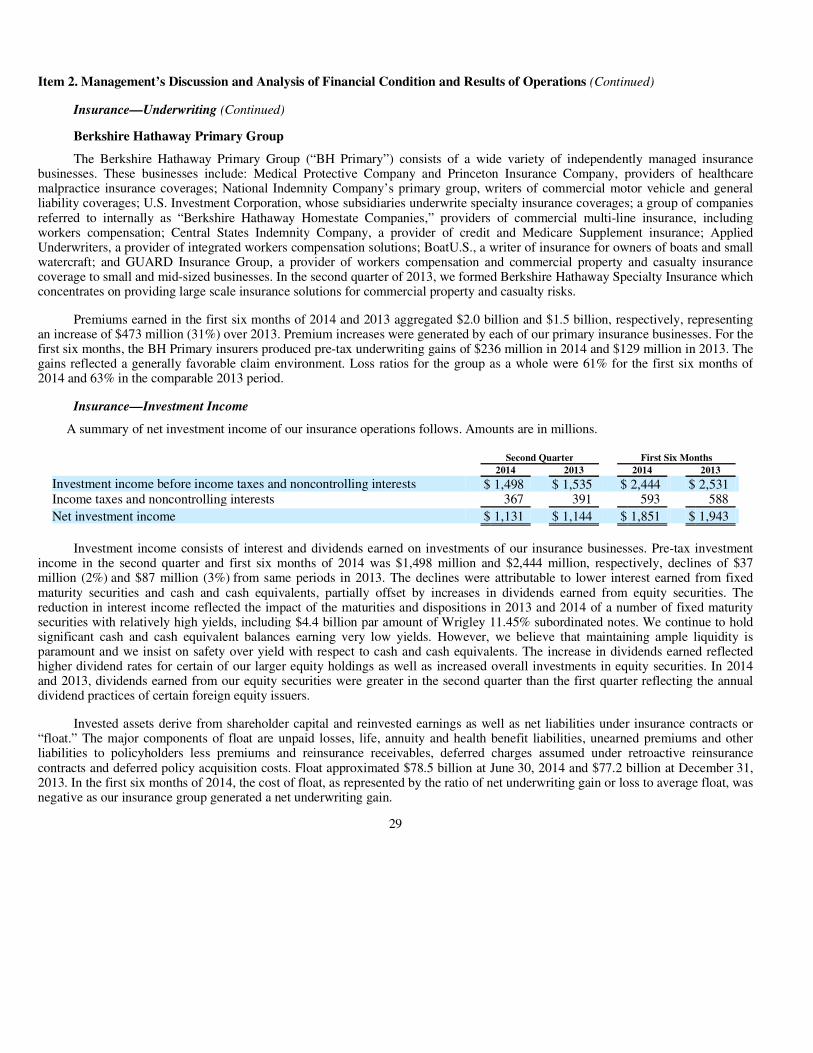
Item 2. Management’s Discussion and Analysis of Financial Condition and Results of Operations (Continued)
Insurance—Underwriting (Continued)
Berkshire Hathaway Primary Group
The Berkshire Hathaway Primary Group (“BH Primary”) consists of a wide variety of independently managed insurancebusinesses. These businesses include: Medical Protective Company and Princeton Insurance Company, providers of healthcaremalpractice insurance coverages; National Indemnity Company’s primary group, writers of commercial motor vehicle and generalliability coverages; U.S. Investment Corporation, whose subsidiaries underwrite specialty insurance coverages; a group of companiesreferred to internally as “Berkshire Hathaway Homestate Companies,” providers of commercial multi-line insurance, including workers compensation; Central States Indemnity Company, a provider of credit and Medicare Supplement insurance; AppliedUnderwriters, a provider of integrated workers compensation solutions; BoatU.S., a writer of insurance for owners of boats and smallwatercraft; and GUARD Insurance Group, a provider of workers compensation and commercial property and casualty insurancecoverage to small and mid-sized businesses. In the second quarter of 2013, we formed Berkshire Hathaway Specialty Insurance whichconcentrates on providing large scale insurance solutions for commercial property and casualty risks.
Premiums earned in the first six months of 2014 and 2013 aggregated $2.0 billion and $1.5 billion, respectively, representingan increase of $473 million (31%) over 2013. Premium increases were generated by each of our primary insurance businesses. For thefirst six months, the BH Primary insurers produced pre-tax underwriting gains of $236 million in 2014 and $129 million in 2013. Thegains reflected a generally favorable claim environment. Loss ratios for the group as a whole were 61% for the first six months of2014 and 63% in the comparable 2013 period.
Insurance—Investment Income
A summary of net investment income of our insurance operations follows. Amounts are in millions.
Investment income consists of interest and dividends earned on investments of our insurance businesses. Pre-tax investment income in the second quarter and first six months of 2014 was $1,498 million and $2,444 million, respectively, declines of $37million (2%) and $87 million (3%) from same periods in 2013. The declines were attributable to lower interest earned from fixedmaturity securities and cash and cash equivalents, partially offset by increases in dividends earned from equity securities. Thereduction in interest income reflected the impact of the maturities and dispositions in 2013 and 2014 of a number of fixed maturitysecurities with relatively high yields, including $4.4 billion par amount of Wrigley 11.45% subordinated notes. We continue to holdsignificant cash and cash equivalent balances earning very low yields. However, we believe that maintaining ample liquidity isparamount and we insist on safety over yield with respect to cash and cash equivalents. The increase in dividends earned reflectedhigher dividend rates for certain of our larger equity holdings as well as increased overall investments in equity securities. In 2014 and 2013, dividends earned from our equity securities were greater in the second quarter than the first quarter reflecting the annualdividend practices of certain foreign equity issuers.
Invested assets derive from shareholder capital and reinvested earnings as well as net liabilities under insurance contracts or“float.” The major components of float are unpaid losses, life, annuity and health benefit liabilities, unearned premiums and otherliabilities to policyholders less premiums and reinsurance receivables, deferred charges assumed under retroactive reinsurancecontracts and deferred policy acquisition costs. Float approximated $78.5 billion at June 30, 2014 and $77.2 billion at December 31,2013. In the first six months of 2014, the cost of float, as represented by the ratio of net underwriting gain or loss to average float, wasnegative as our insurance group generated a net underwriting gain.
29
Second Quarter First Six Months 2014 2013 2014 2013
Investment income before income taxes and noncontrolling interests $ 1,498 $ 1,535 $ 2,444 $ 2,531 Income taxes and noncontrolling interests 367 391 593 588
Net investment income $ 1,131 $ 1,144 $ 1,851 $ 1,943

Item 2. Management’s Discussion and Analysis of Financial Condition and Results of Operations (Continued)
Insurance—Investment Income (Continued)
A summary of cash and investments held in our insurance businesses follows. Other investments include The Dow ChemicalCompany convertible preferred stock and Bank of America Corporation preferred stock and common stock warrants. See Note 6 tothe Consolidated Financial Statements. Amounts are in millions.
Fixed maturity securities as of June 30, 2014 were as follows. Amounts are in millions.
All U.S. government obligations are rated AA+ or Aaa by the major rating agencies and approximately 86% of all state,municipal and political subdivisions, foreign government obligations and mortgage-backed securities were rated AA or higher. Non-investment grade securities represent securities that are rated below BBB- or Baa3. Foreign government securities include obligations issued or unconditionally guaranteed by national or provincial government entities.
Railroad (“BNSF”)
Burlington Northern Santa Fe Corporation (“BNSF”) operates one of the largest railroad systems in North America withapproximately 32,500 route miles of track in 28 states and two Canadian provinces. BNSF’s major business groups are classified by product/commodity shipped and include consumer products, coal, industrial products and agricultural products. Earnings of BNSF aresummarized below (in millions).
30
June 30,
2014 December 31,
2013 Cash and cash equivalents $ 38,178 $ 32,572 Equity securities 116,277 114,832 Fixed maturity securities 27,242 27,059 Other 12,197 12,334
$ 193,894 $ 186,797
Amortized
cost Unrealized gains/losses
Carrying value
U.S. Treasury, U.S. government corporations and agencies $ 2,819 $ 13 $ 2,832 States, municipalities and political subdivisions 2,003 108 2,111 Foreign governments 10,553 267 10,820 Corporate bonds, investment grade 5,618 508 6,126 Corporate bonds, non-investment grade 2,961 758 3,719 Mortgage-backed securities 1,444 190 1,634
$ 25,398 $ 1,844 $ 27,242
Second Quarter First Six Months 2014 2013 2014 2013
Revenues $ 5,735 $ 5,322 $ 11,182 $ 10,606
Operating expenses: Compensation and benefits 1,234 1,128 2,452 2,267Fuel 1,156 1,076 2,315 2,198Purchased services 634 617 1,287 1,234Depreciation and amortization 523 489 1,038 972Equipment rents, materials and other 510 438 1,047 894
Total operating expenses 4,057 3,748 8,139 7,565Interest expense 206 177 402 355
4,263 3,925 8,541 7,920
Pre-tax earnings 1,472 1,397 2,641 2,686Income taxes 556 513 1,001 1,004
Net earnings $ 916 $ 884 $ 1,640 $ 1,682

Item 2. Management’s Discussion and Analysis of Financial Condition and Results of Operations (Continued)
Railroad (“BNSF”) (Continued)
Revenues during the second quarter and first six months of 2014 were approximately $5.7 billion and $11.2 billion,respectively, representing increases of $413 million (8%) and $576 million (5%), respectively, over 2013. The overall year-to-date increase in revenues reflected a 3% increase in cars/units handled and a 2% increase in average revenue per car/unit. In the firstquarter of 2014, BNSF’s operations were negatively affected by severe winter weather conditions and service-related challenges, particularly in the Northern U.S. service territory. During the second quarter of 2014, our volumes increased but service levelscontinued to be well below our internal standards, as well as those expected by our customers. As a result, we continued to experienceoperating inefficiencies. We are working diligently to promptly address these service issues. Our planned capital investments and newemployee hiring in 2014 will expand capacity and help us to improve and maintain service levels in the future.
Revenues from consumer products during the second quarter and first six months of 2014 were $1.8 billion and $3.5 billion,respectively, representing increases of about $80 million over the comparable 2013 periods. These increases were primarily due toincreases in unit volume. In the second quarter and first six months of 2014, revenues from industrial products increased 7% to $1.5billion and 6% to $2.9 billion, respectively, reflecting increases in unit volume and changes in rates and product mix. Revenues fromagricultural products in the second quarter of 2014 increased 23% to approximately $1.0 billion and for the first six months increased15% to approximately $2.0 billion. These increases were primarily attributable to increased rates and product mix, and to an 8%increase in second quarter unit volume. Coal revenues during the second quarter of 2014 increased 3% to $1.2 billion, and for the firstsix months increased $51 million (2%) to $2.4 billion. The increases in coal revenues reflected a 5% increase in year-to-date unit volume, partially offset by lower average rates.
Operating expenses in 2014 were $4.1 billion for the second quarter and $8.1 billion for the first six months, representingincreases of $309 million (8%) and $574 million (8%), respectively, over 2013. Compensation and benefits expenses increased $106million (9%) and $185 million (8%) in the second quarter and first six months of 2014, respectively, over 2013 primarily due toincreased employment levels, and to a lesser extent, wage inflation and higher overtime. Fuel expenses increased $80 million(7%) and $117 million (5%) in the second quarter and first six months of 2014, respectively, over 2013 primarily due to increasedvolumes. Fuel efficiency improved slightly in the second quarter, which was partly offset by higher average prices. Fuel efficienciesfor the first six months were slightly unfavorable, which was partially offset by lower average fuel prices. In 2014, depreciation andamortization expense increased $34 million (7%) in the second quarter and $66 million (7%) in the first six months as a result ofadditional assets in service. In 2014, equipment rents, materials and other expenses increased $72 million (16%) in the second quarterand $153 million (17%) in the first six months compared to 2013 as a result of comparatively higher crew transportation and othertravel costs, and increased utilities and locomotive materials costs.
Utilities and Energy (“Berkshire Hathaway Energy Company”)
We hold an 89.8% ownership interest in Berkshire Hathaway Energy Company (“BHE”), which operates an internationalenergy business. BHE’s domestic regulated utility interests are currently comprised of four companies, PacifiCorp, MidAmericanEnergy Company (“MEC”), as well as Nevada Power Company and Sierra Pacific Power Company (together, “NV Energy”). NV Energy was acquired on December 19, 2013. BHE also owns two domestic regulated interstate natural gas pipeline companies. InGreat Britain, BHE subsidiaries operate two regulated electricity distribution businesses referred to as Northern Powergrid. The ratesthat our regulated businesses charge customers for energy and services are based in large part on the costs of business operations,including a return on capital, and are subject to regulatory approval. To the extent these operations are not allowed to include suchcosts in the approved rates, operating results will be adversely affected. In addition, BHE also operates a diversified portfolio ofindependent power projects and the second-largest residential real estate brokerage firm and franchise network in the United States.
31

Item 2. Management’s Discussion and Analysis of Financial Condition and Results of Operations (Continued)
Utilities and Energy (“Berkshire Hathaway Energy Company”) (Continued)
Revenues and earnings of BHE are summarized below. Amounts are in millions.
PacifiCorp’s revenues in the second quarter and first six months of 2014 increased $30 million (2%) and $88 million (4%),respectively, over revenues in the same periods of 2013. For the first six months of 2014, retail revenues increased $51 million, whichwas attributable to higher rates, partially offset by lower customer loads. In 2014, wholesale revenues also increased, primarily due tohigher rates. PacifiCorp’s EBIT in the second quarter and first six months of 2014 were $269 million and $492 million, respectively,increases of $32 million (14%) and $27 million (6%), respectively, over earnings in the comparable 2013 periods. EBIT in 2014periods included the recognition of estimated insurance recoveries on fire losses.
MEC’s revenues in the second quarter and first six months of 2014 increased $22 million (3%) and $335 million (20%),respectively, compared to 2013. In the first six months of 2014, MEC’s revenues from regulated natural gas increased $190 millioncompared to 2013. The increase was driven by higher per-unit natural gas costs, which are recovered from customers via adjustmentclauses, and higher volumes attributable to colder weather in the first quarter of 2014. In the first six months of 2014, regulatedelectricity revenues and revenues from nonregulated markets increased $50 million and $85 million, respectively, compared to thefirst six months of 2013. The increase in regulated electricity revenues was primarily due to increased retail rates and customer loads.The increase in nonregulated revenues was due to higher natural gas and electricity prices, partly offset by lower natural gas volumes.MEC’s EBIT increased $54 million (61%) in the first six months of 2014 compared to 2013. The increase in EBIT was primarily dueto increased earnings from regulated electricity, reflecting the impact of higher revenues and lower depreciation and amortizationexpense.
NV Energy was acquired December 19, 2013, and its results are included in our consolidated results beginning as of that date.NV Energy’s revenues in the second quarter and first six months of 2014 were $808 million and $1,451 million, respectively, andEBIT in the corresponding periods were $121 million and $164 million, respectively. For comparative purposes, NV Energy’s reported operating revenues for the second quarter and first six months of 2013 were approximately $732 million and $1,316 million,respectively, and pre-tax earnings were $98 million and $131 million, respectively, for the corresponding 2013 periods. NV Energy’s revenues and EBIT are normally higher in the second and third quarters due to higher electricity consumption in certain of its serviceterritories.
Natural gas pipeline revenues in the second quarter and first six months of 2014 increased $26 million (13%) and $114 million(23%), respectively, compared to 2013. These increases reflected comparatively higher revenues from system rebalancing activitiesand increased natural gas rates and volumes as a result of significantly colder weather conditions in the first quarter in NorthernNatural Gas Company’s service territory. EBIT in the second quarter of 2014 declined $37 million (73%) and for the first six monthsincreased $17 million (8%) compared to EBIT in the same 2013 periods. In the second quarter of 2014, the system rebalancingactivities resulted in sales of natural gas at losses as a result of price declines, which partly offset the exceptionally high earnings inthe first quarter.
32
Second Quarter First Six Months Revenues Earnings Revenues Earnings 2014 2013 2014 2013 2014 2013 2014 2013
PacifiCorp $ 1,261 $ 1,231 $ 269 $ 237 $ 2,568 $ 2,480 $ 492 $ 465MidAmerican Energy Company
(“MEC”) 789 767 17 13 2,033 1,698 143 89NV Energy 808 — 121 — 1,451 — 164 —Natural gas pipelines 229 203 14 51 618 504 228 211Northern Powergrid 323 254 141 99 641 554 285 244Real estate brokerage and other 775 601 121 104 1,180 936 97 119
$ 4,185 $ 3,056 $ 8,491 $ 6,172
Earnings before corporate interest and income taxes (“EBIT”)
683 504 1,409 1,128
Corporate interest 105 69 212 140Income taxes and noncontrolling interests 203 156 370 315
Net earnings attributable to Berkshire $ 375 $ 279 $ 827 $ 673

Item 2. Management’s Discussion and Analysis of Financial Condition and Results of Operations (Continued)
Utilities and Energy (“Berkshire Hathaway Energy Company”) (Continued)
Northern Powergrid’s revenues increased $69 million (27%) in the second quarter of 2014 and $87 million (16%) in the firstsix months of 2014, compared to 2013. EBIT in 2014 increased $42 million (42%) in the second quarter and $41 million (17%) in thefirst six months over the same periods of 2013. The increases in revenues and EBIT were due mainly to foreign currency exchangerate effects over the first six months of 2014 and the impact of increased distribution revenues due to increased rates and favorableregulatory provisions in the second quarter of 2014.
In the second quarter and first six months of 2014, revenues of the real estate brokerage and other businesses increased$174 million (29%) and $244 million (26%), respectively, over 2013. The increases in revenues reflected a 24% increase in year-to-date brokerage revenues primarily attributable to business acquisitions, as well as a 72% increase in revenues from renewable energyprojects primarily due to increased assets in service. EBIT of the real estate brokerage and other businesses in the second quarter of2014 increased $17 million (16%) over 2013 and in the first six months of 2014 decreased $22 million (18%) compared to 2013. Inthe first six months of 2014, the increased revenues from real estate brokerage businesses were offset by higher operating costs(including employment, marketing and promotional costs), resulting in a $33 million decline in EBIT.
Corporate interest includes interest on the unsecured debt issued by BHE. In 2014 periods, corporate interest expense increaseddue to new borrowings in connection with the NV Energy acquisition, including borrowings from certain Berkshire insurancesubsidiaries. BHE’s consolidated income tax expense as a percentage of pre-tax earnings for the first six months was 22% in 2014 and 23% in 2013. In each year, BHE’s utility subsidiaries effective income tax rates reflect significant production tax credits from wind-powered electricity generation. In addition, pre-tax earnings of Northern Powergrid are taxed at lower statutory rates in the U.K.compared to the statutory tax rate in the U.S.
Manufacturing, Service and Retailing
A summary of revenues and earnings of our manufacturing, service and retailing businesses follows. Amounts are in millions.
McLane Company
Through McLane, we operate a wholesale distribution business that provides grocery and non-food products to retailers, convenience stores and restaurants. Through its subsidiaries, McLane also operates as a wholesale distributor of distilled spirits, wineand beer. McLane’s grocery and foodservice businesses are marked by high sales volume and very low profit margins and haveseveral significant customers, including Wal-Mart, 7-Eleven and Yum! Brands. A curtailment of purchasing by Wal-Mart or another of its significant customers could have a material adverse impact on McLane’s periodic revenues and earnings.
Revenues and pre-tax earnings for the second quarter of 2014 were $11.7 billion and $126 million, respectively, representingincreases of $347 million (3%) and $12 million (11%), respectively, compared to the second quarter of 2013. Revenues and pre-tax earnings for the first six months of 2014 were relatively unchanged from 2013. Earnings in the second quarter and first half of 2013included a pre-tax gain of $24 million from the sale of a logistics business. Before the impact of this gain, McLane’s earnings for the second quarter and first six months of 2014 increased 40% and 9%, respectively, over the corresponding prior year periods. Theseincreases reflected increased inventory price change gains and a one-time, sales based tax refund realized in the second quarter of2014.
33
Second Quarter First Six Months Revenues Earnings Revenues Earnings 2014 2013 2014 2013 2014 2013 2014 2013
McLane Company $ 11,722 $ 11,375 $ 126 $ 114 $ 22,176 $ 22,160 $ 241 $ 246 Manufacturing 9,613 8,896 1,369 1,151 18,254 17,057 2,437 2,099 Service 2,533 2,310 362 324 4,921 4,414 605 533 Retailing 1,072 1,003 91 76 2,042 1,990 135 149
$ 24,940 $ 23,584 $ 47,393 $ 45,621
Pre-tax earnings 1,948 1,665 3,418 3,027 Income taxes and noncontrolling
interests 684 687 1,221 1,187
$ 1,264 $ 978 $ 2,197 $ 1,840

Item 2. Management’s Discussion and Analysis of Financial Condition and Results of Operations (Continued)
Manufacturing, Service and Retailing (Continued)
Manufacturing
Included in this group are a variety of businesses that manufacture industrial and end-user products and include: Lubrizol Corporation (“Lubrizol”), a specialty chemical manufacturer, IMC International Metalworking Companies (“Iscar”), an industry leader in the metal cutting tools business with operations worldwide, Forest River, a leading manufacturer of leisure vehicles andCTB, a manufacturer of equipment and systems for the livestock and agricultural industries. Also included are the diversifiedmanufacturing operations of Marmon, which were previously presented separately, together with its transportation equipmentmanufacturing, repair and leasing operations. In this report, Marmon’s transportation equipment manufacturing, repair and leasingbusinesses are included in our finance and financial products group. Our manufacturing businesses also include several buildingproducts businesses (Acme Building Brands, Benjamin Moore, Johns Manville, Shaw and MiTek) and six apparel businesses (led byFruit of the Loom which includes Russell athletic apparel and Vanity Fair Brands women’s intimate apparel).
Revenues and pre-tax earnings of our manufacturing businesses are summarized as follows (in millions).
Aggregate revenues in the second quarter and first six months of 2014 from manufacturing increased $717 million (8%) and$1.2 billion (7%), respectively, compared to the corresponding 2013 periods. Pre-tax earnings in 2014 of our manufacturing businesses were approximately $1.4 billion in the second quarter and $2.4 billion in the first six months, representing increases of$218 million (19%) and $338 million (16%), respectively, versus 2013.
Revenues in 2014 from our industrial and end-user products manufacturers increased $536 million (10%) in the second quarterand $928 million (9%) in the first six months as compared to 2013. Pre-tax earnings from these businesses increased $127 million (15%) in the second quarter and $225 million (14%) in the first six months of 2014 over the comparable 2013 periods. Lubrizol’s revenues in the second quarter and first six months of 2014 increased 11% to $1.8 billion and 10% to $3.5 billion, respectively. Theincreases were primarily due to the impact of bolt-on acquisitions in 2013 and 2014 (including LSPI), and, to a lesser extent, tochanges in product mix. Lubrizol’s pre-tax earnings in the second quarter and first six months of 2014 increased 16% and 9%,respectively, over 2013. The increases reflected the impact of the aforementioned increases in revenues. Forest River’s revenues for the second quarter and first six months of 2014 increased 10% to $1.1 billion and 13% to $2.0 billion, respectively. Forest River’s earnings for the second quarter and first six months of 2014 increased 29% and 37%, respectively, over the same periods in 2013. Theincreases in earnings were primarily due to increased unit sales and lower material costs. In the second quarter and first six months of2014, Iscar’s pre-tax earnings increased 8% and 22%, respectively, reflecting the impact of increased sales volume, as well asincreases in gross margins.
Marmon’s manufacturing revenues were $1.6 billion and $3.0 billion, in the second quarter and first half of 2014, respectively,representing increases of $215 million (16%) and $311 million (12%), respectively, compared to the same periods in 2013. Therevenue increases in the second quarter and first half of 2014 were primarily due to the beverage dispensing and merchandisingbusinesses acquired from IMI plc at the beginning of 2014, as well as from increased sales in the retail store fixtures and the watertreatment sectors. Marmon’s manufacturing pre-tax earnings were $212 million and $356 million in the second quarter and first sixmonths of 2014, respectively, which represented increases of $43 million (26%) and $49 million (16%), respectively, over thecomparable periods in 2013. Earnings as a percentage of sales increased one full percentage point to 13.5% in the second quarter of2014 versus 2013. The earnings increases reflect the impact of the previously mentioned business acquisition and the positive impactof the revenue growth in the retail store fixtures and water treatment markets.
34
Second Quarter First Six Months Revenues Pre-tax earnings Revenues Pre-tax earnings 2014 2013 2014 2013 2014 2013 2014 2013
Industrial and end-user products $ 5,905 $ 5,369 $ 968 $ 841 $ 11,269 $ 10,341 $ 1,786 $ 1,561
Building products 2,651 2,510 294 258 4,884 4,659 439 398 Apparel 1,057 1,017 107 52 2,101 2,057 212 140
$ 9,613 $ 8,896 $ 1,369 $ 1,151 $ 18,254 $ 17,057 $ 2,437 $ 2,099

Item 2. Management’s Discussion and Analysis of Financial Condition and Results of Operations (Continued)
Manufacturing, Service and Retailing (Continued)
Manufacturing (Continued)
Revenues in the second quarter and first six months of 2014 from our building products businesses were approximately $2.7billion and $4.9 billion, respectively, increases of 6% and 5% over 2013. The increase for the first six months was primarily due toincreases at Johns Manville, MiTek and Acme, partially offset by revenue declines at Shaw and Benjamin Moore. Pre-tax earnings of the building products businesses in 2014 increased 14% in the second quarter and 10% in the first six months compared to 2013. Eachbusiness generated increased earnings in 2014 over 2013, with the exception of Shaw where earnings declined primarily due to lowergross sales margins.
Apparel revenues in the second quarter and first six months of 2014 were $1.1 billion and $2.1 billion, respectively, increasesof 4% and 2%, respectively, over the prior year periods. Earnings increased $55 million (106%) and $72 million (51%), respectively,over 2013. The increase in earnings for the first six months of 2014 was primarily attributable to Fruit of the Loom, which benefittedfrom lower manufacturing and pension costs.
Service
Our service businesses include NetJets, the world’s leading provider of fractional ownership programs for general aviationaircraft and FlightSafety, a provider of high technology training to operators of aircraft. Among the other businesses included in thisgroup are: TTI, a leading electronic components distributor; Business Wire, a leading distributor of corporate news, multimedia andregulatory filings; Dairy Queen, which licenses and services a system of over 6,300 stores that offer prepared dairy treats and food;Buffalo News and the BH Media Group (“BH Media”), which includes the Omaha World-Herald, as well as 29 other daily newspapers and numerous other publications; and businesses that provide management and other services to insurance companies.
Revenues of our service businesses in the second quarter and first six months of 2014 were approximately $2.5 billion and $4.9billion, respectively, representing increases of $223 million (10%) and $507 million (11%), respectively, compared to 2013. In thefirst six months of 2014, revenue increases were generated by NetJets ($135 million) and TTI ($219 million), as well as byFlightSafety and BH Media. The revenue increase at NetJets reflected increased flight services revenues, which was attributable toincreased flight hours and, to a lesser degree, rates and product mix changes. TTI’s revenue increase was driven by higher unit volume. FlightSafety’s revenue increase in 2014 was primarily due to increased simulator training activity, while BH Media’s revenue increase was primarily due to bolt-on business acquisitions.
Pre-tax earnings of our service businesses in the second quarter and first six months of 2014 were $362 million and $605million, respectively, representing increases of $38 million (12%) and $72 million (14%), respectively, versus 2013. The increases inearnings were generated by BH Media, FlightSafety, NetJets and TTI. The increases in earnings of FlightSafety, BH Media and TTIwere primarily due to the aforementioned increases in revenues. NetJets’ earnings benefitted from the increased revenues and lower financing expenses, which were somewhat offset by increased aircraft impairment charges, depreciation expense, maintenance costsand subcontracted flight expenses.
Retailing
Our retailing operations consist of four home furnishings businesses (Nebraska Furniture Mart, R.C. Willey, Star Furniture andJordan’s), three jewelry businesses (Borsheims, Helzberg and Ben Bridge), See’s Candies, Pampered Chef, a direct seller of high quality kitchen tools and Oriental Trading Company (“OTC”), a direct retailer of party supplies, school supplies and toys and novelties. Revenues in the second quarter and first six months of 2014 from the retailing businesses increased $69 million (7%) and$52 million (3%), respectively, compared to the second quarter and first six months of 2013. Pre-tax earnings in the second quarter of 2014 increased $15 million (20%) versus 2013 and for the first six months declined $14 million (9%) compared to the same period in2013. Most of our retailers generated lower comparative earnings in the first six months of 2014 versus 2013.
35

Item 2. Management’s Discussion and Analysis of Financial Condition and Results of Operations (Continued)
Finance and Financial Products
Our finance and financial products businesses include manufactured housing and finance (Clayton Homes), transportationequipment manufacturing, repair and leasing businesses (Marmon and XTRA), as well as other leasing and financing activities.Marmon manufactures, owns and leases railcars and intermodal tank cars, and also owns and leases cranes, while XTRA owns andleases over-the-road trailers. A summary of earnings from these businesses follows. Amounts are in millions.
Clayton Homes’ earnings in the second quarter and first six months of 2014 increased $41 million (40%) and $85 million(49%), respectively, compared to 2013. In the 2014 periods, earnings benefitted from lower loan loss provisions on installment loanportfolios, lower interest expense on borrowings, and improved manufacturing results. The declines in loan loss provisions reflecteddeclining delinquencies and foreclosures, while the declines in interest expense were primarily due to lower rates. Clayton Homes’manufactured housing business continues to operate at a competitive disadvantage compared to traditional single family housingmarkets, which receive significant interest rate subsidies from the U.S. government through government agency insured mortgages.For the most part, these subsidies are not available to factory built homes. Nevertheless, Clayton Homes remains the largestmanufactured housing business in the United States and we believe that it will continue to operate profitably, even under theprevailing conditions.
Earnings in the second quarter and first six months of 2014 from our transportation equipment manufacturing, repair andleasing businesses were $198 million and $380 million, respectively, representing increases of $19 million (11%) and $53 million(16%), respectively, over 2013. The increase in year-to-date earnings reflected a 9% increase in aggregate lease revenues, primarilyresulting from increased units on lease and higher lease rates for railcars. A significant portion of the costs of these businesses arefixed, so changes in revenues can have a disproportionate effect on earnings.
Earnings from our other finance activities include CORT’s furniture leasing business, interest and dividends from a portfolio ofinvestments and our share of the earnings of a commercial mortgage servicing business in which we own a 50% joint venture interest.In addition, other earnings includes income from interest rate spreads charged to Clayton Homes on borrowings by a Berkshirefinancing subsidiary that are used to fund loans to Clayton Homes and guaranty fees charged to NetJets. Corresponding expenses areincluded in Clayton Homes’ and NetJets’ results. Guaranty fees and interest spreads charged to NetJets and Clayton Homesaggregated $18 million and $36 million in the second quarter and first six months of 2014 compared to $24 million and $48 million inthe corresponding 2013 periods.
Investment and Derivative Gains/Losses
A summary of investment and derivative gains and losses and other-than-temporary impairments on investments follows. Amounts are in millions.
36
Second Quarter First Six Months 2014 2013 2014 2013
Manufactured housing and finance $ 144 $ 103 $ 259 $ 174 Transportation equipment manufacturing, repair and leasing 198 179 380 327 Other 80 73 155 150
Pre-tax earnings 422 355 794 651 Income taxes and noncontrolling interests 142 124 276 229
$ 280 $ 231 $ 518 $ 422
Second Quarter First Six Months 2014 2013 2014 2013 Investment gains/losses $ 2,366 $ 492 $ 3,516 $ 1,082 Other-than-temporary impairments — — (19) (85) Derivative gains/losses 155 461 391 1,667
Gains/losses before income taxes and noncontrolling interests 2,521 953 3,888 2,664 Income taxes and noncontrolling interests 457 331 652 932
Net gains/losses $ 2,064 $ 622 $ 3,236 $ 1,732
Item 2. Management’s Discussion and Analysis of Financial Condition and Results of Operations (Continued)
Investment and Derivative Gains/Losses (Continued)
Investment gains/losses arise primarily from the sale or redemption of investments or when investments are carried at fair valuewith the periodic changes in fair values recorded in earnings. The timing of investment gains or losses can have a material effect onperiodic earnings. Investment gains and losses usually have a minimal impact on the periodic changes in our consolidatedshareholders’ equity since most of our investments are regularly recorded at fair value with the unrealized gains and losses included inshareholders’ equity as a component of accumulated other comprehensive income.
We believe the amount of investment gains/losses included in earnings in any given period typically has little analytical orpredictive value. Our decisions to sell securities are not motivated by the impact that the resulting gains or losses will have on ourreported earnings. Although our management does not consider investment gains and losses in a given period as necessarilymeaningful or useful in evaluating periodic earnings, we are providing information to explain the nature of such gains and losseswhen they are reflected in earnings.
Pre-tax investment gains in the second quarter and first six months of 2014 were $2,366 million and $3,516 million,respectively, representing increases of $1,874 million and $2,434 million over the corresponding 2013 periods. Investment gains inthe second quarter and first six months of 2014 included non-cash, pre-tax holding gains of approximately $1.1 billion and $2.1 billion, respectively, realized in connection with the exchanges of common stock of Phillips 66 and Graham Holdings Company for100% of the common stock of a specified subsidiary of each of those companies. Each exchange transaction was structured as a tax-free reorganization under the Internal Revenue Code. As a result, no income taxes were provided on the excess of the fair value of thebusinesses received over the tax-basis cost of the common stock of Phillips 66 and Graham Holdings Company exchanged.Investment gains in 2013 included $728 million from our investments in General Electric and Goldman Sachs common stockwarrants, which beginning in 2013 were carried at fair value with the unrealized gain or loss included in earnings. These warrantswere exercised during the fourth quarter of 2013.
Other-than-temporary impairment (“OTTI”) charges in the second quarter and first six months of 2014 were insignificant.Charges in 2013 related to our investments in Texas Competitive Electric Holdings bonds. Although we have periodically recordedOTTI charges in earnings in the past, we continue to hold positions in certain of those securities. In cases where the market values ofthese investments have increased since the dates the OTTI charges were recorded in earnings, the related gains are not reflected inearnings but are instead included in shareholders’ equity as a component of accumulated other comprehensive income. Whenrecorded, OTTI charges had no impact whatsoever on the asset values otherwise recorded in our Consolidated Balance Sheets or onour consolidated shareholders’ equity as those investments were carried at fair value on a recurring basis. In addition, the recognitionof such losses in earnings rather than in accumulated other comprehensive income does not necessarily indicate that sales areimminent or planned and sales ultimately may not occur for a number of years. Furthermore, the recognition of OTTI charges doesnot necessarily indicate that the loss in value of the security is permanent or that the market price of the security will not subsequentlyincrease to and ultimately exceed our original cost.
As of June 30, 2014, consolidated gross unrealized losses on our investments in equity and fixed maturity securities determinedon an individual purchase lot basis were $416 million. We concluded that as of that date, such losses were temporary. We considerseveral factors in determining whether or not impairments are deemed to be other than temporary, including the current and expectedlong-term business prospects and if applicable, the creditworthiness of the issuer, our ability and intent to hold the investment untilthe price recovers and the length of time and relative magnitude of the price decline.
Derivative gains/losses primarily represent the changes in fair value of our credit default and equity index put option contracts.Periodic changes in the fair values of these contracts are reflected in earnings and can be significant, reflecting the volatility ofunderlying credit and equity markets.
37

Item 2. Management’s Discussion and Analysis of Financial Condition and Results of Operations (Continued)
Investment and Derivative Gains/Losses (Continued)
In the second quarter and first six months of 2014, derivative contracts produced pre-tax gains of $155 million and $391 million, respectively. Our credit default contract exposures currently relate to municipality/state issuers and changes in valuationsduring 2014 produced pre-tax gains of $84 million in the second quarter and $457 million for the first six months. The gains wereattributable to lower credit spreads. Equity index put option contracts produced pre-tax gains of $65 million in the second quarter of 2014 and pre-tax losses of $67 million for the first six months. These gains and losses reflected valuation changes primarilyattributable to lower interest rate assumptions and changes in equity index prices.
In the second quarter and first six months of 2013, our derivative contracts generated pre-tax gains of $461 million and $1,667 million, respectively, which were primarily attributed to changes in the fair values of our equity index put option contracts. In 2013,the gains were primarily due to higher equity prices and favorable foreign currency exchange rate movements from effects of astronger U.S. Dollar.
Other
Other sources of after-tax earnings in the second quarter and first six months of 2014 included earnings of $116 million and$293 million, respectively, related to Berkshire’s investments in Heinz Holding which were made in June 2013. Also included inother earnings during both the second quarter and first six months of 2014 and 2013 are amortization of fair value adjustments madein connection with several prior business acquisitions (primarily related to the amortization of identifiable intangible assets) andcorporate interest expense. In the first six months of 2014 and 2013, these two charges (after-tax) aggregated approximately $300 million and $316 million, respectively.
Financial Condition
Our balance sheet continues to reflect significant liquidity and a strong capital base. Our consolidated shareholders’ equity at June 30, 2014 was $234.0 billion, an increase of $12.1 billion since December 31, 2013. Consolidated cash and investments of ourinsurance and other businesses approximated $207.5 billion (excludes our investments in H.J. Heinz Holding Corporation) at June 30,2014, and included cash and cash equivalents of $49.2 billion. As of June 30, 2014, our insurance subsidiaries held approximately$193.9 billion in cash and investments.
Berkshire Hathaway parent company borrowings include $8.0 billion of senior notes, of which $750 million mature in August2014 and an additional $1.7 billion mature in February 2015. We currently expect to issue new senior notes to replace some or all ofthe upcoming maturities. During the first quarter of 2014, Berkshire paid approximately $1.2 billion as final payment in connectionwith our acquisition of substantially all the outstanding shares held by Marmon non-controlling shareholders at December 31, 2013.
Berkshire’s Board of Directors has authorized Berkshire to repurchase its Class A and Class B common shares at prices nohigher than a 20% premium over the book value of the shares. Berkshire may repurchase shares at management’s discretion. The repurchase program is expected to continue indefinitely, but does not obligate Berkshire to repurchase any dollar amount or numberof Class A or Class B common shares. Repurchases will not be made if they would reduce Berkshire’s consolidated cash and cash equivalent holdings below $20 billion. Financial strength and redundant liquidity will always be of paramount importance atBerkshire. There were no share repurchases under the program during the first six months of 2014.
Our railroad, utilities and energy businesses (conducted by BNSF and BHE) maintain very large investments in capital assets(property, plant and equipment) and will regularly make capital expenditures in the normal course of business. In the first six monthsof 2014, aggregate capital expenditures of these businesses were approximately $4.6 billion, including $2.4 billion by BHE and $2.2billion by BNSF. BNSF and BHE forecast aggregate capital expenditures of approximately $6.9 billion over the remainder of 2014.Future capital expenditures are expected to be funded from cash flows from operations and debt issuances.
In March 2014, BNSF issued $500 million of 3.75% debentures due in 2024 and $1.0 billion of 4.9% debentures due in 2044.BNSF’s outstanding debt was $17.9 billion as of June 30, 2014. In the first six months of 2014, BHE subsidiaries issued term debt of$1.3 billion and its aggregate outstanding borrowings were approximately $31.0 billion as of June 30, 2014. BNSF and BHE haveaggregate debt and capital lease maturities over the remainder of 2014 of about $560 million. Berkshire’s commitment to provide up to $2 billion of additional capital to BHE to permit the repayment of its debt obligations or to fund its regulated utility subsidiariesexpired on February 28, 2014. Berkshire does not guarantee the repayment of debt issued by BNSF, BHE or any of their subsidiaries.
38

Item 2. Management’s Discussion and Analysis of Financial Condition and Results of Operations (Continued)
Financial Condition (Continued)
Assets of the finance and financial products businesses consisted primarily of loans and finance receivables, cash and cashequivalents, a portfolio of fixed maturity and equity investments and a sizable portfolio of assets held for lease, consisting of varioustypes of transportation equipment and furniture. Finance and financial products assets were approximately $33.6 billion as of June 30,2014 and $33.2 billion as of December 31, 2013. Liabilities were $19.1 billion as of June 30, 2014 and $19.8 billion as ofDecember 31, 2013, which included notes payable and other borrowings of $12.8 billion and $13.1 billion, respectively. As ofJune 30, 2014, notes payable included $11.2 billion of notes issued by Berkshire Hathaway Finance Corporation (“BHFC”). In January 2014, $750 million of BHFC senior notes matured and BHFC issued $750 million of new senior notes to replace maturingnotes. The new senior notes consisted of $650 million of floating rate notes due in 2017 and $100 million of 2% notes due in 2018.An additional $400 million of BHFC debt matured in July 2014 and $1.0 billion will mature in January 2015. We currently intend toissue additional new debt through BHFC to replace some or all of these debt maturities. The proceeds from the BHFC notes are usedto finance originated loans and acquired loans of Clayton Homes. The full and timely payment of principal and interest on the BHFCnotes is guaranteed by Berkshire.
We regularly access the credit markets, particularly through our railroad, utilities and energy and finance and financial productsbusinesses. Restricted access to credit markets at affordable rates in the future could have a significant negative impact on ouroperations.
As described in Note 13 to the Consolidated Financial Statements, we are party to equity index put option and credit defaultcontracts. With limited exception, these contracts contain no collateral posting requirements under any circumstances, includingchanges in either the fair value or intrinsic value of the contracts or a downgrade in Berkshire’s credit ratings. At June 30, 2014, the liabilities recorded for such contracts were approximately $4.9 billion and we had no collateral posting requirements.
In 2010, the Dodd-Frank Wall Street Reform and Consumer Protection Act (the “Reform Act”) was signed into law. The Reform Act reshapes financial regulations in the United States by creating new regulators, regulating new markets and marketparticipants and providing new enforcement powers to regulators. Virtually all major areas of the Reform Act have been subject toextensive rulemaking proceedings being conducted both jointly and independently by multiple regulatory agencies, some of whichhave been completed and others that are expected to be finalized during the next several months. Although the Reform Act mayadversely affect some of our business activities, it is not currently expected to have a material impact on our consolidated financialresults or financial condition.
Contractual Obligations
We are party to contracts associated with ongoing business and financing activities, which will result in cash payments tocounterparties in future periods. Certain obligations reflected in our Consolidated Balance Sheets, such as notes payable, requirefuture payments on contractually specified dates and in fixed and determinable amounts, while others (including unpaid loss and lossadjustment expenses and life, annuity and health benefit liabilities assumed under insurance contracts) are contingent upon theoutcome of future events. Actual payments will likely vary, perhaps significantly, from the liability estimates currently recorded inthe Consolidated Balance Sheets. Other obligations, such as minimum rentals under operating leases, pertain to the acquisition ofgoods or services in the future and are not currently reflected in the financial statements. Such obligations will be reflected in futureperiods as the goods are delivered or services provided. Our contractual obligations as of June 30, 2014 were, in the aggregate, notmaterially different from those disclosed in the “Contractual Obligations” section of “Management’s Discussion and Analysis of Financial Condition and Results of Operations” contained in Berkshire’s Annual Report on Form 10-K for the year ended December 31, 2013.
Critical Accounting Policies
Certain accounting policies require us to make estimates and judgments regarding transactions that have occurred andultimately will be settled several years in the future or concerning the recoverability of assets. Amounts recognized in the financialstatements from such estimates are necessarily based on assumptions about numerous factors involving varying, and possiblysignificant, degrees of judgment and uncertainty. Accordingly, the amounts currently recorded in the financial statements may prove,with the benefit of hindsight, to be inaccurate. Reference is made to “Critical Accounting Policies” discussed in “Management’s Discussion and Analysis of Financial Condition and Results of Operations” included in Berkshire’s Annual Report on Form 10-K for the year ended December 31, 2013.
39

Item 2. Management’s Discussion and Analysis of Financial Condition and Results of Operations (Continued)
Critical Accounting Policies (Continued)
Our Consolidated Balance Sheet as of June 30, 2014 includes estimated liabilities for unpaid losses from property and casualtyinsurance and reinsurance contracts of $65.6 billion. Due to the inherent uncertainties in the process of establishing loss reserveamounts, the actual ultimate claim amounts will likely differ from the currently recorded amounts. A very small percentage change inestimates of this magnitude will result in a material effect on periodic earnings. The effects from changes in these estimates arerecorded as a component of losses incurred in the period of the change.
Our Consolidated Balance Sheet as of June 30, 2014 includes goodwill of acquired businesses of $58.8 billion. We evaluategoodwill for impairment at least annually and conducted our most recent annual review during the fourth quarter of 2013. Althoughwe believe that the goodwill reflected in the Consolidated Balance Sheet as of June 30, 2014 is not impaired, goodwill maysubsequently become impaired as a result of changes in facts and circumstances affecting the valuation of the reporting unit. Agoodwill impairment charge could have a material effect on periodic earnings.
Our Consolidated Balance Sheets include significant amounts of derivative contract liabilities that are measured at fair value.As of June 30, 2014 our most significant derivative contract exposures relate to equity index put option contracts written between2004 and 2008. These contracts were entered into in over-the-counter markets and certain elements in the terms and conditions ofsuch contracts are not standard. In particular, we are not required to post collateral under most of our contracts. Furthermore, there isno source of independent data available to us showing trading volume and actual prices of completed transactions. As a result, thevalues of these liabilities are based on valuation models that are believed to be used by market participants. Such models or othervaluation techniques may use inputs that are observable in the marketplace, while others are unobservable. Unobservable inputsrequire us to make certain projections and assumptions about the information that would be used by market participants inestablishing prices. Changes in assumptions may have a significant effect on recorded values and periodic earnings.
Information concerning new accounting pronouncements is included in Note 2 to the accompanying Consolidated FinancialStatements.
Forward-Looking Statements
Investors are cautioned that certain statements contained in this document as well as some statements in periodic press releasesand some oral statements of Berkshire officials during presentations about Berkshire or its subsidiaries are “forward-looking”statements within the meaning of the Private Securities Litigation Reform Act of 1995 (the “Act”). Forward-looking statements include statements which are predictive in nature, which depend upon or refer to future events or conditions, which include wordssuch as “expects,” “anticipates,” “intends,” “plans,” “believes,” “estimates” or similar expressions. In addition, any statements concerning future financial performance (including future revenues, earnings or growth rates), ongoing business strategies orprospects and possible future Berkshire actions, which may be provided by management, are also forward-looking statements as defined by the Act. Forward-looking statements are based on current expectations and projections about future events and are subjectto risks, uncertainties and assumptions about Berkshire and its subsidiaries, economic and market factors and the industries in whichwe do business, among other things. These statements are not guaranties of future performance and we have no specific intention toupdate these statements.
Actual events and results may differ materially from those expressed or forecasted in forward-looking statements due to a number of factors. The principal important risk factors that could cause our actual performance and future events and actions to differmaterially from such forward-looking statements include, but are not limited to, changes in market prices of our investments in fixedmaturity and equity securities, losses realized from derivative contracts, the occurrence of one or more catastrophic events, such as anearthquake, hurricane or act of terrorism that causes losses insured by our insurance subsidiaries or affects our other operatingbusinesses, changes in laws or regulations affecting our insurance, railroad, utilities and energy or finance subsidiaries, changes infederal income tax laws, and changes in general economic and market factors that affect the prices of securities or the industries inwhich we do business.
40

Item 3. Quantitative and Qualitative Disclosures About Market Risk
Reference is made to Berkshire’s most recently issued Annual Report and in particular the “Market Risk Disclosures” included in “Management’s Discussion and Analysis of Financial Condition and Results of Operations.” As of June 30, 2014, there were no material changes in the market risks described in Berkshire’s Annual Report on Form 10-K for the year ended December 31, 2013.
Item 4. Controls and Procedures
As of the end of the period covered by this Quarterly Report on Form 10-Q, the Corporation carried out an evaluation, under the supervision and with the participation of the Corporation’s management, including the Chairman (Chief Executive Officer) andthe Senior Vice President (Chief Financial Officer), of the effectiveness of the design and operation of the Corporation’s disclosure controls and procedures pursuant to Exchange Act Rule 13a-15. Based upon that evaluation, the Chairman (Chief Executive Officer)and the Senior Vice President (Chief Financial Officer) concluded that the Corporation’s disclosure controls and procedures are effective in timely alerting them to material information relating to the Corporation (including its consolidated subsidiaries) requiredto be included in the Corporation’s periodic SEC filings. During the quarter, there have been no significant changes in theCorporation’s internal control over financial reporting or in other factors that could significantly affect internal control over financialreporting.
41
Part II Other Information
Item 1. Legal Proceedings
We are party in a variety of legal actions arising out of the normal course of business. In particular, such legal actions affect our insuranceand reinsurance businesses. Such litigation generally seeks to establish liability directly through insurance contracts or indirectly throughreinsurance contracts issued by Berkshire subsidiaries. Plaintiffs occasionally seek punitive or exemplary damages. We do not believe that suchnormal and routine litigation will have a material effect on our financial condition or results of operations.
Item 1A. Risk Factors
Our significant business risks are described in Item 1A to Form 10-K for the year ended December 31, 2013 to which reference is madeherein.
Item 2. Unregistered Sales of Equity Securities and Use of Proceeds and Issuer Repurchases of Equity Securities
In September 2011, Berkshire’s Board of Directors (“Berkshire’s Board”) approved a common stock repurchase program under which Berkshire may repurchase its Class A and Class B shares at prices no higher than a 10% premium over the book value of the shares. In December2012, Berkshire’s Board amended the repurchase program by raising the price limit to no higher than a 20% premium over book value. Berkshiremay repurchase shares in the open market or through privately negotiated transactions. Berkshire’s Board authorization does not specify a maximum number of shares to be repurchased. However, repurchases will not be made if they would reduce Berkshire’s consolidated cash equivalent holdings below $20 billion. The repurchase program is expected to continue indefinitely and the amount of repurchases will dependentirely upon the level of cash available, the attractiveness of investment and business opportunities either at hand or on the horizon, and the degreeof discount of the market price relative to management’s estimate of intrinsic value. The repurchase program does not obligate Berkshire torepurchase any dollar amount or number of Class A or Class B shares and there is no expiration date to the program. There were no sharerepurchases under the program in the first six months of 2014.
In addition, on June 30, 2014, we exchanged 1,620,190 shares of Graham Holding Company (“GHC”) common stock for a GHC subsidiary. Among its assets were 2,107 shares of Berkshire Hathaway Class A Common Stock and 1,278 shares of Class B Common Stock. Theseshares are reflected as treasury stock in our Consolidated Financial Statements. The value of the Berkshire shares received was approximately $400million.
Item 3. Defaults Upon Senior Securities
None
Item 4. Mine Safety Disclosures
Information regarding the Company’s mine safety violations and other legal matters disclosed in accordance with Section 1503(a) of theDodd-Frank Reform Act is included in Exhibit 95 to this Form 10-Q.
Item 5. Other Information
None
Item 6. Exhibits
a. Exhibits
42
12 Calculation of Ratio of Consolidated Earnings to Consolidated Fixed Charges
31.1 Rule 13a-14(a)/15d-14(a) Certifications
31.2 Rule 13a-14(a)/15d-14(a) Certifications
32.1 Section 1350 Certifications
32.2 Section 1350 Certifications
95 Mine Safety Disclosures
101
The following financial information from Berkshire Hathaway Inc.’s Quarterly Report on Form 10-Q for the quarter ended June 30, 2014, formatted in XBRL (Extensible Business Reporting Language) includes: (i) the Consolidated Balance Sheets as of June 30, 2014 and December 31, 2013, (ii) the Consolidated Statements of Earnings for each of the three-month and six-month periods ended June 30, 2014 and 2013, (iii) the Consolidated Statements of Comprehensive Income for each of the three-month and six-month periods ended June 30, 2014 and 2013, (iv) the Consolidated Statements of Changes in Shareholders’ Equity for each of the six-month periods ended June 30, 2014 and 2013, (v) the Consolidated Statements of Cash Flows for each of the six-month periods ended June 30, 2014 and 2013, and (vi) the Notes to Consolidated Financial Statements, tagged in summary and detail.

SIGNATURE
Pursuant to the requirement of the Securities Exchange Act of 1934, the Registrant has duly caused this Report to be signed onits behalf by the undersigned thereunto duly authorized.
43
BERKSHIRE HATHAWAY INC. (Registrant)
Date: August 1, 2014 /S/ MARC D. HAMBURG
(Signature) Marc D. Hamburg,
Senior Vice President and Principal Financial Officer
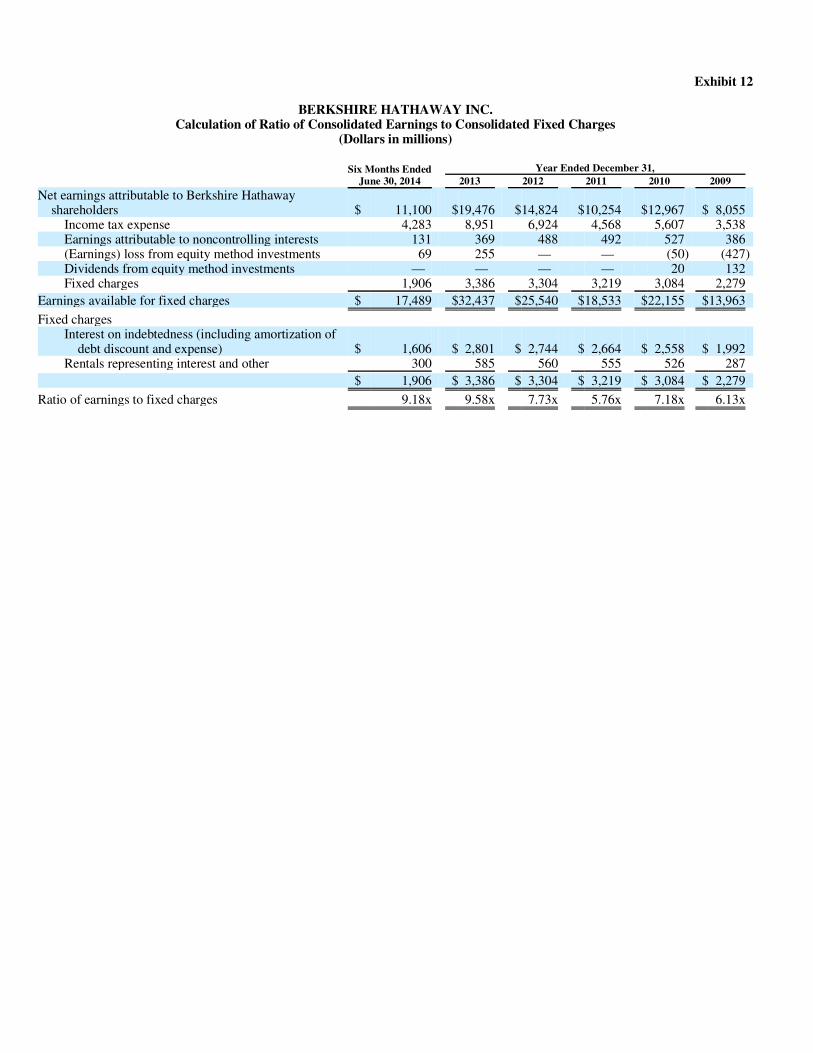
Exhibit 12
BERKSHIRE HATHAWAY INC. Calculation of Ratio of Consolidated Earnings to Consolidated Fixed Charges
(Dollars in millions) Six Months Ended
June 30, 2014 Year Ended December 31,
2013 2012 2011 2010 2009Net earnings attributable to Berkshire Hathaway
shareholders $ 11,100 $19,476 $14,824 $10,254 $12,967 $ 8,055 Income tax expense 4,283 8,951 6,924 4,568 5,607 3,538 Earnings attributable to noncontrolling interests 131 369 488 492 527 386 (Earnings) loss from equity method investments 69 255 — — (50) (427) Dividends from equity method investments — — — — 20 132 Fixed charges 1,906 3,386 3,304 3,219 3,084 2,279
Earnings available for fixed charges $ 17,489 $32,437 $25,540 $18,533 $22,155 $13,963
Fixed charges Interest on indebtedness (including amortization of
debt discount and expense) $ 1,606 $ 2,801 $ 2,744 $ 2,664 $ 2,558 $ 1,992 Rentals representing interest and other 300 585 560 555 526 287
$ 1,906 $ 3,386 $ 3,304 $ 3,219 $ 3,084 $ 2,279
Ratio of earnings to fixed charges 9.18x 9.58x 7.73x 5.76x 7.18x 6.13x

EXHIBIT 31.1
Quarter ended June 30, 2014
Rule 13a-14(a)/15d-14(a) Certifications
CERTIFICATIONS
I, Warren E. Buffett, certify that:
Date: August 1, 2014
1. I have reviewed this quarterly report on Form 10-Q of Berkshire Hathaway Inc.;
2. Based on my knowledge, this report does not contain any untrue statement of a material fact or omit to state a material factnecessary to make the statements made, in light of the circumstances under which such statements were made, not misleadingwith respect to the period covered by this report;
3. Based on my knowledge, the financial statements, and other financial information included in this report, fairly present in allmaterial respects the financial condition, results of operations and cash flows of the registrant as of, and for, the periodspresented in this report;
4. The registrant’s other certifying officer(s) and I are responsible for establishing and maintaining disclosure controls andprocedures (as defined in Exchange Act Rules 13a-15(e) and 15d-15(e)) and internal control over financial reporting (as defined in Exchange Act Rules 13a-15(f) and 15d-15(f)) for the registrant and have:
a) Designed such disclosure controls and procedures, or caused such disclosure controls and procedures to be designedunder our supervision, to ensure that material information relating to the registrant, including its consolidatedsubsidiaries, is made known to us by others within those entities, particularly during the period in which this report isbeing prepared;
b) Designed such internal control over financial reporting, or caused such internal control over financial reporting to be
designed under our supervision, to provide reasonable assurance regarding the reliability of financial reporting and thepreparation of financial statements for external purposes in accordance with generally accepted accounting principles;
c) Evaluated the effectiveness of the registrant’s disclosure controls and procedures and presented in this report our
conclusions about the effectiveness of the disclosure controls and procedures, as of the end of the period covered by thisreport based on such evaluation; and
d) Disclosed in this report any change in the registrant’s internal control over financial reporting that occurred during theregistrant’s most recent fiscal quarter (the registrant’s fourth fiscal quarter in the case of an annual report) that hasmaterially affected, or is reasonably likely to materially affect, the registrant’s internal control over financial reporting; and
5. The registrant’s other certifying officer(s) and I have disclosed, based on our most recent evaluation of internal control overfinancial reporting, to the registrant’s auditors and the audit committee of the registrant’s board of directors (or personsperforming the equivalent functions):
a) All significant deficiencies and material weaknesses in the design or operation of internal control over financial
reporting which are reasonably likely to adversely affect the registrant’s ability to record, process, summarize and report financial information; and
b) Any fraud, whether or not material, that involves management or other employees who have a significant role in theregistrant’s internal control over financial reporting.
/S/ WARREN E. BUFFETT Chairman—Principal Executive Officer

EXHIBIT 31.2
Quarter ended June 30, 2014
Rule 13a-14(a)/15d-14(a) Certifications
CERTIFICATIONS
I, Marc D. Hamburg, certify that:
Date: August 1, 2014
1. I have reviewed this quarterly report on Form 10-Q of Berkshire Hathaway Inc.;
2. Based on my knowledge, this report does not contain any untrue statement of a material fact or omit to state a material factnecessary to make the statements made, in light of the circumstances under which such statements were made, not misleadingwith respect to the period covered by this report;
3. Based on my knowledge, the financial statements, and other financial information included in this report, fairly present in allmaterial respects the financial condition, results of operations and cash flows of the registrant as of, and for, the periodspresented in this report;
4. The registrant’s other certifying officer(s) and I are responsible for establishing and maintaining disclosure controls andprocedures (as defined in Exchange Act Rules 13a-15(e) and 15d-15(e)) and internal control over financial reporting (as defined in Exchange Act Rules 13a-15(f) and 15d-15(f)) for the registrant and have:
a) Designed such disclosure controls and procedures, or caused such disclosure controls and procedures to be designedunder our supervision, to ensure that material information relating to the registrant, including its consolidatedsubsidiaries, is made known to us by others within those entities, particularly during the period in which this report isbeing prepared;
b) Designed such internal control over financial reporting, or caused such internal control over financial reporting to be
designed under our supervision, to provide reasonable assurance regarding the reliability of financial reporting and thepreparation of financial statements for external purposes in accordance with generally accepted accounting principles;
c) Evaluated the effectiveness of the registrant’s disclosure controls and procedures and presented in this report our
conclusions about the effectiveness of the disclosure controls and procedures, as of the end of the period covered by thisreport based on such evaluation; and
d) Disclosed in this report any change in the registrant’s internal control over financial reporting that occurred during theregistrant’s most recent fiscal quarter (the registrant’s fourth fiscal quarter in the case of an annual report) that hasmaterially affected, or is reasonably likely to materially affect, the registrant’s internal control over financial reporting; and
5. The registrant’s other certifying officer(s) and I have disclosed, based on our most recent evaluation of internal control overfinancial reporting, to the registrant’s auditors and the audit committee of the registrant’s board of directors (or personsperforming the equivalent functions):
a) All significant deficiencies and material weaknesses in the design or operation of internal control over financial
reporting which are reasonably likely to adversely affect the registrant’s ability to record, process, summarize and report financial information; and
b) Any fraud, whether or not material, that involves management or other employees who have a significant role in theregistrant’s internal control over financial reporting.
/S/ MARC D. HAMBURG Senior Vice President—Principal Financial Officer

EXHIBIT 32.1
Section 1350 Certifications
Quarter ended June 30, 2014
I, Warren E. Buffett, Chairman and Chief Executive Officer of Berkshire Hathaway Inc. (the “Company”), certify, pursuant to Section 906 of the Sarbanes-Oxley Act of 2002, 18 U.S.C. Section 1350, that to the best of my knowledge:
Dated: August 1, 2014
(1) the Quarterly Report on Form 10-Q of the Company for the period ended June 30, 2014 (the “Report”) fully complies with the requirements of Section 13(a) or 15(d) of the Securities Exchange Act of 1934 (15 U.S.C. 78m or 78o(d)); and
(2) the information contained in the Report fairly presents, in all material respects, the financial condition and results of operationsof the Company.
/S/ WARREN E. BUFFETT Warren E. Buffett
Chairman and Chief Executive Officer

EXHIBIT 32.2
Section 1350 Certifications
Quarter ended June 30, 2014
I, Marc D. Hamburg, Senior Vice President and Chief Financial Officer of Berkshire Hathaway Inc. (the “Company”), certify, pursuant to Section 906 of the Sarbanes-Oxley Act of 2002, 18 U.S.C. Section 1350, that to the best of my knowledge:
Dated: August 1, 2014
(1) the Quarterly Report on Form 10-Q of the Company for the period ended June 30, 2014 (the “Report”) fully complies with the requirements of Section 13(a) or 15(d) of the Securities Exchange Act of 1934 (15 U.S.C. 78m or 78o(d)); and
(2) the information contained in the Report fairly presents, in all material respects, the financial condition and results of operationsof the Company.
/S/ MARC D. HAMBURG Marc D. Hamburg
Senior Vice President and Chief Financial Officer

EXHIBIT 95
MINE SAFETY VIOLATIONS AND OTHER LEGAL MATTER DISCLOSURES PURSUANT TO SECTION 1503(a) OF THE DODD-FRANK WALL STREET
REFORM AND CONSUMER PROTECTION ACT
PacifiCorp and its subsidiaries operate coal mines and coal processing facilities and Acme Brick and its affiliates operate clay, shaleand limestone excavation facilities (collectively, the “mining facilities”) that are regulated by the Federal Mine Safety and Health Administration (“MSHA”) under the Federal Mine Safety and Health Act of 1977 (the “Mine Safety Act”). MSHA inspects mining facilities on a regular basis. The total number of reportable Mine Safety Act citations, orders, assessments and legal actions for thethree-month period ended June 30, 2014 are summarized in the table below and are subject to contest and appeal. The severity andassessment of penalties may be reduced or, in some cases, dismissed through the contest and appeal process. Amounts are reportedregardless of whether PacifiCorp or Acme has challenged or appealed the matter. Coal, clay and other reserves that are not yet minedand mines that are closed or idled are not included in the information below as no reportable events occurred at those locations duringthe three-month period ended June 30, 2014. PacifiCorp and Acme have not received any notice of a pattern, or notice of the potentialto have a pattern, of violations of mandatory health or safety standards that are of such nature as could have significantly andsubstantially contributed to the cause and effect of coal or other mine health or safety hazards under Section 104(e) of the Mine SafetyAct during the three-month period ended June 30, 2014.
Mine Safety Act TotalValue of Proposed
MSHA Assessments
(in thousands)
Total
Number ofMining Related
Fatalities
Legal Actions
Mining Facilities
Section 104Significant
and SubstantialCitations(1)
Section 104(b)
Orders(2)
Section 104(d)
Citations/Orders(3)
Section110(b)(2)
Violations(4)
Section107(a)
ImminentDanger
Orders(5)
Pending as of Last
Day of Period(6)
InstitutedDuringPeriod
ResolvedDuringPeriod
Coal: Deer Creek 1 — — — — $ 11 — 5 1 6 Bridger (surface) 2 — — — — 1 — 1 — 2 Bridger (underground) 15 — — — — 95 — 13 5 4 Cottonwood Preparatory Plant — — — — — — — — — — Wyodak Coal Crushing Facility — — — — — — — — — — Clay, shale and limestone: Minnesota — — — — — — — — — — Malvern — — — — — — — — — — Wheeler — — — — — — — — — — Eureka — — — — — — — — — — Fort Smith — — — — — — — — — — Kanopolis — — — — — — — — — — Oklahoma City — — — — — — — — — — Tulsa — — — — — — — — — — Denver — — — — — — — — — — Bennett — — — — — — — — — — Denton — — — — — — — — — — Elgin — — — — — — — — — — McQueeney — — — — — — — — — — Garrison — — — — — — — — — — Sealy — — — — — — — — — — Texas Clay — — — — — — — — — — Leeds — — — — — — — — — — Montgomery — — — — — — — — — — Lueders — — — — — — — — — — Cordova — — — — — — — — — —
(1) Citations for alleged violations of mandatory health and safety standards that could significantly or substantially contribute to the cause and effect of a safety or health hazardunder Section 104 of the Mine Safety Act.
(2) For alleged failure to totally abate the subject matter of a Mine Safety Act Section 104(a) citation within the period specified in the citation. (3) For alleged unwarrantable failure (i.e., aggravated conduct constituting more than ordinary negligence) to comply with a mandatory health or safety standard. (4) For alleged flagrant violations (i.e., reckless or repeated failure to make reasonable efforts to eliminate a known violation of a mandatory health or safety standard that
substantially and proximately caused, or reasonably could have been expected to cause, death or serious bodily injury). (5) For the existence of any condition or practice in a coal or other mine which could reasonably be expected to cause death or serious physical harm before such condition or
practice can be abated. (6) Amounts include 15 contests of proposed penalties under Subpart C, three contests of citations or orders under Subpart B and one labor-related complaint under Subpart E of
the Federal Mine Safety and Health Review Commission’s procedural rules. The pending legal actions are not exclusive to citations, notices, orders and penalties assessed byMSHA during the reporting period.
Related Documents