BERKSHIRE HATHAWAY INC. 2021 ANNUAL REPORT

Welcome message from author
This document is posted to help you gain knowledge. Please leave a comment to let me know what you think about it! Share it to your friends and learn new things together.
Transcript

BERKSHIRE HATHAWAY INC.
2021ANNUAL REPORT

BERKSHIRE HATHAWAY INC.
2021 ANNUAL REPORT
TABLE OF CONTENTS
Berkshire’s Performance vs. the S&P 500 . . . . . . . . . . . . . . . . . . . . . . . . . . . . . . . . . . . . . . . . . . . . . . 2
Chairman’s Letter* . . . . . . . . . . . . . . . . . . . . . . . . . . . . . . . . . . . . . . . . . . . . . . . . . . . . . . . . . . . . . . . 3-12
Form 10-K –Business Description . . . . . . . . . . . . . . . . . . . . . . . . . . . . . . . . . . . . . . . . . . . . . . . . . . . . . . . . . K-1
Risk Factors . . . . . . . . . . . . . . . . . . . . . . . . . . . . . . . . . . . . . . . . . . . . . . . . . . . . . . . . . . . . . . . . K-24
Description of Properties . . . . . . . . . . . . . . . . . . . . . . . . . . . . . . . . . . . . . . . . . . . . . . . . . . . . . . K-27
Management’s Discussion . . . . . . . . . . . . . . . . . . . . . . . . . . . . . . . . . . . . . . . . . . . . . . . . . . . . . K-32
Management’s Report on Internal Controls . . . . . . . . . . . . . . . . . . . . . . . . . . . . . . . . . . . . . . . K-66
Independent Auditor’s Report . . . . . . . . . . . . . . . . . . . . . . . . . . . . . . . . . . . . . . . . . . . . . . . . . . K-67
Consolidated Financial Statements . . . . . . . . . . . . . . . . . . . . . . . . . . . . . . . . . . . . . . . . . . . . . . K-70
Notes to Consolidated Financial Statements . . . . . . . . . . . . . . . . . . . . . . . . . . . . . . . . . . . . . . . K-75
Appendices –Annual Meeting Information . . . . . . . . . . . . . . . . . . . . . . . . . . . . . . . . . . . . . . . . . . . . . . . . . . . A-1
Greg Abel Letter . . . . . . . . . . . . . . . . . . . . . . . . . . . . . . . . . . . . . . . . . . . . . . . . . . . . . . . . . . . . A-3
Property/Casualty Insurance . . . . . . . . . . . . . . . . . . . . . . . . . . . . . . . . . . . . . . . . . . . . . . . . . . . A-5
Operating Companies . . . . . . . . . . . . . . . . . . . . . . . . . . . . . . . . . . . . . . . . . . . . . . . . . . . . . . . . . A-6
Stock Transfer Agent . . . . . . . . . . . . . . . . . . . . . . . . . . . . . . . . . . . . . . . . . . . . . . . . . . . . . . . . . A-7
Directors and Officers of the Company . . . . . . . . . . . . . . . . . . . . . . . . . . . . . . . . . . . . . . . . . . . . . . . . .Inside Back Cover
*Copyright© 2022 By Warren E. BuffettAll Rights Reserved
1

Berkshire’s Performance vs. the S&P 500
Annual Percentage Change
Year
in Per-ShareMarket Value of
Berkshire
in S&P 500with Dividends
Included
1965 . . . . . . . . . . . . . . . . . . . . . . . . . . . . . . . . . . . . . . . . . . . . . . . . . . . . . . . . . . . . . . . . . . . . . . . . . 49.5 10.01966 . . . . . . . . . . . . . . . . . . . . . . . . . . . . . . . . . . . . . . . . . . . . . . . . . . . . . . . . . . . . . . . . . . . . . . . . . (3.4) (11.7)1967 . . . . . . . . . . . . . . . . . . . . . . . . . . . . . . . . . . . . . . . . . . . . . . . . . . . . . . . . . . . . . . . . . . . . . . . . . 13.3 30.91968 . . . . . . . . . . . . . . . . . . . . . . . . . . . . . . . . . . . . . . . . . . . . . . . . . . . . . . . . . . . . . . . . . . . . . . . . . 77.8 11.01969 . . . . . . . . . . . . . . . . . . . . . . . . . . . . . . . . . . . . . . . . . . . . . . . . . . . . . . . . . . . . . . . . . . . . . . . . . 19.4 (8.4)1970 . . . . . . . . . . . . . . . . . . . . . . . . . . . . . . . . . . . . . . . . . . . . . . . . . . . . . . . . . . . . . . . . . . . . . . . . . (4.6) 3.91971 . . . . . . . . . . . . . . . . . . . . . . . . . . . . . . . . . . . . . . . . . . . . . . . . . . . . . . . . . . . . . . . . . . . . . . . . . 80.5 14.61972 . . . . . . . . . . . . . . . . . . . . . . . . . . . . . . . . . . . . . . . . . . . . . . . . . . . . . . . . . . . . . . . . . . . . . . . . . 8.1 18.91973 . . . . . . . . . . . . . . . . . . . . . . . . . . . . . . . . . . . . . . . . . . . . . . . . . . . . . . . . . . . . . . . . . . . . . . . . . (2.5) (14.8)1974 . . . . . . . . . . . . . . . . . . . . . . . . . . . . . . . . . . . . . . . . . . . . . . . . . . . . . . . . . . . . . . . . . . . . . . . . . (48.7) (26.4)1975 . . . . . . . . . . . . . . . . . . . . . . . . . . . . . . . . . . . . . . . . . . . . . . . . . . . . . . . . . . . . . . . . . . . . . . . . . 2.5 37.21976 . . . . . . . . . . . . . . . . . . . . . . . . . . . . . . . . . . . . . . . . . . . . . . . . . . . . . . . . . . . . . . . . . . . . . . . . . 129.3 23.61977 . . . . . . . . . . . . . . . . . . . . . . . . . . . . . . . . . . . . . . . . . . . . . . . . . . . . . . . . . . . . . . . . . . . . . . . . . 46.8 (7.4)1978 . . . . . . . . . . . . . . . . . . . . . . . . . . . . . . . . . . . . . . . . . . . . . . . . . . . . . . . . . . . . . . . . . . . . . . . . . 14.5 6.41979 . . . . . . . . . . . . . . . . . . . . . . . . . . . . . . . . . . . . . . . . . . . . . . . . . . . . . . . . . . . . . . . . . . . . . . . . . 102.5 18.21980 . . . . . . . . . . . . . . . . . . . . . . . . . . . . . . . . . . . . . . . . . . . . . . . . . . . . . . . . . . . . . . . . . . . . . . . . . 32.8 32.31981 . . . . . . . . . . . . . . . . . . . . . . . . . . . . . . . . . . . . . . . . . . . . . . . . . . . . . . . . . . . . . . . . . . . . . . . . . 31.8 (5.0)1982 . . . . . . . . . . . . . . . . . . . . . . . . . . . . . . . . . . . . . . . . . . . . . . . . . . . . . . . . . . . . . . . . . . . . . . . . . 38.4 21.41983 . . . . . . . . . . . . . . . . . . . . . . . . . . . . . . . . . . . . . . . . . . . . . . . . . . . . . . . . . . . . . . . . . . . . . . . . . 69.0 22.41984 . . . . . . . . . . . . . . . . . . . . . . . . . . . . . . . . . . . . . . . . . . . . . . . . . . . . . . . . . . . . . . . . . . . . . . . . . (2.7) 6.11985 . . . . . . . . . . . . . . . . . . . . . . . . . . . . . . . . . . . . . . . . . . . . . . . . . . . . . . . . . . . . . . . . . . . . . . . . . 93.7 31.61986 . . . . . . . . . . . . . . . . . . . . . . . . . . . . . . . . . . . . . . . . . . . . . . . . . . . . . . . . . . . . . . . . . . . . . . . . . 14.2 18.61987 . . . . . . . . . . . . . . . . . . . . . . . . . . . . . . . . . . . . . . . . . . . . . . . . . . . . . . . . . . . . . . . . . . . . . . . . . 4.6 5.11988 . . . . . . . . . . . . . . . . . . . . . . . . . . . . . . . . . . . . . . . . . . . . . . . . . . . . . . . . . . . . . . . . . . . . . . . . . 59.3 16.61989 . . . . . . . . . . . . . . . . . . . . . . . . . . . . . . . . . . . . . . . . . . . . . . . . . . . . . . . . . . . . . . . . . . . . . . . . . 84.6 31.71990 . . . . . . . . . . . . . . . . . . . . . . . . . . . . . . . . . . . . . . . . . . . . . . . . . . . . . . . . . . . . . . . . . . . . . . . . . (23.1) (3.1)1991 . . . . . . . . . . . . . . . . . . . . . . . . . . . . . . . . . . . . . . . . . . . . . . . . . . . . . . . . . . . . . . . . . . . . . . . . . 35.6 30.51992 . . . . . . . . . . . . . . . . . . . . . . . . . . . . . . . . . . . . . . . . . . . . . . . . . . . . . . . . . . . . . . . . . . . . . . . . . 29.8 7.61993 . . . . . . . . . . . . . . . . . . . . . . . . . . . . . . . . . . . . . . . . . . . . . . . . . . . . . . . . . . . . . . . . . . . . . . . . . 38.9 10.11994 . . . . . . . . . . . . . . . . . . . . . . . . . . . . . . . . . . . . . . . . . . . . . . . . . . . . . . . . . . . . . . . . . . . . . . . . . 25.0 1.31995 . . . . . . . . . . . . . . . . . . . . . . . . . . . . . . . . . . . . . . . . . . . . . . . . . . . . . . . . . . . . . . . . . . . . . . . . . 57.4 37.61996 . . . . . . . . . . . . . . . . . . . . . . . . . . . . . . . . . . . . . . . . . . . . . . . . . . . . . . . . . . . . . . . . . . . . . . . . . 6.2 23.01997 . . . . . . . . . . . . . . . . . . . . . . . . . . . . . . . . . . . . . . . . . . . . . . . . . . . . . . . . . . . . . . . . . . . . . . . . . 34.9 33.41998 . . . . . . . . . . . . . . . . . . . . . . . . . . . . . . . . . . . . . . . . . . . . . . . . . . . . . . . . . . . . . . . . . . . . . . . . . 52.2 28.61999 . . . . . . . . . . . . . . . . . . . . . . . . . . . . . . . . . . . . . . . . . . . . . . . . . . . . . . . . . . . . . . . . . . . . . . . . . (19.9) 21.02000 . . . . . . . . . . . . . . . . . . . . . . . . . . . . . . . . . . . . . . . . . . . . . . . . . . . . . . . . . . . . . . . . . . . . . . . . . 26.6 (9.1)2001 . . . . . . . . . . . . . . . . . . . . . . . . . . . . . . . . . . . . . . . . . . . . . . . . . . . . . . . . . . . . . . . . . . . . . . . . . 6.5 (11.9)2002 . . . . . . . . . . . . . . . . . . . . . . . . . . . . . . . . . . . . . . . . . . . . . . . . . . . . . . . . . . . . . . . . . . . . . . . . . (3.8) (22.1)2003 . . . . . . . . . . . . . . . . . . . . . . . . . . . . . . . . . . . . . . . . . . . . . . . . . . . . . . . . . . . . . . . . . . . . . . . . . 15.8 28.72004 . . . . . . . . . . . . . . . . . . . . . . . . . . . . . . . . . . . . . . . . . . . . . . . . . . . . . . . . . . . . . . . . . . . . . . . . . 4.3 10.92005 . . . . . . . . . . . . . . . . . . . . . . . . . . . . . . . . . . . . . . . . . . . . . . . . . . . . . . . . . . . . . . . . . . . . . . . . . 0.8 4.92006 . . . . . . . . . . . . . . . . . . . . . . . . . . . . . . . . . . . . . . . . . . . . . . . . . . . . . . . . . . . . . . . . . . . . . . . . . 24.1 15.82007 . . . . . . . . . . . . . . . . . . . . . . . . . . . . . . . . . . . . . . . . . . . . . . . . . . . . . . . . . . . . . . . . . . . . . . . . . 28.7 5.52008 . . . . . . . . . . . . . . . . . . . . . . . . . . . . . . . . . . . . . . . . . . . . . . . . . . . . . . . . . . . . . . . . . . . . . . . . . (31.8) (37.0)2009 . . . . . . . . . . . . . . . . . . . . . . . . . . . . . . . . . . . . . . . . . . . . . . . . . . . . . . . . . . . . . . . . . . . . . . . . . 2.7 26.52010 . . . . . . . . . . . . . . . . . . . . . . . . . . . . . . . . . . . . . . . . . . . . . . . . . . . . . . . . . . . . . . . . . . . . . . . . . 21.4 15.12011 . . . . . . . . . . . . . . . . . . . . . . . . . . . . . . . . . . . . . . . . . . . . . . . . . . . . . . . . . . . . . . . . . . . . . . . . . (4.7) 2.12012 . . . . . . . . . . . . . . . . . . . . . . . . . . . . . . . . . . . . . . . . . . . . . . . . . . . . . . . . . . . . . . . . . . . . . . . . . 16.8 16.02013 . . . . . . . . . . . . . . . . . . . . . . . . . . . . . . . . . . . . . . . . . . . . . . . . . . . . . . . . . . . . . . . . . . . . . . . . . 32.7 32.42014 . . . . . . . . . . . . . . . . . . . . . . . . . . . . . . . . . . . . . . . . . . . . . . . . . . . . . . . . . . . . . . . . . . . . . . . . . 27.0 13.72015 . . . . . . . . . . . . . . . . . . . . . . . . . . . . . . . . . . . . . . . . . . . . . . . . . . . . . . . . . . . . . . . . . . . . . . . . . (12.5) 1.42016 . . . . . . . . . . . . . . . . . . . . . . . . . . . . . . . . . . . . . . . . . . . . . . . . . . . . . . . . . . . . . . . . . . . . . . . . . 23.4 12.02017 . . . . . . . . . . . . . . . . . . . . . . . . . . . . . . . . . . . . . . . . . . . . . . . . . . . . . . . . . . . . . . . . . . . . . . . . . 21.9 21.82018 . . . . . . . . . . . . . . . . . . . . . . . . . . . . . . . . . . . . . . . . . . . . . . . . . . . . . . . . . . . . . . . . . . . . . . . . . 2.8 (4.4)2019 . . . . . . . . . . . . . . . . . . . . . . . . . . . . . . . . . . . . . . . . . . . . . . . . . . . . . . . . . . . . . . . . . . . . . . . . . 11.0 31.52020 . . . . . . . . . . . . . . . . . . . . . . . . . . . . . . . . . . . . . . . . . . . . . . . . . . . . . . . . . . . . . . . . . . . . . . . . . 2.4 18.42021 . . . . . . . . . . . . . . . . . . . . . . . . . . . . . . . . . . . . . . . . . . . . . . . . . . . . . . . . . . . . . . . . . . . . . . . . . 29.6 28.7Compounded Annual Gain – 1965-2021 . . . . . . . . . . . . . . . . . . . . . . . . . . . . . . . . . . . . . . . . . . . . 20.1% 10.5%Overall Gain – 1964-2021 . . . . . . . . . . . . . . . . . . . . . . . . . . . . . . . . . . . . . . . . . . . . . . . . . . . . . . . . 3,641,613% 30,209%
Note: Data are for calendar years with these exceptions: 1965 and 1966, year ended 9/30; 1967, 15 months ended 12/31.
2
BERKSHIRE HATHAWAY INC.
To the Shareholders of Berkshire Hathaway Inc.:
Charlie Munger, my long-time partner, and I have the job of managing a portion of your savings. We arehonored by your trust.
Our position carries with it the responsibility to report to you what we would like to know if we were theabsentee owner and you were the manager. We enjoy communicating directly with you through this annual letter, andthrough the annual meeting as well.
Our policy is to treat all shareholders equally. Therefore, we do not hold discussions with analysts nor largeinstitutions. Whenever possible, also, we release important communications on Saturday mornings in order tomaximize the time for shareholders and the media to absorb the news before markets open on Monday.
A wealth of Berkshire facts and figures are set forth in the annual 10-K that the company regularly files withthe S.E.C. and that we reproduce on pages K-1 – K-119. Some shareholders will find this detail engrossing; otherswill simply prefer to learn what Charlie and I believe is new or interesting at Berkshire.
Alas, there was little action of that sort in 2021. We did, though, make reasonable progress in increasing theintrinsic value of your shares. That task has been my primary duty for 57 years. And it will continue to be.
What You Own
Berkshire owns a wide variety of businesses, some in their entirety, some only in part. The second grouplargely consists of marketable common stocks of major American companies. Additionally, we own a few non-U.S.equities and participate in several joint ventures or other collaborative activities.
Whatever our form of ownership, our goal is to have meaningful investments in businesses with both durableeconomic advantages and a first-class CEO. Please note particularly that we own stocks based upon our expectationsabout their long-term business performance and not because we view them as vehicles for timely market moves. Thatpoint is crucial: Charlie and I are not stock-pickers; we are business-pickers.
I make many mistakes. Consequently, our extensive collection of businesses includes some enterprises thathave truly extraordinary economics, many others that enjoy good economic characteristics, and a few that aremarginal. One advantage of our common-stock segment is that – on occasion – it becomes easy to buy pieces ofwonderful businesses at wonderful prices. That shooting-fish-in-a-barrel experience is very rare in negotiatedtransactions and never occurs en masse. It is also far easier to exit from a mistake when it has been made in themarketable arena.
3

Surprise, Surprise
Here are a few items about your company that often surprise even seasoned investors:
• Many people perceive Berkshire as a large and somewhat strange collection of financial assets. In truth,Berkshire owns and operates more U.S.-based “infrastructure” assets – classified on our balance sheet asproperty, plant and equipment – than are owned and operated by any other American corporation. Thatsupremacy has never been our goal. It has, however, become a fact.
At yearend, those domestic infrastructure assets were carried on Berkshire’s balance sheet at $158 billion.That number increased last year and will continue to increase. Berkshire always will be building.
• Every year, your company makes substantial federal income tax payments. In 2021, for example, we paid$3.3 billion while the U.S. Treasury reported total corporate income-tax receipts of $402 billion.Additionally, Berkshire pays substantial state and foreign taxes. “I gave at the office” is an unassailableassertion when made by Berkshire shareholders.
Berkshire’s history vividly illustrates the invisible and often unrecognized financial partnership betweengovernment and American businesses. Our tale begins early in 1955, when Berkshire Fine Spinning andHathaway Manufacturing agreed to merge their businesses. In their requests for shareholder approval, thesevenerable New England textile companies expressed high hopes for the combination.
The Hathaway solicitation, for example, assured its shareholders that “The combination of the resources andmanagements will result in one of the strongest and most efficient organizations in the textile industry.” Thatupbeat view was endorsed by the company’s advisor, Lehman Brothers (yes, that Lehman Brothers).
I’m sure it was a joyous day in both Fall River (Berkshire) and New Bedford (Hathaway) when the unionwas consummated. After the bands stopped playing and the bankers went home, however, the shareholdersreaped a disaster.
In the nine years following the merger, Berkshire’s owners watched the company’s net worth crater from$51.4 million to $22.1 million. In part, this decline was caused by stock repurchases, ill-advised dividendsand plant shutdowns. But nine years of effort by many thousands of employees delivered an operating lossas well. Berkshire’s struggles were not unusual: The New England textile industry had silently entered anextended and non-reversible death march.
During the nine post-merger years, the U.S. Treasury suffered as well from Berkshire’s troubles. All told, thecompany paid the government only $337,359 in income tax during that period – a pathetic $100 per day.
Early in 1965, things changed. Berkshire installed new management that redeployed available cash andsteered essentially all earnings into a variety of good businesses, most of which remained good through theyears. Coupling reinvestment of earnings with the power of compounding worked its magic, and shareholdersprospered.
Berkshire’s owners, it should be noted, were not the only beneficiary of that course correction. Their “silentpartner,” the U.S. Treasury, proceeded to collect many tens of billions of dollars from the company in incometax payments. Remember the $100 daily? Now, Berkshire pays roughly $9 million daily to the Treasury.
4

In fairness to our governmental partner, our shareholders should acknowledge – indeed trumpet – the factthat Berkshire’s prosperity has been fostered mightily because the company has operated in America. Ourcountry would have done splendidly in the years since 1965 without Berkshire. Absent our American home,however, Berkshire would never have come close to becoming what it is today. When you see the flag, saythanks.
• From an $8.6 million purchase of National Indemnity in 1967, Berkshire has become the world leader ininsurance “float” – money we hold and can invest but that does not belong to us. Including a relatively smallsum derived from life insurance, Berkshire’s total float has grown from $19 million when we entered theinsurance business to $147 billion.
So far, this float has cost us less than nothing. Though we have experienced a number of years when insurancelosses combined with operating expenses exceeded premiums, overall we have earned a modest 55-yearprofit from the underwriting activities that generated our float.
Of equal importance, float is very sticky. Funds attributable to our insurance operations come and go daily,but their aggregate total is immune from precipitous decline. When it comes to investing float, we cantherefore think long-term.
If you are not already familiar with the concept of float, I refer you to a long explanation on page A-5. Tomy surprise, our float increased $9 billion last year, a buildup of value that is important to Berkshire ownersthough is not reflected in our GAAP (“generally-accepted accounting principles”) presentation of earningsand net worth.
Much of our huge value creation in insurance is attributable to Berkshire’s good luck in my 1986 hiring ofAjit Jain. We first met on a Saturday morning, and I quickly asked Ajit what his insurance experience hadbeen. He replied, “None.”
I said, “Nobody’s perfect,” and hired him. That was my lucky day: Ajit actually was as perfect a choice ascould have been made. Better yet, he continues to be – 35 years later.
One final thought about insurance: I believe that it is likely – but far from assured – that Berkshire’s floatcan be maintained without our incurring a long-term underwriting loss. I am certain, however, that there willbe some years when we experience such losses, perhaps involving very large sums.
Berkshire is constructed to handle catastrophic events as no other insurer – and that priority will remain longafter Charlie and I are gone.
Our Four Giants
Through Berkshire, our shareholders own many dozens of businesses. Some of these, in turn, have acollection of subsidiaries of their own. For example, Marmon has more than 100 individual business operations,ranging from the leasing of railroad cars to the manufacture of medical devices.
• Nevertheless, operations of our “Big Four” companies account for a very large chunk of Berkshire’s value.Leading this list is our cluster of insurers. Berkshire effectively owns 100% of this group, whose massivefloat value we earlier described. The invested assets of these insurers are further enlarged by the extraordinaryamount of capital we invest to back up their promises.
5
The insurance business is made to order for Berkshire. The product will never be obsolete, and sales volumewill generally increase along with both economic growth and inflation. Also, integrity and capital will foreverbe important. Our company can and will behave well.
There are, of course, other insurers with excellent business models and prospects. Replication of Berkshire’soperation, however, would be almost impossible.
• Apple – our runner-up Giant as measured by its yearend market value – is a different sort of holding. Here,our ownership is a mere 5.55%, up from 5.39% a year earlier. That increase sounds like small potatoes. Butconsider that each 0.1% of Apple’s 2021 earnings amounted to $100 million. We spent no Berkshire fundsto gain our accretion. Apple’s repurchases did the job.
It’s important to understand that only dividends from Apple are counted in the GAAP earnings Berkshirereports – and last year, Apple paid us $785 million of those. Yet our “share” of Apple’s earnings amountedto a staggering $5.6 billion. Much of what the company retained was used to repurchase Apple shares, an actwe applaud. Tim Cook, Apple’s brilliant CEO, quite properly regards users of Apple products as his firstlove, but all of his other constituencies benefit from Tim’s managerial touch as well.
• BNSF, our third Giant, continues to be the number one artery of American commerce, which makes it anindispensable asset for America as well as for Berkshire. If the many essential products BNSF carries wereinstead hauled by truck, America’s carbon emissions would soar.
Your railroad had record earnings of $6 billion in 2021. Here, it should be noted, we are talking about theold-fashioned sort of earnings that we favor: a figure calculated after interest, taxes, depreciation,amortization and all forms of compensation. (Our definition suggests a warning: Deceptive “adjustments” toearnings – to use a polite description – have become both more frequent and more fanciful as stocks haverisen. Speaking less politely, I would say that bull markets breed bloviated bull . . ..)
BNSF trains traveled 143 million miles last year and carried 535 million tons of cargo. Both accomplishmentsfar exceed those of any other American carrier. You can be proud of your railroad.
• BHE, our final Giant, earned a record $4 billion in 2021. That’s up more than 30-fold from the $122 millionearned in 2000, the year that Berkshire first purchased a BHE stake. Now, Berkshire owns 91.1% of thecompany.
BHE’s record of societal accomplishment is as remarkable as its financial performance. The company hadno wind or solar generation in 2000. It was then regarded simply as a relatively new and minor participant inthe huge electric utility industry. Subsequently, under David Sokol’s and Greg Abel’s leadership, BHE hasbecome a utility powerhouse (no groaning, please) and a leading force in wind, solar and transmissionthroughout much of the United States.
Greg’s report on these accomplishments appears on pages A-3 and A-4. The profile you will find there is notin any way one of those currently-fashionable “green-washing” stories. BHE has been faithfully detailing itsplans and performance in renewables and transmissions every year since 2007.
To further review this information, visit BHE’s website at brkenergy.com. There, you will see that thecompany has long been making climate-conscious moves that soak up all of its earnings. More opportunitieslie ahead. BHE has the management, the experience, the capital and the appetite for the huge power projectsthat our country needs.
6

Investments
Now let’s talk about companies we don’t control, a list that again references Apple. Below we list our fifteenlargest equity holdings, several of which are selections of Berkshire’s two long-time investment managers, ToddCombs and Ted Weschler. At yearend, this valued pair had total authority in respect to $34 billion of investments,many of which do not meet the threshold value we use in the table. Also, a significant portion of the dollars that Toddand Ted manage are lodged in various pension plans of Berkshire-owned businesses, with the assets of these plans notincluded in this table.
12/31/21
Shares Company
Percentage ofCompanyOwned Cost* Market
(in millions)151,610,700 American Express Company . . . . . . . . . . . . . . . . . . . . 19.9 1,287 24,804907,559,761 Apple Inc. . . . . . . . . . . . . . . . . . . . . . . . . . . . . . . . . . . 5.6 31,089 161,155
1,032,852,006 Bank of America Corp. . . . . . . . . . . . . . . . . . . . . . . . . 12.8 14,631 45,95266,835,615 The Bank of New York Mellon Corp. . . . . . . . . . . . . 8.3 2,918 3,882
225,000,000 BYD Co. Ltd.**. . . . . . . . . . . . . . . . . . . . . . . . . . . . . . 7.7 232 7,6933,828,941 Charter Communications, Inc. . . . . . . . . . . . . . . . . . . 2.2 643 2,496
38,245,036 Chevron Corporation . . . . . . . . . . . . . . . . . . . . . . . . . . 2.0 3,420 4,488400,000,000 The Coca-Cola Company . . . . . . . . . . . . . . . . . . . . . . 9.2 1,299 23,68452,975,000 General Motors Company . . . . . . . . . . . . . . . . . . . . . . 3.6 1,616 3,10689,241,000 ITOCHU Corporation . . . . . . . . . . . . . . . . . . . . . . . . . 5.6 2,099 2,72881,714,800 Mitsubishi Corporation . . . . . . . . . . . . . . . . . . . . . . . . 5.5 2,102 2,59393,776,200 Mitsui & Co., Ltd. . . . . . . . . . . . . . . . . . . . . . . . . . . . . 5.7 1,621 2,21924,669,778 Moody’s Corporation . . . . . . . . . . . . . . . . . . . . . . . . . 13.3 248 9,636
143,456,055 U.S. Bancorp . . . . . . . . . . . . . . . . . . . . . . . . . . . . . . . . 9.7 5,384 8,058158,824,575 Verizon Communications Inc. . . . . . . . . . . . . . . . . . . 3.8 9,387 8,253
Others*** . . . . . . . . . . . . . . . . . . . . . . . . . . . . . . . . . . 26,629 39,972
Total Equity Investments Carried at Market . . . . . . . . $ 104,605 $ 350,719
* This is our actual purchase price and also our tax basis.** Held by BHE; consequently, Berkshire shareholders have only a 91.1% interest in this position.*** Includes a $10 billion investment in Occidental Petroleum, consisting of preferred stock and warrants to
buy common stock, a combination now being valued at $10.7 billion.
In addition to the footnoted Occidental holding and our various common-stock positions, Berkshire also ownsa 26.6% interest in Kraft Heinz (accounted for on the “equity” method, not market value, and carried at $13.1 billion)and 38.6% of Pilot Corp., a leader in travel centers that had revenues last year of $45 billion.
Since we purchased our Pilot stake in 2017, this holding has warranted “equity” accounting treatment. Earlyin 2023, Berkshire will purchase an additional interest in Pilot that will raise our ownership to 80% and lead to ourfully consolidating Pilot’s earnings, assets and liabilities in our financial statements.
7
U.S. Treasury Bills
Berkshire’s balance sheet includes $144 billion of cash and cash equivalents (excluding the holdings ofBNSF and BHE). Of this sum, $120 billion is held in U.S. Treasury bills, all maturing in less than a year. That stakeleaves Berkshire financing about 1⁄2 of 1% of the publicly-held national debt.
Charlie and I have pledged that Berkshire (along with our subsidiaries other than BNSF and BHE) will alwayshold more than $30 billion of cash and equivalents. We want your company to be financially impregnable and neverdependent on the kindness of strangers (or even that of friends). Both of us like to sleep soundly, and we want ourcreditors, insurance claimants and you to do so as well.
But $144 billion?
That imposing sum, I assure you, is not some deranged expression of patriotism. Nor have Charlie and I lostour overwhelming preference for business ownership. Indeed, I first manifested my enthusiasm for that 80 years ago,on March 11, 1942, when I purchased three shares of Cities Services preferred stock. Their cost was $114.75 andrequired all of my savings. (The Dow Jones Industrial Average that day closed at 99, a fact that should scream to you:Never bet against America.)
After my initial plunge, I always kept at least 80% of my net worth in equities. My favored status throughoutthat period was 100% – and still is. Berkshire’s current 80%-or-so position in businesses is a consequence of myfailure to find entire companies or small portions thereof (that is, marketable stocks) which meet our criteria for long-term holding.
Charlie and I have endured similar cash-heavy positions from time to time in the past. These periods arenever pleasant; they are also never permanent. And, fortunately, we have had a mildly attractive alternative during2020 and 2021 for deploying capital. Read on.
Share Repurchases
There are three ways that we can increase the value of your investment. The first is always front and centerin our minds: Increase the long-term earning power of Berkshire’s controlled businesses through internal growth orby making acquisitions. Today, internal opportunities deliver far better returns than acquisitions. The size of thoseopportunities, however, is small compared to Berkshire’s resources.
Our second choice is to buy non-controlling part-interests in the many good or great businesses that arepublicly traded. From time to time, such possibilities are both numerous and blatantly attractive. Today, though, wefind little that excites us.
That’s largely because of a truism: Long-term interest rates that are low push the prices of all productiveinvestments upward, whether these are stocks, apartments, farms, oil wells, whatever. Other factors influencevaluations as well, but interest rates will always be important.
Our final path to value creation is to repurchase Berkshire shares. Through that simple act, we increase yourshare of the many controlled and non-controlled businesses Berkshire owns. When the price/value equation is right,this path is the easiest and most certain way for us to increase your wealth. (Alongside the accretion of value tocontinuing shareholders, a couple of other parties gain: Repurchases are modestly beneficial to the seller of therepurchased shares and to society as well.)
8

Periodically, as alternative paths become unattractive, repurchases make good sense for Berkshire’s owners.During the past two years, we therefore repurchased 9% of the shares that were outstanding at yearend 2019 for a totalcost of $51.7 billion. That expenditure left our continuing shareholders owning about 10% more of all Berkshirebusinesses, whether these are wholly-owned (such as BNSF and GEICO) or partly-owned (such as Coca-Cola andMoody’s).
I want to underscore that for Berkshire repurchases to make sense, our shares must offer appropriate value.We don’t want to overpay for the shares of other companies, and it would be value-destroying if we were to overpaywhen we are buying Berkshire. As of February 23, 2022, since yearend we repurchased additional shares at a cost of$1.2 billion. Our appetite remains large but will always remain price-dependent.
It should be noted that Berkshire’s buyback opportunities are limited because of its high-class investor base.If our shares were heavily held by short-term speculators, both price volatility and transaction volumes wouldmaterially increase. That kind of reshaping would offer us far greater opportunities for creating value by makingrepurchases. Nevertheless, Charlie and I far prefer the owners we have, even though their admirable buy-and-keepattitudes limit the extent to which long-term shareholders can profit from opportunistic repurchases.
Finally, one easily-overlooked value calculation specific to Berkshire: As we’ve discussed, insurance “float”of the right sort is of great value to us. As it happens, repurchases automatically increase the amount of “float” pershare. That figure has increased during the past two years by 25% – going from $79,387 per “A” share to $99,497, ameaningful gain that, as noted, owes some thanks to repurchases.
A Wonderful Man and a Wonderful Business
Last year, Paul Andrews died. Paul was the founder and CEO of TTI, a Fort Worth-based subsidiary ofBerkshire. Throughout his life – in both his business and his personal pursuits – Paul quietly displayed all the qualitiesthat Charlie and I admire. His story should be told.
In 1971, Paul was working as a purchasing agent for General Dynamics when the roof fell in. After losing ahuge defense contract, the company fired thousands of employees, including Paul.
With his first child due soon, Paul decided to bet on himself, using $500 of his savings to found Tex-Tronics(later renamed TTI). The company set itself up to distribute small electronic components, and first-year sales totaled$112,000. Today, TTI markets more than one million different items with annual volume of $7.7 billion.
But back to 2006: Paul, at 63, then found himself happy with his family, his job, and his associates. But hehad one nagging worry, heightened because he had recently witnessed a friend’s early death and the disastrous resultsthat followed for that man’s family and business. What, Paul asked himself in 2006, would happen to the many peopledepending on him if he should unexpectedly die?
For a year, Paul wrestled with his options. Sell to a competitor? From a strictly economic viewpoint, thatcourse made the most sense. After all, competitors could envision lucrative “synergies” – savings that would beachieved as the acquiror slashed duplicated functions at TTI.
But . . . Such a purchaser would most certainly also retain its CFO, its legal counsel, its HR unit. Their TTIcounterparts would therefore be sent packing. And ugh! If a new distribution center were to be needed, the acquirer’shome city would certainly be favored over Fort Worth.
9
Whatever the financial benefits, Paul quickly concluded that selling to a competitor was not for him. He nextconsidered seeking a financial buyer, a species once labeled – aptly so – a leveraged buyout firm. Paul knew, however,that such a purchaser would be focused on an “exit strategy.” And who could know what that would be? Broodingover it all, Paul found himself having no interest in handing his 35-year-old creation over to a reseller.
When Paul met me, he explained why he had eliminated these two alternatives as buyers. He then summedup his dilemma by saying – in far more tactful phrasing than this – “After a year of pondering the alternatives, I wantto sell to Berkshire because you are the only guy left.” So, I made an offer and Paul said “Yes.” One meeting; onelunch; one deal.
To say we both lived happily ever after is an understatement. When Berkshire purchased TTI, the companyemployed 2,387. Now the number is 8,043. A large percentage of that growth took place in Fort Worth and environs.Earnings have increased 673%.
Annually, I would call Paul and tell him his salary should be substantially increased. Annually, he would tellme, “We can talk about that next year, Warren; I’m too busy now.”
When Greg Abel and I attended Paul’s memorial service, we met children, grandchildren, long-timeassociates (including TTI’s first employee) and John Roach, the former CEO of a Fort Worth company Berkshire hadpurchased in 2000. John had steered his friend Paul to Omaha, instinctively knowing we would be a match.
At the service, Greg and I heard about the multitudes of people and organizations that Paul had silentlysupported. The breadth of his generosity was extraordinary – geared always to improving the lives of others,particularly those in Fort Worth.
In all ways, Paul was a class act.* * * * * * * * * * * *
Good luck – occasionally extraordinary luck – has played its part at Berkshire. If Paul and I had not enjoyeda mutual friend – John Roach – TTI would not have found its home with us. But that ample serving of luck was onlythe beginning. TTI was soon to lead Berkshire to its most important acquisition.
Every fall, Berkshire directors gather for a presentation by a few of our executives. We sometimes choosethe site based upon the location of a recent acquisition, by that means allowing directors to meet the new subsidiary’sCEO and learn more about the acquiree’s activities.
In the fall of 2009, we consequently selected Fort Worth so that we could visit TTI. At that time, BNSF,which also had Fort Worth as its hometown, was the third-largest holding among our marketable equities. Despite thatlarge stake, I had never visited the railroad’s headquarters.
Deb Bosanek, my assistant, scheduled our board’s opening dinner for October 22. Meanwhile, I arranged toarrive earlier that day to meet with Matt Rose, CEO of BNSF, whose accomplishments I had long admired. When Imade the date, I had no idea that our get-together would coincide with BNSF’s third-quarter earnings report, whichwas released late on the 22nd.
The market reacted badly to the railroad’s results. The Great Recession was in full force in the third quarter,and BNSF’s earnings reflected that slump. The economic outlook was also bleak, and Wall Street wasn’t feelingfriendly to railroads – or much else.
10
On the following day, I again got together with Matt and suggested that Berkshire would offer the railroad abetter long-term home than it could expect as a public company. I also told him the maximum price that Berkshirewould pay.
Matt relayed the offer to his directors and advisors. Eleven busy days later, Berkshire and BNSF announceda firm deal. And here I’ll venture a rare prediction: BNSF will be a key asset for Berkshire and our country a centuryfrom now.
The BNSF acquisition would never have happened if Paul Andrews hadn’t sized up Berkshire as the righthome for TTI.
Thanks
I taught my first investing class 70 years ago. Since then, I have enjoyed working almost every year withstudents of all ages, finally “retiring” from that pursuit in 2018.
Along the way, my toughest audience was my grandson’s fifth-grade class. The 11-year-olds were squirmingin their seats and giving me blank stares until I mentioned Coca-Cola and its famous secret formula. Instantly, everyhand went up, and I learned that “secrets” are catnip to kids.
Teaching, like writing, has helped me develop and clarify my own thoughts. Charlie calls this phenomenonthe orangutan effect: If you sit down with an orangutan and carefully explain to it one of your cherished ideas, youmay leave behind a puzzled primate, but will yourself exit thinking more clearly.
Talking to university students is far superior. I have urged that they seek employment in (1) the field and (2)with the kind of people they would select, if they had no need for money. Economic realities, I acknowledge, mayinterfere with that kind of search. Even so, I urge the students never to give up the quest, for when they find that sortof job, they will no longer be “working.”
Charlie and I, ourselves, followed that liberating course after a few early stumbles. We both started as part-timers at my grandfather’s grocery store, Charlie in 1940 and I in 1942. We were each assigned boring tasks and paidlittle, definitely not what we had in mind. Charlie later took up law, and I tried selling securities. Job satisfactioncontinued to elude us.
Finally, at Berkshire, we found what we love to do. With very few exceptions, we have now “worked” formany decades with people whom we like and trust. It’s a joy in life to join with managers such as Paul Andrews orthe Berkshire families I told you about last year. In our home office, we employ decent and talented people – no jerks.Turnover averages, perhaps, one person per year.
I would like, however, to emphasize a further item that turns our jobs into fun and satisfaction - - - - workingfor you. There is nothing more rewarding to Charlie and me than enjoying the trust of individual long-termshareholders who, for many decades, have joined us with the expectation that we would be a reliable custodian of theirfunds.
Obviously, we can’t select our owners, as we could do if our form of operation were a partnership. Anyonecan buy shares of Berkshire today with the intention of soon reselling them. For sure, we get a few of that type ofshareholder, just as we get index funds that own huge amounts of Berkshire simply because they are required to doso.
11

To a truly unusual degree, however, Berkshire has as owners a very large corps of individuals and familiesthat have elected to join us with an intent approaching “til death do us part.” Often, they have trusted us with a large– some might say excessive – portion of their savings.
Berkshire, these shareholders would sometimes acknowledge, might be far from the best selection they couldhave made. But they would add that Berkshire would rank high among those with which they would be mostcomfortable. And people who are comfortable with their investments will, on average, achieve better results than thosewho are motivated by ever-changing headlines, chatter and promises.
Long-term individual owners are both the “partners” Charlie and I have always sought and the ones weconstantly have in mind as we make decisions at Berkshire. To them we say, “It feels good to ‘work’ for you, and youhave our thanks for your trust.”
The Annual Meeting
Clear your calendar! Berkshire will have its annual gathering of capitalists in Omaha on Friday, April 29th
through Sunday, May 1st. The details regarding the weekend are laid out on pages A-1 and A-2. Omaha eagerly awaitsyou, as do I.
I will end this letter with a sales pitch. “Cousin” Jimmy Buffett has designed a pontoon “party” boat that isnow being manufactured by Forest River, a Berkshire subsidiary. The boat will be introduced on April 29 at ourBerkshire Bazaar of Bargains. And, for two days only, shareholders will be able to purchase Jimmy’s masterpiece ata 10% discount. Your bargain-hunting chairman will be buying a boat for his family’s use. Join me.
February 26, 2022 Warren E. BuffettChairman of the Board
12
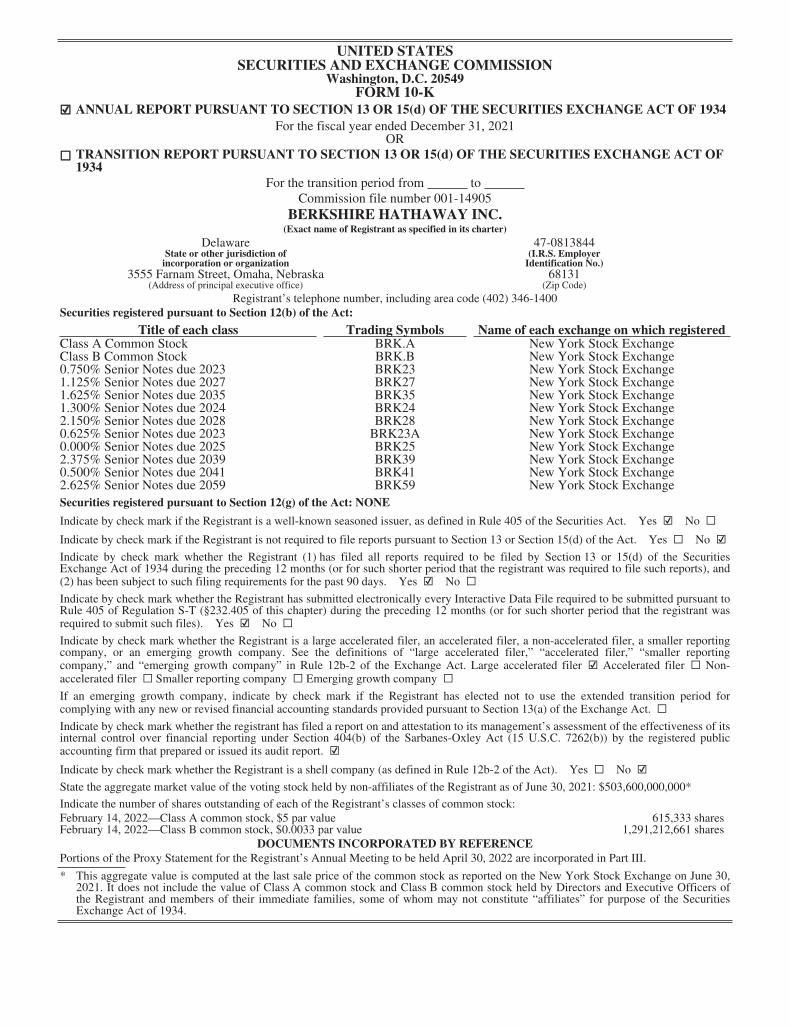
UNITED STATESSECURITIES AND EXCHANGE COMMISSION
Washington, D.C. 20549FORM 10-K
☑ ANNUAL REPORT PURSUANT TO SECTION 13 OR 15(d) OF THE SECURITIES EXCHANGE ACT OF 1934For the fiscal year ended December 31, 2021
OR☐ TRANSITION REPORT PURSUANT TO SECTION 13 OR 15(d) OF THE SECURITIES EXCHANGE ACT OF
1934For the transition period from to
Commission file number 001-14905BERKSHIRE HATHAWAY INC.(Exact name of Registrant as specified in its charter)
Delaware 47-0813844State or other jurisdiction ofincorporation or organization
(I.R.S. EmployerIdentification No.)
3555 Farnam Street, Omaha, Nebraska 68131(Address of principal executive office) (Zip Code)
Registrant’s telephone number, including area code (402) 346-1400Securities registered pursuant to Section 12(b) of the Act:
Title of each class Trading Symbols Name of each exchange on which registeredClass A Common StockClass B Common Stock0.750% Senior Notes due 20231.125% Senior Notes due 20271.625% Senior Notes due 20351.300% Senior Notes due 20242.150% Senior Notes due 20280.625% Senior Notes due 20230.000% Senior Notes due 20252.375% Senior Notes due 20390.500% Senior Notes due 20412.625% Senior Notes due 2059
BRK.ABRK.BBRK23BRK27BRK35BRK24BRK28BRK23ABRK25BRK39BRK41BRK59
New York Stock ExchangeNew York Stock ExchangeNew York Stock ExchangeNew York Stock ExchangeNew York Stock ExchangeNew York Stock ExchangeNew York Stock ExchangeNew York Stock ExchangeNew York Stock ExchangeNew York Stock ExchangeNew York Stock ExchangeNew York Stock Exchange
Securities registered pursuant to Section 12(g) of the Act: NONE
Indicate by check mark if the Registrant is a well-known seasoned issuer, as defined in Rule 405 of the Securities Act. Yes ☑ No ☐Indicate by check mark if the Registrant is not required to file reports pursuant to Section 13 or Section 15(d) of the Act. Yes ☐ No ☑Indicate by check mark whether the Registrant (1) has filed all reports required to be filed by Section 13 or 15(d) of the SecuritiesExchange Act of 1934 during the preceding 12 months (or for such shorter period that the registrant was required to file such reports), and(2) has been subject to such filing requirements for the past 90 days. Yes ☑ No ☐Indicate by check mark whether the Registrant has submitted electronically every Interactive Data File required to be submitted pursuant toRule 405 of Regulation S-T (§232.405 of this chapter) during the preceding 12 months (or for such shorter period that the registrant wasrequired to submit such files). Yes ☑ No ☐Indicate by check mark whether the Registrant is a large accelerated filer, an accelerated filer, a non-accelerated filer, a smaller reportingcompany, or an emerging growth company. See the definitions of “large accelerated filer,” “accelerated filer,” “smaller reportingcompany,” and “emerging growth company” in Rule 12b-2 of the Exchange Act. Large accelerated filer ☑ Accelerated filer ☐ Non-accelerated filer ☐ Smaller reporting company ☐ Emerging growth company ☐If an emerging growth company, indicate by check mark if the Registrant has elected not to use the extended transition period forcomplying with any new or revised financial accounting standards provided pursuant to Section 13(a) of the Exchange Act. ☐Indicate by check mark whether the registrant has filed a report on and attestation to its management’s assessment of the effectiveness of itsinternal control over financial reporting under Section 404(b) of the Sarbanes-Oxley Act (15 U.S.C. 7262(b)) by the registered publicaccounting firm that prepared or issued its audit report. ☑Indicate by check mark whether the Registrant is a shell company (as defined in Rule 12b-2 of the Act). Yes ☐ No ☑State the aggregate market value of the voting stock held by non-affiliates of the Registrant as of June 30, 2021: $503,600,000,000*
Indicate the number of shares outstanding of each of the Registrant’s classes of common stock:February 14, 2022—Class A common stock, $5 par value 615,333 sharesFebruary 14, 2022—Class B common stock, $0.0033 par value 1,291,212,661 shares
DOCUMENTS INCORPORATED BY REFERENCEPortions of the Proxy Statement for the Registrant’s Annual Meeting to be held April 30, 2022 are incorporated in Part III.
* This aggregate value is computed at the last sale price of the common stock as reported on the New York Stock Exchange on June 30,2021. It does not include the value of Class A common stock and Class B common stock held by Directors and Executive Officers ofthe Registrant and members of their immediate families, some of whom may not constitute “affiliates” for purpose of the SecuritiesExchange Act of 1934.

Table of Contents
Page No.
Part I
Item 1. Business DescriptionItem 1A. Risk FactorsItem 1B. Unresolved Staff CommentsItem 2. Description of PropertiesItem 3. Legal ProceedingsItem 4. Mine Safety Disclosures
Part II
Item 5. Market for Registrant’s Common Equity, Related Security Holder Matters and IssuerPurchases of Equity Securities
Item 6. [Reserved]Item 7. Management’s Discussion and Analysis of Financial Condition and Results of OperationsItem 7A. Quantitative and Qualitative Disclosures About Market RiskItem 8. Financial Statements and Supplementary Data
Consolidated Balance Sheets—December 31, 2021 and December 31, 2020
Consolidated Statements of Earnings—Years Ended December 31, 2021, December 31, 2020, and December 31, 2019
Consolidated Statements of Comprehensive Income—Years Ended December 31, 2021, December 31, 2020, and December 31, 2019
Consolidated Statements of Changes in Shareholders’ Equity—Years Ended December 31, 2021, December 31, 2020, and December 31, 2019
Consolidated Statements of Cash Flows—Years Ended December 31, 2021, December 31, 2020, and December 31, 2019
Notes to Consolidated Financial StatementsItem 9. Changes in and Disagreements with Accountants on Accounting and Financial DisclosureItem 9A. Controls and ProceduresItem 9B. Other Information
Part III
Item 10. Directors, Executive Officers and Corporate GovernanceItem 11. Executive CompensationItem 12. Security Ownership of Certain Beneficial Owners and Management and Related Stockholder
MattersItem 13. Certain Relationships and Related Transactions and Director IndependenceItem 14. Principal Accountant Fees and Services
Part IV
Item 15. Exhibits and Financial Statement Schedules
Exhibit IndexSignatures
. . . . . . . . . . . . . . . . . . . . . . . . . . . . . . . . . . . . . . . . . . . . . . . . . . . . . . . . . . . . . . . . . . . . . . . . .. . . . . . . . . . . . . . . . . . . . . . . . . . . . . . . . . . . . . . . . . . . . . . . . . . . . . . . . . . . . . . . . . . . . . . . . . . . . . . . .
. . . . . . . . . . . . . . . . . . . . . . . . . . . . . . . . . . . . . . . . . . . . . . . . . . . . . . . . . . . . . . . . . . .. . . . . . . . . . . . . . . . . . . . . . . . . . . . . . . . . . . . . . . . . . . . . . . . . . . . . . . . . . . . . . . . . . . . .
. . . . . . . . . . . . . . . . . . . . . . . . . . . . . . . . . . . . . . . . . . . . . . . . . . . . . . . . . . . . . . . . . . . . . . . . . . .. . . . . . . . . . . . . . . . . . . . . . . . . . . . . . . . . . . . . . . . . . . . . . . . . . . . . . . . . . . . . . . . . . . . . .
. . . . . . . . . . . . . . . . . . . . . . . . . . . . . . . . . . . . . . . . . . . . . . . . . . . . . . . . . . . . . .
. . . . . . . . . . . . . . .. . . . . . . . . . . . . . . . . . . . . . . . . . . . . . . . . . . . . . .
. . . . . . . . . . . . . . . . . . . . . . . . . . . . . . . . . . . . . . . . . . . . . . . . . . .
. . . . . . . . . . . . . . . . . . . . . . . . .
. . . . . . . . . . . . . . . . . . . . . . . . .
. . . . . . . . . . . . . . . . . . . . . . . . .
. . . . . . . . . . . . . . . . . . . . . . . . .. . . . . . . . . . . . . . . . . . . . . . . . . . . . . . . . . . . . . . . . . . . . . . . . . . . . . . . .
. . . . . . . . . . . . . .. . . . . . . . . . . . . . . . . . . . . . . . . . . . . . . . . . . . . . . . . . . . . . . . . . . . . . . . . . . . . . . . . . . . .
. . . . . . . . . . . . . . . . . . . . . . . . . . . . . . . . . . . . . . . . . . . . . . . . . . . . . . . . . . . . . . . . . . . . . . . . . . .
. . . . . . . . . . . . . . . . . . . . . . . . . . . . . . . . . . . . . . . . . .. . . . . . . . . . . . . . . . . . . . . . . . . . . . . . . . . . . . . . . . . . . . . . . . . . . . . . . . . . . . . . . . . . . . .
. . . . . . . . . . . . . . . . . . . . . . . . . . . . . . . . . . . . . . . . . . . . . . . . . . . . . . . . . . . . . . . . . . . . . . . . . . . . . . . . .. . . . . . . . . . . . . . . . . . . . . . . . . .
. . . . . . . . . . . . . . . . . . . . . . . . . . . . . . . . . . . . . . . . . . . . . . . . . . . . . . . . .
. . . . . . . . . . . . . . . . . . . . . . . . . . . . . . . . . . . . . . . . . . . . . . . . . . . . .
. . . . . . . . . . . . . . . . . . . . . . . . . . . . . . . . . . . . . . . . . . . . . . . . . . . . . . . . . . . . . . . . . . . . . . . . . . . . . . . . . . . . . . . . .. . . . . . . . . . . . . . . . . . . . . . . . . . . . . . . . . . . . . . . . . . . . . . . . . . . . . . . . . . . . . . . . . . . . . . . . . . . . . . . . . . . . . . . . . . .
. . . . . . . . . . . . . . . . . . . . . . . . . . . . . . . . . . . . . . . . . . . . . . . . . . .
K-1K-24K-27K-27K-29K-30
K-30
K-32K-66K-67
K-70
K-72
K-73
K-73
K-74K-75
K-113K-113K-113
K-113K-113
K-113K-113K-113
K-113
K-117K-119

K-1
Part I
Item 1. Business Description
Berkshire Hathaway Inc. (“Berkshire,” “Company” or “Registrant”) is a holding company owning subsidiariesengaged in numerous diverse business activities. The most important of these are insurance businesses conducted on both aprimary basis and a reinsurance basis, a freight rail transportation business and a group of utility and energy generation anddistribution businesses. Berkshire also owns and operates numerous other businesses engaged in a variety of manufacturing,services, retailing and other activities. Berkshire is domiciled in the state of Delaware, and its corporate headquarters is inOmaha, Nebraska.
Berkshire’s operating businesses are managed on an unusually decentralized basis. There are few centralized orintegrated business functions. Berkshire’s corporate senior management team participates in and is ultimately responsible forsignificant capital allocation decisions, investment activities and the selection of the Chief Executive to head each of theoperating businesses.
Berkshire’s senior management is also responsible for establishing and monitoring Berkshire’s corporate governancepractices, including monitoring governance efforts, including those at the operating businesses, and participating in theresolution of governance-related issues as needed. Berkshire’s Board of Directors is responsible for assuring an appropriatesuccessor to the Chief Executive Officer. The Berkshire Code of Business Conduct and Ethics emphasizes, among otherthings, the commitment to ethics and compliance with the law and provides basic standards for ethical and legal behavior ofits employees.
Human capital and resources are an integral and essential component of Berkshire’s businesses. Berkshire and itsconsolidated subsidiaries employed approximately 372,000 people worldwide at the end of 2021, of which approximately77% were in the United States and 21% were represented by unions. Employees engage in a wide variety of occupations.Consistent with Berkshire’s decentralized management philosophy, Berkshire’s operating businesses individually establishspecific policies and practices concerning the attraction and retention of personnel within the organizations. Given the widevariations in the nature and size of business activities, policies and practices often vary widely among Berkshire’s operatingsubsidiaries. Policies and practices commonly address, among other things: maintaining a safe work environment andminimizing or eliminating workplace injuries; offering competitive compensation to employees, which includes varioushealth insurance and retirement benefits, as well as other benefits such as incentives to recognize and reward performance;wellness programs; training, learning and career advancement opportunities; and hiring practices intended to identifyqualified candidates and promote diversity and inclusion in the workforce.
Insurance and Reinsurance Businesses
Berkshire’s insurance and reinsurance business activities are conducted through numerous domestic and foreign-basedinsurance subsidiaries. Berkshire’s insurance subsidiaries provide insurance and reinsurance of property and casualty risksand reinsurance of life and health risks worldwide. Berkshire’s insurance subsidiaries employed approximately 50,500 peopleat the end of 2021. For purposes of this discussion, entities that provide insurance or reinsurance are referred to as insurers.
In direct or primary insurance activities, the insurer assumes the risk of loss from persons or organizations that aredirectly subject to the risks. Such risks may relate to property, casualty (or liability), life, accident, health, financial or otherperils that may arise from an insurable event. In reinsurance activities, the insurer assumes defined portions of risks that otherdirect insurers or reinsurers assumed in their own insuring activities.
Reinsurance contracts are normally classified as treaty or facultative contracts. Treaty reinsurance refers to reinsurancecoverage for all or a portion of a specified group or class of risks ceded by a direct insurer or reinsurer, while facultativereinsurance involves coverage of specific individual underlying risks. Reinsurance contracts are further classified as quota-share or excess. Under quota-share (proportional or pro-rata) reinsurance, the reinsurer shares proportionally in the originalpremiums and losses of the direct insurer or reinsurer. Excess (or non-proportional) reinsurance provides for theindemnification of the direct insurer or reinsurer for all or a portion of the loss in excess of an agreed upon amount or“retention.” Both quota-share and excess reinsurance contracts may provide for aggregate limits of indemnification.
Insurance and reinsurance are generally subject to regulatory oversight throughout the world. Except for regulatoryconsiderations, there are virtually no barriers to entry into the insurance and reinsurance industry. Competitors may bedomestic or foreign, as well as licensed or unlicensed. The number of competitors within the industry is not known. Insurerscompete on the basis of reliability, financial strength and stability, financial ratings, underwriting consistency, service,business ethics, price, performance, capacity, policy terms and coverage conditions.
K-2
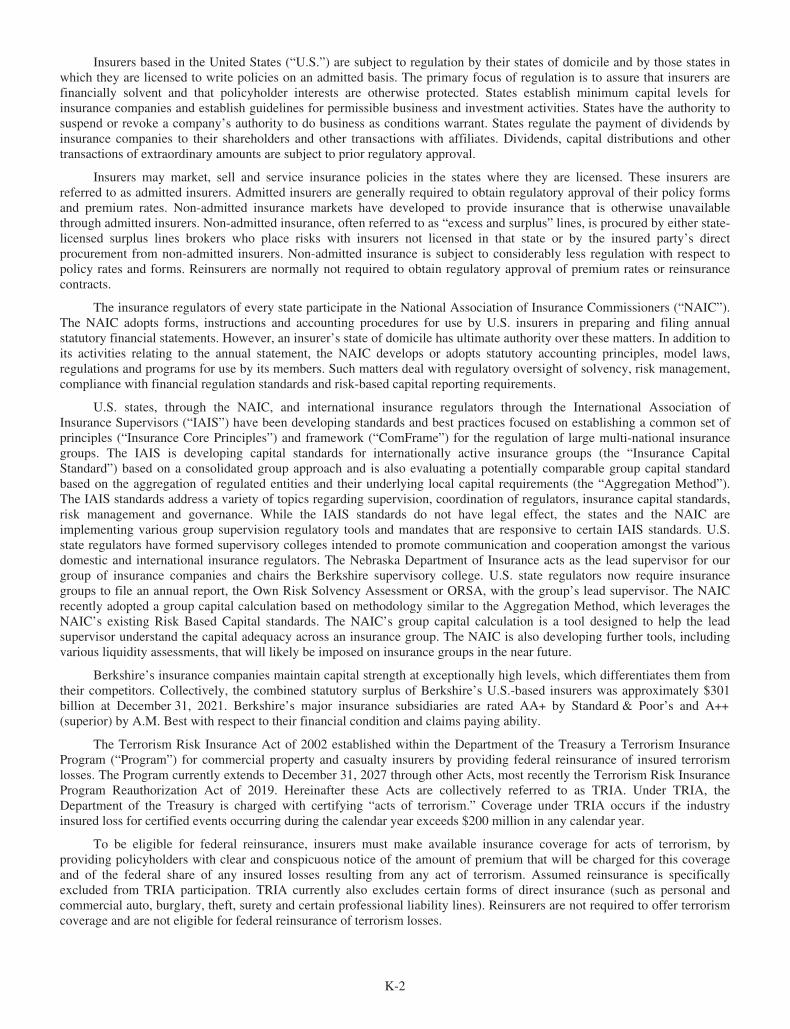
Insurers based in the United States (“U.S.”) are subject to regulation by their states of domicile and by those states inwhich they are licensed to write policies on an admitted basis. The primary focus of regulation is to assure that insurers arefinancially solvent and that policyholder interests are otherwise protected. States establish minimum capital levels forinsurance companies and establish guidelines for permissible business and investment activities. States have the authority tosuspend or revoke a company’s authority to do business as conditions warrant. States regulate the payment of dividends byinsurance companies to their shareholders and other transactions with affiliates. Dividends, capital distributions and othertransactions of extraordinary amounts are subject to prior regulatory approval.
Insurers may market, sell and service insurance policies in the states where they are licensed. These insurers arereferred to as admitted insurers. Admitted insurers are generally required to obtain regulatory approval of their policy formsand premium rates. Non-admitted insurance markets have developed to provide insurance that is otherwise unavailablethrough admitted insurers. Non-admitted insurance, often referred to as “excess and surplus” lines, is procured by either state-licensed surplus lines brokers who place risks with insurers not licensed in that state or by the insured party’s directprocurement from non-admitted insurers. Non-admitted insurance is subject to considerably less regulation with respect topolicy rates and forms. Reinsurers are normally not required to obtain regulatory approval of premium rates or reinsurancecontracts.
The insurance regulators of every state participate in the National Association of Insurance Commissioners (“NAIC”).The NAIC adopts forms, instructions and accounting procedures for use by U.S. insurers in preparing and filing annualstatutory financial statements. However, an insurer’s state of domicile has ultimate authority over these matters. In addition toits activities relating to the annual statement, the NAIC develops or adopts statutory accounting principles, model laws,regulations and programs for use by its members. Such matters deal with regulatory oversight of solvency, risk management,compliance with financial regulation standards and risk-based capital reporting requirements.
U.S. states, through the NAIC, and international insurance regulators through the International Association ofInsurance Supervisors (“IAIS”) have been developing standards and best practices focused on establishing a common set ofprinciples (“Insurance Core Principles”) and framework (“ComFrame”) for the regulation of large multi-national insurancegroups. The IAIS is developing capital standards for internationally active insurance groups (the “Insurance CapitalStandard”) based on a consolidated group approach and is also evaluating a potentially comparable group capital standardbased on the aggregation of regulated entities and their underlying local capital requirements (the “Aggregation Method”).The IAIS standards address a variety of topics regarding supervision, coordination of regulators, insurance capital standards,risk management and governance. While the IAIS standards do not have legal effect, the states and the NAIC areimplementing various group supervision regulatory tools and mandates that are responsive to certain IAIS standards. U.S.state regulators have formed supervisory colleges intended to promote communication and cooperation amongst the variousdomestic and international insurance regulators. The Nebraska Department of Insurance acts as the lead supervisor for ourgroup of insurance companies and chairs the Berkshire supervisory college. U.S. state regulators now require insurancegroups to file an annual report, the Own Risk Solvency Assessment or ORSA, with the group’s lead supervisor. The NAICrecently adopted a group capital calculation based on methodology similar to the Aggregation Method, which leverages theNAIC’s existing Risk Based Capital standards. The NAIC’s group capital calculation is a tool designed to help the leadsupervisor understand the capital adequacy across an insurance group. The NAIC is also developing further tools, includingvarious liquidity assessments, that will likely be imposed on insurance groups in the near future.
Berkshire’s insurance companies maintain capital strength at exceptionally high levels, which differentiates them fromtheir competitors. Collectively, the combined statutory surplus of Berkshire’s U.S.-based insurers was approximately $301billion at December 31, 2021. Berkshire’s major insurance subsidiaries are rated AA+ by Standard & Poor’s and A++(superior) by A.M. Best with respect to their financial condition and claims paying ability.
The Terrorism Risk Insurance Act of 2002 established within the Department of the Treasury a Terrorism InsuranceProgram (“Program”) for commercial property and casualty insurers by providing federal reinsurance of insured terrorismlosses. The Program currently extends to December 31, 2027 through other Acts, most recently the Terrorism Risk InsuranceProgram Reauthorization Act of 2019. Hereinafter these Acts are collectively referred to as TRIA. Under TRIA, theDepartment of the Treasury is charged with certifying “acts of terrorism.” Coverage under TRIA occurs if the industryinsured loss for certified events occurring during the calendar year exceeds $200 million in any calendar year.
To be eligible for federal reinsurance, insurers must make available insurance coverage for acts of terrorism, byproviding policyholders with clear and conspicuous notice of the amount of premium that will be charged for this coverageand of the federal share of any insured losses resulting from any act of terrorism. Assumed reinsurance is specificallyexcluded from TRIA participation. TRIA currently also excludes certain forms of direct insurance (such as personal andcommercial auto, burglary, theft, surety and certain professional liability lines). Reinsurers are not required to offer terrorismcoverage and are not eligible for federal reinsurance of terrorism losses.

K-3
In the event of a certified act of terrorism, the federal government will reimburse insurers (conditioned on theirsatisfaction of policyholder notification requirements) for 80% of their insured losses in excess of an insurance group’sdeductible. Under the Program, the deductible is 20% of the aggregate direct subject earned premium for relevant commerciallines of business in the immediately preceding calendar year. The aggregate deductible in 2022 for Berkshire’s insurancegroup is expected to approximate $1.6 billion. There is also an aggregate program limit of $100 billion on the amount of thefederal government coverage for each TRIA year.
The extent of insurance regulation varies significantly among the countries in which our non-U.S. operations conductbusiness. While each country imposes licensing, solvency, auditing and financial reporting requirements, the type and extentof the requirements differ substantially. For example:
• in some countries, insurers are required to prepare and file monthly and/or quarterly financial reports, andin others, only annual reports;
• some regulators require intermediaries to be involved in the sale of insurance products, whereas otherregulators permit direct sales contact between the insurer and the customer;
• the extent of restrictions imposed upon an insurer’s use of local and offshore reinsurance vary;
• policy form filing and rate regulation vary by country;
• the frequency of contact and periodic on-site examinations by insurance authorities differ by country;
• the scope and prescriptive requirements of an insurer’s risk management and governance framework varysignificantly by country; and
• regulatory requirements relating to insurer dividend policies vary by country.
Significant variations can also be found in the size, structure and resources of the local regulatory departments that overseeinsurance activities. Certain regulators prefer close relationships with all subject insurers and others operate a risk-basedapproach.
Berkshire’s insurance group operates in some countries through subsidiaries and in some countries through branches ofsubsidiaries. Berkshire insurance subsidiaries are located in several countries, including Germany, the United Kingdom(“U.K.”), Ireland, Australia and South Africa, and also maintain branches in several other countries. Most of these foreignjurisdictions impose local capital requirements. Other legal requirements include discretionary licensing procedures, localretention of funds and records, and data privacy and protection program requirements. Berkshire’s international insurancecompanies are also subject to multinational application of certain U.S. laws.
There are various regulatory bodies and initiatives that impact Berkshire in multiple international jurisdictions and thepotential for significant effect on the Berkshire insurance group could be heightened as a result of recent industry andeconomic developments.
In 2016, the U.K. voted in a national referendum to withdraw from the European Union (“EU”) (“Brexit”), whichresulted in the U.K.’s withdrawal from the EU on January 31, 2020. In anticipation of the U.K. leaving the EU, BerkshireHathaway European Insurance DAC in Ireland was established to permit property and casualty insurance and reinsurancebusinesses to continue to operate in the EU, and Berkshire continues to maintain a substantial presence in London followingBrexit.
Berkshire’s insurance underwriting operations include the following groups: (1) GEICO, (2) Berkshire HathawayPrimary Group and (3) Berkshire Hathaway Reinsurance Group. Except for retroactive reinsurance and periodic paymentannuity products that generate significant amounts of up-front premiums along with estimated claims expected to be paidover long time periods (creating “float,” see Investments section), Berkshire expects to achieve an underwriting profit overtime and to reject inadequately priced risks. Underwriting profit is defined as earned premiums less associated incurredlosses, loss adjustment expenses and underwriting and policy acquisition expenses. Underwriting profit does not includeincome earned from investments. Additional information related to each of Berkshire’s underwriting groups follows.
GEICO—GEICO is headquartered in Chevy Chase, Maryland. GEICO’s insurance subsidiaries consist of GovernmentEmployees Insurance Company, GEICO General Insurance Company, GEICO Indemnity Company, GEICO CasualtyCompany, GEICO Advantage Insurance Company, GEICO Choice Insurance Company, GEICO Secure Insurance Company,GEICO County Mutual Insurance Company, GEICO Texas County Mutual Insurance Company and GEICO MarineInsurance Company. The GEICO companies primarily offer private passenger automobile insurance to individuals in all 50states and the District of Columbia. GEICO also provides insurance for motorcycles, all-terrain vehicles, recreationalvehicles, boats and small commercial fleets and acts as an agent for other insurers who offer homeowners, renters, life andidentity management insurance to individuals who desire insurance coverages other than those offered by GEICO.
K-4
GEICO’s marketing is primarily through direct response methods in which applications for insurance are submitteddirectly to the companies via the Internet or by telephone, and to a lesser extent, through captive agents. GEICO conductsbusiness through regional service centers and claims adjustment and other facilities in 39 states.
The automobile insurance business is highly competitive in the areas of price and service. GEICO competes for privatepassenger automobile insurance customers in the preferred, standard and non-standard risk markets with other companies thatsell directly to the customer and with companies that use agency sales forces, including State Farm, Allstate, Progressive andUSAA. GEICO’s advertising campaigns and competitive rates contributed to a cumulative increase in voluntary policies-in-force of approximately 26.0% over the past five years. According to the most recently published A.M. Best data for 2020, thefive largest automobile insurers had a combined market share in 2020 of approximately 59.7% based on written premiums,with GEICO’s market share being the second largest at approximately 13.5%. GEICO’s written premiums in 2020 werereduced by the effects of the GEICO Giveback Program implemented in response to significant reductions in claimfrequencies attributable to reduced policyholder driving during the initial stages of the COVID-19 pandemic. Pandemic-related premium credit programs of other private passenger insurers may not have been reported as premium reductions,which impacts the industry data reported by A.M Best. Since the publication of that data, GEICO’s management estimates itscurrent market share is approximately 14.2%. Seasonal variations in GEICO’s insurance business are not significant.However, extraordinary weather conditions or other factors may have a significant effect upon the frequency or severity ofautomobile claims.
State insurance departments stringently regulate private passenger auto insurance. As a result, it is difficult forinsurance companies to differentiate their products. Competition for private passenger automobile insurance, which issubstantial, tends to focus on price and level of customer service provided. GEICO’s cost-efficient direct response marketingmethods and emphasis on customer satisfaction enable it to offer competitive rates and value to its customers. GEICOprimarily uses its own claims staff to manage and settle claims. The name and reputation of GEICO are material assets andmanagement protects those and other service marks through appropriate registrations.
Berkshire Hathaway Primary Group—The Berkshire Hathaway Primary Group (“BH Primary”) is a collection ofindependently managed insurers that provide a wide variety of insurance coverages to policyholders located principally in theUnited States. These various operations are discussed below.
National Indemnity Company (“NICO”), domiciled in Nebraska, and certain affiliates (“NICO Primary”) underwritecommercial motor vehicle and general liability insurance on an admitted basis and on an excess and surplus basis. Insurancecoverages are offered nationwide primarily through insurance agents and brokers.
The Berkshire Hathaway Homestate Companies (“BHHC”) is a group of insurers offering workers’ compensation,commercial auto and commercial property coverages to a diverse client base. BHHC has a national reach, with the ability toprovide first-dollar and small to large deductible workers’ compensation coverage to employers in all states, except thosewhere coverage is available only through state-operated workers’ compensation funds. NICO Primary and BHHC are eachbased in Omaha, Nebraska.
Berkshire Hathaway Specialty Insurance (“BH Specialty”) offers commercial property, casualty, healthcareprofessional liability, executive and professional, surety, travel, medical stop loss and homeowner’s insurance throughBerkshire Hathaway Specialty Insurance Company and other Berkshire insurance affiliates. BH Specialty writes primary andexcess policies on an admitted and surplus basis in the U.S., and on a local or foreign non-admitted basis outside the U.S. BHSpecialty is based in Boston, Massachusetts, with regional offices currently in several U.S. cities. BH Specialty alsomaintains international offices located in Australia, New Zealand, Canada and several countries in Asia, Europe and theMiddle East. BH Specialty writes business through wholesale and retail insurance brokers, as well as managing generalagents.
MedPro Group (“MedPro”) is a leading provider of healthcare liability (“HCL”) insurance in the United States.MedPro provides customized HCL insurance, claims, patient safety and risk solutions to physicians, surgeons, dentists andother healthcare professionals, as well as hospitals, senior care and other healthcare facilities. Additionally, MedPro providesHCL insurance solutions to international markets through other Berkshire insurance affiliates, delivers liability insurance toother professionals, and offers specialized accident and health insurance solutions to colleges and other customers through itssubsidiaries and other Berkshire insurance affiliates. MedPro is based in Fort Wayne, Indiana.
U.S. Liability Insurance Company (“USLI”) includes a group of five specialty insurers that underwrite commercial,professional and personal lines insurance on an admitted basis, as well as on an excess and surplus basis. USLI marketspolicies in all 50 states, the District of Columbia and Canada through wholesale and retail insurance agents. USLI companiesalso underwrite and market a wide variety of specialty insurance products. USLI is based in Wayne, Pennsylvania.
K-5
Berkshire Hathaway GUARD Insurance Companies (“GUARD”) is a group of five insurance companies that provide afull suite of commercial insurance products, as well as homeowners policies to over 350,000 small to mid-sized businessesand homeowners. These offerings are made through independent agents and retail and wholesale brokers. GUARD is basedin Wilkes-Barre, Pennsylvania.
MLMIC Insurance Company (“MLMIC”) has been the leading writer of medical professional liability insurance inNew York State for over 40 years. MLMIC distributes the majority of its policies on a direct basis to medical and dentalprofessionals, health care providers and hospitals.
Berkshire Hathaway Reinsurance Group—Berkshire’s combined global reinsurance business, referred to as theBerkshire Hathaway Reinsurance Group (“BHRG”), offers a wide range of coverages on property, casualty, life and healthrisks to insurers and reinsurers worldwide. BHRG conducts business activities in 24 countries. Reinsurance business iswritten through NICO and certain other Berkshire insurance subsidiaries (collectively, the “NICO Group”) and General ReCorporation, domiciled in Delaware, and its subsidiaries (collectively the “General Re Group”). BHRG’s underwritingoperations in the U.S. are based in Stamford, Connecticut.
The type and volume of business written is dependent on market conditions, including prevailing premium rates andcoverage terms. The level of underwriting activities often fluctuates significantly from year to year depending on theperceived level of price adequacy in specific insurance and reinsurance markets as well as from the timing of particularlylarge reinsurance transactions.
Property/casualty
The NICO Group offers traditional property/casualty reinsurance on both an excess-of-loss and a quota-share basis,catastrophe excess-of-loss treaty and facultative reinsurance, and primary insurance on an excess-of-loss basis for large orunusual risks. The type and volume of business written by the NICO Group may vary significantly from period to periodresulting from changes in perceived premium rate adequacy and from unique or large transactions. A significant portion ofNICO Group’s annual reinsurance premium volume currently derives from a 20% quota-share agreement with InsuranceAustralia Group Limited (“IAG”) that expires July 1, 2025. IAG is a multi-line insurer in Australia, New Zealand and otherAsia-Pacific countries.
The General Re Group conducts a global property and casualty reinsurance business. Reinsurance contracts are writtenon both a quota-share and excess basis for multiple lines of business. Contracts are primarily in the form of treaties, and to alesser degree, on a facultative basis. General Re Group conducts business in North America primarily through GeneralReinsurance Corporation (“GRC”), which is licensed in the District of Columbia and all states, except Hawaii, where it is anaccredited reinsurer. GRC conducts operations in North America from its headquarters in Stamford, Connecticut and through12 branch offices in the U.S. and Canada.
In North America, the General Re Group includes General Star National Insurance Company, General Star IndemnityCompany and Genesis Insurance Company, which offer a broad array of specialty and surplus lines and property, casualtyand professional liability coverages. Such business is marketed through a select group of wholesale brokers, managinggeneral underwriters and program administrators, and offer solutions for the unique needs of public entity, commercial andcaptive customers.
General Re Group’s international reinsurance business is conducted on a direct basis through General Reinsurance AG,based in Cologne, Germany, and through several other subsidiaries and branches in numerous other countries. Internationalbusiness is also written through brokers, including Faraday Underwriting Limited (“Faraday”), a wholly-owned subsidiary.Faraday owns the managing agent of Syndicate 435 at Lloyd’s of London and provides capacity and participates in 100% ofthe results of Syndicate 435.
Life/health
The General Re Group also conducts a global life and health reinsurance business. In the U.S. and internationally, theGeneral Re Group writes life, disability, supplemental health, critical illness and long-term care coverages. The life/healthbusiness is marketed on a direct basis. Life/health net premiums written by the General Re Group in 2021 were primarily inthe Asia Pacific, United States and Western Europe.
Berkshire Hathaway Life Insurance Company of Nebraska (“BHLN”), a subsidiary of NICO, and its affiliates writereinsurance covering various forms of traditional life insurance exposures and, on a limited basis, health insurance exposures.BHLN and affiliates are parties to contracts that reinsure certain guaranteed minimum death, income and similar benefit riskson closed-blocks of variable annuity risks under reinsurance contracts, with the most recent contract incepting in 2014.
K-6
Retroactive reinsurance
NICO also periodically writes retroactive reinsurance contracts. Retroactive reinsurance contracts indemnify cedingcompanies against the adverse development of claims arising from loss events that have already occurred under property andcasualty policies issued in prior years. Coverages under such contracts are provided on an excess basis (above a statedretention) or for losses payable after the inception of the contract with no additional ceding company retention. Contracts arenormally subject to aggregate limits of indemnification, which can be exceptionally large in amount. Significant amounts ofasbestos, environmental and latent injury claims may arise under these contracts.
The concept of time-value-of-money is an important element in establishing retroactive reinsurance contract prices andterms since loss payments may occur over decades. Normally, expected ultimate losses payable under these policies areexpected to exceed premiums, thus producing underwriting losses. Nevertheless, this business is written, in part, because ofthe large amounts of policyholder funds generated for investment, the economic benefit of which will be reflected throughinvestment results in future periods.
Periodic payment annuity
BHLN writes periodic payment annuity insurance policies and reinsures existing annuity-like obligations. Under thesepolicies, BHLN receives upfront premiums and agrees in the future to make periodic payments that often extend for decades.These policies generally relate to the settlement of underlying personal injury or workers’ compensation cases of otherinsurers, known as structured settlements. Consistent with retroactive reinsurance contracts, time-value-of-money conceptsare an important factor in establishing annuity premiums, and underwriting losses are expected from the periodic accretion oftime-value discounted liabilities.
Investments of insurance businesses—Berkshire’s insurance subsidiaries hold significant levels of invested assets.Investment portfolios are primarily managed by Berkshire’s Chief Executive Officer. Investments include a very largeportfolio of publicly traded equity securities, which are concentrated in relatively few issuers, as well as fixed maturitysecurities and cash and short-term investments. Generally, there are no targeted allocations by investment type or attempts tomatch investment asset and insurance liability durations. However, investment portfolios have historically included a muchgreater proportion of equity securities than is customary in the insurance industry.
Invested assets derive from shareholder capital as well as funds provided from policyholders through insurance andreinsurance business (“float”). Float is the approximate amount of net policyholder funds generated through underwritingactivities that is available for investment. The major components of float are unpaid losses and loss adjustment expenses, life,annuity and health benefit liabilities, unearned premiums and other policyholder liabilities less premium and reinsurancereceivables, deferred policy acquisition costs and deferred charges on assumed retroactive reinsurance contracts. On aconsolidated basis, float has grown from approximately $91 billion at the end of 2016 to approximately $147 billion at theend of 2021. The cost of float can be measured as the net pre-tax underwriting loss as a percentage of average float. In eachof the three years ending December 31, 2021, Berkshire’s consolidated cost of float was negative, as its insurance businessesproduced net underwriting gains.
Railroad Business—Burlington Northern Santa Fe
Burlington Northern Santa Fe, LLC (“BNSF”) is based in Fort Worth, Texas, and through BNSF Railway Company(“BNSF Railway”) operates one of the largest railroad systems in North America. BNSF Railway had approximately 35,000employees at the end of 2021. BNSF also operates a relatively smaller third-party logistics services business.
In serving the Midwest, Pacific Northwest, Western, Southwestern and Southeastern regions and ports of the UnitedStates, BNSF transports a range of products and commodities derived from manufacturing, agricultural and natural resourceindustries. Freight revenues are covered by contractual agreements of varying durations or common carrier published pricesor company quotations. BNSF’s financial performance is influenced by, among other things, general and industry economicconditions at the international, national and regional levels.
BNSF’s primary routes, including trackage rights, allow it to access major cities and ports in the western and southernUnited States as well as parts of Canada and Mexico. In addition to major cities and ports, BNSF Railway efficiently servesmany smaller markets by working closely with approximately 200 shortline railroads. BNSF Railway has also entered intomarketing agreements with other rail carriers, expanding the marketing reach for each railroad and their customers. For theyear ending December 31, 2021, approximately 38% of freight revenues were derived from consumer products, 24% fromindustrial products, 23% from agricultural products and 15% from coal.
K-7
Regulatory Matters
BNSF is subject to federal, state and local laws and regulations generally applicable to its businesses. Rail operationsare subject to the regulatory jurisdiction of the Surface Transportation Board (“STB”), the Federal Railroad Administration ofthe United States Department of Transportation (“DOT”), the Occupational Safety and Health Administration (“OSHA”), aswell as other federal and state regulatory agencies and Canadian regulatory agencies for operations in Canada. The STB hasjurisdiction over disputes and complaints involving certain rates, routes and services, the sale or abandonment of rail lines,applications for line extensions and construction, and the merger with or acquisition of control of rail common carriers. Theoutcome of STB proceedings can affect the profitability of BNSF Railway’s business.
The DOT and OSHA have jurisdiction under several federal statutes over a number of safety and health aspects of railoperations, including the transportation of hazardous materials. BNSF Railway is required to transport these materials to theextent of its common carrier obligation. State agencies regulate some aspects of rail operations with respect to health andsafety in areas not otherwise preempted by federal law.
Environmental Matters
BNSF’s rail operations, as well as those of its competitors, are also subject to extensive federal, state and localenvironmental regulation covering discharges to the ground or waters, air emissions, toxic substances and the generation,handling, storage, transportation and disposal of waste and hazardous materials. Such regulations effectively increase thecosts and liabilities associated with rail operations. Environmental risks are also inherent in rail operations, which frequentlyinvolve transporting chemicals and other hazardous materials.
Many of BNSF’s land holdings are or have been used for industrial or transportation-related purposes or leased tocommercial or industrial companies whose activities may have resulted in discharges onto the property. Under federal (inparticular, the Comprehensive Environmental Response, Compensation and Liability Act) and state statutes, BNSF may beheld jointly and severally liable for cleanup and enforcement costs associated with a particular site without regard to fault orthe legality of the original conduct. BNSF may also be subject to claims by third parties for investigation, cleanup, restorationor other environmental costs under environmental statutes or common law with respect to properties they own that have beenimpacted by BNSF operations.
Consumption of diesel fuel by locomotives accounted for approximately 80% of BNSF’s greenhouse gas (“GHG”)emissions in its baseline year of 2018. BNSF management has committed to a broad sustainability model, applying science-based approaches, that will provide a 30% reduction in BNSF’s GHG-emissions by 2030 from its baseline year of 2018.BNSF intends to continue improvements in fuel efficiency and increased utilization of renewable diesel fuel. Long-termsolutions, such as battery-electric and hydrogen locomotives, are also being evaluated and field-tested.
Competition
The business environment in which BNSF operates is highly competitive. Depending on the specific market,deregulated motor carriers and other railroads, as well as river barges, ships and pipelines, may exert pressure on price andservice levels. The presence of advanced, high service truck lines with expedited delivery, subsidized infrastructure andminimal empty mileage continues to affect the market for non-bulk, time-sensitive freight. The potential expansion of longercombination vehicles could further encroach upon markets traditionally served by railroads. In order to remain competitive,BNSF Railway and other railroads seek to develop and implement operating efficiencies to improve productivity.
As railroads streamline, rationalize and otherwise enhance their franchises, competition among rail carriers intensifies.BNSF Railway’s primary rail competitor in the Western region of the United States is the Union Pacific Railroad Company.Other Class I railroads and numerous regional railroads and motor carriers also operate in parts of the same territories servedby BNSF Railway.
Utilities and Energy Businesses—Berkshire Hathaway Energy
Berkshire currently has a 91.1% ownership interest in Berkshire Hathaway Energy Company (“BHE”). BHE is a globalenergy company with subsidiaries and affiliates that generate, transmit, store, distribute and supply energy. BHE’s locallymanaged businesses are organized as separate operating units. BHE’s domestic regulated energy interests are comprised offour regulated utility companies serving approximately 5.2 million retail customers, five interstate natural gas pipelinecompanies with approximately 21,100 miles of operated pipeline having a design capacity of approximately 21 billion cubicfeet of natural gas per day and ownership interests in electricity transmission businesses. BHE’s Great Britain electricitydistribution subsidiaries serve about 3.9 million electricity end-users and its electricity transmission-only business in Alberta,Canada serves approximately 85% of Alberta’s population. BHE’s interests also include a diversified portfolio ofindependent power projects, a liquefied natural gas export, import and storage facility, the largest residential real estatebrokerage firm in the United States, and one of the largest residential real estate brokerage franchise networks in the UnitedStates. BHE employs approximately 24,000 people in connection with its various operations.

K-8
General Matters
PacifiCorp is a regulated electric utility company headquartered in Oregon, serving electric customers in portions ofUtah, Oregon, Wyoming, Washington, Idaho and California. The combined service territory’s diverse regional economyranges from rural, agricultural and mining areas to urban, manufacturing and government service centers. No single segmentof the economy dominates the combined service territory, which helps mitigate PacifiCorp’s exposure to economicfluctuations. In addition to retail sales, PacifiCorp sells electricity on a wholesale basis.
MidAmerican Energy Company (“MEC”) is a regulated electric and natural gas utility company headquartered inIowa, serving electric and natural gas customers primarily in Iowa and also in portions of Illinois, South Dakota andNebraska. MEC has a diverse retail customer base consisting of urban and rural residential customers and a variety ofcommercial and industrial customers. In addition to retail sales and natural gas transportation, MEC sells electricity andnatural gas on a wholesale basis.
NV Energy, Inc. (“NV Energy”) is an energy holding company headquartered in Nevada, primarily consisting of tworegulated utility subsidiaries, Nevada Power Company (“Nevada Power”) and Sierra Pacific Power Company (“SierraPacific”) (collectively, the “Nevada Utilities”). Nevada Power serves retail electric customers in southern Nevada and SierraPacific serves retail electric and natural gas customers in northern Nevada. The Nevada Utilities’ combined service territory’seconomy includes gaming, mining, recreation, warehousing, manufacturing and governmental services. In addition to retailsales and natural gas transportation, the Nevada Utilities sell electricity and natural gas on a wholesale basis.
As vertically integrated utilities, BHE’s domestic utilities own approximately 29,400 net megawatts of generationcapacity in operation and under construction. The domestic utilities business is subject to seasonal variations principallyrelated to the use of electricity for air conditioning and natural gas for heating. Typically, regulated electric revenues arehigher in the summer months, while regulated natural gas revenues are higher in the winter months.
The Great Britain distribution companies consist of Northern Powergrid (Northeast) plc and Northern Powergrid(Yorkshire) plc, which own a substantial electricity distribution network that delivers electricity to end-users in northeastEngland in an area covering approximately 10,000 square miles. The distribution companies primarily charge supplycompanies regulated tariffs for the use of their distribution systems.
AltaLink L.P. (“AltaLink”) is a regulated electric transmission-only utility company headquartered in Calgary, Alberta.AltaLink’s high voltage transmission lines and related facilities transmit electricity from generating facilities to major loadcenters, cities and large industrial plants throughout its 87,000 square mile service territory.
The natural gas pipelines consist of BHE GT&S, LLC (“BHE GT&S”), Northern Natural Gas Company (“NorthernNatural”) and Kern River Gas Transmission Company (“Kern River”). BHE GT&S was acquired on November 1, 2020.
BHE GT&S, based in Virginia, operates three interstate natural gas pipeline systems that consist of approximately5,400 miles of natural gas transmission, gathering and storage pipelines and operates seventeen underground natural gasstorage fields in the eastern region of the United States. BHE GT&S’s large underground natural gas storage assets andpipeline systems are part of an interconnected gas transmission network that provides transportation services to utilities andnumerous other customers. BHE GT&S is also an industry leader in liquefied natural gas solutions through its investments inand ownership of several liquefied natural gas facilities located throughout the eastern region of the United States.
Northern Natural, based in Nebraska, operates the largest interstate natural gas pipeline system in the United States, asmeasured by pipeline miles, reaching from west Texas to Michigan’s Upper Peninsula. Northern Natural’s pipeline systemconsists of approximately 14,300 miles of natural gas pipelines. Northern Natural’s extensive pipeline system, which isinterconnected with many interstate and intrastate pipelines in the national grid system, has access to supplies from multiplemajor supply basins and provides transportation services to utilities and numerous other customers. Northern Natural alsooperates three underground natural gas storage facilities and two liquefied natural gas storage peaking units. NorthernNatural’s pipeline system experiences significant seasonal swings in demand and revenue, with the highest demand typicallyoccurring during the months of November through March.
Kern River, based in Utah, operates an interstate natural gas pipeline system that consists of approximately 1,400 milesand extends from supply areas in the Rocky Mountains to consuming markets in Utah, Nevada and California. Kern Rivertransports natural gas for electric and natural gas distribution utilities, major oil and natural gas companies or affiliates ofsuch companies, electric generating companies, energy marketing and trading companies, and financial institutions.
BHE Renewables, based in Iowa, owns interests in independent power projects having approximately 4,900 netmegawatts of generation capacity that are in service in California, Texas, Illinois, Nebraska, New York, Arizona, Minnesota,Kansas, Iowa and Hawaii. These independent power projects sell power generated primarily from wind, solar, geothermaland hydro sources under long-term contracts. Additionally, $6.9 billion has been invested in wind projects sponsored by thirdparties, commonly referred to as tax equity investments.
K-9
Regulatory Matters
PacifiCorp, MEC and the Nevada Utilities are subject to comprehensive regulation by various federal, state and localagencies. The Federal Energy Regulatory Commission (“FERC”) is an independent agency with broad authority toimplement provisions of the Federal Power Act, the Energy Policy Act of 2005 and other federal statutes. The FERCregulates rates for wholesale sales of electricity; transmission of electricity, including pricing and regional planning for theexpansion of transmission systems; electric system reliability; utility holding companies; accounting and records retention;securities issuances; construction and operation of hydroelectric facilities; and other matters. The FERC also has theenforcement authority to assess civil penalties of up to $1.4 million per day per violation of rules, regulations and ordersissued under the Federal Power Act. MEC is also subject to regulation by the Nuclear Regulatory Commission pursuant tothe Atomic Energy Act of 1954, as amended, with respect to its 25% ownership of the Quad Cities Nuclear Station.
With certain limited exceptions, BHE’s domestic utilities have an exclusive right to serve retail customers within theirservice territories and, in turn, have an obligation to provide service to those customers. In some jurisdictions, certain classesof customers may choose to purchase all or a portion of their energy from alternative energy suppliers, and in somejurisdictions retail customers can generate all or a portion of their own energy. Historically, state regulatory commissionshave established retail electric and natural gas rates on a cost-of-service basis, designed to allow a utility the opportunity torecover what each state regulatory commission deems to be the utility’s reasonable costs of providing services, including afair opportunity to earn a reasonable return on its investments based on its cost of debt and equity. The retail electric rates ofPacifiCorp, MEC and the Nevada Utilities are generally based on the cost of providing traditional bundled services, includinggeneration, transmission and distribution services; however, rates are available for transmission-only and distribution-onlyservices.
Northern Powergrid (Northeast) and Northern Powergrid (Yorkshire) each charge fees for the use of their distributionsystems that are controlled by a formula prescribed by the British electricity regulatory body, the Gas and Electricity MarketsAuthority. The current eight-year price control period runs from April 1, 2015 through March 31, 2023.
AltaLink is regulated by the Alberta Utilities Commission (“AUC”), pursuant to the Electric Utilities Act (Alberta), thePublic Utilities Act (Alberta), the Alberta Utilities Commission Act (Alberta) and the Hydro and Electric Energy Act(Alberta). The AUC is an independent quasi-judicial agency, which regulates and oversees Alberta’s electricity transmissionsector with broad authority that may impact many of AltaLink’s activities, including its tariffs, rates, construction, operationsand financing. Under the Electric Utilities Act, AltaLink prepares and files applications with the AUC for approval of tariffsto be paid by the Alberta Electric System Operator (“AESO”) for the use of its transmission facilities, and the terms andconditions governing the use of those facilities. The AESO is an independent system operator in Alberta, Canada thatoversees Alberta’s integrated electrical system (“AIES”) and wholesale electricity market. The AESO is responsible fordirecting the safe, reliable and economic operation of the AIES, including long-term transmission system planning.
The natural gas pipelines are subject to regulation by various federal and state agencies. The natural gas pipeline andstorage operations of BHE GT&S, Northern Natural and Kern River are regulated by the FERC pursuant to the Natural GasAct and the Natural Gas Policy Act of 1978. Under this authority, the FERC regulates, among other items, (a) rates, charges,terms and conditions of service; (b) the construction and operation of interstate pipelines, storage and related facilities,including the extension, expansion or abandonment of such facilities; and (c) the construction and operation of liquefiednatural gas import/export facilities. Interstate natural gas pipeline companies are also subject to regulations administered bythe Office of Pipeline Safety within the Pipeline and Hazardous Materials Safety Administration, an agency of the DOT.Federal pipeline safety regulations are issued pursuant to the Natural Gas Pipeline Safety Act of 1968, as amended, whichestablishes safety requirements in the design, construction, operation and maintenance of interstate natural gas pipelinefacilities.
Environmental Matters
BHE and its energy businesses are subject to federal, state, local and foreign laws and regulations regarding climatechange, renewable portfolio standards, air and water quality, emissions performance standards, coal combustion byproductdisposal, hazardous and solid waste disposal, protected species and other environmental matters that have the potential toimpact current and future operations. In addition to imposing continuing compliance obligations, these laws and regulations,such as the Federal Clean Air Act, provide regulators with the authority to levy substantial penalties for noncompliance,including fines, injunctive relief and other sanctions.
The Federal Clean Air Act, as well as state laws and regulations impacting air emissions, provides a framework forprotecting and improving the nation’s air quality and controlling sources of air emissions. These laws and regulationscontinue to be promulgated and implemented and will impact the operation of BHE’s generating facilities and require them toreduce emissions at those facilities to comply with the requirements.
K-10
Renewable portfolio standards have been established by certain state governments and generally require electricityproviders to obtain a minimum percentage of their power from renewable energy resources by a certain date. Utah, Oregon,Washington, California, Iowa and Nevada have adopted renewable portfolio standards. In addition, the potential adoption ofstate or federal clean energy standards, which include low-carbon, non-carbon and renewable electricity generating resources,may also impact electricity generators and natural gas providers.
In December 2015, an international agreement was negotiated by 195 nations to create a universal framework forcoordinated action on climate change in what is referred to as the Paris Agreement. The Paris Agreement reaffirms the goalof limiting global temperature increase well below 2 degrees Celsius, while urging efforts to limit the increase to 1.5 degreesCelsius; establishes commitments by all parties to make nationally determined contributions and pursue domestic measuresaimed at achieving the commitments; commits all countries to submit emissions inventories and report regularly on theiremissions and progress made in implementing and achieving their nationally determined commitments; and commits allcountries to submit new commitments every five years, with the expectation that the commitments will get more aggressive.In the context of the Paris Agreement, the United States agreed to reduce greenhouse gas emissions 26% to 28% by 2025from 2005 levels. The Paris Agreement formally entered into force on November 4, 2016. The United States completed itswithdrawal from the Paris Agreement on November 4, 2020. President Biden accepted the terms of the climate agreement onJanuary 21, 2021, and the United States completed its reentry on February 19, 2021. New commitments to the ParisAgreement were announced in April 2021, with the United States pledging to cut its overall greenhouse gas emissions by 50-52% below 2005 levels by 2030 and to reach 100% carbon pollution-free electricity by 2035.
On October 10, 2017, the Environmental Protection Agency (“EPA”) issued a proposal to repeal the Clean Power Plan,which was intended to achieve an overall reduction in carbon dioxide emissions from existing fossil-fueled electricgenerating units of 32% below 2005 levels. On June 19, 2019, the EPA repealed the Clean Power Plan and issued theAffordable Clean Energy rule, which fully replaced the Clean Power Plan. In the Affordable Clean Energy rule, the EPAdetermined that the best system of emissions reduction for existing coal fueled power plants is heat rate improvements andidentified a set of candidate technologies and measures that could improve heat rates. Measures taken to meet the standardsof performance must be achieved at the source itself. On January 19, 2021, the D.C. Circuit Court of Appeals vacated theAffordable Clean Energy Rule in its entirety. In October 2021, the U.S. Supreme Court agreed to hear an appeal of thatdecision. Arguments in the case will be held in February 2022 and a decision regarding the scope of the EPA’s authority toregulate greenhouse gas emissions under the Clean Air Act is expected by June 2022. Increasingly, states are adoptinglegislation and regulations to reduce greenhouse gas emissions, and local governments and consumers are seeking increasingamounts of clean and renewable energy.
BHE and its energy subsidiaries continue to focus on delivering reliable, affordable, safe and clean energy to itscustomers and on actions to mitigate its greenhouse gas (“GHG”) emissions. BHE’s primary source of GHG emissions is thegeneration of electricity from its power plants that are fueled by coal or natural gas. In managing its electricity generation,BHE works with its regulators to protect the energy and economic needs of customers by considering costs, reliability andsources of electric generation. Over the years, BHE has invested heavily in owned wind, solar and geothermal generation,with cumulative investments of $30.1 billion through 2021 and has retired 16 coal generation units. As a result, BHE hasreduced its annual GHG emissions by about 20% from 2005 levels. BHE plans to continue investing in wind, solar and otherlow-carbon generation in the future and to retire an additional 16 coal generation units between 2022 and 2030 in a reliableand cost-effective manner, thereby achieving a 50% reduction in GHG emissions from 2005 levels in 2030.
Non-Energy Businesses
HomeServices of America, Inc. (“HomeServices”) is the largest residential real estate brokerage firm in the UnitedStates. In addition to providing traditional residential real estate brokerage services, HomeServices offers other integrated realestate services, including mortgage originations and mortgage banking, title and closing services, property and casualtyinsurance, home warranties, relocation services and other home-related services. It operates under 55 brand names withapproximately 46,000 real estate agents in over 900 brokerage offices in 33 states and the District of Columbia.
HomeServices’ franchise network currently includes approximately 360 franchisees primarily in the United States, andinternationally in over 1,600 brokerage offices with over 53,000 real estate agents under two brand names. In exchange forcertain fees, HomeServices provides the right to use the Berkshire Hathaway HomeServices or Real Living brand names andother related service marks, as well as providing orientation programs, training and consultation services, advertisingprograms and other services.
HomeServices’ principal sources of revenue are dependent on residential real estate sales, which are generally higherin the second and third quarters of each year. This business is highly competitive and subject to general real estate marketconditions.

K-11
Manufacturing Businesses
Berkshire’s numerous and diverse manufacturing subsidiaries are grouped into three categories: (1) industrial products,(2) building products and (3) consumer products. Berkshire’s industrial products businesses manufacture components foraerospace and power generation applications, specialty chemicals, metal cutting tools, and a variety of other productsprimarily for industrial use. The building products group produces prefabricated and site-built residential homes, flooringproducts, insulation, roofing and engineered products, building and engineered components, paint and coatings and bricksand masonry products. The consumer products group manufactures recreational vehicles, alkaline batteries, various apparelproducts, jewelry and custom picture framing products. Information concerning the major activities of these three groupsfollows. Berkshire’s manufacturing businesses employed approximately 187,000 people at the end of 2021.
Industrial products
Precision Castparts
Precision Castparts Corp. (“PCC”) manufactures complex metal components and products, provides high-qualityinvestment castings, forgings, fasteners/fastener systems and aerostructures for critical aerospace and power and energyapplications. PCC also manufactures seamless pipe for coal-fired, industrial gas turbine (“IGT”) and nuclear power plants;downhole casing and tubing, fittings and various mill forms in a variety of nickel and steel alloys for severe-service oil andgas environments; investment castings and forgings for general industrial, armament, medical and other applications; nickeland titanium alloys in all standard mill forms from large ingots and billets to plate, foil, sheet, strip, tubing, bar, rod, extrudedshapes, rod-in-coil, wire and welding consumables, as well as cobalt alloys, for the aerospace, chemical processing, oil andgas, pollution control and other industries; revert management solutions; fasteners for automotive and general industrialmarkets; specialty alloys for the investment casting and forging industries; heat treating and destructive testing services forthe investment cast products and forging industries; grinder pumps and affiliated components for low-pressure sewersystems; critical auxiliary equipment and gas monitoring systems for the power generation industry; and metalworking toolsfor the fastener market and other applications.
Investment casting technology involves a multi-step process that uses ceramic molds in the manufacture of metalcomponents with more complex shapes, closer tolerances and finer surface finishes than parts manufactured using othermethods. PCC uses this process to manufacture products for aircraft engines, IGT and other aeroderivative engines,airframes, medical implants, armament, unmanned aerial vehicles and other industrial applications. PCC also manufactureshigh temperature carbon and ceramic composite components, including ceramic matrix composites, for use in next-generation aerospace engines.
PCC uses forging processes to manufacture components for the aerospace and power generation markets, includingseamless pipe for coal-fired, IGT and nuclear power plants, and downhole casings and tubing pipe for severe service oil andgas markets. PCC manufactures high-performance, nickel-based alloys used to produce forged components for aerospace andnon-aerospace applications in such markets as oil and gas, chemical processing and pollution control. These titaniumproducts are used to manufacture components for the commercial and military aerospace, power generation, energy and otherindustrial end markets.
PCC is also a leading developer and manufacturer of highly engineered fasteners, fastener systems, aerostructures andprecision components, primarily for critical aerospace applications. These products are produced for the aerospace and powerand energy markets, as well as for construction, automotive, heavy truck, farm machinery, mining and constructionequipment, shipbuilding, machine tools, medical equipment, appliance and recreation markets.
PCC has several significant customers, including aerospace original equipment manufacturers (Boeing and Airbus) andaircraft engine manufacturer suppliers (General Electric, Rolls Royce and Pratt &Whitney). The majority of PCC’s sales arefrom customer orders or demand schedules pursuant to long-term agreements. Contractual terms may provide for terminationby the customer, subject to payment for work performed. PCC typically does not experience significant order cancellations,although periodically it receives requests for delays in delivery schedules. Since the onset of the COVID-19 pandemic in2020, delay requests increased, with delivery dates extending in some cases beyond 2021.
The effects of the COVID-19 pandemic produced significant adverse effects on the PCC aerospace business in 2020and 2021. The sudden and material reductions in air travel led to aircraft build rate reductions and customer destocking atextraordinary rates. The grounding of the Boeing 737 MAX also adversely impacted 2020 and 2021 and quality issues withthe Boeing 787 negatively impacted 2021. Aircraft build rates have not recovered in any meaningful way. During 2020, PCCsignificantly reduced its worldwide workforce by about 40% to help align operations to reduced aircraft build rates. Therestructuring actions taken began to improve margins in late 2020 and further margin improvements were achieved in 2021.

K-12
PCC is subject to substantial competition in all of its markets. Components and similar products may be produced bycompetitors, who use either the same types of manufacturing processes as PCC or other processes. Although PCC believes itsmanufacturing processes, technology and experience provide advantages to its customers, such as high quality, competitiveprices and physical properties that often meet more stringent demands, alternative forms of manufacturing can be used toproduce many of the same components and products. Despite intense competition, PCC is a leading supplier in most of itsprincipal markets. Several factors, including long-standing customer relationships, technical expertise, state-of-the-artfacilities and dedicated employees, aid PCC in maintaining competitive advantages.
Several raw materials used in PCC products, including certain metals such as nickel, titanium, cobalt, tantalum andmolybdenum, are found in only a few parts of the world. These metals are required for the alloys used in manufacturedproducts. The availability and costs of these metals may be influenced by private or governmental cartels, changes in worldpolitics, labor relations between the metal producers and their workforces and inflation.
PCC is currently subject to various federal, state and foreign environmental laws concerning, among other things,water discharges, air emissions, waste management, toxic materials use reduction and environmental cleanup. Laws andregulations continue to evolve, and it is reasonably possible that environmental standards will become more stringent in thefuture, particularly under air quality and water quality laws and standards related to climate change, including reporting ofgreenhouse gas emissions. As a result, it is also reasonably likely that PCC will be regularly required to make additionalexpenditures, including capital expenditures, which could be significant, relating to environmental matters.
Lubrizol
The Lubrizol Corporation (“Lubrizol”) is a specialty chemical and performance materials company that manufacturesproducts and supplies technologies for the global transportation, industrial and consumer markets. Lubrizol currently operatestwo business segments: Lubrizol Additives, which produces engine lubricant additives, driveline lubricant additives andindustrial specialties products; and Lubrizol Advanced Materials, which includes engineered materials (engineered polymersand performance coatings) and life sciences (beauty and personal care, and health and home care solutions).
Lubrizol Additives’ products are used in a broad range of applications including engine oils, transmission fluids, gearoils, specialty driveline lubricants, fuels, metalworking fluids and compressor lubricants for transportation and industrialapplications. Lubrizol Advanced Materials’ products are used in many different types of applications including beauty,personal care, home care, over-the-counter pharmaceuticals, medical devices, performance coatings, sporting goods,plumbing and fire sprinkler systems. Lubrizol is an industry leader in many of the markets in which it competes, and itsprincipal lubricant additives competitors are Infineum International Ltd., Chevron Oronite Company and Afton ChemicalCorporation. Lubrizol Advanced Materials’ businesses compete in many markets with a variety of competitors in eachproduct line.
With its considerable patent portfolio, Lubrizol uses its technological leadership position and applies its sciencecapabilities, formulation know-how and market expertise in product development to improve the demand, quality and valueof its solutions. Lubrizol also leverages its scientific and applications knowledge to meet and exceed customer performanceand sustainability requirements. While Lubrizol typically has patents that expire each year, it invests resources to protect itsintellectual property and to develop or acquire innovative products for the markets it serves. Lubrizol uses many specialtyand commodity chemical raw materials in its manufacturing processes. Raw materials are primarily feedstocks derived frompetroleum and petrochemicals and, generally, are obtainable from several sources. The materials that Lubrizol chooses topurchase from a single source typically are subject to long-term supply contracts to ensure supply reliability.
Lubrizol operates its business on a global basis through more than 100 offices, laboratories, production facilities andwarehouses on six continents, the most significant of which are North America, Europe, Asia and South America. Lubrizolmarkets its products worldwide through direct sales, sales agents and distributors. Lubrizol’s customers principally consist ofmajor global and regional oil companies and industrial and consumer products companies. Some of Lubrizol’s largestcustomers also may be suppliers. During 2021, no single customer accounted for more than 10% of Lubrizol’s consolidatedrevenues. In 2021, the COVID-19 pandemic continued to have an adverse effect on many of the markets that Lubrizol serves,as did worldwide supply chain disruptions, affecting both the availability of raw materials and fulfillment of customer orders.In addition, the occurrence and duration of the February 2021 winter storms and freezing temperatures in Texas significantlyinterrupted operations at Lubrizol’s manufacturing facilities.
Lubrizol expends significant capital to ensure the safety of its employees and the communities where it operates, aswell as delivering on its commitments to operational excellence and cybersecurity. Lubrizol also makes significant capitalinvestments to ensure reliable supply and compliance with regulations governing its operations, while reducing theirenvironmental footprint.

K-13
Lubrizol is subject to foreign, federal, state and local laws to protect the environment, limit manufacturing waste andemissions, ensure product and employee safety and regulate trade. While the company believes that its policies, practices andprocedures are designed to limit the risks of non-compliance with laws and consequent financial liability, it experienced a fireat one of its chemical manufacturing facilities in 2019, which resulted in significant cleanup and remediation costs. Lubrizolalso suffered a fire in 2021 that resulted in a total loss of its grease manufacturing facility. The operation of chemicalmanufacturing plants entails ongoing environmental and other risks, and significant capital expenditures, costs or liabilitiescould be incurred in the future.
IMC
IMC International Metalworking Companies (“IMC”) is one of the world’s three largest multinational manufacturers ofconsumable precision carbide metal cutting tools for applications in a broad range of industrial end markets. IMC’s principalbrand names include ISCAR®, TaeguTec®, Ingersoll®, Tungaloy®, Unitac®, UOP®, It.te.di®, Qutiltec®, Tool—Flo®, PCT®
and IMCO®. IMC’s primary manufacturing facilities are in Israel, the United States, South Korea, Japan, Germany, Italy,Switzerland, India and China.
IMC has five primary product lines: milling tools, gripping tools, turning/thread tools, drilling tools and tooling. Themain products are split within each product line between consumable cemented tungsten carbide inserts and steel toolholders. Inserts comprise the vast majority of sales and earnings. Metal cutting inserts are used by industrial manufacturers tocut metals and are consumed during their use in cutting applications. IMC manufactures hundreds of types of highlyengineered inserts within each product line that are tailored to maximize productivity and meet the technical requirements ofcustomers. IMC’s staff of scientists and engineers continuously develop and innovate products that address end user needsand requirements.
IMC’s global sales and marketing network operates in virtually every major manufacturing center around the world,staffed with highly skilled engineers and technical personnel. IMC’s customer base is very diverse, with its primarycustomers being large, multinational businesses in the automotive, aerospace, engineering and machinery industries. IMCoperates a regional central warehouse system with locations in Israel, the United States, Belgium, Korea, Japan and China.Additional small quantities of products are maintained at local IMC offices to provide on-time customer support andinventory management.
IMC competes in the metal cutting tools segment of the global metalworking tools market. The segment includeshundreds of participants who range from small, private manufacturers of specialized products for niche applications andmarkets to larger, global multinational businesses (such as Sandvik and Kennametal, Inc.) with a wide assortment of productsand extensive distribution networks. Other manufacturing companies such as Kyocera, Mitsubishi, Sumitomo, Ceratizit andKorloy also play a significant role in the cutting tool market.
Cemented tungsten carbide powder is the main raw material used in manufacturing cutting tools. Most of IMC’smetalworking insert products are made from tungsten. While supplies are currently adequate, a significant disruption orconstraints in production processing facilities could cause a price increase.
IMC is committed to follow, comply and obey all government and environmental regulations and requirements of allapplicable laws. IMC considers environmental preservation and pollution prevention as important factors in all operationsand activities. IMC production facilities are built with the highest standards and follow all applicable regulations.
Marmon
Marmon Holdings, Inc. (“Marmon”) is a global industrial organization comprising 11 diverse business groups andmore than 100 autonomous manufacturing and service businesses. Marmon’s manufacturing and service operations areconducted at approximately 400 manufacturing, distribution and service facilities located primarily in the United States, aswell as 22 other countries worldwide. Marmon’s business groups are as follows.
Foodservice Technologies manufactures beverage dispensing and cooling equipment, hot and cold food preparationand holding equipment and related products for restaurants, global brand owners and other foodservice providers. Operationsare based in the U.S. with manufacturing in the U.S., Mexico, China, the U.K., Germany and Italy. Products are soldprimarily throughout the U.S., Europe and Asia.
Water Technologies manufactures water treatment equipment for residential, commercial and industrial applicationsworldwide. Operations are based primarily in the U.S., Canada, China, Singapore, India and Mexico with business centerslocated in Belgium, France, Poland, Germany, the U.K., Italy, Switzerland and U.A.E.
Transportation Products serves the automotive, heavy-duty highway transportation and aerospace industries withprecision-molded plastic components; fastener thread solutions; metal tubing; auto aftermarket transmission and chassisproducts; platform and lowbed trailers; and truck and trailer components. Operations and business are conducted primarily inthe U.S., Mexico, Canada, Europe and Asia.
K-14
Retail Solutions provides retail environment design services; in-store digital merchandising, dispensing and displayfixtures; shopping, material handling and security carts. Operations and business are conducted in the U.S., U.K. and CzechRepublic.
Metal Services provides specialty metal pipe, tubing and related value-added services to customers across a broadrange of industries. Operations are based in the U.S., Canada and Mexico and business is conducted primarily in thosecountries.
Electrical produces electrical wire for use in residential and commercial buildings, and specialty wire and cable for usein energy, transit, aerospace, defense, communication and other industrial applications. Operations are based in the U.S.,Canada, India and England. Business is conducted globally and primarily in the U.S., Canada, India, the U.K., U.A.E. andChina.
Plumbing & Refrigeration supplies copper tubing and copper, brass, aluminum and stainless-steel fittings andcomponents for the plumbing, HVAC and refrigeration markets; custom coils ducting, air handling units and heatpipe for theHVAC market; HVAC systems and structures for military, nuclear and medical markets and aluminum and brass forgings formany commercial and industrial applications. Business and operations are conducted primarily in the U.S.
Industrial Products supplies construction fasteners; masonry and stone anchoring systems used in commercialconstruction; two component polymer products for anchoring, bonding and repair applications, gloves and other protectivewear; gear drives, gearboxes, fan drives and pump drives for various markets; wind machines for agricultural use; andwheels, axles and gears for rail, mining and other applications and equipment for the manufacture and assembly of lead acidbatteries. Operations are primarily based in the U.S., U.K., Canada and China and business is conducted in those countries.
Rail & Leasing manufactures, leases and maintains railcars; leases intermodal tank containers; manufactures mobilerailcar movers; provides in-plant rail switching and loading services; performs track construction and maintenance; andmanufactures steel tank heads and cylinders.
Union Tank Car Company (“UTLX”) is the largest component of Rail & Leasing and is a leading designer, builder andfull-service lessor of railroad tank cars and other specialized railcars. Together with its Canadian affiliate Procor, UTLXowns a fleet of approximately 122,000 railcars for lease to customers in chemical, petrochemical, energy andagricultural/food industries. UTLX manufactures tank cars in the U.S. and performs railcar maintenance services at more than100 locations across North America.
UTLX has a diversified customer base, both geographically and across industries. UTLX, while subject to cyclicalityand significant competition in most of its markets, competes by offering a broad range of high-quality products and servicestargeted at its niche markets. Railcars are typically leased for multiple-year terms and most of the leases are renewed uponexpiration. Due to selective ongoing capital investment, utilization rates (the number of railcars on lease as a percentage ofthe total fleet) of the railcar fleet are generally high.
Intermodal tank containers are leased through EXSIF Worldwide. EXSIF is a leading international lessor of intermodaltank containers with a fleet of approximately 75,000 units, primarily serving chemical producers and logistics operators.
Crane Services is a provider of mobile cranes and operators in North America and Australia with a combined fleet ofapproximately 1,100 cranes, primarily serving the energy, mining, petrochemical and infrastructure markets.
Medical (formed in 2019 through the acquisition of the Colson Medical Companies) develops, manufactures anddistributes a wide range of innovative medical devices in the extremities fixation, craniomaxillofacial surgery, neurosurgery,biologics, aesthetics and powered instruments markets. The group’s leading-edge medical technology and products are usedglobally to help improve patient care and outcomes. Operations are based in the U.S., Europe and China. Business isconducted primarily in North and South America, Europe, Asia and Australia.
Certain Marmon business, including the Rail and Medical groups, are subject to government regulation and oversight.Marmon has numerous known environmental matters which are subject to on-going monitoring and/or remediation efforts.Marmon follows all federal, state and local environmental regulations.
Other industrial products
CTB International Corp. (“CTB”), headquartered in Milford, Indiana, is a leading global designer, manufacturer andmarketer of a wide range of agricultural systems and solutions for preserving grain, producing poultry, pigs and eggs, and forprocessing poultry, fish, vegetables and other foods. CTB operates from facilities located around the globe and supportscustomers through a worldwide network of independent distributors and dealers.

K-15
CTB competes with a variety of manufacturers and suppliers, many of which offer only a limited number of theproducts offered by CTB and four of which offer products across several of CTB’s product lines. Competition is based on theprice, value, reputation, quality and design of the products offered and the customer service provided by distributors, dealersand manufacturers of the products. CTB’s leading brand names, distribution network, diversified product line, productsupport and high-quality products enable it to compete effectively. CTB manufactures its products primarily from galvanizedsteel, steel wire, stainless steel and polymer materials and supplies of these materials have been sufficient in recent years.
LiquidPower Specialty Products Inc. (“LSPI”), headquartered in Houston, Texas, is a global leader in the science ofdrag reduction application (“DRA”) technology by maximizing the flow potential of pipelines, increasing operationalflexibility and throughput capacity, and efficiencies for customers. LSPI develops innovative flow improver solutions withcustomers in over 20 countries on five continents, treating over 50 million barrels of hydrocarbon liquids per day. LSPI’sDRA offering is part of a comprehensive, full-service solution that encompasses industry-leading technology, qualitymanufacturing, technical support and consulting, a reliable supply chain, injection equipment and field service. LSPI issubject to foreign, federal, state and local laws to protect the environment and limit manufacturing waste and emissions.
The Scott Fetzer companies are a group of businesses that manufacture, distribute, service and finance a wide varietyof products for residential, industrial and institutional use.
Building Products
Clayton
Clayton Homes, Inc. (“Clayton”), headquartered near Knoxville, Tennessee, is a vertically integrated housing companyoffering traditional site-built homes and off-site built housing, including modular, manufactured, CrossMod™ and tinyhomes. In 2021, Clayton delivered approximately 50,000 off-site built and 11,000 site-built homes. Clayton also offers homefinancing and insurance products and competes on price, service, location and delivery capabilities.
All Clayton Built® off-site homes are designed, engineered and assembled in the United States. As of December 2021,off-site backlog was $1.4 billion, up 10% from the prior year. Clayton sells its homes through independent and company-owned home centers, realtors and subdivision channels. Clayton considers its ability to make financing available to retailpurchasers a factor affecting the market acceptance of its off-site built homes. Clayton’s financing programs utilizeproprietary loan underwriting guidelines to evaluate loan applicants, which include ability to repay calculations, includingdebt to income limits, and incorporate residual income and credit score requirements.
Since 2015, Clayton’s site-built division, Clayton Properties Group, has expanded through the acquisition of ninebuilders across 14 states with over 300 subdivisions, supplementing the portfolio of housing products offered to customers.Clayton’s site-builders currently own and control approximately 83,000 homesites, with a home order backlog ofapproximately $2.5 billion.
Historically, access to key inputs such as lumber, steel and resin products has been adequate. During 2021, theavailability and pricing of these and other inputs has been volatile. Input shortages coupled with labor and subcontractoravailability have increased the time to construct a home, constraining our ability to meet current demand.
Clayton’s home building business regularly makes capital and non-capital expenditures with respect to compliancewith federal, state and local environmental regulations, primarily related to erosion control, permitting and stormwaterprotection for site-built home subdivisions. The financing business originates and services loans which are federally regulatedby the Consumer Financial Protection Bureau, various state regulatory agencies and reviewed by the U.S. Department ofHousing and Urban Development, the Government National Mortgage Association and government-sponsored enterprises.
Shaw
Shaw Industries Group, Inc. (“Shaw”), headquartered in Dalton, Georgia, is a leading manufacturer and distributor ofcarpet and flooring products. Shaw designs and manufactures over 4,100 styles of tufted carpet, wood and resilient flooringfor residential and commercial use under about 30 brand and trade names and under certain private labels. Shaw alsoprovides project management and installation services. Shaw’s manufacturing operations are fully integrated from theprocessing of raw materials used to make fiber through the finishing of carpet. Shaw manufactures and distributes carpet tilethroughout Europe. Shaw also manufactures or distributes a variety of hardwood, wood plastic composite (WPC), stoneplastic composite (SPC) and vinyl and laminate floor products (“hard surfaces”). Shaw’s soft and hard surface products aresold in a broad range of patterns, colors and textures. Shaw operates Shaw Sports Turf and Southwest Greens International,LLC, which provide synthetic sports turf, golf greens and landscape turf products. In 2021, Shaw’s businesses includeWatershed Geosynthetics, LLC, which sells innovative and patented environmental solutions for utility, waste management,erosion control and mining industries.

K-16
Shaw products are sold wholesale to over 47,000 retailers, distributors and commercial users throughout the UnitedStates, Canada and Mexico and are also exported to various overseas markets. Shaw’s wholesale products are marketeddomestically by over 2,100 salaried and commissioned sales personnel directly to retailers and distributors and to largenational accounts. Shaw’s seven carpet, nine hard surface, one sample full-service distribution facility, three sample satellitelocations and 30 redistribution centers, along with centralized management information systems, enable it to provide promptand efficient delivery of its products to both its retail customers and wholesale distributors.
Substantially all carpet manufactured by Shaw is tufted carpet made from nylon, polypropylene and polyester. In thetufting process, yarn is inserted by multiple needles into a synthetic backing, forming loops, which may be cut or left uncut,depending on the desired texture or construction. During 2021, Shaw processed approximately 97% of its requirements forcarpet yarn in its own yarn processing facilities. The availability of raw materials is adequate, but costs are impacted bypetro-chemical and natural gas price changes. Raw material cost changes are periodically factored into selling prices tocustomers.
The soft floor covering industry is highly competitive with only a handful of key players domestically where themajority of Shaw’s business occurs. There are numerous manufacturers, domestically and internationally, that are engaged inhard surface floor covering production, distribution and sales. According to industry estimates, carpet accounts forapproximately 44% of the total United States consumption of all flooring types. The principal competitive measures withinthe floor covering industry are quality, style, price and service.
Johns Manville
Johns Manville Corporation (“JM”), headquartered in Denver, Colorado, is a leading manufacturer and marketer ofpremium-quality products for building insulation, mechanical and industrial insulation, commercial roofing and roofinsulation, as well as fibers and nonwovens for commercial, industrial and residential applications. JM serves markets thatinclude aerospace, automotive and transportation, air handling, appliance, HVAC, pipe and equipment, filtration,waterproofing, building, flooring, interiors and wind energy. Fiberglass is the basic material in a majority of JM’s products,although JM also manufactures a significant portion of its products with other materials to satisfy the broader needs of itscustomers. Raw materials are generally available in sufficient quantities from various sources for JM to maintain and expandits current production levels. JM regards its patents and licenses as valuable, however it does not consider any of itsbusinesses to be materially dependent on any single patent or license. JM operates over 40 manufacturing facilities in NorthAmerica and Europe and conducts research and development at its technical center in Littleton, Colorado and at otherfacilities in the U.S. and Europe.
Fiberglass is made from earthen raw materials and recycled glass, together with agents to bind many of its glass fibers.JM’s products also contain materials other than fiberglass, including various chemical and petrochemical-based materialsused in roofing and other specialized products. JM uses recycled material when available and suitable to satisfy the broaderneeds of its customers. The raw materials used in these various products are generally readily available in sufficient quantitiesfrom various sources to maintain and expand its current production levels.
JM identifies and strives to mitigate risk with respect to material applicable laws and regulations, includingenvironmental laws and regulations. JM’s operations are subject to a variety of federal, state and local environmental lawsand regulations, which regulate or impose liability for the discharge of materials into the air, land and water and govern theuse and disposal of hazardous substances and use of chemical substances. The most relevant of the federal laws are theFederal Clean Air Act, the Clean Water Act, the Toxic Substances Control Act, the Resource Conservation and Recovery Actand the Comprehensive Environmental Response, Compensation and Liability Act, which are administered by the EPA.Canadian and European regulatory authorities have also adopted their own environmental laws and regulations. JMcontinually monitors new and pending regulations and assesses their potential impact on the business. JM’s capital projectsregularly address environmental compliance and are generally incidental to other capital projects.
JM sells its products through a wide variety of channels including contractors, distributors, retailers, manufacturers andfabricators. JM operates in highly competitive markets, with competitors comprising primarily several large global andnational manufacturers and smaller regional manufacturers. JM holds leadership positions in the key markets that it serves.JM’s products compete primarily on value, differentiation and customization, and breadth of product line. Sales of JM’sproducts are moderately seasonal due to increases in construction activity that typically occur in the second and third quartersof the calendar year. JM sees a marketplace trend in customer purchasing decisions being influenced by the sustainable andenergy efficient attributes of its products, services and operations.
MiTek
MiTek Industries, Inc. (“MiTek”), based in Chesterfield, Missouri, operates in two separate markets: residential andcommercial. MiTek operates worldwide with sales in over 100 countries and with manufacturing facilities and/orsales/engineering offices located in 21 countries.

K-17
In the residential building market, MiTek is a leading supplier of engineered connector products, constructionhardware, engineering software and services and computer-driven manufacturing machinery to the truss component market ofthe building components industry. MiTek’s primary customers are component manufacturers who manufacture prefabricatedroof and floor trusses and wall panels for the residential building market. MiTek also sells construction hardware tocommercial distributors and do-it-yourself retail stores.
A significant raw material used by MiTek is hot dipped galvanized sheet steel. While supplies are presently adequate,variations in supply have historically occurred, producing significant variations in cost and availability.
Benjamin Moore
Benjamin Moore & Co. (“Benjamin Moore”), headquartered in Montvale, New Jersey, is one of North America’sleading manufacturers of premium quality residential, commercial and industrial maintenance coatings. Benjamin Moore iscommitted to innovation and sustainable manufacturing practices. The Benjamin Moore premium portfolio spans the brand’sflagship paint lines including Aura®, Regal® Select, Ultra Spec®, ben®, ADVANCE®, ARBORCOAT® and more. TheBenjamin Moore diversified brands include specialty and architectural paints from Coronado®, Insl-x® and Lenmar®.Benjamin Moore coatings are available from its more than 7,500 independently owned and operated paint, decorating andhardware retailers throughout the United States and Canada as well as 75 countries globally. In July 2019, Benjamin Mooreannounced the expansion of its relationship with Ace Hardware (“Ace”), through which Benjamin Moore has become thepreferred paint supplier for approximately 3,800 Ace stores, which are included in the count above. Through this agreement,these Ace stores are afforded the opportunity to carry a full line premium assortment of Benjamin Moore products or astreamlined offering of Regal® Select and ben®, or ben® only branded products. As part of the expansion, Benjamin Mooreassumed responsibility for manufacturing Clark+Kensington® and Royal®, as well as the balance of Ace’s private labelpaint brands.
In addition, Benjamin Moore operates an online “pick up in store” program, which allows consumers to place ordersvia an e-commerce site or, for national accounts and government agencies, via its customer information center. These ordersmay be picked up at the customer’s nearest retailer or delivered. For national accounts, drop-ship orders can be fulfilled byBenjamin Moore if a minimum gallon threshold is met.
Benjamin Moore competes with numerous manufacturers, distributors and paint, coatings and related productsretailers. Product quality, product innovation, breadth of product line, technical expertise, service and price determine thecompetitive advantage. Competitors include other paint and decorating stores, mass merchandisers, home centers,independent hardware stores, hardware chains and manufacturer-operated direct outlets, such as Sherwin-Williams Company,PPG Industries, Inc., The Valspar Corporation, The Home Depot, Inc. and Lowe’s Companies, Inc.
The most significant raw materials in Benjamin Moore products are titanium dioxide, monomers, polymers andpigments. Historically, these materials have been generally available, with pricing and availability subject to fluctuation. In2021, raw material supply constraints and increased customer demand for products prevailed and disrupted BenjaminMoore’s ability to build inventory. A major winter storm that impacted the Gulf Coast region of the United States in Februaryof 2021 caused substantial supply chain disruptions for Benjamin Moore, which contributed to significant inflation inmanufacturing costs.
Benjamin Moore undertakes to comply with applicable regulations relating to protection of the environment andworkers’ safety and products meet or exceed environmental standards. Benjamin Moore has certain known pastenvironmental matters, which are subject to on-going monitoring and/or remediation efforts.
Acme
Acme Brick Company (“Acme”), headquartered in Fort Worth, Texas, manufactures and distributes clay bricks (AcmeBrick®) and concrete block (Featherlite). In addition, Acme distributes numerous other building products of othermanufacturers, including floor and wall tile, wood flooring and other masonry products. Products are sold primarily in theSouth Central and Southeastern United States through company-operated sales offices. Acme distributes products primarilyto homebuilders and masonry and general contractors.
Over the past three years, Acme closed multiple manufacturing and sales facilities. Acme operates 12 clay brickmanufacturing sites located in four states, three concrete block facilities and a quarrying operation all located in Texas. Thedemand for Acme’s products is seasonal, with higher sales in the warmer weather months, and is subject to the level ofconstruction activity, which is cyclical. Acme also owns and leases properties and mineral rights that supply raw materialsused in many of its manufactured products. Acme’s raw materials supply is believed to be adequate.

K-18
The brick industry is subject to the EPA Maximum Achievable Control Technology Standards (“MACT”). As requiredunder the 1990 Clean Air Act, the EPA developed a list of source categories that require the development of NationalEmission Standards for Hazardous Air Pollutants, which are also referred to as MACT Standards (“Rule”). Key elements ofthe MACT Rule include emission limits established for certain hazardous air pollutants and acidic gases. Acme’s brick plantsare in compliance with the current Rule.
Consumer Products
Apparel
Fruit of the Loom Inc. (“FOL”), headquartered in Bowling Green, Kentucky, is primarily a manufacturer anddistributor of basic apparel, underwear, casualwear, athletic apparel and sports equipment. Products under the Fruit of theLoom® and JERZEES® labels are primarily sold in the mass merchandise, mid-tier chains and wholesale markets. In theVanity Fair Brands product line, Vassarette®, Curvation® and Radiant® by Vanity Fair are sold in the mass merchandisemarket, while Vanity Fair® and Lily of France® products are sold to mid-tier chains and department stores. FOL also marketsand sells apparel, sports equipment and balls to team dealers and athletic apparel, sports equipment and balls to sportinggoods retailers under the Russell Athletic® and Spalding® brands. Additionally, Spalding® markets and sells balls and sportsequipment in the mass merchandise market and dollar store channels. In 2021, a significant portion of FOL’s sales were toWalmart Inc.(“Walmart”).
FOL generally performs its own knitting, cloth finishing, cutting, sewing and packaging for apparel. For the NorthAmerican market, which is FOL’s predominant sales region, cloth manufacturing is primarily performed in Honduras. Labor-intensive cutting, sewing and packaging operations are in Central America, the Caribbean and Vietnam. For the Europeanmarket, products are either sourced from third-party contractors in Europe or Asia or sewn in Morocco from textilesinternally produced in Morocco. Bras, athletic equipment, sporting goods and other athletic apparel lines are generallysourced from third-party contractors located primarily in Asia.
U.S.-grown cotton fiber and U.S.-manufactured polyester fiber are the main raw materials used in manufacturingFOL’s products. Historically, fibers have been purchased from a limited number of third parties. In 2015, FOL entered intoan agreement with one key supplier to provide the majority of its yarn spinning/raw material conversion services. As a result,yarn production was primarily with one supplier. Supply chain issues related to the COVID pandemic including laborshortage at suppliers, yarn shortages, and price inflation in raw materials and freight resulted in FOL utilizing alternativesources of raw materials and yarn in 2021. Further, FOL has contracted with an additional supplier for a significant portion ofFOL’s yarn spinning/raw material conversion services that is scheduled to begin in July 2022. If relationships with supplierscannot be maintained or delays occur in obtaining alternative sources of supply, production and operating results can beadversely affected. FOL’s markets are highly competitive, consisting of many domestic and foreign manufacturers anddistributors. Competition is generally based upon product features, quality, customer service and price.
Garan Incorporated (“Garan”), headquartered in New York, New York designs, manufactures, imports and sellsapparel primarily for children, including boys, girls, toddlers and infants. Products are sold under its own trademarksGaranimals® and 365 Kids from Garanimals®, as well as customer private label brands. Garan conducts its business throughoperating subsidiaries located in the United States, Central America and Asia. Garan’s products are sold through itsdistribution centers in the United States. Fechheimer Brothers Company (“Fechheimers”) manufactures and distributesuniforms, principally for the public service and safety markets, including police, fire, postal and military markets.Fechheimers is based in Cincinnati, Ohio.
The BH Shoe Holdings Group, headquartered in Greenwich, Connecticut, manufactures and distributes work, ruggedoutdoor and casual shoes and western-style footwear under a number of brand names, including Justin, Tony Lama®,Chippewa®, BØRN®, B•Ø•C®, Carolina®, EuroSofft, Söfft, Double-H Boots®, Nursemates® and Comfortiva®. Brooks Sports,Inc., headquartered in Seattle, Washington, markets and sells performance running footwear and apparel to specialty andnational retailers and directly to consumers under the Brooks® brand. A significant volume of the shoes sold by Berkshire’sshoe businesses are manufactured or purchased from sources located outside the United States. Products are sold worldwidethrough a variety of channels including department stores, footwear chains, specialty stores, catalogs and the Internet, as wellas through company-owned retail stores.
K-19
Other consumer products
Forest River, Inc. (“Forest River”) is a manufacturer of recreational vehicles (“RV”), utility cargo trailers, buses andpontoon boats, headquartered in Elkhart, Indiana with products sold in the United States and Canada through an independentdealer network. Forest River has numerous manufacturing facilities located in six states and is a leading manufacturer of RVswith numerous brand names, including Forest River, Coachmen RV and Prime Time. Utility cargo trailers are sold under avariety of brand names. Buses are sold under several brand names, including Starcraft Bus. Pontoon boats are sold under theBerkshire, South Bay and Trifecta brand names. The RV industry is very competitive. Competition is based primarily onprice, design, quality and service. The industry has consolidated over the past several years and is currently concentrated in afew companies, the largest of which had a market share of approximately 41% based on industry data as of December 2021.Forest River held a market share of approximately 36% at that time.
Forest River is subject to regulations of the National Traffic and Motor Vehicle Safety Act, the safety standards forrecreational vehicles established by the U.S. Department of Transportation and similar laws and regulations issued by theCanadian government. Forest River is a member of the Recreational Vehicle Industry Association, a voluntary association ofrecreational vehicle manufacturers which promotes safety standards for recreational vehicles. Forest River believes itsproducts comply in all material respects to the standards that govern its products.
The Duracell Company (“Duracell”), headquartered in Chicago, Illinois, is a leading manufacturer of high-performancealkaline batteries. Duracell manufactures batteries in the U.S., Europe and China and provides a network of worldwide salesand distribution centers. Costco and Walmart are significant customers, representing approximately 30% of Duracell’s annualrevenue. There are several competitors in the battery manufacturing market with Duracell holding an approximately 29%market share of the global alkaline battery market. Management believes there are currently sufficient sources of rawmaterials available, which are primarily steel, zinc, manganese and nickel-based chemistries.
Albecca Inc. (“Albecca”), headquartered in Suwanee, Georgia, operates in the U.S., Canada and 12 other countries,with products primarily under the Larson-Juhl® name. Albecca designs, manufactures and distributes a complete line of highquality, branded custom framing products, including wood and metal moulding, matboard, foamboard, glass and framingsupplies. Complementary to its framing products, Albecca offers art printing and fulfillment services.
Richline Group, Inc., headquartered in New York, New York, operates five strategic business units: Richline Jewelry,Richline Digital, LeachGarner, Rio Grande and Inverness. Each business unit is a manufacturer and/or distributor of preciousmetal, non-precious metal, diamond and gem products to specific target markets including large jewelry chains, departmentstores, shopping networks, mass merchandisers, e-commerce retailers and artisans plus worldwide manufacturers andwholesalers and the medical, electronics and aerospace industries.
Service and Retailing Businesses
Service Businesses
Berkshire’s service businesses provide grocery and foodservice distribution, professional aviation training programs,shared aircraft ownership programs and distribution of electronic components. Other service businesses include franchisingand servicing of quick service restaurants, media businesses (television and information distribution), as well as logisticsbusinesses. Berkshire’s service businesses employed approximately 48,500 people at the end of 2021. Informationconcerning these activities follows.
McLane
McLane Company, Inc. (“McLane”) provides wholesale distribution services in all 50 states to customers that includeconvenience stores, discount retailers, wholesale clubs, drug stores, military bases, quick service restaurants and casualdining restaurants. McLane provides wholesale distribution services to Walmart, which accounted for approximately 16.5%of McLane’s revenues in 2021. McLane’s other significant customers include 7-Eleven (approximately 13.9% of revenues)and Yum! Brands, (approximately 11.5% of revenues). McLane’s business model is based on a high volume of sales, rapidinventory turnover and stringent expense controls. Operations are currently divided into three business units: grocerydistribution, foodservice distribution and beverage distribution.
McLane’s grocery distribution unit, based in Temple, Texas, maintains a dominant market share within theconvenience store industry and serves most of the national convenience store chains and major oil company retail outlets.Grocery operations provide products to approximately 48,600 retail locations nationwide, including Walmart. McLane’sgrocery distribution unit operates 25 distribution facilities in 20 states.
McLane’s foodservice distribution unit, based in Carrollton, Texas, focuses on serving the quick service and casualdining restaurant industry with high quality, timely-delivered products. Operations are conducted through 47 facilities in 22states. The foodservice distribution unit services approximately 34,000 restaurants nationwide.
K-20
Through its subsidiaries, McLane also operates wholesale distributors of distilled spirits, wine and beer. The beverageunit operates as Empire Distributors and operations are conducted through 14 distribution centers in Georgia, North Carolina,Tennessee and Colorado. Empire Distributors services approximately 26,500 retail locations in the southeastern United Statesand Colorado.
FlightSafety
FlightSafety International Inc. (“FlightSafety”) is an industry leading provider of professional aviation training servicesand flight simulation products. FlightSafety and FlightSafety Textron Aviation Training, a joint venture with Textron whichbegan operations in 2019, provide high technology training to pilots, aircraft maintenance technicians, flight attendants anddispatchers who operate and support a wide variety of business, commercial and military aircraft. The training is providedusing a large fleet of advanced full flight simulators at learning centers and training locations in the United States, Australia,Brazil, Canada, France, Japan, Norway, South Africa and the United Kingdom. Compliance with applicable environmentalregulations is an inherent requirement to operate the facilities. The vast majority of the instructors, training programs andflight simulators are qualified by the United States Federal Aviation Administration (“FAA”) and other aviation regulatoryagencies around the world.
FlightSafety is also a leader in the design and manufacture of full flight simulators, visual systems, displays and otheradvanced technology training devices. This equipment is used to support FlightSafety training programs and is offered forsale to airlines and government and military organizations around the world. Manufacturing facilities are located inOklahoma, Missouri and Texas. FlightSafety strives to maintain and manufacture simulators and develop courseware usingstate-of-the-art technology and invests in research and development as it builds new equipment and training programs.
NetJets
NetJets Inc. (“NetJets”) is the world’s leading provider of shared ownership programs for general aviation aircraft.NetJets’ global headquarters is located in Columbus, Ohio, with most of its logistical and flight operations based at JohnGlenn Columbus International Airport. NetJets’ European operations are based in Lisbon, Portugal. The shared ownershipconcept is designed to meet the travel needs of customers who require the scale, flexibility and access of a large fleet thatwhole aircraft ownership cannot deliver. In addition, shared ownership programs are available for corporate flightdepartments seeking to outsource their general aviation needs or add capacity for peak periods and for others that previouslychartered aircraft.
With a focus on safety and service, NetJets’ programs are designed to offer customers guaranteed availability ofaircraft, predictable operating costs and increased liquidity. NetJets’ shared aircraft ownership programs permit customers toacquire a specific percentage of a certain aircraft type and allows customers to utilize the aircraft for a specified number offlight hours annually. In addition, NetJets offers prepaid flight cards and other aviation solutions and services for aircraftmanagement, customized aircraft sales and acquisition, ground support and flight operation services under a number ofprograms including NetJets Shares™, NetJets Leases™ and the NetJets Card Program™.
NetJets is subject to the rules and regulations of the FAA, the Portuguese Civil Aviation Authority and the EuropeanUnion Aviation Safety Agency. Regulations address aircraft registration, maintenance requirements, pilot qualifications andairport operations, including flight planning and scheduling as well as security issues and other matters. NetJets maintains acomprehensive training and development program in compliance with regulatory requirements for pilots, flight attendants,maintenance mechanics, and other flight operations specialists.
TTI
TTI, Inc. (“TTI”), headquartered in Fort Worth, Texas, is a global specialty distributor of passive, interconnect,electromechanical, discrete, and semiconductor components used by customers in the manufacturing and assembling ofelectronic products. TTI’s customer base includes original equipment manufacturers, electronic manufacturing services,original design manufacturers and military and commercial customers, as well as design and system engineers. TTI’sdistribution agreements with the industry’s leading suppliers allow it to uniquely leverage its product cost and to expand itsbusiness by providing new lines and products to its customers. TTI operates sales offices and distribution centers from morethan 100 locations throughout North America, South America, Europe, Asia and Israel.
TTI services a variety of industries including telecommunications, medical devices, computers and office equipment,military/aerospace, automotive and industrial electronics. TTI’s core customers include businesses in the design throughproduction stages in the electronic component supply chain, which supports its high-volume business, and its Mousersubsidiary, which supports a broader base of customers with lower volume purchases through internet-based marketing.

K-21
Other services
XTRA Corporation (“XTRA”), headquartered in St. Louis, Missouri, is a leading transportation equipment lessoroperating under the XTRA Lease® brand name. XTRA manages a diverse fleet of approximately 87,000 units located at 47facilities throughout the United States. The fleet includes over-the-road and storage trailers, chassis, temperature-controlledvans and flatbed trailers. XTRA is one of the largest lessors (in terms of units available) of over-the-road trailers in NorthAmerica. Transportation equipment customers lease equipment to cover cyclical, seasonal and geographic needs and as asubstitute for purchasing equipment. Therefore, as a provider of marginal capacity to its customers, XTRA’s utilization ratesand operating results tend to be cyclical. In addition, transportation providers often use leasing to maximize their assetutilization and reduce capital expenditures. By maintaining a large fleet, XTRA is able to provide customers with a broadselection of equipment and quick response times.
International Dairy Queen Inc. develops and services a worldwide system of over 7,000 franchised restaurantsoperating primarily under the names DQ Grill and Chill®, Dairy Queen® and Orange Julius® that offer various dairy desserts,beverages, prepared foods and blended fruit drinks. Business Wire Inc. (“Business Wire”) transmits full-text news releases,regulatory filings, photos and other multimedia content to journalists, financial professionals, investor services, regulatoryauthorities and the general public. Releases are distributed globally via Business Wire’s patented NX network. CORTBusiness Services Corporation (“CORT”) is a leading national provider of rental furniture and related services in the “rent-to-rent” segment of the furniture rental industry. CORT’s primary revenue streams include furniture rental to individuals,businesses, government agencies, the trade show and events industry and retail sales of new and used furniture. WPLG, Inc.is an ABC affiliate broadcast station in Miami, Florida and Charter Brokerage Holdings Corp. is a leading non-asset basedthird party logistics provider to the petroleum and chemical industries. Until March 2020, other services included thenewspaper publishing businesses conducted through The Buffalo News and BH Media Group, Inc. These operations weresold in 2020.
Retailing Businesses
Berkshire’s retailing businesses include automotive, home furnishings and several other operations that sell variousconsumer products. Berkshire’s retailing businesses employed approximately 26,000 people at the end of 2021. Informationregarding each of these operations follows.
Berkshire Hathaway Automotive
Berkshire Hathaway Automotive, Inc. (“BHA”) and its affiliates is one of the largest automotive retailers in the UnitedStates, currently operating 105 new vehicle franchises through 82 dealerships located primarily in major metropolitanmarkets in the United States. The dealerships sell new and used vehicles, vehicle maintenance and repair services, extendedservice contracts, vehicle protection products and other aftermarket products. BHA also arranges financing for its customersthrough third-party lenders. BHA operates 28 collision centers directly connected to the dealerships’ operations and owns andoperates two auto auctions and a fluid maintenance products distribution company.
Dealership operations are highly concentrated in the Arizona and Texas markets, with approximately 75% ofdealership-related revenues derived from sales in these markets. BHA currently maintains franchise agreements with 27different vehicle manufacturers, although it derives a significant portion of its revenue from the Toyota/Lexus, GeneralMotors, Ford/Lincoln, Nissan/Infiniti and Honda/Acura brands. Approximately 90% of BHA’s annual revenues are fromdealerships representing these manufacturers.
The retail automotive industry is highly competitive. BHA faces competition from other large public and privatedealership groups, as well as individual franchised dealerships and competition via the Internet. Given the pricingtransparency available via the Internet, and the fact that franchised dealers acquire vehicles from the manufacturers on thesame terms irrespective of volume, the location and quality of the dealership facility, customer service and transaction speedare key differentiators in attracting customers.
BHA’s overall relationships with the automobile manufacturers are governed by framework agreements. Theframework agreements contain provisions relating to the management, operation, acquisition and ownership structure ofBHA’s dealerships. Failure to meet the terms of these agreements could adversely impact BHA’s ability to acquire additionaldealerships representing those manufacturers. Additionally, these agreements contain limitations on the number ofdealerships from a specific manufacturer that may be owned by BHA.

K-22
Individual dealerships operate under franchise agreements with the manufacturer, which grants the dealership entity anon-exclusive right to sell the manufacturer’s brand of vehicles and offer related parts and service within a specified marketarea, as well as the right to use the manufacturer’s trademarks. The agreements contain various requirements and restrictionsrelated to the management and operation of the franchised dealership and provide for termination of the agreement by themanufacturer or non-renewal for a variety of causes. States generally have automotive dealership franchise laws that providesubstantial protection to the franchisee, and it is difficult for a manufacturer to terminate or not renew a franchise agreementoutside of bankruptcy or with “good cause” under the applicable state franchise law.
BHA also develops, underwrites and administers various vehicle protection plans as well as life and accident andhealth insurance plans sold to consumers through BHA’s dealerships and third-party dealerships. BHA also developsproprietary training programs and materials and provides ongoing monitoring and training of the dealership’s finance andinsurance personnel.
Home furnishings retailing
The home furnishings businesses consist of Nebraska Furniture Mart Inc. (“NFM”), R.C. Willey Home Furnishings(“R.C. Willey”), Star Furniture Company (“Star”) and Jordan’s Furniture, Inc. (“Jordan’s”). These businesses offer a wideselection of furniture, bedding and accessories. In addition, NFM and R.C. Willey sell a full line of major householdappliances, electronics, computers and other home furnishings and offer customer financing to complement their retailoperations. An important feature of each of these businesses is their ability to control costs and to produce high businessvolume by offering significant value to their customers.
NFM operates its business from four retail complexes with almost 4.5 million square feet of retail, warehouse andadministrative facilities located in Omaha, Nebraska, Clive, Iowa, Kansas City, Kansas and The Colony, Texas. NFM alsoowns Homemakers Furniture located in Urbandale, Iowa, which has approximately 600,000 square feet of retail, warehouseand administrative space. NFM is the largest furniture retailer in each of these markets. R.C. Willey, based in Salt Lake City,Utah, currently operates eleven full-line retail home furnishings stores and three distribution centers. These facilities includeapproximately 1.5 million square feet of retail space with five stores located in Utah, one store in Meridian, Idaho, threestores in Nevada (Las Vegas and Reno) and two stores in the Sacramento, California area.
Jordan’s operates a retail furniture business from seven locations with approximately 890,000 square feet of retailspace in stores located in Massachusetts, New Hampshire, Rhode Island, Maine and Connecticut. The retail stores aresupported by an 800,000 square foot distribution center in Taunton, Massachusetts. Jordan’s is the largest furniture retailer,as measured by sales, in Massachusetts, Maine and New Hampshire. Jordan’s is well known in its markets for its unique storearrangements and advertising campaigns. Star has operated home furnishings retail stores in Texas for many years. Star’sretail facilities currently include about 700,000 square feet of retail space in 10 locations in Texas, including seven inHouston.
Other retailing
Borsheim Jewelry Company, Inc. (“Borsheims”) operates from a single store in Omaha, Nebraska. Borsheims is ahigh-volume retailer of fine jewelry, watches, crystal, china, stemware, flatware, gifts and collectibles. Helzberg’s DiamondShops, LLC. (“Helzberg”) is based in North Kansas City, Missouri, and operates a chain of 173 retail jewelry stores in 34states, which includes approximately 400,000 square feet of retail space. Helzberg’s stores are located in malls, lifestylecenters, power strip centers and outlet malls, and all stores operate under the name Helzberg Diamonds® or HelzbergDiamonds Outlet®. The Ben Bridge Corporation (“Ben Bridge Jeweler”), based in Seattle, Washington, operates 74 retailjewelry stores under three different brand names, located primarily in major shopping malls in nine western states and inBritish Columbia, Canada. Thirty-five of its retail locations are upscale jewelry stores selling loose diamonds, finishedjewelry and high-end timepieces. Thirty-eight of its retail locations are concept stores operating under a franchise agreementthat sell only Pandora jewelry. One store is a Breitling concept store, selling only Breitling timepieces.
See’s Candy Shops, Incorporated (“See’s”) produces boxed chocolates and other confectionery products with anemphasis on quality and distinctiveness in two large kitchens in Los Angeles and South San Francisco and a facility inBurlingame, California. See’s operates approximately 250 retail and volume saving stores located mainly in California andother Western states, as well as over 125 seasonal locations. See’s revenues are highly seasonal with approximately half of itsannual revenues earned in the fourth quarter.
The Pampered Chef, Ltd. (“Pampered Chef”) is a premier direct seller of distinctive high-quality kitchenware productswith sales and operations in the United States, Canada, Germany, Austria and France and operations in China. PamperedChef’s product portfolio consists of approximately 420 Pampered Chef® branded kitchenware items in categories rangingfrom stoneware and cutlery to grilling and entertaining. Pampered Chef’s products are available through its sales force ofindependent cooking consultants and online.

K-23
Oriental Trading Company (“OTC”) is a leading multi-channel retailer and online destination for fun-value-pricedparty supplies, seasonal products, arts and crafts, toys and novelties, school supplies, educational games and patientgiveaways. OTC, headquartered in Omaha, Nebraska, serves a broad base of nearly four million customers annually,including consumers, schools, churches, non-profit organizations, medical and dental offices, online marketplaces and otherbusinesses. OTC offers a unique assortment of over 80,000 fun products emphasizing proprietary designs. OTC operates bothdirect-to-consumer and business-to-business brands including Oriental Trading®, Fun Express®, MindWare®, SmileMakers®,Morris Costumes® and HalloweenExpress.com® and utilizes digital and print marketing along with dedicated sales teams todrive traffic and industry-leading customer satisfaction.
Detlev Louis Motorrad (“Louis”), headquartered in Hamburg, Germany, is a leading retailer of motorcycle apparel andequipment in Europe. Louis carries over 32,000 different products from more than 600 manufacturers, primarily covering theclothing, technical equipment and leisure markets. Louis has over 80 stores in Germany, Austria, Switzerland and theNetherlands and also sells via the Internet throughout most of Europe.
Additional information with respect to Berkshire’s businesses
Revenue, earnings before taxes and identifiable assets attributable to Berkshire’s reportable business segments areincluded in Note 25 to Berkshire’s Consolidated Financial Statements contained in Item 8, Financial Statements andSupplementary Data. Additional information regarding Berkshire’s investments in fixed maturity and equity securities isincluded in Notes 3 and 4, respectively, to Berkshire’s Consolidated Financial Statements.
Berkshire owns 26.6% of the outstanding common stock of The Kraft Heinz Company (“Kraft Heinz”). Kraft Heinz isone of the largest food and beverage companies in the world, with sales in numerous countries within developed andemerging markets and territories. Kraft Heinz manufactures and markets food and beverage products, including condimentsand sauces, cheese and dairy meals, meats, refreshment beverages, coffee and other grocery products, throughout the world,under a diverse mix of iconic and emerging brands. Berkshire subsidiaries also own a 50% joint venture interest in BerkadiaCommercial Mortgage LLC, a 38.6% interest in Pilot Travel Centers LLC, a 50% joint venture interest in ElectricTransmission Texas, LLC and a 50% noncontrolling interest in Iroquois Gas Transmission System L.P. Informationconcerning these investments is included in Note 5 to Berkshire’s Consolidated Financial Statements.
Berkshire maintains a website (http://www.berkshirehathaway.com) where its annual reports, certain corporategovernance documents, press releases, interim shareholder reports and links to its subsidiaries’ websites can be found.Berkshire’s periodic reports filed with the SEC, which include Form 10-K, Form 10-Q, Form 8-K and amendments thereto,may be accessed by the public free of charge from the SEC and through Berkshire. Electronic copies of these reports can beaccessed at the SEC’s website (http://www.sec.gov) and indirectly through Berkshire’s website(http://www.berkshirehathaway.com). Copies of these reports may also be obtained, free of charge, upon written request to:Berkshire Hathaway Inc., 3555 Farnam Street, Omaha, NE 68131, Attn: Corporate Secretary.
K-24
Item 1A. Risk Factors
Berkshire and its subsidiaries (referred to herein as “we,” “us,” “our” or similar expressions) are subject to certain risksand uncertainties in its business operations which are described below. The risks and uncertainties described below are notthe only risks we face. Additional risks and uncertainties that are presently unknown or are currently deemed immaterial mayalso impair our business operations.
General Business Risks
Terrorist acts could hurt our operating businesses.
A cyber, biological, nuclear or chemical attack could produce significant losses to our worldwide operations. Ourbusiness operations could be adversely affected from such acts through the loss of human resources or destruction ofproduction facilities and information systems. We share the risk with all businesses.
Cyber security risks
We rely on technology in virtually all aspects of our business. Like those of many large businesses, certain of ourinformation systems have been subject to computer viruses, malicious codes, unauthorized access, phishing efforts, denial-of-service attacks and other cyber-attacks and we expect to be subject to similar attacks in the future as such attacks becomemore sophisticated and frequent. A significant disruption or failure of our technology systems could result in serviceinterruptions, safety failures, security events, regulatory compliance failures, an inability to protect information and assetsagainst unauthorized users and other operational difficulties. Attacks perpetrated against our systems could result in loss ofassets and critical information and expose us to remediation costs and reputational damage.
Although we have taken steps intended to mitigate these risks, including business continuity planning, disasterrecovery planning and business impact analysis, a significant disruption or cyber intrusion at one or more of our significantoperations could adversely affect our results of operations, financial condition and liquidity. Additionally, if we are unable toacquire, develop, implement, adopt or protect rights around new technology, we may suffer a competitive disadvantage,which could also have an adverse effect on our results of operations, financial condition and/or liquidity.
Cyber-attacks could further adversely affect our ability to operate facilities, information technology and businesssystems or compromise confidential customer and employee information. Political, economic, social or financial marketinstability or damage to or interference with our operating assets, customers or suppliers from cyber-attacks may result inbusiness interruptions, lost revenues, higher commodity prices, disruption in fuel supplies, lower energy consumption,unstable markets, increased security, repair or other costs, or may materially adversely affect us in ways that cannot bepredicted at this time. Any of these risks could materially affect our consolidated financial results. Furthermore, instability inthe financial markets resulting from terrorism, sustained or significant cyber-attacks or war could also have a materialadverse effect on our ability to raise capital. We share these risks with all businesses.
We are dependent on a few key people for our major investment and capital allocation decisions.
Major investment decisions and all major capital allocation decisions are made by Warren E. Buffett, Chairman of theBoard of Directors and Chief Executive Officer, age 91, in consultation with Charles T. Munger, Vice Chairman of the Boardof Directors, age 98. In 2018, Berkshire’s Board of Directors appointed Mr. Gregory Abel as Vice Chairman of Berkshire’snon-insurance operations and Mr. Ajit Jain as Vice Chairman of Berkshire’s insurance operations. Mr. Abel and Mr. Jaineach report directly to Mr. Buffett. Mr. Buffett continues to be responsible for major capital allocation and investmentdecisions.
If for any reason the services of our key personnel, particularly Mr. Buffett, were to become unavailable, there could bea material adverse effect on our operations. Should a replacement for Mr. Buffett be needed currently, Berkshire’s Board ofDirectors has agreed that Mr. Abel should replace Mr. Buffett. The Board continually monitors this risk and could alter itscurrent view regarding a replacement for Mr. Buffett in the future. We believe that the Board’s succession plan, together withthe outstanding managers running our numerous and highly diversified operating units helps to mitigate this risk.

K-25
We need qualified personnel to manage and operate our various businesses.
In our decentralized business model, we need qualified and competent management to direct day-to-day businessactivities of our operating subsidiaries and to manage changes in future business operations due to changing business orregulatory environments. Our operating subsidiaries also need qualified and competent personnel in executing their businessplans and serving their customers, suppliers and other stakeholders. Our inability to recruit and retain qualified andcompetent managers and personnel could negatively affect the operating results, financial condition and liquidity of oursubsidiaries and Berkshire as a whole.
Investments are unusually concentrated in equity securities and fair values are subject to loss in value.
We concentrate a high percentage of the equity security investments of our insurance subsidiaries in a relatively smallnumber of equity securities. A significant decline in the fair values of our larger investments in equity securities may producea material decline in our consolidated shareholders’ equity and our consolidated earnings.
Since a large percentage of our equity securities are held by our insurance subsidiaries, significant decreases in the fairvalues of these investments will produce significant declines in the statutory surplus of our insurance business. Our largestatutory surplus is a competitive advantage, and a long-term material decline could have an adverse effect on our claims-paying ability ratings and our ability to write new insurance business thus potentially reducing our future underwritingprofits.
Competition and technology may erode our business franchises and result in lower earnings.
Each of our operating businesses face intense competition within markets in which they operate. While we manage ourbusinesses with the objective of achieving long-term sustainable growth by developing and strengthening competitiveadvantages, many factors, including technological changes, may erode or prevent the strengthening of competitiveadvantages. Accordingly, our future operating results will depend to some degree on our operating units successfullyprotecting and enhancing their competitive advantages. If our operating businesses are unsuccessful in these efforts, ourperiodic operating results in the future may decline.
Unfavorable general economic conditions may significantly reduce our operating earnings and impair our ability toaccess capital markets at a reasonable cost.
Our operating businesses are subject to normal economic cycles affecting the general economy or the specificindustries in which they operate. Significant deteriorations of economic conditions over a prolonged period could produce amaterial adverse effect on one or more of our significant operations. In addition, our utilities and energy businesses and ourrailroad business regularly utilize debt as a component of their capital structures and depend on having access to borrowedfunds through the capital markets at reasonable rates. To the extent that access to the capital markets is restricted or the costof funding increases, these operations could be adversely affected.
Epidemics, pandemics or other outbreaks, including COVID-19, could hurt our operating businesses.
The outbreak of COVID-19 has adversely affected, and in the future it or other epidemics, pandemics or outbreaks mayadversely affect, our operations, including our equity securities portfolio. This is or may be due to closures or restrictionsrequested or mandated by governmental authorities, disruption to supply chains and workforce, reduction of demand for ourproducts and services, credit losses when customers and other counterparties fail to satisfy their obligations to us, andvolatility in global equity securities markets, among other factors. We share most of these risks with all businesses.
Regulatory changes may adversely impact our future operating results.
Over time, in response to financial markets crises, global economic recessions, and social and environmental issues,regulatory initiatives were adopted in the United States and elsewhere. Such initiatives addressed for example, the regulationof banks and other major financial institutions, products and environmental and global-warming matters. These initiativesimpact all of our businesses, albeit in varying ways. Increased regulatory compliance costs could have a significant negativeimpact on our operating businesses, as well as on the businesses in which we have a significant, but not controlling economicinterests. We cannot predict whether such initiatives will have a material adverse impact on our consolidated financialposition, results of operations and/or cash flows.
Data privacy regulations have recently been enacted in various jurisdictions in the U.S. and throughout the world.These regulations address numerous aspects related to the security of personal information that is stored in our informationsystems, networks and facilities. Failure to comply with these regulations could result in reputational damage and significantpenalties.

K-26
Risks unique to our regulated businesses
Our tolerance for risk in our insurance businesses may result in significant underwriting losses.
When properly paid for the risk assumed, we have been and will continue to be willing to assume more risk from asingle event than any other insurer has knowingly assumed. Accordingly, we could incur a significant loss from a singlecatastrophe event resulting from a natural disaster or man-made catastrophes such as terrorism or cyber-attacks. We employvarious disciplined underwriting practices intended to mitigate potential losses and attempt to take into account all possiblecorrelations and avoid writing groups of policies from which pre-tax losses from a single catastrophe event might aggregateabove $10 billion. However, despite our efforts, it is possible that losses could manifest in ways that we do not anticipate andthat our risk mitigation strategies are not designed to address. Additionally, various provisions of our policies, such aslimitations or exclusions from coverage, negotiated to limit our risks, may not be enforceable in the manner we intend. Ourtolerance for significant insurance losses may result in lower reported earnings in a future period.
The degree of estimation error inherent in the process of estimating property and casualty insurance loss reservesmay result in significant underwriting losses.
The principal cost associated with the property and casualty insurance business is claims. In writing property andcasualty insurance policies, we receive premiums today and promise to pay covered losses in the future. However, it will takedecades before all claims that have occurred as of any given balance sheet date will be reported and settled. Although webelieve that liabilities for unpaid losses are adequate, we will not know whether these liabilities or the premiums charged forthe coverages provided were sufficient until well after the balance sheet date. Estimating insurance claim costs is inherentlyimprecise. Our estimated unpaid losses arising under contracts covering property and casualty insurance risks are large ($125billion at December 31, 2021), and a small percentage increase to those liabilities can result in materially lower reportedearnings.
Climate change may impact our businesses.
Climate change could cause increases in hurricanes, floods, wildfires, and other risks that could produce lossesaffecting our businesses. Also, failure to comply with new or existing regulations or reinterpretations of existing regulationsrelating to climate change could have a significant adverse effect on our financial results.
Changes in regulations and regulatory actions can adversely affect our operating results and our ability to allocatecapital.
Our insurance businesses are subject to regulation in the jurisdictions in which we operate. Such regulations may relateto among other things, the types of business that can be written, the rates that can be charged for coverage, the level of capitalthat must be maintained, and restrictions on the types and size of investments that can be made. Regulations may also restrictthe timing and amount of dividend payments to Berkshire by these businesses. U.S. state insurance regulators andinternational insurance regulators are also actively developing various regulatory mechanisms to address the regulation oflarge internationally active insurance groups, including regulations concerning group capital, liquidity, governance and riskmanagement. Accordingly, changes in regulations related to these or other matters or regulatory actions imposing restrictionson our insurance businesses may adversely impact our results of operations and restrict our ability to allocate capital.
Our railroad business conducted through BNSF is also subject to a significant number of laws and regulations withrespect to rates and practices, taxes, railroad operations and a variety of health, safety, labor, environmental and othermatters. Failure to comply with applicable laws and regulations could have a material adverse effect on BNSF’s business.Governments may change the legislative and/or regulatory framework within which BNSF operates, without providing anyrecourse for any adverse effects that the change may have on the business. Complying with legislative and regulatory changesmay pose significant operating and implementation risks and require significant capital expenditures.
BNSF derives significant amounts of revenue from the transportation of energy-related commodities, particularly coal.To the extent that changes in government policies limit or restrict the usage of coal as a source of fuel in generatingelectricity or alternate fuels, such as natural gas, or displace coal on a competitive basis, revenues and earnings could beadversely affected. As a common carrier, BNSF is also required to transport toxic inhalation hazard chemicals and otherhazardous materials. A release of hazardous materials could expose BNSF to significant claims, losses, penalties andenvironmental remediation obligations. Changes in the regulation of the rail industry could negatively impact BNSF’s abilityto determine prices for rail services and to make capital improvements to its rail network, resulting in an adverse effect on ourresults of operations, financial condition and/or liquidity.
K-27
Our utilities and energy businesses operated under BHE are highly regulated by numerous federal, state, local andforeign governmental authorities in the jurisdictions in which they operate. These laws and regulations are complex, dynamicand subject to new interpretations or change. Regulations affect almost every aspect of our utilities and energy businesses.Regulations broadly apply and may limit management’s ability to independently make and implement decisions regardingnumerous matters including: acquiring businesses; constructing, acquiring, disposing or retiring of operating assets; operatingand maintaining generating facilities and transmission and distribution system assets; complying with pipeline safety andintegrity and environmental requirements; setting rates charged to customers; establishing capital structures and issuing debt;managing and reporting transactions between our domestic utilities and our other subsidiaries and affiliates; and payingdividends or similar distributions. Failure to comply with or reinterpretations of existing regulations and new legislation orregulations, such as those relating to air and water quality, renewable portfolio standards, emissions performance standards,climate change, coal combustion byproduct disposal, hazardous and solid waste disposal, protected species and otherenvironmental matters, or changes in the nature of the regulatory process may have a significant adverse impact on ourfinancial results.
Our railroad business requires significant ongoing capital investment to improve and maintain its railroad network sothat transportation services can be safely and reliably provided to customers on a timely basis. Our utilities and energybusinesses also require significant amounts of capital to construct, operate and maintain generation, transmission anddistribution systems to meet their customers’ needs and reliability criteria. Additionally, system assets may need to beoperational for long periods of time in order to justify the financial investment. The operational or financial failure of capitalprojects may not be recoverable through rates that are charged to customers. Further, a significant portion of costs of capitalimprovements may be funded through debt issued by BNSF and BHE and their subsidiaries. Disruptions in debt capitalmarkets that restrict access to funding when needed could adversely affect the results of operations, liquidity and/or capitalresources of these businesses.
Item 1B. Unresolved Staff Comments
None.
Item 2. Description of Properties
The properties used by Berkshire’s business segments are summarized in this section. Berkshire’s railroad and utilitiesand energy businesses, in particular, utilize considerable physical assets in their businesses.
Railroad Business—Burlington Northern Santa Fe
Through BNSF Railway, BNSF operates over 32,500 route miles of track (excluding multiple main tracks, yard tracksand sidings) in 28 states, and also operates in three Canadian provinces. BNSF owns over 23,000 route miles, includingeasements, and operates over 9,000 route miles of trackage rights that permit BNSF to operate its trains with its crews overother railroads’ tracks. As of December 31, 2021, the total BNSF Railway system, including single and multiple main tracks,yard tracks and sidings, consisted of over 50,000 operated miles of track.
BNSF operates various facilities and equipment to support its transportation system, including its infrastructure,locomotives and freight cars. It also owns or leases other equipment to support rail operations, such as vehicles. Supportfacilities for rail operations include yards and terminals throughout its rail network, system locomotive shops to performlocomotive servicing and maintenance, a centralized network operations center for train dispatching and network operationsmonitoring and management, computers, telecommunications equipment, signal systems and other support systems. Transferfacilities are maintained for rail-to-rail as well as intermodal transfer of containers, trailers and other freight traffic andinclude approximately 25 intermodal hubs located across the system. BNSF owns or holds under non-cancelable leasesexceeding one year approximately 7,500 locomotives and 63,600 freight cars, in addition to maintenance of way and otherequipment.
In the ordinary course of business, BNSF incurs significant costs in repairing and maintaining its properties. In 2021,BNSF recorded approximately $2 billion in repairs and maintenance expense.

K-28
Utilities and Energy Businesses—Berkshire Hathaway Energy
BHE’s energy properties consist of the physical assets necessary to support its electricity and natural gas businesses.Properties of BHE’s electricity businesses include electric generation, transmission and distribution facilities, as well as coalmining assets that support certain of BHE’s electric generating facilities. Properties of BHE’s natural gas businesses includenatural gas distribution facilities, interstate pipelines, storage facilities, liquefied natural gas facilities, compressor stationsand meter stations. The transmission and distribution assets are primarily within each of BHE’s utility service territories. Inaddition to these physical assets, BHE has rights-of-way, mineral rights and water rights that enable BHE to utilize itsfacilities. Pursuant to separate financing agreements, the majority of these properties are pledged or encumbered to support orotherwise provide the security for the related subsidiary debt. BHE or its affiliates own or have interests in the followingtypes of operating electric generating facilities at December 31, 2021:
Energy Source Entity Location by Significance
FacilityNet
Capacity(MW) (1)
NetOwnedCapacity(MW) (1)
Wind PacifiCorp, MEC and BHERenewables
Iowa, Wyoming, Texas, Nebraska,Washington, California, Illinois, Montana,Oregon and Kansas 11,517 11,517
Natural gas PacifiCorp, MEC, NV Energy,BHE Renewables and BHECanada
Nevada, Utah, Iowa, Illinois, Washington,Wyoming, Oregon, Texas, New York,Arizona and Canada 11,112 10,833
Coal PacifiCorp, MEC andNV Energy
Wyoming, Iowa, Utah, Nevada, Coloradoand Montana 13,235 8,193
Solar BHE Renewables andNV Energy
California, Texas, Arizona, Minnesota andNevada 1,719 1,571
Hydroelectric PacifiCorp, MEC andBHE Renewables
Washington, Oregon, Idaho, California,Utah, Hawaii, Montana, Illinois andWyoming 1,149 1,149
Nuclear MEC Illinois 1,823 456Geothermal PacifiCorp and BHE Renewables California and Utah 377 377
Total 40,932 34,096
(1) Facility Net Capacity in megawatts (MW) represents the lesser of nominal ratings or any limitations under applicableinterconnection, power purchase, or other agreements for intermittent resources and the total net dependablecapability available during summer conditions for all other units. An intermittent resource’s nominal rating is themanufacturer’s contractually specified capability (in MW) under specified conditions. Net Owned Capacity indicatesBHE’s ownership of Facility Net Capacity.
As of December 31, 2021, BHE’s subsidiaries also have electric generating facilities that are under construction inNevada, Iowa and Canada having total Facility Net Capacity and Net Owned Capacity of 421 MW.
PacifiCorp, MEC and NV Energy own electric transmission and distribution systems, including approximately 27,700miles of transmission lines and approximately 1,660 substations and gas distribution facilities, including approximately27,700 miles of gas mains and service lines.
Northern Powergrid (Northeast) and Northern Powergrid (Yorkshire) operate an electricity distribution network thatincludes approximately 17,400 miles of overhead lines, approximately 43,300 miles of underground cables andapproximately 780 major substations. AltaLink’s electricity transmission system includes approximately 8,200 miles oftransmission lines and approximately 310 substations.
The BHE GT&S pipeline system consists of approximately 5,400 miles of natural gas transmission, gathering andstorage pipelines located in portions of Maryland, New York, Ohio, Pennsylvania, Virginia, West Virginia, South Carolinaand Georgia. Storage services are provided through the operation of 17 underground natural gas storage fields located inPennsylvania, West Virginia and New York. BHE GT&S also operates, as the general partner, and owns a 25% limitedpartnership interest in one liquefied natural gas export, import and storage facility in Maryland and operates and hasownership interests in three modular liquefied natural gas facilities in Alabama, Florida and Pennsylvania.
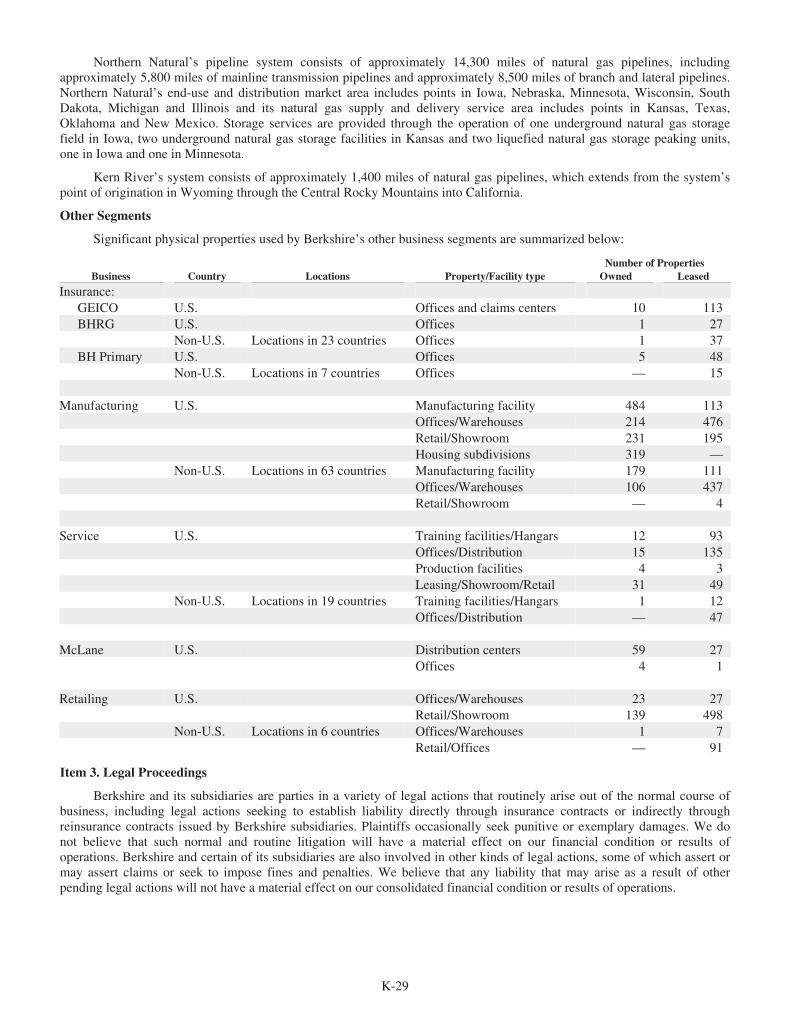
K-29
Northern Natural’s pipeline system consists of approximately 14,300 miles of natural gas pipelines, includingapproximately 5,800 miles of mainline transmission pipelines and approximately 8,500 miles of branch and lateral pipelines.Northern Natural’s end-use and distribution market area includes points in Iowa, Nebraska, Minnesota, Wisconsin, SouthDakota, Michigan and Illinois and its natural gas supply and delivery service area includes points in Kansas, Texas,Oklahoma and New Mexico. Storage services are provided through the operation of one underground natural gas storagefield in Iowa, two underground natural gas storage facilities in Kansas and two liquefied natural gas storage peaking units,one in Iowa and one in Minnesota.
Kern River’s system consists of approximately 1,400 miles of natural gas pipelines, which extends from the system’spoint of origination in Wyoming through the Central Rocky Mountains into California.
Other Segments
Significant physical properties used by Berkshire’s other business segments are summarized below:
Number of PropertiesBusiness Country Locations Property/Facility type Owned Leased
Insurance:GEICO U.S. Offices and claims centers 10 113BHRG U.S. Offices 1 27
Non-U.S. Locations in 23 countries Offices 1 37BH Primary U.S. Offices 5 48
Non-U.S. Locations in 7 countries Offices — 15
Manufacturing U.S. Manufacturing facility 484 113Offices/Warehouses 214 476Retail/Showroom 231 195Housing subdivisions 319 —
Non-U.S. Locations in 63 countries Manufacturing facility 179 111Offices/Warehouses 106 437Retail/Showroom — 4
Service U.S. Training facilities/Hangars 12 93Offices/Distribution 15 135Production facilities 4 3Leasing/Showroom/Retail 31 49
Non-U.S. Locations in 19 countries Training facilities/Hangars 1 12Offices/Distribution — 47
McLane U.S. Distribution centers 59 27Offices 4 1
Retailing U.S. Offices/Warehouses 23 27Retail/Showroom 139 498
Non-U.S. Locations in 6 countries Offices/Warehouses 1 7Retail/Offices — 91
Item 3. Legal Proceedings
Berkshire and its subsidiaries are parties in a variety of legal actions that routinely arise out of the normal course ofbusiness, including legal actions seeking to establish liability directly through insurance contracts or indirectly throughreinsurance contracts issued by Berkshire subsidiaries. Plaintiffs occasionally seek punitive or exemplary damages. We donot believe that such normal and routine litigation will have a material effect on our financial condition or results ofoperations. Berkshire and certain of its subsidiaries are also involved in other kinds of legal actions, some of which assert ormay assert claims or seek to impose fines and penalties. We believe that any liability that may arise as a result of otherpending legal actions will not have a material effect on our consolidated financial condition or results of operations.
K-30
Item 4. Mine Safety Disclosures
Information regarding the Company’s mine safety violations and other legal matters disclosed in accordance withSection 1503 (a) of the Dodd-Frank Reform Act is included in Exhibit 95 to this Form 10-K.
Executive Officers of the Registrant
Following is a list of the Registrant’s named executive officers:
Name Age Position with Registrant Since
Warren E. Buffett 91 Chairman and Chief Executive Officer 1970Charles T. Munger 98 Vice Chairman 1978Gregory E. Abel 59 Vice Chairman – Non-Insurance Operations 2018Ajit Jain 70 Vice Chairman – Insurance Operations 2018Marc D. Hamburg 72 Senior Vice-President – Chief Financial Officer 1992
Each executive officer serves, in accordance with the by-laws of the Registrant, until the first meeting of the Board ofDirectors following the next annual meeting of shareholders and until a successor is chosen and qualified or until suchexecutive officer sooner dies, resigns, is removed or becomes disqualified.
FORWARD-LOOKING STATEMENTS
Investors are cautioned that certain statements contained in this document as well as some statements in periodic pressreleases and some oral statements of Berkshire officials during presentations about Berkshire or its subsidiaries are “forward-looking” statements within the meaning of the Private Securities Litigation Reform Act of 1995 (the “Act”). Forward-lookingstatements include statements which are predictive in nature, which depend upon or refer to future events or conditions, orwhich include words such as “expects,” “anticipates,” “intends,” “plans,” “believes,” “estimates” or similar expressions. Inaddition, any statements concerning future financial performance (including future revenues, earnings or growth rates),ongoing business strategies or prospects and possible future Berkshire actions, which may be provided by management, arealso forward-looking statements as defined by the Act. Forward-looking statements are based on current expectations andprojections about future events and are subject to risks, uncertainties and assumptions about Berkshire and its subsidiaries,economic and market factors and the industries in which we do business, among other things. These statements are notguarantees of future performance and we have no specific intention to update these statements.
Actual events and results may differ materially from those expressed or forecasted in forward-looking statements dueto a number of factors. The principal risk factors that could cause our actual performance and future events and actions todiffer materially from such forward-looking statements include, but are not limited to, changes in market prices of ourinvestments in fixed maturity and equity securities; losses realized from derivative contracts; the occurrence of one or morecatastrophic events, such as an earthquake, hurricane, act of terrorism or cyber-attack that causes losses insured by ourinsurance subsidiaries and/or losses to our business operations; the frequency and severity of epidemics, pandemics or otheroutbreaks, including COVID-19, that negatively affect our operating results and restrict our access to borrowed funds throughthe capital markets at reasonable rates; changes in laws or regulations affecting our insurance, railroad, utilities and energyand finance subsidiaries; changes in federal income tax laws; and changes in general economic and market factors that affectthe prices of securities or the industries in which we do business.
Part II
Item 5. Market for Registrant’s Common Equity, Related Security Holder Matters and Issuer Purchases of EquitySecurities
Market Information
Berkshire’s Class A and Class B common stock are listed for trading on the New York Stock Exchange, tradingsymbols: BRK.A and BRK.B, respectively.
Shareholders
Berkshire had approximately 1,400 record holders of its Class A common stock and 18,400 record holders of itsClass B common stock at February 15, 2022. Record owners included nominees holding at least 346,000 shares of Class Acommon stock and 1,287,000,000 shares of Class B common stock on behalf of beneficial-but-not-of-record owners.
Dividends
Berkshire has not declared a cash dividend since 1967.

K-31
Common Stock Repurchase Program
Berkshire’s common stock repurchase program permits Berkshire to repurchase its Class A and Class B shares at anytime that Warren Buffett, Berkshire’s Chairman of the Board and Chief Executive Officer, and Charles Munger, ViceChairman of the Board, believe that the repurchase price is below Berkshire’s intrinsic value, conservatively determined.Repurchases may be in the open market or through privately negotiated transactions. Information with respect to Berkshire’sClass A and Class B common stock repurchased during the fourth quarter of 2021 follows.
Period
Total number ofshares
purchasedAverage pricepaid per share
Total number ofshares
purchased aspart of publiclyannouncedprogram
Maximumnumber or value ofshares that yet
may berepurchased under
the program
OctoberClass A common stock 680 $ 431,525.72 680 *Class B common stock 5,862,551 $ 282.86 5,862,551 *
NovemberClass A common stock 403 $ 430,172.46 403 *Class B common stock 7,013,482 $ 284.39 7,013,482 *
DecemberClass A common stock 1,828 $ 439,625.92 1,828 *Class B common stock 6,259,164 $ 287.62 6,259,164 *
* TheTT program does not specify a maximum number of shares to be repurchased or obligate Berkshire to repue rchase anyspecific dollar amount or number of Class A or Class B shares and there is no expiration date to the repurchaseprogram. Berkshire will not repurchase its common stock if the repurchases reduce the total value of Berkshire’sconsolidated cash, cash equivalentstt and U.S. Treasury Bills holdings to less than $30 billion.
Stock Performance Graph
The following chart compares the subsequent value of $100 invested in Berkshire common stock on December 31,2016 with a similar investment in the Standard & Poor’s 500 Stock Index and in the Standard & Poor’s Property – CasualtyInsurance Index**.
* Cumulative return for the Standard & Poor’s indices based on reinvestment of dividends.
** It would be difficult to develop a peer group of companies similar to Berkshire. The Corporation owns subsidiariesengaged in a number of diverse business activities of which the most important is the property and casualty insurancebusiness and, accordingly, management has used the Standard & Poor’s Property—Casualty Insurance Index forcomparative purposes.
DO
LL
AR
S
60
80
120
100
160
140
180
240
220
200
260
2016 2017 2018 2019 2020 2021
S&P 500 Property & Casualty Insurance Index*
S&P 500 Index*
Berkshire Hathaway Inc.
122
122122 125
117116
153
139
147
157
142
181
184
187
233
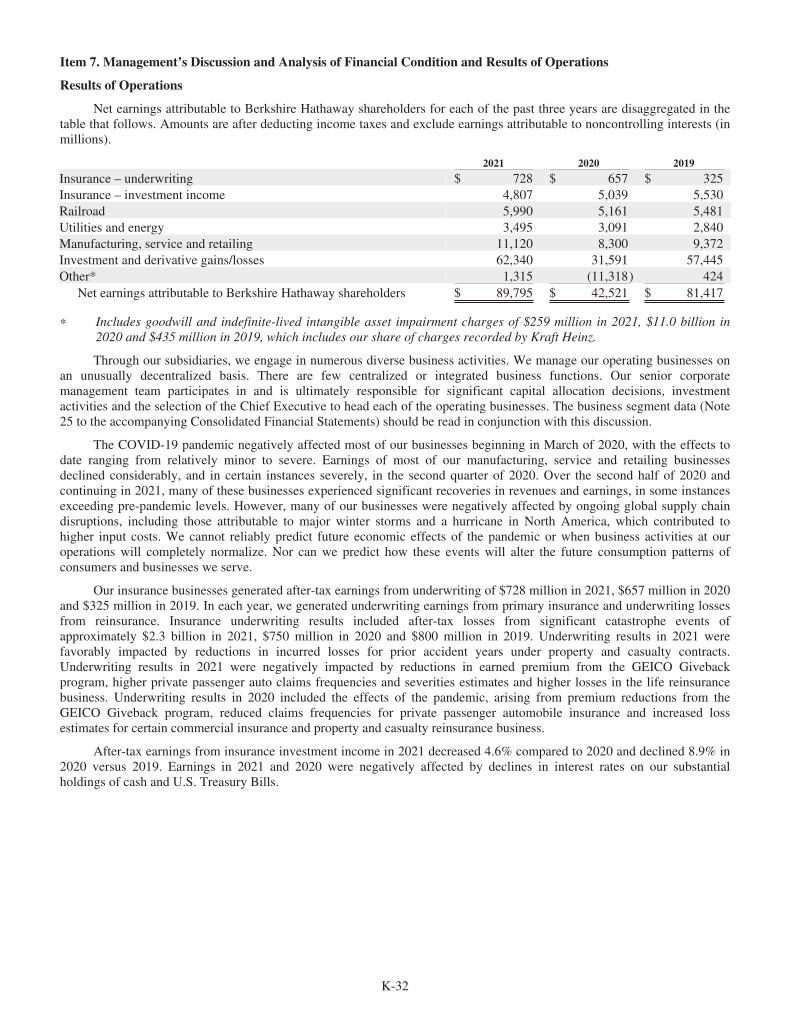
K-32
Item 7. Management’s Discussion and Analysis of Financial Condition and Results of Operations
Results of Operations
Net earnings attributable to Berkshire Hathaway shareholders for each of the past three years are disaggregated in thetable that follows. Amounts are after deducting income taxes and exclude earnings attributable to noncontrolling interests (inmillions).
2021 2020 2019
Insurance – underwriting $ 728 $ 657 $ 325Insurance – investment income 4,807 5,039 5,530Railroad 5,990 5,161 5,481Utilities and energy 3,495 3,091 2,840Manufacturing, service and retailing 11,120 8,300 9,372Investment and derivative gains/losses 62,340 31,591 57,445Other* 1,315 (11,318) 424
Net earnings attributable to Berkshire Hathaway shareholders $ 89,795 $ 42,521 $ 81,417
∗ Includes goodwill and indefinite-lived intangible asset impairment charges of $259 million in 2021, $11.0 billion in2020 and $435 million in 2019, which includes our share of charges recorded by Kraft Heinz.
Through our subsidiaries, we engage in numerous diverse business activities. We manage our operating businesses onan unusually decentralized basis. There are few centralized or integrated business functions. Our senior corporatemanagement team participates in and is ultimately responsible for significant capital allocation decisions, investmentactivities and the selection of the Chief Executive to head each of the operating businesses. The business segment data (Note25 to the accompanying Consolidated Financial Statements) should be read in conjunction with this discussion.
The COVID-19 pandemic negatively affected most of our businesses beginning in March of 2020, with the effects todate ranging from relatively minor to severe. Earnings of most of our manufacturing, service and retailing businessesdeclined considerably, and in certain instances severely, in the second quarter of 2020. Over the second half of 2020 andcontinuing in 2021, many of these businesses experienced significant recoveries in revenues and earnings, in some instancesexceeding pre-pandemic levels. However, many of our businesses were negatively affected by ongoing global supply chaindisruptions, including those attributable to major winter storms and a hurricane in North America, which contributed tohigher input costs. We cannot reliably predict future economic effects of the pandemic or when business activities at ouroperations will completely normalize. Nor can we predict how these events will alter the future consumption patterns ofconsumers and businesses we serve.
Our insurance businesses generated after-tax earnings from underwriting of $728 million in 2021, $657 million in 2020and $325 million in 2019. In each year, we generated underwriting earnings from primary insurance and underwriting lossesfrom reinsurance. Insurance underwriting results included after-tax losses from significant catastrophe events ofapproximately $2.3 billion in 2021, $750 million in 2020 and $800 million in 2019. Underwriting results in 2021 werefavorably impacted by reductions in incurred losses for prior accident years under property and casualty contracts.Underwriting results in 2021 were negatively impacted by reductions in earned premium from the GEICO Givebackprogram, higher private passenger auto claims frequencies and severities estimates and higher losses in the life reinsurancebusiness. Underwriting results in 2020 included the effects of the pandemic, arising from premium reductions from theGEICO Giveback program, reduced claims frequencies for private passenger automobile insurance and increased lossestimates for certain commercial insurance and property and casualty reinsurance business.
After-tax earnings from insurance investment income in 2021 decreased 4.6% compared to 2020 and declined 8.9% in2020 versus 2019. Earnings in 2021 and 2020 were negatively affected by declines in interest rates on our substantialholdings of cash and U.S. Treasury Bills.
K-33
Management’s Discussion and Analysis (Continued)
Results of Operations (Continued)
After-tax earnings of our railroad business in 2021 rose 16.1% compared to 2020 and decreased 5.8% in 2020compared to 2019. The earnings increase in 2021 reflected overall higher freight volumes, higher average revenue percar/unit and improved productivity, partly offset by higher average fuel prices and volume related costs. Earnings in 2020reflected lower railroad operating revenues from lower shipping volumes, attributable to the negative effects of the COVID-19 pandemic, partly offset by lower operating costs and the effects of productivity improvements. After-tax earnings of ourutilities and energy business in 2021 increased 13.1% versus 2020 and increased 8.8% in 2020 compared to 2019. Theincrease in 2021 included higher earnings from the utilities and natural gas pipelines businesses, including the effects of abusiness acquisition, and from the real estate brokerage business, while the earnings increase in 2020 reflected increased taxbenefits from renewable energy and increased earnings from the real estate brokerage business.
Earnings in 2021 from our manufacturing, service and retailing businesses increased 34.0% versus 2020 and declined11.4% in 2020 versus 2019. Many of our businesses generated significantly higher earnings in 2021 compared to 2020.While customer demand for products was relatively high during the year, several of our businesses experienced highermaterials, freight and other input costs attributable to ongoing disruptions in global supply chains. The effects of the COVID-19 pandemic have varied among our businesses relative to significance and duration.
Other earnings included after-tax goodwill and indefinite-lived intangible asset impairment charges of $259 million in2021, $11.0 billion in 2020 and $435 million in 2019. Such amounts included our share of impairment charges recorded byKraft Heinz. Approximately $9.8 billion of the charges in 2020 were attributable to impairments of goodwill and indefinite-lived intangible assets recorded in connection with Berkshire’s acquisition of Precision Castparts in 2016. Other earnings in2021 also included after-tax foreign exchange rate gains of $955 million and after-tax losses of $764 million in 2020 relatedto non-U.S. Dollar denominated debt issued by Berkshire and its U.S.-based finance subsidiary, Berkshire Hathaway FinanceCorporation (“BHFC”).
Investment and derivative gains/losses in each of the three years presented predominantly derived from ourinvestments in equity securities and included significant net unrealized gains from market price changes. We believe thatinvestment and derivative gains/losses, whether realized from dispositions or unrealized from changes in market prices ofequity securities, are generally meaningless in understanding our reported quarterly or annual results or evaluating theeconomic performance of our operating businesses. These gains and losses have caused and will continue to cause significantvolatility in our periodic earnings.
Insurance—Underwriting
Our management views our insurance businesses as possessing two distinct activities – underwriting and investing.Underwriting decisions are the responsibility of the unit managers, while investing decisions are the responsibility ofBerkshire’s Chairman and CEO, Warren E. Buffett and Berkshire’s corporate investment managers. Accordingly, weevaluate performance of underwriting operations without any allocation of investment income or investment gains and losses.We consider investment income as an integral component of our aggregate insurance operating results. However, we considerinvestment gains and losses, whether realized or unrealized, as non-operating. We believe that such gains and losses are notmeaningful in understanding the periodic operating results of our insurance businesses.
The timing and magnitude of catastrophe losses can produce significant volatility in our periodic underwriting results,particularly with respect to our reinsurance businesses. Generally, we consider incurred losses exceeding $100 million from acurrent year catastrophic event to be significant. The significant catastrophe events in 2021 included Hurricane Ida and floodsin Europe in the third quarter, as well as Winter Storm Uri in the first quarter.
Changes in estimates for unpaid losses and loss adjustment expenses, including amounts established for occurrences inprior years, can also significantly affect our periodic underwriting results. Unpaid loss estimates, including estimates underretroactive reinsurance contracts, were approximately $125 billion as of December 31, 2021. Our periodic underwritingresults may also include significant foreign currency transaction gains and losses arising from the changes in the valuation ofnon-U.S. Dollar denominated liabilities of our U.S. based insurance subsidiaries due to foreign currency exchange ratefluctuations.

K-34
Management’s Discussion and Analysis (Continued)
Insurance—Underwriting (Continued)
Underwriting results of certain of our commercial insurance and reinsurance businesses were negatively affected in2021 and 2020 by estimated losses and costs associated with the COVID-19 pandemic, including incremental provisions forclaims and uncollectible premiums and incremental operating costs to maintain customer service levels. The effects of thepandemic on future periods may be affected by judicial rulings and regulatory and legislative actions pertaining to insurancecoverage and claims and by its effects on general economic activity, which we cannot reasonably estimate at this time.
We provide primary insurance and reinsurance products covering property and casualty risks, as well as life and healthrisks. Our insurance and reinsurance businesses are GEICO, Berkshire Hathaway Primary Group and Berkshire HathawayReinsurance Group.
Underwriting results of our insurance businesses are summarized below (dollars in millions).
2021 2020 2019
Pre-tax underwriting earnings (loss):GEICO $ 1,259 $ 3,428 $ 1,506Berkshire Hathaway Primary Group 607 110 383Berkshire Hathaway Reinsurance Group (930) (2,700) (1,472)
Pre-tax underwriting earnings 936 838 417Income taxes and noncontrolling interests 208 181 92Net underwriting earnings $ 728 $ 657 $ 325
Effective income tax rate 22.2% 21.5% 24.2%
GEICO
GEICO writes private passenger automobile insurance, offering coverages to insureds in all 50 states and the District ofColumbia. GEICO markets its policies mainly by direct response methods where most customers apply for coverage directlyto the company via the Internet or over the telephone. A summary of GEICO’s underwriting results follows (dollars inmillions).
2021 2020 2019Amount % Amount % Amount %
Premiums written $ 38,395 $ 34,928 $ 36,016
Premiums earned $ 37,706 100.0 $ 35,093 100.0 $ 35,572 100.0Losses and loss adjustment expenses 30,999 82.2 26,018 74.1 28,937 81.3Underwriting expenses 5,448 14.5 5,647 16.1 5,129 14.5Total losses and expenses 36,447 96.7 31,665 90.2 34,066 95.8
Pre-tax underwriting earnings $ 1,259 $ 3,428 $ 1,506
GEICO’s pre-tax underwriting earnings in 2021 and 2020 were significantly affected by changes in average claimsfrequencies. Beginning in the first quarter of 2020 and continuing through the first quarter of 2021, average claimsfrequencies were significantly below historical levels from the effects of less driving by policyholders during the COVID-19pandemic. These effects were partially offset by higher average claims severities and lower premiums earned from theGEICO Giveback program, which provided for a 15% premium credit to all voluntary auto and motorcycle new policies orpolicies renewing between April 8, 2020 and October 7, 2020. Starting in the second quarter of 2021, average claimsfrequencies began to increase as driving by policyholders increased. In addition, average property claims severities increaseddue to increases in used vehicle valuations.

K-35
Management’s Discussion and Analysis (Continued)
Insurance—Underwriting (Continued)
GEICO (Continued)
2021 versus 2020
Premiums written in 2021 increased $3.5 billion (9.9%) compared to 2020, which included a reduction ofapproximately $2.9 billion attributable to the GEICO Giveback program. Premiums earned in 2021 increased $2.6 billion(7.4%) compared to 2020. The GEICO Giveback Program reduced earned premiums by approximately $2.5 billion in 2020with the remainder of the impact included in 2021. Voluntary auto policies-in-force in 2021 were slightly higher compared to2020.
Losses and loss adjustment expenses increased $5.0 billion (19.1%) compared to 2020. GEICO’s ratio of losses andloss adjustment expenses to premiums earned (the “loss ratio”) increased 8.1 percentage points compared to 2020. Theincrease in the loss ratio reflected an increase in average claims frequencies and severities and higher losses from significantcatastrophe events, partially offset by increased reductions of ultimate estimated losses for claims occurring in prior years.
Claims frequencies in 2021 were higher for all coverages, including property damage and bodily injury (thirteen tofourteen percent range), personal injury (sixteen to seventeen percent range) and collision (twenty-one to twenty-two percentrange). Average claims severities in 2021 were also higher for property damage coverage (two to three percent range),collision coverage (fifteen to sixteen percent range) and bodily injury coverage (eight to ten percent range). Ultimate claimloss estimates for claims occurring in prior years were reduced approximately $1.8 billion in 2021 and $253 million in 2020,which produced corresponding reductions in losses and loss adjustment expenses. Losses incurred attributable to HurricaneIda in 2021 were $375 million, while losses in 2020 included $81 million attributable to Hurricanes Laura and Sally and U.S.wildfires.
Underwriting expenses decreased $199 million (3.5%) compared to 2020, reflecting lower advertising expenses.GEICO’s expense ratio (underwriting expenses to premiums earned) decreased 1.6 percentage points in 2021, reflectinglower nominal expenses and higher premiums earned.
2020 versus 2019
Premiums written and earned in 2020 decreased $1.1 billion (3.0%) and $479 million (1.3%), respectively, comparedto 2019. The GEICO Giveback program reduced premiums written $2.9 billion and premiums earned $2.5 billion in 2020.Voluntary auto policies-in-force increased approximately 820,000 during 2020.
Losses and loss adjustment expenses in 2020 decreased $2.9 billion (10.1%) compared to 2019. GEICO’s loss ratiowas 74.1%, a decrease of 7.2 percentage points compared to 2019. The decrease in the loss ratio reflected declines in claimsfrequencies, partly offset by increases in claims severities and the impact of lower premiums earned attributable to theGEICO Giveback program.
Claims frequencies in 2020 were lower for property damage, bodily injury and personal injury protection coverages(twenty-eight to thirty percent range) and collision coverage (twenty-three to twenty-four percent range) compared to 2019.Average claims severities in 2020 were higher for property damage and collision coverages (eight to ten percent range) andbodily injury coverage (twelve to thirteen percent range). Losses and loss adjustment expenses included net reductions of$253 million in 2020 for decreases in the ultimate loss estimates for claims occurring in prior years compared to net increasesof $42 million in 2019. Losses incurred included $81 million in 2020 from Hurricanes Laura and Sally and U.S. wildfires.There were no losses from significant catastrophe events in 2019.
Underwriting expenses in 2020 increased $518 million (10.1%) compared to 2019, reflecting higher employee-related,advertising and technology costs, partly offset by lower premium taxes. GEICO’s expense ratio in 2020 was 16.1%, anincrease of 1.6 percentage points compared to 2019. The expense ratio increase was primarily attributable to the decline inearned premiums from the GEICO Giveback program.

K-36
Management’s Discussion and Analysis (Continued)
Insurance—Underwriting (Continued)
Berkshire Hathaway Primary Group
The Berkshire Hathaway Primary Group (“BH Primary”) provides a variety of commercial insurance solutions,including healthcare professional liability, workers’ compensation, automobile, general liability, property and specialtycoverages for small, medium and large clients. BH Primary’s larger insurers include Berkshire Hathaway Specialty Insurance(“BH Specialty”), Berkshire Hathaway Homestate Companies (“BHHC”), MedPro Group, Berkshire Hathaway GUARDInsurance Companies (“GUARD”), National Indemnity Company (“NICO Primary”) and U.S. Liability Insurance Company(“USLI”). A summary of BH Primary underwriting results follows (dollars in millions).
2021 2020 2019Amount % Amount % Amount %
Premiums written $ 12,595 $ 10,212 $ 9,843
Premiums earned $ 11,575 100.0 $ 9,615 100.0 $ 9,165 100.0Losses and loss adjustment expenses 8,107 70.0 7,129 74.1 6,336 69.1Underwriting expenses 2,861 24.8 2,376 24.7 2,446 26.7Total losses and expenses 10,968 94.8 9,505 98.8 8,782 95.8
Pre-tax underwriting earnings $ 607 $ 110 $ 383
Premiums written increased $2.4 billion (23.3%) in 2021 compared to 2020, reflecting increases from BH Specialty(36%), MedPro Group (16%), NICO Primary (25%), GUARD (7%), BHHC (5%) and USLI (20%). The increases wereacross multiple coverages and occurred in several markets.
Premiums written increased $369 million (3.7%) in 2020 compared to 2019, reflecting increased premiums writtenfrom BH Specialty (34%) and MedPro Group (9%), partially offset by a 13% decrease in premiums written by our otherprimary insurers. The decline in volume by our other primary insurers was primarily due to lower workers’ compensation andcommercial automobile volumes and the effect of the divestiture of Applied Underwriters in October 2019.
BH Primary’s loss ratios were 70.0% in 2021, 74.1% in 2020 and 69.1% in 2019. Losses and loss adjustment expensesattributable to significant catastrophe events were $402 million in 2021 from Hurricane Ida and Winter Storm Uri and $207million in 2020 from Hurricanes Laura and Sally and U.S. wildfires. Losses and loss adjustment expenses were reduced $631million in 2021, $265 million in 2020 and $499 million in 2019 for net reductions in estimated ultimate liabilities for prioryears’ loss events. Losses in 2020 also included increased liabilities of $167 million attributable to the pandemic.
BH Primary insurers write significant levels of commercial and professional liability and workers’ compensationinsurance and the related claim costs may be subject to high severity and long claim-tails. Accordingly, we could experiencesignificant increases in claims liabilities in the future attributable to higher-than-expected claim settlements, adverse litigationoutcomes or judicial rulings and other factors not currently anticipated.
Underwriting expenses increased $485 million (20.4%) in 2021 compared to 2020, reflecting the increase in business,changes in business mix and the costs associated with new product development. The expense ratio in 2021 was relativelyunchanged versus 2020. The expense ratio in 2020 declined 2.0 percentage points compared to 2019 and reflected changes inbusiness mix and the impact of the Applied Underwriters divestiture.
Berkshire Hathaway Reinsurance Group
The Berkshire Hathaway Reinsurance Group (“BHRG”) offers excess-of-loss and quota-share reinsurance coverageson property and casualty risks to insurers and reinsurers worldwide through several subsidiaries, led by National IndemnityCompany (“NICO”), General Reinsurance Corporation and General Reinsurance AG. We also write life and healthreinsurance coverages through General Re Life Corporation, General Reinsurance AG and Berkshire Hathaway LifeInsurance Company of Nebraska (“BHLN”). We periodically assume property and casualty risks under retroactivereinsurance contracts written through NICO. In addition, we write periodic payment annuity contracts through BHLN.
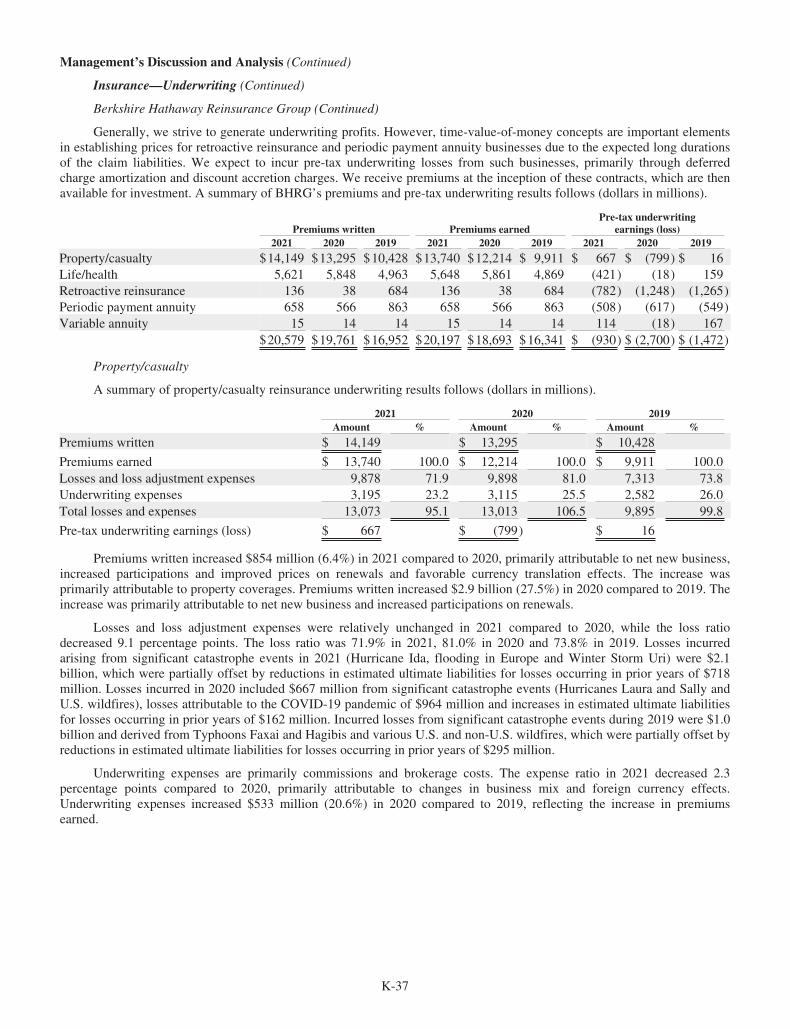
K-37
Management’s Discussion and Analysis (Continued)
Insurance—Underwriting (Continued)
Berkshire Hathaway Reinsurance Group (Continued)
Generally, we strive to generate underwriting profits. However, time-value-of-money concepts are important elementsin establishing prices for retroactive reinsurance and periodic payment annuity businesses due to the expected long durationsof the claim liabilities. We expect to incur pre-tax underwriting losses from such businesses, primarily through deferredcharge amortization and discount accretion charges. We receive premiums at the inception of these contracts, which are thenavailable for investment. A summary of BHRG’s premiums and pre-tax underwriting results follows (dollars in millions).
Premiums written Premiums earnedPre-tax underwriting
earnings (loss)2021 2020 2019 2021 2020 2019 2021 2020 2019
Property/casualty $14,149 $13,295 $10,428 $13,740 $12,214 $ 9,911 $ 667 $ (799) $ 16Life/health 5,621 5,848 4,963 5,648 5,861 4,869 (421) (18) 159Retroactive reinsurance 136 38 684 136 38 684 (782) (1,248) (1,265)Periodic payment annuity 658 566 863 658 566 863 (508) (617) (549)Variable annuity 15 14 14 15 14 14 114 (18) 167
$20,579 $19,761 $16,952 $20,197 $18,693 $16,341 $ (930) $ (2,700) $ (1,472)
Property/casualty
A summary of property/casualty reinsurance underwriting results follows (dollars in millions).
2021 2020 2019Amount % Amount % Amount %
Premiums written $ 14,149 $ 13,295 $ 10,428
Premiums earned $ 13,740 100.0 $ 12,214 100.0 $ 9,911 100.0Losses and loss adjustment expenses 9,878 71.9 9,898 81.0 7,313 73.8Underwriting expenses 3,195 23.2 3,115 25.5 2,582 26.0Total losses and expenses 13,073 95.1 13,013 106.5 9,895 99.8
Pre-tax underwriting earnings (loss) $ 667 $ (799) $ 16
Premiums written increased $854 million (6.4%) in 2021 compared to 2020, primarily attributable to net new business,increased participations and improved prices on renewals and favorable currency translation effects. The increase wasprimarily attributable to property coverages. Premiums written increased $2.9 billion (27.5%) in 2020 compared to 2019. Theincrease was primarily attributable to net new business and increased participations on renewals.
Losses and loss adjustment expenses were relatively unchanged in 2021 compared to 2020, while the loss ratiodecreased 9.1 percentage points. The loss ratio was 71.9% in 2021, 81.0% in 2020 and 73.8% in 2019. Losses incurredarising from significant catastrophe events in 2021 (Hurricane Ida, flooding in Europe and Winter Storm Uri) were $2.1billion, which were partially offset by reductions in estimated ultimate liabilities for losses occurring in prior years of $718million. Losses incurred in 2020 included $667 million from significant catastrophe events (Hurricanes Laura and Sally andU.S. wildfires), losses attributable to the COVID-19 pandemic of $964 million and increases in estimated ultimate liabilitiesfor losses occurring in prior years of $162 million. Incurred losses from significant catastrophe events during 2019 were $1.0billion and derived from Typhoons Faxai and Hagibis and various U.S. and non-U.S. wildfires, which were partially offset byreductions in estimated ultimate liabilities for losses occurring in prior years of $295 million.
Underwriting expenses are primarily commissions and brokerage costs. The expense ratio in 2021 decreased 2.3percentage points compared to 2020, primarily attributable to changes in business mix and foreign currency effects.Underwriting expenses increased $533 million (20.6%) in 2020 compared to 2019, reflecting the increase in premiumsearned.
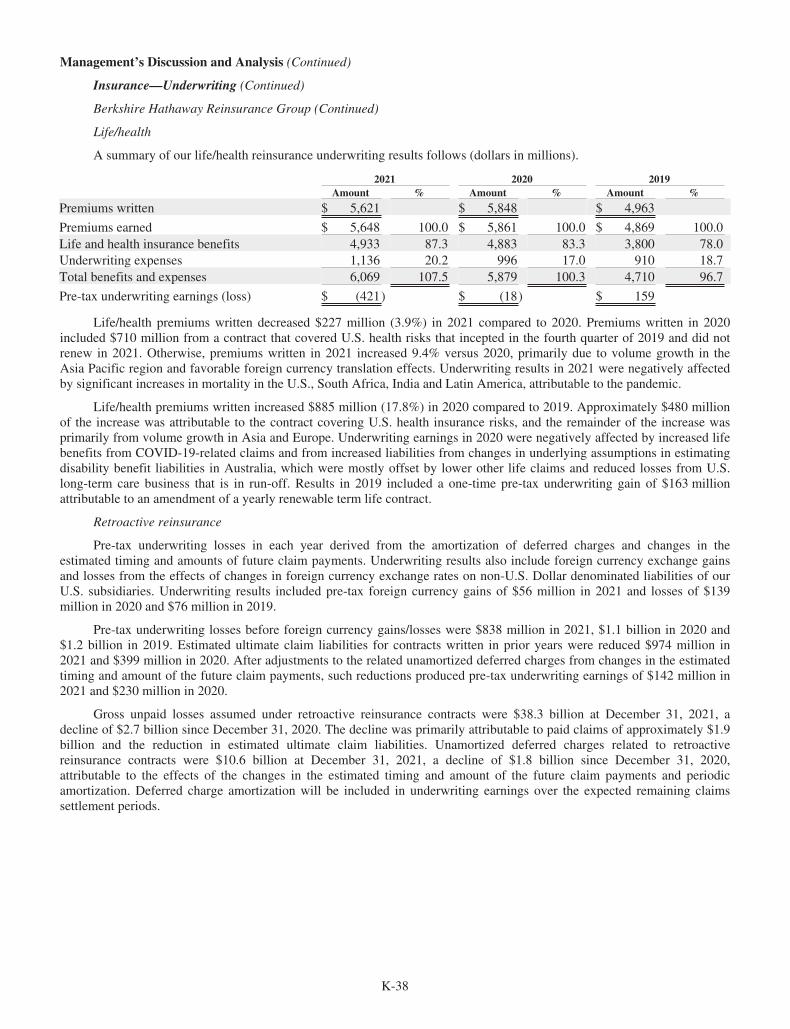
K-38
Management’s Discussion and Analysis (Continued)
Insurance—Underwriting (Continued)
Berkshire Hathaway Reinsurance Group (Continued)
Life/health
A summary of our life/health reinsurance underwriting results follows (dollars in millions).
2021 2020 2019Amount % Amount % Amount %
Premiums written $ 5,621 $ 5,848 $ 4,963
Premiums earned $ 5,648 100.0 $ 5,861 100.0 $ 4,869 100.0Life and health insurance benefits 4,933 87.3 4,883 83.3 3,800 78.0Underwriting expenses 1,136 20.2 996 17.0 910 18.7Total benefits and expenses 6,069 107.5 5,879 100.3 4,710 96.7
Pre-tax underwriting earnings (loss) $ (421) $ (18) $ 159
Life/health premiums written decreased $227 million (3.9%) in 2021 compared to 2020. Premiums written in 2020included $710 million from a contract that covered U.S. health risks that incepted in the fourth quarter of 2019 and did notrenew in 2021. Otherwise, premiums written in 2021 increased 9.4% versus 2020, primarily due to volume growth in theAsia Pacific region and favorable foreign currency translation effects. Underwriting results in 2021 were negatively affectedby significant increases in mortality in the U.S., South Africa, India and Latin America, attributable to the pandemic.
Life/health premiums written increased $885 million (17.8%) in 2020 compared to 2019. Approximately $480 millionof the increase was attributable to the contract covering U.S. health insurance risks, and the remainder of the increase wasprimarily from volume growth in Asia and Europe. Underwriting earnings in 2020 were negatively affected by increased lifebenefits from COVID-19-related claims and from increased liabilities from changes in underlying assumptions in estimatingdisability benefit liabilities in Australia, which were mostly offset by lower other life claims and reduced losses from U.S.long-term care business that is in run-off. Results in 2019 included a one-time pre-tax underwriting gain of $163 millionattributable to an amendment of a yearly renewable term life contract.
Retroactive reinsurance
Pre-tax underwriting losses in each year derived from the amortization of deferred charges and changes in theestimated timing and amounts of future claim payments. Underwriting results also include foreign currency exchange gainsand losses from the effects of changes in foreign currency exchange rates on non-U.S. Dollar denominated liabilities of ourU.S. subsidiaries. Underwriting results included pre-tax foreign currency gains of $56 million in 2021 and losses of $139million in 2020 and $76 million in 2019.
Pre-tax underwriting losses before foreign currency gains/losses were $838 million in 2021, $1.1 billion in 2020 and$1.2 billion in 2019. Estimated ultimate claim liabilities for contracts written in prior years were reduced $974 million in2021 and $399 million in 2020. After adjustments to the related unamortized deferred charges from changes in the estimatedtiming and amount of the future claim payments, such reductions produced pre-tax underwriting earnings of $142 million in2021 and $230 million in 2020.
Gross unpaid losses assumed under retroactive reinsurance contracts were $38.3 billion at December 31, 2021, adecline of $2.7 billion since December 31, 2020. The decline was primarily attributable to paid claims of approximately $1.9billion and the reduction in estimated ultimate claim liabilities. Unamortized deferred charges related to retroactivereinsurance contracts were $10.6 billion at December 31, 2021, a decline of $1.8 billion since December 31, 2020,attributable to the effects of the changes in the estimated timing and amount of the future claim payments and periodicamortization. Deferred charge amortization will be included in underwriting earnings over the expected remaining claimssettlement periods.
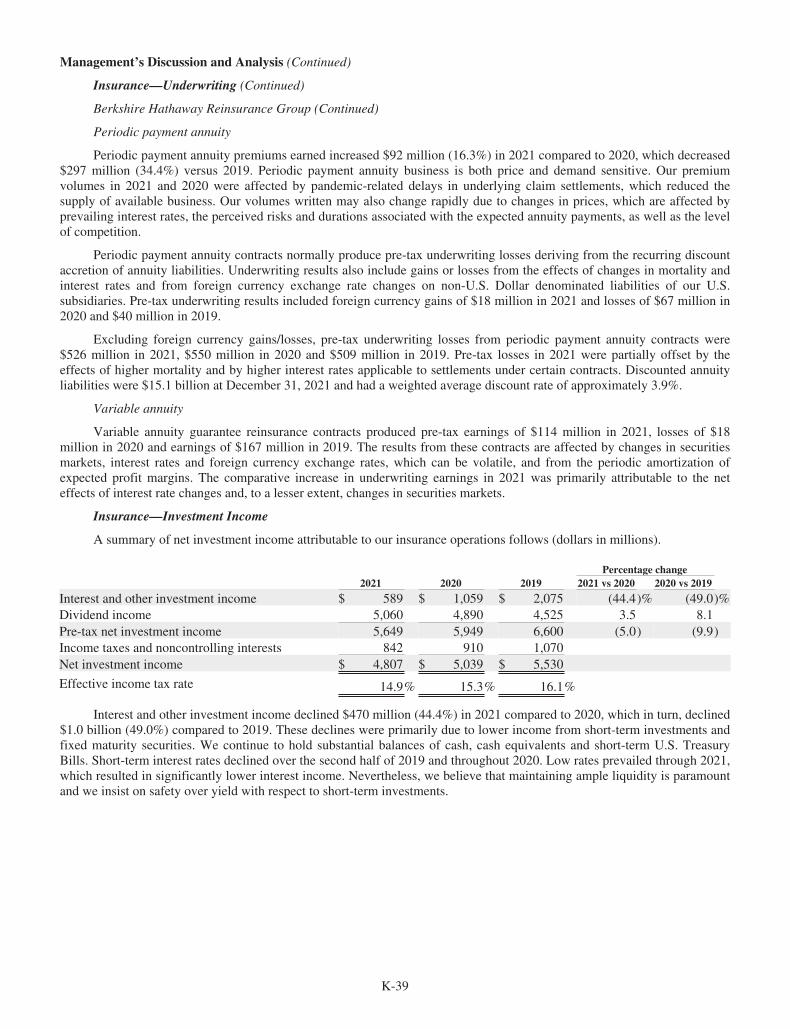
K-39
Management’s Discussion and Analysis (Continued)
Insurance—Underwriting (Continued)
Berkshire Hathaway Reinsurance Group (Continued)
Periodic payment annuity
Periodic payment annuity premiums earned increased $92 million (16.3%) in 2021 compared to 2020, which decreased$297 million (34.4%) versus 2019. Periodic payment annuity business is both price and demand sensitive. Our premiumvolumes in 2021 and 2020 were affected by pandemic-related delays in underlying claim settlements, which reduced thesupply of available business. Our volumes written may also change rapidly due to changes in prices, which are affected byprevailing interest rates, the perceived risks and durations associated with the expected annuity payments, as well as the levelof competition.
Periodic payment annuity contracts normally produce pre-tax underwriting losses deriving from the recurring discountaccretion of annuity liabilities. Underwriting results also include gains or losses from the effects of changes in mortality andinterest rates and from foreign currency exchange rate changes on non-U.S. Dollar denominated liabilities of our U.S.subsidiaries. Pre-tax underwriting results included foreign currency gains of $18 million in 2021 and losses of $67 million in2020 and $40 million in 2019.
Excluding foreign currency gains/losses, pre-tax underwriting losses from periodic payment annuity contracts were$526 million in 2021, $550 million in 2020 and $509 million in 2019. Pre-tax losses in 2021 were partially offset by theeffects of higher mortality and by higher interest rates applicable to settlements under certain contracts. Discounted annuityliabilities were $15.1 billion at December 31, 2021 and had a weighted average discount rate of approximately 3.9%.
Variable annuity
Variable annuity guarantee reinsurance contracts produced pre-tax earnings of $114 million in 2021, losses of $18million in 2020 and earnings of $167 million in 2019. The results from these contracts are affected by changes in securitiesmarkets, interest rates and foreign currency exchange rates, which can be volatile, and from the periodic amortization ofexpected profit margins. The comparative increase in underwriting earnings in 2021 was primarily attributable to the neteffects of interest rate changes and, to a lesser extent, changes in securities markets.
Insurance—Investment Income
A summary of net investment income attributable to our insurance operations follows (dollars in millions).
Percentage change2021 2020 2019 2021 vs 2020 2020 vs 2019
Interest and other investment income $ 589 $ 1,059 $ 2,075 (44.4)% (49.0)%Dividend income 5,060 4,890 4,525 3.5 8.1Pre-tax net investment income 5,649 5,949 6,600 (5.0) (9.9)Income taxes and noncontrolling interests 842 910 1,070Net investment income $ 4,807 $ 5,039 $ 5,530
Effective income tax rate 14.9% 15.3% 16.1%
Interest and other investment income declined $470 million (44.4%) in 2021 compared to 2020, which in turn, declined$1.0 billion (49.0%) compared to 2019. These declines were primarily due to lower income from short-term investments andfixed maturity securities. We continue to hold substantial balances of cash, cash equivalents and short-term U.S. TreasuryBills. Short-term interest rates declined over the second half of 2019 and throughout 2020. Low rates prevailed through 2021,which resulted in significantly lower interest income. Nevertheless, we believe that maintaining ample liquidity is paramountand we insist on safety over yield with respect to short-term investments.

K-40
Management’s Discussion and Analysis (Continued)
Insurance—Investment Income (Continued)
Dividend income included $121 million in 2021 and $26 million in 2020 from investments in preferred stock ofBerkshire Hathaway Energy. Such amounts are deducted from earnings of the utilities and energy segment. Dividend incomemay vary from period to period due to changes in the investment portfolio and the frequency and timing of dividends fromcertain investees. Dividend income increased $365 million (8.1%) in 2020 compared to 2019. The increase was primarilyattributable to dividends from the investment in $10 billion liquidation value of 8% cumulative preferred stock of OccidentalPetroleum Corporation (“Occidental”) on August 8, 2019, partly offset by lower dividends from common stock investments.
Invested assets of our insurance businesses derive from shareholder capital and from net liabilities under insurance andreinsurance contracts or “float.” The major components of float are unpaid losses and loss adjustment expenses, includingliabilities under retroactive reinsurance contracts, life, annuity and health insurance benefit liabilities, unearned premiums andother liabilities due to policyholders, reduced by insurance premiums and reinsurance receivables, deferred charges assumedunder retroactive reinsurance contracts and deferred policy acquisition costs. Float approximated $147 billion at December31, 2021, $138 billion at December 31, 2020 and $129 billion at December 31, 2019. Our combined insurance operationsgenerated pre-tax underwriting earnings in each of the past three years, and consequently, the average cost of float for eachyear was negative.
A summary of cash and investments held in our insurance businesses as of December 31, 2021 and 2020 follows (inmillions).
December 31,2021 2020
Cash, cash equivalents and U.S. Treasury Bills $ 90,688 $ 67,082Equity securities 334,907 269,498Fixed maturity securities 16,386 20,317Other 4,296 6,220
$ 446,277 $ 363,117
Fixed maturity investments as of December 31, 2021 were as follows (in millions).
Amortizedcost
Unrealizedgains/losses
Carryingvalue
U.S. Treasury, U.S. government corporations and agencies $ 3,278 $ 17 $ 3,295Foreign governments 10,997 (4) 10,993Corporate bonds 1,350 411 1,761Other 292 45 337
$ 15,917 $ 469 $ 16,386
U.S. government obligations are rated AA+ or Aaa by the major rating agencies. Approximately 93% of all foreigngovernment obligations were rated AA or higher by at least one of the major rating agencies. Foreign government securitiesinclude obligations issued or unconditionally guaranteed by national or provincial government entities.
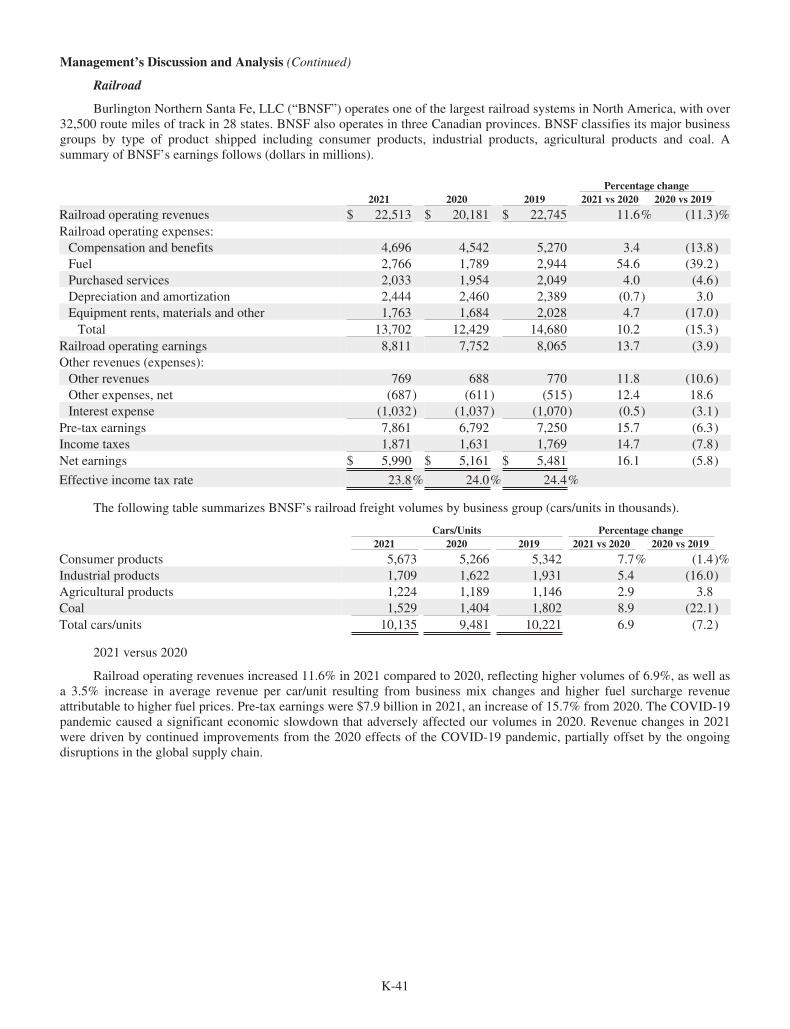
K-41
Management’s Discussion and Analysis (Continued)
Railroad
Burlington Northern Santa Fe, LLC (“BNSF”) operates one of the largest railroad systems in North America, with over32,500 route miles of track in 28 states. BNSF also operates in three Canadian provinces. BNSF classifies its major businessgroups by type of product shipped including consumer products, industrial products, agricultural products and coal. Asummary of BNSF’s earnings follows (dollars in millions).
Percentage change2021 2020 2019 2021 vs 2020 2020 vs 2019
Railroad operating revenues $ 22,513 $ 20,181 $ 22,745 11.6% (11.3)%Railroad operating expenses:Compensation and benefits 4,696 4,542 5,270 3.4 (13.8)Fuel 2,766 1,789 2,944 54.6 (39.2)Purchased services 2,033 1,954 2,049 4.0 (4.6)Depreciation and amortization 2,444 2,460 2,389 (0.7) 3.0Equipment rents, materials and other 1,763 1,684 2,028 4.7 (17.0)Total 13,702 12,429 14,680 10.2 (15.3)
Railroad operating earnings 8,811 7,752 8,065 13.7 (3.9)Other revenues (expenses):Other revenues 769 688 770 11.8 (10.6)Other expenses, net (687) (611) (515) 12.4 18.6Interest expense (1,032) (1,037) (1,070) (0.5) (3.1)
Pre-tax earnings 7,861 6,792 7,250 15.7 (6.3)Income taxes 1,871 1,631 1,769 14.7 (7.8)Net earnings $ 5,990 $ 5,161 $ 5,481 16.1 (5.8)
Effective income tax rate 23.8% 24.0% 24.4%
The following table summarizes BNSF’s railroad freight volumes by business group (cars/units in thousands).
Cars/Units Percentage change2021 2020 2019 2021 vs 2020 2020 vs 2019
Consumer products 5,673 5,266 5,342 7.7% (1.4)%Industrial products 1,709 1,622 1,931 5.4 (16.0)Agricultural products 1,224 1,189 1,146 2.9 3.8Coal 1,529 1,404 1,802 8.9 (22.1)Total cars/units 10,135 9,481 10,221 6.9 (7.2)
2021 versus 2020
Railroad operating revenues increased 11.6% in 2021 compared to 2020, reflecting higher volumes of 6.9%, as well asa 3.5% increase in average revenue per car/unit resulting from business mix changes and higher fuel surcharge revenueattributable to higher fuel prices. Pre-tax earnings were $7.9 billion in 2021, an increase of 15.7% from 2020. The COVID-19pandemic caused a significant economic slowdown that adversely affected our volumes in 2020. Revenue changes in 2021were driven by continued improvements from the 2020 effects of the COVID-19 pandemic, partially offset by the ongoingdisruptions in the global supply chain.
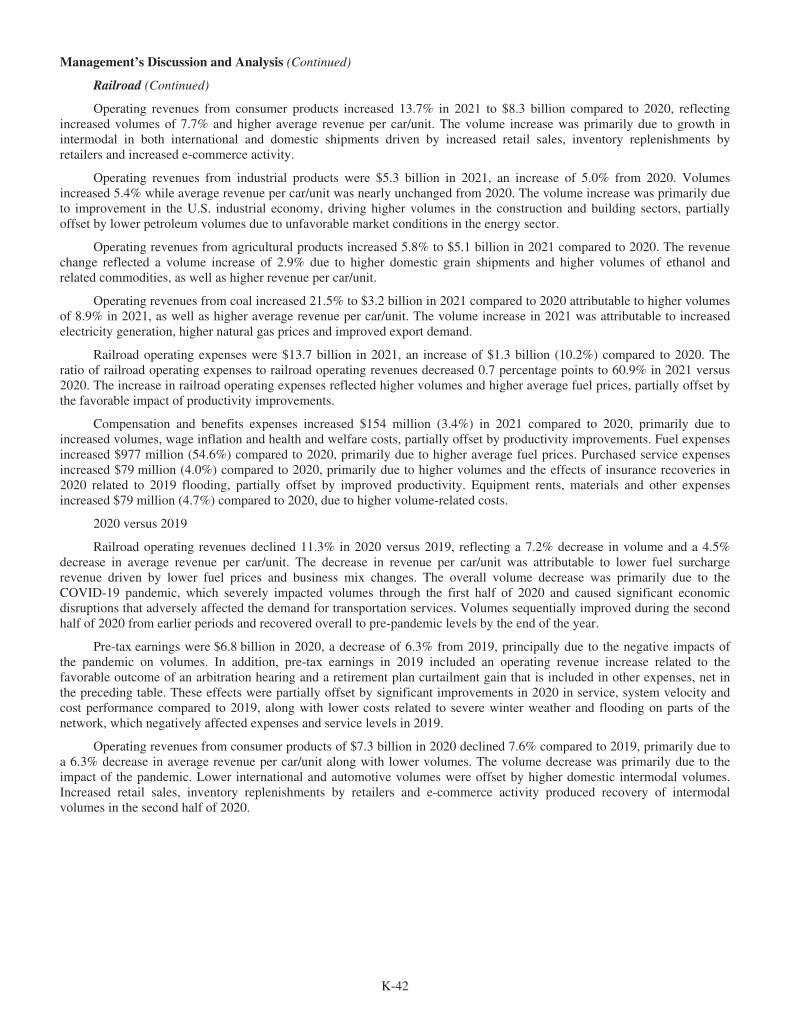
K-42
Management’s Discussion and Analysis (Continued)
Railroad (Continued)
Operating revenues from consumer products increased 13.7% in 2021 to $8.3 billion compared to 2020, reflectingincreased volumes of 7.7% and higher average revenue per car/unit. The volume increase was primarily due to growth inintermodal in both international and domestic shipments driven by increased retail sales, inventory replenishments byretailers and increased e-commerce activity.
Operating revenues from industrial products were $5.3 billion in 2021, an increase of 5.0% from 2020. Volumesincreased 5.4% while average revenue per car/unit was nearly unchanged from 2020. The volume increase was primarily dueto improvement in the U.S. industrial economy, driving higher volumes in the construction and building sectors, partiallyoffset by lower petroleum volumes due to unfavorable market conditions in the energy sector.
Operating revenues from agricultural products increased 5.8% to $5.1 billion in 2021 compared to 2020. The revenuechange reflected a volume increase of 2.9% due to higher domestic grain shipments and higher volumes of ethanol andrelated commodities, as well as higher revenue per car/unit.
Operating revenues from coal increased 21.5% to $3.2 billion in 2021 compared to 2020 attributable to higher volumesof 8.9% in 2021, as well as higher average revenue per car/unit. The volume increase in 2021 was attributable to increasedelectricity generation, higher natural gas prices and improved export demand.
Railroad operating expenses were $13.7 billion in 2021, an increase of $1.3 billion (10.2%) compared to 2020. Theratio of railroad operating expenses to railroad operating revenues decreased 0.7 percentage points to 60.9% in 2021 versus2020. The increase in railroad operating expenses reflected higher volumes and higher average fuel prices, partially offset bythe favorable impact of productivity improvements.
Compensation and benefits expenses increased $154 million (3.4%) in 2021 compared to 2020, primarily due toincreased volumes, wage inflation and health and welfare costs, partially offset by productivity improvements. Fuel expensesincreased $977 million (54.6%) compared to 2020, primarily due to higher average fuel prices. Purchased service expensesincreased $79 million (4.0%) compared to 2020, primarily due to higher volumes and the effects of insurance recoveries in2020 related to 2019 flooding, partially offset by improved productivity. Equipment rents, materials and other expensesincreased $79 million (4.7%) compared to 2020, due to higher volume-related costs.
2020 versus 2019
Railroad operating revenues declined 11.3% in 2020 versus 2019, reflecting a 7.2% decrease in volume and a 4.5%decrease in average revenue per car/unit. The decrease in revenue per car/unit was attributable to lower fuel surchargerevenue driven by lower fuel prices and business mix changes. The overall volume decrease was primarily due to theCOVID-19 pandemic, which severely impacted volumes through the first half of 2020 and caused significant economicdisruptions that adversely affected the demand for transportation services. Volumes sequentially improved during the secondhalf of 2020 from earlier periods and recovered overall to pre-pandemic levels by the end of the year.
Pre-tax earnings were $6.8 billion in 2020, a decrease of 6.3% from 2019, principally due to the negative impacts ofthe pandemic on volumes. In addition, pre-tax earnings in 2019 included an operating revenue increase related to thefavorable outcome of an arbitration hearing and a retirement plan curtailment gain that is included in other expenses, net inthe preceding table. These effects were partially offset by significant improvements in 2020 in service, system velocity andcost performance compared to 2019, along with lower costs related to severe winter weather and flooding on parts of thenetwork, which negatively affected expenses and service levels in 2019.
Operating revenues from consumer products of $7.3 billion in 2020 declined 7.6% compared to 2019, primarily due toa 6.3% decrease in average revenue per car/unit along with lower volumes. The volume decrease was primarily due to theimpact of the pandemic. Lower international and automotive volumes were offset by higher domestic intermodal volumes.Increased retail sales, inventory replenishments by retailers and e-commerce activity produced recovery of intermodalvolumes in the second half of 2020.

K-43
Management’s Discussion and Analysis (Continued)
Railroad (Continued)
Operating revenues from industrial products were $5.0 billion in 2020, a decrease of 17.0% from 2019. The decreasewas primarily attributable to the decline in volume and to a lesser extent lower average revenue per car/unit. Volumesdecreased primarily due to lower U.S. industrial production driven by the pandemic, including reduced production anddemand in the energy sector, which lowered sand and petroleum products volume, and reduced steel demand, which loweredtaconite volume.
Operating revenues from agricultural products increased 2.9% to $4.8 billion in 2020 compared to 2019. The increasewas due to higher volumes, partially offset by slightly lower average revenue per car/unit. The volume increase was primarilydue to higher grain and meal exports, partially offset by lower ethanol and sweeteners shipments.
Operating revenues from coal decreased 28.5% to $2.7 billion in 2020 compared to 2019. This decrease was primarilydue to lower volumes, as well as lower revenues per car/unit. Volumes decreased primarily due to lower natural gas prices,lower electricity demand driven by the pandemic, utility coal plant retirements and mild temperatures.
Railroad operating expenses declined 15.3% to $12.4 billion in 2020 as compared to 2019. The ratio of railroadoperating expenses to railroad operating revenues declined 2.9 percentage points to 61.6% in 2020 versus 2019. Railroadoperating expenses in 2020 reflected lower volume-related costs, productivity improvements, the effects of cost controlinitiatives and improved weather conditions compared to 2019.
Compensation and benefits expenses decreased $728 million (13.8%) in 2020 compared to 2019, primarily due tolower employee counts associated with lower volume and improved workforce productivity. Fuel expenses decreased $1.2billion (39.2%) compared to 2019, primarily due to lower average fuel prices, lower volumes and improved fuel efficiency.Purchased services expense declined $95 million (4.6%) compared to 2019. The decrease was primarily due to lower volume,improved productivity and higher insurance recoveries in 2020 related to network flooding in 2019. Equipment rents,materials and other expense decreased $344 million (17.0%) compared to 2019, primarily due to lower volume-related costs,the effects of cost controls and lower personal injury and derailment expenses.
Utilities and Energy
We currently own a 91.1% ownership interest in Berkshire Hathaway Energy Company (“BHE”), which operates aglobal energy business. BHE’s domestic regulated utility interests include PacifiCorp, MidAmerican Energy Company(“MEC”) and NV Energy. BHE subsidiaries also operate two regulated electricity distribution businesses referred to asNorthern Powergrid in Great Britain. BHE’s natural gas pipelines consist of five domestic regulated interstate natural gaspipeline systems and a 25% interest in a liquefied natural gas export, import and storage facility (“LNG interest”), whichBHE operates and consolidates for financial reporting purposes. Three of the natural gas pipeline systems and the LNGinterest were acquired on November 1, 2020 from Dominion Energy, Inc. (“BHE GT&S”). Other energy businesses include aregulated electricity transmission-only business in Alberta, Canada (“AltaLink, L.P.”) and a diversified portfolio of mostlyrenewable independent power projects and investments. BHE also operates the largest residential real estate brokerage firmand one of the largest residential real estate brokerage franchise networks in the United States.

K-44
Management’s Discussion and Analysis (Continued)
Utilities and Energy (Continued)
The rates our regulated businesses charge customers for energy and services are based in large part on the costs ofbusiness operations, including income taxes and a return on capital, and are subject to regulatory approval. To the extent suchcosts are not allowed in the approved rates, operating results will be adversely affected. A summary of BHE’s net earningsfollows (dollars in millions).
2021 2020 2019
Revenues:Energy operating revenue $ 18,935 $ 15,556 $ 15,371Real estate operating revenue 6,215 5,396 4,473Other income (loss) (163) 79 270Total revenue 24,987 21,031 20,114
Costs and expense:Energy cost of sales 5,504 4,187 4,586Energy operating expense 8,535 7,539 6,824Real estate operating costs and expense 5,710 4,885 4,251Interest expense 2,054 1,941 1,835Total costs and expense 21,803 18,552 17,496
Pre-tax earnings 3,184 2,479 2,618Income tax expense (benefit)* (1,177) (1,010) (526)Net earnings after income taxes 4,361 3,489 3,144Noncontrolling interests of BHE subsidiaries 399 71 18Net earnings attributable to BHE 3,962 3,418 3,126Noncontrolling interests and preferred stock dividends 467 327 286Net earnings attributable to Berkshire Hathaway shareholders $ 3,495 $ 3,091 $ 2,840
Effective income tax rate (37.0)% (40.7)% (20.1)%
* Includes significant production tax credits from wind-powered electricity generation.
The discussion of BHE’s operating results that follows is based on after-tax earnings, reflecting how the energybusinesses are managed and evaluated. A summary of net earnings attributable to BHE follows (dollars in millions).
Percentage change2021 2020 2019 2021 vs 2020 2020 vs 2019
PacifiCorp $ 889 $ 741 $ 773 20.0% (4.1)%MidAmerican Energy Company 883 818 781 7.9 4.7NV Energy 439 410 365 7.1 12.3Northern Powergrid 247 201 256 22.9 (21.5)Natural gas pipelines 774 528 422 46.6 25.1Other energy businesses 680 697 608 (2.4) 14.6Real estate brokerage 387 375 160 3.2 134.4Corporate interest and other (337) (352) (239) (4.3) 47.3
$ 3,962 $ 3,418 $ 3,126 15.9 9.3
2021 versus 2020
PacifiCorp operates a regulated electric utility in portions of several Western states, including Utah, Oregon andWyoming. After-tax earnings increased $148 million in 2021 compared to 2020. The increase reflected higher utility margin(operating revenue less cost of sales) and increased income tax benefits from the impacts of ratemaking as well as higherproduction tax credits recognized on new wind-powered generating facilities placed in-service. The earnings increase waspartially offset by lower allowances for equity and borrowed funds used during construction and higher operating expenses.Operating expenses in 2021 reflected increased depreciation expense from the impacts of a deprecation study effectiveJanuary 1, 2021, and incremental costs associated with wind-powered generating facilities placed in-service, offset by lowercosts associated with wildfires and a settlement agreement.

K-45
Management’s Discussion and Analysis (Continued)
Utilities and Energy (Continued)
PacifiCorp utility margin was $3.5 billion in 2021, an increase of $145 million compared to 2020. The increasereflected higher retail revenue from increases in customer volumes and higher wholesale and other revenue, partially offsetby higher thermal generation and purchased power costs. Retail customer volumes increased 3.1% in 2021 as compared to2020, primarily due to higher customer usage, an increase in the average number of customers and the favorable impacts ofweather.
MEC operates a regulated electric and natural gas utility primarily in Iowa and Illinois. After-tax earnings increased$65 million in 2021 compared to 2020. The increase reflected higher electric utility margin and increased income taxbenefits, partly offset by higher operating expenses. The increase in operating expenses included incremental costs associatedwith wind-powered generating facilities placed in-service and higher natural gas distribution costs, partially offset by lowerstorm restoration costs. The income tax benefit increases were mainly due to higher production tax credits recognized on newwind-powered generating facilities placed in-service, partially offset by the impacts of ratemaking.
MEC electric utility margin increased $190 million to $2.0 billion in 2021 compared to 2020. The electric utilitymargin increase was attributable to higher operating revenue from increases in retail and wholesale customer volumes, aswell as favorable wholesale prices, partially offset by higher thermal generation and purchased power costs. Electric retailcustomer volumes increased 5.8% in 2021 as compared to 2020, primarily due to increased usage by certain industrialcustomers and the favorable impacts of weather.
NV Energy operates regulated electric and natural gas utilities in Nevada. After-tax earnings increased $29 million in2021 compared to 2020. The increase reflected lower operating expenses, lower net interest and finance expense and lowerincome tax expense from the impacts of ratemaking, partially offset by lower electric utility margin. The decreases inoperating expenses were mainly due to lower earnings sharing, partially offset by higher depreciation expense fromadditional assets placed in-service.
NV Energy’s electric utility margin decreased $97 million to $1.6 billion in 2021 compared to 2020. The decrease wasprimarily due to revenue reductions from lower base tariff general rates in 2021 and a favorable regulatory decision in 2020,partially offset by a 3.3% increase in electric retail customer volumes. The increase in electric retail customer volumes wasprimarily due to an increase in the average number of customers, higher customer usage and the favorable impacts ofweather.
Northern Powergrid’s after-tax earnings increased $46 million in 2021 compared to 2020. The increase reflected highertariff rates and units distributed, lower write-offs of gas exploration costs, lower pension expense and favorable foreigncurrency exchange rate movements in 2021, partially offset by the impact of increases in the United Kingdom corporateincome tax rate. Earnings in 2021 included deferred income tax expense of $109 million related to the enactment in June2021 of an increase in the income tax rate from 19% to 25%, effective April 1, 2023. Earnings in 2020 included deferredincome tax expense of $35 million related to the enactment in July 2020 of an increase in the income tax rate from 17% to19%, effective April 1, 2020.
Natural gas pipelines’ after-tax earnings increased $246 million in 2021 compared to 2020. Earnings in 2021 includedBHE GT&S for the full year compared to two months in 2020. The incremental earnings in 2021 from BHE GT&S were$211 million. In addition, earnings in 2021 reflected the effects of higher margins on natural gas sales and highertransportation revenue at Northern Natural Gas due to increased demand from the February 2021 winter storms, partiallyoffset by lower transportation revenue primarily due to lower volumes for the remainder of the year.
Other energy businesses’ after-tax earnings in 2021 decreased $17 million compared to 2020. The decrease was mainlydue to a decline in wind tax equity investment earnings of $56 million, which included increased losses from pre-existing taxequity investments of $165 million, largely attributable to the February 2021 winter storms, partially offset by increasedincome tax benefits from projects reaching commercial operation over the past twelve months. Earnings in 2021 from otherenergy projects increased due to higher operating revenue from owned renewable energy projects and a transmissioninvestment, as well as favorable foreign currency exchange rate movements in 2021.
Real estate brokerage after-tax earnings increased $12 million in 2021 compared to 2020. The increase was due to acomparative increase in closed brokerage transaction volumes in 2021, partially offset by lower funded mortgage volume dueto a decrease in refinance activity.
Corporate interest and other after-tax earnings increased $15 million in 2021 compared to 2020. The increase wasprimarily due to favorable comparative state income tax benefits and higher earnings from non-regulated energy services,offset by higher operating expenses and higher interest expense from corporate debt issued in 2020.
K-46
Management’s Discussion and Analysis (Continued)
Utilities and Energy (Continued)
2020 versus 2019
PacifiCorp after-tax earnings decreased $32 million in 2020 compared to 2019. The decrease reflected higher operatingexpenses and net interest expense, partially offset by increased production tax credit benefits driven by repowered windprojects placed in-service, higher utility margin and higher other income. The increase in operating expenses was largely dueto costs associated with wildfires, a settlement agreement and pension benefits.
PacifiCorp utility margin was $3.3 billion in 2020, an increase of $47 million compared to 2019. The increase reflectedhigher operating revenue from an increase in average retail prices and lower generation and purchased power costs, partiallyoffset by lower operating revenue from a decline in retail customer volumes. The decline in retail customer volumes was dueto the impacts of the pandemic, partly offset by an increase in the average number of customers and the favorable impacts ofweather.
MEC after-tax earnings increased $37 million in 2020 compared to 2019. The increase reflected increased income taxbenefits, primarily from production tax credits, driven by repowered and new wind projects placed in-service, and the effectsof ratemaking. These effects were partially offset by higher depreciation expense from additional assets placed in-service,higher net interest expense, lower other income and lower electric and natural gas utility margins.
MEC electric utility margin decreased $10 million to $1.8 billion in 2020 compared to 2019. The electric utility margindecrease was attributable to lower operating revenue from unfavorable wholesale prices and price impacts from changes inretail sales mix. These effects were mostly offset by lower generation and purchased power costs and higher operatingrevenue from a 1.2% increase in retail customer volumes. The increase in electric retail customer volumes was primarily dueto increased usage by certain industrial customers, partially offset by the impacts of the pandemic. Natural gas utility margindecreased $9 million in 2020 compared to 2019, due to the unfavorable impacts of weather.
NV Energy after-tax earnings increased $45 million in 2020 compared to 2019. The increase reflected higher electricutility margin and lower income tax expense from the favorable impacts of ratemaking, partially offset by higher operatingexpenses. The increase in operating expenses was mainly due to higher earnings sharing accruals for customers at NevadaPower Company and higher depreciation expense from additional assets placed in-service.
NV Energy electric utility margin increased $100 million to $1.7 billion in 2020 compared to 2019. The increase wasprimarily due to higher operating revenue from a 1.5% increase in electric retail customer volumes, including distribution-only service customers and price impacts from changes in retail sales mix. The increase in electric retail customer volumeswas primarily due to the favorable impacts of weather, partially offset by the impacts of the pandemic.
Northern Powergrid after-tax earnings decreased $55 million in 2020 compared to 2019. The earnings decreasereflected write-offs of gas exploration costs and higher income tax expense, in large part from a change in the UnitedKingdom corporate income tax rate, partially offset by lower pension costs and interest expense.
Natural gas pipelines after-tax earnings increased $106 million in 2020 compared to 2019. The increase was primarilydue to $73 million of earnings from BHE GT&S, the favorable impact of a rate case settlement at Northern Natural Gas andhigher transportation volume and rates, partially offset by higher depreciation, operating expenses and interest expenses.
Other energy business after-tax earnings in 2020 increased $89 million compared to 2019. The increase was primarilydue to increased income tax benefits from renewable wind tax equity investments, largely from projects reaching commercialoperation, partially offset by lower operating revenue and higher operating expenses from geothermal and natural gas units.
Real estate brokerage after-tax earnings increased $215 million in 2020 compared to 2019. The increase reflectedhigher earnings from mortgage and brokerage services. The increase in earnings from mortgage services was attributable tohigher refinance activity from the favorable interest rate environment and the earnings increase from brokerage services wasdue to an increase of 13.1% in closed transaction dollar volume.
Corporate interest and other after-tax earnings decreased $113 million in 2020 compared to 2019. The decline wasprimarily due to higher interest expense and lower state income tax benefits.

K-47
Management’s Discussion and Analysis (Continued)
Manufacturing, Service and Retailing
A summary of revenues and earnings of our manufacturing, service and retailing businesses follows (dollars inmillions).
Percentage change2021 2020 2019 2021 vs 2020 2020 vs 2019
RevenuesManufacturing $ 68,730 $ 59,079 $ 62,730 16.3% (5.8)%Service and retailing 84,282 75,018 79,945 12.3 (6.2)
$ 153,012 $ 134,097 $ 142,675 14.1 (6.0)
Pre-tax earningsManufacturing $ 9,841 $ 8,010 $ 9,522 22.9% (15.9)%Service and retailing 4,711 2,879 2,843 63.6 1.3
14,552 10,889 12,365 33.6 (11.9)Income taxes and noncontrolling interests 3,432 2,589 2,993Net earnings* $ 11,120 $ 8,300 $ 9,372
Effective income tax rate 23.0% 23.3% 23.7%
Pre-tax earnings as a percentage of revenues 9.5% 8.1% 8.7%
* Excludes certain acquisition accounting expenses, which primarily related to the amortization of identified intangibleassets recorded in connection with our business acquisitions. The after-tax acquisition accounting expenses excludedfrom earnings above were $690 million in 2021, $783 million in 2020 and $788 million in 2019. In 2020, net earningsalso excluded after-tax goodwill and indefinite-lived intangible asset impairment charges of $10.4 billion. Theseexpenses are included in “Other” in the summary of earnings on page K-32 and in the “Other Berkshire corporate”earnings section on page K-56.
Manufacturing
Our manufacturing group includes a variety of industrial, building and consumer products businesses. A summary ofrevenues and pre-tax earnings of our manufacturing operations follows (dollars in millions).
Percentage change2021 2020 2019 2021 vs 2020 2020 vs 2019
RevenuesIndustrial products $ 28,176 $ 25,667 $ 30,594 9.8% (16.1)%Building products 24,974 21,244 20,327 17.6 4.5Consumer products 15,580 12,168 11,809 28.0 3.0
$ 68,730 $ 59,079 $ 62,730
Pretax earningsIndustrial products $ 4,469 $ 3,755 $ 5,635 19.0% (33.4)%Building products 3,390 2,858 2,636 18.6 8.4Consumer products 1,982 1,397 1,251 41.9 11.7
$ 9,841 $ 8,010 $ 9,522
Pre-tax earnings as a percentage of revenuesIndustrial products 15.9% 14.6% 18.4%Building products 13.6% 13.5% 13.0%Consumer products 12.7% 11.5% 10.6%

K-48
Management’s Discussion and Analysis (Continued)
Manufacturing, Service and Retailing (Continued)
Industrial products
The industrial products group includes metal products for aerospace, power and general industrial markets (PrecisionCastparts Corp. (“PCC”)), specialty chemicals (The Lubrizol Corporation (“Lubrizol”)), metal cutting tools/systems (IMCInternational Metalworking Companies (“IMC”)), and Marmon, which consists of more than 100 autonomous manufacturingand service businesses, internally aggregated into eleven groups, and includes equipment leasing for the rail, intermodal tankcontainer and mobile crane industries. The industrial products group also includes equipment and systems for the livestockand agricultural industries (CTB International) and a variety of industrial products for diverse markets (Scott Fetzer andLiquidPower Specialty Products).
2021 versus 2020
Revenues of the industrial products group in 2021 increased $2.5 billion (9.8%) from 2020. Pre-tax earnings increased$714 million (19.0%) compared to 2020 and pre-tax earnings as a percentage of revenues in 2021 was 15.9%, an increase of1.3 percentage points compared 2020.
PCC’s revenues were $6.5 billion in 2021, a decrease of $853 million (11.6%) compared to 2020. Historically, PCChas derived significant revenues and earnings from aerospace products. The COVID-19 pandemic contributed to materialdeclines in commercial air travel and original equipment manufacturing (“OEM”) aircraft production in 2021 and 2020.While commercial air travel increased in both the U.S. and international markets in 2021 versus 2020, demand remains wellbelow pre-pandemic levels, especially for international routes. Long-term industry forecasts continue to show growth andstrong demand for travel, however, the recovery has been uneven between domestic and international markets. Air trafficrecovery will continue to be impacted by the pandemic, though likely more on a seasonal or localized basis as the pandemicshifts to an endemic phase. Near term recovery in build rates will lag recovery in air travel due to the significant finishedgoods inventory following quality issues with the Boeing 737 and Boeing 787 planes and industry supply chain issues.
PCC’s pre-tax earnings in 2021 were $1.2 billion, an increase of 78.8% compared to 2020. The increase reflects theactions taken by management to resize, restructure and improve operations and to prepare for more normalized demand forPCC’s products, as well as from a decline in restructuring costs. We do not expect significant increases in PCC’s aerospacerevenues or earnings to occur in the near term, primarily due to the relatively low aircraft build rates related to Boeing’ssignificant inventory levels and the ongoing impact of the COVID-19 pandemic on commercial air travel.
Lubrizol’s revenues were $6.5 billion in 2021, an increase of 8.6% compared to 2020. The increase reflects higheraverage selling prices, driven by significant increases in materials and other manufacturing costs, as well as slightly highervolumes. Sales volumes in the Additives product lines were negatively affected by severe winter storms in February 2021,which caused the temporary shut-down of several U.S. facilities, as well as other temporary production shut-downs in thesecond half of 2021.
Lubrizol’s pre-tax earnings in 2021 decreased 50.8% compared to 2020. Earnings in 2021 included significant lossesrelated to a fire in June 2021 at a facility of Chemtool Incorporated, a Lubrizol subsidiary, located in Rockton, Illinois andimpairment charges in the second half of 2021 related to an underperforming business in the Advanced Materials productlines. These losses and charges aggregated $257 million in 2021. Earnings in 2021 were also negatively impacted by theeffects of accelerating raw material costs and the previously mentioned temporary shut-down of Additives productionfacilities, which resulted in lost sales and incremental manufacturing costs.
Marmon’s revenues were $9.8 billion in 2021, an increase of $2.1 billion (27.9%) compared to 2020. Revenues in 2021from the Electrical, Metal Services and Plumbing & Refrigeration groups increased 54% over 2020, accounting for over halfof the aggregate increase in Marmon’s revenues. These increases were attributable to higher volumes and prices, includingthe impact of significantly higher average copper and metal prices. Revenues of most of Marmon’s other groups, particularlythose serving the construction, automotive, heavy-duty truck and restaurant markets, also increased in 2021, reflecting highervolumes and favorable foreign currency translation effects. These increases were partially offset by the impact of divestituresand business closures in the Water Technologies and Retail Solutions groups and lower lease revenues in the Rail & Leasinggroup, reflecting fewer railcars on lease and changes in lease mix.
Marmon’s pre-tax earnings in 2021 increased 40.3% compared to 2020. The increase was primarily due to earningsincreases in the Electrical, Metal Services and Plumbing & Refrigeration groups due to higher volumes and average margins.Earnings of several other business groups also increased attributable to higher sales volumes, sales mix changes and lowerrestructuring charges, which were partially offset by lower earnings from the Rail & Leasing and Water Technologies groups.

K-49
Management’s Discussion and Analysis (Continued)
Manufacturing, Service and Retailing (Continued)
Industrial products (Continued)
IMC’s revenues increased 19.5% in 2021 compared to 2020, reflecting improving business conditions in mostgeographic regions and favorable foreign currency translation effects. IMC’s pre-tax earnings increased 47.7% in 2021 versus2020, primarily attributable to higher customer demand, improved manufacturing efficiencies, operating cost managementsaving initiatives and favorable foreign currency translation effects.
2020 versus 2019
Revenues of the industrial products group in 2020 declined $4.9 billion (16.1%) from 2019, while pre-tax earningsdeclined $1.9 billion (33.4%). Pre-tax earnings as a percentage of revenues for the group was 14.6% in 2020 compared to18.4% in 2019.
PCC’s revenues were $7.3 billion in 2020, a decrease of $3.0 billion (28.9%) compared to 2019. The COVID-19pandemic contributed to material declines in commercial air travel and aircraft production. Airlines responded to thepandemic by delaying delivery of aircraft orders or, in some cases, cancelling aircraft orders, resulting in significantreductions in build rates by aircraft manufacturers and significant inventory reduction initiatives by PCC’s customers.Further, Boeing’s 737 MAX aircraft production issues contributed to the declines in aerospace product sales across theindustry in 2020. These factors resulted in significant declines in demand for PCC’s aerospace products in 2020. PCC’s salesof products for power markets increased 2.2% in 2020, primarily driven by increases in industrial gas turbine products, offsetby reductions in oil and gas products.
PCC’s pre-tax earnings were $650 million in 2020, a decrease of 64.5% compared to 2019, which reflected the declinein aerospace product sales as well as increased manufacturing inefficiencies attributable to lower volumes. In response to theeffects of the pandemic, PCC took aggressive restructuring actions to resize operations in response to reduced expectedvolumes in aerospace markets. PCC’s worldwide workforce was reduced by about 40% from the end of 2019. PCC recordedrestructuring, inventory and fixed asset charges of approximately $295 million in 2020. Earnings as a percentage of revenueswere negatively impacted in 2020 due to inefficiencies associated with aligning operations to reduced aircraft build rates.
Lubrizol’s revenues were $5.95 billion in 2020, a decrease of 8.0% compared to 2019. The decline was primarilyattributable to lower volumes from economic effects of the pandemic and a fire at an Additives manufacturing, blending andstorage facility in Rouen, France at the end of the third quarter of 2019, which resulted in the temporary suspension ofoperations. Revenues in 2020 also reflected lower selling prices, partly offset by favorable changes in sales mix. Lubrizol’sconsolidated volume for the year declined 9% in 2020 compared to 2019 due to declines in the Additives and EngineeredMaterials product lines, partly offset by higher volumes in Life Science products.
Lubrizol’s pre-tax earnings in 2020 were approximately $1.0 billion, essentially unchanged compared to 2019. Theeffects of lower sales volumes, including the effects from the Rouen fire, and lower average selling prices were offset bylower average raw material costs, lower operating expenses and insurance recoveries in 2020 associated with the Rouen fire.
Marmon’s revenues were $7.6 billion in 2020, a decrease of $681 million (8.2%) compared to 2019. Excluding theeffects of business acquisitions, revenues decreased in essentially all groups, primarily attributable to lower demand from theeffects of the pandemic. The largest effects were experienced in the Transportation Products and Foodservice Technologiesgroups. Additionally, revenues decreased due to lower metal prices in the Metal Services group and the effect of businessdivestitures in 2019. Declines in oil prices in 2020 also adversely affected demand and revenues in the Rail & Leasing andCrane Services groups. Marmon acquired the Colson Medical companies on October 31, 2019, which represents Marmon’sMedical group.
Marmon’s pre-tax earnings in 2020 decreased $312 million (24.3%) compared to 2019. The decrease reflected thedeclines in revenues and increased restructuring charges. Restructuring initiatives were initiated in response to the lowerproduct demand, particularly in the sectors most impacted by the pandemic.

K-50
Management’s Discussion and Analysis (Continued)
Manufacturing, Service and Retailing (Continued)
Industrial products (Continued)
IMC’s revenues declined 13.2% in 2020 compared to 2019, reflecting negative economic effects from the pandemic ondemand for cutting tools in most geographic regions, partly offset by the effects of business acquisitions. IMC’s pre-taxearnings declined 26.6% in 2020 versus 2019, attributable to declines in sales and margins due to lower volumes and tochanges in sales mix.
Building products
The building products group includes manufactured and site-built home construction and related lending and financialservices (Clayton Homes), flooring (Shaw), insulation, roofing and engineered products (Johns Manville), bricks andmasonry products (Acme Building Brands), paint and coatings (Benjamin Moore) and residential and commercialconstruction and engineering products and systems (MiTek).
2021 versus 2020
Revenues of the building products group increased $3.7 billion (17.6%) in 2021 and pre-tax earnings increased $532million (18.6%) compared to 2020. Pre-tax earnings as percentages of revenues were 13.6% in 2021 and 13.5% in 2020.During 2021, our businesses experienced strong customer demand and higher sales volumes. We also experienced variousforms of supply chain disruptions, which affected the general economy, and contributed to considerable raw material andlogistics cost inflation and supply constraints.
Clayton Homes’ revenues were approximately $10.5 billion in 2021, an increase of $1.9 billion (22.2%) over 2020.Revenues from home sales increased $1.8 billion (26.5%) in 2021 to approximately $8.3 billion, reflecting increased revenueper home sold, changes in sales mix and a net increase in new units sold. Unit sales of site-built homes increased 15.8% in2021, while factory-built manufactured home unit sales increased 1.5%. Site-built home unit sales were constrained by longerconstruction periods arising from supply chain constraints and labor shortages. Financial services revenues, which includemortgage origination and services, insurance and interest income from lending activities, increased 7.8% in 2021 comparedto 2020. Loan balances, net of allowances for credit losses, were approximately $18.8 billion as of December 31, 2021, anincrease of approximately $1.7 billion compared to December 31, 2020.
Pre-tax earnings of Clayton Homes were approximately $1.7 billion in 2021, an increase of $440 million (35.3%)compared to 2020. Earnings in 2021 reflected higher earnings from home sales, mortgage originations, net interest incomeand lower provisions for expected credit losses, partially offset by the impact of rising manufacturing and supply chain costs.The provision for expected credit losses in 2020 was unusually high and included provisions for the expected impact of theCOVID-19 pandemic. The comparative decline in the provision for expected credit losses was due to fewer actual andanticipated loan foreclosures.
Aggregate revenues of our other building products businesses were approximately $14.5 billion in 2021, an increase of14.4% versus 2020. The increase was primarily due to higher average selling prices driven by significantly higher input andsupply chain costs, as well as higher unit volumes for paint and coatings, flooring, insulation, roofing and other engineeredproducts.
Pre-tax earnings of the other building products businesses were approximately $1.7 billion in 2021, an increase of 5.7%over 2020. Pre-tax earnings as a percentage of revenues was 11.8% in 2021, a 1.0 percentage point decrease compared to2020. While customer demand in 2021 was generally strong, reduced availability of materials and other product inputs fromsupply chain disruptions negatively affected sales and operating results. In addition, higher costs for raw materials and freightand higher restructuring and impairment charges contributed to the reduction in our pre-tax margin rates.
2020 versus 2019
Revenues of the building products group increased $917 million (4.5%) in 2020 compared to 2019 and pre-tax earningsincreased $222 million (8.4%) over 2019. Pre-tax earnings as percentages of revenues were 13.5% in 2020 and 13.0% in2019.

K-51
Management’s Discussion and Analysis (Continued)
Manufacturing, Service and Retailing (Continued)
Building products (Continued)
Clayton Homes’ revenues were approximately $8.6 billion in 2020, an increase of $1.3 billion (17.1%) over 2019. Theincrease was primarily due to increases in home sales of $1.0 billion (18.4%), driven by increases in units sold and revenueper home sold and by changes in sales mix. Unit sales of site-built homes increased 28.6% in 2020 over 2019, while revenueper home increased slightly. Manufactured home unit sales increased 2.8% in 2020. Financial services revenues increased13.7% in 2020 compared to 2019, attributable to increased loan originations and average outstanding loan balances. Loanbalances, net of allowances for credit losses, were approximately $17.1 billion at December 31, 2020 compared to$15.9 billion as of December 31, 2019.
Pre-tax earnings of Clayton Homes were approximately $1.25 billion in 2020, an increase of $152 million (13.9%)compared to 2019. The earnings increase reflected higher earnings from home sales, partly offset by higher materials costs,which lowered manufactured housing gross margin rates. Earnings in 2020 also benefitted from increased interest income,lower interest expense and higher earnings from mortgage services, partly offset by increased provisions for credit andinsurance losses.
Aggregate revenues of our other building products businesses were approximately $12.6 billion in 2020, a decrease of2.6% versus 2019. The revenue decrease reflected lower flooring volumes, in part attributable to the negative effects of theCOVID-19 pandemic, partially offset by increased paint and coatings volumes, including volumes from a new agreementwith Ace Hardware Stores, and increased volumes in residential markets.
Pre-tax earnings of the other building products businesses were approximately $1.6 billion in 2020, an increase of 4.6%over 2019. The earnings increase reflected the effects of lower average input costs, operating cost containment efforts andlower facilities closure costs.
Consumer products
The consumer products group includes leisure vehicles (Forest River), several apparel and footwear operations(including Fruit of the Loom, Garan, H.H. Brown Shoe Group and Brooks Sports) and a manufacturer of high-performancealkaline batteries (Duracell). This group also includes custom picture framing products (Larson-Juhl) and jewelry products(Richline).
2021 versus 2020
Consumer products revenues increased $3.4 billion (28.0%) in 2021 versus 2020. Revenues from Forest Riverincreased 40.2% in 2021 compared to 2020, driven by a 27.6% increase in recreational vehicle unit sales and higher averageselling prices, primarily due to significant increases in manufacturing costs.
Revenues of several of our other consumer products businesses were significantly higher in 2021 as compared to 2020.The initial impacts of the pandemic in the first half of 2020 from temporary retail store closures and reduced demand had asevere impact on most of these businesses. Apparel and footwear revenues increased 25.3% in 2021 compared to 2020,reflecting significant increases in unit sales, partly attributable to inventory restocking by certain customers, and fromincreased consumer demand. Revenues from Richline increased 39.9%, while revenues from Duracell increased 2.4%.
Consumer products pre-tax earnings increased $585 million (41.9%) in 2021 compared to 2020 and as a percentage ofrevenues in 2021 increased 1.2 percentage points to 12.7%. The increase reflected significant earnings increases at many ofour businesses, driven by Forest River, the apparel and footwear businesses, Richline and Larson-Juhl. However, ourconsumer products businesses, particularly the apparel and footwear businesses, also experienced significant cost increasesand supply chain disruptions, causing pre-tax margins in the second half of 2021 to be 1.1 percentage points lower than in thefirst half of the year.
2020 versus 2019
Consumer products revenues increased $359 million (3.0%) in 2020 versus 2019, while pre-tax earnings increased$146 million (11.7%). Pre-tax earnings as a percentage of revenues in 2020 increased 0.9 percentage points to 11.5%.
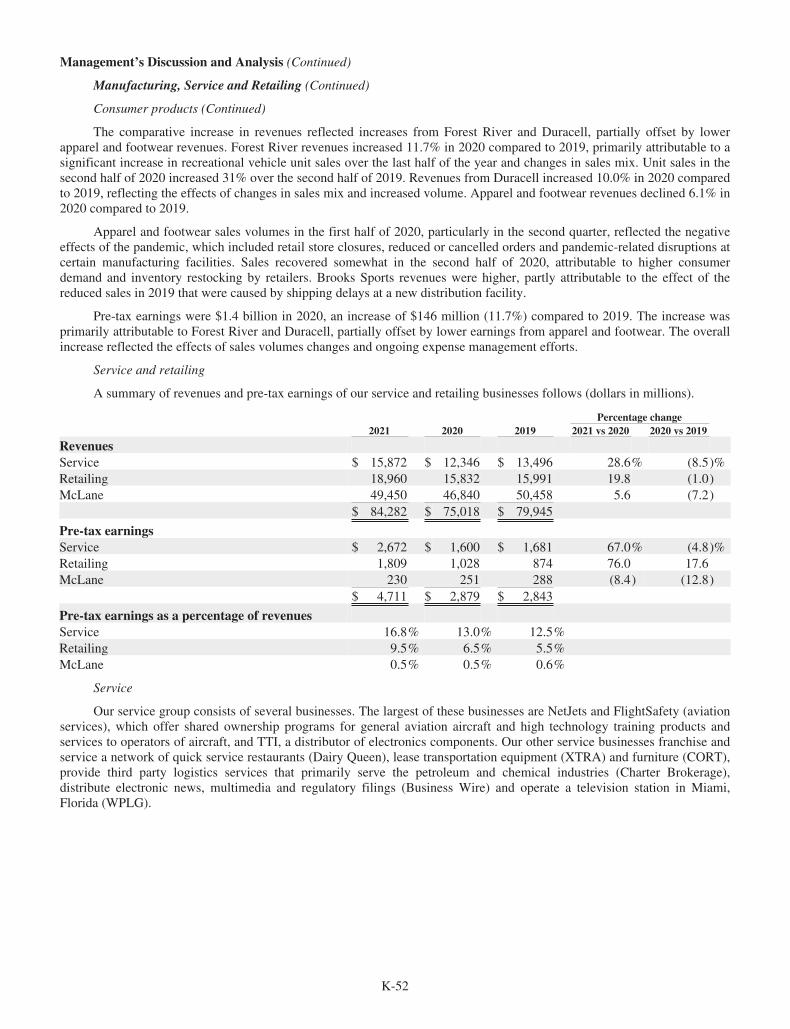
K-52
Management’s Discussion and Analysis (Continued)
Manufacturing, Service and Retailing (Continued)
Consumer products (Continued)
The comparative increase in revenues reflected increases from Forest River and Duracell, partially offset by lowerapparel and footwear revenues. Forest River revenues increased 11.7% in 2020 compared to 2019, primarily attributable to asignificant increase in recreational vehicle unit sales over the last half of the year and changes in sales mix. Unit sales in thesecond half of 2020 increased 31% over the second half of 2019. Revenues from Duracell increased 10.0% in 2020 comparedto 2019, reflecting the effects of changes in sales mix and increased volume. Apparel and footwear revenues declined 6.1% in2020 compared to 2019.
Apparel and footwear sales volumes in the first half of 2020, particularly in the second quarter, reflected the negativeeffects of the pandemic, which included retail store closures, reduced or cancelled orders and pandemic-related disruptions atcertain manufacturing facilities. Sales recovered somewhat in the second half of 2020, attributable to higher consumerdemand and inventory restocking by retailers. Brooks Sports revenues were higher, partly attributable to the effect of thereduced sales in 2019 that were caused by shipping delays at a new distribution facility.
Pre-tax earnings were $1.4 billion in 2020, an increase of $146 million (11.7%) compared to 2019. The increase wasprimarily attributable to Forest River and Duracell, partially offset by lower earnings from apparel and footwear. The overallincrease reflected the effects of sales volumes changes and ongoing expense management efforts.
Service and retailing
A summary of revenues and pre-tax earnings of our service and retailing businesses follows (dollars in millions).
Percentage change2021 2020 2019 2021 vs 2020 2020 vs 2019
RevenuesService $ 15,872 $ 12,346 $ 13,496 28.6% (8.5)%Retailing 18,960 15,832 15,991 19.8 (1.0)McLane 49,450 46,840 50,458 5.6 (7.2)
$ 84,282 $ 75,018 $ 79,945
Pre-tax earningsService $ 2,672 $ 1,600 $ 1,681 67.0% (4.8)%Retailing 1,809 1,028 874 76.0 17.6McLane 230 251 288 (8.4) (12.8)
$ 4,711 $ 2,879 $ 2,843
Pre-tax earnings as a percentage of revenuesService 16.8% 13.0% 12.5%Retailing 9.5% 6.5% 5.5%McLane 0.5% 0.5% 0.6%
Service
Our service group consists of several businesses. The largest of these businesses are NetJets and FlightSafety (aviationservices), which offer shared ownership programs for general aviation aircraft and high technology training products andservices to operators of aircraft, and TTI, a distributor of electronics components. Our other service businesses franchise andservice a network of quick service restaurants (Dairy Queen), lease transportation equipment (XTRA) and furniture (CORT),provide third party logistics services that primarily serve the petroleum and chemical industries (Charter Brokerage),distribute electronic news, multimedia and regulatory filings (Business Wire) and operate a television station in Miami,Florida (WPLG).
K-53
Management’s Discussion and Analysis (Continued)
Manufacturing, Service and Retailing (Continued)
Service (Continued)
2021 versus 2020
Service group revenues increased $3.5 billion (28.6%) in 2021 compared to 2020, primarily attributable to higherrevenues from TTI and the aviation services businesses. Revenues from TTI increased 37.4% in 2021 versus 2020, primarilyattributable to significantly higher volumes across all significant markets and product categories, and to a lesser extent,higher average prices and changes in sales mix. Customer demand accelerated throughout 2021, as customers attempted tomaintain adequate inventories in response to high demand for components in end products and effects of supply chaindisruptions. Revenues from aviation services increased 27.5% in 2021 over low 2020 levels, primarily due to higher traininghours (24%) and customer flight hours (70%).
Pre-tax earnings of our service business group increased $1.1 billion (67.0%) to $2.7 billion. Pre-tax earnings of thegroup as a percentage of revenues were 16.8% in 2021, an increase of 3.8 percentage points compared to 2020. Earnings atnearly all service businesses increased in 2021 compared to 2020, with the largest increases from TTI, the aviation servicesbusinesses and the XTRA leasing business. TTI’s earnings increase was primarily attributable to the increases in salesvolumes, as well as from improved operating cost leverage and changes in sales mix. The increase in earnings from aviationservices was attributable to the favorable effects of higher volume, changes in business mix, increased operating efficiencies,lower impairment charges and the effects of past restructuring efforts, partly offset by higher subcontractor costs attributableto the significant increase in flight demand.
2020 versus 2019
Service group revenues declined $1.15 billion (8.5%) in 2020 compared to 2019 and pre-tax earnings decreased $81million (4.8%). Pre-tax earnings of the group as a percentage of revenues were 13.0% in 2020, an increase of 0.5 percentagepoints compared to 2019.
The aggregate revenues of NetJets and FlightSafety in 2020 declined $816 million (13.5%) compared to 2019,reflecting lower demand for air travel and aviation services attributable to the COVID-19 pandemic. NetJets experienced adecline in customer flight hours of 27% and FlightSafety’s commercial and corporate simulator training hours declined 30%from 2019. The comparative service group revenue decline also reflected the disposition of the newspaper operations inMarch of 2020 and lower revenues from CORT, which was driven by lower demand attributable to the pandemic. Thesedeclines were partially offset by revenue increases from TTI and WPLG.
The decline in earnings reflected lower earnings from NetJets, TTI and CORT and the divestiture of the newspaperoperations, partly offset by higher earnings from XTRA, Business Wire, WPLG and FlightSafety. TTI’s earnings declinereflected lower average gross margin rates, attributable to product mix changes and sales price pressures deriving from ampleinventory availability. The decline at NetJets was primarily attributable to increased asset impairment charges andrestructuring costs, partly offset by lower general and administrative expenses and a slight net increase in margins. Thedecline at CORT was driven by lower revenues, partly offset by the effects of cost control initiatives. The increase atFlightSafety was attributable to the effects of contract losses of approximately $165 million recorded in 2019 with respect toan existing government contract and cost control efforts in 2020, which more than offset significantly lower earnings fromcommercial and corporate training services.
Retailing
Our largest retailing business is Berkshire Hathaway Automotive, Inc. (“BHA”), representing 62% of our combinedretailing revenue in 2021. BHA consists of over 80 auto dealerships that sell new and pre-owned automobiles and offer repairservices and related products. BHA also operates two insurance businesses, two auto auctions and an automotive fluidmaintenance products distributor. Our retailing businesses also include four home furnishings retailing businesses (NebraskaFurniture Mart, R.C. Willey, Star Furniture and Jordan’s), which sell furniture, appliances, flooring and electronics. Thehome furnishings group represented 21% of the combined retailing revenues in 2021.
Other retailing businesses include three jewelry retailing businesses (Borsheims, Helzberg and Ben Bridge), See’sCandies (confectionary products), Pampered Chef (high quality kitchen tools), Oriental Trading Company (party supplies,school supplies and toys and novelties) and Detlev Louis Motorrad (“Louis”), a retailer of motorcycle accessories based inGermany.

K-54
Management’s Discussion and Analysis (Continued)
Manufacturing, Service and Retailing (Continued)
Retailing (Continued)
2021 versus 2020
Retailing group revenues in 2021 increased $3.1 billion (19.8%) compared to 2020. BHA’s revenues increased 19.0%in 2021 compared to 2020, with vehicle sales, service and repair, and finance and service contract revenues each increasingversus 2020. Revenues from vehicle sales in 2021 increased $1.7 billion (20.7%) versus 2020, primarily due to higheraverage selling prices, as well as a 2.7% increase in units sold. However, new vehicle unit sales in the second half of 2021declined 18% compared to the second half of 2020, reflecting significant new vehicle supply shortages at OEMs attributableto the global computer chip shortages and other supply chain disruptions. Home furnishings group revenues increased 22.0%in 2021 as compared to 2020, attributable to higher consumer demand and higher average selling prices, driven by higherinventory and freight costs.
Pre-tax earnings in 2021 of the retailing group increased $781 million (76.0%) from 2020 and the pre-tax margin rateincreased 3.0 percentage points to 9.5%. BHA’s pre-tax earnings increased 47.5% in 2021 compared to 2020, primarily dueto increased vehicle sales margins and higher earnings from finance and service contract activities. In addition, earnings in2021 benefitted from lower floorplan interest expense, attributable to significant declines in inventory levels, and fromongoing operating cost control efforts.
Home furnishings group pre-tax earnings increased 67.6% in 2021 versus 2020, reflecting generally higher averagegross margin rates and sales mix changes and cost control efforts, partly offset by higher personnel costs. Aggregate pre-taxearnings for the remainder of our retailing group increased $321 million in 2021 compared to 2020. The initial effects of thepandemic in 2020 were severe for most of our other retailers due to the restricted operations at many of those businesses.Results in 2021 also benefitted from relatively strong consumer demand and the effects of restructuring efforts in 2020.
2020 versus 2019
Retailing group revenues in 2020 declined $159 million (1.0%) compared to 2019. The spread of COVID-19 resultedin the temporary closures or restricted operations at several of our retailing businesses and effected consumer spendingpatterns during 2020. The severity and duration of the effects from the pandemic varied widely at our retail operations.
BHA’s revenues decreased 2.9% in 2020 compared to 2019. BHA’s revenues in 2020 reflected decreases in new andpre-owned vehicle sales of 2.6%, as well as lower vehicle service and repair revenues. Home furnishings revenues wereessentially unchanged in 2020 compared to 2019. The retailing group experienced lower revenues in the first half of 2020,attributable to restricted store hours, which were substantially offset by increased revenues over the second half of the year.However, supply chain disruptions had a negative effect on obtaining product at certain times, which negatively affectedsales levels.
The effects of the pandemic contributed to significantly lower sales in 2020 for our jewelry stores, See’s Candies andOriental Trading Company, which were more than offset by significant revenue increases from Pampered Chef and Louis.Sales volumes generally increased and operating results improved beginning in the latter part of the second quarter as ouroperations slowly reopened.
Retail group pre-tax earnings increased $154 million (17.6%) in 2020 from 2019. BHA’s pre-tax earnings increased37.7%, primarily due to lower selling, general and administrative expenses, lower floorplan interest expense and higheraverage gross sales margin rates. Aggregate pre-tax earnings for the remainder of our retailing group increased 1.1% in 2020compared to 2019, reflecting higher earnings from the home furnishings businesses and from Pampered Chef, which weresubstantially offset by lower earnings from our other retailing operations.
Home furnishings group pre-tax earnings increased $79 million (36%) in 2020 versus 2019, reflecting generally higheraverage gross margin rates, sales mix changes and fewer sales promotions and lower advertising and other operatingexpenses. Certain of our other operations, including Pampered Chef and Louis experienced significant earnings increases in2020, while others, including See’s Candies and Oriental Trading Company, experienced significant declines driven by thenegative effects of the pandemic.

K-55
Management’s Discussion and Analysis (Continued)
Manufacturing, Service and Retailing (Continued)
Retailing (Continued)
McLane
McLane Company, Inc. (“McLane”) operates a wholesale distribution business that provides grocery and non-foodconsumer products to retailers and convenience stores (“grocery”) and to restaurants (“foodservice”). McLane also operatesbusinesses that are wholesale distributors of distilled spirits, wine and beer (“beverage”). The grocery and foodservicebusinesses generate high sales and very low profit margins. These businesses have several significant customers, includingWalmart, 7-Eleven, Yum! Brands and others. Grocery sales comprised about 63% of McLane’s consolidated sales in 2021with food service comprising most of the remainder. A curtailment of purchasing by any of its significant customers couldhave an adverse impact on periodic revenues and earnings.
2021 versus 2020
Revenues increased $2.6 billion (5.6%) in 2021 compared to 2020. Revenues from the grocery business increased 1.5%compared to 2020, while revenues from the foodservice and beverage businesses increased 13.1% and 17.8%, respectively.The foodservice business was significantly impacted by pandemic-related restaurant closures in 2020.
Pre-tax earnings decreased $21 million (8.4%) in 2021 as compared to 2020. The decrease reflected significantincreases in personnel, contract transportation and fuel costs, which more than offset the favorable impact of higher sales andslightly higher gross sales margins. McLane’s grocery and food service operations were significantly affected in 2021 byupstream supply chain constraints, including the effects of labor and truck driver shortages, which contributed to higherinventory costs reflected in a LIFO inventory reserve increase of $130 million, and disruptions in inventory availability.These upstream supply chain effects, together with the truck driver and warehouse personnel shortages that we areexperiencing, adversely affected our customer service levels and reduced our operating efficiencies. In response, our hiringand wage and benefits costs increased significantly in 2021. The increase in fuel expense was primarily attributable tosignificant increases in petroleum prices. We expect the current difficult operating environment to continue through 2022.
2020 versus 2019
Revenues declined $3.6 billion (7.2%) in 2020 compared to 2019. The decline was attributable to COVID-19-relatedrestaurant closures (particularly in the casual dining category) in the foodservice business and lower sales in certain productcategories within the grocery business. McLane operates on a 52/53-week fiscal year and 2020 included 52 weeks comparedto 53 weeks in 2019. Otherwise, revenues declined 5.2% in the grocery business and 7.7% in the foodservice business in2020 as compared to 2019.
Pre-tax earnings decreased $37 million (12.8%) in 2020 as compared to 2019. The earnings decrease included theeffects of increased LIFO inventory reserves of $22 million, credit and inventory losses of $12 million in the foodserviceoperations and the impact of lower sales.
Investment and Derivative Contract Gains/Losses
A summary of investment and derivative contract gains/losses follows (dollars in millions).
2021 2020 2019
Investment gains/losses $ 77,576 $ 40,905 $ 71,123Derivative contract gains/losses 966 (159) 1,484Gains/losses before income taxes and noncontrolling interests 78,542 40,746 72,607Income taxes and noncontrolling interests 16,202 9,155 15,162Net earnings $ 62,340 $ 31,591 $ 57,445
Effective income tax rate 20.4% 21.7% 20.9%
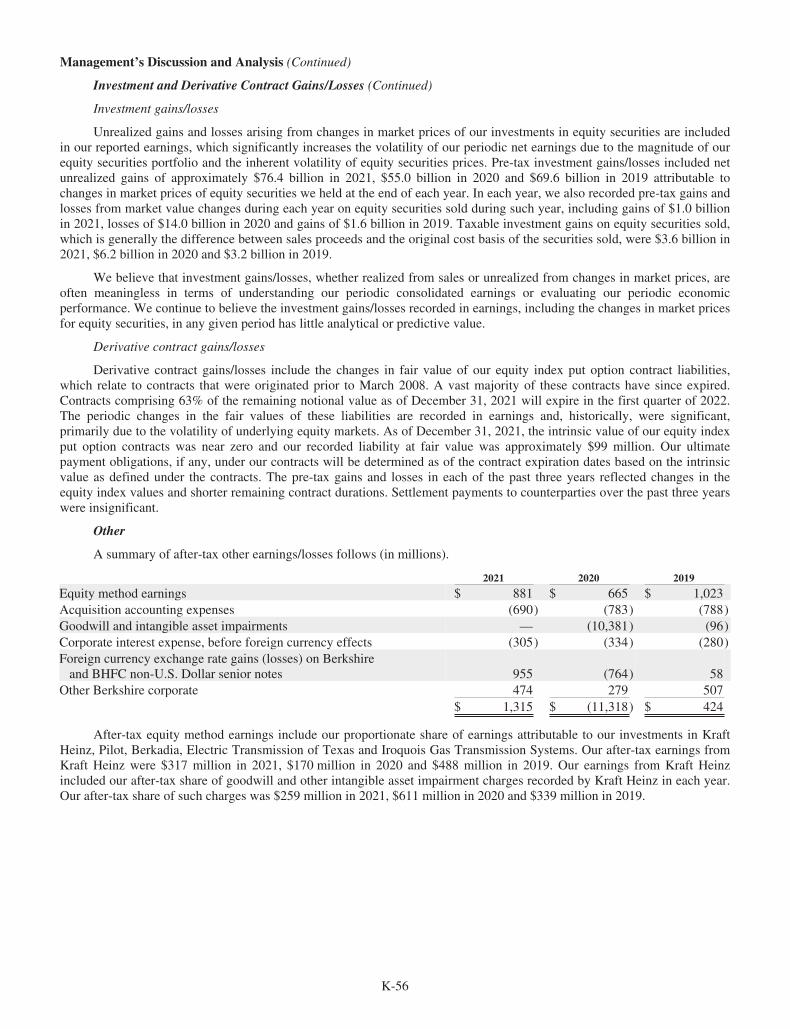
K-56
Management’s Discussion and Analysis (Continued)
Investment and Derivative Contract Gains/Losses (Continued)
Investment gains/losses
Unrealized gains and losses arising from changes in market prices of our investments in equity securities are includedin our reported earnings, which significantly increases the volatility of our periodic net earnings due to the magnitude of ourequity securities portfolio and the inherent volatility of equity securities prices. Pre-tax investment gains/losses included netunrealized gains of approximately $76.4 billion in 2021, $55.0 billion in 2020 and $69.6 billion in 2019 attributable tochanges in market prices of equity securities we held at the end of each year. In each year, we also recorded pre-tax gains andlosses from market value changes during each year on equity securities sold during such year, including gains of $1.0 billionin 2021, losses of $14.0 billion in 2020 and gains of $1.6 billion in 2019. Taxable investment gains on equity securities sold,which is generally the difference between sales proceeds and the original cost basis of the securities sold, were $3.6 billion in2021, $6.2 billion in 2020 and $3.2 billion in 2019.
We believe that investment gains/losses, whether realized from sales or unrealized from changes in market prices, areoften meaningless in terms of understanding our periodic consolidated earnings or evaluating our periodic economicperformance. We continue to believe the investment gains/losses recorded in earnings, including the changes in market pricesfor equity securities, in any given period has little analytical or predictive value.
Derivative contract gains/losses
Derivative contract gains/losses include the changes in fair value of our equity index put option contract liabilities,which relate to contracts that were originated prior to March 2008. A vast majority of these contracts have since expired.Contracts comprising 63% of the remaining notional value as of December 31, 2021 will expire in the first quarter of 2022.The periodic changes in the fair values of these liabilities are recorded in earnings and, historically, were significant,primarily due to the volatility of underlying equity markets. As of December 31, 2021, the intrinsic value of our equity indexput option contracts was near zero and our recorded liability at fair value was approximately $99 million. Our ultimatepayment obligations, if any, under our contracts will be determined as of the contract expiration dates based on the intrinsicvalue as defined under the contracts. The pre-tax gains and losses in each of the past three years reflected changes in theequity index values and shorter remaining contract durations. Settlement payments to counterparties over the past three yearswere insignificant.
Other
A summary of after-tax other earnings/losses follows (in millions).
2021 2020 2019
Equity method earnings $ 881 $ 665 $ 1,023Acquisition accounting expenses (690) (783) (788)Goodwill and intangible asset impairments — (10,381) (96)Corporate interest expense, before foreign currency effects (305) (334) (280)Foreign currency exchange rate gains (losses) on Berkshireand BHFC non-U.S. Dollar senior notes 955 (764) 58
Other Berkshire corporate 474 279 507$ 1,315 $ (11,318) $ 424
After-tax equity method earnings include our proportionate share of earnings attributable to our investments in KraftHeinz, Pilot, Berkadia, Electric Transmission of Texas and Iroquois Gas Transmission Systems. Our after-tax earnings fromKraft Heinz were $317 million in 2021, $170 million in 2020 and $488 million in 2019. Our earnings from Kraft Heinzincluded our after-tax share of goodwill and other intangible asset impairment charges recorded by Kraft Heinz in each year.Our after-tax share of such charges was $259 million in 2021, $611 million in 2020 and $339 million in 2019.

K-57
Management’s Discussion and Analysis (Continued)
Other (Continued)
After-tax acquisition accounting expenses include charges arising from the application of the acquisition method inconnection with certain of Berkshire’s past business acquisitions. Such charges arise primarily from the amortization orimpairment of intangible assets recorded in connection with those business acquisitions. Goodwill and intangible assetimpairments in 2020 included after-tax charges of $9.8 billion attributable to impairments of goodwill and certain identifiableintangible assets that were recorded in connection with our acquisition of PCC in 2016. See Other Critical AccountingPolicies on page K-62 for additional details.
Foreign currency exchange rate gains and losses pertain to Berkshire’s Euro and Japanese Yen denominated debt andBHFC’s Great Britain Pound denominated debt. Changes in foreign currency exchange rates produce unrealized gains andlosses from the periodic revaluation of these liabilities into U.S. Dollars. The gains and losses recorded in any given periodcan be significant due to the magnitude of the borrowings and the inherent volatility in foreign currency exchange rates.Berkshire corporate items consist primarily of Berkshire parent company investment income and corporate expenses, otherintercompany interest income where the interest expense is included in earnings of the operating businesses and unallocatedincome taxes.
Financial Condition
Our consolidated balance sheet continues to reflect very significant liquidity and a very strong capital base.Consolidated shareholders’ equity at December 31, 2021 was $506.2 billion, an increase of $63.0 billion since December 31,2020. Net earnings attributable to Berkshire shareholders was $89.8 billion and included after-tax gains on our investments ofapproximately $61.6 billion. Over each of the last three years, investment gains and losses from changes in the market pricesof our investments in equity securities produced exceptional volatility in our periodic earnings.
Berkshire’s common stock repurchase program, as amended, permits Berkshire to repurchase its Class A and Class Bshares at prices below Berkshire’s intrinsic value, as conservatively determined by Warren Buffett, Berkshire’s Chairman ofthe Board and Chief Executive Officer, and Charlie Munger, Vice Chairman of the Board. The program does not specify amaximum number of shares to be repurchased and does not require any specified repurchase amount. The program isexpected to continue indefinitely. We will not repurchase our stock if it reduces the total amount of Berkshire’s consolidatedcash, cash equivalents and U.S. Treasury Bill holdings below $30 billion. Financial strength and redundant liquidity willalways be of paramount importance at Berkshire. Berkshire paid $27.1 billion in 2021 to repurchase shares of its Class A andB common stock.
At December 31, 2021, our insurance and other businesses held cash, cash equivalents and U.S. Treasury Bills of$143.9 billion, which included $119.6 billion in U.S. Treasury Bills. Investments in equity and fixed maturity securities(excluding our investment in Kraft Heinz) were $367.2 billion. Our fixed maturity securities at December 31, 2021 includedapproximately $14.4 billion of investments that mature in 2022 and 2023.
Our consolidated borrowings at December 31, 2021 were $114.3 billion, of which over 95% were by the Berkshireparent company, BHFC, BNSF and BHE and its subsidiaries. Expected principal and interest payments related to ourconsolidated borrowings in each of the next five years are (in billions): $10.2 in 2022; $14.6 in 2023; $9.7 in 2024; $9.9 in2025; and $8.7 in 2026.
Berkshire parent company debt outstanding at December 31, 2021 was $21.4 billion, a decrease of $1.3 billion sinceDecember 31, 2020, which was primarily due to the effects of foreign currency exchange rate changes on Euro and JapaneseYen denominated debt. In 2021, Berkshire repaid Euro and U.S. Dollar denominated debt aggregating approximately $2.2billion of maturing senior notes and issued Euro and Yen denominated senior notes aggregating approximately $2.2 billionwith maturity dates ranging from 2026 to 2041 and a weighted average interest rate of 0.5%. In January 2022, Berkshirerepaid $600 million of maturing senior notes and issued ¥128.5 billion (approximately $1.1 billion) of senior notes withmaturity dates ranging from 2027 to 2052 and a weighted average interest rate of 0.5%.
Berkshire’s insurance and other subsidiary outstanding borrowings were approximately $17.9 billion at December 31,2021, which included senior note borrowings of BHFC, a wholly-owned financing subsidiary, of approximately $13.1 billion.BHFC’s borrowings are used to fund a portion of loans originated and acquired by Clayton Homes and equipment held forlease by our railcar leasing business. In 2021, BHFC repaid $750 million of maturing senior notes and issued $750 million of2.5% senior notes due in 2051. Berkshire guarantees BHFC’s senior notes for the full and timely payment of principal andinterest.
K-58
Management’s Discussion and Analysis (Continued)
Financial Condition (Continued)
BNSF’s outstanding debt was $23.2 billion as of December 31, 2021, relatively unchanged from December 31, 2020.During 2021, BNSF repaid $1.54 billion of debt and issued $1.55 billion of debentures with a weighted average interest rateof 3.1% with maturity dates in 2051 and 2052. Outstanding borrowings of BHE and its subsidiaries were $51.8 billion atDecember 31, 2021, a decrease of $382 million since December 31, 2020. In 2021, BHE and its subsidiaries issued new termdebt of approximately $2.2 billion with maturity dates ranging from 2028 to 2052 and repaid term debt of approximately$2.5 billion. Berkshire does not guarantee the repayment of debt issued by BNSF, BHE or any of their subsidiaries.
In each of the past three years, our diverse group of businesses generated net operating cash flows of approximately$39 billion. Our consolidated capital expenditures for property, plant and equipment and equipment held for lease were $13.3billion in 2021, which included capital expenditures by our railroad, utilities and energy businesses (BNSF and BHE) of $9.5billion. BNSF and BHE maintain very large investments in capital assets (property, plant and equipment) and will regularlymake significant capital expenditures in the normal course of business. We forecast capital expenditures of these twooperations will approximate $11.1 billion in 2022.
Contractual Obligations
We are party to other contracts associated with ongoing business activities, which will result in cash payments tocounterparties in future periods. Certain obligations are included in our Consolidated Balance Sheets, such as operating leaseliabilities and shared aircraft repurchase liabilities of NetJets. Estimated payments of these liabilities in each of the next fiveyears are (in billions): $1.6 in 2022; $1.5 in 2023; $1.4 in 2024; $1.2 in 2025; and $1.2 in 2026.
We are also obligated to pay claims arising from property and casualty insurance companies. Such liabilities, includingamounts from retroactive reinsurance, were approximately $125 billion at December 31, 2021. We currently forecast claimpayments in 2022 of approximately $29 billion with respect to claims occurring prior to 2022. Additionally, we estimate netpayments of approximately $3 billion in 2022 for life, health and annuity benefits under contracts. However, the timing andamount of the payments under insurance and reinsurance contracts are contingent upon the outcome of future events. Actualpayments will likely vary, perhaps materially, from the forecasted payments, as well as from the liabilities currently recordedin our Consolidated Balance Sheet. We anticipate that these payments will be funded by operating cash flows.
Other obligations pertaining to the acquisition of goods or services in the future, such as certain purchase obligations,are not currently reflected in the Consolidated Financial Statements and will be recognized in future periods as the goods aredelivered or services are provided. As of December 31, 2021, the largest categories of our long-term contractual obligationsprimarily related to fuel, capacity, transmission and maintenance contracts and capital expenditure commitments of BHE andBNSF and aircraft purchase commitments of NetJets. We estimate future payments associated with these contracts over thenext five years of approximately $19 billion, including $8 billion in 2022. We also have an agreement to acquire anadditional 41.4% of Pilot in 2023 and agreements to acquire certain non-controlling interests of consolidated subsidiaries.Reference is made to Note 26 to the Consolidated Financial Statements for additional information regarding thesecommitments.
Critical Accounting Policies
Certain accounting policies require us to make estimates and judgments in determining the amounts reflected in ourConsolidated Financial Statements. Such estimates and judgments necessarily involve varying and possibly significantdegrees of uncertainty. Accordingly, certain amounts currently recorded in our Consolidated Financial Statements will likelybe adjusted in the future based on new available information and changes in other facts and circumstances. A discussion ofour principal accounting policies that required the application of significant judgments as of December 31, 2021 follows.
Property and casualty insurance unpaid losses
We record liabilities for unpaid losses and loss adjustment expenses (also referred to as “gross unpaid losses” or “claimliabilities”) based upon estimates of the ultimate amounts payable for loss events occurring on or before the balance sheetdate. The timing and amount of ultimate loss payments are contingent upon, among other things, the timing of claimreporting from insureds and ceding companies and the final determination of the loss amount through the loss adjustment andsettlement process. We use a variety of techniques in establishing claim liabilities, which may require significant judgmentsand assumptions.
As of the balance sheet date, recorded claim liabilities include estimates for reported claims and for claims not yetreported. The period between the loss occurrence date and loss settlement date is the “claim-tail.” Property claims usuallyhave relatively short claim-tails, absent litigation. Casualty claims usually have longer claim-tails, occasionally extending fordecades. Casualty claims may be more susceptible to litigation and the impact of changing contract interpretations. The legalenvironment and judicial process further contribute to extending claim-tails.
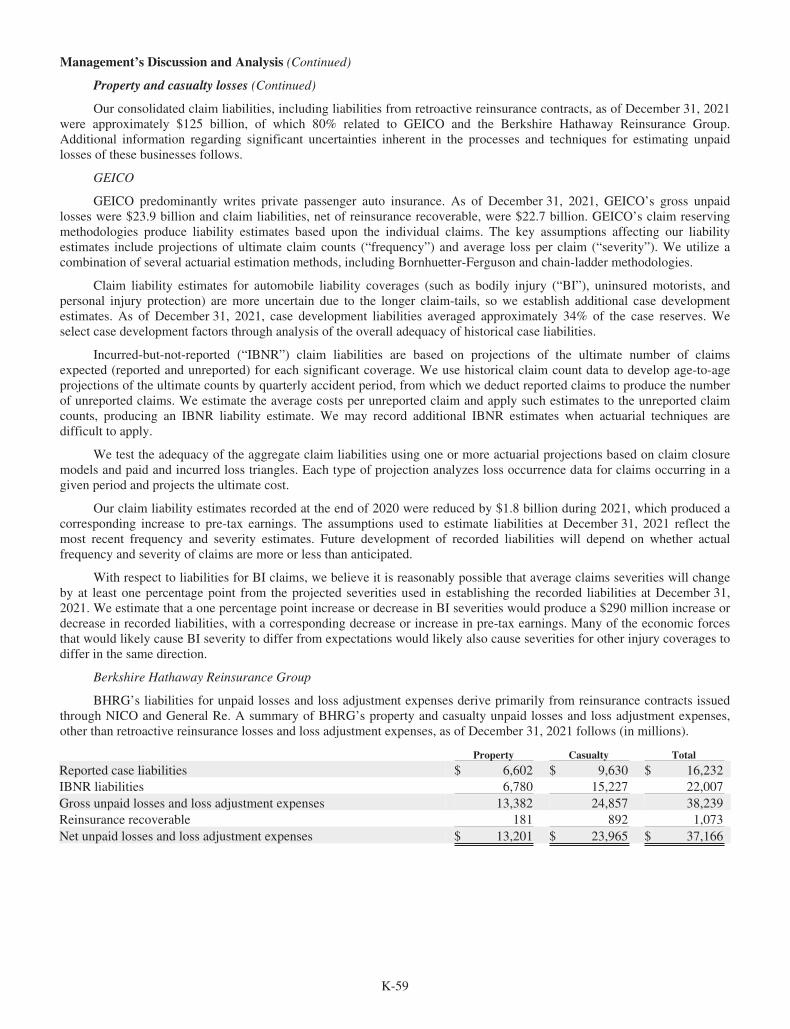
K-59
Management’s Discussion and Analysis (Continued)
Property and casualty losses (Continued)
Our consolidated claim liabilities, including liabilities from retroactive reinsurance contracts, as of December 31, 2021were approximately $125 billion, of which 80% related to GEICO and the Berkshire Hathaway Reinsurance Group.Additional information regarding significant uncertainties inherent in the processes and techniques for estimating unpaidlosses of these businesses follows.
GEICO
GEICO predominantly writes private passenger auto insurance. As of December 31, 2021, GEICO’s gross unpaidlosses were $23.9 billion and claim liabilities, net of reinsurance recoverable, were $22.7 billion. GEICO’s claim reservingmethodologies produce liability estimates based upon the individual claims. The key assumptions affecting our liabilityestimates include projections of ultimate claim counts (“frequency”) and average loss per claim (“severity”). We utilize acombination of several actuarial estimation methods, including Bornhuetter-Ferguson and chain-ladder methodologies.
Claim liability estimates for automobile liability coverages (such as bodily injury (“BI”), uninsured motorists, andpersonal injury protection) are more uncertain due to the longer claim-tails, so we establish additional case developmentestimates. As of December 31, 2021, case development liabilities averaged approximately 34% of the case reserves. Weselect case development factors through analysis of the overall adequacy of historical case liabilities.
Incurred-but-not-reported (“IBNR”) claim liabilities are based on projections of the ultimate number of claimsexpected (reported and unreported) for each significant coverage. We use historical claim count data to develop age-to-ageprojections of the ultimate counts by quarterly accident period, from which we deduct reported claims to produce the numberof unreported claims. We estimate the average costs per unreported claim and apply such estimates to the unreported claimcounts, producing an IBNR liability estimate. We may record additional IBNR estimates when actuarial techniques aredifficult to apply.
We test the adequacy of the aggregate claim liabilities using one or more actuarial projections based on claim closuremodels and paid and incurred loss triangles. Each type of projection analyzes loss occurrence data for claims occurring in agiven period and projects the ultimate cost.
Our claim liability estimates recorded at the end of 2020 were reduced by $1.8 billion during 2021, which produced acorresponding increase to pre-tax earnings. The assumptions used to estimate liabilities at December 31, 2021 reflect themost recent frequency and severity estimates. Future development of recorded liabilities will depend on whether actualfrequency and severity of claims are more or less than anticipated.
With respect to liabilities for BI claims, we believe it is reasonably possible that average claims severities will changeby at least one percentage point from the projected severities used in establishing the recorded liabilities at December 31,2021. We estimate that a one percentage point increase or decrease in BI severities would produce a $290 million increase ordecrease in recorded liabilities, with a corresponding decrease or increase in pre-tax earnings. Many of the economic forcesthat would likely cause BI severity to differ from expectations would likely also cause severities for other injury coverages todiffer in the same direction.
Berkshire Hathaway Reinsurance Group
BHRG’s liabilities for unpaid losses and loss adjustment expenses derive primarily from reinsurance contracts issuedthrough NICO and General Re. A summary of BHRG’s property and casualty unpaid losses and loss adjustment expenses,other than retroactive reinsurance losses and loss adjustment expenses, as of December 31, 2021 follows (in millions).
Property Casualty Total
Reported case liabilities $ 6,602 $ 9,630 $ 16,232IBNR liabilities 6,780 15,227 22,007Gross unpaid losses and loss adjustment expenses 13,382 24,857 38,239Reinsurance recoverable 181 892 1,073Net unpaid losses and loss adjustment expenses $ 13,201 $ 23,965 $ 37,166

K-60
Management’s Discussion and Analysis (Continued)
Property and casualty losses (Continued)
Berkshire Hathaway Reinsurance Group (Continued)
Gross unpaid losses and loss adjustment expenses consist primarily of traditional property and casualty coverageswritten primarily under excess-of-loss and quota-share treaties. Under certain contracts, coverage can apply to multiple linesof business written and the ceding company may not report loss data by such lines consistently, if at all. In those instances,we allocate losses to property and casualty coverages based on internal estimates.
In connection with reinsurance contracts, the nature, extent, timing and perceived reliability of loss informationreceived from ceding companies varies widely depending on the type of coverage and the contractual reporting terms.Reinsurance contract terms, conditions and coverages also tend to lack standardization and may evolve more rapidly thanprimary insurance policies.
The nature and extent of loss information provided under many facultative (individual risk) or per occurrence excesscontracts may be comparable to the information received under a primary insurance contract. However, loss information withrespect to aggregate excess-of-loss and quota-share contracts is often in a summary format rather than on an individual claimbasis. Loss data includes recoverable paid losses, as well as case loss estimates. Ceding companies infrequently providereliable IBNR loss estimates.
Loss reporting to reinsurers is typically slower in comparison to primary insurers. In the U.S., such reporting isgenerally required at quarterly intervals ranging from 30 to 90 days after the end of the quarterly period, while outside of theU.S., reinsurance reporting practices may vary further. In certain countries, clients report annually from 90 to 180 days afterthe end of the annual period. To the extent that reinsurers assume and cede underlying risks from other reinsurers, furtherdelays in claims reporting may occur. The relative impact of reporting delays on the reinsurer may vary depending on thetype of coverage, contractual reporting terms, the magnitude of the claim relative to the attachment point of the reinsurancecoverage, and for other reasons.
As reinsurers, the premium and loss data we receive is at least one level removed from the underlying claimant, sothere is a risk that the loss data reported is incomplete, inaccurate or the claim is outside the coverage terms. We maintaincertain internal procedures to determine that the information is complete and in compliance with the contract terms.Generally, our reinsurance contracts permit us to access the ceding company’s records with respect to the subject business,thus providing the ability to audit the reported information. In the normal course of business, disputes occasionally ariseconcerning whether claims are covered by our reinsurance policies. We resolve most coverage disputes through negotiationwith the client. If disputes cannot be resolved, our contracts generally provide arbitration or alternative dispute resolutionprocesses. There are no coverage disputes at this time for which an adverse resolution would likely have a material impact onour consolidated results of operations or financial condition.
Establishing claim liability estimates for reinsurance assumed requires evaluation of loss information received from ourclients. We generally rely on the ceding companies’ reported case loss estimates. We independently evaluate certain reportedcase losses and if appropriate, we use our own case liability estimate. For instance, as of December 31, 2021, our case lossestimates exceeded ceding company estimates by approximately $700 million for certain legacy workers’ compensationclaims occurring over 10 years ago. We also periodically conduct detailed reviews of individual client claims, which maycause us to adjust our case estimates.
Although liabilities for losses are initially determined based on pricing and underwriting analysis, we use a variety ofactuarial methodologies that place reliance on the extrapolation of actual historical data, loss development patterns, industrydata and other benchmarks, as appropriate. The estimate of the IBNR liabilities also requires judgment by actuaries andmanagement to reflect the impact of additional factors like change in business mix, volume, claim reporting and handlingpractices, inflation, social and legal environment and the terms and conditions of the contracts. The methodologies generallyfall into one of the following categories or are hybrids of one or more of the following categories:

K-61
Management’s Discussion and Analysis (Continued)
Property and casualty losses (Continued)
Berkshire Hathaway Reinsurance Group (Continued)
Paid and incurred loss development methods – these methods consider expected case loss emergence and developmentpatterns, together with expected loss ratios by year. Factors affecting our loss development analysis include, but are notlimited to, changes in the following: client claims reporting and settlement practices; the frequency of client company claimreviews; policy terms and coverage (such as loss retention levels and occurrence and aggregate policy limits); loss trends; andlegal trends that result in unanticipated losses. Collectively, these factors influence our selections of expected case lossemergence patterns.
Incurred and paid loss Bornhuetter-Ferguson methods – these methods consider actual paid and incurred losses andexpected patterns of paid and incurred losses, taking the initial expected ultimate losses into account to determine an estimateof the expected unpaid or unreported losses.
Frequency and severity methods – these methods commonly focus on a review of the number of anticipated claims andthe anticipated claims severity and may also rely on development patterns to derive such estimates. However, our processesand techniques for estimating liabilities in such analyses generally rely more on a per-policy assessment of the ultimate costassociated with the individual loss rather than with an analysis of historical development patterns of past losses.
Additional analysis – in some cases we have established reinsurance claim liabilities on a contract-by-contract basis,determined from case loss estimates reported by the ceding company and IBNR liabilities that are primarily a function of ananticipated loss ratio for the contract and the reported case loss estimate. Liabilities are adjusted upward or downward overtime to reflect case losses reported versus expected case losses, which we use to form revised judgement on the adequacy ofthe expected loss ratio and the level of IBNR liabilities required for unreported claims. Anticipated loss ratios are also revisedto include estimates of known major catastrophe events.
Our claim liability estimation process for short-tail lines, primarily property exposures, utilizes a combination of thepaid and incurred loss development methods and the incurred and paid loss Bornhuetter-Ferguson methods. Certaincatastrophe, individual risk and aviation excess-of-loss contracts tend to generate low frequency/high severity losses. Ourprocesses and techniques for estimating liabilities under such contracts generally rely more on a per contract assessment ofthe ultimate cost associated with the individual loss event rather than with an analysis of the historical development patternsof past losses.
For our long-tail lines, primarily casualty exposures, we may rely on different methods depending on the maturity ofthe business, with estimates for the most recent years being based on priced loss expectations and more mature yearsreflecting the paid or incurred development pattern indications.
In 2021, certain workers’ compensation claims reported losses were less than expected. As a result, we reducedestimated ultimate losses for prior years’ loss events by $136 million. We estimate that increases of ten percent in the tail ofthe expected loss emergence pattern and in the expected loss ratios would produce a net increase of approximately $1.0billion in IBNR liabilities, producing a corresponding decrease in pre-tax earnings. We believe it is reasonably possible forthese assumptions to increase at these rates.
For other casualty losses, excluding asbestos, environmental, and other latent injury claims, we reduced estimatedultimate liabilities for prior years’ events by approximately $375 million in 2021. For certain significant casualty and generalliability portfolios, we estimate that increases of five percent in the claim-tails of the expected loss emergence patterns and inthe expected loss ratios would produce a net increase in our nominal IBNR liabilities and a corresponding reduction in pre-tax earnings of approximately $950 million, although outcomes of greater than or less than $950 million are possible giventhe diversification in worldwide business.
The change in estimated ultimate liabilities for asbestos, environmental and other latent injury claims, excludingamounts assumed under retroactive reinsurance contracts was not significant in 2021. Net liabilities for such claims wereapproximately $2.1 billion at December 31, 2021. Loss estimations for these exposures are difficult to determine due to thechanging legal environment and increases may be required in the future if new exposures or claimants are identified, newclaims are reported or new theories of liability emerge.
K-62
Management’s Discussion and Analysis (Continued)
Property and casualty losses (Continued)
Retroactive reinsurance
Our retroactive reinsurance contracts cover loss events occurring before the contract inception dates. Claim liabilitiesassociated with our retroactive reinsurance contracts predominately pertain to casualty or liability exposures. We expect theclaim-tails to be very long. As of December 31, 2021, gross unpaid losses were $38.3 billion and deferred charges were $10.6billion.
Our contracts are generally subject to maximum limits of indemnifications and, as such, we currently expect thatmaximum remaining gross losses payable under our retroactive policies will not exceed $54 billion. Absent significantjudicial or legislative changes affecting asbestos, environmental or latent injury exposures, we also currently believe itunlikely that losses will develop upward to the maximum losses payable or downward by more than 15% of our estimatedgross liability.
We establish liability estimates by individual contract, considering exposure and development trends. In establishingour liability estimates, we often analyze historical aggregate loss payment patterns and project expected ultimate losses undervarious scenarios. We assign judgmental probability factors to these scenarios and an expected outcome is determined. Wethen monitor subsequent loss payment activity and review ceding company reports and other available informationconcerning the underlying losses. We re-estimate the expected ultimate losses when significant events or significantdeviations from expected results are revealed.
Certain of our retroactive reinsurance contracts include asbestos, environmental and other latent injury claims. Ourestimated liabilities for such claims were approximately $12.3 billion at December 31, 2021. We do not consistently receivereliable detailed data regarding asbestos, environmental and latent injury claims from all ceding companies, particularly withrespect to multi-line or aggregate excess-of-loss policies. When possible, we conduct a detailed analysis of the underlyingloss data to make an estimate of ultimate reinsured losses. When detailed loss information is unavailable, we developestimates by applying recent industry trends and projections to aggregate client data. Judgments in these areas necessarilyconsider the stability of the legal and regulatory environment under which we expect claims will be adjudicated. Legal reformand legislation could also have a significant impact on our ultimate liabilities.
We reduced estimated ultimate liabilities for prior years’ retroactive reinsurance contracts by $974 million in 2021,which after the changes in related deferred charges, resulted in pre-tax earnings of $142 million. In 2021, we paid losses andloss adjustment expenses of $1.9 billion with respect to our retroactive reinsurance contracts.
In connection with our retroactive reinsurance contracts, we also record deferred charges, which at contract inceptionrepresents the excess, if any, of the estimated ultimate liability for unpaid losses over premiums received. We amortizedeferred charges, which produces charges to pre-tax earnings in future periods based on the expected timing and amount ofloss payments. We also adjust deferred charge balances due to changes in the expected timing and ultimate amount of claimpayments and the effects of the adjustments are included in pre-tax earnings. Significant changes in such estimates may havea significant effect on unamortized deferred charge balances. Based on the contracts in effect as of December 31, 2021, weestimate that amortization expense in 2022 will approximate $950 million.
Other Critical Accounting Policies
Our Consolidated Balance Sheet at December 31, 2021 includes goodwill of acquired businesses of $73.9 billion andother indefinite-lived intangible assets of $18.5 billion. We evaluate these assets for impairment annually in the fourth quarterand on an interim basis if the facts and circumstances lead us to believe that more-likely-not there has been an impairment.
Goodwill and indefinite-lived intangible asset impairment reviews include determining the estimated fair values of ourreporting units and indefinite-lived intangible assets. The key assumptions and inputs used in such determinations mayinclude forecasting revenues and expenses, cash flows and capital expenditures, as well as an appropriate discount rate andother inputs. Significant judgment by management is required in estimating the fair value of a reporting unit and inperforming impairment reviews. Due to the inherent subjectivity and uncertainty in forecasting future cash flows andearnings over long periods of time, actual results may differ materially from the forecasts. If the carrying value of theindefinite-lived intangible asset exceeds fair value, the excess is charged to earnings as an impairment loss. If the carryingvalue of a reporting unit exceeds the estimated fair value of the reporting unit, then the excess, limited to the carrying amountof goodwill, will be charged to earnings as an impairment loss.
K-63
Management’s Discussion and Analysis (Continued)
Other Critical Accounting Policies (Continued)
As of December 31, 2021, we concluded it is more likely than not that goodwill recorded in our Consolidated BalanceSheet was not impaired. The fair value estimates of reporting units are and will likely be significantly affected byassumptions on the severity, duration or long-term effects of the pandemic on the reporting unit’s business, as well as otherassumptions concerning the long-term economic performance of the reporting unit, which we cannot reliably predict.Consequently, any fair value estimates in such instances can be subject to wide variations.
We primarily use discounted projected future earnings or cash flow methods in determining fair values. The keyassumptions and inputs used in such methods may include forecasting revenues and expenses, cash flows and capitalexpenditures, as well as an appropriate discount rate and other inputs. A significant amount of judgment is required inestimating the fair value of a reporting unit and in performing goodwill impairment tests.
In connection with the annual goodwill impairment review conducted in the fourth quarter of 2021, the estimated fairvalues of five reporting units did not exceed our carrying values by at least 20%. The most significant of these reporting unitswas Precision Castparts Corp. (“PCC”). The estimated fair value of PCC was approximately $34.5 billion, exceeding ourcarrying value of approximately $31.1 billion by 10.7%. Our carrying value of PCC included goodwill of approximately $7.5billion. For the four other reporting units, our aggregate estimated fair value was approximately $2.5 billion, which exceededour aggregate carrying value of approximately $2.3 billion by 9.2%. Our carrying value of these units included goodwill ofapproximately $1.2 billion.
In the second quarter of 2020, we quantitively reevaluated goodwill for impairment for certain reporting units, andmost significantly for PCC. As a result of our reviews, we recorded pre-tax goodwill impairment charges of $10.0 billion andindefinite-lived intangible asset impairment charges of $638 million, of which approximately $10 billion related to PCC.Prior to the reevaluation, the carrying value of PCC-related goodwill was approximately $17 billion. Additionally, thecarrying value of PCC-related indefinite-lived intangible assets was approximately $14 billion. Substantially all of theseamounts were recorded in connection with Berkshire’s acquisition of PCC in 2016. The initial effects of the COVID-19pandemic on commercial airlines and aircraft manufacturers were particularly severe. At that time, we considered severalfactors in our reevaluation, including but not limited to the announcements by airlines concerning potential future demand,employment levels and aircraft orders, announcements by manufacturers of reduced aircraft production, and the actions wewere taking or may be taking in the future to restructure operations. Consequently, we deemed it prudent under the prevailingcircumstances to increase discount rates and reduce prior long-term forecasts of future cash flows for purposes of reviewingfor impairments.
Market Risk Disclosures
Our Consolidated Balance Sheets include substantial amounts of assets and liabilities whose fair values are subject tomarket risks. Our significant market risks are primarily associated with equity prices, interest rates, foreign currencyexchange rates and commodity prices. The fair values of our investment portfolios remain subject to considerable volatility.The following sections address the significant market risks associated with our business activities.
Equity Price Risk
Equity securities represent a significant portion of our consolidated investment portfolio. Strategically, we strive toinvest in businesses that possess excellent economics and able and honest management, and we prefer to invest a meaningfulamount in each company. Historically, equity investments have been concentrated in relatively few issuers. At December 31,2021, approximately 73% of the total fair value of equity securities was concentrated in four companies.
We often hold our equity securities for long periods and short-term price volatility has occurred in the past and willoccur in the future. We also strive to maintain significant levels of shareholder capital and ample liquidity to provide amargin of safety against short-term price volatility.
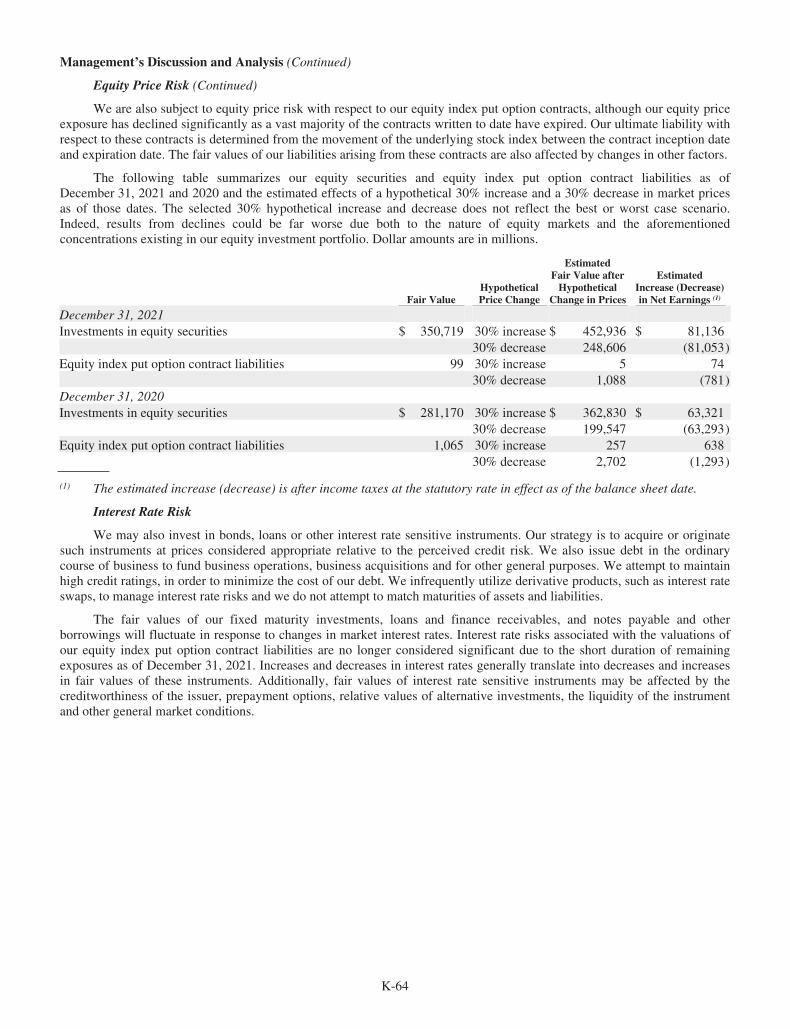
K-64
Management’s Discussion and Analysis (Continued)
Equity Price Risk (Continued)
We are also subject to equity price risk with respect to our equity index put option contracts, although our equity priceexposure has declined significantly as a vast majority of the contracts written to date have expired. Our ultimate liability withrespect to these contracts is determined from the movement of the underlying stock index between the contract inception dateand expiration date. The fair values of our liabilities arising from these contracts are also affected by changes in other factors.
The following table summarizes our equity securities and equity index put option contract liabilities as ofDecember 31, 2021 and 2020 and the estimated effects of a hypothetical 30% increase and a 30% decrease in market pricesas of those dates. The selected 30% hypothetical increase and decrease does not reflect the best or worst case scenario.Indeed, results from declines could be far worse due both to the nature of equity markets and the aforementionedconcentrations existing in our equity investment portfolio. Dollar amounts are in millions.
Fair ValueHypotheticalPrice Change
EstimatedFair Value afterHypothetical
Change in Prices
EstimatedIncrease (Decrease)in Net Earnings (1)
December 31, 2021Investments in equity securities $ 350,719 30% increase $ 452,936 $ 81,136
30% decrease 248,606 (81,053)Equity index put option contract liabilities 99 30% increase 5 74
30% decrease 1,088 (781)December 31, 2020Investments in equity securities $ 281,170 30% increase $ 362,830 $ 63,321
30% decrease 199,547 (63,293)Equity index put option contract liabilities 1,065 30% increase 257 638
30% decrease 2,702 (1,293)
(1) The estimated increase (decrease) is after income taxes at the statutory rate in effect as of the balance sheet date.
Interest Rate Risk
We may also invest in bonds, loans or other interest rate sensitive instruments. Our strategy is to acquire or originatesuch instruments at prices considered appropriate relative to the perceived credit risk. We also issue debt in the ordinarycourse of business to fund business operations, business acquisitions and for other general purposes. We attempt to maintainhigh credit ratings, in order to minimize the cost of our debt. We infrequently utilize derivative products, such as interest rateswaps, to manage interest rate risks and we do not attempt to match maturities of assets and liabilities.
The fair values of our fixed maturity investments, loans and finance receivables, and notes payable and otherborrowings will fluctuate in response to changes in market interest rates. Interest rate risks associated with the valuations ofour equity index put option contract liabilities are no longer considered significant due to the short duration of remainingexposures as of December 31, 2021. Increases and decreases in interest rates generally translate into decreases and increasesin fair values of these instruments. Additionally, fair values of interest rate sensitive instruments may be affected by thecreditworthiness of the issuer, prepayment options, relative values of alternative investments, the liquidity of the instrumentand other general market conditions.
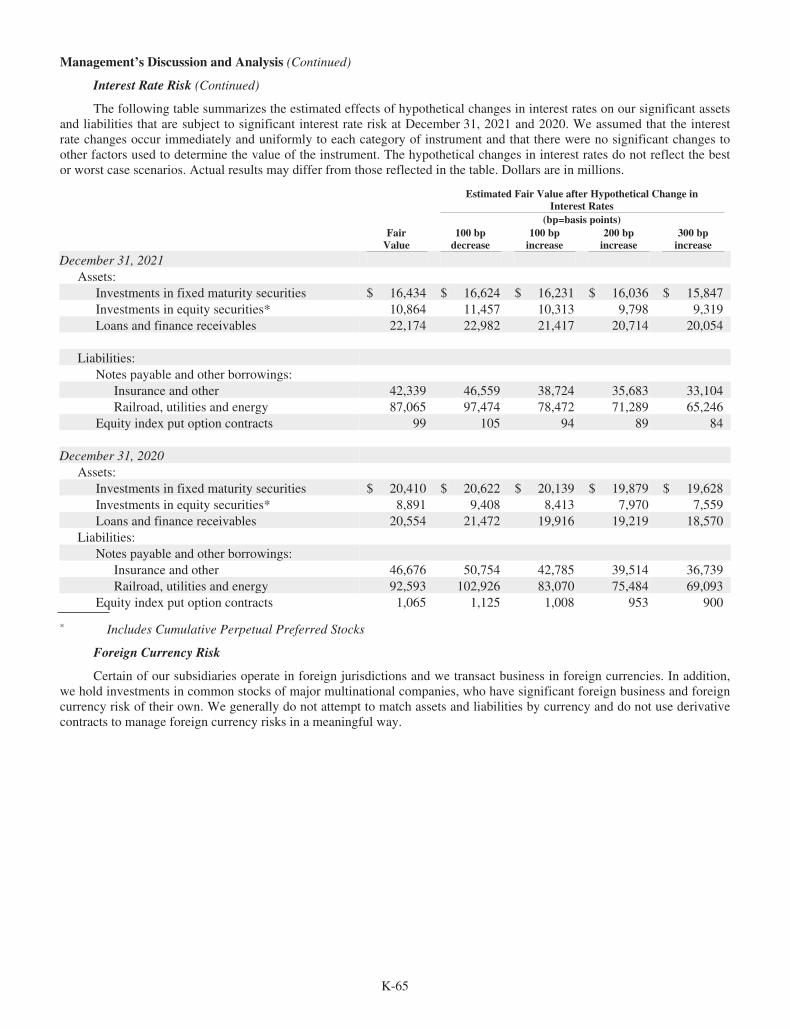
K-65
Management’s Discussion and Analysis (Continued)
Interest Rate Risk (Continued)
The following table summarizes the estimated effects of hypothetical changes in interest rates on our significant assetsand liabilities that are subject to significant interest rate risk at December 31, 2021 and 2020. We assumed that the interestrate changes occur immediately and uniformly to each category of instrument and that there were no significant changes toother factors used to determine the value of the instrument. The hypothetical changes in interest rates do not reflect the bestor worst case scenarios. Actual results may differ from those reflected in the table. Dollars are in millions.
Estimated Fair Value after Hypothetical Change inInterest Rates
(bp=basis points)FairValue
100 bpdecrease
100 bpincrease
200 bpincrease
300 bpincrease
December 31, 2021Assets:
Investments in fixed maturity securities $ 16,434 $ 16,624 $ 16,231 $ 16,036 $ 15,847Investments in equity securities* 10,864 11,457 10,313 9,798 9,319Loans and finance receivables 22,174 22,982 21,417 20,714 20,054
Liabilities:Notes payable and other borrowings:
Insurance and other 42,339 46,559 38,724 35,683 33,104Railroad, utilities and energy 87,065 97,474 78,472 71,289 65,246
Equity index put option contracts 99 105 94 89 84
December 31, 2020Assets:
Investments in fixed maturity securities $ 20,410 $ 20,622 $ 20,139 $ 19,879 $ 19,628Investments in equity securities* 8,891 9,408 8,413 7,970 7,559Loans and finance receivables 20,554 21,472 19,916 19,219 18,570
Liabilities:Notes payable and other borrowings:
Insurance and other 46,676 50,754 42,785 39,514 36,739Railroad, utilities and energy 92,593 102,926 83,070 75,484 69,093
Equity index put option contracts 1,065 1,125 1,008 953 900
* Includes Cumulative Perpetual Preferred Stocks
Foreign Currency Risk
Certain of our subsidiaries operate in foreign jurisdictions and we transact business in foreign currencies. In addition,we hold investments in common stocks of major multinational companies, who have significant foreign business and foreigncurrency risk of their own. We generally do not attempt to match assets and liabilities by currency and do not use derivativecontracts to manage foreign currency risks in a meaningful way.

K-66
Management’s Discussion and Analysis (Continued)
Foreign Currency Risk (Continued)
Our net assets subject to financial statement translation into U.S. Dollars are primarily in our insurance, utilities andenergy and certain manufacturing and service subsidiaries. A portion of our financial statement translation-related impactfrom changes in foreign currency rates is recorded in other comprehensive income. In addition, we include gains or lossesfrom changes in foreign currency exchange rates in net earnings related to non-U.S. Dollar denominated assets and liabilitiesof Berkshire and U.S.-based subsidiaries. A summary of these gains (losses), after-tax, for each of the years endingDecember 31, 2021 and 2020 follows (in millions).
2021 2020
Non-U.S. denominated debt included in net earnings $ 955 $ (764)Net liabilities under certain reinsurance contracts included in net earnings 58 (163)Foreign currency translation included in other comprehensive income (1,021) 1,264
Commodity Price Risk
Our subsidiaries use commodities in various ways in manufacturing and providing services. As such, we are subject toprice risks related to various commodities. In most instances, we attempt to manage these risks through the pricing of ourproducts and services to customers. To the extent that we are unable to sustain price increases in response to commodity priceincreases, our operating results will likely be adversely affected. We do not utilize derivative contracts to manage commodityprice risks to any significant degree.
Item 7A. Quantitative and Qualitative Disclosures About Market Risk
See “Market Risk Disclosures” contained in Item 7 “Management’s Discussion and Analysis of Financial Conditionand Results of Operations.”
Management’s Report on Internal Control Over Financial Reporting
Management of Berkshire Hathaway Inc. is responsible for establishing and maintaining adequate internal control overfinancial reporting, as such term is defined in the Securities Exchange Act of 1934 Rule 13a-15(f). Under the supervision andwith the participation of our management, including our principal executive officer and principal financial officer, weconducted an evaluation of the effectiveness of the Company’s internal control over financial reporting as of December 31,2021, as required by the Securities Exchange Act of 1934 Rule 13a-15(c). In making this assessment, we used the criteria setforth in the framework in Internal Control—Integrated Framework (2013) issued by the Committee of SponsoringOrganizations of the Treadway Commission. Based on our evaluation under the framework in Internal Control—IntegratedFramework (2013), our management concluded that our internal control over financial reporting was effective as ofDecember 31, 2021.
The effectiveness of our internal control over financial reporting as of December 31, 2021 has been audited byDeloitte & Touche LLP, an independent registered public accounting firm, as stated in their report which appears on page K-67.
Berkshire Hathaway Inc.February 26, 2022

K-67
Item 8. Financial Statements and Supplementary Data
REPORT OF INDEPENDENT REGISTERED PUBLIC ACCOUNTING FIRM
To the Shareholders and the Board of Directors ofBerkshire Hathaway Inc.Omaha, Nebraska
Opinions on the Financial Statements and Internal Control over Financial ReportingWe have audited the accompanying consolidated balance sheets of Berkshire Hathaway Inc. and subsidiaries (the“Company”) as of December 31, 2021 and 2020, the related consolidated statements of earnings, comprehensive income,changes in shareholders’ equity, and cash flows, for each of the three years in the period ended December 31, 2021, and therelated notes (collectively referred to as the “financial statements”). We also have audited the Company’s internal controlover financial reporting as of December 31, 2021, based on criteria established in Internal Control — Integrated Framework(2013) issued by the Committee of Sponsoring Organizations of the Treadway Commission (COSO).
In our opinion, the financial statements referred to above present fairly, in all material respects, the financial position of theCompany as of December 31, 2021 and 2020, and the results of its operations and its cash flows for each of the three years inthe period ended December 31, 2021, in conformity with accounting principles generally accepted in the United States ofAmerica. Also, in our opinion, the Company maintained, in all material respects, effective internal control over financialreporting as of December 31, 2021, based on criteria established in Internal Control — Integrated Framework (2013) issuedby COSO.
Basis for OpinionsThe Company’s management is responsible for these financial statements, for maintaining effective internal control overfinancial reporting, and for its assessment of the effectiveness of internal control over financial reporting, included in theaccompanying Management’s Report on Internal Control Over Financial Reporting. Our responsibility is to express anopinion on these financial statements and an opinion on the Company’s internal control over financial reporting based on ouraudits. We are a public accounting firm registered with the Public Company Accounting Oversight Board (United States)(PCAOB) and are required to be independent with respect to the Company in accordance with the US federal securities lawsand the applicable rules and regulations of the Securities and Exchange Commission and the PCAOB.
We conducted our audits in accordance with the standards of the PCAOB. Those standards require that we plan and performthe audits to obtain reasonable assurance about whether the financial statements are free of material misstatement, whetherdue to error or fraud, and whether effective internal control over financial reporting was maintained in all material respects.
Our audits of the financial statements included performing procedures to assess the risks of material misstatement of thefinancial statements, whether due to error or fraud, and performing procedures to respond to those risks. Such proceduresincluded examining, on a test basis, evidence regarding the amounts and disclosures in the financial statements. Our auditsalso included evaluating the accounting principles used and significant estimates made by management, as well as evaluatingthe overall presentation of the financial statements. Our audit of internal control over financial reporting included obtainingan understanding of internal control over financial reporting, assessing the risk that a material weakness exists, and testingand evaluating the design and operating effectiveness of internal control based on the assessed risk. Our audits also includedperforming such other procedures as we considered necessary in the circumstances. We believe that our audits provide areasonable basis for our opinions.
Definition and Limitations of Internal Control over Financial ReportingA company’s internal control over financial reporting is a process designed to provide reasonable assurance regarding thereliability of financial reporting and the preparation of financial statements for external purposes in accordance with generallyaccepted accounting principles. A company’s internal control over financial reporting includes those policies and proceduresthat (1) pertain to the maintenance of records that, in reasonable detail, accurately and fairly reflect the transactions anddispositions of the assets of the company; (2) provide reasonable assurance that transactions are recorded as necessary topermit preparation of financial statements in accordance with generally accepted accounting principles, and that receipts andexpenditures of the company are being made only in accordance with authorizations of management and directors of thecompany; and (3) provide reasonable assurance regarding prevention or timely detection of unauthorized acquisition, use, ordisposition of the company’s assets that could have a material effect on the financial statements.

K-68
REPORT OF INDEPENDENT REGISTERED PUBLIC ACCOUNTING FIRM (Continued)
Because of its inherent limitations, internal control over financial reporting may not prevent or detect misstatements. Also,projections of any evaluation of effectiveness to future periods are subject to the risk that controls may become inadequatebecause of changes in conditions, or that the degree of compliance with the policies or procedures may deteriorate.
Critical Audit MattersThe critical audit matters communicated below are matters arising from the current-period audit of the financial statementsthat were communicated or required to be communicated to the audit committee and that (1) relate to accounts or disclosuresthat are material to the financial statements and (2) involved our especially challenging, subjective, or complex judgments.The communication of critical audit matters does not alter in any way our opinion on the financial statements, taken as awhole, and we are not, by communicating the critical audit matters below, providing separate opinions on the critical auditmatters or on the accounts or disclosures to which they relate.
Unpaid Losses and Loss Adjustment Expenses— Refer to Notes 1 and 16 to the financial statements
Critical Audit Matter DescriptionThe Company’s unpaid losses and loss adjustment expenses (“claim liabilities”) under short duration property and casualtyinsurance and reinsurance contracts are $86,664 million as of December 31, 2021. The key assumptions affecting certainclaim liabilities include expected loss and expense (“loss”) ratios, expected claim count emergence patterns, expected losspayment emergence patterns and expected loss reporting emergence patterns.
Given the subjectivity of estimating these key assumptions, performing audit procedures to evaluate whether claim liabilitieswere appropriately recorded as of December 31, 2021, required a high degree of auditor judgment and an increased extent ofeffort, including the need to involve our actuarial specialists.
How the Critical Audit Matter Was Addressed in the AuditOur audit procedures related to the key assumptions affecting certain claim liabilities included the following, among others:• We tested the operating effectiveness of controls over claim liabilities, including those over the key assumptions.• We evaluated the methods and assumptions used by management to estimate the claim liabilities by:
• Testing the underlying data that served as the basis for the actuarial analysis, such as historical claims and earnedpremium, to test that the inputs to the actuarial estimate were reasonable.
• Comparing management’s prior-year claim liabilities to actual development during the current year to identifypotential bias in the determination of the claim liabilities.
• With the assistance of our actuarial specialists:• We developed independent estimates of the claim liabilities, including loss data and industry claim development
factors as needed, and compared our estimates to management’s estimates.• We compared management’s change in ultimate loss and loss adjustment expense to prior year estimates to test the
reasonableness of the prior year estimates and assessed unexpected development.
Unpaid Losses and Loss Adjustment Expenses Under Retroactive Reinsurance Contracts — Refer to Notes 1 and 17 to thefinancial statements
Critical Audit Matter DescriptionThe Company’s unpaid losses and loss adjustment expenses (“claim liabilities”) for property and casualty retroactivereinsurance contracts are $38,256 million as of December 31, 2021. The key assumptions affecting certain claim liabilitiesand related deferred charge reinsurance assumed assets (“related assets”) include expected loss and expense (“loss”) ratios,expected loss payment emergence patterns and expected loss reporting emergence.
Given the subjectivity of estimating these key assumptions, performing audit procedures to evaluate whether claim liabilitieswere appropriately recorded as of December 31, 2021, required a high degree of auditor judgment and an increased extent ofeffort, including the need to involve our actuarial specialists.
How the Critical Audit Matter Was Addressed in the AuditOur audit procedures related to the key assumptions affecting claim liabilities and related assets included the following,among others:• We tested the operating effectiveness of controls over claim liabilities and related assets, including those over the key
assumptions.
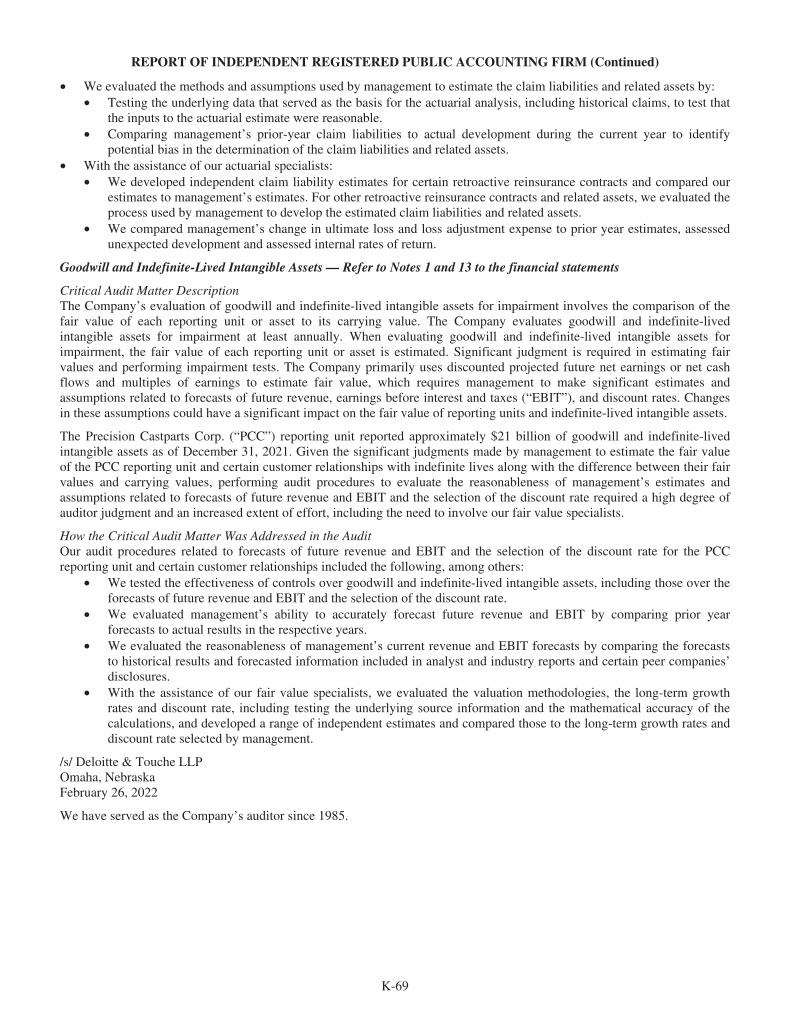
K-69
REPORT OF INDEPENDENT REGISTERED PUBLIC ACCOUNTING FIRM (Continued)
• We evaluated the methods and assumptions used by management to estimate the claim liabilities and related assets by:• Testing the underlying data that served as the basis for the actuarial analysis, including historical claims, to test that
the inputs to the actuarial estimate were reasonable.• Comparing management’s prior-year claim liabilities to actual development during the current year to identify
potential bias in the determination of the claim liabilities and related assets.• With the assistance of our actuarial specialists:
• We developed independent claim liability estimates for certain retroactive reinsurance contracts and compared ourestimates to management’s estimates. For other retroactive reinsurance contracts and related assets, we evaluated theprocess used by management to develop the estimated claim liabilities and related assets.
• We compared management’s change in ultimate loss and loss adjustment expense to prior year estimates, assessedunexpected development and assessed internal rates of return.
Goodwill and Indefinite-Lived Intangible Assets — Refer to Notes 1 and 13 to the financial statements
Critical Audit Matter DescriptionThe Company’s evaluation of goodwill and indefinite-lived intangible assets for impairment involves the comparison of thefair value of each reporting unit or asset to its carrying value. The Company evaluates goodwill and indefinite-livedintangible assets for impairment at least annually. When evaluating goodwill and indefinite-lived intangible assets forimpairment, the fair value of each reporting unit or asset is estimated. Significant judgment is required in estimating fairvalues and performing impairment tests. The Company primarily uses discounted projected future net earnings or net cashflows and multiples of earnings to estimate fair value, which requires management to make significant estimates andassumptions related to forecasts of future revenue, earnings before interest and taxes (“EBIT”), and discount rates. Changesin these assumptions could have a significant impact on the fair value of reporting units and indefinite-lived intangible assets.
The Precision Castparts Corp. (“PCC”) reporting unit reported approximately $21 billion of goodwill and indefinite-livedintangible assets as of December 31, 2021. Given the significant judgments made by management to estimate the fair valueof the PCC reporting unit and certain customer relationships with indefinite lives along with the difference between their fairvalues and carrying values, performing audit procedures to evaluate the reasonableness of management’s estimates andassumptions related to forecasts of future revenue and EBIT and the selection of the discount rate required a high degree ofauditor judgment and an increased extent of effort, including the need to involve our fair value specialists.
How the Critical Audit Matter Was Addressed in the AuditOur audit procedures related to forecasts of future revenue and EBIT and the selection of the discount rate for the PCCreporting unit and certain customer relationships included the following, among others:
• We tested the effectiveness of controls over goodwill and indefinite-lived intangible assets, including those over theforecasts of future revenue and EBIT and the selection of the discount rate.
• We evaluated management’s ability to accurately forecast future revenue and EBIT by comparing prior yearforecasts to actual results in the respective years.
• We evaluated the reasonableness of management’s current revenue and EBIT forecasts by comparing the forecaststo historical results and forecasted information included in analyst and industry reports and certain peer companies’disclosures.
• With the assistance of our fair value specialists, we evaluated the valuation methodologies, the long-term growthrates and discount rate, including testing the underlying source information and the mathematical accuracy of thecalculations, and developed a range of independent estimates and compared those to the long-term growth rates anddiscount rate selected by management.
/s/ Deloitte & Touche LLPOmaha, NebraskaFebruary 26, 2022
We have served as the Company’s auditor since 1985.
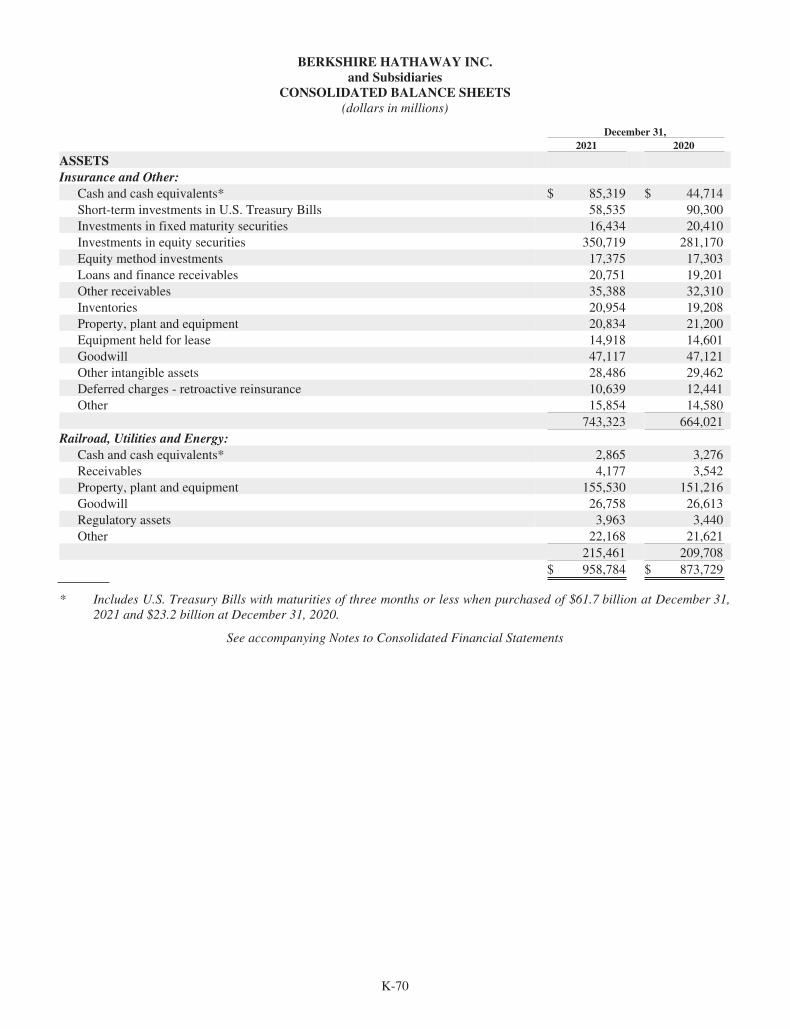
K-70
BERKSHIRE HATHAWAY INC.and Subsidiaries
CONSOLIDATED BALANCE SHEETS(dollars in millions)
December 31,2021 2020
ASSETSInsurance and Other:
Cash and cash equivalents* $ 85,319 $ 44,714Short-term investments in U.S. Treasury Bills 58,535 90,300Investments in fixed maturity securities 16,434 20,410Investments in equity securities 350,719 281,170Equity method investments 17,375 17,303Loans and finance receivables 20,751 19,201Other receivables 35,388 32,310Inventories 20,954 19,208Property, plant and equipment 20,834 21,200Equipment held for lease 14,918 14,601Goodwill 47,117 47,121Other intangible assets 28,486 29,462Deferred charges - retroactive reinsurance 10,639 12,441Other 15,854 14,580
743,323 664,021Railroad, Utilities and Energy:
Cash and cash equivalents* 2,865 3,276Receivables 4,177 3,542Property, plant and equipment 155,530 151,216Goodwill 26,758 26,613Regulatory assets 3,963 3,440Other 22,168 21,621
215,461 209,708$ 958,784 $ 873,729
* Includes U.S. Treasury Bills with maturities of three months or less when purchased of $61.7 billion at December 31,2021 and $23.2 billion at December 31, 2020.
See accompanying Notes to Consolidated Financial Statements

K-71
BERKSHIRE HATHAWAY INC.and Subsidiaries
CONSOLIDATED BALANCE SHEETS(dollars in millions)
December 31,2021 2020
LIABILITIES AND SHAREHOLDERS’ EQUITYInsurance and Other:
Unpaid losses and loss adjustment expenses $ 86,664 $ 79,854Unpaid losses and loss adjustment expenses under retroactive reinsurance contracts 38,256 40,966Unearned premiums 23,512 21,395Life, annuity and health insurance benefits 22,452 21,616Other policyholder liabilities 9,330 8,670Accounts payable, accruals and other liabilities 30,376 30,344Aircraft repurchase liabilities and unearned lease revenues 5,849 5,856Notes payable and other borrowings 39,272 41,522
255,711 250,223Railroad, Utilities and Energy:
Accounts payable, accruals and other liabilities 15,696 15,224Regulatory liabilities 7,214 7,475Notes payable and other borrowings 74,990 75,373
97,900 98,072Income taxes, principally deferred 90,243 74,098
Total liabilities 443,854 422,393Shareholders’ equity:
Common stock 8 8Capital in excess of par value 35,592 35,626Accumulated other comprehensive income (4,027) (4,243)Retained earnings 534,421 444,626Treasury stock, at cost (59,795) (32,853)
Berkshire Hathaway shareholders’ equity 506,199 443,164Noncontrolling interests 8,731 8,172
Total shareholders’ equity 514,930 451,336$ 958,784 $ 873,729
See accompanying Notes to Consolidated Financial Statements

K-72
BERKSHIRE HATHAWAY INC.and Subsidiaries
CONSOLIDATED STATEMENTS OF EARNINGS(dollars in millions except per share amounts)
Year Ended December 31,2021 2020 2019
Revenues:Insurance and Other:
Insurance premiums earned $ 69,478 $ 63,401 $ 61,078Sales and service revenues 145,043 127,044 134,989Leasing revenues 5,988 5,209 5,856Interest, dividend and other investment income 7,465 8,092 9,240
227,974 203,746 211,163Railroad, Utilities and Energy:
Freight rail transportation revenues 23,177 20,750 23,357Energy operating revenues 18,891 15,540 15,353Service revenues and other income 6,052 5,474 4,743
48,120 41,764 43,453Total revenues 276,094 245,510 254,616
Investment and derivative contract gains 78,542 40,746 72,607
Costs and expenses:Insurance and Other:
Insurance losses and loss adjustment expenses 49,964 43,951 44,456Life, annuity and health insurance benefits 6,007 5,812 4,986Insurance underwriting expenses 12,569 12,798 11,200Cost of sales and services 114,138 101,091 107,041Cost of leasing 4,201 3,520 4,003Selling, general and administrative expenses 18,843 19,809 19,226Goodwill and intangible asset impairments — 10,671 96Interest expense 1,086 1,105 1,056
206,808 198,757 192,064Railroad, Utilities and Energy:
Freight rail transportation expenses 14,477 13,120 15,436Utilities and energy cost of sales and other expenses 13,959 11,638 11,296Other expenses 5,615 4,796 4,002Interest expense 3,086 2,978 2,905
37,137 32,532 33,639Total costs and expenses 243,945 231,289 225,703Earnings before income taxes and equity method earnings 110,691 54,967 101,520
Equity method earnings 995 726 1,176Earnings before income taxes 111,686 55,693 102,696
Income tax expense 20,879 12,440 20,904Net earnings 90,807 43,253 81,792
Earnings attributable to noncontrolling interests 1,012 732 375Net earnings attributable to Berkshire Hathaway shareholders $ 89,795 $ 42,521 $ 81,417
Net earnings per average equivalent Class A share $ 59,460 $ 26,668 $ 49,828Net earnings per average equivalent Class B share* $ 39.64 $ 17.78 $ 33.22Average equivalent Class A shares outstanding 1,510,180 1,594,469 1,633,946Average equivalent Class B shares outstanding 2,265,269,867 2,391,703,454 2,450,919,020
* Class B shares are economically equivalent to one-fifteen-hundredth of a Class A share. Accordingly, net earnings peraverage equivalent Class B share outstanding is equal to one-fifteen-hundredth of the equivalent Class A amount. SeeNote 21.
See accompanying Notes to Consolidated Financial Statements
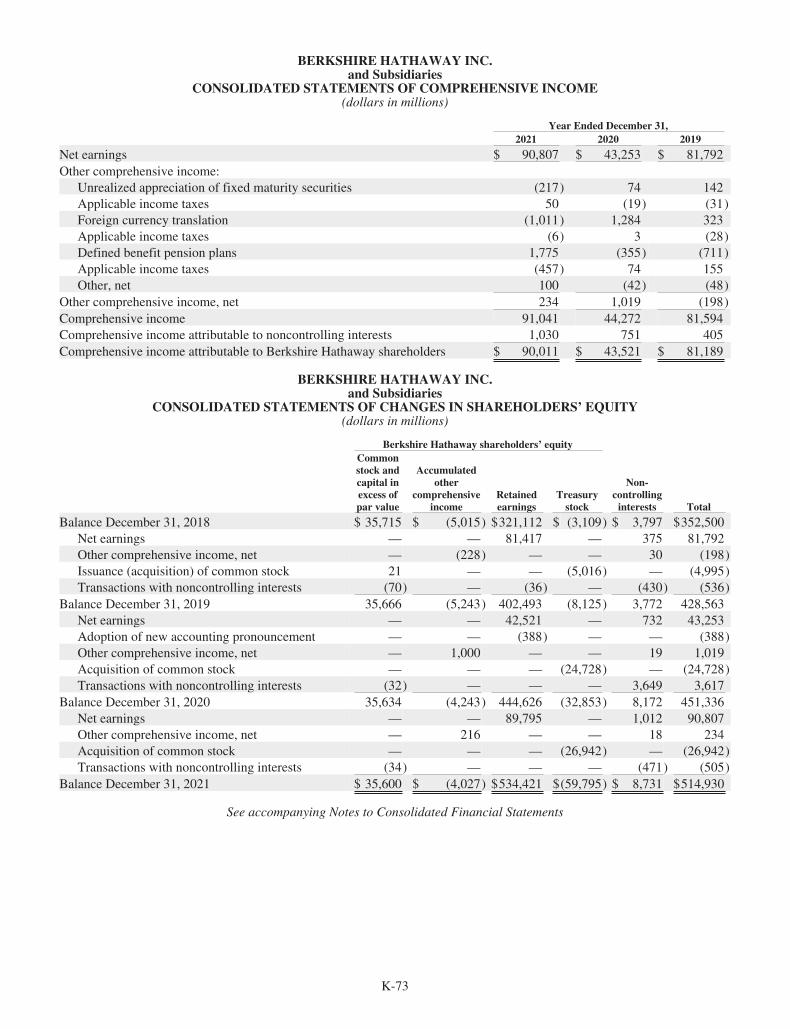
K-73
BERKSHIRE HATHAWAY INC.and Subsidiaries
CONSOLIDATED STATEMENTS OF COMPREHENSIVE INCOME(dollars in millions)
Year Ended December 31,2021 2020 2019
Net earnings $ 90,807 $ 43,253 $ 81,792Other comprehensive income:
Unrealized appreciation of fixed maturity securities (217) 74 142Applicable income taxes 50 (19) (31)Foreign currency translation (1,011) 1,284 323Applicable income taxes (6) 3 (28)Defined benefit pension plans 1,775 (355) (711)Applicable income taxes (457) 74 155Other, net 100 (42) (48)
Other comprehensive income, net 234 1,019 (198)Comprehensive income 91,041 44,272 81,594Comprehensive income attributable to noncontrolling interests 1,030 751 405Comprehensive income attributable to Berkshire Hathaway shareholders $ 90,011 $ 43,521 $ 81,189
BERKSHIRE HATHAWAY INC.and Subsidiaries
CONSOLIDATED STATEMENTS OF CHANGES IN SHAREHOLDERS’ EQUITY(dollars in millions)
Berkshire Hathaway shareholders’ equityCommonstock andcapital inexcess ofpar value
Accumulatedother
comprehensiveincome
Retainedearnings
Treasurystock
Non-controllinginterests Total
Balance December 31, 2018 $ 35,715 $ (5,015) $321,112 $ (3,109) $ 3,797 $352,500Net earnings — — 81,417 — 375 81,792Other comprehensive income, net — (228) — — 30 (198)Issuance (acquisition) of common stock 21 — — (5,016) — (4,995)Transactions with noncontrolling interests (70) — (36) — (430) (536)
Balance December 31, 2019 35,666 (5,243) 402,493 (8,125) 3,772 428,563Net earnings — — 42,521 — 732 43,253Adoption of new accounting pronouncement — — (388) — — (388)Other comprehensive income, net — 1,000 — — 19 1,019Acquisition of common stock — — — (24,728) — (24,728)Transactions with noncontrolling interests (32) — — — 3,649 3,617
Balance December 31, 2020 35,634 (4,243) 444,626 (32,853) 8,172 451,336Net earnings — — 89,795 — 1,012 90,807Other comprehensive income, net — 216 — — 18 234Acquisition of common stock — — — (26,942) — (26,942)Transactions with noncontrolling interests (34) — — — (471) (505)
Balance December 31, 2021 $ 35,600 $ (4,027) $534,421 $(59,795) $ 8,731 $514,930
See accompanying Notes to Consolidated Financial Statements

K-74
BERKSHIRE HATHAWAY INC.and Subsidiaries
CONSOLIDATED STATEMENTS OF CASH FLOWS(dollars in millions)
Year Ended December 31,2021 2020 2019
Cash flows from operating activities:Net earnings $ 90,807 $ 43,253 $ 81,792Adjustments to reconcile net earnings to operating cash flows:
Investment (gains) losses (77,576) (40,905) (71,123)Depreciation and amortization 10,718 10,596 10,064Other, including asset impairment charges (3,397) 11,263 (1,254)
Changes in operating assets and liabilities:Unpaid losses and loss adjustment expenses 4,595 4,819 6,087Deferred charges - retroactive reinsurance 1,802 1,307 357Unearned premiums 2,306 1,587 1,707Receivables and originated loans (5,834) (1,609) (2,303)Other assets (1,686) (1,109) (2,011)Other liabilities 2,389 3,376 190Income taxes 15,297 7,195 15,181
Net cash flows from operating activities 39,421 39,773 38,687Cash flows from investing activities:
Purchases of equity securities (8,448) (30,161) (18,642)Sales of equity securities 15,849 38,756 14,336Purchases of U.S. Treasury Bills and fixed maturity securities (152,637) (208,429) (136,123)Sales of U.S. Treasury Bills and fixed maturity securities 27,188 31,873 15,929Redemptions and maturities of U.S. Treasury Bills and fixed maturity securities 160,402 149,709 137,767Purchases of loans and finance receivables (88) (772) (75)Collections of loans and finance receivables 561 393 345Acquisitions of businesses, net of cash acquired (456) (2,532) (1,683)Purchases of property, plant and equipment and equipment held for lease (13,276) (13,012) (15,979)Other 297 (3,582) (1,496)
Net cash flows from investing activities 29,392 (37,757) (5,621)Cash flows from financing activities:
Proceeds from borrowings of insurance and other businesses 2,961 5,925 8,144Repayments of borrowings of insurance and other businesses (3,032) (2,700) (5,095)Proceeds from borrowings of railroad, utilities and energy businesses 3,959 8,445 5,400Repayments of borrowings of railroad, utilities and energy businesses (4,016) (3,761) (2,638)Changes in short term borrowings, net (624) (1,118) 266Acquisition of treasury stock (27,061) (24,706) (4,850)Other (695) (429) (497)
Net cash flows from financing activities (28,508) (18,344) 730Effects of foreign currency exchange rate changes 5 92 25Increase (decrease) in cash and cash equivalents and restricted cash 40,310 (16,236) 33,821Cash and cash equivalents and restricted cash at beginning of year 48,396 64,632 30,811Cash and cash equivalents and restricted cash at end of year * $ 88,706 $ 48,396 $ 64,632
* Cash and cash equivalents and restricted cash at end of year are comprised of:Insurance and Other $ 85,319 $ 44,714 $ 61,151Railroad, Utilities and Energy 2,865 3,276 3,024Restricted cash included in other assets 522 406 457
$ 88,706 $ 48,396 $ 64,632
See accompanying Notes to Consolidated Financial Statements
K-75
BERKSHIRE HATHAWAY INC.and Subsidiaries
NOTES TO CONSOLIDATED FINANCIAL STATEMENTSDecember 31, 2021
(1) Significant accounting policies and practices
(a) Nature of operations and basis of consolidation
Berkshire Hathaway Inc. (“Berkshire”) is a holding company owning subsidiaries engaged in a number ofdiverse business activities, including insurance and reinsurance, freight rail transportation, utilities and energy,manufacturing, service and retailing. In these notes the terms “us,” “we,” or “our” refer to Berkshire and itsconsolidated subsidiaries. Further information regarding our reportable business segments is contained in Note 25.Information concerning business acquisitions completed over the past three years appears in Note 2. We believe thatreporting the Railroad, Utilities and Energy subsidiaries separately is appropriate given the relative significance of theirlong-lived assets, capital expenditures and debt, which is not guaranteed by Berkshire.
The accompanying Consolidated Financial Statements include the accounts of Berkshire consolidated with theaccounts of all subsidiaries and affiliates in which we hold a controlling financial interest as of the financial statementdate. Normally a controlling financial interest reflects ownership of a majority of the voting interests. We consolidatevariable interest entities (“VIE”) when we possess both the power to direct the activities of the VIE that mostsignificantly affect its economic performance, and we (a) are obligated to absorb the losses that could be significant tothe VIE or (b) hold the right to receive benefits from the VIE that could be significant to the VIE. Intercompanyaccounts and transactions have been eliminated.
(b) Use of estimates in preparation of financial statements
We prepare our Consolidated Financial Statements in conformity with accounting principles generally acceptedin the United States (“GAAP”) which requires us to make estimates and assumptions that affect the reported amountsof assets and liabilities at the balance sheet date and the reported amounts of revenues and expenses during the period.Our estimates of unpaid losses and loss adjustment expenses are subject to considerable estimation error due to theinherent uncertainty in projecting ultimate claim costs. In addition, estimates and assumptions associated with theamortization of deferred charges on retroactive reinsurance contracts, determinations of fair values of certain financialinstruments and evaluations of goodwill and indefinite-lived intangible assets for impairment require considerablejudgment. Actual results may differ from the estimates used in preparing our Consolidated Financial Statements.
The novel coronavirus (“COVID-19”) spread rapidly across the world in 2020 and was declared a pandemic bythe World Health Organization. The government and private sector responses to contain its spread began tosignificantly affect our operating businesses in March of 2020. The COVID-19 pandemic adversely affected nearly allof our operations during 2020, although the effects varied significantly. The extent of the effects over longer terms onthe demand for certain of our products and services cannot be reasonably estimated at this time. Accordingly,significant estimates used in the preparation of our financial statements including those associated with evaluations ofcertain long-lived assets, goodwill and other intangible assets for impairment, expected credit losses on amounts owedto us and the estimations of certain losses assumed under insurance and reinsurance contracts may be subject tosignificant adjustments in future periods.
(c) Cash and cash equivalents and short-term investments in U.S. Treasury Bills
Cash equivalents consist of demand deposit and money market accounts and investments with maturities of threemonths or less when purchased. Short-term investments in U.S. Treasury Bills consist of U.S. Treasury Bills withmaturities exceeding three months at the time of purchase and are stated at amortized cost, which approximates fairvalue.
(d) Investments in fixed maturity securities
We classify investments in fixed maturity securities on the acquisition date and at each balance sheet date.Securities classified as held-to-maturity are carried at amortized cost, reflecting the ability and intent to hold thesecurities to maturity. Securities classified as trading are acquired with the intent to sell in the near term and are carriedat fair value with changes in fair value reported in earnings. All other securities are classified as available-for-sale andare carried at fair value. Substantially all of investments in fixed maturity securities are classified as available-for-sale.We amortize the difference between the original cost and maturity value of a fixed maturity security to earnings usingthe interest method.
K-76
Notes to Consolidated Financial Statements (Continued)
(1) Significant accounting policies and practices (Continued)
(d) Investments in fixed maturity securities (Continued)
We record investment gains and losses on available-for-sale fixed maturity securities when the securities aresold, determined on a specific identification basis. For securities in an unrealized loss position, we recognize a loss inearnings for the excess of amortized cost over fair value if we intend to sell before the price recovers. As of the balancesheet date, we evaluate whether the other unrealized losses are attributable to credit losses or other factors. We considerthe severity of the decline in value, creditworthiness of the issuer and other relevant factors. We record an allowancefor credit losses, limited to the excess of amortized cost over fair value, with a corresponding charge to earnings if thepresent value of estimated cash flows is less than the present value of contractual cash flows. The allowance may besubsequently increased or decreased based on the prevailing facts and circumstances. The portion of the unrealized lossthat we believe is not related to a credit loss is recognized in other comprehensive income.
(e) Investments in equity securities
We carry substantially all investments in equity securities at fair value and record the subsequent changes in fairvalues in the Consolidated Statements of Earnings as a component of investment gains or losses.
(f) Investments under the equity method
We utilize the equity method to account for investments when we possess the ability to exercise significantinfluence, but not control, over the operating and financial policies of the investee. The ability to exercise significantinfluence is presumed when the investor possesses more than 20% of the voting interests of the investee. Thispresumption may be overcome based on specific facts and circumstances that demonstrate that the ability to exercisesignificant influence is restricted. We apply the equity method to investments in common stock and other investmentswhen such investments possess substantially identical subordinated interests to common stock.
In applying the equity method, we record the investment at cost and subsequently increase or decrease thecarrying amount of the investment by our proportionate share of the net earnings or losses and other comprehensiveincome of the investee. We record dividends or other equity distributions as reductions in the carrying value of theinvestment. If net losses reduce our carrying amount to zero, additional net losses may be recorded if other investmentsin the investee are at-risk, even if we have not committed to provide financial support to the investee. Such additionalequity method losses, if any, are based upon the change in our claim on the investee’s book value.
(g) Loans and finance receivables
Loans and finance receivables are primarily manufactured home loans, and to a lesser extent, commercial loansand site-built home loans. We carry substantially all loans and finance receivables at amortized cost, net of allowancesfor expected credit losses, based on our ability and intent to hold such loans to maturity. Acquisition costs and loanorigination and commitment costs paid and fees received, as well as acquisition premiums or discounts, are amortizedas yield adjustments over the lives of the loans.
Prior to 2020, credit losses were measured when non-collection was considered probable based on the prevailingfacts and circumstances. Beginning in 2020, measurements of expected credit losses include provisions for non-collection, whether the risk is probable or remote. Expected credit losses on manufactured home loans are based on thenet present value of future principal payments less estimated expenses related to the charge-off and foreclosure ofexpected uncollectible loans and include provisions for loans that are not in foreclosure. Our principal credit qualityindicator is whether the loans are performing. Expected credit loss estimates consider historical default rates, collateralrecovery rates, historical runoff rates, interest rates, reductions of future cash flows for modified loans and thehistorical time elapsed from last payment until foreclosure, among other factors. In addition, our estimates considercurrent conditions and reasonable and supportable forecasts.
Loans are considered delinquent when payments are more than 30 days past due. We place loans over 90 dayspast due on nonaccrual status and accrued but uncollected interest is reversed. Subsequent collections on the loans arefirst applied to the principal and interest owed for the most delinquent amount. We resume interest income accrualonce a loan is less than 90 days delinquent.
Loans are considered non-performing when the foreclosure process has started. Once a loan is in the process offoreclosure, interest income is not recognized until the foreclosure is cured or the loan is modified. Once a modificationis complete, interest income is recognized based on the terms of the new loan. Foreclosed loans are charged off whenthe collateral is sold. Loans not in foreclosure are evaluated for charge-off based on individual circumstancesconcerning the future collectability of the loan and the condition of the collateral securing the loan.
K-77
Notes to Consolidated Financial Statements (Continued)
(1) Significant accounting policies and practices (Continued)
(h) Other receivables
Other receivables include balances due from customers, insurance premiums receivable and reinsurance lossesrecoverable, as well as other receivables. Trade receivables, insurance premium receivables and other receivables areprimarily short-term in nature with stated collection terms of less than one year from the date of origination.Reinsurance recoverables are comprised of amounts ceded under reinsurance contracts or pursuant to mandatorygovernment-sponsored insurance programs. Reinsurance recoverables relate to unpaid losses and loss adjustmentexpenses arising from property and casualty contracts and benefits under life and health contracts. Receivables arestated net of estimated allowances for uncollectible balances. Prior to 2020, we recorded provisions for uncollectiblebalances when it was probable counterparties or customers would be unable to pay all amounts due based on thecontractual terms and historical loss history.
Beginning in 2020, we adopted a new accounting pronouncement that affects the measurement of allowances forcredit losses. In measuring credit loss allowances, we primarily utilize credit loss history, with adjustments to reflectcurrent or expected future economic conditions when reasonable and supportable forecasts of losses deviate fromhistorical experience. In evaluating expected credit losses of reinsurance recoverables on unpaid losses, we review thecredit quality of the counterparty and consider right-of-offset provisions within reinsurance contracts and other formsof credit enhancement including collateral, guarantees and other available information. We charge-off receivablesagainst the allowances after all reasonable collection efforts are exhausted.
(i) Derivatives
We carry derivative contracts in accounts payable, accruals and other liabilities in our Consolidated BalanceSheets at fair value, net of reductions permitted under master netting agreements with counterparties. We record thechanges in fair value of derivative contracts that do not qualify as hedging instruments for financial reporting purposesin earnings or, if such contracts involve our regulated utilities subsidiaries, as regulatory assets or liabilities wheninclusion in regulated rates is probable.
(j) Fair value measurements
As defined under GAAP, fair value is the price that would be received to sell an asset or paid to transfer aliability between market participants in the principal market or in the most advantageous market when no principalmarket exists. Adjustments to transaction prices or quoted market prices may be required in illiquid or disorderlymarkets in estimating fair value. Alternative valuation techniques may be appropriate under the circumstances todetermine the value that would be received to sell an asset or paid to transfer a liability in an orderly transaction.Market participants are assumed to be independent, knowledgeable, and able and willing to transact an exchange andnot acting under duress. Our nonperformance or credit risk is considered in determining the fair value of liabilities.Considerable judgment may be required in interpreting market data used to develop the estimates of fair value.Accordingly, estimates of fair value presented herein are not necessarily indicative of the amounts that could berealized in a current or future market exchange.
(k) Inventories
Inventories consist of manufactured goods, goods or products acquired for resale and homes constructed for sale.Manufactured inventory costs include materials, direct and indirect labor and factory overhead. At December 31, 2021,we used the last-in-first-out (“LIFO”) method to value approximately 31% of consolidated inventories with theremainder primarily determined under first-in-first-out and average cost methods. Non-LIFO inventories are stated atthe lower of cost or net realizable value. The excess of current or replacement costs over costs determined under LIFOwas approximately $1.9 billion as of December 31, 2021 and $1.1 billion as of December 31, 2020.
(l) Property, plant and equipment
We record additions to property, plant and equipment used in operations at cost, which includes asset additions,improvements and betterments. With respect to constructed assets, all materials, direct labor and contract services aswell as certain indirect costs are capitalized. Indirect costs include interest over the construction period. With respect toconstructed assets of our utility and energy subsidiaries that are subject to authoritative guidance for regulatedoperations, capitalized costs also include an allowance for funds used during construction, which represents the cost ofequity funds used to finance the construction of the regulated facilities. Normal repairs and maintenance and othercosts that do not improve the property, extend its useful life or otherwise do not meet capitalization criteria are chargedto expense as incurred.
K-78
Notes to Consolidated Financial Statements (Continued)
(1) Significant accounting policies and practices (Continued)
(l) Property, plant and equipment (Continued)
Depreciation of assets of our regulated utilities and railroad is generally determined using group depreciationmethods where rates are based on periodic depreciation studies approved by the applicable regulator. Under groupdepreciation, a composite rate is applied to the gross investment in a particular class of property, despite differences inthe service life or salvage value of individual property units within the same class. When such assets are retired or sold,no gain or loss is recognized. Gains or losses on disposals of all other assets are recorded through earnings.
We depreciate property, plant and equipment used by our other businesses to the estimated salvage valueprimarily using the straight-line method over estimated useful lives. Ranges of estimated useful lives of depreciableassets used in our other businesses are as follows: buildings and improvements – 5 to 50 years, machinery andequipment – 3 to 25 years and furniture, fixtures and other – 3 to 15 years. Ranges of estimated useful lives ofdepreciable assets unique to our railroad business are as follows: track structure and other roadway – 10 to 100 yearsand locomotives, freight cars and other equipment – 6 to 43 years. Ranges of estimated useful lives of assets unique toour regulated utilities and energy businesses are as follows: utility generation, transmission and distribution systems –5 to 80 years, interstate natural gas pipeline assets – 3 to 80 years and independent power plants and other assets – 2 to50 years.
We evaluate property, plant and equipment for impairment when events or changes in circumstances indicatethat the carrying value of such assets may not be recoverable or when the assets are held for sale. Upon the occurrenceof a triggering event, we assess whether the estimated undiscounted cash flows expected from the use of the asset andthe residual value from the ultimate disposal of the asset exceeds the carrying value. If the carrying value exceeds theestimated recoverable amounts, we reduce the carrying value to fair value and record an impairment loss in earnings,except with respect to impairment of assets of our regulated utility and energy subsidiaries where the impacts ofregulation are considered in evaluating the carrying value.
(m) Leases
We are party to contracts where we lease property to others (“lessor” contracts) and where we lease propertyfrom others (“lessee” contracts). We record acquisitions of and additions to equipment that we lease to others at cost.We depreciate equipment held for lease to estimated salvage value primarily using the straight-line method overestimated useful lives ranging from 3 to 35 years. We use declining balance depreciation methods for assets when therevenue-earning power of the asset is greater during the earlier years of its life. We also evaluate equipment held forlease for impairment consistent with policies for property, plant and equipment.
When we lease assets from others, we record right-of-use assets and lease liabilities. Right-of-use assetsrepresent our right to use an underlying asset for the lease term and lease liabilities represent our obligation to makelease payments arising from the lease. In this regard, lease payments include fixed payments and variable paymentsthat depend on an index or rate. The lease term is generally considered the non-cancellable lease period. Certain leasecontracts contain renewal options or other terms that provide for variable payments based on performance or usage.Options are not included in determining right-of-use assets or lease liabilities unless it is reasonably certain that optionswill be exercised. Generally, incremental borrowing rates are used in measuring lease liabilities. Right-of-use assets aresubject to review for impairment. As permitted under GAAP, we do not separate lease components from non-leasecomponents by class of asset and do not record assets or liabilities for leases with terms of one year or less.
(n) Goodwill and other intangible assets
Goodwill represents the excess of the acquisition price of a business over the fair value of identified net assets ofthat business. We evaluate goodwill for impairment at least annually. When evaluating goodwill for impairment, weestimate the fair value of the reporting unit. Several methods may be used to estimate a reporting unit’s fair value,including market quotations, asset and liability fair values and other valuation techniques, including, but not limited to,discounted projected future net earnings or net cash flows and multiples of earnings. When the carrying amount of areporting unit, including goodwill, exceeds the estimated fair value, the excess is charged to earnings as an impairmentloss.
Intangible assets with indefinite lives are also tested for impairment at least annually and when events or changesin circumstances indicate that, more-likely-than-not, the asset is impaired. Significant judgment is required inestimating fair values and performing goodwill and indefinite-lived intangible asset impairment tests. We amortizeintangible assets with finite lives in a pattern that reflects the expected consumption of related economic benefits or ona straight-line basis over the estimated economic useful lives. Intangible assets with finite lives are reviewed forimpairment when events or changes in circumstances indicate that the carrying amount may not be recoverable.

K-79
Notes to Consolidated Financial Statements (Continued)
(1) Significant accounting policies and practices (Continued)
(o) Revenue recognition
We earn insurance premiums on prospective property/casualty insurance and reinsurance contracts over the lossexposure or coverage period in proportion to the level of protection provided. Premiums are generally earned inproportion to the coverage provided, which is generally ratable over the term of the contract with unearned premiumscomputed on a monthly or daily pro-rata basis. Premiums on retroactive property/casualty reinsurance contracts aregenerally received in full and are earned at the inception of the contracts, as all underlying loss events covered by thepolicies occurred prior to contract inception. Premiums for life reinsurance and periodic payment annuity contracts areearned when due. Premiums for periodic payment annuity contracts are usually received in full at the inception of thecontracts. Premiums earned are stated net of amounts ceded to reinsurers. Premiums earned on contracts withexperience-rating provisions reflect estimated loss experience under such contracts.
Sales and service revenues are recognized when goods or services are transferred to a customer. A good orservice is transferred when (or as) the customer obtains control of that good or service. Revenues are based on theconsideration we expect to receive in connection with our promises to deliver goods and services to our customers.
We manufacture and/or distribute a wide variety of industrial, building and consumer products. Our salescontracts provide customers with these products through wholesale and retail channels in exchange for considerationspecified under the contracts. Contracts generally represent customer orders for individual products at stated prices.Sales contracts may contain either single or multiple performance obligations. In instances where contracts containmultiple performance obligations, we allocate the revenue to each obligation based on the relative stand-alone sellingprices of each product or service.
Sales revenue reflects reductions for returns, allowances, volume discounts and other incentives, some of whichmay be contingent on future events. In certain customer contracts, sales revenue includes certain state and local excisetaxes billed to customers on specified products when those taxes are levied directly upon us by the taxing authorities.Sales revenue excludes sales taxes and value-added taxes collected on behalf of taxing authorities. Sales revenueincludes consideration for shipping and other fulfillment activities performed prior to the customer obtaining control ofthe goods. We also elect to treat consideration for such services performed after control has passed to the customer assales revenue.
Our product sales revenues are generally recognized at a point in time when control of the product transfers tothe customer, which coincides with customer pickup or product delivery or acceptance, depending on terms of thearrangement. We recognize sales revenues and related costs with respect to certain contracts over time, primarily fromcertain castings, forgings and aerostructures contracts. Control of the product units under these contracts transferscontinuously to the customer as the product is manufactured. These products generally have no alternative use and thecontract requires the customer to provide reasonable compensation if terminated for reasons other than breach ofcontract.
The primary performance obligation under our freight rail transportation service contracts is to move freightfrom a point of origin to a point of destination. The performance obligations are represented by bills of lading whichcreate a series of distinct services that have a similar pattern of transfer to the customer. The revenues for eachperformance obligation are based on various factors including the product being shipped, the origin and destinationpair and contract incentives, which are outlined in various private rate agreements, common carrier public tariffs,interline foreign road agreements and pricing quotes. The transaction price is generally a per car/unit amount totransport railcars from a specified origin to a specified destination. Freight revenues are recognized over time as theservice is performed because the customer simultaneously receives and consumes the benefits of the service. Revenuesrecognized represent the proportion of the service completed as of the balance sheet date. Invoices for freighttransportation services are generally issued to customers and paid within 30 days or less. Customer incentives, whichare primarily provided for shipping a specified cumulative volume or shipping to/from specific locations, are recordedas a reduction to revenue on a pro-rata basis based on actual or projected future customer shipments.

K-80
Notes to Consolidated Financial Statements (Continued)
(1) Significant accounting policies and practices (Continued)
(o) Revenue recognition (Continued)
Our energy revenue derives primarily from tariff-based sales arrangements approved by various regulatorycommissions. These tariff-based revenues are mainly comprised of energy, transmission, distribution and natural gasand have performance obligations to deliver energy products and services to customers which are satisfied over time asenergy is delivered or services are provided. Our nonregulated energy revenue primarily relates to our renewableenergy business. Energy revenues are equivalent to the amounts we have the right to invoice and correspond directlywith the value to the customer of the performance to date and include billed and unbilled amounts. Payments fromcustomers are generally due within 30 days of billing. Rates charged for energy products and services are establishedby regulators or contractual arrangements that establish the transaction price, as well as the allocation of price amongthe separate performance obligations. When preliminary regulated rates are permitted to be billed prior to finalapproval by the applicable regulator, certain revenue collected may be subject to refund and a liability for estimatedrefunds is accrued. Other service revenues derive from contracts with customers in which performance obligations aresatisfied over time, where customers receive and consume benefits as we perform the services or at a point in timewhen the services are provided. Other service revenues primarily derive from real estate brokerage, automotive repair,aircraft management, aviation training, franchising and news distribution.
Leasing revenue is generally recognized ratably over the term of the lease or based on usage, if applicable underthe terms of the contract. A substantial portion of our lessor contracts are classified as operating leases.
(p) Losses and loss adjustment expenses
We record liabilities for unpaid losses and loss adjustment expenses under property/casualty insurance andreinsurance contracts for loss events that have occurred on or before the balance sheet date. Such liabilities representthe estimated ultimate payment amounts without discounting for time value.
We base liability estimates on (1) loss reports from policyholders and cedents, (2) individual case estimates and(3) estimates of incurred but not reported losses. Losses and loss adjustment expenses in the Consolidated Statementsof Earnings include paid claims, claim settlement costs and changes in estimated claim liabilities. Losses and lossadjustment expenses charged to earnings are net of amounts recovered and estimates of amounts recoverable underceded reinsurance contracts. Reinsurance contracts do not relieve the ceding company of its obligations to indemnifypolicyholders with respect to the underlying insurance and reinsurance contracts.
(q) Retroactive reinsurance contracts
We record liabilities for unpaid losses and loss adjustment expenses under short duration retroactive reinsurancecontracts consistent with property/casualty insurance and reinsurance contracts described in Note 1(p). With respect toretroactive reinsurance contracts, we also record deferred charge assets at the inception of the contracts, representingthe excess, if any, of the estimated ultimate claim liabilities over the premiums earned. We subsequently amortize thedeferred charge assets over the expected claim settlement periods using the interest method. Changes to the estimatedtiming or amount of future loss payments also produce changes in deferred charge balances. We apply changes in suchestimates retrospectively and the resulting changes in deferred charge balances, together with periodic amortization, areincluded in insurance losses and loss adjustment expenses in the Consolidated Statements of Earnings.
(r) Insurance policy acquisition costs
We capitalize the incremental costs that directly relate to the successful sale of insurance contracts, subject toultimate recoverability. For short duration contracts, we subsequently amortize such costs to underwriting expenses asthe related premiums are earned. Acquisition costs related to long duration life insurance contracts are amortized overthe expected premium-paying period in proportion to the anticipated premiums over the life of the policy. Suchanticipated premiums are estimated using the same assumptions used for computing liabilities for future policybenefits. Direct incremental acquisition costs include commissions, premium taxes and certain other costs associatedwith successful efforts. We expense all other underwriting costs as incurred. The recoverability of capitalized insurancepolicy acquisition costs generally reflects anticipation of investment income. The unamortized balances are included inother assets and were approximately $3.4 billion and $3.25 billion at December 31, 2021 and 2020, respectively.
K-81
Notes to Consolidated Financial Statements (Continued)
(1) Significant accounting policies and practices (Continued)
(s) Life and annuity insurance benefits
We compute liabilities for benefits under life insurance contracts based upon estimated future investment yields,expected mortality, morbidity and lapse or withdrawal rates, as well as estimates of premiums we expect to receive andexpenses we expect to incur in the future. These assumptions, as applicable, also include a margin for adversedeviation and may vary with the characteristics of the contract’s date of issuance, policy duration and country of risk.The interest rate assumptions used may vary by contract or jurisdiction. We discount periodic payment annuityliabilities based on the implicit rate as of the inception of the contracts such that the present value of the liabilitiesequals the premiums. Discount rates for most contracts range from 3% to 7%.
(t) Regulated utilities and energy businesses
Certain energy subsidiaries prepare their financial statements in accordance with authoritative guidance forregulated operations, reflecting the economic effects of regulation from the ability to recover certain costs fromcustomers and the requirement to return revenues to customers in the future through the regulated rate-setting process.Accordingly, certain costs are deferred as regulatory assets and certain income is accrued as regulatory liabilities.Regulatory assets and liabilities will be amortized into operating expenses and revenues over various future periods.
Regulatory assets and liabilities are continually assessed for probable future inclusion in regulatory rates byconsidering factors such as applicable regulatory or legislative changes and recent rate orders received by otherregulated entities. If future inclusion in regulatory rates ceases to be probable, the amount no longer probable ofinclusion in regulatory rates is charged or credited to earnings (or other comprehensive income, if applicable) orreturned to customers.
(u) Foreign currency
The accounts of our non-U.S. based subsidiaries are measured, in most instances, using functional currenciesother than the U.S. Dollar. Revenues and expenses in the financial statements of these subsidiaries are translated intoU.S. Dollars at the average exchange rate for the period and assets and liabilities are translated at the exchange rate asof the end of the reporting period. The net effects of translating the financial statements of these subsidiaries areincluded in shareholders’ equity as a component of accumulated other comprehensive income. Gains and losses arisingfrom transactions denominated in a currency other than the functional currency of the reporting entity, including gainsand losses from the remeasurement of assets and liabilities due to changes in currency exchange rates, are included inearnings.
(v) Income taxes
Berkshire files a consolidated federal income tax return in the United States, which includes eligible subsidiaries.In addition, we file income tax returns in state, local and foreign jurisdictions as applicable. Provisions for currentincome tax liabilities are calculated and accrued on income and expense amounts expected to be included in the incometax returns for the current year. Income taxes reported in earnings also include deferred income tax provisions.
Deferred income tax assets and liabilities are computed on differences between the financial statement bases andtax bases of assets and liabilities at the enacted tax rates. Changes in deferred income tax assets and liabilitiesassociated with components of other comprehensive income are charged or credited directly to other comprehensiveincome. Otherwise, changes in deferred income tax assets and liabilities are included as a component of income taxexpense. The effect on deferred income tax assets and liabilities attributable to changes in enacted tax rates are chargedor credited to income tax expense in the period of enactment. Valuation allowances are established for certain deferredtax assets when realization is not likely.
Assets and liabilities are established for uncertain tax positions taken or positions expected to be taken in incometax returns when such positions, in our judgment, do not meet a more-likely-than-not threshold based on the technicalmerits of the positions. Estimated interest and penalties related to uncertain tax positions are included as a componentof income tax expense.

K-82
Notes to Consolidated Financial Statements (Continued)
(1) Significant accounting policies and practices (Continued)
(w) New accounting pronouncements adopted in 2020
We adopted Accounting Standards Codification (“ASC”) 326 “Financial Instruments-Credit Losses” on January1, 2020. ASC 326 provides for the measurement of expected credit losses on financial assets that are carried atamortized cost based on the net amounts expected to be collected. Measurements of expected credit losses thereforeinclude provisions for non-collection, whether the risk is probable or remote. Prior to the adoption of ASC 326, creditlosses were measured when non-collection was considered probable. Upon adoption of ASC 326, we recorded a chargeto retained earnings of $388 million representing the cumulative after-tax increase in our allowances for credit losses.
(x) New accounting pronouncements adopted in 2019
Berkshire adopted ASC 842 “Leases” on January 1, 2019 with respect to contracts in effect as of the adoptionand elected to not restate prior period financial statements. Most significantly, ASC 842 requires a lessee to recognize aliability to make operating lease payments and an asset with respect to its right to use the underlying asset for the leaseterm. Upon adoption, we recorded operating lease right-of-use assets of approximately $6.2 billion, lease liabilities of$5.9 billion and reduced other assets by approximately $300 million.
(y) New accounting pronouncements to be adopted subsequent to December 31, 2021
In August 2018, the Financial Accounting Standards Board issued Accounting Standards Update 2018-12“Targeted Improvements to the Accounting for Long-Duration Contracts” (“ASU 2018-12”). ASU 2018-12 requiresreassessment of cash flow assumptions at least annually and revision of discount rate assumptions each reportingperiod in valuing policyholder liabilities and related deferred acquisition costs of long-duration insurance andreinsurance contracts. The effects from changes in cash flow assumptions are reflected in earnings and the effects fromchanges in discount rate assumptions are reflected in other comprehensive income. Currently, the cash flow anddiscount rate assumptions are set at the contract inception date and not subsequently changed, except under limitedcircumstances. ASU 2018-12 is to be applied retrospectively to the earliest period presented in the financial statements,requires new disclosures and is effective for fiscal years beginning after December 15, 2022, with early adoptionpermitted.
We currently intend to adopt ASU 2018-12 as of January 1, 2023 using the modified retrospective method,which provides that the revised cash flow and discount rate assumptions as of January 1, 2021 (the transition date) beapplied to contracts then in-force, with liabilities then remeasured as provided under the standard. The cumulativeeffects from discount rate assumption changes as of the transition date will be reflected in accumulated othercomprehensive income and the cumulative effect from cash flow assumption changes will be included in retainedearnings. While we have not finalized our assessment of the impact of the adoption as of the transition date, wecurrently believe that the changes in discount rate assumptions will have a greater effect on our recorded liabilities thanchanges in cash flow assumptions. We also preliminarily estimate that the changes in discount rate assumptions as ofJanuary 1, 2021 will increase our life, health and annuity benefit liabilities from the amounts previously reported due tothe historically low interest rate environment at that time. However, the ultimate impact of adopting ASU 2018-12 willbe based on the discount rate and cash flow assumptions determined as of the January 1, 2023 adoption date. We,therefore, continue to evaluate the effect this standard will have on our Consolidated Financial Statements.
(2) Business acquisitions
Our long-held acquisition strategy is to acquire businesses that have consistent earning power, good returns on equityand able and honest management. Financial results attributable to business acquisitions are included in our ConsolidatedFinancial Statements beginning on their respective acquisition dates.
Berkshire Hathaway Energy (“BHE”) acquired certain businesses of Dominion Energy, Inc. (“Dominion”) onNovember 1, 2020, pursuant to a definitive agreement with Dominion in July 2020. The acquired businesses included naturalgas transmission, gathering and storage pipelines, natural gas storage capacity and partial ownership of a liquefied natural gasexport, import and storage facility (“Cove Point”). In October 2020, BHE and Dominion also agreed to provide for theexclusion of certain pipeline businesses from the initial agreement and entered into a second acquisition agreement withrespect to the excluded pipeline businesses. The closing of the second agreement was subject to regulatory and customaryclosing conditions; however, in July 2021, BHE and Dominion agreed to terminate the second agreement.

K-83
Notes to Consolidated Financial Statements (Continued)
(2) Business acquisitions (Continued)
The cost of the acquisition was approximately $2.5 billion after post-closing adjustments as provided in the agreement.The fair values of identified assets acquired and liabilities assumed and residual goodwill are summarized as follows (inmillions).
Property, plant and equipment $ 9,264Goodwill 1,741Other 2,398Assets acquired $ 13,403
Notes payable and other borrowings $ 5,615Other 1,358Liabilities assumed 6,973Noncontrolling interests 3,916Net assets $ 2,514
As part of this acquisition, BHE acquired an indirect 25% economic interest in Cove Point, consisting of 100% of thegeneral partnership interest and 25% of the limited partnership interests. We concluded that Cove Point is a VIE and that wehave the power to direct the activities that most significantly impact its economic performance as well as the obligation toabsorb losses and receive benefits which could be significant to Cove Point. Therefore, we treat Cove Point as a consolidatedsubsidiary. The noncontrolling interests are attributable to the limited partner interests held by third parties.
In each of the past three years, we also completed several smaller-sized business acquisitions, which we consider as“bolt-ons” to several of our existing business operations. We do not believe that these acquisitions are material, individuallyor in the aggregate to our Consolidated Financial Statements.
(3) Investments in fixed maturity securities
Investments in fixed maturity securities as of December 31, 2021 and 2020 are summarized by type below (inmillions).
AmortizedCost
UnrealizedGains
UnrealizedLosses
FairValue
December 31, 2021U.S. Treasury, U.S. government corporations and agencies $ 3,286 $ 22 $ (5) $ 3,303Foreign governments 10,998 29 (33) 10,994Corporate bonds 1,363 412 (1) 1,774Other 317 47 (1) 363
$ 15,964 $ 510 $ (40) $ 16,434
December 31, 2020U.S. Treasury, U.S. government corporations and agencies $ 3,348 $ 55 $ — $ 3,403Foreign governments 11,233 110 (5) 11,338Corporate bonds 4,729 464 (2) 5,191Other 414 66 (2) 478
$ 19,724 $ 695 $ (9) $ 20,410
Investments in foreign governments include securities issued by national and provincial government entities as well asinstruments that are unconditionally guaranteed by such entities. As of December 31, 2021, approximately 93% of ourforeign government holdings were rated AA or higher by at least one of the major rating agencies. The amortized cost andestimated fair value of fixed maturity securities at December 31, 2021 are summarized below by contractual maturity dates.Amounts are in millions. Actual maturities may differ from contractual maturities due to prepayment rights held by issuers.
Due in oneyear or less
Due after oneyear throughfive years
Due after fiveyears through
ten yearsDue afterten years
Mortgage-backedsecurities Total
Amortized cost $ 9,171 $ 6,044 $ 307 $ 207 $ 235 $ 15,964Fair value 9,165 6,086 559 347 277 16,434

K-84
Notes to Consolidated Financial Statements (Continued)
(4) Investments in equity securities
Investments in equity securities as of December 31, 2021 and 2020 are summarized based on the primary industry ofthe investee in the table below (in millions).
CostBasis
NetUnrealized
GainsFairValue
December 31, 2021 *Banks, insurance and finance $ 26,822 $ 62,236 $ 89,058Consumer products 36,076 154,945 191,021Commercial, industrial and other 41,707 28,933 70,640
$ 104,605 $ 246,114 $ 350,719
* Approximately 73% of the aggregate fair value was concentrated in four companies (American Express Company –$24.8 billion; Apple Inc. – $161.2 billion; Bank of America Corporation – $46.0 billion and The Coca-Cola Company– $23.7 billion).
CostBasis
NetUnrealized
GainsFairValue
December 31, 2020 *Banks, insurance and finance $ 26,312 $ 40,167 $ 66,479Consumer products 34,747 111,583 146,330Commercial, industrial and other 47,561 20,800 68,361
$ 108,620 $ 172,550 $ 281,170
* Approximately 68% of the aggregate fair value was concentrated in four companies (American Express Company –$18.3 billion; Apple Inc. – $120.4 billion; Bank of America Corporation – $31.3 billion and The Coca-Cola Company– $21.9 billion).
Investments in commercial, industrial and other equity securities include our investments in Occidental Corporation(“Occidental”), which we acquired in 2019. These investments were acquired for a total of $10 billion and consist ofOccidental Cumulative Perpetual Preferred Stock with an aggregate liquidation value of $10 billion and warrants, whichcurrently permit us to purchase up to 83.86 million shares of Occidental common stock at an exercise price of $59.62 pershare. The preferred stock accrues dividends at 8% per annum and is redeemable at the option of Occidental commencing in2029 at a redemption price equal to 105% of the liquidation preference plus any accumulated and unpaid dividends and ismandatorily redeemable under certain specified events. The warrants are exercisable in whole or in part until one year afterthe redemption of the preferred stock.
(5) Equity method investments
Berkshire and its subsidiaries hold investments in certain businesses that are accounted for pursuant to the equitymethod. Currently, the most significant of these is our investment in the common stock of The Kraft Heinz Company (“KraftHeinz”). Kraft Heinz is one of the world’s largest manufacturers and marketers of food and beverage products, includingcondiments and sauces, cheese and dairy, meals, meats, refreshment beverages, coffee and other grocery products. Berkshirecurrently owns 26.6% of the outstanding shares of Kraft Heinz common stock.
We recorded equity method earnings from our investment in Kraft Heinz of $269 million in 2021, $95 million in 2020and $493 million in 2019. Equity method earnings included the effects of goodwill and identifiable intangible assetimpairment charges recorded by Kraft Heinz. Our share of such charges was approximately $350 million in 2021, $850million in 2020 and $450 million in 2019. We received dividends from Kraft Heinz of $521 million in each of 2021, 2020and 2019, which we recorded as reductions in our carrying value.
Shares of Kraft Heinz common stock are publicly-traded and the fair value of our investment was approximately $11.7billion at December 31, 2021 and $11.3 billion at December 31, 2020. The carrying value of our investment wasapproximately $13.1 billion at December 31, 2021 and $13.3 billion at December 31, 2020. As of December 31, 2021, thecarrying value of our investment exceeded the fair value based on the quoted market price by approximately 11% of thecarrying value. We evaluated our investment in Kraft Heinz for impairment. Based on the prevailing facts and circumstances,we concluded recognition of an impairment charge in earnings was not required as of December 31, 2021.

K-85
Notes to Consolidated Financial Statements (Continued)
(5) Equity method investments (Continued)
Summarized consolidated financial information of Kraft Heinz follows (in millions).
December 25,2021
December 26,2020
Assets $ 93,394 $ 99,830Liabilities 43,942 49,587
Year endingDecember 25,
2021
Year endingDecember 26,
2020
Year endingDecember 28,
2019
Sales $ 26,042 $ 26,185 $ 24,977
Net earnings attributable to Kraft Heinz common shareholders $ 1,012 $ 356 $ 1,935
Other investments accounted for pursuant to the equity method include our investments in Berkadia CommercialMortgage LLC (“Berkadia”), Pilot Travel Centers LLC (“Pilot”), Electric Transmission Texas, LLC (“ETT”) and beginningin 2021, Iroquois Gas Transmission System L.P. (“Iroquois”). The aggregate carrying value of our investments in theseentities was $4.3 billion as of December 31, 2021 and $4.0 billion as of December 31, 2020. Our equity method earnings inthese entities were $726 million in 2021, $631 million in 2020 and $683 million in 2019. During 2021, we receiveddistributions of approximately $1.2 billion from these investees. Additional information concerning these investmentsfollows.
We own a 50% interest in Berkadia, with Jefferies Financial Group Inc. (“Jefferies”) owning the other 50% interest.Berkadia is a servicer of commercial real estate loans in the U.S., performing primary, master and special servicing functionsfor U.S. government agency programs, commercial mortgage-backed securities transactions, banks, insurance companies andother financial institutions. Berkadia funds a portion of its operations through commercial paper borrowings, which arecurrently limited to $1.5 billion. On December 31, 2021, Berkadia’s commercial paper outstanding was $1.47 billion.Berkadia’s commercial paper is supported by a surety policy issued by a Berkshire insurance subsidiary. Jefferies is obligatedto indemnify us for one-half of any losses incurred under the policy. BHE subsidiaries own a 50% noncontrolling interest inETT, an owner and operator of electric transmission assets in Texas and a 50% noncontrolling interest in Iroquois, whichowns and operates a natural gas pipeline located in New York and Connecticut.
We own a 38.6% interest in Pilot, headquartered in Knoxville, Tennessee. Pilot is the largest operator of travel centersin North America with more than 800 retail locations across 44 U.S. states and six Canadian provinces and through wholesaledistribution. Pilot’s revenues in 2021 were approximately $45 billion. The Haslam family currently owns a 50.1% interest inPilot and a third party owns the remaining 11.3% interest. We have an agreement to acquire in 2023 an additional 41.4%interest in Pilot with the Haslam family retaining a 20% interest. As a result, Berkshire will become the majority owner ofPilot in 2023.
(6) Investment and derivative contract gains/losses
Investment and derivative contract gains/losses for each of the three years ending December 31, 2021 are summarizedas follows (in millions).
2021 2020 2019
Investment gains (losses):Equity securities:
Change in unrealized investment gains (losses) during the year onsecurities held at the end of the year $ 76,375 $ 54,951 $ 69,581
Investment gains (losses) during the year on securities sold 997 (14,036) 1,58577,372 40,915 71,166
Fixed maturity securities:Gross realized gains 85 56 87Gross realized losses (29) (27) (25)
Other 148 (39) (105)Investment gains (losses) 77,576 40,905 71,123Derivative contract gains (losses) 966 (159) 1,484
$ 78,542 $ 40,746 $ 72,607
K-86
Notes to Consolidated Financial Statements (Continued)
(6) Investment and derivative contract gains/losses (Continued)
Equity securities gains and losses include unrealized gains and losses from changes in fair values during the year onequity securities we still owned at the end of the year, as well as gains and losses on securities we sold during the year. Asreflected in the Consolidated Statements of Cash Flows, we received proceeds of approximately $15.8 billion in 2021, $38.8billion in 2020 and $14.3 billion in 2019 from sales of equity securities. In the preceding table, investment gains and losseson equity securities sold during the year represent the difference between the sales proceeds and the fair value of the equitysecurities sold at the beginning of the applicable year or, if later, the purchase date. Our taxable gains and losses on equitysecurities sold are generally the difference between the proceeds from sales and original cost. Taxable gains were $3.6 billionin 2021, $6.2 billion in 2020 and $3.2 billion in 2019.
The derivative contract gains and losses derive from equity index put option contracts written prior to March 2008 onfour major equity indexes. Information related to these contracts follows (dollars in millions).
December 31,2021 2020
Balance sheet liabilities - at fair value $ 99 $ 1,065Notional value 6,992 10,991Intrinsic value — 727Weighted average remaining life (in years) 0.5 1.2
Notional value in the preceding table represents the aggregate undiscounted amounts payable assuming the value ofeach index is zero on each contract’s expiration date. Intrinsic value is the undiscounted liability assuming the contracts aresettled based on the index values and foreign currency exchange rates as of the balance sheet date. Contracts comprising 63%of the notional value as of December 31, 2021 will expire in the first quarter of 2022. Future payments, if any, under anygiven contract will be required if the index value is below the contract strike price at the contract expiration date. Wereceived aggregate premiums on the contract inception dates of $1.3 billion with respect to unexpired contracts as ofDecember 31, 2021 and we have no counterparty credit risk.
(7) Loans and finance receivables
Loans and finance receivables are summarized as follows (in millions).
December 31,2021 2020
Loans and finance receivables before allowances and discounts $ 22,065 $ 20,436Allowances for credit losses (765) (712)Unamortized acquisition discounts and points (549) (523)
$ 20,751 $ 19,201
Loans and finance receivables are principally manufactured home loans, and to a lesser extent, commercial loans andsite-built home loans. Reconciliations of the allowance for credit losses on loans and finance receivables for 2021, 2020 and2019 follow (in millions).
2021 2020 2019
Balance at beginning of year $ 712 $ 167 $ 177Adoption of ASC 326 — 486 —Provision for credit losses 88 177 125Charge-offs, net of recoveries (35) (118) (135)Balance at December 31 $ 765 $ 712 $ 167
At December 31, 2021, approximately 99% of manufactured and site-built home loan balances were evaluatedcollectively for impairment. At December 31, 2021, we considered approximately 97% of the loan balances to be current asto payment status. A summary of performing and non-performing home loans before discounts and allowances by year ofloan origination as of December 31, 2021 follows (in millions).
Origination Year
2021 2020 2019 2018 2017 Prior Total
Performing $ 4,898 $ 3,164 $ 2,238 $ 1,694 $ 1,259 $ 6,842 $ 20,095Non-performing 4 5 6 7 5 40 67Total $ 4,902 $ 3,169 $ 2,244 $ 1,701 $ 1,264 $ 6,882 $ 20,162
K-87
Notes to Consolidated Financial Statements (Continued)
(7) Loans and finance receivables (Continued)
We are also party to commercial loan agreements with Seritage Growth Properties (“Seritage”) and Lee Enterprises,Inc, (“Lee”), in which loan balances aggregated $1.9 billion at December 31, 2021 and $2.1 billion at December 31, 2020.The Seritage loan is pursuant to a $2.0 billion term loan facility and the outstanding loan is secured by mortgages on its realestate properties. During the fourth quarter of 2021, the loan agreement with Seritage was amended to allow optional loanprepayments without penalty and on December 31, 2021, Seritage made a loan prepayment of $160 million. The amendmentsfurther provide Seritage with the option to extend the maturity of the loan to July 31, 2025, if the outstanding principal hasbeen reduced to $800 million by the original expiration date of July 31, 2023. The loan to Lee matures in 2045 and was madein connection with its acquisition of our newspaper operations and the repayment by Lee of its then outstanding creditfacilities. We are the sole lender to each of these entities and each of these loans is current as to payment status.
(8) Other receivables
Other receivables are comprised of the following (in millions).
December 31,2021
December 31,2020
Insurance and other:Insurance premiums receivable $ 15,050 $ 14,025Reinsurance recoverables 4,900 4,805Trade receivables 12,971 11,521Other 3,146 2,637Allowances for credit losses (679) (678)
$ 35,388 $ 32,310
Railroad, utilities and energy:Trade receivables $ 3,678 $ 3,235Other 650 438Allowances for credit losses (151) (131)
$ 4,177 $ 3,542
Provisions for credit losses with respect to receivables summarized above were $441 million in 2021, $564 million in2020 and $363 million in 2019. Charge-offs, net of recoveries, were $420 million in 2021, $401 million in 2020 and $350million in 2019.
(9) Inventories
Inventories are comprised of the following (in millions).
December 31,2021 2020
Raw materials $ 5,743 $ 4,821Work in process and other 3,192 2,541Finished manufactured goods 4,530 4,412Goods acquired for resale 7,489 7,434
$ 20,954 $ 19,208
(10) Property, plant and equipment
A summary of property, plant and equipment of our insurance and other businesses follows (in millions).
December 31,2021 2020
Land, buildings and improvements $ 14,070 $ 13,799Machinery and equipment 26,063 25,488Furniture, fixtures and other 4,640 4,530
44,773 43,817Accumulated depreciation (23,939) (22,617)
$ 20,834 $ 21,200
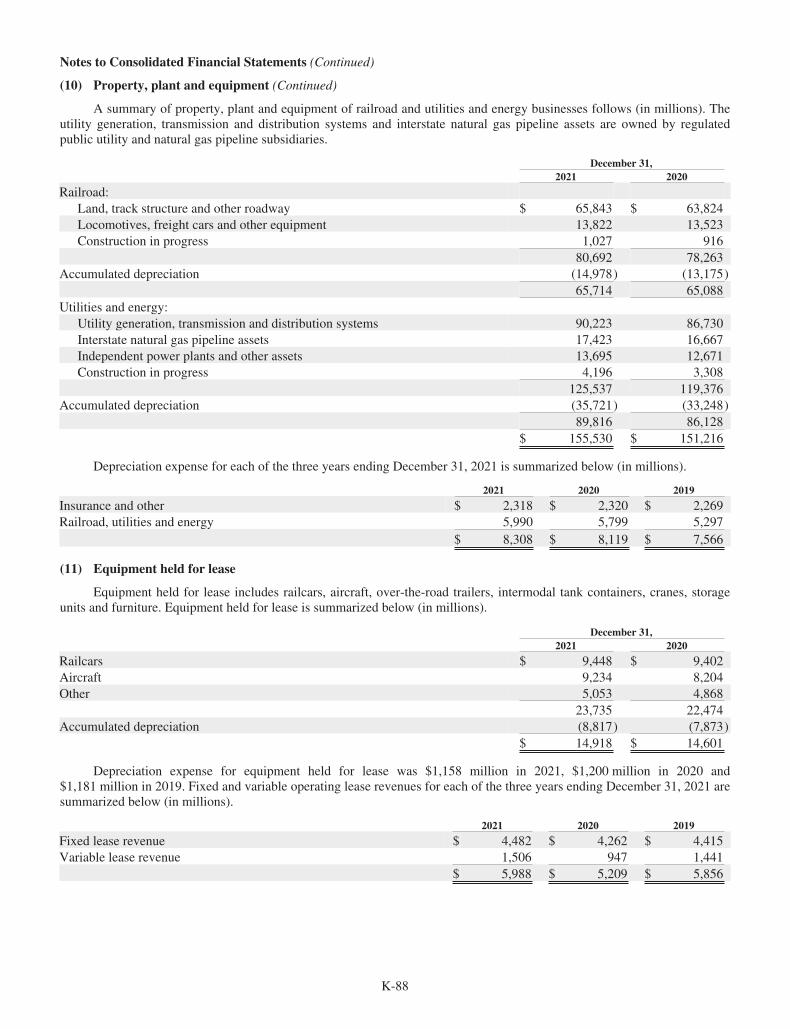
K-88
Notes to Consolidated Financial Statements (Continued)
(10) Property, plant and equipment (Continued)
A summary of property, plant and equipment of railroad and utilities and energy businesses follows (in millions). Theutility generation, transmission and distribution systems and interstate natural gas pipeline assets are owned by regulatedpublic utility and natural gas pipeline subsidiaries.
December 31,2021 2020
Railroad:Land, track structure and other roadway $ 65,843 $ 63,824Locomotives, freight cars and other equipment 13,822 13,523Construction in progress 1,027 916
80,692 78,263Accumulated depreciation (14,978) (13,175)
65,714 65,088Utilities and energy:
Utility generation, transmission and distribution systems 90,223 86,730Interstate natural gas pipeline assets 17,423 16,667Independent power plants and other assets 13,695 12,671Construction in progress 4,196 3,308
125,537 119,376Accumulated depreciation (35,721) (33,248)
89,816 86,128$ 155,530 $ 151,216
Depreciation expense for each of the three years ending December 31, 2021 is summarized below (in millions).
2021 2020 2019
Insurance and other $ 2,318 $ 2,320 $ 2,269Railroad, utilities and energy 5,990 5,799 5,297
$ 8,308 $ 8,119 $ 7,566
(11) Equipment held for lease
Equipment held for lease includes railcars, aircraft, over-the-road trailers, intermodal tank containers, cranes, storageunits and furniture. Equipment held for lease is summarized below (in millions).
December 31,2021 2020
Railcars $ 9,448 $ 9,402Aircraft 9,234 8,204Other 5,053 4,868
23,735 22,474Accumulated depreciation (8,817) (7,873)
$ 14,918 $ 14,601
Depreciation expense for equipment held for lease was $1,158 million in 2021, $1,200 million in 2020 and$1,181 million in 2019. Fixed and variable operating lease revenues for each of the three years ending December 31, 2021 aresummarized below (in millions).
2021 2020 2019
Fixed lease revenue $ 4,482 $ 4,262 $ 4,415Variable lease revenue 1,506 947 1,441
$ 5,988 $ 5,209 $ 5,856

K-89
Notes to Consolidated Financial Statements (Continued)
(11) Equipment held for lease (Continued)
A summary of future operating lease receipts as of December 31, 2021 follows (in millions).
2022 2023 2024 2025 2026 Thereafter Total
$ 2,922 $ 2,233 $ 1,623 $ 1,009 $ 536 $ 392 $ 8,715
(12) Leases
We are party to contracts where we lease property from others under contracts classified as operating leases. Weprimarily lease office and operating facilities, locomotives, freight cars, energy generation facilities and transmission assets.The weighted average remaining term of our operating leases was approximately 7.2 years at December 31, 2021 and 7.3years at December 31, 2020. Operating lease right-of-use assets are included in other assets and were $5,091 million atDecember 31, 2021 and $5,579 million at December 31, 2020. Our lease liabilities are included in accounts payable, accrualsand other liabilities and were $4,991 million at December 31, 2021 and $5,469 million at December 31, 2020. The weightedaverage discount rate used to measure lease liabilities was approximately 3.5% at December 31, 2021 and 3.6% at December31, 2020. A summary of our remaining future operating lease payments reconciled to lease liabilities as of December 31,2021 and December 31, 2020 follows (in millions).
Year 1 Year 2 Year 3 Year 4 Year 5 Thereafter
Totallease
payments
Amountrepresenting
interestLease
liabilities
December 31:2021 $ 1,238 $ 1,038 $ 835 $ 631 $ 418 $ 1,571 $ 5,731 $ (740) $ 4,9912020 1,342 1,111 905 725 544 1,691 6,318 (849) 5,469
Components of operating lease costs for the three years ending December 31, 2021, by type, are summarized in thefollowing table (in millions).
2021 2020 2019
Operating lease cost $ 1,426 $ 1,413 $ 1,459Short-term lease cost 154 145 178Variable lease cost 223 228 276Sublease income (10) (10) (24)Total lease cost $ 1,793 $ 1,776 $ 1,889
(13) Goodwill and other intangible assets
Reconciliations of the changes in the carrying value of goodwill during 2021 and 2020 follow (in millions).
December 31,2021 2020
Balance at beginning of year $ 73,734 $ 81,882Business acquisitions 353 1,758Impairment charges — (10,033)Other, including foreign currency translation (212) 127Balance at end of year* $ 73,875 $ 73,734
* Net of accumulated goodwill impairments of $11.0 billion as of December 31, 2021 and 2020.
During 2020, we reevaluated goodwill and indefinite-lived intangible assets of certain of our reporting units forimpairment due to the disruptions arising from the COVID-19 pandemic, which we believed most significantly affected theair travel, commercial aerospace and supporting industries. We recorded goodwill impairment charges of approximately $10billion and indefinite-lived intangible asset impairment charges of $638 million in the second quarter of 2020. Approximately$10 billion of these charges pertained to Precision Castparts Corp. (“PCC”), one of the largest businesses within Berkshire’smanufacturing segment. The carrying values of PCC-related goodwill and indefinite-lived intangible assets prior to theimpairment charges were approximately $31 billion. The impairment charges were determined based on discounted cash flowmethods and reflected our assessments of the risks and uncertainties associated with the aerospace industry. Significantjudgment is required in estimating the fair value of a reporting unit and in performing impairment tests. Due to the inherentuncertainty in forecasting future cash flows and earnings, actual results in the future may vary significantly from theforecasts.
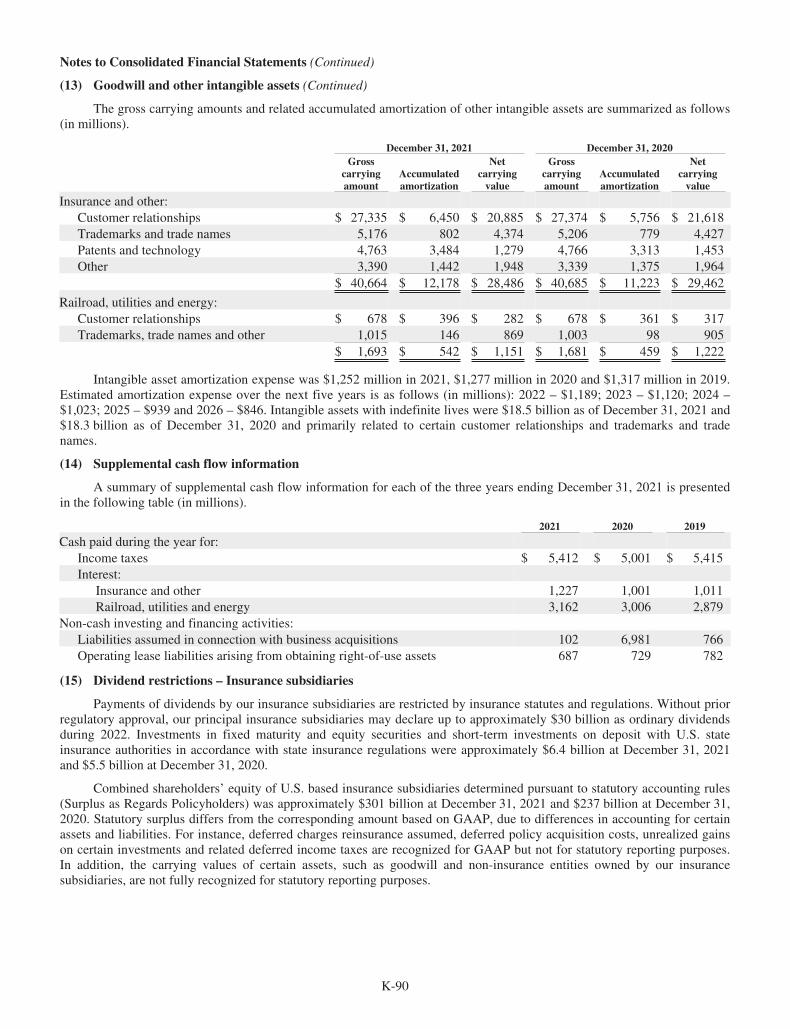
K-90
Notes to Consolidated Financial Statements (Continued)
(13) Goodwill and other intangible assets (Continued)
The gross carrying amounts and related accumulated amortization of other intangible assets are summarized as follows(in millions).
December 31, 2021 December 31, 2020Gross
carryingamount
Accumulatedamortization
Netcarryingvalue
Grosscarryingamount
Accumulatedamortization
Netcarryingvalue
Insurance and other:Customer relationships $ 27,335 $ 6,450 $ 20,885 $ 27,374 $ 5,756 $ 21,618Trademarks and trade names 5,176 802 4,374 5,206 779 4,427Patents and technology 4,763 3,484 1,279 4,766 3,313 1,453Other 3,390 1,442 1,948 3,339 1,375 1,964
$ 40,664 $ 12,178 $ 28,486 $ 40,685 $ 11,223 $ 29,462
Railroad, utilities and energy:Customer relationships $ 678 $ 396 $ 282 $ 678 $ 361 $ 317Trademarks, trade names and other 1,015 146 869 1,003 98 905
$ 1,693 $ 542 $ 1,151 $ 1,681 $ 459 $ 1,222
Intangible asset amortization expense was $1,252 million in 2021, $1,277 million in 2020 and $1,317 million in 2019.Estimated amortization expense over the next five years is as follows (in millions): 2022 – $1,189; 2023 – $1,120; 2024 –$1,023; 2025 – $939 and 2026 – $846. Intangible assets with indefinite lives were $18.5 billion as of December 31, 2021 and$18.3 billion as of December 31, 2020 and primarily related to certain customer relationships and trademarks and tradenames.
(14) Supplemental cash flow information
A summary of supplemental cash flow information for each of the three years ending December 31, 2021 is presentedin the following table (in millions).
2021 2020 2019
Cash paid during the year for:Income taxes $ 5,412 $ 5,001 $ 5,415Interest:
Insurance and other 1,227 1,001 1,011Railroad, utilities and energy 3,162 3,006 2,879
Non-cash investing and financing activities:Liabilities assumed in connection with business acquisitions 102 6,981 766Operating lease liabilities arising from obtaining right-of-use assets 687 729 782
(15) Dividend restrictions – Insurance subsidiaries
Payments of dividends by our insurance subsidiaries are restricted by insurance statutes and regulations. Without priorregulatory approval, our principal insurance subsidiaries may declare up to approximately $30 billion as ordinary dividendsduring 2022. Investments in fixed maturity and equity securities and short-term investments on deposit with U.S. stateinsurance authorities in accordance with state insurance regulations were approximately $6.4 billion at December 31, 2021and $5.5 billion at December 31, 2020.
Combined shareholders’ equity of U.S. based insurance subsidiaries determined pursuant to statutory accounting rules(Surplus as Regards Policyholders) was approximately $301 billion at December 31, 2021 and $237 billion at December 31,2020. Statutory surplus differs from the corresponding amount based on GAAP, due to differences in accounting for certainassets and liabilities. For instance, deferred charges reinsurance assumed, deferred policy acquisition costs, unrealized gainson certain investments and related deferred income taxes are recognized for GAAP but not for statutory reporting purposes.In addition, the carrying values of certain assets, such as goodwill and non-insurance entities owned by our insurancesubsidiaries, are not fully recognized for statutory reporting purposes.
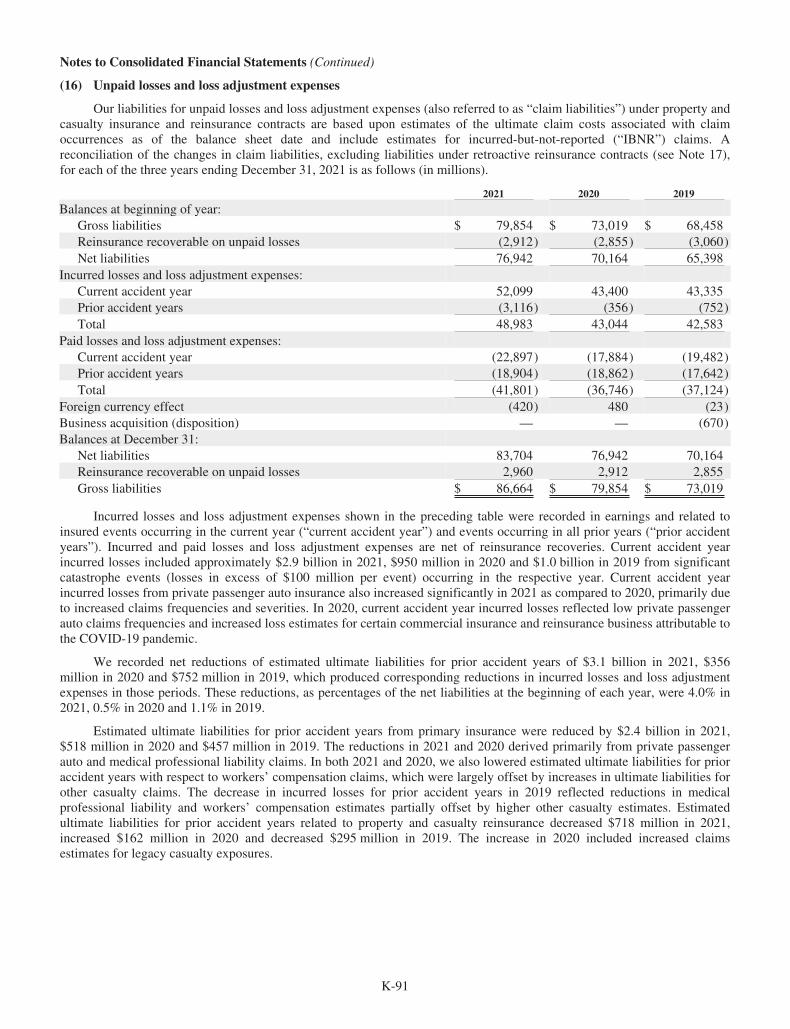
K-91
Notes to Consolidated Financial Statements (Continued)
(16) Unpaid losses and loss adjustment expenses
Our liabilities for unpaid losses and loss adjustment expenses (also referred to as “claim liabilities”) under property andcasualty insurance and reinsurance contracts are based upon estimates of the ultimate claim costs associated with claimoccurrences as of the balance sheet date and include estimates for incurred-but-not-reported (“IBNR”) claims. Areconciliation of the changes in claim liabilities, excluding liabilities under retroactive reinsurance contracts (see Note 17),for each of the three years ending December 31, 2021 is as follows (in millions).
2021 2020 2019
Balances at beginning of year:Gross liabilities $ 79,854 $ 73,019 $ 68,458Reinsurance recoverable on unpaid losses (2,912) (2,855) (3,060)Net liabilities 76,942 70,164 65,398
Incurred losses and loss adjustment expenses:Current accident year 52,099 43,400 43,335Prior accident years (3,116) (356) (752)Total 48,983 43,044 42,583
Paid losses and loss adjustment expenses:Current accident year (22,897) (17,884) (19,482)Prior accident years (18,904) (18,862) (17,642)Total (41,801) (36,746) (37,124)
Foreign currency effect (420) 480 (23)Business acquisition (disposition) — — (670)Balances at December 31:
Net liabilities 83,704 76,942 70,164Reinsurance recoverable on unpaid losses 2,960 2,912 2,855Gross liabilities $ 86,664 $ 79,854 $ 73,019
Incurred losses and loss adjustment expenses shown in the preceding table were recorded in earnings and related toinsured events occurring in the current year (“current accident year”) and events occurring in all prior years (“prior accidentyears”). Incurred and paid losses and loss adjustment expenses are net of reinsurance recoveries. Current accident yearincurred losses included approximately $2.9 billion in 2021, $950 million in 2020 and $1.0 billion in 2019 from significantcatastrophe events (losses in excess of $100 million per event) occurring in the respective year. Current accident yearincurred losses from private passenger auto insurance also increased significantly in 2021 as compared to 2020, primarily dueto increased claims frequencies and severities. In 2020, current accident year incurred losses reflected low private passengerauto claims frequencies and increased loss estimates for certain commercial insurance and reinsurance business attributable tothe COVID-19 pandemic.
We recorded net reductions of estimated ultimate liabilities for prior accident years of $3.1 billion in 2021, $356million in 2020 and $752 million in 2019, which produced corresponding reductions in incurred losses and loss adjustmentexpenses in those periods. These reductions, as percentages of the net liabilities at the beginning of each year, were 4.0% in2021, 0.5% in 2020 and 1.1% in 2019.
Estimated ultimate liabilities for prior accident years from primary insurance were reduced by $2.4 billion in 2021,$518 million in 2020 and $457 million in 2019. The reductions in 2021 and 2020 derived primarily from private passengerauto and medical professional liability claims. In both 2021 and 2020, we also lowered estimated ultimate liabilities for prioraccident years with respect to workers’ compensation claims, which were largely offset by increases in ultimate liabilities forother casualty claims. The decrease in incurred losses for prior accident years in 2019 reflected reductions in medicalprofessional liability and workers’ compensation estimates partially offset by higher other casualty estimates. Estimatedultimate liabilities for prior accident years related to property and casualty reinsurance decreased $718 million in 2021,increased $162 million in 2020 and decreased $295 million in 2019. The increase in 2020 included increased claimsestimates for legacy casualty exposures.

K-92
Notes to Consolidated Financial Statements (Continued)
(16) Unpaid losses and loss adjustment expenses (Continued)
Estimated net claim liabilities for environmental, asbestos and other latent injury exposures were approximately $2.1billion at December 31, 2021 and 2020. These liabilities are subject to change due to changes in the legal and regulatoryenvironment. We are unable to reliably estimate additional losses or a range of losses that are reasonably possible for theseclaims.
Disaggregated information concerning our claims liabilities is provided below and in the pages that follow. The effectsof businesses acquired or disposed during the year are reflected in the data presented on a retrospective basis. Areconciliation of the disaggregated net unpaid losses and allocated loss adjustment expenses (the latter referred to as“ALAE”) of GEICO, Berkshire Hathaway Primary Group (“BH Primary”) and Berkshire Hathaway Reinsurance Group(“BHRG”) to our consolidated unpaid losses and loss adjustment expenses as of December 31, 2021 follows (in millions).
GEICOPhysicalDamage
GEICOAuto
Liability
BHPrimaryMedical
ProfessionalLiability
BH PrimaryWorkers’
Compensationand OtherCasualty
BHRGProperty
BHRGCasualty Total
Unpaid losses and ALAE, net $ 729 $ 19,768 $ 8,506 $ 13,579 $ 13,119 $ 23,611 $ 79,312Reinsurance recoverable 11 1,085 28 639 181 892 2,836Unpaid unallocated lossadjustment expenses 2,448
Other unpaid losses and lossadjustment expenses 2,068
Unpaid losses and loss adjustmentexpenses $ 86,664
GEICO
GEICO’s claim liabilities predominantly relate to various types of private passenger auto liability and physical damageclaims. For such claims, we establish and evaluate unpaid claim liabilities using standard actuarial loss development methodsand techniques. The actuarial methods utilize historical claims data, adjusted when deemed appropriate to reflect perceivedchanges in loss patterns. Claim liabilities include average, case, case development and IBNR estimates.
We establish average liabilities based on expected severities for newly reported physical damage and liability claimsprior to establishing individual case reserves when insufficient time or information is available for specific claim estimatesand for large volumes of minor physical damage claims that once reported are quickly settled. We establish case lossestimates for liability claims, including estimates for loss adjustment expenses, as the facts and merits of the claim areevaluated.
Claim estimates for liability coverages normally reflect greater uncertainty than physical damage coverages, primarilydue to the longer claim-tails, the greater chance of litigation and the time needed to evaluate facts at the time the caseestimate is first established. The “claim-tail” is the period between the claim occurrence date and claim settlement or paymentdate. Consequently, we establish additional case development liabilities, which are usually percentages of the case liabilities.For unreported claims, IBNR liabilities are estimated by projecting the ultimate number of claims expected (reported andunreported) for each significant coverage and deducting reported claims to produce estimated unreported claims. The productof the average cost per unreported claim and the number of unreported claims produces the IBNR liability estimate. We mayrecord supplemental IBNR liabilities in certain situations when actuarial techniques are difficult to apply.
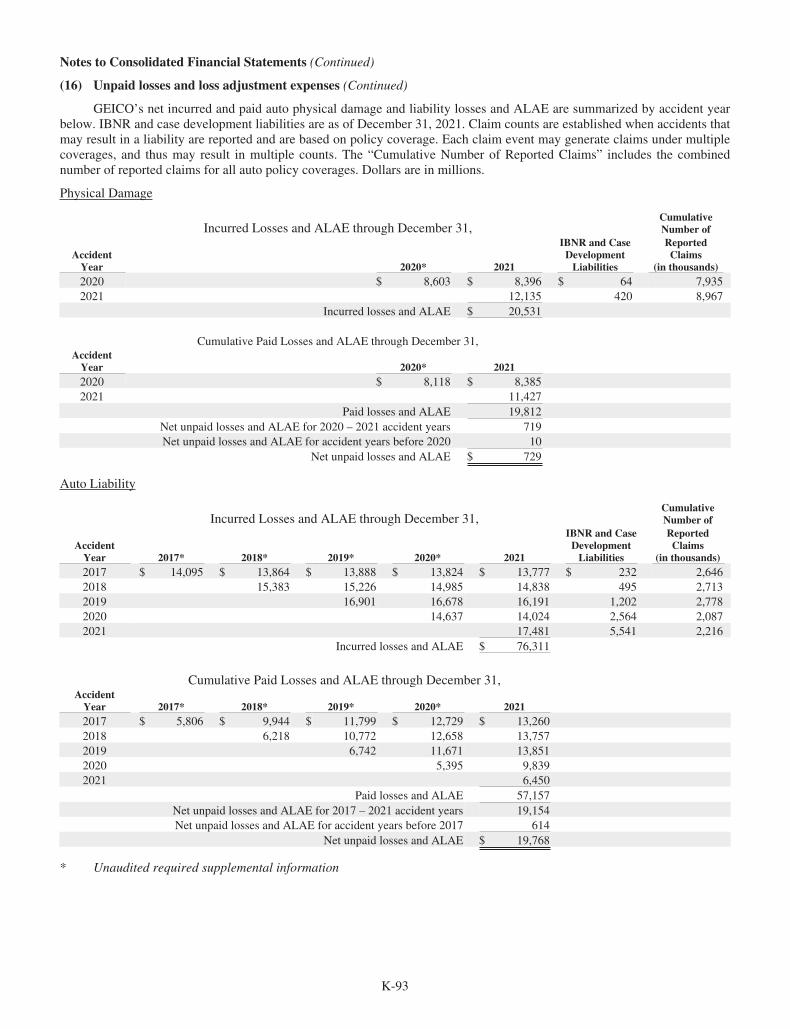
K-93
Notes to Consolidated Financial Statements (Continued)
(16) Unpaid losses and loss adjustment expenses (Continued)
GEICO’s net incurred and paid auto physical damage and liability losses and ALAE are summarized by accident yearbelow. IBNR and case development liabilities are as of December 31, 2021. Claim counts are established when accidents thatmay result in a liability are reported and are based on policy coverage. Each claim event may generate claims under multiplecoverages, and thus may result in multiple counts. The “Cumulative Number of Reported Claims” includes the combinednumber of reported claims for all auto policy coverages. Dollars are in millions.
Physical Damage
Incurred Losses and ALAE through December 31,CumulativeNumber of
AccidentYear 2020* 2021
IBNR and CaseDevelopmentLiabilities
ReportedClaims
(in thousands)2020 $ 8,603 $ 8,396 $ 64 7,9352021 12,135 420 8,967
Incurred losses and ALAE $ 20,531
Cumulative Paid Losses and ALAE through December 31,AccidentYear 2020* 20212020 $ 8,118 $ 8,3852021 11,427
Paid losses and ALAE 19,812Net unpaid losses and ALAE for 2020 – 2021 accident years 719Net unpaid losses and ALAE for accident years before 2020 10
Net unpaid losses and ALAE $ 729
Auto Liability
Incurred Losses and ALAE through December 31,CumulativeNumber of
AccidentYear 2017* 2018* 2019* 2020* 2021
IBNR and CaseDevelopmentLiabilities
ReportedClaims
(in thousands)2017 $ 14,095 $ 13,864 $ 13,888 $ 13,824 $ 13,777 $ 232 2,6462018 15,383 15,226 14,985 14,838 495 2,7132019 16,901 16,678 16,191 1,202 2,7782020 14,637 14,024 2,564 2,0872021 17,481 5,541 2,216
Incurred losses and ALAE $ 76,311
Cumulative Paid Losses and ALAE through December 31,AccidentYear 2017* 2018* 2019* 2020* 20212017 $ 5,806 $ 9,944 $ 11,799 $ 12,729 $ 13,2602018 6,218 10,772 12,658 13,7572019 6,742 11,671 13,8512020 5,395 9,8392021 6,450
Paid losses and ALAE 57,157Net unpaid losses and ALAE for 2017 – 2021 accident years 19,154Net unpaid losses and ALAE for accident years before 2017 614
Net unpaid losses and ALAE $ 19,768
* Unaudited required supplemental information
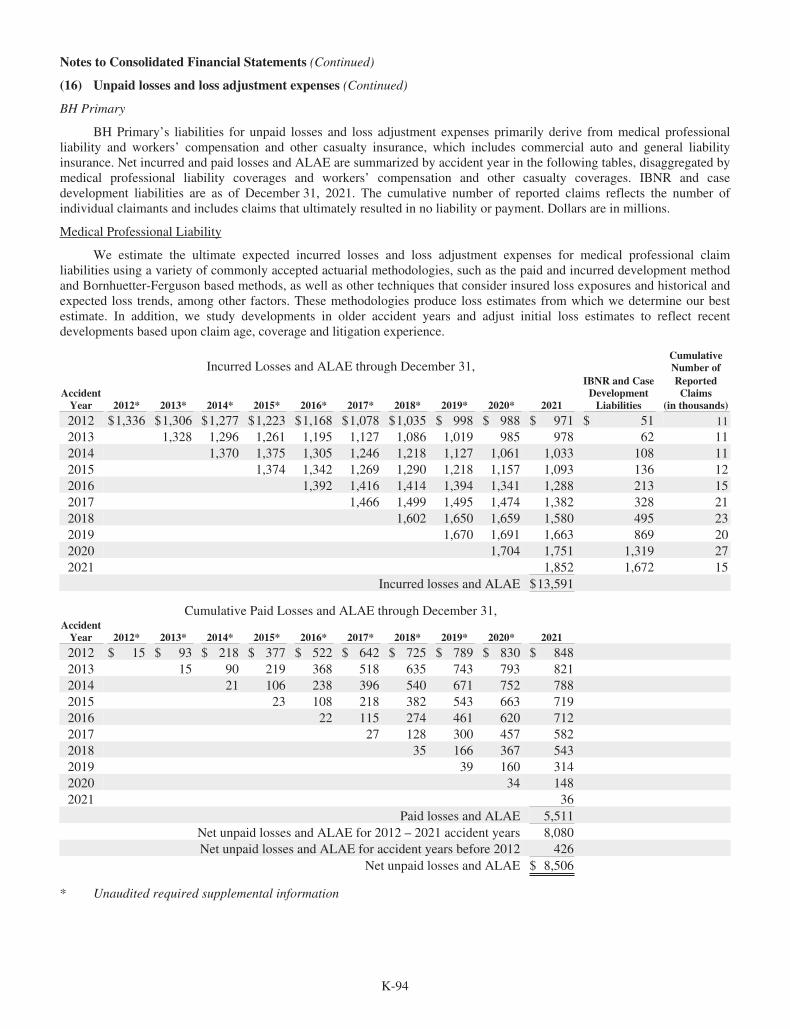
K-94
Notes to Consolidated Financial Statements (Continued)
(16) Unpaid losses and loss adjustment expenses (Continued)
BH Primary
BH Primary’s liabilities for unpaid losses and loss adjustment expenses primarily derive from medical professionalliability and workers’ compensation and other casualty insurance, which includes commercial auto and general liabilityinsurance. Net incurred and paid losses and ALAE are summarized by accident year in the following tables, disaggregated bymedical professional liability coverages and workers’ compensation and other casualty coverages. IBNR and casedevelopment liabilities are as of December 31, 2021. The cumulative number of reported claims reflects the number ofindividual claimants and includes claims that ultimately resulted in no liability or payment. Dollars are in millions.
Medical Professional Liability
We estimate the ultimate expected incurred losses and loss adjustment expenses for medical professional claimliabilities using a variety of commonly accepted actuarial methodologies, such as the paid and incurred development methodand Bornhuetter-Ferguson based methods, as well as other techniques that consider insured loss exposures and historical andexpected loss trends, among other factors. These methodologies produce loss estimates from which we determine our bestestimate. In addition, we study developments in older accident years and adjust initial loss estimates to reflect recentdevelopments based upon claim age, coverage and litigation experience.
Incurred Losses and ALAE through December 31,CumulativeNumber of
AccidentYear 2012* 2013* 2014* 2015* 2016* 2017* 2018* 2019* 2020* 2021
IBNR and CaseDevelopmentLiabilities
ReportedClaims
(in thousands)
2012 $1,336 $1,306 $1,277 $1,223 $1,168 $1,078 $1,035 $ 998 $ 988 $ 971 $ 51 112013 1,328 1,296 1,261 1,195 1,127 1,086 1,019 985 978 62 112014 1,370 1,375 1,305 1,246 1,218 1,127 1,061 1,033 108 112015 1,374 1,342 1,269 1,290 1,218 1,157 1,093 136 122016 1,392 1,416 1,414 1,394 1,341 1,288 213 152017 1,466 1,499 1,495 1,474 1,382 328 212018 1,602 1,650 1,659 1,580 495 232019 1,670 1,691 1,663 869 202020 1,704 1,751 1,319 272021 1,852 1,672 15
Incurred losses and ALAE $13,591
Cumulative Paid Losses and ALAE through December 31,AccidentYear 2012* 2013* 2014* 2015* 2016* 2017* 2018* 2019* 2020* 2021
2012 $ 15 $ 93 $ 218 $ 377 $ 522 $ 642 $ 725 $ 789 $ 830 $ 8482013 15 90 219 368 518 635 743 793 8212014 21 106 238 396 540 671 752 7882015 23 108 218 382 543 663 7192016 22 115 274 461 620 7122017 27 128 300 457 5822018 35 166 367 5432019 39 160 3142020 34 1482021 36
Paid losses and ALAE 5,511Net unpaid losses and ALAE for 2012 – 2021 accident years 8,080Net unpaid losses and ALAE for accident years before 2012 426
Net unpaid losses and ALAE $ 8,506
* Unaudited required supplemental information

K-95
Notes to Consolidated Financial Statements (Continued)
(16) Unpaid losses and loss adjustment expenses (Continued)
Workers’ Compensation and Other Casualty
We periodically evaluate ultimate loss and loss adjustment expense estimates for the workers’ compensation and othercasualty claims using a combination of commonly accepted actuarial methodologies such as the Bornhuetter-Ferguson andchain-ladder approaches using paid and incurred loss data. Paid and incurred loss data is segregated and analyzed by state dueto the different state regulatory frameworks that may impact certain factors, including the duration and amount of losspayments. We also separately study the various components of liabilities, such as employee lost wages, medical expenses andthe costs of claims investigations and administration. We establish case liabilities for reported claims based upon the factsand circumstances of the claim. The excess of the ultimate projected losses, including the expected development of caseestimates, and the case-basis liabilities is included in IBNR liabilities.
Incurred Losses and ALAE through December 31,CumulativeNumber of
AccidentYear 2012* 2013* 2014* 2015* 2016* 2017* 2018* 2019* 2020* 2021
IBNR and CaseDevelopmentLiabilities
ReportedClaims
(in thousands)
2012 $ 873 $ 850 $ 837 $ 791 $ 780 $ 762 $ 750 $ 736 $ 718 $ 709 $ 39 532013 1,258 1,228 1,178 1,127 1,096 1,072 1,050 1,028 1,008 96 672014 1,743 1,638 1,614 1,548 1,482 1,497 1,477 1,460 163 902015 2,169 2,127 2,042 2,014 2,025 1,997 2,006 242 1112016 2,511 2,422 2,359 2,325 2,365 2,370 396 1152017 3,044 2,907 2,842 2,843 2,852 503 1392018 3,544 3,412 3,480 3,536 908 1602019 4,074 4,102 4,175 1,278 1732020 4,421 4,278 2,089 1412021 5,197 3,545 218
Incurred losses and ALAE $27,591
Cumulative Paid Losses and ALAE through December 31,AccidentYear 2012* 2013* 2014* 2015* 2016* 2017* 2018* 2019* 2020* 2021
2012 $ 116 $ 299 $ 414 $ 501 $ 560 $ 592 $ 611 $ 626 $ 634 $ 6402013 177 422 609 725 793 835 858 874 8842014 239 557 800 1,007 1,111 1,176 1,214 1,2452015 289 700 1,017 1,289 1,488 1,570 1,6482016 329 775 1,148 1,461 1,661 1,7782017 441 1,003 1,434 1,771 1,9562018 538 1,198 1,683 2,0282019 682 1,478 2,0222020 695 1,3912021 833
Paid losses and ALAE 14,425Net unpaid losses and ALAE for 2012 – 2021 accident years 13,166Net unpaid losses and ALAE for accident years before 2012 413
Net unpaid losses and ALAE $13,579
* Unaudited required supplemental information
BHRG
We use a variety of methodologies to establish BHRG’s estimates for property and casualty claims liabilities. Thesemethodologies include paid and incurred loss development techniques, incurred and paid loss Bornhuetter-Fergusontechniques and frequency and severity techniques, as well as ground-up techniques when appropriate.
Our claims liabilities are principally a function of reported losses from ceding companies, case development and IBNRliability estimates. Case loss estimates are reported under our contracts either individually or in bulk as provided under theterms of the contracts. We may independently evaluate case losses reported by the ceding company, and if deemedappropriate, we may establish case liabilities based on our estimates.

K-96
Notes to Consolidated Financial Statements (Continued)
(16) Unpaid losses and loss adjustment expenses (Continued)
Estimated IBNR liabilities are affected by expected case loss emergence patterns and expected loss ratios, which areevaluated as groups of contracts with similar exposures or on a contract-by-contract basis. Estimated case and IBNRliabilities for major catastrophe events are generally based on a per-contract assessment of the ultimate cost associated withthe individual loss event. Claim count data is not provided consistently by ceding companies under our contracts or isotherwise considered unreliable.
Net incurred and paid losses and ALAE of BHRG are disaggregated based on losses that are expected to have shorterclaim-tails (property) and losses expected to have longer claim-tails (casualty). Under certain contracts, the coverage canapply to multiple lines of business written by the ceding company, whether property, casualty or combined, and the cedingcompany may not report loss data by such lines consistently, if at all. In those instances, we allocated losses to property andcasualty coverages based on internal estimates. BHRG’s disaggregated incurred and paid losses and ALAE are summarizedby accident year. IBNR and case development liabilities are as of December 31, 2021. Dollars are in millions.
Property
Incurred Losses and ALAE through December 31,
AccidentYear 2012* 2013* 2014* 2015* 2016* 2017* 2018* 2019* 2020* 2021
IBNR and CaseDevelopmentLiabilities
2012 $ 3,129 $ 2,822 $ 2,621 $ 2,382 $ 2,330 $ 2,327 $ 2,309 $ 2,294 $ 2,285 $ 2,305 $ 312013 3,198 3,035 2,690 2,600 2,579 2,520 2,469 2,455 2,453 292014 2,619 2,408 2,297 2,154 2,100 2,028 1,999 1,996 332015 3,256 3,103 2,546 2,950 2,948 2,971 2,975 1542016 3,261 3,890 3,616 3,585 3,589 3,578 1122017 5,253 4,953 4,806 4,698 4,631 1412018 4,375 4,467 4,344 4,227 4612019 4,065 4,234 3,992 5412020 5,795 6,048 1,5042021 6,669 3,405
Incurred losses and ALAE $38,874
Cumulative Paid Losses and ALAE through December 31,AccidentYear 2012* 2013* 2014* 2015* 2016* 2017* 2018* 2019* 2020* 2021
2012 $ 259 $ 1,218 $ 1,796 $ 1,934 $ 2,022 $ 2,097 $ 2,117 $ 2,162 $ 2,180 $ 2,2012013 515 1,424 1,863 2,060 2,180 2,260 2,300 2,328 2,3522014 465 1,234 1,555 1,693 1,758 1,808 1,838 1,8602015 577 1,596 1,946 2,141 2,245 2,427 2,5102016 705 1,794 2,186 2,647 2,899 3,0832017 1,025 2,712 3,633 3,944 4,1632018 907 2,310 2,831 3,0612019 748 2,247 2,8302020 956 2,8822021 1,214
Paid losses and ALAE 26,156Net unpaid losses and ALAE for 2012 – 2021 accident years 12,718Net unpaid losses and ALAE for accident years before 2012 401
Net unpaid losses and ALAE $13,119
* Unaudited required supplemental information

K-97
Notes to Consolidated Financial Statements (Continued)
(16) Unpaid losses and loss adjustment expenses (Continued)
Casualty
Incurred Losses and ALAE through December 31,
AccidentYear 2012* 2013* 2014* 2015* 2016* 2017* 2018* 2019* 2020* 2021
IBNR and CaseDevelopmentLiabilities
2012 $ 2,792 $ 2,974 $ 2,808 $ 2,871 $ 2,799 $ 2,686 $ 2,619 $ 2,562 $ 2,556 $ 2,557 $ 3722013 2,132 2,268 2,298 2,141 2,086 2,032 1,937 1,865 1,837 3312014 1,872 2,069 2,038 2,001 1,915 1,952 1,942 1,847 4312015 1,877 2,082 2,109 2,008 1,882 1,844 1,817 3952016 1,906 2,115 2,023 1,980 1,900 1,843 4512017 2,193 2,685 2,563 2,470 2,383 5822018 2,924 3,559 3,482 3,340 9042019 3,429 3,901 3,780 1,5212020 3,861 3,987 2,1472021 3,744 2,584
Incurred losses and ALAE $27,135
Cumulative Paid Losses and ALAE through December 31,AccidentYear 2012* 2013* 2014* 2015* 2016* 2017* 2018* 2019* 2020* 2021
2012 $ 308 $ 747 $ 1,139 $ 1,368 $ 1,525 $ 1,650 $ 1,750 $ 1,810 $ 1,868 $ 1,9062013 290 519 805 933 1,037 1,139 1,199 1,256 1,2902014 149 477 642 752 874 959 1,103 1,1472015 196 489 713 833 924 1,014 1,0882016 253 555 732 862 960 1,0432017 230 564 819 1,269 1,3762018 265 867 1,639 1,9092019 353 896 1,1762020 404 9702021 307
Paid losses and ALAE 12,212Net unpaid losses and ALAE for 2012 – 2021 accident years 14,923Net unpaid losses and ALAE for accident years before 2012 8,688
Net unpaid losses and ALAE $23,611
* Unaudited required supplemental information
Required supplemental unaudited average historical claims duration information based on the net losses and ALAEincurred and paid accident year data in the preceding tables follows. The percentages show the average portions of net lossesand ALAE paid by each succeeding year, with year 1 representing the current accident year.
Average Annual Percentage Payout of Incurred Losses by Age, Net of ReinsuranceIn Year 1 2 3 4 5 6 7 8 9 10
GEICO Physical Damage 97% 3%GEICO Auto Liability 41% 30% 13% 8% 4%BH Primary Medical Professional Liability 2% 8% 12% 14% 13% 11% 8% 5% 4% 2%BH Primary Workers’ Compensation and Other Casualty 16% 21% 16% 12% 8% 4% 3% 2% 1% 1%BHRG Property 19% 36% 16% 8% 5% 4% 2% 1% 1% 1%BHRG Casualty 11% 16% 13% 9% 6% 5% 5% 3% 2% 2%
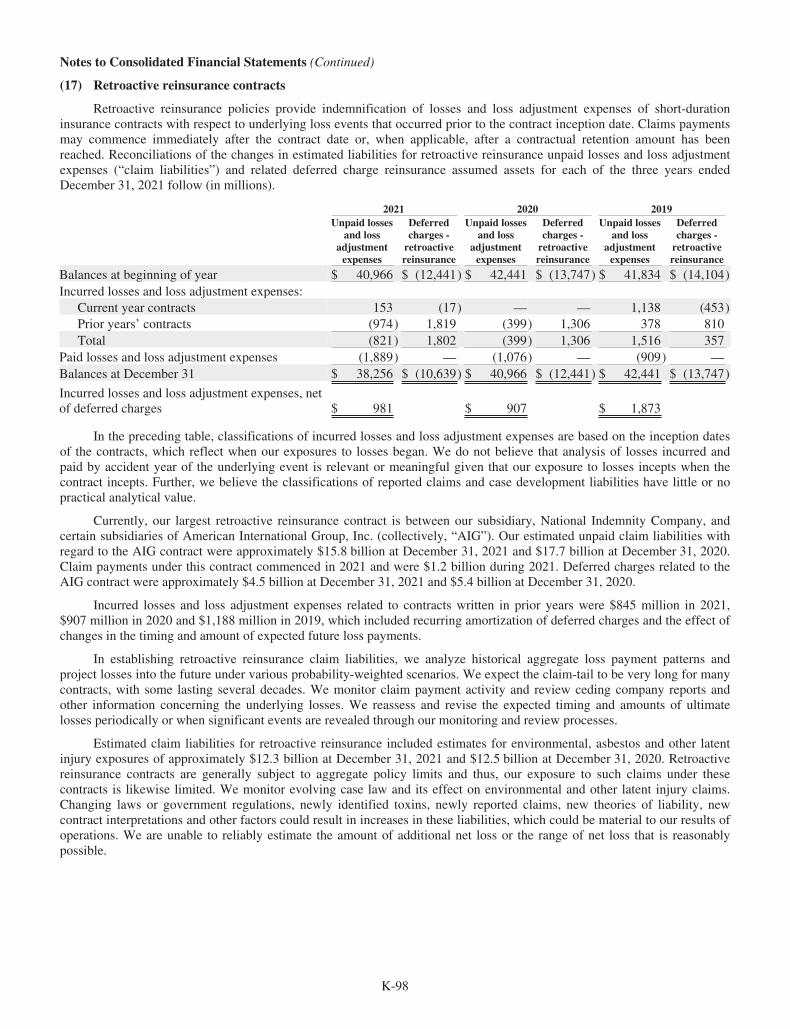
K-98
Notes to Consolidated Financial Statements (Continued)
(17) Retroactive reinsurance contracts
Retroactive reinsurance policies provide indemnification of losses and loss adjustment expenses of short-durationinsurance contracts with respect to underlying loss events that occurred prior to the contract inception date. Claims paymentsmay commence immediately after the contract date or, when applicable, after a contractual retention amount has beenreached. Reconciliations of the changes in estimated liabilities for retroactive reinsurance unpaid losses and loss adjustmentexpenses (“claim liabilities”) and related deferred charge reinsurance assumed assets for each of the three years endedDecember 31, 2021 follow (in millions).
2021 2020 2019Unpaid losses
and lossadjustmentexpenses
Deferredcharges -retroactivereinsurance
Unpaid lossesand loss
adjustmentexpenses
Deferredcharges -retroactivereinsurance
Unpaid lossesand loss
adjustmentexpenses
Deferredcharges -retroactivereinsurance
Balances at beginning of year $ 40,966 $ (12,441) $ 42,441 $ (13,747) $ 41,834 $ (14,104)Incurred losses and loss adjustment expenses:
Current year contracts 153 (17) — — 1,138 (453)Prior years’ contracts (974) 1,819 (399) 1,306 378 810Total (821) 1,802 (399) 1,306 1,516 357
Paid losses and loss adjustment expenses (1,889) — (1,076) — (909) —Balances at December 31 $ 38,256 $ (10,639) $ 40,966 $ (12,441) $ 42,441 $ (13,747)
Incurred losses and loss adjustment expenses, netof deferred charges $ 981 $ 907 $ 1,873
In the preceding table, classifications of incurred losses and loss adjustment expenses are based on the inception datesof the contracts, which reflect when our exposures to losses began. We do not believe that analysis of losses incurred andpaid by accident year of the underlying event is relevant or meaningful given that our exposure to losses incepts when thecontract incepts. Further, we believe the classifications of reported claims and case development liabilities have little or nopractical analytical value.
Currently, our largest retroactive reinsurance contract is between our subsidiary, National Indemnity Company, andcertain subsidiaries of American International Group, Inc. (collectively, “AIG”). Our estimated unpaid claim liabilities withregard to the AIG contract were approximately $15.8 billion at December 31, 2021 and $17.7 billion at December 31, 2020.Claim payments under this contract commenced in 2021 and were $1.2 billion during 2021. Deferred charges related to theAIG contract were approximately $4.5 billion at December 31, 2021 and $5.4 billion at December 31, 2020.
Incurred losses and loss adjustment expenses related to contracts written in prior years were $845 million in 2021,$907 million in 2020 and $1,188 million in 2019, which included recurring amortization of deferred charges and the effect ofchanges in the timing and amount of expected future loss payments.
In establishing retroactive reinsurance claim liabilities, we analyze historical aggregate loss payment patterns andproject losses into the future under various probability-weighted scenarios. We expect the claim-tail to be very long for manycontracts, with some lasting several decades. We monitor claim payment activity and review ceding company reports andother information concerning the underlying losses. We reassess and revise the expected timing and amounts of ultimatelosses periodically or when significant events are revealed through our monitoring and review processes.
Estimated claim liabilities for retroactive reinsurance included estimates for environmental, asbestos and other latentinjury exposures of approximately $12.3 billion at December 31, 2021 and $12.5 billion at December 31, 2020. Retroactivereinsurance contracts are generally subject to aggregate policy limits and thus, our exposure to such claims under thesecontracts is likewise limited. We monitor evolving case law and its effect on environmental and other latent injury claims.Changing laws or government regulations, newly identified toxins, newly reported claims, new theories of liability, newcontract interpretations and other factors could result in increases in these liabilities, which could be material to our results ofoperations. We are unable to reliably estimate the amount of additional net loss or the range of net loss that is reasonablypossible.

K-99
Notes to Consolidated Financial Statements (Continued)
(18) Notes payable and other borrowings
Notes payable and other borrowings are summarized below (in millions). The weighted average interest rates andmaturity date ranges shown in the following tables are based on borrowings as of December 31, 2021.
WeightedAverage December 31,
Interest Rate 2021 2020
Insurance and other:Berkshire Hathaway Inc. (“Berkshire”):
U.S. Dollar denominated due 2022-2047 3.3% $ 6,820 $ 8,308Euro denominated due 2023-2041 1.0% 7,792 8,326Japanese Yen denominated due 2023-2060 0.6% 6,797 6,031
Berkshire Hathaway Finance Corporation (“BHFC”):U.S. Dollar denominated due 2022-2051 3.6% 10,758 10,766Great Britain Pound denominated due 2039-2059 2.5% 2,325 2,347
Other subsidiary borrowings due 2022-2045 4.0% 4,438 4,682Short-term subsidiary borrowings 2.9% 342 1,062
$ 39,272 $ 41,522
During 2021, Berkshire repaid €550 million and $1.5 billion of maturing senior notes and issued €600 million of 0.5% senior notes due in 2041 and ¥160 billion (approximately $1.5 billion) of senior notes with maturity dates ranging from 2026 to 2041 and a weighted average interest rate of 0.5%. In January 2022, Berkshire repaid $600 million of maturing debt and issued ¥128.5 billion (approximately $1.1 billion) of senior notes with maturity dates ranging from 2027 to 2052 and a weighted average interest rate of 0.5%.
Borrowings of BHFC, a wholly owned finance subsidiary of Berkshire, consist of senior unsecured notes used to fund manufactured housing loans originated or acquired and equipment held for lease of certain subsidiaries. BHFC borrowings are fully and unconditionally guaranteed by Berkshire. In 2021, BHFC repaid $750 million of maturing senior notes and issued $750 million of 2.5% senior notes due in 2051.
The carrying values of Berkshire and BHFC non-U.S. Dollar denominated senior notes (€6.9 billion, £1.75 billion and¥785.5 billion par) reflect the applicable exchange rates as of the balance sheet dates. The effects of changes in foreigncurrency exchange rates during the period are recorded in earnings as a component of selling, general and administrativeexpenses. Changes in the exchange rates resulted in pre-tax gains of $1.3 billion in 2021, pre-tax losses of $1.0 billion in2020 and pre-tax gains of $192 million in 2019.
Berkshire also guarantees debt of other subsidiaries, aggregating approximately $3.8 billion at December 31, 2021.Generally, Berkshire’s guarantee of a subsidiary’s debt obligation is an absolute, unconditional and irrevocable guarantee forthe full and prompt payment when due of all payment obligations.
WeightedAverage December 31,
Interest Rate 2021 2020
Railroad, utilities and energy:Berkshire Hathaway Energy Company (“BHE”) and subsidiaries:
BHE senior unsecured debt due 2023-2051 4.3% $ 13,003 $ 13,447Subsidiary and other debt due 2022-2064 4.1% 36,759 36,420Short-term borrowings 1.4% 2,009 2,286
Burlington Northern Santa Fe (“BNSF”) and subsidiaries due 2022-2097 4.5% 23,219 23,220$ 74,990 $ 75,373
BHE subsidiary debt represents amounts issued pursuant to separate financing agreements. Substantially all of theassets of certain BHE subsidiaries are, or may be, pledged or encumbered to support or otherwise secure debt. Theseborrowing arrangements generally contain various covenants, including covenants which pertain to leverage ratios, interestcoverage ratios and/or debt service coverage ratios. During 2021, BHE and its subsidiaries issued term debt of approximately$2.2 billion with maturity dates ranging from 2028 to 2052 and a weighted average interest rate of 3.2% and repaid $2.5billion of term debt.
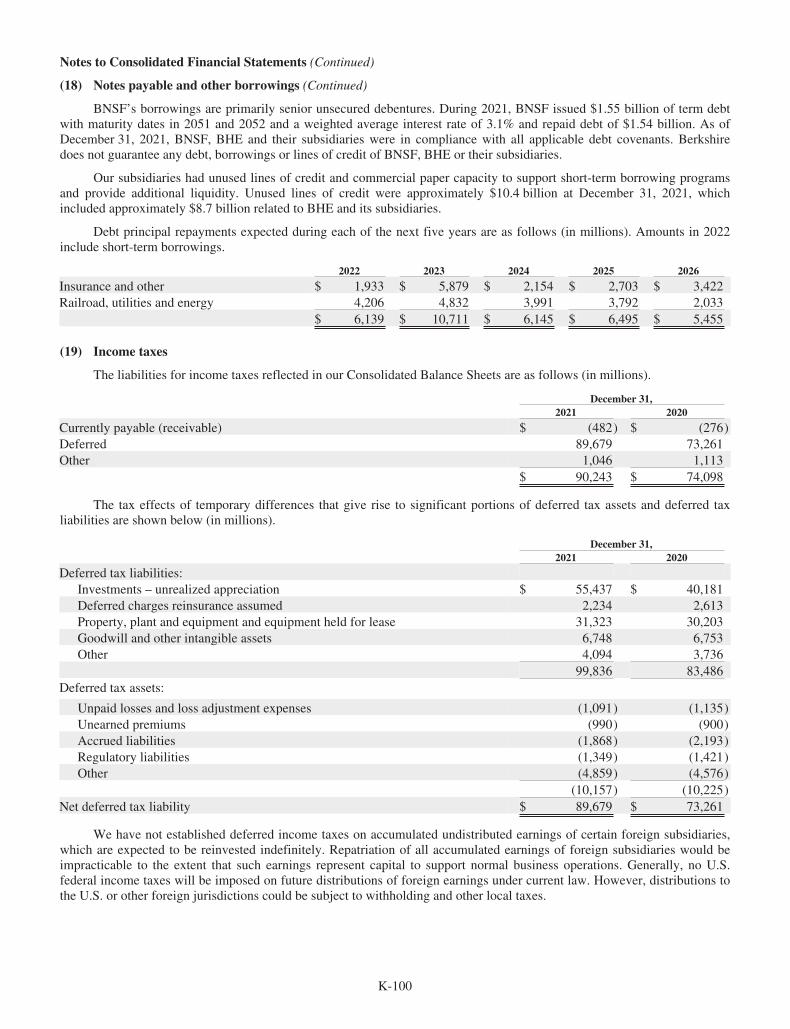
K-100
Notes to Consolidated Financial Statements (Continued)
(18) Notes payable and other borrowings (Continued)
BNSF’s borrowings are primarily senior unsecured debentures. During 2021, BNSF issued $1.55 billion of term debtwith maturity dates in 2051 and 2052 and a weighted average interest rate of 3.1% and repaid debt of $1.54 billion. As ofDecember 31, 2021, BNSF, BHE and their subsidiaries were in compliance with all applicable debt covenants. Berkshiredoes not guarantee any debt, borrowings or lines of credit of BNSF, BHE or their subsidiaries.
Our subsidiaries had unused lines of credit and commercial paper capacity to support short-term borrowing programsand provide additional liquidity. Unused lines of credit were approximately $10.4 billion at December 31, 2021, whichincluded approximately $8.7 billion related to BHE and its subsidiaries.
Debt principal repayments expected during each of the next five years are as follows (in millions). Amounts in 2022include short-term borrowings.
2022 2023 2024 2025 2026
Insurance and other $ 1,933 $ 5,879 $ 2,154 $ 2,703 $ 3,422Railroad, utilities and energy 4,206 4,832 3,991 3,792 2,033
$ 6,139 $ 10,711 $ 6,145 $ 6,495 $ 5,455
(19) Income taxes
The liabilities for income taxes reflected in our Consolidated Balance Sheets are as follows (in millions).
December 31,2021 2020
Currently payable (receivable) $ (482) $ (276)Deferred 89,679 73,261Other 1,046 1,113
$ 90,243 $ 74,098
The tax effects of temporary differences that give rise to significant portions of deferred tax assets and deferred taxliabilities are shown below (in millions).
December 31,2021 2020
Deferred tax liabilities:Investments – unrealized appreciation $ 55,437 $ 40,181Deferred charges reinsurance assumed 2,234 2,613Property, plant and equipment and equipment held for lease 31,323 30,203Goodwill and other intangible assets 6,748 6,753Other 4,094 3,736
99,836 83,486Deferred tax assets:
Unpaid losses and loss adjustment expenses (1,091) (1,135)Unearned premiums (990) (900)Accrued liabilities (1,868) (2,193)Regulatory liabilities (1,349) (1,421)Other (4,859) (4,576)
(10,157) (10,225)Net deferred tax liability $ 89,679 $ 73,261
We have not established deferred income taxes on accumulated undistributed earnings of certain foreign subsidiaries,which are expected to be reinvested indefinitely. Repatriation of all accumulated earnings of foreign subsidiaries would beimpracticable to the extent that such earnings represent capital to support normal business operations. Generally, no U.S.federal income taxes will be imposed on future distributions of foreign earnings under current law. However, distributions tothe U.S. or other foreign jurisdictions could be subject to withholding and other local taxes.

K-101
Notes to Consolidated Financial Statements (Continued)
(19) Income taxes (Continued)
Income tax expense reflected in our Consolidated Statements of Earnings for each of the three years endingDecember 31, 2021 was as follows (in millions).
2021 2020 2019
Federal $ 20,345 $ 10,596 $ 19,069State (527) 1,086 625Foreign 1,061 758 1,210
$ 20,879 $ 12,440 $ 20,904
Current $ 5,326 $ 5,052 $ 5,818Deferred 15,553 7,388 15,086
$ 20,879 $ 12,440 $ 20,904
Income tax expense is reconciled to hypothetical amounts computed at the U.S. federal statutory rate for each of thethree years ending December 31, 2021 in the table below (in millions).
2021 2020 2019
Earnings before income taxes $ 111,686 $ 55,693 $ 102,696
Hypothetical income tax expense computed at the U.S. federal statutory rate $ 23,454 $ 11,696 $ 21,566Dividends received deduction and tax-exempt interest (457) (448) (433)State income taxes, less U.S. federal income tax benefit (417) 858 494U.S. income tax credits (1,860) (1,519) (942)Goodwill impairments — 1,977 20Other differences, net 159 (124) 199
$ 20,879 $ 12,440 $ 20,904
Effective income tax rate 18.7% 22.3% 20.4%
We file income tax returns in the United States and in state, local and foreign jurisdictions. We have settled income taxliabilities with the U.S. federal taxing authority (“IRS”) for tax years through 2011. The U.S. federal income tax returns from2012 through 2019 remain open, and tax years 2014 through 2019 are under audit. We are also under audit or subject to auditwith respect to income taxes in many state and foreign jurisdictions. It is reasonably possible that certain of these income taxexaminations will be settled in 2022. We currently do not believe that the outcome of unresolved issues or claims will bematerial to our Consolidated Financial Statements.
At December 31, 2021 and 2020, net unrecognized tax benefits were $1,046 million and $1,113 million, respectively.Included in the balance at December 31, 2021, were $878 million of tax positions that, if recognized, would impact theeffective tax rate. The remaining balance in net unrecognized tax benefits principally relates to tax positions where theultimate recognition is highly certain but there is uncertainty about the timing of recognition. Because of the impact ofdeferred income tax accounting, these positions, when recognized, would not affect the annual effective income tax rate.Other differences, net included expense of $60 million in 2020 and $377 million in 2019 for uncertain tax positions related toinvestments by a subsidiary in certain tax equity investment funds that generated income tax benefits from 2015 through2018. We concluded it was more likely than not those income tax benefits are not valid. We do not expect any materialincreases to the estimated amount of unrecognized tax benefits during 2022.
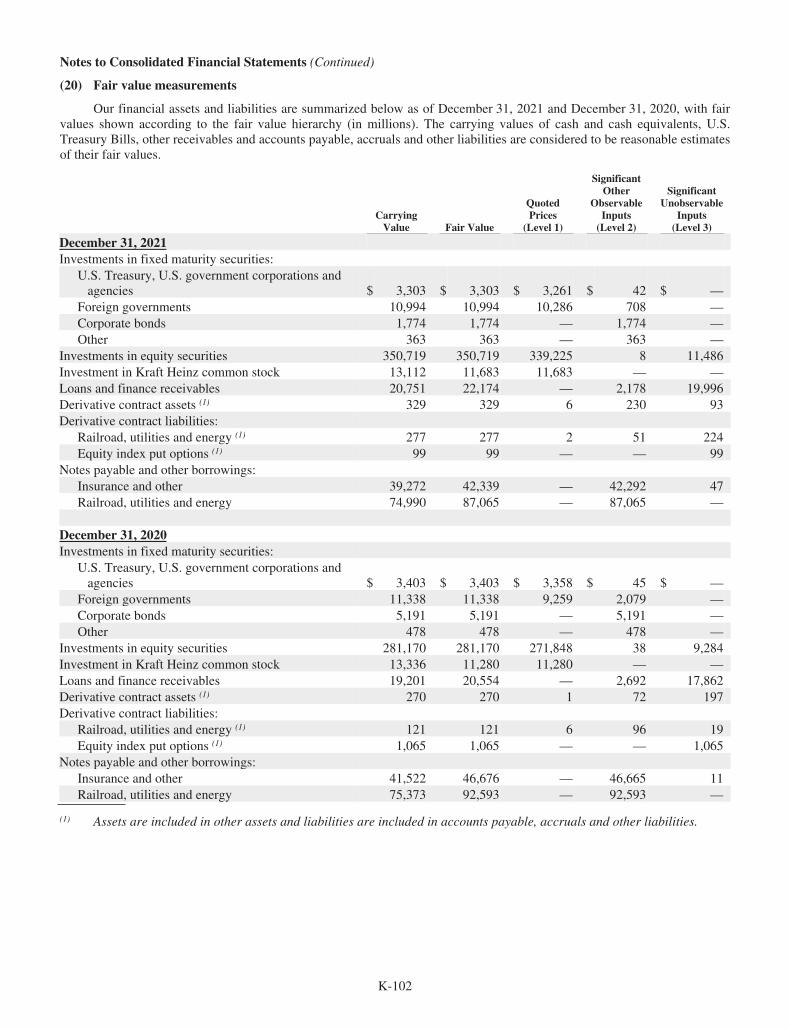
K-102
Notes to Consolidated Financial Statements (Continued)
(20) Fair value measurements
Our financial assets and liabilities are summarized below as of December 31, 2021 and December 31, 2020, with fairvalues shown according to the fair value hierarchy (in millions). The carrying values of cash and cash equivalents, U.S.Treasury Bills, other receivables and accounts payable, accruals and other liabilities are considered to be reasonable estimatesof their fair values.
CarryingValue Fair Value
QuotedPrices
(Level 1)
SignificantOther
ObservableInputs(Level 2)
SignificantUnobservable
Inputs(Level 3)
December 31, 2021Investments in fixed maturity securities:
U.S. Treasury, U.S. government corporations andagencies $ 3,303 $ 3,303 $ 3,261 $ 42 $ —
Foreign governments 10,994 10,994 10,286 708 —Corporate bonds 1,774 1,774 — 1,774 —Other 363 363 — 363 —
Investments in equity securities 350,719 350,719 339,225 8 11,486Investment in Kraft Heinz common stock 13,112 11,683 11,683 — —Loans and finance receivables 20,751 22,174 — 2,178 19,996Derivative contract assets (1) 329 329 6 230 93Derivative contract liabilities:
Railroad, utilities and energy (1) 277 277 2 51 224Equity index put options (1) 99 99 — — 99
Notes payable and other borrowings:Insurance and other 39,272 42,339 — 42,292 47Railroad, utilities and energy 74,990 87,065 — 87,065 —
December 31, 2020Investments in fixed maturity securities:
U.S. Treasury, U.S. government corporations andagencies $ 3,403 $ 3,403 $ 3,358 $ 45 $ —
Foreign governments 11,338 11,338 9,259 2,079 —Corporate bonds 5,191 5,191 — 5,191 —Other 478 478 — 478 —
Investments in equity securities 281,170 281,170 271,848 38 9,284Investment in Kraft Heinz common stock 13,336 11,280 11,280 — —Loans and finance receivables 19,201 20,554 — 2,692 17,862Derivative contract assets (1) 270 270 1 72 197Derivative contract liabilities:
Railroad, utilities and energy (1) 121 121 6 96 19Equity index put options (1) 1,065 1,065 — — 1,065
Notes payable and other borrowings:Insurance and other 41,522 46,676 — 46,665 11Railroad, utilities and energy 75,373 92,593 — 92,593 —
(1) Assets are included in other assets and liabilities are included in accounts payable, accruals and other liabilities.
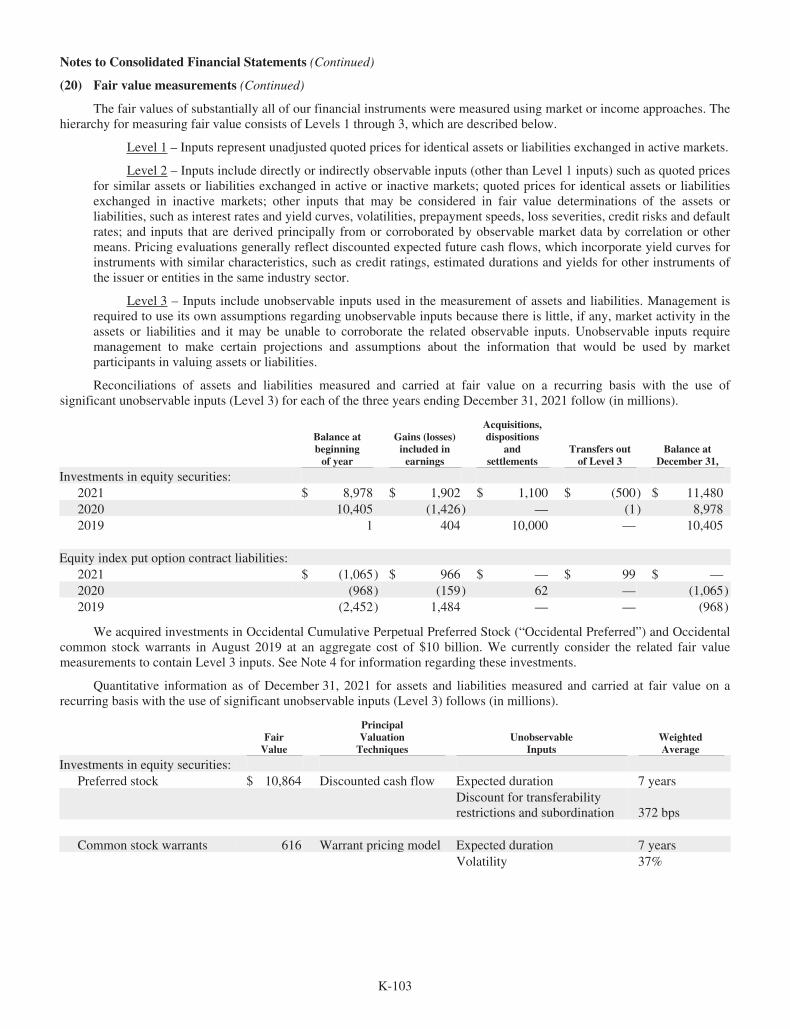
K-103
Notes to Consolidated Financial Statements (Continued)
(20) Fair value measurements (Continued)
The fair values of substantially all of our financial instruments were measured using market or income approaches. Thehierarchy for measuring fair value consists of Levels 1 through 3, which are described below.
Level 1 – Inputs represent unadjusted quoted prices for identical assets or liabilities exchanged in active markets.
Level 2 – Inputs include directly or indirectly observable inputs (other than Level 1 inputs) such as quoted pricesfor similar assets or liabilities exchanged in active or inactive markets; quoted prices for identical assets or liabilitiesexchanged in inactive markets; other inputs that may be considered in fair value determinations of the assets orliabilities, such as interest rates and yield curves, volatilities, prepayment speeds, loss severities, credit risks and defaultrates; and inputs that are derived principally from or corroborated by observable market data by correlation or othermeans. Pricing evaluations generally reflect discounted expected future cash flows, which incorporate yield curves forinstruments with similar characteristics, such as credit ratings, estimated durations and yields for other instruments ofthe issuer or entities in the same industry sector.
Level 3 – Inputs include unobservable inputs used in the measurement of assets and liabilities. Management isrequired to use its own assumptions regarding unobservable inputs because there is little, if any, market activity in theassets or liabilities and it may be unable to corroborate the related observable inputs. Unobservable inputs requiremanagement to make certain projections and assumptions about the information that would be used by marketparticipants in valuing assets or liabilities.
Reconciliations of assets and liabilities measured and carried at fair value on a recurring basis with the use ofsignificant unobservable inputs (Level 3) for each of the three years ending December 31, 2021 follow (in millions).
Balance atbeginningof year
Gains (losses)included inearnings
Acquisitions,dispositions
andsettlements
Transfers outof Level 3
Balance atDecember 31,
Investments in equity securities:2021 $ 8,978 $ 1,902 $ 1,100 $ (500) $ 11,4802020 10,405 (1,426) — (1) 8,9782019 1 404 10,000 — 10,405
Equity index put option contract liabilities:2021 $ (1,065) $ 966 $ — $ 99 $ —2020 (968) (159) 62 — (1,065)2019 (2,452) 1,484 — — (968)
We acquired investments in Occidental Cumulative Perpetual Preferred Stock (“Occidental Preferred”) and Occidentalcommon stock warrants in August 2019 at an aggregate cost of $10 billion. We currently consider the related fair valuemeasurements to contain Level 3 inputs. See Note 4 for information regarding these investments.
Quantitative information as of December 31, 2021 for assets and liabilities measured and carried at fair value on arecurring basis with the use of significant unobservable inputs (Level 3) follows (in millions).
FairValue
PrincipalValuationTechniques
UnobservableInputs
WeightedAverage
Investments in equity securities:Preferred stock $ 10,864 Discounted cash flow Expected duration 7 years
Discount for transferabilityrestrictions and subordination 372 bps
Common stock warrants 616 Warrant pricing model Expected duration 7 yearsVolatility 37%

K-104
Notes to Consolidated Financial Statements (Continued)
(20) Fair value measurements (Continued)
Investments in equity securities in the preceding table include our investments in certain preferred and common stockwarrants that do not have readily determinable market values as defined under GAAP. These investments are subject tocontractual restrictions on transferability and contain provisions that currently prevent us from economically hedging ourinvestments. We applied discounted cash flow techniques in valuing the preferred stock and we made assumptions regardingthe expected duration of the investment and the effects of subordination in liquidation. In valuing the common stockwarrants, we used a warrant valuation model. While most of the inputs to the model are observable, we made assumptionsregarding the expected duration and volatility of the warrants.
(21) Common stock
Changes in Berkshire’s issued, treasury and outstanding common stock during the three years ending December 31,2021 are shown in the table below. In addition to our common stock, 1,000,000 shares of preferred stock are authorized, butnone are issued.
Class A, $5 Par Value(1,650,000 shares authorized)
Class B, $0.0033 Par Value(3,225,000,000 shares authorized)
Issued Treasury Outstanding Issued Treasury Outstanding
Balance December 31, 2018 742,213 (12,897) 729,316 1,373,558,983 (6,138,909) 1,367,420,074Conversions of Class A common stock toClass B common stock and exercises ofreplacement stock options (22,906) — (22,906) 34,624,869 — 34,624,869
Treasury stock acquired — (4,440) (4,440) — (17,563,410) (17,563,410)Balance December 31, 2019 719,307 (17,337) 701,970 1,408,183,852 (23,702,319) 1,384,481,533Conversions of Class A common stock toClass B common stock (40,784) — (40,784) 61,176,000 — 61,176,000
Treasury stock acquired — (17,255) (17,255) — (95,614,062) (95,614,062)Balance December 31, 2020 678,523 (34,592) 643,931 1,469,359,852 (119,316,381) 1,350,043,471Conversions of Class A common stock toClass B common stock (12,622) — (12,622) 18,933,000 — 18,933,000
Treasury stock acquired — (14,196) (14,196) — (78,501,968) (78,501,968)Balance December 31, 2021 665,901 (48,788) 617,113 1,488,292,852 (197,818,349) 1,290,474,503
Each Class A common share is entitled to one vote per share. Class B common stock possesses dividend anddistribution rights equal to one-fifteen-hundredth (1/1,500) of such rights of Class A common stock. Each Class B commonshare possesses voting rights equal to one-ten-thousandth (1/10,000) of the voting rights of a Class A share. Unless otherwiserequired under Delaware General Corporation Law, Class A and Class B common shares vote as a single class. Each share ofClass A common stock is convertible, at the option of the holder, into 1,500 shares of Class B common stock. Class Bcommon stock is not convertible into Class A common stock. On an equivalent Class A common stock basis, there were1,477,429 shares outstanding as of December 31, 2021 and 1,543,960 shares outstanding as of December 31, 2020.
Since we have two classes of common stock, we provide earnings per share data on the Consolidated Statements ofEarnings for average equivalent Class A shares outstanding and average equivalent Class B shares outstanding. Class Bshares are economically equivalent to one-fifteen-hundredth (1/1,500) of a Class A share. Average equivalent Class A sharesoutstanding represents average Class A shares outstanding plus one-fifteen-hundredth (1/1,500) of the average Class B sharesoutstanding. Average equivalent Class B shares outstanding represents average Class B shares outstanding plus 1,500 timesaverage Class A shares outstanding.
Berkshire’s common stock repurchase program, as amended, permits Berkshire to repurchase shares any time thatWarren Buffett, Berkshire’s Chairman of the Board and Chief Executive Officer, and Charlie Munger, Vice Chairman of theBoard, believe that the repurchase price is below Berkshire’s intrinsic value, conservatively determined. The programcontinues to allow share repurchases in the open market or through privately negotiated transactions and does not specify amaximum number of shares to be repurchased. However, repurchases will not be made if they would reduce the total value ofBerkshire’s consolidated cash, cash equivalents and U.S. Treasury Bill holdings below $30 billion. The repurchase programdoes not obligate Berkshire to repurchase any specific dollar amount or number of Class A or Class B shares and there is noexpiration date to the program.

K-105
Notes to Consolidated Financial Statements (Continued)
(22) Revenues from contracts with customers
We recognize revenue when a good or service is transferred to a customer. A good or service is transferred when or asthe customer obtains control of that good or service. Revenues are based on the consideration we expect to receive inconnection with our promises to deliver goods and services to our customers. The following tables summarize customercontract revenues disaggregated by reportable segment and the source of the revenue for each of the three years endedDecember 31, 2021 (in millions). Other revenues, which are not considered to be revenues from contracts with customersunder GAAP, are primarily insurance premiums earned, interest, dividend and other investment income and leasing revenues.
2021 Manufacturing McLaneService andretailing BNSF
BerkshireHathawayEnergy
Insurance,Corporateand other Total
Manufactured products:Industrial and commercial products $ 22,184 $ — $ 159 $ — $ — $ — $ 22,343Building products 19,604 — — — — — 19,604Consumer products 18,540 — — — — — 18,540
Grocery and convenience store distribution — 31,245 — — — — 31,245Food and beverage distribution — 17,332 — — — — 17,332Auto sales — — 9,966 — — — 9,966Other retail and wholesale distribution 2,997 — 15,898 — — — 18,895Service 1,486 751 4,123 23,120 5,583 — 35,063Electricity and natural gas — — — — 18,264 — 18,264Total 64,811 49,328 30,146 23,120 23,847 — 191,252Other revenues 3,766 122 4,601 57 1,096 75,200 84,842
$ 68,577 $ 49,450 $ 34,747 $ 23,177 $ 24,943 $ 75,200 $276,094
2020
Manufactured products:Industrial and commercial products $ 20,772 $ — $ 192 $ — $ — $ — $ 20,964Building products 15,943 — — — — — 15,943Consumer products 14,757 — — — — — 14,757
Grocery and convenience store distribution — 30,795 — — — — 30,795Food and beverage distribution — 15,368 — — — — 15,368Auto sales — — 8,258 — — — 8,258Other retail and wholesale distribution 2,452 — 12,470 — — — 14,922Service 1,456 584 3,332 20,693 4,595 — 30,660Electricity and natural gas — — — — 15,066 — 15,066Total 55,380 46,747 24,252 20,693 19,661 — 166,733Other revenues 3,598 93 3,859 57 1,353 69,817 78,777
$ 58,978 $ 46,840 $ 28,111 $ 20,750 $ 21,014 $ 69,817 $245,510
2019
Manufactured products:Industrial and commercial products $ 25,311 $ — $ 184 $ — $ — $ — $ 25,495Building products 15,620 — — — — — 15,620Consumer products 14,120 — — — — — 14,120
Grocery and convenience store distribution — 33,057 — — — — 33,057Food and beverage distribution — 16,767 — — — — 16,767Auto sales — — 8,481 — — — 8,481Other retail and wholesale distribution 2,299 — 12,213 — — — 14,512Service 1,642 539 4,062 23,302 4,096 — 33,641Electricity and natural gas — — — — 14,819 — 14,819Total 58,992 50,363 24,940 23,302 18,915 — 176,512Other revenues 3,632 95 4,459 55 1,181 68,682 78,104
$ 62,624 $ 50,458 $ 29,399 $ 23,357 $ 20,096 $ 68,682 $254,616
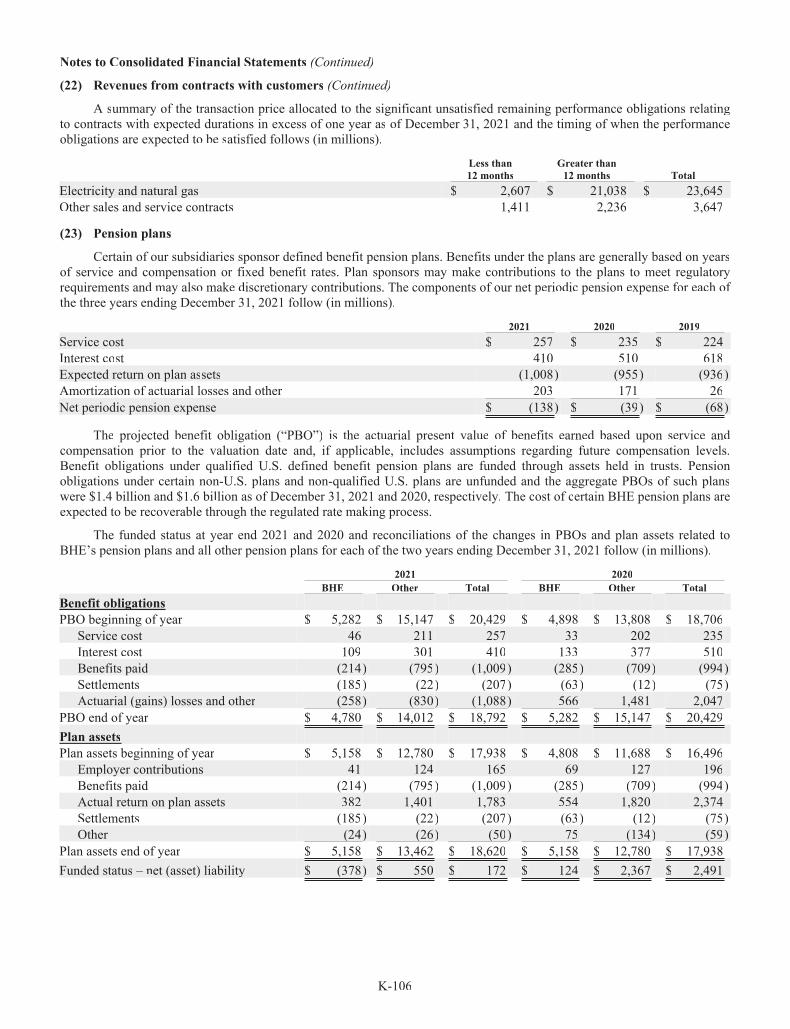
K-106
Notes to Consolidated Financial Statements (Continued)
(22) Revenues from contracts with customers (Continued)
A summary of the transaction price allocated to the significant unsatisfied remaining performance obligations relatingto contracts with expected durations in excess of one year as of December 31, 2021 and the timing of when the performanceobligations are expected to be satisfied follows (in millions).
Less than12 months
Greater than12 months Total
Electricity and natural gas $ 2,607 $ 21,038 $ 23,645Other sales and service contracts 1,411 2,236 3,647
(23) Pension plans
Certain of our subsidiaries sponsor defined benefit pension plans. Benefits under the plans are generally based on yearsof service and compensation or fixed benefit rates. Plan sponsors may make contributions to the plans to meet regulatoryrequirements and may also make discretionary contributions. The components of our net periodic pension expense for eachff ofthe three years ending December 31, 2021 follow (in millions).
2021 2020 2019Service cost $ 257 $ 235 $ 224Interest cost 410 510 618Expected return on plan assets (1,008) (955) (936)Amortization of actuarial losses and other 203 171 26NNet periodic pension expense $ (138) $ (39) $ (68)
The projected benefit obligation (“PBO”) is the actuarial present value of benefits earned based upon service andcompensation prior to the valuation date and, if applicable, includes assumptions regarding future compensation levels.Benefit obligations under qualified U.S. defined benefit pension plans are funded through assets held in trusts. Pensionobligations under certain non-U.S. plans and non-qualified U.S. plans are unfunded and the aggregate PBOs of such planswere $1.4 billion and $1.6 billion as of December 31, 2021 and 2020, respectively. The cost of certain BHE pension plans areexpected to be recoverable through the regulated rate making process.
The funded status at year end 2021 and 2020 and reconciliations of the changes in PBOs and plan assets related toBHE’s pension plans and all other pension plans for each of the two years ending December 31, 2021 follow (in millions).
2021 2020BHE Other Total BHE Other Total
Benefit obligationsPBO beginning of year $ 5,282 $ 15,147 $ 20,429 $ 4,898 $ 13,808 $ 18,706
Service cost 46 211 257 33 202 235Interest cost 109 301 410 133 377 510Benefits paid (214) (795) (1,009) (285) (709) (994)Settlements (185) (22) (207) (63) (12) (75)Actuarial (gains) losses and other (258) (830) (1,088) 566 1,481 2,047
PBO end of year $ 4,780 $ 14,012 $ 18,792 $ 5,282 $ 15,147 $ 20,429Plan assetsPlan assets beginning of year $ 5,158 $ 12,780 $ 17,938 $ 4,808 $ 11,688 $ 16,496
Employer contributions 41 124 165 69 127 196Benefits paid (214) (795) (1,009) (285) (709) (994)Actual return on plan assets 382 1,401 1,783 554 1,820 2,374Settlements (185) (22) (207) (63) (12) (75)Other (24) (26) (50) 75 (134) (59)
Plan assets end of year $ 5,158 $ 13,462 $ 18,620 $ 5,158 $ 12,780 $ 17,938Funded status – net (asset) liability $ (378) $ 550 $ 172 $ 124 $ 2,367 $ 2,491

K-107
Notes to Consolidated Financial Statements (Continued)
(23) Pension plans (Continued)
The funded status reflected in assets was $1,954 million and in liabilities was $2,126 million at December 31, 2021.The funded status included in assets was $1,351 million and in liabilities was $3,842 million at December 31, 2020.
The accumulated benefit obligation (“ABO”) is the actuarial present value of benefits earned based on service andcompensation prior to the valuation date. The ABO was $17.9 billion at December 31, 2021 and $19.4 billion at December31, 2020. Information for plans with PBOs and ABOs in excess of plan assets as of December 31, 2021 and 2020 follows (inmillions).
2021 2020
PBOs $ 9,643 $ 12,775Plan assets 7,518 9,018
ABOs 9,111 10,875Plan assets 7,429 7,820
Weighted average assumptions used in determining PBOs and net periodic pension expense follow.
2021 2020 2019
Discount rate applicable to PBOs 2.7% 2.3% 3.1%Expected long-term rate of return on plan assets 6.1 6.2 6.4Rate of compensation increase 2.6 2.6 2.5Discount rate applicable to net periodic pension expense 2.4 3.1 4.0
Pension benefit payments expected over the next ten years are as follows (in millions): in 2022 – $1,048; in 2023 –$1,006; in 2024 – $1,007; in 2025 – $1,013; in 2026 – $1,014; and in 2027 to 2031 – $4,948. Sponsoring subsidiaries expectto contribute $149 million to the plans in 2022.
Fair value measurements of plan assets as of December 31, 2021 and 2020 follow (in millions).
Fair Value
Investmentfunds and
partnerships
Total Level 1 Level 2 Level 3at net asset
value
December 31, 2021Cash and cash equivalents $ 992 $ 901 $ 91 $ — $ —Equity securities 11,343 10,358 660 325 —Fixed maturity securities 3,422 2,226 1,168 28 —Investment funds and other 2,863 180 361 57 2,265
$ 18,620 $ 13,665 $ 2,280 $ 410 $ 2,265
December 31, 2020Cash and cash equivalents $ 383 $ 243 $ 140 $ — $ —Equity securities 11,383 10,123 851 409 —Fixed maturity securities 3,173 2,214 926 33 —Investment funds and other 2,999 198 398 56 2,347
$ 17,938 $ 12,778 $ 2,315 $ 498 $ 2,347
See Note 20 for a discussion of the three levels of fair value measurements. Plan assets are generally invested with thelong-term objective of producing earnings to adequately cover expected benefit obligations, while assuming a prudent levelof risk. Allocations may change due to changing market conditions and investment opportunities. The expected rates ofreturn on plan assets reflect subjective assessments of expected long-term investment returns. Generally, past investmentreturns are not given significant consideration when establishing assumptions for expected long-term rates of return on planassets. Actual experience will differ from the assumed rates of return.

K-108
Notes to Consolidated Financial Statements (Continued)
(23) Pension plans (Continued)
A reconciliation of the pre-tax accumulated other comprehensive income (loss) related to defined benefit pension plansfor each of the two years ending December 31, 2021 follows (in millions).
2021 2020Balance beginning of year $ (2,251) $ (1,896)
Amount included in net periodic pension expense 170 141Actuarial gains (losses) and other 1,596 (496)
Balance end of year $ (485) $ (2,251)
Several of our subsidiaries also sponsor defined contribution retirement plans, such as 401(k) or profit-sharing plans.Employee contributions are subject to regulatory limitations and the specific plan provisions. Several plans provide foremployer matching contributions up to levels specified in the plans and provide for additional discretionary contributions asdetermined by management. Our defined contribution plan expense was approximately $1.0 billion in 2021, $1.4 billion in2020 and $1.2 billion in 2019.
(24) Accumulated other comprehensive income
A summary of the net changes in after-tax accumulated other comprehensive income attributable to BerkshireHathaway shareholders for each of the three years ending December 31, 2021 follows (in millions).
Unrealizedappreciation offixed maturitysecurities, net
Foreigncurrencytranslation
Defined benefitpension plans Other
Accumulatedother
comprehensiveincome
Balance December 31, 2018 $ 370 $ (4,603) $ (816) $ 34 $ (5,015)Other comprehensive income 160 257 (644) (48) (275)Reclassifications into net earnings (49) — 91 5 47
Balance December 31, 2019 481 (4,346) (1,369) (9) (5,243)Other comprehensive income 78 1,264 (385) (52) 905Reclassifications into net earnings (23) — 109 9 95
Balance December 31, 2020 536 (3,082) (1,645) (52) (4,243)Other comprehensive income (123) (1,021) 1,163 80 99Reclassifications into net earnings (44) 11 135 15 117
Balance December 31, 2021 $ 369 $ (4,092) $ (347) $ 43 $ (4,027)
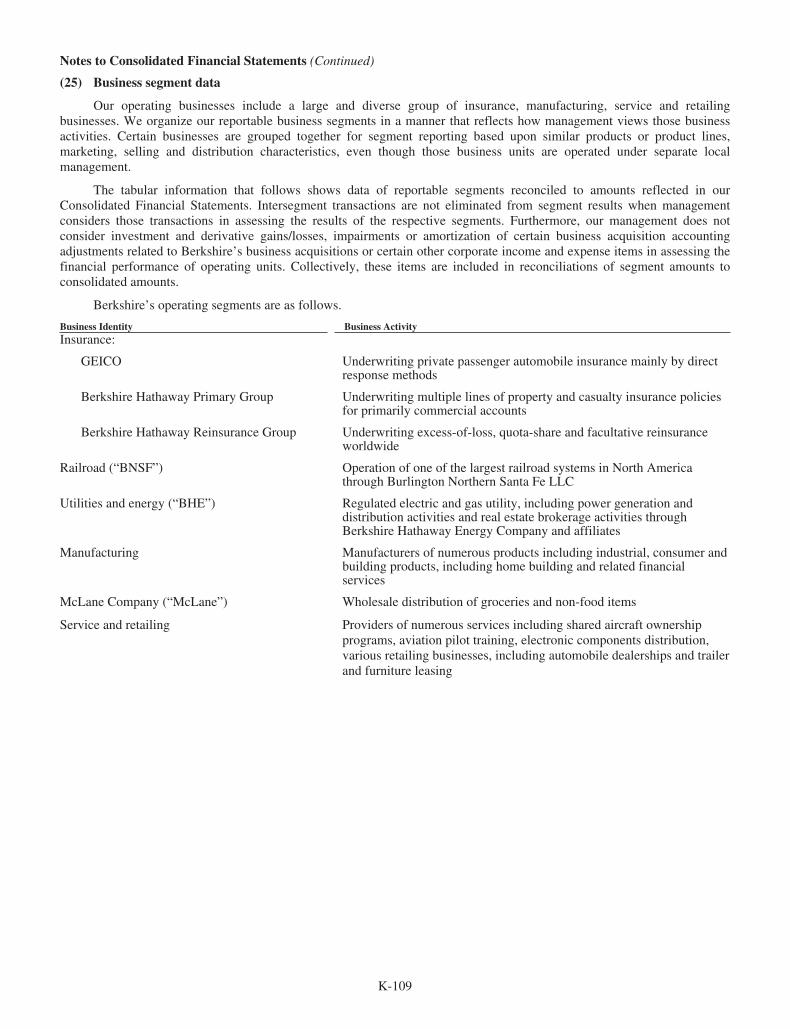
K-109
Notes to Consolidated Financial Statements (Continued)
(25) Business segment data
Our operating businesses include a large and diverse group of insurance, manufacturing, service and retailingbusinesses. We organize our reportable business segments in a manner that reflects how management views those businessactivities. Certain businesses are grouped together for segment reporting based upon similar products or product lines,marketing, selling and distribution characteristics, even though those business units are operated under separate localmanagement.
The tabular information that follows shows data of reportable segments reconciled to amounts reflected in ourConsolidated Financial Statements. Intersegment transactions are not eliminated from segment results when managementconsiders those transactions in assessing the results of the respective segments. Furthermore, our management does notconsider investment and derivative gains/losses, impairments or amortization of certain business acquisition accountingadjustments related to Berkshire’s business acquisitions or certain other corporate income and expense items in assessing thefinancial performance of operating units. Collectively, these items are included in reconciliations of segment amounts toconsolidated amounts.
Berkshire’s operating segments are as follows.
Business Identity Business ActivityInsurance:
GEICO Underwriting private passenger automobile insurance mainly by directresponse methods
Berkshire Hathaway Primary Group Underwriting multiple lines of property and casualty insurance policiesfor primarily commercial accounts
Berkshire Hathaway Reinsurance Group Underwriting excess-of-loss, quota-share and facultative reinsuranceworldwide
Railroad (“BNSF”) Operation of one of the largest railroad systems in North Americathrough Burlington Northern Santa Fe LLC
Utilities and energy (“BHE”) Regulated electric and gas utility, including power generation anddistribution activities and real estate brokerage activities throughBerkshire Hathaway Energy Company and affiliates
Manufacturing Manufacturers of numerous products including industrial, consumer andbuilding products, including home building and related financialservices
McLane Company (“McLane”) Wholesale distribution of groceries and non-food items
Service and retailing Providers of numerous services including shared aircraft ownershipprograms, aviation pilot training, electronic components distribution,various retailing businesses, including automobile dealerships and trailerand furniture leasing
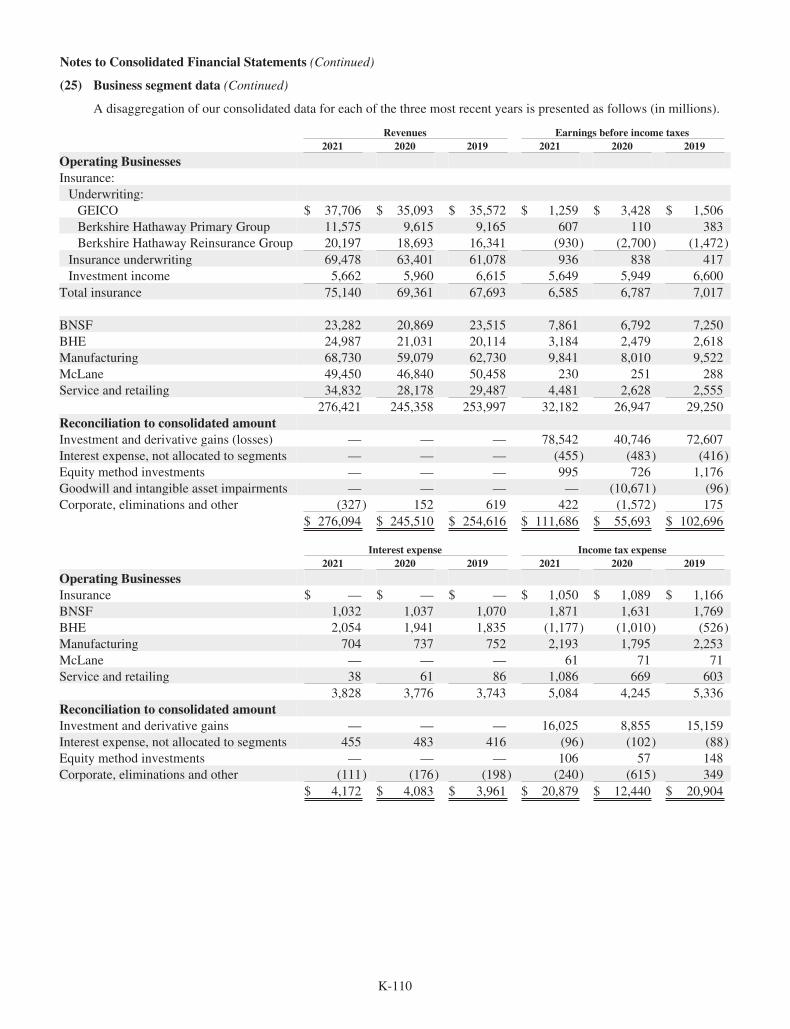
K-110
Notes to Consolidated Financial Statements (Continued)
(25) Business segment data (Continued)
A disaggregation of our consolidated data for each of the three most recent years is presented as follows (in millions).
Revenues Earnings before income taxes2021 2020 2019 2021 2020 2019
Operating BusinessesInsurance:Underwriting:GEICO $ 37,706 $ 35,093 $ 35,572 $ 1,259 $ 3,428 $ 1,506Berkshire Hathaway Primary Group 11,575 9,615 9,165 607 110 383Berkshire Hathaway Reinsurance Group 20,197 18,693 16,341 (930) (2,700) (1,472)
Insurance underwriting 69,478 63,401 61,078 936 838 417Investment income 5,662 5,960 6,615 5,649 5,949 6,600
Total insurance 75,140 69,361 67,693 6,585 6,787 7,017
BNSF 23,282 20,869 23,515 7,861 6,792 7,250BHE 24,987 21,031 20,114 3,184 2,479 2,618Manufacturing 68,730 59,079 62,730 9,841 8,010 9,522McLane 49,450 46,840 50,458 230 251 288Service and retailing 34,832 28,178 29,487 4,481 2,628 2,555
276,421 245,358 253,997 32,182 26,947 29,250Reconciliation to consolidated amountInvestment and derivative gains (losses) — — — 78,542 40,746 72,607Interest expense, not allocated to segments — — — (455) (483) (416)Equity method investments — — — 995 726 1,176Goodwill and intangible asset impairments — — — — (10,671) (96)Corporate, eliminations and other (327) 152 619 422 (1,572) 175
$ 276,094 $ 245,510 $ 254,616 $ 111,686 $ 55,693 $ 102,696
Interest expense Income tax expense2021 2020 2019 2021 2020 2019
Operating BusinessesInsurance $ — $ — $ — $ 1,050 $ 1,089 $ 1,166BNSF 1,032 1,037 1,070 1,871 1,631 1,769BHE 2,054 1,941 1,835 (1,177) (1,010) (526)Manufacturing 704 737 752 2,193 1,795 2,253McLane — — — 61 71 71Service and retailing 38 61 86 1,086 669 603
3,828 3,776 3,743 5,084 4,245 5,336Reconciliation to consolidated amountInvestment and derivative gains — — — 16,025 8,855 15,159Interest expense, not allocated to segments 455 483 416 (96) (102) (88)Equity method investments — — — 106 57 148Corporate, eliminations and other (111) (176) (198) (240) (615) 349
$ 4,172 $ 4,083 $ 3,961 $ 20,879 $ 12,440 $ 20,904

K-111
Notes to Consolidated Financial Statements (Continued)
(25) Business segment data (Continued)
Capital expenditures Depreciation of tangible assets2021 2020 2019 2021 2020 2019
Operating BusinessesInsurance $ 62 $ 50 $ 108 $ 72 $ 74 $ 82BNSF 2,910 3,063 3,608 2,406 2,423 2,350BHE 6,611 6,765 7,364 3,584 3,376 2,947Manufacturing 2,100 2,133 2,981 2,037 2,026 1,951McLane 106 98 158 189 204 225Service and retailing 1,487 903 1,760 1,177 1,216 1,192
$ 13,276 $ 13,012 $ 15,979 $ 9,465 $ 9,319 $ 8,747
Goodwill at year-end Identifiable assets at year-end2021 2020 2019 2021 2020 2019
Operating BusinessesInsurance $ 15,181 $ 15,224 $ 15,289 $ 482,813 $ 399,169 $ 364,550BNSF 14,852 14,851 14,851 76,586 73,809 73,699BHE 11,906 11,763 9,979 112,117 109,286 88,651Manufacturing 25,463 25,512 34,800 107,231 104,318 104,437McLane 232 232 734 6,841 6,771 6,872Service and retailing 6,241 6,152 6,229 28,221 26,173 26,494
$ 73,875 $ 73,734 $ 81,882 813,809 719,526 664,703
Reconciliation to consolidated amountCorporate and other 71,100 80,469 71,144Goodwill 73,875 73,734 81,882
$ 958,784 $ 873,729 $ 817,729
Property/casualty and life/health insurance premiums written and earned are summarized below (in millions).
Property/Casualty Life/Health2021 2020 2019 2021 2020 2019
Premiums Written:Direct $ 53,829 $ 47,838 $ 47,578 $ 649 $ 510 $ 839Assumed 12,461 11,533 10,214 5,685 5,960 5,046Ceded (1,015) (898) (821) (40) (42) (45)
$ 65,275 $ 58,473 $ 56,971 $ 6,294 $ 6,428 $ 5,840
Premiums Earned:Direct $ 52,139 $ 46,418 $ 46,540 $ 649 $ 510 $ 839Assumed 12,072 11,449 9,643 5,713 5,973 4,952Ceded (1,054) (907) (851) (41) (42) (45)
$ 63,157 $ 56,960 $ 55,332 $ 6,321 $ 6,441 $ 5,746

K-112
Notes to Consolidated Financial Statements (Continued)
(25) Business segment data (Continued)
Insurance premiums written by geographic region (based upon the domicile of the insured or reinsured) aresummarized below (in millions).
Property/Casualty Life/Health2021 2020 2019 2021 2020 2019
United States $ 55,451 $ 50,250 $ 50,529 $ 2,161 $ 2,820 $ 2,553Western Europe 4,613 3,751 2,535 1,298 1,120 908Asia Pacific 3,822 3,410 3,114 2,030 1,652 1,582All other 1,389 1,062 793 805 836 797
$ 65,275 $ 58,473 $ 56,971 $ 6,294 $ 6,428 $ 5,840
Consolidated sales, service and leasing revenues were $151.0 billion in 2021, $132.3 billion in 2020 and $140.8 billionin 2019. Sales, service and leasing revenues attributable to the United States were 85% in 2021, 86% in 2020 and 85% in2019 of such amounts. The remainder of sales, service and leasing revenues were primarily in Europe, Canada and the AsiaPacific region. Railroad, utilities and energy revenues were $48.1 billion in 2021, $41.8 billion in 2020 and $43.5 billion in2019. In each of the three years, approximately 96% of such revenues were attributable to the United States. At December 31,2021, approximately 89% of our consolidated net property, plant and equipment and equipment held for lease was located inthe United States with the remainder primarily in Canada and the United Kingdom.
(26) Contingencies and Commitments
We are parties in a variety of legal actions that routinely arise out of the normal course of business, including legalactions seeking to establish liability directly through insurance contracts or indirectly through reinsurance contracts issued byBerkshire subsidiaries. Plaintiffs occasionally seek punitive or exemplary damages. We do not believe that such normal androutine litigation will have a material effect on our financial condition or results of operations. Berkshire and certain of itssubsidiaries are also involved in other kinds of legal actions, some of which assert or may assert claims or seek to imposefines and penalties. We believe that any liability that may arise as a result of other pending legal actions will not have amaterial effect on our consolidated financial condition or results of operations.
Our subsidiaries regularly make commitments in the ordinary course of business for the future purchase of goods andservices used in their businesses, which are not yet reflected in our Consolidated Financial Statements. The most significantof our long-term commitments relate to our railroad, utilities and energy businesses and our shared aircraft ownership andleasing business. As of December 31, 2021, estimated future payments under those arrangements were as follows: $8 billionin 2022, $4 billion in 2023, $3 billion in 2024, $2 billion in 2025, $2 billion in 2026 and $15 billion after 2026.
As indicated in Note 5, we have an agreement to acquire an additional 41.4% ownership interest in Pilot in 2023. Atthat time, Pilot will become a consolidated subsidiary. Additionally, we may be obligated to acquire certain noncontrollinginterests in less-than-wholly-owned subsidiaries in the future, pursuant to the terms of agreements with the noncontrollingshareholders. The timing and the amount of any future payments that might be required to such noncontrolling shareholdersare contingent on future actions of the noncontrolling owners and the value of the interest being acquired. If we had acquiredthe additional interest in Pilot and all outstanding noncontrolling interests as of December 31, 2021, we estimate theaggregate cost of these acquisitions would approximate $11 billion.

K-113
Item 9. Changes in and Disagreements with Accountants on Accounting and Financial Disclosure
None
Item 9A. Controls and Procedures
At the end of the period covered by this Annual Report on Form 10-K, the Corporation carried out an evaluation, underthe supervision and with the participation of the Corporation’s management, including the Chairman (Chief ExecutiveOfficer) and the Senior Vice President (Chief Financial Officer), of the effectiveness of the design and operation of theCorporation’s disclosure controls and procedures pursuant to Exchange Act Rule 13a-15. Based upon that evaluation, theChairman (Chief Executive Officer) and the Senior Vice President (Chief Financial Officer) concluded that the Corporation’sdisclosure controls and procedures are effective in timely alerting them to material information relating to the Corporation(including its consolidated subsidiaries) required to be included in the Corporation’s periodic SEC filings. The report calledfor by Item 308(a) of Regulation S-K is incorporated herein by reference to Management’s Report on Internal Control OverFinancial Reporting, included on page K-66 of this report. The attestation report called for by Item 308(b) of Regulation S-Kis incorporated herein by reference to the Report of Independent Registered Public Accounting Firm, included on page K-67of this report. There has been no change in the Corporation’s internal control over financial reporting during the quarterended December 31, 2021 that has materially affected, or is reasonably likely to materially affect, the Corporation’s internalcontrol over financial reporting.
Item 9B. Other Information
NonePart III
Except for the information set forth under the caption “Executive Officers of the Registrant” in Part I hereof,information required by this Part (Items 10, 11, 12, 13 and 14) is incorporated by reference from the Registrant’s definitiveproxy statement, filed pursuant to Regulation 14A, for the Annual Meeting of Shareholders of the Registrant to be held onApril 30, 2022, which meeting will involve the election of directors.
Part IV
Item 15. Exhibits and Financial Statement Schedules
(a)1. Financial Statements
The following Consolidated Financial Statements, as well as the Report of Independent Registered Public AccountingFirm, are included in Part II Item 8 of this report:
PAGE
Report of Independent Registered Public Accounting Firm (PCAOB ID No. 34) K-67Consolidated Balance Sheets—
December 31, 2021 and December 31, 2020 K-70Consolidated Statements of Earnings—
Years Ended December 31, 2021, December 31, 2020, and December 31, 2019 K-72Consolidated Statements of Comprehensive Income—
Years Ended December 31, 2021, December 31, 2020, and December 31, 2019 K-73Consolidated Statements of Changes in Shareholders’ Equity—
Years Ended December 31, 2021, December 31, 2020, and December 31, 2019 K-73Consolidated Statements of Cash Flows—
Years Ended December 31, 2021, December 31, 2020, and December 31, 2019 K-74Notes to Consolidated Financial Statements K-75
2. Financial Statement ScheduleReport of Independent Registered Public Accounting Firm K-114Schedule I—Parent Company Condensed Financial Information
Balance Sheets as of December 31, 2021 and 2020, Statements of Earnings and Comprehensive Incomeand Cash Flows for the years ended December 31, 2021, December 31, 2020 and December 31, 2019and Note to Condensed Financial Information K-115
Other schedules are omitted because they are not required, information therein is not applicable, or is reflected inthe Consolidated Financial Statements or notes thereto.
(b) Exhibits
See the “Exhibit Index” at page K-117.
K-114
REPORT OF INDEPENDENT REGISTERED PUBLIC ACCOUNTING FIRM
To the Shareholders and the Board of Directors ofBerkshire Hathaway Inc.Omaha, Nebraska
Opinion on the Financial Statement Schedule
We have audited the consolidated financial statements of Berkshire Hathaway Inc. and subsidiaries (the “Company”) as ofDecember 31, 2021 and 2020, and for each of the three years in the period ended December 31, 2021, and the Company’sinternal control over financial reporting as of December 31, 2021, and have issued our report thereon dated February 26,2022; such consolidated financial statements and report are included elsewhere in this Form 10-K. Our audits also includedthe financial statement schedule of the Company listed in the Index at Item 15. This financial statement schedule is theresponsibility of the Company’s management. Our responsibility is to express an opinion on the Company’s financialstatement schedule based on our audits. In our opinion, such financial statement schedule, when considered in relation to thefinancial statements taken as a whole, presents fairly, in all material respects, the information set forth therein.
/s/ Deloitte & Touche LLPOmaha, NebraskaFebruary 26, 2022
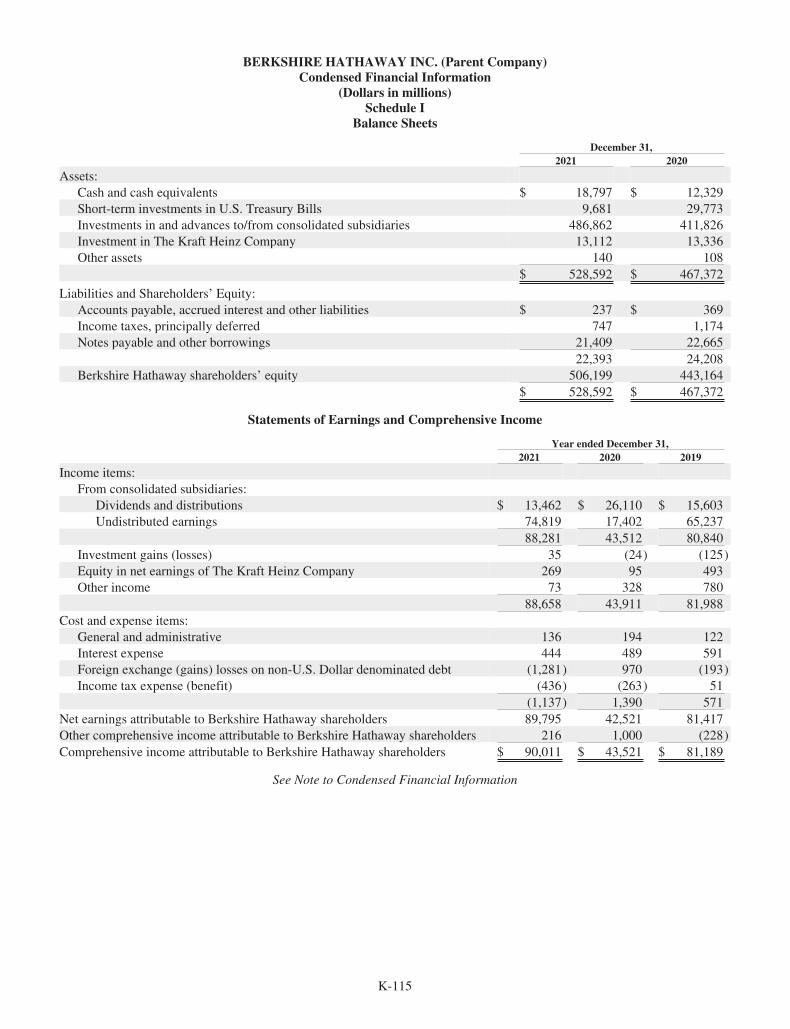
K-115
BERKSHIRE HATHAWAY INC. (Parent Company)Condensed Financial Information
(Dollars in millions)Schedule I
Balance Sheets
December 31,2021 2020
Assets:Cash and cash equivalents $ 18,797 $ 12,329Short-term investments in U.S. Treasury Bills 9,681 29,773Investments in and advances to/from consolidated subsidiaries 486,862 411,826Investment in The Kraft Heinz Company 13,112 13,336Other assets 140 108
$ 528,592 $ 467,372
Liabilities and Shareholders’ Equity:Accounts payable, accrued interest and other liabilities $ 237 $ 369Income taxes, principally deferred 747 1,174Notes payable and other borrowings 21,409 22,665
22,393 24,208Berkshire Hathaway shareholders’ equity 506,199 443,164
$ 528,592 $ 467,372
Statements of Earnings and Comprehensive Income
Year ended December 31,2021 2020 2019
Income items:From consolidated subsidiaries:
Dividends and distributions $ 13,462 $ 26,110 $ 15,603Undistributed earnings 74,819 17,402 65,237
88,281 43,512 80,840Investment gains (losses) 35 (24) (125)Equity in net earnings of The Kraft Heinz Company 269 95 493Other income 73 328 780
88,658 43,911 81,988Cost and expense items:
General and administrative 136 194 122Interest expense 444 489 591Foreign exchange (gains) losses on non-U.S. Dollar denominated debt (1,281) 970 (193)Income tax expense (benefit) (436) (263) 51
(1,137) 1,390 571Net earnings attributable to Berkshire Hathaway shareholders 89,795 42,521 81,417Other comprehensive income attributable to Berkshire Hathaway shareholders 216 1,000 (228)Comprehensive income attributable to Berkshire Hathaway shareholders $ 90,011 $ 43,521 $ 81,189
See Note to Condensed Financial Information
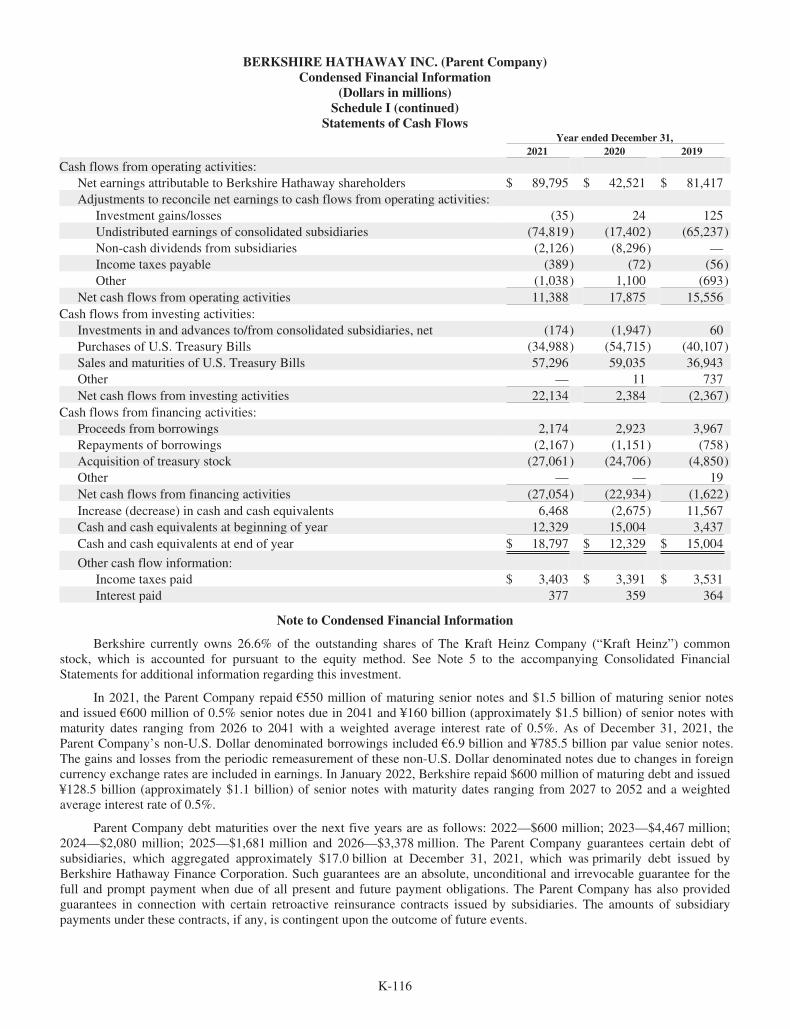
K-116
BERKSHIRE HATHAWAY INC. (Parent Company)Condensed Financial Information
(Dollars in millions)Schedule I (continued)
Statements of Cash FlowsYear ended December 31,
2021 2020 2019
Cash flows from operating activities:Net earnings attributable to Berkshire Hathaway shareholders $ 89,795 $ 42,521 $ 81,417Adjustments to reconcile net earnings to cash flows from operating activities:
Investment gains/losses (35) 24 125Undistributed earnings of consolidated subsidiaries (74,819) (17,402) (65,237)Non-cash dividends from subsidiaries (2,126) (8,296) —Income taxes payable (389) (72) (56)Other (1,038) 1,100 (693)
Net cash flows from operating activities 11,388 17,875 15,556Cash flows from investing activities:
Investments in and advances to/from consolidated subsidiaries, net (174) (1,947) 60Purchases of U.S. Treasury Bills (34,988) (54,715) (40,107)Sales and maturities of U.S. Treasury Bills 57,296 59,035 36,943Other — 11 737Net cash flows from investing activities 22,134 2,384 (2,367)
Cash flows from financing activities:Proceeds from borrowings 2,174 2,923 3,967Repayments of borrowings (2,167) (1,151) (758)Acquisition of treasury stock (27,061) (24,706) (4,850)Other — — 19Net cash flows from financing activities (27,054) (22,934) (1,622)Increase (decrease) in cash and cash equivalents 6,468 (2,675) 11,567Cash and cash equivalents at beginning of year 12,329 15,004 3,437Cash and cash equivalents at end of year $ 18,797 $ 12,329 $ 15,004
Other cash flow information:Income taxes paid $ 3,403 $ 3,391 $ 3,531Interest paid 377 359 364
Note to Condensed Financial Information
Berkshire currently owns 26.6% of the outstanding shares of The Kraft Heinz Company (“Kraft Heinz”) common stock, which is accounted for pursuant to the equity method. See Note 5 to the accompanying Consolidated Financial Statements for additional information regarding this investment.
In 2021, the Parent Company repaid €550 million of maturing senior notes and $1.5 billion of maturing senior notes and issued €600 million of 0.5% senior notes due in 2041 and ¥160 billion (approximately $1.5 billion) of senior notes with maturity dates ranging from 2026 to 2041 with a weighted average interest rate of 0.5%. As of December 31, 2021, the Parent Company’s non-U.S. Dollar denominated borrowings included €6.9 billion and ¥785.5 billion par value senior notes. The gains and losses from the periodic remeasurement of these non-U.S. Dollar denominated notes due to changes in foreign currency exchange rates are included in earnings. In January 2022, Berkshire repaid $600 million of maturing debt and issued¥128.5 billion (approximately $1.1 billion) of senior notes with maturity dates ranging from 2027 to 2052 and a weightedaverage interest rate of 0.5%.
Parent Company debt maturities over the next five years are as follows: 2022—$600 million; 2023—$4,467 million;2024—$2,080 million; 2025—$1,681 million and 2026—$3,378 million. The Parent Company guarantees certain debt ofsubsidiaries, which aggregated approximately $17.0 billion at December 31, 2021, which was primarily debt issued byBerkshire Hathaway Finance Corporation. Such guarantees are an absolute, unconditional and irrevocable guarantee for thefull and prompt payment when due of all present and future payment obligations. The Parent Company has also providedguarantees in connection with certain retroactive reinsurance contracts issued by subsidiaries. The amounts of subsidiarypayments under these contracts, if any, is contingent upon the outcome of future events.

K-117
EXHIBIT INDEX
Exhibit No.
2(i)Agreement and Plan of Merger dated as of June 19, 1998 between Berkshire and General Re Corporation.Incorporated by reference to Annex I to Registration Statement No. 333-61129 filed on Form S-4.
2(ii) Agreement and Plan of Merger dated as of November 2, 2009 by and among Berkshire, R AcquisitionCompany, LLC and BNSF. Incorporated by reference to Annex A to Registration Statement No. 333-163343on Form S-4.
2(iii) Agreement and Plan of Merger dated August 8, 2015, by and among Berkshire, NW Merger Sub Inc. andPrecision Castparts Corporation (“PCC”) Incorporated by reference to Exhibit 2.1 to PCC’s Current Report onForm 8-K filed on August 10, 2015 (SEC File No. 001-10348)
3(i) Restated Certificate of Incorporation Incorporated by reference to Exhibit 3(i) to Form 10-K filed on March 2,2015.
3(ii) By-Laws Incorporated by reference to Exhibit 3(ii) to Form 8-K filed on May 4, 2016.
4.1 Indenture, dated as of December 22, 2003, between Berkshire Hathaway Finance Corporation, BerkshireHathaway Inc. and The Bank of New York Mellon Trust Company, N.A. (as successor to J.P. Morgan TrustCompany, National Association), as trustee. Incorporated by reference to Exhibit 4.1 on Form S-4 of BerkshireHathaway Finance Corporation and Berkshire Hathaway Inc. filed on February 4, 2004. SEC File No. 333-112486
4.2 Indenture, dated as of February 1, 2010, among Berkshire Hathaway Inc., Berkshire Hathaway FinanceCorporation and The Bank of New York Mellon Trust Company, N.A., as trustee. Incorporated by reference toExhibit 4.1 to Berkshire’s Registration Statement on Form S-3 filed on February 1, 2010. SEC File No. 333-164611
4.3 Indenture, dated as of January 26, 2016, by and among Berkshire Hathaway Inc., Berkshire Hathaway FinanceCorporation and The Bank of New York Mellon Trust Company, N.A., as trustee. Incorporated by reference toExhibit 4.1 to Berkshire’s Registration Statement on Form S-3 filed on January 26, 2016. SEC File No. 333-209122
4.4 Indenture, dated as of December 1, 1995, between BNSF and The First National Bank of Chicago, as trustee.Incorporated by reference to Exhibit 4 on Form S-3 of BNSF filed on February 8, 1999.
4.5 Indenture, dated as of October 4, 2002, by and between MidAmerican Energy Holdings Company and TheBank of New York, Trustee. Incorporated by reference to Exhibit 4.1 to the Berkshire Hathaway EnergyCompany Registration Statement No. 333-101699 dated December 6, 2002.
4.6 Indenture, dated as of January 28, 2022, by and among Berkshire Hathaway Inc., as an issuer and a guarantor ofthe debt securities issued by Berkshire Hathaway Finance Corporation, Berkshire Hathaway FinanceCorporation, as an issuer, and The Bank of New York Mellon Trust Company, N.A., as trustee. Incorporated byreference to Exhibit 4.1 to Berkshire’s Registration Statement on Form S-3 filed on January 28, 2022. SEC FileNo 333-262384.
Other instruments defining the rights of holders of long-term debt of Registrant and its subsidiaries arenot being filed since the total amount of securities authorized by all other such instruments does notexceed 10% of the total assets of the Registrant and its subsidiaries on a consolidated basis as ofDecember 31, 2021. The Registrant hereby agrees to furnish to the Commission upon request a copy ofany such debt instrument to which it is a party.
10.1 Equity Commitment Letter of Berkshire Hathaway Inc. with Hawk Acquisition Holding Corporation datedFebruary 13, 2013. Incorporated by reference to Exhibit 10.1 on Form 8-K of Berkshire Hathaway Inc. filed onFebruary 14, 2013.
14 Code of EthicsBerkshire’s Code of Business Conduct and Ethics is posted on its Internet website atwww.berkshirehathaway.com
21 Subsidiaries of Registrant
23 Consent of Independent Registered Public Accounting Firm
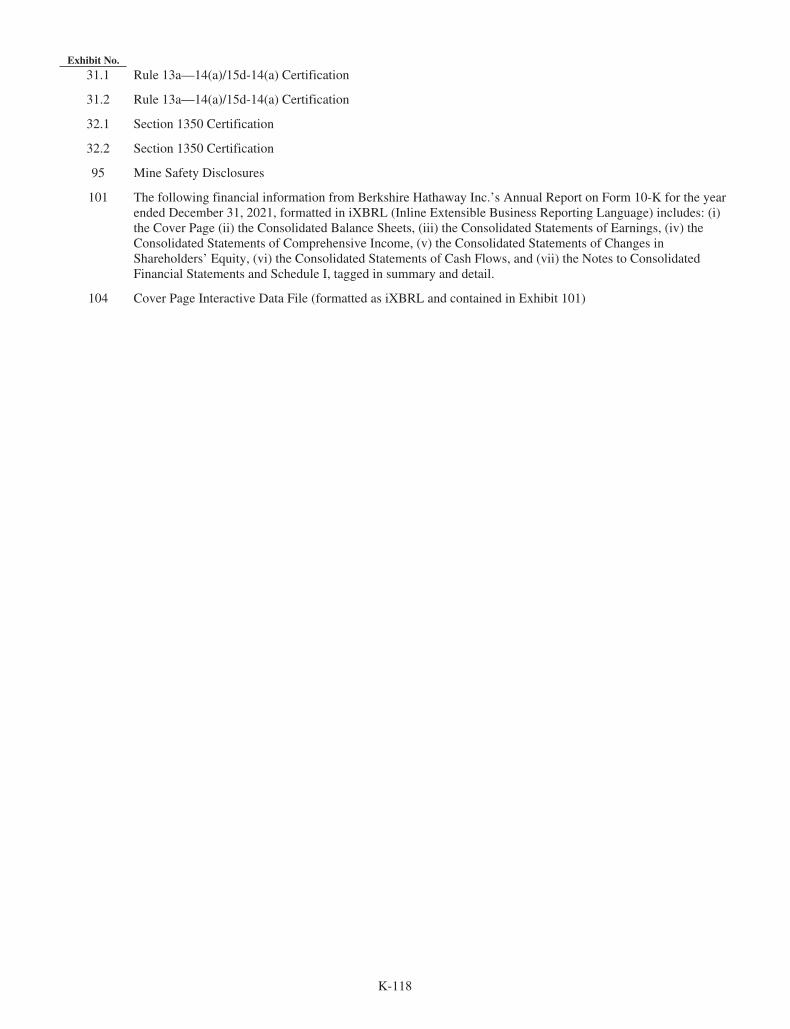
K-118
Exhibit No.
31.1 Rule 13a—14(a)/15d-14(a) Certification
31.2 Rule 13a—14(a)/15d-14(a) Certification
32.1 Section 1350 Certification
32.2 Section 1350 Certification
95 Mine Safety Disclosures
101 The following financial information from Berkshire Hathaway Inc.’s Annual Report on Form 10-K for the yearended December 31, 2021, formatted in iXBRL (Inline Extensible Business Reporting Language) includes: (i)the Cover Page (ii) the Consolidated Balance Sheets, (iii) the Consolidated Statements of Earnings, (iv) theConsolidated Statements of Comprehensive Income, (v) the Consolidated Statements of Changes inShareholders’ Equity, (vi) the Consolidated Statements of Cash Flows, and (vii) the Notes to ConsolidatedFinancial Statements and Schedule I, tagged in summary and detail.
104 Cover Page Interactive Data File (formatted as iXBRL and contained in Exhibit 101)

K-119
SIGNATURES
Pursuant to the requirements of Section 13 or 15(d) of the Securities Exchange Act of 1934, the Registrant has dulycaused this report to be signed on its behalf by the undersigned thereunto duly authorized.
BERKSHIRE HATHAWAY INC.
Date: February 26, 2022 /S/ MARC D. HAMBURGMarc D. Hamburg
Senior Vice President andPrincipal Financial Officer
Pursuant to the requirements of the Securities Exchange Act of 1934, this report has been signed below by thefollowing persons on behalf of the Registrant and in the capacities and on the dates indicated.
/S/ WARREN E. BUFFETT
Warren E. Buffett
Chairman of the Board ofDirectors—Chief Executive Officer
February 26, 2022Date
/S/ GREGORY E. ABEL
Gregory E. Abel
Director—Vice Chairman—Non-Insurance Operations February 26, 2022Date
/S/ HOWARD G. BUFFETT
Howard G. Buffett
Director February 26, 2022Date
/S/ SUSAN A. BUFFETT
Susan A. Buffett
Director February 26, 2022Date
/S/ STEPHEN B. BURKE
Stephen B. Burke
Director February 26, 2022Date
/S/ KENNETH I. CHENAULT
Kenneth I. Chenault
Director February 26, 2022Date
/S/ CHRISTOPHER C. DAVIS
Christopher C. Davis
Director February 26, 2022Date
/S/ SUSAN L. DECKER
Susan L. Decker
Director February 26, 2022Date
/S/ DAVID S. GOTTESMAN
David S. Gottesman
Director February 26, 2022Date
/S/ CHARLOTTE GUYMAN
Charlotte Guyman
Director February 26, 2022Date
/S/ AJIT JAINAjit Jain
Director—Vice Chairman—Insurance Operations February 26, 2022Date
/S/ CHARLES T. MUNGER
Charles T. Munger
Director—Vice Chairman February 26, 2022Date
/S/ RONALD L. OLSON
Ronald L. Olson
Director February 26, 2022Date
/S/ MERYL B. WITMER
Meryl B. Witmer
Director February 26, 2022Date
/S/ MARC D. HAMBURG
Marc D. Hamburg
Senior Vice President—Principal Financial Officer February 26, 2022Date
/S/ DANIEL J. JAKSICHDaniel J. Jaksich
Vice President—Principal Accounting Officer February 26, 2022Date

BERKSHIRE HATHAWAY INC.ANNUAL MEETING INFORMATION
HEALTH AND SAFETY INFORMATION
As part of our commitment to the health and safety of our shareholders, proof of COVID-19 vaccinationwill be required to attend the 2022 Annual Meeting and the Berkshire Bazaar of Bargains.
Berkshire has partnered with CLEAR Health Pass to help make your entry to the Annual Meetingseamless. The easy, free, and secure health pass can be created with just a few taps on your smartphone.We encourage you to complete your health screening with CLEAR Health Pass ahead of time.
Your one-time enrollment only takes a few minutes and can be done from anywhere. Download the app,tap “Get Started” on the Health Pass button, enter event code BRK2022 to access the 2022 AnnualMeeting and follow the instructions.
• Already a CLEAR Member? Just use the email address for your existing membership and snap aselfie to confirm that you are you.
• New to CLEAR? There is no cost to you in using CLEAR Health Pass. Grab your ID (driver’slicense or passport) and your phone – then you’ll never need your ID for CLEAR again!
Shareholders who use CLEAR will use Fast Pass doors to gain entry to the CHI Health Center.
For international attendees and shareholders who do not use the CLEAR app, we will have marked doorsfor you to provide proof of COVID-19 vaccination and proper identification. Digital or hard copy of yourCOVID-19 vaccination record will be required.
ANNUAL MEETING SCHEDULE – SATURDAY, APRIL 30CHI Health Center
7:00am Doors Open8:30am Annual Meeting Movie9:15am Q & A SessionNoon Lunch Break1:00pm Q & A Session3:30pm Short Recess3:45pm Formal Business Meeting
Details: Becky Quick, of CNBC will review questions that shareholders have submitted by e-mail and selectthose she believes will have the widest interest. Questions can be submitted to Becky [email protected]. We will have a drawing at 8:15 am at each of the 11 microphone locations forthose shareholders wishing to ask questions themselves. At the meeting, Warren will alternate the questionsasked by Becky and the shareholders in attendance.
At the morning session, Warren as well as Charlie, Greg and Ajit will be available to answer questions. At theafternoon session, Warren and Charlie will be available to answer questions.
CNBC will webcast the April 30th Berkshire meeting, going live at 8:45 am central time and will begin thewebcast of the Q & A session at 9:15 am central time. Visit www.cnbc.com/BRKlive22.
A-1

BERKSHIRE HATHAWAY INC.ANNUAL MEETING INFORMATION
OTHER SPECIAL EVENTS INFORMATION
Friday, April 29
Berkshire Bazaar of Bargains (Shareholder Shopping Day)-CHI Health Center Noon – 5pm
Details: An extended afternoon of shopping for our shareholders. (Must provide proof of COVID-19 vaccinationand have a meeting credential to participate.)
Borsheims Shareholder-Only Shopping Night 6:00pm – 8:00pm
Saturday, April 30
NFM’s Berkshire Picnic 5:30pm – 8:00pm
Details: NFM will be hosting a Berkshire Picnic at the Omaha store with food and live entertainment.
Sunday, May 1
Berkshire Hathaway “Invest in Yourself” 5K presented by Brooks 8:00am – 11:00am
Details: Brooks and Berkshire Hathaway are bringing the Run Happy spirit to the Annual Shareholders Meetingby again hosting the “Invest in Yourself” 5K fun run and walk. The event will be held in downtown Omaha. Run,jog, or walk to the starting line by registering at www.investinyourself5k.com.
Borsheims Shareholder-Only Shopping Day 11:00am – 4:00pm
NFM Shareholder Discount PeriodWednesday, April 20 through Tuesday, May 3
(Discounts also available at Dallas/Fort Worth, Kansas City and Des Moines Stores.)
Store Hours:Sunday – Friday: 11am – 8pm | Saturday: 10am – 8pm
Borsheims Shareholder Discount PeriodSaturday, April 23 through Sunday, May 8
Store Hours:Monday – Friday*: 10am – 6pm
Saturday**: 10am – 5:30pm | Sunday***Closed* Shareholder-Only Shopping Night, Friday, April 29 / 6 – 8pm
** Shareholder Shopping Day, Saturday, April 30 / 10am – 5:30pm*** Shareholder-Only Shopping Day Sunday, May 1 / 11am – 4pm
Books for Shareholders
The Bookworm will be back with a selection of books. Shareholders receive a 20% discount. The books selectedfor sale at the Berkshire annual meeting are available year round at www.bookwormomaha.com. Shareholderswith credentials also receive the 20% shareholder discount Friday, April 29 through Monday, May 2, at TheBookworm, 90th and Center Street.
A-2
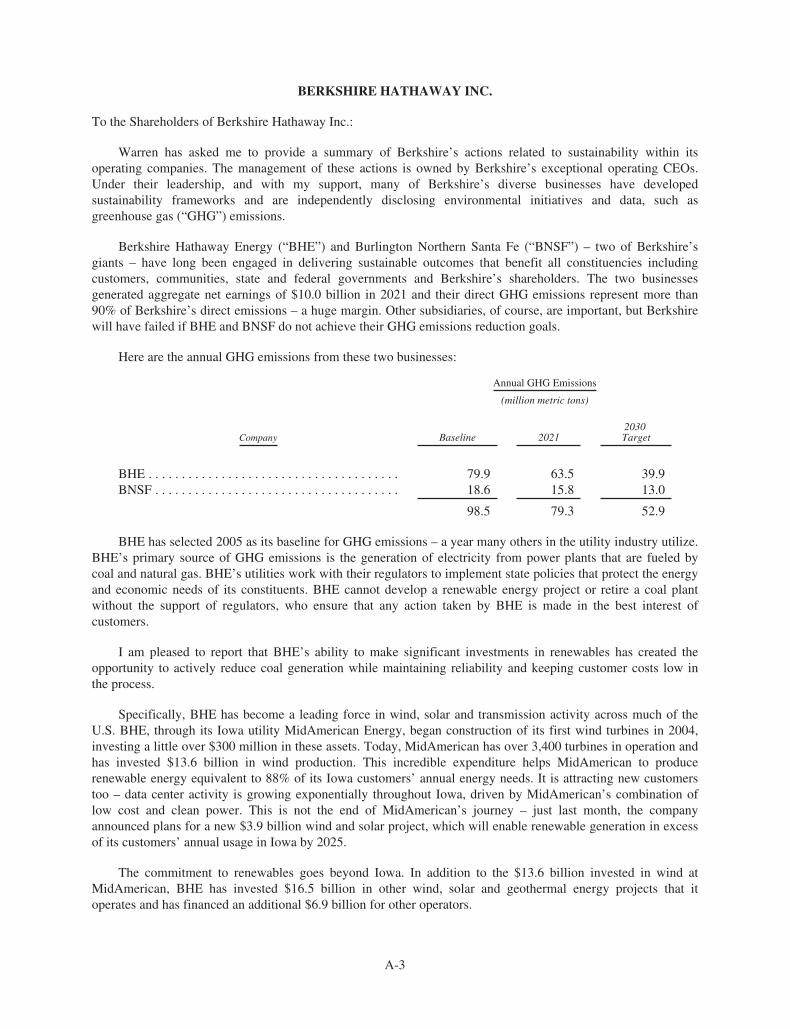
BERKSHIRE HATHAWAY INC.
To the Shareholders of Berkshire Hathaway Inc.:
Warren has asked me to provide a summary of Berkshire’s actions related to sustainability within itsoperating companies. The management of these actions is owned by Berkshire’s exceptional operating CEOs.Under their leadership, and with my support, many of Berkshire’s diverse businesses have developedsustainability frameworks and are independently disclosing environmental initiatives and data, such asgreenhouse gas (“GHG”) emissions.
Berkshire Hathaway Energy (“BHE”) and Burlington Northern Santa Fe (“BNSF”) – two of Berkshire’sgiants – have long been engaged in delivering sustainable outcomes that benefit all constituencies includingcustomers, communities, state and federal governments and Berkshire’s shareholders. The two businessesgenerated aggregate net earnings of $10.0 billion in 2021 and their direct GHG emissions represent more than90% of Berkshire’s direct emissions – a huge margin. Other subsidiaries, of course, are important, but Berkshirewill have failed if BHE and BNSF do not achieve their GHG emissions reduction goals.
Here are the annual GHG emissions from these two businesses:
Annual GHG Emissions
(million metric tons)
Company Baseline 20212030Target
BHE . . . . . . . . . . . . . . . . . . . . . . . . . . . . . . . . . . . . . . 79.9 63.5 39.9BNSF . . . . . . . . . . . . . . . . . . . . . . . . . . . . . . . . . . . . . 18.6 15.8 13.0
98.5 79.3 52.9
BHE has selected 2005 as its baseline for GHG emissions – a year many others in the utility industry utilize.BHE’s primary source of GHG emissions is the generation of electricity from power plants that are fueled bycoal and natural gas. BHE’s utilities work with their regulators to implement state policies that protect the energyand economic needs of its constituents. BHE cannot develop a renewable energy project or retire a coal plantwithout the support of regulators, who ensure that any action taken by BHE is made in the best interest ofcustomers.
I am pleased to report that BHE’s ability to make significant investments in renewables has created theopportunity to actively reduce coal generation while maintaining reliability and keeping customer costs low inthe process.
Specifically, BHE has become a leading force in wind, solar and transmission activity across much of theU.S. BHE, through its Iowa utility MidAmerican Energy, began construction of its first wind turbines in 2004,investing a little over $300 million in these assets. Today, MidAmerican has over 3,400 turbines in operation andhas invested $13.6 billion in wind production. This incredible expenditure helps MidAmerican to producerenewable energy equivalent to 88% of its Iowa customers’ annual energy needs. It is attracting new customerstoo – data center activity is growing exponentially throughout Iowa, driven by MidAmerican’s combination oflow cost and clean power. This is not the end of MidAmerican’s journey – just last month, the companyannounced plans for a new $3.9 billion wind and solar project, which will enable renewable generation in excessof its customers’ annual usage in Iowa by 2025.
The commitment to renewables goes beyond Iowa. In addition to the $13.6 billion invested in wind atMidAmerican, BHE has invested $16.5 billion in other wind, solar and geothermal energy projects that itoperates and has financed an additional $6.9 billion for other operators.
A-3
While making these significant investments in renewables, BHE has retired 16 of its coal generation units.Looking ahead, BHE plans to retire an additional 16 coal units between 2022 and 2030 in a reliable and cost-effectivemanner for its customers, thereby achieving its 50% GHG emissions reduction target for 2030. Progress has beenconsistent with this objective.
Simultaneously, BHE plans to invest billions of dollars in wind, solar and storage capacity, as well as invest innew transmission lines in the West – a story told in Berkshire’s 2020 annual report. These transmission linesconnect remote noncarbon resources to far-away population centers. As additional noncarbon generation isdeployed and transmission is expanded, BHE plans to retire all remaining coal units by 2049 and all natural gasunits by 2050, enabling it to achieve net zero GHG emissions.
BHE routinely communicates in detail its approach to decarbonization, outlining its strategies and the capital itwill deploy to achieve this objective. BHE’s regulated U.S. utilities issue third-party debt as part of their capitalstructure. Consequently, BHE has made environmental disclosures every year for the past 15 years through investorpresentations. These documents are publicly available on BHE’s website.
BNSF has selected 2018 as its GHG emissions baseline year, which is consistent with its largest peer in theWest. BNSF’s GHG emissions profile is comprised of the consumption of diesel fuel in its locomotives (accountingfor 80% of its baseline GHG emissions), the third-party production and transportation of those fuels and, to a lesserextent, the consumption of natural gas and electricity across its broader operations.
BNSF is a common carrier railroad with a federal legal obligation to transport any commodity – including coaland hazardous materials – upon its customers’ request. Yet, the environmental impacts of the transportation of thesegoods are reduced thanks to BNSF’s focus on safety and efficiency. By nature, rail is the most environmentallyefficient mode of land-based transportation, moving its customers’ products more than three times as far as truckson a per ton mile basis. To build on this, BNSF has committed to and embraced a broader sustainability model,applying a science-based approach that will provide a 30% reduction in BNSF’s GHG emissions by 2030 asmeasured from its baseline. Progress has been consistent with this objective.
More will follow. Berkshire’s railroad will continue its improvements in fuel efficiency and increase itsutilization of renewable diesel fuel. Long-term solutions, such as battery-electric and hydrogen locomotives, arealso being evaluated and field tested. When successful, these measures will lower BNSF’s GHG emissions andincrease its cost competitiveness. Sustainability is fundamental to BNSF’s value proposition.
BHE and BNSF are not alone when it comes to these sustainability endeavors at Berkshire. Many subsidiarieshave also been responding to their customers’ varied needs by carrying out commitments to sustainable outcomesand communicating environmental information. Equally, these efforts make good business sense.
For example, many consumers are interested in improved environmental outcomes for apparel products. As aresult, three of Berkshire’s manufacturing businesses that specialize in these products – Fruit of the Loom, BrooksSports and Garan – each disclose the environmental impacts of the products they sell and their plans to reduce thoseimpacts long term. Further, all three businesses have committed to 2030 GHG emissions reduction targets,consistent with the expectations of each customer base. This information can be found on their websites.
Additionally, four manufacturing businesses across Berkshire’s industrial and building products groups –Lubrizol, Johns Manville, Acme Brick and Shaw Industries – disclose on their websites recent GHG emissions dataand other sustainability information that is most relevant to their customers and operations.
Berkshire’s culture is strong, and its operating managers daily demonstrate ownership and accountability bybeing responsive to the needs of their customers. The managers of these subsidiaries will continue to own allbusiness decisions, including their approach to sustainability and related environmental outcomes. Berkshire’sbusinesses are exceptionally well positioned to deliver on ever-changing customer expectations regardingsustainability, in both resources and attitude, while also driving value for Berkshire’s shareholders. I am supportiveof these outlined objectives and fully committed to Berkshire’s ongoing journey of delivering sustainable solutions.
February 26, 2022 Gregory E. AbelVice Chairman – Non-Insurance Operations
A-4

BERKSHIRE HATHAWAY INC.PROPERTY/CASUALTY INSURANCE*
Our property/casualty (“P/C”) insurance business has been the engine propelling Berkshire’s growth since 1967, the year we acquiredNational Indemnity and its sister company, National Fire & Marine, for $8.6 million. Today, National Indemnity is the largest P/C company inthe world as measured by net worth. Insurance is a business of promises, and Berkshire’s ability to honor its commitments is unmatched.
One reason we were attracted to the P/C business was the industry’s business model: P/C insurers receive premiums upfront and payclaims later. In extreme cases, such as claims arising from exposure to asbestos, or severe workplace accidents, payments can stretch overmany decades.
This collect-now, pay-later model leaves P/C companies holding large sums – money we call “float” – that will eventually go to others.Meanwhile, insurers get to invest this float for their own benefit. Though individual policies and claims come and go, the amount of float aninsurer holds usually remains fairly stable in relation to premium volume. Consequently, as our business grows, so does our float. And how ithas grown, as the following table shows:
Year Float (in millions)
1970 . . . . . . . . . . . . . . . . . . . . . . . . . . . . . . . . . . . . . . . . . . . . . . . . . . . . . . . . . . . . $ 391980 . . . . . . . . . . . . . . . . . . . . . . . . . . . . . . . . . . . . . . . . . . . . . . . . . . . . . . . . . . . . 2371990 . . . . . . . . . . . . . . . . . . . . . . . . . . . . . . . . . . . . . . . . . . . . . . . . . . . . . . . . . . . . 1,6322000 . . . . . . . . . . . . . . . . . . . . . . . . . . . . . . . . . . . . . . . . . . . . . . . . . . . . . . . . . . . . 27,8712010 . . . . . . . . . . . . . . . . . . . . . . . . . . . . . . . . . . . . . . . . . . . . . . . . . . . . . . . . . . . . 65,8322018 . . . . . . . . . . . . . . . . . . . . . . . . . . . . . . . . . . . . . . . . . . . . . . . . . . . . . . . . . . . . 122,7322019 . . . . . . . . . . . . . . . . . . . . . . . . . . . . . . . . . . . . . . . . . . . . . . . . . . . . . . . . . . . . 129,423
We may in time experience a decline in float. If so, the decline will be very gradual – at the outside no more than 3% in any year. Thenature of our insurance contracts is such that we can never be subject to immediate or near-term demands for sums that are of significance toour cash resources. That structure is by design and is a key component in the unequaled financial strength of our insurance companies. Thatstrength will never be compromised.
If our premiums exceed the total of our expenses and eventual losses, our insurance operation registers an underwriting profit that adds tothe investment income the float produces. When such a profit is earned, we enjoy the use of free money – and, better yet, get paid for holdingit.
For the P/C industry as a whole, the financial value of float is now far less than it was for many years. That’s because the standardinvestment strategy for almost all P/C companies is heavily – and properly – skewed toward high-grade bonds. Changes in interest ratestherefore matter enormously to these companies, and during the last decade the bond market has offered pathetically low rates.
Consequently, insurers suffered, as year by year they were forced – by maturities or issuer-call provisions – to recycle their “old”investment portfolios into new holdings providing much lower yields. Where once these insurers could safely earn 5 cents or 6 cents on eachdollar of float, they now take in only 2 cents or 3 cents (or even less if their operations are concentrated in countries mired in the never-neverland of negative rates).
Some insurers may try to mitigate their loss of revenue by buying lower-quality bonds or non-liquid “alternative” investments promisinghigher yields. But those are dangerous games and activities that most institutions are ill-equipped to play.
Berkshire’s situation is more favorable than that of insurers in general. Most important, our unrivaled mountain of capital, abundance ofcash and a huge and diverse stream of non-insurance earnings allow us far more investment flexibility than is generally available to othercompanies in the industry. The many choices open to us are always advantageous – and sometimes have presented us with majoropportunities.
Our P/C companies have meanwhile had an excellent underwriting record. Berkshire has now operated at an underwriting profit for 16 ofthe last 17 years, the exception being 2017, when our pre-tax loss was a whopping $3.2 billion. For the entire 17-year span, our pre-tax gaintotaled $27.5 billion, of which $400 million was recorded in 2019.
That record is no accident: Disciplined risk evaluation is the daily focus of our insurance managers, who know that the rewards of floatcan be drowned by poor underwriting results. All insurers give that message lip service. At Berkshire it is a religion, Old Testament style.
As I have repeatedly done in the past, I will emphasize now that happy outcomes in insurance are far from a sure thing: We will mostcertainly not have an underwriting profit in 16 of the next 17 years. Danger always lurks.
Mistakes in assessing insurance risks can be huge and can take many years – even decades – to surface and ripen. (Think asbestos.) Amajor catastrophe that will dwarf hurricanes Katrina and Michael will occur – perhaps tomorrow, perhaps many decades from now. “The BigOne” may come from a traditional source, such as wind or earthquake, or it may be a total surprise involving, say, a cyber attack havingdisastrous consequences beyond anything insurers now contemplate. When such a mega-catastrophe strikes, Berkshire will get its share of thelosses and they will be big – very big. Unlike many other insurers, however, handling the loss will not come close to straining our resources,and we will be eager to add to our business the next day.
* Reproduced from Berkshire Hathaway Inc. 2019 Annual Report
A-5

BERKSHIRE HATHAWAY INC.OPERATING COMPANIES
INSURANCE: Employees
GEICO . . . . . . . . . . . . . . . . . . . . . . . . . . . . . . . . . . . . . . 41,005Berkshire Hathaway Reinsurance Group . . . . . . . . . 538General Re . . . . . . . . . . . . . . . . . . . . . . . . . . . . . . . . . . . 2,014Berkshire Hathaway Homestate Companies . . . . . . . 1,149Berkshire Hathaway Specialty . . . . . . . . . . . . . . . . . . 1,214Berkshire Hathaway GUARD Insurance Companies . . 1,270MedPro Group Inc. . . . . . . . . . . . . . . . . . . . . . . . . . . . 1,108MLMIC Insurance Companies . . . . . . . . . . . . . . . . . . 238National Indemnity Primary Group . . . . . . . . . . . . . . 862United States Liability Insurance Companies . . . . . . 1,055Central States Indemnity . . . . . . . . . . . . . . . . . . . . . . . 27
50,480
MANUFACTURING:
Acme . . . . . . . . . . . . . . . . . . . . . . . . . . . . . . . . . . . . . . . 1,794Benjamin Moore . . . . . . . . . . . . . . . . . . . . . . . . . . . . . . 2,042Brooks Sports . . . . . . . . . . . . . . . . . . . . . . . . . . . . . . . . 1,117Clayton Homes . . . . . . . . . . . . . . . . . . . . . . . . . . . . . . . 20,830CTB . . . . . . . . . . . . . . . . . . . . . . . . . . . . . . . . . . . . . . . . 2,685Duracell . . . . . . . . . . . . . . . . . . . . . . . . . . . . . . . . . . . . . 2,975Fechheimer . . . . . . . . . . . . . . . . . . . . . . . . . . . . . . . . . . 426Forest River . . . . . . . . . . . . . . . . . . . . . . . . . . . . . . . . . . 13,457Fruit of the Loom . . . . . . . . . . . . . . . . . . . . . . . . . . . . . 32,591Garan . . . . . . . . . . . . . . . . . . . . . . . . . . . . . . . . . . . . . . . 3,899H. H. Brown Shoe Group . . . . . . . . . . . . . . . . . . . . . . . 1,163IMC International Metalworking Companies . . . . . . 13,016Johns Manville . . . . . . . . . . . . . . . . . . . . . . . . . . . . . . . 7,748Larson-Juhl . . . . . . . . . . . . . . . . . . . . . . . . . . . . . . . . . . 867LiquidPower Specialty Products, Inc. . . . . . . . . . . . . 433Lubrizol . . . . . . . . . . . . . . . . . . . . . . . . . . . . . . . . . . . . . 8,368Marmon(1) . . . . . . . . . . . . . . . . . . . . . . . . . . . . . . . . . . . 22,835MiTek Inc. . . . . . . . . . . . . . . . . . . . . . . . . . . . . . . . . . . . 5,510Precision Castparts . . . . . . . . . . . . . . . . . . . . . . . . . . . . 19,804Richline Group . . . . . . . . . . . . . . . . . . . . . . . . . . . . . . . 2,386Scott Fetzer Companies . . . . . . . . . . . . . . . . . . . . . . . . 1,823Shaw Industries . . . . . . . . . . . . . . . . . . . . . . . . . . . . . . 21,482
187,251
RAILROAD, UTILITIES AND ENERGY: Employees
BNSF:BNSF Railway . . . . . . . . . . . . . . . . . . . . . . . . . . . . 35,125BNSF Logistics . . . . . . . . . . . . . . . . . . . . . . . . . . . 550
Berkshire Hathaway Energy Company:Corporate Office . . . . . . . . . . . . . . . . . . . . . . . . . . 32PacifiCorp . . . . . . . . . . . . . . . . . . . . . . . . . . . . . . . 4,783MidAmerican Energy . . . . . . . . . . . . . . . . . . . . . . 3,427NV Energy . . . . . . . . . . . . . . . . . . . . . . . . . . . . . . . 2,273Northern Powergrid . . . . . . . . . . . . . . . . . . . . . . . 2,527BHE Pipeline Group . . . . . . . . . . . . . . . . . . . . . . . 2,692BHE Transmission . . . . . . . . . . . . . . . . . . . . . . . . 726BHE Renewables . . . . . . . . . . . . . . . . . . . . . . . . . . 345MidAmerican Energy Services . . . . . . . . . . . . . . 75HomeServices of America . . . . . . . . . . . . . . . . . . 6,757
59,312
SERVICE AND RETAILING:
Affordable Housing Partners, Inc. . . . . . . . . . . . . . . . 27Ben Bridge Jeweler . . . . . . . . . . . . . . . . . . . . . . . . . . . . 696Berkshire Hathaway Automotive . . . . . . . . . . . . . . . . 9,530Borsheims . . . . . . . . . . . . . . . . . . . . . . . . . . . . . . . . . . . 136Business Wire . . . . . . . . . . . . . . . . . . . . . . . . . . . . . . . . 415Charter Brokerage . . . . . . . . . . . . . . . . . . . . . . . . . . . . 172CORT . . . . . . . . . . . . . . . . . . . . . . . . . . . . . . . . . . . . . . . 1,966Dairy Queen . . . . . . . . . . . . . . . . . . . . . . . . . . . . . . . . . 493Detlev Louis . . . . . . . . . . . . . . . . . . . . . . . . . . . . . . . . . . 1,403FlightSafety . . . . . . . . . . . . . . . . . . . . . . . . . . . . . . . . . . 4,005Helzberg Diamonds . . . . . . . . . . . . . . . . . . . . . . . . . . . 1,657Jordan’s Furniture . . . . . . . . . . . . . . . . . . . . . . . . . . . . 1,040McLane Company . . . . . . . . . . . . . . . . . . . . . . . . . . . . 26,204Nebraska Furniture Mart . . . . . . . . . . . . . . . . . . . . . . 4,407NetJets . . . . . . . . . . . . . . . . . . . . . . . . . . . . . . . . . . . . . . 6,616Oriental Trading . . . . . . . . . . . . . . . . . . . . . . . . . . . . . . 1,278Pampered Chef . . . . . . . . . . . . . . . . . . . . . . . . . . . . . . . 348R.C. Willey Home Furnishings . . . . . . . . . . . . . . . . . . 2,591See’s Candies . . . . . . . . . . . . . . . . . . . . . . . . . . . . . . . . . 2,546Star Furniture . . . . . . . . . . . . . . . . . . . . . . . . . . . . . . . . 426TTI, Inc. . . . . . . . . . . . . . . . . . . . . . . . . . . . . . . . . . . . . . 8,043WPLG, Inc. . . . . . . . . . . . . . . . . . . . . . . . . . . . . . . . . . . 210XTRA . . . . . . . . . . . . . . . . . . . . . . . . . . . . . . . . . . . . . . . 375
74,584
Berkshire Hathaway Corporate Office . . . . . . . . . . . . . . 26
371,653
(1) Marmon Holding, Inc. (“Marmon”) is a holding company that conducts operations through more than 100manufacturing and service businesses organized into 11 business groups.
A-6

BERKSHIRE HATHAWAY INC.STOCK TRANSFER AGENT
EQ Shareowner Services (“EQ”), a division of Equiniti Trust Company, P. O. Box 64854, St. Paul, MN55164-0854 serves as Transfer Agent and Registrar for the Company’s common stock. Correspondence may bedirected to EQ at the address indicated or at www.shareowneronline.com. Telephone inquiries should be directedto the Shareowner Relations Department at 1-877-602-7411 between 7:00 A.M. and 7:00 P.M. Central Time.Certificates for re-issue or transfer should be directed to the Transfer Department at the address indicated.
Berkshire has two classes of common stock designated Class A common stock and Class B common stock.Each share of Class A common stock is convertible, at the option of the holder, into 1,500 shares of Class Bcommon stock. Shares of Class B common stock are not convertible into shares of Class A common stock.
Registered owner’s holding Berkshire stock in certificate form or through EQ’s direct registration system,may contact EQ directly for instructions regarding changes in registration, including shareowner’s mailingaddress or conversion of Class A shares to Class B shares. Correspondence may be directed to EQ at the addressindicated above or at www.shareowneronline.com. Telephone inquiries should be directed to the ShareownerRelations Department at 1-877-602-7411 between 7:00 A.M. and 7:00 P.M. Central Time. Certificates forre-issue or transfer should be directed to the Transfer Department at the address indicated above. Shareownerscan also view account information at the EQ website www.shareowneronline.com.
If a shareowner has lost or misplaced stock certificates, he or she should contact EQ to arrange forreplacements. Transfer agent’s, including EQ, will require the shareowner to provide an indemnification bondbased on the value of the share certificate being replaced. Shareholders are encouraged to contact EQ periodicallyto verify the mailing address of record to assure that Company communications are delivered. We encourage youto vote on shareholder proposals contained in our annual proxy solicitation. Contact with EQ is establishedautomatically through the voting process.
Shareholders of record wishing to convert Class A common stock into Class B common stock may contactEQ in writing. Along with the underlying stock certificate, shareholders should provide EQ with specific writteninstructions regarding the number of shares to be converted and the manner in which the Class B shares are to beregistered. We recommend that you use certified or registered mail addressed to EQ Shareowner Services, 1110Centre Pointe Curve, Suite 101, Mendota Heights, MN 55120 when delivering the stock certificates and writteninstructions.
Owners holding Berkshire common stock in street name (in a bank, broker or other nominee account)should contact the bank, broker or nominee for changes in registration. If Class A shares are held in “streetname,” shareholders wishing to convert all or a portion of their holding to Class B should contact their broker orbank nominee. It will be necessary for the nominee to make the request for conversion.
A-7
BERKSHIRE HATHAWAY INC.
DIRECTORS OFFICERS
WARREN E. BUFFETT,Chairman and CEO of Berkshire
WARREN E. BUFFETT, Chairman and CEO
CHARLES T. MUNGER, Vice Chairman
GREGORY E. ABEL, Vice Chairman - Non Insurance Operations
AJIT JAIN, Vice Chairman - Insurance Operations
MARC D. HAMBURG, Senior Vice President and CFO
DANIEL J. JAKSICH, Vice President, Controller
MARK D. MILLARD, Vice President
JO ELLEN RIECK, Vice President
KERBY S. HAM, Treasurer
REBECCA K. AMICK, Director of Internal Auditing
CHARLES T. MUNGER,Vice Chairman of Berkshire
GREGORY E. ABEL,Vice Chairman of Berkshire - Non Insurance Operations
AJIT JAIN,Vice Chairman of Berkshire - Insurance Operations
HOWARD G. BUFFETT,Chairman and Chief Executive Officer of the Howard G.
Buffett Foundation, a charitable foundation that directsfunding for humanitarian and conservation related issues.
SUSAN A. BUFFETT,Chairman of the Susan Thompson Buffett Foundation and
of the Sherwood Foundation, each of which is a grantmaking foundation.
STEPHEN B. BURKE,Former Chairman and CEO of NBCUniversal, a media and
entertainment company.
KENNETH I. CHENAULT,Chairman and Managing Director of General Catalyst, a
venture capital firm and Former Chairman and CEO ofAmerican Express Company.
CHRISTOPHER C. DAVIS,Chairman of Davis Advisors, an investment management
and counseling firm.
SUSAN L. DECKER,Founder and CEO of Raftr, a community-building platform
for university students and administrators.
DAVID S. GOTTESMAN,Senior Managing Director of First Manhattan Company,
an investment advisory firm.
CHARLOTTE GUYMAN,Independent Director of Space Needle/Chihuly Garden &
Glass, Landings Holdings and Evercase.
RONALD L. OLSON,Partner of the law firm of Munger, Tolles & Olson LLP
MERYL B. WITMER,Managing member of the General Partner of Eagle Capital
Partners L.P., an investment partnership.
Letters from Annual Reports (1977 through 2021), quarterly reports, press releases and other information about Berkshire maybe obtained on the Internet at www.berkshirehathaway.com.

BERKSHIRE HATHAWAY INC.Executive Offices — 3555 Farnam Street, Omaha, Nebraska 68131
Related Documents