Copyright is owned by the Author of the thesis. Permission is given for a copy to be downloaded by an individual for the purpose of research and private study only. The thesis may not be reproduced elsewhere without the permission of the Author.

Welcome message from author
This document is posted to help you gain knowledge. Please leave a comment to let me know what you think about it! Share it to your friends and learn new things together.
Transcript

Copyright is owned by the Author of the thesis. Permission is given for a copy to be downloaded by an individual for the purpose of research and private study only. The thesis may not be reproduced elsewhere without the permission of the Author.
Benchmarking Agri-food Supply Chains: A Case of Pakistan and New Zealand
Milk Systems
A thesis presented in partial fulfilment of the requirements for the degree of
Doctor of Philosophy in
Logistics and Supply Chain Management
at Massey University, Palmerston North, New Zealand.
Muhammad Moazzam
2015
i
DECLARATION
I, Muhammad Moazzam, declare that this thesis entitled “Learning Lessons Through
Benchmarking: A Benchmarking Study of Milk Supply Chain Networks of Pakistan and
New Zealand” submitted to the Massey University for the degree of Doctor of
Philosophy is the outcome of my own research work. Acknowledgement is given where
material from other resources was used. I also certify that the thesis has not been
presented, in whole or partly, for any degrees or diplomas.
Signed………………..….
Student ID: 08532664
Full Name: Muhammad Moazzam
ii
ABSTRACT
Businesses are now operating as parts of collaborative networks sharing skills and
information synergistically to offer superior value to the customers. In order to stay
competitive or surpass competitors, businesses benchmark their performance against
industry leaders or best-in-class competitors. A benchmarking study aimed to examine
the causes of poor performance of the milk supply chain in Pakistan was undertaken. Fo
this purpose the performance of key players of milk supply chain in Pakistan was
benchmarked against those of New Zealand. An extensive review of literature was
conducted with the objective to choose an appropriate performance measurement
framework. For this purpose existing frameworks were evaluated against five criteria
characterising performance measurement in agri-food supply chains and not a single
framework qualified. This research gap was abridged by developing a framework based
on supply chain operations reference (SCOR) model but with certain modifications to
food quality.
Pragmatic approach was used to select appropriate research design. Cross-sectional data
was collected using survey strategy. A total of 490 respondents were accessed through
personal interviews (430 in Pakistan) and online questionnaires (60 in New Zealand).
Samples were drawn using a combination of multi-stage and purposive sampling
methods. A three-step approach was proposed to address the individual objectives of the
overall study. The first-step was to conduct value chain analysis of both the milk
supply chains. The second-step was to measure the performance of key players of both
the milk supply chains using the performance measurement framework developed as a
result of literature review. The third-step was to perform gap analysis of the SCOR
metrics for key players of both the milk supply chains and suggest appropriate policy
measures for the improvement of milk Supply chain in Pakistan. The data were
analysed with statistical package for social scientists (SPSS) and Microsoft Excel.
The value chain analysis was performed to explore the benchmarking milk supply
chains as well as to gauge the level of vale addition. The value chain maps discussed the
primary functions, activities, operators, facilitators, and enablers in the milk supply
chains in Pakistan and New Zealand. Moreover, the analysis of value distribution along
the entire chain indicated that the informal chain of milk (unprocessed milk) in Pakistan
had 22.39% ex-farm gate value addition, with the largest (almost 82%) share of the
value captured by the dairy farmers. Whereas, the formal chain of milk (processed milk)
iii
in Pakistan had 104.23% ex-farm gate value addition, with the largest (51%) share of
the value captured by the dairy farmers. The milk supply chain in New Zealand had
216.83% ex-farm gate value addition, with the largest (55.6%) share of value captured
by the retailers.
The findings of the gap analysis were:
Pakistani dairy farmers under performed in supply chain reliability, cost of
production, and return on working capital as compare to NZ dairy farmers. The
majority of the Pakistani dairy farmers were smallholders and due to
diseconomies of the scale of their operation they could not afford modern dairy
farming technologies such automatic milking, milk storage at controlled
temperature, and other precision dairy farming (PDF) technologies.
The Pakistani milk collectors underperformed in perfect order fulfilment,
flexibility and cost of milk sold and outperformed in value at risk, SCM cost and
return on assets as compared to NZ dairy companies.
The Pakistani milk shops underperformed in cost of milk sold and outperformed
in order fulfilment cycle time, flexibility, value at risk, SCM cost and return on
assets as compared to NZ dairy companies.
The Pakistani dairy companies underperformed in perfect order fulfilment and
flexibility as compared to NZ dairy companies.
On the basis of findings of the value chain analysis, SCOR analysis, and gap analysis,
promotion of agricultural cooperatives as a phased-out medium to long term policy
intervension was recommended.
iv
ACKNOWLEDGEMENT
In the name of Almighty God, the Gracious and the Affectionate who bestowed me with
the opportunity to complete this thesis. I feel short of words to express my sincere
gratitude to my supervisors Dr. Norman E. Marr and Dr. Elena Garnevska for their
auspicious guidance, encouragement, advice, and support in my academic as well as
personal endeavours. Norman’s visionary leadership and extensive experience in
logistics and supply chain industry have truly benefited this research work right from
choosing the topic and methodology through to the completion of the thesis.
I would like to acknowledge the Higher Education Commission (HEC), Pakistan for the
financial support in the form of MS leading to PhD Scholarship. Moreover, I am
thankful to Massey University for providing excellent research facilities and working
environment. Thanks also to ‘The Claude McCarthy Fellowships’ who provided me
financial support to present my research work at Cranfield University, UK.
Furthermore, I feel indebted to Nicola Shadbolt (Director, Fonterra and Chair in Farm
Management, Massey University, New Zealand), Abdul Ghafoor (Assistant Professor,
University of Agriculture, Faisalabad, Pakistan), Tom Phillips (Senior Tutor, Center of
Excellence in Farm Business Management, Massey University, New Zealand), Irfan
Habib (Dairy Solutions, New Zealand), Muhammad Imran Siddique (fellow PhD
student), Zaka Ullah (fellow PhD student), and Zafar Iqbal (fellow PhD student) for
their guidance and support.
I would also like to pay my gratitude to the research participants from Pakistan as well
as New Zealand who donated priceless time from their busy schedules. Finally, how can
I forget to acknowledge my wife (Shamsa), son (Arham), and daughter (Meerab) for
their affection and support through thick and thin.
Lastly, I dedicate this piece of work to my parents for their unconditional love and
source of inspiration.
Muhammad Moazzam
v
TABLE OF CONTENTS
DECLARATION.......................................................................................................................... i
ABSTRACT ................................................................................................................................. ii
ACKNOWLEDGEMENT ......................................................................................................... iv
TABLE OF CONTENTS ........................................................................................................... v
LIST OF TABLES ................................................................................................................... viii
LIST OF FIGURES ................................................................................................................... xi
1. INTRODUCTION ............................................................................................................... 1 1.1 Introduction ................................................................................................................................ 1
1.2 Benchmarking in Supply Chain Management ............................................................................. 1
1.3 The Research Problem ................................................................................................................ 2
1.4 The Research Questions and Objectives ..................................................................................... 4
1.5 Why New Zealand Milk Supply Chain as Benchmark? ............................................................... 5
1.6 Structure of the Thesis ................................................................................................................ 6
1.7 Summary ..................................................................................................................................... 8
2. BACKGROUND ................................................................................................................. 9 2.1 Introduction ................................................................................................................................ 9
2.2 World Dairy Outlook .................................................................................................................. 9 2.2.1 Global Dairy Production ........................................................................................................ 9 2.2.2 Global Dairy Trade ............................................................................................................... 10
2.3 Pakistan Dairy Industry ............................................................................................................ 13 2.3.1 Dairy Production in Pakistan ................................................................................................ 13 2.3.2 Dairy Trade of Pakistan ........................................................................................................ 16 2.3.3 Milk Supply Chain in Pakistan ............................................................................................. 18
2.4 New Zealand Dairy Industry..................................................................................................... 23 2.4.1 Dairy Production in New Zealand ........................................................................................ 24 2.4.2 Dairy Trade of New Zealand ................................................................................................ 27 2.4.3 Milk Supply Chain in New Zealand ..................................................................................... 28
2.5 Summary ................................................................................................................................... 31
3. LITERATURE REVIEW................................................................................................. 32 3.1 Introduction .............................................................................................................................. 32
3.2 Supply Chain Management ....................................................................................................... 32 3.2.1 Supply Chain Management Definitions ............................................................................... 33 3.2.2 Evolution of Supply Chain Management ............................................................................. 35
3.3 Benchmarking in Supply Chain Management ........................................................................... 39 3.3.1 Evolution of Benchmarking ................................................................................................. 41 3.3.2 Benchmarking Frameworks.................................................................................................. 42 3.3.3 Benchmarking in Agri-Food Supply Chains ........................................................................ 45
vi
3.4 Supply Chain Performance Measurement ................................................................................ 46 3.4.1 Supply Chain Performance Measurement Definitions ......................................................... 47 3.4.2 Evolution of Supply Chain Performance Measurement ....................................................... 48 3.4.3 Performance Measurement in Agri-Food Supply Chains ..................................................... 50 3.4.4 Selecting a Performance Measurement System for Agri-food Supply Chains ..................... 51 3.4.5 Supply Chain Performance Measurement Systems .............................................................. 55
3.5 Potential Research Gap and Way Forward .............................................................................. 69
3.6 Proposed Analytical Framework for Dairy Supply Chain ........................................................ 70
3.7 Summary ................................................................................................................................... 72
4. RESEARCH METHODOLOGY .................................................................................... 74 4.1 Introduction .............................................................................................................................. 74
4.2 Research Objectives.................................................................................................................. 74
4.3 The Research Process ............................................................................................................... 75
4.4 Research Philosophy and Approach ......................................................................................... 77 4.4.1 Positivism ............................................................................................................................. 77 4.4.2 Interpretivism ....................................................................................................................... 78 4.4.3 Pragmatism ........................................................................................................................... 78 4.4.4 The Choice of Research Philosophy and Approach ............................................................. 80
4.5 Research Design ....................................................................................................................... 81 4.4.1 Research Category ................................................................................................................ 81 4.4.2 Research Strategy and Data Administration ......................................................................... 82 4.4.3 Sampling Design .................................................................................................................. 84 4.4.4 Hypothesis Testing ............................................................................................................... 88 4.4.5 Validity and Reliability ........................................................................................................ 89 4.4.6 The Research Ethics ............................................................................................................. 89
4.6 Pilot Survey............................................................................................................................... 90 4.6.1 Pilot Survey in Pakistan ....................................................................................................... 91 4.6.2 Pilot Survey in New Zealand ................................................................................................ 94
4.7 Summary of Methodology used in this Study ............................................................................ 95
5. RESULTS .......................................................................................................................... 96 5.1 Introduction .............................................................................................................................. 96
5.2 Value Chain Analysis of Milk in Pakistan and New Zealand ................................................... 96 5.2.1 Milk Value Chain in Pakistan............................................................................................... 97 5.2.2 Milk Value Chain in New Zealand ..................................................................................... 100
5.3 SCOR Metrics For Dairy Farmers in Pakistan and New Zealand ......................................... 103 5.3.1 Dairy Farming in Pakistan .................................................................................................. 104 5.3.2 Dairy Farming in New Zealand .......................................................................................... 118
5.4 SCOR Metrics For Informal Chain of Milk in Pakistan ......................................................... 126 5.4.1 Milk Collectors in Pakistan ................................................................................................ 126 5.4.2 Milk Shops in Pakistan ....................................................................................................... 140
5.5 SCOR Metrics for Dairy Companies in Pakistan and New Zealand ...................................... 153 5.5.1 SCOR Metrics for Dairy Products Manufacturing Companies in Pakistan ........................ 154 5.5.2 SCOR Metrics for Dairy Companies in New Zealand ....................................................... 158
vii
6. DISCUSSION .................................................................................................................. 164 6.1 Introduction ............................................................................................................................ 164
6.2 Gap Analysis of Dairy Farmers .............................................................................................. 164
6.3 Gap Analysis of Informal Chain of Milk in Pakistan .............................................................. 169
6.4 Gap Analysis of Dairy Companies in Pakistan and New Zealand .......................................... 174
6.5 Key Findings and Recommendations ...................................................................................... 177
6.6 Summary ................................................................................................................................. 179
7. CONCLUSION ............................................................................................................... 181 7.1 Introduction ............................................................................................................................ 181
7.2 Research Objectives................................................................................................................ 181
7.3 Linking Results with Objectives .............................................................................................. 181
7.4 Major Limitations of This Study ............................................................................................. 184
7.5 Contribution of This Study ...................................................................................................... 185 7.5.1 Contribution to Body of Knowledge .................................................................................. 185 7.5.2 Contribution to Milk Supply Chains in Pakistan and New Zealand ................................... 186
7.6 Future Research ..................................................................................................................... 186
REFERENCES ........................................................................................................................ 188
APPENDICES ......................................................................................................................... 212 Appendix-A Definitions of Supply Chain ............................................................................................. 212
Appendix-B Definitions of Supply Chain Management........................................................................ 213
Appendix-C Supply Chain Performance Measurement Frameworks .................................................. 214
Appendix-D Selected SCOR Metrics for Milk Supply Chain ............................................................... 218
Appendix-E Linking SCOR Metrics with the Business Performance ................................................... 219
Appendix-F Approval Letter from Massey University Human Ethics Committee ............................... 220
Appendix-G Cover Letter for Survey Debriefing ................................................................................. 221
Appendix-H Questionnaire for Dairy Farmers in Pakistan ................................................................ 222
Appendix-I Questionnaire for Milk Collectors in Pakistan ................................................................ 224
Appendix-J Questionnaire for Milk Shops in Pakistan ....................................................................... 226
Appendix-K Questionnaire for Dairy Companies in Pakistan ............................................................ 228
Appendix-L Questionnaire for New Zealand Dairy Farmers .............................................................. 230
Appendix-M Questionnaire for New Zealand Dairy Companies ......................................................... 232
viii
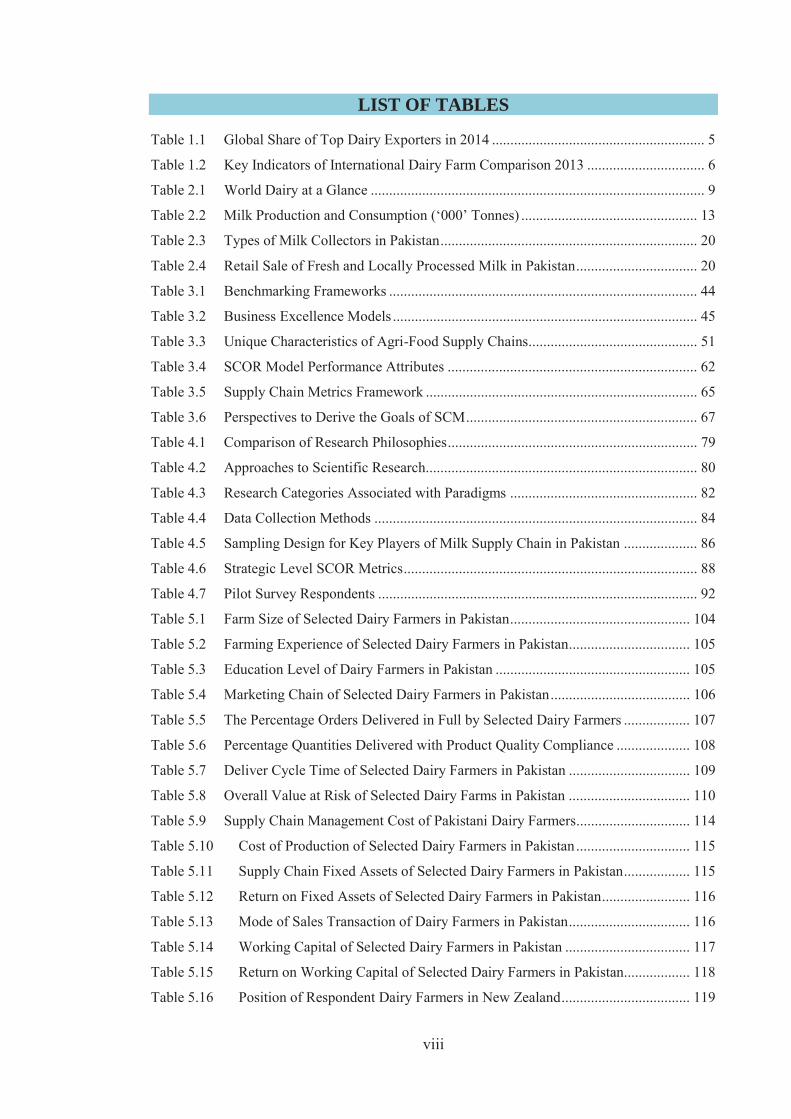
LIST OF TABLES
Table 1.1 Global Share of Top Dairy Exporters in 2014 .......................................................... 5
Table 1.2 Key Indicators of International Dairy Farm Comparison 2013 ................................ 6
Table 2.1 World Dairy at a Glance ........................................................................................... 9
Table 2.2 Milk Production and Consumption (‘000’ Tonnes) ................................................ 13
Table 2.3 Types of Milk Collectors in Pakistan ...................................................................... 20
Table 2.4 Retail Sale of Fresh and Locally Processed Milk in Pakistan ................................. 20
Table 3.1 Benchmarking Frameworks .................................................................................... 44
Table 3.2 Business Excellence Models ................................................................................... 45
Table 3.3 Unique Characteristics of Agri-Food Supply Chains .............................................. 51
Table 3.4 SCOR Model Performance Attributes .................................................................... 62
Table 3.5 Supply Chain Metrics Framework .......................................................................... 65
Table 3.6 Perspectives to Derive the Goals of SCM ............................................................... 67
Table 4.1 Comparison of Research Philosophies .................................................................... 79
Table 4.2 Approaches to Scientific Research.......................................................................... 80
Table 4.3 Research Categories Associated with Paradigms ................................................... 82
Table 4.4 Data Collection Methods ........................................................................................ 84
Table 4.5 Sampling Design for Key Players of Milk Supply Chain in Pakistan .................... 86
Table 4.6 Strategic Level SCOR Metrics ................................................................................ 88
Table 4.7 Pilot Survey Respondents ....................................................................................... 92
Table 5.1 Farm Size of Selected Dairy Farmers in Pakistan ................................................. 104
Table 5.2 Farming Experience of Selected Dairy Farmers in Pakistan ................................. 105
Table 5.3 Education Level of Dairy Farmers in Pakistan ..................................................... 105
Table 5.4 Marketing Chain of Selected Dairy Farmers in Pakistan ...................................... 106
Table 5.5 The Percentage Orders Delivered in Full by Selected Dairy Farmers .................. 107
Table 5.6 Percentage Quantities Delivered with Product Quality Compliance .................... 108
Table 5.7 Deliver Cycle Time of Selected Dairy Farmers in Pakistan ................................. 109
Table 5.8 Overall Value at Risk of Selected Dairy Farms in Pakistan ................................. 110
Table 5.9 Supply Chain Management Cost of Pakistani Dairy Farmers............................... 114
Table 5.10 Cost of Production of Selected Dairy Farmers in Pakistan ............................... 115
Table 5.11 Supply Chain Fixed Assets of Selected Dairy Farmers in Pakistan .................. 115
Table 5.12 Return on Fixed Assets of Selected Dairy Farmers in Pakistan ........................ 116
Table 5.13 Mode of Sales Transaction of Dairy Farmers in Pakistan ................................. 116
Table 5.14 Working Capital of Selected Dairy Farmers in Pakistan .................................. 117
Table 5.15 Return on Working Capital of Selected Dairy Farmers in Pakistan.................. 118
Table 5.16 Position of Respondent Dairy Farmers in New Zealand ................................... 119
ix
Table 5.17 Farming Experience of NZ Dairy farmers ........................................................ 119
Table 5.18 Education Level of NZ Dairy Farmers.............................................................. 120
Table 5.19 Location of Respondent NZ Dairy Farms ......................................................... 120
Table 5.20 Order Fulfilment Cycle Time of NZ Dairy Farmers ......................................... 122
Table 5.21 Overall Value of NZ Dairy Farms at Risk ........................................................ 123
Table 5.22 SCM Cost of NZ Dairy Farmers as Percentage of SCR ................................... 124
Table 5.23 Cost of Production of NZ Dairy Farmers as Percentage of SCR ...................... 124
Table 5.24 Fixed Assets of NZ Dairy Farmers ................................................................... 125
Table 5.25 Return on Working Capital of NZ Dairy Farmers ............................................ 125
Table 5.26 Working Capital of NZ Dairy Farmers ............................................................. 126
Table 5.27 Business Volume of Milk Collectors in Pakistan ............................................. 127
Table 5.28 Milk Collector’s Experience of Doing Business ............................................... 127
Table 5.29 Formal Education Level of Milk Collectors in Pakistan ................................... 128
Table 5.30 Sources of Milk Supply of Milk Collectors in Pakistan ................................... 128
Table 5.31 Marketing channels of the Milk Collectors in Pakistan .................................... 129
Table 5.32 Percentage Orders Delivered in Full by Milk Collectors in Pakistan ............... 130
Table 5.33 Product Quality of Milk Sourced by Milk Collectors in Pakistan .................... 130
Table 5.34 Pakistani Milk Collector’s Deliver Product Quality Compliance ..................... 131
Table 5.35 Perfect Order Fulfilment of the Milk Collectors in Pakistan ............................ 132
Table 5.36 Make Cycle Time of the Milk Collectors in Pakistan ....................................... 133
Table 5.37 Deliver Cycle Time of the Milk Collectors in Pakistan .................................... 133
Table 5.38 Delivery Retail Cycle Time of Milk Collectors in Pakistan ............................. 134
Table 5.39 Upside Supply Chain Flexibility of Milk Collectors in Pakistan ...................... 134
Table 5.40 Value at Risk for Selected Milk Collectors in Pakistan .................................... 136
Table 5.41 The SCM Cost of Selected Milk Collectors in Pakistan ................................... 136
Table 5.42 Cost of Milk Sold of Selected Milk Collectors in Pakistan .............................. 137
Table 5.43 The SC Fixed Assets of the Milk Collectors in Pakistan .................................. 138
Table 5.44 Return on SC Fixed Assets of the Milk Collectors in Pakistan ........................ 138
Table 5.45 Mode of Payment of Selected Milk Collectors in Pakistan .............................. 139
Table 5.46 Working Capital of Selected Milk Collectors in Pakistan ................................ 139
Table 5.47 Return on Working Capital of the Milk Collectors in Pakistan ........................ 140
Table 5.48 Business Experience of Respondents at Pakistani Milk Shops ......................... 141
Table 5.49 Education Level of the Respondents at Pakistani Milk Shops .......................... 141
Table 5.50 Business Volume of Selected Milk Shops in Pakistan ...................................... 142
Table 5.51 Type of Selected Milk Shops in Pakistan ......................................................... 142
Table 5.52 Source of Milk Supply to Selected Milk Shops in Pakistan ............................. 143
Table 5.53 Orders Delivered in Full by Selected Milk Shops in Pakistan .......................... 143

x
Table 5.54 Source Product Quality of Selected Milk Shops in Pakistan ............................ 144
Table 5.55 Deliver Product Quality of Selected Milk Shops in Pakistan ........................... 145
Table 5.56 Perfect Order Fulfilment of Selected Milk Shops in Pakistan .......................... 146
Table 5.57 Source Cycle Time of the Milk Shops in Pakistan ........................................... 146
Table 5.58 Delivery Retail Cycle Time of the Milk Shops in Pakistan .............................. 147
Table 5.59 Supply Chain Flexibility of Selected Milk Shops in Pakistan .......................... 148
Table 5.60 Value at Risk of Selected Milk Shops in Pakistan ............................................ 148
Table 5.61 SCM Cost of Selected Milk Shops in Pakistan ................................................. 150
Table 5.62 Cost of Products Sold of Selected Milk Shops in Pakistan ............................... 150
Table 5.63 Fixed Assets of Selected Milk Shops in Pakistan ............................................. 151
Table 5.64 Return on Fixed Assets of Selected Milk Shops in Pakistan ............................ 151
Table 5.65 Mode of Payment of Selected Milk Shops in Pakistan ..................................... 152
Table 5.66 Working Capital of Selected Milk Shops in Pakistan ....................................... 153
Table 5.67 Return on Working Capital of Selected Milk Shops in Pakistan ...................... 153
Table 5.68 Perfect Order Fulfillment of Dairy Companies in Pakistan .............................. 155
Table 5.69 Order Fulfilment Cycle Time of Dairy Companies in Pakistan ........................ 156
Table 5.70 Asset Management of Dairy Companies in Pakistan ........................................ 158
Table 5.71 Perfect Order Fulfilment of Dairy Companies in New Zealand ....................... 159
Table 5.72 Order Fulfilment Cycle Time of Dairy Companies in New Zealand ................ 160
Table 5.73 Asset Management of Dairy Companies in New Zealand ................................ 163
Table 6.1 Gap Analysis of Dairy Farmers ............................................................................ 165
Table 6.2 Gap Analysis of Informal Chain of Milk in Pakistan............................................ 170
Table 6.3 Gap Analysis of SCOR Metrics for Dairy Companies ......................................... 174

xi
LIST OF FIGURES
Figure 1.1 Evolution of FAO Food Price Indices ................................................................... 2
Figure 2.1 Trends in Global Milk Production ...................................................................... 10
Figure 2.2 Major Exporters of Dairy Products ..................................................................... 11
Figure 2.3 Major Importers of Dairy Products ..................................................................... 11
Figure 2.4 Global Per Capita Food Supply from Milk ......................................................... 12
Figure 2.5 Dairy Production Systems in Pakistan ................................................................ 14
Figure 2.6 Trends in the Milk Production in Pakistan .......................................................... 15
Figure 2.7 Dairy Farms in Pakistan by Geographical Location and Herd Size .................... 15
Figure 2.8 Trends in Dairy Exports of Pakistan ................................................................... 17
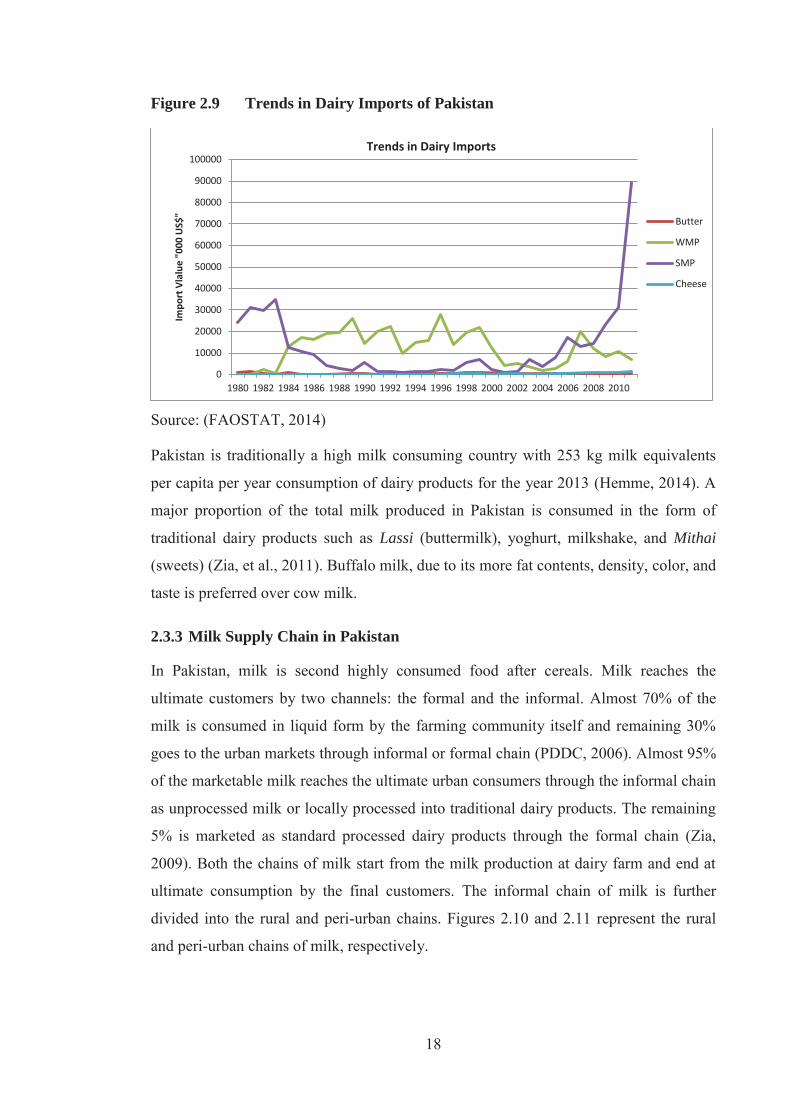
Figure 2.9 Trends in Dairy Imports of Pakistan ................................................................... 18
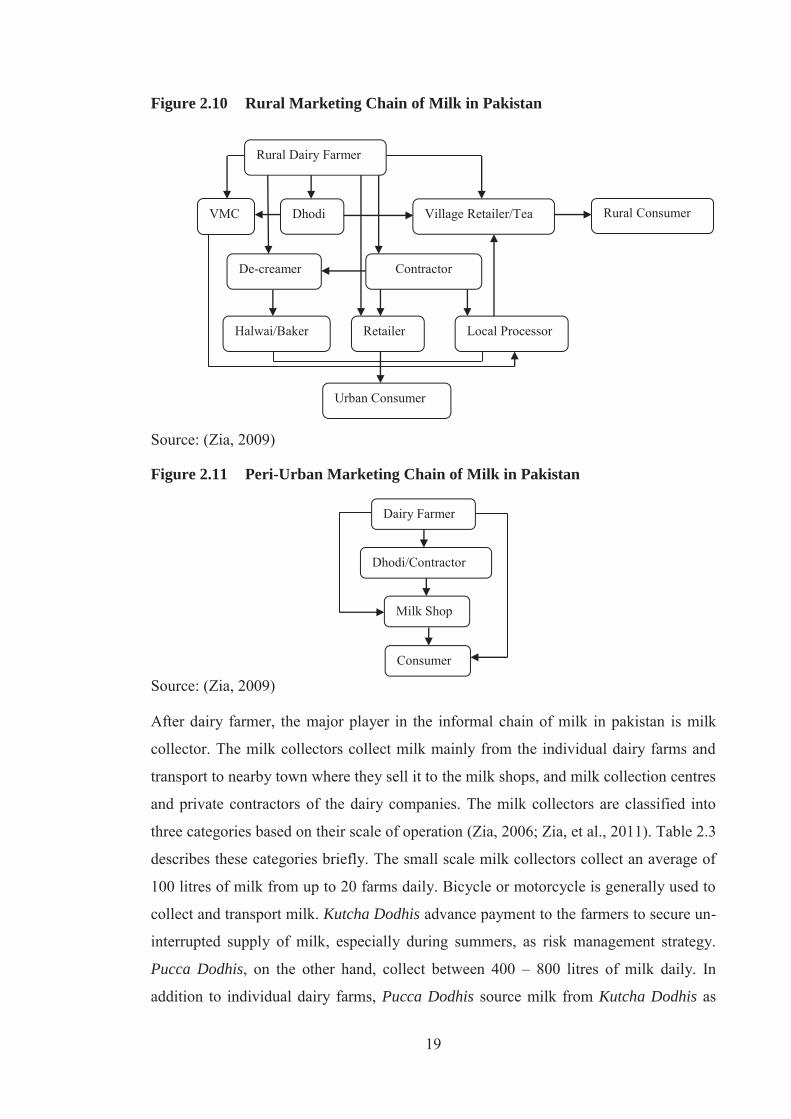
Figure 2.10 Rural Marketing Chain of Milk in Pakistan ........................................................ 19
Figure 2.11 Peri-Urban Marketing Chain of Milk in Pakistan ............................................... 19
Figure 2.12 Milk Processors in Pakistan ................................................................................ 21
Figure 2.13 Supply Chain of UHT Milk ................................................................................ 22
Figure 2.14 Trends in Milk Production in New Zealand ........................................................ 24
Figure 2.15 Regional Distribution of Dairy Cows in New Zealand ....................................... 25
Figure 2.16 New Zealand Milk Production Pattern ................................................................ 26
Figure 2.17 Trends in Number of Herds and Average Herd Size .......................................... 26
Figure 2.18 Trends in Dairy Exports of New Zealand ........................................................... 27
Figure 2.19 Dairy Value Chain in New Zealand .................................................................... 28
Figure 2.20 Dairy Products Manufacturing Enterprises in New Zealand .............................. 29
Figure 2.21 Food Retailing Entreprises in New Zealand ....................................................... 30
Figure 3.1 Evolution of Supply Chain Management ............................................................ 37
Figure 3.2 The Generic Value Chain .................................................................................... 38
Figure 3.3 Definitions of Benchmarking .............................................................................. 40
Figure 3.4 Evolution of Benchmarking ................................................................................ 42
Figure 3.5 Performance Measurement-Definitions .............................................................. 47
Figure 3.6 Definitions of Performance Measurement System ............................................. 48
Figure 3.7 Industry Average Cost Model ............................................................................. 56
Figure 3.8 Conceptual Framework for Agri-food Supply Chain Performance .................... 58
Figure 3.9 The Balanced Scorecard ...................................................................................... 60
Figure 3.10 The SCOR Model Supply Chain Processes ........................................................ 70
Figure 3.11 Analytical Framework for Agri-Food Supply Chains ......................................... 71
Figure 4.1 The Research Process of this Study .................................................................... 76
Figure 4.2 Sampling Techniques .......................................................................................... 85

xii
Figure 4.3 Universe of the Study in Pakistan ....................................................................... 87
Figure 4.4 The Research Methodology Summarised ........................................................... 95
Figure 5.1 Value Chain Map of Milk Supply Chain Network of Pakistan........................... 97
Figure 5.2 Distribution of Value in Informal Chain of Milk in Pakistan ............................. 99
Figure 5.3 Distribution of Value in Formal Chain of Milk in Pakistan .............................. 100
Figure 5.4 Value Chain Map of Milk Systems in New Zealand ........................................ 101
Figure 5.5 Distribution of Value in Milk Supply Chain in New Zealand .......................... 103
Figure 5.6 Seasonal Availability of Green Fodder in Pakistan .......................................... 111
Figure 5.7 Seasonal Demand and Supply of Milk in Pakistan Dairy Industry ................... 112
Figure 6.1 A Rural Farmer in Pakistan ............................................................................... 166
Figure 6.2 Key Players of Informal Chain on Milk in Pakistan ......................................... 172
Figure 6.3 Order Fulfilment in the Informal Chain of Milk in Pakistan ............................ 172
Figure 6.4 Order Fulfilment in formal Chain of Milk in Pakistan...................................... 175
1
CHAPTER 1
1. INTRODUCTION
1.1 Introduction
This chapter aims to introduce the subject of the research study at large. The chapter is
organized into following sections:
Section 1.2 justifies the need for a benchmarking study in dairy industry.
Section 1.3 proposes to benchmark the performance of milk supply chain in
Pakistan with milk supply chain in New Zealand.
Section 1.4 states research objectives of the proposed study.
Section 1.5 describes the format of overall thesis.
Section 1.6 summaries the chapter.
1.2 Benchmarking in Supply Chain Management
Businesses are now operating as part of collaborative networks called supply chains
(Kehoe et al., 2007). These networks share information and skills in a synergetic way to
offer superior value to the customers. Lee (2004) claims that just fast and cost-effective
supply chains are not able to respond to the unexpected changes in demand and supply.
Rather, Lee (2004) adds that agility, adaptability, and alignment of a supply chain are
necessary to be sustainable. Although all the supply chains are inherently risky, a supply
chain’s reliability and ability to mitigate risks and disruptions is positively correlated
with overall performance (Craighead et al., 2007; Zhang & Wang, 2011). Zhang and
Wang (2011) view that supply chains are becoming increasingly robust due to their
increasing reliance on the use of information technology.
In order to be successful in increasingly competitive and globalised market place
businesses must evaluate, benchmark, and improve their performance (Gomes & Yasin,
2011). Benchmarking is one of the most effective tools for any serious organizational
improvement (Andersen et al., 1999; Papaioannou et al., 2006; Yasin, 2002). Businesses
benchmark their performance against industry leaders or best in class competitors. In
this way best practices driving to the superior performance are adopted. In the past,
benchmarking has been used to attain competitive edge or even surpass the competitors.
2
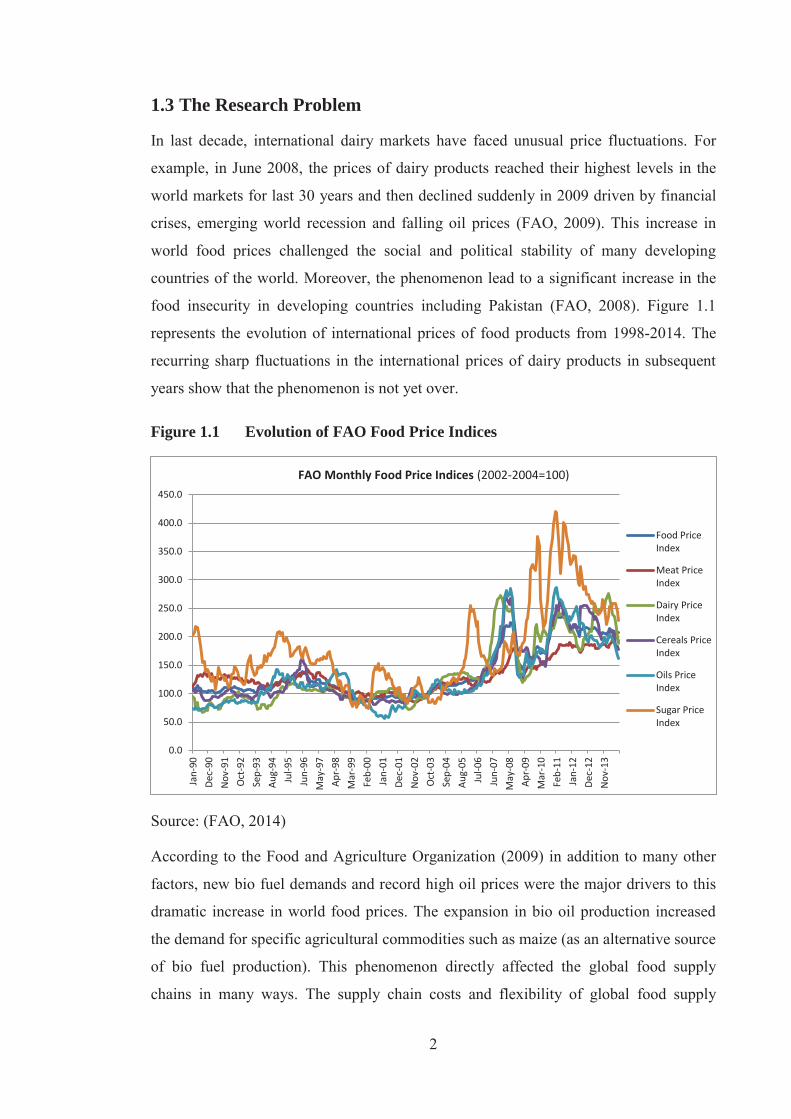
1.3 The Research Problem
In last decade, international dairy markets have faced unusual price fluctuations. For
example, in June 2008, the prices of dairy products reached their highest levels in the
world markets for last 30 years and then declined suddenly in 2009 driven by financial
crises, emerging world recession and falling oil prices (FAO, 2009). This increase in
world food prices challenged the social and political stability of many developing
countries of the world. Moreover, the phenomenon lead to a significant increase in the
food insecurity in developing countries including Pakistan (FAO, 2008). Figure 1.1
represents the evolution of international prices of food products from 1998-2014. The
recurring sharp fluctuations in the international prices of dairy products in subsequent
years show that the phenomenon is not yet over.
Figure 1.1 Evolution of FAO Food Price Indices
Source: (FAO, 2014)
According to the Food and Agriculture Organization (2009) in addition to many other
factors, new bio fuel demands and record high oil prices were the major drivers to this
dramatic increase in world food prices. The expansion in bio oil production increased
the demand for specific agricultural commodities such as maize (as an alternative source
of bio fuel production). This phenomenon directly affected the global food supply
chains in many ways. The supply chain costs and flexibility of global food supply
0.0
50.0
100.0
150.0
200.0
250.0
300.0
350.0
400.0
450.0
Jan-
90De
c-90
Nov
-91
Oct
-92
Sep-
93Au
g-94
Jul-9
5Ju
n-96
May
-97
Apr-
98M
ar-9
9Fe
b-00
Jan-
01De
c-01
Nov
-02
Oct
-03
Sep-
04Au
g-05
Jul-0
6Ju
n-07
May
-08
Apr-
09M
ar-1
0Fe
b-11
Jan-
12De
c-12
Nov
-13
FAO Monthly Food Price Indices (2002-2004=100)
Food PriceIndex
Meat PriceIndex
Dairy PriceIndex
Cereals PriceIndex
Oils PriceIndex
Sugar PriceIndex
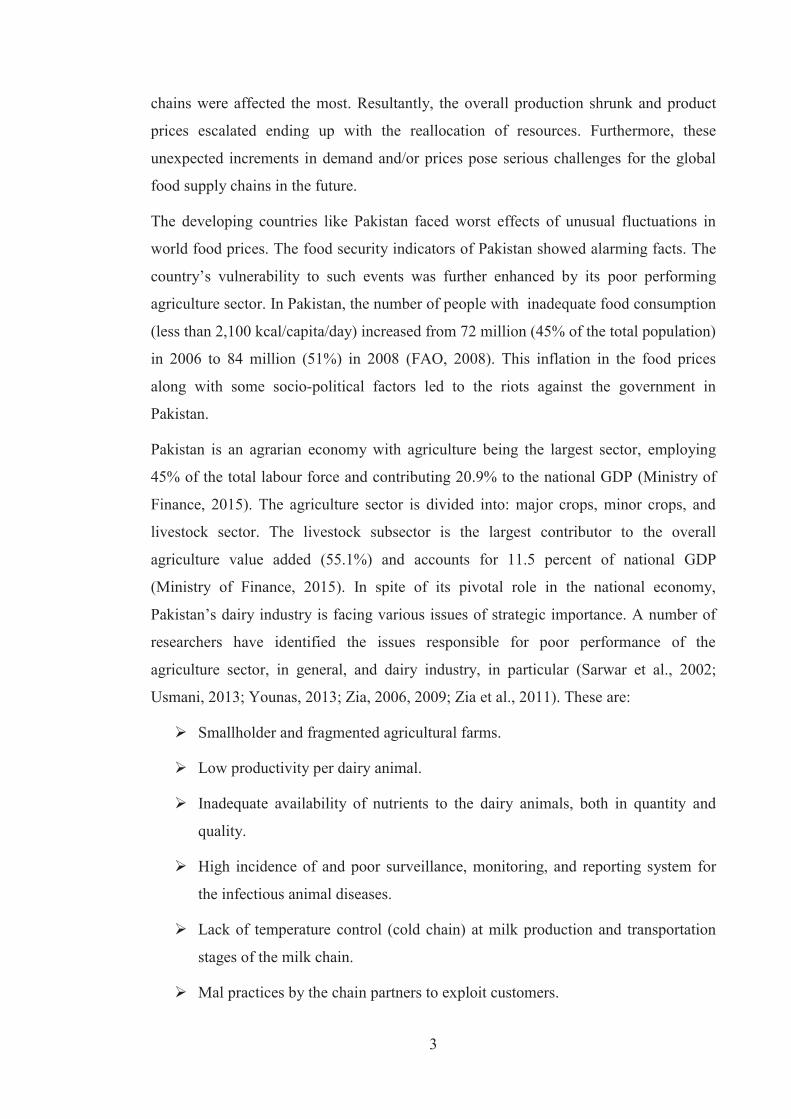
3
chains were affected the most. Resultantly, the overall production shrunk and product
prices escalated ending up with the reallocation of resources. Furthermore, these
unexpected increments in demand and/or prices pose serious challenges for the global
food supply chains in the future.
The developing countries like Pakistan faced worst effects of unusual fluctuations in
world food prices. The food security indicators of Pakistan showed alarming facts. The
country’s vulnerability to such events was further enhanced by its poor performing
agriculture sector. In Pakistan, the number of people with inadequate food consumption
(less than 2,100 kcal/capita/day) increased from 72 million (45% of the total population)
in 2006 to 84 million (51%) in 2008 (FAO, 2008). This inflation in the food prices
along with some socio-political factors led to the riots against the government in
Pakistan.
Pakistan is an agrarian economy with agriculture being the largest sector, employing
45% of the total labour force and contributing 20.9% to the national GDP (Ministry of
Finance, 2015). The agriculture sector is divided into: major crops, minor crops, and
livestock sector. The livestock subsector is the largest contributor to the overall
agriculture value added (55.1%) and accounts for 11.5 percent of national GDP
(Ministry of Finance, 2015). In spite of its pivotal role in the national economy,
Pakistan’s dairy industry is facing various issues of strategic importance. A number of
researchers have identified the issues responsible for poor performance of the
agriculture sector, in general, and dairy industry, in particular (Sarwar et al., 2002;
Usmani, 2013; Younas, 2013; Zia, 2006, 2009; Zia et al., 2011). These are:
Smallholder and fragmented agricultural farms.
Low productivity per dairy animal.
Inadequate availability of nutrients to the dairy animals, both in quantity and
quality.
High incidence of and poor surveillance, monitoring, and reporting system for
the infectious animal diseases.
Lack of temperature control (cold chain) at milk production and transportation
stages of the milk chain.
Mal practices by the chain partners to exploit customers.
4
Seasonal demand and supply patterns.
Lack of access (particularly of smallholder farmers) to the financial services.
Obsolete food safety regulations and hygiene standards for milk production,
processing and marketing.
Insufficient institutional capacity in delivering veterinary and extension services
to the farmers.
In the light of above-mentioned issues, the research problem is stated as:
Examining the causes of poor performance of milk supply chain in Pakistan.
In order to identify the causes of poor performance of milk supply chain in Pakistan,
this study aims to benchmark the performance of key players of milk supply chain in
Pakistan with the same in New Zealand. The performance of key players of milk supply
chain in New Zealand serves as a benchmark. This benchmarking study should answer
two research questions derived from the research problem.
1. What is/are the performance gap(s) in the milk supply chain in Pakistan as
compared to milk supply chain in New Zealand?
2. How to improve the performance of milk supply chain in Pakistan?
1.4 The Research Questions and Objectives
This study primarily aims to benchmark the performance of key players of milk supply
chain in Pakistan with the same in New Zealand in order to identify the performance
gaps, reasons behind those performance gaps, and suggest appropriate policy measures
to improve the overall performance of milk supply chain in Pakistan. To achieve this
aim, following research objectives are framed:
Objective 1: to overview dairy industries of Pakistan and New Zealand.
Objective 2: to measure the performance of key players of milk supply chains in
Pakistan and New Zealand.
Objective 3: to identify and analyse performance gaps between milk supply chains in
Pakistan and New Zealand.
5
Objective 4: to suggest policy measures for the improvement of milk supply chain in
Pakistan.
1.5 Why New Zealand Milk Supply Chain as Benchmark?
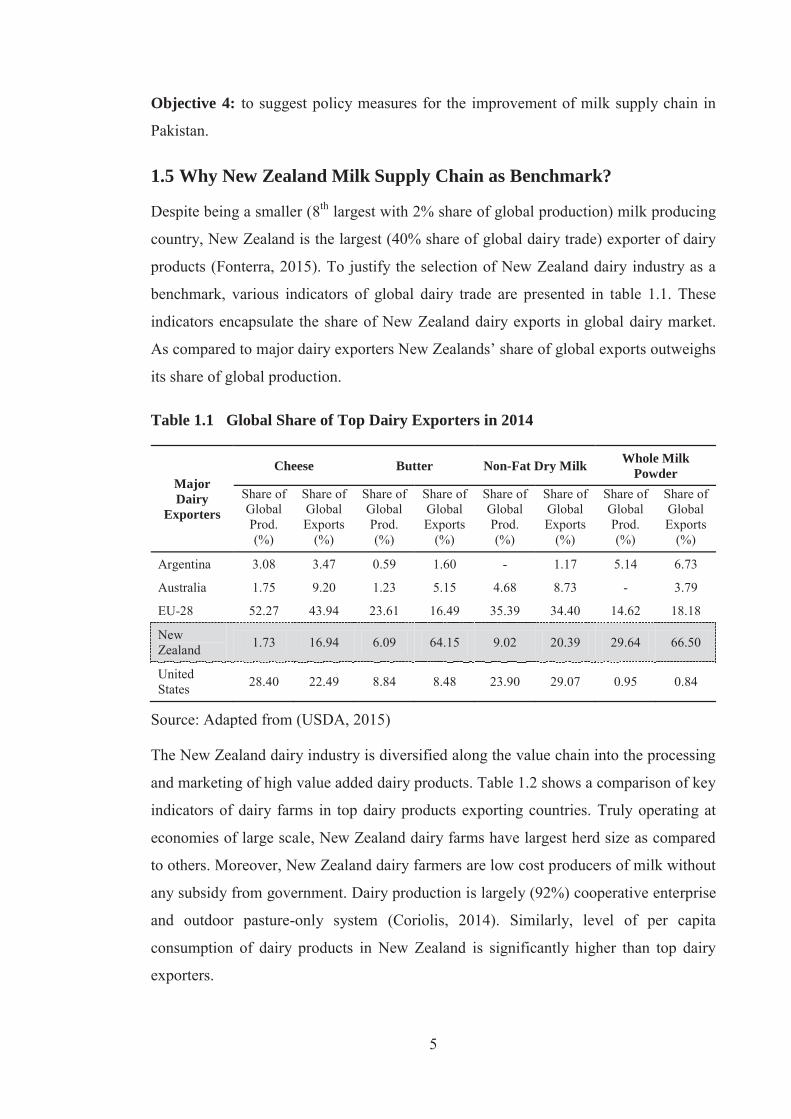
Despite being a smaller (8th largest with 2% share of global production) milk producing
country, New Zealand is the largest (40% share of global dairy trade) exporter of dairy
products (Fonterra, 2015). To justify the selection of New Zealand dairy industry as a
benchmark, various indicators of global dairy trade are presented in table 1.1. These
indicators encapsulate the share of New Zealand dairy exports in global dairy market.
As compared to major dairy exporters New Zealands’ share of global exports outweighs
its share of global production.
Table 1.1 Global Share of Top Dairy Exporters in 2014
Major Dairy
Exporters
Cheese Butter Non-Fat Dry Milk Whole Milk Powder
Share of Global Prod. (%)
Share of Global Exports
(%)
Share of Global Prod. (%)
Share of Global Exports
(%)
Share of Global Prod. (%)
Share of Global Exports
(%)
Share of Global Prod. (%)
Share of Global Exports
(%)
Argentina 3.08 3.47 0.59 1.60 - 1.17 5.14 6.73
Australia 1.75 9.20 1.23 5.15 4.68 8.73 - 3.79
EU-28 52.27 43.94 23.61 16.49 35.39 34.40 14.62 18.18
New Zealand 1.73 16.94 6.09 64.15 9.02 20.39 29.64 66.50
United States 28.40 22.49 8.84 8.48 23.90 29.07 0.95 0.84
Source: Adapted from (USDA, 2015)
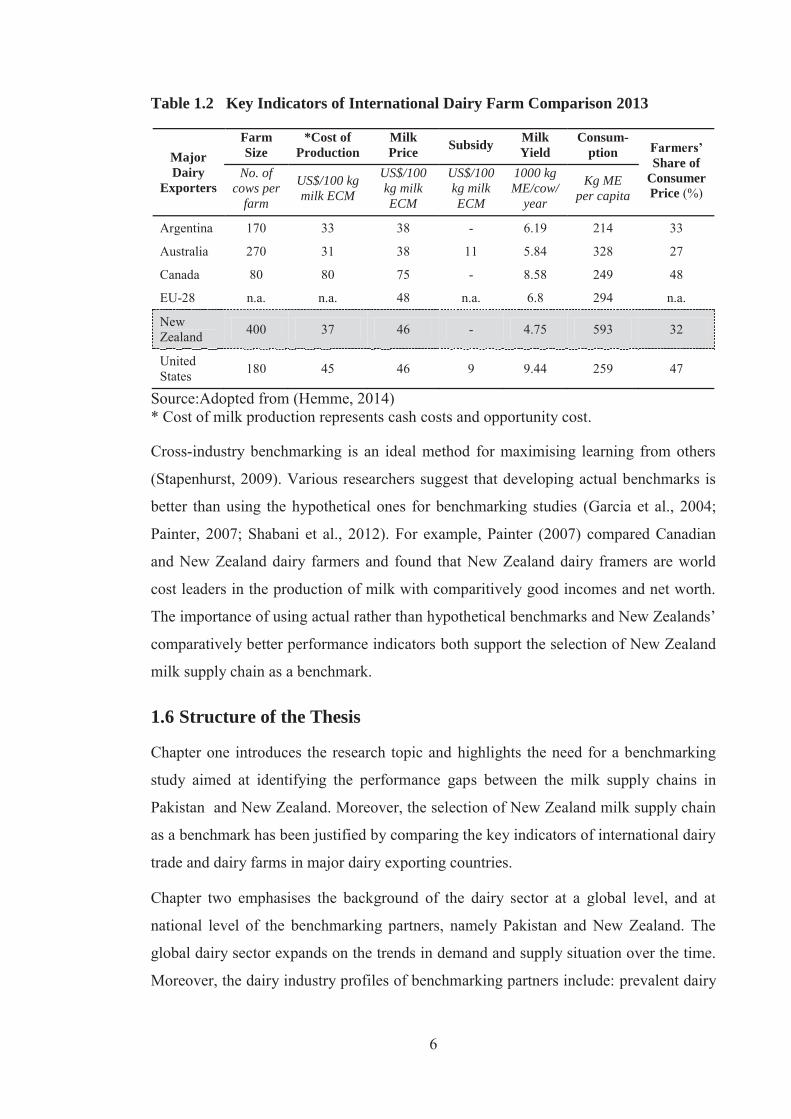
The New Zealand dairy industry is diversified along the value chain into the processing
and marketing of high value added dairy products. Table 1.2 shows a comparison of key
indicators of dairy farms in top dairy products exporting countries. Truly operating at
economies of large scale, New Zealand dairy farms have largest herd size as compared
to others. Moreover, New Zealand dairy farmers are low cost producers of milk without
any subsidy from government. Dairy production is largely (92%) cooperative enterprise
and outdoor pasture-only system (Coriolis, 2014). Similarly, level of per capita
consumption of dairy products in New Zealand is significantly higher than top dairy
exporters.
6
Table 1.2 Key Indicators of International Dairy Farm Comparison 2013
Major Dairy
Exporters
Farm Size
*Cost of Production
Milk Price Subsidy Milk
Yield Consum-
ption Farmers’ Share of
Consumer Price (%)
No. of cows per
farm
US$/100 kg milk ECM
US$/100 kg milk ECM
US$/100 kg milk ECM
1000 kg ME/cow/
year
Kg ME per capita
Argentina 170 33 38 - 6.19 214 33
Australia 270 31 38 11 5.84 328 27
Canada 80 80 75 - 8.58 249 48
EU-28 n.a. n.a. 48 n.a. 6.8 294 n.a.
New Zealand 400 37 46 - 4.75 593 32
United States 180 45 46 9 9.44 259 47
Source:Adopted from (Hemme, 2014) * Cost of milk production represents cash costs and opportunity cost.
Cross-industry benchmarking is an ideal method for maximising learning from others
(Stapenhurst, 2009). Various researchers suggest that developing actual benchmarks is
better than using the hypothetical ones for benchmarking studies (Garcia et al., 2004;
Painter, 2007; Shabani et al., 2012). For example, Painter (2007) compared Canadian
and New Zealand dairy farmers and found that New Zealand dairy framers are world
cost leaders in the production of milk with comparitively good incomes and net worth.
The importance of using actual rather than hypothetical benchmarks and New Zealands’
comparatively better performance indicators both support the selection of New Zealand
milk supply chain as a benchmark.
1.6 Structure of the Thesis
Chapter one introduces the research topic and highlights the need for a benchmarking
study aimed at identifying the performance gaps between the milk supply chains in
Pakistan and New Zealand. Moreover, the selection of New Zealand milk supply chain
as a benchmark has been justified by comparing the key indicators of international dairy
trade and dairy farms in major dairy exporting countries.
Chapter two emphasises the background of the dairy sector at a global level, and at
national level of the benchmarking partners, namely Pakistan and New Zealand. The
global dairy sector expands on the trends in demand and supply situation over the time.
Moreover, the dairy industry profiles of benchmarking partners include: prevalent dairy

7
production systems, structure of existing milk supply chain network, and the market
situation.
Chapter three reviews the literature on benchmarking and performance measurement
with particular focus on agri-food supply chains. The chapter is organized into supply
chain management, benchmarking in supply chain management, and supply chain
performance measurement. The performance measurement systems are critically
reviewed against five criteria characterising performance measurement in agri-food
supply chains. Finally, an analytical framework based on SCOR model has been
proposed to fill the research gap as well as for performance measurement in milk supply
chains in Pakistan and New Zealand.
Chapter four discusses the research methodology employed. It gives an overview of the
existing research methodologies, the research design, the benchmarking model, and
pilot testing of the questionnaires. The survey strategy was employed to gather data
from both the benchmarking partners. Face-to-face interviews of the milk supply chain
actors were conducted for data collection in Pakistan. However, mixed method (face-to-
face interviews and mail questionnaires) was adopted for data collection in the milk
SCN of New Zealand. The SCOR model modified to the specific needs of agri-food
supply chains was used to measure and benchmark the performance of both the milk
SCNs. Finally, the questionnaires were developed for data collection from both the milk
SCNs. The questionnaires were pilot tested to calibrate in line of the SC functions and
activities being performed by the chain players.
Chapter five presents value chain analysis and SCOR metrics for key players of milk
supply chains in Pakistan and New Zealand. The chapter is organized into four sections;
value chain analysis, SCOR metrics for dairy framers, SCOR metrics for informal chain
of milk in Pakistan and SCOR metrics for dairy companies. The value chain analysis
includes mapping of the milk value chains as well as quantification of the value
distributed along the entire milk supply chains of the benchmarking partners. The data
for 29 SCOR metrics is organized into five SCOR attributes: reliability, responsiveness,
agility, cost, and asset.
Chapter six discusses the gap analysis by statistically comparing means from two
independent groups (i.e. milk supply chains). Moreover, the results are compared and/or
supported with relevant literature. Finally, a phased-out medium to long term policy
8
intervention was recommended to overcome the issues responsible for poor
performance and to improve the overall performance of milk supply chain in Pakistan.
Chapter seven concludes the overall thesis, links results with the individual objectives,
identifies the limitaions of the study, adds contribution of this research study, and
finally suggests the future research.
1.7 Summary
This chapter introduces the research problem of examining the poor performance of
milk supply chain in Pakistan. A number of inherent inefficiencies in milk supply chain
in Pakistan identified and highlighted by previous researchers are summarised.
However, to quantify the impact of these issues on the supply chain performance a
benchmarking study is undertaken. The prime objective of the study is to benchmark the
performance of key players of the milk supply chain in Pakistan against key players of
the milk supply chain in New Zealand. The selection of New Zealand dairy industry as
a benchmark is justified and supported by key indicators of world dairy trade and
international dairy farm compraison. The study concludes at identification of
performance gaps between the benchmarking partners and recommendation of
appropriate policy interventions. Finally, format of the overall thesis is discussed
chapterwise.
9
CHAPTER 2
2. BACKGROUND
2.1 Introduction
This chapter investigates the dairy industry from global as well as national perspectives.
For this purpose the chapter is organized into three sections.
Section 2.2 overviews global dairy industry in terms of production, trade, and
demand and supply situation.
Section 2.3 explores the structure of milk supply chain in Pakistan.
Section 2.4 explores the structure of milk supply chain in New Zealand.
Section 2.5 summarizes the overall chapter.
2.2 World Dairy Outlook
The world agricultural markets are predominantly driven by economic indicators such
as rising per-capita incomes and increasing urbanization leading to dietary changes in
most developing countries and generating increased demand for livestock products
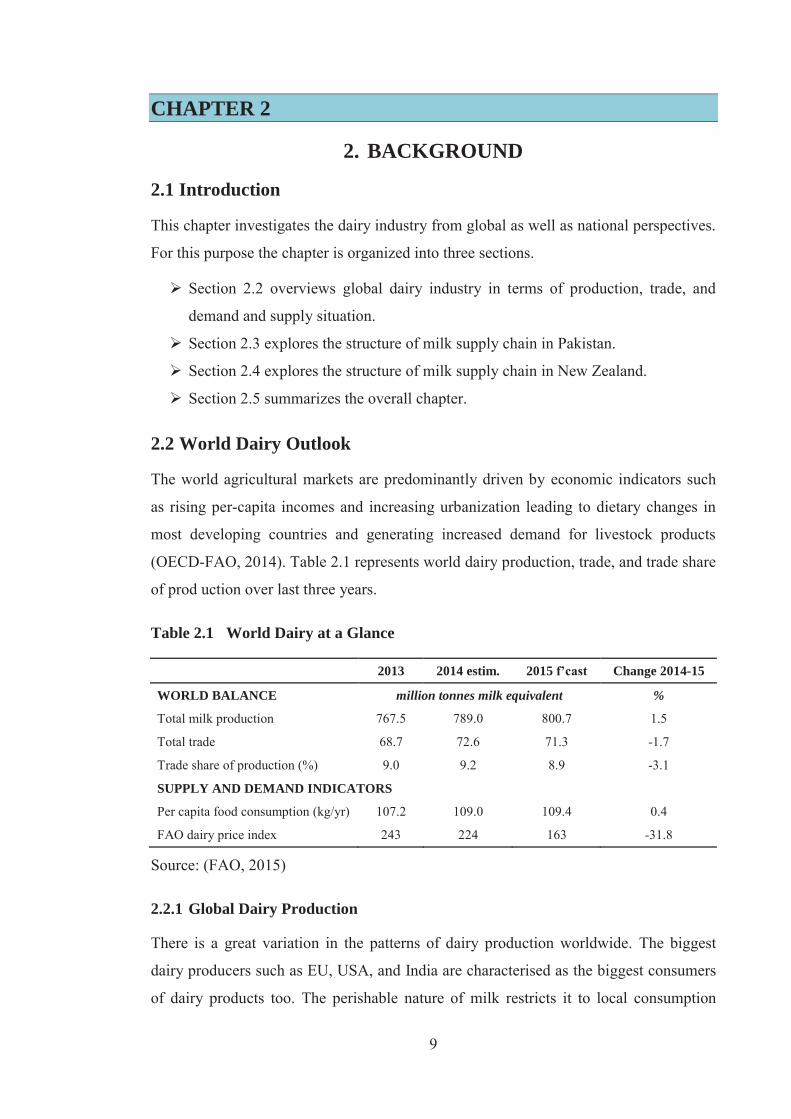
(OECD-FAO, 2014). Table 2.1 represents world dairy production, trade, and trade share
of prod uction over last three years.
Table 2.1 World Dairy at a Glance
2013 2014 estim. 2015 f’cast Change 2014-15
WORLD BALANCE million tonnes milk equivalent %
Total milk production 767.5 789.0 800.7 1.5
Total trade 68.7 72.6 71.3 -1.7
Trade share of production (%) 9.0 9.2 8.9 -3.1
SUPPLY AND DEMAND INDICATORS
Per capita food consumption (kg/yr) 107.2 109.0 109.4 0.4
FAO dairy price index 243 224 163 -31.8
Source: (FAO, 2015)
2.2.1 Global Dairy Production
There is a great variation in the patterns of dairy production worldwide. The biggest
dairy producers such as EU, USA, and India are characterised as the biggest consumers
of dairy products too. The perishable nature of milk restricts it to local consumption
10
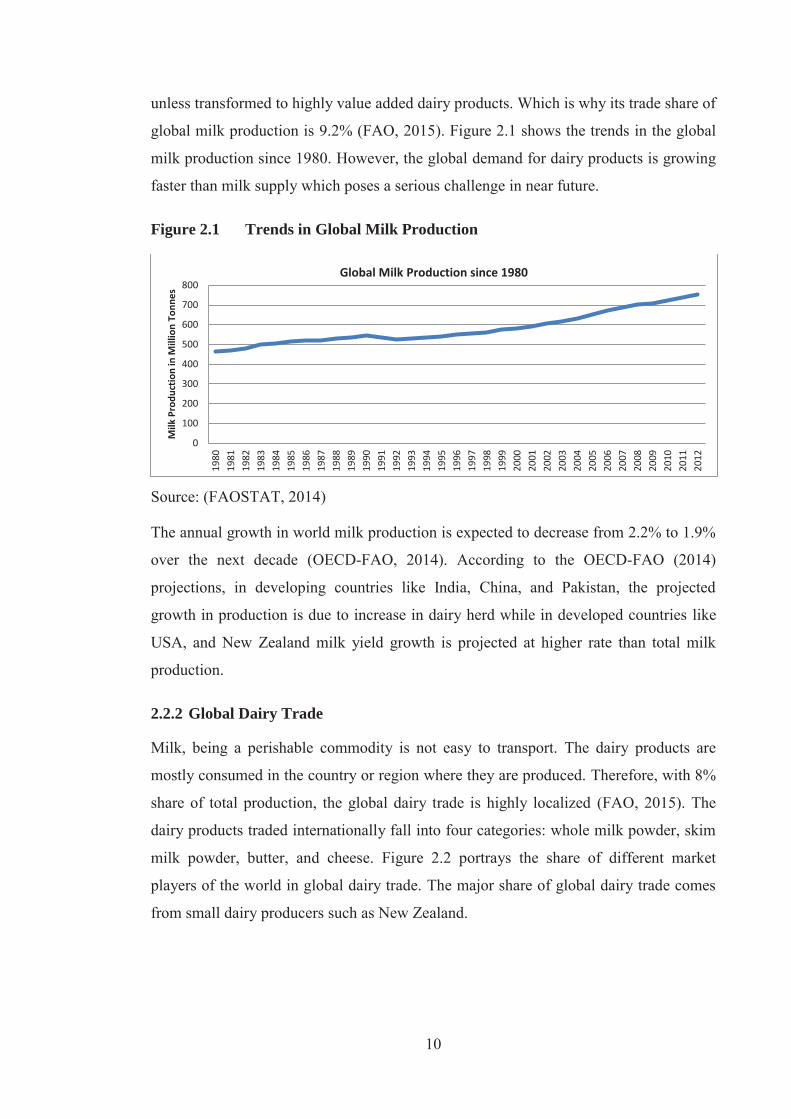
unless transformed to highly value added dairy products. Which is why its trade share of
global milk production is 9.2% (FAO, 2015). Figure 2.1 shows the trends in the global
milk production since 1980. However, the global demand for dairy products is growing
faster than milk supply which poses a serious challenge in near future.
Figure 2.1 Trends in Global Milk Production
Source: (FAOSTAT, 2014)
The annual growth in world milk production is expected to decrease from 2.2% to 1.9%
over the next decade (OECD-FAO, 2014). According to the OECD-FAO (2014)
projections, in developing countries like India, China, and Pakistan, the projected
growth in production is due to increase in dairy herd while in developed countries like
USA, and New Zealand milk yield growth is projected at higher rate than total milk
production.
2.2.2 Global Dairy Trade
Milk, being a perishable commodity is not easy to transport. The dairy products are
mostly consumed in the country or region where they are produced. Therefore, with 8%
share of total production, the global dairy trade is highly localized (FAO, 2015). The
dairy products traded internationally fall into four categories: whole milk powder, skim
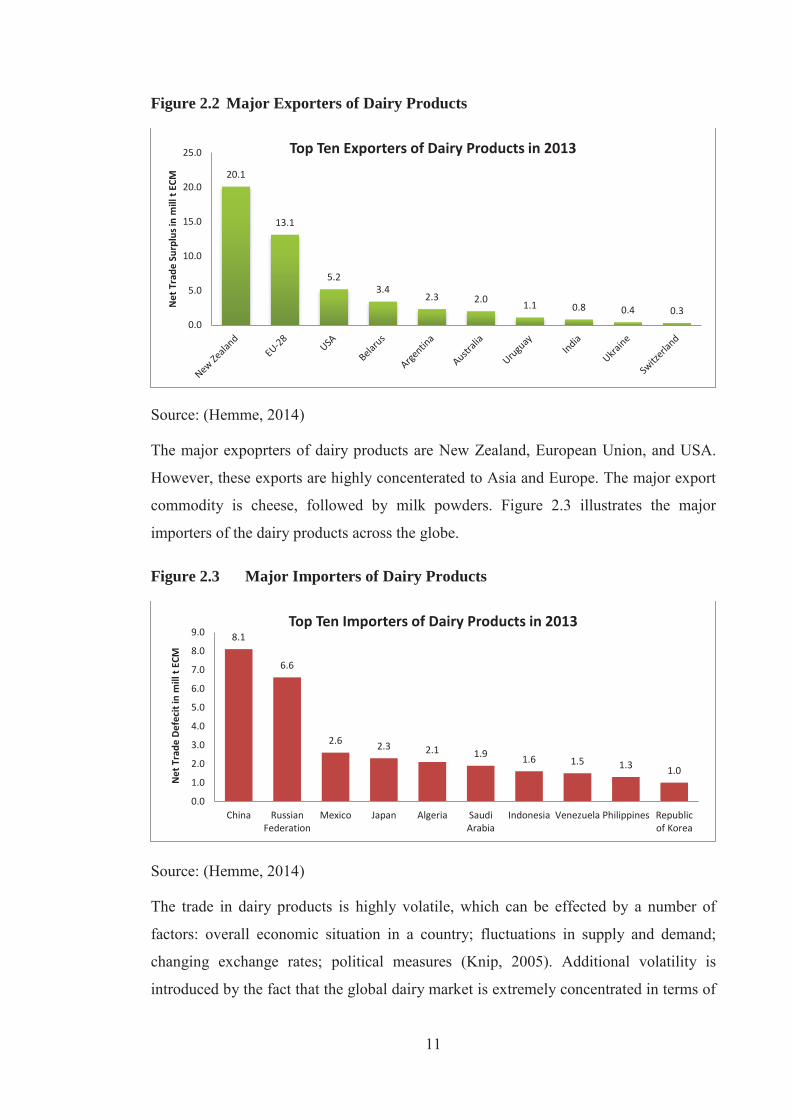
milk powder, butter, and cheese. Figure 2.2 portrays the share of different market
players of the world in global dairy trade. The major share of global dairy trade comes
from small dairy producers such as New Zealand.
0
100
200
300
400
500
600
700
800
1980
1981
1982
1983
1984
1985
1986
1987
1988
1989
1990
1991
1992
1993
1994
1995
1996
1997
1998
1999
2000
2001
2002
2003
2004
2005
2006
2007
2008
2009
2010
2011
2012
Milk
Pro
duct
ion
in M
illio
n To
nnes
Global Milk Production since 1980
11
Figure 2.2 Major Exporters of Dairy Products
Source: (Hemme, 2014)
The major expoprters of dairy products are New Zealand, European Union, and USA.
However, these exports are highly concenterated to Asia and Europe. The major export
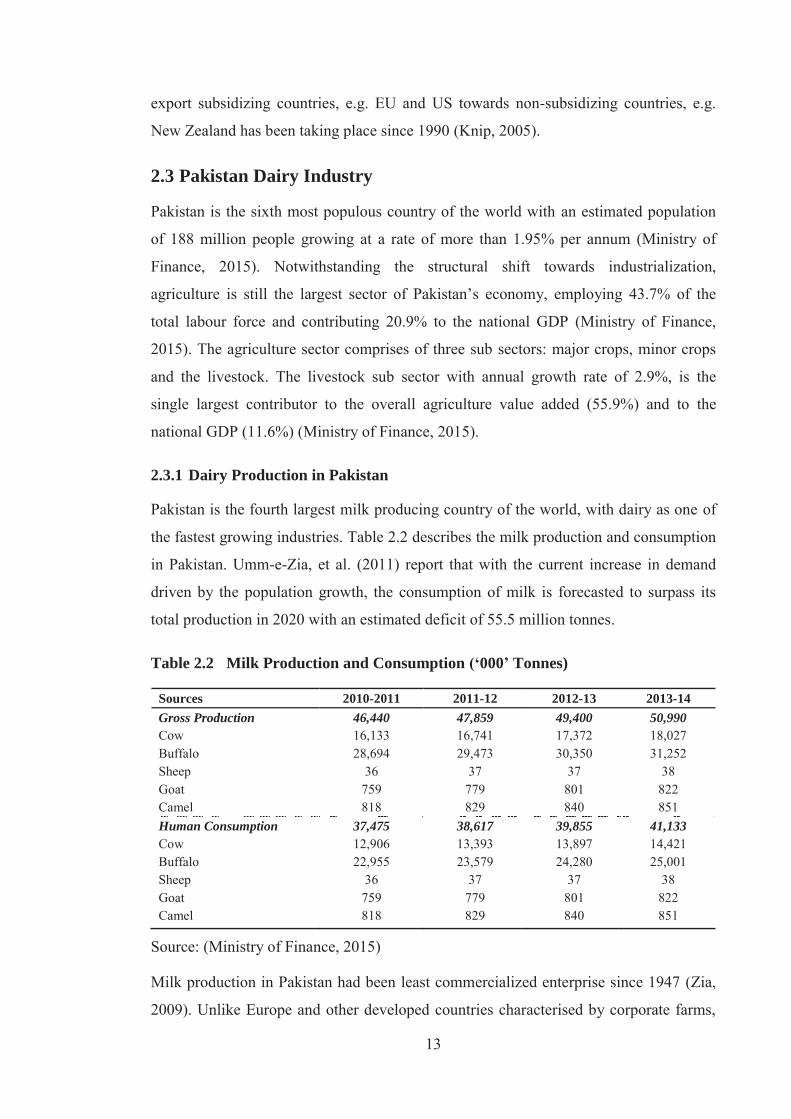
commodity is cheese, followed by milk powders. Figure 2.3 illustrates the major
importers of the dairy products across the globe.
Figure 2.3 Major Importers of Dairy Products
Source: (Hemme, 2014)
The trade in dairy products is highly volatile, which can be effected by a number of
factors: overall economic situation in a country; fluctuations in supply and demand;
changing exchange rates; political measures (Knip, 2005). Additional volatility is
introduced by the fact that the global dairy market is extremely concentrated in terms of
20.1
13.1
5.2 3.4
2.3 2.0 1.1 0.8 0.4 0.3 0.0
5.0
10.0
15.0
20.0
25.0
Net
Tra
de S
urpl
us in
mill
t EC
M
Top Ten Exporters of Dairy Products in 2013
8.1
6.6
2.6 2.3 2.1 1.9 1.6 1.5 1.3 1.0
0.0
1.0
2.0
3.0
4.0
5.0
6.0
7.0
8.0
9.0
China RussianFederation
Mexico Japan Algeria SaudiArabia
Indonesia Venezuela Philippines Republicof Korea
Net
Tra
de D
efec
it in
mill
t EC
M
Top Ten Importers of Dairy Products in 2013

12
buyers and sellers; hence, supply or demand shocks are not easily absorbed. A key to
determining the likelihood of milk surplus or milk deficit of a country is its population
relative to its production of milk. Furthermore, increasing numbers of customer
requirements coupled with increasing customer power is constantly pushing world dairy
companies in a cut-throat competition. Another challenge the global dairy industry is
facing, is the negative impact of financial crisis and recession on the ease of access to
credit.
Billions of people around the world consume milk and milk products every day. Milk
provides nutrients such as calcium, magnesium, selenium, riboflavin, vitamin B12, and
pantothenic acid (vitamin B5) which are essential components of human diet (FAO,
2013). Figure 2.4 shows that per capita supply of dietry nutrition from milk and milk
products is less for the people in Africa and Asia as compared to Europe, Oceania, and
Americas.
Figure 2.4 Global Per Capita Food Supply from Milk
Source: (FAOSTAT, 2014)
Globally, the dairy sector is probably one of the most distorted agricultural sectors.
According to FAO (2005) the production and export subsidies are put in place by
developing as well as developed countries to encourage surplus production for the
world markets. Tariff and non-tariff barriers (TBT’s) have been used as a tool to protect
domestic dairy industry from global competition. These market distortions are having
significant impacts on producers and consumers of other global trade partners, which
are however extremely difficult to quantify. A shift in world dairy exports from high
83
4.5 4.6
257
14.9 14.8
94
5.6 4.7
307
19.3 18.1
288
16.7 17.7
0
50
100
150
200
250
300
350
Energy (kcal/capita/day) Protein (g/capita/day) Fat (g/capita/day)
Per Capita Supply of Energy, Protein, and Fats from Milk
Africa
Americas
Asia
Europe
Oceania
13
export subsidizing countries, e.g. EU and US towards non-subsidizing countries, e.g.
New Zealand has been taking place since 1990 (Knip, 2005).
2.3 Pakistan Dairy Industry
Pakistan is the sixth most populous country of the world with an estimated population
of 188 million people growing at a rate of more than 1.95% per annum (Ministry of
Finance, 2015). Notwithstanding the structural shift towards industrialization,
agriculture is still the largest sector of Pakistan’s economy, employing 43.7% of the
total labour force and contributing 20.9% to the national GDP (Ministry of Finance,
2015). The agriculture sector comprises of three sub sectors: major crops, minor crops
and the livestock. The livestock sub sector with annual growth rate of 2.9%, is the
single largest contributor to the overall agriculture value added (55.9%) and to the
national GDP (11.6%) (Ministry of Finance, 2015).
2.3.1 Dairy Production in Pakistan
Pakistan is the fourth largest milk producing country of the world, with dairy as one of
the fastest growing industries. Table 2.2 describes the milk production and consumption
in Pakistan. Umm-e-Zia, et al. (2011) report that with the current increase in demand
driven by the population growth, the consumption of milk is forecasted to surpass its
total production in 2020 with an estimated deficit of 55.5 million tonnes.
Table 2.2 Milk Production and Consumption (‘000’ Tonnes)
Sources 2010-2011 2011-12 2012-13 2013-14 Gross Production 46,440 47,859 49,400 50,990 Cow 16,133 16,741 17,372 18,027 Buffalo 28,694 29,473 30,350 31,252 Sheep 36 37 37 38 Goat 759 779 801 822 Camel 818 829 840 851 Human Consumption 37,475 38,617 39,855 41,133 Cow 12,906 13,393 13,897 14,421 Buffalo 22,955 23,579 24,280 25,001 Sheep 36 37 37 38 Goat 759 779 801 822 Camel 818 829 840 851
Source: (Ministry of Finance, 2015)
Milk production in Pakistan had been least commercialized enterprise since 1947 (Zia,
2009). Unlike Europe and other developed countries characterised by corporate farms,
14
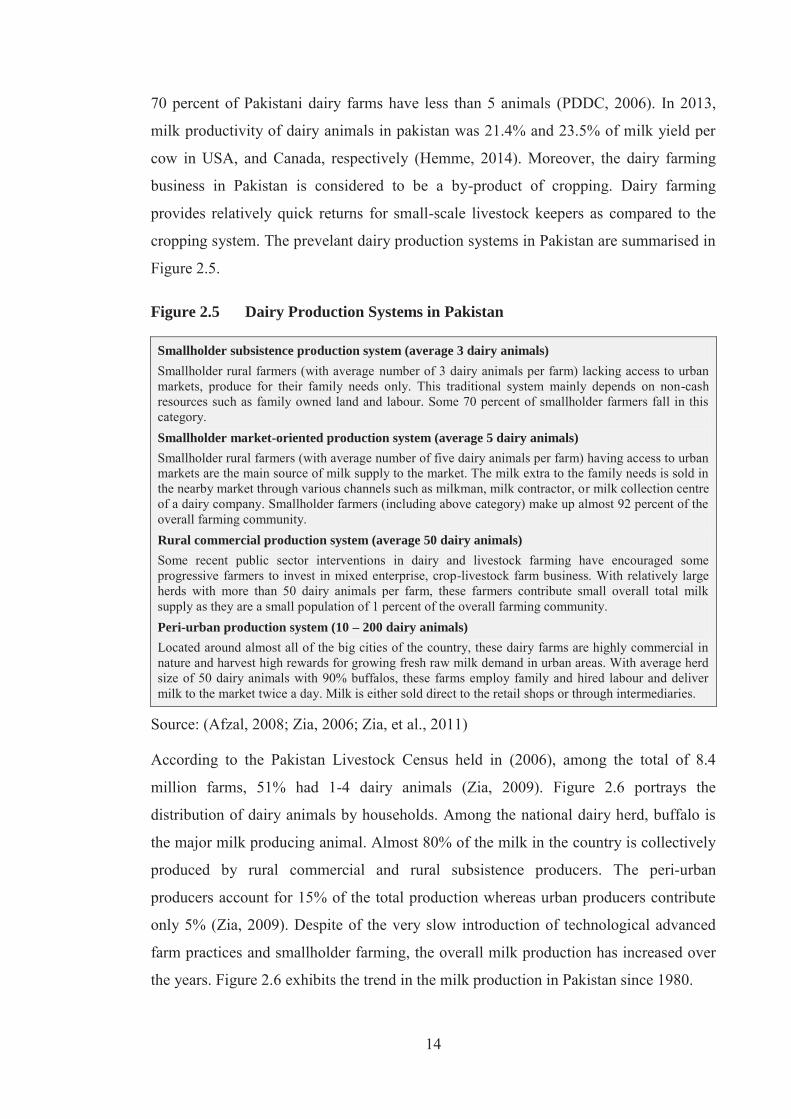
70 percent of Pakistani dairy farms have less than 5 animals (PDDC, 2006). In 2013,
milk productivity of dairy animals in pakistan was 21.4% and 23.5% of milk yield per
cow in USA, and Canada, respectively (Hemme, 2014). Moreover, the dairy farming
business in Pakistan is considered to be a by-product of cropping. Dairy farming
provides relatively quick returns for small-scale livestock keepers as compared to the
cropping system. The prevelant dairy production systems in Pakistan are summarised in
Figure 2.5.
Figure 2.5 Dairy Production Systems in Pakistan
Smallholder subsistence production system (average 3 dairy animals) Smallholder rural farmers (with average number of 3 dairy animals per farm) lacking access to urban markets, produce for their family needs only. This traditional system mainly depends on non-cash resources such as family owned land and labour. Some 70 percent of smallholder farmers fall in this category. Smallholder market-oriented production system (average 5 dairy animals) Smallholder rural farmers (with average number of five dairy animals per farm) having access to urban markets are the main source of milk supply to the market. The milk extra to the family needs is sold in the nearby market through various channels such as milkman, milk contractor, or milk collection centre of a dairy company. Smallholder farmers (including above category) make up almost 92 percent of the overall farming community. Rural commercial production system (average 50 dairy animals) Some recent public sector interventions in dairy and livestock farming have encouraged some progressive farmers to invest in mixed enterprise, crop-livestock farm business. With relatively large herds with more than 50 dairy animals per farm, these farmers contribute small overall total milk supply as they are a small population of 1 percent of the overall farming community. Peri-urban production system (10 – 200 dairy animals) Located around almost all of the big cities of the country, these dairy farms are highly commercial in nature and harvest high rewards for growing fresh raw milk demand in urban areas. With average herd size of 50 dairy animals with 90% buffalos, these farms employ family and hired labour and deliver milk to the market twice a day. Milk is either sold direct to the retail shops or through intermediaries.
Source: (Afzal, 2008; Zia, 2006; Zia, et al., 2011)
According to the Pakistan Livestock Census held in (2006), among the total of 8.4
million farms, 51% had 1-4 dairy animals (Zia, 2009). Figure 2.6 portrays the
distribution of dairy animals by households. Among the national dairy herd, buffalo is
the major milk producing animal. Almost 80% of the milk in the country is collectively
produced by rural commercial and rural subsistence producers. The peri-urban
producers account for 15% of the total production whereas urban producers contribute
only 5% (Zia, 2009). Despite of the very slow introduction of technological advanced
farm practices and smallholder farming, the overall milk production has increased over
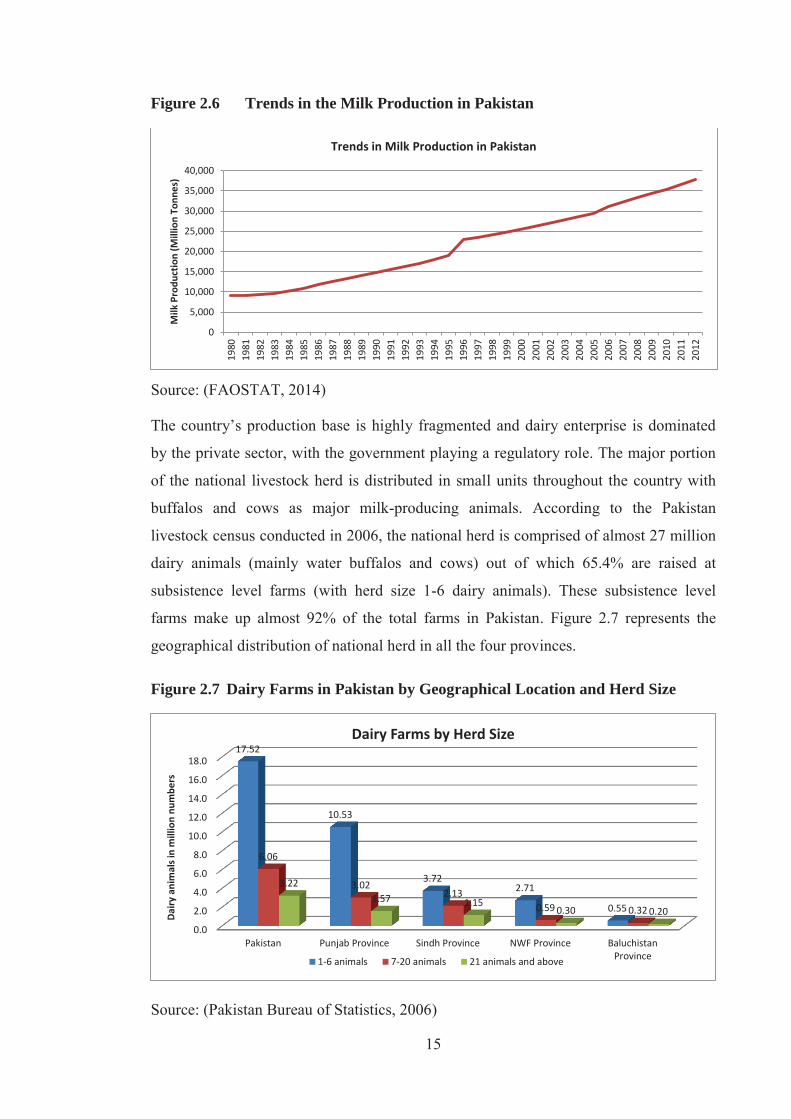
the years. Figure 2.6 exhibits the trend in the milk production in Pakistan since 1980.
15
Figure 2.6 Trends in the Milk Production in Pakistan
Source: (FAOSTAT, 2014)
The country’s production base is highly fragmented and dairy enterprise is dominated
by the private sector, with the government playing a regulatory role. The major portion
of the national livestock herd is distributed in small units throughout the country with
buffalos and cows as major milk-producing animals. According to the Pakistan
livestock census conducted in 2006, the national herd is comprised of almost 27 million
dairy animals (mainly water buffalos and cows) out of which 65.4% are raised at
subsistence level farms (with herd size 1-6 dairy animals). These subsistence level
farms make up almost 92% of the total farms in Pakistan. Figure 2.7 represents the
geographical distribution of national herd in all the four provinces.
Figure 2.7 Dairy Farms in Pakistan by Geographical Location and Herd Size
Source: (Pakistan Bureau of Statistics, 2006)
0
5,000
10,000
15,000
20,000
25,000
30,000
35,000
40,000
1980
1981
1982
1983
1984
1985
1986
1987
1988
1989
1990
1991
1992
1993
1994
1995
1996
1997
1998
1999
2000
2001
2002
2003
2004
2005
2006
2007
2008
2009
2010
2011
2012
Milk
Pro
duct
ion
(Mill
ion
Tonn
es)
Trends in Milk Production in Pakistan
0.0
2.0
4.0
6.0
8.0
10.0
12.0
14.0
16.0
18.0
Pakistan Punjab Province Sindh Province NWF Province BaluchistanProvince
17.52
10.53
3.72 2.71
0.55
6.06
3.02 2.13
0.59 0.32
3.22 1.57 1.15
0.30 0.20 Dairy
ani
mal
s in
mill
ion
num
bers
Dairy Farms by Herd Size
1-6 animals 7-20 animals 21 animals and above
16
Over 56.4% of the national herd is kept in Punjab province followed by the remaining
26.1% in Sindh, 13.5% in NWF province (the name of North Western Frontier province
has been changed to Khyber Pakhtunkhwa), and 4% in Baluchistan province. Zia, et al.
(2011) compared herd size of 1996 and 2006 censuses to understand the trends in dairy
production systems in Pakistan and observed increasing fragmentation which means
that a greater percentage of the national herd is reared at small farms. The reasons for
this increase in fragmentation are attributed to the increase in the cost of production and
division of agricultural land due to the law of inheritance.
The government, after initially ignoring the dairy sector, has now realized its
importance and embarked upon a number of initiatives to boost the sector. To speed up
the pace of development in livestock sector, the Ministry of Livestock and Dairy
Development has initiated seven mega development projects as a part of reform agenda
and political commitment of government to improve: public-private partnership led
development; national economic growth; poverty alleviation; food security; to improve
livestock service delivery; and to expand opportunities for livelihood needs of farmers.
The Government livestock policy focus is “private sector led development with public
sector providing enabling environment through policy interventions. Capacity building
for improved livestock husbandry practices, improving per unit animal productivity, and
moving from subsistence to market oriented and then commercial livestock farming in
the country to meet the domestic demand and surplus for export are the basis of the
agenda. The Ministry of Industries, Production & Special Initiatives established a
Strategy Working Group (SWOG) on dairy to chalk out a strategy and suggest
institutional arrangements for promoting the dairy sector in the country. In 2005,
SWOG recommended the establishment of Pakistan Dairy Development Company
(PDDC) on the lines and model of Dairy Australia.
2.3.2 Dairy Trade of Pakistan
The standard milk processing in Pakistan started in the mid sixties when 23 milk
pasteurization plants were installed around the three big cities to cater the needs of
rapidly growing urban sector (Anjum et al., 1989). These plants were intended to
provide pasteurized and recombined milk under the World Food Program. Eventually,
all these plants, except the one at Lahore, were closed down. In addition to the
operational problems, the poor acceptance of pasteurized and recombined milk by the
17
consumers was the major reason of the failure (Anjum, et al., 1989). The second-
generation dairy processing plants started with experimental production of UHT milk in
1977 which was successful due to the extended shelf life of the product. After the
successful experiment, the first UHT processing plant was established at Sheikhupura as
a joint venture by Milkpak and Tetra Pak Limited.
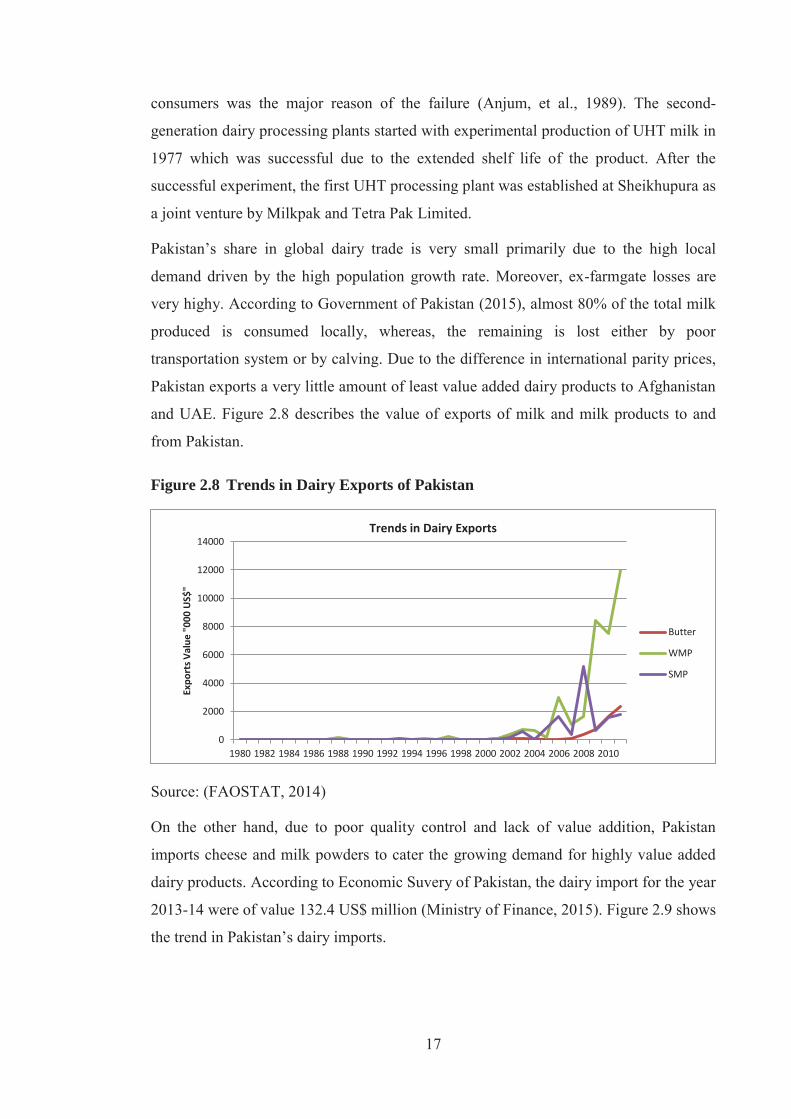
Pakistan’s share in global dairy trade is very small primarily due to the high local
demand driven by the high population growth rate. Moreover, ex-farmgate losses are
very highy. According to Government of Pakistan (2015), almost 80% of the total milk
produced is consumed locally, whereas, the remaining is lost either by poor
transportation system or by calving. Due to the difference in international parity prices,
Pakistan exports a very little amount of least value added dairy products to Afghanistan
and UAE. Figure 2.8 describes the value of exports of milk and milk products to and
from Pakistan.
Figure 2.8 Trends in Dairy Exports of Pakistan
Source: (FAOSTAT, 2014)
On the other hand, due to poor quality control and lack of value addition, Pakistan
imports cheese and milk powders to cater the growing demand for highly value added
dairy products. According to Economic Suvery of Pakistan, the dairy import for the year
2013-14 were of value 132.4 US$ million (Ministry of Finance, 2015). Figure 2.9 shows
the trend in Pakistan’s dairy imports.
0
2000
4000
6000
8000
10000
12000
14000
1980 1982 1984 1986 1988 1990 1992 1994 1996 1998 2000 2002 2004 2006 2008 2010
Expo
rts V
alue
"00
0 U
S$"
Trends in Dairy Exports
Butter
WMP
SMP
18
Figure 2.9 Trends in Dairy Imports of Pakistan
Source: (FAOSTAT, 2014)
Pakistan is traditionally a high milk consuming country with 253 kg milk equivalents
per capita per year consumption of dairy products for the year 2013 (Hemme, 2014). A
major proportion of the total milk produced in Pakistan is consumed in the form of
traditional dairy products such as Lassi (buttermilk), yoghurt, milkshake, and Mithai
(sweets) (Zia, et al., 2011). Buffalo milk, due to its more fat contents, density, color, and
taste is preferred over cow milk.
2.3.3 Milk Supply Chain in Pakistan
In Pakistan, milk is second highly consumed food after cereals. Milk reaches the
ultimate customers by two channels: the formal and the informal. Almost 70% of the
milk is consumed in liquid form by the farming community itself and remaining 30%
goes to the urban markets through informal or formal chain (PDDC, 2006). Almost 95%
of the marketable milk reaches the ultimate urban consumers through the informal chain
as unprocessed milk or locally processed into traditional dairy products. The remaining
5% is marketed as standard processed dairy products through the formal chain (Zia,
2009). Both the chains of milk start from the milk production at dairy farm and end at
ultimate consumption by the final customers. The informal chain of milk is further
divided into the rural and peri-urban chains. Figures 2.10 and 2.11 represent the rural
and peri-urban chains of milk, respectively.
0
10000
20000
30000
40000
50000
60000
70000
80000
90000
100000
1980 1982 1984 1986 1988 1990 1992 1994 1996 1998 2000 2002 2004 2006 2008 2010
Impo
rt V
lalu
e "0
00 U
S$"
Trends in Dairy Imports
Butter
WMP
SMP
Cheese
19
Figure 2.10 Rural Marketing Chain of Milk in Pakistan
Source: (Zia, 2009)
Figure 2.11 Peri-Urban Marketing Chain of Milk in Pakistan
Source: (Zia, 2009)
After dairy farmer, the major player in the informal chain of milk in pakistan is milk
collector. The milk collectors collect milk mainly from the individual dairy farms and
transport to nearby town where they sell it to the milk shops, and milk collection centres
and private contractors of the dairy companies. The milk collectors are classified into
three categories based on their scale of operation (Zia, 2006; Zia, et al., 2011). Table 2.3
describes these categories briefly. The small scale milk collectors collect an average of
100 litres of milk from up to 20 farms daily. Bicycle or motorcycle is generally used to
collect and transport milk. Kutcha Dodhis advance payment to the farmers to secure un-
interrupted supply of milk, especially during summers, as risk management strategy.
Pucca Dodhis, on the other hand, collect between 400 – 800 litres of milk daily. In
addition to individual dairy farms, Pucca Dodhis source milk from Kutcha Dodhis as
Rural Dairy Farmer
VMC Dhodi Village Retailer/Tea Rural Consumer
De-creamer Contractor
Halwai/Baker Retailer Local Processor
Urban Consumer
Dairy Farmer
Dhodi/Contractor
Milk Shop
Consumer
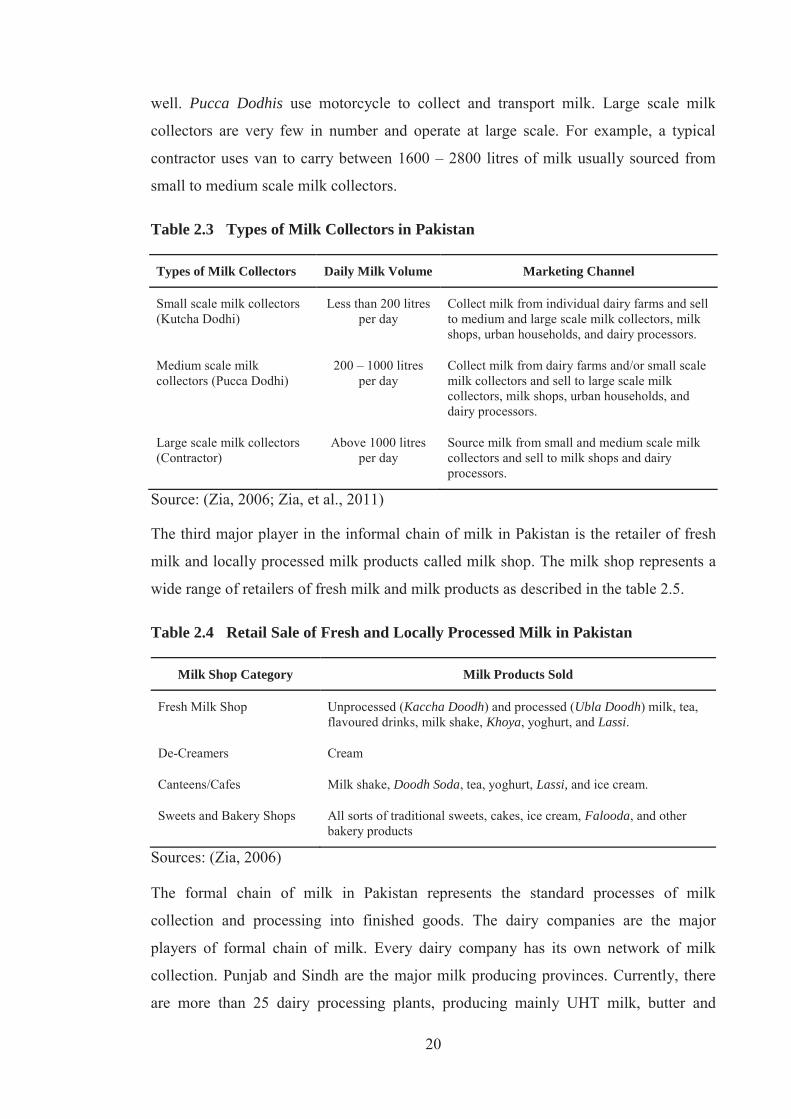
20
well. Pucca Dodhis use motorcycle to collect and transport milk. Large scale milk
collectors are very few in number and operate at large scale. For example, a typical
contractor uses van to carry between 1600 – 2800 litres of milk usually sourced from
small to medium scale milk collectors.
Table 2.3 Types of Milk Collectors in Pakistan
Types of Milk Collectors Daily Milk Volume Marketing Channel
Small scale milk collectors (Kutcha Dodhi)
Less than 200 litres per day
Collect milk from individual dairy farms and sell to medium and large scale milk collectors, milk shops, urban households, and dairy processors.
Medium scale milk collectors (Pucca Dodhi)
200 – 1000 litres per day
Collect milk from dairy farms and/or small scale milk collectors and sell to large scale milk collectors, milk shops, urban households, and dairy processors.
Large scale milk collectors (Contractor)
Above 1000 litres per day
Source milk from small and medium scale milk collectors and sell to milk shops and dairy processors.
Source: (Zia, 2006; Zia, et al., 2011)
The third major player in the informal chain of milk in Pakistan is the retailer of fresh
milk and locally processed milk products called milk shop. The milk shop represents a
wide range of retailers of fresh milk and milk products as described in the table 2.5.
Table 2.4 Retail Sale of Fresh and Locally Processed Milk in Pakistan
Milk Shop Category Milk Products Sold
Fresh Milk Shop Unprocessed (Kaccha Doodh) and processed (Ubla Doodh) milk, tea, flavoured drinks, milk shake, Khoya, yoghurt, and Lassi.
De-Creamers Cream
Canteens/Cafes Milk shake, Doodh Soda, tea, yoghurt, Lassi, and ice cream.
Sweets and Bakery Shops All sorts of traditional sweets, cakes, ice cream, Falooda, and other bakery products
Sources: (Zia, 2006)
The formal chain of milk in Pakistan represents the standard processes of milk
collection and processing into finished goods. The dairy companies are the major
players of formal chain of milk. Every dairy company has its own network of milk
collection. Punjab and Sindh are the major milk producing provinces. Currently, there
are more than 25 dairy processing plants, producing mainly UHT milk, butter and
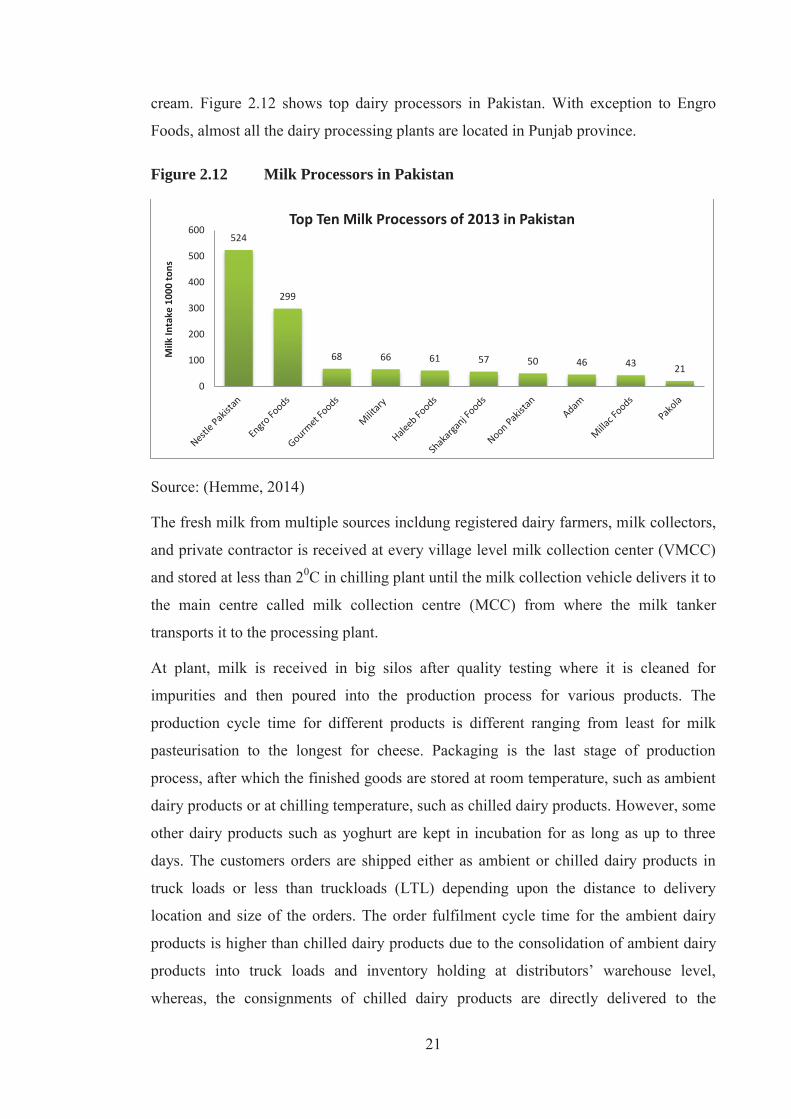
21
cream. Figure 2.12 shows top dairy processors in Pakistan. With exception to Engro
Foods, almost all the dairy processing plants are located in Punjab province.
Figure 2.12 Milk Processors in Pakistan
Source: (Hemme, 2014)
The fresh milk from multiple sources incldung registered dairy farmers, milk collectors,
and private contractor is received at every village level milk collection center (VMCC)
and stored at less than 20C in chilling plant until the milk collection vehicle delivers it to
the main centre called milk collection centre (MCC) from where the milk tanker
transports it to the processing plant.
At plant, milk is received in big silos after quality testing where it is cleaned for
impurities and then poured into the production process for various products. The
production cycle time for different products is different ranging from least for milk
pasteurisation to the longest for cheese. Packaging is the last stage of production
process, after which the finished goods are stored at room temperature, such as ambient
dairy products or at chilling temperature, such as chilled dairy products. However, some
other dairy products such as yoghurt are kept in incubation for as long as up to three
days. The customers orders are shipped either as ambient or chilled dairy products in
truck loads or less than truckloads (LTL) depending upon the distance to delivery
location and size of the orders. The order fulfilment cycle time for the ambient dairy
products is higher than chilled dairy products due to the consolidation of ambient dairy
products into truck loads and inventory holding at distributors’ warehouse level,
whereas, the consignments of chilled dairy products are directly delivered to the
524
299
68 66 61 57 50 46 43 21
0
100
200
300
400
500
600
Milk
Inta
ke 1
000
tons
Top Ten Milk Processors of 2013 in Pakistan
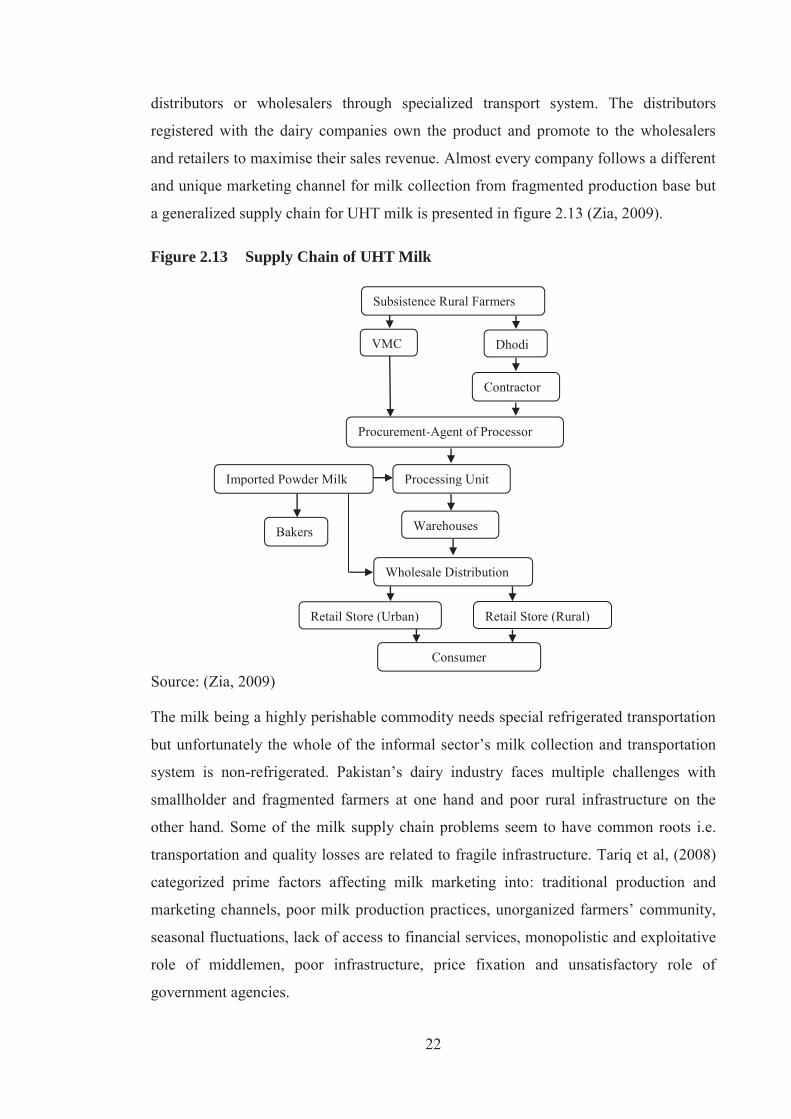
22
distributors or wholesalers through specialized transport system. The distributors
registered with the dairy companies own the product and promote to the wholesalers
and retailers to maximise their sales revenue. Almost every company follows a different
and unique marketing channel for milk collection from fragmented production base but
a generalized supply chain for UHT milk is presented in figure 2.13 (Zia, 2009).
Figure 2.13 Supply Chain of UHT Milk
Source: (Zia, 2009)
The milk being a highly perishable commodity needs special refrigerated transportation
but unfortunately the whole of the informal sector’s milk collection and transportation
system is non-refrigerated. Pakistan’s dairy industry faces multiple challenges with
smallholder and fragmented farmers at one hand and poor rural infrastructure on the
other hand. Some of the milk supply chain problems seem to have common roots i.e.
transportation and quality losses are related to fragile infrastructure. Tariq et al, (2008)
categorized prime factors affecting milk marketing into: traditional production and
marketing channels, poor milk production practices, unorganized farmers’ community,
seasonal fluctuations, lack of access to financial services, monopolistic and exploitative
role of middlemen, poor infrastructure, price fixation and unsatisfactory role of
government agencies.
Subsistence Rural Farmers
Procurement-Agent of Processor
VMC Dhodi
Contractor
Processing Unit
Warehouses
Imported Powder Milk
Wholesale Distribution
Bakers
Retail Store (Rural) Retail Store (Urban)
Consumer
23
2.4 New Zealand Dairy Industry
New Zealand is a market economy with GDP 211.6 NZ$ billion (Statistics New
Zealand, 2014c). Its population of 4.5 million is growing at the rate of 0.89% (Statistics
New Zealand, 2014c). International trade is essential to the New Zealand economy.
Exports of goods and services make up the largest share (29.2%) of GDP (Statistics
New Zealand, 2014c). With 18.6% share of the total exports, the dairy industry is New
Zealand’s biggest export earner. New Zealand population has one of the world’s highest
per capita consumption (593 Kg ME per capita per year) of dairy products (Hemme,
2014). The New Zealand dairy industry is predominantly an export business with only
less than 5% of production consumed domestically whereas the remaining 95% goes to
over 150 countries of the world with key markets in China, the US, Japan and the EU
(Fonterra, 2015). With around 2% share of global milk production, the New Zealand is
the world’s largest exporter (almost one third of global market) of dairy products
(Fonterra, 2015).
Dairy farming is part of a long and proud agricultural tradition in New Zealand
(DCANZ, 2014). Since its inception in late nineteenth century, the New Zealand dairy
industry got comparative advantage over many of its competitors due to New Zealand’s
temperate climate (New Zealand Treasury, 2005). After the colonization of New
Zealand, the dairy production served only domestic markets with a little export to
Australia (Conforte et al., 2008). With the development of refrigeration technology, its
exports entered European markets (UK) around 1919. The companies’ numbers kept
increasing from 23 factories in 1885 (Pimenta, 2010) to more than 400 individual dairy
cooperatives by the 1930’s operating throughout the country (DCANZ, 2014). In 1961,
New Zealand Dairy Board (NZDB) was established by the government to market dairy
products (Conforte, et al., 2008).
The New Zealand, dairy companies have always been export driven, however, since the
1970s there has been significant diversification in both dairy products and markets
(DCANZ, 2014). In 1973, only butter and cheddar cheese were exported (Conforte, et
al., 2008). Later on dairy cooperatives began to expand their manufacturing capabilities,
shifting from butter and cheese (the mainstay of exports to the UK) to begin investing in
the infrastructure to manufacture the milk powders which are an important part of
today's product mix (DCANZ, 2014). This diversification of product lines and markets
led to the increased investments in the dairy sector. By 1995, the New Zealand Dairy

24
Board became the world’s biggest marketing network which was later on dissolved in
1996 and transferred ownership of its assets to the country's 12 dairy co-operatives
(DCANZ, 2014).
In search of efficient manufacturing processes, the companies started consolidation and
integration of their operations. As a result, by the year 2000, more than 95 per cent of
the industry was represented by the two largest dairy companies New Zealand Dairy
Group and Kiwi Co-operative Dairies. Farmer’s strong ideology towards control and
ownership of downstream manufacturing and marketing activities led to vertical
integration and continuous institutional and organizational changes (Conforte, et al.,
2008). In 2001, the dairy industry deregulated and the two largest dairy companies
merged to form Fonterra (Pimenta, 2010).
2.4.1 Dairy Production in New Zealand
The New Zealand dairy farming is characterised as the lowest cost producer at the farm
gate due to the ability to feed on grass all-year-round and the absence of a need for
winter housing of stock. The production base of New Zealand dairy industry has shown
tremendous growth over the last three decades. Figure 2.14 shows the long term trends
in milk production in New Zealand.
Figure 2.14 Trends in Milk Production in New Zealand
Source: (FAOSTAT, 2014)
The New Zealand’s predominately pasture based milk production system follows a
seasonal pattern where cows are in milk from July to early May. The seasonal milk
production system of New Zealand dairy industry relies predominantly on highly
0
50
100
150
200
250
1980
1981
1982
1983
1984
1985
1986
1987
1988
1989
1990
1991
1992
1993
1994
1995
1996
1997
1998
1999
2000
2001
2002
2003
2004
2005
2006
2007
2008
2009
2010
2011
2012
Milk
Pro
duct
ion
"Mill
ion
Tonn
es"
Trends in Milk Production in New Zealand

25
productive, rotationally grazed pasture and herds of high genetic merit. It is this system
that enables farmers to produce milk substantially below average world costs, giving
New Zealand its advantage over global competitors. Dairy New Zealand classifies the
dairy farms into five production systems, system-1 being “all grass selcontained”
whereas system-5 “imported feed used all year”. Figure 2.15 illustrates distribution of
dairy cows across New Zealand.
Figure 2.15 Regional Distribution of Dairy Cows in New Zealand
Source: (DairyNZ, 2014)
The dairy season in New Zealand starts from June and ends in May. Over the years
husbandry practices have been managed in such a way that all the dairy cows dry up in
May and calving season starts from the end of July. This reproductive pattern adheres to
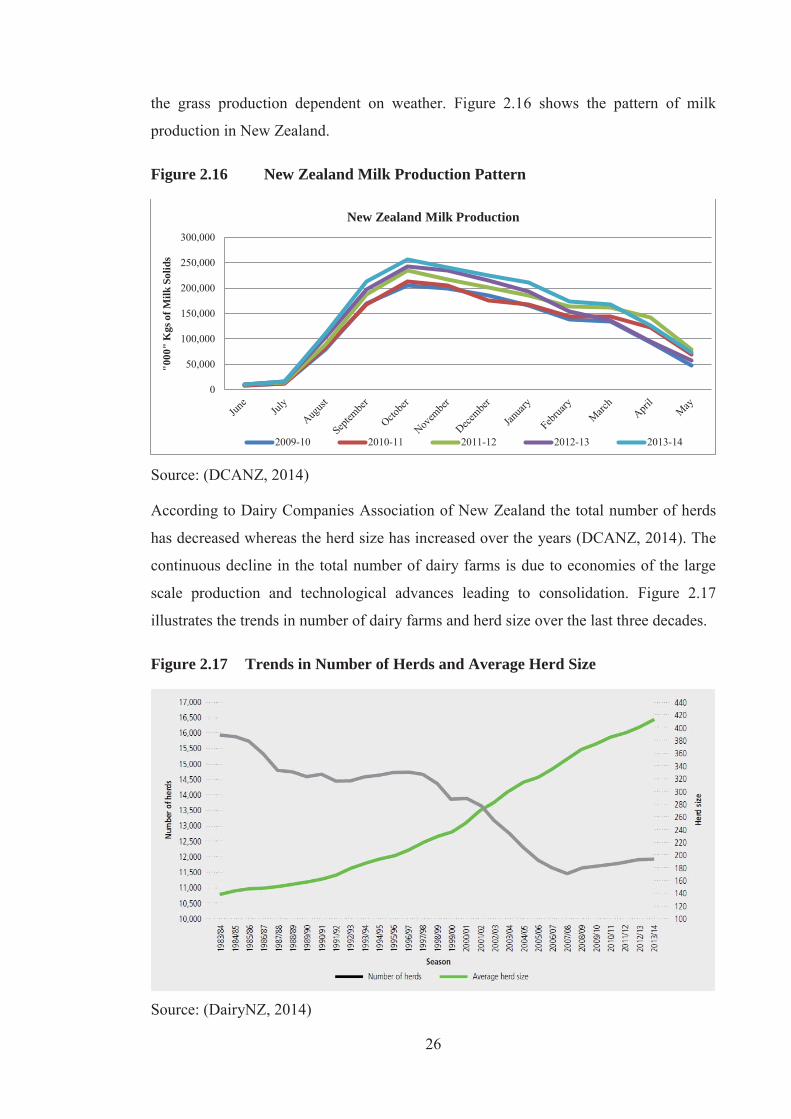
26
the grass production dependent on weather. Figure 2.16 shows the pattern of milk
production in New Zealand.
Figure 2.16 New Zealand Milk Production Pattern
Source: (DCANZ, 2014)
According to Dairy Companies Association of New Zealand the total number of herds
has decreased whereas the herd size has increased over the years (DCANZ, 2014). The
continuous decline in the total number of dairy farms is due to economies of the large
scale production and technological advances leading to consolidation. Figure 2.17
illustrates the trends in number of dairy farms and herd size over the last three decades.
Figure 2.17 Trends in Number of Herds and Average Herd Size
Source: (DairyNZ, 2014)
0
50,000
100,000
150,000
200,000
250,000
300,000
"000
" K
gs o
f Milk
Sol
ids
New Zealand Milk Production
2009-10 2010-11 2011-12 2012-13 2013-14
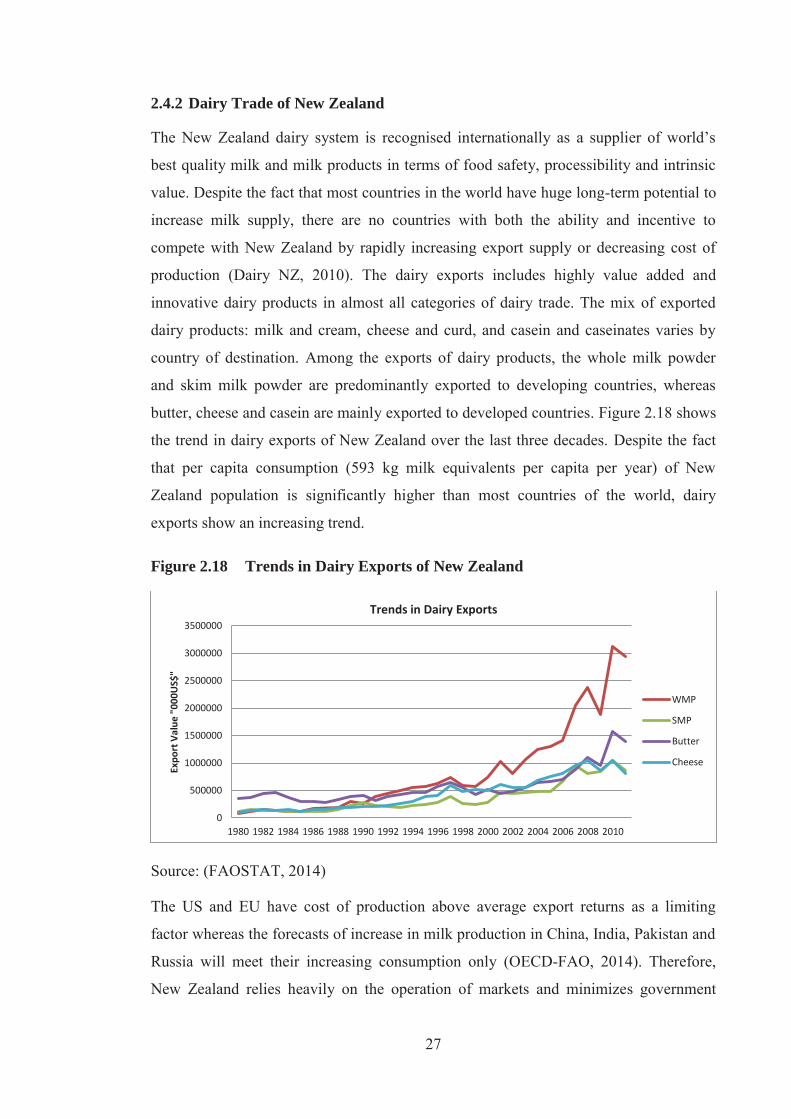
27
2.4.2 Dairy Trade of New Zealand
The New Zealand dairy system is recognised internationally as a supplier of world’s
best quality milk and milk products in terms of food safety, processibility and intrinsic
value. Despite the fact that most countries in the world have huge long-term potential to
increase milk supply, there are no countries with both the ability and incentive to
compete with New Zealand by rapidly increasing export supply or decreasing cost of
production (Dairy NZ, 2010). The dairy exports includes highly value added and
innovative dairy products in almost all categories of dairy trade. The mix of exported
dairy products: milk and cream, cheese and curd, and casein and caseinates varies by
country of destination. Among the exports of dairy products, the whole milk powder
and skim milk powder are predominantly exported to developing countries, whereas
butter, cheese and casein are mainly exported to developed countries. Figure 2.18 shows
the trend in dairy exports of New Zealand over the last three decades. Despite the fact
that per capita consumption (593 kg milk equivalents per capita per year) of New
Zealand population is significantly higher than most countries of the world, dairy
exports show an increasing trend.
Figure 2.18 Trends in Dairy Exports of New Zealand
Source: (FAOSTAT, 2014)
The US and EU have cost of production above average export returns as a limiting
factor whereas the forecasts of increase in milk production in China, India, Pakistan and
Russia will meet their increasing consumption only (OECD-FAO, 2014). Therefore,
New Zealand relies heavily on the operation of markets and minimizes government
0
500000
1000000
1500000
2000000
2500000
3000000
3500000
1980 1982 1984 1986 1988 1990 1992 1994 1996 1998 2000 2002 2004 2006 2008 2010
Expo
rt V
alue
"00
0US$
"
Trends in Dairy Exports
WMP
SMP
Butter
Cheese
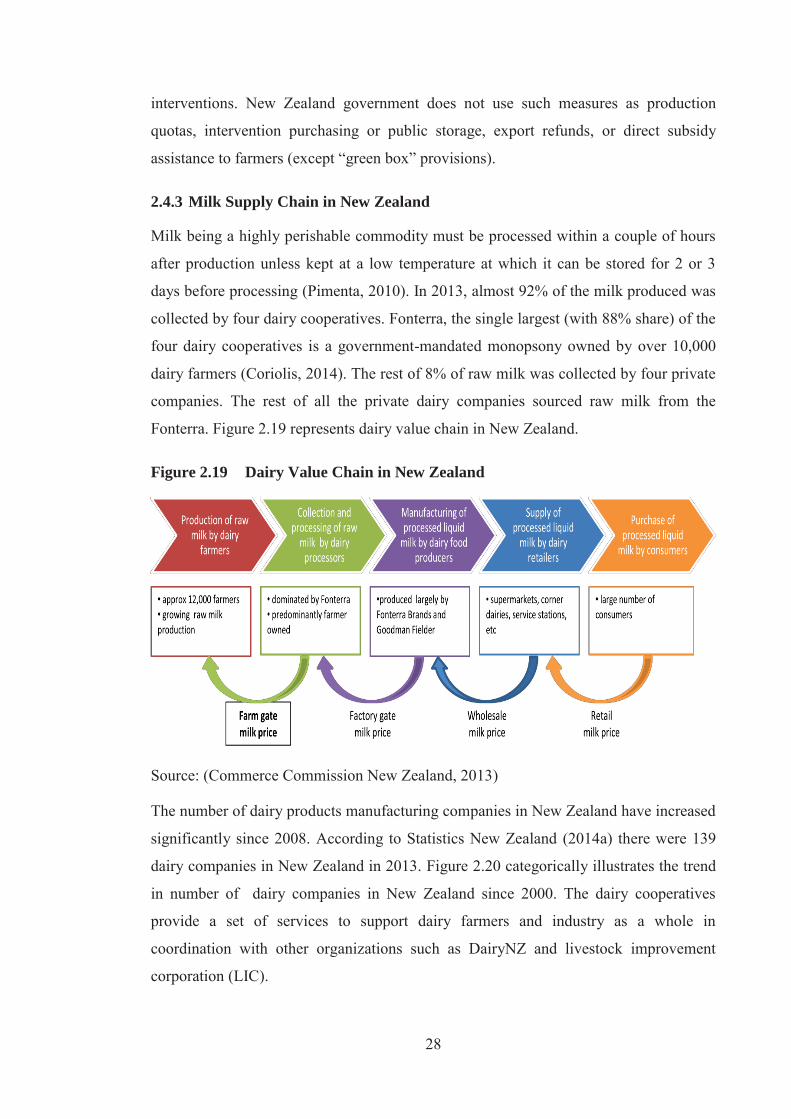
28
interventions. New Zealand government does not use such measures as production
quotas, intervention purchasing or public storage, export refunds, or direct subsidy
assistance to farmers (except “green box” provisions).
2.4.3 Milk Supply Chain in New Zealand
Milk being a highly perishable commodity must be processed within a couple of hours
after production unless kept at a low temperature at which it can be stored for 2 or 3
days before processing (Pimenta, 2010). In 2013, almost 92% of the milk produced was
collected by four dairy cooperatives. Fonterra, the single largest (with 88% share) of the
four dairy cooperatives is a government-mandated monopsony owned by over 10,000
dairy farmers (Coriolis, 2014). The rest of 8% of raw milk was collected by four private
companies. The rest of all the private dairy companies sourced raw milk from the
Fonterra. Figure 2.19 represents dairy value chain in New Zealand.
Figure 2.19 Dairy Value Chain in New Zealand
Source: (Commerce Commission New Zealand, 2013)
The number of dairy products manufacturing companies in New Zealand have increased
significantly since 2008. According to Statistics New Zealand (2014a) there were 139
dairy companies in New Zealand in 2013. Figure 2.20 categorically illustrates the trend
in number of dairy companies in New Zealand since 2000. The dairy cooperatives
provide a set of services to support dairy farmers and industry as a whole in
coordination with other organizations such as DairyNZ and livestock improvement
corporation (LIC).
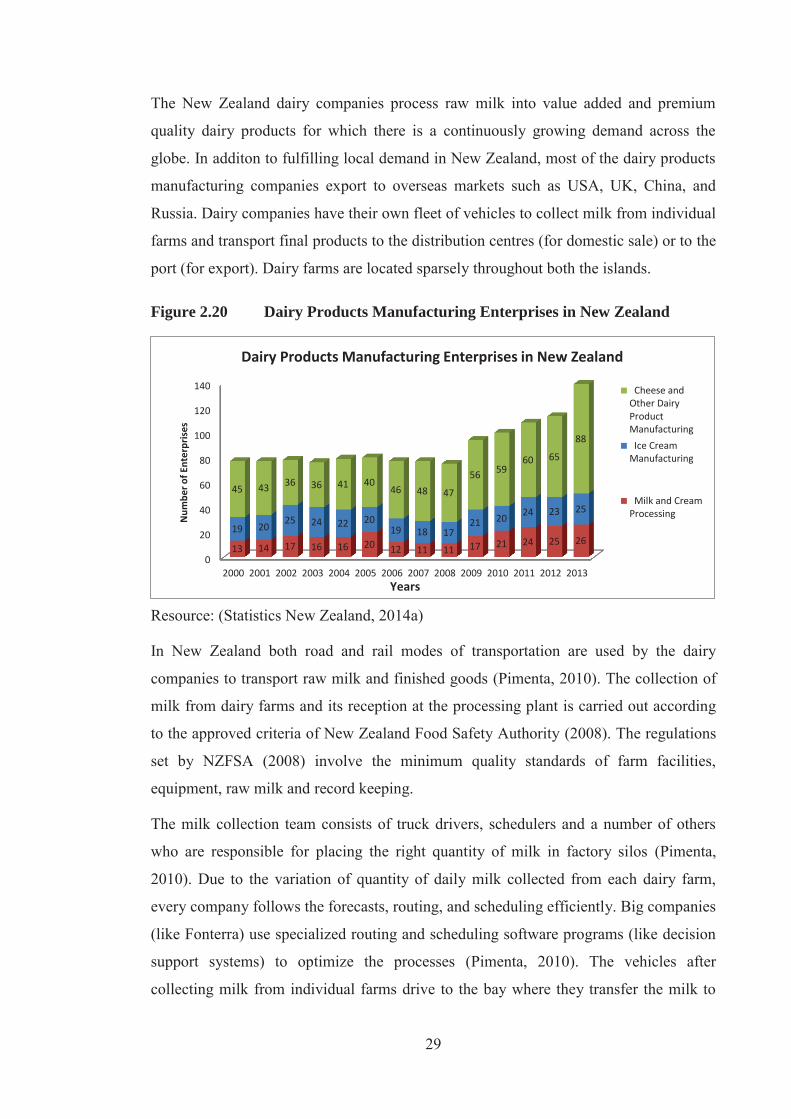
29
The New Zealand dairy companies process raw milk into value added and premium
quality dairy products for which there is a continuously growing demand across the
globe. In additon to fulfilling local demand in New Zealand, most of the dairy products
manufacturing companies export to overseas markets such as USA, UK, China, and
Russia. Dairy companies have their own fleet of vehicles to collect milk from individual
farms and transport final products to the distribution centres (for domestic sale) or to the
port (for export). Dairy farms are located sparsely throughout both the islands.
Figure 2.20 Dairy Products Manufacturing Enterprises in New Zealand
Resource: (Statistics New Zealand, 2014a)
In New Zealand both road and rail modes of transportation are used by the dairy
companies to transport raw milk and finished goods (Pimenta, 2010). The collection of
milk from dairy farms and its reception at the processing plant is carried out according
to the approved criteria of New Zealand Food Safety Authority (2008). The regulations
set by NZFSA (2008) involve the minimum quality standards of farm facilities,
equipment, raw milk and record keeping.
The milk collection team consists of truck drivers, schedulers and a number of others
who are responsible for placing the right quantity of milk in factory silos (Pimenta,
2010). Due to the variation of quantity of daily milk collected from each dairy farm,
every company follows the forecasts, routing, and scheduling efficiently. Big companies
(like Fonterra) use specialized routing and scheduling software programs (like decision
support systems) to optimize the processes (Pimenta, 2010). The vehicles after
collecting milk from individual farms drive to the bay where they transfer the milk to
0
20
40
60
80
100
120
140
2000 2001 2002 2003 2004 2005 2006 2007 2008 2009 2010 2011 2012 2013
13 14 17 16 16 20 12 11 11 17 21 24 25 26 19 20
25 24 22 20 19 18 17
21 20 24 23 25
45 43 36 36 41 40 46 48 47
56 59 60 65
88
Num
ber o
f Ent
erpr
ises
Years
Dairy Products Manufacturing Enterprises in New Zealand
Cheese andOther DairyProductManufacturing Ice CreamManufacturing
Milk and CreamProcessing
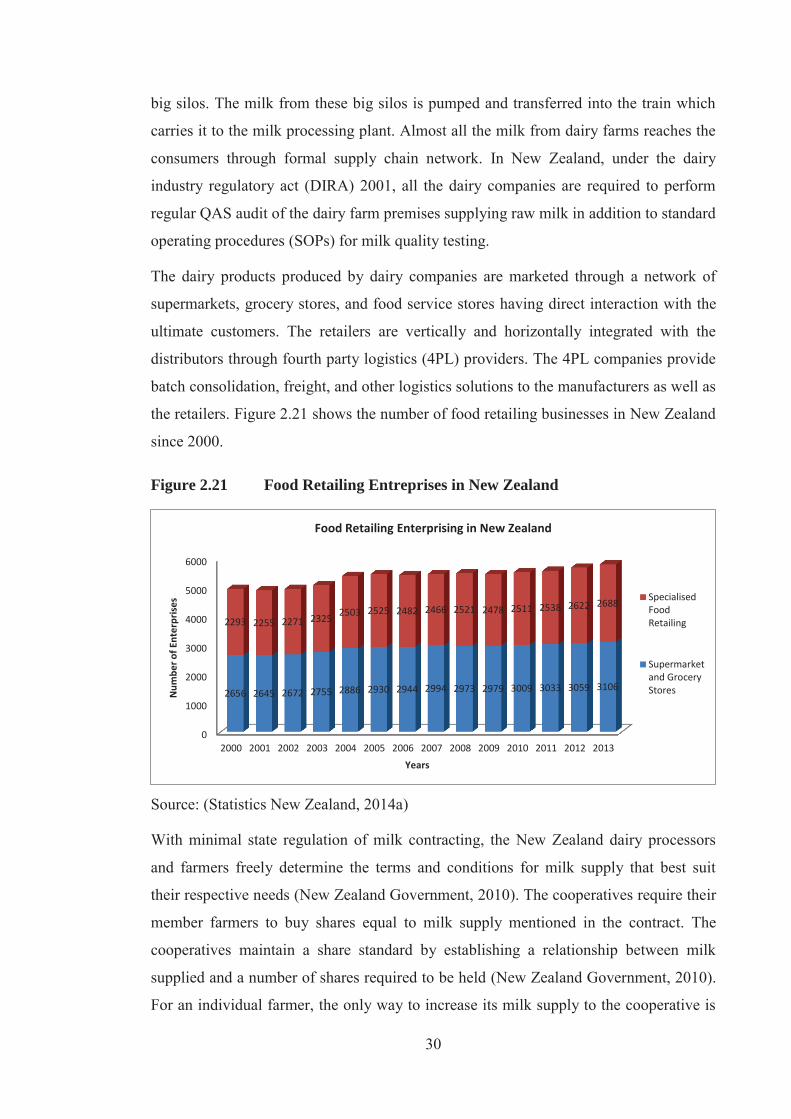
30
big silos. The milk from these big silos is pumped and transferred into the train which
carries it to the milk processing plant. Almost all the milk from dairy farms reaches the
consumers through formal supply chain network. In New Zealand, under the dairy
industry regulatory act (DIRA) 2001, all the dairy companies are required to perform
regular QAS audit of the dairy farm premises supplying raw milk in addition to standard
operating procedures (SOPs) for milk quality testing.
The dairy products produced by dairy companies are marketed through a network of
supermarkets, grocery stores, and food service stores having direct interaction with the
ultimate customers. The retailers are vertically and horizontally integrated with the
distributors through fourth party logistics (4PL) providers. The 4PL companies provide
batch consolidation, freight, and other logistics solutions to the manufacturers as well as
the retailers. Figure 2.21 shows the number of food retailing businesses in New Zealand
since 2000.
Figure 2.21 Food Retailing Entreprises in New Zealand
Source: (Statistics New Zealand, 2014a)
With minimal state regulation of milk contracting, the New Zealand dairy processors
and farmers freely determine the terms and conditions for milk supply that best suit
their respective needs (New Zealand Government, 2010). The cooperatives require their
member farmers to buy shares equal to milk supply mentioned in the contract. The
cooperatives maintain a share standard by establishing a relationship between milk
supplied and a number of shares required to be held (New Zealand Government, 2010).
For an individual farmer, the only way to increase its milk supply to the cooperative is
0
1000
2000
3000
4000
5000
6000
2000 2001 2002 2003 2004 2005 2006 2007 2008 2009 2010 2011 2012 2013
2656 2645 2672 2755 2886 2930 2944 2994 2973 2979 3009 3033 3059 3106
2293 2255 2271 2325 2503 2525 2482 2466 2521 2478 2511 2538 2622 2688
Num
ber o
f Ent
erpr
ises
Years
Food Retailing Enterprising in New Zealand
SpecialisedFoodRetailing
Supermarketand GroceryStores
31
to buy additional shares of that cooperative. The investor owned companies, on the
other hand, offer farmers long term supply contacts (ranging from 3-6 seasons) rather
than requiring them as suppliers (to purchase shares in the company).
According to the New Zealand dairy industry restructuring act (DIRA) 2001, the dairy
cooperatives are required to allow free exit to its member farmers (New Zealand
Government, 2010). The dairy cooperatives in New Zealand are required to offer “fair
value” share price to its farmers otherwise their suppliers will switch to the other
companies. The result is that the cooperatives have strong incentives to efficiently price
raw milk prior to the start of each season. These provisions nullify the need to impose a
regulated milk price (New Zealand Government, 2010).
2.5 Summary
The background chapter provides exploratory basis for the overall study. This chapter is
directly linked with the first research objective of investigating the milk SCN of
Pakistan and New Zealand to develop deeper understanding of the structure of dairy
industry. The chapter emphasises the background of dairy industry at global level as
well as the benchmarking partner’s national levels. The overall patterns of global milk
production, dairy trade, and consumption of dairy products are discussed. The
international terms of trade between the major exporters and importers of dairy
commidities are described.
Subsequently, the dairy industries of Pakistan and New Zealand are described from milk
production, dairy trade, and demand and supply mechanism of the dairy produucts
persepectives. The milk production system of Pakistan is fodder-based smallholder,
whereas, in New Zealand its Pasture-based cooperative farming. Moreover, the dairy
processing, distribution, and retail sale is predominantly done by an integrated and
collaborative network of producer and consumer cooperatives.
32
CHAPTER 3
3. LITERATURE REVIEW
3.1 Introduction
This chapter reviews the literature on supply chain management (SCM), performance
measurement (PM) in SCM, and benchmarking. The chapter is organized into following
sections.
Section 3.2 focuses on SCM literature, in context of definitions and evolution of
SCM over the years.
Section 3.3 presents the literature on benchmarking in SCM. This section covers
introduction to benchmarking, history of benchmarking, benchmarking
frarmeworks, and benchmarking in agri-food supply chains.
Section 3.4 critically reviews the literature on performance measurement in
SCM. This section expands on definitions, evolution of SC performance
measurement, performance measurement in agri-food supply chains, selecting a
performance measurement framework for agri-food supply chains, and SC
performance measurement systems (PMS).
Section 3.5 discusses potential research gap and the way forward.
Section 3.6 introduces the proposed analytical framework for agri-food supply
chains.
Section 3.7 presents the summary of the overall chapter.
3.2 Supply Chain Management
Various terms have been used in the history conforming supply chain management such
as physical distribution management before 1960’s, logistics management in 1970’s,
and finally supply chain management in 1980’s. Supply Chain Management (SCM) is
one of the fastest evolving areas of interest in industry and academia. Now the
competition is among supply chains, not the individual firms. Supply chains are
collaborating to overcome the future challenges such as to optimise costs, reduce risks
and improve reliability, responsiveness, agility, and flexibility of the overall supply
chain. The use of information technology in the form of various softwares such as EDI,
VMI, ECR, MRP, and ERP has played a pivotal role. The literature on supply chain
management can be summarised under following subsections.
33
3.2.1 Supply Chain Management Definitions
In literature, the term supply chain management has been defined as ‘supply chain’ as
well as ‘supply chain management’. The definition of ‘supply chain’ seems to be more
common in literature than ‘supply chain management’ (Cooper & Ellram, 1993; La
Londe & Masters, 1994; Lambert, Stock, et al., 1998). The former term is a proposition
noun describing an amalgamation of firms involved in the flow of goods, service, and
information from a point of initial production to ultimate consumption. Whereas, the
later term describes the management of integrated business processes responsible for
creating and transferring value at all the links in an overall supply chain.
The most common definitions of supply chain are presented in Appendix-A. These
definitions of supply chain focus on few common elements. These are: flow of goods
from source of production to ultimate consumer; value addition conforming to the
dynamic customer demands; manufacturing perspective; integration of supply chain
processes and activities at intra-firm and inter-firm levels; relationship management
with suppliers and customers; exchange of information; and holistic/system’s approach
of solving problems. The flow of goods and services and integration of processes is the
overall focus of almost all the definitions of supply chain. Earlier definitions such as
given by (Cavinato, 1992) emphasise on relationship management while others focus on
customer value (Christopher, 1998), information sharing (Lummus & Vokurka, 1999;
Mentzer et al., 2001; Quinn, 1997; Van der Vorst, 2000a), manufacturing perspective
(Beamon, 1998; Swaminathan et al., 1998), and holistic/system’s approach (Lummus &
Vokurka, 1999; Quinn, 1997; Van der Vorst, 2000a).
A careful look over the focus of definitions of supply chain yields an evolutionary trend
in the concept of supply chain. The focus of earlier definitions is on flow of goods
whereas the later definitions include the flow of services and information as well. The
integration of all the supply chain activities and decision making units can be seen in
late 1990’s definitions. Moreover, the concepts of customer value and holistic thinking
approach are found in later definitions.
The SCOR model developed by Supply Chain Council in 1996 emphasizes that every
supply chain consists of five supply chain processes namely Plan, Source, Make,
Deliver, and Return (Stewart, 1997). Lambert, Cooper, and Pagh (1998) on the other
hand, view that a supply chain is built on eight business processes: customer
relationship management; customer service management; demand management; order

34
fulfillment; manufacturing flow management; supplier relationship management;
product development and commercialization; and returns management. Lambert and
Cooper (2000) describe four main characteristics of a supply chain. These are: vertical
coordination at intra- and inter-organization levels; relationship management; two-way
flow of products, services, and information; and create and deliver high value to the
customer with optimal use of resources. What a supply chain comprises of and what it
does not, is debatable.
The term ‘supply chain management’ on the other hand, has been viewed from various
perspectives in the literature. For example, Cox (1997) uses it to describe strategic inter-
organizational issues, whereas earlier Thorelli (1986) looked over it as an alternative
organizational form to vertical integration. Lamming (1993) employs SCM to describe
supplier relationships. However, a number of authors claim that the concept ‘supply
chain management’ is not well-understood (Babbar & Prasad, 1998; Cooper et al., 1997;
Gibson et al., 2005), and therefore, highlight the necessity of a consensus definition.
The commonly found definitions of SCM found in the literature are presented in
Appendix-B.
Lambert et al. (1998) believe that supply chain management is a set of management
processes rather than functional silos. Mentzer et al. (2001) classify the definitions of
SCM found in the literature into three categories: a management philosophy,
implementation of a management philosophy, and a set of management processes.
Gibson, Mentzer, and Cook (2005) are of the view that all the definitions of SCM found
in the literature focus on strategy, activities, and processes or any of their combinations.
The definitions of SCM found in the literature exhibit a series of evolutionary steps
towards refinement. The focus of earlier definitions of SCM is on flow of goods
(Cooper & Ellram, 1993), and relationship management (Berry et al., 1994;
Christopher, 1998). Counter wise the focus of later definitions is on supply chain
coordination (Ballou, 2007; Mentzer, et al., 2001; Van der Vorst, 2000a), customer
value (Levi et al., 2003; Van der Vorst, 2000a), and holistic/system’s approach (Ballou,
2007; Mentzer, et al., 2001; Van der Vorst, 2000a).
This shift in the focus of the definitions of SCM shows evolution towards refinement.
However, two elements: the integration of business processes; and efficiency and
effectiveness have always been the major focus of most of the definitions. The

35
integration here means both forward and backward integration at intra-firm as well as
inter-firm levels. Efficiency and effectiveness refer to the performance of business
activities performed at intra-organization as well as inter-organization levels required to
move the goods and services from point of initial production to final consumption.
These performance measures include reliability, responsiveness, agility, and flexibility.
3.2.2 Evolution of Supply Chain Management
Supply chain management evolved as war strategy and later on shifted to business
domain (Soni & Kodali, 2008). In different periods of history, supply chain
management has been referred differently, such as ‘physical distribution management’,
‘logistics management’, ‘business logistics management’, ‘integrated logistics
management’, and ‘supply chain management’ (Soni & Kodali, 2008, p. 7). The concept
of SCM entered in business domain in 1980s’ when firms experienced the benefits of
collaborative advantage (Cooper, et al., 1997). The globalization of marketplace lead
organization to integrate vertically so as to harvest a number of collaborative
advantages, such as economies of the scale, sourcing quality material suppliers, and
specializing as low cost (Christopher, 2005). A systems’ thinking emerged in SCM in
order to satisfy dynamic customer demands and to survive in cut-throat competition.
The origin of supply chain management roots from ancient history of mankind.
Logistics practices originated due to surplus grains, raw materials, and trade of scarcer
and surplus commodities (Soni & Kodali, 2008). The logistics strengths and capabilities
have been the determining factor in success or failure of wars in human history
(Christopher, 2005). The industrial revolution added to the standardization of the
products, and shifted primary production to mass production. In the early part of 20th
century, distribution of goods was not considered to be the responsibility of the
manufacturer (Rushton et al., 2006). The Ford’s highly integrated manufacturing
complex in 1917 was a revolutionary initiative in the evolution of SCM in
manufacturing. During the World War-I and II the movement of huge amount of
supplies further raised the importance of logistics.
Before 1950’s the term ‘logistics’ was used mainly by the military organization and
unknown in industry (Ballou, 2007). During 1950’s the manufacturers adopted mass
production to reduce costs and improve productivity and very little efforts were
employed to make supplier partnerships, improving process design and product quality
36
(Soni & Kodali, 2008). Afterwards, physical distribution management got recognition
as a separate department in manufacturing companies with main focus to minimize
physical distribution costs (Helson, 1964). The notion of system’s approach to problem
solving for the accomplishment of organizational goals is a product of physical
distribution analysis (Bowersox, 1969).
During 1960s’ the share of physical distribution cost in dollar sales was 25-33%
because now consisted of materials handling, packaging, finished goods inventory,
distribution planning, order processing, transportation, and customer service (Reese,
1961). The vision of physical distribution of that time is much like SCM today as can be
inferred from the definition of physical distribution given by Smykay, Bowersox, and
Mossman (1961, p. 1).
“Physical distribution can be broadly defined as that area of business management
responsible for the movement of raw materials and finished products and the
development of movement systems”
In 1970’s logistics management emerged as a result of integration of physical
distribution and materials management recognizing the need of coordination between
inbound and outbound movement of information and goods (Langley, 1986). Ballou
(2007) pointed out that the typical firms at that time had fragmented their key activities
in terms of responsibilities and objectives for marketing, finance and production. This
fragmentation led to the conflict of sub-optimization of costs and customer service
among those responsible for the logistics activities. Moreover, the logistics costs on an
individual firm level were as high as 32 percent of the sales (La Londe & Zinszer,
1976). On national level, the estimated logistics costs were 15 percent of gross national
product in USA (Heskett et al., 1973), and 16 percent of sales in UK (Murphy, 1972).
During 1980s’ the use of computers and industrial automation provide basis for
centralized distribution and finally resulted in remarkable reductions in stock holdings.
Firms realized the benefits of mass production, collaboration and supplier relationships.
Third party logistics providers came into being letting the businesses focus their core
competencies. With such technological advancements in the logistics environment,
supply chain management emerged in 1980s’ (Cooper, et al., 1997; Gibson, et al., 2005;
La Londe, 1998; Levy & Grewal, 2000; Lummus & Vokurka, 1999; Mentzer, et al.,
2001) and was first used in literature by Oliver and Weber (1982). There are two
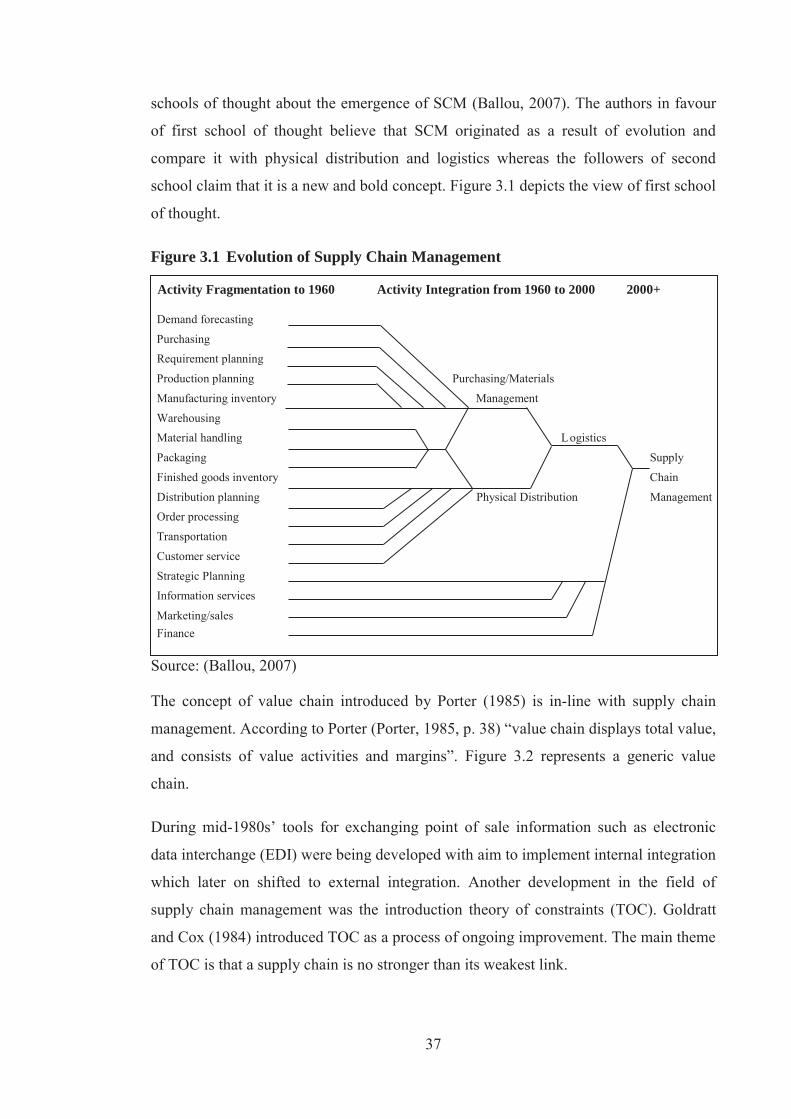
37
schools of thought about the emergence of SCM (Ballou, 2007). The authors in favour
of first school of thought believe that SCM originated as a result of evolution and
compare it with physical distribution and logistics whereas the followers of second
school claim that it is a new and bold concept. Figure 3.1 depicts the view of first school
of thought.
Figure 3.1 Evolution of Supply Chain Management
Activity Fragmentation to 1960 Activity Integration from 1960 to 2000 2000+
Demand forecasting
Purchasing Requirement planning
Production planning Purchasing/Materials
Manufacturing inventory Management
Warehousing Material handling Logistics
Packaging Supply
Finished goods inventory Chain
Distribution planning Physical Distribution Management Order processing
Transportation
Customer service
Strategic Planning Information services
Marketing/sales Finance
Source: (Ballou, 2007)
The concept of value chain introduced by Porter (1985) is in-line with supply chain
management. According to Porter (Porter, 1985, p. 38) “value chain displays total value,
and consists of value activities and margins”. Figure 3.2 represents a generic value
chain.
During mid-1980s’ tools for exchanging point of sale information such as electronic
data interchange (EDI) were being developed with aim to implement internal integration
which later on shifted to external integration. Another development in the field of
supply chain management was the introduction theory of constraints (TOC). Goldratt
and Cox (1984) introduced TOC as a process of ongoing improvement. The main theme
of TOC is that a supply chain is no stronger than its weakest link.
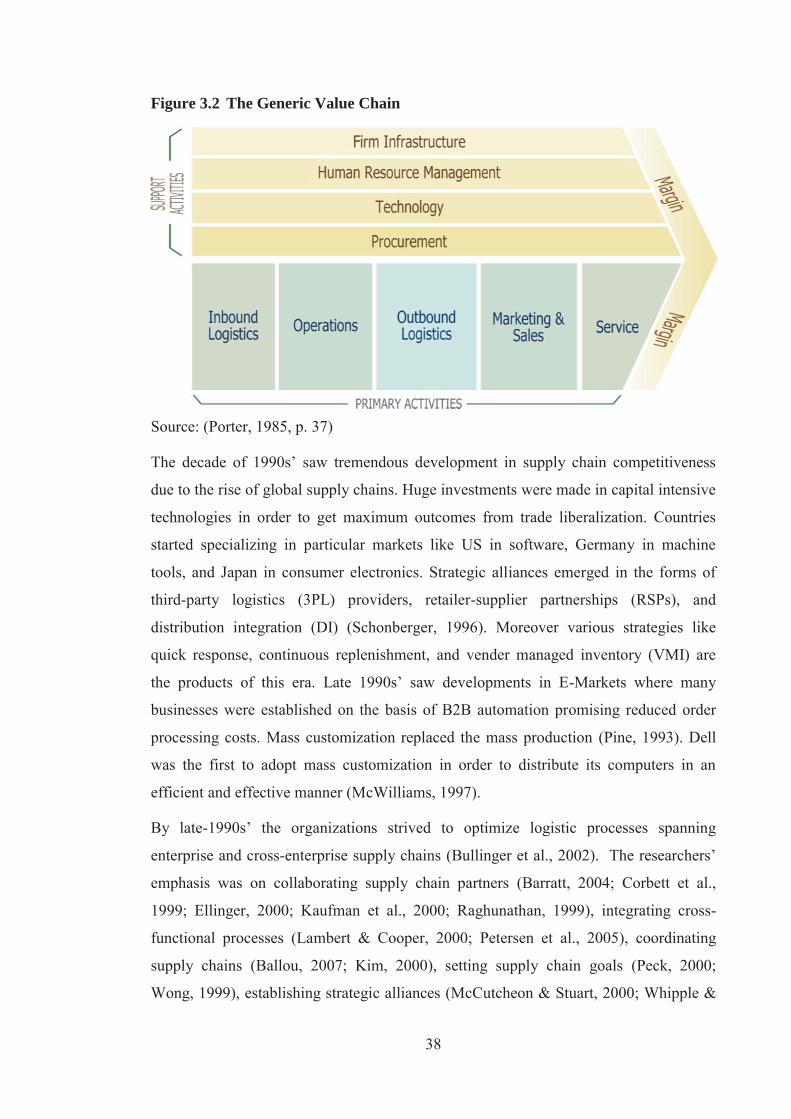
38
Figure 3.2 The Generic Value Chain
Source: (Porter, 1985, p. 37)
The decade of 1990s’ saw tremendous development in supply chain competitiveness
due to the rise of global supply chains. Huge investments were made in capital intensive
technologies in order to get maximum outcomes from trade liberalization. Countries
started specializing in particular markets like US in software, Germany in machine
tools, and Japan in consumer electronics. Strategic alliances emerged in the forms of
third-party logistics (3PL) providers, retailer-supplier partnerships (RSPs), and
distribution integration (DI) (Schonberger, 1996). Moreover various strategies like
quick response, continuous replenishment, and vender managed inventory (VMI) are
the products of this era. Late 1990s’ saw developments in E-Markets where many
businesses were established on the basis of B2B automation promising reduced order
processing costs. Mass customization replaced the mass production (Pine, 1993). Dell
was the first to adopt mass customization in order to distribute its computers in an
efficient and effective manner (McWilliams, 1997).
By late-1990s’ the organizations strived to optimize logistic processes spanning
enterprise and cross-enterprise supply chains (Bullinger et al., 2002). The researchers’
emphasis was on collaborating supply chain partners (Barratt, 2004; Corbett et al.,
1999; Ellinger, 2000; Kaufman et al., 2000; Raghunathan, 1999), integrating cross-
functional processes (Lambert & Cooper, 2000; Petersen et al., 2005), coordinating
supply chains (Ballou, 2007; Kim, 2000), setting supply chain goals (Peck, 2000;
Wong, 1999), establishing strategic alliances (McCutcheon & Stuart, 2000; Whipple &
39
Frankel, 2000), outsourcing (Ansari et al., 1999; Heriot & Kulkarni, 2001), and supply
chain power relationships (Cox, 1999, 2001a, 2001b, 2001c; Cox et al., 2001) explored
new areas of specialization and innovativeness in supply chain management. This era
transformed supply chains into value chains (Bovel & Martha, 2000; Christopher, 2005;
Rayport & Sviokla, 1995). The concept of value chain emerged and developed side by
side with the supply chain and later on overwhelmed the supply chain.
During the first decade of twenty first century, the use of information technology got
heavy reliance for gaining and sustaining the competitiveness (Dehning & Stratopoulos,
2003; Gulledge & Chavusholu, 2008; Hidding, 2001; Staley & Warfield, 2007), for
example, the use of ERP for quality assurance (Millet et al., 2009). The businesses are
now entering into a ‘network competition’ where challenges would be to better
structure, coordinate, and manage relationships with the network partners to deliver
higher customer value to the ultimate consumers (Christopher, 2005). The value chains
are developing into value chain networks (Peppard & Rylander, 2006).
3.3 Benchmarking in Supply Chain Management
Benchmarking has emerged as an increasingly essential tool for organizational
improvement (Andersen, et al., 1999; Dattakumar & Jagadeesh, 2003). Businesses
benchmark for variety of reasons including: enhancement of improvement culture, as a
short-cut to the improvement, as a driver for improvement, as an aid to planning, as a
solution of specific problems, submission for business excellence awards, to build-up
network of like-minded people, and to justify proposals (Stapenhurst, 2009).
Benchmarking is also considered to be fundamental in successful implementation of
business process re-engineering (BPR), total quality management (TQM), and best
practices (Bessant & Rush, 1998). Moreover, it has been an effective tool for improving
quality (Zairi & Hutton, 1995), performance, and customer service (Yasin & Zimmerer,
1995); identifying operational and strategic gaps; and finding best practices to bridge
these gaps (Yasin, 2002). Furthermore, it is more than just comparing performance with
competitors, as it includes analysis of how competitors achieved that position
(Mathaisel et al., 2004).
Benchmarking has been defined differently by academicians, managers and
practitioners. However, the most commonly found definitions of benchmarking are
given in the figure 3.3. The definitions of benchmarking given in figure 3.3 are based on
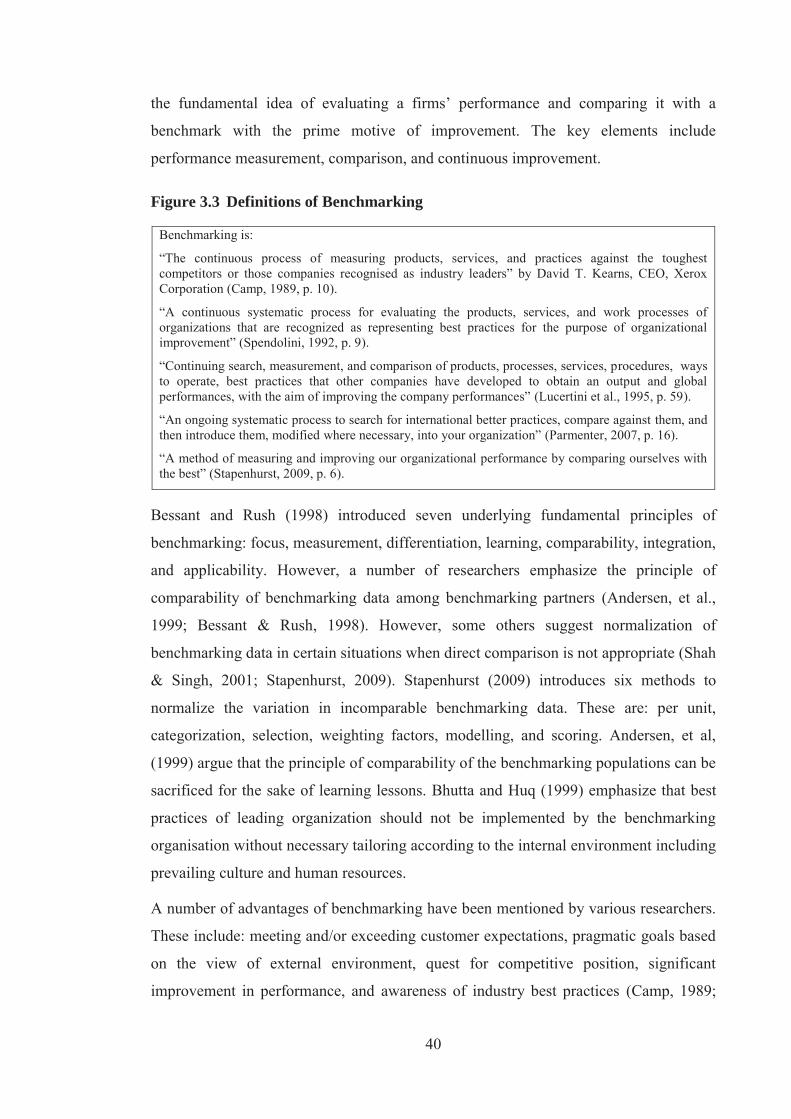
40
the fundamental idea of evaluating a firms’ performance and comparing it with a
benchmark with the prime motive of improvement. The key elements include
performance measurement, comparison, and continuous improvement.
Figure 3.3 Definitions of Benchmarking
Benchmarking is:
“The continuous process of measuring products, services, and practices against the toughest competitors or those companies recognised as industry leaders” by David T. Kearns, CEO, Xerox Corporation (Camp, 1989, p. 10).
“A continuous systematic process for evaluating the products, services, and work processes of organizations that are recognized as representing best practices for the purpose of organizational improvement” (Spendolini, 1992, p. 9).
“Continuing search, measurement, and comparison of products, processes, services, procedures, ways to operate, best practices that other companies have developed to obtain an output and global performances, with the aim of improving the company performances” (Lucertini et al., 1995, p. 59).
“An ongoing systematic process to search for international better practices, compare against them, and then introduce them, modified where necessary, into your organization” (Parmenter, 2007, p. 16).
“A method of measuring and improving our organizational performance by comparing ourselves with the best” (Stapenhurst, 2009, p. 6).
Bessant and Rush (1998) introduced seven underlying fundamental principles of
benchmarking: focus, measurement, differentiation, learning, comparability, integration,
and applicability. However, a number of researchers emphasize the principle of
comparability of benchmarking data among benchmarking partners (Andersen, et al.,
1999; Bessant & Rush, 1998). However, some others suggest normalization of
benchmarking data in certain situations when direct comparison is not appropriate (Shah
& Singh, 2001; Stapenhurst, 2009). Stapenhurst (2009) introduces six methods to
normalize the variation in incomparable benchmarking data. These are: per unit,
categorization, selection, weighting factors, modelling, and scoring. Andersen, et al,
(1999) argue that the principle of comparability of the benchmarking populations can be
sacrificed for the sake of learning lessons. Bhutta and Huq (1999) emphasize that best
practices of leading organization should not be implemented by the benchmarking
organisation without necessary tailoring according to the internal environment including
prevailing culture and human resources.
A number of advantages of benchmarking have been mentioned by various researchers.
These include: meeting and/or exceeding customer expectations, pragmatic goals based
on the view of external environment, quest for competitive position, significant
improvement in performance, and awareness of industry best practices (Camp, 1989;
41
Shetty, 1993; Spendolini, 1992). Moreover, benchmarking saves time and cost to adopt
industry leader’s best-practices and advanced technologies (Sekhar, 2010). Conversely,
some authors have also identified possible drawbacks of benchmarking practice. For
example, Elnathan and Kim (1995) pointed out the hidden costs of benchmarking such
as the cost of time and efforts employed to quantify data which is hard to get otherwise.
Elmuti and Kathawala (1997) discussed six legal aspects which the benchmarking
partners have to deal with. These are: expectation, proprietary information, intellectual
property, antitrust and unfair trade practices, evidence, and disparagement and trade
libel. Cox and Thompson (1998) emphasized the inappropriateness of benchmarking as
it carries serious strategic risks, such as possibility to lose sensitive data to competitors.
Zairi and Ahmed (1999) highlight some of the issues related to the transferability. These
are:
How do we know that ‘best practices’ are really the best?
How do we assess the relevance of best practices to our business operations?
What is the best approach for cascading down best practices to support our corporate goals?
Is there any particular method for capturing and transferring best practices?
How to deal with a culture resistant to change?
How to instil new ideas in environments where the `not invented here’ is very strong?
How do you know that you are succeeding with best practices?
3.3.1 Evolution of Benchmarking
The origin of benchmarking perhaps can be traced back to the human history when a
man first compared his hut with that of his neighbours (Stapenhurst, 2009). However,
the story of Xerox is the first documented evidence of benchmarking practice in
industry (Camp, 1989; Shetty, 1993; Spendolini, 1992). In 1970s’ when the Japanese
entered the photocopier machine market, Xerox was near to getting out of the market
because its copier machines badly failed in the market (Camp, 1989). In 1979, Xerox
conducted competitive benchmarking against Japanese machines and found its
manufacturing costs significantly higher than Japanese (Camp, 1989). Benchmarking,
after conception, was practiced by organizations from different industries. For example,
Nissan/Infinity benchmarked its customer service standards against the best practices
learned from the survey of McDonalds, Walt Disney Co., Nordstrom, Ritz-Carlton, and
Mercedes-Benz (for after-sale services) (Walsh, 1992). The success stories of
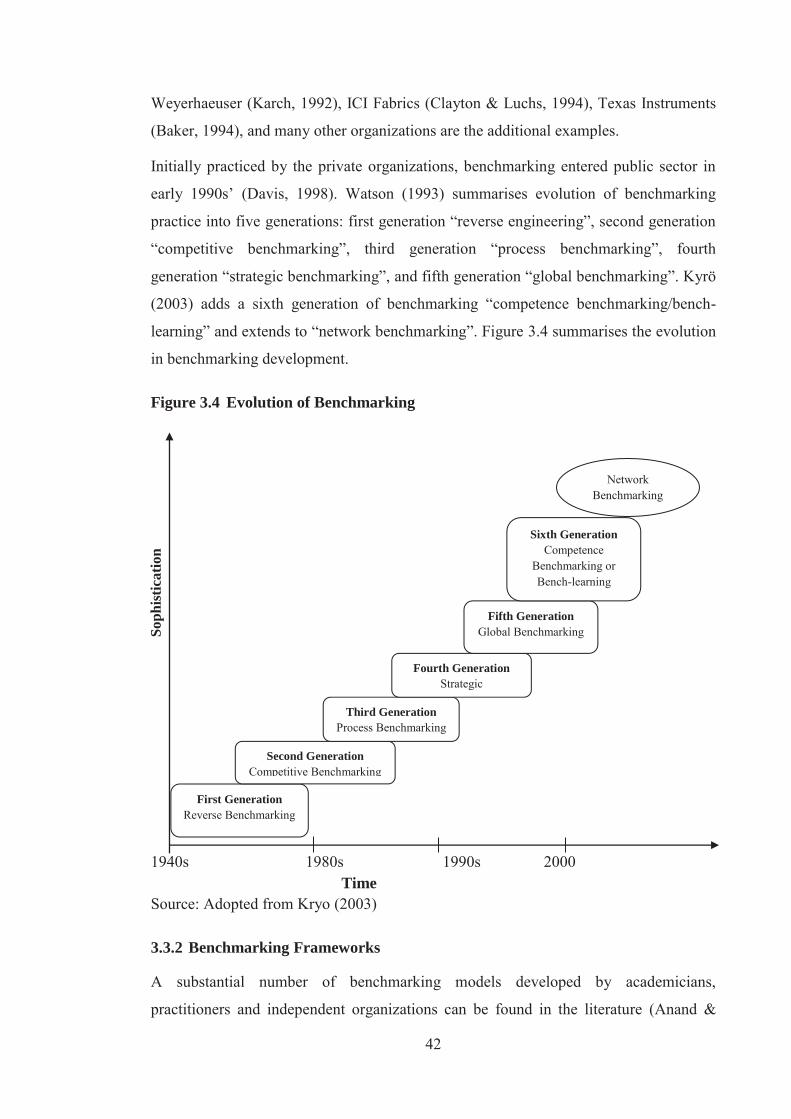
42
Weyerhaeuser (Karch, 1992), ICI Fabrics (Clayton & Luchs, 1994), Texas Instruments
(Baker, 1994), and many other organizations are the additional examples.
Initially practiced by the private organizations, benchmarking entered public sector in
early 1990s’ (Davis, 1998). Watson (1993) summarises evolution of benchmarking
practice into five generations: first generation “reverse engineering”, second generation
“competitive benchmarking”, third generation “process benchmarking”, fourth
generation “strategic benchmarking”, and fifth generation “global benchmarking”. Kyrö
(2003) adds a sixth generation of benchmarking “competence benchmarking/bench-
learning” and extends to “network benchmarking”. Figure 3.4 summarises the evolution
in benchmarking development.
Figure 3.4 Evolution of Benchmarking
1940s 1980s 1990s 2000 Time Source: Adopted from Kryo (2003)
3.3.2 Benchmarking Frameworks
A substantial number of benchmarking models developed by academicians,
practitioners and independent organizations can be found in the literature (Anand &
Soph
istic
atio
n
First Generation Reverse Benchmarking
Second Generation Competitive Benchmarking
Third Generation Process Benchmarking
Fourth Generation Strategic
Fifth Generation Global Benchmarking
Network Benchmarking
Sixth Generation Competence
Benchmarking or Bench-learning
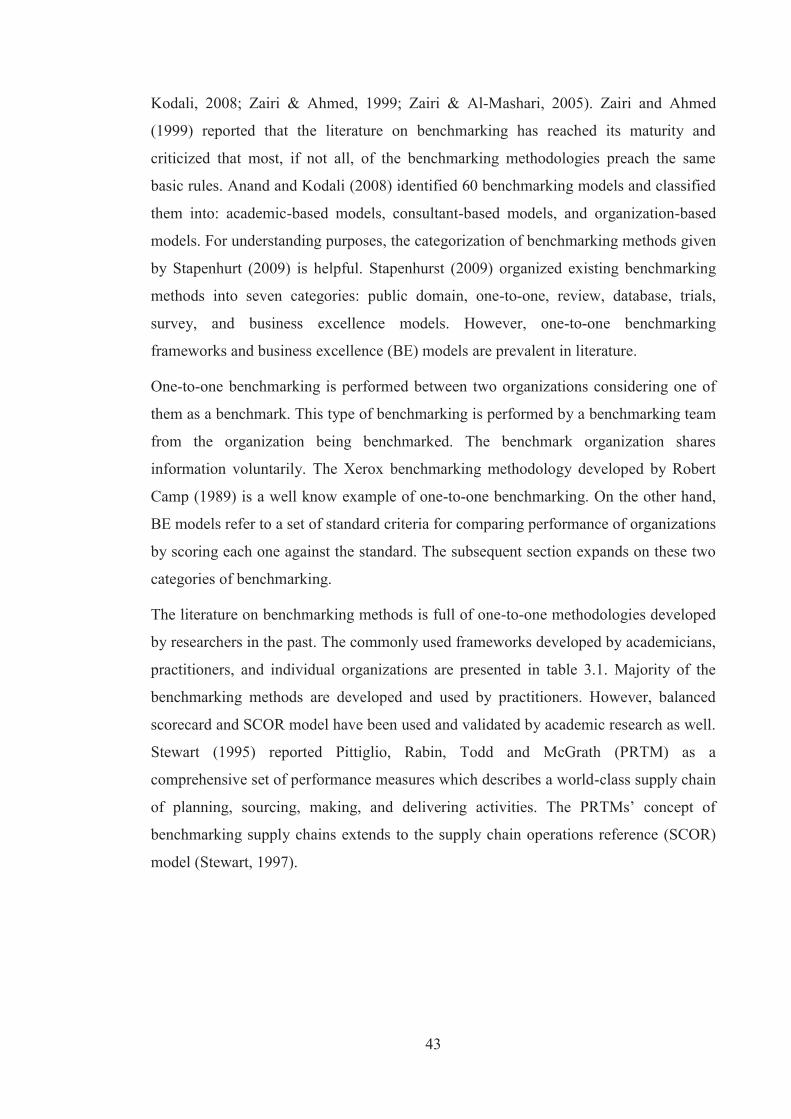
43
Kodali, 2008; Zairi & Ahmed, 1999; Zairi & Al-Mashari, 2005). Zairi and Ahmed
(1999) reported that the literature on benchmarking has reached its maturity and
criticized that most, if not all, of the benchmarking methodologies preach the same
basic rules. Anand and Kodali (2008) identified 60 benchmarking models and classified
them into: academic-based models, consultant-based models, and organization-based
models. For understanding purposes, the categorization of benchmarking methods given
by Stapenhurt (2009) is helpful. Stapenhurst (2009) organized existing benchmarking
methods into seven categories: public domain, one-to-one, review, database, trials,
survey, and business excellence models. However, one-to-one benchmarking
frameworks and business excellence (BE) models are prevalent in literature.
One-to-one benchmarking is performed between two organizations considering one of
them as a benchmark. This type of benchmarking is performed by a benchmarking team
from the organization being benchmarked. The benchmark organization shares
information voluntarily. The Xerox benchmarking methodology developed by Robert
Camp (1989) is a well know example of one-to-one benchmarking. On the other hand,
BE models refer to a set of standard criteria for comparing performance of organizations
by scoring each one against the standard. The subsequent section expands on these two
categories of benchmarking.
The literature on benchmarking methods is full of one-to-one methodologies developed
by researchers in the past. The commonly used frameworks developed by academicians,
practitioners, and individual organizations are presented in table 3.1. Majority of the
benchmarking methods are developed and used by practitioners. However, balanced
scorecard and SCOR model have been used and validated by academic research as well.
Stewart (1995) reported Pittiglio, Rabin, Todd and McGrath (PRTM) as a
comprehensive set of performance measures which describes a world-class supply chain
of planning, sourcing, making, and delivering activities. The PRTMs’ concept of
benchmarking supply chains extends to the supply chain operations reference (SCOR)
model (Stewart, 1997).

44
Table 3.1 Benchmarking Frameworks
Benchmarking Frameworks Remarks
Xerox benchmarking methodology by Robert Camp (1989).
A ten-step process organized into five phases: planning, analysis, integration, action, and maturity.
Balanced Scorecard by Kaplan and Norton (1992)
A performance measurement framework that complements financial indicators with performance measures for customers, internal business processes, and innovation and improvement activities.
Spendolini’s five-step benchmarking process (1992).
These steps are: determine what to benchmark; form a benchmarking team; identify benchmark partner; collect and analyze benchmarking data; and take action.
Codling’s twelve-step benchmarking process (1992).
Twelve steps are categorized into four operational stages: planning, analysis, action, and review and recycle.
Business Performance Improvement Resource (2012).
The BPIR improvement cycle is a nine-step benchmarking process.
TRADE methodology by Center for Organizational excellence Research (2012)
Ten step TRADE methodology stands for: Terms of Reference, Research, Act, Deploy, and Evaluate.
Supply Chain Operations Reference (SCOR) model version 10 by Supply Chain Council (2012)
A cross-industry reference model structured around five processes: Plan, Source, Make, Deliver, and Return and four levels of process detail.
Gilmour (1998) developed a framework comprising of 11 capabilities in order to
benchmark supply chain operations. Simatupang and Sridharan (2004) acknowledged
SCOR model as the most suitable for benchmarking purposes due to its
comprehensiveness and standard process and metrics definitions which enable
companies to evaluate and improve performance at individual as well as entire supply
chain levels. Moreover, the model has been used by a number of researchers for
benchmarking at supply chain level (Eryuruk et al., 2014; Jolly-Desodt et al., 2006;
Reiner & Hofmann, 2006).
Business excellence models are fundamentally diagnostic in nature and focus on
identifying, developing, and promoting best practices leading to superior performance at
organization level. The key performance indicators used by BE models focus individual
firms and not the network of businesses such as supply chains which ultimately leads to
local optimization. The conflict of local versus global optimization provides the basis
for performance measurement in supply chain management. Moreover, BE models are
poor in replication best practices having potential for incomplete or inaccurate analysis
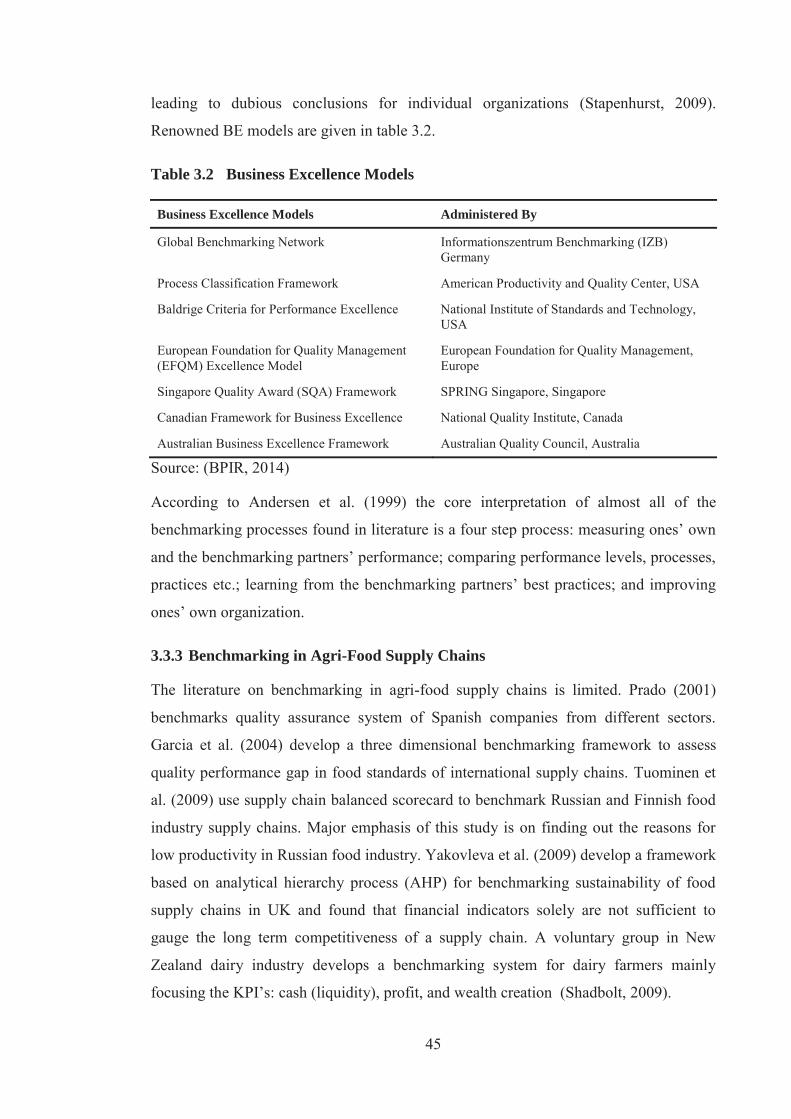
45
leading to dubious conclusions for individual organizations (Stapenhurst, 2009).
Renowned BE models are given in table 3.2.
Table 3.2 Business Excellence Models
Business Excellence Models Administered By
Global Benchmarking Network Informationszentrum Benchmarking (IZB) Germany
Process Classification Framework American Productivity and Quality Center, USA
Baldrige Criteria for Performance Excellence National Institute of Standards and Technology, USA
European Foundation for Quality Management (EFQM) Excellence Model
European Foundation for Quality Management, Europe
Singapore Quality Award (SQA) Framework SPRING Singapore, Singapore
Canadian Framework for Business Excellence National Quality Institute, Canada
Australian Business Excellence Framework Australian Quality Council, Australia
Source: (BPIR, 2014)
According to Andersen et al. (1999) the core interpretation of almost all of the
benchmarking processes found in literature is a four step process: measuring ones’ own
and the benchmarking partners’ performance; comparing performance levels, processes,
practices etc.; learning from the benchmarking partners’ best practices; and improving
ones’ own organization.
3.3.3 Benchmarking in Agri-Food Supply Chains
The literature on benchmarking in agri-food supply chains is limited. Prado (2001)
benchmarks quality assurance system of Spanish companies from different sectors.
Garcia et al. (2004) develop a three dimensional benchmarking framework to assess
quality performance gap in food standards of international supply chains. Tuominen et
al. (2009) use supply chain balanced scorecard to benchmark Russian and Finnish food
industry supply chains. Major emphasis of this study is on finding out the reasons for
low productivity in Russian food industry. Yakovleva et al. (2009) develop a framework
based on analytical hierarchy process (AHP) for benchmarking sustainability of food
supply chains in UK and found that financial indicators solely are not sufficient to
gauge the long term competitiveness of a supply chain. A voluntary group in New
Zealand dairy industry develops a benchmarking system for dairy farmers mainly
focusing the KPI’s: cash (liquidity), profit, and wealth creation (Shadbolt, 2009).

46
Iribarren et al. (2011) use life cycle analysis (LCA) and data envelopment analysis
(DEA) to assess and benchmark the environmental and operational efficiency of 75
Spanish dairy farms. They are of the opinion that combined approach can be adopted to
integrate management system tools for better decision making. Shabani et al. (2012)
develop an output oriented linear pair model for developing actual benchmarks for sales
agents in Iranian dairy industry. They view that developing actual benchmarks is better
than using the hypothetical ones for benchmarking studies. Tiwong et al. (2012)
benchmark Thai mango supply chain with respect to Japanese market using supply
chain integration (SCI) model and integration definition for function modelling
(IDEFO) and find that like other emerging economies, food quality and food safety are
the weakest links in Thai mango supply chain. Dolman et al. (2014) benchmark the
economic, environmental, and societal performance of nine Dutch dairy farms internally
recycling nutrients against the benchmark dairy farms and find that dairy farms
internally recycling nutrients are using less renewable energy, having higher soil
organic carbon content, and receiving higher payments for agri-environmental
measures.
The overall effectiveness of a benchmarking practice is based on its performance
measurement framework. Therefore, selecting a benchmarking framework implies
selecting a performance measurement framework. This argument leads to the next
section providing an extensive review and selection of appropriate performance
measurement framework for agri-food supply chains.
3.4 Supply Chain Performance Measurement
Measuring the performance of an activity or a business is as important as the activity or
business itself. “Anything measured improves; what you measure is what you get;
anything measured gets done; and you can’t manage what you do not measure” are
some of the common adages in support of performance measurement (Lapide, 2000, p.
287). Neely (1998) identified seven important reasons for measuring performance such
as dynamic nature of work, increasing competition, specific improvement initiatives,
international quality standards, changing organizational roles, changing customer
demands, and the power of information technology. The literature on supply chain
performance measurement (SCPM) is divided into four sub-sections: supply chain

47
performance measurement (SCPM) definitions, evolution of SCPM, SCPM systems,
and issues in SCPM.
3.4.1 Supply Chain Performance Measurement Definitions
Performance measurement has been defined from two different perspectives. Some
authors define performance measurement in terms of efficiency and effectiveness of
performing tasks (Mentzer & Konrad, 1991; Neely et al., 1995) while others think it a
systematic way of evaluating resource utilization and output (Harbour, 2009; Lockamy,
1995). All the definitions of performance measurement are aimed at providing
information necessary for decision making at task as well as organization level. The
definitions of performance measurement reflecting both the perspectives are represented
in figure 3.5.
Figure 3.5 Performance Measurement-Definitions
Performance measurement is “an analysis of both effectiveness and efficiency in accomplishing a given task” (Mentzer & Konrad, 1991, p. 33).
Performance measurement is “the process of quantifying the efficiency and effectiveness of action” (Neely, et al., 1995, p. 81).
Performance measurement is “the process of quantifying the efficiency and effectiveness of organisations and actions” (Li et al., 2007, p. 1131).
Performance measurement is “the process of measuring actual outcomes, or the end goals of performance, as well as the means of achieving that outcome as represented by in-process measures” (Harbour, 2009, p. 10).
A substantial number of performance measures are mentioned in the literature (Beamon,
1999; Lapide, 2000; Van Amstel & D'hert, 1996) but the measures spanning the entire
supply chain do not exist (Lambert & Pohlen, 2001; Lee & Billington, 1992) and the
logistics and related measures are unable to adequately address to the scope of SCM
(Caplice & Sheffi, 1995). Various authors have highlighted the need for limited number
of measures to be employed in order to avoid administrative complicacies (Chan & Qi,
2002; Lapide, 2000). Parker (2000) classified the existing performance measures into
four major categories: outcome measures, action measures, input measures, and
diagnostic measures. Van der Vorst (2000b), on the other hand, made a distinction
between performance indicators at three levels namely supply chain network,
organization, and process. Beside all the prescriptions given in literature, the enigma of
how to select the most appropriate set of measures is still there.
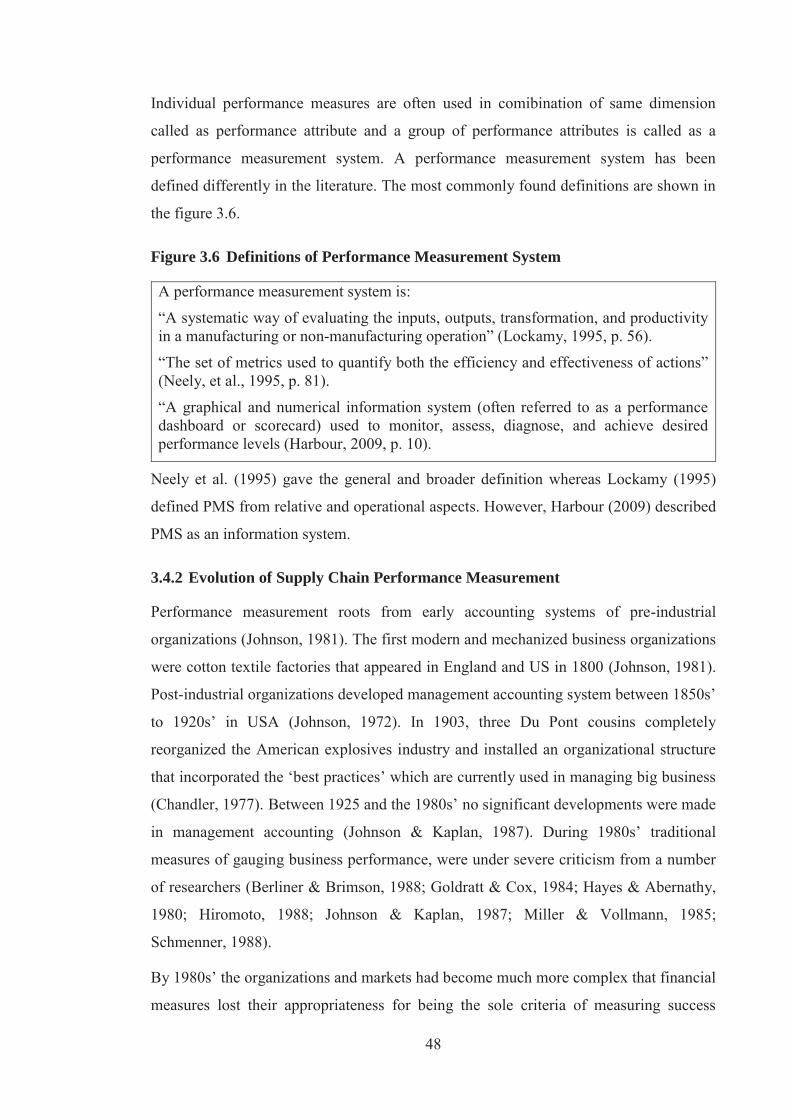
48
Individual performance measures are often used in comibination of same dimension
called as performance attribute and a group of performance attributes is called as a
performance measurement system. A performance measurement system has been
defined differently in the literature. The most commonly found definitions are shown in
the figure 3.6.
Figure 3.6 Definitions of Performance Measurement System
A performance measurement system is:
“A systematic way of evaluating the inputs, outputs, transformation, and productivity in a manufacturing or non-manufacturing operation” (Lockamy, 1995, p. 56).
“The set of metrics used to quantify both the efficiency and effectiveness of actions” (Neely, et al., 1995, p. 81).
“A graphical and numerical information system (often referred to as a performance dashboard or scorecard) used to monitor, assess, diagnose, and achieve desired performance levels (Harbour, 2009, p. 10).
Neely et al. (1995) gave the general and broader definition whereas Lockamy (1995)
defined PMS from relative and operational aspects. However, Harbour (2009) described
PMS as an information system.
3.4.2 Evolution of Supply Chain Performance Measurement
Performance measurement roots from early accounting systems of pre-industrial
organizations (Johnson, 1981). The first modern and mechanized business organizations
were cotton textile factories that appeared in England and US in 1800 (Johnson, 1981).
Post-industrial organizations developed management accounting system between 1850s’
to 1920s’ in USA (Johnson, 1972). In 1903, three Du Pont cousins completely
reorganized the American explosives industry and installed an organizational structure
that incorporated the ‘best practices’ which are currently used in managing big business
(Chandler, 1977). Between 1925 and the 1980s’ no significant developments were made
in management accounting (Johnson & Kaplan, 1987). During 1980s’ traditional
measures of gauging business performance, were under severe criticism from a number
of researchers (Berliner & Brimson, 1988; Goldratt & Cox, 1984; Hayes & Abernathy,
1980; Hiromoto, 1988; Johnson & Kaplan, 1987; Miller & Vollmann, 1985;
Schmenner, 1988).
By 1980s’ the organizations and markets had become much more complex that financial
measures lost their appropriateness for being the sole criteria of measuring success

49
(Kaplan & Norton, 1992; Kennerley & Neely, 2002). Kaplan and Norton (1992)
reported the misleading behavior of traditional financial accounting measures as they
report on past performance rather than suggesting future improvements. Moreover,
traditional cost accounting practices focus on controlling processes in isolation and do
not recognize the need for integrating the business processes (Bititci, 1994). Non-
financial measures like quality, delivery flexibility, and responsiveness were employed
by majority of the managers, practitioners, and academicians during late 1990s’ to
gauge the business performance (Gunasekaran et al., 2001; Kennerley & Neely, 2002;
Stewart, 1995).
The criticism on the traditional accounting system resulted in the shift in philosophy of
performance measurement which lead to the development of new methods of valuing
businesses, such as, the activity-based costing (Johnson & Kaplan, 1987), throughput
accounting (Galloway & Waldron, 1988), the performance measurement matrix
(Keegan et al., 1989), SMART performance pyramid (Lynch & Cross, 1991), the
balanced scorecard (Kaplan & Norton, 1992), economic value-added (Young &
O'Byrne, 2001), logistics scorecard (Frazelle, 2002), and the performance prism (Neely
et al., 2002). The integrated and collaborative performance measurement systems were
proposed by a number of authors (Bechtel & Jayaram, 1997; La Forme et al., 2007; Li
& O'Brien, 1999; Li, et al., 2007; Lockamy, 1995). The Supply Chain Council
developed a standard process-based measurement system, the SCOR model in 1997
(Stewart, 1997). Methods of valuing shareholder profitability, such as customer
profitability analysis, shifted the focus of supply chain management to the management
of relationships in order to be more profitable for the all the shareholders (Christopher,
1998).
Innovative ways of measuring business value, like performance of activity (POA)
method (Chan & Qi, 2003a), and performance based costing system (Gunasekaran et
al., 2005) were introduced. Various graphical (for instance, kiviat graph, spider
diagram, and radar diagram) and spreadsheet-based tools for measuring and comparing
performance were devised (Vanteddu et al., 2006). The predominant focus of the recent
literature on performance measurement is on measuring sustainability (Bourlakis et al.,
2014; Mohezar & Nor, 2014; Rota et al., 2012; Van der Vorst et al., 2013; Wiengarten
& Longoni, 2015), integration (Bourlakis, et al., 2014; Manzini & Accorsi, 2013;
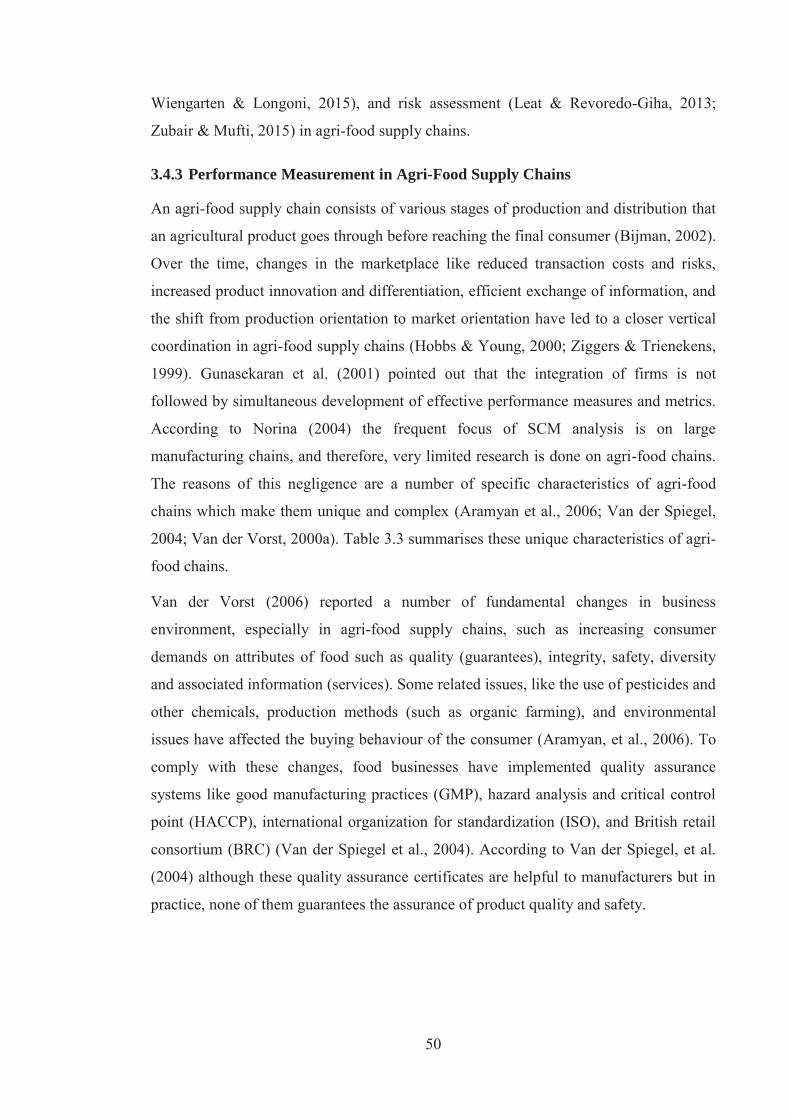
50
Wiengarten & Longoni, 2015), and risk assessment (Leat & Revoredo-Giha, 2013;
Zubair & Mufti, 2015) in agri-food supply chains.
3.4.3 Performance Measurement in Agri-Food Supply Chains
An agri-food supply chain consists of various stages of production and distribution that
an agricultural product goes through before reaching the final consumer (Bijman, 2002).
Over the time, changes in the marketplace like reduced transaction costs and risks,
increased product innovation and differentiation, efficient exchange of information, and
the shift from production orientation to market orientation have led to a closer vertical
coordination in agri-food supply chains (Hobbs & Young, 2000; Ziggers & Trienekens,
1999). Gunasekaran et al. (2001) pointed out that the integration of firms is not
followed by simultaneous development of effective performance measures and metrics.
According to Norina (2004) the frequent focus of SCM analysis is on large
manufacturing chains, and therefore, very limited research is done on agri-food chains.
The reasons of this negligence are a number of specific characteristics of agri-food
chains which make them unique and complex (Aramyan et al., 2006; Van der Spiegel,
2004; Van der Vorst, 2000a). Table 3.3 summarises these unique characteristics of agri-
food chains.
Van der Vorst (2006) reported a number of fundamental changes in business
environment, especially in agri-food supply chains, such as increasing consumer
demands on attributes of food such as quality (guarantees), integrity, safety, diversity
and associated information (services). Some related issues, like the use of pesticides and
other chemicals, production methods (such as organic farming), and environmental
issues have affected the buying behaviour of the consumer (Aramyan, et al., 2006). To
comply with these changes, food businesses have implemented quality assurance
systems like good manufacturing practices (GMP), hazard analysis and critical control
point (HACCP), international organization for standardization (ISO), and British retail
consortium (BRC) (Van der Spiegel et al., 2004). According to Van der Spiegel, et al.
(2004) although these quality assurance certificates are helpful to manufacturers but in
practice, none of them guarantees the assurance of product quality and safety.
51
Table 3.3 Unique Characteristics of Agri-Food Supply Chains
SC Stage Product and Process Characteristics
Overall Shelf life constraints for raw materials, intermediate and finished products, and changes in product quality level along the SC (decay).
Recycling and reverse logistics of materials.
Producer Long production throughput times (producing new or additional products takes a lot of time).
Seasonality in production.
Auction / Wholesaler /Retailer
Variability of quality and quantity of supply of farm-based inputs. Seasonal supply of products requires global (year-round) sourcing. Requirements for conditioned transportation and storage means.
Food Industry
Variability of quality and quantity of supply of farm-based inputs. High volume, low variety (although the variety is increasing) production systems. Highly sophisticated capital-intensive machinery focusing on capacity utilization. Variable process yield in quantity and quality due to biological variations,
seasonality, random factors connected with weather, pests, and other biological hazards.
A possible necessity to wait for the results of quality tests (quarantine). Alternative installations, alternative recipes, and product-dependent cleaning and
processing times. Necessity to value all parts because of complementarity of agricultural inputs (for
example, beef cannot be produced without the co-product hides). Necessity for lot traceability of work in process due to quality and environmental
requirements and product responsibility Storage buffer capacity is restricted, when material, intermediates or finished
products can only be kept in special tanks or containers.
Source: Adopted from (Van der Vorst, 2000a)
3.4.4 Selecting a Performance Measurement System for Agri-food Supply Chains
The literature on supply chain performance measurement is too large and multi-
dimensional to develop a clear understanding from all aspects. Different researchers
view supply chain performance from different aspects. For example, Christopher (1995)
view supply chain as a series of functions and emphasize to align the performance of
each function. Christopher introduced average cost model to consolidate cost drivers for
manufacturing functions at firm level. A substantial number of researchers evaluate
supply chain performance measurement from different dimensions such as agility,
quality, cost, flexibility, responsiveness, time, and innovativeness (Aramyan et al.,
2007; Aramyan, et al., 2006; Beamon, 1999; Joshi et al., 2012; Neely, et al., 1995).
Various researchers employ balanced scorecard to measure supply chain performance
(Bhagwat & Sharma, 2007b; Bigliardi & Bottani, 2010; Brewer & Speh, 2000; Kaplan
52
& Norton, 1992; Varma & Deshmukh, 2009). Balanced scorecard complements
traditional financial indicators with performance measures for customers, internal
business processes, and innovation and improvement activities. Few researchers
organize performance measures at various levels of organizational hierarchy such
strategic, tactical, and operational levels (Bhagwat & Sharma, 2007a; Chan & Qi,
2003b; Fattahi et al., 2013; Gunasekaran et al., 2004; Gunasekaran, et al., 2001; Li &
O'Brien, 1999; Li, et al., 2007; Rangone, 1996). A growing number of researchers use
SCOR model to quantify performance at supply chain process level (Huang et al., 2005;
Irfan et al., 2008; Millet, et al., 2009; Stewart, 1997; Widyaningrum & Masruroh,
2012). Lambert and Pohlen (2001) view supply chain as a series of different interfaces
and devised a framework to align the performance of each link within the supply chain.
This link-by-link approach aims to optimise the performance at individual links level as
well as the supply chain as a whole. Several researchers analyse supply chain
performance from one or more perspectives (Gerbens-Leenes et al., 2003; Leat &
Revoredo-Giha, 2013; Li et al., 2005; Otto & Kotzab, 2003; Van der Vorst, et al., 2013;
Yakovleva, 2007).
In selection of appropriate performance measures, a number of researchers evaluate
existing performance measurement frameworks against a set of criteria (Beamon, 1999;
Gunasekaran, et al., 2001; Neely, et al., 1995; Van der Spiegel, et al., 2004; Varma &
Deshmukh, 2009). For example, Van der Spiegel, et al. (2004) developed a criteria-
based approach for the selection of appropriate measurement framework for food
quality systems. They evaluated performance measurement frameworks against six
quality dimensions namely product quality, availability, costs, flexibility, reliability, and
service. This study uses five criteria to evaluate existing performance measurement
frameworks and choose the appropriate one for agri-food supply chains. These criteria
are briefly discussed as following.
A. Balance between Financial and Non-financial Performance Measures
A substantial number of researchers emphasize that there is need for balance while
selecting between financial and non-financial performance measures (Aramyan, et al.,
2007; Beamon, 1999; Chan, 2003; De Toni & Tonchia, 2001; Gunasekaran, et al., 2004;
Holmberg, 2000; Van Aken & Coleman, 2002; Van der Vorst, 2006; Vanteddu, et al.,
2006). Beamon (1999) viewed that existing supply chain performance measurement
systems are inadequate as they heavily rely on the use of financial measures as a
53
primary (if not sole) criteria. According to Gunasekaran et al. (2001) the firms or supply
chains using performance measures focusing purely on financial or operational aspects
deprive themselves of the benefits that would accrue from adopting a balanced
approach. Similarly, Van der Vorst (2006) urged the need to develop a balanced set of
financial and non-financial food supply chain indicators that reflect the inter-
dependencies of different areas at the right aggregation level. According to Van der
Vorst, a balanced approach must consider account chain network structure (such as total
value added, ROI, etc.), chain business processes and management structure (such as
lead time, responsiveness, inventory levels, delivery reliability, product quality, etc.),
and chain resources (such as process yield, degree of utilization, human wellbeing,
perseverance, etc.).
B. Holistic to Entire Supply Chain
Multi-echelon food supply chains consist of cross-industry processes involving different
players with goals conflicting with supply chain strategy. The use of single firm
performance measures results in local optimization. This conflict between local and
global optimization highlights the need for systems thinking. Therefore, numerous
researchers have emphasized the need for a framework of holistic nature spanning the
entire supply chain rather than single firm (Chan, 2003; Chan & Qi, 2003b; Lambert &
Pohlen, 2001; Van der Vorst, 2006; Vanteddu, et al., 2006). Moreover, a holistic
framework aligns the performance of individual players with supply chain strategy.
C. Food Quality Focus
Food quality is an inherent characteristic of agri-food supply chains which distinguishes
them from general supply chains. Van der Spiegel, et al. (2004, p. 505) defined quality
in food production systems as “to comply with the expectations of the user or consumer,
while the production process is optimally organized, utilized, and controlled”. A
number of researchers have emphasized on measuring food quality as part of overall
performance measurement system. For example, Aramyan et al. (2006) developed a
performance measurement framework for agri-food supply chains by grouping relevant
performance indicators from best-know methods in to four: efficiency, flexibility,
responsiveness, and quality. They classified agri-food chains in to two: 1) supply chains
of fresh products such as dairy, fruit, and vegetables; 2) supply chains of processed food
products such as canned fruits. The supply chain of processed food products can further
54
be divided on the basis of perishability and shelf-life. These are: the supply chain of
highly perishable commodities such as milk and dairy products; and less perishable
such as fruits and vegetables.
Knura et al. (2006) classified food quality into intrinsic (such as taste, nutritional value,
freshness, appearance, sensory properties, shelf-life, safety, and health) and extrinsic
(such as the use of pesticides, the type of packaging material, a specific processing
technology, and the use of preservatives) quality attributes. In order to maximise
customer value, the product quality must be ensured at each stage along the entire agri-
food supply chain. Therefore, the measurement tool must incorporate appropriate
performance indicators related to food quality at various stages of the supply chain.
D. Risk Assessment
The second most important characteristic of agri-food supply chains is risk assessment.
Inherently, food products are prone to various types of risk at almost all stages of an
agri-food supply chain. The negative impact of supply chain risks on supply chain
performance has been evidenced by Wagner and Bode (2008). A number of researchers
highlighted the importance of risk in agri-food supply chains and developed
performance measurement frameworks accordingly. Tummala and Schoenherr (2011)
developed a supply chain risk management process (SCRMP) to help SC managers
identify, assess, evaluate and control risk to improve supply chain performance. In an
attempt to measure risk in agri-food supply chains Leat and Revoredo-Giha (2013)
organized performance measures related to risk into individual level and supply chain
level. Zubair and Mufti (2015) identified eighteen risk perspectives in supply chain of
dairy products in Pakistan and developed a risk matrix based on probability and impact
scores in order to prioritize these risk perspectives.
E. Environmental Sustainability
Environmental sustainability, another feature of agri-food supply chains has gained
predominant focus recently. The recent literature is full of performance measures on
sustainability at individual echelon of agri-food supply chains. For example, Rota et al.
(2012) provided a theoretical framework of life cycle analysis for measuring
collaboration and sustainability at various stages of agri-food supply chains. Manzini
and Accorsi (2013) proposed a conceptual framework to integrate supply chain design
and management for simultaneous control of quality, safety, sustainability, and logistics
55
efficiency of the food products and processes along the whole food supply chain. Van
der Vorst et al. (2013) used triple bottom line framework to assess the sustainability of
food supply chain logistics in Dutch food industry. Bourlakis, et al. (2014) integrate a
plethora of performance indicators related to efficiency, flexibility, responsiveness, and
product quality to develop an integrated framework for measuring SC sustainability in
Greek dairy sector. They report that the large manufacturers are true champions of
sustainability.
3.4.5 Supply Chain Performance Measurement Systems
This section critically evaluates supply chain performance measurement frameworks
found in the literature against five criteria mentioned in the previous section. Moreover,
the frameworks are organized in to seven categories, as shown in Appendix-C. The
framework suitable to evaluate agri-food supply chains should satisfy all the five
selection criteria.
A. Function Based Measurement System (FBMS)
A FBMS measures the performance of an individual function performed in an
organization. The average cost model given by Christopher (1995) is the first FBMS
which measures the performance of the individual functions in an organization. The
major purpose of average cost model is to consolidate the cost drivers for manufacturing
functions at firm level. Figure 3.7 illustrates the industry average cost model for
measuring performance.
According to Lapide (2000) the industry average cost model is diagnostic in nature and
therefore is helpful in identifying problem areas. However, in FBMS each function is
evaluated in isolation from the supply chain which leads towards the local optimization
at the cost of entire chains’ performance (Lapide, 2000). Ramaa et al (2009) discussed
that the approach is easy to implement and is suitable when individual departments’
performance is needed to be optimized. The FBMS given by Christopher (1995) can be
replicated at supply chain level.

56
Figure 3.7 Industry Average Cost Model
Source: (Christopher, 1995)
B. Dimension Based Measurement System (DBMS)
A substantial number of researchers view supply chain performance measurement from
different dimensions (Aramyan, et al., 2007; Aramyan, et al., 2006; Beamon, 1999;
Joshi, et al., 2012; Neely, et al., 1995). The review of dimension based performance
measurement systems found in literature and their assessment against five selection
criteria is given in Appendix-C. To highlight the issues associated with the design of
performance measurement systems, Neely et al. (1995) identified performance measures
as individual measures, part of a PMS, and related to internal or external environment.
They organized the existing performance measures under four measurement dimensions
namely quality, time, flexibility, and cost. The proposed framework is a balanced
approach and adequately focuses food quality. However, it is not holistic as was
primarily designed for individual organizations. Moreover, the framework does not
consider risk assessment and environmental sustainability.
57
In an attempt to develop a framework for the selection of supply chain performance
measures, Beamon (1999) suggested that a PMS consisting of single firm performance
measures is inadequate and inappropriate for evaluating supply chains. Beamon (1999)
developed a framework for manufacturing supply chains by organizing performance
measures under resource, output, and flexibility attributes. The framework is balanced,
holistic, and focuses product quality. However, it does not take into account risk
assessment and environmental sustainability, as shown in Appendix-C.
Van der Vorst et al. (2000) developed a method for modelling dynamic behaviour of
multi-echelon food systems and evaluating alternative designs of the supply chain
infrastructure and operational management and control by applying discrete-event
simulation. They used case study of an actual food supply chain of chilled salad in
Netherlands, comprising of one producer, one distribution centre, and one retailer of
100 retail outlets to validate the model. They found thet for increasing ordering and
delivery frequencies, reducing the producer’s lead time and introducing new
information systems improved supply chain performance. The model is holistic in
nature and focuses food quality adequately but it is not a balanced approach and does
not include risk assessment and environmental sustainability related measures.
However, the simulation model involves computer-assisted ordering (CAO) and EDI
which indicate its capacity to expand and customize as required.
In order to develop a flexible conceptual framework for measuring performance in agri-
food supply chains, Aramyan et al. (2006) highlighted advantages and disadvantages of
best-known performance measurement methods namely activity based costing (ABC),
balanced scorecard (BSC), economic value added (EVA), multi-criteria analysis
(MCA), life-cycle analysis (LCA), data enevelopment analysis (DEA), and supply chain
operations reference (SCOR) model. They grouped performance measures from selected
methods especially SCOR model and balanced scorecard in to four: efficiency,
flexibility, responsiveness, and quality. The performance measures relevant to food
quality in agri-food supply chains were adopted from Lunning et al. (2002). Figure 3.8
describes measurement dimensions of this framework.
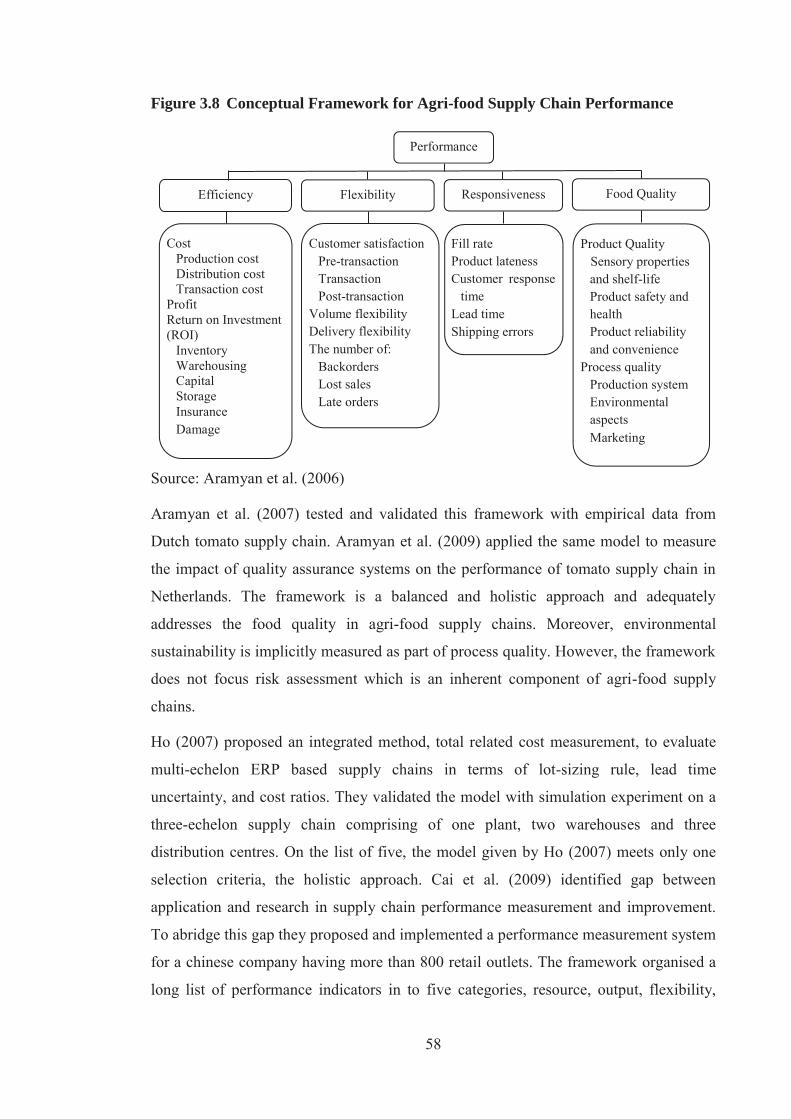
58
Figure 3.8 Conceptual Framework for Agri-food Supply Chain Performance
Source: Aramyan et al. (2006)
Aramyan et al. (2007) tested and validated this framework with empirical data from
Dutch tomato supply chain. Aramyan et al. (2009) applied the same model to measure
the impact of quality assurance systems on the performance of tomato supply chain in
Netherlands. The framework is a balanced and holistic approach and adequately
addresses the food quality in agri-food supply chains. Moreover, environmental
sustainability is implicitly measured as part of process quality. However, the framework
does not focus risk assessment which is an inherent component of agri-food supply
chains.
Ho (2007) proposed an integrated method, total related cost measurement, to evaluate
multi-echelon ERP based supply chains in terms of lot-sizing rule, lead time
uncertainty, and cost ratios. They validated the model with simulation experiment on a
three-echelon supply chain comprising of one plant, two warehouses and three
distribution centres. On the list of five, the model given by Ho (2007) meets only one
selection criteria, the holistic approach. Cai et al. (2009) identified gap between
application and research in supply chain performance measurement and improvement.
To abridge this gap they proposed and implemented a performance measurement system
for a chinese company having more than 800 retail outlets. The framework organised a
long list of performance indicators in to five categories, resource, output, flexibility,
Cost Production cost Distribution cost Transaction cost
Profit Return on Investment (ROI)
Inventory Warehousing Capital Storage Insurance Damage
Customer satisfaction Pre-transaction Transaction Post-transaction
Volume flexibility Delivery flexibility The number of:
Backorders Lost sales Late orders
Fill rate Product lateness Customer response
time Lead time Shipping errors
Product Quality Sensory properties
and shelf-life Product safety and health Product reliability and convenience
Process quality Production system Environmental aspects Marketing
Performance
Efficiency Flexibility Responsiveness Food Quality
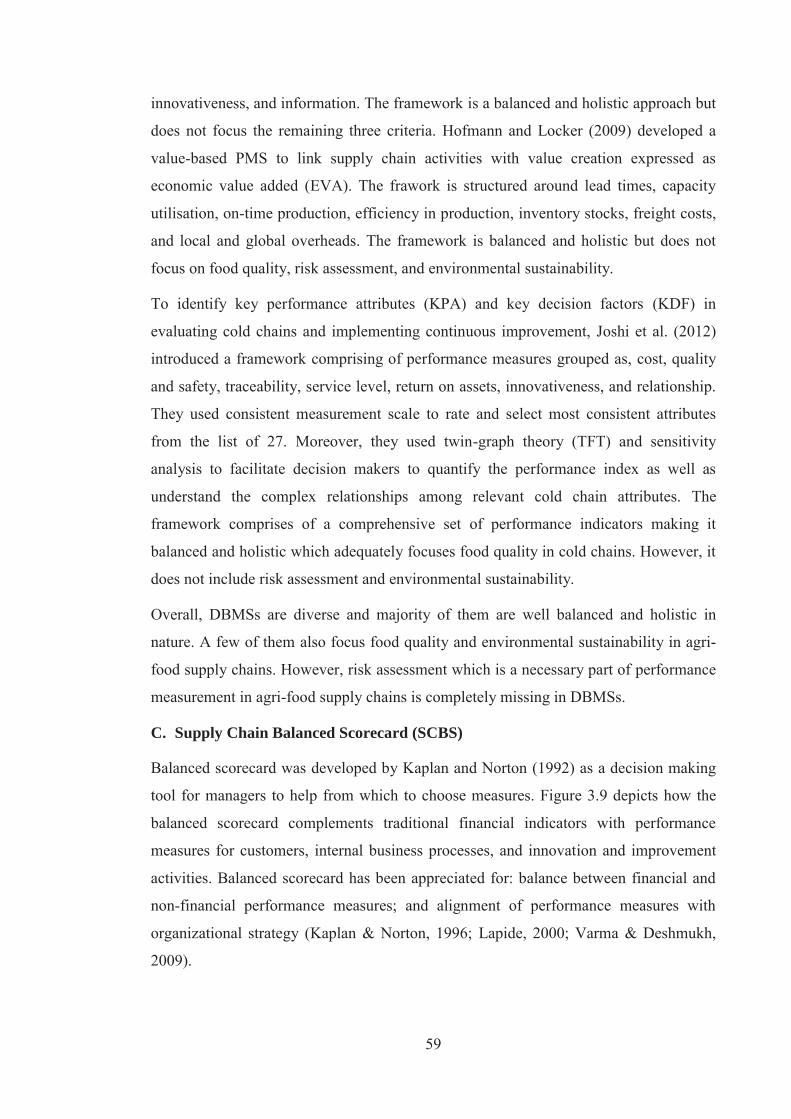
59
innovativeness, and information. The framework is a balanced and holistic approach but
does not focus the remaining three criteria. Hofmann and Locker (2009) developed a
value-based PMS to link supply chain activities with value creation expressed as
economic value added (EVA). The frawork is structured around lead times, capacity
utilisation, on-time production, efficiency in production, inventory stocks, freight costs,
and local and global overheads. The framework is balanced and holistic but does not
focus on food quality, risk assessment, and environmental sustainability.
To identify key performance attributes (KPA) and key decision factors (KDF) in
evaluating cold chains and implementing continuous improvement, Joshi et al. (2012)
introduced a framework comprising of performance measures grouped as, cost, quality
and safety, traceability, service level, return on assets, innovativeness, and relationship.
They used consistent measurement scale to rate and select most consistent attributes
from the list of 27. Moreover, they used twin-graph theory (TFT) and sensitivity
analysis to facilitate decision makers to quantify the performance index as well as
understand the complex relationships among relevant cold chain attributes. The
framework comprises of a comprehensive set of performance indicators making it
balanced and holistic which adequately focuses food quality in cold chains. However, it
does not include risk assessment and environmental sustainability.
Overall, DBMSs are diverse and majority of them are well balanced and holistic in
nature. A few of them also focus food quality and environmental sustainability in agri-
food supply chains. However, risk assessment which is a necessary part of performance
measurement in agri-food supply chains is completely missing in DBMSs.
C. Supply Chain Balanced Scorecard (SCBS)
Balanced scorecard was developed by Kaplan and Norton (1992) as a decision making
tool for managers to help from which to choose measures. Figure 3.9 depicts how the
balanced scorecard complements traditional financial indicators with performance
measures for customers, internal business processes, and innovation and improvement
activities. Balanced scorecard has been appreciated for: balance between financial and
non-financial performance measures; and alignment of performance measures with
organizational strategy (Kaplan & Norton, 1996; Lapide, 2000; Varma & Deshmukh,
2009).

60
Figure 3.9 The Balanced Scorecard
Source: (Kaplan & Norton, 1992)
Despite of various advantages, balanced scorecard has a number of shortcomings too.
For example, balanced scorecard does not provide adequate assistance for the process of
designing a performance measurement system and competitive benchmarking (Neely, et
al., 1995; Varma & Deshmukh, 2009). Moreover, the original framework does not
provide a holistic view spanning entire supply chain rather it captures the performance
of individual organization (Aramyan, et al., 2006; Gilmour, 1999; Lambert & Pohlen,
2001; Lapide, 2000).
A number of researchers have tried to link balanced scorecard to supply chain
performance measurement, thus making it more holistic in nature. For example, Brewer
and Speh (2000) developed a supply chain performance measurement framework based
on balanced scorecard by integrating appropriate inter-functional and inter-firm level
performance measures related to SCM goals, customer benefits, financial benefits, and
SCM improvement with four measurement perspectives shown in figure 3.6. Bhagwat
and Sharma (2007b) conducted a comprehensive review of SCM performance metrics
and distributed into four balanced scorecard perspectives. In addition to being balanced
and holistic approach, the framework developed by Bhagwat and Sharma considers
quality in supply chains but does not suffice the needs of agri-food supply chains.
The use of balanced scorecard in supply chain performance is becoming more and more
popular. In order to evaluate and benchmark Petrolium supply chain in India, Varma
and Deshmaukh (2009) identified and overcome three major shortcomings of balanced
scorecard. These include: balanced scorecard not define the relative importance of
Financial Perspective How do we look to our
shareholders?
Customer Perspective How do our customers see
us?
Internal Business Perspective
What must we excel at?
Innovation and Learning Perspective
Can we continue to improve and create value?

61
metrics; it does not allow benchmarking with competitors; and it does not allow
dissimilar metrics to be combined. The framework developed by Varma and Deshmukh
is quite comprehensive, balanced, holistic, measures risk, and focuses product quality
implicitly. Bigliardi and Bottani (2010) included food quality related performance
measures to the BSC based framework developed by Bhagwat and Sharma (2007b) to
evaluate agri-food supply chains. Bigliardi and Bottani used Delphi technique to
examine and validate the proposed framework.
Overall, the balanced scorecard developed by Kaplan and Norton (1992) is a balanced
approach but not holistic as it was originally developed as a decision making tool for
single firms. Subsequantly, balanced scorecard has been promoted at supply chain level
which makes it holistic as well. However, it assumes quality implicitly and does not
consider risk assessment and environmental sustainability at all.
D. Supply Chain Operations Reference (SCOR) Model
Supply chain operations reference (SCOR) model is a standard process-based
measurement system developed by Supply Chain Council (2012). The SCOR model
after release of its first version in 1996 has undergone several updates in the form of
improved versions. The latest version is SCOR 10.0 which is structured around five
processes namely Plan, Source, Make, Deliver, and Return and four levels of process
detail. Level-1 defines these five processes for a supply chain whereas level-2 specifies
the configurations of these processes, for example, the ‘Make’ process is decomposed
into make-to-stock (M1), make-to-order (M2), or engineer-to-order (M3). Level-3
further describes the process categories of level-2 into detailed elements and activities
of implementation. Level-4 describes the industry specific activities. The performance
measures are organized under five performance attributes: reliability, responsiveness,
agility, cost, and asset. The performance attributes reliability, responsiveness, and
agility are customer-focused, whereas cost and asset are internal-focused. Product
quality and environmental sustainability are measured as level-3 metrics under
reliability attribute.Table 3.4 summarises performance attributes and relevant strategic
level SCOR metrics.
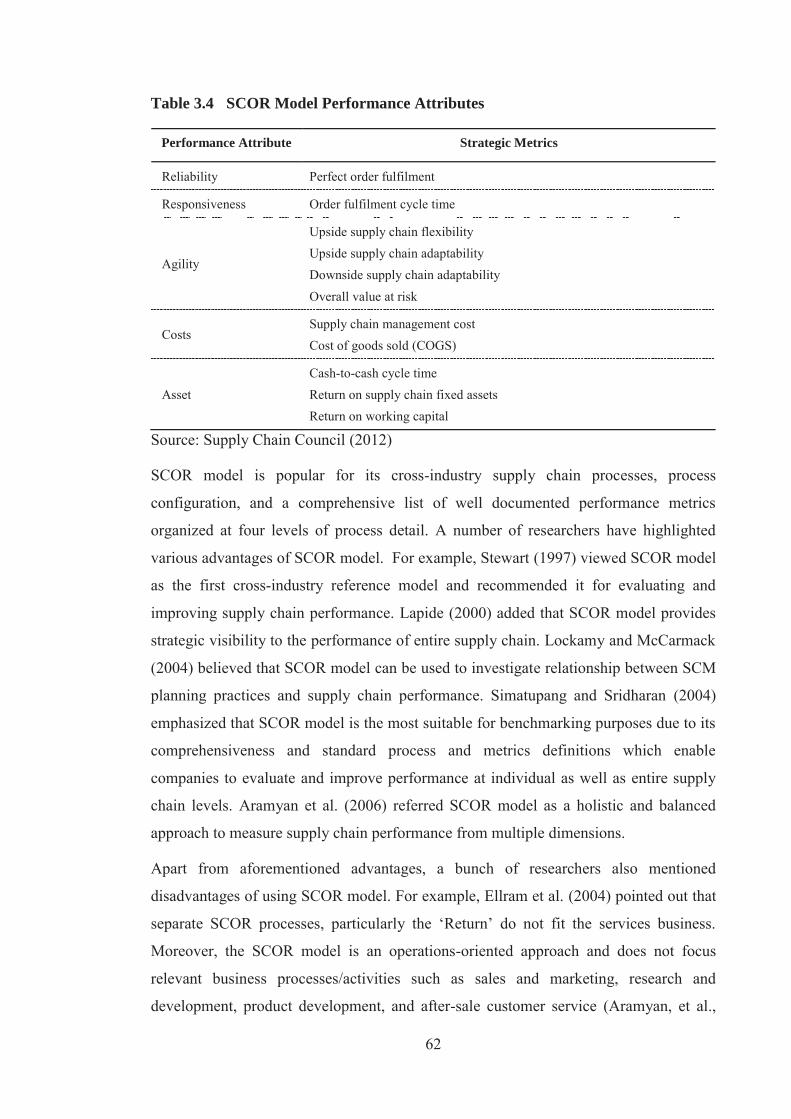
62
Table 3.4 SCOR Model Performance Attributes
Performance Attribute Strategic Metrics
Reliability Perfect order fulfilment
Responsiveness Order fulfilment cycle time
Agility
Upside supply chain flexibility Upside supply chain adaptability Downside supply chain adaptability Overall value at risk
Costs Supply chain management cost Cost of goods sold (COGS)
Asset Cash-to-cash cycle time Return on supply chain fixed assets Return on working capital
Source: Supply Chain Council (2012)
SCOR model is popular for its cross-industry supply chain processes, process
configuration, and a comprehensive list of well documented performance metrics
organized at four levels of process detail. A number of researchers have highlighted
various advantages of SCOR model. For example, Stewart (1997) viewed SCOR model
as the first cross-industry reference model and recommended it for evaluating and
improving supply chain performance. Lapide (2000) added that SCOR model provides
strategic visibility to the performance of entire supply chain. Lockamy and McCarmack
(2004) believed that SCOR model can be used to investigate relationship between SCM
planning practices and supply chain performance. Simatupang and Sridharan (2004)
emphasized that SCOR model is the most suitable for benchmarking purposes due to its
comprehensiveness and standard process and metrics definitions which enable
companies to evaluate and improve performance at individual as well as entire supply
chain levels. Aramyan et al. (2006) referred SCOR model as a holistic and balanced
approach to measure supply chain performance from multiple dimensions.
Apart from aforementioned advantages, a bunch of researchers also mentioned
disadvantages of using SCOR model. For example, Ellram et al. (2004) pointed out that
separate SCOR processes, particularly the ‘Return’ do not fit the services business.
Moreover, the SCOR model is an operations-oriented approach and does not focus
relevant business processes/activities such as sales and marketing, research and
development, product development, and after-sale customer service (Aramyan, et al.,
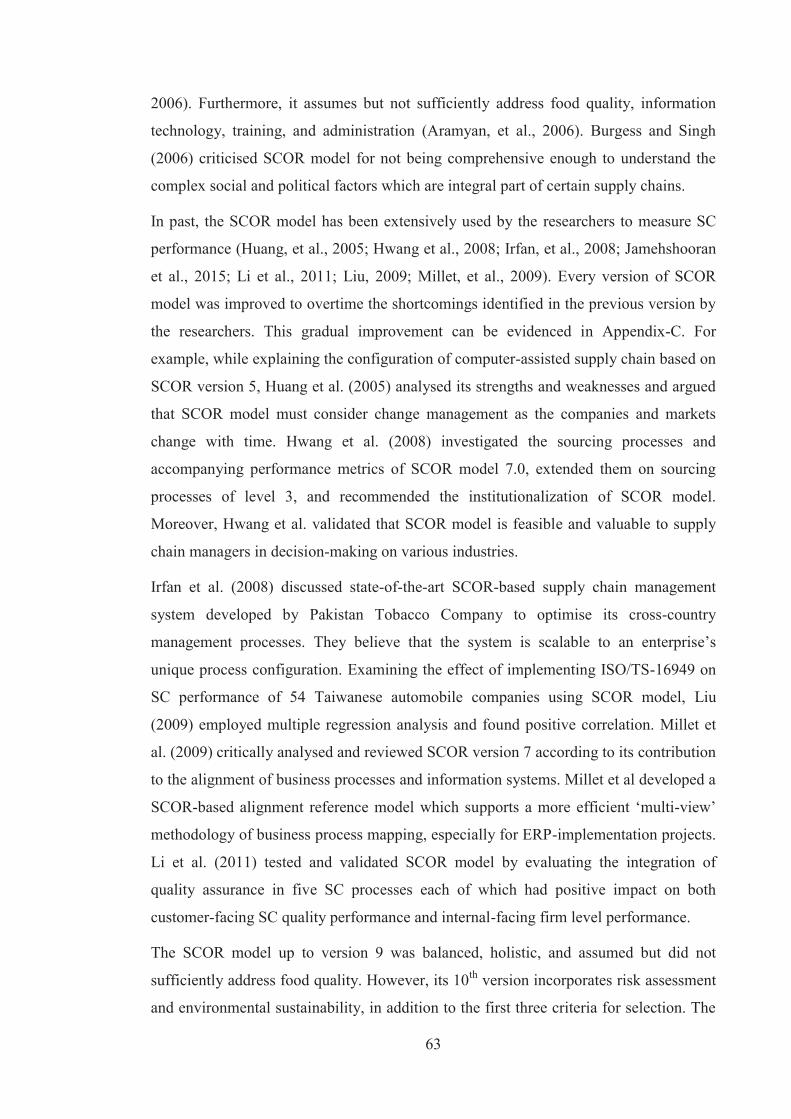
63
2006). Furthermore, it assumes but not sufficiently address food quality, information
technology, training, and administration (Aramyan, et al., 2006). Burgess and Singh
(2006) criticised SCOR model for not being comprehensive enough to understand the
complex social and political factors which are integral part of certain supply chains.
In past, the SCOR model has been extensively used by the researchers to measure SC
performance (Huang, et al., 2005; Hwang et al., 2008; Irfan, et al., 2008; Jamehshooran
et al., 2015; Li et al., 2011; Liu, 2009; Millet, et al., 2009). Every version of SCOR
model was improved to overtime the shortcomings identified in the previous version by
the researchers. This gradual improvement can be evidenced in Appendix-C. For
example, while explaining the configuration of computer-assisted supply chain based on
SCOR version 5, Huang et al. (2005) analysed its strengths and weaknesses and argued
that SCOR model must consider change management as the companies and markets
change with time. Hwang et al. (2008) investigated the sourcing processes and
accompanying performance metrics of SCOR model 7.0, extended them on sourcing
processes of level 3, and recommended the institutionalization of SCOR model.
Moreover, Hwang et al. validated that SCOR model is feasible and valuable to supply
chain managers in decision-making on various industries.
Irfan et al. (2008) discussed state-of-the-art SCOR-based supply chain management
system developed by Pakistan Tobacco Company to optimise its cross-country
management processes. They believe that the system is scalable to an enterprise’s
unique process configuration. Examining the effect of implementing ISO/TS-16949 on
SC performance of 54 Taiwanese automobile companies using SCOR model, Liu
(2009) employed multiple regression analysis and found positive correlation. Millet et
al. (2009) critically analysed and reviewed SCOR version 7 according to its contribution
to the alignment of business processes and information systems. Millet et al developed a
SCOR-based alignment reference model which supports a more efficient ‘multi-view’
methodology of business process mapping, especially for ERP-implementation projects.
Li et al. (2011) tested and validated SCOR model by evaluating the integration of
quality assurance in five SC processes each of which had positive impact on both
customer-facing SC quality performance and internal-facing firm level performance.
The SCOR model up to version 9 was balanced, holistic, and assumed but did not
sufficiently address food quality. However, its 10th version incorporates risk assessment
and environmental sustainability, in addition to the first three criteria for selection. The
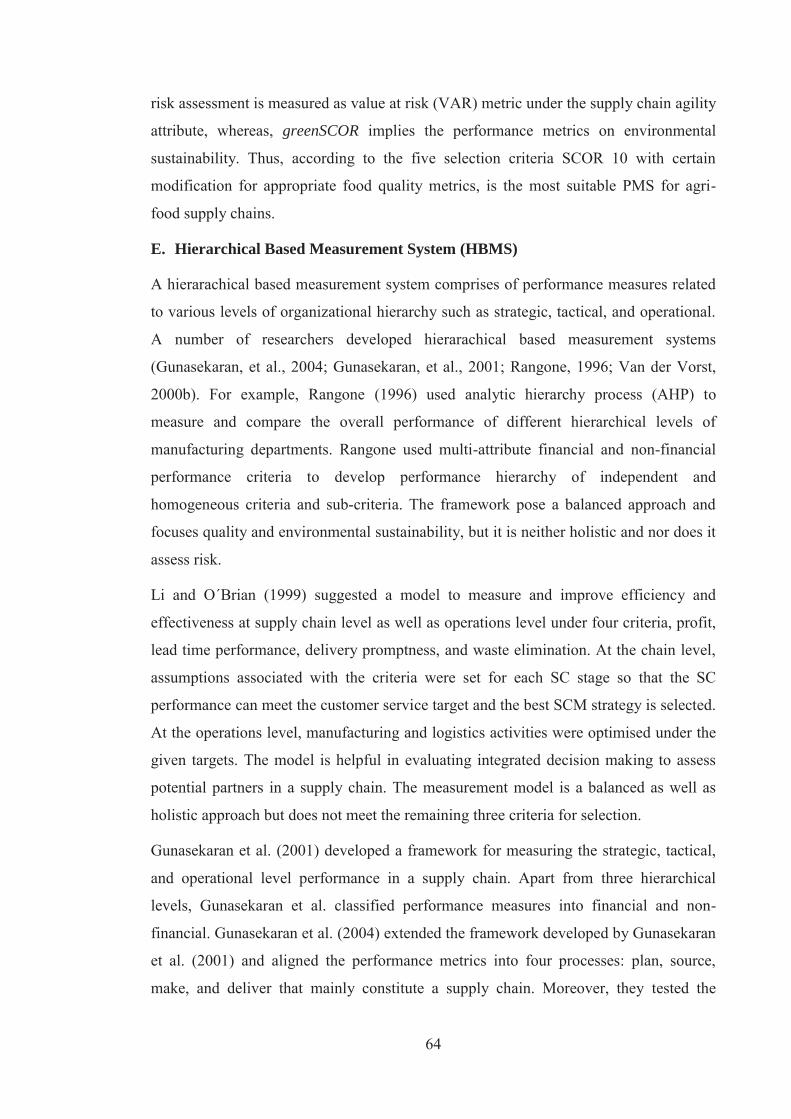
64
risk assessment is measured as value at risk (VAR) metric under the supply chain agility
attribute, whereas, greenSCOR implies the performance metrics on environmental
sustainability. Thus, according to the five selection criteria SCOR 10 with certain
modification for appropriate food quality metrics, is the most suitable PMS for agri-
food supply chains.
E. Hierarchical Based Measurement System (HBMS)
A hierarachical based measurement system comprises of performance measures related
to various levels of organizational hierarchy such as strategic, tactical, and operational.
A number of researchers developed hierarachical based measurement systems
(Gunasekaran, et al., 2004; Gunasekaran, et al., 2001; Rangone, 1996; Van der Vorst,
2000b). For example, Rangone (1996) used analytic hierarchy process (AHP) to
measure and compare the overall performance of different hierarchical levels of
manufacturing departments. Rangone used multi-attribute financial and non-financial
performance criteria to develop performance hierarchy of independent and
homogeneous criteria and sub-criteria. The framework pose a balanced approach and
focuses quality and environmental sustainability, but it is neither holistic and nor does it
assess risk.
Li and OˊBrian (1999) suggested a model to measure and improve efficiency and
effectiveness at supply chain level as well as operations level under four criteria, profit,
lead time performance, delivery promptness, and waste elimination. At the chain level,
assumptions associated with the criteria were set for each SC stage so that the SC
performance can meet the customer service target and the best SCM strategy is selected.
At the operations level, manufacturing and logistics activities were optimised under the
given targets. The model is helpful in evaluating integrated decision making to assess
potential partners in a supply chain. The measurement model is a balanced as well as
holistic approach but does not meet the remaining three criteria for selection.
Gunasekaran et al. (2001) developed a framework for measuring the strategic, tactical,
and operational level performance in a supply chain. Apart from three hierarchical
levels, Gunasekaran et al. classified performance measures into financial and non-
financial. Gunasekaran et al. (2004) extended the framework developed by Gunasekaran
et al. (2001) and aligned the performance metrics into four processes: plan, source,
make, and deliver that mainly constitute a supply chain. Moreover, they tested the
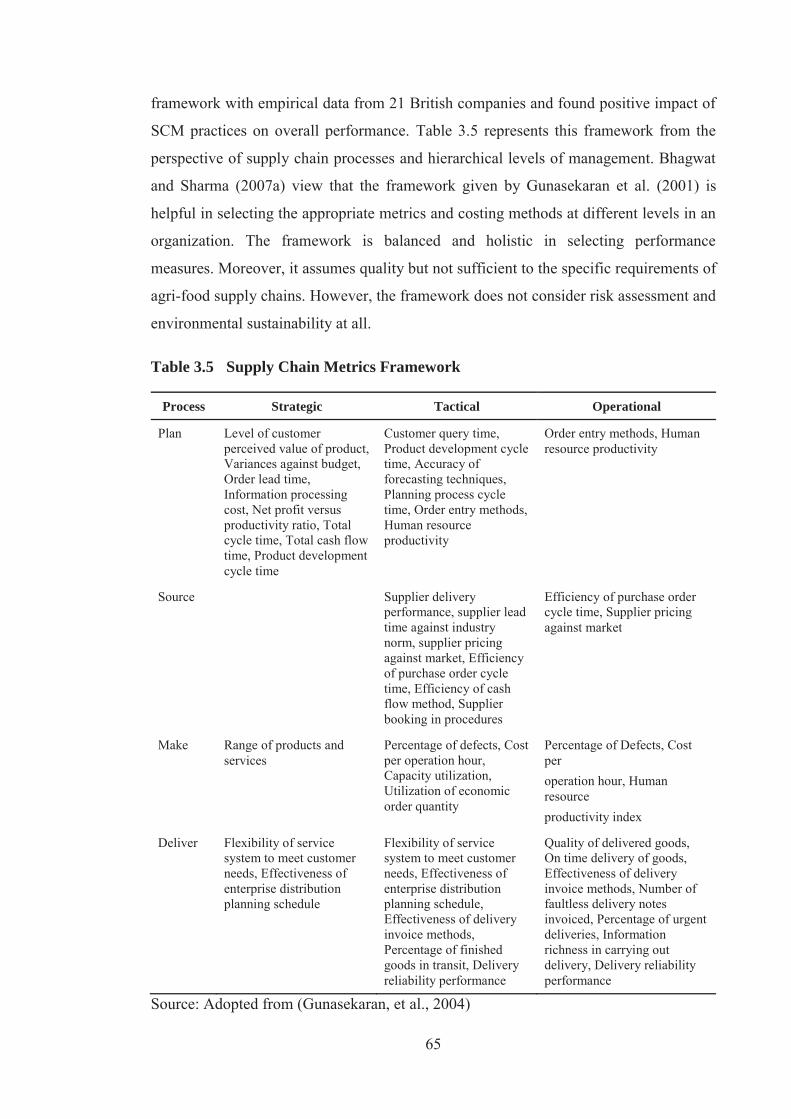
65
framework with empirical data from 21 British companies and found positive impact of
SCM practices on overall performance. Table 3.5 represents this framework from the
perspective of supply chain processes and hierarchical levels of management. Bhagwat
and Sharma (2007a) view that the framework given by Gunasekaran et al. (2001) is
helpful in selecting the appropriate metrics and costing methods at different levels in an
organization. The framework is balanced and holistic in selecting performance
measures. Moreover, it assumes quality but not sufficient to the specific requirements of
agri-food supply chains. However, the framework does not consider risk assessment and
environmental sustainability at all.
Table 3.5 Supply Chain Metrics Framework
Process Strategic Tactical Operational
Plan Level of customer perceived value of product, Variances against budget, Order lead time, Information processing cost, Net profit versus productivity ratio, Total cycle time, Total cash flow time, Product development cycle time
Customer query time, Product development cycle time, Accuracy of forecasting techniques, Planning process cycle time, Order entry methods, Human resource productivity
Order entry methods, Human resource productivity
Source Supplier delivery performance, supplier lead time against industry norm, supplier pricing against market, Efficiency of purchase order cycle time, Efficiency of cash flow method, Supplier booking in procedures
Efficiency of purchase order cycle time, Supplier pricing against market
Make Range of products and services
Percentage of defects, Cost per operation hour, Capacity utilization, Utilization of economic order quantity
Percentage of Defects, Cost per operation hour, Human resource productivity index
Deliver Flexibility of service system to meet customer needs, Effectiveness of enterprise distribution planning schedule
Flexibility of service system to meet customer needs, Effectiveness of enterprise distribution planning schedule, Effectiveness of delivery invoice methods, Percentage of finished goods in transit, Delivery reliability performance
Quality of delivered goods, On time delivery of goods, Effectiveness of delivery invoice methods, Number of faultless delivery notes invoiced, Percentage of urgent deliveries, Information richness in carrying out delivery, Delivery reliability performance
Source: Adopted from (Gunasekaran, et al., 2004)

66
Li et al. (2007) postulated an integrated performance measurement approach to evaluate
a supply chain from structure and operational levels. The approach is both balanced and
holistic, but does not consider food quality, risk assessment, and environmental
sustainability. In order to develop a PMS for meat supply chain in Iran, Fattahi et al.
(2013) considered six criteria base the unique characteristics of agri-food supply chains.
These are: financial, quality and safety, customer service, efficiency, flexibility, and
chain coordination. The framework has been structured around balanced scorecard and
uses Delphi technique to allocate selected performance indicators at strategic and
tactical levels, thus making it of hierarchical nature. On the list of five, this framework
meets four criteria, as shown in Appendix-C.
F. Interface Based Measurement System (IBMS)
Lambert and Pohlen (2001) devised a framework to align the performance of each link
within the supply chain. This link-by-link approach looks at the supply chain as a series
of different interfaces and aims to optimise the performance at individual links level as
well as the supply chain as a whole. The IBMS given by Lambert and Pohlen (2001) has
been appreciated by the researchers for a variety of reasons. For example, Pohlen (2003)
emphasized that interfaces can be used to demonstrate the outcome of supply chain
collaboration. Gaiardelli et al. (2007) suggested that Lambert and Pohlen’s framework
is helpful in managing customer relationships and supplier relationships at each link in
the supply chain. Apart from being holistic Lambert and Pohlen’s framework does not
fulfil the remaining four selection criteria.
G. Perspective Based Measurement System (PBMS)
A PBMS evaluates a supply chain from one or more perspectives. Otto and Kotzab
(2003) developed a framework to measure supply chain performance from six possible
perspectives: system dynamics, operations research, logistics, marketing, organization,
and strategy. Hofmann (2006) viewed that the framework given by Otto and Kotzab can
be employed to identify standard problems, their possible solutions, and most
importantly to optimize the trade-off of measures among the perspectives based upon
the perceived dominancy of perspectives in a supply chain. However,
Papakiriakopolous and Pramatari (2010) argued that existence of different perspectives
makes it difficult to identify the significance level of different areas of performance
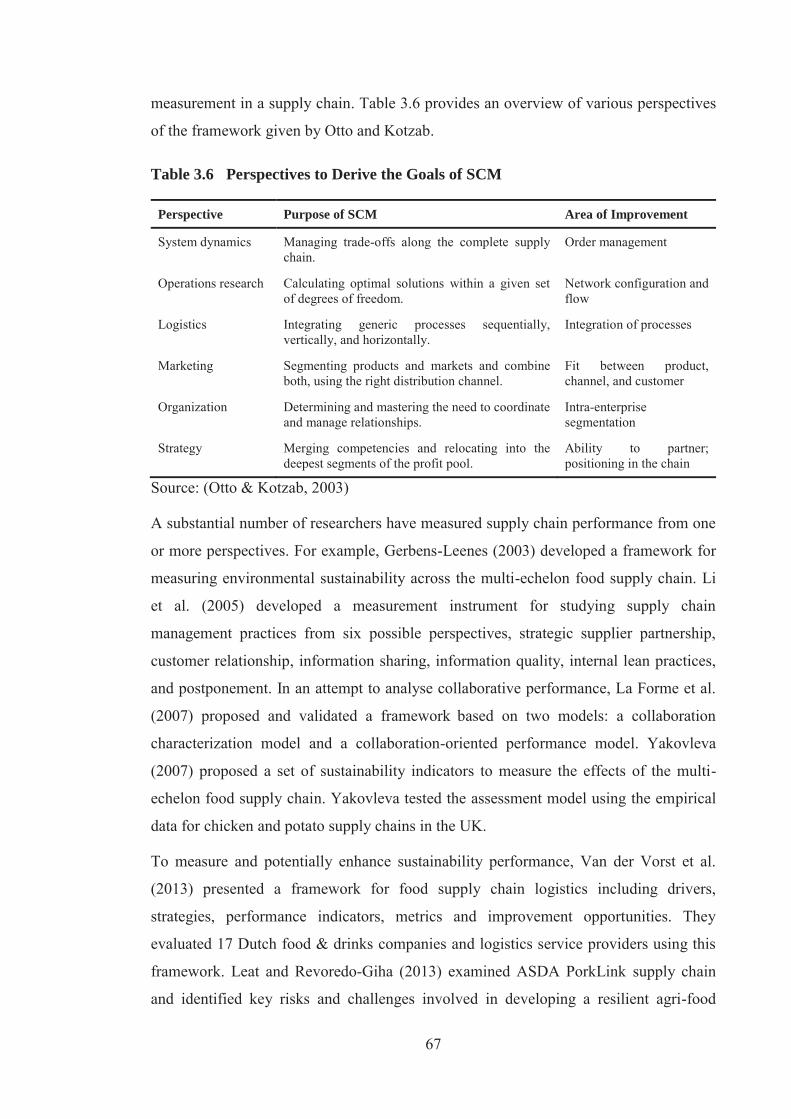
67
measurement in a supply chain. Table 3.6 provides an overview of various perspectives
of the framework given by Otto and Kotzab.
Table 3.6 Perspectives to Derive the Goals of SCM
Perspective Purpose of SCM Area of Improvement
System dynamics Managing trade-offs along the complete supply chain.
Order management
Operations research Calculating optimal solutions within a given set of degrees of freedom.
Network configuration and flow
Logistics Integrating generic processes sequentially, vertically, and horizontally.
Integration of processes
Marketing Segmenting products and markets and combine both, using the right distribution channel.
Fit between product, channel, and customer
Organization Determining and mastering the need to coordinate and manage relationships.
Intra-enterprise segmentation
Strategy Merging competencies and relocating into the deepest segments of the profit pool.
Ability to partner; positioning in the chain
Source: (Otto & Kotzab, 2003)
A substantial number of researchers have measured supply chain performance from one
or more perspectives. For example, Gerbens-Leenes (2003) developed a framework for
measuring environmental sustainability across the multi-echelon food supply chain. Li
et al. (2005) developed a measurement instrument for studying supply chain
management practices from six possible perspectives, strategic supplier partnership,
customer relationship, information sharing, information quality, internal lean practices,
and postponement. In an attempt to analyse collaborative performance, La Forme et al.
(2007) proposed and validated a framework based on two models: a collaboration
characterization model and a collaboration-oriented performance model. Yakovleva
(2007) proposed a set of sustainability indicators to measure the effects of the multi-
echelon food supply chain. Yakovleva tested the assessment model using the empirical
data for chicken and potato supply chains in the UK.
To measure and potentially enhance sustainability performance, Van der Vorst et al.
(2013) presented a framework for food supply chain logistics including drivers,
strategies, performance indicators, metrics and improvement opportunities. They
evaluated 17 Dutch food & drinks companies and logistics service providers using this
framework. Leat and Revoredo-Giha (2013) examined ASDA PorkLink supply chain
and identified key risks and challenges involved in developing a resilient agri-food
68
supply system. They particularly focused primary product supply, and how risk
management and collaboration amongst stakeholders can increase chain resilience.
Zubair and Mufti (2015) identified eighteen risk perspectives in supply chain of dairy
products in Pakistan and developed a risk matrix based on probability and impact scores
in order to prioritize these risk perspectives. Wiengarten and Longoni (2015) surveyed
90 Indian manufacturing companies to assess the impact of supply chain integration on
operational, environmental, and social sustainability. They used cluster analysis and
analysis of covariance methods and found that coordinative outward-facing integration
had positive impact on several operational and sustainability performance dimensions,
whereas collaborative outward-facing integration provided significantly higher benefits
mainly on the flexibility and sustainability performance dimensions compared to other
collaborative integration strategies.
A review of aforementioned PBMSs against five selection criteria is summarized in
Appendix-C. All of the reviewed frameworks are holistic in nature, however, majority
of them are not balanced. Apart from being holistic, a major limitation of PBMSs is
their focus on individual perspectives of supply chain performance. Since, by definition
PBMSs focus one or more perspectives and not the overall performance of supply
chain, therefore, none of the PBMSs meet all the five selection criteria.
In addition to seven categories mentioned above, a huge number of researchers adopted
hybrid frameworks to measure the supply chain performance. For example, Bullinger et
al (2002) integrated SCOR model and balanced scorecard to develop a balanced
measurement approach. The approach is balanced and holistic but does not focus food
quality, risk assessment, and environmental sustainability. Pohlen (2003) proposed a
hybrid approach of economic value added (EVA) and activity based costing (ABC) to
measure performance in a supply chain. The framework is balanced and holistic but
does not focus food quality, risk assessment, and environmental sustainability.
Reiner and Hofmann (2006) used a combination of data envelopment analysis (DEA)
and SCOR model to evaluate and benchmark the efficiency of supply chain processes
between decision making units. The model developed is balanced and holistic but
limited to make-to-stock configuration only. Yao and Liu (2006) integrated economic
value added (EVA), balanced scorecard (BSC), and activity based costing (ABC) to
balance short-term and long-term factors and to link the strategic performance indexes
with process measuring in supply chains. The framework is both balanced and holistic
69
but does not consider food quality, risk assessment, and environmental sustainability.
Bhagwat and Sharma (2007a) integrated balanced scorecard and analytical hierarchy
process and organized metrics into strategic, tactical and operational levels of
organizational hierarchy. Thakkar et al. (2009) combined balanced scorecard with
SCOR model to develop a performance measurement framework for supply chain
evaluation and planning in SMEs. The framework is both balanced and holistic but does
not consider food quality, risk assessment, and environmental sustainability.
Widyaningrum and Masruroh (2012) developed an agri-food supply chain performance
measurement framework based on SCOR model and Aramyan et al. (2007). The
framework focuses on efficiency, flexibility, responsiveness, food quality, facility and
government involvement. Among the PBMSs reviewed in this study, the framework
developed by Widyaningrum and Masruroh (2012) is balanced, holistic, and focuses
food quality and environmental sustainability. However, like other PBMSs this
framework does not consider risk assessment either. A common problem in using
hybrid frameworks is the lack of synchronization between the metrics from two
different contexts.
3.5 Potential Research Gap and Way Forward
The choice of right performance measurement framework for benchmarking a supply
chain very much depends upon the nature of problem(s) that the researcher is going to
address. Previous section presents a critical review of literature against five selection
criteria. The review revealed that there is no performance measurement framework
which satisfies all the five selection criteria. This research gap in performance
measurement in agri-food supply chains needs to be abridged by developing a
framework comprising of performance measures related to all the five selection criteria.
The review of existing literature also highlighted that according to criteria approach
SCOR model (version 10) was the most suitable framework for performance
measurement in agri-food supply chains. The SCOR model is a balanced and holistic
framework. Moreover, it focuses risk assessment and environmental sustainability
which are inherent part of agri-food supply chains. Furthermore, in addition to PM
framework, SCOR model is also a benchmarking framework widely used in industry
and also validated by academic researchers. However, SCOR model assumes but does
not explicitly address food quality, for which it needs to be modified by incorporating
relevant food quality metrics. Therefore, SCOR model with certain modifications to
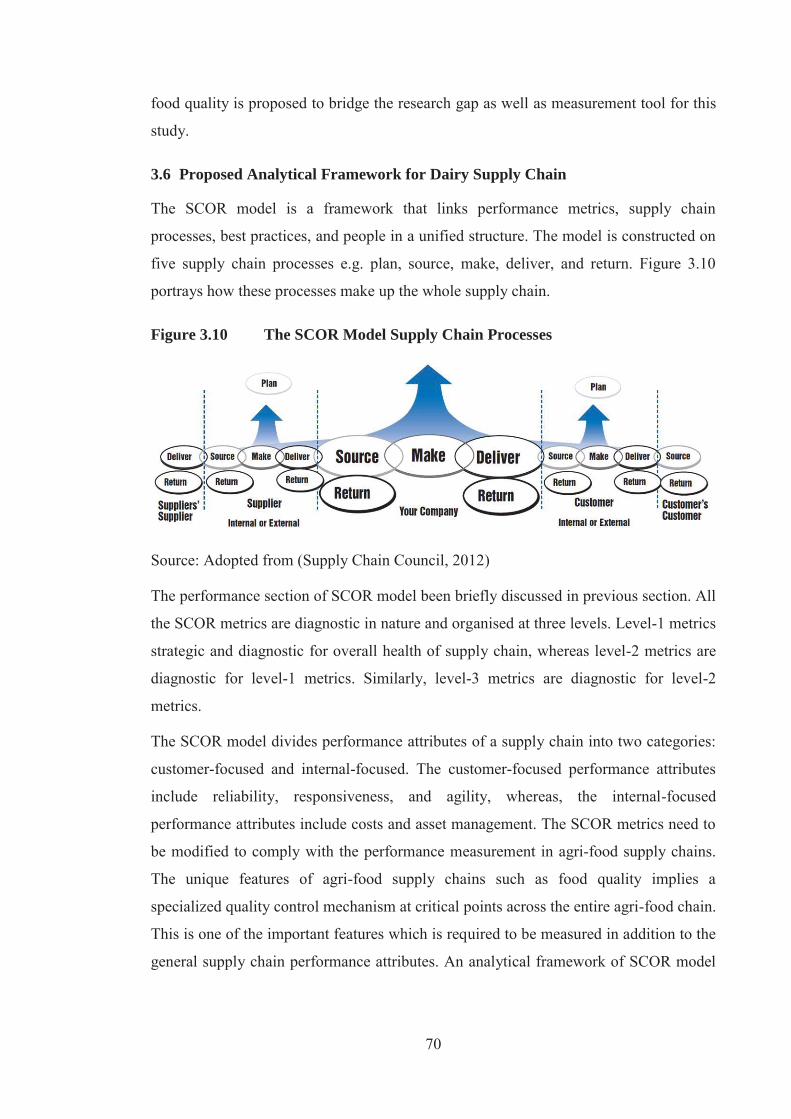
70
food quality is proposed to bridge the research gap as well as measurement tool for this
study.
3.6 Proposed Analytical Framework for Dairy Supply Chain
The SCOR model is a framework that links performance metrics, supply chain
processes, best practices, and people in a unified structure. The model is constructed on
five supply chain processes e.g. plan, source, make, deliver, and return. Figure 3.10
portrays how these processes make up the whole supply chain.
Figure 3.10 The SCOR Model Supply Chain Processes
Source: Adopted from (Supply Chain Council, 2012)
The performance section of SCOR model been briefly discussed in previous section. All
the SCOR metrics are diagnostic in nature and organised at three levels. Level-1 metrics
strategic and diagnostic for overall health of supply chain, whereas level-2 metrics are
diagnostic for level-1 metrics. Similarly, level-3 metrics are diagnostic for level-2
metrics.
The SCOR model divides performance attributes of a supply chain into two categories:
customer-focused and internal-focused. The customer-focused performance attributes
include reliability, responsiveness, and agility, whereas, the internal-focused
performance attributes include costs and asset management. The SCOR metrics need to
be modified to comply with the performance measurement in agri-food supply chains.
The unique features of agri-food supply chains such as food quality implies a
specialized quality control mechanism at critical points across the entire agri-food chain.
This is one of the important features which is required to be measured in addition to the
general supply chain performance attributes. An analytical framework of SCOR model
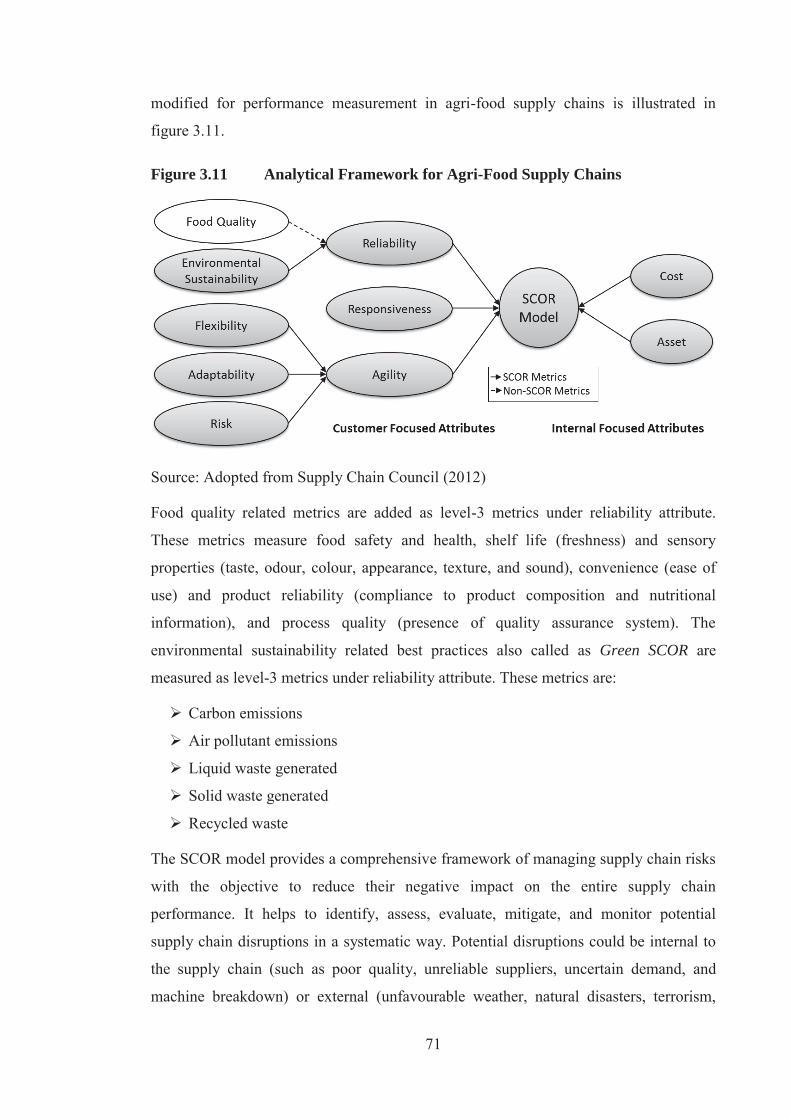
71
modified for performance measurement in agri-food supply chains is illustrated in
figure 3.11.
Figure 3.11 Analytical Framework for Agri-Food Supply Chains
Source: Adopted from Supply Chain Council (2012)
Food quality related metrics are added as level-3 metrics under reliability attribute.
These metrics measure food safety and health, shelf life (freshness) and sensory
properties (taste, odour, colour, appearance, texture, and sound), convenience (ease of
use) and product reliability (compliance to product composition and nutritional
information), and process quality (presence of quality assurance system). The
environmental sustainability related best practices also called as Green SCOR are
measured as level-3 metrics under reliability attribute. These metrics are:
Carbon emissions
Air pollutant emissions
Liquid waste generated
Solid waste generated
Recycled waste
The SCOR model provides a comprehensive framework of managing supply chain risks
with the objective to reduce their negative impact on the entire supply chain
performance. It helps to identify, assess, evaluate, mitigate, and monitor potential
supply chain disruptions in a systematic way. Potential disruptions could be internal to
the supply chain (such as poor quality, unreliable suppliers, uncertain demand, and
machine breakdown) or external (unfavourable weather, natural disasters, terrorism,

72
labour strikes). The SCOR model employs the term value at risk (VAR) to measure the
level of risk involved at process level. Value at risk refers to the sum of probability of
risk events times the monetary impact of events for all supply chain functions. The
SCOR attributes and relevant metric selected for performance measurement of dairy
supply chain are presented in Appendix-D.
3.7 Summary
The literature review chapter provides an extensive overview of existing literature in the
field of supply chain management, and benchmarking and performance measurement in
agri-food supply chains. The literature on supply chain management shows a shift in the
focus of SCM definitions from the flow of goods and relationship management in
1990’s to the supply chain coordination, customer value, and holistic/system’s approach
afterwards. The evolution of supply chain management from activity fragmentation in
1960’s through to activity integration in 2000 and afterwards has been described.
Benchmarking practice has evolved from reverse benchmarking in 1940’s to network
benchmarking in 2000 and afterwards.
The benchmarking frameworks commonly found in the literature were reviewed under
one-to-one benchmarking frameworks and business excellence models. The limitations
of both the categories were discussed and SCOR models was found as widely used for
benchmarking in industry and also validated by researchers. In order to select an
appropriate performance measurement system for agri-food supply chains, five criteria
were used to evaluate existing supply chain performance measurement frameworks. In
addition to five criteria, the PM frameworks were also organized in to seven categories.
namely function based measurement systems (FBMS), dimension based measurement
systems (DBMS), supply chain balanced scorecard (SCBS), supply chain operations
reference model (SCOR), hierarchical based measurement systems (HBMS), interface
based measurement systems (IBMS), and perspective based measurement systems
(PBMS).
A substantial number of frameworks were reviewed against these five criteria and not a
single one of them satisfied all the criteria which points out a potential research gap.
The review also revealed that SCOR model version 10 satisfies four selection criteria.
However, it assumes but does not explicitly address food quality, for which it needs to
be modified by incorporating necessary food quality metrics. In addition to performance

73
measurement framework, SCOR model is also a benchmarking framework widely used
in industry and also validated by academic researchers. Therefore, SCOR model with
certain modifications to food quality is proposed as measurement tool for this study.
74
CHAPTER 4
4. RESEARCH METHODOLOGY
4.1 Introduction
This chapter deals with the research methodology employed. The chapter is organised
into following sections
Section 4.2 reitirates the research objectives of this study.
Section 4.3 schematically represents the research process governing this chapter.
Section 4.4 reviews existing research philosophies and presents the one selected
for this study.
Section 4.5 expands on the research design thereby explaining research category,
data collection strategy, sampling design, hypothesis testing, and the issues of
validity, reliability and ethics employed in this research.
Section 4.6 explains pilot survey performed to callibrate questionnaires in line
with the functions and activities performed by the players of milk supply chains in
Pakistan and New Zealand.
Section 4.7 summarises methodology used in this study.
4.2 Research Objectives
This study aims to examine the causes of poor performance of milk supply chain in
Pakistan. For this purpose the milk supply chain in Pakistan was benchmarked against
that of New Zealand with following research objectives.
Objective 1: to overview dairy industries of Pakistan and New Zealand.
Objective 2: to measure the performance of key players of milk supply chains in
Pakistan and New Zealand.
Objective 3: to identify and analyse performance gaps between milk supply chains in
Pakistan and New Zealand.
Objective 4: to suggest policy measures for the improvement of milk supply chain in
Pakistan.
75
4.3 The Research Process
Saunders, Lewis and Thornhill (2012) describe research as a multistage process that the
researchers must follow in order to complete a research project. They add that the stages
of research process usually include formulating and clarifying a topic, reviewing the
literature, designing the research, collecting data, analyzing data, and writing up.
Nonetheless, Cooper and Schindler (2014) argue that no one claims that the research
requires to complete each step before going to the next. Instead, they believe that
recycling, circumventing, and skipping do occur. Figure 4.1 portrays the schematic
steps involved in the research process employed in this study.
The research process starts with problem identification, research objectives and research
questions to achive those objectives. To construct and refine the research objectives and
questions, the exploratory information about the benchmarking partners has been given
in the background chapter and about the literature on performance measurement and
benchmarking in supply chain management has been given in the literature review
chapter. The literature review chapter systematically evaluates performance
measurement frameworks against five criteria characterising the performance
measurement in agri-food supply chains. The review reveals a potential research gap in
literature and introduces an analytical framework to measure and benchmark the
performance of milk supply chains in Pakistan and New Zealand. This chapter expands
on research philosophies, research design, questionnaire development, data collection,
pilot survey, and data analysis techniques used in this study.
The questionnaires are developed and pilot tested before final data collection from the
sample respondents. The data sets for key players in the milk supply chains of Pakistan
and New Zealand are statistically analysed and compared or supported with relevant
literature. Finally, the findings are concluded and appropriate policy interventions are
recommended for the improvement of milk supply chain in Pakistan.
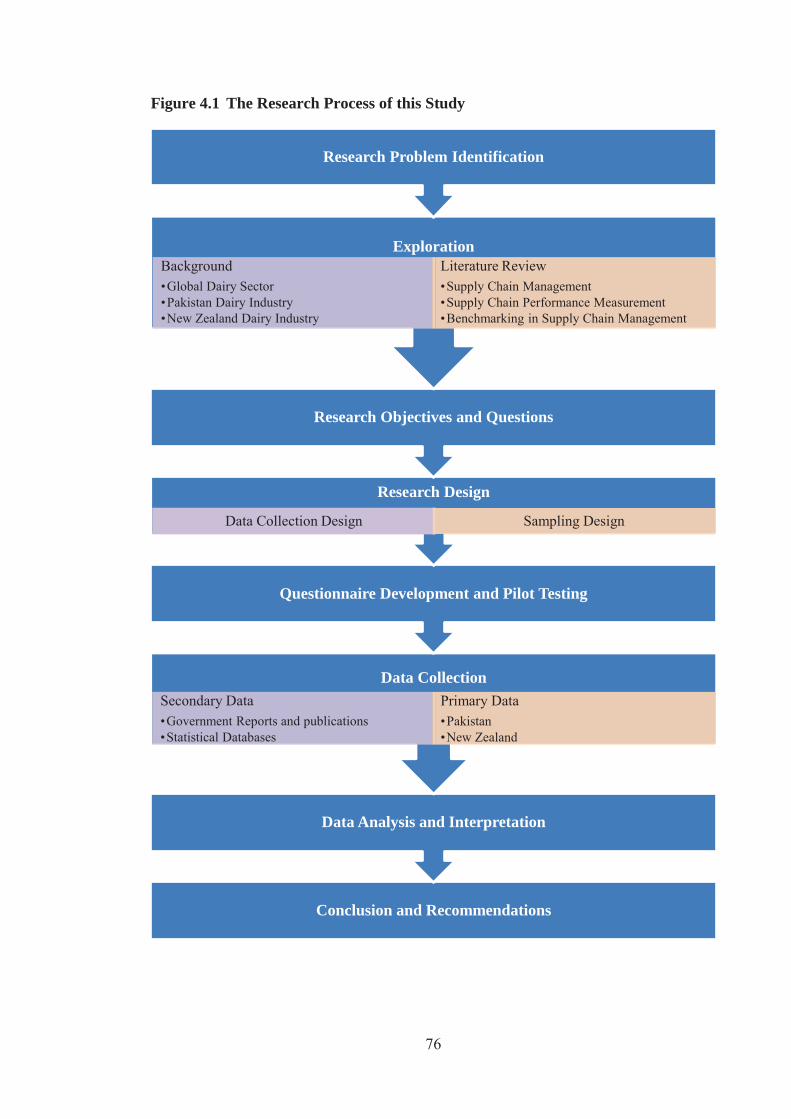
76
Figure 4.1 The Research Process of this Study
Conclusion and Recommendations
Data Analysis and Interpretation
Data Collection Secondary Data •Government Reports and publications •Statistical Databases
Primary Data •Pakistan •New Zealand
Questionnaire Development and Pilot Testing
Research Design
Data Collection Design Sampling Design
Research Objectives and Questions
Exploration Background •Global Dairy Sector •Pakistan Dairy Industry •New Zealand Dairy Industry
Literature Review •Supply Chain Management •Supply Chain Performance Measurement •Benchmarking in Supply Chain Management
Research Problem Identification

77
4.4 Research Philosophy and Approach
How best to conduct a research, has always been a debatable topic for scientists and
methodologists. This debate always focussed on two fundamentally different and
competent schools of thought: the positivists and the interpretive (Amaratunga et al.,
2002; Carson et al., 2001; Collis & Hussey, 2014). However, in recent years there is a
growing concern that in some cases it is more appropriate to adopt a multi-dimensional
set of continua rather than taking extreme positions (Saunders, et al., 2012). This
selection of multi-dimensional set of continua is called mixed methods or pragmatism.
This section discusses theoretical foundations of the three scientific paradigms and
explains which paradigm has been used in this study and why?
4.4.1 Positivism
Positivism is an objectivist approach which assumes that the world is external and
objective (Carson, et al., 2001). It originated in the natural sciences and involves a
deductive processes with a view to provide explanatory theories to understand social
phenomena (Collis & Hussey, 2014). It generally uses quantitative and experimental
methods to test theories and hypothetical deductive generalizations (Amaratunga, et al.,
2002). The scientific objectivity advocates the need of independence of the observer
from the subject being observed (Carson, et al., 2001) that is the researcher remains
emotionally neutral and detached from the object of research. The objective of a
positivist enquiry is to explain causal relationships with the help of objective facts and
statistical analysis (Perry et al., 1999). The approach of measuring and quantifying the
phenomena provides basis for deduction about the whole from the analysis of its parts
(Myers, 2000).
The quantitative research predominantly uses formalized statistical and mathematical
methods of data collection and analysis (Carson, et al., 2001). It seeks to estimate the
average effect of causation across the population (Mahoney & Goertz, 2006). Therefore,
the sample sizes are greater than those used in qualitative research in order to be true
representative of the population and the results to be generalizable (Sale et al., 2002).
Moreover, the quantitative research deducts on the basis of objective facts and derives
an empirical model which is used to predict within that ‘absolute truth’ (Davies, 2003).
The proponents of quantitative research regard qualitative researchers as soft scientists
or even journalists (Denzin & Lincoln, 1994). In support of dominating role of
78
positivism, quantitative researchers often quote the issue of lack of generalizability of
qualitative results (Larsen-Freeman & Long, 1991; Myers, 2000).
4.4.2 Interpretivism
Interpretivism is an anti-positivist approach which states that the world is essentially
relativistic, thus one must understand it from the inside rather than the outside (Denzin
& Lincoln, 1994). Therefore, the interpretivists emphasise the use of personal process to
understand reality (Carson, et al., 2001). Interpretivism emerged in response to
positivism and rests on the assumption that social reality is in our minds and it is
sujective and multiple (Collis & Hussey, 2014). Interpretivism uses qualitative (or
phenomenological) and naturalistic inquiry to inductively understand the reality through
observer’s personal involvement in context-specific situations (Amaratunga, et al.,
2002). Using this approach, it is therefore hard to generate objective knowledge.
The interpretivist view of scientific research is qualitative and subjective (Altheide &
Johnson, 1994). In contrast to the quantitative, this paradigm assumes that there are
multiple realities based on one’s construction of reality (Davies, 2003). The investigator
actively seeks interaction with the object of study so that the findings reflect the context
of the situation (Denzin & Lincoln, 1994; Guba & Lincoln, 1994). The qualitative
researchers like Guba and Lincoln (1994) criticize quantitative research for: context
stripping; exclusion of meaning and purpose about human activities; disjunction of
major theories with local contexts (the etic/emic dilemma); inapplicability of general
data to individual cases and exclusion of discovery dimension in inquiry. Lazaraton
(1995) views that the quantification of a data set does not ensure its generalizability to
all the contexts. Moreover, in certain contexts, statistical significant findings based on
large sample size and random selection are not applicable on individual level especially
in medical science (Lazaraton, 1995).
4.4.3 Pragmatism
Pragmatism contends that rather than be constrained by a single paradigm, researchers
should be free to mix methods from different paradigms, choosing them on the basis of
usefulness for answering the question (Collis & Hussey, 2014). A number of past
researchers support the use of a combination of both the research methods (Amaratunga,
et al., 2002; Kaplan & Maxwell, 2005; Remenyi et al., 1998; Sale, et al., 2002). For
example, King et al. (1994) view that both the methodologies share the unified logic of
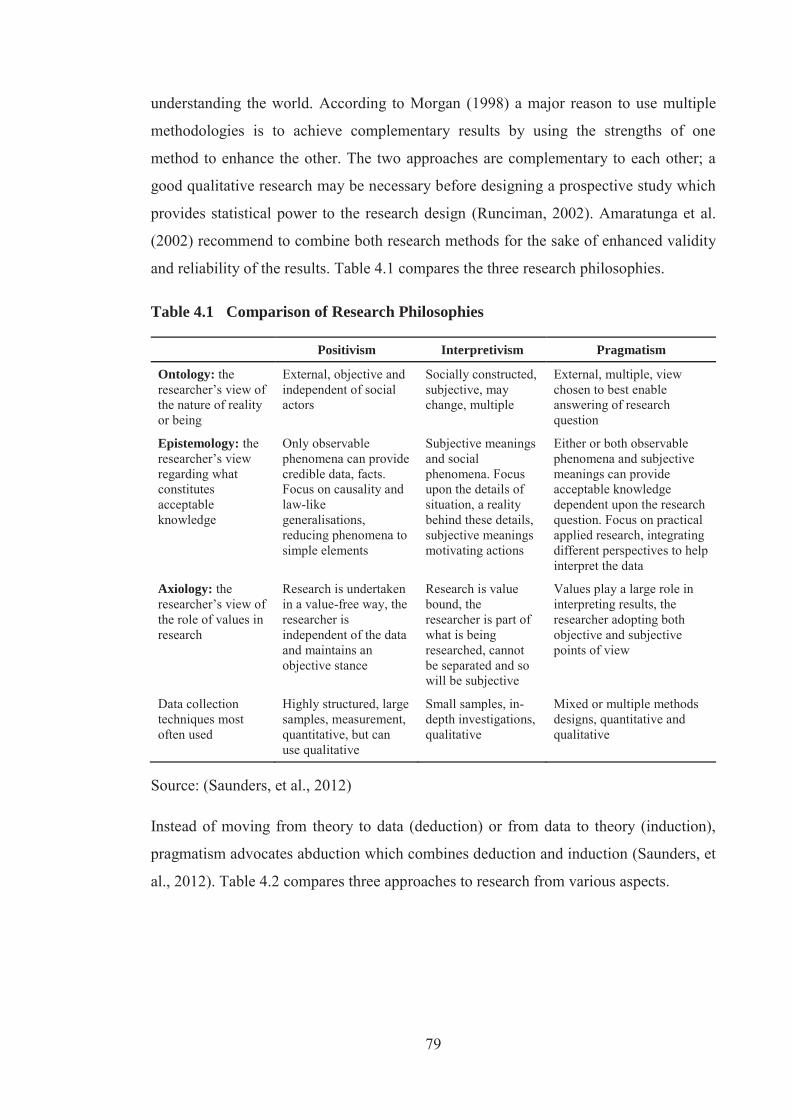
79
understanding the world. According to Morgan (1998) a major reason to use multiple
methodologies is to achieve complementary results by using the strengths of one
method to enhance the other. The two approaches are complementary to each other; a
good qualitative research may be necessary before designing a prospective study which
provides statistical power to the research design (Runciman, 2002). Amaratunga et al.
(2002) recommend to combine both research methods for the sake of enhanced validity
and reliability of the results. Table 4.1 compares the three research philosophies.
Table 4.1 Comparison of Research Philosophies
Positivism Interpretivism Pragmatism
Ontology: the researcher’s view of the nature of reality or being
External, objective and independent of social actors
Socially constructed, subjective, may change, multiple
External, multiple, view chosen to best enable answering of research question
Epistemology: the researcher’s view regarding what constitutes acceptable knowledge
Only observable phenomena can provide credible data, facts. Focus on causality and law-like generalisations, reducing phenomena to simple elements
Subjective meanings and social phenomena. Focus upon the details of situation, a reality behind these details, subjective meanings motivating actions
Either or both observable phenomena and subjective meanings can provide acceptable knowledge dependent upon the research question. Focus on practical applied research, integrating different perspectives to help interpret the data
Axiology: the researcher’s view of the role of values in research
Research is undertaken in a value-free way, the researcher is independent of the data and maintains an objective stance
Research is value bound, the researcher is part of what is being researched, cannot be separated and so will be subjective
Values play a large role in interpreting results, the researcher adopting both objective and subjective points of view
Data collection techniques most often used
Highly structured, large samples, measurement, quantitative, but can use qualitative
Small samples, in-depth investigations, qualitative
Mixed or multiple methods designs, quantitative and qualitative
Source: (Saunders, et al., 2012)
Instead of moving from theory to data (deduction) or from data to theory (induction),
pragmatism advocates abduction which combines deduction and induction (Saunders, et
al., 2012). Table 4.2 compares three approaches to research from various aspects.

80
Table 4.2 Approaches to Scientific Research
Deduction Induction Abduction
Logic In a deductive inference, when the premises are true, the conclusion must also be true
In an inductive inference, known premises are used to generate untested conclusions
In an abductive inference, known premises are used to generate testable conclusions
Generalisability Generalisisng from the general to the specific
Generalisisng from specific to the general
Generalisisng from the interactions between the specific and the general
Use of data Data collected is used to evaluate propositions or hypothesis related to an existing theory
Data collection is used to explore a phenomenon, identify themes and patterns and create a conceptual framework
Data collection is used to explore a phenomenon, identify themes and patterns, locate these in a conceptual framework and test this through subsequent data collection and so forth
Theory Theory falsification or verification
Theory generation and building
Theory generation or modification; incorporating existing theory where appropriate, to build new theory or modify existing theory
Source: (Saunders, et al., 2012)
4.4.4 The Choice of Research Philosophy and Approach
Existing research philosophies are just like different cultures each of which has its own
values, beliefs and norms. Having known the strengths and weaknesses of all research
forms, the researcher should use the most appropriate method, given the particular
research problem. Keeping in view the prime objective of this study, pragmatic (mixed
methods) approach was adopted. There are various justificatiosn to this choice of
research philosophy.
a) The exploration of research problem was carried out in the form of:
An overview of dairy industries in Pakistan and New Zealand (chapter 2)
A critical review of literature to find/develop a performance measurement
framework for agri-food supply chains (chapter 3)
Pilot survey of the semi-structured questionnaires to explore overall
structure of milk supply chains and functions performed by the key players
(in chapter 4)
Value chain analysis of milk supply chains of Pakistan and New Zealand (in
chapter 5).
81
These are qualitative inquiries and therefore, employ qualitative approach.
b) The performance measurement of key players of milk supply chains in Pakistan
and New Zealand in the form of SCOR metrics implies quantitative inquiry.
c) The gap analysis of SCOR metrics included hypothesis testing for comparison of
mean values from two independent samples/groups (quantitative approach) and
phenomenological discussion of performance gaps (qualitative approach) between
the benchmarking partners.
Due to the pragmatist nature of this study, abductive approach was adopted to generate
testable conclusions. Abduction uses both inductive as well as deductive approach at
different stages (Saunders, et al., 2012). For example, in this study inductive approach
was used for the exploration of research problem and development of conceptual model
and then deductive approach was used to test a series of hypothesis.
4.5 Research Design
A research paradigm provides a philosophical framework that guides the selection of
research design (Collis & Hussey, 2014). A research design provides a framework for
the collection and analysis of data (Bryman & Bell, 2015). It includes selection of
appropriate research strategy, sampling design, data collection methodology, and data
analysis technique. Moreover, it deals with the validity and reliability of measurement
and ethical issues related to the research being undertaken. According to Saunders, et al.
(2012) the research design should be selected to best answer the research question(s).
4.4.1 Research Category
A number of researchers (Baines & Chansarkar, 2002; Saunders, et al., 2012; Webb,
2002; Zikmund et al., 2013) agree on three basic categories of research: exploratory,
descriptive, and explanatory (also called causal or inferential). The degree of formality
increases and the degree of flexibility decreases from exploratory through to
explanatory research (Webb, 2002). Exploratory research is not an end unto itself rather
it is conducted as a first step with the expectation that additional research will be needed
to provide a conclusive evidence (Zikmund, et al., 2013). Descriptive research is to gain
an accurate profile of events, persons, or situations, whereas explanatory research seeks
to establish causal relationship between variables (Saunders, et al., 2012). Desrcriptive
research includes measures of tendency, variability, deviation from normality, size, and
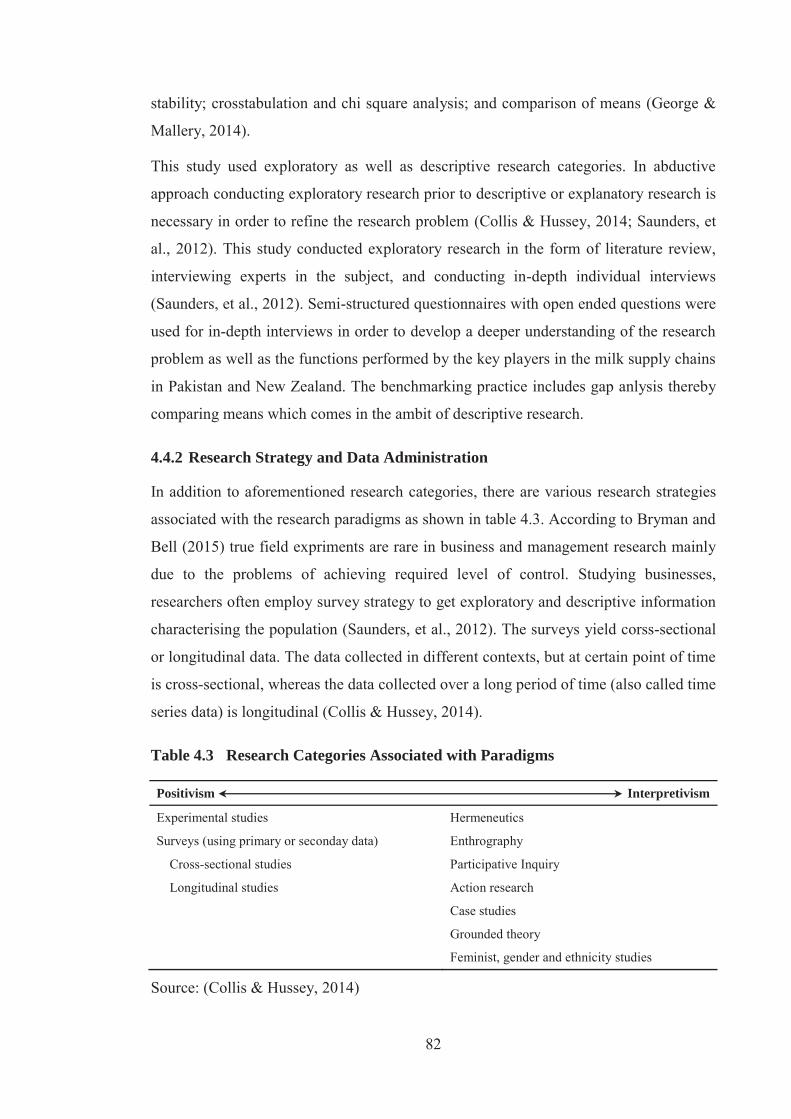
82
stability; crosstabulation and chi square analysis; and comparison of means (George &
Mallery, 2014).
This study used exploratory as well as descriptive research categories. In abductive
approach conducting exploratory research prior to descriptive or explanatory research is
necessary in order to refine the research problem (Collis & Hussey, 2014; Saunders, et
al., 2012). This study conducted exploratory research in the form of literature review,
interviewing experts in the subject, and conducting in-depth individual interviews
(Saunders, et al., 2012). Semi-structured questionnaires with open ended questions were
used for in-depth interviews in order to develop a deeper understanding of the research
problem as well as the functions performed by the key players in the milk supply chains
in Pakistan and New Zealand. The benchmarking practice includes gap anlysis thereby
comparing means which comes in the ambit of descriptive research.
4.4.2 Research Strategy and Data Administration
In addition to aforementioned research categories, there are various research strategies
associated with the research paradigms as shown in table 4.3. According to Bryman and
Bell (2015) true field expriments are rare in business and management research mainly
due to the problems of achieving required level of control. Studying businesses,
researchers often employ survey strategy to get exploratory and descriptive information
characterising the population (Saunders, et al., 2012). The surveys yield corss-sectional
or longitudinal data. The data collected in different contexts, but at certain point of time
is cross-sectional, whereas the data collected over a long period of time (also called time
series data) is longitudinal (Collis & Hussey, 2014).
Table 4.3 Research Categories Associated with Paradigms
Positivism Interpretivism
Experimental studies Hermeneutics
Surveys (using primary or seconday data) Enthrography
Cross-sectional studies Participative Inquiry
Longitudinal studies Action research
Case studies
Grounded theory
Feminist, gender and ethnicity studies
Source: (Collis & Hussey, 2014)
83
In this study, data from both secondary as well as primary sources was utilised to
answer the research questions. Seconday information was gathered from various
research organizations, expert persons related to dairy industry, reports, periodicals, and
article databases. Secondary information was mainly used for exploration of research
problm. To answer the research questions of this study survey strategy was employed to
collect primary data (Sreejesh et al., 2014). Survey strategy is often used to answer the
research questions ‘what’, ‘who’, ‘where’, ‘how much’, and ‘how many’ (Saunders, et
al., 2012). The nature of research questions required data on performance indicators of
key players of milk supply chains of Pakistan and New Zealand at a certain point of
time.
There are three data collection methods: observation, interview, and questionnaire
(Saunders, et al., 2012). Table 4.4 describes the data collection methods for scientific
research. Every method of data collection has its own advantages and disadvantages,
however, the selection of an appropriate data collection method is affected by four
major factors: the objectives of the study, available sources of data, time frame, and the
cost constraints (Zikmund, et al., 2013).
In this study two methods of data collection, personal interviews and questionnaires
were used. Personal interviews offer unique advantages such as opportunity for
feedback, probing complex questions, controlling length of interview, and high rate of
completed questionnaires, whereas, self-administered questionnaires delivered through
internet are quick, cost effective and protect respondent anonymity (Zikmund, et al.,
2013). For data collection in Pakistan, structured face-to-face interviews were
conducted. Whereas, in New Zealand online questionnaires were used to collect data
using internet. The questionnaires developed for each SC operator were comprised of
both open ended and close ended questions.

84
Table 4.4 Data Collection Methods
Data Collection Method Definitions
Observation The observation involves: the systematic observation, recording, description, analysis, and interpretation of people’s behaviour. There are two types of observation: Participant observation is qualitative and derived from social anthropology where ‘the researcher attempts to participate fully in the lives and activities of members’. Structured observation is quantitative and is more concerned with the frequency of actions.
Interview The purposeful conversation between two or more people, requiring the interviewer to establish rapport, to ask concise and unambiguous questions and to listen attentively. There are three types of interviews: Structured interview is a data collection technique in which an interviewer physically meets the respondent, reads them the same set of questions in a predetermind order, and records his or her response to each. Semi-structured interview is a data collection technique in which an interviewer commences with a set of interview themes but is prepared to vary the order in which questions are are asked. Unstructured interview is a loosly structured and informally conducted that may commence with one or more themes to explore.
Questionnaire All methods of data collection in which each person is asked to respond to the same set of questions in a predetermind order. There are two main types or questionnaires: Self-completed questionnaires are usually completed bythe respondent such as internet-mediated or mail questionnaires. Interviewer-completed questionnaires are recorded by the interviewer on the basis of each respondent’s answers such as telephone questionnaires.
Source: (Saunders, et al., 2012)
4.4.3 Sampling Design
A population is “any complete group – for example, of people, sales territories, stores,
products, or college students – whose members share some common set of
characteristics” (Zikmund, et al., 2013, p. 301). To understand the characteristics or
response of the individuals of a population, Cooper and Schindler (2014) provide
several reasons for drawing samples rather than a complete census. These reasons are:
lower cost, greater accuracy of results, greater speed of data collection, and availability
of population elements. A sample is “a subset, or some part, of a larger population”
(Zikmund, et al., 2013, p. 301).
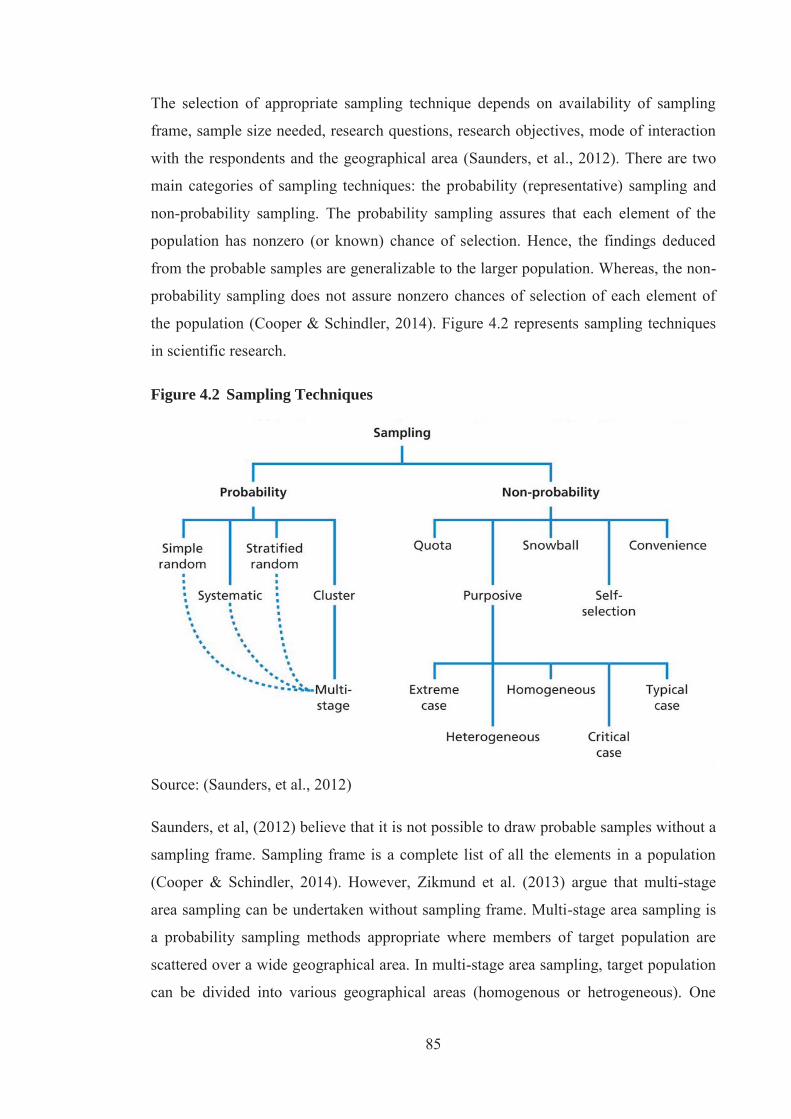
85
The selection of appropriate sampling technique depends on availability of sampling
frame, sample size needed, research questions, research objectives, mode of interaction
with the respondents and the geographical area (Saunders, et al., 2012). There are two
main categories of sampling techniques: the probability (representative) sampling and
non-probability sampling. The probability sampling assures that each element of the
population has nonzero (or known) chance of selection. Hence, the findings deduced
from the probable samples are generalizable to the larger population. Whereas, the non-
probability sampling does not assure nonzero chances of selection of each element of
the population (Cooper & Schindler, 2014). Figure 4.2 represents sampling techniques
in scientific research.
Figure 4.2 Sampling Techniques
Source: (Saunders, et al., 2012)
Saunders, et al, (2012) believe that it is not possible to draw probable samples without a
sampling frame. Sampling frame is a complete list of all the elements in a population
(Cooper & Schindler, 2014). However, Zikmund et al. (2013) argue that multi-stage
area sampling can be undertaken without sampling frame. Multi-stage area sampling is
a probability sampling methods appropriate where members of target population are
scattered over a wide geographical area. In multi-stage area sampling, target population
can be divided into various geographical areas (homogenous or hetrogeneous). One
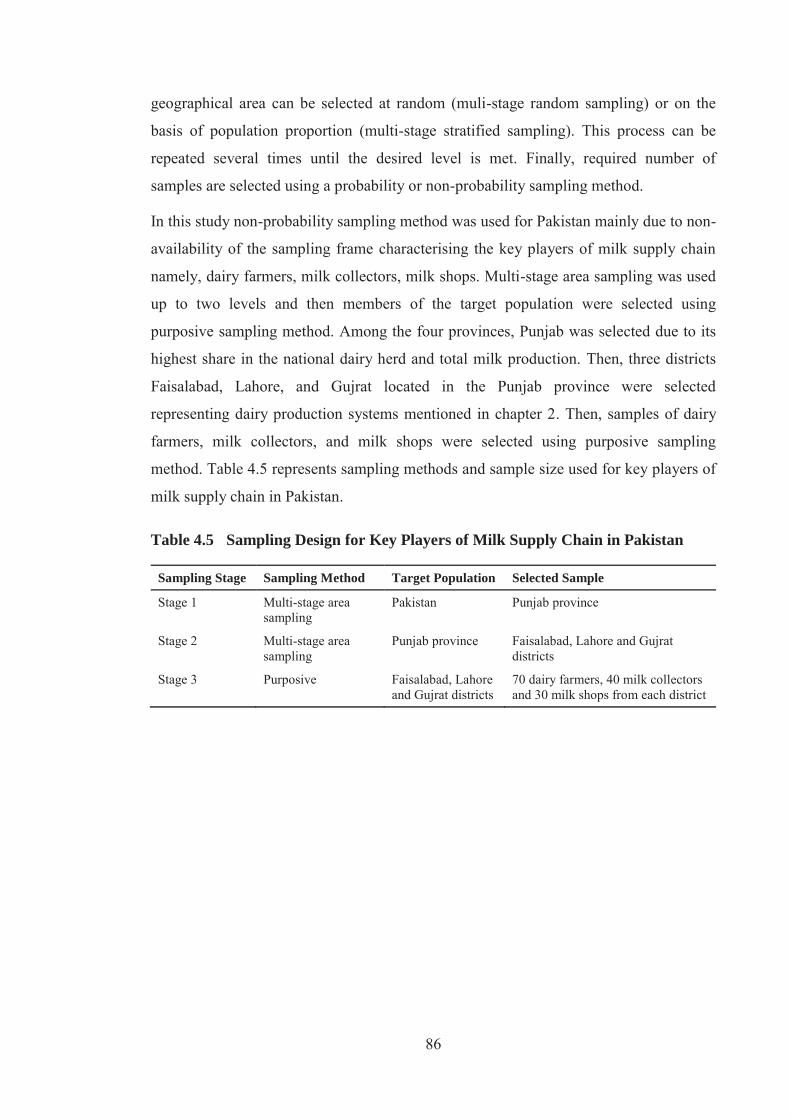
86
geographical area can be selected at random (muli-stage random sampling) or on the
basis of population proportion (multi-stage stratified sampling). This process can be
repeated several times until the desired level is met. Finally, required number of
samples are selected using a probability or non-probability sampling method.
In this study non-probability sampling method was used for Pakistan mainly due to non-
availability of the sampling frame characterising the key players of milk supply chain
namely, dairy farmers, milk collectors, milk shops. Multi-stage area sampling was used
up to two levels and then members of the target population were selected using
purposive sampling method. Among the four provinces, Punjab was selected due to its
highest share in the national dairy herd and total milk production. Then, three districts
Faisalabad, Lahore, and Gujrat located in the Punjab province were selected
representing dairy production systems mentioned in chapter 2. Then, samples of dairy
farmers, milk collectors, and milk shops were selected using purposive sampling
method. Table 4.5 represents sampling methods and sample size used for key players of
milk supply chain in Pakistan.
Table 4.5 Sampling Design for Key Players of Milk Supply Chain in Pakistan
Sampling Stage Sampling Method Target Population Selected Sample
Stage 1 Multi-stage area sampling
Pakistan Punjab province
Stage 2 Multi-stage area sampling
Punjab province Faisalabad, Lahore and Gujrat districts
Stage 3 Purposive Faisalabad, Lahore and Gujrat districts
70 dairy farmers, 40 milk collectors and 30 milk shops from each district

87
Figure 4.3 illustrates the selected districs on the map of Pakistan.
Figure 4.3 Universe of the Study in Pakistan
Source: Adopted from (UN, 2004)
The sampling frame for dairy companies in Pakistan was developed in the light of the
information acquired from Pakistan dairy association (PDA), Pakistan dairy
development company (PDDC) and other sources in dairy companies. Around 25 dairy
companies are operating in Pakistan. All of them were contacted but only 10 of them
participated in this study.
The key players of milk supply chain in New Zealand are dairy farmers and dairy
companies (as mentioned in chapter 2). Internet survey method was used to gain access
to dairy farmers and dairy companies due to time and cost constraints (Zikmund, et al.,
2013). For this purpose, qualtrics software was used and the survey link was shared
with dairy farmers through their group blog. A total of 50 questionnaires completed by
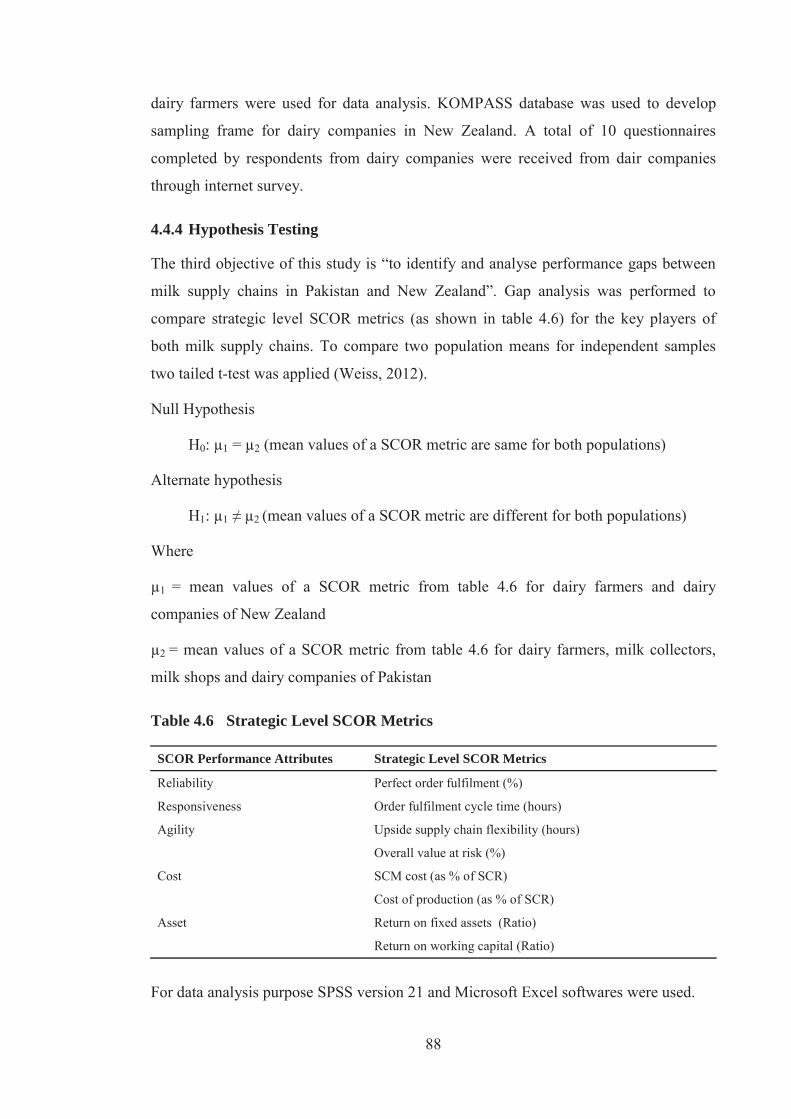
88
dairy farmers were used for data analysis. KOMPASS database was used to develop
sampling frame for dairy companies in New Zealand. A total of 10 questionnaires
completed by respondents from dairy companies were received from dair companies
through internet survey.
4.4.4 Hypothesis Testing
The third objective of this study is “to identify and analyse performance gaps between
milk supply chains in Pakistan and New Zealand”. Gap analysis was performed to
compare strategic level SCOR metrics (as shown in table 4.6) for the key players of
both milk supply chains. To compare two population means for independent samples
two tailed t-test was applied (Weiss, 2012).
Null Hypothesis
H0: μ1 = μ2 (mean values of a SCOR metric are same for both populations)
Alternate hypothesis
H1: μ1 ≠ μ2 (mean values of a SCOR metric are different for both populations)
Where
μ1 = mean values of a SCOR metric from table 4.6 for dairy farmers and dairy
companies of New Zealand
μ2 = mean values of a SCOR metric from table 4.6 for dairy farmers, milk collectors,
milk shops and dairy companies of Pakistan
Table 4.6 Strategic Level SCOR Metrics
SCOR Performance Attributes Strategic Level SCOR Metrics
Reliability Perfect order fulfilment (%)
Responsiveness Order fulfilment cycle time (hours)
Agility Upside supply chain flexibility (hours)
Overall value at risk (%)
Cost SCM cost (as % of SCR)
Cost of production (as % of SCR)
Asset Return on fixed assets (Ratio)
Return on working capital (Ratio)
For data analysis purpose SPSS version 21 and Microsoft Excel softwares were used.
89
4.4.5 Validity and Reliability
The validity of a measurement generally means “the extent to which the instrument
measures what it is designed to measure” (Wiersma & Jurs, 2009, p. 357). Cooper and
schindler (2014) report two major types of validity: external and internal validity. The
external validity refers to ‘the data’s generalized across persons, settings, and time;
whereas, the internal validity is the ability of a research instrument to measure what it is
purported to measure’ (Cooper & Schindler, 2014). On the other hand, reliability refers
to “the consistency of the instrument in measuring whatever it measures” (Wiersma &
Jurs, 2009, p. 354). Neuman (2006) claims that perfect reliability can rarely be
achieved, however, reliability of a measurement instrument can be increased: by clearly
conceptualizing the constructs; by using precise level of measurement; by using
multiple indicators; and by using pilot survey of the questionnaires.
Apart from the scientific requirements of validity and relaibaility of the measurement
instrument, it must be operationally practicle from economic, convienience, and
interpretation perspectives. The choice of sampling and data collection method is often
dictated by time and budget contraints and administrative capabilities. Testing the
validity and reliability of the measurement is dependent on the statistical technique used
for data analysis. In this study, a number of research design instruments including larger
sample size; calibration of the questionnaires through pilot survey; calibration of the
questionnaires with experts of relevant areas; and data collection through face-to-face
interviews were used to ensure validity and reliability of the data to the extent possible.
4.4.6 The Research Ethics
The goal of ethics in research is to ensure that no one is harmed or suffers adverse
consequences from the research activities (Cooper & Schindler, 2014). Guillemin and
Gillam (2004) describe two different dimensions of ethics in research termed as
“procedural ethics” and “ethics in practice”. The procedural ethics involves seeking
approval from a relevant ethics committee through the completion of an application
form to undertake research involving humans. They are of the view that procedural
ethics describes the measures that researcher/s have put in place in the event of
unexpected outcomes or adverse effects. They further argue that firstly, the research
ethics committees satisfy an obvious need to protect the basic rights and safety of
research participants from obvious forms of abuse. Secondly, it offers researchers an
90
ethics “checklist” by reminding them to consider such issues as the potential risks to
participants, the balancing of the benefits of the research against those risks, the steps
needed to ensure confidentiality of data, and the inclusion of consent forms and plain
language statements in the material provided to participants. Besides all this, procedural
ethics is not the forum in which issues of potential harm and other “ethically important
moments” can be fully dealt with.
The second dimension is “ethics in practice” which pertains to the day-to-day ethical
issues that arise in doing the actual research (Guillemin and Gillam, 2004). These issues
are pervasive and include violating nondisclosure agreements, breaking participant
confidentiality, misrepresenting results, deceiving people, using invoicing regularities,
avoiding legal liability, and more (Cooper & Schindler, 2014). In this research study the
ethical issues in both forms: procedural ethics and ethics in practices are taken care of.
This study adhered to both “procedural ethics” and “ethics in practice”. To address the
procedural ethics, approval from the Research Ethic Committee of Massey University
was taken prior to the data collection. This research study was registered as low risk at
register of the Research Ethic Committee of Massey University. To address the ethics in
practice, the project debriefing and informed consent were attached to the questinnaires
for data collection. Moreover, other forms of ethich in practice such as maintaining the
respondent’s confidentiality, plagiarism, and fabrication were strictly followed. The
approval letter from Research Ethic Committee of Massey University is attached as
Appendix-F.
4.6 Pilot Survey
A pilot survey is “a small-scale research project that collects data from respondents
similar to those that will be used in the full study” (Zikmund, et al., 2013, p. 54). A pilot
survey is helpful in identifying weaknesses of the proposed research instrument (Cooper
& Schindler, 2014). Moreover, a pilot survey can provide researcher with the
experience of interaction with the respondents and builds a sense of confidence
(Bryman, 2008). Saunders et al. (2012) suggest a pilot survey of minimum 10 sample
size for an academic research.
A pilot survey was undertaken with the objective to calibrate preliminary questionnaires
with first hand information. Moreover, the field visits and interviews with the chain
partners enhanced researcher’s understanding of the demographic characteristics of
91
target population and respondents. The key players of both the milk supply chain were
interviewed in person with semi-structured questionnaires containing mostly open
ended questions. The subsequent section expands on the response from the key players
of milk supply chains in Pakistan and New Zealand. The feedback of the respondents
from both the supply chains is summarised in the end of this section.
4.6.1 Pilot Survey in Pakistan
The major objective of the pilot study was to test the questionnaires designed to collect
data from milk SC players in Pakistan. Initially semistructured questionnaires were
developed for face-to-face interviews of SC functionaries such as dairy farmers, milk
collectors, milk shops, dairy companies, and grocery retailers. Another objective of the
pilot study was to identify the key players and function and activities performed by
them in the milk SCN of Pakistan. For this purpose relevant public sector instritutions
(Pakistan dairy development company), industry associations (Pakistan dairy
association), and universities (University of Agriculture, Faisalabad) were visited. The
visits to these institutions were aimed at collecting exploratory information about milk
systems in Pakistan.
The Pakistan dairy development company (PDDC) is a public-private partnership
envisioned to turn Pakistan into one of the top five dairy manufacturing countries in the
world. For this purpose, the PDDC aims to meet the needs of dairy farmers, consumers,
and the industry. Its key partners in the private sector include packaging companies,
dairy processors, and progressive dairy farmers. The model farm and cooling tank
programmes of PDDC are successfully in progress. Pakistan dairy association, on the
other hand, is representative body of the dairy companies in Pakistan and aims to assist
and promote dairy companies and small dairy farmers. The University of Agriculture,
Faisalabad is one of the biggest contributor of highly skilled manpower and research
and development to the agriculture sector of Pakistan. The university is fulfilling the
needs of public as well as private sector by producing graduates in 160 specialized
subject related to agriculture.
These vists were helpful in:
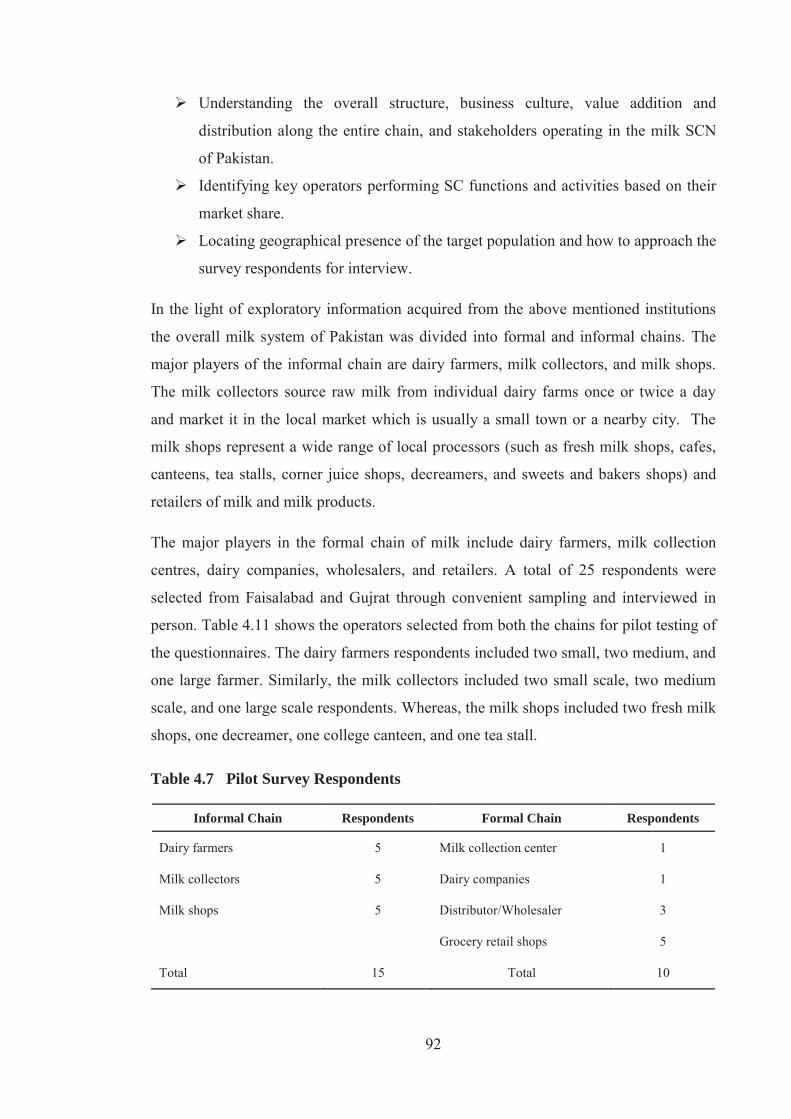
92
Understanding the overall structure, business culture, value addition and
distribution along the entire chain, and stakeholders operating in the milk SCN
of Pakistan.
Identifying key operators performing SC functions and activities based on their
market share.
Locating geographical presence of the target population and how to approach the
survey respondents for interview.
In the light of exploratory information acquired from the above mentioned institutions
the overall milk system of Pakistan was divided into formal and informal chains. The
major players of the informal chain are dairy farmers, milk collectors, and milk shops.
The milk collectors source raw milk from individual dairy farms once or twice a day
and market it in the local market which is usually a small town or a nearby city. The
milk shops represent a wide range of local processors (such as fresh milk shops, cafes,
canteens, tea stalls, corner juice shops, decreamers, and sweets and bakers shops) and
retailers of milk and milk products.
The major players in the formal chain of milk include dairy farmers, milk collection
centres, dairy companies, wholesalers, and retailers. A total of 25 respondents were
selected from Faisalabad and Gujrat through convenient sampling and interviewed in
person. Table 4.11 shows the operators selected from both the chains for pilot testing of
the questionnaires. The dairy farmers respondents included two small, two medium, and
one large farmer. Similarly, the milk collectors included two small scale, two medium
scale, and one large scale respondents. Whereas, the milk shops included two fresh milk
shops, one decreamer, one college canteen, and one tea stall.
Table 4.7 Pilot Survey Respondents
Informal Chain Respondents Formal Chain Respondents
Dairy farmers 5 Milk collection center 1
Milk collectors 5 Dairy companies 1
Milk shops 5 Distributor/Wholesaler 3
Grocery retail shops 5
Total 15 Total 10
93
The response from the selected SC operators highlighted various challenges in the data
collection in milk SCN of Pakistan. The questionnaires were calliberated for final data
collection in the light of these challenges. These challenges are:
1. The vast majority of the dairy farmers, milk collectors, milk shops, wholesalers,
and grocery retail shops do not maintain formal accounting records of their
business transactions and therefore do not develop periodical financial statements.
2. The dairy farming is predominantly a subsistence level smallholder entreprise
with major part of milk production consumed by the farming community itself.
Therefore, sales revenue of the dairy farmers is not a true representation of the
income generated by dairy activity and should be replaced for the value of total
milk produced.
3. The milk collectors were reported to create additional value by diluting the milk
with ice or water at the rate of 4 litres per 40 litres of milk and adding some
adultrants such as caustic soda, ammonia, urea fertilizer, and water chestnut
powder.
4. The respondents from milk collectors and milk shops reported that individual
customers prefer switching over to the other retailers for quality constraints rather
than complaining formally. This was one of the limitation of measuring product
quality in terms of number of complaints per 100 orders fulfilled.
During data collection in Pakistan through semi-structured interviews, a number of
problems were faced by the researcher such as:
1. Intercept face-to-face interviews, particularly with milk collectors provided too
little time to get sufficient information from the respondents. Therefore,
organised interviews were proposed for main data collection.
2. Respondents felt insecure and hesitated to share sufficient and true information
with the interviewer. Some respondents such as local processors perceive
researcher as a media person who is going to expose their misadventures.
3. There is no system in place to register and maintain record of the incomes of
chain functionaries, especially of the milk collector. These SC functionaries also
do not pay any tax to the government. Therefore, they perceive a researcher as a
tax officer from a government department.
94
4. Low level of education of the respondents is another issue faced not only while
motivating them to participate and share information, but also to make them
understand the importance of their information and contents of the questions.
Contrarily, the respondents with high education level welcomed and shared
sufficient information.
5. The general awareness about food safety standards of the respondents as well as
their customers was low compared to the same in New Zealand. For example,
the literacy rate (an important indicator of general awareness) of New Zealand
according to adult literacy and life skills survey (ALL) 2006 is 93% (Lane,
2011) and that of Pakistan is 60% (Pakistan Bureau of Statistics, 2014).
4.6.2 Pilot Survey in New Zealand
The pilot testing in New Zealand was under taken with the objective to calliberate the
questionnaires developed for the key operator of milk SCN of New Zealand in line with
the functions and activities performed by the chain operators. For this purpose, three
relevant institutions were visited primarily for acquiring secondary information about
the milk SCN in New Zealand. Moreover, they were requested to provide help in
distributing an online survey link to their member dairy farmers electronically which
they declined due to confidentiality of information and privacy rights of their members.
Thus, the samples of New Zealand dairy farmers were drawn convieniently. However,
for final data collection the questionnaires were sent to the dairy companies through
mail.
Apart from the visits to aforementioned institutions, the key SC operators: dairy
farmers, dairy processors, distributors, and grocery retail stores were interviewed in
person with semi-structured questionnaires. A total of 10 respondents (3 dairy farmers,
2 dairy companies, 2 distributors, and 3 grocery retail stores) were interviewed. These
interviews were helpful in identifying the key operators, functions and activities,
facilitators and enablers of the milk SCN of New Zealand (discussed in detail in chapter
5). Moreover, the semi-structured questionnaires were finalized as structured with the
primary information acquired from the respondents. Furthermore, the porposed
sampling farme and data collection method were reviewed for final data collection.
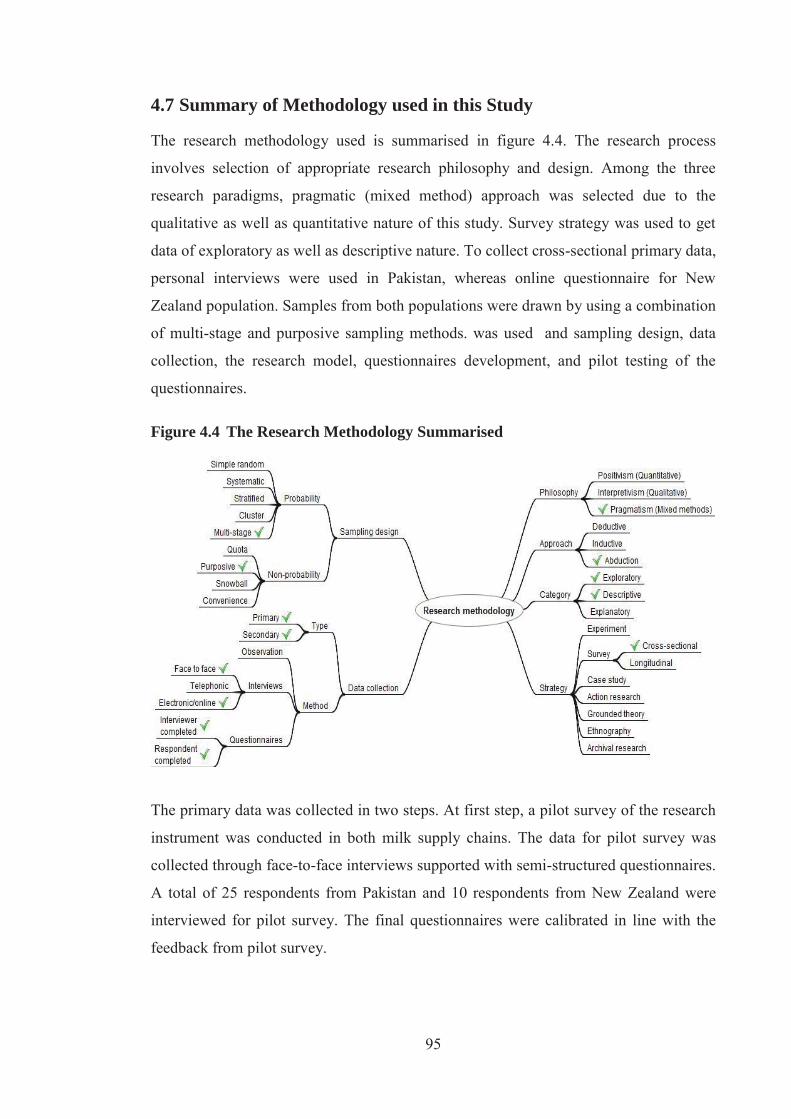
95
4.7 Summary of Methodology used in this Study
The research methodology used is summarised in figure 4.4. The research process
involves selection of appropriate research philosophy and design. Among the three
research paradigms, pragmatic (mixed method) approach was selected due to the
qualitative as well as quantitative nature of this study. Survey strategy was used to get
data of exploratory as well as descriptive nature. To collect cross-sectional primary data,
personal interviews were used in Pakistan, whereas online questionnaire for New
Zealand population. Samples from both populations were drawn by using a combination
of multi-stage and purposive sampling methods. was used and sampling design, data
collection, the research model, questionnaires development, and pilot testing of the
questionnaires.
Figure 4.4 The Research Methodology Summarised
The primary data was collected in two steps. At first step, a pilot survey of the research
instrument was conducted in both milk supply chains. The data for pilot survey was
collected through face-to-face interviews supported with semi-structured questionnaires.
A total of 25 respondents from Pakistan and 10 respondents from New Zealand were
interviewed for pilot survey. The final questionnaires were calibrated in line with the
feedback from pilot survey.
96
CHAPTER 5
5. RESULTS
5.1 Introduction
This chapter presents results of the data collected from the key operators in the milk
supply chains of Pakistan and New Zealand. Moreover, the results are supported with
phenomenological discussion from functions and activities performed by the key
players. The chapter is organized into four sections.
Section 5.2 provides value chain perspective of both the benchmarking supply
chains. The value chain analysis of the milk supply chains of Pakistan and New
Zealand include value chain maps and analysis of value distribution along the
entire chain.
Section 5.3 expands on SCOR metrics for dairy farming in Pakistan and New
Zealand. The inherent differences of both the dairy farming systems are
discussed phenomenologically.
Section 5.4 presents SCOR metrics for key players (milk collectors and milk
shops) in informal chain of milk in Pakistan.
Section 5.5 comprises of SCOR metrics of dairy companies in Pakistan and New
Zealand.
5.2 Value Chain Analysis of Milk in Pakistan and New Zealand
The value chain approach is helpful in understanding structural and dynamic
components of a supply chain. The structure of a value chain includes all the firms in
the chain whereas dynamics represents the choices these firms make in response to that
structure. Value chain analysis (VCA) facilitates an improved understanding of
functions and activities performed by chain actors. Moreover, it helps identify
relationships among chain actors, coordination mechanisms, and structure of powers
and governance in a particular supply chain. The value chain analysis (VCA) of milk
supply chains of Pakistan and New Zealand included the value chain maps and analysis
of value distribution along the entire network.

97
5.2.1 Milk Value Chain in Pakistan
Chapter 2 describes that milk supply chain in Pakistan is divided into: the informal
chain and the formal chain of milk. The informal chain of milk represents the marketing
of unprocessed (fresh) milk and locally processed (into various traditional dairy
products) milk. The key SC operators involved in the informal chain of milk are the
dairy farmers, the milk collectors, and the milk shops. The formal chain of milk
represents the standard processed (pasteurised or UHT tetra pack) dairy products by the
dairy companies. The key SC operators in the formal chain of milk are the dairy
companies. Figure 5.1 illustrates the SC functions, the activities, the SC operators, the
facilitators, and the enablers in the milk supply chain in Pakistan. The dotted arrows
represent the weak link between the SC operators.
Figure 5.1 Value Chain Map of Milk Supply Chain Network of Pakistan
NB: The percentage shares of the operators were calculated from primary data collected in 2012.
Source: Adapted from (Springer-Heinze, 2007)
The SC operators occupy the central role in a value chain map and perform core
functions and activities with the support of facilitators and under the regulatory
framework from the enablers. The fresh milk in the informal chain reached the urban
98
consumers through various marketing channels. The common marketing channels
reported by the respondents are:
1. Farmer – Neighbourhood + Urban Consumer
2. Farmer – Milk Collector – Urban Consumer
3. Farmer –Milk shop – Urban Consumer
4. Farmer –Milk Collector – Milk shop – Urban Consumer
5. Farmer – Milk Collector – Tea Satlls, Cafes, Canteens, Restaurants, Sweets &
Bakers’ shops and others traditional processors – Urban Consumer
6. Farmer – Milk Collector – De-creamer –Milk Collector – Urban consumers
The presence of a large number of players make the informal chain more complex as
compared to the formal chain. On the other hand, the dairy companies, the key SC
operators of the formal chain, had established their own milk collection network. Dairy
companies reported to source milk through a combination of suppliers of fresh milk.
These sources are:
1. Mega farms – Processor
2. Farmers – Village level milk collection centre (VMCC) – Main milk collection
centre (MCC) – Processor
3. Farmers –Milk collectors – Village level milk collection centre (VMCC) – Main
milk collection centre (MCC) – Processor
4. Farmers –Milk collectors –Mini Contractors – Processor
5. Farmers – Milk collectors – Mini Contractors – Big Contractors/Strategic Milk
Suppliers – Processor
The fresh milk collected at VMCC was assembled at regional milk collection centres
from where big tankers delivered it to the processing plants. Dairy companies marketed
their finished goods to the retailers through contract distributors who own the product.
Dairy companies supplying dairy products at national level divide the country into north
zone, central zone, and south zone. The ownership of the product was transferred along
the distribution channel.
The facilitators in the milk supply chain in Pakistan represent those associations who
perform support activities to help SC operators to perform their functions. These
include:

99
Pakistan agriculture and dairy farmers association (PADFA)
Pakistan dairy association (PDA)
Pakistan dairy development company (PDDC)
Livestock and dairy development board (LDDB)
Small and medium enterprise development authority (SMEDA)
Pakistan agricultural research council (PARC)
Provincial livestock and dairy development departments (L&DD)
Provincial agriculture departments
Agriculture sector universities
Non-governmental organizations (NGOs)
The enablers in dairy value chain in Pakistan are the government agencies responsible
to regulate and enforce legislative laws. These involve:
Pakistan standards and quality control authority (PSQCA)
Provincial food departments
Provincial health departments
Local governments
The analysis of value distribution along the entire value chain is another concept to
gauge the level of overall value addition as well as the individual share of the value
captured by various SC operators. Figure 5.2 represents the share of value per litre of
milk received by each SC operator in the informal chain of milk in Pakistan.
Figure 5.2 Distribution of Value in Informal Chain of Milk in Pakistan
Source: Industry interviews 2012
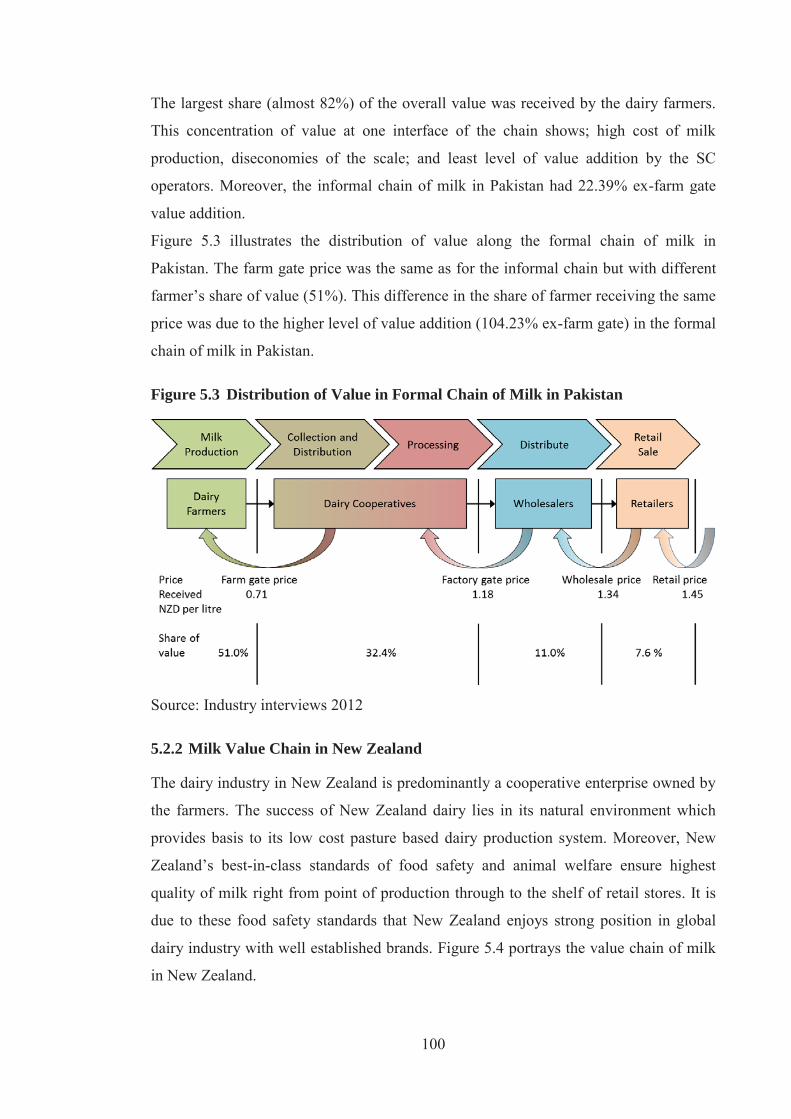
100
The largest share (almost 82%) of the overall value was received by the dairy farmers.
This concentration of value at one interface of the chain shows; high cost of milk
production, diseconomies of the scale; and least level of value addition by the SC
operators. Moreover, the informal chain of milk in Pakistan had 22.39% ex-farm gate
value addition.
Figure 5.3 illustrates the distribution of value along the formal chain of milk in
Pakistan. The farm gate price was the same as for the informal chain but with different
farmer’s share of value (51%). This difference in the share of farmer receiving the same
price was due to the higher level of value addition (104.23% ex-farm gate) in the formal
chain of milk in Pakistan.
Figure 5.3 Distribution of Value in Formal Chain of Milk in Pakistan
Source: Industry interviews 2012
5.2.2 Milk Value Chain in New Zealand
The dairy industry in New Zealand is predominantly a cooperative enterprise owned by
the farmers. The success of New Zealand dairy lies in its natural environment which
provides basis to its low cost pasture based dairy production system. Moreover, New
Zealand’s best-in-class standards of food safety and animal welfare ensure highest
quality of milk right from point of production through to the shelf of retail stores. It is
due to these food safety standards that New Zealand enjoys strong position in global
dairy industry with well established brands. Figure 5.4 portrays the value chain of milk
in New Zealand.
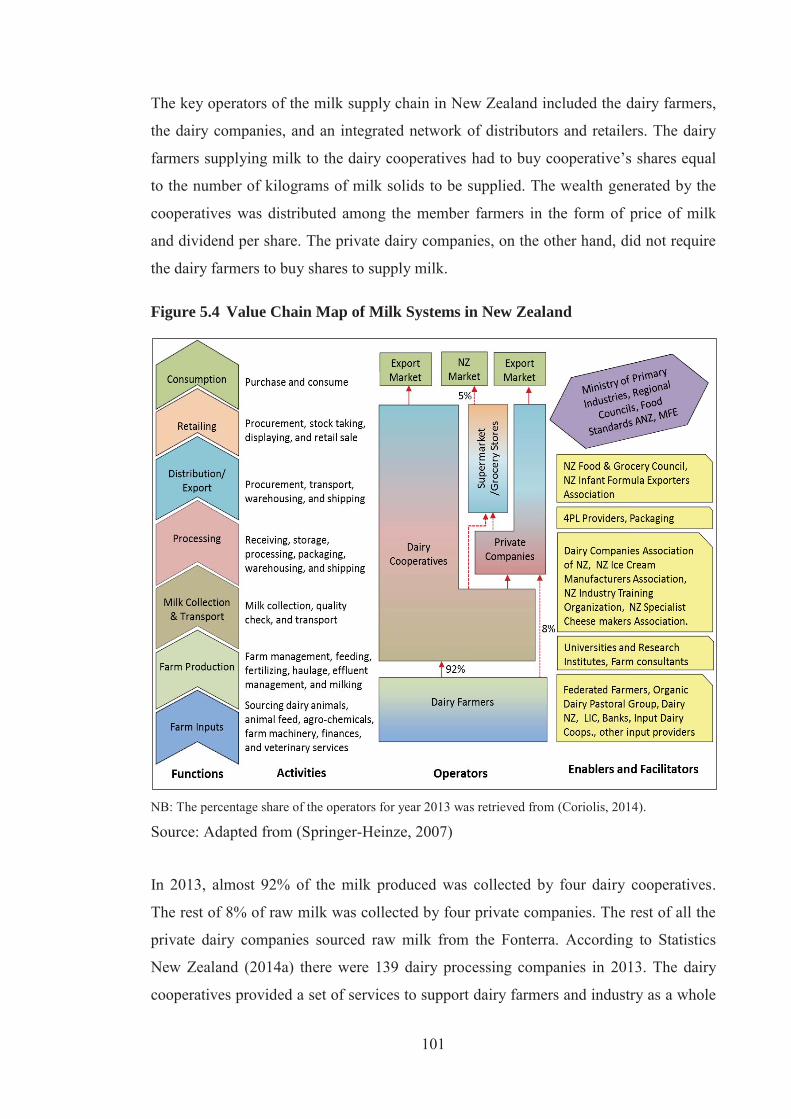
101
The key operators of the milk supply chain in New Zealand included the dairy farmers,
the dairy companies, and an integrated network of distributors and retailers. The dairy
farmers supplying milk to the dairy cooperatives had to buy cooperative’s shares equal
to the number of kilograms of milk solids to be supplied. The wealth generated by the
cooperatives was distributed among the member farmers in the form of price of milk
and dividend per share. The private dairy companies, on the other hand, did not require
the dairy farmers to buy shares to supply milk.
Figure 5.4 Value Chain Map of Milk Systems in New Zealand
NB: The percentage share of the operators for year 2013 was retrieved from (Coriolis, 2014).
Source: Adapted from (Springer-Heinze, 2007)
In 2013, almost 92% of the milk produced was collected by four dairy cooperatives.
The rest of 8% of raw milk was collected by four private companies. The rest of all the
private dairy companies sourced raw milk from the Fonterra. According to Statistics
New Zealand (2014a) there were 139 dairy processing companies in 2013. The dairy
cooperatives provided a set of services to support dairy farmers and industry as a whole
102
in coordination with other organizations such as DairyNZ and livestock improvement
corporation (LIC). These services included those environmental and food safety
requirements that assist dairy farmers in meeting regulatory requirements. These
services include: annual farm dairy and environmental, assessment; milk quality
support; milk temperature management; mastitis support; animal health and welfare;
effluent management; nitrogen management; waterway management; and water use
management (Fonterra, 2014).
The facilitators perform support functions to help SC operators perform their primary
functions effectively. These facilitators were:
Federated farmers (association of farmers in New Zealand)
Organic dairy pastoral group
Dairy NZ
Livestock improvement corporation (LIC)
Banks and financing institutions
Input dairy cooperatives
Farm input providers
Universities and research institutions
Farm consultants
Dairy companies association of New Zealand (DCANZ)
NZ ice cream manufacturers association
NZ industry training organization
NZ specialist cheese makers association
Third party (3PL) and fourth party (4PL) logistic providers
Packaging companies
NZ food and grocery council
NZ infant formula exporters association
The enablers represent the public sector organizations (ministries or departments) who
regulate the functions performed by the operators and facilitators by developing and
enforcing legislative laws. The enablers in the milk supply chain in New Zealand were:
Ministry of Primary Industries (MPI)
Regional councils
Food standards Australia New Zealand (FSANZ)
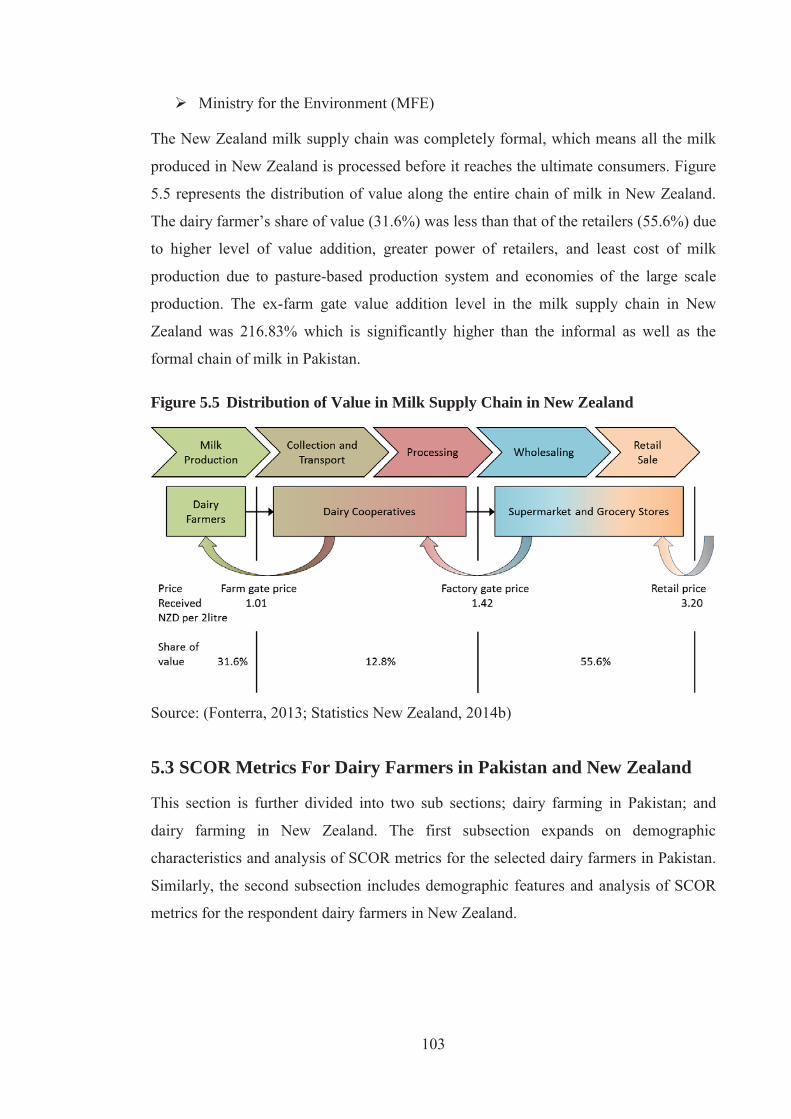
103
Ministry for the Environment (MFE)
The New Zealand milk supply chain was completely formal, which means all the milk
produced in New Zealand is processed before it reaches the ultimate consumers. Figure
5.5 represents the distribution of value along the entire chain of milk in New Zealand.
The dairy farmer’s share of value (31.6%) was less than that of the retailers (55.6%) due
to higher level of value addition, greater power of retailers, and least cost of milk
production due to pasture-based production system and economies of the large scale
production. The ex-farm gate value addition level in the milk supply chain in New
Zealand was 216.83% which is significantly higher than the informal as well as the
formal chain of milk in Pakistan.
Figure 5.5 Distribution of Value in Milk Supply Chain in New Zealand
Source: (Fonterra, 2013; Statistics New Zealand, 2014b)
5.3 SCOR Metrics For Dairy Farmers in Pakistan and New Zealand
This section is further divided into two sub sections; dairy farming in Pakistan; and
dairy farming in New Zealand. The first subsection expands on demographic
characteristics and analysis of SCOR metrics for the selected dairy farmers in Pakistan.
Similarly, the second subsection includes demographic features and analysis of SCOR
metrics for the respondent dairy farmers in New Zealand.
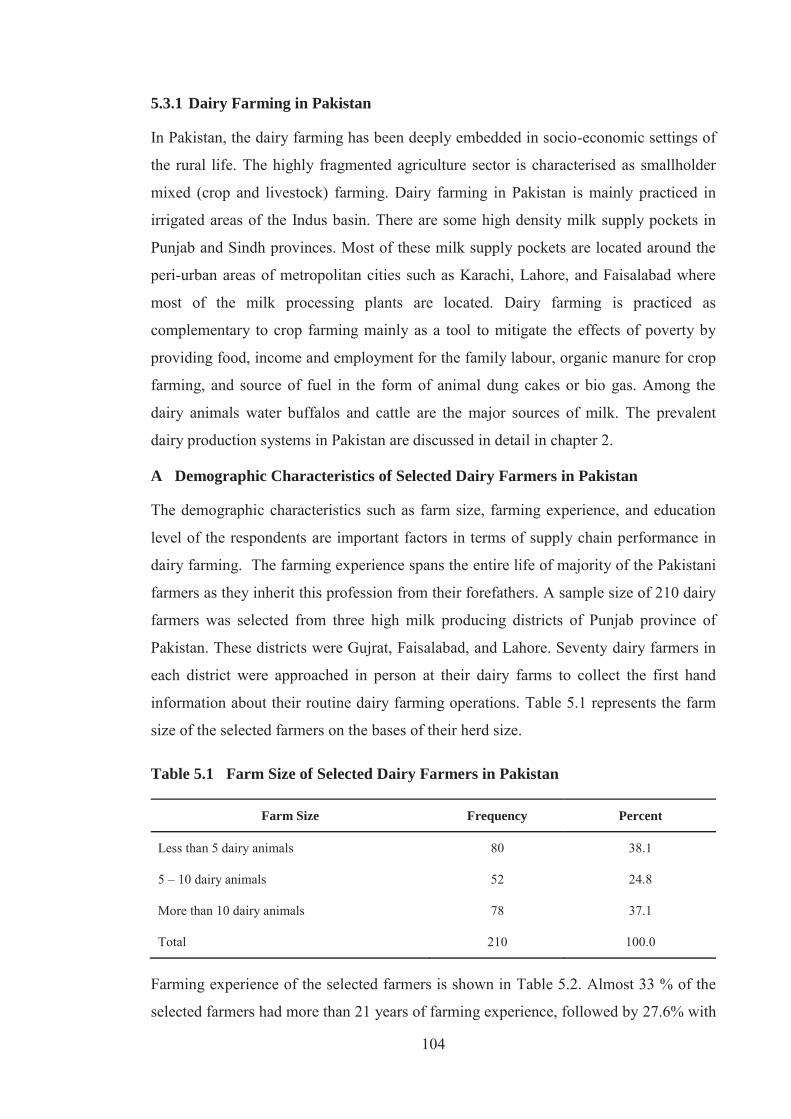
104
5.3.1 Dairy Farming in Pakistan
In Pakistan, the dairy farming has been deeply embedded in socio-economic settings of
the rural life. The highly fragmented agriculture sector is characterised as smallholder
mixed (crop and livestock) farming. Dairy farming in Pakistan is mainly practiced in
irrigated areas of the Indus basin. There are some high density milk supply pockets in
Punjab and Sindh provinces. Most of these milk supply pockets are located around the
peri-urban areas of metropolitan cities such as Karachi, Lahore, and Faisalabad where
most of the milk processing plants are located. Dairy farming is practiced as
complementary to crop farming mainly as a tool to mitigate the effects of poverty by
providing food, income and employment for the family labour, organic manure for crop
farming, and source of fuel in the form of animal dung cakes or bio gas. Among the
dairy animals water buffalos and cattle are the major sources of milk. The prevalent
dairy production systems in Pakistan are discussed in detail in chapter 2.
A Demographic Characteristics of Selected Dairy Farmers in Pakistan
The demographic characteristics such as farm size, farming experience, and education
level of the respondents are important factors in terms of supply chain performance in
dairy farming. The farming experience spans the entire life of majority of the Pakistani
farmers as they inherit this profession from their forefathers. A sample size of 210 dairy
farmers was selected from three high milk producing districts of Punjab province of
Pakistan. These districts were Gujrat, Faisalabad, and Lahore. Seventy dairy farmers in
each district were approached in person at their dairy farms to collect the first hand
information about their routine dairy farming operations. Table 5.1 represents the farm
size of the selected farmers on the bases of their herd size.
Table 5.1 Farm Size of Selected Dairy Farmers in Pakistan
Farm Size Frequency Percent
Less than 5 dairy animals 80 38.1
5 – 10 dairy animals 52 24.8
More than 10 dairy animals 78 37.1
Total 210 100.0
Farming experience of the selected farmers is shown in Table 5.2. Almost 33 % of the
selected farmers had more than 21 years of farming experience, followed by 27.6% with
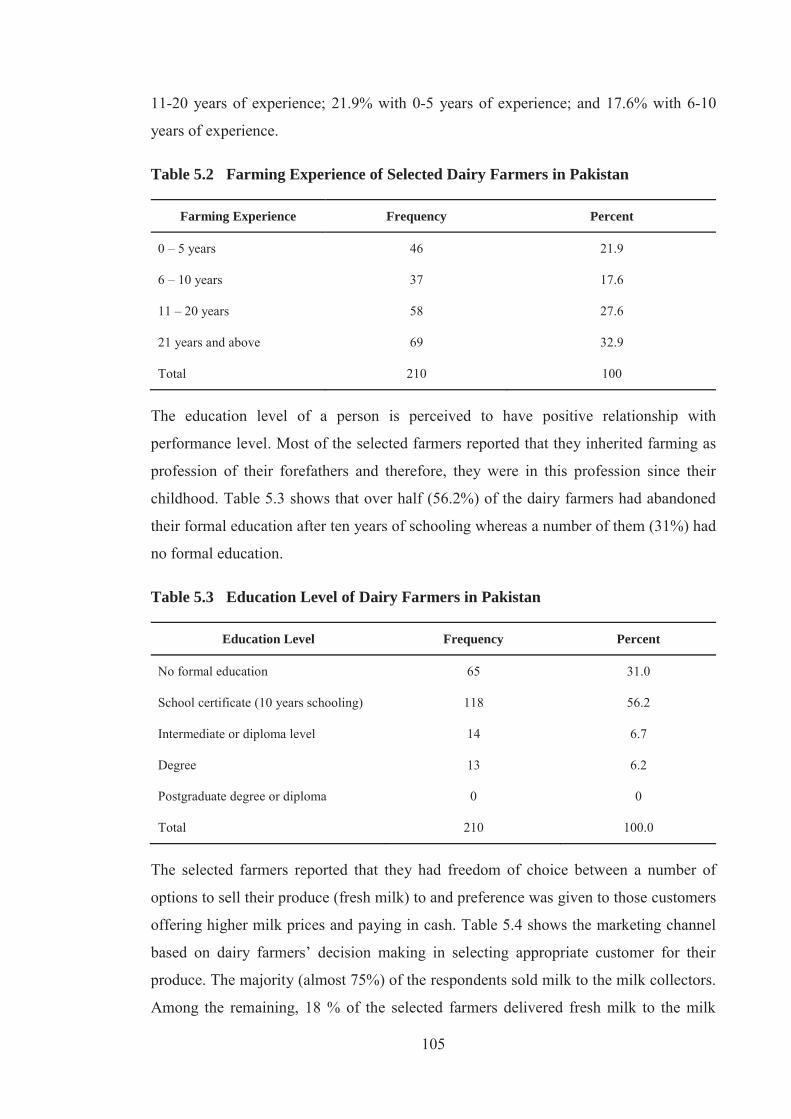
105
11-20 years of experience; 21.9% with 0-5 years of experience; and 17.6% with 6-10
years of experience.
Table 5.2 Farming Experience of Selected Dairy Farmers in Pakistan
Farming Experience Frequency Percent
0 – 5 years 46 21.9
6 – 10 years 37 17.6
11 – 20 years 58 27.6
21 years and above 69 32.9
Total 210 100
The education level of a person is perceived to have positive relationship with
performance level. Most of the selected farmers reported that they inherited farming as
profession of their forefathers and therefore, they were in this profession since their
childhood. Table 5.3 shows that over half (56.2%) of the dairy farmers had abandoned
their formal education after ten years of schooling whereas a number of them (31%) had
no formal education.
Table 5.3 Education Level of Dairy Farmers in Pakistan
Education Level Frequency Percent
No formal education 65 31.0
School certificate (10 years schooling) 118 56.2
Intermediate or diploma level 14 6.7
Degree 13 6.2
Postgraduate degree or diploma 0 0
Total 210 100.0
The selected farmers reported that they had freedom of choice between a number of
options to sell their produce (fresh milk) to and preference was given to those customers
offering higher milk prices and paying in cash. Table 5.4 shows the marketing channel
based on dairy farmers’ decision making in selecting appropriate customer for their
produce. The majority (almost 75%) of the respondents sold milk to the milk collectors.
Among the remaining, 18 % of the selected farmers delivered fresh milk to the milk
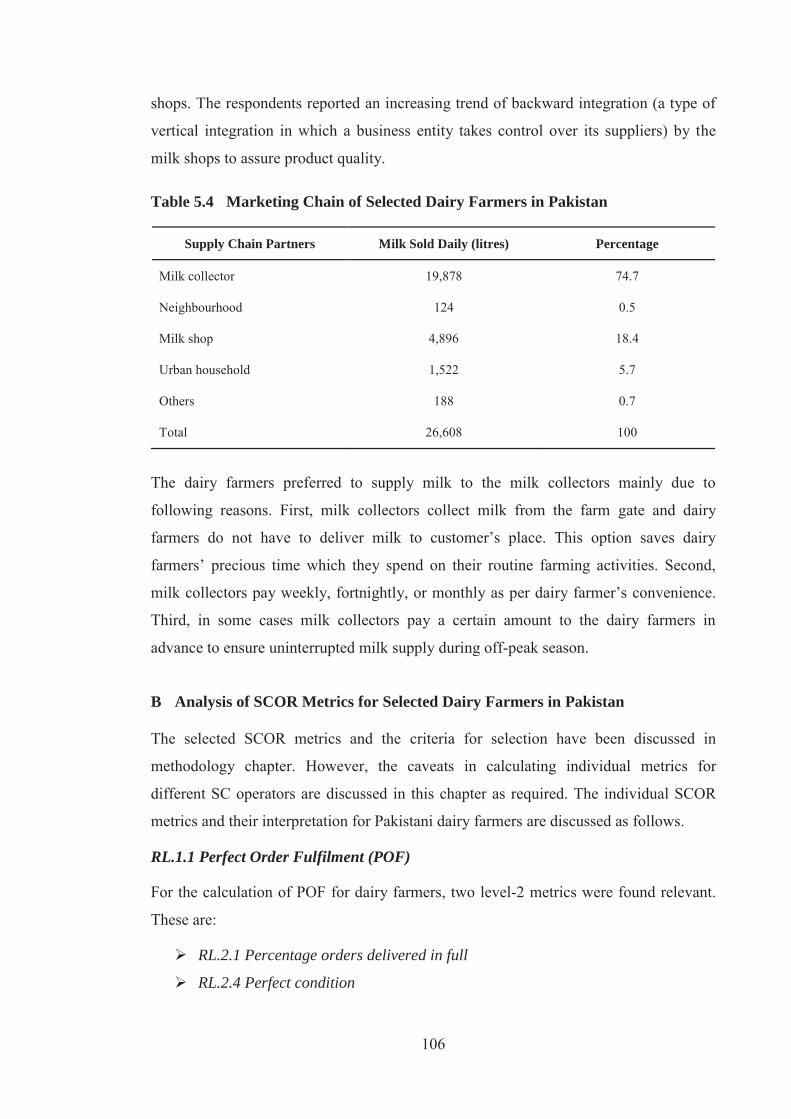
106
shops. The respondents reported an increasing trend of backward integration (a type of
vertical integration in which a business entity takes control over its suppliers) by the
milk shops to assure product quality.
Table 5.4 Marketing Chain of Selected Dairy Farmers in Pakistan
Supply Chain Partners Milk Sold Daily (litres) Percentage
Milk collector 19,878 74.7
Neighbourhood 124 0.5
Milk shop 4,896 18.4
Urban household 1,522 5.7
Others 188 0.7
Total 26,608 100
The dairy farmers preferred to supply milk to the milk collectors mainly due to
following reasons. First, milk collectors collect milk from the farm gate and dairy
farmers do not have to deliver milk to customer’s place. This option saves dairy
farmers’ precious time which they spend on their routine farming activities. Second,
milk collectors pay weekly, fortnightly, or monthly as per dairy farmer’s convenience.
Third, in some cases milk collectors pay a certain amount to the dairy farmers in
advance to ensure uninterrupted milk supply during off-peak season.
B Analysis of SCOR Metrics for Selected Dairy Farmers in Pakistan
The selected SCOR metrics and the criteria for selection have been discussed in
methodology chapter. However, the caveats in calculating individual metrics for
different SC operators are discussed in this chapter as required. The individual SCOR
metrics and their interpretation for Pakistani dairy farmers are discussed as follows.
RL.1.1 Perfect Order Fulfilment (POF)
For the calculation of POF for dairy farmers, two level-2 metrics were found relevant.
These are:
RL.2.1 Percentage orders delivered in full
RL.2.4 Perfect condition
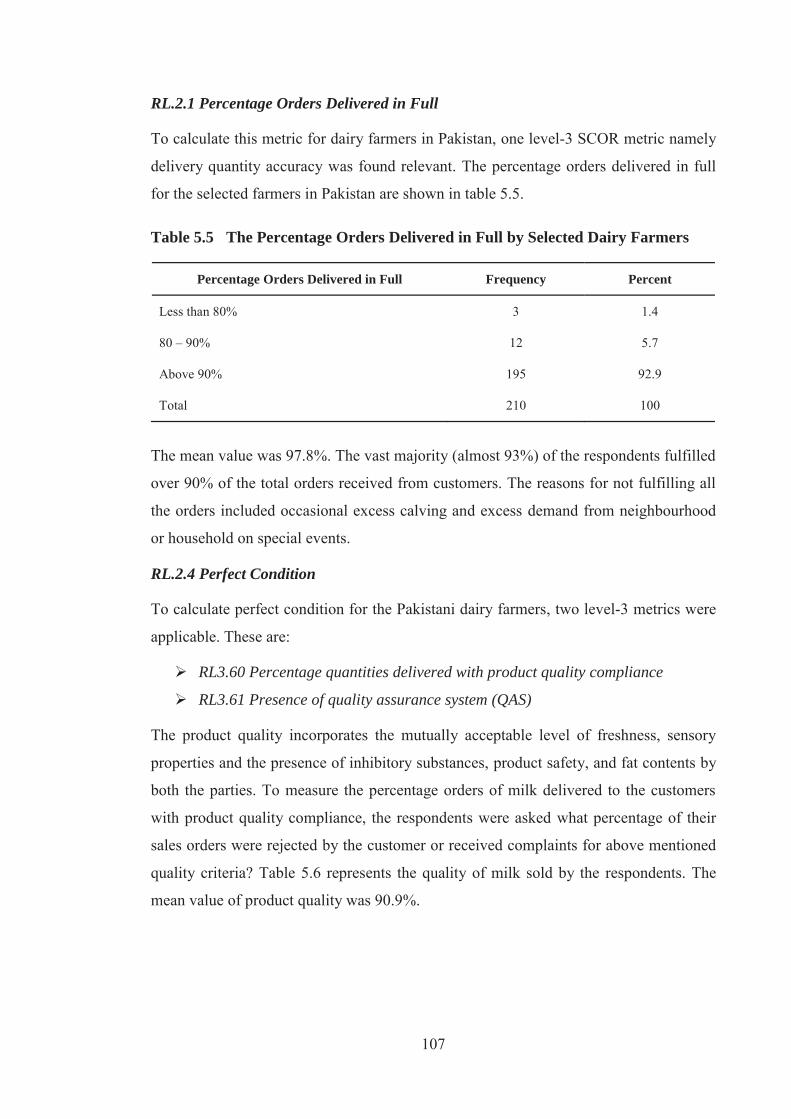
107
RL.2.1 Percentage Orders Delivered in Full
To calculate this metric for dairy farmers in Pakistan, one level-3 SCOR metric namely
delivery quantity accuracy was found relevant. The percentage orders delivered in full
for the selected farmers in Pakistan are shown in table 5.5.
Table 5.5 The Percentage Orders Delivered in Full by Selected Dairy Farmers
Percentage Orders Delivered in Full Frequency Percent
Less than 80% 3 1.4
80 – 90% 12 5.7
Above 90% 195 92.9
Total 210 100
The mean value was 97.8%. The vast majority (almost 93%) of the respondents fulfilled
over 90% of the total orders received from customers. The reasons for not fulfilling all
the orders included occasional excess calving and excess demand from neighbourhood
or household on special events.
RL.2.4 Perfect Condition
To calculate perfect condition for the Pakistani dairy farmers, two level-3 metrics were
applicable. These are:
RL3.60 Percentage quantities delivered with product quality compliance
RL3.61 Presence of quality assurance system (QAS)
The product quality incorporates the mutually acceptable level of freshness, sensory
properties and the presence of inhibitory substances, product safety, and fat contents by
both the parties. To measure the percentage orders of milk delivered to the customers
with product quality compliance, the respondents were asked what percentage of their
sales orders were rejected by the customer or received complaints for above mentioned
quality criteria? Table 5.6 represents the quality of milk sold by the respondents. The
mean value of product quality was 90.9%.
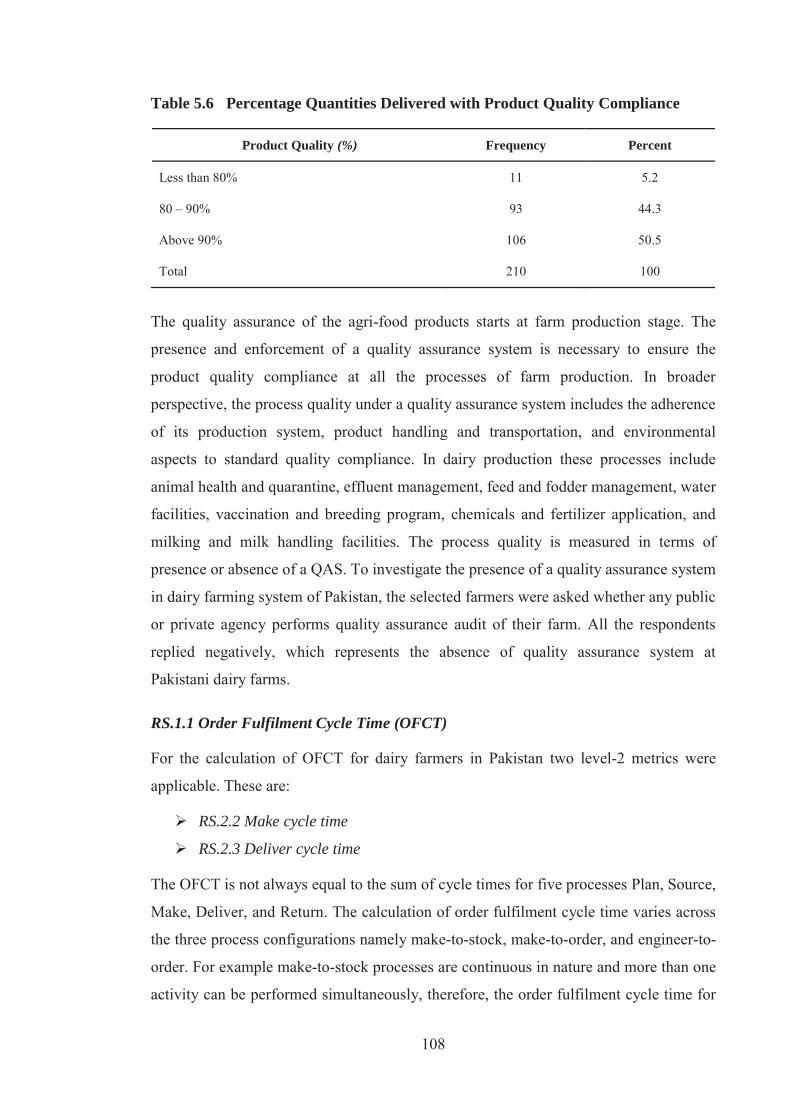
108
Table 5.6 Percentage Quantities Delivered with Product Quality Compliance
Product Quality (%) Frequency Percent
Less than 80% 11 5.2
80 – 90% 93 44.3
Above 90% 106 50.5
Total 210 100
The quality assurance of the agri-food products starts at farm production stage. The
presence and enforcement of a quality assurance system is necessary to ensure the
product quality compliance at all the processes of farm production. In broader
perspective, the process quality under a quality assurance system includes the adherence
of its production system, product handling and transportation, and environmental
aspects to standard quality compliance. In dairy production these processes include
animal health and quarantine, effluent management, feed and fodder management, water
facilities, vaccination and breeding program, chemicals and fertilizer application, and
milking and milk handling facilities. The process quality is measured in terms of
presence or absence of a QAS. To investigate the presence of a quality assurance system
in dairy farming system of Pakistan, the selected farmers were asked whether any public
or private agency performs quality assurance audit of their farm. All the respondents
replied negatively, which represents the absence of quality assurance system at
Pakistani dairy farms.
RS.1.1 Order Fulfilment Cycle Time (OFCT)
For the calculation of OFCT for dairy farmers in Pakistan two level-2 metrics were
applicable. These are:
RS.2.2 Make cycle time
RS.2.3 Deliver cycle time
The OFCT is not always equal to the sum of cycle times for five processes Plan, Source,
Make, Deliver, and Return. The calculation of order fulfilment cycle time varies across
the three process configurations namely make-to-stock, make-to-order, and engineer-to-
order. For example make-to-stock processes are continuous in nature and more than one
activity can be performed simultaneously, therefore, the order fulfilment cycle time for
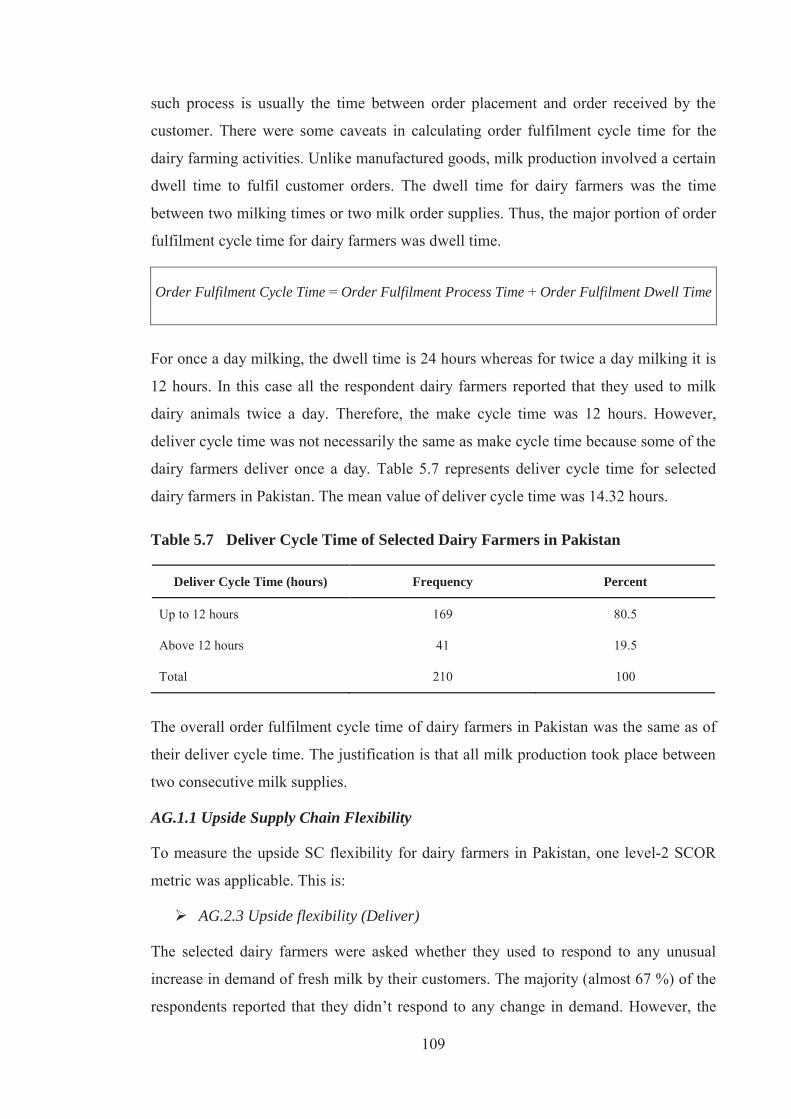
109
such process is usually the time between order placement and order received by the
customer. There were some caveats in calculating order fulfilment cycle time for the
dairy farming activities. Unlike manufactured goods, milk production involved a certain
dwell time to fulfil customer orders. The dwell time for dairy farmers was the time
between two milking times or two milk order supplies. Thus, the major portion of order
fulfilment cycle time for dairy farmers was dwell time.
Order Fulfilment Cycle Time = Order Fulfilment Process Time + Order Fulfilment Dwell Time
For once a day milking, the dwell time is 24 hours whereas for twice a day milking it is
12 hours. In this case all the respondent dairy farmers reported that they used to milk
dairy animals twice a day. Therefore, the make cycle time was 12 hours. However,
deliver cycle time was not necessarily the same as make cycle time because some of the
dairy farmers deliver once a day. Table 5.7 represents deliver cycle time for selected
dairy farmers in Pakistan. The mean value of deliver cycle time was 14.32 hours.
Table 5.7 Deliver Cycle Time of Selected Dairy Farmers in Pakistan
Deliver Cycle Time (hours) Frequency Percent
Up to 12 hours 169 80.5
Above 12 hours 41 19.5
Total 210 100
The overall order fulfilment cycle time of dairy farmers in Pakistan was the same as of
their deliver cycle time. The justification is that all milk production took place between
two consecutive milk supplies.
AG.1.1 Upside Supply Chain Flexibility
To measure the upside SC flexibility for dairy farmers in Pakistan, one level-2 SCOR
metric was applicable. This is:
AG.2.3 Upside flexibility (Deliver)
The selected dairy farmers were asked whether they used to respond to any unusual
increase in demand of fresh milk by their customers. The majority (almost 67 %) of the
respondents reported that they didn’t respond to any change in demand. However, the
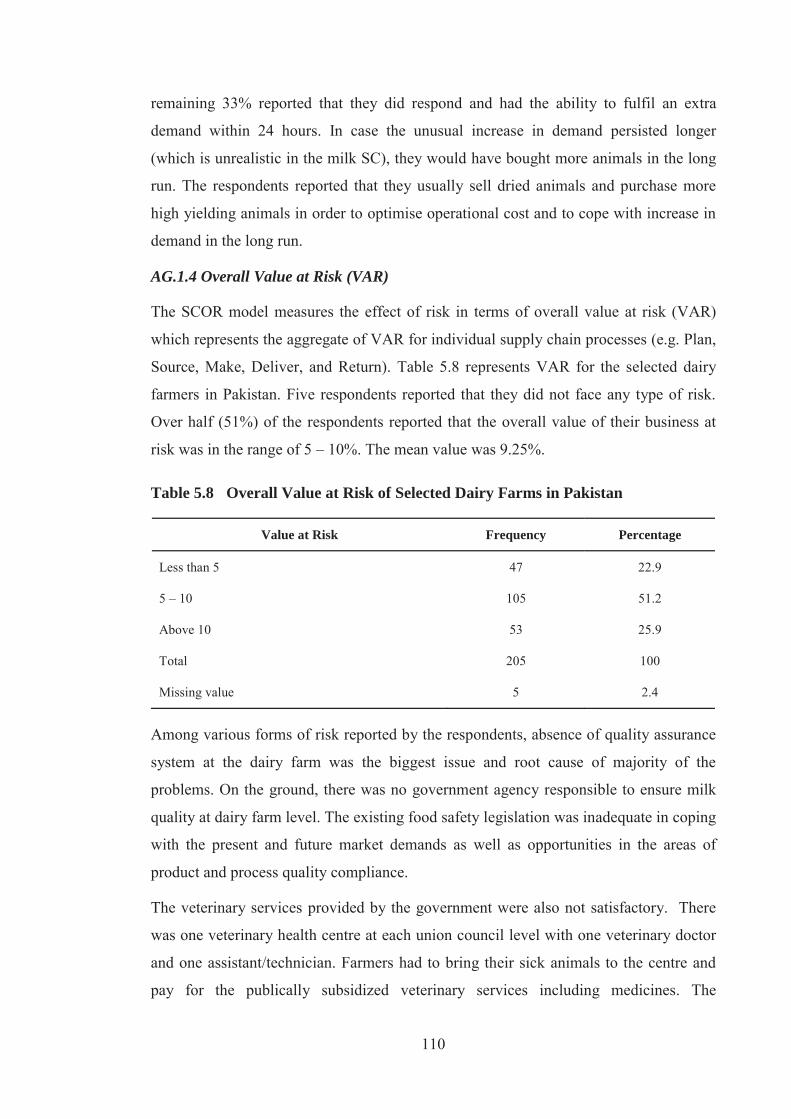
110
remaining 33% reported that they did respond and had the ability to fulfil an extra
demand within 24 hours. In case the unusual increase in demand persisted longer
(which is unrealistic in the milk SC), they would have bought more animals in the long
run. The respondents reported that they usually sell dried animals and purchase more
high yielding animals in order to optimise operational cost and to cope with increase in
demand in the long run.
AG.1.4 Overall Value at Risk (VAR)
The SCOR model measures the effect of risk in terms of overall value at risk (VAR)
which represents the aggregate of VAR for individual supply chain processes (e.g. Plan,
Source, Make, Deliver, and Return). Table 5.8 represents VAR for the selected dairy
farmers in Pakistan. Five respondents reported that they did not face any type of risk.
Over half (51%) of the respondents reported that the overall value of their business at
risk was in the range of 5 – 10%. The mean value was 9.25%.
Table 5.8 Overall Value at Risk of Selected Dairy Farms in Pakistan
Value at Risk Frequency Percentage
Less than 5 47 22.9
5 – 10 105 51.2
Above 10 53 25.9
Total 205 100
Missing value 5 2.4
Among various forms of risk reported by the respondents, absence of quality assurance
system at the dairy farm was the biggest issue and root cause of majority of the
problems. On the ground, there was no government agency responsible to ensure milk
quality at dairy farm level. The existing food safety legislation was inadequate in coping
with the present and future market demands as well as opportunities in the areas of
product and process quality compliance.
The veterinary services provided by the government were also not satisfactory. There
was one veterinary health centre at each union council level with one veterinary doctor
and one assistant/technician. Farmers had to bring their sick animals to the centre and
pay for the publically subsidized veterinary services including medicines. The
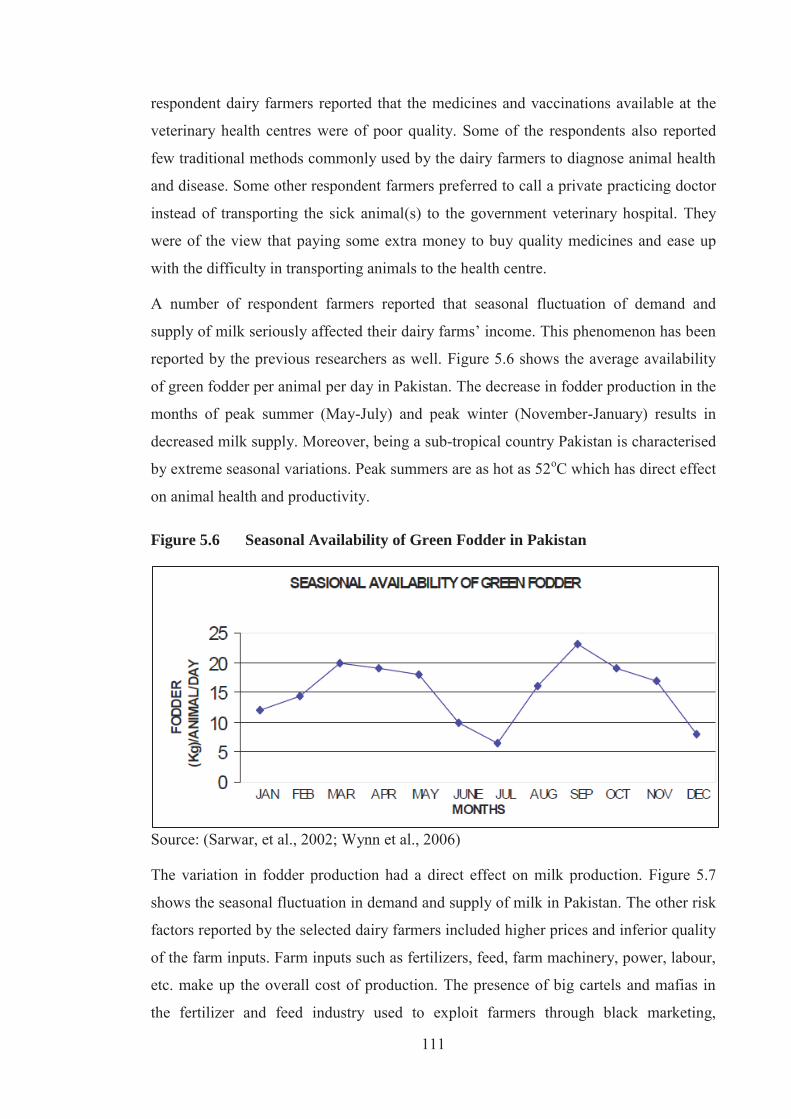
111
respondent dairy farmers reported that the medicines and vaccinations available at the
veterinary health centres were of poor quality. Some of the respondents also reported
few traditional methods commonly used by the dairy farmers to diagnose animal health
and disease. Some other respondent farmers preferred to call a private practicing doctor
instead of transporting the sick animal(s) to the government veterinary hospital. They
were of the view that paying some extra money to buy quality medicines and ease up
with the difficulty in transporting animals to the health centre.
A number of respondent farmers reported that seasonal fluctuation of demand and
supply of milk seriously affected their dairy farms’ income. This phenomenon has been
reported by the previous researchers as well. Figure 5.6 shows the average availability
of green fodder per animal per day in Pakistan. The decrease in fodder production in the
months of peak summer (May-July) and peak winter (November-January) results in
decreased milk supply. Moreover, being a sub-tropical country Pakistan is characterised
by extreme seasonal variations. Peak summers are as hot as 52oC which has direct effect
on animal health and productivity.
Figure 5.6 Seasonal Availability of Green Fodder in Pakistan
Source: (Sarwar, et al., 2002; Wynn et al., 2006)
The variation in fodder production had a direct effect on milk production. Figure 5.7
shows the seasonal fluctuation in demand and supply of milk in Pakistan. The other risk
factors reported by the selected dairy farmers included higher prices and inferior quality
of the farm inputs. Farm inputs such as fertilizers, feed, farm machinery, power, labour,
etc. make up the overall cost of production. The presence of big cartels and mafias in
the fertilizer and feed industry used to exploit farmers through black marketing,
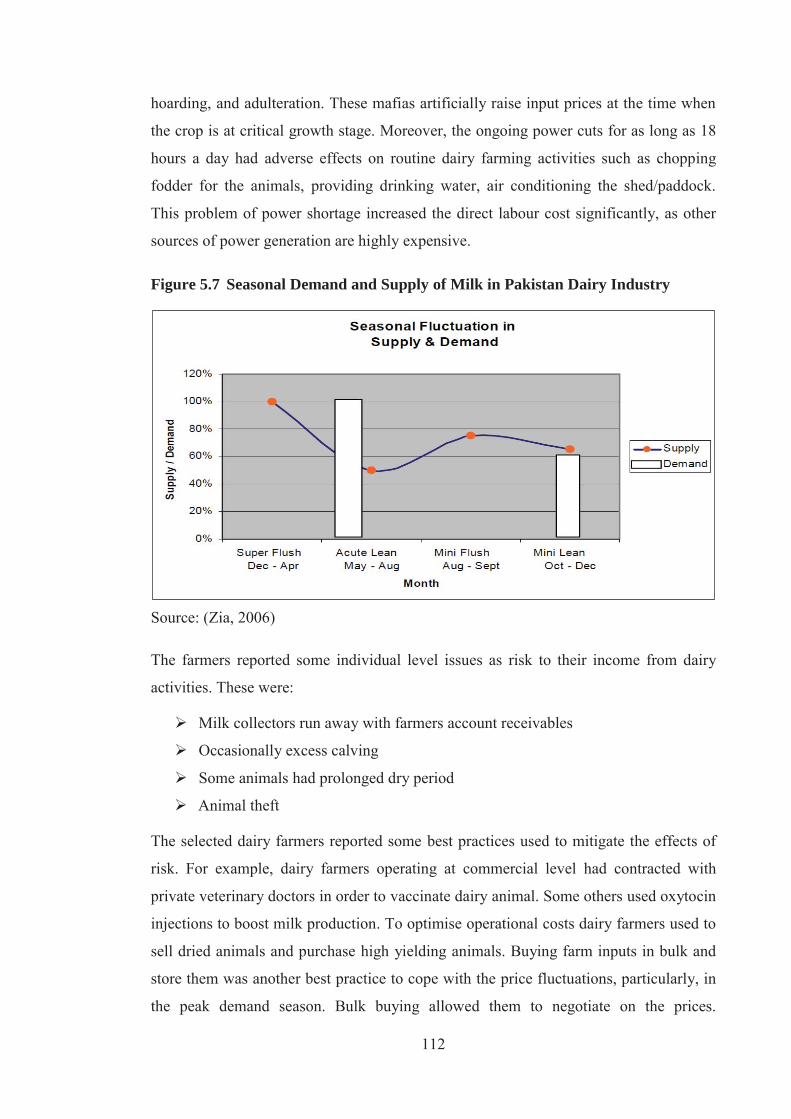
112
hoarding, and adulteration. These mafias artificially raise input prices at the time when
the crop is at critical growth stage. Moreover, the ongoing power cuts for as long as 18
hours a day had adverse effects on routine dairy farming activities such as chopping
fodder for the animals, providing drinking water, air conditioning the shed/paddock.
This problem of power shortage increased the direct labour cost significantly, as other
sources of power generation are highly expensive.
Figure 5.7 Seasonal Demand and Supply of Milk in Pakistan Dairy Industry
Source: (Zia, 2006)
The farmers reported some individual level issues as risk to their income from dairy
activities. These were:
Milk collectors run away with farmers account receivables
Occasionally excess calving
Some animals had prolonged dry period
Animal theft
The selected dairy farmers reported some best practices used to mitigate the effects of
risk. For example, dairy farmers operating at commercial level had contracted with
private veterinary doctors in order to vaccinate dairy animal. Some others used oxytocin
injections to boost milk production. To optimise operational costs dairy farmers used to
sell dried animals and purchase high yielding animals. Buying farm inputs in bulk and
store them was another best practice to cope with the price fluctuations, particularly, in
the peak demand season. Bulk buying allowed them to negotiate on the prices.

113
Moreover, the dairy farmers mentioned to use feed mixtures of least cost and of high
productivity. To deal with the customers (the milk collectors in most cases), the farmers
preferred advance payments for their milk as a security.
Supply Chain Costs
The SCOR model divided supply chain costs into SCM cost and cost of goods sold
(COGS). Calculating the supply chain costs for Pakistani dairy farmers was different
from the New Zealand dairy farmers. In New Zealand, 100% of the milk produced on a
dairy farm was supplied to the dairy cooperative, whereas, in Pakistan, the major
proportion of the milk produced was consumed at farm (by the farmer and other farm
workers). The majority of the respondents reported that they rear dairy animals
primarily to fulfil their household consumption needs and the milk excess to their needs
was sold. This highlights a possible caveat in calculating supply chain costs as
percentage of supply chain revenue (SCR). For this study, the value of total milk
produced at dairy farm (it includes milk consumed by farm household plus milk sold in
the market) was considered as supply chain revenue, instead of just sales revenue.
CO.1.1 Supply Chain Management Cost
The SCM cost is the sum of all the costs associated with processes Plan, Source, Make,
Deliver, and Return. The information required to calculate SCM cost was retrieved from
following level-2 metrics:
CO.2.1 Cost to Plan
CO.2.2 Cost to Source
CO.2.3 Cost to Make
CO.2.4 Cost to Deliver (if applicable)
CO.2.7 Mitigation Cost
The “Cost-to-Plan” for Pakistani dairy farmers accounted for all the administrative
expenses such as managers’ salary. Majority of the small farmers worked as manager-
cum-worker and their salaries were estimated in terms of the opportunity cost based on
the comparative wage rates in the labour market. For manager-cum-worker dairy
farmers, half the opportunity cost was accounted for administrative expenses and the
remaining half accounted for in the Cost-to-Make as direct labour. Having known that
the majority of the smallholder and rural farmers used to rear dairy animals as a side
business to crop farming, their opportunity cost for the dairy farming was allocated as
half for dairy farming and half for crop farming.
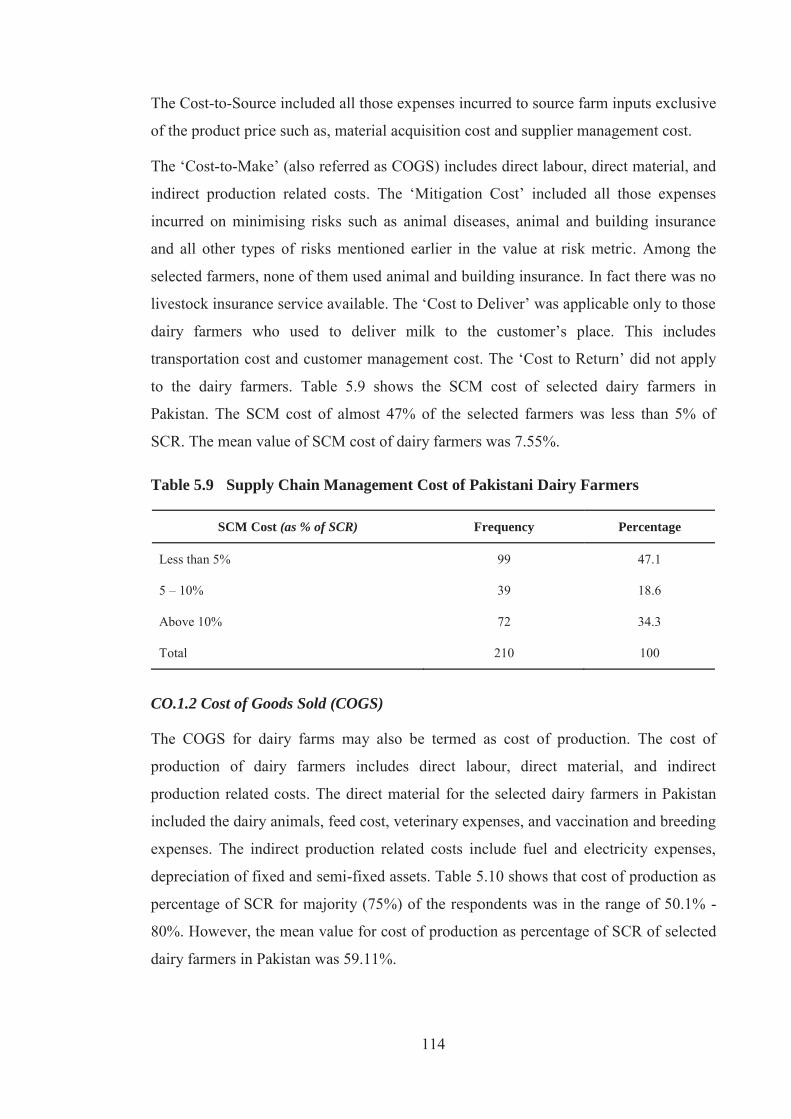
114
The Cost-to-Source included all those expenses incurred to source farm inputs exclusive
of the product price such as, material acquisition cost and supplier management cost.
The ‘Cost-to-Make’ (also referred as COGS) includes direct labour, direct material, and
indirect production related costs. The ‘Mitigation Cost’ included all those expenses
incurred on minimising risks such as animal diseases, animal and building insurance
and all other types of risks mentioned earlier in the value at risk metric. Among the
selected farmers, none of them used animal and building insurance. In fact there was no
livestock insurance service available. The ‘Cost to Deliver’ was applicable only to those
dairy farmers who used to deliver milk to the customer’s place. This includes
transportation cost and customer management cost. The ‘Cost to Return’ did not apply
to the dairy farmers. Table 5.9 shows the SCM cost of selected dairy farmers in
Pakistan. The SCM cost of almost 47% of the selected farmers was less than 5% of
SCR. The mean value of SCM cost of dairy farmers was 7.55%.
Table 5.9 Supply Chain Management Cost of Pakistani Dairy Farmers
SCM Cost (as % of SCR) Frequency Percentage
Less than 5% 99 47.1
5 – 10% 39 18.6
Above 10% 72 34.3
Total 210 100
CO.1.2 Cost of Goods Sold (COGS)
The COGS for dairy farms may also be termed as cost of production. The cost of
production of dairy farmers includes direct labour, direct material, and indirect
production related costs. The direct material for the selected dairy farmers in Pakistan
included the dairy animals, feed cost, veterinary expenses, and vaccination and breeding
expenses. The indirect production related costs include fuel and electricity expenses,
depreciation of fixed and semi-fixed assets. Table 5.10 shows that cost of production as
percentage of SCR for majority (75%) of the respondents was in the range of 50.1% -
80%. However, the mean value for cost of production as percentage of SCR of selected
dairy farmers in Pakistan was 59.11%.
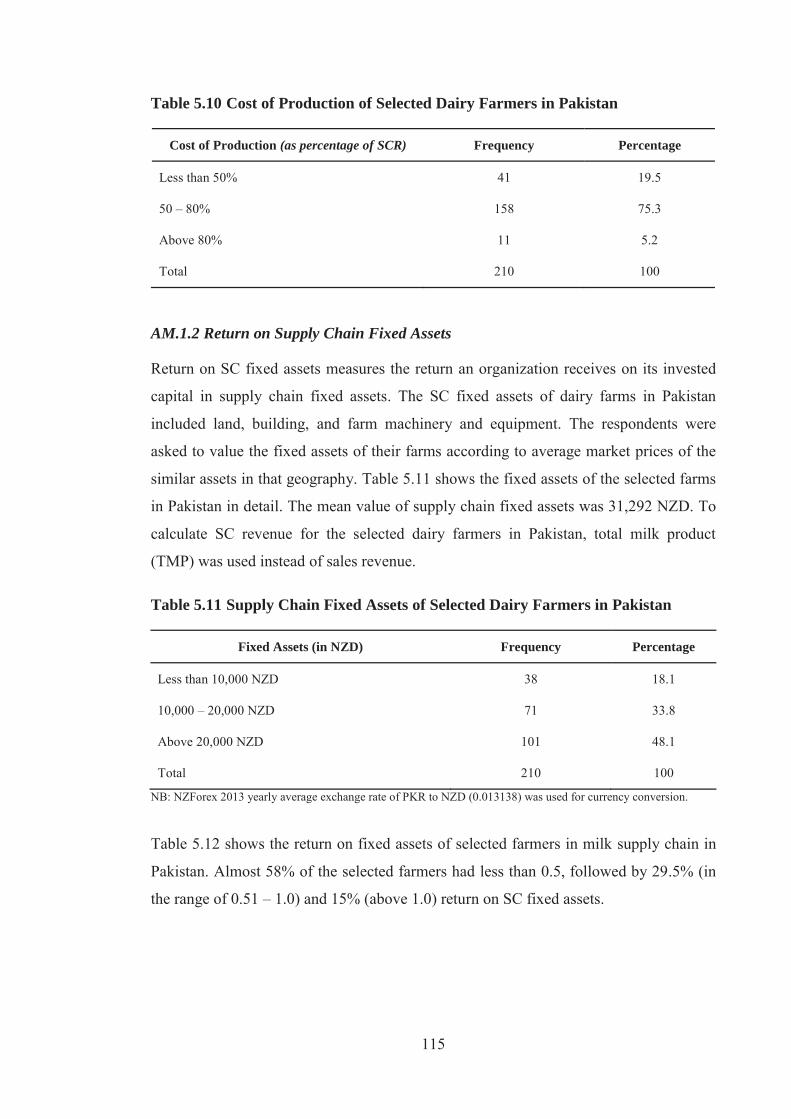
115
Table 5.10 Cost of Production of Selected Dairy Farmers in Pakistan
Cost of Production (as percentage of SCR) Frequency Percentage
Less than 50% 41 19.5
50 – 80% 158 75.3
Above 80% 11 5.2
Total 210 100
AM.1.2 Return on Supply Chain Fixed Assets
Return on SC fixed assets measures the return an organization receives on its invested
capital in supply chain fixed assets. The SC fixed assets of dairy farms in Pakistan
included land, building, and farm machinery and equipment. The respondents were
asked to value the fixed assets of their farms according to average market prices of the
similar assets in that geography. Table 5.11 shows the fixed assets of the selected farms
in Pakistan in detail. The mean value of supply chain fixed assets was 31,292 NZD. To
calculate SC revenue for the selected dairy farmers in Pakistan, total milk product
(TMP) was used instead of sales revenue.
Table 5.11 Supply Chain Fixed Assets of Selected Dairy Farmers in Pakistan
Fixed Assets (in NZD) Frequency Percentage
Less than 10,000 NZD 38 18.1
10,000 – 20,000 NZD 71 33.8
Above 20,000 NZD 101 48.1
Total 210 100
NB: NZForex 2013 yearly average exchange rate of PKR to NZD (0.013138) was used for currency conversion.
Table 5.12 shows the return on fixed assets of selected farmers in milk supply chain in
Pakistan. Almost 58% of the selected farmers had less than 0.5, followed by 29.5% (in
the range of 0.51 – 1.0) and 15% (above 1.0) return on SC fixed assets.
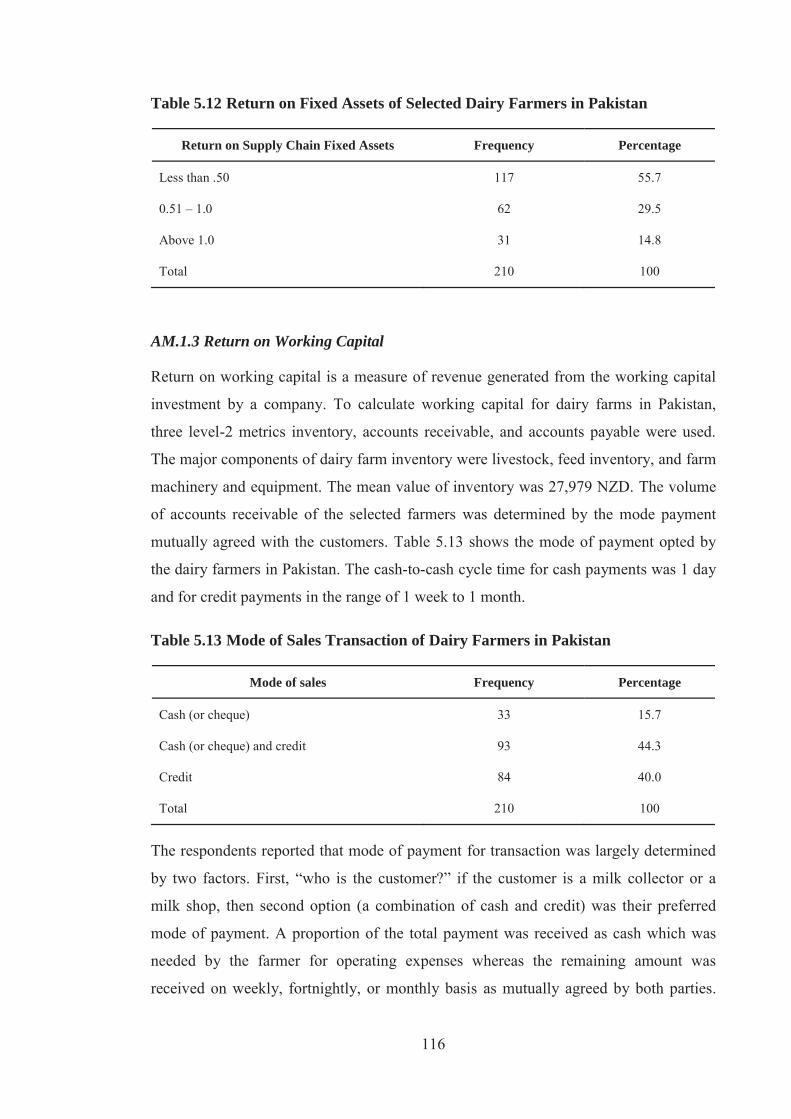
116
Table 5.12 Return on Fixed Assets of Selected Dairy Farmers in Pakistan
Return on Supply Chain Fixed Assets Frequency Percentage
Less than .50 117 55.7
0.51 – 1.0 62 29.5
Above 1.0 31 14.8
Total 210 100
AM.1.3 Return on Working Capital
Return on working capital is a measure of revenue generated from the working capital
investment by a company. To calculate working capital for dairy farms in Pakistan,
three level-2 metrics inventory, accounts receivable, and accounts payable were used.
The major components of dairy farm inventory were livestock, feed inventory, and farm
machinery and equipment. The mean value of inventory was 27,979 NZD. The volume
of accounts receivable of the selected farmers was determined by the mode payment
mutually agreed with the customers. Table 5.13 shows the mode of payment opted by
the dairy farmers in Pakistan. The cash-to-cash cycle time for cash payments was 1 day
and for credit payments in the range of 1 week to 1 month.
Table 5.13 Mode of Sales Transaction of Dairy Farmers in Pakistan
Mode of sales Frequency Percentage
Cash (or cheque) 33 15.7
Cash (or cheque) and credit 93 44.3
Credit 84 40.0
Total 210 100
The respondents reported that mode of payment for transaction was largely determined
by two factors. First, “who is the customer?” if the customer is a milk collector or a
milk shop, then second option (a combination of cash and credit) was their preferred
mode of payment. A proportion of the total payment was received as cash which was
needed by the farmer for operating expenses whereas the remaining amount was
received on weekly, fortnightly, or monthly basis as mutually agreed by both parties.
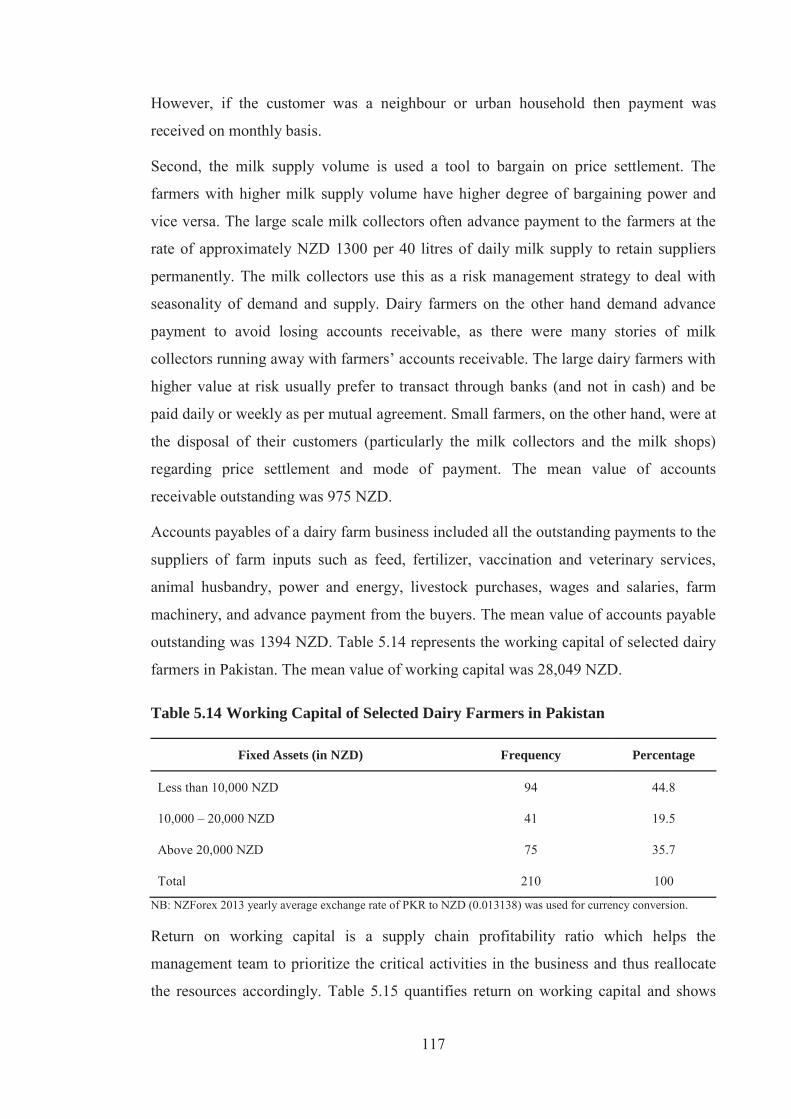
117
However, if the customer was a neighbour or urban household then payment was
received on monthly basis.
Second, the milk supply volume is used a tool to bargain on price settlement. The
farmers with higher milk supply volume have higher degree of bargaining power and
vice versa. The large scale milk collectors often advance payment to the farmers at the
rate of approximately NZD 1300 per 40 litres of daily milk supply to retain suppliers
permanently. The milk collectors use this as a risk management strategy to deal with
seasonality of demand and supply. Dairy farmers on the other hand demand advance
payment to avoid losing accounts receivable, as there were many stories of milk
collectors running away with farmers’ accounts receivable. The large dairy farmers with
higher value at risk usually prefer to transact through banks (and not in cash) and be
paid daily or weekly as per mutual agreement. Small farmers, on the other hand, were at
the disposal of their customers (particularly the milk collectors and the milk shops)
regarding price settlement and mode of payment. The mean value of accounts
receivable outstanding was 975 NZD.
Accounts payables of a dairy farm business included all the outstanding payments to the
suppliers of farm inputs such as feed, fertilizer, vaccination and veterinary services,
animal husbandry, power and energy, livestock purchases, wages and salaries, farm
machinery, and advance payment from the buyers. The mean value of accounts payable
outstanding was 1394 NZD. Table 5.14 represents the working capital of selected dairy
farmers in Pakistan. The mean value of working capital was 28,049 NZD.
Table 5.14 Working Capital of Selected Dairy Farmers in Pakistan
Fixed Assets (in NZD) Frequency Percentage
Less than 10,000 NZD 94 44.8
10,000 – 20,000 NZD 41 19.5
Above 20,000 NZD 75 35.7
Total 210 100
NB: NZForex 2013 yearly average exchange rate of PKR to NZD (0.013138) was used for currency conversion.
Return on working capital is a supply chain profitability ratio which helps the
management team to prioritize the critical activities in the business and thus reallocate
the resources accordingly. Table 5.15 quantifies return on working capital and shows
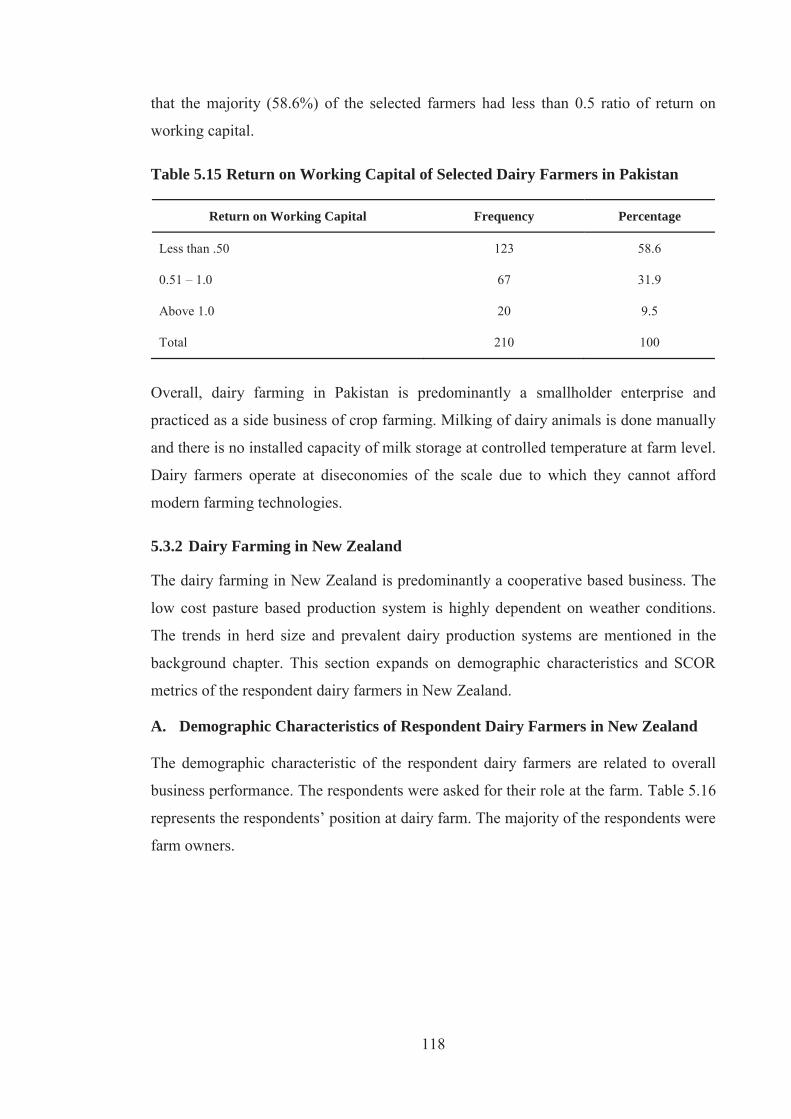
118
that the majority (58.6%) of the selected farmers had less than 0.5 ratio of return on
working capital.
Table 5.15 Return on Working Capital of Selected Dairy Farmers in Pakistan
Return on Working Capital Frequency Percentage
Less than .50 123 58.6
0.51 – 1.0 67 31.9
Above 1.0 20 9.5
Total 210 100
Overall, dairy farming in Pakistan is predominantly a smallholder enterprise and
practiced as a side business of crop farming. Milking of dairy animals is done manually
and there is no installed capacity of milk storage at controlled temperature at farm level.
Dairy farmers operate at diseconomies of the scale due to which they cannot afford
modern farming technologies.
5.3.2 Dairy Farming in New Zealand
The dairy farming in New Zealand is predominantly a cooperative based business. The
low cost pasture based production system is highly dependent on weather conditions.
The trends in herd size and prevalent dairy production systems are mentioned in the
background chapter. This section expands on demographic characteristics and SCOR
metrics of the respondent dairy farmers in New Zealand.
A. Demographic Characteristics of Respondent Dairy Farmers in New Zealand
The demographic characteristic of the respondent dairy farmers are related to overall
business performance. The respondents were asked for their role at the farm. Table 5.16
represents the respondents’ position at dairy farm. The majority of the respondents were
farm owners.
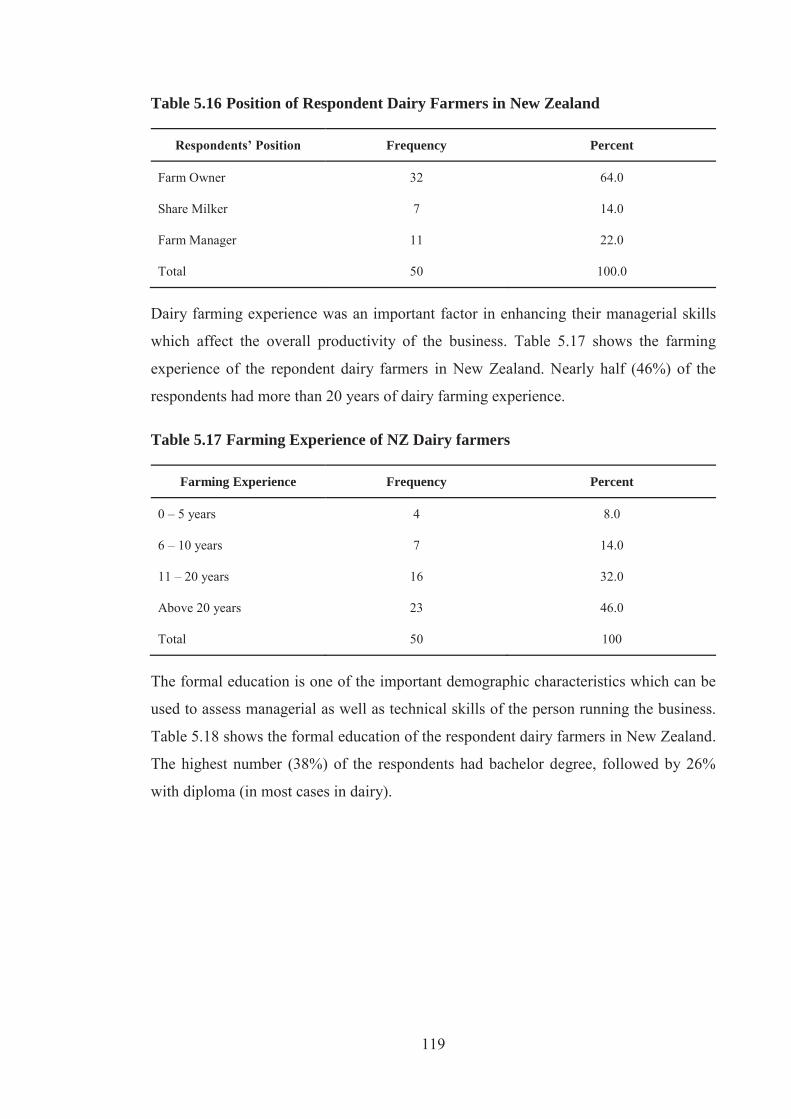
119
Table 5.16 Position of Respondent Dairy Farmers in New Zealand
Respondents’ Position Frequency Percent
Farm Owner 32 64.0
Share Milker 7 14.0
Farm Manager 11 22.0
Total 50 100.0
Dairy farming experience was an important factor in enhancing their managerial skills
which affect the overall productivity of the business. Table 5.17 shows the farming
experience of the repondent dairy farmers in New Zealand. Nearly half (46%) of the
respondents had more than 20 years of dairy farming experience.
Table 5.17 Farming Experience of NZ Dairy farmers
Farming Experience Frequency Percent
0 – 5 years 4 8.0
6 – 10 years 7 14.0
11 – 20 years 16 32.0
Above 20 years 23 46.0
Total 50 100
The formal education is one of the important demographic characteristics which can be
used to assess managerial as well as technical skills of the person running the business.
Table 5.18 shows the formal education of the respondent dairy farmers in New Zealand.
The highest number (38%) of the respondents had bachelor degree, followed by 26%
with diploma (in most cases in dairy).
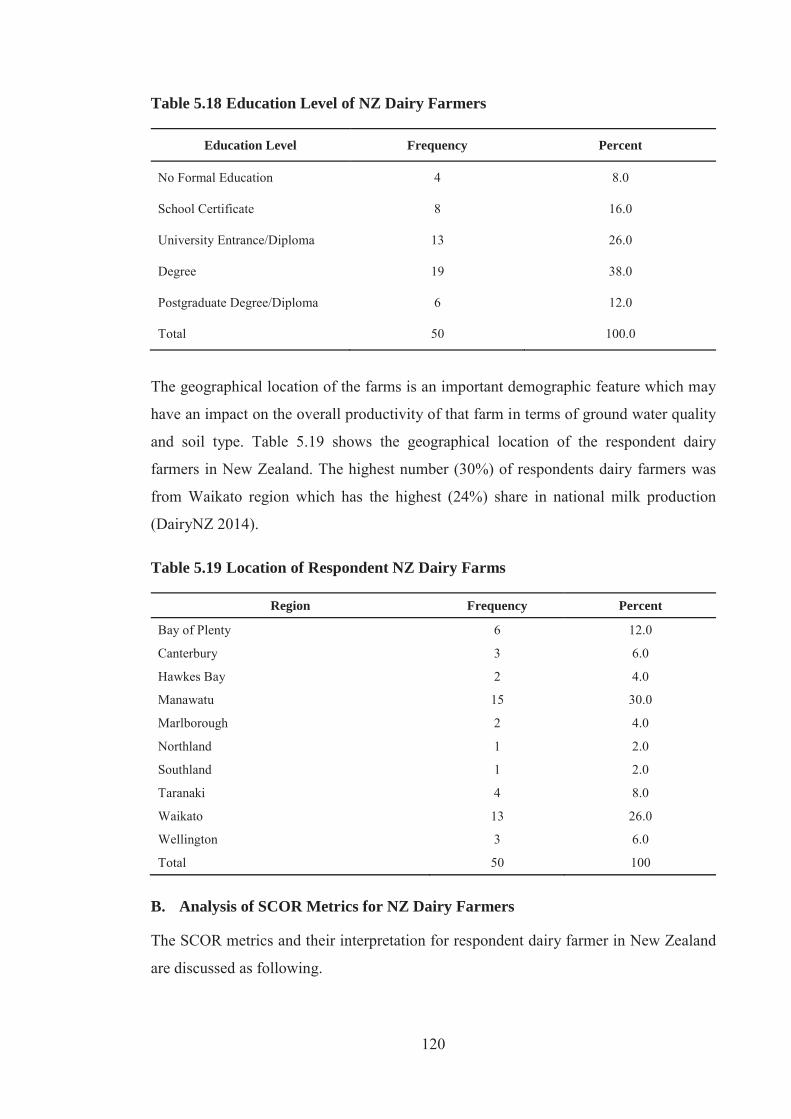
120
Table 5.18 Education Level of NZ Dairy Farmers
Education Level Frequency Percent
No Formal Education 4 8.0
School Certificate 8 16.0
University Entrance/Diploma 13 26.0
Degree 19 38.0
Postgraduate Degree/Diploma 6 12.0
Total 50 100.0
The geographical location of the farms is an important demographic feature which may
have an impact on the overall productivity of that farm in terms of ground water quality
and soil type. Table 5.19 shows the geographical location of the respondent dairy
farmers in New Zealand. The highest number (30%) of respondents dairy farmers was
from Waikato region which has the highest (24%) share in national milk production
(DairyNZ 2014).
Table 5.19 Location of Respondent NZ Dairy Farms
Region Frequency Percent
Bay of Plenty 6 12.0
Canterbury 3 6.0
Hawkes Bay 2 4.0
Manawatu 15 30.0
Marlborough 2 4.0
Northland 1 2.0
Southland 1 2.0
Taranaki 4 8.0
Waikato 13 26.0
Wellington 3 6.0
Total 50 100
B. Analysis of SCOR Metrics for NZ Dairy Farmers
The SCOR metrics and their interpretation for respondent dairy farmer in New Zealand
are discussed as following.
121
RL.1.1 Perfect Order Fulfilment (POF)
Milk production, transportation, and processing in New Zealand is practiced under strict
regulation by Ministry of Primary Industries (MPI). The dairy companies are required
under dairy industry regulatory act (DIRA) 2001 to collect all the milk produced by
their member farmers. Keeping this in mind, the level-2 SCOR metric namely
‘percentage orders delivered in full’ was not applicable to NZ dairy farmers. To
calculate POF for dairy farmers in New Zealand, only one level-2 SCOR metric “perfect
condition” was appropriate.
RL.2.4 Perfect Condition
To calculate perfect condition for agri-food supply chains, particularly the milk, two
metrics were added to SCOR model at level-3 under perfect condition. These are:
RL3.60 Percentage quantities delivered with product quality compliance
RL3.62 Presence of quality assurance system (QAS)
In New Zealand, under the dairy industry regulatory act (DIRA) 2001, all the dairy
companies are required to perform regular quality assurance audit of the dairy farm
premises supplying raw milk in addition to the standard operating procedures (SOPs)
for milk quality testing. Milk quality testing includes all quality attributes such as
sensory properties, bactoscan, temperature, somatic cell count. Moreover, regional
councils conduct environmental audit for the effluence management of every dairy farm
once a year. For low quality or hazardous milk, the dairy companies penalize dairy
farmers to a variable extent ranging from demerit points to the cost of all the effected
milk or loss to the company. The respondent dairy farmers were asked for penalty from
the dairy company or cooperative for milk quality and the penalty amount in NZD. All
the respondent dairy farmers reported that more than 90% of the total milk quantity
supplied was in compliance with quality standards. However, the mean value for perfect
condition was 99.87% which makes perfect order fulfilment.
RS.1.1 Order Fulfilment Cycle Time (OFCT)
To calculate OFCT for NZ dairy farmers, two level-2 metrics were selected.
RS.2.2 Make cycle time
RS.2.3 Deliver cycle time
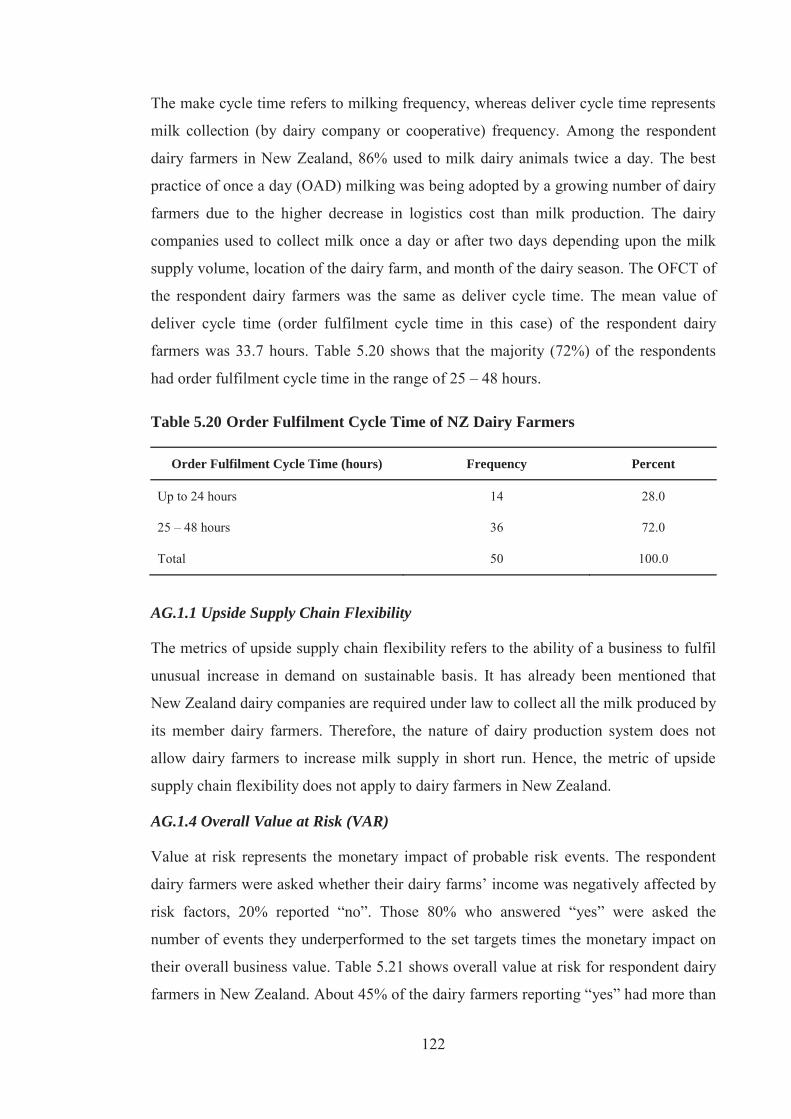
122
The make cycle time refers to milking frequency, whereas deliver cycle time represents
milk collection (by dairy company or cooperative) frequency. Among the respondent
dairy farmers in New Zealand, 86% used to milk dairy animals twice a day. The best
practice of once a day (OAD) milking was being adopted by a growing number of dairy
farmers due to the higher decrease in logistics cost than milk production. The dairy
companies used to collect milk once a day or after two days depending upon the milk
supply volume, location of the dairy farm, and month of the dairy season. The OFCT of
the respondent dairy farmers was the same as deliver cycle time. The mean value of
deliver cycle time (order fulfilment cycle time in this case) of the respondent dairy
farmers was 33.7 hours. Table 5.20 shows that the majority (72%) of the respondents
had order fulfilment cycle time in the range of 25 – 48 hours.
Table 5.20 Order Fulfilment Cycle Time of NZ Dairy Farmers
Order Fulfilment Cycle Time (hours) Frequency Percent
Up to 24 hours 14 28.0
25 – 48 hours 36 72.0
Total 50 100.0
AG.1.1 Upside Supply Chain Flexibility
The metrics of upside supply chain flexibility refers to the ability of a business to fulfil
unusual increase in demand on sustainable basis. It has already been mentioned that
New Zealand dairy companies are required under law to collect all the milk produced by
its member dairy farmers. Therefore, the nature of dairy production system does not
allow dairy farmers to increase milk supply in short run. Hence, the metric of upside
supply chain flexibility does not apply to dairy farmers in New Zealand.
AG.1.4 Overall Value at Risk (VAR)
Value at risk represents the monetary impact of probable risk events. The respondent
dairy farmers were asked whether their dairy farms’ income was negatively affected by
risk factors, 20% reported “no”. Those 80% who answered “yes” were asked the
number of events they underperformed to the set targets times the monetary impact on
their overall business value. Table 5.21 shows overall value at risk for respondent dairy
farmers in New Zealand. About 45% of the dairy farmers reporting “yes” had more than
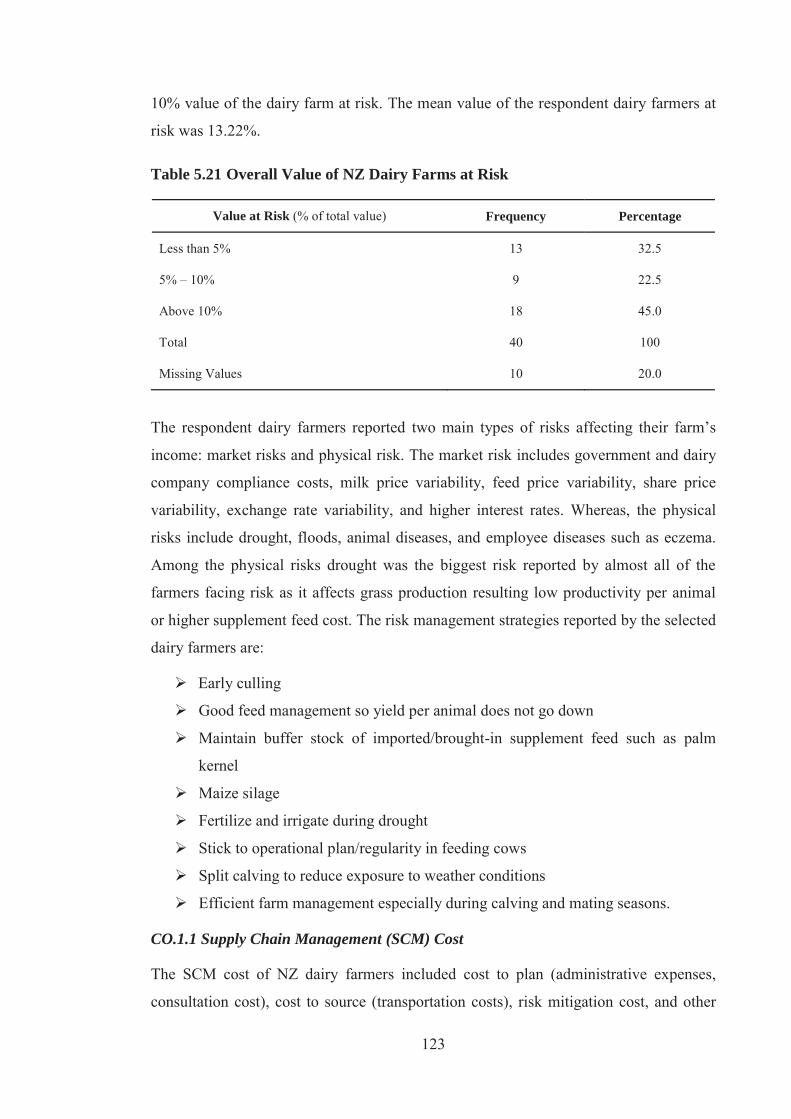
123
10% value of the dairy farm at risk. The mean value of the respondent dairy farmers at
risk was 13.22%.
Table 5.21 Overall Value of NZ Dairy Farms at Risk
Value at Risk (% of total value) Frequency Percentage
Less than 5% 13 32.5
5% – 10% 9 22.5
Above 10% 18 45.0
Total 40 100
Missing Values 10 20.0
The respondent dairy farmers reported two main types of risks affecting their farm’s
income: market risks and physical risk. The market risk includes government and dairy
company compliance costs, milk price variability, feed price variability, share price
variability, exchange rate variability, and higher interest rates. Whereas, the physical
risks include drought, floods, animal diseases, and employee diseases such as eczema.
Among the physical risks drought was the biggest risk reported by almost all of the
farmers facing risk as it affects grass production resulting low productivity per animal
or higher supplement feed cost. The risk management strategies reported by the selected
dairy farmers are:
Early culling
Good feed management so yield per animal does not go down
Maintain buffer stock of imported/brought-in supplement feed such as palm
kernel
Maize silage
Fertilize and irrigate during drought
Stick to operational plan/regularity in feeding cows
Split calving to reduce exposure to weather conditions
Efficient farm management especially during calving and mating seasons.
CO.1.1 Supply Chain Management (SCM) Cost
The SCM cost of NZ dairy farmers included cost to plan (administrative expenses,
consultation cost), cost to source (transportation costs), risk mitigation cost, and other
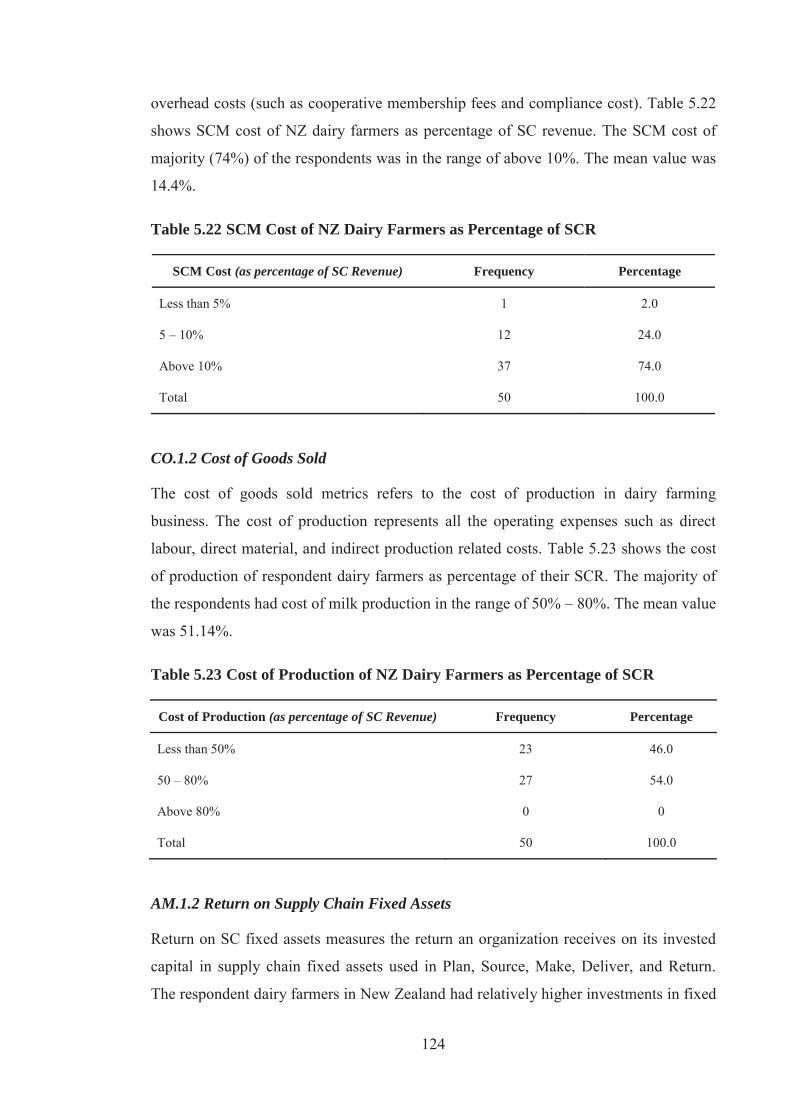
124
overhead costs (such as cooperative membership fees and compliance cost). Table 5.22
shows SCM cost of NZ dairy farmers as percentage of SC revenue. The SCM cost of
majority (74%) of the respondents was in the range of above 10%. The mean value was
14.4%.
Table 5.22 SCM Cost of NZ Dairy Farmers as Percentage of SCR
SCM Cost (as percentage of SC Revenue) Frequency Percentage
Less than 5% 1 2.0
5 – 10% 12 24.0
Above 10% 37 74.0
Total 50 100.0
CO.1.2 Cost of Goods Sold
The cost of goods sold metrics refers to the cost of production in dairy farming
business. The cost of production represents all the operating expenses such as direct
labour, direct material, and indirect production related costs. Table 5.23 shows the cost
of production of respondent dairy farmers as percentage of their SCR. The majority of
the respondents had cost of milk production in the range of 50% – 80%. The mean value
was 51.14%.
Table 5.23 Cost of Production of NZ Dairy Farmers as Percentage of SCR
Cost of Production (as percentage of SC Revenue) Frequency Percentage
Less than 50% 23 46.0
50 – 80% 27 54.0
Above 80% 0 0
Total 50 100.0
AM.1.2 Return on Supply Chain Fixed Assets
Return on SC fixed assets measures the return an organization receives on its invested
capital in supply chain fixed assets used in Plan, Source, Make, Deliver, and Return.
The respondent dairy farmers in New Zealand had relatively higher investments in fixed

125
assets as compared to selected dairy farmers in Pakistan. The investment on land at NZ
dairy farms was higher for self-contained milk production system. The return on SC
fixed assets of all the respondent dairy farmers was in the range less than 0.50. The
mean value was 0.11 which show 11% return on fixed assets. The major fixed assets of
NZ dairy farmers are in the form of share capital, land and building, and equipment.
Table 5.24Error! Reference source not found. represents the fixed assets of the
respondent dairy farms in New Zealand. The mean value was 12,640,860 NZD.
Table 5.24 Fixed Assets of NZ Dairy Farmers
Supply Chain Fixed Assets (million NZD) Frequency Percentage
Less than 5 million 17 34.0
5 – 10 million 21 42.0
Above 10 million 12 24.0
Total 50 100
AM.1.3 Return on Working Capital
Return on working capital is a measurement which assesses the revenue generated from
the investment by a company in working capital. Table 5.25 shows the return on
working capital of the selected New Zealand dairy farms. The majority (64%) had
return on working capital ratio higher than 1.0. The mean value was 1.29.
Table 5.25 Return on Working Capital of NZ Dairy Farmers
Return on Working Capital Frequency Percentage
Less than .50 9 18.0
0.51 – 1.0 9 18.0
Above 1.0 32 64.0
Total 50 100.0
The working capital of the respondent dairy farmers represents net current assets
(current assets minus current liabilities). The major current assets reported by NZ dairy
farms were cash in hand, stock inventories, and dairy animals. Table 5.26 shows the
working capital of selected NZ dairy farms. The mean value of working capital was
820,163 NZD.
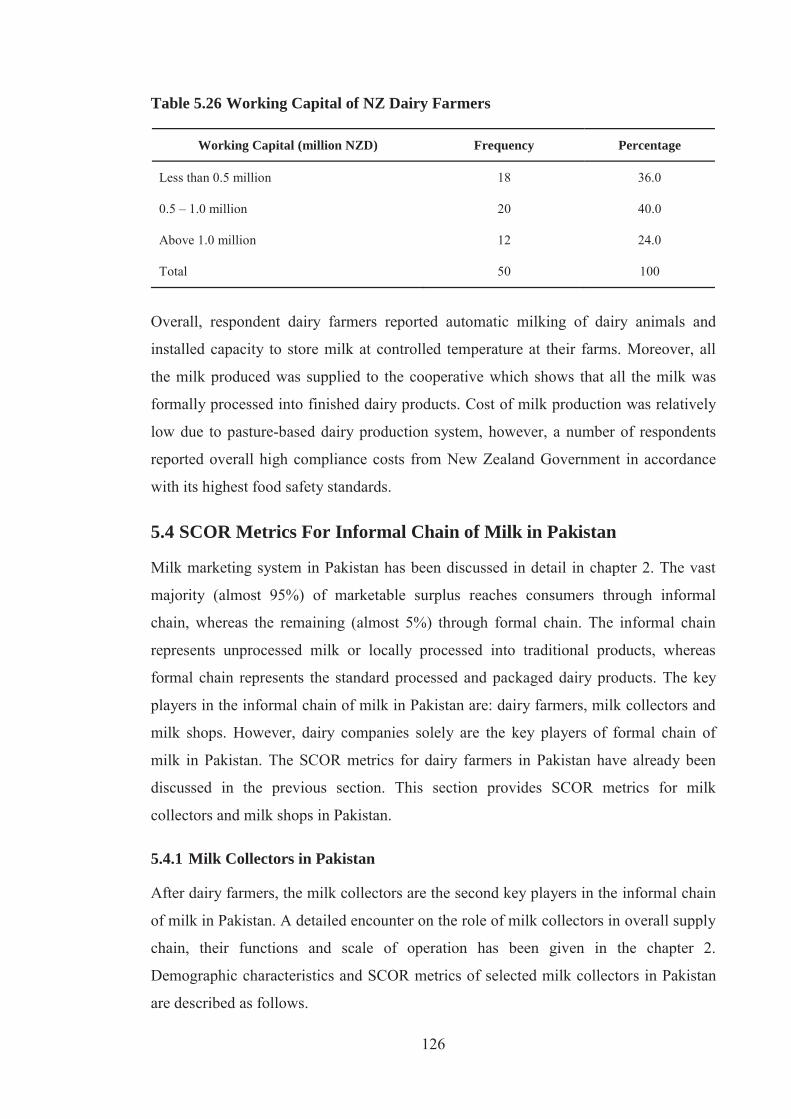
126
Table 5.26 Working Capital of NZ Dairy Farmers
Working Capital (million NZD) Frequency Percentage
Less than 0.5 million 18 36.0
0.5 – 1.0 million 20 40.0
Above 1.0 million 12 24.0
Total 50 100
Overall, respondent dairy farmers reported automatic milking of dairy animals and
installed capacity to store milk at controlled temperature at their farms. Moreover, all
the milk produced was supplied to the cooperative which shows that all the milk was
formally processed into finished dairy products. Cost of milk production was relatively
low due to pasture-based dairy production system, however, a number of respondents
reported overall high compliance costs from New Zealand Government in accordance
with its highest food safety standards.
5.4 SCOR Metrics For Informal Chain of Milk in Pakistan
Milk marketing system in Pakistan has been discussed in detail in chapter 2. The vast
majority (almost 95%) of marketable surplus reaches consumers through informal
chain, whereas the remaining (almost 5%) through formal chain. The informal chain
represents unprocessed milk or locally processed into traditional products, whereas
formal chain represents the standard processed and packaged dairy products. The key
players in the informal chain of milk in Pakistan are: dairy farmers, milk collectors and
milk shops. However, dairy companies solely are the key players of formal chain of
milk in Pakistan. The SCOR metrics for dairy farmers in Pakistan have already been
discussed in the previous section. This section provides SCOR metrics for milk
collectors and milk shops in Pakistan.
5.4.1 Milk Collectors in Pakistan
After dairy farmers, the milk collectors are the second key players in the informal chain
of milk in Pakistan. A detailed encounter on the role of milk collectors in overall supply
chain, their functions and scale of operation has been given in the chapter 2.
Demographic characteristics and SCOR metrics of selected milk collectors in Pakistan
are described as follows.
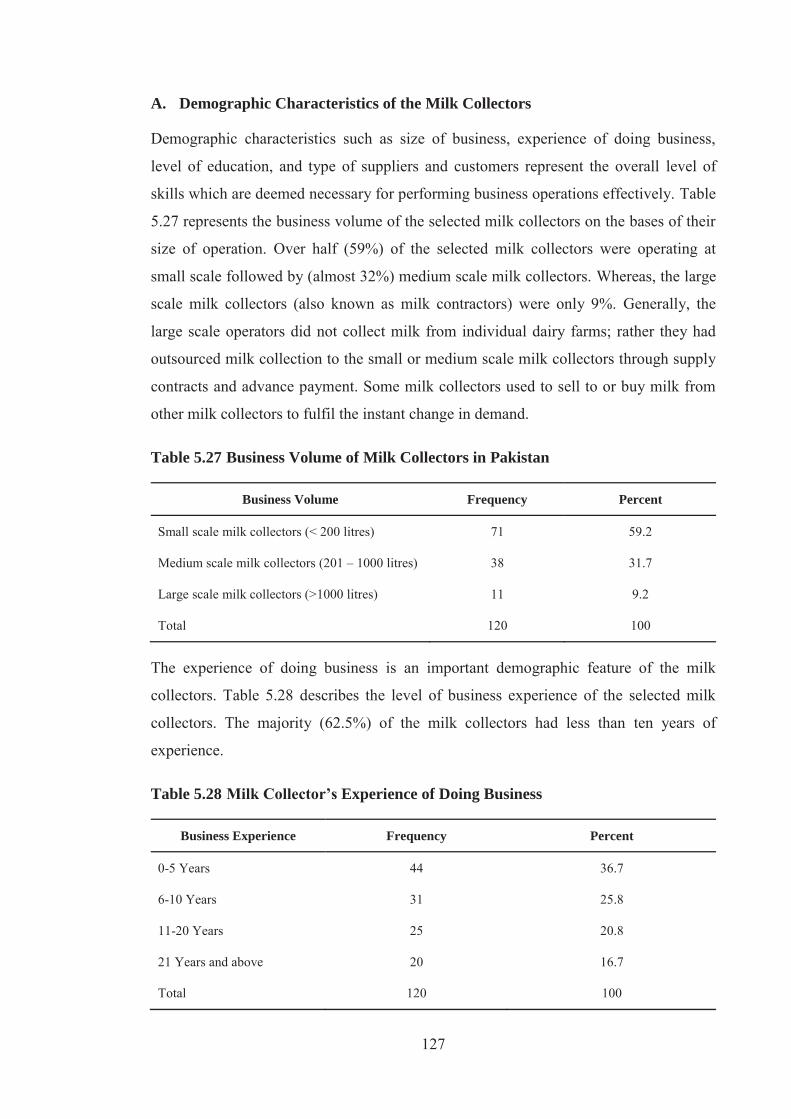
127
A. Demographic Characteristics of the Milk Collectors
Demographic characteristics such as size of business, experience of doing business,
level of education, and type of suppliers and customers represent the overall level of
skills which are deemed necessary for performing business operations effectively. Table
5.27 represents the business volume of the selected milk collectors on the bases of their
size of operation. Over half (59%) of the selected milk collectors were operating at
small scale followed by (almost 32%) medium scale milk collectors. Whereas, the large
scale milk collectors (also known as milk contractors) were only 9%. Generally, the
large scale operators did not collect milk from individual dairy farms; rather they had
outsourced milk collection to the small or medium scale milk collectors through supply
contracts and advance payment. Some milk collectors used to sell to or buy milk from
other milk collectors to fulfil the instant change in demand.
Table 5.27 Business Volume of Milk Collectors in Pakistan
Business Volume Frequency Percent
Small scale milk collectors (< 200 litres) 71 59.2
Medium scale milk collectors (201 – 1000 litres) 38 31.7
Large scale milk collectors (>1000 litres) 11 9.2
Total 120 100
The experience of doing business is an important demographic feature of the milk
collectors. Table 5.28 describes the level of business experience of the selected milk
collectors. The majority (62.5%) of the milk collectors had less than ten years of
experience.
Table 5.28 Milk Collector’s Experience of Doing Business
Business Experience Frequency Percent
0-5 Years 44 36.7
6-10 Years 31 25.8
11-20 Years 25 20.8
21 Years and above 20 16.7
Total 120 100
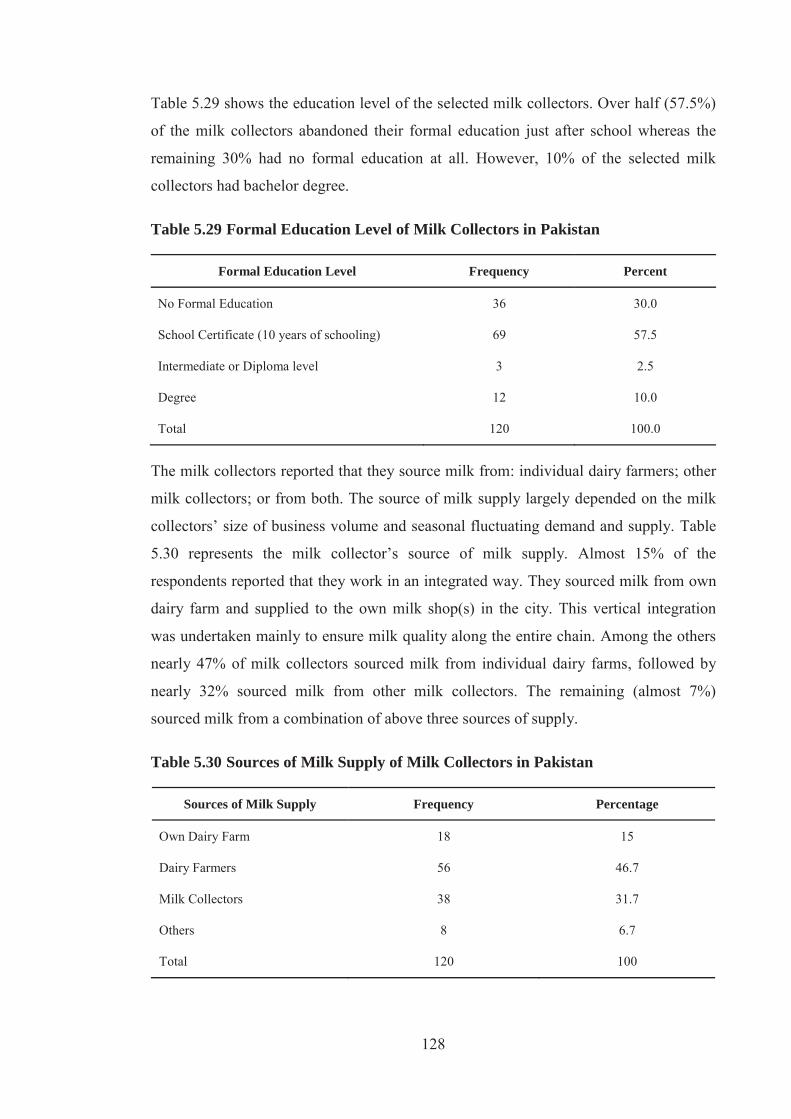
128
Table 5.29 shows the education level of the selected milk collectors. Over half (57.5%)
of the milk collectors abandoned their formal education just after school whereas the
remaining 30% had no formal education at all. However, 10% of the selected milk
collectors had bachelor degree.
Table 5.29 Formal Education Level of Milk Collectors in Pakistan
Formal Education Level Frequency Percent
No Formal Education 36 30.0
School Certificate (10 years of schooling) 69 57.5
Intermediate or Diploma level 3 2.5
Degree 12 10.0
Total 120 100.0
The milk collectors reported that they source milk from: individual dairy farmers; other
milk collectors; or from both. The source of milk supply largely depended on the milk
collectors’ size of business volume and seasonal fluctuating demand and supply. Table
5.30 represents the milk collector’s source of milk supply. Almost 15% of the
respondents reported that they work in an integrated way. They sourced milk from own
dairy farm and supplied to the own milk shop(s) in the city. This vertical integration
was undertaken mainly to ensure milk quality along the entire chain. Among the others
nearly 47% of milk collectors sourced milk from individual dairy farms, followed by
nearly 32% sourced milk from other milk collectors. The remaining (almost 7%)
sourced milk from a combination of above three sources of supply.
Table 5.30 Sources of Milk Supply of Milk Collectors in Pakistan
Sources of Milk Supply Frequency Percentage
Own Dairy Farm 18 15
Dairy Farmers 56 46.7
Milk Collectors 38 31.7
Others 8 6.7
Total 120 100
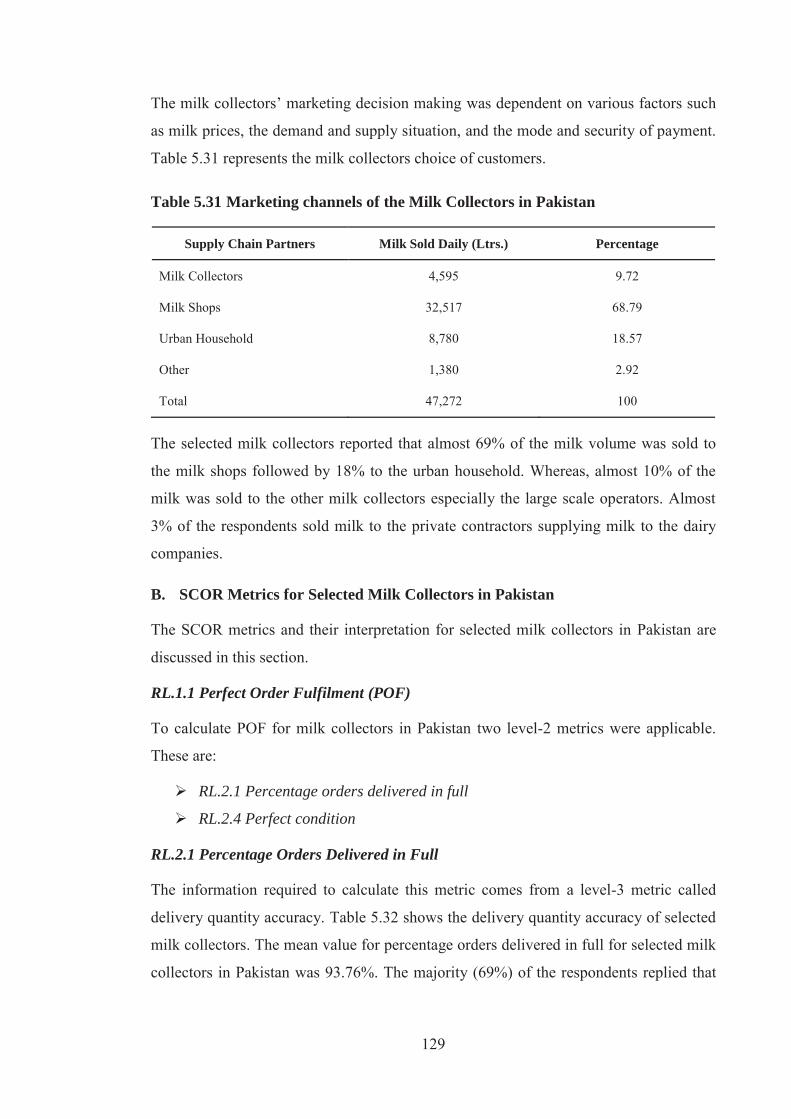
129
The milk collectors’ marketing decision making was dependent on various factors such
as milk prices, the demand and supply situation, and the mode and security of payment.
Table 5.31 represents the milk collectors choice of customers.
Table 5.31 Marketing channels of the Milk Collectors in Pakistan
Supply Chain Partners Milk Sold Daily (Ltrs.) Percentage
Milk Collectors 4,595 9.72
Milk Shops 32,517 68.79
Urban Household 8,780 18.57
Other 1,380 2.92
Total 47,272 100
The selected milk collectors reported that almost 69% of the milk volume was sold to
the milk shops followed by 18% to the urban household. Whereas, almost 10% of the
milk was sold to the other milk collectors especially the large scale operators. Almost
3% of the respondents sold milk to the private contractors supplying milk to the dairy
companies.
B. SCOR Metrics for Selected Milk Collectors in Pakistan
The SCOR metrics and their interpretation for selected milk collectors in Pakistan are
discussed in this section.
RL.1.1 Perfect Order Fulfilment (POF)
To calculate POF for milk collectors in Pakistan two level-2 metrics were applicable.
These are:
RL.2.1 Percentage orders delivered in full
RL.2.4 Perfect condition
RL.2.1 Percentage Orders Delivered in Full
The information required to calculate this metric comes from a level-3 metric called
delivery quantity accuracy. Table 5.32 shows the delivery quantity accuracy of selected
milk collectors. The mean value for percentage orders delivered in full for selected milk
collectors in Pakistan was 93.76%. The majority (69%) of the respondents replied that
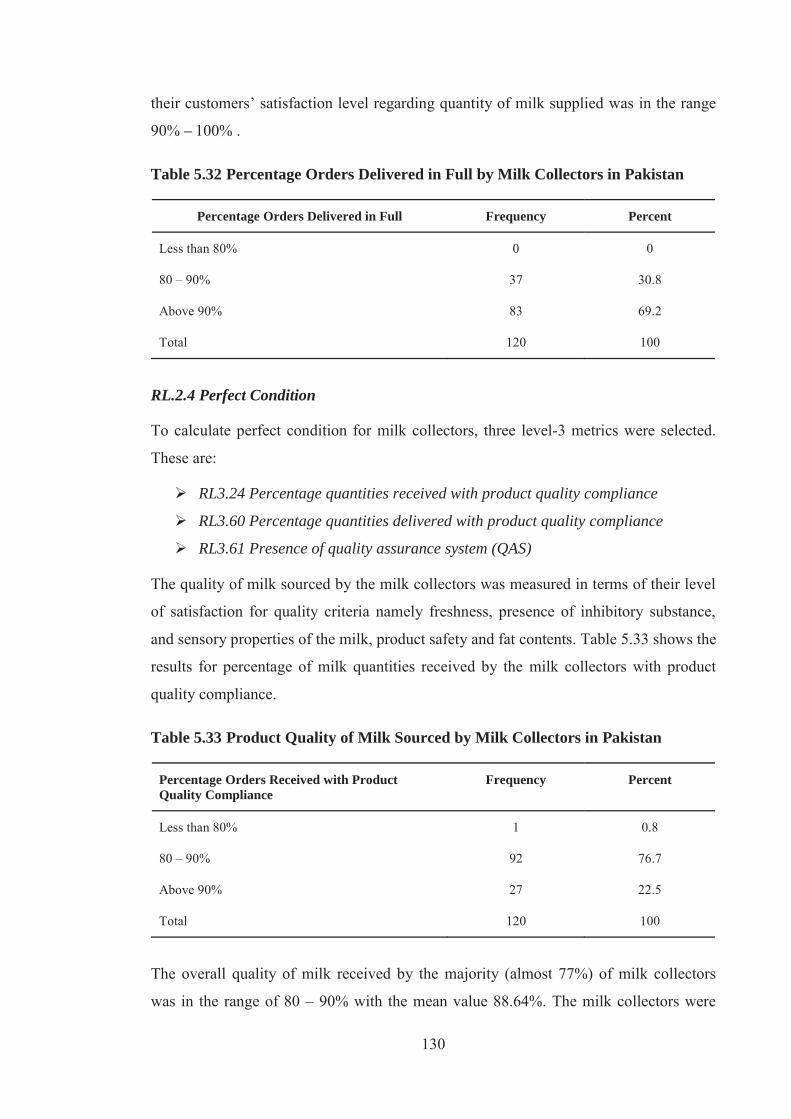
130
their customers’ satisfaction level regarding quantity of milk supplied was in the range
90% – 100% .
Table 5.32 Percentage Orders Delivered in Full by Milk Collectors in Pakistan
Percentage Orders Delivered in Full Frequency Percent
Less than 80% 0 0
80 – 90% 37 30.8
Above 90% 83 69.2
Total 120 100
RL.2.4 Perfect Condition
To calculate perfect condition for milk collectors, three level-3 metrics were selected.
These are:
RL3.24 Percentage quantities received with product quality compliance
RL3.60 Percentage quantities delivered with product quality compliance
RL3.61 Presence of quality assurance system (QAS)
The quality of milk sourced by the milk collectors was measured in terms of their level
of satisfaction for quality criteria namely freshness, presence of inhibitory substance,
and sensory properties of the milk, product safety and fat contents. Table 5.33 shows the
results for percentage of milk quantities received by the milk collectors with product
quality compliance.
Table 5.33 Product Quality of Milk Sourced by Milk Collectors in Pakistan
Percentage Orders Received with Product Quality Compliance
Frequency Percent
Less than 80% 1 0.8
80 – 90% 92 76.7
Above 90% 27 22.5
Total 120 100
The overall quality of milk received by the majority (almost 77%) of milk collectors
was in the range of 80 – 90% with the mean value 88.64%. The milk collectors were
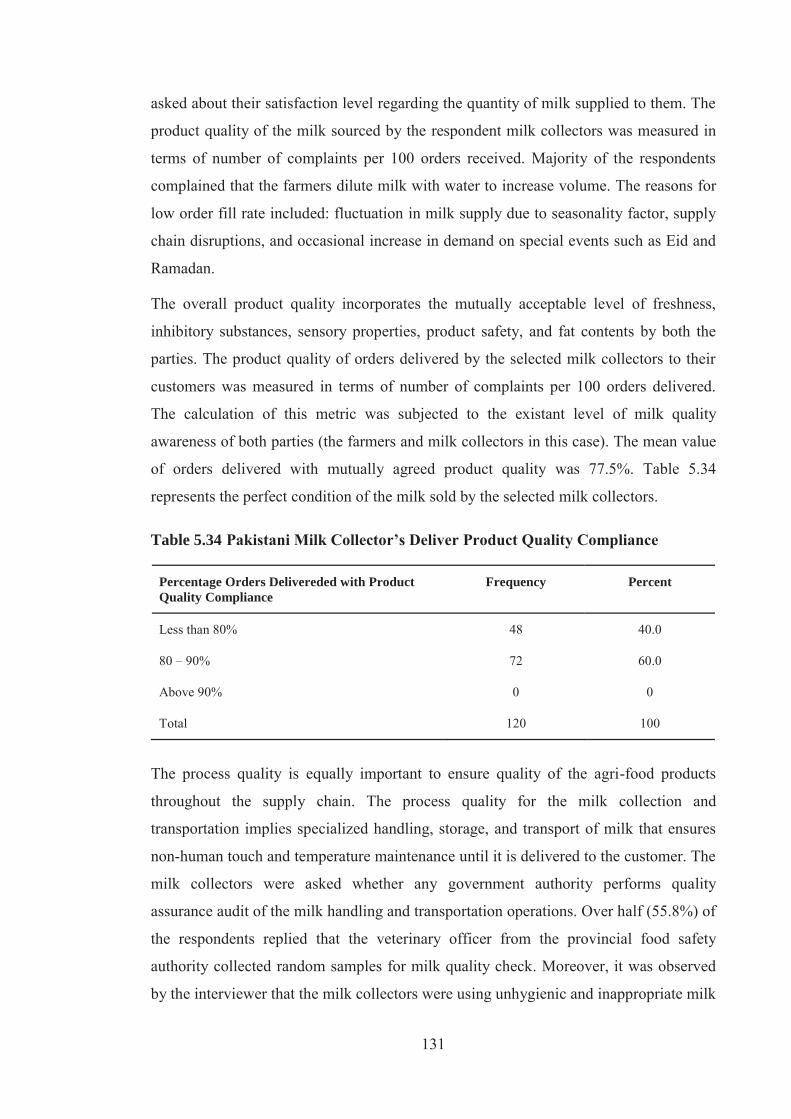
131
asked about their satisfaction level regarding the quantity of milk supplied to them. The
product quality of the milk sourced by the respondent milk collectors was measured in
terms of number of complaints per 100 orders received. Majority of the respondents
complained that the farmers dilute milk with water to increase volume. The reasons for
low order fill rate included: fluctuation in milk supply due to seasonality factor, supply
chain disruptions, and occasional increase in demand on special events such as Eid and
Ramadan.
The overall product quality incorporates the mutually acceptable level of freshness,
inhibitory substances, sensory properties, product safety, and fat contents by both the
parties. The product quality of orders delivered by the selected milk collectors to their
customers was measured in terms of number of complaints per 100 orders delivered.
The calculation of this metric was subjected to the existant level of milk quality
awareness of both parties (the farmers and milk collectors in this case). The mean value
of orders delivered with mutually agreed product quality was 77.5%. Table 5.34
represents the perfect condition of the milk sold by the selected milk collectors.
Table 5.34 Pakistani Milk Collector’s Deliver Product Quality Compliance
Percentage Orders Delivereded with Product Quality Compliance
Frequency Percent
Less than 80% 48 40.0
80 – 90% 72 60.0
Above 90% 0 0
Total 120 100
The process quality is equally important to ensure quality of the agri-food products
throughout the supply chain. The process quality for the milk collection and
transportation implies specialized handling, storage, and transport of milk that ensures
non-human touch and temperature maintenance until it is delivered to the customer. The
milk collectors were asked whether any government authority performs quality
assurance audit of the milk handling and transportation operations. Over half (55.8%) of
the respondents replied that the veterinary officer from the provincial food safety
authority collected random samples for milk quality check. Moreover, it was observed
by the interviewer that the milk collectors were using unhygienic and inappropriate milk
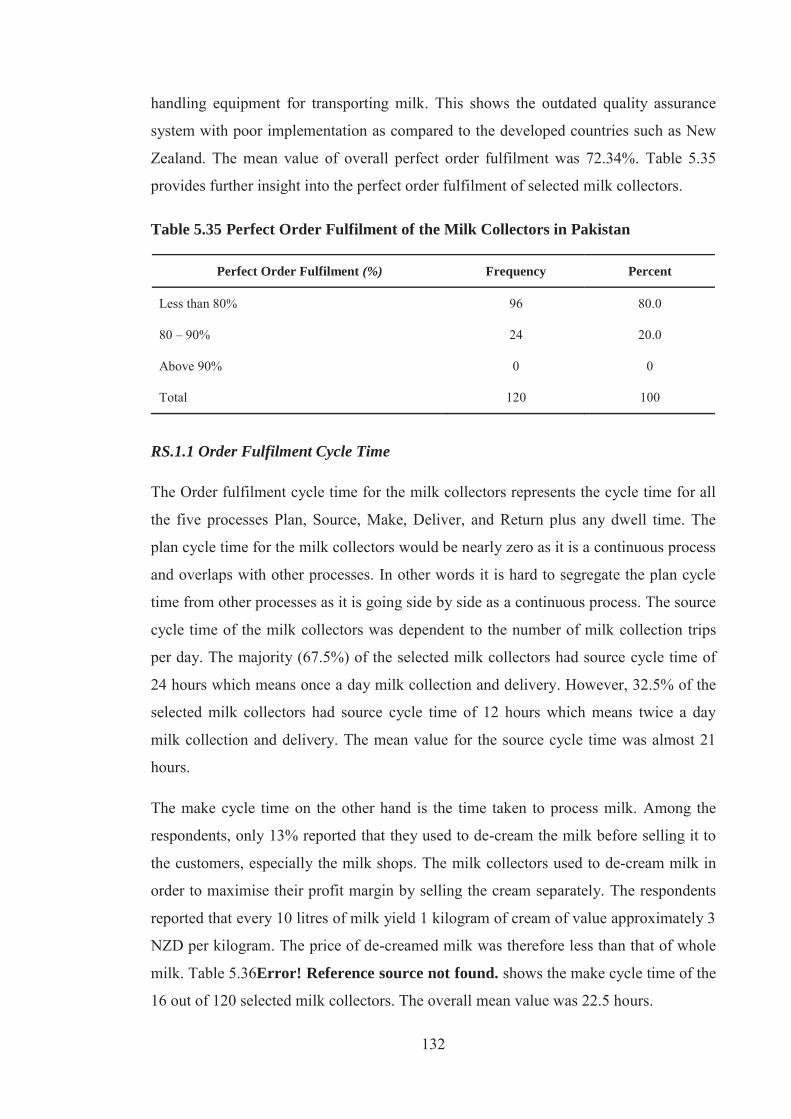
132
handling equipment for transporting milk. This shows the outdated quality assurance
system with poor implementation as compared to the developed countries such as New
Zealand. The mean value of overall perfect order fulfilment was 72.34%. Table 5.35
provides further insight into the perfect order fulfilment of selected milk collectors.
Table 5.35 Perfect Order Fulfilment of the Milk Collectors in Pakistan
Perfect Order Fulfilment (%) Frequency Percent
Less than 80% 96 80.0
80 – 90% 24 20.0
Above 90% 0 0
Total 120 100
RS.1.1 Order Fulfilment Cycle Time
The Order fulfilment cycle time for the milk collectors represents the cycle time for all
the five processes Plan, Source, Make, Deliver, and Return plus any dwell time. The
plan cycle time for the milk collectors would be nearly zero as it is a continuous process
and overlaps with other processes. In other words it is hard to segregate the plan cycle
time from other processes as it is going side by side as a continuous process. The source
cycle time of the milk collectors was dependent to the number of milk collection trips
per day. The majority (67.5%) of the selected milk collectors had source cycle time of
24 hours which means once a day milk collection and delivery. However, 32.5% of the
selected milk collectors had source cycle time of 12 hours which means twice a day
milk collection and delivery. The mean value for the source cycle time was almost 21
hours.
The make cycle time on the other hand is the time taken to process milk. Among the
respondents, only 13% reported that they used to de-cream the milk before selling it to
the customers, especially the milk shops. The milk collectors used to de-cream milk in
order to maximise their profit margin by selling the cream separately. The respondents
reported that every 10 litres of milk yield 1 kilogram of cream of value approximately 3
NZD per kilogram. The price of de-creamed milk was therefore less than that of whole
milk. Table 5.36Error! Reference source not found. shows the make cycle time of the
16 out of 120 selected milk collectors. The overall mean value was 22.5 hours.
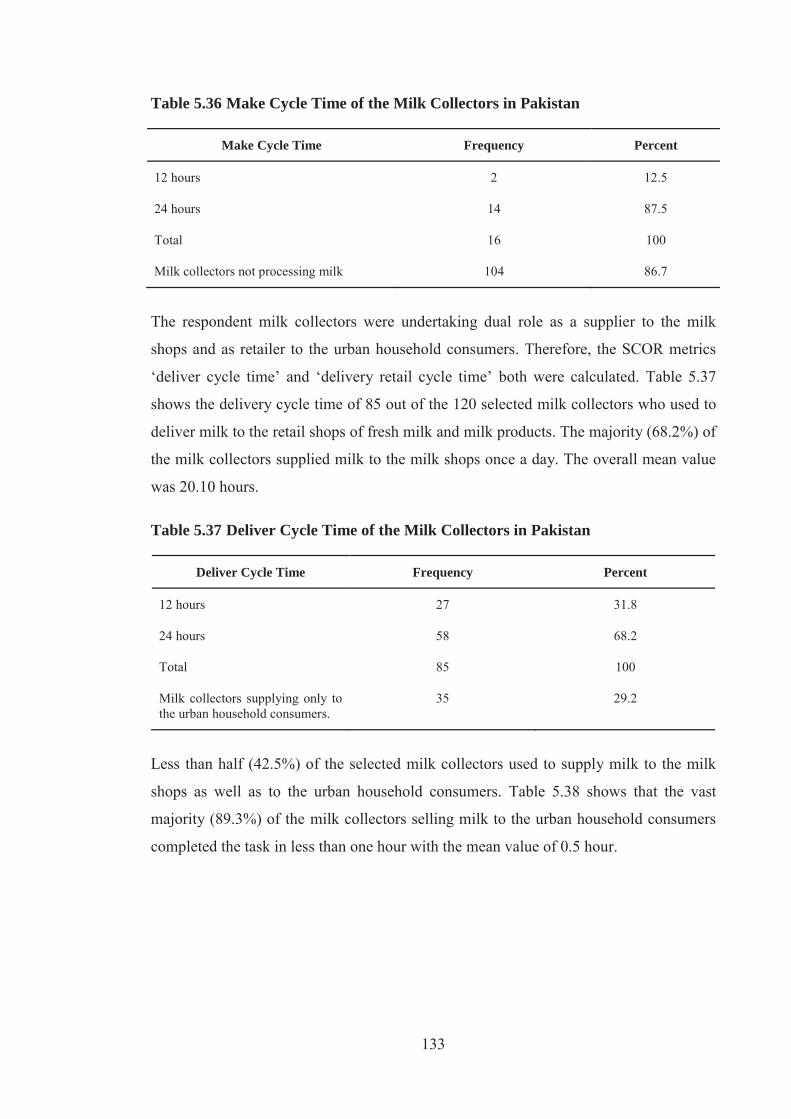
133
Table 5.36 Make Cycle Time of the Milk Collectors in Pakistan
Make Cycle Time Frequency Percent
12 hours 2 12.5
24 hours 14 87.5
Total 16 100
Milk collectors not processing milk 104 86.7
The respondent milk collectors were undertaking dual role as a supplier to the milk
shops and as retailer to the urban household consumers. Therefore, the SCOR metrics
‘deliver cycle time’ and ‘delivery retail cycle time’ both were calculated. Table 5.37
shows the delivery cycle time of 85 out of the 120 selected milk collectors who used to
deliver milk to the retail shops of fresh milk and milk products. The majority (68.2%) of
the milk collectors supplied milk to the milk shops once a day. The overall mean value
was 20.10 hours.
Table 5.37 Deliver Cycle Time of the Milk Collectors in Pakistan
Deliver Cycle Time Frequency Percent
12 hours 27 31.8
24 hours 58 68.2
Total 85 100
Milk collectors supplying only to the urban household consumers.
35 29.2
Less than half (42.5%) of the selected milk collectors used to supply milk to the milk
shops as well as to the urban household consumers. Table 5.38 shows that the vast
majority (89.3%) of the milk collectors selling milk to the urban household consumers
completed the task in less than one hour with the mean value of 0.5 hour.

134
Table 5.38 Delivery Retail Cycle Time of Milk Collectors in Pakistan
Delivery Retail Cycle Time Frequency Percent
Less than 1 hour 50 89.3
1 – 2 hours 6 10.7
Above 2 hours 0 0
Total 56 100
Milk collectors supplying only to the milk shops.
64 53.3
The order fulfilment cycle time may or may not be equal to the sum of all the cycle
times depending upon the process configuration. The order fulfilment cycle time for
milk collectors was equal to deliver cycle time which is 20.10 hours.
AG.1.1 Upside Supply Chain Flexibility
To measure the upside SC flexibility of the milk collection, distribution and retail
business in the informal sector of the Pakistan dairy industry, the selected milk
collectors were asked whether they respond to any unusual increase in demand due to
some special event or decrease in supply due to SC disruption. Table 5.39 shows that
majority (80.8%) of the respondents replied positively that they did respond to the
change in demand and could sustain it. However, the remaining 19.2% replied that they
did not respond to the increase in demand at all.
Table 5.39 Upside Supply Chain Flexibility of Milk Collectors in Pakistan
Response to a Change in Demand Frequency Percentage
Less than 12 hours 41 42.3
12 – 24 hours 51 52.5
Above 24 hours 5 5.2
Total 97 100
Milk collectors not responding to the change in demand
23 19.2
Among those who did respond to the change in demand, over half (52.5%) had the
flexibility to fulfil the extra demand within 12 – 24 hours, followed by 42.3% who
135
could fulfil that extra demand within less than 12 hours. The mean value was 16.53
hours.
AG.1.4 Supply Chain Value at Risk
The value of milk collection and distribution businesses at risk indicates the monetary
impact of all the events with performance below the targets. The overall value (VAR) at
risk is equal to sum of VAR for source, make, and deliver processes. The respondent
milk collectors reported a number of risk factors affecting their business performance.
Seasonality of demand and supply is one of them and affects the milk collection and
distribution business directly. The milk production reduces during peak summer and
peak winter seasons due to limited fodder availability and high cost of production on
alternative feed mix. The nearly perfect competition in the market restricted the milk
collectors to increase milk prices in the months of low milk supply. On the other hand,
the milk collectors were bound to buy milk from the suppliers during the period of high
milk supply and low demand in order to retain them for the time of low supply. The
milk collectors used to advance payment and pay higher prices for milk to the dairy
farmers in order to ensure smooth milk supply in the months of low milk production. In
the months of high milk supply, the milk collectors used to pay competitive rates which
discourage the farmers to sell milk in the market and they prefer to consume at home or
convert it to other products such as Lassi (butter milk), butter, or Desi Ghee. Moreover,
the milk collectors find more customers, particularly the urban households.
Among other risk types include: spoilage of milk, high transportation losses due to
extreme temperature during summer, poor roads infrastructure, and non-specialised
transportation. Pakistan is a tropical country with extreme weather conditions ranging
from hallucinating hot summer (as high as 50oC) to cold chilly winter. Summer season
is usually prolonged than winter. The prolonged power cuts increased the probability of
milk spoilage. The milk collectors used to add ice to the milk as a remedial measure as
well as to increase the milk volume simultaneously. The other risk factors reported by
the selected milk collectors are: financial insecurity due to verbal/informal nature of
agreements, being looted at gun point, and Kaat (milk shops pay less for substandard,
diluted, or low fat milk). The mean value of supply chain value at risk as percentage of
supply chain revenue was 10.17%. Table 5.40 describes the supply chain value of milk
collection and distribution business in Pakistan at risk.

136
Table 5.40 Value at Risk for Selected Milk Collectors in Pakistan
Value at Risk (as percentage of SCR) Frequency Percentage
Less than 5 6 5.0
5 – 10 65 54.2
Above 10 49 40.8
Total 120 100
The supply chain costs of milk collectors represent the SCM cost and the cost of goods
sold (COGS). The cost of goods sold for milk collectors may also be termed as cost of
milk sold.
CO.1.1 Supply Chain Management Cost
The supply chain management cost for milk collection and distribution would account
for cost to source and deliver. For non-cash family businesses such as the milk
collectors and milk shops, the business processes were not well defined. Therefore, a
redundant overlap was observed between the cost to plan and cost to source. Moreover,
the cost to plan for such subsistence level businesses was nominal as compared to the
total cost. Table 5.41 illustrates that the majority (64%) of the selected milk collectors
had supply chain management cost as percentage of supply chain revenue in the range
of 1 – 5% which shows the least value added activities performed by the milk
collectors. Direct labour and transportation costs are all of their expenses. The mean
value of supply chain management cost as percentage of supply chain revenue for the
selected milk collectors was 1.77%.
Table 5.41 The SCM Cost of Selected Milk Collectors in Pakistan
SCM Cost (as percentage of SCR) Frequency Percentage
Less than 1 41 34.2
1 – 5 77 64.1
Above 5 2 1.7
Total 120 100
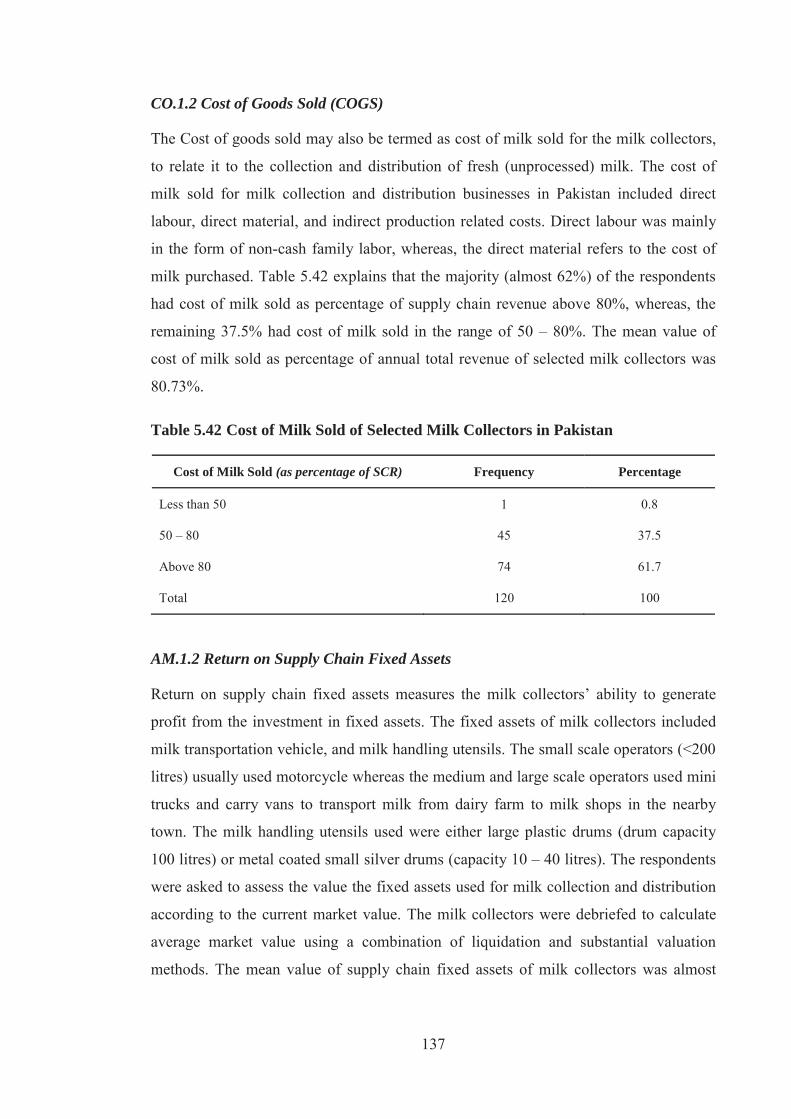
137
CO.1.2 Cost of Goods Sold (COGS)
The Cost of goods sold may also be termed as cost of milk sold for the milk collectors,
to relate it to the collection and distribution of fresh (unprocessed) milk. The cost of
milk sold for milk collection and distribution businesses in Pakistan included direct
labour, direct material, and indirect production related costs. Direct labour was mainly
in the form of non-cash family labor, whereas, the direct material refers to the cost of
milk purchased. Table 5.42 explains that the majority (almost 62%) of the respondents
had cost of milk sold as percentage of supply chain revenue above 80%, whereas, the
remaining 37.5% had cost of milk sold in the range of 50 – 80%. The mean value of
cost of milk sold as percentage of annual total revenue of selected milk collectors was
80.73%.
Table 5.42 Cost of Milk Sold of Selected Milk Collectors in Pakistan
Cost of Milk Sold (as percentage of SCR) Frequency Percentage
Less than 50 1 0.8
50 – 80 45 37.5
Above 80 74 61.7
Total 120 100
AM.1.2 Return on Supply Chain Fixed Assets
Return on supply chain fixed assets measures the milk collectors’ ability to generate
profit from the investment in fixed assets. The fixed assets of milk collectors included
milk transportation vehicle, and milk handling utensils. The small scale operators (<200
litres) usually used motorcycle whereas the medium and large scale operators used mini
trucks and carry vans to transport milk from dairy farm to milk shops in the nearby
town. The milk handling utensils used were either large plastic drums (drum capacity
100 litres) or metal coated small silver drums (capacity 10 – 40 litres). The respondents
were asked to assess the value the fixed assets used for milk collection and distribution
according to the current market value. The milk collectors were debriefed to calculate
average market value using a combination of liquidation and substantial valuation
methods. The mean value of supply chain fixed assets of milk collectors was almost

138
3,536 NZD. Table 5.43 categories the fixed assets of the selected milk collectors in milk
supply chain of Pakistan.
Table 5.43 The SC Fixed Assets of the Milk Collectors in Pakistan
Supply Chain Fixed Assets (in NZD) Frequency Percentage
Less than 1,000 61 50.8
1,000 – 10,000 52 43.4
Above 10,000 7 5.8
Total 210 100
NB: NZForex 2013 yearly average exchange rate of PKR to NZD (0.013138) was used for currency conversion.
The mean value of return on supply chain fixed assets for the selected milk collectors
was 7.82. Table 5.44 shows the rate of return on fixed assets for the selected milk
collectors in milk supply chain in Pakistan. The highest percentage (42.5%) of the
selected milk collectors had return on fixed assets less than 5 which means every dollar
invested in fixed assets is earning less than 5 dollars.
Table 5.44 Return on SC Fixed Assets of the Milk Collectors in Pakistan
Return on Supply Chain Fixed Assets Frequency Percentage
Less than 5 51 42.5
5 – 10 36 30.0
Above 10 33 27.5
Total 120 100
AM.1.3 Return on Working Capital
Return on working capital assesses the revenue generated from the investment in
working capital. The SCOR model uses accounts payable outstanding, inventory, and
accounts receivable outstanding to calculate supply chain working capital. The accounts
payables of the milk collectors include all the short term liabilities which include
outstanding payments to suppliers. The mean value of accounts payable outstanding of
the selected milk collectors was 1,237 NZD. The inventory in a milk collection and
distribution business is mainly in the form of milk, cash in hand, and milk handling
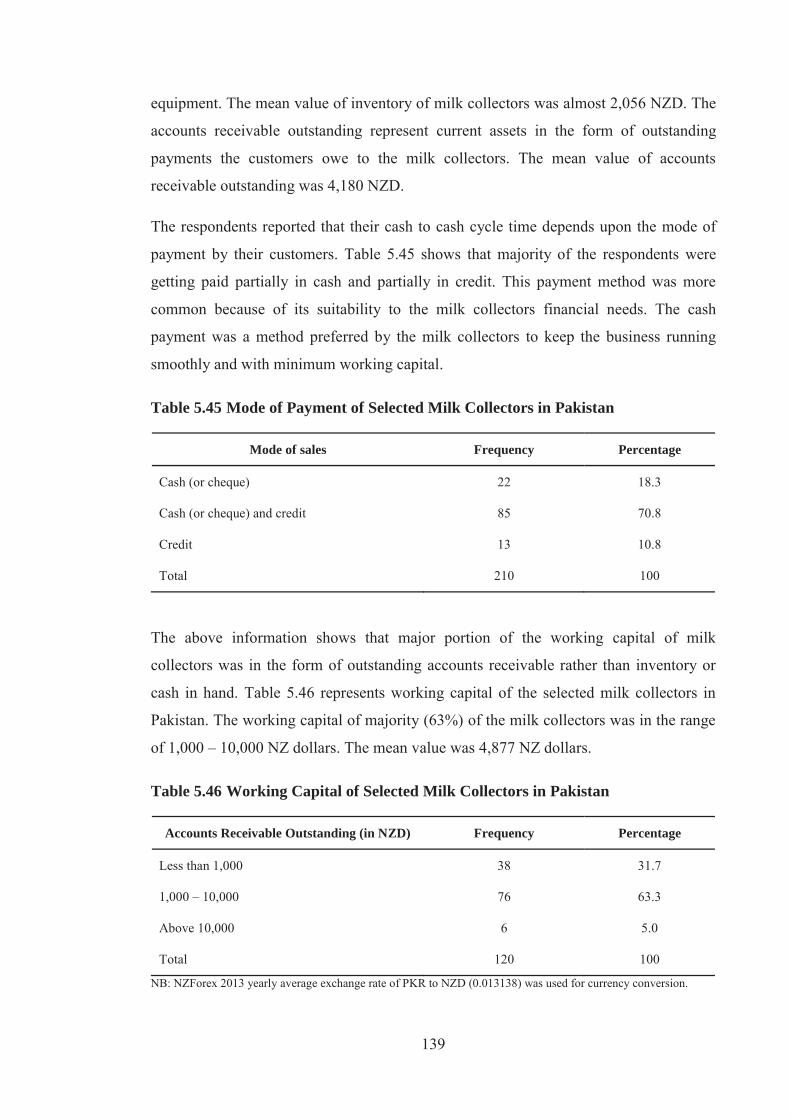
139
equipment. The mean value of inventory of milk collectors was almost 2,056 NZD. The
accounts receivable outstanding represent current assets in the form of outstanding
payments the customers owe to the milk collectors. The mean value of accounts
receivable outstanding was 4,180 NZD.
The respondents reported that their cash to cash cycle time depends upon the mode of
payment by their customers. Table 5.45 shows that majority of the respondents were
getting paid partially in cash and partially in credit. This payment method was more
common because of its suitability to the milk collectors financial needs. The cash
payment was a method preferred by the milk collectors to keep the business running
smoothly and with minimum working capital.
Table 5.45 Mode of Payment of Selected Milk Collectors in Pakistan
Mode of sales Frequency Percentage
Cash (or cheque) 22 18.3
Cash (or cheque) and credit 85 70.8
Credit 13 10.8
Total 210 100
The above information shows that major portion of the working capital of milk
collectors was in the form of outstanding accounts receivable rather than inventory or
cash in hand. Table 5.46 represents working capital of the selected milk collectors in
Pakistan. The working capital of majority (63%) of the milk collectors was in the range
of 1,000 – 10,000 NZ dollars. The mean value was 4,877 NZ dollars.
Table 5.46 Working Capital of Selected Milk Collectors in Pakistan
Accounts Receivable Outstanding (in NZD) Frequency Percentage
Less than 1,000 38 31.7
1,000 – 10,000 76 63.3
Above 10,000 6 5.0
Total 120 100
NB: NZForex 2013 yearly average exchange rate of PKR to NZD (0.013138) was used for currency conversion.
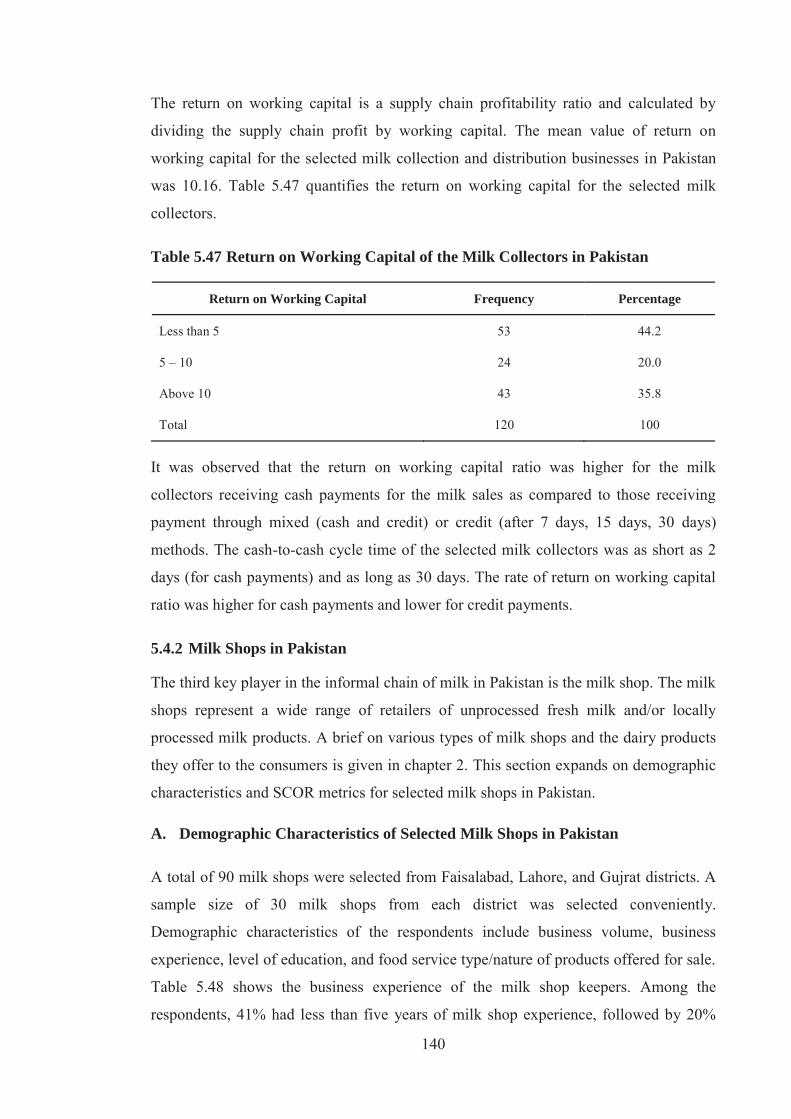
140
The return on working capital is a supply chain profitability ratio and calculated by
dividing the supply chain profit by working capital. The mean value of return on
working capital for the selected milk collection and distribution businesses in Pakistan
was 10.16. Table 5.47 quantifies the return on working capital for the selected milk
collectors.
Table 5.47 Return on Working Capital of the Milk Collectors in Pakistan
Return on Working Capital Frequency Percentage
Less than 5 53 44.2
5 – 10 24 20.0
Above 10 43 35.8
Total 120 100
It was observed that the return on working capital ratio was higher for the milk
collectors receiving cash payments for the milk sales as compared to those receiving
payment through mixed (cash and credit) or credit (after 7 days, 15 days, 30 days)
methods. The cash-to-cash cycle time of the selected milk collectors was as short as 2
days (for cash payments) and as long as 30 days. The rate of return on working capital
ratio was higher for cash payments and lower for credit payments.
5.4.2 Milk Shops in Pakistan
The third key player in the informal chain of milk in Pakistan is the milk shop. The milk
shops represent a wide range of retailers of unprocessed fresh milk and/or locally
processed milk products. A brief on various types of milk shops and the dairy products
they offer to the consumers is given in chapter 2. This section expands on demographic
characteristics and SCOR metrics for selected milk shops in Pakistan.
A. Demographic Characteristics of Selected Milk Shops in Pakistan
A total of 90 milk shops were selected from Faisalabad, Lahore, and Gujrat districts. A
sample size of 30 milk shops from each district was selected conveniently.
Demographic characteristics of the respondents include business volume, business
experience, level of education, and food service type/nature of products offered for sale.
Table 5.48 shows the business experience of the milk shop keepers. Among the
respondents, 41% had less than five years of milk shop experience, followed by 20%
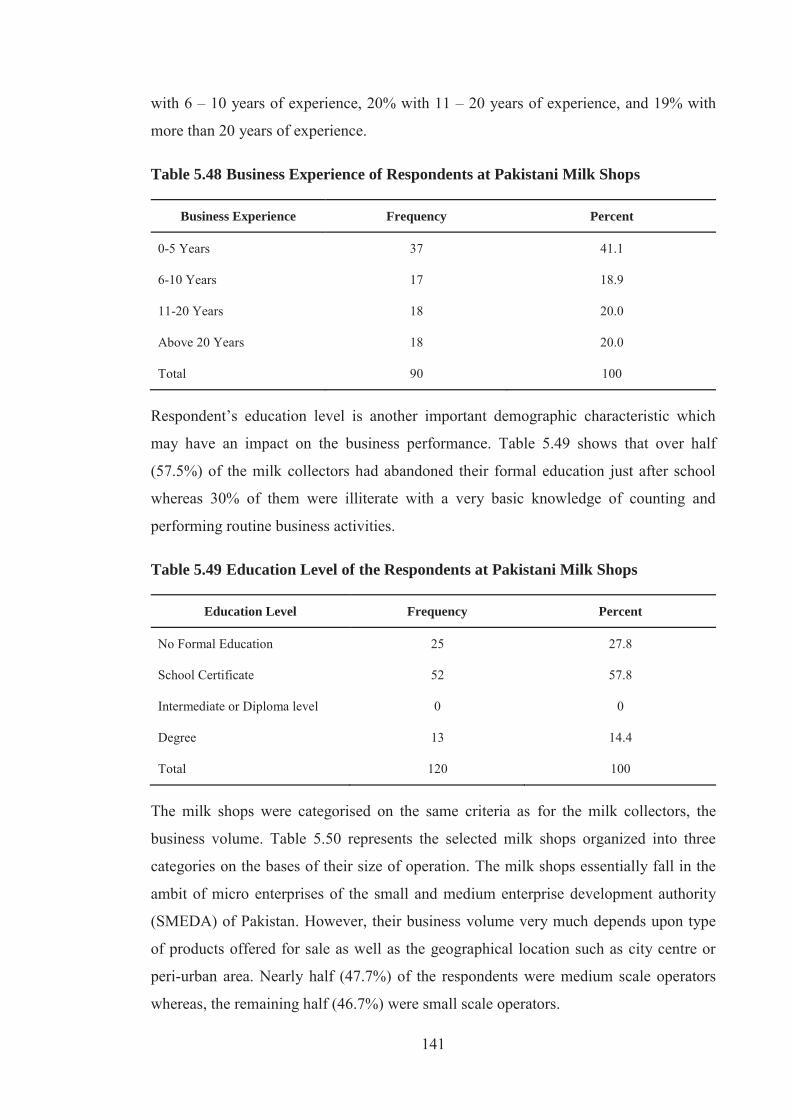
141
with 6 – 10 years of experience, 20% with 11 – 20 years of experience, and 19% with
more than 20 years of experience.
Table 5.48 Business Experience of Respondents at Pakistani Milk Shops
Business Experience Frequency Percent
0-5 Years 37 41.1
6-10 Years 17 18.9
11-20 Years 18 20.0
Above 20 Years 18 20.0
Total 90 100
Respondent’s education level is another important demographic characteristic which
may have an impact on the business performance. Table 5.49 shows that over half
(57.5%) of the milk collectors had abandoned their formal education just after school
whereas 30% of them were illiterate with a very basic knowledge of counting and
performing routine business activities.
Table 5.49 Education Level of the Respondents at Pakistani Milk Shops
Education Level Frequency Percent
No Formal Education 25 27.8
School Certificate 52 57.8
Intermediate or Diploma level 0 0
Degree 13 14.4
Total 120 100
The milk shops were categorised on the same criteria as for the milk collectors, the
business volume. Table 5.50 represents the selected milk shops organized into three
categories on the bases of their size of operation. The milk shops essentially fall in the
ambit of micro enterprises of the small and medium enterprise development authority
(SMEDA) of Pakistan. However, their business volume very much depends upon type
of products offered for sale as well as the geographical location such as city centre or
peri-urban area. Nearly half (47.7%) of the respondents were medium scale operators
whereas, the remaining half (46.7%) were small scale operators.
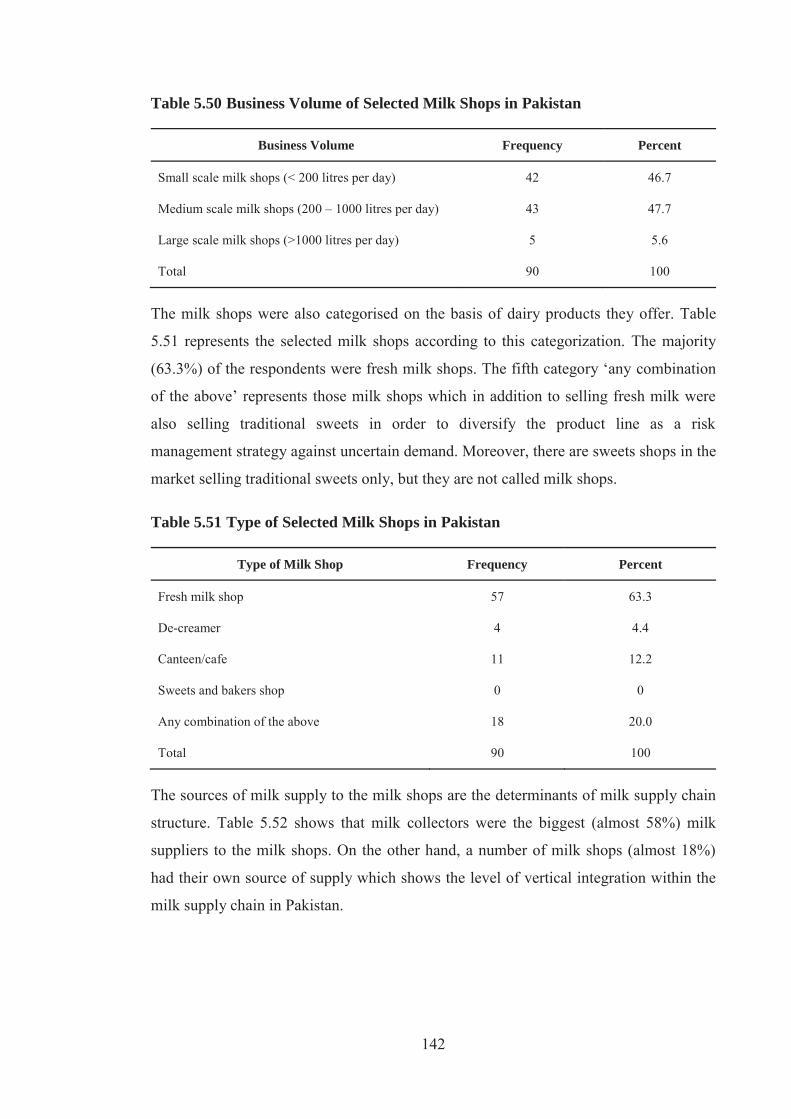
142
Table 5.50 Business Volume of Selected Milk Shops in Pakistan
Business Volume Frequency Percent
Small scale milk shops (< 200 litres per day) 42 46.7
Medium scale milk shops (200 – 1000 litres per day) 43 47.7
Large scale milk shops (>1000 litres per day) 5 5.6
Total 90 100
The milk shops were also categorised on the basis of dairy products they offer. Table
5.51 represents the selected milk shops according to this categorization. The majority
(63.3%) of the respondents were fresh milk shops. The fifth category ‘any combination
of the above’ represents those milk shops which in addition to selling fresh milk were
also selling traditional sweets in order to diversify the product line as a risk
management strategy against uncertain demand. Moreover, there are sweets shops in the
market selling traditional sweets only, but they are not called milk shops.
Table 5.51 Type of Selected Milk Shops in Pakistan
Type of Milk Shop Frequency Percent
Fresh milk shop 57 63.3
De-creamer 4 4.4
Canteen/cafe 11 12.2
Sweets and bakers shop 0 0
Any combination of the above 18 20.0
Total 90 100
The sources of milk supply to the milk shops are the determinants of milk supply chain
structure. Table 5.52 shows that milk collectors were the biggest (almost 58%) milk
suppliers to the milk shops. On the other hand, a number of milk shops (almost 18%)
had their own source of supply which shows the level of vertical integration within the
milk supply chain in Pakistan.
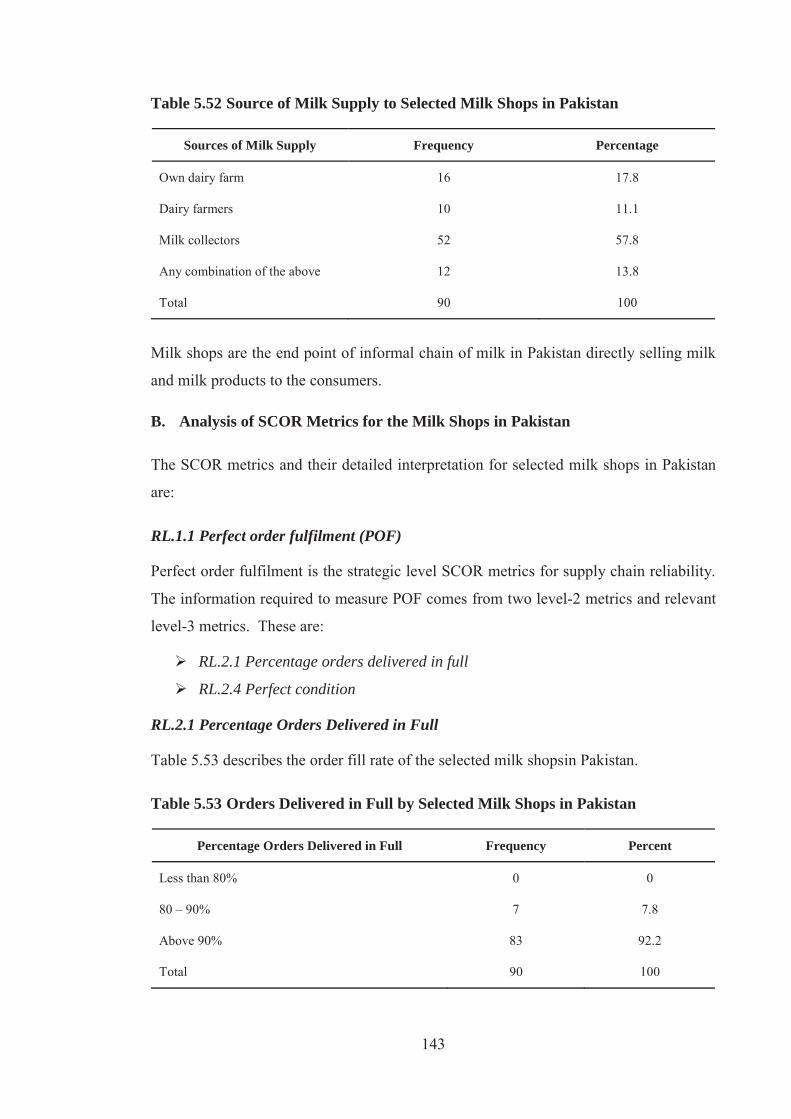
143
Table 5.52 Source of Milk Supply to Selected Milk Shops in Pakistan
Sources of Milk Supply Frequency Percentage
Own dairy farm 16 17.8
Dairy farmers 10 11.1
Milk collectors 52 57.8
Any combination of the above 12 13.8
Total 90 100
Milk shops are the end point of informal chain of milk in Pakistan directly selling milk
and milk products to the consumers.
B. Analysis of SCOR Metrics for the Milk Shops in Pakistan
The SCOR metrics and their detailed interpretation for selected milk shops in Pakistan
are:
RL.1.1 Perfect order fulfilment (POF)
Perfect order fulfilment is the strategic level SCOR metrics for supply chain reliability.
The information required to measure POF comes from two level-2 metrics and relevant
level-3 metrics. These are:
RL.2.1 Percentage orders delivered in full
RL.2.4 Perfect condition
RL.2.1 Percentage Orders Delivered in Full
Table 5.53 describes the order fill rate of the selected milk shopsin Pakistan.
Table 5.53 Orders Delivered in Full by Selected Milk Shops in Pakistan
Percentage Orders Delivered in Full Frequency Percent
Less than 80% 0 0
80 – 90% 7 7.8
Above 90% 83 92.2
Total 90 100
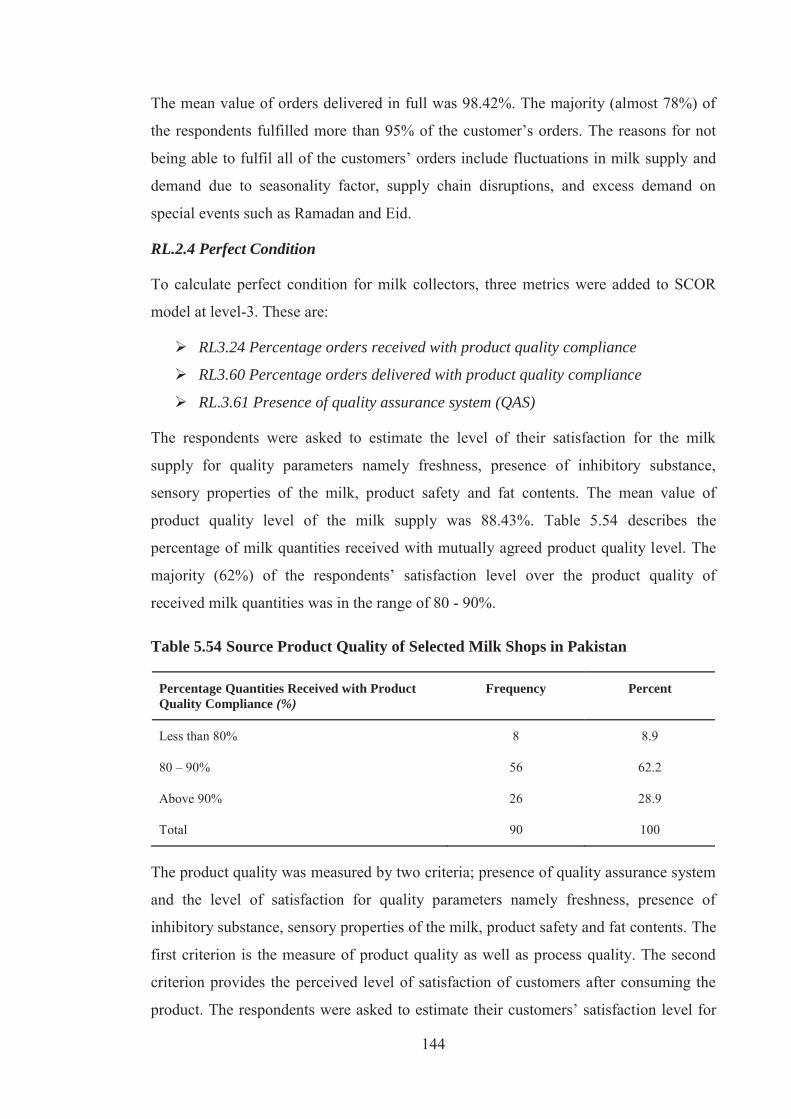
144
The mean value of orders delivered in full was 98.42%. The majority (almost 78%) of
the respondents fulfilled more than 95% of the customer’s orders. The reasons for not
being able to fulfil all of the customers’ orders include fluctuations in milk supply and
demand due to seasonality factor, supply chain disruptions, and excess demand on
special events such as Ramadan and Eid.
RL.2.4 Perfect Condition
To calculate perfect condition for milk collectors, three metrics were added to SCOR
model at level-3. These are:
RL3.24 Percentage orders received with product quality compliance
RL3.60 Percentage orders delivered with product quality compliance
RL.3.61 Presence of quality assurance system (QAS)
The respondents were asked to estimate the level of their satisfaction for the milk
supply for quality parameters namely freshness, presence of inhibitory substance,
sensory properties of the milk, product safety and fat contents. The mean value of
product quality level of the milk supply was 88.43%. Table 5.54 describes the
percentage of milk quantities received with mutually agreed product quality level. The
majority (62%) of the respondents’ satisfaction level over the product quality of
received milk quantities was in the range of 80 - 90%.
Table 5.54 Source Product Quality of Selected Milk Shops in Pakistan
Percentage Quantities Received with Product Quality Compliance (%)
Frequency Percent
Less than 80% 8 8.9
80 – 90% 56 62.2
Above 90% 26 28.9
Total 90 100
The product quality was measured by two criteria; presence of quality assurance system
and the level of satisfaction for quality parameters namely freshness, presence of
inhibitory substance, sensory properties of the milk, product safety and fat contents. The
first criterion is the measure of product quality as well as process quality. The second
criterion provides the perceived level of satisfaction of customers after consuming the
product. The respondents were asked to estimate their customers’ satisfaction level for
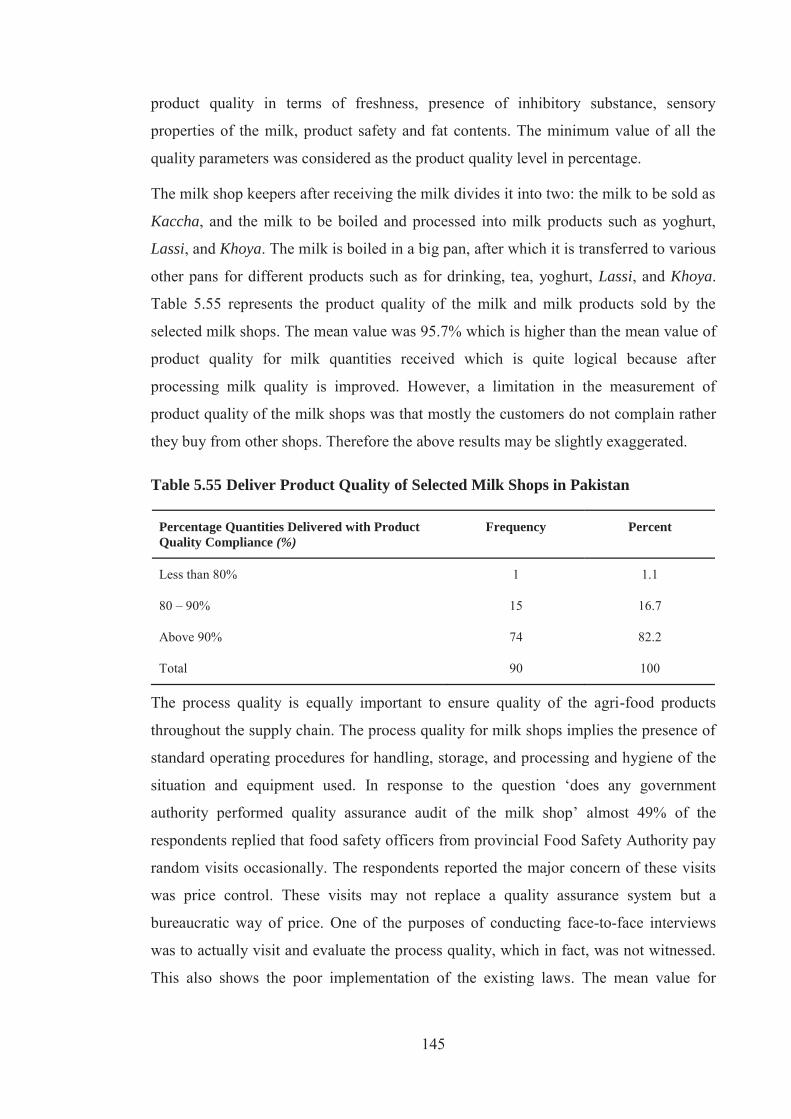
145
product quality in terms of freshness, presence of inhibitory substance, sensory
properties of the milk, product safety and fat contents. The minimum value of all the
quality parameters was considered as the product quality level in percentage.
The milk shop keepers after receiving the milk divides it into two: the milk to be sold as
Kaccha, and the milk to be boiled and processed into milk products such as yoghurt,
Lassi, and Khoya. The milk is boiled in a big pan, after which it is transferred to various
other pans for different products such as for drinking, tea, yoghurt, Lassi, and Khoya.
Table 5.55 represents the product quality of the milk and milk products sold by the
selected milk shops. The mean value was 95.7% which is higher than the mean value of
product quality for milk quantities received which is quite logical because after
processing milk quality is improved. However, a limitation in the measurement of
product quality of the milk shops was that mostly the customers do not complain rather
they buy from other shops. Therefore the above results may be slightly exaggerated.
Table 5.55 Deliver Product Quality of Selected Milk Shops in Pakistan
Percentage Quantities Delivered with Product Quality Compliance (%)
Frequency Percent
Less than 80% 1 1.1
80 – 90% 15 16.7
Above 90% 74 82.2
Total 90 100
The process quality is equally important to ensure quality of the agri-food products
throughout the supply chain. The process quality for milk shops implies the presence of
standard operating procedures for handling, storage, and processing and hygiene of the
situation and equipment used. In response to the question ‘does any government
authority performed quality assurance audit of the milk shop’ almost 49% of the
respondents replied that food safety officers from provincial Food Safety Authority pay
random visits occasionally. The respondents reported the major concern of these visits
was price control. These visits may not replace a quality assurance system but a
bureaucratic way of price. One of the purposes of conducting face-to-face interviews
was to actually visit and evaluate the process quality, which in fact, was not witnessed.
This also shows the poor implementation of the existing laws. The mean value for
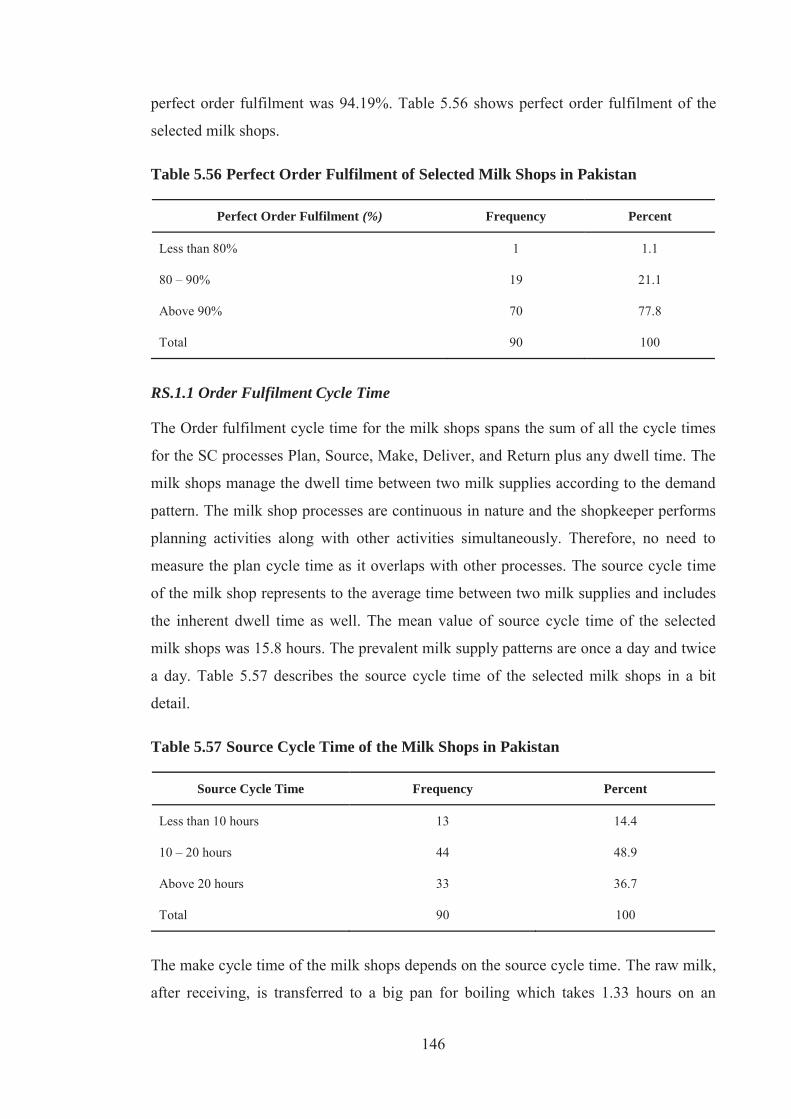
146
perfect order fulfilment was 94.19%. Table 5.56 shows perfect order fulfilment of the
selected milk shops.
Table 5.56 Perfect Order Fulfilment of Selected Milk Shops in Pakistan
Perfect Order Fulfilment (%) Frequency Percent
Less than 80% 1 1.1
80 – 90% 19 21.1
Above 90% 70 77.8
Total 90 100
RS.1.1 Order Fulfilment Cycle Time
The Order fulfilment cycle time for the milk shops spans the sum of all the cycle times
for the SC processes Plan, Source, Make, Deliver, and Return plus any dwell time. The
milk shops manage the dwell time between two milk supplies according to the demand
pattern. The milk shop processes are continuous in nature and the shopkeeper performs
planning activities along with other activities simultaneously. Therefore, no need to
measure the plan cycle time as it overlaps with other processes. The source cycle time
of the milk shop represents to the average time between two milk supplies and includes
the inherent dwell time as well. The mean value of source cycle time of the selected
milk shops was 15.8 hours. The prevalent milk supply patterns are once a day and twice
a day. Table 5.57 describes the source cycle time of the selected milk shops in a bit
detail.
Table 5.57 Source Cycle Time of the Milk Shops in Pakistan
Source Cycle Time Frequency Percent
Less than 10 hours 13 14.4
10 – 20 hours 44 48.9
Above 20 hours 33 36.7
Total 90 100
The make cycle time of the milk shops depends on the source cycle time. The raw milk,
after receiving, is transferred to a big pan for boiling which takes 1.33 hours on an
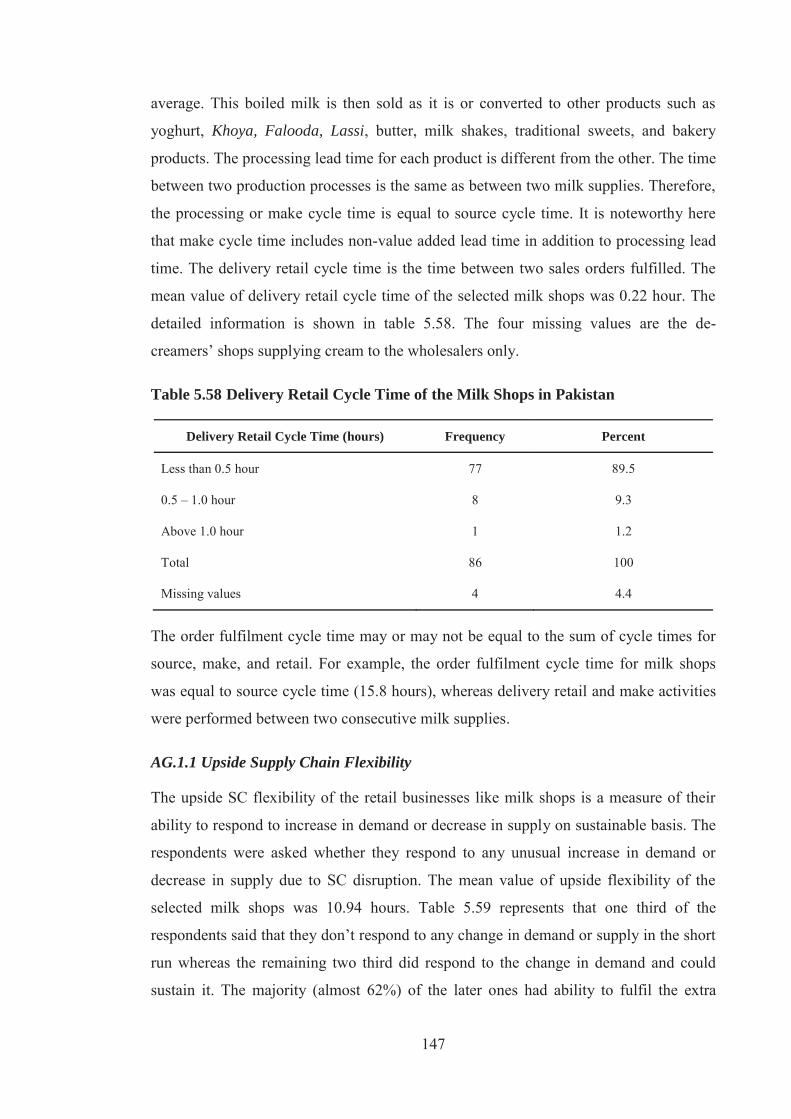
147
average. This boiled milk is then sold as it is or converted to other products such as
yoghurt, Khoya, Falooda, Lassi, butter, milk shakes, traditional sweets, and bakery
products. The processing lead time for each product is different from the other. The time
between two production processes is the same as between two milk supplies. Therefore,
the processing or make cycle time is equal to source cycle time. It is noteworthy here
that make cycle time includes non-value added lead time in addition to processing lead
time. The delivery retail cycle time is the time between two sales orders fulfilled. The
mean value of delivery retail cycle time of the selected milk shops was 0.22 hour. The
detailed information is shown in table 5.58. The four missing values are the de-
creamers’ shops supplying cream to the wholesalers only.
Table 5.58 Delivery Retail Cycle Time of the Milk Shops in Pakistan
Delivery Retail Cycle Time (hours) Frequency Percent
Less than 0.5 hour 77 89.5
0.5 – 1.0 hour 8 9.3
Above 1.0 hour 1 1.2
Total 86 100
Missing values 4 4.4
The order fulfilment cycle time may or may not be equal to the sum of cycle times for
source, make, and retail. For example, the order fulfilment cycle time for milk shops
was equal to source cycle time (15.8 hours), whereas delivery retail and make activities
were performed between two consecutive milk supplies.
AG.1.1 Upside Supply Chain Flexibility
The upside SC flexibility of the retail businesses like milk shops is a measure of their
ability to respond to increase in demand or decrease in supply on sustainable basis. The
respondents were asked whether they respond to any unusual increase in demand or
decrease in supply due to SC disruption. The mean value of upside flexibility of the
selected milk shops was 10.94 hours. Table 5.59 represents that one third of the
respondents said that they don’t respond to any change in demand or supply in the short
run whereas the remaining two third did respond to the change in demand and could
sustain it. The majority (almost 62%) of the later ones had ability to fulfil the extra
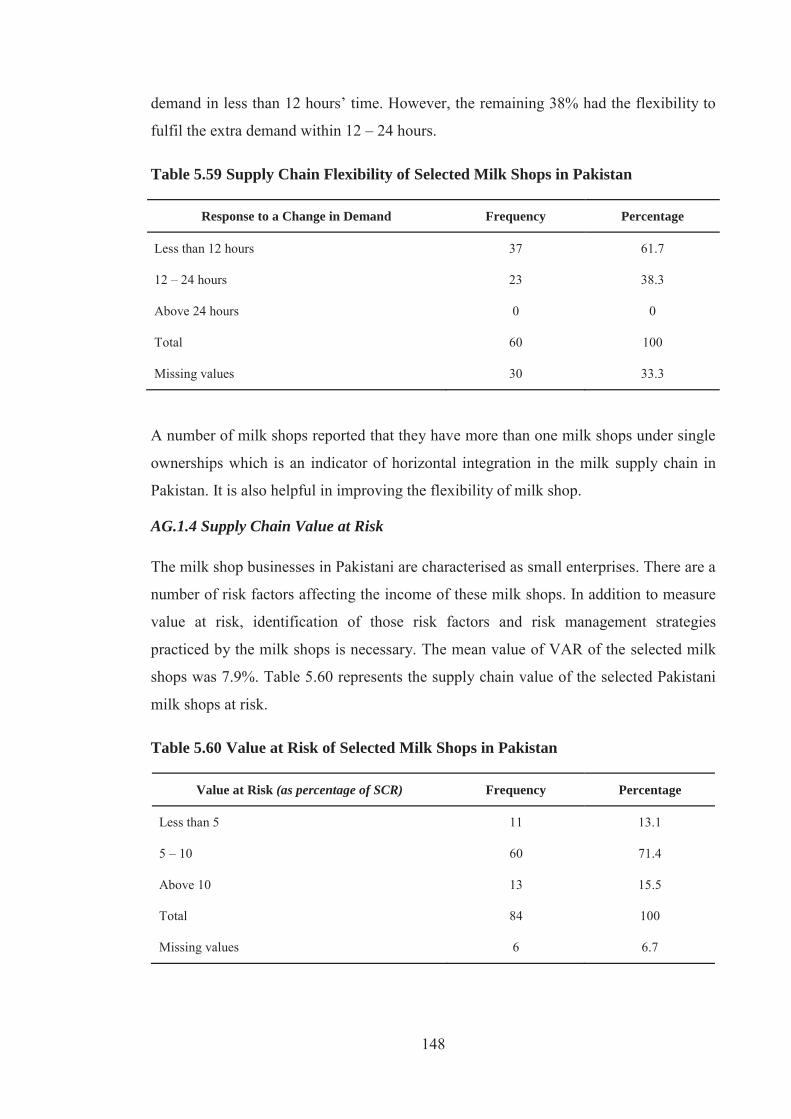
148
demand in less than 12 hours’ time. However, the remaining 38% had the flexibility to
fulfil the extra demand within 12 – 24 hours.
Table 5.59 Supply Chain Flexibility of Selected Milk Shops in Pakistan
Response to a Change in Demand Frequency Percentage
Less than 12 hours 37 61.7
12 – 24 hours 23 38.3
Above 24 hours 0 0
Total 60 100
Missing values 30 33.3
A number of milk shops reported that they have more than one milk shops under single
ownerships which is an indicator of horizontal integration in the milk supply chain in
Pakistan. It is also helpful in improving the flexibility of milk shop.
AG.1.4 Supply Chain Value at Risk
The milk shop businesses in Pakistani are characterised as small enterprises. There are a
number of risk factors affecting the income of these milk shops. In addition to measure
value at risk, identification of those risk factors and risk management strategies
practiced by the milk shops is necessary. The mean value of VAR of the selected milk
shops was 7.9%. Table 5.60 represents the supply chain value of the selected Pakistani
milk shops at risk.
Table 5.60 Value at Risk of Selected Milk Shops in Pakistan
Value at Risk (as percentage of SCR) Frequency Percentage
Less than 5 11 13.1
5 – 10 60 71.4
Above 10 13 15.5
Total 84 100
Missing values 6 6.7

149
The risk factors reported by the selected milk shops risk include all those issues
negatively related to the income generation directly or indirectly. Milk spoilage is
perhaps the biggest issue of the milk shops, especially during hot summers. In addition
to this power cut (both electricity and gas) for as long as 16 hours a day make it from
bad to worst. To avoid milk spoilage, milk shop keepers process milk immediately after
receipt. Alternative sources of energy such as gas cylinders are used. Ice cubes are used
to save milk from spoilage.
Seasonal fluctuation of demand and supply affect the milk shops directly. The milk
supply reduces during peak summer and peak winter seasons due to the limited fodder
availability and high cost of production on alternative feed mix. To deal with the
fluctuating demand and supply the retailers of fresh milk produce a number of dairy
products such as yoghurt, Khoya, and traditional sweets from the processed milk. This
diversification strategy is helpful when supply is greater than demand. Vertical and
horizontal integration strategy is helpful when demand is greater than the supply. If not
vertically integrated, the milk shops advance pay to the suppliers of milk in order to
retain them. The customer base of the milk shop is highly localised to its proximity.
There is a nearly perfect competition situation in central areas of the city which restricts
milk shops to increase milk prices in the period of low milk supply. Moreover, it asserts
pressure for product quality to stay in the market place.
Supply Chain Costs
The supply chain cost of the milk shops was calculated in terms of SCM cost and cost
of milk and milk products sold. The major cost heads are transportation, cost of milk
purchased, processing cost, direct labour, depreciation, rent, and utility bills. Direct
labour is usually in the form of non-cash family labour whereas the transportation cost
covers cost to source and cost to deliver. The mean value of supply chain costs as
percentage of SCR was 82.51%. The higher supply chain costs and nominal operating
profits show a typical dilemma of diseconomies of the scale at subsistence level micro
enterprises in Pakistan. Other reasons include perfect competition situation in the
market, poor collaboration, and lack of value addition across the entire supply chain
network. In nutshell, it is the opportunity cost of the non-cash family labour which
keeps them in the business.
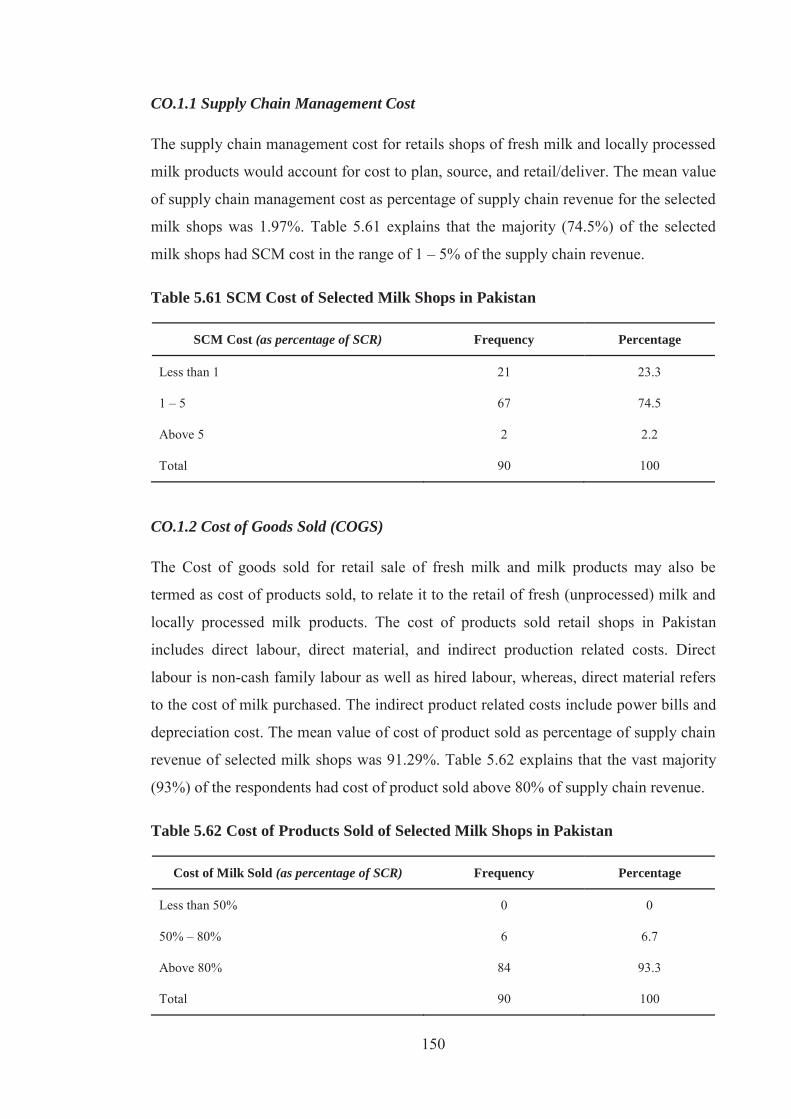
150
CO.1.1 Supply Chain Management Cost
The supply chain management cost for retails shops of fresh milk and locally processed
milk products would account for cost to plan, source, and retail/deliver. The mean value
of supply chain management cost as percentage of supply chain revenue for the selected
milk shops was 1.97%. Table 5.61 explains that the majority (74.5%) of the selected
milk shops had SCM cost in the range of 1 – 5% of the supply chain revenue.
Table 5.61 SCM Cost of Selected Milk Shops in Pakistan
SCM Cost (as percentage of SCR) Frequency Percentage
Less than 1 21 23.3
1 – 5 67 74.5
Above 5 2 2.2
Total 90 100
CO.1.2 Cost of Goods Sold (COGS)
The Cost of goods sold for retail sale of fresh milk and milk products may also be
termed as cost of products sold, to relate it to the retail of fresh (unprocessed) milk and
locally processed milk products. The cost of products sold retail shops in Pakistan
includes direct labour, direct material, and indirect production related costs. Direct
labour is non-cash family labour as well as hired labour, whereas, direct material refers
to the cost of milk purchased. The indirect product related costs include power bills and
depreciation cost. The mean value of cost of product sold as percentage of supply chain
revenue of selected milk shops was 91.29%. Table 5.62 explains that the vast majority
(93%) of the respondents had cost of product sold above 80% of supply chain revenue.
Table 5.62 Cost of Products Sold of Selected Milk Shops in Pakistan
Cost of Milk Sold (as percentage of SCR) Frequency Percentage
Less than 50% 0 0
50% – 80% 6 6.7
Above 80% 84 93.3
Total 90 100
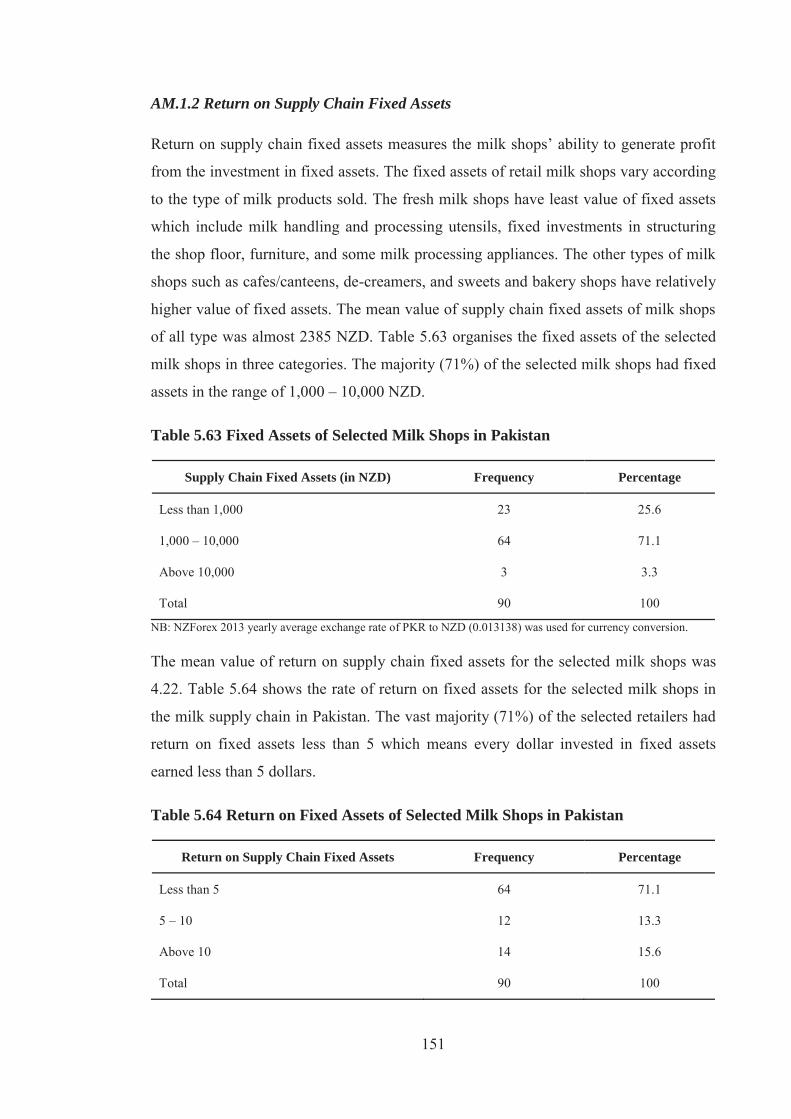
151
AM.1.2 Return on Supply Chain Fixed Assets
Return on supply chain fixed assets measures the milk shops’ ability to generate profit
from the investment in fixed assets. The fixed assets of retail milk shops vary according
to the type of milk products sold. The fresh milk shops have least value of fixed assets
which include milk handling and processing utensils, fixed investments in structuring
the shop floor, furniture, and some milk processing appliances. The other types of milk
shops such as cafes/canteens, de-creamers, and sweets and bakery shops have relatively
higher value of fixed assets. The mean value of supply chain fixed assets of milk shops
of all type was almost 2385 NZD. Table 5.63 organises the fixed assets of the selected
milk shops in three categories. The majority (71%) of the selected milk shops had fixed
assets in the range of 1,000 – 10,000 NZD.
Table 5.63 Fixed Assets of Selected Milk Shops in Pakistan
Supply Chain Fixed Assets (in NZD) Frequency Percentage
Less than 1,000 23 25.6
1,000 – 10,000 64 71.1
Above 10,000 3 3.3
Total 90 100
NB: NZForex 2013 yearly average exchange rate of PKR to NZD (0.013138) was used for currency conversion.
The mean value of return on supply chain fixed assets for the selected milk shops was
4.22. Table 5.64 shows the rate of return on fixed assets for the selected milk shops in
the milk supply chain in Pakistan. The vast majority (71%) of the selected retailers had
return on fixed assets less than 5 which means every dollar invested in fixed assets
earned less than 5 dollars.
Table 5.64 Return on Fixed Assets of Selected Milk Shops in Pakistan
Return on Supply Chain Fixed Assets Frequency Percentage
Less than 5 64 71.1
5 – 10 12 13.3
Above 10 14 15.6
Total 90 100
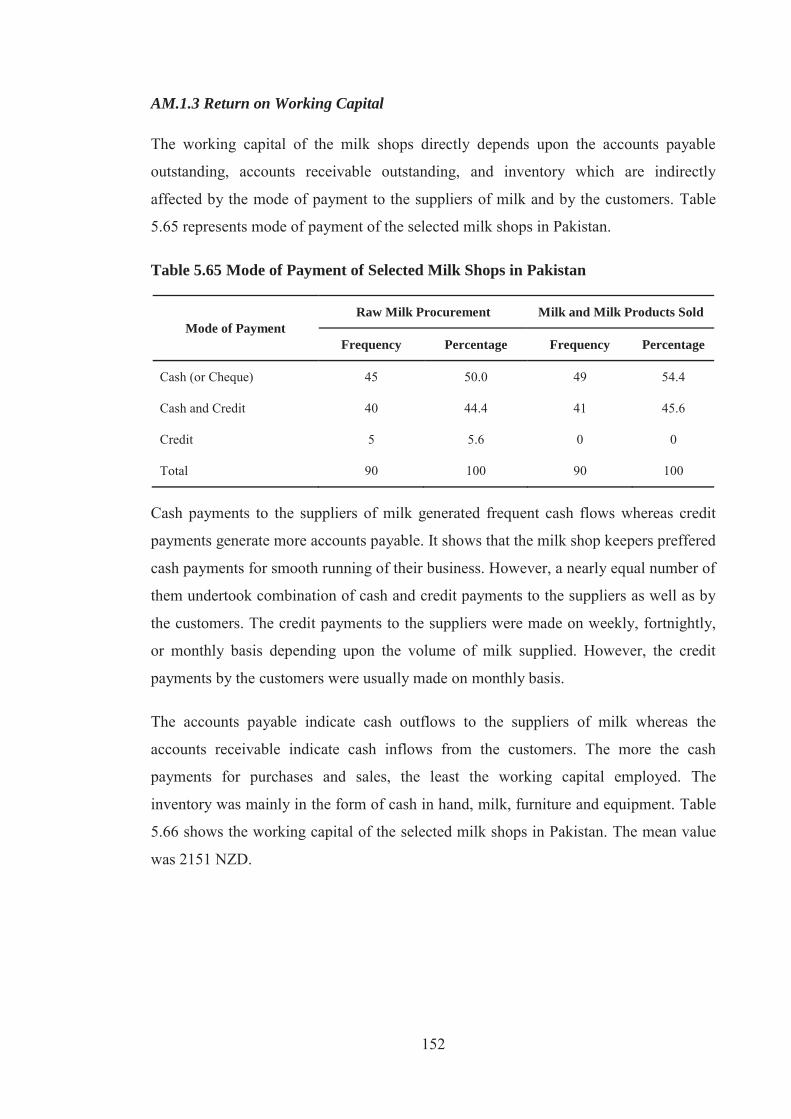
152
AM.1.3 Return on Working Capital
The working capital of the milk shops directly depends upon the accounts payable
outstanding, accounts receivable outstanding, and inventory which are indirectly
affected by the mode of payment to the suppliers of milk and by the customers. Table
5.65 represents mode of payment of the selected milk shops in Pakistan.
Table 5.65 Mode of Payment of Selected Milk Shops in Pakistan
Mode of Payment Raw Milk Procurement Milk and Milk Products Sold
Frequency Percentage Frequency Percentage
Cash (or Cheque) 45 50.0 49 54.4
Cash and Credit 40 44.4 41 45.6
Credit 5 5.6 0 0
Total 90 100 90 100
Cash payments to the suppliers of milk generated frequent cash flows whereas credit
payments generate more accounts payable. It shows that the milk shop keepers preffered
cash payments for smooth running of their business. However, a nearly equal number of
them undertook combination of cash and credit payments to the suppliers as well as by
the customers. The credit payments to the suppliers were made on weekly, fortnightly,
or monthly basis depending upon the volume of milk supplied. However, the credit
payments by the customers were usually made on monthly basis.
The accounts payable indicate cash outflows to the suppliers of milk whereas the
accounts receivable indicate cash inflows from the customers. The more the cash
payments for purchases and sales, the least the working capital employed. The
inventory was mainly in the form of cash in hand, milk, furniture and equipment. Table
5.66 shows the working capital of the selected milk shops in Pakistan. The mean value
was 2151 NZD.
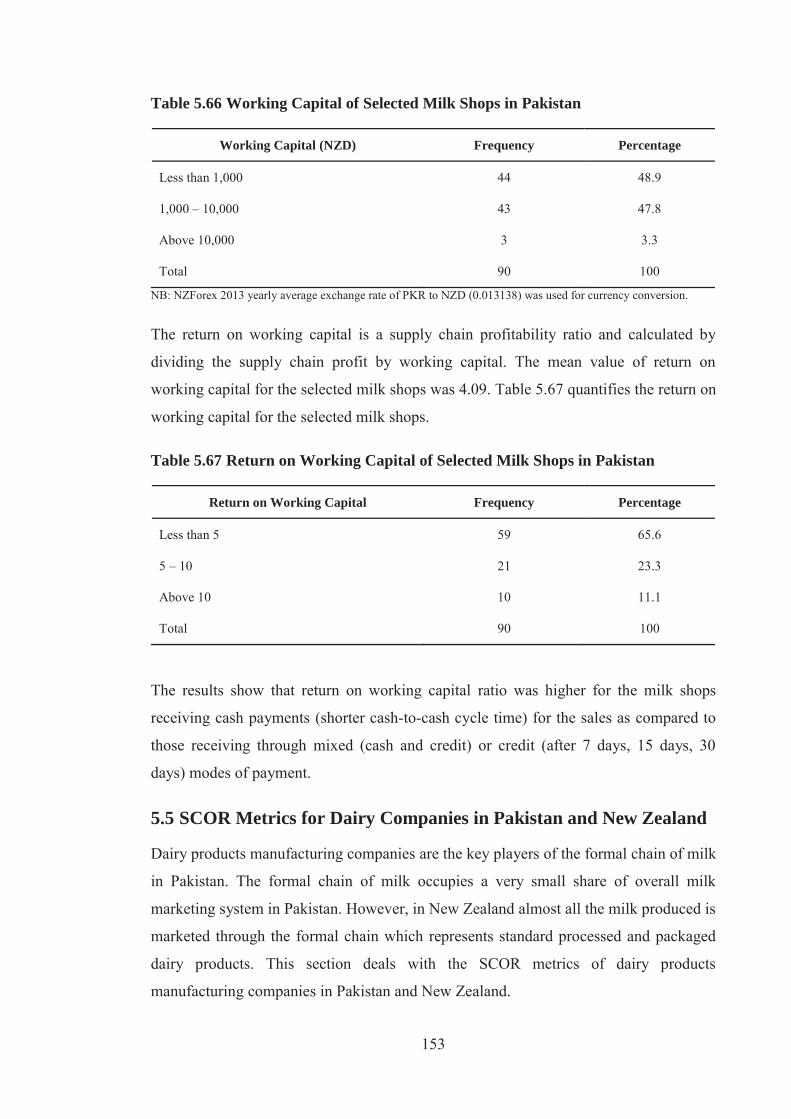
153
Table 5.66 Working Capital of Selected Milk Shops in Pakistan
Working Capital (NZD) Frequency Percentage
Less than 1,000 44 48.9
1,000 – 10,000 43 47.8
Above 10,000 3 3.3
Total 90 100
NB: NZForex 2013 yearly average exchange rate of PKR to NZD (0.013138) was used for currency conversion.
The return on working capital is a supply chain profitability ratio and calculated by
dividing the supply chain profit by working capital. The mean value of return on
working capital for the selected milk shops was 4.09. Table 5.67 quantifies the return on
working capital for the selected milk shops.
Table 5.67 Return on Working Capital of Selected Milk Shops in Pakistan
Return on Working Capital Frequency Percentage
Less than 5 59 65.6
5 – 10 21 23.3
Above 10 10 11.1
Total 90 100
The results show that return on working capital ratio was higher for the milk shops
receiving cash payments (shorter cash-to-cash cycle time) for the sales as compared to
those receiving through mixed (cash and credit) or credit (after 7 days, 15 days, 30
days) modes of payment.
5.5 SCOR Metrics for Dairy Companies in Pakistan and New Zealand
Dairy products manufacturing companies are the key players of the formal chain of milk
in Pakistan. The formal chain of milk occupies a very small share of overall milk
marketing system in Pakistan. However, in New Zealand almost all the milk produced is
marketed through the formal chain which represents standard processed and packaged
dairy products. This section deals with the SCOR metrics of dairy products
manufacturing companies in Pakistan and New Zealand.

154
5.5.1 SCOR Metrics for Dairy Products Manufacturing Companies in Pakistan
The dairy companies in Pakistan collect milk through their own milk collection
network. Punjab and Sindh are the major milk producing provinces in Pakistan.
Currently, there are more than 25 milk processing plants producing UHT milk, butter
and cream. The majority of milk processing plants are located around milk production
pocket areas in Punjab and Sindh provinces. The leading milk processing companies are
Nestlé Pakistan Limited, Engro Foods Limited, Haleeb Foods Limited, Shakarganj Food
Products Limited, Nirala Dairy (Pvt.) Limited, Noon Group of Companies, Idara-e-
Kisaan (Halla), Royal Dairy and Gourmet Foods. With exception to Engro Foods,
almost all the dairy processing plants are located in Punjab province.
RL.1.1 Perfect Order Fulfilment
The perfect order fulfilment represents the reliability of products and services offered by
the dairy companies. It represents the orders received by the customers in perfect
condition (at right time, at right place, and in right condition) which incorporates
product as well as process quality which is ensured by the quality assurance system. The
respondent dairy companies reported that their operations were performed under the
quality assurance system that ensures the product as well as process quality. The quality
assurance system of dairy companies comes into effect once the fresh milk is received at
village level milk collection centres (VMCC) or at milk collection centres (MCC).
However, the overall milk quality still depends upon the quality compliance at the dairy
farm level which is the primary point of production. The POF metrics was calculated
with the information from three level-2 metrics. These are:
RL.2.1 Percentage orders delivered in full
RL.2.2Delivery performance to customer commit date
RL.2.4 Perfect condition
Table 5.68 shows mean values and standard deviation of perfect order fulfilment metric
and its relevant level-2 and level-3 metrics. The perfect condition of a product depends
on the quality level of raw milk and production process.
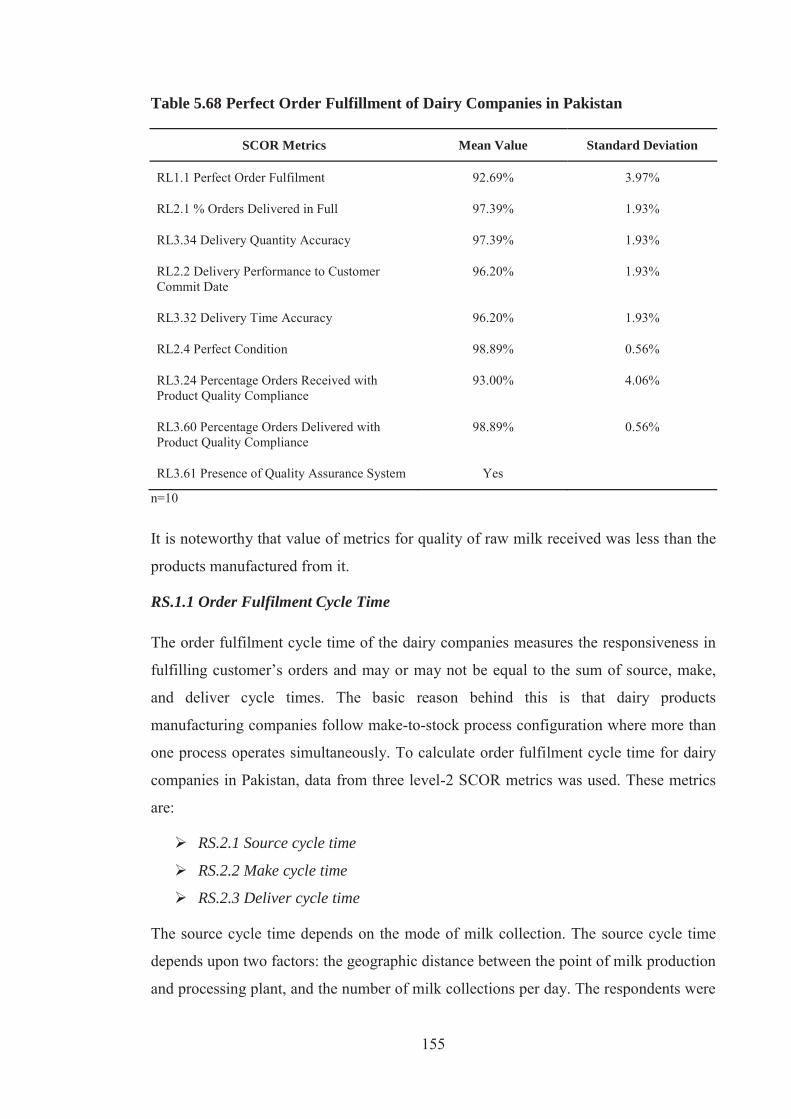
155
Table 5.68 Perfect Order Fulfillment of Dairy Companies in Pakistan
SCOR Metrics Mean Value Standard Deviation
RL1.1 Perfect Order Fulfilment 92.69% 3.97%
RL2.1 % Orders Delivered in Full 97.39% 1.93%
RL3.34 Delivery Quantity Accuracy 97.39% 1.93%
RL2.2 Delivery Performance to Customer Commit Date
96.20% 1.93%
RL3.32 Delivery Time Accuracy 96.20% 1.93%
RL2.4 Perfect Condition 98.89% 0.56%
RL3.24 Percentage Orders Received with Product Quality Compliance
93.00% 4.06%
RL3.60 Percentage Orders Delivered with Product Quality Compliance
98.89% 0.56%
RL3.61 Presence of Quality Assurance System Yes
n=10
It is noteworthy that value of metrics for quality of raw milk received was less than the
products manufactured from it.
RS.1.1 Order Fulfilment Cycle Time
The order fulfilment cycle time of the dairy companies measures the responsiveness in
fulfilling customer’s orders and may or may not be equal to the sum of source, make,
and deliver cycle times. The basic reason behind this is that dairy products
manufacturing companies follow make-to-stock process configuration where more than
one process operates simultaneously. To calculate order fulfilment cycle time for dairy
companies in Pakistan, data from three level-2 SCOR metrics was used. These metrics
are:
RS.2.1 Source cycle time
RS.2.2 Make cycle time
RS.2.3 Deliver cycle time
The source cycle time depends on the mode of milk collection. The source cycle time
depends upon two factors: the geographic distance between the point of milk production
and processing plant, and the number of milk collections per day. The respondents were
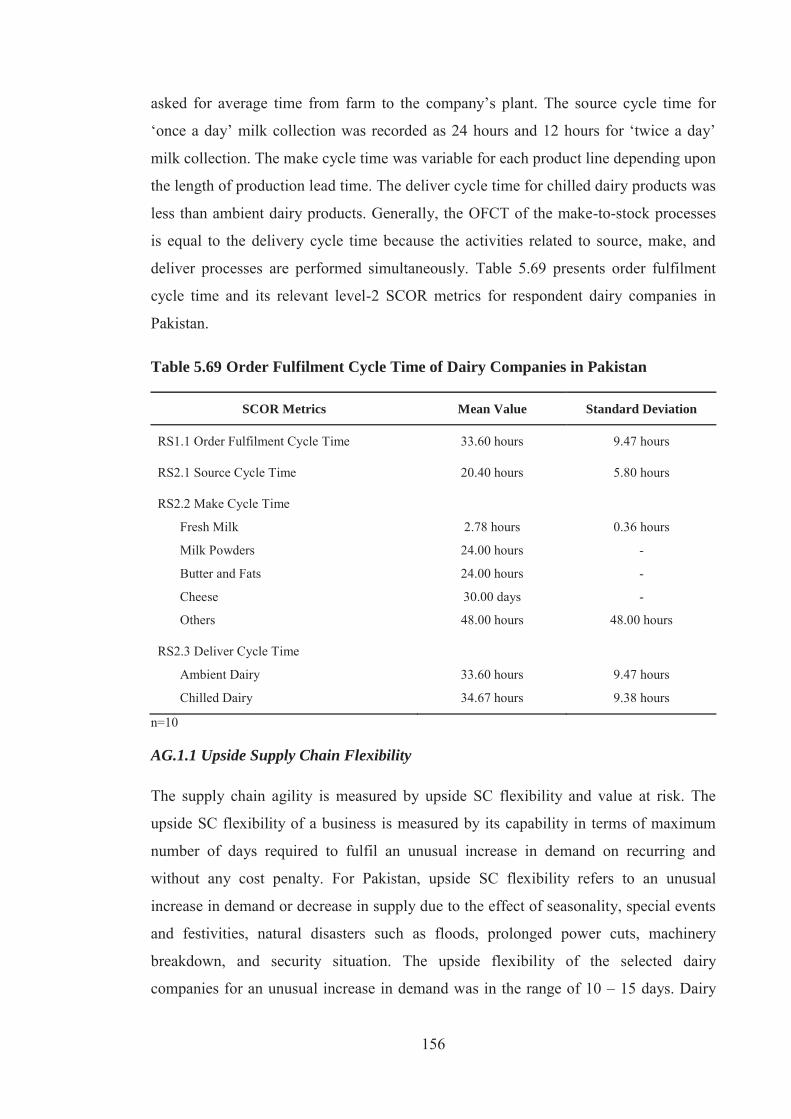
156
asked for average time from farm to the company’s plant. The source cycle time for
‘once a day’ milk collection was recorded as 24 hours and 12 hours for ‘twice a day’
milk collection. The make cycle time was variable for each product line depending upon
the length of production lead time. The deliver cycle time for chilled dairy products was
less than ambient dairy products. Generally, the OFCT of the make-to-stock processes
is equal to the delivery cycle time because the activities related to source, make, and
deliver processes are performed simultaneously. Table 5.69 presents order fulfilment
cycle time and its relevant level-2 SCOR metrics for respondent dairy companies in
Pakistan.
Table 5.69 Order Fulfilment Cycle Time of Dairy Companies in Pakistan
SCOR Metrics Mean Value Standard Deviation
RS1.1 Order Fulfilment Cycle Time 33.60 hours 9.47 hours
RS2.1 Source Cycle Time 20.40 hours 5.80 hours
RS2.2 Make Cycle Time
Fresh Milk
Milk Powders
Butter and Fats
Cheese
Others
2.78 hours
24.00 hours
24.00 hours
30.00 days
48.00 hours
0.36 hours
-
-
-
48.00 hours
RS2.3 Deliver Cycle Time
Ambient Dairy
Chilled Dairy
33.60 hours
34.67 hours
9.47 hours
9.38 hours
n=10
AG.1.1 Upside Supply Chain Flexibility
The supply chain agility is measured by upside SC flexibility and value at risk. The
upside SC flexibility of a business is measured by its capability in terms of maximum
number of days required to fulfil an unusual increase in demand on recurring and
without any cost penalty. For Pakistan, upside SC flexibility refers to an unusual
increase in demand or decrease in supply due to the effect of seasonality, special events
and festivities, natural disasters such as floods, prolonged power cuts, machinery
breakdown, and security situation. The upside flexibility of the selected dairy
companies for an unusual increase in demand was in the range of 10 – 15 days. Dairy
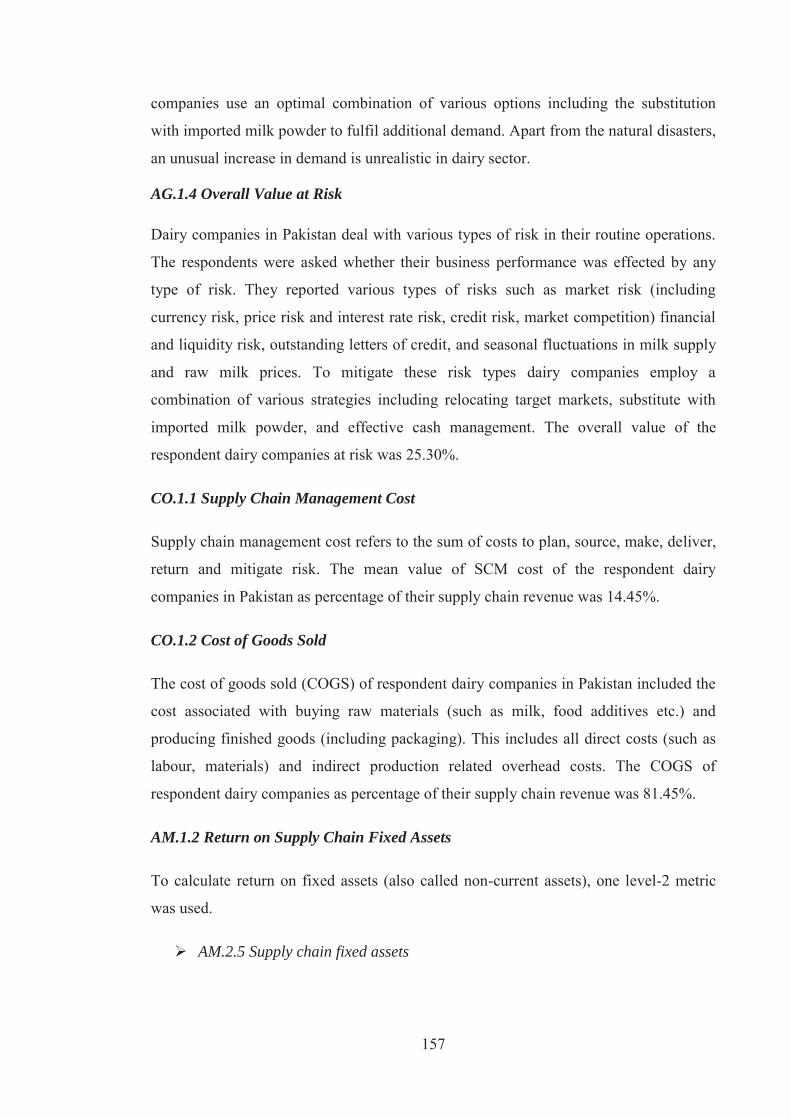
157
companies use an optimal combination of various options including the substitution
with imported milk powder to fulfil additional demand. Apart from the natural disasters,
an unusual increase in demand is unrealistic in dairy sector.
AG.1.4 Overall Value at Risk
Dairy companies in Pakistan deal with various types of risk in their routine operations.
The respondents were asked whether their business performance was effected by any
type of risk. They reported various types of risks such as market risk (including
currency risk, price risk and interest rate risk, credit risk, market competition) financial
and liquidity risk, outstanding letters of credit, and seasonal fluctuations in milk supply
and raw milk prices. To mitigate these risk types dairy companies employ a
combination of various strategies including relocating target markets, substitute with
imported milk powder, and effective cash management. The overall value of the
respondent dairy companies at risk was 25.30%.
CO.1.1 Supply Chain Management Cost
Supply chain management cost refers to the sum of costs to plan, source, make, deliver,
return and mitigate risk. The mean value of SCM cost of the respondent dairy
companies in Pakistan as percentage of their supply chain revenue was 14.45%.
CO.1.2 Cost of Goods Sold
The cost of goods sold (COGS) of respondent dairy companies in Pakistan included the
cost associated with buying raw materials (such as milk, food additives etc.) and
producing finished goods (including packaging). This includes all direct costs (such as
labour, materials) and indirect production related overhead costs. The COGS of
respondent dairy companies as percentage of their supply chain revenue was 81.45%.
AM.1.2 Return on Supply Chain Fixed Assets
To calculate return on fixed assets (also called non-current assets), one level-2 metric
was used.
AM.2.5 Supply chain fixed assets
158
The mean value of fixed assets of respondent dairy companies in Pakistan was 89.3
million New Zealand dollars, whereas, the mean value of return on fixed assets ratio
was 0.12.
AM.1.3 Return on Working Capital
To calculate working capital, three level-2 metric were used.
AM.2.6 Accounts payable
AM.2.7 Accounts receivable
AM.2.8 Inventory
The mean value of working capital of respondent dairy companies in Pakistan was 9.2
million New Zealand dollars, whereas, the mean value of return on fixed assets ratio
was 0.29. Table 5.70 shows selected SCOR metrics to evaluate asset management of
respondent dairy companies in Pakistan.
Table 5.70 Asset Management of Dairy Companies in Pakistan
SCOR Metrics Mean Value Standard Deviation
AM1.2 Return on SC Fixed Assets 0.12 0.22
AM2.5 SC Fixed Assets 89.31 million NZD 14.17 million NZD
AM1.3 Return on Working Capital 0.29 0.39
AM2.9 Working Capital 9.22 million NZD 1.85 million NZD
n=10
Overall, respondent dairy companies in Pakistan reported quality constraints in sourcing
raw milk mainly due to non-existing cool chain infrastructure at dairy farm level.
Moreover, among other risk factors seasonality of milk production was the major one,
leading them to substitute their product mix with imported dairy products in order to
meet market demand.
5.5.2 SCOR Metrics for Dairy Companies in New Zealand
The role of dairy products manufacturing companies in New Zealand dairy industry has
been discussed in detail in the background chapter. The milk from individual dairy
farms is mainly collected by a large dairy cooperative in order to be cost effective and

159
optimise economies of the scale. The company profiles and contact details of 52 dairy
products manufacturing companies were retrieved from KOMPASS database. With a
response rate of 26%, only 13 questionnaires were returned by the respondents with 5 of
them incomplete or simply not qualified for data analysis. Moreover, two dairy
companies were surveyed through face-to-face interviews.
RL.1.1 Perfect Order Fulfilment
The mean value for perfect order fulfilment of NZ dairy companies was 96.15%. To
calculate perfect order fulfilment information from three level-2 metrics and relevant
level-3 metrics was used. Table 5.71 shows perfect order fulfilment of selected dairy
companies in New Zealand.
Table 5.71 Perfect Order Fulfilment of Dairy Companies in New Zealand
SCOR Metrics Mean Value Standard Deviation
RL1.1 Perfect Order Fulfilment 96.15% 1.65%
RL2.1 % Orders Delivered in Full 98.55% 0.80%
RL3.34 Delivery Quantity Accuracy 98.55% 0.80%
RL2.2 Delivery Performance to Customer Commit Date
98.85% 0.58%
RL3.32 Delivery Time Accuracy 98.85% 0.58%
RL2.4 Perfect Condition 98.70% 0.89%
RL3.24 Percentage Orders Received with Product Quality Compliance
99.15% 0.62%
RL3.60 Percentage Orders Delivered with Product Quality Compliance
98.70% 0.89%
RL3.61 Presence of Quality Assurance System Yes
n=10
RS.1.1 Order Fulfilment Cycle Time
To calculate order fulfilment cycle time for dairy companies in New Zealand, data from
three level-2 SCOR metrics was used. These metrics are:
RS.2.1 Source cycle time
RS.2.2 Make cycle time
RS.2.3 Deliver cycle time

160
The source cycle time of dairy companies depends on geographic distance between the
point of milk production and processing plant, and the number of milk collections per
day. The respondents were asked for average time from farm to the company’s plant.
The milk collection frequency of the respondent dairy companies was variable along the
dairy season and for milk volume of the individual dairy farms. During the peak season,
milk is collected ‘twice a day’ from large dairy farms and ‘once a day’ from small dairy
farms whereas during the off-peak season ‘once a day’ from large dairy farms and once
in two days from small dairy farms. The source cycle time for ‘once a day’ milk
collection was recorded as 24 hours and 48 hours for ‘once in two days’ milk collection.
The make cycle time was variable for each product line depending upon the length of
production lead time. The deliver cycle time for chilled dairy products was less than that
for ambient dairy products. Generally, the OFCT of the make-to-stock processes is
equal to the delivery cycle time because the activities related to source, make, and
deliver processes are performed simultaneously. Table 5.72 presents order fulfilment
cycle time and its relevant level-2 SCOR metrics for respondent dairy companies in
Pakistan.
Table 5.72 Order Fulfilment Cycle Time of Dairy Companies in New Zealand
SCOR Metrics Mean Value Standard Deviation
RS1.1 Order Fulfilment Cycle Time 24.00 hours 20.91 hours
RS2.1 Source Cycle Time 8.8 hours 6.25 hours
RS2.2 Make Cycle Time
Fresh Milk
Milk Powders
Butters and Fats
Cheese
Others
2.33 hours
12.00 hours
10.00 hours
14.20 days
16.83 hours
0.58 hours
-
-
12.30 days
15.52 hours
RS2.3 Deliver Cycle Time
Ambient Dairy
Chilled Dairy
11.20 hours
14.40 hours
22.69 hours
14.39 hours
n=10
161
AG.1.1 Upside Supply Chain Flexibility
The NZ dairy companies were quite flexible to any increase in demand of dairy
products. However, the respondentds reported that an unusual increase in demand is
unrealistic in dairy sector except during natural disasters. With the logistics function
outsourced to 4PL providers NZ companies truly benefit from SC collaboration. All of
the respondents reported that they do respond to a change in demand for dairy products.
The upside supply chain flexibility of the respondent dairy companies for an unusual
increase in demand was 4.5 days.
AG.1.4 Overall Value at Risk
All of the respondents reported that their business performance is being affected by
various risk factors. These risk factros and relevant risk management strategies are
briefly described as:
Fluctuation in milk production with direct effect of weather.
Foreign exchange risk affects sales, purchases, investments and borrowings
made in foreign currencies – maintain financial assets in hard currencies such as
USD and AUD.
Interest rate risk affects company’s borrowing and funds in deposit – actively
hedge re-pricing against volatile interest rates
Credit risk arises from company’s receivables when customers fail to meet
contractual obligations – secure trading according to importing country’s trade
regulations.
Liquidity risk refers to the company’s inability to meet its financial obligations
when due – effectively manage operating cash flows.
Capital risk poses non-optimal use of shareholders equity – maximise
shareholder’s value by optimal allocation of funds.
Dairy products price risk posed by price volatility in global dairy trade –
diversify product mix.
The mean value of VAR for respondent dairy companies in New Zealand was 23.6%.
162
CO.1.1 Supply Chain Management Cost
Supply chain management cost refers to the sum of costs to plan, source, make, deliver,
return and mitigate risks. The mean value of SCM cost of the respondent NZ dairy
companies as percentage of their supply chain revenue was 16.5%.
CO.1.2 Cost of Goods Sold
The cost of goods sold (COGS) of respondent NZ dairy companies refers to the cost
associated with buying raw materials (such as milk, food additives etc.) and producing
finished goods (including packaging). This includes all direct costs (such as labour,
materials) and indirect production related overhead costs. The mean value of COGS of
the respondent dairy companies as percentage of their supply chain revenue was 72.7%.
AM.1.2 Return on Supply Chain Fixed Assets
To calculate return on fixed assets ratio, one level-2 metric was used.
AM.2.5 Supply chain fixed assets
The mean value of fixed assets of respondent NZ dairy companies was 1,100 million
New Zealand dollars, whereas, the mean value of return on fixed assets ratio was 0.11.
AM.1.3 Return on Working Capital
To calculate working capital, three level-2 metric were used.
AM.2.6 Accounts payable
AM.2.7 Accounts receivable
AM.2.8 Inventory
The mean value of working capital of respondent NZ dairy companies was 153 million
New Zealand dollars, whereas, the mean value of return on fixed assets ratio was 0.36.
Table 5.73 shows selected SCOR metrics to evaluate asset management of respondent
dairy companies in New Zealand.

163
Table 5.73 Asset Management of Dairy Companies in New Zealand
SCOR Metrics Mean Value Standard Deviation
AM1.2 Return on SC Fixed Assets 0.11 0.05
AM2.5 SC Fixed Assets 1,100 million NZD 2,710 million NZD
AM1.3 Return on Working Capital 0.36 0.28
AM2.9 Working Capital 153 million NZD 512 million NZD n=10
Overall, dairy products manufacturing in New Zealand was predominantly a
cooperative business with private companies performing secondary processing for value
addition to the dairy export mix. The respondent dairy companies reported a number of
challenges to their performance. Milk supply from New Zealand dairy farms is highly
unstable due to variable weather conditions. In addition to this, major share of NZ dairy
exports is destined to few overseas markets with variable demand and ever changing
exchange rates.
164
CHAPTER 6
6. DISCUSSION
6.1 Introduction
This chapter is about interpretation of the results presented in chapter 5. The discussion
includes performance gap analysis between the key players in Pakistan and New
Zealand milk supply chains. Independent sample t-test was used to compare mean
values of individual SCOR metrics of key operators in the milk supply chains of
Pakistan and New Zealand. The null hypothesis [H0: μ1 = μ2] was that mean values of
samples from two groups were equal to each other, whereas alternate hypothesis [H1: μ1
≠ μ2] was that mean values of samples from two groups were not equal to each other.
For p-value less than .05 for the two tailed t-test null hypothesis was rejected and
alternate hypothesis was accepted, that means the mean value of samples from one
group is significantly different from the mean value of samples from the other group. Following the introduction, this chapter is organized into four sections.
Section 6.2 includes statistical comparison of mean SCOR metrics for dairy
farmers in both the milk supply chains.
Section 6.3 includes statistical comparison of mean SCOR metrics between
informal milk supply chain in Pakistan and dairy companies in New Zealand.
Section 6.4 includes statistical comparison of mean SCOR metrics for dairy
companies in Pakistan and New Zealand.
Section 6.5 summarises the discussion chapter.
6.2 Gap Analysis of Dairy Farmers
Dairy farming is the first interface of milk supply chain. To statistically compare SCOR
means for dairy farmers from Pakistan and New Zealand, independent-sample two-
tailed t-tests were performed for individual SCOR metrics. Table 6.1 illustrates that
almost all SCOR metrics for NZ dairy farmers are significantly different from Pakistani
dairy farmers. As discussed earlier in the results chapter that SCOR metrics are either
upward or downward directed. The upward directed metrics are those for which higher
value refers to the higher performance and vice versa, for example, perfect order
fulfilment. Oppositely, for downward metrics lower value refers to higher performance
and vice versa, for example, order fulfilment cycle time.
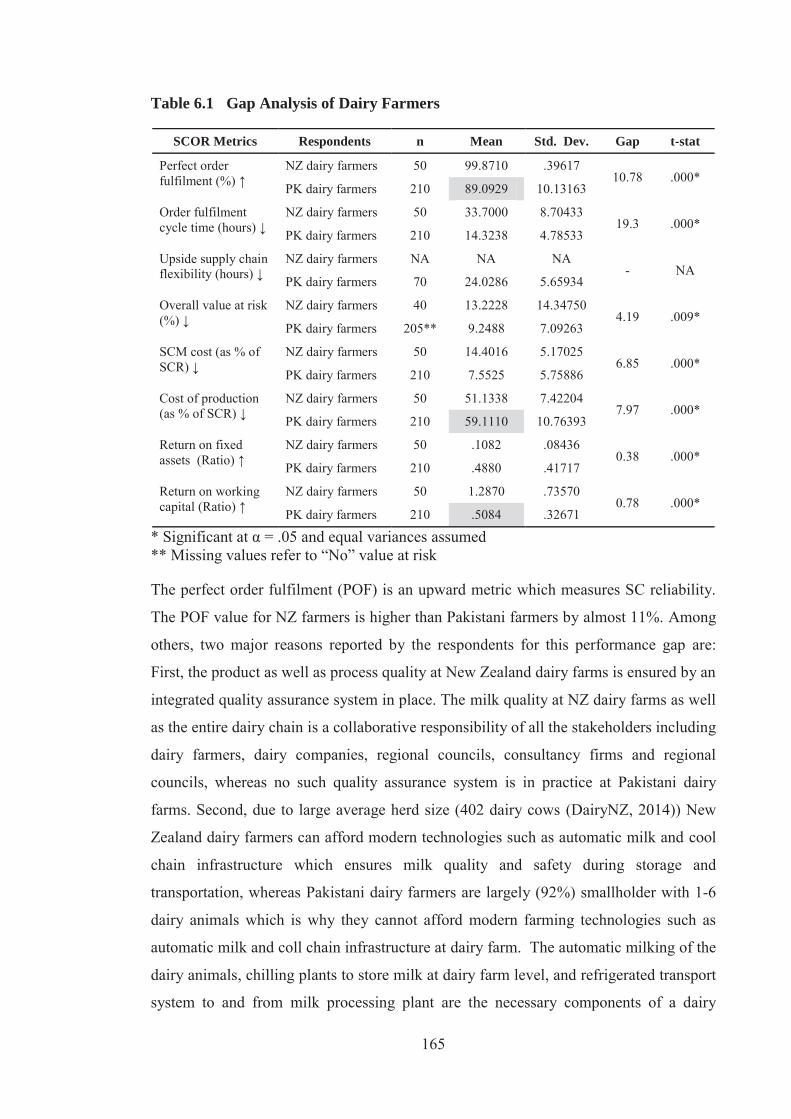
165
Table 6.1 Gap Analysis of Dairy Farmers
SCOR Metrics Respondents n Mean Std. Dev. Gap t-stat
Perfect order fulfilment (%) ↑
NZ dairy farmers 50 99.8710 .39617 10.78 .000*
PK dairy farmers 210 89.0929 10.13163
Order fulfilment cycle time (hours) ↓
NZ dairy farmers 50 33.7000 8.70433 19.3 .000*
PK dairy farmers 210 14.3238 4.78533
Upside supply chain flexibility (hours) ↓
NZ dairy farmers NA NA NA - NA
PK dairy farmers 70 24.0286 5.65934
Overall value at risk (%) ↓
NZ dairy farmers 40 13.2228 14.34750 4.19 .009*
PK dairy farmers 205** 9.2488 7.09263
SCM cost (as % of SCR) ↓
NZ dairy farmers 50 14.4016 5.17025 6.85 .000*
PK dairy farmers 210 7.5525 5.75886
Cost of production (as % of SCR) ↓
NZ dairy farmers 50 51.1338 7.42204 7.97 .000*
PK dairy farmers 210 59.1110 10.76393
Return on fixed assets (Ratio) ↑
NZ dairy farmers 50 .1082 .08436 0.38 .000*
PK dairy farmers 210 .4880 .41717
Return on working capital (Ratio) ↑
NZ dairy farmers 50 1.2870 .73570 0.78 .000*
PK dairy farmers 210 .5084 .32671
* Significant at α = .05 and equal variances assumed ** Missing values refer to “No” value at risk
The perfect order fulfilment (POF) is an upward metric which measures SC reliability.
The POF value for NZ farmers is higher than Pakistani farmers by almost 11%. Among
others, two major reasons reported by the respondents for this performance gap are:
First, the product as well as process quality at New Zealand dairy farms is ensured by an
integrated quality assurance system in place. The milk quality at NZ dairy farms as well
as the entire dairy chain is a collaborative responsibility of all the stakeholders including
dairy farmers, dairy companies, regional councils, consultancy firms and regional
councils, whereas no such quality assurance system is in practice at Pakistani dairy
farms. Second, due to large average herd size (402 dairy cows (DairyNZ, 2014)) New
Zealand dairy farmers can afford modern technologies such as automatic milk and cool
chain infrastructure which ensures milk quality and safety during storage and
transportation, whereas Pakistani dairy farmers are largely (92%) smallholder with 1-6
dairy animals which is why they cannot afford modern farming technologies such as
automatic milk and coll chain infrastructure at dairy farm. The automatic milking of the
dairy animals, chilling plants to store milk at dairy farm level, and refrigerated transport
system to and from milk processing plant are the necessary components of a dairy
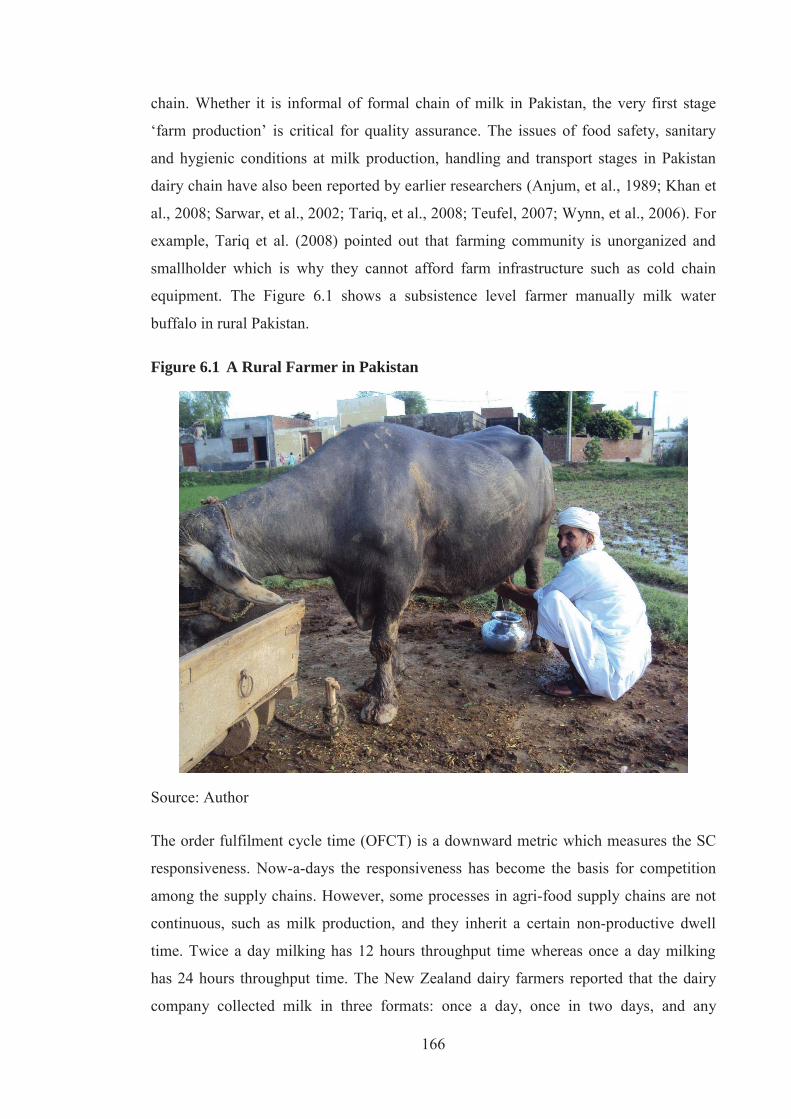
166
chain. Whether it is informal of formal chain of milk in Pakistan, the very first stage
‘farm production’ is critical for quality assurance. The issues of food safety, sanitary
and hygienic conditions at milk production, handling and transport stages in Pakistan
dairy chain have also been reported by earlier researchers (Anjum, et al., 1989; Khan et
al., 2008; Sarwar, et al., 2002; Tariq, et al., 2008; Teufel, 2007; Wynn, et al., 2006). For
example, Tariq et al. (2008) pointed out that farming community is unorganized and
smallholder which is why they cannot afford farm infrastructure such as cold chain
equipment. The Figure 6.1 shows a subsistence level farmer manually milk water
buffalo in rural Pakistan.
Figure 6.1 A Rural Farmer in Pakistan
Source: Author
The order fulfilment cycle time (OFCT) is a downward metric which measures the SC
responsiveness. Now-a-days the responsiveness has become the basis for competition
among the supply chains. However, some processes in agri-food supply chains are not
continuous, such as milk production, and they inherit a certain non-productive dwell
time. Twice a day milking has 12 hours throughput time whereas once a day milking
has 24 hours throughput time. The New Zealand dairy farmers reported that the dairy
company collected milk in three formats: once a day, once in two days, and any
167
combination of the both in order to minimise milk transportation cost. The appropriate
milk collection format depends on the time of year (as milk production varies with
seasonality and lactation), herd size, and distance between dairy farm and factory. All
the respondent dairy farmers in Pakistan reported twice a day milking of dairy animals.
Therefore, the vast majority (80.5%) reported to supply milk twice a day to their
customers. However, the remaining (19.5%) used to supply milk once a day mainly due
to small volume of sales. The overall OFCT of Pakistani dairy farmers was almost 19
hours less than NZ dairy farmers.
Supply chain agility is measured as upside SC flexibility and value at risk. The upside
SC flexibility is a downward metric which measures the ability of a business to
response to any unusual increase in demand. The mean value for Pakistani dairy farmers
was 24 hours whereas this does not apply to NZ dairy farmers because they already
supply all the milk produced to the dairy cooperative or company. The overall value at
risk (VAR) is a downward metric and was calculated as VAR as percentage of SC
revenue. The VAR for NZ dairy farmers was higher than Pakistani dairy farmers by
4.19%. This performance gap is primarily due to the inherent differences in both the
milk supply chains such as the dairy farming in New Zealand is pasture-based, exposed
to highly fluctuating weather and employing huge capital investment in land resources
whereas in Pakistan is fodder-based where animals are kept in barns and therefore,
relatively less investment required for land.
The SC costs are divided into SCM cost and cost of milk production, both downward
metrics. The SCM cost of Pakistani dairy farmers as percentage of their supply chain
revenue (SCR) was 6.85% less than NZ dairy farmers. The prime reason behind this
performance gap is the fundamental difference of scale of operation of the
benchmarking partners. Majority (almost 63%) of the selected dairy farmers in Pakistan
were smallholders (having less than 10 dairy animals). Moreover, milk transportation
cost which is the largest contributor to SCM cost is not applicable to majority of the
Pakistani farmers whereas this cost is deducted from farm gate milk pay out of all NZ
dairy farmers. The cost of milk production as percentage of SCR of selected dairy
farmers in Pakistan was almost 8% higher than NZ dairy farmers. Tariq et al. (2008)
report a bunch of reasons for higher cost of milk production at Pakistani dairy farms.
These are small scale of production, poor farm management practices, poor productivity
per dairy animal, and seasonal variation in fodder availability. On the other side, dairy
168
farming in New Zealand is least cost due to its pasture-based milk production system
whereas, Pakistani dairy farming is mainly fodder based which is a labour intensive
milk production system.
The efficiency and effectiveness of doing business is gauged as return on investment.
Asset management varies across geographical locations, cultural norms, regulatory
structure, and managerial expertise. The SCOR model measures return on investment in
terms of return on fixed (non-current) assets and return on working capital, both upward
directed metrics. The value of return on fixed assets ratio for NZ dairy farmers was less
than Pakistani dairy farmers with a performance gap of 0.38. This performance gap is
mainly due to different structure of capital investment in both dairy industries. This
relatively higher level of investment in fixed assets in NZ dairy farms is due to three
factors. First, it is predominantly a pasture-based production system where huge capital
investments are attached to land. Second, higher compliance cost which means
investment in farm infrastructure including automatic milking parlour, chilling plant,
effluent management. Third, is the investment in the form of share capital (wet shares)
of cooperative which is a pre-requisite to become a cooperative member and to supply
milk. On the other hand, Pakistani farmers utilize fixed assets such as land and
machinery predominantly for crop farming and relatively less fixed invetment is
required for stall-fed dairy production system. The value of return on working capital
ratio for NZ dairy farmers was higher than Pakistani dairy farmers by 0.78. Despite of
higher investment in the fixed assets at NZ dairy farms, farm working expenses were
comparatively less due to the least cost pasture-based production system and economies
of the large scale production. On the other hand, Pakistani smallholder farms were
operating at diseconomies of the scale and at comparatively higher working expenses.
The above gap analysis can be summarised as the Pakistani dairy farmers under
performed in supply chain reliability, cost of production, and return on working capital
as compare to NZ dairy farmers. The majority of the Pakistani dairy farmers were
smallholders and due to diseconomies of the scale of their operation they could not
afford modern dairy farming technologies such automatic milking, milk storage at
controlled temperature, and other precision dairy farming (PDF) technologies.
169
6.3 Gap Analysis of Informal Chain of Milk in Pakistan
As discussed in chapter 5 that the milk supply chain in Pakistan is a complex multi-
echelon network. Milk and milk products reach ultimate consumers in two ways, the
informal and the formal chain of milk. This section discusses the gap analysis between
key players of informal chain of milk in Pakistan and dairy companies in New Zealand.
The informal chain of milk in Pakistan is responsible for almost 95% of milk supply to
the market. The informal chain represents the set of processes and activities involved in
the flow of fresh/unprocessed milk and traditionally processed milk products from farm
to ultimate consumer. The key players of informal chain are dairy farmers, milk
collectors, and milk shops. As gap analysis of SCOR metrics for dairy farmers has
already been covered in previous section, this section expands on milk collectors and
milk shops. On the other hand, milk supply chain in New Zealand is completely formal,
which means that all the milk produced at dairy farms is collected, transported, and
processed by dairy companies according to the standard operating procedures set by
New Zealand Ministry of Primary Industries. Table 6.2 represents the statistical
comparison of mean SCOR metric values of NZ dairy companies with PK milk
collectors and PK milk shops.
The milk collector is second key player of informal chain of milk in Pakistan. The
functions and activities performed by milk collectors have been discussed in detail in
results chapter. The mean value for perfect order fulfilment (POF) of milk collectors in
Pakistan was 72.35% which shows statistically significant difference of 23.4% from
mean value of POF for NZ dairy companies. Respondents reported two reasons for this
performance gap. First, lack of cool chain storage and specialized transportation
facilities. Similar to dairy farmers, milk collectors operate at diseconomies of the scale
due to which they cannot afford modern technologies. Similar findings have been
reported by a number of researchers in the past (Anjum, et al., 1989; Khan et al., 2013;
Khan, et al., 2008; Sarwar, et al., 2002; Shahid et al., 2012; Tariq, et al., 2008; Teufel,
2007; Wynn, et al., 2006). Wynn et al. (2006) indicated that poor milk distribution
infrastructure in Pakistan is a major constraint to milk supply chain. According to Khan
et al. (2013) lack of infrastructure facilities and value addition are the major constraints
in milk marketing system in Pakistan.
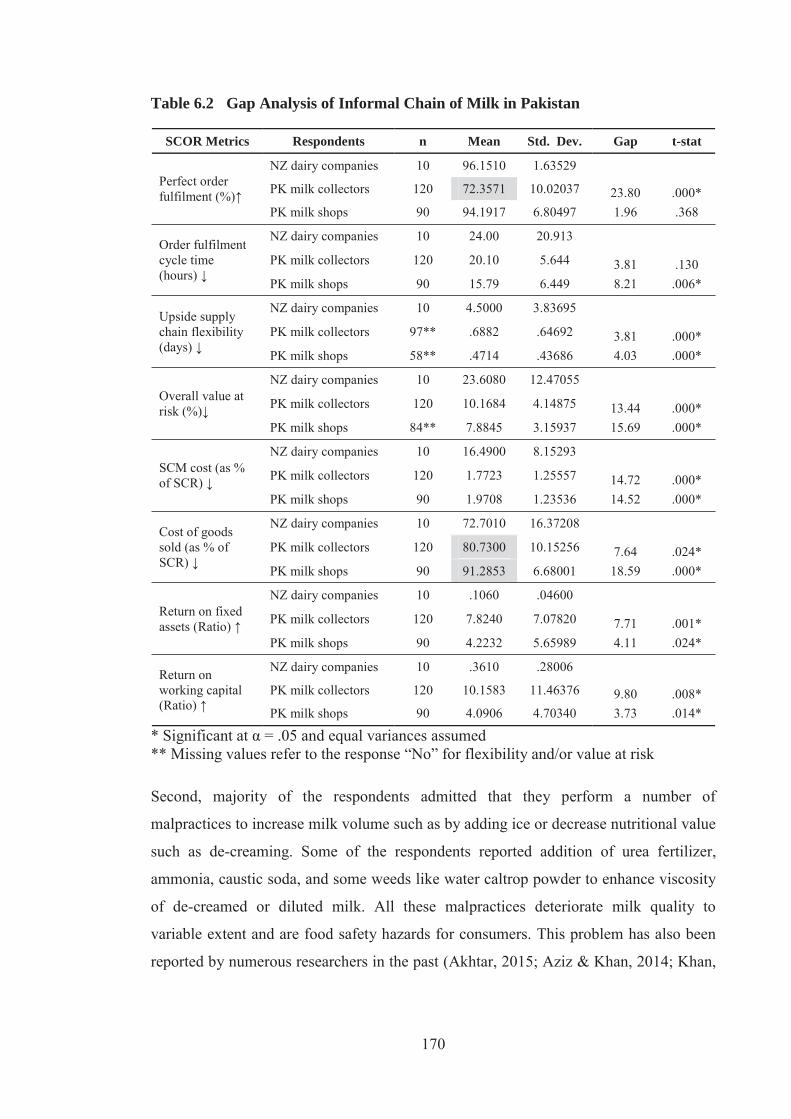
170
Table 6.2 Gap Analysis of Informal Chain of Milk in Pakistan
SCOR Metrics Respondents n Mean Std. Dev. Gap t-stat
Perfect order fulfilment (%)↑
NZ dairy companies 10 96.1510 1.63529
23.80 1.96
.000* .368
PK milk collectors 120 72.3571 10.02037
PK milk shops 90 94.1917 6.80497
Order fulfilment cycle time (hours) ↓
NZ dairy companies 10 24.00 20.913
3.81 8.21
.130 .006*
PK milk collectors 120 20.10 5.644
PK milk shops 90 15.79 6.449
Upside supply chain flexibility (days) ↓
NZ dairy companies 10 4.5000 3.83695
3.81 4.03
.000*
.000*
PK milk collectors 97** .6882 .64692
PK milk shops 58** .4714 .43686
Overall value at risk (%)↓
NZ dairy companies 10 23.6080 12.47055
13.44 15.69
.000*
.000*
PK milk collectors 120 10.1684 4.14875
PK milk shops 84** 7.8845 3.15937
SCM cost (as % of SCR) ↓
NZ dairy companies 10 16.4900 8.15293
14.72 14.52
.000*
.000*
PK milk collectors 120 1.7723 1.25557
PK milk shops 90 1.9708 1.23536
Cost of goods sold (as % of SCR) ↓
NZ dairy companies 10 72.7010 16.37208
7.64 18.59
.024*
.000*
PK milk collectors 120 80.7300 10.15256
PK milk shops 90 91.2853 6.68001
Return on fixed assets (Ratio) ↑
NZ dairy companies 10 .1060 .04600
7.71 4.11
.001*
.024*
PK milk collectors 120 7.8240 7.07820
PK milk shops 90 4.2232 5.65989
Return on working capital (Ratio) ↑
NZ dairy companies 10 .3610 .28006
9.80 3.73
.008*
.014*
PK milk collectors 120 10.1583 11.46376
PK milk shops 90 4.0906 4.70340
* Significant at α = .05 and equal variances assumed ** Missing values refer to the response “No” for flexibility and/or value at risk
Second, majority of the respondents admitted that they perform a number of
malpractices to increase milk volume such as by adding ice or decrease nutritional value
such as de-creaming. Some of the respondents reported addition of urea fertilizer,
ammonia, caustic soda, and some weeds like water caltrop powder to enhance viscosity
of de-creamed or diluted milk. All these malpractices deteriorate milk quality to
variable extent and are food safety hazards for consumers. This problem has also been
reported by numerous researchers in the past (Akhtar, 2015; Aziz & Khan, 2014; Khan,
171
et al., 2013; Sarwar, et al., 2002). Sarwar et al. (2002) mentioned that the suppliers of
milk in Pakistan practice one of the three ways of adulteration.
a) Dilution – mainly by adding water or ice.
b) De-creaming the milk before selling to customer
c) A combination of both (a) and (b)
According to Akhtar (2015) almost 80% of the total milk sold in tetrapacks or in the
loose form in Pakistan is adulterated. Hydrogen peroxide, carbonates, bicarbonates,
antibiotics, caustic soda, and formalin have been confirmed in the milk as adulterants.
The mean value of POF for respondent milk shops in Pakistan was not significantly
different from NZ dairy companies. It is noteworthy here that respondent milk shops
claimed a higher POF (94.2%) for the same milk they sourced from milk collectors with
POF (72.4%). The respondent milk shops reported that they process raw milk for any
impurities such as added water thus improving milk quality back to standard. Figure 6.2
shows (a) a milk collector on his way to collect milk from rural smallholder farms (b) a
milk collector unloading milk at a local de-creamer shop before delivering to urban
customers (c) a local de-creamer de-creaming milk (d) a corner milk shop processing
milk in a large open pan after receiving from milk collector. The un-hygienic containers
(noticeable in the figure 6.2) used for milk handling and transportation represent the
state of process quality in the informal chain of milk in Pakistan.
The order fulfilment cycle time (OFCT) of respondent milk collectors and milk shops in
Pakistan is shorter than dairy companies in New Zealand. However, the statistical
comparison of the means shows that OFCT of milk collectors was not significantly
different from NZ dairy companies. The reason is that more or less both collect and
transport milk from dairy farms to milk shops (in case of Pakistan) or to processing
plant (in case of NZ) once a day. However, the milk shops in Pakistan receive milk
supply more than once a day. Figure 6.3 portrays milk flow in informal chain of milk in
Pakistan.
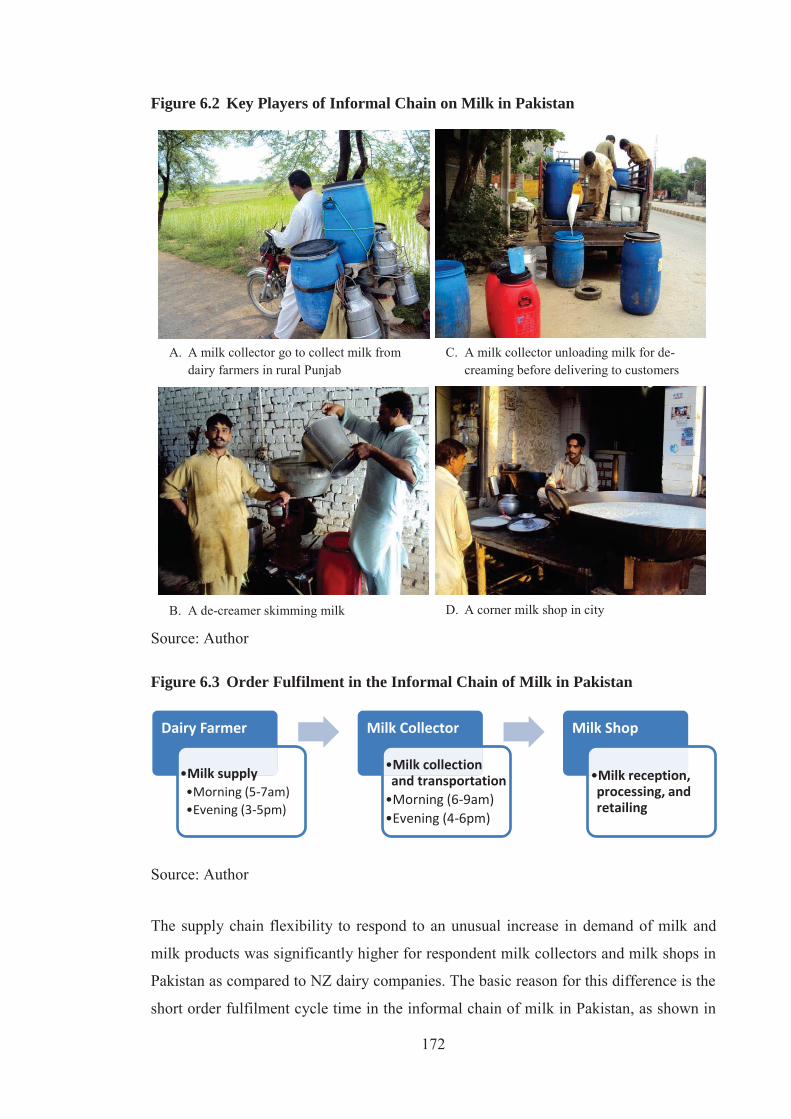
172
Figure 6.2 Key Players of Informal Chain on Milk in Pakistan
Source: Author
Figure 6.3 Order Fulfilment in the Informal Chain of Milk in Pakistan
Source: Author
The supply chain flexibility to respond to an unusual increase in demand of milk and
milk products was significantly higher for respondent milk collectors and milk shops in
Pakistan as compared to NZ dairy companies. The basic reason for this difference is the
short order fulfilment cycle time in the informal chain of milk in Pakistan, as shown in
Dairy Farmer
•Milk supply •Morning (5-7am) •Evening (3-5pm)
Milk Collector
•Milk collection and transportation
•Morning (6-9am) •Evening (4-6pm)
Milk Shop
•Milk reception, processing, and retailing
A. A milk collector go to collect milk from dairy farmers in rural Punjab
B. A de-creamer skimming milk
C. A milk collector unloading milk for de-creaming before delivering to customers
D. A corner milk shop in city

173
figure 6.3. The milk shop’s process configuration was make-to-order with raw milk
supply at fixed intervals. Moreover, small scale of operation allows milk collectors and
milk shops in Pakistan to respond quickly to change in demand and manage
accordingly. Similarly, value at risk for milk collectors as well as milk shops was
significantly less than NZ dairy companies. The major reason is the structural advantage
of small scale businesses over large businesses in managing risk efficiently.
The total cost as percentage of supply chain revenue of milk collectors and milk shops
in Pakistan were less than NZ dairy companies. However, SCOR model divides supply
chain costs into SCM cost and cost of goods sold (COGS). The gap analysis of SCOR
metrics given in table 6.2 shows that the mean value of SCM cost as percentage of
supply chain revenue for milk collectors (1.8%) and milk shops (1.9%) in Pakistan are
significantly less than NZ dairy companies (16.5%). However, COGS as percentage of
supply chain revenue for milk collectors (80.7%) and milk shops (91.3%) in Pakistan
are significantly higher than NZ dairy companies (72.7%). Table 6.2 represents that
major cost for both milk collectors and milk shops in Pakistan is the price of milk itself.
All the overheads contribute a quite small proportion of the total cost, whereas, this is
not the case with NZ dairy companies. Moreover, lower total costs for NZ dairy
companies are a result of economies of the large scale.
The SCOR metrics used to gauge efficiency and effectiveness of doing business in
terms of return on return on fixed assets and return on working capital, both upward
directed metrics. The return on fixed assets ratios of selected milk collectors (7.8) and
milk shops (4.2) in Pakistan were significantly higher than respondent dairy companies
(0.1) in New Zealand. The major reasons behind this include very short cash-to-cash
cycle time and least level of investment required to run such small level businesses in
Pakistan. Due to pasture-based dairy production system in New Zealand, major share of
investment in fixed assets goes to land. Moreover, compliance cost of New Zealand
dairy farms is very high as compared to Pakistan where it is trivial. Similar to return on
fixed assets ratio, return on working capital ratio of the selected milk collectors (10.15)
and milk shops (4.09) in Pakistan were significantly higher than respondent dairy
companies (0.36) in New Zealand.
The above gap analysis can be summarised in two steps. First, the key players (milk
collectors and milk shops) of informal chain of milk are responsible for major share
(almost 95%) of total milk marketed in Pakistan. Milk collectors collect fresh milk from

174
smallholder farms and transport it to the milk shops (and/or urban household) without
processing it. The retail milk shops sell as unprocessed milk or traditional dairy
products. Whereas, in New Zealand all the milk produced is collected and processed
formally by dairy companies. Second, the milk collectors and milk shops in Pakistan
require a nominal investment to start such micro level businesses which operate at
diseconomies of the scale.
6.4 Gap Analysis of Dairy Companies in Pakistan and New Zealand
The performance gaps between SCOR metrics of respondent dairy companies in
Pakistan and New Zealand are shown in table 6.3.
Table 6.3 Gap Analysis of SCOR Metrics for Dairy Companies
SCOR Metrics Respondents n Mean Std. Dev. Gap t-stat
Perfect order fulfilment (%) ↑
NZ dairy companies 10 96.1510 1.63529
3.46 .020* PK dairy companies 10 92.6920 3.97181
Order fulfilment cycle time (hours) ↓
NZ dairy companies 10 24.00 20.913
9.6 .203 PK dairy companies 10 33.60 9.466
Upside supply chain flexibility (days) ↓
NZ dairy companies 10 4.5000 3.83695
6.8 .000* PK dairy companies 10 11.3000 1.63639
Overall value at risk (%) ↓
NZ dairy companies 10 23.6080 12.47055
1.69 .769 PK dairy companies 10 25.3000 12.86727
SCM cost (as % of SCR) ↓
NZ dairy companies 10 16.4900 8.15293
2.04 .448 PK dairy companies 10 14.4495 1.68281
Cost of Goods Sold (% of SCR) ↓
NZ dairy companies 10 72.7010 16.37208
8.75 .134 PK dairy companies 10 81.4490 6.51758
Return on fixed assets (Ratio) ↑
NZ dairy companies 10 .1060 .04600
0.01 .804 PK dairy companies 10 .1240 .22102
Return on working capital (Ratio) ↑
NZ dairy companies 10 .3610 .28006
0.07 .734 PK dairy companies 9** .3067 .40056
* Significant at α = .05 and equal variances assumed ** one missing value corresponds to the outlier
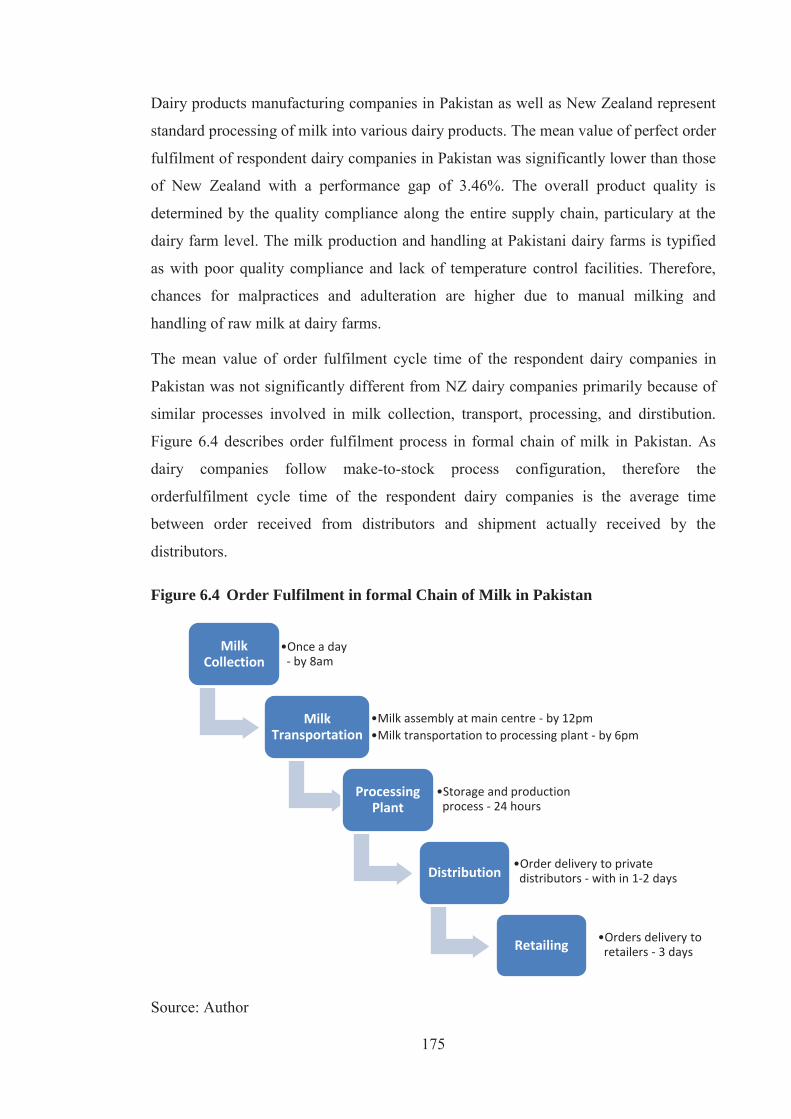
175
Dairy products manufacturing companies in Pakistan as well as New Zealand represent
standard processing of milk into various dairy products. The mean value of perfect order
fulfilment of respondent dairy companies in Pakistan was significantly lower than those
of New Zealand with a performance gap of 3.46%. The overall product quality is
determined by the quality compliance along the entire supply chain, particulary at the
dairy farm level. The milk production and handling at Pakistani dairy farms is typified
as with poor quality compliance and lack of temperature control facilities. Therefore,
chances for malpractices and adulteration are higher due to manual milking and
handling of raw milk at dairy farms.
The mean value of order fulfilment cycle time of the respondent dairy companies in
Pakistan was not significantly different from NZ dairy companies primarily because of
similar processes involved in milk collection, transport, processing, and dirstibution.
Figure 6.4 describes order fulfilment process in formal chain of milk in Pakistan. As
dairy companies follow make-to-stock process configuration, therefore the
orderfulfilment cycle time of the respondent dairy companies is the average time
between order received from distributors and shipment actually received by the
distributors.
Figure 6.4 Order Fulfilment in formal Chain of Milk in Pakistan
Source: Author
Milk Collection
•Once a day - by 8am
Milk Transportation
•Milk assembly at main centre - by 12pm •Milk transportation to processing plant - by 6pm
Processing Plant
•Storage and production process - 24 hours
Distribution •Order delivery to private distributors - with in 1-2 days
Retailing •Orders delivery to retailers - 3 days
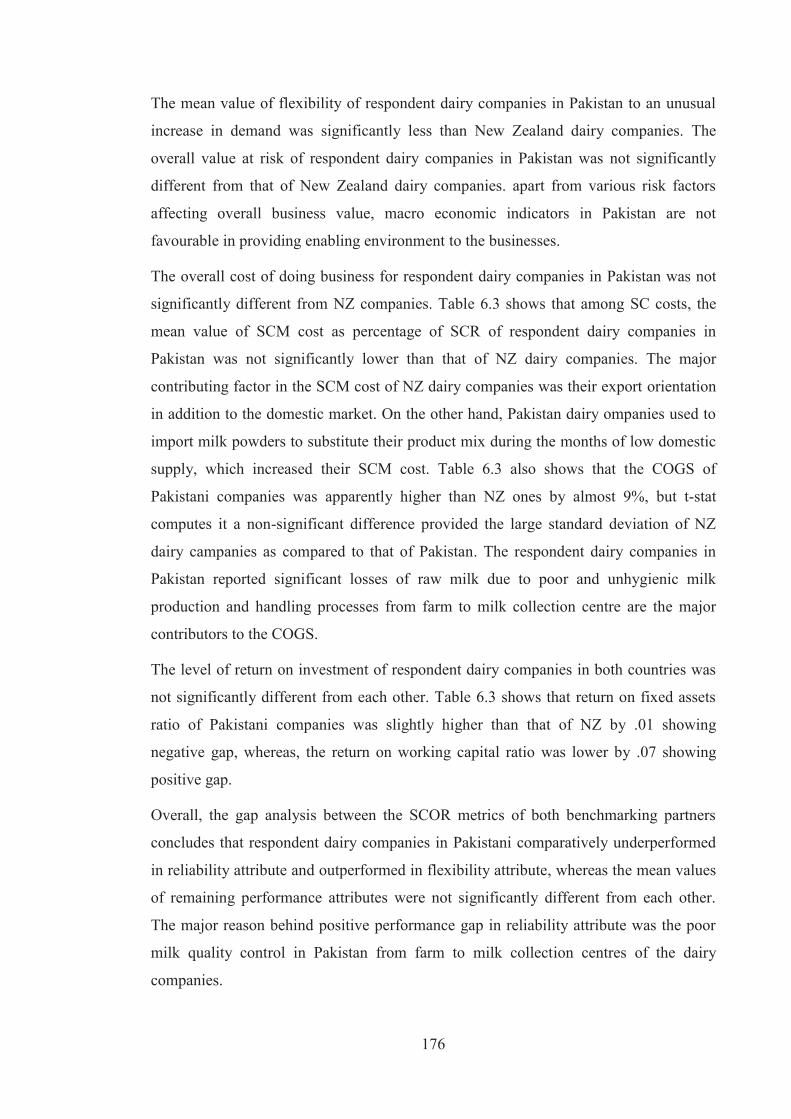
176
The mean value of flexibility of respondent dairy companies in Pakistan to an unusual
increase in demand was significantly less than New Zealand dairy companies. The
overall value at risk of respondent dairy companies in Pakistan was not significantly
different from that of New Zealand dairy companies. apart from various risk factors
affecting overall business value, macro economic indicators in Pakistan are not
favourable in providing enabling environment to the businesses.
The overall cost of doing business for respondent dairy companies in Pakistan was not
significantly different from NZ companies. Table 6.3 shows that among SC costs, the
mean value of SCM cost as percentage of SCR of respondent dairy companies in
Pakistan was not significantly lower than that of NZ dairy companies. The major
contributing factor in the SCM cost of NZ dairy companies was their export orientation
in addition to the domestic market. On the other hand, Pakistan dairy ompanies used to
import milk powders to substitute their product mix during the months of low domestic
supply, which increased their SCM cost. Table 6.3 also shows that the COGS of
Pakistani companies was apparently higher than NZ ones by almost 9%, but t-stat
computes it a non-significant difference provided the large standard deviation of NZ
dairy campanies as compared to that of Pakistan. The respondent dairy companies in
Pakistan reported significant losses of raw milk due to poor and unhygienic milk
production and handling processes from farm to milk collection centre are the major
contributors to the COGS.
The level of return on investment of respondent dairy companies in both countries was
not significantly different from each other. Table 6.3 shows that return on fixed assets
ratio of Pakistani companies was slightly higher than that of NZ by .01 showing
negative gap, whereas, the return on working capital ratio was lower by .07 showing
positive gap.
Overall, the gap analysis between the SCOR metrics of both benchmarking partners
concludes that respondent dairy companies in Pakistani comparatively underperformed
in reliability attribute and outperformed in flexibility attribute, whereas the mean values
of remaining performance attributes were not significantly different from each other.
The major reason behind positive performance gap in reliability attribute was the poor
milk quality control in Pakistan from farm to milk collection centres of the dairy
companies.

177
6.5 Key Findings and Recommendations
Since benchmarking is the process of looking at best practices leading to superior
performance, the performance gaps identified in the dairy supply chain of Pakistan
prove that there is an ample room for improvement. This section aims to look at
possible corrective measures and best practices in context of Pakistan dairy industry.
Salient findings of the gap analysis performed in this chapter can be summarised as:
By and large dairy farmers in Pakistan are smallholders and dairy farming
complementary to crop farming
Majority of the dairy farmers, milk collectors, and milk shops in Pakistan
operate at diseconomies of the scale.
Due to diseconomies of the scale dairy farmers cannot afford modern
technologies such as automatic milking, infrastructure to store milk at controlled
temperature, and other precision dairy farming (PDF) technologies.
There is no system of quality assurance in place (at least in practice) from the
government.
These findings reveal that key players in the milk supply chain in Pakistan operate at
subsistance level. Diseconomies of the scale is the root cause of all the issues
undermining the overall performance of milk supply chain in Pakistan. Nonetheless,
increasing competition in global agricultural markets incite agricultural producers to
achieve scale economies in production, processing and marketing, and to coordinate
along the supply chain to provide better channels of communication between producers
and consumers. Agricultural cooperatives are one means of achieving scale economies
and coordination along the entire food chain. Evans and Meade (2006) claim that
modern cooperative form of enterprise has found successful application in farm
production and processing and marketing of agricultural products. The critical success
factor is homogeneity of interest among cooperative members which is further
facilitated by product homogeneity (i.e. milk). Cooperative form of business can be
defined as,
“A cooperative is an organisation in which those who transact with (i.e.
“patronise”) the organisation also own and formally control the organisation,
and derive significant benefits from those transactions over and above any
178
financial returns they derive from their investment in the organisation” (Evans &
Meade, 2006).
New Zealand dairy industry is the best example of successful agricultural cooperatives.
Cooperative farming is part of a long and proud agricultural tradition in New Zealand.
In dairy industry, farm production, dairy products manufacturing, distribution and retail
sale is predominantly carried out by an amalgamation of producer and consumer
cooperatives. This amalgamation benefits society in a number of ways. First, the
cooperative form of business has ease of capital accumulation from its members in the
form of pooling up resources to achieve economies of the scale as well as create wealth
in comparatively less time. Second, the wealth created by the cooperatives is distributed
among its members in the form of dividend per share which helps to decrease income
inequality in the society. Third, the cooperatives enable small enterprises to gain
bargaining power.
A number of reseachers found cooperative form of business performing better compared
to independently owned firms (IOFs) (Painter, 2007; Parliament et al., 1989; Sabir et
al., 2012). For example, Parliament et al. (1989) analyse relative performance of a
sample of cooperatives and IOFs in the US dairy industry over 1971 – 1987. They
found that the cooperatives performed significantly better than the IOFs in terms of
leverage, liquidity and asset efficiency. In a comparison of dairy industries in Canada
and New Zealand Painter (2007) conclude that due to cooperative farming New Zealand
dairy farmers out performed in average farm size, cost and production efficiencies and
prices paid to dairy farmers for their milk. Similarly, Sabir et al. (2012) compare
production efficiency of cooperative and non-cooperative farming in Pakistan and
identify that productivity of cooperative farmers was 38% higher than non-cooperative
farmers.
Agriculture sector contributes 20.9% (Ministry of Finance, 2015) to Pakistan’s GDP
which highlights that any minor improvement implies significant impact. At the same
time any policy recommendation must consider its good or bad impact on those 40.3%
of the total population employed by this sector. Moreover, dairy farming in Pakistan is
predominantly practiced as complementary to crop framing. Therefore, the
recommendation must be equally applicable to other areas of agriculture. In Pakistan,
agricultural cooperatives have not been very successful form of business in the past.
179
Khan (2008) views that the absence of external and internal pre-requisits of cooperative
development are the major reasons of this failure. In a similar context, Garnevska et al.
(2011) reported that a stable legal environment; a dedicated initiator and leader;
government financial and technical support; farmer understanding and participation of
cooperative activities and appropriate external support from professional NGOs were
the key factors for the successful development of farmer cooperatives in Northwest of
China.
To overcome the issue identified in this study responsible for undermining the overall
performance of milk supply chain in Pakistan, promotion of agricultural cooperatives
through policy intervention is recommended. To provide a cost benefit analysis and
feasibility report for this recommendation is beyond the scope of this study due to time
and resource constraints which are inherent part of academic research. However, a
phased-out medium to long term strategy can better serve the needs of smallholder and
subsistence level dairy farms in Pakistan enabling them to pool up resources, increase
productivity and profitability and eventually to break the vicious cycle of poverty. The
attainment and use of capital intensive farming technologies such as farming machinery,
automatic milking, infrastructure to store milk at controlled temperature, and other
precision dairy farming (PDF) technologies can be made possible for the subsistence
level farmers who otherwise cannot afford due to diseconomies of the scale.
6.6 Summary
This chapter discusses the performance gaps between the key operators of milk supply
chains of benchmarking partners. Independent sample t-test was used to compare mean
values of individual SCOR metrics of key operators in the milk supply chains of
Pakistan and New Zealand. The null hypothesis [H0: μ1 = μ2] was that mean values of
samples from two groups were equal to each other, whereas alternate hypothesis [H1: μ1
≠ μ2] was that mean values of samples from two groups were not equal to each other.
For p-value less than .05 for the two tailed t-test null hypothesis was rejected and
alternate hypothesis was accepted, that means the mean value of samples from one
group is significantly different from the mean value of samples from other group. The
key findings of gap analysis of SCOR metrics are outlined as:
By and large dairy farmers in Pakistan are smallholders and dairy farming is
complementary to crop farming.
180
Majority of the dairy farmers, milk collectors, and milk shops in Pakistan
operate at diseconomies of the scale.
Due to diseconomies of the scale dairy farmers cannot afford modern
technologies such as automatic milking, infrastructure to store milk at controlled
temperature, and other precision dairy farming (PDF) technologies.
There is no system of quality assurance in place (at least in practice) from the
government.
The key findings reveal that key players in the milk supply chain in Pakistan operate at
subsistance level. Diseconomies of the scale is root cause of all the issues undermining
the overall performance of milk supply chain in Pakistan. To overcome the issue
identified in this study, promotion of agricultural cooperatives policy intervention is
recommended. A phased-out medium to long term strategy to promote agricultural
cooperatives can better serve the needs of smallholder and subsistence level dairy farms
in Pakistan enabling them to pool up resources, increase productivity and profitability
and eventually to break the vicious cycle of poverty. Cooperatives are the best way to
introduce competitive prices for consumers and maximise returns for producers at the
same time.

181
CHAPTER 7
7. CONCLUSION
7.1 Introduction
This chapter concludes the overall thesis under following sections.
Section 7.2 reiterates the research objectives
Section 7.3 links the results with research objectives of this study.
Section 7.4 presents limitations of the research methodology used and the
overall study.
Section 7.5 is about the contribution of this study and future research.
7.2 Research Objectives
This study aims to examine the causes of poor performance of milk supply chain in
Pakistan. For this purpose the milk supply chain in Pakistan was benchmarked against
that of New Zealand with following research objectives.
Objective 1: to overview dairy industries of Pakistan and New Zealand.
Objective 2: to measure the performance of key players of milk supply chains in
Pakistan and New Zealand.
Objective 3: to identify and analyse performance gaps between milk supply chains in
Pakistan and New Zealand.
Objective 4: to suggest policy measures for the improvement of milk supply chain in
Pakistan.
7.3 Linking Results with Objectives
The results from value chain analysis, SCOR analysis and gap analysis are discussed in
detail in previous chapter. The key findings of these results are linked with the study
objectives in the subsequest section.
Objectives 1: to overview dairy industries of Pakistan and New Zealand.
Chapter 2 provides a detailed description on the dairy industry from global as well as
national perspectives which provides exploratory information about the milk supply
182
chains in Pakistan and New Zealand. Moreover, the pilot survey (in chapter 4) and value
chain analysis (in chapter 5) were performed to develop a deeper understanding of the
supply chain functions, activities, key operators, facilitators, and enablers in the milk
supply chains of Pakistan and New Zealand.
The value chain analysis was performed to explore the benchmarking milk supply
chains as well as to gauge the level of vale addition. The analysis of value distribution
along the entire chain indicated:
The informal chain of milk (unprocessed milk) in Pakistan had 22.39% ex-
farmgate value addition, with the largest (almost 82%) share of the value
captured by the dairy farmers.
The formal chain of milk (processed milk) in Pakistan had 104.23% ex-farmgate
value addition, with the largest (51%) share of the value captured by the dairy
farmers.
The milk supply chain in New Zealand had 216.83% ex-farmgate value addition,
with the largest (55.6%) share of value captured by the retailers.
Objective 2: to measure the performance of key players of milk supply chains in
Pakistan and New Zealand.
A framework based on SCOR model version 10 was developed (in chapter 4) and used
to measure performance of key players in milk supply chains of Pakistan and New
Zealand. The selected SCOR metrics for dairy farmers, milk collectors, milk shops and
dairy companies in milk supply chain in Pakistan and for dairy farmers and dairy
companies in New Zealand are presented in chapter 5. Moreover, these metrics were
used to compare performance of both the benchmarking partners in the form of gap
analysis (in chapter 6). The SCOR metrics are organised under five performance
attributes: reliability, responsiveness, agility, cost, and asset. The SCOR metrics were
computed according to the guidelines of SCOR model version 10. These was collected
from the SC operators of both the benchmarking partners was presented in previous
chapter supported with phenomenological discussion.
Objective 3: to identify and analyse performance gaps between milk supply chains in
Pakistan and New Zealand.
183
The gap analysis of SCOR metrics was organised into three sentions: the dairy farming,
the informal chain, and the formal chain. In first section the mean values of strategic
level SCOR metrics for dairy farmers from Pakistan and New Zealand were compared.
In second section the mean values of strategic level SCOR metrics for milk collectors
and milk shops from Pakistan were compared with dairy companies in New Zealand.
Whereas, in third section the mean values of strategic level SCOR metrics for dairy
companies from Pakistan and New Zealand were compared The key findings are:
Pakistani dairy farmers under performed in supply chain reliability, cost of
production, and return on working capital as compare to NZ dairy farmers. The
majority of the Pakistani dairy farmers were smallholders and due to
diseconomies of the scale of their operation they could not afford modern dairy
farming technologies such automatic milking, milk storage at controlled
temperature, and other precision dairy farming (PDF) technologies.
The Pakistani milk collectors underperformed in perfect order fulfilment,
flexibility and cost of milk sold and outperformed in value at risk, SCM cost and
return on assets as compared to NZ dairy companies.
The Pakistani milk shops underperformed in cost of milk sold and outperformed
in order fulfilment cycle time, flexibility, value at risk, SCM cost and return on
assets as compared to NZ dairy companies.
The Pakistani dairy companies underperformed in perfect order fulfilment and
flexibility as compared to NZ dairy companies.
Objective 4: to suggest policy measures for the improvement of milk supply chain in
Pakistan.
The ultimate objective of every business is to maximise the shareholder value.
Appendix-E shows the linkage between SCOR metrics and shareholder value. The key
findings of this study conclude that dairy farmers, milk collectors and milk shops in
Pakistan operate as micro enterprises and small scale diseconomies is the root cause to
many other issues such as mentioned in chapter 1. This study suggests to promote
agricultural cooperatives as a phased-out medium to long term policy intervention.
Agricultural cooperatives are one means of achieving scale economies and coordination
along the entire food chain. Evans and Meade (2006) claim that modern cooperative
form of enterprise has found successful application in farm production and processing
184
and marketing of agricultural products. Some earlier studies conducted in settings
similar to this study, claim that cooperative farming is more profitable than non-
cooperative farming (Riaz, 2008; Sabir, et al., 2012). However, the reasons of failure of
cooperatives in developing countries must also be considered while formulating policies
(Khan, 2008).
Farmer cooperatives are started mainly to source farm inputs (such as agricultural
machinery, fertilizer, seed, and finance), farm services (such as consultancy and
veterinary), market farm produce, and process agricultural commodities. For small
holder farmers in Pakistan with fragmented landholdings cooperative farming is the
most effective way to pool up resources, adopt advanced farming technologies such as
automatic milking and cool chain infrastructure, and resultantly create more value of
their farm produce through economies of the large scale. Once established, these
cooperatives can extend their operations to processing as well and ultimately contribute
to the expansion of the formal chain of milk in Pakistan.
7.4 Major Limitations of This Study
This study was largely descriptive in nature and focused on performance measurement
and benchmarking in agri-food supply chain networks. However, it implies few
limitations.
This study included only key operators rather than all the stakeholders of the
milk supply chain networks of Pakistan and New Zealand, mainly due to the
time and cost constraints, which are usually attached with most of the academic
research projects.
The samples drawn from both the benchmarking populations were not
statistically representative of their respective populations. The reasons were:
time and cost contraints; and unavailability of the sampling frame for key SC
operators such as milk collectors and milk shops in the milk supply chain in
Pakistan. Lack of institutional support in distributing questionnaires to the New
Zealand dairy farmers was another constraint.
The SCOR performance measurement and benchmarking framework assumes
that the participant companies use SCOR model to manage and measure
performance and researcher’s full access to the company’s IT systems to retrieve
the required information. It was a challenging task for the researchers to acquire
185
such information particularly from those companies or individuals not using IT
systems or in worse case not maintaining accounting record of their business
transaction. The respondents from the informal chain of milk in Pakistan were
such examples. Utmost care was taken in preparing interview sheets and
collecting data required to construct SCOR metrics for such respondents. The
accounting principles for preparing financial statements were taken care of to the
extent possible. However, the validity and reliability of such data may not be as
higher as of the one retrieved from the company’s financial statements and IT
systems.
The best practices reported by the respondents in the milk supply chain in New
Zealand were not statistically tested for their positive impact on the business
performance, however, they were discussed with the experts on dairy in New
Zealand before recommending for the improvement of milk supply chain in
Pakistan.
7.5 Contribution of This Study
This study contributes in two ways.
7.5.1 Contribution to Body of Knowledge
The literature on supply chain performance measurement is too large and multi-
dimensional to develop a clear understanding from all aspects. The performance
measurement frameworks found in the literature were reviewed against five criteria
characterising agri-food supply chains. These criteria are balance between financial and
non-financial performance measures, holistic to entire supply chain, food quality focus,
risk assessment, and environmental sustainability. A number of past researchers have
used criteria approach to evaluate existing performance measurement frameworks
against a set of criteria and select an appropriate one (Beamon, 1999; Gunasekaran, et
al., 2001; Neely, et al., 1995; Van der Spiegel, et al., 2004; Varma & Deshmukh, 2009).
The review of literature revealed that no such performance measurement framework
exists which satifies all five criteria characterising agri-food supply chains. This study
abridged this research gap by developing a performance measurment and benchmarking
framework for agri-food supply chains. The framework is based on SCOR model
version 10 and incorporates food quality metrics relevant to milk supply chain. The

186
food quality metrics include product as well as process quality at all interfaces of a
supply chain.
7.5.2 Contribution to Milk Supply Chains in Pakistan and New Zealand
The role of stakeholders of milk supply chains in Pakistan and New Zealand has been
described in value chain analysis (in chapter 5). This research is helpful for milk supply
chain stakeholders in Pakistan in a number of ways.
a) The past research on Pakistan dairy industry highlights a number of issues
responsible for poor performance, such as those mentioned in chapter 1. This
study concludes that small scale diseconomies is the key issue of farmers, milk
collectors, and milk shops in Pakistan. Almost all of the other issues such as
those mentioned in chapter 1 are somehow dependent on this issue. Moreover,
this study suggests policy makers to promote agricultural cooperatives as a
phased-out medium to long term policy intervention.
b) This document is helpful for key players of milk supply chain in Pakistan in
improving output of their routine activities. For instance, it highlights various
risk factors affecting their business value and best practices to effective risk
management.
c) This study is helpful for relevant researchers in updating their understanding of
the subject as well as for exploratory research. Moreover, the research work of
this thesis presented at international conferences and published in scientific
journals added to the literature on performance measurement and benchmarking
in agri-food supply chains.
For milk supply chain in New Zealand, the performance measurement framework
developed and used in this study documents performance benchmarks for dairy farmers
and dairy products manufacturing companies. These benchmarks provide novel and
unique SCOR metrics for New Zealand dairy industry.
7.6 Future Research
This study suggests future research in following areas:
The food safety regulations in Pakistan are inadequate and outdated in global
perspective. A benchmarking study of the food safety regulations of Pakistan
against a benchmark with particular focus on the milk supply chain is needed.
187
The analytical framework developed in this study is scalable and can be
replicated to other agri-food supply chains such as fruits, vegetables, and sea
food.
Further research is required on successful development of sustainable
agricultural cooperatives in developing countries such as Pakistan.
188
REFERENCES
Afzal, M. (2008). Corporate dairy farming in Pakistan - Is there a future? Pakistan
Journal of Agricultural Sciences, 45(2), 250-253.
Akhtar, S. (2015). Food safety challenges - A Pakistan's perspective. Critical Reviews in
Food Science and Nutrition, 55(2), 219-226.
Altheide, D. L., & Johnson, J. M. (1994). Criteria for assessing interpretive validity in
qualitative research. In N. K. Denzin & Y. S. Lincoln (Eds.), Handbook of
qualitative research (Vol. 2, pp. 485-499). Thousand Oaks: Sage Publications.
Amaratunga, D., Baldry, D., Sarshar, M., & Newton, R. (2002). Quantitative and
qualitative research in the built environment: Application of “mixed” research
approach. Work Study, 51(1), 17-31.
Anand, G., & Kodali, R. (2008). Benchmarking the benchmarking models.
Benchmarking: An International Journal, 15(3), 257-291.
Andersen, B., Fagerhaug, T., Randmæl, S., Schuldmaier, J., & Prenninger, J. (1999).
Benchmarking supply chain management: Finding best practices. Journal of
Business & Industrial Marketing, 14(5/6), 378-389.
Anjum, M. S., Lodhi, K., Raza, A. A., Walters, F., & Krause, S. (1989). Pakistan's
dairy industry: Issues and policy alternatives. Islamabad: Directorate of
Agricultural Policy, Government of Pakistan, and the United States Agency for
International Development.
Ansari, A., Modarress, B., & Lockwood, D. (1999). Supplier product integration a new
competitive approach. Production and Inventory Management Journal, 40, 57-
61.
Aramyan, L., Lansink, A., Van der Vorst, J., & Van Kooten, O. (2007). Performance
measurement in agri-food supply chains: A case study. Supply Chain
Management: An International Journal, 12(4), 304-315.
Aramyan, L., Ondersteijn, C., Kooten, O., & Lansink, A. (2006). Performance
indicators in agri-food production chains. In C. J. Ondersteijn, J. H. Vijnands, R.
B. Huirne & O. Kooten (Eds.), Quantifying the agri-food supply chain (pp. 49-
66). Dordrecht, The Netherlands: Springer.
Aramyan, L. H., Meuwissen, M. P., Oude Lansink, A. G., van der Vorst, J. G., van
Kooten, O., & Van der Lans, I. A. (2009). The perceived impact of quality
189
assurance systems on tomato supply chain performance. Total Quality
Management, 20(6), 633-653.
Aziz, T., & Khan, H. (2014). A survey on milk adultration at retail outlets of Islamabad,
Pakistan. Carpathian Journal of Food Science & Technology, 6(2), 44-52.
Babbar, S., & Prasad, S. (1998). International purchasing, inventory management and
logistics research: An assessment and agenda. International Journal of Physical
Distribution & Logistics Management, 28(6), 403-433.
Baines, P., & Chansarkar, B. (2002). Introducing marketing research. West Sussex,
UK: John Wiley & Sons Ltd.
Baker, W. H. (1994). In pursuit of benchmarking excellence: The Texas Instruments
story. National Productivity Review, 14(1), 63-72.
Ballou, R. H. (2007). The evolution and future of logistics and supply chain
management. European Business Review, 19(4), 332-348.
Barratt, M. (2004). Understanding the meaning of collaboration in the supply chain.
Supply Chain Management: An International Journal, 9(1), 30-42.
Beamon, B. M. (1998). Supply chain design and analysis: Models and methods.
International Journal of Production Economics, 55(3), 281-294.
Beamon, B. M. (1999). Measuring supply chain performance. International Journal of
Operations & Production Management, 19(3), 275-292.
Bechtel, C., & Jayaram, J. (1997). Supply chain management: A strategic perspective.
The International Journal of Logistics Management, 8(1), 15-34.
Berliner, C., & Brimson, J. (1988). Cost management for today's advanced
manufacturing: The CAM-I conceptual design. Boston, MA: Harvard Business
School Press.
Berry, D., Towill, D. R., & Wadsley, N. (1994). Supply chain management in the
electronics products industry. International Journal of Physical Distribution &
Logistics Management, 24(10), 20-32.
Bessant, J., & Rush, H. (1998). Approaches to Benchmarking: The Case of 'framework
Conditions' and ICT-Os. Brighton, UK: Centre for Research in Innovation
Management, University of Brighton.
Bhagwat, R., & Sharma, M. K. (2007a). Performance measurement of supply chain
management using the analytical hierarchy process. Production planning and
control, 18(8), 666-680.
190
Bhagwat, R., & Sharma, M. K. (2007b). Performance measurement of supply chain
management: A balanced scorecard approach. Computers & Industrial
Engineering, 53(1), 43-62.
Bhutta, K. S., & Huq, F. (1999). Benchmarking–best practices: An integrated approach.
Benchmarking: An International Journal, 6(3), 254-268.
Bigliardi, B., & Bottani, E. (2010). Performance measurement in the food supply chain:
A balanced scorecard approach. Facilities, 28(5/6), 249-260.
Bijman, W. J. J. (2002). Essays on Agricultural Co-operatives: Governance Structure in
Fruit and Vegetable Chains. (Doctoral thesis, Erasmus Research Institute of
Management, Rotterdam, The Netherlands). Retrieved from
hdl.handle.net/1765/867
Bititci, U. S. (1994). Measuring your way to profit. Management Decision, 32(6), 16-
24.
Bourlakis, M., Maglaras, G., Gallear, D., & Fotopoulos, C. (2014). Examining
sustainability performance in the supply chain: The case of the Greek dairy
sector. Industrial Marketing Management, 43(1), 56-66.
Bovel, D., & Martha, J. (2000). From supply chain to value net. Journal of Business
Strategy, 21(4), 24-28.
Bowersox, D. J. (1969). Physical distribution development, current status, and potential.
The Journal of Marketing, 33(1), 63-70.
BPIR. (2014). Business excellence models. Retrieved from http://www.bpir.com/total-
quality-management-business-excellence-models-bpir.com.html
Brewer, P. C., & Speh, T. W. (2000). Using the balanced scorecard to measure supply
chain performance. Journal of Business Logistics, 21(1), 75-94.
Bryman, A. (2008). Social research methods (3 ed.). New York, NY: Oxford University
Press.
Bryman, A., & Bell, E. (2015). Business research methods (4 ed.). Oxford, United
Kingdom: Oxford university press.
Bullinger, H. J., Kühner, M., & Van Hoof, A. (2002). Analysing supply chain
performance using a balanced measurement method. International Journal of
Production Research, 40(15), 3533-3543.
Burgess, K., & Singh, P. J. (2006). A proposed integrated framework for analysing
supply chains. Supply Chain Management: An International Journal, 11(4),
337-344.

191
Business Performance Improvement Resource. (2012). Business Excellence Models,
from http://www.bpir.com/total-quality-management-business-excellence-
models-bpir.com.html
Cai, J., Liu, X., Xiao, Z., & Liu, J. (2009). Improving supply chain performance
management: A systematic approach to analyzing iterative KPI accomplishment.
Decision Support Systems, 46(2), 512-521.
Camp, R. C. (1989). Benchmarking: The search for industry best practices that lead to
superior performance. New York: Quality press Milwaukee.
Caplice, C., & Sheffi, Y. (1995). A review and evaluation of logistics performance
measurement systems. The International Journal of Logistics Management, 6(1),
61-74.
Carson, D., Gilmore, A., Perry, C., & Gronhaug, K. (2001). Qualitative marketing
research. London, UK: Sage Publications.
Cavinato, J. L. (1992). A total cost/value model for supply chain competitiveness.
Journal of Business Logistics, 13(2), 285-301.
Center for Organizational Excellence Research. (2012). TRADE best practice
benchmarking, from http://www.coer.org.nz/apply/trade-best-practice-
benchmarking
Chan, F. T. S. (2003). Performance measurement in a supply chain. The International
Journal of Advanced Manufacturing Technology, 21(7), 534-548.
Chan, F. T. S., & Qi, H. J. (2002). A fuzzy basis channel-spanning performance
measurement method for supply chain management. Proceedings of the
Institution of Mechanical Engineers, Part B: Journal of Engineering
Manufacture, 216(8), 1155-1167.
Chan, F. T. S., & Qi, H. J. (2003a). Feasibility of performance measurement system for
supply chain: A process-based approach and measures. Integrated
Manufacturing Systems, 14(3), 179-190.
Chan, F. T. S., & Qi, H. J. (2003b). An innovative performance measurement method
for supply chain management. Supply Chain Management: An International
Journal, 8(3), 209-223.
Chandler, A. D. (1977). The visible hand - managerial revolution in American business.
Boston, MA: Harvard University Press
Christopher, M. (1995). Supply chain management: The past, the present and the future.
Manufacturing Engineer, 74(5), 213-217.
192
Christopher, M. (1998). Logistics and supply chain management: Strategies for
reducing cost and improving service (2nd ed.). London, UK: Financial Times.
Christopher, M. (2005). Logistics and supply chain management: Creating value-added
networks (3rd ed.). London: Pearson Education.
Clayton, T., & Luchs, B. (1994). Strategic benchmarking at ICI Fibres. Long Range
Planning, 27(3), 54-63.
Codling, S. (1992). Best practice benchmarking. London, UK: Gower.
Collis, J., & Hussey, R. (2014). Business research: A practical guide for undergraduate
and postgraduate students. Hampshire, UK: Palgrave Macmillan.
Commerce Commission New Zealand. (2013). Information paper – The setting of the
farm gate milk price in New Zealand, from http://www.comcom.govt.nz
Conforte, D., Garnevska, G., Kilgour, M., Locke, S., & Scrimgeour, F. (2008). The Key
Elements of Success and Failure in the New Zealand Dairy Industry. Lincoln,
New Zealand: Agribusiness and Economic Research Unit (AERU), Lincoln
University.
Cooper, D. R., & Schindler, P. S. (2014). Business research methods. New York, NY:
McGraw-Hill Irwin.
Cooper, M. C., & Ellram, L. M. (1993). Characteristics of supply chain management
and the implications for purchasing and logistics strategy. The International
Journal of Logistics Management, 4(2), 13-24.
Cooper, M. C., Lambert, D. M., & Pagh, J. D. (1997). Supply chain management: More
than a new name for logistics. The International Journal of Logistics
Management, 8(1), 1-14.
Corbett, C. J., Blackburn, J. D., & Van Wassenhove, L. N. (1999). Partnerships to
improve supply chains. Sloan management review, 40(4), 71-82.
Coriolis. (2014). Dairy review: iFAB 2013. Ministry of Business, Innovation &
Employment, New Zealand. Retrieved from
http://www.coriolisresearch.com/pdfs/coriolis_iFAB_2013_dairy.pdf.
Cox, A. (1997). Business success: A way of thinking about strategy, critical supply
chain assets and operational best practice. Midsomer Norton, UK: Earlsgate
Press.
Cox, A. (1999). Power, value and supply chain management. Supply Chain
Management: An International Journal, 4(4), 167-175.
193
Cox, A. (2001a). Managing with power: Strategies for improving value appropriation
from supply relationships. Journal of Supply Chain Management, 37(2), 42-47.
Cox, A. (2001b). The power perspective in procurement and supply management.
Journal of Supply Chain Management, 37(2), 4-7.
Cox, A. (2001c). Understanding buyer and supplier power: A framework for
procurement and supply competence. Journal of Supply Chain Management,
37(2), 8-15.
Cox, A., Sanderson, J., & Watson, G. (2001). Supply chains and power regimes:
Toward an analytic framework for managing extended networks of buyer and
supplier relationships. Journal of Supply Chain Management, 37(2), 28-35.
Cox, A., & Thompson, I. (1998). On the appropriateness of benchmarking. Journal of
General Management, 23, 1-20.
Craighead, C. W., Blackhurst, J., Rungtusanatham, M. J., & Handfield, R. B. (2007).
The severity of supply chain disruptions: Design characteristics and mitigation
capabilities. Decision Sciences, 38(1), 131-156.
Dairy NZ. (2010). Competitiveness: Towards 2020 - the next decade in dairying. Dairy
NZ Retrieved from http://www.dairynz.co.nz/file/fileid/29447.
DairyNZ. (2014). New Zealand dairy statistics 2013-14. Retrieved from
http://www.dairynz.co.nz/media/1327583/nz-dairy-statistics-2013-2014-
web.pdf.
Dattakumar, R., & Jagadeesh, R. (2003). A review of literature on benchmarking.
Benchmarking: An International Journal, 10(3), 176-209.
Davies, B. (2003). The role of quantitative and qualitative research in industrial studies
of tourism. International Journal of Tourism Research, 5(2), 97-111.
Davis, P. (1998). The burgeoning of benchmarking in British local government: The
value of 'learning by looking' in the public services. Benchmarking: An
International Journal, 5(4), 260-270.
DCANZ. (2014). New Zealand dairy industry, from http://www.dcanz.com/about-nz-
dairy-industry
De Toni, A., & Tonchia, S. (2001). Performance measurement systems: Models,
characteristics and measures. International Journal of Operations & Production
Management, 21(1/2), 46-71.
194
Dehning, B., & Stratopoulos, T. (2003). Determinants of a sustainable competitive
advantage due to an IT-enabled strategy. The Journal of Strategic Information
Systems, 12(1), 7-28.
Denzin, N. K., & Lincoln, Y. S. (1994). Entering the field of qualitative research. In N.
K. Denzin & Y. S. Lincoln (Eds.), Handbook of qualitative research (Vol. 2, pp.
1-17). Thousand Oaks, CA: Sage Publications.
Dolman, M., Sonneveld, M., Mollenhorst, H., & de Boer, I. (2014). Benchmarking the
economic, environmental and societal performance of Dutch dairy farms aiming
at internal recycling of nutrients. Journal of Cleaner Production, 73, 245-252.
Ellinger, A. E. (2000). Improving marketing/logistics cross-functional collaboration in
the supply chain. Industrial Marketing Management, 29(1), 85-96.
Ellram, L. M., Tate, W. L., & Billington, C. (2004). Understanding and managing the
services supply chain. Journal of Supply Chain Management, 40(4), 17-32.
Elmuti, D., & Kathawala, Y. (1997). An overview of benchmarking process: A tool for
continuous improvement and competitive advantage. Benchmarking: An
International Journal, 4(4), 229-243.
Elnathan, D., & Kim, O. (1995). Partner selection and group formation in cooperative
benchmarking. Journal of Accounting & Economics, 19(2/3), 345-364.
Eryuruk, S. H., Aydin, S., & Kalaoglu, F. (2014). Determining performance attributes
using SCOR model to compare apparel retailares. RMUTP Research
Journal(Special Issue), 337-351.
Evans, L., & Meade, R. (2006). The Role and Significance of Cooperatives in New
Zealand Agriculture, A Comparative Institutional Analysis. New Zealand
Institute for the Study of Competition and Regulations Retrieved from
http://researcharchive.vuw.ac.nz/handle/10063/3847.
FAO. (2008). High food prices in Pakistan: Impact assessment and the way forward.
Rome, Italy: Food and Agriculture Organization.
FAO. (2009). The state of agricultural commodity markets 2009. Rome, Italy: Food and
Agriculture Organization.
FAO. (2013). Milk and dairy products in human nutrition. Rome, Italy: Food and
Agriculture Organization.
FAO. (2014). World food situation. Rome, Italy: Food and Agriculture Organization.
FAO. (2015). Food outlook: Biannual report of global food markets. Retrieved from
http://www.fao.org/3/a-I5003E.pdf.
195
FAOSTAT. (2014). Online Database. http://faostat3.fao.org/compare/E
Fattahi, F., Nookabadi, A. S., & Kadivar, M. (2013). A model for measuring the
performance of the meat supply chain. British Food Journal, 115(8), 1090-1111.
Fonterra. (2013). The milk price statement 2013, from
http://www.fonterra.com/wps/wcm/connect/b969c33c-f3d6-4e6b-8679-
0c5666e3f481/2013+Farmgate+Milk+Price+Statement.pdf?MOD=AJPERES
Fonterra. (2014). Sustainable dairying: New Zealand, from
https://www.fonterra.com/nz/en/sustainability+platform/sustainable+dairying/ne
w+zealand/new+zealand
Fonterra. (2015). The global dairy industry. Retrieved from
http://www2.fonterra.com/our-financials/the-global-dairy-industry
Frazelle, E. (2002). Supply chain strategy: The logistics of supply chain management.
New York, NY: McGraw-Hill Professional.
Gaiardelli, P., Saccani, N., & Songini, L. (2007). Performance measurement of the
after-sales service network-Evidence from the automotive industry. Computers
in Industry, 58(7), 698-708.
Galloway, D., & Waldron, D. (1988). Throughput accounting: The need for a new
language for manufacturing. Management Accounting, 11, 34-50.
Garcia, M., Poole, N., Briz, J., Felipe, I., Yalcin, I., Koc, A., et al. (2004).
Benchmarking international food safety performance in the fresh produce
sector. Paper presented at the 84th Seminar of EAAE of Food Safety on a
Dynamic World, Zeist, The Netherlands.
Garnevska, E., Liu, G., & Shadbolt, N. M. (2011). Factors for successful development
of farmer cooperatives in Northwest China. International Food and
Agribusiness Management Review, 14(4), 69-84.
George, D., & Mallery, P. (2014). IBM SPSS Statistics 21: Step by Step. Boston: MA:
Pearson.
Gerbens-Leenes, P., Moll, H., & Uiterkamp, A. S. (2003). Design and development of a
measuring method for environmental sustainability in food production systems.
Ecological Economics, 46(2), 231-248.
Gibson, B., Mentzer, J., & Cook, R. (2005). Supply chain management: The pursuit of a
consensus definition. Journal of Business logistics, 26(2), 17.
Gilmour, P. (1998). Benchmarking supply chain operations. Benchmarking for Quality
Management & Technology, 5(4), 283-290.
196
Gilmour, P. (1999). A strategic audit framework to improve supply chain performance.
Journal of Business & Industrial Marketing, 14(5/6), 355-366.
Goldratt, E. M., & Cox, J. (1984). The goal: An ongoing improvement process. Gower,
MO: North River Press.
Gomes, C. F., & Yasin, M. M. (2011). A systematic benchmarking perspective on
performance management of global small to medium-sized organizations: An
implementation-based approach. Benchmarking: An International Journal,
18(4), 543-562.
Guba, E. G., & Lincoln, Y. S. (1994). Competing paradigms in qualitative research. In
N. K. Denzin & Y. S. Lincoln (Eds.), Handbook of qualitative research (Vol. 2,
pp. 105-117). Thousand Oaks: Sage Publications.
Gulledge, T., & Chavusholu, T. (2008). Automating the construction of supply chain
key performance indicators. Industrial Management & Data Systems, 108(6),
750-774.
Gunasekaran, A., Patel, C., & McGaughey, R. (2004). A framework for supply chain
performance measurement. International Journal of Production Economics,
87(3), 333-347.
Gunasekaran, A., Patel, C., & Tirtiroglu, E. (2001). Performance measures and metrics
in a supply chain environment. International Journal of Operations &
Production Management, 21(1/2), 71-87.
Gunasekaran, A., Williams, H. J., & McGaughey, R. E. (2005). Performance
measurement and costing system in new enterprise. Technovation, 25(5), 523-
533.
Harbour, J. L. (2009). The basics of performance measurement (2nd ed.). New York,
NY: Productivity Press.
Hayes, R. H., & Abernathy, W. J. (1980). Managing our way to economic decline.
Harvard Business Review, 58(4), 67-77.
Helson, H. (1964). Adaptation level theory: An experimental and systematic approach
to behavior. New York, NY: Harper & Row.
Hemme, T. (2014). IFCN Dairy Report 2014. Keil, Germany: IFCN Dairy Research
Center.
Heriot, K. C., & Kulkarni, S. P. (2001). The use of intermediate sourcing strategies.
Journal of Supply Chain Management, 37(1), 18-26.
197
Heskett, J., Glaskowsky, N., & Ivie, R. (1973). Business logistics; physical distribution
and materials management (2 ed.). New York, NY: Ronald Press Co.
Hidding, G. J. (2001). Sustaining strategic IT advantage in the information age: How
strategy paradigms differ by speed. The Journal of Strategic Information
Systems, 10(3), 201-222.
Hiromoto, T. (1988). Another hidden edge-Japanese management accounting. Harvard
Business Review, 66(4), 22-26.
Ho, C. (2007). Measuring system performance of an ERP-based supply chain.
International Journal of Production Research, 45(6), 1255-1277.
Hobbs, J. E., & Young, L. M. (2000). Closer vertical co-ordination in agri-food supply
chains: A conceptual framework and some preliminary evidence. Supply Chain
Management: An International Journal, 5(3), 131-143.
Hofmann, E. (2006). Quantifying and setting off network performance. International
Journal of Networking and Virtual Organisations, 3(3), 317-339.
Hofmann, E., & Locker, A. (2009). Value-based performance measurement in supply
chains: a case study from the packaging industry. Production Planning and
Control, 20(1), 68-81.
Holmberg, S. (2000). A systems perspective on supply chain measurements.
International Journal of Physical Distribution & Logistics Management, 30(10),
847-868.
Huang, S. H., Sheoran, S. K., & Keskar, H. (2005). Computer-assisted supply chain
configuration based on supply chain operations reference (SCOR) model.
Computers & Industrial Engineering, 48(2), 377-394.
Hwang, Y. D., Lin, Y. C., & Lyu, J. (2008). The performance evaluation of SCOR
sourcing process: The case study of Taiwan's TFT-LCD industry. International
Journal of Production Economics, 115(2), 411-423.
Irfan, D., Xu, X., Deng, S., & He, Z. (2008). A SCOR Reference Model of the Supply
Chain Management System in an Enterprise. The International Arab Journal of
Informantion Technology, 5(3), 288-295.
Iribarren, D., Hospido, A., Moreira, M. T., & Feijoo, G. (2011). Benchmarking
environmental and operational parameters through eco-efficiency criteria for
dairy farms. Science of the Total Environment, 409(10), 1786-1798.
198
Jamehshooran, B. G., Shaharoun, M., & Haron, H. N. (2015). Assessing Supply Chain
Performance through Applying the SCOR Model. International Journal of
Supply Chain Management, 4(1), 1-11.
Johnson, H. T. (1972). Early cost accounting for internal management control: Lyman
Mills in the 1850's. The Business History Review, 46(4), 466-474.
Johnson, H. T. (1981). Toward a new understanding of nineteenth-century cost
accounting. Accounting Review, 56(3), 510-518.
Johnson, H. T., & Kaplan, R. S. (1987). Relevance lost: The rise and fall of
management accounting. Boston, MA: Harvard Business School Press.
Jolly-Desodt, A.-M., Rabenasolo, B., & Lo, J. L. W. (2006). Benchmarking of the textile
garment supply chain using the SCOR model. Paper presented at the Service
Systems and Service Management, 2006 International Conference on.
Joshi, R., Banwet, D., Shankar, R., & Gandhi, J. (2012). Performance improvement of
cold chain in an emerging economy. Production Planning & Control, 23(10-11),
817-836.
Kaplan, B., & Maxwell, J. (2005). Qualitative research methods for evaluating
computer information systems. In J. G. Anderson & C. E. Aydin (Eds.),
Evaluating the organizational impact of healthcare information systems (2 ed.,
pp. 30-55). New York, NY: Springer.
Kaplan, R. S., & Norton, D. P. (1992). The balanced scorecard–measures that drive
performance. Harvard Business Review, 43(1), 71-79.
Kaplan, R. S., & Norton, D. P. (1996). The balanced scorecard: Translating strategy
into action. Boston, MA: Harvard Business Press.
Karch, K. M. (1992). Getting organizational buy in for benchmarking: Environmental
management at weyerhaeuser. National Productivity Review, 12(1), 13-22.
Kaufman, A., Wood, C. H., & Theyel, G. (2000). Collaboration and technology
linkages: a strategic supplier typology. Strategic Management Journal, 21(6),
649-663.
Keegan, D. P., Eiler, R. G., & Jones, C. R. (1989). Are your performance measures
obsolete? Management Accounting, 70(12), 45-50.
Kehoe, D. F., Dani, S., Sharifi, H., Burns, N. D., & Backhouse, C. J. (2007). Demand
network alignment: Aligning the physical, informational and relationship issues
in supply chains. International Journal of Production Research, 45(5), 1141-
1160.
199
Kennerley, M., & Neely, A. (2002). A framework of the factors affecting the evolution
of performance measurement systems. International Journal of Operations &
Production Management, 22(11), 1222-1245.
Khan, M. J., Abbas, A., Naeem, M., Ayaz, M. M., & Akhter, S. (2013). Current issues
and future prospects of dairy sector in Pakistan. Science Technology and
Development, 32(2), 126-139.
Khan, N. M. (2008). Cooperatives in agriculture and its implications in less developed
countries. Sarhad Journal of Agriculture, 24(1), 191-197.
Khan, U., Lund, J., & Javaid, S. (2008). Economic analysis of milk production in
different cattle colonies of Karachi. Pakistan Journal of Agricultural Sciences
(Pakistan), 45(2), 403-409.
Kim, B. (2000). Coordinating an innovation in supply chain management. European
Journal of Operational Research, 123(3), 568-584.
King, G., Keohane, R. O., & Verba, S. (1994). Designing social inquiry: Scientific
inference in qualitative research. Princeton: Princeton University Press.
Knip, V. (2005). Developing countries and the global dairy sector: Part-1 global
overview. Rome, Italy: Food and Agriculture Organization.
Knura, S., Gymnich, S., Rembialkowska, E., & Petersen, B. (2006). Agri-food
production chain. In P. A. Luning, F. Devlieghere & R. Verhé (Eds.), Safety in
the agri-food chain. Wageningen: The Netherlands: Wageningen Academic
Publishers.
Kyrö, P. (2003). Revising the concept and forms of benchmarking. Benchmarking: An
International Journal, 10(3), 210-225.
La Forme, F. A. G., Genoulaz, V. B., & Campagne, J. P. (2007). A framework to
analyse collaborative performance. Computers in Industry, 58(7), 687-697.
La Londe, B. J. (1998). Supply chain evolution by the numbers. Supply Chain
Management Review, 2(1), 7–8.
La Londe, B. J., & Masters, J. M. (1994). Emerging logistics strategies: Blueprints for
the next century. International Journal of Physical Distribution & Logistics
Management, 24(7), 35-47.
La Londe, B. J., & Zinszer, P. H. (1976). Customer service: Meaning and measurement.
Chicago, IL: National Council of Physical Distribution Management.
Lambert, D. M., & Cooper, M. C. (2000). Issues in supply chain management.
Industrial Marketing Management, 29(1), 65-83.
200
Lambert, D. M., Cooper, M. C., & Pagh, J. D. (1998). Supply chain management:
Implementation issues and research opportunities. The International Journal of
Logistics Management, 9(2), 1-19.
Lambert, D. M., & Pohlen, T. L. (2001). Supply chain metrics. The International
Journal of Logistics Management, 12(1), 1-19.
Lambert, D. M., Stock, J. R., & Ellram, L. M. (1998). Fundamentals of logistics
management. Boston, MA: Irwin/McGraw-Hill.
Lamming, R. (1993). Beyond partnership: Strategies for innovation and lean supply.
Hemel Hampstead, UK: Prentice Hall.
Lane, C. (2011). Adult literacy and life skills survey (ALL) - 2006. Retrieved from
http://www.educationcounts.govt.nz/publications/series/ALL.
Langley, C. J. (1986). The evolution of the logistics concept. Journal of Business
logistics, 7(2), 1-13.
Lapide, L. (2000). What about measuring supply chain performance? Achieving Supply
Chain Excellence Through Technology, 2, 287-297.
Larsen-Freeman, D., & Long, M. H. (1991). An introduction to second language
acquisition research. London, UK: Longman.
Lazaraton, A. (1995). Qualitative research in applied linguistics: A progress report.
Tesol Quarterly, 29(3), 455-472.
Leat, P., & Revoredo-Giha, C. (2013). Risk and resilience in agri-food supply chains:
the case of the ASDA PorkLink supply chain in Scotland. Supply Chain
Management: An International Journal, 18(2), 219-231.
Lee, H. L. (2004). The triple-A supply chain. Harvard Business Review, 82(10), 102-
113.
Lee, H. L., & Billington, C. (1992). Managing supply chain inventory: Pitfalls and
opportunities. Sloan Management Review, 33(3), 65-73.
Levi, D. S., Kaminsky, P., & Levi, E. S. (2003). Designing and managing the supply
chain: Concepts, strategies, and case studies. New York, NY: Irwin/McGraw-
Hill.
Levy, M., & Grewal, D. (2000). Supply chain management in a networked economy.
Journal of Retailing, 76(4), 415-429.
Li, D., & O'Brien, C. (1999). Integrated decision modelling of supply chain efficiency.
International Journal of Production Economics, 59(1-3), 147-157.
201
Li, L., Su, Q., & Chen, X. (2011). Ensuring supply chain quality performance through
applying the SCOR model. International Journal of Production Research, 49(1),
33-57.
Li, S., Rao, S. S., Ragu-Nathan, T. S., & Ragu-Nathan, B. (2005). Development and
validation of a measurement instrument for studying supply chain management
practices. Journal of Operations Management, 23(6), 618-641.
Li, Z., Xu, X., & Kumar, A. (2007). Supply chain performance evaluation from
structural and operational levels. Paper presented at the IEEE conference on
Emerging Technologies and Factory Automation (EFTA), Patras, Greece.
Liu, C. H. (2009). The effect of a quality management system on supply chain
performance: An empirical study in Taiwan. International Journal of
Management, 26(2), 285-294.
Lockamy, A. (1995). A conceptual framework for assessing strategic packaging
decisions. The International Journal of Logistics Management, 6(1), 51-60.
Lockamy, A., & McCormack, K. (2004). Linking SCOR planning practices to supply
chain performance: An exploratory study. International Journal of Operations
& Production Management, 24(12), 1192-1218.
Lucertini, M., Nicolo, F., & Telmon, D. (1995). Integration of benchmarking and
benchmarking of integration. International Journal of Production Economics,
38(1), 59-71.
Lummus, R. R., & Vokurka, R. J. (1999). Defining supply chain management: A
historical perspective and practical guidelines. Industrial Management & Data
Systems, 99(1), 11-17.
Luning, P. A., Marcelis, W. J., & Jongen, W. M. (2002). Food quality management: A
techno-managerial approach. Wageningen: Wageningen Pers.
Lynch, R. L., & Cross, K. F. (1991). Measure up–the essential guide to measuring
business performance. London, UK: Mandarin
Mahoney, J., & Goertz, G. (2006). A tale of two cultures: Contrasting quantitative and
qualitative research. Political Analysis, 14(3), 227.
Manzini, R., & Accorsi, R. (2013). The new conceptual framework for food supply
chain assessment. Journal of Food Engineering, 115(2), 251-263.
Mathaisel, D. F. X., Cathcart, T. P., & Comm, C. L. (2004). A framework for
benchmarking, classifying, and implementing best sustainment practices.
Benchmarking: An International Journal, 11(4), 403-417.
202
McCutcheon, D., & Stuart, F. I. (2000). Issues in the choice of supplier alliance
partners. Journal of Operations Management, 18(3), 279-301.
McWilliams, G. (1997). Whirlwind on the web. Business Week(3521), 132-136.
Mentzer, J. T., DeWitt, W., Keebler, J. S., Min, S., Nix, N. W., Smith, C. D., et al.
(2001). Defining supply chain management. Journal of Business logistics, 22(2),
1-26.
Mentzer, J. T., & Konrad, B. P. (1991). An efficiency/effectiveness approach to
logistics performance analysis. Journal of Business logistics, 12(1), 33-62.
Miller, J. G., & Vollmann, T. E. (1985). The hidden factory. Harvard Business Review,
63(5), 142-150.
Millet, P. A., Schmitt, P., & Botta-Genoulaz, V. (2009). The SCOR model for the
alignment of business processes and information systems. Enterprise
Information Systems, 3(4), 393-407.
Ministry of Finance. (2015). Pakistan economic survey 2014-15. Retrieved from
http://www.finance.gov.pk/survey/chapters_15/02_Agricultre.pdf.
Mohezar, S., & Nor, M. N. M. (2014). Could supply chain technology improve food
operators' innovativeness? A developing country's perspective. Trends in Food
Science & Technology, 38(1), 75-82.
Morgan, D. L. (1998). Practical strategies for combining qualitative and quantitative
methods: Applications to health research. Qualitative health research, 8(3), 362.
Murphy, G. (1972). Transport and distribution. London, UK: Business Books.
Myers, M. (2000). Qualitative research and the generalizability question: Standing firm
with Proteus. The Qualitative Report, 4(3/4), 1-9.
Neely, A. (1998). Measuring business performance. London, UK: Economist Books.
Neely, A., Adams, C., & Kennerley, M. (2002). The performance prism: The scorecard
for measuring and managing business success. London, UK: Prentice Hall
Financial Times.
Neely, A., Gregory, M., & Platts, K. (1995). Performance measurement system design:
A literature review and research agenda. International Journal of Operations &
Production Management, 15(4), 80-116.
Neuman, W. L. (2006). Social research methods: Qualitative and quantitative
approaches. Boston, MA: Pearson/Allyn and Bacon.
New Zealand Food Safety Authority. (2008). Animal products approved criteria for
farm dairies. Retrieved from
203
http://www.nzfsa.govt.nz/dairy/publications/approved-criteria/dcp2/dpc2-
approved-criteria-for-farm-dairies.pdf.
New Zealand Government. (2010). New Zealand Government paper for the European
Union high level experts group on milk, 12 January 2010. Retrieved from
http://ec.europa.eu/agriculture//markets/milk/hlg/3countries_nz1_en.pdf.
New Zealand Treasury. (2005). The Contribution of Primary Sector to New Zealand's
Economic Growth. Retrieved from
http://www.treasury.govt.nz/publications/research-policy/ppp/2005/05-04/tpp05-
04.pdf.
Norina, L. (2004). Measuring performance of agri-food chains. (Doctoral thesis,
Massey University, Palmerston North, New Zealand). Retrieved from
http://hdl.handle.net/10179/1733
OECD-FAO. (2014). OECD-FAO agricultural outlook 2014. Retrieved from
http://www.oecd-ilibrary.org/agriculture-and-food/oecd-fao-agricultural-
outlook-2014_agr_outlook-2014-en.
Oliver, R. K., & Weber, M. D. (1982). Supply chain management: Logistics catches up
with strategy. In M. Christopher (Ed.), Logistics: The strategic issues (pp. 63-
75). London, UK: Chapman & Hall.
Otto, A., & Kotzab, H. (2003). Does supply chain management really pay? Six
perspectives to measure the performance of managing a supply chain. European
Journal of Operational Research, 144(2), 306-320.
Painter, M. J. (2007). A comparison of the dairy industries in Canada and New Zealand.
Journal of International Farm Management, 4(1), 41-60.
Pakistan Bureau of Statistics. (2006). Pakistan livestock census 2006. Retrieved from
http://www.pbs.gov.pk/content/pakistan-livestock-census-2006.
Pakistan Bureau of Statistics. (2014). Pakistan social and living standards measurement
survey 2012-13. Retrieved from http://www.pbs.gov.pk/content/pakistan-social-
and-living-standards-measurement-survey-pslm-2012-13-provincial-district.
Papaioannou, T., Rush, H., & Bessant, J. (2006). Benchmarking as a policy-making
tool: From the private to the public sector. Science and Public Policy, 33(2), 91-
102.
Papakiriakopoulos, D., & Pramatari, K. (2010). Collaborative performance
measurement in supply chain. Industrial Management & Data Systems, 110(9),
1297-1318.

204
Parker, C. (2000). Performance measurement. Work Study, 49(2), 63-66.
Parliament, C., Lerman, Z., & Fulton, J. R. (1989) Performance of cooperatives and
investor owned firms in the dairy industry. University of Minnesota, Department
of Applied Economics.
Parmenter, D. (2007). Key performance indicators: Developing, implementing, and
using winning KPIs. Hoboken, New Jersey: John Wiley & Sons, Inc.
PDDC. (2006). The white revolution "dhoodh darya": White paper on Pakistan's dairy
sector. Retrieved from http://www.pddc.com.pk/DairyPakistan-Publication.pdf.
Peck, H. (2000). Strategy and relationships: Defining the interface in supply chain
contexts. The International Journal of Logistics Management, 11(2), 33-44.
Peppard, J., & Rylander, A. (2006). From value chain to value network: Insights for
mobile operators. European Management Journal, 24(2-3), 128-141.
Perry, C., Riege, A., & Brown, L. (1999). Realism’s role among scientific paradigms in
marketing research. Irish Marketing Review, 12(2), 16-23.
Petersen, K. J., Handfield, R. B., & Ragatz, G. L. (2005). Supplier integration into new
product development: Coordinating product, process and supply chain design.
Journal of Operations Management, 23(3-4), 371-388.
Pimenta, L. C. Q. (2010). The logistics of milk collection: An exploratory case study
between New Zealand and Brazil. (Master's thesis, Massey University,
Palmerston North, New Zealand). Retrieved from
http://hdl.handle.net/10179/1334
Pine, B. J. (1993). Mass customization. Boston, MA: Harvard Business School Press
Pohlen, T. L. (2003). A framework for evaluating supply chain performance. Journal of
Transportation Management, 14(2), 1-21.
Porter, M. E. (1985). Competitive advantage: Creating and sustaining superior
performance. New York: Free Press
Prado, J. C. P. (2001). Benchmarking for the development of quality assurance systems.
Benchmarking: An International Journal, 8(1), 62-69.
Quinn, F. J. (1997). What’s the buzz? Logistics Management, 36(2), 43-47.
Raghunathan, S. (1999). Interorganizational collaborative forecasting and replenishment
systems and supply chain implications. Decision Sciences, 30(4), 1053-1071.
Ramaa, A., Rangaswamy, T. M., & Subramanya, K. N. (2009). A review of literature on
performance measurement of supply chain network. Paper presented at the
205
Second International Conference on Emerging Trends in Engineering and
Technology, ICETET-09.
Rangone, A. (1996). An analytical hierarchy process framework for comparing the
overall performance of manufacturing departments. International Journal of
Operations & Production Management, 16(8), 104-119.
Rayport, J. F., & Sviokla, J. J. (1995). Exploiting the virtual value chain. Harvard
Business Review, 73(6), 75-85.
Reese, B. (1961). Physical distribution: The neglected marketing function. Industrial
Marketing, 46, 102-106.
Reiner, G., & Hofmann, P. (2006). Efficiency analysis of supply chain processes.
International Journal of Production Research, 44(23), 5065-5087.
Remenyi, D., Williams, B., Money, A., & Swartz, E. (1998). Doing research in
business and management: An introduction to process and management.
London, UK: Sage Publications.
Riaz, K. (2008). A case study of milk processing: The Idara-e-Kissan cooperative. The
Lahore Journal of Economics, 13(1), 87-128.
Rota, C., Reynolds, N., & Zanasi, C. (2012). Collaboration and sustainable
relationships: Their contribution to the life cycle analysis in agri-food supply
chains. Proceedings in Food System Dynamics, 574-583.
Runciman, W. B. (2002). Qualitative versus quantitative research-balancing cost, yield
and feasibility. Quality and Safety in Health Care, 11(2), 146.
Rushton, A., Croucher, P., & Baker, P. (2006). The handbook of logistics and
distribution management. London, UK: Kogan Page Ltd.
Sabir, H. M., Tahir, S. H., Arshad, S., & Nasir, S. B. (2012). Future of cooperative
farming in Pakistan. Journal of Biology, Agriculture, and Healthcare, 2(6), 42-
47.
Sale, J. E. M., Lohfeld, L. H., & Brazil, K. (2002). Revisiting the quantitative-
qualitative debate: Implications for mixed-methods research. Quality and
Quantity, 36(1), 43-53.
Sarwar, M., Khan, M. A., Nisa, M., & Iqbal, Z. (2002). Dairy industry in Pakistan: A
scenario. International Journal of Agriculture & Biology, 4(3), 420-428.
Saunders, M., Lewis, P., & Thornhill, A. (2012). Research methods for business
students. Harlow, UK: Pearson Education.
206
Schmenner, R. W. (1988). Escaping the black holes of cost accounting. Business
Horizons, 31(1), 66-72.
Schonberger, R. J. (1996). Strategic collaboration: Breaching the castle walls. Business
Horizons, 39(2), 20-26.
Sekhar, S. C. (2010). Benchmarking. African Journal of Business Management, 4(6),
882-885.
Shabani, A., Saen, R. F., & Torabipour, S. M. R. (2012). A new benchmarking
approach in cold chain. Applied Mathematical Modelling, 36(1), 212-224.
Shadbolt, N. (2009). DairyBase: Building a best practice benchmarking system. In L.
Jack (Ed.), Benchmarking in food and farming: Creating sustainable change.
Surrey, UK: Gower.
Shah, J., & Singh, N. (2001). Benchmarking internal supply chain performance:
Development of a framework. Journal of Supply Chain Management, 37(1), 37-
47.
Shahid, H., Shafique, O., & Shokat, A. (2012). Dairy Industry of Pakistan. European
Journal of Business and Management, 4(18), 1-4.
Shetty, Y. K. (1993). Aiming high: Competitive benchmarking for superior
performance. Long Range Planning, 26(1), 39-44.
Simatupang, T. M., & Sridharan, R. (2004). A benchmarking scheme for supply chain
collaboration. Benchmarking: An International Journal, 11(1), 9-30.
Smykay, E. W., Bowersox, D. J., & Mossman, F. H. (1961). Physical distribution
management. New York: The Macmillan Company.
Soni, G., & Kodali, R. (2008). Evolution of supply chain management: Developments
in academia and industry. The ICFIA University Journal of Supply Chain
Management, 5(4), 7-40.
Spendolini, M. J. (1992). The benchmarking book. New York, NY: Amacom.
Springer-Heinze, A. (2007). Valuelinks manual: The methodology of value chain
promotion. Retrieved from
http://eprints.icrisat.ac.in/10641/1/valuelinks_complete.pdf.
Sreejesh, S., Mohapatra, S., & Anusree, M. R. (2014). Busines research methods: An
applied orientation. Switzerland: Springer.
Staley, S. M., & Warfield, J. N. (2007). Enterprise integration of product development
data: Systems science in action. Enterprise Information Systems, 1(3), 269-285.

207
Stapenhurst, T. (2009). The benchmarking book: A how-to-guide to best practice for
managers and practitioners. Oxford, UK: Butterworth-Heinemann.
Statistics New Zealand. (2014a). Business demographic statistics: Detailed industry for
enterprises 2000-13, from http://nzdotstat.stats.govt.nz/wbos/Index.aspx
Statistics New Zealand. (2014b). Food price index 2012-13, from
http://www.stats.govt.nz/browse_for_stats/economic_indicators/prices_indexes/f
ood-price-index-info-releases.aspx
Statistics New Zealand. (2014c). New Zealand in profile: 2014, from
http://www.stats.govt.nz/browse_for_stats/snapshots-of-nz/nz-in-profile-
2014.aspx
Stewart, G. (1995). Supply chain performance benchmarking study reveals keys to
supply chain excellence. Logistics Information Management, 8(2), 38-44.
Stewart, G. (1997). Supply chain operations reference (SCOR) model: The first cross-
industry framework for integrated supply chain management. Logistics
Information Management, 10(2), 62-67.
Supply Chain Council. (2012). Supply chain operations reference (SCOR) model
(version 10.0): Overview Retrieved November, 2012, from http://supply-
chain.org/f/SCOR-Overview-Web.pdf
Swaminathan, J. M., Smith, S. F., & Sadeh, N. M. (1998). Modeling supply chain
dynamics: A multiagent approach. Decision Sciences, 29(3), 607-632.
Tan, K. C., Kannan, V. R., Handfield, R. B., & Ghosh, S. (1999). Supply chain
management: An empirical study of its impact on performance. International
Journal of Operations & Production Management, 19(10), 1034-1052.
Tariq, M., Mustafa, M. I., Iqbal, A., & Nawaz, H. (2008). Milk marketing and value
chain constraints. Pakistan Journal of Agricultural Sciences, 45(2), 195-200.
Teufel, N. (2007). Smallholder milk production in the Punjab of Pakistan and the
evaluation of potential interventions. University of Hohenheim.
Thakkar, J., Kanda, A., & Deshmukh, S. G. (2009). Supply chain performance
measurement framework for small and medium scale enterprises.
Benchmarking: An International Journal, 16(5), 702-723.
Thorelli, H. B. (1986). Networks: Between markets and hierarchies. Strategic
Management Journal, 7(1), 37-51.
208
Tiwong, S., Sopadang, A., Banomyong, R., & Ramingwong, S. (2012). Thai mango
supply chain comparison and analysis to Japanese market. Memoirs of the
Muroran Institute of Technology, 62, 15-19.
Tummala, R., & Schoenherr, T. (2011). Assessing and managing risks using the supply
chain risk management process (SCRMP). Supply Chain Management: An
International Journal, 16(6), 474-483.
Tuominen, T., Kitaygorodskaya, N., & Helo, P. (2009). Benchmarking Russian and
Finnish food industry supply chains. Benchmarking: An International Journal,
16(3), 415-431.
UN (Cartographer). (2004). United Nation's cartographic section: Country profiles -
Pakistan. Retrieved from
http://www.un.org/Depts/Cartographic/map/profile/pakistan.pdf
USDA. (2015). Dairy: World markets and trade. Retrieved from
http://apps.fas.usda.gov/psdonlbine/circulars/dairy.pdf.
Usmani, R. (2013). Country reports - Pakistan. Report of the Thirty-seventh Session of
the Animal Production and Health Commission for Asia and the Pacific
(APHCA) (pp. 112-116). Bangkok, Thailanad.
Van Aken, E. M., & Coleman, G. D. (2002). Building better measurement. Industrial
Management, 44(4), 28-33.
Van Amstel, P. R., & D'hert, G. (1996). Performance indicators in distribution. The
International Journal of Logistics Management, 7(1), 73-82.
Van der Spiegel, M. (2004). Measuring effectiveness of food quality management.
Wageningen, The Netherlands: Wageningen Universiteit.
Van der Spiegel, M., Luning, P., Ziggers, G., & Jongen, W. (2004). Evaluation of
performance measurement instruments on their use for food quality systems.
Critical Reviews in Food Science and Nutrition, 44, 7(8), 501-512.
Van der Vorst, J. (2000a). Effective food supply chains: Generating, modelling and
evaluating supply chain scenarios. PhD Thesis, Wageningen University,
Wageningen, The Netherlands.
Van der Vorst, J. (2000b). Effective food supply chains: Generating, modelling and
evaluating supply chain scenarios. Doctoral thesis, Wageningen University,
Wageningen: The Netherlands. Retrieved from http://edepot.wur.nl/121244
Van der Vorst, J. (2006). Performance measurement in agri-food supply-chain
networks: An overview. In C. J. Ondersteijn, J. H. Wijnands, R. B. Huirne & O.
209
Van Kooten (Eds.), Quantifying the agri-food supply chain (pp. 15-26).
Dordrecht, The Netherlands: Springer.
Van der Vorst, J., Beulens, A. J., & van Beek, P. (2000). Modelling and simulating
multi-echelon food systems. European Journal of Operational Research, 122(2),
354-366.
Van der Vorst, J., Peeters, L., & Bloemhof, J. M. (2013). Sustainability assessment
framework for food supply chain logistics: Empirical findings from Dutch food
industry. Proceedings in Food System Dynamics, 480-491.
Vanteddu, G., Chinnam, R. B., & Yang, K. (2006). A performance comparison tool for
supply chain management. International Journal of Logistics Systems and
Management, 2(4), 342-356.
Varma, S., & Deshmukh, S. (2009). Evaluating petroleum supply chain performance:
overcoming shortcomings of Balanced Scorecard. Global Journal of Flexible
Systems Management, 10(4), 11.
Wagner, S. M., & Bode, C. (2008). An empirical examination of supply chain
performance along several dimensions of risk. Journal of Business Logistics,
29(1), 307-325.
Walsh, J. (1992). The pursuit of a benchmark: How Nissan/Infinity developed its
service standard. Multinational Business, 4, 19-26.
Watson, G. H. (1993). Strategic benchmarking: How to rate your company's
performance against the world's best. New York, NY: John Wiley & Sons, Inc.
Webb, J. R. (2002). Understanding and designing market research. Padstow, UK:
Thomson Learning.
Weiss, N. A. (2012). Introductory statistics. Boston, MA: Pearson Education.
Whipple, J. M., & Frankel, R. (2000). Strategic alliance success factors. Journal of
Supply Chain Management, 36(3), 21-28.
Widyaningrum, D., & Masruroh, N. A. (2012). Development of the sea fishery supply
chain performance measurement system: A case study. International Journal of
Supply Chain Management, 1(3), 20-32.
Wiengarten, F., & Longoni, A. (2015). A nuanced view on supply chain integration: a
coordinative and collaborative approach to operational and sustainability
performance improvement. Supply Chain Management: An International
Journal, 20(2), 139-150.
210
Wiersma, W., & Jurs, S. G. (2009). Research methods in education: An introduction.
Boston, MA: Pearson/Allyn and Bacon.
Wong, A. (1999). Partnering through cooperative goals in supply chain relationships.
Total Quality Management & Business Excellence, 10(4), 786-792.
Wynn, P., Harris, D., Moss, R., Clem, B., Sutton, R., & Doyle, P. (2006). Report on
Dairy Mission to Pakistan. Australian Centre for International Agricultural
Research (ACIAR).
Yakovleva, N. (2007). Measuring the sustainability of the food supply chain: a case
study of the UK. Journal of Environmental Policy & Planning, 9(1), 75-100.
Yakovleva, N., Sarkis, J., & Sloan, T. (2009). Sustainable benchmarking of food supply
chains. (Working Paper). Worcester, MA: George Perkins Marsh Institute, Clark
University.
Yao, K., & Liu, C. (2006). An integrated approach for measuring supply chain
performance. Journal of Modern Accounting and Auditing, 2(10), 17.
Yasin, M. M. (2002). The theory and practice of benchmarking: Then and now.
Benchmarking: An International Journal, 9(3), 217-243.
Yasin, M. M., & Zimmerer, T. W. (1995). The role of benchmarking in achieving
continuous service quality. International Journal of Contemporary Hospitality
Management, 7(4), 27-32.
Younas, M. (2013) The dairy value chain: A promoter of development and employment
in Pakistan. ICDD Working Papers. Kassel, Germany: International Center for
Development and Decent Work.
Young, S. D., & O'Byrne, S. F. (2001). EVA and value based management: A practical
guide to implementation. New York, NY: McGraw-Hill.
Zairi, M., & Ahmed, P. K. (1999). Benchmarking maturity as we approach the
millennium? Total Quality Management & Business Excellence, 10(4), 810-816.
Zairi, M., & Al-Mashari, M. (2005). The role of benchmarking in best practice
management and knowledge sharing. The Journal of Computer Information
Systems, 45(4), 14-31.
Zairi, M., & Hutton, R. (1995). Benchmarking: A process-driven tool for quality
improvement. The TQM Magazine, 7(3), 35-40.
Zhang, X., & Wang, H. (2011). Empirical research on associations among information
technology, supply chain robustness and supply chain performance.
International Journal of Business & Management, 6(2), 231-235.
211
Zia, U. (2006). Analysis of milk marketing chain. Rome, Italy: Food and Agriculture
Organization.
Zia, U. (2009). Pakistan: A dairy sector at a crossroads. In N. Morgan (Ed.),
Smallholder dairy development: Lessons learned in Asia. (Vol. 2, pp. 76-92).
Rome, Italy: Food and Agriculture Organization.
Zia, U., Mahmood, T., & Ali, M. R. (2011). Dairy development in Pakistan. Rome,
Italy: Food and Agriculture Organization.
Ziggers, G. W., & Trienekens, J. (1999). Quality assurance in food and agribusiness
supply chains: Developing successful partnerships. International Journal of
Production Economics, 60, 271-279.
Zikmund, W. G., Babin, B. J., Carr, J. C., & Griffin, M. (2013). Business research
methods (9 ed.). Canada: South-Western, Cengage Learning.
Zubair, M., & Mufti, N. A. (2015). Identification and Assessment of Supply Chain
Risks Associated with Dairy Products Sector. Journal of Basic and Applied
Sciences, 11, 167-175.
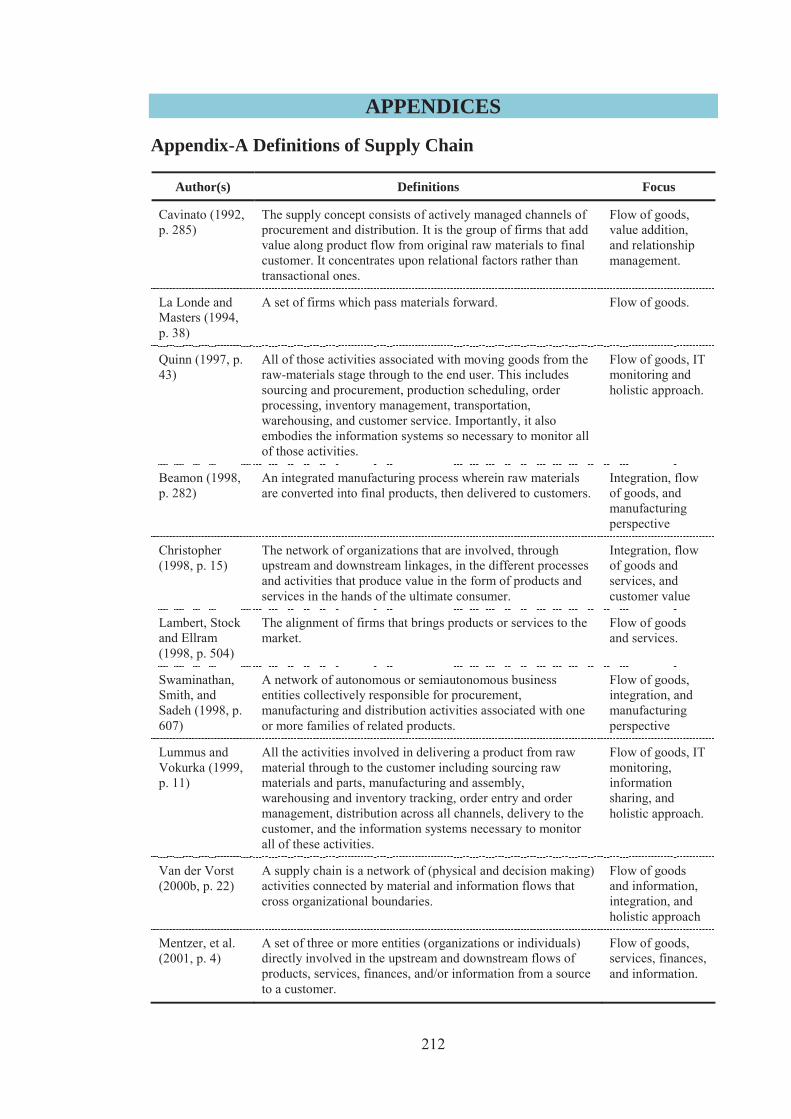
212
APPENDICES
Appendix-A Definitions of Supply Chain
Author(s) Definitions Focus
Cavinato (1992, p. 285)
The supply concept consists of actively managed channels of procurement and distribution. It is the group of firms that add value along product flow from original raw materials to final customer. It concentrates upon relational factors rather than transactional ones.
Flow of goods, value addition, and relationship management.
La Londe and Masters (1994, p. 38)
A set of firms which pass materials forward. Flow of goods.
Quinn (1997, p. 43)
All of those activities associated with moving goods from the raw-materials stage through to the end user. This includes sourcing and procurement, production scheduling, order processing, inventory management, transportation, warehousing, and customer service. Importantly, it also embodies the information systems so necessary to monitor all of those activities.
Flow of goods, IT monitoring and holistic approach.
Beamon (1998, p. 282)
An integrated manufacturing process wherein raw materials are converted into final products, then delivered to customers.
Integration, flow of goods, and manufacturing perspective
Christopher (1998, p. 15)
The network of organizations that are involved, through upstream and downstream linkages, in the different processes and activities that produce value in the form of products and services in the hands of the ultimate consumer.
Integration, flow of goods and services, and customer value
Lambert, Stock and Ellram (1998, p. 504)
The alignment of firms that brings products or services to the market.
Flow of goods and services.
Swaminathan, Smith, and Sadeh (1998, p. 607)
A network of autonomous or semiautonomous business entities collectively responsible for procurement, manufacturing and distribution activities associated with one or more families of related products.
Flow of goods, integration, and manufacturing perspective
Lummus and Vokurka (1999, p. 11)
All the activities involved in delivering a product from raw material through to the customer including sourcing raw materials and parts, manufacturing and assembly, warehousing and inventory tracking, order entry and order management, distribution across all channels, delivery to the customer, and the information systems necessary to monitor all of these activities.
Flow of goods, IT monitoring, information sharing, and holistic approach.
Van der Vorst (2000b, p. 22)
A supply chain is a network of (physical and decision making) activities connected by material and information flows that cross organizational boundaries.
Flow of goods and information, integration, and holistic approach
Mentzer, et al. (2001, p. 4)
A set of three or more entities (organizations or individuals) directly involved in the upstream and downstream flows of products, services, finances, and/or information from a source to a customer.
Flow of goods, services, finances, and information.
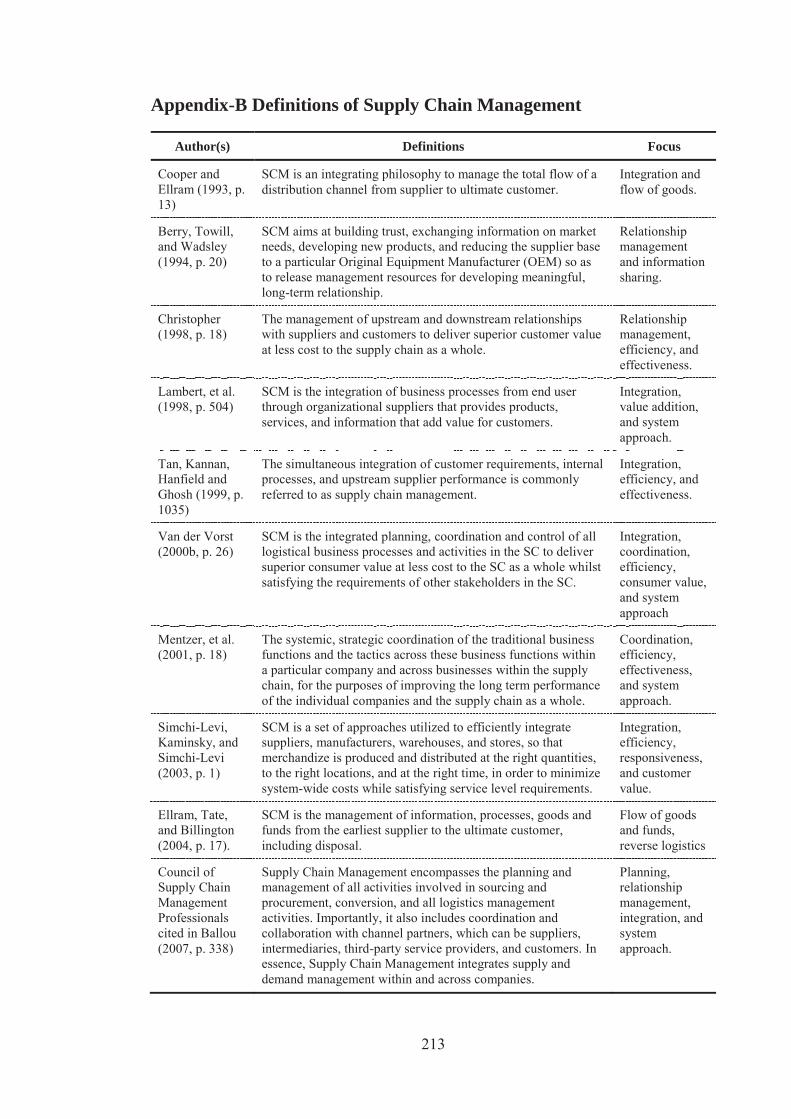
213
Appendix-B Definitions of Supply Chain Management
Author(s) Definitions Focus
Cooper and Ellram (1993, p. 13)
SCM is an integrating philosophy to manage the total flow of a distribution channel from supplier to ultimate customer.
Integration and flow of goods.
Berry, Towill, and Wadsley (1994, p. 20)
SCM aims at building trust, exchanging information on market needs, developing new products, and reducing the supplier base to a particular Original Equipment Manufacturer (OEM) so as to release management resources for developing meaningful, long-term relationship.
Relationship management and information sharing.
Christopher (1998, p. 18)
The management of upstream and downstream relationships with suppliers and customers to deliver superior customer value at less cost to the supply chain as a whole.
Relationship management, efficiency, and effectiveness.
Lambert, et al. (1998, p. 504)
SCM is the integration of business processes from end user through organizational suppliers that provides products, services, and information that add value for customers.
Integration, value addition, and system approach.
Tan, Kannan, Hanfield and Ghosh (1999, p. 1035)
The simultaneous integration of customer requirements, internal processes, and upstream supplier performance is commonly referred to as supply chain management.
Integration, efficiency, and effectiveness.
Van der Vorst (2000b, p. 26)
SCM is the integrated planning, coordination and control of all logistical business processes and activities in the SC to deliver superior consumer value at less cost to the SC as a whole whilst satisfying the requirements of other stakeholders in the SC.
Integration, coordination, efficiency, consumer value, and system approach
Mentzer, et al. (2001, p. 18)
The systemic, strategic coordination of the traditional business functions and the tactics across these business functions within a particular company and across businesses within the supply chain, for the purposes of improving the long term performance of the individual companies and the supply chain as a whole.
Coordination, efficiency, effectiveness, and system approach.
Simchi-Levi, Kaminsky, and Simchi-Levi (2003, p. 1)
SCM is a set of approaches utilized to efficiently integrate suppliers, manufacturers, warehouses, and stores, so that merchandize is produced and distributed at the right quantities, to the right locations, and at the right time, in order to minimize system-wide costs while satisfying service level requirements.
Integration, efficiency, responsiveness, and customer value.
Ellram, Tate, and Billington (2004, p. 17).
SCM is the management of information, processes, goods and funds from the earliest supplier to the ultimate customer, including disposal.
Flow of goods and funds, reverse logistics
Council of Supply Chain Management Professionals cited in Ballou (2007, p. 338)
Supply Chain Management encompasses the planning and management of all activities involved in sourcing and procurement, conversion, and all logistics management activities. Importantly, it also includes coordination and collaboration with channel partners, which can be suppliers, intermediaries, third-party service providers, and customers. In essence, Supply Chain Management integrates supply and demand management within and across companies.
Planning, relationship management, integration, and system approach.
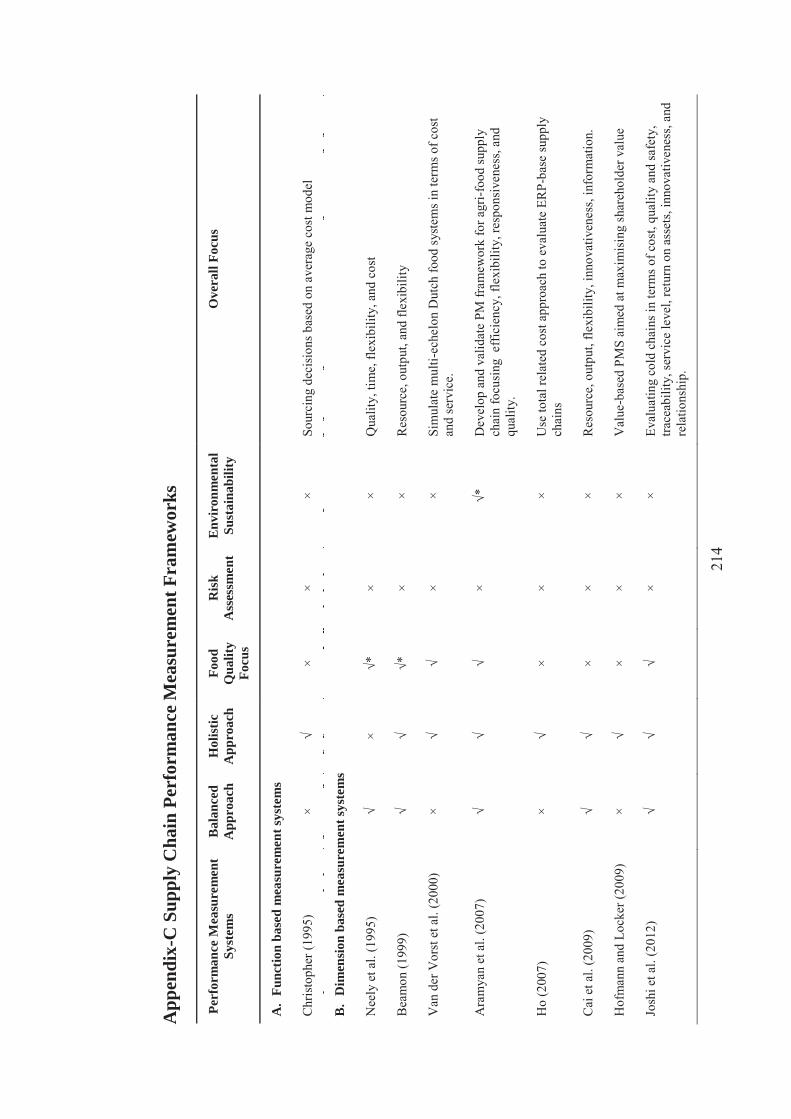
214
App
endi
x-C
Sup
ply
Cha
in P
erfo
rman
ce M
easu
rem
ent F
ram
ewor
ks
Perf
orm
ance
Mea
sure
men
t Sy
stem
s B
alan
ced
App
roac
h H
olis
tic
App
roac
h Fo
od
Qua
lity
Focu
s
Ris
k A
sses
smen
t E
nvir
onm
enta
l Su
stai
nabi
lity
Ove
rall
Focu
s
A.
Func
tion
base
d m
easu
rem
ent s
yste
ms
Chr
isto
pher
(199
5)
× √
× ×
× So
urci
ng d
ecis
ions
bas
ed o
n av
erag
e co
st m
odel
B.
Dim
ensi
on b
ased
mea
sure
men
t sys
tem
s
Nee
ly e
t al.
(199
5)
√ ×
√*
× ×
Qua
lity,
tim
e, fl
exib
ility
, and
cos
t
Bea
mon
(199
9)
√ √
√*
× ×
Res
ourc
e, o
utpu
t, an
d fle
xibi
lity
Van
der
Vor
st e
t al.
(200
0)
× √
√ ×
× Si
mul
ate
mul
ti-ec
helo
n D
utch
food
syst
ems i
n te
rms o
f cos
t an
d se
rvic
e.
Ara
mya
n et
al.
(200
7)
√ √
√ ×
√*
Dev
elop
and
val
idat
e PM
fram
ewor
k fo
r agr
i-foo
d su
pply
ch
ain
focu
sing
eff
icie
ncy,
flex
ibili
ty, r
espo
nsiv
enes
s, an
d qu
ality
.
Ho
(200
7)
× √
× ×
× U
se to
tal r
elat
ed c
ost a
ppro
ach
to e
valu
ate
ERP-
base
supp
ly
chai
ns
Cai
et a
l. (2
009)
√
√ ×
× ×
Res
ourc
e, o
utpu
t, fle
xibi
lity,
inno
vativ
enes
s, in
form
atio
n.
Hof
man
n an
d Lo
cker
(200
9)
× √
× ×
× V
alue
-bas
ed P
MS
aim
ed a
t max
imis
ing
shar
ehol
der v
alue
Josh
i et a
l. (2
012)
√
√ √
× ×
Eval
uatin
g co
ld c
hain
s in
term
s of c
ost,
qual
ity a
nd sa
fety
, tra
ceab
ility
, ser
vice
leve
l, re
turn
on
asse
ts, i
nnov
ativ
enes
s, an
d re
latio
nshi
p.
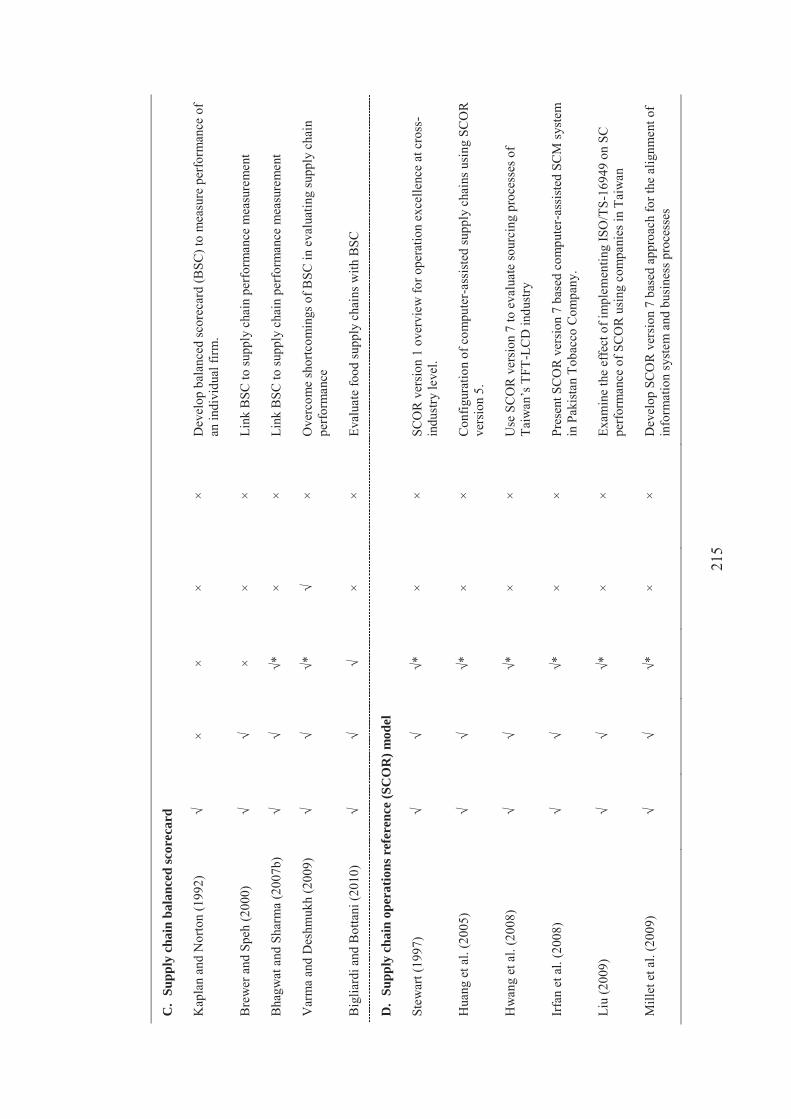
215
C.
Supp
ly c
hain
bal
ance
d sc
orec
ard
Kap
lan
and
Nor
ton
(199
2)
√ ×
× ×
× D
evel
op b
alan
ced
scor
ecar
d (B
SC) t
o m
easu
re p
erfo
rman
ce o
f an
indi
vidu
al fi
rm.
Bre
wer
and
Spe
h (2
000)
√
√ ×
× ×
Link
BSC
to su
pply
cha
in p
erfo
rman
ce m
easu
rem
ent
Bha
gwat
and
Sha
rma
(200
7b)
√ √
√*
× ×
Link
BSC
to su
pply
cha
in p
erfo
rman
ce m
easu
rem
ent
Var
ma
and
Des
hmuk
h (2
009)
√
√ √*
√
× O
verc
ome
shor
tcom
ings
of B
SC in
eva
luat
ing
supp
ly c
hain
pe
rfor
man
ce
Big
liard
i and
Bot
tani
(201
0)
√ √
√ ×
× Ev
alua
te fo
od su
pply
cha
ins w
ith B
SC
D.
Supp
ly c
hain
ope
ratio
ns r
efer
ence
(SC
OR
) mod
el
Stew
art (
1997
) √
√ √*
×
× SC
OR
ver
sion
1 o
verv
iew
for o
pera
tion
exce
llenc
e at
cro
ss-
indu
stry
leve
l.
Hua
ng e
t al.
(200
5)
√ √
√*
× ×
Con
figur
atio
n of
com
pute
r-as
sist
ed su
pply
cha
ins u
sing
SC
OR
ve
rsio
n 5 .
Hw
ang
et a
l. (2
008)
√
√ √*
×
× U
se S
CO
R v
ersi
on 7
to e
valu
ate
sour
cing
pro
cess
es o
f Ta
iwan
’s T
FT-L
CD
indu
stry
Irfa
n et
al.
(200
8)
√ √
√*
× ×
Pres
ent S
CO
R v
ersi
on 7
bas
ed c
ompu
ter-
assi
sted
SC
M s
yste
m
in P
akis
tan
Toba
cco
Com
pany
.
Liu
(200
9)
√ √
√*
× ×
Exam
ine
the
effe
ct o
f im
plem
entin
g IS
O/T
S-16
949
on S
C
perf
orm
ance
of S
CO
R u
sing
com
pani
es in
Tai
wan
Mill
et e
t al.
(200
9)
√ √
√*
× ×
Dev
elop
SC
OR
ver
sion
7 b
ased
app
roac
h fo
r the
alig
nmen
t of
info
rmat
ion
syst
em a
nd b
usin
ess p
roce
sses
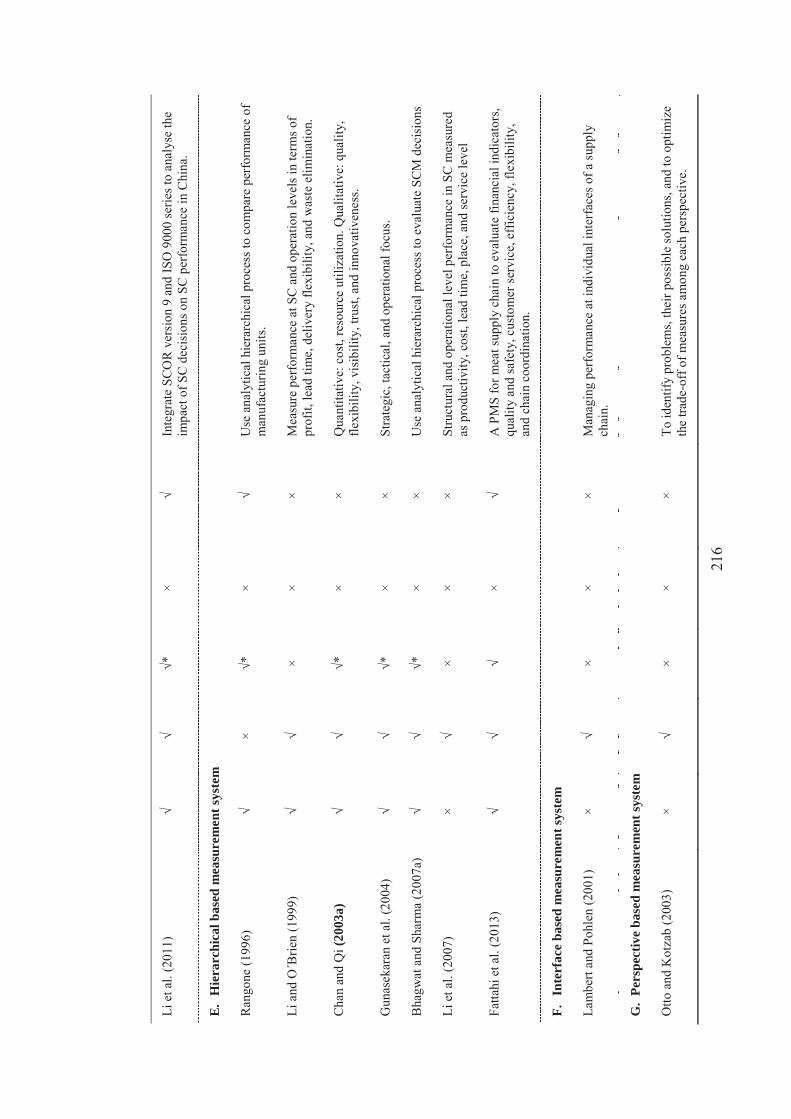
216
Li e
t al.
(201
1)
√ √
√*
× √
Inte
grat
e SC
OR
ver
sion
9 a
nd IS
O 9
000
serie
s to
anal
yse
the
impa
ct o
f SC
dec
isio
ns o
n SC
per
form
ance
in C
hina
.
E.
Hie
rarc
hica
l bas
ed m
easu
rem
ent s
yste
m
Ran
gone
(199
6)
√ ×
√*
× √
Use
ana
lytic
al h
iera
rchi
cal p
roce
ss to
com
pare
per
form
ance
of
man
ufac
turin
g un
its.
Li a
nd O΄B
rien
(199
9)
√ √
× ×
× M
easu
re p
erfo
rman
ce a
t SC
and
ope
ratio
n le
vels
in te
rms o
f pr
ofit,
lead
tim
e, d
eliv
ery
flexi
bilit
y, a
nd w
aste
elim
inat
ion.
Cha
n an
d Q
i (20
03a)
√
√ √*
×
× Q
uant
itativ
e: c
ost,
reso
urce
util
izat
ion.
Qua
litat
ive:
qua
lity,
fle
xibi
lity,
vis
ibili
ty, t
rust
, and
inno
vativ
enes
s.
Gun
asek
aran
et a
l. (2
004)
√
√ √*
×
× St
rate
gic,
tact
ical
, and
ope
ratio
nal f
ocus
.
Bha
gwat
and
Sha
rma
(200
7a)
√ √
√*
× ×
Use
ana
lytic
al h
iera
rchi
cal p
roce
ss to
eva
luat
e SC
M d
ecis
ions
Li e
t al.
(200
7)
× √
× ×
× St
ruct
ural
and
ope
ratio
nal l
evel
per
form
ance
in S
C m
easu
red
as p
rodu
ctiv
ity, c
ost,
lead
tim
e, p
lace
, and
serv
ice
leve
l
Fatta
hi e
t al.
(201
3)
√ √
√ ×
√ A
PM
S fo
r mea
t sup
ply
chai
n to
eva
luat
e fin
anci
al in
dica
tors
, qu
ality
and
safe
ty, c
usto
mer
serv
ice,
eff
icie
ncy,
flex
ibili
ty,
and
chai
n co
ordi
natio
n.
F. I
nter
face
bas
ed m
easu
rem
ent s
yste
m
Lam
bert
and
Pohl
en (2
001)
×
√ ×
× ×
Man
agin
g pe
rfor
man
ce a
t ind
ivid
ual i
nter
face
s of a
supp
ly
chai
n.
G.
Pers
pect
ive
base
d m
easu
rem
ent s
yste
m
Otto
and
Kot
zab
(200
3)
× √
× ×
× To
iden
tify
prob
lem
s, th
eir p
ossi
ble
solu
tions
, and
to o
ptim
ize
the
trade
-off
of m
easu
res a
mon
g ea
ch p
ersp
ectiv
e.
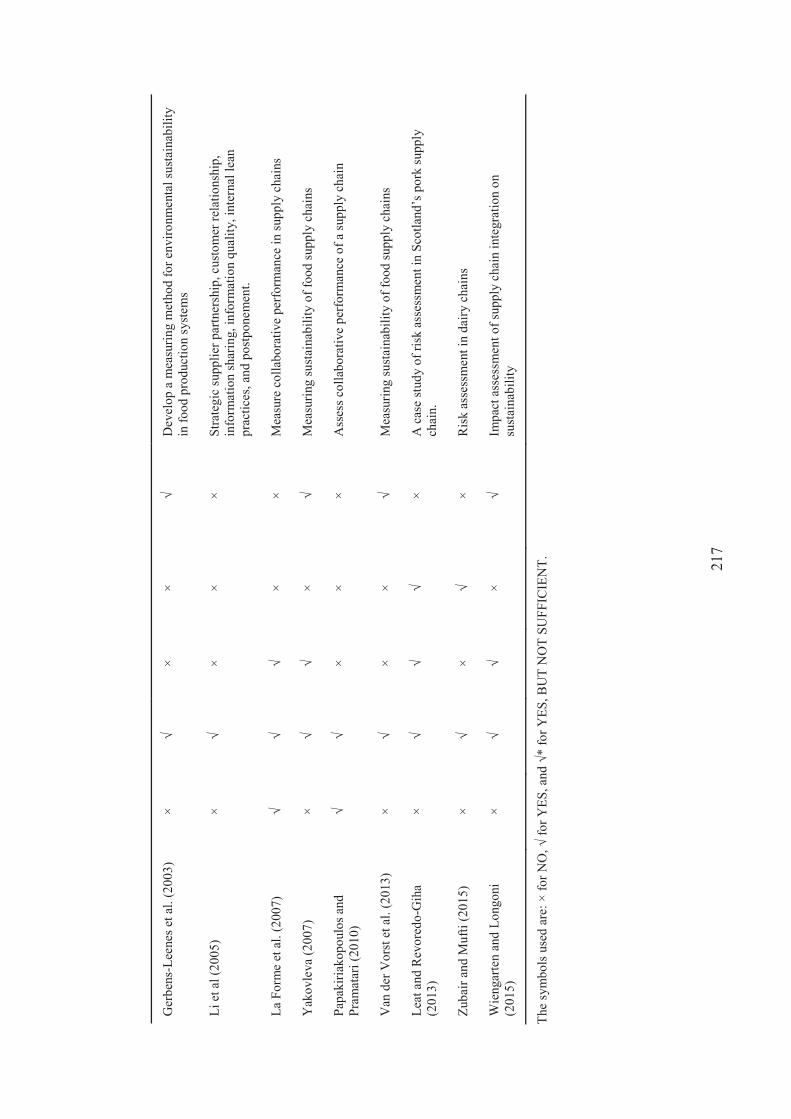
217
Ger
bens
-Lee
nes e
t al.
(200
3)
× √
× ×
√ D
evel
op a
mea
surin
g m
etho
d fo
r env
ironm
enta
l sus
tain
abili
ty
in fo
od p
rodu
ctio
n sy
stem
s
Li e
t al (
2005
) ×
√ ×
× ×
Stra
tegi
c su
pplie
r par
tner
ship
, cus
tom
er re
latio
nshi
p,
info
rmat
ion
shar
ing,
info
rmat
ion
qual
ity, i
nter
nal l
ean
prac
tices
, and
pos
tpon
emen
t.
La F
orm
e et
al.
(200
7)
√ √
√ ×
× M
easu
re c
olla
bora
tive
perf
orm
ance
in su
pply
cha
ins
Yak
ovle
va (2
007)
×
√ √
× √
Mea
surin
g su
stai
nabi
lity
of fo
od su
pply
cha
ins
Papa
kiria
kopo
ulos
and
Pr
amat
ari (
2010
) √
√ ×
× ×
Ass
ess c
olla
bora
tive
perf
orm
ance
of a
supp
ly c
hain
Van
der
Vor
st e
t al.
(201
3)
× √
× ×
√ M
easu
ring
sust
aina
bilit
y of
food
supp
ly c
hain
s
Leat
and
Rev
ored
o-G
iha
(201
3)
× √
√ √
× A
cas
e st
udy
of ri
sk a
sses
smen
t in
Scot
land
’s p
ork
supp
ly
chai
n.
Zuba
ir an
d M
ufti
(201
5)
× √
× √
× R
isk
asse
ssm
ent i
n da
iry c
hain
s
Wie
ngar
ten
and
Long
oni
(201
5 )
× √
√ ×
√ Im
pact
ass
essm
ent o
f sup
ply
chai
n in
tegr
atio
n on
su
stai
nabi
lity
The
sym
bols
use
d ar
e: ×
for N
O, √
for Y
ES, a
nd √
* fo
r YES
, BU
T N
OT
SUFF
ICIE
NT.
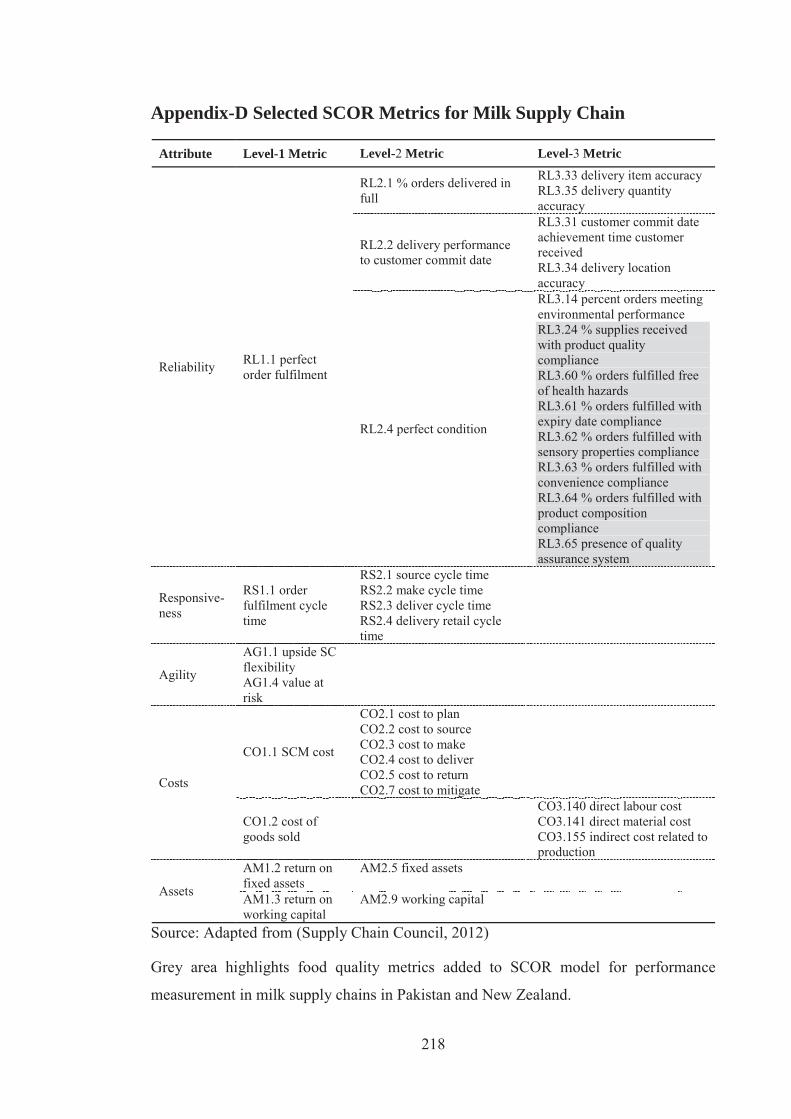
218
Appendix-D Selected SCOR Metrics for Milk Supply Chain
Attribute Level-1 Metric Level-2 Metric Level-3 Metric
Reliability RL1.1 perfect order fulfilment
RL2.1 % orders delivered in full
RL3.33 delivery item accuracy RL3.35 delivery quantity accuracy
RL2.2 delivery performance to customer commit date
RL3.31 customer commit date achievement time customer received RL3.34 delivery location accuracy
RL2.4 perfect condition
RL3.14 percent orders meeting environmental performance RL3.24 % supplies received with product quality compliance RL3.60 % orders fulfilled free of health hazards RL3.61 % orders fulfilled with expiry date compliance RL3.62 % orders fulfilled with sensory properties compliance RL3.63 % orders fulfilled with convenience compliance RL3.64 % orders fulfilled with product composition compliance RL3.65 presence of quality assurance system
Responsive- ness
RS1.1 order fulfilment cycle time
RS2.1 source cycle time RS2.2 make cycle time RS2.3 deliver cycle time RS2.4 delivery retail cycle time
Agility
AG1.1 upside SC flexibility AG1.4 value at risk
Costs
CO1.1 SCM cost
CO2.1 cost to plan CO2.2 cost to source CO2.3 cost to make CO2.4 cost to deliver CO2.5 cost to return CO2.7 cost to mitigate
CO1.2 cost of goods sold
CO3.140 direct labour cost CO3.141 direct material cost CO3.155 indirect cost related to production
Assets
AM1.2 return on fixed assets
AM2.5 fixed assets
AM1.3 return on working capital
AM2.9 working capital
Source: Adapted from (Supply Chain Council, 2012)
Grey area highlights food quality metrics added to SCOR model for performance
measurement in milk supply chains in Pakistan and New Zealand.

219
Appendix-E Linking SCOR Metrics with the Business Performance
Shar
ehol
der V
alue
Increase SC Revenue
↑ Perfect Order Fulfilment
↑ Order Fill Rate
↑ Product Quality
↑ Process Quality
↓ Order Fulfilment Cycle Time
↓ Source Cycle Time
↓ Make Cycle Time
↓ Deliver Cycle Time
↑ Upside SC Flexibility ↓ Order Fulfilment Cycle Time
Reduce SC Costs ↓ SCM Cost ↓ Procurement and distribution costs
↓ COGS ↑ yield and ↓ waste of production process
Improve ROI
↓ Non-Current Assets
↓ Working Capital ↓ Cash-to-cash cycle time
Optimise inventory management
↓ Overall Value at Risk
Comply with food regulations
Implement SOPs for SC processes
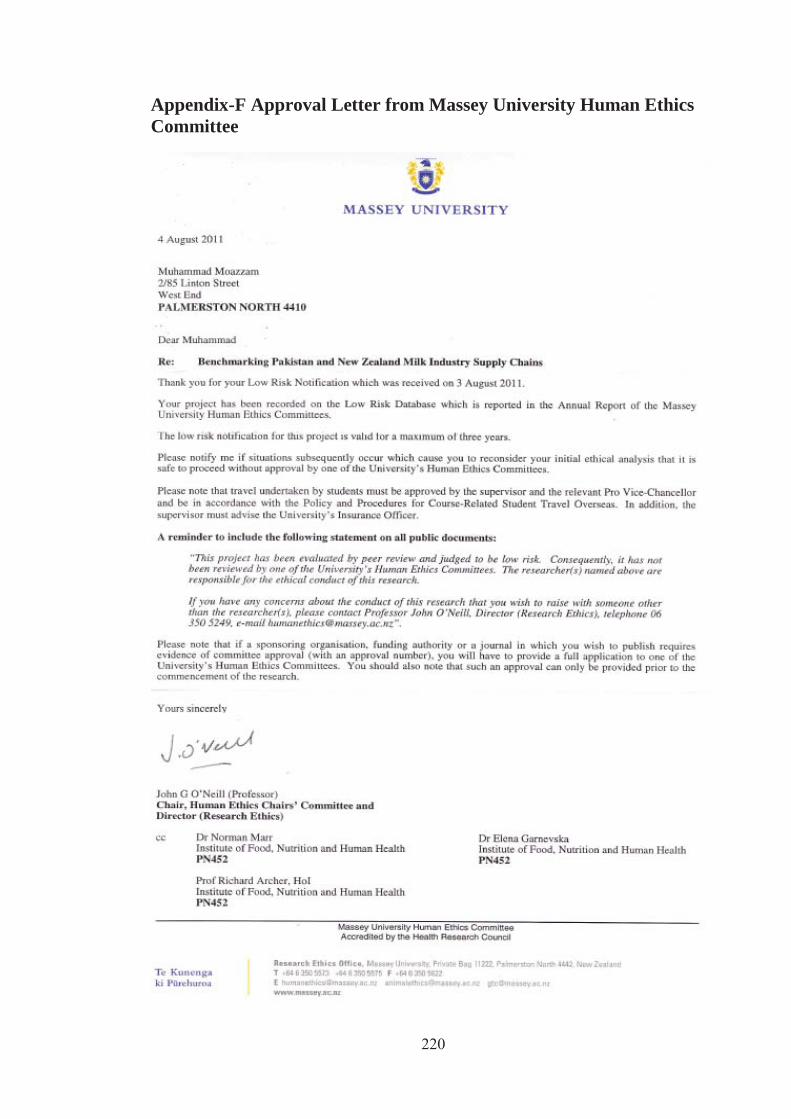
220
Appendix-F Approval Letter from Massey University Human Ethics Committee
221
Appendix-G Cover Letter for Survey Debriefing
Dear Sir/Madam,
My name is Muhammad Moazzam and I am undertaking PhD degree under the supervision of Professor Norman E. Marr, [email protected] Co-Director of Logistics and Supply Chain Management at Massey University, New Zealand. My research entitled “Benchmarking Agri-food Supply Chain Networks” aims to measure and benchmark the performance of milk supply chain networks in the dairy industries of Pakistan and New Zealand. It would be very much appreciated if you could complete the survey questionnaire which is designed to estimate the performance and best practices leading to superior performance in New Zealand Dairy Industry. We respect your rights to:
1. Not answer any particular question or abandon the survey at any level. 2. Provide information on the understanding that it is completely confidential
to the research team only and will be used solely for the academic research purpose. Confidentiality of information will be ensured in a way that it will not be possible to identify you or your company in any reports prepared from this study.
3. Be given the access to the summary of findings, once concluded. Your cooperation and valuable information will be highly appreciated. Best Regards, Muhammad Moazzam PhD Candidate Logistics & Supply Chain Management, School of Engineering & Advanced Technology Massey University, PN, New Zealand E: [email protected]
This project has been evaluated by the peer review and judged to be low risk. Consequently, it has not been reviewed by one of the University’s Human Ethics Committee. The researcher(s) named above are responsible for the ethical conduct of this research. If you have any concerns about the conduct of this research that you wish to raise with someone other than the researcher(s), please contact Professor John O’Neill, Director (Research Ethics), Telephone 06 350 5249, Email: [email protected]
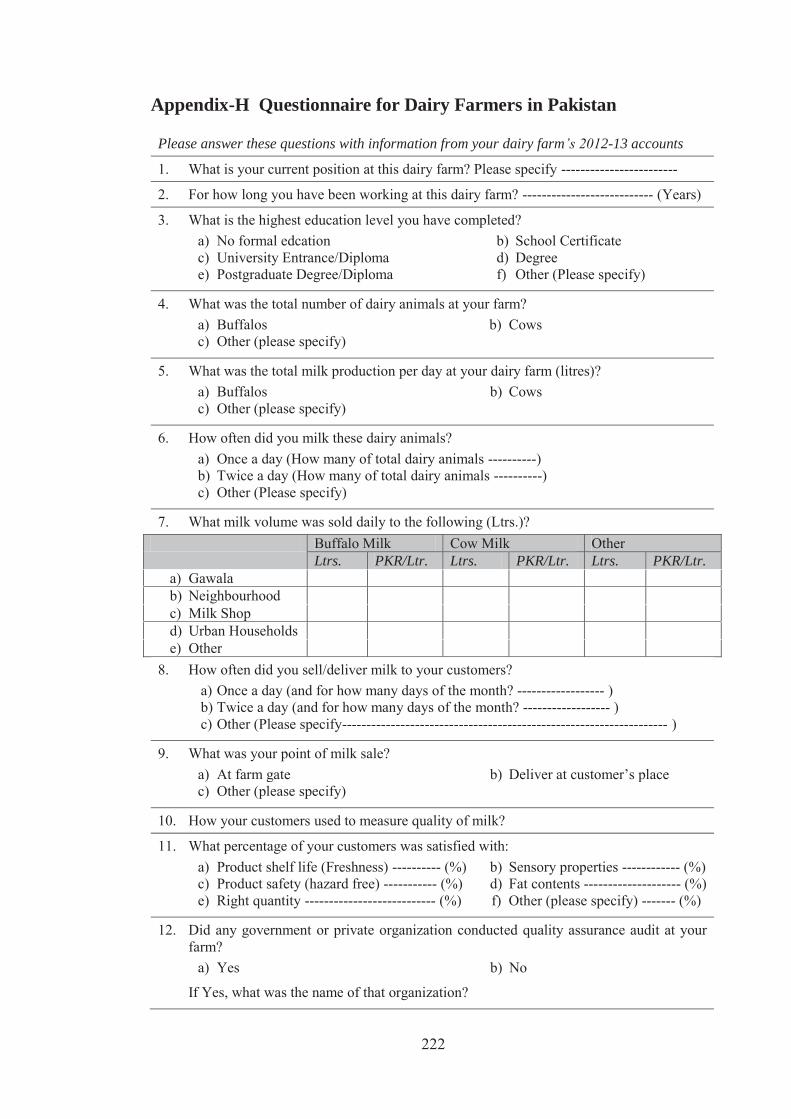
222
Appendix-H Questionnaire for Dairy Farmers in Pakistan
Please answer these questions with information from your dairy farm’s 2012-13 accounts
1. What is your current position at this dairy farm? Please specify ------------------------
2. For how long you have been working at this dairy farm? --------------------------- (Years)
3. What is the highest education level you have completed? a) No formal edcation b) School Certificate c) University Entrance/Diploma d) Degree e) Postgraduate Degree/Diploma f) Other (Please specify)
4. What was the total number of dairy animals at your farm? a) Buffalos b) Cows c) Other (please specify)
5. What was the total milk production per day at your dairy farm (litres)? a) Buffalos b) Cows c) Other (please specify)
6. How often did you milk these dairy animals? a) Once a day (How many of total dairy animals ----------) b) Twice a day (How many of total dairy animals ----------) c) Other (Please specify)
7. What milk volume was sold daily to the following (Ltrs.)? Buffalo Milk Cow Milk Other
Ltrs. PKR/Ltr. Ltrs. PKR/Ltr. Ltrs. PKR/Ltr. a) Gawala b) Neighbourhood c) Milk Shop d) Urban Households e) Other
8. How often did you sell/deliver milk to your customers? a) Once a day (and for how many days of the month? ------------------ ) b) Twice a day (and for how many days of the month? ------------------ ) c) Other (Please specify------------------------------------------------------------------- )
9. What was your point of milk sale? a) At farm gate b) Deliver at customer’s place c) Other (please specify)
10. How your customers used to measure quality of milk?
11. What percentage of your customers was satisfied with: a) Product shelf life (Freshness) ---------- (%) b) Sensory properties ------------ (%) c) Product safety (hazard free) ----------- (%) d) Fat contents -------------------- (%) e) Right quantity --------------------------- (%) f) Other (please specify) ------- (%)
12. Did any government or private organization conducted quality assurance audit at your farm?
a) Yes b) No
If Yes, what was the name of that organization?
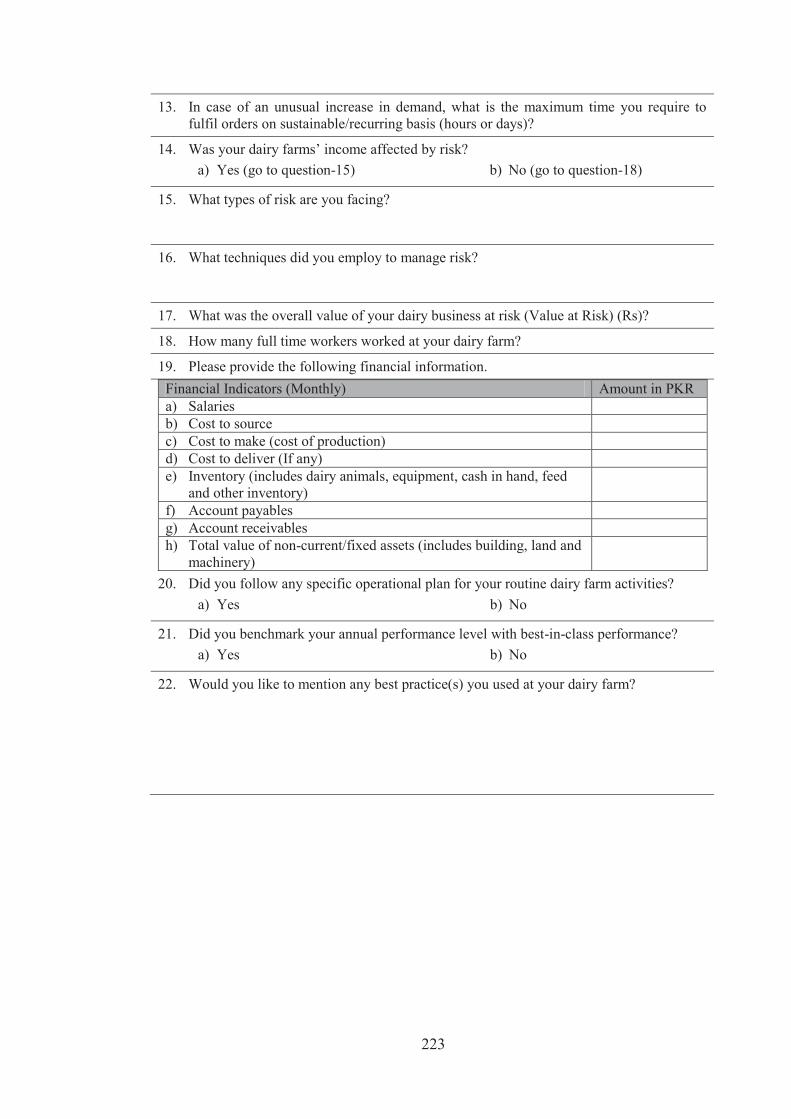
223
13. In case of an unusual increase in demand, what is the maximum time you require to fulfil orders on sustainable/recurring basis (hours or days)?
14. Was your dairy farms’ income affected by risk? a) Yes (go to question-15) b) No (go to question-18)
15. What types of risk are you facing?
16. What techniques did you employ to manage risk?
17. What was the overall value of your dairy business at risk (Value at Risk) (Rs)?
18. How many full time workers worked at your dairy farm?
19. Please provide the following financial information. Financial Indicators (Monthly) Amount in PKR a) Salaries b) Cost to source c) Cost to make (cost of production) d) Cost to deliver (If any) e) Inventory (includes dairy animals, equipment, cash in hand, feed
and other inventory)
f) Account payables g) Account receivables h) Total value of non-current/fixed assets (includes building, land and
machinery)
20. Did you follow any specific operational plan for your routine dairy farm activities? a) Yes b) No
21. Did you benchmark your annual performance level with best-in-class performance? a) Yes b) No
22. Would you like to mention any best practice(s) you used at your dairy farm?
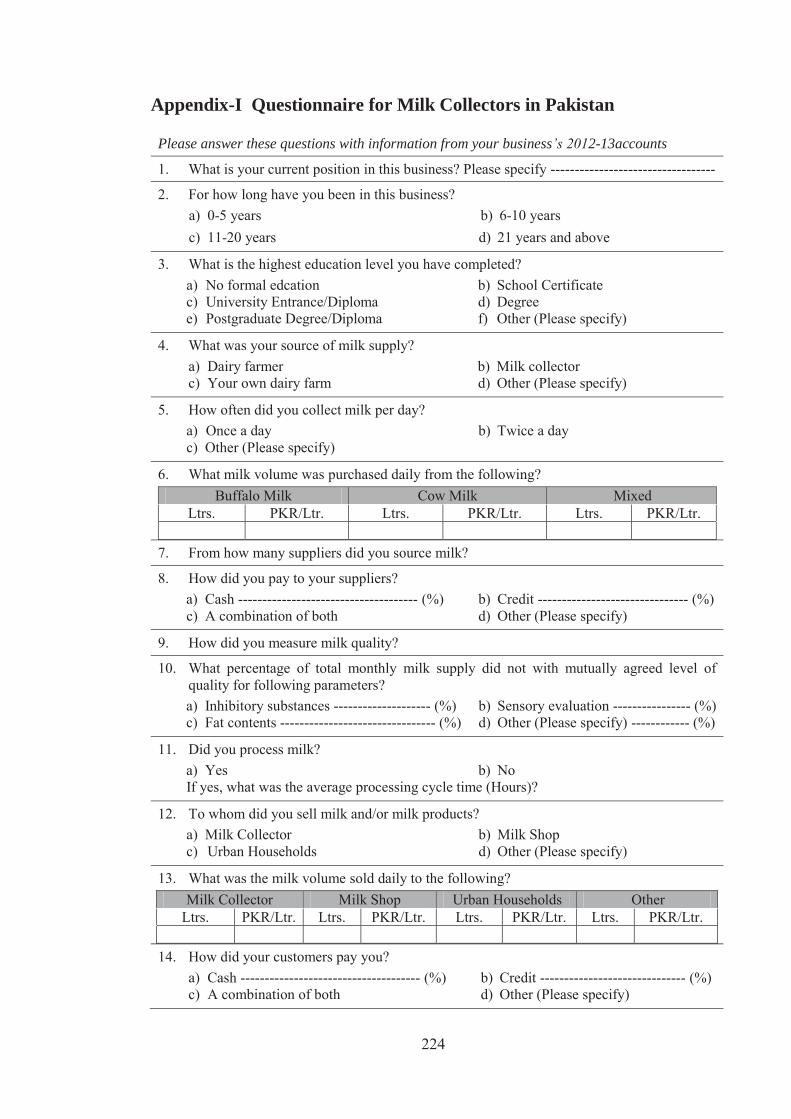
224
Appendix-I Questionnaire for Milk Collectors in Pakistan
Please answer these questions with information from your business’s 2012-13accounts
1. What is your current position in this business? Please specify ----------------------------------
2. For how long have you been in this business? a) 0-5 years b) 6-10 years c) 11-20 years d) 21 years and above
3. What is the highest education level you have completed? a) No formal edcation b) School Certificate c) University Entrance/Diploma d) Degree e) Postgraduate Degree/Diploma f) Other (Please specify)
4. What was your source of milk supply? a) Dairy farmer b) Milk collector c) Your own dairy farm d) Other (Please specify)
5. How often did you collect milk per day? a) Once a day b) Twice a day c) Other (Please specify)
6. What milk volume was purchased daily from the following? Buffalo Milk Cow Milk Mixed
Ltrs. PKR/Ltr. Ltrs. PKR/Ltr. Ltrs. PKR/Ltr.
7. From how many suppliers did you source milk?
8. How did you pay to your suppliers? a) Cash ------------------------------------- (%) b) Credit ------------------------------- (%) c) A combination of both d) Other (Please specify)
9. How did you measure milk quality?
10. What percentage of total monthly milk supply did not with mutually agreed level of quality for following parameters? a) Inhibitory substances -------------------- (%) b) Sensory evaluation ---------------- (%) c) Fat contents -------------------------------- (%) d) Other (Please specify) ------------ (%)
11. Did you process milk? a) Yes b) No If yes, what was the average processing cycle time (Hours)?
12. To whom did you sell milk and/or milk products? a) Milk Collector b) Milk Shop c) Urban Households d) Other (Please specify)
13. What was the milk volume sold daily to the following? Milk Collector Milk Shop Urban Households Other
Ltrs. PKR/Ltr. Ltrs. PKR/Ltr. Ltrs. PKR/Ltr. Ltrs. PKR/Ltr.
14. How did your customers pay you? a) Cash ------------------------------------- (%) b) Credit ------------------------------ (%) c) A combination of both d) Other (Please specify)
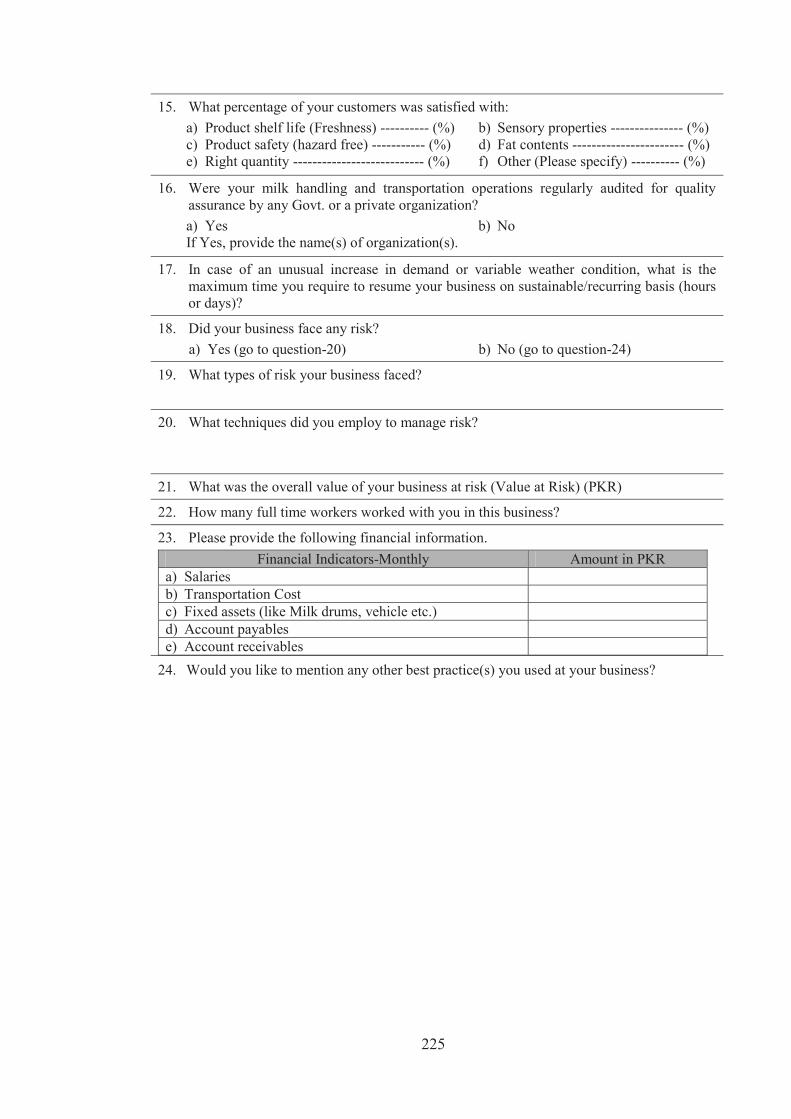
225
15. What percentage of your customers was satisfied with: a) Product shelf life (Freshness) ---------- (%) b) Sensory properties --------------- (%) c) Product safety (hazard free) ----------- (%) d) Fat contents ----------------------- (%) e) Right quantity --------------------------- (%) f) Other (Please specify) ---------- (%)
16. Were your milk handling and transportation operations regularly audited for quality assurance by any Govt. or a private organization? a) Yes b) No If Yes, provide the name(s) of organization(s).
17. In case of an unusual increase in demand or variable weather condition, what is the maximum time you require to resume your business on sustainable/recurring basis (hours or days)?
18. Did your business face any risk? a) Yes (go to question-20) b) No (go to question-24)
19. What types of risk your business faced?
20. What techniques did you employ to manage risk?
21. What was the overall value of your business at risk (Value at Risk) (PKR)
22. How many full time workers worked with you in this business?
23. Please provide the following financial information. Financial Indicators-Monthly Amount in PKR
a) Salaries b) Transportation Cost c) Fixed assets (like Milk drums, vehicle etc.) d) Account payables e) Account receivables
24. Would you like to mention any other best practice(s) you used at your business?

226
Appendix-J Questionnaire for Milk Shops in Pakistan
Please answer these questions with information from your business’s 2012-13 accounts
1. What is your current position in this business? Please specify --------------------------------
2. For how long have you been in this business? a) 0-5 years b) 6-10 years c) 11-20 years d) 21 years and above
3. What is the highest education level you have completed? a) No formal edcation b) School Certificate c) University Entrance/Diploma d) Degree e) Postgraduate Degree/Diploma f) Other (Please specify)
4. What was your source of milk supply? a) Dairy farmer b) Milk collector c) Your own source d) Other (Please specify)
5. How often did you source milk daily? a) Once a day b) Twice a day c) Other (Please specify)
6. What milk volume was purchased daily?
Buffalo Milk Cow Milk Others Ltrs. PKR/Ltr. Ltrs. PKR/Ltr. Ltrs. PKR/Ltr.
7. From how many suppliers did you buy milk?
8. How did you pay to the suppliers of milk? a) Cash ------------------------------------- (%) b) Credit ----------------------------- (%) c) Other (Please specify)
9. How did you measure milk quality?
10. What percentage of total monthly milk supply did not comply with the mutually agreed level of quality for following parameters? a) Inhibitory substances ------------------- (%) b) Sensory evaluation -------------- (%) c) Fat contents ---------------------------- (%) d) Other (Please specify) ---------- (%)
11. What milk products did you sell? a) Fresh milk b) Milk Shake c) Yoghurt d) Tea d) Sweets and Bakery e) Other (Please specify)
12. What quantities of milk and/or milk products were sold daily?
Fresh Milk Milk Shake Yoghurt Tea S & Bakers Other Ltrs. PKR
/Ltr. Ltrs. PKR
/Ltr. Ltrs. PKR
/Ltr. Ltrs. PKR
/Ltr. Ltrs. PKR
/Ltr. Ltrs. PKR
/Ltr.
13. How did your customers pay you? a) Cash ------------------------------------- (%) b) Credit -------------------------------------c) Other (Please specify)

227
14. What percentage of your customers was satisfied with: a) Product shelf life (Freshness) ----------- (%) b) Sensory properties --------------- (%) c) Product safety (hazard free) ------------- (%) d) Fat contents ---------------------- (%) e) Right quantity ---------------------------- (%) f) Other (Please specify) ---------- (%)
15. What was the average processing cycle time (time from milk supply received until a product is ready for sale) dairy products (hours)? a) Fresh milk --------------------------------------- b) Milkshake --------------------------------------- c) Yoghurt --------------------------------------- d) Tea --------------------------------------- e) Sweets and Bakery ---------------------------- f) Other (Please specify)
16. Was your milk shop regularly audited for quality assurance by any Govt. or a private organization? a) Yes b) No If Yes, provide the name(s) of organization(s).
17. In case of an unusual increase in demand or variable weather condition, what is the maximum time you require to resume your business on sustainable/recurring basis (hours)?
18. Did your business face any risk? a) Yes (go to question-19) b) No (go to question-22)
19. What types of risk were faced by your business?
20. What techniques did you employ to manage risk?
21. What was the overall value of your business at risk (Value at Risk) (PKR)
22. How many full time workers worked at shop?
23. Please provide the following financial information Financial Indicators Amount in PKR
a) Salaries b) Bills c) Shop Rent d) Fixed assets (like shop utilities) e) Account payables f) Account receivables
24. From the following best practices select all which were in use at your company and describe briefly the reason/problem they address.
a) Carrier Agreement b) Customer relationship management system c) Electronic data interchange (EDI) d) Full visibility of inventory and demand to all supply
chain participants
e) Performance measurement and reporting system f) Outsource non-core activities to third party g) Supplier performance assessment system h) Benchmark performance level with best-in-class
25. Would you like to mention any other best practice(s) you are using at your company?
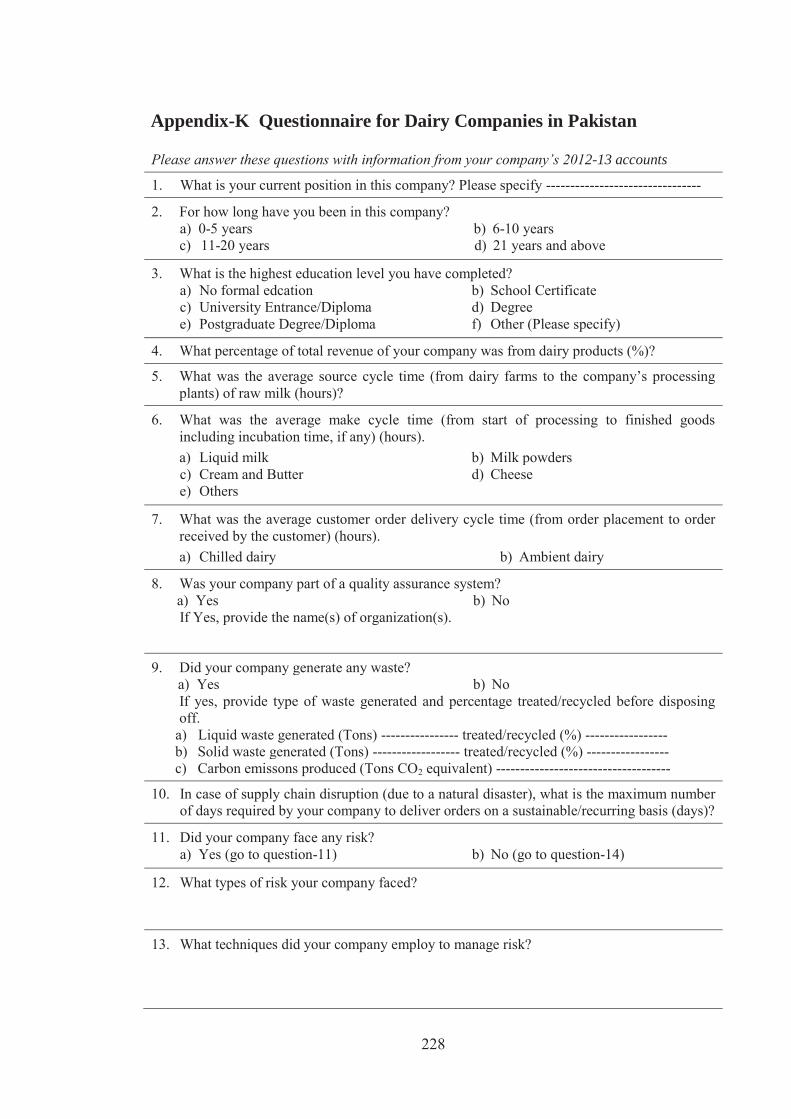
228
Appendix-K Questionnaire for Dairy Companies in Pakistan
Please answer these questions with information from your company’s 2012-13 accounts
1. What is your current position in this company? Please specify --------------------------------
2. For how long have you been in this company? a) 0-5 years b) 6-10 years c) 11-20 years d) 21 years and above
3. What is the highest education level you have completed? a) No formal edcation b) School Certificate c) University Entrance/Diploma d) Degree e) Postgraduate Degree/Diploma f) Other (Please specify)
4. What percentage of total revenue of your company was from dairy products (%)?
5. What was the average source cycle time (from dairy farms to the company’s processing plants) of raw milk (hours)?
6. What was the average make cycle time (from start of processing to finished goods including incubation time, if any) (hours). a) Liquid milk b) Milk powders c) Cream and Butter d) Cheese e) Others
7. What was the average customer order delivery cycle time (from order placement to order received by the customer) (hours). a) Chilled dairy b) Ambient dairy
8. Was your company part of a quality assurance system? a) Yes b) No If Yes, provide the name(s) of organization(s).
9. Did your company generate any waste? a) Yes b) No If yes, provide type of waste generated and percentage treated/recycled before disposing off.
a) Liquid waste generated (Tons) ---------------- treated/recycled (%) ----------------- b) Solid waste generated (Tons) ------------------ treated/recycled (%) ----------------- c) Carbon emissons produced (Tons CO2 equivalent) ------------------------------------
10. In case of supply chain disruption (due to a natural disaster), what is the maximum number of days required by your company to deliver orders on a sustainable/recurring basis (days)?
11. Did your company face any risk? a) Yes (go to question-11) b) No (go to question-14)
12. What types of risk your company faced?
13. What techniques did your company employ to manage risk?
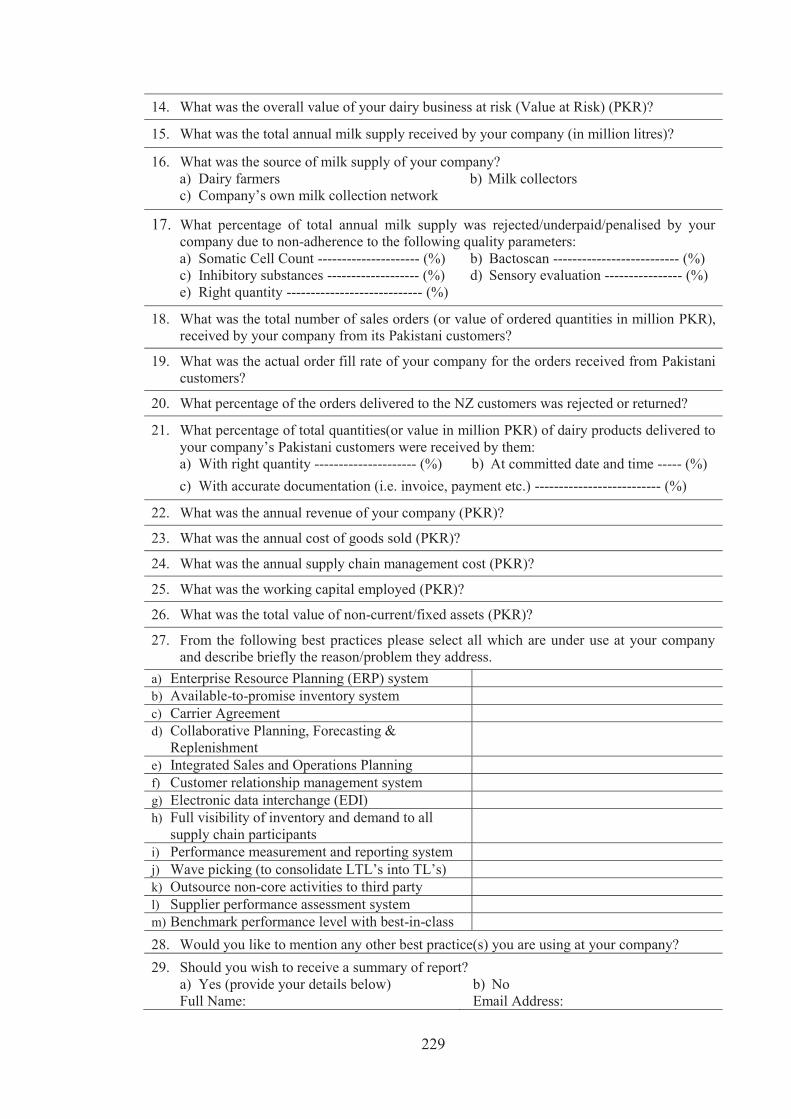
229
14. What was the overall value of your dairy business at risk (Value at Risk) (PKR)?
15. What was the total annual milk supply received by your company (in million litres)?
16. What was the source of milk supply of your company? a) Dairy farmers b) Milk collectors c) Company’s own milk collection network
17. What percentage of total annual milk supply was rejected/underpaid/penalised by your company due to non-adherence to the following quality parameters: a) Somatic Cell Count --------------------- (%) b) Bactoscan -------------------------- (%) c) Inhibitory substances ------------------- (%) d) Sensory evaluation ---------------- (%) e) Right quantity ---------------------------- (%)
18. What was the total number of sales orders (or value of ordered quantities in million PKR), received by your company from its Pakistani customers?
19. What was the actual order fill rate of your company for the orders received from Pakistani customers?
20. What percentage of the orders delivered to the NZ customers was rejected or returned?
21. What percentage of total quantities(or value in million PKR) of dairy products delivered to your company’s Pakistani customers were received by them: a) With right quantity --------------------- (%) b) At committed date and time ----- (%) c) With accurate documentation (i.e. invoice, payment etc.) -------------------------- (%)
22. What was the annual revenue of your company (PKR)?
23. What was the annual cost of goods sold (PKR)?
24. What was the annual supply chain management cost (PKR)?
25. What was the working capital employed (PKR)?
26. What was the total value of non-current/fixed assets (PKR)?
27. From the following best practices please select all which are under use at your company and describe briefly the reason/problem they address.
a) Enterprise Resource Planning (ERP) system b) Available-to-promise inventory system c) Carrier Agreement d) Collaborative Planning, Forecasting &
Replenishment
e) Integrated Sales and Operations Planning f) Customer relationship management system g) Electronic data interchange (EDI) h) Full visibility of inventory and demand to all
supply chain participants
i) Performance measurement and reporting system j) Wave picking (to consolidate LTL’s into TL’s) k) Outsource non-core activities to third party l) Supplier performance assessment system m) Benchmark performance level with best-in-class 28. Would you like to mention any other best practice(s) you are using at your company? 29. Should you wish to receive a summary of report?
a) Yes (provide your details below) b) No Full Name: Email Address:
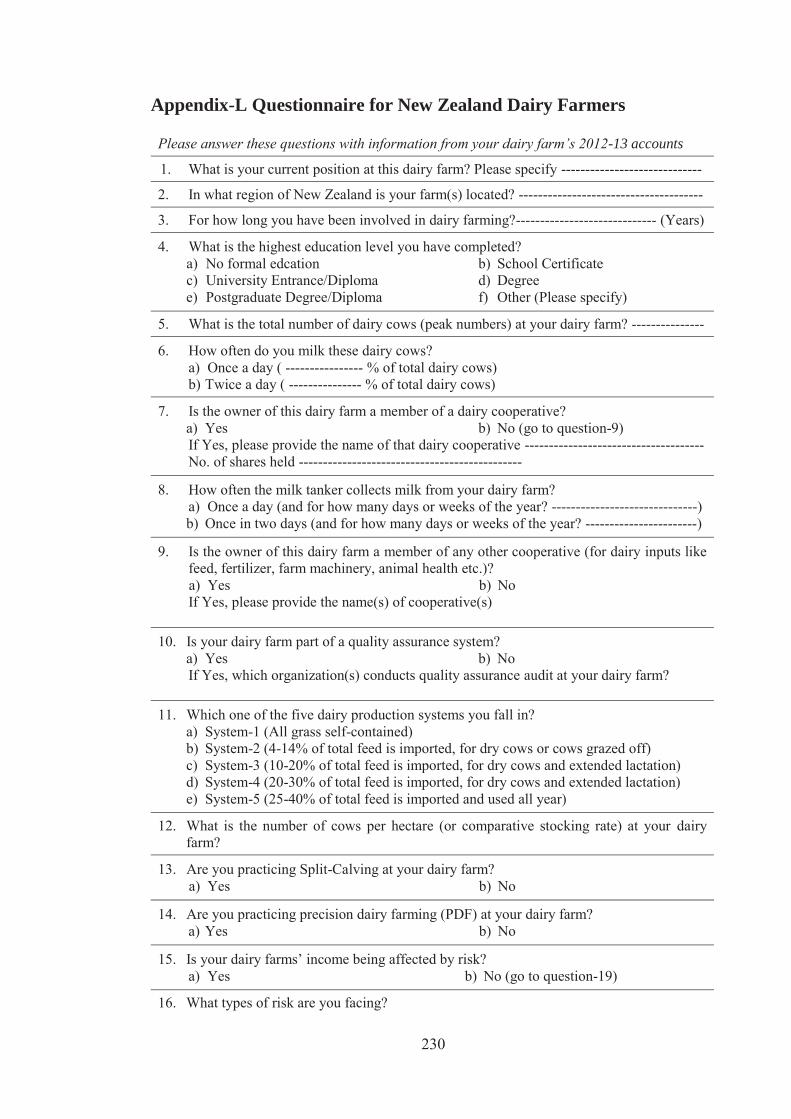
230
Appendix-L Questionnaire for New Zealand Dairy Farmers
Please answer these questions with information from your dairy farm’s 2012-13 accounts
1. What is your current position at this dairy farm? Please specify -----------------------------
2. In what region of New Zealand is your farm(s) located? --------------------------------------
3. For how long you have been involved in dairy farming?----------------------------- (Years)
4. What is the highest education level you have completed? a) No formal edcation b) School Certificate c) University Entrance/Diploma d) Degree e) Postgraduate Degree/Diploma f) Other (Please specify)
5. What is the total number of dairy cows (peak numbers) at your dairy farm? ---------------
6. How often do you milk these dairy cows? a) Once a day ( ---------------- % of total dairy cows) b) Twice a day ( --------------- % of total dairy cows)
7. Is the owner of this dairy farm a member of a dairy cooperative? a) Yes b) No (go to question-9) If Yes, please provide the name of that dairy cooperative ------------------------------------- No. of shares held ----------------------------------------------
8. How often the milk tanker collects milk from your dairy farm? a) Once a day (and for how many days or weeks of the year? ------------------------------) b) Once in two days (and for how many days or weeks of the year? -----------------------)
9. Is the owner of this dairy farm a member of any other cooperative (for dairy inputs like feed, fertilizer, farm machinery, animal health etc.)? a) Yes b) No If Yes, please provide the name(s) of cooperative(s)
10. Is your dairy farm part of a quality assurance system?
a) Yes b) No If Yes, which organization(s) conducts quality assurance audit at your dairy farm?
11. Which one of the five dairy production systems you fall in?
a) System-1 (All grass self-contained) b) System-2 (4-14% of total feed is imported, for dry cows or cows grazed off) c) System-3 (10-20% of total feed is imported, for dry cows and extended lactation) d) System-4 (20-30% of total feed is imported, for dry cows and extended lactation) e) System-5 (25-40% of total feed is imported and used all year)
12. What is the number of cows per hectare (or comparative stocking rate) at your dairy farm?
13. Are you practicing Split-Calving at your dairy farm? a) Yes b) No
14. Are you practicing precision dairy farming (PDF) at your dairy farm? a) Yes b) No
15. Is your dairy farms’ income being affected by risk? a) Yes b) No (go to question-19)
16. What types of risk are you facing?
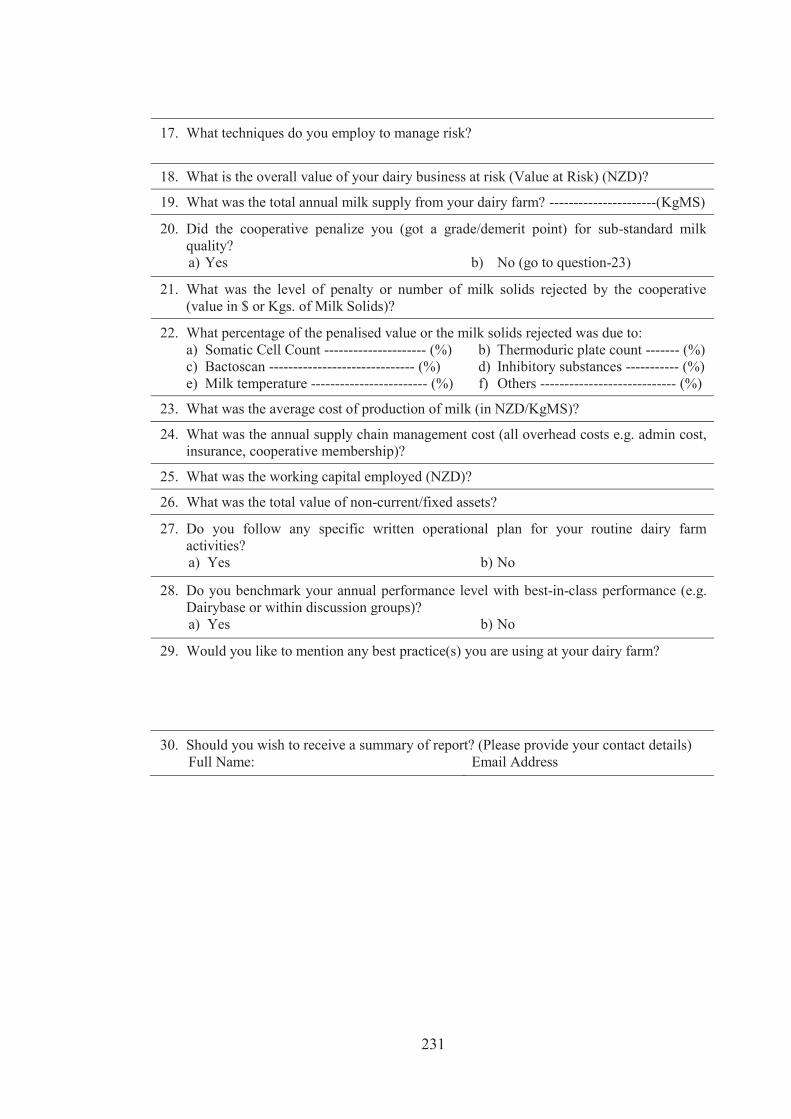
231
17. What techniques do you employ to manage risk? 18. What is the overall value of your dairy business at risk (Value at Risk) (NZD)?
19. What was the total annual milk supply from your dairy farm? ----------------------(KgMS)
20. Did the cooperative penalize you (got a grade/demerit point) for sub-standard milk quality? a) Yes b) No (go to question-23)
21. What was the level of penalty or number of milk solids rejected by the cooperative (value in $ or Kgs. of Milk Solids)?
22. What percentage of the penalised value or the milk solids rejected was due to: a) Somatic Cell Count --------------------- (%) b) Thermoduric plate count ------- (%) c) Bactoscan ------------------------------ (%) d) Inhibitory substances ----------- (%) e) Milk temperature ------------------------ (%) f) Others ---------------------------- (%)
23. What was the average cost of production of milk (in NZD/KgMS)?
24. What was the annual supply chain management cost (all overhead costs e.g. admin cost, insurance, cooperative membership)?
25. What was the working capital employed (NZD)?
26. What was the total value of non-current/fixed assets?
27. Do you follow any specific written operational plan for your routine dairy farm activities? a) Yes b) No
28. Do you benchmark your annual performance level with best-in-class performance (e.g. Dairybase or within discussion groups)? a) Yes b) No
29. Would you like to mention any best practice(s) you are using at your dairy farm?
30. Should you wish to receive a summary of report? (Please provide your contact details) Full Name: Email Address
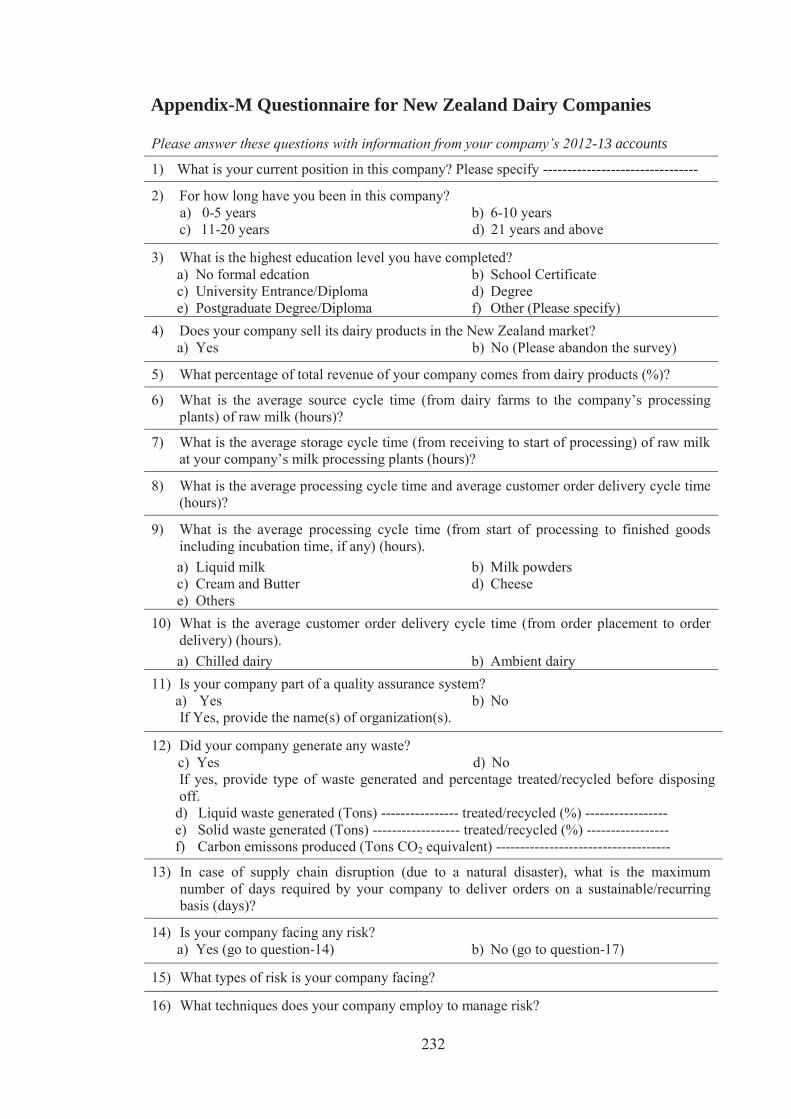
232
Appendix-M Questionnaire for New Zealand Dairy Companies
Please answer these questions with information from your company’s 2012-13 accounts
1) What is your current position in this company? Please specify --------------------------------
2) For how long have you been in this company? a) 0-5 years b) 6-10 years c) 11-20 years d) 21 years and above
3) What is the highest education level you have completed? a) No formal edcation b) School Certificate c) University Entrance/Diploma d) Degree e) Postgraduate Degree/Diploma f) Other (Please specify)
4) Does your company sell its dairy products in the New Zealand market? a) Yes b) No (Please abandon the survey)
5) What percentage of total revenue of your company comes from dairy products (%)?
6) What is the average source cycle time (from dairy farms to the company’s processing plants) of raw milk (hours)?
7) What is the average storage cycle time (from receiving to start of processing) of raw milk at your company’s milk processing plants (hours)?
8) What is the average processing cycle time and average customer order delivery cycle time (hours)?
9) What is the average processing cycle time (from start of processing to finished goods including incubation time, if any) (hours). a) Liquid milk b) Milk powders c) Cream and Butter d) Cheese e) Others
10) What is the average customer order delivery cycle time (from order placement to order delivery) (hours). a) Chilled dairy b) Ambient dairy
11) Is your company part of a quality assurance system? a) Yes b) No If Yes, provide the name(s) of organization(s).
12) Did your company generate any waste? c) Yes d) No If yes, provide type of waste generated and percentage treated/recycled before disposing off.
d) Liquid waste generated (Tons) ---------------- treated/recycled (%) ----------------- e) Solid waste generated (Tons) ------------------ treated/recycled (%) ----------------- f) Carbon emissons produced (Tons CO2 equivalent) ------------------------------------
13) In case of supply chain disruption (due to a natural disaster), what is the maximum number of days required by your company to deliver orders on a sustainable/recurring basis (days)?
14) Is your company facing any risk? a) Yes (go to question-14) b) No (go to question-17)
15) What types of risk is your company facing?
16) What techniques does your company employ to manage risk?
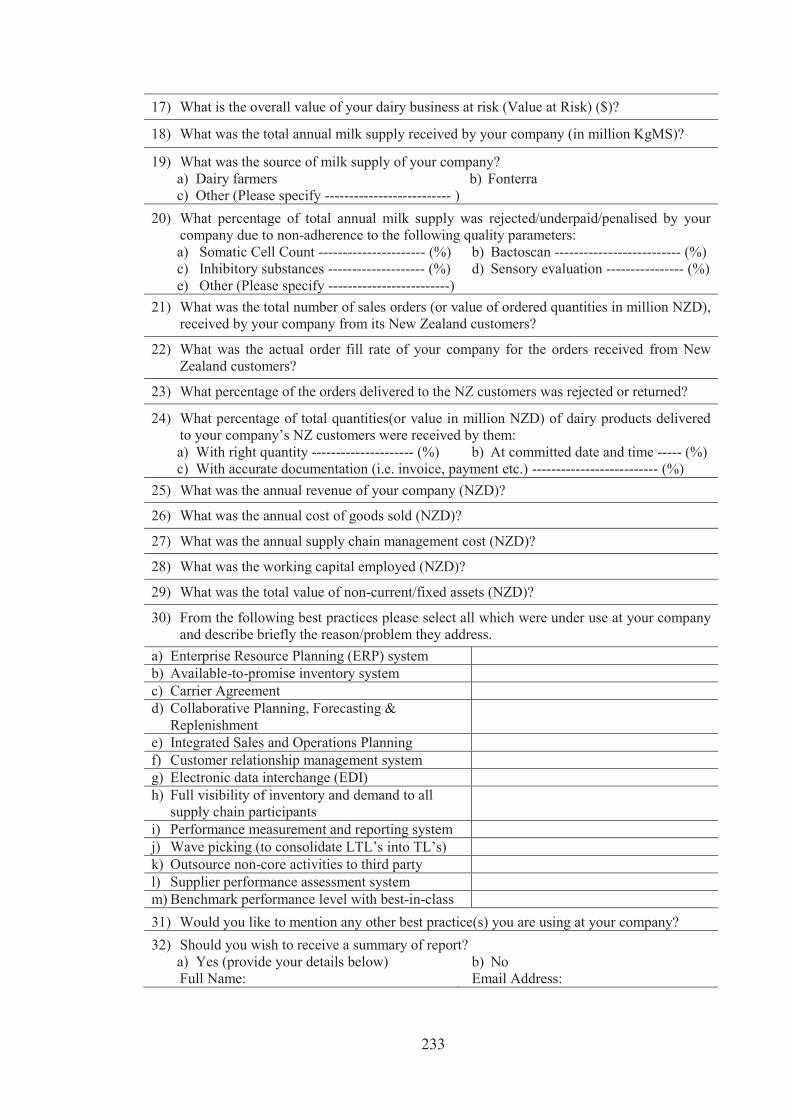
233
17) What is the overall value of your dairy business at risk (Value at Risk) ($)?
18) What was the total annual milk supply received by your company (in million KgMS)?
19) What was the source of milk supply of your company? a) Dairy farmers b) Fonterra c) Other (Please specify -------------------------- )
20) What percentage of total annual milk supply was rejected/underpaid/penalised by your company due to non-adherence to the following quality parameters: a) Somatic Cell Count ---------------------- (%) b) Bactoscan -------------------------- (%) c) Inhibitory substances -------------------- (%) d) Sensory evaluation ---------------- (%) e) Other (Please specify -------------------------)
21) What was the total number of sales orders (or value of ordered quantities in million NZD), received by your company from its New Zealand customers?
22) What was the actual order fill rate of your company for the orders received from New Zealand customers?
23) What percentage of the orders delivered to the NZ customers was rejected or returned?
24) What percentage of total quantities(or value in million NZD) of dairy products delivered to your company’s NZ customers were received by them: a) With right quantity --------------------- (%) b) At committed date and time ----- (%) c) With accurate documentation (i.e. invoice, payment etc.) -------------------------- (%)
25) What was the annual revenue of your company (NZD)?
26) What was the annual cost of goods sold (NZD)?
27) What was the annual supply chain management cost (NZD)?
28) What was the working capital employed (NZD)?
29) What was the total value of non-current/fixed assets (NZD)?
30) From the following best practices please select all which were under use at your company and describe briefly the reason/problem they address.
a) Enterprise Resource Planning (ERP) system b) Available-to-promise inventory system c) Carrier Agreement d) Collaborative Planning, Forecasting &
Replenishment
e) Integrated Sales and Operations Planning f) Customer relationship management system g) Electronic data interchange (EDI) h) Full visibility of inventory and demand to all
supply chain participants
i) Performance measurement and reporting system j) Wave picking (to consolidate LTL’s into TL’s) k) Outsource non-core activities to third party l) Supplier performance assessment system m) Benchmark performance level with best-in-class 31) Would you like to mention any other best practice(s) you are using at your company? 32) Should you wish to receive a summary of report?
a) Yes (provide your details below) b) No Full Name: Email Address:
Related Documents