Below- and aboveground architecture of Androstachys johnsonii prain: topological analysis of the root and shoot systems Tarquinio Mateus Magalhães & Thomas Seifert Received: 18 September 2014 /Accepted: 19 May 2015 /Published online: 30 May 2015 # The Author(s) 2015. This article is published with open access at Springerlink.com Abstract Aim This study aimed to analyse the topological branching pattern, area-preserving branching, and frac- tal branching pattern (self-similarity) of the root and shoot systems of 93 Androstachys johnsonii trees with diameter-at-breast heights of 5–32 cm. Methods Topological parameters were calculated. Results Visual analysis indicated herringbone-like branching pattern for both the root and shoot systems. However, the topological index (TI) and topological trend (TT) suggested otherwise. This discrepancy was attributed to the fact that A. johnsonii has multiple laterals per stem/taproot node, suggesting that the topo- logical indexes (TI and TT) might yield biased conclu- sions regarding the branching pattern when the main axis has multiple laterals per node. Hence, modified topological index (TIM) that could be applied in the cases of multiple laterals per node while conserving the values of TI for cases with one lateral per node was developed; the modified index was more efficient and realistic than TI. Conclusion The area preserving branching was con- firmed for each stem node confirming thus, the self- similar branching. For the root system, the area- preserving branching was only confirmed for the first node; therefore, self-similarity was not confirmed. Keywords Topology . Leonardo da Vinci rule . Branching pattern . Self-similarity . Mecrusse Introduction Architecture of biological objects refers to the spatial configuration of the assemblage of subunits such that the overall configuration has some functional signifi- cance (Lynch 1995). Root architecture refers to the spatial configuration of the root system (Lynch 1995) and, analogously, shoot architecture refers to the spatial configuration of the shoot system. Root architecture determines the ability of plants to exploit soil resources (Lynch 1995), thereby affecting water and nutrient acquisition, carbon metabolism, and environmental stress resistance (Trubat 2012). Shoot architecture, on the other hand, affects the allocation of light to leaf area and the manner in which leaves are arranged and displayed (Valladares 1999), thereby playing an important role in plant growth and survival (Valladares and Pearcy 2000). Plants are known to respond to nutrient limitation by modifying branching and root system architecture (Trubat Plant Soil (2015) 394:257–269 DOI 10.1007/s11104-015-2527-0 Responsible Editor: Alain Pierret. T. M. Magalhães Departamento de Engenharia Florestal, Universidade Eduardo Mondlane, Campus Universitário Principal, Edifício n. 1, Maputo, Mozambique T. M. Magalhães (*) : T. Seifert Department of Forest and Wood Science, University of Stellenbosch, Private Bag X1 Matieland 7602, Stellenbosch, South Africa e-mail: [email protected] T. Seifert e-mail: [email protected] REGULAR ARTICLE

Welcome message from author
This document is posted to help you gain knowledge. Please leave a comment to let me know what you think about it! Share it to your friends and learn new things together.
Transcript
Below- and aboveground architecture of Androstachysjohnsonii prain: topological analysis of the root and shootsystems
Tarquinio Mateus Magalhães & Thomas Seifert
Received: 18 September 2014 /Accepted: 19 May 2015 /Published online: 30 May 2015# The Author(s) 2015. This article is published with open access at Springerlink.com
AbstractAim This study aimed to analyse the topologicalbranching pattern, area-preserving branching, and frac-tal branching pattern (self-similarity) of the root andshoot systems of 93 Androstachys johnsonii trees withdiameter-at-breast heights of 5–32 cm.Methods Topological parameters were calculated.Results Visual analysis indicated herringbone-likebranching pattern for both the root and shoot systems.However, the topological index (TI) and topologicaltrend (TT) suggested otherwise. This discrepancy wasattributed to the fact that A. johnsonii has multiplelaterals per stem/taproot node, suggesting that the topo-logical indexes (TI and TT) might yield biased conclu-sions regarding the branching pattern when the mainaxis has multiple laterals per node. Hence, modifiedtopological index (TIM) that could be applied in thecases of multiple laterals per node while conservingthe values of TI for cases with one lateral per node
was developed; the modified index was more efficientand realistic than TI.Conclusion The area preserving branching was con-firmed for each stem node confirming thus, the self-similar branching. For the root system, the area-preserving branching was only confirmed for the firstnode; therefore, self-similarity was not confirmed.
Keywords Topology . Leonardo daVinci rule .
Branching pattern . Self-similarity .Mecrusse
Introduction
Architecture of biological objects refers to the spatialconfiguration of the assemblage of subunits such thatthe overall configuration has some functional signifi-cance (Lynch 1995). Root architecture refers to thespatial configuration of the root system (Lynch 1995)and, analogously, shoot architecture refers to the spatialconfiguration of the shoot system.
Root architecture determines the ability of plants toexploit soil resources (Lynch 1995), thereby affectingwater and nutrient acquisition, carbon metabolism, andenvironmental stress resistance (Trubat 2012). Shootarchitecture, on the other hand, affects the allocation oflight to leaf area and the manner in which leaves arearranged and displayed (Valladares 1999), therebyplaying an important role in plant growth and survival(Valladares and Pearcy 2000).
Plants are known to respond to nutrient limitation bymodifying branching and root system architecture (Trubat
Plant Soil (2015) 394:257–269DOI 10.1007/s11104-015-2527-0
Responsible Editor: Alain Pierret.
T. M. MagalhãesDepartamento de Engenharia Florestal, Universidade EduardoMondlane, Campus Universitário Principal, Edifício n. 1,Maputo, Mozambique
T. M. Magalhães (*) : T. SeifertDepartment of Forest and Wood Science,University of Stellenbosch, Private Bag X1 Matieland 7602,Stellenbosch, South Africae-mail: [email protected]
T. Seiferte-mail: [email protected]
REGULAR ARTICLE
et al. 2012; Lynch andHo 2005) towards herringbone-likeroot system (Fitter 1987; Fitter et al. 1991). In a similarway the response to water limitation is also by inhibitinglateral branching (Malamy 2005) and thus promotingherringbone-like root systems (Fitter 1987). Therefore,during the life of a tree, from seedling to adult stage, theroot system can undergo transformations according to theavailability of nutrients and water resources.
The majority of the existing studies on root systemarchitecture focus on seedlings (Martínez-Sánchez et al.2003; Trubat et al. 2012; Chiatante et al. 2004; Berntson1997; Fitter and Stickland 1991; Larkin et al. 1995;Nicotra et al. 2002; Tworkoski and Scorza 2001;Cortina et al. 2008; Riccardo 2007) and saplings (Collet al. 2008; Spanos et al. 2008; Salas et al. 2004; vanNoordwijk and Purnomosidhi 1995; Oppelt et al. 2001);this is probably because of the difficulty in excavatingthe root system of adult trees. Further, if the architectureof the root system of an adult tree is studied, often theroot system is not totally removed and is therefore onlypartially analysed (Kalliokoski 2011; Kalliokoski et al.2008; Soethe et al. 2007).
Field studies of below- and aboveground architectureare relatively scarce in Africa (Oppelt et al. 2000, 2001).To our knowledge, similar studies in Mozambique and,especially, on Androstachys johnsonii, an commerciallyimportant woodland tree species restricted only toMozambique (Cardoso 1963), are lacking. Hence, weaimed to investigate branching behaviour and determinethe application of the Leonardo da Vinci rule and fractalbranching pattern (self-similarity) of the root and shootsystems of A. johnsonii.
Material and methods
Study area
Mecrusse is a forest type where the main species, andoccasionally, the only one in the upper canopy, isA. johnsonii. It is the dominant and co-dominant specieswith a relative cover varying from 80 to 100 % (Matillaand Timane 2005).
In Mozambique (18°15′S and 35°00′E), Mecrusse-dominated woodlands are mainly found in Inhambaneand Gaza Provinces and in Massangena, Chicualacuala,Mabalane, Chigubo, Guijá, Mabote, Funhalouro, Panda,Mandlakaze, and Chibuto Districts. The east-mostMecrusse forest patches, covering the last five districts,
were defined as the study area. The study area has anextension of 4,502,828 ha (DINAGECA 1997), ofwhich 226,013 ha (5 %) are covered by Mecrussewoodlands.
In the study area, the climate is dry tropical except inthe west part of Panda district and south-west part ofMandlakaze district where the climate is humid tropical(Dinageca 1997; Mae 2005a; b, c, d, e). The climate isdivided into two seasons: warm or rainy season fromOctober to March and cool or dry season fromMarch toSeptember (Mae 2005a; b, c, d, e).
The mean annual temperature is generally greaterthan 24 °C, and the mean annual precipitation variesfrom 400 to 950 mm (Dinageca 1997; Mae 2005a; b, c,d, e). According to the FAO classification (FAO 2003),the soils in the study area are mainly Ferralic Arenosolscovering more than 70 % of the study area (Dinageca1997). Arenosols, Umbric Fluvisols, and Stagnic soilsare also predominant in the north-most part of the studyarea (Dinageca 1997).
The study area is characterised by shortage of waterresources as well as precipitation; of the five districtscomprising the study area, only Chibuto andMandlakaze districts have water resources (Dinageca1997; Mae 2005a; b, c, d, e).
Data collection
Ninety-three trees with diameter-at-breast heights vary-ing from 5 to 32 cm and heights varying from 5.69 to16 m were randomly selected within 23 circular plots of20-m radius and divided into root and shoot systems.The entire root system was completely excavated, andthe distal diameters before branching and the proximaldiameters after branching were measured at each nodeby using a calliper or calliper rule. Similarly, the shootsystem was measured. Only the primary laterals (lateralroots or branches), those originating from the main axis(taproot or stem), were considered. The link length(internode distance: internal link; distance from the lastnode to the apex (meristem): external link; Fig. 1) wasmeasured using a tape.
Additionally, the dry weight of the taproot, primarylateral roots, higher-order lateral roots (mainly second-ary roots), primary branches, and higher-order brancheswere determined by multiplying the ratio of fresh- tooven-dry weight of samples taken from those compo-nents by the total fresh weight of the relevant compo-nent. Dry weight of the stem was obtained by
258 Plant Soil (2015) 394:257–269
multiplying the estimated density of each sample by thestem volume. Dry weights of the root and shoot systemswere obtained by summing the dry weights of theirconstituent components. This information was used todetermine how much biomass is allocated in heigher-order axes (branches and roots).
Data processing and analysis
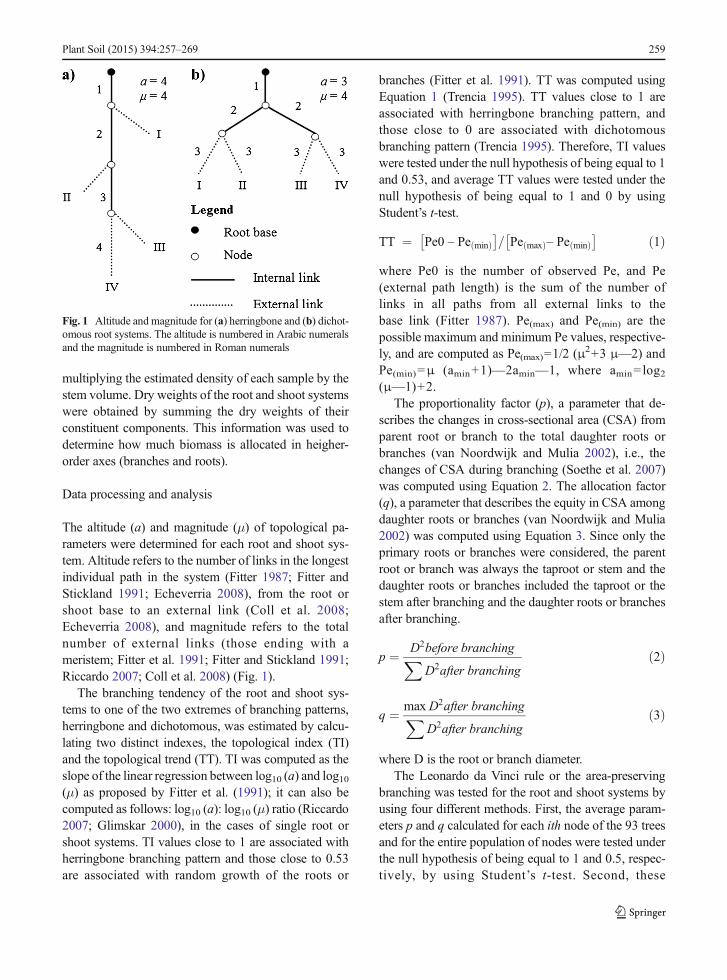
The altitude (a) and magnitude (μ) of topological pa-rameters were determined for each root and shoot sys-tem. Altitude refers to the number of links in the longestindividual path in the system (Fitter 1987; Fitter andStickland 1991; Echeverria 2008), from the root orshoot base to an external link (Coll et al. 2008;Echeverria 2008), and magnitude refers to the totalnumber of external links (those ending with ameristem; Fitter et al. 1991; Fitter and Stickland 1991;Riccardo 2007; Coll et al. 2008) (Fig. 1).
The branching tendency of the root and shoot sys-tems to one of the two extremes of branching patterns,herringbone and dichotomous, was estimated by calcu-lating two distinct indexes, the topological index (TI)and the topological trend (TT). TI was computed as theslope of the linear regression between log10 (a) and log10(μ) as proposed by Fitter et al. (1991); it can also becomputed as follows: log10 (a): log10 (μ) ratio (Riccardo2007; Glimskar 2000), in the cases of single root orshoot systems. TI values close to 1 are associated withherringbone branching pattern and those close to 0.53are associated with random growth of the roots or
branches (Fitter et al. 1991). TT was computed usingEquation 1 (Trencia 1995). TT values close to 1 areassociated with herringbone branching pattern, andthose close to 0 are associated with dichotomousbranching pattern (Trencia 1995). Therefore, TI valueswere tested under the null hypothesis of being equal to 1and 0.53, and average TT values were tested under thenull hypothesis of being equal to 1 and 0 by usingStudent’s t-test.
TT ¼ Pe0 – Pe minð Þ� �
= Pe maxð Þ– Pe minð Þ� � ð1Þ
where Pe0 is the number of observed Pe, and Pe(external path length) is the sum of the number oflinks in all paths from all external links to thebase link (Fitter 1987). Pe(max) and Pe(min) are thepossible maximum and minimum Pe values, respective-ly, and are computed as Pe(max)=1/2 (μ2+3 μ—2) andPe(min)=μ (amin+1)—2amin—1, where amin= log2(μ—1)+2.
The proportionality factor (p), a parameter that de-scribes the changes in cross-sectional area (CSA) fromparent root or branch to the total daughter roots orbranches (van Noordwijk and Mulia 2002), i.e., thechanges of CSA during branching (Soethe et al. 2007)was computed using Equation 2. The allocation factor(q), a parameter that describes the equity in CSA amongdaughter roots or branches (van Noordwijk and Mulia2002) was computed using Equation 3. Since only theprimary roots or branches were considered, the parentroot or branch was always the taproot or stem and thedaughter roots or branches included the taproot or thestem after branching and the daughter roots or branchesafter branching.
p ¼ D2before branchingX
D2after branchingð2Þ
q ¼ maxD2after branchingX
D2after branchingð3Þ
where D is the root or branch diameter.The Leonardo da Vinci rule or the area-preserving
branching was tested for the root and shoot systems byusing four different methods. First, the average param-eters p and q calculated for each ith node of the 93 treesand for the entire population of nodes were tested underthe null hypothesis of being equal to 1 and 0.5, respec-tively, by using Student’s t-test. Second, these
Fig. 1 Altitude and magnitude for (a) herringbone and (b) dichot-omous root systems. The altitude is numbered in Arabic numeralsand the magnitude is numbered in Roman numerals
Plant Soil (2015) 394:257–269 259
parameters (p and q) were tested for independence to thelink diameter by running a linear regression of p and qagainst the link diameter and testing the significance ofthe regression slope. Third, the diameter exponent Δfrom Equation 4 of each stem or taproot node in eachtree was estimated separately by nonlinear optimisationusing Newton coordinate search, and the average wasobtained per ith node and per total number of nodes. Thediameter exponent is the value of exponent Δ that isused to solve Equation 4.
dΔb ¼Xn
a¼1
dΔa ð4Þ
where db is the distal diameter before branching, and dais the proximal diameter after branching. Finally, assum-ingΔ=2, the regression through the origin (RTO) of theCSA before branching against total CSA after branchingwas run by using Equation 5 reported by Spek and vanNoordwijk (1994).
d2b ¼ αXn
a¼1
d2a ð5Þ
The average parameterΔ and the regression slope αwere tested under the null hypothesis of being equal to 2and 1, respectively, by using Student’s t-test. The re-gression slope α is also referred to as the proportionalityfactor (p) by some authors such as Oppelt et al. (2001),although their values estimated from equations 2 and 5are distinct. In this study, these parameters were treateddistinctly.
In the cases where the average parameter p and slopeα were statistically different from 1 and the averageparameter Δ was not statistically different from 2, thearea-preserving branching was confirmed. This was be-cause if p=1 (i.e., Δ=2 or α=1), the CSA does notchange across a branching point (node), whereas if p>1(i.e.,Δ>2 or α>1), the CSA decreases from the parentto daughter and, if p<1 (i.e.,Δ<2 or α<1), it increases(Kalliokoski 2011; Oppelt et al. 2001; Richardson andzu Dohna 2003). Further, in the cases where the averageparameter q was not found to be statistically differentfrom 0.5, equity in CSA was implied among daughterroots or branches.
Furthermore, in the cases in which the area-preserving branching was observed for all nodes acrossthe stem or taproot, the self-similar branching patternwas confirmed (van Noordwijk and Mulia 2002; Soethe
et al. 2007 and Richardson and zuDohna 2003). In otherwords, if the branching parameters (p and q) for allnodes across the stem or taproot were not found to bedependent on the link diameter, the self-similarbranching pattern was confirmed (Salas et al. 2004;van Noordwijk and Purnomosidhi 1995). All the statis-tical analyses were performed at the 5 % significancelevel using Microsoft Excel Data Analysis Tools.
Results
Topology
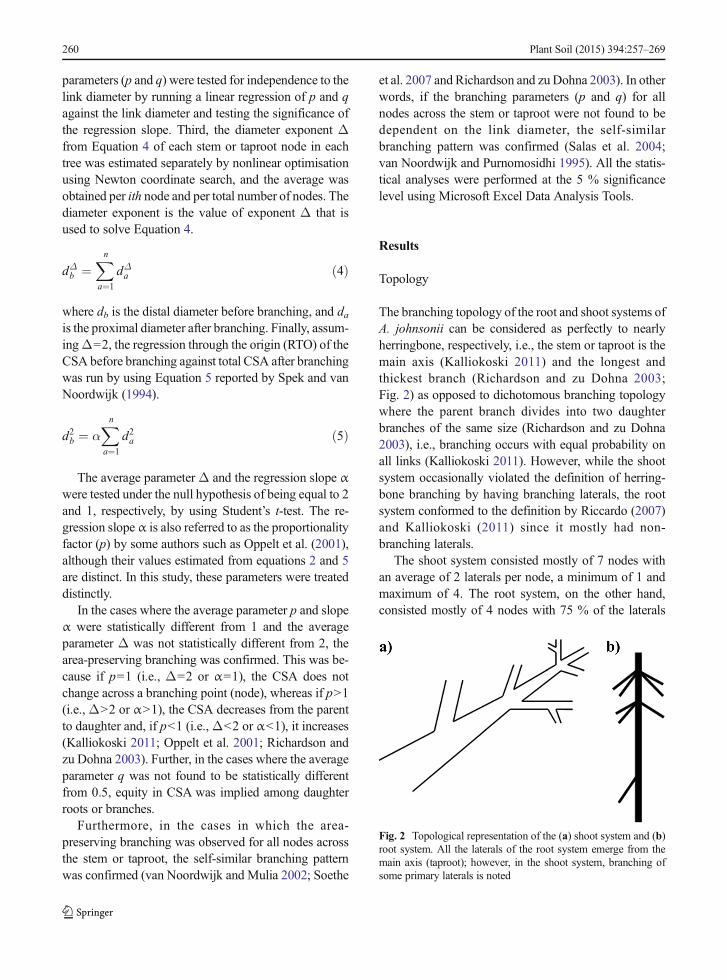
The branching topology of the root and shoot systems ofA. johnsonii can be considered as perfectly to nearlyherringbone, respectively, i.e., the stem or taproot is themain axis (Kalliokoski 2011) and the longest andthickest branch (Richardson and zu Dohna 2003;Fig. 2) as opposed to dichotomous branching topologywhere the parent branch divides into two daughterbranches of the same size (Richardson and zu Dohna2003), i.e., branching occurs with equal probability onall links (Kalliokoski 2011). However, while the shootsystem occasionally violated the definition of herring-bone branching by having branching laterals, the rootsystem conformed to the definition by Riccardo (2007)and Kalliokoski (2011) since it mostly had non-branching laterals.
The shoot system consisted mostly of 7 nodes withan average of 2 laterals per node, a minimum of 1 andmaximum of 4. The root system, on the other hand,consisted mostly of 4 nodes with 75 % of the laterals
Fig. 2 Topological representation of the (a) shoot system and (b)root system. All the laterals of the root system emerge from themain axis (taproot); however, in the shoot system, branching ofsome primary laterals is noted
260 Plant Soil (2015) 394:257–269

located in the first and second nodes. The averagenumber of laterals per node in the root system was 4and 3 for the first and second nodes, respectively,and 2 per remaining nodes; the minimum andmaximum numbers of laterals per node were 1 and 11,respectively. Table 1 provides details on the num-ber of nodes and laterals per node for the root andshoot systems.
In all, 81 % of the stem nodes had only 1 lateral;15%, had 2 and 3; and 1%, had 3 and 4 laterals. Further,32 % of the taproot nodes had only 1 lateral, and17, 13, and 6 % had 2, 3, and 4 laterals, respec-tively; in 32 % of the nodes, the number of lateralsvaried from 5 to 11. In the shoot system, thelaterals per node increased with height; on theother hand, in the root system, the laterals decreasedwith depth. The diameters of the laterals at the insertionpoint decreased with height (aboveground) and depth(belowground).
In the shoot system, the average link length per treevaried from 115 to 719 cm, with an overall weightedaverage of 193 cm; on the other hand, in the root system,it varied from 35 to 235 cm, with an overall weightedaverage of 90 cm. The average link diameter in the shootsystem was 9.73 cm, varying from a minimum of 2.5 toa maximum of 32 cm; in the root system, the averagelink diameter was 12.59 cm, ranging from 3.5 to 47 cm.The biomass allocated in each tree component is givenin the Table 2; where it can be seen that higher-orderroots account, on average, with 2.922 % (0.704 kg) of
the biomass of all lateral roots (24.083 kg); and higher-order branches account with 5.631 % (3.130 kg) of thebiomass of all branches (55.586 kg).
The lower amount of biomass allocated to higher-order axes (roots and branches) support the visualanalysis results that the branching topology of theroot and shoot systems is herringbone; with theroot system showing a tendency to a perfect her-ringbone branching, judging by the amout of bio-mass allocated to higher-order roots when compared tothe shoot system.
The altitude of the shoot system varied from 2 to 8,with an average of 4.6, and the magnitude varied from 2to 13, with an average of 5.40. The TI for the shootsystem was 0.70, consequentelly the hypotheses ofbeing equal to 1 (P<0.0001) or 0.53 (P<0.0001)were rejected. The altitude of the root systemvaried from 3 to 5, with an average of 2.82, andthe magnitude varied from 2 to 15, with an average of7.29. The TI for the root system was 0.30, and thehypotheses of being equal to 1 (P<0.0001) or 0.53(P=0.0002) were rejected.
The external path length (Pe) of the shoot systemvaried from 4 to 68, with an average of 21.40; theaverage TT value was 0.90; however, the hypothesesof being equal to 1 (P<0.0001) or 0 (P<0.0001) wererejected. Pe for the root system varied from 4 to 46, withan average of 17.80; the average TT was 0.37, and thehypotheses of being equal to 1 (P<0.0001) or 0(P<0.0001) were rejected.
Table 1 Summary description of the number of nodes and laterals in the sampled trees
Firstnode
Secondnode
Thirdnode
Fourthnode
Fifithnode
Sixthnode
Seventhnode
Total
Shoot system Number of nodes in the sampled trees 86.00 80.00 69.00 44.00 23.00 6.00 1.00 309.00
Number of branches after bifurcation 175.00 168.00 158.00 110.00 57.00 20.00 3.00 691.00
Average number of branches per node per tree 2.03 2.10 2.29 2.50 2.48 3.33 3.00 17.74
Number of lateral branches after bifurcation(excluding the stem)
172.00 160.00 141.00 93.00 48.00 17.00 2.00 633.00
Average number of lateral branches per nodeper tree (excluding the stem)
2.00 2.00 2.04 2.11 2.09 2.83 2.00 15.08
Root system Number of nodes in the sampled trees 73.00 40.00 19.00 1.00 133.00
Number of lateral roots after bifurcation 386.00 160.00 43.00 3.00 592.00
Average number of lateral roots afterbifurcation per node per tree
5.29 4.00 2.26 3.00 14.55
Number of lateral roots after bifurcation(excluding the taproot)
327.00 134.00 39.00 2.00 502.00
Average number of lateral roots after bifurcationper node per tree (excluding the taproot)
4.48 3.35 2.05 2.00 11.88
Plant Soil (2015) 394:257–269 261
Branching parameters (p and q)
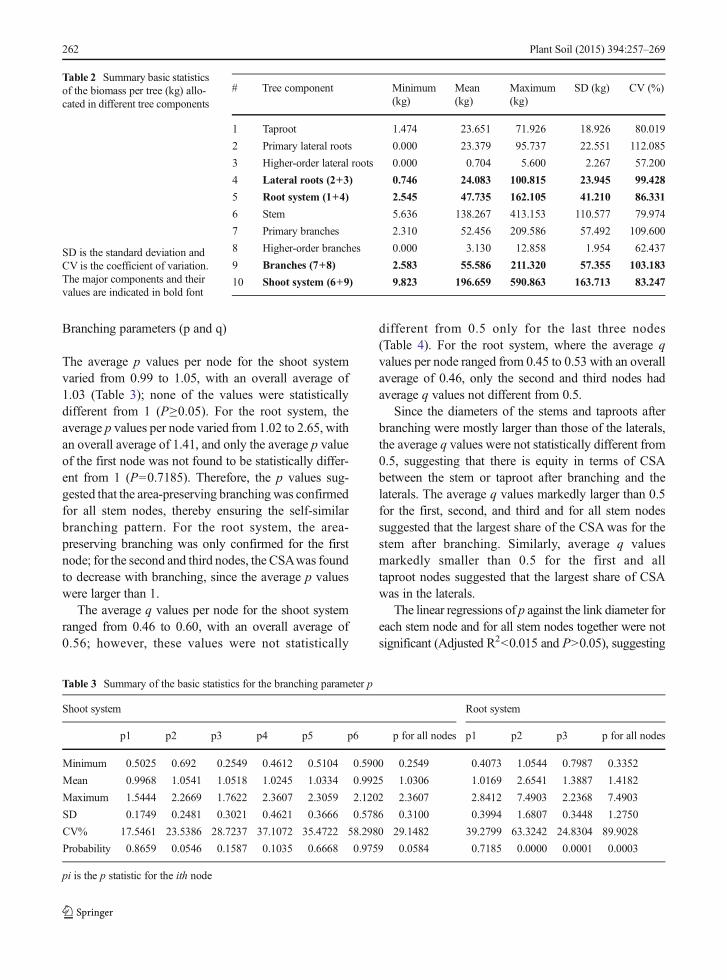
The average p values per node for the shoot systemvaried from 0.99 to 1.05, with an overall average of1.03 (Table 3); none of the values were statisticallydifferent from 1 (P≥0.05). For the root system, theaverage p values per node varied from 1.02 to 2.65, withan overall average of 1.41, and only the average p valueof the first node was not found to be statistically differ-ent from 1 (P=0.7185). Therefore, the p values sug-gested that the area-preserving branchingwas confirmedfor all stem nodes, thereby ensuring the self-similarbranching pattern. For the root system, the area-preserving branching was only confirmed for the firstnode; for the second and third nodes, the CSAwas foundto decrease with branching, since the average p valueswere larger than 1.
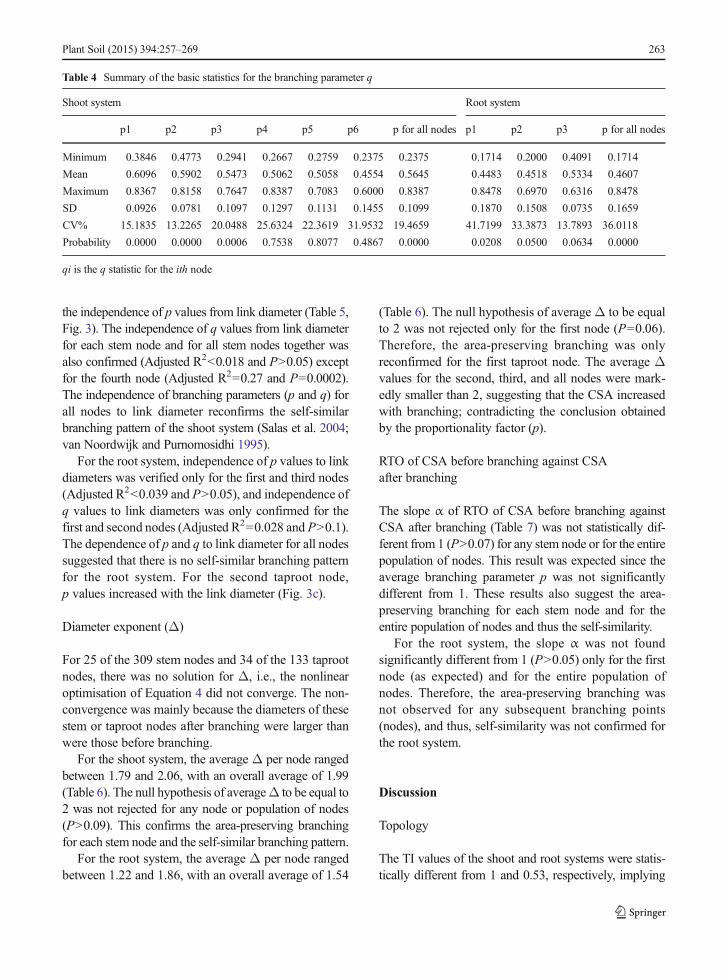
The average q values per node for the shoot systemranged from 0.46 to 0.60, with an overall average of0.56; however, these values were not statistically
different from 0.5 only for the last three nodes(Table 4). For the root system, where the average qvalues per node ranged from 0.45 to 0.53 with an overallaverage of 0.46, only the second and third nodes hadaverage q values not different from 0.5.
Since the diameters of the stems and taproots afterbranching were mostly larger than those of the laterals,the average q values were not statistically different from0.5, suggesting that there is equity in terms of CSAbetween the stem or taproot after branching and thelaterals. The average q values markedly larger than 0.5for the first, second, and third and for all stem nodessuggested that the largest share of the CSAwas for thestem after branching. Similarly, average q valuesmarkedly smaller than 0.5 for the first and alltaproot nodes suggested that the largest share of CSAwas in the laterals.
The linear regressions of p against the link diameter foreach stem node and for all stem nodes together were notsignificant (Adjusted R2<0.015 and P>0.05), suggesting
Table 2 Summary basic statisticsof the biomass per tree (kg) allo-cated in different tree components
SD is the standard deviation andCV is the coefficient of variation.The major components and theirvalues are indicated in bold font
# Tree component Minimum(kg)
Mean(kg)
Maximum(kg)
SD (kg) CV (%)
1 Taproot 1.474 23.651 71.926 18.926 80.019
2 Primary lateral roots 0.000 23.379 95.737 22.551 112.085
3 Higher-order lateral roots 0.000 0.704 5.600 2.267 57.200
4 Lateral roots (2+3) 0.746 24.083 100.815 23.945 99.428
5 Root system (1+4) 2.545 47.735 162.105 41.210 86.331
6 Stem 5.636 138.267 413.153 110.577 79.974
7 Primary branches 2.310 52.456 209.586 57.492 109.600
8 Higher-order branches 0.000 3.130 12.858 1.954 62.437
9 Branches (7+8) 2.583 55.586 211.320 57.355 103.183
10 Shoot system (6+9) 9.823 196.659 590.863 163.713 83.247
Table 3 Summary of the basic statistics for the branching parameter p
Shoot system Root system
p1 p2 p3 p4 p5 p6 p for all nodes p1 p2 p3 p for all nodes
Minimum 0.5025 0.692 0.2549 0.4612 0.5104 0.5900 0.2549 0.4073 1.0544 0.7987 0.3352
Mean 0.9968 1.0541 1.0518 1.0245 1.0334 0.9925 1.0306 1.0169 2.6541 1.3887 1.4182
Maximum 1.5444 2.2669 1.7622 2.3607 2.3059 2.1202 2.3607 2.8412 7.4903 2.2368 7.4903
SD 0.1749 0.2481 0.3021 0.4621 0.3666 0.5786 0.3100 0.3994 1.6807 0.3448 1.2750
CV% 17.5461 23.5386 28.7237 37.1072 35.4722 58.2980 29.1482 39.2799 63.3242 24.8304 89.9028
Probability 0.8659 0.0546 0.1587 0.1035 0.6668 0.9759 0.0584 0.7185 0.0000 0.0001 0.0003
pi is the p statistic for the ith node
262 Plant Soil (2015) 394:257–269
the independence of p values from link diameter (Table 5,Fig. 3). The independence of q values from link diameterfor each stem node and for all stem nodes together wasalso confirmed (Adjusted R2<0.018 and P>0.05) exceptfor the fourth node (Adjusted R2=0.27 and P=0.0002).The independence of branching parameters (p and q) forall nodes to link diameter reconfirms the self-similarbranching pattern of the shoot system (Salas et al. 2004;van Noordwijk and Purnomosidhi 1995).
For the root system, independence of p values to linkdiameters was verified only for the first and third nodes(Adjusted R2<0.039 and P>0.05), and independence ofq values to link diameters was only confirmed for thefirst and second nodes (Adjusted R2=0.028 and P>0.1).The dependence of p and q to link diameter for all nodessuggested that there is no self-similar branching patternfor the root system. For the second taproot node,p values increased with the link diameter (Fig. 3c).
Diameter exponent (Δ)
For 25 of the 309 stem nodes and 34 of the 133 taprootnodes, there was no solution for Δ, i.e., the nonlinearoptimisation of Equation 4 did not converge. The non-convergence was mainly because the diameters of thesestem or taproot nodes after branching were larger thanwere those before branching.
For the shoot system, the average Δ per node rangedbetween 1.79 and 2.06, with an overall average of 1.99(Table 6). The null hypothesis of averageΔ to be equal to2 was not rejected for any node or population of nodes(P>0.09). This confirms the area-preserving branchingfor each stem node and the self-similar branching pattern.
For the root system, the average Δ per node rangedbetween 1.22 and 1.86, with an overall average of 1.54
(Table 6). The null hypothesis of averageΔ to be equalto 2 was not rejected only for the first node (P=0.06).Therefore, the area-preserving branching was onlyreconfirmed for the first taproot node. The average Δvalues for the second, third, and all nodes were mark-edly smaller than 2, suggesting that the CSA increasedwith branching; contradicting the conclusion obtainedby the proportionality factor (p).
RTO of CSA before branching against CSAafter branching
The slope α of RTO of CSA before branching againstCSA after branching (Table 7) was not statistically dif-ferent from 1 (P>0.07) for any stem node or for the entirepopulation of nodes. This result was expected since theaverage branching parameter p was not significantlydifferent from 1. These results also suggest the area-preserving branching for each stem node and for theentire population of nodes and thus the self-similarity.
For the root system, the slope α was not foundsignificantly different from 1 (P>0.05) only for the firstnode (as expected) and for the entire population ofnodes. Therefore, the area-preserving branching wasnot observed for any subsequent branching points(nodes), and thus, self-similarity was not confirmed forthe root system.
Discussion
Topology
The TI values of the shoot and root systems were statis-tically different from 1 and 0.53, respectively, implying
Table 4 Summary of the basic statistics for the branching parameter q
Shoot system Root system
p1 p2 p3 p4 p5 p6 p for all nodes p1 p2 p3 p for all nodes
Minimum 0.3846 0.4773 0.2941 0.2667 0.2759 0.2375 0.2375 0.1714 0.2000 0.4091 0.1714
Mean 0.6096 0.5902 0.5473 0.5062 0.5058 0.4554 0.5645 0.4483 0.4518 0.5334 0.4607
Maximum 0.8367 0.8158 0.7647 0.8387 0.7083 0.6000 0.8387 0.8478 0.6970 0.6316 0.8478
SD 0.0926 0.0781 0.1097 0.1297 0.1131 0.1455 0.1099 0.1870 0.1508 0.0735 0.1659
CV% 15.1835 13.2265 20.0488 25.6324 22.3619 31.9532 19.4659 41.7199 33.3873 13.7893 36.0118
Probability 0.0000 0.0000 0.0006 0.7538 0.8077 0.4867 0.0000 0.0208 0.0500 0.0634 0.0000
qi is the q statistic for the ith node
Plant Soil (2015) 394:257–269 263

Tab
le5
Regressionof
thebranchingparametersagainstthe
linkdiam
eter
fortheshootand
root
system
s
Shootsystem
Nodesequence
p=b 0+b 1d
q=b 0+b 1d
b 0b 1
AdjustedR2
Probability
b 0b 1
AdjustedR2
Probability
First
0.9066
0.0056
0.0141
0.0530
0.6114
–0.0001
–0.0118
0.9380
Second
1.1189
–0.0048
–0.0018
0.3576
0.5607
0.0022
0.0102
0.1823
Third
1.0843
–0.0028
–0.0131
0.7275
0.4719
0.0064
0.0161
0.0523
Fourth
1.0287
0.0206
0.0108
0.2319
0.3303
0.0167
0.2662
0.0002
Fifth
1.0759
–0.0047
–0.0458
0.8493
0.5082
–0.0003
–0.0476
0.9716
Sixth
0.2681
0.0852
–0.1605
0.6082
0.5219
–0.0078
–0.2381
0.8540
Allnodes
1.0770
–0.0010
–0.0029
0.7297
0.4971
0.0052
0.0176
0.0593
Rootsystem
Nodesequence
p=b 0+b 1d
q=b 0+b 1d
b 0b 1
AdjustedR2
Probability
b 0b 1
AdjustedR2
Probability
First
1.4050
–0.0147
0.0389
0.0580
0.5056
–0.0022
0.0284
0.3954
Second
–0.3843
0.1096
0.3514
0.0000
0.5555
–0.0037
0.0284
0.1519
Third
1.1501
0.0174
–0.0140
0.3980
0.6538
–0.0088
0.1920
0.0346
Allnodes
0.7324
0.0333
0.0625
0.0022
0.5487
–0.0035
0.0348
0.0179
disthelin
kdiam
eter;p
robabilityrefersto
thesignificance
oftheregression
slope
264 Plant Soil (2015) 394:257–269

that their branching patterns could not be considered to beherringbone or to have a random growth, thereby contra-dicting the results of visual analysis. Nonetheless, the TIvalues were closer to 0.53 than to 1, suggesting a tenden-cy to grow randomly. On the other hand, the TT values,although not statistically different from 1 and 0, wereconsiderably closer to 1 for the shoot system (a tendencyto assume the herringbone branching pattern) and 0 forthe root system (a tendency to assume the dichotomousbranching pattern).
The TI might indicate a non-herringbone branchingpattern since A. johnsonii has multiple laterals per stemor taproot node. However, the herringbone mathemati-cal tree based on which TI is calculated, as described byFitter (1987), Fitter and Stickland (1991), Spek and vanNoordwijk (1994), Larkin (1995), van Noordwijk andPurnomosidhi (1995), Richardson and zu Dohna(2003), and Riccardo (2007), has only one lateral pernode, and thus, a is equal to μ, as revealed by Fitter(1991), and TI is equal to 1 (Martínez-Sánchez et al.2003). However, the maximum number of laterals pernode of A. johnsonii was 4 for the shoot system and 11for the root system, making μ considerably larger than a,and thus, TI was lesser than 1 and closer to 0.53. This
was confirmed by our results, where the average μ of theroot system was 3 times the average a.
The same holds true for TT values, at least for theroot system, since P(max) and P(min) are functions of μ,making the denominator of Equation 1 larger than thenumerator and causing TT to be much lesser than 1 andcloser to 0. The TT value for the shoot systemwas closerto 1 because the average a was closer to average μ,which in turn was due to the smaller number of lateralsper node associated with the larger number of links,unlike in the root system.
This suggests that the TI and TT defined by Fitter et al.(1991) and Trencia (1995), respectively, might lead tobiased conclusions with regards to the branching patternwhen the main axis has multiple laterals per node, i.e., inthese cases, a herringbone branching pattern might beregarded as a dichotomous one or as having randombranching according to the topological indexes (TI andTT), even if the branching pattern is clearly herringboneas is the case of the root system of A. johnsonii.
This situation can be overcome by using the modifiedTI (TIM) that addresses the situation of multiple lateralsper node while conserving the value of TI for the casesof one lateral per node. TIM is computed as the slope of
0
0.5
1
1.5
2
2.5
0.00 5.00 10.00 15.00 20.00 25.00 30.00 35.00
Prop
or�o
nalit
y fa
ctor
, p
Link diameter (cm)
a)
First node Second node Third node Fourth node
Fi�h node Sixth node Seventh node
0
1
2
3
4
5
6
7
8
0 10 20 30 40 50
Prop
or�o
naly
fac
tor,
p
Link diameter (cm)
c)
First node Second node Third node Fourth node
0
0.1
0.2
0.3
0.4
0.5
0.6
0.7
0.8
0.9
0.00 5.00 10.00 15.00 20.00 25.00 30.00 35.00
Allo
ca�o
n fa
ctor
, q
Link diameter (cm)
b)
First node Second node Third node Fourth node
Fi�h node Sixth node Seventh node
0
0.1
0.2
0.3
0.4
0.5
0.6
0.7
0.8
0.9
0 10 20 30 40 50
Allo
ca�o
n fa
ctor
, q
Link diameter (cm)
d)
First node Second node Third node Fourth node
Fig. 3 Regression of branching parameters (p and q) against link diameter for (a, b) shoot system and (c, d) root system
Plant Soil (2015) 394:257–269 265
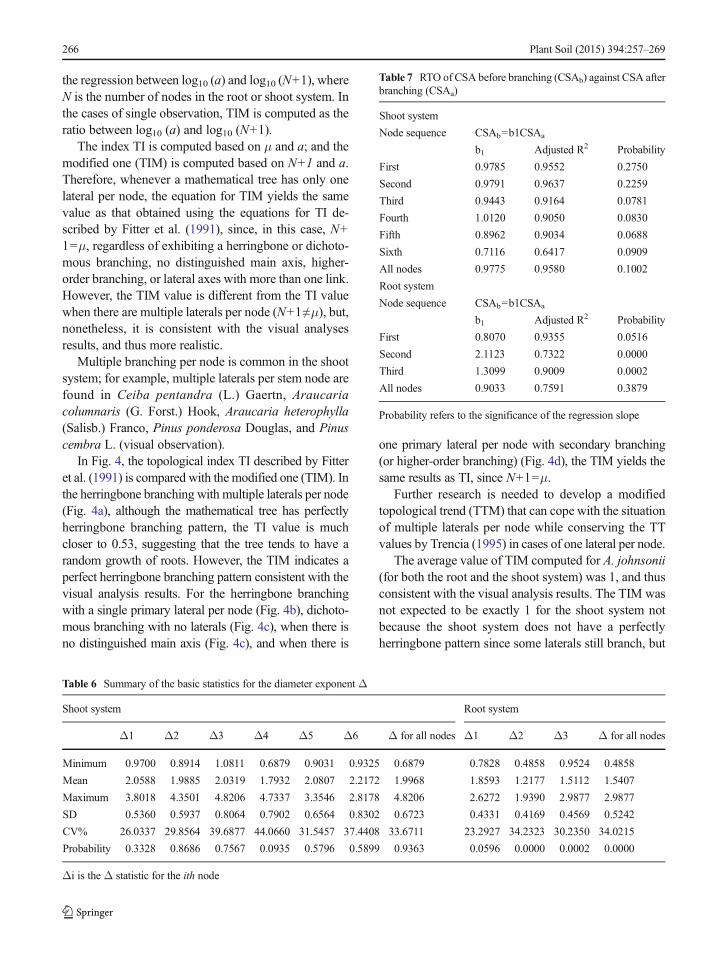
the regression between log10 (a) and log10 (N+1), whereN is the number of nodes in the root or shoot system. Inthe cases of single observation, TIM is computed as theratio between log10 (a) and log10 (N+1).
The index TI is computed based on μ and a; and themodified one (TIM) is computed based on N+1 and a.Therefore, whenever a mathematical tree has only onelateral per node, the equation for TIM yields the samevalue as that obtained using the equations for TI de-scribed by Fitter et al. (1991), since, in this case, N+1=μ, regardless of exhibiting a herringbone or dichoto-mous branching, no distinguished main axis, higher-order branching, or lateral axes with more than one link.However, the TIM value is different from the TI valuewhen there are multiple laterals per node (N+1≠μ), but,nonetheless, it is consistent with the visual analysesresults, and thus more realistic.
Multiple branching per node is common in the shootsystem; for example, multiple laterals per stem node arefound in Ceiba pentandra (L.) Gaertn, Araucariacolumnaris (G. Forst.) Hook, Araucaria heterophylla(Salisb.) Franco, Pinus ponderosa Douglas, and Pinuscembra L. (visual observation).
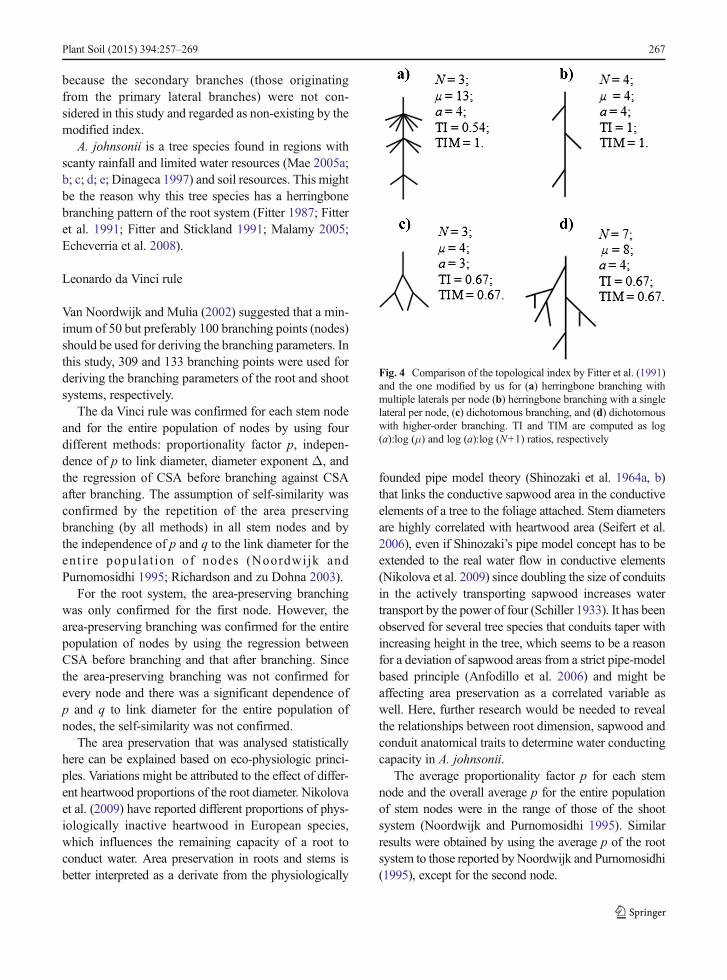
In Fig. 4, the topological index TI described by Fitteret al. (1991) is compared with the modified one (TIM). Inthe herringbone branching with multiple laterals per node(Fig. 4a), although the mathematical tree has perfectlyherringbone branching pattern, the TI value is muchcloser to 0.53, suggesting that the tree tends to have arandom growth of roots. However, the TIM indicates aperfect herringbone branching pattern consistent with thevisual analysis results. For the herringbone branchingwith a single primary lateral per node (Fig. 4b), dichoto-mous branching with no laterals (Fig. 4c), when there isno distinguished main axis (Fig. 4c), and when there is
one primary lateral per node with secondary branching(or higher-order branching) (Fig. 4d), the TIM yields thesame results as TI, since N+1=μ.
Further research is needed to develop a modifiedtopological trend (TTM) that can cope with the situationof multiple laterals per node while conserving the TTvalues by Trencia (1995) in cases of one lateral per node.
The average value of TIM computed for A. johnsonii(for both the root and the shoot system) was 1, and thusconsistent with the visual analysis results. The TIM wasnot expected to be exactly 1 for the shoot system notbecause the shoot system does not have a perfectlyherringbone pattern since some laterals still branch, but
Table 6 Summary of the basic statistics for the diameter exponent Δ
Shoot system Root system
Δ1 Δ2 Δ3 Δ4 Δ5 Δ6 Δ for all nodes Δ1 Δ2 Δ3 Δ for all nodes
Minimum 0.9700 0.8914 1.0811 0.6879 0.9031 0.9325 0.6879 0.7828 0.4858 0.9524 0.4858
Mean 2.0588 1.9885 2.0319 1.7932 2.0807 2.2172 1.9968 1.8593 1.2177 1.5112 1.5407
Maximum 3.8018 4.3501 4.8206 4.7337 3.3546 2.8178 4.8206 2.6272 1.9390 2.9877 2.9877
SD 0.5360 0.5937 0.8064 0.7902 0.6564 0.8302 0.6723 0.4331 0.4169 0.4569 0.5242
CV% 26.0337 29.8564 39.6877 44.0660 31.5457 37.4408 33.6711 23.2927 34.2323 30.2350 34.0215
Probability 0.3328 0.8686 0.7567 0.0935 0.5796 0.5899 0.9363 0.0596 0.0000 0.0002 0.0000
Δi is the Δ statistic for the ith node
Table 7 RTO of CSA before branching (CSAb) against CSA afterbranching (CSAa)
Shoot system
Node sequence CSAb=b1CSAa
b1 Adjusted R2 Probability
First 0.9785 0.9552 0.2750
Second 0.9791 0.9637 0.2259
Third 0.9443 0.9164 0.0781
Fourth 1.0120 0.9050 0.0830
Fifth 0.8962 0.9034 0.0688
Sixth 0.7116 0.6417 0.0909
All nodes 0.9775 0.9580 0.1002
Root system
Node sequence CSAb=b1CSAa
b1 Adjusted R2 Probability
First 0.8070 0.9355 0.0516
Second 2.1123 0.7322 0.0000
Third 1.3099 0.9009 0.0002
All nodes 0.9033 0.7591 0.3879
Probability refers to the significance of the regression slope
266 Plant Soil (2015) 394:257–269
because the secondary branches (those originatingfrom the primary lateral branches) were not con-sidered in this study and regarded as non-existing by themodified index.
A. johnsonii is a tree species found in regions withscanty rainfall and limited water resources (Mae 2005a;b; c; d; e; Dinageca 1997) and soil resources. This mightbe the reason why this tree species has a herringbonebranching pattern of the root system (Fitter 1987; Fitteret al. 1991; Fitter and Stickland 1991; Malamy 2005;Echeverria et al. 2008).
Leonardo da Vinci rule
Van Noordwijk and Mulia (2002) suggested that a min-imum of 50 but preferably 100 branching points (nodes)should be used for deriving the branching parameters. Inthis study, 309 and 133 branching points were used forderiving the branching parameters of the root and shootsystems, respectively.
The da Vinci rule was confirmed for each stem nodeand for the entire population of nodes by using fourdifferent methods: proportionality factor p, indepen-dence of p to link diameter, diameter exponent Δ, andthe regression of CSA before branching against CSAafter branching. The assumption of self-similarity wasconfirmed by the repetition of the area preservingbranching (by all methods) in all stem nodes and bythe independence of p and q to the link diameter for theentire populat ion of nodes (Noordwijk andPurnomosidhi 1995; Richardson and zu Dohna 2003).
For the root system, the area-preserving branchingwas only confirmed for the first node. However, thearea-preserving branching was confirmed for the entirepopulation of nodes by using the regression betweenCSA before branching and that after branching. Sincethe area-preserving branching was not confirmed forevery node and there was a significant dependence ofp and q to link diameter for the entire population ofnodes, the self-similarity was not confirmed.
The area preservation that was analysed statisticallyhere can be explained based on eco-physiologic princi-ples. Variations might be attributed to the effect of differ-ent heartwood proportions of the root diameter. Nikolovaet al. (2009) have reported different proportions of phys-iologically inactive heartwood in European species,which influences the remaining capacity of a root toconduct water. Area preservation in roots and stems isbetter interpreted as a derivate from the physiologically
founded pipe model theory (Shinozaki et al. 1964a, b)that links the conductive sapwood area in the conductiveelements of a tree to the foliage attached. Stem diametersare highly correlated with heartwood area (Seifert et al.2006), even if Shinozaki’s pipe model concept has to beextended to the real water flow in conductive elements(Nikolova et al. 2009) since doubling the size of conduitsin the actively transporting sapwood increases watertransport by the power of four (Schiller 1933). It has beenobserved for several tree species that conduits taper withincreasing height in the tree, which seems to be a reasonfor a deviation of sapwood areas from a strict pipe-modelbased principle (Anfodillo et al. 2006) and might beaffecting area preservation as a correlated variable aswell. Here, further research would be needed to revealthe relationships between root dimension, sapwood andconduit anatomical traits to determine water conductingcapacity in A. johnsonii.
The average proportionality factor p for each stemnode and the overall average p for the entire populationof stem nodes were in the range of those of the shootsystem (Noordwijk and Purnomosidhi 1995). Similarresults were obtained by using the average p of the rootsystem to those reported by Noordwijk and Purnomosidhi(1995), except for the second node.
Fig. 4 Comparison of the topological index by Fitter et al. (1991)and the one modified by us for (a) herringbone branching withmultiple laterals per node (b) herringbone branching with a singlelateral per node, (c) dichotomous branching, and (d) dichotomouswith higher-order branching. TI and TIM are computed as log(a):log (μ) and log (a):log (N+1) ratios, respectively
Plant Soil (2015) 394:257–269 267
The diameter exponent Δ in this study for the rootand shoot systems was in the range of those reported byOppelt et al. (2001) and Richardson and zu Dohna(2003), although, in this case, the self-similarity wasonly confirmed for the shoot system. Further, the lackof dependence of p and q to link diameter of the shootsystem and for the first taproot node was also in accor-dance with the finding by Noordwijk and Purnomosidhi(1995), Soethe et al. (2007), and Salas et al. (2004).
The average p for the second and third taproot nodessuggested that the CSA decreased with branching sincethe average p values were larger than 1. However, thiscontradicts the conclusion obtained using average Δ,since, for the second and third nodes, the average Δvalues were markedly smaller than 2, suggesting that theCSA increased with branching. These contradictions areattributed to the fact that, for 34 of the 133 observedtaproot nodes, there was no solution for Δ, which af-fected each node’s averageΔ and the overall averageΔ.
Conclusion
The newly developed topological index TIM is an un-biased estimator of the branching tendency, since thisindex considers both the situations of single and multi-ple branching per node as opposed to the traditionallyused topological index TI. The branching topology ofthe root and shoot systems of A. johnsonii trees wasfound to be perfectly to nearly herringbone, respective-ly. The area preserving branching was confirmed foreach stem node, thereby confirming the self-similarbranching. For the root system, the area preservingbranching was only confirmed for the first node; there-fore, the self-similarity was not confirmed.
Acknowledgments This study was funded by the SwedishInternational Development Cooperation Agency (SIDA).
Conflicts of interest The author(s) declare that they have nocompeting interests
Open Access This article is distributed under the terms of theCreative Commons Attribution 4.0 International License (http://creativecommons.org/licenses/by/4.0/), which permits unrestrict-ed use, distribution, and reproduction in any medium, providedyou give appropriate credit to the original author(s) and the source,provide a link to the Creative Commons license, and indicate ifchanges were made.
References
Anfodillo T, Carraro V, Carrer M, Fior C, Rossi S (2006)Convergent tapering of xylem conduits in different woodyspecies. New Phytol 169(2):279–290
Berntson GM (1997) Topological scalling and plant root architec-ture: developmental and functional hierarchies. New Phytol135:621–634
Cardoso GA (1963) Madeiras de Moçambique: Androstachysjohnsonii. serviços de agricultura e serviços de veterinária.Maputo, Moçambique
Chiatante D, Di Iorio A, Scippa GS, Schirone B (2004) Rootarchitectural and morphological response of Pinus NigraArn. andQuercus roburL. to nutrient supply and root densityin the soil. Annali di Botanica 4:159–170
Coll L, Potvin C, Messier C, Delagrange S (2008) Root architec-ture and allocation patterns of eight tropical native specieswith different successional status used in open-grown mixedplantations in Panama. Trees 22:585–596. doi:10.1007/s00468-008-0219-6
Cortina J, Green JJ, Baddeley JA, Watson CA (2008) Root mor-phology and water transport of Pistacia lentiscus seedlingsunder contrasting water supply: a test of the pipe stem theory.Environ Exp Bot 62:343–350. doi:10.1016/j.envexpbot.2007.10.007
DINAGECA (1997) Mapa digital de uso e cobertura de terra.projecto de mapeamento de uso e cobertura de terra. CENACARTA, Maputo
Echeverria M, Scambato AA, Sannazarro AI, Maiale S, Ruiz OA,Menéndez AB (2008) Phenotypic plasticity with respect tosalt stress response by Lotus glaber: the role of its AM fungaland rhizobial symbionts. Mycorrhiza 18(6–7):317–329. doi:10.1007/s00572-008-0184-3
FAO (2003) FAO map of world soil resources. FAO, RomeFitter AH (1987) An architectural approach to the comparative
ecology of plant root system. New Phytol 106:61–77Fitter AH (1991) Characteristics and function of root systems. In:
Waissel Y, Eshel A, Kafkafi U (eds) Plant roots: the hiddenhalf. Marcel Dekker, New York, pp 3–25
Fitter AH, Stickland TR (1991) Architectural analysis of plant rootsystem 2. influence of nutrient supply on architecture incontrasting plant species. New Phytol 118:383–389
Fitter AH, Stickland TR, Harvey GWW (1991) Architecturalanalysis of plant root system 3. architectural correlates ofexploitation efficiency. New Phytol 118:375–382
Glimskar A (2000) Estimates of root system topology of five plantspecies grown at steady-state nutrition. Plant Soil 227:249–256
Kalliokoski T (2011) Root system traits of Norway spruce, Scotspine, and silver birch in mixed boreal forests: an analysis ofroot architecture, morphology, and anatomy. Dissertation,University of Helsinki
Kalliokoski T, Nygren P, Siev nen R (2008) Coarse root architec-ture of three boreal tree species growing in mixed stands.Silva Fennica 42(2):189–210
Larkin RP, English JT, Mihail JD (1995) Effects of infection byPythium spp. on root systemmorphology of alfalfa seedlings.Phyto-Pathol 85:430–435
Lynch J (1995) Root achitecture and plant produtivity. PlantPhysiol 109:7–13
268 Plant Soil (2015) 394:257–269
Lynch JP, Ho MD (2005) Rhizoeconomics: carbon costs of phos-phorus acquisition. Plant Soil 269:45–56
Mae (2005a) Perfil do distrito de Chibuto, província deGaza.Mae,Maputo, Moçambique
Mae (2005b) Perfil do distrito de Funhalouro, província deInhambane. Mae, Maputo, Moçambique
Mae (2005c) Perfil do distrito deMabote, província de Inhambane.Mae, Maputo, Moçambique
Mae (2005d) Perfil do distrito deMandhlakaze, província deGaza.Mae, Maputo, Moçambique
Mae (2005e) Perfil do distrito de Panda, província de Inhambane.Mae, Maputo, Moçambique
Malamy JE (2005) Intrinsic and environmental response pathwaysthat regulate root system architecture. Plant Cell Environ28:67–77
Mantilla J, Timane R (2005) Orientação para maneio de mecrusse.SymfoDesign, Lda. Maputo, Mozambique
Martínez-Sánchez JJ, Ferrandis B, Trabaud L, Galindo R, FrancoJA, Herranz JM (2003) Comparative root system structure ofpost-fire Pinus halepensis Mill. and Cistus monspeliensis L.saplings. Plant Ecol 168:309–320
Nicotra AB, Babicka N,WestobyM (2002) Seedling root anatomyandmorphology: an examination of ecological differentiationwith rainfall using phylogenetically independent contrasts.Oecologia 130:136–145
Nikolova P, Blaschke H, Matyssek R, Pretzsch H, Seifert T (2009)Combined application of computer tomography and lightmicroscopy for analysis of conductive xylem area of beechand spruce coarse roots. Eur J For Res 128(2):145–153
Oppelt AL, Kurth W, Dzierzon H, Jentschke G, Godbold DL(2000) Structure and fractal dimensions of root systems offour co-occuring fruit tree species from Botswana. Ann ForSci 57:463–475
Oppelt AL, Kurth W, Godbold DL (2001) Topology, scaling andLeonardo’s rule in root system from African tree species.Tree Physiol 21:117–128
Riccardo LB (2007) Root topology and allocation patterns ofAtriplex patula seedlings supplied with different nutrientconcentrations. Italian J Agrometeorol 2:35–39
Richardson AD, zu Dohna H (2003) Predicting root biomass frombranching patterns of Douglas-fir root systems. OIKOS 100:96–104
Salas E, Ozier-LafontaineH, Nygren P (2004) A fractal root modelfor estimating the root biomass and architecture in two trop-ical legume tree species. Ann For Sci 61:337–345. doi:10.1051/forest:2004027
Schiller L (1933) Ed. Drei Klassiker der Strömungslehre: Hagen,Poiseuille, Hagenbach. Akademische Verlagsgesellschaft,Leipzig
Seifert T, Schuck J, Block J, Pretzsch H (2006) Simulation vonBiomasse- und Nährstoffgehalt von Waldbäumen mit demWaldwachstumssimulator SILVA. Tagungsband derJahrestagung der Sektion Ertragskunde im DeutschenVerband Forstlicher Forschungsanstalten, 208–223
Shinozaki K, Yoda K, Hozumi K, Kira T (1964a) A quantitativeanalysis of plant form-the pipe model theory. I. basic analy-ses. Jpn Ecol 14:97–105
Shinozaki K, Yoda K, Hozumi K, Kira T (1964b) A quantitativeanalysis of plant form- the pipe model theory: II. furtherevidence of the theory and its application in forest ecology.Jpn Ecol 14:133–139
Soethe N, Lehmann J, Engels C (2007) Root taperingbetween branching points should be included in fractalroot system analysis. Ecol Model 207:363–366. doi:10.1016/j.ecolmodel.2007.05.007
Spanos I, Ganatsas P, Raftoyannis Y (2008) The root systemarchitecture of young Greek fir (Abies cephalonica Loudon)trees. Plant Biosyst 142(2):414–419
Spek LY, van Noordwijk M (1994) Proximal root diameter aspredictor of total root size for fractal branching. II. numericalmodel. Plant Soil 164:119–127
Trencia J (1995) Identification de descripteurs morphomètriquessensibles aux conditions gènèrales croissance des semis dechêne rouge (Quercus rubra) en milieu naturale. Can J ForestRes 25:157–165
Trubat R, Cortina J, Vilagrosa A (2012) Root architecture andhydraulic conductance in nutrient deprived Pistacia lentiscusL. seedlings. Oecologia 170(4):899–908. doi:10.1007/s00442-012-2380-2
Tworkoski T, Scorza R (2001) Root and shoot characteristics ofpeach trees with different growth habitats. J Am Soc Hort Sci126(6):785–790
Valladares F (1999) Architecture, ecology and evolution of plantcrowns. In: Valladares F, Pugnaire FI (eds) Handbook offunctional plant ecology. Marcel Dekker, Inc, New York, pp121–194
Valladares F, Pearcy RW (2000) The role of crown architecture forlight harvesting and carbon gain in extreme light environ-ments assessedwith a structurally realistic 3-Dmodel. AnalesJard Bot Madrid 58(1):3–16
Van Noordwijk M, Mulia R (2002) Functional branch analysis astool for fractal scaling above- and belowground trees for theiradditive and non-additive properties. Ecol Model 149:41–51
Van Noordwijk M, Purnomosidhi P (1995) Root architecture inrelation to tree-soil-crop interactions and shoot pruning inagroforestry. Agrofor Syst 30:161–173
Plant Soil (2015) 394:257–269 269
Related Documents


![[Oil]aboveground oil storage tanks 2009](https://static.cupdf.com/doc/110x72/55a50ed41a28abda588b48e1/oilaboveground-oil-storage-tanks-2009.jpg)


