Top Banner
Bell Ringer 1.What does the slope of this graph show? 2.What is the acceleration from 4 seconds to 6 seconds?
21

Bell Ringer 1.What does the slope of this graph show? 2.What is the acceleration from 4 seconds to 6 seconds?

Dec 16, 2015

Download

Documents

Nya Matis
Welcome message from author
This document is posted to help you gain knowledge. Please leave a comment to let me know what you think about it! Share it to your friends and learn new things together.
Transcript
Page 1: Bell Ringer 1.What does the slope of this graph show? 2.What is the acceleration from 4 seconds to 6 seconds?

Bell Ringer

1. What does the slope of this graph show?2. What is the acceleration from 4 seconds

to 6 seconds?

Page 2: Bell Ringer 1.What does the slope of this graph show? 2.What is the acceleration from 4 seconds to 6 seconds?

P H Y S I C S  

Objects in Free Fall and Gravity

Objectives:1)We will understand free fall, and how it is

impacted by gravity2)We will understand what forces act upon an

object that is thrown up into the air

Page 3: Bell Ringer 1.What does the slope of this graph show? 2.What is the acceleration from 4 seconds to 6 seconds?

Free Fall

Free Fall Motion of an

object when only gravity is acting on it.

Page 4: Bell Ringer 1.What does the slope of this graph show? 2.What is the acceleration from 4 seconds to 6 seconds?

Free-fall acceleration

The acceleration of an object due only to the effect of gravity

Page 5: Bell Ringer 1.What does the slope of this graph show? 2.What is the acceleration from 4 seconds to 6 seconds?

Acceleration Due to Gravity

g = -9.8 m/s2

(we’re going to use 10 m/s2)

Objects go 10 m/s faster each second

Negative Velocity downward movement

v = 0 m/s

v = -9.8 m/s

v = -19.6 m/s

v = -29.4 m/s

v = -39.2 m/s

t = 0 s

t = 1 s

t = 2 s

t = 3 s

t = 4 s

Page 6: Bell Ringer 1.What does the slope of this graph show? 2.What is the acceleration from 4 seconds to 6 seconds?

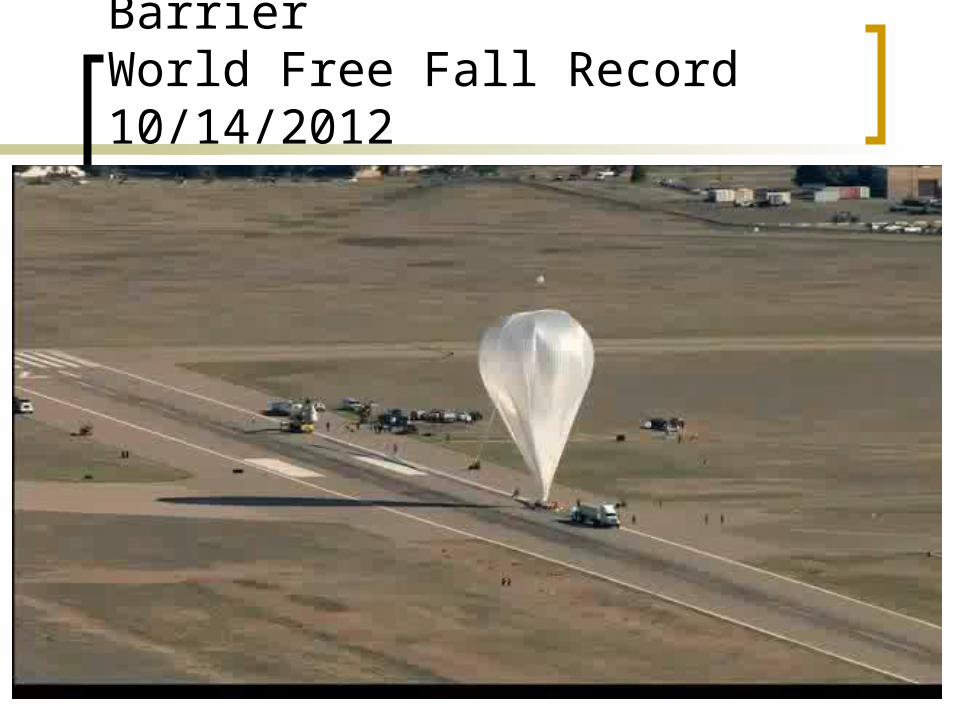
Human Breaks Sound BarrierWorld Free Fall Record 10/14/2012

Page 7: Bell Ringer 1.What does the slope of this graph show? 2.What is the acceleration from 4 seconds to 6 seconds?

Position and Velocity and Free Fall

t = 0 s

t = 1 s

t = 2 s

t = 3 s

t = 4 s

Position and velocity can be determined as a function of time

If you know the time and position, you can determine the velocity.

Page 8: Bell Ringer 1.What does the slope of this graph show? 2.What is the acceleration from 4 seconds to 6 seconds?

Skydivers

Page 9: Bell Ringer 1.What does the slope of this graph show? 2.What is the acceleration from 4 seconds to 6 seconds?

Which drops first?

Page 10: Bell Ringer 1.What does the slope of this graph show? 2.What is the acceleration from 4 seconds to 6 seconds?

Bowling Ball and Tennis Ball

Page 11: Bell Ringer 1.What does the slope of this graph show? 2.What is the acceleration from 4 seconds to 6 seconds?

Demo All objects accelerate at a constant rate of 10

m/s2 regardless of mass or weight

123 TIMES MORE!

Bowling Ball = 7 kg Tennis ball = 0.057 kg

Page 12: Bell Ringer 1.What does the slope of this graph show? 2.What is the acceleration from 4 seconds to 6 seconds?

1 Second Challenge

1 Second in Air “A” for the semester No tardies, cuts or absences

1.225 m in the air to get 1 s.

Page 13: Bell Ringer 1.What does the slope of this graph show? 2.What is the acceleration from 4 seconds to 6 seconds?

Jordan From Free-Throw Line

Page 14: Bell Ringer 1.What does the slope of this graph show? 2.What is the acceleration from 4 seconds to 6 seconds?

Jordan From Free-Throw Line

Time in Air = 0.98 s

Page 15: Bell Ringer 1.What does the slope of this graph show? 2.What is the acceleration from 4 seconds to 6 seconds?

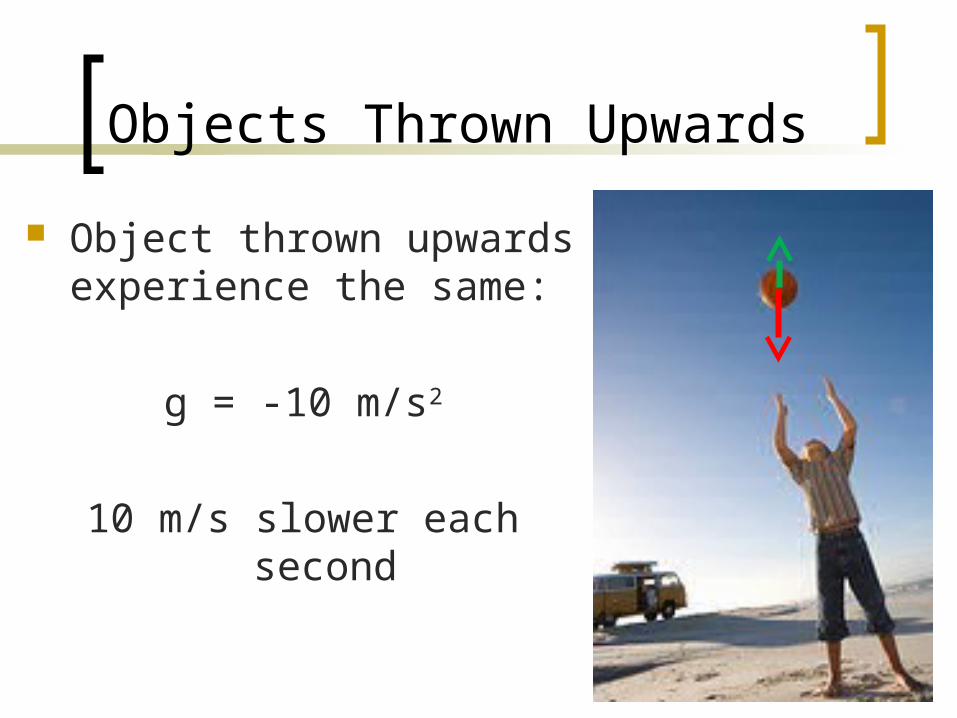
Objects Thrown Upwards

Object thrown upwards experience the same:

g = -10 m/s2

10 m/s slower each second

Page 16: Bell Ringer 1.What does the slope of this graph show? 2.What is the acceleration from 4 seconds to 6 seconds?

Remember…

When you are speeding up… You have positive acceleration

When you are slowing down… You have negative acceleration

Vector A quantity, such as position, that has

both magnitude and direction

Page 17: Bell Ringer 1.What does the slope of this graph show? 2.What is the acceleration from 4 seconds to 6 seconds?

Acceleration Due to Gravityv = 0 m/s

v = +9.8 m/s

v = +19.6 m/s

v = +29.4 m/s

v = -9.8 m/s

v = -19.6 m/s

v = -29.4 m/s

v = -39.2 m/s

Velocity VectorAcceleration “g” Vector

Page 18: Bell Ringer 1.What does the slope of this graph show? 2.What is the acceleration from 4 seconds to 6 seconds?

Velocity Direction

Positive (+) value Up Negative (-) value Down

Page 19: Bell Ringer 1.What does the slope of this graph show? 2.What is the acceleration from 4 seconds to 6 seconds?

Peak of the Path

Maximum HeightVelocity = 0 m/s

Returning to Initial Height:Time up = Time downVelocity up = - Velocity down

Page 20: Bell Ringer 1.What does the slope of this graph show? 2.What is the acceleration from 4 seconds to 6 seconds?

Position vs TimeVelocity vs Time

• What is happening at the apex of the position vs time graph?

• What is happening in the velocity vs. time graph at the x-axis?

Page 21: Bell Ringer 1.What does the slope of this graph show? 2.What is the acceleration from 4 seconds to 6 seconds?