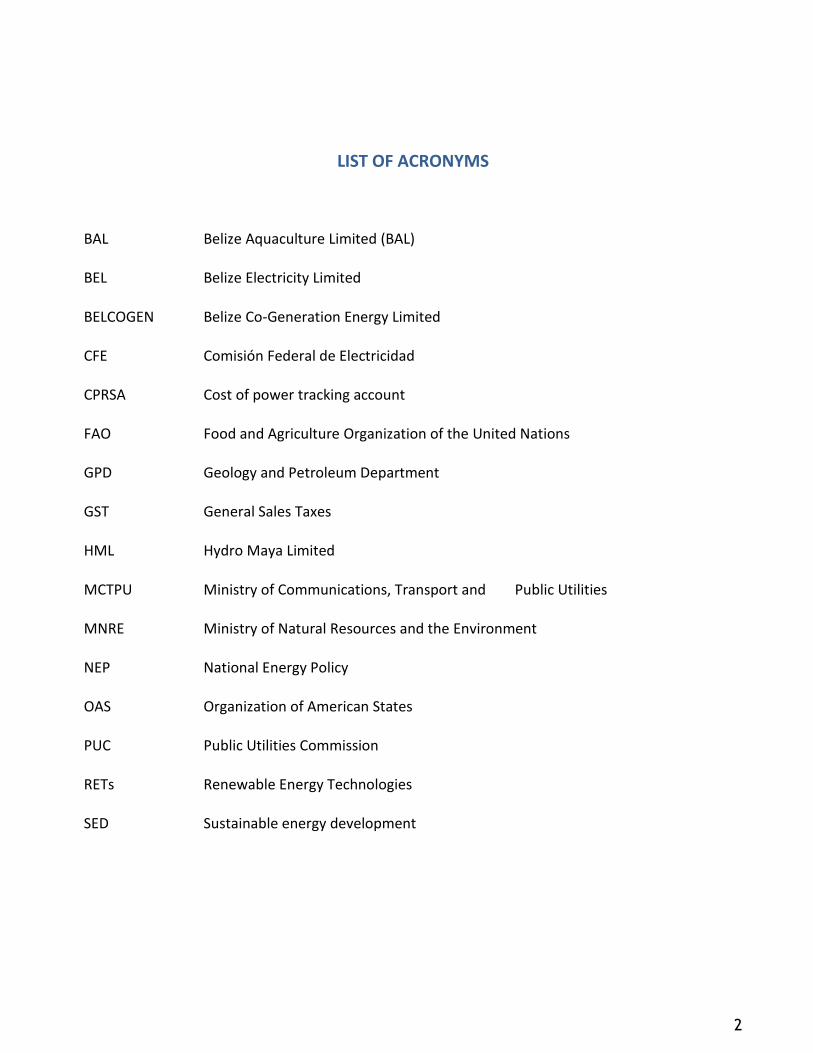
1 TOWARD A NATIONAL ENERGY POLICY ASSESMENT OF THE ENERGY SECTOR IN BELIZE Study Conducted by the Department of Sustainable Development of the Executive Secretariat for Integral Development of the Organization of American States March 2011

Welcome message from author
This document is posted to help you gain knowledge. Please leave a comment to let me know what you think about it! Share it to your friends and learn new things together.
Transcript
1
TOWARD A NATIONAL ENERGY POLICY
ASSESMENT OF THE ENERGY SECTOR IN BELIZE
Study Conducted by the Department of Sustainable Development of the Executive Secretariat for Integral Development of the Organization of American
States
March 2011
2
LIST OF ACRONYMS
BAL Belize Aquaculture Limited (BAL)
BEL Belize Electricity Limited
BELCOGEN Belize Co-Generation Energy Limited
CFE Comisión Federal de Electricidad
CPRSA Cost of power tracking account
FAO Food and Agriculture Organization of the United Nations
GPD Geology and Petroleum Department
GST General Sales Taxes
HML Hydro Maya Limited
MCTPU Ministry of Communications, Transport and Public Utilities
MNRE Ministry of Natural Resources and the Environment
NEP National Energy Policy
OAS Organization of American States
PUC Public Utilities Commission
RETs Renewable Energy Technologies
SED Sustainable energy development
3
Contents
LIST OF ACRONYMS .................................................................................................................................................................. 2
1. INTRODUCTION .................................................................................................................................................................... 4
2. ENERGY SECTOR ................................................................................................................................................................... 5
2.1 THE ENERGY SECTOR IN BELIZE ...................................................................................................................................... 5
2.1.1 General ................................................................................................................................................................... 5
2.2 Sub-Sector Analysis ........................................................................................................................................................ 6
2.2.1 Electricity Sub-Sector .............................................................................................................................................. 6
2.2.2 Electricity sub sector - Legal and institutional framework ................................................................................... 10
2.2.4 Petroleum sub sector - Legal and institutional framework .................................................................................. 13
2.2.5 Household energy Sub-Sector .............................................................................................................................. 16
2.3 Biomass resource base for wood fuel and derivatives ................................................................................................ 17
2.3.1 Residues from logging and commercial sawmilling .............................................................................................. 18
2.4 Renewable Energy Technologies and LPG use ............................................................................................................. 21
2.4.1 Renewable Energy Technologies .......................................................................................................................... 21
2.5 The Transport sub-sector ............................................................................................................................................. 22
2.5.1 Governance and Regulation ................................................................................................................................. 24
2.5.2 Road Transport ..................................................................................................................................................... 24
2.5.3 Ports and Maritime Administration ...................................................................................................................... 25
2.5.4 Airports and Civil Aviation .................................................................................................................................... 25
3. ENERGY CONSERVATION .................................................................................................................................................... 26
3.1 General ........................................................................................................................................................................ 26
3.1.2 Transport .............................................................................................................................................................. 26
3.1.3 Industry and Commercial Buildings ...................................................................................................................... 27
3.1.4 Households and Institutions ................................................................................................................................. 27
3.1.5 Agriculture ............................................................................................................................................................ 27
4. KEY ISSUES IN THE ENERGY SECTOR ................................................................................................................................... 28
4.1 Sectoral issues .............................................................................................................................................................. 28
4.2 Sub-sector issues ......................................................................................................................................................... 28
4.2.1 Electricity sub-sector ............................................................................................................................................ 28
4.2.2 Household energy sector ...................................................................................................................................... 29
4.2.3 Petroleum/Mining Sub-sector .............................................................................................................................. 29
4.2.4 Energy conservation issues................................................................................................................................... 30
5. CONCLUSIONS .................................................................................................................................................................... 31

4
1. INTRODUCTION
Successful policy formulation warrants in-depth knowledge of a country’s energy sector. It is only after the key
issues are identified, and the public is given the opportunity to provide educated input, that the policy maker
can truly begin the task of drafting a policy which addressees the varying, and sometimes conflicting needs of
the wide spectrum of energy stakeholders. This study aims at providing a baseline analysis of Belize’s energy
sector, thus paving the road toward the passing of a new policy. It outlines a preliminary draft of Belize’s
energy policy, including priority areas, broad goals and specific objectives for the development of the energy
sector linked to security of supplies, environmental protection and competitiveness.
Although a nation’s energy sector is a complex structure comprising several players with different roles and
varying needs, it is largely driven by supply and demand. In Belize, for the last decade the focus of the energy
policy has been to increase supply without considering the source. Although this practice ensured a stable
flow of energy, it increased dependency with regard to imported fossil fuels and electricity.
Undeniably, fossil fuels will remain a significant source of energy in Belize for years to come —as it will for
most of Latin America and the Caribbean region. Nevertheless, it must be an imperative of the country’s
energy policy to reduce its dependency on imported fossil fuels and to decouple increased energy demand
from increased fossil fuels imports. A move toward renewable energy solutions is sought as the most viable
solution to improve energy security and reduce the volatility of energy costs.
Energy sector analysis starts with the identification of the different demand and supply sub-sectors. Belize
must implement actions that will allow it to close the gap in reliable energy sector data in order to address, in
the short-term, the introduction of effective policies based on the analysis of all the energy sub-sectors.
5
2. ENERGY SECTOR
2.1 THE ENERGY SECTOR IN BELIZE
2.1.1 General
Belize boasts a small economy with tourism as the main source of foreign exchange. The last decade
witnessed steady economic growth and increasing population rates, albeit slow industrialization. With regard
to energy, Belize is faced with the challenge of high energy costs and fossil fuel dependence, high energy
imports, increasing environmental impacts, inadequate energy policies, antiquated infrastructure and
technologies, outdated production approaches, scarce qualified workforce and inadequate energy data. The
energy sector is one of the major sources of government revenue (e.g., fuel taxes, license fees and royalties).
Roughly 75% of total energy demand is supplied through foreign sources.
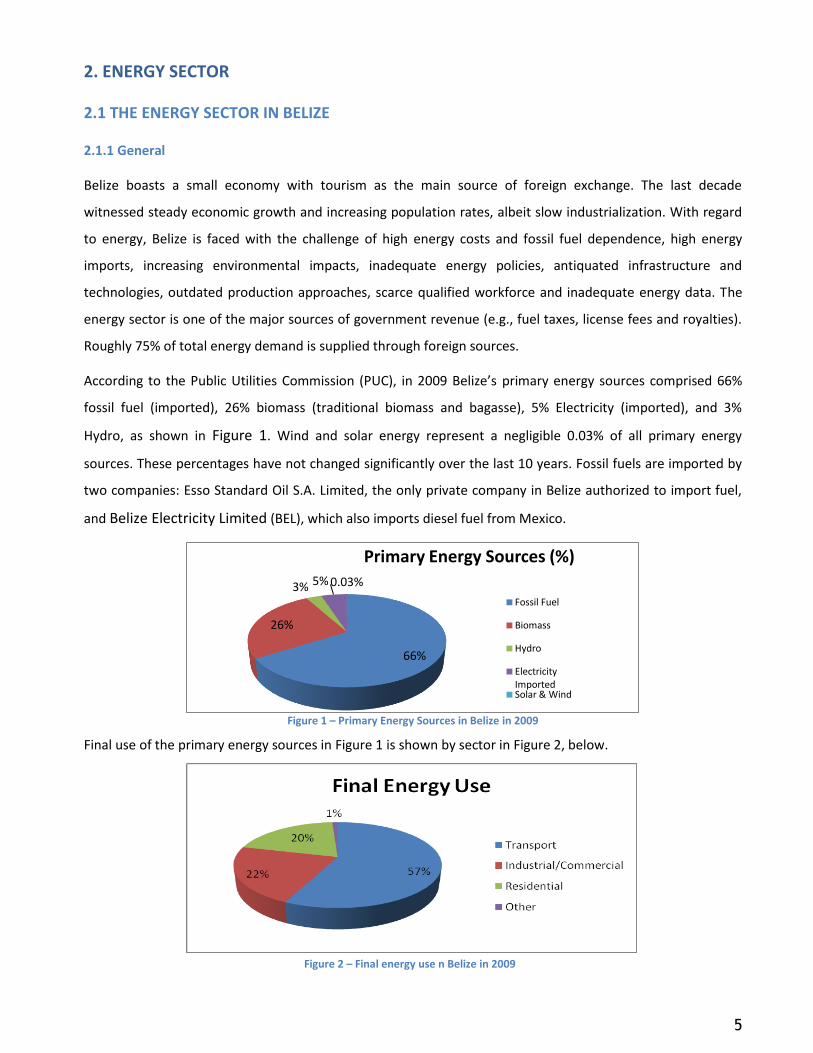
According to the Public Utilities Commission (PUC), in 2009 Belize’s primary energy sources comprised 66%
fossil fuel (imported), 26% biomass (traditional biomass and bagasse), 5% Electricity (imported), and 3%
Hydro, as shown in Figure 1. Wind and solar energy represent a negligible 0.03% of all primary energy
sources. These percentages have not changed significantly over the last 10 years. Fossil fuels are imported by
two companies: Esso Standard Oil S.A. Limited, the only private company in Belize authorized to import fuel,
and Belize Electricity Limited (BEL), which also imports diesel fuel from Mexico.
Figure 1 – Primary Energy Sources in Belize in 2009
Final use of the primary energy sources in Figure 1 is shown by sector in Figure 2, below.
Figure 2 – Final energy use n Belize in 2009
66%
26%
3% 5% 0.03%
Primary Energy Sources (%)
Fossil Fuel
Biomass
Hydro
Electricity ImportedSolar & Wind

6
2.2 Sub-Sector Analysis
2.2.1 Electricity Sub-Sector
BEL operates the only electricity utility in Belize.1 It is the primary distributor of electricity to more than 76,000
customers. BEL is a private corporation owned by Fortis Incorporated of Canada (67%), the Social Security
Board (25%) and a small group of shareholders (8%). Current licensing agreements extend to 2015, and BEL
has the right of first refusal on any subsequent license grant.
Belize’s peak demand of about 76 megawatts (MW) is met from multiple sources of energy. These sources
include electricity purchases from Belize Electric Company Ltd. (BECOL), which operates the Chalillo and
Mollejon Hydroelectric Facilities in Western Belize; Hydro Maya Limited and Belize Aquaculture Limited, both
located in Southern Belize; Comisión Federal de Electricidad (CFE), the Mexican state-owned electricity
company; Belize Cogeneration Energy Limited (BELCOGEN); and BEL's gas turbine unit and diesel fired
generators. All major load centers are connected to the country’s national electricity system, which in turn is
connected to the Mexican electricity grid. Cogeneration represents only a very small fraction of electricity
generation.
In 2009, estimated net electricity generation amounted to 200,000MWh. The residential, industry and
construction sectors are the largest electricity consumers. Technical losses in generation and distribution are
estimated at 11% to 13%. Although an historical analysis of peak demand and losses denotes an improvement
in these rates over the last 10 years, there is still a need to reduce technical losses to 7%. On the other hand,
peak demand analysis shows the need to heighten consumer awareness with regard to energy efficiency.
Figure 3 describes the trends in peak demand and losses over the last 10 years.
Figure 3 – Historical losses and peak demand in Belize
1 Information about BEL is available at http://www.bel.com.bz/.
0%
5%
10%
15%
0
20
40
60
80
100
2000 2001 2002 2003 2004 2005 2006 2007 2008 2009
Loss
es
(%)
MW
Historical Losses and Peak Demand in Belize
Peak Demand (MW) Losses

7
Roughly 50% of the electricity consumed is imported from Mexico. An interconnection between the national
grids of Belize and Mexico allows the Comisión Federal de Electricidad (CFE), a state-owned utility, to sell
electricity to Belize’s BEL. Hydropower, diesel and bagasse account for the remaining balance. Other electricity
sources include the following:
Mollejon Hydro Plant, equipped with three 8.4 MW turbines, located on the Macal River, with a capacity of 6.5
MW during dry season and 10 MW during wet season;
Diesel and gas fired generators owned by BEL, with an installed capacity of 19.8 MW, and five 1.2 MW mobile
container units deployed at different stations. BEL runs these units with diesel fuel it imports from Mexico;
Chalillo Hydroelectric Dam Plant, with an installed capacity of 7.5 MW;
Belize Aquaculture Limited (BAL) generates power from diesel generators, has a generation capacity of
about 24 MW and currently supplies the grid with some 10MW;
Hydro Maya Limited (HML), generated 8GWh in 2009 from its run-of-the-river hydroelectric facility; and
Belize Co-Generation Energy Limited (BELCOGEN) generates electricity burning bagasse with a capacity of 13.5
MW.
As shown in Figure 4 below, about 46% of the electricity consumed in Belize is imported from Mexico. The
remaining generation is distributed as follows: Belize Electric Company Ltd. (BECOL) 38% from hydro, BAL
generates 10% from heavy fuel oil, HML generates 2% from hydro, BELCOGEN generates 0.005% from
bagasse, and BEL generates 4% from diesel and 0.003% from solar and wind.
Figure 4 – Electricity generation sources
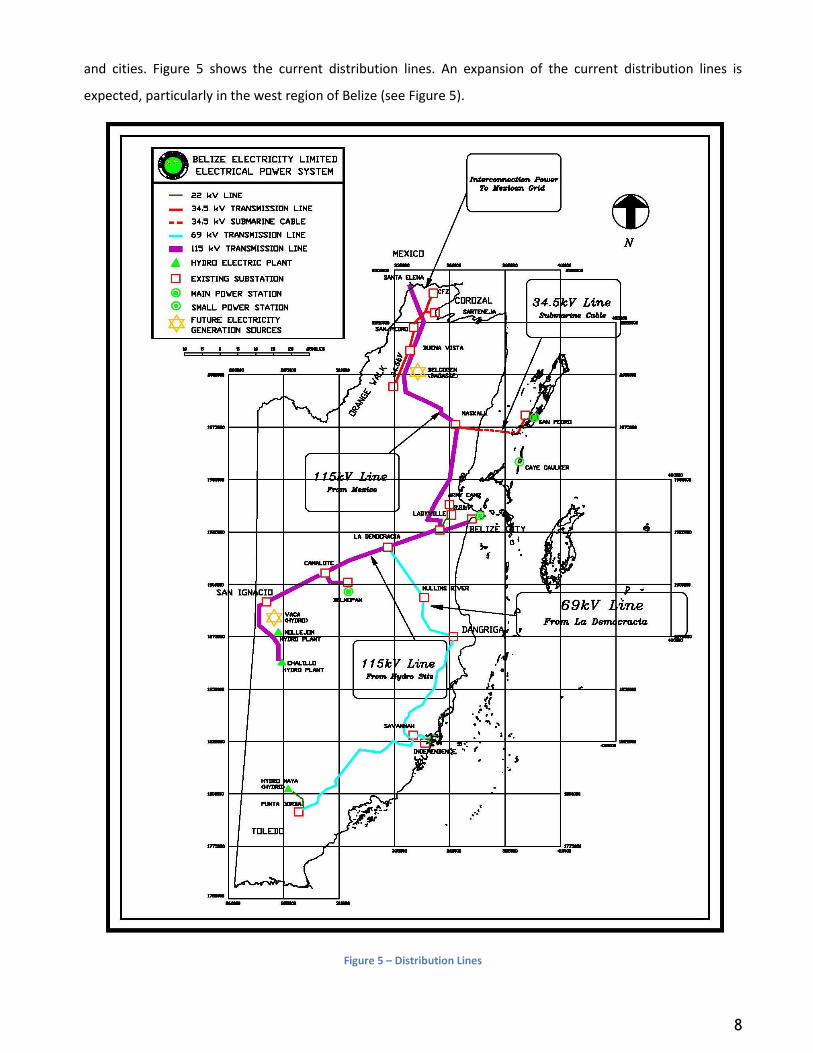
Belize’s electricity demand is supplied through a 115 kV (kilovolts) transmission line that covers the entire
northern and western sections of the country. The remainder of the country is supplied by means of a 69.5 kV
line. The lines are distributed across various load centers and distribution lines to the customers in main towns
46%
0.01%
4%
38%
0.03%
10%
2%Electricity Sources (%)
Imported (Mex.)
BELCOGEN
BEL - Diesel
BECOL
Solar/wind
BAL
HML
8
and cities. Figure 5 shows the current distribution lines. An expansion of the current distribution lines is
expected, particularly in the west region of Belize (see Figure 5).
Figure 5 – Distribution Lines
9
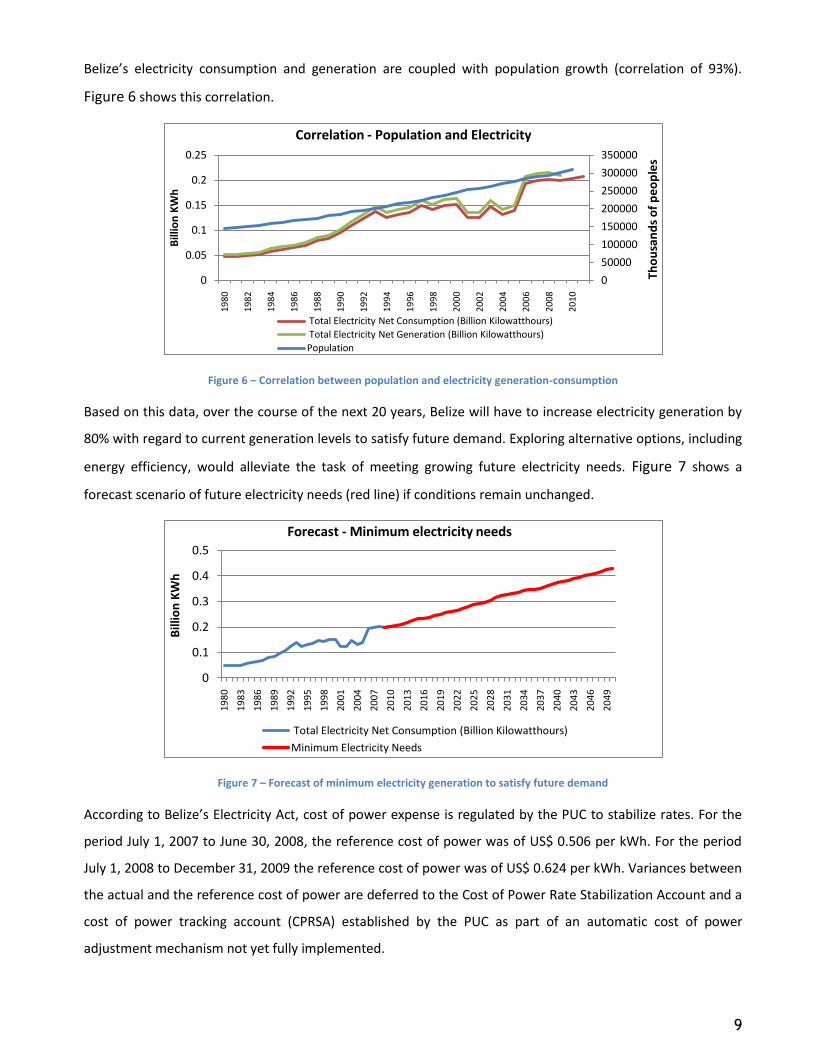
Belize’s electricity consumption and generation are coupled with population growth (correlation of 93%).
Figure 6 shows this correlation.
Figure 6 – Correlation between population and electricity generation-consumption
Based on this data, over the course of the next 20 years, Belize will have to increase electricity generation by
80% with regard to current generation levels to satisfy future demand. Exploring alternative options, including
energy efficiency, would alleviate the task of meeting growing future electricity needs. Figure 7 shows a
forecast scenario of future electricity needs (red line) if conditions remain unchanged.
Figure 7 – Forecast of minimum electricity generation to satisfy future demand
According to Belize’s Electricity Act, cost of power expense is regulated by the PUC to stabilize rates. For the
period July 1, 2007 to June 30, 2008, the reference cost of power was of US$ 0.506 per kWh. For the period
July 1, 2008 to December 31, 2009 the reference cost of power was of US$ 0.624 per kWh. Variances between
the actual and the reference cost of power are deferred to the Cost of Power Rate Stabilization Account and a
cost of power tracking account (CPRSA) established by the PUC as part of an automatic cost of power
adjustment mechanism not yet fully implemented.
0
50000
100000
150000
200000
250000
300000
350000
0
0.05
0.1
0.15
0.2
0.25
19
80
19
82
19
84
19
86
19
88
19
90
19
92
19
94
19
96
19
98
20
00
20
02
20
04
20
06
20
08
20
10
Tho
usa
nd
s o
f p
eo
ple
s
Bill
ion
KW
h
Correlation - Population and Electricity
Total Electricity Net Consumption (Billion Kilowatthours)
Total Electricity Net Generation (Billion Kilowatthours)
Population
0
0.1
0.2
0.3
0.4
0.5
19
80
19
83
19
86
19
89
19
92
19
95
19
98
20
01
20
04
20
07
20
10
20
13
20
16
20
19
20
22
20
25
20
28
20
31
20
34
20
37
20
40
20
43
20
46
20
49
Bill
ion
KW
h
Forecast - Minimum electricity needs
Total Electricity Net Consumption (Billion Kilowatthours)
Minimum Electricity Needs
10
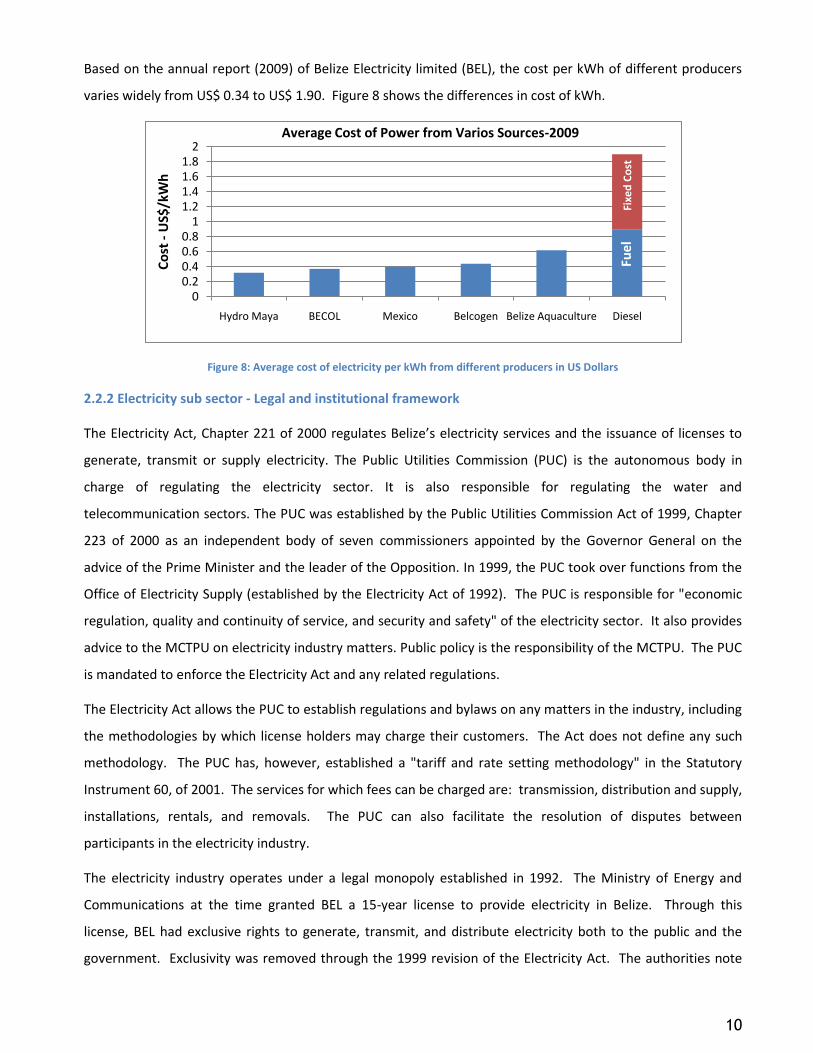
Based on the annual report (2009) of Belize Electricity limited (BEL), the cost per kWh of different producers
varies widely from US$ 0.34 to US$ 1.90. Figure 8 shows the differences in cost of kWh.
Figure 8: Average cost of electricity per kWh from different producers in US Dollars
2.2.2 Electricity sub sector - Legal and institutional framework
The Electricity Act, Chapter 221 of 2000 regulates Belize’s electricity services and the issuance of licenses to
generate, transmit or supply electricity. The Public Utilities Commission (PUC) is the autonomous body in
charge of regulating the electricity sector. It is also responsible for regulating the water and
telecommunication sectors. The PUC was established by the Public Utilities Commission Act of 1999, Chapter
223 of 2000 as an independent body of seven commissioners appointed by the Governor General on the
advice of the Prime Minister and the leader of the Opposition. In 1999, the PUC took over functions from the
Office of Electricity Supply (established by the Electricity Act of 1992). The PUC is responsible for "economic
regulation, quality and continuity of service, and security and safety" of the electricity sector. It also provides
advice to the MCTPU on electricity industry matters. Public policy is the responsibility of the MCTPU. The PUC
is mandated to enforce the Electricity Act and any related regulations.
The Electricity Act allows the PUC to establish regulations and bylaws on any matters in the industry, including
the methodologies by which license holders may charge their customers. The Act does not define any such
methodology. The PUC has, however, established a "tariff and rate setting methodology" in the Statutory
Instrument 60, of 2001. The services for which fees can be charged are: transmission, distribution and supply,
installations, rentals, and removals. The PUC can also facilitate the resolution of disputes between
participants in the electricity industry.
The electricity industry operates under a legal monopoly established in 1992. The Ministry of Energy and
Communications at the time granted BEL a 15-year license to provide electricity in Belize. Through this
license, BEL had exclusive rights to generate, transmit, and distribute electricity both to the public and the
government. Exclusivity was removed through the 1999 revision of the Electricity Act. The authorities note
00.20.40.60.8
11.21.41.61.8
2
Hydro Maya BECOL Mexico Belcogen Belize Aquaculture Diesel
Co
st -
US$
/kW
h
Average Cost of Power from Varios Sources-2009
Fixe
d C
ost
Fuel
11
that the new license provided to BEL when Fortis Inc. became the majority owner did not specify exclusivity
rights. In practice, though, BEL is the only operating business in the sector. Since Fortis Inc. is the majority
owner of BECOL, the Canadian-based company controls all hydroelectric production in Belize, transmission,
and the distribution of electricity.
The Electricity Act makes no distinction between national and foreign companies, and there are no
requirements on national ownership or management. The Electricity Act requires the PUC, inter alia, to:
ensure that all reasonable electricity needs are met; ensure that license holders are able to finance the
business for which they are licensed; protect the interests of consumers in general, and in particular in rural
areas. The authorities note that the Government of Belize pays the difference, if any, in the supply of
electricity in rural areas. Tariffs and rates are regulated by the PUC.
Private individuals are allowed to operate their own electricity generating units. However, they must be
licensed if these exceed 75 kW. The supply of electricity is exempted from the sales tax as it is considered an
input in the production of other goods. The authorities note that exemption must be sought from the Ministry
of Finance on a case-by-case basis. The legislation does not contemplate tax incentives for those who generate
electricity by means of renewable energy technologies.
2.2.3 Petroleum Sub-Sector
Currently there are no refineries in Belize and the country is served primarily by refineries from the
Netherlands Antilles and, to a lesser degree, the United States. Tankers dock at the Port of Belize in Belize City
every twenty days with refined fuels (carrying about 75,000-100,000 barrels per shipment). Refined fuels are
delivered to service stations by trucks and barges in the case of small islands or keys located across the coast
of Belize. Main petroleum derivates used are gasoline, kerosene and diesel, supplied by three main retailers:
Esso Standard Oil, Shell Belize and Texaco Belize, and imported by the sole commercial importer, Esso.
Petroleum products are sold in small, regulated open markets of about 70-85 service stations operated
countrywide.
In 2002, about 6,000 barrels of petroleum per day were imported for domestic consumption. That same year,
oil represented 66% of primary energy consumption in both transport and power generation (see figure 8.1).
In 2006, Belize began producing small amounts of oil2 —about 2,600 barrels per day (2007).3 The company
leading this venture is Belize Natural Energy Ltd. (BNE).4 BNE manages exploration activities at the Spanish
Lookout site, located to the west of Belize’s capital, Belmopan, in the central region of the country, in the
2 In the form of 38Þ-gravity API
3 Energy Information Administration; http://tonto.eia.doe.gov/country/country_energy_data.cfm?fips=BH
4 New York Times, Touched by Oil and Hope in Belize
http://www.nytimes.com/2006/02/21/business/worldbusiness/21belize.html?_r=1
12
Spanish Lacote district of the Corozal Basin. BNE has an early estimate of available reserves for the Spanish
Field site set at 10 million barrels (2008).
In 2007, Belize consumed about 7,000 barrels of petroleum derivates per day. There seems to be stagnation in
consumption growth since 2005 for multiple reasons. For instance, weather related disasters impact the
export of agricultural products, leading to lower economic activity and therefore demand. In 2007, one of the
primary uses of petroleum derivates imports was for transport, comprising 30% of the total imported oil
products. This sums to a total consumption of about 2,100 barrels of petroleum derived fuels in 2007.
Gasoline is mainly consumed in the transportation sector. This fuel is imported as regular (octane 87) and
premium (octane 91) gasoline. Within the transport sector, diesel and butane are direct competitors to
gasoline. Table 1 below reflects the cost and imports of gasoline, diesel and butane for road transport for the
years 2005 to 2007.
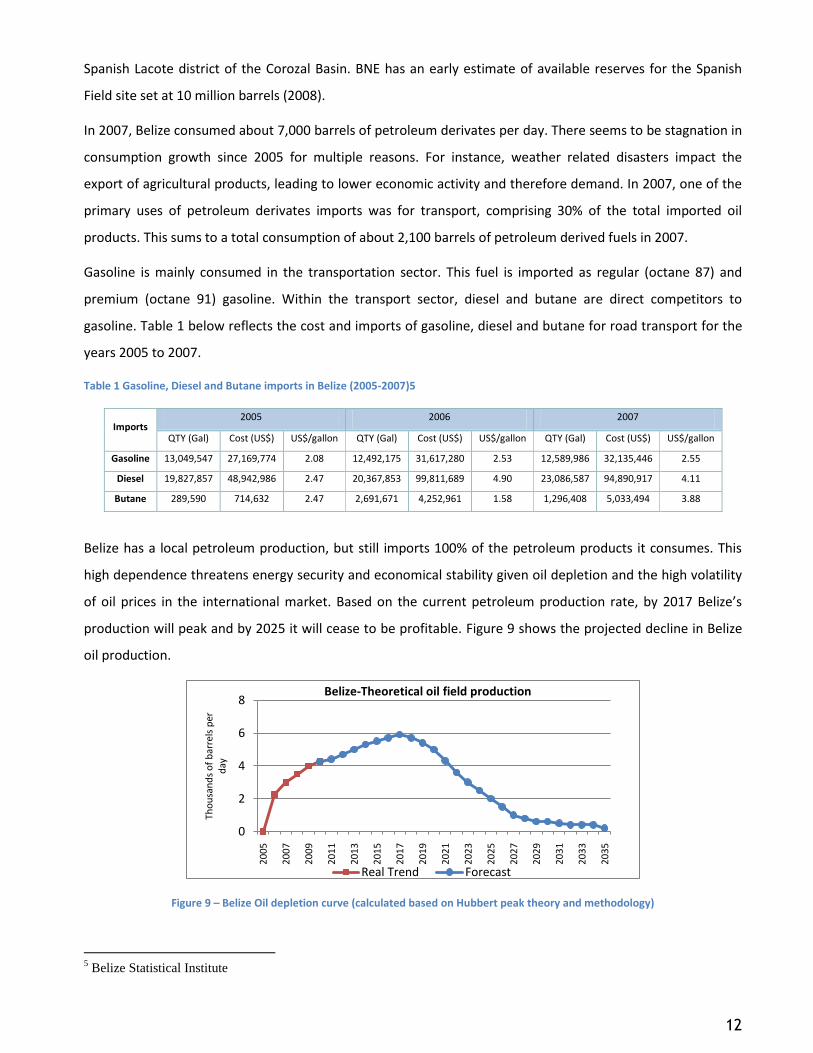
Table 1 Gasoline, Diesel and Butane imports in Belize (2005-2007)5
Imports 2005 2006 2007
QTY (Gal) Cost (US$) US$/gallon QTY (Gal) Cost (US$) US$/gallon QTY (Gal) Cost (US$) US$/gallon
Gasoline 13,049,547 27,169,774 2.08 12,492,175 31,617,280 2.53 12,589,986 32,135,446 2.55
Diesel 19,827,857 48,942,986 2.47 20,367,853 99,811,689 4.90 23,086,587 94,890,917 4.11
Butane 289,590 714,632 2.47 2,691,671 4,252,961 1.58 1,296,408 5,033,494 3.88
Belize has a local petroleum production, but still imports 100% of the petroleum products it consumes. This
high dependence threatens energy security and economical stability given oil depletion and the high volatility
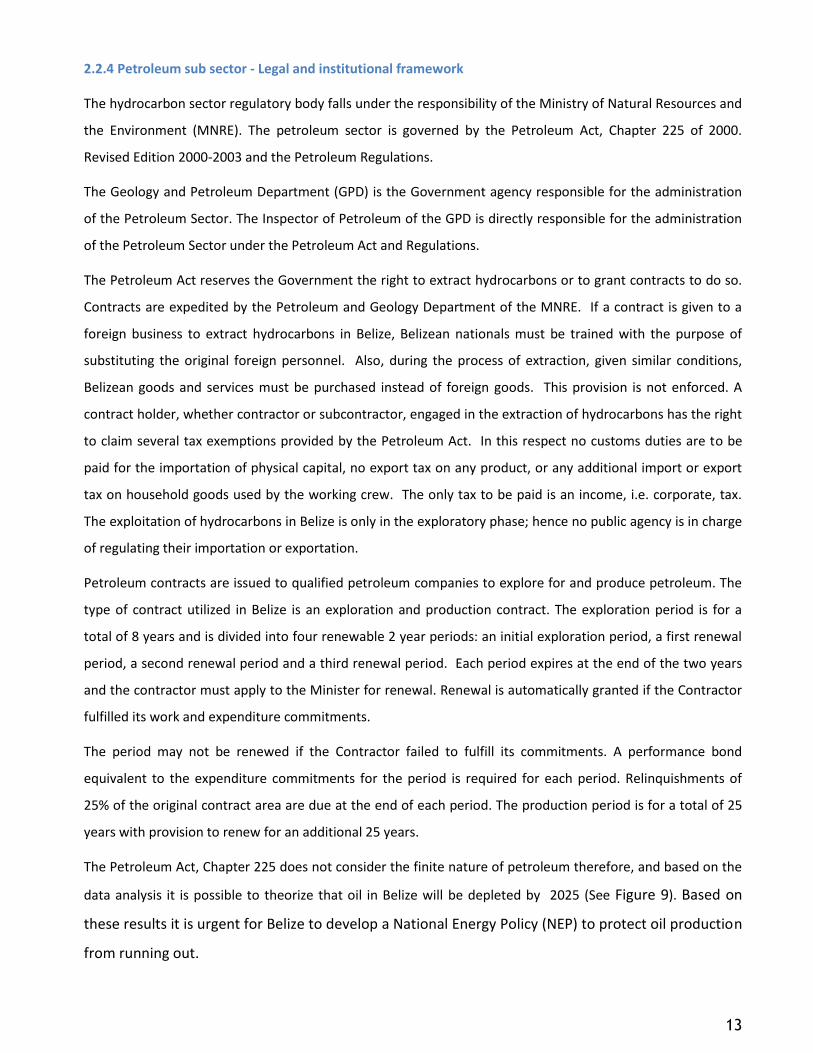
of oil prices in the international market. Based on the current petroleum production rate, by 2017 Belize’s
production will peak and by 2025 it will cease to be profitable. Figure 9 shows the projected decline in Belize
oil production.
Figure 9 – Belize Oil depletion curve (calculated based on Hubbert peak theory and methodology)
5 Belize Statistical Institute
0
2
4
6
8
20
05
20
07
20
09
20
11
20
13
20
15
20
17
20
19
20
21
20
23
20
25
20
27
20
29
20
31
20
33
20
35
Tho
usa
nd
s o
f b
arre
ls p
erd
ay
Belize-Theoretical oil field production
Real Trend Forecast
13
2.2.4 Petroleum sub sector - Legal and institutional framework
The hydrocarbon sector regulatory body falls under the responsibility of the Ministry of Natural Resources and
the Environment (MNRE). The petroleum sector is governed by the Petroleum Act, Chapter 225 of 2000.
Revised Edition 2000-2003 and the Petroleum Regulations.
The Geology and Petroleum Department (GPD) is the Government agency responsible for the administration
of the Petroleum Sector. The Inspector of Petroleum of the GPD is directly responsible for the administration
of the Petroleum Sector under the Petroleum Act and Regulations.
The Petroleum Act reserves the Government the right to extract hydrocarbons or to grant contracts to do so.
Contracts are expedited by the Petroleum and Geology Department of the MNRE. If a contract is given to a
foreign business to extract hydrocarbons in Belize, Belizean nationals must be trained with the purpose of
substituting the original foreign personnel. Also, during the process of extraction, given similar conditions,
Belizean goods and services must be purchased instead of foreign goods. This provision is not enforced. A
contract holder, whether contractor or subcontractor, engaged in the extraction of hydrocarbons has the right
to claim several tax exemptions provided by the Petroleum Act. In this respect no customs duties are to be
paid for the importation of physical capital, no export tax on any product, or any additional import or export
tax on household goods used by the working crew. The only tax to be paid is an income, i.e. corporate, tax.
The exploitation of hydrocarbons in Belize is only in the exploratory phase; hence no public agency is in charge
of regulating their importation or exportation.
Petroleum contracts are issued to qualified petroleum companies to explore for and produce petroleum. The
type of contract utilized in Belize is an exploration and production contract. The exploration period is for a
total of 8 years and is divided into four renewable 2 year periods: an initial exploration period, a first renewal
period, a second renewal period and a third renewal period. Each period expires at the end of the two years
and the contractor must apply to the Minister for renewal. Renewal is automatically granted if the Contractor
fulfilled its work and expenditure commitments.
The period may not be renewed if the Contractor failed to fulfill its commitments. A performance bond
equivalent to the expenditure commitments for the period is required for each period. Relinquishments of
25% of the original contract area are due at the end of each period. The production period is for a total of 25
years with provision to renew for an additional 25 years.
The Petroleum Act, Chapter 225 does not consider the finite nature of petroleum therefore, and based on the
data analysis it is possible to theorize that oil in Belize will be depleted by 2025 (See Figure 9). Based on
these results it is urgent for Belize to develop a National Energy Policy (NEP) to protect oil production
from running out.
14
2.2.4.1 Petroleum sub sector royalties
Each contract requires the Contractor to pay a royalty, production share and income tax to the
Government. A petroleum surcharge fixed to oil prices was recently introduced in 2008 and is
payable according to oil prices. Each contract also requires the Contractor to assign to the
Government a minimum of 10% working interest in a field if the Government opts to take it. The
royalty, production share and working interest is negotiable with a minimum royalty of 7.5% for oil
and 5% for natural gas. The income tax is fixed at 40% on net income. 100% of all expenditures are
recoverable before payment of production share
2.2.4.2 Pricing
Prices are adjusted per an agreed upon formula which takes into consideration the Platt price for petroleum
products, and the exchange rate. Allowances are made for various levies and a distribution cost to get to the
pump price. Prices also differ in various parts of the country. From 2005 to 2007 gasoline imports fluctuated
between 12.5 and 13.0 million gallons. Gasoline import costs have steadily increased from US$ 27.2 million in
2005 to US$ 32.1 million in 2007. After July 2008, gasoline prices steadily decreased and, due to lack of data, it
is difficult to estimate what the total cost of gasoline imports was for 2008.
There are three major gasoline distribution chains in Belize: Esso Standard Oil (Esso), Shell Belize and Texaco
Belize. As mentioned before, they import the gasoline and diesel from refineries located in the Netherlands
Antilles and to a lesser extent from the United States and sell petroleum products in a regulated market,
where the government regulates the retail prices of the service stations. These prices include a high
proportion of taxes, used in part to buffer against the international fluctuations in the petroleum market.
In January 2005, the retail price for regular gasoline was US$ 4.16 per gallon. By April 2008, the retail price
rose to US$ 5.00 and US$ 4.95 per gallon for the regular and premium gasoline, respectively. In August of
2008, the retail price was US$ 5.06 and US$ 5.22 per gallon for the regular and premium, respectively.
Table 2 shows how Belizean retail gasoline prices were affected by the taxes in 2005 and 2008. In the period
between 2005 and 2008, a change has occurred in the regular gasoline price structure. In 2005 neither an
environmental tax nor a charge on additives were included, also an increase in import duty charges from
B$0.41 to B$0.45 and the import duty RRD charge from B$0.55 to B$1.45 can be noted. On the other hand the
sales tax GST charge was lowered from B$4.18 to B$0.81 per gallon. These gasoline price structure changes
resulted in a net decrease in overall tax costs of B$2.32 per gallon for regular gas. Even with this reduction in
taxes, an increase of B$1.57 for the retail gasoline price was recorded; this was principally due to the increase
of the imported international gasoline price. July 2008 was the month when the highest international
petroleum price was recorded, at a level of about US$ 147 per barrel. In 2008, the cost of gasoline import

15
represented about 57% of the retail price. This record clearly shows how much the cost of imported gasoline
influences the price at the pump.
Table 2 Example of taxes and final gasoline retail prices (B$) per gallon in Belize in 2005 and 2008
International crude oil prices declined from September 2008 to February 2011. In November 2008,
the Ministry of Finance mandated a reduction in gasoline prices at the pump, bringing the costs down
to US$3.53 per gallon for regular fuel, US$3.71 per gallon for premium fuel, and US$3.48 per gallon for diesel
fuel. As the costs of transport fuels declined by approximately 30%, other public sector resources felt the
brunt of government-subsidized gasoline prices. In early 2011, crude oil prices began a steady rise, breaking
the 100-dollar mark in March.6 By February 2011, the price of gasoline at the pump had reached US$4.76 per
gallon for premium fuel. Diesel and kerosene were being sold at US$4.98 and US$4.43 respectively. It is
anticipated that, by the end of the second quarter of 2011, consumers will pay more than five dollars per
gallon.
Crude oil prices have become increasingly volatile, with peaks and lows ranging from US$148 to US$30 per
barrel over the last five years. However, prices are expected to increase dramatically over the next few years
(see Figure 10). Oil prices can be affected by geo-political events, climate change, the global economy, and
demand projections due to emerging population growth. The latest price development is in contrast to what
several renowned energy experts have predicted or projected a year ago. The volatility is very significant, and
makes long-term projections difficult to almost impossible. Therefore one has to consider the independence
from imported fossil fuels as a main motivation for the development of indigenous renewable power and
fuels.
6 On March 25, 2011, crude oil was being traded at US$103.36 per barrel in international markets. As of the writing of this
report, the price is expected to reach the 120-dollar mark in the course of 2011.
5-Jan-05 Super
(US$)
Regular
(US$)
Cost of Fuel N.A. 1.560
Import Duty N.A. 0.205
RRD N.A. 0.275
Environ Tax N.A. -
Freight N.A. 0.035
Additive N.A. -
GST N.A. 2.090
Total Taxes Cost N.A. 2.605
US$ at Pump N.A. 4.165
7-Apr-08 Super
(US$) Regular (US$)
Cost of Fuel 3.083 2.820
Import Duty 0.225 0.225
RRD 0.720 0.497
Environ Tax 0.119 0.109
Freight 0.035 0.035
Additive 0.001 0.001
GST 0.4075 0.4035
Total Taxes Cost 1.5075 1.280
US$ at Pump 4.60 4.10

16
Figure 10 – Historical and Future international oil price
2.2.5 Household energy Sub-Sector
Belize boasts abundant renewable energy resources, including woody and non-woody biomass, solar, wind,
and hydrological resources. Presently, with the exception of biomass, only a small fraction of the country’s
renewable energy potential is exploited. Biomass (firewood and bagasse) plays some significant role in Belize’s
energy supply. Liquefied Petroleum Gas (LPG), Kerosene and firewood provide almost all the energy needed to
meet basic demand such as cooking in rural and most urban households, and are the main source of energy in
rural areas. Although the total amount of imported LPG (including propane and butane) can be determined,
there is no data relating to how much is consumed by households for cooking, heating or transport.
Between 25% and 35% of Belizean households are poor and use wood and charcoal to supply their energy
needs, especially cooking. Kerosene is the main petroleum product used by these households. Wood is mainly
used for cooking and ironing and hardly ever used for lighting purposes. LPG is used too, but not necessarily in
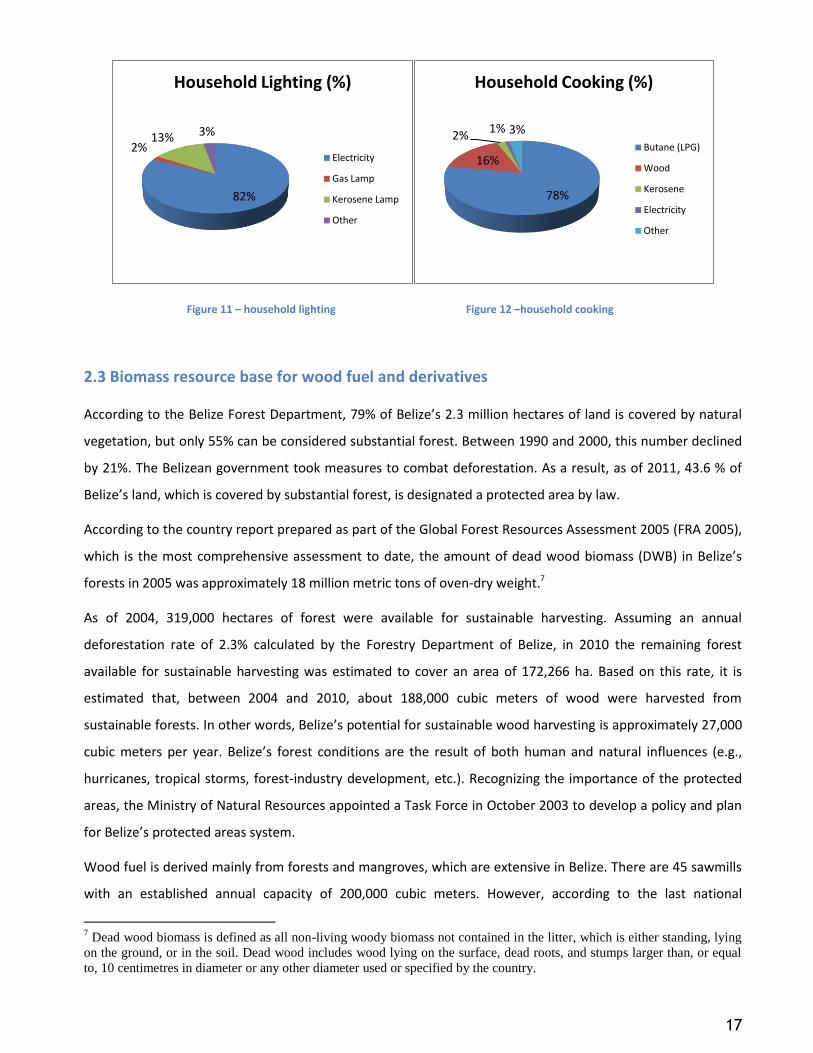
households below the poverty line. According to a preliminary assessment conducted in Belize through
interviews and stakeholder consultations, households’ main energy requirements are cooking and lighting (see
Figure 11 and Figure 12). With regard to lighting, 82% of households use electricity, 13%
use kerosene, and 2% use gas. Additionally, 3% of households use other sources of lighting, such as butane or
firewood. With regard to cooking 78% of households use butane, 16% use wood, 2% use kerosene, 1% use
electricity and 3% use other sources.
$0.00
$50.00
$100.00
$150.00
$200.00
$250.00
1980 1985 1990 1995 2000 2005 2010 2015 2020 2025 2030 2035
US$
pe
r B
arre
l
International Oil Price Historical and Forecast
Hystoric Oil Prices Forecast Oil Prices
17
Figure 11 – household lighting Figure 12 –household cooking
2.3 Biomass resource base for wood fuel and derivatives
According to the Belize Forest Department, 79% of Belize’s 2.3 million hectares of land is covered by natural
vegetation, but only 55% can be considered substantial forest. Between 1990 and 2000, this number declined
by 21%. The Belizean government took measures to combat deforestation. As a result, as of 2011, 43.6 % of
Belize’s land, which is covered by substantial forest, is designated a protected area by law.
According to the country report prepared as part of the Global Forest Resources Assessment 2005 (FRA 2005),
which is the most comprehensive assessment to date, the amount of dead wood biomass (DWB) in Belize’s
forests in 2005 was approximately 18 million metric tons of oven-dry weight.7
As of 2004, 319,000 hectares of forest were available for sustainable harvesting. Assuming an annual
deforestation rate of 2.3% calculated by the Forestry Department of Belize, in 2010 the remaining forest
available for sustainable harvesting was estimated to cover an area of 172,266 ha. Based on this rate, it is
estimated that, between 2004 and 2010, about 188,000 cubic meters of wood were harvested from
sustainable forests. In other words, Belize’s potential for sustainable wood harvesting is approximately 27,000
cubic meters per year. Belize’s forest conditions are the result of both human and natural influences (e.g.,
hurricanes, tropical storms, forest-industry development, etc.). Recognizing the importance of the protected
areas, the Ministry of Natural Resources appointed a Task Force in October 2003 to develop a policy and plan
for Belize’s protected areas system.
Wood fuel is derived mainly from forests and mangroves, which are extensive in Belize. There are 45 sawmills
with an established annual capacity of 200,000 cubic meters. However, according to the last national
7 Dead wood biomass is defined as all non-living woody biomass not contained in the litter, which is either standing, lying
on the ground, or in the soil. Dead wood includes wood lying on the surface, dead roots, and stumps larger than, or equal
to, 10 centimetres in diameter or any other diameter used or specified by the country.
82%
2%13% 3%
Household Lighting (%)
Electricity
Gas Lamp
Kerosene Lamp
Other
78%
16%
2%1% 3%
Household Cooking (%)
Butane (LPG)
Wood
Kerosene
Electricity
Other
18
inventory, with timber resources exhausted in public lands there has been a change in forestry concessions to
access private and public land to exploit forest reserves. Studies in the past showed that only about 14% of
forested lands are suitable for sustainable timber production. Of these, 4.4% are within public land and the
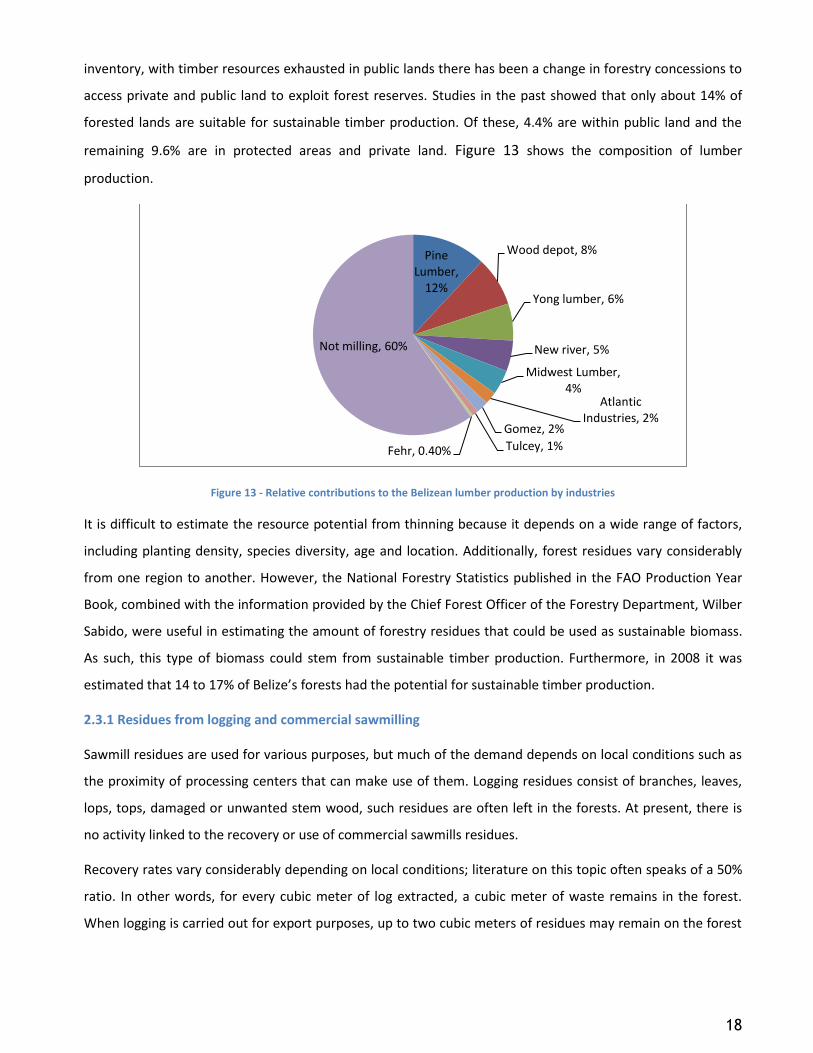
remaining 9.6% are in protected areas and private land. Figure 13 shows the composition of lumber
production.
Figure 13 - Relative contributions to the Belizean lumber production by industries
It is difficult to estimate the resource potential from thinning because it depends on a wide range of factors,
including planting density, species diversity, age and location. Additionally, forest residues vary considerably
from one region to another. However, the National Forestry Statistics published in the FAO Production Year
Book, combined with the information provided by the Chief Forest Officer of the Forestry Department, Wilber
Sabido, were useful in estimating the amount of forestry residues that could be used as sustainable biomass.
As such, this type of biomass could stem from sustainable timber production. Furthermore, in 2008 it was
estimated that 14 to 17% of Belize’s forests had the potential for sustainable timber production.
2.3.1 Residues from logging and commercial sawmilling
Sawmill residues are used for various purposes, but much of the demand depends on local conditions such as
the proximity of processing centers that can make use of them. Logging residues consist of branches, leaves,
lops, tops, damaged or unwanted stem wood, such residues are often left in the forests. At present, there is
no activity linked to the recovery or use of commercial sawmills residues.
Recovery rates vary considerably depending on local conditions; literature on this topic often speaks of a 50%
ratio. In other words, for every cubic meter of log extracted, a cubic meter of waste remains in the forest.
When logging is carried out for export purposes, up to two cubic meters of residues may remain on the forest
Pine Lumber,
12%
Wood depot, 8%
Yong lumber, 6%
New river, 5%
Midwest Lumber, 4%
Atlantic Industries, 2%
Gomez, 2%
Tulcey, 1%Fehr, 0.40%
Not milling, 60%
19
ground for every cubic meter extracted.8
An analysis on the availability and use of logging residues led by FAO in 2001 was able to ascertain a range of
30% to 40% in logging waste,9 indicating a recovery rate of 66% with 34% being residues consisting of stumps,
branches, leaves, unusable logs, off-cuts and sawdust. This figure may be higher if unwanted species are
computed as well. In order to calculate the amount of logging residues, a conservative average recovery rate
of 40% has been used. However, recovery rates vary with local practices as well as species. According to FAO,
about 12% of a log consists of waste in the form of bark.10 Slabs, edgings and trimmings amount to nearly 34%
while sawdust constitutes another 12% of the log input. After kiln-drying the wood, further processing may
take place resulting in another 8% waste of the log input in the form of sawdust and trim end (2%), and planer
shavings (6%). In order to calculate the residues, a yield factor of 50% has been used in this research —38%
solid wood waste and 12% sawdust.
To calculate the potential amount of harvestable forestry residues in tons, the following steps were taken:
Step 1: In commercial logging, it is estimated that the ‘round wood’ volume is equivalent to 60% of the total
volume of a tree, and that 40% remains as residue on the ground. To estimate this total volume of residues in
tons, it is necessary to determine the total amount of ‘round wood’, which is the sum of ‘fuel wood’ and
‘industrial round wood’. To do this, a balance of volume of production by species was used to calculate the
total amount of logged wood11. See Error! Reference source not found. for a schematic overview of the
ethodology12.
Step 2: The total volume of ‘round wood’, identified for the year 200413 was equivalent to 62,000 cubic meters
of industrial round wood14 and 126,000 cubic meters as fuel wood. During the milling process about 50% of
the industrial round wood remained as residue. The total volume of this sawmill residue was 31,000 cubic
meters.
Step 3: Once the relative residues from general logging activities is determined, the relative contribution to
the overall wood production is assessed.
8 Adams, M. (1995), Technical Report: Forest Products, Harvesting and Utilization Component, Paper presented to a
Project Formulation Workshop on Sustainable Conservation, Management and Utilization of Tropical Rainforests in Asia,
GCP/RAS/148/AUL, Bangkok, 6-8 February 1995. 9 Trash or Ttreasure? Logging and mill residues in Asia and the Pacific (2001), available at:
http://www.fao.org/docrep/003/X6966E/X6966E00.htm#TOC 10
Energy Conservation in the Mechanical Forest Industries (1990), FAO Forestry Paper 93.
http://www.fao.org/docrep/T0269e/T0269e00.htm 11
Conversion factor, sources; http://www.simetric.co.uk/si_wood.htm 12
Latin American Forestry Sector Outlook Study, Working Paper, National Report Belize, 2004.
http://www.fao.org/docrep/007/j4051b/j4051b00.htm 13
This was the only available reported data. 14
Industrial round wood, as defined in FAO Forest Products Yearbook, includes all industrial wood in the rough (saw logs
and veneer logs, pulpwood and other industrial round wood).

20
Figure 14- Flow chart of the wood volumes from logging to wood product in Belize
Table 3 and 4 provides statistics on potential harvestable forestry residues from wood logging and industrial
round wood processing.
Table 3 Potential harvestable forestry residues from logging activities in Belize
Logging Residues Potentially Harvestable (MT dw)
Caribbean/ Ocote Pine 46,062 Santa Maria (Calophyllum antillanum) 8,012 Mahogany (Swietenia macrophylla) 6,570 Yemeri (Vochysia hondurensis Sprague) 7,837 Others 1,3125
Total from Logging 81,607
Table 4 Potential harvestable forestry residues from industrial round wood processing in Belize
Sawmill Residues Potentially Harvestable (MT dw)
Pine 11,423 Santa Maria (Calophyllum brasiliense) 1,987 Mahogany (Swietenia macrophylla) 1,629 Yemeri (Vochysia hondurensis Sprague)
1,943
Others 3255
Total from Sawmill 20,239
Total amount of biomass from forestry is approximately 101,846 metric tones dry weight (dw) per year. As
such, Belize’s biomass resources suggest a good potential for cogeneration and biofuels production projects,
among others. Finally, it should be noted that, although the amount of biomass from forestry represents an
estimate only, the actual amount reached in practice should not be higher than the estimate provided.

21
2.4 Renewable Energy Technologies and LPG use
2.4.1 Renewable Energy Technologies
There are very few companies dealing in renewable energy technologies (RETs) in Belize. Solar energy systems
are extremely small and a modest number of solar photovoltaic (PV) panels were deployed under the auspices
of several international initiatives. For example, a solar PV project was deployed in the remote rural
community of San Benito Poite village in southern Belize. The project sponsored the installation of one 100-
watt solar panel power system and its ancillary equipment in every home. Solar water heaters are found in
some areas only as the result of small pilot projects.
Deployment of RETs for sustainable development faces various challenges, specifically the establishment of
suitable institutional frameworks, the leveling of the playing field between grid-connected and off-grid
electrification, the lack of awareness about RETs and poor technical support. Many of the traditional financing
institutions dealing with Belize’s rural poor who were interviewed for this report have very little or no
knowledge of RET programs.
2.4.1.1 Solar Energy
Not much work has been done in this field. However, solar PV could be an economically viable option,
particularly considering the future in crude oil prices. Belize’s average solar radiation in an optimal tilt angle is
roughly estimated at 2,000-3,000 kWh/m2 per year. Taking into consideration the cost of deploying current
technologies, solar generation would cost between 0.20 and 0.50 US$/kWh. This cost could drop to 0.10
US$/kWh by 2020. In addition to households, large scale solar PV systems could contribute significantly to
power the industrial sector. Solar PV home systems typically consist of one 40 to 60 Watts-peak (Wp) module
and one battery, which are highly cost-effective considering Belize’s climate and solar radiation values.
National legislation does not contemplate tax incentives for the generation of electricity by means of
photovoltaic systems.
2.4.1.2 Wind energy
Estimate mean wind velocity at 80 meters above ground is approximately 7 to 8m/s. Assuming an average
velocity of 6 m/s, electricity generation costs are calculated at 0.05 to 0.10 US$/kWh for off-grid systems.
Some studies suggest that Belize’s potential for wind power is some 20 MW. However, no comprehensive
study on wind generation capacity has been conducted nationwide. The Baldy Beacon area shows
considerable potential for wind power generation.
22
2.4.1.3 Geothermal energy
Belize has a very low potential for geothermal resources. However, neighboring countries such as
Honduras, Guatemala and El Salvador have great geothermal potentials, which they could export in
the form of electricity to Belize. The government of Belize should explore agreements with those
countries with the aim of gaining access to cheaper, clean electricity.
2.5 The Transport sub-sector
The transport sector is an important category of policy and regulation to be considered in the development of
a national energy policy. All of the fuel consumed by the transport sector is imported. Further, Belize
consumed about 7,000 barrels of oil derived products per day in 2009. That same year, about 30% of imported
petroleum derivates were consumed by this sector. This sums to a total of about 2,100 barrels per day.
Belize has not enacted policies or passed laws on renewable energy, agro-energy or biofuels for transport. Tax
benefits for ultra efficient car imports are not contemplated either. The government is aware of the need for
new policy and legislation in this field, and has some basic guidelines governing these types of investments.
These guidelines include environmental impact assessment requirements and requesting adequate
compensation for alleviating poverty and promoting rural development, but there is no existence of clear
compliance mandates.
Belize has one of the lowest population densities in the world and its areas of production are scattered
throughout the country. Therefore, adequate transportation is crucial to the development of the country’s
production and export sector. The existence of a proper road infrastructure is one component for improving
the access from rural to urban activities and vice versa. At the same time, infrastructure provision is inherently
a challenge given the low population density and high per unit costs.
The public uses mainly taxis and minivans as their mean of transport. Many of these vehicles are secondhand.
From 2001 to 2007, imports of new and used vehicles increased by 51%. Although this results in a higher
number of licensed vehicles on the road, the volume of imported gasoline remains relatively stable. This is in
part due to the increased use of butane for public transportation. According to the Ministry of Transport, a
significant number of buses running on butane (of which a large number is not registered) have been imported
mainly for public and private transport within Belize’s borders only. Neither the Department of Transport nor
the Statistical Institute of Belize has data on the number of licensed vehicles that run on butane and diesel.
Table 5 shows the number of vehicles licensed from 1995 to 2007. The data shows a rapid growth of the
transport from 2001 to 2007. In this period, the automobile purchases increased 34% whereas motorcycle
purchases grew 198%.

23
Table 5 Number of vehicles licensed15
Category Type 1995 1996 1997 1998 1999 2000 2001 2007 Avg. Annual Growth (%) 1995-2001
Growth (%) 2001-2007
Public
Buses 404 435 447 211 640 638 642 710 8 11
Taxis 1,727 1,765 1,918 1,901 1,927 2,192 2,191 2,759 4 24
Private
Automobiles 7,250 7,517 8,098 8,028 8,960 8,896 9,939 13,390 5 34
Pick-ups 6,867 7,387 8,847 8,485 9,826 10,198 11,158 14,350 9 28
Motorcycles 679 607 670 513 504 527 518 1,546 -3 198
Vans 2,242 2,459 2,761 2,854 3,044 2,992 3,474 4,596 8 32
Other 1,764 1,782 2,157 2,680 2,575 2,317 4,758 12,130 24 154
Utility
Trucks 247 284 190 862 283 171 195 220 -3 12
Dumps 302 307 257 252 120 151 264 254 -2 -4
Tractors 317 304 384 288 245 251 243 391 -3 60
Other 1,694 1,738 3,348 1,911 2,449 2,286 3,570 3,879 16 9
TOTAL 23,493 24,585 29,077 27,985 30,573 30,619 36,952 54,225
Figure 15 – Number of vehicles imported by type over the last 12 years
15
Information provided by the Statistical Institute of Belize
0
200
400
600
800
1000
1200
1400
1600
1800
0
2000
4000
6000
8000
10000
12000
14000
16000
19
95
19
96
19
97
19
98
19
99
20
00
20
01
20
02
20
03
20
04
20
05
20
06
20
07
Nu
mb
er
of
imp
ort
ed
Mo
torc
ycle
s
Nu
mb
er
of
veh
icle
s
Imported vehicles by type Passengers Bus
Taxi
Private Cars
Private Pick-up truckPrivate Van
Other Private vehiclesTruck
Dump
Tractor
Private Motorcycles
24
2.5.1 Governance and Regulation
There are three main pieces of legislation that govern transport matters in Belize. Transport by land is
governed by the Motor Vehicles and Road Traffic Act, Chapter 230 of 2000. The Belize Land Transportation
Authority (BLTA) is the government agency in charge of its enforcement under the umbrella of the Ministry of
Transport, Communications and National Emergency Management. Transport by air is governed by the Belize
Airports Authority Act, Chapter 238 of 2000, and the Civil Aviation Act, Chapter 239 of 2000. The Ministry of
Tourism, Civil Aviation and Culture is the government agency in charge of their enforcement. Finally, the
transport of goods by sea is governed by the Carriage of Goods by Sea Act, Chapter 248 of 2000. The Ministry
of Transport, Communications and National Emergency Management is the agency in charge of its
enforcement.
2.5.2 Road Transport
In 2008, a new regulatory body was formed to improve Belize’s growing transportation industry. The new
agency, called Belize Land Transportation Authority (BLTA), has legal powers under the Belize Land
Transportation Authority Act of 2007. This autonomous body does not depend on government revenue and
sustains itself. The BLTA generates its revenue from road permits, operation of the various bus
terminals across the country and revenues generated from ticket fines among other things. It may
issue road permits with no ministerial interference.
Outdated transport infrastructure, particularly roads and ports, is a factor inhibiting commercial and industrial
growth. Belize’s highway system has 3,281 km of roads. Of these, 573 km are main roads or highways, 765 km
are secondary roads, and 1,943 km are rural roads. About 658 km of these roads are paved, 1,423 km are
gravel, 1,000 km are marl, and 200 km are earth. An extensive construction program funded by the
government, starting in the early 1980s, as well as improvement projects funded by international aid, has led
to significant improvements in the road network. Paved highways connect most major urban settlements and
border areas.
However, the situation is difficult in rural areas, where many roads remain unpaved or are made of gravel or
marl. Only 17% of roads are paved. This percentage is low even when compared with other countries of the
region. In addition, Inadequate funding for maintenance has caused deterioration in road conditions. This not
only turns transportation of goods more expensive, but it is likely to result in more costly road reconstruction
programs.

25
2.5.3 Ports and Maritime Administration
The Belize Port Authority (BPA) is in charge of managing the nation’s three ports: Belize City Port, the largest
port in Belize; Commerce Bight Port, just outside Dangriga; and Big Creek Port. Belize City Port handles an
increasingly high traffic of cruise ships, in addition to exports and imports. It has leased Commerce Bight Port
for the past 30 years. Only Big Creek Port, which is used primarily for the export of bananas, is not under its
control. The port is owned by Toledo Enterprises Limited, a private company set up by banana merchants.
Belize City Port, which is the primary destination of incoming cruise ships, is currently undergoing an extension
project to make it better able to handle tourism. The relatively high port charges, which have gone up since
the 2002 privatization, are a constraint to private sector growth.
The high cost of maritime transport is a deterrent to private sector activity. Import and export costs are
exceedingly steep due to high port tariffs at US$1,710 for outbound containers and US$1,870 for inbound
containers. Inbound containers pay a higher tariff because there is more being imported than exported. As a
result of these costs, many containers leave the Belize City Port empty. Import and export costs are much
higher than the OECD average and double the cost of other small, low population, natural resource based
economies, such as Guyana and Suriname.
2.5.4 Airports and Civil Aviation
The Belize Airports Authority (BAA) is the government agency in charge of the country’s airports. There is one
international airport —Philip S.W. Goldson International Airport (PGIA), located 16 km outside Belize City. Its
privatization was deemed successful. Runways have recently been extended in order to accommodate larger
jets and several other projects are underway to improve airport capacity with a view to diversifying the
sources of tourism. The international airport provides services to some 500,000 passengers every year. Airport
infrastructure is Belize’s strongest point with regard to transport. The terminal’s capacity is adequate to
generate revenue and cover its operational costs. A second airport located in Placencia is expected to be open
at the end of 2011. The situation is less favorable with regard to smaller municipal airports. This is a critical
component of the tourism industry. Municipal airports lack the ability to receive planes at night, which limits
connectivity with international flights and sometimes forces tourists to overnight in Belize City.

26
3. ENERGY CONSERVATION
3.1 General
Belize has great potential for energy efficiency. There is considerable room for improvement in the various
energy sub sectors. Energy constitutes a large proportion of the country’s GDP and a considerable percentage
of household energy expenditure. Pursuing energy efficiency measures will contribute significantly to savings.
Fuel substitution is also important to reduce the negative impact of the use of some fuels on the environment
and to reduce the cost of energy services. The major sectors for energy conservation include:
Transport
Industry and commercial buildings
Households and institutions
Agriculture
The long term functioning of all sectors must take into consideration energy efficiency and conservation.
Energy audits are important tools that help to determine energy consumption patterns and thus propose
measures to achieve energy savings. There is a lack of awareness and inappropriate consumer behavior
regarding rational use of energy, as well as an absence of legislative and regulatory frameworks to foster
energy efficiency and conservation. Energy efficiency and conservation awareness must be raised in order to
induce behavioral change. It is also important to encourage cleaner production and recycling, integrate energy
efficiency in architecture and building designs and establish standards and legal frameworks. Finally, before
starting an energy audit the creation of an Energy Unit capable of storing, analyzing and supplying information
to the government and the public in general is the first step to consider. The unavailability of reliable energy
generation and consumption data makes it almost impossible to implement a successful energy audit
program.
3.1.2 Transport
As previously mentioned in this report, the transport sector consumes a large share of the petroleum products
imported to Belize. Therefore, addressing energy efficiency must be a priority for this sector. The mediocre
road conditions, the lack of a mass transport system and the poor mechanical condition of vehicles sorely
affect the sector. Vehicle emissions also constitute a significant portion of pollutants in towns and greenhouse
gas emissions.
27
3.1.3 Industry and Commercial Buildings
The industrial sector is small and there have been very little investments in new industries. Energy efficiency
factors are low in most factories. This is due to a combination of aspects including operating below rated
capacity and the use of old inefficient technologies. Industrial energy efficiency is extremely low compared to
other countries of the Central American Isthmus. The actual percentage that may be achieved through energy
efficiency can be determined through energy audits. However, current energy data is limited, unreliable and
outdated. The value of energy audits is limited if results cannot be compared to a baseline.
3.1.4 Households and Institutions
Most households use LPG and electricity. Poor rural households have resorted to charcoal and firewood
burned in a variety of largely inefficient traditional cook stoves. Improved stoves and kilns, as well as
substitution fuels (LPG and kerosene) for cooking, are not extensively spread due to their cost. General lack of
awareness and other different socio-economic factors are the most important challenges of the sub-sector.
Most urban households use electricity for lighting, whereas the majority of rural households use kerosene,
which is more expensive. The use of incandescent lamp light bulbs is widespread. Appliances found in
households (refrigerators, deep freezers, air conditioners, etc.) are often old, bought in the secondhand
market and therefore inefficient. New standards and labeling for appliances are needed.
3.1.5 Agriculture
Agriculture accounts for some 21.3% of Belize’s GDP, albeit fuel consumption is negligible because of the
largely non-mechanical nature of the sector. Energy consumption in agriculture is not accounted for in the
national energy balance. There are very few agro-based industries. The amount of diesel used in farms is
minimal. Some government programs supported by the Inter-American Institute for Cooperation on
Agriculture (IICA), IDB, CARICOM and other international organizations and NGOs, in which energy will play a
significant part, involve agriculture sector modernization. The aim is to improve the agricultural sector by
2020. The potential use of agricultural residues to produce energy, particularly ethanol, is technically feasible
and should be explored in a prospective energy policy.
28
4. KEY ISSUES IN THE ENERGY SECTOR
A robust and effective National Energy Policy must address the key issues that affect supply and demand, or
generation and consumption. A list of these issues was compiled, based on the analysis conducted.
4.1 Sectoral issues
Lack of coordination among the various energy sub-sectors.
Inadequate information on energy supply, demand and resource potential.
Budgetary constraints.
Inadequate coordination and information sharing among projects, government institutions and the private sector.
Lack of appropriate mechanisms to enable modern and efficient energy services to be accessed by the rural population.
Insufficient energy planning and energy statistics.
Absence of a technical and planning body within the Ministry of Energy & Power charged with coordinating actions aimed at streamlining and coordinating processes within the energy sector.
Need to strengthen the capacity of the Public Utilities Commission (PUC), in particular with regard to:
Adequate resources to fulfill the Commission’s functions;
Independence and autonomy from the government and the utilities;
Revised chart which defines the Commission’s powers, duties and responsibilities;
Implementation of internal and external auditing mechanisms to improve transparency; and
Governing body comprised of representatives form different social and economic groups.
4.2 Sub-sector issues
Some key issues are specifically identified with certain sub-sectors. A list of these issues was compiled over the
course of the study.
4.2.1 Electricity sub-sector
Inadequate public financing to meet increasingly growing demand.
High non-technical losses.
Limited access to electricity services in rural areas.
High electricity tariffs.
Rural electrification rate of 45%.
29
4.2.2 Household energy sector
4.2.2.1 Fuel wood and charcoal
Unsustainable use of biomass resulting in adverse effects on health and the environment, particularly in rural households.
Unreliable information systems and data collection resulting in poor planning and monitoring.
Limited access to competitive alternative energy sources and lack of incentives for their development
Absence of policies that promote the use of energy substitutes such as agricultural residues, biogas, solar energy, peat, lignite and natural gas, which have the potential to reduce fuel wood consumption.
Deficient regulations and standards applicable to the fuelwood and charcoal industries.
4.2.2.2 Renewable Energy Technologies / Improved stoves / LPG use
Low public awareness on RETs’ real potential and technical constraints.
Immature RET markets due in part to the inability to finance higher initial capital costs.
Lack of mechanisms to monitor standards and ensure quality of RETs (poor quality of some technologies reduces lifetime and damages image of RETs. Applies also to improved stoves).
Inadequate financing mechanisms and other incentives to facilitate investment, communication, promotion and dissemination of RETs and improved stoves.
Inadequate data on the potential of indigenous renewable energy sources.
4.2.3 Petroleum/Mining Sub-sector
4.2.3.1 Petroleum exploration and production/mining sub-sector
Limited public investment.
Lack of efficient oil extraction techniques to reduce oil production at above its current depletion date.
Lack of mechanisms to restrict production through market conditions or government regulation.
Lack of an “Oil depletion protocol” to protect local economy, increase energy and food security, assess oil vulnerability and provide alternative energy options.
4.2.3.2 Petroleum marketing and sales sub sector
Low storage capacity compared to national requirements.
Fuel adulteration and overcharging, especially in rural areas.
Additional transportation costs for fuels sold in rural areas.
Lack of a strategic petroleum reserve strategy.
Overlapping monitoring responsibilities of various institutions.
Ambiguous market standards.
Ineffective institutional and legal frameworks to govern the petroleum industry.

30
Growing energy demand in industrial and mining and sectors might cause fuel shortages.
Need to analyze the viability of a refinery.
4.2.4 Energy conservation issues
4.2.4.1 General
Lack of awareness among end energy users about energy conservation.
Lack of demand-side management policies.
Lack of incentives including financing mechanisms to invest in modern, efficient technologies.
Lack of specialized and skilled manpower in energy management.
4.2.4.2 Industry
Dominance of old energy-inefficient technologies and lack of replacement parts.
Lack of proper instrumentation in a number of plants.
Lack of skilled manpower and appropriate financing mechanisms.
4.2.4.3 Transport
Dominance of energy inefficient old vehicle fleets, resulting in increased pollution.
Poor maintenance of vehicle fleet.
Inadequate mass transit system, resulting in increased traffic congestion during peak hours and energy consumption per passenger.
Inadequate road infrastructure and low road maintenance.
4.2.4.4 Agriculture
Overdependence on human and animal energy.
Lack of data on energy consumption in agriculture.
4.2.4.5 Households and institutions
Low efficiency of technologies in use, including wood fuel stoves, lights and other appliances.
Insufficient incentives to introduce fuel/technology substitution (e.g., electricity for kerosene and wood fuel, LPG for wood fuel, solar water heaters for electric water heaters and wood fuel, fluorescent lamps for incandescent lamps, etc.)
Lack of information about improved energy technologies and efficient practices.
31
5. CONCLUSIONS
The following conclusions are drawn as a result of this study:
Belize does not have a formal energy strategy to reduce the sector’s extreme vulnerability therefore there is a
need for a comprehensive National Energy Policy.
The lack of reliable energy data prevents the implementation of energy audits as a tool to improve energy
efficiency in buildings.
There is no government agency charged with analyzing energy statistics and issuing recommendations,
guidelines or policies on improving energy efficiency and curbing demand.
High dependency on imported fossil fuels, coupled high cost of electricity, a growing demand for energy and
high population growth index.
Declining oil reserve due to lack of good prospecting, exploration, and exploitation policies, which may cause
depletion within the next 15 years.
Need to promote competitive business practices in the energy sector.
Need for an assessment of renewable energy resources, particularly with regard to sustainable biomass, solar
and wind energy.
32
REFERENCES
This document was prepared based on several interviews with key energy stakeholders in Belize during the
month of November, 2010 by ing.Ruben Contreras Lisperguer MSc. and Francisco Burgos MSc.
Other sources:
1. Government of Belize, “About Belize” 2006, 28 Mar. 2008, http://www.belize.gov.bz/
2. Central Statistical Office, “Foreign Trade Statistics 2000-2005.” 2005, 25 Oct. 2006
http://www.cso.gov.bz/statistics/foreigntrade
3. Charles W. Schmidt, “Keeping Afloat: A Strategy for Small Island Developing Nations,” Environmental
Health Perspectives 2005: 113(9), 606-609.
4. Energy for Sustainable Development Toward a National Energy Strategy for Belize Energy Sector
Diagnostic, prepared by: Launchpad Consulting Belize, C.A in collaboration with Dr. Ivan Azurdia-Bravo
Fundación Solar, Guatemala. For Formulation of a National Energy Plan; November 5, 2003.
5. Small Island Developing States Network, “Who are the SIDS.” UN DESA, 2003, 28 Mar. 2008.
http://www.sidsnet.org/2.html
6. Jan C. Meerman, Protected Areas System Assessment and Analysis: PA Analysis. (Belize: Protected
Areas System Plan Office, 2005).
7. Protected Areas Conservation Trust, “Background” 2006, 11 Apr. 2007 http://www.pactbelize.org/
8. GOB, “Table 32: Gross Domestic Product.” (Belmopan: Central Statistical Office, 2009-2010)
9. Source: Statistical Institute of Belize, Annual Gross Domestic Product.
http://www.statisticsbelize.org.bz
10. Launchpad Consulting and David M. Russell, Belize Draft Tourism Policy. (Belize City, 2005).
11. Central Statistical Office, “2005 Labor Force Survey.” (Belmopan: Ministry of National Development,
2005).
12. Robert Richardson, “Economic Development in Belize: Two Steps Forward, Two Steps Back.” Taking
Stock: Belize at 25 Years of Independence, ed. Barbara Balboni and Joseph Palacio (Benque Viejo:
Cubola Productions, 2007) 25.
13. United Nations Development Programme; Formulation of a National Energy Plan for Belize: (Sector
Diagnostic and Policy Recommendations) Project Document UNDP, Energy Thematic Trust Fund (TTF),
September 2002 Belize.

33
14. Public Utilities Commission, web site; http://www.puc.bz/nep.asp, visited 8 November 2010
15. Formulation of a National Energy Plan for Belize: Energy Policy. Recommendations, December 2003;
web: (Sector Diagnostic & Policy Recommendations) Project
http://www.puc.bz/publications/Policy%20Recommendations%20INTERNET.pdf, visited November 5,
2010.
16. BP Statistical Review; Data in the BP Statistical Review is based on government or trade association
sources
17. http://www.fao.org/countryprofiles/index.asp?lang=en&iso3=BLZ&subj=4
18. Singh, R.H, Rankine, L.B., Seepersad, G., 2005. A Review of Agricultural Policies: Case Study of Belize.
Report Prepared for the CARICOM Secretariat by the Department of Agricultural Economics and
Extension the University of the West Indies
19. St. Augustine, Trinidad W.I. Source:
http://www.caricom.org/jsp/community/agribusiness_forum/agri_policy_belize.pdf
20. BELIZE SOLID WASTE PROGRAM, Draft for Discussion 30/01/2005, Consultants: Olga Samper, Stephen
Pereira, Monica Ramirez. Sources: idbdocs.iadb.org/wsdocs/getDocument.aspx?DOCNUM=583502
21. National Solid Waste Management Project, 199 and the Central Statistical Office of Belize (CSO) in
2002; source: NATIONAL ASSESSMENT REPORT for Barbados +10, Government of Belize September
2003. Last visited 09 November, 2010
22. Albert Roches, 2007. Solid Waste Management: Present State in Belize.
http://www.epa.gov/landfill/conf/ca_workshop/SolidWasteBelize.pdf
23. Latin American Forestry Sector Outlook Study, Working Paper, National Report Belize, 2004.
http://www.fao.org/docrep/007/j4051b/j4051b00.htm
24. Conversion factor, sources; http://www.simetric.co.uk/si_wood.htm
25. World Bank, http://devdata.worldbank.org/AAG/blz_aag.pdf
26. Energy Information Administration (EIA), International Energy Annual
http://tonto.eia.doe.gov/country/country_energy_data.cfm?fips=BH; Last visited February 20, 2010.
Related Documents