ELSEVIER Early Human Development 39 (1994) 159-175 Behavioral states in the fetal baboon Philip G. Grieve *b*c, Michael M. Myer~~‘~,Raymond I. Stark” aDepartment of Pediatrics bDepartment of Psychiatry, Columbia College of Physicians and Surgeons, BHS 115, 622 W. 168th St., New York, NY 10032, USA cDepartment of Developmental Psychobiology, New York State Psychiatric Institute, New York, NY 10032, USA Received 25 February 1994; revision received 5 July 1994; accepted 7 July 1994 Abstract This study was designed to characterize behavioral states in the fetal baboon. Automated methods were developed and validated to recognize behavioral states based on relationships among three physiologic variables (EEG patterns, eye movements, heart period variability). Data included twelve 16-h records from 3 chronically instrumented fetal baboons at 0.8-0.9 of term. Randomly generated control records were used to differentiate occurrences of state from chance association of the variables. For 41.2 f 4.6% (mean f S.E.) of the time, the physiologic variables were synchronous and formed cycles of state with a mean duration of 34.4 min. Components of these cycles had mean f S.E. durations of 7.2 f 0.3 min for state 1FB (the analogue of quiet sleep in the human infant and state 1F in the human fetus), 20.7 f 1.2 min for the state 2FB (the analogue of active sleep in the human infant and state 2F in the human fetus), and 3.6 f 0.2 min for state transitions. For 24.6 f 2.4% of the time, the state variables exhibited coincidental, state-like agreements, that were not part of state cycles. Finally, for 34.3 f 2.7% of the time, there was no systematic agreement among the three variables. These data provide convincing evidence that organized behavioral states are present in the fetal baboon as early as 0.8 of term gestation. Keywords: Behavioral state; Electroencephalogram (EEG); Electrooculogram (EOG); Elec- trocardiogram (ECG); Heart period variability; Fetal baboon 1. Introduction Behavioral states are patterns of activity in which many physiologic and behav- ioral variables form constellations that are stable over time and recur repeatedly. * Corresponding author. 0378-3782/94/$07.00 0 1994 Elsevier Science Ireland Ltd. All rights reserved SSDI 0378-3782(94)01574-Z

Welcome message from author
This document is posted to help you gain knowledge. Please leave a comment to let me know what you think about it! Share it to your friends and learn new things together.
Transcript

ELSEVIER Early Human Development 39 (1994) 159-175
Behavioral states in the fetal baboon
Philip G. Grieve *b*c, Michael M. Myer~~‘~, Raymond I. Stark”
aDepartment of Pediatrics bDepartment of Psychiatry, Columbia College of Physicians and Surgeons, BHS 115, 622 W. 168th St., New York, NY 10032, USA
cDepartment of Developmental Psychobiology, New York State Psychiatric Institute, New York, NY 10032, USA
Received 25 February 1994; revision received 5 July 1994; accepted 7 July 1994
Abstract
This study was designed to characterize behavioral states in the fetal baboon. Automated methods were developed and validated to recognize behavioral states based on relationships among three physiologic variables (EEG patterns, eye movements, heart period variability). Data included twelve 16-h records from 3 chronically instrumented fetal baboons at 0.8-0.9 of term. Randomly generated control records were used to differentiate occurrences of state from chance association of the variables. For 41.2 f 4.6% (mean f S.E.) of the time, the physiologic variables were synchronous and formed cycles of state with a mean duration of 34.4 min. Components of these cycles had mean f S.E. durations of 7.2 f 0.3 min for state 1FB (the analogue of quiet sleep in the human infant and state 1F in the human fetus), 20.7 f 1.2 min for the state 2FB (the analogue of active sleep in the human infant and state 2F in the human fetus), and 3.6 f 0.2 min for state transitions. For 24.6 f 2.4% of the time, the state variables exhibited coincidental, state-like agreements, that were not part of state cycles. Finally, for 34.3 f 2.7% of the time, there was no systematic agreement among the three variables. These data provide convincing evidence that organized behavioral states are present in the fetal baboon as early as 0.8 of term gestation.
Keywords: Behavioral state; Electroencephalogram (EEG); Electrooculogram (EOG); Elec- trocardiogram (ECG); Heart period variability; Fetal baboon
1. Introduction
Behavioral states are patterns of activity in which many physiologic and behav- ioral variables form constellations that are stable over time and recur repeatedly.
* Corresponding author.
0378-3782/94/$07.00 0 1994 Elsevier Science Ireland Ltd. All rights reserved SSDI 0378-3782(94)01574-Z

160 P.G. Grieve et al. /Early Hum. Dev. 39 (1994) 159-175
States reflect modes of coordinated brain activity in which both baseline physiologic functions and the responsiveness to stimuli are altered. Therefore, it is critical that state be considered whenever the behavior and well-being of an animal are being evaluated.
The study of state during early development has received a great deal of attention because the emergence of state represents one of the earliest forms of organized cen- tral nervous system (CNS) activity [ 13,181. Commonly used physiologic correlates of behavioral states in newborn infants are the electrical activities of the brain, eyes, and heart [1,21]. These are quantified by measuring the electroencephalogram (EEG), the electrooculogram (EOG), and the electrocardiogram (ECG). State orga- nization in the human fetus has been characterized with ultrasound imaging sensors to measure eye and body movements and a fetal heart monitor to measure heart rate patterns [ 10,15,17,18]. After 36 weeks of gestation, distinct recurring patterns of these variables are found and thought to constitute fetal behavioral states. While cri- teria for four fetal states have been widely accepted, the near term fetus is most often in one of two states which are analogous to quiet and active sleep in infants and adults [15,18].
Research with the human fetus is limited by the indirect nature and short duration over which observations of behavior can be made. Thus, it is important to find suitable animal models in which normal and abnormal fetal states can be studied and manipulated. Although many adult animals exhibit organized states [5], there are only a few animals that have been observed to do so prenatally. For example, the rat, rabbit, and cat do not exhibit fully developed adult-like EEG aspects of sleep and wakefulness until l-3 weeks after birth [24]. In contrast, the CNS of the fetal lamb is well developed in late gestation and it has been shown that the lamb exhibits behavioral states in utero [8,24].
We have recently developed techniques for long-term monitoring of physiologic variables from the fetus of the pregnant baboon [23]. In initial studies [11,22] we documented the cycling of the fetal baboon EEG between two distinct patterns. One pattern observed, trace alternant, is characteristic of the EEG during quiet sleep in human infants less than 2 months of age. The other predominant pattern of EEG activity is characterized by the absence of trace alternant and the presence of increas- ed high frequency activity. This pattern is analogous to the EEG activity associated with active sleep [ 11. The associations of patterns in other physiologic variables with these EEG patterns are required for the rigorous description of behavioral states.
The goals of this study were to determine if multivariate behavioral states exist in the fetal baboon and to quantify key descriptors of these states. To attain these goals we have developed comprehensive, quantitative methods for measurement of states in the fetal baboon based on measurements of fetal EEG, EOG and heart period variability.
2. Methods
2. I. Animal preparation Data were obtained from the fetuses of three pregnant baboons (Papio sp.) who
delivered between 163 and 175 days (term = 175-180 days). Birth weights of the

P.G. Grieve et al. /Early Hum: Dev. 39 (19943 159-175 161
fetuses ranged from 630 to 710 g which is within the normal range for our colony. Data collection began after at least 1 week of recovery from surgical instrumentation of the mother and fetus and discontinuation of all post-operative medications. All animals were maintained in an AAALAC approved facility in accordance with the regulations of the NIH [ 121.
A detailed description of the maintenance, breeding and preconditioning to the backpack and tether device, anesthetic, surgical techniques and success rate has been reported previously [22,23]. Thus, only a brief summary is included here.
At a mean gestation of 134 days, under general anesthesia and with sterile surgical technique, the fetal head was delivered through a low segment hysterotomy. Stainless steel wires tipped with silver solder balls were placed on the parietal (Ps,P& and frontal (F,) dura, sites comparable with those in the standard montage for human neonatal EEG [ 11. EOG electrodes were placed subcutaneously on either side of the orbit - one medial and above the palpebral fissure, the other lateral and below the fissure. With this electrode placement, an EOG signal was produced by eye movements in both horizontal and vertical directions. For measurement of the electrocardiogram (ECG), electrodes were placed subcutaneously over the lateral deltoid at each humoral head and over the pectoral muscles on the precordium.
In addition, catheters were placed in the fetal carotid and maternal femoral arteries for blood sampling. Catheters and bioelectric leads were brought out through the uterine incision and maternal fascia, tunnelled subcutaneously to the midscapular area of the mother, and passed into a backpack and tether which allow- ed continuous monitoring of electrical signals from the fetus with minimal physical restraint of the mother. With prior conditioning, the behavior pattern of mothers in the tether appeared virtually identical to that seen normally in individually caged animals. The well-being of each of the fetuses during the study period was monitored by daily (between 15:OO and 17:00 h) acid-base and blood gas measurements. The results were within the normal range for fetal baboons [7].
2.2. Acquisition of biological signals The EEG was recorded as the electrical potential measured between one of the two
parietal leads and the frontal lead (PJ or P4 and F,) and the EOG as the potential measured between the two EOG leads. Both signals were conditioned with Hewlett- Packard (Model 88llA) bioelectric amplifiers with bandpass settings of 1.5-30 Hz for the EEG and 1.5-5 Hz for the EOG. Digital recordings of the signals were made using a Labmaster (Scientific Solutions) 12-bit analog-to-digital converter sampling at a rate of 50 Hz per channel. The 50-Hz sampling of the EEG, when coupled with the attenuation characteristics of the bandpass filter, produced minimal aliasing [l 11. A calibration signal of 100 PV was also recorded for the two signals at the beginning of each day’s collection.
The raw data used for analysis of heart period variability was a time series of R- wave to R-wave (RR) intervals. The ECG signal was directed to a Hewlett-Packard (Model 4784) special purpose heart rate monitor. This monitor outputs a timing pulse that is coincident (f 1 ms) with each R-wave. The time intervals between pulses were measured by a special device and passed to the computer.
162 P.G. Grieve et al. /Early Hum. Dev. 39 (1994) 159-175
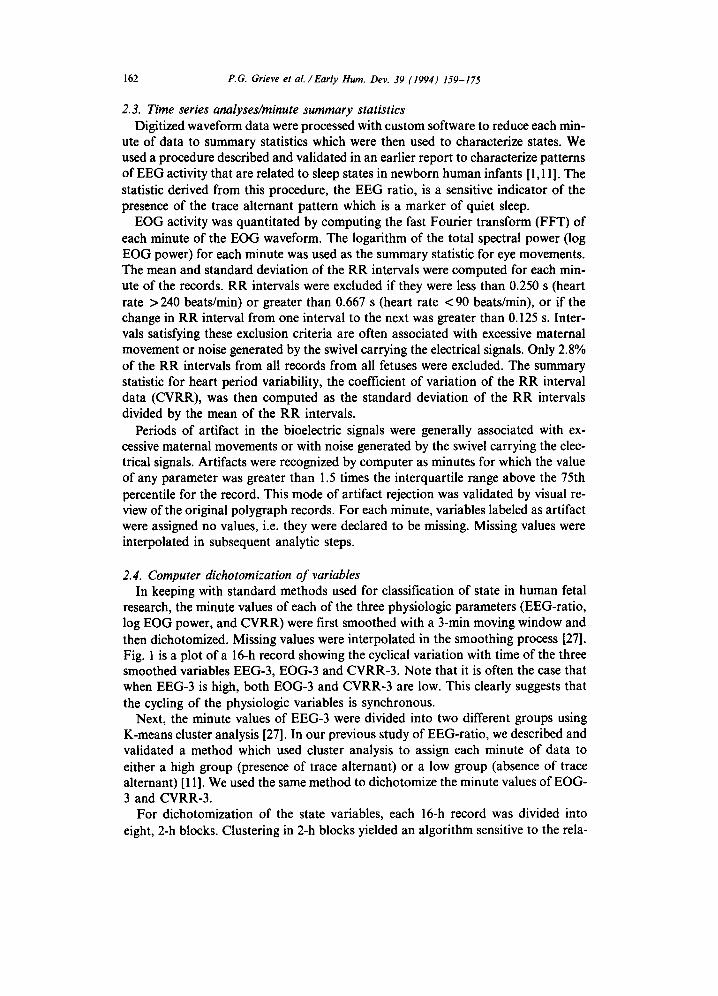
2.3. Time series analyses/minute summary statistics Digitized waveform data were processed with custom software to reduce each min-
ute of data to summary statistics which were then used to characterize states. We used a procedure described and validated in an earlier report to characterize patterns of EEG activity that are related to sleep states in newborn human infants [ 1,111. The statistic derived from this procedure, the EEG ratio, is a sensitive indicator of the presence of the trace alternant pattern which is a marker of quiet sleep.
EOG activity was quantitated by computing the fast Fourier transform (FFT) of each minute of the EOG waveform. The logarithm of the total spectral power (log EOG power) for each minute was used as the summary statistic for eye movements. The mean and standard deviation of the RR intervals were computed for each min- ute of the records. RR intervals were excluded if they were less than 0.250 s (heart rate > 240 beats/min) or greater than 0.667 s (heart rate c 90 beats/min), or if the change in RR interval from one interval to the next was greater than 0.125 s. Inter- vals satisfying these exclusion criteria are often associated with excessive maternal movement or noise generated by the swivel carrying the electrical signals. Only 2.8% of the RR intervals from all records from all fetuses were excluded. The summary statistic for heart period variability, the coefficient of variation of the RR interval data (CVRR), was then computed as the standard deviation of the RR intervals divided by the mean of the RR intervals.
Periods of artifact in the bioelectric signals were generally associated with ex- cessive maternal movements or with noise generated by the swivel carrying the elec- trical signals. Artifacts were recognized by computer as minutes for which the value of any parameter was greater than 1.5 times the interquartile range above the 75th percentile for the record. This mode of artifact rejection was validated by visual re- view of the original polygraph records. For each minute, variables labeled as artifact were assigned no values, i.e. they were declared to be missing. Missing values were interpolated in subsequent analytic steps.
2.4. Computer dichotomization of variables In keeping with standard methods used for classification of state in human fetal
research, the minute values of each of the three physiologic parameters (EEG-ratio, log EOG power, and CVRR) were first smoothed with a 3-min moving window and then dichotomized. Missing values were interpolated in the smoothing process [27]. Fig. 1 is a plot of a 16-h record showing the cyclical variation with time of the three smoothed variables EEG-3, EOG-3 and CVRR-3. Note that it is often the case that when EEG-3 is high, both EOG-3 and CVRR-3 are low. This clearly suggests that the cycling of the physiologic variables is synchronous.
Next, the minute values of EEG-3 were divided into two different groups using K-means cluster analysis [27]. In our previous study of EEG-ratio, we described and validated a method which used cluster analysis to assign each minute of data to either a high group (presence of trace alternant) or a low group (absence of trace alternant) [ 111. We used the same method to dichotomize the minute values of EOG- 3 and CVRR-3.
For dichotomization of the state variables, each 16-h record was divided into eight, 2-h blocks. Clustering in 2-h blocks yielded an algorithm sensitive to the rela-

P.G. Grieve et al./Early Hum. Dq. 39 (1994) 159-175 163
rB
0 200 400 600
Time (mid
800 1000
Fig. 1. Plots of 16 h of minute-by-minute data after smoothing with a 3-min moving average filter. Panel A is EEG-ratio (EEG-3), Panel B is log EOG power (EOG-3) and Panel C is the coeflicient of variation (SD/mean) of RR intervals (CVRR-3). See text for definitions and derivations of these variables.
tive difference between the state-dependent low and high values of a variable within a block but insensitive to longer-term, state-independent variation in the average value of the variable. Fig. 2 shows the first 2 h of the data depicted in Fig. 1, along with the clustered waveforms EEGCL, EOGCL, and CVRRCL obtained from dichotomization of the smoothed physiologic variables EEG-3, EOG-3 and CVRR- 3. These binary waveforms are equivalent to the profiles of state variables used in the assessment of human fetal state [14]. Overall, we found that low values of EEGCL, EOGCL, and CVRRCL were present (mean * SE.) 34.2 f 1.8, 24.4 f 1.0, and 31.4 f 1.6% of the time, respectively.
2.5. Validation of dichotomization In a prior study [ll] we validated a computerized clustering procedure for
dichotomizing smoothed EEG-ratio using the results from visual scoring of the EEG as the standard [22]. A similar validation procedure was used for the log EOG power and CVRR data. Six hours of data from each of the three fetuses in the study were visually scored. Three examiners independently classified each minute of the EOG voltage waveform as either few or many eye movements and each minute of the in- stantaneous heart rate waveform (a time series composed of inverse RR intervals)

164 P.G. Grieve et al. /Early Hum. Dev. 39 (1994) 159-175
.z 2 Smooth
s ii
Cluster --iv
Smooth
; Cluster
3 Smooth
Cluster
0 20 40 60
Time (min)
80 100 120
Fig. 2. Smoothed and cluster representations of the three physiologic variables. The plots are the first 2 h of data shown in Fig. I. Panel A is EEG-ratio; the upper part is smoothed data, the lower part is clustered data. Also shown are similar plots for EOG (Panel B) and the coefficient of variation of RR intervals, CVRR (Panel C).
as either high or low heart rate variability. Each examiner’s waveform classifications were then smoothed using a 3-min sliding window as follows. First, 3 min of waveform data were observed on a computer monitor and each minute was ten- tatively scored. The final (smoothed) score for the center minute of the window was taken to be the average of the scores of all 3 min on the screen. The sliding window was then moved to the right by 1 min and the procedure continued until all minutes were scored.
We then utilized the Delphi Group Opinion Procedure [6,26] to arrive at a single final score for each minute of the two physiologic variables. In this procedure ex- aminers were allowed to restore each minute of data after the scores from the other examiners were revealed. This sometimes involved discussion among the examiners about their reasons for giving a particular score. Finally, the examiners voted on a single score for each minute using majority logic. The final score for each minute was then compared with the computer’s score to determine the percent agreement. The result was 85% agreement between visual and computer dichotomization for heart rate variability and 86% agreement for the EOG. These levels of agreement are

P.G. Grieve er al. /Early Hum. Dev. 39 (1994) 159-175 165
comparable with the 88% agreement we found previously in the validation of compu- ter scoring of EEG data.
2.6. Definition of fetal baboon states We characterized the data from the fetal baboon into two state patterns using the
binary variables EEGCL, EOGCL, and CVRRCL. The definitions of state patterns 1FB and 2FB for the fetal baboon are given in Table 1.
State 1FB parallels quiet sleep in the human neonate in that EEG activity is dominated by the trace alternant pattern (i.e. high EEG-ratio), heart period variability is low, and low EOG activity. In contrast, state 2FB is similar to active sleep, with increased high frequency EEG activity and the absence of the trace alter- nant pattern, and with high heart period variability and high levels of EOG activity.
2.7. Minute-by-minute assignment of state An algorithm was developed to score every minute of data as one of four types
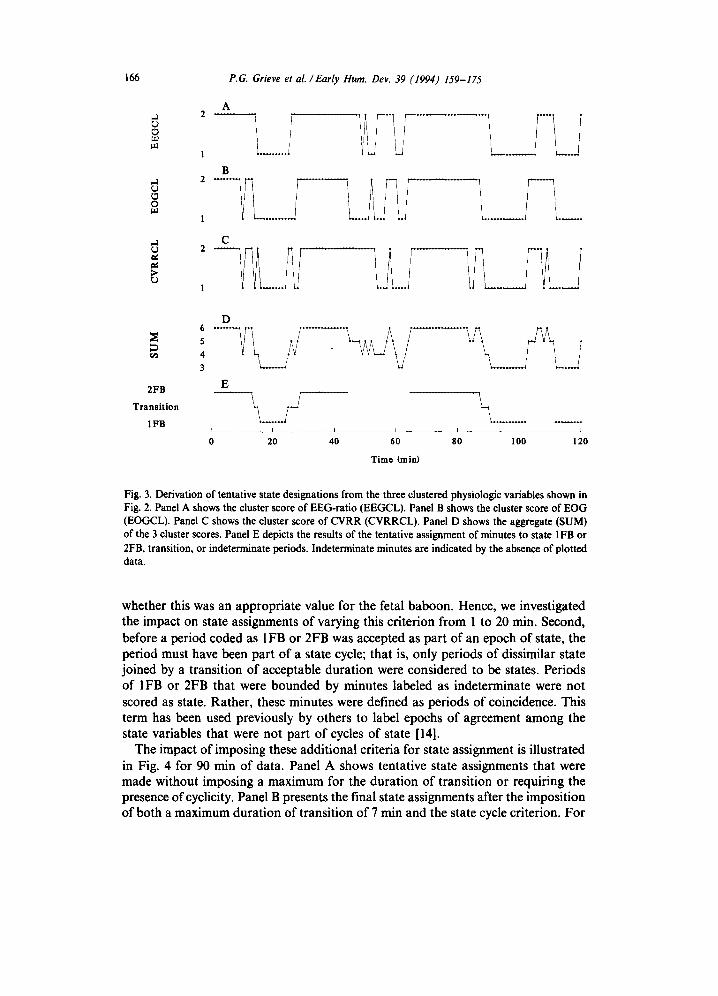
of activity. Tentatively, periods of state were scored as minutes for which the con- figuration of the dichotomized variables met the criteria for state 1FB or 2FB and persisted for at least 3 min. During these periods, a change in pattern for less than 3 min was not considered to be a change in state. Periods of transition were tentative- ly defined as those minutes which did not meet the criteria for state and which were bounded by periods of dissimilar state. Finally, indeterminate periods were defined as epochs which did not meet the criteria for 1FB or 2FB and were bounded by periods of the same state. Fig. 3 demonstrates the application of this procedure. Panels A, B, and C show the binary waveforms (EEGCL, EOGCL, CVRRCL) ob- tained from the physiologic variables by the clustering procedure. Panel D is the minute-by-minute sum of the three cluster scores. Finally, Panel E shows the resulting assignments of the four types of activity coded by the above logic. Note that in Panel E the indeterminate periods are indicated by the absence of plotted data.
Before patterns of activity were classified as states, two additional interrelated fac- tors were considered. First, the maximum acceptable duration for periods of transi- tion from one state to another was established. Although a 3-min maximum transition has been utilized in most studies of the human fetus, it was unknown
Table 1 Fetal baboon state pattern definitions
Physiologic variable State pattern
IFB 2FB
EEG Activity EOG Activity Heart Period Variability
High EEG-ratio (EEGCL = 1) Low EOG power (EOGCL = I) Low CVRR (CVRRCL = I)
Low EEG-ratio (EEGCL = 2) High EOG power (EOGCL = 2) High CVRR (CVRRCL = 2)
166 P.G. Grieve et al. /Early Hum. Dev. 39 (1994) 159-175
2FB
Transition
1FB ,yiJ--y- ,--;-, 0 20 40 60 80 100 120
Time (mm)
Fig. 3. Derivation of tentative state designations from the three clustered physiologic variables shown in Fig. 2. Panel A shows the cluster score of EEG-ratio (EEGCL). Panel B shows the cluster score of EOG (EOGCL). Panel C shows the cluster score of CVRR (CVRRCL). Panel D shows the aggregate (SUM) of the 3 cluster scores. Panel E depicts the results of the tentative assignment of minutes to state IFB or ZFB, transition, or indeterminate periods. Indeterminate minutes are indicated by the absence of plotted data.
whether this was an appropriate value for the fetal baboon. Hence, we investigated the impact on state assignments of varying this criterion from 1 to 20 min. Second, before a period coded as 1FB or 2FB was accepted as part of an epoch of state, the period must have been part of a state cycle; that is, only periods of dissimilar state joined by a transition of acceptable duration were considered to be states. Periods of 1FB or 2FB that were bounded by minutes labeled as indeterminate were not scored as state. Rather, these minutes were defined as periods of coincidence. This term has been used previously by others to label epochs of agreement among the state variables that were not part of cycles of state [14].
The impact of imposing these additional criteria for state assignment is illustrated in Fig. 4 for 90 min of data. Panel A shows tentative state assignments that were made without imposing a maximum for the duration of transition or requiring the presence of cyclicity. Panel B presents the final state assignments after the imposition of both a maximum duration of transition of 7 min and the state cycle criterion. For

P.G. Grieve et al/Early Hum. Deu. 39 (1994) 159-175 167
b)
;;; 2FB
s
? Transition and
.” Indeterminate
2
2
G IFB
s c s 2FB
d) Transition and
zi Indeterminate
;;
1FB
I 1 I 1 1 , I / 1 I
0 IO 20 30 40 50 60 70 80 90
Time (min)
Fig. 4. Derivation of final state designations from the tentative state assignments. Panel A shows tentative assignments. T labels periods of transition and I indeterminate periods. Panel B shows the final state assignments after limiting the maximum duration of transitions to 7 min. S labels epochs of state, C labels epochs of coincidence. I and T are the same as above.
example, between 60 and 90 min of the record, two periods tentatively scored as transition were restored as indeterminate epochs because each had a maximum dura- tion greater than 7 min. Note also that the 3-min period of 2FB which occurs at 60 min becomes a period of coincidence 2FB since it is bounded by indeterminate periods and therefore is not part of a state cycle.
2.8. Statistical analyses Analyses were conducted on twelve 16-h records (four records from each of three
fetuses). Eleven of the 16-h records began at approximately 16:00 while one began at 1O:OO. The data spanned a gestational age interval of 144-152 days. These data were chosen to coincide with the gestational age interval of our earlier work with the cycling of fetal baboon EEG [11,22].
To determine if our characterization of states in the fetal baboon differed from that which might occur from chance association of the state variables, we generated control records by randomly combining dichotomized variables from the three study fetuses. In these records the temporal patterning of the state variables was unrelated

168 P.G. Grieve et .al. /Early Hum. Dev. 39 (1994) 159-175
and associations among the state variables occurred solely by chance. The only con- straint imposed for the generation of the control records was that they included ex- actly one variable from each fetus. Twelve random records of this type were generated to form the control group. This method for generating a record in which states form by chance association has been described previously [14].
For statistical analysis, we computed the mean of each variable for each of the three animals. The twelve random records were randomly assorted into three groups and the means of each variable from each group were found. To test for statistical significance of differences between the real and control data, we used Student’s r-test (n = 3). Differences were considered to be significant when there was no overlap in the range of each real and control variable and P-values were less than 0.05.
3. Results
As a first step in deciding whether the associations among the three physiologic variables (EEG, EOG, CVRR) were more than chance occurrence, we performed an analysis which quantified the number of minutes and the duration of epochs labeled as patterns 1FB and 2FB. The assignment of these patterns was made with no con- straints on the duration of transitions between patterns or the cyclicity of the pat- terns. Table 2 shows the mean and S.E. percent of time occupied by minutes of pattern 1FB and 2FB and the mean and S.E. duration of epochs of these patterns. The mean percent of time and the mean duration of epochs of patterns 1 FB and 2FB were significantly greater for the real records than for the random controls. These results demonstrate that the associations among EEG activity, eye movements, and heart period variability are not random. However, because no constraints were plac- ed on transition duration or cyclicity, these associations are not necessarily states.
State cyclicity can only be characterized after the selection of a criterion for the maximum duration of transitions. In studies of the human fetus and infant, the wide- ly accepted criterion for the maximum duration of transition is 3 min; however, this criterion may not be appropriate for the fetal baboon [14]. We explored this issue
Table 2 Mean ( f S.E.) of epoch duration and percent of time in patterns I FB and 2FB for real and random con- trol records
Pattern Epoch duration (min)
Real data Random control data
Percent of time
Real data Random control data
1FB 6.8 (0.4)* 4.1 (0.5) 10.5 (1.5)** 1.7 (0.5) 2FB 17.4 (1.3)** 9.1 (0.2) 50.1 (2.6)** 32.1 (0.7)
‘P < 0.03. **p < 0.005.

P.G. Grieve et al. /Early Hum. Dev. 39 (1994) 159-175 169
by first examining the total number and durations of the periods of transition be- tween patterns 1FB and 2FB. In the 184 h of data from the real records there were 295 periods of transition while in an identical amount of data from the random con- trol records there were only 81 periods. Fig. 5 shows frequency histograms of the durations of periods of transition in each set of data. It is apparent from these histograms that the real data have a greater number and percentage of short periods of transition. In the real data, the median duration of periods of transition was 6 min while the median for the random data was 12 min (P < 0.001).
Next, we repeatedly classified state as we varied the criterion for maximum dura- tion of transition. In each iteration, periods of transition longer than the selected maximum were recoded as indeterminate periods. When periods of pattern 1 FB and 2FB were joined by admissible state transitions, they were recoded as states 1 FB and 2FB. In contrast, periods of 1FB and 2FB not connected by admissible state transi- tions were recoded as periods of coincidence. For each record we then computed the percentage of time occupied by states 1FB and 2FB. This procedure was performed for both the real and random control data.
The mean percentages of time occupied by states (exclusive of transitions) is plot- ted against the maximum duration of transition in Panel A of Fig. 6 for both the real data (total state) and random control data (state formed by chance occurrence). Also shown in Panel A is the difference between these two percentages (true state). The difference is an estimate of the true incidence of state in the real data because the contribution of states formed by chance occurrence is removed by subtraction. Panel B of Fig. 6 is a plot of the ratio of true state incidence to total state incidence, expressed as a percent. We selected the maximum duration of transition as the larg- est value for which the proportion of true state was at least 95%. As shown in Panel
0.1s , A B
0 10 20 30 40 50 0 10 20 30 40 50
Duration of Transitions (min) Duration of Transitions (min) In Real Data In Random Control Data
Fig. 5. Frequency histograms of the durations of transitions in the real data (Panel A) and in the random control data (Panel B).

170 P.G. Grieve et al. /Early Hum. Dev. 39 (1994) 159-175
10
0
100
95
90
85
80
m Total State
----a True State
State formed by Chance Occurrence
I
I3 :
0 5 10 15 20 25
Maximum Duration of Transition (mid
Fig. 6. Panel A shows the average incidence of state (percent of time) from real (total state) and random control (state formed by chance occurrence) records plotted against the maximum duration of transition used for the assignment of state. Also shown is true state, the difference between total state and state formed by chance occurrence. Panel B shows the ratio of true state to total state, expressed as a percent (% true state), plotted against the maximum duration of transition. The vertical dashed lines indicate a ‘I-min maximum duration of transition.

Table 3
P.G. Grieve et al. /Early Hum. Dev. 39 (1994) 159-175 171
Mean (f SE.) percent of time spent in state, coincidence and indeterminate periods when the maximum duration of transition equals 7 min
Percent of time
Real data Random control data
State Coincidence Indeterminate
*P < 0.006; **p < 0.001.
41.2 (4.6)** 1.8 (0.7) 24.6 (2.4)’ 32.4 (1.5) 34.3 (2.7)** 65.8 (1.1)
B, this procedure yielded a value of 7 min as the maximum duration of transition for the fetal baboon.
With the criterion for maximum duration of transition set to 7 min, the percen- tages of time occupied by states, periods of coincidence and indeterminate periods were quantified. As summarized in Table 3, for the real records on average 41.2% of the time was spent in state cycles, while for the control records the amount is only 1.8%. This difference is highly significant (P < 0.001). Note that these values include minutes of transition. This analysis also shows that the percent of time in which there are coincident associations among physiologic variables is less in the real than in the random control records (24.6% vs. 32.4% of time; P < 0.006).
Finally, we computed the average duration of indeterminate periods and of epochs of coincidence, transition and state for each fetus. The mean f S.E. of these averages was as follows: 11.7 i 0.1 min for indeterminate periods, 6.0 f 0.3 min for coincidence IFB, 14.8 f 0.2 min for coincidence 2FB, 3.6 f 0.3 min for transi- tions, 7.2 f 0.4 min for state IFB, and 20.1 & 1.6 min for state 2FB. Thus a representative state cycle consisting of one epoch each of states 1FB and 2FB and two epochs of transition has a duration of 34.5 min.
4. Discussion
In this study we determined that the fetal baboon has behavioral states which are based on the organized physiologic activities of the EEG, EOG, and ECG. We employed an approach that had many features in common with strategies used for the characterization of behavioral states in the human fetus and infant [14,15,21]. Our analysis recognized two states whose identification required the persistence over time (3 min or more) of specific patterns of activity of the three physiologic variables (EEG, EOG, heart period variability) as summarized in Table 1. In addition, to satis- fying the definition for state, transitions between these patterns had to occur in 7 min or less. With these criteria, we have demonstrated that states are present on average 40% of time at 0.8-0.9 of term gestation with a cycle duration of about 35 min.

172 P.G. Grieve et al. /Early Hum. Dev. 39 (1994) 159-175
Our approach to the quantification and evaluation of state organization is novel in several ways. First, conclusions with regard to the occurrence of state were validated statistically by comparing results of analyses of real data with those from random control data. Second, each minute of data was objectively categorized as belonging to an epoch of state, transition, coincidence, or indeterminate condition. Finally, rather than adopting the definition for maximum duration of state transi- tions used in human studies, we determined the appropriate criterion for the fetal baboon.
Control data, generated by random combination of the physiologic variables from the same fetuses, met our criteria for state less than 2% of the time. This percentage is one-twentieth of that found for the real data. In both the real and the random con- trol data there were periods during which the physiologic variables were discordant. These indeterminate periods, when no pattern among the variables was observed, were twice as frequent in the random controls as in the real data (66% vs. 34%, P < 0.001). These results indicate that behavioral states in the fetal baboon are much more likely to occur than would be expected by chance alone.
There were also periods of time when the physiologic variables were concordant although they did not meet the criteria for state. For example as shown in Fig. 4, panel B, the period of pattern 1FB which occurred at about 75 min is a period of coincidence because it is bounded by indeterminate periods and is not joined to epochs of pattern 2FB by transitions. Epochs designated as coincidence were present for a greater percentage of the time (32% vs. 25%, P < 0.006) in the random control data than in the real data. This lower incidence of epochs of coincidence is also con- sistent with the presence of a greater degree of organization in the real records than in the control data.
Our analyses demonstrated that in every record there were periods of state and transition, epochs of coincidence, and indeterminate periods. This differs con- siderably from results described for the human fetus. In human studies, the coex- istence in individual records of states and periods of coincidence is not found. Rather, before 36 weeks of gestation (0.9 of term), it is reported that associations among state-related variables are coincidental, while, after 36 weeks of gestation, these associations are described as behavioral states and periods of coincidence are not present [2-4,9,10,14-16,18,19,25,26]. A similar change in the temporal organi- zation of state variables has been reported in studies of the developing fetal lamb. In these studies, state organization emerged by about 120 days gestation or about 0.8 of term [24].
Differences in the pattern of state organization of the fetal baboon with those of the human and sheep fetus could simply reflect differences in brain development among species, but there may be other reasons. First, periods of state and coinci- dence may coexist in the records from the fetal baboon because the length of the records was relatively long (16 h). In human studies, records are typically no longer than 2 h in duration. If the incidence of state is infrequent, then in short duration records, epochs of state could be overlooked and the entire record would be con- sidered to contain only periods of coincidence. A second possible explanation for the occurrence of both state and coincidence in the records from the fetal baboon might

P.G. Grieve et al. /Early Hum. Dev. 39 (1994) 159-175 173
be that the study interval of 0.8-0.9 of term spans a period of development during which rapid changes in state organization are taking place. The reported dramatic shift in human state patterning at about 0.9 of term gestation is consistent with the notion that a very rapid developmental change can occur. For example, Pillai and James reported that the percentage of infants exhibiting sleep states increased rapid- ly from about 7% at 33 weeks gestation to over 80% at 35 weeks [ 181. Similarly, Szeto [24] found that no fetal lambs exhibited organized state behavior before 110 days while all lambs had highly organized states after 125 days. In our study of the fetal baboon, the incidence of state across records ranged from 20% to 68% of the time. This wide variation in incidence of state is consistent with the hypothesis that the data from the fetal baboon were recorded during a period of lability perhaps due to rapid developmental changes in state organization.
A third possible explanation for the differences in fetal state organization among species may be that in studies of the fetal baboon the duration of transitions was allowed to be as long as 7 min, whereas a 3-min maximum duration is routine in human studies. Perhaps if longer transitions were allowed in the human studies a mixture of coincidence and state might be found. Interestingly, when we applied the 3-min transition criterion to data from the fetal baboon, the coexistence of periods of state and coincidence was still found, although the incidence of state decreased from 40% to 20%.
While the choice of maximum transition duration is always somewhat arbitrary, we developed a systematic procedure for selecting the appropriate maximum dura- tion of transition for the fetal baboon. The incidence of state was computed for both the study data and for randomly generated control data as a function of the allowed maximum duration of transition. Control records were generated by random selec- tion of state variables from different fetuses and thus combination of these variables could form state only by chance. The optimal value for the maximum duration of transition was determined from the results of this analysis and is depicted graphically in Fig. 6. It is reasonable that the value for the maximum duration of transition should classify 95% of state as true state ensuring that the amount of state formed by chance occurrence would be less than 5%. This procedure resulted in the selection of a 7-min maximum duration criterion for transition in the fetal baboon.
These findings illustrate the fundamental importance of transitions in the char- acterization of the amount and degree of state organization in the baboon fetus. In- terestingly, studies of the human fetus have indicated that pathological conditions such as maternal diabetes, intrauterine growth retardation, and fetal alcohol expo- sure may alter the duration of transitions [20]. Hence, careful scrutiny of transitions may provide new insights into fetal well-being. Our findings also illustrate that at least two patterns of physiologic activity can be discriminated for the fetal baboon which conform to strict definitions of behavioral state. None the less, rigorous exam- ination of indeterminate periods using the methodologies developed in this study may yield new insights into the repertoire of other behavioral states exhibited by the fetal baboon.
The purpose of this study was to discover if the fetal baboon had organized behav- ioral states, and if so, to determine their statistical characteristics in healthy fetuses.

174 P.G. Grieve et al. /Early Hum. Dev. 39 (1994) 159-l 75
This normative data can be contrasted, in subsequent studies, with state behavior of fetal baboons with various induced morbidities (e.g. hypoxia). These studies of non-human primate state behavior are a step in the development of clinical tools to be used for the diagnosis of similar morbidities in the human fetus. Further, the al- teration of patterns in fetal baboon state organization caused by the interventions may contribute to the understanding of their effect on fetal well-being and CNS development.
Acknowledgments
This research was supported Grant HD-13063 from the National Institute of Child Health and Human Development and by Grant 5T32-MH18264 from the National Institute of Mental Health.
References
[I] Anders, T.F., Ende R. and Pat-melee, A.H. (1971): A Manual of Standardized Terminology, Techniques and Criteria for the Scoring of Sleep and Wakefulness in Newborn Infants. UCLA Brain Information Service/BRI Publication Office, Los Angeles.
(21 Arabin, B. and Riedewald, S. (1992): An attempt to quantify characteristics of behavioral states. Am. J. Perinatol., 9, 115-119.
[3] Arabin, B., Riedewald, S., Zacharias C., and Saling, E. (1988): Quantitative analysis of fetal behav- ioural patterns with real-time sonography and the actocardiograph. Gynecol. Obstet. Invest., 26, 21 I-218.
[4] Arduini, D., Rizzo, G., Carforio, L., Boccolini,M.R., Romanini, C., and Mancuso, S. (1989): Be- havioural state transitions in healthy and growth retarded fetuses. Early Hum. Dev., 19, 155-165.
(51 Carskadon, M.A. (1992): Sleep: a Complex Behavioral Adaptation. Grass Instrument Co. Bulletin No. X226J92, Quincy, MA, USA.
[6] Dalkey, N(1969): An experimental study of group opinion: the Delphi method. Futures, 408-426. (71 Daniel, S.S., James, L.S., MacCarter,G., Morishima, H.O., and Stark, RI. (1992): Long-term
acid-base measurement in the fetal and maternal baboon. Am. J. Obstet. Gynecol., 2, 707-712. [8] Dawes, G.S., Fox, H.E., Leduc, B.M., Liggins G.C., and Richards, R.T. (1972): Respiratory move-
ments and rapid eye movement sleep in the foetal lamb. J. Physiol. (London), 220, 119-143. 191 Groome, L.J., Singh, K.P., Burgard, S.L., Neely, C.L. and Bartolucci, A.A. (1992): The relation-
ship between heart rate and eye movement in the human fetus at 38-40 weeks of gestation. Early Hum. Dev., 30, 93-100.
[IO] Martin, C.B. Jr. (1981): Behavioral states in the human fetus. 3. Reprod. Med., 26, 425-432. [I I] Myers, M.M., Stark, R.I., Fifer, W.P., Grieve, P., Haiken, J., Leung, K. and Schulze, K.F. (1993):
A quantitative method for classification of EEG in the fetal baboon. Am. J. Physiol., 265, R706-R714.
(121 National Institutes of Health. (1985): Guide for the Care and Use of Laboratory Animals. DHEW publication no. 86-23, Office of Science and Health Reports, DRR/NIH, Bethesda, MD 20205.
[13] Nijhuis, J.G. and van de Pas, M. (1992): Behavioral states and their ontogeny: human studies. Sem. Perinatol., 16, 206-210.
(141 Nijhuis, J.G., Martin Jr., C.B. and Prechtl, H.F.R. (1984): Behavioral states of the human fetus. In: Continuity of Neural Functions from Prenatal to Postnatal Life, pp. 65-78. Editor: H.F.R. Prechtl. Spastics International Medical Publications, London.
[15] Nijhuis, J.G., Prechtl, H.F.R., Martin Jr., C.B. and Bots, R.S.G.M. (1982): Are there behavioural states in the human fetus? Early Hum. Dev., 6, 177-195.
[16] Okai, T., Kozuma, S., Shinozuka, N., Kuwabara, Y. and Mizuno, M. (1992): A study on the de- velopment of sleep-wakefulness cycle in the human fetus. Early Hum. Dev., 29, 391-396.
P.G. Grieve et al. /Early Hum. Dev. 39 (1994) 159-175 175
[17] Parkes, M.J. (1991): Sleep and wakefulness - do they occur in utero? In: The Fetal and Neonatal Brain Stem, pp 230-2.56. Editor: M.A. Hanson. Cambridge University Press, Cambridge.
[18] Pillai, M. and James, D. (1990): Development of human fetal behavior: a review. Fetal Diagn. Ther., 5, 15-32.
[19] Pillai, M. and James, D. (1990): Are the behavioural states of the newborn comparable to those of the fetus? Early Hum. Dev., 22, 39-49.
[20] Prechtl, H.F.R. (1992): The organization of behavioral states and their dysfunction. Sem. Perinatol., 16, 258-263.
[21] Prechtl, H.F.R. (1974): The behavioral states of the newborn infant (a review). Brain Res., 76, 185-212.
[22] Stark, RI., Haiken, J., Nordli, D. and Myers, M.M. (1991): Characterization of electroence- phalographic state in fetal baboons. Am. J. Physiol., 261, R496-RSOO.
[23] Stark, R.I., Daniel, S.S., James, L.S., MacCarter, G., Morishima, H.O., Niemann, W.H., Tropper, P.J. and Yeh, M-N. (1989): Chronic instrumentation and long term investigation in the fetal and maternal baboon: tether system, conditioning procedures and surgical techniques. Lab. Anim. Sci., 39, 25-32.
[24] Szeto, H.H. (1992): Behavioral states and their ontogeny: animal studies. Sem. Perinatol., 16, 21 I-216.
[25] van Vliet, M.A.T., Martin Jr., C.B., Nijhuis, J.G. and Prechtl, H.F.R. (1985): Behavioural states in the fetuses of nulliparous women. Early Hum. Dev., 12, 121-135.
[26] van Woerden, E.E., van Cieijn, H.P., Caron, F.J.M., Swartjes, J.M., Mantel R. and Arts, N.F.Th. (1989): Automated assignment of behavioural states in the human near term fetus. Early Hum. Dev., 19, 137-146.
(271 Wilkinson, L. (1988): SYSTAT: The System for Statistics, SYSTAT, Inc., Evanston, IL.
Related Documents