Behavior of high strength concrete columns under eccentric loads Hany A. Kottb, Nasser F. El-Shafey * , Akram A. Torkey Cairo University, Faculty of Engineering, Giza, Egypt Received 18 November 2013; revised 9 February 2014; accepted 10 February 2014 KEYWORDS High strength concrete HSC; Eccentric loads; Nonlinear finite element analysis; R.C. Column Abstract In recent decades, high strength concrete (HSC) has been widely accepted by designers and contractors to be used in concrete structures, especially in high compressive stress elements. The research aims to study the behavior of high strength concrete columns under eccentric compres- sion using experimental and analytical programs. The research is divided into two main parts; the first part is an experimental investigation for ten square columns tested at the Cairo University Concrete Research Laboratory. The main studied parameters were eccentricity of the applied load, column slenderness ratio; and ratios of longitudinal and transverse reinforcement. The second part is analytical analysis using nonlinear finite element program ANSYS11 on nineteen columns (ten tested square columns and nine rectangular section columns) to study the effect of the previous parameters on the column ultimate load, mid-height displacement, and column cracking patterns. The analyzed columns revealed a good agreement with the experimental results with an average dif- ference of 16% and 17% for column ultimate load and mid-height displacement respectively. Results showed an excellent agreement for cracking patterns. Predictions of columns capacities using the interaction diagrams based on ACI 318-08 stress block parameters indicated a safe design procedure of HSC columns under eccentric compression, with ACI 318-08 being more conservative for moderate reinforced HSC columns. ª 2014 Production and hosting by Elsevier B.V. on behalf of Housing and Building National Research Center. Introduction In recent years, high strength concrete columns have been widely used in many structures, especially, in high-rise build- ings. ACI Committee 363 [1] defined high strength concrete as a concrete strength of 41 MPa. More recently, compressive strengths approaching 138 MPa have been used in cast- in-place buildings. Concrete compressive strength higher than 65 MPa is referred to as high-strength concrete in this study. Experimental and analytical studies have been carried out to study the effect of some parameters on the behavior of HSC columns. Results obtained from previous researches on * Corresponding author. Tel.: +20 201005006391; fax: +20 20235732655. E-mail addresses: [email protected] (N.F. El-Shafey), [email protected] (A.A. Torkey). Peer review under responsibility of Housing and Building National Research Center. Production and hosting by Elsevier HBRC Journal (2014) xxx, xxx–xxx Housing and Building National Research Center HBRC Journal http://ees.elsevier.com/hbrcj 1687-4048 ª 2014 Production and hosting by Elsevier B.V. on behalf of Housing and Building National Research Center. http://dx.doi.org/10.1016/j.hbrcj.2014.02.006 Please cite this article in press as: H.A. Kottb et al., Behavior of high strength concrete columns under eccentric loads, HBRC Journal (2014), http://dx.doi.org/10.1016/j.hbrcj.2014.02.006

Welcome message from author
This document is posted to help you gain knowledge. Please leave a comment to let me know what you think about it! Share it to your friends and learn new things together.
Transcript
HBRC Journal (2014) xxx, xxx–xxx
Housing and Building National Research Center
HBRC Journal
http://ees.elsevier.com/hbrcj
Behavior of high strength concrete columns under
eccentric loads
Hany A. Kottb, Nasser F. El-Shafey *, Akram A. Torkey
Cairo University, Faculty of Engineering, Giza, Egypt
Received 18 November 2013; revised 9 February 2014; accepted 10 February 2014
*
20
E-
ak
Pe
R
16
ht
Ph
KEYWORDS
High strength concrete HSC;
Eccentric loads;
Nonlinear finite element
analysis;
R.C. Column
Corresponding author. Te
235732655.
mail addresses: Nasser.els
[email protected] (A.A. T
er review under responsibili
esearch Center.
Production an
87-4048 ª 2014 Production
tp://dx.doi.org/10.1016/j.hbrc
lease cite this article in pressttp://dx.doi.org/10.1016/j.hbr
l.: +20
hafey@ya
orkey).
ty of Ho
d hostin
and hosti
j.2014.02
as: H.A.cj.2014.0
Abstract In recent decades, high strength concrete (HSC) has been widely accepted by designers
and contractors to be used in concrete structures, especially in high compressive stress elements.
The research aims to study the behavior of high strength concrete columns under eccentric compres-
sion using experimental and analytical programs. The research is divided into two main parts; the
first part is an experimental investigation for ten square columns tested at the Cairo University
Concrete Research Laboratory. The main studied parameters were eccentricity of the applied load,
column slenderness ratio; and ratios of longitudinal and transverse reinforcement. The second part
is analytical analysis using nonlinear finite element program ANSYS11 on nineteen columns (ten
tested square columns and nine rectangular section columns) to study the effect of the previous
parameters on the column ultimate load, mid-height displacement, and column cracking patterns.
The analyzed columns revealed a good agreement with the experimental results with an average dif-
ference of 16% and 17% for column ultimate load and mid-height displacement respectively.
Results showed an excellent agreement for cracking patterns. Predictions of columns capacities
using the interaction diagrams based on ACI 318-08 stress block parameters indicated a safe design
procedure of HSC columns under eccentric compression, with ACI 318-08 being more conservative
for moderate reinforced HSC columns.ª 2014 Production and hosting by Elsevier B.V. on behalf of Housing and Building National Research
Center.
201005006391; fax: +20
hoo.com (N.F. El-Shafey),
using and Building National
g by Elsevier
ng by Elsevier B.V. on behalf of H
.006
Kottb et al., Behavior of high stre2.006
Introduction
In recent years, high strength concrete columns have beenwidely used in many structures, especially, in high-rise build-
ings. ACI Committee 363 [1] defined high strength concreteas a concrete strength of 41 MPa. More recently, compressivestrengths approaching 138 MPa have been used in cast-in-place buildings. Concrete compressive strength higher than
65 MPa is referred to as high-strength concrete in this study.Experimental and analytical studies have been carried out
to study the effect of some parameters on the behavior of
HSC columns. Results obtained from previous researches on
ousing and Building National Research Center.
ngth concrete columns under eccentric loads, HBRC Journal (2014),
2 H.A. Kottb et al.
HSC column due to centric and eccentric loads [2–10] indi-cated the following behaviors.
a. Rectangular columns with tie spacing equal to lateraldimension of columns showed no confinement effect.
b. Spalling of concrete cover tends to occur at strength
below 85% of the unconfined concrete strength in col-umns with higher concrete strength and closely spacedtransverse reinforcement. Columns behavior with clo-
sely spaced transverse reinforcement improves signifi-cantly with the use of high-strength confinement steel.
c. The use of larger bar diameters for longitudinal rein-forcement produces little beneficial effect on the ductility
of column.d. Increasing ratio of longitudinal reinforcement in high-
strength concrete columns leads to an increase in column
capacity but decreases its ductility.e. Tie configuration is very effective in strength and ductil-
ity of HSC columns.
f. In general, when axial load increases, the flexural ductil-ity of the column decreases.
g. As eccentricity increases, columns give more ductile
behavior in under and post-peak stage.
Objectives
The main objective of this study is to investigate the behaviorof column members with high-strength concrete throughexperimental and analytical research. The study included test-
ing of ten square columns subjected to eccentric axial compres-sion. The aim of experimental program is to evaluate the effectof some testing parameters on the strength of HSC columns. In
addition, the test results will be used to develop a recom-mended design approach using nonlinear finite element analy-sis to simulate columns leading to a better understanding of its
behavior. This approach depends on the interaction betweenaxial load and corresponding moments based on ACI 318-08[11] stress block parameters.
Moreover, it is aimed to use the conclusion of this researchto extend the current ECP 203-07 [12] design code provisionsfor HSC columns.
Experimental program
An experimental program was carried out by Hani. A. Kottb[13] which consisted of ten square columns tested under eccen-
tric loads by AMSELLER compression machine with 5000KN capacity at the Cairo University Concrete Research Lab-oratory. A trial concrete mix design was made to get the target
cubic compressive strength in range of 75 MPa, High-grade
Table 1 Mechanical properties of steel bars.
Steel diameter (mm) Steel grade Actual area (mm2) Y
U6 Mid steel 28.4 34
U8 51.13 29
U10 High grade steel 77.31 65
U12 108.27 58
U16 200.0 54
Please cite this article in press as: H.A. Kottb et al., Behavior of high strehttp://dx.doi.org/10.1016/j.hbrcj.2014.02.006
steel bars 10, 12, and 16 mm diameter were used for longitudi-nal reinforcement and mild steel bars 6 and 8 mm diameterwere used for stirrups. The mechanical properties of the chosen
steel bars obtained from tensile test of three samples, randomlyselected from each batch, are shown in Table 1. Test programwas divided into reference column and four groups represent-
ing the different studied parameters. These parameters are asfollows:
a. Eccentricity of applied load (e)b. Column slenderness ratio (H/t)c. Longitudinal steel reinforcement ratio (l)d. Diameter of stirrups–transverse steel ratio (St)
Description of column groups is classified as follows:Group A, studies the effect of load eccentricity, Group B,
studies the effect of slenderness ratio (H/t), Group C, studiesthe effect of longitudinal reinforcement ratios (l), while.Group D, studies the effect of different diameters of ties (St),
Table 2 lists the details of these different groups.
Test specimens and test set up
All columns have cross sectional dimensions of 150 · 150 mm,but height varied from 1500 to 2250 mm. Longitudinal steelreinforcements were 4U12, 8U10, 6U12, and 4U16 mm toachieve steel percentage 2%, 2.7%, 3%, and 3.5%. Ties were
U6 or U8 or U10 mm with constant spacing of 60 mm. Con-crete external cover was 15 mm. All tested columns wereloaded as pinned-end columns with eccentric load. Steel plate
250 · 250 · 20 mm was placed between machine head and col-umn end to reduce the effect of load concentration.
The concrete strains in both compression and tension sides
were measured by 200 mm demec gauges, the demec gaugeswere placed at column mid-height, lower, and upper quartersof column height in both tension and compression sides. Prior
to casting of columns, two electrical strain gauges having10 mm length were attached to longitudinal and transversesteel at mid height and were connected to data logger indicatorto observe strains of steel directly. Lateral deformations of col-
umns due to applied load were measured using three LVDT, of0.001 mm accuracy, placed at column mid-height and both ofcolumn quarters in tension side.
In order to avoid premature failure, column ends were con-fined internally by reducing spacing of ties from 60 to 30 mm,and externally by adding external steel end caps to a depth of
100 mm. Those caps were constructed using steel plates of10 mm thickness. Steel cylinders were used to give target eccen-tricity in both upper and lower ends of tested columns.
All specimens were tested and loaded until failure. The load
was applied gradually with initial increment of 40 KN untilcracking load; hence, increment was reduced to 20 KN up to
ield strength (MPa) Ultimate strength (MPa) Elongation%
0 489.4 20
0 453.8 18.8
0 728.3 6.0
0 726.9 16.7
0 728 18.75
ngth concrete columns under eccentric loads, HBRC Journal (2014),
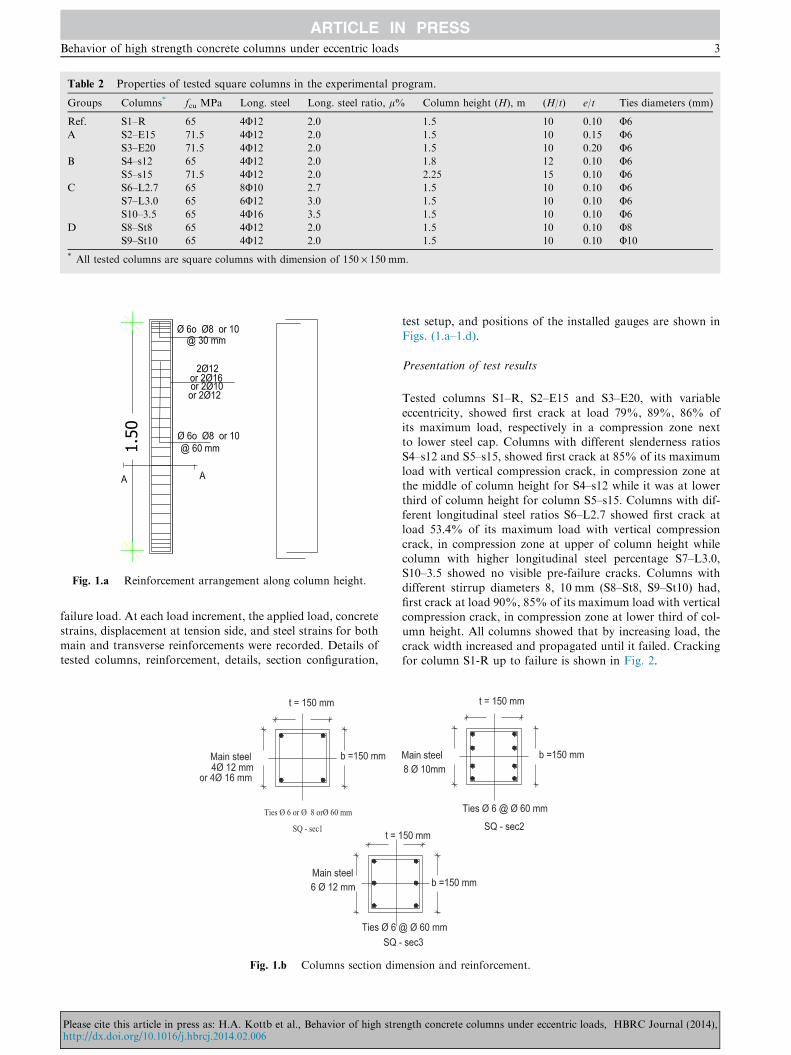
Table 2 Properties of tested square columns in the experimental program.
Groups Columns* fcu MPa Long. steel Long. steel ratio, l% Column height (H), m (H/t) e/t Ties diameters (mm)
Ref. S1–R 65 4U12 2.0 1.5 10 0.10 U6
A S2–E15 71.5 4U12 2.0 1.5 10 0.15 U6
S3–E20 71.5 4U12 2.0 1.5 10 0.20 U6
B S4–s12 65 4U12 2.0 1.8 12 0.10 U6
S5–s15 71.5 4U12 2.0 2.25 15 0.10 U6
C S6–L2.7 65 8U10 2.7 1.5 10 0.10 U6
S7–L3.0 65 6U12 3.0 1.5 10 0.10 U6
S10–3.5 65 4U16 3.5 1.5 10 0.10 U6
D S8–St8 65 4U12 2.0 1.5 10 0.10 U8
S9–St10 65 4U12 2.0 1.5 10 0.10 U10
* All tested columns are square columns with dimension of 150 · 150 mm.
1.50
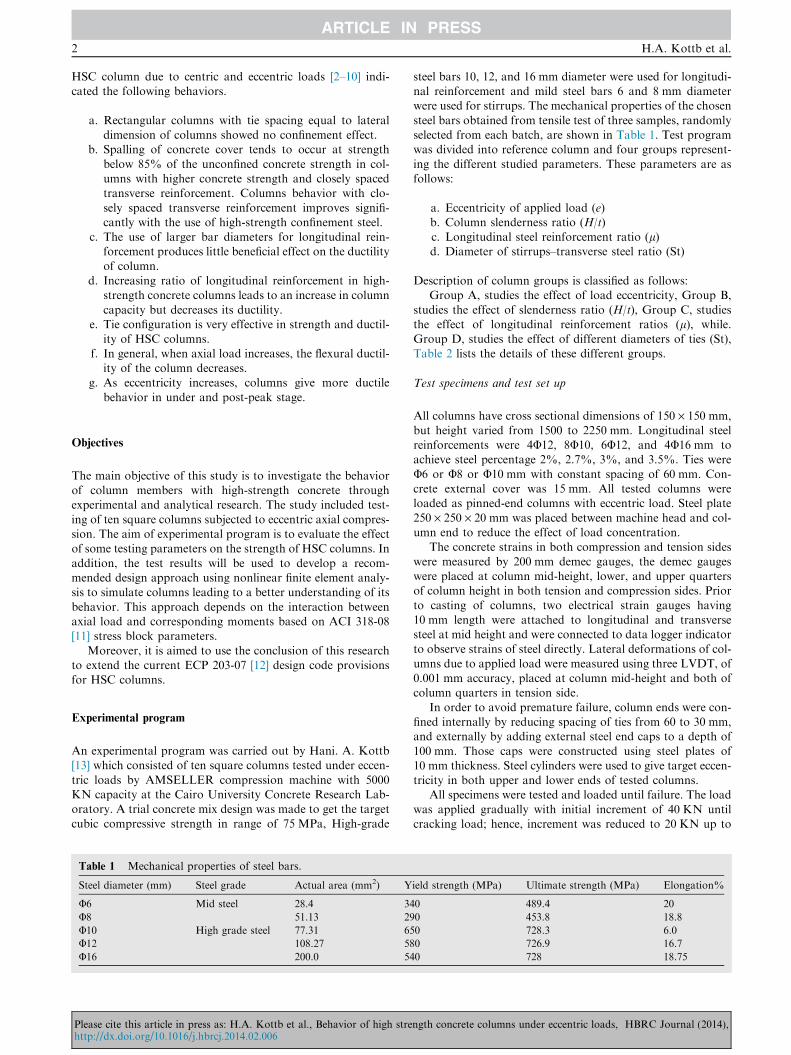
Fig. 1.a Reinforcement arrangement along column height.
Behavior of high strength concrete columns under eccentric loads 3
failure load. At each load increment, the applied load, concrete
strains, displacement at tension side, and steel strains for bothmain and transverse reinforcements were recorded. Details oftested columns, reinforcement, details, section configuration,
Fig. 1.b Columns section dim
Please cite this article in press as: H.A. Kottb et al., Behavior of high strehttp://dx.doi.org/10.1016/j.hbrcj.2014.02.006
test setup, and positions of the installed gauges are shown in
Figs. (1.a–1.d).
Presentation of test results
Tested columns S1–R, S2–E15 and S3–E20, with variable
eccentricity, showed first crack at load 79%, 89%, 86% ofits maximum load, respectively in a compression zone nextto lower steel cap. Columns with different slenderness ratios
S4–s12 and S5–s15, showed first crack at 85% of its maximumload with vertical compression crack, in compression zone atthe middle of column height for S4–s12 while it was at lower
third of column height for column S5–s15. Columns with dif-ferent longitudinal steel ratios S6–L2.7 showed first crack atload 53.4% of its maximum load with vertical compression
crack, in compression zone at upper of column height whilecolumn with higher longitudinal steel percentage S7–L3.0,S10–3.5 showed no visible pre-failure cracks. Columns withdifferent stirrup diameters 8, 10 mm (S8–St8, S9–St10) had,
first crack at load 90%, 85% of its maximum load with verticalcompression crack, in compression zone at lower third of col-umn height. All columns showed that by increasing load, the
crack width increased and propagated until it failed. Crackingfor column S1-R up to failure is shown in Fig. 2.
ension and reinforcement.
ngth concrete columns under eccentric loads, HBRC Journal (2014),

Fig. 1.c Columns setup and details.
4 H.A. Kottb et al.
For all tested columns, the maximum column displacementoccurred at column mid height and with a limited displacementup to cracking loads. The maximum longitudinal concrete
compressive strain corresponding to failure load occurred atmid height of column. Variations of load eccentricity on longi-tudinal steel strain are insignificant. Longitudinal steel strainsin all columns were in compression and did not reach yield lim-
it. Stirrups in all columns at mid height were subjected to ten-sile strain, but none of them reached their yield limit.
Columns with different slenderness ratios S4–s12 and S5–
s15 showed maximum longitudinal concrete compressive strainat mid height of column respectively. Tension steel and stirrup
Fig. 1.d Columns setup d
Please cite this article in press as: H.A. Kottb et al., Behavior of high strehttp://dx.doi.org/10.1016/j.hbrcj.2014.02.006
strain reached its yield strain after failure load due to excessivedeformation. Column has different longitudinal steel ratiosS6–L2.7, S7–L3.0, S10–3.5, the tension steel did not reach its
yield strain at failure load, but compression steel buckled. Stir-rup strain did not reach its yield strain at failure load. Columnswith different stirrup diameters U8, U10 mm (S8–St8, S9–St10)
showed maximum longitudinal concrete compressive strain atcolumn mid height. Tension steel did not reach its yield strainat failure load, while compression steel buckled under excessive
compression.For reference column, S1–R failure occurred suddenly at
upper third of column in compression side associated withspread in crushing of concrete and buckling of main bars in
compression zone simultaneously in explosive brittle manner.For columns S2–E15, S3–E20 failure occurred gradually atlower third of column height in compression associated with
spread in crushing of concrete, buckling of main bars in com-pression zone and tensile cracks simultaneously in a relativelyductile manner. For columns S4–s12, S5–s15 failure occurred
gradually at middle of column height in compression associ-ated with spread in crushing of concrete, buckling of main barsin compression zone and obvious tensile cracks simultaneously
in a ductile manner. Columns with different longitudinal steelratios S6–L2.7 showed that gradual failure occurred at upperthird of column height in compression associated with spreadin crushing of concrete, buckling of main bars in compression
zone simultaneously in a brittle manner. S7–L3.0, S10–3.5showed a catastrophic failure at upper third of column heightin compression side. After ultimate load, failure was associated
with spread in crushing of concrete, buckling of main bars incompression zone, and tensile cracks simultaneously in a rela-tively ductile manner. Columns S8–St8, S9–St10 with different
stirrup diameters U8, U10 mm failed suddenly at upper third ofcolumn height in compression side. After ultimate load, failurewas associated with spread in crushing of concrete, buckling of
main bars in compression zone, and tensile cracks simulta-neously in a relatively ductile manner.
emec points and details.
ngth concrete columns under eccentric loads, HBRC Journal (2014),

Tension side at first crack
Tension side after failure
Compression side at first crack
Compression side after failure
Fig. 2 Column S1–R, reference column at first crack and after failure.
Behavior of high strength concrete columns under eccentric loads 5
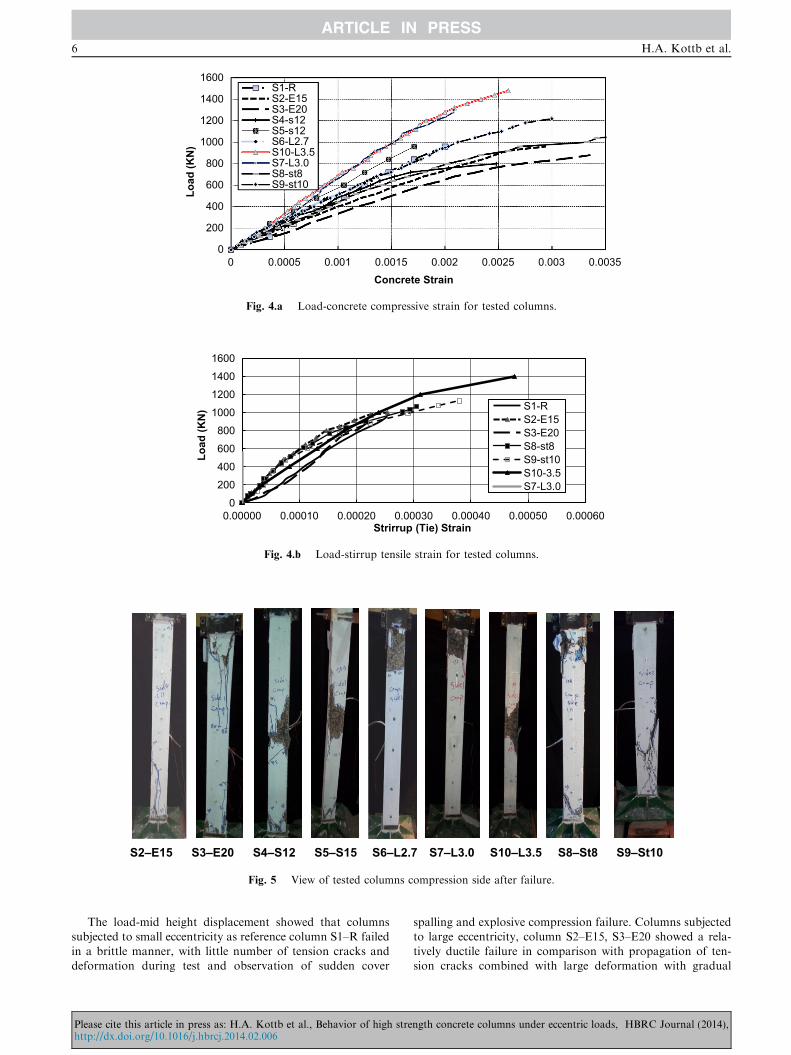
The load-mid height displacement for all of the tested col-umns is shown in Fig. 3. The load-concrete compressive strainsand stirrup strains for all tested columns are shown inFigs. 4.a, 4.b. Column crack patterns for the tested column
after failure at compression side are shown in Fig. 5.
Analysis of test results
Effect of load eccentricity
Group A, is designed to study the effect of load eccentricity. Itcontains control columns S1–R, S2–E15, and S3–E20, witheccentricities of 0.1, 0.15, and 0.2 of column thickness, respec-
tively. As eccentricity of the applied loads increased, depth ofcompressed zone at mid height decreased. In column S1–R, theentire section was under compression; but in columns S2–E15
and S3–E20 the ratios of compressed zone to column depthwere 83% and 73%, respectively.
0
200
400
600
800
1000
1200
1400
1600
0 10 20
Load
(KN
)
Mid-height Displ
Fig. 3 Load-mid height displa
Please cite this article in press as: H.A. Kottb et al., Behavior of high strehttp://dx.doi.org/10.1016/j.hbrcj.2014.02.006
Columns S2–E15 and S3–E20 had maximum concrete com-pressive strains of, 2900 and 3360 micron, respectively greaterthan maximum concrete compressive strain for reference col-umn S1–R.
Specimens subjected to large load eccentricity S2–E15, S3–E20 showed greater mid height deflection at ultimate load of63%, 89% respectively than column subjected to small load
eccentricity S1–R. This amount of increase can be attributedto the increase of both eccentricity ratio as well as concretestrength in this group. Comparing displacement of S2–E15,
S3–E20 specimens (having the same concrete strength) showedan increase of about 15% due to the increase of load eccentric-ity from 0.15 to 0.2. This assured the previous conclusions
mentioned by many researches earlier, as load eccentricity in-creases, column undergoes greater mid height displacement.
Column S1–R failed at load 9.5% greater than columnS3–E20 but 1.5% less than column S2–E15 due to greater con-
crete compressive strength of this column.
30 40 50acement (mm)
S1-RS2-E15S3-E20S4-S12S5-S15S6-L2.7S7-L3S8-st8S9-st10S10-L3.5
cement for tested columns.
ngth concrete columns under eccentric loads, HBRC Journal (2014),
0
200
400
600
800
1000
1200
1400
1600
0 0.0005 0.001 0.0015 0.002 0.0025 0.003 0.0035
Load
(KN
)
Concrete Strain
S1-RS2-E15S3-E20S4-s12S5-s12S6-L2.7S10-L3.5S7-L3.0S8-st8S9-st10
Fig. 4.a Load-concrete compressive strain for tested columns.
0200400600800
1000120014001600
0.00000 0.00010 0.00020 0.00030 0.00040 0.00050 0.00060
Load
(KN
)
Strirrup (Tie) Strain
S1-RS2-E15S3-E20S8-st8S9-st10S10-3.5S7-L3.0
Fig. 4.b Load-stirrup tensile strain for tested columns.
S2—E15 S3—E20 S4—S12 S5—S15 S6—L2.7 S7—L3.0 S10—L3.5 S8—St8 S9—St10
Fig. 5 View of tested columns compression side after failure.
6 H.A. Kottb et al.
The load-mid height displacement showed that columnssubjected to small eccentricity as reference column S1–R failedin a brittle manner, with little number of tension cracks anddeformation during test and observation of sudden cover
Please cite this article in press as: H.A. Kottb et al., Behavior of high strehttp://dx.doi.org/10.1016/j.hbrcj.2014.02.006
spalling and explosive compression failure. Columns subjectedto large eccentricity, column S2–E15, S3–E20 showed a rela-tively ductile failure in comparison with propagation of ten-sion cracks combined with large deformation with gradual
ngth concrete columns under eccentric loads, HBRC Journal (2014),
Behavior of high strength concrete columns under eccentric loads 7
cover spalling and tendency to buckle after peak load isreached. The degradation of loads also was less steeper thanreference specimen S1–R which explains extension of post-
peak stage longer than reference column.
Effect of column slenderness ratio
Group B, is designed to study the effect of column slendernessratio and it consists of columns S1–R as a control column,S4–S12, and S5–S15 with slenderness ratios of 10, 12, 15,
respectively. As slenderness ratio increased, depth of com-pressed zone at mid height decreased. In column S1–R, the en-tire section is under compression; but in columns S4–S12 and
S5–S15 the ratios of compressed zone to depth of column are89% and 94%, respectively.
Columns with greater slenderness ratio as in columnsS4–S12 and S5–S15 had maximum concrete compressive
strains of 2300 and 2100 micron, respectively greater thanthe maximum concrete compressive strain of 2000 micron forcolumn S1–R.
Longitudinal steel strains in columns S4–S12 and S5–S15turned from compression stage to tension stage and passedyield limit, while for column S1–R longitudinal steel strain
was in compression stage and did not reach yield limit. Stirrupsin all columns at mid height were subjected to tensile strain,but only columns S4–S12 and S5–S15 reached yield limit.
Specimens having greater slenderness ratios as specimens
S4–S12, S5–S15 showed 200%, 345% greater mid heightdeflection at ultimate load than reference column S1–R withsmall slenderness ratio.
Column S1–R has slenderness ratio of 10, failed in a brittleway and greater load than columns S4–S12, S5–S15 whichhave greater slenderness ratio. They failed at lower load in
ductile behavior with gradual cover spalling more tensilecracks, and large mid height displacement than reference col-umn. The load mid height displacement for this group is
shown in Fig. 5.
Effect of longitudinal steel ratio
Group C, studies the effect of longitudinal steel ratio. It con-
sists of columns S1–R as a control column, S6–L2.7, S7–L3.0, and S10–L3.5 with longitudinal steel ratios of 2.0%,2.7%, 3.0%, and 3.5%. In column S1–R, the entire section
was under compression; but in columns S6–L2.7, S7–L3.0,and S10–L3.5 the ratios of compressed zone were 94%,
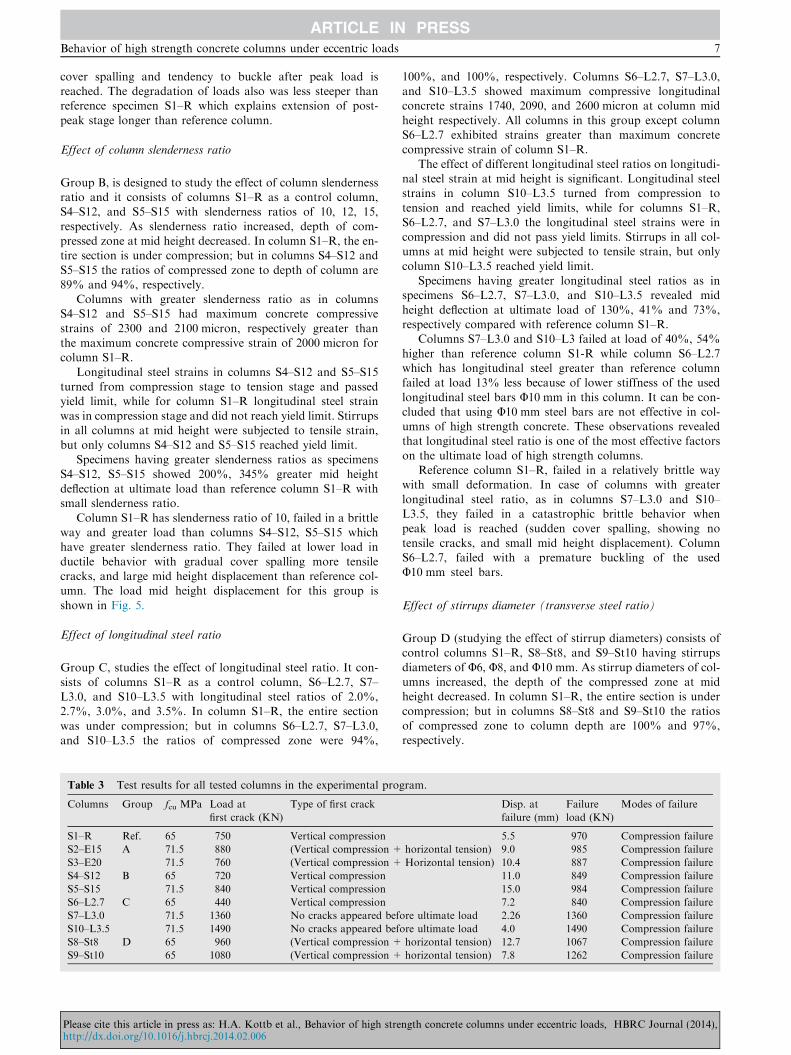
Table 3 Test results for all tested columns in the experimental pro
Columns Group fcu MPa Load at
first crack (KN)
Type of first crack
S1–R Ref. 65 750 Vertical compression
S2–E15 A 71.5 880 (Vertical compression +
S3–E20 71.5 760 (Vertical compression +
S4–S12 B 65 720 Vertical compression
S5–S15 71.5 840 Vertical compression
S6–L2.7 C 65 440 Vertical compression
S7–L3.0 71.5 1360 No cracks appeared bef
S10–L3.5 71.5 1490 No cracks appeared bef
S8–St8 D 65 960 (Vertical compression +
S9–St10 65 1080 (Vertical compression +
Please cite this article in press as: H.A. Kottb et al., Behavior of high strehttp://dx.doi.org/10.1016/j.hbrcj.2014.02.006
100%, and 100%, respectively. Columns S6–L2.7, S7–L3.0,and S10–L3.5 showed maximum compressive longitudinalconcrete strains 1740, 2090, and 2600 micron at column mid
height respectively. All columns in this group except columnS6–L2.7 exhibited strains greater than maximum concretecompressive strain of column S1–R.
The effect of different longitudinal steel ratios on longitudi-nal steel strain at mid height is significant. Longitudinal steelstrains in column S10–L3.5 turned from compression to
tension and reached yield limits, while for columns S1–R,S6–L2.7, and S7–L3.0 the longitudinal steel strains were incompression and did not pass yield limits. Stirrups in all col-umns at mid height were subjected to tensile strain, but only
column S10–L3.5 reached yield limit.Specimens having greater longitudinal steel ratios as in
specimens S6–L2.7, S7–L3.0, and S10–L3.5 revealed mid
height deflection at ultimate load of 130%, 41% and 73%,respectively compared with reference column S1–R.
Columns S7–L3.0 and S10–L3 failed at load of 40%, 54%
higher than reference column S1-R while column S6–L2.7which has longitudinal steel greater than reference columnfailed at load 13% less because of lower stiffness of the used
longitudinal steel bars U10 mm in this column. It can be con-cluded that using U10 mm steel bars are not effective in col-umns of high strength concrete. These observations revealedthat longitudinal steel ratio is one of the most effective factors
on the ultimate load of high strength columns.Reference column S1–R, failed in a relatively brittle way
with small deformation. In case of columns with greater
longitudinal steel ratio, as in columns S7–L3.0 and S10–L3.5, they failed in a catastrophic brittle behavior whenpeak load is reached (sudden cover spalling, showing no
tensile cracks, and small mid height displacement). ColumnS6–L2.7, failed with a premature buckling of the usedU10 mm steel bars.
Effect of stirrups diameter (transverse steel ratio)
Group D (studying the effect of stirrup diameters) consists ofcontrol columns S1–R, S8–St8, and S9–St10 having stirrups
diameters of U6, U8, and U10 mm. As stirrup diameters of col-umns increased, the depth of the compressed zone at midheight decreased. In column S1–R, the entire section is under
compression; but in columns S8–St8 and S9–St10 the ratiosof compressed zone to column depth are 100% and 97%,respectively.
gram.
Disp. at
failure (mm)
Failure
load (KN)
Modes of failure
5.5 970 Compression failure
horizontal tension) 9.0 985 Compression failure
Horizontal tension) 10.4 887 Compression failure
11.0 849 Compression failure
15.0 984 Compression failure
7.2 840 Compression failure
ore ultimate load 2.26 1360 Compression failure
ore ultimate load 4.0 1490 Compression failure
horizontal tension) 12.7 1067 Compression failure
horizontal tension) 7.8 1262 Compression failure
ngth concrete columns under eccentric loads, HBRC Journal (2014),
8 H.A. Kottb et al.
Columns S8–St8 and S9–St10 had maximum concrete com-pressive strains of 3800, and 4000 micron greater than maxi-mum concrete compressive strain for column S1–R.
Longitudinal steel strains in all columns were in compressionand did not reach yield limit. Stirrups in all columns at midheight were subjected to tensile strain, but none of them
reached yield limit.Specimens having greater stirrups diameter U8, and
U10 mm as in specimens S8–St8 and S9–St10 showed mid
height deflection at ultimate load of 230% and 142% respec-tively greater than column with small stirrup diameters U6 asin reference column S1–R.
Columns S8–St8 and S9–St10 failed at load greater than
column S1–R with ratios of 12% and 33%. It can be con-cluded that increasing stirrup diameter is effective in enhancingHSC column capacity - this conclusion was stated by Erdem
Canbay [9] and others.It was observed that column with small tie diameter, as
reference column S1–R, failed at lower load in a brittle
way with small deformation. In case of columns with greatertie diameter, as specimens S8–St8, S9–St10, they failed athigher load than reference column in a ductile manner with
more tensile cracks and deformation when peak load isreached.
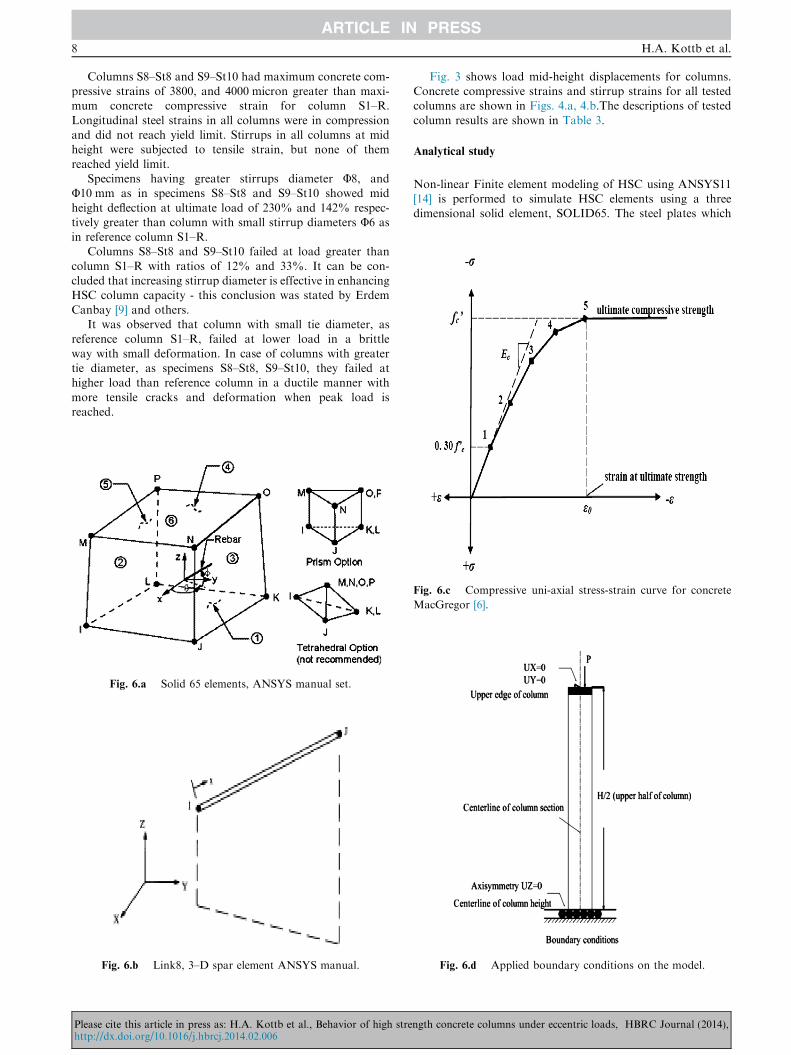
Fig. 6.a Solid 65 elements, ANSYS manual set.
Fig. 6.b Link8, 3–D spar element ANSYS manual.
Please cite this article in press as: H.A. Kottb et al., Behavior of high strehttp://dx.doi.org/10.1016/j.hbrcj.2014.02.006
Fig. 3 shows load mid-height displacements for columns.Concrete compressive strains and stirrup strains for all testedcolumns are shown in Figs. 4.a, 4.b.The descriptions of tested
column results are shown in Table 3.
Analytical study
Non-linear Finite element modeling of HSC using ANSYS11[14] is performed to simulate HSC elements using a threedimensional solid element, SOLID65. The steel plates which
Fig. 6.c Compressive uni-axial stress-strain curve for concrete
MacGregor [6].
Fig. 6.d Applied boundary conditions on the model.
ngth concrete columns under eccentric loads, HBRC Journal (2014),

Behavior of high strength concrete columns under eccentric loads 9
are placed between column and applied loads to avoid stressconcentration are, modeled using SOLID45 element. The dis-crete model was used to represent steel bars by using 3D spar
link8 element. Bond between concrete and steel is assessed bythe number of shared nodes between steel bar elements(LINK8) and concrete elements (SOLID65). All columns are
modeled considering the advantage of symmetry (only one-halfof columns) across their entire length to reduce computationaltime with the applied boundary conditions. Failure load is de-
fined as that load when solution criterion for any of force ordisplacement is not convergent. Figs. 6.a–6.d shows the usedelements and the stress–strain curve for concrete.
Studied cases
Finite element analysis for nineteen HSC columns (ten testedsquare columns and nine rectangular columns with aspect ratio
2 is carried out by ANSYS11. The properties of the analyzedcolumns are shown in Table 4. Results are presented and acomparison between the square column results and the corre-
sponding actual test results is conducted. Results of rectangu-lar columns were used as an indication to check the effect ofthe studied parameters on HSC rectangular columns, then a
proposed interaction diagram based on ACI 318-08 [11] spec-ifications was presented. The applicability of the interaction
0
200
400
600
800
1000
1200
1400
1600
S1-R
S2-
E15
S3-
E20
S4-
S12
S5-
Ulti
mat
e lo
ad (K
N)
Pexp. (KN) Panal. (KN
Fig. 7.a Comparisons between columns load capacit
0
2
4
6
8
10
12
14
16
S1-R S2
-E1
5
S3-
E20
S4-
S12
S5-
Mid
-hei
ght D
ispl
acem
ent (
mm
)
Fig. 7.b Comparisons between columns maximum mid-height d
Please cite this article in press as: H.A. Kottb et al., Behavior of high strehttp://dx.doi.org/10.1016/j.hbrcj.2014.02.006
diagram is verified by comparing results with experimental re-sults of the square columns.
Results of the analyzed columns
Results of tested square columns
All columns showed analytically load capacities less thanexperimental ones, except column S6–L2.7, as analytical load
capacity increased by 8% than the experimental result asshown in Fig. 7.a. This is due to the premature buckling of arelatively small longitudinal steel diameter U10 mm used in
the compression side. As longitudinal steel ratio in the columnincreased, the difference between analytical and experimentalresults increased, this is revealed obviously in case of columns
S7–L3.0 and S10–L3.5 which gave the lowest analytical estima-tion (74% and 68% of experimental load capacity), this refersto a greater stiffness provided from higher bar diameter.
Analytical results for mid height displacements at ultimate
loads for all columns showed lower values than experimentalones, by 13–22% except for columns with higher longitudinalsteel ratios S7–L3.0 and S10–L3.5. These two columns gave
greater values of analytical mid height displacement thanexperimental ones, which can be explained, with the brittlebehavior of these two columns as shown in Fig. 7.b. A
S15
S6-
L2.7
S7-
L3.0
S10-
L3.5
S8-
St8
S9-
St10
)
y from both experimental and analytical analyses.
S15
S6-
L2.7
S7-
L3.0
S10 -
L3.5
S8-
St8
S9-
St10
∆exp. (mm) ∆anal. (mm)
isplacement from both experimental and analytical analyses.
ngth concrete columns under eccentric loads, HBRC Journal (2014),
0100200300400500600700800900
10001100
0 3 5 8 10 13 15 18 20
Load
(KN
)
Mid-height Displacement (mm)
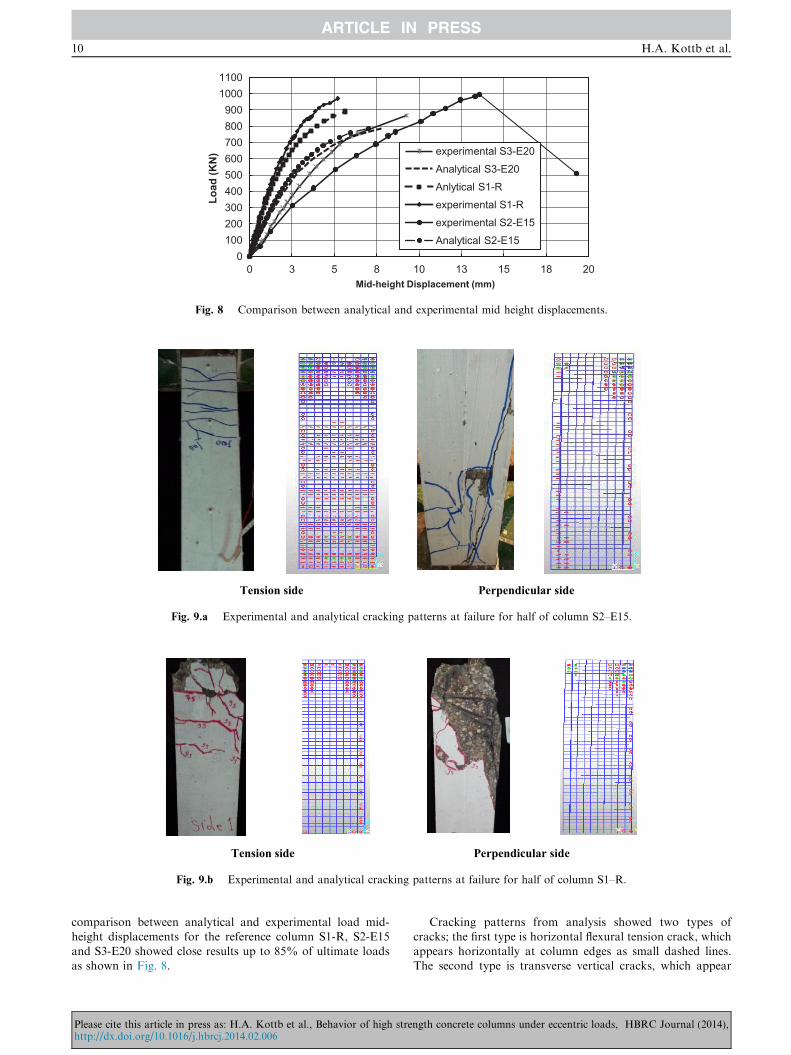
experimental S3-E20Analytical S3-E20Anlytical S1-Rexperimental S1-Rexperimental S2-E15Analytical S2-E15
Fig. 8 Comparison between analytical and experimental mid height displacements.
Tension side Perpendicular side
Fig. 9.a Experimental and analytical cracking patterns at failure for half of column S2–E15.
Tension side Perpendicular side
Fig. 9.b Experimental and analytical cracking patterns at failure for half of column S1–R.
10 H.A. Kottb et al.
comparison between analytical and experimental load mid-height displacements for the reference column S1-R, S2-E15and S3-E20 showed close results up to 85% of ultimate loadsas shown in Fig. 8.
Please cite this article in press as: H.A. Kottb et al., Behavior of high strehttp://dx.doi.org/10.1016/j.hbrcj.2014.02.006
Cracking patterns from analysis showed two types ofcracks; the first type is horizontal flexural tension crack, whichappears horizontally at column edges as small dashed lines.The second type is transverse vertical cracks, which appear
ngth concrete columns under eccentric loads, HBRC Journal (2014),
Behavior of high strength concrete columns under eccentric loads 11
as small circles represent transverse vertical tension cracks thatresulted in crushing of concrete. The analytical simulation ofcrack propagation is in good agreement with experimental
one as shown in Figs. 9.a, 9.b. Analytical results of all testedsquare columns are listed in Table 5.
Results of rectangular columns
Analytical results for all rectangular columns are shown in Ta-ble 6, indicating the following;
As load eccentricity (in longer dimension) increased, col-umns load capacity decreased by 25%. The same effect isshown in case of increasing slenderness ratio, which resulted
in decrease in columns load capacity, by 13%, while in casefor changing both longitudinal steel ratio or stirrups diametera trivial increase in columns ultimate loads by 1.2% is observed.
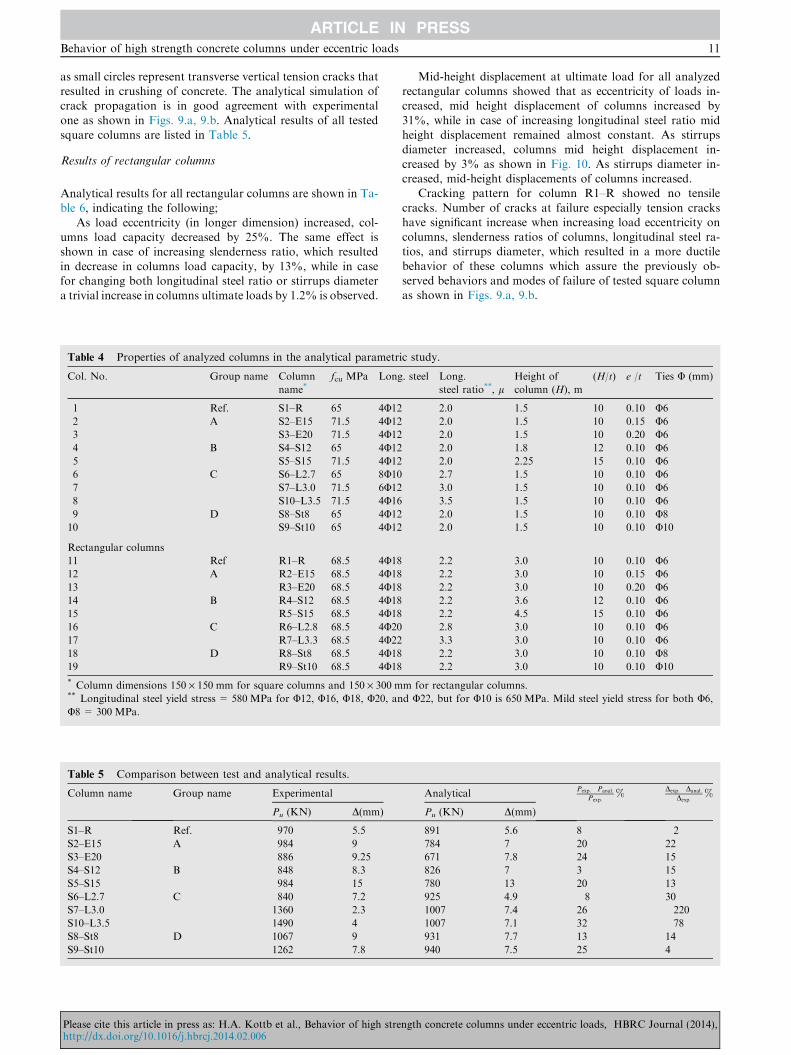
Table 4 Properties of analyzed columns in the analytical parametr
Col. No. Group name Column
name*fcu MPa Long
1 Ref. S1–R 65 4U12
2 A S2–E15 71.5 4U12
3 S3–E20 71.5 4U12
4 B S4–S12 65 4U12
5 S5–S15 71.5 4U12
6 C S6–L2.7 65 8U10
7 S7–L3.0 71.5 6U12
8 S10–L3.5 71.5 4U16
9 D S8–St8 65 4U12
10 S9–St10 65 4U12
Rectangular columns
11 Ref R1–R 68.5 4U18
12 A R2–E15 68.5 4U18
13 R3–E20 68.5 4U18
14 B R4–S12 68.5 4U18
15 R5–S15 68.5 4U18
16 C R6–L2.8 68.5 4U20
17 R7–L3.3 68.5 4U22
18 D R8–St8 68.5 4U18
19 R9–St10 68.5 4U18
* Column dimensions 150 · 150 mm for square columns and 150 · 300 m** Longitudinal steel yield stress = 580 MPa for U12, U16, U18, U20, an
U8 = 300 MPa.
Table 5 Comparison between test and analytical results.
Column name Group name Experimental
Pu (KN) D(mm)
S1–R Ref. 970 5.5
S2–E15 A 984 9
S3–E20 886 9.25
S4–S12 B 848 8.3
S5–S15 984 15
S6–L2.7 C 840 7.2
S7–L3.0 1360 2.3
S10–L3.5 1490 4
S8–St8 D 1067 9
S9–St10 1262 7.8
Please cite this article in press as: H.A. Kottb et al., Behavior of high strehttp://dx.doi.org/10.1016/j.hbrcj.2014.02.006
Mid-height displacement at ultimate load for all analyzedrectangular columns showed that as eccentricity of loads in-creased, mid height displacement of columns increased by
31%, while in case of increasing longitudinal steel ratio midheight displacement remained almost constant. As stirrupsdiameter increased, columns mid height displacement in-
creased by 3% as shown in Fig. 10. As stirrups diameter in-creased, mid-height displacements of columns increased.
Cracking pattern for column R1–R showed no tensile
cracks. Number of cracks at failure especially tension crackshave significant increase when increasing load eccentricity oncolumns, slenderness ratios of columns, longitudinal steel ra-tios, and stirrups diameter, which resulted in a more ductile
behavior of these columns which assure the previously ob-served behaviors and modes of failure of tested square columnas shown in Figs. 9.a, 9.b.
ic study.
. steel Long.
steel ratio**, lHeight of
column (H), m
(H/t) e /t Ties U (mm)
2.0 1.5 10 0.10 U6
2.0 1.5 10 0.15 U6
2.0 1.5 10 0.20 U6
2.0 1.8 12 0.10 U6
2.0 2.25 15 0.10 U6
2.7 1.5 10 0.10 U6
3.0 1.5 10 0.10 U6
3.5 1.5 10 0.10 U6
2.0 1.5 10 0.10 U8
2.0 1.5 10 0.10 U10
2.2 3.0 10 0.10 U6
2.2 3.0 10 0.15 U6
2.2 3.0 10 0.20 U6
2.2 3.6 12 0.10 U6
2.2 4.5 15 0.10 U6
2.8 3.0 10 0.10 U6
3.3 3.0 10 0.10 U6
2.2 3.0 10 0.10 U8
2.2 3.0 10 0.10 U10
m for rectangular columns.
d U22, but for U10 is 650 MPa. Mild steel yield stress for both U6,
AnalyticalPexp:�Panal:
Pexp:%
Dexp:�Danal:
Dexp:%
Pu (KN) D(mm)
891 5.6 8 �2784 7 20 22
671 7.8 24 15
826 7 3 15
780 13 20 13
925 4.9 �8 30
1007 7.4 26 �2201007 7.1 32 �78931 7.7 13 14
940 7.5 25 4
ngth concrete columns under eccentric loads, HBRC Journal (2014),
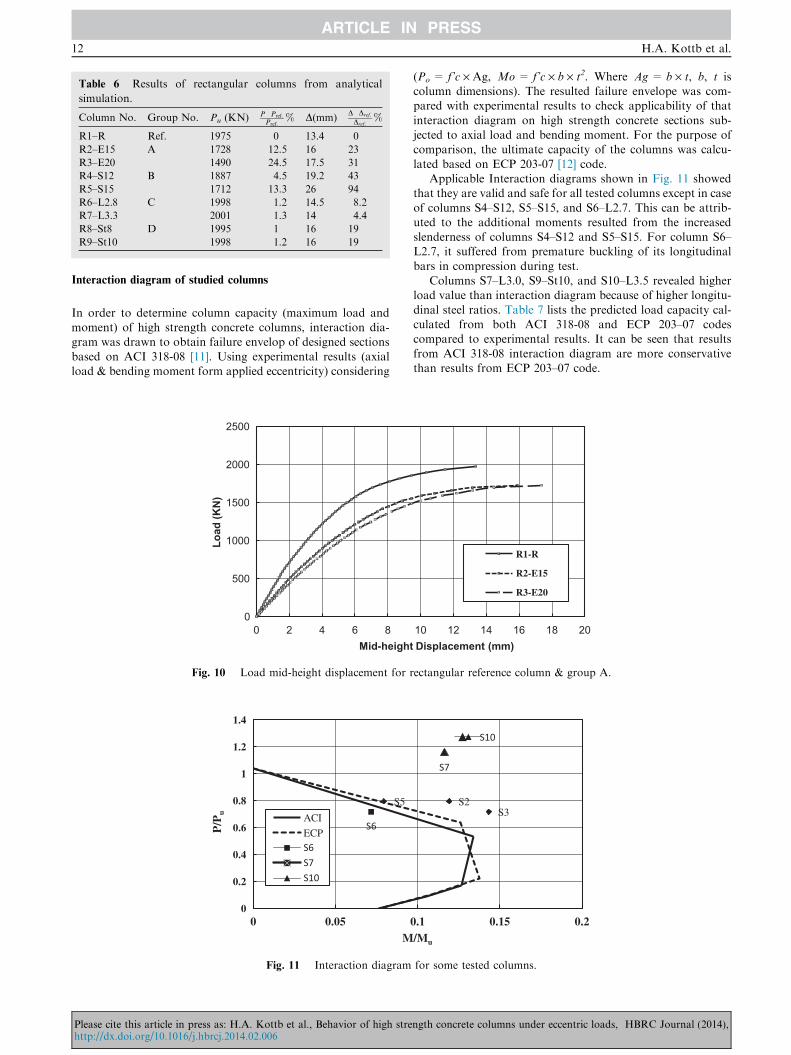
Table 6 Results of rectangular columns from analytical
simulation.
Column No. Group No. Pu (KN) P�Pref:
Pref:% D(mm)
D�Dref:
Dref:%
R1–R Ref. 1975 0 13.4 0
R2–E15 A 1728 �12.5 16 23
R3–E20 1490 �24.5 17.5 31
R4–S12 B 1887 �4.5 19.2 43
R5–S15 1712 �13.3 26 94
R6–L2.8 C 1998 1.2 14.5 8.2
R7–L3.3 2001 1.3 14 4.4
R8–St8 D 1995 �1 16 19
R9–St10 1998 1.2 16 19
12 H.A. Kottb et al.
Interaction diagram of studied columns
In order to determine column capacity (maximum load andmoment) of high strength concrete columns, interaction dia-gram was drawn to obtain failure envelop of designed sections
based on ACI 318-08 [11]. Using experimental results (axialload & bending moment form applied eccentricity) considering
0
500
1000
1500
2000
2500
0 2 4 6 8
Load
(KN
)
Mid-height
Fig. 10 Load mid-height displacement for r
S5
S6
0
0.2
0.4
0.6
0.8
1
1.2
1.4
0 0.05
P/P
u
M
ACI
ECPS6S7S10
Fig. 11 Interaction diagram
Please cite this article in press as: H.A. Kottb et al., Behavior of high strehttp://dx.doi.org/10.1016/j.hbrcj.2014.02.006
(Po = f’c · Ag, Mo= f’c · b · t2. Where Ag= b · t, b, t iscolumn dimensions). The resulted failure envelope was com-pared with experimental results to check applicability of that
interaction diagram on high strength concrete sections sub-jected to axial load and bending moment. For the purpose ofcomparison, the ultimate capacity of the columns was calcu-
lated based on ECP 203-07 [12] code.Applicable Interaction diagrams shown in Fig. 11 showed
that they are valid and safe for all tested columns except in case
of columns S4–S12, S5–S15, and S6–L2.7. This can be attrib-uted to the additional moments resulted from the increasedslenderness of columns S4–S12 and S5–S15. For column S6–L2.7, it suffered from premature buckling of its longitudinal
bars in compression during test.Columns S7–L3.0, S9–St10, and S10–L3.5 revealed higher
load value than interaction diagram because of higher longitu-
dinal steel ratios. Table 7 lists the predicted load capacity cal-culated from both ACI 318-08 and ECP 203–07 codescompared to experimental results. It can be seen that results
from ACI 318-08 interaction diagram are more conservativethan results from ECP 203–07 code.
10 12 14 16 18 20 Displacement (mm)
R1-R
R2-E15
R3-E20
ectangular reference column & group A.
S2S3
S7
S10
0.1 0.15 0.2/Mu
for some tested columns.
ngth concrete columns under eccentric loads, HBRC Journal (2014),
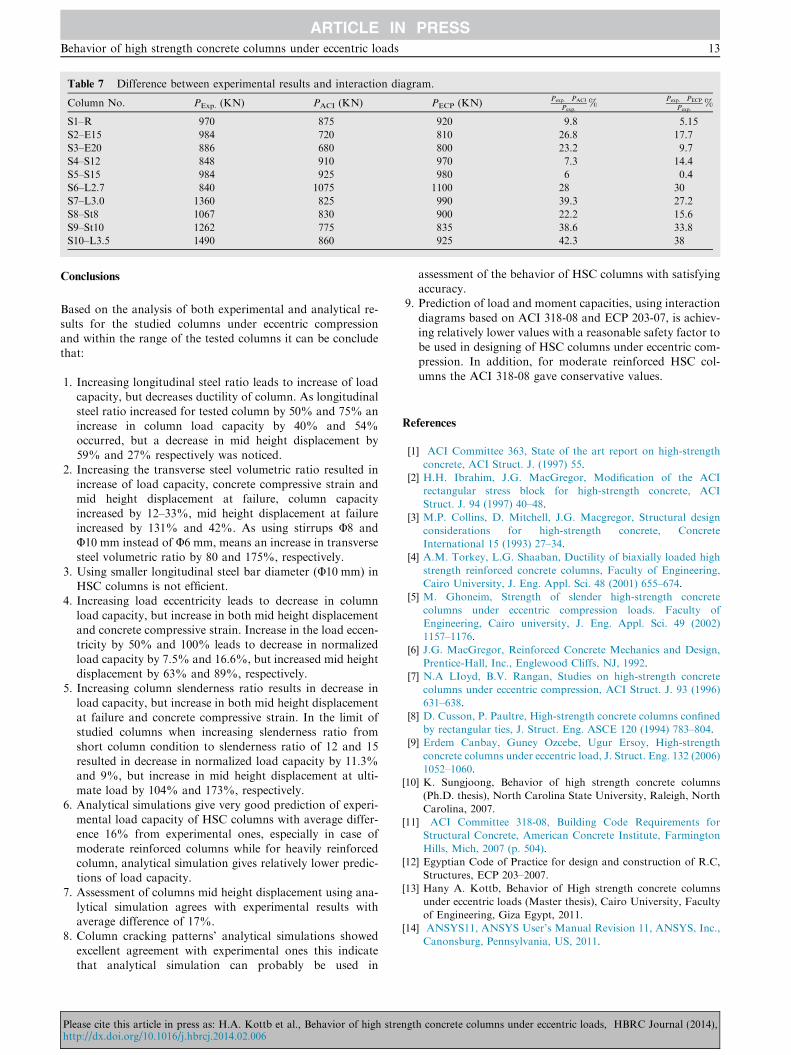
Table 7 Difference between experimental results and interaction diagram.
Column No. PExp. (KN) PACI (KN) PECP (KN)Pexp:�PACI
Pexp:%
Pexp:�PECP
Pexp:%
S1–R 970 875 920 9.8 5.15
S2–E15 984 720 810 26.8 17.7
S3–E20 886 680 800 23.2 9.7
S4–S12 848 910 970 �7.3 �14.4S5–S15 984 925 980 6 0.4
S6–L2.7 840 1075 1100 �28 �30S7–L3.0 1360 825 990 39.3 27.2
S8–St8 1067 830 900 22.2 15.6
S9–St10 1262 775 835 38.6 33.8
S10–L3.5 1490 860 925 42.3 38
Behavior of high strength concrete columns under eccentric loads 13
Conclusions
Based on the analysis of both experimental and analytical re-
sults for the studied columns under eccentric compressionand within the range of the tested columns it can be concludethat:
1. Increasing longitudinal steel ratio leads to increase of loadcapacity, but decreases ductility of column. As longitudinalsteel ratio increased for tested column by 50% and 75% an
increase in column load capacity by 40% and 54%occurred, but a decrease in mid height displacement by59% and 27% respectively was noticed.
2. Increasing the transverse steel volumetric ratio resulted inincrease of load capacity, concrete compressive strain andmid height displacement at failure, column capacity
increased by 12–33%, mid height displacement at failureincreased by 131% and 42%. As using stirrups U8 andU10 mm instead of U6 mm, means an increase in transversesteel volumetric ratio by 80 and 175%, respectively.
3. Using smaller longitudinal steel bar diameter (U10 mm) inHSC columns is not efficient.
4. Increasing load eccentricity leads to decrease in column
load capacity, but increase in both mid height displacementand concrete compressive strain. Increase in the load eccen-tricity by 50% and 100% leads to decrease in normalized
load capacity by 7.5% and 16.6%, but increased mid heightdisplacement by 63% and 89%, respectively.
5. Increasing column slenderness ratio results in decrease in
load capacity, but increase in both mid height displacementat failure and concrete compressive strain. In the limit ofstudied columns when increasing slenderness ratio fromshort column condition to slenderness ratio of 12 and 15
resulted in decrease in normalized load capacity by 11.3%and 9%, but increase in mid height displacement at ulti-mate load by 104% and 173%, respectively.
6. Analytical simulations give very good prediction of experi-mental load capacity of HSC columns with average differ-ence 16% from experimental ones, especially in case of
moderate reinforced columns while for heavily reinforcedcolumn, analytical simulation gives relatively lower predic-tions of load capacity.
7. Assessment of columns mid height displacement using ana-lytical simulation agrees with experimental results withaverage difference of 17%.
8. Column cracking patterns’ analytical simulations showed
excellent agreement with experimental ones this indicatethat analytical simulation can probably be used in
Please cite this article in press as: H.A. Kottb et al., Behavior of high strehttp://dx.doi.org/10.1016/j.hbrcj.2014.02.006
assessment of the behavior of HSC columns with satisfyingaccuracy.
9. Prediction of load and moment capacities, using interactiondiagrams based on ACI 318-08 and ECP 203-07, is achiev-
ing relatively lower values with a reasonable safety factor tobe used in designing of HSC columns under eccentric com-pression. In addition, for moderate reinforced HSC col-
umns the ACI 318-08 gave conservative values.
References
[1] ACI Committee 363, State of the art report on high-strength
concrete, ACI Struct. J. (1997) 55.
[2] H.H. Ibrahim, J.G. MacGregor, Modification of the ACI
rectangular stress block for high-strength concrete, ACI
Struct. J. 94 (1997) 40–48.
[3] M.P. Collins, D. Mitchell, J.G. Macgregor, Structural design
considerations for high-strength concrete, Concrete
International 15 (1993) 27–34.
[4] A.M. Torkey, L.G. Shaaban, Ductility of biaxially loaded high
strength reinforced concrete columns, Faculty of Engineering,
Cairo University, J. Eng. Appl. Sci. 48 (2001) 655–674.
[5] M. Ghoneim, Strength of slender high-strength concrete
columns under eccentric compression loads. Faculty of
Engineering, Cairo university, J. Eng. Appl. Sci. 49 (2002)
1157–1176.
[6] J.G. MacGregor, Reinforced Concrete Mechanics and Design,
Prentice-Hall, Inc., Englewood Cliffs, NJ, 1992.
[7] N.A LIoyd, B.V. Rangan, Studies on high-strength concrete
columns under eccentric compression, ACI Struct. J. 93 (1996)
631–638.
[8] D. Cusson, P. Paultre, High-strength concrete columns confined
by rectangular ties, J. Struct. Eng. ASCE 120 (1994) 783–804.
[9] Erdem Canbay, Guney Ozcebe, Ugur Ersoy, High-strength
concrete columns under eccentric load, J. Struct. Eng. 132 (2006)
1052–1060.
[10] K. Sungjoong, Behavior of high strength concrete columns
(Ph.D. thesis), North Carolina State University, Raleigh, North
Carolina, 2007.
[11] ACI Committee 318-08, Building Code Requirements for
Structural Concrete, American Concrete Institute, Farmington
Hills, Mich, 2007 (p. 504).
[12] Egyptian Code of Practice for design and construction of R.C,
Structures, ECP 203–2007.
[13] Hany A. Kottb, Behavior of High strength concrete columns
under eccentric loads (Master thesis), Cairo University, Faculty
of Engineering, Giza Egypt, 2011.
[14] ANSYS11, ANSYS User’s Manual Revision 11, ANSYS, Inc.,
Canonsburg, Pennsylvania, US, 2011.
ngth concrete columns under eccentric loads, HBRC Journal (2014),
Related Documents