Frequency Distributions 2007 Washington State University Beginning College Survey of Student Engagement

Welcome message from author
This document is posted to help you gain knowledge. Please leave a comment to let me know what you think about it! Share it to your friends and learn new things together.
Transcript
Frequency Distributions2007
Washington State University
Beginning College Survey ofStudent Engagement

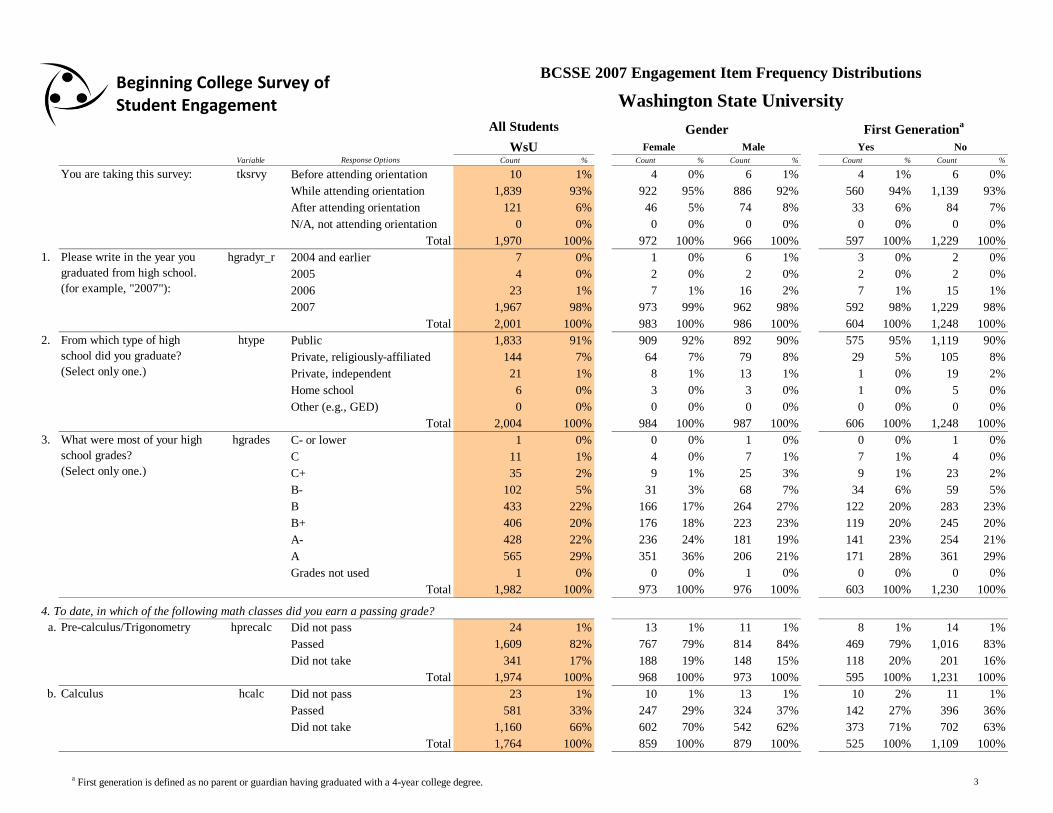
Variable Response Options Count % Count % Count % Count % Count %
Before attending orientation 10 1% 4 0% 6 1% 4 1% 6 0%
While attending orientation 1,839 93% 922 95% 886 92% 560 94% 1,139 93%
After attending orientation 121 6% 46 5% 74 8% 33 6% 84 7%
N/A, not attending orientation 0 0% 0 0% 0 0% 0 0% 0 0%
Total 1,970 100% 972 100% 966 100% 597 100% 1,229 100%
1. 2004 and earlier 7 0% 1 0% 6 1% 3 0% 2 0%
2005 4 0% 2 0% 2 0% 2 0% 2 0%
2006 23 1% 7 1% 16 2% 7 1% 15 1%
2007 1,967 98% 973 99% 962 98% 592 98% 1,229 98%
Total 2,001 100% 983 100% 986 100% 604 100% 1,248 100%
2. Public 1,833 91% 909 92% 892 90% 575 95% 1,119 90%
Private, religiously-affiliated 144 7% 64 7% 79 8% 29 5% 105 8%
Private, independent 21 1% 8 1% 13 1% 1 0% 19 2%
Home school 6 0% 3 0% 3 0% 1 0% 5 0%
Other (e.g., GED) 0 0% 0 0% 0 0% 0 0% 0 0%
Total 2,004 100% 984 100% 987 100% 606 100% 1,248 100%
3. C- or lower 1 0% 0 0% 1 0% 0 0% 1 0%
C 11 1% 4 0% 7 1% 7 1% 4 0%
C+ 35 2% 9 1% 25 3% 9 1% 23 2%
B- 102 5% 31 3% 68 7% 34 6% 59 5%
B 433 22% 166 17% 264 27% 122 20% 283 23%
B+ 406 20% 176 18% 223 23% 119 20% 245 20%
A- 428 22% 236 24% 181 19% 141 23% 254 21%
A 565 29% 351 36% 206 21% 171 28% 361 29%
Grades not used 1 0% 0 0% 1 0% 0 0% 0 0%
Total 1,982 100% 973 100% 976 100% 603 100% 1,230 100%
4. To date, in which of the following math classes did you earn a passing grade?
a. Did not pass 24 1% 13 1% 11 1% 8 1% 14 1%
Passed 1,609 82% 767 79% 814 84% 469 79% 1,016 83%
Did not take 341 17% 188 19% 148 15% 118 20% 201 16%
Total 1,974 100% 968 100% 973 100% 595 100% 1,231 100%
b. Did not pass 23 1% 10 1% 13 1% 10 2% 11 1%
Passed 581 33% 247 29% 324 37% 142 27% 396 36%
Did not take 1,160 66% 602 70% 542 62% 373 71% 702 63%
Total 1,764 100% 859 100% 879 100% 525 100% 1,109 100%
No
BCSSE 2007 Engagement Item Frequency Distributions
Washington State University
YesMaleFemale
All Students
WsU
First Generationa
hgradyr_rPlease write in the year you
graduated from high school.
(for example, "2007"):
Calculus hcalc
htype
What were most of your high
school grades?
(Select only one.)
From which type of high
school did you graduate?
(Select only one.)
hgrades
Pre-calculus/Trigonometry
Gender
You are taking this survey: tksrvy
hprecalc
Beginning College Survey ofStudent Engagement
a First generation is defined as no parent or guardian having graduated with a 4-year college degree. 3
Variable Response Options Count % Count % Count % Count % Count %
No
BCSSE 2007 Engagement Item Frequency Distributions
Washington State University
YesMaleFemale
All Students
WsU
First Generationa
Gender
Beginning College Survey ofStudent Engagement
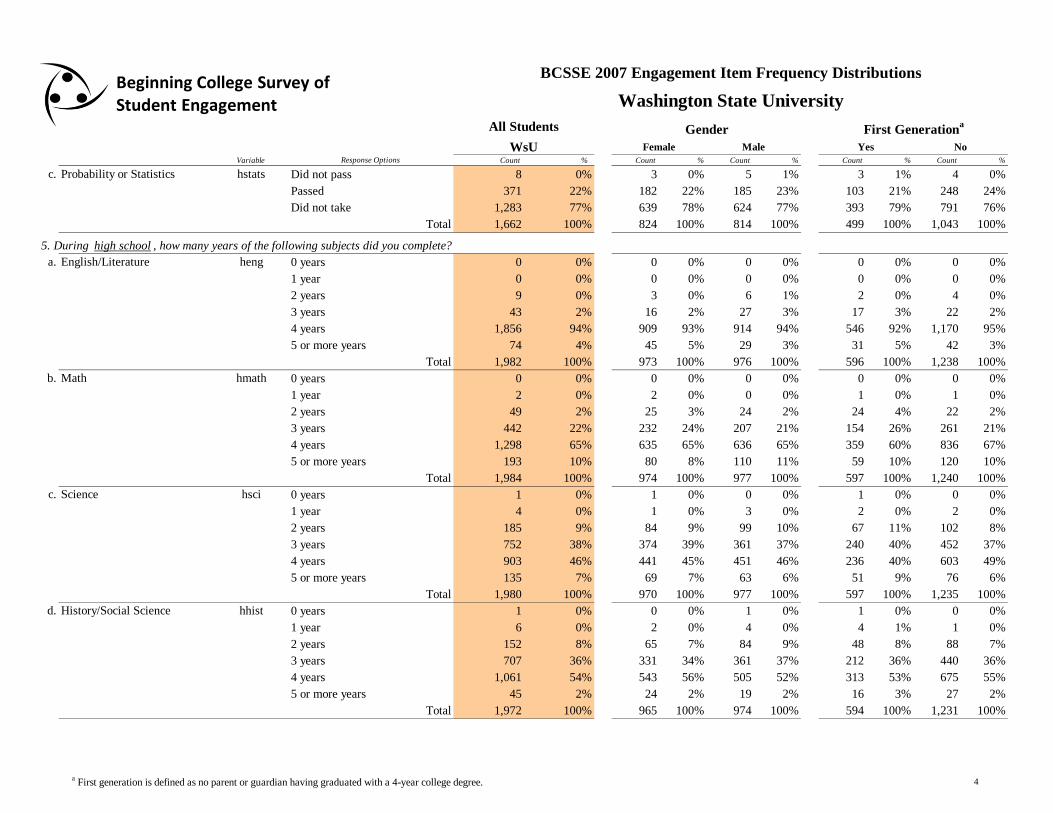
c. Did not pass 8 0% 3 0% 5 1% 3 1% 4 0%
Passed 371 22% 182 22% 185 23% 103 21% 248 24%
Did not take 1,283 77% 639 78% 624 77% 393 79% 791 76%
Total 1,662 100% 824 100% 814 100% 499 100% 1,043 100%
5. During high school , how many years of the following subjects did you complete?
a. 0 years 0 0% 0 0% 0 0% 0 0% 0 0%
1 year 0 0% 0 0% 0 0% 0 0% 0 0%
2 years 9 0% 3 0% 6 1% 2 0% 4 0%
3 years 43 2% 16 2% 27 3% 17 3% 22 2%
4 years 1,856 94% 909 93% 914 94% 546 92% 1,170 95%
5 or more years 74 4% 45 5% 29 3% 31 5% 42 3%
Total 1,982 100% 973 100% 976 100% 596 100% 1,238 100%
b. 0 years 0 0% 0 0% 0 0% 0 0% 0 0%
1 year 2 0% 2 0% 0 0% 1 0% 1 0%
2 years 49 2% 25 3% 24 2% 24 4% 22 2%
3 years 442 22% 232 24% 207 21% 154 26% 261 21%
4 years 1,298 65% 635 65% 636 65% 359 60% 836 67%
5 or more years 193 10% 80 8% 110 11% 59 10% 120 10%
Total 1,984 100% 974 100% 977 100% 597 100% 1,240 100%
c. 0 years 1 0% 1 0% 0 0% 1 0% 0 0%
1 year 4 0% 1 0% 3 0% 2 0% 2 0%
2 years 185 9% 84 9% 99 10% 67 11% 102 8%
3 years 752 38% 374 39% 361 37% 240 40% 452 37%
4 years 903 46% 441 45% 451 46% 236 40% 603 49%
5 or more years 135 7% 69 7% 63 6% 51 9% 76 6%
Total 1,980 100% 970 100% 977 100% 597 100% 1,235 100%
d. 0 years 1 0% 0 0% 1 0% 1 0% 0 0%
1 year 6 0% 2 0% 4 0% 4 1% 1 0%
2 years 152 8% 65 7% 84 9% 48 8% 88 7%
3 years 707 36% 331 34% 361 37% 212 36% 440 36%
4 years 1,061 54% 543 56% 505 52% 313 53% 675 55%
5 or more years 45 2% 24 2% 19 2% 16 3% 27 2%
Total 1,972 100% 965 100% 974 100% 594 100% 1,231 100%
hmath
hstats
Science
Math
History/Social Science hhist
English/Literature heng
hsci
Probability or Statistics
a First generation is defined as no parent or guardian having graduated with a 4-year college degree. 4
Variable Response Options Count % Count % Count % Count % Count %
No
BCSSE 2007 Engagement Item Frequency Distributions
Washington State University
YesMaleFemale
All Students
WsU
First Generationa
Gender
Beginning College Survey ofStudent Engagement
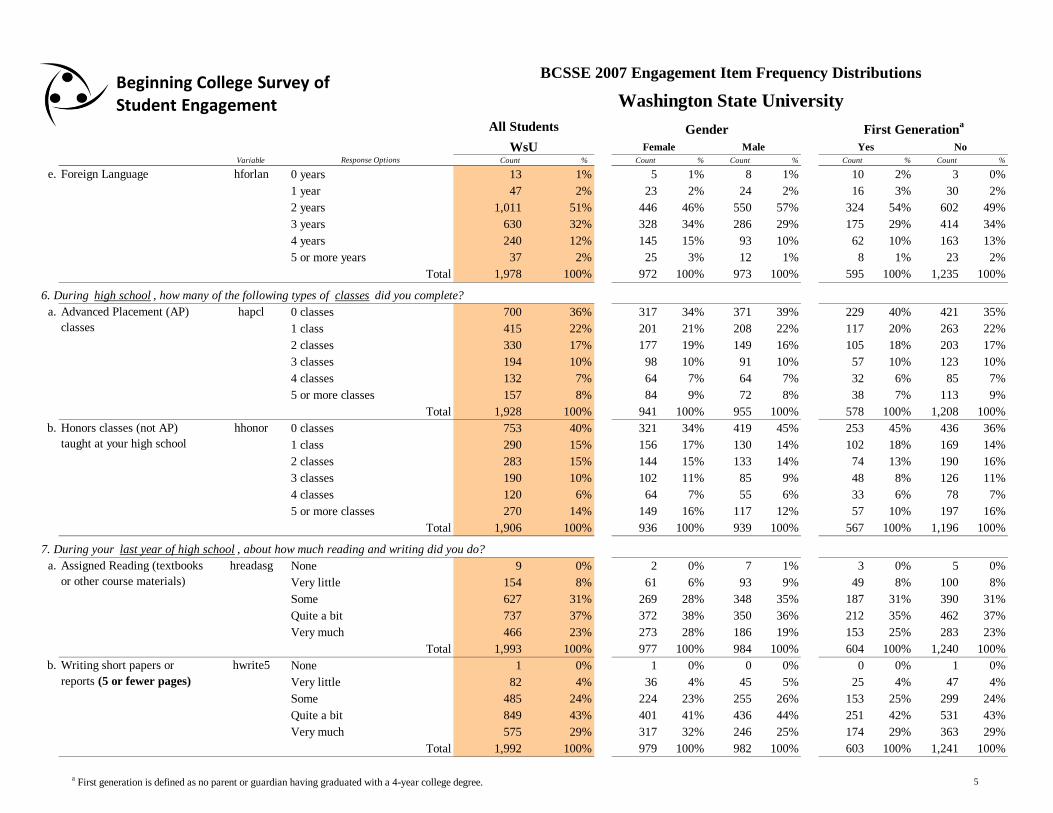
e. 0 years 13 1% 5 1% 8 1% 10 2% 3 0%
1 year 47 2% 23 2% 24 2% 16 3% 30 2%
2 years 1,011 51% 446 46% 550 57% 324 54% 602 49%
3 years 630 32% 328 34% 286 29% 175 29% 414 34%
4 years 240 12% 145 15% 93 10% 62 10% 163 13%
5 or more years 37 2% 25 3% 12 1% 8 1% 23 2%
Total 1,978 100% 972 100% 973 100% 595 100% 1,235 100%
6. During high school , how many of the following types of classes did you complete?
a. 0 classes 700 36% 317 34% 371 39% 229 40% 421 35%
1 class 415 22% 201 21% 208 22% 117 20% 263 22%
2 classes 330 17% 177 19% 149 16% 105 18% 203 17%
3 classes 194 10% 98 10% 91 10% 57 10% 123 10%
4 classes 132 7% 64 7% 64 7% 32 6% 85 7%
5 or more classes 157 8% 84 9% 72 8% 38 7% 113 9%
Total 1,928 100% 941 100% 955 100% 578 100% 1,208 100%
b. 0 classes 753 40% 321 34% 419 45% 253 45% 436 36%
1 class 290 15% 156 17% 130 14% 102 18% 169 14%
2 classes 283 15% 144 15% 133 14% 74 13% 190 16%
3 classes 190 10% 102 11% 85 9% 48 8% 126 11%
4 classes 120 6% 64 7% 55 6% 33 6% 78 7%
5 or more classes 270 14% 149 16% 117 12% 57 10% 197 16%
Total 1,906 100% 936 100% 939 100% 567 100% 1,196 100%
7. During your last year of high school , about how much reading and writing did you do?
a. None 9 0% 2 0% 7 1% 3 0% 5 0%
Very little 154 8% 61 6% 93 9% 49 8% 100 8%
Some 627 31% 269 28% 348 35% 187 31% 390 31%
Quite a bit 737 37% 372 38% 350 36% 212 35% 462 37%
Very much 466 23% 273 28% 186 19% 153 25% 283 23%
Total 1,993 100% 977 100% 984 100% 604 100% 1,240 100%
b. None 1 0% 1 0% 0 0% 0 0% 1 0%
Very little 82 4% 36 4% 45 5% 25 4% 47 4%
Some 485 24% 224 23% 255 26% 153 25% 299 24%
Quite a bit 849 43% 401 41% 436 44% 251 42% 531 43%
Very much 575 29% 317 32% 246 25% 174 29% 363 29%
Total 1,992 100% 979 100% 982 100% 603 100% 1,241 100%
Writing short papers or
reports (5 or fewer pages)
hhonor
hwrite5
Assigned Reading (textbooks
or other course materials)
Honors classes (not AP)
taught at your high school
Advanced Placement (AP)
classes
hapcl
hreadasg
Foreign Language hforlan
a First generation is defined as no parent or guardian having graduated with a 4-year college degree. 5
Variable Response Options Count % Count % Count % Count % Count %
No
BCSSE 2007 Engagement Item Frequency Distributions
Washington State University
YesMaleFemale
All Students
WsU
First Generationa
Gender
Beginning College Survey ofStudent Engagement
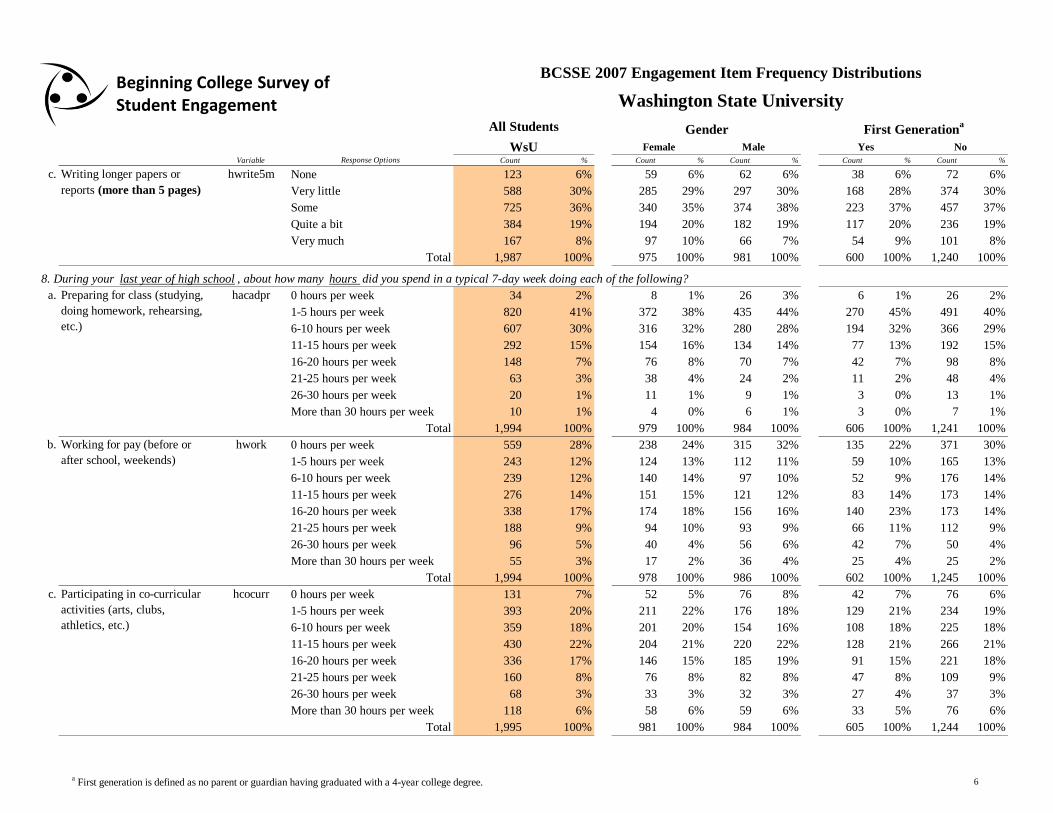
c. None 123 6% 59 6% 62 6% 38 6% 72 6%
Very little 588 30% 285 29% 297 30% 168 28% 374 30%
Some 725 36% 340 35% 374 38% 223 37% 457 37%
Quite a bit 384 19% 194 20% 182 19% 117 20% 236 19%
Very much 167 8% 97 10% 66 7% 54 9% 101 8%
Total 1,987 100% 975 100% 981 100% 600 100% 1,240 100%
8. During your last year of high school , about how many hours did you spend in a typical 7-day week doing each of the following?
a. 0 hours per week 34 2% 8 1% 26 3% 6 1% 26 2%
1-5 hours per week 820 41% 372 38% 435 44% 270 45% 491 40%
6-10 hours per week 607 30% 316 32% 280 28% 194 32% 366 29%
11-15 hours per week 292 15% 154 16% 134 14% 77 13% 192 15%
16-20 hours per week 148 7% 76 8% 70 7% 42 7% 98 8%
21-25 hours per week 63 3% 38 4% 24 2% 11 2% 48 4%
26-30 hours per week 20 1% 11 1% 9 1% 3 0% 13 1%
More than 30 hours per week 10 1% 4 0% 6 1% 3 0% 7 1%
Total 1,994 100% 979 100% 984 100% 606 100% 1,241 100%
b. 0 hours per week 559 28% 238 24% 315 32% 135 22% 371 30%
1-5 hours per week 243 12% 124 13% 112 11% 59 10% 165 13%
6-10 hours per week 239 12% 140 14% 97 10% 52 9% 176 14%
11-15 hours per week 276 14% 151 15% 121 12% 83 14% 173 14%
16-20 hours per week 338 17% 174 18% 156 16% 140 23% 173 14%
21-25 hours per week 188 9% 94 10% 93 9% 66 11% 112 9%
26-30 hours per week 96 5% 40 4% 56 6% 42 7% 50 4%
More than 30 hours per week 55 3% 17 2% 36 4% 25 4% 25 2%
Total 1,994 100% 978 100% 986 100% 602 100% 1,245 100%
c. 0 hours per week 131 7% 52 5% 76 8% 42 7% 76 6%
1-5 hours per week 393 20% 211 22% 176 18% 129 21% 234 19%
6-10 hours per week 359 18% 201 20% 154 16% 108 18% 225 18%
11-15 hours per week 430 22% 204 21% 220 22% 128 21% 266 21%
16-20 hours per week 336 17% 146 15% 185 19% 91 15% 221 18%
21-25 hours per week 160 8% 76 8% 82 8% 47 8% 109 9%
26-30 hours per week 68 3% 33 3% 32 3% 27 4% 37 3%
More than 30 hours per week 118 6% 58 6% 59 6% 33 5% 76 6%
Total 1,995 100% 981 100% 984 100% 605 100% 1,244 100%
Working for pay (before or
after school, weekends)
hwork
hcocurrParticipating in co-curricular
activities (arts, clubs,
athletics, etc.)
Writing longer papers or
reports (more than 5 pages)
Preparing for class (studying,
doing homework, rehearsing,
etc.)
hacadpr
hwrite5m
a First generation is defined as no parent or guardian having graduated with a 4-year college degree. 6

Variable Response Options Count % Count % Count % Count % Count %
No
BCSSE 2007 Engagement Item Frequency Distributions
Washington State University
YesMaleFemale
All Students
WsU
First Generationa
Gender
Beginning College Survey ofStudent Engagement
d. 0 hours per week 5 0% 2 0% 3 0% 3 0% 2 0%
1-5 hours per week 317 16% 207 21% 103 10% 97 16% 196 16%
6-10 hours per week 521 26% 296 30% 217 22% 162 27% 315 25%
11-15 hours per week 447 22% 227 23% 215 22% 123 20% 289 23%
16-20 hours per week 336 17% 126 13% 206 21% 101 17% 212 17%
21-25 hours per week 160 8% 63 6% 94 10% 55 9% 100 8%
26-30 hours per week 77 4% 28 3% 47 5% 25 4% 48 4%
More than 30 hours per week 133 7% 31 3% 100 10% 39 6% 82 7%
Total 1,996 100% 980 100% 985 100% 605 100% 1,244 100%
9. During your last year of high school, about how often did you do each of the following?
a. Never 21 1% 7 1% 14 1% 4 1% 16 1%
Sometimes 491 25% 243 25% 247 25% 162 27% 297 24%
Often 751 38% 345 36% 393 40% 220 37% 470 38%
Very often 704 36% 372 38% 318 33% 214 36% 441 36%
Total 1,967 100% 967 100% 972 100% 600 100% 1,224 100%
b. Never 8 0% 3 0% 5 1% 1 0% 5 0%
Sometimes 853 43% 404 42% 439 45% 247 41% 537 44%
Often 816 41% 392 40% 411 42% 250 42% 507 41%
Very often 290 15% 169 17% 116 12% 101 17% 176 14%
Total 1,967 100% 968 100% 971 100% 599 100% 1,225 100%
c. Never 498 25% 295 31% 197 20% 147 25% 317 26%
Sometimes 1,250 64% 593 61% 642 66% 385 64% 775 63%
Often 173 9% 59 6% 109 11% 54 9% 104 9%
Very often 43 2% 19 2% 22 2% 12 2% 27 2%
Total 1,964 100% 966 100% 970 100% 598 100% 1,223 100%
d. Never 58 3% 23 2% 34 4% 17 3% 34 3%
Sometimes 783 40% 365 38% 409 42% 247 41% 490 40%
Often 807 41% 416 43% 381 39% 236 39% 508 42%
Very often 313 16% 161 17% 144 15% 98 16% 190 16%
Total 1,961 100% 965 100% 968 100% 598 100% 1,222 100%
e. Never 23 1% 10 1% 13 1% 4 1% 17 1%
Sometimes 576 29% 298 31% 270 28% 164 28% 367 30%
Often 1,018 52% 479 50% 524 54% 318 53% 630 52%
Very often 344 18% 180 19% 159 16% 110 18% 208 17%
Total 1,961 100% 967 100% 966 100% 596 100% 1,222 100%
Discussed grades or
assignments with a teacher
Made a class presentation
hsocial
hclunpre
Asked questions in class or
contributed to class
discussions
Relaxing and socializing
(watching TV, partying, etc.)
hclquest
Worked with other students
on projects during class
hclassgr
hfacgrad
hclprese
Came to class without
completing readings or
assignments
a First generation is defined as no parent or guardian having graduated with a 4-year college degree. 7
Variable Response Options Count % Count % Count % Count % Count %
No
BCSSE 2007 Engagement Item Frequency Distributions
Washington State University
YesMaleFemale
All Students
WsU
First Generationa
Gender
Beginning College Survey ofStudent Engagement
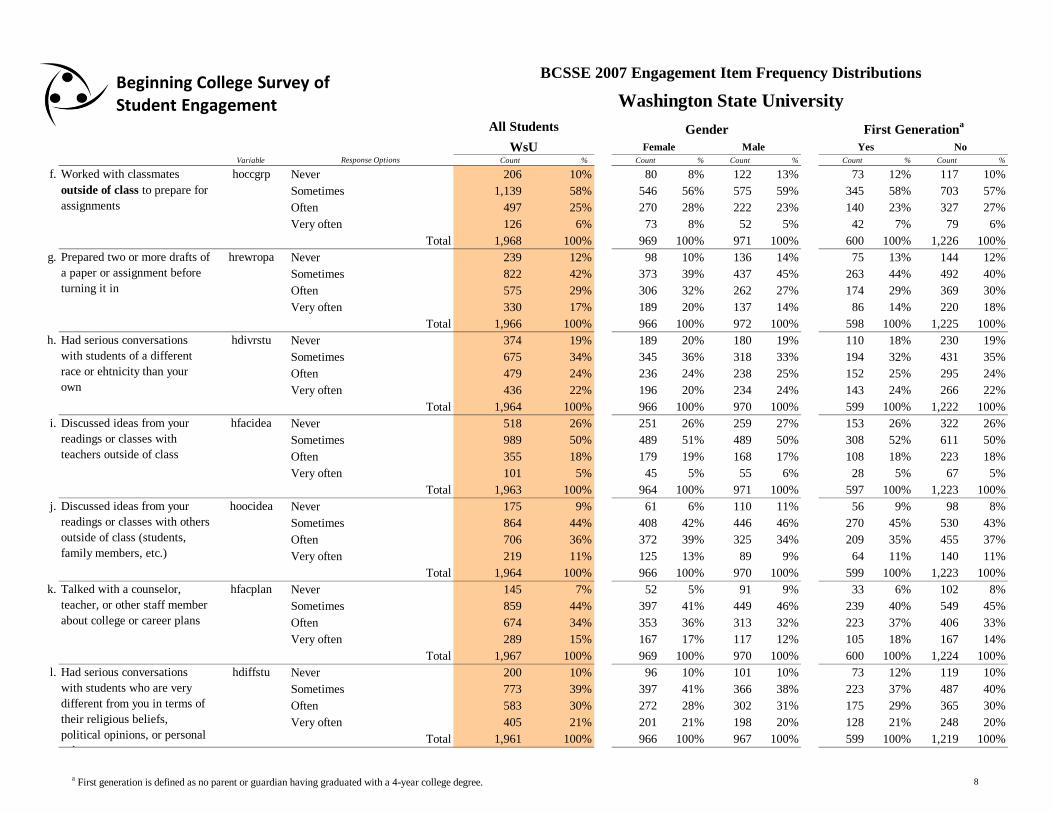
f. Never 206 10% 80 8% 122 13% 73 12% 117 10%
Sometimes 1,139 58% 546 56% 575 59% 345 58% 703 57%
Often 497 25% 270 28% 222 23% 140 23% 327 27%
Very often 126 6% 73 8% 52 5% 42 7% 79 6%
Total 1,968 100% 969 100% 971 100% 600 100% 1,226 100%
g. Never 239 12% 98 10% 136 14% 75 13% 144 12%
Sometimes 822 42% 373 39% 437 45% 263 44% 492 40%
Often 575 29% 306 32% 262 27% 174 29% 369 30%
Very often 330 17% 189 20% 137 14% 86 14% 220 18%
Total 1,966 100% 966 100% 972 100% 598 100% 1,225 100%
h. Never 374 19% 189 20% 180 19% 110 18% 230 19%
Sometimes 675 34% 345 36% 318 33% 194 32% 431 35%
Often 479 24% 236 24% 238 25% 152 25% 295 24%
Very often 436 22% 196 20% 234 24% 143 24% 266 22%
Total 1,964 100% 966 100% 970 100% 599 100% 1,222 100%
i. Never 518 26% 251 26% 259 27% 153 26% 322 26%
Sometimes 989 50% 489 51% 489 50% 308 52% 611 50%
Often 355 18% 179 19% 168 17% 108 18% 223 18%
Very often 101 5% 45 5% 55 6% 28 5% 67 5%
Total 1,963 100% 964 100% 971 100% 597 100% 1,223 100%
j. Never 175 9% 61 6% 110 11% 56 9% 98 8%
Sometimes 864 44% 408 42% 446 46% 270 45% 530 43%
Often 706 36% 372 39% 325 34% 209 35% 455 37%
Very often 219 11% 125 13% 89 9% 64 11% 140 11%
Total 1,964 100% 966 100% 970 100% 599 100% 1,223 100%
k. Never 145 7% 52 5% 91 9% 33 6% 102 8%
Sometimes 859 44% 397 41% 449 46% 239 40% 549 45%
Often 674 34% 353 36% 313 32% 223 37% 406 33%
Very often 289 15% 167 17% 117 12% 105 18% 167 14%
Total 1,967 100% 969 100% 970 100% 600 100% 1,224 100%
l. Never 200 10% 96 10% 101 10% 73 12% 119 10%
Sometimes 773 39% 397 41% 366 38% 223 37% 487 40%
Often 583 30% 272 28% 302 31% 175 29% 365 30%
Very often 405 21% 201 21% 198 20% 128 21% 248 20%
Total 1,961 100% 966 100% 967 100% 599 100% 1,219 100%
Worked with classmates
outside of class to prepare for
assignments
hoccgrp
Discussed ideas from your
readings or classes with
teachers outside of class
Had serious conversations
with students of a different
race or ehtnicity than your
own
Discussed ideas from your
readings or classes with others
outside of class (students,
family members, etc.)
Had serious conversations
with students who are very
different from you in terms of
their religious beliefs,
political opinions, or personal
values
Talked with a counselor,
teacher, or other staff member
about college or career plans
hfacidea
Prepared two or more drafts of
a paper or assignment before
turning it in
hrewropa
hdivrstu
hoocidea
hfacplan
hdiffstu
a First generation is defined as no parent or guardian having graduated with a 4-year college degree. 8

Variable Response Options Count % Count % Count % Count % Count %
No
BCSSE 2007 Engagement Item Frequency Distributions
Washington State University
YesMaleFemale
All Students
WsU
First Generationa
Gender
Beginning College Survey ofStudent Engagement
m. Never 270 14% 101 10% 164 17% 75 13% 169 14%
Sometimes 1,349 69% 684 71% 648 67% 412 69% 842 69%
Often 231 12% 120 12% 107 11% 76 13% 141 12%
Very often 106 5% 58 6% 46 5% 34 6% 66 5%
Total 1,956 100% 963 100% 965 100% 597 100% 1,218 100%
10. hsatact No 1 0% 1 0% 0 0% 1 0% 0 0%
Yes 1953 100% 960 100% 965 100% 594 100% 1217 100%
Total 1954 100% 961 100% 965 100% 595 100% 1217 100%
a. SAT_ACTr 1000 or lower 202 15% 107 17% 91 12% 88 22% 91 10%
1001 - 1100 307 23% 139 23% 164 22% 90 23% 195 22%
1101 - 1200 403 30% 179 29% 220 30% 124 31% 258 30%
1201 - 1300 293 22% 120 20% 170 23% 65 16% 208 24%
1301 - 1400 107 8% 49 8% 58 8% 25 6% 77 9%
1401 - 1600 48 4% 20 3% 28 4% 8 2% 39 4%
Total 1360 100% 614 100% 731 100% 400 100% 868 100%
11. During your high school years , how involved were you in the following activities at your school or elsewhere?
a. 1 Not involved 1,012 52% 417 43% 581 60% 310 52% 627 52%
2 264 14% 154 16% 108 11% 82 14% 164 13%
3 157 8% 94 10% 60 6% 49 8% 94 8%
4 119 6% 68 7% 48 5% 37 6% 69 6%
5 119 6% 66 7% 53 5% 34 6% 79 6%
6 Highly involved 282 14% 161 17% 118 12% 85 14% 184 15%
Total 1,953 100% 960 100% 968 100% 597 100% 1,217 100%
b. 1 Not involved 346 18% 183 19% 157 16% 135 23% 185 15%
2 133 7% 61 6% 71 7% 47 8% 79 6%
3 184 9% 89 9% 91 9% 56 9% 113 9%
4 236 12% 123 13% 112 12% 69 12% 150 12%
5 271 14% 136 14% 131 14% 77 13% 173 14%
6 Highly involved 786 40% 372 39% 405 42% 214 36% 519 43%
Total 1,956 100% 964 100% 967 100% 598 100% 1,219 100%
Did you take the SAT and/or
ACT?
SAT Composite Score
categories
(SAT scores or ACT scores
convertd to SAT scale)
Performing or visual arts
programs (band, chorus,
theater, art, etc.)
Athletic teams (varsity, junior
varsity, club sport, etc.)
hinvathl
hmisssch
hinvarts
Missed a day of school
a First generation is defined as no parent or guardian having graduated with a 4-year college degree. 9
Variable Response Options Count % Count % Count % Count % Count %
No
BCSSE 2007 Engagement Item Frequency Distributions
Washington State University
YesMaleFemale
All Students
WsU
First Generationa
Gender
Beginning College Survey ofStudent Engagement
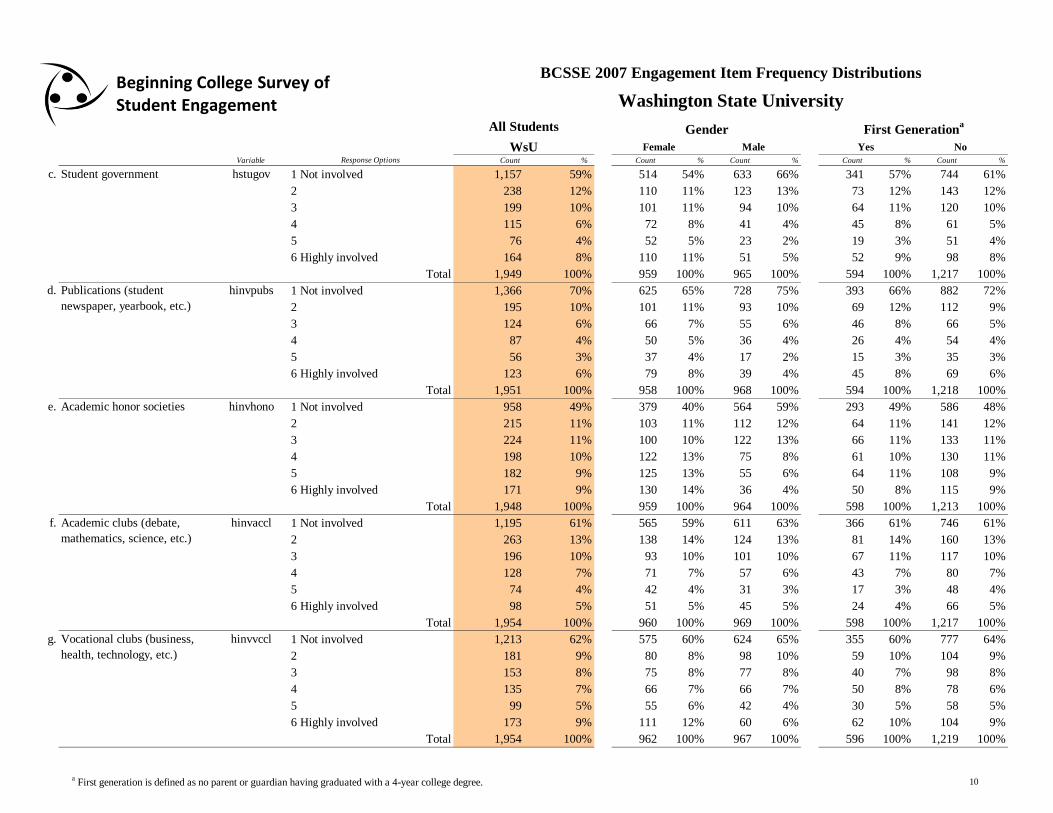
c. 1 Not involved 1,157 59% 514 54% 633 66% 341 57% 744 61%
2 238 12% 110 11% 123 13% 73 12% 143 12%
3 199 10% 101 11% 94 10% 64 11% 120 10%
4 115 6% 72 8% 41 4% 45 8% 61 5%
5 76 4% 52 5% 23 2% 19 3% 51 4%
6 Highly involved 164 8% 110 11% 51 5% 52 9% 98 8%
Total 1,949 100% 959 100% 965 100% 594 100% 1,217 100%
d. 1 Not involved 1,366 70% 625 65% 728 75% 393 66% 882 72%
2 195 10% 101 11% 93 10% 69 12% 112 9%
3 124 6% 66 7% 55 6% 46 8% 66 5%
4 87 4% 50 5% 36 4% 26 4% 54 4%
5 56 3% 37 4% 17 2% 15 3% 35 3%
6 Highly involved 123 6% 79 8% 39 4% 45 8% 69 6%
Total 1,951 100% 958 100% 968 100% 594 100% 1,218 100%
e. 1 Not involved 958 49% 379 40% 564 59% 293 49% 586 48%
2 215 11% 103 11% 112 12% 64 11% 141 12%
3 224 11% 100 10% 122 13% 66 11% 133 11%
4 198 10% 122 13% 75 8% 61 10% 130 11%
5 182 9% 125 13% 55 6% 64 11% 108 9%
6 Highly involved 171 9% 130 14% 36 4% 50 8% 115 9%
Total 1,948 100% 959 100% 964 100% 598 100% 1,213 100%
f. 1 Not involved 1,195 61% 565 59% 611 63% 366 61% 746 61%
2 263 13% 138 14% 124 13% 81 14% 160 13%
3 196 10% 93 10% 101 10% 67 11% 117 10%
4 128 7% 71 7% 57 6% 43 7% 80 7%
5 74 4% 42 4% 31 3% 17 3% 48 4%
6 Highly involved 98 5% 51 5% 45 5% 24 4% 66 5%
Total 1,954 100% 960 100% 969 100% 598 100% 1,217 100%
g. 1 Not involved 1,213 62% 575 60% 624 65% 355 60% 777 64%
2 181 9% 80 8% 98 10% 59 10% 104 9%
3 153 8% 75 8% 77 8% 40 7% 98 8%
4 135 7% 66 7% 66 7% 50 8% 78 6%
5 99 5% 55 6% 42 4% 30 5% 58 5%
6 Highly involved 173 9% 111 12% 60 6% 62 10% 104 9%
Total 1,954 100% 962 100% 967 100% 596 100% 1,219 100%
Academic honor societies hinvhono
Academic clubs (debate,
mathematics, science, etc.)
hinvaccl
Student government hstugov
hinvvcclVocational clubs (business,
health, technology, etc.)
Publications (student
newspaper, yearbook, etc.)
hinvpubs
a First generation is defined as no parent or guardian having graduated with a 4-year college degree. 10

Variable Response Options Count % Count % Count % Count % Count %
No
BCSSE 2007 Engagement Item Frequency Distributions
Washington State University
YesMaleFemale
All Students
WsU
First Generationa
Gender
Beginning College Survey ofStudent Engagement
h. 1 Not involved 1,207 62% 564 59% 630 65% 389 65% 734 60%
2 195 10% 103 11% 88 9% 57 10% 125 10%
3 205 10% 95 10% 110 11% 62 10% 131 11%
4 121 6% 69 7% 50 5% 33 6% 79 6%
5 81 4% 48 5% 32 3% 22 4% 49 4%
6 Highly involved 144 7% 83 9% 57 6% 33 6% 101 8%
Total 1,953 100% 962 100% 967 100% 596 100% 1,219 100%
12. 1 Not at all challenging 68 4% 22 2% 44 5% 27 5% 33 3%
2 213 11% 84 9% 126 13% 74 12% 124 10%
3 451 23% 207 22% 235 24% 141 24% 278 23%
4 730 38% 374 39% 352 37% 238 40% 439 36%
5 388 20% 222 23% 164 17% 96 16% 271 22%
6 Extremely challenging 88 5% 43 5% 42 4% 17 3% 63 5%
Total 1,938 100% 952 100% 963 100% 593 100% 1,208 100%
13. During the coming school year , about how many hours do you think you will spend in a typical 7-day week doing each of the following?
a. 0 hours per week 1 0% 1 0% 0 0% 0 0% 1 0%
1-5 hours per week 23 1% 6 1% 17 2% 9 2% 11 1%
6-10 hours per week 172 9% 86 9% 84 9% 54 9% 111 9%
11-15 hours per week 410 21% 210 22% 199 21% 130 22% 250 21%
16-20 hours per week 507 26% 236 25% 261 27% 139 23% 331 27%
21-25 hours per week 407 21% 214 22% 187 19% 132 22% 247 20%
26-30 hours per week 247 13% 130 14% 117 12% 70 12% 163 13%
More than 30 hours per week 174 9% 71 7% 100 10% 58 10% 101 8%
Total 1,941 100% 954 100% 965 100% 592 100% 1,215 100%
b. 0 hours per week 752 39% 363 38% 379 39% 170 29% 532 44%
1-5 hours per week 201 10% 114 12% 85 9% 59 10% 128 11%
6-10 hours per week 396 20% 210 22% 182 19% 141 24% 222 18%
11-15 hours per week 304 16% 139 15% 160 17% 110 19% 177 15%
16-20 hours per week 213 11% 96 10% 117 12% 77 13% 121 10%
21-25 hours per week 49 3% 22 2% 27 3% 20 3% 26 2%
26-30 hours per week 17 1% 10 1% 7 1% 10 2% 6 0%
More than 30 hours per week 7 0% 2 0% 5 1% 4 1% 1 0%
Total 1,939 100% 956 100% 962 100% 591 100% 1,213 100%
hacachal
Preparing for class (studying,
reading, writing, doing
homework or lab work,
analyzing data, rehearsing,
and other academic activities)
cacadpr
Working for pay on- or off-
campus
cwork
Religious youth groups hrelgrp
Overall, how academically
challenging was your high
school?
a First generation is defined as no parent or guardian having graduated with a 4-year college degree. 11

Variable Response Options Count % Count % Count % Count % Count %
No
BCSSE 2007 Engagement Item Frequency Distributions
Washington State University
YesMaleFemale
All Students
WsU
First Generationa
Gender
Beginning College Survey ofStudent Engagement
c. 0 hours per week 66 3% 20 2% 46 5% 28 5% 36 3%
1-5 hours per week 423 22% 241 25% 179 19% 143 24% 248 20%
6-10 hours per week 619 32% 294 31% 318 33% 189 32% 393 32%
11-15 hours per week 439 23% 206 22% 226 23% 129 22% 273 22%
16-20 hours per week 235 12% 117 12% 115 12% 62 10% 153 13%
21-25 hours per week 75 4% 45 5% 30 3% 21 4% 49 4%
26-30 hours per week 36 2% 13 1% 23 2% 11 2% 24 2%
More than 30 hours per week 47 2% 16 2% 30 3% 8 1% 39 3%
Total 1,940 100% 952 100% 967 100% 591 100% 1,215 100%
d. 0 hours per week 7 0% 3 0% 4 0% 2 0% 5 0%
1-5 hours per week 342 18% 212 22% 128 13% 120 20% 198 16%
6-10 hours per week 664 34% 345 36% 313 32% 213 36% 399 33%
11-15 hours per week 513 26% 227 24% 281 29% 148 25% 337 28%
16-20 hours per week 261 13% 119 12% 137 14% 59 10% 180 15%
21-25 hours per week 104 5% 35 4% 66 7% 38 6% 60 5%
26-30 hours per week 24 1% 9 1% 15 2% 6 1% 18 1%
More than 30 hours per week 30 2% 5 1% 25 3% 7 1% 21 2%
Total 1,945 100% 955 100% 969 100% 593 100% 1,218 100%
14. During the coming school year , about how often do you expect to do each of the following?
a. Never 12 1% 6 1% 6 1% 5 1% 6 0%
Sometimes 521 27% 265 27% 249 26% 152 26% 331 27%
Often 923 47% 436 45% 479 50% 277 46% 581 48%
Very often 497 25% 260 27% 232 24% 162 27% 304 25%
Total 1,953 100% 967 100% 966 100% 596 100% 1,222 100%
b. Never 31 2% 13 1% 17 2% 9 2% 18 1%
Sometimes 897 46% 442 46% 446 46% 261 44% 578 47%
Often 832 43% 412 43% 410 43% 260 44% 509 42%
Very often 190 10% 99 10% 91 9% 65 11% 115 9%
Total 1,950 100% 966 100% 964 100% 595 100% 1,220 100%
c. Never 2 0% 1 0% 1 0% 0 0% 2 0%
Sometimes 128 7% 47 5% 79 8% 35 6% 85 7%
Often 958 49% 424 44% 525 55% 298 50% 593 49%
Very often 861 44% 494 51% 358 37% 263 44% 539 44%
Total 1,949 100% 966 100% 963 100% 596 100% 1,219 100%
csocial
Work on a paper or project
that requires integrating ideas
or information from various
sources
cclquestAsk questions in class or
contribute to class discussions
cintegra
Participating in co-curricular
activities (organizations,
campus publications, student
government, fraternity or
sorority, intercollegiate or
intramural sports, etc.)
ccocurr
Make a class presentation cclprese
Relaxing or socializing
(watching TV, partying, etc.)
a First generation is defined as no parent or guardian having graduated with a 4-year college degree. 12

Variable Response Options Count % Count % Count % Count % Count %
No
BCSSE 2007 Engagement Item Frequency Distributions
Washington State University
YesMaleFemale
All Students
WsU
First Generationa
Gender
Beginning College Survey ofStudent Engagement
d. Never 101 5% 52 5% 47 5% 20 3% 72 6%
Sometimes 677 35% 363 38% 307 32% 194 33% 438 36%
Often 858 44% 392 41% 456 47% 277 47% 524 43%
Very often 308 16% 154 16% 153 16% 101 17% 184 15%
Total 1,944 100% 961 100% 963 100% 592 100% 1,218 100%
e. Never 5 0% 3 0% 2 0% 2 0% 2 0%
Sometimes 290 15% 129 13% 160 17% 95 16% 178 15%
Often 990 51% 483 50% 495 51% 301 51% 620 51%
Very often 665 34% 351 36% 307 32% 197 33% 420 34%
Total 1,950 100% 966 100% 964 100% 595 100% 1,220 100%
f. Never 13 1% 8 1% 5 1% 5 1% 8 1%
Sometimes 387 20% 168 17% 214 22% 105 18% 246 20%
Often 1,031 53% 486 50% 534 55% 332 56% 625 51%
Very often 516 27% 302 31% 210 22% 150 25% 341 28%
Total 1,947 100% 964 100% 963 100% 592 100% 1,220 100%
g. Never 18 1% 6 1% 12 1% 5 1% 12 1%
Sometimes 637 33% 293 30% 336 35% 187 32% 398 33%
Often 877 45% 455 47% 418 43% 256 43% 571 47%
Very often 414 21% 209 22% 197 20% 145 24% 238 20%
Total 1,946 100% 963 100% 963 100% 593 100% 1,219 100%
h. Never 109 6% 63 7% 45 5% 23 4% 79 6%
Sometimes 982 50% 481 50% 488 51% 297 50% 615 50%
Often 623 32% 300 31% 318 33% 197 33% 380 31%
Very often 234 12% 121 13% 112 12% 76 13% 146 12%
Total 1,948 100% 965 100% 963 100% 593 100% 1,220 100%
i. Never 38 2% 19 2% 18 2% 8 1% 28 2%
Sometimes 676 35% 354 37% 316 33% 207 35% 420 34%
Often 909 47% 429 45% 472 49% 285 48% 560 46%
Very often 324 17% 161 17% 158 16% 94 16% 210 17%
Total 1,947 100% 963 100% 964 100% 594 100% 1,218 100%
j. Never 190 10% 81 8% 105 11% 48 8% 125 10%
Sometimes 1,082 56% 545 57% 527 55% 329 56% 677 56%
Often 505 26% 251 26% 249 26% 155 26% 315 26%
Very often 161 8% 79 8% 81 8% 58 10% 96 8%
Total 1,938 100% 956 100% 962 100% 590 100% 1,213 100%
Work with faculty members
on activities other than
coursework (committees,
orientation, student life
activities, etc.)
cfacothe
cfacidea
Work with classmates outside
of class to prepare class
assignments
coccgrp
Discuss ideas from your
readings or classes with
faculty members outside of
class
Work with other students on
projects during class
cclassgr
Discuss grades or assignments
with an instructor
cfacgrad
Receive prompt feedback from
faculty on your academic
performance (written or oral)
cfacfeed
Put together ideas or concepts
from different courses when
completing assignments or
during class discussions
cintidea
a First generation is defined as no parent or guardian having graduated with a 4-year college degree. 13
Variable Response Options Count % Count % Count % Count % Count %
No
BCSSE 2007 Engagement Item Frequency Distributions
Washington State University
YesMaleFemale
All Students
WsU
First Generationa
Gender
Beginning College Survey ofStudent Engagement
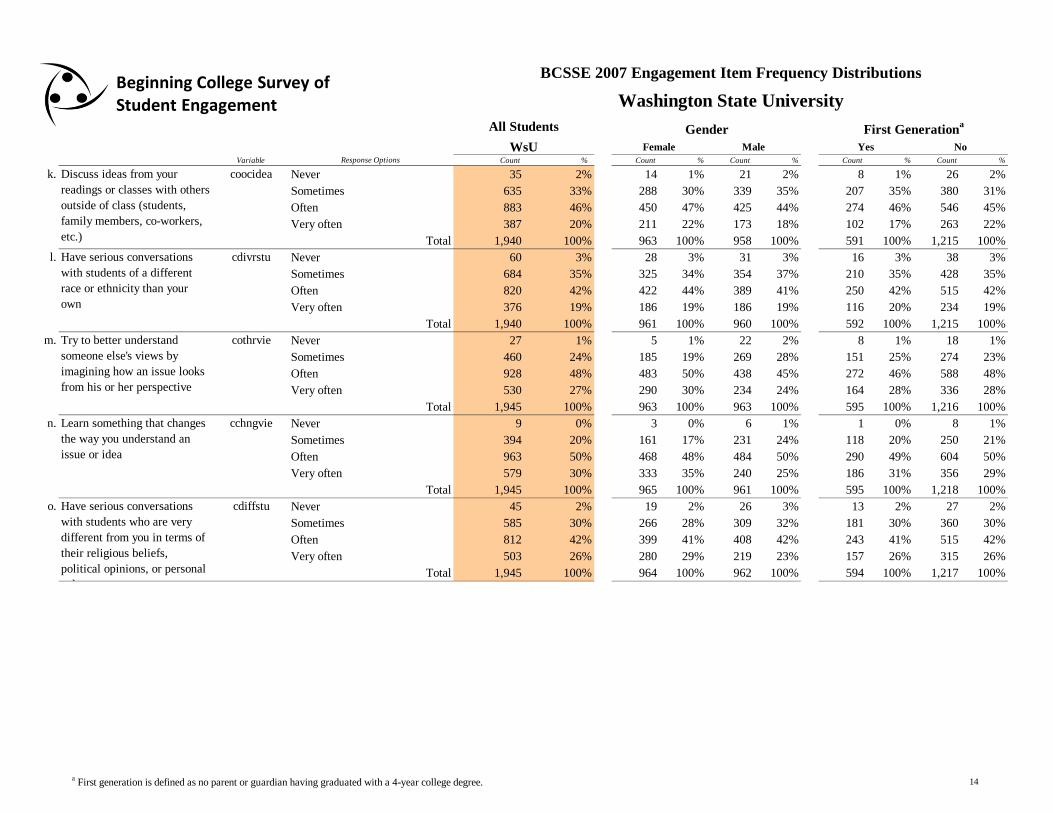
k. Never 35 2% 14 1% 21 2% 8 1% 26 2%
Sometimes 635 33% 288 30% 339 35% 207 35% 380 31%
Often 883 46% 450 47% 425 44% 274 46% 546 45%
Very often 387 20% 211 22% 173 18% 102 17% 263 22%
Total 1,940 100% 963 100% 958 100% 591 100% 1,215 100%
l. Never 60 3% 28 3% 31 3% 16 3% 38 3%
Sometimes 684 35% 325 34% 354 37% 210 35% 428 35%
Often 820 42% 422 44% 389 41% 250 42% 515 42%
Very often 376 19% 186 19% 186 19% 116 20% 234 19%
Total 1,940 100% 961 100% 960 100% 592 100% 1,215 100%
m. Never 27 1% 5 1% 22 2% 8 1% 18 1%
Sometimes 460 24% 185 19% 269 28% 151 25% 274 23%
Often 928 48% 483 50% 438 45% 272 46% 588 48%
Very often 530 27% 290 30% 234 24% 164 28% 336 28%
Total 1,945 100% 963 100% 963 100% 595 100% 1,216 100%
n. Never 9 0% 3 0% 6 1% 1 0% 8 1%
Sometimes 394 20% 161 17% 231 24% 118 20% 250 21%
Often 963 50% 468 48% 484 50% 290 49% 604 50%
Very often 579 30% 333 35% 240 25% 186 31% 356 29%
Total 1,945 100% 965 100% 961 100% 595 100% 1,218 100%
o. Never 45 2% 19 2% 26 3% 13 2% 27 2%
Sometimes 585 30% 266 28% 309 32% 181 30% 360 30%
Often 812 42% 399 41% 408 42% 243 41% 515 42%
Very often 503 26% 280 29% 219 23% 157 26% 315 26%
Total 1,945 100% 964 100% 962 100% 594 100% 1,217 100%
Try to better understand
someone else's views by
imagining how an issue looks
from his or her perspective
cothrvie
Learn something that changes
the way you understand an
issue or idea
cchngvie
cdiffstuHave serious conversations
with students who are very
different from you in terms of
their religious beliefs,
political opinions, or personal
values
coocidea
Have serious conversations
with students of a different
race or ethnicity than your
own
cdivrstu
Discuss ideas from your
readings or classes with others
outside of class (students,
family members, co-workers,
etc.)
a First generation is defined as no parent or guardian having graduated with a 4-year college degree. 14
Variable Response Options Count % Count % Count % Count % Count %
No
BCSSE 2007 Engagement Item Frequency Distributions
Washington State University
YesMaleFemale
All Students
WsU
First Generationa
Gender
Beginning College Survey ofStudent Engagement
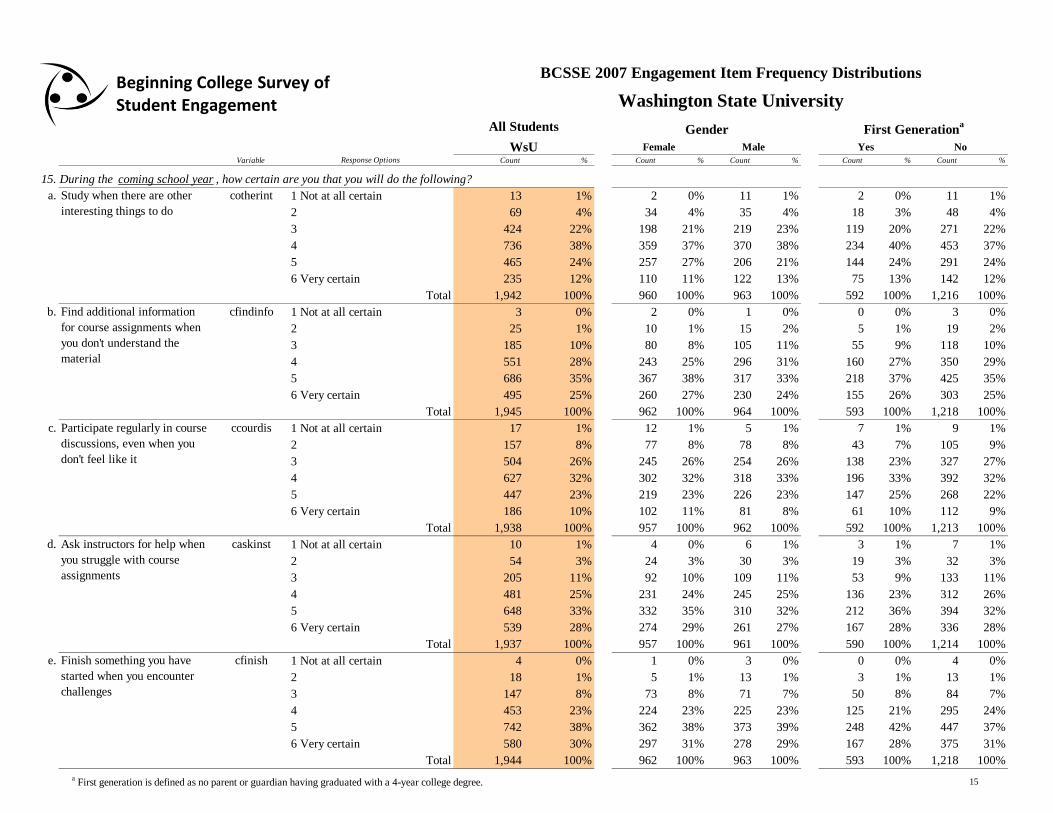
15. During the coming school year , how certain are you that you will do the following?
a. 1 Not at all certain 13 1% 2 0% 11 1% 2 0% 11 1%
2 69 4% 34 4% 35 4% 18 3% 48 4%
3 424 22% 198 21% 219 23% 119 20% 271 22%
4 736 38% 359 37% 370 38% 234 40% 453 37%
5 465 24% 257 27% 206 21% 144 24% 291 24%
6 Very certain 235 12% 110 11% 122 13% 75 13% 142 12%
Total 1,942 100% 960 100% 963 100% 592 100% 1,216 100%
b. 1 Not at all certain 3 0% 2 0% 1 0% 0 0% 3 0%
2 25 1% 10 1% 15 2% 5 1% 19 2%
3 185 10% 80 8% 105 11% 55 9% 118 10%
4 551 28% 243 25% 296 31% 160 27% 350 29%
5 686 35% 367 38% 317 33% 218 37% 425 35%
6 Very certain 495 25% 260 27% 230 24% 155 26% 303 25%
Total 1,945 100% 962 100% 964 100% 593 100% 1,218 100%
c. 1 Not at all certain 17 1% 12 1% 5 1% 7 1% 9 1%
2 157 8% 77 8% 78 8% 43 7% 105 9%
3 504 26% 245 26% 254 26% 138 23% 327 27%
4 627 32% 302 32% 318 33% 196 33% 392 32%
5 447 23% 219 23% 226 23% 147 25% 268 22%
6 Very certain 186 10% 102 11% 81 8% 61 10% 112 9%
Total 1,938 100% 957 100% 962 100% 592 100% 1,213 100%
d. 1 Not at all certain 10 1% 4 0% 6 1% 3 1% 7 1%
2 54 3% 24 3% 30 3% 19 3% 32 3%
3 205 11% 92 10% 109 11% 53 9% 133 11%
4 481 25% 231 24% 245 25% 136 23% 312 26%
5 648 33% 332 35% 310 32% 212 36% 394 32%
6 Very certain 539 28% 274 29% 261 27% 167 28% 336 28%
Total 1,937 100% 957 100% 961 100% 590 100% 1,214 100%
e. 1 Not at all certain 4 0% 1 0% 3 0% 0 0% 4 0%
2 18 1% 5 1% 13 1% 3 1% 13 1%
3 147 8% 73 8% 71 7% 50 8% 84 7%
4 453 23% 224 23% 225 23% 125 21% 295 24%
5 742 38% 362 38% 373 39% 248 42% 447 37%
6 Very certain 580 30% 297 31% 278 29% 167 28% 375 31%
Total 1,944 100% 962 100% 963 100% 593 100% 1,218 100%
Finish something you have
started when you encounter
challenges
cfinish
Ask instructors for help when
you struggle with course
assignments
caskinst
Participate regularly in course
discussions, even when you
don't feel like it
ccourdis
Find additional information
for course assignments when
you don't understand the
material
cfindinfo
Study when there are other
interesting things to do
cotherint
a First generation is defined as no parent or guardian having graduated with a 4-year college degree. 15
Variable Response Options Count % Count % Count % Count % Count %
No
BCSSE 2007 Engagement Item Frequency Distributions
Washington State University
YesMaleFemale
All Students
WsU
First Generationa
Gender
Beginning College Survey ofStudent Engagement
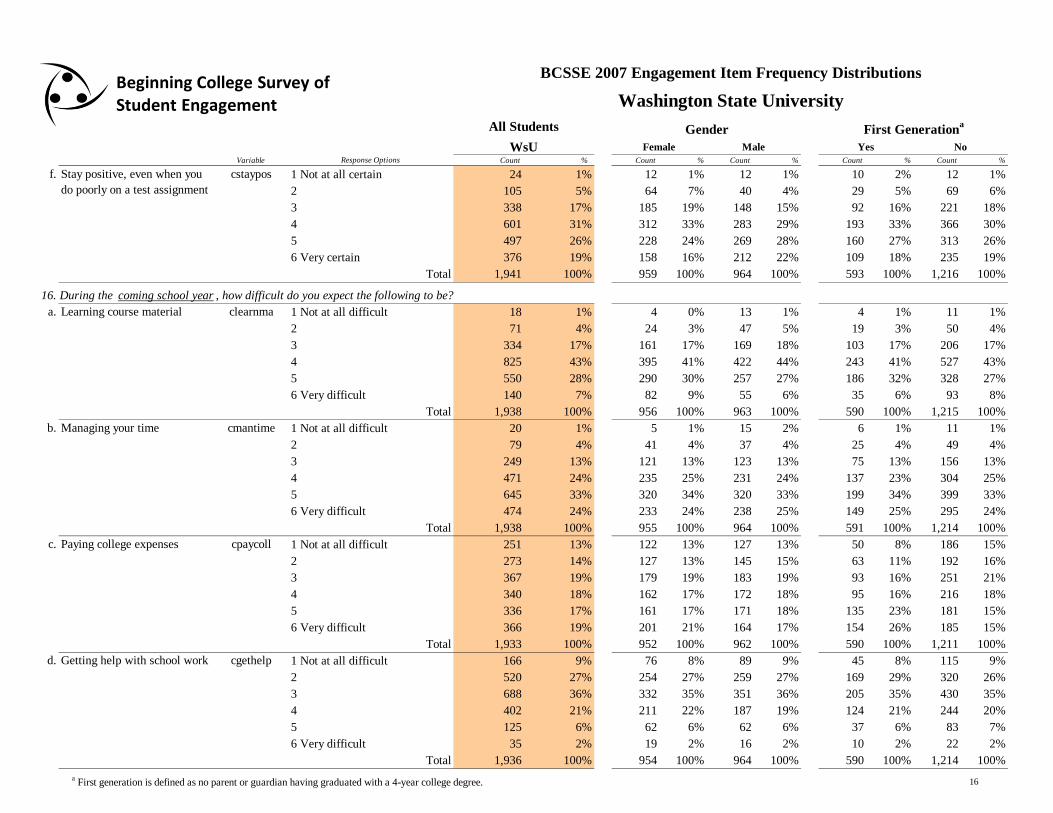
f. 1 Not at all certain 24 1% 12 1% 12 1% 10 2% 12 1%
2 105 5% 64 7% 40 4% 29 5% 69 6%
3 338 17% 185 19% 148 15% 92 16% 221 18%
4 601 31% 312 33% 283 29% 193 33% 366 30%
5 497 26% 228 24% 269 28% 160 27% 313 26%
6 Very certain 376 19% 158 16% 212 22% 109 18% 235 19%
Total 1,941 100% 959 100% 964 100% 593 100% 1,216 100%
16. During the coming school year , how difficult do you expect the following to be?
a. 1 Not at all difficult 18 1% 4 0% 13 1% 4 1% 11 1%
2 71 4% 24 3% 47 5% 19 3% 50 4%
3 334 17% 161 17% 169 18% 103 17% 206 17%
4 825 43% 395 41% 422 44% 243 41% 527 43%
5 550 28% 290 30% 257 27% 186 32% 328 27%
6 Very difficult 140 7% 82 9% 55 6% 35 6% 93 8%
Total 1,938 100% 956 100% 963 100% 590 100% 1,215 100%
b. 1 Not at all difficult 20 1% 5 1% 15 2% 6 1% 11 1%
2 79 4% 41 4% 37 4% 25 4% 49 4%
3 249 13% 121 13% 123 13% 75 13% 156 13%
4 471 24% 235 25% 231 24% 137 23% 304 25%
5 645 33% 320 34% 320 33% 199 34% 399 33%
6 Very difficult 474 24% 233 24% 238 25% 149 25% 295 24%
Total 1,938 100% 955 100% 964 100% 591 100% 1,214 100%
c. 1 Not at all difficult 251 13% 122 13% 127 13% 50 8% 186 15%
2 273 14% 127 13% 145 15% 63 11% 192 16%
3 367 19% 179 19% 183 19% 93 16% 251 21%
4 340 18% 162 17% 172 18% 95 16% 216 18%
5 336 17% 161 17% 171 18% 135 23% 181 15%
6 Very difficult 366 19% 201 21% 164 17% 154 26% 185 15%
Total 1,933 100% 952 100% 962 100% 590 100% 1,211 100%
d. 1 Not at all difficult 166 9% 76 8% 89 9% 45 8% 115 9%
2 520 27% 254 27% 259 27% 169 29% 320 26%
3 688 36% 332 35% 351 36% 205 35% 430 35%
4 402 21% 211 22% 187 19% 124 21% 244 20%
5 125 6% 62 6% 62 6% 37 6% 83 7%
6 Very difficult 35 2% 19 2% 16 2% 10 2% 22 2%
Total 1,936 100% 954 100% 964 100% 590 100% 1,214 100%
cstaypos
cgethelp
Managing your time cmantime
Paying college expenses cpaycoll
Learning course material clearnma
Stay positive, even when you
do poorly on a test assignment
Getting help with school work
a First generation is defined as no parent or guardian having graduated with a 4-year college degree. 16
Variable Response Options Count % Count % Count % Count % Count %
No
BCSSE 2007 Engagement Item Frequency Distributions
Washington State University
YesMaleFemale
All Students
WsU
First Generationa
Gender
Beginning College Survey ofStudent Engagement
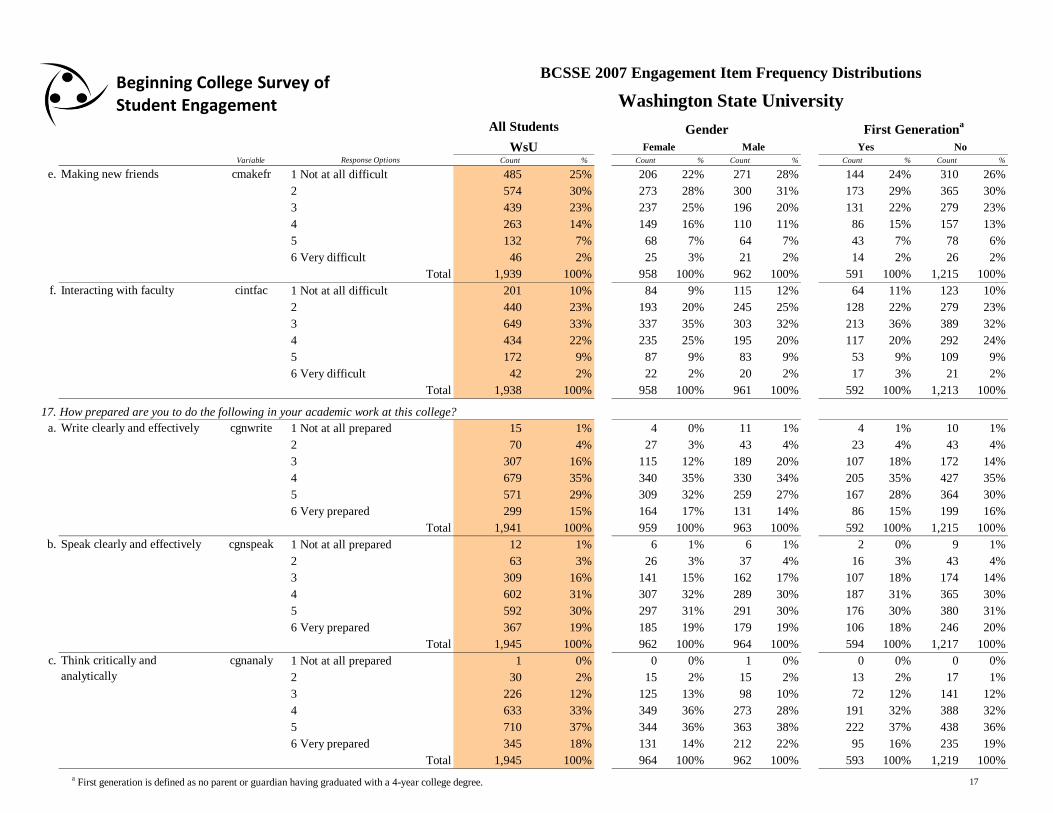
e. 1 Not at all difficult 485 25% 206 22% 271 28% 144 24% 310 26%
2 574 30% 273 28% 300 31% 173 29% 365 30%
3 439 23% 237 25% 196 20% 131 22% 279 23%
4 263 14% 149 16% 110 11% 86 15% 157 13%
5 132 7% 68 7% 64 7% 43 7% 78 6%
6 Very difficult 46 2% 25 3% 21 2% 14 2% 26 2%
Total 1,939 100% 958 100% 962 100% 591 100% 1,215 100%
f. 1 Not at all difficult 201 10% 84 9% 115 12% 64 11% 123 10%
2 440 23% 193 20% 245 25% 128 22% 279 23%
3 649 33% 337 35% 303 32% 213 36% 389 32%
4 434 22% 235 25% 195 20% 117 20% 292 24%
5 172 9% 87 9% 83 9% 53 9% 109 9%
6 Very difficult 42 2% 22 2% 20 2% 17 3% 21 2%
Total 1,938 100% 958 100% 961 100% 592 100% 1,213 100%
17. How prepared are you to do the following in your academic work at this college?
a. 1 Not at all prepared 15 1% 4 0% 11 1% 4 1% 10 1%
2 70 4% 27 3% 43 4% 23 4% 43 4%
3 307 16% 115 12% 189 20% 107 18% 172 14%
4 679 35% 340 35% 330 34% 205 35% 427 35%
5 571 29% 309 32% 259 27% 167 28% 364 30%
6 Very prepared 299 15% 164 17% 131 14% 86 15% 199 16%
Total 1,941 100% 959 100% 963 100% 592 100% 1,215 100%
b. 1 Not at all prepared 12 1% 6 1% 6 1% 2 0% 9 1%
2 63 3% 26 3% 37 4% 16 3% 43 4%
3 309 16% 141 15% 162 17% 107 18% 174 14%
4 602 31% 307 32% 289 30% 187 31% 365 30%
5 592 30% 297 31% 291 30% 176 30% 380 31%
6 Very prepared 367 19% 185 19% 179 19% 106 18% 246 20%
Total 1,945 100% 962 100% 964 100% 594 100% 1,217 100%
c. 1 Not at all prepared 1 0% 0 0% 1 0% 0 0% 0 0%
2 30 2% 15 2% 15 2% 13 2% 17 1%
3 226 12% 125 13% 98 10% 72 12% 141 12%
4 633 33% 349 36% 273 28% 191 32% 388 32%
5 710 37% 344 36% 363 38% 222 37% 438 36%
6 Very prepared 345 18% 131 14% 212 22% 95 16% 235 19%
Total 1,945 100% 964 100% 962 100% 593 100% 1,219 100%
Making new friends cmakefr
Interacting with faculty cintfac
Think critically and
analytically
cgnanaly
Write clearly and effectively
Speak clearly and effectively cgnspeak
cgnwrite
a First generation is defined as no parent or guardian having graduated with a 4-year college degree. 17
Variable Response Options Count % Count % Count % Count % Count %
No
BCSSE 2007 Engagement Item Frequency Distributions
Washington State University
YesMaleFemale
All Students
WsU
First Generationa
Gender
Beginning College Survey ofStudent Engagement
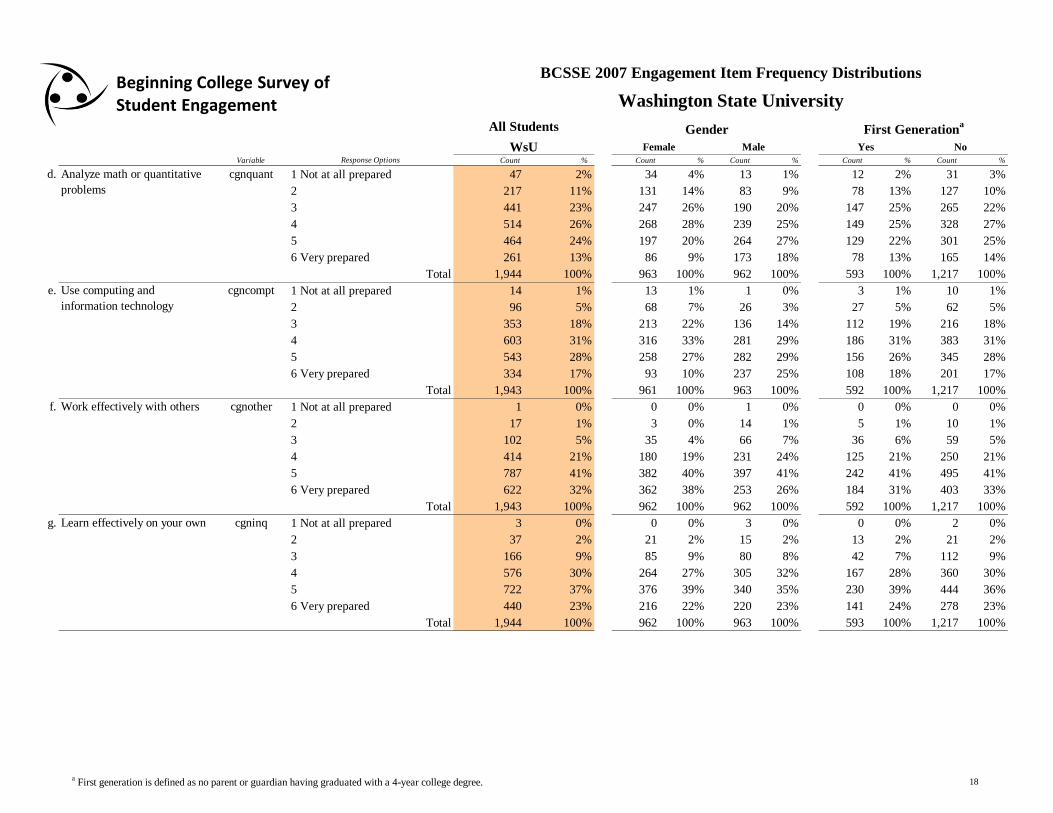
d. 1 Not at all prepared 47 2% 34 4% 13 1% 12 2% 31 3%
2 217 11% 131 14% 83 9% 78 13% 127 10%
3 441 23% 247 26% 190 20% 147 25% 265 22%
4 514 26% 268 28% 239 25% 149 25% 328 27%
5 464 24% 197 20% 264 27% 129 22% 301 25%
6 Very prepared 261 13% 86 9% 173 18% 78 13% 165 14%
Total 1,944 100% 963 100% 962 100% 593 100% 1,217 100%
e. 1 Not at all prepared 14 1% 13 1% 1 0% 3 1% 10 1%
2 96 5% 68 7% 26 3% 27 5% 62 5%
3 353 18% 213 22% 136 14% 112 19% 216 18%
4 603 31% 316 33% 281 29% 186 31% 383 31%
5 543 28% 258 27% 282 29% 156 26% 345 28%
6 Very prepared 334 17% 93 10% 237 25% 108 18% 201 17%
Total 1,943 100% 961 100% 963 100% 592 100% 1,217 100%
f. 1 Not at all prepared 1 0% 0 0% 1 0% 0 0% 0 0%
2 17 1% 3 0% 14 1% 5 1% 10 1%
3 102 5% 35 4% 66 7% 36 6% 59 5%
4 414 21% 180 19% 231 24% 125 21% 250 21%
5 787 41% 382 40% 397 41% 242 41% 495 41%
6 Very prepared 622 32% 362 38% 253 26% 184 31% 403 33%
Total 1,943 100% 962 100% 962 100% 592 100% 1,217 100%
g. 1 Not at all prepared 3 0% 0 0% 3 0% 0 0% 2 0%
2 37 2% 21 2% 15 2% 13 2% 21 2%
3 166 9% 85 9% 80 8% 42 7% 112 9%
4 576 30% 264 27% 305 32% 167 28% 360 30%
5 722 37% 376 39% 340 35% 230 39% 444 36%
6 Very prepared 440 23% 216 22% 220 23% 141 24% 278 23%
Total 1,944 100% 962 100% 963 100% 593 100% 1,217 100%
Analyze math or quantitative
problems
cgnquant
Use computing and
information technology
cgnother
Learn effectively on your own cgninq
cgncompt
Work effectively with others
a First generation is defined as no parent or guardian having graduated with a 4-year college degree. 18
Variable Response Options Count % Count % Count % Count % Count %
No
BCSSE 2007 Engagement Item Frequency Distributions
Washington State University
YesMaleFemale
All Students
WsU
First Generationa
Gender
Beginning College Survey ofStudent Engagement
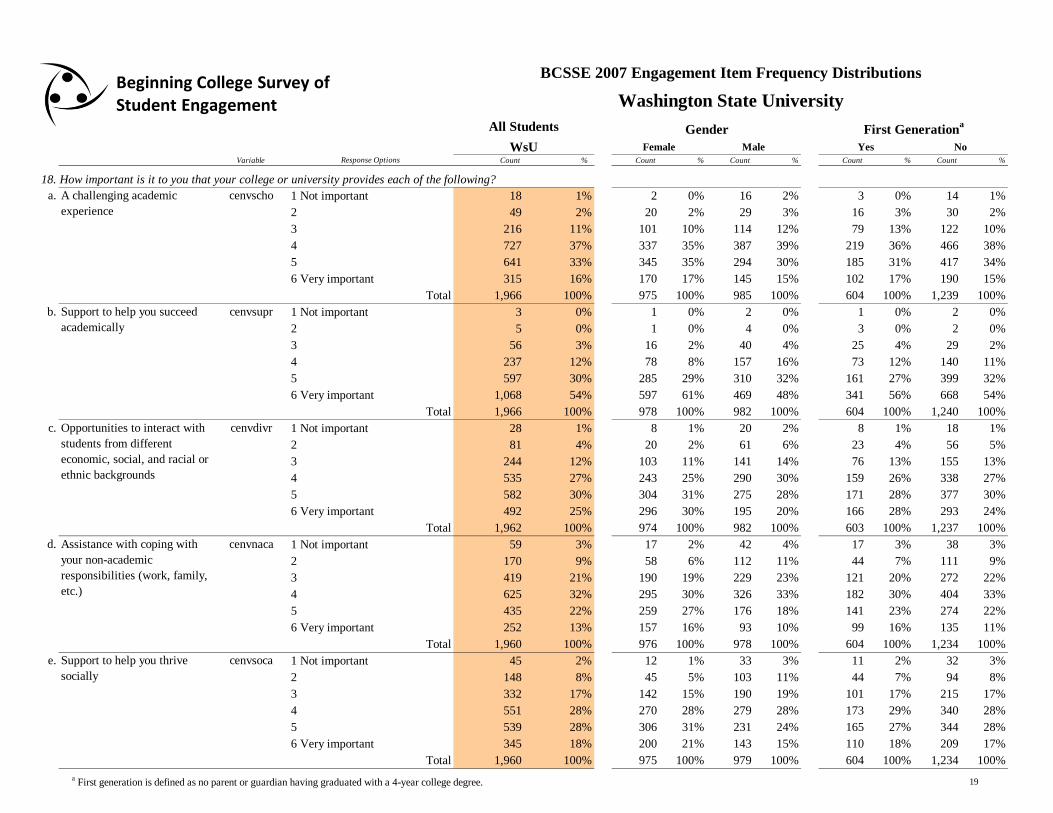
18. How important is it to you that your college or university provides each of the following?
a. 1 Not important 18 1% 2 0% 16 2% 3 0% 14 1%
2 49 2% 20 2% 29 3% 16 3% 30 2%
3 216 11% 101 10% 114 12% 79 13% 122 10%
4 727 37% 337 35% 387 39% 219 36% 466 38%
5 641 33% 345 35% 294 30% 185 31% 417 34%
6 Very important 315 16% 170 17% 145 15% 102 17% 190 15%
Total 1,966 100% 975 100% 985 100% 604 100% 1,239 100%
b. 1 Not important 3 0% 1 0% 2 0% 1 0% 2 0%
2 5 0% 1 0% 4 0% 3 0% 2 0%
3 56 3% 16 2% 40 4% 25 4% 29 2%
4 237 12% 78 8% 157 16% 73 12% 140 11%
5 597 30% 285 29% 310 32% 161 27% 399 32%
6 Very important 1,068 54% 597 61% 469 48% 341 56% 668 54%
Total 1,966 100% 978 100% 982 100% 604 100% 1,240 100%
c. 1 Not important 28 1% 8 1% 20 2% 8 1% 18 1%
2 81 4% 20 2% 61 6% 23 4% 56 5%
3 244 12% 103 11% 141 14% 76 13% 155 13%
4 535 27% 243 25% 290 30% 159 26% 338 27%
5 582 30% 304 31% 275 28% 171 28% 377 30%
6 Very important 492 25% 296 30% 195 20% 166 28% 293 24%
Total 1,962 100% 974 100% 982 100% 603 100% 1,237 100%
d. 1 Not important 59 3% 17 2% 42 4% 17 3% 38 3%
2 170 9% 58 6% 112 11% 44 7% 111 9%
3 419 21% 190 19% 229 23% 121 20% 272 22%
4 625 32% 295 30% 326 33% 182 30% 404 33%
5 435 22% 259 27% 176 18% 141 23% 274 22%
6 Very important 252 13% 157 16% 93 10% 99 16% 135 11%
Total 1,960 100% 976 100% 978 100% 604 100% 1,234 100%
e. 1 Not important 45 2% 12 1% 33 3% 11 2% 32 3%
2 148 8% 45 5% 103 11% 44 7% 94 8%
3 332 17% 142 15% 190 19% 101 17% 215 17%
4 551 28% 270 28% 279 28% 173 29% 340 28%
5 539 28% 306 31% 231 24% 165 27% 344 28%
6 Very important 345 18% 200 21% 143 15% 110 18% 209 17%
Total 1,960 100% 975 100% 979 100% 604 100% 1,234 100%
A challenging academic
experience
cenvscho
cenvsoca
cenvsupr
Opportunities to interact with
students from different
economic, social, and racial or
ethnic backgrounds
Support to help you succeed
academically
cenvdivr
Assistance with coping with
your non-academic
responsibilities (work, family,
etc.)
cenvnaca
Support to help you thrive
socially
a First generation is defined as no parent or guardian having graduated with a 4-year college degree. 19
Variable Response Options Count % Count % Count % Count % Count %
No
BCSSE 2007 Engagement Item Frequency Distributions
Washington State University
YesMaleFemale
All Students
WsU
First Generationa
Gender
Beginning College Survey ofStudent Engagement
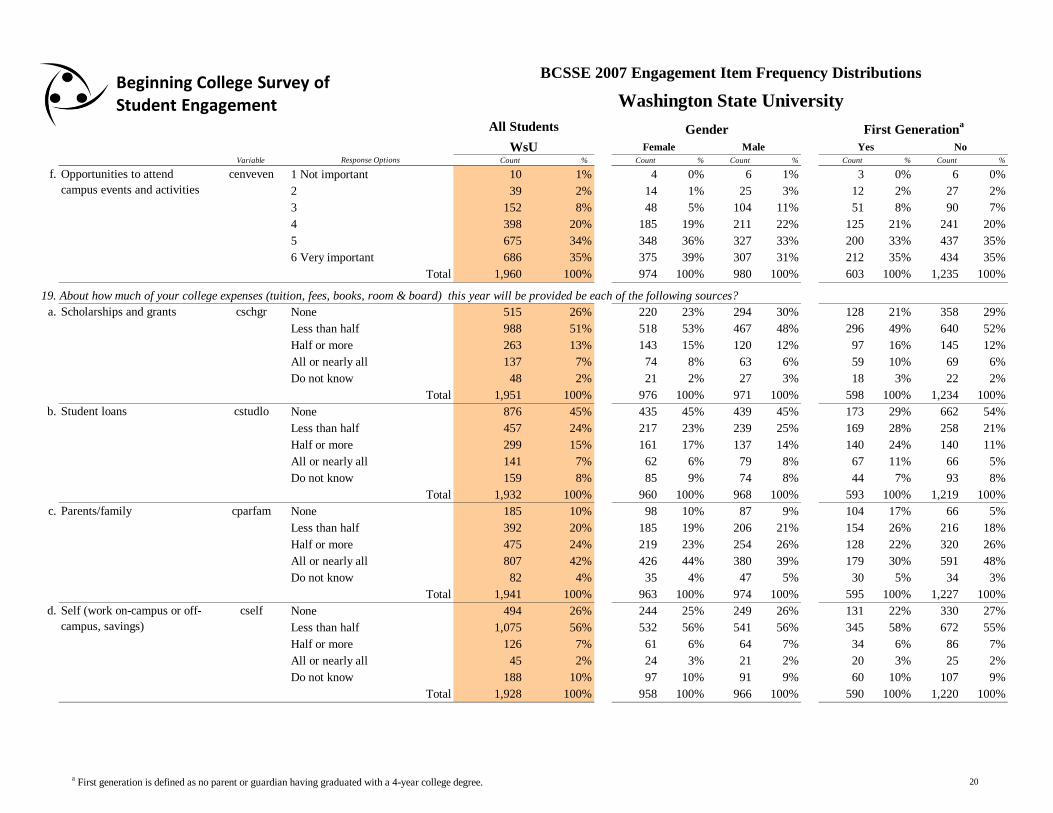
f. 1 Not important 10 1% 4 0% 6 1% 3 0% 6 0%
2 39 2% 14 1% 25 3% 12 2% 27 2%
3 152 8% 48 5% 104 11% 51 8% 90 7%
4 398 20% 185 19% 211 22% 125 21% 241 20%
5 675 34% 348 36% 327 33% 200 33% 437 35%
6 Very important 686 35% 375 39% 307 31% 212 35% 434 35%
Total 1,960 100% 974 100% 980 100% 603 100% 1,235 100%
19. About how much of your college expenses (tuition, fees, books, room & board) this year will be provided be each of the following sources?
a. None 515 26% 220 23% 294 30% 128 21% 358 29%
Less than half 988 51% 518 53% 467 48% 296 49% 640 52%
Half or more 263 13% 143 15% 120 12% 97 16% 145 12%
All or nearly all 137 7% 74 8% 63 6% 59 10% 69 6%
Do not know 48 2% 21 2% 27 3% 18 3% 22 2%
Total 1,951 100% 976 100% 971 100% 598 100% 1,234 100%
b. None 876 45% 435 45% 439 45% 173 29% 662 54%
Less than half 457 24% 217 23% 239 25% 169 28% 258 21%
Half or more 299 15% 161 17% 137 14% 140 24% 140 11%
All or nearly all 141 7% 62 6% 79 8% 67 11% 66 5%
Do not know 159 8% 85 9% 74 8% 44 7% 93 8%
Total 1,932 100% 960 100% 968 100% 593 100% 1,219 100%
c. None 185 10% 98 10% 87 9% 104 17% 66 5%
Less than half 392 20% 185 19% 206 21% 154 26% 216 18%
Half or more 475 24% 219 23% 254 26% 128 22% 320 26%
All or nearly all 807 42% 426 44% 380 39% 179 30% 591 48%
Do not know 82 4% 35 4% 47 5% 30 5% 34 3%
Total 1,941 100% 963 100% 974 100% 595 100% 1,227 100%
d. None 494 26% 244 25% 249 26% 131 22% 330 27%
Less than half 1,075 56% 532 56% 541 56% 345 58% 672 55%
Half or more 126 7% 61 6% 64 7% 34 6% 86 7%
All or nearly all 45 2% 24 3% 21 2% 20 3% 25 2%
Do not know 188 10% 97 10% 91 9% 60 10% 107 9%
Total 1,928 100% 958 100% 966 100% 590 100% 1,220 100%
Opportunities to attend
campus events and activities
Parents/family
cenveven
cparfam
Self (work on-campus or off-
campus, savings)
Scholarships and grants cschgr
Student loans cstudlo
cself
a First generation is defined as no parent or guardian having graduated with a 4-year college degree. 20
Variable Response Options Count % Count % Count % Count % Count %
No
BCSSE 2007 Engagement Item Frequency Distributions
Washington State University
YesMaleFemale
All Students
WsU
First Generationa
Gender
Beginning College Survey ofStudent Engagement
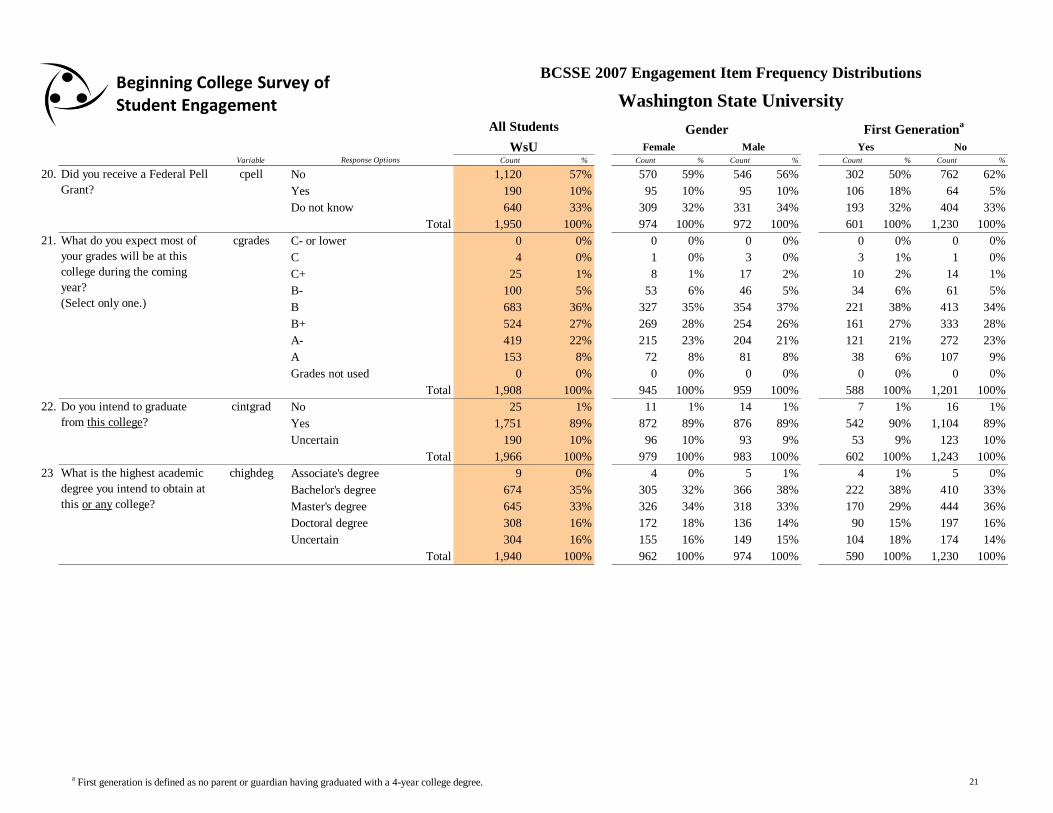
20. cpell No 1,120 57% 570 59% 546 56% 302 50% 762 62%
Yes 190 10% 95 10% 95 10% 106 18% 64 5%
Do not know 640 33% 309 32% 331 34% 193 32% 404 33%
Total 1,950 100% 974 100% 972 100% 601 100% 1,230 100%
21. C- or lower 0 0% 0 0% 0 0% 0 0% 0 0%
C 4 0% 1 0% 3 0% 3 1% 1 0%
C+ 25 1% 8 1% 17 2% 10 2% 14 1%
B- 100 5% 53 6% 46 5% 34 6% 61 5%
B 683 36% 327 35% 354 37% 221 38% 413 34%
B+ 524 27% 269 28% 254 26% 161 27% 333 28%
A- 419 22% 215 23% 204 21% 121 21% 272 23%
A 153 8% 72 8% 81 8% 38 6% 107 9%
Grades not used 0 0% 0 0% 0 0% 0 0% 0 0%
Total 1,908 100% 945 100% 959 100% 588 100% 1,201 100%
22. cintgrad No 25 1% 11 1% 14 1% 7 1% 16 1%
Yes 1,751 89% 872 89% 876 89% 542 90% 1,104 89%
Uncertain 190 10% 96 10% 93 9% 53 9% 123 10%
Total 1,966 100% 979 100% 983 100% 602 100% 1,243 100%
23 Associate's degree 9 0% 4 0% 5 1% 4 1% 5 0%
Bachelor's degree 674 35% 305 32% 366 38% 222 38% 410 33%
Master's degree 645 33% 326 34% 318 33% 170 29% 444 36%
Doctoral degree 308 16% 172 18% 136 14% 90 15% 197 16%
Uncertain 304 16% 155 16% 149 15% 104 18% 174 14%
Total 1,940 100% 962 100% 974 100% 590 100% 1,230 100%
cgrades
Do you intend to graduate
from this college?
What is the highest academic
degree you intend to obtain at
this or any college?
chighdeg
Did you receive a Federal Pell
Grant?
What do you expect most of
your grades will be at this
college during the coming
year?
(Select only one.)
a First generation is defined as no parent or guardian having graduated with a 4-year college degree. 21
Variable Response Options Count % Count % Count % Count % Count %
No
BCSSE 2007 Engagement Item Frequency Distributions
Washington State University
YesMaleFemale
All Students
WsU
First Generationa
Gender
Beginning College Survey ofStudent Engagement
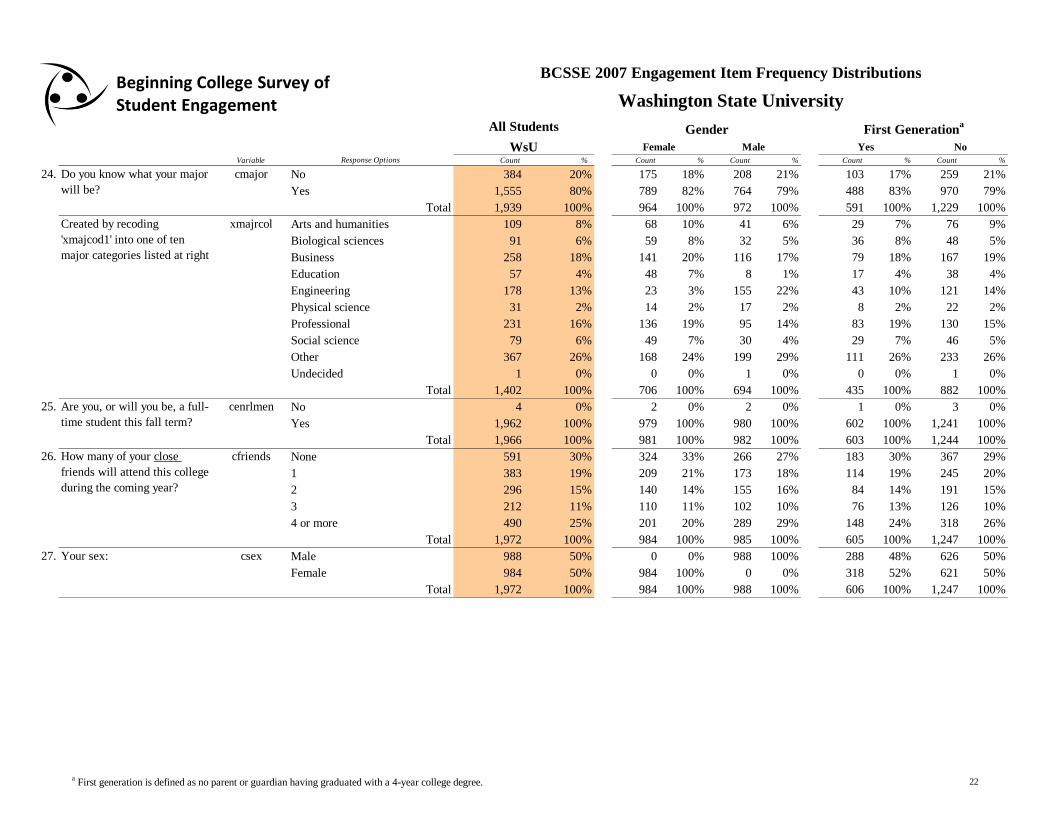
24. cmajor No 384 20% 175 18% 208 21% 103 17% 259 21%
Yes 1,555 80% 789 82% 764 79% 488 83% 970 79%
Total 1,939 100% 964 100% 972 100% 591 100% 1,229 100%
xmajrcol Arts and humanities 109 8% 68 10% 41 6% 29 7% 76 9%
Biological sciences 91 6% 59 8% 32 5% 36 8% 48 5%
Business 258 18% 141 20% 116 17% 79 18% 167 19%
Education 57 4% 48 7% 8 1% 17 4% 38 4%
Engineering 178 13% 23 3% 155 22% 43 10% 121 14%
Physical science 31 2% 14 2% 17 2% 8 2% 22 2%
Professional 231 16% 136 19% 95 14% 83 19% 130 15%
Social science 79 6% 49 7% 30 4% 29 7% 46 5%
Other 367 26% 168 24% 199 29% 111 26% 233 26%
Undecided 1 0% 0 0% 1 0% 0 0% 1 0%
Total 1,402 100% 706 100% 694 100% 435 100% 882 100%
25. cenrlmen No 4 0% 2 0% 2 0% 1 0% 3 0%
Yes 1,962 100% 979 100% 980 100% 602 100% 1,241 100%
Total 1,966 100% 981 100% 982 100% 603 100% 1,244 100%
26. None 591 30% 324 33% 266 27% 183 30% 367 29%
1 383 19% 209 21% 173 18% 114 19% 245 20%
2 296 15% 140 14% 155 16% 84 14% 191 15%
3 212 11% 110 11% 102 10% 76 13% 126 10%
4 or more 490 25% 201 20% 289 29% 148 24% 318 26%
Total 1,972 100% 984 100% 985 100% 605 100% 1,247 100%
27. csex Male 988 50% 0 0% 988 100% 288 48% 626 50%
Female 984 50% 984 100% 0 0% 318 52% 621 50%
Total 1,972 100% 984 100% 988 100% 606 100% 1,247 100%
Do you know what your major
will be?
Are you, or will you be, a full-
time student this fall term?
How many of your close
friends will attend this college
during the coming year?
cfriends
Your sex:
Created by recoding
'xmajcod1' into one of ten
major categories listed at right
a First generation is defined as no parent or guardian having graduated with a 4-year college degree. 22

Variable Response Options Count % Count % Count % Count % Count %
No
BCSSE 2007 Engagement Item Frequency Distributions
Washington State University
YesMaleFemale
All Students
WsU
First Generationa
Gender
Beginning College Survey ofStudent Engagement
28. cinterna No 1,925 98% 966 99% 956 97% 588 97% 1,221 98%
Yes 40 2% 14 1% 26 3% 17 3% 19 2%
Total 1,965 100% 980 100% 982 100% 605 100% 1,240 100%
29. crace American Indian or other Native
American17 1% 10 1% 7 1% 10 2% 6 0%
Asian, Asian American, or
Pacific Islander131 7% 53 5% 78 8% 39 6% 76 6%
Black or African American 23 1% 12 1% 11 1% 12 2% 9 1%
White (non-Hispanic) 1,551 79% 786 80% 762 78% 446 74% 1,021 82%
Mexican or Mexican American 36 2% 22 2% 14 1% 22 4% 13 1%
Puerto Rican 4 0% 1 0% 3 0% 0 0% 3 0%
Other Hispanic or Latino 16 1% 7 1% 9 1% 9 1% 6 0%
Multiracial 73 4% 37 4% 36 4% 31 5% 37 3%
Other 22 1% 7 1% 15 2% 5 1% 15 1%
I prefer not to respond 90 5% 43 4% 47 5% 29 5% 55 4%
Total 1,963 100% 978 100% 982 100% 603 100% 1,241 100%
30. Please indicate whether your parents completed a 4-year college degree.
a. Did not complete 4-year degree 910 46% 455 46% 454 46% 606 100% 286 23%
Did complete 4-year degree 991 50% 505 51% 485 49% 0 0% 963 77%
Do not know 68 3% 22 2% 45 5% 0 0% 0 0%
Total 1,969 100% 982 100% 984 100% 606 100% 1,249 100%
b. Did not complete 4-year degree 829 42% 425 43% 403 41% 606 100% 209 17%
Did complete 4-year degree 1,064 54% 526 54% 536 55% 0 0% 1,040 83%
Do not know 71 4% 29 3% 42 4% 0 0% 0 0%
Total 1,964 100% 980 100% 981 100% 606 100% 1,249 100%
31. cdistanc 20 miles or less 39 2% 23 2% 16 2% 7 1% 30 2%
21-50 miles 18 1% 9 1% 9 1% 4 1% 13 1%
51-100 miles 169 9% 74 8% 95 10% 42 7% 116 9%
101-200 miles 239 12% 124 13% 114 12% 79 13% 140 11%
201-400 miles 1,152 59% 555 57% 595 61% 381 64% 706 57%
more than 400 miles 339 17% 186 19% 153 16% 84 14% 235 19%
Total 1,956 100% 971 100% 982 100% 597 100% 1,240 100%
How far is your home from
this college?
What is your racial or ethnic
identification?
(Select only one.)
Father (or guardian) cfathred
Mother (or guardian) cmothred
Are you an international
student or foreign national?
a First generation is defined as no parent or guardian having graduated with a 4-year college degree. 23
Related Documents