Central Ohio Technical College Graduate Survey AY 2014-2015 Prepared by Derek L. Thatcher Manager, Office of Career Development Central Ohio Technical College 1179 University Drive, Newark, Ohio 43055 E-mail: [email protected] Phone: (740) 366-9453 Fax: (740) 364-3646

Welcome message from author
This document is posted to help you gain knowledge. Please leave a comment to let me know what you think about it! Share it to your friends and learn new things together.
Transcript

Central Ohio Technical College
Graduate SurveyAY 2014-2015
Prepared by Derek L. Thatcher
Manager, Office of Career Development
Central Ohio Technical College
1179 University Drive, Newark, Ohio 43055
E-mail: [email protected]
Phone: (740) 366-9453
Fax: (740) 364-3646
Central Ohio Technical College
Graduate Survey AY 2014-2015
Key Results Summary
Response Rate
575 graduates for SU14 through SP15 term, 219 responses received, 38% response rate for AY 2014-2015.*
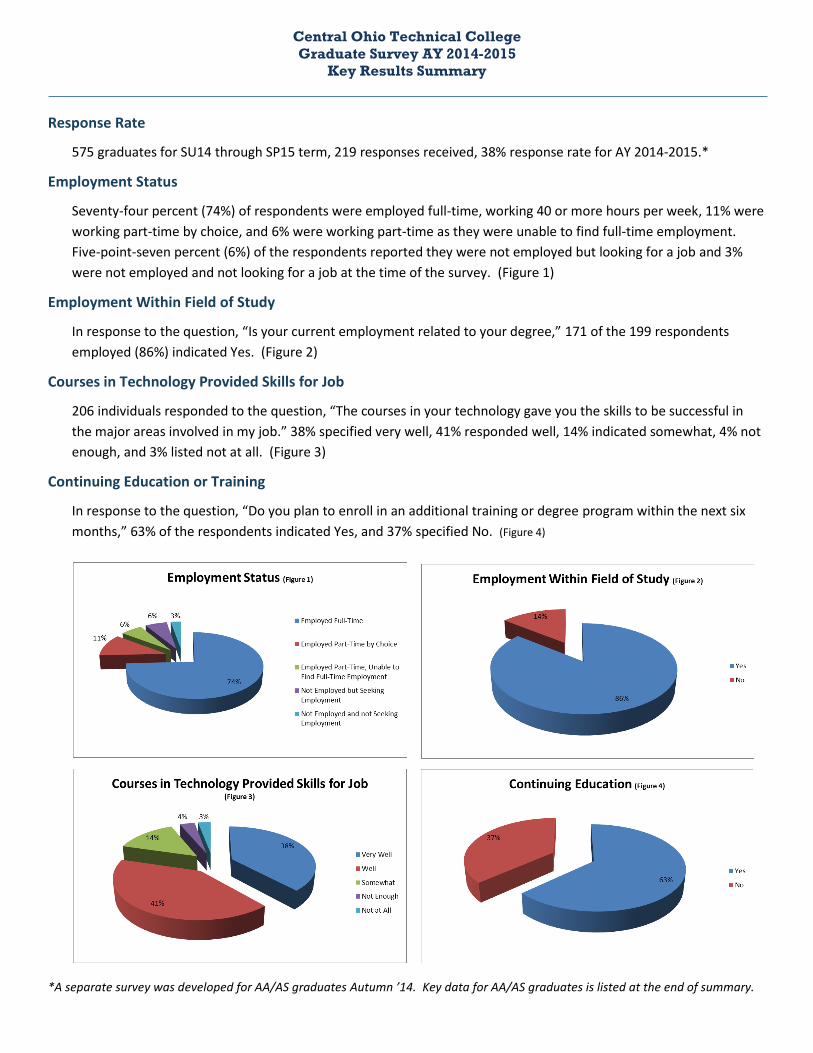
Employment Status
Seventy-four percent (74%) of respondents were employed full-time, working 40 or more hours per week, 11% were
working part-time by choice, and 6% were working part-time as they were unable to find full-time employment.
Five-point-seven percent (6%) of the respondents reported they were not employed but looking for a job and 3%
were not employed and not looking for a job at the time of the survey. (Figure 1)
Employment Within Field of Study
In response to the question, “Is your current employment related to your degree,” 171 of the 199 respondents
employed (86%) indicated Yes. (Figure 2)
Courses in Technology Provided Skills for Job
206 individuals responded to the question, “The courses in your technology gave you the skills to be successful in
the major areas involved in my job.” 38% specified very well, 41% responded well, 14% indicated somewhat, 4% not
enough, and 3% listed not at all. (Figure 3)
Continuing Education or Training
In response to the question, “Do you plan to enroll in an additional training or degree program within the next six
months,” 63% of the respondents indicated Yes, and 37% specified No. (Figure 4)
*A separate survey was developed for AA/AS graduates Autumn ’14. Key data for AA/AS graduates is listed at the end of summary.
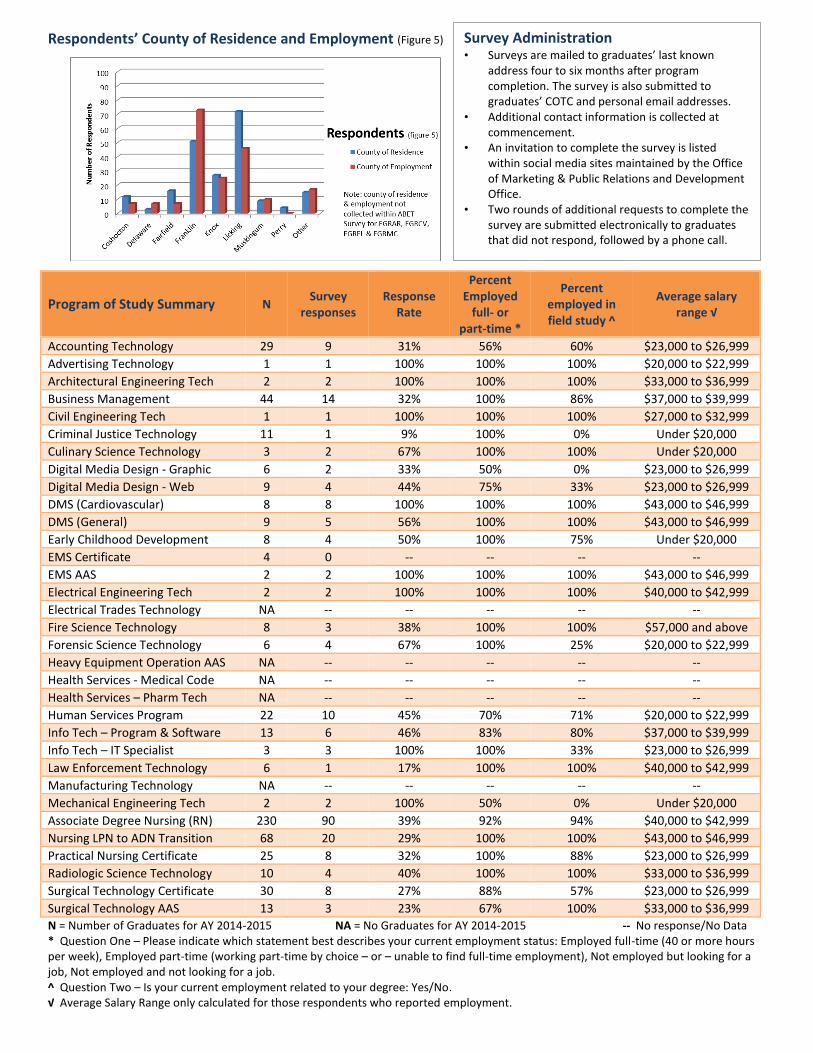
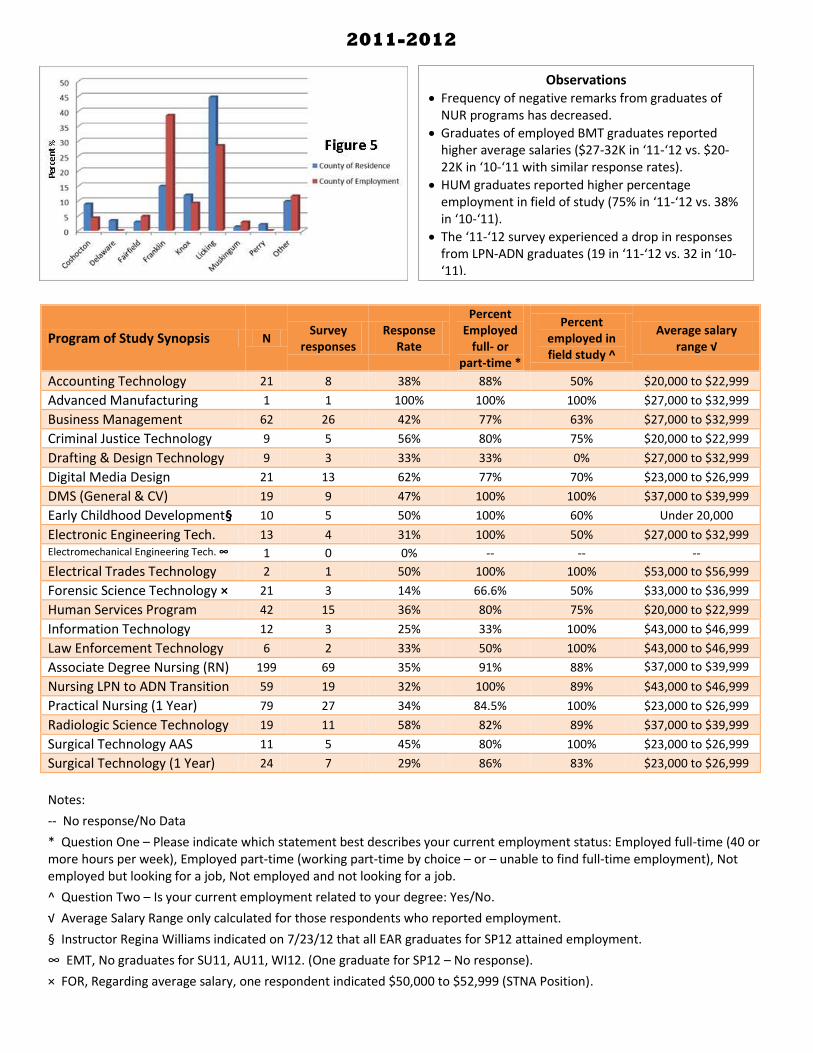
Respondents’ County of Residence and Employment (Figure 5)
Program of Study Summary N Survey
responses Response
Rate
Percent Employed
full- or part-time *
Percent employed in field study ^
Average salary range √
Accounting Technology 29 9 31% 56% 60% $23,000 to $26,999
Advertising Technology 1 1 100% 100% 100% $20,000 to $22,999
Architectural Engineering Tech 2 2 100% 100% 100% $33,000 to $36,999
Business Management 44 14 32% 100% 86% $37,000 to $39,999
Civil Engineering Tech 1 1 100% 100% 100% $27,000 to $32,999
Criminal Justice Technology 11 1 9% 100% 0% Under $20,000
Culinary Science Technology 3 2 67% 100% 100% Under $20,000
Digital Media Design - Graphic 6 2 33% 50% 0% $23,000 to $26,999
Digital Media Design - Web 9 4 44% 75% 33% $23,000 to $26,999
DMS (Cardiovascular) 8 8 100% 100% 100% $43,000 to $46,999
DMS (General) 9 5 56% 100% 100% $43,000 to $46,999
Early Childhood Development 8 4 50% 100% 75% Under $20,000
EMS Certificate 4 0 -- -- -- --
EMS AAS 2 2 100% 100% 100% $43,000 to $46,999
Electrical Engineering Tech 2 2 100% 100% 100% $40,000 to $42,999
Electrical Trades Technology NA -- -- -- -- --
Fire Science Technology 8 3 38% 100% 100% $57,000 and above
Forensic Science Technology 6 4 67% 100% 25% $20,000 to $22,999
Heavy Equipment Operation AAS NA -- -- -- -- --
Health Services - Medical Code NA -- -- -- -- --
Health Services – Pharm Tech NA -- -- -- -- --
Human Services Program 22 10 45% 70% 71% $20,000 to $22,999
Info Tech – Program & Software 13 6 46% 83% 80% $37,000 to $39,999
Info Tech – IT Specialist 3 3 100% 100% 33% $23,000 to $26,999
Law Enforcement Technology 6 1 17% 100% 100% $40,000 to $42,999
Manufacturing Technology NA -- -- -- -- --
Mechanical Engineering Tech 2 2 100% 50% 0% Under $20,000
Associate Degree Nursing (RN) 230 90 39% 92% 94% $40,000 to $42,999
Nursing LPN to ADN Transition 68 20 29% 100% 100% $43,000 to $46,999
Practical Nursing Certificate 25 8 32% 100% 88% $23,000 to $26,999
Radiologic Science Technology 10 4 40% 100% 100% $33,000 to $36,999
Surgical Technology Certificate 30 8 27% 88% 57% $23,000 to $26,999
Surgical Technology AAS 13 3 23% 67% 100% $33,000 to $36,999
N = Number of Graduates for AY 2014-2015 NA = No Graduates for AY 2014-2015 -- No response/No Data * Question One – Please indicate which statement best describes your current employment status: Employed full-time (40 or more hoursper week), Employed part-time (working part-time by choice – or – unable to find full-time employment), Not employed but looking for a job, Not employed and not looking for a job. ^ Question Two – Is your current employment related to your degree: Yes/No. √ Average Salary Range only calculated for those respondents who reported employment.
Survey Administration • Surveys are mailed to graduates’ last known
address four to six months after programcompletion. The survey is also submitted tograduates’ COTC and personal email addresses.
• Additional contact information is collected atcommencement.
• An invitation to complete the survey is listedwithin social media sites maintained by the Officeof Marketing & Public Relations and DevelopmentOffice.
• Two rounds of additional requests to complete thesurvey are submitted electronically to graduatesthat did not respond, followed by a phone call.

Central Ohio Technical College
Graduate Survey AY 2013-2014
Prepared by Derek L. Thatcher Manager, Office of Career Development Central Ohio Technical College 1179 University Drive, Newark, Ohio 43055 E-mail: [email protected] Phone: (740) 366-9453 Fax: (740) 364-3646
Central Ohio Technical College Graduate Survey AY 2013-2014
Key Results Summary
Response Rate
573 graduates for SU13 through SP14 term, 225 responses received, 39% response rate for AY 2013-2014.
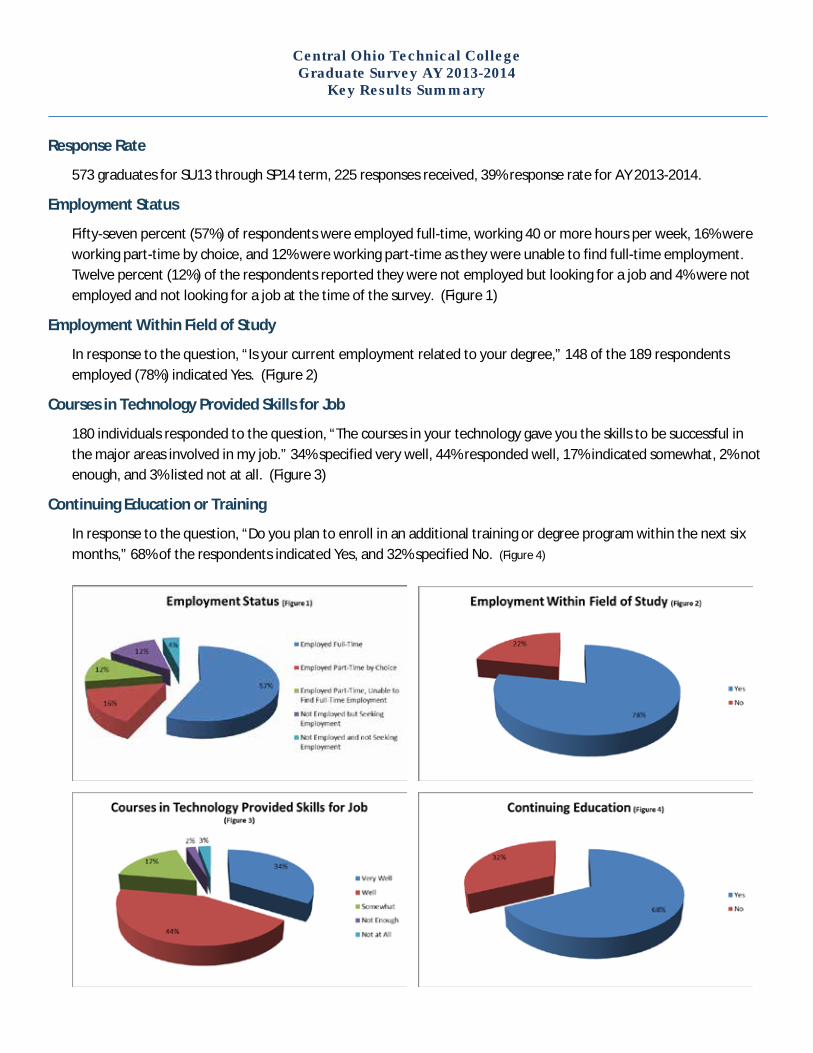
Employment Status
Fifty-seven percent (57%) of respondents were employed full-time, working 40 or more hours per week, 16% were working part-time by choice, and 12% were working part-time as they were unable to find full-time employment. Twelve percent (12%) of the respondents reported they were not employed but looking for a job and 4% were not employed and not looking for a job at the time of the survey. (Figure 1)
Employment Within Field of Study
In response to the question, “Is your current employment related to your degree,” 148 of the 189 respondents employed (78%) indicated Yes. (Figure 2)
Courses in Technology Provided Skills for Job
180 individuals responded to the question, “The courses in your technology gave you the skills to be successful in the major areas involved in my job.” 34% specified very well, 44% responded well, 17% indicated somewhat, 2% not enough, and 3% listed not at all. (Figure 3)
Continuing Education or Training
In response to the question, “Do you plan to enroll in an additional training or degree program within the next six months,” 68% of the respondents indicated Yes, and 32% specified No. (Figure 4)
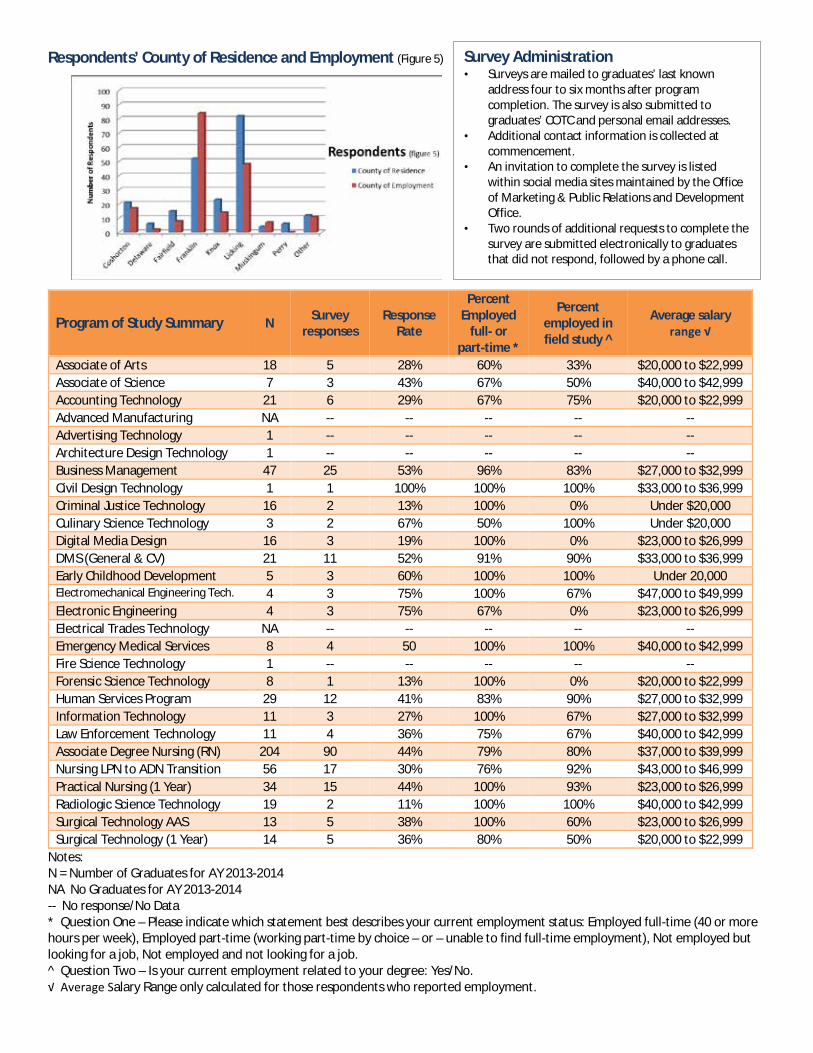
Respondents’ County of Residence and Employment (Figure 5)
Program of Study Summary N Survey responses
Response Rate
Percent Employed
full- or part-time *
Percent employed in field study ^
Average salary range √
Associate of Arts 18 5 28% 60% 33% $20,000 to $22,999 Associate of Science 7 3 43% 67% 50% $40,000 to $42,999 Accounting Technology 21 6 29% 67% 75% $20,000 to $22,999 Advanced Manufacturing NA -- -- -- -- -- Advertising Technology 1 -- -- -- -- -- Architecture Design Technology 1 -- -- -- -- -- Business Management 47 25 53% 96% 83% $27,000 to $32,999 Civil Design Technology 1 1 100% 100% 100% $33,000 to $36,999 Criminal Justice Technology 16 2 13% 100% 0% Under $20,000 Culinary Science Technology 3 2 67% 50% 100% Under $20,000 Digital Media Design 16 3 19% 100% 0% $23,000 to $26,999 DMS (General & CV) 21 11 52% 91% 90% $33,000 to $36,999 Early Childhood Development 5 3 60% 100% 100% Under 20,000 Electromechanical Engineering Tech. 4 3 75% 100% 67% $47,000 to $49,999 Electronic Engineering 4 3 75% 67% 0% $23,000 to $26,999 Electrical Trades Technology NA -- -- -- -- -- Emergency Medical Services 8 4 50 100% 100% $40,000 to $42,999 Fire Science Technology 1 -- -- -- -- -- Forensic Science Technology 8 1 13% 100% 0% $20,000 to $22,999 Human Services Program 29 12 41% 83% 90% $27,000 to $32,999 Information Technology 11 3 27% 100% 67% $27,000 to $32,999 Law Enforcement Technology 11 4 36% 75% 67% $40,000 to $42,999 Associate Degree Nursing (RN) 204 90 44% 79% 80% $37,000 to $39,999 Nursing LPN to ADN Transition 56 17 30% 76% 92% $43,000 to $46,999 Practical Nursing (1 Year) 34 15 44% 100% 93% $23,000 to $26,999 Radiologic Science Technology 19 2 11% 100% 100% $40,000 to $42,999 Surgical Technology AAS 13 5 38% 100% 60% $23,000 to $26,999 Surgical Technology (1 Year) 14 5 36% 80% 50% $20,000 to $22,999
Notes: N = Number of Graduates for AY 2013-2014 NA No Graduates for AY 2013-2014 -- No response/No Data * Question One – Please indicate which statement best describes your current employment status: Employed full-time (40 or morehours per week), Employed part-time (working part-time by choice – or – unable to find full-time employment), Not employed but looking for a job, Not employed and not looking for a job. ^ Question Two – Is your current employment related to your degree: Yes/No. √ Average Salary Range only calculated for those respondents who reported employment.
Survey Administration • Surveys are mailed to graduates’ last known
address four to six months after program completion. The survey is also submitted to graduates’ COTC and personal email addresses.
• Additional contact information is collected atcommencement.
• An invitation to complete the survey is listedwithin social media sites maintained by the Office of Marketing & Public Relations and Development Office.
• Two rounds of additional requests to complete thesurvey are submitted electronically to graduates that did not respond, followed by a phone call.

Central Ohio Technical College
Graduate SurveyAY 2012-2013
Prepared by Derek L. Thatcher
Director of Career Development
Central Ohio Technical College
1179 University Drive, Newark, Ohio 43055
E-mail: [email protected]
Phone: (740) 366-9453
Fax: (740) 364-3646
Survey Administration
• Hardcopy surveys are mailed to graduates’ last known address four to six
months after program completion. The survey is also submitted to graduates’
COTC and personal email address if available.
• Graduates have the opportunity to complete the hardcopy survey or respond
electronically.
• An invitation to complete the survey is listed within social media sites
maintained by the Office of Marketing & Public Relations and Development
Office.
• Two rounds of additional requests to complete the survey are submitted
electronically to graduates that did not respond, followed by a phone call.
Central Ohio Technical College
Graduate Survey 2012-2013
Key Results Summary
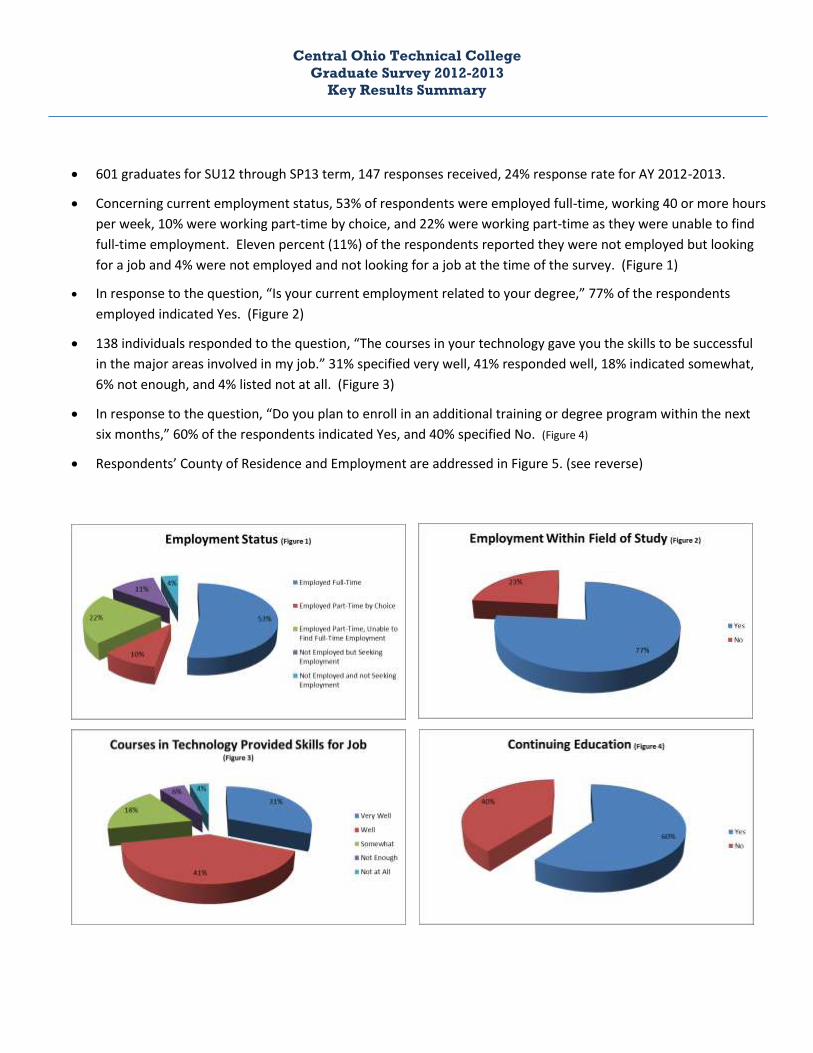
601 graduates for SU12 through SP13 term, 147 responses received, 24% response rate for AY 2012-2013.
Concerning current employment status, 53% of respondents were employed full-time, working 40 or more hours
per week, 10% were working part-time by choice, and 22% were working part-time as they were unable to find
full-time employment. Eleven percent (11%) of the respondents reported they were not employed but looking
for a job and 4% were not employed and not looking for a job at the time of the survey. (Figure 1)
In response to the question, “Is your current employment related to your degree,” 77% of the respondents
employed indicated Yes. (Figure 2)
138 individuals responded to the question, “The courses in your technology gave you the skills to be successful
in the major areas involved in my job.” 31% specified very well, 41% responded well, 18% indicated somewhat,
6% not enough, and 4% listed not at all. (Figure 3)
In response to the question, “Do you plan to enroll in an additional training or degree program within the next
six months,” 60% of the respondents indicated Yes, and 40% specified No. (Figure 4)
Respondents’ County of Residence and Employment are addressed in Figure 5. (see reverse)
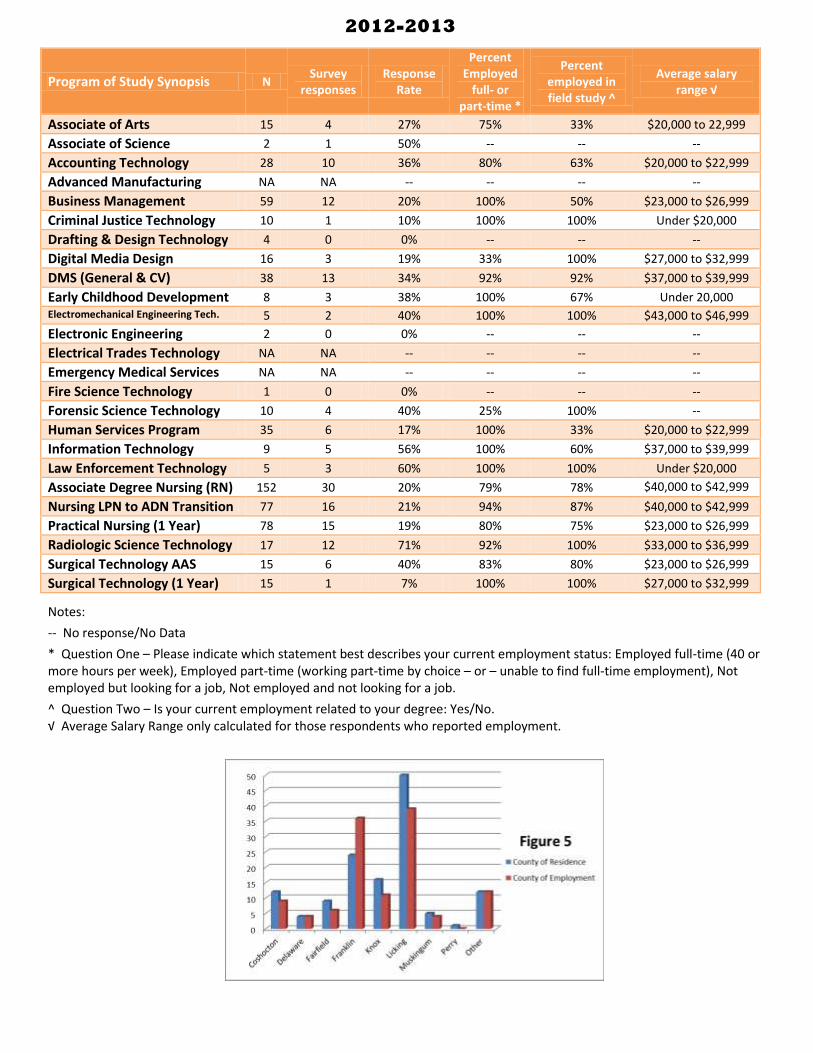
Program of Study Synopsis N Survey
responses Response
Rate
Percent Employed
full- or part-time *
Percent employed in field study ^
Average salary range √
Associate of Arts 15 4 27% 75% 33% $20,000 to 22,999
Associate of Science 2 1 50% -- -- --
Accounting Technology 28 10 36% 80% 63% $20,000 to $22,999
Advanced Manufacturing NA NA -- -- -- --
Business Management 59 12 20% 100% 50% $23,000 to $26,999
Criminal Justice Technology 10 1 10% 100% 100% Under $20,000
Drafting & Design Technology 4 0 0% -- -- --
Digital Media Design 16 3 19% 33% 100% $27,000 to $32,999
DMS (General & CV) 38 13 34% 92% 92% $37,000 to $39,999
Early Childhood Development 8 3 38% 100% 67% Under 20,000 Electromechanical Engineering Tech. 5 2 40% 100% 100% $43,000 to $46,999
Electronic Engineering 2 0 0% -- -- --
Electrical Trades Technology NA NA -- -- -- --
Emergency Medical Services NA NA -- -- -- --
Fire Science Technology 1 0 0% -- -- --
Forensic Science Technology 10 4 40% 25% 100% --
Human Services Program 35 6 17% 100% 33% $20,000 to $22,999
Information Technology 9 5 56% 100% 60% $37,000 to $39,999
Law Enforcement Technology 5 3 60% 100% 100% Under $20,000
Associate Degree Nursing (RN) 152 30 20% 79% 78% $40,000 to $42,999
Nursing LPN to ADN Transition 77 16 21% 94% 87% $40,000 to $42,999
Practical Nursing (1 Year) 78 15 19% 80% 75% $23,000 to $26,999
Radiologic Science Technology 17 12 71% 92% 100% $33,000 to $36,999
Surgical Technology AAS 15 6 40% 83% 80% $23,000 to $26,999
Surgical Technology (1 Year) 15 1 7% 100% 100% $27,000 to $32,999
Notes:
-- No response/No Data
* Question One – Please indicate which statement best describes your current employment status: Employed full-time (40 ormore hours per week), Employed part-time (working part-time by choice – or – unable to find full-time employment), Not employed but looking for a job, Not employed and not looking for a job.
^ Question Two – Is your current employment related to your degree: Yes/No. √ Average Salary Range only calculated for those respondents who reported employment.
2012-2013

Graduate Survey Results
2011 – 2012
SU11, AU11, WI12, & SP12
Office of Career Development
Page 821 of 905
www.cotc.edu
Survey Administration
• Hardcopy surveys are mailed to graduates’ last known address four to six months after
program completion. The survey is also submitted to graduates’ COTC and personal email
address if available.
• Graduates have the opportunity to complete the hardcopy survey or respond electronically.
• An invitation to complete the survey is listed within social media sites maintained by the
Office of Marketing & Public Relations and Development Office.
• Two rounds of additional requests to complete the survey are submitted electronically to
graduates which did not respond, followed by a phone call.
• Data was not processed for graduates of the A.A. & A.S. programs.
• 640 graduates for SU11 through SP12 term.
• 236 responses received, 37% response rate for 2011 – 2012.
Page 824 of 905
Program of Study Synopsis N Survey
responses Response
Rate
Percent Employed
full- or part-time *
Percent employed in field study ^
Average salary range √
Accounting Technology 21 8 38% 88% 50% $20,000 to $22,999
Advanced Manufacturing 1 1 100% 100% 100% $27,000 to $32,999
Business Management 62 26 42% 77% 63% $27,000 to $32,999
Criminal Justice Technology 9 5 56% 80% 75% $20,000 to $22,999
Drafting & Design Technology 9 3 33% 33% 0% $27,000 to $32,999
Digital Media Design 21 13 62% 77% 70% $23,000 to $26,999
DMS (General & CV) 19 9 47% 100% 100% $37,000 to $39,999
Early Childhood Development§ 10 5 50% 100% 60% Under 20,000
Electronic Engineering Tech. 13 4 31% 100% 50% $27,000 to $32,999 Electromechanical Engineering Tech. ∞ 1 0 0% -- -- --
Electrical Trades Technology 2 1 50% 100% 100% $53,000 to $56,999
Forensic Science Technology × 21 3 14% 66.6% 50% $33,000 to $36,999
Human Services Program 42 15 36% 80% 75% $20,000 to $22,999
Information Technology 12 3 25% 33% 100% $43,000 to $46,999
Law Enforcement Technology 6 2 33% 50% 100% $43,000 to $46,999
Associate Degree Nursing (RN) 199 69 35% 91% 88% $37,000 to $39,999
Nursing LPN to ADN Transition 59 19 32% 100% 89% $43,000 to $46,999
Practical Nursing (1 Year) 79 27 34% 84.5% 100% $23,000 to $26,999
Radiologic Science Technology 19 11 58% 82% 89% $37,000 to $39,999
Surgical Technology AAS 11 5 45% 80% 100% $23,000 to $26,999
Surgical Technology (1 Year) 24 7 29% 86% 83% $23,000 to $26,999
Notes:
-- No response/No Data
* Question One – Please indicate which statement best describes your current employment status: Employed full-time (40 ormore hours per week), Employed part-time (working part-time by choice – or – unable to find full-time employment), Not employed but looking for a job, Not employed and not looking for a job.
^ Question Two – Is your current employment related to your degree: Yes/No.
√ Average Salary Range only calculated for those respondents who reported employment.
§ Instructor Regina Williams indicated on 7/23/12 that all EAR graduates for SP12 attained employment.
∞ EMT, No graduates for SU11, AU11, WI12. (One graduate for SP12 – No response).
× FOR, Regarding average salary, one respondent indicated $50,000 to $52,999 (STNA Position).
Observations Frequency of negative remarks from graduates of
NUR programs has decreased.
Graduates of employed BMT graduates reportedhigher average salaries ($27-32K in ‘11-‘12 vs. $20-22K in ‘10-‘11 with similar response rates).
HUM graduates reported higher percentageemployment in field of study (75% in ‘11-‘12 vs. 38%in ‘10-‘11).
The ‘11-‘12 survey experienced a drop in responsesfrom LPN-ADN graduates (19 in ‘11-‘12 vs. 32 in ‘10-‘11).
2011-2012
Central Ohio Technical College
Graduate Survey 2011-2012
Key Results Summary
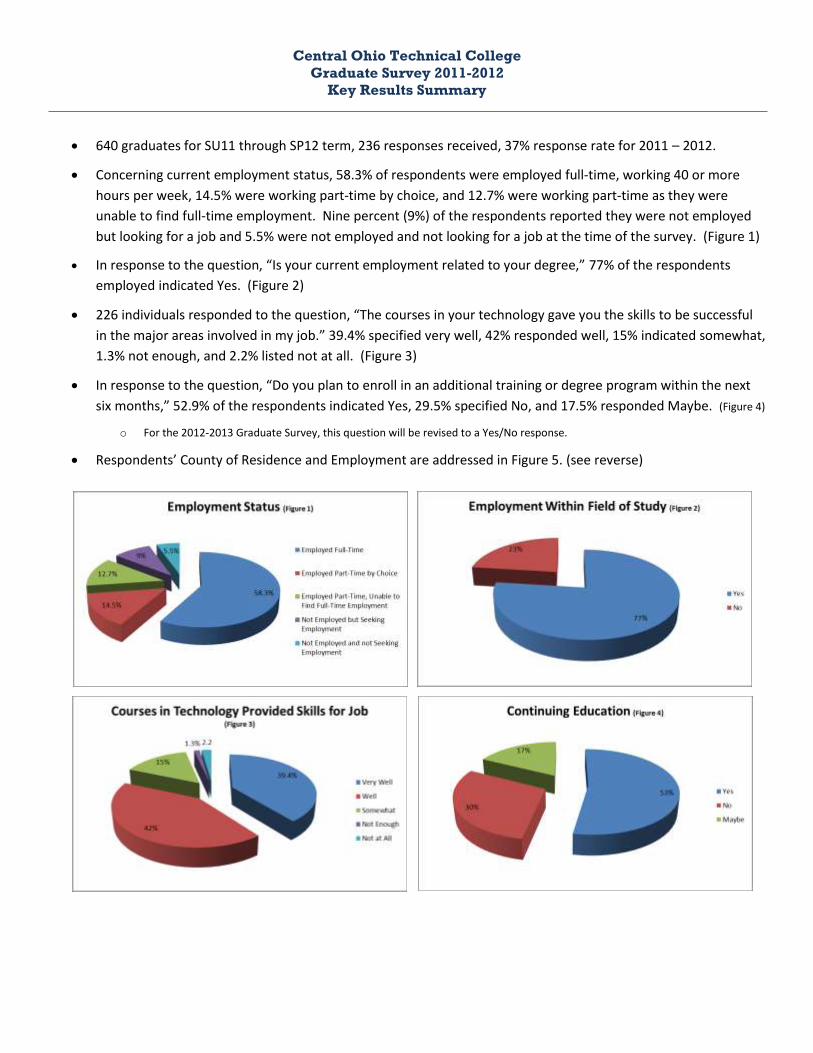
640 graduates for SU11 through SP12 term, 236 responses received, 37% response rate for 2011 – 2012.
Concerning current employment status, 58.3% of respondents were employed full-time, working 40 or more
hours per week, 14.5% were working part-time by choice, and 12.7% were working part-time as they were
unable to find full-time employment. Nine percent (9%) of the respondents reported they were not employed
but looking for a job and 5.5% were not employed and not looking for a job at the time of the survey. (Figure 1)
In response to the question, “Is your current employment related to your degree,” 77% of the respondents
employed indicated Yes. (Figure 2)
226 individuals responded to the question, “The courses in your technology gave you the skills to be successful
in the major areas involved in my job.” 39.4% specified very well, 42% responded well, 15% indicated somewhat,
1.3% not enough, and 2.2% listed not at all. (Figure 3)
In response to the question, “Do you plan to enroll in an additional training or degree program within the next
six months,” 52.9% of the respondents indicated Yes, 29.5% specified No, and 17.5% responded Maybe. (Figure 4)
o For the 2012-2013 Graduate Survey, this question will be revised to a Yes/No response.
Respondents’ County of Residence and Employment are addressed in Figure 5. (see reverse)

2010 -2011
Graduate Survey Results
Office of Career Development & Experiential Learning
Page 737 of 905
Central Ohio Technical College
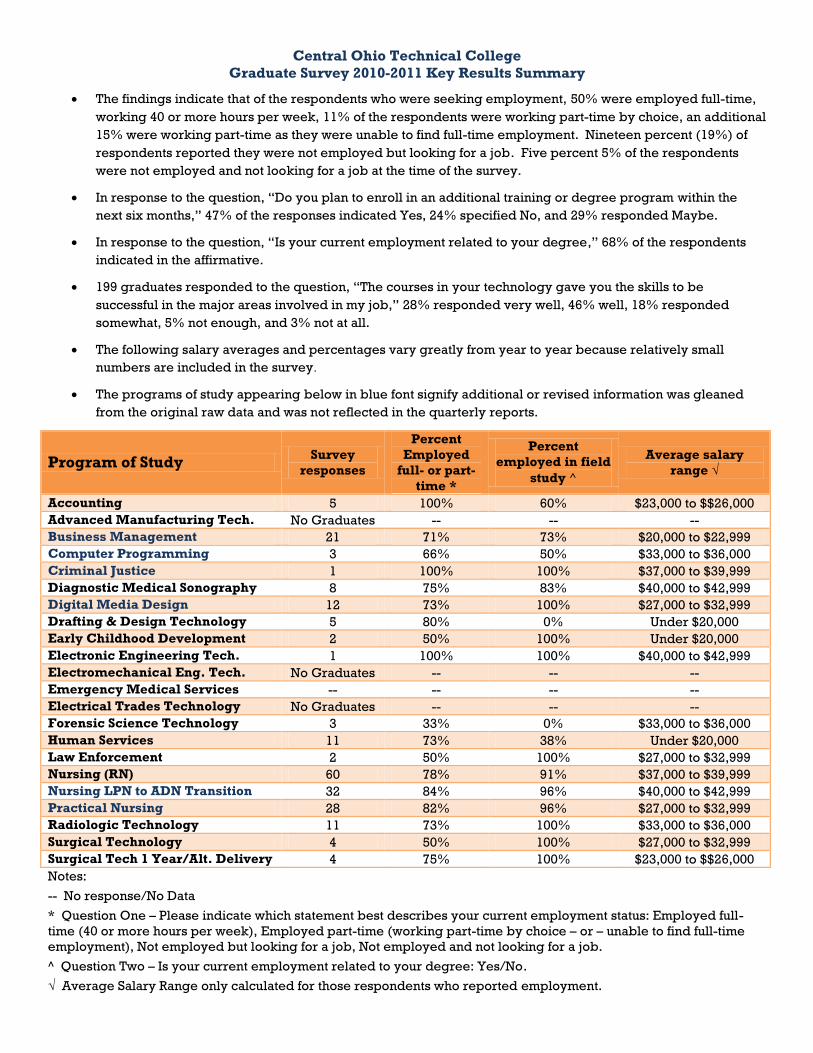
Graduate Survey 2010-2011 Key Results Summary
The findings indicate that of the respondents who were seeking employment, 50% were employed full-time,
working 40 or more hours per week, 11% of the respondents were working part-time by choice, an additional
15% were working part-time as they were unable to find full-time employment. Nineteen percent (19%) of
respondents reported they were not employed but looking for a job. Five percent 5% of the respondents
were not employed and not looking for a job at the time of the survey.
In response to the question, “Do you plan to enroll in an additional training or degree program within the
next six months,” 47% of the responses indicated Yes, 24% specified No, and 29% responded Maybe.
In response to the question, “Is your current employment related to your degree,” 68% of the respondents
indicated in the affirmative.
199 graduates responded to the question, “The courses in your technology gave you the skills to be
successful in the major areas involved in my job,” 28% responded very well, 46% well, 18% responded
somewhat, 5% not enough, and 3% not at all.
The following salary averages and percentages vary greatly from year to year because relatively small
numbers are included in the survey.
The programs of study appearing below in blue font signify additional or revised information was gleaned
from the original raw data and was not reflected in the quarterly reports.
Program of StudySurvey
responses
Percent
Employed
full- or part-
time *
Percent
employed in field
study ^
Average salary
range √
Accounting 5 100% 60% $23,000 to $$26,000
Advanced Manufacturing Tech. No Graduates -- -- --
Business Management 21 71% 73% $20,000 to $22,999
Computer Programming 3 66% 50% $33,000 to $36,000
Criminal Justice 1 100% 100% $37,000 to $39,999
Diagnostic Medical Sonography 8 75% 83% $40,000 to $42,999
Digital Media Design 12 73% 100% $27,000 to $32,999
Drafting & Design Technology 5 80% 0% Under $20,000
Early Childhood Development 2 50% 100% Under $20,000
Electronic Engineering Tech. 1 100% 100% $40,000 to $42,999
Electromechanical Eng. Tech. No Graduates -- -- --
Emergency Medical Services -- -- -- --
Electrical Trades Technology No Graduates -- -- --
Forensic Science Technology 3 33% 0% $33,000 to $36,000
Human Services 11 73% 38% Under $20,000
Law Enforcement 2 50% 100% $27,000 to $32,999
Nursing (RN) 60 78% 91% $37,000 to $39,999
Nursing LPN to ADN Transition 32 84% 96% $40,000 to $42,999
Practical Nursing 28 82% 96% $27,000 to $32,999
Radiologic Technology 11 73% 100% $33,000 to $36,000
Surgical Technology 4 50% 100% $27,000 to $32,999
Surgical Tech 1 Year/Alt. Delivery 4 75% 100% $23,000 to $$26,000
Notes:
-- No response/No Data
* Question One – Please indicate which statement best describes your current employment status: Employed full-
time (40 or more hours per week), Employed part-time (working part-time by choice – or – unable to find full-time
employment), Not employed but looking for a job, Not employed and not looking for a job.
^ Question Two – Is your current employment related to your degree: Yes/No.
√ Average Salary Range only calculated for those respondents who reported employment.

2009 – 2010 Graduate Survey Results
Office of Career Development & Experiential Learning
Page 697 of 905
www.cotc.edu
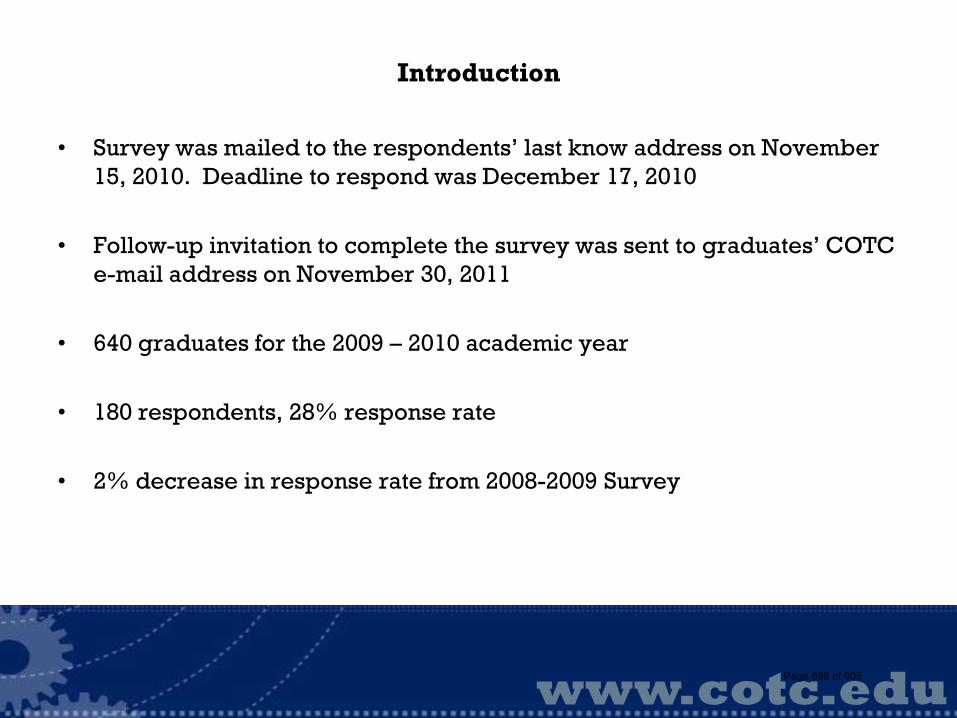
Introduction
• Survey was mailed to the respondents’ last know address on November15, 2010. Deadline to respond was December 17, 2010
• Follow-up invitation to complete the survey was sent to graduates’ COTCe-mail address on November 30, 2011
• 640 graduates for the 2009 – 2010 academic year
• 180 respondents, 28% response rate
• 2% decrease in response rate from 2008-2009 Survey
Page 698 of 905
Central Ohio Technical College
Graduate Survey 2009-2010
Key Results
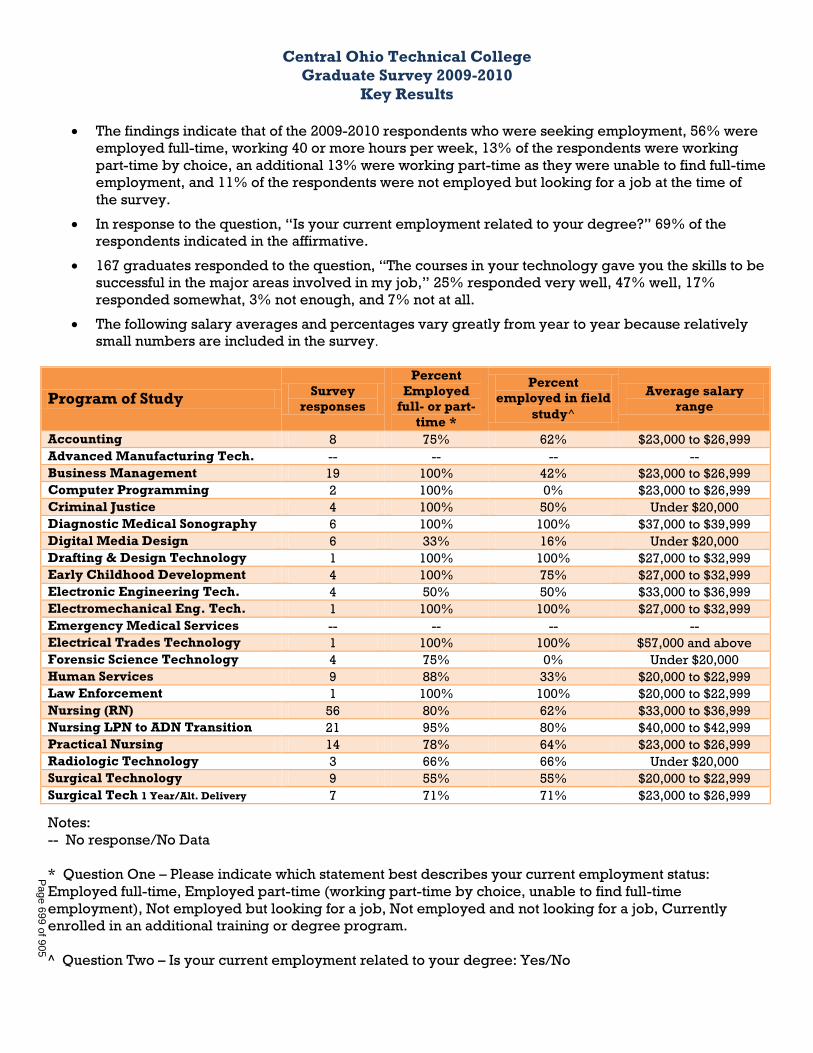
The findings indicate that of the 2009-2010 respondents who were seeking employment, 56% were
employed full-time, working 40 or more hours per week, 13% of the respondents were working
part-time by choice, an additional 13% were working part-time as they were unable to find full-time
employment, and 11% of the respondents were not employed but looking for a job at the time of
the survey.
In response to the question, “Is your current employment related to your degree?” 69% of the
respondents indicated in the affirmative.
167 graduates responded to the question, “The courses in your technology gave you the skills to be
successful in the major areas involved in my job,” 25% responded very well, 47% well, 17%
responded somewhat, 3% not enough, and 7% not at all.
The following salary averages and percentages vary greatly from year to year because relatively
small numbers are included in the survey.
Program of StudySurvey
responses
Percent
Employed
full- or part-
time *
Percent
employed in field
study^
Average salary
range
Accounting 8 75% 62% $23,000 to $26,999
Advanced Manufacturing Tech. -- -- -- --
Business Management 19 100% 42% $23,000 to $26,999
Computer Programming 2 100% 0% $23,000 to $26,999
Criminal Justice 4 100% 50% Under $20,000
Diagnostic Medical Sonography 6 100% 100% $37,000 to $39,999
Digital Media Design 6 33% 16% Under $20,000
Drafting & Design Technology 1 100% 100% $27,000 to $32,999
Early Childhood Development 4 100% 75% $27,000 to $32,999
Electronic Engineering Tech. 4 50% 50% $33,000 to $36,999
Electromechanical Eng. Tech. 1 100% 100% $27,000 to $32,999
Emergency Medical Services -- -- -- --
Electrical Trades Technology 1 100% 100% $57,000 and above
Forensic Science Technology 4 75% 0% Under $20,000
Human Services 9 88% 33% $20,000 to $22,999
Law Enforcement 1 100% 100% $20,000 to $22,999
Nursing (RN) 56 80% 62% $33,000 to $36,999
Nursing LPN to ADN Transition 21 95% 80% $40,000 to $42,999
Practical Nursing 14 78% 64% $23,000 to $26,999
Radiologic Technology 3 66% 66% Under $20,000
Surgical Technology 9 55% 55% $20,000 to $22,999
Surgical Tech 1 Year/Alt. Delivery 7 71% 71% $23,000 to $26,999
Notes:
-- No response/No Data
* Question One – Please indicate which statement best describes your current employment status:
Employed full-time, Employed part-time (working part-time by choice, unable to find full-time
employment), Not employed but looking for a job, Not employed and not looking for a job, Currently
enrolled in an additional training or degree program.
^ Question Two – Is your current employment related to your degree: Yes/No
Page 699 of 905
2008 – 2009 Graduate Survey
Office of Career Development & Experiential Learning Services
Related Documents