Bechtel Nevada - DOE/NV/11718-019 UC-702 APRIL 1997 SENSING LABORATORY OPERATEDBYBECHTELNEVADA FOR THE U.S. DEPARTMENT OF ENERGY AN AERIAL RADIOLOGICAL SURVEY OF THE FERNALD ENVIRONMENTAL MANAGEMENT PROJECT AND SURROUNDING AREA FERNALD, OHIO 19980416 044 DATE OF SURVEY: MAY 1994 ASTER ,9

Welcome message from author
This document is posted to help you gain knowledge. Please leave a comment to let me know what you think about it! Share it to your friends and learn new things together.
Transcript

Bechtel Nevada - DOE/NV/11718-019 UC-702 APRIL 1997
SENSING LABORATORY
OPERATEDBYBECHTELNEVADA FOR THE U.S. DEPARTMENT OF ENERGY
AN AERIAL RADIOLOGICAL SURVEY OF THE FERNALD ENVIRONMENTAL
MANAGEMENT PROJECT AND SURROUNDING AREA
FERNALD, OHIO
19980416 044
DATE OF SURVEY: MAY 1994 ASTER ,9
DISCLAIMER
This report was prepared as an account of work sponsored by an agency of the United States government. Neither the United States government nor an agency thereof, or any of their employees, makes a warranty, express or implied, or assumes legal liability or responsibility for the accuracy, completeness, or usefulness of any disclosed information, apparatus, product, or process, or represents that its use would not infringe privately owned rights. Reference herein to a specific commercial product, process, or service by trade name, trademark, manufacturer, or otherwise does not necessarily constitute or imply an endorsement, recommendation, or favoring by the United States government or an agency thereof. The views and opinions of the authors expressed herein do not necessarily state or reflect those of the United States government or an agency thereof.
This report has been reproduced directly from the best available copy.
This report is available to DOE and DOE contractors from the Office of Scientific and Technical Information, P.O. Box 62, Oak Ridge, TN 37831. Call (423) 576-8401 to obtain prices.
This report is available to the public from the National Technical Information Service, U.S. Department of Commerce, 5285 Port Royal, Springfield, VA 221 61. Call (703) 487-4650 for information.

AN AERIAL RADIOLOGICALSURVEY OFTHE FERNALD ENVIRONMENTAL
MANAGEMENT PROJECT AND SURROUNDING AREA
FERNALD, OHIO
DATE OF SURVEY: MAY 1994
K. A. Phoenix Project Scientist
REVIEWED BY
i ? + & A / z @ 4 q
H. W.’Clark, Jr., Manag/ Radiation Science
This Document is UNCLASSIFIED
Authorized Derivafive Classihh
This work was performed for the US. Department of Energy by EG&G/EM under Contract Number DE-AC08-93NV11265 and Bechtel Nevada under Contract Number DE-AC08-96NV11718.

ABSTRACT
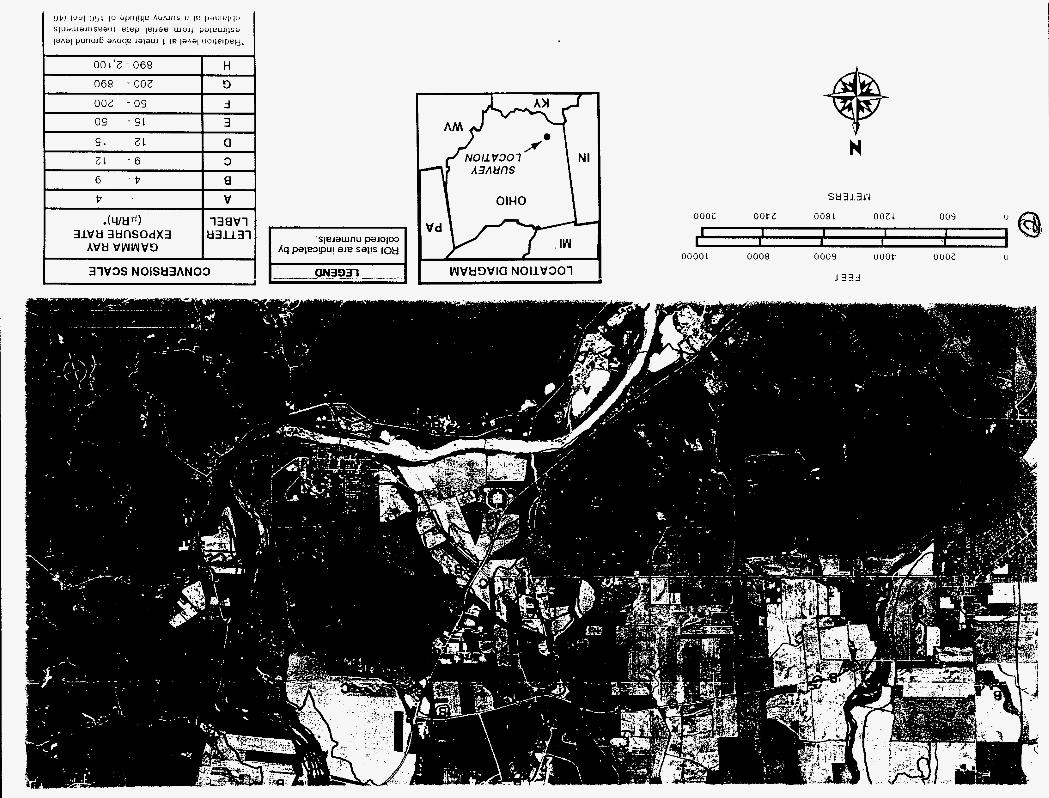
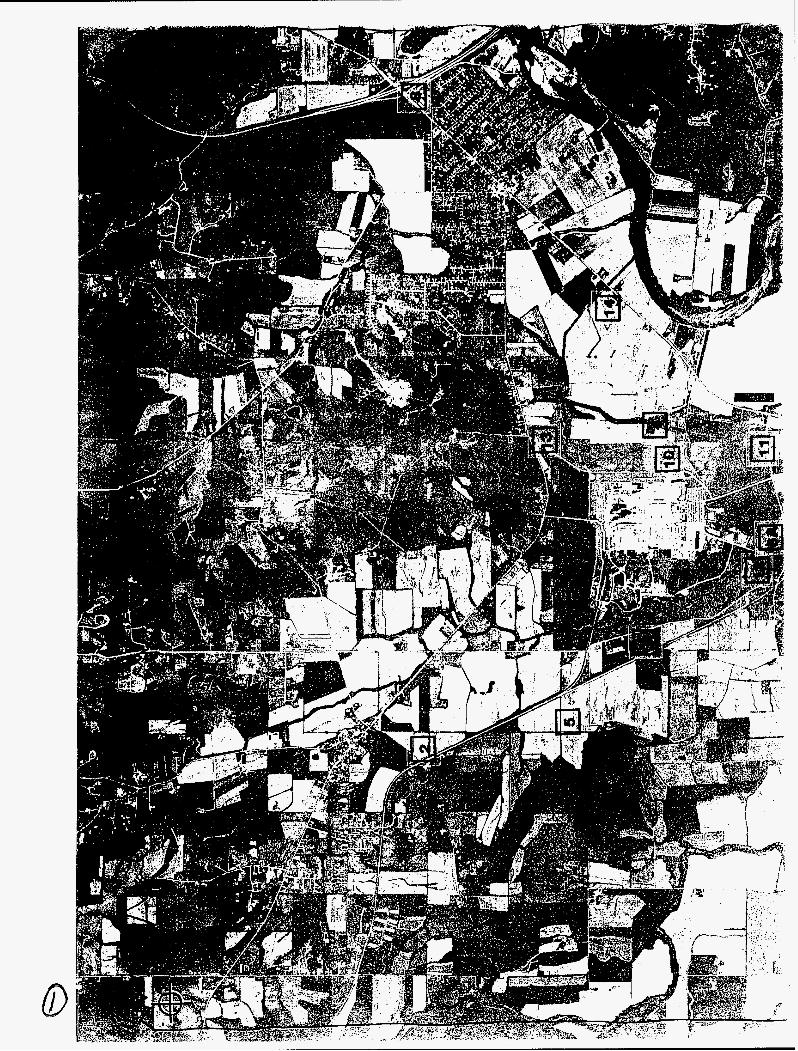
An aerial radiological survey was conducted from May 17- 22,1994, over a 36-square-mile (93-square-kilometer) area centered on the Fernald Environmental Management Project located in Fernald, Ohio. The purpose of the survey was to detect anomalous gamma radiation in the environment surrounding the plant. The survey was con- ducted at a nominal altitude of 150 feet (46 meters) with a line spacing of 250 feet (76 meters). A contour map of the terrestrial gamma exposure rate extrapolated to 1 meter (3.3 feet) above ground was prepared and overlaid on an aerial photograph of the area. Analysis of the data for man-made sources showed five sites within the boundaries of the Fernald Environmental Management Project having elevated readings. The exposure rates out- side the plant boundary were typical of naturally occurring background radiation. Soil samples and pressurized ion chamber measurements were obtained at four locations within the survey boundaries to supplement the aerial data.
ii
CONTENTS
..................................................................................... Abstract
Sections
1 . 0
2.0
3.0
4.0
5.0
6.0
7.0
8.0
Introduction ............................................................................. Site Description ......................................................................... Natural Background ..................................................................... Survey Equipment ....................................................................... Methods of Aerial Data Analysis ........................................................... Ground-Based Measurements ............................................................ Results ................................................................................ 7.1 Aerial Measurements ............................................................... 7.2 Ground-Based Measurements ....................................................... Conclusions ............................................................................
Figures
1
2
3
4
5
6
7
8
9
10
11
MBB BO-105 Helicopter with Nal(TI) Detector Pods Mounted above the Skids . . . . . . . . . . . . . . . . . .
Survey Site. Fernald. Ohio ................................................................ Gamma-Ray Energy Spectrum Showing Natural Terrestrial Background ........................ Gamma-Ray Energy Spectrum for ROI 1 ................................................... Gamma-Ray Energy Spectrum for ROI 2 ................................................... Gamma-Ray Energy Spectrum for ROI 3 ................................................... Gamma-Ray Energy Spectrum for ROI 4 ................................................... Gamma-Ray Energy Spectrum for ROI 5 ................................................... Thorium-232 Decay Chain ................................................................. Uranium-238 Decay Chain ............................................................... Ground-Based Measurement Locations ....................................................
Isopleth Contour of the Fernald Environmental Management Project
ii
1
1
2
3
2
6
7
8
10
iii

Tables
1 Comparison of Aerial and Ground-Based Measurements ..................................... 9
2 Soil Analysis Results .................................................................... 9
Appendix
A Survey Parameters ...................................................................... 11
References .................................................................................. 12
iv

1 .O Introduction three of these sources combine to contribute to the annual radiation dose to individuals.
An aerial radiological survey was performed over the Fernald Environmental Management Project (FEMP), located in Fernald, Ohio. The survey, con- ducted during the period of May 17- 22, 1994, is typi- cal of those repeated every several years around vari- ous facilities of interest to the U.S. Department of Energy (DOE). The surveys provide a means of moni- toring changes in the gamma radiation levels at the facilities and in the surrounding areas. The FEMP sur- vey was requested by DOE. Previous surveys of the plant, formerly called the Feed Materials Production Center, were performed in 1976’ and 198E1.~
The aerial survey was performed by EG&G Energy Measurements, Inc. (EG&G/EM), which operated the Remote Sensing Laboratory (RSL) for the DOE Nevada Operations Office (DOE/NV). The RSL main- tains and manages an aerial monitoring program called the Aerial Measuring System (AMs). Since its inception in 1958, the AMS has continued a nation- wide effort to document baseline radiological condi- tions at nuclear-energy-related sites of interest to DOE. These sites include power plants, manufactur- ing and processing plants, and research laboratories that use nuclear materials.
2.0 Site Description
The FEMP, located in southwestern Ohio, processes uranium products for DOE. The survey area is charac- terized by occasionat large hills and ridges. The Greater Miami River flows through the survey area on its way to the Ohio River. Significant nearby popula- tion centers include Ross, 1 mile (1.6 kilometers) to the northeast, and Cincinnati, 20 miles (32 kilometers) to the southeast.
The actual survey site consists of a 6- x 6-mile (9.7- x 9.7-kilometer) area centered on the plant. This area is only slightly larger than the 5- x 5-mile (8- x 8-kilometer) area surveyed in 1985. A total of 127 parallel lines 250 feet (76 meters) apart were flown at an altitude of 150 feet (46 meters) and at an airspeed of 70 knots (36 meters per second).
3.0 Natural Background
Natural background radiation has three main sources: terrestrial radiation, cosmic radiation from space, and radon gas emanating from the ground. All
The terrestrial component of natural background is due to gamma-ray-emitting radionuclides present in the soil. These naturally occurring radionuclides, members of the uranium (238U) and thorium (232Th) decay chains and a single isotope of potassium (4oK), are long-lived radioactive materials with half-lives measured in billions of years. Gamma rays emitted from these radionuclides contribute to background radiation levels on the surface. Most often, regions exhibiting high levels of natural terrestrial radiation are located over particular geological deposits of materi- als high in the concentration of uranium and/or tho- rium or over sites where mining operations have pro- duced tailings or other waste products. Terrestrial radiation levels can be significantly reduced due to shielding by moisture in the soil or overlying bodies of water or snow. The median whole-body dose-equiva- lent rate from terrestrial radiation for the United States is 30 millirems per year (mrem/~r).~
Radon is produced through decay of radioactive materials in both the uranium and thorium chains. As a gas, radon migrates out of the ground into the air where it can contribute a dose to individuals on the surface. Because the mobility of the gas through rock fractures and soil is slowed by the presence of mois- ture, radon concentrations on the surface vary consid- erably.
Cosmic radiation arises from sources outside of the earth’s atmosphere. The earth’s atmosphere provides shielding equivalent to about 30 feet of water, so the radiation dose is significantly reduced by the time the cosmic radiation reaches the earth’s surface. Conse- quently, cosmic radiation doses increase with eleva- tion above sea level. The average whole-body dose equivalent in the United States from cosmic radiation is 3.2 microroentgens per hour (pWh) (27 mrern/~r).~ However, in Denver, Colorado, with its elevation of 1 mile (1.6 kilometers), the dose equivalent from cosmic radiation is 6.0 pWh (50 mrem/yr).
4.0 Survey Equipment
The aerial measuring system used to perform the FEMP survey consisted of a radiation detector and data-acquisition computer system mounted aboard a high-performance helicopter. A data-analysis com- puter system located at the RSLfacility at Andrews Air Force Base near Washington, D.C., supported the helicopter and allowed the spectral data to be reduced
1

and presented as isopleth contour maps of exposure rates and isotopic intensities.
The Messerschmitt-Bolkow-BIohm (MBB) BO-1 05 helicopter, shown in Figure 1, was used as the aerial platform. The helicopter carried a crew of two and the Radiation and Environmental Data Acquisition and Recorder, Model IV, (REDAR IV) system. Two detec- tor pods, each containing four 2- x 4- x 16-inch log- type, sodium iodide thallium-activated [Nal(TZ )] scin- tillation detectors, were mounted on the side landing skids of the helicopter. The signals from the eight detectors were combined and fed into a single analog- to-digital converter (ADC) to record the gamma radi- ation. The output of a single detector was fed into a second ADC to extend the dynamic range and is use- ful in examining enhanced radiation areas.
The voltage pulses produced through the interaction of gamma rays with the Nal(T1) crystals were ana- lyzed by successive-approximation ADCs in the REDAR IV system. The REDAR IV is a multi-micro- processor data-acquisition and real-time analysis system designed to operate in the severe environ- ments associated with platforms such as helicopters, fixed-wing aircraft, and various ground-based vehicles. The system displays radiation and positional information to the operator in real time through video displays and multiple light-emitting diode (LED) read- outs. The gamma-ray spectrum, helicopter position, and weather data are recorded at one-second inter- vals on magnetic cartridge tapes for postflight analy- sis on a ground-based minicomputer system.
Helicopter position was established using two sys- tems: a Real-Time Differential Global Positioning System (RDGPS) and a radar altimeter. The RDGPS is a ranging system which uses precise timing signals generated by a constellation of 24 satellites to deter- mine position. The RDGPS stationary ground unit and
FIGURE 1. MBB 60-105 HELICOPTER WITH Nal(7l) DEl‘ECTOR PODS MOUNTED ABOVE THE SKIDS
antenna were placed in or near the survey area. The accuracy of the Gobal Positioning System (GPS) is purposefully degraded by the Department of Defense. While in an operational mode called “Selective Avail- ability‘‘ or S/A, a pseudo-random error is added to the satellite timing signals. S/A is designed to deny hostile forces the precise positioning ability of the GPS. Dur- ing a survey, the position of the ground station is con- tinually determined and a correction term is trans- mitted to the aircraft’s’ RDGPS unit, which then corrects its own position. This correction removes positional errors resulting from atmospheric condi- tions and S/A, greatly increasing the accuracy of the positional measurement. The RDGPS has the ability to locate the position of the aircraft to within f 16 feet (5 meters), as opposed to *330 feet (100 meters) achieved with a standard GPS.
The radar altimeter determines the helicopter’s alti- tude by measuring the round-trip propagation time of a signal reflected off the ground. For altitudes up to 1,000 feet (300 meters), the accuracy of this system is f2 feet (0.6 meter) or f 2 percent, whichever is greater. The positional information from the RDGPS system was directed to an aircraft steering indicator used by the pilot to guide the aircraft along the prede- termined flight lines.
In aerial surveys, aircraft altitude, line spacing, and speed are chosen to optimize the detector system’s sensitivity to radionuclides and the system’s spatial resolution while maintaining a safe flight configura- tion. For the FEMP survey, the helicopter flew 127 parallel lines, 250 feet (76 meters) apart, at an altitude of 150 feet (46 meters) and an airspeed of 70 knots (36 meters per second).
A minicomputer-based system, the Radiation and Environmental Data Analysis and Computer (REDAC) system, was used during the survey to eval- uate the aerial data immediately following each sur- vey flight. The REDAC system consists of a Data General 32-bit minicomputer system with two giga- bytes of disk space for data storage, two 8-millimeter (1/4-inch) tape drives for data transfer and archiving, and a 36-inch color ink jet plotter for data contouring. Other peripheral devices include a laser printer and three graphics terminals with hard-copy units. This system has an extensive library of software routines available for complete data processing in the field.
5.0 Methods of Aerial Data Analysis The algorithms described below were used to gener- ate a terrestrial exposure-rate c~n tou r .~ To obtain this
2
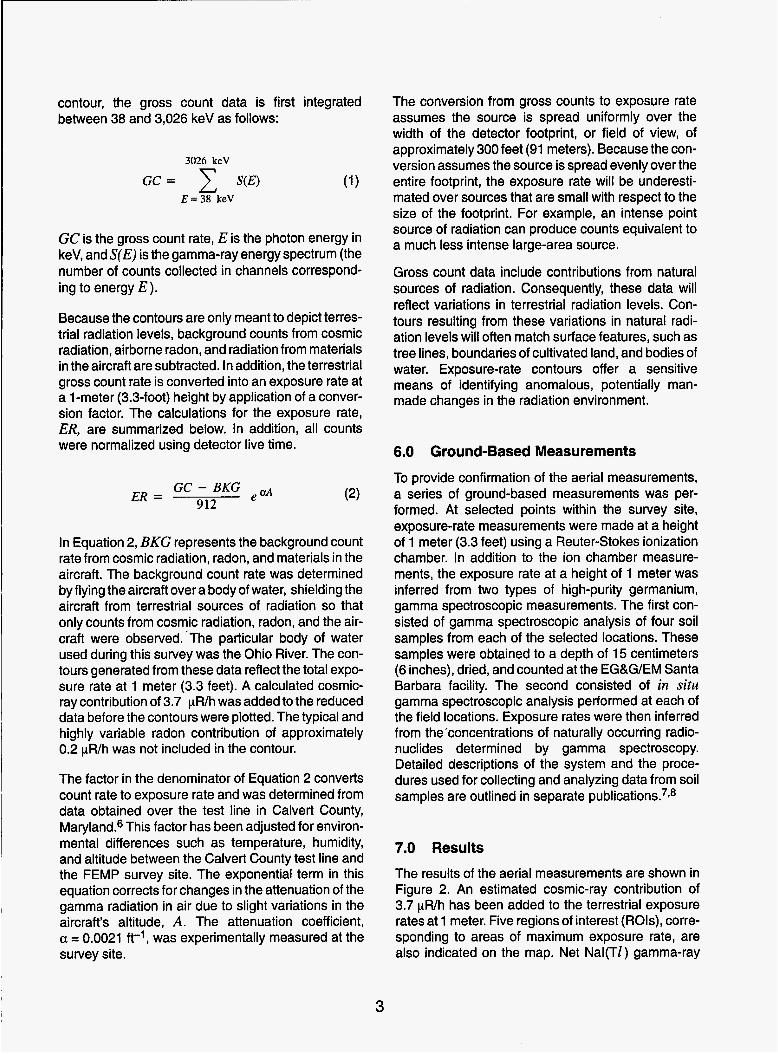
contour, the gross count data is first integrated between 38 and 3,026 keV as follows:
3026 keV
G C = S(E) u
E = 38 keV
GC is the gross count rate, E is the photon energy in keV, and S(E) is the gamma-ray energy spectrum (the number of counts collected in channels correspond- ing to energy E ).
Because the contours are only meant to depict terres- trial radiation levels, background counts from cosmic radiation, airborne radon, and radiation from materials in the aircraft are subtracted. In addition, the terrestrial gross count rate is converted into an exposure rate at a l-meter (3.3-foot) height by application of a conver- sion factor. The calculations for the exposure rate, ER, are summarized below. In addition, all counts were normalized using detector live time.
eaA GC - BKG
912 ER =
In Equation 2, BKG represents the background count rate from cosmic radiation, radon, and materials in the aircraft. The background count rate was determined by flying the aircraft over a body of water, shielding the aircraft from terrestrial sources of radiation so that only counts from cosmic radiation, radon, and the air- crafl were observed.-The particular body of water used during this survey was the Ohio River. The con- tours generated from these data reflect the total expo- sure rate at 1 meter (3.3 feet). A calculated cosmic- ray contribution of 3.7 y Wh was added to the reduced data before the contours were plotted. The typical and highly variable radon contribution of approximately 0.2 yWh was not included in the contour.
The factor in the denominator of Equation 2 converts count rate to exposure rate and was determined from data obtained over the test line in Calvert County, Maryland.6 This factor has been adjusted for environ- mental differences such as temperature, humidity, and altitude between the Calvert County test line and the FEMP survey site. The exponential term in this equation corrects for changes in the attenuation of the gamma radiation in air due to slight variations in the aircraft’s altitude, A. The attenuation coefficient, a = 0.0021 ft-’, was experimentally measured at the survey site.
The conversion from gross counts to exposure rate assumes the source is spread uniformly over the width of the detector footprint, or field of view, of approximately 300 feet (91 meters). Because the con- version assumes the source is spread evenly over the entire footprint, the exposure rate will be underesti- mated over sources that are small with respect to the size of the footprint. For example, an intense point source of radiation can produce counts equivalent to a much less intense large-area source.
Gross count data include contributions from natural sources of radiation. Consequently, these data will reflect variations in terrestrial radiation levels. Con- tours resulting from these variations in natural radi- ation levels will often match surface features, such as tree lines, boundaries of cultivated land, and bodies of water. Exposure-rate contours offer a sensitive means of identifying anomalous, potentially man- made changes in the radiation environment.
6.0 Ground-Based Measurements
To provide confirmation of the aerial measurements, a series of ground-based measurements was per- formed. At selected points within the survey site, exposure-rate measurements were made at a height of 1 meter (3.3 feet) using a Reuter-Stokes ionization chamber. In addition to the ion chamber measure- ments, the exposure rate at a height of 1 meter was inferred from two types of high-purity germanium, gamma spectroscopic measurements. The first con- sisted of gamma spectroscopic analysis of four soil samples from each of the selected locations. These samples were obtained to a depth of 15 centimeters (6 inches), dried, and counted at the EG&G/EM Santa Barbara facility. The second consisted of in situ gamma spectroscopic analysis performed at each of the field locations. Exposure rates were then inferred from the’concentrations of naturally occurring radio- nuclides determined by gamma spectroscopy. Detailed descriptions of the system and the proce- dures used for collecting and analyzing data from soil samples are outlined in separate publication^.^^^
7.0 Results The results of the aerial measurements are shown in Figure 2. An estimated cosmic-ray contribution of 3.7 yWh has been added to the terrestrial exposure rates at 1 meter. Five regions of interest (ROls), corre- sponding to areas of maximum exposure rate, are also indicated on the map. Net Nal(T1) gamma-ray
3

r I 4
11 - 6 3
6 - P 0
13ElVl 31VH 3HnSOdX3 H3LL3-l
31V3S NOISH3AN03
N
S u 31 3Ly
L 1
I I 1 I ;s 000c O O t Z 008 L 002 I 009
I I I I 0000 1 oooe 0009 O O O t 0002 u

I
I
n W \
!
!
..
3 3 J
c
4

spectra from these regions were extracted for identifi- cation of the gamma-ray emitters. A typical back- ground gamma-ray spectrum appears in Figure 3. Gamma-ray spectra for the five ROls appear in Figures 4 through 8.
7.1 Aerial Measurements
The survey area surrounding the FEMP consists of a fairly uniform background radiation field of 7 to 12 pWh. This level is typical throughout the United States. The outline of the Great Miami River is plainly visible where it passes though the survey area, as are the boundaries of several wooded areas. Many of the contours in this area roughly match those from the 1985 survey.
Figure 3 depicts a Nal(TZ) gamma-ray spectrum due to terrestrial background radiation. Counts for this spectrum were obtained within the survey boundary, over a large area surrounding the FEMP. A major peak occurs at an energy of 1,460 keV. The source of this radiation is the naturally occurring isotope of potas- sium (40K). Also visible in this spectrum are peaks due to gamma rays from actinium-228 (228A~) at 911 keV and thallium-208 (208TI) at 2,614 keV. Both of these radionuclides are members of the 232Th chain of natu- rally occurring radionuclides (see Figure 9 on page 7). Bismuth-214 (214Bi), a member of the 238U chain of naturally occurring radionuclides, contributes peaks at 1,120, 1,728, and 2,204 keV (see Figure 10 on page 8).
The FEMP itself is the only area where exposure rates were significantly above background levels. The large-area averaging inherent in the aerial measure- ment system has resulted in an underestimate of the peak exposure rates in these areas. The actual expo- sure rates could be as much as two orders of magni- tude larger than shown in Figure 2, depending on how localized the radiation source is. Also, the contours will often appear to imply a large-area source of radi- ation near high-exposure-rate areas when, in fact, the source is quite localized. This is caused by radiation from the high-exposure-rate area traveling some dis- tance before striking the detectors on the aircraft at an oblique angle. Five ROls, labeled in Figure 2, were chosen to correspond to the peak exposure rates measured over the plant. Figures 4 through 8 are gamma-ray spectra obtained with the airborne sys- tem over these regions.
The 214Bi peaks appearing in Figure 4 are seen wher- ever radium-226 (226Ra), radon-222 (222Rn), or 238U
and its progeny are present. The magnitude of the exposure rates encountered in ROI 1 suggests that a large quantity of such material is present at this loca- tion.
The gamma-ray spectra obtained over ROls 2,3, and 4 appear in Figures 5,6, and 7, respectively. Gamma- ray spectra such as these are typical of 238U but only when uranium has been separated from its progeny, particularly 214Bi. Before separation, the 1,001 -keV and 765-keV peaks from protactinium-234m (234mPa) are ovetwhelmed by 214Bi emissions. Also present in Figures 5 and 6 is a 208TI peak at 2,614 keV.
The gamma-ray spectrum obtained over ROI 5 con- tains prominent 208TI and 228A~ peaks. The Nal(TZ) detectors used are not able to resolve the 911-keV and 969-keV 228A~ peaks. Instead, a distorted peak appears in this energy region. Both 208TI and 228A~ are members of the naturally occurring 232Th decay chain.
7.2 Ground-Based Measurements
The results of the ionization chamber exposure-rate measurements, as well as the results from the soil sampling, are tabulated in Tables 1 and 2. The three ground-based ionization chamber measurements fal- ling within the survey site boundary are in agreement with the levels plotted in Figure 2. All three fall within the 9 to 12 pWh contour. The fourth measurement, at Site 15, is located outside the survey site boundary. The soil sample locations are shown in Figure 11.
The activities from the soil analysis fall within the wide range of values typically encountered within surface soils in the United States. Where the ground-based measurements from the 1985 survey have been repeated, the recent results show agreement with the 1985 results within their stated limits of precision.
8.0 Conclusions
Contours within the FEMP area are similar to those measured in 1985. Although the radionuclides identi- fied in the high-exposure-rate areas are naturally occurring, the levels encountered are greatly enhanced due to industrial activities at the plant. There are no areas of man-made or enhanced natu- rally occurring radioactivity outside the plant bound- ary.
5

300000
0 I- z 3
8
0 0 3000
EN E RGY (keV)
FIGURE 3. GAMMA-RAY ENERGYSPECTRUM SHOWING NATURAL TERRESTRIAL BACKGROUND
2000
LT 14.6 S TOTALCTS: 553253
v) I- z 3
8
00
0 0 3000
ENERGY (keV)
FIGURE 5. GAMMA-RAY ENERGYSPECTRUM FOR ROI 2
3000
v) t- z 3
8
0
7
0 0 ROI 4
d LT 10.4 s TOTALCTS: 829209
7
b FS=300
0 3000 ENERGY (keV)
FIGURE 7. GAMMA-RAY ENERGY SPECTRUM FOR ROI 4
4000
v) I- z I)
8
0 0 3000
ENERGY (keV)
FIGURE 4. GAMMA-RAY ENERGY SPECTRUM FOR ROI 1
ROI 3 LT 21.5 s TOTALCTS: 182182
0 3000 ENERGY (keV)
FIGURE 6. GAMMA-RAY ENERGY SPECTRUM FOR ROI 3
10000 FS= 1000 ROI 5
a (0 LT 13.2 s 9 TOTALCTS: 229042
(I) I- z 3
8
0 0 3000
ENERGY (keV)
FIGURE 8. GAMMA-RAY ENERGY SPECTRUM FOR ROI 5
6

2’6Po&$ 0.15 s
/ 21 *P b82 10.6 h
FIGURE 9. THORIUM-232 DECAY CHAIN. Beta decays are denoted by diagonal arrows; alpha decays are indicated by vertical arrows. Gamma rays from shaded isotopes are used in the analysis.
7

214P084 I 210Bigg + 206Pb82
stable
FIGURE 10. URANIUM-238 DECAY CHAIN. Beta decays are denoted by diagonal arrows; alpha decays are indicated by vertical arrows. Gamma rays from shaded isotopes are used in the analysis.
8

Table 1. Comparison of Aerial and Ground-Based Measurements
Exposure Rate ( pWh at 1 m AGL)
I Site ID Number
Soil Analysis Estimatea Ion Chamber
~~
9.7 f 0.7
10.2 f 1.0
11.7 f 0.3
11.2 f 0.3
8.7 f 0.5 9.3 f 0.5
9.6 f 0.5
10.0 f 0.8
Inferred Aerial Dataa
9.7 f 0.5
9.6 f 0.7
9.2 f 0.3
a Estimate includes a cosmic-ray contribution of 3.7 pWh and a moisture correction of the form l/(l+m) where rn is the
b Reuter-Stokes PIC Model RSS-112, Serial Number G-003 fractional moisture content.
Table 2. Soil Analysis Results
Site ID NumbeP
1 Ab 2 3 5 6A
7
8 9
11 12
13 14 15
Moisture ("/.I
19 f 1 18 f 4 13 f 1 11 f 2 4 f l
8 f l 12 f 2 10 f 1 16 f 1 17 f 2
20 f 2 14 f 1
15 f 3
Average Isotopic Concentration f Standard Deviation (pCi/g) .
234mpa
N DC ND
4 f 1 ND ND
ND 2 f 1
ND 3 f 1 3 f l
3 f l 3 f l
ND
a Site inaccessible. Alternate Site 1A used.
22sRa
1.0 f 0.2 1.0 f 0.1 1.0 f 0.1 1.0 f 0.1 0.50 f 0.05
0.40 f 0.05 0.7 f 0.1 0.8 f 0.1 0.9 f 0.03 0.8 f 0.1
1.1 f 0.1 1.1 f 0.03 1.0 f 0.1
232Th
0.9 f 0.06 0.9 f 0.1 1.1 f 0.1 1.0 f 0.1 0.20 f 0.02
0.50 f 0.05 0.8 f 0.1 1.0 f 0.1 1.0 f 0.02 1.0 f 0.1
1.3 f 0.1 1.1 f 0.02 1.2 f 0.04
'37cs
0.35 'f 0.07 0.27 f 0.08 0.28 f 0.01 0.24 f 0.02
ND
ND 0.08 f 0.01 0.24 f 0.01 0.35 f 0.01 0.35 f 0.01
0.37 f 0.01 0.26 f 0.01 0.18 f 0.16
40K
14.9 f 0.4 17 f 1 18.4 f 0.3 19 f 1 5.9 f 0.1
11.3 f 0.2 15.1 f 0.1 17.1 f 0.3 15.0 f 0.8 15.1 f 0.3
20.8 f 0.3 21.6 f 0.8 18.4 f 1.5
Remedial/clean-up actions prevented entrance to Sites 4, 6B, and 10. C ND indicates that the isotope was not detected in the measured soil sample.
9

0 0 0 0 7
0 0 0 m
0 0 0 + -
w W U
0 0 0 -?
0 0 0 N
0
0 0 #
Z

i
2
10
, '\
c
-..... ~ .. . .

APPENDIX A
SURVEY PARAMETERS
Survey Site:
Survey Location:
Survey Area:
Survey Date:
Survey Altitude:
Survey Speed:
Line Spacing:
Line Direction:
Number of Lines:
Detector Array:
Data Acquisition System:
Aircraft:
Project Scientist:
Survey Scientist:
Fernald Environmental Management Project
Fernald, Ohio
6 x 6 miles (9.7 x 9.7 kilometers)
May 17-22,1994
150 feet (46 meters)
70 knots (36 meters per second)
250 feet (76 meters)
North-South
127
Eight 2- x 4- x 16-inch Nal(T1) detectors Two 2- x 4- x 4-inch Nal(T1) detectors
REDAR IV
MBB BO-105 Helicopter (Tail Number: N40EG)
K. Phoenix
G. Sampoll-Ramirez
Data Processing: Gross Count Energy Window: 38-3,026 keV Conversion Factors: 91 2 cps/(pWh) Cosmic Contribution: 3.7 WWh
REFERENCES
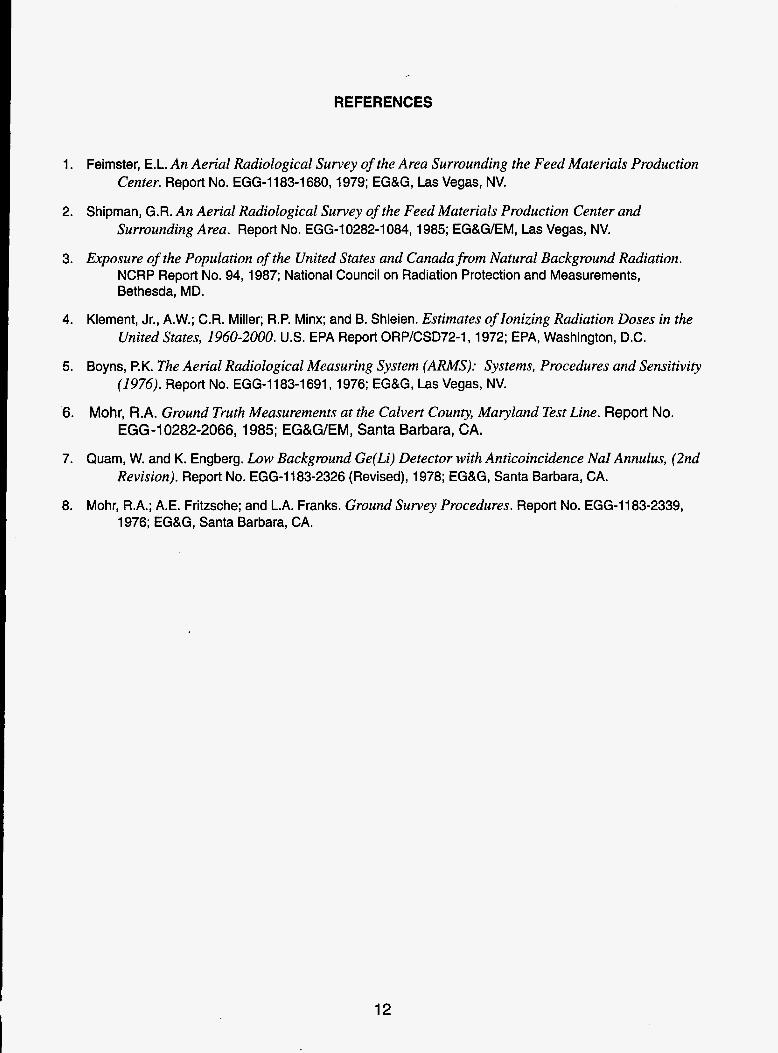
1. Feimster, E.L. An Aerial Radiological Survey of the Area Surrounding the Feed Materials Production Center. Report No. EGG-ll83-1680,1979; EG&G, Las Vegas, NV.
2. Shipman, G.R. An Aerial Radiological Survey of the Feed Materials Production Center and Surrounding Area. Report No. EGG-10282-1084,1985; EG&G/EM, Las Vegas, NV.
3. Exposure of the Population of the United States and Canada from Natural Background Radiation. NCRP Report No. 94, 1987; National Council on Radiation Protection and Measurements, Bethesda, MD.
4. Klement, Jr., A.W.; C.R. Miller; R.P. Minx; and B. Shleien. Estimates of Ionizing Radiation Doses in the United States, 1960-2000. US. EPA Report ORP/CSD72-1,1972; EPA, Washington, D.C.
5. Boyns, P.K. The Aerial Radiological Measuring System (ARMS): Systems, Procedures and Sensitivity (1976). Report No. EGG-1183-1691,1976; EG&G, Las Vegas, NV.
6. Mohr, R.A. Ground Truth Measurements at the Culvert County, Maryland Test Line. Report No. EGG-10282-2066, 1985; EG&G/EM, Santa Barbara, CA.
7. Quam, W. and K. Engberg. Low Background Ge(Li) Detector with Anticoincidence Nu1 Annulus, (2nd Revision). Report No. EGG-1183-2326 (Revised), 1978; EG&G, Santa Barbara, CA.
8. Mohr, R.A.; A.E. Fritzsche; and L.A. Franks. Ground Survey Procedures. Report No. EGG-1183-2339, 1976; EG&G, Santa Barbara, CA.
12

DISTRIBUTION
DOE/DP
L. E. Gordon-Hagerty (1)
DOWNV
K.D. Lachman (1) Public Reading Room (1) TI RC (1)
DOWFN J. A. Jalovec
FERMCO P. Kraps
BN
C. E. Ezra LVAO (1) P. P. Guss WAMO (1) R. E. Kelley LVAO (1) K. R. Lamison LVAO (1) J. T. Mitchell LVAO (1) K.A. Phoenix WAMO (1) L. G. Sasso LVAO (1)
LIBRARIES
RSL WAMO
OSTl
AN AERIAL RADIOLOGICAL SURVEY OF THE FERNALD ENVIRONMENTAL
MANAGEMENT PROJECT AND SURROUNDING AREA
FERNALD, OHIO
DATE OF SURVEY MAY 1994 DATE OF REPORT APRIL 1997
DOVNV/11718-019

M97054116 I11111111 111111Il1111111111 lllllllllllllll lllllllll1111
Publ. Date (11) 1997 09 Sponsor Code (18) a (2 d XF U C Category (1 9) EL-::& DOE/&&
DOE
Related Documents