1 1 Bayesian networks for reconstructing transcriptional regulatory networks Prof Su-In Lee Computer Science & Genome Sciences University of Washington, Seattle GENOME 541 Introduction to Computational Molecular Biology II 2 All living organisms are composed of cells

Welcome message from author
This document is posted to help you gain knowledge. Please leave a comment to let me know what you think about it! Share it to your friends and learn new things together.
Transcript

1
1
Bayesian networks for reconstructing transcriptional regulatory networks
Prof Su-In LeeComputer Science & Genome Sciences
University of Washington, Seattle
GENOME 541Introduction to Computational Molecular Biology II
2
All living organisms are composed of cells

2
3
From DNA to proteinperson x’s cell
AGATATGTGGATTGTTAGGATTTATGCGCGTCAGTGACTACGCATGTTACGCACCTACGACTAGGTAATGATTGATC
DNA
AUGUGGAUUGUU AUGCGCGUC AUGUUACGCACCUAC AUGAUUGAURNA
Protein MWIV MRV MLRTY MID
GeneAGATATGTGGATTGTTAGGATTTATGCGCGTCAGTGACTACGCATGTTACGCACCTACGACTAGGTAATGATTGATC
AUGCGCGUC
MID
AUGAUUAUAUGAUUGAU
MID
“Gene Expression”
a switch! (“transcription factor binding site”)
“Gene regulation”
transcription
translation
MWIV MLRTY
Transcription factor
Transcription factor
22,000 genes in human!
MRV
Genes regulate each others’ expression⇒ some biological processes
gene regulatory network
A and B regulate the expression of CA
B
C
4
Inferring the regulatory network
For example,
Given gene expression datameasuring RNA levels of all genes
Infer the regulatory network that controls gene expression
DNA (3 billion-long string)…AGCTATAGCATAGCACTACAGACAGCATACACACCATTTTAAAACGCGCACAAAAATCAGCTAAACCAGGGTTACTACGACACTTACAACTACATT…
gene regulatory network
N instancesDifferent conditions
g1 gQ…g5
gene expression data
3
5
Outline
Mathematical toolsGene expression data and basic analysis techniquesReconstructing regulatory networksIndividual sequence variation and gene regulation
6
Learning goals
Be familiar with:a well-known Comp Bio problem
Reconstructing the regulatory network from expression dataHow to evaluate the learned network
probabilistic models in ML Bayesian network representationParameter/structure learning of a Bayesian networkFeature selection problem
4
7
Outline
Mathematical toolsBayesian network representationLearning the structure of Bayesian networks
Gene expression data and basic analysis techniquesReconstructing regulatory networksIndividual sequence variation and gene regulation
8
Probability theory reviewAssume random variables Val(A)={a1,a2,a3}, Val(B)={b1,b2}Conditional probability
Definition
Chain rule
Bayes’ rule
Probabilistic independence
5
9
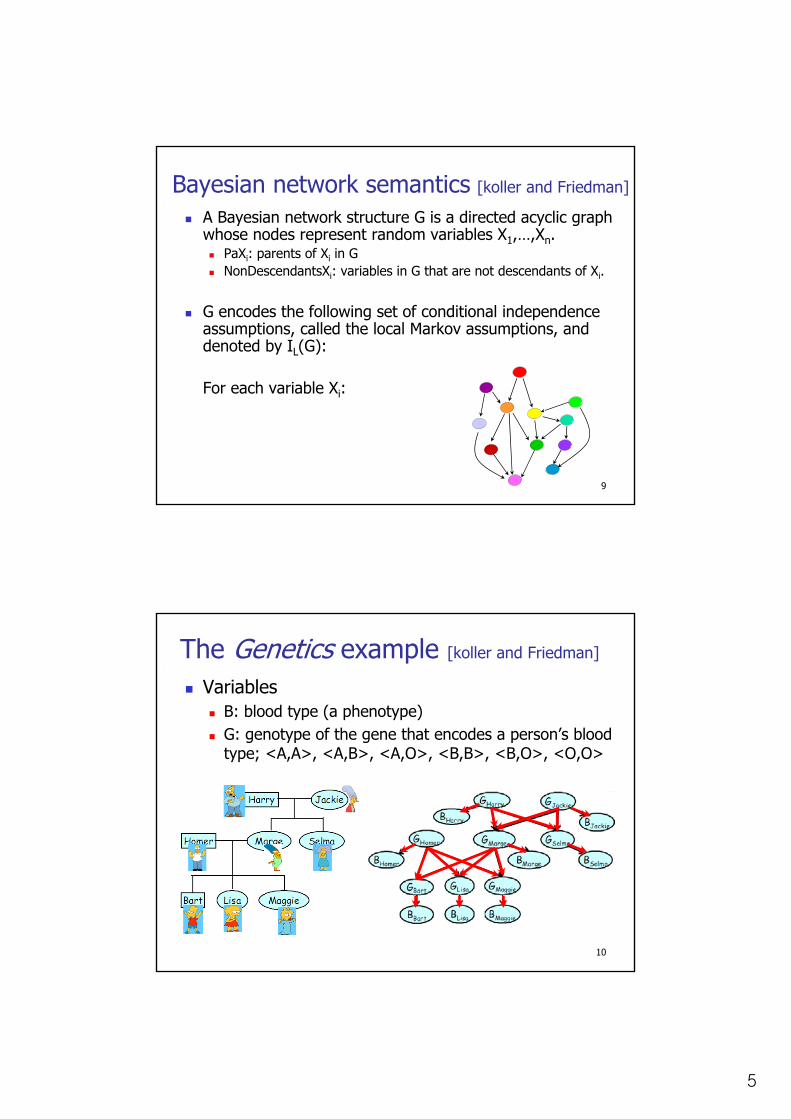
Bayesian network semantics [koller and Friedman]
A Bayesian network structure G is a directed acyclic graph whose nodes represent random variables X1,…,Xn.
PaXi: parents of Xi in GNonDescendantsXi: variables in G that are not descendants of Xi.
G encodes the following set of conditional independence assumptions, called the local Markov assumptions, and denoted by IL(G):
For each variable Xi: x1
x2
x3
x4
x5
x6
x3
x7
x11
x10
x8
x9
10
The Genetics example [koller and Friedman]
VariablesB: blood type (a phenotype)G: genotype of the gene that encodes a person’s blood type; <A,A>, <A,B>, <A,O>, <B,B>, <B,O>, <O,O>
6
11
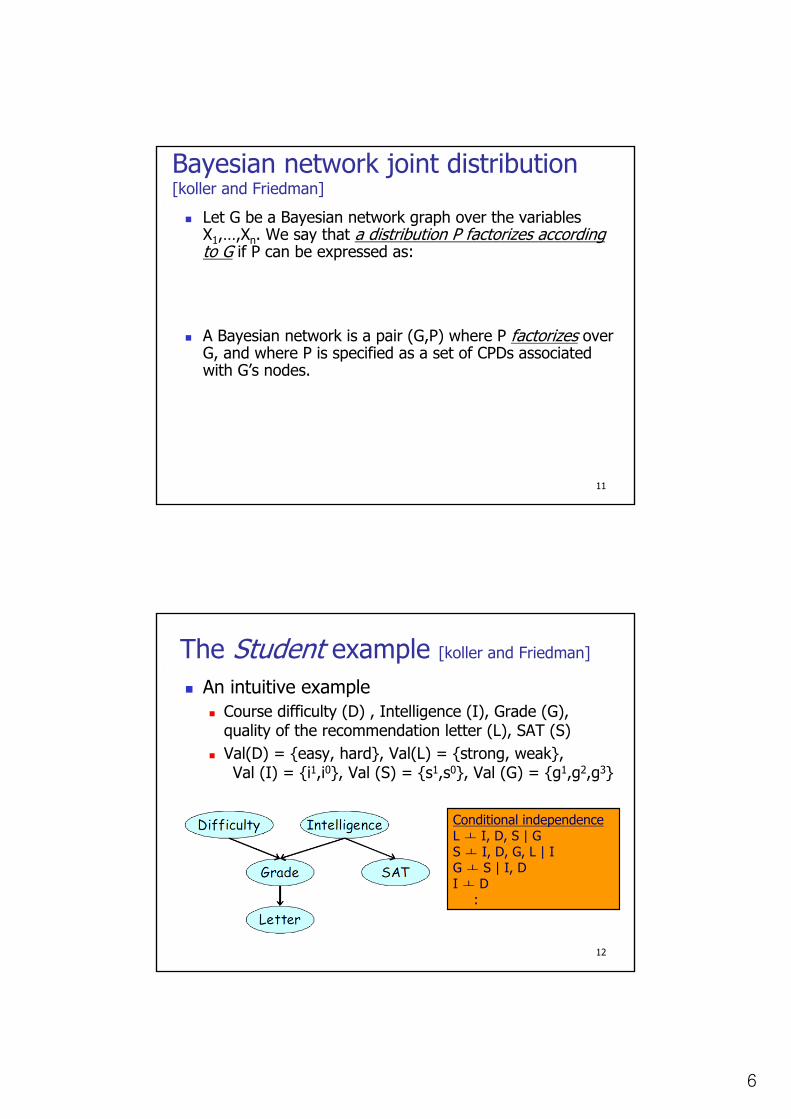
Bayesian network joint distribution [koller and Friedman]
Let G be a Bayesian network graph over the variables X1,…,Xn. We say that a distribution P factorizes according to G if P can be expressed as:
A Bayesian network is a pair (G,P) where P factorizes over G, and where P is specified as a set of CPDs associated with G’s nodes.
12
The Student example [koller and Friedman]
An intuitive exampleCourse difficulty (D) , Intelligence (I), Grade (G), quality of the recommendation letter (L), SAT (S)Val(D) = {easy, hard}, Val(L) = {strong, weak}, Val (I) = {i1,i0}, Val (S) = {s1,s0}, Val (G) = {g1,g2,g3}
Conditional independenceL ㅗ I, D, S | GS ㅗ I, D, G, L | IG ㅗ S | I, DI ㅗ D
:
7
13
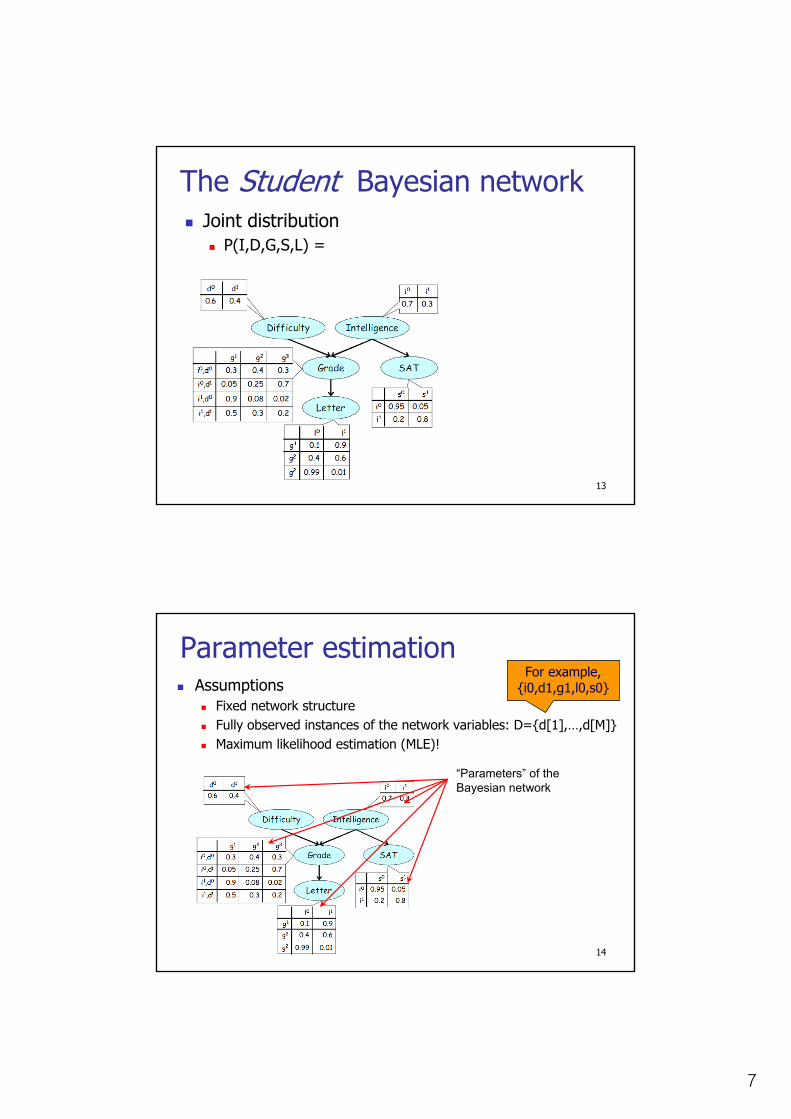
The Student Bayesian networkJoint distribution
P(I,D,G,S,L) =
14
Parameter estimationAssumptions
Fixed network structureFully observed instances of the network variables: D={d[1],…,d[M]}Maximum likelihood estimation (MLE)!
“Parameters” of the Bayesian network
For example, {i0,d1,g1,l0,s0}

8
15
The Thumbtack example [koller and Friedman]
Parameter learning for a single variable.
VariableX: an outcome of a thumbtack tossVal(X) = {head, tail}
DataA set of thumbtack tosses: x[1],…x[M]
X
16
Maximum likelihood estimationSay that P(x=head) = Θ, P(x=tail) = 1-Θ
P(HHTTHHH…<Mh heads, Mt tails>; Θ) =
Definition: The likelihood functionL(Θ : D) = P(D; Θ)
Maximum likelihood estimation (MLE)Given data D=HHTTHHH…<Mh heads, Mt tails>, find Θthat maximizes the likelihood function L(Θ : D).
9
17
MLE for the Thumbtack problemGiven data D=HHTTHHH…<Mh heads, Mt tails>,
MLE solution Θ* = Mh / (Mh+Mt ).
Proof:
18
MLE for Bayesian networksLikelihood decomposition:
The local likelihood function for Xi is:
Bayesian network with table CPDs
10
19
Activator’s RNA level
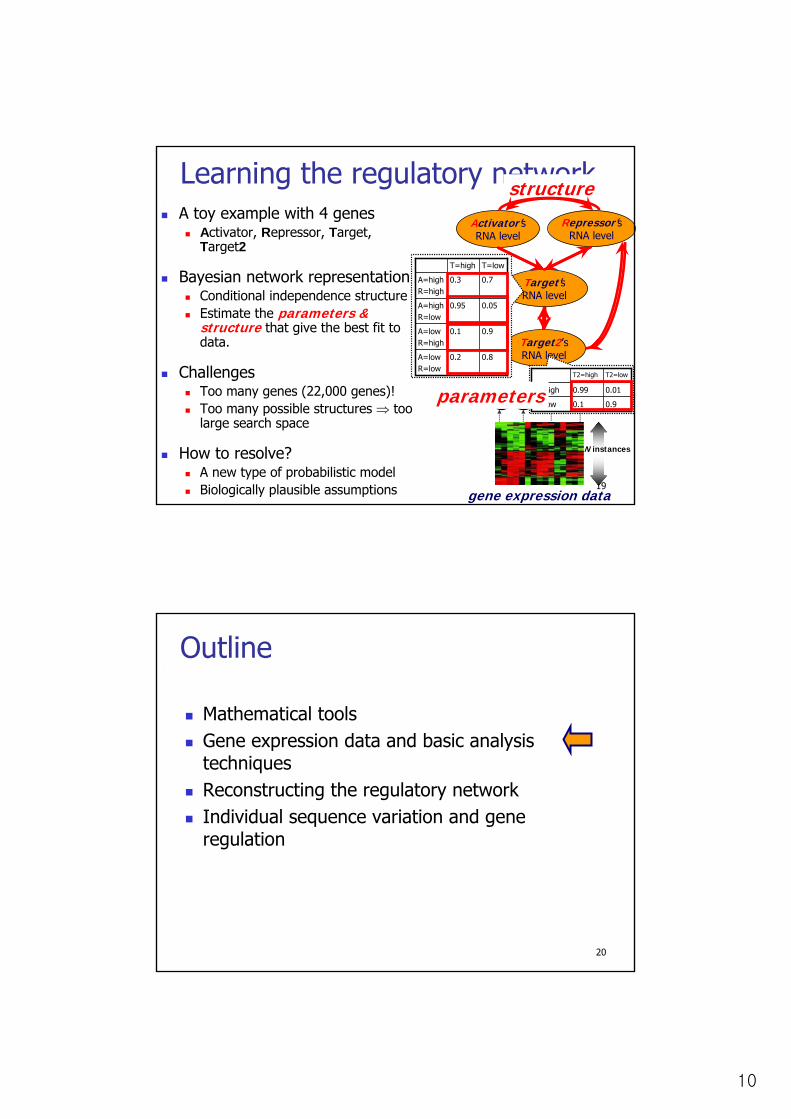
A toy example with 4 genesActivator, Repressor, Target, Target2
Bayesian network representationConditional independence structureEstimate the parameters & structure that give the best fit to data.
ChallengesToo many genes (22,000 genes)!Too many possible structures ⇒ too large search space
How to resolve?A new type of probabilistic modelBiologically plausible assumptions
Target2’s RNA level
Target’s RNA level
Learning the regulatory networkRepressor’s
RNA level
0.2
0.1
0.95
0.3
T=high
0.9A=lowR=high
0.8A=lowR=low
0.05A=high R=low
0.7A=high R=high
T=low
TA R T20.1
0.99
T2=high
0.9T=low
0.01T=high
T2=low
gene expression data
N instances
parameters
structure
20
Outline
Mathematical toolsGene expression data and basic analysis techniquesReconstructing the regulatory networkIndividual sequence variation and gene regulation
11
21
Experiments (samples)
Gen
esInduced
Repressed
j
i
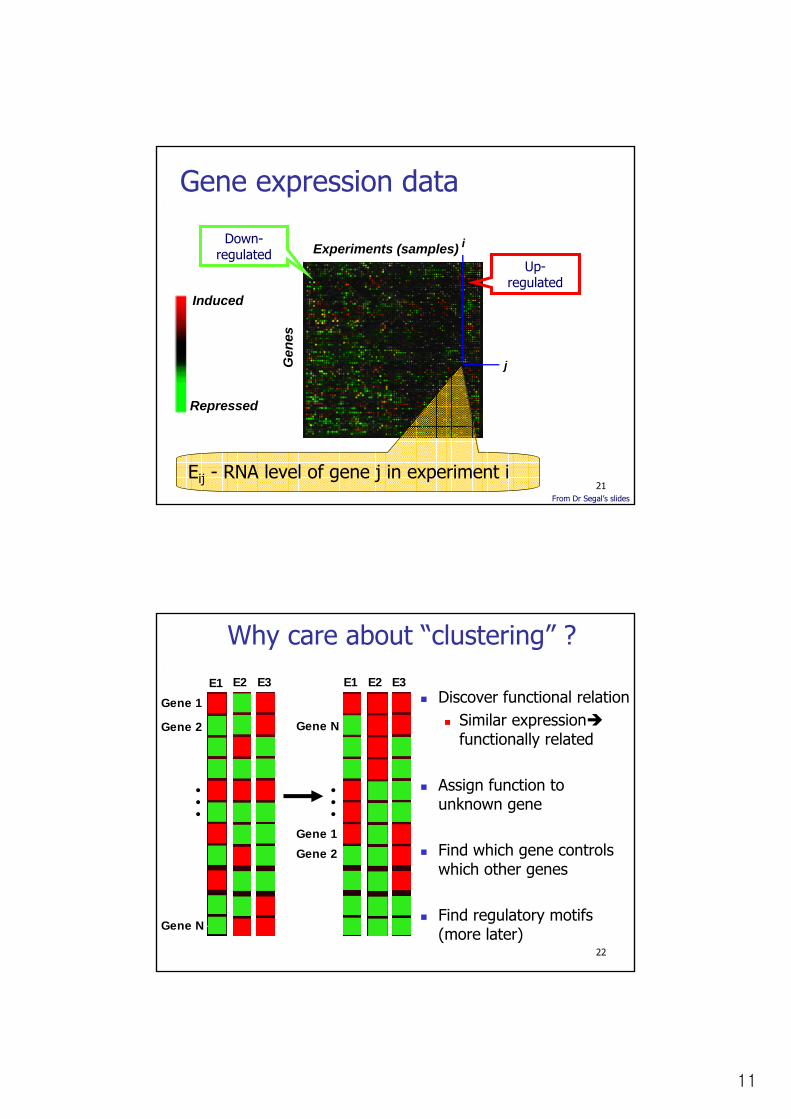
Eij - RNA level of gene j in experiment i
Gene expression data
Down-regulated
Up-regulated
From Dr Segal’s slides
22
Why care about “clustering” ?
E1 E2 E3
Gene 1
Gene 2
Gene N
E1 E2 E3
Gene N
Gene 1
Gene 2
Discover functional relationSimilar expressionfunctionally related
Assign function to unknown gene
Find which gene controls which other genes
Find regulatory motifs (more later)

12
23
Hierarchical agglomerative
Compute all pairwise distancesData instances
Merge closest pair
From Dr Segal’s slides
24
Clustering expression profilesData instances
Co-regulated genes cluster together
Infer gene function
Limitations:No explanation on what caused expression of each gene(No regulatory mechanism)
Limitations:No explanation on what caused expression of each gene(No regulatory mechanism)
From Dr Segal’s slides
13
25
Outline
Mathematical toolsGene expression data and basic analysis techniquesReconstructing the regulatory networkIndividual sequence variation and gene regulation
26
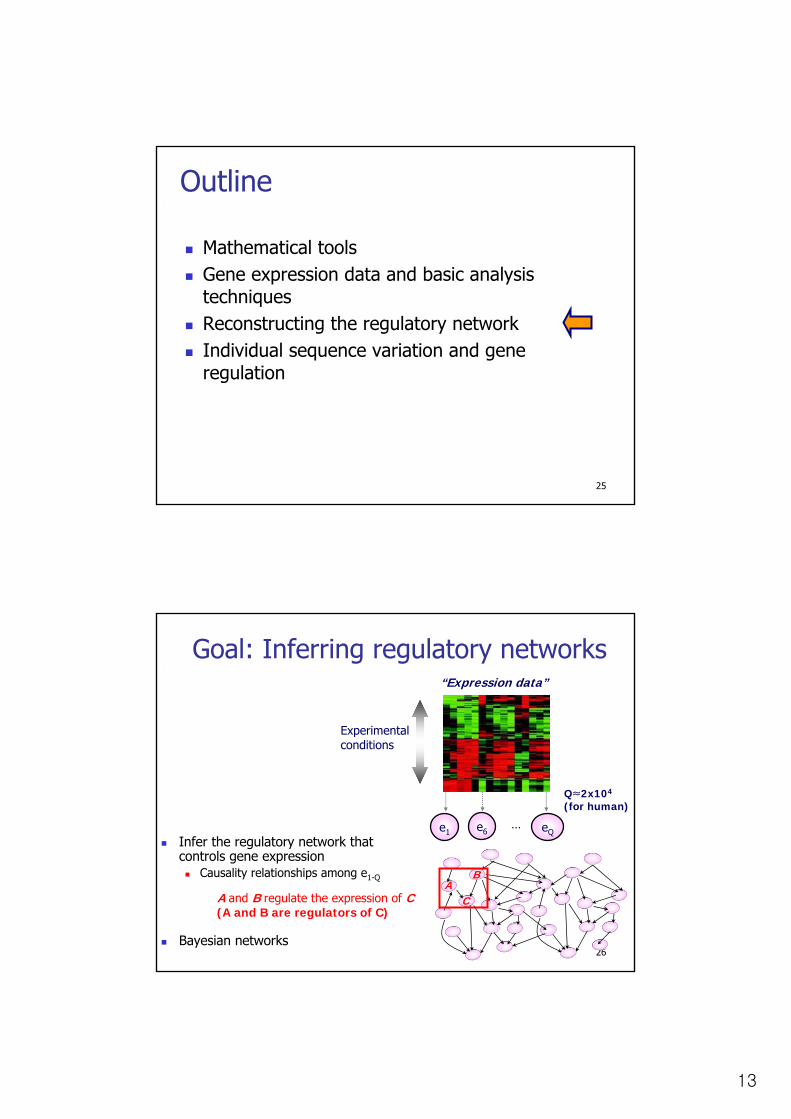
Goal: Inferring regulatory networks“Expression data”
e1 eQe6…
Infer the regulatory network that controls gene expression
Causality relationships among e1-Q
Bayesian networks
Q≈2x10⁴
(for human)
A and B regulate the expression of C(A and B are regulators of C)
AB
C
Experimental conditions

14
27
Regulatory networkBayesian network representation
Xi: expression level of gene iVal(Xi): continuous
InterpretationConditional independenceCausal relationships
Joint distributionP(X) =
X1
X3 X4
X5 X6
X2
Conditional probability distribution (CPD)?
28
Context specificity of gene expression
Context ABasal expression level
Upstream regionof target gene (X5)
RNAlevel
Activator (X3)
activatorbinding site
Context BActivator induces expression
repressorbinding site
Repressor (X4)
activatorbinding site
Activator (X3)
Context CActivator + repressor decrease expression
X1
X3 X4
X5 X6
X2
?
Segal et al. Nat Genet 2003

15
29
Context specificity of gene expression
Context ABasal expression level
Upstream regionof target gene (X5)
RNAlevel
Activator (X3)
activatorbinding site
Context BActivator induces expression
repressorbinding site
Repressor (X4)
activatorbinding site
Activator (X3)
Context CActivator + repressor decrease expression
X1
X3 X4
X5 X6
X2
?
truefalse
X4
-3
P(Level)
Level
. . .
truefalse
3
P(Level)
Level
0
P(Level)
Level
X3
Context A
Context CContext B
30
ParameterizationTree conditional probability distributions (CPDs)
mean (µ) & variance (σ2) of the normal distribution in each context
X1
X3 X4
X5 X6
X2
Tree CPD
truefalse
X4
-3
P(Level)
Level
. . .
truefalse
3
P(Level)
Level
0
P(Level)
Level
X3
Context AContext B Context C
(μA,σA)(μB,σB) (μC,σC)
16
31
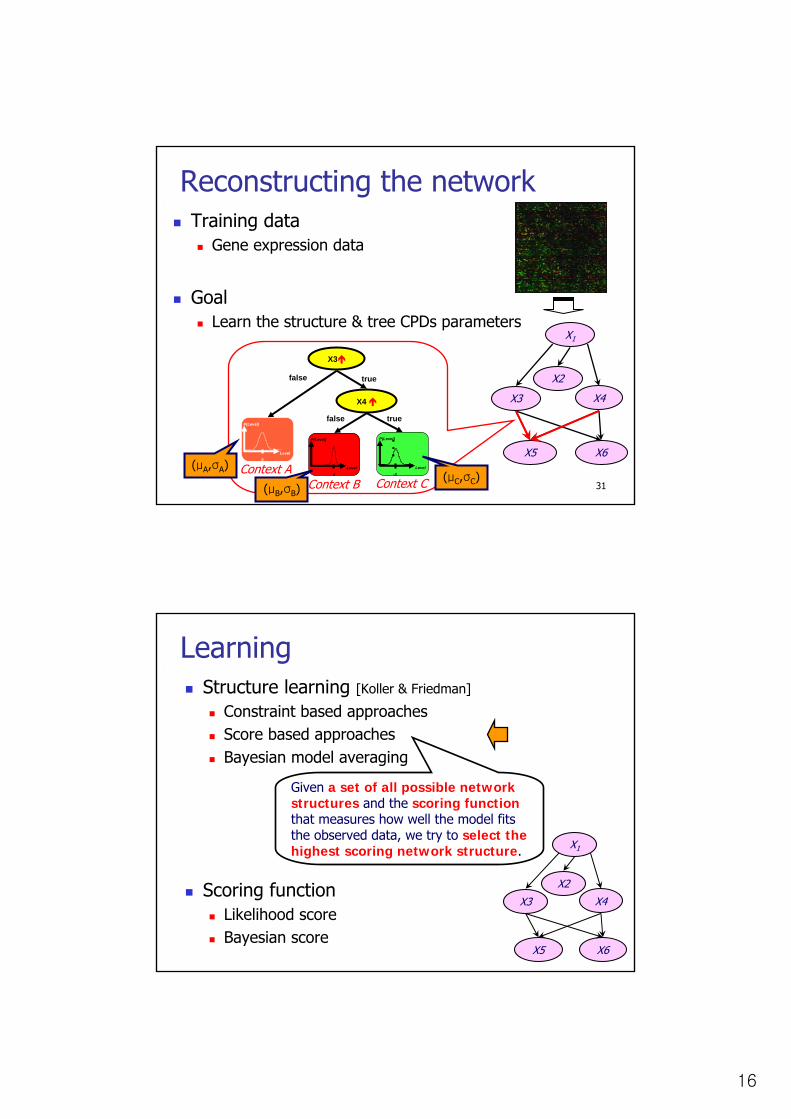
Reconstructing the networkTraining data
Gene expression data
GoalLearn the structure & tree CPDs parameters
X1
X3 X4
X5 X6
X2truefalse
X4
-3
P(Level)
Level
. . .
truefalse
3
P(Level)
Level
0
P(Level)
Level
X3
Context AContext B Context C
(μA,σA)
(μB,σB)(μC,σC)
32
LearningStructure learning [Koller & Friedman]
Constraint based approachesScore based approachesBayesian model averaging
Scoring functionLikelihood scoreBayesian score
X1
X3 X4
X5 X6
X2
Given a set of all possible network structures and the scoring functionthat measures how well the model fits the observed data, we try to select the highest scoring network structure.

17
33
Scoring functionsLet S: structure, ΘS: parameters for S, D: dataLikelihood score
Bayesian scoreX1
X3 X4
X5 X6
X2
X1
X3 X4
X5 X6
X2
34
Modularity of regulatory networksGenes tend to be co-regulated with others by the same factors.
X1
X3 X4
X5 X6
X2Module 2
Module 3
Module 1
Same module ⇒Share the CPD
Biologically more relevant
More compact representationSmaller number of parametersReduced search space for structure learning
Candidate regulatorsA small set of genes that can be parents of other modules.
X1
X3 X4
18
35
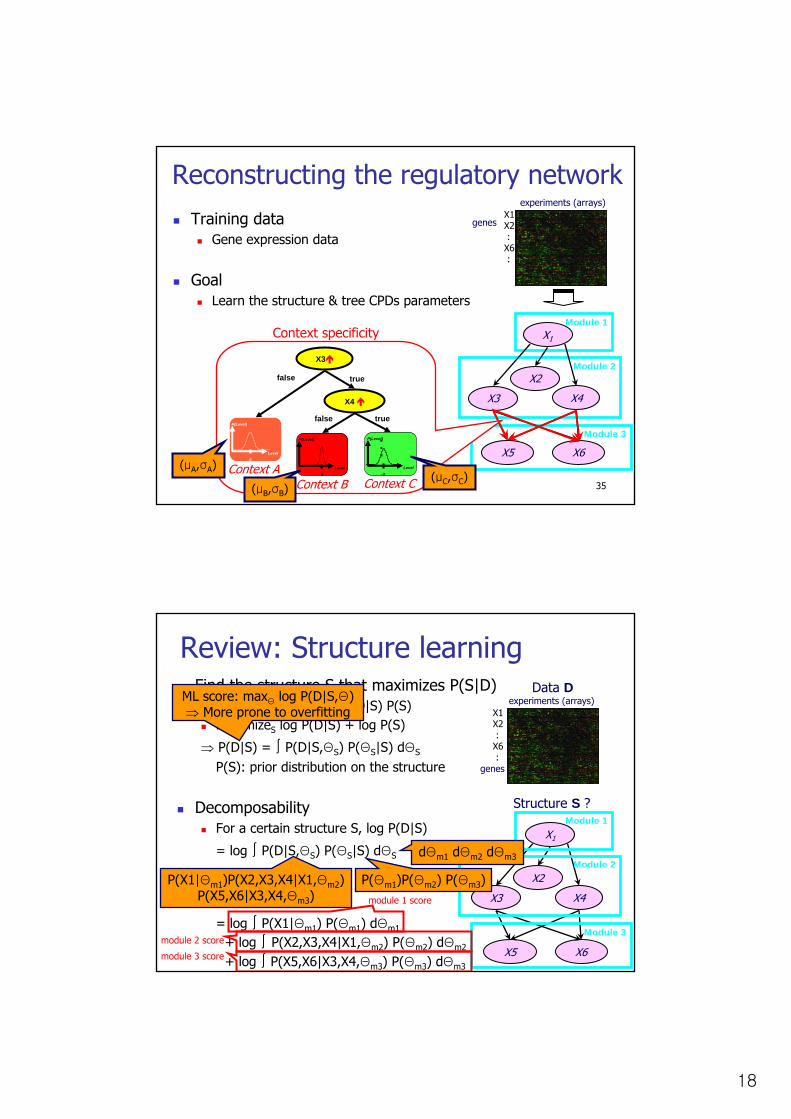
Reconstructing the regulatory networkTraining data
Gene expression data
GoalLearn the structure & tree CPDs parameters
X1
X3 X4
X5 X6
X2Module 2
Module 3
Module 1
truefalse
X4
-3
P(Level)
Level
. . .
truefalse
3
P(Level)
Level
0
P(Level)
Level
X3
Context AContext B Context C
(μA,σA)
(μB,σB)(μC,σC)
X1X2:
X6:
genes
experiments (arrays)
Context specificity
36
Review: Structure learningFind the structure S that maximizes P(S|D)
P(Structure|Data) ∝ P(D|S) P(S)maximizeS log P(D|S) + log P(S)
⇒ P(D|S) = ∫ P(D|S,ΘS) P(ΘS|S) dΘS
P(S): prior distribution on the structure
DecomposabilityFor a certain structure S, log P(D|S)
= log ∫ P(D|S,ΘS) P(ΘS|S) dΘS
= log ∫ P(X1|Θm1) P(Θm1) dΘm1
+ log ∫ P(X2,X3,X4|X1,Θm2) P(Θm2) dΘm2
+ log ∫ P(X5,X6|X3,X4,Θm3) P(Θm3) dΘm3
X1
X3 X4
X5 X6
X2
Structure S ?
Data D
X1X2:
X6:
genes
experiments (arrays)
Module 2
Module 3
Module 1
P(X1|Θm1)P(X2,X3,X4|X1,Θm2) P(X5,X6|X3,X4,Θm3)
P(Θm1)P(Θm2) P(Θm3)
dΘm1 dΘm2 dΘm3
ML score: maxΘ log P(D|S,Θ)⇒ More prone to overfitting
module 1 score
module 2 score
module 3 score
19
37
X1
X3 X4
X5 X6
X2Module 2
Module 3
Module 1
truefalse
X4
-3
P(Level)
Level
. . .
truefalse
3
P(Level)
Level
0
P(Level)
Level
X3
Context AContext B Context C
(μA,σA)
GoalIdentify modules (member genes)Discover module regulation program
genes(X’s)
experiments
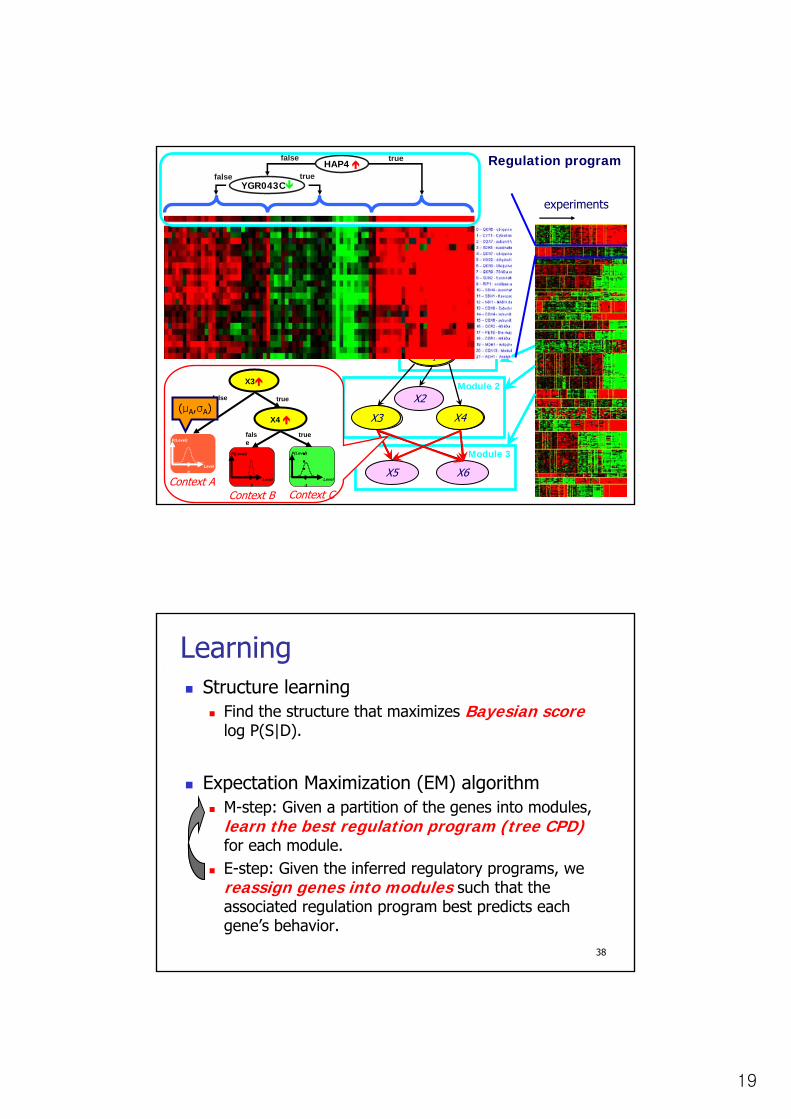
Regulation program
X1
X3 X4
Candidate regulators
HAP4
YGR043Ctruefalse
truefalse
38
LearningStructure learning
Find the structure that maximizes Bayesian scorelog P(S|D).
Expectation Maximization (EM) algorithmM-step: Given a partition of the genes into modules, learn the best regulation program (tree CPD)for each module.E-step: Given the inferred regulatory programs, we reassign genes into modules such that the associated regulation program best predicts each gene’s behavior.
20
39
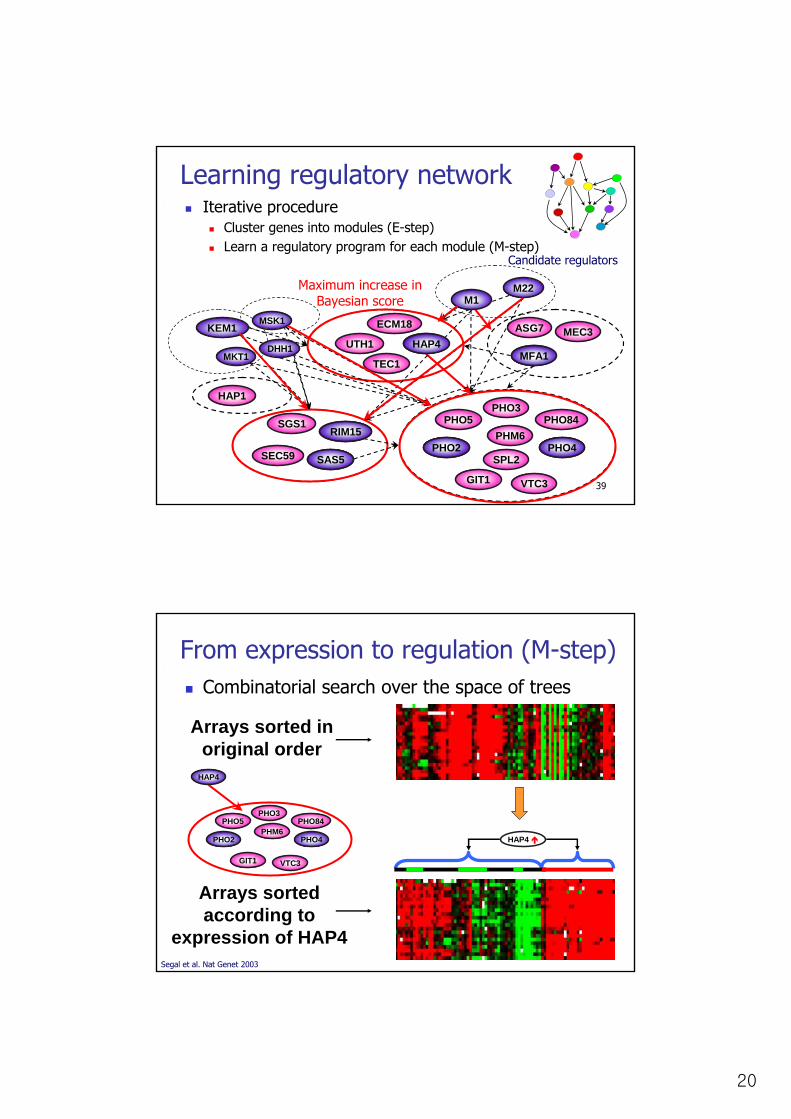
Iterative procedureCluster genes into modules (E-step)Learn a regulatory program for each module (M-step)
Learning regulatory network
PHO5PHM6
SPL2
PHO3PHO84
VTC3GIT1
PHO2
GPA1
ECM18
UTH1MEC3
MFA1
SAS5SEC59
SGS1
PHO4
ASG7
RIM15
HAP1
TEC1
M1
MSK1
M22
KEM1
MKT1DHH1
PHO2
HAP4MFA1
SAS5PHO4
RIM15
Maximum increase in Bayesian score
Candidate regulators
40
From expression to regulation (M-step)Combinatorial search over the space of trees
Arrays sorted in original order
HAP4
Arrays sorted according to
expression of HAP4Segal et al. Nat Genet 2003
PHO5PHM6
PHO3PHO84
VTC3GIT1
PHO2
HAP4
PHO4
21
41
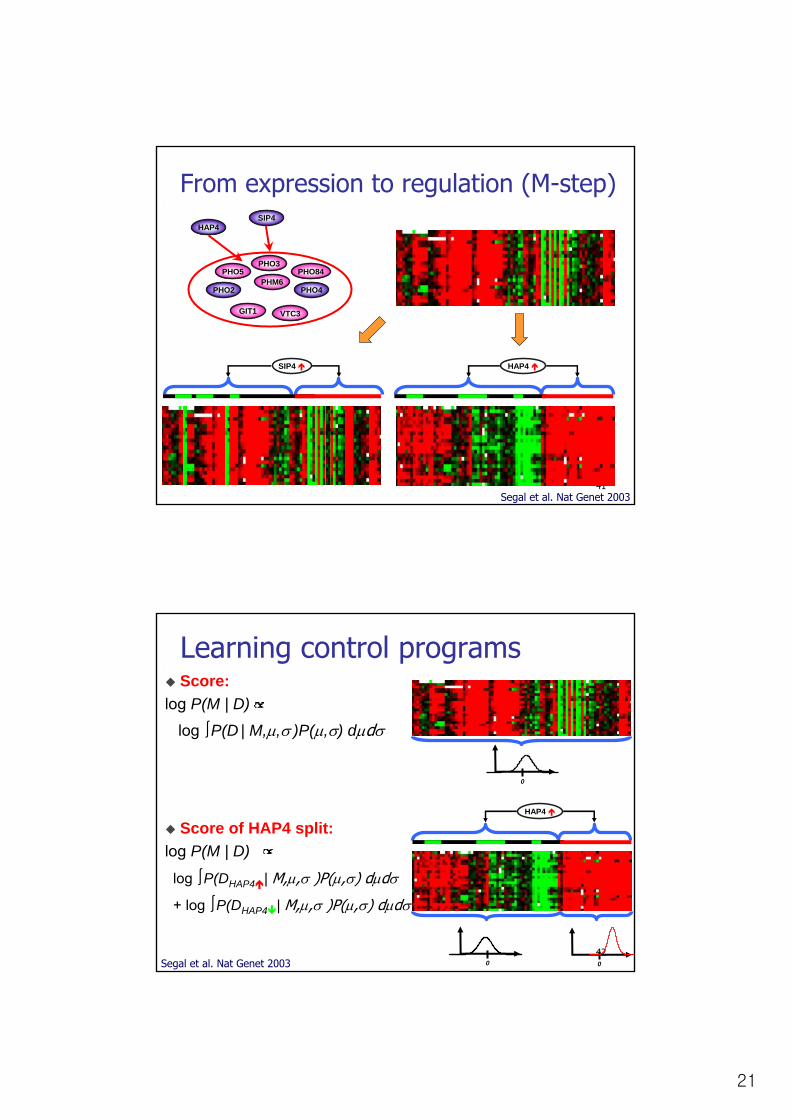
From expression to regulation (M-step)
HAP4 SIP4
Segal et al. Nat Genet 2003
PHO5PHM6
PHO3PHO84
VTC3GIT1
PHO2
HAP4
PHO4
SIP4
42
Learning control programs
HAP4
0 0
Score:log P(M | D)
log ∫P(D | M,µ,σ )P(µ,σ) dµdσ
Score of HAP4 split:log P(M | D)
log ∫P(DHAP4 | M,µ,σ )P(µ,σ) dµdσ
+ log ∫P(DHAP4 | M,µ,σ )P(µ,σ) dµdσ
0
Segal et al. Nat Genet 2003
22
43
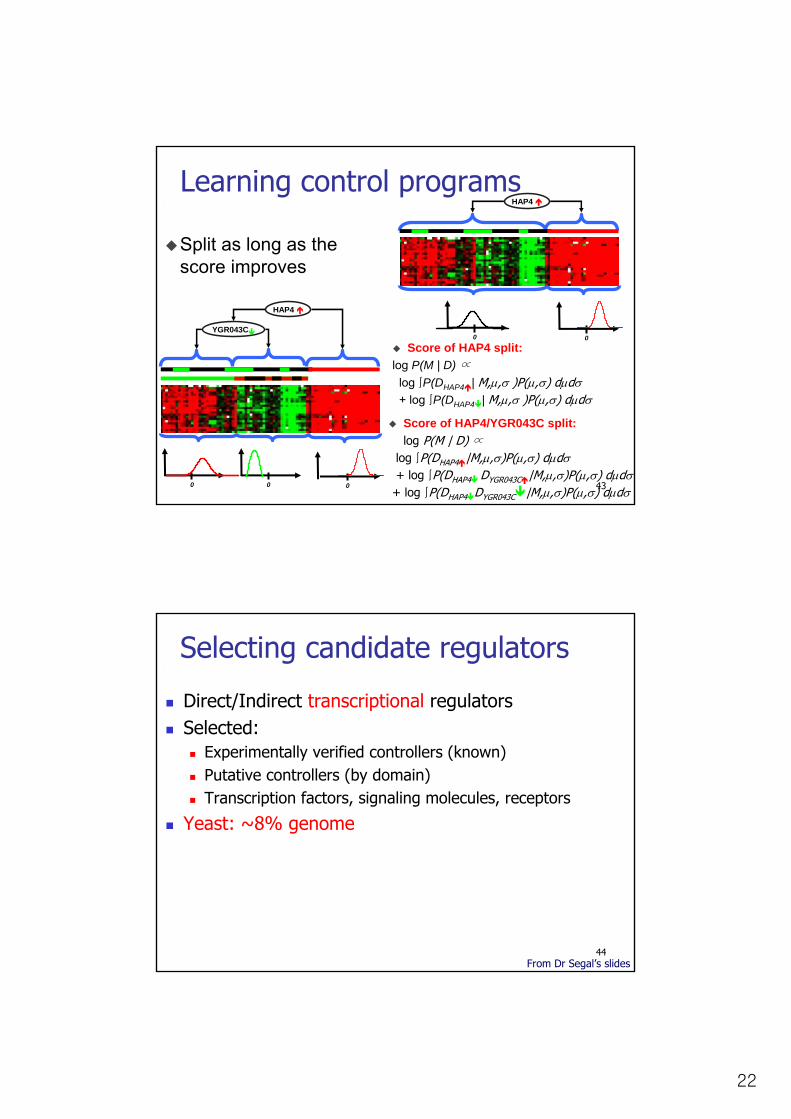
Learning control programsHAP4
0 0
Split as long as the score improves
HAP4
0 0
YGR043C
0
Score of HAP4/YGR043C split:log P(M | D) ∝
log ∫P(DHAP4 |M,µ,σ)P(µ,σ) dµdσ+ log ∫P(DHAP4 DYGR043C |M,µ,σ)P(µ,σ) dµdσ
+ log ∫P(DHAP4 DYGR043C |M,µ,σ)P(µ,σ) dµdσ
Score of HAP4 split:log P(M | D) ∝
log ∫P(DHAP4 | M,µ,σ )P(µ,σ) dµdσ+ log ∫P(DHAP4 | M,µ,σ )P(µ,σ) dµdσ
44
Selecting candidate regulators
Direct/Indirect transcriptional regulatorsSelected:
Experimentally verified controllers (known)Putative controllers (by domain)Transcription factors, signaling molecules, receptors
Yeast: ~8% genome
From Dr Segal’s slides

23
45
Module network proceduredata selectionExpression
data
Experimental tests of computational predictions
Gene reassignment
to modules
Pre-processing
Gene partition
clustering
Module networkprocedure
Modules
Mot
ifsA
nnot
atio
ns
Candidate regulators
regulatorselection
Conditions
Gen
es
(TRANSFAC)
Annotations (GO, KEGG)
Regulation program learning
Functional modules
Post-processing
Graphic presentation GeneXPress.stanford.edu
Segal et al. Nat Genet 2003
M-step
E-step
46
Yeast Stress Data (Gasch et al)Genes
Selected 2355 genes that showedactivity
ExperimentsDiverse environmental stressconditions (heat shock, hydrogenperoxide, menadione,…)Time series for each conditionUsed all 173 arrays
From Dr Segal’s slides
24
47
Module Evaluation CriteriaAre the module genes functionally coherent?Do the regulators have regulatory roles in the predicted conditions?Are the genes in the module known targets of the predicted regulators?Are the regulators consistent with the regulatory motifs found in upstream of the module genes?
48
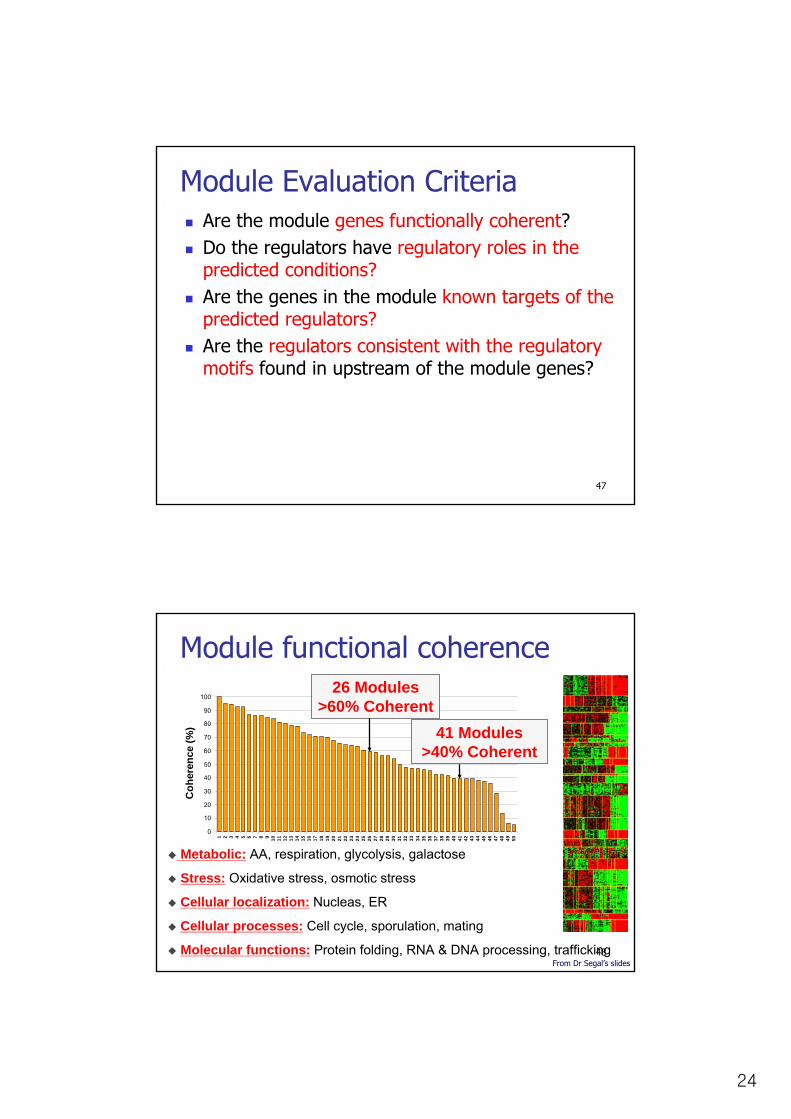
Module functional coherence
Metabolic: AA, respiration, glycolysis, galactose
Stress: Oxidative stress, osmotic stress
Cellular localization: Nucleas, ER
Cellular processes: Cell cycle, sporulation, mating
Molecular functions: Protein folding, RNA & DNA processing, trafficking
0
10
20
30
40
50
60
70
80
90
100
1 2 3 4 5 6 7 8 9 10 11 12 13 14 15 16 17 18 19 20 21 22 23 24 25 26 27 28 29 30 31 32 33 34 35 36 37 38 39 40 41 42 43 44 45 46 47 48 49 50
Coh
eren
ce (%
)
26 Modules>60% Coherent
41 Modules>40% Coherent
From Dr Segal’s slides

25
49
Respiration module
HAP4 known to up regulate Oxid. Phos.
From Dr Segal’s slides
50
Respiration Module
HAP4 known to up regulate Oxid. Phos.
HAP4, MSN4, XBP1 known to be regulators under predicted conditions
From Dr Segal’s slides

26
51
Respiration Module
HAP4, MSN4, XBP1 known to be regulators under predicted conditions
HAP4 known to up regulate Oxid. Phos.
HAP4 Binding sitefound in 39/55 genes
From Dr Segal’s slides
52
Respiration Module
HAP4 Binding sitefound in 39/55 genes
HAP4, MSN4, XBP1 known to be regulators under predicted conditions
HAP4 known to up regulate Oxid. Phos.
MSN4 Binding sitefound in 28/55 genes
From Dr Segal’s slides
27
53
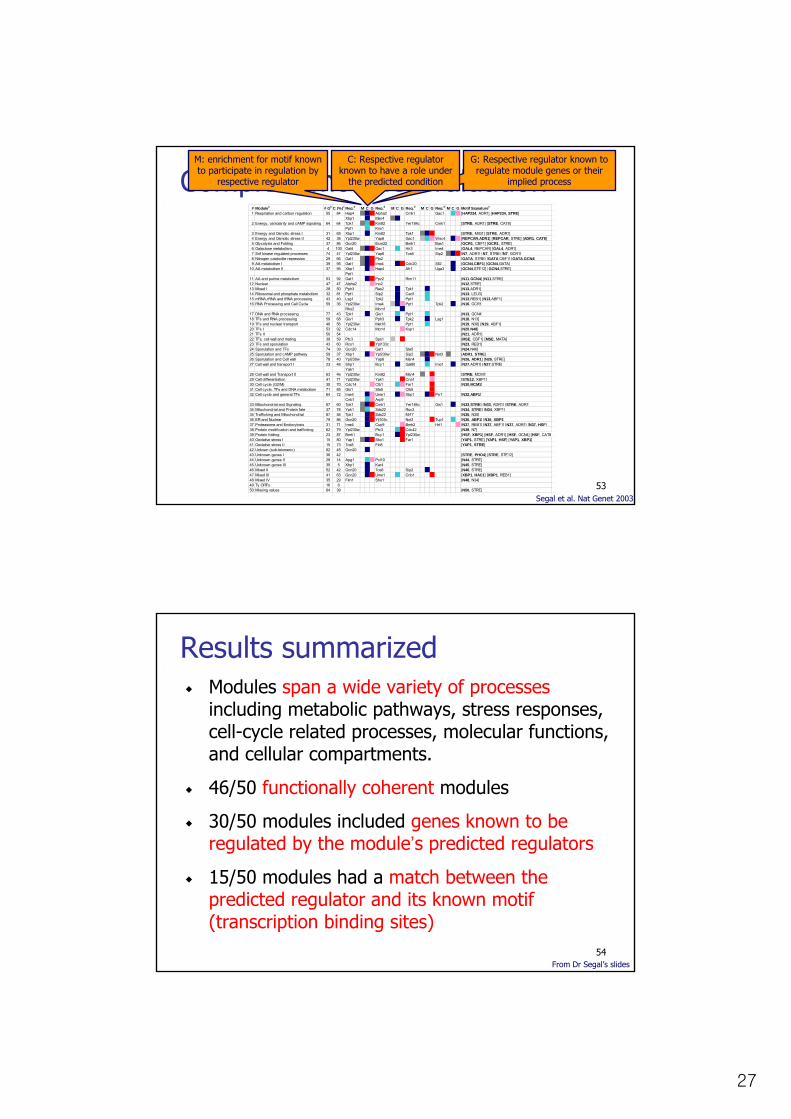
Complete module evaluation# Modulea # Gb C (%)c Reg.d M C G Reg.d M C G Reg.d M C G Reg.d M C G Motif Signaturee
1 Respiration and carbon regulation 55 84 Hap4 Alpha2 Cmk1 Gac1 [HAP234, ADR1] [HAP234, STRE]Xbp1 Msn4
2 Energy, osmolarity and cAMP signaling 64 64 Tpk1 Kin82 Yer184c Cmk1 [STRE, ADR1] [STRE, CAT8]Ppt1 Kns1
3 Energy and Osmotic stress I 31 65 Xbp1 Kin82 Tpk1 [STRE, MIG1] [STRE, ADR1]4 Energy and Osmotic stress II 42 38 Ypl230w Yap6 Gac1 Wsc4 [REPCAR,ADR1] [REPCAR, STRE] [ADR1, CAT8]5 Glycolysis and Folding 37 86 Gcn20 Ecm22 Bmh1 Bas1 [GCR1, CBF1] [GCR1, STRE]6 Galactose metabolism 4 100 Gal4 Gac1 Hir3 Ime4 [GAL4, REPCAR] [GAL4, ADR1]7 Snf kinase regulated processes 74 47 Ypl230w Yap6 Tos8 Sip2 [N7, ADR1] [N7, STRE] [N7, GCR1]8 Nitrogen catabolite repression 29 66 Gat1 Plp2 [GATA, STRE] [GATA,CBF1] [GATA,GCN4]9 AA metabolism I 39 95 Gat1 Ime4 Cdc20 Slt2 [GCN4,CBF1] [GCN4,GATA]
10 AA metabolism II 37 95 Xbp1 Hap4 Afr1 Uga3 [GCN4,STE12] [GCN4,STRE]Ppt1
11 AA and purine metabolism 53 92 Gat1 Ppz2 Rim11 [N11,GCN4] [N11,STRE]12 Nuclear 47 47 Alpha2 Ino2 [N12,STRE]13 Mixed I 28 50 Pph3 Ras2 Tpk1 [N13,ADR1]14 Ribosomal and phosphate metabolism 32 81 Ppt1 Sip2 Cad1 [N13, LEU3]15 mRNA,rRNA and tRNA processing 43 40 Lsg1 Tpk2 Ppt1 [N13,REB1] [N13,ABF1]16 RNA Processing and Cell Cycle 59 36 Ypl230w Ime4 Ppt1 Tpk2 [N16, GCR1]
Rho2 Mcm117 DNA and RNA processing 77 43 Tpk1 Gis1 Ppt1 [N13, GCN4]18 TFs and RNA processing 59 68 Gis1 Pph3 Tpk2 Lsg1 [N18, N13]19 TFs and nuclear transport 48 56 Ypl230w Met18 Ppt1 [N19, N38] [N19, ABF1]20 TFs I 53 92 Cdc14 Mcm1 Ksp1 [N20,N48]21 TFs II 50 54 [N21, ADR1]22 TFs, cell wall and mating 39 59 Ptc3 Sps1 [MSE, CBF1] [MSE, MATA]23 TFs and sporulation 43 60 Rcs1 Ypl133c [N23, REB1]24 Sporulation and TFs 74 39 Gcn20 Gat1 Ste5 [N24,N46]25 Sporulation and cAMP pathway 59 37 Xbp1 Ypl230w Sip2 Not3 [ADR1, STRE]26 Sporulation and Cell wall 78 40 Ypl230w Yap6 Msn4 [N26, ADR1] [N26, STRE]27 Cell wall and transport I 23 48 Shp1 Bcy1 Gal80 Ime1 [N27,ADR1] [N27,STRE]
Yak128 Cell wall and Transport II 63 46 Ypl230w Kin82 Msn4 [STRE, MCM1]29 Cell differentiation 41 71 Ypl230w Ypk1 Cna1 [STE12, XBP1]30 Cell cycle (G2/M) 30 70 Cdc14 Clb1 Far1 [N30,MCM1]31 Cell cycle, TFs and DNA metabolism 71 85 Gis1 Ste5 Clb532 Cell cycle and general TFs 64 72 Ime4 Ume1 Xbp1 Prr1 [N32,ABF1]
Cnb1 Arp933 Mitochondrial and Signaling 87 60 Tpk1 Cmk1 Yer184c Gis1 [N33,STRE] [N33, ADR1] [STRE, ADR1]34 Mitochondrial and Protein fate 37 78 Ypk1 Sds22 Rsc3 [N34, STRE] [N34, XBP1]35 Trafficking and Mitochondrial 87 56 Tpk1 Sds22 Mrf1' [N35, N30]36 ER and Nuclear 79 86 Gcn20 Yjl103c Not3 Tup1 [N36, ABF1] [N36, XBP1]37 Proteasome and Endocytosis 31 71 Ime4 Cup9 Bmh2 Hrt1 [N37, REB1] [N37, ABF1] [N37, ADR1] [N37, HSF]38 Protein modification and trafficking 62 79 Ypl230w Ptc3 Cdc42 [N38, N7]39 Protein folding 23 87 Bmh1 Bcy1 Ypl230w [HSF, XBP1] [HSF, ADR1] [HSF, GCN4] [HSF, CAT8]40 Oxidative stress I 15 80 Yap1 Sko1 Far1 [YAP1, STRE] [YAP1, HSF] [YAP1, XBP1]41 Oxidative stress II 15 73 Tos8 Flo8 [YAP1, STRE]42 Unkown (sub-telomeric) 82 45 Gcn2043 Unknown genes I 36 42 [STRE, PHO4] [STRE, STE12]44 Unknown genes II 29 14 Apg1 Pcl10 [N44, STRE]45 Unknown genes III 39 5 Xbp1 Kar4 [N45, STRE]46 Mixed II 52 42 Gcn20 Tos8 Sip2 [N46, STRE]47 Mixed III 41 63 Gcn20 Ume1 Cnb1 [XBP1, HAC1] [XBP1, REB1]48 Mixed IV 35 29 Fkh1 Sho1 [N48, N34]49 Ty ORFs 16 650 Missing values 64 39 [N50, STRE]
M: enrichment for motif known to participate in regulation by
respective regulator
G: Respective regulator known to regulate module genes or their
implied process
C: Respective regulator known to have a role under
the predicted condition
Segal et al. Nat Genet 2003
54
Results summarizedModules span a wide variety of processesincluding metabolic pathways, stress responses, cell-cycle related processes, molecular functions, and cellular compartments.
46/50 functionally coherent modules
30/50 modules included genes known to be regulated by the module’s predicted regulators
15/50 modules had a match between the predicted regulator and its known motif (transcription binding sites)
From Dr Segal’s slides
Related Documents