1 Lectures 14 – Nov 14, 2011 CSE 527 Computational Biology, Fall 2011 Instructor: Su-In Lee TA: Christopher Miles Monday & Wednesday 12:00-1:20 Johnson Hall (JHN) 022 Inferring Protein-Signaling Networks 1 Course Announcement http://www.cs.washington.edu/education/courses/cse527/11au/notes.html 2

Welcome message from author
This document is posted to help you gain knowledge. Please leave a comment to let me know what you think about it! Share it to your friends and learn new things together.
Transcript

1
Lectures 14 – Nov 14, 2011CSE 527 Computational Biology, Fall 2011
Instructor: Su-In LeeTA: Christopher Miles
Monday & Wednesday 12:00-1:20Johnson Hall (JHN) 022
Inferring Protein-Signaling Networks
1
Course Announcement http://www.cs.washington.edu/education/courses/cse527/11au/notes.html
2
2
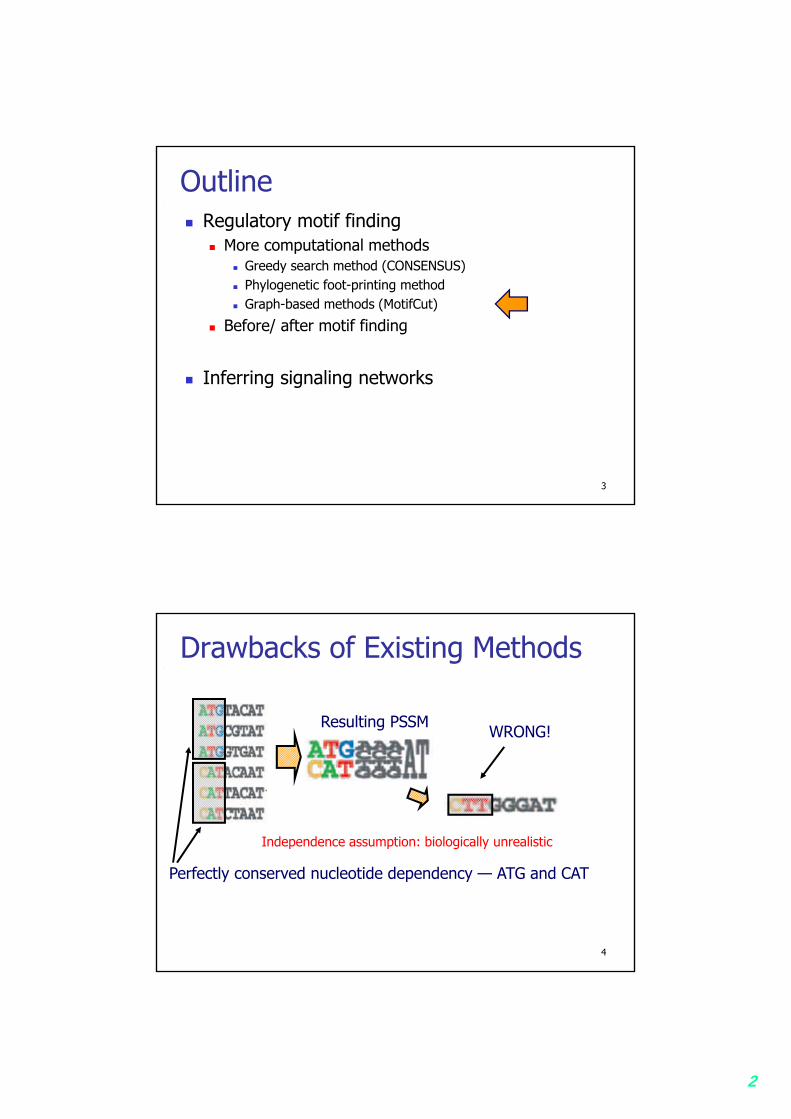
Outline Regulatory motif finding
More computational methods Greedy search method (CONSENSUS) Phylogenetic foot-printing method Graph-based methods (MotifCut)
Before/ after motif finding
Inferring signaling networks
3
Drawbacks of Existing Methods
Perfectly conserved nucleotide dependency — ATG and CAT
Resulting PSSMWRONG!
Independence assumption: biologically unrealistic
4

3
Overview: Graph-Based Representation Nodes: k-mers of input sequence
Edges: pairwise k-mer similarity
Motif search maximum density subgraph
5
MotifCut Algorithm Convert sequence into a collection of k-mers
Each overlap/duplicate considered distinct
6
k=3
Each k-mer is a node
4
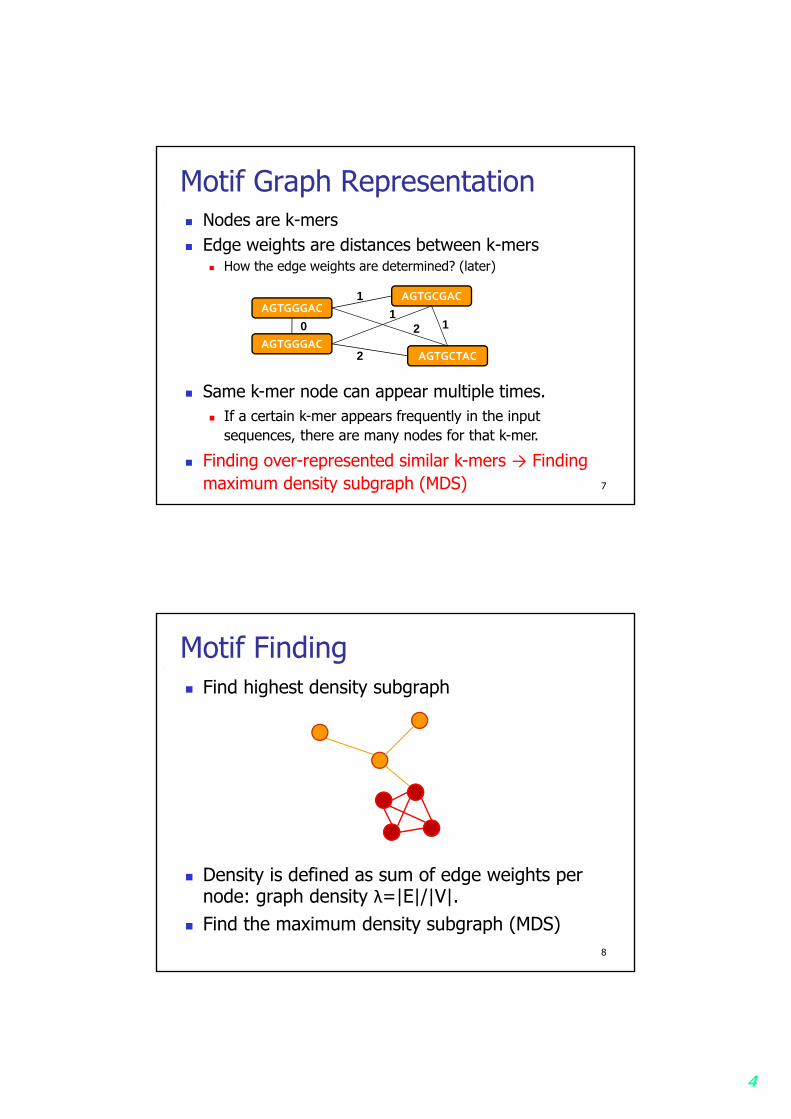
Motif Graph Representation Nodes are k-mers Edge weights are distances between k-mers
How the edge weights are determined? (later)
7
AGTGGGAC
AGTGGGAC
AGTGCGAC
AGTGCTAC
0
1
2
11
2
Same k-mer node can appear multiple times. If a certain k-mer appears frequently in the input
sequences, there are many nodes for that k-mer.
Finding over-represented similar k-mers → Finding maximum density subgraph (MDS)
Motif Finding Find highest density subgraph
Density is defined as sum of edge weights per node: graph density λ=|E|/|V|.
Find the maximum density subgraph (MDS)8

5
Motif Dependency in MDS
9
MotifCut Algorithm Read input sequences Generate graph as previously described
K-mers are generated by shifting one base pair Each k-mer in the sequence gets a node, including identical k-mers Graph contains as many nodes as there are base pairs Connect edges with weights based on distances between nodes
Find maximum density subgraphs (MDSs) 10

6
Edge Weights Semantics: Edge weight is the likelihood of two k-mers
to be in the same motif
Use Hamming distance as a way to quantify distance between k-mers
GG AA CC CC GGGG AA CC CC GG 0TT AACC 123
11
Edge Weights
12
BvBv
MvMvMvMvw
ji
ijjiij
PrPr
|Pr|Pr
Background distributionM k-mers of binding siteB background k-mers
Let’s make this a bit more precise: For every pair of vertices (vi, vj) create an edge with weight wij
wij = f(Hamming distance between k-mers in vi, vj)
But how to compute ?
Simulate it! Way too many variables to account for analytically:
Background model, kmer length, hamming distance, etc…

7
Maximum Density Subgraph Standard graph theory method
Max-flow / min-cut: simple and easy to implement However, its running time is O(nm log(n2m)), where n is
the number of vertices and m is the number of edges
Need faster method
Developed heuristic approach that utilizes max-flow / min-cut method with modifications
13
MotifCut Algorithm Find the maximum density subgraph (MDS) MDS optimization
14
Remove all edges below a certain threshold
Pick one vertex (do this for every vertex)
Put back all neighboring edges for that vertex
Use standard algorithm to calculate densest subgraph
Repeat for every vertex

8
Synthetic Experiment Results
15Input size in nucleotides
Per
cen
tage
of
mot
ifs
corr
ectl
y id
enti
fied
MotifCut: regulatory motifs finding with maximum density subgraphs. Fratkin et al. Bioinformatics (2006).
Yeast Test Results Gold standard data (Harbinson et al., 2004)
16

9
Outline Regulatory motif finding
More computational methods Greedy search method (CONSENSUS) Phylogenetic foot-printing method Graph-based methods (MotifCut)
Before/ after motif finding
Inferring signaling networks
17
What After Motif Finding ? Experiments to confirm results DNaseI footprinting & gel-shift assays Tells us which subsequences are the binding sites
18

10
Before Motif Finding How do we obtain a set of sequences on which to
run motif finding ? In other words, how do we get genes that we believe
are regulated by the same transcription factor ? Two high-throughput experimental methods: ChIP-
chip and microarray.
19
Gene 1Gene 2Gene 3Gene 4Gene 5
Binding sites for TF
Before Motif Finding ChIP-chip
Take a particular transcription factor TF Take hundreds or thousands of promoter
sequences Measure how strongly TF binds to each
of the promoter sequences Collect the set to which TF binds
strongly, do motif finding on these
Gene expression data Collect set of genes with similar
expression (activity) profiles and do motif finding on these.
20
11
Outline Regulatory motif finding
More computational methods Before/ after motif finding
Inferring signaling networks Signaling network Flow cytometry Bayesian networks
21
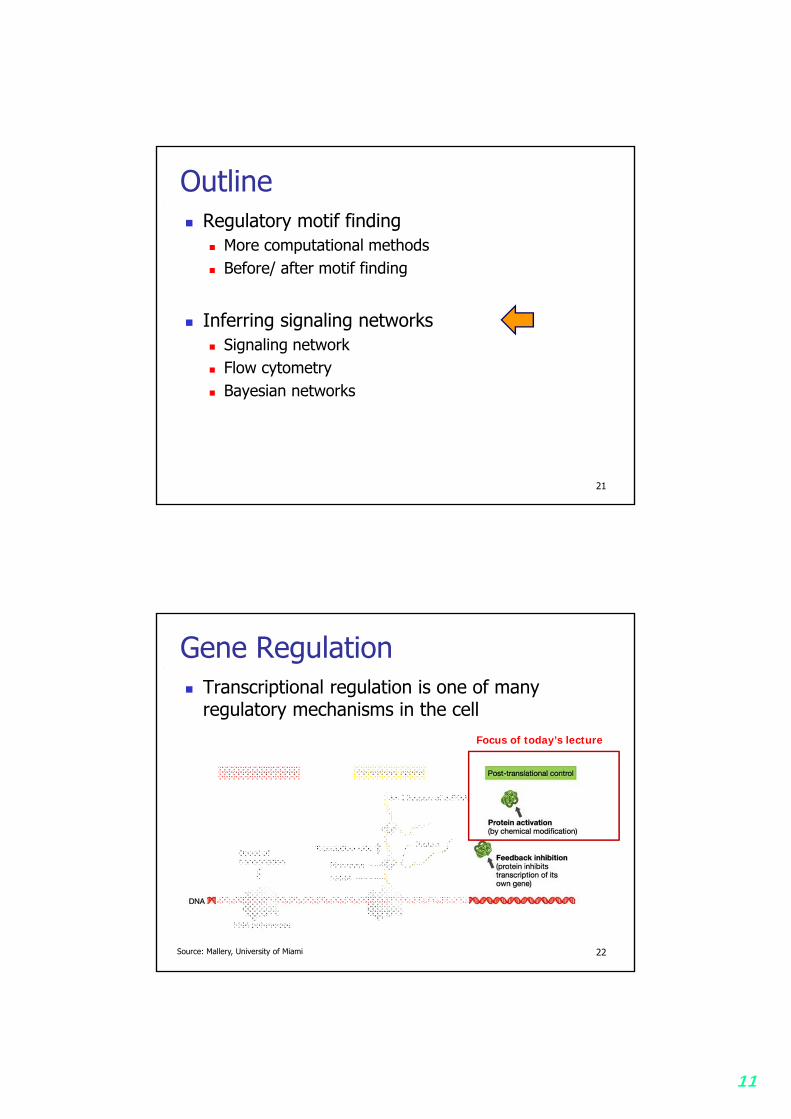
Gene Regulation Transcriptional regulation is one of many
regulatory mechanisms in the cellFocus of today’s lecture
Source: Mallery, University of Miami 22

12
Post-translational Modification Most proteins undergo some form of modification following translation. Phosphorylation is the most studied and best understood post-
translation modification. Addition of a phosphate (PO43-) group to a protein It activates or deactivates many protein enzymes
23
ProteinPO4
Receptor site
ProteinPO4
Change cell function
Hormones, neurotransmitters, transcription factors
Activators, repressors, other proteins
Phosphorylation
Interventions – artificially introducing chemicals which activate/repress the phosphorylation of a protein.
Cellular Signaling Networks Cellular signaling
Part of a complex system of communication that governs basic cellular activities and coordinates cell actions.
The ability of cells to perceive and correctly respond to their microenvironment is the basis of development, tissue repair, and immunity as well as normal tissue homeostasis.
24Overview of signal transduction pathwaysSource: Wikipedia
13
Cellular Signaling Networks
Overview of signal transduction pathwaysSource: Wikipedia
25
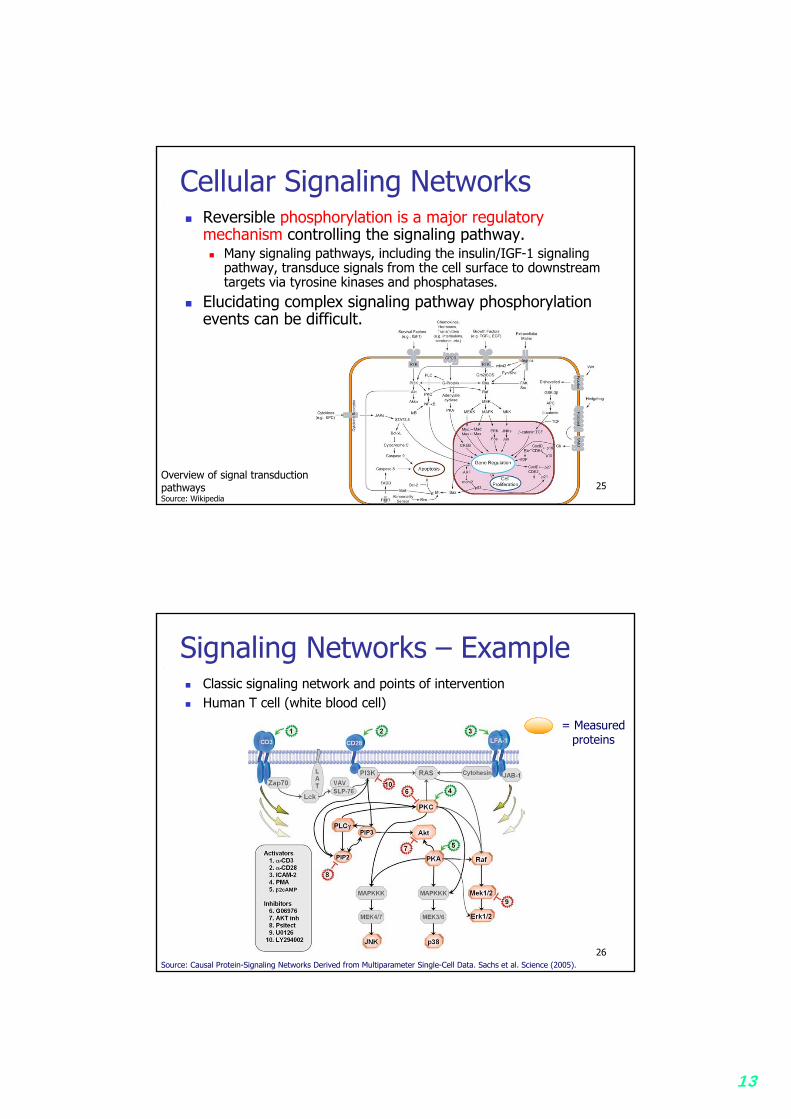
Reversible phosphorylation is a major regulatory mechanism controlling the signaling pathway. Many signaling pathways, including the insulin/IGF-1 signaling
pathway, transduce signals from the cell surface to downstream targets via tyrosine kinases and phosphatases.
Elucidating complex signaling pathway phosphorylation events can be difficult.
Signaling Networks – Example Classic signaling network and points of intervention Human T cell (white blood cell)
26Source: Causal Protein-Signaling Networks Derived from Multiparameter Single-Cell Data. Sachs et al. Science (2005).
= Measured proteins
14
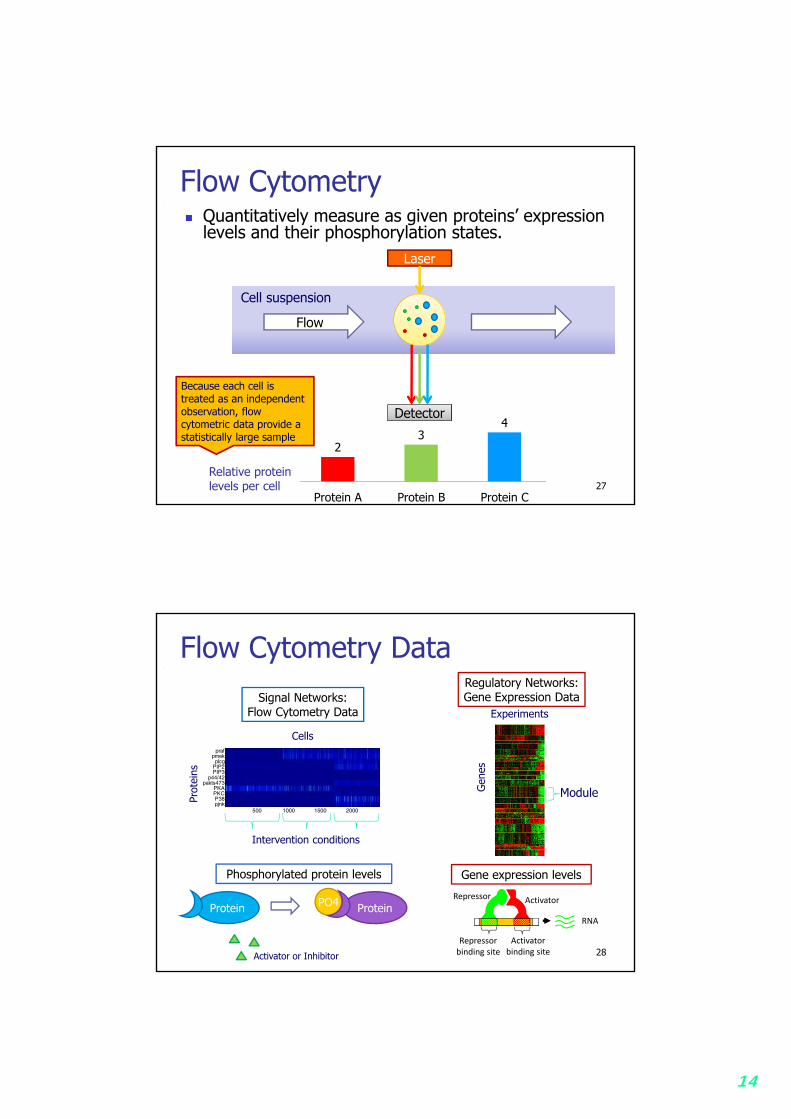
Flow Cytometry Quantitatively measure as given proteins’ expression
levels and their phosphorylation states.
Flow
Laser
Cell suspension
Detector
23
4
Protein A Protein B Protein C
Relative protein levels per cell 27
Because each cell is treated as an independent observation, flow cytometric data provide a statistically large sample
Flow Cytometry DataRegulatory Networks:Gene Expression Data
Experiments
Gen
es
Prot
eins
Cells
Signal Networks:Flow Cytometry Data
Intervention conditions
500 1000 1500 2000
prafpmekplcg
PIP2PIP3
p44/42pakts473
PKAPKCP38pjnk
Module
Repressorbinding site
Repressor
Activatorbinding site
Activator
RNA
Gene expression levelsPhosphorylated protein levels
Activator or Inhibitor 28
ProteinPO4 ProteinPO4
15
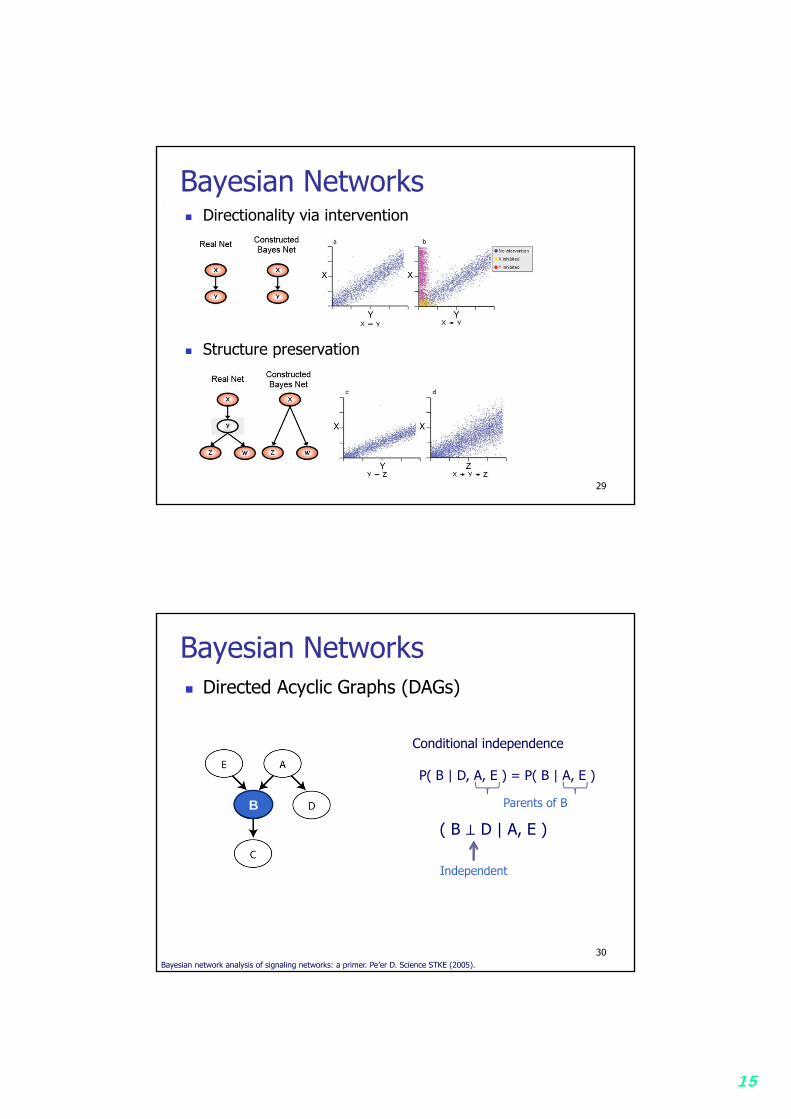
Bayesian Networks Directionality via intervention
Structure preservation
29
Bayesian Networks Directed Acyclic Graphs (DAGs)
30Bayesian network analysis of signaling networks: a primer. Pe’er D. Science STKE (2005).
B
Conditional independence
P( B | D, A, E ) = P( B | A, E )
( B D | A, E )
Independent
Parents of B
16
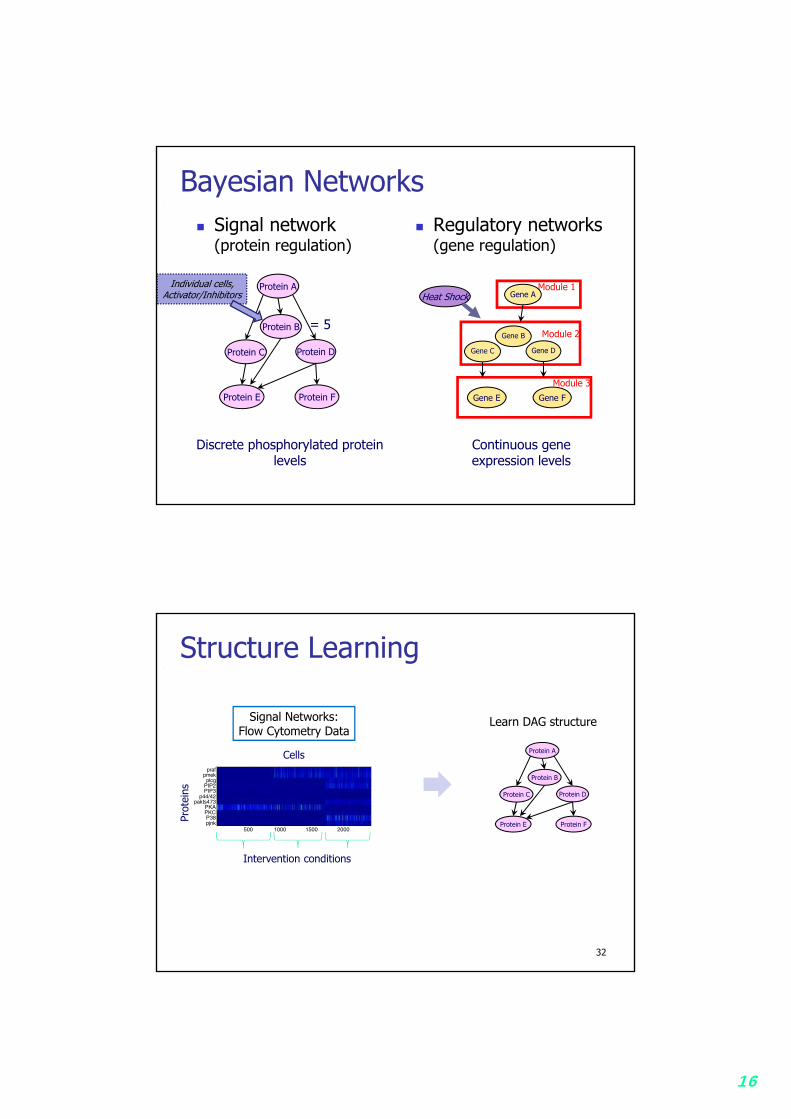
Bayesian Networks Signal network
(protein regulation) Regulatory networks
(gene regulation)
Continuous gene expression levels
Discrete phosphorylated protein levels
Protein A
Protein C Protein D
Protein E Protein F
Protein B
Individual cells, Activator/Inhibitors
= 5
Gene E Gene F
Gene B Module 2
Module 3
Module 1Gene A
Gene C Gene D
Heat Shock
Structure Learning
32
Prot
eins
Cells
Signal Networks:Flow Cytometry Data
Intervention conditions
500 1000 1500 2000
prafpmekplcg
PIP2PIP3
p44/42pakts473
PKAPKCP38pjnk
Learn DAG structure
Protein A
Protein C Protein D
Protein E Protein F
Protein B
17
33
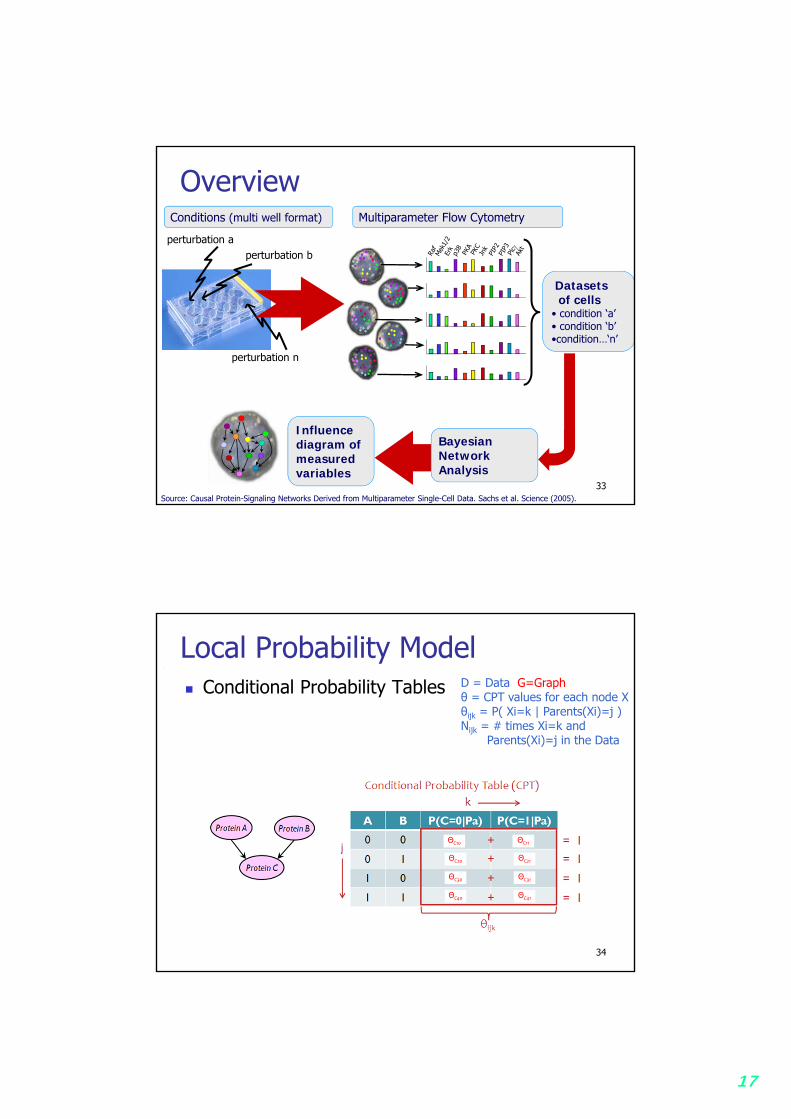
Overview
Influence diagram of measured variables
Bayesian Network Analysis
Datasets of cells
• condition ‘a’• condition ‘b’•condition…‘n’
Multiparameter Flow Cytometry
perturbation a
perturbation n
perturbation b
Conditions (multi well format)
Source: Causal Protein-Signaling Networks Derived from Multiparameter Single-Cell Data. Sachs et al. Science (2005).33
Local Probability Model Conditional Probability Tables
34
D = Data G=Graphθ = CPT values for each node Xθijk = P( Xi=k | Parents(Xi)=j )Nijk = # times Xi=k and
Parents(Xi)=j in the Data
ΘC10 ΘC11
ΘC20 ΘC21
ΘC30 ΘC31
ΘC40 ΘC41
18
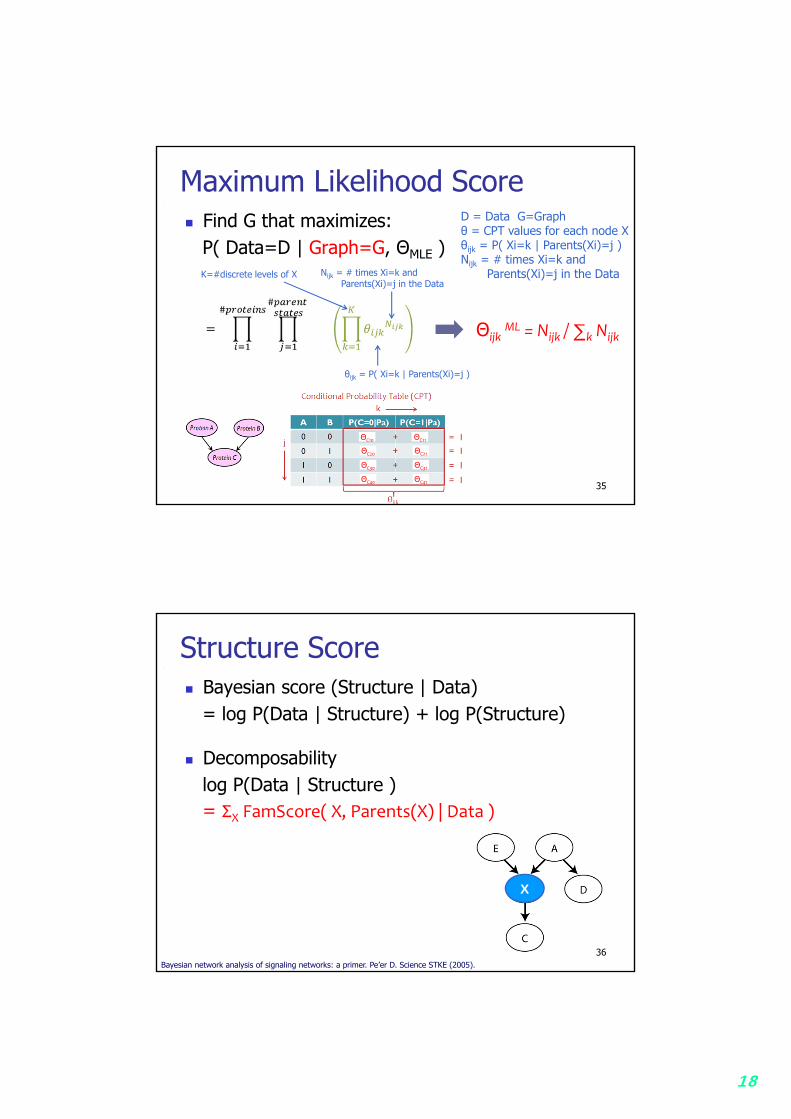
Maximum Likelihood Score Find G that maximizes:
P( Data=D | Graph=G, ΘMLE )
35
D = Data G=Graph θ = CPT values for each node Xθijk = P( Xi=k | Parents(Xi)=j )Nijk = # times Xi=k and
Parents(Xi)=j in the DataNijk = # times Xi=k and Parents(Xi)=j in the Data
θijk = P( Xi=k | Parents(Xi)=j )
K=#discrete levels of X
ΘijkML = Nijk / ∑k Nijk
ΘC10 ΘC11
ΘC20 ΘC21
ΘC30 ΘC31
ΘC40 ΘC41
Structure Score Bayesian score (Structure | Data)
= log P(Data | Structure) + log P(Structure)
Decomposabilitylog P(Data | Structure )= ΣX FamScore( X, Parents(X) | Data )
= ΣX log P( X, Parents(X) | Data )
Bayesian network analysis of signaling networks: a primer. Pe’er D. Science STKE (2005).
X
36

19
Structure Score P( Data=D | Graph=G )
= ∫ P(D|G,θ) P(θ|G) dθ
37
Dirichlet prior ~ Dir(α)Multinomial(see page 35)
D = Data G=Graph θ = CPT values for each node Xθijk = P( Xi=k | Parents(Xi)=j )Nijk = # times Xi=k and
Parents(Xi)=j in the Data
Nijk = # times Xi=k and Parents(Xi)=j in the Data
θijk = P( Xi=k | Parents(Xi)=j )
K=#discrete levels of X
Θij = Simplex {∑kθijk = 1}
Dirichlet normalizer
D. Heckerman. A Tutorial on Learning with Bayesian Networks. 1999, 1997, 1995.G. Cooper E. Herskovits. A Bayesian Method for the Induction of Probabilistic Networks from Data. Machine Learning, 9, 309-347. 1992.
Structure Score
38
D = Data G=Graph θ = CPT values for each node Xθijk = P( Xi=k | Parents(Xi)=j )Nijk = # times Xi=k and
Parents(Xi)=j in the Data
G. Cooper E. Herskovits. A Bayesian Method for the Induction of Probabilistic Networks from Data. Machine Learning, 9, 309-347. 1992.
20
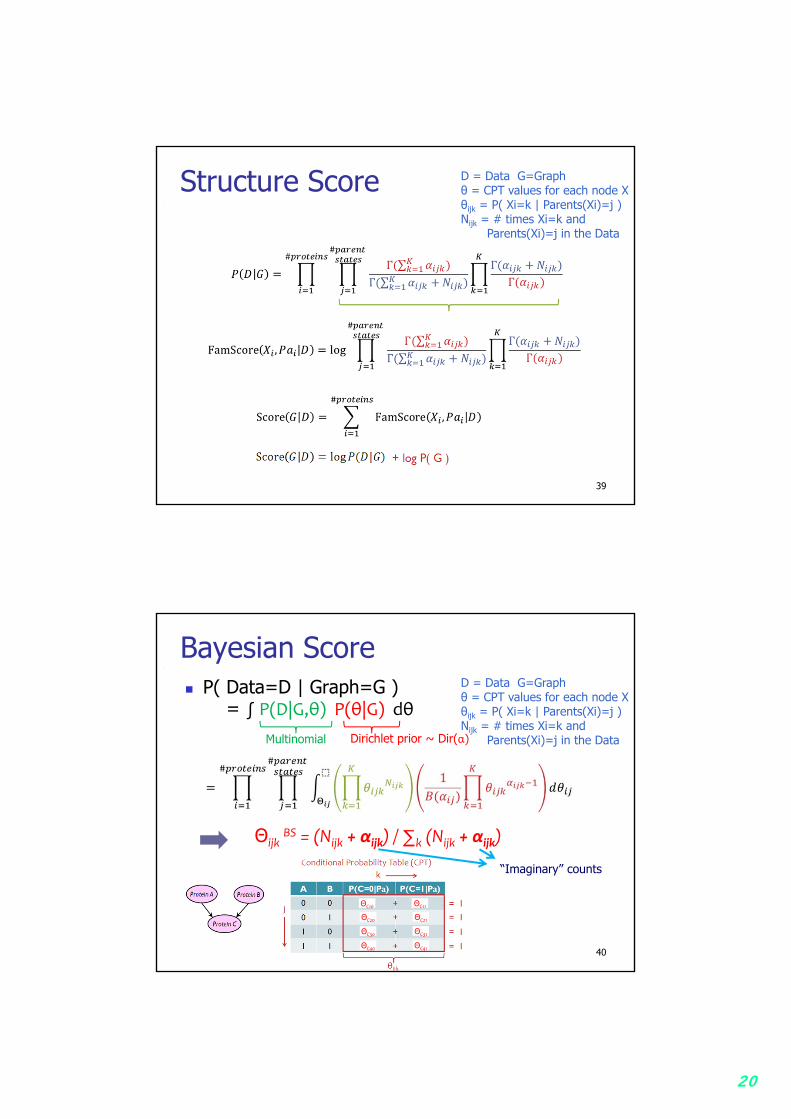
Structure Score
39
D = Data G=Graph θ = CPT values for each node Xθijk = P( Xi=k | Parents(Xi)=j )Nijk = # times Xi=k and
Parents(Xi)=j in the Data
Bayesian Score P( Data=D | Graph=G )
= ∫ P(D|G,θ) P(θ|G) dθ
40
D = Data G=Graph θ = CPT values for each node Xθijk = P( Xi=k | Parents(Xi)=j )Nijk = # times Xi=k and
Parents(Xi)=j in the Data
ΘijkBS = (Nijk + αijk) / ∑k (Nijk + αijk)
ΘC10 ΘC11
ΘC20 ΘC21
ΘC30 ΘC31
ΘC40 ΘC41
Dirichlet prior ~ Dir(α)Multinomial
“Imaginary” counts
Related Documents