Normal fault evolution and coupled landscape response: examples from the Southern Apennines, Italy Duna C. Roda-Boluda and Alexander C. Whittaker Department of Earth Science and Engineering, Imperial College London, London, UK ABSTRACT We present new data addressing the evolution, activity and geomorphic impact of three normal faults in the Southern Apennines: the Vallo di Diano, East Agri and Monti della Maddalena faults. We show that these faults have minimum total throws of ca. 1000–2000 m, and throw rates of ca. 0.7– 1 mm year 1 for at least the last ca. 18 ka. We demonstrate that for the Vallo di Diano and East Agri faults, the landscape is effectively recording tectonics, with relief, channel and catchment slopes varying along fault strike in the same manner as normal fault activity does, with little apparent influ- ence of lithology. We therefore use these data to reconstruct the time-integrated history of fault interaction and growth. From the distribution of knickpoints on the footwall channels, we infer two episodes of base level change, which we attribute to fault interaction episodes. We reconstruct the amount of throw accumulated after each of these events, and the segments involved in each, from the fault throw profiles, and use fault interaction theory to estimate the magnitude of the perturba- tions and past throw rates. We estimate that fault linkage events took place 0.7 0.2 Ma and 1.4 0.3 Ma in the Vallo di Diano fault, and 1 0.1 in the East Agri Fault, and that both faults likely started their activity between 3 and 3.5 Ma. These fault linkage scenarios are consistent with the observed knickpoint heights. This method for reconstructing fault evolution could potentially be applied for any normal faults for which there is information about throw and throw rates, and in which channels are transiently responding to tectonics. INTRODUCTION Study motivation Normal faults provide excellent settings in which to study landscape response to tectonics, because slip rates can often be constrained with high temporal and spatial reso- lution (e.g. Roberts & Michetti, 2004; Commins et al., 2005; Papanikolaou & Roberts, 2007). Moreover, we have a good knowledge of how normal fault segments grow and interact through time (e.g. Peacock & Sanderson, 1991; McLeod et al., 2000; Cowie & Roberts, 2001). Recent studies have investigated how normal fault growth and interaction controls topographic relief (e.g. Densmore et al., 2004, 2007; Strak et al., 2011), the evolution of drainage networks (e.g. Whittaker et al., 2007; Attal et al., 2011; Hopkins & Dawers, 2015) and sediment supply dynamics (e.g. Cowie et al., 2006; Whittaker et al., 2010). Rivers crossing normal faults are sensitive to fault activity and their long profiles can record information about the timing and magnitude of tectonic perturbations over timescales up to 10 6 years (e.g. Commins et al., 2005; Boulton & Whittaker, 2009; Whittaker, 2012; Hopkins & Dawers, 2015). In con- trast, catchment slopes are expected to grow until they reach a critical strength-limited threshold, beyond which erosion becomes landslide-dominated, and slopes become decoupled from the tectonic forcing (e.g. Montgomery & Brandon, 2002; Ouimet et al., 2009; DiBiase et al., 2010), limiting further relief growth (e.g. Densmore et al., 2004, 2007). However, few empirical studies quantify how relief, channels and hill- slope gradients compare with the distribution of normal fault uplift before such critical threshold slopes are sur- passed, and how lithology and fault interaction influ- ences these responses (e.g. Cyr et al., 2010; Whittaker, 2012). In this article, we characterize how the geomorphol- ogy of catchments eroding the footwalls of active normal faults in the Southern Apennines, Italy, reflects their tectonic history. First, we present new data on fault total throw and throw rates for three faults (the Vallo di Diano, Monti della Maddalena and East Agri faults), based on the integration of published and new fault dis- placement constraints. We then use these tectonic boundary conditions to test landscape sensitivity to active tectonics across different lithologies. Finally, we combine fault interaction theory with geomorphological data to infer the evolution and linkage history of two of these faults. Correspondence: Duna C. Roda-Boluda, Department of Earth Science and Engineering, Imperial College London, South Kensington Campus, London SW7 2AZ, UK. E-mail: d.roda- [email protected] © 2016 The Authors Basin Research © 2016 John Wiley & Sons Ltd, European Association of Geoscientists & Engineers and International Association of Sedimentologists 186 Basin Research (2018) 30 (Suppl. 1), 186–209, doi: 10.1111/bre.12215 EAGE

Welcome message from author
This document is posted to help you gain knowledge. Please leave a comment to let me know what you think about it! Share it to your friends and learn new things together.
Transcript

Normal fault evolutionand coupled landscaperesponse: examples from the Southern Apennines,ItalyDuna C. Roda-Boluda and Alexander C. Whittaker
Department of Earth Science and Engineering, Imperial College London, London, UK
ABSTRACT
We present new data addressing the evolution, activity and geomorphic impact of three normal faults
in the Southern Apennines: the Vallo di Diano, East Agri and Monti della Maddalena faults. We
show that these faults have minimum total throws of ca. 1000–2000 m, and throw rates of ca. 0.7–1 mm year�1 for at least the last ca. 18 ka. We demonstrate that for the Vallo di Diano and East Agri
faults, the landscape is effectively recording tectonics, with relief, channel and catchment slopes
varying along fault strike in the same manner as normal fault activity does, with little apparent influ-
ence of lithology. We therefore use these data to reconstruct the time-integrated history of fault
interaction and growth. From the distribution of knickpoints on the footwall channels, we infer two
episodes of base level change, which we attribute to fault interaction episodes. We reconstruct the
amount of throw accumulated after each of these events, and the segments involved in each, from
the fault throw profiles, and use fault interaction theory to estimate the magnitude of the perturba-
tions and past throw rates. We estimate that fault linkage events took place 0.7 � 0.2 Ma and
1.4 � 0.3 Ma in the Vallo di Diano fault, and 1 � 0.1 in the East Agri Fault, and that both faults
likely started their activity between 3 and 3.5 Ma. These fault linkage scenarios are consistent with
the observed knickpoint heights. This method for reconstructing fault evolution could potentially be
applied for any normal faults for which there is information about throw and throw rates, and in
which channels are transiently responding to tectonics.
INTRODUCTION
Studymotivation
Normal faults provide excellent settings in which to study
landscape response to tectonics, because slip rates can
often be constrained with high temporal and spatial reso-
lution (e.g. Roberts & Michetti, 2004; Commins et al.,2005; Papanikolaou & Roberts, 2007). Moreover, we have
a good knowledge of how normal fault segments grow and
interact through time (e.g. Peacock & Sanderson, 1991;
McLeod et al., 2000; Cowie & Roberts, 2001).
Recent studies have investigated how normal fault
growth and interaction controls topographic relief (e.g.
Densmore et al., 2004, 2007; Strak et al., 2011), the
evolution of drainage networks (e.g. Whittaker et al.,2007; Attal et al., 2011; Hopkins & Dawers, 2015) and
sediment supply dynamics (e.g. Cowie et al., 2006;
Whittaker et al., 2010). Rivers crossing normal faults
are sensitive to fault activity and their long profiles can
record information about the timing and magnitude of
tectonic perturbations over timescales up to 106 years
(e.g. Commins et al., 2005; Boulton & Whittaker, 2009;
Whittaker, 2012; Hopkins & Dawers, 2015). In con-
trast, catchment slopes are expected to grow until they
reach a critical strength-limited threshold, beyond
which erosion becomes landslide-dominated, and slopes
become decoupled from the tectonic forcing (e.g.
Montgomery & Brandon, 2002; Ouimet et al., 2009;
DiBiase et al., 2010), limiting further relief growth
(e.g. Densmore et al., 2004, 2007). However, few
empirical studies quantify how relief, channels and hill-
slope gradients compare with the distribution of normal
fault uplift before such critical threshold slopes are sur-
passed, and how lithology and fault interaction influ-
ences these responses (e.g. Cyr et al., 2010; Whittaker,
2012).
In this article, we characterize how the geomorphol-
ogy of catchments eroding the footwalls of active normal
faults in the Southern Apennines, Italy, reflects their
tectonic history. First, we present new data on fault
total throw and throw rates for three faults (the Vallo di
Diano, Monti della Maddalena and East Agri faults),
based on the integration of published and new fault dis-
placement constraints. We then use these tectonic
boundary conditions to test landscape sensitivity to
active tectonics across different lithologies. Finally, we
combine fault interaction theory with geomorphological
data to infer the evolution and linkage history of two of
these faults.
Correspondence: Duna C. Roda-Boluda, Department of EarthScience and Engineering, Imperial College London, SouthKensington Campus, London SW7 2AZ, UK. E-mail: [email protected]
© 2016 The AuthorsBasin Research © 2016 John Wiley & Sons Ltd, European Association of Geoscientists & Engineers and International Association of Sedimentologists186
Basin Research (2018) 30 (Suppl. 1), 186–209, doi: 10.1111/bre.12215
EAGE

Normal fault growth and linkage
To fully understand landscape response to normal fault-
ing, it is necessary to understand how normal faults grow
and link. The mechanisms of fault growth, interaction
and linkage have been increasingly well-established from
theoretical models and field studies (e.g. Peacock & San-
derson, 1991; Cowie & Scholz, 1992a, b; Anders & Schlis-
che, 1994; Cartwright et al., 1995; Dawers & Anders,
1995). Immediately after nucleation, faults start accumu-
lating displacement, and when the stress concentration at
their tips overcomes the yield strength, they propagate
along the tip-line (Fig. 1; e.g. Peacock & Sanderson,
1991; Cowie & Scholz, 1992a, b; Gupta & Scholz, 2000).
Originally, faults nucleate randomly, but their evolution
is controlled by stress feedback mechanisms, so they
evolve differently depending on their location with
respect to the stress field (Cowie, 1998). Positive stress
feedback dictates that faults located in the centre of the
array and preferentially oriented along-strike will grow
more rapidly and become larger, while faults located more
distally in the array will decrease their activity. In individ-
ual faults, positive stress feedback also implies that the
central portions of the faults will slip more readily, and
therefore have greater slip rates and accumulate more dis-
placement than the distal sectors, leading to approxi-
mately elliptical or triangular normal fault displacement
profiles (Fig. 1c; Cowie, 1998; McLeod et al., 2000;
Cowie & Roberts, 2001). Conversely, negative stress feed-
back creates a “stress shadow” zone at a critical distance
across-strike from the most active faults, so across-strike
faults decrease their activity and eventually die out (e.g.
Cowie, 1998; Cowie & Roberts, 2001).
When the growing tips of adjacent faults, particularly
those located preferentially along-strike, reach a critical
distance from each other, they start to interact and may
eventually link (Fig. 1f; e.g. Cartwright et al., 1995;
McLeod et al., 2000; Gupta & Scholz, 2000; Cowie &
Roberts, 2001). Faults tend to maintain their characteris-
tic displacement/length scaling relationship (c), so that
their displacement profiles are often self-similar as they
grow (Fig. 1c, f; Cowie & Scholz, 1992a, b; Anders &
Schlische, 1994; Cowie & Roberts, 2001). Hence, faults
growing laterally by linkage re-adjust their displacement
profiles to recover the pre-linkage c value. They do so by
enhancing their slip rates to accumulate the displacement
deficit: the centres of the faults experience greater slip rate
changes, while the fault tips remain relatively unaffected
(Fig. 1d–f; Dawers & Anders, 1995; McLeod et al., 2000;Cowie & Roberts, 2001). This enhancement begins prior
to segment linkage (Peacock & Sanderson, 1991; Dawers
& Anders, 1995; Gupta & Scholz, 2000; Hopkins & Daw-
ers, 2015), and continues during and after the linkage
(Cartwright et al., 1995; Gupta & Scholz, 2000; Commins
et al., 2005), so that at different stages of fault evolution
the displacement profile can be transiently under- or
over-displaced (Cowie & Roberts, 2001).
Based on the assumption that during linkage, fault dis-
placement increases to recover pre-linkage c values, and
that this will be principally accommodated at the fault,
STAGE 1: FAULTS GROW BY TIP PROPAGATION STAGE 2: FAULTS GROW BY SEGMENT LINKAGE
T0
T 0 +
T 1
T1
L1L0
Segment boundary
segment boundariesThrow deficits on old
T0 T0
T0 + T1
r0
r0
r1
T0
Downstream distanceDownstream distance
Elev
atio
n
Elev
atio
n
Time (Ma)Time (Ma)
Cum
ulat
ive
thro
w
Cum
ulat
ive
thro
w
Lk1 Lk1Fi
Fi
knickpoint (Fi)
knickpoint (Fi)
knickpoint (Lk1)pre-F
i ksn
ksn (r
0 ) ksn (r
1 )
ksn (r
0 )
Fi ksn
γ0 = T0/L0 γ1 = (T1 + T0)/L1 = γ0
(a)
(c) (f)
(b) (d) (e)Fault cumulative throw Fault cumulative throw
Throw profileThrow profile
Channel long profileChannel long profilepre-
Fig. 1. Simplified growth pattern of a normal fault and normal fault array, adapted from Cowie & Roberts (2001). During the first
stage (a–c), faults grow by tip propagation up to a length of L0, and a throw of T0 accumulates at a rate of r0 (a, b). Fault initiation (Fi)
marks the first perturbation for channels crossing the fault and creates a knickpoint, as channels adjust their slopes from pre-Fi ksn toksn (r0) (b). In the following fault growth stage (d–f), the segments or faults start to link (Linkage 1, Lk1) to create a longer structure of
length L1, and the fault grows at a higher throw rate of r1 (d) until it accumulates the throw necessary to achieve the same throw/length
ratio (c) as in the previous stage, T1. The new throw rate at the centre of the fault, r1 is defined by r1 = E1r0, in which E1 is the
enhancement factor associated with Lk1, derived from Eqn 1 using L0 and R1 values (the “radius” of the new linked fault). This throw
rate increase results in another knickpoint in the channel long profiles, as they incise and steepen (to a ksn (r1) value) to keep pace withthe new rates of base level lowering (e). After Lk1, the throw profile substantially changes (f), particularly in the centres of the linked
fault or array, but the old segment boundaries and the throw accumulated on the previous stage, T0, may still be recognized.
© 2016 The AuthorsBasin Research © 2016 John Wiley & Sons Ltd, European Association of Geoscientists & Engineers and International Association of Sedimentologists 187
Normal faulting and landscape response

Cowie & Roberts (2001) proposed an equation to calculate
the slip rate enhancement, E, that different fault segments
experience after linkage:
En ¼ 2Rn=Ln�1 ð1Þwhere Ln-1 is the length of the nth segment before the nthlinkage episode, and Rn is the distance from the centre of
the nth segment to the closest linked fault tip (c.f. Cowie
& Roberts, 2001; Roberts et al., 2004; Fig. 1). This model
makes several over-simplifications (such as assuming tri-
angular displacement profiles, and neglecting fault over-
lap or interactions with across-strike or more distal
faults), but it has produced valuable and plausible predic-
tions in many cases (e.g. Cowie & Roberts, 2001; Roberts
et al., 2004; Boulton & Whittaker, 2009; Whittaker &
Walker, 2015).
After linkage, tip propagation stops (Peacock & San-
derson, 1991; Cartwright et al., 1995), so the centres of
the pre-linkage segments and their segment boundaries
can still be recognized, by the positions of maximum and
minimum cumulative displacement zones in the footwall
(Fig. 1f; Peacock & Sanderson, 1991; Dawers & Anders,
1995; Cowie & Roberts, 2001) and by depocentres and
intra-basin highs in the hangingwall basin (Anders & Sch-
lische, 1994; McLeod et al., 2000). Throughout faultinghistory, displacement deficits at former segment tips can
be sustained or obliterated depending on the 3D geometry
of the segments and breached faults (Faure-Walker et al.,2009).
In principle, the timing, location and magnitude of
these interactions lead to temporal and spatial changes in
fault slip rates, which will exert a significant control on
landscape morphology, particularly with respect to chan-
nels draining between fault segment boundaries (c.f.
Commins et al., 2005). Hence, the process of fault growth
and linkage represents an important opportunity to quan-
tify landscape response to tectonics, because it is possible
to estimate slip rate changes through time and space.
However to date, relatively few studies have characterised
landscape response to tectonics explicitly within the con-
text of fault growth and interaction theory (c.f. Densmore
et al., 2004, 2007; Hopkins & Dawers, 2015; Whittaker &
Walker, 2015).
Landscape response tonormal faulting
Upland rivers are sensitive to tectonics and set the bound-
ary conditions for hillslope steepening and relief develop-
ment (Whipple & Tucker, 1999; DiBiase et al., 2010;
Kirby & Whipple, 2012). Their geometry is often well-
described by the well-known family of stream power ero-
sion “laws” (e.g. Whipple & Tucker, 2002; Wobus et al.,2006a; Kirby & Whipple, 2012; D’Arcy & Whittaker,
2014). In these cases, channel slope, S, is related to drai-
nage area, A, by a power law, which dictates that channels
in topographic steady-state exhibit a concave up profile
that represents the erosional balance between downstream
increase in discharge and decrease in gradient. For a sim-
ple stream power model, we can write:
S ¼ U
K
� �1n
A�mn ð2Þ
where U is an uplift rate, K is a coefficient that includes
bedrock erodibility and other factors, and m and n are pos-itive exponents related to the dominant erosional process
and hydraulic geometry (e.g. Whipple & Tucker, 2002).
The term UK
� �1n can be represented by the channel steep-
ness index, ks, and the ratio of m/n by the channel concav-ity, h. A reference value of h is often used to estimate a
normalized channel steepness index, ksn, allowing com-
parisons between channels with different concavities (e.g.
Snyder et al., 2000; Wobus et al., 2006a).Equation (2) makes an explicit prediction of the rela-
tionship between ksn and uplift rate; which empirical
studies have shown both to be linear (Lague & Davy,
2003; Wobus et al., 2006a; Kirby & Whipple, 2012), and
nonlinear (Snyder et al., 2003; Cyr et al., 2010). Its formis mediated by bedrock erodibility and the stream power
law assumed, which may differ between study areas (e.g.
Whittaker, 2012; D’Arcy & Whittaker, 2014). Adjust-
ments of channel geometry and sediment cover in
response to tectonic forcing (e.g. Sklar & Dietrich, 2001;
Finnegan et al., 2005; Wobus et al., 2006b; Whittaker
et al., 2007; Attal et al., 2008) may add scatter or hamper
the correlation.
Channels that have completely adjusted to the uplift
field of a normal fault are expected to have different val-
ues of ksn along the strike of the structure as slip rates varyfrom tip to centre (Densmore et al., 2007; Miller et al.,2012; Papanikolaou et al., 2013). Additionally, hillslopeslopes and footwall relief are expected to be greater where
slip rates are higher (e.g. Anders & Schlische, 1994) and
channels steeper. If slip rates are greater than erosion
rates, slopes will continue steepening and relief will con-
tinue to grow as fault displacement increases (Mirabella
et al., 2004; Cowie et al., 2006), until they reach the criti-
cal threshold dictated by each lithology’s bedrock strength
(e.g. Schmidt & Montgomery, 1995; Montgomery &
Brandon, 2002). After this critical threshold, erosion rates
increase non-linearly through landsliding (e.g. Ouimet
et al., 2009; DiBiase et al., 2010). Densmore et al. (2004)proposed that this non-linearity explains why relief is
constant along the footwalls of some long faults (ca.
140 km, and with numerous segments) of the NE Basin
and Range: as cumulative fault slip creates greater relief
and steeper slopes towards the centres of faults, erosional
processes become more effective and impose a geomor-
phic threshold (e.g. Strak et al., 2011) that limits further
relief growth and decouples the topography from the fault
displacement. Additionally, fault footwall relief and range
width is also limited by the fault dip and thickness of the
seismogenic layer (Scholz and Contreras, 1998), the
geometry and spacing of neighbouring faults, and the
© 2016 The AuthorsBasin Research © 2016 John Wiley & Sons Ltd, European Association of Geoscientists & Engineers and International Association of Sedimentologists188
D.C. Roda-Boluda and A.C. Whittaker

extent of hangingwall sedimentation (Densmore et al.,2005).
As mentioned above, bedrock channels crossing faults
can experience changes in relative base-level as a result of
slip rate increases resulting from fault interaction and
linkage (Cowie et al., 2006; Whittaker et al., 2007; Attalet al., 2008). In these cases, channels are expected to pro-
gressively steepen, incise and adjust to the new boundary
conditions (e.g. Snyder et al., 2000; Attal et al., 2008;Fig. 1). These changes typically precede physical linkage
along the faults (Hopkins & Dawers, 2015). The boundary
between the incised, lower river reach, and the unincised,
unadjusted upper reach is marked by a convexity in the
long profile, often referred as knickpoint (Fig. 1b, e; e.g.
Crosby & Whipple, 2006; Kirby & Whipple, 2012). As
incision progresses, knickpoints migrate upstream with a
vertical velocity that is a function of the magnitude of the
perturbation experienced (Niemann et al., 2001; Attal
et al., 2008, 2011; Whittaker et al., 2008; Whittaker &
Boulton, 2012; Whittaker & Walker, 2015). Because
knickpoints propagate upstream at analytically pre-
dictable rates, and transient long profiles can retain tec-
tonic information for periods >106 years (e.g. Snyder
et al., 2000; Whittaker et al., 2008; Attal et al., 2011),they can be used to extract information about past
changes in tectonic boundary conditions (Commins et al.,2005; Wobus et al., 2006a; Boulton & Whittaker, 2009;
Miller et al., 2012; Whittaker & Walker, 2015). Hillslope
gradients would also adjust to spatial and temporal
changes in channel steepness and incision (e.g. Whipple
& Tucker, 1999, 2002; Wobus et al., 2006a, b; Kirby &
Whipple, 2012), if they have not yet reached their
strength-limited threshold.
By combining transient stream profile analysis with
normal fault interaction theory, Commins et al. (2005)reconstructed the timing of normal fault profile re-adjust-
ment in Utah and the associated magnitude of slip rate
change. Similarly, Hopkins & Dawers (2015) studied how
channel morphology changes through previously identi-
fied stages of fault interaction and linkage. Boulton &
Whittaker (2009), and more recently Whittaker & Walker
(2015) estimated the time of fault linkage and current
throw rates in tectonically active areas of Turkey and
Greece by comparing knickpoint heights upstream of
faults and ksn values upstream and downstream of knick-
points. Nevertheless, the integrated response of channels
and landscapes as normal faults grow and link remains rel-
atively under-researched, by comparison to the numerous
studies that link river long profiles to base level changes in
general (c.f. Kirby & Whipple, 2012). In particular, we
still lack empirical data of river response to active faulting
collected systematically along the strike of faults whose
slip rates and fault throws are well-constrained, especially
for cases in which rock strength-limited thresholds have
not yet been reached. Additionally, there has been little
work that has attempted to reconcile geomorphic infer-
ences of base-level change with predictions from fault
growth and interaction theory. Here, we present new data
to address these challenges, using case studies of normal
faults in the Southern Apennines of Italy.
GEOLOGICAL SETTING
The Apennines are a NE verging fold-and-thrust belt
generated during the Alpine orogeny as a result of the col-
lision between the African and Eurasian plates (e.g. Pan-
tosti & Valensise, 1990). Since the Pliocene much of the
orogenic system has been subjected to back-arc extension
(Hippolyte et al., 1994; Papanikolaou & Roberts, 2007;
Patacca & Scandone, 2007), attributed to the roll-back of
the African plate under the Eurasian plate (e.g. Cinque
et al., 1993). In the Southern Apennines, extension acco-
modates 2–5 mm year�1 of horizontal deformation (e.g.
Ferranti et al., 2014). Extensional tectonics has created a
large array of NW-SE striking normal faults along the axis
of the Apenninic orogen, which overprint the previous
compressional structures (Amato & Montone, 1997;
Roberts & Michetti, 2004; Papanikolaou & Roberts,
2007). In most cases, these normal faults have attained
lengths of >30 km and displacements of >1000 m, and
have generated substantial hangingwall basins (Cinque
et al., 1993, 2000; Maschio et al., 2005; Barchi et al.,2006; Papanikolaou & Roberts, 2007). These structures
are associated with magnitude 5.5–7.0 earthquakes (Pan-
tosti & Valensise, 1990; Amato & Montone, 1997; Roberts
et al., 2004; Villani & Pierdominici, 2010).
We have selected three normal faults in the Campa-
nian-Lucanian sector of the Southern Apennines because
they have numerous published constraints regarding their
fault geometries and activity, which we evaluate and rec-
oncile in this study: the Vallo di Diano (VDF), East Agri
(EAF) and Monti della Maddalena faults (MMF)
(Fig. 2). Located in the centre of the Southern Apennines
fault array, they bound the two biggest hangingwall basins
in the area: the Vallo di Diano (175 km2) and the Val
d’Agri basins (120 km2). They dip ca. 45–60�, based on
field and seismic data (Maschio et al., 2005; Barchi et al.,2006; Papanikolaou & Roberts, 2007; Amicucci et al.,2008), and their motion is almost purely dip-slip
(Papanikolaou & Roberts, 2007). These faults displace a
range of Mesozoic and Cenozoic lithologies (Fig. 2b),
including platform carbonates thrusted during the com-
pressional phase, and Tertiary siliciclastic sediments (fly-
sch units) deposited in the former foredeep of the
Apenninic orogen.
Thrusting in the study area had ceased by the Early to
Mid Pliocene (Cinque et al., 1993; Hippolyte et al., 1995;Ferranti & Oldow, 2005), because there are ca. 3.7 Ma
clastic, undeformed deposits which uncomformably drape
the thrust sheets (Patacca & Scandone, 2007). The pres-
ence of Upper Pliocene – Lower Pleistocene sediments in
the normal fault hangingwall basins suggest extension in
the Southern Apennines started 1.8–3.6 Ma (Oldow
et al., 1993; Ferranti & Oldow, 2005; Barchi et al., 2006;Papanikolaou & Roberts, 2007; Bruno et al., 2013). The
© 2016 The AuthorsBasin Research © 2016 John Wiley & Sons Ltd, European Association of Geoscientists & Engineers and International Association of Sedimentologists 189
Normal faulting and landscape response

oldest dated basin sediments in our study area are Lower-
Middle Pleistocene deposits (0.7 � 0.2 Ma, from bore-
holes by Santangelo ,1991; and Giano et al., 2014) in the
Vallo di Diano basin, and inferred Lower Pleistocene
slope deposits in the Val d’Agri basin (Giano, 2011). Nev-
ertheless, seismic imaging in these basins reveals syn-tec-
tonic sequences that are ca. 2–4 times thicker than
borehole depths, so an Upper Pliocene-Early Pleistocene
fault initiation time has been suggested (Barchi et al.,2006; Amicucci et al., 2008; Bruno et al., 2013). For theMMF, a younger, Middle to Late Pleistocene fault initia-
tion age of ca. 0.18–0.75-Ma has been proposed, based on
the displacement of ca. 0.75 Ma surfaces and “inmature
morphology” (Maschio et al., 2005), the geometry of allu-
vial fan deposits on the SE end of the Val d’Agri basin
(Zembo et al., 2009, 2012), and palaeoseismological back-
stripping calculations (Improta et al., 2010).For the VDF, Villani & Pierdominici (2010) produced
a minimum total throw profile by summing the footwall
relief along strike to the bedrock depth in the basin,
imaged by 12 ENI-acquired seismic lines, and outlined in
an isobaths map (Amicucci et al., 2008). Values for the
Polla segment (Fig. 2) were extracted by Villani & Pier-
dominici from estimates published by Spina et al. (2008)and Cello et al. (2003) based on geological markers. Addi-
tionally, Barchi et al. (2006) and Bruno et al. (2013) pub-lished seismic reflection profiles imaging the hangingwall
basin deposits and the bedrock below them, which is up
to ca. 1000 m below the basin base level. Papanikolaou &
Roberts (2007) also published estimates of total geological
throw for the VDF and EAF, based on the offsets of
mapped Miocene (on the VDF) and Triassic-Jurassic
units (on the EAF). For both sides of the Val d’Agri basin,
minimum hangingwall deposits thickness (i.e. minimum
bedrock depth below the basin) of up to ca. 600 m were
imaged on six electrical resistivity tomography (ERT)
profiles (Colella et al., 2004), and a geological cross-sec-
tion based on outcrops along incised alluvial fans (Zembo
et al., 2009). Two seismic lines (Barchi et al., 2006) alsoconstrain the bedrock depth on the Val d’Agri basin.
Along the MMF footwall there is one published throw
constraint, based on the displacement of a Miocene-Plio-
cene thrust fault (Maschio et al., 2005; Improta et al.,2010).
There are also diverse published constraints on the slip
rates of these faults. On the VDF, three throw rate values
have been derived by Papanikolaou & Roberts (2007) from
bedrock fault scarps that are assumed to be post-glacial.
Villani & Pierdominici (2010) obtained a throw rate esti-
mate from scarps on dated alluvial fan deposits (ca. 3000–2100 years BP), and Cinque et al. (2000) estimated a
throw rate averaged since ca. 0.4–0.6 Ma from offsets of
dated basin deposits. The dip-slip component of the dis-
placement rate has also been geodetically estimated (Fer-
ranti et al., 2014). Constraints on throw rates along the
EAF have been obtained from fault bedrock scarps that
16°0'0"E
16°0'0"E
15°50'0"E
15°50'0"E
15°40'0"E
15°40'0"E
15°30'0"E
15°30'0"E
40°3
0'0"
N
40°3
0'0"
N
40°2
0'0"
N
40°2
0'0"
N
40°1
0'0"
N
40°1
0'0"
N
0 5 10 15 202,5Kilometers
16°0'0"E
16°0'0"E
15°50'0"E
15°50'0"E
15°40'0"E
15°40'0"E
15°30'0"E
15°30'0"E40
°30'
0"N
40°3
0'0"
N
40°2
0'0"
N
40°2
0'0"
N
40°1
0'0"
N
40°1
0'0"
N
0 5 10 15 202,5Kilometers
Vallo di Diano Basin
Val d’Agri Basin
Pergola-Melandro
Basin
200 kmItaly N
study area
Adriatic Sea
Tyrrhenian Sea
Rome
Venice
activ
e
extensio
n
Active normal faults
Vallo di Diano Fault (VDF)
Monti della Maddalena Fault (MMF)
East Agri Fault (EAF)
Faults Lithologies
(a) (b)
Flysch formations and sandstone units (Upper Jurassic to Miocene)
Carbonates: limestones, dolomites, calcarenites and marls (Middle Triassic to Miocene)
Red chert (Upper Triassic to Upper Jurassic)
Sasso di Castalda
Marsico Nuovo
Marsicovetere
Viggiano
Polla
Atena Lucana - Sala Cosilina
Padula
Western branch
Eastern branch
Montemurro
Moliterno
Padula
Brienza
Fig. 2. (a) Hillshade image showing a simplified map of the Vallo di Diano (VDF), Monti della Maddalena (MMF) and East Agri
(EAF) faults, with the main fault strands in bold. Footwall catchments along the faults are delimited with black, bold lines. Inset image
shows the location of the study area within Italy and the Apennines fault array. (b) Simplified lithological map, with the main basin-
bounding fault segments labelled.
© 2016 The AuthorsBasin Research © 2016 John Wiley & Sons Ltd, European Association of Geoscientists & Engineers and International Association of Sedimentologists190
D.C. Roda-Boluda and A.C. Whittaker

are assumed to be post-glacial (Benedetti et al., 1998;
Papanikolaou & Roberts, 2007) and offsets of Middle
Pleistocene to recent geomorphic markers (Cinque et al.,2000). Along the MMF, there are four published sources
of throw rate estimates: geodetic data (Ferranti et al.,2014); presumably post-glacial bedrock and soil scarps
(Maschio et al., 2005; Improta et al., 2010); and the dis-
placement of late Pleistocene to recent (post-1.2 Ma) ero-
sional surfaces (Schiattarella et al., 2003).In our results section, we evaluate how these con-
straints agree in time and space, because many of these
measurements have not yet been reconciled with each
other and with respect to faulting history. While
Papanikolaou & Roberts (2007) studied the evolution of
Southern Apennines normal faults, they could not resolve
any slip rate increases based on the array-scale resolution
of their data. However, they noted that early faulting his-
tory is poorly known, and therefore this possibility could
not be ruled out. Our combined geomorphic and tectonic
analyses shed light on the evolution of these normal
faults.
METHODS
Fault tracesand lithologies
Fault segments were mapped based on (i) published maps
(Maschio et al., 2005; Villani & Pierdominici, 2010;
Zembo et al., 2012), (ii) lithological contacts between
basement and Quaternary deposits, (iii) fault escarpments
identified in the DEM by laterally continuous, high gradi-
ent, breaks in topographic slope, and (iv) field observa-
tions. Segment boundaries were further identified based
on the identification of relay structures, and changes in
the strike of the fault segments, following Cartwright
et al. (1996), and verified using throw profiles. Geological
units were digitized based on the 199 (Potenza), 200 (Tri-
carico), 210 (Lauria) and 211 (San Arcangelo) 1 : 100 000
Italian Geological Survey maps. Outcropping formations
have been grouped into four major lithological classes
based on field observations and lithofacies descriptions
(Fig. 2b): (i) Pliocene to Recent fluvial and alluvial depos-
its, (ii) flysch formations and sandstones, (iii) carbonates
(limestones, dolomites, calcarenites and marls) and (iv)
red chert. Footwall catchments were assigned a dominant
lithology when a lithological group covered ≥50% of the
catchment area; otherwise, they were classified as having
“mixed lithologies”.
DEManalysis
Topographic data were acquired from an ASTER digital
elevation model (DEM), with a resolution of
27.3 9 27.3 m, projected in WGS 1984 UTM Zone
33N. A drainage network was obtained using a flow accu-
mulation threshold of 0.37 km2 (500 pixels), and con-
firmed against mapped streams on topographic maps.
Fifty-seven footwall catchments were extracted upstream
of the mapped fault strands, with drainage areas up to
65 km2. Catchments smaller than 1.5 km2 were excluded,
as field observations indicate they are not dominated by
fluvial processes.
Swath profiles of the mean, minimum and maximum
footwall elevations were constructed across the fault foot-
walls in ArcMap. Footwall relief profiles were obtained
by subtracting the basin base level elevation profile from
the footwall elevation profile (e.g. Mirabella et al., 2004).A slope map was derived from the DEM from which we
extracted the median slope value for each catchment.
Stream long profiles were extracted for 70 channels
draining the fault footwalls, using the Stream Profiler
toolbar (Wobus et al., 2006a) in ArcGis and Matlab. To
ensure that our extracted drainage networks are represen-
tative of the catchments’ drainages, if catchments have
multiple tributaries that share <2/3 of their total channellength, a stream long profile was extracted for each. For
catchments with several tributaries that share at least 2/3
of their length, only the channel with greater drainage
area was extracted. A reference concavity of 0.45 was used
to calculate ksn values (e.g. Wobus et al., 2006a; Cyr
et al., 2010). Knickpoints (sensu Whittaker & Boulton,
2012) were identified in the stream long profiles and gra-
dient-distance plots, and positioned where the rate of
change in the channel gradient was greatest. As this study
focuses on landscape response to faulting, knickpoints
that were obviously coincident with mapped lithological
boundaries were excluded from our analysis. Similarly,
only ‘slope-break’ knickpoints (c.f. Kirby & Whipple,
2012; their Fig. 4), that bound a lower section of the chan-
nel recording at least a 10% increase in channel steepness
were included, as ‘vertical-step’ knickpoints - unassoci-
ated with changes in steepness index - are typically related
to changes in bedrock erodibility (Kirby & Whipple,
2012). For completeness, we have included in the supple-
mentary material the long profiles of all the analysed
channels, with the identified slope-break knickpoints, and
the modelled fits of ksn for the channel sections above andbelow the knickpoints. Following Whittaker & Walker
(2015), the vertical heights of knickpoints were measured
from the elevation of the mapped main fault trace that
bounds the footwall catchments.
Total throwprofiles and throwrateconstraints
Throw and throw rates are often used in geomorphic
studies because they can be measured independently of
fault dip and because rivers are most sensitive to the verti-
cal uplift rate (e.g. Whittaker et al., 2007). We built mini-
mum total throw (vertical component of the net
displacement) profiles using: (i) published total geological
throw estimates by Papanikolaou & Roberts (2007), Mas-
chio et al. (2005) and Improta et al. (2010); (ii) seven new
measurements of geological throw along the W-strand of
the MMF fault, derived from the offset of mapped
(1 : 100 000 Italian Geological Survey maps, references
© 2016 The AuthorsBasin Research © 2016 John Wiley & Sons Ltd, European Association of Geoscientists & Engineers and International Association of Sedimentologists 191
Normal faulting and landscape response
above) Cretaceous to Miocene bedrock units (see supple-
mentary material); and (iii) estimates of the minimum
geological throw, given by the minimum bedrock depth in
the hangingwall basins, measured from the basin base
level (derived from published estimates by Colella et al.,2004; Barchi et al., 2006; Amicucci et al., 2008; Zembo
et al., 2009 and Bruno et al., 2013; see Geological Set-
ting) and the sum of the footwall relief measured from the
basin base level. The latter approach has been validated in
faults with dominantly dip-slip movement (e.g. Mirabella
et al., 2004; Villani and Pierdominici, 2010), but because
footwall erosion is neglected, it provides only minimum
estimates of the total throw accumulated throughout
faulting history. Our calculations of minimum total
throws, together with the published constraints that we
use, can be found in tables in the supplementary material.
Constraints are plotted at the along-strike positions
where they were obtained. If these were not provided
(e.g. Cinque et al., 2000), we consider these constraints asa minimum estimates and plot them at the centre of the
faults, with generous error bars. Total throw profiles are
built by interpolating all the available constraints along
the fault strike. In the MMF, we use the mean of Maschio
et al. (2005) and Improta et al. (2010) throw and throw
rate estimates because they were acquired from the same
scarps. We assume that throw decays to zero at the tips of
the mapped faults, as observed by Papanikolaou &
Roberts (2007) and Villani & Pierdominici (2010). We
propagated the error estimates of the published con-
straints, or if not provided, we applied a conservative
�20% error, in line with previous works on normal faults
(e.g. Densmore et al., 2004; Papanikolaou & Roberts,
2007).
Bedrock fault scarps along the Apennines normal faults
have been used by a number of authors to estimate fault
throw rates; they are generally assumed to be post-glacial,
because it is considered unlikely that they could have been
preserved under periglacial conditions (Roberts &
Michetti, 2004; Papanikolaou & Roberts, 2007; Faure-
Walker et al., 2009). This assumption is supported by
exposure dating (36Cl) of the fault scarp in the Magnola
fault (Central Apennines) by Palumbo et al. (2004) andSchlagenhauf et al. (2011). Due to the uncertainty on the
last glacial maximum age on the Southern Apennines
(15 � 3 ka, Roberts & Michetti, 2004; Faure-Walker
et al., 2009), throw rate constraints could have errors up
to �20%. In our analysis, we assume an age of 18 ka for
consistency with published data sets (Roberts & Michetti,
2004; Papanikolaou & Roberts, 2007), but we propagate
errors accordingly. Most throw rate constraints used are
recent (post ca. 3 ka, or geodetic measurements) or post-
glacial, so we refer to them generically as post-18 ka
throw rates. The only exceptions are rates from Cinque
et al. (2000), and Schiattarella et al. (2003), which repre-
sent time-averaged throw rates over longer timescales.
Data from Cinque et al. (2000) are based on the displace-
ment of deposits attributed to the Middle Pleistocene,
while the data of Schiattarella et al. (2003) are based on
the displacement of an erosional surface supposed by the
authors to be ca. 1.2 Ma. We plot the throw rate con-
straints on the along strike position where they were mea-
sured.
RESULTS
Here, we characterize the tectonic activity of the VDF,
EAF, and MMF normal faults (Fig. 2), and evaluate their
effects on catchment geomorphology and river long pro-
files, for a range of lithologies. Based on published geolog-
ical maps (see Methods), we observe that flysch and
sandstone formations outcrop mostly in the E-SE and
NW parts of the EAF and MMF footwalls, whereas the
central areas of these footwall blocks are dominated by
carbonate formations and some red chert (Fig. 2b). Com-
petent limestones and dolomites form the VDF footwall,
alongside minor outcrops of red chert and flysch. Pliocene
to Recent deposits infill the hangingwall and perched
basins.
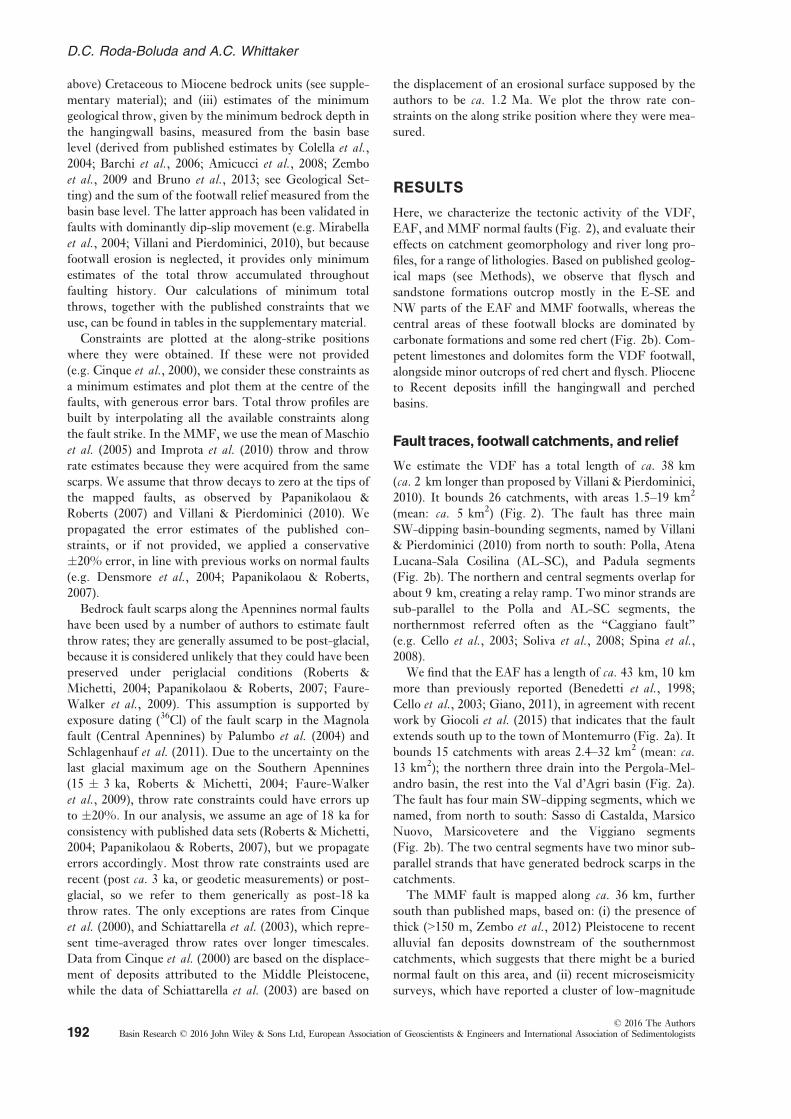
Fault traces, footwall catchments, and relief
We estimate the VDF has a total length of ca. 38 km
(ca. 2 km longer than proposed by Villani & Pierdominici,
2010). It bounds 26 catchments, with areas 1.5–19 km2
(mean: ca. 5 km2) (Fig. 2). The fault has three main
SW-dipping basin-bounding segments, named by Villani
& Pierdominici (2010) from north to south: Polla, Atena
Lucana-Sala Cosilina (AL-SC), and Padula segments
(Fig. 2b). The northern and central segments overlap for
about 9 km, creating a relay ramp. Two minor strands are
sub-parallel to the Polla and AL-SC segments, the
northernmost referred often as the “Caggiano fault”
(e.g. Cello et al., 2003; Soliva et al., 2008; Spina et al.,2008).
We find that the EAF has a length of ca. 43 km, 10 km
more than previously reported (Benedetti et al., 1998;
Cello et al., 2003; Giano, 2011), in agreement with recent
work by Giocoli et al. (2015) that indicates that the faultextends south up to the town of Montemurro (Fig. 2a). It
bounds 15 catchments with areas 2.4–32 km2 (mean: ca.13 km2); the northern three drain into the Pergola-Mel-
andro basin, the rest into the Val d’Agri basin (Fig. 2a).
The fault has four main SW-dipping segments, which we
named, from north to south: Sasso di Castalda, Marsico
Nuovo, Marsicovetere and the Viggiano segments
(Fig. 2b). The two central segments have two minor sub-
parallel strands that have generated bedrock scarps in the
catchments.
The MMF fault is mapped along ca. 36 km, further
south than published maps, based on: (i) the presence of
thick (>150 m, Zembo et al., 2012) Pleistocene to recent
alluvial fan deposits downstream of the southernmost
catchments, which suggests that there might be a buried
normal fault on this area, and (ii) recent microseismicity
surveys, which have reported a cluster of low-magnitude
© 2016 The AuthorsBasin Research © 2016 John Wiley & Sons Ltd, European Association of Geoscientists & Engineers and International Association of Sedimentologists192
D.C. Roda-Boluda and A.C. Whittaker

earthquakes (M < 2.7) on this region (e.g. Valoroso et al.,2009). In contrast with Maschio et al. (2005) and Zembo
et al. (2012), we do not find conclusive evidence for the
fault extending N into the Pergola-Melandro basin
(Fig. 2). We have extracted 16 footwall catchments with
areas 2–65 km2 (mean: 17 km2), all but the northernmost
draining into the Val d’Agri basin. Several perched basins
lie along the footwall, infilled with Quaternary deposits
(Fig. 2b). The fault has two main parallel strands dipping
towards the NE: a western one that runs close to the drai-
nage divide with the VDF catchments, and an eastern one
bounding the SW side of the Val d’Agri basin; as well as
some minor strands that create several relay zones
between them (Fig. 2).
Swath profiles (Fig. 3) show maximum elevations of
ca. 1400–1600 m for the three footwall blocks, and
mean elevations of ca. 800–1400 m. In the VDF and
EAF, footwall relief varies between 200 and 900 m,
reaching the maximum at the fault centres and decaying
towards the fault tips (Fig. 3a–b). The footwall relief
mirrors the mapped fault segments (Fig. 2b), with min-
imum values at the segment boundaries. However, for
the MMF footwall (Fig. 3c) fault segments cannot be
distinguished.
Fault throwsand post-18 ka throwrates
Vallo di Diano Fault
We have recalculated the VDF total throw profile pub-
lished by Villani & Pierdominici (2010), by: (i) summing
the throws in relay zones and overlapping segments (c.f.
Dawers & Anders, 1995), in contrast with Villani & Pier-
dominici, who only aggregated the displacement of two
strands where two discrete measurements overlapped
along strike (Fig. 4a); and (ii) complementing this profile
with total throw estimates published by Papanikolaou &
Roberts (2007), and those that we derive from the hang-
ingwall subsidence data by Barchi et al. (2006) and Ami-
cucci et al. (2008) (see supplementary material). At the
fault centre, these estimates agree well with Villani &
Pierdominici’s profile. However, our inferred profile in
the northern sector of the Polla segment (dashed, Fig. 4a)
differs from theirs, because we consider the Caggiano
fault as a branch of the VDF (c.f. Soliva et al., 2008;Spina et al., 2008; Papanikolaou & Roberts, 2007). In the
northern section of the Padula segment, our minimum
throw estimates derived from seismic profiles by Ami-
cucci et al. (2008) and Bruno et al. (2013) suggest thattotal throw is lower than that inferred by Villani & Pier-
dominici (2010), so we modify our profile accordingly
(dashed, Fig. 4a).
Total throw (Fig. 4a) displays three maxima at the cen-
tres of the three mapped fault segments (Fig. 2), sepa-
rated by a local minimum that corresponds to the relay
zone between the Polla and the AL-SC segments and a
southern minimum between the AL-SC and Padula seg-
ments. Total throw is highest at the centre of the central
segment, reaching values of ca. 2000 m. Footwall relief
apparently mirrors the mapped geological fault segment
boundaries: for instance where the Padula and Sala Cosi-
lina segments meet there is marked (but non zero) relief
minimum. Because geological throw estimates (Papaniko-
laou & Roberts, 2007), and the minimum throw estimates
based on the sum of the footwall relief and the bedrock
depth on the hangingwall (Villani & Pierdominici, 2010;
our estimates using seismic profiles from Barchi et al.,2006; Amicucci et al., 2008; Bruno et al., 2013) are gener-ally in close agreement, we hypothesize that erosion of the
basin base level (average: 537m)Val d’Agri BasinPergola-Melandro
Basin
basin base level (average: 537 m)Val d’Agri BasinPergola-Melandro
Basin
Monti della Maddalena Fault (MMF)
Distance along-strike (km)
Vallo di Diano Fault (VDF)
basin base level (average: 470 m)Vallo di Diano Basin
East Agri Fault (EAF)
Atena Lucana - Sala Cosilina Padula Polla
ViggianoMarsicovetere Marsico Nuovo Sasso di Castalda
Distance along-strike (km)
Distance along-strike (km)
NW SSE
NW SE
NNW SE
(a)
(b)
(c)
Fig. 3. Swath profiles of the footwall blocks of the VDF (a),
EAF (b) and MMF (c), taken along the fault strikes. Footwall
relief profiles were obtained by subtracting the basin base level
from the mean elevations of the swaths (black, bold line).
© 2016 The AuthorsBasin Research © 2016 John Wiley & Sons Ltd, European Association of Geoscientists & Engineers and International Association of Sedimentologists 193
Normal faulting and landscape response

footwall block has not been enough to reduce its relief sig-
nificantly. Otherwise, our minimum throw estimates that
use footwall relief as input, would be significantly lower
than geological throw estimates. In this case, based on the
depth of the carbonatic bedrock on the hangingwall basin
(up to ca. 1000 m across the central area of the basin), and
the footwall relief along the fault (up to ca. 900 m in the
fault centre), we can infer that fault total throw is almost
equally divided (~1 : 1) between the footwall uplift and
the hangingwall subsidence.
East Agri Fault
To build the EAF profile (Fig. 4b), we integrated: (i)
Papanikolaou & Roberts’ (2007) geological throw esti-
mates; and (ii) newly derived minimum throw
3 Ma
2.4 Ma
1.6 Ma
1.6 Ma
2.4 Ma3 Ma
3 Ma
0.5
Ma
Footwall reliefTotal throw (Villani & Pierdominici, 2010)Amicucci et al., 2008
Barchi et al., 2006Papanikolaou & Roberts, 2007
Bruno et al., 2013
Polla Atena Lucana - Sala Cosilina Padula
Papanikolaou & Roberts, 2007Colella et al., 2004 Barchi et al., 2006Zembo et al., 2009
Sasso di Castalda Marsico Nuovo Marsicovetere Viggiano
Footwall reliefInferred total throw
W-strand throw x2Colella et al.,2004Zembo et al., 2009
Footwall reliefWest strand throwInferred total throw
Maschio et al. (2005) & Improta et al. (2010)
Post-18 ka throw rate [1.8 Ma]Post-18 ka throw rate [2 Ma]
Cinque et al., 2000Papanikolaou & Roberts (2007) & Benedetti (1998)
Post-18 ka throw rate [1.8 Ma]Post-18 ka throw rate [1 Ma]
Maschio et al. (2005) & Improta et al. (2010)Schiattarella et al., 2003 Ferranti et al., 2014
Post-18 ka throw rates [2 Ma]Post-18 ka throw rates [1.8 Ma]
Papanikolaou & Roberts, 2007Villani & Pierdominici, 2010Ferranti et al., 2014Cinque et al., 2000 *
*
*
Vallo di Diano Fault (VDF)
East Agri Fault (EAF)
Monti della Maddalena Fault (MMF)
Vallo di Diano Fault (VDF)
East Agri Fault (EAF)
Monti della Maddalena Fault (MMF)
Post
-18
ka th
row
rate
s (m
m y
ear–1
)Po
st-1
8 ka
thro
w ra
tes
(mm
yea
r–1)
Distance along-strike (km) Distance along-strike (km)
Distance along-strike (km)Distance along-strike (km)
Distance along-strike (km)Distance along-strike (km)
Tota
l thr
ow (m
)To
tal t
hrow
(m)
Tota
l thr
ow (m
)
Foot
wal
l rel
ief (
m)
Foot
wal
l rel
ief (
m)
Foot
wal
l rel
ief (
m)
NW SSE
NW SSE
NW SE
NW SE
NNW SE
NNW SE
Post
-18
ka th
row
rate
s (m
m y
ear–1
)
(a) (d)
(b) (e)
(c) (f)
Fig. 4. Total throw (a–c) and post-18 ka throw rate (d–f) profiles along fault strikes, built from the constraints showed here. We also
show throw rate profiles derived from different fault initiaton times for comparison. An asterisk indicates that the data point represents
throw rates averaged over a longer time period than 18 ka (see text). The x-error bars from the Cinque et al. (2000) constraints indi-cate the uncertainty in the position along strike from where they derived their data.
© 2016 The AuthorsBasin Research © 2016 John Wiley & Sons Ltd, European Association of Geoscientists & Engineers and International Association of Sedimentologists194
D.C. Roda-Boluda and A.C. Whittaker

estimates, from the minimum bedrock depth on the
hangingwall and the footwall relief. For all these new
estimates, the minimum footwall throw values were
higher than the minimum hangingwall subsidence esti-
mates. For the footwall relief (i.e. footwall elevation
minus the basin base level) to be greater than the hang-
ingwall subsidence (i.e. bedrock depth below the hang-
ingwall sediments), the basin would need to be severely
underfilled, which is not the case (e.g. Zembo et al.,2009). We contend that the published minimum hang-
ingwall subsidence values are lower than our obtained
footwall relief values because constraints from Colella
et al. (2004) and Zembo et al. (2009) only provide mini-
mum bedrock depth estimates, and Barchi et al. (2006)have relatively large uncertainties in their depth/veloc-
ity conversion model. Therefore, we rectify our esti-
mates of minimum throw assuming a minimum 1 : 1
partitioning between the hangingwall subsidence and
footwall throw, as observed on the VDF. This is also
the minimum ratio suggested by theoretical considera-
tions and fault geometries datasets (e.g. Anders et al.,1993; Stein et al., 1988; Anders & Schlische, 1994;
King et al., 1988). This correction only produced sub-
stantial changes to the throw values for four data
points, and we extend our range of error to include the
uncorrected data point (Fig. 4b).
The fault has four footwall relief maxima, which cor-
relate with the centres of the geologically mapped fault
segments, and two derived throw maxima: one at
ca. 17 km, corresponding to the centre of the Marsico
Nuovo segment, with ca. 1800 m of throw; and one at
ca. 27 km along strike, the centre of the Marsicovetere
segment, with ca. 2100 m of throw. They are separated
by a minimum where throw drops to ca. 1000 m. In
contrast with the VDF, there are far fewer constraints in
the northern and southern distal segments of the fault,
which reduces the resolution of the throw profile in
these sectors.
Monti della Maddalena Fault
The MMF is composed of two main sub-parallel fault
strands (Fig. 2). We have estimated the geological throw
across the western strand (dotted line in Fig. 4c) from the
offsets of geological markers across seven geological cross-
sections (in the supplementary information). However,
total throw is partitioned between the two subparallel
strands: a western one running along the footwall, and an
eastern one bounding the hangingwall basin, whose dis-
placement is mostly buried under the hangingwall sedi-
ments. Hence, in order to convert these western-strand
throw constraints to total throw estimates, we follow two
approaches. Firstly, we assume an equal throw partition-
ing between the two strands, and plot the summed values
where our new throw estimates have been obtained (or-
ange triangles, Fig. 4c). Secondly, we add the western
strand geological throws (from dotted profile) to the mini-
mum hangingwall subsidence values estimated from
Colella et al. (2004) and Zembo et al. (2009) (pink circles,Fig. 4c). Bedrock in the basin is at shallower depths than
in the EAF side of the fault, so it can be imaged by Colella
et al.’s (2004) ERT profiles (which image to depths up to
ca. 600 m). As the data two sets give similar results, we
combine them to produce a total throw profile (dashed,
Fig. 4c).
The total throw profile resembles that expected for
normal faults (e.g. Cowie, 1998; McLeod et al., 2000;Cowie & Roberts, 2001), with a maximum throw of ca.1100 m that decays towards the tips (Fig. 4c). Throw is
poorly reflected by the footwall relief, likely because the
MMF footwall is a horst also bounded by the VDF
(Fig. 2), which is thought to have a longer faulting history
and higher throw rates (see Geological Setting and
Fig. 4d, f).
Post-18 ka throw rate profiles
Estimates of time-averaged throw rate along strike since
fault initiation were constructed by backstripping the total
throw profiles using the documented post-18 ka throw
rates: i.e. the total throw profiles presented above were
divided by possible fault initiation ages using 0.2 Ma
increments, and the results which best fitted the post-18
ka constraints along strike were selected (Fig. 4d–f). Forthe VDF and EAF we select the mean values between the
two most likely profiles differing by 0.2 Ma (Fig. 4d–e),with an error envelope of �10% from each of these pro-
files.
The time-averaged throw rate profiles that best match
the independent post-18 ka rates for these two faults
imply minimum fault initiation ages of ca. 1.8–2 Ma,
which gives a range of throw rates along strike between 0
and ca. 1 mm year�1 for both faults (Fig. 4d–e). Faultinitiation times younger than this require, to produce the
observed minimum throw, greater time-averaged throw
rates than those documented by most of the constraints
for the last ca. 18 ka. The geodetically estimated throw
rate value from Ferranti et al. (2014) on the VDF only
agrees with the 1.8 Ma fault initiation profile at their
lower error limit, but these constraints are derived from
short-lived geodetic surveys whose long-term applicabil-
ity is uncertain. For the MMF, post-18 ka throw rate
constraints fall between a wider range of throw rate pro-
files produced using minimum fault initiation ages of 1
and 1.8 Ma (Fig. 4f), so we include this range in the error
envelope for the MMF. Geodetic measurements of verti-
cal displacement from Ferranti et al. (2014) have a very
large uncertainty, but include the suggested range of val-
ues. A fault initiation age of 1.4 Ma is the mean fit to the
post 18 ka data and would imply time-average throw rates
of 0–0.7 mm year�1 since this period.
We emphasize that because in some cases we have
summed hangingwall subsidence to measurements of
footwall relief, these total throw, throw rate, and fault ini-
tiation times must be considered minimum estimates.
However, independently derived geological throw
© 2016 The AuthorsBasin Research © 2016 John Wiley & Sons Ltd, European Association of Geoscientists & Engineers and International Association of Sedimentologists 195
Normal faulting and landscape response

constraints from Papanikolaou & Roberts (2007) are very
close to our estimates, giving us confidence that our values
are reasonable. Finally, we stress that the fault initiation
times used here are those required to convert total throw
profiles into time-averaged throw rate profiles that best
match the post-18 ka constraints. However, fault interac-
tion and linkage would lead to a throw rate increase over
time (Fig. 1); if this has taken place, then the real fault
initiation ages would also be older than described here.
Papanikolaou & Roberts (2007) found inconclusive evi-
dence for significant throw rate increases in this area but
could not reject the possibility. We use these throw rate
estimates below, but we return to this issue in the discus-
sion, after examining the geomorphological indicators of
fault activity.
Catchment response to tectonicsandlithology
The slope map (Fig. 5a) shows that steep slopes (>20°)are preferentially distributed in narrow bands along and/
or above the fault traces, especially in the centres of the
segments, and along some footwall channels, reflecting
incision. Additionally, relay zones between segments can
be identified as bands of gentler gradients crossing several
catchments (e.g. between the Polla and the AL-SC seg-
ment in the VDF; and between the W and E strands of
the MMF). Thus, we hypothesize that catchment slopes
are tectonically controlled, either directly, via fault-
related base-level change close to fault planes; or indi-
rectly, trigering channel incision that in turn steepens the
hillslopes at the valley sides of the channels.
Figure 5b shows the main channels draining the foot-
wall catchments, coloured according to their ksn m0.9 val-
ues (also presented on Table 1). Channels are steeper in
the centres of the faults and segments, and progressively
less steep towards the fault and segment tips. Catchments
along the MMF are an exception: many channels run par-
allel to the fault segments along wide relay zones instead
of across them, and hence experience lower cumulative
uplift because they are not crossing both main fault
strands.
We contrast and compare channel and catchment-aver-
aged ksn values, median slopes (S50, also on Table 1) and
throw and throw rates along faults strike in Fig. 6. For
the VDF (Fig. 6a), there is a good correlation between
catchment slopes, channel slopes, and fault activity. Hill-
slopes and channels are steeper in the centres of the fault
segments where throw and throw rates are higher, and
decay markedly towards their tips and segment bound-
aries. The exception is the relay ramp between the Polla
and AL-SC segments (ca. 10 km along strike), where hill-
slopes and channel metrics do not match the throw rate
profile, because the latter represents the summed profile
of both segments, while the relay ramp channels only
drain across the AL-SC segment (see Fig. 5b).
In the EAF, hillslope, channel steepness and fault
throw and throw rates also correlate well, with lower val-
ues at the fault tips that become progressively greater
towards the fault centre (Fig. 6b). The S50 and ksn profilesdefine a clear single-humped shape in contrast to the
post-18 ka throw rate profile, which has two peaks sepa-
rated by a marked throw low. Given the large density of
independent constraints that we have in this sector of the
fault (Fig. 4b), which include measured geological throw
from a bedrock horizon (Papanikolaou & Roberts, 2007),
it is most probable that a real throw deficit, rather than
simply a relief deficit, exists in this area. Therefore, we
suggest that a recent throw rate increase may have
occurred at the fault centre, to which catchment
16°0'0"E
16°0'0"E
15°50'0"E
15°50'0"E
15°40'0"E
15°40'0"E
15°30'0"E
15°30'0"E
40°3
0'0"
N
40°3
0'0"
N
40°2
0'0"
N
40°2
0'0"
N
40°1
0'0"
N
40°1
0'0"
N
Val d’Agri Basin
16°0'0"E
16°0'0"E
15°50'0"E
15°50'0"E
15°40'0"E
15°40'0"E
15°30'0"E
15°30'0"E
40°3
0'0"
N
40°3
0'0"
N
40°2
0'0"
N
40°2
0'0"
N
40°1
0'0"
N
40°1
0'0"
N
0 5 10 15 202,5 Kilometers
Vallo di Diano FaultMonti della Maddalena FaultEast Agri Fault
Faults
Channel normalized steepness index (ksn)
192900
Vallo di Diano Basin
Vallo di Diano FaultMonti della Maddalena FaultEast Agri Fault
Faults
Slope (degrees)40º-max0º 10º 20º 30º
0 5 10 15 202,5 Kilometers (a) (b)
Polla
Atena Lucana - Sala CosilinaPadula
Western branch
Eastern branch
Sasso di Castalda
Marsico Nuovo
Marsicovetere
Viggiano
Fig. 5. (a) Slope map of the study area (b) Hillshade map showing the channels draining the footwall catchments, coloured according
to their ksn value.
© 2016 The AuthorsBasin Research © 2016 John Wiley & Sons Ltd, European Association of Geoscientists & Engineers and International Association of Sedimentologists196
D.C. Roda-Boluda and A.C. Whittaker

Table
1.MedianSlope(S
50),catchment-averaged
wholechannelk sn,catchment-averaged
k snof
thesectionsaboveandbelow
knickpointsandknickpointheightsfrom
fault,forallstudiedcatch-
ments(catchmentnumbersinFig.6).Stream
longprofilesfortheVallodiDianoandEastAgrifaultscanbefoundin
thesupplementary
material.
Fault
Fault
segm
ent
Catchment
number
S50,median
slope
(degrees)
Wholechannel*
k sn(m
0.9),
h=0.45
k1 sn,lowest
reach
k2 sn,upper
ormiddler
each
k3 sn,upper
reach
k1 sn/k2 sn
Average
ratioof
segm
ent
k2 sn/k3 sn
Average
ratioof
segm
ent
Knickpointheight
from
fault(m
),
lowestor
single
Knickpoint
heightfrom
fault(m
),upper
Vallodi
Diano
Fault
Polla
111.6
64�
13
87�
1263
�9
46�
121.4
1.7
1.4
1.4
170�
48281�
71
221.3
131
––
––
––
––
–3
19.9
131�
3184�
1785
�24
–2.2
––
–198�
13–
418.0
76128
86–
1.5
––
–189
–5
15.4
60�
2–
––
––
––
––
Atena
Lucana–
Sala
Cosilina
611.9
63–
––
–2.5
–2.5
––
711.8
69�
3130
80�
1717
1.6
–4.7
–159
369
813.3
6992
5632
1.6
–1.8
–287
465
914.1
7189
42–
2.1
––
–270
–10
18.6
105
150
6443
2.3
–1.5
–467
660
11
24.1
95104
8835
1.2
–2.5
–248
337
12
27.3
133
223
112
532.0
–2.1
–332
608
13
27.2
162
162
86–
1.9
––
–543
–14
20.2
96168
31–
5.4
––
–494
–15
15.4
96�
1158�
352
�5
–3.0
––
–364�
20–
1617.3
99
122
32–
3.8
––
–446
–Padula
1715.3
81�
30189
19�
18–
9.9
3.3
––
476�
97–
1821.4
104
120
43–
2.8
––
–590
–19
20.2
123
139
96–
1.4
––
–555
–20
19.3
105�
11
126�
1190
�9
–1.4
––
–263
–21
20.2
120
147
82–
1.8
––
–369
–22
15.4
156
202
46–
4.4
––
–248
–23
20.9
111
––
––
––
––
–24
17.1
68
7464
–1.2
––
–147
–25
13.3
53�
12
73�
3321
�1
–3.5
––
–215�
10–
2613.6
55�
14
––
––
––
––
–
(continued)
© 2016 The AuthorsBasin Research © 2016 John Wiley & Sons Ltd, European Association of Geoscientists & Engineers and International Association of Sedimentologists 197
Normal faulting and landscape response

Table1(continued)
Fault
Fault
segm
ent
Catchment
number
S50,median
slope
(degrees)
Wholechannel*
k sn(m
0.9),
h=0.45
k1 sn,lowest
reach
k2 sn,upper
ormiddler
each
k3 sn,upper
reach
k1 sn/k2 sn
Average
ratioof
segm
ent
k2 sn/k3 sn
Average
ratioof
segm
ent
Knickpointheight
from
fault(m
),
lowestor
single
Knickpoint
heightfrom
fault(m
),upper
EastAgri
Fault
Sasso
di
Castalda
2710.7
54�
9–
––
–1.7
––
––
28
8.5
18–
––
––
––
––
29
13.9
77�
3115�
3169
�6
–1.7
––
–151
–Marsico
Nuovo
3013.8
6478
7024
1.1
1.6
2.9
–159.0
299
3113.7
85�
13
141
97�
1929
�8
1.5
–3.3
–170
532�
114
3216.8
104�
18109�
1343
–2.5
––
–387
–33
16.7
99105
81–
1.3
––
–403
–Marsico-
vetere
3421.7
97�
20118�
2185
�28
–1.4
1.8
––
300�
34–
3516.6
141�
20170�
951
�31
–3.3
––
–573�
56–
3616.3
79–
––
1.1
––
––
–37
17.7
112
�18
127�
2185
�3
–1.5
––
–376�
57–
Viggiano
3815.8
101�
8146
110�
554
�4
1.3
1.8
2.0
–258
532�
72
3914.5
83�
986
�13
66�
1–
1.3
––
–311�
86–
4013.9
88�
12108�
663
�14
–1.7
––
–252�
85–
4113.3
48�
1150
17–
2.9
––
–111
–Montidella
Maddalena
Fault
4212.9
67�
31–
––
––
––
––
43
23.5
101�
28–
––
––
––
––
44
18.2
142
––
––
––
––
–45
21.6
74–
––
––
––
––
46
19.2
76–
––
––
––
––
47
17.7
115�
1–
––
––
––
––
48
11.1
29�
8–
––
––
––
––
49
11.5
53�
9–
––
––
––
––
50
10.6
57–
––
––
––
––
51
12.9
71�
11–
––
––
––
––
52
12.8
49�
5–
––
––
––
––
53
14.7
43�
13–
––
––
––
––
5414.0
59�
18–
––
––
––
––
5515.7
73–
––
––
––
––
5617.0
97�
14–
––
––
––
––
578.8
41–
––
––
––
––
*For
catchmentsthathavemorethan
onetributary
channel,wepresentcatchment-averaged
values
forthewhole-channelk sn,thek snsectionsaboveandbelow
knickpoints,andtheknickpointheights.The�
errorsrepre-
sentthescatterof
valuesforthedifferenttributariesin
thecatchments.
AL-SC,AtenaLucana-SalaCosilina;Sasso,Sasso
diCastalda;M.Nuovo,Marsico
Nuovo;M.Vetere,Marsicovetere.
© 2016 The AuthorsBasin Research © 2016 John Wiley & Sons Ltd, European Association of Geoscientists & Engineers and International Association of Sedimentologists198
D.C. Roda-Boluda and A.C. Whittaker

geomorphology has adjusted, but which has not generated
sufficient cumulative throw to remove this deficit (see
Discussion). This is unlikely to be captured by Cinque
et al.’s (2000) published throw rate constraint (red square,
Fig. 4e), as it is time-averaged since the Middle Pleis-
tocene and its location along strike is not made precise by
the authors.
For the MMF, S50 and ksn values correlate well
together, but, like relief (Fig. 4c), they do not reflect the
inferred post-18 ka throw rate profile (Fig. 6c). We
hypothesize that the geomorphology of these catchments
does not reflect fault activity well for two important rea-
sons. One is the interaction with the displacement field of
the VDF, a faster-slipping and likely older structure that
has generated much of the range’s relief. The other is the
geometry of the fault, which creates multiple wide relay
zones through which channels flow, and thus channels
experience a tectonic forcing that reflects segment interac-
tion (Hopkins & Dawers, 2015) but not the cumulative
throw rate.
Overall, for the VDF and EAF, geomorphology is a
good reflection of normal fault activity (Fig. 6a, b), and
we exploit this to explore the evolution of these two faults
below. We do not observe in Fig. 6a, b a significant litho-
logical modulation in the way these catchments record the
active tectonics. Despite the fact that the VDF footwall is
dominated by carbonates, and the EAF footwall has a mix
of carbonates and flysch sandstones, we observe a similar
range of ksn and S50 values along both fault systems. The
southeastern catchments of the EAF fault have mostly fly-
sch sandstone bedrock, and exhibit similar ksn and S50 val-ues to other catchments affected by similar throw rates
that are covered by carbonates or mixed lithologies.
Because channels set the boundary condition for hill-
slopes, we expect catchment slopes and ksn to correlate.
We have observed this in all the faults (Fig. 6a–c), and wetest this explicitly in Fig. 7. We find that these
VALLO DI DIANO FAULT (VDF)
EAST AGRI FAULT (EAF)
MONTI DELLA MADDALENA FAULT (MMF)
Throw rate [1.8-2 Ma]Throw rate ± 10% error
S50
Catchment-averaged ksnChannels ksn
Total throw
Throw rate [1.8-1 Ma]Total throw
Throw rate [1.4 Ma]
S50
Catchment-averaged ksnChannels ksn
Throw rate [1.8-2 Ma]Throw rate ± 10% error Total throw
S50
Catchment-averaged ksnChannels ksn
S50(degrees) ksn
ksn
ksn
Post-18 ka throwrate (mm year–1)
Total throw
(m)
Distance along-strike (km)
Distance along-strike (km)
Distance along-strike (km)
Total throw
(m)Post-18 ka throwrate (mm year–1)
Post-18 ka throw rate (mm year–1)
Total throw
(m)
NNW SE
SENW
NW SSE1
23 4 5 6 7 8 910 11 12 13
14
15 16
17 18
192021
22
23
2425
26
27
2829
30
31
32 33
34
35 36 37
38 3940
41
42 4344
45
4647
48
4950
51 52
53 54
55
56
57
S50(degrees)
S50(degrees)
(a)
(b)
(c)
Fig. 6. Along strike distribution of fault total throws, post-
18 ka throw rates, S50, and channels and catchment-averaged ksnvalues. For the VDF (a) and EAF (b), the throw rate values
between the two most likely post-18 ka profiles from Fig. 4, are
coloured in dark grey, while the range of uncertainty in those
estimates is shown in lighter grey. For the MMF (c), the mean
value between the likely range of throw rates from Fig. 4 is
shown as a bold, black line, and the wider range of uncertainty
in lighter grey. Main fault strands, footwall catchments, and the
lithologies underlying them are shown above the graphs. The
numbering of the catchments corresponds to that used in
Table 1.
Catchment-averaged channel steepness index (ksn)
Catc
hmen
t med
ian
slop
e, S
50 (d
egre
es)
Vallo di Diano East AgriMonti della MaddalenaFlysch & sandstonesCarbonatesMixed lithologies
y = 8.4(±1.2) + 0.1(±0.0)x
R2 = 0.5
Fig. 7. S50 plotted against catchment-averaged ksn values for allfootwall catchments of the VDF, EAF and MMF, coloured by
their dominant lithology.
© 2016 The AuthorsBasin Research © 2016 John Wiley & Sons Ltd, European Association of Geoscientists & Engineers and International Association of Sedimentologists 199
Normal faulting and landscape response

geomorphic metrics correlate well (R2–0.5), with catch-
ments getting ca. 1° steeper for each 10-point increase in
ksn. Therefore, these channels are effectively propagating
tectonic signals to the hillslopes. Importantly, all studied
lithologies follow the same trend, so we hypothesize that
adjustment of hillslopes to channel boundary conditions
happens in a similar manner and in a similar timescale for
all studied lithologies, which supports our findings of only
minor lithological control. The remaining scatter might
be explained by footwall uplift and rotation, which would
partially influence catchment slopes directly in addition to
channel incision; or by different parts of the channels
incising at different rates. This last hypothesis would
imply that some parts of the catchment, and therefore
their slopes, diverge from the catchment-averaged whole
channel ksn, which we examine in the Discussion.
Knickpoints and fault interaction
Information about faulting history can be extracted from
the presence of knickpoints in the channels. For this anal-
ysis we focus on the VDF and EAF because their footwall
catchments appear to record fault activity coherently. We
include the long profiles of the 70 channels draining the
VDF and EAF footwalls in the supplementary material,
with the identified knickpoints and modelled ksn values.
Catchment maps in Fig. 8 show the distribution of slope-
break knickpoints along the channels, and the values of ksnabove and below them (also on Table 1). In these cases,
channels become between 1.1 and 5 times steeper down-
stream of the knickpoints with respect to their upstream
sections. Most catchments have at least one knickpoint
(85% of the catchments along the VDF, and 87% of those
along the EAF), and six catchments on the VDF (40% of
the total), and three catchments on the EAF (20% of the
total) have two sets of knickpoints.
For each catchment, we plot along strike the mean
height of each set of knickpoints measured from the fault,
and show the range of elevations as error bars (Fig. 8;
Table 1). On the VDF, the single or lowest set of knick-
points are found throughout the fault length at elevations
between ca. 150 m and ca. 600 m, which reach a maxi-
mum in the sector between the AL-SC and Padula seg-
ments. The upper set of knickpoints on the VDF is only
found in catchments of the Polla and AL-SC segments, at
elevations between 270 and 660 m. On the EAF, knick-
points are found at elevations between ca. 110 m and ca.570 m, and reach maximum values on the area of the
throw minimum between the Marsico Nuovo and the
Marsicovetere segments. The upper set of knickpoints on
the EAF is found at elevations between 300 m and
530 m, close to the footwall relief.
As we have excluded lithological knickpoints from our
analysis, these slope-break knickpoints likely reflect base-
level changes that have affected the catchments. While
both basins had episodic lakes during the Pleistocene,
they were not long-lived or deep enough to have gener-
ated significant high-magnitude base level changes (e.g.
Karner et al., 1999; Giano, 2011; Zembo et al., 2012).The hangingwall basins are filled, so there has been no-
abrupt base-level fall due to basin incision or drainage
capture. Consequently, we argue that the most likely
explanation for the existence of these knickpoints is the
fact that these channels cross active faults. Moreover,
given that (i) lower set of knickpoints are consistently pre-
sent where catchments drain through mapped fault seg-
ment boundaries, and (ii) throw does not decay to zero at
any fault segment boundaries (c.f. Papanikolaou &
Roberts, 2007), a plausible explanation for the generation
of these knickpoints is fault growth and linkage, which
should lead to slip rate increases as fault segments interact
and later link (c.f. Fig. 1).
Because the vertical component of knickpoint migra-
tion scales with the magnitude of the throw-rate perturba-
tion experienced (e.g. Attal et al., 2008; Whittaker et al.,2008; Whittaker & Walker, 2015), knickpoints should be
higher in the areas along the fault that have experienced
greater throw rate changes (i.e. the centre of the fault and
old segment boundaries; Fig. 1; Cowie & Roberts, 2001).
The systematic variation in knickpoint heights along
strike is consistent with this explanation and this is likely
why knickpoints close to fault tips lie at low elevations
(Fig. 8), because distal sectors of the fault experience the
smallest throw rate changes prior, during and post-link-
age, as they only have one along-strike segment neighbour
to interact with (e.g. Cowie & Roberts, 2001). The upper
set of knickpoints may reflect an early stage of fault link-
age or fault initiation, and we analyse the significance of
both these knickpoint sets in further detail in the discus-
sion, below.
DISCUSSION
Fault throwsandpost-18 ka throwrates
We have reconstructed throw profiles for three Southern
Apennines normal faults, and we have inferred three new
post-18 ka throw rate profiles (Fig. 4). The ca. 2 km total
throws of the Vallo di Diano and East Agri faults are the
greatest reported in the Southern Apennines (c.f.
Papanikolaou & Roberts, 2007). For both faults, the
throw/length ratios are ca. 0.05, at the upper end of val-
ues reported for the Southern Apennines array (0.025–0.058; Papanikolaou & Roberts, 2007). Backstripping the
total throw using post-18 ka throw rates, we obtain mini-
mum fault initiation ages of 1.8–2 Ma for the VDF and
EAF (Fig. 4). However, our evidence from the presence
of non-zero throw values near fault segment boundaries,
and knickpoints in the long profiles suggest that throw
rates have increased as the fault segments have grown,
interacted and eventually linked (Fig. 8). Consequently,
the fault initiation time is probably older than 2 Ma.
The MMF has a lower total throw (ca. 1100 m) and
throw rate values (ca. 0.4 mm year�1), and comparatively
smaller throw/length ratio (ca. 0.03) than the other faults
(Fig. 4). Nevertheless, our maximum inferred throw rates
© 2016 The AuthorsBasin Research © 2016 John Wiley & Sons Ltd, European Association of Geoscientists & Engineers and International Association of Sedimentologists200
D.C. Roda-Boluda and A.C. Whittaker
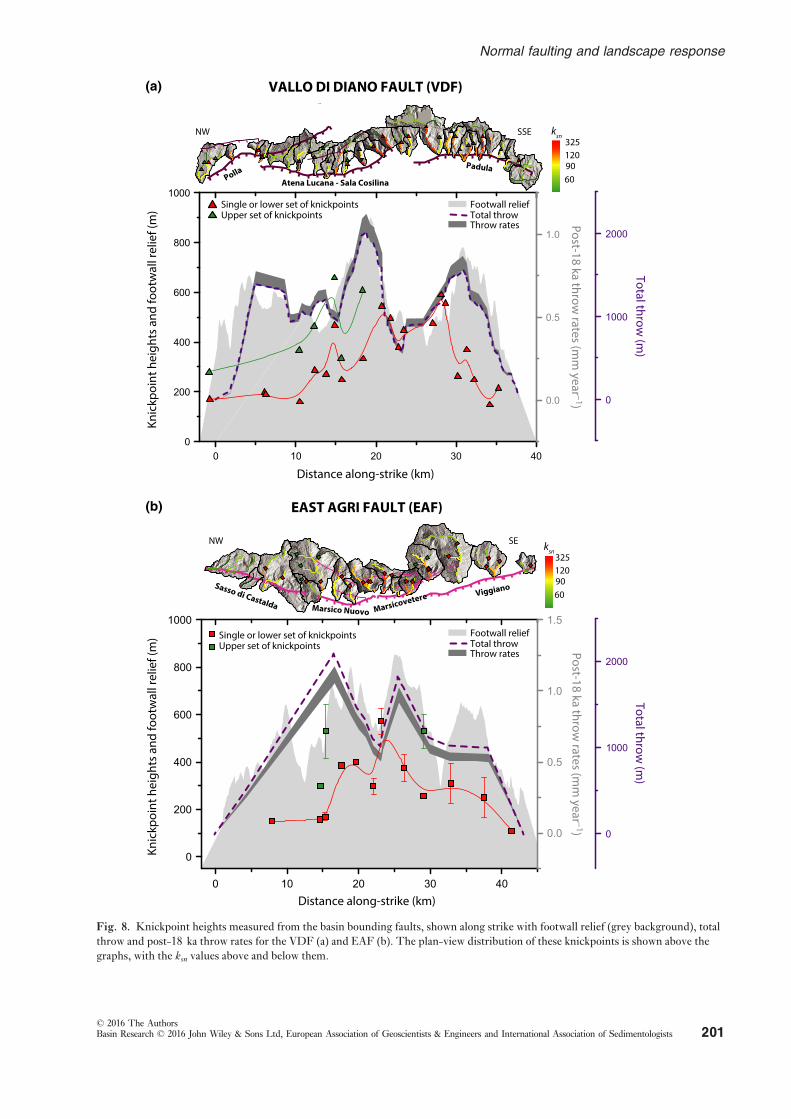
Distance along-strike (km)
ksn3251209060
Distance along-strike (km)
ksn
Post-18 ka throw rates (m
m year –1)
Post-18 ka throw rates (m
m year –1)
Total throw (m
)Total throw
(m)
VALLO DI DIANO FAULT (VDF)
EAST AGRI FAULT (EAF)
Sasso di Castalda Marsico Nuovo Marsicovetere Viggiano
Atena Lucana - Sala CosilinaPollaPadula
Total throwThrow rates
Footwall relief
NW SSE
NW SE
Total throwThrow rates
Footwall relief
Single or lower set of knickpointsUpper set of knickpoints
Single or lower set of knickpointsUpper set of knickpoints
3251209060
Knic
kpoi
nt h
eigh
ts a
nd fo
otw
all r
elie
f (m
)Kn
ickp
oint
hei
ghts
and
foot
wal
l rel
ief (
m)
(a)
(b)
Fig. 8. Knickpoint heights measured from the basin bounding faults, shown along strike with footwall relief (grey background), total
throw and post-18 ka throw rates for the VDF (a) and EAF (b). The plan-view distribution of these knickpoints is shown above the
graphs, with the ksn values above and below them.
© 2016 The AuthorsBasin Research © 2016 John Wiley & Sons Ltd, European Association of Geoscientists & Engineers and International Association of Sedimentologists 201
Normal faulting and landscape response

are higher than Papanikolaou & Roberts (2007) suggested
(<0.2 mm year�1) based on the estimates of Maschio
et al. (2005), because these were collected closer to the
southern fault tip than to the fault centre (Fig. 4c). A
0.75–0.18 Ma fault initiation age has been suggested by
several authors (Maschio et al., 2005; Zembo et al., 2009,2012; Improta et al., 2010); however, all these studies arerestricted to the SE fault segments. Our throw backstrip-
ping suggests a younger onset age than the other studied
faults, (1.4 � 0.4 Ma). However, a very late Pleistocene
initiation of this fault is unlikely: to achieve the cumula-
tive throw at the centre of the fault (Fig. 4c) in as little as
180 ka, fault throw rates would have to be an order of
magnitude greater than reported (Schiattarella et al.,2003; Maschio et al., 2005). The Spinoso conglomerates,
attributed an Early Pleistocene age and found adjacent to
the MMF eastern branch (Zembo et al., 2012), also sug-
gest that this fault started its activity around this time.
We hypothesize that the MMF nucleated at a similar time
as the other studied faults, but may have had its growth
inhibited by a stress shadow created by the more active
VDF and EAF (e.g. Cowie, 1998; Gupta et al., 1998),which would explain its subdued geomorphic expression
(Figs 4c and 7c; Maschio et al., 2005).
Landscape response tonormal faulting fortheVallo di Dianoand East Agri faults
Figures 6 and 7 show that landscape metrics of catch-
ments eroding the footwall of the VDF and EAF correlate
with measures of tectonic activity. Catchment geomor-
phology reflects the variation in fault slip rate along strike,
with those in the centres of the faults having median
slopes ca. 10–15° steeper than those at the fault tips
(Fig. 6a–b). Catchment-averaged ksn values also record
the along-strike fault activity: ksn values are ca. 100 m0.9
greater in the fastest uplifting catchments than in those at
the tips (Fig. 6a–b). The response of channels and hill-
slopes to tectonics is similar and both geomorphic indica-
tors track fault activity with comparable sensitivities
(Fig. 7), suggesting that incision is propagating the signal
of faulting to the channels and hillslopes at a similar rate.
Couplings between ksn, slope, relief and tectonic rates
have been previously reported in settings that are actively
uplifting (e.g. Lague & Davy, 2003; Wobus et al., 2006a;Ouimet et al., 2009; Cyr et al., 2010; DiBiase et al., 2010;Miller et al., 2012). Some of these authors have found
that ksn and catchment slopes correlate well, in most cases
non-linearly (Ouimet et al., 2009; DiBiase et al., 2010;Bookhagen & Strecker, 2012), which implies that chan-
nels can steepen beyond the point in which slopes are
strength limited and become invariable (ca. 20–30°, intheir studies corresponding to a ksn value of ca. 100–150).Consequently, Ouimet et al. (2009) and DiBiase et al.(2010) concluded that channel gradients are a more faith-
ful recorder of tectonic activity than catchment slopes as a
whole. However, in our study, channels and hillslopes are
still steepening at similar rates with increasing throw
rates, with catchments becoming ca. 1° steeper for each
10-point increase in ksn value. This compares well with
the below-threshold relation found by Ouimet et al.(2009) and Bookhagen & Strecker (2012), but is three
times lower than the relation found by DiBiase et al.(2010) and Miller et al. (2013).Densmore et al. (2004, 2007) found that along normal
faults of the Basin and Range, relief only reflects the fault
displacement profile within ca. 15 km of the fault tips.
Beyond this, channels and hillslope slopes reach critical
values marking the onset of very effective erosion, limit-
ing footwall relief and decoupling it from the total throw
profile. Consequently, relief, channel and catchment
slopes are uniform in the centre of the faults, and insensi-
tive to the along strike variations of fault activity. Our
results differ because we find that the landscape (relief,
channels and catchment slopes) reflects fault activity
along the entire fault length; mapped fault segment
boundaries correlate with minima in footwall relief, and
geological measurements of high fault throw are typically
located near footwall relief maxima. We suggest that the
fact that topographic and channel steepness metrics both
reflect fault activity is most likely because slopes have not
yet surpassed the critical strength-limited threshold for
hillslopes that marks the onset of landslide-dominated
erosion. Field observations indicate that there is incipient
shallow landsliding in flysch and sandstone outcrops so
critical slopes might have been reached in some areas, but
have not yet decoupled the geomorphology from the nor-
mal fault activity. Moreover, our faults are younger,
shorter, and have fewer segments than those studied by
Densmore et al. (2007), meaning that the fault centres are
still relatively close to the fault tips, there is less potential
for interactions, and that there has not been enough time
to develop very large cumulative throws that could lead to
erosional thresholds being exceeded. Figures 6 and 7 do
not reveal any significant changes in landscape response
to tectonics due to lithology, and instead catchments with
different lithologies seem to respond similarly and fall
within the same trends, as was also found by Miller et al.(2013) for below-threshold catchments in the
Appalachians.
Fault linkageand faultinghistory for theVallodi Dianoand East Agri faults
While whole channel ksn values and catchment averaged
slopes reflect time-integrated tectonic activity along the
studied faults, the presence of knickpoints on the studied
channels indicates that fault throw rates have changed
over time. The knickpoints also indicate that different
parts of the catchments are transiently responding to dif-
fering tectonic boundary conditions, which may also
explain part of the scatter in Fig. 7. Our geomorphic anal-
ysis presented above suggested two episodes of relative
base-level change, which we inferred to be due to fault
growth, interaction and linkage. Here we combine fault
interaction theory with the total throw profiles (Fig. 4)
© 2016 The AuthorsBasin Research © 2016 John Wiley & Sons Ltd, European Association of Geoscientists & Engineers and International Association of Sedimentologists202
D.C. Roda-Boluda and A.C. Whittaker

and the distribution of knickpoints along the fault strikes
(Fig. 8) to infer possible fault segment linkage scenarios
that could plausibly explain our observations.
In the VDF, the single or lower set of knickpoints is
found all along the fault, reaching higher elevations in the
area around the segment boundary between the AL-SC
and Padula segments. This suggests that all catchments
along the fault have experienced relative slip rate changes,
but the sector between AL-SC and Padula segments has
experienced the greater relative changes (Fig. 8a). We
also observe (Fig. 9a) that between these two segments
there is a throw minimum that has accumulated only ca.560 m of throw (Fig. 9a). In contrast, between the Polla
and the AL-SC segments, the throw minimum has accu-
mulated ca. 930 m of throw, about ca. 370 m more. Pro-
vided that our throw rate profiles are capturing well the
distribution of throw rates along strike, a good way to
explain this difference is that the area between the AL-SC
and Polla segments has been accumulating throw for
longer than the sector between the AL-SC and Padula
segments, which would imply that the former segments
linked earlier than the latter. Therefore, the single or
lower set of knickpoints probably reflects a linkage event
between the previously linked Polla and AL-SC segments
with the Padula segment, and ca. 560 m of throw have
been accumulated since then. The upper set of
knickpoints is only found in catchments of the Polla and
AL-SC segments (Fig. 8a), so it is possible that these
reflect the previous linkage event between these two seg-
ments, which would have accumulated ca. 370 m of throw
before the subsequent linkage episode (Fig. 9a).
In the EAF, we find the lower or single knickpoints all
along the fault, at higher elevations around the central
catchments of the fault (Fig. 8b). This distribution would
agree with a single linkage event in which all segments
along the fault have linked, and the centre of the fault is
accommodating more of the consequent slip rate enhance-
ment. Based on the elevation of the only throw minima
that we can identify in this fault, ca. 1050 of throw would
have been accumulated following this linkage event
(Fig. 9b). This scenario also explains the discrepancy in
the centre of the fault between S50 and ksn and total throw:
Sasso di Castalda Marsico Nuovo Marsicovetere Viggiano
East Agri Fault (EAF)
T2 = 1050 m
Vallo di Diano fault (VDF)
Polla Atena Lucana -Sala Cosilina
Padula
T2 = 560 m
T1 = 370 m
T0 T0+T1
T0
T0 T0+T1
T2 : post - Lk2 throwT1 : post - Lk1 and pre-Lk2 throw
Distance along-strike (km) Distance along-strike (km)
Thro
w (m
)
Thro
w (m
)
Foot
wal
l rel
ief (
m)
Foot
wal
l rel
ief (
m)
Cum
ulat
ive
thro
w (m
)
Cum
ulat
ive
thro
w (m
)
Time (Ma)Time (Ma)
T0 : pre-Lk1 throwT2 : post - Lk2 throwT1 : post - Lk1 and pre-Lk2 throw
T0 : pre-Lk1 throw
Linkage 2 Linkage 1
Fault initiation
AL - SC
Polla
Padula
E = 1.7
E = 1.4E = 2.4
E = 1.7
E = 1.4
Linkage 2
Marsico Nuovo
Marsicovetere
Minimum fault initiation
E = 2.3
E = 1.8
0.7 ± 0.2 1.4 ± 0.3
3.5 ± 0.2 2.9 ± 0.3
1 ± 0.1
Linkage event Linkage event
Pre-Lk1 length (L0)Post-Lk1 length (L1)Post-Lk2 length (L2)
Pre-Lk1 length (L0)Post-Lk1 length (L1)Post-Lk2 length (L2)
tΔr (
m)
Measured knickpoint height (m)Measured knickpoint height (m)
tΔr (
m)
y = 0.7(±0.1)xR2 = 0.96
y = 1(±0.3)xR2 = 0.78
Single or lower knickpoints
Single or lower knickpointsUpper knickpoints
(a) (b)
(c) (d)
Fig. 9. Throw accumulated at each stage of fault linkage for the VDF and EAF (a–b), reconstructed faulting histories (c–d), and acomparison of the expected knickpoint heights based on theorical considerations against the measured heights, for the highest knick-
point in each generation and fault segment (insets on c–d). Throw values from (a) and (b), and enhancement (E) and throw rate values
presented in Table 2 are used to reconstruct the faulting histories in (c) and (d). On the inset graphs, the uncertainty on measured
knickpoint heights reflects the smoothing window used when extracting the river long profiles (108 m), while uncertainties in Eqn 4
(y axis) are propagated from the uncertainties in the reconstructed mean values of Lk2 and Lk1.
© 2016 The AuthorsBasin Research © 2016 John Wiley & Sons Ltd, European Association of Geoscientists & Engineers and International Association of Sedimentologists 203
Normal faulting and landscape response

catchments here are responding to the newly enhanced
throw rates, but the total throw deficit that existed before
the segments linked still persists (c.f. Fig. 1). An upper
set of knickpoints is only found in three catchments; and
it is very close to the footwall relief, so they could have
been formed as faults initiated and fault-driven relief
started to develop (e.g. Fig. 1, Whittaker & Walker,
2015). However, we cannot rule out the possibility that
they might be related to a previous segment interaction
event in which the two northern (Sasso di Castalda and
Marsico Nuovo) and the two southern (Marsicovetere
and Viggiano) segments linked.
Based on these plausible fault linkage scenarios, and
the post-18 ka throw rates presented in Fig. 4, fault inter-
action theory can be used to reconstruct the possible tim-
ing of the fault linkage episodes and the associated
magnitude of the throw rate perturbations. Using the
mapped fault segment lengths, we calculate throw
enhancement values, E, for segments of the VDF and
EAF using Eqn 1 for the inferred fault linkage episodes
(Table 2). For the second and youngest linkage event
(Lk2), we use Ln-1 values corresponding to the two
northern and two southern segments of each fault (L1,
Fig. 9a–b), previously linked during Lk1, and Rn values
corresponding to the fully linked fault (E2 values,
Table 2). For the first linkage event (Lk1), Ln-1 values
correspond to individual, unlinked segments (L0,
Fig. 9a–b), and Rn values that reflect the combined length
of the segments that linked at this stage (E1 values,
Table 1). The length of post-linkage segments is not
always the sum of the lengths of the previous segments, as
they commonly overlap in en �echelon arrays (e.g. Peacock
& Sanderson, 1991; McLeod et al., 2000).On the VDF, the possible linkage between the Polla
and the AL-SC (Lk1) would have resulted in a throw
rate enhancement (E1) of about 1.4 for both segments,
and we inferred earlier that ca. 370 m of throw (T1)
accumulated after this linkage (Fig. 9a; Table 2). This
episode could have created the upper set of knickpoints
that is found on some catchments along these segments
(Fig. 8a), which are associated with downstream chan-
nel steepness increases of a factor of ca. 2 on average
(Table 1). The subsequent linkage of the Polla-AL-SC
linked segments with the Padula segment (Lk2) would
have produced throw rate enhancements (E2) of about
1.7 on the previously linked segments, and about 2.4
Table 2. Enhancement values for each fault segment and fault linkage event for the VDF and EAF, input values used to calculate
them, inferred past throw rate values, and inferred timing of fault linkage and faulting histories
Vallo di Diano fault (VDF) East Agri fault (EAF)
Polla
Atena
Lucana-Sala
Cosilina Padula
Sasso di
Castalda
Marsico
Nuovo Marsicovetere Viggiano
Pre-Lk1, L0 (m) 15 400 15 500 15 800 13 360 7000 9800 15 900
Post-Lk1, L1 (m) 22 000 22 000 15 800 20 360* 20 360* 25 700* 25 700*
Post-Lk2, L2,
final length (m)
38 000 38 000 38 000 46 000 46 000 46 000 46 000
E1 = 2R1/L0 1.4 1.4 n/a 1.5* 2.9* 2.6* 1.6*
E2 = 2R2/L1 1.7 1.7 2.4 2.3*/1† 2.3*/4.8† 1.8*/4.2† 1.8*/1†
r2, post-18 ka throwrates (mm year�1)
0.7 1.1 0.8 – 1.1 0.9 –
r1 = r2/E2 (mm year�1) 0.4 0.6 0.3 – 0.5*/0.2† 0.5*/0.2† –r0 = r1/E1 (mm year�1) 0.3 0.4 0.3 – 0.2* 0.2* –Post-Lk2 cumulative throw, T2 (m) 560 560 560 – 1050 1050 –Post-Lk1 cumulative throw, T1 (m) 370 370 n/a – 1040 (T1 + T0) 770 (T1 + T0) –Pre-Lk1 cumulative throw, T0 (m) 480 1050 1000 – Unresolved Unresolved –Time to accumulate T2 at
an r2 rate, t2 (Myr)
0.8 0.5 0.7 – 1.0*,† 1.1*,† –
Time to accumulate T1 at
an r1 rate, t1 (Myr)
0.9 0.6 n/a – 2.2*/4.6† (T1 +T0) 1.5*/3.4† (T1 +T0)
–
Time to accumulate T0 at
an r0 rate, t0 (Myr)
1.6 2.4 3.0 – Unresolved Unresolved –
Time of Lk2, t2 (Ma) 0.7 � 0.2 Ma (all three
segments)
1.0 � 0.1 Ma*,† (all segments)
Time of Lk1, t2 + t1 (Ma) 1.4 � 0.3 Ma (Polla and AL-
SC segments)
Unresolved
Time of fault initiaton,
t2 + t1 + t0, (Ma)
3.5 � 0.2 Ma (all three
segments)
>2.9 � 0.3 Ma* / >5 � 0.5 Ma† (all segments)
*If the two northern and two southern segments linked earlier.†If all segments linked at the same time.
© 2016 The AuthorsBasin Research © 2016 John Wiley & Sons Ltd, European Association of Geoscientists & Engineers and International Association of Sedimentologists204
D.C. Roda-Boluda and A.C. Whittaker

on the Padula segment (Table 2). This youngest link-
age event (Lk2) would have resulted in the formation
of the lowest (or single) set of knickpoints (Fig. 8a),
and subsequent accumulation of ca. 560 m of throw
(T2, Fig. 9a). The ratios of channel steepness indices
below and above this lowest set of knickpoints have an
average value of ca. 2 for the Polla and AL-SC seg-
ments, and ca. 3 for the Padula segment (Table 1),
reflecting that the Padula segment has experienced
greater slip rate changes, in agreement with the
enhancement calculations.In order for ca. 560 m of throw to have been accumu-
lated at the post-Lk2 throw rates (i.e. those presented ear-
lier in this paper), between 0.5 and 0.8 Myr would be
required, considering all linked segments (Table 2).
Therefore, we hypothesize that the youngest linkage
event on the VDF fault took place ca. 0.7 � 0.2 Ma
(Table 2; Fig. 9c). We estimate pre-Lk2 throw rates (r1)for each segment using Eqn 3, dividing the maximum
post-18 ka (i.e. post-Lk2) throw rate value (r2, from
Fig. 6) by the corresponding enhancement value associ-
ated with Lk2, E2 (Table 2, Fig. 1).
rn�1 ¼ rn=En ð3ÞUnder this pre-Lk2 throw rates, between 0.6 and
0.9 Myr would be required to accumulate the ca. 370 m
of throw that we inferred followed the linkage of the Polla
and AL-SC segments (Table 2). Therefore, this first link-
age event that created the upper set of knickpoints could
have occurred around 1.4 � 0.3 Ma (Table 2; Fig. 9c).
We can also estimate the likely fault onset age following a
similar approach. On the Padula segment, a minimum of
ca. 1000 m of throw were accumulated before Lk2 (the
only linkage event that we can show this segment has
experienced), at an r1 rate that we can calculate with
Eqn 3, which would require about 3 Myr of faulting his-
tory preceding Lk2 (Table 2). On the Polla and AL-SC
segments, a minimum ca. 450 m and ca. 1050 m of throw
(T0) were accumulated before Lk1, respectively (Fig. 9a).
Using inferred pre-Lk1 throw rates (Eqn 3; Table 2), we
can estimate that between 1.6 and 2.4 Myr would have
been required by each segment, correspondingly, to accu-
mulate these pre-Lk1 throws. If we sum the respective
times required by each segment to accumulate the pre-
Lk1, post-Lk1, and post-Lk2 throws, we obtain an overall
estimate of fault initiation age of about 3.5 � 0.2 Ma
(Table 2; Fig. 9c).
On the EAF, we inferred earlier that ca. 1050 m of
cumulative throw (T2, Fig. 9b) postdate the youngest
linkage event (Lk2), which resulted in the formation of
the lowest or single set of knickpoints. Based on the post-
Lk2 throw rates of the two central segments of the fault
(the ones presented on Fig. 6; we only use throw rates
from the two central segments because we have a much
lower resolution of constraints on our throw profile for
the distal segments); about 1 � 0.1 Myr would be
required to produce this throw; so Lk2 probably occurred
around 1 � 0.1 Ma (Table 2; Fig. 9d). As we mentioned
earlier, there are two possible fault linkage scenarios for
the EAF: either all segments linked at the same time (so
Lk2 was the only linkage event), or the two northern and
the two southern segments had linked in a previous Lk1event. In Table 2, we report the enhancement values,
pre-linkage throw rates and linkage times that could be
predicted for these two scenarios. If all the individual seg-
ments linked during Lk2 (results marked by a “†” in
Table 2), the throw rate enhancement values on the two
central segments would be between 4 and 5, while the dis-
tal segments would have experienced no enhancement at
all (E = 1). This would result in pre-Lk2 throw rates of
only ca. 0.2 mm year�1, which, in order to accumulate
the pre-Lk2 throws, would require ca. 4 � 0.6 Myr. This
would imply fault initiation ages older than 5 Ma, which
is not plausible given that at that time, this area was still
subject to compression (e.g. Cinque et al., 1993; Hip-
polyte et al., 1995; Ferranti & Oldow, 2005). Moreover, if
the distal segments of the fault had experienced no
enhancement, we would not expect to find any knick-
points in their catchments.
The linkage scenario in which the Sasso di Castalda
and the Marsico Nuovo segments, and the Marsicovet-
ere and Viggiano segments had linked following previ-
ous interaction (Lk1) would result in lower enhancement
values associated with the youngest linkage event, Lk2.
In this case, we obtain enhancement values of between
2.3 and 1.8 for the northern and southern segments,
respectively (values marked with an asterisk in Table 2),
which are in close agreement with the observed
increases in channel steepness indices below the young-
est knickpoints, of about a factor of ca. 2 (Table 1). We
favour this hypothesis, which would imply pre-Lk2throw rates of about 0.5 mm year�1 (Table 2). In the
EAF, the resolution of our profile does not allow us to
differentiate post-Lk1 and pre-Lk1 cumulative throws,
which means that we cannot resolve the time when Lk1took place. The combined throw accumulated before the
youngest linkage event (T0 + T1) is ca. 1040 m on the
Marsico Nuovo segment and ca. 770 m on the Marsi-
covetere segment (Fig. 9b, Table 2). To accumulate
these throws at the pre-Lk2 rates of ca. 0.5 mm year�1
would require about 2.2 and 1.5 Myr, respectively,
which would imply an overall minimum fault onset age
of about 2.9 � 0.3 Ma (Table 2; Fig. 9d). However, an
undetermined part of these pre-Lk2 throws were accu-
mulated at pre-Lk1 throw rates; therefore, this is only a
minimum estimate, and the EAF activity probably initi-
ated earlier than this.
Overall, these faulting histories suggest that the VDF
and EAF probably have experienced two linkage events
that have resulted in subsequent throw rate enhancements
and have generated knickpoints on the channels crossing
the faults. We estimate that the VDF started its activity
around 3.5 � 0.2 Ma, and a minimum fault onset age of
2.9 � 0.3 Ma for the EAF. These estimates are in close
agreement with the ages of normal fault initiation for the
whole Southern Apennines array suggested by
© 2016 The AuthorsBasin Research © 2016 John Wiley & Sons Ltd, European Association of Geoscientists & Engineers and International Association of Sedimentologists 205
Normal faulting and landscape response

Papanikolaou & Roberts (2007). Our reconstruction of
Lk2 provides similar ages to the ca. 0.7 Ma fault interac-
tion event inferred by Roberts & Michetti (2004) for the
Central Apennines. Independently, several authors have
identified a change in the intensity, style and/or orienta-
tion of the extensional stress field at ca. 0.7 Ma on the
Central-Southern Apennines and Calabria (e.g. Cinque
et al., 1993; Hippolyte et al., 1994; Amato & Montone,
1997; Patacca & Scandone, 2007).
Moreover, we can examine if the faulting histories
reconstructed above are reasonable and consistent with
the heights of the knickpoints that record the fault inter-
action events. Field data and modelling work (Wobus
et al., 2006b; Whittaker et al., 2008) indicate that knick-point heights upstream of faults, Hknickpoint, are propor-
tional to the throw rate difference (rn � rn-1) and the time,
tn, since the perturbation took place:
Hknickpoint � tnðrn � rn�1Þ ð4ÞThe coefficient of proportionality in this relationship
also depends on factors such as long-term sediment aggra-
dations in the hangingwall so Eqn 4 produces only rough
estimates. We compare the highest knickpoint found in
each segment of the fault (Fig. 8, Table 1) with predic-
tions from Eqn 4. To do this, we use the mean Lk2 and
Lk1 age estimates presented in Fig. 9c–d, and the throw
rates (r2, r1 and r0) calculated for each segment and pre-
sented in Table 2. To calculate the final knickpoint
heights, we use the throw rates and timing associated with
each linkage interval, because throughout faulting history
knickpoints have migrated vertically at different rates that
relate to the magnitude of the last perturbation experi-
enced. In the EAF, to increase the robustness of the test,
we have also included the most distal segments (Sasso di
Castalda and Viggiano), not used to reconstruct faulting
histories.
The insets in Fig. 9c–d show statistically significant
linear correlations (R2 = 0.96; VDF; R2 = 0.78 EAF)
between the throw rate difference and time, and the
heights of knickpoints presented in Fig. 8. For the
EAF, measured knickpoint heights are similar to those
estimated by Eqn 4, while in the VDF, measured
heights are about 40% greater than the predicted val-
ues. This difference likely arises from other factors
that control knickpoint migration rates which have not
been considered here, such as lithology, discharge or
sediment supply. Nevertheless, these correlations
between measured heights and those based on the tim-
ing and magnitude of the throw rate perturbations
indicate that our reconstructed faulting histories are
plausible.
CONCLUSIONS
Compilation of published and new data on throw and
throw rates for three normal faults in the centre of the
Southern Apennines fault array (the Vallo di Diano,
Monti della Maddalena and East Agri faults) allows us to
characterize landscape response to normal fault growth,
and to reconstruct the faulting histories for two of these
faults. Our results show total cumulative throws of ca.2000 m for the VDF and EAF, and ca. 1100 m for the
MMF. Post-glacial (i.e. post-18 ka) throw rates are up to
ca. 1 mm year�1 for the VDF and EAF, and
ca. 0.7 mm year�1 for the MMF.
For the VDF and EAF, footwall catchments are
responding to normal faulting by steepening their chan-
nels and slope distributions at similar rates. Therefore,
catchment geomorphology is still coupled with the tec-
tonic forcing, and ksn and catchment slopes track the along
strike distribution of fault activity. In this area, lithology
apparently has had a limited influence on the landscape
response to normal forcing.
Because the landscape effectively records normal fault-
ing in the VDF and EAF, we use it to reconstruct fault-
ing histories. We identify two generations of knickpoints
in channels crossing these faults, which we suggest relate
to fault linkage events. Using information from our con-
structed total throw profiles, post-18 ka throw rates, and
fault interaction theory, we estimate that these linkage
events took place at 0.7 � 0.2 Ma and 1.4 � 0.3 Ma for
the VDF, and 1 � 0.1 for the EAF. These faulting histo-
ries suggest an overall fault initiation age of
3.5 � 0.2 Ma for the VDF, and a minimum age of
2.9 � 0.3 Ma for the EAF, and are consistent with the
knickpoint height distributions, and independent geolog-
ical constraints of the timing of extension in the Southern
Apennines.
ACKNOWLEDGEMENTS
DRB was supported by an Imperial College Janet Watson
Bursary, and acknowledges the Geological Society of
London and the British Society for Geomorphology
(BSG) for their support. The authors would like to thank
the editor, George Hilley, Nancye Dawers, and two
anonymous reviewers for their constructive comments
which helped us improve the manuscript.
CONFLICTOF INTEREST
No conflict of interest declared.
REFERENCESAMATO, A. & MONTONE, P. (1997) Present-day stress field and
active tectonics in southern peninsular Italy. Geophys. J. Int.,130, 519–534.
AMICUCCI, L., BARCHI, M.R., MONTONE, P. & RUBILIANI, N.
(2008) The Vallo Di Diano and Auletta extensional basins in
the Southern Apennines (Italy): a simple model for a complex
setting. Terra Nova, 20, 475–482.
© 2016 The AuthorsBasin Research © 2016 John Wiley & Sons Ltd, European Association of Geoscientists & Engineers and International Association of Sedimentologists206
D.C. Roda-Boluda and A.C. Whittaker
ANDERS, M.H. & SCHLISCHE, R.W. (1994) Overlapping faults,
intrabasin highs, and the growth of normal faults. J. Geol.,102, 165–179.
ANDERS, M.H., SPIEGELMAN, M., RODGERS, D.W. & HAGSTRUM,
J.T. (1993) The growth of fault-bounded tilt blocks. Tectonics,12, 1451–1459.
ATTAL, M., TUCKER, G., WHITTAKER, A., COWIE, P. & ROBERTS,
G.P. (2008) Modeling fluvial incision and transient landscape
evolution: influence of dynamic channel adjustment. J.Geophys. Res. Series F, 113.
ATTAL, M., COWIE, P., WHITTAKER, A., HOBLEY, D., TUCKER,
G. & ROBERTS, G.P. (2011) Testing fluvial erosion models
using the transient response of bedrock rivers to tectonic
forcing in the Apennines, Italy. J. Geophys. Res. Series F,116.
BARCHI, M., AMATO, A., CIPPITELLI, G., ENI, D.A., SAN DONATO
MILANESE, M., MERLINI, S. & MONTONE, P. (2006) Exten-
sional tectonics and seismicity in the axial zone of the South-
ern Apennines. Boll. Soc. Geol. It.BENEDETTI, L., TAPPONNIER, P., KING, G. & PICCARDI, L. (1998)
Surface rupture of the 1857 Southern Italian Earthquake?
Terra Nova, 10, 206–210.BOOKHAGEN, B. & STRECKER, M.R. (2012) Spatiotemporal trends
in erosion rates across a pronounced rainfall gradient: exam-
ples from the Southern Central Andes. Earth Planet. Sci.Lett., 327, 97–110.
BOULTON, S.J. & WHITTAKER, A.C. (2009) Quantifying the slip
rates, spatial distribution and evolution of active normal faults
from geomorphic analysis: field examples from an oblique-
extensional Graben, Southern Turkey. Geomorphology, 104,299–316.
BRUNO, P.P., CASTIELLO, A., VILLANI, F. & IMPROTA, L. (2013)
High-resolution densely spaced wide-aperture seismic pro-
filing as a tool to aid seismic hazard assessment of fault-
bounded intramontane basins: application to Vallo Di
Diano, Southern Italy. Bull. Seismol. Soc. Am., 103, 1969–1980.
CARTWRIGHT, J.A., MANSFIELD, C. & TRUDGILL, B. (1996) The
growth of normal faults by segment linkage. Geol. Soc. LondonSpec. Publi., 99, 163–177.
CARTWRIGHT, J.A., TRUDGILL, B.D. & MANSFIELD, C.S. (1995)
Fault growth by segment linkage: an explanation for scatter in
maximum displacement and trace length data from the
canyonlands Grabens of Se Utah. J. Struct. Geol., 17, 1319–1326.
CELLO, G., TONDI, E., MICARELLI, L. & MATTIONI, L. (2003)
Active tectonics and earthquake sources in the epicentral area
of the 1857 Basilicata Earthquake (Southern Italy). J. Geo-dyn., 36, 37–50.
CINQUE, A., PATACCA, E., SCANDONE, P. & TOZZI, M. (1993)
Quaternary kinematic evolution of the Southern Appennines.
Relationships between surface geological features and deep
lithospheric structures. Ann. Geophys., 36, 249–260.CINQUE, A., ASCIONE, A. & CAIAZZO, C. (2000) Distribuzione
Spazio-Temporale E Caratterizzazione Della Fagliazione
Quaternaria in Appennino Meridionale. Le Ricerche delGNDT nel Campo Della Pericolosit�a Sismica (1996 E1999).CNR-GNDT, Rome, pp. 203–218 (in Italian).
COLELLA, A., LAPENNA, V. & RIZZO, E. (2004) High-resolu-
tion imaging of the high agri Valley Basin (Southern Italy)
with electrical resistivity tomography. Tectonophysics, 386,
29–40.
COMMINS, D., GUPTA, S. & CARTWRIGHT, J. (2005) Deformed
streams reveal growth and linkage of a normal fault array in
the Canyonlands Graben, Utah.Geology, 33, 645–648.COWIE, P. (1998) A healing-reloading feedback control on the
growth rate of seismogenic faults. J. Struct. Geol., 20, 1075–1087.
COWIE, P.A. & ROBERTS, G.P. (2001) Constraining slip rates and
spacings for active normal faults. J. Struct. Geol., 23, 1901–1915.
COWIE, P.A. & SCHOLZ, C.H. (1992a) Physical explanation for
the displacement-length relationship of faults using a post-
yield fracture mechanics model. J. Struct. Geol., 14, 1133–1148.
COWIE, P.A. & SCHOLZ, C.H. (1992b) Displacement-length scal-
ing relationship for faults: data synthesis and discussion. J.Struct. Geol., 14, 1149–1156.
COWIE, P., ATTAL, M., TUCKER, G., WHITTAKER, A., NAYLOR,
M., GANAS, A. & ROBERTS, G. (2006) Investigating the surface
process response to fault interaction and linkage using a
numerical modelling approach. Basin Res., 18, 231–266.CROSBY, B.T. & WHIPPLE, K.X. (2006) Knickpoint initiation and
distribution within fluvial networks: 236 Waterfalls in the
Waipaoa River, North Island, New Zealand. Geomorphology,82, 16–38.
CYR, A.J., GRANGER, D.E., OLIVETTI, V. & MOLIN, P. (2010)
Quantifying rock uplift rates using channel steepness and
cosmogenic nuclide-determined erosion rates: examples
from Northern and Southern Italy. Lithosphere, 2, 188–198.
D’ARCY, M. &WHITTAKER, A.C. (2014) Geomorphic constraints
on landscape sensitivity to climate in tectonically active areas.
Geomorphology, 204, 366–381.DAWERS, N.H. & ANDERS, M.H. (1995) Displacement-length
scaling and fault linkage. J. Struct. Geol., 17, 607–614.DENSMORE, A.L., DAWERS, N.H., GUPTA, S., GUIDON, R. &
GOLDIN, T. (2004) Footwall topographic development during
continental extension. J. Geophys. Res. Series F, 109.DENSMORE, A.L., LI, Y., ELLIS, M.A. & ZHOU, R. (2005) Active
tectonics and erosional unloading at the eastern margin of the
Tibetan Plateau. J. Mt. Sci., 2, 146–154.DENSMORE, A.L., ALLEN, P.A. & SIMPSON, G. (2007) Develop-
ment and response of a coupled catchment fan system under
changing tectonic and climatic forcing. J. Geophys. Res. SeriesF, 112.
DIBIASE, R.A., WHIPPLE, K.X., HEIMSATH, A.M. & OUIMET,
W.B. (2010) Landscape form and millennial erosion rates in
the San Gabriel Mountains, Ca. Earth Planet. Sci. Lett., 289,134–144.
FAURE-WALKER, J., ROBERTS, G.P., COWIE, P., PAPANIKOLAOU,
I.D., SAMMONDS, P., MICHETTI, A. & PHILLIPS, R. (2009) Hor-
izontal strain-rates and throw-rates across breached relay
zones, central Italy: implications for the preservation of throw
deficits at points of normal fault linkage. J. Struct. Geol., 31,1145–1160.
FERRANTI, L. & OLDOW, J.S. (2005) Latest miocene to quater-
nary horizontal and vertical displacement rates during simul-
taneous contraction and extension in the Southern Apennines
Orogen, Italy. Terra Nova, 17, 209–214.FERRANTI, L., PALANO, M., CANNAV�O, F., MAZZELLA, M.E.,
OLDOW, J.S., GUEGUEN, E., MATTIA, M. & MONACO, C.
(2014) Rates of geodetic deformation across active faults in
Southern Italy. Tectonophysics, 621, 101–122.
© 2016 The AuthorsBasin Research © 2016 John Wiley & Sons Ltd, European Association of Geoscientists & Engineers and International Association of Sedimentologists 207
Normal faulting and landscape response
FINNEGAN, N.J., ROE, G., MONTGOMERY, D.R. & HALLET, B.
(2005) Controls on the channel width of rivers: implications
for modeling fluvial incision of bedrock. Geology, 33, 229–232.
GIANO, S.I. (2011) Quaternary alluvial fan systems of the agri
intermontane Basin (Southern Italy): tectonic and climatic
controls. Geol. Carpath., 62, 65–76.GIANO, S., GIOIA, D., LAURENZI, M.A. & SCHIATTARELLA, M.
(2014) Nuovi vincoli su et�a, entit�a e velocit�a delle dislocazioniquaternarie nell’area del Vallo Di Diano (Appennino
meridionale). Dialogo Intorno al Paesaggio. Percezione, Inter-pretazione Rappresentazione. Culture Territori Linguaggi, 4,
159–173.GIOCOLI, A., STABILE, T., ADURNO, I., PERRONE, A., GALLIPOLI,
M., GUEGUEN, E., NORELLI, E. & PISCITELLI, S. (2015) Geo-
logical and geophysical characterization of the South-Eastern
side of the high agri valley (Southern Apennines, Italy). Nat.Haz. Ear. Sys. Sci., 15, 315–323.
GUPTA, A. & SCHOLZ, C.H. (2000) A model of normal fault
interaction based on observations and theory. J. Struct. Geol.,22, 865–879.
GUPTA, S., COWIE, P.A., DAWERS, N.H. & UNDERHILL, J.R.
(1998) A mechanism to explain rift-basin subsidence and
stratigraphic patterns through fault-array evolution. Geology,26, 595–598.
HIPPOLYTE, J.-C., ANGELIER, J. & ROURE, F. (1994) A major geo-
dynamic change revealed by quaternary stress patterns in the
Southern Apennines (Italy). Tectonophysics, 230, 199–210.HIPPOLYTE, J.-C., ANGELIER, J. & BARRIER, E. (1995) Compres-
sional and extensional tectonics in an arc system: example of
the Southern Apennines. J. Struct. Geol., 17, 1725–1740.HOPKINS, M.C. & DAWERS, N.H. (2015) Changes in bedrock
channel morphology driven by displacement rate increase
during normal fault interaction and linkage. Basin Res., 27(1),43–59.
IMPROTA, L., FERRANTI, L., de MARTINI, P., PISCITELLI, S.,
BRUNO, P., BURRATO, P., CIVICO, R., GIOCOLI, A., IORIO, M. &
D’ADDEZIO, G. (2010) Detecting young, slow-slipping active
faults by geologic and multidisciplinary high-resolution geo-
physical investigations: a case study from the Apennine Seis-
mic Belt, Italy. J. Geophys. Res., 115, B11307.KARNER, D., JUVIGNE, E., BRANCACCIO, L., CINQUE, A., RUSSO
ERMOLLI, E., SANTANGELO, N., BERNASCONI, S. & LIRER, L.
(1999) A potential early middle pleistocene tephrostratotype
for the Mediterranean Basin: The Vallo Di Diano, Campania,
Italy. Global Planet. Change, 21, 1–15.KING, G.C., STEIN, R.S. & RUNDLE, J.B. (1988) The growth of
geological structures by repeated earthquakes 1. Conceptual
framework. J. Geophys. Res. Solid Earth, (1978–2012), 93,13307–13318.
KIRBY, E. & WHIPPLE, K.X. (2012) Expression of active tectonics
in erosional landscapes. J. Struct. Geol., 44, 54–75.LAGUE, D. & DAVY, P. (2003) Constraints on the long-term col-
luvial erosion law by analyzing slope-area relationships at var-
ious tectonic uplift rates in the Siwaliks Hills (Nepal). J.Geophys. Res., Solid Earth (1978–2012), 108. doi:10.1029/2002JB001893.
MASCHIO, L., FERRANTI, L. & BURRATO, P. (2005) Active exten-
sion in Val D’agri Area, Southern Apennines, Italy: implica-
tions for the geometry of the seismogenic belt. Geophys. J.Int., 162, 591–609.
MCLEOD, A.E., DAWERS, N.H. & UNDERHILL, J.R. (2000) The
propagation and linkage of normal faults: insights from the
strathspey–brent–statfjord fault array, Northern North Sea.
Basin Res., 12, 263–284.MILLER, S.R., BALDWIN, S.L. & FITZGERALD, P.G. (2012)
Transient fluvial incision and active surface uplift in the
woodlark rift of Eastern Papua New Guinea. Lithosphere, 4,131–149.
MILLER, S.R., SAK, P.B., KIRBY, E. & BIERMAN, P.R. (2013)
Neogene rejuvenation of central Appalachian topography:
evidence for differential rock uplift from stream profiles and
erosion rates. Earth Planet. Sci. Lett., 369, 1–12.MIRABELLA, F., CIACCIO, M., BARCHI, M. & MERLINI, S. (2004)
The gubbio normal fault (Central Italy): geometry, displace-
ment distribution and tectonic evolution. J. Struct. Geol., 26,2233–2249.
MONTGOMERY, D.R. & BRANDON, M.T. (2002) Topographic
controls on erosion rates in tectonically active mountain
ranges. Earth Planet. Sci. Lett., 201, 481–489.NIEMANN, J.D., GASPARINI, N.M., TUCKER, G.E. & BRAS, R.L.
(2001) A quantitative evaluation of Playfair’s law and its use
in testing long-term stream erosion models. Earth Surf. Proc.Land., 26, 1317–1332.
OLDOW, J.S., D’ARGENIO, B., FERRANTI, L., PAPPONE, G., MAR-
SELLA, E. & SACCHI, M. (1993) Large-scale longitudinal exten-
sion in the southern Apennines contractional belt, Italy.
Geology, 21, 1123–1126.OUIMET, W.B., WHIPPLE, K.X. & GRANGER, D.E. (2009)
Beyond threshold hillslopes: channel adjustment to base-
level fall in tectonically active mountain ranges. Geology,37, 579–582.
PALUMBO, L., BENEDETTI, L., BOURL�ES, D., CINQUE, A. & FIN-
KEL, R. (2004) Slip history of the Magnola fault (Apennines,
Central Italy) from 36Cl surface exposure dating: evidence for
strong earthquakes over the Holocene. Earth Planet. Sci. Lett.,225, 163–176.
PANTOSTI, D. & VALENSISE, G. (1990) Faulting mechanism and
complexity of the November 23, 1980, Campania-Lucania
Earthquake, inferred from surface observations. J. Geophys.Res. Solid Earth, 95, 15319–15341.
PAPANIKOLAOU, I.D. & ROBERTS, G.P. (2007) Geometry, kine-
matics and deformation rates along the active normal fault
system in the Southern Apennines: implications for fault
growth. J. Struct. Geol., 29, 166–188.PAPANIKOLAΟU, I.D., ROBERTS, G.P., DELIGIANNAKIS, G., SAKEL-
LARIOU, A. & VASSILAKIS, E. (2013) The sparta fault, Southern
Greece: from segmentation and tectonic geomorphology to
seismic hazard mapping and time dependent probabilities.
Tectonophysics, 597, 85–105.PATACCA, E. & SCANDONE, P. (2007) Constraints on the Interpreta-
tion of the Crop-04 Seismic Line Derived from Plio–PleistoceneForedeep and Thrust-Sheet-Top Deposits (Southern Apenni-
nes, Italy). CROP-04. (Ed. by Mazzotti A., Patacca E. & Scan-
done, P.) Boll. della Soc. Geol. It. Special, 241–256.PEACOCK, D. & SANDERSON, D. (1991) Displacements, segment
linkage and relay ramps in normal fault zones. J. Struct. Geol.,13, 721–733.
ROBERTS, G.P. & MICHETTI, A.M. (2004) Spatial and temporal
variations in growth rates along active normal fault systems:
an example from the Lazio-Abruzzo Apennines, Central Italy.
J. Struct. Geol., 26, 339–376.ROBERTS, G.P., COWIE, P., PAPANIKOLAOU, I. & MICHETTI, A.M.
(2004) Fault scaling relationships, deformation rates and seis-
mic hazards: an example from the Lazio-Abruzzo Apennines,
Central Italy. J. Struct. Geol., 26, 377–398.
© 2016 The AuthorsBasin Research © 2016 John Wiley & Sons Ltd, European Association of Geoscientists & Engineers and International Association of Sedimentologists208
D.C. Roda-Boluda and A.C. Whittaker
SANTANGELO, N. (1991) Evoluzione Stratigrafica, GeomorfologicaE Neotettonica Di Alcuni Bacini Lacustri Del Confine CampanoLucano (Italia Meridionale): Tesi Di Dottorato. PhD thesis.
Naples University “Federico II”, 1991. 109 pp.SCHIATTARELLA, M., DI LEO, P., BENEDUCE, P. & IVO GIANO, S.
(2003) Quaternary uplift vs tectonic loading: a case study from
the Lucanian Apennine, Southern Italy. Quatern. Int., 101,239–251.
SCHLAGENHAUF, A., MANIGHETTI, I., BENEDETTI, L., GAUDEMER,
Y., FINKEL, R., MALAVIEILLE, J. & POU, K. (2011) Earthquake
supercycles in Central Italy, inferred from 36 Cl exposure
dating. Earth Planet. Sci. Lett., 307, 487–500.SCHMIDT, K.M. & MONTGOMERY, D.R. (1995) Limits to relief.
Science, 270, 617.SCHOLZ, C.H. & CONTRERAS, J.C. (1998) Mechanics of continen-
tal rift architecture. Geology, 26, 967–970.SKLAR, L.S. & DIETRICH, W.E. (2001) Sediment and rock
strength controls on river incision into bedrock. Geology, 29,1087–1090.
SNYDER, N.P., WHIPPLE, K.X., TUCKER, G.E. & MERRITTS, D.J.
(2000) Landscape response to tectonic forcing: digital eleva-
tion model analysis of stream profiles in the mendocino triple
junction region, Northern California. Geol. Soc. Am. Bull.,112, 1250–1263.
SNYDER, N.P., WHIPPLE, K.X., TUCKER, G.E. & MERRITTS, D.J.
(2003) Channel response to tectonic forcing: field analysis of
stream morphology and hydrology in the mendocino triple
junction region, Northern California. Geomorphology, 53, 97–127.
SOLIVA, R., BENEDICTO, A., SCHULTZ, R., MAERTEN, L. &MICAR-
ELLI, L. (2008) Displacement and interaction of normal fault
segments branched at depth: implications for fault growth
and potential earthquake rupture size. J. Struct. Geol., 30,1288–1299.
SPINA, V., TONDI, E., GALLI, P., MAZZOLI, S. & CELLO, G.
(2008) Quaternary fault segmentation and interaction in the
epicentral area of the 1561 earthquake (Mw= 6.4), Vallo Di
Diano, Southern Apennines, Italy. Tectonophysics, 453, 233–245.
STEIN, R.S., KING, G.C. & RUNDLE, J.B. (1988) The growth of
geological structures by repeated earthquakes 2. Field exam-
ples of continental dip-slip faults. J. Geophys. Res. SolidEarth, 93, 13319–13331.
STRAK, V., DOMINGUEZ, S., PETIT, C., MEYER, B. & LOGET, N.
(2011) Interaction between normal fault slip and erosion on
relief evolution: insights from experimental modelling.
Tectonophysics, 513, 1–19.VALOROSO, L., IMPROTA, L., CHIARALUCE, L., di STEFANO, R.,
FERRANTI, L., GOVONI, A. & CHIARABBA, C. (2009) Active
faults and induced seismicity in the Val D’agri Area (South-
ern Apennines, Italy).Geophys. J. Int., 178, 488–502.
VILLANI, F. & PIERDOMINICI, S. (2010) Late quaternary tectonics
of the Vallo Di Diano Basin (Southern Apennines, Italy).
Quatern. Sci. Rev., 29, 3167–3183.WHIPPLE, K.X. & TUCKER, G.E. (1999) Dynamics of the stream-
power river incision model: implications for height limits of
mountain ranges, landscape response timescales, and research
needs. J. Geophys. Res. Solid Earth, 104, 17661–17674.WHIPPLE, K.X. & TUCKER, G.E. (2002) Implications of sedi-
ment-flux-dependent river incision models for landscape evo-
lution. J. Geophys. Res., 107, 2039.WHITTAKER, A.C. (2012) How do landscapes record tectonics
and climate? Lithosphere, 4, 160–164.WHITTAKER, A.C. & BOULTON, S.J. (2012) Tectonic and climatic
controls on knickpoint retreat rates and landscape response
times. J. Geophys. Res. Series F, 117.WHITTAKER, A.C. & WALKER, A.S. (2015) Geomorphic con-
straints on fault throw rates and linkage times: examples from
the Northern Gulf of Evia, Greece. J. Geophys. Res. Series F,120, 137–158.
WHITTAKER, A.C., COWIE, P.A., ATTAL, M., TUCKER, G.E. &
ROBERTS, G.P. (2007) Contrasting transient and steady-state
rivers crossing active normal faults: new field observations from
the Central Apennines, Italy. Basin Res., 19, 529–556.WHITTAKER, A.C., ATTAL, M., COWIE, P.A., TUCKER, G.E. &
ROBERTS, G. (2008) Decoding temporal and spatial patterns of
fault uplift using transient river long profiles. Geomorphology,100, 506–526.
WHITTAKER, A.C., ATTAL, M. & ALLEN, P.A. (2010) Character-
ising the origin, nature and fate of sediment exported from
catchments perturbed by active tectonics. Basin Res., 22, 809–828.
WOBUS, C., WHIPPLE, K.X., KIRBY, E., SNYDER, N., JOHNSON, J.,
SPYROPOLOU, K., CROSBY, B. & SHEEHAN, D. (2006a) Tecton-
ics from topography: procedures, promise, and pitfalls. Spec.Pap. Geol. Soc. Am., 398, 55.
WOBUS, C.W., CROSBY, B.T. & WHIPPLE, K.X. (2006b) Hanging
valleys in fluvial systems: controls on occurrence and implica-
tions for landscape evolution. J. Geophys. Res. Series F, 111.ZEMBO, I., PANZERI, L., GALLI, A., BERSEZIO, R., MARTINI, M. &
SIBILIA, E. (2009) Quaternary evolution of the intermontane
Val D’agri Basin, Southern Apennines. Quatern. Res., 72,
431–442.ZEMBO, I., TROMBINO, L., BERSEZIO, R., FELLETTI, F. & DAPI-
AGGI, M. (2012) Climatic and tectonic controls on pedogenesis
and landscape evolution in a quaternary intramontane basin
(Val D’agri Basin, Southern Apennines, Italy). J. Sediment.Res., 82, 283–309.
Manuscript received 19 September 2015; In revised form 28July 2016; Manuscript accepted 1 August 2016.
© 2016 The AuthorsBasin Research © 2016 John Wiley & Sons Ltd, European Association of Geoscientists & Engineers and International Association of Sedimentologists 209
Normal faulting and landscape response
Related Documents


![Apresentação BRE.pptx [Somente leitura]sebsa.com.br/projetodynamics/Comunicado/Documentos/Apresentacao... · Empresas BRE Araçatuba BRE Belo Horizonte BRE Brasília BRE Lauro de](https://static.cupdf.com/doc/110x72/5c460ffb93f3c323b1794352/apresentacao-brepptx-somente-leiturasebsacombrprojetodynamicscomunicadodocumentosapresentacao.jpg)


