APPENDIX 1 Baseline Evidence Data - Blaenau Gwent Extracts from adopted Local Development Plan C.1 Economic Characteristics Incomes and Economic Activity C.1.1 70% of Blaenau Gwent is classified as rural. C.1.2 In terms of employment sectors, statistics indicate a tendency towards employment within the manufacturing sectors as representing a higher proportion of employment than the regional and national averages. The relative value of employment in this sector is reflected in wage levels, which are below regional averages: in 2006 the average gross weekly income for Blaenau Gwent was £346, compared to the regional average gross weekly income of £474. C.1.3 A 2009 report indicates that “tourism was worth £26.9 million to the economy of Blaenau Gwent in 2007: This visitor spending was up by £1.56 million – 6% - over the figures for 2006; The total number of visitors was 527,000 – up 9%; Tourists spent a total of 705,000 days in Blaenau Gwent – up 8%; Most of the revenue came from day visitors and visitors staying with friends and relatives; and the tourism sector is now responsible for the equivalent of 516 full time jobs in Blaenau Gwent – up 27 on the previous year. C.1.4 Tourism and heritage initiatives in Blaenau Gwent include: The Valleys Walking Festival, Heritage adult education classes, Sirhowy Ironworks, Ebbw Vale steelworks – part of The Works regeneration project, Hafod Arch restoration, Clydach Gorge partnership and Bedwellty House and Park restoration. C.1.5 In 2008 29.5% of the workforce were economically inactive, with 9.1% of those ‘wanting a job. This figure is significantly above the Welsh average of 24.3%, of which 6.4% are‘wanting a job. C.1.6 Between 2004 and 2007, the proportion of working age adults claiming Job Seekers Allowance increased very slightly to 4.6%, but Incapacity Benefit claim and total Welfare Benefit claim percentages continued to fall slowly to 17% and 29% respectively. In 2009, the proportion of working age adults claiming job seekers allowance rose to 7.9%. Entrepreneurial Dynamism C.1.7 The key indicator used to assess economic enterprise is total VAT registrations – at the end of 2007 there were 1,020 businesses registered in Blaenau Gwent. During 2005 new registrations totalled 1.46 per 1000 population; however, in the previous year (2004), new registrations totalled 1.61 per 1000 population thus the percentage change between 2004 and 2005 was -9%. These statistics are broadly similar to the South East Wales region (-8%) and Wales (-9%) figures. In contrast, there were 80 deregistrations (1.2 per 1000 population) in Blaenau Gwent in 2005 (-9.6%) in comparison with -6.8% for Wales. A comparison at the regional level reveals that Blaenau Gwent has consistently experienced the second least number of new registrations over the past five years after Merthyr Tydfil and, in most recent years, registrations in Blaenau Gwent have been over 150 less than any other authority in the region (with the exception of Merthyr Tydfil, which is performing below Blaenau Gwent).

Welcome message from author
This document is posted to help you gain knowledge. Please leave a comment to let me know what you think about it! Share it to your friends and learn new things together.
Transcript
APPENDIX 1
Baseline Evidence Data - Blaenau Gwent
Extracts from adopted Local Development Plan
C.1 Economic Characteristics Incomes and Economic Activity C.1.1 70% of Blaenau Gwent is classified as rural. C.1.2 In terms of employment sectors, statistics indicate a tendency towards employment within the manufacturing sectors as representing a higher proportion of employment than the regional and national averages. The relative value of employment in this sector is reflected in wage levels, which are below regional averages: in 2006 the average gross weekly income for Blaenau Gwent was
£346, compared to the regional average gross weekly income of £474.
C.1.3 A 2009 report indicates that “tourism was worth £26.9 million to the economy of Blaenau
Gwent in 2007:
This visitor spending was up by £1.56 million – 6% - over the figures for 2006;
The total number of visitors was 527,000 – up 9%;
Tourists spent a total of 705,000 days in Blaenau Gwent – up 8%;
Most of the revenue came from day visitors and visitors staying with friends and relatives; and the
tourism sector is now responsible for the equivalent of 516 full time jobs in Blaenau Gwent – up 27 on
the previous year. C.1.4 Tourism and heritage initiatives in Blaenau Gwent include: The Valleys Walking Festival,
Heritage adult education classes, Sirhowy Ironworks, Ebbw Vale steelworks – part of The Works
regeneration project, Hafod Arch restoration, Clydach Gorge partnership and Bedwellty House and Park restoration.
C.1.5 In 2008 29.5% of the workforce were economically inactive, with 9.1% of those ‘wanting a
job. This figure is significantly above the Welsh average of 24.3%, of which 6.4% are‘wanting a job.
C.1.6 Between 2004 and 2007, the proportion of working age adults claiming Job Seekers Allowance increased very slightly to 4.6%, but Incapacity Benefit claim and total Welfare Benefit claim percentages continued to fall slowly to 17% and 29% respectively. In 2009, the proportion of working age adults claiming job seekers allowance rose to 7.9%.
Entrepreneurial Dynamism C.1.7 The key indicator used to assess economic enterprise is total VAT registrations – at the end of
2007 there were 1,020 businesses registered in Blaenau Gwent. During 2005 new registrations totalled 1.46 per 1000 population; however, in the previous year (2004), new registrations totalled 1.61 per 1000 population thus the percentage change between 2004 and 2005 was -9%. These statistics are broadly similar to the South East Wales region (-8%) and Wales (-9%) figures. In contrast, there were 80 deregistrations (1.2 per 1000 population) in Blaenau Gwent in 2005 (-9.6%) in comparison with -6.8% for Wales. A comparison at the regional level reveals that Blaenau Gwent has consistently experienced the second least number of new registrations over the past five years after Merthyr Tydfil and, in most recent years, registrations in Blaenau Gwent have been over 150 less than any other authority in the region (with the exception of Merthyr Tydfil, which is performing below Blaenau Gwent).
Retail C.1.8 The central shopping areas in Blaenau Gwent are Abertillery, Blaina, Brynmawr, Ebbw Vale, and Tredegar. The towns are located within the deeply incised and roughly parallel valleys of the Sirhowy, Ebbw Fach and Ebbw Fawr rivers which flow in a north to south direction through the County Borough. C.1.9 Tredegar is located in the Sirhowy valley to the North of the County Borough; Ebbw Vale sits along the Ebbw Fach river in the next valley towards the East; and Brynmawr, Blaina and Abertillery are situated in the Ebbw Fawr valley, with Brynmawr in the extreme North of the Borough, Abertillery in the South, and Blaina between them. C.1.10 Out of centre retail parks have created negative impacts upon the vitality and viability of town centres in Blaenau Gwent. High vacancy rates currently exist within many of the town centres. However, the Council through mechanisms such as Commercial Improvement Grants and Town Centre Strategies are endeavouring to address this problem.
Car Ownership Rates C.1.11 Blaenau Gwent experiences low car ownership rates, (35% of households with no car or van, compared to 26% in Wales) in conjunction with high levels of deprivation; meaning that accessibility to town centres may be difficult for some members of the community.
C.2 Social Characteristics Welsh Index of Multiple Deprivation 20081
C.2.1 Of the 47 LSOAs in Blaenau Gwent, 10 were in the most deprived 10% LSOAs in Wales. The three most deprived LSOAs in Blaenau Gwent were: Tredegar Central and West 2 with a score of 69.9, which ranked 15 out of 1896 in Wales. This LSOA was placed in the 10% most deprived category in Wales. Sirhowy 2 with a score of 67.5, which ranked 23 out of 1896 in Wales. This LSOA was placed in the 10 % most deprived category in Wales. Ebbw Vale North 2 with a score of 54.6, which ranked 75 out of 1896 in Wales. This LSOA was placed in the 10 % most deprived category in Wales. C.2.2 In Blaenau Gwent: the LSOAs had deprivation score distribution over 71% of the range for Wales. 21% of its LSOAs fall within the 10% most deprived LSOAs in Wales. 83% of its LSOAs fall within the 50% most deprived LSOAs in Wales. There are much higher than average levels of deprivation in all of the 4 most deprived categories (most deprived 10%, 20%, 30% and 50%).
Housing C.2.3 In 2000, 83.4% of the housing in Blaenau Gwent was within council tax bands A and B, compared to the South East which had 22% in band A and 26% in band B. Furthermore, seven of the 16 electoral divisions in Blaenau Gwent had more than 90% of housing within these two bands and only 0.09% of housing in Blaenau Gwent was within council tax bands G and H compared to 4% for the South East. This suggests that the overall size and market value of housing stock in the County Borough is relatively modest, particularly in the regional context.
C.2.4 The average house price in Blaenau Gwent in 2007 was £95000. Trend data indicates that the
area has seen substantial increases in house prices in recent years, which is likely to be a reflection of the increase in house prices in Cardiff and Newport, encouraging people to buy further north. It is likely that this trend will continue with the new rail line and proportional increase in prices across Wales. C.2.5 In 2001, 55% of Blaenau Gwent's housing stock consisted of terraced properties built pre 1919. This may be a further reason for lower average house prices in the County Borough since a higher representation of smaller properties, i.e. terraces and flats, will skew the statistic downwards. In addition to this, 8% of private properties were considered unfit (1,740) and a further 12% were classified as being in need of substantial repair (2,610) in the latest survey.
C.2.6 The total number of households in Blaenau Gwent was 29,586 in 2001. Average household
sizes were above the national averages but below regional averages – 2.34 compared to 2.40 in the
South East region and 1.87 in Wales. C.2.7 According to the 2001 census, a significant proportion of properties in Blaenau Gwent were owned outright (62.62%). However, this was significantly less than regional and national averages, which were 72.79% and 71.3% respectively. There was also a significant percentage of council housing rental (24.34%) compared to regional and national averages of 13.59% and 17.9% respectively.
Population C.2.8 The population of Blaenau Gwent has been falling since its peak of 127,611 in 1921 - according to the 2005 mid year population estimate the total was 68,400. In the context of the County Borough, the population is projected to grow by 7% between 2003 and 2011, which would equate to a total population of approximately 73,725 by 2011. However, although the overall longer term trend suggests a likely net increase, in recent years (1999-2002) the population has experienced a decline of -4.63%, attributed to a combination of accelerated out-migration and falling birth rates. Over the same period in the South East region as a whole, population grew at a rate of 0.034% and the national population increased by 1.59% in the same period. C.2.9 An examination of population demographics indicates that Blaenau Gwent has a relatively ageing population in comparison to national averages,particularly notable for persons over 65 (16.89% compared to 16% for South East Wales, in 2001). In addition, the proportion of the population under the age of 16 is lower than the South East average. C.2.10 A continuation of these trends is likely to result in conditions which will be increasingly difficult to sustain, both socially and economically, with a smaller proportion of workers being required to support a higher proportion of elderly dependents. This trend also places additional pressure on services and decreases demand for school places, particularly in the primary sector.
C.2.11 However, the new railway, relatively low house prices and economic growth generated through the Heads of the Valleys Strategic Programme could promote inwards migration from other areas in Wales/UK, as well as reduce the amount of outward migration, resulting in a larger and more balanced population. Planned improvements to post 16 educational opportunities through the Learning Campus on The Works site may also affect this. C.2.12 The population is still very homogenous, although numbers of welsh speakers and demand for welsh language education has increased, and there is a modest inward migration of workers from Eastern Europe and Iberia.
Health and Well Being C.2.13 Life expectancies for both males and females across the County Borough are below national
averages. Males have an average life expectancy of 73.8 years and females of 78.4 years – this
compares to 75.8 for males and 80.3 for females nationally (2002 - 2004). C.2.14 The proportion of people with limiting long term illness is above the South East and national averages: 28.26% compared to 23.4% in the South East and 23.3% in Wales. In addition, people who self-assessed their general health as good (2001 Census) represented a lower proportion of the population than the South East and national averages: 59.38% in Blaenau Gwent compared to 64.48% in the South East and 60.06% in Wales.
Crime and Fear of Crime C.2.15 In general terms, Blaenau Gwent has relatively low levels of crime, totalling 2,978 crimes in 2004/05 (including violence against the person, burglary in a dwelling, theft of a motor vehicle and theft from a motor vehicle), falling to 2,731 crimes in 2005/06. Within this total, the majority of crime types appear to be falling in the area, including crimes related to violence, which represent the largest proportion of all recorded crimes in the County Borough. However, motor vehicle theft statistics appear to be higher and less stable than the regional average and theft from motor vehicles seems to be rising.
Education, Skills and Qualifications C.2.16 Data relating to education, skills and qualifications in the area indicates a considerable disparity between Blaenau Gwent and the South East and Wales. In Blaenau Gwent the proportion of people holding NVQ level 2 in 2008 was 57.1% compared to 65.5% for Wales. However, this is an increase from previous years: the proportion in 2003 was 41.1%, which was also a growth from 2001 when the proportion was 30.92%. . C.2.17 There is also a lower percentage of the population achieving a level 4/5 qualification (such as a degree, HNC, HND) with only 13.6% in Blaenau Gwent compared to the Welsh average of 17.4%. Blaenau Gwent had 4,360 adults engaged in adult education in 2003, which represented 6.3% of the total population; this was lower than the Welsh average of 6.8%. Latest statistics also show that there was a lower proportion of 19 year olds with 5 GCSEs (A*-C), with 43% achieving this compared to the Welsh average of 56%. These educational attainment statistics have implications for the manner in which the local economy will be able to expand and grow over the Plan period. C.2.18 In 2001, 45.02% of the Blaenau Gwent population held no qualifications, compared to 34.37% and 33% for the South East and Wales respectively. By 2003, this had considerably improved to approximately 13,000 persons, which represented 30.4% of the population at the time. Although this compares unfavourably to the Welsh average of 37.8% for the same year, the statistic does suggest that the trend is moving in a positive direction, with a substantial reduction in the proportion of the population with no qualifications.
Recreation C.2.19 Research identified within the Healthy and Active Lifestyle in Wales document (2003) reports that only 28% of adults in Wales are active at the recommended levels for health. Furthermore, in excess of 50% of adults are considered overweight, with the prevalence of obesity approximately doubling over the last ten years. C.2.20 Blaenau Gwent Leisure Services offers a wealth of recreational facilities with excellent dual use Sports Centres at Abertillery, Ebbw Vale, Nantyglo and Tredegar, together with satellite facilities in Glyncoed and Brynmawr Athletics Track. C.2.21 Blaenau Gwent Sports Centres caters for all ages and abilities, with rugby, football and netball sessions as well as a wide range of classes from Aqua Aerobics, Parent and Toddler swimming sessions and Fit Ball Sessions. C.2.22 As well as the Blaenau Gwent Sports Centres, the borough also has the Abertillery Indoor Bowls Centre, Ebbw Vale Cricket School, Glyncoed Community Hall and the new Brynmawr Athletics track, which only opened in September 2006. C.2.23 Sports and Leisure activities include: Splash Programme over 100 youths participating holiday periods Street League football currently being held at Glyncoed Sports Centre Newly Established Disability Sport Forum Volunteering opportunities through: Volunteering Counts, Dragon Sport and Millennium Volunteers. (Sport in Blaenau Gwent highly dependent upon volunteers.)
D.1 Biodiversity, Flora and Fauna D.1.1 Draft TAN5 defines biodiversity and geodiversity and their importance for sustainable development in the following way: ‘“Biodiversity” is the term applied to the variety of life on earth and is short for biological diversity. It describes the richness and variety of all living things, from the smallest microscopic organism to the largest tree. “Geodiversity” is the variety of geological environments, phenomena and active processes that make landscapes, rocks, minerals, fossils, soils and other superficial deposits that provide the framework for life on earth... Wildlife and its habitats are of fundamental importance to our future well-being and prosperity because a rich and diverse environment supports a long-term sustainable economy and contributes to a healthier and happier society. Biodiversity is an important
indicator of sustainable development. Biodiversity and geodiversity add to the quality of life and local distinctiveness.’ D.1.2 There are two Special Areas of Conservation (SAC) adjacent to Blaenau Gwent: Usk Bat Sites and Cwm Clydach Woodlands, each designated under the EC Habitats and Species Directives. Usk Bat Sites is one of the best areas in the United Kingdom for the lesser horseshoe bat. Usk Bat sites SAC is also referred to as Mynydd Llangattock SSSI. Some features of both SAC sites are found to be in favourable condition, whilst others are in an unfavourable condition. D.1.3 Cwm Clydach SAC is underpinned by Cwm Clydach Sites of Special Scientific Interest (SSSI) while Usk Bat Sites is underpinned by Mynydd Llangatwg SSSI, Siambre ddu SSSI, Buskland Coachhouse and Ice House SSSI and Fox Wood SSSI. D.1.4 There are also three SSSI in the area:
Cwm Merddog Woodlands,
Brynmawr Sections (geological site) and
Mynydd Llangatwg (Mynydd Llangattock).
D.1.5 The Cwm Merddog Woodlands site is in an unfavourable but recovering condition, Brynmawr
Sections’ condition is unfavourable maintained and the condition of Mynydd Llangatwg is partially
favourable and partially unfavourable for different features.
D.1.6 Cwm Clydach is designated as a National Nature Reserve (NNR). It is the largest and most representative area of native beechwood in South East Wales. Blaenau Gwent has one Local Nature Reserve (LNR) - the Silent Valley LNR, which includes Cwm Merddog and Coed Ty‘n y Gelli SSSIs and covers a total area of 51.62 ha. The parts of the LNR that include SSSIs have been designated as such as a result of the presence of Ancient Semi- Natural Woodland. The Silent Valley is designated as a Wildlife Trust Reserve (WTR). D.1.7 The designation of LNRs is in accordance with targets in the community plan and that the Authority aims to designate 2 per year pending resources. 5 candidate LNRs have been currently defined for the County Borough area. D.1.8 Part of the Brecon Beacons National Park falls within the northern part of the Blaenau Gwent administrative area, and includes Brynmawr Sections and Mynydd Llangattock (Usk Bat) SSSIs and Cwm Clydach NNR.
D.1.9 There are 14 Ancient Semi-Natural Woodland (ASNW) sites and three Plantations on Ancient Woodland Sites (PAWS). There are 60 SINCs. . D.1.10 Blaenau Gwent is nationally important for breeding lapwings, a scarce and declining bird species in Wales. D.1.11 The Blaenau Gwent Local Biodiversity Action Plan contains key habitat and species as well as protected species. Species and habitats for which action plans have been prepared include: Amphibians Great Crested Newt (Triturus cristatus) Birds Skylark (Alauda arvensis); Grey Partridge (Perdix perdix); Lapwing (Vanellus vanellus) Birds Grey Partridge (Perdix perdix) Butterflies Pearl-bordered Fritillary (Boloria euphrosyne) Mammals Brown Hare (Lepus europaeus) Mammals Otter (Lutra lutra) Mammals Pipistrelle Bat (Pipistrellus pipistrellus) Mammals Lesser Horseshoe Bat (Rhinolophus hipposideros) Broad Habitats Calcareous grassland Broad Habitats Dwarf shrub heath Priority Habitats Blanket bog Priority Habitats Mesotrophic lakes Priority Habitats Purple moor grass and rush pastures Priority Habitats Upland mixed ashwoods
Priority Habitats Upland oakwood Priority Habitats Wet woodland
D.2 Cultural Heritage D.2.1 Blaenau Gwent has 53 listed buildings, recognised for their special historical and architectural importance. The majority are Grade II listed, although of the total, ten fall into the higher category of Grade II*. However, there are also a number of listed buildings in the County Borough that appear on Cadw’s register of listed buildings ‘at risk’, namely:
British Steel Tinplate Works General Office
Former Boiler House at Dunlop Semtex Factory
Ebbw Vale Adult Education Centre
Stables and Barn at the Fountain Inn
The Fountain Inn
Milgatw - Agricultural Range at Milgatw
Mount Pleasant Stores
Roundhouse at Roundhouse Farm (1863 AA SW)
Roundhouse at Roundhouse Farm (17086 AB NE)
Agricultural Range at Roundhouse Farm
Former Tredegar Company Shop D.2.2 Part of the Blaenavon Special Landscape of Historic Interest lies within Blaenau Gwent and part of the Clydach Gorge Landscape of Historic Interest also lies within Blaenau Gwent. D.2.3 Currently there is one conservation area in Blaenau Gwent, Bedwellty House and Park. Additional conservation area designations under review include:
Garden City;
Ebbw Vale;
St. Michael's Church area in Abertillery;
St. Illtyds Church area in Brynithel;
Castle Street and the Circle, Tredegar. D.2.4 The South East Wales region, which comprises 10 local authority areas, contains approximately 56 Registered Historic Parks and Gardens. Of these, only one falls within the boundary of Blaenau Gwent – the Bedwellty Park (also designated as a conservation area). This site is included in Cadw's ‘Register of Parks and Gardens of Special Historic Interest in Wales'. Blaenau Gwent also has 9 Scheduled Ancient Monuments (SAMs), which are: -
St Illtyd Castle Mound;
Incline Haulage Winding Engine, Mynydd Bedwellty;
Sirhowy Ironworks;
Marine Colliery Pumping Engine;
Clydach Railroad Bridge, Brynmawr;
Clydach Coal Levels;
Tredegar Ironworks Cholera Cemetery;
Y Domen Fawr Round Cairn; and
Trefil Quarries North
D.3 Air Quality and Greenhouse Gas Emissions D.3.1 There are currently no designated Air Quality Management Areas (AQMAs) within the Blaenau Gwent area. However, at the regional level there are AQMAs in place in Cardiff and Newport as a result of significant traffic flows and peak hour congestion. D.3.2 Data relating to estimated carbon dioxide emissions in 2004 indicate that the County Borough had slightly higher Industrial/Commercial and Domestic emissions in terms of proportions of total emissions than the average proportional breakdowns for the South East Wales authorities. However,
as a percentage of the overall regional emissions total, Blaenau Gwent was contributing very little - only 3.5% of Industrial/Commercial and 4% of Domestic emissions in the South East region actually originate from Blaenau Gwent. When emissions are cross-referenced per capita, Blaenau Gwent compares favourably against the South East Wales average, producing 6.5 tonnes per capita as opposed to 9.8 tonnes per capita.
D.4 Water and Flood Risk D.4.1 The main water courses in Blaenau Gwent are the rivers Ebbw Fach, Ebbw Fawr and Sirhowy. D.4.2 From 1999 to 2005 the following trends for chemical and biological quality were observed at the sites monitored by the Environment Agency:
Ebbw Fach (Afon Tyleri - Trib.Henwaun Coll.) - remained ‘B’ (Good) chemical classification in the period 1999-2005. Biological water quality deteriorated from ‘B’ (Good) in 2000 to ‘C’ (Fairly good) in 2003-2004.
Ebbw Fach (Conf.Trib.Henwaun Coll-Conf.Nant Ystruth) - remained ‘B’ (Good) chemical classification in the period 1999-2005. Biological water quality deteriorated from ‘B’ (Good) in 2000 to ‘C’ (Fairly good) in 2004.
Ebbw Fach (Ebbw Fawr Conf. - Afon Tyleri) – had a chemical classification of ‘B’ (Good) in 1999-2003, which improved to ‘A’ (Very good) in 2003-2005. Biological water quality was classified as ‘D’ (Fair) in 2000. Biological water quality of the site was not assessed in other years.
Ebbw Fawr (Conf.Ebbw Fach - Conf.Nant Big) – chemical water quality improved from ‘B’ (Good) in 1999-2003 to ‘A’ (Very good) in 2003-2005. Biological water quality was classified as ‘B’ (Good) in 2000 deteriorating to ‘C’ (Fairly good) in 2004.
Ebbw Fawr (Conf.Nant Big - Conf.Nant Merddog) – chemical water quality remained at ‘B’ (Good) level in 1999-2003 and then improved to ‘A’ (Very good) in 2003-2005. Biological water quality was assessed as B (Good) in 2000 deteriorating to ‘C’ (Fairly good) in 2004.
Ebbw Fawr (Conf.Nant Kendon - Glandwr Bk.) – chemical water quality was classified as ‘B’ (Good) throughout the years 1999-2003 improving to ‘A’ (Very Good) in 2003-2005. Biological water quality remained C (Fairly good) classification in 2000-2003.
Ebbw Fawr (Conf.Nant Merddog - Culvert Inlet) – chemical water quality was classified as ‘C’ (Fairly good) in 1999-2001 deteriorating to ‘E’ (Poor) in2001-2003 and slightly improving to ‘D’ (Fair) in 2003-2005. Biological water quality remained stable at ‘C’ (Fairly good) level in 2000-2004.
Ebbw Fawr (Culvert Inlet - Rassau Bk.) – chemical water quality was ‘B’ (Good) in 1999-2001 deteriorating to C (Fairly good) in 2001-03 and improving to ‘B’ (Good) in 2003-2005. Biological water quality was at D (Fair) level in 2000 and improved to C (Fairly good) in 2002-2003.
Ebbw Fawr ( Glandwr Bk. - Conf.Ebbw Fach) – chemical water quality was ‘A’ (Very good) in 2005. Biological water quality on this site remained fairly good in 2000-2005.
Sirhowy (Nant Melyn - Outlet Shon-Shefris Res. – chemical water quality remained at B (Good) level throughout 1999-2003 improving to ‘A’ (Very good) in 2003/2005. Biological water quality was ‘C’ (Fairly good) in 2000 improving to B (Good) in 2002 and subsequently declining back to ‘C’ (Fairly good) in 2005.
Sirhowy ( Nant Yr Helyg - Scotch Peter Trib. – chemical water quality remained at B (Good) level throughout 1999-2003 improving to ‘A’ (Very good) in 2003-2005. Biological water quality was C (Fairly good) in 2000 improving to ‘B’ (Good) in 2002 and then deteriorating back to ‘C’ (Fairly good) in 2005.
Sirhowy (Scotch Peter Trib.-Nant Melyn) – chemical water quality was ‘E’ (Poor) in 2003-2005 – a decline from ‘C’ (Fairly good) in 2001-2003 and D (Fair) in 1999-2001. Biological water quality was assessed as ‘E’ (Poor) in 2000 improving to ‘C’ (Fairly good) in 2002 but then deteriorating to ‘D’ (Fair) in 2005. D.4.3 Aggregate data for England and Wales for the same period indicate that there was a slight improvement in water quality: an increase from 91.9% (1999) of Good/Fair grades to 93.5% (2005) for chemical water quality and from 94.9% (2000) to 95.4% (2005) for biological water quality. D.4.4 Water service provision in Blaenau Gwent is the responsibility of Welsh Water/Dwr Cymru. Wales has a relatively high rainfall compared to the rest of the UK, with an average of 1400mm per year compared to 700mm in the south east of England. Companies in Wales are predicting increases in household demand for water over coming years, not just because of rising numbers of households
but also because of greater individual consumption. Only 5% of households in Blaenau Gwent have a metered water supply. D.4.5 TAN15 Development and Flood Risk (July 2004) is the appropriate framework for guiding planning decisions with respect to flood risk. The policy refers to the Welsh Assembly Government’s (WAG) Development Advice Maps (DAM), which are based on Environment Agency Wales’ flood outlines. In Blaenau Gwent there are zones of both defended and undefended floodplain (C1 and C2 respectively). The dam maps should be used as a trigger for guiding development away from areas of flood risk.
D.4.6 Flood defences are only present in one location – to the north west of Cwm. These form part of a network of defences for the rivers Ebbw, Llwyd and Sirhowy. They are designed to be effective for a 1 in 100 year flood event and, to date, have performed acceptably.
D.4.7 Draft policies for the plan area from the CFMP are: Upper and Mid Reaches: Reduce existing flood risk management actions (accepting that flood risk will increase with time). Upper Ebbw: Take further action to sustain the current scale of flood risk into the future (responding to the potential increases in flood risk from urban development, land use change and climate change).
D.5 Waste D.5.1 In 2004/05, the total municipal waste arisings in Blaenau Gwent were 54,853 tonnes, of which 22.5% was recycled or composted. The total household waste arisings were 44,578 tonnes. The majority of waste originates from industrial and commercial sources (not including special waste) – in 2003 waste from these sources totalled 56,971 tonnes, of which 17,422 tonnes went to landfill (31%). In order for Blaenau Gwent to meet the national maximum landfill 2009/10 target of 37,525 tonnes for the County Borough, based on predicted arisings of 53,883 tonnes for the County Borough, 16,358 tonnes will need to be diverted from landfill. This will require significant alterations to current waste production and management practices in the County Borough.
D.6 Energy D.6.1 Expressed as a percentage of industrial and commercial energy consumption in the South East Wales region, Blaenau Gwent contributed 4.6% in 2003. The same percentage in respect of domestic energy consumption was 6.4%, with the statistic for transport based energy consumption being just 1%. It should be noted, however, that the relatively low proportional contribution may, in part at least, be explained by the fact that the South East Wales region includes the capital and second cities of Wales, together with the busiest section of the principal east-west road corridor (the M4 motorway from the Severn bridge to J32), which together make a significantly greater contribution to the regional totals. D.6.2 Figures on national, regional and local gas consumption (Kwh) indicate that Blaenau Gwent uses a higher share of gas domestically when compared to the regional averages, but less industrially than neighbouring authorities. This may potentially be a reflection of Blaenau Gwent’s housing conditions - there is a considerable amount of older housing stock in the local authority area that, due to its age, may be less energy efficient and this will be combined with the fact that the altitude results in a relatively cooler climate than neighbouring authorities. D.6.3 There is no specific data relating to electricity generated from renewable sources within the Blaenau Gwent area alone. However, in 2003 it was estimated that 2.6% of electricity in Wales was generated from renewables, representing a slight increase from 2.44% in 2002. The UK has set a target of producing 10% of electricity from renewable sources by 2010. TAN 8 doesn’t identify any areas within the County Borough as having potential for the generation of energy from wind.
D.7 Landscape, Land Use and Soil D.7.1 The main features of Blaenau Gwent are the deeply incised valleys of the Sirhowy, Ebbw Fach and Ebbw Fawr rivers, which flow in a southerly direction from the relatively high moorland plateau running across the northern extremity in an east to west direction. Much of the natural vegetation has been removed because of the industrialisation of the area.
D.7.2 The largest land use designation in the County Borough is open countryside (45%) and the defined urban area is only 23%. The remainder comprises a combination of other designations including rural settlements and forestry. D.7.3 Blaenau Gwent has recently proposed a number of Special Landscape Areas (SLAs)2 which are: St Illtyd Plateau & Ebbw Eastern Sides; Eastern Ridge & Mynydd James; Cwm Tyleri & Cwm Celyn.; Mynydd Carn-y-Cefn & Cefn yr Arail; Mynydd Bedwellty, Rhymney Hill & Sirhowy Sides; Cefn Manmoel: Trefil & Garnlydan Surrounds; and Beaufort Common. D.7.4 Blaenau Gwent has a history of potentially contaminating land uses that may have introduced soil contamination to the area. The 2003 Contaminated Land Strategy Review identified 1607 potentially contaminated sites in Blaenau Gwent of which there were 51 High Risk sites (previous or current uses include gas works, landfill sites, petrol stations and military land); 880 Medium Risk sites; and 676 Low Risk Sites. Sites with a history of contaminative usage that have been remediated include the former British Coal Workshops at Tredegar and the Dunlop Semtex site at Brynmawr. D.7.5 In Blaenau Gwent there are currently 30 installations regulated under the Pollution Prevention and Control (England and Wales) Regulations.
Transport D.7.6 The public rights of way network in the County Borough is 299.4km in length. 69% of this network is footpaths available solely to walkers, or carriageways mainly used a footpaths; Also, the distribution of the network is not even across the County Borough, and there are several factors arising from a lack of maintenance that have lead to restricted usability of this facility. Three factors identified that need improving are: more circular routes- signed and advertised as such; the need to link paths together- defragmentation; and more long distance routes. D.7.7 In terms of travel distances to work, in Blaenau Gwent the majority of the population travels less than 5km commuting distance. 31% of the County Borough’s population relies on the private car for their work journey, with only 6.6% of the population walking or cycling to work. In terms of car ownership, 45.1% of the resident population owns one car only, with 35.1% of Blaenau Gwent’s residents neither owning nor having access to a car or van. In comparison to regional and national statistics, in general terms car ownership levels are considerably below average in Blaenau Gwent and a considerably greater proportion of the population is without access to a car. D.7.8 Currently the nearest rail links are at the Valleys line station at Rhymney and West coast mainline at Abergavenny. Valleys lines provide access to and from Cardiff, which is linked with the Great Western line giving links eastward to London and westward to Swansea, Fishguard and the Republic of Ireland. Rhymney station has a good bus service (Route 20) to Tredegar including Parc Bryn Bach. Abergavenny Station links to the X3 service between Cardiff and Hereford via Pontypool and Cwmbran. The X4 service between Hereford and Cardiff via Brynmawr, Ebbw Vale, Tredegar, Merthyr and Pontypridd is available within a walking distance to the bus station. D.7.9 The Ebbw Valley Railway Line, providing an hourly service to Cardiff Central, with six stations, is set to be re-opened to passenger transport in autumn 2007 for the first time since 1962. The stations will be located at Ebbw Vale Parkway, Llanhilleth, Newbridge, Crosskeys, Risca & Pontymister and Rogerstone on brownfield sites, of which only Ebbw Vale and Llanhilleth will be in
the Blaenau Gwent County Borough area. Although these stations offer good interchange
opportunities with local bus services, new bus routes are needed to connect more settlements, e.g. Tredegar, Brynmawr, Nantyglo and Blaina, with this railway line. National Cycle Network Route 47 crosses the line and runs south, parallel to the railway, from near Crosskeys Station. Cwmcarn Forest Drive, which has an off-road cycle route, is also accessible. The rail service from Abertillery to Newport and Cardiff is due to commence in the near future according to the Abertillery Urban Function Analysis. D.7.10 The X15 and X16 bus links connect Brynmawr, Nantyglo, Blaina and Abertillery with Newport and Cardiff respectively. Other bus services include the X18 between Ebbw Vale and Newport, and the E3 and E4, both between Brynmawr, Ebbw Vale, Abertillery and Brynmawr, and the 22 service between Ebbw Vale and Newport via Pontypool. These bus links provide a good level of service

during weekdays and on Saturday, connecting the Blaenau Gwent major towns with the area. Conversely, Sunday service is limited and some lateral connections between valleys are poor.
D.7.11 The area’s principal road system provides A-road access to the motorway network (the M4,
M5 and M50) and combined with the A470 and A465 Heads of the Valley roads, connects the area
with the South East, South West, Midlands and London. Dualling work is being carried out to improve
the motorway access. D.7.12 The nearest airports to Blaenau Gwent are Cardiff International, Bristol and Birmingham. Locals are largely reliant on private transport or car hire to access the airports, as public transport links are limited to the proposed rail link to Cardiff, which will connect with the onward rail link from Cardiff to the airport.
APPENDIX 2
Baseline Evidence Data - Caerphilly
Extracts from adopted Local Development Plan
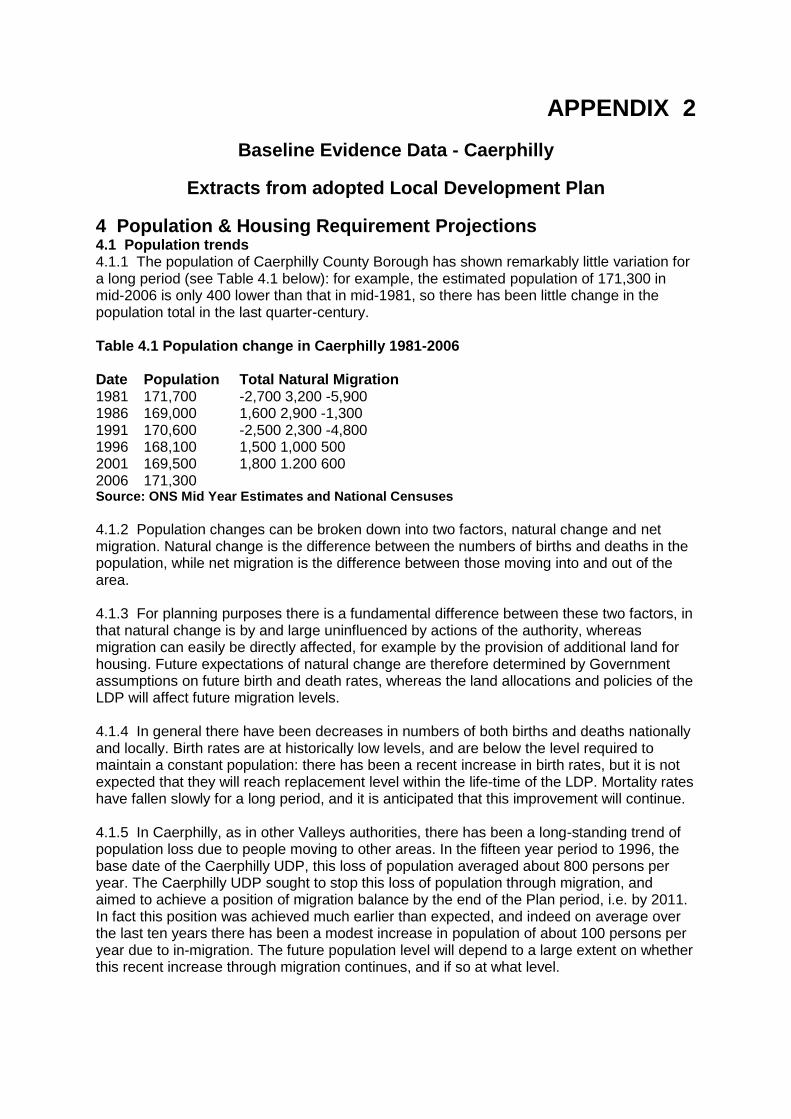
4 Population & Housing Requirement Projections 4.1 Population trends 4.1.1 The population of Caerphilly County Borough has shown remarkably little variation for a long period (see Table 4.1 below): for example, the estimated population of 171,300 in mid-2006 is only 400 lower than that in mid-1981, so there has been little change in the population total in the last quarter-century. Table 4.1 Population change in Caerphilly 1981-2006 Date Population Total Natural Migration 1981 171,700 -2,700 3,200 -5,900 1986 169,000 1,600 2,900 -1,300 1991 170,600 -2,500 2,300 -4,800 1996 168,100 1,500 1,000 500 2001 169,500 1,800 1.200 600 2006 171,300 Source: ONS Mid Year Estimates and National Censuses
4.1.2 Population changes can be broken down into two factors, natural change and net migration. Natural change is the difference between the numbers of births and deaths in the population, while net migration is the difference between those moving into and out of the area. 4.1.3 For planning purposes there is a fundamental difference between these two factors, in that natural change is by and large uninfluenced by actions of the authority, whereas migration can easily be directly affected, for example by the provision of additional land for housing. Future expectations of natural change are therefore determined by Government assumptions on future birth and death rates, whereas the land allocations and policies of the LDP will affect future migration levels. 4.1.4 In general there have been decreases in numbers of both births and deaths nationally and locally. Birth rates are at historically low levels, and are below the level required to maintain a constant population: there has been a recent increase in birth rates, but it is not expected that they will reach replacement level within the life-time of the LDP. Mortality rates have fallen slowly for a long period, and it is anticipated that this improvement will continue. 4.1.5 In Caerphilly, as in other Valleys authorities, there has been a long-standing trend of population loss due to people moving to other areas. In the fifteen year period to 1996, the base date of the Caerphilly UDP, this loss of population averaged about 800 persons per year. The Caerphilly UDP sought to stop this loss of population through migration, and aimed to achieve a position of migration balance by the end of the Plan period, i.e. by 2011. In fact this position was achieved much earlier than expected, and indeed on average over the last ten years there has been a modest increase in population of about 100 persons per year due to in-migration. The future population level will depend to a large extent on whether this recent increase through migration continues, and if so at what level.
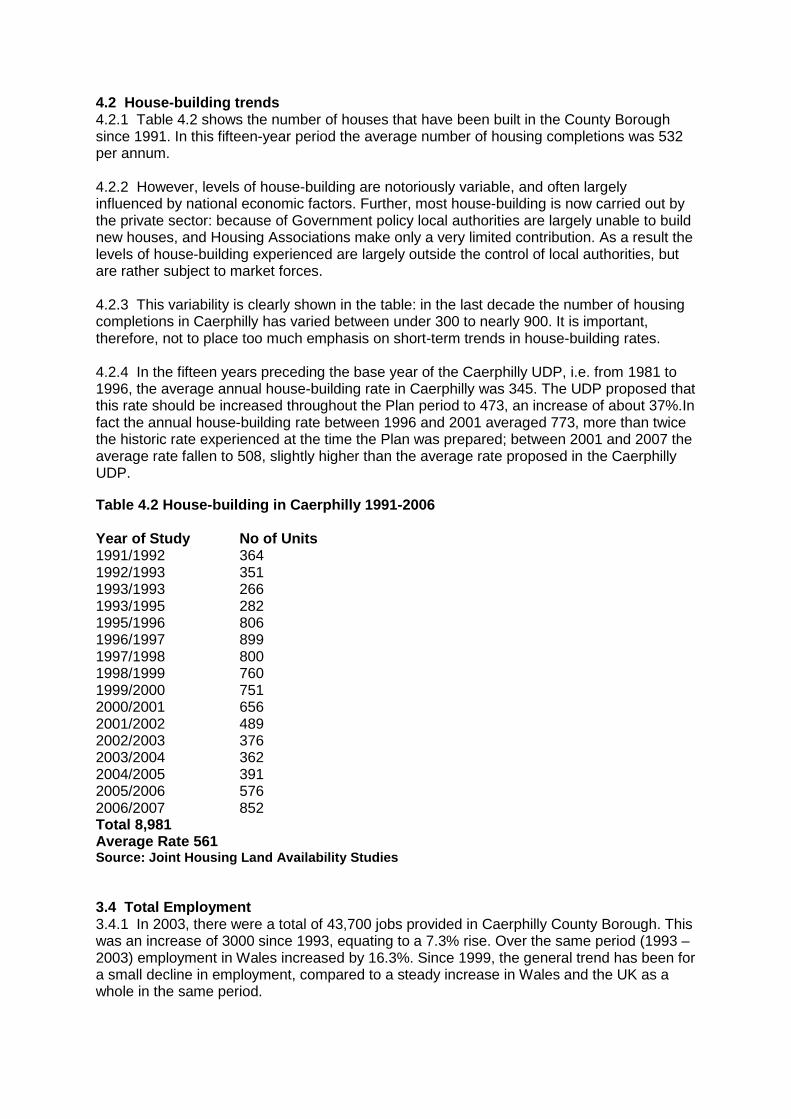
4.2 House-building trends 4.2.1 Table 4.2 shows the number of houses that have been built in the County Borough since 1991. In this fifteen-year period the average number of housing completions was 532 per annum. 4.2.2 However, levels of house-building are notoriously variable, and often largely influenced by national economic factors. Further, most house-building is now carried out by the private sector: because of Government policy local authorities are largely unable to build new houses, and Housing Associations make only a very limited contribution. As a result the levels of house-building experienced are largely outside the control of local authorities, but are rather subject to market forces. 4.2.3 This variability is clearly shown in the table: in the last decade the number of housing completions in Caerphilly has varied between under 300 to nearly 900. It is important, therefore, not to place too much emphasis on short-term trends in house-building rates. 4.2.4 In the fifteen years preceding the base year of the Caerphilly UDP, i.e. from 1981 to 1996, the average annual house-building rate in Caerphilly was 345. The UDP proposed that this rate should be increased throughout the Plan period to 473, an increase of about 37%.In fact the annual house-building rate between 1996 and 2001 averaged 773, more than twice the historic rate experienced at the time the Plan was prepared; between 2001 and 2007 the average rate fallen to 508, slightly higher than the average rate proposed in the Caerphilly UDP.
Table 4.2 House-building in Caerphilly 1991-2006 Year of Study No of Units 1991/1992 364 1992/1993 351 1993/1993 266 1993/1995 282 1995/1996 806 1996/1997 899 1997/1998 800 1998/1999 760 1999/2000 751 2000/2001 656 2001/2002 489 2002/2003 376 2003/2004 362 2004/2005 391 2005/2006 576 2006/2007 852 Total 8,981 Average Rate 561 Source: Joint Housing Land Availability Studies
3.4 Total Employment 3.4.1 In 2003, there were a total of 43,700 jobs provided in Caerphilly County Borough. This was an increase of 3000 since 1993, equating to a 7.3% rise. Over the same period (1993 – 2003) employment in Wales increased by 16.3%. Since 1999, the general trend has been for a small decline in employment, compared to a steady increase in Wales and the UK as a whole in the same period.
3.5 Part-Time and Full-Time Employment 3.5.1 The total number of jobs in the County Borough is shared almost equally between males (21,900 jobs) and females (21,800 jobs), although the split between full-time and part-time in relation to the genders is significantly different. A total of 88.6% of males are employed on a full-time basis compared to only 52.8% of females. 3.5.2 Since the 1980s there has been a decline in the number of males in full-time employment, which has been counteracted by a growth in female part-time employment, as women are increasing entering the workplace Since 1997 the number of males in full-time employment has decreased by approximately 450 people to 19,400, whereas over the same period, female part-time employment has increased by approximately 1300. Whilst the total number of jobs has therefore increased in the County Borough, it is important to note that the increase has been in relation to female part-time work, which is often low paid and low skilled.
3.6 Broad Employment Sectors 3.6.1 Historically, the economy of Caerphilly County Borough reflects that of other South Wales Valleys, with a past reliance on the coal mining industry. The closure of the collieries across the County Borough has resulted in high levels of unemployment and long term limiting illness, particularly in the north of the County Borough. Deep mining no longer contributes to the total employment in Caerphilly, but the closure of the pits have resulted in major environmental impacts as well as economic impacts, with many former colliery sites such as Oakdale and North Celynen undergoing reclamation to provide new land uses such as industrial estates and business parks. 3.6.2 In the last two decades, restructuring has occurred in the local economy reflecting national economic trends. There has been a decline in the manufacturing industry, which has decreased by 18.3% over the period 1993 to 2003. This is due to a number of factors including increased international competition and lower labour costs outside the UK. Manufacturing does still remains a key sector in the County Borough, providing 29.5% of employment, which is a higher proportion than the Welsh or Great Britain average, although it is declining at a faster rate than any sector apart from agriculture and fishing. The trend towards decline is likely to continue, with the manufacturing sector continuing to provide fewer jobs.
3.6.3 In the same period, there has been a major increase in employment in the public administration, education and health, which now accounts for 24.3% of employment. The increase in public administration employment is possibly due to restructuring mechanisms including Local Government reorganisation in 1996 and devolution in 1997. In addition, there has been an increase of 50.8% since 1993 in banking, finance and insurance, which accounts for 10.8% of employment and an increase in distribution, hotels and restaurants (21.1%), which equates to a 38.7% increase.
3.6.4 In comparison to the Wales and Great Britain figures for the growth in employment, Caerphilly County Borough’s declining industries have contracted at a faster rate, but increases in distribution, hotels and restaurants; transport and communications; banking, finance and insurance and other services have all increased at faster rates than national averages. 3.7 Business Units 3.7.1 In line with the increase in jobs within the County Borough, there has also been an increase in the total number of business units, which had increased by nearly 64% to 4,132 units between 1993 and 2003. The growth rate in Caerphilly has been slightly higher than the Welsh overall growth, which was 55% in the same period.
3.7.2 The greatest growth rates have been in the banking, finance and insurance sectors, which are based predominantly in office units. In addition, the construction industry has seen a major growth in the number of business units, which will range in terms of unit size.
3.8 Business Sizes 3.8.1 In the period 1993 to 2003, there have been major changes in the size of businesses in the County Borough in terms of the number of people employed. There has been a significant increase in the number of micro businesses operating with between 1 and 10 employees. Despite each firm employing less than 10 people, micro firms now account for 23.5% of all employment within the County Borough. 3.8.2 The majority of micro businesses will be located predominately in office accommodation or small workshop units either on existing industrial estates or business parks or within town centre locations. It is important that the LDP takes account of the trend towards smaller businesses by supporting the specific locational and business unit requirements of such firms. 3.8.3 Whilst the number of micro businesses has increased, the number of small, medium and large firms have remained relatively stable. It is likely that a number of well established firms have retained the same level of employees and where small, medium or large firms have closed, the overall trend has seen their replacement with firms of similar sizes. 3.9 Economic Activity 3.9.1 The economic activity rate is the combined total of those people of working age who are in employment or who are registered as unemployed. A total of 71, 421 people in the County Borough are classed as economically active, equating to 66.7% of the working age population. This rate has decreased slightly since 1991, and still remains slightly lower than the Welsh average but nearly 8% lower than the England and Wales average. 3.9.2 Economic inactivity is high in Caerphilly County Borough due to high levels of the population who are classified as permanently sick or disabled. As a local authority area, Caerphilly is one of the most deprived areas in Wales with 12 super output areas fallings within the 10% most deprived areas in the country and low inactivity rates reinforce this deprivation.
3.9.3 Economic activity rates for both working age males and females have decreased in Caerphilly County Borough in the period 1991 to 2001. There has been some convergence between male and female economic activity rates in the County Borough in line with national trends, but this decrease in the gap between male and females has not been as pronounced as in all-Wales figures. In Wales, female economic activity rates have increased by 3.3% over the 10-year period reflecting the increase in the number of women entering the workplace, whereas the numbers of females in Caerphilly who are economically active have has decreased by 1.5% over the same period.
3.10 Projections for Future Economic Activity Rates 3.10.1 The estimates and projections of economic activity rates are available at United Kingdom level, but are not available at Local Authority level. It is projected that over the period 2005 to 2020, working age male economic activity rates are projected to remain stable at approximately 83.3%. At the same time, female economic activity is projected to increase marginally from 69.9% in 2005 to 73.1% by 2020 as the trend continues for more women to enter the workplace.
3.10.2 Caerphilly’s male and female economic activity rates are lower than the UK
average but the past trends for the County Borough have mirrored those of the UK in relation to the convergence between male and female economic activity rates and it is anticipated that such trends will continue. 3.11 Unemployment 3.11.1 Since 1992, there has been a general trend towards a decline in the number of people claiming unemployment benefit both nationally and within Caerphilly County Borough itself. In 2005, unemployment rates in the County Borough have risen slightly, now reaching 2.9%, which was higher than the rates in both Wales (2.3%) and Great Britain as a whole (2.4%). 3.11.2 Whilst employment rates are relatively low, it should be recognised that the high numbers of people are not actively seeking work due to permanent illness or disability are not identified as unemployed within this count. 3.12 Commuting Patterns to and from Caerphilly County Borough 3.12.1 Out-commuting rates from Caerphilly County Borough are high, with a total of 29,732 people travelling out of the County Borough to work and only 56% of the population working within the County Borough itself. Given the continuing growth in employment opportunities along the M4 Corridor, which is in close proximity to the County Borough, out-commuting provides a feasible option for many people seeking employment.
Air Quality 5.54 Air quality issues in the county borough are likely to become increasingly important in the future. An Air Quality Management Area (AQMA) has been established within Caerphilly Town Centre.
Part B – Protection of the Natural Heritage 4.1 Special Area of Conservation 4.1.4 In planning law, SACs are afforded the highest possible biodiversity protection. Wales has a total of 85 SACs including Caerphilly County Boroughs one designated SAC, Aberbargoed Grasslands, which is a 40ha area of land and was designated in December 2004 due primarily to the presence of Marsh Fritillary Butterflies. 4.1.5 Aberbargoed grasslands current condition is “unfavourable, recovering”. A number of reasons contribute to this current condition, including the site being regularly burnt and damaged by vandals, historic land ownership issues and various sections of the site having been managed more efficiently or regularly than others. In 2005 a management plan for the SAC was agreed by the Countryside Council for Wales, under the requirements of the Habitats Directive. Caerphilly CBC has a duty under the Habitats Directive to implement the management plan. 4.1.6 The SAC received Objective 1 funding in May 2005 which provided £184,000 for the implementation of the management plan and for promoting the site as an education resource, including the provision of a classroom on the site and a dedicated ranger for the site. 4.2 Sites of Special Scientific Interest 4.2.6 Caerphilly County Borough has 10 designated SSSI's, these are of varying sizes and are in varying condition. 4.4 Local Nature Reserves 4.4.6 Caerphilly County Borough currently has 4 designated LNRs. 1 in Blackwood (Memorial Park Meadows), 1 in Cwmfelinfach (Graig Goch), 1 in Sirhowy Valley Country
Park (Flatwood Meadow Nature Reserve) and 1 in Parc Cwm Darran (Cwmllydrew Meadows). 5.0 LANDSCAPE 5.0.4 Caerphilly County Borough has a recognised and valued landscape within both the rural and built environment. The council realise the importance of a well managed living landscape, which can benefit the economy, safeguard and create wildlife habitats and add to the general public amenity and perception of the area. 5.3 GREEN BELTS 5.3.6 Caerphilly and Blackwood are the largest in terms of area and population of the five principal settlements in Caerphilly County Borough, the remaining three principal towns Ystrad Mynach, Bargoed and Risca are in relative terms, smaller. The designation of green belts around any of the principle towns to contain urban sprawl is considered unnecessary in Caerphilly County Borough. 5.4 GREEN WEDGES 5.4.2 Caerphilly County Borough currently has 33 green wedges. 6. GEOLOGY & GEOMORHOLOGY 6.1 Regionally Important Geological Sites 6.1.3 Caerphilly County Borough has five RIGS, which are not formally designated due to their recognition as they are also important national sites and as such are designated as SSSIs, which is a higher level of protection in policy terms. 7. ACCESS, RECREATION & TOURISM 7.0.3 Caerphilly County Borough has a number of existing access, recreation and tourism attractions that promote, encourage and respond to people’s desires and needs to enjoy the natural heritage, Cwmcarn forest drive, the country parks, the long distance walks and the extensive cycle networks for example. 7.1 Access 7.1.2 Currently, Caerphilly County Borough has over 1000km of public rights of way including bridleways and cycle ways.
B RETAILING PROVISION
Retail Centre Hierarchy B.1 There are five Principal Town Centres; these being Bargoed serving that part of the Heads of the Valleys Regeneration area (HOVRA), within the County Borough, Blackwood and Ystrad Mynach in the Northern Connections Corridor (NCC), and Caerphilly and Risca / Pontymister in the Southern Connections Corridor (SCC). There are four Key Settlements, namely Rhymney in HOVRA, Newbridge and Nelson in NCC and Bedwas in SCC. Below them in the hierarchy there are a large number of local centres and numerous neighbourhood shops and Individual units serving more immediate needs. There are also long established retail units, typically bulky goods retailers, which are free-standing in edge-of-centre and out-of-centre locations, which complete the retail hierarchy. B.2 In recent years types of retailing new to the County Borough have appeared in the form of food superstores and retail warehouse units. These have located within the designated town centre and retail warehouse boundaries and often have more retail sales floorspace than the majority of the small centres.
Quality of Provision B.18 There are small areas of modern pedestrianised retail development in both the Caerphilly and the Blackwood shopping centres. However, the major part of these two centres and all the other centres can best be described as traditional shopping areas, without comprehensive rear servicing, nor indoor shopping arcades, nor necessarily adequate and convenient car parking, nor many shops built to modern standards. They are also characterised by environments dominated by traffic. However, Blackwood’s centre was relieved of through traffic by the opening of the Sirhowy Enterprise Way at the end of 2005, and Bargoed’s centre will be similarly assisted by the completion of Angel Way by 2009. B.19 Many of the free-standing out of centre stores, particularly the older ones, are not at convenient or accessible locations and have poor local environments, while none are grouped together to offer the benefits of shared facilities and comparison shopping. B.20 As a result, even now, the County Borough’s retail facilities do not fully meet the needs of its residents. Generally speaking, there is still room for improvement in terms of building stock and shopping environments. There are continuing large outflows of expenditure from most areas of the County Borough in every shopping category, but especially in durable (i.e. non-food) goods. The situation has improved markedly from the 1980s in terms of some sectors and with regard to some of the centres, but further provision and enhancement can be justified. Caerphilly CACI Study C.16 Key Findings of the Caerphilly CACI Study • CACI‘s Retail Footprint model shows that Caerphilly‘s retail catchment contains 909,600 residents with annual comparison goods expenditure of £1.9 billion. • Caerphilly town centre captures 4.7% of this expenditure, representing£89.5 million of annual comparison goods expenditure. • In the Primary sub catchment (where 50% of shoppers originate), Caerphilly‘s market share is 35%. • In CACI‘s national ranking of Retail Footprint town centres, Caerphilly is ranked 310th, above Tonbridge, Falmouth and Dartford. In the ranking of Welsh town centres, Caerphilly is in 17th place, ahead of Abergavenny, Llandudno and Aberdare. • Tourists are a significant source of additional potential in Caerphilly, representing £2.3 million of retail spend per annum, or 2.5% of the current retail market. • The total Clothing & Footwear market in Caerphilly is worth an estimated £24.9 million per annum, representing 28% of total expenditure potential. Within this sector, Womenswear is the largest retail category (£11.0 million per annum). Spend on Durable Goods also makes a significant contribution to annual expenditure (£26.5 million or 30% of potential expenditure). • Expenditure per household in Caerphilly is above the Welsh national average in the vast majority of retail categories. In terms of value, spend is highest on Womenswear, Menswear, Music &Video and Toys & Hobbies. • Caerphilly has a broad-based ACORN lifestyle profile covering a range of life stages and affluence levels, but biased towards families. The town has strong concentrations of Flourishing Families, Secure Families, Blue Collar Roots and Struggling Families. • Caerphilly‘s market size and ACORN profile make it similar to towns such as Castleford, Wellingborough and Sittingbourne. • The town offers particularly strong opportunities in the Womenswear, Menswear, Leisure Goods and Leisure sectors (where including restaurants, coffee shops, etc), Caerphilly is under-provided relative to similar centres. • In terms of market position, Caerphilly offers strong opportunities for mid market retailers, which are under-represented relative to similar centres, e.g. Next, Marks & Spencer, Dorothy Perkins, Millets and Edinburgh Woollen Mill.
• Overall, Caerphilly represents a strong opportunity for good quality retailers to satisfy demand from currently under-served comfortably off and affluent residents, and better serve family-oriented shoppers, providing them with an attractive local alternative to Cardiff. Blackwood CACI Study C.22 Key Findings of the Blackwood CACI Study: • CACI‘s Retail Footprint model shows that Blackwood‘s retail catchment contains 395,800 residents with annual comparison goods expenditure of £795 million. • Blackwood town centre captures 5.8% of this expenditure, representing £45.9 million of annual comparison goods expenditure. • In the core catchment (where 75% of shoppers originate), Blackwood‘s market share is 21%. Within the Primary catchment alone (where 50% of shoppers originate), Blackwood‘s market share is almost 40%. • In CACI‘s national ranking of Retail Footprint town centres, Blackwood is ranked 447th
above Fleetwood, Ludlow and Minehead. In the ranking of Welsh town centres, Blackwood is in 22nd place, ahead of Colwyn Bay, Newtown and Cardigan. • Tourists are an important source of additional potential in Blackwood, representing £910,000 of retail spend per annum, or 1.9% of the current retail market.
• The total Clothing & Footwear market in Blackwood is worth an estimated £12.7 million per
annum, representing 28% of total expenditure potential. Within this sector, Womenswear is the largest retail category (£5.6 million per annum). Spend on Durable Goods also makes a significant contribution to annual expenditure (£13.5 million or 29% of potential expenditure). • Expenditure per household in Blackwood is on a par with or above the Welsh national average in the majority of retail categories. In terms of value, spend is highest on Womenswear, Menswear, Music & Video and Toys & Hobbies. • Blackwood has a broad-based ACORN lifestyle profile covering a range of life stages and affluence levels, but biased towards families. The town has strong concentrations of Secure Families, Post-Industrial Families, Blue Collar Roots and Struggling Families. • Blackwood‘s market size and ACORN profile make it similar to towns such as Leeds - Morley, Chester Le Street, Sutton-in-Ashfield and Rushden. • The town offers particularly strong opportunities in the Fashion, Health & Beauty, Leisure Goods, Household Goods and Leisure sectors (including restaurants, coffee shops, etc), where Blackwood is under-provided relative to similar centres. • In terms of market position, Blackwood offers opportunities for good quality middle market retailers, which are under-represented relative to similar centres, e.g. Clarks, Adams, Burton, Evans and Warren James. • Overall, Blackwood represents a strong opportunity for good quality retailers to satisfy demand from currently under-served comfortably off residents in the town‘s catchment, and better serve local family-oriented shoppers. Bargoed CACI Study Key Findings of the Bargoed CACI Study: • CACI‘s Retail Footprint model shows that Bargoed‘s retail catchment contains 272,100 residents with annual comparison goods expenditure of £541 million. • Bargoed town centre captures 3.7% of this expenditure, representing £20.1 million of annual comparison goods expenditure. • In the core catchment (where 75% of shoppers originate) Bargoed‘s market share is 13%. Within the Primary catchment alone (where 50% of shoppers originate), Bargoed‘s market share is just under 21%.
• The total Clothing & Footwear market in Bargoed is worth an estimated £5.6 million per
annum, representing 28% of total expenditure potential. Within this sector, Womenswear is the largest retail category (£2.5 million per annum). Spend on Durable Goods also makes a significant contribution to annual expenditure (£5.8 million or 29% of potential expenditure).
• Expenditure per household in Bargoed is average or above average compared to Wales as a whole in the Jewellery, Computer Games / Consoles, Toys & Hobbies and TV, Audio & Video categories. In terms of value, spend is highest on Womenswear, Menswear, Music & Video and Toys & Hobbies. • Bargoed‘s ACORN lifestyle profile is biased towards households with moderate or low incomes. The town has strong concentrations of the Blue Collar Roots and Struggling Families groups. • Bargoed‘s market size and ACORN profile make it similar to towns such as Maesteg, Pontypool, Heywood, Denton, and Harwich.
• The town offers particularly strong opportunities in the Menswear, Childrenswear,
Jewellery, Leisure Goods, Electrical Goods and Leisure sectors (including restaurants, coffee shops, etc), where Bargoed is underprovided relative to similar centres.
• In terms of market position, Bargoed offers opportunities Mid and Lower Mid market
retailers, which are under-represented relative to similar centres, e.g. New Look, Ethel Austin, Evans and J D Sports. • In terms of catchment spend per outlet, comparing Bargoed against similar centres and other Rural Centres reveals strong potential across a range of sectors, including Leisure Goods, House & Home, Durable Goods and Convenience. • Occupier suitability analysis has produced 40 Very Strong or Strong comparison goods retailer matches to the opportunity at Bargoed, including retailers such as Ethel Austin, Mk One, New Look and TKMaxx. • Overall, Bargoed offers clear opportunities for improving Mid and Lower Mid market retailer provision. The broad range of non-fashion categories across which Bargoed is under-served relative to similar centres suggests that a Mixed Goods retailer could trade particularly successfully. 3. TRENDS IN LEISURE Recreational activity is constantly evolving, as a result of higher standards of living and the increasing availability of individual leisure time. Factors influencing demand for recreation are complex and vary geographically throughout the county borough. However, trends in the past 10 years indicate that overall Caerphilly County Borough has experienced a net growth in recreational demand. The main contributing factors are considered to be as follows. 3.1 Economic Influences A society’s level of economic development is a major determinant of the magnitude of recreational demand because the economy influences so many critical, and interrelated, factors. In common with other parts of the UK, Wales has experienced a continual process of economic restructuring over the past half century. New jobs have gradually replaced those lost in the traditional mining and manufacturing industries, and total employment has grown steadily since the 1980s. Nevertheless, GVA (Gross Value Added) per head remains low compared to the rest of the UK and European averages. Source: Wales Spatial Plan, 2004. Caerphilly County Borough is by no means an exception to this case. The main economic issue in Caerphilly is unemployment coupled with the problems of low income, low skills and below average levels of qualifications within the workforce. The economic climate has and will continue to have a significant impact on adult and youth sports participation. The demand for leisure facilities within the county borough will inevitably relate to the economic climate. In periods of economic growth, it is suggested that increases in disposable income, coupled with increases in leisure time will lead to growth in demand for leisure facilities. 3.2 Demographic Influences Population Change: Population growth is one of the most important determinants of demand in the recreation sector. The population of Caerphilly County Borough was estimated most
recently at 171,300 [Source: ONS mid year population estimates, 2006]. This is only 400 lower than that in mid-1981, reflecting remarkably little variation in the County Borough’s population in the last quarter century. However there have recently been small positive levels of net in-migration into Caerphilly, and the total population of the county borough is expected to grow during the Plan period (up to 2021). In view of a moderate growth scenario being pursued in the Local Development Plan, the increase in population is projected from 171,300 in 2006 to 177,500 in 2021, an increase of 6,200, or 3.6%. For the purpose of planning future leisure provision the changes in the age structure of the population are particularly relevant. Fertility rates are difficult to predict, but they are currently rising and this trend is expected to continue for some time, while mortality rates are consistently improving. The effects of these changes, together with those of population movements, are that the number of children is expected to decrease slightly between 1996 and 2021, whereas the number of persons of pensionable age is expected to increase by 15% over the period. Falling rolls in schools however recent information indicates slight increase in live births, therefore it will be necessary to continually monitor this information to assist in the planning processes in relation to leisure, playgrounds and other facilities.
Population Density: The average population density in Caerphilly County Borough is 6.2 persons per hectare, relatively high when compared to the Welsh average of 1.4 persons. [Source: ONS mid year population estimates, 2006]. However, this average does not reflect the County Borough’s population overall, the highest densities being located in two key locations – the Mid Valleys Corridor and the Caerphilly Basin. Despite high levels of demand, there is a shortage of leisure facilities and useable recreational space here, particularly in the Caerphilly Basin area where land is scarcer and development pressure is greatest. In rural locations where densities are lower, certain recreational facilities – particularly commercial leisure tend to be less prevalent. Age Structure: As a result of improving mortality rates in line with national trends, the County Borough has an ageing population. This is most evident in the expected increase in the numbers of the elderly: for example, the number of persons of pensionable age in Caerphilly is expected to increase by 15% over the Plan period. This trend implies the need for an increase in the targeted provision of recreational facilities suitable for older generations, for example, the provision of walking opportunities in quality open spaces and appropriate low impact leisure activity. 3.3 Socio-cultural Cultural trends are also crucial. Nationally, there have been a number of changes in recreational trends. Local performance indicators show that there has been increase in use of facilities over the same time period. In recent years there have been a number of changes in culture and consumer behaviour influencing recreational trends. Participation in sport and physical activity has declined in the last 6 years. While this is disappointing, the figures represent a return to the levels of participation found by surveys in the mid 1990s and show that over a long period, the level of participation has been stable. Gender is another key socio-cultural determinant. The Sports Council for Wales (SCW) ‘Sports Update’ (2005) identified that women and men were equally likely to participate in indoor games and outdoor pursuits, but more than three times as many men as women took part in outdoor games. The study found differences. More than 20% of men enjoyed competitive aspects of sport, compared to only 6% of women. There are also disparities between prosperity and levels of participation. The Adult Sports Participation and Club Membership analysis undertaken by SCW in 2003 found that the higher the prosperity of an area, the higher the level of participation. This is reflected geographically where rural areas across Wales demonstrated higher levels of participation and physical activity than urban areas. Caerphilly County Borough is among the most deprived areas in Wales, and according to the Welsh Health Survey areas of deprivation, is also an area with the greatest health need.
The needs assessment has identified the salient health and lifestyle characteristics of the Borough. The results portray a population with significant health concerns. Key messages from the assessment are illustrated below: • Life expectancy in Caerphilly County Borough is the fourth worst out of all local authority areas in Wales. There are particular issues in the North of the Borough. • Main causes of death in the area are heart disease, stroke and some cancers. • Numbers of older people in the County Borough are increasing; this is likely to result in a rise in age-related illnesses and an increase in the number of vulnerable adults. • Caerphilly County Borough residents have the third worst mental and physical health status in Wales as a whole (1998 Welsh Health Survey). • There are a high number of people that have a long-term illness, health problem or disability that limits their daily activities or the work they can do. This is particularly high in the North of the County Borough. • 20% of the borough’s population is obese (highest in Wales). Adult Participation in Caerphilly County Borough When compared against the recommended healthy levels, results indicate that less than a quarter of adults in Caerphilly undertake sufficient physical activity. This means that more than half of adults can be considered inactive against this measure. Overall, levels of adult participation in physical activities across Wales have fallen since 2000/01. The participation rates in Caerphilly County Borough however (57%), are amongst the highest of the valley authorities in South East Wales, all of which record participation scores below the Wales average of 59%. Participation rates in any activity when the activities of billiards, snooker and walking are excluded give a figure of 35% in Caerphilly County Borough, emphasising the importance of distinguishing between outdoor/indoor activities. In terms of indoor games, Caerphilly County Borough is ranked 11th in participation rates with a figure of 26%, slightly below the national average of 27%. Children’s Participation Three quarters of young people in Caerphilly have participated in extra curricular sports and physical activity in the year 2004-05. In fact the second highest participation rates in the South East Wales valleys and the third highest in Wales are to be found in Caerphilly. In terms of regular extra curricular participation, Caerphilly tops the all-Wales rankings with 50% of young people taking doing so on a weekly basis – 8% higher than the national average. There is a slight gap in gender participation, with a higher rate among boys (55%) than girls (46%), but age appears to have little bearing on these figures when comparing figures for those between 11-18 years old. Indeed the consistently high extra curricular activity throughout secondary school ages bucks the national trend of decline in the later school years.
3. HISTORIC ENVIRONMENT OF CAERPHILLY COUNTY BOROUGH
3.6 There are currently 410 listed buildings or structures within the County Borough, ranging from Blackwood War Memorial to the impressive Hengoed/Maesycwmmer Viaduct dominating the lower Rhymney Valley. 3.19 At present, there are 15 conservation areas within the County Borough, although up-to-date character appraisals are required: • Butetown; • Rhymney; • Nelson; • Ruperra Castle and Park; • Gelligaer; • Gellihaf; • Maesycwmmer/Hengoed; • Gelligroes;
• Tredomen; • Cwmcarn Memorial Park; • Garden Suburbs, Pontywaun; • Llanbradach; • Groeswen; • Draethen; • Newbridge . 3.20 Cadw, in association with the International Council on Monuments and Sites and the Countryside Council for Wales, has prepared a Register of Landscapes, Parks and Gardens of Special Historic Interest in Wales. The register has been prepared in two parts. The first, covering historic parks and gardens, lists the following sites within the County Borough as historic gardens. The second lists Gelligaer Common as a special historic landscape: • Maes Manor Hotel, Blackwood; • The Van, Caerphilly; • Ruperra Castle, Rudry; • Cefn Mably. 4 GEOLOGY OF THE COUNTY BOROUGH 4.1 Caerphilly County Borough lies on the eastern edge of the South Wales coalfield. The coalfield is a syncline stretching from Pembrokeshire in the west to Torfaen in the east and from the Brecon Beacons in the north to the outskirts of Cardiff in the south. The outcrops are steeper on the southern rim than the northern rim. The Coal Measures underlie the majority of the County Borough. In South Wales the coal formation took place during the Carboniferous period due to the burial of organic material. The rank of the coal increases with age, the highest rank of coals (Anthracite) is found in the west of the coalfield, Bituminous coals are found in the east and the Rhondda valleys produced steam coal. Thicker seams are found at depth. Folding and faulting of the strata has distorted the coal bearing strata making it more difficult to exploit by underground long wall mining methods. 4.2 The coal bearing rocks are overlain over the majority of the County Borough north of Caerphilly by Pennant Sandstone, predominantly the Hughes and Grovesend Beds. Sandstones are found stratigraphically within the whole of the sequence of the Coal Measures but the sandstone beds become thicker towards the surface, eventually replacing the coal seams altogether. Sandstone is a lithified accumulation of sand grains ranging in size from 0.06 2mm in diameter produced by weathering and attrition of pre-existing rocks. The grains were sorted, abraided and transported by glaciers, air and water to the areas of deposition where they became consolidated into a rock. The composition of sandstones varies according to the nature of the source material. 4.3 The properties of the Pennant Sandstone in Caerphilly County Borough make it suitable for use as High Specification Aggregate (HSA) as well as general aggregate and building stone. HSA is used in applications that require a high degree of skid resistance like motorways and airport runways. The sandstones used as HSA are composed of angular grains which resist polishing and which are strong and durable. The availability of such material is available in relatively few locations in England and Wales and is therefore a nationally important resource. 4.4 There are outcrops of Carboniferous Limestone on the northern and southern edges of the coalfield. Limestone is a sedimentary rock consisting mainly of calcium carbonate. It formed in shallow marine conditions and is very versatile being used not only in construction but also in industrial applications such as iron, steel and glass manufacture, cement manufacture and in flue gas desulphurisation at power stations (where the purity allows). The limestone has been dolomitised in places to varying degrees (i.e it contains a higher amount of magnesia).

. 4.5 There are Quaternary deposits of boulder clay and Moranic drift overlying the sandstones. These deposits were left behind as the glaciers that covered the South Wales Valleys during the Devensian retreated (80,000 years ago). Glacial sand and gravel is found in a limited number of locations, most notably around Caerphilly. Alluvium is found in the valley of the river Rhymney at various locations.
FROM WASTE DISPOSAL TO RESOURCE MANAGEMENT The type of existing facilities in Caerphilly CBC area are listed below: Civic, Amenity, ELV / Scrap Yard / Metal Reprocessing, MRF Transfer, Windrow Composting. The Caerphilly CBC area has none of the following types of facilities: Chemical Treatment Facility, In-vessel Composting, MBT, Mobile Plants, Physical Treatment, Physico-Chemical Treatment, Sewage Treatment / Landfarm, or Thermal Treatment. 9.1 HEALTH - Current Provision 9.1.3 The County Borough is mainly served by a network of 3 District General Hospitals within the Gwent Healthcare NHS Trust. Some parts of the south (particularly around Caerphilly town) fall within the catchment of the Critical Care Centre at University Hospital of Wales, Heath and other hospitals in the Cardiff and Vale NHS Trust. 9.1.4 The District General Hospitals all lie outside the County Borough boundaries but provide a range of similar services. These are Royal Gwent, Newport and Nevill Hall, Abergavenny in the Gwent NHS sub regional area, and Prince Charles Hospital in the Merthyr Tydfil, Rhondda, Cynon and Taff NHS subregion. The latter (upon which most of the northern Caerphilly valleys are dependent) and Royal Glamorgan Hospital, Llantrisant (which links into provision for the southern Caerphilly valleys) will work closely together to maintain and improve services. 9.1.5 Within the County Borough, there are 5 smaller hospitals with various functions in the wider system located at Caerphilly District Miners, Ystrad Mynach, Aberbargoed, Oakdale and Rhymney. In addition there are 13 buildings providing community health services, 9 health centres providing General Practitioner (GP) services and 36 GP owned and operated premises, a total of 63 premises altogether. 9.2 HEALTH - Future Provision 9.2.1 Among the most significant of factors influencing health service provision in the area is the difficulty in sustaining current patterns of delivery to a dispersed local population. Also spatial inequalities exist in terms of deprivation and infrastructure. In Caerphilly and Blaenau Gwent, the Local Health Board has embarked upon pathfinder projects with new Local General Hospitals to be located at Ystrad Mynach and Ebbw Vale. In the new system, existing hospitals at Caerphilly District Miners, Oakdale, Aberbargoed, Ystrad Mynach, Ebbw Vale and Abertillery will close and Redwood (Rhymney) Hospital replaced with a combined health/social care centre. 5. Renewable/ Sustainable Energy Technologies The full potential of renewable sources in Caerphilly County Borough has not yet been identified or tapped into. Planning Policy Wales requires local planning authorities, when preparing development plans to undertake an “assessment of all renewable energy resources and the potential for renewable energy technologies…and include detailed policies in their UDPs” (para 12.9.1). Currently no initial or detailed assessment work of this nature has been undertaken for Caerphilly County Borough. However, assessment work will be undertaken to inform the first review of the plan. The assessment work will take into account the contribution that can be made by the area towards climate change and renewable targets, and recognise the different approaches that will be appropriate for he
deployment of different renewable technologies as required by planning policy wales (PPW, para 12.9.2). 5.1.5 Strategic Search Areas (SSAs) are specifically defined areas, that have been identified by the Welsh Assembly Government, that are considered the most suited to large scale wind farm development. Caerphilly County Borough does not currently have any SSAs. 5.2.6 Caerphilly County Borough has no local targets specifically in relation to solar energy generation, a generic strategic local development plan policy that directly relates to renewable energy production at the local level, specifically as a requirement of new development, will be included within the plan to address this issue. 5.3.6 Caerphilly County Borough, due to the potentially sufficient supply of biomass materials to supply energy on an individual and community scale should consider biomass as a valuable resource and seek to integrate the use of the biomass technology and encourage community based biomass schemes on all new development. A generic strategic policy is included within the LDP to address the provision of renewable energy within the local context, specifically as a requirement of new development, of Caerphilly County Borough. 5.4.6 Caerphilly County Borough has no provisions for a large-scale CHP provision. Community and individual CHP units would however, contribute to the International and national commitment to renewable energy. A generic strategic policy is included within the LDP to address the provision of renewable energy within the local context, specifically as a requirement of new development, of Caerphilly County Borough. 5.5.6 Caerphilly County Borough has no provisions for the generation of renewable energy from hydropower. The water ways that could potentially be utilised to generate the energy are in many cases ecologically sensitive. However, a generic strategic policy is included within the LDP to address the provision of renewable energy within the local context of Caerphilly County Borough, specifically as a requirement of new development, and would include hydropower in the right circumstances. 5.6.6 The potential to exploit natural geothermal energy within Caerphilly County Borough is limited due to the fact the we are not located within a ‘hot spot’. 5.7.4 The potential to exploit renewable energy using heat pumps within Caerphilly County Borough is high due to the topography and the natural features present within the borough. 5.8.5 Currently, Caerphilly County Borough currently has no provisions for energy to be produced from waste. BROAD LEVEL FLOOD RISK ASSESSMENT 4.9 Transport Infrastructure 4.9.1 Transport infrastructure is classified as less vulnerable development under the TAN 15 classification and therefore would be permitted within a zone C flood risk area where it can be justified that its location in zone C is necessary to assist or be part of a local authority regeneration initiative or strategy required to sustain an existing community as well as being located on previously developed land and the consequences of flooding having been considered and found to be acceptable. 4.9.2 The Deposit LDP is likely to include two proposals for highways improvements that lie within zone C flood risk areas: • Improvements to the Crumlin junction of the A472
• Improvements to the roundabout at the A468 Bedwas Bridge 4.9.3 In recent years there has been significant increase in congestion within the Northern and Southern LDP strategy areas. One of the key objectives of the LDP is to reduce congestion by minimising the need to travel, promoting more sustainable modes of transport and making the most efficient use of existing transport infrastructure. As a result, development in these strategy areas will be required to contribute towards necessary infrastructure improvements. 4.9.4 The two transport infrastructure projects highlighted within zone C are improvements to existing junctions that are crucial in making the most efficient use of the strategic transport network. By their nature, it would not be possible for these improvements to occur in areas outside of zone C as the road infrastructure is already in place. By improving the flow of traffic in particular areas there is the potential to significantly improve the quality of life for residents and sustain communities by ensuring access can be obtained along the strategic highways network to jobs and services. 4.9.5 Both proposals are for improvements to the road infrastructure in place, rather than new road development and, as such, the impact of small-scale improvements on the risk of flooding is likely to be minimal, with the significant benefits gained from the improvements put in place outweighing the minimal risk. There will be a requirement in accordance with TAN 15 for a flood consequences assessment to be undertaken, although due to the minimal impact of the development it would be more appropriate for this to be undertaken at planning application stage as the timescale for these improvements to be undertaken will depend on the timing of other allocations coming forward since these will facilitate the necessary funding for such improvements.
APPENDIX 3
Baseline Evidence Data - Merthyr Tydfil
Extracts from adopted Local Development Plan
2.1 MERTHYR TYDFIL IN CONTEXT: SOCIAL, ENVIRONMENTAL & ECONOMIC CONDITIONS 2.1.1 Merthyr Tydfil is situated in the Heads of the Valleys Region and is the smallest
local authority in Wales with an area of around 11,100 hectares. Approximately one fifth of the County Borough lies within the Brecon Beacons National Park to the north, leaving some 8,668 hectares of land under the planning control of the County Borough Council. The County Borough’s other neighbouring authorities are Rhondda Cynon Taf County Borough Council to the west and Caerphilly County Borough Council to the east and south.
2.1.2 Merthyr Tydfil has a population of approximately 54,600, of which, approximately
44,000 reside in the main town of Merthyr Tydfil which functions as the main commercial, retail and service centre of the County Borough and the Heads of the Valleys Region. As such, the main town of Merthyr Tydfil contains administrative headquarters (e.g. the County Borough Council), the primary shopping areas, the majority of employment opportunities, a hospital, and many other higher order services and facilities which serve surrounding settlements. The remainder of the population is distributed amongst eight interdependent settlements situated further south along the Taff and Taff Bargoed river valleys. These settlements contain more limited job opportunities and a range of lower order services and facilities serving local needs.
2.1.3 Merthyr Tydfil fulfils a key strategic role at the centre of the Heads of the Valleys
region, benefiting from high levels of accessibility through its location at The intersection of the A470 (T) and A465 (T) strategic transport corridors in the north, and the A470 (T) and A472 strategic transport corridors in the south. The County Borough lies just 25 minutes north of Cardiff and the M4 corridor. Currently 600,000 people and 150,000 jobs are within 30 minutes of Merthyr Tydfil.
2.1.4 Accessibility by public transport both to and within the County Borough varies
considerably and in certain areas, remains quite poor. An hourly train service operates to Cardiff where onward connections are available, but this suffers in terms of timetabling, frequency of service, reliability and integration with different modes of transport. Insufficient public transport limits the ability and choice of the local labour force without access to a car to seek employment opportunities and to have equal access to shopping, cultural and leisure opportunities. The proportion of working-age households without a car in Merthyr is 26%, the highest rate in Wales.
2.1.5 Notwithstanding this, improving accessibility means that Merthyr is well placed to
benefit from any future economic growth. In particular, the ongoing dualling of the A465 (T) will contribute to the establishment of an important new growth corridor across the Heads of the Valleys, and improvements to the frequency of the train service will enhance levels of access to Cardiff and beyond.
2.1.6 Merthyr Tydfil is facing considerable economic and social challenges that have
arisen from the economic restructuring of the late 20th Century. This restructuring
process has impacted negatively on the socio-economic conditions of the County Borough and has resulted in a 7.5% fall in population between 1991 and 2004, the greatest amongst all Welsh local authorities. The effect of fit, younger people leaving to take up employment, or to enter higher education, has left sicker, older and more disabled population and has contributed to a high rate of dependency. There are currently 71 dependents for every 100 people of working age, which is higher than the Welsh average.
2.1.7 The socio-economic condition of Merthyr Tydfil is such that most of the electoral
divisions fall within the 20% most deprived in Wales. The County Borough compares poorly with the averages of England and Wales in respect of all key socio-economic indicators and faces some significant challenges, including: high levels of economic inactivity; low educational attainment and skill levels; low quality jobs and opportunities; and high incidences of long term health problems.
2.1.8 It is widely recognised that sustained, targeted intervention is required if Merthyr
Tydfil is to regenerate and action is currently being undertaken through the Heads of the Valleys Programme entitled Turning Heads: A Strategy for the Heads of the Valleys (2020).
2.1.9 The number of jobs in Merthyr has been steadily increasing since 1998, due
primarily to increases in the public administration, education and health sectors, and in recent years, manufacturing, transport and communications and construction. However, despite this growth the County Borough’s job-density, economic activity rates and wage levels remain lower than the Wales and UK averages. Moreover, many of the sectors strongly represented in the County Borough are not expected to grow over the next 15 years and the County Borough is not well represented in the likely “key growth” sectors such as air transport, computing services and financial and professional services.
2.1.10 The quality and mix of housing within Merthyr Tydfil is not of a high standard and
needs to be improved if people are going to relocate into the County Borough. Currently around 60% of the housing stock in the County Borough remains of the terraced variety, many of which were built before 1919. The Welsh Housing Condition Survey (1998) also indicates that the highest proportion of unfit housing in Wales is in Merthyr Tydfil – around 12% of the total.
2.1.11 The County Borough comprises of a mixture of urban, semi-urban and rural
communities situated in a rich and varied natural, semi-natural and historic environment containing exceptional wildlife habitats, historic landscapes and archaeological features. The steeply sloping valley sides with their high ridges and moorland vegetation define the character of the area and provide an environmental and ecological context for the settlements of the County Borough.
2.1.12 Two thirds of the LDP area is semi-natural in character. It consists of a complex
array of landscape types including open moorland, common land, broad-leaved and coniferous woodlands, agriculturally productive land, semi-improved grassland, old industrial landscapes and reclaimed areas.
2.1.13 Merthyr Tydfil benefits from a range of environmental resources with a number of
sites in the County Borough identified as having particular biodiversity and / or nature conservation importance. These include 1 Local Nature Reserve, 2 Sites of Special Scientific Interest and numerous Sites of Importance for Nature Conservation.
2.1.14 In addition, the shallow basin in which the town of Merthyr Tydfil is situated is included in the Register of Landscapes, Parks and Gardens of Special Historic Interest in Wales (Part 2) and the built fabric of the Merthyr Tydfil reflects a rich heritage ranging from imposing bridges and viaducts to more humble workers cottages. The County Borough has 7 Conservation Areas and over 200 Listed Buildings and Ancient Monuments. The full potential of Merthyr Tydfil’s industrial heritage as a tourist resource has yet to be realised.
2.1.15 The historical development of Merthyr Tydfil has been heavily influenced by the
location and exploitation of mineral resources. There are a number of resources that continue to be worked within the borough as well as further reserves of coal and sandstone. In relation to the former, there are extant permissions for coal extraction at the Ffos-y-Fran land reclamation scheme on the eastern flank of the Merthyr Tydfil basin; limestone extraction at the Vaynor Quarry located to the north of the main Merthyr Tydfil settlement straddling the boundary of the Brecon Beacons National Park; and sandstone extraction at the Gelligaer Quarry situated to the east of the County Borough near Gelligaer Common.
2.2 KEY ISSUES 2.2.1 In order to deliver population growth within the County Borough and reflect the
community views expressed to date, there are a number of key issues that need to be addressed.
2.2.2 There is a clear consensus on the need to sustain the focus on the regeneration of
the main town of Merthyr Tydfil so that it can successfully function as a service and employment hub for surrounding settlements within the Heads of Valleys Region. A key challenge to the success of this approach is the need to develop sustainable transport links with the surrounding valley settlements to ensure that the higher order services and employment opportunities which are not available locally are accessible to all.
2.2.3 To deliver a sustainable future for the County Borough, resource-efficient
settlement patterns served by an efficient and sustainable transport system are essential. Opportunities need to be taken to integrate land use with transport and in particular to co-locate new housing growth with new employment sites, and retail and indoor leisure facilities. Improving the integration of different transport modes is also essential. In addition, the use of brownfield land in preference to greenfield sites needs to be optimised and the sustainable use and management of natural resources needs to be promoted.
2.2.4 Providing a suitable mix of high quality housing, including affordable, is crucial for
attracting people to the County Borough. Ensuring that all new housing developments are well served by essential services and facilities is vital to the overall appeal of the County Borough to potential inhabitants.
2.2.5 Creating a competitive business and investment environment is an essential
element to the regeneration of Merthyr Tydfil. A key challenge is the need to ensure that an adequate range and choice of good quality employment land is available which is attractive to the market.
2.2.6 Progress towards reducing levels of social deprivation and high unemployment
within local communities needs to continue. Central to this is the need to provide accessible jobs, services, and facilities, particularly for those who do not have access to the private car, such as the young, elderly, disabled and those of low-income.
2.2.7 Merthyr Tydfil has one of the poorest health profiles in Wales with a lower life
expectancy than the national average for males and females. A major challenge is therefore to improve the mental and physical wellbeing of local people by providing accessible leisure and recreational opportunities and a network of routes and destinations that maximise the potential for activity by foot or by bicycle.
2.2.8 Creating an attractive and safe living environment is a key priority for members of
the community. Securing well-designed development that contributes to the County Borough’s social, economic and environmental wellbeing and, more specifically, reduces opportunities for crime, disorder and anti-social behaviour, therefore remains essential to enhancing the quality of life of residents.
2.2.9 Greater emphasis needs to be placed on safeguarding and enhancing the historic
environment and measures need to be taken to allow residents and visitors to explore the culture and history of the County Borough. Linked to this is the need for new development to be sensitively designed so that it respects the area’s historic fabric and is locally distinctive.
2.2.10 A key challenge will be the need to balance population growth and new
development with the continued emphasis on the protection and enhancement of the natural environment. Opportunities for increased access to the countryside and enjoyment of biodiversity need to be advanced through new development.
2.2.11 Linked to the pursuit of sustainable development is the need to combat climate
change and adapt to any unavoidable impacts. Wherever practicable, the highest standards of resource /energy efficiency, and renewable energy technologies need to be secured in new development in order to achieve reduced CO2 emissions arising from construction and operation. The promotion of energy efficiency and renewable energy technologies will also contribute towards addressing the community’s concerns over the need to deliver affordable warmth and tackle fuel poverty.
APPENDIX 4
Baseline Evidence Data - Rhondda Cynon Taf
Extracts from adopted Local Development Plan
3.0 BASELINE CONDITIONS 3.1 Collection of baseline information is required under SEA legislation, and is fundamental to the SA process to provide a background to, and evidence base for, identifying sustainability problems and opportunities in Rhondda Cynon Taf and providing the basis for predicting the effects of the LDP. To make judgements about how the emerging content of the LDP will progress or hinder sustainable development, it is essential to understand the economic, environmental and social circumstances in Rhondda Cynon Taf today and their likely evolution in the future. The aim is to collect only relevant and sufficient data on the present and future state of the County Borough to allow the potential effects of the Local Development Plan to be adequately predicted. 3.2 The draft WAG SA Guidance proposes a practical approach to data collection, recognising that information may not yet be available, and that information gaps for future improvements should be reported as well as the need to consider uncertainties in data. Collection of baseline information should be continuous as the SA process guides plan making and as new information becomes available. 3.3 SA Guidance advises that, where possible, information should be collated to include:
‘comparators’ – (i.e. the same information for different areas) - as points of reference against which local data may be compared
established targets, which will highlight how far the current situation is from such thresholds
trends – to ascertain whether the situation is currently improving or deteriorating 3.4 The baseline information has been compiled in a table showing data for Rhondda Cynon Taf compared with data, where available, for, the South Wales Region, and Wales. We have also sought to identify targets and trends, and summarise the key issues arising for particular SA topics. Identification of key sustainability problems, objectives and issues assist in developing the SA Framework. Key examples of characteristics apparent from the baseline information, relative to other areas, are summarised below. Environment
Rhondda Cynon Taf has a large amount of land designated for biodiversity protection.
The previous industrial use of the area has led to degradation of the water environment.
There are 20 wind turbines in the Plan area. Part of the County Borough is encompassed by one of the proposed TAN8 (Wales) Strategic Search Areas.
The topography and water environment of Rhondda Cynon Taf means that large areas of the valley floors are prone to flooding, especially along river frontages where ribbon development has occurred.
4.2% of the Brecon Beacons National Park lies within the plan area to the north.
94.1% of the land in Rhondda Cynon Taf is of Grade 4 or 5 (low grade). Waste
Rhondda Cynon Taf show a net import of waste to its’ landfill sites of 132,000 tonnes in 2003.
Rhondda Cynon Taf has shown a relative decrease in municipal waste generated compared to neighbouring County Boroughs.
Development
The undulating nature of the topography of the area will guide suitability of locations for development.
Rhondda Cynon Taf’s foul drainage system is old and overloaded. Communities/Health
Rhondda Cynon Taf ranks 5th in England and Wales (out of 376 areas), for the proportion of population with a limiting long term illness, and general health ‘not good’.
17 of Rhondda Cynon Taf’s 53 electoral wards are amongst the 100 most deprived in Wales.
53% of the housing stock is terraced.
Depopulation affecting the valleys.
Decreasing population overall but increase in south. Transport
Away from the two north/south main routes (the A4119 and A470), accessibility in the County Borough is poor.
62% of people travel to work by car, ranking 19th out of 376 for England and Wales, however, 31.6% of households do not have a car.
Poor access to facilities. Culture
Rhondda Cynon Taf has a rich cultural heritage but few sites are statutorily protected.
Rhondda Cynon Taf has the highest percentage of Welsh speakers in Mid Glamorgan (9.8% speak, read and write Welsh).
Employment
18.8% of all residents work outside the County Borough, the third largest percentage net outflow in Wales.
The County Borough is covered by Objective 1 European funding. The Gross Domestic Product for Rhondda Cynon Taff was estimated, at the time of Objective 1 designation, as being 64.5% of the EU average.
The majority of people are employed in manufacturing (22.9%).
221.61 ha of land allocated for employment in the previous plan has not been taken up.
44% of the population have no qualifications.
Mineral extraction is an important industry within the economy of Rhondda Cynon Taf (Tower Colliery is the only deep mine left in Wales).
Key Social Issues • The population of Rhondda Cynon Taf has remained largely unchanged between 1991 and 2001. However this masks significant local variation, between 1991 – 2001 the population of the central and northern valleys declined by 5% whilst the population of the south increased by 10%. • The population projections for South East Wales forecast an overall increase in population of 7.8% between 2003 and 2023. • The number of households in South East Wales will increase by 18.6% from 583,700 in 2003 to 692,600 in 2023.
• The number of households in Rhondda Cynon Taf is forecast to increase by 16.2% or 17,627 between 2003 and 2023. • 30 of the 152 lower super output areas in Rhondda Cynon Taf are in the top 10% of most deprived areas in Wales. • The highest overall concentration of deprivation in Rhondda Cynon Taf are located in the central and northern valleys. • The highest levels of ‘housing’ deprivation in Rhondda Cynon Taf are located in the central and northern valleys. • Of the 94,553 dwellings in Rhondda Cynon Taf 53% are terraced, 26% semi detached, 12% detached and 9% are flats. • 75% of new housing constructed between 2000 –04 took place in the south of the County Borough. • Average house prices in the south of the County Borough are between 10 and 50% higher than those in the central and northern valley areas. • There is an estimated annual surplus of 398 affordable homes in Rhondda Cynon Taf. However, this trend masks significant local variation, in the south of the County Borough there is an annual shortfall in supply of 146 affordable homes • The highest levels of ‘health’ deprivation in Rhondda Cynon Taf are located in the central and northern valleys. • 27% of residents in Rhondda Cynon Taf suffer with a limiting long term illness. • More than half the electoral w• The volume of motor vehicle traffic on the roads of Rhondda Cynon Taf increased by 13% b ards in Rhondda Cynon Taf have between 11 and 18% of working age people claiming long term incapacity benefit. • 40% of residents in Rhondda Cynon Taf have no academic qualifications. • The highest levels of ‘educational’ deprivation in Rhondda Cynon Taf are located in the central and northern valleys.
Key Economic Issues • Between 2000 and 2003, Gross Value Added per capita in Rhondda Cynon Taf grew from £9312 to £10,505, averaging some 4.1% a year. This compared with average annual growth of 5.2% in Wales and 5% in Great Britain. • The highest levels of ‘employment’ deprivation in Rhondda Cynon Taf are located in the central and northern valleys. • Only 73% of the resident population of Rhondda Cynon Taf are economically active. • Only 60% of the workforce of Rhondda Cynon Taf work in the County Borough. • 22,000 residents commute out of Rhondda Cynon Taf every day to work, of these 19,000 commute to Cardiff. • Of the 78,370 people who work in Rhondda Cynon Taf 35% are employed in public administration, education and health, 23% are employed in manufacturing and 20% are employed in distribution, hotels and restaurants. • Of 415 hectares of land allocated in the 3 Local Plan areas, 222 hectares remain undeveloped. This assumes an average annual take up rate of some 13 hectares per annum. • The main concentrations of out of centre retail development are in the Talbot Green/Pontyclun, Pontypridd/Upper Boat and Aberdare/Aberaman areas. Existing out of centre food floor space amounts to 22,500 sq metres (gross) whilst non-food amounts to 50,885 sq m (gross).. • From 2001–2005 the percentage of vacant retail units in town centres of Pontypridd, Aberdare, Talbot Green, Tonypandy, Porth, Mountain Ash, Treorchy, Ferndale and Tonyrefail fell from 14% to 9.5%. • Major retail investment on comparison shopping, has in recent years been concentrated in larger towns and retail parks outside the County Borough. An assessment of comparison goods shopping patterns suggested that comparison expenditure outflow from the County Borough is approximately 60% of total expenditure on comparison goods.
Key Environmental Issues • The highest levels of ‘physical environment’ deprivation in Rhondda Cynon Taf are located in the central and northern valleys. • Municipal waste arisings in Rhondda Cynon Taf for 2004/05 stood at 131,777 tonnes. There was an average annual growth in arisings of 2.18% over the previous 6 year period compared with the SE Wales average of 2.92%. • Average household waste arisings per household for 2004/05 stood at 1.332 kilogram’s compared with the SE Wales average of 1.284kg.. • Only 15.6% of municipal waste was recycled and composted in Rhondda Cynon Taf in 2004/05 compared with 20.7% in SE Wales as a whole. • Car ownership in Rhondda Cynon Taf has grown since 1991 from 60% to 68% in 2001. • The dominant mode of transport for travelling in Rhondda Cynon Taf is the private car. When travelling to work for example, 74% of residents travel by car, 10% on foot and 8% use public transport. • The volume of motor vehicle traffic on the roads of Rhondda Cynon Taf increased by 13% between 1996 – 2004. This is in line with the growth in road traffic in Wales for the same period. • Rhondda Cynon Taf has 4 sites of special areas of nature conservation and 11 designated sites of special scientific interest. • Rhondda Cynon Taf has 17 conservation areas and 360 listed buildings. • There are 8 sites in Rhondda Cynon Taf which have potential sand and gravel resources together with other areas where high quality hard rock resources are known to exist. In view of their relatively limited regional availability and significance to the construction industry, there will be a need to safeguard such areas from development which could sterilise potential mineral reserves.
Key Sustainability Issues 3.12 It is important to distil the key sustainability issues, problems and opportunities relevant to the County Borough from the collated information and consideration of the particular character of the area. These issues are considered to be priorities for consideration through the Sustainability Appraisal, and the SA Framework of sustainability objectives seeks to address them. In summary the potential sustainability issues identified for RCT are:
An increase in emissions per capita of carbon dioxide (CO2) as a result of car usage over other forms of transport.
A difficulty in providing adequate water supplies for parts of Wales during dry summers by 2025.
An increase in flooding in low lying areas.
An increase in renewable energy projects.
A decrease in water quality through an inadequate sewerage system.
A decrease in municipal waste generated.
An increase in household waste recycling.
A decrease in soil quality.
Continuing depopulation.
An increase in deprivation.
An increase in ill-health.
An increase in drug-related crime.
An increase in development on unprotected sites which are potentially of importance for cultural or archaeological heritage.
A decrease in speakers of the Welsh Language.
Increase in tourism.
An increase in people travelling to work by car.

An increase in roads and other access routes.
APPENDIX 5
Baseline Evidence Data - Torfaen
Extracts from adopted Local Development Plan
Overview of SEA Topic Area Baseline - Key Issues and Features Air Quality 1.1 No Air Quality Management Areas have been designated in Torfaen. Estimated background air pollution data is collected yearly for Torfaen, and measured air quality in the County Borough currently meets national standards. However, it has been identified that areas near to the A4042 road suffer from poor air quality. Also the following road networks may exceed statutory limits for air quality in the future, particularly if Annual Average Daily traffic flow increases significantly: Broad Street running through Abersychan; Sunnybank Road running through Griffithstown; A4051 Cwmbran Drive (particularly in the Pontrhydrun area where facades of residential properties lie alongside the road and Henllys Way. 1.2 There is one automatic air quality monitoring site in Cwmbran from which background concentrations of NOx, NO2 and PM10 have been obtained. The results revealed that the estimated background concentrations of NO2 are below the objective limit of 40μg/m³ to be achieved by 2005 and thereafter. Estimated background concentrations of PM10 meet the objective limit of 40μg/m³ to be achieved by 2004 and thereafter. 1.3 Concentrations of NO2 and PM10 are measured at automatic monitoring stations within the administrative boundary of TCBC. The automatic monitoring results show that concentrations of NO2 meet the AQS annual average objective level and that concentrations of PM10 at all monitoring locations meet the annual mean objective. 1.4 TCBC has undertaken diffusion tube monitoring at 12 locations throughout the administrative area. The results from Torfaen in 2008 show that the annual average for Torfaen is below the AQS objective level for NO2 of 40 μg/m³. Torfaen County Borough Council has examined the results from monitoring in the borough. Concentrations are all below the objectives, therefore there is no need to proceed to a Detailed Assessment. Levels of nitrogen oxide were approaching objectives limit at some roadside locations in Torfaen. Increased levels of air pollution continue to be closely monitored at Cwmbran Air Quality Monitoring Station and traffic flows on the major road networks are being scrutinised. The Council monitors Ozone on a continuous basis at the Cwmbran Site. To date there have been no recorded exceedences of the 120μg/m3 8-hour mean objective. 2010 will be the first year in assessing this target and Torfaen are currently on track to meet the target. 1.5 The 2009 Updated Screening Assessment confirms that measured air quality within Torfaen continues to meet national objectives. Monitoring carried out in the County has not identified any exceedences of the PM10 or nitrogen dioxide objectives. Since the 2006 Updated Screening Assessment was undertaken, monitoring has been carried out at Commercial Street in Pontypool Town Centre, as the 2006 USA had identified levels of nitrogen dioxide approaching the annual mean objective. The 2010 Updated Progress Report confirms that measured air quality within Torfaen continues to meet national standards, as concentrations of all pollutants are within the stipulated limits. There is therefore no requirement to proceed to a Detailed Assessment for any pollutant.
1.6 In Torfaen, air quality meets national targets. However, future development in Torfaen may have a detrimental effect as the Malpas Road Air Quality Management Area in Newport. 1.7 Odour related complaints have fallen consistently year on year since 2005 and have decreased by 55% from 2005-2009. The LDP will need to ensure that the location of development does not cause unacceptable odour nuisances to nearby residents. Biodiversity and Flora and Fauna 1.8 The County Borough covers an area of approximately 31,000 acres (12546 ha) of which the land profile is as follows: - 20% built up areas - 50% mixed agriculture - 5% woodland - 10% open moorland - 15% post industrial land 1.9 Torfaen has a diverse countryside ranging from heathland at the Blorenge; upland bog at Waunafon, medieval field patterns at Cwmbran, enclosed valley sides from Abersychan to Blaenavon; coniferous and broadleaf woodland and gently sloping agricultural land to the south. 1.10 Torfaen contains areas of national and local conservation importance. There are 4 Sites of Special Scientific Interest namely Mynydd y Garn Fawr, forming part of the Blorenge SSSI, which is a dry heathland and important to its upland heathland community, home to important bird species and the common lizard. The Henllys Bog SSSI is an area of fenland, and the Llandegfedd Reservoir is the largest area of open standing water in Torfaen, and is designated for over wintering bird species. The Ty’r Hen Forwen SSSI has been recently designated for its large population of nationally scarce wood bitter vetch, an uncommon and very attractive grassland plant. The site is also of special interest for its species rich neutral grassland. In relation to the Blorenge SSSI, in 2008 there was a concern for both the habitat condition and the struggling grouse population on the moors, but work has now been undertaken to address these issues which is positive. 1.11 Torfaen also has 156 Sites of Importance for Nature Conservation with a further 15 sites to be designated in 2011. There is an issue with lack of monitoring and management of SINCs within the Council due to resource issues. The full list of SINC’s is contained as part of the LDP Appendices. 1.12 There were six Local Nature Reserves designated in Torfaen in 2008. The total LNR coverage in Torfaen is 133.6ha. Torfaen has a large area of LNR, therefore the continued protection and enhancement of these important resources should be a continued aim of the plan. In 2010 the Ecology team will work to prepare a new LNR at the fields around the new cemetery at Lwyncelyn. The six designated LNR’s are: • Church wood and Springvale Ponds – The reserve is home to ancient woodland and woodland, ponds and wetland. (16.35ha) • Henllys Open Space – The reserve is made up of a range of habitats, from grassland and brooks to majestic broadleaf woodland. It is home to a wealth of wildlife, such as the marble white and meadow brown butterfly. (7.44ha) • Tirpentwys (former landfill site) – This reserve used to be an old tipping site, but has recently been reclaimed and is now made up of a number of different habitats including ponds, woodland and streams. (33.86ha) • The Cycle route - Varteg Road to Garndiffaith Viaduct – This reserve covers over 45 hectares. Its main feature is the cycle trail, which follows the route of an old railway through grassland and mature woodland of sessile oak, beech and hazel at an
altitude of 300m. Key species of woodland birds such as pied flycatcher, wood warbler and redstart. (17.74ha) • Garn Lakes – The three lakes which make up this reserve, are home to breeding wildfowl, wading birds and a variety of dragonflies such as the black tailed skimmer (52.96ha) • Cwmynysycoy Quarry - Situated near Pontypool, within a disused quarry, this reserve is home to a number of important species including noctule bats and barn owls. (5.25 ha) 1.13 The Afon Lwyd is an important ecological corridor in Torfaen alongside the Monmouthshire and Brecon canal. Also there are Natura 2000 sites adjacent to Torfaen, which have been considered under the Habitats Regulations Assessment of the Plan, including the River Usk and Usk Valley Bat sites. Of particular importance to the Usk Bat Site is to maintain a network of linear habitat corridors particularly the Afon Lwyd which could be used by bats. In respect of the River Usk key issues will include the need to reduce source pollution into the Afon Lwyd as this is a direct tributary of the river Usk and to move to a sustainable strategy for water abstraction, to avoid adverse effects on the flow rates of the River Usk. 1.14 The key issue to emerge from the baseline in relation to certain sites is that their condition is generally not favourable. This has occurred due to lack of management and constrained resource issues that have affected the ability to protect and enhance these designated sites, and have resulted in the loss of certain species and habitats. 1.15 There has been approximately 24 Habitat Action Plans established in accordance with the Local Biodiversity Action Plan, but again whilst these have been established they suffer from a lack of management to ensure improvements, and many suffer from invasive species. Key habitats include Deciduous Woodland, Wildlife Corridors, Wetlands, Species rich grassland and Heath land. Woodlands in general comprise 5% of the total area in Torfaen. The main Afon Lwyd river corridor is the primary conservation feature in Torfaen. Flowing through the heart of the County Borough and along with its tributaries it provides a wildlife corridor for a huge number of species, not just fish. It has otters present and there needs to be recognition that there is a small but thriving population of both salmon and trout in the river and its tributaries. There are a number of still waters (ponds, lakes and reservoirs) in the area including Llandegfedd reservoir, Cwmbran boating lake as examples. 1.16 There are 38 Species Action Plans and key protected species present in Torfaen include the Dartford Warbler, Common lizard, Badgers, Dormice Great Crested Newts, Otters and Bats and white-clawed crayfish. There are also over 130 species of conservation concern and 40 species of interest. Ancient woodlands provide a key habitat for these species. Of major concern is the fact that Great Crested Newts are almost at the point of becoming extinct in the borough. General trends indicate that species of bats are decreasing but otters are increasing. An important positive find in 2010 was that there are 3 pairs of breeding Peregrine Falcons raising their young in Torfaen. 1.17 Whilst habitat action plans have been established, there is again the problem of the lack of management to ensure the improvements in the habitats. The extent and condition of key species contained within the LBAP and threats facing the species are contained in the baseline tables. Climate change factors present an issue to habitats alongside acid deposition. There is an issue with the influx of invasive species into some habitats. Loss of grassland habitats to development is a significant problem in Torfaen. Also fragmentation of habitats, due to development and recreational pressures is an issue. The LBAP identifies Habitat Conservation priorities which are divided into High, Medium and Low Conservation concern.
1.18 Following several years of variation, the ecological footprint of Wales increased from 4.2 global hectares per person in 1999 to 4.8(r) in 2004. However, it has since fallen to 4.4 in 2006. For reference, it is recognised that the Ecological footprint encompasses areas wider than Ecology and includes Food and Drink, Energy, Travel, Housing, Consumables, Services, Holiday Activities, Government and Capital Investment, but it is located under this Biodiversity section of the baseline analysis 1.19 Global Footprint Network estimates for 2006 show that the average 'earthshare' was 1.8 global hectares per person and the ecological footprint of the world was 2.6 global hectares per person. This means that there was an ecological deficit of 0.8 global hectares per person. 1.20 The ecological footprint of Wales was slightly lower than for the UK in 2006, but was more than double the average earthshare. Stockholm Environment Estimates show that Welsh local authorities in rural areas generally had a higher ecological footprint than authorities in urban or valley areas in 2006. 1.21 Torfaen has decreased its ecological footprint by 0.8 global hectares compared to South East Wales average 1.22 Based on available information (Gwent Ancient Woodland Inventory) only small areas of ancient woodland remain in Gwent. CCW lists 8190 hectares of ancient woodland in the county of Gwent. There are examples of urban ancient woodlands in Cwmbran, and in Blaenau Gwent there exists approximately 200h.a of ancient woodland located in steep sided locations not subject to development. Also there are a large number of ancient woodlands in Gwent less than 2 h.a. Newport has up to 1000 small ancient woodlands. 1.23 There are 12 ancient woodland sites in Torfaen designated as an SINCs. There are community woodlands located in the new town of Cwmbran and on the fringes of Newport. Torfaen has gained Objective 1 funding to manage the woodlands. Also important in Torfaen, is the ancient woodlands provide important habitats for dormice and therefore the importance to such species needs to be recognised. 1.24 Other key issues affecting the biodiversity resource in Torfaen, include loss of grassland habitats to development, the reclamation of Brownfield sites leading to loss of habitats, and the loss of green space (important for wildlife corridors) to development, the fragmentation of habitats due to development and recreational pressures and the issue of wildlife crime. Future developments should take account of biodiversity interests in the design of sites. Ecological corridors should be protected and new corridors promoted. As such loss of connectivity in these corridors is an important issue that should be tackled. Similarly invasive species such as Japanese Knotweed also presents a problem to the biological resource in Torfaen. Road verges in Torfaen also present a biological resource and their enhancement should be promoted. 1.25 The increase in development sites as part of the Deposit LDP will be likely to have a negative effect on SINCs through habitat loss and fragmentation. The Torfaen Local Biodiversity Action Plan (LBAP) identifies and gives advice on habitats and species of importance within Torfaen and the Council will produce a Biodiversity and Geodiversity SPG which will describe the mechanisms that TCBC will provide to help identify those biodiversity resources that should be protected. The SPG will also identify suitable mitigation / compensation measures designed to maintain and enhance the biodiversity network in Torfaen where biodiversity resources will be unavoidably lost. Climatic Factors 1.26 Data relating to local and regional estimates for carbon dioxide emissions in 2005
indicated that Torfaen had lower industry and commercial and domestic emissions than neighbouring authorities, but the larger populations present in certain neighbouring authorities is a reason for these differences. Of the total Wales emissions, Torfaen accounted for 5.9% of total emissions. Generally at the all Wales level emissions of C02 were increasing through the 1990s but gradually decreased since 2000. 2009 data on Carbon Dioxide emissions in Wales indicate the largest emissions in Torfaen are from industry and commercial uses and it had the 6th lowest emissions out of the SE Wales authorities. It was ranked 19th out of 22 for the lowest emissions in Wales. Industrial and Commercial emissions accounted for 58% of all emissions in Wales. Only 4 authorities increased their Carbon Dioxide emissions in Wales during 2005-2007, Torfaen not being one of them. Energy 1.27 Energy consumption in 2009 was 3.3 million tonnes lower than 1990, a fall of 2.3%. The main trends in energy in 2009 (Digest of UK Energy Statistics, 2010)1 indicate • Overall there was a decrease in indigenous energy production of 5.7% and a decrease in primary energy consumption of 6.3% in the UK compared with 2008 largely driven by the recession; • The reduced demand for fossil fuels and switching from coal to nuclear reduced emissions of Carbon Dioxide by 9.7% in 2009 • Electricity generated from renewable sources in the UK in 2009 represented a 6.7% of total UK electricity generation, up from 5.6% in 2008; • Overall there was a decrease of 6.7% in final energy consumption in the UK compared with 2008. The changes between sectors, between 2008 and 2009 were a 13.1% decrease in Industry emissions, 4% decrease in transport emissions, 5.2% decrease in domestic emissions and an 8.5% decrease in service, public administration and agriculture emissions. 1.28 Figures relating to regional and local energy consumption in 2005 indicate Torfaen consumed a lower amount of coal compared to adjoining authorities and also less gas and electricity. Expressed as a percentage of the all Wales consumption, in terms of coal Torfaen consumed 5.8%, in terms of natural gas it consumed 3.5%, for electricity it contributed 2.9%, and for renewables Torfaen contributed 0.8%. Overall Torfaen contributes 2.25% to overall energy consumption in Wales. Torfaen also consumes a lower percentage of renewables than neighbouring authorities and hence the LDP should see the promotion of the use of renewable energy sources and the development of renewable energy projects a key priority of the strategy. There is no Torfaen specific data on electricity generated from renewable sources. The development of renewable energy projects and the use of renewable sources in new development should be promoted to meet government objectives to increase the use of renewable energy resources. 1.29 Torfaen does not lie within a Strategic Search Area as identified by TAN8: Renewable Energy and as such large-scale wind farms are not considered appropriate in the County Borough. However TAN8 lists other technologies that can be used to meet the targets outside SSA’s including biogas, bio fuels, combined heat and power, energy from waste, solar thermal. The LDP will expect developers to explore opportunities for achieving higher sustainable building standards of the strategic sites(of 100 or more houses) and will promote developments adapting to climate change through design and incorporation of low and zero carbon energy sources. Cultural Heritage 1.30 The Blaenavon Industrial Landscape was inscribed as a World Heritage Site in November 2000 and covers an area of 32.9km2. The industrial landscape satisfied four of the criteria for consideration for inclusion on the World Heritage List. This is a significant cultural and tourist resource and the continued protection and enhancement of this important asset should be ensured. Torfaen also has two historic parks and gardens included on part 1

of the Register of Landscapes, Parks and Gardens of Historic Interest. They are Pontypool Park and Llantarnam Abbey. 1.31 Torfaen has five designated Conservation Areas, namely Blaenavon Town Centre, Cwmavon, Upper Cwmbran, Pontypool Town Centre and Llantarnam. A key problem in Torfaen was the lack of conservation area review during the last 22 years; however Conservation Area Appraisals for Pontypool Conservation Area, Blaenavon Conservation Area and Cwmavon Conservation Area have recently been completed. It is important that appraisals for the remaining conservation areas are undertaken in the near future. The Blaenavon Industrial landscape has been registered as a Landscape of Historic Interest by CADW. Also the importance of the Monmouthshire and Brecon canal should be promoted, as this is a key heritage asset. It should be recognised that the canal has a valuable regeneration, recreation and ecological function. 1.32 At January 2009 there were 253 Listed buildings in the County Borough, 3 designated as Grade 1, 23 designated as Grade 2* and 227 designated as Grade 2. As of 2005 there were 50 buildings on the ‘Buildings at Risk’ register and a further 60 that need to be monitored. The total number of Scheduled Ancient Monuments in 2009 was 25. Lack of management and resources is a problem and therefore this presents a difficulty in ensuring the continued protection and enhancement of our built heritage. 1.33 Of the total population the 2001 census indicated that 11.10% were classified as welsh speakers, and this, as an important part of cultural heritage should be preserved. Human Health 1.34 The Health and Well-Being Needs Assessment (2010) undertaken for Torfaen indicates that there are some serious challenges affecting the health and well being of the people in Torfaen. These challenges include: – Our people have, on average, shorter and less healthy lives than people elsewhere in Wales. – There are high levels of long-term illness, of disability and of death from coronary heart disease. – Our population is ageing and the numbers of older people are growing and older people locally have a high level of ill health, impairments and physical discomfort that may require health and social care support. – There is significant deprivation and economic inactivity amongst adults in some parts of the County Borough, contributing to poverty amongst children and young people in many families in Torfaen – Local people have one of the lowest levels of physical activity in Wales and this is linked to increasing levels of obesity, which, in turn, leads to poorer health. More people smoke in Torfaen and eat a less than healthy diet. 1.35 The majority of people’s health needs are self managed or managed within the primary care arena. Primary care facilities are normally owned by independent contractors and include family doctors, community dentists, community pharmacists etc. Gwent Healthcare Trust manages the three local hospitals in Torfaen – Blaenavon, County and Llanfrechfa Grange as well as Health clinics in Trevethin, Pontypool, Croesyceiliog, Cwmbran Town Centre and Fairwater. Torfaen residents also rely on services provided at Royal Gwent Hospital and Nevill Hall Hospital and to lesser extent, hospitals outside Gwent. Health: Life Expectancy and Illness 1.36 Life expectancy for Torfaen for the period 2007-2009 stands at 76.8 years for men and 81.0 years for women. This compares favourably with the Welsh average of 77.2 years for men and 81.6 years for women over the same period. Life expectancy in Torfaen has increased considerably since the early 1990’s, where for the period 1991 to 1993, life

expectancy stood at 72.5 for men and 78.1 for women. This increase is also reflected in the figures for the Welsh average. 1.37 In terms of health demographics, as part of the 2001 Census 24.8% people reported having a limiting long term illness in Torfaen, compared to the Welsh average figure of 23.3%. The latest Welsh Health Survey 2008 and 2009 shows a figure of approximately 31% of people in Torfaen who reported having a limiting long-term illness, compared to the Welsh average of 27%.3 Therefore the percentage of people having a limited long term illness in Torfaen has stayed relatively consistent over recent years and is similar to, but slightly above, the Welsh average. Health Deprivation 1.38 There is great inequality throughout the County Borough in terms of health deprivation, with Torfaen having some of the most deprived and least deprived areas in Wales with regards to health.4 The 2008 Wales Index of Multiple Deprivation defines 1896 Lower Super Output Areas for Wales and scores these areas on levels of deprivation. In terms of health deprivation, Torfaen contains some of the 10% most deprived Lower Super Output Areas for Wales, with other areas categorised as being some of the least deprived. For example, the 2008 Index categorises Blaenavon 1 as being the most deprived Lower Super Output Area in Torfaen for health scoring 39 out of 1896 areas in Wales and New Inn 3 being the least deprived area in Torfaen for health scoring 1798th out of 1896 areas in Wales overall. In terms of location, the most deprived Lower Super Output Areas in Torfaen are located throughout the County Borough in areas such as Blaenavon, Upper Cwmbran and Trevethin. Therefore reducing these inequalities in health deprivation is an important objective for Torfaen. 1.39 It is indicated that lifestyle plays a part in the health of people in Torfaen with significant amounts of ill health being attributed to smoking, poor diet, lack of exercise, drug and alcohol use and unsafe sexual practise. Evidence highlighting the poor lifestyle choices in Torfaen includes the fact that that around 32% of people reported eating five or more portions of fruit and vegetables the previous day; this compares with 36% for the Welsh average. Further, around 23% of people in Torfaen are obese compared to around 21% for the Welsh average. Health: Mortality 1.40 The latest 2010 Health Social Care and Wellbeing Needs Assessment states that the premature mortality rate in Torfaen, using age standardised rates amongst people aged under 75, was sixth highest of all the 22 locality areas. The death rate was consistent with the rate for Wales for the period between 1998 and 2007 – rates fluctuated but exhibited an overall downward trend. The age standardised rates for 2004 to 2008 at a sub-Torfaen level shows that whilst the County Borough as a whole is similar to the Wales average there are a small number of areas where death rates are significantly higher than the all Wales average – although none are amongst the highest ranges in Wales. 1.41 With regards to specific causes of death, mortality rates from circulatory diseases in Torfaen are slightly lower than the Welsh average. In particular, rates of heart diseases in Torfaen in both males and females have declined since the mid 1990s to the mid 2000s, with deaths by heart disease for females in Torfaen amounting to approximately 140 per 100,000 population in Torfaen during the period 1996-1998, this trend had decreased to just under 100 per 100,000 population in Torfaen for the period 2003-2005. A similar trend can be seen for men and for the all Wales figures for both sexes. 1.42 The figures of deaths from cancer for both males and females have not decreased over recent years and overall have remained constant.

1.43 As the above shows that the rate of deaths from heart disease has fallen since the 1990’s in Torfaen, therefore it can be seen that actions to counter heart disease have reduced death rates, in line with other areas within Wales. However, in common with other Welsh areas, health activities over the last decade have had no apparent impact on deaths from cancer in Torfaen, despite prioritisation of resources towards cancer services over the last few years. 1.44 Infant mortality rates in Torfaen at 2008 were at 8.6 deaths per 1,000 live births compared to the Welsh average of 4.1 deaths per 1,000 live births. Therefore Torfaen has higher death rates than the Welsh average figure for infant mortality. Health: Pregnancies 1.45 Torfaen has relatively high numbers of teenage pregnancies and low birth–weight babies. Torfaen has some of the highest teenage pregnancy rates in Wales and this can be linked to cycles of poverty. This can be linked to the increase in sexually transmitted infections in Wales since 1994. The rate of low birth weight babies in Torfaen is slightly higher but not significantly different to the Welsh average of 5.9 per cent, which carries a whole range of potential poor health issues. Smoking, poverty and teenage pregnancy contribute to low birth rates. Health – Crime Statistics 1.46 In terms of figures and perceptions of crime, from a survey of all 24 wards in Torfaen, 90.3% of people felt safe in the daytime, with 65.6% of people feeling safe at night. The perception of night time crime therefore appears to be an issue in Torfaen. The actual recorded rate for crime in Torfaen as part of the Gwent Police region (made up of the local authorities of Blaenau Gwent, Caerphilly, Monmouthshire, Newport and Torfaen) compared reasonably well to the other local authority areas within this region during the period 2009/2010. For example, violent crime in Torfaen was recorded at 14 per 1000 population during the period 2009/2010, the second lowest out of the 5 local authority areas for the Gwent Police region. Health - Key Issues Summary 1.47 The changes to the population profile means that we need to plan now to meet the needs of increasing numbers of older people who require more care and support. At the same time, we need to challenge some of the lifestyle issues and focus attention on children and young people. Key issues to come out of the heath statistics and information are therefore as follows: • Life expectancy and illness rates for Torfaen are similar to that of the all Wales average; • There is great inequalities within the County Borough in terms of health deprivation; • Mortality rates in Torfaen are relatively high compares to other areas within Wales; however they have decreased over the years in relation to certain illnesses, but in others (i.e. cancer) they have stayed approximately the same; • Torfaen has a relatively high number of teenage pregnancies and low birth–weight babies in comparison to other areas within Wales; • Torfaen compares favourably to other local authorities within the same police force area on crime rates. Landscape 1.48 The valley landscape of Torfaen has a predominantly enclosed character, and is characterised by the urban and suburban landscape of Cwmbran, Pontypool and Abersychan to the south, and the predominantly rural and post industrial landscape around Blaenavon to the north. Torfaen is characterised by a great variety of landscape types and this is due to its location on the edge of the south Wales coalfield, so the geology of the area is very important, so is the role that man has had in shaping the landscape of the valley through agriculture and industry.
• The north of the County Borough is a mix of post industrial landscapes with many important historic and cultural features with semi natural landscapes of high ecological and landscape value including moorland and woodlands. In recognition of the outstanding qualities of the landscape the Blaenavon Industrial landscape was inscribed as a World Heritage Site in November 2000. • The eastern side of the valley in Mid Torfaen is important because of its medieval field system and ancient semi natural woodland. • The southern landscape of Torfaen is characterised as being largely low lying with more gentle relief and dominated by more traditional agricultural fields and hedgerows. • The area surrounding Blaenavon is included on the Register of Landscapes of Outstanding Historic Interest in Wales as the area is one of the best-preserved industrial landscapes in Wales. 1.49 It is identified that 80% of the land use in Torfaen is characterised as greenspace. Data from LANDMAP identifies that hedgerows and woodland blocks are particularly significant in the Torfaen landscape, with their loss being of major detriment to the landscape value of certain areas. Four areas in Torfaen have been identified as areas of high quality landscape value and were identified as Special Landscape Areas in the Adopted Local Plan in order to protect their special landscape value. Similarly Green Wedges were identified to prevent the coalescence of settlements particularly between Cwmbran and Newport and to protect valued landscape. Important green space between communities should be recognised for the value it brings. The legacy of certain derelict landscapes such as the western side of the valley covering the eastern edge of the former South Wales Coalfield from coalmining is an issue. The sensitive treatment of these areas should be favoured. 1.50 Recent LANDMAP data for Torfaen has identified a number of ‘high’ and ‘outstanding’ geographical ‘aspect areas’ for Torfaen, including in biodiversity and history and archaeology. Special Landscape Areas 1.51 The Designation of Special Landscape Areas Study produced for the Council in May 2010 recommends 8 SLAs for designation, as follows: • SLA 1 – Blaenavon Heritage Landscape • SLA 2 – Eastern Uplands • SLA 3 – Afon Lwyd Valley • SLA 4 – Llandegfedd Reservoir • SLA 5 – South Eastern Lowlands • SLA 6 – Southern Lowlands • SLA 7 – South West Uplands • SLA 8 – Western Uplands 1.52 The recommendations for SLA designation listed above are based upon a number of factors; desk survey and field work has been undertaken to identify the qualities of each individual SLA. Ground truthing of the boundaries and a detailed investigation of the LANDMAP criteria have also been used to identify and justify each specific designation. Public Rights of Way 1.53 The Council manages 370km of the Rights of Way Network as well as access to common land and open access land. In 2010 there were 105 complaints regarding the Rights of Way Network. A 5% random sample of paths was surveyed for the annual Performance Indicators. To fulfil the ‘ease of use’ criteria, the paths surveyed have be appropriately signed, be unobstructed and all path furniture has to be to a satisfactory standard. The results showed that 57% of paths surveyed were ‘easy to use’, a 5% increase on 2007/08 figures.
1.54 Different pressures exist in the south of the County Borough compared to the north as a consequence of the development pressures on open space within the urban boundary and agricultural land for housing and commercial developments. It must also be recognised that there is more pressure on the north of the County Borough now with the area becoming increasingly desirable for building than before. This is likely to increase significantly over the next ten years and there must be strong controls in place to protect the integrity and quality of the landscape and its features. This is particularly pertinent in respecting the need to protect the integrity and the Outstanding Universal Values of the Blaenavon Industrial Landscape World Heritage Site. 1.55 The quality of the landscape has a significant contribution to make to the health of local people and also promoting sustainable economic and environmental development. The visual perception of the County Borough is of paramount importance in terms of the local economy. Retention of traditional field patterns is important to the landscape of Torfaen. Buildings of historic character are an important addition to the landscape, alongside traditional boundary enclosures such as stone walls. The quality of the landscape of Torfaen is one of its greatest assets. There are other challenges facing the landscape and it needs to recognised that the landscape is being degraded by activities such as off road motorcycling that can cause scars on hillsides, and other issues such as litter, fly tipping and abandonment of cars. Material Assets Community Infrastructure - Community Facilities 1.56 There are a range of community facilities in the County Borough. On balance a key aim will be to improve the range and quality across the County Borough, which can be facilitated by the LDP and wider planning process. A summary of facilities include: • 21 Community Halls • 5 Sports Centres (including 3 Leisure Centres, 1 Active Centre, 1 Ski Centre) • 3 Libraries and 2 mobile libraries • 3 Parks –Pontypool Park and Shell Grotto, Folly Tower, Shell Grotto • 16 Play clubs for children/nursery • 11 Hotels/Guest Houses/Bed and Breakfast throughout the County Borough Football 1.57 In terms of recreation provision, overall there is a shortfall of grass pitch provision based on crude supply and demand analysis. There are 75 football pitches available for community use in Torfaen, accommodating 184 teams. A number of pitches have spare capacity but there are issues in relation to waterlogged pitches. There is anticipated to be an oversupply of senior pitches but a shortfall of junior/min pitches in the future. Overall there is deemed to be a shortfall of 1.5 pitches across the County Borough. Cricket 1.58 There are seven cricket pitches available for community use in Torfaen accommodating 45 teams. Pitch quality is generally good and current provision should be protected and further pitches may need to be sought in the future to ensure all clubs have access to two pitches. Rugby 1.59 Both codes of rugby are played in the County Borough and there are 28 rugby pitches accommodating 93 teams of which 4 are rugby league teams. Certain pitches in the County Borough are overplayed. There is anticipated to be an oversupply of senior pitches but a shortfall of junior/mini pitches in the future. Overall there is deemed to be a shortfall of 2.5 pitches across the County Borough.
Hockey 1.60 There are two, full sized pitches suitable to play competitive hockey, and current provision is adequate to meet the needs of hockey in Torfaen. However demand should be updated in five years to assess the future need in response to the merging of the two clubs. Provision of smaller multi use games area (suitable for hockey skills/practise) located on school sites could help to increase participation in the sport locally. Bowls 1.61 There are nine bowling greens, which provide flat greens. The distribution of provision is relatively well spread throughout the County Borough. Current demand is being accommodated on current provision and it is unlikely that future demand for bowling facilities will result in the need for new facilities. Golf 1.62 There are four golf clubs in Torfaen, and current provision is deemed satisfactory. Tennis 1.63 There are 58 tennis courts in TCBC and one tennis club. The level of provision and size varies between each site. The quality of both club and public courts is generally good and there is no unmet demand. Athletics 1.64 There is a synthetic athletics track in Cwmbran which is in good condition and there is no unmet demand or need for additional facilities. Play Provision for Children and Young People 1.65 There are 59 sites classified as play areas in Torfaen, equating to just over three hectares of provision. 1.66 Each significant settlement area across the County Borough has access to at least one children’s play area. The most plentiful provision is in Cwmbran. With the exception of North Pontypool and Ponthir, each analysis area has provision of at least one play area of NEAP standard. However, North Pontypool does have a SEAP sized play area. Almost half (46%) of all play area provision across Torfaen is of LEAP standard. However, there is also a significant amount of LAP provision 32%, suggesting that there may be opportunities to increase the size of some of these play areas to meet deficiencies. This highlights the opportunity to rationalise play area provision through investment in fewer sites of higher quality and value. 1.67 Several play areas within Torfaen are highlighted as being poorly located. Sites located, away from informal surveillance such as overlooking houses or pathways. In general, consultation identifies a perception that children under 12 years of age are well catered for in terms of access to play provision. However, consultation highlights that there is a lack of variety of play equipment. Assessment indicates that equipment does not often cater for a range of ages or abilities. There is also a lack of more challenging and adventurous play equipment suitable for older children (11+ yrs) e.g.zip wire, web climbers. There is also a clear lack of provision of interactive play equipment e.g. sounds, colour, touch, such as mirrors, sand pits, panel grids and talk tubes. 1.68 There is particular need for greater provision of spaces designated for use by young people (there is no provision in South Pontypool), of which they can take ownership, so that they can avoid being moved from place to place.
Quality 1.69 Consultation and site assessments identify that quality of play areas varies significantly across the Borough. Better quality play areas tend to be located in Cwmbran analysis area and poorer quality play areas in North Pontypool. However, several sites were identified as having no equipment or as having a significant amount of equipment removed. Unsurprisingly, these sites are marked low for quality and value. Vandalism is a perceived problem throughout the Borough. Consultation suggests most sites are vandalised on a weekly basis. Local Standards 1.70 Fields in Trust recommends a national minimum standard for outdoor recreation space of 2.4 hectares (six acres) for every 1,000 people. The Six Acre Standard aims to help land use planners ensure a sufficient level of open space to enable residents of all ages to participate in sports and games with an emphasis on access for children to play grounds and other play space. Based on the current population there are significant deficiencies against the six acre standard. Allotments 1.71 There are 43 sites classified as allotments in Torfaen, equating to just over 22 hectares. 1.72 There is no provision in Ponthir, although the majority of residents living here can access provision in Cwmbran. Although there is no provision in Henllys and Ponthir, there is some local demand and with promotion, provision would be well used. 1.73 There are gaps in North Pontypool and Cwmbran which should be priority areas for new provision. The mapping exercise highlights that 11% (9,705) of residents across Torfaen are currently not serviced by allotment provision. This is highest in North Pontypool, where 16% (3631) of its population is not serviced by provision. 1.74 The majority of allotment sites are currently operating at almost 100% capacity. The combined allotment waiting list across Torfaen, of 161, demonstrates that the high demand for allotments is not currently being met by provision. There is particularly high demand for more provision in South Pontypool, demonstrated by high waiting lists operated at sites in this area. 1.75 The largest site in operation is at Woodland Road with 83 plots, followed by St Dials Allotments (79 plots) and Tynewydd Road Allotments (70 plots). Even the largest sites operate a waiting list, with the greatest demand in Woodland Road, which has a waiting list of seven. 1.76 Throughout Torfaen there is a lack of promotion of allotments and the associated benefits of health and well being. However, as current provision cannot meet the high demand that already exists, it may not be in the best interest of users, for the time being, to promote the benefits of taking up an allotment as further demand may be generated. This could, in the future, be achieved through increased information accessible on the TCBC website, production and distribution of a promotional leaflet and establishment of allotment starter packs to provide relevant information for new tenants with tips regarding how to cultivate plots and achieve maximum benefit. Economic Activity 1.77 Torfaen suffers from a north –south split in terms of investment and private sector interest. Whereby the south of the borough attracts the greatest investment and economic activity, the north of the borough, does not attract such interest and the poor transport infrastructure to the north is a significant problem in generating economic development.
However, this tends to be dictated to a certain extent by business demand as locations in the south of the borough are generally more attractive for example due to improved transport infrastructure in terms of proximity to the M4. 1.78 Torfaen has 1725 businesses registered for VAT in 2007, an increase of 155 from 2005. Between 2003 and 2007 the number of VAT registrations in Torfaen increased from 9.8-9.9%. During the same time period business de registrations fell from 7.3-7.2%. Therefore this data shows there was a growth in business start ups and a corresponding decrease in the number of businesses closing down. The number of de registrations was relatively low compared to other local authorities in SE Wales. 1.79 Commuting statistics for Torfaen indicate that 4,500 of the population commute outside the borough for work purposes. In order to redress this issue and the corresponding issue that the borough has had nil growth in population over the ten year period 1991-2001; there is a need for the economy to diversify in order to attract increased employment opportunities and attract people into Torfaen. One issue that has been identified is the fact that old business estates in Torfaen do not satisfy the demands of new businesses looking to locate into the area. 1.80 The number of people economically inactive between 2000 and 2005 equated to 25.1% of the workforce, but this figure was below the Welsh average of 28.1%. Between 2008-2009 the figure had risen to 28.0% and the data indicates that Torfaen has the highest % of economically inactive people in comparison to other surrounding authorities and is above the welsh average of 24.6%. Reducing the numbers of economically inactive in the borough should be a key aim, and the promotion of increased employment opportunities in Torfaen will be a key facet in reducing this figure. 1.81 Data from the 2008 Annual Population Survey in relation to Employment by sector indicates that the largest employment sector in Torfaen The data indicates that Torfaen has a heavy reliance on Public Admin., Education and Health employment, with this industry accounting for approximately a third of all employment in Torfaen. Other important industrial employers in Torfaen are Manufacturing and Distribution, Hotels and Restaurants. In terms of satisfying objectives to diversify the economy, it would be an objective for employment in other sectors to increase. Minerals 1.82 Torfaen is not self sufficient for aggregates, and the South Wales Regional Aggregates Working Party has apportioned an aggregates allocation to Torfaen; details of this are discussed in the following paragraphs. The previously worked high PSV sandstone, a national important mineral at Tirpentwys, will need to be considered for safeguarding in the LDP. Similarly there is a requirement to safeguard economically viable and environmentally acceptable coal reserves and therefore the importance of mineral extraction should be considered in the LDP. In order to meet a proportionate share of demand, Torfaen as MPA should assess the potential to make a resource allocation in the LDP of 5-6 million tonnes for the Plan period. Also limestone/sandstone resources should be investigated and safeguarded for possible future use. 1.83 There are no active sites or reserves of aggregate minerals. Unworked resources of Carboniferous sandstone exist in areas of high and medium environmental capacity. A narrow outcrop of Carboniferous Limestone runs along the eastern flank; this has a generally low environmental capacity and may be physically difficult to work, not withstanding any planning constraints. 1.84 Some secondary aggregate sources (foundry sand / colliery shale) may be available
for substitution, but the sources are not significant in tonnage or quality terms. Regeneration schemes in this area are likely to produce CD&EW, which has potential use as aggregate. Although the MPA area is not on the coast, it is within 30 km of the marine wharves in Newport. 1.85 There has been no aggregate produced for several years so an “existing share” cannot be stated. On the basis of a per capita approach, the SE Wales Regional Technical Statement on aggregates identifies that Torfaen would be expected to produce 25% of the joint total equating to 5 – 6 Mt over the next 15 years. Retail 1.86 Torfaen has three main shopping centres at Cwmbran, Pontypool and Blaenavon. Within the regional retail hierarchy Cwmbran is identified as a Minor sub regional centre, Pontypool and Blaenavon are identified as District Centres. Cwmbran is the largest retail centre in the Torfaen administrative area and continues to function as the principal retail centre in Torfaen. The retail turnover of the centre far outstrips the other town centres of Pontypool and Blaenavon. It will be important to ensure that additional growth in Cwmbran does not demonstrably detract from the health of surrounding towns; in particular Pontypool and the LDP strategy will need to ensure that the role and function of the smaller shopping centres of Pontypool and Blaenavon are enhanced. 1.87 Zone A rental values for properties in a prime position in the town centre are relatively high in Cwmbran. This is expected given the town’s position in the sub regional hierarchy, which is lower than the major sub regional centre of Newport. Lower order centres, particularly Pontypool, portray a relatively low value. The figures reinforce Cwmbran’s position within the sub regional hierarchy and as the primary shopping centre in the County Borough. Tourism 1.88 The total number of visitors to attractions in Torfaen increased from 206,280 visitors in 1999 to 340,825 in 2005. Whilst this increase, is favourable this indicator does not include all visitors to Torfaen, therefore these ‘hidden visitors’, could add significantly to these totals. Therefore, the measured figures suggest an approximate 65% increase in visitors over the six-year period. Building upon our tourism potential should be a significant aim of the LDP, which will contribute to achieving economic development. 1.89 In 2005 Torfaen had 852,000 visitors, with 1083,000 tourist days spent in the borough. The number of visitors has increased by 228,000 between 1999 and 2005 and the number of tourist days has increased by 238,000 during the same time period. It is also important to note that the natural environment in Torfaen should be capitalised on and will assist in achieving tourism targets. Transport 1.90 It is estimated the volume of motor traffic on all roads in Wales in 2009 has decreased by 1.4% compared to 2008 levels. The volume of traffic on roads in general in Wales has increased from by 12.1% from 2000-2009.17 The volume of traffic in Torfaen (billion vehicle kilometres) has increased from 0.56 to 0.64 over the period 2001-2009. In any case, in common with the rest of the UK traffic growth will increase and the LDP Strategy has an important role in attempting to reduce this trend. 1.91 Travel distances to work between 2km-5km, involve the highest percentage of the population. 65.7% of the population rely on the private car for their work journey, with only 10% of the population walking or cycling. In terms of car ownership, 46% of the population own 1 or more cars with 27% not owning a car.
1.92 Figures for road length by road class in 2010 (km) indicate that Torfaen has 1.6% of the total Wales road network. Torfaen has 14km of Trunk Road, of which 1km is built up. It has 26km of County roads, of which 16km is built up. The Regional Transport Plan includes a 5 year Capital Investment Plan for a prioritised programme of work. Schemes in Torfaen include: • Additional train services to provide at least half hourly frequencies and encourage an increased modal transfer on the Abergavenny - Newport - Cardiff rail corridor which is also proposed for capacity improvement works; • Train station improvements (including Pontypool / New Inn Park and Ride/Share) and integration measures across the region (improvements at Cwmbran Train Station listed in the RTP have already been completed); • Improvements to the Pontypool - Cwmbran - Newport strategic bus corridor; • Improvements at Cwmbran and Pontypool bus interchanges; • New cycle routes in Blaenavon; • Road improvements to make better use of the A472 / A4043 New Inn to Blaenavon. (This is being investigated through the North Torfaen Highway and Regeneration Study, which is looking at ways to improve the efficiency of the road network in North Torfaen.); and • Improvements of the A4051 at Malpas in Newport. Whilst this scheme is not within Torfaen it will assist in improving the efficiency of the road network serving Torfaen. 1.93 There are train stations on the ‘Marches’ main railway line (Newport to Shrewsbury, South to Mid Wales) at Cwmbran and Pontypool & New Inn in Torfaen. Train services from Cwmbran and Pontypool/New Inn are currently not completely clock face (at the same time past the hour all day), with more trains stopping at Cwmbran. Cwmbran Train station has recently undergone major improvements as a new Park and Ride facility (additional car parking, bus waiting and layover area, improved pedestrian & cycle routes and enhanced signage). 1.94 The coverage and quality of the local bus network in Torfaen is very good; therefore, as there is spare capacity on most of these buses, there is an opportunity for modal shift. The National cycle route NCN Route 46 runs north/south through Torfaen (from Abergavenny to Newport, via Brynmawr, Blaenavon, Pontypool and Cwmbran), the majority of which is off road. 1.95 The need to discourage the reliance on the private car will be helped with improvements in the public transport system in Torfaen. Data has illustrated a poor quality rail network, with frequency of services and unreliability being key problems. In achieving a sustainable transport infrastructure there will be a need to improve the cycling and walking network in Torfaen. Particularly, in Torfaen there is a lack of roadside footways in many areas, especially the north of the County Borough in the older areas not designated for vehicles. 1.96 For Torfaen in 2008 the majority of people living in Torfaen also worked in the County Borough, whilst the majority of workers in the County Borough lived in Torfaen. A substantial proportion of the working population living in Torfaen worked outside of the area (approximately 38.2%). Also many people working in the Borough lived outside of the area (approximately 30.7%). Torfaen is part of a wider South East Wales region in relation to living and working patterns as people do not stay necessary live and work in the same area, often commuting between adjoining local authorities. 1.97 In common with many adjoining local authorities the bulletin highlights that residents of Torfaen are less likely to work within their own county (at 62%) than the Welsh average (at 71%), with Torfaen having a net outflow of 4,500 commuters. This can be seen in the table below and gives further credence to Torfaen being part of a wider regional area within South East Wales in relation to living and working patterns.
1.98 There has been difficulty in obtaining passenger numbers for public transport usage in Torfaen on commercial carriers. However data has been sourced for passenger information on local bus services which are subsidised by TCBC, which excludes commercially operated bus services. The estimated number of passengers per annum via the Torfaen Bus subsidy Budget is 118,416. The number of passengers per annum using Local Transport Service Grant is 179,790. 1.99 The total number of concessionary journeys (persons in receipt of a concessionary bus pass because they are eligible due to age or disability) in 2009/2010 was 2153233.. Waste Municipal Waste Arisings 1.100 Statistics on municipal waste arisings show that Torfaen has reduced its municipal waste arisings overall from 52,783 tonnes during 1998/1999 to approximately 46,440 tonnes during 2009/2010. This compares to other adjoining local authorities and the figures for the South East Wales region as a whole, where on the whole municipal waste arisings increased from the period 1998/1999 to 2005/2006, but have then shown a decrease year on year up to 2009/2010. Waste reused/recycled/composted Percentage of municipal and household waste reused/recycled/composted 1.101 Statistics on municipal and household waste reused/recycled/composted shows that the percentage of waste recycled in Wales has risen by 35.7% over an 11 year period. For Torfaen that figure over the same 11 year period has risen by 42.8%, diverting 47.5% of its waste from landfill in 2009/2010. This shows that Torfaen is performing increasingly well in waste recycling. Total waste reused/recycled 1.102 The total tonnage of waste reused or recycled increased from 8,400 tonnes in 2006/7 to 11,100 tonnes in 2008/9 for Torfaen. Municipal waste disposed of by landfill and incinerated 1.103 The latest trends show that both for Torfaen and Wales as a whole, the amount of municipal waste disposed of by landfill and incinerated has decreased year on year from 2005/2006 to 2009/2010. In particular the amount of municipal waste disposed of by landfill and incinerated has decreased in Torfaen from 45,450 tonnes disposed of in 2005/2006 to 26,637 tonnes disposed of in 2009/2010. Residual household waste produced per dwelling 1.104 Residual household waste produced per dwelling for Wales as a whole and for Torfaen and its adjoining local authorities has decreased year on year from 2007 to 2010 (in quarterly periods). For example during the period January to March 2007 residual household waste produced per dwelling for Torfaen was at 207.30 kilogram’s; this figure had decreased to 159.86 kilogram’s produced per dwelling for Torfaen during the period January to March 2010. Major Landfill Sites & Landfill Gas 1.105 There are no current or proposed landfill sites in Torfaen. However there are a number of former landfill sites that have been identified as requiring monitoring on a monthly basis due to their methane emissions, namely Tirpentwys Tip in Pontypool, Maendy Way Tips in Cwmbran and Ty Coch Tips in Cwmbran. There are also other five other former landfill sites within Torfaen which have been identified as ‘low risk’ by reason of the nature and concentrations of the ground gas emissions.
Existing Waste Management Infrastructure 1.106 During 2005/2006 Torfaen had a total of 5 Licensed and Permitted Non Landfill Facilities, compared to 10 for Monmouthshire and 19 for Newport. The review of potential areas for new waste facilities (B2 industrial land) indicates Torfaen has 25.6 hectares of potentially suitable sites for waste facilities. 1.107 The Regional Waste Plan 1st Review provides an estimate for each Council, based upon how much waste it produces, of the total land area required for new in-building waste facilities. For Torfaen this is between 4.4 - 8.0ha depending on the technologies used. Recycling 1.108 Torfaen has a number of recycling stations available throughout the County Borough, including one Civic Amenity Site at Panteg Way, New Inn and around 20 Bring Bank Sites (offering collection of materials including paper, glass etc). In addition kerbside collections also take place through the County Borough. Waste Imports / Exports 1.109 Figures show that Torfaen exported a total 56,927 tonnes of waste during 2001/2002. This compared favourably to neighbouring local authorities at the time; for example Newport imported a total 150,603 tonnes of waste and Monmouthshire exported a total of 27,532 tonnes of waste during this period. Authorities such as Torfaen at the time were net exporters of waste during this period mainly due to the location of the landfill sites (in Merthyr Tydfil, Rhondda Cynon Taff and Blaenau Gwent - 271,000, 132,000 and 121,000 tonnes respectively) or specialist facilities (metal recycling in Cardiff - 335,000 tonnes). However, these figures should have reduced since 2001/2002, with the reduction in waste going to landfill and as authorities provide regional treatment facilities and the diversion of waste to recycling and composting. Commercial and Industrial Waste 1.110 Figures for Torfaen relating to commercial and industrial waste show that from the period 1998/1999 to 2002/2003, commercial and industrial waste arisings combined decreased from 137,700 tonnes combined in 1998/1999 to 73,133 tonnes combined in 2002/2003. This is in line with the pattern for adjoining local authorities and the South East Wales region as a whole. Construction and Demolition Waste 1.111 With regards to construction and demolition waste, during 2000/2001, Torfaen produced 152,608 tonnes of construction and demolition waste. This compared favourably to neighbouring local authorities at the time. Hazardous Waste 1.112 Figures for 2003 and 2004 show that Torfaen has dealt with a comparable amount of hazardous waste compared to adjoining local authorities. For example, during 2004 Torfaen dealt with 10,906 tonnes of special waste compared to 2,322 tonnes for Monmouthshire and 138,782 tonnes for Caerphilly. Such figures show that hazardous/special waste is an issue which will need to be dealt with in planning for future waste provisions within the South East Wales area. Other Types of Waste 1.113 Torfaen has had to deal with varying types of waste over recent years, examples including End of Life Vehicles (ELVs), with the weight of ELVs at 3,580 tonnes for Torfaen during 2001, and Waste Electrical and Electronic Equipment (WEEE), with 1,556 tonnes disposed of during 2000.
Specific Types of Waste Recycled 1.114 Torfaen has recycled different types of waste during recent years, including packaging waste (recycling/composting 5 tonnes of municipal cardboard beverage packaging during 2009/10) and tyres (recycling/composting 10 tonnes of municipal car tyres during 2009/10). Waste Key Issues Summary • Waste reused/recycled has considerably increased over the past 10 or so years for Torfaen, whilst municipal waste arisings (including residual household waste per dwelling) for Torfaen has on the whole reduced over the past few years. • Municipal waste disposed of by landfill and incinerated has decreased year on year for Torfaen and Wales as a whole from 2005/2006 to 2009/2010. • There are no current or proposed landfill sites in Torfaen whilst Torfaen has a number of recycling sites throughout the County Borough. During 2005/2006 Torfaen had a total of 5 Licensed and Permitted Non Landfill Facilities, compared to 10 for Monmouthshire and 19 for Newport. • Figures show that Torfaen exported a total 56,927 tonnes of waste during 2001/2002. This compared favourably to neighbouring local authorities at the time and is expected to have reduced further during recent years. • Other types of waste dealt with in Torfaen include commercial and industrial waste, construction and demolition waste and hazardous waste. Torfaen has recycled many different types of waste during recent years, including packaging waste and tyres. Population Overall Population 1.115 The County Borough has a population of around 90,94922 making it the 6th (out of 22) smallest local authority in Wales. Torfaen County Borough comprises of three key settlements and a number of smaller villages, many of which are located on the valley floor of the Afon Lwyd Valley which runs north to south through the County Borough. Population Breakdown between Areas 1.116 The largest settlement in Torfaen is Cwmbran. Cwmbran is located in the south of the County Borough and had a population of some 49,174 people recorded at the time of the 2001 Census. Another key settlement in Torfaen is Pontypool. Pontypool is located in the centre of the County Borough, with a population of some 36,012 people recorded for this settlement and surrounding area at the time of the 2001 Census. The smallest of the key settlements in Torfaen is Blaenavon. Blaenavon is located in the north of the County Borough and is substantially smaller that Cwmbran and Pontypool with a population of 5,763 people recorded for this settlement at the time of the 2001 Census. Population Composition 1.117 In relation to the composition of people that lived in Torfaen at the time of the 2001 Census, residents were predominantly born in the UK at 98% of the total population, 11.1% of residents aged over 3 years old were classified as Welsh speakers and the majority ethnic group was white, making up 99.1% of the total population. The structure of the population for Torfaen at the time of the 2001 Census is shown in the table below. This shows a fairly even distribution of the population between 5 year age bands with a decrease in the number of people after the age of 60. Age Group All People Male Females TORFAEN 90,940 44,014 46,926 0 to 4 5,256 2,682 2,574 5 to 9 6,284 3,242 3,042 10 to 14 6,562 3,353 3,209
15 to 19 5,794 3,071 2,723 20 to 24 4,612 2,195 2,417 25 to 29 5,139 2,532 2,607 30 to 34 6,242 2,902 3,340 35 to 39 6,962 3,416 3,546 40 to 44 6,252 3,120 3,132 45 to 49 5,985 2,946 3,039 50 to 54 6,522 3,301 3,221 55 to 59 5,518 2,794 2,724 60 to 64 4,529 2,199 2,330 65 to 69 4,403 1,973 2,430 70 to 74 3,888 1,691 2,197 75 to 79 3,443 1,473 1,970 80 to 84 2,101 714 1,387 85 to 89 990 306 684 90 to 94 376 90 286 95 to 99 70 14 56 100 and over 12 0 12 Table Source: 2001 Census Population Trends 1.118 The overall population of Torfaen has remained fairly constant over the past decade from the year 2001 to 2009 staying at a level between 90,000 to 91,000 people. However there has been some variation in the population within the County Borough with some areas experiencing a population decline during recent decades. This is particularly prevalent in the north, where the north of the County Borough’s population (incorporating the Abersychan and Blaenavon wards) has fallen by 3.9% between the periods of the 1991 and the 2001 Census. The more populated Cwmbran area in the south has had a population increase of 2.9% over the same period. 1.119 Latest 2008-Based Population Projections indicate that the population of Torfaen is projected to remain relatively constant during the initial years of the projection period up until around mid-2019 before decreasing up to mid-2033 by when the population is projected to have decreased by 1,500 (1.6 per cent) from mid-2008. 1.120 The 2008-Based Population Projections indicate that the number of people age 65+ in Torfaen will rise significantly from 16,300 in mid-2008 to 24,700 by mid-2033. 1.121 Trends from 1996 to 2000 indicate a decrease in the number of live births in Torfaen over this period as there were 1185 live births in Torfaen during 1996 and this figure had decreased to 957 live births in Torfaen during 2000.26 The most recent actual data shows that births in Torfaen have fluctuated from 2003/04 to 2007/08. Latest 2008-Based Projections indicate that births are projected to generally decrease slowly during the initial years of the projection period, before decreasing at a faster rate from around 2016/17 onwards. 1.122 In relation to deaths the most recent data shows that deaths in Torfaen dipped in 2005/06 and then increased to 2007/08. The latest 2008-Based Projections indicate that deaths are projected to continue decreasing until around 2018/19, before increasing from this period onwards. This is in line with the general pattern expected to be seen across Welsh local authorities. 1.123 The aim of the Torfaen LDP will be to focus growth in the key settlements of Cwmbran and Pontypool, ensuring that they are successful and function as service hubs for the surrounding settlements. The key focus will therefore be to ensure a stable or net gain of
migration into the area, complimenting the role of the key towns and service hubs where people should be able to feel that they can stay in the area and do not need to move in order to gain access to jobs and services. This reflects the strategy of creating strong sustainable communities as part of the wider South East Wales Capital Region, as set out in the 2008 Update to the Wales Spatial Plan (dated July 2008). The future population level will depend on whether or not a stable or net gain of migration can be achieved and if the trends in population figures from recent decades are carried forward into the future. The future population and housing strategy of the LDP will therefore deviate from the latest set of population projections by looking to create growth rather than population decline. In terms of future population levels this will have a significant affect in relation to the need for new development areas and additional pressures that this will bring on infrastructure, services and the environment. Population and Employment 1.124 Torfaen has a large number of people employed in the public administration, education and health sectors, with these sectors accounting for over a third of all employment in Torfaen (at 36.4% for 2008).29 This is similar to employment levels in these sectors for Wales as a whole with an estimated 32.9% of employed people working in these sectors during 2008. Manufacturing is another major employer in Torfaen, with an estimated 20.4% of employed people working in the manufacturing sector during 2008, compared to 13.7% for Wales as a whole. 1.125 Taking into account the latest Annual Population Survey data, it is estimated Torfaen has a higher percentage of employed people working as process, plant and machine operatives than the Welsh average (at 10.3% for Torfaen compared to 7.3% for the Welsh average) for the period April 2009 to March 2010. Conversely Torfaen has a lower percentage of employed people working in professional occupations (9.5% for Torfaen compared to 12.5% for the Welsh average) for the period April 2009 to March 2010. 1.126 With regards to unemployment rates, unemployment in Torfaen for age 16 to 64 year olds is estimated to be 10.6% compared to a figure of 8.6% for Wales as a whole over the period April 2009 to March 2010.32 The unemployment rate for Torfaen at the time was also higher than some adjoining authorities; for example Newport at the time had an estimated unemployment rate of 10.1% and Monmouthshire 5.8% 1.127 The high unemployment rate is reflected in the estimated high percentage of economically inactive people of working age in Torfaen. For the period April 2009 to March 2010 it is estimated that 30.3% of people in Torfaen between the ages of 16 to 64 were economically inactive, compared to the Welsh average figure of 27.3%. As with the unemployment figures, the neighbouring authorities of Monmouthshire and Newport have an estimated percentage of economically inactive people of working age which is lower than for Torfaen at 24.1% and 26.2% respectively. 1.128 In common with neighbouring authorities, Torfaen’s residents are less likely to work within their own county than the residents for Wales are as a whole. For example, the percentage of residents living in Torfaen that also work within the County Borough stood at 62% in 2008 as taken from the latest Statistical Bulletin on Commuting in Wales, compared to 71% of residents for Wales as a whole. Torfaen has a net outflow of commuters with 4,500 more people travelling out of the local authority to their place of work, rather than travelling into the area to work. This gives rise to a need to create sustainable communities within Torfaen in order to increase services and jobs for local people within the County Borough and further beyond as part of the South East Wales region. Population and Income 1.129 There are large numbers of people within the County Borough living on low incomes
as is highlighted by recent figures on annual pay. For 2010, annual pay (gross) figures showed that the mean income for people living in Torfaen was £22,330. This figure is lower than the figure for the mean income of people living in Wales as a whole at £22,406 and for the mean income of people living in Monmouthshire and Newport, at £27,755 and £24,207 respectively.
Population and Households 1.130 The 2006 Newport, Torfaen and Monmouthshire Household Survey undertaken as part of the Local Housing Market Assessment at the time indicates that 67% of all properties in Torfaen are either owned outright or owned with a mortgage. This is a lower percentage figure than for the sub-regional area combining Monmouthshire, Newport and Torfaen as a whole where for this sub-region a figure of just over 70% was recorded. 1.131 Torfaen has a high percentage of people renting properties with the 2006 Newport, Torfaen and Monmouthshire Household Survey indicating that 33% of all properties in Torfaen are rented, compared to 29% for the sub-regional area of Monmouthshire, Newport and Torfaen as a whole. 40 This indicates a particularly high level of rented housing in Torfaen when also taking into account the sub-regional area incorporating Newport and Monmouthshire. 1.132 Figures from 1998 indicated that Torfaen had 11.3% unfit homes, which is substantially higher than the Welsh average of 8.5% at the time. The rates of unfitness in both the owner occupied and social rented sector, at 10.8% and 11.9% respectively, were both considerably higher than the respective all Wales average rate of unfitness. Whilst no recent data exists for Torfaen, recent figures for all of Wales show a decrease in the rate of unfit homes from 8.5% in 1998 to 4.8% in 2004. This indicates that the number of unfit homes is decreasing over time across Wales and therefore this may be less of an issue in the future than it has been in previous years. 1.133 The 2007 Torfaen, Newport and Monmouthshire Local Housing Market Assessment (and 2010 Update document) identifies three specific local housing markets for Torfaen, namely the Cwmbran Housing Market Area, Pontypool Housing Market Area and North Torfaen Housing Market Area. These housing market areas are defined as the geographical area in which a substantial majority of the employed population both live and work and where those moving house without changing employment choose to stay. Each housing market area has distinctive characteristics in relation to housing types and population. Torfaen contains some of the least prosperous housing market areas within the sub-regional area of Monmouthshire, Newport and Torfaen as a whole. 1.134 The 2010 Update to the Joint Local Housing Market Assessment identifies affordable housing need for the County Borough. Constrained (as based upon LDP policy targets) and unconstrained figures have been produced in this regard. Taking Torfaen in isolation, the constrained figures require a total of 1,100 dwellings out of 2,156 to be affordable in Torfaen over a 5-year period, equating to an affordable housing need of 51%. However taking Torfaen as part of the sub-region of Monmouthshire, Newport and Torfaen, for this sub-region the constrained figures imply that there is a requirement for 2,205 out of 6,950 dwellings to be affordable over a 5-year period, equating to an affordable housing need of 32%. The unconstrained figures for Torfaen specify a net housing requirement of 1,540 houses to be delivered over a 5-year period, with an affordable housing need of 59% (equating to 904 dwellings). In terms of delivery it is important to consider the constrained figures foremost as they are more realistic because they are based upon local policy targets of the number of houses Torfaen are likely to deliver over the remaining LDP period up to 2021. All the above sets of figures indicate a relatively significant affordable housing need for Torfaen up to the end of the LDP period in 2021.
1.135 As has been indicated in figures above and the 2007 Local Housing Market Assessment, household income in Torfaen is lower than for the neighbouring authorities of Monmouthshire and Newport and is lower than for the sub-region of Monmouthshire, Newport and Torfaen as a whole. This implies that people in Torfaen cannot afford to spend as much on housing as the rest of the sub region and therefore identifies a need for a suitable level of affordable housing to be provided within the County Borough. 1.136 Average house prices for Torfaen are generally lower than those for neighbouring authorities and for Wales as a whole (excluding Caerphilly and Blaenau Gwent). The average house price in Torfaen (as based upon sales and valuations) during September 2010 was £134,539, compared to the Welsh average of £168,331. However it should be noted that there may be differences between the average house prices of the different housing market areas within Torfaen. During recent years, in line with the rest of the UK, average house prices for Torfaen have increased on the whole but decreased more recently due to the recession. I.e. the average price for a household in Torfaen during March 2002 was £64,655 and this had risen to £147,247 by March 2008. However house prices have decreased on the whole between March 2008 and September 2010 and this trend is likely to continue until the economic climate picks up. 1.137 Housing demographics indicate that there are 7.2 people per hectare living in housing for Torfaen compared to 1.4 people per hectare living in housing for the Welsh average. This shows that Torfaen has an above average number of people per hectare living in housing compared to Wales as a whole; Torfaen is ranked 2nd out of the 22 local authorities for Wales in this regard. 1.138 As taken from the latest set of household/population projections, Torfaen has a high average projected household size in comparison to the average for Wales as a whole, with an average projected household size of 2.31 people per household in 2008 compared to the Welsh average of 2.27 projected people per household in 2008. Torfaen is ranked joint 4h
highest out of the 22 local authorities in Wales for average projected household size. 1.139 Figures as taken from the annual Joint Housing Land Availability Study show that the annual housing land supply had increased during the last few years before 2007, with the housing land supply having risen from 3.0 years in 2004 to 10.2 years in 2007 when set against the past five year build rates. This is due to the progressing of several large housing sites within the County Borough over this period. However, the annual housing land supply decreased overall from 10.2 years in 2007 to 5.9 years in 2010; this downward trend may continue in forthcoming years due to the current economic climate impacting on number of houses granted planning permission in Torfaen, which in turns affects the housing land supply. The latest Housing Land Availability Study states that Torfaen should have at least a five year available supply of housing land to support future growth in the County Borough. 1.140 Recent information on homelessness household decisions show that Torfaen has dealt with a comparable number of homeless households when compared to adjoining authorities for the period July to September 2009. For instance for this period, 83 households were reported as eligible homeless in Torfaen, compared to 66 for Blaenau Gwent, 63 for Caerphilly, 40 for Monmouthshire and 165 for Newport. This indicates that whilst homelessness is a problem in Torfaen, it is not significantly more of an issue in Torfaen than it is for neighbouring authorities in South East Wales. Population and Education 1.141 With regards to education statistics, an estimated 17.1% of people in the County Borough aged 16 to 64 have no formal qualifications, with some 13.6% of people aged 16 to 64 having a degree or equivalent qualification or above for the period January to December 2009. This compares poorly to the Welsh average; for Wales as a whole 15.0% of people
aged 16 to 64 have no qualifications, with 18.7% of people aged 16 to 64 having a degree or equivalent qualification or above for the period January to December 2009. 1.142 The geography of Torfaen is that of a self contained valley with three distinct centres of population, namely Cwmbran in the south, Pontypool in the centre and Blaenavon in the north. These distinct communities lend themselves to a schooling system with relatively well-defined boundaries. Principally 39 primary schools, 8 secondary schools, 1 special school, 3 nursery schools and Coleg Gwent, Pontypool campus provide education for the 3-19 age groups in Torfaen. There are eight secondary schools within Torfaen, five of which have on site sixth form provision. The Pontypool campus of Coleg Gwent is the principal provider of post 16 education to pupils that attend schools without on site sixth form provision. Post 16 education is a significant concern due to uncertainty and influence over the differing provision of post 16 education and training in the North and South of the County Borough. 1.143 The education achievements of pupils in the County Borough with GCSE grades are positively comparable with some neighbouring authorities and for Wales as a whole. The estimated proportion of 16 to 19 year olds with GCSE grades A to C or equivalent for Torfaen was recorded at 50.3% for the period January to December 2009. This compares to 52.4% of 16 to 19 year olds for Blaenau Gwent, 45.6% for Caerphilly, 36.7% for Monmouthshire, 46.8% for Newport and 47.1% for Wales as a whole. 1.144 Torfaen has a low percentage of people staying on in full time education in comparison to Wales as a whole with 77.8% of 16 year olds (Year 11 pupils) in Torfaen staying on in full time education compared to the Wales average of 82.2%. 1.145 Torfaen performs poorly in comparison to neighbouring authorities and is below the Welsh average in terms of numeracy and literacy skills; 25% of people in Torfaen are seen as having no basic numeracy and literacy skills compared to 22% for the South 4.9.5 Both proposals are for improvements to the road infrastructure in place, rather than new road development and, as such, the impact of small-scale improvements on the risk of flooding is likely to be minimal, with the significant benefits gained from the improvements put in place outweighing the minimal risk. There will be a requirement in accordance with TAN 15 for a flood consequences assessment to be undertaken, although due to the minimal impact of the development it would be more appropriate for this to be undertaken at planning application stage as the timescale for these improvements to be undertaken will depend on the timing of other allocations coming forward since these will facilitate the necessary funding for such improvements. 1.146 The 2008 Welsh Index of Multiple Deprivation for Torfaen indicates large variants in educational deprivation across the County Borough.55 Therefore there is a need to improve education skills across the County Borough in order to reduce variances of education deprivation and to address the current lack of qualifications that people currently possess. Population - Key Issues Summary • The County Borough is one of the smallest in Wales (6th smallest out of 22 local authorities for Wales) and has a varying population between its specific settlement areas. • Latest 2008-Based Population Projections predict a decrease in the overall population for the County Borough from 2008 to 2033, however there is predicted to be an increase in the number of people aged 65+ over the same period. • People within the County Borough are largely employed in the public administration, education, health and manufacturing sectors. However the County Borough has a high unemployment rate when compared to Wales as a whole and some adjoining local authorities. • In relation to the local population and households, people in Torfaen generally have relatively low incomes and a relatively high affordable housing need in comparison to
other areas. • Education statistics indicate that the County Borough has a poor educational achievement performance in comparison to other areas within Wales, although Torfaen has done well in GCSE grade performance for 16 to 19 year olds during 2009. Soils Contaminated Land 1.147 The County Borough has an industrial legacy and therefore remediation of contaminated sites should be promoted through the plan. Around 1,800 potentially contaminated sites have been identified in Torfaen to date. Much of the land contamination within Torfaen can be attributed to the long industrial heritage of the area which largely revolved around the exploitation of coal and production/processing of steel. Soils and Agriculture 1.148 In 2009 it was estimated that Torfaen had at least 3,640 hectares of area farmed, based upon Welsh Assembly Government statistics. What with climate change, it is considered that farmers should adapt to maintain or enhance their ability to adapt to change and take steps to reduce emissions of greenhouse gases. Use of Brownfield Sites (Previously Developed Land) 1.149 The percentage of brownfield completions over the past 3 years for Torfaen has decreased year on year from 88% during 2007/2008 to 71% during 2009/2010. Future trends for the next five years (2010-2015) indicate that there will be a 66% contribution from brownfield land towards housing completions. Water 1.150 The Development Advice Maps issued with Technical Advice Note 15: Development and flood Risk indicate that there are certain areas without significant flood defence infrastructure and are therefore at increased risk from flooding. Torfaen Zone C2 floodplains generally follow the course of the Afon Lwyd and its tributaries from Blaenavon in the north through the centre of Pontypool and Cwmbran in the south, with the width of the zones gradually increasing as one travels south down the valley. Affected areas are more prominent in the southern part of the borough. Areas at greatest risk from flooding are listed in the baseline data table. 1.151 Areas with relatively extensive C2 zones include firstly to the north of the County Borough, the south west of Gilchrist Thomas Industrial estate (near Blaenavon), Emlyn Road, Garndiffaith, parts of the British site in Talywain, secondly to the centre of Torfaen near Pontypool, the Usk road site at Mamhilad and the New Inn/Pontymoile roundabout area, and finally to the south of the borough, parts of Pontnewydd, Northville, Croesyceiliog, Llanyrafon, Llantarnam Industrial Park and Ponthir. Environment Agency figures indicate the number of properties at risk from the 0.1% (1 in 1000year) extreme flood event is 2288. The figure for properties at risk from the 1% (1 in 100 year) flood is 1736. Avoiding development on floodplains and reducing floodrisk will be a key issue for the LDP. 1.152 The Afon Lwyd is the main river in Torfaen and descends from its source at Garn-yrerw to join the River Usk at Caerleon. This river flows through the valley from Blaenavon in the north to Ponthir to the south. Above the Pontypool gap the Afon Lwyd has only one tributary in the east which contrasts with the western slope where there are several. The Monmouthshire and Brecon Canal is an important water resource also. Similarly Llandegfedd reservoir is also a major water resource. Public Water Supply Abstraction 1.153 The Talybont reservoir supplies all areas north of and including Pontypool, whilst
south of Pontypool is fed by Sluvad (Llantrisant abstraction from the River Usk) and Court Farm, from the Prioress Mill abstractions fed from the River Usk and supported from a transfer from the River Wye. Water Supply 1.154 Dwr Cymru have outlined that whilst there should be a water supply available to serve the proposed level of development, the Review Of Consents (Environment Agency) may have implications for the Wye and Usk river catchments in South East Wales. In respect of the availability of the water supply there could be potential for loss of supply during the plan period. Dwr Cymru would address this through future regulatory funding. Water Pressure 1.155 There were issues of low water pressure to the north of the County Borough, in Varteg, Talywain and Garndiffaith, due to the elevation of these communities. This issue has now been overcome following a programme of water mains upgrades, therefore the water pressure at both Cwmbran and Pontypool and North Torfaen is acceptable. Sewerage 1.156 Torfaen is unique in terms of its sewerage infrastructure as there is one major trunk sewer (the Eastern Valley Trunk Sewer (EVTS) that serves the County from north to south, culminating in waste water being treated at Ponthir Waste Water Treatment Works. In relation to sewerage capacities in Torfaen the EVTS is considered to be performing satisfactorily. Prior to the end of the plan period in 2021 the local sewerage networks will need to be upgraded to support the main trunk sewer. Dwr Cymru have identified that the capacity of the Ponthir treatment works is sufficient to accommodate the proposed level of development in the LDP, subject to appropriate phasing. They have outlined there is sufficient capacity within the sewerage network for the existing local plan sites, but again capacity will need to be addressed before the end of the plan period in 2021 Dwr Cymru has a long-term plan to improve the Eastern Valleys Trunk Sewer and this will assist in promoting economic development in Torfaen. Waste Water Treatment 1.157 Waste Water for the whole of Torfaen is treated at the Ponthir Waste Water Treatment Works (WwTW). Dwr Cymru have outlined the WwTW will be unable to accommodate the total allocations proposed without further improvements, therefore the rate and phasing of growth will have to be monitored by Dwr Cymru in order they can submit the necessary plans to deliver the infrastructure necessary to meet the future growth. Water Quality 1.158 The Biological and Chemical water quality of the watercourses in Torfaen has generally been improving over the last 9 years. In 2006 75% of the river length for Chemical Quality was classed as good and for Biological Quality 29.7% was classed as good. Biological Quality needs to continue to improve. 1.159 River Quality in terms of phosphate levels has been steadily increasing and 84.5% of the river length was classed as good in 2004. The quality of the river length in terms of nitrate levels has also generally increased but fell slightly between 2003 and 2004. 1.160 The Biological River quality is improving with rivers classed as ‘good’ improving by 13% over 11 year period. Whilst improving, the amount of river length classed as good quality performs poorly compared to neighbouring authorities. The amount of rivers classed as good quality in Torfaen has also declined over recent years. In line with Water Framework directive there is a need to ensure all inland water courses reach good standard by 2015. The LDP will need to have strong water protection and enhancement policies to reduce negative impacts on the water environment.

Groundwater 1.161 A large area of North Torfaen as outlined in Map 4.5 of the SAR has been designated a Source Protection Zone and are delineated to protect potable water supplies against the polluting effects of human activity. This will be particularly important where developments proposing non mains drainage.
Related Documents