Barings Investment Funds Plc (a variable capital investment company incorporated with limited liability in Ireland with registration number 392526) Interim Report & Unaudited Financial Statements For the financial period ended 31 October 2020

Welcome message from author
This document is posted to help you gain knowledge. Please leave a comment to let me know what you think about it! Share it to your friends and learn new things together.
Transcript
Barings Investment Funds Plc(a variable capital investment company incorporated withlimited liability in Ireland with registration number 392526) Interim Report & Unaudited Financial Statements For the financial period ended 31 October 2020
Barings Investment Funds PlcInterim Report and Unaudited Financial Statements
ContentsFor the financial period ended 31 October 2020
Directors and Other Information 1
Introduction 3
Investment Objective and Policy 4
Investment Managers’ Report 8
Statement of Financial Position 18
Statement of Comprehensive Income 25
Statement of Changes in Net Assets Attributable to Holders of Redeemable Participating Shares 31
Notes to the financial statements 37
Schedule of InvestmentsBarings China A-Share Fund 62
Barings Europe Select Fund 64
Barings European Opportunities Fund 68
Barings German Growth Fund 71
Barings Global Dividend Champions Fund 74
Barings Global Equity Allocation Fund 76
General information 90
Appendix 1 – Information for investors in Switzerland 91
Appendix 2 – Information for investors in Germany 94
Appendix 3 – Additional information Hong Kong Code 95
Appendix 4 – Significant Changes in Portfolio Composition 97
1
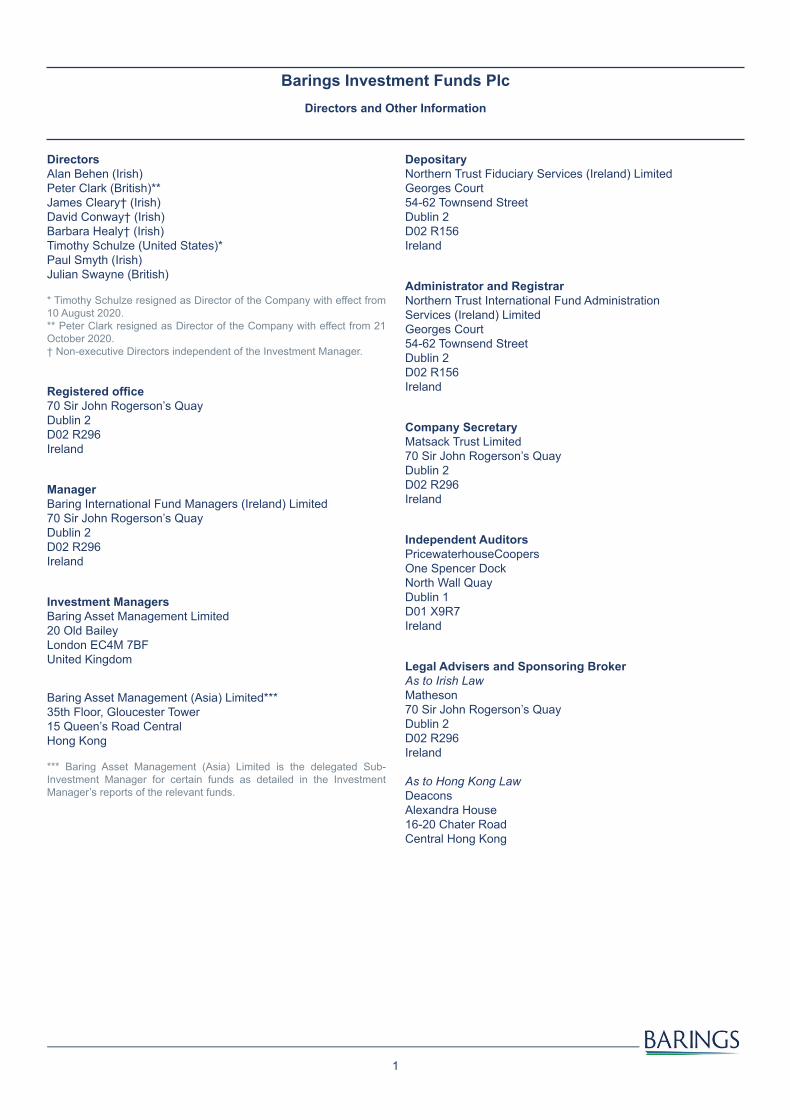
Barings Investment Funds PlcDirectors and Other Information
DirectorsAlan Behen (Irish)Peter Clark (British)**James Cleary† (Irish)David Conway† (Irish)Barbara Healy† (Irish)Timothy Schulze (United States)*Paul Smyth (Irish)Julian Swayne (British) * Timothy Schulze resigned as Director of the Company with effect from 10 August 2020.** Peter Clark resigned as Director of the Company with effect from 21 October 2020.† Non-executive Directors independent of the Investment Manager.
Registered office70 Sir John Rogerson’s Quay Dublin 2 D02 R296Ireland
ManagerBaring International Fund Managers (Ireland) Limited70 Sir John Rogerson’s Quay Dublin 2 D02 R296Ireland
Investment Managers Baring Asset Management Limited 20 Old BaileyLondon EC4M 7BF United Kingdom
Baring Asset Management (Asia) Limited*** 35th Floor, Gloucester Tower 15 Queen’s Road Central Hong Kong *** Baring Asset Management (Asia) Limited is the delegated Sub-Investment Manager for certain funds as detailed in the Investment Manager’s reports of the relevant funds.
Depositary Northern Trust Fiduciary Services (Ireland) LimitedGeorges Court 54-62 Townsend StreetDublin 2 D02 R156Ireland
Administrator and Registrar Northern Trust International Fund AdministrationServices (Ireland) Limited Georges Court 54-62 Townsend StreetDublin 2 D02 R156Ireland
Company SecretaryMatsack Trust Limited70 Sir John Rogerson’s QuayDublin 2D02 R296Ireland
Independent Auditors PricewaterhouseCoopers One Spencer Dock North Wall Quay Dublin 1 D01 X9R7Ireland
Legal Advisers and Sponsoring BrokerAs to Irish Law Matheson70 Sir John Rogerson’s QuayDublin 2D02 R296Ireland As to Hong Kong LawDeaconsAlexandra House16-20 Chater RoadCentral Hong Kong
2
Barings Investment Funds PlcDirectors and Other Information (continued)
Paying Agents UniCredit Bank Austria AG Schottengasse 6-8 1010 Vienna Austria
BNP Paribas Securities Services9 rue du Débarcadère 93500 Pantin Cedex France
Deutsche Bank AGGlobal Transaction Banking Issuer Services – Global Securities Services Post IPO Services Taunusanlage 12 60325 Frankfurt am Main Germany
Northern Trust Global Services LimitedLuxembourg Branch 6, rue Lou Hemmer L-1748 SenningerbergGrand Duchy of Luxembourg
S.E. BankenSkandinaviska Enskilda Banken AB (publ)Transaction BankingKB BV, SE-106 40StockholmSweden
BNP Paribas Securities Services, ParisSuccursale de Zurich Selnaustrasse 16 CH-8002 ZurichSwitzerland
Caceis Belgium SAB-1000 BrusselsAvenue du Port 86 C b320 Belgium
BNP Paribas Securities Services (BNP Paribas Succursale Italia)Succursale di Milano Via Ansperto, 5 20123 Milan Italy

3
Barings Investment Funds PlcIntroduction
Barings Investment Funds Plc (the “Company”) is an open-ended umbrella investment company with segregated liability between funds and with variable capital incorporated in Ireland on 18 October 2004 under the Companies Act 2014 (as amended) with registration number 392526 and is designed to give both individual and institutional investors the benefit of experienced professional portfolio management. The Company has been authorised by the Central Bank of Ireland (the “CBI”), pursuant to the European Communities (Undertakings for Collective Investment in Transferable Securities) Regulations 2011 (as amended) (the “UCITS Regulations”). The Company is also listed on Euronext Dublin Global Exchange Market.
As the Barings European Opportunities Fund (the “Fund") is registered for sale in Hong Kong, the Fund has also been authorised by the Hong Kong Securities and Futures Commission (“SFC”) pursuant to the provisions of the Hong Kong Code on Unit Trusts and Mutual Funds, supplemented or consolidated from time to time. Further details of the Fund is contained in the individual supplements to the Prospectus. The other Funds within this report are not authorised in Hong Kong and are not available to Hong Kong residents.
The Company is an umbrella fund in that different funds may be issued from time to time by the Directors with the prior approval of the CBI. The assets of each Fund are invested in accordance with the investment objective and policy applicable to such Fund.
The Company has six active Funds as at 31 October 2020 which have been approved by the CBI:
Fund Fund launch date
Barings China A-Share Fund 06/02/2020
Barings Europe Select Fund 08/02/2019
Barings European Opportunities Fund 29/10/2013
Barings German Growth Fund 08/02/2019
Barings Global Dividend Champions Fund 20/10/2016
Barings Global Equity Allocation Fund 28/06/2019
Barings Global Flexible Allocation Fund (closed 1 October 2020) 13/03/2013
Each of the Funds had several classes of shares on offer at the financial period-end, which are outlined in note 10 to these financial statements. Further details of the Funds are contained in the individual supplements to the full Prospectus.
The financial statements include all the trades received up until 12:00p.m. (Irish time) on 30 October 2020, the valuation point for the Funds.
4
Barings Investment Funds PlcInvestment Objective and Policy
For the financial period ended 31 October 2020
Barings China A-Share FundThe investment objective of the Barings China A-Share Fund (the “Fund”) is to achieve capital growth through investing in companies established or operating in the People’s Republic of China.
The Fund will seek to achieve its investment objective by investing at least 70% of its total assets in quoted or traded equity investments in China A-Shares or other Qualified Foreign Institutional Investor (the “QFII”) permitted securities which are listed on the Shanghai or Shenzhen markets listed in the Prospectus, as permitted under the QFII Regulations.
Barings Europe Select FundThe investment objective of the Barings Europe Select Fund (the “Fund”) is to achieve long term capital growth by investing in Europe excluding the United Kingdom.
The Fund will seek to achieve its investment objective by investing at least 75% of its total assets directly and indirectly in equities and equity-related securities of smaller companies incorporated in, or exercising the predominant part of their economic activity, or quoted or traded on the stock exchanges in Europe excluding the United Kingdom.
Barings European Opportunities FundThe investment objective of the Barings European Opportunities Fund (the “Fund”) is to seek to achieve long-term capital growth primarily through investment in the securities of smaller European companies.
The Fund will seek to achieve its investment objective by investing at least 75% of its total assets in equities and equity-related securities of smaller companies incorporated in, or exercising the predominant part of their economic activity in, Europe, or quoted or traded on the stock exchanges in Europe.
Barings German Growth FundThe investment objective of the Barings German Growth Fund (the “Fund”) is to achieve long-term capital growth by investing in Germany.
The Fund will seek to achieve its investment objective by investing at least 75% of its total assets directly and indirectly in equities and equity related securities of companies incorporated in, or exercising the predominant part of their economic activity in Germany, or quoted or traded on the stock exchanges in Germany.
Barings Global Dividend Champions FundThe investment objective of the Barings Global Dividend Champions Fund (the “Fund”) is to generate income together with long-term capital growth through investment in the securities of companies worldwide.
The Fund will seek to achieve its investment objective by investing at least 70% of its total assets at any one time in equity and equity-related securities (as described further below) of companies worldwide. For this purpose, total assets exclude cash and ancillary liquidities.
In addition, up to 30% of the total assets of the Fund may be invested in, or provide exposure to:
• debt securities of issuers worldwide. The debt securities in which the Fund may invest may be fixed or floating rate, issued by governments, supranationals, agencies and companies. Debt securities may be rated investment grade or sub-investment grade by Standard & Poor’s (“S&P”) or another internationally recognised rating agency, or be, in the opinion of the Manager, of similar credit status, or may be unrated. There are no limits or restrictions on credit rating, maturity or duration of any debt or equity-related security (such as debt securities convertible into equities) which may be held by the Fund; however, investment in sub-investment grade debt securities and unrated debt securities together will not exceed 10% of the Net Asset Value of the Fund.
• cash and ancillary liquidities, including deposits, treasury bills, government bonds or short-term Money Market Instruments, including commercial paper and certificates of deposit, in normal market conditions.
5
Barings Investment Funds PlcInvestment Objective and Policy (continued)For the financial period ended 31 October 2020
Barings Global Equity Allocation FundThe investment objective of the Barings Global Equity Allocation Fund (the “Fund”) is to achieve long-term capital growth by investing in equities listed or traded in markets globally.
The Fund is actively managed and seeks to achieve its investment objective by investing at least 70% of its total assets directly and indirectly in equities and equity-related securities of companies which are constituents of the MSCI All Country World Index (ACWI) (the “Index”). The Fund seeks to outperform the Index. The Index captures large and mid-cap representation and as at the date of this Supplement captures approximately 85% of global investable equities. The Index is designed to measure the equity market performance of developed and emerging markets. The Fund’s exposure to emerging markets may exceed 20% of Net Asset Value. Investors should note that the Fund does not intend to track the Index.
In order to implement the investment policy the Fund may gain indirect exposure through equity-related securities, such as American depositary receipts and global depositary receipts. Investment may also be made in cash and ancillary liquidities such as deposits, treasury bills or short-term Money Market Instruments, including commercial paper and certificates of deposit, in normal market conditions. The Fund may also invest up to 10% of its Net Asset Value in collective investment schemes including money market funds.
Barings Global Flexible Allocation FundThe investment objective of the Barings Global Flexible Allocation Fund (the “Fund”) was to generate a total return consisting of capital and income appreciation which exceeded European cash rates over the medium to long term.
In order to achieve its investment objective, the Fund used a tactical asset allocation strategy which had no formal limitations on exposure to any specific asset class, sector, country or region, including emerging markets. In this regard, the Investment Manager sought to actively allocate the Fund’s portfolio of investments across asset classes to diversify returns, manage risk and achieve the investment objective. The asset allocation model was adjusted dynamically in anticipation of and in response to changes in economic and market conditions. Allocations were made at the Investment Manager’s discretion, based upon analysis of investment returns primarily from asset allocation but also from sector and security selection. Investments within each asset class were then selected by analysing the profitability, cash flow, earnings and valuations to determine their attractiveness.
The Fund terminated on 1 October 2020.
Please refer to the Prospectus for the full investment objective and policy of all the Funds.
How the Funds are managedThe Manager of the Company, Baring International Fund Managers (Ireland) Limited, has appointed Baring Asset Management Limited as the Investment Manager of Barings China A-Share Fund. In turn, Baring Asset Management Limited has appointed Baring Asset Management (Asia) Limited as Sub-Investment Manager of the Fund.
The Fund invests in Chinese companies listed on the stock exchanges of Shanghai and Shenzhen using a “bottom-up” investment approach. This means that we are focused more on the individual merits of specific companies, rather than taking a stance on the outcome of a sector of the market or macroeconomic developments such as interest rate rises.
Within this, the Fund is managed using a quality Growth at a Reasonable Price (the “GARP”) approach. When researching candidates for the portfolio, we look for companies with three characteristics. Firstly, companies with good potential for long-term earnings growth. Secondly, companies with attributes which in our experience are associated with “high-quality” companies, such as strong balance sheets and good management teams, with experience in delivering value to shareholders. Finally, companies with share price valuations which still have room for upside when compared with history or similar companies – in other words, potential for an attractive investment return.
The Manager of the Company, has also appointed Baring Asset Management Limited as the Investment Manager of Barings Europe Select Fund, Barings European Opportunities Fund and Barings German Growth Fund.

6
Barings Investment Funds PlcInvestment Objective and Policy (continued)For the financial period ended 31 October 2020
At Barings, our equity investment teams share the philosophy of quality “Growth at a Reasonable Price” or GARP. We believe that earnings growth is the principal driver of equity market performance over the medium to long term, and favour high-quality companies for their ability to outperform the market on a risk-adjusted basis. In particular, we believe that structured fundamental research and a disciplined investment process combining quality, growth and upside disciplines can allow us to identify attractively priced, long-term growth companies which will outperform the market. Our approach emphasises quality criteria when looking at companies and a three-to five-year time horizon when forecasting company earnings. In determining upside, we use consistent and transparent methods to place emphasis on discounted earnings models.
The Manager of the Company, has appointed Baring Asset Management Limited as the Investment Manager of Barings Global Dividend Champions Fund.
Our investment process is predominantly “bottom-up”. To find the exceptional businesses that make up the strategy, we use a broad range of research inputs: Barings’ internal analytical resources, industry experts, company meetings, quantitative research and company reports, among others. We are natural sceptics – rather than buying into a “story”, we seek proof of a company’s excellence. Only our highest-conviction ideas make it into the strategy, so robust debate and close analysis of fundamentals are key.
We evaluate candidate companies using the following three-stage process:
1. Quality: we scrutinise a company’s business model, looking for a range of features and competitive advantages, including network effects, benefits to incumbency, large installed bases, leading brands or a sustainable research and development (“R&D”) edge. Upon inspection, companies must earn attractive returns on capital, possess excellent financial profiles and have a management team committed to its role as the steward of shareholder wealth.
2. Growth: we assess our candidate companies’ ability to deliver long-term profit growth. Sustained growth of both capital and dividends can only be achieved if the underlying business is flourishing. Our process leads us to firms with stable and visible growth profiles rather than companies with more speculative growth ambitions, or those businesses whose fortunes are heavily linked to unpredictable external forces. The ideal investment is a growing company with meaningful control of its own destiny.
3. Valuation and scenario analysis: financial statements are “cleaned” of any accounting distortions (such as off balance-sheet liabilities) which may obscure the true financial position of a business, and companies are put through a series of business-specific stress tests. The aim is to ascertain the underlying risk that an investment presents, and to gauge the scale of profit and dividend progression we can reasonably expect under various circumstances. Many companies “fail” this stage of the process – businesses are often found to present too much risk once their underlying fundamentals are “tested”. If a company does pass this stage, we then ascertain the long-term value of the business using a highly consistent and cash-based set of valuation techniques.
The Manager of the Company, has appointed Baring Asset Management Limited as the Investment Manager of Barings Global Equity Allocation Fund.
The Investment Manager adopts a top-down approach to investing in this Fund. For Global equities, this means that the Investment Manager dynamically allocates to countries, sectors, currencies and styles. This approach incorporates the Investment Manager’s views on macroeconomic trends such as economic growth and interest rate levels. The investment strategy is implemented using passive stock selection via a portfolio which consists of directly held equities that are constituents of the reference index. This portfolio will normally hold between 400 and 500 stocks.
The Manager of the Company, appointed Baring Asset Management Limited as the Investment Manager of Barings Global Flexible Allocation Fund.
The Manager used the ideas generated by the Strategic Policy Group, our global macro research asset allocation group, to choose what we believed were the best investments to achieve the investment objectives of the Fund. This meant that we constructed a portfolio of stocks or bonds from a mix of companies, countries and sectors to suit our current asset allocation policy at that point in time.
How the Funds are managed (continued)
7
Barings Investment Funds PlcInvestment Objective and Policy (continued)For the financial period ended 31 October 2020
We believed that asset allocation was the most important driver of returns. It was important to be in the right market at the right time, and to be able to retreat to a more defensive position to help manage risk. We followed a two-stage investment process that accessed both long-term return opportunities, driven by slowly evolving macroeconomic factors, and shorter-term opportunities generated by market volatility. We maintained a forward-looking approach and were conscious that what proved to be a defensive asset in a previous downturn may not always be suitable. We used our wide investment universe to ensure that we avoided over diversification and focus on assets that we believed were appropriate for the prevailing economic and market cycle.
Please refer to the Prospectus for the full risk profile for each of the Funds. Investors should read the Prospectus and carefully consider the potential risk factors as well as reward factors before investing.
How the Funds are managed (continued)

Barings Investment Funds PlcInvestment Managers’ Report
For the financial period ended 31 October 2020
8
Barings China A-Share Fund
Performance Barings China A-Share Fund (the “Fund”) generated a gross return of 45.2% on the Class A USD Acc share class and outperformed the performance comparator with a return of 27.5%* during the reporting period. The Fund generated a net return of 43.4% on the Class A USD Acc share class.
Chinese onshore equities recovered from March lows after the outbreak of the Covid-19 pandemic and rallied over the 6-month period. In addition to robust macro readings which indicated a solid economic recovery path on track, positive earnings surprises particularly from some of the new economy names also buoyed market outperformance. Meanwhile, a strong pipeline of IPOs in the Chinese equity markets also underpinned positive investment momentum despite some market fluctuations partly resulting from re-escalated China-US tensions.
Stock selection was a key contributor to the relative outperformance over the reporting period, especially in the consumer and industrial sectors. On the stock level, beer manufacturer Chongqing Brewery continued its uptrend and ended the review period as a notable contributor. Share price was buoyed by the announcement of the company’s asset reorganisation plan through acquiring stakes of the joint venture held with Carlsberg Brewery Hong Kong, which is expected to not only inject quality assets but also increase brand awareness of the company in the longer run. Meituan Dianping also contributed positively, largely driven by satisfactory earnings results of the second quarter thanks to strong order growth in food and grocery delivery and lower-than-expected operating cost. Solar cell equipment manufacturer Suzhou Maxwell Technologies also added value to the Fund, as the share price was buoyed by its R&D (Research & Development) progress on solar cell equipment.
On the other hand, our investment in electronic component manufacturer Shennan Circuit detracted from relative performance, as the news flow around the US’ ban on Huawei alongside potential export restrictions posed on one of China’s top chipmakers hurt the near-term sentiment of the domestic semiconductor industry. Our lack of exposure to solar wafer manufacturer Longi Green Energy Technology was another drag, largely due to resilient solar demand recovery globally which underpinned solid earnings growth momentum of the company in the near-term.
Market outlook In the near term, we expect proactive fiscal stimulus alongside flexible monetary measures to remain the status quo, which would be instrumental in terms of further stabilizing the economy and paving the way for the rebound momentum in areas such as consumption, which have relatively lagged behind the expected recovery progress. We have seen a strong demand for domestic leisure travel especially stimulated by the Chinese Golden Week Holiday, with a solid rebound of hotel bookings and airline load factors. This could potentially indicate positive signs of growth catching-up for these more severely impacted industries amid the pandemic should the recovery momentum continue. Recent news on the positive development of the Covid-19 vaccine from Pfizer also confirms that outlook.
Meanwhile, the just-concluded 5th Plenum of the 19th Party Congress provided a brief summary of the proposals for the 14th five-year plan (2021-2025), with key highlights including the continuation of economic transformation towards higher quality and sustainable growth, as well as self-sufficiency and innovation of key technologies in the next 5-15 years. We expect these policy directions to bring strong support and subsequent positive market sentiment to certain areas, such as new infrastructure, domestic consumption, new energy, health care and technology localisation.

9
Barings Investment Funds PlcInvestment Managers’ Report (continued)
For the financial period ended 31 October 2020
Nonetheless, we expect volatility to prevail in the short run as the US presidential elections conclude and Covid-19 vaccine development progresses, which may change the near-term outlook on leisure industries, technology sectors and more. While we will closely monitor these key factors and accustom to the appropriate portfolio construction steps driven by share price movements on a case-by-case scenario, we still hold a positive outlook on the relevant names within our portfolio in the longer run on the back of their resilient structural growth potentials and quality franchises.
* The Fund return uses the midday prices, whereas the return of the comparator is calculated using global close prices. Baring Asset Management (Asia) Limited,appointed as Sub-Investment Manager byBaring Asset Management LimitedNovember 2020 Baring Asset Management Limited (the “Investment Manager”) gives its portfolio managers full authority to manage their funds as they see fit, within the established guidelines set down. This includes the views that managers may take of the markets and sectors they invest in, which may differ from the views of other Barings portfolio managers.
Barings China A-Share Fund (continued)
Market outlook (continued)
10
Barings Investment Funds PlcInvestment Managers’ Report (continued)
For the financial period ended 31 October 2020
Barings Europe Select Fund
PerformanceBarings Europe Select Fund (the “Fund”) generated a gross return of 7.3% on the Class J EUR Inc share class and underperformed against the performance comparator with a return of 9.8%* during the reporting period. The Fund generated a net return of 6.8% on the Class J EUR Inc share class.
This relative underperformance followed a very strong start to the year during which our portfolio proved relatively resilient in a rapidly declining equity market, as the Covid-19 pandemic arrested market sentiment in February and March. In more recent months, however, European Smaller Companies have seen a strong rally in the shares of companies that had been experiencing negative earnings revisions. Our focus on companies that are improving the quality of their earnings and business models, therefore, while helping our relative performance during the market downturn, meant that our portfolio did not participate as meaningfully in the recent short-term market rally.
At the stock level, shares in Norwegian oil services company TGS-Nopec were relatively weak, partly reflecting weakness in the oil price. We continue to hold shares in TGS-Nopec as we believe it remains a strong, high quality business irrespective of the oil price due its robust balance sheet, cash generation ability, attractive valuation, and favourable position compared to peers. Shares in Royal Vopak, a Dutch storage and handling company specialising in oil and natural gas-related services, suffered profit-taking following results which were slightly below market expectations; meanwhile management stated that they expect the current oil price environment to have a positive impact on demand for its oil storage services in the coming quarters. Partially offsetting this relative weakness, shares in KION, a German leader in automating warehouse workflows and production warehouse trucks, were strong following better than expected Q2 results which indicated that orders in its warehouse automation solutions division had risen significantly, largely driven by high value orders from e-tailing and online clients.
Market outlookThe strong performance by stock markets in the last six months appears at odds with an apparent slow-down in the rate of recovery of most developed market economies from earlier lockdowns. Consistently, manufacturing activities appear to be leading the global recovery, suggesting that companies and suppliers are becoming more proficient at maintaining output in factories that have been reconfigured to support social distancing and other measures aimed at preventing the spread of coronavirus. Services sectors are generally weak, however, in part reflecting the continued widespread reluctance to travel, both for recreational and business purposes, to repopulate offices, or to indulge in leisure activities.
As a result of the significant rebound in equity prices over the last six months, valuations suggest there is very limited potential for further re-rating, although reinstatement of dividends that were postponed earlier this year may provide further support to equity markets. This indicates that company fundamentals will become even more important to determine a company’s long-term value in the coming months. This is especially true of the smaller company universe, as recovering margins are likely to push earnings growth to double digits in 2021. Nonetheless, consensus earnings growth forecasts for 2021 likely remain too optimistic, in our view, as companies’ ability to generate 2021 earnings in excess of 2019 profits is likely to be challenged given the deterioration in economic conditions.
11
Barings Investment Funds PlcInvestment Managers’ Report (continued)
For the financial period ended 31 October 2020
In this context, and in line with our quality Growth at a Reasonable Price investment approach, we continue to rely on bottom-up stock selection to identify investment opportunities in companies which we believe will benefit from long-term, structural growth that is not necessarily dependent on economic growth; the ability to fund their own growth ambitions; and clear, open communication with stakeholders. Likewise, we continue to avoid investments in highly cyclical companies, particularly those whose fortunes are dependent on commodity price developments; balance sheet stressed companies; and companies that display poor corporate governance and shareholder rights protection.
* The Fund return uses the midday prices, whereas the return of the comparator is calculated using global close prices. Baring Asset Management LimitedNovember 2020 Baring Asset Management Limited (the “Investment Manager”) gives its portfolio managers full authority to manage their funds as they see fit, within the established guidelines set down. This includes the views that managers may take of the markets and sectors they invest in, which may differ from the views of other Barings portfolio managers.
Barings Europe Select Fund (continued)
Market outlook (continued)
12
Barings Investment Funds PlcInvestment Managers’ Report (continued)
For the financial period ended 31 October 2020
Barings European Opportunities Fund
PerformanceBarings European Opportunities Fund (the “Fund”) generated a gross return of 5.5% on the Class A EUR Acc share class and underperformed against the performance comparator which returned 8.2%* during the reporting period. The Fund generated a net return of 4.4% on the Class A EUR Acc share class.
This relative underperformance followed a very strong start to 2020 during which our portfolio proved relatively resilient in a rapidly declining equity market, as the Covid-19 pandemic arrested market sentiment in February and March. In more recent months, however, Pan-European Smaller Companies have seen a strong rally in the shares of companies that had been experiencing negative earnings revisions. Our focus on companies that are improving the quality of their earnings and business models, therefore, while helping our relative performance during the market downturn, meant that our portfolio did not participate as meaningfully in the recent short-term market rally.
At the stock level, shares in Norwegian oil services company TGS-Nopec were relatively weak, partly reflecting weakness in the oil price. We continue to hold shares in TGS-Nopec as we believe it remains a strong, high quality business irrespective of the oil price due its robust balance sheet, cash generation ability, attractive valuation, and favourable position compared to peers. Shares in Royal Vopak, a Dutch storage and handling company specialising in oil and natural gas-related services, suffered profit-taking following results that were slightly below market expectations; meanwhile management stated that they expect the current oil price environment to have a positive impact on demand for its oil storage services in the coming quarters. The share price of Beazley, the UK listed insurance company, was also negatively impacted after the company increased estimates for the cost of insurance claims related to Covid. Partially offsetting this relative weakness, shares in KION, a German leader in automating warehouse workflows and production warehouse trucks, were strong following better than expected Q2 results that indicated that orders in its warehouse automation solutions division had risen significantly, largely driven by high value orders from e-tailing and online clients. In addition, the shares of JD Sports Fashion, the UK retailer, responded positively to the company’s reports that trading had recovered strongly following the reopening of its stores after the spring lockdown.
Market outlookThe strong performance by stock markets in the last six months appears at odds with an apparent slow-down in the rate of recovery of most developed market economies from earlier lockdowns. Consistently, manufacturing activities appear to be leading the global recovery, suggesting that companies and suppliers are becoming more proficient at maintaining output in factories that have been reconfigured to support social distancing and other measures aimed at preventing the spread of coronavirus. Services sectors are generally weak, however, in part reflecting the continued widespread reluctance to travel, both for recreational and business purposes, to repopulate offices, or to indulge in leisure activities.
As a result of the significant rebound in equity prices over the last six months, valuations suggest there is very limited potential for further re-rating, although reinstatement of dividends that were postponed earlier this year may provide further support to equity markets. This indicates that company fundamentals will become even more important to determine companies’ long-term value in the coming months. This is especially true of the smaller company universe, as recovering margins are likely to push earnings growth to double digits in 2021. Nonetheless, consensus earnings growth forecasts for 2021 likely remain too optimistic, in our view, as companies’ ability to generate 2021 earnings in excess of 2019 profits is likely to be challenged given the deterioration in economic conditions.
13
Barings Investment Funds PlcInvestment Managers’ Report (continued)
For the financial period ended 31 October 2020
In this context, and in line with our quality Growth at a Reasonable Price investment approach, we continue to rely on bottom-up stock selection to identify investment opportunities in companies which we believe will benefit from long-term, structural growth that is not necessarily dependent on economic growth; the ability to fund their own growth ambitions; and clear, open communication with stakeholders. Likewise, we continue to avoid investments in highly cyclical companies, particularly those whose fortunes are dependent on commodity price developments; balance sheet stressed companies; and companies that display poor corporate governance and shareholder rights protection.
* The Fund return uses the midday prices, whereas the return of the comparator is calculated using global close prices. Baring Asset Management LimitedNovember 2020 Baring Asset Management Limited (the “Investment Manager”) gives its portfolio managers full authority to manage their funds as they see fit, within the established guidelines set down. This includes the views that managers may take of the markets and sectors they invest in, which may differ from the views of other Barings portfolio managers.
Barings European Opportunities Fund (continued)
Market outlook (continued)

14
Barings Investment Funds PlcInvestment Managers’ Report (continued)
For the financial period ended 31 October 2020
Barings German Growth Fund
PerformanceBarings German Growth Fund (the “Fund”) generated a gross return of 0.7% on the Class J EUR Acc share class and underperformed against the performance comparator with a return of 7.0%* during the reporting period. The Fund generated a net return of 0.2% on the Class J EUR Acc share class.
Stock selection among larger companies was the key detractor from returns, stemming from our decision not to hold shares in companies including Siemens, Daimler and Adidas. These companies are not held in the portfolio because we do not feel they meet our Growth at a Reasonable Price investment criteria, or where we have higher conviction ideas elsewhere; however, these stocks performed strongly in the period under review, in some cases due to a broader market preference for defensive companies which were somewhat underrepresented in the German Growth Fund portfolio. At the stock level, the Fund was also impacted by weakness from holdings such as LPKF Laser and Electronics, which suffered profit-taking despite better than expected Q3 profitability.
On the positive side, we did see strong performance from some of the portfolio’s holdings including Allgeier following the announcement that the company is planning to spin off its Nagarro software division, which should release value, while management upgraded profit guidance. Shares in KION, a German leader in automating warehouse workflows and production warehouse trucks, were strong following better than expected Q2 results which indicated that orders in its warehouse automation solutions division had risen significantly, largely driven by high value orders from e-tailing and online clients.
Market outlookWhilst the short term market outlook is probably as uncertain as it has been in at least a generation - at the time of writing Pfizer BioNTech have recently announced a successful trial of their Covid-19 vaccine, Donald Trump is still contesting the US Presidential Election result, and Covid-19 cases continue to rise - we remain confident that, over the longer term, the global economy will recover to “pre-Covid-19” levels in due course.
In part the timing will be dependent on when a vaccine is available and able to be widely distributed. We have also been encouraged by the quick rebound in macroeconomic data from the lows seen through the spring and early summer when tight lockdown restrictions were in place. Furthermore, there is also the release of pent-up consumer demand to consider as a driver to company profits, in addition to the various government and central bank stimulus packages that are already in place. As such, as we will continue to focus on our key long-term investment tenets, and we remain confident the fund is well positioned to prosper in the years ahead.
However, there is no doubt that whilst the world as a whole should return to some sort of normality in the next year or so, the make-up/mix of company profits/GDP will have changed for good. With this in mind, we need to consider such questions as: will Covid-19 lead to a longer term change in consumer spending habits for certain items, and how will various industry trends now develop over the longer term; for example, in travel, and property? There are also broader trends that have continued to gain prominence over the past six months or so, including the shift of the global energy mix towards renewables, aided by parts of these government stimulus packages.
In this context, and in line with our quality Growth at a Reasonable Price investment approach, we continue to rely on bottom-up stock selection to identify investment opportunities in companies which we believe will benefit from long-term, structural growth that is not necessarily dependent on economic growth; the ability to fund their own growth ambitions; and clear, open communication with stakeholders.
* The Fund return uses the midday prices, whereas the return of the comparator is calculated using global close prices. Baring Asset Management LimitedNovember 2020 Baring Asset Management Limited (the “Investment Manager”) gives its portfolio managers full authority to manage their funds as they see fit, within the established guidelines set down. This includes the views that managers may take of the markets and sectors they invest in, which may differ from the views of other Barings portfolio managers.
15
Barings Investment Funds PlcInvestment Managers’ Report (continued)
For the financial period ended 31 October 2020
Barings Global Dividend Champions Fund
Performance Barings Global Dividend Champions Fund (the “Fund”) generated a gross return of 7.3% on the Class A USD Acc share class and underperformed against the performance comparator with a return of 12.6%* during the reporting period. The Fund generated a net return of 6.4% on the Class A USD Acc share class.
Shares in consumer-focused companies, such as global contract caterer Compass Group, were relatively weak in the period as profits were severely impacted by the lower customer demand related to Covid-19. Despite short-term weakness, we continue to believe the Fund’s holdings offer resilient earnings and dividend streams over the longer term, and should emerge from the pandemic in a strong competitive position. Compass Group, for example, benefits from a very durable franchise with market shares in some of its markets more than double the nearest competitor, meanwhile it is a capital light business and is operating in a highly fragmented market with plenty of scope for consolidation. Partially offsetting these weaker returns, a number of the Fund’s holdings delivered strong returns over the period, including Japanese gaming company Nintendo. Nintendo is a great example of the type of companies we like to own in our portfolio as the company has a durable and growing franchise, benefitting from its globally-recognised portfolio of characters, as well as an exceptionally strong balance sheet and a healthy long-term growth profile.
Market outlookThis year continues to surprise in so many ways. Initially the surprise was the emergence of the Covid-19 pandemic, then the shut-down of much of the global economy, then the unprecedented (in peacetime) fiscal and monetary response of virtually all major economies. There are likely more surprises to come with the US election, decisions about continuing with fiscal programmes and, at some point, debates about how to pay for the measures implemented so far. In this environment, we have been continuing to focus on the longer term beyond when short-term fiscal and monetary measures are likely to have normalised and after Covid-19 will hopefully have passed, and the economy will function more like before.
We remain cognisant of the issues facing the global economy in the near term, and that various programmes that have been put in place to support economies and industries cannot continue indefinitely. As a result, we have been continuing to focus on finding companies whose business models are resilient enough to withstand the current crisis and where they will continue to grow once the crisis has passed.
* The Fund return uses the midday prices, whereas the return of the comparator is calculated using global close prices. Baring Asset Management LimitedNovember 2020 Baring Asset Management Limited (the “Investment Manager”) gives its portfolio managers full authority to manage their funds as they see fit, within the established guidelines set down. This includes the views that managers may take of the markets and sectors they invest in, which may differ from the views of other Barings portfolio managers.
16
Barings Investment Funds PlcInvestment Managers’ Report (continued)
For the financial period ended 31 October 2020
Barings Global Equity Allocation Fund
PerformanceBarings Global Equity Allocation Fund (the “Fund”) generated a gross return of 12.7% on the Class I USD Acc share class and underperformed against the performance comparator with a return of 13.6%* during the reporting period. The Fund generated a net return of 12.3% on the Class I USD Acc share class.
On a sector level the Fund’s underperformance was driven by positions in some of the more cyclical sectors, such as Consumer Discretionary, Industrials and Financials. Offsetting these positions were gains from our underweight positions to defensive sectors such as Consumer Staples and Real Estate, which were left behind in a period of strong market performance.
On a country level the Fund’s underperformance was primarily due to positions in the Asian markets – China and Japan in particular. Offsetting this were gains from the underweight position to the UK market, which continues to suffer from an out of favour sector mix and a Brexit overhang.
Market outlookThe swift and sizeable Covid-19 policy response from central banks and governments has managed to cushion the economic shock and lift markets, as policymakers try to see past the virus and think longer term. However, the second wave in Europe reminds us that the battle is far from over and until a vaccine is widely available, economies will likely remain constrained by measures aimed at slowing the spread of the virus. It is therefore important that governments continue to support consumer incomes and businesses until a vaccine is available or until the virus is brought under control by other means.
With the initial shock fading, a new normal will come into view that includes a persistent virus that continues to prevent a full return across all sectors, but global activity that can still rebound in spite of the risks. The near term can continue to get better as we have seen in recent data, even as we take stock of the longer term damage to balance sheets, investment and productivity.
Investors also need to start paying attention to old, familiar risks they had pushed to the back burner during the crisis: potential tensions with China are on the rise around the world. We expect tough talk together with some action against weaker players (example: new trade sanctions on Australia by China). Over the next few months the US election outcome and its implications will dominate the news cycle.
While we still remain optimistic, investors will need to stay alert and we continue to believe it makes sense to aim for a well-diversified, dynamic portfolio.
* The Fund return uses the midday prices, whereas the return of the comparator is calculated using global close prices. Baring Asset Management LimitedNovember 2020 Baring Asset Management Limited (the “Investment Manager”) gives its portfolio managers full authority to manage their funds as they see fit, within the established guidelines set down. This includes the views that managers may take of the markets and sectors they invest in, which may differ from the views of other Barings portfolio managers.

17
Barings Investment Funds PlcInvestment Managers’ Report (continued)
For the financial period ended 31 October 2020
Barings Global Flexible Allocation Fund
PerformanceBarings Global Flexible Allocation Fund (the “Fund”) terminated on 1 October 2020. The Fund generated a gross return of +6.3% on the Class I EUR Acc share class and outperformed against the performance comparator with a return of -0.2%* during the reporting period. The Fund generated a net return of +6.0% on the Class I EUR Acc share class.
In the first quarter of 2020 the dual crisis of Covid-19 and the simultaneous oil price war caused a rapid market sell-off. The speed and depth of the sell-off had a significant impact to performance. No market was unscathed and even defensive assets such as government bonds and gold proved unreliable.
With Covid-19 spreading globally we started to move to a more defensive positioning. We cut equities, which to us were the obvious areas that would feel pain. We added to certain credit areas such as investment grade credit and emerging market hard currency bonds which we felt would be the beneficiaries of a low interest environment.
In the period under review, we have built up our equity exposure, funded from cash and government bonds, while maintaining a preference for growth equities via our technology exposure. Technology we feel will be one of the most resilient sectors during this slowdown. Not only will certain online trends accelerate during the shutdown, but we expect corporate spend on IT to increase during the recovery. Recently we have added some more cyclicality within equities, buying the European Banks sector and US Midcap companies.
High yield bonds and emerging bonds also were a strong contributor to the Q2 return as the stimulus measures discussed above reassured markets and allowed spreads to compress.
* The Fund return uses the midday prices, whereas the return of the comparator is calculated using global close prices. Baring Asset Management LimitedNovember 2020 Baring Asset Management Limited (the “Investment Manager”) gives its portfolio managers full authority to manage their funds as they see fit, within the established guidelines set down. This includes the views that managers may take of the markets and sectors they invest in, which may differ from the views of other Barings portfolio managers.

The accompanying notes form an integral part of these financial statements.
18
Barings Investment Funds PlcStatement of Financial Position
As at 31 October 2020
Barings China A-Share Fund
31 October 2020
Barings Europe Select Fund
31 October 2020
Barings European Opportunities
Fund 31 October 2020
Assets Notes US$ € €Financial assets at fair value through profit or loss 2 11,881,787 50,329,498 104,131,632Cash and cash equivalents 3 322,671 2,641,445 4,073,312Securities sold receivable 38,049 – –Receivable for shares sold – 7,053 –Dividends receivable 395 10,546 55,796Total assets 12,242,902 52,988,542 108,260,740
LiabilitiesManagement fees payable 6 (76) (107,270) (43,584)Securities purchased payable (21,111) – –Payable for shares redeemed – (2,231) –Administration, depositary and operating fees payable 6 (4,878) (5,379) (49,017)Total liabilities (excluding net assets attributable to holders of redeemable participating shares) (26,065) (114,880) (92,601)
Net assets attributable to holders of redeemable participating shares 12,216,837 52,873,662 108,168,139
The accompanying notes form an integral part of these financial statements.
19
Barings Investment Funds PlcStatement of Financial Position (continued)
As at 31 October 2020
Barings German Growth Fund
31 October 2020
Barings Global Dividend
Champions Fund 31 October 2020
Barings Global Equity Allocation
Fund 31 October 2020
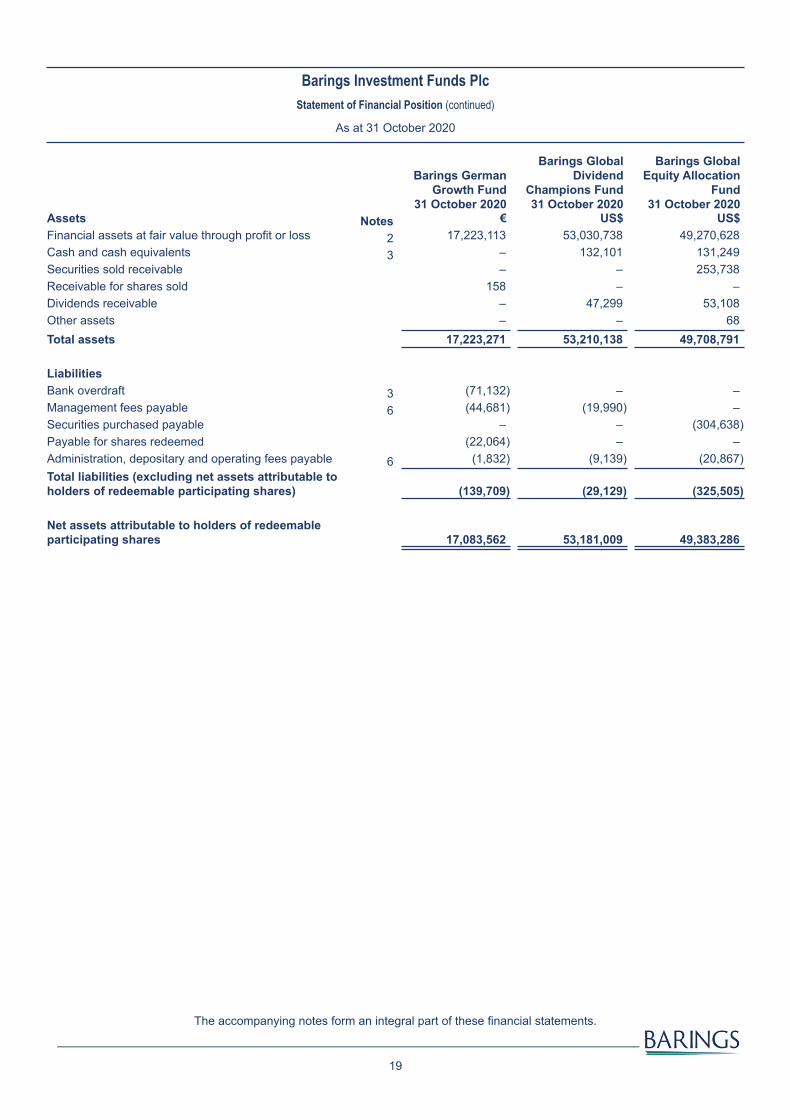
Assets Notes € US$ US$Financial assets at fair value through profit or loss 2 17,223,113 53,030,738 49,270,628Cash and cash equivalents 3 – 132,101 131,249Securities sold receivable – – 253,738Receivable for shares sold 158 – –Dividends receivable – 47,299 53,108Other assets – – 68Total assets 17,223,271 53,210,138 49,708,791
LiabilitiesBank overdraft 3 (71,132) – –Management fees payable 6 (44,681) (19,990) –Securities purchased payable – – (304,638)Payable for shares redeemed (22,064) – –Administration, depositary and operating fees payable 6 (1,832) (9,139) (20,867)Total liabilities (excluding net assets attributable to holders of redeemable participating shares) (139,709) (29,129) (325,505)
Net assets attributable to holders of redeemable participating shares 17,083,562 53,181,009 49,383,286
The accompanying notes form an integral part of these financial statements.
20
Barings Investment Funds PlcStatement of Financial Position (continued)
As at 31 October 2020
Barings Global Flexible Allocation
Fund* 31 October 2020
Company Total 31 October 2020
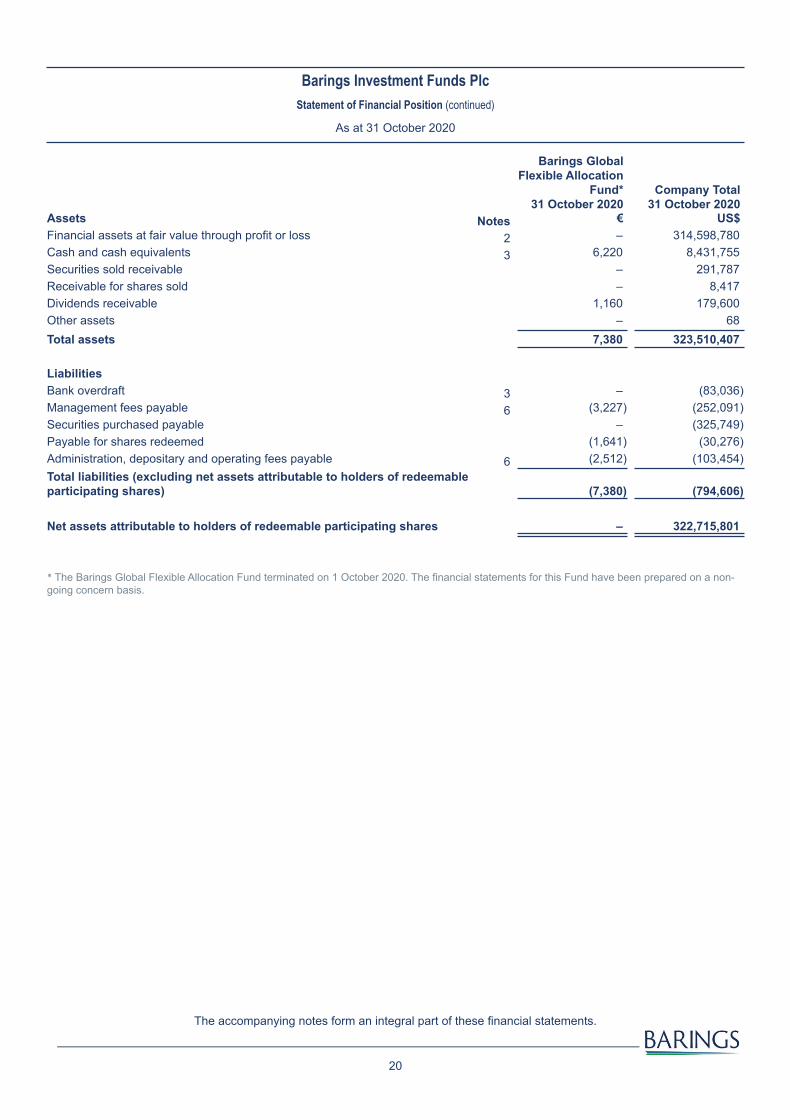
Assets Notes € US$Financial assets at fair value through profit or loss 2 – 314,598,780Cash and cash equivalents 3 6,220 8,431,755Securities sold receivable – 291,787Receivable for shares sold – 8,417Dividends receivable 1,160 179,600Other assets – 68Total assets 7,380 323,510,407
LiabilitiesBank overdraft 3 – (83,036)Management fees payable 6 (3,227) (252,091)Securities purchased payable – (325,749)Payable for shares redeemed (1,641) (30,276)Administration, depositary and operating fees payable 6 (2,512) (103,454)Total liabilities (excluding net assets attributable to holders of redeemable participating shares) (7,380) (794,606)
Net assets attributable to holders of redeemable participating shares – 322,715,801
* The Barings Global Flexible Allocation Fund terminated on 1 October 2020. The financial statements for this Fund have been prepared on a non-going concern basis.
The accompanying notes form an integral part of these financial statements.
21
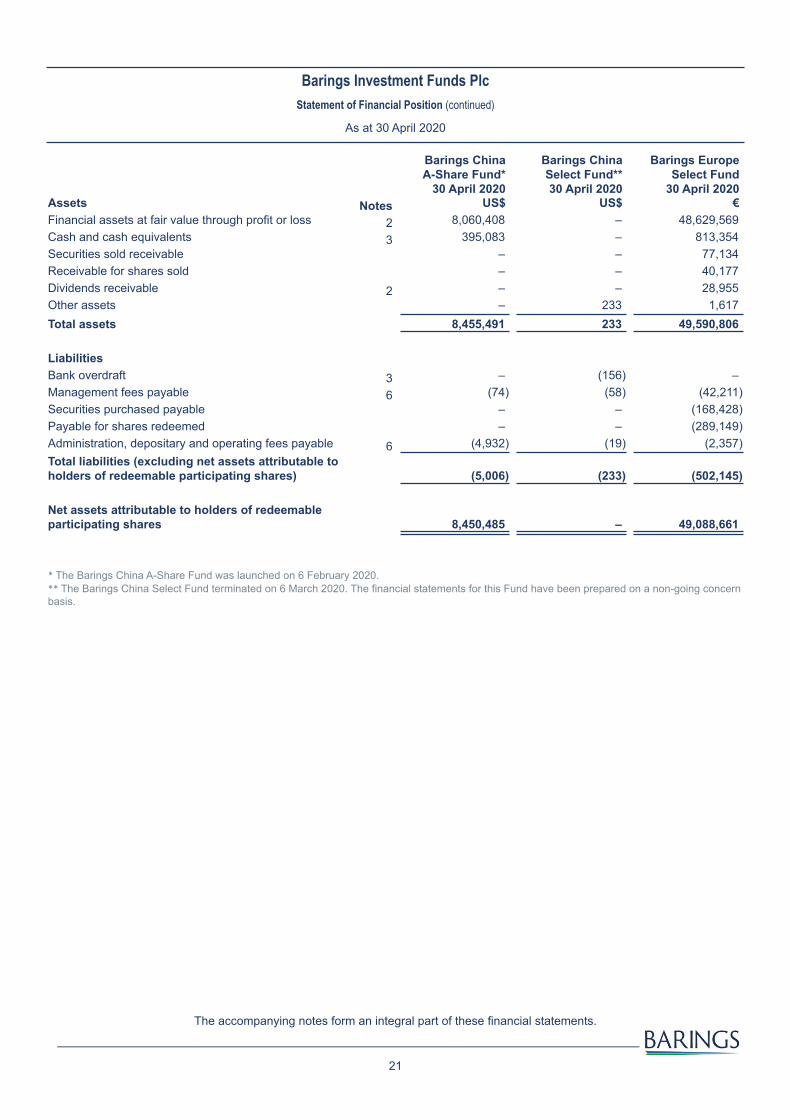
Barings Investment Funds PlcStatement of Financial Position (continued)
As at 30 April 2020
Barings China A-Share Fund*
30 April 2020
Barings China Select Fund** 30 April 2020
Barings Europe Select Fund
30 April 2020Assets Notes US$ US$ €Financial assets at fair value through profit or loss 2 8,060,408 – 48,629,569Cash and cash equivalents 3 395,083 – 813,354Securities sold receivable – – 77,134Receivable for shares sold – – 40,177Dividends receivable 2 – – 28,955Other assets – 233 1,617Total assets 8,455,491 233 49,590,806
LiabilitiesBank overdraft 3 – (156) –Management fees payable 6 (74) (58) (42,211)Securities purchased payable – – (168,428)Payable for shares redeemed – – (289,149)Administration, depositary and operating fees payable 6 (4,932) (19) (2,357)Total liabilities (excluding net assets attributable to holders of redeemable participating shares) (5,006) (233) (502,145)
Net assets attributable to holders of redeemable participating shares 8,450,485 – 49,088,661
* The Barings China A-Share Fund was launched on 6 February 2020.** The Barings China Select Fund terminated on 6 March 2020. The financial statements for this Fund have been prepared on a non-going concern basis.
The accompanying notes form an integral part of these financial statements.
22
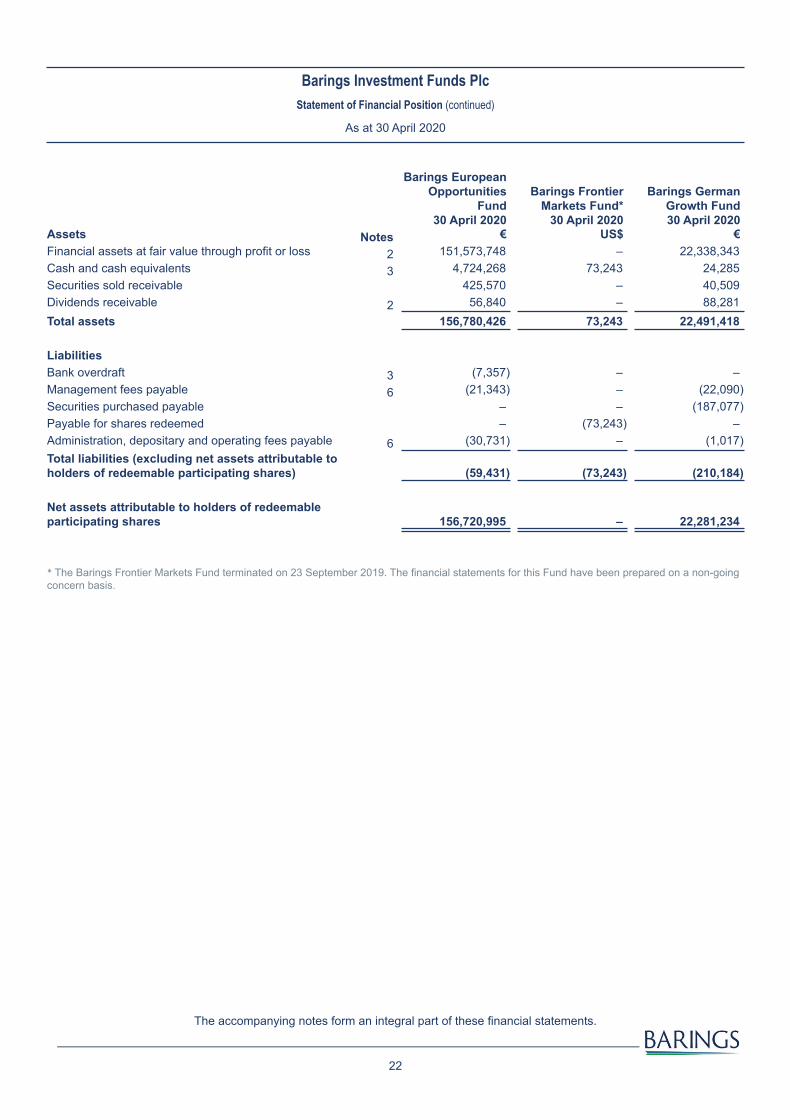
Barings Investment Funds PlcStatement of Financial Position (continued)
As at 30 April 2020
Barings European Opportunities
Fund 30 April 2020
Barings Frontier Markets Fund*
30 April 2020
Barings German Growth Fund 30 April 2020
Assets Notes € US$ €Financial assets at fair value through profit or loss 2 151,573,748 – 22,338,343Cash and cash equivalents 3 4,724,268 73,243 24,285Securities sold receivable 425,570 – 40,509Dividends receivable 2 56,840 – 88,281Total assets 156,780,426 73,243 22,491,418
LiabilitiesBank overdraft 3 (7,357) – –Management fees payable 6 (21,343) – (22,090)Securities purchased payable – – (187,077)Payable for shares redeemed – (73,243) –Administration, depositary and operating fees payable 6 (30,731) – (1,017)Total liabilities (excluding net assets attributable to holders of redeemable participating shares) (59,431) (73,243) (210,184)
Net assets attributable to holders of redeemable participating shares 156,720,995 – 22,281,234
* The Barings Frontier Markets Fund terminated on 23 September 2019. The financial statements for this Fund have been prepared on a non-going concern basis.

The accompanying notes form an integral part of these financial statements.
23
Barings Investment Funds PlcStatement of Financial Position (continued)
As at 30 April 2020
Barings Global Dividend
Champions Fund 30 April 2020
Barings Global Equity Allocation
Fund* 30 April 2020
Barings Global Flexible Allocation
Fund** 30 April 2020
Assets Notes US$ US$ €Financial assets at fair value through profit or loss 2 59,099,204 39,429,185 38,109,118Cash and cash equivalents 3 226,450 295,775 4,897,209Receivable for shares sold – – 1,047Interest receivable 2 3 2 183,473Dividends receivable 2 91,465 61,136 2,580Management fee rebate due 6 – – 1,659Total assets 59,417,122 39,786,098 43,195,086
LiabilitiesFinancial liabilities at fair value through profit or loss 2 – – (102,367)Margin overdraft 3 – – (521,343)Management fees payable 6 (20,217) – (1,918)Indonesian Capital Gains Tax – – (3,534)Payable for shares redeemed – – (35)Administration, depositary and operating fees payable 6 (4,280) (7,545) (6,028)Total liabilities (excluding net assets attributable to holders of redeemable participating shares) (24,497) (7,545) (635,225)
Net assets attributable to holders of redeemable participating shares 59,392,625 39,778,553 42,559,861
* The Barings Global Equity Allocation Fund was launched on 28 June 2019.** The Barings Global Flexible Allocation Fund will be terminated on 1 October 2020. The financial statements for this Fund have been prepared on a non-going concern basis.

The accompanying notes form an integral part of these financial statements.
24
Barings Investment Funds PlcStatement of Financial Position (continued)
As at 30 April 2020
Company Total 30 April 2020
Assets Notes US$Financial assets at fair value through profit or loss 2 390,085,743Cash and cash equivalents 3 12,366,414Securities sold receivable 590,826Receivable for shares sold 44,837Interest receivable 2 199,560Dividends receivable 2 344,741Management fee rebate due 6 1,804Other assets 1,992Total assets 403,635,917
LiabilitiesFinancial liabilities at fair value through profit or loss 2 (111,340)Bank overdraft 3 (8,158)Margin overdraft 3 (567,039)Management fees payable 6 (115,586)Indonesian Capital Gains Tax (3,844)Securities purchased payable (386,665)Payable for shares redeemed (387,774)Administration, depositary and operating fees payable 6 (60,426)Total liabilities (excluding net assets attributable to holders of redeemable participating shares) (1,640,832)
Net assets attributable to holders of redeemable participating shares 401,995,085

The accompanying notes form an integral part of these financial statements.
25
Barings Investment Funds PlcStatement of Comprehensive Income
For the financial period ended 31 October 2020
Barings China A-Share Fund
31 October 2020
Barings Europe Select Fund
31 October 2020
Barings European Opportunities
Fund 31 October 2020
Notes US$ € €IncomeBank interest income 3,309 630 1,209Dividend income 119,094 603,734 1,615,936Net fair value gain on financial assets and financial liabilities at fair value through profit or loss 3,670,645 3,017,932 9,159,913Total income 3,793,048 3,622,296 10,777,058
ExpensesManagement fees 6 (209) (312,859) (136,568)Administration, depositary and operating fees 6 (13,326) (13,381) (176,038)General expenses (40) (95) (665)Total operating expenses (13,575) (326,335) (313,271)
Net profit before finance costs and taxation 3,779,473 3,295,961 10,463,787
Finance costsDistributions 5 (127) (33,879) (60,849)Bank interest expense (1,231) (4,681) (7,217)Total finance costs (1,358) (38,560) (68,066)
Increase in net assets attributable to holders of redeemable participating shares before taxation 3,778,115 3,257,401 10,395,721
TaxationWithholding tax on dividends and other investment income (11,887) (94,536) (121,793)Total taxation (11,887) (94,536) (121,793)
Increase in net assets attributable to holders of redeemable participating shares 3,766,228 3,162,865 10,273,928
Gains and losses solely from continuing operations. There were no gains or losses other than those dealt with in the Statement of Comprehensive Income.

The accompanying notes form an integral part of these financial statements.
26
Barings Investment Funds PlcStatement of Comprehensive Income (continued)
For the financial period ended 31 October 2020
Barings German Growth Fund
31 October 2020
Barings Global Dividend
Champions Fund 31 October 2020
Barings Global Equity Allocation
Fund 31 October 2020
Notes € US$ US$IncomeBank interest income 702 3,396 84Dividend income 325,057 555,543 497,743Net fair value gain on financial assets and financial liabilities at fair value through profit or loss 285,746 4,061,993 4,803,851Total income 611,505 4,620,932 5,301,678
ExpensesManagement fees 6 (146,406) (107,377) (3)Administration, depositary and operating fees 6 (6,210) (29,582) (58,707)General expenses (208) (259) (178)Total operating expenses (152,824) (137,218) (58,888)
Net profit before finance costs and taxation 458,681 4,483,714 5,242,790
Finance costsDistributions 5 (7,311) (355,831) –Bank interest expense (117) (3,654) (712)Total finance costs (7,428) (359,485) (712)
Increase in net assets attributable to holders of redeemable participating shares before taxation 451,253 4,124,229 5,242,078
TaxationWithholding tax on dividends and other investment income (44,426) (73,301) (114,522)Total taxation (44,426) (73,301) (114,522)
Increase in net assets attributable to holders of redeemable participating shares 406,827 4,050,928 5,127,556
Gains and losses solely from continuing operations. There were no gains or losses other than those dealt with in the Statement of Comprehensive Income.

The accompanying notes form an integral part of these financial statements.
27
Barings Investment Funds PlcStatement of Comprehensive Income (continued)
For the financial period ended 31 October 2020
Barings Global Flexible Allocation
Fund* 31 October 2020
Company Total 31 October 2020
Notes € US$IncomeBank interest income 48 9,763Interest income 160,744 184,632Dividend income 24,268 4,123,158Net fair value gain on financial assets and financial liabilities at fair value through profit or loss 4,334,986 31,831,536Total income 4,520,046 36,149,089
ExpensesManagement fees 6 (8,049) (801,215)Administration, depositary and operating fees 6 (17,462) (346,374)General expenses (186) (1,802)Total operating expenses (25,697) (1,149,391)
Net profit before finance costs and taxation 4,494,349 34,999,698
Finance costsDistributions 5 (270) (473,471)Bank interest expense (1,421,407) (1,652,043)Total finance costs (1,421,677) (2,125,514)
Increase in net assets attributable to holders of redeemable participating shares before taxation 3,072,672 32,874,184
TaxationWithholding tax on dividends and other investment income (4,758) (504,681)Capital Gains Tax (97) (112)Total taxation (4,855) (504,793)
Increase in net assets attributable to holders of redeemable participating shares 3,067,817 32,369,391
* The Barings Global Flexible Allocation Fund terminated on 1 October 2020. The financial statements for this Fund have been prepared on a non-going concern basis.
In the case of Barings Global Flexible Allocation Fund, gains and losses arose solely from discontinued activities. For all other Funds, gains and losses arose solely from continuing activities. There were no gains or losses other than those dealt with in the Statement of Comprehensive Income.
The accompanying notes form an integral part of these financial statements.
28
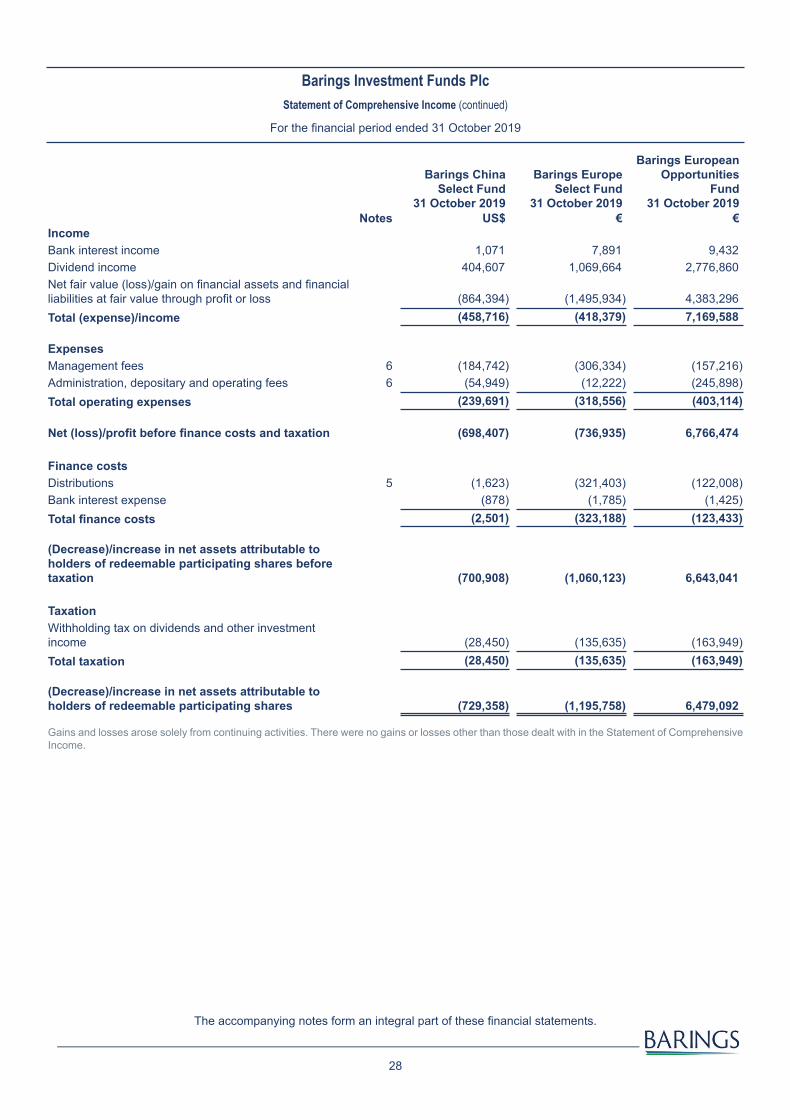
Barings Investment Funds PlcStatement of Comprehensive Income (continued)
For the financial period ended 31 October 2019
Barings China Select Fund
31 October 2019
Barings Europe Select Fund
31 October 2019
Barings European Opportunities
Fund 31 October 2019
Notes US$ € €IncomeBank interest income 1,071 7,891 9,432Dividend income 404,607 1,069,664 2,776,860Net fair value (loss)/gain on financial assets and financial liabilities at fair value through profit or loss (864,394) (1,495,934) 4,383,296Total (expense)/income (458,716) (418,379) 7,169,588
ExpensesManagement fees 6 (184,742) (306,334) (157,216)Administration, depositary and operating fees 6 (54,949) (12,222) (245,898)Total operating expenses (239,691) (318,556) (403,114)
Net (loss)/profit before finance costs and taxation (698,407) (736,935) 6,766,474
Finance costsDistributions 5 (1,623) (321,403) (122,008)Bank interest expense (878) (1,785) (1,425)Total finance costs (2,501) (323,188) (123,433)
(Decrease)/increase in net assets attributable to holders of redeemable participating shares before taxation (700,908) (1,060,123) 6,643,041
TaxationWithholding tax on dividends and other investment income (28,450) (135,635) (163,949)Total taxation (28,450) (135,635) (163,949)
(Decrease)/increase in net assets attributable to holders of redeemable participating shares (729,358) (1,195,758) 6,479,092
Gains and losses arose solely from continuing activities. There were no gains or losses other than those dealt with in the Statement of Comprehensive Income.

The accompanying notes form an integral part of these financial statements.
29
Barings Investment Funds PlcStatement of Comprehensive Income (continued)
For the financial period ended 31 October 2019
Barings Frontier Markets Fund*
31 October 2019
Barings German Growth Fund
31 October 2019
Barings Global Dividend
Champions Fund 31 October 2019
Notes US$ € US$IncomeBank interest income 5,317 38 578Dividend income 509,745 457,949 352,717Net fair value (loss)/gain on financial assets and financial liabilities at fair value through profit or loss (1,071,928) (1,123,485) 1,094,176Total (expense)/income (556,866) (665,498) 1,447,471
ExpensesManagement fees 6 (24,670) (198,719) (89,334)Administration, depositary and operating fees 6 (33,792) (9,085) (13,480)Total operating expenses (58,462) (207,804) (102,814)
Net (loss)/profit before finance costs and taxation (615,328) (873,302) 1,344,657
Finance costsDistributions 5 (75,782) (1,900) (314,201)Bank interest expense (1,352) (55) (1,476)Total finance costs (77,134) (1,955) (315,677)
(Decrease)/increase in net assets attributable to holders of redeemable participating shares before taxation (692,462) (875,257) 1,028,980
TaxationWithholding tax on dividends and other investment income (33,590) (55,224) (60,241)Total taxation (33,590) (55,224) (60,241)
(Decrease)/increase in net assets attributable to holders of redeemable participating shares (726,052) (930,481) 968,739
* The Barings Frontier Markets Fund terminated on 23 September 2019.
In the case of Barings Frontier Markets Fund, gains and losses arose solely from discontinued activities. For all other Funds, gains and losses arose solely from continuing activities. There were no gains or losses other than those dealt with in the Statement of Comprehensive Income.
The accompanying notes form an integral part of these financial statements.
30
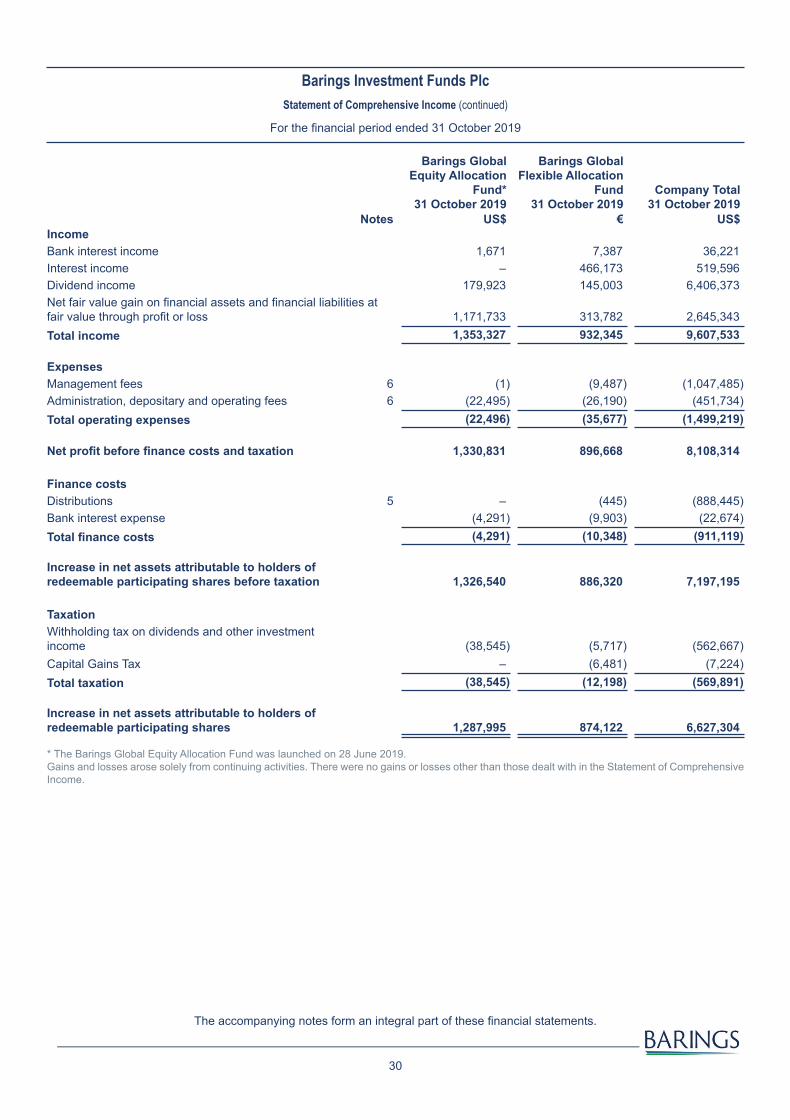
Barings Investment Funds PlcStatement of Comprehensive Income (continued)
For the financial period ended 31 October 2019
Barings Global Equity Allocation
Fund* 31 October 2019
Barings Global Flexible Allocation
Fund 31 October 2019
Company Total 31 October 2019
Notes US$ € US$IncomeBank interest income 1,671 7,387 36,221Interest income – 466,173 519,596Dividend income 179,923 145,003 6,406,373Net fair value gain on financial assets and financial liabilities at fair value through profit or loss 1,171,733 313,782 2,645,343Total income 1,353,327 932,345 9,607,533
ExpensesManagement fees 6 (1) (9,487) (1,047,485)Administration, depositary and operating fees 6 (22,495) (26,190) (451,734)Total operating expenses (22,496) (35,677) (1,499,219)
Net profit before finance costs and taxation 1,330,831 896,668 8,108,314
Finance costsDistributions 5 – (445) (888,445)Bank interest expense (4,291) (9,903) (22,674)Total finance costs (4,291) (10,348) (911,119)
Increase in net assets attributable to holders of redeemable participating shares before taxation 1,326,540 886,320 7,197,195
TaxationWithholding tax on dividends and other investment income (38,545) (5,717) (562,667)Capital Gains Tax – (6,481) (7,224)Total taxation (38,545) (12,198) (569,891)
Increase in net assets attributable to holders of redeemable participating shares 1,287,995 874,122 6,627,304
* The Barings Global Equity Allocation Fund was launched on 28 June 2019.Gains and losses arose solely from continuing activities. There were no gains or losses other than those dealt with in the Statement of Comprehensive Income.

The accompanying notes form an integral part of these financial statements.
31
Barings Investment Funds PlcStatement of Changes in Net Assets Attributable to Holders of Redeemable Participating Shares
For the financial period ended 31 October 2020
Barings China A-Share Fund
31 October 2020
Barings Europe Select Fund
31 October 2020
Barings European Opportunities
Fund 31 October 2020
Notes US$ € €Net assets attributable to holders of redeemable participating shares at the beginning of the financial period 8,450,485 49,088,661 156,720,995Increase in net assets attributable to holders of redeemable participating shares 3,766,228 3,162,865 10,273,928Issue of redeemable participating shares during the financial period 4 124 5,089,892 786Redemption of redeemable participating shares during the financial period 4 – (4,465,367) (58,827,570)Income equalisation 5 – (2,389) –Net assets attributable to holders of redeemable participating shares at the end of the financial period 12,216,837 52,873,662 108,168,139
The accompanying notes form an integral part of these financial statements.
32
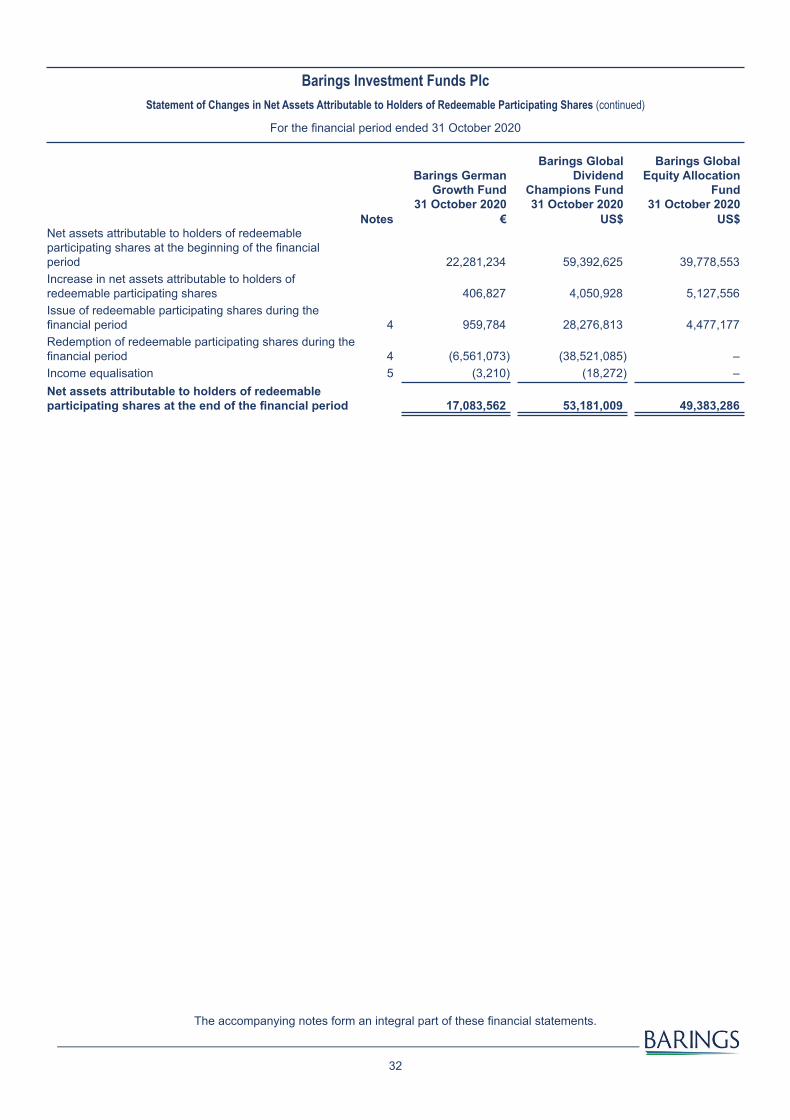
Barings Investment Funds PlcStatement of Changes in Net Assets Attributable to Holders of Redeemable Participating Shares (continued)
For the financial period ended 31 October 2020
Barings German Growth Fund
31 October 2020
Barings Global Dividend
Champions Fund 31 October 2020
Barings Global Equity Allocation
Fund 31 October 2020
Notes € US$ US$Net assets attributable to holders of redeemable participating shares at the beginning of the financial period 22,281,234 59,392,625 39,778,553Increase in net assets attributable to holders of redeemable participating shares 406,827 4,050,928 5,127,556Issue of redeemable participating shares during the financial period 4 959,784 28,276,813 4,477,177Redemption of redeemable participating shares during the financial period 4 (6,561,073) (38,521,085) –Income equalisation 5 (3,210) (18,272) –Net assets attributable to holders of redeemable participating shares at the end of the financial period 17,083,562 53,181,009 49,383,286
The accompanying notes form an integral part of these financial statements.
33
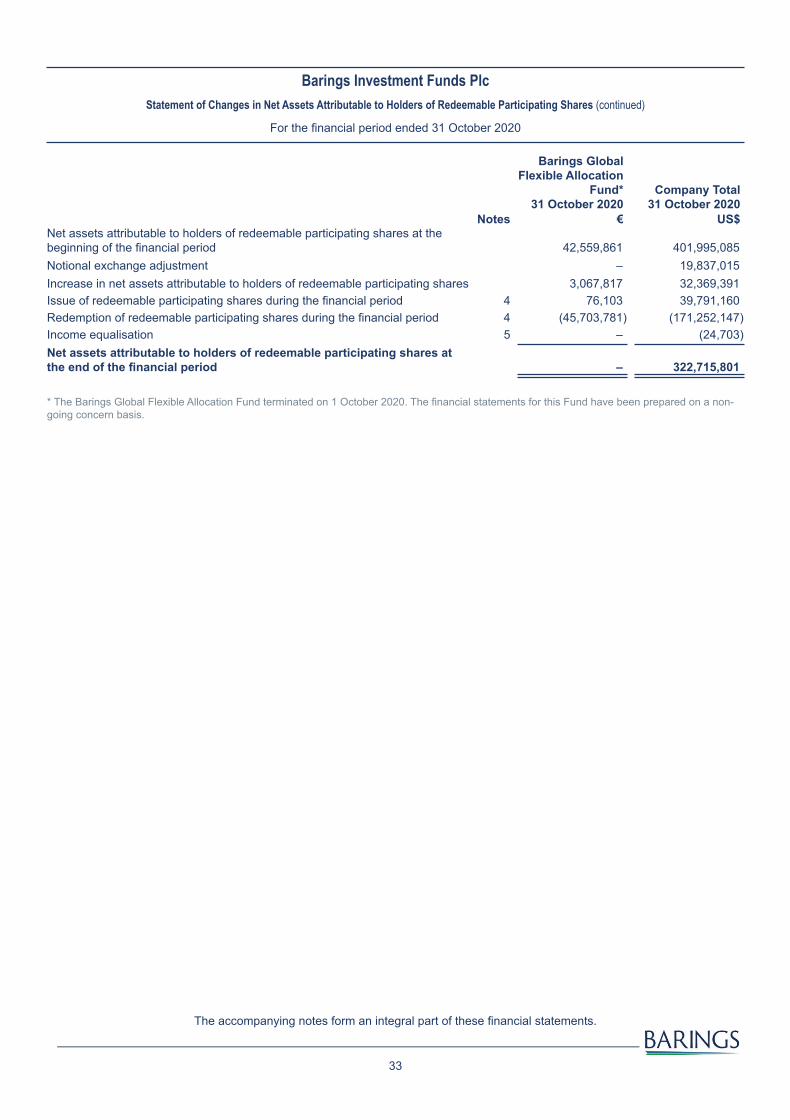
Barings Investment Funds PlcStatement of Changes in Net Assets Attributable to Holders of Redeemable Participating Shares (continued)
For the financial period ended 31 October 2020
Barings Global Flexible Allocation
Fund* 31 October 2020
Company Total 31 October 2020
Notes € US$Net assets attributable to holders of redeemable participating shares at the beginning of the financial period 42,559,861 401,995,085Notional exchange adjustment – 19,837,015Increase in net assets attributable to holders of redeemable participating shares 3,067,817 32,369,391Issue of redeemable participating shares during the financial period 4 76,103 39,791,160Redemption of redeemable participating shares during the financial period 4 (45,703,781) (171,252,147)Income equalisation 5 – (24,703)Net assets attributable to holders of redeemable participating shares at the end of the financial period – 322,715,801
* The Barings Global Flexible Allocation Fund terminated on 1 October 2020. The financial statements for this Fund have been prepared on a non-going concern basis.
The accompanying notes form an integral part of these financial statements.
34
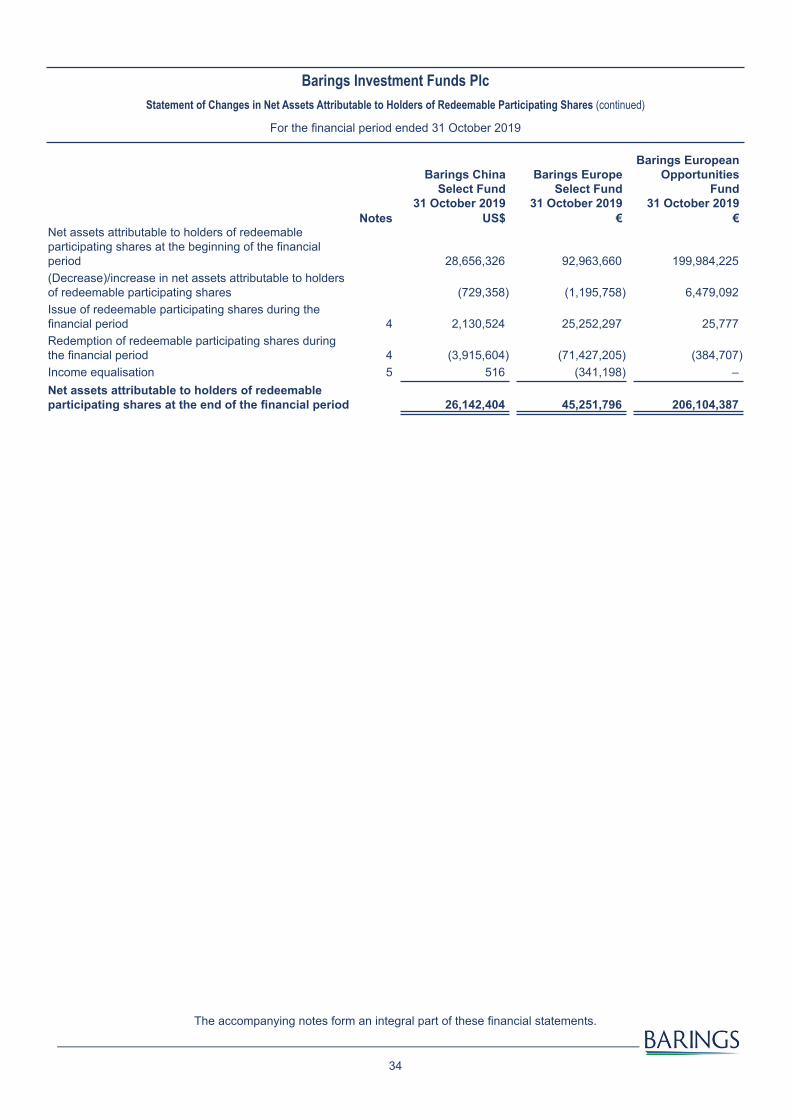
Barings Investment Funds PlcStatement of Changes in Net Assets Attributable to Holders of Redeemable Participating Shares (continued)
For the financial period ended 31 October 2019
Barings China Select Fund
31 October 2019
Barings Europe Select Fund
31 October 2019
Barings European Opportunities
Fund 31 October 2019
Notes US$ € €Net assets attributable to holders of redeemable participating shares at the beginning of the financial period 28,656,326 92,963,660 199,984,225(Decrease)/increase in net assets attributable to holders of redeemable participating shares (729,358) (1,195,758) 6,479,092Issue of redeemable participating shares during the financial period 4 2,130,524 25,252,297 25,777Redemption of redeemable participating shares during the financial period 4 (3,915,604) (71,427,205) (384,707)Income equalisation 5 516 (341,198) –Net assets attributable to holders of redeemable participating shares at the end of the financial period 26,142,404 45,251,796 206,104,387

The accompanying notes form an integral part of these financial statements.
35
Barings Investment Funds PlcStatement of Changes in Net Assets Attributable to Holders of Redeemable Participating Shares (continued)
For the financial period ended 31 October 2019
Barings Frontier Markets Fund*
31 October 2019
Barings German Growth Fund
31 October 2019
Barings Global Dividend
Champions Fund 31 October 2019
Notes US$ € US$Net assets attributable to holders of redeemable participating shares at the beginning of the financial period 30,073,465 32,399,684 20,894,023(Decrease)/increase in net assets attributable to holders of redeemable participating shares (726,052) (930,481) 968,739Issue of redeemable participating shares during the financial period 4 314,254 612,816 17,065,454Redemption of redeemable participating shares during the financial period 4 (29,634,122) (2,983,289) (421,970)Income equalisation 5 (27,545) (1,429) 16,360Net assets attributable to holders of redeemable participating shares at the end of the financial period – 29,097,301 38,522,606
* The Barings Frontier Markets Fund terminated on 23 September 2019. The financial statements for this Fund have been prepared on a non-going concern basis.
The accompanying notes form an integral part of these financial statements.
36
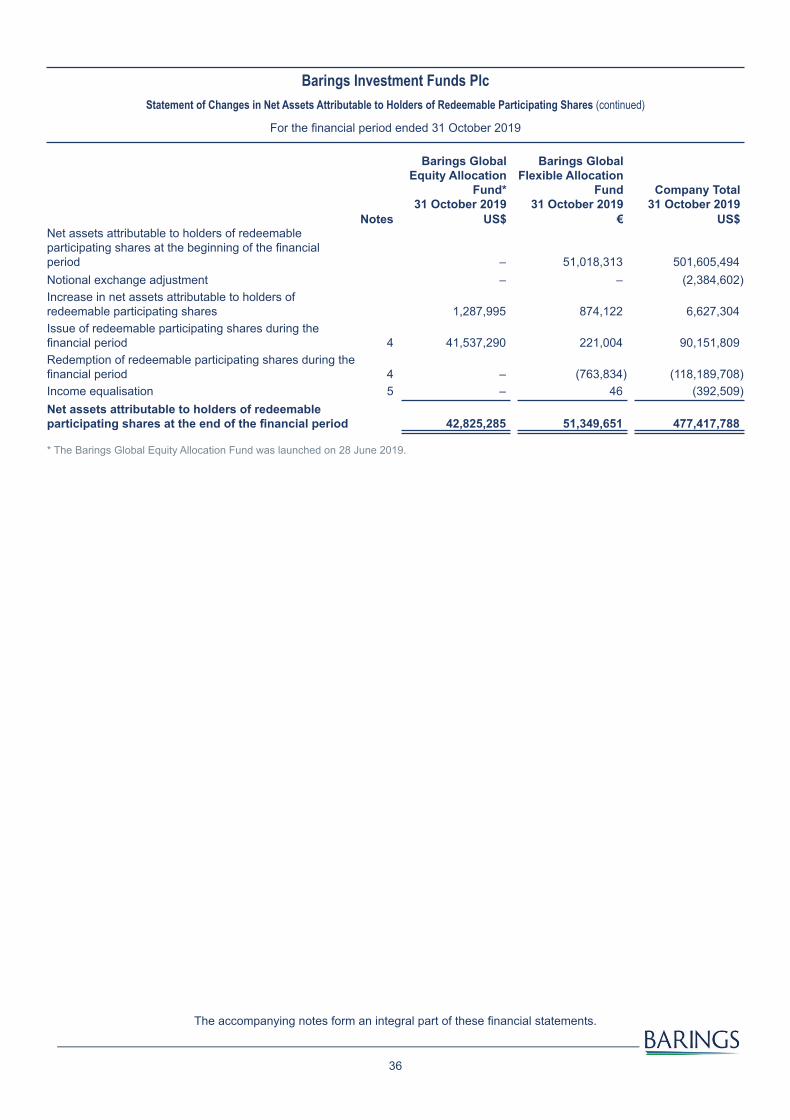
Barings Investment Funds PlcStatement of Changes in Net Assets Attributable to Holders of Redeemable Participating Shares (continued)
For the financial period ended 31 October 2019
Barings Global Equity Allocation
Fund* 31 October 2019
Barings Global Flexible Allocation
Fund 31 October 2019
Company Total 31 October 2019
Notes US$ € US$Net assets attributable to holders of redeemable participating shares at the beginning of the financial period – 51,018,313 501,605,494Notional exchange adjustment – – (2,384,602)Increase in net assets attributable to holders of redeemable participating shares 1,287,995 874,122 6,627,304Issue of redeemable participating shares during the financial period 4 41,537,290 221,004 90,151,809Redemption of redeemable participating shares during the financial period 4 – (763,834) (118,189,708)Income equalisation 5 – 46 (392,509)Net assets attributable to holders of redeemable participating shares at the end of the financial period 42,825,285 51,349,651 477,417,788
* The Barings Global Equity Allocation Fund was launched on 28 June 2019.
37
Barings Investment Funds PlcNotes to the financial statements
For the financial period ended 31 October 2020
1. Basis of measurement
The financial statements presented are unaudited condensed interim financial statements for the financial period ended 31 October 2020 that have been prepared in accordance with Financial Reporting Standard 104 (“FRS 104”) “Interim Financial Reporting”.
The condensed interim financial statements should be read in conjunction with the annual financial statements for the year ended 30 April 2020, which have been prepared in accordance with accounting standards generally accepted in Ireland, including FRS 102 “The Financial Reporting Standard applicable in the UK and Republic of Ireland” and Irish statute, comprising the Companies Act 2014.
The accounting policies in these condensed interim financial statements are consistent with those used in the Company’s most recent annual financial statements for the financial year 30 April 2020.
The condensed interim financial statements have been prepared under the historical cost convention as modified by the revaluation of financial assets and financial liabilities held at fair value through profit or loss. These financial statements were prepared on the going concern basis with the exception of Barings Global Flexible Allocation Fund which has been prepared on a non-going concern basis.
The Company meets all the conditions set out in FRS 102, Section 7, and consequently has availed of the exemption available to certain funds not to prepare a statement of cash flows.
The comparative figures included for the Statement of Financial Position relate to the previous financial year ended 30 April 2020, while the comparative figures included for the Statement of Comprehensive Income and Statement of Changes in Net Assets Attributable to Holders of Redeemable Participating Shares relate to the six month period ended 31 October 2019.
The registered number for the Company is 392526.
2. Significant accounting policies
Fair value measurementBy fully adopting FRS 102, in accounting for its financial instruments, a reporting entity is required to apply either a) the full requirements of FRS 102 relating to Basic Financial Instruments and Other Financial Instruments, b) the recognition and measurement provisions of IAS 39 Financial Instruments: Recognition and Measurement and only the disclosure requirements of FRS 102 relating to Basic Financial Instruments and Other Financial Instruments, or c) the recognition and measurement provisions of IFRS 9 Financial Instruments and only the disclosure requirements of FRS 102 relating to Basic Financial Instruments and Other Financial Instruments. The Company has chosen to implement b) the recognition and measurement provisions of IAS 39 Financial Instruments: Recognition and Measurement and only the disclosure requirements of FRS 102 relating to Basic Financial Instruments and Other Financial Instruments.
The use of IAS 39 recognition and measurement provisions is in line with the pricing policy, which outlines that the fair value of financial assets and financial liabilities be valued at the last traded prices. The financial statements include all the trades received up until 12:00p.m. (Irish time) on 30 October 2020, the valuation point for the Funds.

38
Barings Investment Funds PlcNotes to the financial statements (continued)
For the financial period ended 31 October 2020
3. Cash and cash equivalents, margin cash and bank overdrafts
Cash and cash equivalents, margin cash and bank overdrafts are valued at fair value with interest accrued, where applicable. Cash deposits are maintained with The Northern Trust Company (“TNTC”), London branch, with uninvested cash balances being swept daily into the Northern Trust Global Funds. On the Barings China A-Share Fund, a restricted overdraft of US$99,347 was held with the Central Depositary Shenzhen and the Central Depositary Shanghai. Any margin cash/margin overdraft is held by the broker as this is restricted cash. As at 31 October 2020 and 30 April 2020, the following margin cash was held:
31 October 2020 30 April 2020US$ US$
Union Bank Switzerland ("UBS")* – (524,980)Total – (524,980)
* All cash held with UBS is/was cash held as collateral for derivative purposes.
4. Redeemable shares
The authorised capital of the Company is €2 divided into two non-participating shares of €1 each and 500,000,000,000 shares of no par value.
Non-participating shares shall only be issued at par value and shall not participate in the dividends or assets attributable to redeemable participating shares by the Company, and the dividends, if any, and net assets attributable to the non-participating shares shall be segregated from and shall not form part of the other assets of the Company, and non-participating shares may at the request of any of the holders thereof be purchased by the Company directly or indirectly out of the Company’s assets.
A summary of the shareholders activity during the current financial period and previous financial year is detailed below:
Financial period ended 31 October 2020
Barings China A-Share FundBarings China A-Share Fund Class A USD
Acc No. of Shares
Class F EUR Acc
No. of Shares
Class F GBP Acc
No. of SharesBalance as at 1 May 2020 1,029 10 10Issued – – –Redeemed – – –Balance as at 31 October 2020 1,029 10 10
Barings China A-Share Fund Class F HKD Acc
No. of Shares
Class F USD Acc
No. of Shares
Class X GBP Inc
No. of SharesBalance as at 1 May 2020 78 10 90,500Issued – – 5Redeemed – – –Balance as at 31 October 2020 78 10 90,505
Barings China A-Share Fund Class X USD Acc
No. of SharesBalance as at 1 May 2020 272,898Issued –Redeemed –Balance as at 31 October 2020 272,898
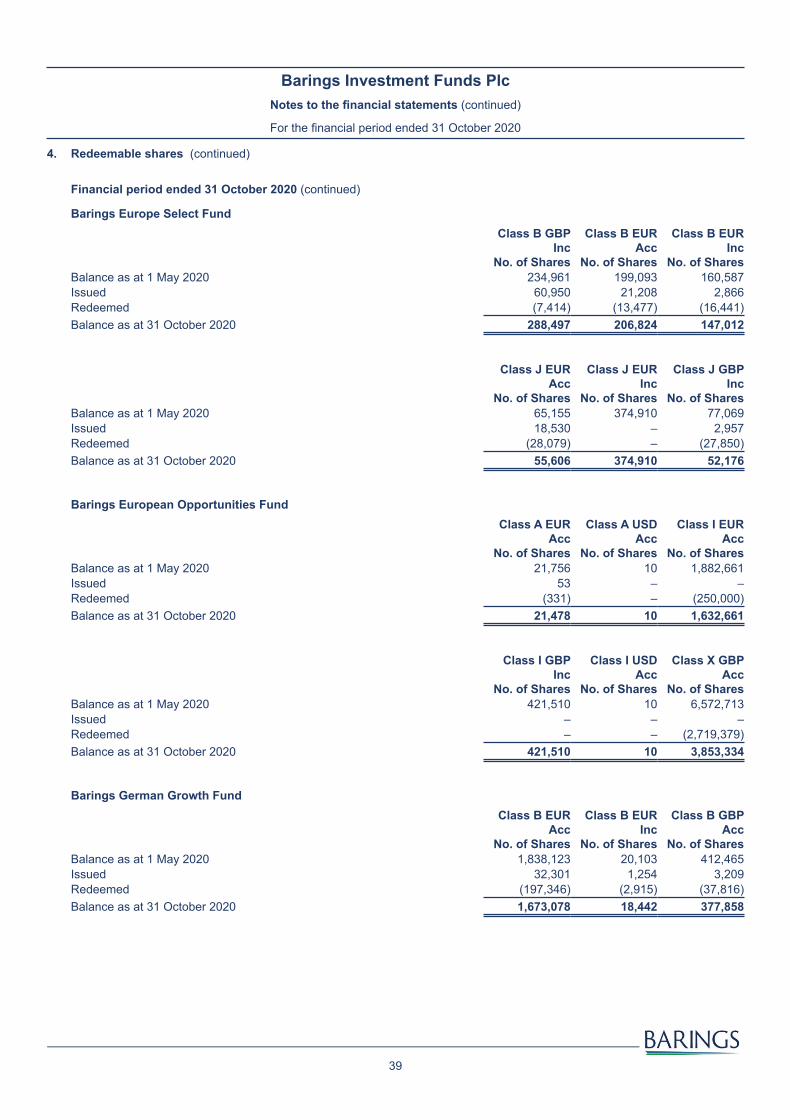
39
Barings Investment Funds PlcNotes to the financial statements (continued)
For the financial period ended 31 October 2020
Barings Europe Select FundBarings Europe Select Fund Class B GBP
Inc No. of Shares
Class B EUR Acc
No. of Shares
Class B EUR Inc
No. of SharesBalance as at 1 May 2020 234,961 199,093 160,587Issued 60,950 21,208 2,866Redeemed (7,414) (13,477) (16,441)Balance as at 31 October 2020 288,497 206,824 147,012
Barings Europe Select Fund Class J EUR Acc
No. of Shares
Class J EUR Inc
No. of Shares
Class J GBP Inc
No. of SharesBalance as at 1 May 2020 65,155 374,910 77,069Issued 18,530 – 2,957Redeemed (28,079) – (27,850)Balance as at 31 October 2020 55,606 374,910 52,176
Barings European Opportunities FundBarings European Opportunities Fund Class A EUR
Acc No. of Shares
Class A USD Acc
No. of Shares
Class I EUR Acc
No. of SharesBalance as at 1 May 2020 21,756 10 1,882,661Issued 53 – –Redeemed (331) – (250,000)Balance as at 31 October 2020 21,478 10 1,632,661
Barings European Opportunities Fund Class I GBP Inc
No. of Shares
Class I USD Acc
No. of Shares
Class X GBP Acc
No. of SharesBalance as at 1 May 2020 421,510 10 6,572,713Issued – – –Redeemed – – (2,719,379)Balance as at 31 October 2020 421,510 10 3,853,334
Barings German Growth FundBarings German Growth Fund Class B EUR
Acc No. of Shares
Class B EUR Inc
No. of Shares
Class B GBP Acc
No. of SharesBalance as at 1 May 2020 1,838,123 20,103 412,465Issued 32,301 1,254 3,209Redeemed (197,346) (2,915) (37,816)Balance as at 31 October 2020 1,673,078 18,442 377,858
4. Redeemable shares (continued)
Financial period ended 31 October 2020 (continued)

40
Barings Investment Funds PlcNotes to the financial statements (continued)
For the financial period ended 31 October 2020
Barings German Growth Fund Class B GBP Inc
No. of Shares
Class J EUR Acc
No. of Shares
Class J GBP Acc
No. of SharesBalance as at 1 May 2020 752 456,402 20,676Issued – – 70,910Redeemed – (444,402) (8,203)Balance as at 31 October 2020 752 12,000 83,383
Barings German Growth Fund Class J GBP Inc
No. of SharesBalance as at 1 May 2020 66,272Issued 9Redeemed (58,434)Balance as at 31 October 2020 7,847
Barings Global Dividend Champions FundBarings Global Dividend Champions Fund Class A USD
Acc No. of Shares
Class F GBP Acc
No. of Shares
Class F GBP Inc
No. of SharesBalance as at 1 May 2020 100 263,521 60,817Issued – 52,159 3,455Redeemed – (78,299) (52,242)Balance as at 31 October 2020 100 237,381 12,030
Barings Global Dividend Champions Fund Class F USD Acc
No. of Shares
Class F USD Inc
No. of Shares
Class I GBP Acc
No. of SharesBalance as at 1 May 2020 10 10 72,809Issued – – 74,2711Redeemed – – (61,061)Balance as at 31 October 2020 10 10 86,019
Barings Global Dividend Champions Fund Class I GBP Inc
No. of Shares
Class X USD Acc*
No. of Shares
Class I USD Inc**
No. of SharesBalance as at 1 May 2020 52 – 1,535,113Issued 1,156 200,000 84Redeemed (42) – (1,535,123)Balance as at 31 October 2020 1,166 200,000 74
* The Barings Global Dividend Champions Fund Class X USD Acc was launched on 18 August 2020.** The Barings Global Dividend Champions Fund Class I USD Inc was closed on 18 August 2020 and was subsequently re-launched on 22 September 2020. The class was further closed on 16 October 2020 and subsequently re-launched on 20 October 2020.
4. Redeemable shares (continued)
Financial period ended 31 October 2020 (continued)
Barings German Growth Fund (continued)
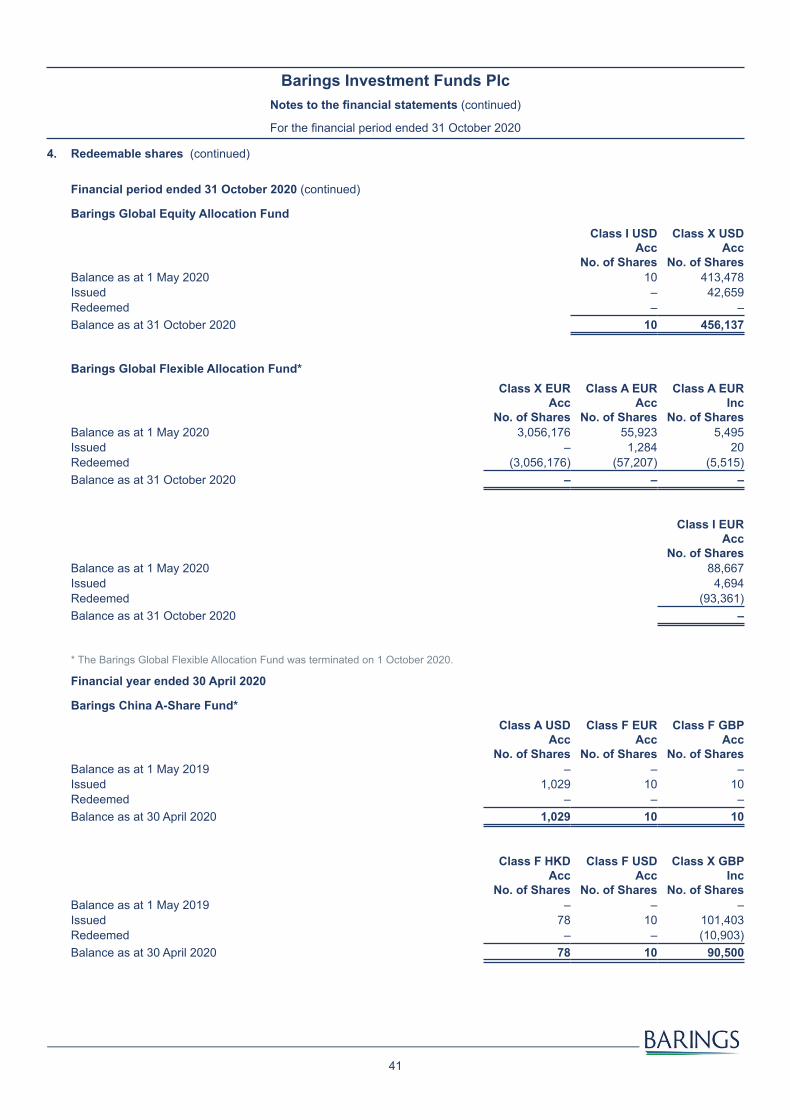
41
Barings Investment Funds PlcNotes to the financial statements (continued)
For the financial period ended 31 October 2020
Barings Global Equity Allocation FundBarings Global Equity Allocation Fund Class I USD
Acc No. of Shares
Class X USD Acc
No. of SharesBalance as at 1 May 2020 10 413,478Issued – 42,659Redeemed – –Balance as at 31 October 2020 10 456,137
Barings Global Flexible Allocation Fund*Barings Global Flexible Allocation Fund* Class X EUR
Acc No. of Shares
Class A EUR Acc
No. of Shares
Class A EUR Inc
No. of SharesBalance as at 1 May 2020 3,056,176 55,923 5,495Issued – 1,284 20Redeemed (3,056,176) (57,207) (5,515)Balance as at 31 October 2020 – – –
Barings Global Flexible Allocation Fund* Class I EUR Acc
No. of SharesBalance as at 1 May 2020 88,667Issued 4,694Redeemed (93,361)Balance as at 31 October 2020 –
* The Barings Global Flexible Allocation Fund was terminated on 1 October 2020.
Financial year ended 30 April 2020
Barings China A-Share Fund*Barings China A-Share Fund* Class A USD
Acc No. of Shares
Class F EUR Acc
No. of Shares
Class F GBP Acc
No. of SharesBalance as at 1 May 2019 – – –Issued 1,029 10 10Redeemed – – –Balance as at 30 April 2020 1,029 10 10
Barings China A-Share Fund* Class F HKD Acc
No. of Shares
Class F USD Acc
No. of Shares
Class X GBP Inc
No. of SharesBalance as at 1 May 2019 – – –Issued 78 10 101,403Redeemed – – (10,903)Balance as at 30 April 2020 78 10 90,500
4. Redeemable shares (continued)
Financial period ended 31 October 2020 (continued)

42
Barings Investment Funds PlcNotes to the financial statements (continued)
For the financial period ended 31 October 2020
Barings China A-Share Fund* Class X USD Acc
No. of SharesBalance as at 1 May 2019 –Issued 309,560Redeemed (36,662)Balance as at 30 April 2020 272,898
* The Barings China A-Share Fund was launched on 6 February 2020.
Barings China Select Fund*Barings China Select Fund* Class A USD
Inc No. of Shares
Class A EUR Inc
No. of Shares
Class A HKD Acc
No. of SharesBalance as at 1 May 2019 1,399,506 212,283 147,229Issued 180,878 3,833 –Redeemed (1,580,384) (216,116) (147,229)Balance as at 30 April 2020 – – –
Barings China Select Fund* Class I EUR Acc
No. of Shares
Class I GBP Inc
No. of Shares
Class I USD Acc
No. of SharesBalance as at 1 May 2019 151 19,197 161,635Issued – 10,851 11,843Redeemed (151) (30,048) (173,478)Balance as at 30 April 2020 – – –
* The Barings China Select Fund was terminated on 6 March 2020.
Barings Europe Select FundBarings Europe Select Fund Class B GBP
Inc No. of Shares
Class B EUR Acc
No. of Shares
Class B EUR Inc
No. of SharesBalance as at 1 May 2019 1,505,452 33,887 123,922Issued 261,904 186,677 58,684Redeemed (1,532,395) (21,471) (22,019)Balance as at 30 April 2020 234,961 199,093 160,587
Barings Europe Select Fund Class J EUR Acc
No. of Shares
Class J EUR Inc
No. of Shares
Class J GBP Inc
No. of SharesBalance as at 1 May 2019 68,280 86,161 148,064Issued 28,905 297,509 24,422Redeemed (32,030) (8,760) (95,417)Balance as at 30 April 2020 65,155 374,910 77,069
4. Redeemable shares (continued)
Financial year ended 30 April 2020 (continued)
Barings China A-Share Fund* (continued)
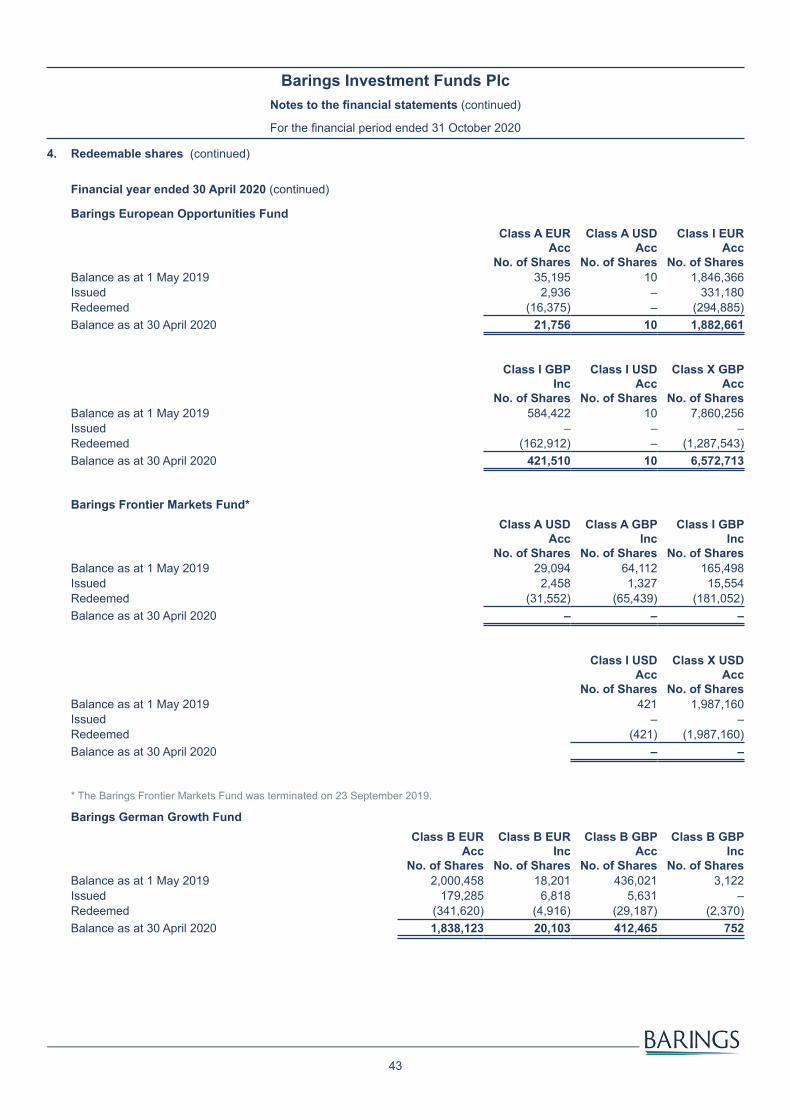
43
Barings Investment Funds PlcNotes to the financial statements (continued)
For the financial period ended 31 October 2020
Barings European Opportunities FundBarings European Opportunities Fund Class A EUR
Acc No. of Shares
Class A USD Acc
No. of Shares
Class I EUR Acc
No. of SharesBalance as at 1 May 2019 35,195 10 1,846,366Issued 2,936 – 331,180Redeemed (16,375) – (294,885)Balance as at 30 April 2020 21,756 10 1,882,661
Barings European Opportunities Fund Class I GBP Inc
No. of Shares
Class I USD Acc
No. of Shares
Class X GBP Acc
No. of SharesBalance as at 1 May 2019 584,422 10 7,860,256Issued – – –Redeemed (162,912) – (1,287,543)Balance as at 30 April 2020 421,510 10 6,572,713
Barings Frontier Markets Fund*Barings Frontier Markets Fund* Class A USD
Acc No. of Shares
Class A GBP Inc
No. of Shares
Class I GBP Inc
No. of SharesBalance as at 1 May 2019 29,094 64,112 165,498Issued 2,458 1,327 15,554Redeemed (31,552) (65,439) (181,052)Balance as at 30 April 2020 – – –
Barings Frontier Markets Fund* Class I USD Acc
No. of Shares
Class X USD Acc
No. of SharesBalance as at 1 May 2019 421 1,987,160Issued – –Redeemed (421) (1,987,160)Balance as at 30 April 2020 – –
* The Barings Frontier Markets Fund was terminated on 23 September 2019.
Barings German Growth FundBarings German Growth Fund Class B EUR
Acc No. of Shares
Class B EUR Inc
No. of Shares
Class B GBP Acc
No. of Shares
Class B GBP Inc
No. of SharesBalance as at 1 May 2019 2,000,458 18,201 436,021 3,122Issued 179,285 6,818 5,631 –Redeemed (341,620) (4,916) (29,187) (2,370)Balance as at 30 April 2020 1,838,123 20,103 412,465 752
4. Redeemable shares (continued)
Financial year ended 30 April 2020 (continued)

44
Barings Investment Funds PlcNotes to the financial statements (continued)
For the financial period ended 31 October 2020
Barings German Growth Fund Class B USD Acc*
No. of Shares
Class J EUR Acc
No. of Shares
Class J GBP Acc
No. of Shares
Class J GBP Inc
No. of SharesBalance as at 1 May 2019 267 610,035 83,341 152,031Issued – 37,007 5,537 4,287Redeemed (267) (190,640) (68,202) (90,046)Balance as at 30 April 2020 – 456,402 20,676 66,272
Barings German Growth Fund Class J USD Acc**
No. of SharesBalance as at 1 May 2019 735Issued –Redeemed (735)Balance as at 30 April 2020 –
* The Barings German Growth Fund Class B USD Acc was closed on 20 June 2019.** The Barings German Growth Fund Class J USD Acc was closed on 30 April 2020.
Barings Global Dividend Champions FundBarings Global Dividend Champions Fund Class A USD
Acc No. of Shares
Class F GBP Acc*
No. of Shares
Class F GBP Inc**
No. of Shares
Class F USD Acc***
No. of SharesBalance as at 1 May 2019 100 – – –Issued – 311,348 66,541 10Redeemed – (47,827) (5,724) –Balance as at 30 April 2020 100 263,521 60,817 10
Barings Global Dividend Champions Fund Class F USD Inc****
No. of Shares
Class I GBP Acc
No. of Shares
Class I GBP Inc*****
No. of Shares
Class I USD Inc
No. of SharesBalance as at 1 May 2019 – 19,015 – 1,647,764Issued 10 131,327 52 –Redeemed – (77,533) – (112,651)Balance as at 30 April 2020 10 72,809 52 1,535,113
* The Barings Global Dividend Champions Fund Class F GBP Acc was launched on 10 June 2019.** The Barings Global Dividend Champions Fund Class F GBP Inc was launched on 10 June 2019.*** The Barings Global Dividend Champions Fund Class F USD Acc was launched on 10 June 2019.**** The Barings Global Dividend Champions Fund Class F USD Inc was launched on 10 June 2019.***** The Barings Global Dividend Champions Fund Class I GBP Inc was launched on 12 July 2019.
4. Redeemable shares (continued)
Financial year ended 30 April 2020 (continued)
Barings German Growth Fund (continued)

45
Barings Investment Funds PlcNotes to the financial statements (continued)
For the financial period ended 31 October 2020
Barings Global Equity Allocation Fund*Barings Global Equity Allocation Fund* Class I USD
Acc No. of Shares
Class X USD Acc
No. of SharesBalance as at 1 May 2019 – –Issued 10 413,478Redeemed – –Balance as at 30 April 2020 10 413,478
* The Barings Global Equity Allocation Fund was launched on 28 June 2019.
Barings Global Flexible Allocation FundBarings Global Flexible Allocation Fund Class X EUR
Acc No. of Shares
Class A EUR Acc
No. of Shares
Class A EUR Inc
No. of SharesBalance as at 1 May 2019 3,418,770 63,141 3,494Issued – 4,418 2,021Redeemed (362,594) (11,636) (20)Balance as at 30 April 2020 3,056,176 55,923 5,495
Barings Global Flexible Allocation Fund Class I EUR Acc
No. of SharesBalance as at 1 May 2019 89,799Issued 20,577Redeemed (21,709)Balance as at 30 April 2020 88,667
4. Redeemable shares (continued)
Financial year ended 30 April 2020 (continued)
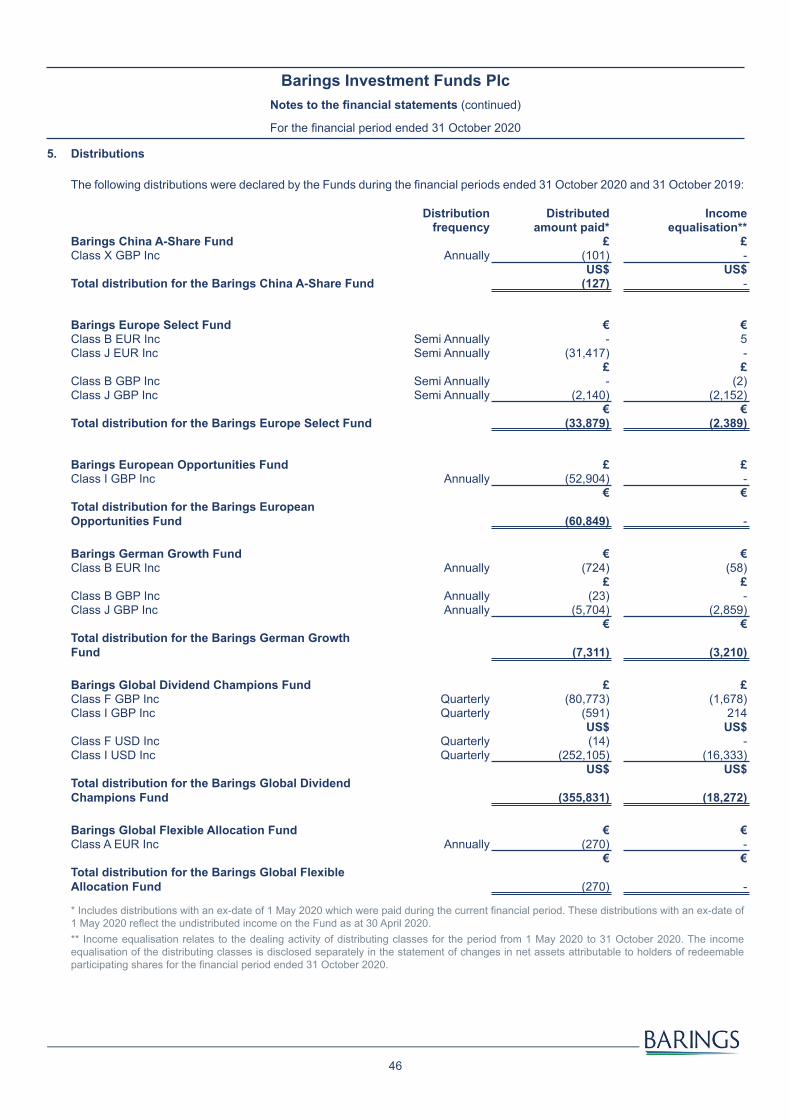
46
Barings Investment Funds PlcNotes to the financial statements (continued)
For the financial period ended 31 October 2020
5. Distributions
The following distributions were declared by the Funds during the financial periods ended 31 October 2020 and 31 October 2019:
Distribution Distributed Incomefrequency amount paid* equalisation**
Barings China A-Share Fund £ £Class X GBP Inc Annually (101) -
US$ US$Total distribution for the Barings China A-Share Fund (127) -
Barings Europe Select Fund € €Class B EUR Inc Semi Annually - 5Class J EUR Inc Semi Annually (31,417) -
£ £Class B GBP Inc Semi Annually - (2)Class J GBP Inc Semi Annually (2,140) (2,152)
€ €Total distribution for the Barings Europe Select Fund (33,879) (2,389)
Barings European Opportunities Fund £ £Class I GBP Inc Annually (52,904) -
€ €Total distribution for the Barings European Opportunities Fund (60,849) -
Barings German Growth Fund € €Class B EUR Inc Annually (724) (58)
£ £Class B GBP Inc Annually (23) -Class J GBP Inc Annually (5,704) (2,859)
€ €Total distribution for the Barings German Growth Fund (7,311) (3,210)
Barings Global Dividend Champions Fund £ £Class F GBP Inc Quarterly (80,773) (1,678)Class I GBP Inc Quarterly (591) 214
US$ US$Class F USD Inc Quarterly (14) -Class I USD Inc Quarterly (252,105) (16,333)
US$ US$Total distribution for the Barings Global Dividend Champions Fund (355,831) (18,272)
Barings Global Flexible Allocation Fund € €Class A EUR Inc Annually (270) -
€ €Total distribution for the Barings Global Flexible Allocation Fund (270) -
* Includes distributions with an ex-date of 1 May 2020 which were paid during the current financial period. These distributions with an ex-date of 1 May 2020 reflect the undistributed income on the Fund as at 30 April 2020. ** Income equalisation relates to the dealing activity of distributing classes for the period from 1 May 2020 to 31 October 2020. The income equalisation of the distributing classes is disclosed separately in the statement of changes in net assets attributable to holders of redeemable participating shares for the financial period ended 31 October 2020.
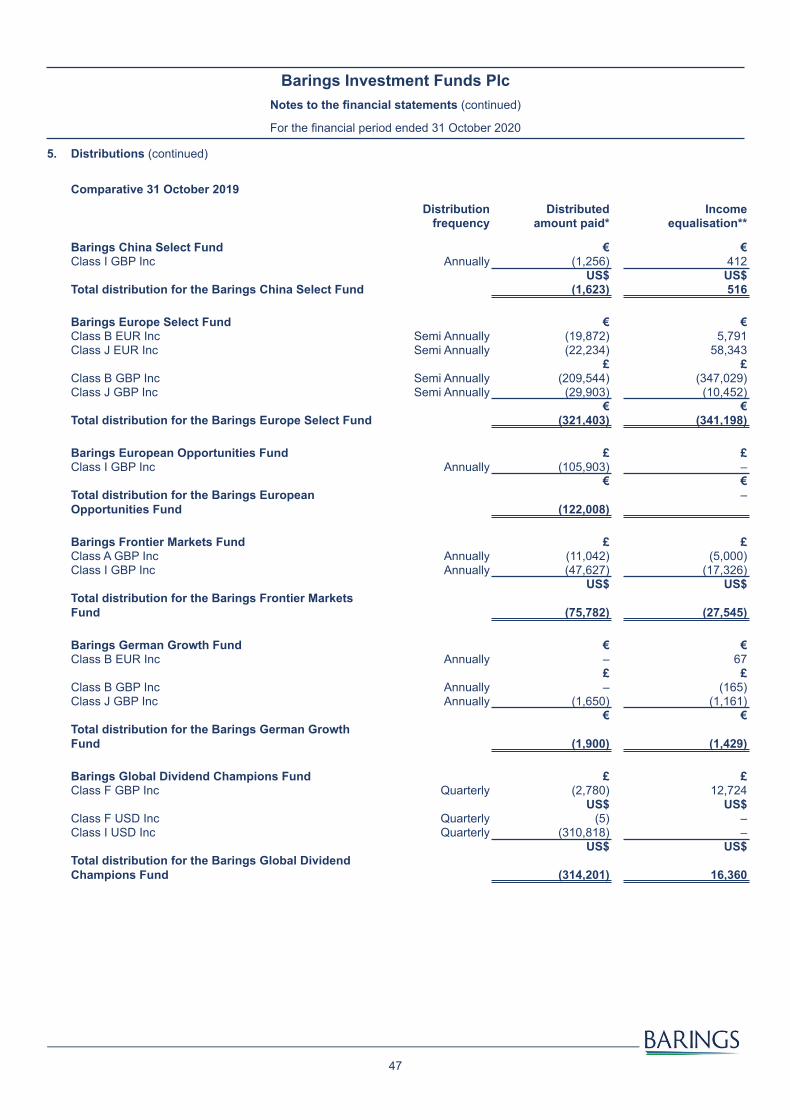
47
Barings Investment Funds PlcNotes to the financial statements (continued)
For the financial period ended 31 October 2020
Comparative 31 October 2019Distribution Distributed Income
frequency amount paid* equalisation**
Barings China Select Fund € €Class I GBP Inc Annually (1,256) 412
US$ US$Total distribution for the Barings China Select Fund (1,623) 516
Barings Europe Select Fund € €Class B EUR Inc Semi Annually (19,872) 5,791Class J EUR Inc Semi Annually (22,234) 58,343
£ £Class B GBP Inc Semi Annually (209,544) (347,029)Class J GBP Inc Semi Annually (29,903) (10,452)
€ €Total distribution for the Barings Europe Select Fund (321,403) (341,198)
Barings European Opportunities Fund £ £Class I GBP Inc Annually (105,903) –
€ €Total distribution for the Barings European Opportunities Fund (122,008)
–
Barings Frontier Markets Fund £ £Class A GBP Inc Annually (11,042) (5,000)Class I GBP Inc Annually (47,627) (17,326)
US$ US$Total distribution for the Barings Frontier Markets Fund (75,782) (27,545)
Barings German Growth Fund € €Class B EUR Inc Annually – 67
£ £Class B GBP Inc Annually – (165)Class J GBP Inc Annually (1,650) (1,161)
€ €Total distribution for the Barings German Growth Fund (1,900) (1,429)
Barings Global Dividend Champions Fund £ £Class F GBP Inc Quarterly (2,780) 12,724
US$ US$Class F USD Inc Quarterly (5) –Class I USD Inc Quarterly (310,818) –
US$ US$Total distribution for the Barings Global Dividend Champions Fund (314,201) 16,360
5. Distributions (continued)

48
Barings Investment Funds PlcNotes to the financial statements (continued)
For the financial period ended 31 October 2020
Distribution Distributed Incomefrequency amount paid* equalisation**
Barings Global Flexible Allocation Fund € €Class A EUR Inc Annually (445) 46
€ €Total distribution for the Barings Global Flexible Allocation Fund (445) 46
* Includes distributions with an ex-date of 1 May 2019 which were paid during the following financial period. These distributions with an ex-date of 1 May 2019 reflect the undistributed income on the Fund as at 30 April 2019.** Income equalisation relates to the dealing activity of distributing classes for the period from 1 May 2019 to 31 October 2019. The income equalisation of the distributing classes is disclosed separately in the statement of changes in net assets attributable to holders of redeemable participating shares for the financial period ended 31 October 2019.
6. Significant agreements and fees
Management feesBaring International Fund Managers (Ireland) Limited (the “Manager”) is entitled under the Management Agreement to charge a management fee at the rates per annum specified in the relevant supplement to the Prospectus and outlined in the tables below:
Fund/Class Management feeBarings China A-Share Fund - Class A USD Acc 1.50%Barings China A-Share Fund - Class F EUR Acc 0.50%Barings China A-Share Fund - Class F GBP Acc 0.50%Barings China A-Share Fund - Class F HKD Acc 0.50%Barings China A-Share Fund - Class F USD Acc 0.50%Barings Europe Select Fund - Class B GBP Inc 1.50%Barings Europe Select Fund - Class B EUR Acc 1.50%Barings Europe Select Fund - Class B EUR Inc 1.50%Barings Europe Select Fund - Class J EUR Acc 0.75%Barings Europe Select Fund - Class J EUR Inc 0.75%Barings Europe Select Fund - Class J GBP Inc 0.75%Barings European Opportunities Fund - Class A EUR Acc 1.50%Barings European Opportunities Fund - Class A USD Acc 1.50%Barings European Opportunities Fund - Class I EUR Acc 0.75%Barings European Opportunities Fund - Class I GBP Inc 0.75%Barings European Opportunities Fund - Class I USD Acc 0.75%Barings German Growth Fund - Class B EUR Acc 1.50%Barings German Growth Fund - Class B EUR Inc 1.50%Barings German Growth Fund - Class B GBP Acc 1.50%Barings German Growth Fund - Class B GBP Inc 1.50%Barings German Growth Fund - Class J EUR Acc 0.75%Barings German Growth Fund - Class J GBP Acc 0.75%Barings German Growth Fund - Class J GBP Inc 0.75%Barings Global Dividend Champions Fund - Class A USD Acc 1.50%Barings Global Dividend Champions Fund - Class F GBP Acc 0.30%Barings Global Dividend Champions Fund - Class F GBP Inc 0.30%Barings Global Dividend Champions Fund - Class F USD Acc 0.30%
5. Distributions (continued)
Comparative 31 October 2019 (continued)
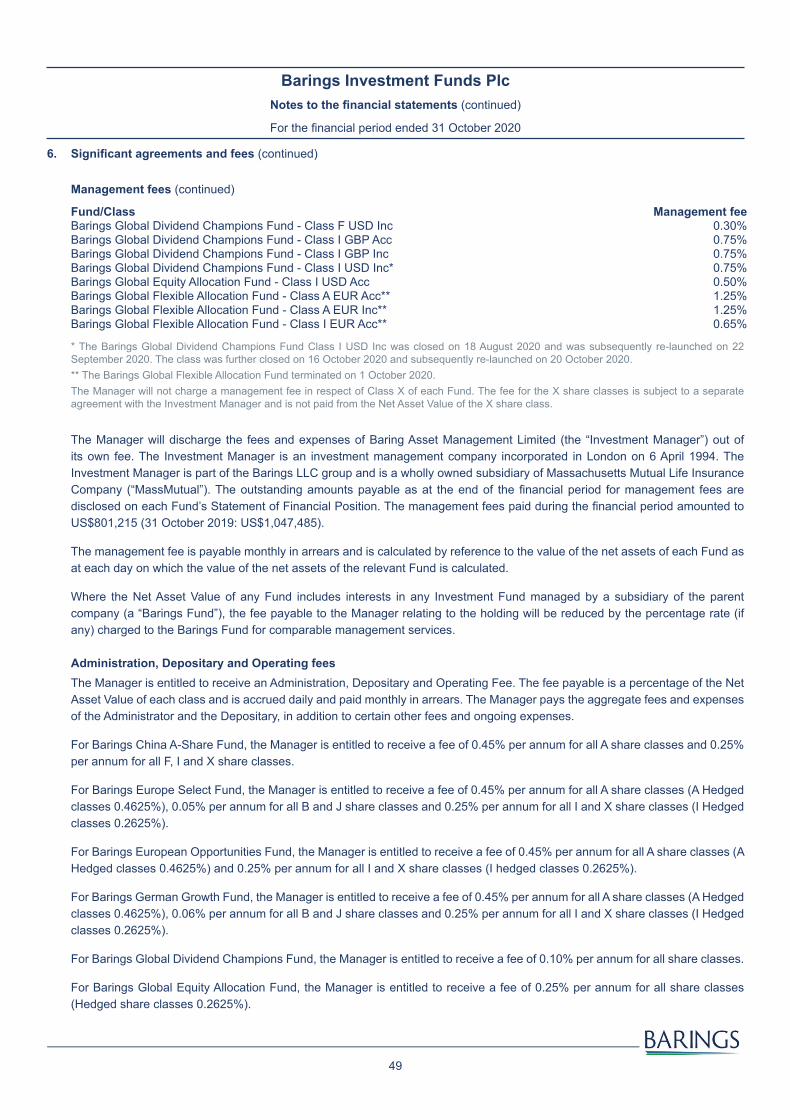
49
Barings Investment Funds PlcNotes to the financial statements (continued)
For the financial period ended 31 October 2020
Fund/Class Management feeBarings Global Dividend Champions Fund - Class F USD Inc 0.30%Barings Global Dividend Champions Fund - Class I GBP Acc 0.75%Barings Global Dividend Champions Fund - Class I GBP Inc 0.75%Barings Global Dividend Champions Fund - Class I USD Inc* 0.75%Barings Global Equity Allocation Fund - Class I USD Acc 0.50%Barings Global Flexible Allocation Fund - Class A EUR Acc** 1.25%Barings Global Flexible Allocation Fund - Class A EUR Inc** 1.25%Barings Global Flexible Allocation Fund - Class I EUR Acc** 0.65%
* The Barings Global Dividend Champions Fund Class I USD Inc was closed on 18 August 2020 and was subsequently re-launched on 22 September 2020. The class was further closed on 16 October 2020 and subsequently re-launched on 20 October 2020.** The Barings Global Flexible Allocation Fund terminated on 1 October 2020.The Manager will not charge a management fee in respect of Class X of each Fund. The fee for the X share classes is subject to a separate agreement with the Investment Manager and is not paid from the Net Asset Value of the X share class.
The Manager will discharge the fees and expenses of Baring Asset Management Limited (the “Investment Manager”) out of its own fee. The Investment Manager is an investment management company incorporated in London on 6 April 1994. The Investment Manager is part of the Barings LLC group and is a wholly owned subsidiary of Massachusetts Mutual Life Insurance Company (“MassMutual”). The outstanding amounts payable as at the end of the financial period for management fees are disclosed on each Fund’s Statement of Financial Position. The management fees paid during the financial period amounted to US$801,215 (31 October 2019: US$1,047,485).
The management fee is payable monthly in arrears and is calculated by reference to the value of the net assets of each Fund as at each day on which the value of the net assets of the relevant Fund is calculated.
Where the Net Asset Value of any Fund includes interests in any Investment Fund managed by a subsidiary of the parent company (a “Barings Fund”), the fee payable to the Manager relating to the holding will be reduced by the percentage rate (if any) charged to the Barings Fund for comparable management services.
Administration, Depositary and Operating fees The Manager is entitled to receive an Administration, Depositary and Operating Fee. The fee payable is a percentage of the Net Asset Value of each class and is accrued daily and paid monthly in arrears. The Manager pays the aggregate fees and expenses of the Administrator and the Depositary, in addition to certain other fees and ongoing expenses.
For Barings China A-Share Fund, the Manager is entitled to receive a fee of 0.45% per annum for all A share classes and 0.25% per annum for all F, I and X share classes.
For Barings Europe Select Fund, the Manager is entitled to receive a fee of 0.45% per annum for all A share classes (A Hedged classes 0.4625%), 0.05% per annum for all B and J share classes and 0.25% per annum for all I and X share classes (I Hedged classes 0.2625%).
For Barings European Opportunities Fund, the Manager is entitled to receive a fee of 0.45% per annum for all A share classes (A Hedged classes 0.4625%) and 0.25% per annum for all I and X share classes (I hedged classes 0.2625%).
For Barings German Growth Fund, the Manager is entitled to receive a fee of 0.45% per annum for all A share classes (A Hedged classes 0.4625%), 0.06% per annum for all B and J share classes and 0.25% per annum for all I and X share classes (I Hedged classes 0.2625%).
For Barings Global Dividend Champions Fund, the Manager is entitled to receive a fee of 0.10% per annum for all share classes.
For Barings Global Equity Allocation Fund, the Manager is entitled to receive a fee of 0.25% per annum for all share classes (Hedged share classes 0.2625%).
6. Significant agreements and fees (continued)
Management fees (continued)

50
Barings Investment Funds PlcNotes to the financial statements (continued)
For the financial period ended 31 October 2020
For Barings Global Flexible Allocation Fund*, the Manager was entitled to receive a fee of 0.45% per annum for all A share classes (A Hedged classes 0.4625%) and 0.10% per annum for all I and X share classes (I and X hedged classes 0.1125%).
Please refer to the Prospectus for full details of the fees payable.
* The Barings Global Flexible Allocation Fund terminated on 1 October 2020.
Trailer fees and reimbursementsTrailer fees (commissions for the marketing of the Funds) are paid to distribution, commission and sales agents out of the management fees. Reimbursements to institutional investors, who, from a commercial perspective, are holding the Funds’ redeemable participating shares for third parties, are also paid out of the management fees.
Transaction costsThe Funds' transaction costs at 31 October 2020 and 31 October 2019 are included in the Net fair value gain on the financial assets at fair value through profit or loss under the Statement of Comprehensive Income.
The transaction costs incurred by the Funds for the financial period ended 31 October 2020 and 31 October 2019, respectively, were as follows:
Fund Name
31 October 2020 US$
31 October 2019 US$
Barings China A-Share Fund* 11,542 –Barings China Select Fund** – 52,434Barings Europe Select Fund*** 27,458 39,869Barings European Opportunities Fund 57,668 115,188Barings Frontier Markets Fund**** – 124,829Barings German Growth Fund*** 5,741 8,056Barings Global Dividend Champions Fund 17,014 27,175Barings Global Equity Allocation Fund***** 9,078 16,471Barings Global Flexible Allocation Fund****** 5,518 3,816
* The Barings China A-Share Fund was launched on 6 February 2020. ** The Barings China Select Fund was terminated on 6 March 2020. *** The Barings Europe Select Fund and Barings German Growth Fund were launched on 8 February 2019.**** The Barings Frontier Markets Fund was terminated on 23 September 2019. ***** The Barings Global Equity Allocation Fund launched on 28 June 2019. ****** The Barings Global Flexible Allocation Fund was terminated on 1 October 2020.
Directors’ fees James Cleary and David Conway receive a fee of €11,250 (excluding VAT) each per annum. Barbara Healy receives a fee of €13,500 (excluding VAT) per annum. Julian Swayne, through employment with Barings LLC and its subsidiaries is not entitled to fees from the Company. Alan Behen and Paul Smyth, through employment with the Manager is not entitled to fees from the Company.
While these Directors don’t receive fees from the Company directly for their role as Directors, they are paid through their employment with Barings LLC, its subsidiaries and the Manager.
Peter Clark and Timothy Schulze, prior to their resignations on 21 October 2020 and 10 August 2020 respectively, through their employment with Barings LLC and its subsidiaries were not entitled to fees from the Company.
6. Significant agreements and fees (continued)
Administration, Depositary and Operating fees (continued)
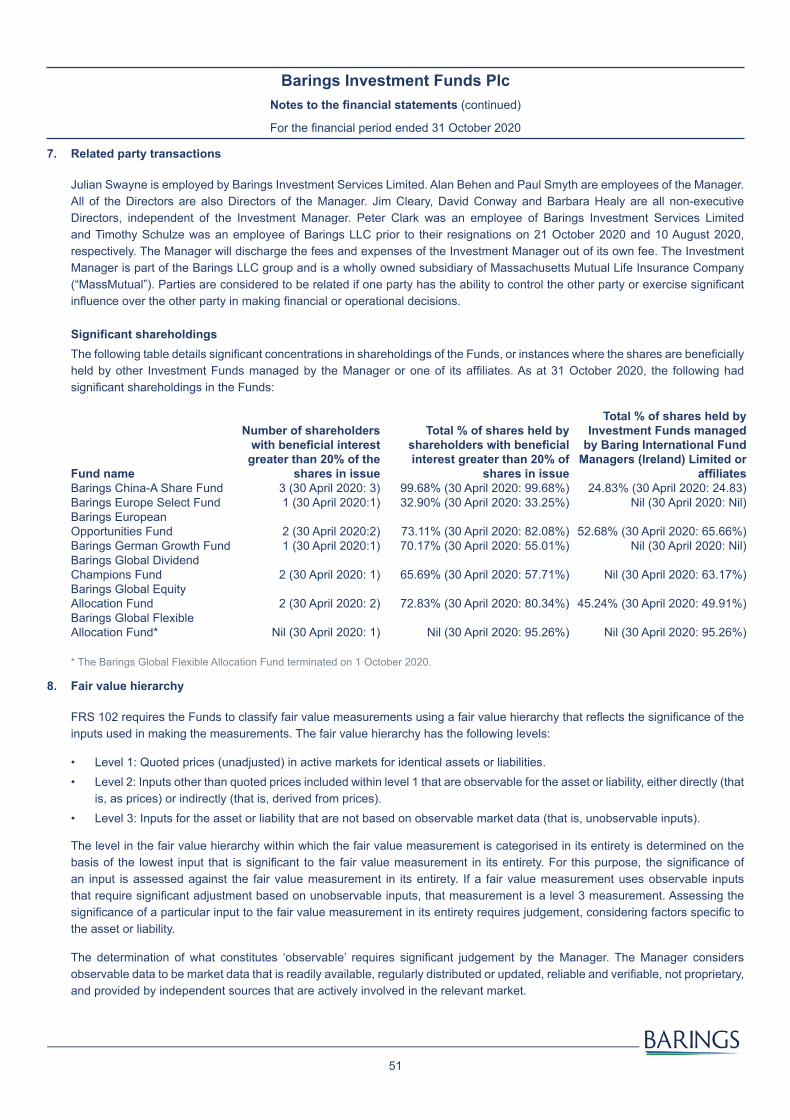
51
Barings Investment Funds PlcNotes to the financial statements (continued)
For the financial period ended 31 October 2020
7. Related party transactions
Julian Swayne is employed by Barings Investment Services Limited. Alan Behen and Paul Smyth are employees of the Manager. All of the Directors are also Directors of the Manager. Jim Cleary, David Conway and Barbara Healy are all non-executive Directors, independent of the Investment Manager. Peter Clark was an employee of Barings Investment Services Limited and Timothy Schulze was an employee of Barings LLC prior to their resignations on 21 October 2020 and 10 August 2020, respectively. The Manager will discharge the fees and expenses of the Investment Manager out of its own fee. The Investment Manager is part of the Barings LLC group and is a wholly owned subsidiary of Massachusetts Mutual Life Insurance Company (“MassMutual”). Parties are considered to be related if one party has the ability to control the other party or exercise significant influence over the other party in making financial or operational decisions.
Significant shareholdingsThe following table details significant concentrations in shareholdings of the Funds, or instances where the shares are beneficially held by other Investment Funds managed by the Manager or one of its affiliates. As at 31 October 2020, the following had significant shareholdings in the Funds:
Fund name
Number of shareholders with beneficial interest greater than 20% of the
shares in issue
Total % of shares held by shareholders with beneficial interest greater than 20% of
shares in issue
Total % of shares held by Investment Funds managed
by Baring International Fund Managers (Ireland) Limited or
affiliatesBarings China-A Share Fund 3 (30 April 2020: 3) 99.68% (30 April 2020: 99.68%) 24.83% (30 April 2020: 24.83)Barings Europe Select Fund 1 (30 April 2020:1) 32.90% (30 April 2020: 33.25%) Nil (30 April 2020: Nil)Barings European Opportunities Fund 2 (30 April 2020:2) 73.11% (30 April 2020: 82.08%) 52.68% (30 April 2020: 65.66%)Barings German Growth Fund 1 (30 April 2020:1) 70.17% (30 April 2020: 55.01%) Nil (30 April 2020: Nil)Barings Global Dividend Champions Fund 2 (30 April 2020: 1) 65.69% (30 April 2020: 57.71%) Nil (30 April 2020: 63.17%)Barings Global Equity Allocation Fund 2 (30 April 2020: 2) 72.83% (30 April 2020: 80.34%) 45.24% (30 April 2020: 49.91%)Barings Global Flexible Allocation Fund* Nil (30 April 2020: 1) Nil (30 April 2020: 95.26%) Nil (30 April 2020: 95.26%) * The Barings Global Flexible Allocation Fund terminated on 1 October 2020.
8. Fair value hierarchy
FRS 102 requires the Funds to classify fair value measurements using a fair value hierarchy that reflects the significance of the inputs used in making the measurements. The fair value hierarchy has the following levels:
• Level 1: Quoted prices (unadjusted) in active markets for identical assets or liabilities.• Level 2: Inputs other than quoted prices included within level 1 that are observable for the asset or liability, either directly (that
is, as prices) or indirectly (that is, derived from prices).• Level 3: Inputs for the asset or liability that are not based on observable market data (that is, unobservable inputs).
The level in the fair value hierarchy within which the fair value measurement is categorised in its entirety is determined on the basis of the lowest input that is significant to the fair value measurement in its entirety. For this purpose, the significance of an input is assessed against the fair value measurement in its entirety. If a fair value measurement uses observable inputs that require significant adjustment based on unobservable inputs, that measurement is a level 3 measurement. Assessing the significance of a particular input to the fair value measurement in its entirety requires judgement, considering factors specific to the asset or liability.
The determination of what constitutes ‘observable’ requires significant judgement by the Manager. The Manager considers observable data to be market data that is readily available, regularly distributed or updated, reliable and verifiable, not proprietary, and provided by independent sources that are actively involved in the relevant market.
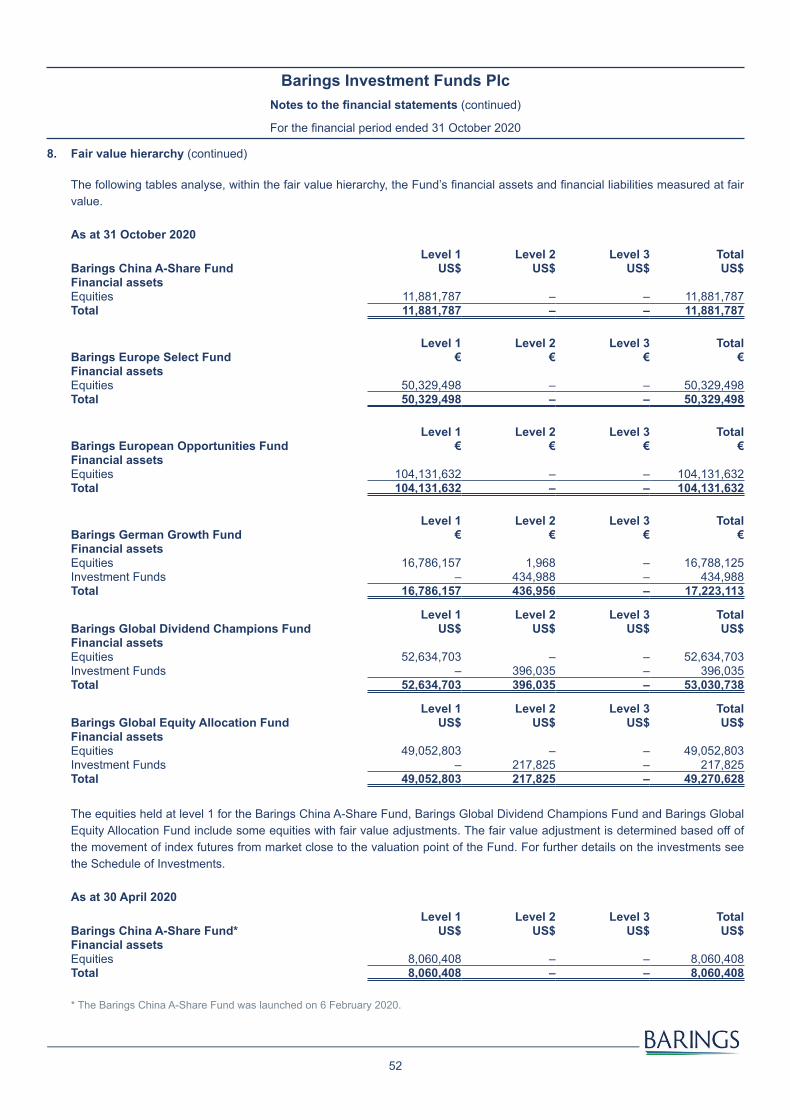
52
Barings Investment Funds PlcNotes to the financial statements (continued)
For the financial period ended 31 October 2020
The following tables analyse, within the fair value hierarchy, the Fund’s financial assets and financial liabilities measured at fair value.
As at 31 October 2020Level 1 Level 2 Level 3 Total
Barings China A-Share Fund US$ US$ US$ US$Financial assetsEquities 11,881,787 – – 11,881,787Total 11,881,787 – – 11,881,787
Level 1 Level 2 Level 3 TotalBarings Europe Select Fund € € € €Financial assetsEquities 50,329,498 – – 50,329,498Total 50,329,498 – – 50,329,498
Level 1 Level 2 Level 3 TotalBarings European Opportunities Fund € € € €Financial assetsEquities 104,131,632 – – 104,131,632Total 104,131,632 – – 104,131,632
Level 1 Level 2 Level 3 TotalBarings German Growth Fund € € € €Financial assetsEquities 16,786,157 1,968 – 16,788,125Investment Funds – 434,988 – 434,988Total 16,786,157 436,956 – 17,223,113
Level 1 Level 2 Level 3 TotalBarings Global Dividend Champions Fund US$ US$ US$ US$Financial assetsEquities 52,634,703 – – 52,634,703Investment Funds – 396,035 – 396,035Total 52,634,703 396,035 – 53,030,738
Level 1 Level 2 Level 3 TotalBarings Global Equity Allocation Fund US$ US$ US$ US$Financial assetsEquities 49,052,803 – – 49,052,803Investment Funds – 217,825 – 217,825Total 49,052,803 217,825 – 49,270,628
The equities held at level 1 for the Barings China A-Share Fund, Barings Global Dividend Champions Fund and Barings Global Equity Allocation Fund include some equities with fair value adjustments. The fair value adjustment is determined based off of the movement of index futures from market close to the valuation point of the Fund. For further details on the investments see the Schedule of Investments.
As at 30 April 2020Level 1 Level 2 Level 3 Total
Barings China A-Share Fund* US$ US$ US$ US$Financial assetsEquities 8,060,408 – – 8,060,408Total 8,060,408 – – 8,060,408
* The Barings China A-Share Fund was launched on 6 February 2020.
8. Fair value hierarchy (continued)
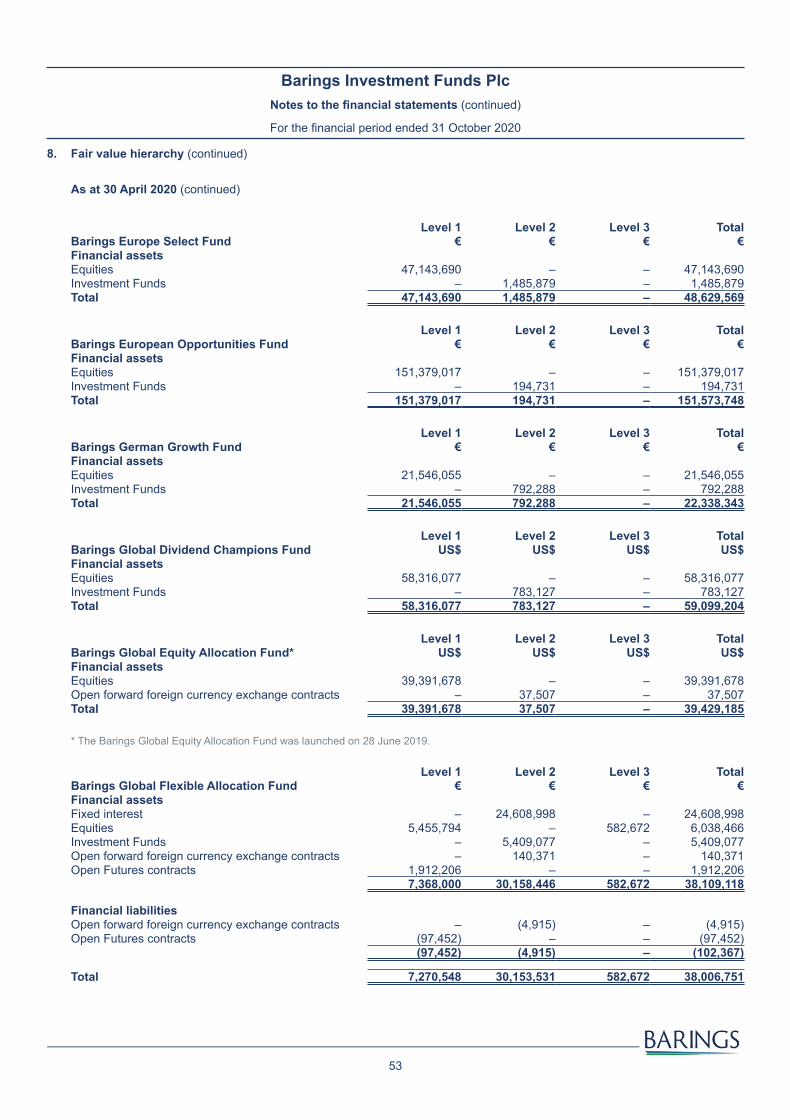
53
Barings Investment Funds PlcNotes to the financial statements (continued)
For the financial period ended 31 October 2020
Level 1 Level 2 Level 3 Total
Barings Europe Select Fund € € € €Financial assetsEquities 47,143,690 – – 47,143,690Investment Funds – 1,485,879 – 1,485,879Total 47,143,690 1,485,879 – 48,629,569
Level 1 Level 2 Level 3 TotalBarings European Opportunities Fund € € € €Financial assetsEquities 151,379,017 – – 151,379,017Investment Funds – 194,731 – 194,731Total 151,379,017 194,731 – 151,573,748
Level 1 Level 2 Level 3 TotalBarings German Growth Fund € € € €Financial assetsEquities 21,546,055 – – 21,546,055Investment Funds – 792,288 – 792,288Total 21,546,055 792,288 – 22,338,343
Level 1 Level 2 Level 3 TotalBarings Global Dividend Champions Fund US$ US$ US$ US$Financial assetsEquities 58,316,077 – – 58,316,077Investment Funds – 783,127 – 783,127Total 58,316,077 783,127 – 59,099,204
Level 1 Level 2 Level 3 TotalBarings Global Equity Allocation Fund* US$ US$ US$ US$Financial assetsEquities 39,391,678 – – 39,391,678Open forward foreign currency exchange contracts – 37,507 – 37,507Total 39,391,678 37,507 – 39,429,185
* The Barings Global Equity Allocation Fund was launched on 28 June 2019.
Level 1 Level 2 Level 3 TotalBarings Global Flexible Allocation Fund € € € €Financial assetsFixed interest – 24,608,998 – 24,608,998Equities 5,455,794 – 582,672 6,038,466Investment Funds – 5,409,077 – 5,409,077Open forward foreign currency exchange contracts – 140,371 – 140,371Open Futures contracts 1,912,206 – – 1,912,206
7,368,000 30,158,446 582,672 38,109,118
Financial liabilitiesOpen forward foreign currency exchange contracts – (4,915) – (4,915)Open Futures contracts (97,452) – – (97,452)
(97,452) (4,915) – (102,367)
Total 7,270,548 30,153,531 582,672 38,006,751
8. Fair value hierarchy (continued)
As at 30 April 2020 (continued)

54
Barings Investment Funds PlcNotes to the financial statements (continued)
For the financial period ended 31 October 2020
During the financial period ending 31 October 2020, the Barings German Growth Funds holding in Grammer Rights was transferred from level 1 to level 2. There have been no transfers from level 2 to level 1 during the financial period ending 31 October 2020. There were no transfers during the financial year ended 30 April 2020 from level 1 to level 2 or from level 2 to level 1. At 31 October 2020, there were no financial assets or financial liabilities classified at Level 3. As at 30 April 2020, the Barings Global Flexible Allocation Funds holding in JPEL Private Equity was transferred from Level 1 to Level 3.
Level 3Barings Global Flexible Allocation Fund €Opening value 582,672Transfer to Level 3 –Movement in unrealised gain –Closing value 582,672
Transfers between levels, when applicable, occur at the end of the financial period.
Cash includes deposits held with banks and other short-term investments in an active market are categorised as Level 1. All receivables and payables are categorised as Level 2.
9. Efficient portfolio management
The Funds may use Financial Derivative Instruments (“FDIs”) for efficient portfolio management. The efficient portfolio management purposes for which the Company intends to employ FDIs are reduction of risk, reduction of cost and the generation of additional capital or income for the relevant Fund with an appropriate level of risk, taking into account the risk profile of the Fund and the general provisions of the UCITS Regulations. The Company may use various types of derivatives for these purposes, including, without limitation, warrants, exchange traded futures and options, forward currency contracts, swaps (including but not limited to total return swaps, credit default swaps, and IRSs), contracts for differences, index-linked notes and share and commodity index futures contracts for these purposes.
Risk Monitoring of Global Exposure
The Funds have been classified as a non-sophisticated user of FDI and, as permitted by the Central Bank UCITS Regulations, the Company has adopted a commitment approach (the “Commitment Approach”) in the calculation of global exposure for the fund during the financial period.
In accordance with the UCITS Regulations, the Commitment Approach has been calculated, in the case of forward currency contracts (“FCCTs”), by converting the FCCT position into an equivalent position based on the market value of the underlying asset. As the FDI are used for hedging purposes, the exposure of the FDI has been calculated and then netted against the instrument being hedged. The Global Exposure calculation is performed on a daily basis.
In no circumstances will the global exposure of the Funds exceed 100% of its Net Asset Value.
8. Fair value hierarchy (continued)

55
Barings Investment Funds PlcNotes to the financial statements (continued)
For the financial period ended 31 October 2020
10. NAV per redeemable participating shares
Net assets attributable to holders of redeemable participating shares
31 October 2020 30 April 2020
Barings China A-Share Fund* US$12,216,837 US$8,450,485
NAV per redeemable sharesBarings China A-Share Fund - Class A USD Acc US$28.88 US$20.14Barings China A-Share Fund - Class F EUR Acc €139.11 €103.53Barings China A-Share Fund - Class F GBP Acc £147.67 £106.27Barings China A-Share Fund - Class F HKD Acc HK$148.05 HK$102.64Barings China A-Share Fund - Class F USD Acc US$148.25 US$102.82Barings China A-Share Fund - Class X GBP Inc £24.75 £17.77Barings China A-Share Fund - Class X USD Acc US$33.98 US$23.50
* Barings China A-Share Fund merged with Barings Investment Funds Plc on 6 February 2020.
Net assets attributable to holders of redeemable participating shares
31 October 2020 30 April 2020 30 April 2019
Barings China Select Fund* – – US$28,656,326
NAV per redeemable sharesBarings China Select Fund - Class A USD Inc – – US$13.77Barings China Select Fund - Class A EUR Inc – – €19.14Barings China Select Fund - Class A HKD Acc – – HK$108.10Barings China Select Fund - Class I EUR Acc – – €22.20Barings China Select Fund - Class I GBP Inc – – £11.26Barings China Select Fund - Class I USD Acc – – US$15.54
* The Barings China Select Fund terminated on 6 March 2020.
Net assets attributable to holders of redeemable participating shares
31 October 2020 30 April 2020 30 April 2019
Barings Europe Select Fund* €52,873,662 €49,088,661 €92,963,660
NAV per redeemable sharesBarings Europe Select Fund - Class B GBP Inc £41.40 £37.62 £40.60Barings Europe Select Fund - Class B EUR Acc €49.20 €46.23 €49.89Barings Europe Select Fund - Class B EUR Inc €45.91 €43.15 €46.97Barings Europe Select Fund - Class J EUR Acc €49.90 €46.72 €50.04Barings Europe Select Fund - Class J EUR Inc €46.57 €43.68 €47.46Barings Europe Select Fund - Class J GBP Inc £41.93 £37.99 £40.90
* The Barings Europe Select Fund was launched on 8 February 2019.
Net assets attributable to holders of redeemable participating shares
31 October 2020 30 April 2020 30 April 2019
Barings European Opportunities Fund €108,168,139 €156,720,995 €199,984,225
NAV per redeemable sharesBarings European Opportunities Fund - Class A EUR Acc €14.83 €14.20 €15.77Barings European Opportunities Fund - Class A USD Acc US$17.10 US$15.28 US$17.53Barings European Opportunities Fund - Class I EUR Acc €15.75 €15.01 €16.51Barings European Opportunities Fund - Class I GBP Inc £15.65 £14.55 £16.05Barings European Opportunities Fund - Class I USD Acc US$18.65 US$16.50 US$18.58Barings European Opportunities Fund - Class X GBP Acc £17.45 £16.02 £17.33
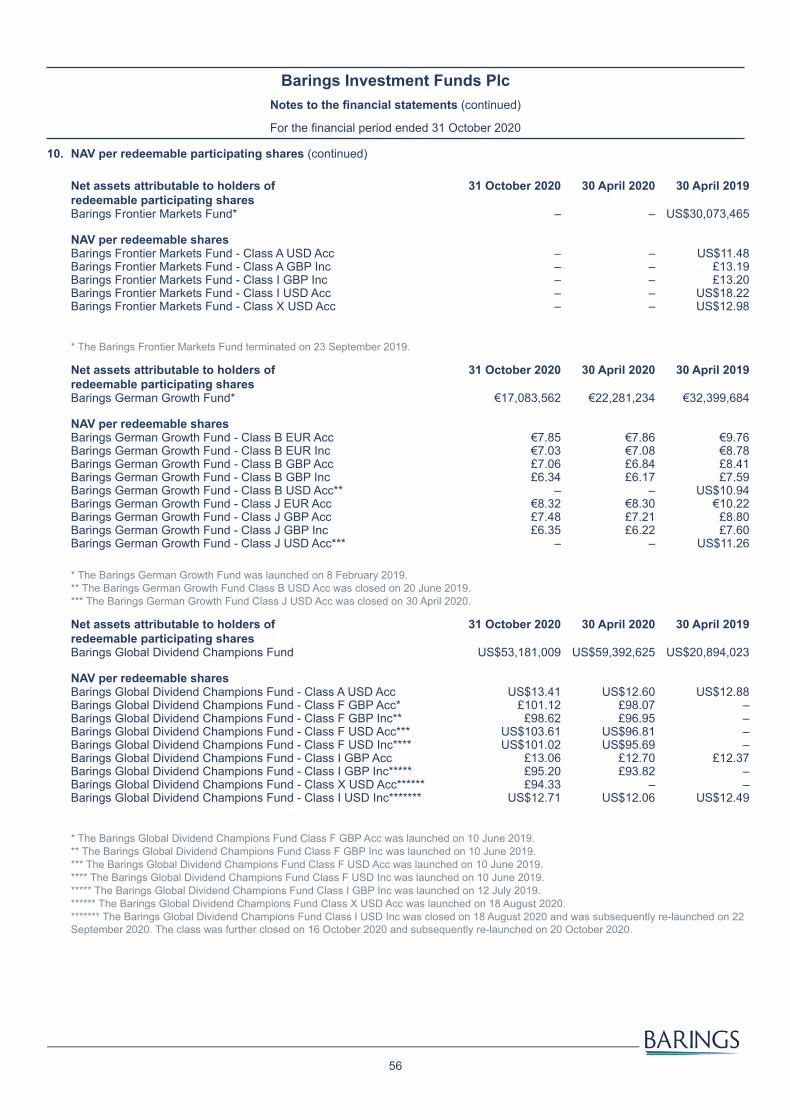
56
Barings Investment Funds PlcNotes to the financial statements (continued)
For the financial period ended 31 October 2020
Net assets attributable to holders of redeemable participating shares
31 October 2020 30 April 2020 30 April 2019
Barings Frontier Markets Fund* – – US$30,073,465
NAV per redeemable sharesBarings Frontier Markets Fund - Class A USD Acc – – US$11.48Barings Frontier Markets Fund - Class A GBP Inc – – £13.19Barings Frontier Markets Fund - Class I GBP Inc – – £13.20Barings Frontier Markets Fund - Class I USD Acc – – US$18.22Barings Frontier Markets Fund - Class X USD Acc – – US$12.98
* The Barings Frontier Markets Fund terminated on 23 September 2019.
Net assets attributable to holders of redeemable participating shares
31 October 2020 30 April 2020 30 April 2019
Barings German Growth Fund* €17,083,562 €22,281,234 €32,399,684
NAV per redeemable sharesBarings German Growth Fund - Class B EUR Acc €7.85 €7.86 €9.76Barings German Growth Fund - Class B EUR Inc €7.03 €7.08 €8.78Barings German Growth Fund - Class B GBP Acc £7.06 £6.84 £8.41Barings German Growth Fund - Class B GBP Inc £6.34 £6.17 £7.59Barings German Growth Fund - Class B USD Acc** – – US$10.94Barings German Growth Fund - Class J EUR Acc €8.32 €8.30 €10.22Barings German Growth Fund - Class J GBP Acc £7.48 £7.21 £8.80Barings German Growth Fund - Class J GBP Inc £6.35 £6.22 £7.60Barings German Growth Fund - Class J USD Acc*** – – US$11.26
* The Barings German Growth Fund was launched on 8 February 2019.** The Barings German Growth Fund Class B USD Acc was closed on 20 June 2019.*** The Barings German Growth Fund Class J USD Acc was closed on 30 April 2020.
Net assets attributable to holders of redeemable participating shares
31 October 2020 30 April 2020 30 April 2019
Barings Global Dividend Champions Fund US$53,181,009 US$59,392,625 US$20,894,023
NAV per redeemable sharesBarings Global Dividend Champions Fund - Class A USD Acc US$13.41 US$12.60 US$12.88Barings Global Dividend Champions Fund - Class F GBP Acc* £101.12 £98.07 –Barings Global Dividend Champions Fund - Class F GBP Inc** £98.62 £96.95 –Barings Global Dividend Champions Fund - Class F USD Acc*** US$103.61 US$96.81 –Barings Global Dividend Champions Fund - Class F USD Inc**** US$101.02 US$95.69 –Barings Global Dividend Champions Fund - Class I GBP Acc £13.06 £12.70 £12.37Barings Global Dividend Champions Fund - Class I GBP Inc***** £95.20 £93.82 –Barings Global Dividend Champions Fund - Class X USD Acc****** £94.33 – –Barings Global Dividend Champions Fund - Class I USD Inc******* US$12.71 US$12.06 US$12.49
* The Barings Global Dividend Champions Fund Class F GBP Acc was launched on 10 June 2019.** The Barings Global Dividend Champions Fund Class F GBP Inc was launched on 10 June 2019.*** The Barings Global Dividend Champions Fund Class F USD Acc was launched on 10 June 2019.**** The Barings Global Dividend Champions Fund Class F USD Inc was launched on 10 June 2019.***** The Barings Global Dividend Champions Fund Class I GBP Inc was launched on 12 July 2019.****** The Barings Global Dividend Champions Fund Class X USD Acc was launched on 18 August 2020.******* The Barings Global Dividend Champions Fund Class I USD Inc was closed on 18 August 2020 and was subsequently re-launched on 22 September 2020. The class was further closed on 16 October 2020 and subsequently re-launched on 20 October 2020.
10. NAV per redeemable participating shares (continued)

57
Barings Investment Funds PlcNotes to the financial statements (continued)
For the financial period ended 31 October 2020
Net assets attributable to holders of redeemable participating shares
31 October 2020 30 April 2020
Barings Global Equity Allocation Fund* US$49,383,286 US$39,778,553
NAV per redeemable sharesBarings Global Equity Allocation Fund - Class I USD Acc US$107.54 US$95.80Barings Global Equity Allocation Fund - Class X USD Acc US$108.26 US$96.20
* The Barings Global Equity Allocation Fund was launched on 28 June 2019.
Net assets attributable to holders of redeemable participating shares
31 October 2020 30 April 2020 30 April 2019
Barings Global Flexible Allocation Fund* – €42,559,861 €51,018,313
NAV per redeemable sharesBarings Global Flexible Allocation Fund - Class X EUR Acc – €13.32 €14.31Barings Global Flexible Allocation Fund - Class A EUR Acc – €11.90 €12.99Barings Global Flexible Allocation Fund - Class A EUR Inc – €11.48 €12.65Barings Global Flexible Allocation Fund - Class I EUR Acc – €12.59 €13.62
* The Barings Global Flexible Allocation Fund was terminated on 1 October 2020.
10. NAV per redeemable participating shares (continued)
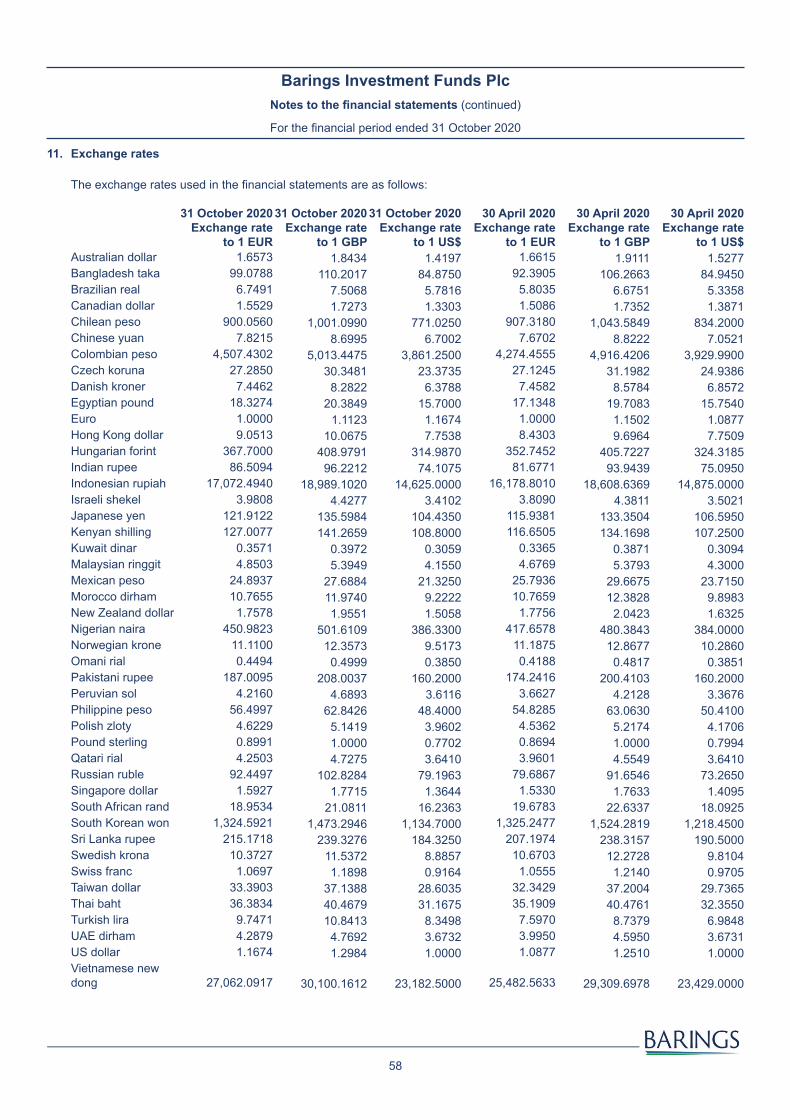
58
Barings Investment Funds PlcNotes to the financial statements (continued)
For the financial period ended 31 October 2020
11. Exchange rates
The exchange rates used in the financial statements are as follows:
31 October 2020 Exchange rate
to 1 EUR
31 October 2020 Exchange rate
to 1 GBP
31 October 2020 Exchange rate
to 1 US$
30 April 2020 Exchange rate
to 1 EUR
30 April 2020 Exchange rate
to 1 GBP
30 April 2020 Exchange rate
to 1 US$Australian dollar 1.6573 1.8434 1.4197 1.6615 1.9111 1.5277Bangladesh taka 99.0788 110.2017 84.8750 92.3905 106.2663 84.9450Brazilian real 6.7491 7.5068 5.7816 5.8035 6.6751 5.3358Canadian dollar 1.5529 1.7273 1.3303 1.5086 1.7352 1.3871Chilean peso 900.0560 1,001.0990 771.0250 907.3180 1,043.5849 834.2000Chinese yuan 7.8215 8.6995 6.7002 7.6702 8.8222 7.0521Colombian peso 4,507.4302 5,013.4475 3,861.2500 4,274.4555 4,916.4206 3,929.9900Czech koruna 27.2850 30.3481 23.3735 27.1245 31.1982 24.9386Danish kroner 7.4462 8.2822 6.3788 7.4582 8.5784 6.8572Egyptian pound 18.3274 20.3849 15.7000 17.1348 19.7083 15.7540Euro 1.0000 1.1123 1.1674 1.0000 1.1502 1.0877Hong Kong dollar 9.0513 10.0675 7.7538 8.4303 9.6964 7.7509Hungarian forint 367.7000 408.9791 314.9870 352.7452 405.7227 324.3185Indian rupee 86.5094 96.2212 74.1075 81.6771 93.9439 75.0950Indonesian rupiah 17,072.4940 18,989.1020 14,625.0000 16,178.8010 18,608.6369 14,875.0000Israeli shekel 3.9808 4.4277 3.4102 3.8090 4.3811 3.5021Japanese yen 121.9122 135.5984 104.4350 115.9381 133.3504 106.5950Kenyan shilling 127.0077 141.2659 108.8000 116.6505 134.1698 107.2500Kuwait dinar 0.3571 0.3972 0.3059 0.3365 0.3871 0.3094Malaysian ringgit 4.8503 5.3949 4.1550 4.6769 5.3793 4.3000Mexican peso 24.8937 27.6884 21.3250 25.7936 29.6675 23.7150Morocco dirham 10.7655 11.9740 9.2222 10.7659 12.3828 9.8983New Zealand dollar 1.7578 1.9551 1.5058 1.7756 2.0423 1.6325Nigerian naira 450.9823 501.6109 386.3300 417.6578 480.3843 384.0000Norwegian krone 11.1100 12.3573 9.5173 11.1875 12.8677 10.2860Omani rial 0.4494 0.4999 0.3850 0.4188 0.4817 0.3851Pakistani rupee 187.0095 208.0037 160.2000 174.2416 200.4103 160.2000Peruvian sol 4.2160 4.6893 3.6116 3.6627 4.2128 3.3676Philippine peso 56.4997 62.8426 48.4000 54.8285 63.0630 50.4100Polish zloty 4.6229 5.1419 3.9602 4.5362 5.2174 4.1706Pound sterling 0.8991 1.0000 0.7702 0.8694 1.0000 0.7994Qatari rial 4.2503 4.7275 3.6410 3.9601 4.5549 3.6410Russian ruble 92.4497 102.8284 79.1963 79.6867 91.6546 73.2650Singapore dollar 1.5927 1.7715 1.3644 1.5330 1.7633 1.4095South African rand 18.9534 21.0811 16.2363 19.6783 22.6337 18.0925South Korean won 1,324.5921 1,473.2946 1,134.7000 1,325.2477 1,524.2819 1,218.4500Sri Lanka rupee 215.1718 239.3276 184.3250 207.1974 238.3157 190.5000Swedish krona 10.3727 11.5372 8.8857 10.6703 12.2728 9.8104Swiss franc 1.0697 1.1898 0.9164 1.0555 1.2140 0.9705Taiwan dollar 33.3903 37.1388 28.6035 32.3429 37.2004 29.7365Thai baht 36.3834 40.4679 31.1675 35.1909 40.4761 32.3550Turkish lira 9.7471 10.8413 8.3498 7.5970 8.7379 6.9848UAE dirham 4.2879 4.7692 3.6732 3.9950 4.5950 3.6731US dollar 1.1674 1.2984 1.0000 1.0877 1.2510 1.0000Vietnamese new dong 27,062.0917 30,100.1612 23,182.5000 25,482.5633 29,309.6978 23,429.0000
59
Barings Investment Funds PlcNotes to the financial statements (continued)
For the financial period ended 31 October 2020
12. Soft commission arrangements
The Investment Manager will pay for research from their own books, as commission paid on trades will be “execution only”, which is the agreed cost for that broker to settle the trade (31 October 2019: same).
13. Contingent liabilities
There are no contingent liabilities at financial period-end 31 October 2020 and financial year-end 30 April 2020.
14. Transactions with connected persons
The UCITS Regulations require that any transaction carried out with the Company by a Manager, Depositary, Investment Manager and/or associate of these (“connected persons”) must be carried out as if negotiated at arm’s length. Transactions must be in the best interests of the shareholders.
The Board of Directors of the Company are satisfied that there are arrangements (evidenced by written procedures) in place to ensure that the obligations set out in Regulation 43(1) of the Central Bank UCITS Regulations are applied to all transactions with connected persons, and are satisfied that transactions with connected persons entered into during the period complied with the obligations set out in Regulation 43(1) of the Central Bank UCITS Regulations.
15. Segregated liability of Funds
The Company is an umbrella fund with segregated liability between Funds. As a result, and as a matter of Irish law, any liability attributable to a particular Fund may only be discharged out of the assets of that Fund and the assets of other Funds may not be used to discharge that liability.
16. Taxation
Under current Irish law and practice, the Company qualifies as an investment undertaking as defined in Section 739B of the Taxes Consolidation Act, 1997, as amended (the “TCA”). On that basis, it is not chargeable to Irish tax on its income or gains.
However, Irish tax may arise if a "chargeable event" occurs. A chargeable event includes any distribution payments to shareholders or any encashment, redemption, cancellation, transfer or deemed disposal of shares for Irish tax purposes arising as a result of holding shares in the Company for a period of eight years or more, or the appropriation or cancellation of shares of a shareholder by the Company for the purposes of meeting the amount of tax payable on a gain arising on a transfer.
No Irish tax will arise on the Company in respect of chargeable events due to:
(a) a shareholder who is neither Irish resident nor ordinarily resident in Ireland for tax purposes at the time of the chargeable event, provided that a relevant declaration is in place (in accordance with Schedule 2b of the TCA) and the Company is not in possession of any information which would reasonably suggest that the information contained therein is no longer materially correct; or
(b) a shareholder who is an exempt Irish investor (as defined in Section 739D TCA).
Dividends, interest and capital gains (if any) received on investments made by the Company may be subject to withholding taxes imposed by the country from which the investment income/gains are received and such taxes may not be recoverable by the Company or its shareholders.
The Finance Act 2010 provides that the Revenue Commissioners may grant approval for Investment Companies marketed outside of Ireland to make payments to non-resident investors without deduction of Irish tax where no relevant declaration is in place, subject to meeting “equivalent measures”. An Investment Company wishing to receive approval must apply in writing to the Revenue Commissioners, confirming compliance with the relevant conditions.
60
Barings Investment Funds PlcNotes to the financial statements (continued)
For the financial period ended 31 October 2020
17. Chinese capital gains tax
On 6 February 2020, Barings China A-Share Fund Plc merged its net assets and contingent tax liability with Barings China A-Share Fund (the “Fund”). As a result, any future tax liabilities will now be incurred by Barings China A-Share Fund, a sub-fund of Barings Investment Funds.
On 15 November 2014, a circular from the Chinese authorities was published which both announced a temporary tax exemption on any gains realised from 17 November 2014 onwards by non-Chinese resident investors on the disposal of China A-Shares and also confirmed that any similar gains realised in the five years prior to 17 November 2014 would potentially be subject to Chinese tax.
As an Irish domiciled fund, the Fund has made a filing with the Chinese authorities on the basis that the gains realised on the disposal of non-land rich China A-Shares could obtain the benefit of the China/Ireland double tax treaty, and filed all appropriate returns for the period up to 17 November 2014. Based on domestic Chinese professional advice in relation to the temporary tax exemption, the Fund does not currently have any provision for capital gains tax on non-land rich China A-Shares.
It should be noted that at this time there remains no indication as to when the temporary tax exemption referred to above might cease, potentially causing some or all of the gains realised after any cessation of the exemption to become subject to Chinese tax. Therefore, given the residual uncertainty surrounding the eventual tax treatment of historic non-land rich gains referred to above and the potential for future land rich or non-land rich gains to become taxable if the current temporary exemption ceases to apply, provisions may have to be made at any time for taxation which could be levied by China on the Fund. Consequently, investors may have been advantaged or disadvantaged depending upon the position of the Chinese tax authorities in the future and the level of any provisioning, proving to be either excessive or inadequate when they subscribed for or when they redeemed their shares in the Company.
18. Bank facilities
There is a bank overdraft facility in place with The Northern Trust Company (“TNTC”). An “uncommitted” multi-currency loan facility has been made available by TNTC to the Funds. During the financial period ended 31 October 2020, Barings China A-Share Fund, Barings Europe Select Fund, Barings European Opportunities Fund, Barings German Growth Fund, Barings Global Dividend Champions Fund, Barings Global Equity Allocation Fund and Barings Global Flexible Allocation Fund have drawn down on this facility (31 October 2019: Barings China A-Share Fund, Barings China Select Fund, Barings Europe Select Fund, Barings European Opportunities Fund, Barings Frontier Markets Fund, Barings German Growth Fund, Barings Global Dividend Champions Fund, Barings Global Equity Allocation Fund and Barings Global Flexible Allocation Fund).
19. Material changes to the Prospectus
An updated Prospectus of the Company was issued on 31 August 2020. The following are the material changes made:
Benchmarks New disclosures were introduced around benchmarks and their use within the context of each Fund.
Fund operating mechanisms The Redemption Deferral Policy was updated to provide for being able to limit redemptions on any dealing day to 10% of the NAV rather than 10% of the shares in issue, as per the current approach. A fourth supplemental Trust Deed has been put in place to facilitate this change in respect of the Unit Trust.
The procedures regarding the Termination of a Fund were updated to provide for proceeds to be paid to charity at the expiration of 3 years from the date of a fund’s termination.
There are other immaterial changes to the Prospectus that are not listed above.

61
Barings Investment Funds PlcNotes to the financial statements (continued)
For the financial period ended 31 October 2020
20. Significant events
Mr. Timothy Schulze resigned as Director of the Company with effect from 10 August 2020.
The Barings Global Dividend Champions Fund Class I USD Inc was closed on 18 August 2020 and was subsequently re-launched on 22 September 2020. The class was further closed on 16 October 2020 and subsequently re-launched on 20 October 2020.
The Prospectus of the Company was updated on 31 August 2020. The material changes to the Prospectus are outlined in note 19.
The Barings Global Flexible Allocation Fund terminated on 1 October 2020.
Mr. Peter Clark resigned as Director of the Company with effect from 21 October 2020.
COVID-19The spread of Covid-19 around the world in 2020 has caused significant volatility in international markets. There is still uncertainty around the breadth and duration of business disruptions related to Covid-19, as well as its impact on international economies and, as such, the Company is actively monitoring the extent of the impact to its operations, financial accounting and reporting.
BrexitThe United Kingdom (the “UK”) held a referendum on 23 June 2016 on whether to leave or remain in the European Union (the “EU”). The outcome of the referendum was in favour of leaving the EU. The UK officially withdrew from the EU on 31 January 2020 but will continue to follow all of the EU rules and its trading relationship will remain the same until the end of the transitional period ending on 31 December 2020.
There are a number of uncertainties in connection with the future of the UK and its relationship with the EU, including the terms of the agreement it reaches in relation to its withdrawal from the EU and any agreements it reaches in relation to its future relationship with the EU and Barings continues to plan for a number of possible scenarios. Barings is committed to ensuring continuity of service for its investors and protecting its business against potential regulatory or other market access barriers related to Brexit. In this regard, Baring International Fund Managers (Ireland) Limited (“BIFMI”), will continue as the Manager of the Company and the Sub-Funds will continue to be registered for distribution into relevant jurisdictions in the EU and elsewhere. Portfolio management in respect of European investments will continue to be delegated to Baring Asset Management Limited, a UK entity. The custodians and administrators of the Sub-Funds are also EU entities. In addition, BIFMI has enhanced its presence in Dublin and recruited locally at all levels to staff its new office, reflecting the increased significance of BIFMI’s role within the Barings business.
Whilst the medium to long-term consequences of the decision to leave the EU remain uncertain in any scenario, there could be short-term volatility which could have a negative impact on general economic conditions, business and consumer confidence in both the UK and EU, which may in turn have negative political, economic and market impacts more widely. The longer-term consequences may be affected by the terms of any future arrangements the UK has with the EU. Among other things, the UK’s decision to leave the EU could lead to changes in the law and tax treatment of funds, instability in the equity, debt and foreign exchange markets, including volatility in the value of sterling or the euro.
There have been no other significant events during the financial period-end that, in the opinion of the Directors, may have had an impact on the financial statements for the financial period ended 31 October 2020.
21. Subsequent events
There have been no events subsequent to the financial period-end which, in the opinion of the Directors, may have had an impact on the financial statement for the financial period ended 31 October 2020.
22. Approval of financial statements
The financial statements were approved by the Board of Directors of the Company on 17 December 2020.
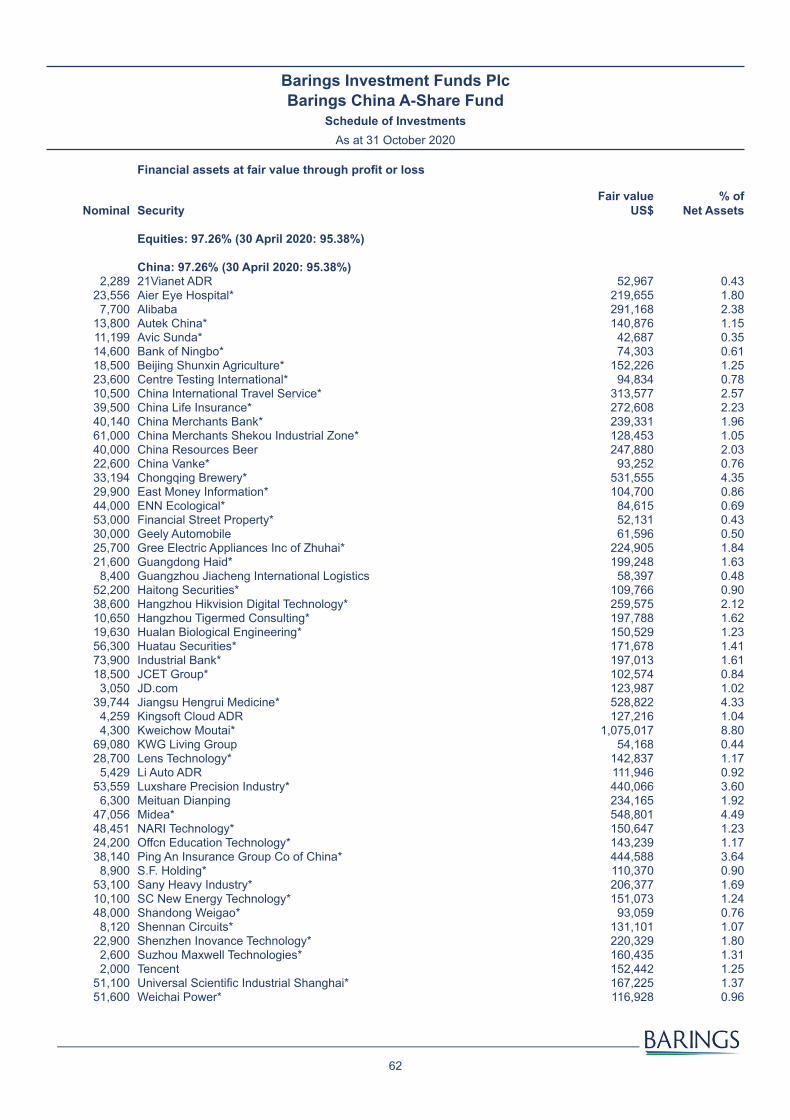
62
Barings Investment Funds Plc Barings China A-Share Fund
Schedule of InvestmentsAs at 31 October 2020
Financial assets at fair value through profit or loss
Nominal SecurityFair value
US$% of
Net Assets
Equities: 97.26% (30 April 2020: 95.38%)
China: 97.26% (30 April 2020: 95.38%)2,289 21Vianet ADR 52,967 0.43
23,556 Aier Eye Hospital* 219,655 1.807,700 Alibaba 291,168 2.38
13,800 Autek China* 140,876 1.1511,199 Avic Sunda* 42,687 0.3514,600 Bank of Ningbo* 74,303 0.6118,500 Beijing Shunxin Agriculture* 152,226 1.2523,600 Centre Testing International* 94,834 0.7810,500 China International Travel Service* 313,577 2.5739,500 China Life Insurance* 272,608 2.2340,140 China Merchants Bank* 239,331 1.9661,000 China Merchants Shekou Industrial Zone* 128,453 1.0540,000 China Resources Beer 247,880 2.0322,600 China Vanke* 93,252 0.7633,194 Chongqing Brewery* 531,555 4.3529,900 East Money Information* 104,700 0.8644,000 ENN Ecological* 84,615 0.6953,000 Financial Street Property* 52,131 0.4330,000 Geely Automobile 61,596 0.5025,700 Gree Electric Appliances Inc of Zhuhai* 224,905 1.8421,600 Guangdong Haid* 199,248 1.63
8,400 Guangzhou Jiacheng International Logistics 58,397 0.4852,200 Haitong Securities* 109,766 0.9038,600 Hangzhou Hikvision Digital Technology* 259,575 2.1210,650 Hangzhou Tigermed Consulting* 197,788 1.6219,630 Hualan Biological Engineering* 150,529 1.2356,300 Huatau Securities* 171,678 1.4173,900 Industrial Bank* 197,013 1.6118,500 JCET Group* 102,574 0.84
3,050 JD.com 123,987 1.0239,744 Jiangsu Hengrui Medicine* 528,822 4.33
4,259 Kingsoft Cloud ADR 127,216 1.044,300 Kweichow Moutai* 1,075,017 8.80
69,080 KWG Living Group 54,168 0.4428,700 Lens Technology* 142,837 1.17
5,429 Li Auto ADR 111,946 0.9253,559 Luxshare Precision Industry* 440,066 3.60
6,300 Meituan Dianping 234,165 1.9247,056 Midea* 548,801 4.4948,451 NARI Technology* 150,647 1.2324,200 Offcn Education Technology* 143,239 1.1738,140 Ping An Insurance Group Co of China* 444,588 3.64
8,900 S.F. Holding* 110,370 0.9053,100 Sany Heavy Industry* 206,377 1.6910,100 SC New Energy Technology* 151,073 1.2448,000 Shandong Weigao* 93,059 0.76
8,120 Shennan Circuits* 131,101 1.0722,900 Shenzhen Inovance Technology* 220,329 1.80
2,600 Suzhou Maxwell Technologies* 160,435 1.312,000 Tencent 152,442 1.25
51,100 Universal Scientific Industrial Shanghai* 167,225 1.3751,600 Weichai Power* 116,928 0.96
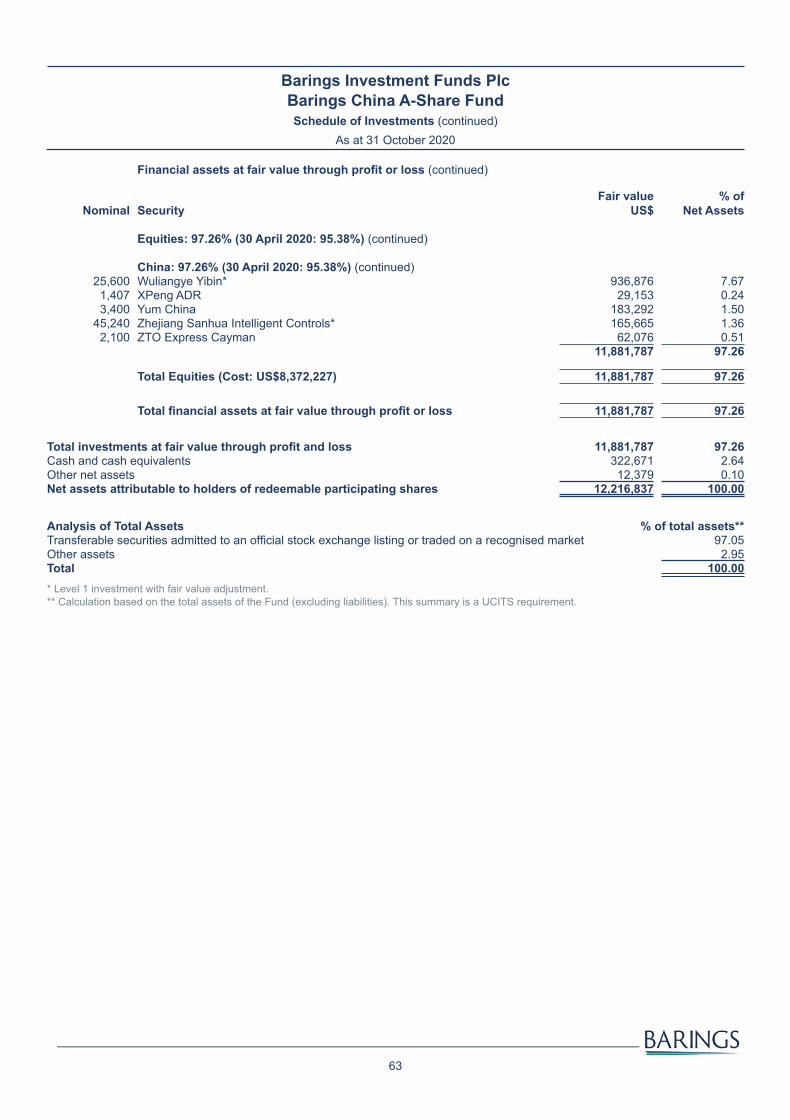
63
Barings Investment Funds Plc Barings China A-Share FundSchedule of Investments (continued)
As at 31 October 2020
Financial assets at fair value through profit or loss (continued)
Nominal SecurityFair value
US$ % of
Net Assets
Equities: 97.26% (30 April 2020: 95.38%) (continued)
China: 97.26% (30 April 2020: 95.38%) (continued) 25,600 Wuliangye Yibin* 936,876 7.67
1,407 XPeng ADR 29,153 0.243,400 Yum China 183,292 1.50
45,240 Zhejiang Sanhua Intelligent Controls* 165,665 1.362,100 ZTO Express Cayman 62,076 0.51
11,881,787 97.26
Total Equities (Cost: US$8,372,227) 11,881,787 97.26XX
Total financial assets at fair value through profit or loss 11,881,787 97.26 Total investments at fair value through profit and loss 11,881,787 97.26Cash and cash equivalents 322,671 2.64Other net assets 12,379 0.10Net assets attributable to holders of redeemable participating shares 12,216,837 100.00
Analysis of Total Assets % of total assets**Transferable securities admitted to an official stock exchange listing or traded on a recognised market 97.05Other assets 2.95Total 100.00* Level 1 investment with fair value adjustment.** Calculation based on the total assets of the Fund (excluding liabilities). This summary is a UCITS requirement.

64
Barings Investment Funds Plc Barings Europe Select Fund
Schedule of InvestmentsAs at 31 October 2020
Financial assets at fair value through profit or loss
Nominal SecurityFair value
€% of
Net Assets
Investment Funds: 0.00% (30 April 2020: 3.02%)
Ireland: 0.00% (30 April 2020: 3.02%)
Equities: 95.19% (30 April 2020: 96.04%)
Austria: 1.96% (30 April 2020: 0.88%)12,386 Bawag Group 384,214 0.73
5,588 S&T 87,340 0.1725,496 Wienerberger 562,952 1.06
1,034,506 1.96
Belgium: 2.47% (30 April 2020: 5.29%)7,878 D'Ieteren 338,360 0.647,051 KBC Ancora 170,493 0.32
29,041 Ontex Group 266,596 0.5117,154 Telenet 529,716 1.00
1,305,165 2.47
Colombia: 0.00% (30 April 2020: 0.35%)
Denmark: 7.86% (30 April 2020: 6.09%)17,243 GN Store Nord 1,068,912 2.02
2,368 Rockwool International 798,849 1.519,665 Royal Unibrew 816,684 1.54
20,316 Topdanmark 681,544 1.2932,982 Tryg 790,639 1.50
4,156,628 7.86
Faroe Island: 0.00% (30 April 2020: 0.42%)
Finland: 5.09% (30 April 2020: 5.28%)11,304 Elisa 478,611 0.9022,226 Huhtamaki Oyj 929,491 1.7613,590 Kemira 144,870 0.2725,346 Nokian Renkaat 666,093 1.2623,376 Valmet 474,065 0.90
2,693,130 5.09
France: 9.27% (30 April 2020: 14.57%)9,588 ALD 87,634 0.17
25,798 Elis 240,695 0.4511,866 Eurazeo 457,553 0.864,056 Gaztransport Et Technigaz 336,040 0.64
26,000 Korian 628,160 1.192,502 Orpea 215,072 0.41
13,454 Publicis Groupe 399,853 0.7662,540 Rexel 566,237 1.07
4,033 SEB 565,830 1.0723,718 SPIE 319,244 0.60
1,585 Teleperformance 411,466 0.781,530 TRIGANO 173,196 0.337,765 Worldline 499,911 0.94
4,900,891 9.27
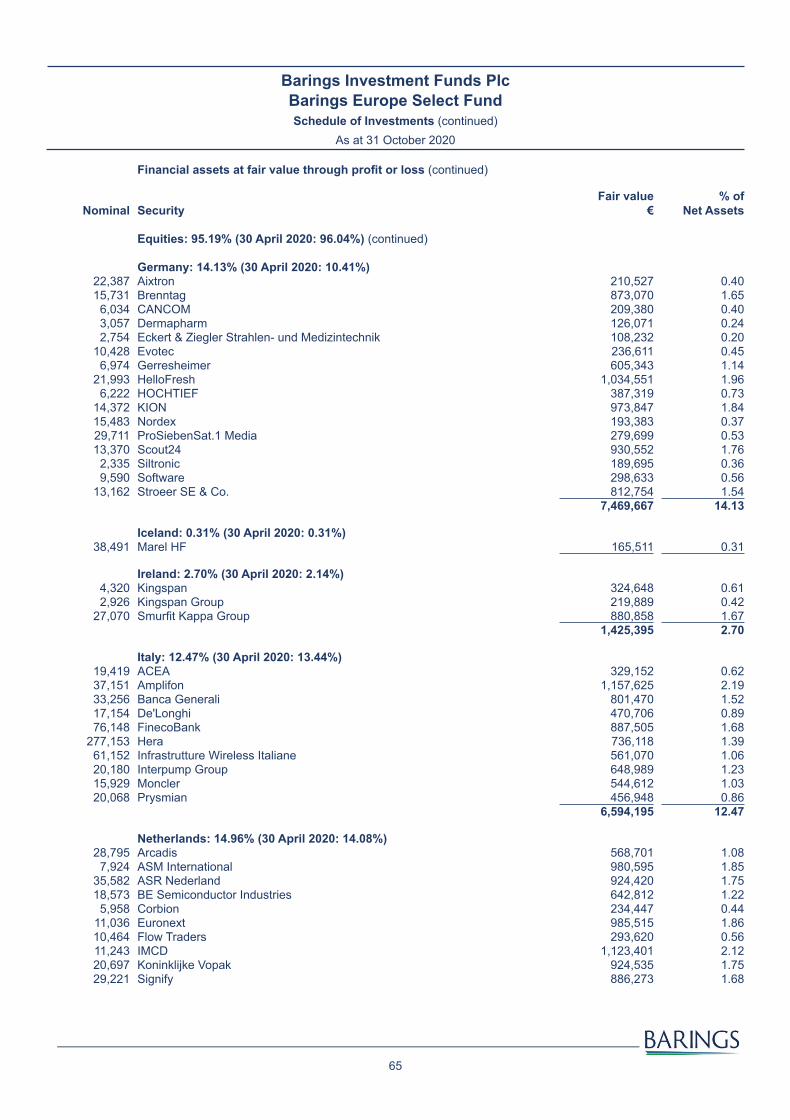
65
Barings Investment Funds Plc Barings Europe Select FundSchedule of Investments (continued)
As at 31 October 2020
Financial assets at fair value through profit or loss (continued)
Nominal SecurityFair value
€ % of
Net Assets
Equities: 95.19% (30 April 2020: 96.04%) (continued)
Germany: 14.13% (30 April 2020: 10.41%)22,387 Aixtron 210,527 0.4015,731 Brenntag 873,070 1.65
6,034 CANCOM 209,380 0.403,057 Dermapharm 126,071 0.242,754 Eckert & Ziegler Strahlen- und Medizintechnik 108,232 0.20
10,428 Evotec 236,611 0.456,974 Gerresheimer 605,343 1.14
21,993 HelloFresh 1,034,551 1.966,222 HOCHTIEF 387,319 0.73
14,372 KION 973,847 1.8415,483 Nordex 193,383 0.3729,711 ProSiebenSat.1 Media 279,699 0.5313,370 Scout24 930,552 1.76
2,335 Siltronic 189,695 0.369,590 Software 298,633 0.56
13,162 Stroeer SE & Co. 812,754 1.547,469,667 14.13
Iceland: 0.31% (30 April 2020: 0.31%)38,491 Marel HF 165,511 0.31
Ireland: 2.70% (30 April 2020: 2.14%)4,320 Kingspan 324,648 0.612,926 Kingspan Group 219,889 0.42
27,070 Smurfit Kappa Group 880,858 1.671,425,395 2.70
Italy: 12.47% (30 April 2020: 13.44%)19,419 ACEA 329,152 0.6237,151 Amplifon 1,157,625 2.1933,256 Banca Generali 801,470 1.5217,154 De'Longhi 470,706 0.8976,148 FinecoBank 887,505 1.68
277,153 Hera 736,118 1.3961,152 Infrastrutture Wireless Italiane 561,070 1.0620,180 Interpump Group 648,989 1.2315,929 Moncler 544,612 1.0320,068 Prysmian 456,948 0.86
6,594,195 12.47
Netherlands: 14.96% (30 April 2020: 14.08%)28,795 Arcadis 568,701 1.08
7,924 ASM International 980,595 1.8535,582 ASR Nederland 924,420 1.7518,573 BE Semiconductor Industries 642,812 1.22
5,958 Corbion 234,447 0.4411,036 Euronext 985,515 1.8610,464 Flow Traders 293,620 0.5611,243 IMCD 1,123,401 2.1220,697 Koninklijke Vopak 924,535 1.7529,221 Signify 886,273 1.68
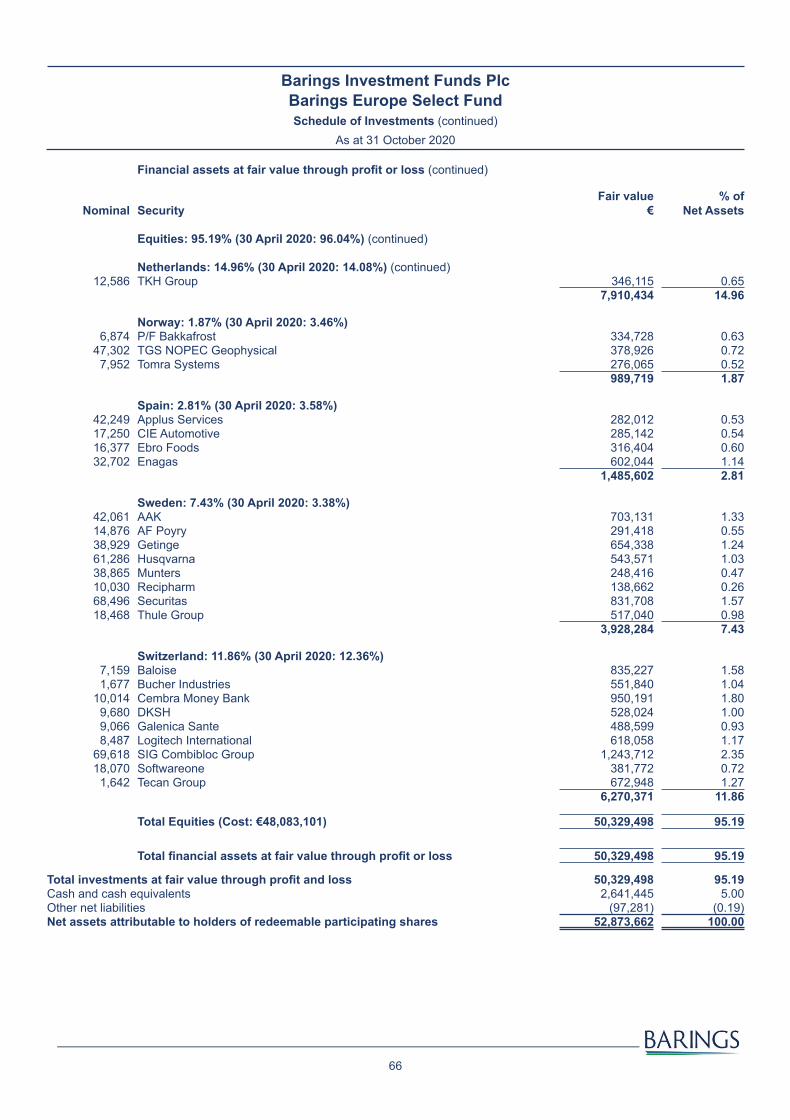
66
Barings Investment Funds Plc Barings Europe Select FundSchedule of Investments (continued)
As at 31 October 2020
Financial assets at fair value through profit or loss (continued)
Nominal SecurityFair value
€ % of
Net Assets
Equities: 95.19% (30 April 2020: 96.04%) (continued)
Netherlands: 14.96% (30 April 2020: 14.08%) (continued) 12,586 TKH Group 346,115 0.65
7,910,434 14.96
Norway: 1.87% (30 April 2020: 3.46%)6,874 P/F Bakkafrost 334,728 0.63
47,302 TGS NOPEC Geophysical 378,926 0.727,952 Tomra Systems 276,065 0.52
989,719 1.87
Spain: 2.81% (30 April 2020: 3.58%)42,249 Applus Services 282,012 0.5317,250 CIE Automotive 285,142 0.5416,377 Ebro Foods 316,404 0.6032,702 Enagas 602,044 1.14
1,485,602 2.81
Sweden: 7.43% (30 April 2020: 3.38%)42,061 AAK 703,131 1.3314,876 AF Poyry 291,418 0.5538,929 Getinge 654,338 1.2461,286 Husqvarna 543,571 1.0338,865 Munters 248,416 0.4710,030 Recipharm 138,662 0.2668,496 Securitas 831,708 1.5718,468 Thule Group 517,040 0.98
3,928,284 7.43
Switzerland: 11.86% (30 April 2020: 12.36%)7,159 Baloise 835,227 1.581,677 Bucher Industries 551,840 1.04
10,014 Cembra Money Bank 950,191 1.809,680 DKSH 528,024 1.009,066 Galenica Sante 488,599 0.938,487 Logitech International 618,058 1.17
69,618 SIG Combibloc Group 1,243,712 2.3518,070 Softwareone 381,772 0.72
1,642 Tecan Group 672,948 1.276,270,371 11.86
Total Equities (Cost: €48,083,101) 50,329,498 95.19XX
Total financial assets at fair value through profit or loss 50,329,498 95.19
Total investments at fair value through profit and loss 50,329,498 95.19Cash and cash equivalents 2,641,445 5.00Other net liabilities (97,281) (0.19)Net assets attributable to holders of redeemable participating shares 52,873,662 100.00
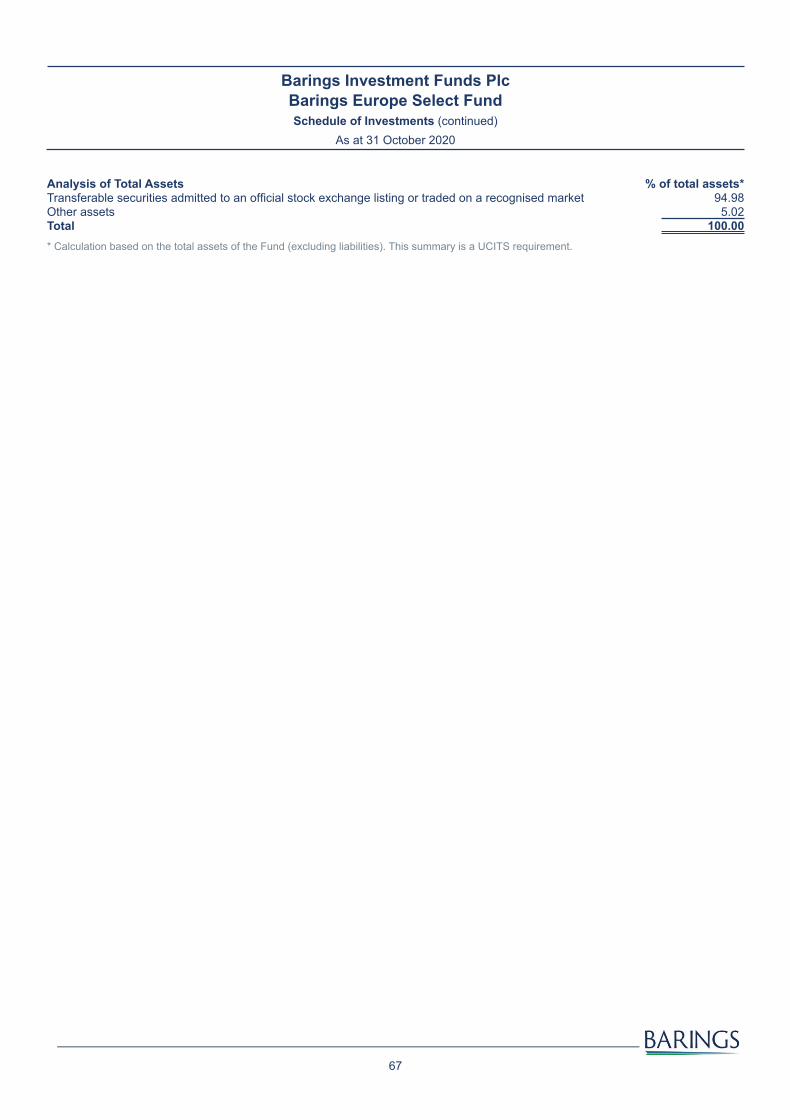
67
Barings Investment Funds Plc Barings Europe Select FundSchedule of Investments (continued)
As at 31 October 2020
Analysis of Total Assets % of total assets*Transferable securities admitted to an official stock exchange listing or traded on a recognised market 94.98Other assets 5.02Total 100.00* Calculation based on the total assets of the Fund (excluding liabilities). This summary is a UCITS requirement.
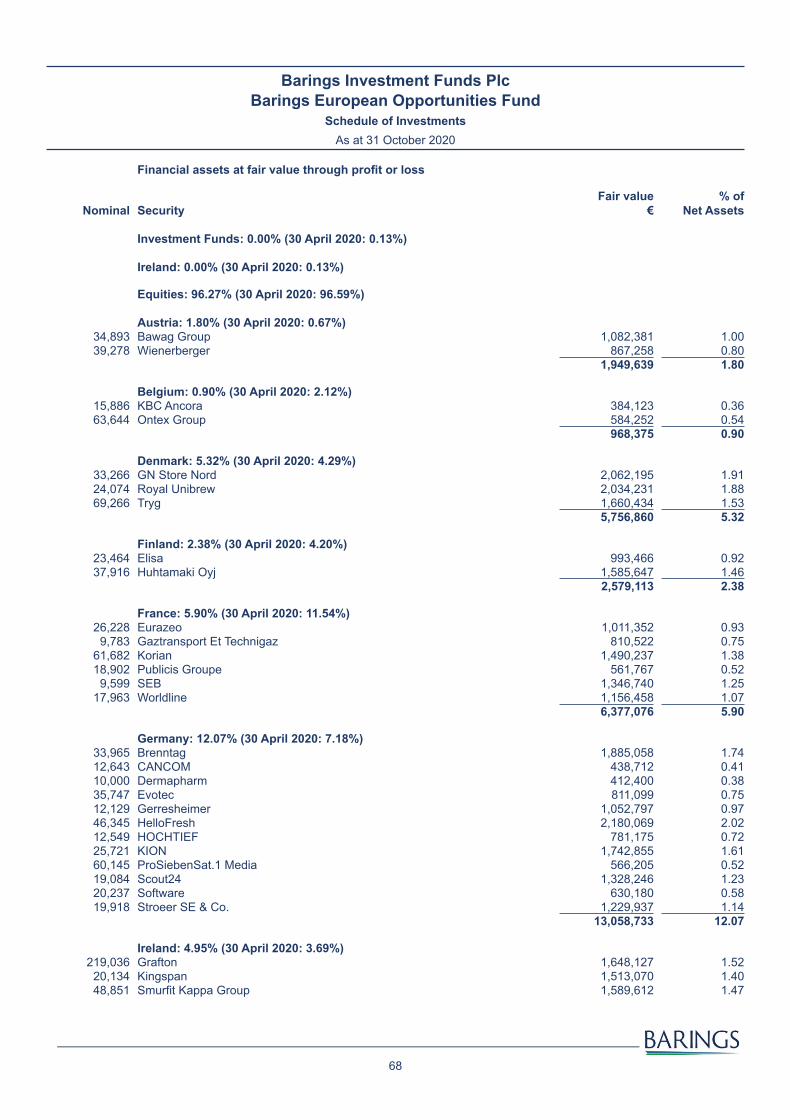
68
Barings Investment Funds Plc Barings European Opportunities Fund
Schedule of InvestmentsAs at 31 October 2020
Financial assets at fair value through profit or loss
Nominal SecurityFair value
€% of
Net Assets
Investment Funds: 0.00% (30 April 2020: 0.13%)
Ireland: 0.00% (30 April 2020: 0.13%)
Equities: 96.27% (30 April 2020: 96.59%)
Austria: 1.80% (30 April 2020: 0.67%)34,893 Bawag Group 1,082,381 1.0039,278 Wienerberger 867,258 0.80
1,949,639 1.80
Belgium: 0.90% (30 April 2020: 2.12%)15,886 KBC Ancora 384,123 0.3663,644 Ontex Group 584,252 0.54
968,375 0.90
Denmark: 5.32% (30 April 2020: 4.29%)33,266 GN Store Nord 2,062,195 1.9124,074 Royal Unibrew 2,034,231 1.8869,266 Tryg 1,660,434 1.53
5,756,860 5.32
Finland: 2.38% (30 April 2020: 4.20%)23,464 Elisa 993,466 0.9237,916 Huhtamaki Oyj 1,585,647 1.46
2,579,113 2.38
France: 5.90% (30 April 2020: 11.54%)26,228 Eurazeo 1,011,352 0.93
9,783 Gaztransport Et Technigaz 810,522 0.7561,682 Korian 1,490,237 1.3818,902 Publicis Groupe 561,767 0.52
9,599 SEB 1,346,740 1.2517,963 Worldline 1,156,458 1.07
6,377,076 5.90
Germany: 12.07% (30 April 2020: 7.18%)33,965 Brenntag 1,885,058 1.7412,643 CANCOM 438,712 0.4110,000 Dermapharm 412,400 0.3835,747 Evotec 811,099 0.7512,129 Gerresheimer 1,052,797 0.9746,345 HelloFresh 2,180,069 2.0212,549 HOCHTIEF 781,175 0.7225,721 KION 1,742,855 1.6160,145 ProSiebenSat.1 Media 566,205 0.5219,084 Scout24 1,328,246 1.2320,237 Software 630,180 0.5819,918 Stroeer SE & Co. 1,229,937 1.14
13,058,733 12.07
Ireland: 4.95% (30 April 2020: 3.69%)219,036 Grafton 1,648,127 1.52
20,134 Kingspan 1,513,070 1.4048,851 Smurfit Kappa Group 1,589,612 1.47
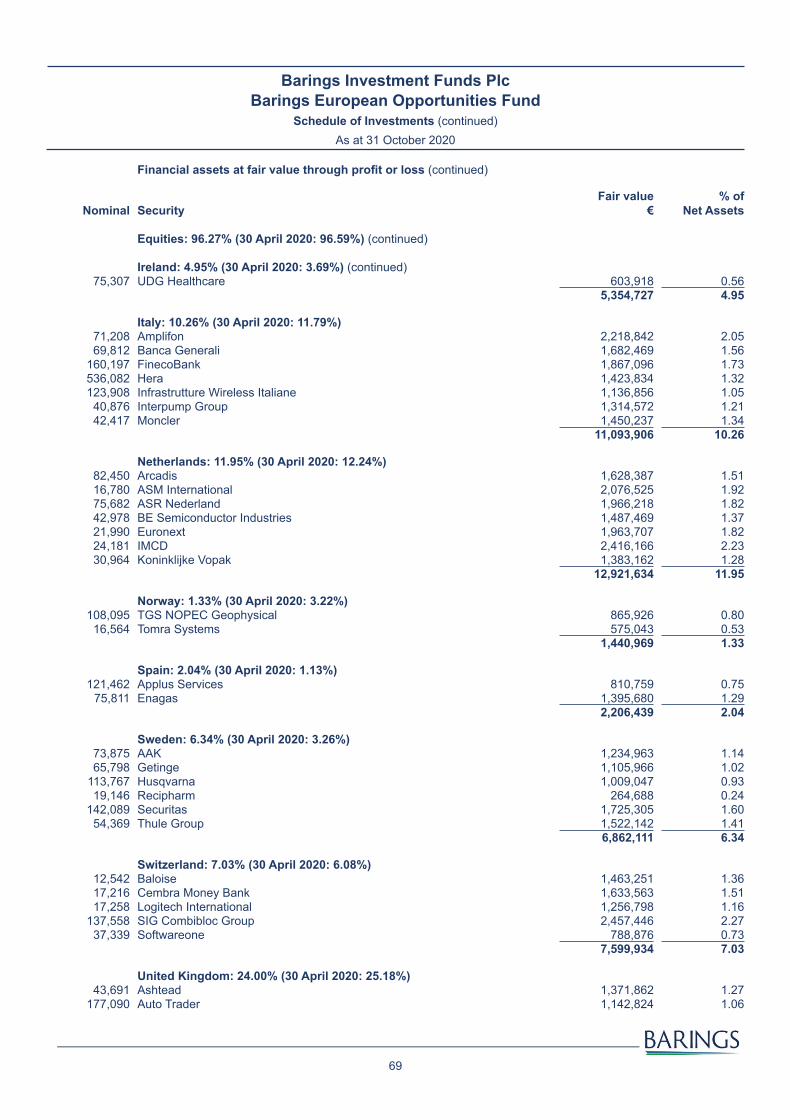
69
Barings Investment Funds Plc Barings European Opportunities Fund
Schedule of Investments (continued)As at 31 October 2020
Financial assets at fair value through profit or loss (continued)
Nominal SecurityFair value
€ % of
Net Assets
Equities: 96.27% (30 April 2020: 96.59%) (continued)
Ireland: 4.95% (30 April 2020: 3.69%) (continued) 75,307 UDG Healthcare 603,918 0.56
5,354,727 4.95
Italy: 10.26% (30 April 2020: 11.79%)71,208 Amplifon 2,218,842 2.0569,812 Banca Generali 1,682,469 1.56
160,197 FinecoBank 1,867,096 1.73536,082 Hera 1,423,834 1.32123,908 Infrastrutture Wireless Italiane 1,136,856 1.05
40,876 Interpump Group 1,314,572 1.2142,417 Moncler 1,450,237 1.34
11,093,906 10.26
Netherlands: 11.95% (30 April 2020: 12.24%)82,450 Arcadis 1,628,387 1.5116,780 ASM International 2,076,525 1.9275,682 ASR Nederland 1,966,218 1.8242,978 BE Semiconductor Industries 1,487,469 1.3721,990 Euronext 1,963,707 1.8224,181 IMCD 2,416,166 2.2330,964 Koninklijke Vopak 1,383,162 1.28
12,921,634 11.95
Norway: 1.33% (30 April 2020: 3.22%)108,095 TGS NOPEC Geophysical 865,926 0.80
16,564 Tomra Systems 575,043 0.531,440,969 1.33
Spain: 2.04% (30 April 2020: 1.13%)121,462 Applus Services 810,759 0.75
75,811 Enagas 1,395,680 1.292,206,439 2.04
Sweden: 6.34% (30 April 2020: 3.26%)73,875 AAK 1,234,963 1.1465,798 Getinge 1,105,966 1.02
113,767 Husqvarna 1,009,047 0.9319,146 Recipharm 264,688 0.24
142,089 Securitas 1,725,305 1.6054,369 Thule Group 1,522,142 1.41
6,862,111 6.34
Switzerland: 7.03% (30 April 2020: 6.08%)12,542 Baloise 1,463,251 1.3617,216 Cembra Money Bank 1,633,563 1.5117,258 Logitech International 1,256,798 1.16
137,558 SIG Combibloc Group 2,457,446 2.2737,339 Softwareone 788,876 0.73
7,599,934 7.03
United Kingdom: 24.00% (30 April 2020: 25.18%)43,691 Ashtead 1,371,862 1.27
177,090 Auto Trader 1,142,824 1.06

70
Barings Investment Funds Plc Barings European Opportunities Fund
Schedule of Investments (continued)As at 31 October 2020
Financial assets at fair value through profit or loss (continued)
Nominal SecurityFair value
€ % of
Net Assets
Equities: 96.27% (30 April 2020: 96.59%) (continued)
United Kingdom: 24.00% (30 April 2020: 25.18%) (continued) 267,522 B&M European Value Retail 1,464,267 1.35344,029 Beazley 1,118,105 1.03267,883 Biffa 637,626 0.59
92,676 Close Brothers 1,097,803 1.0136,988 Cranswick 1,305,796 1.2122,155 DCC 1,241,966 1.1532,018 Fevertree Drinks 752,491 0.7039,876 Genus 1,829,587 1.69
105,494 HomeServe 1,296,023 1.20113,360 Intermediate Capital 1,476,468 1.36184,037 JD Sports Fashion 1,522,950 1.41162,427 Marshalls 1,187,849 1.10346,125 Paragon Banking 1,141,857 1.06256,098 Polypipe Group 1,307,454 1.21452,190 Rotork 1,408,272 1.30
45,483 Spectris 1,247,020 1.15116,146 St James's Place 1,152,329 1.06153,015 Tate & Lyle 1,001,075 0.93696,075 Wm Morrison Supermarkets 1,258,492 1.16
25,962,116 24.00
Total Equities (Cost: €91,930,552) 104,131,632 96.27XX
Total financial assets at fair value through profit or loss 104,131,632 96.27
Total investments at fair value through profit and loss 104,131,632 96.27Cash and cash equivalents 4,073,312 3.77Other net liabilities (36,805) (0.04)Net assets attributable to holders of redeemable participating shares 108,168,139 100.00
Analysis of Total Assets % of total assets*Transferable securities admitted to an official stock exchange listing or traded on a recognised market 96.19Other assets 3.81Total 100.00* Calculation based on the total assets of the Fund (excluding liabilities). This summary is a UCITS requirement.
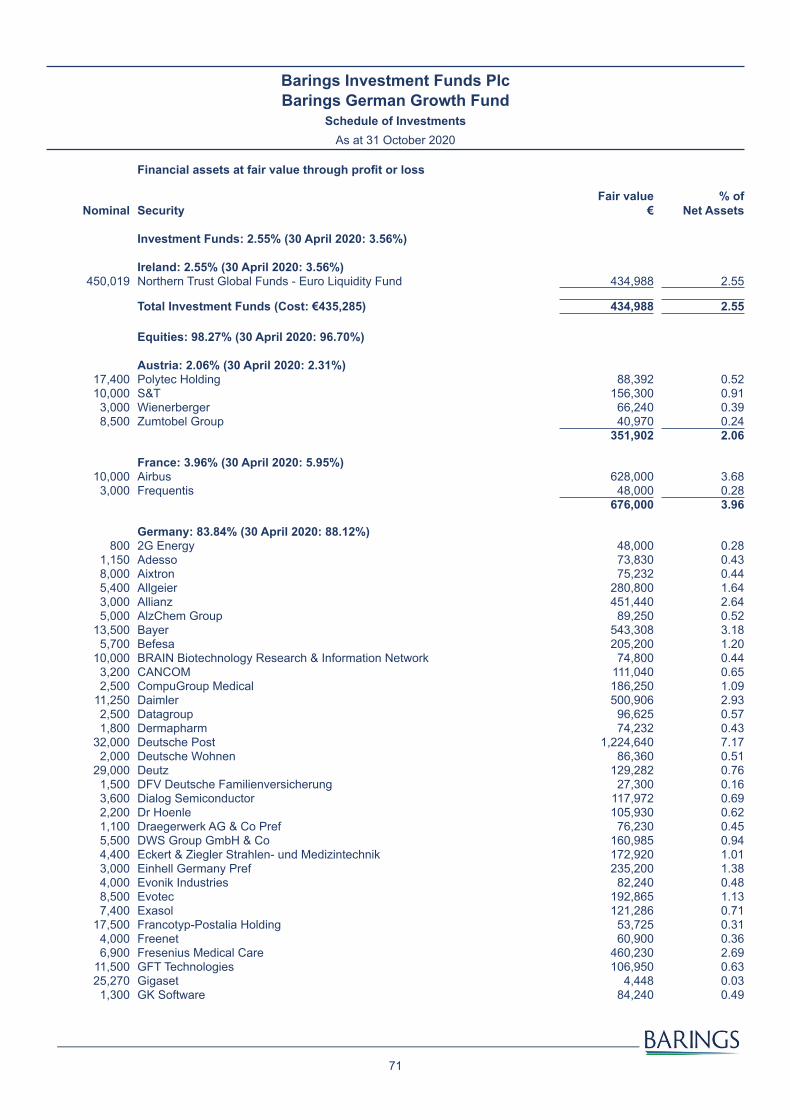
71
Barings Investment Funds Plc Barings German Growth Fund
Schedule of InvestmentsAs at 31 October 2020
Financial assets at fair value through profit or loss
Nominal SecurityFair value
€% of
Net Assets
Investment Funds: 2.55% (30 April 2020: 3.56%)
Ireland: 2.55% (30 April 2020: 3.56%)450,019 Northern Trust Global Funds - Euro Liquidity Fund 434,988 2.55
Total Investment Funds (Cost: €435,285) 434,988 2.55XX
Equities: 98.27% (30 April 2020: 96.70%)
Austria: 2.06% (30 April 2020: 2.31%)17,400 Polytec Holding 88,392 0.5210,000 S&T 156,300 0.91
3,000 Wienerberger 66,240 0.398,500 Zumtobel Group 40,970 0.24
351,902 2.06
France: 3.96% (30 April 2020: 5.95%)10,000 Airbus 628,000 3.68
3,000 Frequentis 48,000 0.28676,000 3.96
Germany: 83.84% (30 April 2020: 88.12%)800 2G Energy 48,000 0.28
1,150 Adesso 73,830 0.438,000 Aixtron 75,232 0.445,400 Allgeier 280,800 1.643,000 Allianz 451,440 2.645,000 AlzChem Group 89,250 0.52
13,500 Bayer 543,308 3.185,700 Befesa 205,200 1.20
10,000 BRAIN Biotechnology Research & Information Network 74,800 0.443,200 CANCOM 111,040 0.652,500 CompuGroup Medical 186,250 1.09
11,250 Daimler 500,906 2.932,500 Datagroup 96,625 0.571,800 Dermapharm 74,232 0.43
32,000 Deutsche Post 1,224,640 7.172,000 Deutsche Wohnen 86,360 0.51
29,000 Deutz 129,282 0.761,500 DFV Deutsche Familienversicherung 27,300 0.163,600 Dialog Semiconductor 117,972 0.692,200 Dr Hoenle 105,930 0.621,100 Draegerwerk AG & Co Pref 76,230 0.455,500 DWS Group GmbH & Co 160,985 0.944,400 Eckert & Ziegler Strahlen- und Medizintechnik 172,920 1.013,000 Einhell Germany Pref 235,200 1.384,000 Evonik Industries 82,240 0.488,500 Evotec 192,865 1.137,400 Exasol 121,286 0.71
17,500 Francotyp-Postalia Holding 53,725 0.314,000 Freenet 60,900 0.366,900 Fresenius Medical Care 460,230 2.69
11,500 GFT Technologies 106,950 0.6325,270 Gigaset 4,448 0.03
1,300 GK Software 84,240 0.49

72
Barings Investment Funds Plc Barings German Growth Fund
Schedule of Investments (continued)As at 31 October 2020
Financial assets at fair value through profit or loss (continued)
Nominal SecurityFair value
€ % of
Net Assets
Equities: 98.27% (30 April 2020: 96.70%) (continued)
Germany: 83.84% (30 April 2020: 88.12%) (continued) 4,100 Grammer 71,545 0.424,100 Grammer Rights 1,968 0.014,700 Hamburger Hafen und Logistik 67,586 0.404,400 Hannover Rueck 550,000 3.222,800 HelloFresh 131,712 0.774,200 HELMA Eigenheimbau 152,880 0.894,000 Hochtief 249,000 1.466,000 Ibu-Tec Advanced Materials 81,600 0.489,000 Infineon Technologies 217,215 1.273,500 Jenoptik 74,620 0.444,700 JOST Werke 149,930 0.884,800 KION 325,248 1.90
13,300 Lanxess 576,422 3.3716,000 LPKF Laser & Electronics 267,520 1.5715,500 M1 Kliniken 127,410 0.7518,000 MagForce 44,280 0.26
2,500 Medios 68,500 0.404,900 Merck 637,980 3.73
13,000 Mobotix 73,775 0.433,600 MPH Health Care 67,500 0.396,600 Nabaltec 133,320 0.78
30,000 Paion 63,000 0.372,000 PharmaSGP Holding 62,000 0.366,500 PSI Software 155,350 0.919,000 PVA TePla 93,780 0.55
12,200 RWE 389,546 2.2820,000 SAF-Holland 144,800 0.8513,100 SAP 1,216,204 7.12
2,500 Schaltbau Holding 59,000 0.355,100 Siltronic 414,324 2.43
12,000 Singulus Technologies 37,680 0.221,400 Sixt Pref 56,980 0.337,000 Softing 32,620 0.193,000 Steico 140,400 0.825,600 Technotrans 96,432 0.565,000 Traffic Systems 121,000 0.718,000 Traton 130,768 0.775,000 VITA 34 58,500 0.343,300 Volkswagen Pref 417,714 2.456,627 Zeal Network 247,518 1.45
14,322,243 83.84
Spain: 0.07% (30 April 2020: 0.00%)500 Siemens Gamesa 12,245 0.07
Switzerland: 0.14% (30 April 2020: 0.32%)3,000 EDAG Engineering Group 24,360 0.14

73
Barings Investment Funds Plc Barings German Growth Fund
Schedule of Investments (continued)As at 31 October 2020
Financial assets at fair value through profit or loss (continued)
Nominal SecurityFair value
€ % of
Net Assets
Equities: 98.27% (30 April 2020: 96.70%) (continued)
United Kingdom: 8.20% (30 April 2020: 0.00%)7,500 Linde 1,401,375 8.20
Total Equities (Cost: €17,650,810) 16,788,125 98.27XX
Total financial assets at fair value through profit or loss 17,223,113 100.82
Total investments at fair value through profit and loss 17,223,113 100.82Bank overdraft (71,132) (0.42)Other net liabilities (68,419) (0.40)Net assets attributable to holders of redeemable participating shares 17,083,562 100.00
Analysis of Total Assets % of total assets*Deposits with credit institutions 2.53Transferable securities admitted to an official stock exchange listing or traded on a recognised market 97.47Total 100.00* Calculation based on the total assets of the Fund (excluding liabilities). This summary is a UCITS requirement.
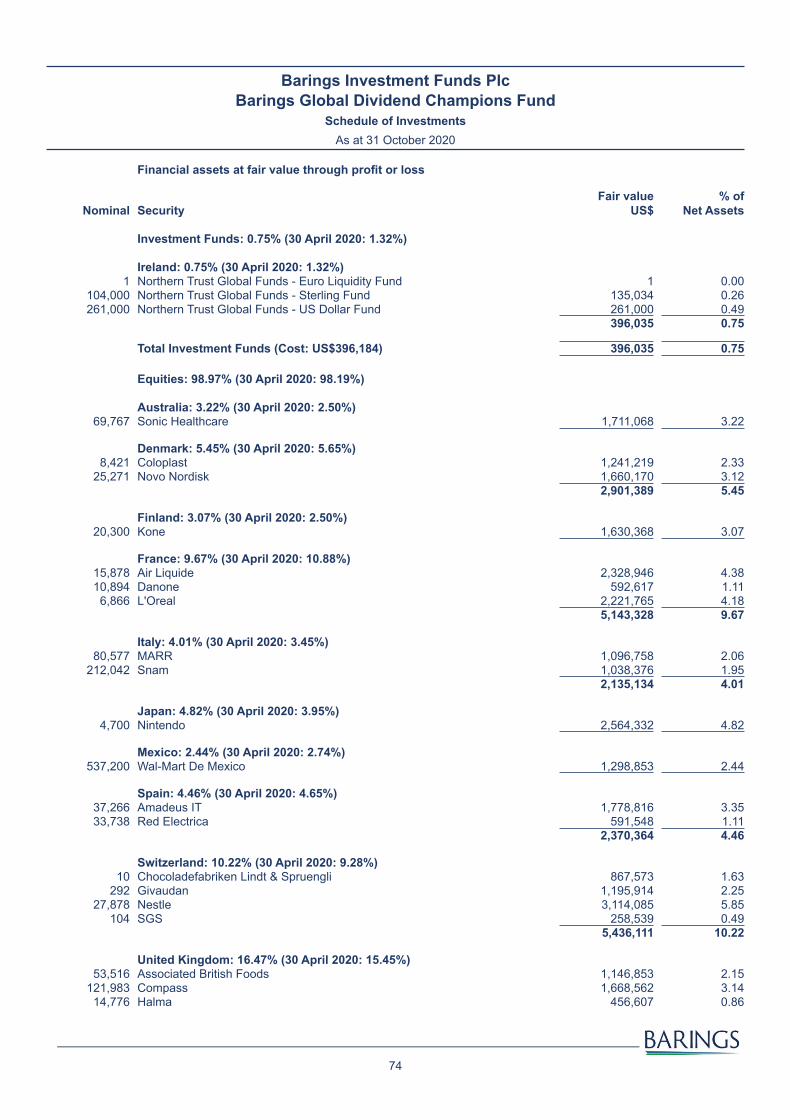
74
Barings Investment Funds Plc Barings Global Dividend Champions Fund
Schedule of InvestmentsAs at 31 October 2020
Financial assets at fair value through profit or loss
Nominal SecurityFair value
US$% of
Net Assets
Investment Funds: 0.75% (30 April 2020: 1.32%)
Ireland: 0.75% (30 April 2020: 1.32%)1 Northern Trust Global Funds - Euro Liquidity Fund 1 0.00
104,000 Northern Trust Global Funds - Sterling Fund 135,034 0.26261,000 Northern Trust Global Funds - US Dollar Fund 261,000 0.49
396,035 0.75
Total Investment Funds (Cost: US$396,184) 396,035 0.75XX
Equities: 98.97% (30 April 2020: 98.19%)
Australia: 3.22% (30 April 2020: 2.50%)69,767 Sonic Healthcare 1,711,068 3.22
Denmark: 5.45% (30 April 2020: 5.65%)8,421 Coloplast 1,241,219 2.33
25,271 Novo Nordisk 1,660,170 3.122,901,389 5.45
Finland: 3.07% (30 April 2020: 2.50%)20,300 Kone 1,630,368 3.07
France: 9.67% (30 April 2020: 10.88%)15,878 Air Liquide 2,328,946 4.3810,894 Danone 592,617 1.11
6,866 L'Oreal 2,221,765 4.185,143,328 9.67
Italy: 4.01% (30 April 2020: 3.45%)80,577 MARR 1,096,758 2.06
212,042 Snam 1,038,376 1.952,135,134 4.01
Japan: 4.82% (30 April 2020: 3.95%)4,700 Nintendo 2,564,332 4.82
Mexico: 2.44% (30 April 2020: 2.74%)537,200 Wal-Mart De Mexico 1,298,853 2.44
Spain: 4.46% (30 April 2020: 4.65%)37,266 Amadeus IT 1,778,816 3.3533,738 Red Electrica 591,548 1.11
2,370,364 4.46
Switzerland: 10.22% (30 April 2020: 9.28%)10 Chocoladefabriken Lindt & Spruengli 867,573 1.63
292 Givaudan 1,195,914 2.2527,878 Nestle 3,114,085 5.85
104 SGS 258,539 0.495,436,111 10.22
United Kingdom: 16.47% (30 April 2020: 15.45%)53,516 Associated British Foods 1,146,853 2.15
121,983 Compass 1,668,562 3.1414,776 Halma 456,607 0.86
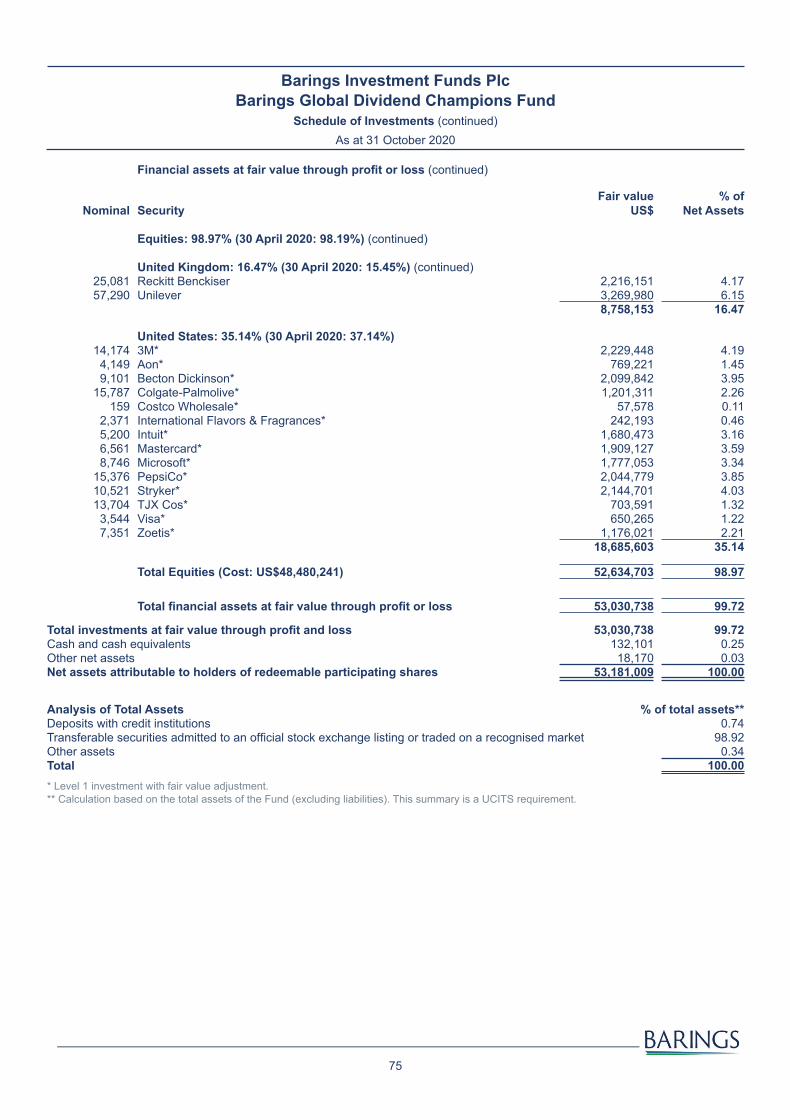
75
Barings Investment Funds Plc Barings Global Dividend Champions Fund
Schedule of Investments (continued)As at 31 October 2020
Financial assets at fair value through profit or loss (continued)
Nominal SecurityFair value
US$ % of
Net Assets
Equities: 98.97% (30 April 2020: 98.19%) (continued)
United Kingdom: 16.47% (30 April 2020: 15.45%) (continued) 25,081 Reckitt Benckiser 2,216,151 4.1757,290 Unilever 3,269,980 6.15
8,758,153 16.47
United States: 35.14% (30 April 2020: 37.14%)14,174 3M* 2,229,448 4.19
4,149 Aon* 769,221 1.459,101 Becton Dickinson* 2,099,842 3.95
15,787 Colgate-Palmolive* 1,201,311 2.26159 Costco Wholesale* 57,578 0.11
2,371 International Flavors & Fragrances* 242,193 0.465,200 Intuit* 1,680,473 3.166,561 Mastercard* 1,909,127 3.598,746 Microsoft* 1,777,053 3.34
15,376 PepsiCo* 2,044,779 3.8510,521 Stryker* 2,144,701 4.0313,704 TJX Cos* 703,591 1.32
3,544 Visa* 650,265 1.227,351 Zoetis* 1,176,021 2.21
18,685,603 35.14
Total Equities (Cost: US$48,480,241) 52,634,703 98.97XX
Total financial assets at fair value through profit or loss 53,030,738 99.72
Total investments at fair value through profit and loss 53,030,738 99.72Cash and cash equivalents 132,101 0.25Other net assets 18,170 0.03Net assets attributable to holders of redeemable participating shares 53,181,009 100.00
Analysis of Total Assets % of total assets**Deposits with credit institutions 0.74Transferable securities admitted to an official stock exchange listing or traded on a recognised market 98.92Other assets 0.34Total 100.00* Level 1 investment with fair value adjustment.** Calculation based on the total assets of the Fund (excluding liabilities). This summary is a UCITS requirement.
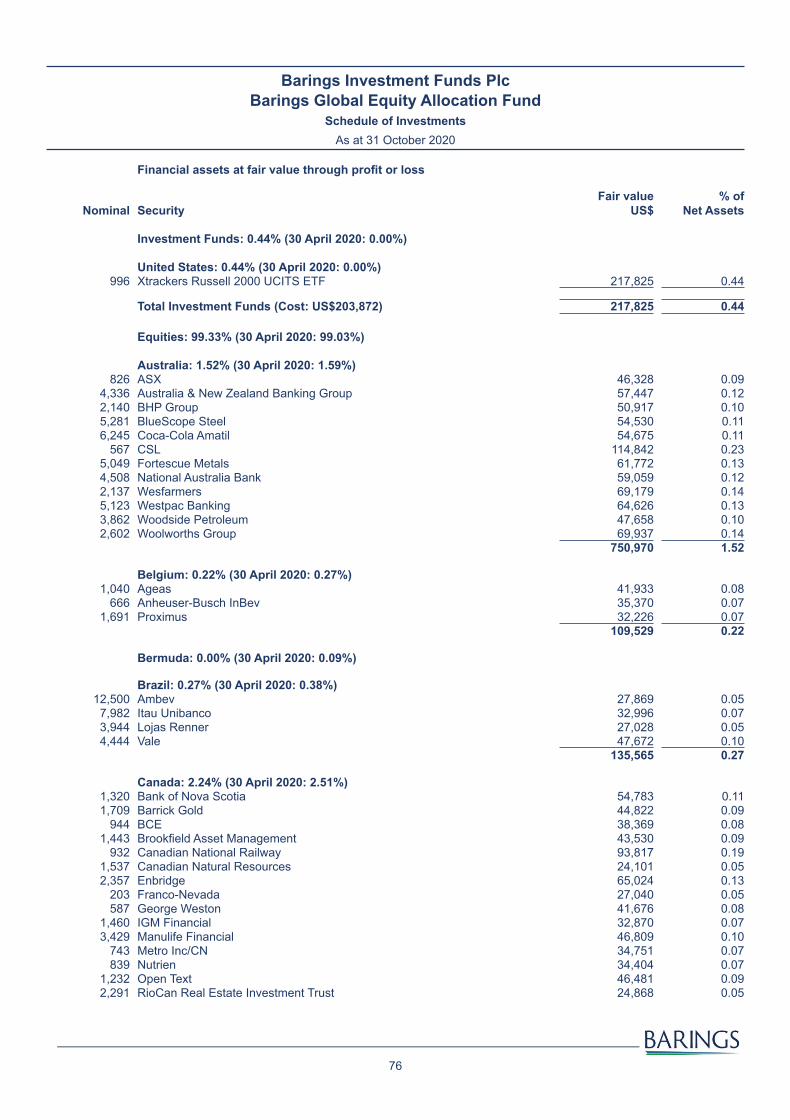
76
Barings Investment Funds Plc Barings Global Equity Allocation Fund
Schedule of InvestmentsAs at 31 October 2020
Financial assets at fair value through profit or loss
Nominal SecurityFair value
US$% of
Net Assets
Investment Funds: 0.44% (30 April 2020: 0.00%)
United States: 0.44% (30 April 2020: 0.00%)996 Xtrackers Russell 2000 UCITS ETF 217,825 0.44
Total Investment Funds (Cost: US$203,872) 217,825 0.44XX
Equities: 99.33% (30 April 2020: 99.03%)
Australia: 1.52% (30 April 2020: 1.59%)826 ASX 46,328 0.09
4,336 Australia & New Zealand Banking Group 57,447 0.122,140 BHP Group 50,917 0.105,281 BlueScope Steel 54,530 0.116,245 Coca-Cola Amatil 54,675 0.11
567 CSL 114,842 0.235,049 Fortescue Metals 61,772 0.134,508 National Australia Bank 59,059 0.122,137 Wesfarmers 69,179 0.145,123 Westpac Banking 64,626 0.133,862 Woodside Petroleum 47,658 0.102,602 Woolworths Group 69,937 0.14
750,970 1.52
Belgium: 0.22% (30 April 2020: 0.27%)1,040 Ageas 41,933 0.08
666 Anheuser-Busch InBev 35,370 0.071,691 Proximus 32,226 0.07
109,529 0.22
Bermuda: 0.00% (30 April 2020: 0.09%)
Brazil: 0.27% (30 April 2020: 0.38%)12,500 Ambev 27,869 0.05
7,982 Itau Unibanco 32,996 0.073,944 Lojas Renner 27,028 0.054,444 Vale 47,672 0.10
135,565 0.27
Canada: 2.24% (30 April 2020: 2.51%)1,320 Bank of Nova Scotia 54,783 0.111,709 Barrick Gold 44,822 0.09
944 BCE 38,369 0.081,443 Brookfield Asset Management 43,530 0.09
932 Canadian National Railway 93,817 0.191,537 Canadian Natural Resources 24,101 0.052,357 Enbridge 65,024 0.13
203 Franco-Nevada 27,040 0.05587 George Weston 41,676 0.08
1,460 IGM Financial 32,870 0.073,429 Manulife Financial 46,809 0.10
743 Metro Inc/CN 34,751 0.07839 Nutrien 34,404 0.07
1,232 Open Text 46,481 0.092,291 RioCan Real Estate Investment Trust 24,868 0.05
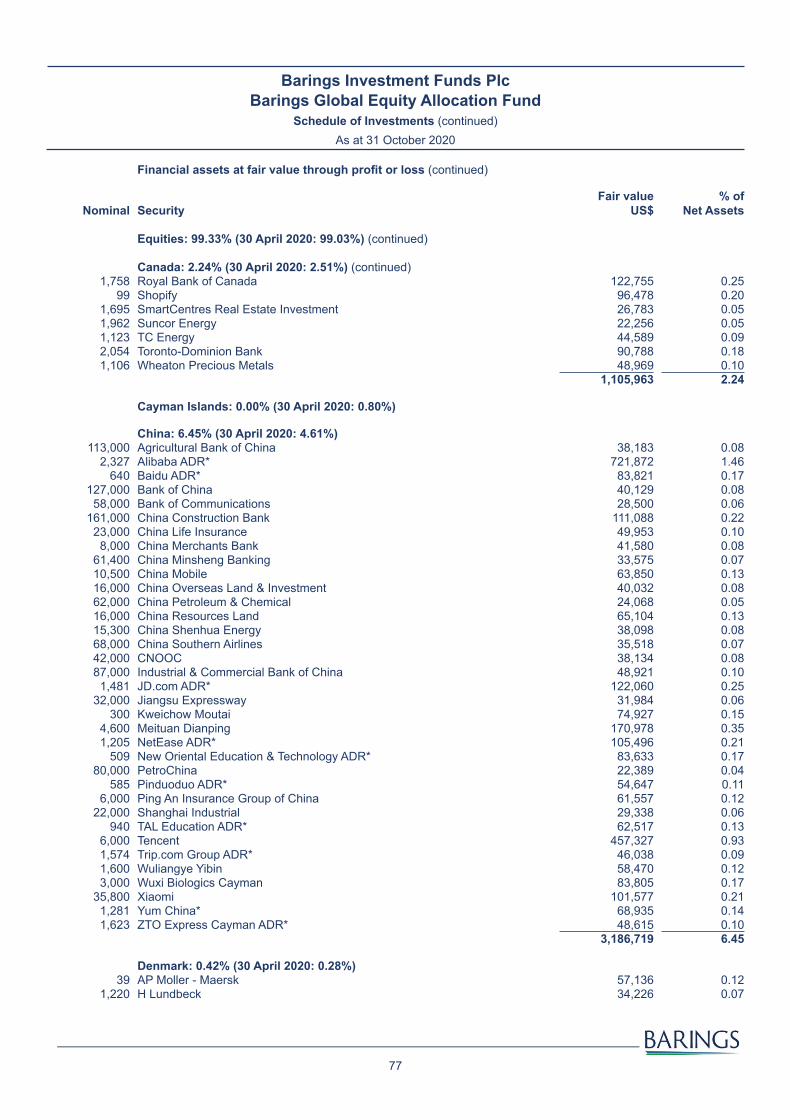
77
Barings Investment Funds Plc Barings Global Equity Allocation Fund
Schedule of Investments (continued)As at 31 October 2020
Financial assets at fair value through profit or loss (continued)
Nominal SecurityFair value
US$ % of
Net Assets
Equities: 99.33% (30 April 2020: 99.03%) (continued)
Canada: 2.24% (30 April 2020: 2.51%) (continued) 1,758 Royal Bank of Canada 122,755 0.25
99 Shopify 96,478 0.201,695 SmartCentres Real Estate Investment 26,783 0.051,962 Suncor Energy 22,256 0.051,123 TC Energy 44,589 0.092,054 Toronto-Dominion Bank 90,788 0.181,106 Wheaton Precious Metals 48,969 0.10
1,105,963 2.24
Cayman Islands: 0.00% (30 April 2020: 0.80%)
China: 6.45% (30 April 2020: 4.61%)113,000 Agricultural Bank of China 38,183 0.08
2,327 Alibaba ADR* 721,872 1.46640 Baidu ADR* 83,821 0.17
127,000 Bank of China 40,129 0.0858,000 Bank of Communications 28,500 0.06
161,000 China Construction Bank 111,088 0.2223,000 China Life Insurance 49,953 0.10
8,000 China Merchants Bank 41,580 0.0861,400 China Minsheng Banking 33,575 0.0710,500 China Mobile 63,850 0.1316,000 China Overseas Land & Investment 40,032 0.0862,000 China Petroleum & Chemical 24,068 0.0516,000 China Resources Land 65,104 0.1315,300 China Shenhua Energy 38,098 0.0868,000 China Southern Airlines 35,518 0.0742,000 CNOOC 38,134 0.0887,000 Industrial & Commercial Bank of China 48,921 0.10
1,481 JD.com ADR* 122,060 0.2532,000 Jiangsu Expressway 31,984 0.06
300 Kweichow Moutai 74,927 0.154,600 Meituan Dianping 170,978 0.351,205 NetEase ADR* 105,496 0.21
509 New Oriental Education & Technology ADR* 83,633 0.1780,000 PetroChina 22,389 0.04
585 Pinduoduo ADR* 54,647 0.116,000 Ping An Insurance Group of China 61,557 0.12
22,000 Shanghai Industrial 29,338 0.06940 TAL Education ADR* 62,517 0.13
6,000 Tencent 457,327 0.931,574 Trip.com Group ADR* 46,038 0.091,600 Wuliangye Yibin 58,470 0.123,000 Wuxi Biologics Cayman 83,805 0.17
35,800 Xiaomi 101,577 0.211,281 Yum China* 68,935 0.141,623 ZTO Express Cayman ADR* 48,615 0.10
3,186,719 6.45
Denmark: 0.42% (30 April 2020: 0.28%)39 AP Moller - Maersk 57,136 0.12
1,220 H Lundbeck 34,226 0.07

78
Barings Investment Funds Plc Barings Global Equity Allocation Fund
Schedule of Investments (continued)As at 31 October 2020
Financial assets at fair value through profit or loss (continued)
Nominal SecurityFair value
US$ % of
Net Assets
Equities: 99.33% (30 April 2020: 99.03%) (continued)
Denmark: 0.42% (30 April 2020: 0.28%) (continued) 1,737 Novo Nordisk 114,111 0.23
205,473 0.42
Finland: 0.22% (30 April 2020: 0.24%)677 Orion 29,438 0.06
3,903 Stora Enso 57,203 0.12796 UPM-Kymmene 22,422 0.04
109,063 0.22
France: 2.95% (30 April 2020: 4.33%)259 Aeroports de Paris 24,853 0.05564 Air Liquide 82,726 0.17542 Airbus 39,734 0.08
4,118 AXA 66,223 0.1411,110 Bollore 39,245 0.08
392 Capgemini 45,202 0.09491 Cie Generale des Etablissements Michelin 52,433 0.11
2,353 CNP Assurances 26,108 0.051,258 Danone 68,433 0.14
451 Dassault Systemes 77,629 0.16482 Eiffage 34,593 0.07640 EssilorLuxottica 79,791 0.16
85 Hermes International 79,955 0.1699 Kering 59,783 0.12
877 Legrand 64,804 0.13242 L'Oreal 78,309 0.16119 LVMH Moet Hennessy Louis Vuitton 56,087 0.11
11,143 Natixis 25,372 0.05343 Pernod Ricard 55,215 0.11455 Safran 48,249 0.10
1,024 Sanofi 92,940 0.191,095 Schneider Electric 132,490 0.271,030 Total 31,003 0.06
652 Vinci 50,568 0.101,519 Vivendi 44,029 0.09
1,455,774 2.95
Germany: 2.36% (30 April 2020: 1.83%)221 Adidas 66,483 0.13497 Allianz 87,304 0.18
1,948 BASF 106,218 0.221,676 Bayer 78,739 0.16
808 Bayerische Motoren Werke Pref 41,634 0.081,111 Covestro 52,811 0.111,264 Daimler 65,698 0.13
296 Deutsche Boerse 43,883 0.092,285 Deutsche Post 102,081 0.216,550 Deutsche Telekom 99,667 0.203,373 E.ON 35,122 0.07
547 Fraport 19,731 0.042,457 Infineon Technologies 69,224 0.14
258 Muenchener Rueckversicherungs 60,928 0.12
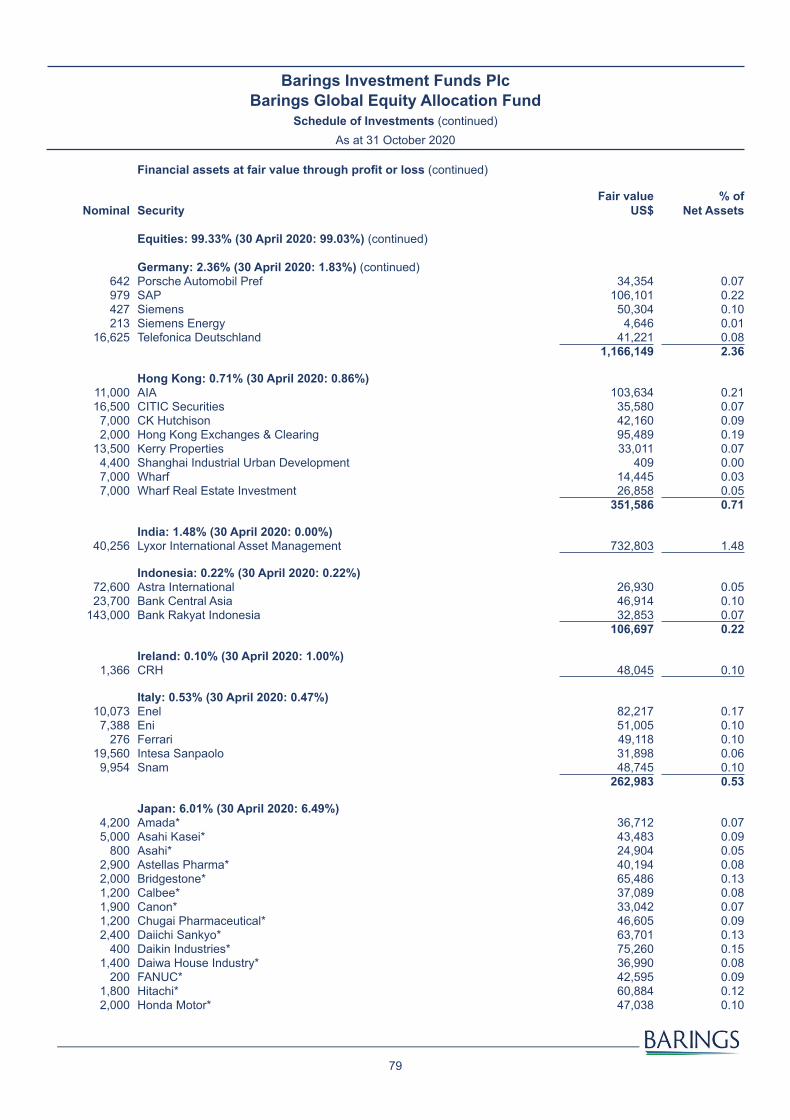
79
Barings Investment Funds Plc Barings Global Equity Allocation Fund
Schedule of Investments (continued)As at 31 October 2020
Financial assets at fair value through profit or loss (continued)
Nominal SecurityFair value
US$ % of
Net Assets
Equities: 99.33% (30 April 2020: 99.03%) (continued)
Germany: 2.36% (30 April 2020: 1.83%) (continued) 642 Porsche Automobil Pref 34,354 0.07979 SAP 106,101 0.22427 Siemens 50,304 0.10213 Siemens Energy 4,646 0.01
16,625 Telefonica Deutschland 41,221 0.081,166,149 2.36
Hong Kong: 0.71% (30 April 2020: 0.86%)11,000 AIA 103,634 0.2116,500 CITIC Securities 35,580 0.07
7,000 CK Hutchison 42,160 0.092,000 Hong Kong Exchanges & Clearing 95,489 0.19
13,500 Kerry Properties 33,011 0.074,400 Shanghai Industrial Urban Development 409 0.007,000 Wharf 14,445 0.037,000 Wharf Real Estate Investment 26,858 0.05
351,586 0.71
India: 1.48% (30 April 2020: 0.00%)40,256 Lyxor International Asset Management 732,803 1.48
Indonesia: 0.22% (30 April 2020: 0.22%)72,600 Astra International 26,930 0.0523,700 Bank Central Asia 46,914 0.10
143,000 Bank Rakyat Indonesia 32,853 0.07106,697 0.22
Ireland: 0.10% (30 April 2020: 1.00%)1,366 CRH 48,045 0.10
Italy: 0.53% (30 April 2020: 0.47%)10,073 Enel 82,217 0.17
7,388 Eni 51,005 0.10276 Ferrari 49,118 0.10
19,560 Intesa Sanpaolo 31,898 0.069,954 Snam 48,745 0.10
262,983 0.53
Japan: 6.01% (30 April 2020: 6.49%)4,200 Amada* 36,712 0.075,000 Asahi Kasei* 43,483 0.09
800 Asahi* 24,904 0.052,900 Astellas Pharma* 40,194 0.082,000 Bridgestone* 65,486 0.131,200 Calbee* 37,089 0.081,900 Canon* 33,042 0.071,200 Chugai Pharmaceutical* 46,605 0.092,400 Daiichi Sankyo* 63,701 0.13
400 Daikin Industries* 75,260 0.151,400 Daiwa House Industry* 36,990 0.08
200 FANUC* 42,595 0.091,800 Hitachi* 60,884 0.122,000 Honda Motor* 47,038 0.10

80
Barings Investment Funds Plc Barings Global Equity Allocation Fund
Schedule of Investments (continued)As at 31 October 2020
Financial assets at fair value through profit or loss (continued)
Nominal SecurityFair value
US$ % of
Net Assets
Equities: 99.33% (30 April 2020: 99.03%) (continued)
Japan: 6.01% (30 April 2020: 6.49%) (continued) 600 Hoya* 68,383 0.14
2,900 ITOCHU* 70,025 0.143,400 JTEKT* 27,060 0.05
13,800 JXTG* 46,731 0.091,800 Kamigumi* 32,407 0.07
600 Kao* 43,000 0.091,900 Kawasaki Heavy Industries* 22,756 0.052,000 KDDI* 53,943 0.11
200 Keyence* 91,274 0.182,000 Kirin* 36,297 0.07
600 Kyocera* 33,212 0.077,100 Marubeni* 37,251 0.085,900 Mazda Motor* 31,114 0.06
961 McDonald's (Japan)* 45,946 0.092,200 Medipal* 39,566 0.082,500 MinebeaMitsumi* 45,251 0.096,600 Mitsubishi Chemical* 37,368 0.083,400 Mitsubishi Electric* 44,005 0.093,500 Mitsubishi* 78,614 0.161,900 Mitsui Fudosan* 32,565 0.076,130 Mizuho Financial* 75,874 0.151,300 Murata Manufacturing* 91,246 0.18
200 Nintendo* 110,070 0.223,800 Nippon Steel* 36,941 0.073,000 Nippon Yusen* 55,489 0.119,100 Nissan Motor* 32,169 0.072,600 ORIX* 30,524 0.061,900 Recruit* 72,855 0.152,500 Sekisui House* 41,689 0.081,400 Seven & i* 42,987 0.09
400 Shin-Etsu Chemical* 53,663 0.11600 Shiseido* 37,379 0.08
6,000 Shizuoka Bank* 40,566 0.08100 SMC* 53,412 0.11
1,700 SoftBank* 111,539 0.231,200 Sony* 100,535 0.203,900 Sumitomo Electric Industries* 43,149 0.094,800 Sumitomo Rubber Industries* 42,328 0.092,500 Sumitomo* 27,636 0.061,779 Takeda Pharmaceutical* 55,655 0.112,300 Teijin* 35,455 0.07
800 Tokio Marine* 36,000 0.07200 Tokyo Electron* 53,895 0.11600 Toyota Motor* 39,425 0.08
1,600 Toyota Tsusho* 44,801 0.092,200 Yokohama Rubber* 31,682 0.06
2,967,715 6.01
Jersey: 0.00% (30 April 2020: 0.08%)
Malaysia: 0.20% (30 April 2020: 0.27%)18,400 HAP Seng Consolidated 32,460 0.07

81
Barings Investment Funds Plc Barings Global Equity Allocation Fund
Schedule of Investments (continued)As at 31 October 2020
Financial assets at fair value through profit or loss (continued)
Nominal SecurityFair value
US$ % of
Net Assets
Equities: 99.33% (30 April 2020: 99.03%) (continued)
Malaysia: 0.20% (30 April 2020: 0.27%) (continued) 8,700 Public Bank Berhad 31,576 0.06
15,300 Tenaga Nasional Berhad 35,129 0.0799,165 0.20
Mexico: 0.08% (30 April 2020: 0.10%)67,700 America Movil SAB de CV 40,890 0.08
Netherlands: 1.28% (30 April 2020: 1.49%)598 ASML 217,835 0.44543 Heineken 48,162 0.10
2,179 Koninklijke Ahold Delhaize 60,310 0.1249 Koninklijke DSM 7,868 0.02
1,229 Koninklijke Philips 57,437 0.12771 Prosus 77,762 0.16
1,488 Unilever 84,471 0.17929 Wolters Kluwers 75,609 0.15
629,454 1.28
People's Republic of China: 0.73% (30 April 2020: 0.00%)130,000 Aluminum Corporation of China 28,335 0.06
600 Changchun High & New Technology Industry 33,606 0.0714,600 Giant Network 41,443 0.08
2,800 Hundsun Technologies 38,919 0.0829,000 Jiangxi Copper 34,484 0.0718,000 Kingdee International Software 47,242 0.10
9,500 Semiconductor Manufacturing 27,874 0.063,400 WuXi AppTec 54,154 0.11
72,000 Zijin Mining 52,093 0.10358,150 0.73
Philippines: 0.08% (30 April 2020: 0.08%)2,650 Ayala 41,776 0.08
Poland: 0.06% (30 April 2020: 0.15%)5,539 Powszechny Zaklad Ubezpieczen 29,694 0.06
Qatar: 0.09% (30 April 2020: 0.11%)8,874 Qatar National Bank 43,139 0.09
Republic of South Korea: 0.13% (30 April 2020: 0.00%)897 LG Electronics 66,403 0.13
Russian Federation: 0.14% (30 April 2020: 0.55%)831 LUKOIL 42,706 0.09
4,980 Tatneft 26,058 0.0568,764 0.14
Singapore: 0.17% (30 April 2020: 0.10%)8,400 UOL Group 38,294 0.08
15,300 Wilmar International 45,303 0.0983,597 0.17
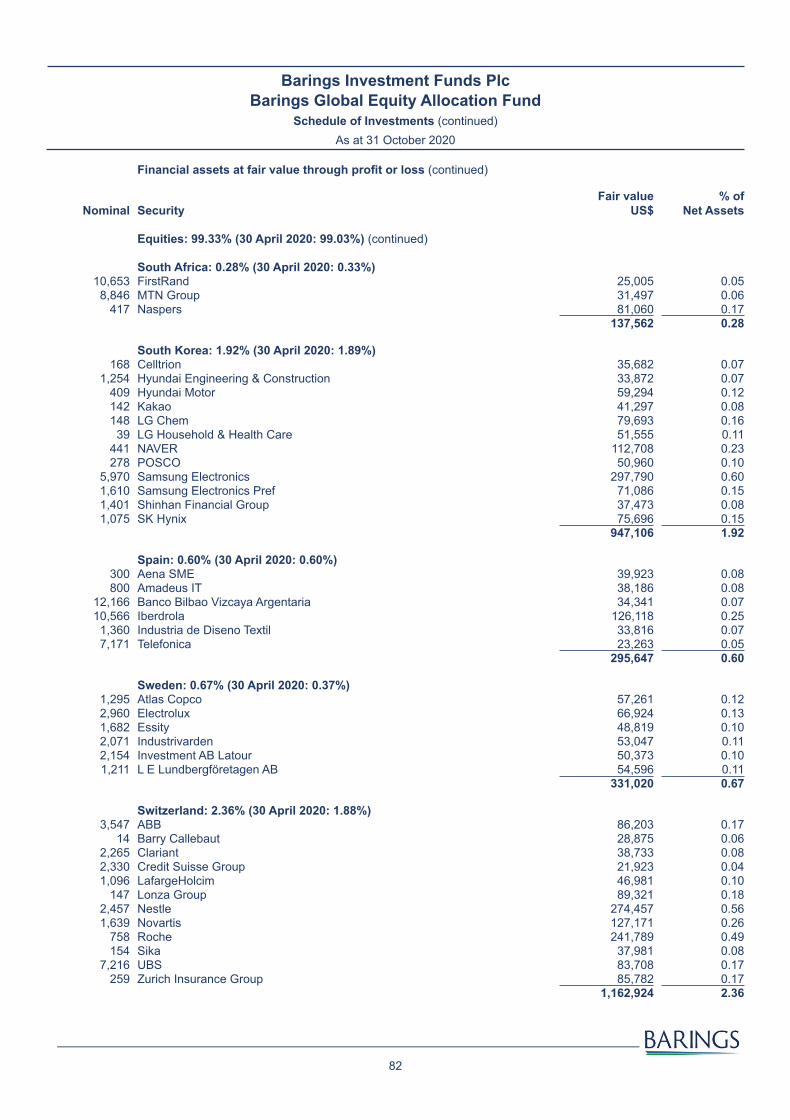
82
Barings Investment Funds Plc Barings Global Equity Allocation Fund
Schedule of Investments (continued)As at 31 October 2020
Financial assets at fair value through profit or loss (continued)
Nominal SecurityFair value
US$ % of
Net Assets
Equities: 99.33% (30 April 2020: 99.03%) (continued)
South Africa: 0.28% (30 April 2020: 0.33%)10,653 FirstRand 25,005 0.05
8,846 MTN Group 31,497 0.06417 Naspers 81,060 0.17
137,562 0.28
South Korea: 1.92% (30 April 2020: 1.89%)168 Celltrion 35,682 0.07
1,254 Hyundai Engineering & Construction 33,872 0.07409 Hyundai Motor 59,294 0.12142 Kakao 41,297 0.08148 LG Chem 79,693 0.16
39 LG Household & Health Care 51,555 0.11441 NAVER 112,708 0.23278 POSCO 50,960 0.10
5,970 Samsung Electronics 297,790 0.601,610 Samsung Electronics Pref 71,086 0.151,401 Shinhan Financial Group 37,473 0.081,075 SK Hynix 75,696 0.15
947,106 1.92
Spain: 0.60% (30 April 2020: 0.60%)300 Aena SME 39,923 0.08800 Amadeus IT 38,186 0.08
12,166 Banco Bilbao Vizcaya Argentaria 34,341 0.0710,566 Iberdrola 126,118 0.25
1,360 Industria de Diseno Textil 33,816 0.077,171 Telefonica 23,263 0.05
295,647 0.60
Sweden: 0.67% (30 April 2020: 0.37%)1,295 Atlas Copco 57,261 0.122,960 Electrolux 66,924 0.131,682 Essity 48,819 0.102,071 Industrivarden 53,047 0.112,154 Investment AB Latour 50,373 0.101,211 L E Lundbergföretagen AB 54,596 0.11
331,020 0.67
Switzerland: 2.36% (30 April 2020: 1.88%)3,547 ABB 86,203 0.17
14 Barry Callebaut 28,875 0.062,265 Clariant 38,733 0.082,330 Credit Suisse Group 21,923 0.041,096 LafargeHolcim 46,981 0.10
147 Lonza Group 89,321 0.182,457 Nestle 274,457 0.561,639 Novartis 127,171 0.26
758 Roche 241,789 0.49154 Sika 37,981 0.08
7,216 UBS 83,708 0.17259 Zurich Insurance Group 85,782 0.17
1,162,924 2.36
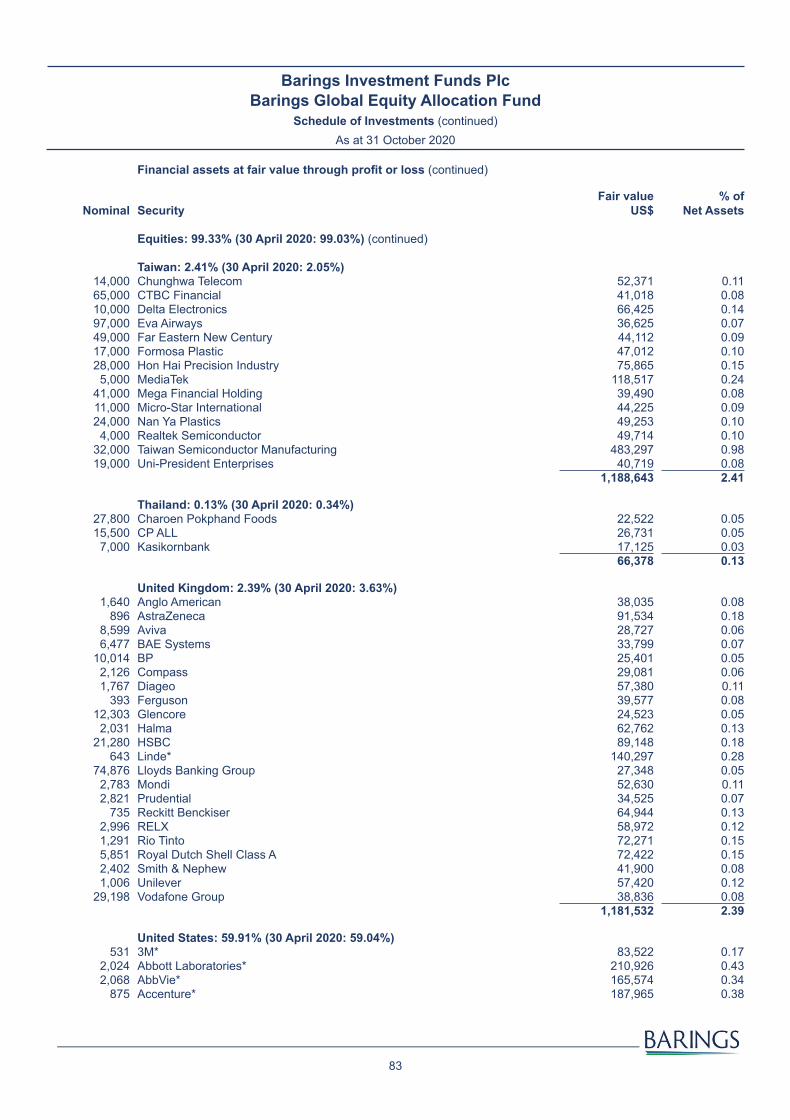
83
Barings Investment Funds Plc Barings Global Equity Allocation Fund
Schedule of Investments (continued)As at 31 October 2020
Financial assets at fair value through profit or loss (continued)
Nominal SecurityFair value
US$ % of
Net Assets
Equities: 99.33% (30 April 2020: 99.03%) (continued)
Taiwan: 2.41% (30 April 2020: 2.05%)14,000 Chunghwa Telecom 52,371 0.1165,000 CTBC Financial 41,018 0.0810,000 Delta Electronics 66,425 0.1497,000 Eva Airways 36,625 0.0749,000 Far Eastern New Century 44,112 0.0917,000 Formosa Plastic 47,012 0.1028,000 Hon Hai Precision Industry 75,865 0.15
5,000 MediaTek 118,517 0.2441,000 Mega Financial Holding 39,490 0.0811,000 Micro-Star International 44,225 0.0924,000 Nan Ya Plastics 49,253 0.10
4,000 Realtek Semiconductor 49,714 0.1032,000 Taiwan Semiconductor Manufacturing 483,297 0.9819,000 Uni-President Enterprises 40,719 0.08
1,188,643 2.41
Thailand: 0.13% (30 April 2020: 0.34%)27,800 Charoen Pokphand Foods 22,522 0.0515,500 CP ALL 26,731 0.05
7,000 Kasikornbank 17,125 0.0366,378 0.13
United Kingdom: 2.39% (30 April 2020: 3.63%)1,640 Anglo American 38,035 0.08
896 AstraZeneca 91,534 0.188,599 Aviva 28,727 0.066,477 BAE Systems 33,799 0.07
10,014 BP 25,401 0.052,126 Compass 29,081 0.061,767 Diageo 57,380 0.11
393 Ferguson 39,577 0.0812,303 Glencore 24,523 0.05
2,031 Halma 62,762 0.1321,280 HSBC 89,148 0.18
643 Linde* 140,297 0.2874,876 Lloyds Banking Group 27,348 0.05
2,783 Mondi 52,630 0.112,821 Prudential 34,525 0.07
735 Reckitt Benckiser 64,944 0.132,996 RELX 58,972 0.121,291 Rio Tinto 72,271 0.155,851 Royal Dutch Shell Class A 72,422 0.152,402 Smith & Nephew 41,900 0.081,006 Unilever 57,420 0.12
29,198 Vodafone Group 38,836 0.081,181,532 2.39
United States: 59.91% (30 April 2020: 59.04%)531 3M* 83,522 0.17
2,024 Abbott Laboratories* 210,926 0.432,068 AbbVie* 165,574 0.34
875 Accenture* 187,965 0.38
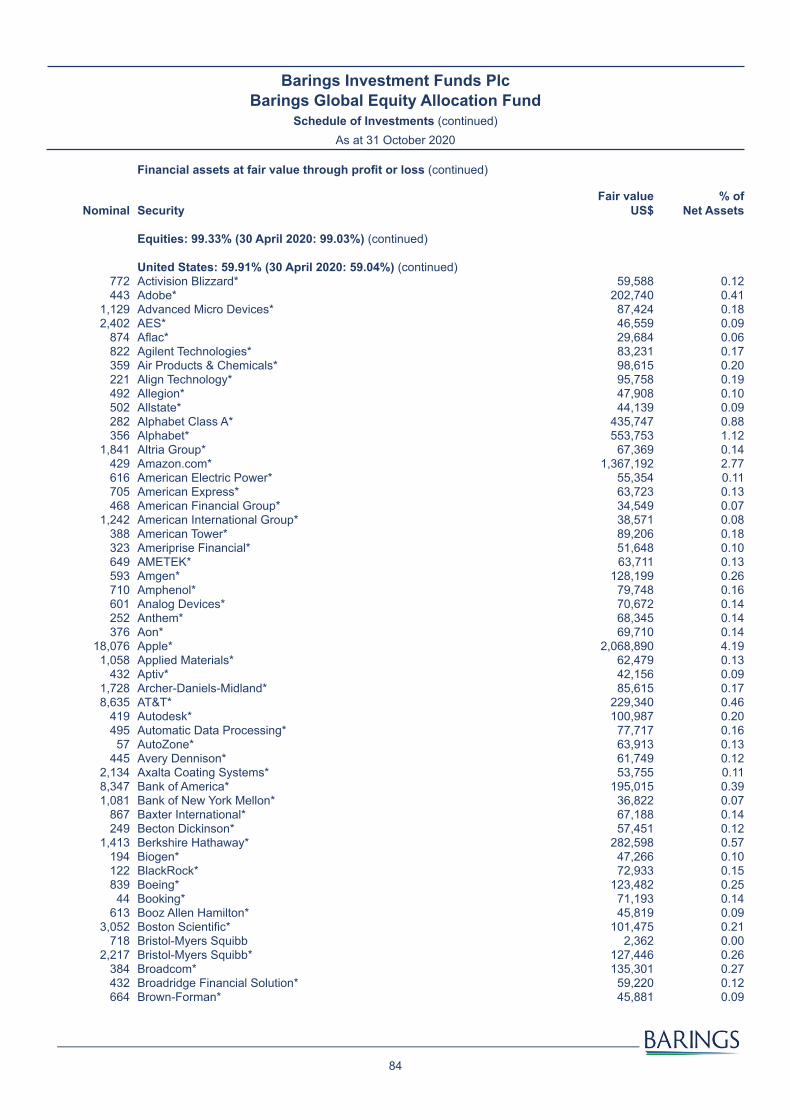
84
Barings Investment Funds Plc Barings Global Equity Allocation Fund
Schedule of Investments (continued)As at 31 October 2020
Financial assets at fair value through profit or loss (continued)
Nominal SecurityFair value
US$ % of
Net Assets
Equities: 99.33% (30 April 2020: 99.03%) (continued)
United States: 59.91% (30 April 2020: 59.04%) (continued) 772 Activision Blizzard* 59,588 0.12443 Adobe* 202,740 0.41
1,129 Advanced Micro Devices* 87,424 0.182,402 AES* 46,559 0.09
874 Aflac* 29,684 0.06822 Agilent Technologies* 83,231 0.17359 Air Products & Chemicals* 98,615 0.20221 Align Technology* 95,758 0.19492 Allegion* 47,908 0.10502 Allstate* 44,139 0.09282 Alphabet Class A* 435,747 0.88356 Alphabet* 553,753 1.12
1,841 Altria Group* 67,369 0.14429 Amazon.com* 1,367,192 2.77616 American Electric Power* 55,354 0.11705 American Express* 63,723 0.13468 American Financial Group* 34,549 0.07
1,242 American International Group* 38,571 0.08388 American Tower* 89,206 0.18323 Ameriprise Financial* 51,648 0.10649 AMETEK* 63,711 0.13593 Amgen* 128,199 0.26710 Amphenol* 79,748 0.16601 Analog Devices* 70,672 0.14252 Anthem* 68,345 0.14376 Aon* 69,710 0.14
18,076 Apple* 2,068,890 4.191,058 Applied Materials* 62,479 0.13
432 Aptiv* 42,156 0.091,728 Archer-Daniels-Midland* 85,615 0.178,635 AT&T* 229,340 0.46
419 Autodesk* 100,987 0.20495 Automatic Data Processing* 77,717 0.16
57 AutoZone* 63,913 0.13445 Avery Dennison* 61,749 0.12
2,134 Axalta Coating Systems* 53,755 0.118,347 Bank of America* 195,015 0.391,081 Bank of New York Mellon* 36,822 0.07
867 Baxter International* 67,188 0.14249 Becton Dickinson* 57,451 0.12
1,413 Berkshire Hathaway* 282,598 0.57194 Biogen* 47,266 0.10122 BlackRock* 72,933 0.15839 Boeing* 123,482 0.25
44 Booking* 71,193 0.14613 Booz Allen Hamilton* 45,819 0.09
3,052 Boston Scientific* 101,475 0.21718 Bristol-Myers Squibb 2,362 0.00
2,217 Bristol-Myers Squibb* 127,446 0.26384 Broadcom* 135,301 0.27432 Broadridge Financial Solution* 59,220 0.12664 Brown-Forman* 45,881 0.09

85
Barings Investment Funds Plc Barings Global Equity Allocation Fund
Schedule of Investments (continued)As at 31 October 2020
Financial assets at fair value through profit or loss (continued)
Nominal SecurityFair value
US$ % of
Net Assets
Equities: 99.33% (30 April 2020: 99.03%) (continued)
United States: 59.91% (30 April 2020: 59.04%) (continued) 453 Camden Property Trust* 39,475 0.08684 Capital One Financial* 49,639 0.10
1,045 Carrier Global* 35,336 0.07595 Caterpillar* 91,338 0.18491 CDW* 58,941 0.12607 Celanese* 68,552 0.14728 Centene* 42,146 0.09
1,725 CF Industries Holdings* 45,849 0.091,096 Charles Schwab* 43,848 0.09
260 Charter Communications* 148,637 0.301,647 Chevron* 112,464 0.23
61 Chipotle Mexican Grill* 75,242 0.15333 Chubb* 43,874 0.09396 Cigna* 64,221 0.13
4,698 Cisco Systems* 166,414 0.342,270 Citigroup* 93,859 0.19
945 Citizens Financial Group* 25,052 0.05434 Citrix Systems* 49,070 0.10237 Clorox* 49,098 0.10333 CME Group* 49,572 0.10
3,885 Coca-Cola* 185,159 0.37695 Cognizant Technology Solutions* 48,989 0.10919 Colgate-Palmolive* 69,931 0.14
4,283 Comcast* 183,043 0.371,267 Comerica* 55,267 0.111,335 ConocoPhillips* 38,637 0.08
244 Constellation Brands* 40,164 0.081,205 Corning* 38,390 0.08
496 Costco Wholesale* 179,613 0.36556 Crown Castle International* 87,029 0.18
1,592 CSX* 123,071 0.25259 Cummins* 55,895 0.11
1,258 CVS Health* 69,832 0.14576 Danaher* 131,526 0.27351 Deere & Co* 79,435 0.16205 DexCom* 68,219 0.14564 Dollar General* 117,960 0.24441 Dollar Tree* 40,228 0.08824 Dominion Energy* 66,203 0.13715 Dow* 32,821 0.07888 DR Horton* 59,958 0.12
1,603 DuPont de Nemours* 92,213 0.19708 Eaton* 73,234 0.15948 eBay* 46,367 0.09385 Ecolab* 71,432 0.14608 Edison International* 33,835 0.07855 Edwards Lifesciences* 61,871 0.13342 Electronic Arts* 42,056 0.09956 Eli Lilly and Company* 125,767 0.25781 Emerson Electric* 49,950 0.10636 EOG Resources* 21,443 0.04215 EPAM Systems* 67,648 0.14
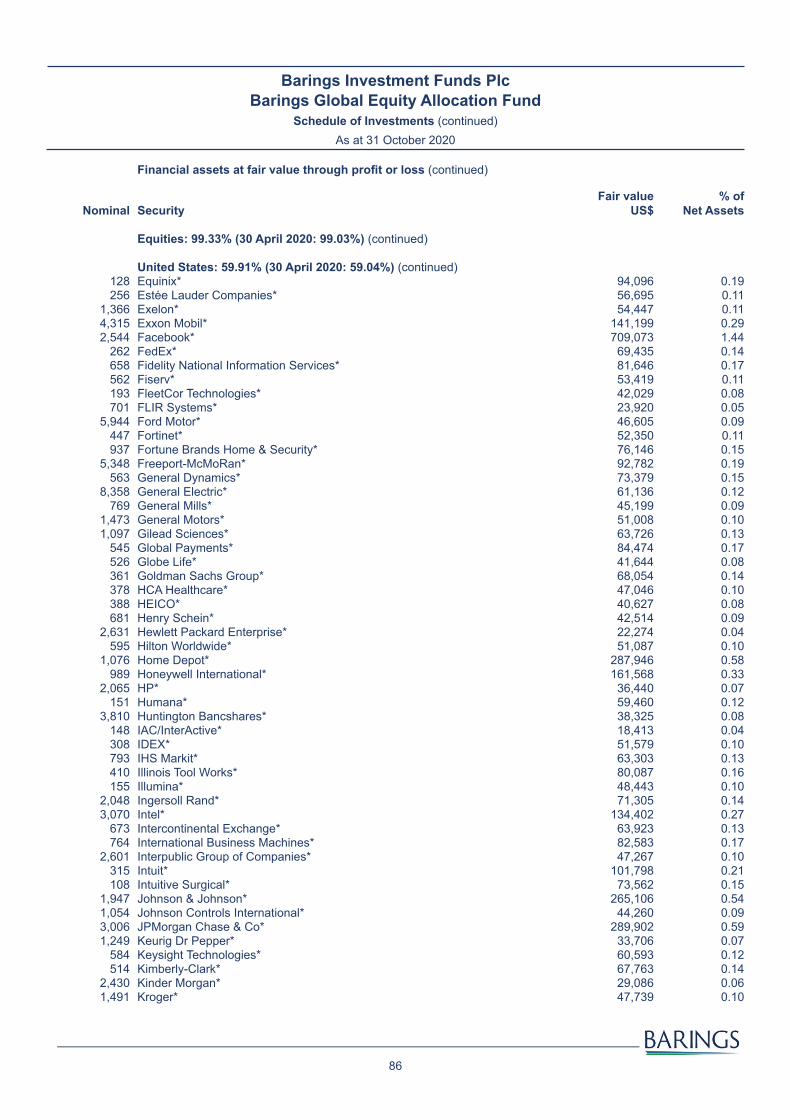
86
Barings Investment Funds Plc Barings Global Equity Allocation Fund
Schedule of Investments (continued)As at 31 October 2020
Financial assets at fair value through profit or loss (continued)
Nominal SecurityFair value
US$ % of
Net Assets
Equities: 99.33% (30 April 2020: 99.03%) (continued)
United States: 59.91% (30 April 2020: 59.04%) (continued) 128 Equinix* 94,096 0.19256 Estée Lauder Companies* 56,695 0.11
1,366 Exelon* 54,447 0.114,315 Exxon Mobil* 141,199 0.292,544 Facebook* 709,073 1.44
262 FedEx* 69,435 0.14658 Fidelity National Information Services* 81,646 0.17562 Fiserv* 53,419 0.11193 FleetCor Technologies* 42,029 0.08701 FLIR Systems* 23,920 0.05
5,944 Ford Motor* 46,605 0.09447 Fortinet* 52,350 0.11937 Fortune Brands Home & Security* 76,146 0.15
5,348 Freeport-McMoRan* 92,782 0.19563 General Dynamics* 73,379 0.15
8,358 General Electric* 61,136 0.12769 General Mills* 45,199 0.09
1,473 General Motors* 51,008 0.101,097 Gilead Sciences* 63,726 0.13
545 Global Payments* 84,474 0.17526 Globe Life* 41,644 0.08361 Goldman Sachs Group* 68,054 0.14378 HCA Healthcare* 47,046 0.10388 HEICO* 40,627 0.08681 Henry Schein* 42,514 0.09
2,631 Hewlett Packard Enterprise* 22,274 0.04595 Hilton Worldwide* 51,087 0.10
1,076 Home Depot* 287,946 0.58989 Honeywell International* 161,568 0.33
2,065 HP* 36,440 0.07151 Humana* 59,460 0.12
3,810 Huntington Bancshares* 38,325 0.08148 IAC/InterActive* 18,413 0.04308 IDEX* 51,579 0.10793 IHS Markit* 63,303 0.13410 Illinois Tool Works* 80,087 0.16155 Illumina* 48,443 0.10
2,048 Ingersoll Rand* 71,305 0.143,070 Intel* 134,402 0.27
673 Intercontinental Exchange* 63,923 0.13764 International Business Machines* 82,583 0.17
2,601 Interpublic Group of Companies* 47,267 0.10315 Intuit* 101,798 0.21108 Intuitive Surgical* 73,562 0.15
1,947 Johnson & Johnson* 265,106 0.541,054 Johnson Controls International* 44,260 0.093,006 JPMorgan Chase & Co* 289,902 0.591,249 Keurig Dr Pepper* 33,706 0.07
584 Keysight Technologies* 60,593 0.12514 Kimberly-Clark* 67,763 0.14
2,430 Kinder Morgan* 29,086 0.061,491 Kroger* 47,739 0.10

87
Barings Investment Funds Plc Barings Global Equity Allocation Fund
Schedule of Investments (continued)As at 31 October 2020
Financial assets at fair value through profit or loss (continued)
Nominal SecurityFair value
US$ % of
Net Assets
Equities: 99.33% (30 April 2020: 99.03%) (continued)
United States: 59.91% (30 April 2020: 59.04%) (continued) 256 L3 Harris Technologies* 41,402 0.08177 Lam Research* 62,058 0.13141 Lockheed Martin* 49,321 0.10833 Lowe's Companies* 132,900 0.27172 Lululemon Athletica* 56,360 0.11434 LyondellBasell Industries* 31,104 0.06
1,678 Marathon Petroleum* 48,014 0.10409 Marriott International* 37,886 0.08936 Marsh & McLennan Cos* 95,638 0.19804 Mastercard* 233,949 0.47319 Match Group* 38,664 0.08825 Maxim Integrated Products* 57,472 0.12266 McCormick & Company* 48,551 0.10688 McDonald's* 146,776 0.30
1,580 Medtronic* 158,963 0.3229 MercadoLibre* 37,445 0.08
2,620 Merck & Co* 197,341 0.40880 MetLife* 32,587 0.07
84 Mettler-Toledo International* 83,686 0.172,314 Micron Technology* 115,935 0.237,718 Microsoft* 1,568,179 3.18
419 Mid-America Apartment Communities* 47,212 0.10902 Molson Coors Beverage* 29,883 0.06
1,589 Mondelez International* 83,885 0.17843 Monster Beverage* 64,876 0.13278 Moody's* 72,566 0.15
1,371 Morgan Stanley* 65,478 0.134,207 National Oilwell Varco* 33,821 0.07
500 Netflix* 250,214 0.51698 Newmont* 41,801 0.08
1,536 NextEra Energy* 112,827 0.231,242 Nike* 151,448 0.31
433 Norfolk Southern* 88,366 0.18192 Northrop Grumman* 55,718 0.11
1,159 NRG Energy* 36,166 0.071,152 Nucor* 54,813 0.11
530 NVIDIA* 274,038 0.55994 OGE Energy* 30,543 0.06
2,082 Oracle* 115,759 0.23137 O'Reilly Automotive* 59,329 0.12522 Otis Worldwide* 31,494 0.06611 PACCAR* 51,952 0.11352 Parker-Hannifin* 72,611 0.15408 Paychex* 33,387 0.07
1,450 PayPal* 280,687 0.572,922 People's United Financial* 31,176 0.061,169 PepsiCo* 155,460 0.315,370 Pfizer* 188,033 0.381,397 Philip Morris International* 97,944 0.20
505 PNC Financial Services Group* 55,043 0.11466 PPG Industries* 59,247 0.12
2,492 Procter & Gamble* 340,253 0.69
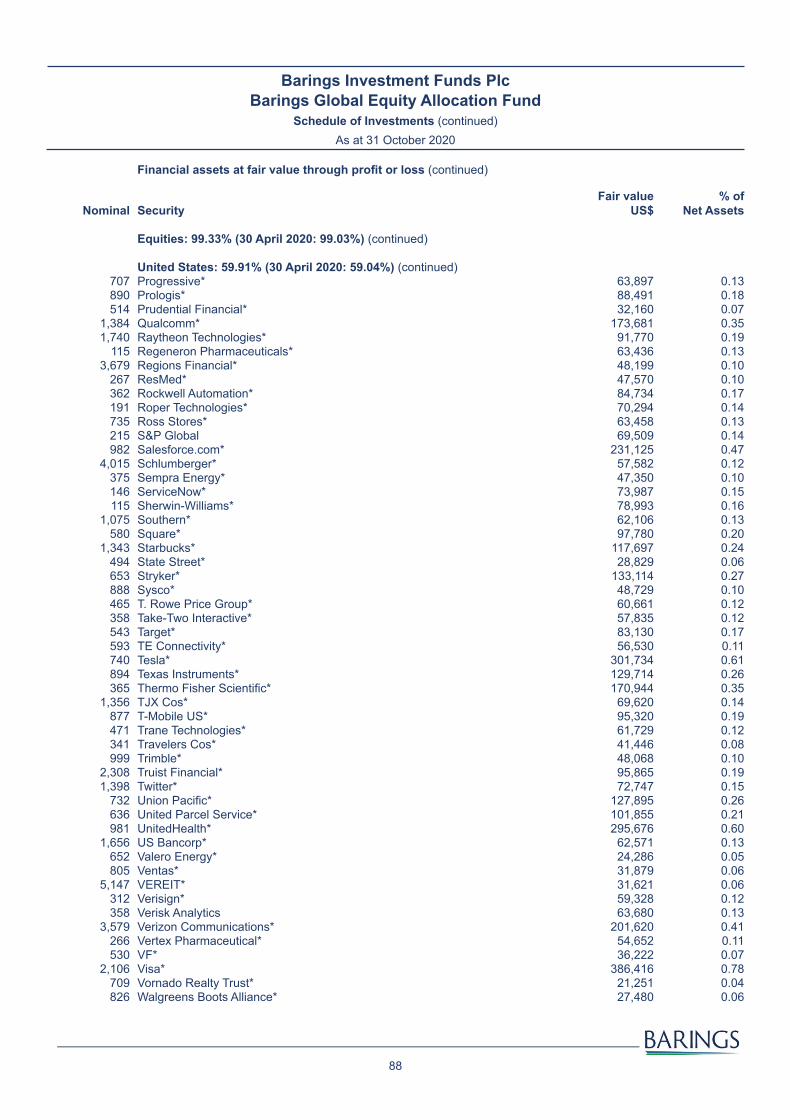
88
Barings Investment Funds Plc Barings Global Equity Allocation Fund
Schedule of Investments (continued)As at 31 October 2020
Financial assets at fair value through profit or loss (continued)
Nominal SecurityFair value
US$ % of
Net Assets
Equities: 99.33% (30 April 2020: 99.03%) (continued)
United States: 59.91% (30 April 2020: 59.04%) (continued) 707 Progressive* 63,897 0.13890 Prologis* 88,491 0.18514 Prudential Financial* 32,160 0.07
1,384 Qualcomm* 173,681 0.351,740 Raytheon Technologies* 91,770 0.19
115 Regeneron Pharmaceuticals* 63,436 0.133,679 Regions Financial* 48,199 0.10
267 ResMed* 47,570 0.10362 Rockwell Automation* 84,734 0.17191 Roper Technologies* 70,294 0.14735 Ross Stores* 63,458 0.13215 S&P Global 69,509 0.14982 Salesforce.com* 231,125 0.47
4,015 Schlumberger* 57,582 0.12375 Sempra Energy* 47,350 0.10146 ServiceNow* 73,987 0.15115 Sherwin-Williams* 78,993 0.16
1,075 Southern* 62,106 0.13580 Square* 97,780 0.20
1,343 Starbucks* 117,697 0.24494 State Street* 28,829 0.06653 Stryker* 133,114 0.27888 Sysco* 48,729 0.10465 T. Rowe Price Group* 60,661 0.12358 Take-Two Interactive* 57,835 0.12543 Target* 83,130 0.17593 TE Connectivity* 56,530 0.11740 Tesla* 301,734 0.61894 Texas Instruments* 129,714 0.26365 Thermo Fisher Scientific* 170,944 0.35
1,356 TJX Cos* 69,620 0.14877 T-Mobile US* 95,320 0.19471 Trane Technologies* 61,729 0.12341 Travelers Cos* 41,446 0.08999 Trimble* 48,068 0.10
2,308 Truist Financial* 95,865 0.191,398 Twitter* 72,747 0.15
732 Union Pacific* 127,895 0.26636 United Parcel Service* 101,855 0.21981 UnitedHealth* 295,676 0.60
1,656 US Bancorp* 62,571 0.13652 Valero Energy* 24,286 0.05805 Ventas* 31,879 0.06
5,147 VEREIT* 31,621 0.06312 Verisign* 59,328 0.12358 Verisk Analytics 63,680 0.13
3,579 Verizon Communications* 201,620 0.41266 Vertex Pharmaceutical* 54,652 0.11530 VF* 36,222 0.07
2,106 Visa* 386,416 0.78709 Vornado Realty Trust* 21,251 0.04826 Walgreens Boots Alliance* 27,480 0.06
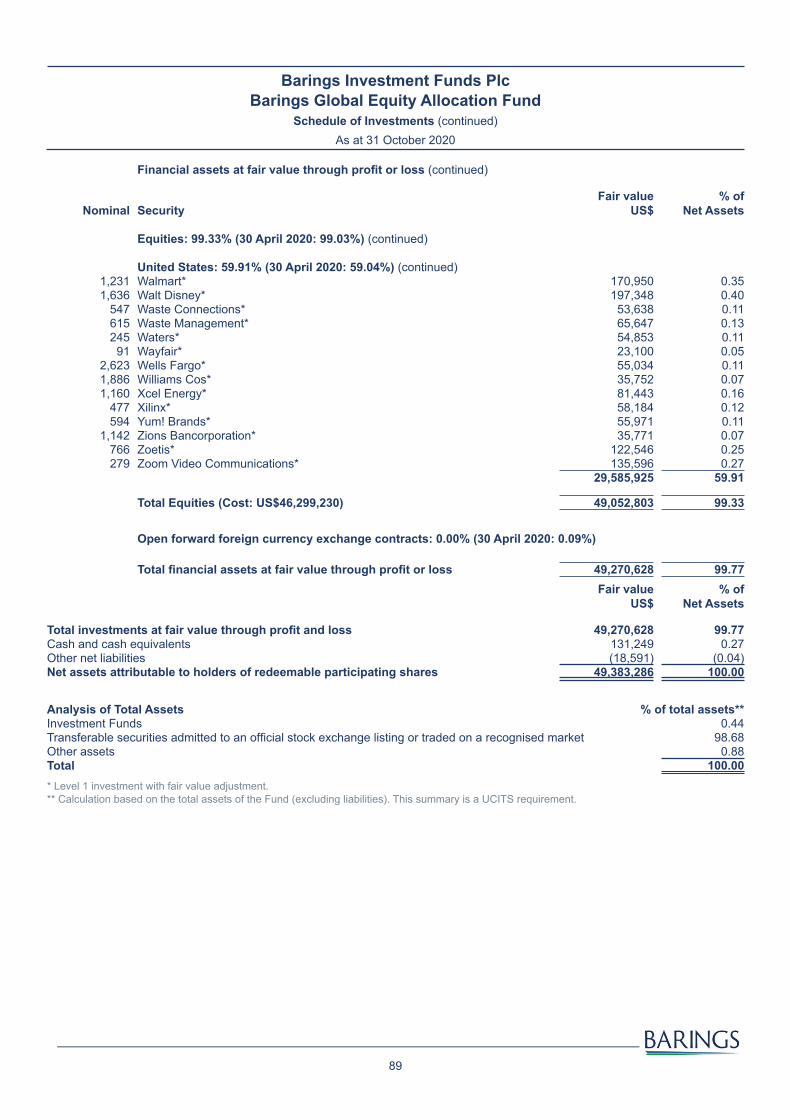
89
Barings Investment Funds Plc Barings Global Equity Allocation Fund
Schedule of Investments (continued)As at 31 October 2020
Financial assets at fair value through profit or loss (continued)
Nominal SecurityFair value
US$ % of
Net Assets
Equities: 99.33% (30 April 2020: 99.03%) (continued)
United States: 59.91% (30 April 2020: 59.04%) (continued) 1,231 Walmart* 170,950 0.351,636 Walt Disney* 197,348 0.40
547 Waste Connections* 53,638 0.11615 Waste Management* 65,647 0.13245 Waters* 54,853 0.11
91 Wayfair* 23,100 0.052,623 Wells Fargo* 55,034 0.111,886 Williams Cos* 35,752 0.071,160 Xcel Energy* 81,443 0.16
477 Xilinx* 58,184 0.12594 Yum! Brands* 55,971 0.11
1,142 Zions Bancorporation* 35,771 0.07766 Zoetis* 122,546 0.25279 Zoom Video Communications* 135,596 0.27
29,585,925 59.91
Total Equities (Cost: US$46,299,230) 49,052,803 99.33XX
Open forward foreign currency exchange contracts: 0.00% (30 April 2020: 0.09%)
Total financial assets at fair value through profit or loss 49,270,628 99.77Fair value
US$% of
Net Assets
Total investments at fair value through profit and loss 49,270,628 99.77Cash and cash equivalents 131,249 0.27Other net liabilities (18,591) (0.04)Net assets attributable to holders of redeemable participating shares 49,383,286 100.00
Analysis of Total Assets % of total assets**Investment Funds 0.44Transferable securities admitted to an official stock exchange listing or traded on a recognised market 98.68Other assets 0.88Total 100.00* Level 1 investment with fair value adjustment.** Calculation based on the total assets of the Fund (excluding liabilities). This summary is a UCITS requirement.

90
Barings Investment Funds PlcGeneral information
For the financial period ended 31 October 2020
Market timingRepeatedly purchasing and selling shares in the Funds in response to short-term market fluctuations – known as ‘market timing’ – can disrupt Baring Asset Management Limited’s (the “Investment Manager’s”) investment strategy and increase the Funds’ expenses to the prejudice of all shareholders. The Funds are not intended for market timing or excessive trading. To deter these activities, the Directors of the Company may refuse to accept an application for shares from persons that it reasonably believes are engaged in market timing or are otherwise excessive or potentially disruptive to the Funds.
The Directors of the Company reserve the right to redeem shares from a shareholder on the basis of the circumstances of the shareholder concerned, or if it has reasonable grounds to believe that the shareholder is engaging in any activity which might result in the Funds or their shareholders as a whole suffering any legal, regulatory, reputational or other material disadvantage which the Funds or their shareholders as a whole might not otherwise have suffered.
UK reporting fund statusUK taxable investors in UK reporting funds are subject to tax on their share of the UK reporting funds’ income attributable to their holdings in the Funds, whether or not distributed, while typically any gains on disposal of their holdings are subject to capital gains tax.
Details of the share classes which currently have UK reporting fund status are available at the Her Majesty's Revenue and Customs (“HMRC”) Investment Funds Centre website:
http://www.hmrc.gov.uk/cisc/offshore-funds.htm.
As stated above, UK tax payers should note that for each share class with reporting fund status, their share of any amounts of income, if any, that have not been distributed will be subject to tax.
Further details will be made available on the Baring Asset Management Limited website: www.barings.com.
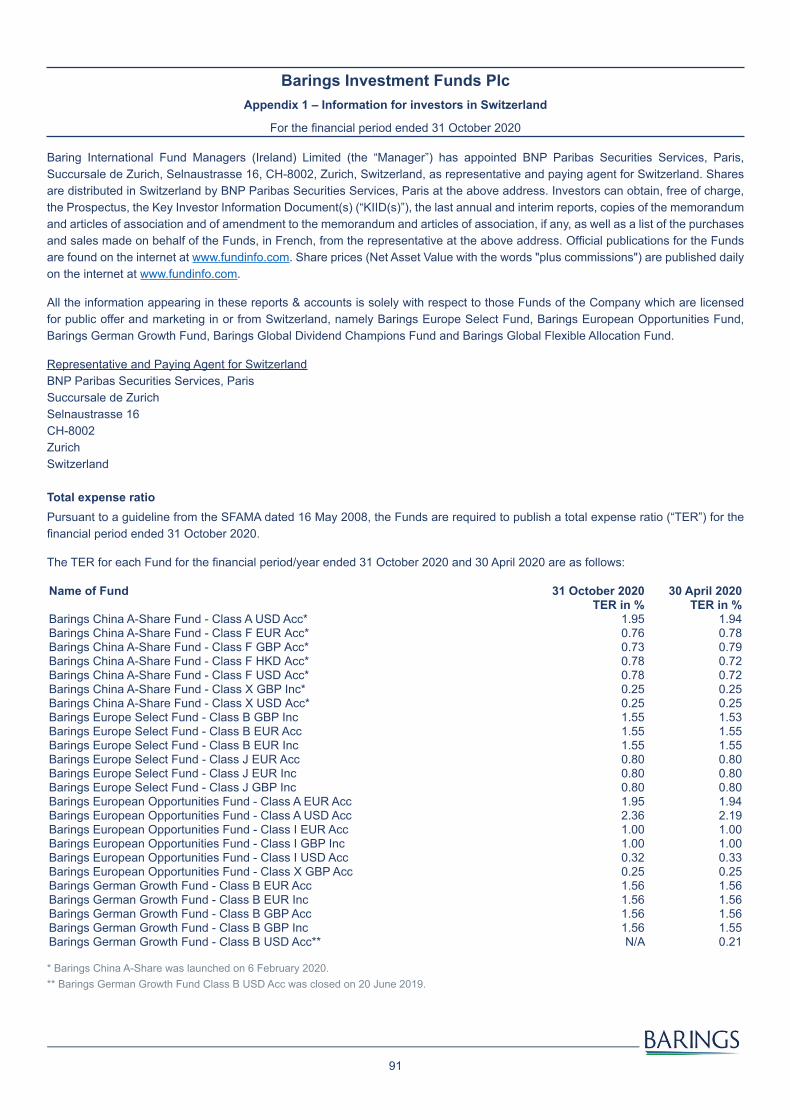
91
Barings Investment Funds PlcAppendix 1 – Information for investors in Switzerland
For the financial period ended 31 October 2020
Baring International Fund Managers (Ireland) Limited (the “Manager”) has appointed BNP Paribas Securities Services, Paris, Succursale de Zurich, Selnaustrasse 16, CH-8002, Zurich, Switzerland, as representative and paying agent for Switzerland. Shares are distributed in Switzerland by BNP Paribas Securities Services, Paris at the above address. Investors can obtain, free of charge, the Prospectus, the Key Investor Information Document(s) (“KIID(s)”), the last annual and interim reports, copies of the memorandum and articles of association and of amendment to the memorandum and articles of association, if any, as well as a list of the purchases and sales made on behalf of the Funds, in French, from the representative at the above address. Official publications for the Funds are found on the internet at www.fundinfo.com. Share prices (Net Asset Value with the words "plus commissions") are published daily on the internet at www.fundinfo.com.
All the information appearing in these reports & accounts is solely with respect to those Funds of the Company which are licensed for public offer and marketing in or from Switzerland, namely Barings Europe Select Fund, Barings European Opportunities Fund, Barings German Growth Fund, Barings Global Dividend Champions Fund and Barings Global Flexible Allocation Fund.
Representative and Paying Agent for SwitzerlandBNP Paribas Securities Services, Paris Succursale de Zurich Selnaustrasse 16 CH-8002 Zurich Switzerland
Total expense ratioPursuant to a guideline from the SFAMA dated 16 May 2008, the Funds are required to publish a total expense ratio (“TER”) for the financial period ended 31 October 2020.
The TER for each Fund for the financial period/year ended 31 October 2020 and 30 April 2020 are as follows:
Name of Fund 31 October 2020 30 April 2020TER in % TER in %
Barings China A-Share Fund - Class A USD Acc* 1.95 1.94Barings China A-Share Fund - Class F EUR Acc* 0.76 0.78Barings China A-Share Fund - Class F GBP Acc* 0.73 0.79Barings China A-Share Fund - Class F HKD Acc* 0.78 0.72Barings China A-Share Fund - Class F USD Acc* 0.78 0.72Barings China A-Share Fund - Class X GBP Inc* 0.25 0.25Barings China A-Share Fund - Class X USD Acc* 0.25 0.25Barings Europe Select Fund - Class B GBP Inc 1.55 1.53Barings Europe Select Fund - Class B EUR Acc 1.55 1.55Barings Europe Select Fund - Class B EUR Inc 1.55 1.55Barings Europe Select Fund - Class J EUR Acc 0.80 0.80Barings Europe Select Fund - Class J EUR Inc 0.80 0.80Barings Europe Select Fund - Class J GBP Inc 0.80 0.80Barings European Opportunities Fund - Class A EUR Acc 1.95 1.94Barings European Opportunities Fund - Class A USD Acc 2.36 2.19Barings European Opportunities Fund - Class I EUR Acc 1.00 1.00Barings European Opportunities Fund - Class I GBP Inc 1.00 1.00Barings European Opportunities Fund - Class I USD Acc 0.32 0.33Barings European Opportunities Fund - Class X GBP Acc 0.25 0.25Barings German Growth Fund - Class B EUR Acc 1.56 1.56Barings German Growth Fund - Class B EUR Inc 1.56 1.56Barings German Growth Fund - Class B GBP Acc 1.56 1.56Barings German Growth Fund - Class B GBP Inc 1.56 1.55Barings German Growth Fund - Class B USD Acc** N/A 0.21 * Barings China A-Share was launched on 6 February 2020.** Barings German Growth Fund Class B USD Acc was closed on 20 June 2019.

92
Barings Investment Funds PlcAppendix 1 – Information for investors in Switzerland (continued)
For the financial period ended 31 October 2020
Name of Fund 31 October 2020 30 April 2020TER in % TER in %
Barings German Growth Fund - Class J EUR Acc 0.80 0.81Barings German Growth Fund - Class J GBP Acc 0.81 0.81Barings German Growth Fund - Class J GBP Inc 0.81 0.81Barings German Growth Fund - Class J USD Acc* N/A 0.80Barings Global Dividend Champions Fund - Class A USD Acc 1.61 1.59Barings Global Dividend Champions Fund - Class F GBP Acc** 0.40 0.40Barings Global Dividend Champions Fund - Class F GBP Inc** 0.40 0.40Barings Global Dividend Champions Fund - Class F USD Acc** 0.44 0.44Barings Global Dividend Champions Fund - Class F USD Inc** 0.44 0.44Barings Global Dividend Champions Fund - Class I GBP Acc 0.85 0.85Barings Global Dividend Champions Fund - Class I GBP Inc*** 0.85 0.81Barings Global Dividend Champions Fund - Class I USD Inc**** 0.84 0.85Barings Global Dividend Champions Fund - Class X USD Acc***** 0.10 N/ABarings Global Equity Allocation Fund - Class I USD Acc****** 0.78 0.75Barings Global Equity Allocation Fund - Class X USD Acc****** 0.25 N/ABarings Global Flexible Allocation Fund - Class A EUR Acc******* N/A 1.70Barings Global Flexible Allocation Fund - Class A EUR Inc******* N/A 1.70Barings Global Flexible Allocation Fund - Class I EUR Acc******* N/A 0.76Barings Global Flexible Allocation Fund - Class X EUR Acc******* N/A 0.11
* Barings German Growth Fund Class J USD Acc was closed on 30 April 2020.** Barings Global Dividend Champions Fund Class F GBP Acc, Class F GBP Inc, Class F USD Acc and Class F USD Inc were launched on 10 June 2019.*** Barings Global Dividend Champions Fund Class I GBP Inc was launched on 12 July 2019.**** Barings Global Dividend Champions Fund Class I USD Inc was closed on 18 August 2020 and was subsequently re-launched on 22 September 2020. The class was further closed on 16 October 2020 and subsequently re-launched on 20 October 2020.***** Barings Global Dividend Champions Fund Class X USD Acc was launched on 18 August 2020.****** Barings Global Equity Allocation Fund was launched on 28 June 2019. ******* Barings Global Flexible Allocation Fund was terminated on 1 October 2020.
This information was established by the Manager, Baring International Fund Managers (Ireland) Limited, based on the data contained in the Statement of Comprehensive Income for the above reference period (Fund management fees, administration fees, depositary fees, taxes and duties, and all other commissions and expenses appearing as per the breakdown of the Statement of Comprehensive Income and not already included in any of the foregoing categories). The TER is calculated using the average daily Net Asset Value for the period.
Trailer fees and reimbursementsTrailer fees (Bestandespflegekommissionen) may only be paid to the sales agents/partners indicated below:• authorised sales agents (distributors) within the meaning of Article 19, Para 1, Collective Investments Scheme Act (“CISA”);• sales agents (distributors) exempted from the authorisation requirement within the meaning of Article 19, Para 4, CISA and Article
8, Collective Investment Scheme Ordinance (“CISO”);• sales partners who place Fund shares exclusively with institutional investors with professional treasury facilities; and/or• sales partners who place Fund shares with their clients exclusively on the basis of a written commission-based asset management
mandate.
Total expense ratio (continued)

93
Barings Investment Funds PlcAppendix 1 – Information for investors in Switzerland (continued)
For the financial period ended 31 October 2020
Reimbursements (Rückvergütungen) may only be paid to the institutional investors detailed below who, from a commercial perspective, are holding the Fund shares for third parties:
• life insurance companies (in respect of Fund shares held for the account of insured persons or to cover obligations towards insured persons);
• pension funds and other retirement provision institutions (in respect of Fund shares held for the account of beneficiaries);• investment foundations (in respect of Fund shares held for the account of in-house funds);• Swiss fund management companies (in respect of Fund shares held for the account of the funds managed);• foreign fund management companies and providers (in respect of Fund shares held for the account of managed funds and
investing shareholders); and/or• investment companies (in respect of the investment of the company assets).
Trailer fees and reimbursements (continued)
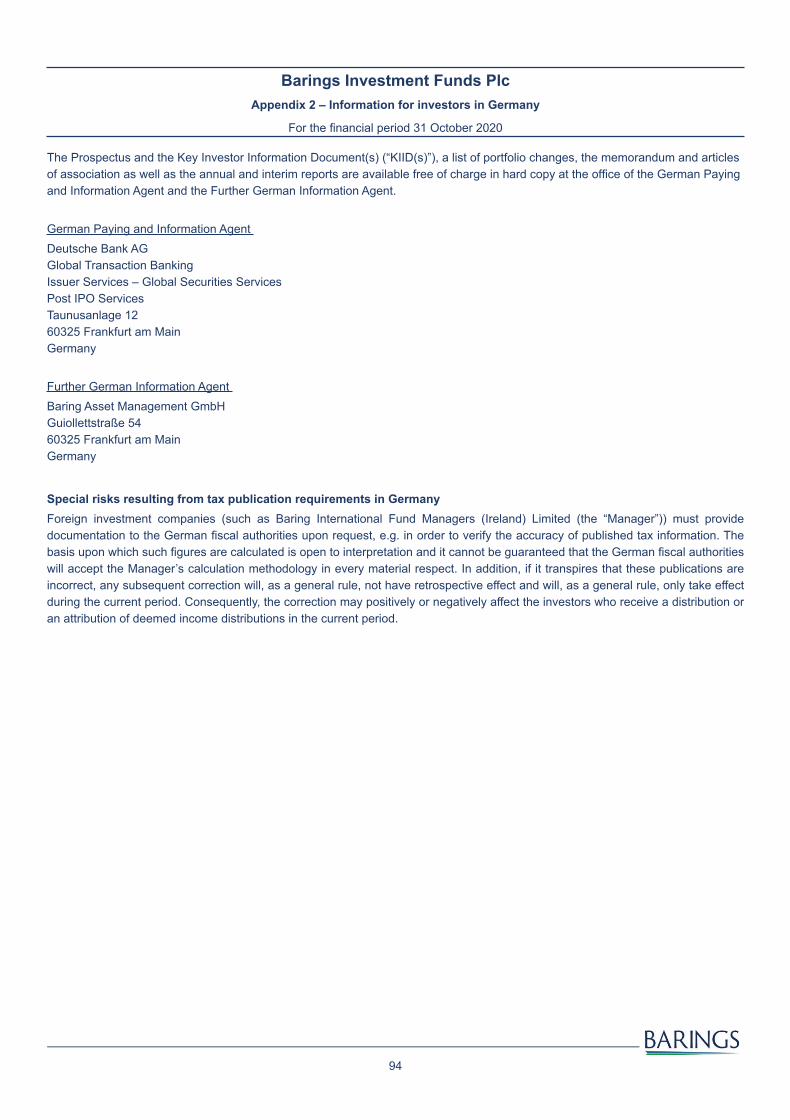
94
Barings Investment Funds PlcAppendix 2 – Information for investors in Germany
For the financial period 31 October 2020
The Prospectus and the Key Investor Information Document(s) (“KIID(s)”), a list of portfolio changes, the memorandum and articles of association as well as the annual and interim reports are available free of charge in hard copy at the office of the German Paying and Information Agent and the Further German Information Agent.
German Paying and Information Agent Deutsche Bank AG Global Transaction Banking Issuer Services – Global Securities Services Post IPO Services Taunusanlage 12 60325 Frankfurt am Main Germany
Further German Information Agent Baring Asset Management GmbH Guiollettstraße 5460325 Frankfurt am Main Germany
Special risks resulting from tax publication requirements in Germany Foreign investment companies (such as Baring International Fund Managers (Ireland) Limited (the “Manager”)) must provide documentation to the German fiscal authorities upon request, e.g. in order to verify the accuracy of published tax information. The basis upon which such figures are calculated is open to interpretation and it cannot be guaranteed that the German fiscal authorities will accept the Manager’s calculation methodology in every material respect. In addition, if it transpires that these publications are incorrect, any subsequent correction will, as a general rule, not have retrospective effect and will, as a general rule, only take effect during the current period. Consequently, the correction may positively or negatively affect the investors who receive a distribution or an attribution of deemed income distributions in the current period.

95
Barings Investment Funds Plc Barings European Opportunities Fund
Appendix 3 – Additional information Hong Kong CodeFor the financial period ended 31 October 2020
The Barings European Opportunities Fund has been registered for sale in Hong Kong.
Highest issue and lowest redemption prices
Highest issue price during the period/year*
31 October 2020 30 April 2020 30 April 2019 30 April 2018 30 April 2017Class A EUR Acc 15.99 18.13 16.37 16.00 13.59Class A USD Acc 18.63 19.42 19.07 19.78 14.83Class I EUR Acc 16.97 19.13 17.00 16.55 15.28Class I EUR Inc** – – – 17.96 16.22Class I GBP Inc 17.01 17.89 17.22 16.66 13.53Class I USD Acc 20.30 20.93 19.84 20.42 15.12Class X GBP Acc 18.95 19.66 18.28 17.64 14.17
Highest issue price during the period/year* (continued)
30 April 2016 30 April 2015 30 April 2014 30 April 2013 30 April 2012Class A EUR Acc 14.38 13.73 11.21 N/A N/AClass A USD Acc 15.59 N/A N/A N/A N/AClass I EUR Acc 14.63 13.90 11.25 N/A N/AClass I EUR Inc** 16.92 N/A N/A N/A N/AClass I GBP Inc 12.14 11.65 10.86 N/A N/AClass I USD Acc 15.36 N/A N/A N/A N/AClass X GBP Acc 12.48 11.82 10.89 N/A N/A
Lowest redemption price during the period/year*
31 October 2020 30 April 2020 30 April 2019 30 April 2018 30 April 2017Class A EUR Acc 13.47 10.86 12.88 14.29 10.42Class A USD Acc 14.38 11.56 14.58 16.21 11.52Class I EUR Acc 14.24 11.47 13.44 14.73 11.79Class I EUR Inc** – – – 17.31 12.31Class I GBP Inc 13.93 11.80 13.66 14.65 10.12Class I USD Acc 15.54 12.46 15.34 16.53 11.61Class X GBP Acc 15.47 12.97 14.28 15.44 10.52
Lowest redemption price during the period/year* (continued)
30 April 2016 30 April 2015 30 April 2014 30 April 2013 30 April 2012Class A EUR Acc 11.58 9.42 9.88 N/A N/AClass A USD Acc 12.96 N/A N/A N/A N/AClass I EUR Acc 11.80 9.50 9.89 N/A N/AClass I EUR Inc** 13.67 N/A N/A N/A N/AClass I GBP Inc 10.60 8.83 9.67 N/A N/AClass I USD Acc 13.01 N/A N/A N/A N/AClass X GBP Acc 10.90 8.92 9.68 N/A N/A
* The above highest issue prices and lowest redemption prices during the financial period/year are quoted in their respective share classes’ denomination currency.** The Barings European Opportunities Fund Class I EUR Inc was closed on 17 June 2017.

96
Barings Investment Funds Plc Barings European Opportunities Fund
Appendix 3 – Additional information Hong Kong Code (continued)For the financial period ended 31 October 2020
Statement of movements in portfolio holdings31 October 2020
% of NAV***30 April 2020 % of NAV***
30 April 2019 % of NAV***
30 April 2018 % of NAV***
Equities and Investment Funds 96.27 96.72 96.34 99.13Total investments at fair value through profit and loss 96.27 96.72 96.34 99.13
Cash and cash equivalents 3.77 3.01 2.71 0.72Other net (liabilities)/assets (0.04) 0.27 0.95 0.15Total net assets 100.00 100.00 100.00 100.00
*** Movement in portfolio holdings have been analysed above based on a percentage of Net Asset Value invested in each geographic location. The movement in each country’s position between the period/year has to be inferred.
Portfolio information
Top Ten Holdings % of Net Assets
SIG Combibloc Group 2.27
IMCD 2.23
Amplifon 2.05
HelloFresh 2.02
ASM International 1.92
GN Store Nord 1.91
Royal Unibrew 1.88
ASR Nederland 1.82
Euronext 1.82
Brenntag 1.74
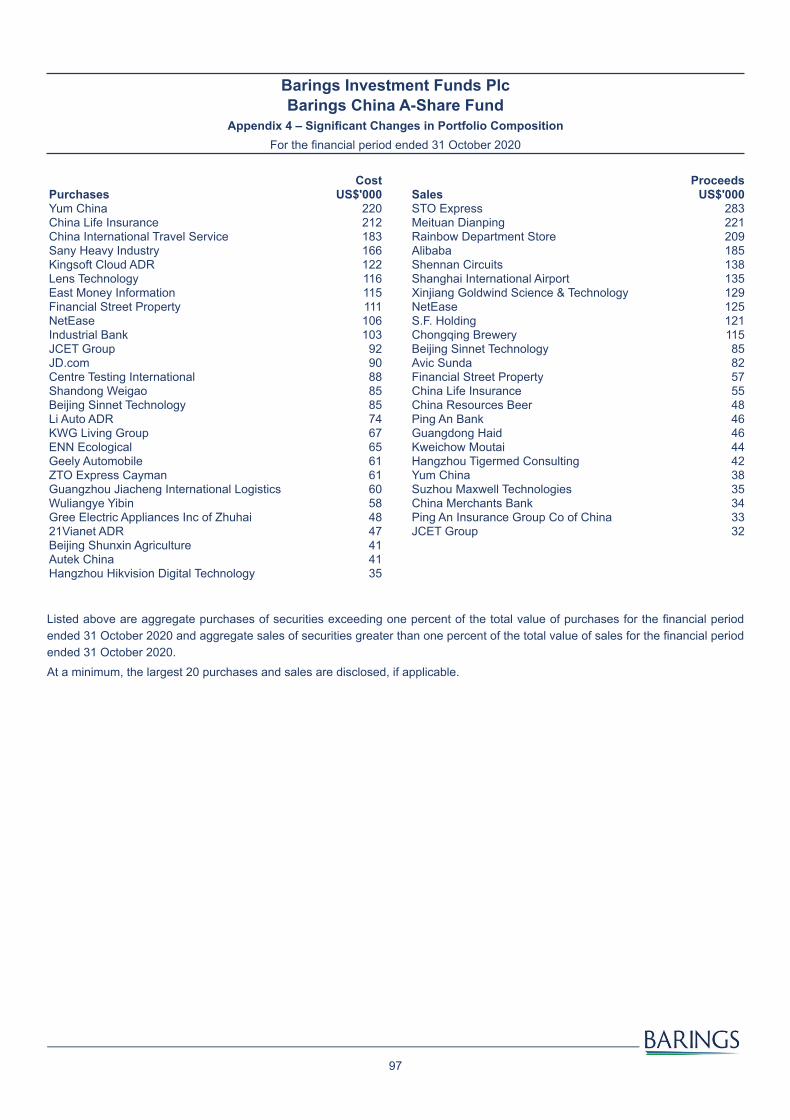
Barings Investment Funds Plc Barings China A-Share Fund
Appendix 4 – Significant Changes in Portfolio CompositionFor the financial period ended 31 October 2020
97
Cost Proceeds Purchases US$'000 Sales US$'000 Yum China 220 STO Express 283China Life Insurance 212 Meituan Dianping 221China International Travel Service 183 Rainbow Department Store 209Sany Heavy Industry 166 Alibaba 185Kingsoft Cloud ADR 122 Shennan Circuits 138Lens Technology 116 Shanghai International Airport 135East Money Information 115 Xinjiang Goldwind Science & Technology 129Financial Street Property 111 NetEase 125NetEase 106 S.F. Holding 121Industrial Bank 103 Chongqing Brewery 115JCET Group 92 Beijing Sinnet Technology 85JD.com 90 Avic Sunda 82Centre Testing International 88 Financial Street Property 57Shandong Weigao 85 China Life Insurance 55Beijing Sinnet Technology 85 China Resources Beer 48Li Auto ADR 74 Ping An Bank 46KWG Living Group 67 Guangdong Haid 46ENN Ecological 65 Kweichow Moutai 44Geely Automobile 61 Hangzhou Tigermed Consulting 42ZTO Express Cayman 61 Yum China 38Guangzhou Jiacheng International Logistics 60 Suzhou Maxwell Technologies 35Wuliangye Yibin 58 China Merchants Bank 34Gree Electric Appliances Inc of Zhuhai 48 Ping An Insurance Group Co of China 3321Vianet ADR 47 JCET Group 32Beijing Shunxin Agriculture 41Autek China 41Hangzhou Hikvision Digital Technology 35
Listed above are aggregate purchases of securities exceeding one percent of the total value of purchases for the financial period ended 31 October 2020 and aggregate sales of securities greater than one percent of the total value of sales for the financial period ended 31 October 2020. At a minimum, the largest 20 purchases and sales are disclosed, if applicable.
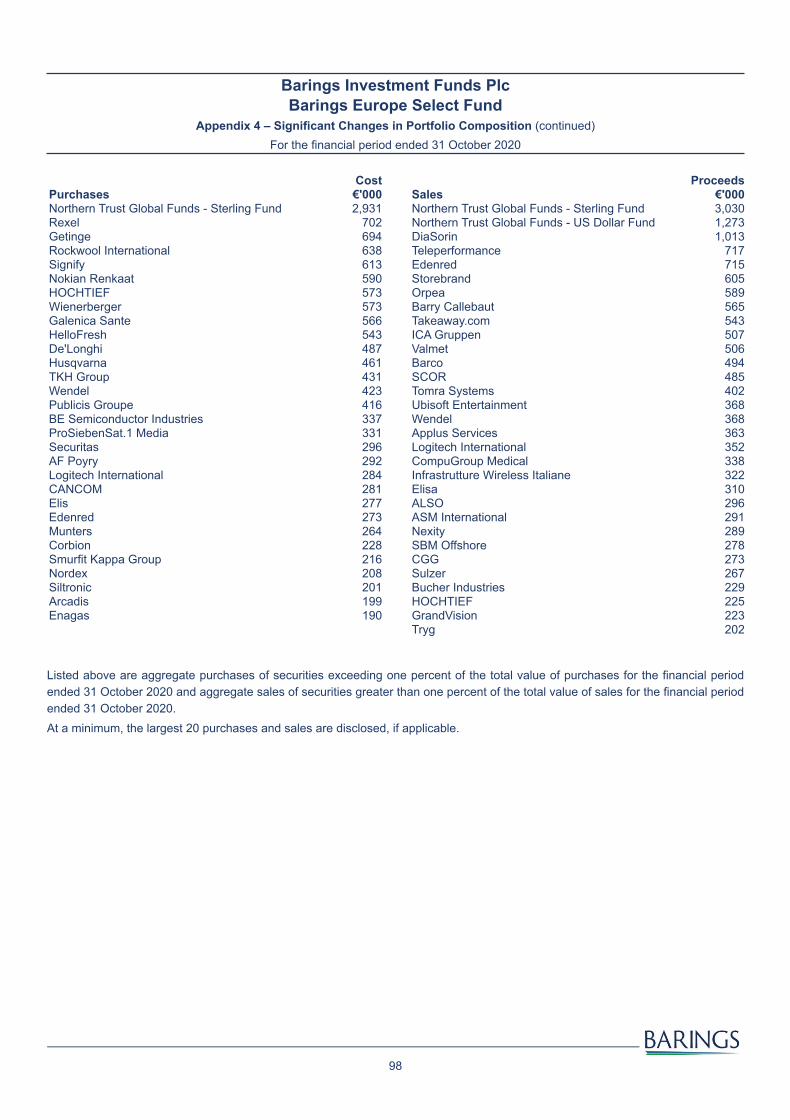
Barings Investment Funds Plc Barings Europe Select Fund
Appendix 4 – Significant Changes in Portfolio Composition (continued)For the financial period ended 31 October 2020
98
Cost Proceeds Purchases €'000 Sales €'000Northern Trust Global Funds - Sterling Fund 2,931 Northern Trust Global Funds - Sterling Fund 3,030Rexel 702 Northern Trust Global Funds - US Dollar Fund 1,273Getinge 694 DiaSorin 1,013Rockwool International 638 Teleperformance 717Signify 613 Edenred 715Nokian Renkaat 590 Storebrand 605HOCHTIEF 573 Orpea 589Wienerberger 573 Barry Callebaut 565Galenica Sante 566 Takeaway.com 543HelloFresh 543 ICA Gruppen 507De'Longhi 487 Valmet 506Husqvarna 461 Barco 494TKH Group 431 SCOR 485Wendel 423 Tomra Systems 402Publicis Groupe 416 Ubisoft Entertainment 368BE Semiconductor Industries 337 Wendel 368ProSiebenSat.1 Media 331 Applus Services 363Securitas 296 Logitech International 352AF Poyry 292 CompuGroup Medical 338Logitech International 284 Infrastrutture Wireless Italiane 322CANCOM 281 Elisa 310Elis 277 ALSO 296Edenred 273 ASM International 291Munters 264 Nexity 289Corbion 228 SBM Offshore 278Smurfit Kappa Group 216 CGG 273Nordex 208 Sulzer 267Siltronic 201 Bucher Industries 229Arcadis 199 HOCHTIEF 225Enagas 190 GrandVision 223
Tryg 202
Listed above are aggregate purchases of securities exceeding one percent of the total value of purchases for the financial period ended 31 October 2020 and aggregate sales of securities greater than one percent of the total value of sales for the financial period ended 31 October 2020. At a minimum, the largest 20 purchases and sales are disclosed, if applicable.

Barings Investment Funds Plc Barings European Opportunities Fund
Appendix 4 – Significant Changes in Portfolio Composition (continued)For the financial period ended 31 October 2020
99
Cost Proceeds Purchases €'000 Sales €'000Northern Trust Global Funds - Euro Liquidity Fund 36,946 Northern Trust Global Funds - Euro Liquidity Fund 36,954Northern Trust Global Funds - Sterling Fund 14,413 Northern Trust Global Funds - Sterling Fund 14,576Enagas 1,678 DiaSorin 3,614HOCHTIEF 1,284 Teleperformance 2,850HelloFresh 1,185 Valmet 2,700Getinge 1,142 Orpea 2,597Auto Trader 1,083 ASM International 2,386Wienerberger 861 KION 1,871Softwareone 828 Edenred 1,868Husqvarna 824 Amplifon 1,732FinecoBank 771 Storebrand 1,689ProSiebenSat.1 Media 669 Euronext 1,598Publicis Groupe 576 Tomra Systems 1,563CANCOM 568 SIG Combibloc Group 1,505Korian 548 HomeServe 1,436Baloise 466 Ashtead 1,390ICA Gruppen 395 Elisa 1,385Securitas 386 Barco 1,380Logitech International 348 SCOR 1,350Smurfit Kappa Group 342 JD Sports Fashion 1,346
Hays 1,320Worldline 1,262
Listed above are aggregate purchases of securities exceeding one percent of the total value of purchases for the financial period ended 31 October 2020 and aggregate sales of securities greater than one percent of the total value of sales for the financial period ended 31 October 2020. At a minimum, the largest 20 purchases and sales are disclosed, if applicable.

Barings Investment Funds Plc Barings German Growth Fund
Appendix 4 – Significant Changes in Portfolio Composition (continued)For the financial period ended 31 October 2020
100
Cost Proceeds Purchases €'000 Sales €'000Northern Trust Global Funds - Euro Liquidity Fund 5,431 Northern Trust Global Funds - Euro Liquidity Fund 5,787Linde 1,474 Allianz 1,098Hannover Rueck 636 Volkswagen 818Daimler 533 Airbus 723Northern Trust Global Funds - Sterling Fund 455 Bayer 587Infineon Technologies 228 Rheinmetall 517Fresenius Medical Care 181 SAP 512Traton 180 Wirecard 511Dialog Semiconductor 161 Northern Trust Global Funds - Sterling Fund 453HelloFresh 129 HOCHTIEF 325Rheinmetall 114 Deutsche Post 273Deutsche Wohnen 88 TUI 245Exasol 84 Aurubis 244Bayer 76 Lanxess 223PharmaSGP Holding 76 Steico 211Wienerberger 69 S&T 1442G Energy 60 Medios 143Siltronic 56 Merck 142Aixtron 37 DFV Deutsche Familienversicherung 133SAF-Holland 35 CompuGroup Medical 129
Listed above are aggregate purchases of securities exceeding one percent of the total value of purchases for the financial period ended 31 October 2020 and aggregate sales of securities greater than one percent of the total value of sales for the financial period ended 31 October 2020. At a minimum, the largest 20 purchases and sales are disclosed, if applicable.

Barings Investment Funds Plc Barings Global Dividend Champions Fund
Appendix 4 – Significant Changes in Portfolio Composition (continued)For the financial period ended 31 October 2020
101
Cost Proceeds Purchases US$'000 Sales US$'000 Northern Trust Global Funds - Sterling Fund 2,855 Northern Trust Global Funds - Sterling Fund 3,506Northern Trust Global Funds - US Dollar Fund 1,299 Colgate-Palmolive 2,632Air Liquide 1,278 Microsoft 2,249Northern Trust Global Funds - Euro Liquidity Fund 1,161 L'Oreal 1,890Aon 868 Northern Trust Global Funds - Euro Liquidity Fund 1,165Visa 723 Northern Trust Global Funds - US Dollar Fund 1,038Becton Dickinson 631 Zoetis 9183M 612 Stryker 630Compass 499 Unilever 570Halma 468 Nestle 563Nestle 319 Air Liquide 475Unilever 316 Coloplast 464Stryker 306 Reckitt Benckiser 457International Flavors & Fragrances 190 Nintendo 418TJX Cos 189 Klepierre REITs 414Novo Nordisk 182 PepsiCo 404Snam 170 Mastercard 398MARR 149 Amadeus IT 376Coloplast 121 Becton Dickinson 372
3M 318Sonic Healthcare 304Kone 302Intuit 302Novo Nordisk 277Compass 270Wal-Mart De Mexico 258Associated British Foods 255
Listed above are aggregate purchases of securities exceeding one percent of the total value of purchases for the financial period ended 31 October 2020 and aggregate sales of securities greater than one percent of the total value of sales for the financial period ended 31 October 2020. At a minimum, the largest 20 purchases and sales are disclosed, if applicable.

Barings Investment Funds Plc Barings Global Equity Allocation Fund
Appendix 4 – Significant Changes in Portfolio Composition (continued)For the financial period ended 31 October 2020
102
Cost Proceeds Purchases US$'000 Sales US$'000 Amazon.com 233 Unilever 143Xtrackers Russell 2000 UCITS ETF 204 BP 123Facebook 177 NVIDIA 123Microsoft 171 MercadoLibre 119Tesla 146 Johnson & Johnson 107Boeing 143 Toyota Motor 107Charter Communications 137 Alphabet 95BP 132 Dollar General 95Alphabet Class A 129 Facebook 91Air Liquide 125 GlaxoSmithKline 91Schneider Electric 122 Bangkok Dusit Medical Services 90Chevron 122 Charter Communications 90Apple 121 Cadence Design Systems 89Berkshire Hathaway 116 AstraZeneca 87BASF 111 Uber Technologies 87Meituan Dianping 111 Digital Realty Trust 87Taiwan Semiconductor Manufacturing 110 Intel 81AT&T 108 Oracle 81Diageo 107 New Oriental Education & Technology ADR 81Dollar General 106 Adyen 80
British American Tobacco 79Synopsys 78Amazon.com 78Yum China 78Lyxor International Asset Management 76Goodman Group 75LVMH Moet Hennessy Louis Vuitton 69Koninklijke DSM 68Commonwealth Bank of Australia 68Duke Energy 66United Parcel Service 64Segro 64Alimentation Couche-Tard 64Nissin Foods 63Jack Henry & Associates 62Celltrion 61Weichai Power 61Duke Realty 58Bunzl 58AT&T 57Mastercard 57Croda International 56BHP 56
Listed above are aggregate purchases of securities exceeding one percent of the total value of purchases for the financial period ended 31 October 2020 and aggregate sales of securities greater than one percent of the total value of sales for the financial period ended 31 October 2020. At a minimum, the largest 20 purchases and sales are disclosed, if applicable.

Barings Investment Funds Plc Barings Global Flexible Allocation Fund
Appendix 4 – Significant Changes in Portfolio Composition (continued)For the financial period ended 31 October 2020
103
Cost Proceeds Purchases €'000 Sales €'000Portugal Treasury Bill 0.00% 18/09/2020 2,403 Barings European High Yield Bond Fund F EUR 3,589Hellenic Republic Government Bond 0.00% 11/09/2020
2,191 Portugal Treasury Bill 0.00% 17/07/2020 2,830
Italy Buoni Ordinari Del Tesoro BOT 0.00% 30/09/2020
2,191 Portugal Treasury Bill 0.00% 18/09/2020 2,401
Portugal Treasury Bill 0.00% 20/11/2020 2,190 Amundi Physical Gold ETC 2,323Spain Letras del Tesoro 0.00% 15/01/2021 2,190 Hellenic Republic Government Bond 0.00%
11/09/20202,192
Spain Letras del Tesoro 0.00% 09/10/2020 1,802 Italy Buoni Ordinari Del Tesoro BOT 0.00% 30/09/2020
2,190
Japan Treasury Discount Bill 0.00% 31/08/2020 1,507 Portugal Treasury Bill 0.00% 20/11/2020 2,188Italy Buoni Ordinari Del Tesoro BOT 0.00% 30/10/2020
1,501 Spain Letras del Tesoro 0.00% 15/01/2021 2,188
Japan Treasury Discount Bill 0.00% 28/09/2020 1,468 Spain Letras del Tesoro 0.00% 10/07/2020 2,000France (Republic of) 0.00% 14/10/2020 1,402 Spain Letras del Tesoro 0.00% 09/10/2020 1,801Amundi Physical Gold ETC 1,393 Italy Buoni Ordinari Del Tesoro BOT 0.00%
30/10/20201,501
US Treasury Inflation Indexed Bonds 0.88% 15/01/2029
422 Italy Buoni Ordinari Del Tesoro BOT 0.00% 14/07/2020
1,500
Brazilian Government International Bond 4.50% 30/05/2029
367 Spain Letras del Tesoro 0.00% 12/06/2020 1,500
Mexican Bonos 8.50% 31/05/2029 237 Hellenic Republic Treasury Bill 0.00% 05/06/2020 1,500Petroleos Mexicanos 6.63% 15/06/2035 224 Japan Treasury Discount Bill 0.00% 28/09/2020 1,495Portugal Obrigacoes do Tesouro OT 2.13% 17/10/2028
222 US Treasury Inflation Indexed Bonds 2.38% 15/01/2027
1,475
Russian Foreign Bond - Eurobond 7.05% 19/01/2028
216 Japan Treasury Discount Bill 0.00% 31/08/2020 1,456
Brazilian Government International Bond 5.00% 27/01/2045
171 France (Republic of) 0.00% 14/10/2020 1,402
Barings European High Yield Bond Fund F EUR 35 Portugal Treasury Bill 0.00% 15/05/2020 1,000Hellenic Republic Government Bond 3.38% 15/02/2025
939
Turkey Government International Bond 5.13% 18/05/2020
850
Indonesia Government International Bond 5.88% 15/01/2024
785
US Treasury Note/Bond 2.50% 31/01/2025 747Brazilian Government International Bond 4.50% 30/05/2029
732
Brazilian Government International Bond 2.63% 05/01/2023
683
Twelve Cat Bond Fund I USD 637Philippine Government International Bond 5.50% 30/03/2026
631
Portugal Obrigacoes do Tesouro OT 2.13% 17/10/2028
628
Listed above are aggregate purchases of securities exceeding one percent of the total value of purchases for the financial period ended 31 October 2020 and aggregate sales of securities greater than one percent of the total value of sales for the financial period ended 31 October 2020. At a minimum, the largest 20 purchases and sales are disclosed, if applicable.

Registered address: Baring International Fund Managers (Ireland) Limited70 Sir John Rogerson’s Quay Dublin 2 D02 R296Ireland
Contact:Tel: +353 1 542 2930 Fax: +353 1 670 1185 www.barings.com
Important information: This document is approved and issued by Baring International Fund Managers (Ireland) Limited.
Disclosure: Baring International Fund Managers (Ireland) Limited Authorised and regulated by the Central Bank of Ireland 70 Sir John Rogerson’s Quay, Dublin 2, D02 R296, Ireland
Related Documents