0 SANLAM UNIVERSAL FUNDS PLC Unaudited condensed interim financial statements for the six months ended 30 June 2014

Welcome message from author
This document is posted to help you gain knowledge. Please leave a comment to let me know what you think about it! Share it to your friends and learn new things together.
Transcript
SANLAM UNIVERSAL FUNDS PLC
0
SANLAM UNIVERSAL FUNDS PLC Unaudited condensed interim financial statements for the six months ended 30 June 2014
SANLAM UNIVERSAL FUNDS PLC
1
UNAUDITED CONDENSED INTERIM FINANCIAL STATEMENTS for the six months ended 30 June 2014 Contents Page(s) Company information 3 - 7 Directors’ report 8 - 13 Economic & market review 14 - 18 Investment Managers’ reports 19 - 55 Statement of comprehensive income
of the Company 56 of the Funds 57 - 68
Statement of financial position
of the Company 69 of the Funds 70 - 82
Statement of changes in net assets attributable to holders of redeemable participating shares
of the Company 83 of the Funds 84 - 95
Statement of cash flows
of the Company 96 of the Funds 97 - 108
Portfolio of investments 109 - 264
Centre Global Equity Fund 109 - 113 Grindrod International Property Fund 114 - 115 P-Solve Inflation Plus Fund 116 - 117 Sanlam African Frontier Markets Fund 118 - 119 Sanlam Global Best Ideas Fund 120 - 122 Sanlam Global Bond Fund 123 - 137 Sanlam Global Financial Fund 138 - 140 Sanlam Global Property Fund 141 - 146 Sanlam Strategic Cash Fund 147 - 148 Sanlam World Equity Fund 149 - 169 Sanlam World Equity Tracker Fund 170 - 189 SIIP India Opportunities Fund 190 - 191 SIM Global Equity Income Fund 192 - 193 SPI Strategic Investment Grade Bond Fund 194 - 196 Sanlam Fund of Alternative UCITS Fund 197 Sanlam Accel Income Fund 198 - 199 Sanlam North America Equity Tracker Fund 200 - 212
SANLAM UNIVERSAL FUNDS PLC
2
UNAUDITED CONDENSED INTERIM FINANCIAL STATEMENTS for the six months ended 30 June 2014 Contents (continued) Page(s) Portfolio of investments (continued)
Sanlam UK Equity Tracker Fund 213 - 215 Sanlam Europe (ex UK) Equity Tracker Fund 216 - 223 Sanlam Equity Allocation Fund 224 - 229 Sanlam Emerging Market Equity Tracker Fund 230 - 246 Sanlam P2strategies Global Fund 246 - 248 Sanlam P2strategies UK Fund 248 - 250 Sanlam P2strategies North America Fund 250 - 252 Sanlam P2strategies Emerging Market Fund 252 - 253 Sanlam P2strategies Europe (ex UK) Fund 254 - 255 Sanlam S&P Africa Tracker Fund 256 - 259 FOUR European L/S Fund 260 - 262 SPI Global High Quality Fund 263 - 264
Notes to the unaudited condensed interim financial statements 265 - 368 Purchases and Sales for the period ended 30 June 2014 369 - 399
SANLAM UNIVERSAL FUNDS PLC
3
COMPANY INFORMATION
Directors of Sanlam Ùniversal Peter Murray – Irish
1
Funds Plc (the “Company”) Paul Dobbyn – Irish1
Anton Gildenhuys – South African Thomas Murray – Irish
2
All Directors are non-executive
Registered number 267451 Funds of the Company 8IP Asia Equity Opportunities Fund
3
8IP Asia Pacific Equity Fund3
Centre Global Equity Fund Grindrod International Property Fund P-Solve Inflation Plus Fund Sanlam African Frontier Markets Fund Sanlam Global Best Ideas Fund Sanlam Global Bond Fund Sanlam Global Financial Fund Sanlam Global Property Fund Sanlam Strategic Cash Fund Sanlam World Equity Fund Sanlam World Equity Tracker Fund SIIP India Opportunities Fund SIM Global Equity Income Fund SPI Strategic Investment Grade Bond Fund Sanlam Fund of Alternative UCITS Fund Sanlam Accel Income Fund Sanlam North America Equity Tracker Fund Sanlam UK Equity Tracker Fund Sanlam Europe (ex UK) Equity Tracker Fund Sanlam Equity Allocation Fund Sanlam Emerging Market Equity Tracker Fund
Sanlam P2strategies Global Fund Sanlam P2strategies UK Fund Sanlam P2strategies North America Fund Sanlam P2strategies Emerging Market Fund Sanlam P2strategies Europe (ex UK) Fund Sanlam S&P Africa Tracker Fund FOUR European L/S Fund
SPI Global High Quality Fund Registered office of the Company Beech House
Beech Hill Road Dublin 4 Ireland
Manager & secretary Sanlam Asset Management (Ireland) Limited Beech House Beech Hill Road Dublin 4 Ireland 1 Peter Murray and Paul Dobbyn are considered independent Directors by the Irish Stock Exchange only
2Thomas Murray is considered an independent Director by the Irish Stock Exchange and in line with the Corporate Governance
Code that was adopted by the Company with effect from 19 December 2012. 3 8IP Asia Equity Opportunities Fund and 8IP Asia Pacific Equity Fund closed during the period ended 30 June 2014. As at 31
January 2014, the Investment Manager, Eight Investment Partners (Pty) Limited, was replaced as Investment Manager by Sanlam International Investments Limited to manage the closure of the Funds.The final redemption date for the Funds was 20 March 2014.
SANLAM UNIVERSAL FUNDS PLC
4
COMPANY INFORMATION (CONTINUED)
Administrator Sanlam Asset Management (Ireland) Limited Beech House Beech Hill Road Dublin 4 Ireland
Registrar & Transfer Agent4 J.P. Morgan Administration Services (Ireland) Limited
JPMorgan House IFSC Dublin 1 Ireland
Investment manager5 Sanlam Investment Management (Pty) Limited
55 Willie Van Schoor Avenue Bellville 7530 South Africa Investment manager – Centre Global Centre Asset Management LLC Equity Fund 48 Wall Street Suite 1100 New York, N.Y. 10005 United States of America
Investment manager – SPI Sanlam Private Investments (UK) Limited Strategic Investment Grade Bond 16 South Park Fund, Sanlam Strategic Cash Sevenoaks Fund and SPI Global High Quality Fund Kent TN13 1AN United Kingdom Investment manager – Sanlam Alliance Bernstein Limited Global Property Fund 50 Berkeley Street London W1J 8HA United Kingdom Investment manager – Grindrod Grindrod Bank Limited International Property Fund 5 Arundel Close Kingsmead Office Park Durban, KZN 4001 South Africa Investment manager – P-Solve P-Solve Investments Limited Inflation Plus Fund 11 Strand London WC2N 5HR United Kingdom Investment manager – Sanlam BlackRock Investment Management UK Limited Global Bond Fund 33 King William Street London EC4R 9AS United Kingdom 4 With effect from 1 September 2014, Brown Brothers Harriman Fund Administration (Ireland) Limited is replacing J.P. Morgan
Administration Services (Ireland) Limited as the appointed Registrar & Transfer Agent. 5 The Sanlam World Equity Tracker Fund, SIIP India Opportunities Fund, Sanlam African Frontier Markets Fund, Sanlam Global
Financial Fund, Sanlam Global Best Ideas Fund, Sanlam North America Equity Tracker Fund, Sanlam UK Equity Tracker Fund, Sanlam Europe (ex UK) Equity Tracker Fund, Sanlam Emerging Market Equity Tracker Fund, Sanlam S&P Africa Tracker Fund and SIM Global Equity Income Fund are managed by Sanlam Investment Management (Pty) Limited.
SANLAM UNIVERSAL FUNDS PLC
5
COMPANY INFORMATION (CONTINUED) Investment managers – Sanlam FOUR Capital Partners Limited World Equity Fund 6-8 Long Lane London, EC1A 9HF United Kingdom Sanlam Investment Management (Pty) Limited
55 Willie Van Schoor Avenue Bellville 7530 South Africa Eight Investment Partners (Pty) Limited Level 11, 131 Macquarie Street Sydney New South Wales Australia, 2000 Centre Asset Management LLC 48 Wall Street Suite 1100 New York N.Y. 10005 United States of America Sanlam International Investments Limited 1 Ely Place London EC1N 6RY United Kingdom Alliance Bernstein Limited 50 Berkeley Street London W1J 8HA United Kingdom Investment manager – Sanlam Fund of Sanlam International Investments Limited Alternative UCITS Fund and Sanlam 1 Ely Place Accel Income Fund London EC1N 6RY United Kingdom Investment manager - Sanlam Equity FOUR Capital Partners Limited Allocation Fund and FOUR European 1 Ely Place L/S Fund London EC1N 6RY United Kingdom Investment managers – Sanlam International Investments Limited Sanlam P2strategies UK Fund 1 Ely Place Sanlam P2strategies Europe (ex UK) Fund London Sanlam P2strategies Emerging Market Fund EC1N 6RY Sanlam P2strategies North America Fund United Kingdom Sanlam P2strategies Global Fund
Milliman Financial Strategies Ltd 11 Old Jewry London EC2R 8DU
United Kingdom

SANLAM UNIVERSAL FUNDS PLC
6
COMPANY INFORMATION (CONTINUED) Investment allocation manager
6 Sanlam International Investments Limited
1 Ely Place London EC1N 6RY United Kingdom
Investment transition managers Morgan Stanley & Co. International Limited 25 Cabot Square Canary Wharf London E14 4QA United Kingdom
State Street Bank Europe Limited 1 Royal Exchange London EC3V 3LL United Kingdom
J.P. Morgan Securities Limited 60 Victoria Embankment London EC4G 0JP United Kingdom
Investment advisor Sanlam International Investments Limited 1 Ely Place London EC1N 6RY United Kingdom
Custodian7 Northern Trust Fiduciary Services (Ireland) Limited
George's Court 54-62 Townsend Street Dublin 2 Ireland
Sub-custodian7 J.P. Morgan Bank (Ireland) plc
J.P. Morgan House IFSC Dublin 1 Ireland
Sponsoring broker Maples and Calder 75 St. Stephen’s Green Dublin 2 Ireland
Auditor8 Ernst & Young
Harcourt Centre Harcourt Street Dublin 2 Ireland
6 Sanlam International Investments Limited is the investment allocation manager to Centre Global Equity Fund, Sanlam Global Bond
Fund, Sanlam Global Property Fund, Sanlam Strategic Cash Fund, Sanlam World Equity Fund, Sanlam World Equity Tracker Fund, SIIP India Opportunities Fund, Sanlam Fund of Alternative UCITS Fund, Sanlam North America Equity Tracker Fund, Sanlam UK Equity Tracker Fund, Sanlam Europe (ex UK) Equity, Sanlam S&P Africa Tracker Fund and Sanlam Equity Allocation Fund. 7
With effect from 1 September 2014, Brown Brothers Harriman Trustee Services (Ireland) Limited is replacing Northern Trust
Fiduciary Services (Ireland) Limited as Custodian to the Company. This will include the removal of J.P. Morgan Bank (Ireland) Limited as current Sub-Custodian with all global custody services provided by Brown Brothers Harriman Trustee Services (Ireland) Limited. 8
The auditor has not expressed an opinion nor have they reviewed the unaudited condensed interim financial statements for the six
months ended 30 June 2014.
SANLAM UNIVERSAL FUNDS PLC
7
COMPANY INFORMATION (CONTINUED) Legal adviser Maples and Calder 75 St. Stephens Green Dublin 2 Ireland Stock lending agent
9 J.P. Morgan Chase Bank (London Branch)
125 London Wall London EC2Y 5AJ United Kingdom Distributors Sanlam Collective Investments Limited 2 Strand Road Bellville 7530 South Africa Sanlam Investment Management (Pty) Limited 55 Willie van Schoor Avenue Bellville 7530 South Africa P-Solve Investments Limited 126 Jermyn Street London SW1Y 4UJ United Kingdom
P-Solve Investments Limited 11 Strand London WC2N 5HR United Kingdom Acordias Limited 91 Peterborough Road London SW6 3 BU United Kingdom Grindrod Bank Limited 20 Kingsmead Boulevard Durban 4001 South Africa Grindrod Bank Limited 5 Arundel Close Kingsmead Office Park PO Box 3211 Durban, KwaZulu Natal, 4001 South Africa Eight Investment Partners Pty Limited
Level 11, 131 Macquarie Street Sydney New South Wales
Australia 2000 9 With effect from 1 September 2014, and subject to the approval of the Central Bank of Ireland, the Manager will replace J.P.
Morgan Chase Bank (London Branch) as Stock lending agent.

SANLAM UNIVERSAL FUNDS PLC
8
DIRECTOR’S REPORT
The Directors of Sanlam Universal Funds plc (the “Company”) present herewith the unaudited
condensed interim financial statements for the period ended 30 June 2014.
RESULTS AND BUSINESS ACTIVITIES
Detailed investment reviews are included in the Investment Managers’ Report on pages 19 to 55. The
results of operations are set out in the Statement of Comprehensive Income on pages 56 to 68.
The Directors also draw your attention to the significant events during the year disclosed in Note 14 on
page 368.
PRINCIPAL RISKS AND UNCERTAINTIES
The Company is exposed to the risks associated with the financial instruments and markets in which
they invest. There has been no significant change to the principal risks and uncertainties to which the
Company is exposed since the most recent annual financial statements of the Company. A further
comprehensive summary of the risk factors that investors should consider is included in the prospectus
of the Company and the offering supplement of each Fund.
DIVIDENDS
The present intention of the Directors is to distribute sufficient surplus net income of specific share
classes, currently:
Fund Name Classes
Distribution
Frequency
Sanlam P-Solve Inflation Plus Fund A GBP / B GBP / C GBP Annual
Sanlam Global Best Ideas Fund A GBP / C GBP Annual
Sanlam Global Financial Fund A GBP / C GBP Annual
Sanlam African Frontier Market Fund A GBP / C GBP Annual
SIIP India Opportunities Fund A GBP Annual
SIM Global Equity Income Fund A USD / C USD / I USD Semi-Annual
Sanlam Fund of Alternative UCITS A GBP Annual
Sanlam World Equity Tracker Fund I GBP Annual
Sanlam Europe excluding UK Equity Tracker Fund I GBP Annual
Sanlam Emerging Market Equity Tracker Fund I GBP / J GBP Annual
Sanlam UK Equity Tracker Fund I GBP Annual
Sanlam North America Equity Tracker Fund I GBP Annual
Sanlam P2strategies Emerging Market Fund A GBP / I GBP Annual
Sanlam P2strategies Europe excluding UK Fund A GBP / I GBP Annual
Sanlam P2strategies Global Fund A GBP / I GBP Annual
Sanlam P2strategies North America Fund A GBP / I GBP Annual
Sanlam P2strategies UK Fund I GBP / A GBP Annual
SPI Strategic Investment Grade Bond Fund A Income (GBP) / P Income (GBP) /
I Income (GBP)
Monthly
Sanlam Accel Income Fund Class A Income Monthly
SPI Global High Quality Fund C Income (GBP) / D Income (USD) /
E Income (USD)
Semi-Annual

SANLAM UNIVERSAL FUNDS PLC
9
DIRECTOR’S REPORT (CONTINUED)
DIVIDENDS (CONTINUED)
The dividends (if any) will be declared and paid in May for the year ended 31 December in each calendar
year for those share classes that distribute annually. For those share classes that distribute semi-
annually, the dividends (if any) will be declared and paid in or around May and November of each year.
The Sanlam Accel Income Fund and SPI Strategic Investment Grade Bon Fund will distribute on a
monthly basis, subject to the discretion of the Directors.
Payment will be made in cash unless the payment is for an amount less than USD100, EUR100 or
GBP100 (depending on the functional currency of each Fund) in which case such payment will be
automatically reinvested in the purchase of shares of the relevant class, for the account of the relevant
shareholder.
The Directors reserve the right to change the dividend policy of the Fund to reflect changes that may
occur from time to time in the requirements for qualifying as a reporting Fund for the purposes of United
Kingdom taxation.
With reference to the Statement of Comprehensive Income on pages 56 to 68, Shareholders should note
that surplus net income for the year ended was distributed during the course of 2014. Grindrod
International Property Fund distributed USD Nil (2013: USD 664), PSolve Inflation Plus Fund distributed
GBP 611,379 (2013: GBP 1,136,554), Sanlam African Frontier Markets Fund distributed USD 3,119
(2013: USD 6,512), Sanlam Global Best Ideas Fund distributed USD 4,246 (2013: USD 5,295), Sanlam
Global Financial Fund USD 35,152 (2013: USD Nil), Sanlam World Equity Tracker Fund USD 111 (2013:
USD Nil), SIM Global Equity Income Fund distributed USD 358,553 (2013: USD 194,293), SPI Strategic
Investment Grade Bond Fund distributed GBP 1,474,668 (2013: GBP 1,493,528), Sanlam Accel Income
Fund distributed GBP 365,183 (2013: GBP Nil), Sanlam North America Equity Tracker USD 1,159 (2013:
USD Nil) and Sanlam UK Equity Tracker Fund GBP 5,487 (2013: USD Nil).
DIRECTORS
The Directors of the Company during the year are as follows:
Peter Murray (Irish) Paul Dobbyn (Irish) Anton Gildenhuys (South African) Thomas Murray (Irish)
Peter Murray is also a Director of Sanlam Asset Management (Ireland) Ltd (SAMI), Sanlam Global Funds
Plc, Sanlam Qualifying Investors Funds Plc, Blue Ink Global Circa Fund Plc (In liquidation), Sanlam
Global Fund of Hedge Fund Plc (formerly Blue Ink global Diversified Fund), Blue Ink Global Medium Hub
Fund Plc (In liquidation), Gensec Ireland Limited and Sanlam Ireland Limited.
Paul Dobbyn is also a Director of Sanlam Global Funds Plc, Sanlam Qualifying Investors Funds Plc, Blue
Ink Global Circa Fund Plc (In liquidation), Sanlam Global Fund of Hedge Fund Plc (formerly Blue Ink
global Diversified Fund) and Blue Ink Global Medium Hub Fund Plc (In liquidation). Paul Dobbyn is also
a Partner in Maples and Calder.
Anton Gildenhuys is also a Director of Sanlam Global Funds Plc, Sanlam Qualifying Funds Plc, Blue Ink
Global Circa Fund Plc (In liquidation), Sanlam Global Fund of Hedge Fund Plc (formerly Blue Ink global
Diversified Fund), Blue Ink Global Medium Hub Fund Plc (In liquidation), Sanlam Financial Services UK
Ltd, Sanlam Life and Pensions UK Ltd, Sanlam Developing Markets Ltd, Channel Life Limited, Eternity
Private Health Fund Administrators (Pty) Ltd, Active Health Fund Administrators (Pty) Ltd, Eternity
Healthcare (Pty) Ltd, Sanlam Healthcare Management and Glacier Financial Holdings (Pty) Ltd.

SANLAM UNIVERSAL FUNDS PLC
10
DIRECTOR’S REPORT (CONTINUED) DIRECTORS (CONTINUED)
Thomas Murray is also a director of Sanlam Global Funds Plc, Sanlam Qualifying Investors Funds Plc,
Blue Ink Global Circa Fund Plc (In liquidation) and Sanlam Global Fund of Hedge Fund Plc (formerly
Blue Ink Global Diversified Fund Plc).
DIRECTOR’S AND SECRETARY’S INTEREST IN SHARES AND CONTRACTS
At 30 June 2014, Anton Guildenhuys, a Director of the Company, holds holds non-participating shares in
Sanlam Global Best Ideas Fund (Class C USD - 33,614.48 units), Sanlam Global Financial Fund (Class
C USD – 93,567.14 units), SIM Global Equity Income Fund (Class C – 94,948.73 units) and Sanlam
World Equity Tracker Fund (Class A (formerly class C) – 46,574.94 units).
None of the other Directors had no interest in the shares of the Company or Funds at that date or at any
time during the financial period. None of the Directors has a service contract with the Company.
The Manager holds non-participating shares of the Company as explained in the notes to the unaudited
condensed interim financial statements.
RELATED PARTIES
Disclosures in respect of related parties are contained in note 7 to the unaudited condensed interim
financial statements.
CONNECTED PARTIES
The Directors are satisfied that there are arrangements (evidenced by written procedures) in place, to
ensure that the obligations set out in paragraph 1 of UCITS Notice 14 are applied to all transactions with
connected parties; and the Directors are satisfied that transactions with connected parties entered into
during the period complied with the obligations set out in paragraph 1 of UCITS Notice 14.
BOOKS OF ACCOUNT
The measures taken by the Directors to ensure compliance with the Company’s obligation to keep
proper books of account are the use of appropriate systems and procedures which are carefully
implemented by the Administrator, Sanlam Asset Management (Ireland) Ltd (“SAMI”). The books of
account are kept at Beech House, Beech Hill Road, Dublin 4, Ireland. SUBSEQUENT EVENTS
Other than as disclosed in note 16, up to the date of the approval of these unaudited condensed interim
financial statements there were no events subsequent to the period end, which, in the opinion of the
Directors of the Company, may have had an impact on the financial statements for the period ended 30
June 2014.
STATEMENT OF DIRECTOR’S RESPONSIBILITIES
Irish Company law requires the Directors to prepare financial statements for each financial period which
give a true and fair view of the state of affairs of the Company and of the results of the Company for that
period. In preparing those financial statements, the Directors are required to:
SANLAM UNIVERSAL FUNDS PLC
11
DIRECTOR’S REPORT (CONTINUED) STATEMENT OF DIRECTOR’S RESPONSIBILITIES (CONTINUED)
select suitable accounting policies and then apply them consistently;
make judgements and estimates that are reasonable and prudent;
follow applicable accounting standards or disclose or explain material departures from them in the financial statements;
provide a fair review of the development and performance of the Company and its subsidiaries;
give a description of principal risks and uncertainties that they face; and
prepare the financial statements on the going concern basis, unless it is inappropriate to presume that the Company will continue in business.
The Directors are responsible for keeping proper books of account which disclose with reasonable
accuracy, at any time, the financial position of the Company and to enable them to ensure that the
financial statements are prepared in accordance with International Financial Reporting Standards (“IFRS”)
as adopted by the EU and comply with the Irish Companies Acts, 1963 to 2013 and the European
Communities (Undertakings for Collective Investment in Transferable Securities) Regulations, 2011 (the
“UCITS Regulations”). They are also responsible for safeguarding the assets of the Company and in
fulfilment of this responsibility, they have entrusted the assets of the Company to the Custodian for
safekeeping, in accordance with the Memorandum and Articles of Association of the Company. The
Directors are responsible for taking reasonable steps for the prevention and detection of fraud and other
irregularities. CORPORATE GOVERNANCE CODE
The European Communities (Directive 2006/46/EC) Regulations (S.I. 450 of 2009 and S.I.83 of 2010) (the
“Regulations”) requires the inclusion of a corporate governance statement in the Director’s Report.
Although there is no specific statutory corporate governance code applicable to Irish collective investment
schemes whose shares are admitted to trading on the Irish Stock Exchange (ISE), the Irish Funds Industry
Association (“IFIA”) has published a corporate governance code (“IFIA Code”) that may be adopted on a
voluntary basis by Irish authorised collective investments schemes. This code became effective from 1
January 2012, with a twelve month transitional period. It should be noted that the IFIA Code reflects
existing corporate governance practices imposed on Irish authorised collective investment schemes, as
noted above.
On 19 December 2012 the Board of Directors voluntarily adopted the IFIA Code as the Company’s
corporate governance code. The Board of Directors has assessed the measures included in the IFIA
Code as being consistent with its corporate governance practices and procedures for the financial year.
The code is available at www.sanlam.ie.
In addition to the IFIA Code, the Company is subject to corporate governance practices imposed by:
i) The Irish Companies Act 1963 to 2013 which are available for inspection at the registered office of the company, and may also be obtained at www.irishstatutebook.ie/home.html
ii) The Articles of Association of the company which are available for inspection at the registered office of the Company at Beech House, Beech Hill Road, Dublin 4, Ireland and the Companies Registration Office in Ireland.
iii) The Central Bank of Ireland in their UCITS Notices and Guidance Notes which can be obtained from the Central Bank of Ireland/Financial Regulators website at http://www.centralbank.ie/regulation/industry-sectors/funds/Pages/default.aspx and are available for inspection at the registered Office of the Company; and

SANLAM UNIVERSAL FUNDS PLC
12
DIRECTOR’S REPORT (CONTINUED)
CORPORATE GOVERNANCE CODE (CONTINUED)
iv) The Irish Stock Exchange (“ISE”) through the ISE Code of Listing Requirements and Procedures
which can be obtained from the ISE’s website at http://www.ise.ie/Investment-Funds/Listing_Rules_Publications_/Listing_Rules_Publications.html
v) SAMI’s Business Plan and Code of Conduct, which is available for inspection at the registered office of SAMI at Beech House, Beech Hill Road, Dublin 4, Ireland
vi) SAMI is also subject to the Corporate Governance Code of the Sanlam Group.
The Board of Directors is responsible for establishing and maintaining internal control and risk
management systems of the company in relation to the financial reporting process. Such systems are
designed to manage rather than eliminate the risk of error or fraud in achieving the company’s financial
reporting objectives and can only provide reasonable and not absolute assurance against material
misstatement and loss. The Board of Directors has delegated this duty to SAMI.
SAMI is appointed as Administrator to maintain the books and records of the Company. SAMI is
authorised and regulated by the Central Bank of Ireland and must comply with the rules imposed by the
Central Bank of Ireland. SAMI also monitors and evaluates the external auditor’s performance,
qualifications and independence.
The Company has procedures in place to ensure all relevant books of accounts are properly maintained
and are readily available, including production of annual and half-yearly financial statements. The annual
financial statements of the Company are required to be approved by the Board of Directors of the
Company and the annual and half yearly financial statements are required to be filed with the Central
Bank of Ireland and the ISE.
The statutory financial statements are required to be audited by the independent auditors who report
annually to the Board on their findings.
The Board evaluates and discusses significant accounting and reporting issues as the need arises.
Shareholder meeting
The convening and conduct of shareholders meetings are governed by the Articles of Association of the
Company and the Companies Acts. Although the Directors may convene an extraordinary general
meeting of the Company at any time, the Directors of the Company are required to convene a general
meeting within eighteen months of incorporation and fifteen months of the previous annual general
meeting thereafter. Shareholders representing not less than one-tenth of the paid up share capital of the
Company may also request to convene a shareholders meeting. Not less than twenty one days notice of
every annual general meeting and any meeting for the passing of a special resolution must be given to
shareholders and fourteen days’ notice must be given in the case of any other general meeting unless the
auditors of the Company and all the shareholders entitled to attend and vote agree to shorter notice.
Two members present either in person or by proxy constitutes a quorum at a general meeting provided
that the quorum for a general meeting convened to consider any alteration to the class rights of shares is
two shareholders holding or representing by proxy at least one third of the issued shares of the relevant
Funds or class.
Every holder of participating shares or non-participating shares present in person or by proxy who votes
on a show of hands is entitled to one vote. On a poll, every holder of participating shares present in
person or by proxy is entitled to one vote in respect of each share held by him and every holder of non-
participating shares is entitled to one vote in respect of all non-participating shares held by him.The
Chairman of a general meeting of the Company, or at least two members present in person or by proxy, or
any holder or holders of participating shares present in person or by proxy representing at least one-tenth
of the shares in issue having the right to vote at such meeting, may demand a poll.

SANLAM UNIVERSAL FUNDS PLC
13
DIRECTOR’S REPORT (CONTINUED)
CORPORATE GOVERNANCE CODE (CONTINUED)
Shareholder meeting (continued)
Shareholders may decide to sanction an ordinary resolution or special resolution at a shareholder’s
meeting. An ordinary resolution of the Company (or of the shareholders of a particular Funds or class)
requires a simple majority vote cast by the shareholders voting in person or by proxy at the meeting at
which the resolution is proposed. A special resolution of the Company (or of the shareholders of a
particular Fund or class ) requires a majority vote of not less than 75% of the shareholders present in
person or by proxy and voting in general meeting in order to pass a special resolution including a
resolution to amend the Articles of Association.
Composition and Operation of the Board
Unless otherwise determined by an ordinary resolution of the Company in a general meeting, the number
of Directors may not be less than two. Currently the Board of Directors of the Company is composed of
four Non-Executive Directors, being those listed on page 1 of these financial statements with Peter
Murray, Thomas Murray and Paul Dobbyn being Irish residents. None of the Company’s Directors hold
directorships with the Custodian.
The business of the Company is managed by the Directors, unless the Companies Acts or the Articles of Association requires to be exercised by the Company in a general meeting.
A Director may, and the Company Secretary of the Company on the requisition of a Director will, at any
time summon a meeting of Directors. Questions arising at any meeting of Directors are determined by a
majority of votes. In the case of quality of votes, the Chairman has a second or casting vote. The quorum
necessary for the transaction of business at a meeting of the Directors is two.
All key management functions of the Company have been delegated to SAMI. SAMI will manage these in
terms of their business plan. SAMI is approved by Central Bank of Ireland, and is authorised as a UCITS
IV Management Company.
Approved by the Board of Directors on 20 August 2014.
SANLAM UNIVERSAL FUNDS PLC
14
ECONOMIC & MARKET REVIEW
for the six months ended 30 June 2014
Economic Review Global real GDP growth recorded one of the weakest growth rates of the current expansion in 1Q14. A primary source of the slowdown was US real GDP growth, which fell 2.9 per cent annualised, while growth in emerging markets (EM) has disappointed.
Amongst the latter, real economic activity has been constrained by modest external demand, slow productivity growth, weaker corporate profits and a credit overhang. Some countries are also plagued by relatively high inflation levels, while commodity producers have experienced a decline in their terms of trade.
EM credit extension growth has been excessive in some countries during the post-recession recovery. China has been a focal point notably due to uncertainty surrounding its shadow banking system. Authorities have implemented measures to constrain the pace of expansion in credit. But, whereas the advance in shadow bank lending has slowed, it remains robust. Accordingly, the share of China’s social financing (a broad measure of credit extension) in GDP, currently close to 200 per cent of GDP, continues to increase.
Elsewhere, Japan’s economy experienced a sharp contraction in the second quarter, following the implementation of its VAT rate hike in April 2014; while positive, but soft growth in Europe serves as a reminder that potential real GDP growth around the world is slower in the post-recession period, given the debt overhang, deleveraging and increased regulatory constraints on the financial sector.
However, the weak first quarter US GDP print partly reflected poor weather conditions and available data suggests an improvement in real economic activity from 2Q14. Non-farm payrolls data was relatively firm in the second quarter and the US unemployment rate has continued to decline.
Further, after weakening the wake of last year’s back-up in mortgage rates, US home sales data has picked-up of late. A decline in housing inventory in recent years has also helped support house prices. The annual advance in house prices has slowed over the past year, but remains in positive territory.
In addition, on credit extension, the US Federal Reserve’s quantitative easing programme largely achieved what it was designed to do as the “Great Recession” unfolded – that is to stabilise the financial system, lower credit spreads and boost asset prices, which in turn were expected to support credit extension and, hence, domestic demand. Admittedly, the private sector has been deleveraging in subsequent years and private sector credit extension is not booming. Nonetheless, US commercial bank loan growth is in positive territory.
Moreover, an improvement has been recorded in the global PMI manufacturing index in the second quarter, following its dip early in 2014. The buoyant index is consistent with relatively firm global industrial production growth.
The nascent improvement in China’s manufacturing PMI data in 2Q14 is encouraging. Despite the weakness in China’s real estate sector real GDP growth firmed in the second quarter, increasing 7.5% year-on-year, supported by retail spending, firmer exports and government stimulus measures.
Meanwhile, global consumer price inflation has lifted in recent months, notably in developed economies (DM). The latter, to a significant extent reflects Japan’s VAT rate hike. But, US core consumer price inflation has drifted higher. In addition, although US wage growth is modest, the US jobs market, which has perked up of late, bears close monitoring. Inflation does, nonetheless, remain low in the Euro area, where the HICP overall index advanced just 0.5 per cent in the year to May 2014. In response, the European Central Bank (ECB) announced a monetary policy stimulus package early in June 2014. The package included additional decreases in the Bank’s key policy rates, the announcement of a large targeted longer-term refinancing operation programme (TLTRO) and “preparatory work” related to outright purchases of asset-backed securities. The reduction in policy rates included a cut of 10bp in the Bank’s deposit rate applicable to reserve holdings in excess of the minimum reserve requirement, which left the deposit rate at -0.10%.

SANLAM UNIVERSAL FUNDS PLC
15
ECONOMIC & MARKET REVIEW (CONTINUED)
for the six months ended 30 June 2014 Economic Review (continued) In contrast, the US Federal Open Market Committee (FOMC) continues to scale back its quantitative easing programme and announced a further decrease in the pace of its asset purchases in June. As from July, the Committee will purchase US$15 billion of agency mortgage-backed securities per month (compared with US$20 billion per month previously) and will increase its longer-term Treasury securities holdings by US$20 billion per month (compared with US$25 billion per month previously). Elsewhere, the increase in asset prices has created some angst, including house prices in the UK. To date, the Bank of England (BOE) has focused on macro-prudential measures (more stringent rules for mortgage lending) to address the inherent risk in the housing market. Economic Outlook The increase in real economic activity in the US and the rebound in Japan’s economy following its second quarter slump should lift global growth in the second half of 2014 – especially if China’s economy continues to hold up. Better demand conditions amongst the DM countries should also benefit EM exporters. This view is supported by the buoyant global manufacturing PMI data, especially the significant improvement in the new orders series. A notable exception is Europe where the industrial production and manufacturing PMI data deteriorated late in the second quarter. On balance, although global growth is expected to firm it is expected to remain moderate for the foreseeable future, which poses challenges in economies plagued by high debt levels. The IMF (Fiscal Monitor, April 2014) expects the average gross debt ratio in DM to stabilize at 107 per cent of GDP in 2014, but this may prove difficult to achieve if growth in nominal income is weaker than expected. In Europe, in particular, the risks implied by unhealthy banks and the debt overhang of corporations and governments continue to lurk in the background. Amongst EM, China’s high level of social financing bears monitoring, considering the implied risk to China’s economy and financial system - especially if the nascent downturn in the housing market intensifies markedly. At least, shadow banking activity is relatively limited compared with the size of China’s total financial system. Loan to deposit ratios are also below 100. Further, China’s credit boom in recent years has been supported by domestic rather than foreign funding. Moreover, there is a high level of state ownership of the bank system, while the government has material resources at its disposal, including a high level of foreign exchange reserves. This suggests the country should, hopefully, be able to manage the situation without losing control. Geo-political risk has also escalated. Events in Syria and Iraq, for example, coincided with an increase in oil prices late in the second quarter of 2014. Oil prices declined early in the third quarter, but, arguably, any renewed spike would be more damaging for the growth outlook than inflation, given the implied deterioration in the terms of trade of DM. In tandem, modest growth and relatively well contained consumer price inflation have encouraged DM central banks to maintain accommodative monetary policies. That said although lower global grain prices are helpful for the inflation outlook, it appears as though the post-recession period of global disinflation has drawn to a close. Also, unemployment rates in the US and the UK have declined faster than central bank projections. While the inflation outlook remains relatively favourable in the UK, the economy has been relatively buoyant and it appears as though the BOE may increase its policy rate by late 2014 or early 2015. Attention is likely to increasingly shift towards the pace and timing of probable hikes by the US Federal Reserve. Given current projections for unemployment and inflation the US monetary authorities are not expected to increase the US policy rate before mid-2015. However, any upside surprise in real economic activity and/or inflation in that prompts earlier and/or more aggressive US policy rate increases than currently expected holds potential market and liquidity risk for EM.
SANLAM UNIVERSAL FUNDS PLC
16
ECONOMIC & MARKET REVIEW (CONTINUED)
for the six months ended 30 June 2014 Market Review
Unlike the beginning of recent previous years, 2014 commenced with a genuine fundamentally based
optimism. This was perhaps best seen by the equity market rally of 2013 which formed high expectations
for what 2014 would bring. Investors perceived a continuing improvement in the global economic
environment, and further recovery from the global financial crisis. An expectation of a return to a normal
economic environment existed and additionally that in certain parts of the world that the threat of deflation
had been virtually eliminated – the euro-zone and Japan being two notable exceptions to this.
Now roughly half-way through 2014, it is clear that while there is cause for optimism many challenges still
remain. The weak US GDP growth for the first quarter of 2014, was put mainly down to the exceptionally
harsh North American winter, and it has not been till the better than expected rebound in US GDP growth
for the second quarter of 2014, that investors have been able to say for certain that the first quarter was a
weather induced economic blip. Elsewhere China has continued to come under pressure from investors
for its ability to deliver economic growth in line with expectations, although for now it is broadly meeting
those targets. In the long-run however, most investors are cognisant that China’s growth will slow over the
coming years if only because the absolute size of the economy becomes ever larger.
The first half of 2014 has also seen geo-political events leading to rising concerns about their potential
economic consequences. For the first quarter, the events in the Ukraine and Crimea are most notable,
and these have continued to remain as potential genuine threats to the global economy. The economic
cause of this now links to sanctions on Russia, which are gradually being increased, and the possibility of
Russian retaliation in other economic ways. Fortunately, the likelihood of a breakout in open warfare does
not suit either side and that remains a distant scenario. During the second quarter the emergence of ISIS
(The Islamic State in Iraq and the Levant) in Iraq and neighbouring countries caused fresh geo-political
worries, and there is a more obvious potential threat to global growth with concerns about Iraq’s oil
production, and the subsequent knock-on effect to the oil price. Equity Market Review
Despite the challenges to markets 2014 has seen solid positive performance for equity markets during the
first half of 2014. For the first six-months of the year equity markets, as measured by the MSCI World
Index, delivered a return of 6.18%1. While this was not a continuation of the rate of progress in 2014, this
more modest gain is much healthier for markets in the long-term. Markets made progress in both the first
and second quarters of 2014, with rises of 1.26% and 4.86% respectively. The first quarter started poorly
with January seeing rotation and profit taking from 2013, and so equity markets declined by almost -4%.
However, February saw a strong rebound with markets rising just over 5%, while March overall was a
relatively flat absolute month.
On the surface for the second quarter appeared much more positive, and while markets made consistent
gains in all three months of 1.02%, 1.97% and 1.79% for April, May and June respectively, there were
ongoing challenges for markets during the second quarter. There was a significant degree of sustained
market rotation during the quarter and this made the environment difficult for active investment managers
whose positioning was generally not best suited to the market’s change in direction. That said it is clear
that the equity market continues to remain optimistic. Investors are still waiting for more solid corporate
earnings growth, which thus far has been mixed, and not as widespread as the expectations which built
up 2013 would demand, and so valuations in certain regions now look to be on the expensive side of fair
value.

SANLAM UNIVERSAL FUNDS PLC
17
ECONOMIC & MARKET REVIEW (CONTINUED)
for the six months ended 30 June 2014 Equity Market Review (continued)
At a regional level the developed world made sound progress. Despite the economic challenges in North
America over the winter, the North America region has risen 7.17% in 2014 so far, though the
overwhelming majority of this arose in the second quarter, but positive progress was still achieved in the
first quarter. The Pacific excluding Japan region was the only major developed region to out-perform North
America so far in 2014, with a gain of 7.40%. This rise was more evenly spread across the first two
quarters of 2014. Europe also posted fairly consistent positive returns in both quarters and gained 5.48%,
which means it is lagging the overall global market in 2014 to this point. The sharp contrast was Japan
however, which managed to post a gain of only 0.68% for the first-half of 2014. This masks the -5.61%
decline in the first quarter and the 6.66% rise in the second quarter – an example of the rotation seen in
the second quarter of 2014.
On a sector basis all sectors achieved positive returns over the first half of 2014. Additionally, they all rose
during the second quarter, and it was only in the first quarter that there were some modest declines in
Consumer Discretionary, Industrials and Telecommunication Services. The strongest sector in 2014 so far
has been Utilities which has risen over 16% – this was strong in both quarters. The Energy sector was the
next best performer rising almost 14%, although this was driven almost entirely by the second quarter
which saw it being the best performing sector by far and gaining almost 12% in that period. Health Care
was the only other sector to post a double-digit return for the first six-months of 2014. At the other end of
the spectrum Consumer Discretionary was the weakest sector of the year so far, with a return of only
1.12%. Telecommunications has performed slightly better rising 2.51%, while Industrials gained just over
3%. Financials and Consumer Staples were the only other two sectors to under-perform the wider market
during the first half of 2014. Fixed Income Market Review
Many investors expected that the difficult market environment for fixed income markets experienced
during 2013 would continue into 2014. And so many investors had positioned themselves accordingly.
However, 2014 has seen a substantial resilience by bond markets in the face of the threat of pending
interest rate rises. Global bond markets, as measured by the Barclays Capital Global Aggregate Bond
Index, achieved a positive return of 4.93% for the first six-months of 2014. This return was well above the
expectations of most investors. Furthermore this was produced with a level of sustainability and
consistency, with both quarters producing returns approaching the 2.5% level. Meanwhile there has only
been one-month, March, in 2014, where global bond markets have actually declined and that was only a
fall of -0.07%. This strong performance has been seen both in sovereign and non-sovereign markets. The
steady income stream from bond coupons has enabled the global bond market to progress even while
pure capital levels remain under threat. However, even there sovereign yield levels have lowered, despite
the expectations of upcoming interest rate rises in certain regions.
There is a notable difference in global bond markets in 2014. In recent previous years global central banks
have loosely co-ordinated policy in the fight against deflation and to spur economic growth in the
aftermath of the global financial crisis. This was reinforced by many of the major economies facing similar
if not identical threats. However, with those policies have been pursued for a number of years, their
success has been achieved to differing degrees in the developed world and so now, in 2014, the
divergence in central bank policy is clearly underway. In very broad terms, on the one-hand there is the
European Central Bank and the Bank of Japan, which continue in their fight to prevent deflation and to
reflate their respective economies. Each of these central banks introduced further policy measures during
the second quarter.

SANLAM UNIVERSAL FUNDS PLC
18
ECONOMIC & MARKET REVIEW (CONTINUED)
for the six months ended 30 June 2014 Fixed Income Market Review (continued)
On the other-hand there is the Federal Reserve and the Bank of England. Here the success of
quantitative easing has helped their economies recover, and investors are adjusting to the upcoming
interest rate rises. The Federal Reserve has not yet ceased its quantitative easing program, but tapering
of this continues, and this is expected to finish around the end of the third quarter of 2014. Based on
indications by the new Federal Reserve head, Janet Yellen, interest rate rises will then follow about six-
months after tapering has ceased implying the US will see its first interest rate rise around the beginning
of the second quarter of 2015. Meanwhile the Bank of England may even raise interest rates during 2014,
as the increasing strength of the UK economy is likely to dictate a need to do so fairly shortly. Many
investors have been rapidly adjusting their expectations and the possibility of UK interest rate rises in
2014 remains very real. That said for both the USA and the UK the pace and extent of interest rate rises
are likely to be much slower and lower than in previous rate tightening cycles, as policymakers remain
vigilant in choking off economic growth.
SANLAM UNIVERSAL FUNDS PLC
19
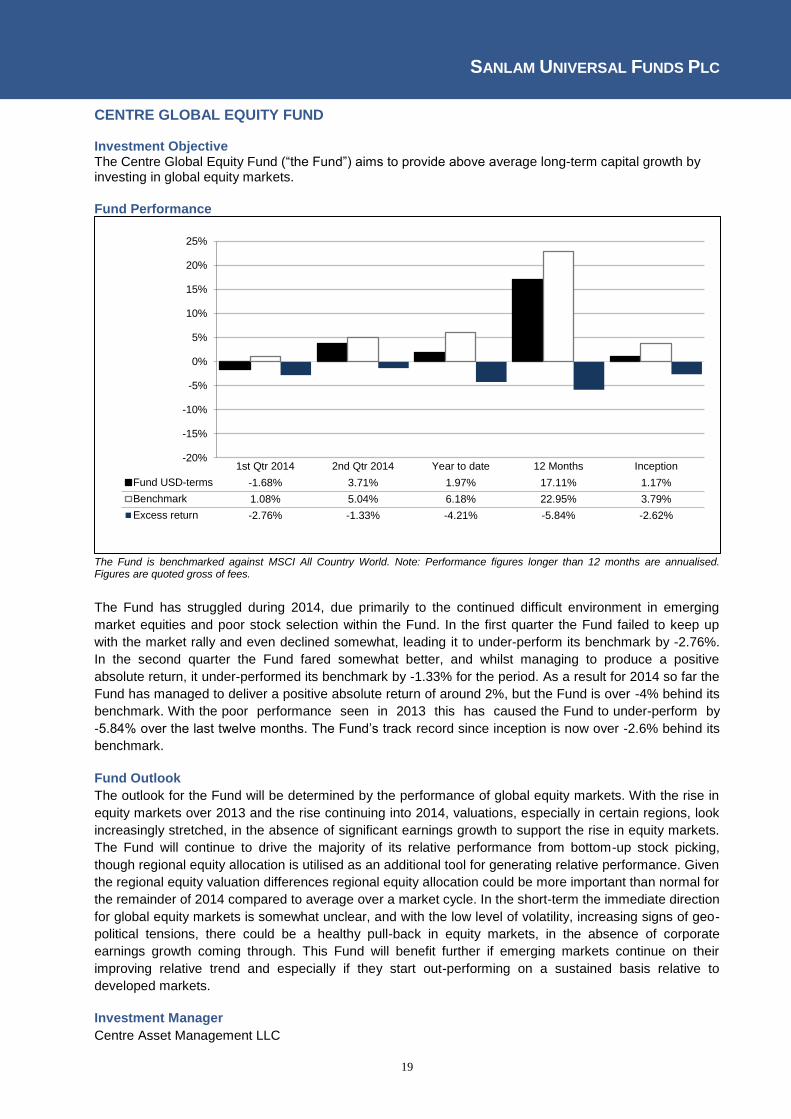
CENTRE GLOBAL EQUITY FUND Investment Objective The Centre Global Equity Fund (“the Fund”) aims to provide above average long-term capital growth by investing in global equity markets.
Fund Performance
The Fund is benchmarked against MSCI All Country World. Note: Performance figures longer than 12 months are annualised. Figures are quoted gross of fees.
The Fund has struggled during 2014, due primarily to the continued difficult environment in emerging
market equities and poor stock selection within the Fund. In the first quarter the Fund failed to keep up
with the market rally and even declined somewhat, leading it to under-perform its benchmark by -2.76%.
In the second quarter the Fund fared somewhat better, and whilst managing to produce a positive
absolute return, it under-performed its benchmark by -1.33% for the period. As a result for 2014 so far the
Fund has managed to deliver a positive absolute return of around 2%, but the Fund is over -4% behind its
benchmark. With the poor performance seen in 2013 this has caused the Fund to under-perform by
-5.84% over the last twelve months. The Fund’s track record since inception is now over -2.6% behind its
benchmark.
Fund Outlook
The outlook for the Fund will be determined by the performance of global equity markets. With the rise in
equity markets over 2013 and the rise continuing into 2014, valuations, especially in certain regions, look
increasingly stretched, in the absence of significant earnings growth to support the rise in equity markets.
The Fund will continue to drive the majority of its relative performance from bottom-up stock picking,
though regional equity allocation is utilised as an additional tool for generating relative performance. Given
the regional equity valuation differences regional equity allocation could be more important than normal for
the remainder of 2014 compared to average over a market cycle. In the short-term the immediate direction
for global equity markets is somewhat unclear, and with the low level of volatility, increasing signs of geo-
political tensions, there could be a healthy pull-back in equity markets, in the absence of corporate
earnings growth coming through. This Fund will benefit further if emerging markets continue on their
improving relative trend and especially if they start out-performing on a sustained basis relative to
developed markets.
Investment Manager
Centre Asset Management LLC
-20%
-15%
-10%
-5%
0%
5%
10%
15%
20%
25%
1st Qtr 2014 2nd Qtr 2014 Year to date 12 Months Inception
Fund USD-terms -1.68% 3.71% 1.97% 17.11% 1.17%
Benchmark 1.08% 5.04% 6.18% 22.95% 3.79%
Excess return -2.76% -1.33% -4.21% -5.84% -2.62%
SANLAM UNIVERSAL FUNDS PLC
20
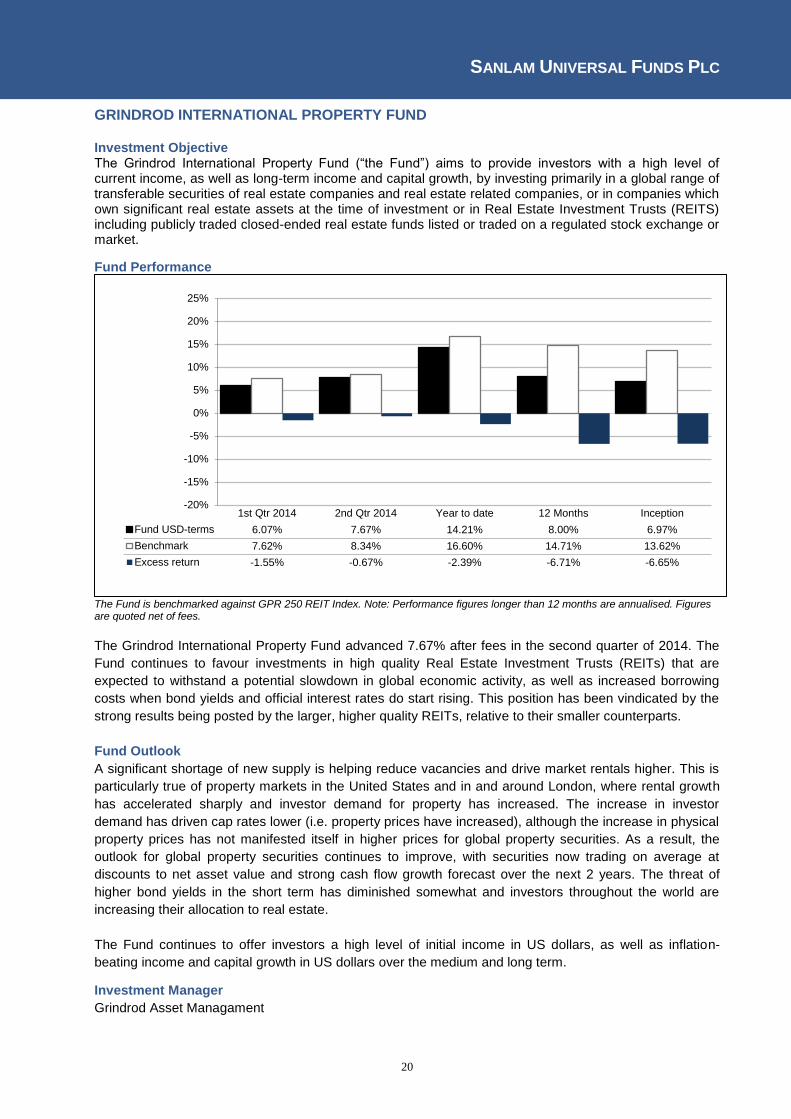
GRINDROD INTERNATIONAL PROPERTY FUND Investment Objective The Grindrod International Property Fund (“the Fund”) aims to provide investors with a high level of current income, as well as long-term income and capital growth, by investing primarily in a global range of transferable securities of real estate companies and real estate related companies, or in companies which own significant real estate assets at the time of investment or in Real Estate Investment Trusts (REITS) including publicly traded closed-ended real estate funds listed or traded on a regulated stock exchange or market.
Fund Performance
The Fund is benchmarked against GPR 250 REIT Index. Note: Performance figures longer than 12 months are annualised. Figures are quoted net of fees.
The Grindrod International Property Fund advanced 7.67% after fees in the second quarter of 2014. The
Fund continues to favour investments in high quality Real Estate Investment Trusts (REITs) that are
expected to withstand a potential slowdown in global economic activity, as well as increased borrowing
costs when bond yields and official interest rates do start rising. This position has been vindicated by the
strong results being posted by the larger, higher quality REITs, relative to their smaller counterparts.
Fund Outlook
A significant shortage of new supply is helping reduce vacancies and drive market rentals higher. This is
particularly true of property markets in the United States and in and around London, where rental growth
has accelerated sharply and investor demand for property has increased. The increase in investor
demand has driven cap rates lower (i.e. property prices have increased), although the increase in physical
property prices has not manifested itself in higher prices for global property securities. As a result, the
outlook for global property securities continues to improve, with securities now trading on average at
discounts to net asset value and strong cash flow growth forecast over the next 2 years. The threat of
higher bond yields in the short term has diminished somewhat and investors throughout the world are
increasing their allocation to real estate.
The Fund continues to offer investors a high level of initial income in US dollars, as well as inflation-
beating income and capital growth in US dollars over the medium and long term.
Investment Manager
Grindrod Asset Managament
-20%
-15%
-10%
-5%
0%
5%
10%
15%
20%
25%
1st Qtr 2014 2nd Qtr 2014 Year to date 12 Months Inception
Fund USD-terms 6.07% 7.67% 14.21% 8.00% 6.97%
Benchmark 7.62% 8.34% 16.60% 14.71% 13.62%
Excess return -1.55% -0.67% -2.39% -6.71% -6.65%

SANLAM UNIVERSAL FUNDS PLC
21
P-SOLVE INFLATION PLUS FUND Investment Objective
The investment objective of the Inflation Plus Fund is to grow capital by delivering a return in excess of UK
inflation as measured by the Retail Price Index. This is achieved by diversifying investments across
various asset classes and providing the opportunity for real capital growth. The reduction of risk will be
accomplished through the diversification and tactical rotation of assets, rather than through the targeting
of risk using a static allocation.
The Fund may offer downside capital preservation during adverse market conditions, however this is not
guaranteed. Fund Performance
The Fund is benchmarked against UK RPI Index. Note: Performance figures longer than 12 months are annualised. Figures are quoted gross of fees.
The Fund size as of 30 June 2014 was £58.4m. The Fund has returned 2.38% over the first half of 2014,
outperforming its benchmark which returned 1.14% for the same period. The main contributors to
performance over the year so far have been the larger allocations to high yield bonds, US equity and
select economies in Asia through the First State Asia Pacific Leaders fund.
Investor optimism was high going into the New Year and, in general, global economic data showed further
signs of improvement. However, high expectations left markets more susceptible to negative surprises
and the improvements have failed to translate into any meaningful increase in momentum.
Increasing signs of emerging market fragility, the threat of war in Ukraine and general profit taking
contributed to a wide-reaching sell-off across equity markets at the start of the year, however most
recovered towards the end of March. Developed market equities produced a small positive return over the
first quarter as a whole.
Debt markets in general performed well, with both broad sovereign and corporate debt producing positive
returns. Elsewhere in debt markets, although short-dated UK gilt yields rose slightly over Q1, those with
longer maturities fell.
-20%
-15%
-10%
-5%
0%
5%
10%
15%
20%
25%
2nd Qtr 2014 Year to date 12 Months 5 Years Inception
Inflation Plus Fund 2.17% 2.38% 6.40% 41.72% 6.93%
RPI 0.59% 1.14% 2.64% 20.10% 3.27%
Value Added 1.58% 1.24% 3.76% 21.62% 3.66%
SANLAM UNIVERSAL FUNDS PLC
22
P-SOLVE INFLATION PLUS FUND (CONTINUED) Fund Performance (continued)
Equity markets posted positive returns in the second quarter, supported by a steadily improving global
economy and continued accommodative monetary policy. Emerging markets outperformed their
developed counterparts, shrugging off increased geopolitical concerns to recover from their negative first
quarter.
In general, broad global sovereign and corporate bond yields fell, resulting in another quarter of positive
returns in the majority of major credit markets.
US tapering will likely continue to be one of the key themes throughout 2014. Many are expecting it to be
completed by the end of the year; however the impact of each announcement on the path of future US
interest rates will perhaps draw more attention.
Fund Outlook
The sell-off at the start of the year acted as a reminder that improving growth does not necessarily always
translate into positive returns in equity markets over the short term. Negative surprises and short-term
fluctuations in investor confidence were exaggerated by stretched valuations, causing an increase in
volatility.
As many return seeking assets now look fairly valued and market conditions fragile, we believe it is not an
appropriate time to be significantly increasing the level of risk in the portfolio, however we remain well
positioned to take advantage of tactical opportunities and, in general, with economic growth improving in
much of the developed world, the outlook remains largely positive.
Investment Manager
P-Solve Investments Limited
SANLAM UNIVERSAL FUNDS PLC
23
SANLAM AFRICAN FRONTIER MARKETS FUND
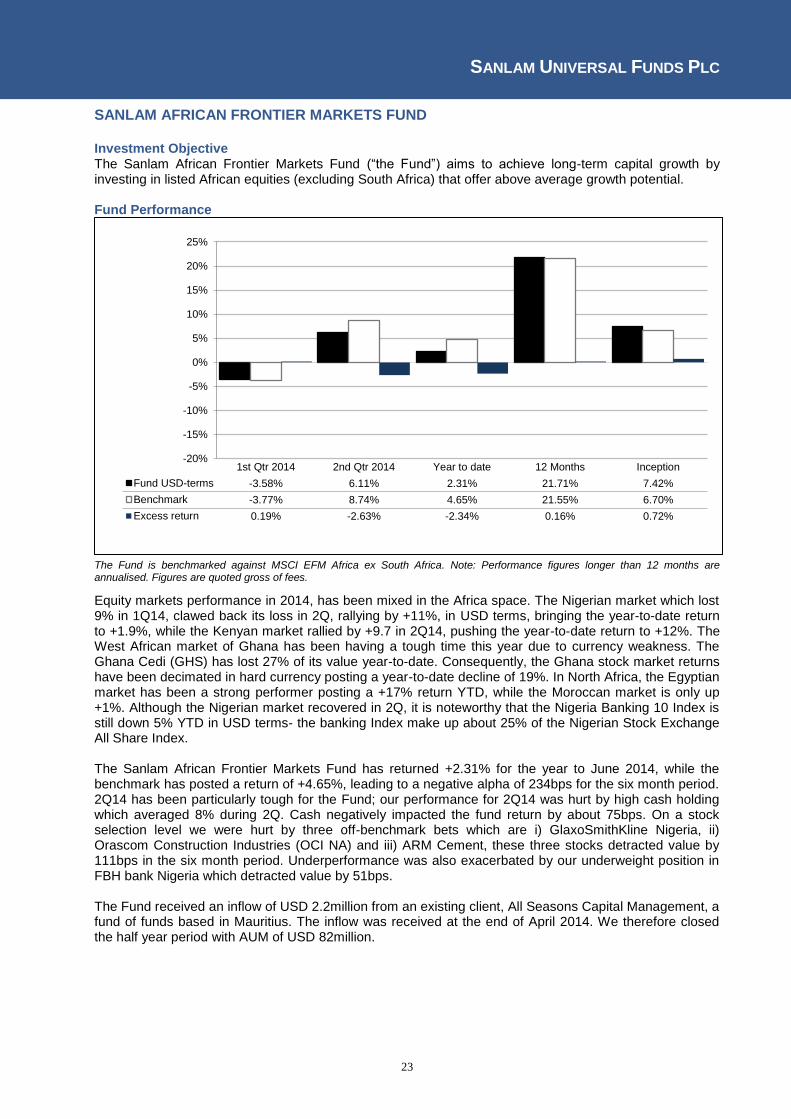
Investment Objective The Sanlam African Frontier Markets Fund (“the Fund”) aims to achieve long-term capital growth by investing in listed African equities (excluding South Africa) that offer above average growth potential. Fund Performance
The Fund is benchmarked against MSCI EFM Africa ex South Africa. Note: Performance figures longer than 12 months are annualised. Figures are quoted gross of fees.
Equity markets performance in 2014, has been mixed in the Africa space. The Nigerian market which lost 9% in 1Q14, clawed back its loss in 2Q, rallying by +11%, in USD terms, bringing the year-to-date return to +1.9%, while the Kenyan market rallied by +9.7 in 2Q14, pushing the year-to-date return to +12%. The West African market of Ghana has been having a tough time this year due to currency weakness. The Ghana Cedi (GHS) has lost 27% of its value year-to-date. Consequently, the Ghana stock market returns have been decimated in hard currency posting a year-to-date decline of 19%. In North Africa, the Egyptian market has been a strong performer posting a +17% return YTD, while the Moroccan market is only up +1%. Although the Nigerian market recovered in 2Q, it is noteworthy that the Nigeria Banking 10 Index is still down 5% YTD in USD terms- the banking Index make up about 25% of the Nigerian Stock Exchange All Share Index. The Sanlam African Frontier Markets Fund has returned +2.31% for the year to June 2014, while the benchmark has posted a return of +4.65%, leading to a negative alpha of 234bps for the six month period. 2Q14 has been particularly tough for the Fund; our performance for 2Q14 was hurt by high cash holding which averaged 8% during 2Q. Cash negatively impacted the fund return by about 75bps. On a stock selection level we were hurt by three off-benchmark bets which are i) GlaxoSmithKline Nigeria, ii) Orascom Construction Industries (OCI NA) and iii) ARM Cement, these three stocks detracted value by 111bps in the six month period. Underperformance was also exacerbated by our underweight position in FBH bank Nigeria which detracted value by 51bps. The Fund received an inflow of USD 2.2million from an existing client, All Seasons Capital Management, a fund of funds based in Mauritius. The inflow was received at the end of April 2014. We therefore closed the half year period with AUM of USD 82million.
-20%
-15%
-10%
-5%
0%
5%
10%
15%
20%
25%
1st Qtr 2014 2nd Qtr 2014 Year to date 12 Months Inception
Fund USD-terms -3.58% 6.11% 2.31% 21.71% 7.42%
Benchmark -3.77% 8.74% 4.65% 21.55% 6.70%
Excess return 0.19% -2.63% -2.34% 0.16% 0.72%
SANLAM UNIVERSAL FUNDS PLC
24
SANLAM AFRICAN FRONTIER MARKETS FUND (CONTINUED)
Fund Outlook
After three years of political transition and instability in Egypt, finally a new President was elected in June.
However, we do not expect the elections to completely settle the political differences in Egypt but we
believe getting a government in place could help in setting economic policies and reforms. Given that the
political environment is stabilising, we expect corporates to start spending and consumer confidence to
improve. The newly elected President has already formed his new government and a tightened budget for
2014/15 was approved. Egypt is currently implementing economic reforms to bring its economy back on
track. Some of these reforms are positive in the long-term, but we believe there will be some short-term
pain. The reforms announced so far include an increase in corporate tax rates from 25% to 30% and an
increase of PAYE tax. The government has also started to reduce energy subsidies which could pose
some risk to inflation. The increase in electricity and gas prices will to some extend negatively affect profit
margins of industrial businesses as some them won’t be able to pass through the full cost increase.
Terrorist attacks by local extremist groups have been increasing in Nigeria and Kenya. The governments
of both countries have been struggling to contain these terrorist activities. We are not too concerned with
these activities in Nigeria as they are confined to the Northern region, however, an extended period of
these terror attacks could eventually hamper distribution of FMCG businesses. In Kenya, the attacks have
negatively affected the Tourism industry and consequently FX inflows. However, following Kenya’s
successful international Eurobond offer in June 2014, we expect some exchange rate stability and support
from the bond FX inflows and that should help stabilize Kenya’s inflation which depends on FX
movements. In that respect we would not expect interest rates to be tightened in Kenya if the currency
remains stable.
We are bottom up investors and we will continue to look for undervalued businesses that we believe can
withstand some of the challenges especially in Nigeria, Egypt and Kenya.
Investment Manager
Sanlam Investment Management (Pty) Limited
SANLAM UNIVERSAL FUNDS PLC
25
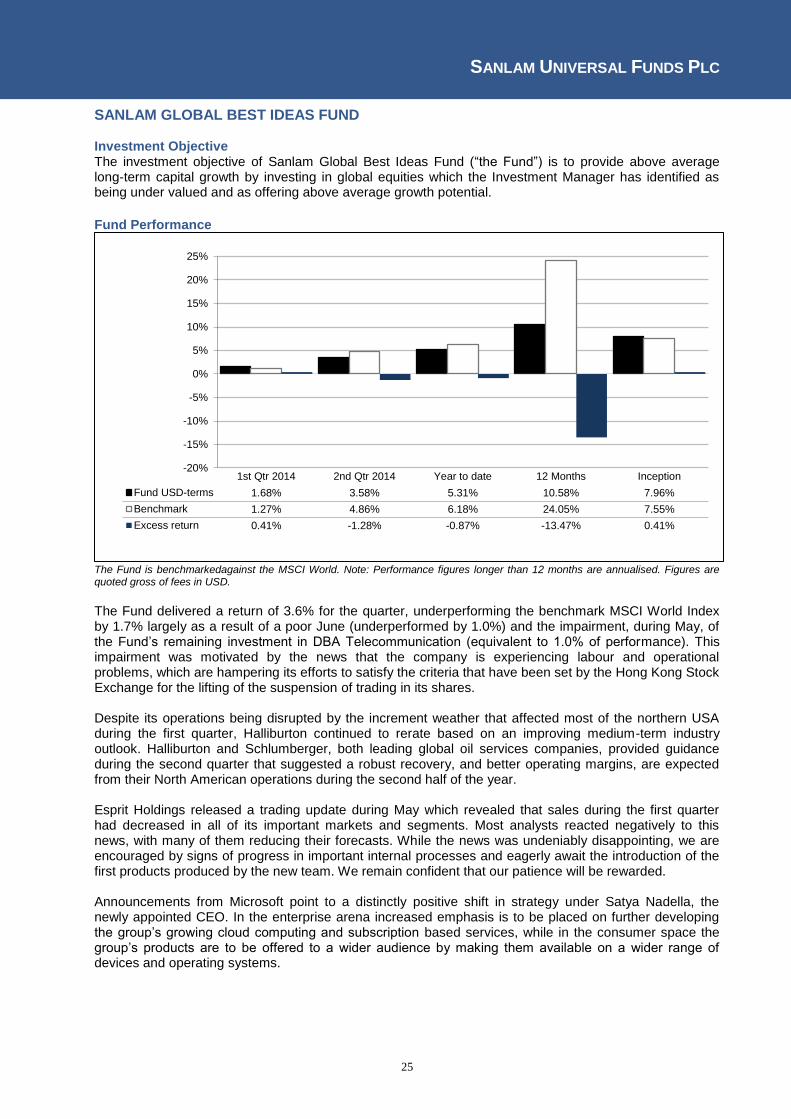
SANLAM GLOBAL BEST IDEAS FUND Investment Objective The investment objective of Sanlam Global Best Ideas Fund (“the Fund”) is to provide above average long-term capital growth by investing in global equities which the Investment Manager has identified as being under valued and as offering above average growth potential.
Fund Performance
The Fund is benchmarkedagainst the MSCI World. Note: Performance figures longer than 12 months are annualised. Figures are quoted gross of fees in USD.
The Fund delivered a return of 3.6% for the quarter, underperforming the benchmark MSCI World Index by 1.7% largely as a result of a poor June (underperformed by 1.0%) and the impairment, during May, of the Fund’s remaining investment in DBA Telecommunication (equivalent to 1.0% of performance). This impairment was motivated by the news that the company is experiencing labour and operational problems, which are hampering its efforts to satisfy the criteria that have been set by the Hong Kong Stock Exchange for the lifting of the suspension of trading in its shares. Despite its operations being disrupted by the increment weather that affected most of the northern USA during the first quarter, Halliburton continued to rerate based on an improving medium-term industry outlook. Halliburton and Schlumberger, both leading global oil services companies, provided guidance during the second quarter that suggested a robust recovery, and better operating margins, are expected from their North American operations during the second half of the year. Esprit Holdings released a trading update during May which revealed that sales during the first quarter had decreased in all of its important markets and segments. Most analysts reacted negatively to this news, with many of them reducing their forecasts. While the news was undeniably disappointing, we are encouraged by signs of progress in important internal processes and eagerly await the introduction of the first products produced by the new team. We remain confident that our patience will be rewarded. Announcements from Microsoft point to a distinctly positive shift in strategy under Satya Nadella, the newly appointed CEO. In the enterprise arena increased emphasis is to be placed on further developing the group’s growing cloud computing and subscription based services, while in the consumer space the group’s products are to be offered to a wider audience by making them available on a wider range of devices and operating systems.
-20%
-15%
-10%
-5%
0%
5%
10%
15%
20%
25%
1st Qtr 2014 2nd Qtr 2014 Year to date 12 Months Inception
Fund USD-terms 1.68% 3.58% 5.31% 10.58% 7.96%
Benchmark 1.27% 4.86% 6.18% 24.05% 7.55%
Excess return 0.41% -1.28% -0.87% -13.47% 0.41%

SANLAM UNIVERSAL FUNDS PLC
26
SANLAM GLOBAL BEST IDEAS FUND (CONTINUED) Fund Outlook Based on current consensus forecasts the Fund trades on a significantly lower forward price/earnings multiple than the benchmark MSCI World Index (12.9x versus 15.0x), while having delivered a superior return on equity (21.9% versus 16.5%) during the past year. In our opinion, this signals that the portfolio harbours significant value to unlock in coming years. Investment Manager Sanlam Investment Management (Pty) Limited
SANLAM UNIVERSAL FUNDS PLC
27
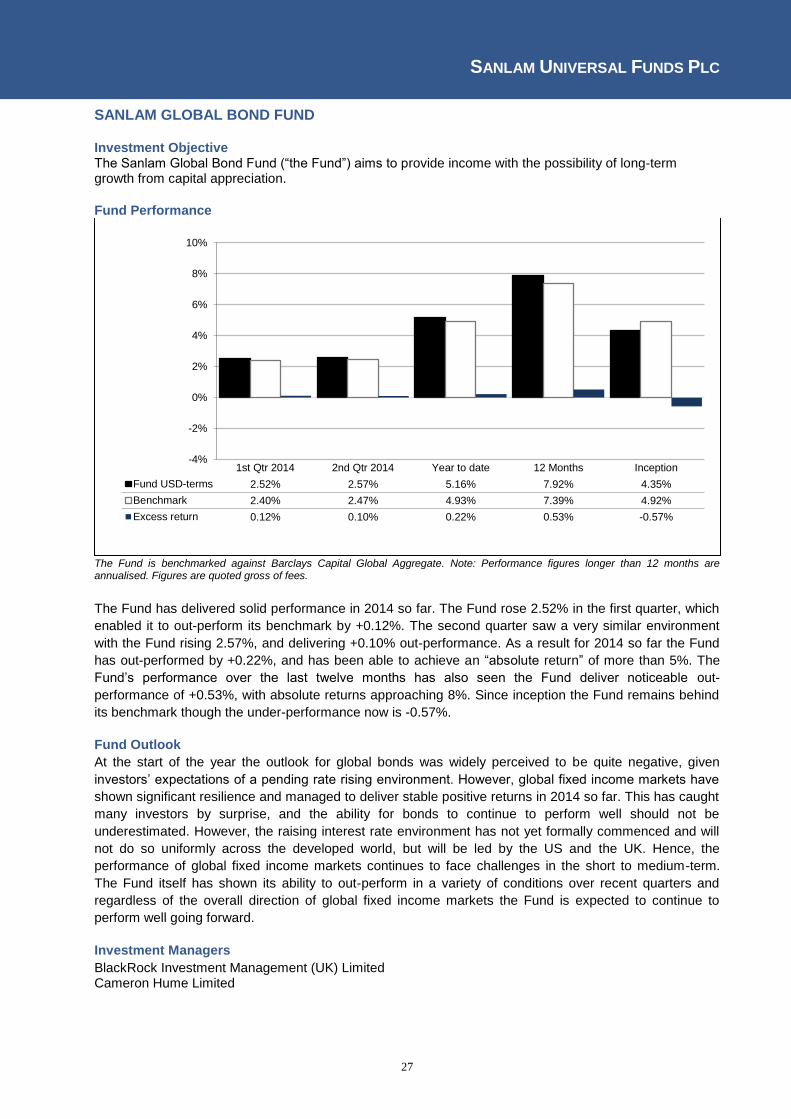
SANLAM GLOBAL BOND FUND Investment Objective The Sanlam Global Bond Fund (“the Fund”) aims to provide income with the possibility of long-term growth from capital appreciation.
Fund Performance
The Fund is benchmarked against Barclays Capital Global Aggregate. Note: Performance figures longer than 12 months are annualised. Figures are quoted gross of fees.
The Fund has delivered solid performance in 2014 so far. The Fund rose 2.52% in the first quarter, which
enabled it to out-perform its benchmark by +0.12%. The second quarter saw a very similar environment
with the Fund rising 2.57%, and delivering +0.10% out-performance. As a result for 2014 so far the Fund
has out-performed by +0.22%, and has been able to achieve an “absolute return” of more than 5%. The
Fund’s performance over the last twelve months has also seen the Fund deliver noticeable out-
performance of +0.53%, with absolute returns approaching 8%. Since inception the Fund remains behind
its benchmark though the under-performance now is -0.57%.
Fund Outlook
At the start of the year the outlook for global bonds was widely perceived to be quite negative, given
investors’ expectations of a pending rate rising environment. However, global fixed income markets have
shown significant resilience and managed to deliver stable positive returns in 2014 so far. This has caught
many investors by surprise, and the ability for bonds to continue to perform well should not be
underestimated. However, the raising interest rate environment has not yet formally commenced and will
not do so uniformly across the developed world, but will be led by the US and the UK. Hence, the
performance of global fixed income markets continues to face challenges in the short to medium-term.
The Fund itself has shown its ability to out-perform in a variety of conditions over recent quarters and
regardless of the overall direction of global fixed income markets the Fund is expected to continue to
perform well going forward.
Investment Managers
BlackRock Investment Management (UK) Limited Cameron Hume Limited
-4%
-2%
0%
2%
4%
6%
8%
10%
1st Qtr 2014 2nd Qtr 2014 Year to date 12 Months Inception
Fund USD-terms 2.52% 2.57% 5.16% 7.92% 4.35%
Benchmark 2.40% 2.47% 4.93% 7.39% 4.92%
Excess return 0.12% 0.10% 0.22% 0.53% -0.57%

SANLAM UNIVERSAL FUNDS PLC
28
SANLAM GLOBAL FINANCIAL FUND
Investment Objective The Sanlam Global Financial Fund (“the Fund”) will be used as an investment vehicle for investors wishing to achieve steady growth in the US Dollar value of investments primarily through global investment in securities of companies of which the principal operations specifically focus on, and derive benefit from or pertain to, the provision of banking, insurance and other financial services. Fund Performance
The Fund is benchmarked against the MSCI World Financials. Note: Performance figures longer than 12 months are annualised. Figures are quoted gross of fees in USD.
The Fund was able to generate excellent returns (9.69% for the six months to June 2014) largely driven by the strong Indian market (Power Finance Corporation gaining 80%) but also the Indonesia banks we hold (Bank Rakyat and Adira Dinamika gained 40%+). At this point it is important to point out that 46% of the Fund is invested in 5 markets (India, Indonesia, Turkey, Russia and Brazil), all of which have bank sectors that have grown their shareholders capital at a compound rate exceeding 19% over the past 10 years. However, these 10 years included significant currency and market volatility. Hence investors must expect intra-year volatility but know that in the background the Companys the Fund is invested in keeps growing their shareholders capital. A good example in the past 6 months was Sberbank (Russia) which grew shareholder capital by 19% whilst the share price fell by 17% reflecting fears about the Russian/Ukraine conflict. The remaining 54% of the Fund is invested in the USA (60% of the 55%) and 33% in the UK/Europe/Korea. Generally these investments all generated good operational results with the exception of the investment banks (Citigroup, Barclays, JP Morgan) whilst the share prices of Korean financials continued to disappoint. We continuously debate our holdings (about 8% of the fund) in investment banking, but we feel the valuations of these companies are pricing in a continuation of the penalties and legal cases against them into perpetuity. The insurance investments in the Fund (19%) should benefit from higher interest rates whilst the US regional banks (7%) will be squeezed in terms of funding costs when interest rates rise. On the other hand higher interest rates would imply a higher economic growth rate from which they would benefit.
-20%
-15%
-10%
-5%
0%
5%
10%
15%
20%
25%
1st Qtr 2014 2nd Qtr 2014 Year to date 12 Months Inception
Fund USD-terms 3.24% 6.24% 9.69% 16.12% 11.58%
Benchmark 0.66% 2.89% 3.57% 20.71% 2.02%
Excess return 2.58% 3.35% 6.12% -4.59% 9.56%
SANLAM UNIVERSAL FUNDS PLC
29
SANLAM GLOBAL FINANCIAL FUND (CONTINUED)
Fund Outlook
The Fund is diversified enough via the combination of high ROE (return on capital) and growth in emerging markets, stability of the US regional banks and insurance companies and then attractive valuations of the investment banks to ensure the Fund should generate satisfactory growth over the next 6 months and more importantly, the next 5 years. The weighted average return on capital exceeds 16% for a price to net asset value of 1.3x which is about 50% below where the market has traded a similar ROE in the past. The Fund should hence benefit from both the compounding of the return of capital plus a more possible higher rating of the financial sector over the next 5 years. Investment Manager
Sanlam Investment Management (Pty) Limited
SANLAM UNIVERSAL FUNDS PLC
30
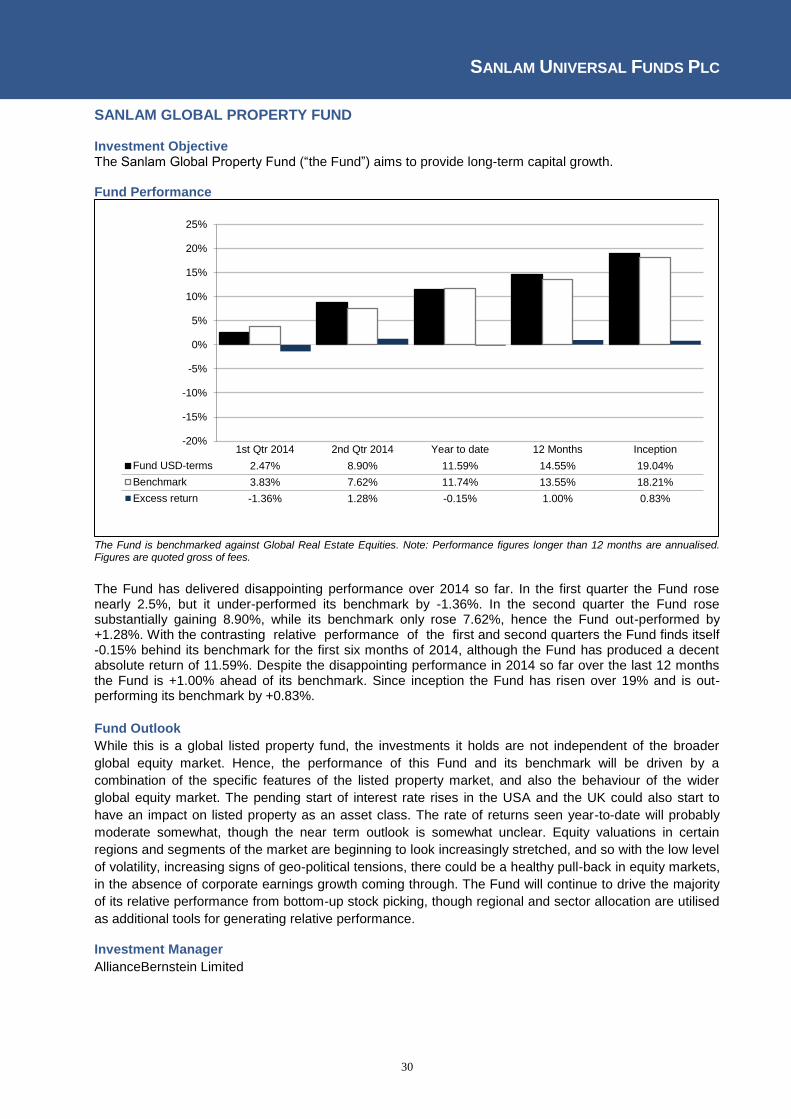
SANLAM GLOBAL PROPERTY FUND Investment Objective The Sanlam Global Property Fund (“the Fund”) aims to provide long-term capital growth. Fund Performance
The Fund is benchmarked against Global Real Estate Equities. Note: Performance figures longer than 12 months are annualised. Figures are quoted gross of fees.
The Fund has delivered disappointing performance over 2014 so far. In the first quarter the Fund rose nearly 2.5%, but it under-performed its benchmark by -1.36%. In the second quarter the Fund rose substantially gaining 8.90%, while its benchmark only rose 7.62%, hence the Fund out-performed by +1.28%. With the contrasting relative performance of the first and second quarters the Fund finds itself -0.15% behind its benchmark for the first six months of 2014, although the Fund has produced a decent absolute return of 11.59%. Despite the disappointing performance in 2014 so far over the last 12 months the Fund is +1.00% ahead of its benchmark. Since inception the Fund has risen over 19% and is out-performing its benchmark by +0.83%.
Fund Outlook
While this is a global listed property fund, the investments it holds are not independent of the broader
global equity market. Hence, the performance of this Fund and its benchmark will be driven by a
combination of the specific features of the listed property market, and also the behaviour of the wider
global equity market. The pending start of interest rate rises in the USA and the UK could also start to
have an impact on listed property as an asset class. The rate of returns seen year-to-date will probably
moderate somewhat, though the near term outlook is somewhat unclear. Equity valuations in certain
regions and segments of the market are beginning to look increasingly stretched, and so with the low level
of volatility, increasing signs of geo-political tensions, there could be a healthy pull-back in equity markets,
in the absence of corporate earnings growth coming through. The Fund will continue to drive the majority
of its relative performance from bottom-up stock picking, though regional and sector allocation are utilised
as additional tools for generating relative performance. Investment Manager
AllianceBernstein Limited
-20%
-15%
-10%
-5%
0%
5%
10%
15%
20%
25%
1st Qtr 2014 2nd Qtr 2014 Year to date 12 Months Inception
Fund USD-terms 2.47% 8.90% 11.59% 14.55% 19.04%
Benchmark 3.83% 7.62% 11.74% 13.55% 18.21%
Excess return -1.36% 1.28% -0.15% 1.00% 0.83%
SANLAM UNIVERSAL FUNDS PLC
31
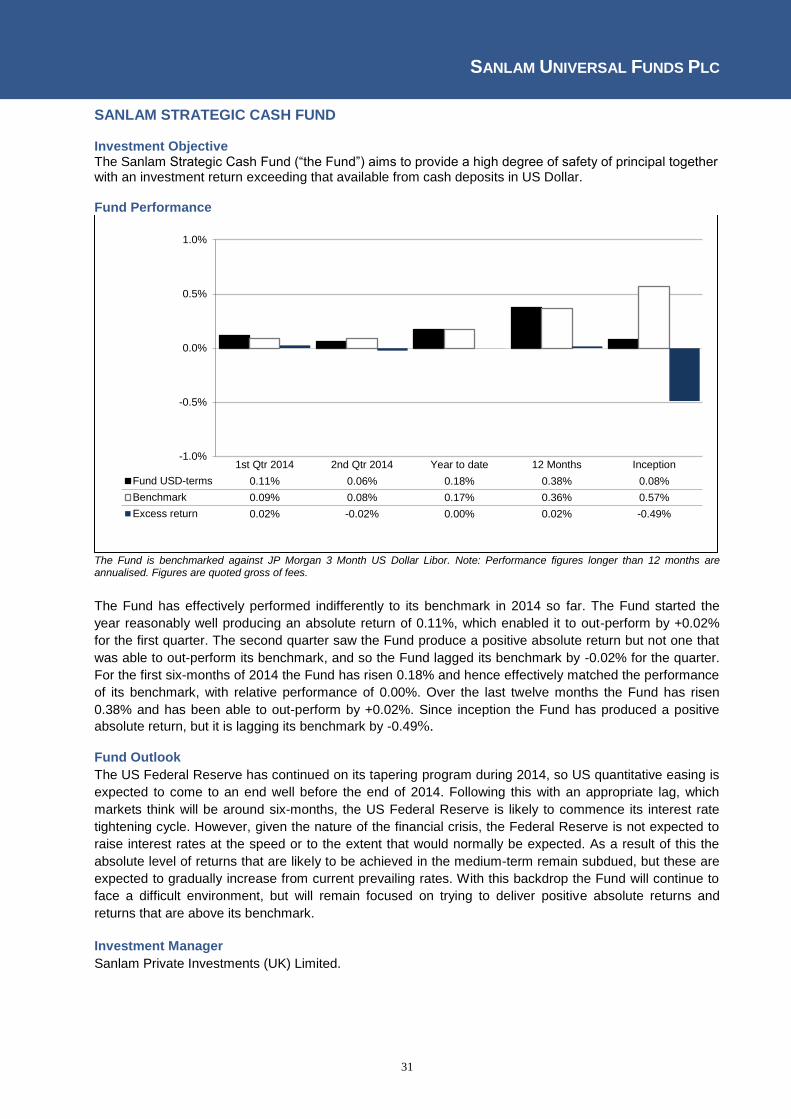
SANLAM STRATEGIC CASH FUND Investment Objective The Sanlam Strategic Cash Fund (“the Fund”) aims to provide a high degree of safety of principal together with an investment return exceeding that available from cash deposits in US Dollar. Fund Performance
The Fund is benchmarked against JP Morgan 3 Month US Dollar Libor. Note: Performance figures longer than 12 months are annualised. Figures are quoted gross of fees.
The Fund has effectively performed indifferently to its benchmark in 2014 so far. The Fund started the
year reasonably well producing an absolute return of 0.11%, which enabled it to out-perform by +0.02%
for the first quarter. The second quarter saw the Fund produce a positive absolute return but not one that
was able to out-perform its benchmark, and so the Fund lagged its benchmark by -0.02% for the quarter.
For the first six-months of 2014 the Fund has risen 0.18% and hence effectively matched the performance
of its benchmark, with relative performance of 0.00%. Over the last twelve months the Fund has risen
0.38% and has been able to out-perform by +0.02%. Since inception the Fund has produced a positive
absolute return, but it is lagging its benchmark by -0.49%. Fund Outlook
The US Federal Reserve has continued on its tapering program during 2014, so US quantitative easing is
expected to come to an end well before the end of 2014. Following this with an appropriate lag, which
markets think will be around six-months, the US Federal Reserve is likely to commence its interest rate
tightening cycle. However, given the nature of the financial crisis, the Federal Reserve is not expected to
raise interest rates at the speed or to the extent that would normally be expected. As a result of this the
absolute level of returns that are likely to be achieved in the medium-term remain subdued, but these are
expected to gradually increase from current prevailing rates. With this backdrop the Fund will continue to
face a difficult environment, but will remain focused on trying to deliver positive absolute returns and
returns that are above its benchmark.
Investment Manager
Sanlam Private Investments (UK) Limited.
-1.0%
-0.5%
0.0%
0.5%
1.0%
1st Qtr 2014 2nd Qtr 2014 Year to date 12 Months Inception
Fund USD-terms 0.11% 0.06% 0.18% 0.38% 0.08%
Benchmark 0.09% 0.08% 0.17% 0.36% 0.57%
Excess return 0.02% -0.02% 0.00% 0.02% -0.49%

SANLAM UNIVERSAL FUNDS PLC
32
SANLAM WORLD EQUITY FUND
Investment Objective The Sanlam World Equity Fund (“the Fund”) aims to provide above average long-term capital growth by investing primarily in global equities.
Fund Performance
The Fund is benchmarked against MSCI World. Note: Performance figures longer than 12 months are annualised. Figures are quoted gross of fees.
The Fund’s performance for 2014 so far has been disappointing, though it is showing signs of moderate improvement. In the first quarter of 2014 the Fund performed satisfactorily with a positive absolute return and out-performance of 0.38% over the benchmark. However, in the second quarter, despite the better absolute return, the market conditions proved challenging, and the Fund failed to keep up with the market rally, and so under-performed by -1.33% for the quarter. The extent of the under-performance did decrease during the quarter, which is an encouraging sign looking forward. The Fund finds itself -0.95% behind its benchmark for the first six months of 2014. The Fund is ahead of its benchmark by +0.16% over the last 12 months, with an absolute rise of over 24%. Since inception the Fund continues to lag its benchmark, and it is now -1.04% behind over that period.
Fund Outlook
The outlook for the Fund will be determined by the performance of global equity markets. With the rise in
equity markets over 2013 and the rise continuing into 2014, valuations, especially in certain regions, look
increasingly stretched, in the absence of significant earnings growth to support the rise in equity markets.
The Fund will continue to drive the majority of its relative performance from bottom-up stock picking,
though regional equity allocation is utilised as an additional tool for generating relative performance. Given
the regional equity valuation differences regional equity allocation could be more important than normal for
the remainder of 2014 compared to average over a market cycle. In the short-term the immediate direction
for global equity markets is somewhat unclear, and with the low level of volatility, increasing signs of geo-
political tensions, there could be a healthy pull-back in equity markets, in the absence of corporate
earnings growth coming through.
Investment Managers
FOUR Capital Partners Limited Sanlam Investment Management (Pty) Limited Eight Investment Partners (Pty) Limited Centre Asset Management, LLC Sanlam International Investments Limited Alliance Bernstein Limited
-10%
-5%
0%
5%
10%
15%
20%
25%
30%
1st Qtr 2014 2nd Qtr 2014 Year to date 12 Months Inception
Fund USD-terms 1.65% 3.52% 5.23% 24.21% 6.65%
Benchmark 1.26% 4.86% 6.18% 24.05% 7.69%
Excess return 0.38% -1.33% -0.95% 0.16% -1.04%
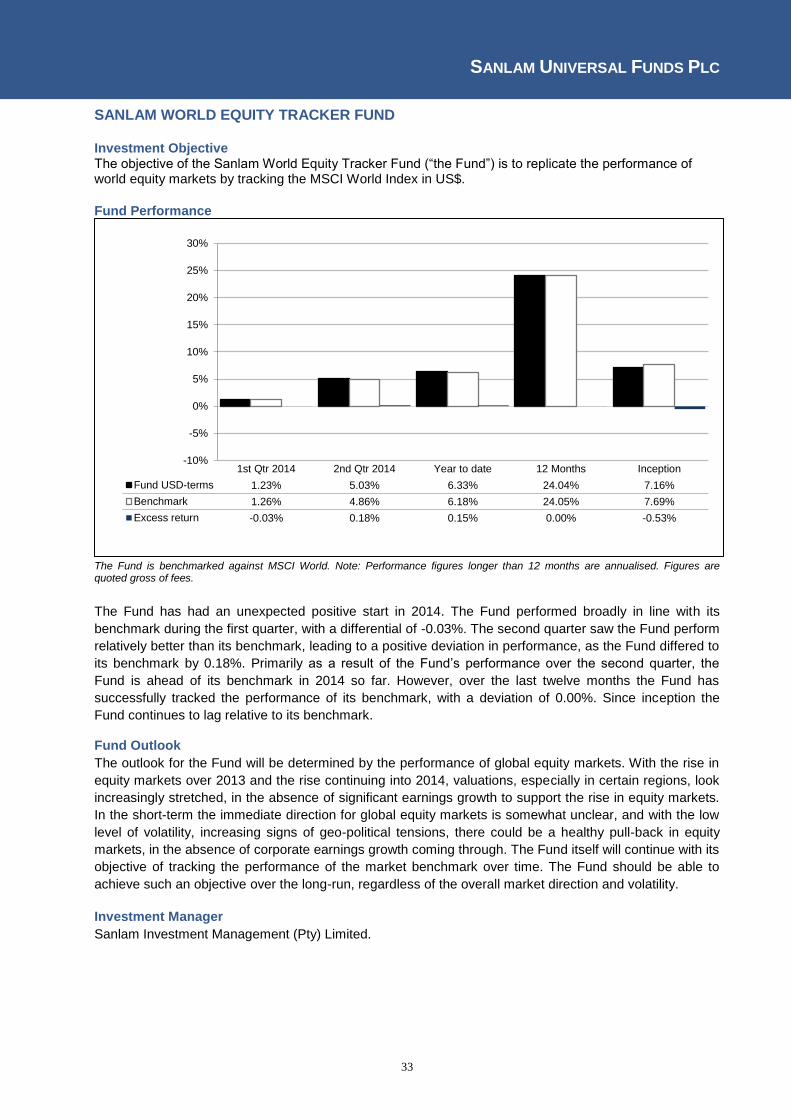
SANLAM UNIVERSAL FUNDS PLC
33
SANLAM WORLD EQUITY TRACKER FUND
Investment Objective The objective of the Sanlam World Equity Tracker Fund (“the Fund”) is to replicate the performance of world equity markets by tracking the MSCI World Index in US$.
Fund Performance
The Fund is benchmarked against MSCI World. Note: Performance figures longer than 12 months are annualised. Figures are quoted gross of fees.
The Fund has had an unexpected positive start in 2014. The Fund performed broadly in line with its
benchmark during the first quarter, with a differential of -0.03%. The second quarter saw the Fund perform
relatively better than its benchmark, leading to a positive deviation in performance, as the Fund differed to
its benchmark by 0.18%. Primarily as a result of the Fund’s performance over the second quarter, the
Fund is ahead of its benchmark in 2014 so far. However, over the last twelve months the Fund has
successfully tracked the performance of its benchmark, with a deviation of 0.00%. Since inception the
Fund continues to lag relative to its benchmark. Fund Outlook
The outlook for the Fund will be determined by the performance of global equity markets. With the rise in
equity markets over 2013 and the rise continuing into 2014, valuations, especially in certain regions, look
increasingly stretched, in the absence of significant earnings growth to support the rise in equity markets.
In the short-term the immediate direction for global equity markets is somewhat unclear, and with the low
level of volatility, increasing signs of geo-political tensions, there could be a healthy pull-back in equity
markets, in the absence of corporate earnings growth coming through. The Fund itself will continue with its
objective of tracking the performance of the market benchmark over time. The Fund should be able to
achieve such an objective over the long-run, regardless of the overall market direction and volatility.
Investment Manager
Sanlam Investment Management (Pty) Limited.
-10%
-5%
0%
5%
10%
15%
20%
25%
30%
1st Qtr 2014 2nd Qtr 2014 Year to date 12 Months Inception
Fund USD-terms 1.23% 5.03% 6.33% 24.04% 7.16%
Benchmark 1.26% 4.86% 6.18% 24.05% 7.69%
Excess return -0.03% 0.18% 0.15% 0.00% -0.53%

SANLAM UNIVERSAL FUNDS PLC
34
SIIP INDIA OPPORTUNITIES FUND Investment Objective The investment objective of the SIIP India Opportunities Fund (“the Fund”) is to provide long-term capital growth.
Fund Performance
The Fund is benchmarked against Bombay Stock Exchange 500. Note: Performance figures longer than 12 months are annualised. Figures are quoted gross of fees.
The Fund has produced very disappointing performance over 2014 so far. In the first quarter the Fund
under-performed its benchmark by -0.04%, whilst producing an absolute return approaching 9.5%,
although this masked the intra-quarter relative monthly deviations in performance. Then in the second
quarter the Fund under-performed its benchmark by -6.86%, but still managed to produce a return of
10.70%. The under-performance in 2014 so far is therefore -7.55%, while the Fund has risen over 21% in
absolute terms. Over the last 12 months the Fund has risen nearly 27%, but it is under-performing its
benchmark by -8.93%. Since inception both the Fund and benchmark are down in absolute terms,
although increasingly close to producing a positive absolute return, and the Fund remains behind its
benchmark, and now by -3.25%.
Fund Outlook
India has undergone some significant changes during 2014 so far with the election of Prime Minister Modi
during the second quarter. The build-up to the election and uncertainty of the outcome, which over the
course of 2014 was increasingly not over who was going to win, but the extent to which they were going to
win by, has created substantial distortions in the Indian equity market. These movements have, in many
cases, not been driven by company fundamentals, but by investors’ expectations of pending government
reform on the back of the election result. While reforms are expected post the election the extent and
nature of them remains unclear, and so the impact on specific sectors and companies is even less
transparent. Consequently, some re-adjustment in the Indian equity market is likely and this will hopefully
see the Fund recoup its relative losses experienced in 2014 so far. The longer-term environment for
India’s equity market is now more positive, but, as stated, short to medium-term volatility remains a risk. Investment Manager
Sanlam Investment Management (Pty) Limited.
-20%
-10%
0%
10%
20%
30%
40%
1st Qtr 2014 2nd Qtr 2014 Year to date 12 Months Inception
Fund USD-terms 9.45% 10.70% 21.16% 26.74% -3.30%
Benchmark 9.49% 17.56% 28.71% 35.67% -0.05%
Excess return -0.04% -6.86% -7.55% -8.93% -3.25%

SANLAM UNIVERSAL FUNDS PLC
35
SIM GLOBAL EQUITY INCOME FUND Investment Objective The objective of SIM Global Equity Income Fund (“the Fund”) is to generate a growing stream of dividend income for investors through investing in equities, while at the same time pursuing moderate growth in the capital invested. Fund Performance
The Fund is benchmarked against the US CPI + Yield on MSCI World High Dividend Yield index. Note: Performance figures longer than 12 months are annualised. Figures are quoted gross of fees in USD.
The Fund delivered a satisfactory performance during the past 6 months, posting a return of 8.3%. This beat the 3.4% target of the Fund’s composite benchmark handsomely and also bettered the 6.2% return posted by the overall market, as represented by the MSCI World Index. The price of AstraZeneca rose sharply during April when Pfizer launched its much publicised bid for the company. Despite a significant fall in the wake of the board’s rejection of the offer, the share price remains substantially higher than it was before the bid. This appears to lend credence to the commonly held opinion that Pfizer will return for another attempt once the statutory six month waiting period has elapsed. Prices of all the shares in the UK FMCG retail sector retreated in the face of generally disappointing results and indications that the industry is going to suffer a price war as Morrisons and Tesco fight to protect their market share from erosion by the discounters and new online competitors. Mooted changes to the UK retirement savings legislation announced in the budget resulted in a sharp correction in the prices of all those companies involved in the annuity business during the first quarter. The price of Legal & General immediately dropped by 15% on the day of the announcement, but began to recover subsequently as it became apparent that their business will not be as severely affected as initially feared (+14%). We believe that it will recover further as more clarity emerges regarding the effects of the intended changes. Shares of Tatts Group, an Australian betting and lottery operator, rerated markedly in response to the positive resolution of two outstanding disputes. First, the company was awarded compensation of AUD451m by the Supreme Court of Victoria as it ruled in the company’s favour in its quarrel with the State of Victoria regarding the loss of a gaming licence in 2012. Second, the company obtained a favourable extension, until 2098, of its race and sports wagering licence in the State of Queensland, while its retail exclusivity was also extended until 2044. These developments, coupled with its current dividend yield of 4.5%, support our view that Tatts Group represents an attractive defensive source of dividend income.
-20%
-15%
-10%
-5%
0%
5%
10%
15%
20%
25%
1st Qtr 2014 2nd Qtr 2014 Year to date 12 Months Inception
Fund USD-terms 2.75% 5.42% 8.31% 24.46% 15.32%
Benchmark 1.25% 2.09% 3.37% 5.38% 5.23%
Excess return 1.50% 3.33% 4.94% 19.08% 10.09%
SANLAM UNIVERSAL FUNDS PLC
36
SIM GLOBAL EQUITY INCOME FUND (CONTINUED) Fund Outlook Despite the pleasing appreciation of many of the shares in the Fund, it continues to trade at a discount to the overall market and, based on consensus estimates, promises to deliver a yield, net of withholding taxes, in the region of 4.0%. This is significantly higher than the net yield of 3.3% calculated for the MSCI World High Dividend Index. Based on our current projections, we expect the Fund to deliver a yield, net of withholding taxes due by the Fund, of around 4.1% during the next twelve months. This compares very favourably to our estimate of 3.4% for the MSCI World High Dividend Yield index. Much of this difference is explained by our greater exposure to European and United Kingdom domiciled companies, which liberates us from the 30% dividend withholding tax levied in the USA. Investment Manager Sanlam Investment Management (Pty) Limited

SANLAM UNIVERSAL FUNDS PLC
37
SPI STRATEGIC INVESTMENT GRADE BOND FUND Investment Objective The SPI Strategic Investment Grade Bond Fund (“the Fund”) objective is to provide a total return through generating an income, that may be received monthly, and the potential for capital growth. The Fund mainly invests in investment grade government and corporate bonds, in the UK and overseas. Fund Performance
The Fund is benchmarked against IMA Sterling Strategic Bond Index. Note: Performance figures longer than 12 months are annualised. Figures are quoted gross of fees.
The Fund increased recorded strong absolute and relative performance in H1 2014, being up by 5.7%.
The IMA strategic bond sector returned 4.2. Gilts were up 3.3%, and iBoxx GBP Corporate bonds were up
4.7%. A broader Global Broad index, such as Merrill Lynch was up 4.3% in H1.
The Fund continued to benefit from its broad sectoral exposure to Tier 1 financials bonds, with an Old
Mutual, and a Barclays bond being the most significant contributors to performance. Tactical exposures in
long maturity US Treasuries were very positive contributors too in Q2. Some short term exposure to USD
denominated Ukraine bonds added some value. EM local currency exposure in January detracted a little,
but this was quickly substituted for further GBP financials exposure towards the end of that month.
Fund Outlook
The ECB’s hurdle for QE remains doesn’t appear to be as high as before, given they are close to utilizing
all other options. We are particularly interested in the ABS support, an area of the market that can still
provide attractive returns for investors. In the US, the Fed are fully expected to continuing their tapering of
QE at $10bn per meeting, as recent activity data continues to improve from the weather impacted start to
2014. This positive growth momentum was highlighted again by a strong payrolls report for June. In the
UK it is becoming clearer that the Bank of England wish to raise rates within the next 12 months and
perhaps as soon as in 2014. Floating rate notes should start to become more valuable to investors in the
near term as a result.
-10%
-8%
-6%
-4%
-2%
0%
2%
4%
6%
8%
10%
1st Qtr 2014 2nd Qtr 2014 Year to date 12 Months Inception
Fund USD-terms 1.89% 3.74% 5.70% 9.07% 7.08%
Benchmark 2.20% 2.01% 4.25% 7.65% 6.83%
Excess return -0.30% 1.73% 1.45% 1.42% 0.25%

SANLAM UNIVERSAL FUNDS PLC
38
SPI STRATEGIC INVESTMENT GRADE BOND FUND (CONTINUED)
Fund Outlook (continued)
The Fund maintains a large exposure to higher yielding and short dated investment grade corporate
bonds, mostly in old style Tier 1 financials where we still see absolute and relative value versus other
corporate bond sectors. The Fund finished June with no non-GBP currency exposure and only a 3%
position in government bonds. We believe the Fund is well positioned for the risk of rising rates with
almost 70% of exposure in fixed to floating rate notes, and in the meantime can continue to provide an
attractive source of income, as the Fund’s holdings see further spread tightening. It is also flexible enough
to add tactical exposure to government bonds should we see short term opportunities to benefit from flight
to safety rallies.
Investment Manager
Sanlam Private Investments (UK) Limited
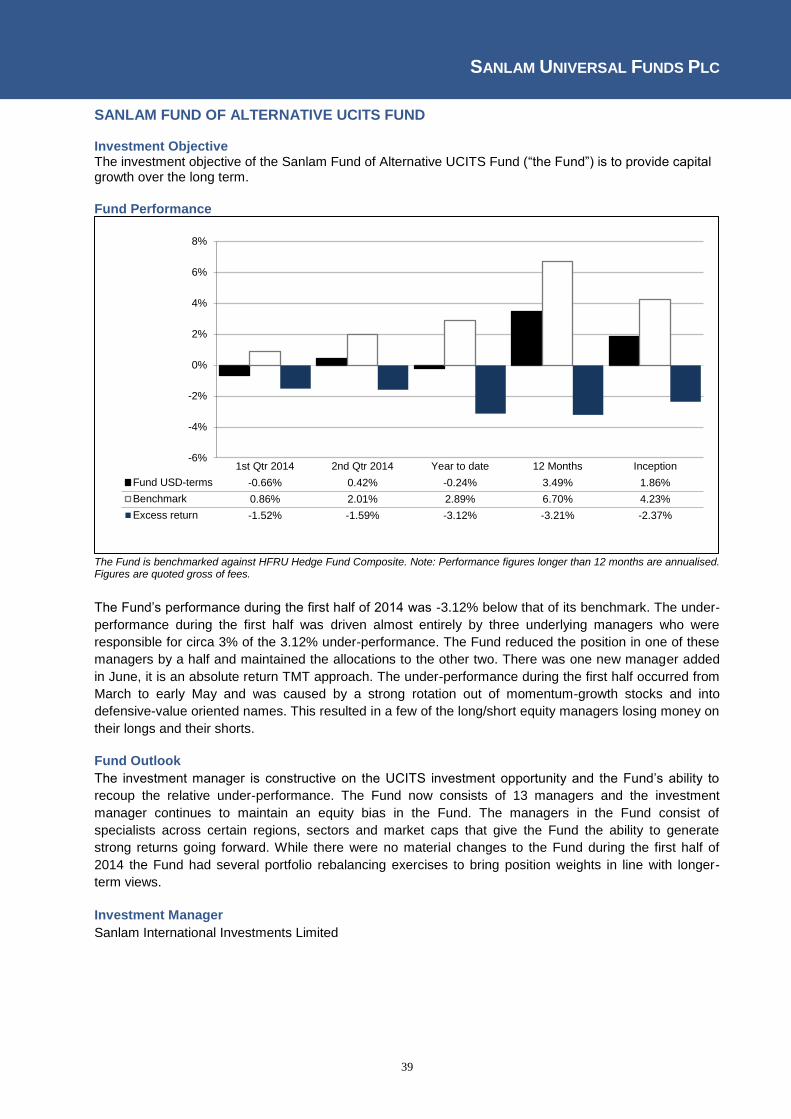
SANLAM UNIVERSAL FUNDS PLC
39
SANLAM FUND OF ALTERNATIVE UCITS FUND Investment Objective The investment objective of the Sanlam Fund of Alternative UCITS Fund (“the Fund”) is to provide capital growth over the long term.
Fund Performance
The Fund is benchmarked against HFRU Hedge Fund Composite. Note: Performance figures longer than 12 months are annualised. Figures are quoted gross of fees.
The Fund’s performance during the first half of 2014 was -3.12% below that of its benchmark. The under-
performance during the first half was driven almost entirely by three underlying managers who were
responsible for circa 3% of the 3.12% under-performance. The Fund reduced the position in one of these
managers by a half and maintained the allocations to the other two. There was one new manager added
in June, it is an absolute return TMT approach. The under-performance during the first half occurred from
March to early May and was caused by a strong rotation out of momentum-growth stocks and into
defensive-value oriented names. This resulted in a few of the long/short equity managers losing money on
their longs and their shorts.
Fund Outlook
The investment manager is constructive on the UCITS investment opportunity and the Fund’s ability to
recoup the relative under-performance. The Fund now consists of 13 managers and the investment
manager continues to maintain an equity bias in the Fund. The managers in the Fund consist of
specialists across certain regions, sectors and market caps that give the Fund the ability to generate
strong returns going forward. While there were no material changes to the Fund during the first half of
2014 the Fund had several portfolio rebalancing exercises to bring position weights in line with longer-
term views.
Investment Manager
Sanlam International Investments Limited
-6%
-4%
-2%
0%
2%
4%
6%
8%
1st Qtr 2014 2nd Qtr 2014 Year to date 12 Months Inception
Fund USD-terms -0.66% 0.42% -0.24% 3.49% 1.86%
Benchmark 0.86% 2.01% 2.89% 6.70% 4.23%
Excess return -1.52% -1.59% -3.12% -3.21% -2.37%
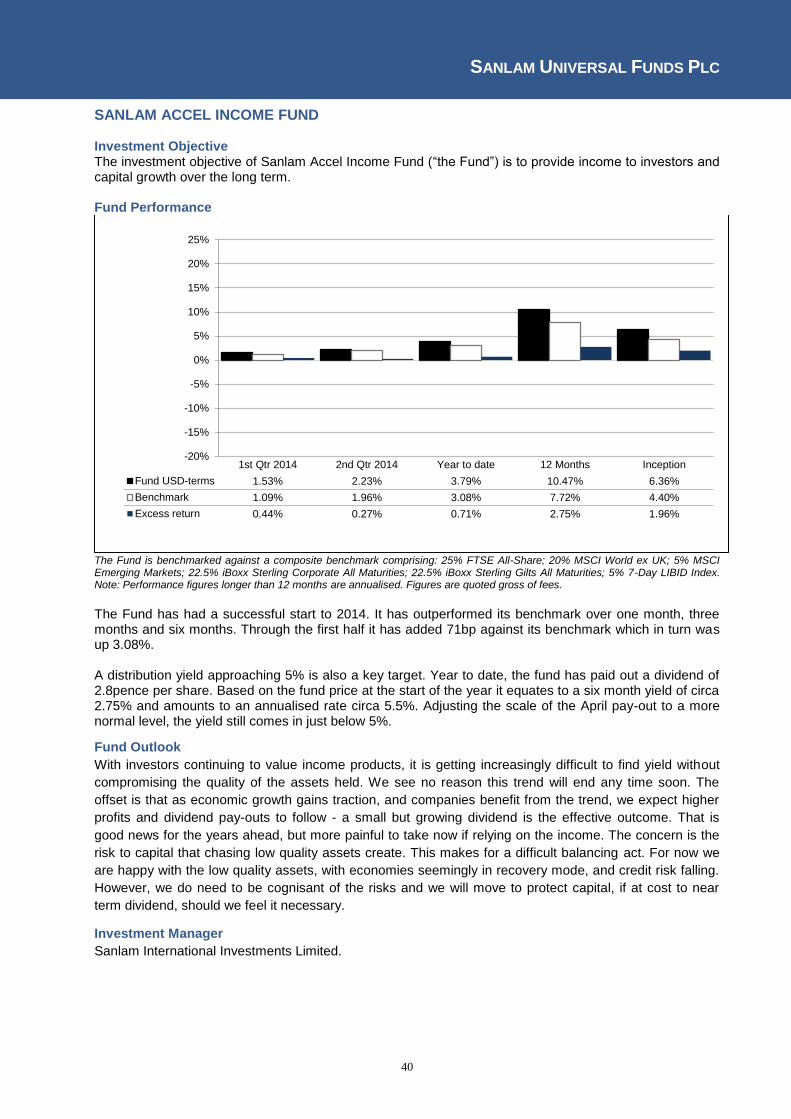
SANLAM UNIVERSAL FUNDS PLC
40
SANLAM ACCEL INCOME FUND Investment Objective The investment objective of Sanlam Accel Income Fund (“the Fund”) is to provide income to investors and capital growth over the long term. Fund Performance
The Fund is benchmarked against a composite benchmark comprising: 25% FTSE All-Share; 20% MSCI World ex UK; 5% MSCI Emerging Markets; 22.5% iBoxx Sterling Corporate All Maturities; 22.5% iBoxx Sterling Gilts All Maturities; 5% 7-Day LIBID Index. Note: Performance figures longer than 12 months are annualised. Figures are quoted gross of fees.
The Fund has had a successful start to 2014. It has outperformed its benchmark over one month, three months and six months. Through the first half it has added 71bp against its benchmark which in turn was up 3.08%. A distribution yield approaching 5% is also a key target. Year to date, the fund has paid out a dividend of 2.8pence per share. Based on the fund price at the start of the year it equates to a six month yield of circa 2.75% and amounts to an annualised rate circa 5.5%. Adjusting the scale of the April pay-out to a more normal level, the yield still comes in just below 5%.
Fund Outlook
With investors continuing to value income products, it is getting increasingly difficult to find yield without
compromising the quality of the assets held. We see no reason this trend will end any time soon. The
offset is that as economic growth gains traction, and companies benefit from the trend, we expect higher
profits and dividend pay-outs to follow - a small but growing dividend is the effective outcome. That is
good news for the years ahead, but more painful to take now if relying on the income. The concern is the
risk to capital that chasing low quality assets create. This makes for a difficult balancing act. For now we
are happy with the low quality assets, with economies seemingly in recovery mode, and credit risk falling.
However, we do need to be cognisant of the risks and we will move to protect capital, if at cost to near
term dividend, should we feel it necessary.
Investment Manager
Sanlam International Investments Limited.
-20%
-15%
-10%
-5%
0%
5%
10%
15%
20%
25%
1st Qtr 2014 2nd Qtr 2014 Year to date 12 Months Inception
Fund USD-terms 1.53% 2.23% 3.79% 10.47% 6.36%
Benchmark 1.09% 1.96% 3.08% 7.72% 4.40%
Excess return 0.44% 0.27% 0.71% 2.75% 1.96%
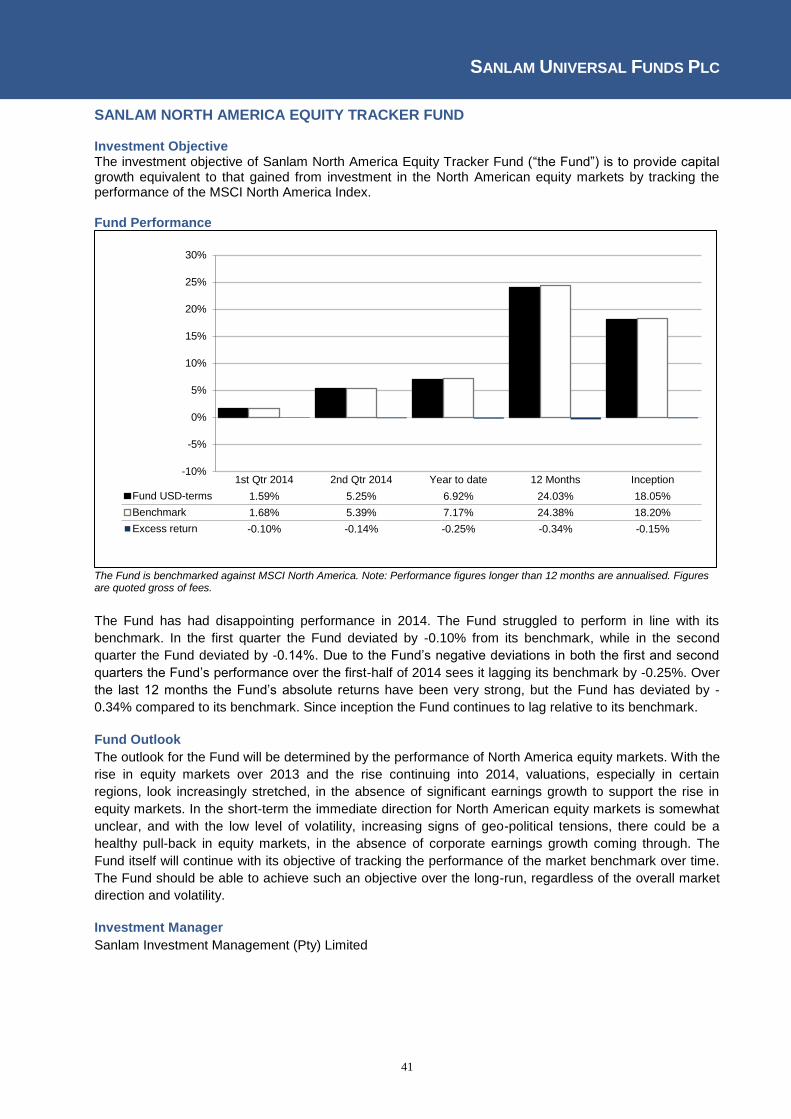
SANLAM UNIVERSAL FUNDS PLC
41
SANLAM NORTH AMERICA EQUITY TRACKER FUND Investment Objective The investment objective of Sanlam North America Equity Tracker Fund (“the Fund”) is to provide capital growth equivalent to that gained from investment in the North American equity markets by tracking the performance of the MSCI North America Index. Fund Performance
The Fund is benchmarked against MSCI North America. Note: Performance figures longer than 12 months are annualised. Figures are quoted gross of fees.
The Fund has had disappointing performance in 2014. The Fund struggled to perform in line with its
benchmark. In the first quarter the Fund deviated by -0.10% from its benchmark, while in the second
quarter the Fund deviated by -0.14%. Due to the Fund’s negative deviations in both the first and second
quarters the Fund’s performance over the first-half of 2014 sees it lagging its benchmark by -0.25%. Over
the last 12 months the Fund’s absolute returns have been very strong, but the Fund has deviated by -
0.34% compared to its benchmark. Since inception the Fund continues to lag relative to its benchmark.
Fund Outlook
The outlook for the Fund will be determined by the performance of North America equity markets. With the
rise in equity markets over 2013 and the rise continuing into 2014, valuations, especially in certain
regions, look increasingly stretched, in the absence of significant earnings growth to support the rise in
equity markets. In the short-term the immediate direction for North American equity markets is somewhat
unclear, and with the low level of volatility, increasing signs of geo-political tensions, there could be a
healthy pull-back in equity markets, in the absence of corporate earnings growth coming through. The
Fund itself will continue with its objective of tracking the performance of the market benchmark over time.
The Fund should be able to achieve such an objective over the long-run, regardless of the overall market
direction and volatility.
Investment Manager
Sanlam Investment Management (Pty) Limited
-10%
-5%
0%
5%
10%
15%
20%
25%
30%
1st Qtr 2014 2nd Qtr 2014 Year to date 12 Months Inception
Fund USD-terms 1.59% 5.25% 6.92% 24.03% 18.05%
Benchmark 1.68% 5.39% 7.17% 24.38% 18.20%
Excess return -0.10% -0.14% -0.25% -0.34% -0.15%
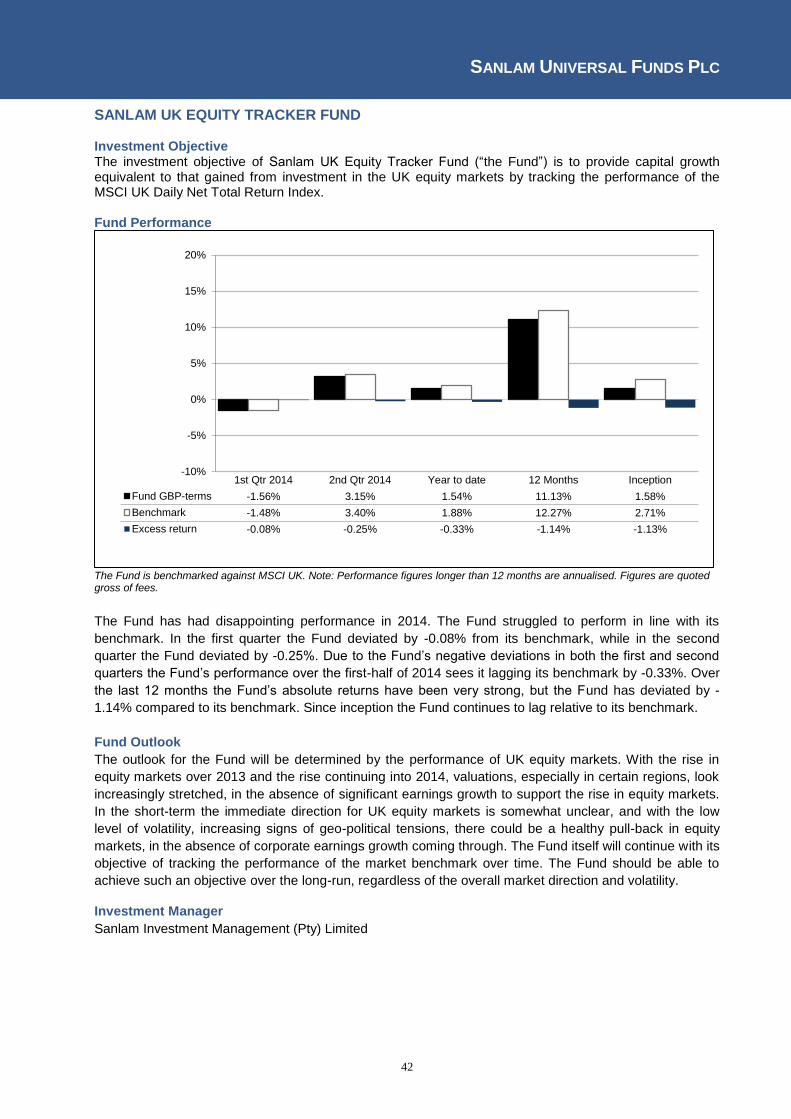
SANLAM UNIVERSAL FUNDS PLC
42
SANLAM UK EQUITY TRACKER FUND Investment Objective The investment objective of Sanlam UK Equity Tracker Fund (“the Fund”) is to provide capital growth equivalent to that gained from investment in the UK equity markets by tracking the performance of the MSCI UK Daily Net Total Return Index. Fund Performance
The Fund is benchmarked against MSCI UK. Note: Performance figures longer than 12 months are annualised. Figures are quoted gross of fees.
The Fund has had disappointing performance in 2014. The Fund struggled to perform in line with its
benchmark. In the first quarter the Fund deviated by -0.08% from its benchmark, while in the second
quarter the Fund deviated by -0.25%. Due to the Fund’s negative deviations in both the first and second
quarters the Fund’s performance over the first-half of 2014 sees it lagging its benchmark by -0.33%. Over
the last 12 months the Fund’s absolute returns have been very strong, but the Fund has deviated by -
1.14% compared to its benchmark. Since inception the Fund continues to lag relative to its benchmark.
Fund Outlook
The outlook for the Fund will be determined by the performance of UK equity markets. With the rise in
equity markets over 2013 and the rise continuing into 2014, valuations, especially in certain regions, look
increasingly stretched, in the absence of significant earnings growth to support the rise in equity markets.
In the short-term the immediate direction for UK equity markets is somewhat unclear, and with the low
level of volatility, increasing signs of geo-political tensions, there could be a healthy pull-back in equity
markets, in the absence of corporate earnings growth coming through. The Fund itself will continue with its
objective of tracking the performance of the market benchmark over time. The Fund should be able to
achieve such an objective over the long-run, regardless of the overall market direction and volatility. Investment Manager
Sanlam Investment Management (Pty) Limited
-10%
-5%
0%
5%
10%
15%
20%
1st Qtr 2014 2nd Qtr 2014 Year to date 12 Months Inception
Fund GBP-terms -1.56% 3.15% 1.54% 11.13% 1.58%
Benchmark -1.48% 3.40% 1.88% 12.27% 2.71%
Excess return -0.08% -0.25% -0.33% -1.14% -1.13%
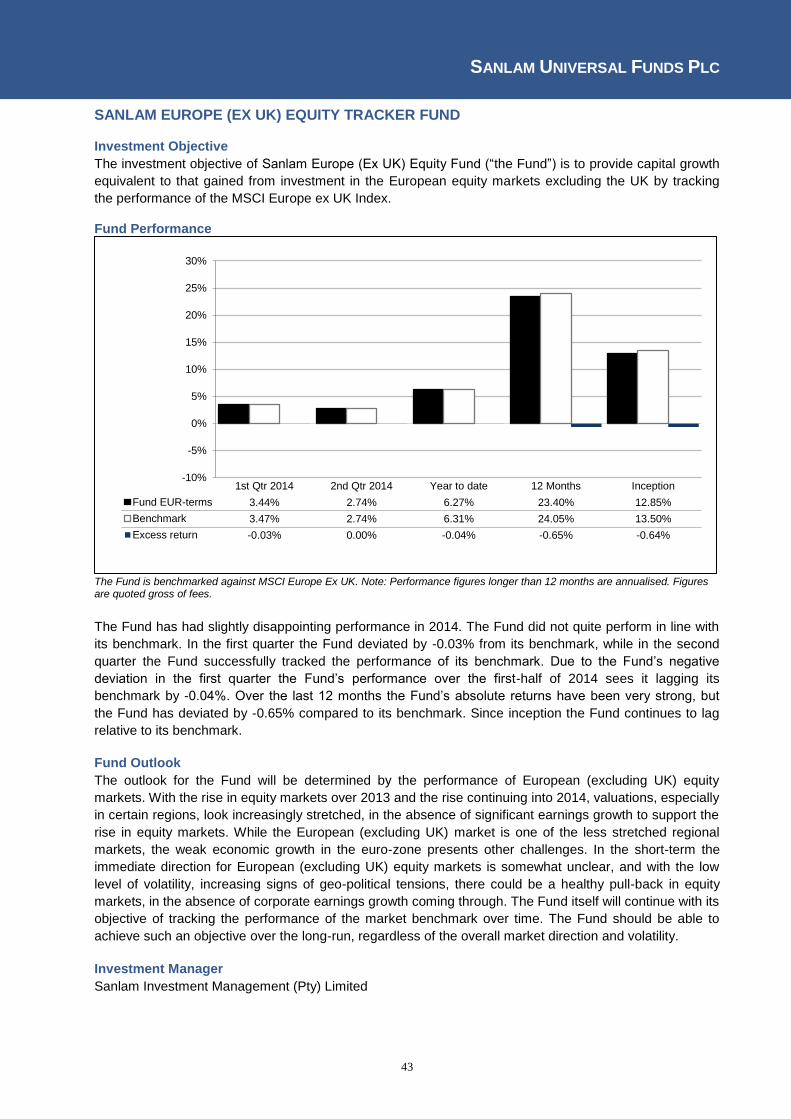
SANLAM UNIVERSAL FUNDS PLC
43
SANLAM EUROPE (EX UK) EQUITY TRACKER FUND Investment Objective
The investment objective of Sanlam Europe (Ex UK) Equity Fund (“the Fund”) is to provide capital growth
equivalent to that gained from investment in the European equity markets excluding the UK by tracking
the performance of the MSCI Europe ex UK Index. Fund Performance
The Fund is benchmarked against MSCI Europe Ex UK. Note: Performance figures longer than 12 months are annualised. Figures are quoted gross of fees.
The Fund has had slightly disappointing performance in 2014. The Fund did not quite perform in line with
its benchmark. In the first quarter the Fund deviated by -0.03% from its benchmark, while in the second
quarter the Fund successfully tracked the performance of its benchmark. Due to the Fund’s negative
deviation in the first quarter the Fund’s performance over the first-half of 2014 sees it lagging its
benchmark by -0.04%. Over the last 12 months the Fund’s absolute returns have been very strong, but
the Fund has deviated by -0.65% compared to its benchmark. Since inception the Fund continues to lag
relative to its benchmark.
Fund Outlook
The outlook for the Fund will be determined by the performance of European (excluding UK) equity
markets. With the rise in equity markets over 2013 and the rise continuing into 2014, valuations, especially
in certain regions, look increasingly stretched, in the absence of significant earnings growth to support the
rise in equity markets. While the European (excluding UK) market is one of the less stretched regional
markets, the weak economic growth in the euro-zone presents other challenges. In the short-term the
immediate direction for European (excluding UK) equity markets is somewhat unclear, and with the low
level of volatility, increasing signs of geo-political tensions, there could be a healthy pull-back in equity
markets, in the absence of corporate earnings growth coming through. The Fund itself will continue with its
objective of tracking the performance of the market benchmark over time. The Fund should be able to
achieve such an objective over the long-run, regardless of the overall market direction and volatility.
Investment Manager
Sanlam Investment Management (Pty) Limited
-10%
-5%
0%
5%
10%
15%
20%
25%
30%
1st Qtr 2014 2nd Qtr 2014 Year to date 12 Months Inception
Fund EUR-terms 3.44% 2.74% 6.27% 23.40% 12.85%
Benchmark 3.47% 2.74% 6.31% 24.05% 13.50%
Excess return -0.03% 0.00% -0.04% -0.65% -0.64%
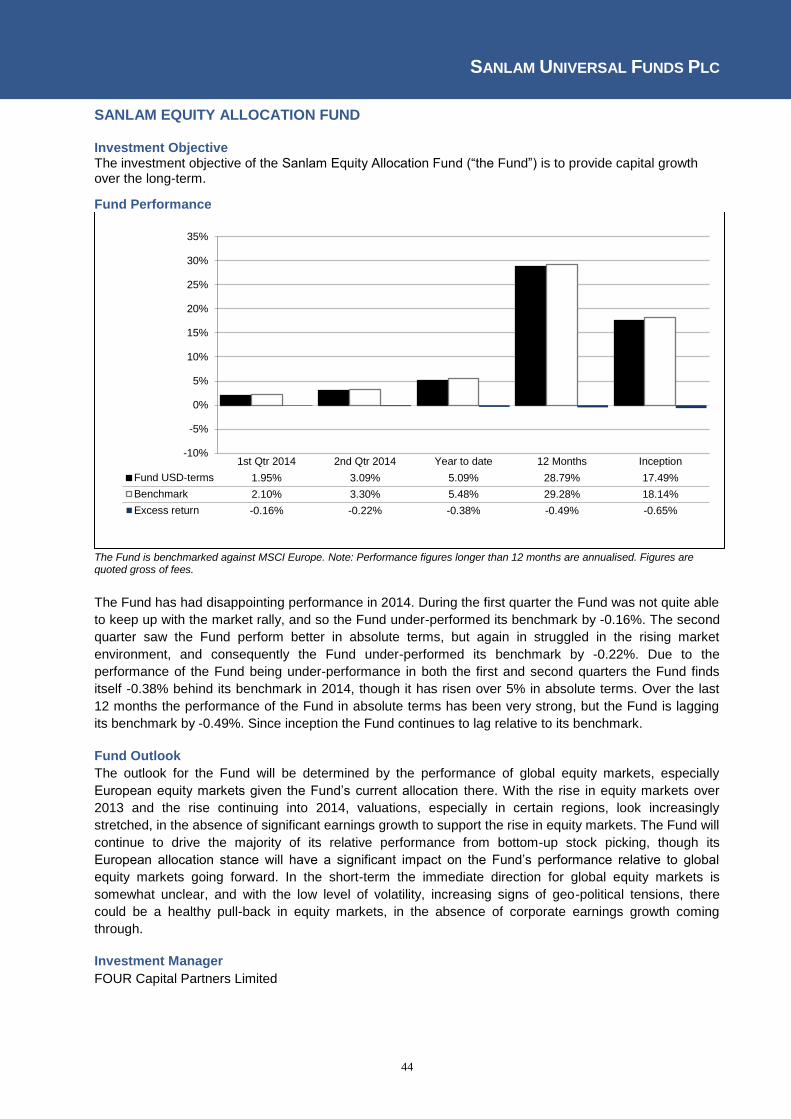
SANLAM UNIVERSAL FUNDS PLC
44
SANLAM EQUITY ALLOCATION FUND Investment Objective The investment objective of the Sanlam Equity Allocation Fund (“the Fund”) is to provide capital growth over the long-term.
Fund Performance
The Fund is benchmarked against MSCI Europe. Note: Performance figures longer than 12 months are annualised. Figures are quoted gross of fees.
The Fund has had disappointing performance in 2014. During the first quarter the Fund was not quite able
to keep up with the market rally, and so the Fund under-performed its benchmark by -0.16%. The second
quarter saw the Fund perform better in absolute terms, but again in struggled in the rising market
environment, and consequently the Fund under-performed its benchmark by -0.22%. Due to the
performance of the Fund being under-performance in both the first and second quarters the Fund finds
itself -0.38% behind its benchmark in 2014, though it has risen over 5% in absolute terms. Over the last
12 months the performance of the Fund in absolute terms has been very strong, but the Fund is lagging
its benchmark by -0.49%. Since inception the Fund continues to lag relative to its benchmark.
Fund Outlook
The outlook for the Fund will be determined by the performance of global equity markets, especially
European equity markets given the Fund’s current allocation there. With the rise in equity markets over
2013 and the rise continuing into 2014, valuations, especially in certain regions, look increasingly
stretched, in the absence of significant earnings growth to support the rise in equity markets. The Fund will
continue to drive the majority of its relative performance from bottom-up stock picking, though its
European allocation stance will have a significant impact on the Fund’s performance relative to global
equity markets going forward. In the short-term the immediate direction for global equity markets is
somewhat unclear, and with the low level of volatility, increasing signs of geo-political tensions, there
could be a healthy pull-back in equity markets, in the absence of corporate earnings growth coming
through.
Investment Manager
FOUR Capital Partners Limited
-10%
-5%
0%
5%
10%
15%
20%
25%
30%
35%
1st Qtr 2014 2nd Qtr 2014 Year to date 12 Months Inception
Fund USD-terms 1.95% 3.09% 5.09% 28.79% 17.49%
Benchmark 2.10% 3.30% 5.48% 29.28% 18.14%
Excess return -0.16% -0.22% -0.38% -0.49% -0.65%
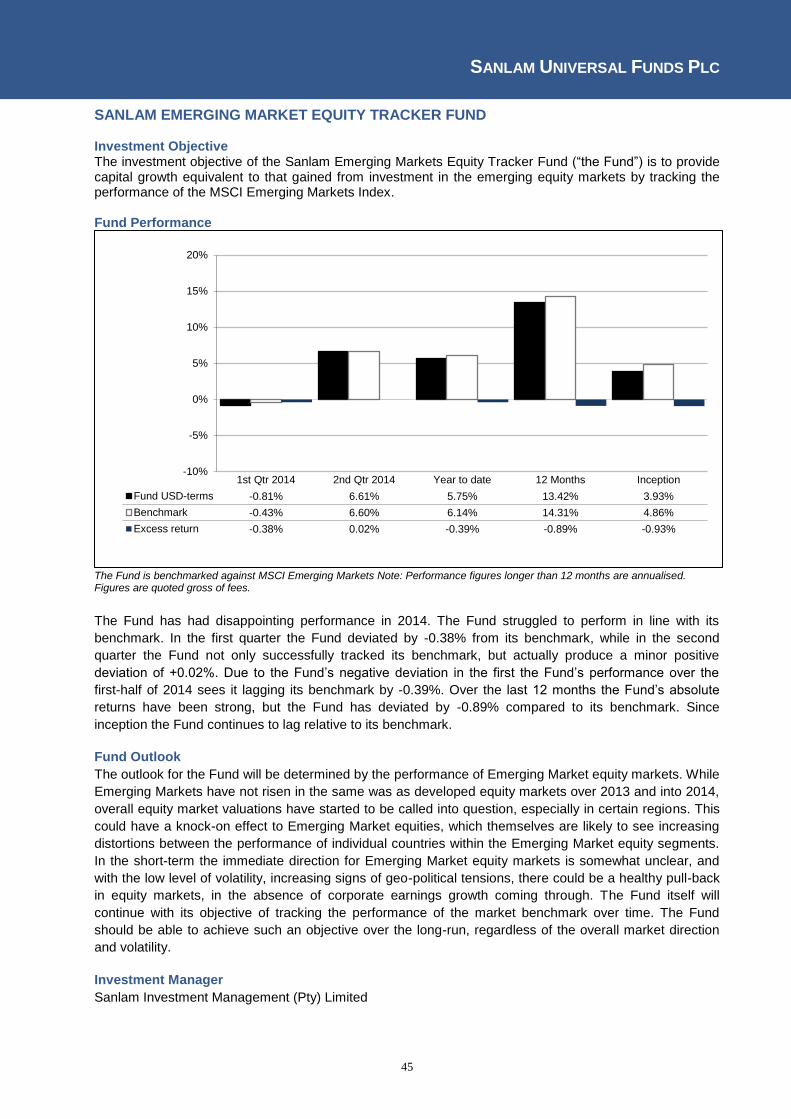
SANLAM UNIVERSAL FUNDS PLC
45
SANLAM EMERGING MARKET EQUITY TRACKER FUND Investment Objective The investment objective of the Sanlam Emerging Markets Equity Tracker Fund (“the Fund”) is to provide capital growth equivalent to that gained from investment in the emerging equity markets by tracking the performance of the MSCI Emerging Markets Index. Fund Performance
The Fund is benchmarked against MSCI Emerging Markets Note: Performance figures longer than 12 months are annualised. Figures are quoted gross of fees.
The Fund has had disappointing performance in 2014. The Fund struggled to perform in line with its
benchmark. In the first quarter the Fund deviated by -0.38% from its benchmark, while in the second
quarter the Fund not only successfully tracked its benchmark, but actually produce a minor positive
deviation of +0.02%. Due to the Fund’s negative deviation in the first the Fund’s performance over the
first-half of 2014 sees it lagging its benchmark by -0.39%. Over the last 12 months the Fund’s absolute
returns have been strong, but the Fund has deviated by -0.89% compared to its benchmark. Since
inception the Fund continues to lag relative to its benchmark.
Fund Outlook
The outlook for the Fund will be determined by the performance of Emerging Market equity markets. While
Emerging Markets have not risen in the same was as developed equity markets over 2013 and into 2014,
overall equity market valuations have started to be called into question, especially in certain regions. This
could have a knock-on effect to Emerging Market equities, which themselves are likely to see increasing
distortions between the performance of individual countries within the Emerging Market equity segments.
In the short-term the immediate direction for Emerging Market equity markets is somewhat unclear, and
with the low level of volatility, increasing signs of geo-political tensions, there could be a healthy pull-back
in equity markets, in the absence of corporate earnings growth coming through. The Fund itself will
continue with its objective of tracking the performance of the market benchmark over time. The Fund
should be able to achieve such an objective over the long-run, regardless of the overall market direction
and volatility.
Investment Manager
Sanlam Investment Management (Pty) Limited
-10%
-5%
0%
5%
10%
15%
20%
1st Qtr 2014 2nd Qtr 2014 Year to date 12 Months Inception
Fund USD-terms -0.81% 6.61% 5.75% 13.42% 3.93%
Benchmark -0.43% 6.60% 6.14% 14.31% 4.86%
Excess return -0.38% 0.02% -0.39% -0.89% -0.93%

SANLAM UNIVERSAL FUNDS PLC
46
SANLAM P2STRATEGIES GLOBAL FUND
Investment Objective The investment objective of the Sanlam P2strategies Global Fund (“the Fund”) is to provide long term capital growth through exposure to world equity markets. The Fund also utilises a risk management strategy designed to reduce volatility and minimise losses in declining markets. Income will not be a consideration.
Fund Performance
The Fund is benchmarked against a composite of Sanlam World Equity Tracker (60%) and 3-Month USD LIBOR (40%). Note: Fund inception date is 1st July 2013.
In April 2014, an appropriate benchmark was added that provides advisors and clients with a more realistic expectation of how the P2strategies Global Fund should perform. The Fund outperformed the benchmark for the six months ending on 30th June 2014, returning 5.63% vs. 3.86%. This equates to an outperformance of 1.78%. The outperformance was due to a slightly higher allocation to equity than the benchmark.
Fund Outlook The P2strategies Funds do not take a forward looking view of the equity markets due to the nature of the investment strategy. However, an outlook of the underlying index tracker fund used in the P2strategies Fund can be viewed in that fund’s investment outlook. Below illustrates the intended behaviour of P2strategies in different market conditions.
Performance in rising markets P2strategies will rise, albeit not to the same degree as the markets. The reason for this is that during a rising market a proportion of the investment will be invested in assets which fall in value as markets rise. It is these assets which provide the “smoothing” effect.
Performance in falling markets It is anticipated that the P2strategies will most likely outperform from a return perspective versus the stock markets as the P2account will cushion the decline. The overall value of the investment is likely to fall, but not by as much as would have been the case without the cushioning effect of the P2account. Please note that the P2account is not intended to provide a cushion against sudden and extreme market falls (for example, those brought about by a catastrophic event such as 9/11). It is anticipated that over the long-term the P2strategies will “smooth” the investment experience, and provide better risk adjusted returns over multiple market cycles.
Investment Managers
Sanlam International Investments Limited Milliman Financial Strategies Ltd
-20%
-15%
-10%
-5%
0%
5%
10%
15%
20%
25%
1st Qtr 2014 2nd Qtr 2014 Year to date 12 Months Inception
Fund USD-terms 1.12% 4.46% 5.63% 16.37% 16.37%
Benchmark 0.81% 3.02% 3.86% 14.09% 14.09%
Excess return 0.31% 1.44% 1.78% 2.28% 2.28%
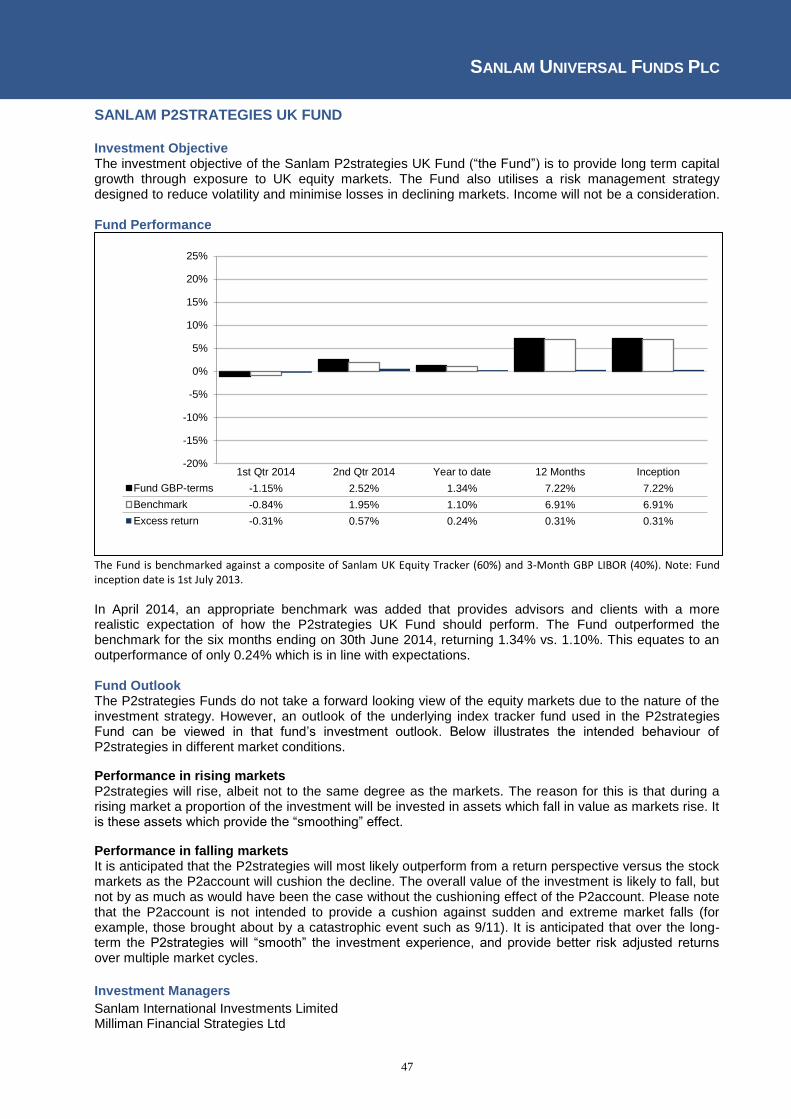
SANLAM UNIVERSAL FUNDS PLC
47
SANLAM P2STRATEGIES UK FUND
Investment Objective The investment objective of the Sanlam P2strategies UK Fund (“the Fund”) is to provide long term capital growth through exposure to UK equity markets. The Fund also utilises a risk management strategy designed to reduce volatility and minimise losses in declining markets. Income will not be a consideration. Fund Performance
The Fund is benchmarked against a composite of Sanlam UK Equity Tracker (60%) and 3-Month GBP LIBOR (40%). Note: Fund inception date is 1st July 2013.
In April 2014, an appropriate benchmark was added that provides advisors and clients with a more realistic expectation of how the P2strategies UK Fund should perform. The Fund outperformed the benchmark for the six months ending on 30th June 2014, returning 1.34% vs. 1.10%. This equates to an outperformance of only 0.24% which is in line with expectations. Fund Outlook The P2strategies Funds do not take a forward looking view of the equity markets due to the nature of the investment strategy. However, an outlook of the underlying index tracker fund used in the P2strategies Fund can be viewed in that fund’s investment outlook. Below illustrates the intended behaviour of P2strategies in different market conditions.
Performance in rising markets P2strategies will rise, albeit not to the same degree as the markets. The reason for this is that during a rising market a proportion of the investment will be invested in assets which fall in value as markets rise. It is these assets which provide the “smoothing” effect.
Performance in falling markets It is anticipated that the P2strategies will most likely outperform from a return perspective versus the stock markets as the P2account will cushion the decline. The overall value of the investment is likely to fall, but not by as much as would have been the case without the cushioning effect of the P2account. Please note that the P2account is not intended to provide a cushion against sudden and extreme market falls (for example, those brought about by a catastrophic event such as 9/11). It is anticipated that over the long-term the P2strategies will “smooth” the investment experience, and provide better risk adjusted returns over multiple market cycles.
Investment Managers
Sanlam International Investments Limited Milliman Financial Strategies Ltd
-20%
-15%
-10%
-5%
0%
5%
10%
15%
20%
25%
1st Qtr 2014 2nd Qtr 2014 Year to date 12 Months Inception
Fund GBP-terms -1.15% 2.52% 1.34% 7.22% 7.22%
Benchmark -0.84% 1.95% 1.10% 6.91% 6.91%
Excess return -0.31% 0.57% 0.24% 0.31% 0.31%
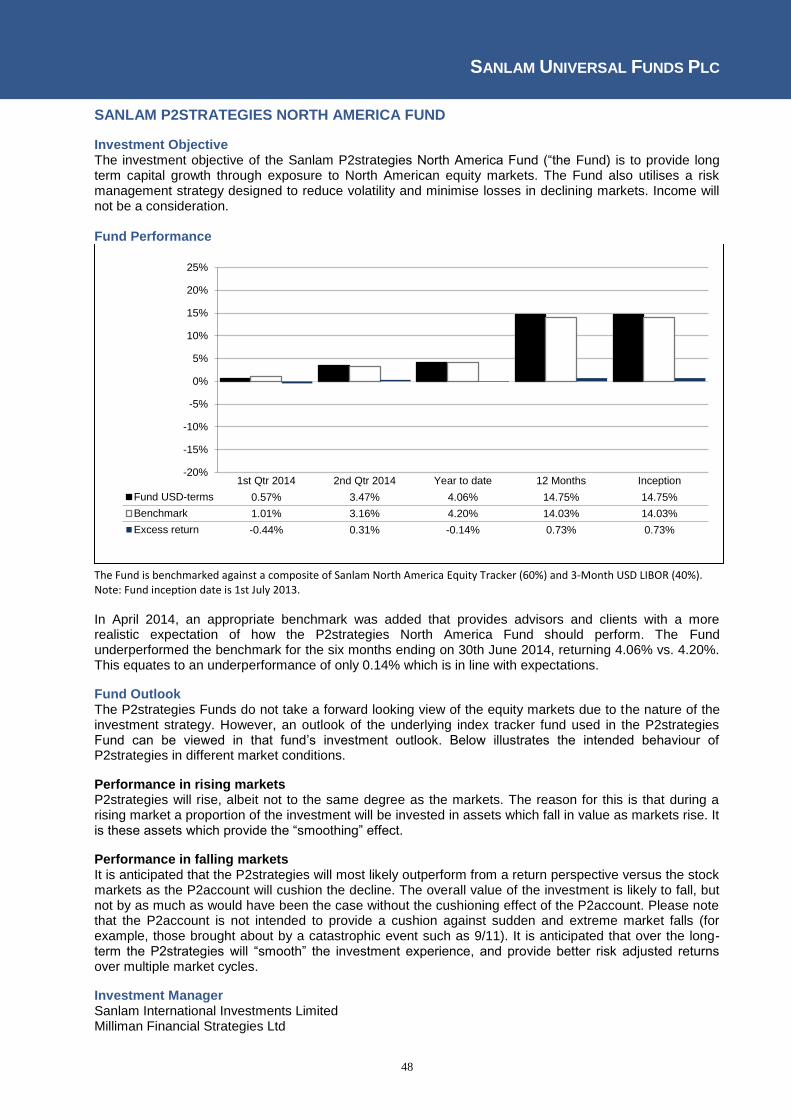
SANLAM UNIVERSAL FUNDS PLC
48
SANLAM P2STRATEGIES NORTH AMERICA FUND
Investment Objective The investment objective of the Sanlam P2strategies North America Fund (“the Fund) is to provide long term capital growth through exposure to North American equity markets. The Fund also utilises a risk management strategy designed to reduce volatility and minimise losses in declining markets. Income will not be a consideration. Fund Performance
The Fund is benchmarked against a composite of Sanlam North America Equity Tracker (60%) and 3-Month USD LIBOR (40%). Note: Fund inception date is 1st July 2013.
In April 2014, an appropriate benchmark was added that provides advisors and clients with a more realistic expectation of how the P2strategies North America Fund should perform. The Fund underperformed the benchmark for the six months ending on 30th June 2014, returning 4.06% vs. 4.20%. This equates to an underperformance of only 0.14% which is in line with expectations.
Fund Outlook The P2strategies Funds do not take a forward looking view of the equity markets due to the nature of the investment strategy. However, an outlook of the underlying index tracker fund used in the P2strategies Fund can be viewed in that fund’s investment outlook. Below illustrates the intended behaviour of P2strategies in different market conditions.
Performance in rising markets P2strategies will rise, albeit not to the same degree as the markets. The reason for this is that during a rising market a proportion of the investment will be invested in assets which fall in value as markets rise. It is these assets which provide the “smoothing” effect.
Performance in falling markets It is anticipated that the P2strategies will most likely outperform from a return perspective versus the stock markets as the P2account will cushion the decline. The overall value of the investment is likely to fall, but not by as much as would have been the case without the cushioning effect of the P2account. Please note that the P2account is not intended to provide a cushion against sudden and extreme market falls (for example, those brought about by a catastrophic event such as 9/11). It is anticipated that over the long-term the P2strategies will “smooth” the investment experience, and provide better risk adjusted returns over multiple market cycles.
Investment Manager
Sanlam International Investments Limited Milliman Financial Strategies Ltd
-20%
-15%
-10%
-5%
0%
5%
10%
15%
20%
25%
1st Qtr 2014 2nd Qtr 2014 Year to date 12 Months Inception
Fund USD-terms 0.57% 3.47% 4.06% 14.75% 14.75%
Benchmark 1.01% 3.16% 4.20% 14.03% 14.03%
Excess return -0.44% 0.31% -0.14% 0.73% 0.73%
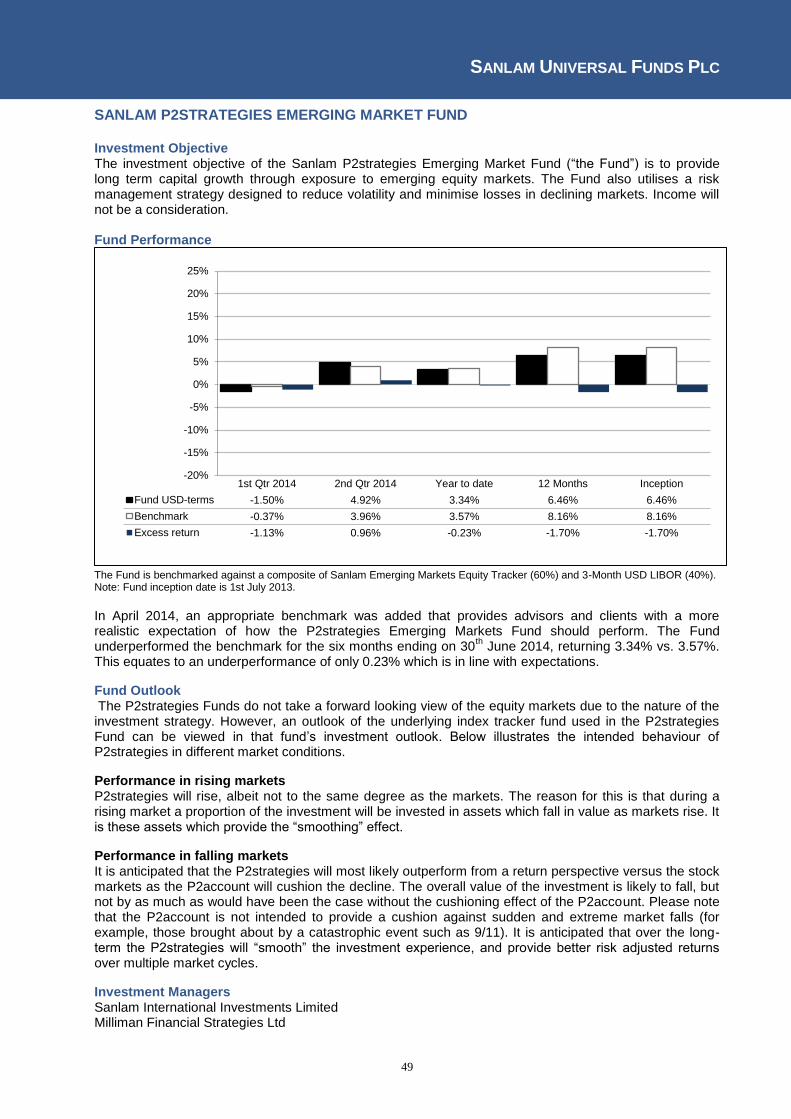
SANLAM UNIVERSAL FUNDS PLC
49
SANLAM P2STRATEGIES EMERGING MARKET FUND
Investment Objective The investment objective of the Sanlam P2strategies Emerging Market Fund (“the Fund”) is to provide long term capital growth through exposure to emerging equity markets. The Fund also utilises a risk management strategy designed to reduce volatility and minimise losses in declining markets. Income will not be a consideration. Fund Performance
The Fund is benchmarked against a composite of Sanlam Emerging Markets Equity Tracker (60%) and 3-Month USD LIBOR (40%). Note: Fund inception date is 1st July 2013.
In April 2014, an appropriate benchmark was added that provides advisors and clients with a more realistic expectation of how the P2strategies Emerging Markets Fund should perform. The Fund underperformed the benchmark for the six months ending on 30
th June 2014, returning 3.34% vs. 3.57%.
This equates to an underperformance of only 0.23% which is in line with expectations.
Fund Outlook The P2strategies Funds do not take a forward looking view of the equity markets due to the nature of the investment strategy. However, an outlook of the underlying index tracker fund used in the P2strategies Fund can be viewed in that fund’s investment outlook. Below illustrates the intended behaviour of P2strategies in different market conditions.
Performance in rising markets P2strategies will rise, albeit not to the same degree as the markets. The reason for this is that during a rising market a proportion of the investment will be invested in assets which fall in value as markets rise. It is these assets which provide the “smoothing” effect.
Performance in falling markets It is anticipated that the P2strategies will most likely outperform from a return perspective versus the stock markets as the P2account will cushion the decline. The overall value of the investment is likely to fall, but not by as much as would have been the case without the cushioning effect of the P2account. Please note that the P2account is not intended to provide a cushion against sudden and extreme market falls (for example, those brought about by a catastrophic event such as 9/11). It is anticipated that over the long-term the P2strategies will “smooth” the investment experience, and provide better risk adjusted returns over multiple market cycles.
Investment Managers Sanlam International Investments Limited Milliman Financial Strategies Ltd
-20%
-15%
-10%
-5%
0%
5%
10%
15%
20%
25%
1st Qtr 2014 2nd Qtr 2014 Year to date 12 Months Inception
Fund USD-terms -1.50% 4.92% 3.34% 6.46% 6.46%
Benchmark -0.37% 3.96% 3.57% 8.16% 8.16%
Excess return -1.13% 0.96% -0.23% -1.70% -1.70%
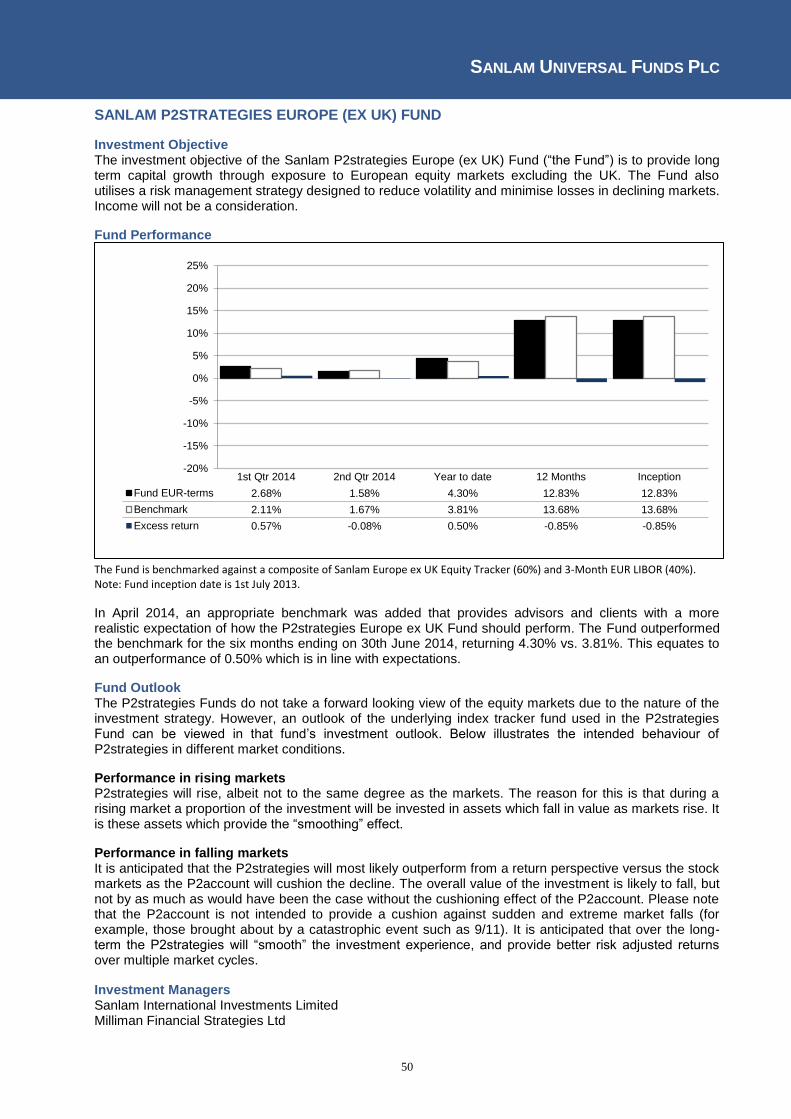
SANLAM UNIVERSAL FUNDS PLC
50
SANLAM P2STRATEGIES EUROPE (EX UK) FUND
Investment Objective The investment objective of the Sanlam P2strategies Europe (ex UK) Fund (“the Fund”) is to provide long term capital growth through exposure to European equity markets excluding the UK. The Fund also utilises a risk management strategy designed to reduce volatility and minimise losses in declining markets. Income will not be a consideration.
Fund Performance
The Fund is benchmarked against a composite of Sanlam Europe ex UK Equity Tracker (60%) and 3-Month EUR LIBOR (40%). Note: Fund inception date is 1st July 2013.
In April 2014, an appropriate benchmark was added that provides advisors and clients with a more realistic expectation of how the P2strategies Europe ex UK Fund should perform. The Fund outperformed the benchmark for the six months ending on 30th June 2014, returning 4.30% vs. 3.81%. This equates to an outperformance of 0.50% which is in line with expectations.
Fund Outlook The P2strategies Funds do not take a forward looking view of the equity markets due to the nature of the investment strategy. However, an outlook of the underlying index tracker fund used in the P2strategies Fund can be viewed in that fund’s investment outlook. Below illustrates the intended behaviour of P2strategies in different market conditions.
Performance in rising markets P2strategies will rise, albeit not to the same degree as the markets. The reason for this is that during a rising market a proportion of the investment will be invested in assets which fall in value as markets rise. It is these assets which provide the “smoothing” effect.
Performance in falling markets It is anticipated that the P2strategies will most likely outperform from a return perspective versus the stock markets as the P2account will cushion the decline. The overall value of the investment is likely to fall, but not by as much as would have been the case without the cushioning effect of the P2account. Please note that the P2account is not intended to provide a cushion against sudden and extreme market falls (for example, those brought about by a catastrophic event such as 9/11). It is anticipated that over the long-term the P2strategies will “smooth” the investment experience, and provide better risk adjusted returns over multiple market cycles.
Investment Managers
Sanlam International Investments Limited Milliman Financial Strategies Ltd
-20%
-15%
-10%
-5%
0%
5%
10%
15%
20%
25%
1st Qtr 2014 2nd Qtr 2014 Year to date 12 Months Inception
Fund EUR-terms 2.68% 1.58% 4.30% 12.83% 12.83%
Benchmark 2.11% 1.67% 3.81% 13.68% 13.68%
Excess return 0.57% -0.08% 0.50% -0.85% -0.85%
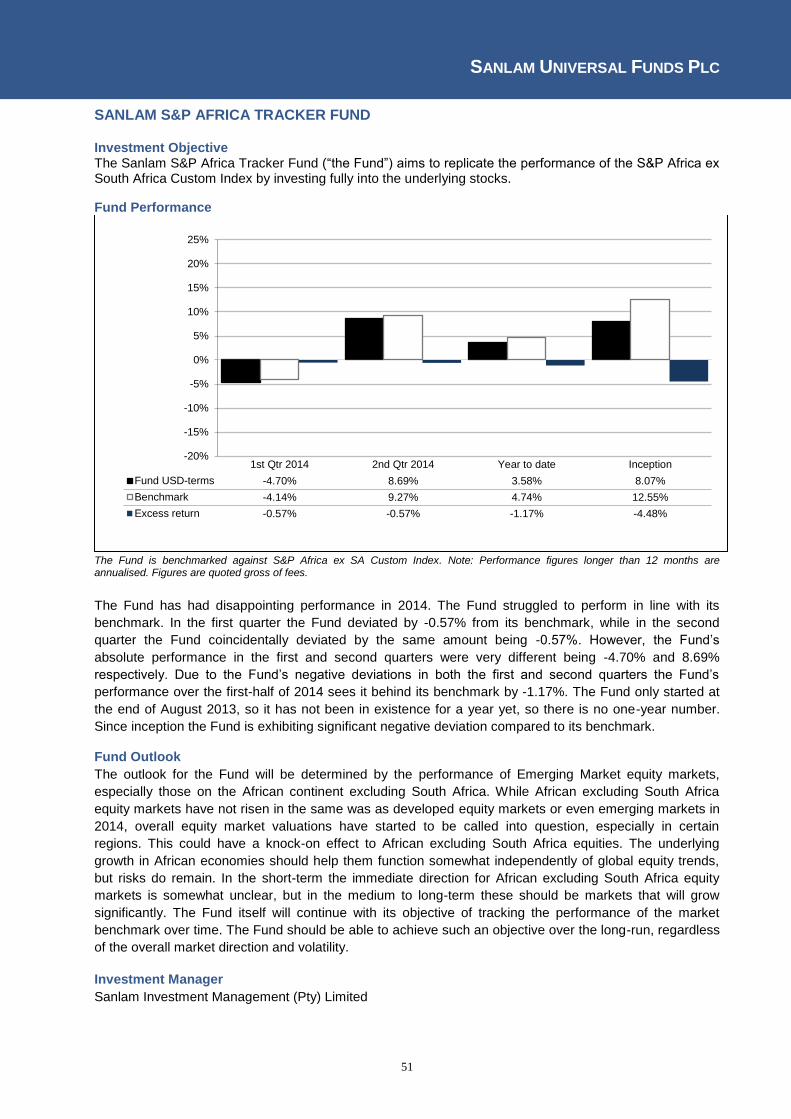
SANLAM UNIVERSAL FUNDS PLC
51
SANLAM S&P AFRICA TRACKER FUND Investment Objective The Sanlam S&P Africa Tracker Fund (“the Fund”) aims to replicate the performance of the S&P Africa ex South Africa Custom Index by investing fully into the underlying stocks.
Fund Performance
The Fund is benchmarked against S&P Africa ex SA Custom Index. Note: Performance figures longer than 12 months are annualised. Figures are quoted gross of fees.
The Fund has had disappointing performance in 2014. The Fund struggled to perform in line with its
benchmark. In the first quarter the Fund deviated by -0.57% from its benchmark, while in the second
quarter the Fund coincidentally deviated by the same amount being -0.57%. However, the Fund’s
absolute performance in the first and second quarters were very different being -4.70% and 8.69%
respectively. Due to the Fund’s negative deviations in both the first and second quarters the Fund’s
performance over the first-half of 2014 sees it behind its benchmark by -1.17%. The Fund only started at
the end of August 2013, so it has not been in existence for a year yet, so there is no one-year number.
Since inception the Fund is exhibiting significant negative deviation compared to its benchmark. Fund Outlook
The outlook for the Fund will be determined by the performance of Emerging Market equity markets,
especially those on the African continent excluding South Africa. While African excluding South Africa
equity markets have not risen in the same was as developed equity markets or even emerging markets in
2014, overall equity market valuations have started to be called into question, especially in certain
regions. This could have a knock-on effect to African excluding South Africa equities. The underlying
growth in African economies should help them function somewhat independently of global equity trends,
but risks do remain. In the short-term the immediate direction for African excluding South Africa equity
markets is somewhat unclear, but in the medium to long-term these should be markets that will grow
significantly. The Fund itself will continue with its objective of tracking the performance of the market
benchmark over time. The Fund should be able to achieve such an objective over the long-run, regardless
of the overall market direction and volatility.
Investment Manager
Sanlam Investment Management (Pty) Limited
-20%
-15%
-10%
-5%
0%
5%
10%
15%
20%
25%
1st Qtr 2014 2nd Qtr 2014 Year to date Inception
Fund USD-terms -4.70% 8.69% 3.58% 8.07%
Benchmark -4.14% 9.27% 4.74% 12.55%
Excess return -0.57% -0.57% -1.17% -4.48%
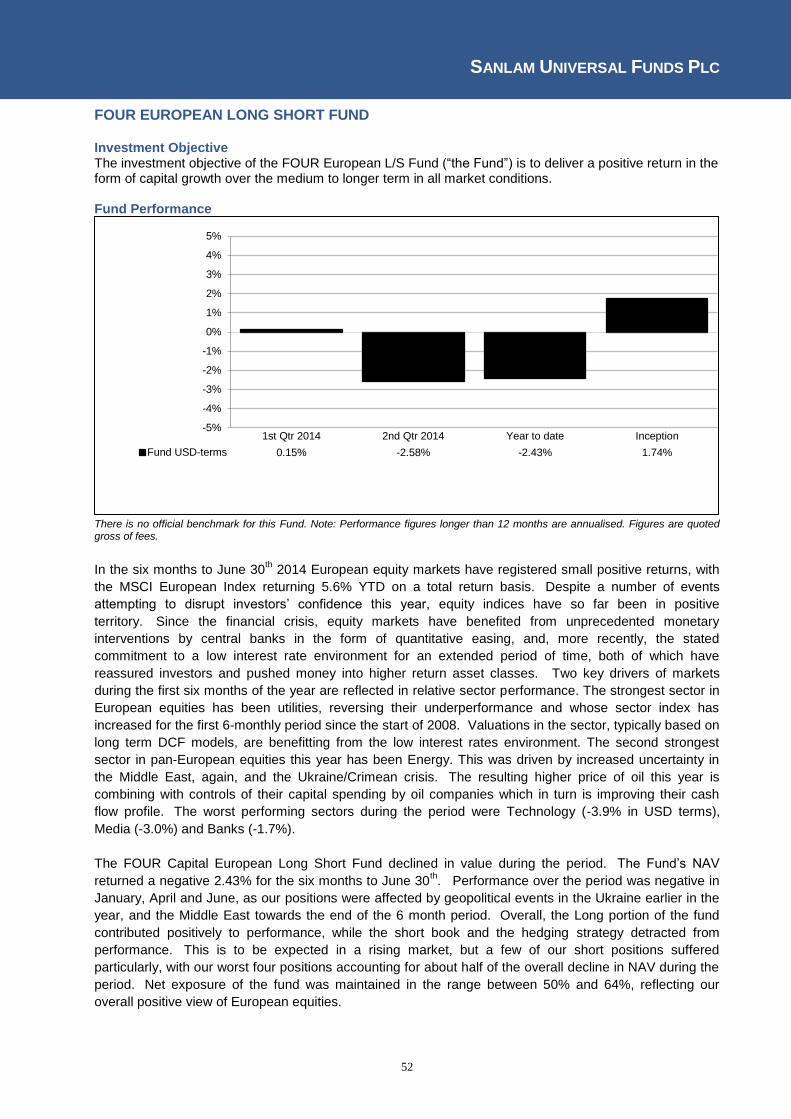
SANLAM UNIVERSAL FUNDS PLC
52
FOUR EUROPEAN LONG SHORT FUND Investment Objective The investment objective of the FOUR European L/S Fund (“the Fund”) is to deliver a positive return in the form of capital growth over the medium to longer term in all market conditions. Fund Performance
There is no official benchmark for this Fund. Note: Performance figures longer than 12 months are annualised. Figures are quoted gross of fees.
In the six months to June 30th 2014 European equity markets have registered small positive returns, with
the MSCI European Index returning 5.6% YTD on a total return basis. Despite a number of events
attempting to disrupt investors’ confidence this year, equity indices have so far been in positive
territory. Since the financial crisis, equity markets have benefited from unprecedented monetary
interventions by central banks in the form of quantitative easing, and, more recently, the stated
commitment to a low interest rate environment for an extended period of time, both of which have
reassured investors and pushed money into higher return asset classes. Two key drivers of markets
during the first six months of the year are reflected in relative sector performance. The strongest sector in
European equities has been utilities, reversing their underperformance and whose sector index has
increased for the first 6-monthly period since the start of 2008. Valuations in the sector, typically based on
long term DCF models, are benefitting from the low interest rates environment. The second strongest
sector in pan-European equities this year has been Energy. This was driven by increased uncertainty in
the Middle East, again, and the Ukraine/Crimean crisis. The resulting higher price of oil this year is
combining with controls of their capital spending by oil companies which in turn is improving their cash
flow profile. The worst performing sectors during the period were Technology (-3.9% in USD terms),
Media (-3.0%) and Banks (-1.7%).
The FOUR Capital European Long Short Fund declined in value during the period. The Fund’s NAV
returned a negative 2.43% for the six months to June 30th. Performance over the period was negative in
January, April and June, as our positions were affected by geopolitical events in the Ukraine earlier in the
year, and the Middle East towards the end of the 6 month period. Overall, the Long portion of the fund
contributed positively to performance, while the short book and the hedging strategy detracted from
performance. This is to be expected in a rising market, but a few of our short positions suffered
particularly, with our worst four positions accounting for about half of the overall decline in NAV during the
period. Net exposure of the fund was maintained in the range between 50% and 64%, reflecting our
overall positive view of European equities.
-5%
-4%
-3%
-2%
-1%
0%
1%
2%
3%
4%
5%
1st Qtr 2014 2nd Qtr 2014 Year to date Inception
Fund USD-terms 0.15% -2.58% -2.43% 1.74%
SANLAM UNIVERSAL FUNDS PLC
53
FOUR EUROPEAN LONG SHORT FUND (CONTINUED)
Fund Outlook
The rise in equity markets in recent years has been accompanied by higher valuations, and while
comparisons with history suggest that European equities are not especially expensive, neither can it be
claimed that they are particularly cheap. It can therefore be expected that further market rises will be
driven by earnings growth coming through at the company level. We remain focused on identifying such
opportunities.
Investment Manager
FOUR Capital Partners Limited

SANLAM UNIVERSAL FUNDS PLC
54
SPI GLOBAL HIGH QUALITY FUND Investment Objective
The SPI Global High Quality Fund (the “Fund”) aims to produce compounded total returns in excess of the
MSCI World index over the medium to long term, through a concentrated portfolio of high quality stocks,
using our proprietary quantitative screening process combined with rigorous fundamental research.
Fund Performance
The Fund is benchmarked against MSCI World Total Return Index (NDDUWI). Note: Performance figures longer than 12 months are annualised. Figures are quoted gross of fees.
The Fund has outperformed the market since inception with the net asset value increasing by 2.83%
compared to a gain of 2.71% for the comparative benchmark, the MSCI World Total Return Index. The
second quarter proved a difficult period for the Fund on a relative basis despite posting an absolute return
of +1.19%. The Fund’s allocation to consumer staples and information technology and limited exposure to
financials contributed to the relative under performance. The energy and utility sectors have performed
strongly this year and the Fund has no exposure to any companies in these sectors. Instead we prefer
exposure to certain stocks in the materials and industrials sectors where the firms have clear pricing
power due to their industry positioning, for example Syngenta (crop protection and seeds) and Intertek
(testing and inspection industry).
-20%
-15%
-10%
-5%
0%
5%
10%
15%
20%
25%
1st Qtr 2014 2nd Qtr 2014 Year to date 12 Months Inception
Fund USD-terms 1.62% 1.19% 2.83% 2.83% 7.96%
Benchmark 0.43% 2.27% 2.71% 2.71% 7.55%
Excess return 1.19% -1.08% 0.12% 0.12% 0.41%
SANLAM UNIVERSAL FUNDS PLC
55
SPI GLOBAL HIGH QUALITY FUND (CONTINUED)
Fund Outlook
Global equity markets continue to perform robustly this year, amid low volatility and Central Bank action.
This year has not gone quite according to script as sterling has been stronger than we expected versus
the US dollar. Emerging markets have rebounded strongly, yet the market seems unfazed by underlying
risks. Economic momentum continues along a slightly more positive path than at the outset of the year.
Revisions of weather-hit US Q1 GDP estimates were very poor and have probably served to downgrade
expectations for 2014 as a whole. Overall, the outlook for equities remains constructive over the longer
term; albeit the question of whether financial markets are prepared for the Fed tightening from the middle
2015 is open to debate. With stronger-than-expected reported earnings, forward earnings estimates have
been revised upwards, supporting equities. That said our return expectations over the short-term are
muted, as last years’ “taper tantrum” faded from memory. The backdrop of easy money and low inflation
has contributed to valuations moving up to uneasy levels. Ominously, volatility remains very low yet
investors have been rotating into energy and utilities stocks which seems an inappropriate strategy if
interest rates are set to increase. We continue to focus on companies that typically have strong balance
sheets enabling comfortable debt servicing, high cash returns on assets, and relatively low capital
requirements.
For our companies, free cash flows are growing at a reasonable pace and balance sheets are in good
shape. An example of an attractively priced business is Oracle. During its recent results announcement
management highlighted the $10bn recurring cloud software revenue growth opportunity in which Oracle
has just shy of 5% market share. Oracle, with its large installed customer base trades at only 13 times
earnings for next year, has a significant buy back program and maintains a 25% return on equity.
Investment Manager
Sanlam Private Investments (UK) Limited
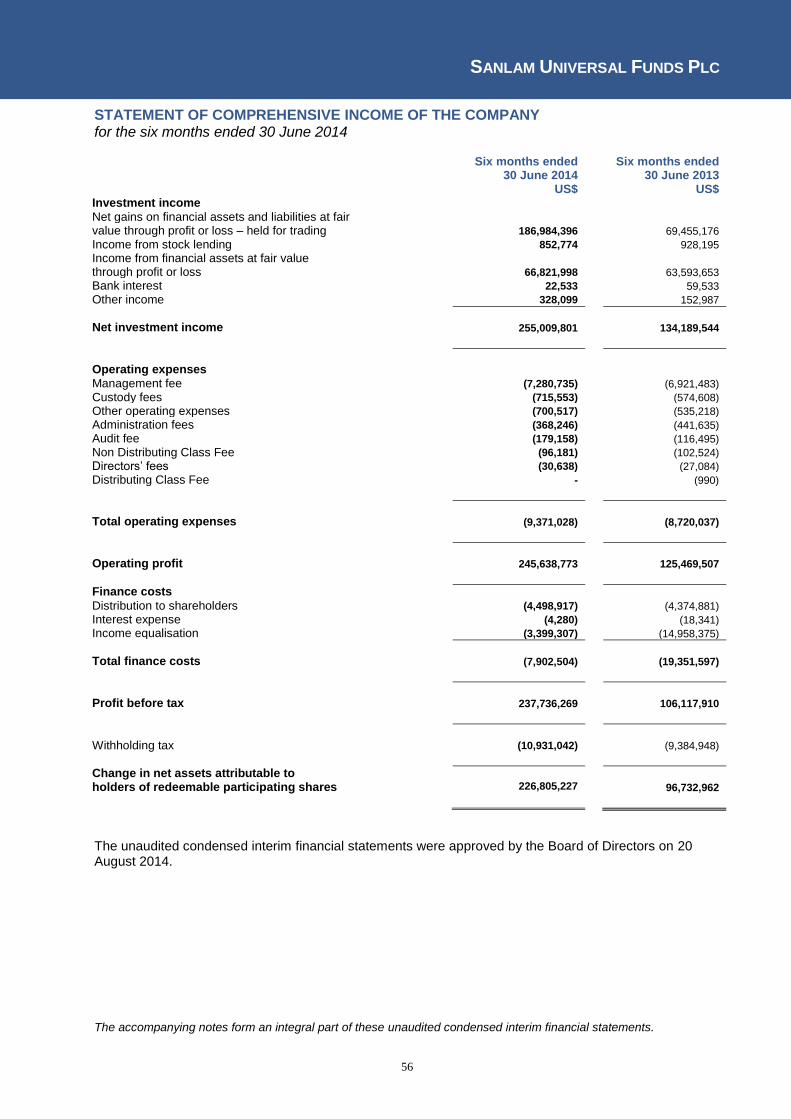
SANLAM UNIVERSAL FUNDS PLC
56
STATEMENT OF COMPREHENSIVE INCOME OF THE COMPANY for the six months ended 30 June 2014
Six months ended
30 June 2014 Six months ended
30 June 2013
US$ US$ Investment income
Net gains on financial assets and liabilities at fair
value through profit or loss – held for trading 186,984,396 69,455,176
Income from stock lending 852,774 928,195
Income from financial assets at fair value
through profit or loss 66,821,998 63,593,653
Bank interest 22,533 59,533
Other income 328,099 152,987
Net investment income 255,009,801 134,189,544
Operating expenses
Management fee (7,280,735) (6,921,483)
Custody fees (715,553) (574,608)
Other operating expenses (700,517) (535,218)
Administration fees (368,246) (441,635)
Audit fee (179,158) (116,495)
Non Distributing Class Fee (96,181) (102,524)
Directors’ fees (30,638) (27,084)
Distributing Class Fee - (990)
Total operating expenses (9,371,028) (8,720,037)
Operating profit 245,638,773 125,469,507
Finance costs
Distribution to shareholders (4,498,917) (4,374,881)
Interest expense (4,280) (18,341)
Income equalisation (3,399,307) (14,958,375)
Total finance costs (7,902,504) (19,351,597)
Profit before tax 237,736,269 106,117,910
Withholding tax (10,931,042) (9,384,948)
Change in net assets attributable to
holders of redeemable participating shares 226,805,227 96,732,962
The unaudited condensed interim financial statements were approved by the Board of Directors on 20 August 2014. The accompanying notes form an integral part of these unaudited condensed interim financial statements.
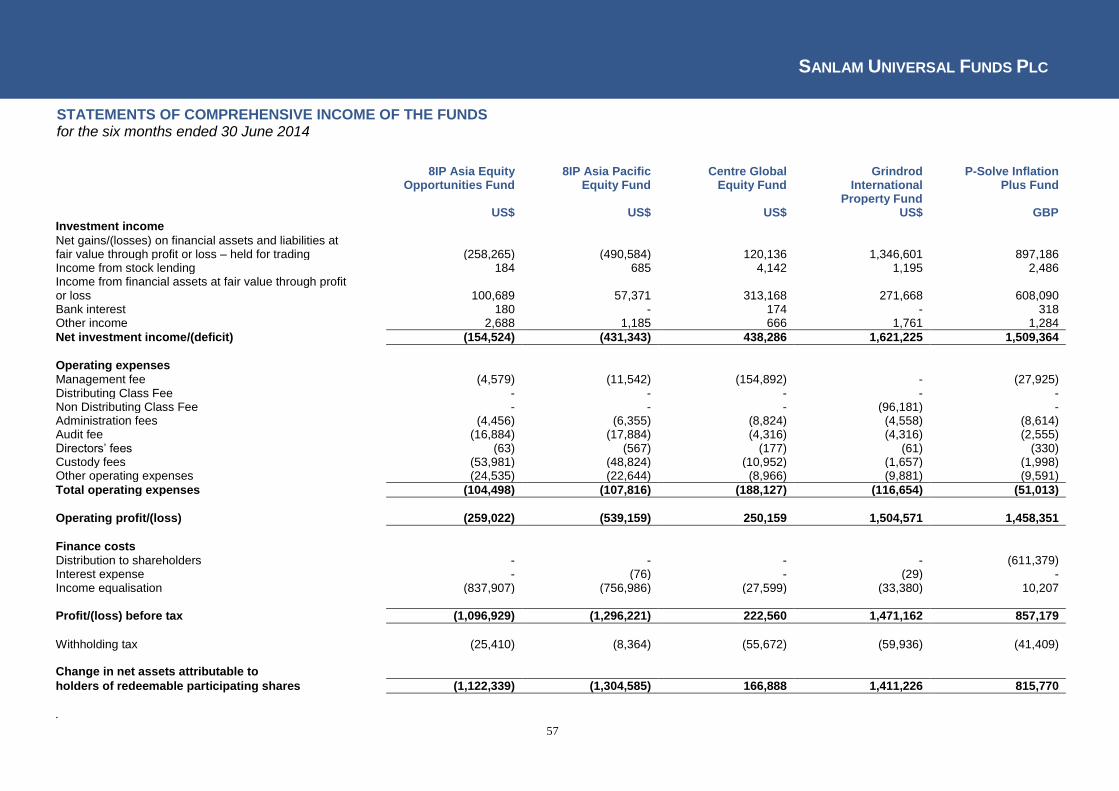
SANLAM UNIVERSAL FUNDS PLC
57
STATEMENTS OF COMPREHENSIVE INCOME OF THE FUNDS for the six months ended 30 June 2014
8IP Asia Equity Opportunities Fund
8IP Asia Pacific Equity Fund
Centre Global Equity Fund
Grindrod International
Property Fund
P-Solve Inflation Plus Fund
US$ US$ US$ US$ GBP Investment income
Net gains/(losses) on financial assets and liabilities at fair value through profit or loss – held for trading (258,265) (490,584) 120,136 1,346,601 897,186 Income from stock lending 184 685 4,142 1,195 2,486 Income from financial assets at fair value through profit or loss 100,689 57,371 313,168 271,668 608,090 Bank interest 180 - 174 - 318 Other income 2,688 1,185 666 1,761 1,284
Net investment income/(deficit) (154,524) (431,343) 438,286 1,621,225 1,509,364
Operating expenses Management fee (4,579) (11,542) (154,892) - (27,925) Distributing Class Fee - - - - - Non Distributing Class Fee - - - (96,181) - Administration fees (4,456) (6,355) (8,824) (4,558) (8,614) Audit fee (16,884) (17,884) (4,316) (4,316) (2,555) Directors’ fees (63) (567) (177) (61) (330) Custody fees (53,981) (48,824) (10,952) (1,657) (1,998) Other operating expenses (24,535) (22,644) (8,966) (9,881) (9,591)
Total operating expenses (104,498) (107,816) (188,127) (116,654) (51,013)
Operating profit/(loss) (259,022) (539,159) 250,159 1,504,571 1,458,351
Finance costs
Distribution to shareholders - - - - (611,379) Interest expense - (76) - (29) - Income equalisation (837,907) (756,986) (27,599) (33,380) 10,207
Profit/(loss) before tax (1,096,929) (1,296,221) 222,560 1,471,162 857,179
Withholding tax (25,410) (8,364) (55,672) (59,936) (41,409) Change in net assets attributable to
holders of redeemable participating shares (1,122,339) (1,304,585) 166,888 1,411,226 815,770
.

SANLAM UNIVERSAL FUNDS PLC
58
STATEMENTS OF COMPREHENSIVE INCOME OF THE FUNDS (CONTINUED) for the six months ended 30 June 2014
Sanlam African Frontier Markets
Fund
Sanlam Global Best Ideas Fund
Sanlam Global Bond Fund
Sanlam Global Financial Fund
Sanlam Global Property Fund
US$ US$ US$ US$ US$ Investment income
Net gains/(losses) on financial assets and liabilities at fair value through profit or loss – held for trading (495,773) 14,376,452 14,647,687 24,678,870 14,366,844 Income from stock lending - 114,263 10,279 7,982 26,676 Income from financial assets fair value through profit or loss through profit or loss 2,641,519 5,676,026 5,366,045 5,185,370 2,978,067 Bank interest 1,128 5,321 1,326 4,206 409 Other income 2,029 73,880 30,007 20,658 1,028
Net investment income/(deficit) 2,148,903 20,245,942 20,055,344 29,897,086 17,373,024
Operating expenses Management fee (382,280) (1,048,812) (458,969) (1,312,213) (174,037) Distributing Class Fee - - - - - Non Distributing Class Fee - - - - - Administration fees (13,140) (54,079) (25,205) (60,267) (11,634) Audit fee (4,316) (8,129) (10,790) (8,129) (4,316) Directors’ fees (309) (3,554) (2,982) (2,239) (507) Custody fees (80,400) (155,200) (7,178) (95,764) (1,656) Other operating expenses (14,031) (73,718) (35,292) (80,431) (18,831)
Total operating expenses (494,476) (1,343,492) (540,416) (1,559,043) (210,981)
Operating profit/(loss) 1,654,427 18,902,450 19,514,928 28,338,043 17,162,043
Finance costs Distribution to shareholders (3,119) (4,246) - (35,152) - Interest expense - - - - - Income equalization 46,510 (4,103,854) 409,587 27,677 (624,590)
Profit/(loss) before tax 1,697,818 14,794,350 19,924,515 28,330,568 16,537,453
Withholding tax (186,769) (1,157,322) (209) (599,236) (756,139) Change in net assets attributable to
holders of redeemable participating shares 1,511,049 13,637,028 19,924,306 27,731,332 15,781,314

SANLAM UNIVERSAL FUNDS PLC
59
STATEMENTS OF COMPREHENSIVE INCOME OF THE FUNDS (CONTINUED) for the six months ended 30 June 2014
Sanlam Strategic
Cash Fund Sanlam World
Equity Fund Sanlam World Equity
Tracker Fund SIIP India
Opportunities Fund SIM Global Equity
Income Fund US$ US$ US$ US$ US$ Investment income
Net gains/(losses) on financial assets and liabilities at fair value through profit or loss – held for trading (281,826) 70,112,282 25,742,423 3,376,824 1,348,993 Income from stock lending 55 327,271 114,135 - 5,209 Income from financial assets at fair value through profit or loss 343,159 23,292,629 6,910,138 104,074 583,243 Bank interest 188 6,679 469 - 159 Other income 2,259 182,897 4,124 1,995 -
Net investment income/(deficit) 63,835 93,921,758 32,771,289 3,482,893 1,937,604
Operating expenses Management fee (20,493) (1,689,134) (892,847) (22,620) (104,291) Distributing Class Fee - - - - - Non Distributing Class Fee - - - - - Administration fees (5,052) (63,430) (27,916) (3,909) (4,246) Audit fee (4,316) (14,386) (3,339) (4,316) (4,316) Directors’ fees (142) (11,988) (1,118) (139) (41) Custody fees (3,499) (158,569) (7,216) (13,634) (2,272) Other operating expenses (9,430) (133,490) (19,870) (22,767) (13,638)
Total operating expenses (42,932) (2,070,997) (952,306) (67,385) (128,804)
Operating profit/(loss) 20,903 91,850,761 31,818,983 3,415,508 1,808,800
Finance costs
Distribution to shareholders - - (111) - (358,553) Interest expense - - - (40) - Income equalisation (502,156) 7,178,582 (2,275,226) (313) 16,688
Profit/(loss) before tax (481,253) 99,029,343 29,543,646 3,415,155 1,466,935
Withholding tax - (4,936,477) (1,443,821) - (79,595) Change in net assets attributable to
holders of redeemable participating shares (481,253) 94,092,866 28,099,825 3,415,155 1,387,340
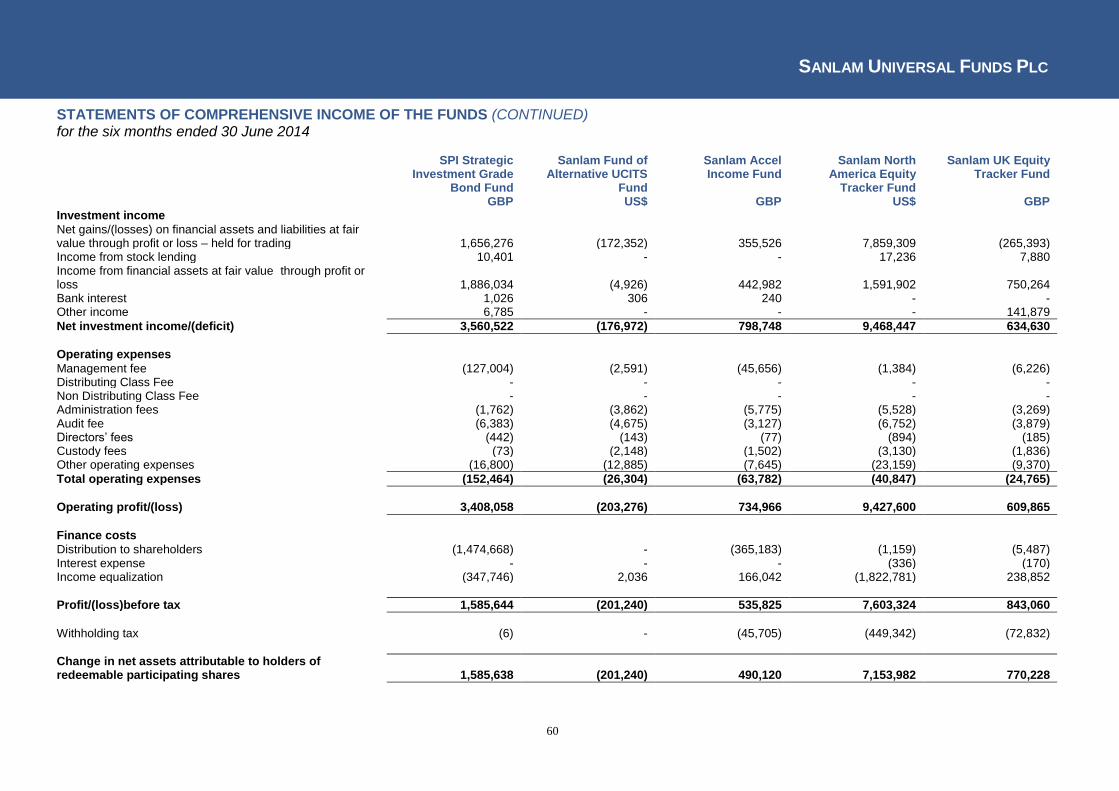
SANLAM UNIVERSAL FUNDS PLC
60
STATEMENTS OF COMPREHENSIVE INCOME OF THE FUNDS (CONTINUED) for the six months ended 30 June 2014
SPI Strategic Investment Grade
Bond Fund
Sanlam Fund of Alternative UCITS
Fund
Sanlam Accel Income Fund
Sanlam North America Equity
Tracker Fund
Sanlam UK Equity Tracker Fund
GBP US$ GBP US$ GBP Investment income
Net gains/(losses) on financial assets and liabilities at fair value through profit or loss – held for trading 1,656,276 (172,352) 355,526 7,859,309 (265,393) Income from stock lending 10,401 - - 17,236 7,880 Income from financial assets at fair value through profit or loss 1,886,034 (4,926) 442,982 1,591,902 750,264 Bank interest 1,026 306 240 - - Other income 6,785 - - - 141,879
Net investment income/(deficit) 3,560,522 (176,972) 798,748 9,468,447 634,630
Operating expenses Management fee (127,004) (2,591) (45,656) (1,384) (6,226) Distributing Class Fee - - - - - Non Distributing Class Fee - - - - - Administration fees (1,762) (3,862) (5,775) (5,528) (3,269) Audit fee (6,383) (4,675) (3,127) (6,752) (3,879) Directors’ fees (442) (143) (77) (894) (185) Custody fees (73) (2,148) (1,502) (3,130) (1,836) Other operating expenses (16,800) (12,885) (7,645) (23,159) (9,370)
Total operating expenses (152,464) (26,304) (63,782) (40,847) (24,765)
Operating profit/(loss) 3,408,058 (203,276) 734,966 9,427,600 609,865
Finance costs
Distribution to shareholders (1,474,668) - (365,183) (1,159) (5,487) Interest expense - - - (336) (170) Income equalization (347,746) 2,036 166,042 (1,822,781) 238,852
Profit/(loss)before tax 1,585,644 (201,240) 535,825 7,603,324 843,060
Withholding tax (6) - (45,705) (449,342) (72,832)
Change in net assets attributable to holders of redeemable participating shares 1,585,638 (201,240) 490,120 7,153,982 770,228
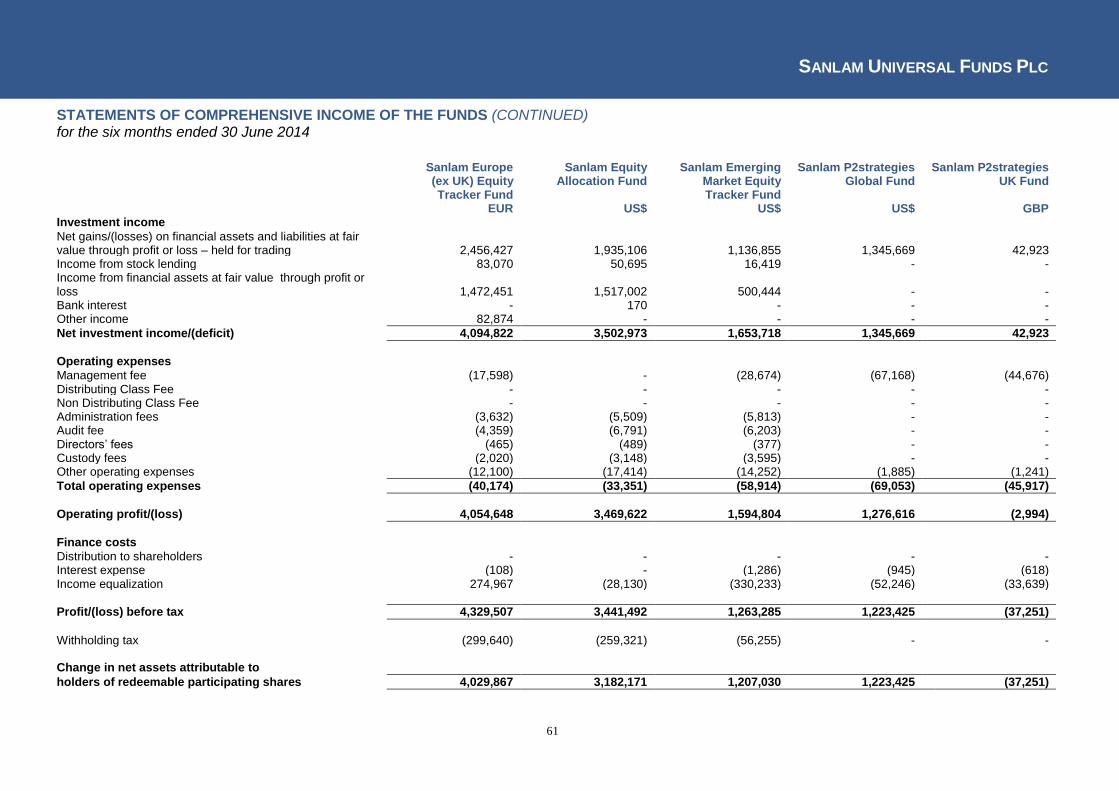
SANLAM UNIVERSAL FUNDS PLC
61
STATEMENTS OF COMPREHENSIVE INCOME OF THE FUNDS (CONTINUED) for the six months ended 30 June 2014
Sanlam Europe (ex UK) Equity Tracker Fund
Sanlam Equity Allocation Fund
Sanlam Emerging Market Equity Tracker Fund
Sanlam P2strategies Global Fund
Sanlam P2strategies UK Fund
EUR US$ US$ US$ GBP Investment income
Net gains/(losses) on financial assets and liabilities at fair value through profit or loss – held for trading 2,456,427 1,935,106 1,136,855 1,345,669 42,923 Income from stock lending 83,070 50,695 16,419 - - Income from financial assets at fair value through profit or loss 1,472,451 1,517,002 500,444 - - Bank interest - 170 - - - Other income 82,874 - - - -
Net investment income/(deficit) 4,094,822 3,502,973 1,653,718 1,345,669 42,923
Operating expenses Management fee (17,598) - (28,674) (67,168) (44,676) Distributing Class Fee - - - - - Non Distributing Class Fee - - - - - Administration fees (3,632) (5,509) (5,813) - - Audit fee (4,359) (6,791) (6,203) - - Directors’ fees (465) (489) (377) - - Custody fees (2,020) (3,148) (3,595) - - Other operating expenses (12,100) (17,414) (14,252) (1,885) (1,241)
Total operating expenses (40,174) (33,351) (58,914) (69,053) (45,917)
Operating profit/(loss) 4,054,648 3,469,622 1,594,804 1,276,616 (2,994)
Finance costs
Distribution to shareholders - - - - - Interest expense (108) - (1,286) (945) (618) Income equalization 274,967 (28,130) (330,233) (52,246) (33,639)
Profit/(loss) before tax 4,329,507 3,441,492 1,263,285 1,223,425 (37,251)
Withholding tax (299,640) (259,321) (56,255) - -
Change in net assets attributable to
holders of redeemable participating shares 4,029,867 3,182,171 1,207,030 1,223,425 (37,251)
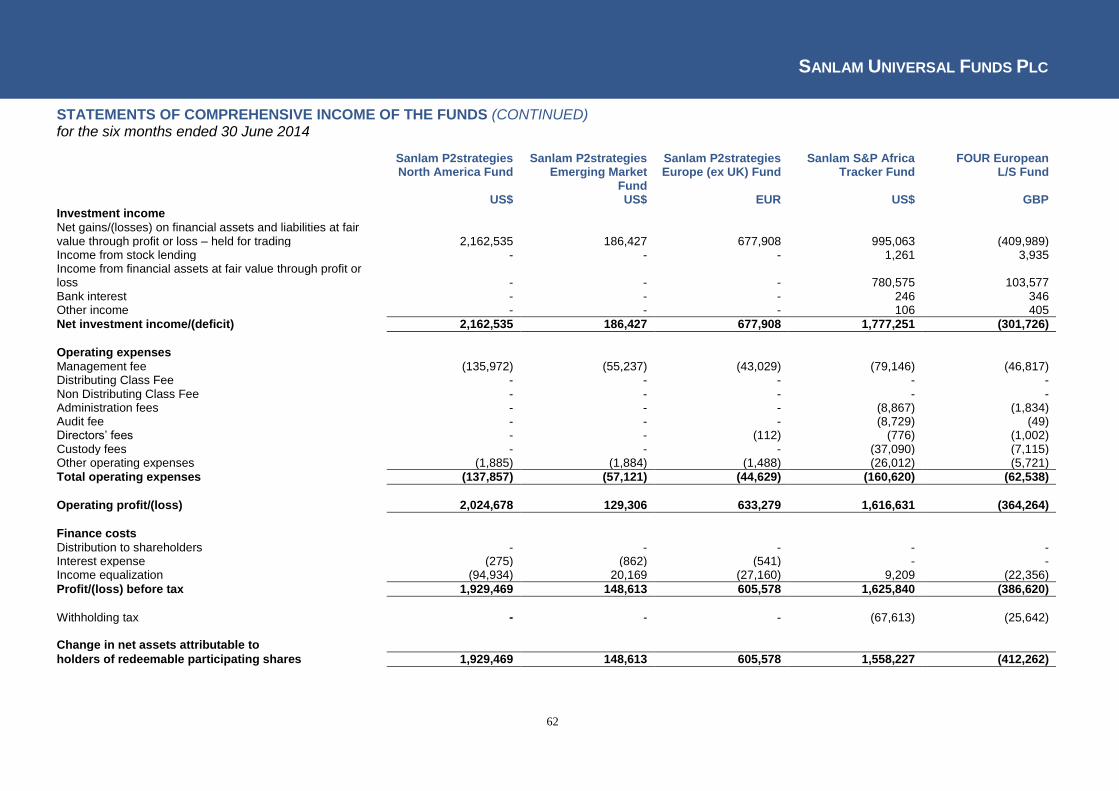
SANLAM UNIVERSAL FUNDS PLC
62
STATEMENTS OF COMPREHENSIVE INCOME OF THE FUNDS (CONTINUED) for the six months ended 30 June 2014
Sanlam P2strategies North America Fund
Sanlam P2strategies Emerging Market
Fund
Sanlam P2strategies Europe (ex UK) Fund
Sanlam S&P Africa Tracker Fund
FOUR European L/S Fund
US$ US$ EUR US$ GBP Investment income
Net gains/(losses) on financial assets and liabilities at fair value through profit or loss – held for trading 2,162,535 186,427 677,908 995,063 (409,989) Income from stock lending - - - 1,261 3,935 Income from financial assets at fair value through profit or loss - - - 780,575 103,577 Bank interest - - - 246 346 Other income - - - 106 405
Net investment income/(deficit) 2,162,535 186,427 677,908 1,777,251 (301,726)
Operating expenses Management fee (135,972) (55,237) (43,029) (79,146) (46,817) Distributing Class Fee - - - - - Non Distributing Class Fee - - - - - Administration fees - - - (8,867) (1,834) Audit fee - - - (8,729) (49) Directors’ fees - - (112) (776) (1,002) Custody fees - - - (37,090) (7,115) Other operating expenses (1,885) (1,884) (1,488) (26,012) (5,721)
Total operating expenses (137,857) (57,121) (44,629) (160,620) (62,538)
Operating profit/(loss) 2,024,678 129,306 633,279 1,616,631 (364,264)
Finance costs
Distribution to shareholders - - - - - Interest expense (275) (862) (541) - - Income equalization (94,934) 20,169 (27,160) 9,209 (22,356)
Profit/(loss) before tax 1,929,469 148,613 605,578 1,625,840 (386,620)
Withholding tax - - - (67,613) (25,642) Change in net assets attributable to
holders of redeemable participating shares 1,929,469 148,613 605,578 1,558,227 (412,262)

SANLAM UNIVERSAL FUNDS PLC
63
STATEMENTS OF COMPREHENSIVE INCOME OF THE FUNDS (CONTINUED) for the six months ended 30 June 2014
SPI Global High
Quality Fund GBP
Investment income
Net gains/(losses) on financial assets and liabilities at fair value through profit or loss – held for trading 326,799 Income from stock lending 33 Income from financial assets at fair value through profit or loss 164,644 Bank interest 39 Other income -
Net investment income/(deficit) 491,515
Operating expenses Management fee (31,992) Distributing Class Fee - Non Distributing Class Fee - Administration fees (3,105) Audit fee (2,167) Directors’ fees (24) Custody fees (1,192) Other operating expenses (6,601)
Total operating expenses (45,081)
Operating profit/(loss) 446,434
Finance costs
Distribution to shareholders - Interest expense - Income equalization 13,209
Profit/(loss) before tax 459,643
Withholding tax (41,648) Change in net assets attributable to
holders of redeemable participating shares 417,995
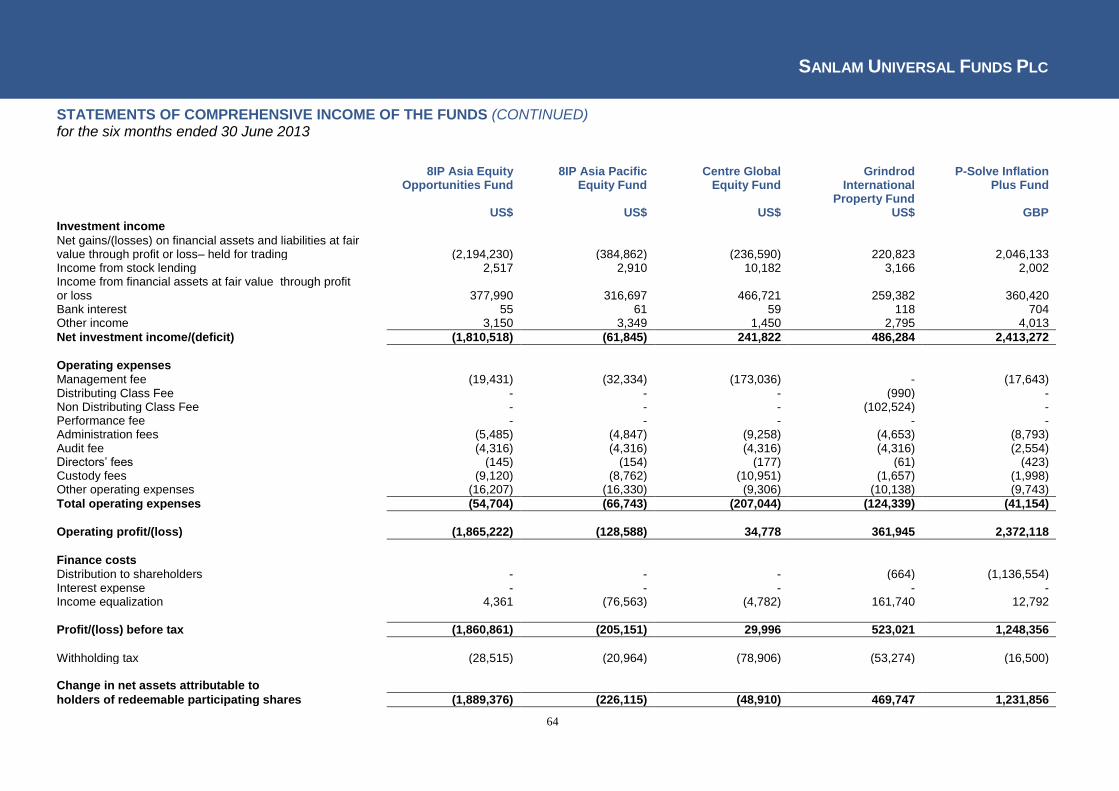
SANLAM UNIVERSAL FUNDS PLC
64
STATEMENTS OF COMPREHENSIVE INCOME OF THE FUNDS (CONTINUED) for the six months ended 30 June 2013
8IP Asia Equity Opportunities Fund
8IP Asia Pacific Equity Fund
Centre Global Equity Fund
Grindrod International
Property Fund
P-Solve Inflation Plus Fund
US$ US$ US$ US$ GBP Investment income
Net gains/(losses) on financial assets and liabilities at fair value through profit or loss– held for trading (2,194,230) (384,862) (236,590) 220,823 2,046,133 Income from stock lending 2,517 2,910 10,182 3,166 2,002 Income from financial assets at fair value through profit or loss 377,990 316,697 466,721 259,382 360,420 Bank interest 55 61 59 118 704 Other income 3,150 3,349 1,450 2,795 4,013
Net investment income/(deficit) (1,810,518) (61,845) 241,822 486,284 2,413,272
Operating expenses Management fee (19,431) (32,334) (173,036) - (17,643) Distributing Class Fee - - - (990) - Non Distributing Class Fee - - - (102,524) - Performance fee - - - - - Administration fees (5,485) (4,847) (9,258) (4,653) (8,793) Audit fee (4,316) (4,316) (4,316) (4,316) (2,554) Directors’ fees (145) (154) (177) (61) (423) Custody fees (9,120) (8,762) (10,951) (1,657) (1,998) Other operating expenses (16,207) (16,330) (9,306) (10,138) (9,743)
Total operating expenses (54,704) (66,743) (207,044) (124,339) (41,154)
Operating profit/(loss) (1,865,222) (128,588) 34,778 361,945 2,372,118
Finance costs
Distribution to shareholders - - - (664) (1,136,554) Interest expense - - - - - Income equalization 4,361 (76,563) (4,782) 161,740 12,792
Profit/(loss) before tax (1,860,861) (205,151) 29,996 523,021 1,248,356
Withholding tax (28,515) (20,964) (78,906) (53,274) (16,500) Change in net assets attributable to
holders of redeemable participating shares (1,889,376) (226,115) (48,910) 469,747 1,231,856

SANLAM UNIVERSAL FUNDS PLC
65
STATEMENTS OF COMPREHENSIVE INCOME OF THE FUNDS (CONTINUED) for the six months ended 30 June 2013
Sanlam African Frontier Markets
Fund
Sanlam Global Best Ideas Fund
Sanlam Global Bond Fund
Sanlam Global Financial Fund
Sanlam Global Property Fund
US$ US$ US$ US$ US$ Investment income
Net gains/(losses) on financial assets and liabilities at fair value through profit or loss – held for trading 2,777,993 (6,295,828) (22,340,656) (7,694,330) (4,781,086) Income from stock lending - 149,439 14,353 76,463 27,522 Income from financial assets at fair value through profit or loss 2,103,788 10,746,298 5,523,491 8,464,096 1,895,982 Bank interest 1,582 3,704 3,869 2,067 737 Other income 5,054 18,021 17,293 11,270 5,099
Net investment income/(deficit) 4,888,417 4,621,634 (16,781,650) 859,566 (2,851,746)
Operating expenses Management fee (361,859) (1,402,032) (549,247) (1,457,356) (185,215) Distributing Class Fee - - - - - Non Distributing Class Fee - - - - - Performance fee - - - - - Administration fees (12,682) (73,434) (38,264) (64,159) (12,651) Audit fee (4,316) (8,129) (10,790) (8,129) (4,316) Directors’ fees (311) (3,555) (2,982) (2,239) (507) Custody fees (80,401) (155,201) (7,178) (95,765) (1,658) Other operating expenses (13,384) (74,409) (35,178) (58,148) (15,493)
Total operating expenses (472,953) (1,716,760) (643,639) (1,685,796) (219,840)
Operating profit/(loss) 4,415,464 2,904,874 (17,425,289) (826,230) (3,071,586)
Finance costs
Distribution to shareholders (6,512) (5,295) - - - Interest expense - - - - - Income equalisation (2,196,547) (2,248,664) (554,948) 225,307 2,554,902
Profit/(loss) before tax 2,212,405 650,915 (17,980,237) (600,923) (516,684)
Withholding tax (161,661) (1,504,588) (1) (888,716) (363,121) Change in net assets attributable to
holders of redeemable participating shares 2,050,744 (853,673) (17,980,238) (1,489,639) (879,805)
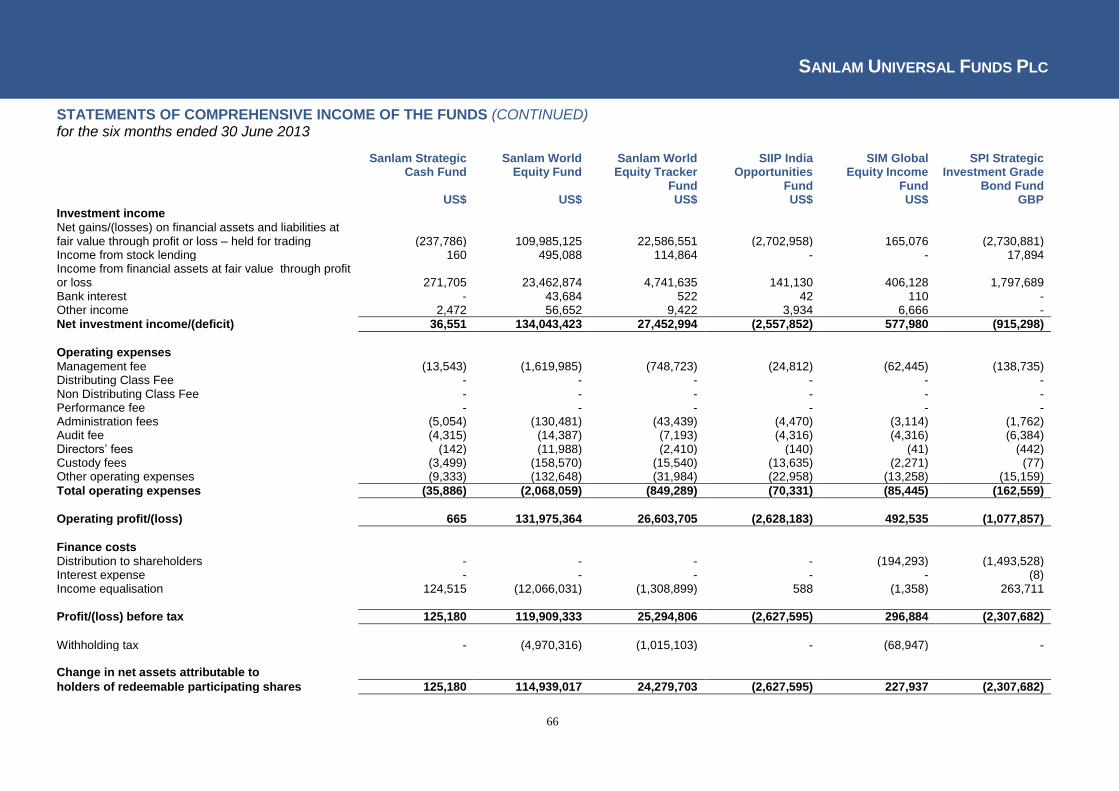
SANLAM UNIVERSAL FUNDS PLC
66
STATEMENTS OF COMPREHENSIVE INCOME OF THE FUNDS (CONTINUED) for the six months ended 30 June 2013
Sanlam Strategic Cash Fund
Sanlam World Equity Fund
Sanlam World Equity Tracker
Fund
SIIP India Opportunities
Fund
SIM Global Equity Income
Fund
SPI Strategic Investment Grade
Bond Fund US$ US$ US$ US$ US$ GBP Investment income
Net gains/(losses) on financial assets and liabilities at fair value through profit or loss – held for trading (237,786) 109,985,125 22,586,551 (2,702,958) 165,076 (2,730,881) Income from stock lending 160 495,088 114,864 - - 17,894 Income from financial assets at fair value through profit or loss 271,705 23,462,874 4,741,635 141,130 406,128 1,797,689 Bank interest - 43,684 522 42 110 - Other income 2,472 56,652 9,422 3,934 6,666 -
Net investment income/(deficit) 36,551 134,043,423 27,452,994 (2,557,852) 577,980 (915,298)
Operating expenses
Management fee (13,543) (1,619,985) (748,723) (24,812) (62,445) (138,735) Distributing Class Fee - - - - - - Non Distributing Class Fee - - - - - - Performance fee - - - - - - Administration fees (5,054) (130,481) (43,439) (4,470) (3,114) (1,762) Audit fee (4,315) (14,387) (7,193) (4,316) (4,316) (6,384) Directors’ fees (142) (11,988) (2,410) (140) (41) (442) Custody fees (3,499) (158,570) (15,540) (13,635) (2,271) (77) Other operating expenses (9,333) (132,648) (31,984) (22,958) (13,258) (15,159)
Total operating expenses (35,886) (2,068,059) (849,289) (70,331) (85,445) (162,559)
Operating profit/(loss) 665 131,975,364 26,603,705 (2,628,183) 492,535 (1,077,857)
Finance costs
Distribution to shareholders - - - - (194,293) (1,493,528) Interest expense - - - - - (8) Income equalisation 124,515 (12,066,031) (1,308,899) 588 (1,358) 263,711
Profit/(loss) before tax 125,180 119,909,333 25,294,806 (2,627,595) 296,884 (2,307,682)
Withholding tax - (4,970,316) (1,015,103) - (68,947) - Change in net assets attributable to
holders of redeemable participating shares 125,180 114,939,017 24,279,703 (2,627,595) 227,937 (2,307,682)
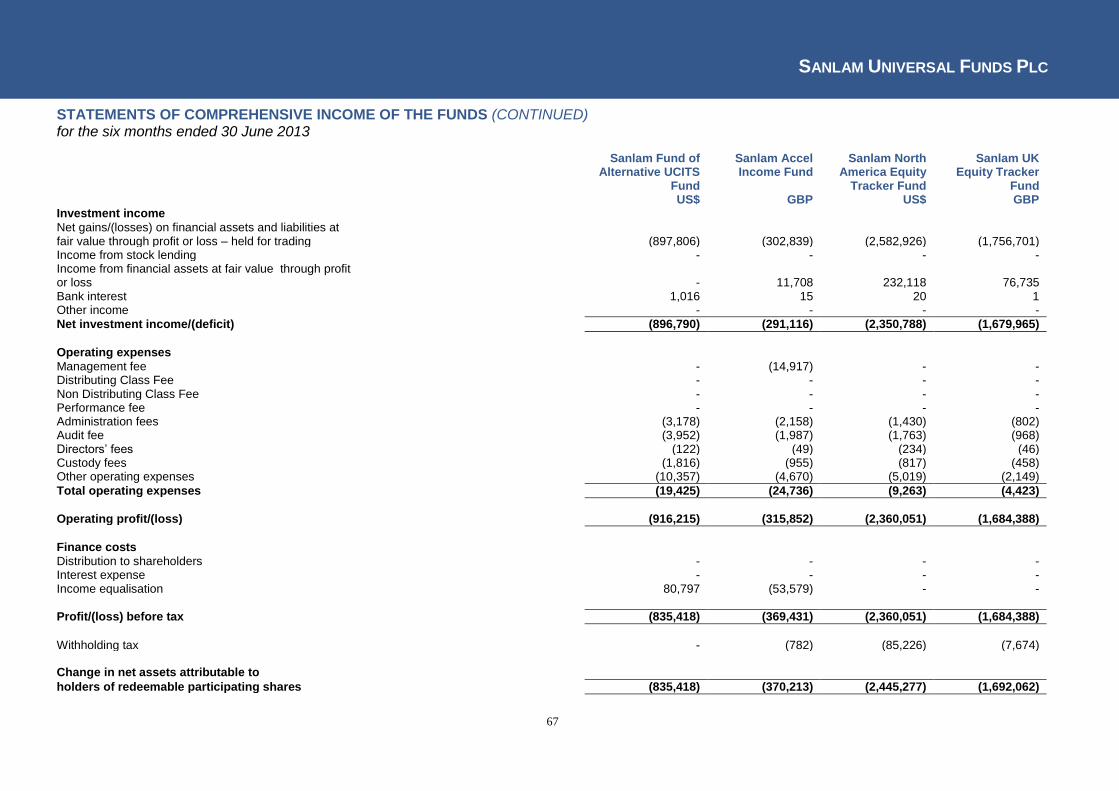
SANLAM UNIVERSAL FUNDS PLC
67
STATEMENTS OF COMPREHENSIVE INCOME OF THE FUNDS (CONTINUED) for the six months ended 30 June 2013
Sanlam Fund of Alternative UCITS
Fund
Sanlam Accel Income Fund
Sanlam North America Equity
Tracker Fund
Sanlam UK Equity Tracker
Fund US$ GBP US$ GBP Investment income
Net gains/(losses) on financial assets and liabilities at fair value through profit or loss – held for trading (897,806) (302,839) (2,582,926) (1,756,701) Income from stock lending - - - - Income from financial assets at fair value through profit or loss - 11,708 232,118 76,735 Bank interest 1,016 15 20 1 Other income - - - -
Net investment income/(deficit) (896,790) (291,116) (2,350,788) (1,679,965)
Operating expenses Management fee - (14,917) - - Distributing Class Fee - - - - Non Distributing Class Fee - - - - Performance fee - - - - Administration fees (3,178) (2,158) (1,430) (802) Audit fee (3,952) (1,987) (1,763) (968) Directors’ fees (122) (49) (234) (46) Custody fees (1,816) (955) (817) (458) Other operating expenses (10,357) (4,670) (5,019) (2,149)
Total operating expenses (19,425) (24,736) (9,263) (4,423)
Operating profit/(loss) (916,215) (315,852) (2,360,051) (1,684,388)
Finance costs
Distribution to shareholders - - - - Interest expense - - - - Income equalisation 80,797 (53,579) - -
Profit/(loss) before tax (835,418) (369,431) (2,360,051) (1,684,388)
Withholding tax - (782) (85,226) (7,674) Change in net assets attributable to
holders of redeemable participating shares (835,418) (370,213) (2,445,277) (1,692,062)
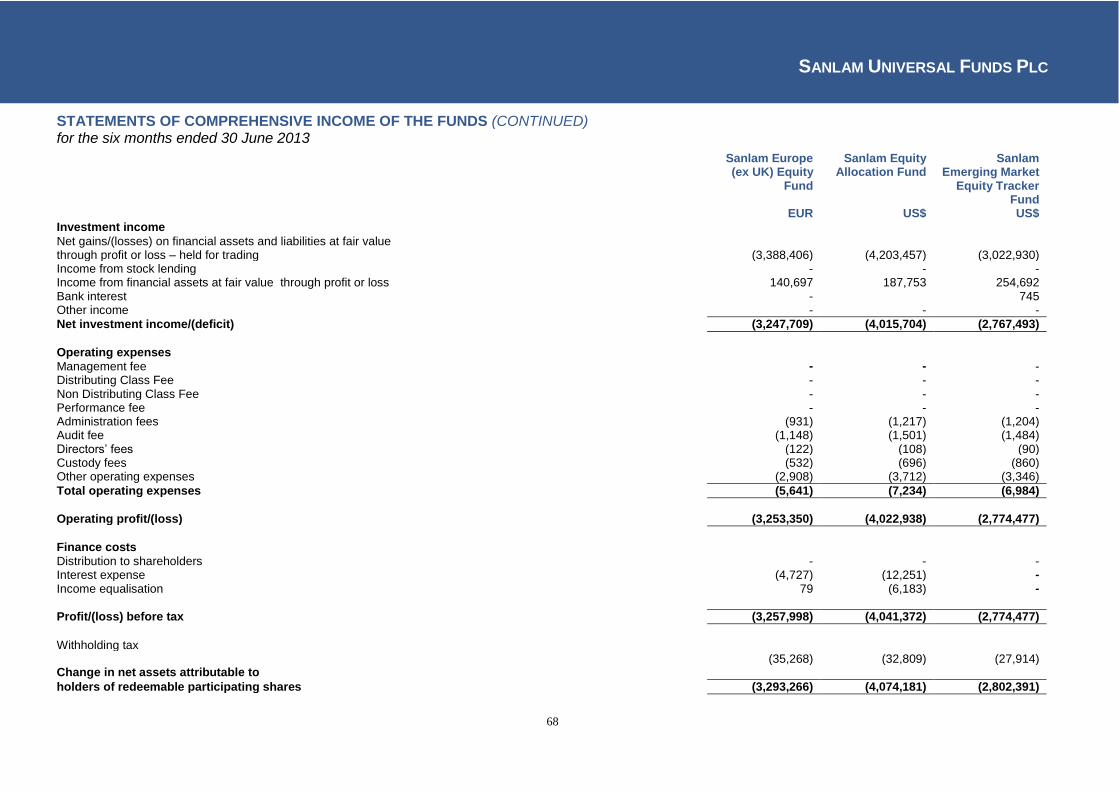
SANLAM UNIVERSAL FUNDS PLC
68
STATEMENTS OF COMPREHENSIVE INCOME OF THE FUNDS (CONTINUED) for the six months ended 30 June 2013
Sanlam Europe (ex UK) Equity
Fund
Sanlam Equity Allocation Fund
Sanlam Emerging Market
Equity Tracker Fund
EUR US$ US$ Investment income
Net gains/(losses) on financial assets and liabilities at fair value through profit or loss – held for trading (3,388,406) (4,203,457) (3,022,930) Income from stock lending - - - Income from financial assets at fair value through profit or loss 140,697 187,753 254,692 Bank interest - 745 Other income - - -
Net investment income/(deficit) (3,247,709) (4,015,704) (2,767,493)
Operating expenses Management fee - - - Distributing Class Fee - - - Non Distributing Class Fee - - - Performance fee - - - Administration fees (931) (1,217) (1,204) Audit fee (1,148) (1,501) (1,484) Directors’ fees (122) (108) (90) Custody fees (532) (696) (860) Other operating expenses (2,908) (3,712) (3,346)
Total operating expenses (5,641) (7,234) (6,984)
Operating profit/(loss) (3,253,350) (4,022,938) (2,774,477)
Finance costs
Distribution to shareholders - - - Interest expense (4,727) (12,251) -
Income equalisation 79 (6,183) -
Profit/(loss) before tax (3,257,998) (4,041,372) (2,774,477)
Withholding tax (35,268) (32,809) (27,914) Change in net assets attributable to
holders of redeemable participating shares (3,293,266) (4,074,181) (2,802,391)
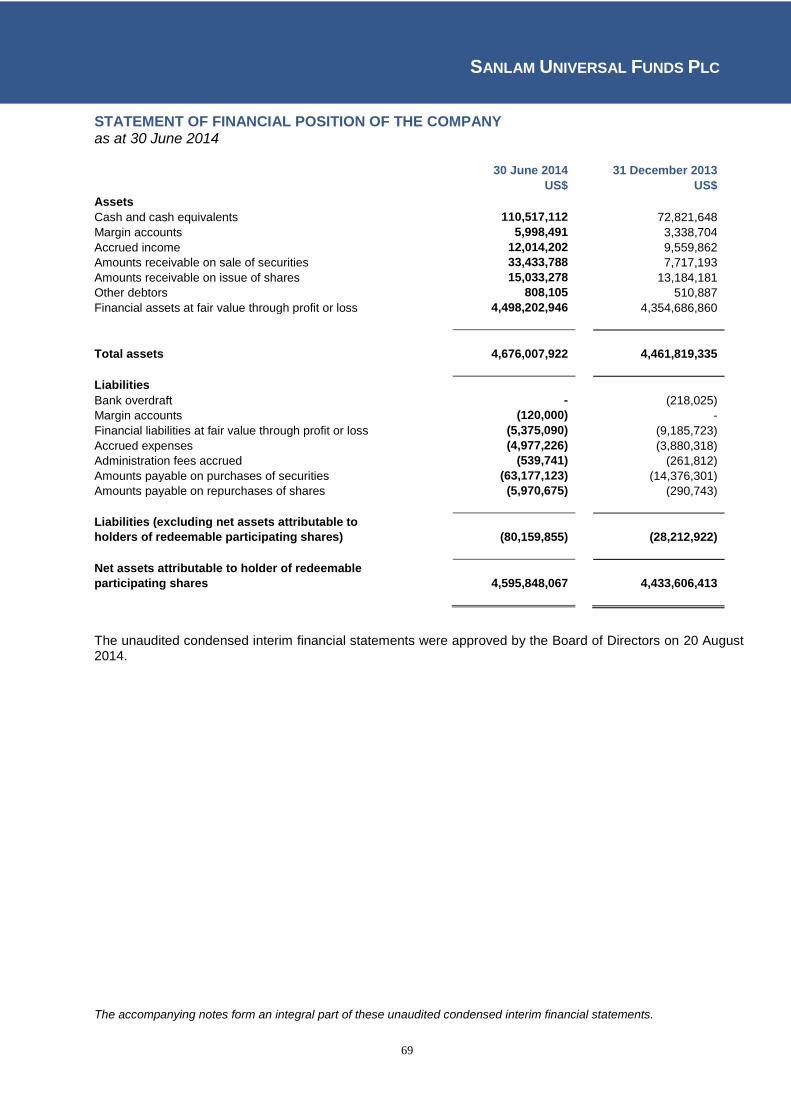
SANLAM UNIVERSAL FUNDS PLC
69
STATEMENT OF FINANCIAL POSITION OF THE COMPANY as at 30 June 2014
30 June 2014 31 December 2013
US$ US$
Assets
Cash and cash equivalents 110,517,112 72,821,648
Margin accounts 5,998,491 3,338,704
Accrued income 12,014,202 9,559,862
Amounts receivable on sale of securities 33,433,788 7,717,193
Amounts receivable on issue of shares 15,033,278 13,184,181
Other debtors 808,105 510,887
Financial assets at fair value through profit or loss 4,498,202,946 4,354,686,860
Total assets 4,676,007,922 4,461,819,335
Liabilities
Bank overdraft - (218,025)
Margin accounts (120,000) -
Financial liabilities at fair value through profit or loss (5,375,090) (9,185,723)
Accrued expenses (4,977,226) (3,880,318)
Administration fees accrued (539,741) (261,812)
Amounts payable on purchases of securities (63,177,123) (14,376,301)
Amounts payable on repurchases of shares (5,970,675) (290,743)
Liabilities (excluding net assets attributable to
holders of redeemable participating shares) (80,159,855) (28,212,922)
Net assets attributable to holder of redeemable
participating shares 4,595,848,067 4,433,606,413
The unaudited condensed interim financial statements were approved by the Board of Directors on 20 August 2014. The accompanying notes form an integral part of these unaudited condensed interim financial statements.
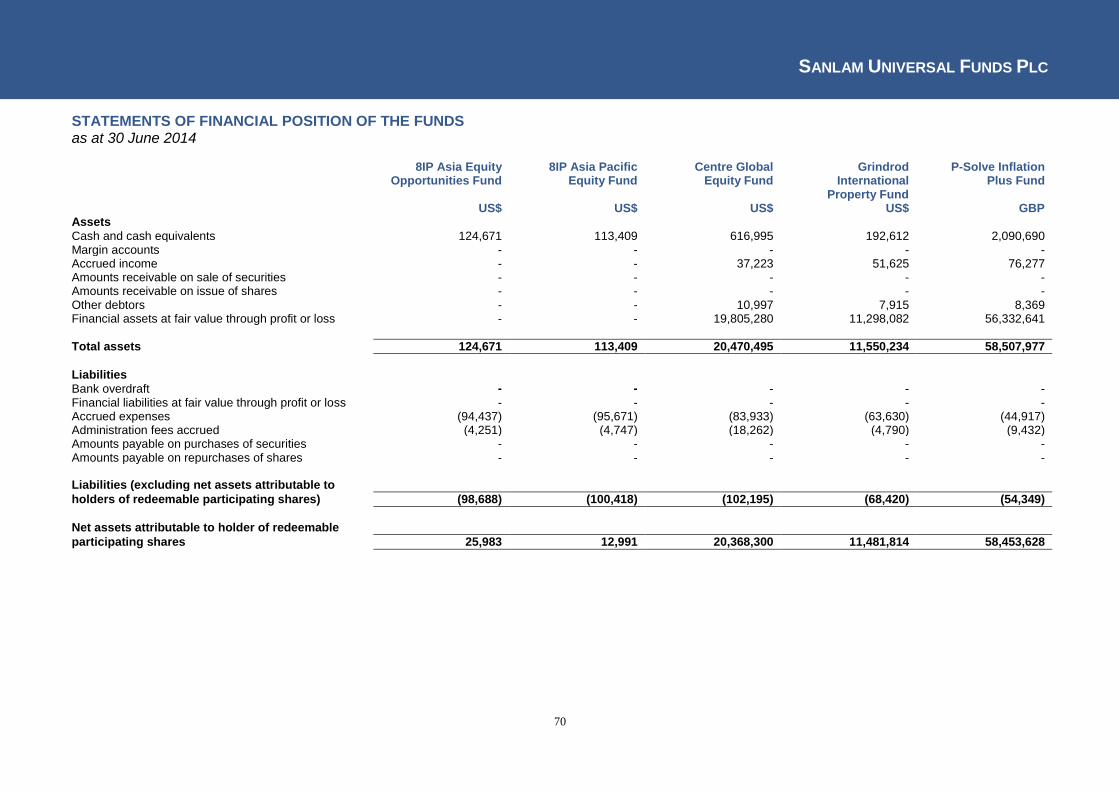
SANLAM UNIVERSAL FUNDS PLC
70
STATEMENTS OF FINANCIAL POSITION OF THE FUNDS as at 30 June 2014
8IP Asia Equity Opportunities Fund
8IP Asia Pacific Equity Fund
Centre Global Equity Fund
Grindrod International
Property Fund
P-Solve Inflation Plus Fund
US$ US$ US$ US$ GBP Assets
Cash and cash equivalents 124,671 113,409 616,995 192,612 2,090,690 Margin accounts - - - - - Accrued income - - 37,223 51,625 76,277 Amounts receivable on sale of securities - - - - - Amounts receivable on issue of shares - - - - - Other debtors - - 10,997 7,915 8,369 Financial assets at fair value through profit or loss - - 19,805,280 11,298,082 56,332,641
Total assets 124,671 113,409 20,470,495 11,550,234 58,507,977
Liabilities Bank overdraft - - - - - Financial liabilities at fair value through profit or loss - - - - - Accrued expenses (94,437) (95,671) (83,933) (63,630) (44,917) Administration fees accrued (4,251) (4,747) (18,262) (4,790) (9,432) Amounts payable on purchases of securities - - - - - Amounts payable on repurchases of shares - - - - -
Liabilities (excluding net assets attributable to
holders of redeemable participating shares) (98,688) (100,418) (102,195) (68,420) (54,349)
Net assets attributable to holder of redeemable
participating shares 25,983 12,991 20,368,300 11,481,814 58,453,628

SANLAM UNIVERSAL FUNDS PLC
71
STATEMENTS OF FINANCIAL POSITION OF THE FUNDS (CONTINUED) as at 30 June 2014
Sanlam African Frontier Markets
Fund
Sanlam Global Best Ideas Fund
Sanlam Global Bond Fund
Sanlam Global Financial Fund
Sanlam Global Property Fund
US$ US$ US$ US$ US$ Assets
Cash and cash equivalents 2,739,066 11,716,552 13,516,823 12,098,142 1,220,230 Margin accounts - - 613,276 - - Accrued income 480,713 351,539 3,224,852 808,127 597,452 Amounts receivable on sale of securities 958,207 337,969 4,423,229 - 2,486,491 Amounts receivable on issue of shares - - - - - Other debtors 26,675 11,258 77,055 32,708 87,911 Financial assets at fair value through profit or loss 79,612,847 367,109,995 434,784,732 332,964,244 156,193,996
Total assets 83,817,508 379,527,313 456,639,967 345,903,221 160,586,080
Liabilities Bank overdraft - - - - - Margin accounts (120,000) Financial liabilities at fair value through profit or loss - - (4,756,737) - (274,395) Accrued expenses (246,626) (817,798) (260,973) (591,418) (85,994) Administration fees accrued (7,757) (90,991) (32,869) (71,227) (11,312) Amounts payable on purchases of securities (1,091,585) - (24,077,848) (84,647) (2,920,634) Amounts payable on repurchases of shares (490) (178,351) (3,747) (82,158) -
Liabilities (excluding net assets attributable to
holders of redeemable participating shares) (1,346,458) (1,087,140) (29,252,174) (829,450) (3,292,335)
Net assets attributable to holder of redeemable
participating shares 82,471,050 378,440,173 427,387,793 345,073,771 157,293,745
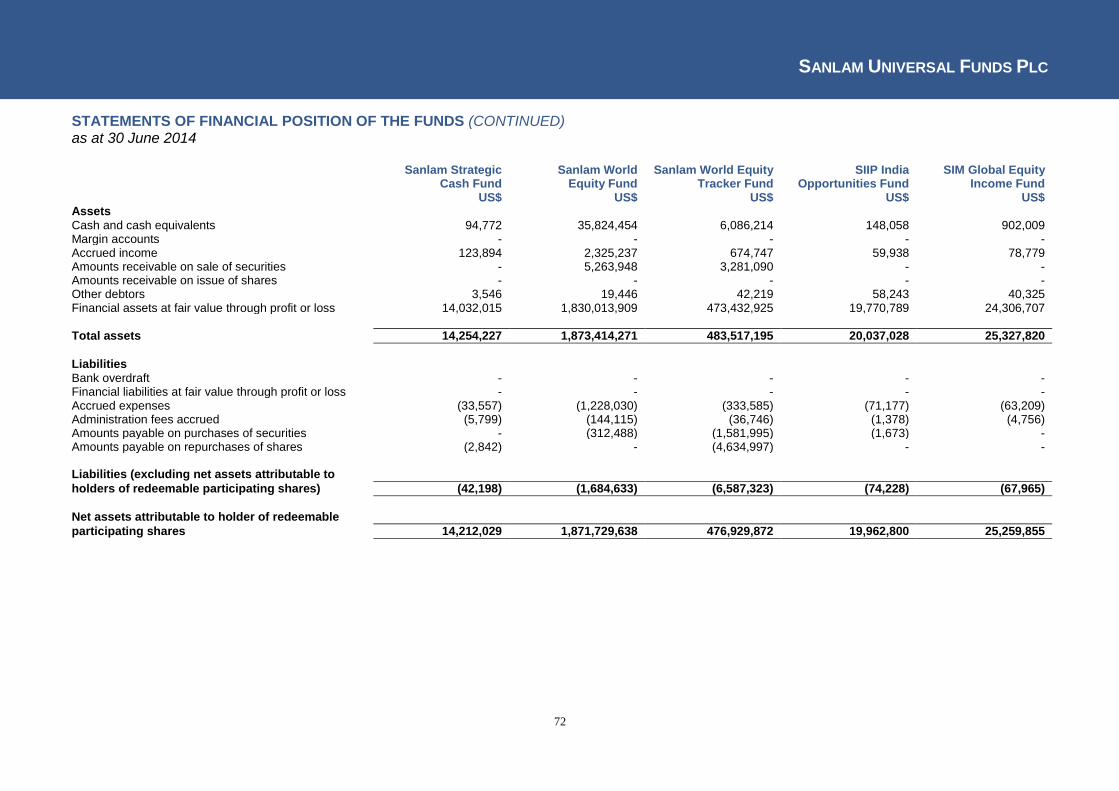
SANLAM UNIVERSAL FUNDS PLC
72
STATEMENTS OF FINANCIAL POSITION OF THE FUNDS (CONTINUED) as at 30 June 2014
Sanlam Strategic
Cash Fund Sanlam World
Equity Fund Sanlam World Equity
Tracker Fund SIIP India
Opportunities Fund SIM Global Equity
Income Fund US$ US$ US$ US$ US$
Assets
Cash and cash equivalents 94,772 35,824,454 6,086,214 148,058 902,009 Margin accounts - - - - - Accrued income 123,894 2,325,237 674,747 59,938 78,779 Amounts receivable on sale of securities - 5,263,948 3,281,090 - - Amounts receivable on issue of shares - - - - - Other debtors 3,546 19,446 42,219 58,243 40,325 Financial assets at fair value through profit or loss 14,032,015 1,830,013,909 473,432,925 19,770,789 24,306,707
Total assets 14,254,227 1,873,414,271 483,517,195 20,037,028 25,327,820
Liabilities Bank overdraft - - - - - Financial liabilities at fair value through profit or loss - - - - - Accrued expenses (33,557) (1,228,030) (333,585) (71,177) (63,209) Administration fees accrued (5,799) (144,115) (36,746) (1,378) (4,756) Amounts payable on purchases of securities - (312,488) (1,581,995) (1,673) - Amounts payable on repurchases of shares (2,842) - (4,634,997) - -
Liabilities (excluding net assets attributable to
holders of redeemable participating shares) (42,198) (1,684,633) (6,587,323) (74,228) (67,965)
Net assets attributable to holder of redeemable
participating shares 14,212,029 1,871,729,638 476,929,872 19,962,800 25,259,855

SANLAM UNIVERSAL FUNDS PLC
73
STATEMENTS OF FINANCIAL POSITION OF THE FUNDS (CONTINUED) as at 30 June 2014
SPI Strategic Investment Grade
Bond Fund
Sanlam Fund of Alternative UCITS
Fund
Sanlam Accel Income Fund
Sanlam North America Equity
Tracker Fund
Sanlam UK Equity Tracker Fund
GBP US$ GBP US$ GBP Assets
Cash and cash equivalents 1,856,370 55,904 2,003,004 811,760 246,108 Margin accounts - - - - - Accrued income 1,243,762 1,341 82,806 66,729 155,380 Amounts receivable on sale of securities 9,009,767 - - 797,924 - Amounts receivable on issue of shares - - 140,085 - 2,400,836 Other debtors 60,161 23,388 16,968 11,804 6,427 Financial assets at fair value through profit or loss 57,684,991 100,468,946 23,441,422 56,599,947 37,887,249
Total assets 69,855,051 100,549,579 25,684,285 58,288,164 40,696,000
Liabilities Bank overdraft - - - - - Financial liabilities at fair value through profit or loss (1,220) - - - - Accrued expenses (141,708) (18,733) (38,522) (36,615) (18,509) Administration fees accrued - (2,992) (4,934) (8,160) (3,680) Amounts payable on purchases of securities (8,722,555) - (1,000,000) (989,998) (2,319,597) Amounts payable on repurchases of shares (367,138) - - (280,408) -
Liabilities (excluding net assets attributable to
holders of redeemable participating shares) (9,232,621) (21,725) (1,043,456) (1,315,181) (2,341,786)
Net assets attributable to holder of redeemable
participating shares 60,622,430 100,527,854 24,640,829 56,972,983 38,354,214
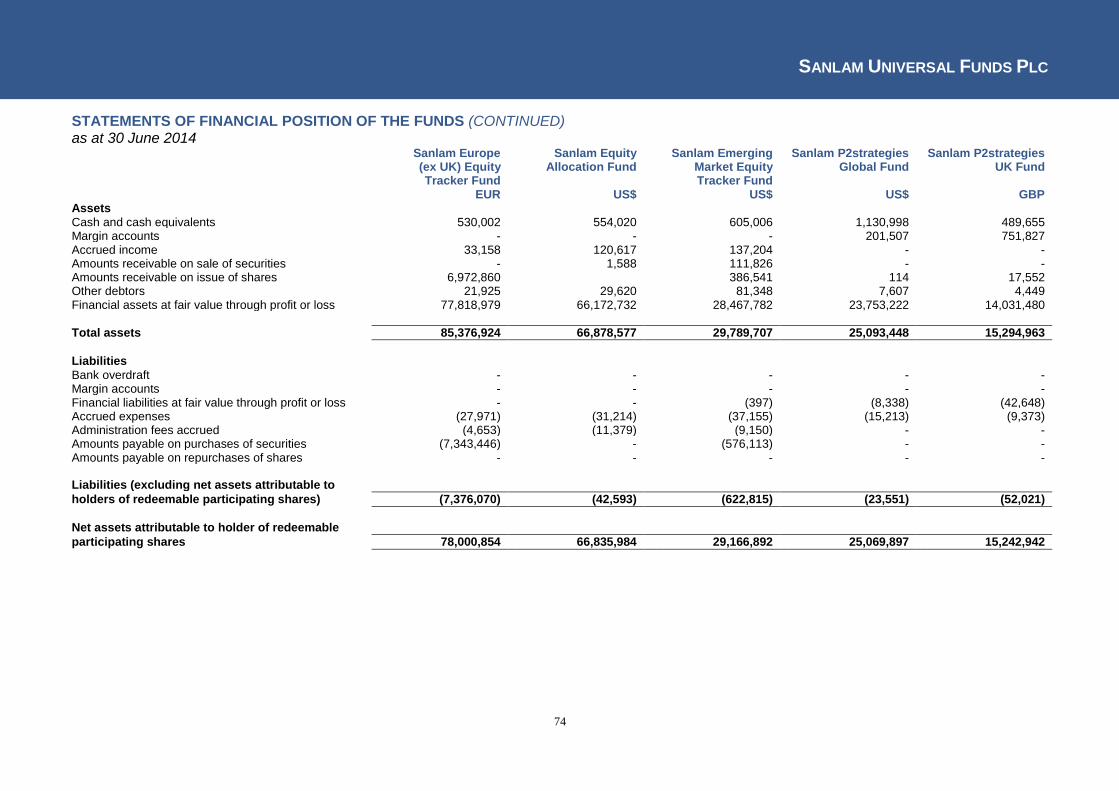
SANLAM UNIVERSAL FUNDS PLC
74
STATEMENTS OF FINANCIAL POSITION OF THE FUNDS (CONTINUED) as at 30 June 2014
Sanlam Europe (ex UK) Equity Tracker Fund
Sanlam Equity Allocation Fund
Sanlam Emerging Market Equity Tracker Fund
Sanlam P2strategies Global Fund
Sanlam P2strategies UK Fund
EUR US$ US$ US$ GBP Assets
Cash and cash equivalents 530,002 554,020 605,006 1,130,998 489,655 Margin accounts - - - 201,507 751,827 Accrued income 33,158 120,617 137,204 - - Amounts receivable on sale of securities - 1,588 111,826 - - Amounts receivable on issue of shares 6,972,860 386,541 114 17,552 Other debtors 21,925 29,620 81,348 7,607 4,449 Financial assets at fair value through profit or loss 77,818,979 66,172,732 28,467,782 23,753,222 14,031,480
Total assets 85,376,924 66,878,577 29,789,707 25,093,448 15,294,963
Liabilities Bank overdraft - - - - - Margin accounts - - - - - Financial liabilities at fair value through profit or loss - - (397) (8,338) (42,648) Accrued expenses (27,971) (31,214) (37,155) (15,213) (9,373) Administration fees accrued (4,653) (11,379) (9,150) - - Amounts payable on purchases of securities (7,343,446) - (576,113) - - Amounts payable on repurchases of shares - - - - -
Liabilities (excluding net assets attributable to
holders of redeemable participating shares) (7,376,070) (42,593) (622,815) (23,551) (52,021)
Net assets attributable to holder of redeemable
participating shares 78,000,854 66,835,984 29,166,892 25,069,897 15,242,942

SANLAM UNIVERSAL FUNDS PLC
75
STATEMENTS OF FINANCIAL POSITION OF THE FUNDS (CONTINUED) as at 30 June 2014
Sanlam P2strategies North America Fund
Sanlam P2strategies Emerging Market
Fund
Sanlam P2strategies Europe (ex UK) Fund
Sanlam S&P Africa Tracker Fund
FOUR European L/S Fund
US$ US$ EUR US$ GBP Assets
Cash and cash equivalents 2,687,703 1,330,457 2,556,734 10,791 352,077
Margin accounts 1,301,119 348,129 73,080 - 1,258,019
Accrued income - - - 122,766 12,703
Amounts receivable on sale of securities - - - 57,828 185,883
Amounts receivable on issue of shares - - - - 0
Other debtors 8,028 8,000 6,359 10,366 4,478,993
Financial assets at fair value through profit or loss 43,310,719 13,979,484 14,287,897 38,544,809 3,662
Total assets 47,307,569 15,666,070 16,924,070 38,746,560 6,291,337
Liabilities Bank overdraft - - - - - Margin accounts - - - - - Financial liabilities at fair value through profit or loss (26,774) (2,783) (151,968) - (13,317) Accrued expenses (28,316) (9,422) (10,311) (123,938) (29,310) Administration fees accrued - - - (12,235) (8,378) Amounts payable on purchases of securities (264,128) - - (18,074) - Amounts payable on repurchases of shares - (59,198) (73,893) - -
Liabilities (excluding net assets attributable to
holders of redeemable participating shares) (319,218) (71,403) (236,172) (154,247) (51,005)
Net assets attributable to holder of redeemable
participating shares 46,988,351 15,594,667 16,687,898 38,592,313 6,240,332

SANLAM UNIVERSAL FUNDS PLC
76
STATEMENTS OF FINANCIAL POSITION OF THE FUNDS (CONTINUED) as at 30 June 2014
SPI Global High Quality Fund
GBP Assets
Cash and cash equivalents 986,762 Margin accounts - Accrued income 12,651 Amounts receivable on sale of securities - Amounts receivable on issue of shares 429,100 Other debtors - Financial assets at fair value through profit or loss 18,244,390
Total assets 19,672,903
Liabilities Bank overdraft - Margin accounts - Financial liabilities at fair value through profit or loss - Accrued expenses (41,978) Administration fees accrued (3,104) Amounts payable on purchases of securities (369,610) Amounts payable on repurchases of shares -
Liabilities (excluding net assets attributable to
holders of redeemable participating shares) (414,692)
Net assets attributable to holder of redeemable
participating shares 19,258,211

SANLAM UNIVERSAL FUNDS PLC
77
STATEMENTS OF FINANCIAL POSITION OF THE FUNDS (CONTINUED) as at 31 December 2013
8IP Asia Equity Opportunities Fund
8IP Asia Pacific Equity Fund
Centre Global Equity Fund
Grindrod International
Property Fund
P-Solve Inflation Plus Fund
US$ US$ US$ US$ GBP Assets
Cash and cash equivalents 254,364 114,239 943,711 381,910 793,744 Margin accounts - - - - - Accrued income 3,049 4,394 9,364 67,283 47,653 Amounts receivable on sale of securities - - - - - Amounts receivable on issue of shares - - - - 453,131 Other debtors 16,158 15,908 3,003 7,693 4,436 Financial assets at fair value through profit or loss 15,666,673 18,208,137 23,082,653 10,179,642 53,716,159
Total assets 15,940,244 18,342,678 24,038,731 10,636,528 55,015,123
Liabilities Bank overdraft - - - - - Financial liabilities at fair value through profit or loss - - - - - Accrued expenses (56,781) (61,647) (74,115) (57,111) (48,810) Administration fees accrued (2,326) (686) (11,791) (1,909) (13,560) Amounts payable on purchases of securities - - - - - Amounts payable on repurchases of shares (21,424) - - - -
Liabilities (excluding net assets attributable to
holders of redeemable participating shares) (80,531) (62,333) (85,906) (59,020) (62,370)
Net assets attributable to holder of redeemable
participating shares 15,859,713 18,280,345 23,952,825 10,577,508 54,952,753

SANLAM UNIVERSAL FUNDS PLC
78
STATEMENTS OF FINANCIAL POSITION OF THE FUNDS (CONTINUED) as at 31 December 2013
Sanlam African Frontier Markets
Fund
Sanlam Global Best Ideas Fund
Sanlam Global Bond Fund
Sanlam Global Financial Fund
Sanlam Global Property Fund
US$ US$ US$ US$ US$ Assets
Cash and cash equivalents 2,240,871 15,822,613 10,525,120 5,746,153 1,005,798 Margin accounts - - 652,633 - - Accrued income 268,868 240,816 3,613,327 98,647 545,479 Amounts receivable on sale of securities 1,206,964 716,942 2,804,468 2,874,885 1,630 Amounts receivable on issue of shares - - - - - Other debtors 11,872 5,920 50,773 56,007 62,260 Financial assets at fair value through profit or loss 75,453,601 409,877,677 404,161,517 323,259,410 152,377,662
Total assets 79,182,176 426,663,968 421,807,838 332,035,102 153,992,829
Liabilities Bank overdraft - - - - - Financial liabilities at fair value through profit or loss - - (8,654,977) - (200,652) Accrued expenses (181,859) (640,726) (267,725) (378,678) (74,553) Administration fees accrued (1,281) (44,271) (13,770) (23,892) (1,661) Amounts payable on purchases of securities - - (6,473,055) (3,377,870) - Amounts payable on repurchases of shares - (1,114,719) - (236,139) -
Liabilities (excluding net assets attributable to
holders of redeemable participating shares) (183,140) (1,799,716) (15,409,527) (4,016,579) (276,866)
Net assets attributable to holder of redeemable
participating shares 78,999,036 424,864,252 406,398,311 328,018,523 153,715,963

SANLAM UNIVERSAL FUNDS PLC
79
STATEMENTS OF FINANCIAL POSITION OF THE FUNDS (CONTINUED) as at 31 December 2013
Sanlam Strategic
Cash Fund Sanlam World
Equity Fund Sanlam World Equity
Tracker Fund SIIP India
Opportunities Fund SIM Global Equity
Income Fund US$ US$ US$ US$ US$
Assets
Cash and cash equivalents 574,736 20,473,137 2,361,415 177,844 339,496 Margin accounts - - - - - Accrued income 212,695 1,246,554 403,643 3,680 53,627 Amounts receivable on sale of securities - - 29,383 - - Amounts receivable on issue of shares - - 304,714 - - Other debtors 8,560 11,472 25,288 41,333 26,285 Financial assets at fair value through profit or loss 20,829,491 1,630,440,175 471,246,442 16,081,175 19,044,546
Total assets 21,625,482 1,652,171,338 474,370,885 16,304,032 19,463,954
Liabilities Bank overdraft - - - - - Financial liabilities at fair value through profit or loss - - - - - Accrued expenses (42,828) (1,024,294) (258,121) (74,839) (43,988) Administration fees accrued (2,793) (83,030) (10,752) (659) (1,448) Amounts payable on purchases of securities - (857,884) - - - Amounts payable on repurchases of shares - (12,563) - - -
Liabilities (excluding net assets attributable to
holders of redeemable participating shares) (45,621) (1,977,771) (268,873) (75,498) (45,436)
Net assets attributable to holder of redeemable
participating shares 21,579,861 1,650,193,567 474,102,012 16,228,534 19,418,518
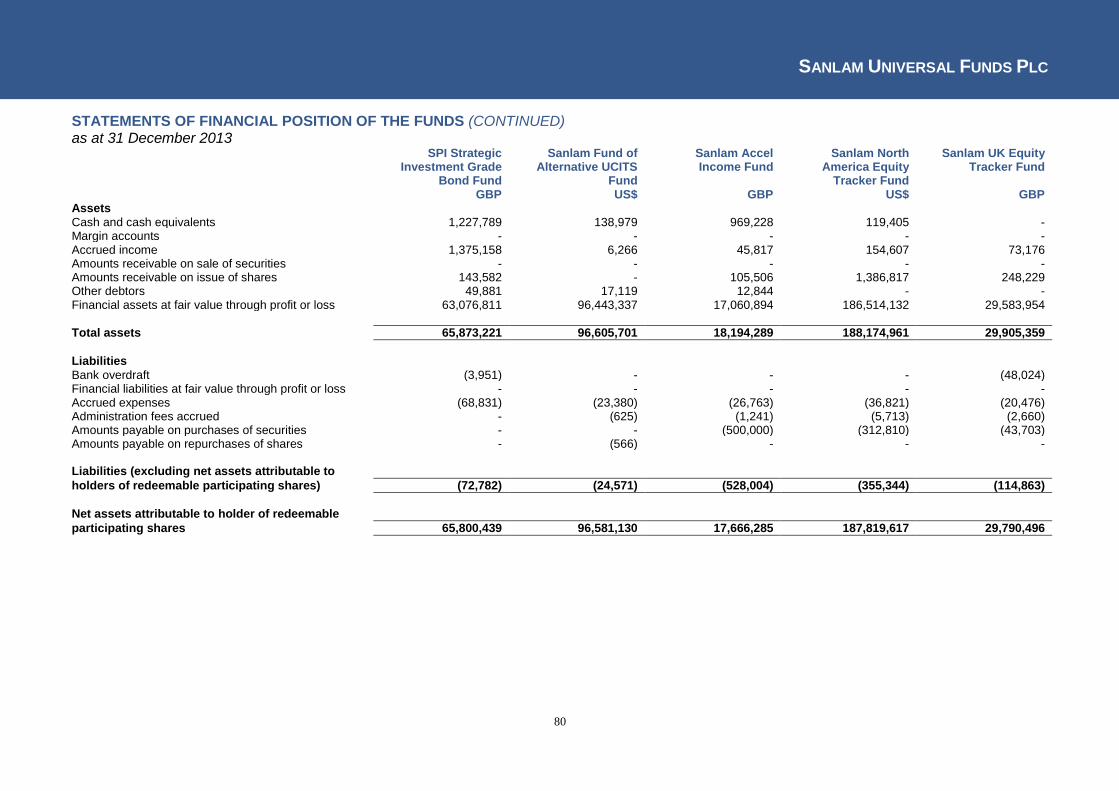
SANLAM UNIVERSAL FUNDS PLC
80
STATEMENTS OF FINANCIAL POSITION OF THE FUNDS (CONTINUED) as at 31 December 2013
SPI Strategic Investment Grade
Bond Fund
Sanlam Fund of Alternative UCITS
Fund
Sanlam Accel Income Fund
Sanlam North America Equity
Tracker Fund
Sanlam UK Equity Tracker Fund
GBP US$ GBP US$ GBP Assets
Cash and cash equivalents 1,227,789 138,979 969,228 119,405 - Margin accounts - - - - - Accrued income 1,375,158 6,266 45,817 154,607 73,176 Amounts receivable on sale of securities - - - - - Amounts receivable on issue of shares 143,582 - 105,506 1,386,817 248,229 Other debtors 49,881 17,119 12,844 - - Financial assets at fair value through profit or loss 63,076,811 96,443,337 17,060,894 186,514,132 29,583,954
Total assets 65,873,221 96,605,701 18,194,289 188,174,961 29,905,359
Liabilities Bank overdraft (3,951) - - - (48,024) Financial liabilities at fair value through profit or loss - - - - - Accrued expenses (68,831) (23,380) (26,763) (36,821) (20,476) Administration fees accrued - (625) (1,241) (5,713) (2,660) Amounts payable on purchases of securities - - (500,000) (312,810) (43,703) Amounts payable on repurchases of shares - (566) - - -
Liabilities (excluding net assets attributable to
holders of redeemable participating shares) (72,782) (24,571) (528,004) (355,344) (114,863)
Net assets attributable to holder of redeemable
participating shares 65,800,439 96,581,130 17,666,285 187,819,617 29,790,496

SANLAM UNIVERSAL FUNDS PLC
81
STATEMENTS OF FINANCIAL POSITION OF THE FUNDS (CONTINUED) as at 31 December 2013
Sanlam Europe (ex UK) Equity Tracker Fund
Sanlam Equity Allocation Fund
Sanlam Emerging Market Equity Tracker Fund
Sanlam P2strategies Global Fund
Sanlam P2strategies UK Fund
EUR US$ US$ US$ GBP Assets
Cash and cash equivalents 174,275 414,943 - 2,030,569 509,798 Margin accounts - - - 412,466 293,213 Accrued income 1,766 54,245 15,565 - - Amounts receivable on sale of securities 60,140 - - - - Amounts receivable on issue of shares 325,302 - 840,870 297,295 381,854 Other debtors 1,224 10,684 7,846 497 280 Financial assets at fair value through profit or loss 58,639,849 65,645,194 40,738,003 13,359,291 7,353,582
Total assets 59,202,556 66,125,066 41,602,284 16,100,118 8,538,727
Liabilities Bank overdraft - - (131,613) - (209) Financial liabilities at fair value through profit or loss - - - (47,127) (46,905) Accrued expenses (25,597) (27,414) (31,697) (11,770) (6,702) Administration fees accrued (3,602) (6,379) (6,086) - - Amounts payable on purchases of securities (83,871) - (244,647) (979,355) - Amounts payable on repurchases of shares - - - - -
Liabilities (excluding net assets attributable to
holders of redeemable participating shares) (113,070) (33,793) (414,043) (1,038,252) (53,816)
Net assets attributable to holder of redeemable
participating shares 59,089,486 66,091,273 41,188,241 15,061,866 8,484,911
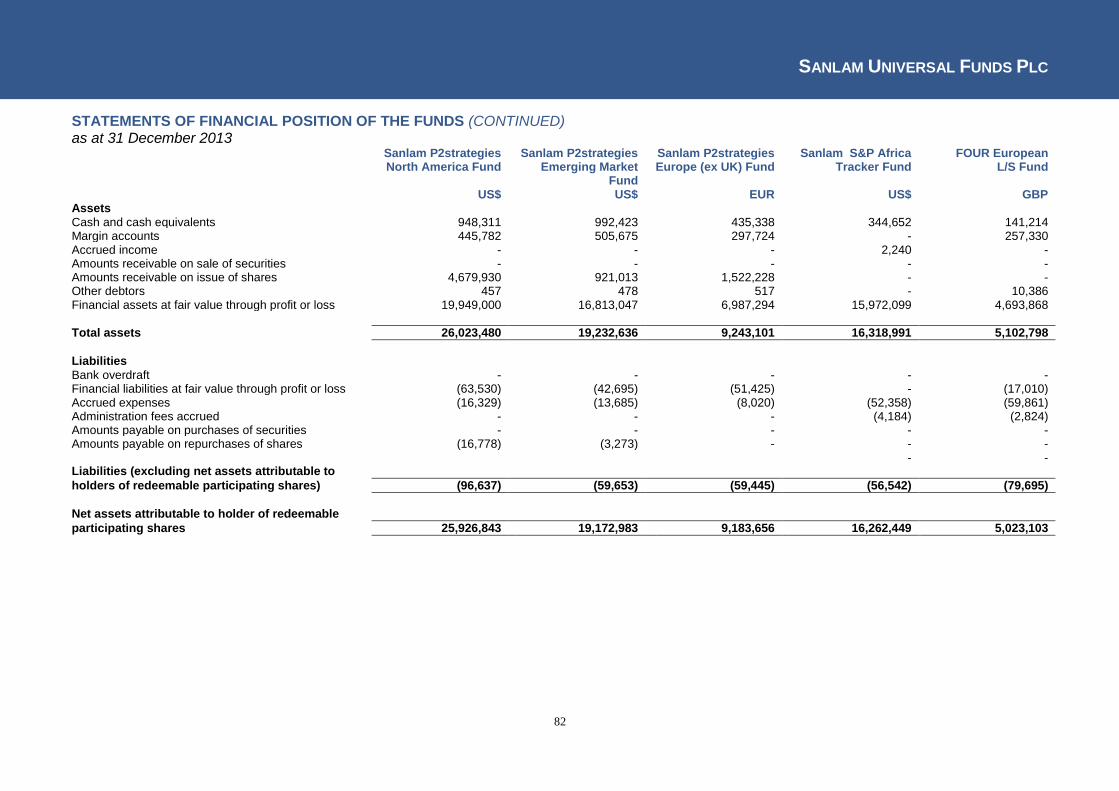
SANLAM UNIVERSAL FUNDS PLC
82
STATEMENTS OF FINANCIAL POSITION OF THE FUNDS (CONTINUED) as at 31 December 2013
Sanlam P2strategies North America Fund
Sanlam P2strategies Emerging Market
Fund
Sanlam P2strategies Europe (ex UK) Fund
Sanlam S&P Africa Tracker Fund
FOUR European L/S Fund
US$ US$ EUR US$ GBP Assets
Cash and cash equivalents 948,311 992,423 435,338 344,652 141,214 Margin accounts 445,782 505,675 297,724 - 257,330 Accrued income - - - 2,240 - Amounts receivable on sale of securities - - - - - Amounts receivable on issue of shares 4,679,930 921,013 1,522,228 - - Other debtors 457 478 517 - 10,386 Financial assets at fair value through profit or loss 19,949,000 16,813,047 6,987,294 15,972,099 4,693,868
Total assets 26,023,480 19,232,636 9,243,101 16,318,991 5,102,798
Liabilities Bank overdraft - - - - - Financial liabilities at fair value through profit or loss (63,530) (42,695) (51,425) - (17,010) Accrued expenses (16,329) (13,685) (8,020) (52,358) (59,861) Administration fees accrued - - - (4,184) (2,824) Amounts payable on purchases of securities - - - - - Amounts payable on repurchases of shares (16,778) (3,273) - - -
- -
Liabilities (excluding net assets attributable to
holders of redeemable participating shares) (96,637) (59,653) (59,445) (56,542) (79,695)
Net assets attributable to holder of redeemable
participating shares 25,926,843 19,172,983 9,183,656 16,262,449 5,023,103
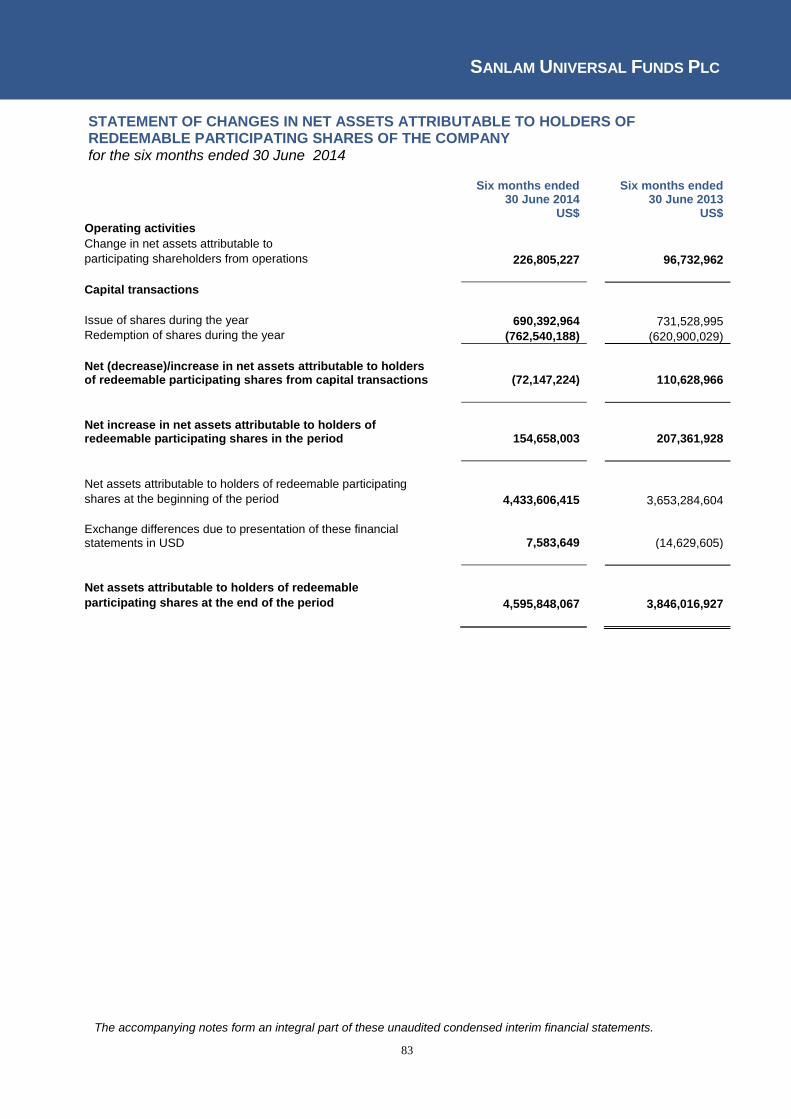
SANLAM UNIVERSAL FUNDS PLC
83
STATEMENT OF CHANGES IN NET ASSETS ATTRIBUTABLE TO HOLDERS OF REDEEMABLE PARTICIPATING SHARES OF THE COMPANY for the six months ended 30 June 2014
Six months ended 30 June 2014
Six months ended 30 June 2013
US$ US$
Operating activities
Change in net assets attributable to
participating shareholders from operations 226,805,227 96,732,962
Capital transactions
Issue of shares during the year 690,392,964 731,528,995 Redemption of shares during the year (762,540,188) (620,900,029)
Net (decrease)/increase in net assets attributable to holders of redeemable participating shares from capital transactions
(72,147,224) 110,628,966
Net increase in net assets attributable to holders of redeemable participating shares in the period
154,658,003 207,361,928
Net assets attributable to holders of redeemable participating
shares at the beginning of the period 4,433,606,415 3,653,284,604 Exchange differences due to presentation of these financial statements in USD
7,583,649
(14,629,605)
Net assets attributable to holders of redeemable participating shares at the end of the period 4,595,848,067 3,846,016,927
The accompanying notes form an integral part of these unaudited condensed interim financial statements.
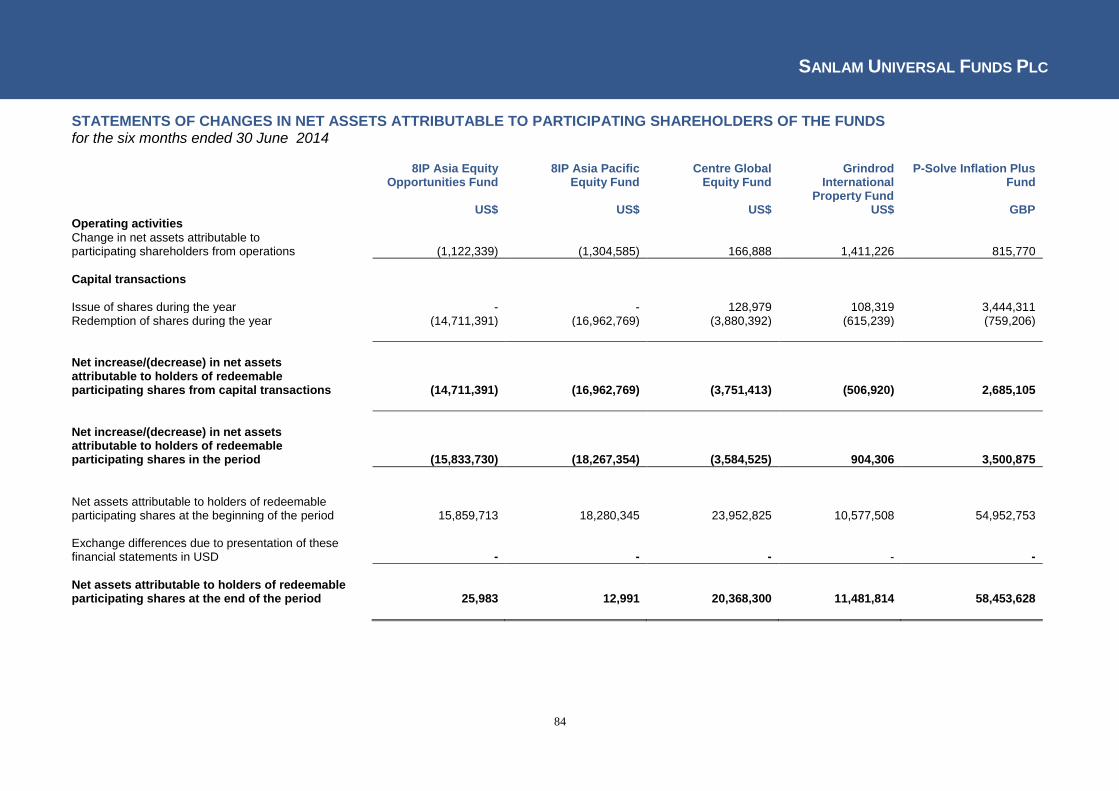
SANLAM UNIVERSAL FUNDS PLC
84
STATEMENTS OF CHANGES IN NET ASSETS ATTRIBUTABLE TO PARTICIPATING SHAREHOLDERS OF THE FUNDS for the six months ended 30 June 2014
8IP Asia Equity Opportunities Fund
8IP Asia Pacific Equity Fund
Centre Global Equity Fund
Grindrod International
Property Fund
P-Solve Inflation Plus Fund
US$ US$ US$ US$ GBP Operating activities
Change in net assets attributable to participating shareholders from operations (1,122,339) (1,304,585) 166,888 1,411,226 815,770
Capital transactions
Issue of shares during the year - - 128,979 108,319 3,444,311 Redemption of shares during the year (14,711,391) (16,962,769) (3,880,392) (615,239) (759,206)
Net increase/(decrease) in net assets attributable to holders of redeemable participating shares from capital transactions
(14,711,391) (16,962,769) (3,751,413) (506,920) 2,685,105
Net increase/(decrease) in net assets attributable to holders of redeemable participating shares in the period
(15,833,730) (18,267,354) (3,584,525) 904,306 3,500,875
Net assets attributable to holders of redeemable participating shares at the beginning of the period
15,859,713 18,280,345 23,952,825 10,577,508 54,952,753
Exchange differences due to presentation of these financial statements in USD
- - - - -
Net assets attributable to holders of redeemable participating shares at the end of the period 25,983 12,991 20,368,300 11,481,814 58,453,628
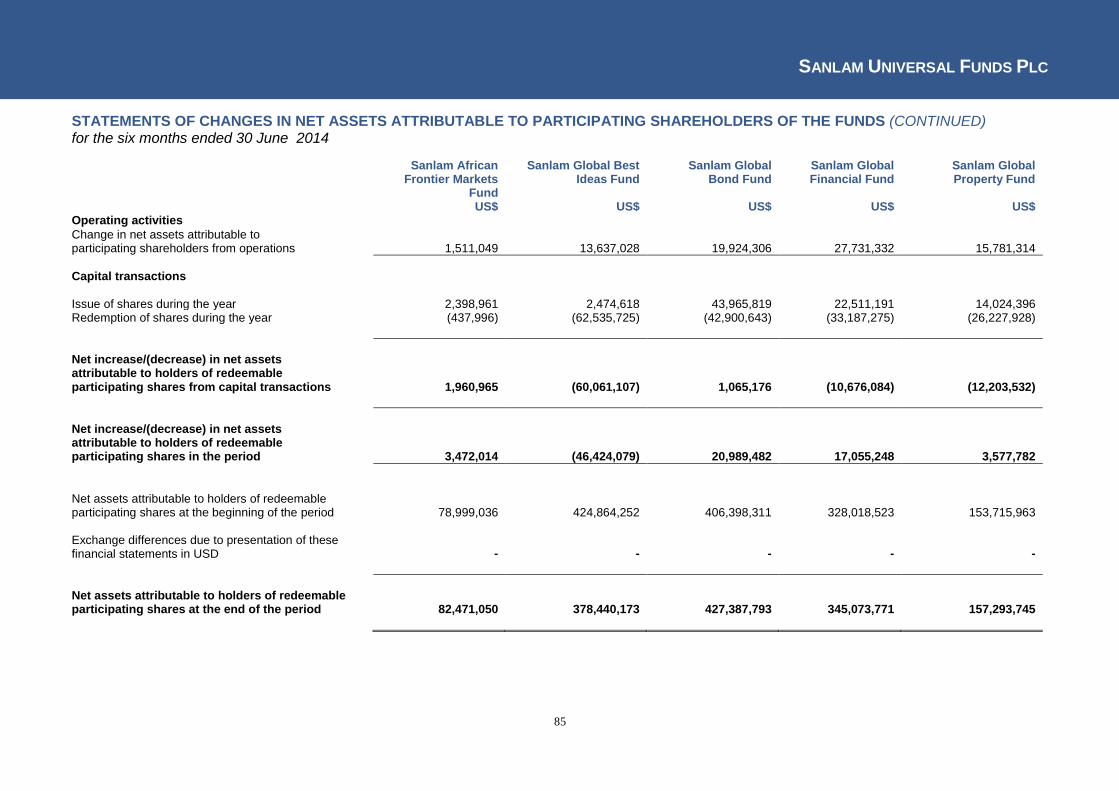
SANLAM UNIVERSAL FUNDS PLC
85
STATEMENTS OF CHANGES IN NET ASSETS ATTRIBUTABLE TO PARTICIPATING SHAREHOLDERS OF THE FUNDS (CONTINUED) for the six months ended 30 June 2014
Sanlam African Frontier Markets
Fund
Sanlam Global Best Ideas Fund
Sanlam Global Bond Fund
Sanlam Global Financial Fund
Sanlam Global Property Fund
US$ US$ US$ US$ US$ Operating activities Change in net assets attributable to participating shareholders from operations 1,511,049 13,637,028 19,924,306 27,731,332 15,781,314
Capital transactions
Issue of shares during the year 2,398,961 2,474,618 43,965,819 22,511,191 14,024,396 Redemption of shares during the year (437,996) (62,535,725) (42,900,643) (33,187,275) (26,227,928)
Net increase/(decrease) in net assets attributable to holders of redeemable participating shares from capital transactions
1,960,965 (60,061,107) 1,065,176 (10,676,084) (12,203,532)
Net increase/(decrease) in net assets attributable to holders of redeemable participating shares in the period
3,472,014 (46,424,079) 20,989,482 17,055,248 3,577,782
Net assets attributable to holders of redeemable participating shares at the beginning of the period
78,999,036 424,864,252 406,398,311 328,018,523 153,715,963
Exchange differences due to presentation of these financial statements in USD
- - - - -
Net assets attributable to holders of redeemable participating shares at the end of the period 82,471,050 378,440,173 427,387,793 345,073,771 157,293,745
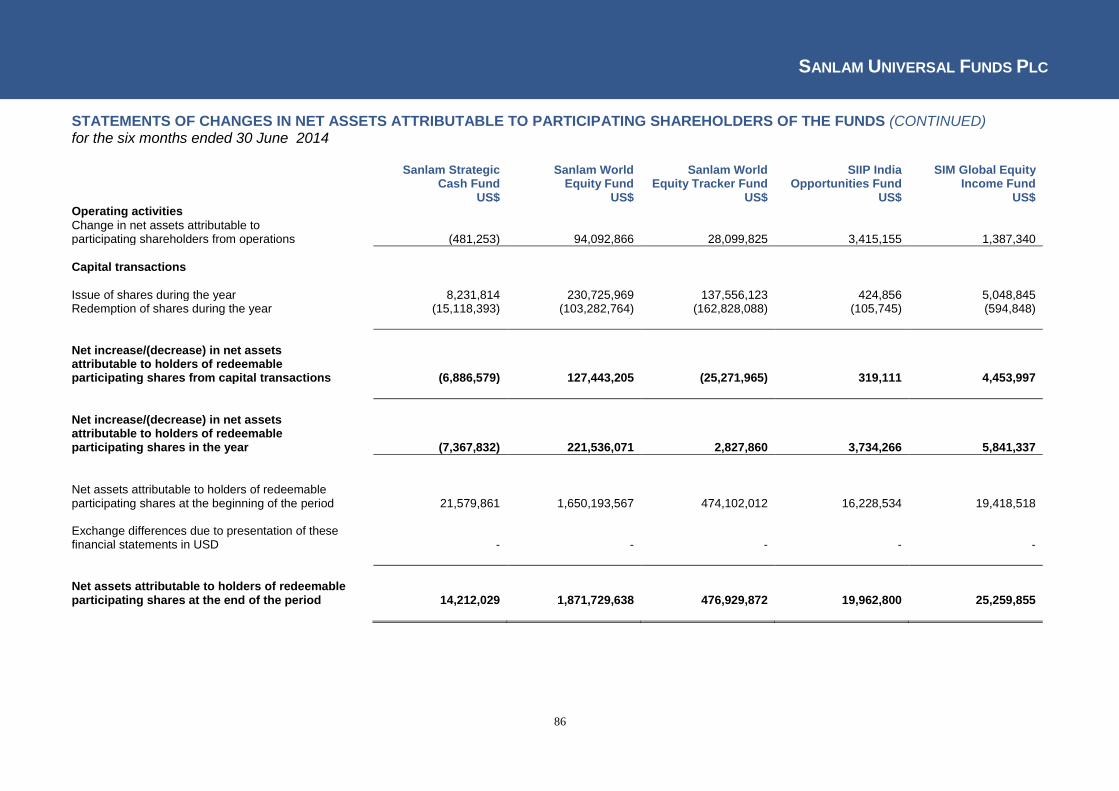
SANLAM UNIVERSAL FUNDS PLC
86
STATEMENTS OF CHANGES IN NET ASSETS ATTRIBUTABLE TO PARTICIPATING SHAREHOLDERS OF THE FUNDS (CONTINUED) for the six months ended 30 June 2014
Sanlam Strategic Cash Fund
Sanlam World Equity Fund
Sanlam World Equity Tracker Fund
SIIP India Opportunities Fund
SIM Global Equity Income Fund
US$ US$ US$ US$ US$ Operating activities Change in net assets attributable to
participating shareholders from operations (481,253) 94,092,866 28,099,825 3,415,155 1,387,340
Capital transactions
Issue of shares during the year 8,231,814 230,725,969 137,556,123 424,856 5,048,845 Redemption of shares during the year (15,118,393) (103,282,764) (162,828,088) (105,745) (594,848)
Net increase/(decrease) in net assets attributable to holders of redeemable participating shares from capital transactions
(6,886,579) 127,443,205 (25,271,965) 319,111 4,453,997
Net increase/(decrease) in net assets attributable to holders of redeemable participating shares in the year
(7,367,832) 221,536,071 2,827,860 3,734,266 5,841,337
Net assets attributable to holders of redeemable participating shares at the beginning of the period
21,579,861 1,650,193,567 474,102,012 16,228,534 19,418,518 Exchange differences due to presentation of these financial statements in USD
- - - - -
Net assets attributable to holders of redeemable participating shares at the end of the period
14,212,029 1,871,729,638 476,929,872 19,962,800 25,259,855
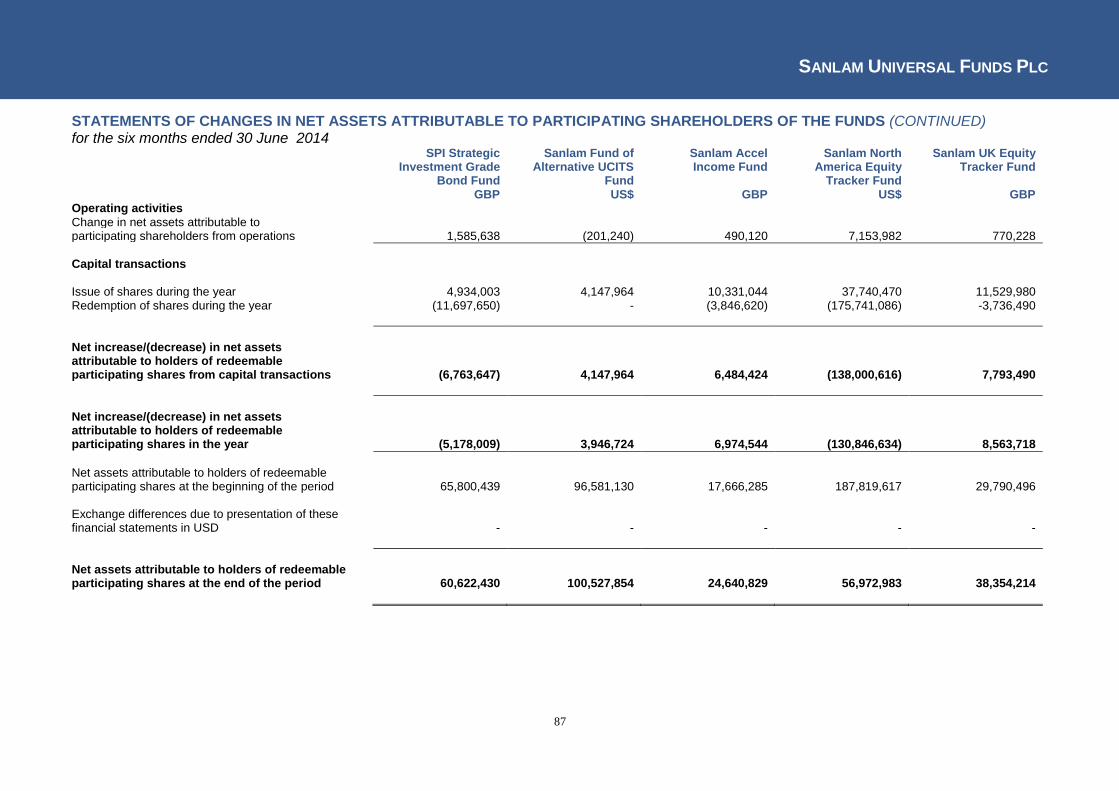
SANLAM UNIVERSAL FUNDS PLC
87
STATEMENTS OF CHANGES IN NET ASSETS ATTRIBUTABLE TO PARTICIPATING SHAREHOLDERS OF THE FUNDS (CONTINUED) for the six months ended 30 June 2014
SPI Strategic Investment Grade
Bond Fund
Sanlam Fund of Alternative UCITS
Fund
Sanlam Accel Income Fund
Sanlam North America Equity
Tracker Fund
Sanlam UK Equity Tracker Fund
GBP US$ GBP US$ GBP Operating activities Change in net assets attributable to
participating shareholders from operations 1,585,638 (201,240) 490,120 7,153,982 770,228
Capital transactions
Issue of shares during the year 4,934,003 4,147,964 10,331,044 37,740,470 11,529,980 Redemption of shares during the year (11,697,650) - (3,846,620) (175,741,086) -3,736,490
Net increase/(decrease) in net assets attributable to holders of redeemable participating shares from capital transactions
(6,763,647) 4,147,964 6,484,424 (138,000,616) 7,793,490
Net increase/(decrease) in net assets attributable to holders of redeemable participating shares in the year
(5,178,009) 3,946,724 6,974,544 (130,846,634) 8,563,718
Net assets attributable to holders of redeemable participating shares at the beginning of the period
65,800,439 96,581,130 17,666,285 187,819,617 29,790,496 Exchange differences due to presentation of these financial statements in USD
- - - - -
Net assets attributable to holders of redeemable participating shares at the end of the period 60,622,430 100,527,854 24,640,829 56,972,983 38,354,214
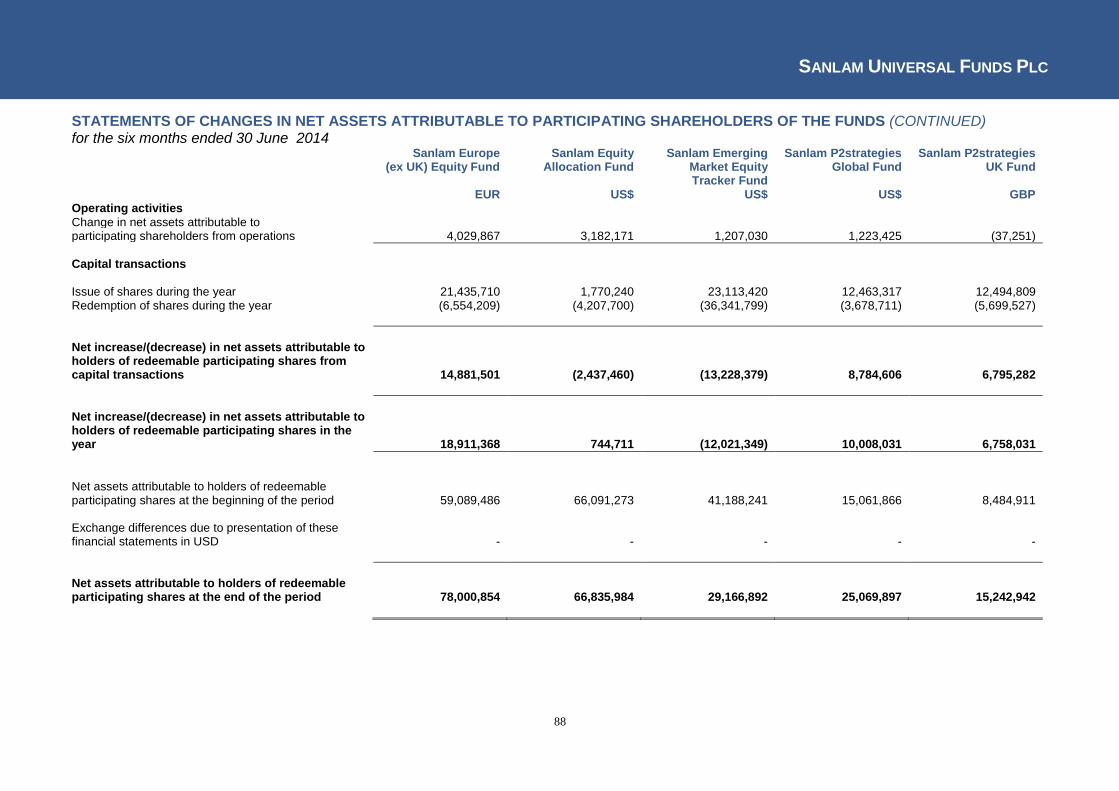
SANLAM UNIVERSAL FUNDS PLC
88
STATEMENTS OF CHANGES IN NET ASSETS ATTRIBUTABLE TO PARTICIPATING SHAREHOLDERS OF THE FUNDS (CONTINUED) for the six months ended 30 June 2014
Sanlam Europe (ex UK) Equity Fund
Sanlam Equity Allocation Fund
Sanlam Emerging Market Equity Tracker Fund
Sanlam P2strategies Global Fund
Sanlam P2strategies UK Fund
EUR US$ US$ US$ GBP Operating activities
Change in net assets attributable to
participating shareholders from operations 4,029,867 3,182,171 1,207,030 1,223,425 (37,251)
Capital transactions
Issue of shares during the year 21,435,710 1,770,240 23,113,420 12,463,317 12,494,809 Redemption of shares during the year (6,554,209) (4,207,700) (36,341,799) (3,678,711) (5,699,527)
Net increase/(decrease) in net assets attributable to holders of redeemable participating shares from capital transactions 14,881,501 (2,437,460) (13,228,379) 8,784,606 6,795,282
Net increase/(decrease) in net assets attributable to holders of redeemable participating shares in the year 18,911,368 744,711 (12,021,349) 10,008,031 6,758,031
Net assets attributable to holders of redeemable participating shares at the beginning of the period 59,089,486 66,091,273 41,188,241 15,061,866 8,484,911 Exchange differences due to presentation of these financial statements in USD - - - - -
Net assets attributable to holders of redeemable participating shares at the end of the period 78,000,854 66,835,984 29,166,892 25,069,897 15,242,942

SANLAM UNIVERSAL FUNDS PLC
89
STATEMENTS OF CHANGES IN NET ASSETS ATTRIBUTABLE TO PARTICIPATING SHAREHOLDERS OF THE FUNDS (CONTINUED) for the six months ended 30 June 2014
Sanlam P2strategies North America Fund
Sanlam P2strategies Emerging Market
Fund
Sanlam P2strategies Europe (ex UK) Fund
Sanlam S&P Africa Tracker Fund
FOUR European L/S Fund
US$ US$ EUR US$ GBP Operating activities
Change in net assets attributable to
participating shareholders from operations 1,929,469 148,613 605,578 1,558,227 (412,262)
Capital transactions
Issue of shares during the year 38,479,655 14,475,473 13,654,125 20,771,637 2,860,527 Redemption of shares during the year (19,347,616) (18,202,402) (6,755,461) - (1,231,036)
Net increase/(decrease) in net assets attributable to holders of redeemable participating shares from capital transactions 19,132,039 (3,726,929) 6,898,664 20,771,637 1,629,491
Net increase/(decrease) in net assets attributable to holders of redeemable participating shares in the year 21,061,508 (3,578,316) 7,504,242 22,329,864 1,217,229
Net assets attributable to holders of redeemable participating shares at the beginning of the period 25,926,843 19,172,983 9,183,656 16,262,449 5,023,103 Exchange differences due to presentation of these financial statements in USD - - - - -
Net assets attributable to holders of redeemable participating shares at the end of the period 46,988,351 15,594,667 16,687,898 38,592,313 6,240,332
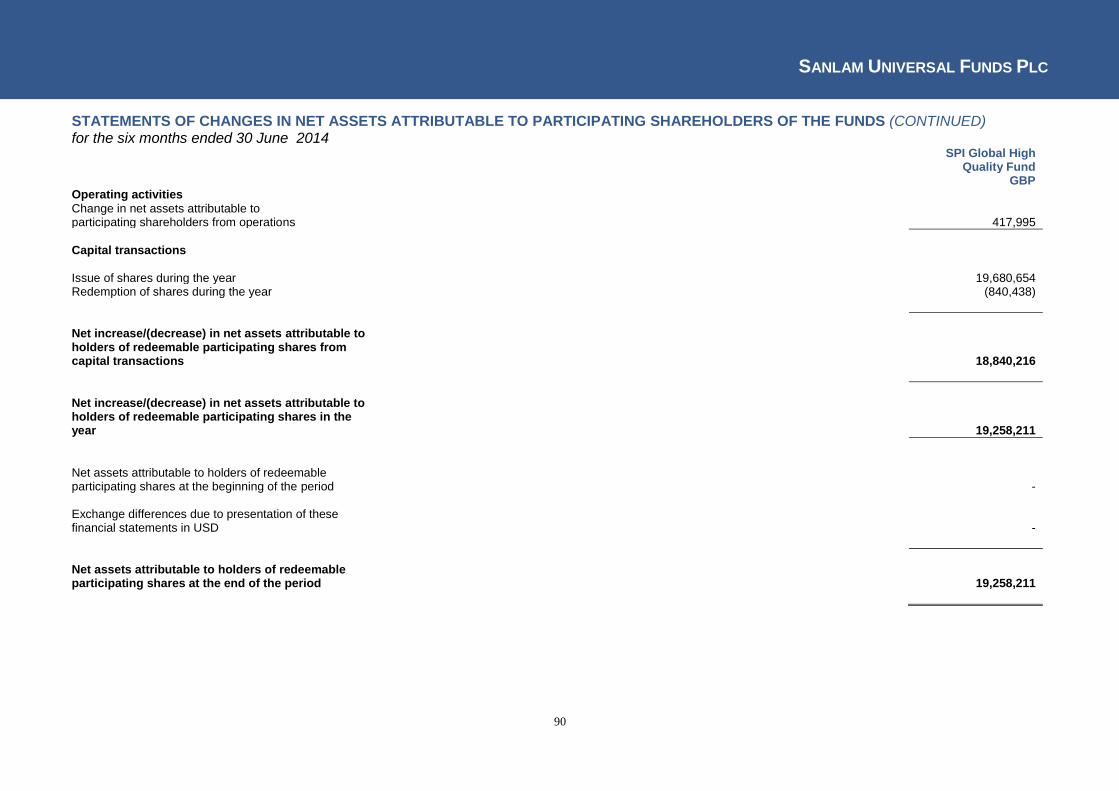
SANLAM UNIVERSAL FUNDS PLC
90
STATEMENTS OF CHANGES IN NET ASSETS ATTRIBUTABLE TO PARTICIPATING SHAREHOLDERS OF THE FUNDS (CONTINUED) for the six months ended 30 June 2014
SPI Global High Quality Fund
GBP Operating activities
Change in net assets attributable to
participating shareholders from operations 417,995
Capital transactions
Issue of shares during the year 19,680,654 Redemption of shares during the year (840,438)
Net increase/(decrease) in net assets attributable to holders of redeemable participating shares from capital transactions 18,840,216
Net increase/(decrease) in net assets attributable to holders of redeemable participating shares in the year 19,258,211
Net assets attributable to holders of redeemable participating shares at the beginning of the period - Exchange differences due to presentation of these financial statements in USD -
Net assets attributable to holders of redeemable participating shares at the end of the period 19,258,211
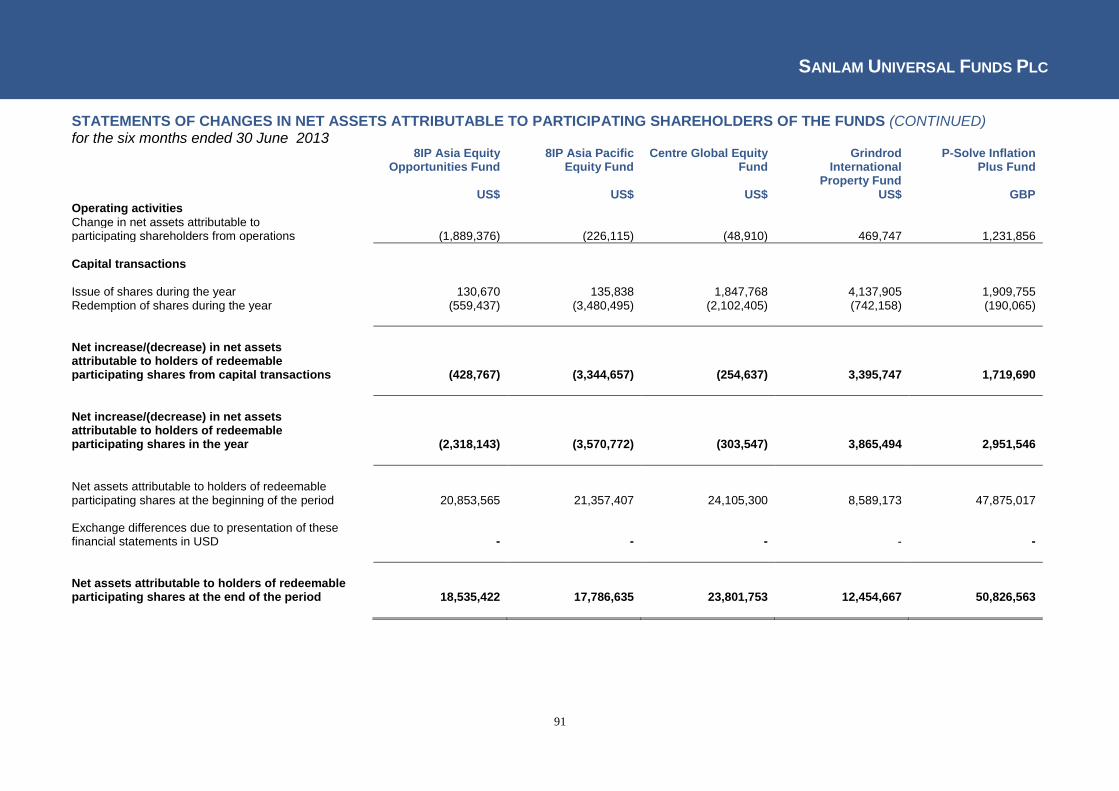
SANLAM UNIVERSAL FUNDS PLC
91
STATEMENTS OF CHANGES IN NET ASSETS ATTRIBUTABLE TO PARTICIPATING SHAREHOLDERS OF THE FUNDS (CONTINUED) for the six months ended 30 June 2013
8IP Asia Equity Opportunities Fund
8IP Asia Pacific Equity Fund
Centre Global Equity Fund
Grindrod International
Property Fund
P-Solve Inflation Plus Fund
US$ US$ US$ US$ GBP Operating activities
Change in net assets attributable to participating shareholders from operations (1,889,376) (226,115) (48,910) 469,747 1,231,856
Capital transactions
Issue of shares during the year 130,670 135,838 1,847,768 4,137,905 1,909,755 Redemption of shares during the year (559,437) (3,480,495) (2,102,405) (742,158) (190,065)
Net increase/(decrease) in net assets attributable to holders of redeemable participating shares from capital transactions
(428,767) (3,344,657) (254,637) 3,395,747 1,719,690
Net increase/(decrease) in net assets attributable to holders of redeemable participating shares in the year
(2,318,143) (3,570,772) (303,547) 3,865,494 2,951,546
Net assets attributable to holders of redeemable participating shares at the beginning of the period
20,853,565 21,357,407 24,105,300 8,589,173 47,875,017 Exchange differences due to presentation of these financial statements in USD
- - - - -
Net assets attributable to holders of redeemable participating shares at the end of the period 18,535,422 17,786,635 23,801,753 12,454,667 50,826,563
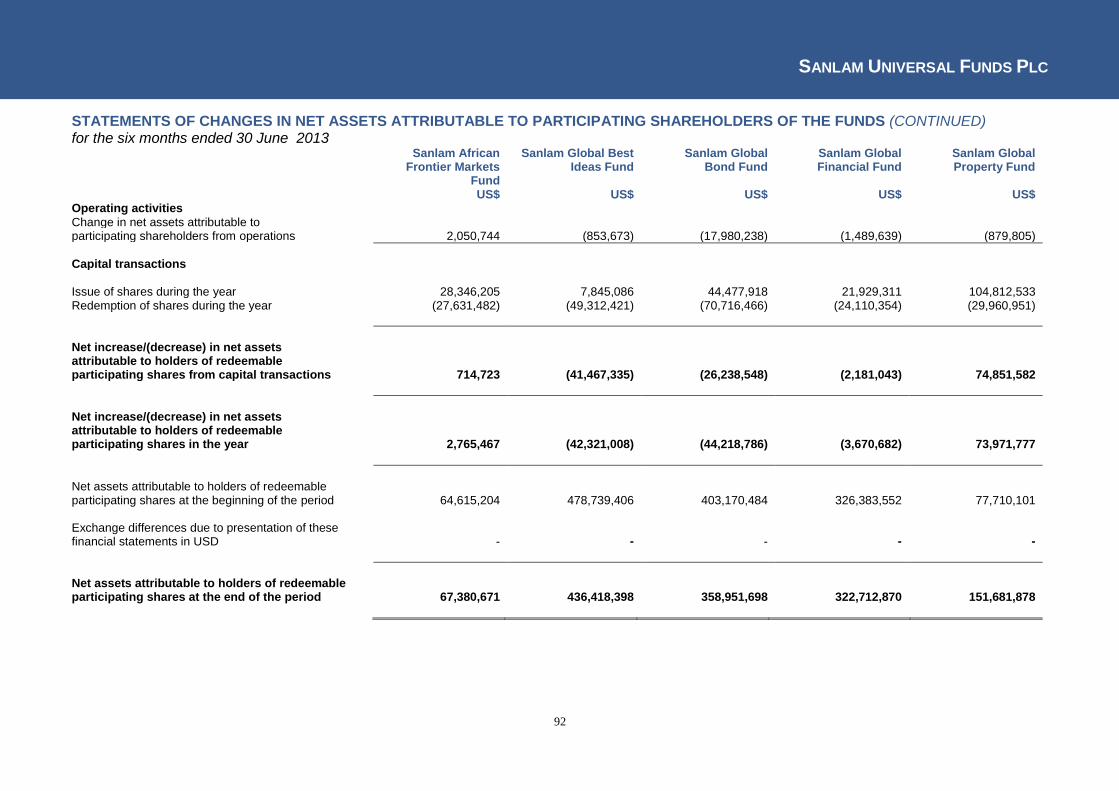
SANLAM UNIVERSAL FUNDS PLC
92
STATEMENTS OF CHANGES IN NET ASSETS ATTRIBUTABLE TO PARTICIPATING SHAREHOLDERS OF THE FUNDS (CONTINUED) for the six months ended 30 June 2013
Sanlam African Frontier Markets
Fund
Sanlam Global Best Ideas Fund
Sanlam Global Bond Fund
Sanlam Global Financial Fund
Sanlam Global Property Fund
US$ US$ US$ US$ US$ Operating activities Change in net assets attributable to
participating shareholders from operations 2,050,744 (853,673) (17,980,238) (1,489,639) (879,805)
Capital transactions
Issue of shares during the year 28,346,205 7,845,086 44,477,918 21,929,311 104,812,533 Redemption of shares during the year (27,631,482) (49,312,421) (70,716,466) (24,110,354) (29,960,951)
Net increase/(decrease) in net assets attributable to holders of redeemable participating shares from capital transactions
714,723 (41,467,335) (26,238,548) (2,181,043) 74,851,582
Net increase/(decrease) in net assets attributable to holders of redeemable participating shares in the year
2,765,467 (42,321,008) (44,218,786) (3,670,682) 73,971,777
Net assets attributable to holders of redeemable participating shares at the beginning of the period
64,615,204 478,739,406 403,170,484 326,383,552 77,710,101
Exchange differences due to presentation of these financial statements in USD
- - - - -
Net assets attributable to holders of redeemable participating shares at the end of the period 67,380,671 436,418,398 358,951,698 322,712,870 151,681,878
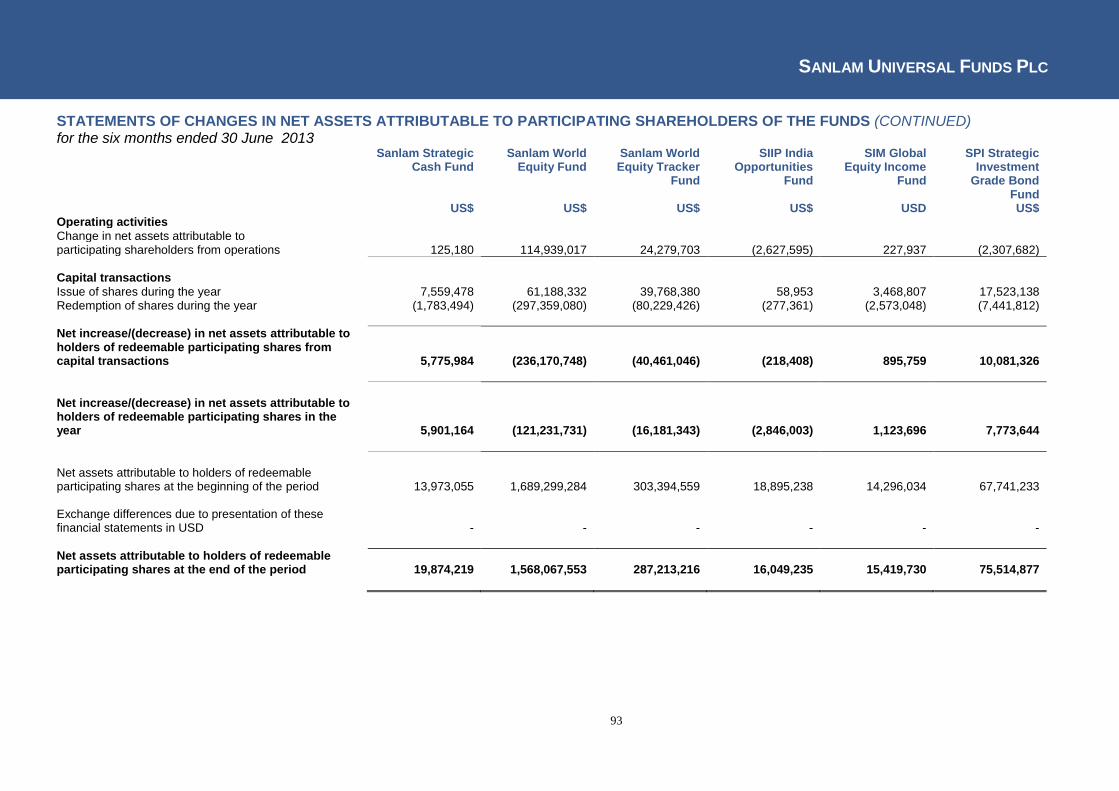
SANLAM UNIVERSAL FUNDS PLC
93
STATEMENTS OF CHANGES IN NET ASSETS ATTRIBUTABLE TO PARTICIPATING SHAREHOLDERS OF THE FUNDS (CONTINUED) for the six months ended 30 June 2013
Sanlam Strategic Cash Fund
Sanlam World Equity Fund
Sanlam World Equity Tracker
Fund
SIIP India Opportunities
Fund
SIM Global Equity Income
Fund
SPI Strategic Investment
Grade Bond Fund
US$ US$ US$ US$ USD US$ Operating activities
Change in net assets attributable to participating shareholders from operations 125,180 114,939,017 24,279,703 (2,627,595) 227,937 (2,307,682)
Capital transactions Issue of shares during the year 7,559,478 61,188,332 39,768,380 58,953 3,468,807 17,523,138 Redemption of shares during the year (1,783,494) (297,359,080) (80,229,426) (277,361) (2,573,048) (7,441,812)
Net increase/(decrease) in net assets attributable to holders of redeemable participating shares from capital transactions 5,775,984 (236,170,748) (40,461,046) (218,408) 895,759 10,081,326
Net increase/(decrease) in net assets attributable to holders of redeemable participating shares in the year 5,901,164 (121,231,731) (16,181,343) (2,846,003) 1,123,696 7,773,644
Net assets attributable to holders of redeemable participating shares at the beginning of the period 13,973,055 1,689,299,284 303,394,559 18,895,238 14,296,034 67,741,233
Exchange differences due to presentation of these financial statements in USD - - - - - -
Net assets attributable to holders of redeemable participating shares at the end of the period 19,874,219 1,568,067,553 287,213,216 16,049,235 15,419,730 75,514,877
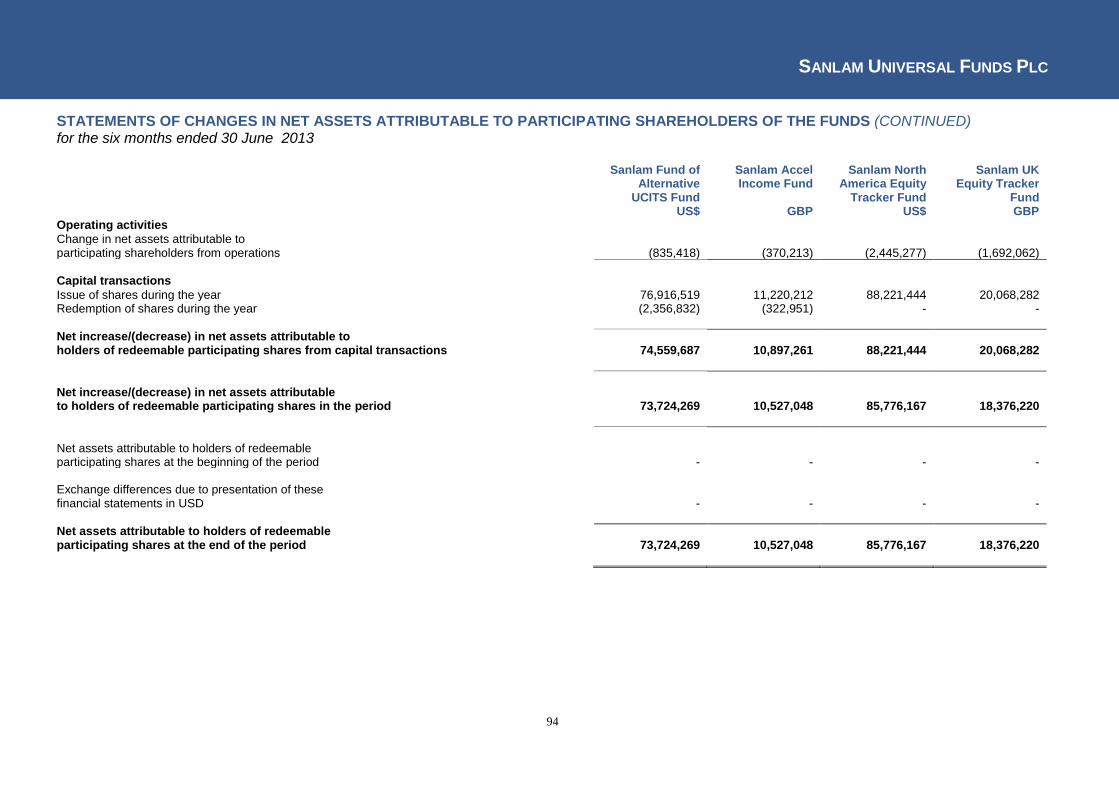
SANLAM UNIVERSAL FUNDS PLC
94
STATEMENTS OF CHANGES IN NET ASSETS ATTRIBUTABLE TO PARTICIPATING SHAREHOLDERS OF THE FUNDS (CONTINUED) for the six months ended 30 June 2013
Sanlam Fund of Alternative
UCITS Fund
Sanlam Accel Income Fund
Sanlam North America Equity
Tracker Fund
Sanlam UK Equity Tracker
Fund US$ GBP US$ GBP Operating activities Change in net assets attributable to
participating shareholders from operations (835,418) (370,213) (2,445,277) (1,692,062)
Capital transactions Issue of shares during the year 76,916,519 11,220,212 88,221,444 20,068,282 Redemption of shares during the year (2,356,832) (322,951) - -
Net increase/(decrease) in net assets attributable to holders of redeemable participating shares from capital transactions 74,559,687 10,897,261 88,221,444 20,068,282
Net increase/(decrease) in net assets attributable to holders of redeemable participating shares in the period 73,724,269 10,527,048 85,776,167 18,376,220
Net assets attributable to holders of redeemable participating shares at the beginning of the period - - - - Exchange differences due to presentation of these financial statements in USD - - - -
Net assets attributable to holders of redeemable participating shares at the end of the period 73,724,269 10,527,048 85,776,167 18,376,220
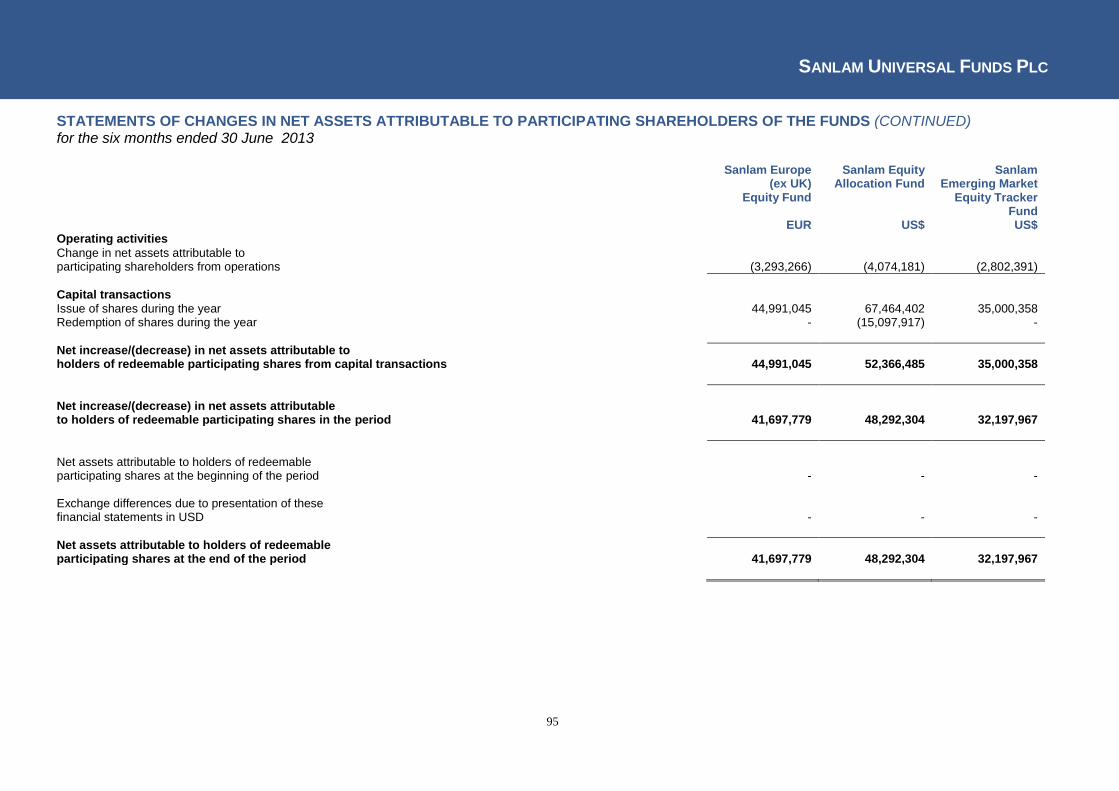
SANLAM UNIVERSAL FUNDS PLC
95
STATEMENTS OF CHANGES IN NET ASSETS ATTRIBUTABLE TO PARTICIPATING SHAREHOLDERS OF THE FUNDS (CONTINUED) for the six months ended 30 June 2013
Sanlam Europe (ex UK)
Equity Fund
Sanlam Equity Allocation Fund
Sanlam Emerging Market
Equity Tracker Fund
EUR US$ US$ Operating activities
Change in net assets attributable to
participating shareholders from operations (3,293,266) (4,074,181) (2,802,391)
Capital transactions Issue of shares during the year 44,991,045 67,464,402 35,000,358 Redemption of shares during the year - (15,097,917) -
Net increase/(decrease) in net assets attributable to holders of redeemable participating shares from capital transactions 44,991,045 52,366,485 35,000,358
Net increase/(decrease) in net assets attributable to holders of redeemable participating shares in the period 41,697,779 48,292,304 32,197,967
Net assets attributable to holders of redeemable participating shares at the beginning of the period - - - Exchange differences due to presentation of these financial statements in USD - - -
Net assets attributable to holders of redeemable participating shares at the end of the period 41,697,779 48,292,304 32,197,967
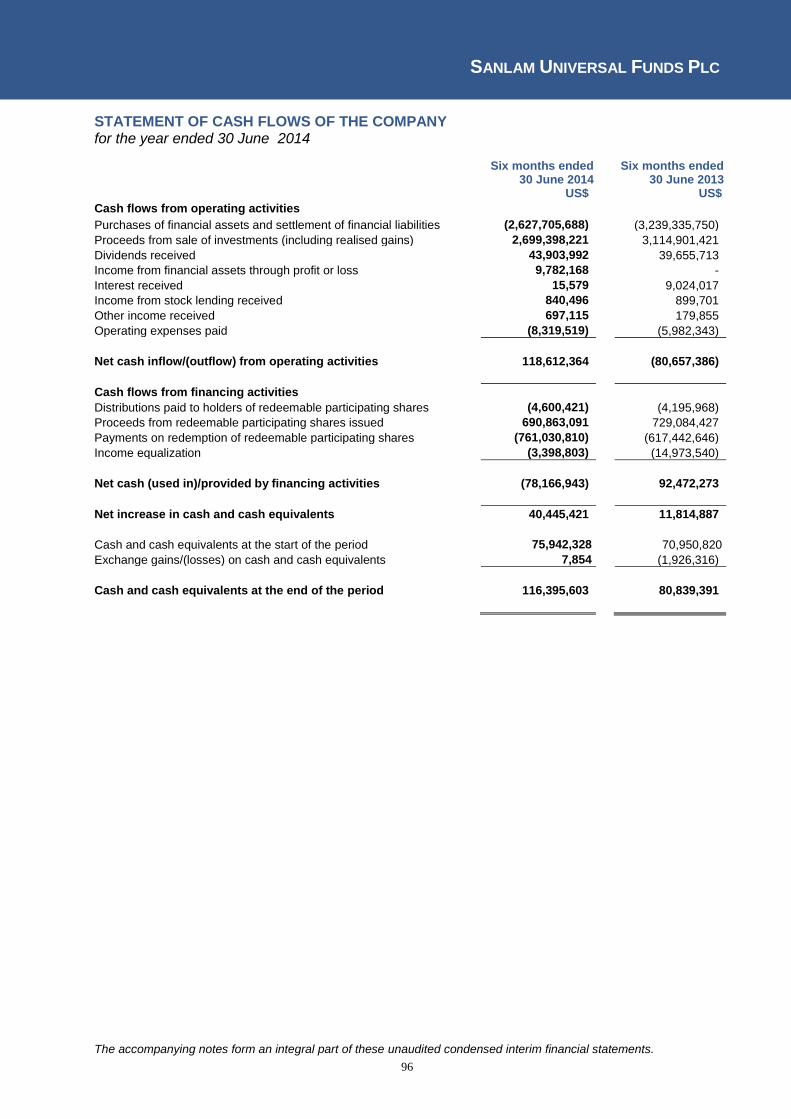
SANLAM UNIVERSAL FUNDS PLC
96
STATEMENT OF CASH FLOWS OF THE COMPANY for the year ended 30 June 2014
Six months ended 30 June 2014
Six months ended 30 June 2013
US$ US$
Cash flows from operating activities
Purchases of financial assets and settlement of financial liabilities (2,627,705,688) (3,239,335,750)
Proceeds from sale of investments (including realised gains) 2,699,398,221 3,114,901,421
Dividends received 43,903,992 39,655,713
Income from financial assets through profit or loss 9,782,168 -
Interest received 15,579 9,024,017
Income from stock lending received 840,496 899,701
Other income received 697,115 179,855
Operating expenses paid (8,319,519) (5,982,343)
Net cash inflow/(outflow) from operating activities 118,612,364 (80,657,386)
Cash flows from financing activities
Distributions paid to holders of redeemable participating shares (4,600,421) (4,195,968)
Proceeds from redeemable participating shares issued 690,863,091 729,084,427
Payments on redemption of redeemable participating shares (761,030,810) (617,442,646)
Income equalization (3,398,803) (14,973,540)
Net cash (used in)/provided by financing activities (78,166,943) 92,472,273
Net increase in cash and cash equivalents 40,445,421 11,814,887
Cash and cash equivalents at the start of the period 75,942,328 70,950,820
Exchange gains/(losses) on cash and cash equivalents 7,854 (1,926,316)
Cash and cash equivalents at the end of the period 116,395,603 80,839,391
The accompanying notes form an integral part of these unaudited condensed interim financial statements.
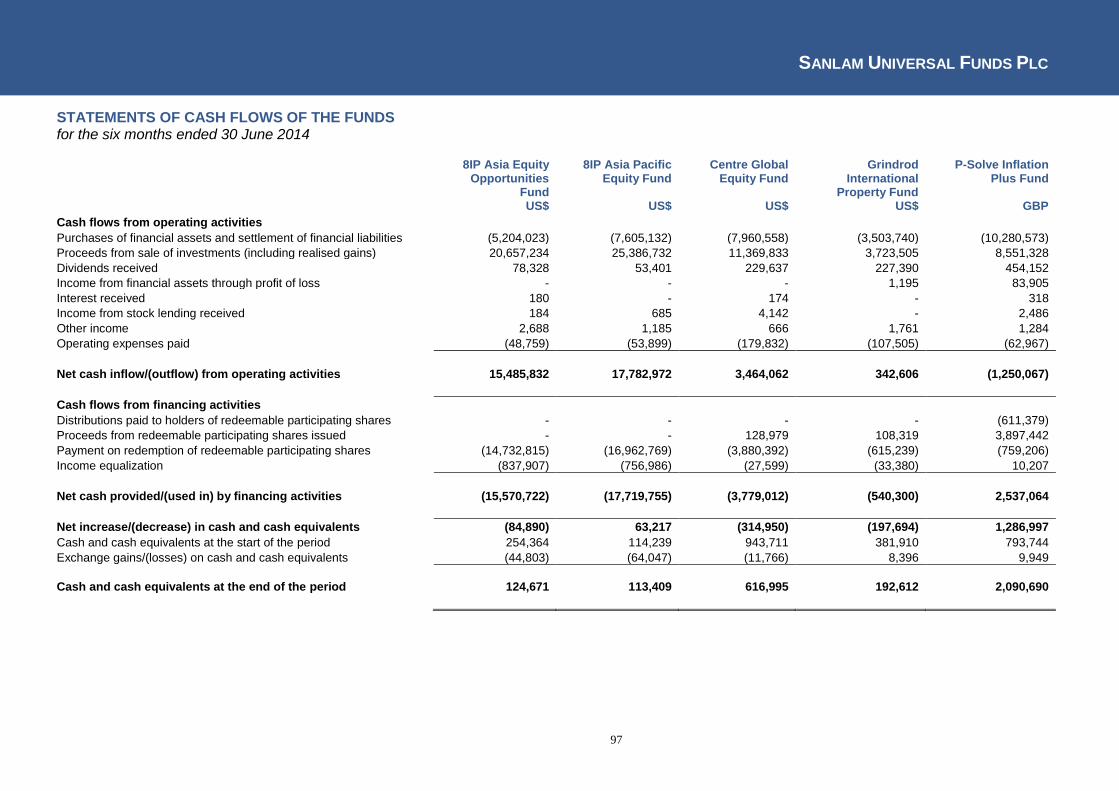
SANLAM UNIVERSAL FUNDS PLC
97
STATEMENTS OF CASH FLOWS OF THE FUNDS for the six months ended 30 June 2014
8IP Asia Equity Opportunities
Fund
8IP Asia Pacific Equity Fund
Centre Global Equity Fund
Grindrod International
Property Fund
P-Solve Inflation Plus Fund
US$ US$ US$ US$ GBP
Cash flows from operating activities
Purchases of financial assets and settlement of financial liabilities (5,204,023) (7,605,132) (7,960,558) (3,503,740) (10,280,573)
Proceeds from sale of investments (including realised gains) 20,657,234 25,386,732 11,369,833 3,723,505 8,551,328
Dividends received 78,328 53,401 229,637 227,390 454,152
Income from financial assets through profit of loss - - - 1,195 83,905
Interest received 180 - 174 - 318
Income from stock lending received 184 685 4,142 - 2,486
Other income 2,688 1,185 666 1,761 1,284
Operating expenses paid (48,759) (53,899) (179,832) (107,505) (62,967)
Net cash inflow/(outflow) from operating activities 15,485,832 17,782,972 3,464,062 342,606 (1,250,067)
Cash flows from financing activities
Distributions paid to holders of redeemable participating shares - - - - (611,379)
Proceeds from redeemable participating shares issued - - 128,979 108,319 3,897,442
Payment on redemption of redeemable participating shares (14,732,815) (16,962,769) (3,880,392) (615,239) (759,206)
Income equalization (837,907) (756,986) (27,599) (33,380) 10,207
Net cash provided/(used in) by financing activities (15,570,722) (17,719,755) (3,779,012) (540,300) 2,537,064
Net increase/(decrease) in cash and cash equivalents (84,890) 63,217 (314,950) (197,694) 1,286,997
Cash and cash equivalents at the start of the period 254,364 114,239 943,711 381,910 793,744
Exchange gains/(losses) on cash and cash equivalents (44,803) (64,047) (11,766) 8,396 9,949
Cash and cash equivalents at the end of the period 124,671 113,409 616,995 192,612 2,090,690
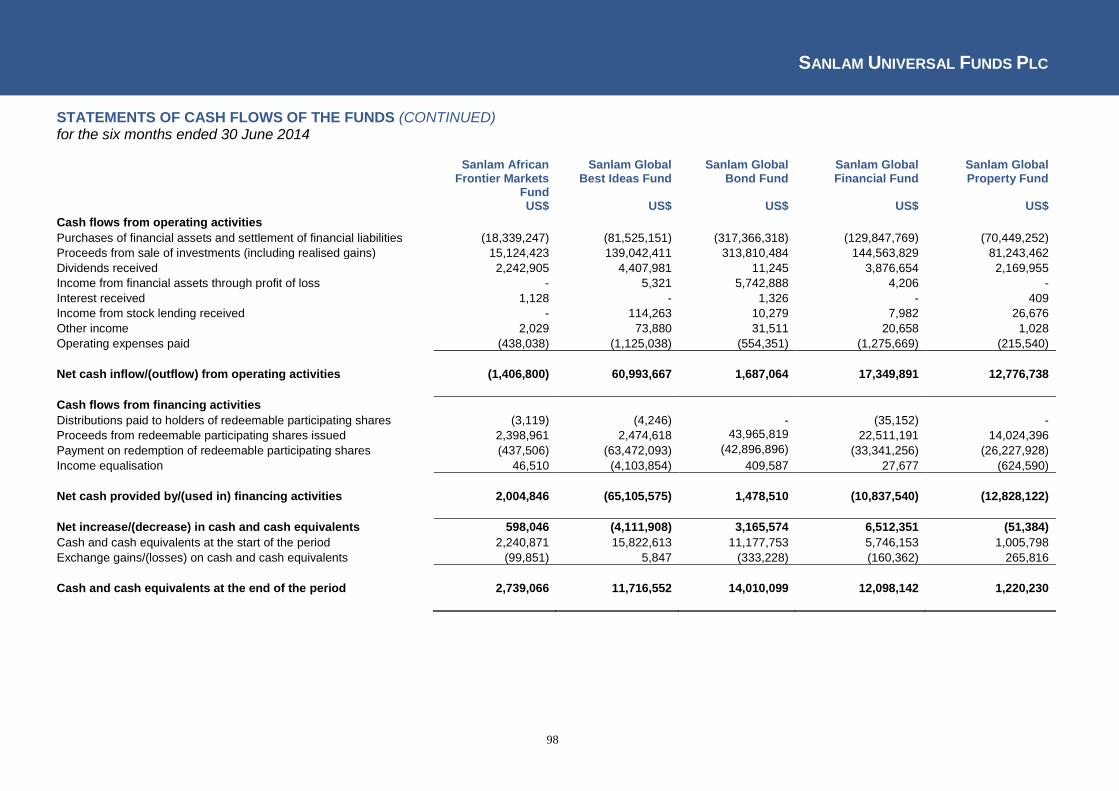
SANLAM UNIVERSAL FUNDS PLC
98
STATEMENTS OF CASH FLOWS OF THE FUNDS (CONTINUED) for the six months ended 30 June 2014
Sanlam African Frontier Markets
Fund
Sanlam Global Best Ideas Fund
Sanlam Global Bond Fund
Sanlam Global Financial Fund
Sanlam Global Property Fund
US$ US$ US$ US$ US$
Cash flows from operating activities
Purchases of financial assets and settlement of financial liabilities (18,339,247) (81,525,151) (317,366,318) (129,847,769) (70,449,252)
Proceeds from sale of investments (including realised gains) 15,124,423 139,042,411 313,810,484 144,563,829 81,243,462
Dividends received 2,242,905 4,407,981 11,245 3,876,654 2,169,955
Income from financial assets through profit of loss - 5,321 5,742,888 4,206 -
Interest received 1,128 - 1,326 - 409
Income from stock lending received - 114,263 10,279 7,982 26,676
Other income 2,029 73,880 31,511 20,658 1,028
Operating expenses paid (438,038) (1,125,038) (554,351) (1,275,669) (215,540)
Net cash inflow/(outflow) from operating activities (1,406,800) 60,993,667 1,687,064 17,349,891 12,776,738
Cash flows from financing activities
Distributions paid to holders of redeemable participating shares (3,119) (4,246) - (35,152) -
Proceeds from redeemable participating shares issued 2,398,961 2,474,618 43,965,819 22,511,191 14,024,396
Payment on redemption of redeemable participating shares (437,506) (63,472,093) (42,896,896) (33,341,256) (26,227,928)
Income equalisation 46,510 (4,103,854) 409,587 27,677 (624,590)
Net cash provided by/(used in) financing activities 2,004,846 (65,105,575) 1,478,510 (10,837,540) (12,828,122)
Net increase/(decrease) in cash and cash equivalents 598,046 (4,111,908) 3,165,574 6,512,351 (51,384)
Cash and cash equivalents at the start of the period 2,240,871 15,822,613 11,177,753 5,746,153 1,005,798
Exchange gains/(losses) on cash and cash equivalents (99,851) 5,847 (333,228) (160,362) 265,816
Cash and cash equivalents at the end of the period 2,739,066 11,716,552 14,010,099 12,098,142 1,220,230

SANLAM UNIVERSAL FUNDS PLC
99
STATEMENTS OF CASH FLOWS OF THE FUNDS (CONTINUED) for the six months ended 30 June 2014
Sanlam Strategic Cash Fund
Sanlam World Equity Fund
Sanlam World Equity Tracker
Fund
SIIP India Opportunities Fund
SIM Global Equity Income Fund
US$ US$ US$ US$ US$
Cash flows from operating activities
Purchases of financial assets and settlement of financial liabilities (43,400,296) (1,310,236,649) (107,511,820) (6,649,650) (4,188,075)
Proceeds from sale of investments (including realised gains) 49,915,946 1,175,005,908 129,382,314 6,357,354 267,375
Dividends received - 17,277,469 5,195,213 47,816 478,496
Income from financial assets through profit of loss 431,960 - 0 - 5,209
Interest received 188 6,679 469 (40) 159
Income from stock lending received 55 327,271 114,135 - -
Other income 2,259 182,897 4,124 1,995 -
Operating expenses paid (44,183) (1,814,150) (867,779) (87,238) (120,315)
Net cash inflow/(outflow) from operating activities 6,905,929 (119,250,575) 26,316,656 (329,763) (3,557,151)
Cash flows from financing activities
Distributions paid to holders of redeemable participating shares - - (111) - (358,553)
Proceeds from redeemable participating shares issued 8,231,814 230,725,969 137,860,837 424,856 5,048,845
Payment on redemption of redeemable participating shares (15,115,551) (103,295,327) (158,193,091) (105,745) (594,848)
Income equalisation (502,156) 7,178,582 (2,275,226) (313) 16,688
Net cash provided by/(used in) financing activities (7,385,893) 134,609,224 (22,607,591) 318,798 4,112,132
Net increase/(decrease) in cash and cash equivalents (479,964) 15,358,649 3,709,065 (10,965) 554,981
Cash and cash equivalents at the start of the period 574,736 20,473,137 2,361,415 177,844 339,496
Exchange gains/(losses) on cash and cash equivalents - (7,332) 15,734 (18,821) 7,532
Cash and cash equivalents at the end of the period 94,772 35,824,454 6,086,214 148,058 902,009
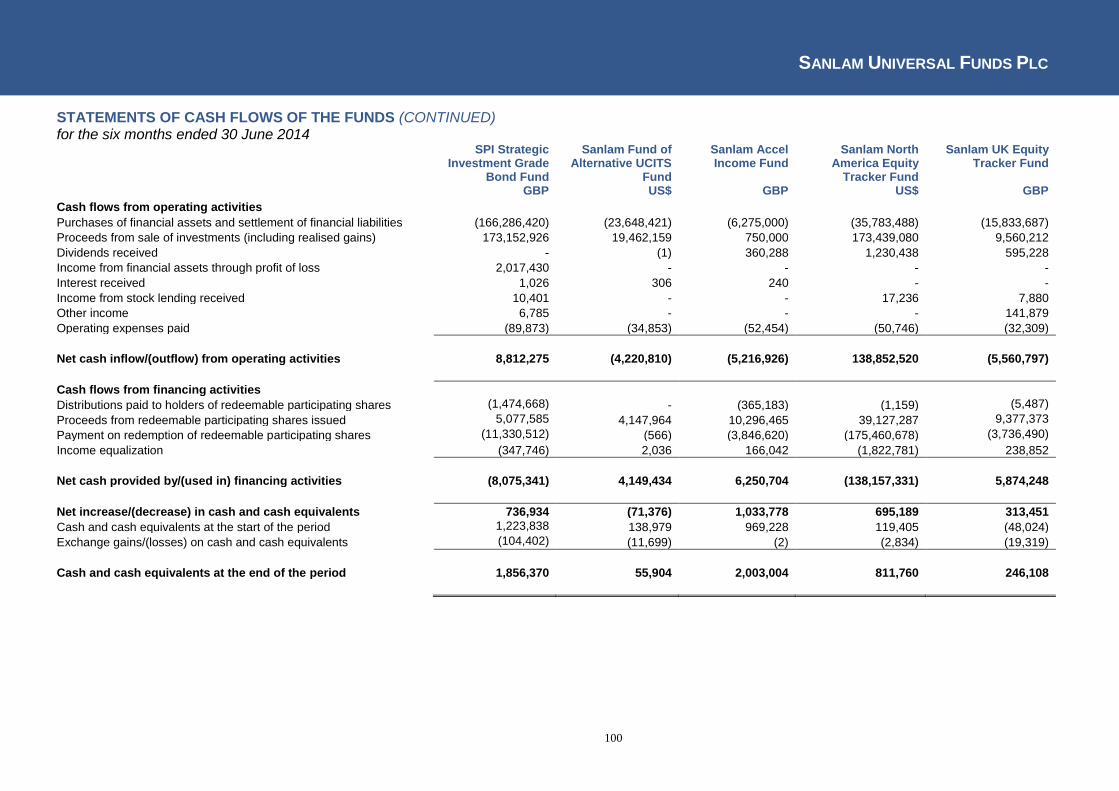
SANLAM UNIVERSAL FUNDS PLC
100
STATEMENTS OF CASH FLOWS OF THE FUNDS (CONTINUED) for the six months ended 30 June 2014
SPI Strategic Investment Grade
Bond Fund
Sanlam Fund of Alternative UCITS
Fund
Sanlam Accel Income Fund
Sanlam North America Equity
Tracker Fund
Sanlam UK Equity Tracker Fund
GBP US$ GBP US$ GBP
Cash flows from operating activities
Purchases of financial assets and settlement of financial liabilities (166,286,420) (23,648,421) (6,275,000) (35,783,488) (15,833,687)
Proceeds from sale of investments (including realised gains) 173,152,926 19,462,159 750,000 173,439,080 9,560,212
Dividends received - (1) 360,288 1,230,438 595,228
Income from financial assets through profit of loss 2,017,430 - - - -
Interest received 1,026 306 240 - -
Income from stock lending received 10,401 - - 17,236 7,880
Other income 6,785 - - - 141,879
Operating expenses paid (89,873) (34,853) (52,454) (50,746) (32,309)
Net cash inflow/(outflow) from operating activities 8,812,275 (4,220,810) (5,216,926) 138,852,520 (5,560,797)
Cash flows from financing activities
Distributions paid to holders of redeemable participating shares (1,474,668) - (365,183) (1,159) (5,487)
Proceeds from redeemable participating shares issued 5,077,585 4,147,964 10,296,465 39,127,287 9,377,373
Payment on redemption of redeemable participating shares (11,330,512) (566) (3,846,620) (175,460,678) (3,736,490)
Income equalization (347,746) 2,036 166,042 (1,822,781) 238,852
Net cash provided by/(used in) financing activities (8,075,341) 4,149,434 6,250,704 (138,157,331) 5,874,248
Net increase/(decrease) in cash and cash equivalents 736,934 (71,376) 1,033,778 695,189 313,451
Cash and cash equivalents at the start of the period 1,223,838 138,979 969,228 119,405 (48,024)
Exchange gains/(losses) on cash and cash equivalents (104,402) (11,699) (2) (2,834) (19,319)
Cash and cash equivalents at the end of the period 1,856,370 55,904 2,003,004 811,760 246,108

SANLAM UNIVERSAL FUNDS PLC
101
STATEMENTS OF CASH FLOWS OF THE FUNDS (CONTINUED) for the six months ended 30 June 2014
Sanlam Europe (ex UK) Equity Tracker Fund
Sanlam Equity Allocation Fund
Sanlam Emerging Market Equity Tracker Fund
Sanlam P2strategies Global
Fund
Sanlam P2strategies UK
Fund EUR US$ US$ US$ GBP
Cash flows from operating activities
Purchases of financial assets and settlement of financial liabilities (19,713,357) (7,914,118) (20,539,320) (12,566,037) (9,145,143)
Proceeds from sale of investments (including realised gains) 10,382,190 9,297,354 34,204,251 2,365,831 2,642,919
Dividends received 1,141,419 1,191,309 322,550 - -
Income from financial assets through profit of loss - - - - -
Interest received (108) 170 (1,286) (945) (618)
Income from stock lending received 83,070 50,695 16,419 - -
Other income 82,874 - - - -
Operating expenses paid (57,450) (43,487) (123,894) (72,720) (46,331)
Net cash inflow/(outflow) from operating activities (8,081,362) 2,581,923 13,878,720 (10,273,871) (6,549,173)
Cash flows from financing activities
Distributions paid to holders of redeemable participating shares - - - - -
Proceeds from redeemable participating shares issued 14,788,152 1,770,240 23,567,749 12,760,498 12,859,111
Payment on redemption of redeemable participating shares (6,554,209) (4,207,700) (36,341,799) (3,678,711) (5,699,525)
Income equalisation 274,967 (28,130) (330,233) (52,246) (33,639)
Net cash provided by/(used in) financing activities 8,508,910 (2,465,590) (13,104,283) 9,029,541 7,125,947
Net increase/(decrease) in cash and cash equivalents 427,548 116,333 774,437 (1,244,330) 576,774
Cash and cash equivalents at the start of the period 174,275 414,943 (131,613) 2,443,035 802,802
Exchange gains/(losses) on cash and cash equivalents (71,821) 22,744 (37,818) 133,800 (138,094)
Cash and cash equivalents at the end of the period 530,002 554,020 605,006 1,332,505 1,241,482
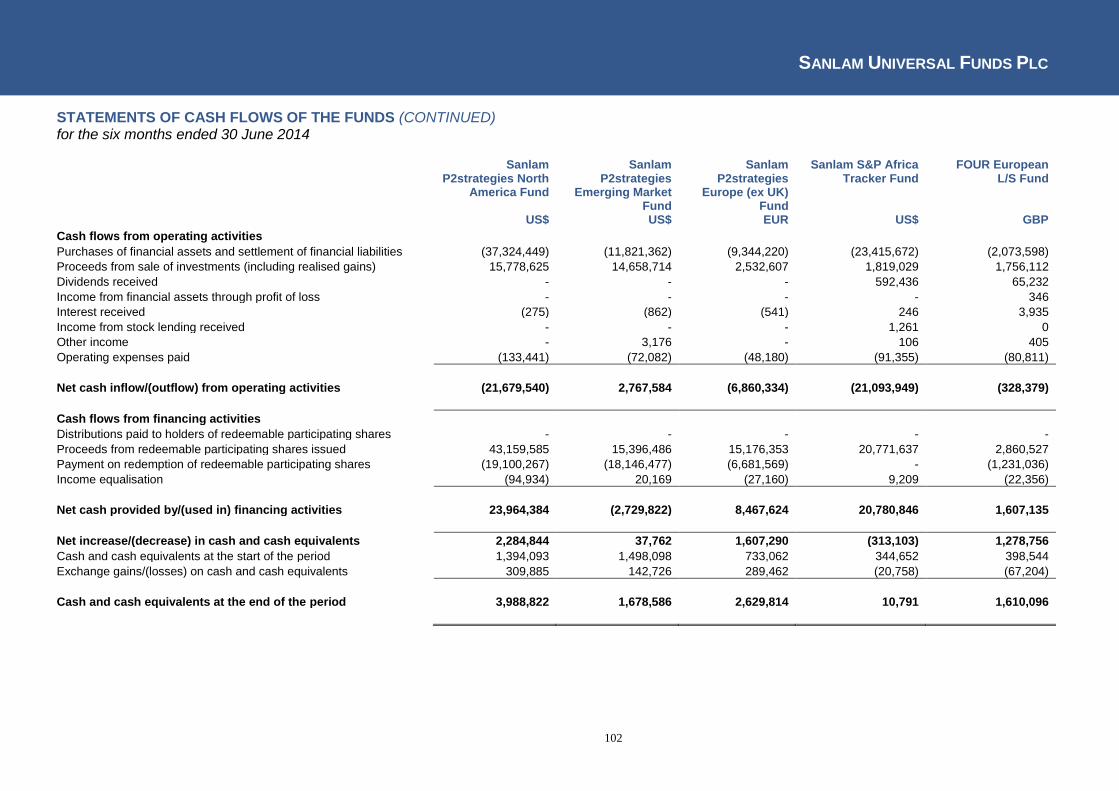
SANLAM UNIVERSAL FUNDS PLC
102
STATEMENTS OF CASH FLOWS OF THE FUNDS (CONTINUED) for the six months ended 30 June 2014
Sanlam P2strategies North
America Fund
Sanlam P2strategies
Emerging Market Fund
Sanlam P2strategies
Europe (ex UK) Fund
Sanlam S&P Africa Tracker Fund
FOUR European L/S Fund
US$ US$ EUR US$ GBP
Cash flows from operating activities
Purchases of financial assets and settlement of financial liabilities (37,324,449) (11,821,362) (9,344,220) (23,415,672) (2,073,598)
Proceeds from sale of investments (including realised gains) 15,778,625 14,658,714 2,532,607 1,819,029 1,756,112
Dividends received - - - 592,436 65,232
Income from financial assets through profit of loss - - - - 346
Interest received (275) (862) (541) 246 3,935
Income from stock lending received - - - 1,261 0
Other income - 3,176 - 106 405
Operating expenses paid (133,441) (72,082) (48,180) (91,355) (80,811)
Net cash inflow/(outflow) from operating activities (21,679,540) 2,767,584 (6,860,334) (21,093,949) (328,379)
Cash flows from financing activities
Distributions paid to holders of redeemable participating shares - - - - -
Proceeds from redeemable participating shares issued 43,159,585 15,396,486 15,176,353 20,771,637 2,860,527
Payment on redemption of redeemable participating shares (19,100,267) (18,146,477) (6,681,569) - (1,231,036)
Income equalisation (94,934) 20,169 (27,160) 9,209 (22,356)
Net cash provided by/(used in) financing activities 23,964,384 (2,729,822) 8,467,624 20,780,846 1,607,135
Net increase/(decrease) in cash and cash equivalents 2,284,844 37,762 1,607,290 (313,103) 1,278,756
Cash and cash equivalents at the start of the period 1,394,093 1,498,098 733,062 344,652 398,544
Exchange gains/(losses) on cash and cash equivalents 309,885 142,726 289,462 (20,758) (67,204)
Cash and cash equivalents at the end of the period 3,988,822 1,678,586 2,629,814 10,791 1,610,096

SANLAM UNIVERSAL FUNDS PLC
103
STATEMENTS OF CASH FLOWS OF THE FUNDS (CONTINUED) for the six months ended 30 June 2014
SPI Global High Quality Fund
GBP
Cash flows from operating activities
Purchases of financial assets and settlement of financial liabilities (17,516,682)
Proceeds from sale of investments (including realised gains) 0
Dividends received 110,345
Income from financial assets through profit of loss 0
Interest received 39
Income from stock lending received 33
Other income 0
Operating expenses paid 1
Net cash inflow/(outflow) from operating activities (17,406,264)
Cash flows from financing activities
Distributions paid to holders of redeemable participating shares -
Proceeds from redeemable participating shares issued 19,251,554
Payment on redemption of redeemable participating shares (840,438)
Income equalisation 13,209
Net cash provided by/(used in) financing activities 18,424,325
Net increase/(decrease) in cash and cash equivalents 1,018,061
Cash and cash equivalents at the start of the period -
Exchange gains/(losses) on cash and cash equivalents (31,299)
Cash and cash equivalents at the end of the period 986,862

SANLAM UNIVERSAL FUNDS PLC
104
STATEMENTS OF CASH FLOWS OF THE FUNDS (CONTINUED) for the six months ended 30 June 2013
8IP Asia Equity Opportunities
Fund
8IP Asia Pacific Equity Fund
Centre Global Equity Fund
Grindrod International
Property Fund
P-Solve Inflation Plus Fund
US$ US$ US$ US$ GBP
Cash flows from operating activities
Purchases of financial assets and settlement of financial liabilities (5,899,149) (5,275,336) (12,185,589) (3,123,576) (30,953,159)
Proceeds from sale of investments (including realised gains) 6,148,437 8,622,373 13,130,667 - 27,114,522
Dividends received 196,644 187,517 325,445 198,473 296,904
Interest received 55 61 59 118 158,849
Income from stock lending received 2,517 2,910 10,182 3,166 2,002
Other income 3,150 3,349 1,450 2,795 4,013
Operating expenses paid (14,138) (15,260) (39,501) (18,244) (13,273)
Net cash inflow/(outflow) from operating activities 437,516 3,525,614 1,242,713 (2,937,268) (3,390,142)
Cash flows from financing activities
Distributions paid to holders of redeemable participating shares - - - (664) (1,136,554)
Proceeds from redeemable participating shares issued 130,670 135,838 1,986,694 4,137,905 1,800,051
Payment on redemption of redeemable participating shares (559,436) (3,530,660) (2,086,554) (731,928) (190,065)
Income equalisation 4,361 (76,563) (4,782) 161,740 12,792
Net cash provided by/(used in) financing activities (424,405) (3,471,385) (104,642) 3,567,053 486,224
Net increase/(decrease) in cash and cash equivalents 13,111 54,229 1,138,071 629,785 (2,903,918)
Cash and cash equivalents at the start of the period 304,802 116,523 246,929 811,855 4,398,026
Exchange gains/(losses) on cash and cash equivalents (13,574) (363) (9,252) (5,147) (3,324)
Cash and cash equivalents at the end of the period 304,339 170,389 1,375,748 1,436,493 1,490,784
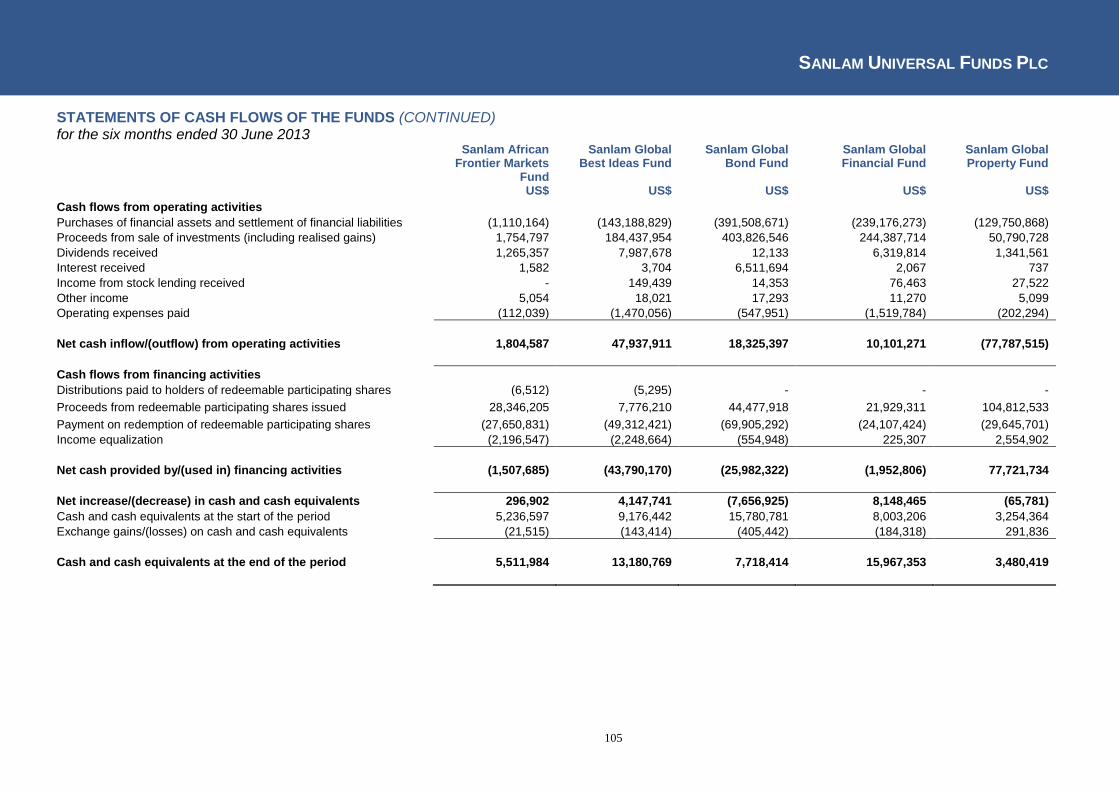
SANLAM UNIVERSAL FUNDS PLC
105
STATEMENTS OF CASH FLOWS OF THE FUNDS (CONTINUED) for the six months ended 30 June 2013
Sanlam African Frontier Markets
Fund
Sanlam Global Best Ideas Fund
Sanlam Global Bond Fund
Sanlam Global Financial Fund
Sanlam Global Property Fund
US$ US$ US$ US$ US$
Cash flows from operating activities
Purchases of financial assets and settlement of financial liabilities (1,110,164) (143,188,829) (391,508,671) (239,176,273) (129,750,868)
Proceeds from sale of investments (including realised gains) 1,754,797 184,437,954 403,826,546 244,387,714 50,790,728
Dividends received 1,265,357 7,987,678 12,133 6,319,814 1,341,561
Interest received 1,582 3,704 6,511,694 2,067 737
Income from stock lending received - 149,439 14,353 76,463 27,522
Other income 5,054 18,021 17,293 11,270 5,099
Operating expenses paid (112,039) (1,470,056) (547,951) (1,519,784) (202,294)
Net cash inflow/(outflow) from operating activities 1,804,587 47,937,911 18,325,397 10,101,271 (77,787,515)
Cash flows from financing activities
Distributions paid to holders of redeemable participating shares (6,512) (5,295) - - -
Proceeds from redeemable participating shares issued 28,346,205 7,776,210 44,477,918 21,929,311 104,812,533
Payment on redemption of redeemable participating shares (27,650,831) (49,312,421) (69,905,292) (24,107,424) (29,645,701)
Income equalization (2,196,547) (2,248,664) (554,948) 225,307 2,554,902
Net cash provided by/(used in) financing activities (1,507,685) (43,790,170) (25,982,322) (1,952,806) 77,721,734
Net increase/(decrease) in cash and cash equivalents 296,902 4,147,741 (7,656,925) 8,148,465 (65,781)
Cash and cash equivalents at the start of the period 5,236,597 9,176,442 15,780,781 8,003,206 3,254,364
Exchange gains/(losses) on cash and cash equivalents (21,515) (143,414) (405,442) (184,318) 291,836
Cash and cash equivalents at the end of the period 5,511,984 13,180,769 7,718,414 15,967,353 3,480,419
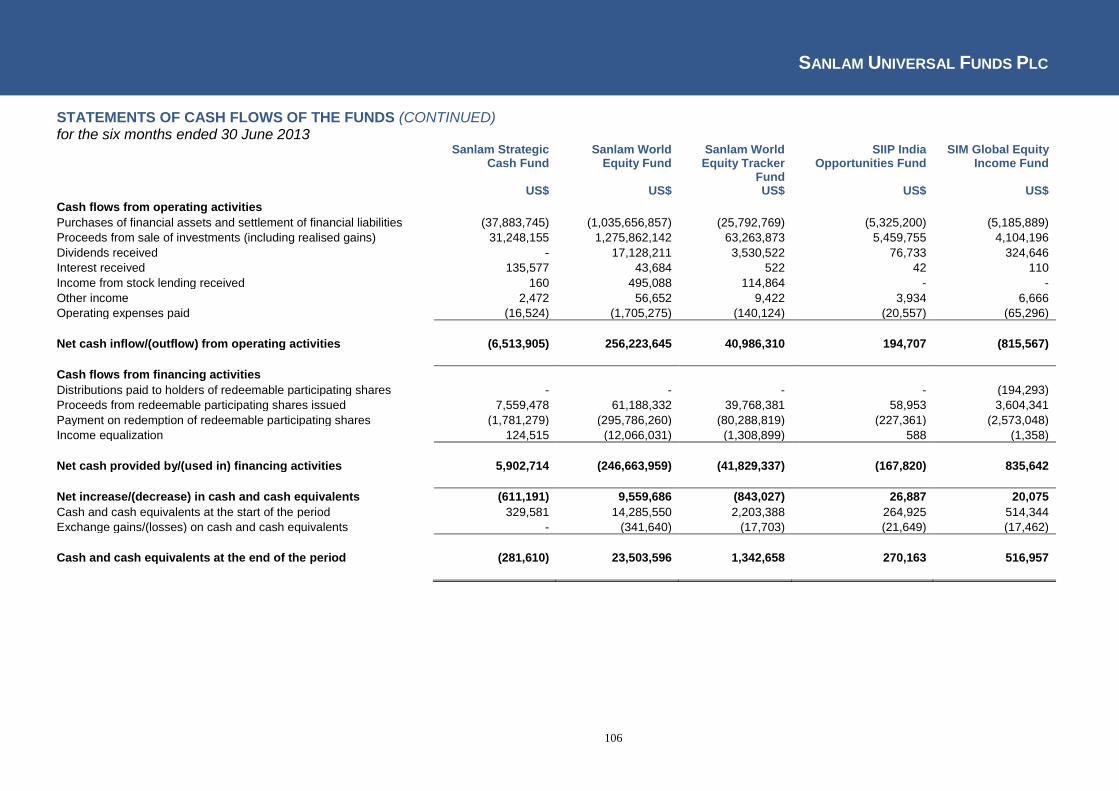
SANLAM UNIVERSAL FUNDS PLC
106
STATEMENTS OF CASH FLOWS OF THE FUNDS (CONTINUED) for the six months ended 30 June 2013
Sanlam Strategic Cash Fund
Sanlam World Equity Fund
Sanlam World Equity Tracker
Fund
SIIP India Opportunities Fund
SIM Global Equity Income Fund
US$ US$ US$ US$ US$
Cash flows from operating activities
Purchases of financial assets and settlement of financial liabilities (37,883,745) (1,035,656,857) (25,792,769) (5,325,200) (5,185,889)
Proceeds from sale of investments (including realised gains) 31,248,155 1,275,862,142 63,263,873 5,459,755 4,104,196
Dividends received - 17,128,211 3,530,522 76,733 324,646
Interest received 135,577 43,684 522 42 110
Income from stock lending received 160 495,088 114,864 - -
Other income 2,472 56,652 9,422 3,934 6,666
Operating expenses paid (16,524) (1,705,275) (140,124) (20,557) (65,296)
Net cash inflow/(outflow) from operating activities (6,513,905) 256,223,645 40,986,310 194,707 (815,567)
Cash flows from financing activities
Distributions paid to holders of redeemable participating shares - - - - (194,293)
Proceeds from redeemable participating shares issued 7,559,478 61,188,332 39,768,381 58,953 3,604,341
Payment on redemption of redeemable participating shares (1,781,279) (295,786,260) (80,288,819) (227,361) (2,573,048)
Income equalization 124,515 (12,066,031) (1,308,899) 588 (1,358)
Net cash provided by/(used in) financing activities 5,902,714 (246,663,959) (41,829,337) (167,820) 835,642
Net increase/(decrease) in cash and cash equivalents (611,191) 9,559,686 (843,027) 26,887 20,075
Cash and cash equivalents at the start of the period 329,581 14,285,550 2,203,388 264,925 514,344
Exchange gains/(losses) on cash and cash equivalents - (341,640) (17,703) (21,649) (17,462)
Cash and cash equivalents at the end of the period (281,610) 23,503,596 1,342,658 270,163 516,957
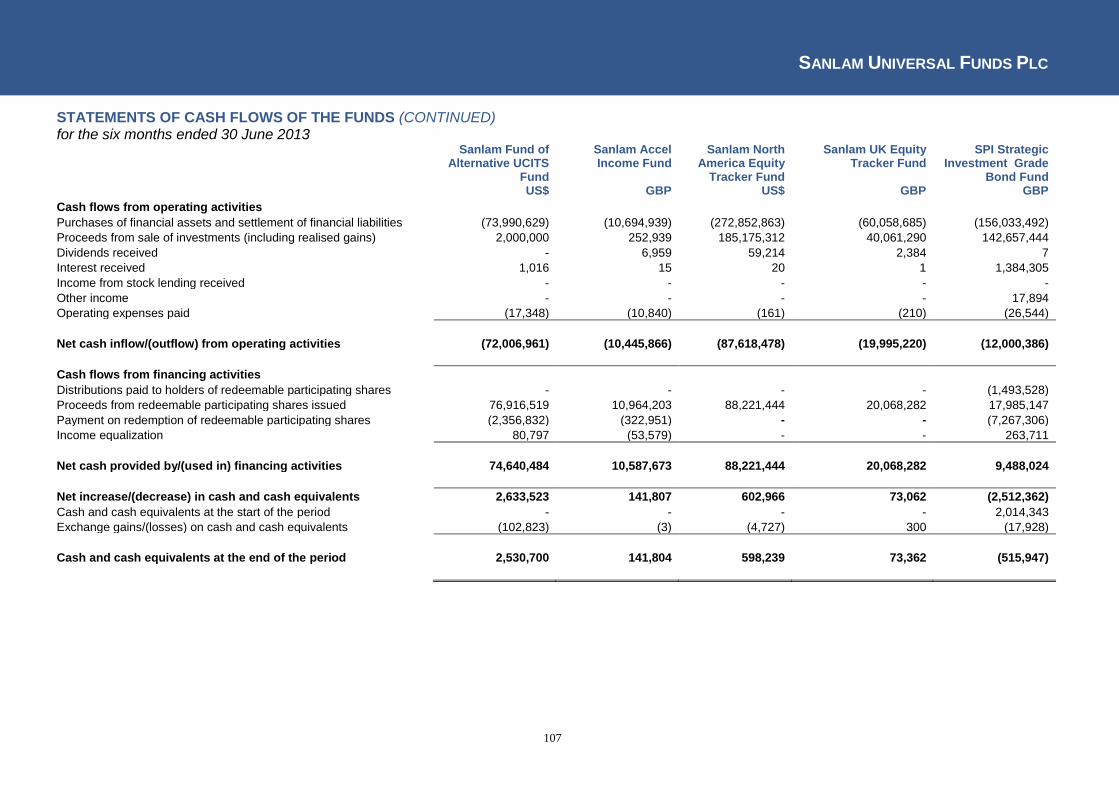
SANLAM UNIVERSAL FUNDS PLC
107
STATEMENTS OF CASH FLOWS OF THE FUNDS (CONTINUED) for the six months ended 30 June 2013
Sanlam Fund of Alternative UCITS
Fund
Sanlam Accel Income Fund
Sanlam North America Equity
Tracker Fund
Sanlam UK Equity Tracker Fund
SPI Strategic Investment Grade
Bond Fund US$ GBP US$ GBP GBP
Cash flows from operating activities
Purchases of financial assets and settlement of financial liabilities (73,990,629) (10,694,939) (272,852,863) (60,058,685) (156,033,492)
Proceeds from sale of investments (including realised gains) 2,000,000 252,939 185,175,312 40,061,290 142,657,444
Dividends received - 6,959 59,214 2,384 7
Interest received 1,016 15 20 1 1,384,305
Income from stock lending received - - - - -
Other income - - - - 17,894
Operating expenses paid (17,348) (10,840) (161) (210) (26,544)
Net cash inflow/(outflow) from operating activities (72,006,961) (10,445,866) (87,618,478) (19,995,220) (12,000,386)
Cash flows from financing activities
Distributions paid to holders of redeemable participating shares - - - - (1,493,528)
Proceeds from redeemable participating shares issued 76,916,519 10,964,203 88,221,444 20,068,282 17,985,147
Payment on redemption of redeemable participating shares (2,356,832) (322,951) - - (7,267,306)
Income equalization 80,797 (53,579) - - 263,711
Net cash provided by/(used in) financing activities 74,640,484 10,587,673 88,221,444 20,068,282 9,488,024
Net increase/(decrease) in cash and cash equivalents 2,633,523 141,807 602,966 73,062 (2,512,362)
Cash and cash equivalents at the start of the period - - - - 2,014,343
Exchange gains/(losses) on cash and cash equivalents (102,823) (3) (4,727) 300 (17,928)
Cash and cash equivalents at the end of the period 2,530,700 141,804 598,239 73,362 (515,947)
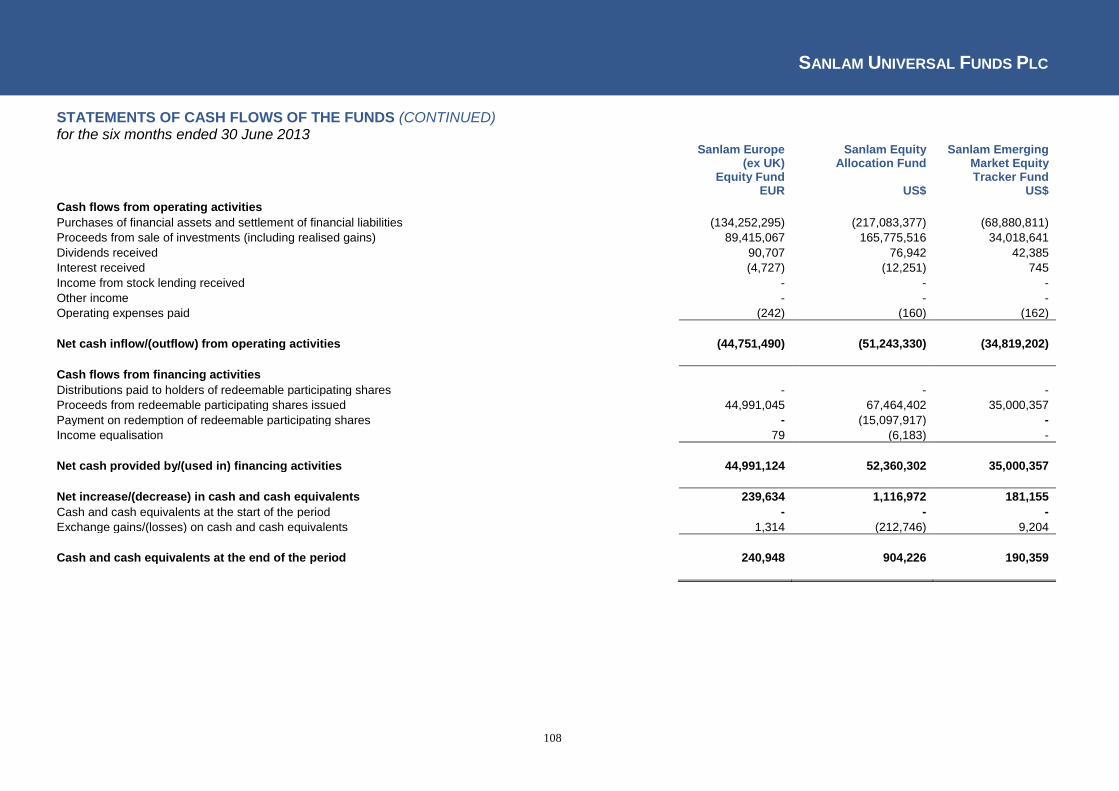
SANLAM UNIVERSAL FUNDS PLC
108
STATEMENTS OF CASH FLOWS OF THE FUNDS (CONTINUED) for the six months ended 30 June 2013
Sanlam Europe (ex UK)
Equity Fund
Sanlam Equity Allocation Fund
Sanlam Emerging Market Equity Tracker Fund
EUR US$ US$
Cash flows from operating activities
Purchases of financial assets and settlement of financial liabilities (134,252,295) (217,083,377) (68,880,811)
Proceeds from sale of investments (including realised gains) 89,415,067 165,775,516 34,018,641
Dividends received 90,707 76,942 42,385
Interest received (4,727) (12,251) 745
Income from stock lending received - - -
Other income - - -
Operating expenses paid (242) (160) (162)
Net cash inflow/(outflow) from operating activities (44,751,490) (51,243,330) (34,819,202)
Cash flows from financing activities
Distributions paid to holders of redeemable participating shares - - -
Proceeds from redeemable participating shares issued 44,991,045 67,464,402 35,000,357
Payment on redemption of redeemable participating shares - (15,097,917) -
Income equalisation 79 (6,183) -
Net cash provided by/(used in) financing activities 44,991,124 52,360,302 35,000,357
Net increase/(decrease) in cash and cash equivalents 239,634 1,116,972 181,155
Cash and cash equivalents at the start of the period - - -
Exchange gains/(losses) on cash and cash equivalents 1,314 (212,746) 9,204
Cash and cash equivalents at the end of the period 240,948 904,226 190,359

SANLAM UNIVERSAL FUNDS PLC
109
PORTFOLIO OF INVESTMENTS OF CENTRE GLOBAL EQUITY FUND as at 30 June 2014
Nominal Security
Classification Fair Value % of
US$ Net Assets
Financial assets at fair value through profit or loss
Equity – 97.24%
Australia – 2.44% 6,108 BHP Billiton Ltd
206,729 1.01%
2,630 Common wealth Bank of Australia
200,542 0.98%
2,810 Westpac Banking Corp Ltd
89,755 0.44%
Total Australia
497,026 2.44%
Belgium – 0.87% 1,539 Anheuser-Busch InBev
176,686 0.87%
Total Belgium
176,686 0.87%
Brazil – 1.65% 13,650 Ambev SA
97,611 0.48%
9,677 Banco Itaú Holding Financeira SA
140,376 0.69%
12,500 Petróleo Brasileiro SA
98,065 0.48%
Total Brazil
336,052 1.65%
Cayman Islands – 1.07% 17,550 Sands China Ltd
132,582 0.65%
5,650 Tencent Holdings Ltd
86,168 0.42%
Total Cayman Islands
218,750 1.07%
China – 2.17% 175,790 Bank of China
78,706 0.39%
90,000 China Construction Bank Corp
68,049 0.33%
23,200 The China Life Insurance Co Ltd
60,767 0.30%
80,000 China Resources Petroleum Co Ltd
76,281 0.37%
63,660 PetroChina Co Ltd
80,414 0.39%
10,000 Ping An Insurance Group Co of China Ltd
77,416 0.38%
Total China
441,633 2.17%
Denmark – 0.96% 4,250 Novo Nordisk AS
195,598 0.96%
Total Denmark
195,598 0.96%
France – 5.51% 3,860 Accor SA
200,659 0.99%
2,160 BNP Paribas
146,438 0.72%
1,570 L'oreal SA
270,367 1.33%
1,745 Sanofi-Aventis SA
185,245 0.91%
4,430 Total SA
319,944 1.57%
Total France
1,122,653 5.51%
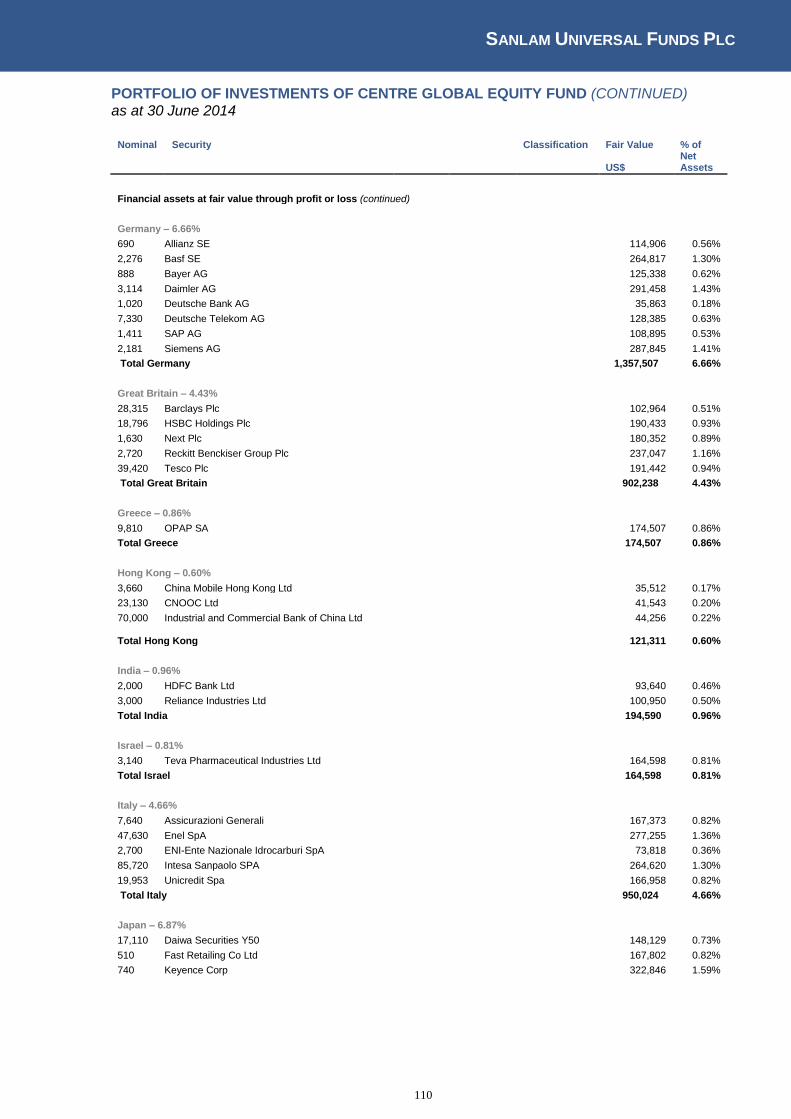
SANLAM UNIVERSAL FUNDS PLC
110
PORTFOLIO OF INVESTMENTS OF CENTRE GLOBAL EQUITY FUND (CONTINUED) as at 30 June 2014
Nominal Security
Classification Fair Value % of
US$ Net Assets
Financial assets at fair value through profit or loss (continued)
Germany – 6.66% 690 Allianz SE
114,906 0.56%
2,276 Basf SE
264,817 1.30%
888 Bayer AG
125,338 0.62%
3,114 Daimler AG
291,458 1.43%
1,020 Deutsche Bank AG
35,863 0.18%
7,330 Deutsche Telekom AG
128,385 0.63%
1,411 SAP AG
108,895 0.53%
2,181 Siemens AG
287,845 1.41%
Total Germany
1,357,507 6.66%
Great Britain – 4.43% 28,315 Barclays Plc
102,964 0.51%
18,796 HSBC Holdings Plc
190,433 0.93%
1,630 Next Plc
180,352 0.89%
2,720 Reckitt Benckiser Group Plc
237,047 1.16%
39,420 Tesco Plc
191,442 0.94%
Total Great Britain
902,238 4.43%
Greece – 0.86% 9,810 OPAP SA
174,507 0.86%
Total Greece
174,507 0.86%
Hong Kong – 0.60% 3,660 China Mobile Hong Kong Ltd
35,512 0.17%
23,130 CNOOC Ltd
41,543 0.20%
70,000 Industrial and Commercial Bank of China Ltd
44,256 0.22%
Total Hong Kong
121,311 0.60%
India – 0.96% 2,000 HDFC Bank Ltd
93,640 0.46%
3,000 Reliance Industries Ltd
100,950 0.50%
Total India
194,590 0.96%
Israel – 0.81% 3,140 Teva Pharmaceutical Industries Ltd
164,598 0.81%
Total Israel
164,598 0.81%
Italy – 4.66% 7,640 Assicurazioni Generali
167,373 0.82%
47,630 Enel SpA
277,255 1.36%
2,700 ENI-Ente Nazionale Idrocarburi SpA
73,818 0.36%
85,720 Intesa Sanpaolo SPA
264,620 1.30%
19,953 Unicredit Spa
166,958 0.82%
Total Italy
950,024 4.66%
Japan – 6.87% 17,110 Daiwa Securities Y50
148,129 0.73%
510 Fast Retailing Co Ltd
167,802 0.82%
740 Keyence Corp
322,846 1.59%
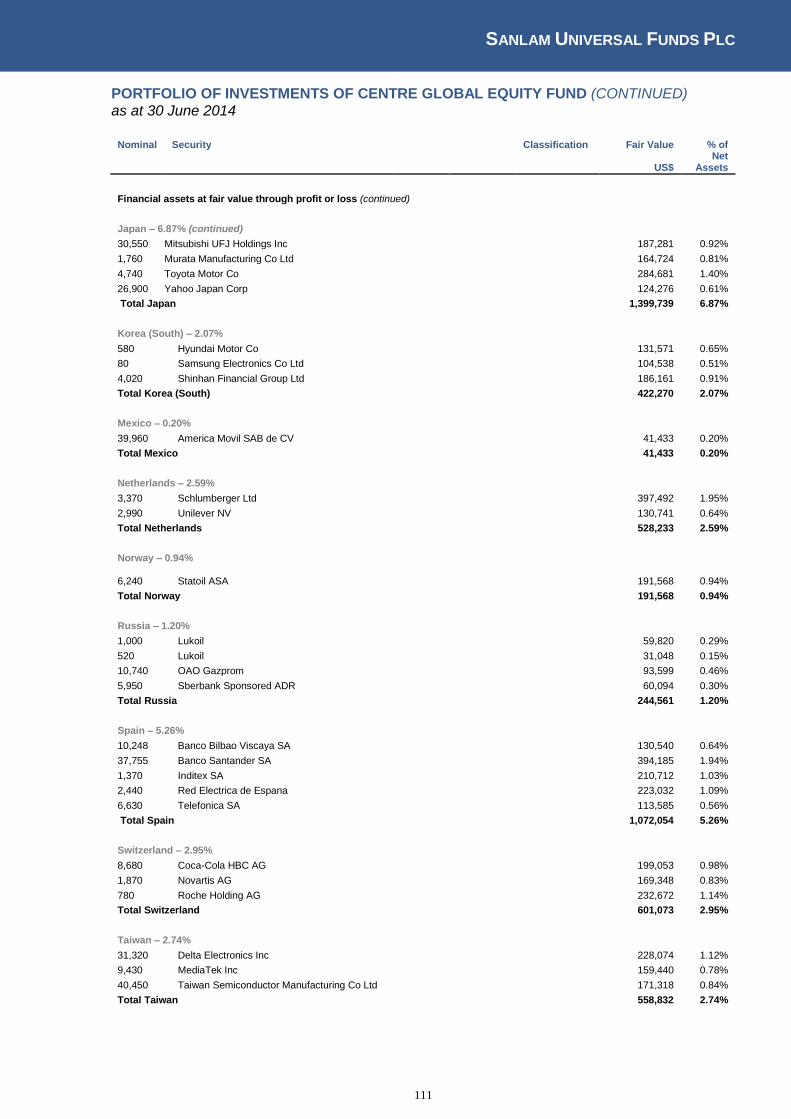
SANLAM UNIVERSAL FUNDS PLC
111
PORTFOLIO OF INVESTMENTS OF CENTRE GLOBAL EQUITY FUND (CONTINUED) as at 30 June 2014
Nominal Security
Classification Fair Value % of
US$ Net
Assets
Financial assets at fair value through profit or loss (continued)
Japan – 6.87% (continued)
30,550 Mitsubishi UFJ Holdings Inc
187,281 0.92%
1,760 Murata Manufacturing Co Ltd
164,724 0.81%
4,740 Toyota Motor Co
284,681 1.40%
26,900 Yahoo Japan Corp
124,276 0.61%
Total Japan
1,399,739 6.87%
Korea (South) – 2.07% 580 Hyundai Motor Co
131,571 0.65%
80 Samsung Electronics Co Ltd
104,538 0.51%
4,020 Shinhan Financial Group Ltd
186,161 0.91%
Total Korea (South)
422,270 2.07%
Mexico – 0.20% 39,960 America Movil SAB de CV
41,433 0.20%
Total Mexico
41,433 0.20%
Netherlands – 2.59% 3,370 Schlumberger Ltd
397,492 1.95%
2,990 Unilever NV
130,741 0.64%
Total Netherlands
528,233 2.59%
Norway – 0.94%
6,240 Statoil ASA
191,568 0.94%
Total Norway
191,568 0.94%
Russia – 1.20% 1,000 Lukoil
59,820 0.29%
520 Lukoil
31,048 0.15%
10,740 OAO Gazprom
93,599 0.46%
5,950 Sberbank Sponsored ADR
60,094 0.30%
Total Russia
244,561 1.20%
Spain – 5.26% 10,248 Banco Bilbao Viscaya SA
130,540 0.64%
37,755 Banco Santander SA
394,185 1.94%
1,370 Inditex SA
210,712 1.03%
2,440 Red Electrica de Espana
223,032 1.09%
6,630 Telefonica SA
113,585 0.56%
Total Spain
1,072,054 5.26%
Switzerland – 2.95% 8,680 Coca-Cola HBC AG
199,053 0.98%
1,870 Novartis AG
169,348 0.83%
780 Roche Holding AG
232,672 1.14%
Total Switzerland
601,073 2.95%
Taiwan – 2.74% 31,320 Delta Electronics Inc
228,074 1.12%
9,430 MediaTek Inc
159,440 0.78%
40,450 Taiwan Semiconductor Manufacturing Co Ltd
171,318 0.84%
Total Taiwan
558,832 2.74%
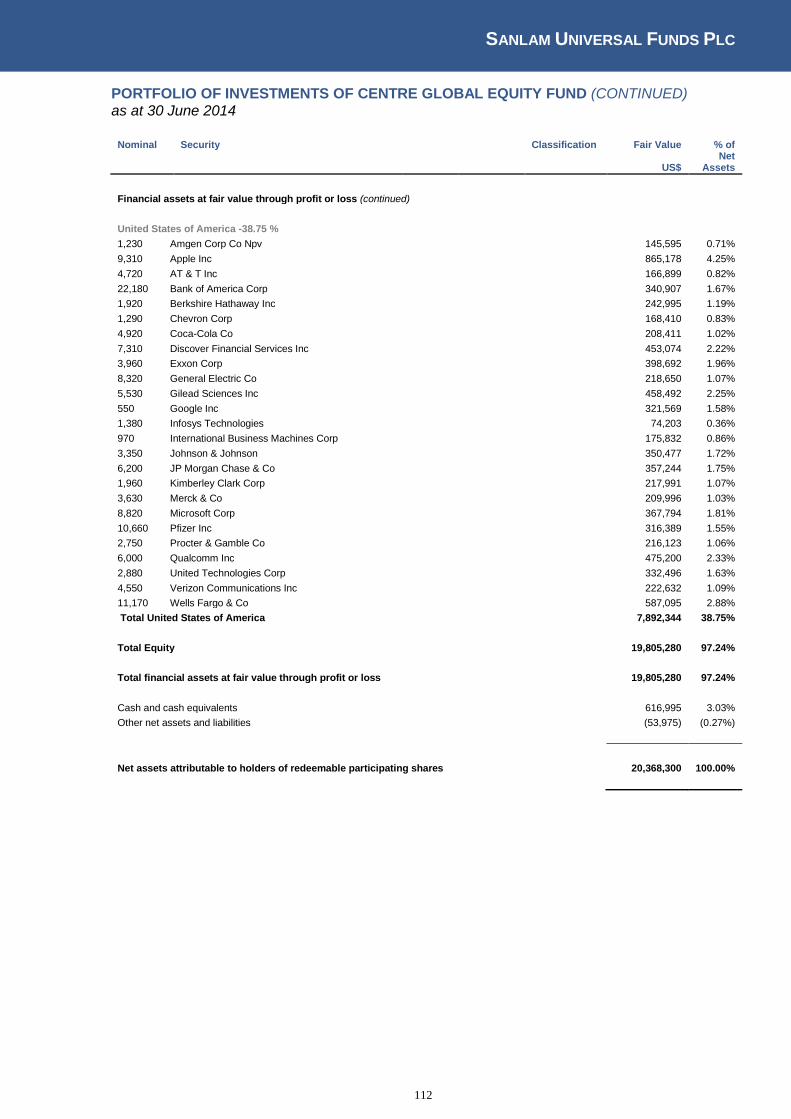
SANLAM UNIVERSAL FUNDS PLC
112
PORTFOLIO OF INVESTMENTS OF CENTRE GLOBAL EQUITY FUND (CONTINUED) as at 30 June 2014
Nominal Security
Classification Fair Value % of
US$ Net
Assets
Financial assets at fair value through profit or loss (continued)
United States of America -38.75 % 1,230 Amgen Corp Co Npv
145,595 0.71%
9,310 Apple Inc
865,178 4.25%
4,720 AT & T Inc
166,899 0.82%
22,180 Bank of America Corp
340,907 1.67%
1,920 Berkshire Hathaway Inc
242,995 1.19%
1,290 Chevron Corp
168,410 0.83%
4,920 Coca-Cola Co
208,411 1.02%
7,310 Discover Financial Services Inc
453,074 2.22%
3,960 Exxon Corp
398,692 1.96%
8,320 General Electric Co
218,650 1.07%
5,530 Gilead Sciences Inc
458,492 2.25%
550 Google Inc
321,569 1.58%
1,380 Infosys Technologies
74,203 0.36%
970 International Business Machines Corp
175,832 0.86%
3,350 Johnson & Johnson
350,477 1.72%
6,200 JP Morgan Chase & Co
357,244 1.75%
1,960 Kimberley Clark Corp
217,991 1.07%
3,630 Merck & Co
209,996 1.03%
8,820 Microsoft Corp
367,794 1.81%
10,660 Pfizer Inc
316,389 1.55%
2,750 Procter & Gamble Co
216,123 1.06%
6,000 Qualcomm Inc
475,200 2.33%
2,880 United Technologies Corp
332,496 1.63%
4,550 Verizon Communications Inc
222,632 1.09%
11,170 Wells Fargo & Co
587,095 2.88%
Total United States of America
7,892,344 38.75%
Total Equity
19,805,280 97.24%
Total financial assets at fair value through profit or loss
19,805,280 97.24%
Cash and cash equivalents
616,995 3.03%
Other net assets and liabilities
(53,975) (0.27%)
Net assets attributable to holders of redeemable participating shares
20,368,300 100.00%

SANLAM UNIVERSAL FUNDS PLC
113
PORTFOLIO OF INVESTMENTS OF CENTRE GLOBAL EQUITY FUND (CONTINUED) as at 30 June 2014
Centre Global Equity Fund
Summary
Classification Description
Fair Value % of % of
Net Assets Total Assets
Tranferable securities and money market instruments admitted to
official stock exchange listing or traded on regulated market
19,805,280 97.24% 96.75%
A Transferabe securities and money market instruments other than
those referred above
- - -
B Collective Investment Schemes
- - -
C Financial derivative instruments dealt in on a regulated market - - -
D Over the counter financial derivative instrument
- - -
Cash and cash equivalents
616,995 3.03% (3.01%)
Other net assets and liabilities
(53,975) (0.27%) (0.27%)
Net assets attributable to holders of redeemable participating shares 20,368,300 100.00%
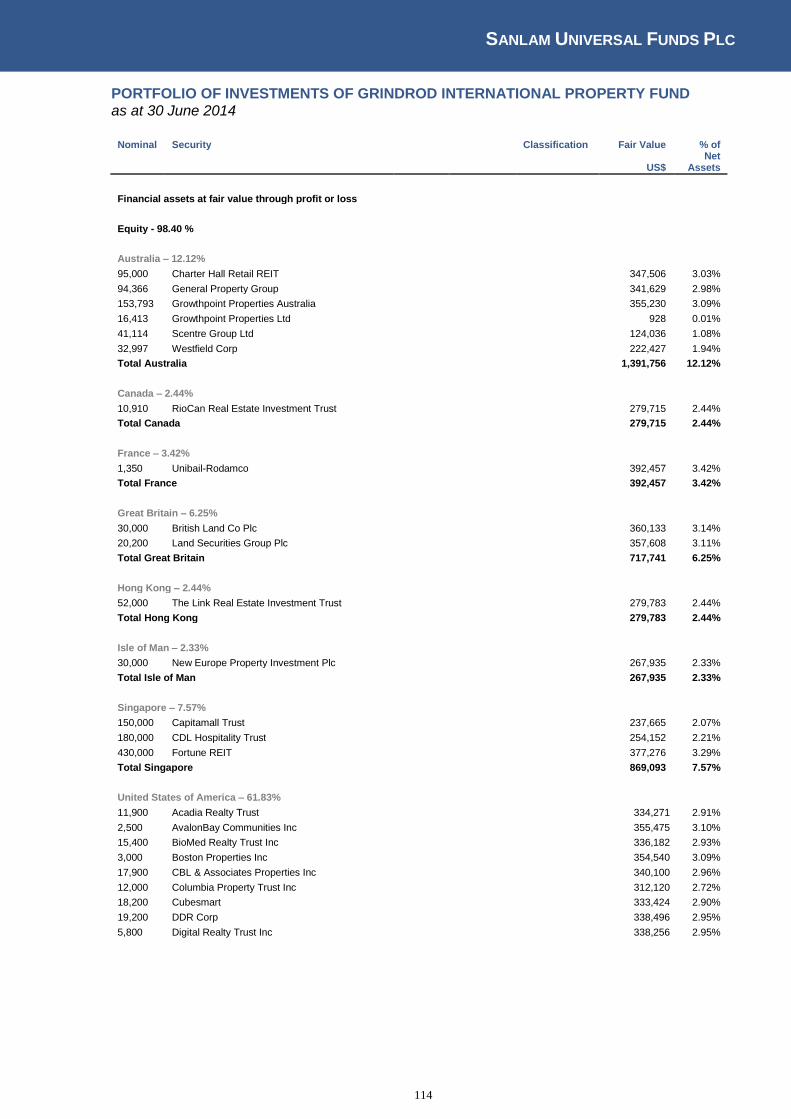
SANLAM UNIVERSAL FUNDS PLC
114
PORTFOLIO OF INVESTMENTS OF GRINDROD INTERNATIONAL PROPERTY FUND as at 30 June 2014
Nominal Security
Classification Fair Value % of
US$ Net
Assets
Financial assets at fair value through profit or loss
Equity - 98.40 %
Australia – 12.12% 95,000 Charter Hall Retail REIT
347,506 3.03%
94,366 General Property Group
341,629 2.98%
153,793 Growthpoint Properties Australia
355,230 3.09%
16,413 Growthpoint Properties Ltd
928 0.01%
41,114 Scentre Group Ltd
124,036 1.08%
32,997 Westfield Corp
222,427 1.94%
Total Australia
1,391,756 12.12%
Canada – 2.44% 10,910 RioCan Real Estate Investment Trust
279,715 2.44%
Total Canada
279,715 2.44%
France – 3.42% 1,350 Unibail-Rodamco
392,457 3.42%
Total France
392,457 3.42%
Great Britain – 6.25% 30,000 British Land Co Plc
360,133 3.14%
20,200 Land Securities Group Plc
357,608 3.11%
Total Great Britain
717,741 6.25%
Hong Kong – 2.44% 52,000 The Link Real Estate Investment Trust
279,783 2.44%
Total Hong Kong
279,783 2.44%
Isle of Man – 2.33% 30,000 New Europe Property Investment Plc
267,935 2.33%
Total Isle of Man
267,935 2.33%
Singapore – 7.57% 150,000 Capitamall Trust
237,665 2.07%
180,000 CDL Hospitality Trust
254,152 2.21%
430,000 Fortune REIT
377,276 3.29%
Total Singapore
869,093 7.57%
United States of America – 61.83% 11,900 Acadia Realty Trust
334,271 2.91%
2,500 AvalonBay Communities Inc
355,475 3.10%
15,400 BioMed Realty Trust Inc
336,182 2.93%
3,000 Boston Properties Inc
354,540 3.09%
17,900 CBL & Associates Properties Inc
340,100 2.96%
12,000 Columbia Property Trust Inc
312,120 2.72%
18,200 Cubesmart
333,424 2.90%
19,200 DDR Corp
338,496 2.95%
5,800 Digital Realty Trust Inc
338,256 2.95%
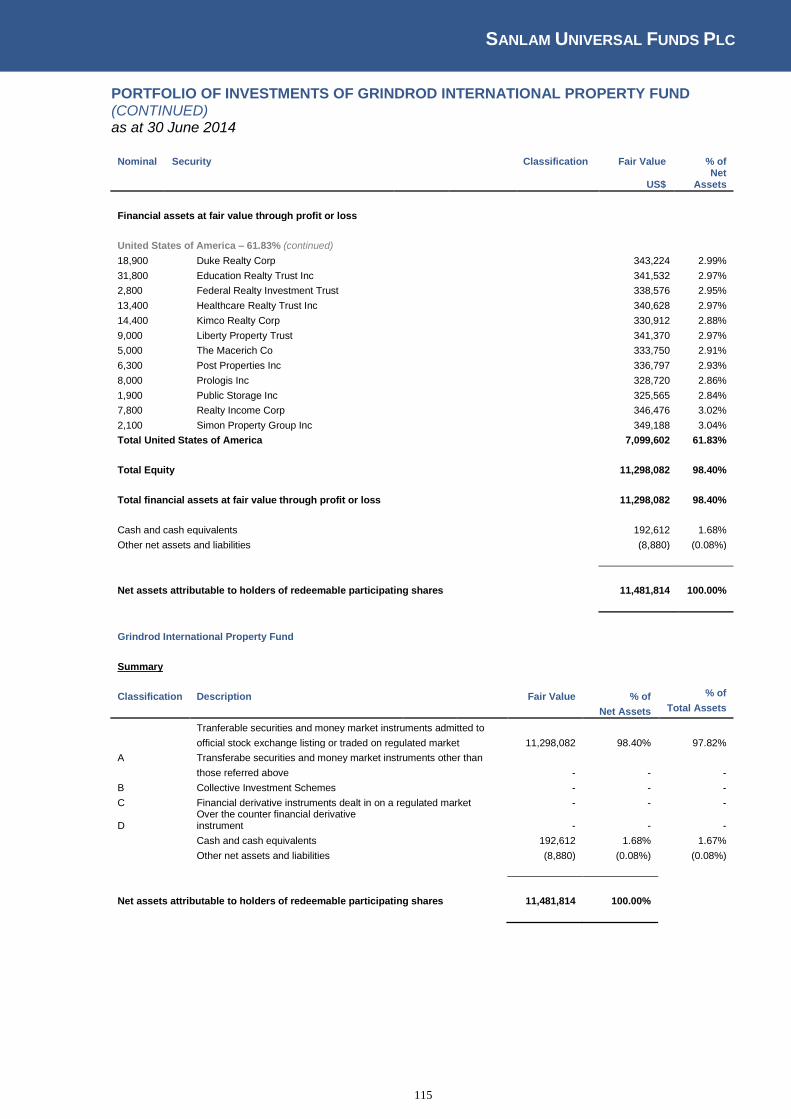
SANLAM UNIVERSAL FUNDS PLC
115
PORTFOLIO OF INVESTMENTS OF GRINDROD INTERNATIONAL PROPERTY FUND (CONTINUED) as at 30 June 2014
Nominal Security
Classification Fair Value % of
US$ Net
Assets
Financial assets at fair value through profit or loss
United States of America – 61.83% (continued) 18,900 Duke Realty Corp
343,224 2.99%
31,800 Education Realty Trust Inc
341,532 2.97%
2,800 Federal Realty Investment Trust
338,576 2.95%
13,400 Healthcare Realty Trust Inc
340,628 2.97%
14,400 Kimco Realty Corp
330,912 2.88%
9,000 Liberty Property Trust
341,370 2.97%
5,000 The Macerich Co
333,750 2.91%
6,300 Post Properties Inc
336,797 2.93%
8,000 Prologis Inc
328,720 2.86%
1,900 Public Storage Inc
325,565 2.84%
7,800 Realty Income Corp
346,476 3.02%
2,100 Simon Property Group Inc
349,188 3.04%
Total United States of America
7,099,602 61.83%
Total Equity
11,298,082 98.40%
Total financial assets at fair value through profit or loss
11,298,082 98.40%
Cash and cash equivalents
192,612 1.68%
Other net assets and liabilities
(8,880) (0.08%)
Net assets attributable to holders of redeemable participating shares
11,481,814 100.00%
Grindrod International Property Fund
Summary
Classification Description
Fair Value % of % of
Net Assets Total Assets
Tranferable securities and money market instruments admitted to
official stock exchange listing or traded on regulated market 11,298,082 98.40% 97.82%
A Transferabe securities and money market instruments other than
those referred above
- - -
B Collective Investment Schemes
- - -
C Financial derivative instruments dealt in on a regulated market - - -
D Over the counter financial derivative instrument
- - -
Cash and cash equivalents
192,612 1.68% 1.67%
Other net assets and liabilities
(8,880) (0.08%) (0.08%)
Net assets attributable to holders of redeemable participating shares 11,481,814 100.00%

SANLAM UNIVERSAL FUNDS PLC
116
PORTFOLIO OF INVESTMENTS OF P SOLVE INFLATION PLUS FUND as at 30 June 2014
Nominal Security Coupon Maturity Classification Fair Value % of
GBP Net
Assets
Financial assets at fair value through profit or loss
Government Debt – 10.38% 2,077,000 Australian Government 4.50% 21/10/2014
1,152,352 1.97%
1,034,000 Canadian Government 1.00% 01/11/2014
568,246 0.97%
1,216,743 UK Treasury 1.75% 07/09/2022
1,147,784 1.96%
1,113,520 UK Treasury 2.75% 07/09/2024
1,112,156 1.90%
4,767,000 Norwegian Government 5.00% 15/05/2015
468,133 0.80%
1,058,000 Singapore Government 1.38% 01/10/2014
498,956 0.85%
19,959,000 Republic of South Africa 8.75% 21/12/2014
1,118,758 1.91%
Total Government Debt
6,066,386 10.38%
Exchange Traded Funds – 53.36% 12,481 Lyxor ETF Eastern Europe
185,209 0.32%
20,859 iShares Barclays Capital Emerging Market Local Govt Bond
1,027,903 1.76%
104,521 iShares MSCI Europe Ex-UK
2,280,126 3.90%
87,854 iShares MSCI Japan GBP Hedged UCITS ETF
3,850,641 6.59%
66,722 iShares MSCI World Islamic
1,175,975 2.01%
51,701 Ishares S&P 500 Index Fund
594,044 1.02%
165,656 Vanguard FTSE 100 ETF
5,036,771 8.62%
288,486 Vanguard S&P 500 ETF
6,312,074 10.80%
13,801 ETFS Brent 1Mth Oil Security
594,384 1.02%
5,979 iShares MSCI South Korea Index Fund
228,023 0.39%
41,771 iShares Core MSCI Emerging Markets ETF
1,270,114 2.17%
3,156 iShares MSCI All Peru Capped
65,600 0.11%
9,601 iShares MSCI China ETF
261,782 0.45%
73,421 Vanguard Emerging Market ETF
1,861,839 3.19%
32,317 Vanguard MSCI European ETF
1,137,257 1.95%
50,403 Vanguard S&P 500 ETF
5,310,196 9.08%
Total Exchange Traded Funds
31,191,937 53.36%
Collective Investment Schemes – 32.63% 681,026 First State Investments ICVC - Asia Pacific Leaders Fund
B 3,076,604 5.26%
118,671 GLG Treasury Plus Fund
B 1,731,170 2.96%
4,580 Finsbury High Income Fund
B 3,453,057 5.91%
982,087 Insight Liquidity Funds Plc
B 982,088 1.68%
133,379 PIMCO Global Investors
B 2,202,086 3.77%
390,325 Pimco-Hi Yield Bond
B 6,932,171 11.86%
4,950 IFDC - Japan Dynamic Fund
B 691,763 1.18%
5,378 Institutional Sterling Liquidity Fund - Class A B 5,378 0.01%
Total Collective Investment Scheme
19,074,318 32.63%
Total financial assets at fair value through profit or loss
56,332,641 96.37%
Cash and cash equivalents
2,090,690 3.58%
Other net assets and liabilities
30,297 0.05%
Net assets attributable to holders of redeemable participating shares
58,453,628 100.00%
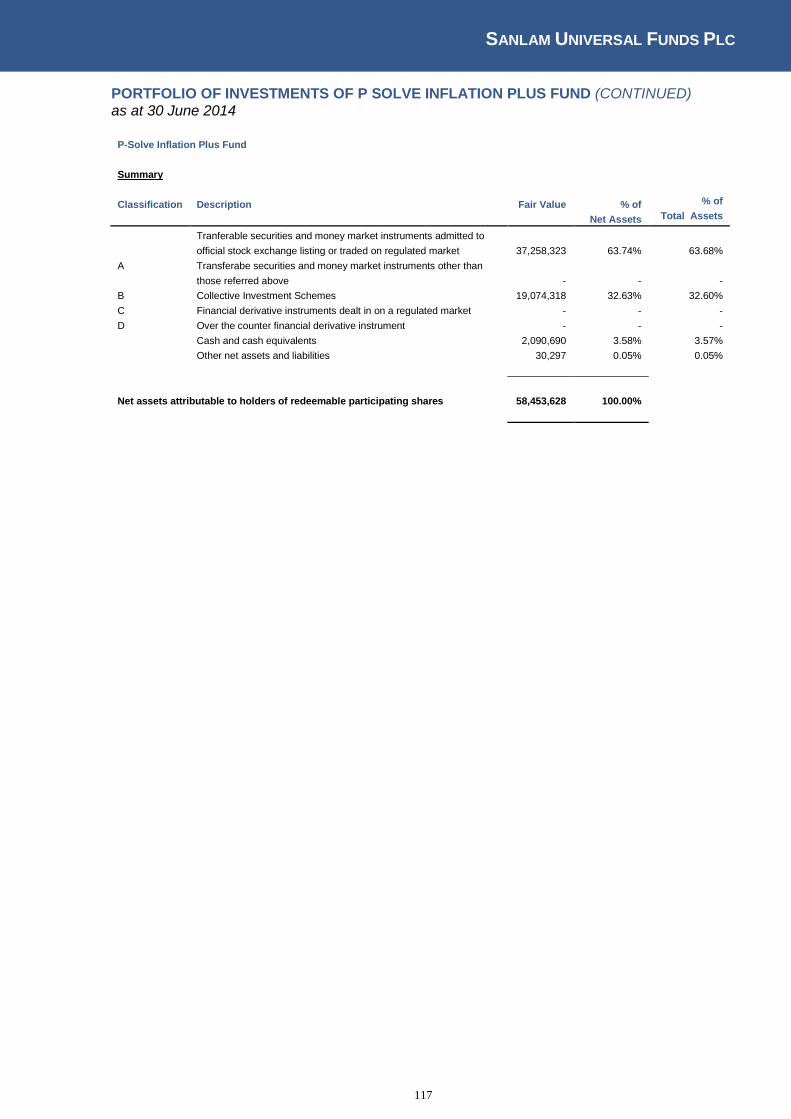
SANLAM UNIVERSAL FUNDS PLC
117
PORTFOLIO OF INVESTMENTS OF P SOLVE INFLATION PLUS FUND (CONTINUED) as at 30 June 2014
P-Solve Inflation Plus Fund
Summary
Classification Description
Fair Value % of % of
Net Assets Total Assets
Tranferable securities and money market instruments admitted to
official stock exchange listing or traded on regulated market 37,258,323 63.74% 63.68%
A Transferabe securities and money market instruments other than
those referred above
- - -
B Collective Investment Schemes
19,074,318 32.63% 32.60%
C Financial derivative instruments dealt in on a regulated market - - -
D Over the counter financial derivative instrument
- - -
Cash and cash equivalents
2,090,690 3.58% 3.57%
Other net assets and liabilities
30,297 0.05% 0.05%
Net assets attributable to holders of redeemable participating shares 58,453,628 100.00%

SANLAM UNIVERSAL FUNDS PLC
118
PORTFOLIO OF INVESTMENTS OF SANLAM AFRICAN FRONTIER FUND as at 30 June 2014
Nominal Security
Classification Fair Value % of
US$ Net Assets
Financial assets at fair value through profit or loss
Equity - 96.53%
Botswana - 2.28% 6,228,532 Letshego Holdings Ltd
1,597,658 1.94%
105,713 Sechaba Breweries Ltd
278,959 0.34%
Total Botswana
1,876,617 2.28%
Egypt - 28.69% 227,180 Arabian Cement Co
349,185 0.42%
1,534,591 Commercial International Bank
7,640,654 9.26%
629,984 Credit Agricole Egypt
1,315,459 1.60%
88,279 Eastern Tobacco Co
1,852,228 2.25%
220,043 Egyptian International Pharmaceutical Industry Co
1,563,976 1.90%
4,665,862 Global Telecom Holding SAE
3,347,628 4.06%
429,740 Oriental Weavers Co
3,063,432 3.71%
240,981 Suez Cement
1,247,017 1.51%
2,073,556 Talaat Moustafa Group Holding Co
2,476,632 3.00%
430,073 Telecom Egypt SAE
806,000 0.98%
Total Egypt
23,662,211 28.69%
Ghana - 0.42% 2,915,000 UT Bank Ltd
347,013 0.42%
Total Ghana
347,013 0.42%
Ivory Coast - 1.83% 33,000 Sonatel
1,508,103 1.83%
Total Ivory Coast
1,508,103 1.83%
Kenya - 14.15% 1,486,850 Athi River Mining Ltd
1,357,389 1.65%
456,579 Bamburi Cement Co Ltd
906,593 1.10%
6,549,230 Co-operative Bank of Kenya Ltd
1,442,430 1.75%
568,658 East African Breweries Ltd
1,836,474 2.23%
5,291,097 Equity Bank Ltd
2,777,479 3.37%
4,181,537 Kenya Commercial Bank Ltd
2,433,623 2.95%
6,420,126 Safaricom Ltd
912,137 1.11%
Total Kenya
11,666,125 14.15%
Mauritius - 3.39% 247,908 MCB Group Ltd
1,764,908 2.14%
29,609,700 State Bank of Mauritius Ltd
1,029,476 1.25%
Total Mauritius
2,794,384 3.39%
Morocco - 5.60% 58,605 Attijariwafa Bank
2,171,507 2.63%
191,800 Douja Prom Addoha
1,331,215 1.61%
96,398 Maroc Telecom
1,115,106 1.35%
Total Morocco
4,617,828 5.60%
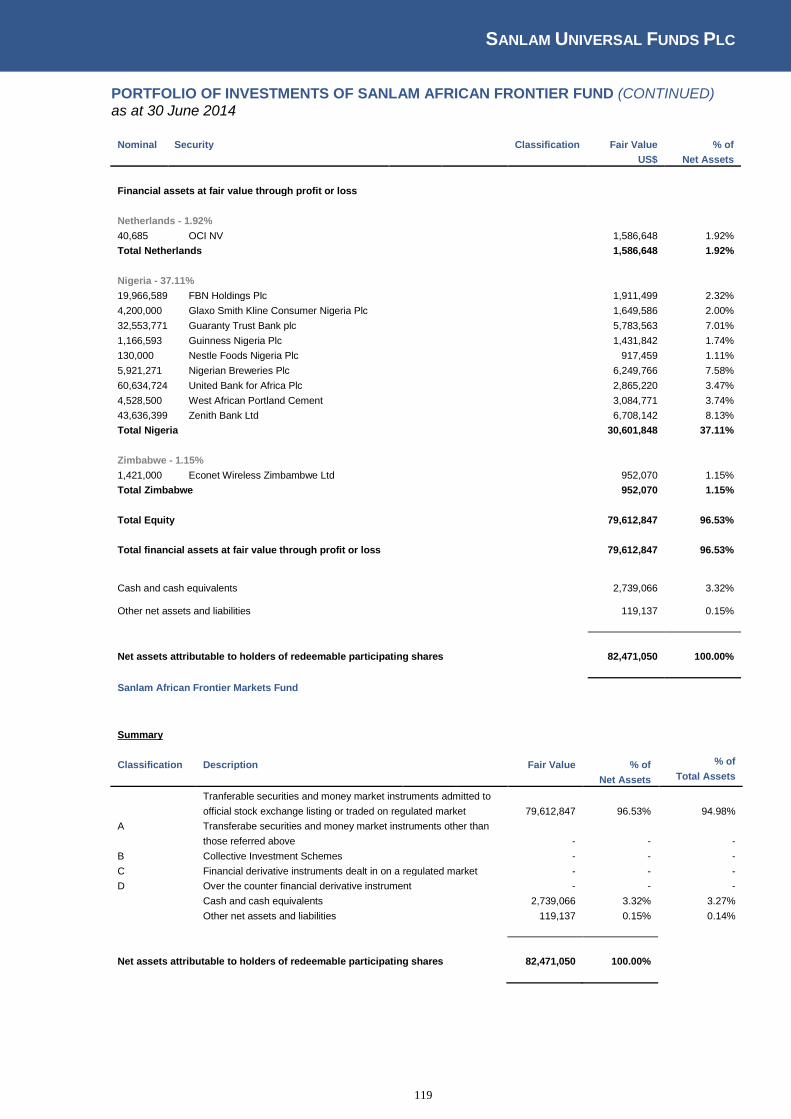
SANLAM UNIVERSAL FUNDS PLC
119
PORTFOLIO OF INVESTMENTS OF SANLAM AFRICAN FRONTIER FUND (CONTINUED) as at 30 June 2014
Nominal Security
Classification Fair Value % of
US$ Net Assets
Financial assets at fair value through profit or loss
Netherlands - 1.92% 40,685 OCI NV
1,586,648 1.92%
Total Netherlands
1,586,648 1.92%
Nigeria - 37.11% 19,966,589 FBN Holdings Plc
1,911,499 2.32%
4,200,000 Glaxo Smith Kline Consumer Nigeria Plc
1,649,586 2.00%
32,553,771 Guaranty Trust Bank plc
5,783,563 7.01%
1,166,593 Guinness Nigeria Plc
1,431,842 1.74%
130,000 Nestle Foods Nigeria Plc
917,459 1.11%
5,921,271 Nigerian Breweries Plc
6,249,766 7.58%
60,634,724 United Bank for Africa Plc
2,865,220 3.47%
4,528,500 West African Portland Cement
3,084,771 3.74%
43,636,399 Zenith Bank Ltd
6,708,142 8.13%
Total Nigeria
30,601,848 37.11%
Zimbabwe - 1.15% 1,421,000 Econet Wireless Zimbambwe Ltd
952,070 1.15%
Total Zimbabwe
952,070 1.15%
Total Equity
79,612,847 96.53%
Total financial assets at fair value through profit or loss
79,612,847 96.53%
Cash and cash equivalents
2,739,066 3.32%
Other net assets and liabilities
119,137 0.15%
Net assets attributable to holders of redeemable participating shares
82,471,050 100.00%
Sanlam African Frontier Markets Fund
Summary
Classification Description
Fair Value % of % of
Net Assets Total Assets
Tranferable securities and money market instruments admitted to
official stock exchange listing or traded on regulated market 79,612,847 96.53% 94.98%
A Transferabe securities and money market instruments other than
those referred above
- - -
B Collective Investment Schemes
- - -
C Financial derivative instruments dealt in on a regulated market - - -
D Over the counter financial derivative instrument
- - -
Cash and cash equivalents
2,739,066 3.32% 3.27%
Other net assets and liabilities
119,137 0.15% 0.14%
Net assets attributable to holders of redeemable participating shares 82,471,050 100.00%
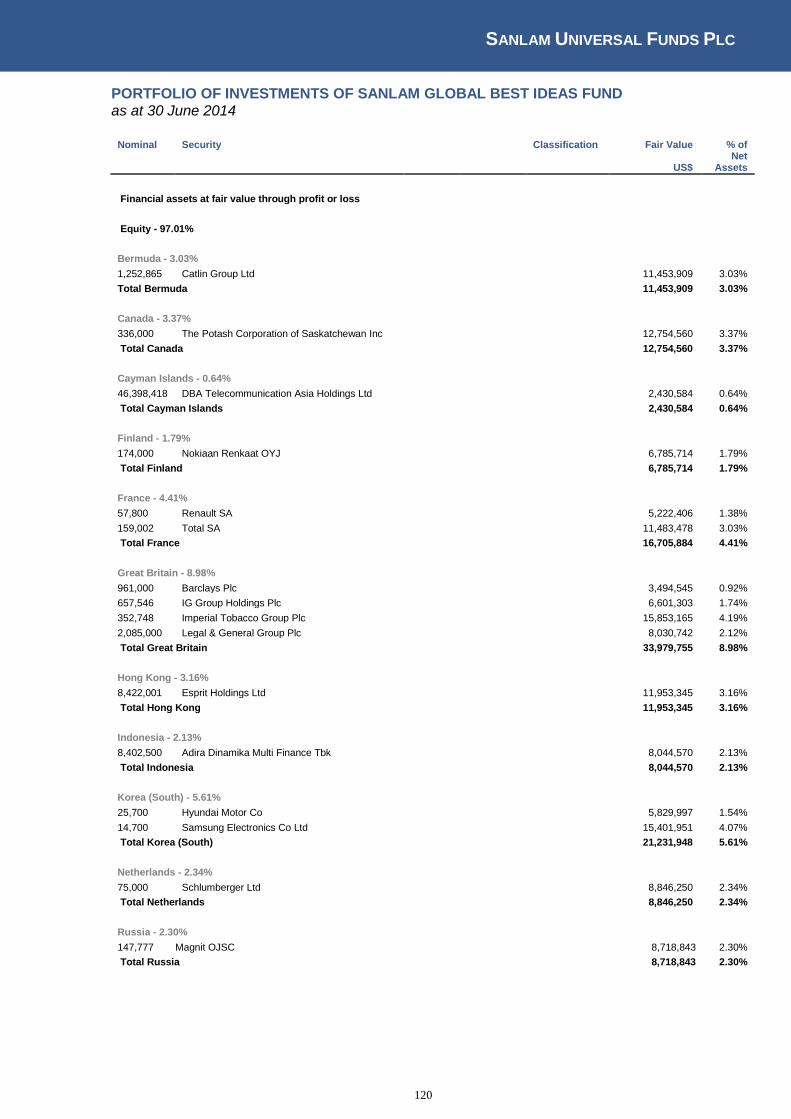
SANLAM UNIVERSAL FUNDS PLC
120
PORTFOLIO OF INVESTMENTS OF SANLAM GLOBAL BEST IDEAS FUND as at 30 June 2014
Nominal Security
Classification Fair Value % of
US$ Net
Assets
Financial assets at fair value through profit or loss
Equity - 97.01%
Bermuda - 3.03% 1,252,865 Catlin Group Ltd
11,453,909 3.03%
Total Bermuda
11,453,909 3.03%
Canada - 3.37% 336,000 The Potash Corporation of Saskatchewan Inc
12,754,560 3.37%
Total Canada
12,754,560 3.37%
Cayman Islands - 0.64% 46,398,418 DBA Telecommunication Asia Holdings Ltd
2,430,584 0.64%
Total Cayman Islands
2,430,584 0.64%
Finland - 1.79% 174,000 Nokiaan Renkaat OYJ
6,785,714 1.79%
Total Finland
6,785,714 1.79%
France - 4.41% 57,800 Renault SA
5,222,406 1.38%
159,002 Total SA
11,483,478 3.03%
Total France
16,705,884 4.41%
Great Britain - 8.98% 961,000 Barclays Plc
3,494,545 0.92%
657,546 IG Group Holdings Plc
6,601,303 1.74%
352,748 Imperial Tobacco Group Plc
15,853,165 4.19%
2,085,000 Legal & General Group Plc
8,030,742 2.12%
Total Great Britain
33,979,755 8.98%
Hong Kong - 3.16% 8,422,001 Esprit Holdings Ltd
11,953,345 3.16%
Total Hong Kong
11,953,345 3.16%
Indonesia - 2.13% 8,402,500 Adira Dinamika Multi Finance Tbk
8,044,570 2.13%
Total Indonesia
8,044,570 2.13%
Korea (South) - 5.61% 25,700 Hyundai Motor Co
5,829,997 1.54%
14,700 Samsung Electronics Co Ltd
15,401,951 4.07%
Total Korea (South)
21,231,948 5.61%
Netherlands - 2.34% 75,000 Schlumberger Ltd
8,846,250 2.34%
Total Netherlands
8,846,250 2.34%
Russia - 2.30% 147,777 Magnit OJSC
8,718,843 2.30%
Total Russia
8,718,843 2.30%
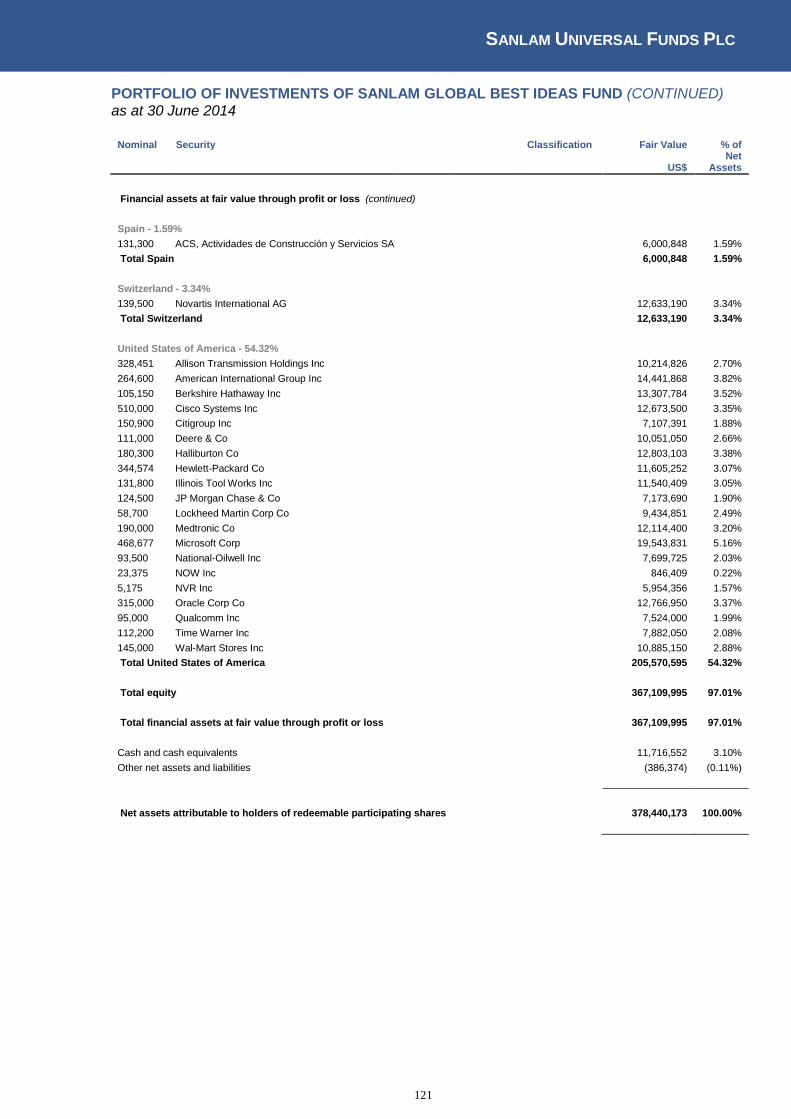
SANLAM UNIVERSAL FUNDS PLC
121
PORTFOLIO OF INVESTMENTS OF SANLAM GLOBAL BEST IDEAS FUND (CONTINUED) as at 30 June 2014
Nominal Security
Classification Fair Value % of
US$ Net
Assets
Financial assets at fair value through profit or loss (continued)
Spain - 1.59% 131,300 ACS, Actividades de Construcción y Servicios SA
6,000,848 1.59%
Total Spain
6,000,848 1.59%
Switzerland - 3.34% 139,500 Novartis International AG
12,633,190 3.34%
Total Switzerland
12,633,190 3.34%
United States of America - 54.32% 328,451 Allison Transmission Holdings Inc
10,214,826 2.70%
264,600 American International Group Inc
14,441,868 3.82%
105,150 Berkshire Hathaway Inc
13,307,784 3.52%
510,000 Cisco Systems Inc
12,673,500 3.35%
150,900 Citigroup Inc
7,107,391 1.88%
111,000 Deere & Co
10,051,050 2.66%
180,300 Halliburton Co
12,803,103 3.38%
344,574 Hewlett-Packard Co
11,605,252 3.07%
131,800 Illinois Tool Works Inc
11,540,409 3.05%
124,500 JP Morgan Chase & Co
7,173,690 1.90%
58,700 Lockheed Martin Corp Co
9,434,851 2.49%
190,000 Medtronic Co
12,114,400 3.20%
468,677 Microsoft Corp
19,543,831 5.16%
93,500 National-Oilwell Inc
7,699,725 2.03%
23,375 NOW Inc
846,409 0.22%
5,175 NVR Inc
5,954,356 1.57%
315,000 Oracle Corp Co
12,766,950 3.37%
95,000 Qualcomm Inc
7,524,000 1.99%
112,200 Time Warner Inc
7,882,050 2.08%
145,000 Wal-Mart Stores Inc
10,885,150 2.88%
Total United States of America
205,570,595 54.32%
Total equity
367,109,995 97.01%
Total financial assets at fair value through profit or loss
367,109,995 97.01%
Cash and cash equivalents
11,716,552 3.10%
Other net assets and liabilities
(386,374) (0.11%)
Net assets attributable to holders of redeemable participating shares
378,440,173 100.00%
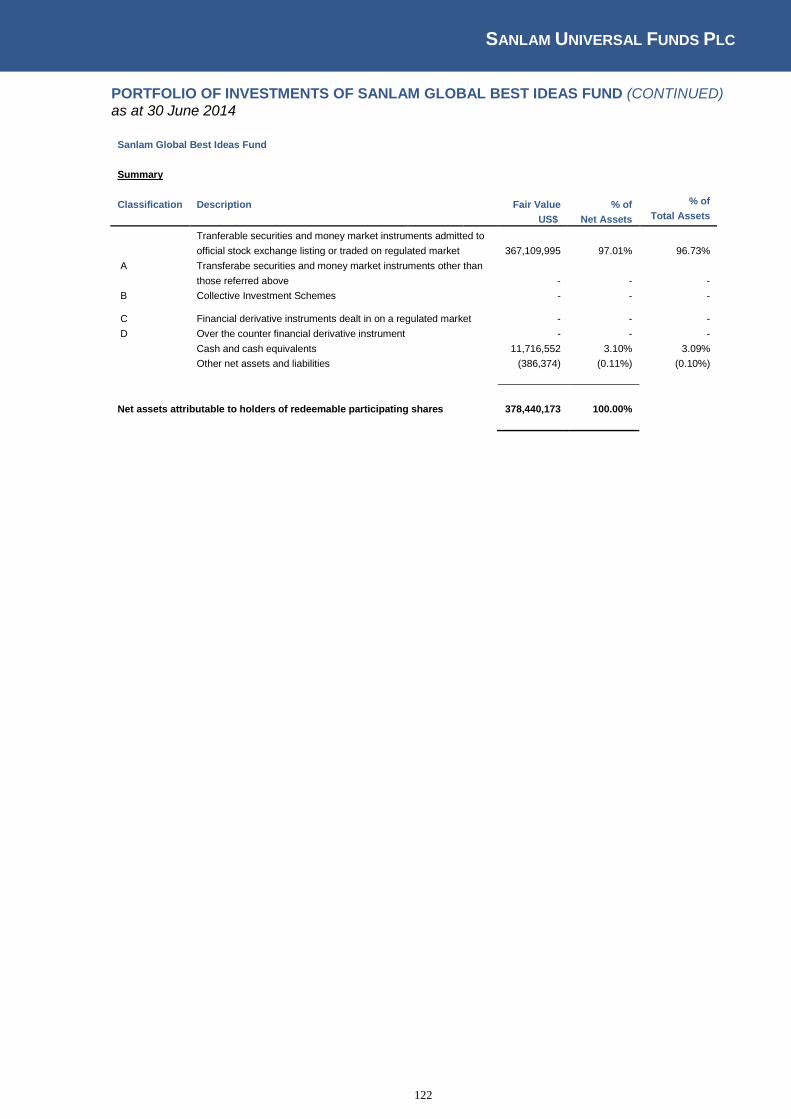
SANLAM UNIVERSAL FUNDS PLC
122
PORTFOLIO OF INVESTMENTS OF SANLAM GLOBAL BEST IDEAS FUND (CONTINUED) as at 30 June 2014
Sanlam Global Best Ideas Fund
Summary
Classification Description
Fair Value % of % of
US$ Net Assets Total Assets
Tranferable securities and money market instruments admitted to
official stock exchange listing or traded on regulated market 367,109,995 97.01% 96.73%
A Transferabe securities and money market instruments other than
those referred above
- - -
B Collective Investment Schemes
- - -
C Financial derivative instruments dealt in on a regulated market
- - -
D Over the counter financial derivative instrument - - -
Cash and cash equivalents
11,716,552 3.10% 3.09%
Other net assets and liabilities
(386,374) (0.11%) (0.10%)
Net assets attributable to holders of redeemable participating shares 378,440,173 100.00%
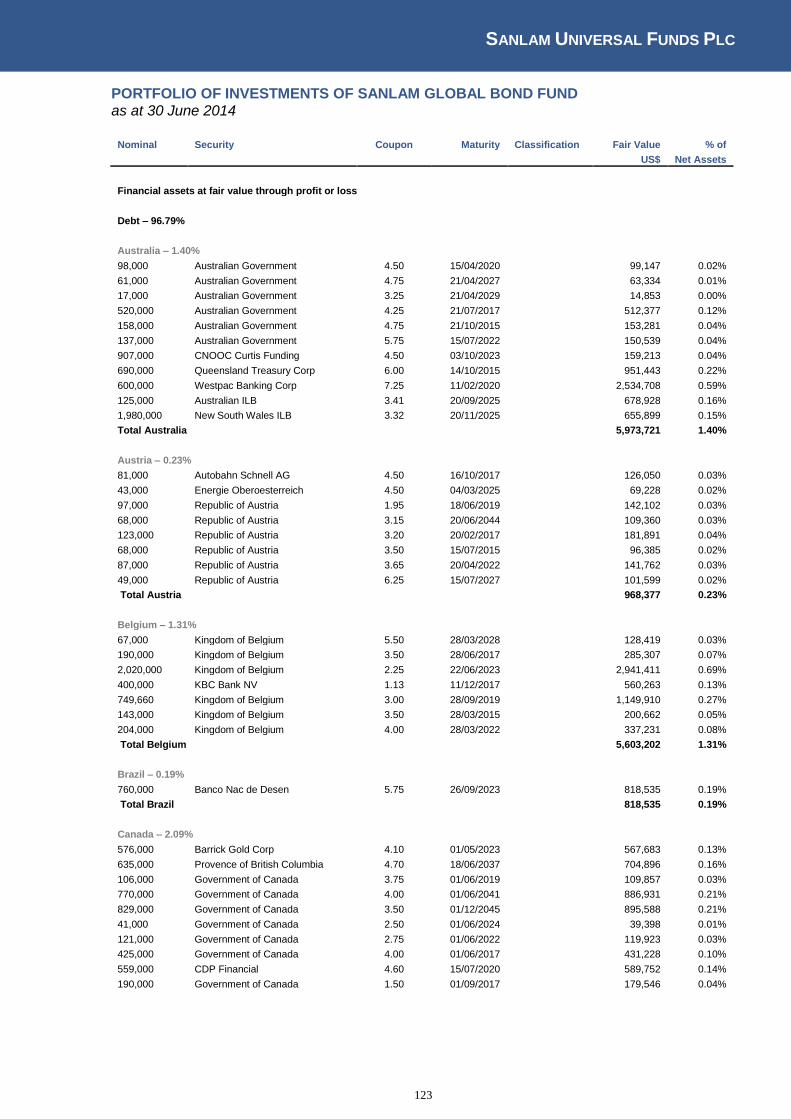
SANLAM UNIVERSAL FUNDS PLC
123
PORTFOLIO OF INVESTMENTS OF SANLAM GLOBAL BOND FUND as at 30 June 2014
Nominal Security Coupon Maturity Classification Fair Value % of
US$ Net Assets
Financial assets at fair value through profit or loss
Debt – 96.79%
Australia – 1.40% 98,000 Australian Government 4.50 15/04/2020
99,147 0.02%
61,000 Australian Government 4.75 21/04/2027
63,334 0.01%
17,000 Australian Government 3.25 21/04/2029
14,853 0.00%
520,000 Australian Government 4.25 21/07/2017
512,377 0.12%
158,000 Australian Government 4.75 21/10/2015
153,281 0.04%
137,000 Australian Government 5.75 15/07/2022
150,539 0.04%
907,000 CNOOC Curtis Funding 4.50 03/10/2023
159,213 0.04%
690,000 Queensland Treasury Corp 6.00 14/10/2015
951,443 0.22%
600,000 Westpac Banking Corp 7.25 11/02/2020
2,534,708 0.59%
125,000 Australian ILB 3.41 20/09/2025
678,928 0.16%
1,980,000 New South Wales ILB 3.32 20/11/2025
655,899 0.15%
Total Australia
5,973,721 1.40%
Austria – 0.23% 81,000 Autobahn Schnell AG 4.50 16/10/2017
126,050 0.03%
43,000 Energie Oberoesterreich 4.50 04/03/2025
69,228 0.02%
97,000 Republic of Austria 1.95 18/06/2019
142,102 0.03%
68,000 Republic of Austria 3.15 20/06/2044
109,360 0.03%
123,000 Republic of Austria 3.20 20/02/2017
181,891 0.04%
68,000 Republic of Austria 3.50 15/07/2015
96,385 0.02%
87,000 Republic of Austria 3.65 20/04/2022
141,762 0.03%
49,000 Republic of Austria 6.25 15/07/2027
101,599 0.02%
Total Austria
968,377 0.23%
Belgium – 1.31% 67,000 Kingdom of Belgium 5.50 28/03/2028
128,419 0.03%
190,000 Kingdom of Belgium 3.50 28/06/2017
285,307 0.07%
2,020,000 Kingdom of Belgium 2.25 22/06/2023
2,941,411 0.69%
400,000 KBC Bank NV 1.13 11/12/2017
560,263 0.13%
749,660 Kingdom of Belgium 3.00 28/09/2019
1,149,910 0.27%
143,000 Kingdom of Belgium 3.50 28/03/2015
200,662 0.05%
204,000 Kingdom of Belgium 4.00 28/03/2022
337,231 0.08%
Total Belgium
5,603,202 1.31%
Brazil – 0.19% 760,000 Banco Nac de Desen 5.75 26/09/2023
818,535 0.19%
Total Brazil
818,535 0.19%
Canada – 2.09% 576,000 Barrick Gold Corp 4.10 01/05/2023
567,683 0.13%
635,000 Provence of British Columbia 4.70 18/06/2037
704,896 0.16%
106,000 Government of Canada 3.75 01/06/2019
109,857 0.03%
770,000 Government of Canada 4.00 01/06/2041
886,931 0.21%
829,000 Government of Canada 3.50 01/12/2045
895,588 0.21%
41,000 Government of Canada 2.50 01/06/2024
39,398 0.01%
121,000 Government of Canada 2.75 01/06/2022
119,923 0.03%
425,000 Government of Canada 4.00 01/06/2017
431,228 0.10%
559,000 CDP Financial 4.60 15/07/2020
589,752 0.14%
190,000 Government of Canada 1.50 01/09/2017
179,546 0.04%

SANLAM UNIVERSAL FUNDS PLC
124
PORTFOLIO OF INVESTMENTS OF SANLAM GLOBAL BOND FUND (CONTINUED) as at 30 June 2014
Nominal Security Coupon Maturity Classification Fair Value % of
US$ Net Assets
Financial assets at fair value through profit or loss (continued)
Canada – 2.09% (continued)
510,000 Husky Energy Inc 4.00 15/04/2024
530,517 0.12%
690,000 Ontario Province 4.20 08/03/2018
706,045 0.17%
480,000 Ontario Province 6.20 02/06/2031
601,054 0.14%
686,000 Province of Alberta 1.85 01/09/2016
652,737 0.15%
1,165,000 Quebec Province 5.00 29/04/2019
1,917,595 0.45%
Total Canada
8,932,751 2.09%
Cayman Islands – 0.98% 1,160,000 Petrobras International Finance 5.75 20/01/2020
1,240,342 0.29%
2,055,000 Petrobras International Finance 3.88 27/01/2016
2,121,726 0.50%
460,000 Petrobras International Finance 5.38 27/01/2021
478,193 0.11%
375,000 Saudi Electricity 5.06 08/04/2043
367,024 0.09%
Total Cayman Islands
4,207,284 0.98%
Czechoslovakia – 0.05% 4,220,000 Czech Republic 2.50 25/08/2028
218,978 0.05%
Total Czechoslovakia
218,978 0.05%
Denmark – 0.16% 463,000 Dong Energy AS 2.63 19/09/2022
674,207 0.16%
Total Denmark
674,207 0.16%
European Union – 1.00%
220,000 European Financial Stability Facility Bond 1.63 17/07/2020
315,264 0.07%
660,853 Red Black Auto Lease 0.91 15/04/2024
905,475 0.21%
862,968 Volta Electricity ABS 2.98 16/02/2021
1,186,716 0.28%
575,000 Abest Asset Backed European Securiitisation F 1.30 10/12/2028
788,282 0.18%
201,956 Copernic 1.16 25/12/2015
277,309 0.06%
600,000 Sunrise SRL ABS 1.13 27/05/2031
821,839 0.19%
Total European Union
4,294,884 1.00%
France – 5.01% 1,195,000 BNP Paribas 2.88 20/03/2026
1,662,764 0.39%
103,000 BNP Paribas 2.88 26/09/2023
150,869 0.04%
400,000 Bpce SA 2.13 17/03/2021
563,667 0.13%
300,000 BPCE SFH 2.75 16/02/2017
436,334 0.10%
220,000 Caisse D'Amort Dette Soc 4.38 25/10/2021
369,903 0.09%
380,000 Caisse Française de Financement Local 4.25 07/02/2019
604,943 0.14%
315,000 Caisse Refinance 3.60 08/03/2024
508,763 0.12%
200,000 Credit Agricole Public 1.88 07/06/2023
282,384 0.07%
400,000 Credit Mutuel CIC Home 4.13 19/01/2024
670,564 0.16%
193,065 Driver France 0.47 21/10/2020
264,343 0.06%
400,000 Electricite De France 5.50 17/10/2041
772,215 0.18%
1,867,000 Electricite De France FRN 5.25 31/12/2049
1,909,269 0.45%
154,069 FCT GINKO FRN 1.58 18/07/2038
212,075 0.05%
276,000 Government of France 8.50 25/04/2023
603,571 0.14%
298,000 Government of France 3.50 25/04/2026
477,045 0.11%
413,000 Government of France 3.75 25/10/2019
658,652 0.15%
454,000 Government of France 4.00 25/10/2038
781,069 0.18%
471,000 Government of France 4.25 25/10/2017
730,269 0.17%
670,000 Government of France 6.00 25/10/2025
1,312,037 0.31%

SANLAM UNIVERSAL FUNDS PLC
125
PORTFOLIO OF INVESTMENTS OF SANLAM GLOBAL BOND FUND (CONTINUED) as at 30 June 2014
Nominal Security Coupon Maturity Classification Fair Value % of
US$ Net
Assets
Financial assets at fair value through profit or loss (continued)
France – 5.01% (continued)
1,068,000 Government of France 4.50 25/04/2041
1,990,955 0.47%
705,000 French Treasury Note 2.50 25/07/2016
1,012,333 0.24%
744,000 GDF Suez 6.38 18/01/2021
1,339,994 0.31%
500,000 GDF Suez FRN 3.00 02/06/2049
690,948 0.16%
600,000 ICADE 2.25 30/01/2019
854,335 0.20%
300,000 Master Credit Cards Pass France FRN 0.74 25/10/2025
411,320 0.10%
75,282 Red and Black Auto France FRN 0.95 28/12/2021
103,252 0.02%
300,000 Reseau Ferre de France 4.25 07/10/2026
506,991 0.12%
250,000 RTE EDF Transport SA 4.13 27/09/2016
369,704 0.09%
800,000 Societe Generale SFH 1.75 05/03/2020
1,150,389 0.27%
Total France
21,400,955 5.01%
Germany – 7.34% 520,000 Bayer Ag 3.00 01/07/2075
719,789 0.17%
835,000 Bayer Ag 3.75 01/07/2074
1,156,900 0.27%
348,000 Bundesrep Deutschland 2.00 04/01/2022
517,562 0.12%
283,021 Bundesobligation 0.50 07/04/2017
392,047 0.09%
1,250,000 Bundesobligation 0.80 15/04/2018
1,919,571 0.45%
640,000 Bundesobligation 1.00 22/02/2019
903,750 0.21%
2,360,000 Bundesrepub 1.75 15/02/2024
3,390,643 0.79%
450,000 Bundesrepub Deutschland 2.50 15/08/2046
659,883 0.15%
427,088 Bundesrepub Deutschland 4.00 04/01/2037
779,605 0.18%
1,795,000 Bundesrepub Deutschland 1.50 15/05/2024
2,514,179 0.59%
350,000 Deutsche Bank AG 5.00 24/06/2020
555,800 0.13%
382,073 Driver GMBH FRN 0.37 21/03/2019
522,748 0.12%
305,000 ENBW 3.63 02/04/2076
417,317 0.10%
216,000 Ewe AG 4.88 14/10/2019
349,472 0.08%
900,000 FMS Wertmanagement 1.13 07/12/2016
1,527,678 0.36%
400,000 FMS Wertmanagement 1.38 15/01/2020
567,663 0.13%
600,000 FMS Wertmanagement 1.88 24/08/2015
837,635 0.20%
342,750 Republic of Germany 4.00 04/01/2018
533,106 0.12%
134,000 Republic of Germany 5.63 04/01/2028
271,062 0.06%
259,000 Republic of Germany 3.25 04/01/2020
409,215 0.10%
287,000 Hypothekenbank Frankfurt 4.38 02/07/2019
463,273 0.11%
9,000,000 KFW 0.50 30/09/2015
9,031,050 2.11%
401,000 KFW 2.25 21/09/2017
584,506 0.14%
500,000 Kreditanst Fur Wie 5.05 04/02/2025
542,594 0.13%
870,000 Kreditanstalt Fur Wiederaufbau 1.88 13/06/2018
821,207 0.19%
885,000 Kreditanstalt Fur Wiederaufbau 3.75 16/08/2017
759,753 0.18%
27,000 Land Nord-Rhein Westfalen 2.00 15/10/2025
38,072 0.01%
300,000 Munich Re Finance FRN 6.63 26/05/2042
589,014 0.14%
Total Germany
31,775,095 7.43%

SANLAM UNIVERSAL FUNDS PLC
126
PORTFOLIO OF INVESTMENTS OF SANLAM GLOBAL BOND FUND (CONTINUED) as at 30 June 2014
Nominal Security Coupon Maturity Classification Fair Value % of
US$ Net
Assets
Financial assets at fair value through profit or loss (continued)
Great Britain – 5.53% 780,000 Abbey National Treasury Serv FRN 0.83 20/01/2017
1,335,423 0.31%
280,000 Aon Plc 2.88 14/05/2026
392,352 0.09%
402,667 Arkle Master Issue FRN 1.93 17/05/2060
409,390 0.10%
12,672 Asset Backed European Securitisation FRN 0.96 15/06/2019
21,664 0.01%
266,000 Barclays Bank Plc 5.14 14/10/2020
291,406 0.07%
134,000 Bat International Finance Plc 6.38 12/12/2019
268,547 0.06%
75,172 E-Carat Plc 1.30 18/06/2020
128,859 0.03%
397,777 Fosse Master Issue FRN 1.93 18/10/2054
679,833 0.16%
346,000 Hammerson Plc 2.75 26/09/2019
507,325 0.12%
200,000 HSBC Holdings Plc 5.25 14/03/2044
214,302 0.05%
450,000 Legal and General Group 6.39 02/05/2017
827,386 0.19%
430,000 Lloyds bank Plc FRN 0.77 14/01/2017
736,320 0.17%
134,400 Motor Plc 1.29 25/02/2020
134,572 0.03%
394,000 Network Rail Infra Finance 4.75 22/01/2024
777,665 0.18%
1,030,000 NGG Finance Plc FRN 4.25 18/06/2076
1,504,000 0.35%
199,000 Northern Gas Networks 4.88 15/11/2035
358,135 0.08%
870,000 Northern Rock Asset Management 5.63 22/06/2017
975,749 0.23%
312,000 Nram Covered 4.13 27/03/2017
469,473 0.11%
450,000 Reed Elsevier Investment 5.63 20/10/2016
833,215 0.19%
279,000 Treasury UK 3.75 07/09/2019
517,356 0.12%
215,000 TSY 4.25 07/12/2027
417,869 0.10%
405,000 TSY 4.75 07/09/2015
725,394 0.17%
269,000 Turbo Finance Plc FRN 1.07 14/12/2020
460,545 0.11%
1,006 Turbo Finance Plc FRN 1.89 20/02/2019
1,720 0.00%
2,865,000 Government of UK 4.25 07/09/2039
5,621,069 1.32%
475,000 UK Gilt 1 1.00 07/09/2017
799,010 0.19%
380,000 UK Gilt 3.50 22/07/2068
670,799 0.16%
912,000 Government of UK Bond 4.50 07/12/2042
1,874,774 0.44%
135,000 Government of UK 4.25 07/12/2040
265,508 0.06%
400,000 UK Treasury 3.25 22/01/2044
661,791 0.15%
395,000 UK Treasury 4.00 07/03/2022
749,704 0.18%
Total Great Britain
23,631,155 5.53%
Hong Kong – 0.07% 265,000 AIA Group 4.88 11/03/2044
280,317 0.07%
Total Hong Kong
280,317 0.07%
India – 0.10% 390,000 Bank of Baroda 5.00 24/08/2016
411,832 0.10%
Total India
411,832 0.10%
Indonesia – 0.09% 330,000 Republic of Indonesia 6.75 15/01/2044
380,401 0.09%
Total Indonesia
380,401 0.09%
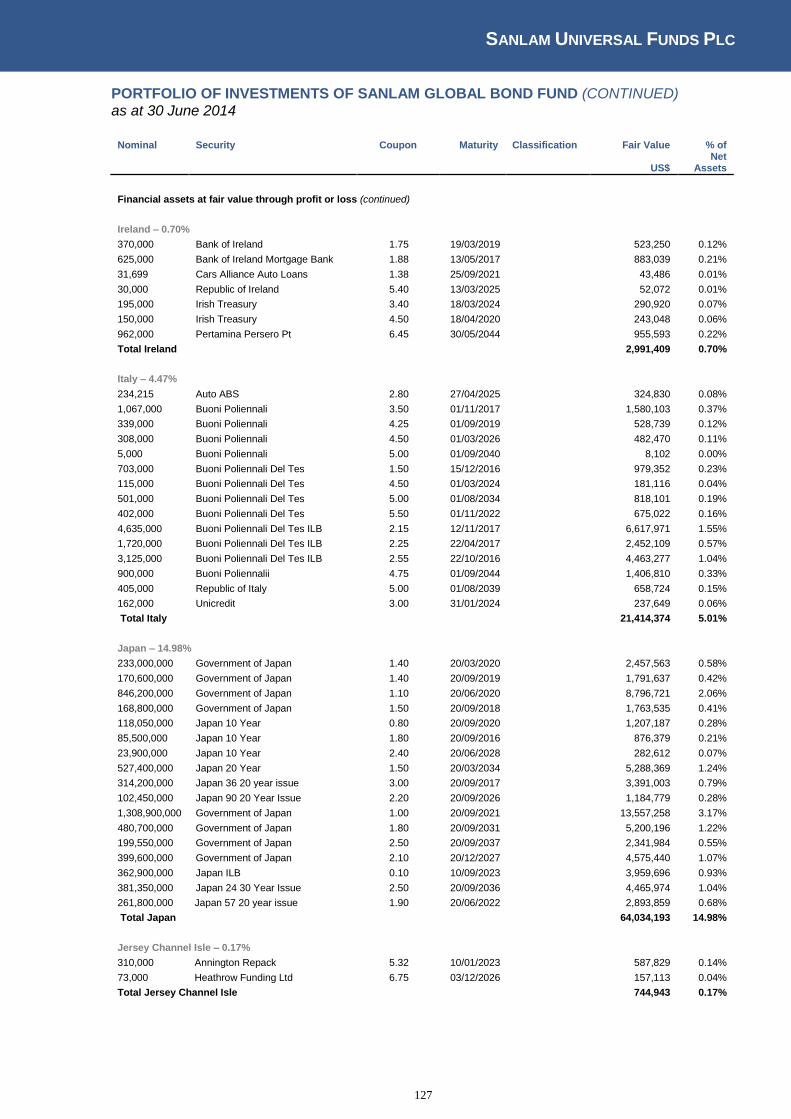
SANLAM UNIVERSAL FUNDS PLC
127
PORTFOLIO OF INVESTMENTS OF SANLAM GLOBAL BOND FUND (CONTINUED) as at 30 June 2014
Nominal Security Coupon Maturity Classification Fair Value % of
US$ Net
Assets
Financial assets at fair value through profit or loss (continued)
Ireland – 0.70% 370,000 Bank of Ireland 1.75 19/03/2019
523,250 0.12%
625,000 Bank of Ireland Mortgage Bank 1.88 13/05/2017
883,039 0.21%
31,699 Cars Alliance Auto Loans 1.38 25/09/2021
43,486 0.01%
30,000 Republic of Ireland 5.40 13/03/2025
52,072 0.01%
195,000 Irish Treasury 3.40 18/03/2024
290,920 0.07%
150,000 Irish Treasury 4.50 18/04/2020
243,048 0.06%
962,000 Pertamina Persero Pt 6.45 30/05/2044
955,593 0.22%
Total Ireland
2,991,409 0.70%
Italy – 4.47% 234,215 Auto ABS 2.80 27/04/2025
324,830 0.08%
1,067,000 Buoni Poliennali 3.50 01/11/2017
1,580,103 0.37%
339,000 Buoni Poliennali 4.25 01/09/2019
528,739 0.12%
308,000 Buoni Poliennali 4.50 01/03/2026
482,470 0.11%
5,000 Buoni Poliennali 5.00 01/09/2040
8,102 0.00%
703,000 Buoni Poliennali Del Tes 1.50 15/12/2016
979,352 0.23%
115,000 Buoni Poliennali Del Tes 4.50 01/03/2024
181,116 0.04%
501,000 Buoni Poliennali Del Tes 5.00 01/08/2034
818,101 0.19%
402,000 Buoni Poliennali Del Tes 5.50 01/11/2022
675,022 0.16%
4,635,000 Buoni Poliennali Del Tes ILB 2.15 12/11/2017
6,617,971 1.55%
1,720,000 Buoni Poliennali Del Tes ILB 2.25 22/04/2017
2,452,109 0.57%
3,125,000 Buoni Poliennali Del Tes ILB 2.55 22/10/2016
4,463,277 1.04%
900,000 Buoni Poliennalii 4.75 01/09/2044
1,406,810 0.33%
405,000 Republic of Italy 5.00 01/08/2039
658,724 0.15%
162,000 Unicredit 3.00 31/01/2024
237,649 0.06%
Total Italy
21,414,374 5.01%
Japan – 14.98% 233,000,000 Government of Japan 1.40 20/03/2020
2,457,563 0.58%
170,600,000 Government of Japan 1.40 20/09/2019
1,791,637 0.42%
846,200,000 Government of Japan 1.10 20/06/2020
8,796,721 2.06%
168,800,000 Government of Japan 1.50 20/09/2018
1,763,535 0.41%
118,050,000 Japan 10 Year 0.80 20/09/2020
1,207,187 0.28%
85,500,000 Japan 10 Year 1.80 20/09/2016
876,379 0.21%
23,900,000 Japan 10 Year 2.40 20/06/2028
282,612 0.07%
527,400,000 Japan 20 Year 1.50 20/03/2034
5,288,369 1.24%
314,200,000 Japan 36 20 year issue 3.00 20/09/2017
3,391,003 0.79%
102,450,000 Japan 90 20 Year Issue 2.20 20/09/2026
1,184,779 0.28%
1,308,900,000 Government of Japan 1.00 20/09/2021
13,557,258 3.17%
480,700,000 Government of Japan 1.80 20/09/2031
5,200,196 1.22%
199,550,000 Government of Japan 2.50 20/09/2037
2,341,984 0.55%
399,600,000 Government of Japan 2.10 20/12/2027
4,575,440 1.07%
362,900,000 Japan ILB 0.10 10/09/2023
3,959,696 0.93%
381,350,000 Japan 24 30 Year Issue 2.50 20/09/2036
4,465,974 1.04%
261,800,000 Japan 57 20 year issue 1.90 20/06/2022
2,893,859 0.68%
Total Japan
64,034,193 14.98%
Jersey Channel Isle – 0.17% 310,000 Annington Repack 5.32 10/01/2023
587,829 0.14%
73,000 Heathrow Funding Ltd 6.75 03/12/2026
157,113 0.04%
Total Jersey Channel Isle
744,943 0.17%

SANLAM UNIVERSAL FUNDS PLC
128
PORTFOLIO OF INVESTMENTS OF SANLAM GLOBAL BOND FUND (CONTINUED) as at 30 June 2014
Nominal Security Coupon Maturity Classification Fair Value % of
US$ Net
Assets
Financial assets at fair value through profit or loss (continued)
Korea (South) – 0.65% 1,050,000 Korea Development Bank 1.00 22/01/2016
1,050,378 0.25%
781,000 Korea Development Bank 1.50 30/05/2018
1,087,223 0.25%
611,000 Korea Finance Corp 2.88 22/08/2018
628,414 0.15%
Total Korea (South)
2,766,014 0.65%
Luxembourg – 0.72% 470,949 Bumper2SA FRN 1.36 23/02/2023
646,886 0.15%
226,003 E-Car ABS FRN 0.53 18/09/2021
309,571 0.07%
222,099 E-CARAT FRN 1.38 18/09/2020
305,077 0.07%
770,000 Gelf Bond Issuer I SA 3.13 03/04/2018
1,113,708 0.26%
75,453 Highway FRN 1.20 26/03/2024
103,467 0.02%
424,665 Volkswagen Car Lease FRN 0.47 21/11/2019
581,485 0.14%
Total Luxembourg
3,060,195 0.72%
Malaysia – 0.48% 400,000 Export Import Bank of Malaysia 2.88 14/12/2017
415,864 0.10%
485,000 Hong Leong Bank Berh 3.75 17/03/2016
502,382 0.12%
1,511,000 Malaysia Government 3.84 12/08/2015
474,218 0.11%
419,000 Malaysia Government 4.13 15/04/2032
124,990 0.03%
389,000 Malaysia Government 5.73 30/07/2019
132,214 0.03%
400,000 Malaysia Government 3.42 15/08/2022
119,656 0.03%
711,000 Malaysia Government 4.01 15/09/2017
224,501 0.05%
215,000 Malaysia Government 4.71 15/09/2026
69,996 0.02%
Total Malaysia
2,063,821 0.48%
Mexico – 0.71% 390,000 America Movil SAB 5.00 16/10/2019
440,244 0.10%
431,000 America Movil SAB 6.13 30/03/2040
511,446 0.12%
13,377,900 Mex Bonos Desarr 6.50 10/06/2021
1,106,674 0.26%
8,000,000 Mex Bonos Desarr fix rt 8.00 07/12/2023
722,996 0.17%
246,000 United Mexican States 4.75 08/03/2044
251,424 0.06%
Total Mexico
3,032,784 0.71%
Netherlands – 2.62% 500,000 ABN Amro Bank 3.75 15/07/2014
684,969 0.16%
500,000 Allianz Finance II FRN 5.75 08/07/2021
803,318 0.19%
712,000 Deutsche Post Finance 2.95 27/06/2022
1,064,765 0.25%
368,000 Deutsche Telekom International Finance 4.75 31/05/2016
544,296 0.13%
25,000 ENBW International Finance BV 6.13 07/07/2039
49,766 0.01%
150,000 Enel Finance International NV 4.88 11/03/2020
242,231 0.06%
520,000 ING Bank NV 6.13 29/05/2018
812,760 0.19%
814,000 Koninklijke KPN NV 4.75 17/01/2017
1,224,820 0.29%
193,000 Neder Waterschapsbank 4.13 23/01/2017
290,115 0.07%
100,000 Nederlandse Gasunie NV 2.63 13/07/2022
147,219 0.03%
690,000 Netherlands Government 2.00 15/07/2024
989,850 0.23%
37,000 Government of Netherlands 5.50 15/01/2028
72,995 0.02%
105,000 Government of Netherlands 3.75 15/01/2042
188,886 0.04%
173,000 Government of Netherlands 2.25 15/07/2022
257,156 0.06%
97,000 Government of Netherlands 4.00 15/07/2019
155,860 0.04%
164,000 Government of Netherlands 4.50 15/07/2017
253,715 0.06%
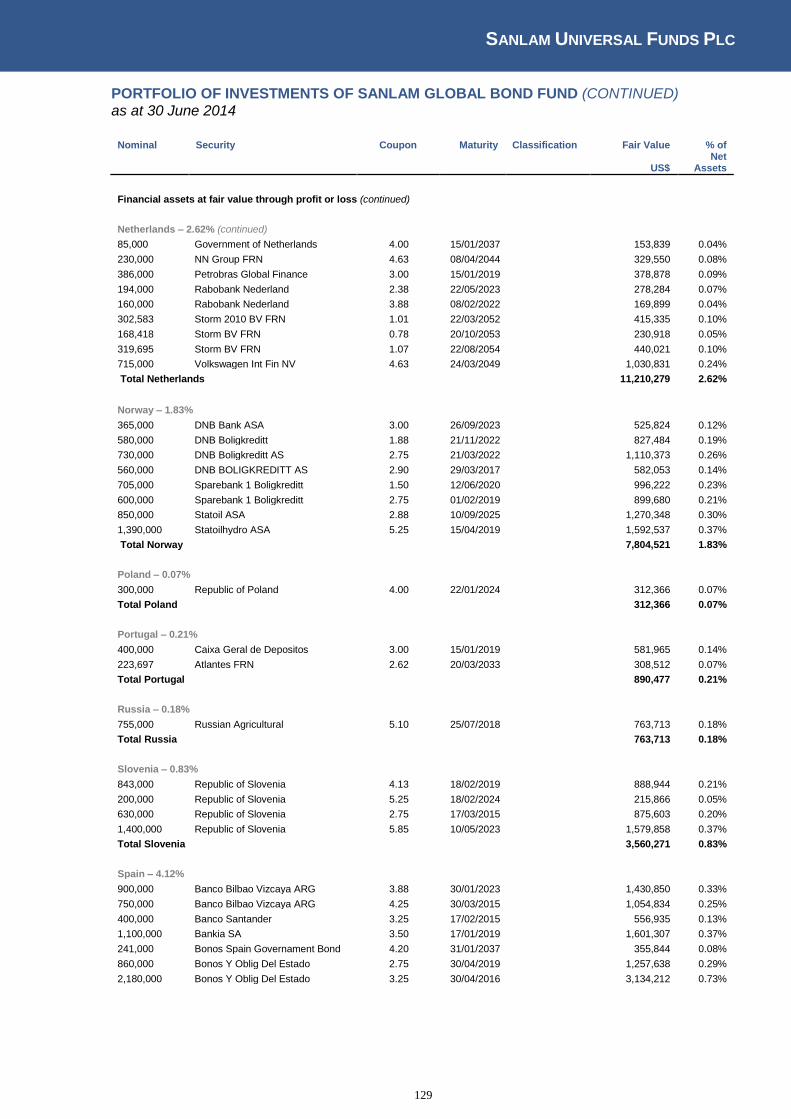
SANLAM UNIVERSAL FUNDS PLC
129
PORTFOLIO OF INVESTMENTS OF SANLAM GLOBAL BOND FUND (CONTINUED) as at 30 June 2014
Nominal Security Coupon Maturity Classification Fair Value % of
US$ Net
Assets
Financial assets at fair value through profit or loss (continued)
Netherlands – 2.62% (continued)
85,000 Government of Netherlands 4.00 15/01/2037
153,839 0.04%
230,000 NN Group FRN 4.63 08/04/2044
329,550 0.08%
386,000 Petrobras Global Finance 3.00 15/01/2019
378,878 0.09%
194,000 Rabobank Nederland 2.38 22/05/2023
278,284 0.07%
160,000 Rabobank Nederland 3.88 08/02/2022
169,899 0.04%
302,583 Storm 2010 BV FRN 1.01 22/03/2052
415,335 0.10%
168,418 Storm BV FRN 0.78 20/10/2053
230,918 0.05%
319,695 Storm BV FRN 1.07 22/08/2054
440,021 0.10%
715,000 Volkswagen Int Fin NV 4.63 24/03/2049
1,030,831 0.24%
Total Netherlands
11,210,279 2.62%
Norway – 1.83% 365,000 DNB Bank ASA 3.00 26/09/2023
525,824 0.12%
580,000 DNB Boligkreditt 1.88 21/11/2022
827,484 0.19%
730,000 DNB Boligkreditt AS 2.75 21/03/2022
1,110,373 0.26%
560,000 DNB BOLIGKREDITT AS 2.90 29/03/2017
582,053 0.14%
705,000 Sparebank 1 Boligkreditt 1.50 12/06/2020
996,222 0.23%
600,000 Sparebank 1 Boligkreditt 2.75 01/02/2019
899,680 0.21%
850,000 Statoil ASA 2.88 10/09/2025
1,270,348 0.30%
1,390,000 Statoilhydro ASA 5.25 15/04/2019
1,592,537 0.37%
Total Norway
7,804,521 1.83%
Poland – 0.07% 300,000 Republic of Poland 4.00 22/01/2024
312,366 0.07%
Total Poland
312,366 0.07%
Portugal – 0.21% 400,000 Caixa Geral de Depositos 3.00 15/01/2019
581,965 0.14%
223,697 Atlantes FRN 2.62 20/03/2033
308,512 0.07%
Total Portugal
890,477 0.21%
Russia – 0.18% 755,000 Russian Agricultural 5.10 25/07/2018
763,713 0.18%
Total Russia
763,713 0.18%
Slovenia – 0.83% 843,000 Republic of Slovenia 4.13 18/02/2019
888,944 0.21%
200,000 Republic of Slovenia 5.25 18/02/2024
215,866 0.05%
630,000 Republic of Slovenia 2.75 17/03/2015
875,603 0.20%
1,400,000 Republic of Slovenia 5.85 10/05/2023
1,579,858 0.37%
Total Slovenia
3,560,271 0.83%
Spain – 4.12% 900,000 Banco Bilbao Vizcaya ARG 3.88 30/01/2023
1,430,850 0.33%
750,000 Banco Bilbao Vizcaya ARG 4.25 30/03/2015
1,054,834 0.25%
400,000 Banco Santander 3.25 17/02/2015
556,935 0.13%
1,100,000 Bankia SA 3.50 17/01/2019
1,601,307 0.37%
241,000 Bonos Spain Governament Bond 4.20 31/01/2037
355,844 0.08%
860,000 Bonos Y Oblig Del Estado 2.75 30/04/2019
1,257,638 0.29%
2,180,000 Bonos Y Oblig Del Estado 3.25 30/04/2016
3,134,212 0.73%
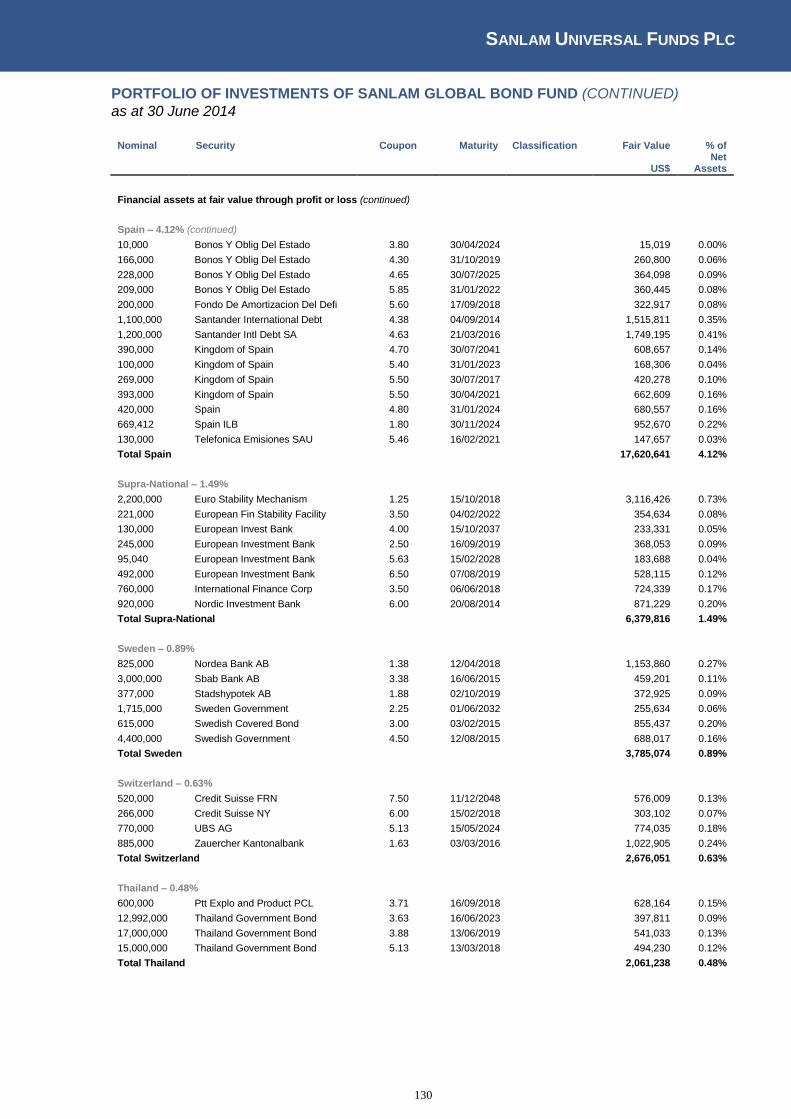
SANLAM UNIVERSAL FUNDS PLC
130
PORTFOLIO OF INVESTMENTS OF SANLAM GLOBAL BOND FUND (CONTINUED)
as at 30 June 2014
Nominal Security Coupon Maturity Classification Fair Value % of
US$ Net
Assets
Financial assets at fair value through profit or loss (continued)
Spain – 4.12% (continued)
10,000 Bonos Y Oblig Del Estado 3.80 30/04/2024
15,019 0.00%
166,000 Bonos Y Oblig Del Estado 4.30 31/10/2019
260,800 0.06%
228,000 Bonos Y Oblig Del Estado 4.65 30/07/2025
364,098 0.09%
209,000 Bonos Y Oblig Del Estado 5.85 31/01/2022
360,445 0.08%
200,000 Fondo De Amortizacion Del Defi 5.60 17/09/2018
322,917 0.08%
1,100,000 Santander International Debt 4.38 04/09/2014
1,515,811 0.35%
1,200,000 Santander Intl Debt SA 4.63 21/03/2016
1,749,195 0.41%
390,000 Kingdom of Spain 4.70 30/07/2041
608,657 0.14%
100,000 Kingdom of Spain 5.40 31/01/2023
168,306 0.04%
269,000 Kingdom of Spain 5.50 30/07/2017
420,278 0.10%
393,000 Kingdom of Spain 5.50 30/04/2021
662,609 0.16%
420,000 Spain 4.80 31/01/2024
680,557 0.16%
669,412 Spain ILB 1.80 30/11/2024
952,670 0.22%
130,000 Telefonica Emisiones SAU 5.46 16/02/2021
147,657 0.03%
Total Spain
17,620,641 4.12%
Supra-National – 1.49% 2,200,000 Euro Stability Mechanism 1.25 15/10/2018
3,116,426 0.73%
221,000 European Fin Stability Facility 3.50 04/02/2022
354,634 0.08%
130,000 European Invest Bank 4.00 15/10/2037
233,331 0.05%
245,000 European Investment Bank 2.50 16/09/2019
368,053 0.09%
95,040 European Investment Bank 5.63 15/02/2028
183,688 0.04%
492,000 European Investment Bank 6.50 07/08/2019
528,115 0.12%
760,000 International Finance Corp 3.50 06/06/2018
724,339 0.17%
920,000 Nordic Investment Bank 6.00 20/08/2014
871,229 0.20%
Total Supra-National
6,379,816 1.49%
Sweden – 0.89% 825,000 Nordea Bank AB 1.38 12/04/2018
1,153,860 0.27%
3,000,000 Sbab Bank AB 3.38 16/06/2015
459,201 0.11%
377,000 Stadshypotek AB 1.88 02/10/2019
372,925 0.09%
1,715,000 Sweden Government 2.25 01/06/2032
255,634 0.06%
615,000 Swedish Covered Bond 3.00 03/02/2015
855,437 0.20%
4,400,000 Swedish Government 4.50 12/08/2015
688,017 0.16%
Total Sweden
3,785,074 0.89%
Switzerland – 0.63% 520,000 Credit Suisse FRN 7.50 11/12/2048
576,009 0.13%
266,000 Credit Suisse NY 6.00 15/02/2018
303,102 0.07%
770,000 UBS AG 5.13 15/05/2024
774,035 0.18%
885,000 Zauercher Kantonalbank 1.63 03/03/2016
1,022,905 0.24%
Total Switzerland
2,676,051 0.63%
Thailand – 0.48% 600,000 Ptt Explo and Product PCL 3.71 16/09/2018
628,164 0.15%
12,992,000 Thailand Government Bond 3.63 16/06/2023
397,811 0.09%
17,000,000 Thailand Government Bond 3.88 13/06/2019
541,033 0.13%
15,000,000 Thailand Government Bond 5.13 13/03/2018
494,230 0.12%
Total Thailand
2,061,238 0.48%
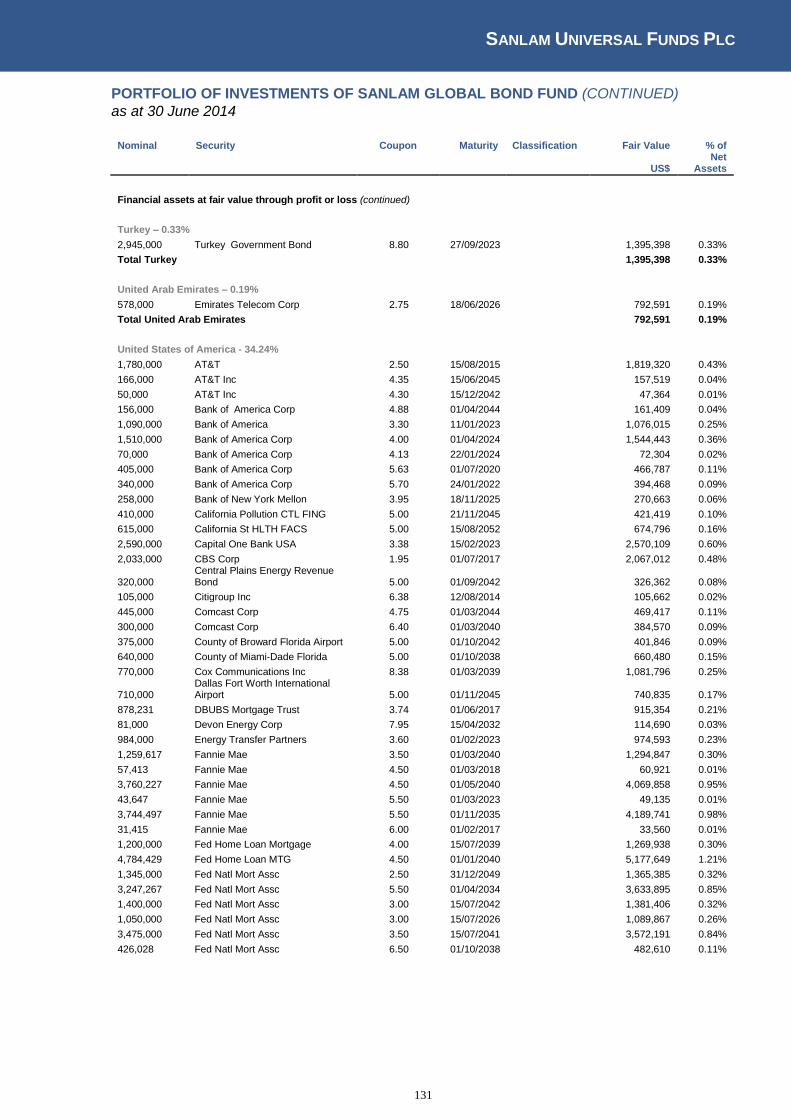
SANLAM UNIVERSAL FUNDS PLC
131
PORTFOLIO OF INVESTMENTS OF SANLAM GLOBAL BOND FUND (CONTINUED)
as at 30 June 2014
Nominal Security Coupon Maturity Classification Fair Value % of
US$ Net
Assets
Financial assets at fair value through profit or loss (continued)
Turkey – 0.33% 2,945,000 Turkey Government Bond 8.80 27/09/2023
1,395,398 0.33%
Total Turkey
1,395,398 0.33%
United Arab Emirates – 0.19% 578,000 Emirates Telecom Corp 2.75 18/06/2026
792,591 0.19%
Total United Arab Emirates
792,591 0.19%
United States of America - 34.24% 1,780,000 AT&T 2.50 15/08/2015
1,819,320 0.43%
166,000 AT&T Inc 4.35 15/06/2045
157,519 0.04%
50,000 AT&T Inc 4.30 15/12/2042
47,364 0.01%
156,000 Bank of America Corp 4.88 01/04/2044
161,409 0.04%
1,090,000 Bank of America 3.30 11/01/2023
1,076,015 0.25%
1,510,000 Bank of America Corp 4.00 01/04/2024
1,544,443 0.36%
70,000 Bank of America Corp 4.13 22/01/2024
72,304 0.02%
405,000 Bank of America Corp 5.63 01/07/2020
466,787 0.11%
340,000 Bank of America Corp 5.70 24/01/2022
394,468 0.09%
258,000 Bank of New York Mellon 3.95 18/11/2025
270,663 0.06%
410,000 California Pollution CTL FING 5.00 21/11/2045
421,419 0.10%
615,000 California St HLTH FACS 5.00 15/08/2052
674,796 0.16%
2,590,000 Capital One Bank USA 3.38 15/02/2023
2,570,109 0.60%
2,033,000 CBS Corp 1.95 01/07/2017
2,067,012 0.48%
320,000 Central Plains Energy Revenue Bond 5.00 01/09/2042
326,362 0.08%
105,000 Citigroup Inc 6.38 12/08/2014
105,662 0.02%
445,000 Comcast Corp 4.75 01/03/2044
469,417 0.11%
300,000 Comcast Corp 6.40 01/03/2040
384,570 0.09%
375,000 County of Broward Florida Airport 5.00 01/10/2042
401,846 0.09%
640,000 County of Miami-Dade Florida 5.00 01/10/2038
660,480 0.15%
770,000 Cox Communications Inc 8.38 01/03/2039
1,081,796 0.25%
710,000 Dallas Fort Worth International Airport 5.00 01/11/2045
740,835 0.17%
878,231 DBUBS Mortgage Trust 3.74 01/06/2017
915,354 0.21%
81,000 Devon Energy Corp 7.95 15/04/2032
114,690 0.03%
984,000 Energy Transfer Partners 3.60 01/02/2023
974,593 0.23%
1,259,617 Fannie Mae 3.50 01/03/2040
1,294,847 0.30%
57,413 Fannie Mae 4.50 01/03/2018
60,921 0.01%
3,760,227 Fannie Mae 4.50 01/05/2040
4,069,858 0.95%
43,647 Fannie Mae 5.50 01/03/2023
49,135 0.01%
3,744,497 Fannie Mae 5.50 01/11/2035
4,189,741 0.98%
31,415 Fannie Mae 6.00 01/02/2017
33,560 0.01%
1,200,000 Fed Home Loan Mortgage 4.00 15/07/2039
1,269,938 0.30%
4,784,429 Fed Home Loan MTG 4.50 01/01/2040
5,177,649 1.21%
1,345,000 Fed Natl Mort Assc 2.50 31/12/2049
1,365,385 0.32%
3,247,267 Fed Natl Mort Assc 5.50 01/04/2034
3,633,895 0.85%
1,400,000 Fed Natl Mort Assc 3.00 15/07/2042
1,381,406 0.32%
1,050,000 Fed Natl Mort Assc 3.00 15/07/2026
1,089,867 0.26%
3,475,000 Fed Natl Mort Assc 3.50 15/07/2041
3,572,191 0.84%
426,028 Fed Natl Mort Assc 6.50 01/10/2038
482,610 0.11%
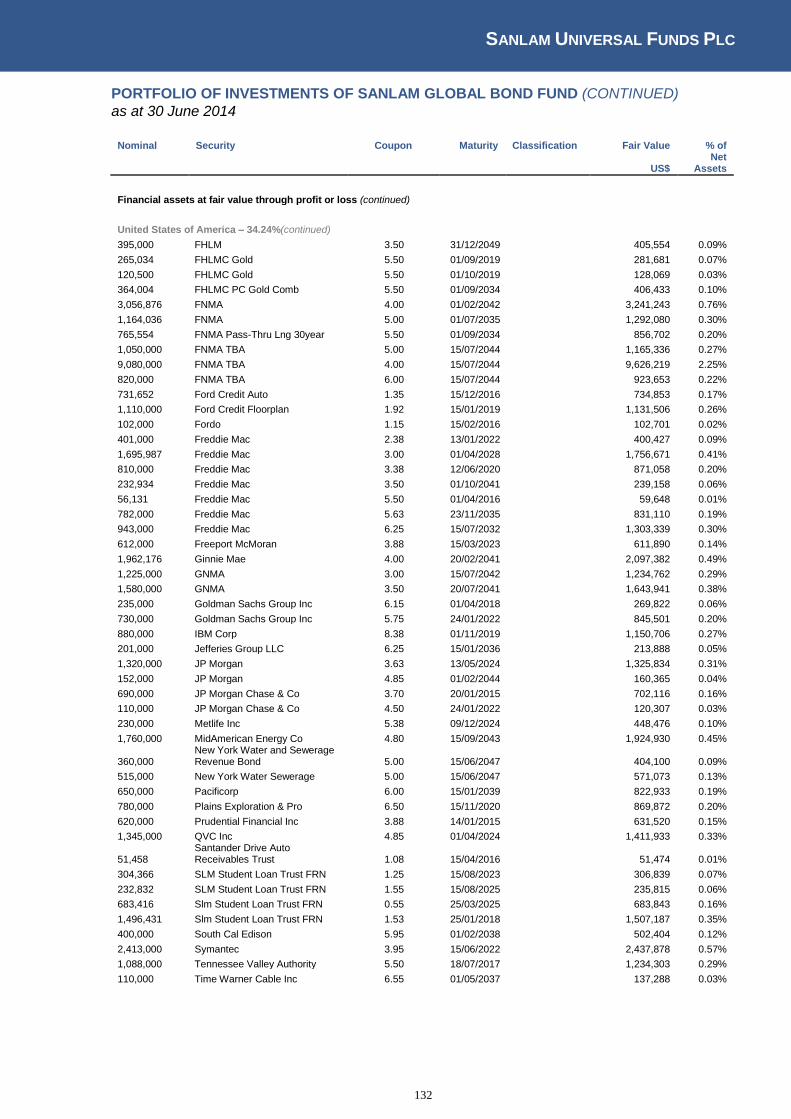
SANLAM UNIVERSAL FUNDS PLC
132
PORTFOLIO OF INVESTMENTS OF SANLAM GLOBAL BOND FUND (CONTINUED)
as at 30 June 2014
Nominal Security Coupon Maturity Classification Fair Value % of
US$ Net
Assets
Financial assets at fair value through profit or loss (continued)
United States of America – 34.24%(continued)
395,000 FHLM 3.50 31/12/2049
405,554 0.09%
265,034 FHLMC Gold 5.50 01/09/2019
281,681 0.07%
120,500 FHLMC Gold 5.50 01/10/2019
128,069 0.03%
364,004 FHLMC PC Gold Comb 5.50 01/09/2034
406,433 0.10%
3,056,876 FNMA 4.00 01/02/2042
3,241,243 0.76%
1,164,036 FNMA 5.00 01/07/2035
1,292,080 0.30%
765,554 FNMA Pass-Thru Lng 30year 5.50 01/09/2034
856,702 0.20%
1,050,000 FNMA TBA 5.00 15/07/2044
1,165,336 0.27%
9,080,000 FNMA TBA 4.00 15/07/2044
9,626,219 2.25%
820,000 FNMA TBA 6.00 15/07/2044
923,653 0.22%
731,652 Ford Credit Auto 1.35 15/12/2016
734,853 0.17%
1,110,000 Ford Credit Floorplan 1.92 15/01/2019
1,131,506 0.26%
102,000 Fordo 1.15 15/02/2016
102,701 0.02%
401,000 Freddie Mac 2.38 13/01/2022
400,427 0.09%
1,695,987 Freddie Mac 3.00 01/04/2028
1,756,671 0.41%
810,000 Freddie Mac 3.38 12/06/2020
871,058 0.20%
232,934 Freddie Mac 3.50 01/10/2041
239,158 0.06%
56,131 Freddie Mac 5.50 01/04/2016
59,648 0.01%
782,000 Freddie Mac 5.63 23/11/2035
831,110 0.19%
943,000 Freddie Mac 6.25 15/07/2032
1,303,339 0.30%
612,000 Freeport McMoran 3.88 15/03/2023
611,890 0.14%
1,962,176 Ginnie Mae 4.00 20/02/2041
2,097,382 0.49%
1,225,000 GNMA 3.00 15/07/2042
1,234,762 0.29%
1,580,000 GNMA 3.50 20/07/2041
1,643,941 0.38%
235,000 Goldman Sachs Group Inc 6.15 01/04/2018
269,822 0.06%
730,000 Goldman Sachs Group Inc 5.75 24/01/2022
845,501 0.20%
880,000 IBM Corp 8.38 01/11/2019
1,150,706 0.27%
201,000 Jefferies Group LLC 6.25 15/01/2036
213,888 0.05%
1,320,000 JP Morgan 3.63 13/05/2024
1,325,834 0.31%
152,000 JP Morgan 4.85 01/02/2044
160,365 0.04%
690,000 JP Morgan Chase & Co 3.70 20/01/2015
702,116 0.16%
110,000 JP Morgan Chase & Co 4.50 24/01/2022
120,307 0.03%
230,000 Metlife Inc 5.38 09/12/2024
448,476 0.10%
1,760,000 MidAmerican Energy Co 4.80 15/09/2043
1,924,930 0.45%
360,000 New York Water and Sewerage Revenue Bond 5.00 15/06/2047
404,100 0.09%
515,000 New York Water Sewerage 5.00 15/06/2047
571,073 0.13%
650,000 Pacificorp 6.00 15/01/2039
822,933 0.19%
780,000 Plains Exploration & Pro 6.50 15/11/2020
869,872 0.20%
620,000 Prudential Financial Inc 3.88 14/01/2015
631,520 0.15%
1,345,000 QVC Inc 4.85 01/04/2024
1,411,933 0.33%
51,458 Santander Drive Auto Receivables Trust 1.08 15/04/2016
51,474 0.01%
304,366 SLM Student Loan Trust FRN 1.25 15/08/2023
306,839 0.07%
232,832 SLM Student Loan Trust FRN 1.55 15/08/2025
235,815 0.06%
683,416 Slm Student Loan Trust FRN 0.55 25/03/2025
683,843 0.16%
1,496,431 Slm Student Loan Trust FRN 1.53 25/01/2018
1,507,187 0.35%
400,000 South Cal Edison 5.95 01/02/2038
502,404 0.12%
2,413,000 Symantec 3.95 15/06/2022
2,437,878 0.57%
1,088,000 Tennessee Valley Authority 5.50 18/07/2017
1,234,303 0.29%
110,000 Time Warner Cable Inc 6.55 01/05/2037
137,288 0.03%

SANLAM UNIVERSAL FUNDS PLC
133
PORTFOLIO OF INVESTMENTS OF SANLAM GLOBAL BOND FUND (CONTINUED)
as at 30 June 2014
Nominal Security Coupon Maturity Classification Fair Value % of
US$ Net
Assets
Financial assets at fair value through profit or loss (continued)
United States of America – 34.24% (continued)
200,000 University of Massachussets 5.00 01/11/2044
228,250 0.05%
2,080,000 US Treasury 0.38 30/04/2016
2,079,350 0.49%
700 US Treasury 0.38 30/06/2015
702 0.00%
4,000,000 US Treasury 0.50 15/08/2014
4,002,031 0.94%
13,030,000 US Treasury 0.50 15/10/2014
13,047,814 3.05%
196,000 US Treasury 2.00 31/05/2021
194,423 0.05%
820,000 US Treasury 2.75 15/02/2024
837,617 0.20%
1,100,000 US Treasury 3.63 15/02/2044
1,156,203 0.27%
5,500,000 US Treasury 4.00 15/02/2015
5,634,063 1.32%
188,100 US Treasury 6.75 15/08/2026
267,367 0.06%
280,000 US Treasury 1.50 31/08/2018
281,411 0.07%
1,753,900 US Treasury 2.00 15/02/2022
1,725,399 0.40%
4,627,700 US Treasury 0.75 30/06/2017
4,608,538 1.08%
1,621,300 US Treasury 3.75 15/08/2041
1,754,677 0.41%
2,013,700 US Treasury 3.63 15/02/2020
2,214,441 0.52%
78,000 Valero Energy Corp 6.63 15/06/2037
96,577 0.02%
105,000 Valet 1.15 21/09/2015
105,853 0.02%
1,560,000 Verizon Communications 2.45 01/11/2022
1,463,920 0.34%
450,000 Verizon Communications 3.25 17/02/2026
670,000 0.16%
825,000 Verizon Communications 4.50 15/09/2020
910,091 0.21%
2,117,000 Verizon Communications 5.15 15/09/2023
2,372,755 0.56%
1,414,000 Verizon Communications 6.55 15/09/2043
1,779,335 0.42%
275,000 Virginia St Small Business Fing Auth Revenue 5.50 01/01/2042
292,377 0.07%
485,000 Wellpoint Inc 5.10 15/01/2044
526,080 0.12%
350,000 Wells Fargo & Co FRN 7.98 31/12/2049
399,014 0.09%
725,000 Wells Fargo and Co 2.25 03/09/2020
1,046,002 0.24%
268,000 Wells Fargo and Co 3.00 22/01/2021
273,202 0.06%
690,000 Wells Fargo and Co 3.45 13/02/2023
687,709 0.16%
345,000 Wells Fargo and Co 5.38 02/11/2043
380,114 0.09%
125,000 Wells Fargo and Co 4.60 01/04/2021
139,354 0.03%
1,165,000 Wells Fargo FRN 5.90 15/12/2050
1,236,321 0.29%
Total United States of America
146,317,045 34.24%
Virgin Islands – 0.17% 745,000 CNPC General Capital 3.40 16/04/2023
718,664 0.17%
Total Virgin Islands
718,664 0.17%
Total Debt
415,967,574 97.33%
Collective investment scheme – 4.18% 17,854,771 Blackrock Inv Mgmt UK Ltd - Inst Liquidity Fund
B 17,857,396 4.18%
Total collective investment scheme
17,857,396 4.18%
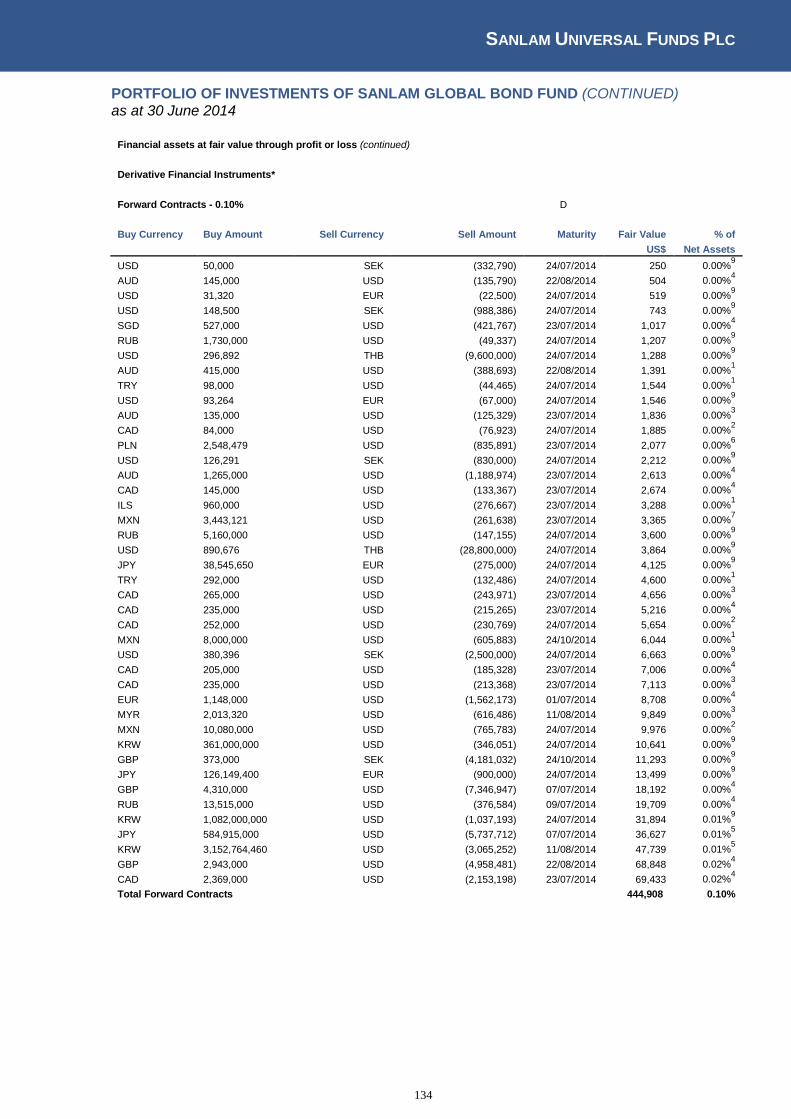
SANLAM UNIVERSAL FUNDS PLC
134
PORTFOLIO OF INVESTMENTS OF SANLAM GLOBAL BOND FUND (CONTINUED) as at 30 June 2014
Financial assets at fair value through profit or loss (continued)
Derivative Financial Instruments*
Forward Contracts - 0.10%
D
Buy Currency Buy Amount Sell Currency Sell Amount Maturity Fair Value % of
US$ Net Assets
USD 50,000 SEK (332,790) 24/07/2014 250 0.00%9
AUD 145,000 USD (135,790) 22/08/2014 504 0.00%4
USD 31,320 EUR (22,500) 24/07/2014 519 0.00%9
USD 148,500 SEK (988,386) 24/07/2014 743 0.00%9
SGD 527,000 USD (421,767) 23/07/2014 1,017 0.00%4
RUB 1,730,000 USD (49,337) 24/07/2014 1,207 0.00%9
USD 296,892 THB (9,600,000) 24/07/2014 1,288 0.00%9
AUD 415,000 USD (388,693) 22/08/2014 1,391 0.00%1
TRY 98,000 USD (44,465) 24/07/2014 1,544 0.00%1
USD 93,264 EUR (67,000) 24/07/2014 1,546 0.00%9
AUD 135,000 USD (125,329) 23/07/2014 1,836 0.00%3
CAD 84,000 USD (76,923) 24/07/2014 1,885 0.00%2
PLN 2,548,479 USD (835,891) 23/07/2014 2,077 0.00%6
USD 126,291 SEK (830,000) 24/07/2014 2,212 0.00%9
AUD 1,265,000 USD (1,188,974) 23/07/2014 2,613 0.00%4
CAD 145,000 USD (133,367) 23/07/2014 2,674 0.00%4
ILS 960,000 USD (276,667) 23/07/2014 3,288 0.00%1
MXN 3,443,121 USD (261,638) 23/07/2014 3,365 0.00%7
RUB 5,160,000 USD (147,155) 24/07/2014 3,600 0.00%9
USD 890,676 THB (28,800,000) 24/07/2014 3,864 0.00%9
JPY 38,545,650 EUR (275,000) 24/07/2014 4,125 0.00%9
TRY 292,000 USD (132,486) 24/07/2014 4,600 0.00%1
CAD 265,000 USD (243,971) 23/07/2014 4,656 0.00%3
CAD 235,000 USD (215,265) 23/07/2014 5,216 0.00%4
CAD 252,000 USD (230,769) 24/07/2014 5,654 0.00%2
MXN 8,000,000 USD (605,883) 24/10/2014 6,044 0.00%1
USD 380,396 SEK (2,500,000) 24/07/2014 6,663 0.00%9
CAD 205,000 USD (185,328) 23/07/2014 7,006 0.00%4
CAD 235,000 USD (213,368) 23/07/2014 7,113 0.00%3
EUR 1,148,000 USD (1,562,173) 01/07/2014 8,708 0.00%4
MYR 2,013,320 USD (616,486) 11/08/2014 9,849 0.00%3
MXN 10,080,000 USD (765,783) 24/07/2014 9,976 0.00%2
KRW 361,000,000 USD (346,051) 24/07/2014 10,641 0.00%9
GBP 373,000 SEK (4,181,032) 24/10/2014 11,293 0.00%9
JPY 126,149,400 EUR (900,000) 24/07/2014 13,499 0.00%9
GBP 4,310,000 USD (7,346,947) 07/07/2014 18,192 0.00%4
RUB 13,515,000 USD (376,584) 09/07/2014 19,709 0.00%4
KRW 1,082,000,000 USD (1,037,193) 24/07/2014 31,894 0.01%9
JPY 584,915,000 USD (5,737,712) 07/07/2014 36,627 0.01%5
KRW 3,152,764,460 USD (3,065,252) 11/08/2014 47,739 0.01%5
GBP 2,943,000 USD (4,958,481) 22/08/2014 68,848 0.02%4
CAD 2,369,000 USD (2,153,198) 23/07/2014 69,433 0.02%4
Total Forward Contracts
444,908 0.10%
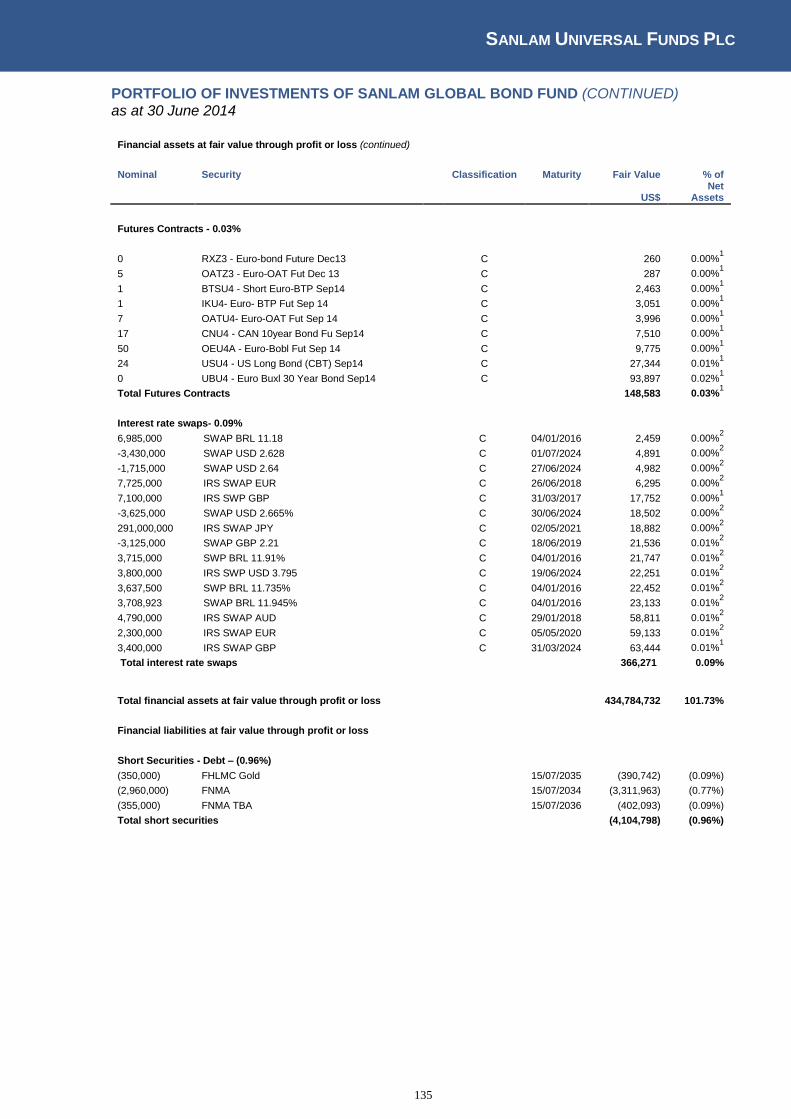
SANLAM UNIVERSAL FUNDS PLC
135
PORTFOLIO OF INVESTMENTS OF SANLAM GLOBAL BOND FUND (CONTINUED) as at 30 June 2014
Financial assets at fair value through profit or loss (continued)
Nominal Security
Classification Maturity Fair Value % of
US$ Net
Assets
Futures Contracts - 0.03%
0 RXZ3 - Euro-bond Future Dec13
C
260 0.00%1
5 OATZ3 - Euro-OAT Fut Dec 13
C
287 0.00%1
1 BTSU4 - Short Euro-BTP Sep14
C
2,463 0.00%1
1 IKU4- Euro- BTP Fut Sep 14
C
3,051 0.00%1
7 OATU4- Euro-OAT Fut Sep 14
C
3,996 0.00%1
17 CNU4 - CAN 10year Bond Fu Sep14
C
7,510 0.00%1
50 OEU4A - Euro-Bobl Fut Sep 14
C
9,775 0.00%1
24 USU4 - US Long Bond (CBT) Sep14
C
27,344 0.01%1
0 UBU4 - Euro Buxl 30 Year Bond Sep14
C
93,897 0.02%1
Total Futures Contracts
148,583 0.03%1
Interest rate swaps- 0.09% 6,985,000 SWAP BRL 11.18
C 04/01/2016 2,459 0.00%2
-3,430,000 SWAP USD 2.628
C 01/07/2024 4,891 0.00%2
-1,715,000 SWAP USD 2.64
C 27/06/2024 4,982 0.00%2
7,725,000 IRS SWAP EUR
C 26/06/2018 6,295 0.00%2
7,100,000 IRS SWP GBP
C 31/03/2017 17,752 0.00%1
-3,625,000 SWAP USD 2.665%
C 30/06/2024 18,502 0.00%2
291,000,000 IRS SWAP JPY
C 02/05/2021 18,882 0.00%2
-3,125,000 SWAP GBP 2.21
C 18/06/2019 21,536 0.01%2
3,715,000 SWP BRL 11.91%
C 04/01/2016 21,747 0.01%2
3,800,000 IRS SWP USD 3.795
C 19/06/2024 22,251 0.01%2
3,637,500 SWP BRL 11.735%
C 04/01/2016 22,452 0.01%2
3,708,923 SWAP BRL 11.945%
C 04/01/2016 23,133 0.01%2
4,790,000 IRS SWAP AUD
C 29/01/2018 58,811 0.01%2
2,300,000 IRS SWAP EUR
C 05/05/2020 59,133 0.01%2
3,400,000 IRS SWAP GBP
C 31/03/2024 63,444 0.01%1
Total interest rate swaps
366,271 0.09%
Total financial assets at fair value through profit or loss
434,784,732 101.73%
Financial liabilities at fair value through profit or loss
Short Securities - Debt – (0.96%) (350,000) FHLMC Gold 15/07/2035 (390,742) (0.09%)
(2,960,000) FNMA 15/07/2034 (3,311,963) (0.77%)
(355,000) FNMA TBA 15/07/2036 (402,093) (0.09%)
Total short securities
(4,104,798) (0.96%)
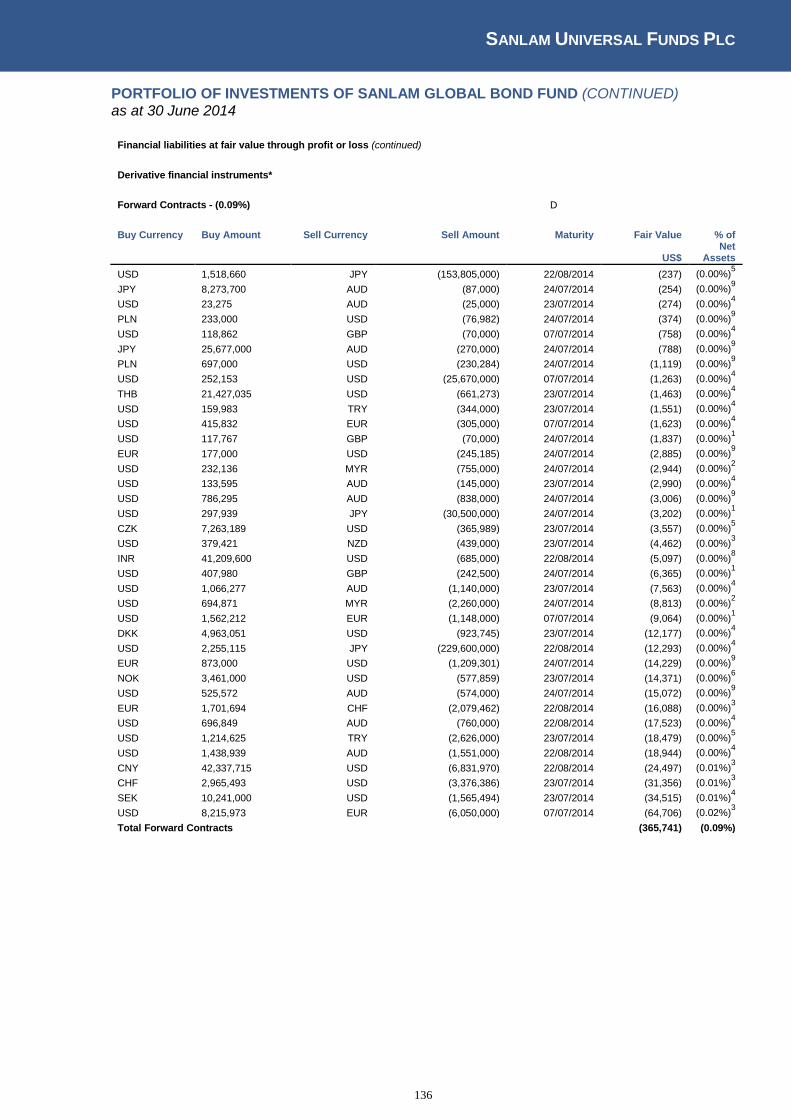
SANLAM UNIVERSAL FUNDS PLC
136
PORTFOLIO OF INVESTMENTS OF SANLAM GLOBAL BOND FUND (CONTINUED) as at 30 June 2014
Financial liabilities at fair value through profit or loss (continued)
Derivative financial instruments*
Forward Contracts - (0.09%)
D
Buy Currency Buy Amount Sell Currency Sell Amount Maturity Fair Value % of
US$ Net
Assets
USD 1,518,660 JPY (153,805,000) 22/08/2014 (237) (0.00%)5
JPY 8,273,700 AUD (87,000) 24/07/2014 (254) (0.00%)9
USD 23,275 AUD (25,000) 23/07/2014 (274) (0.00%)4
PLN 233,000 USD (76,982) 24/07/2014 (374) (0.00%)9
USD 118,862 GBP (70,000) 07/07/2014 (758) (0.00%)4
JPY 25,677,000 AUD (270,000) 24/07/2014 (788) (0.00%)9
PLN 697,000 USD (230,284) 24/07/2014 (1,119) (0.00%)9
USD 252,153 USD (25,670,000) 07/07/2014 (1,263) (0.00%)4
THB 21,427,035 USD (661,273) 23/07/2014 (1,463) (0.00%)4
USD 159,983 TRY (344,000) 23/07/2014 (1,551) (0.00%)4
USD 415,832 EUR (305,000) 07/07/2014 (1,623) (0.00%)4
USD 117,767 GBP (70,000) 24/07/2014 (1,837) (0.00%)1
EUR 177,000 USD (245,185) 24/07/2014 (2,885) (0.00%)9
USD 232,136 MYR (755,000) 24/07/2014 (2,944) (0.00%)2
USD 133,595 AUD (145,000) 23/07/2014 (2,990) (0.00%)4
USD 786,295 AUD (838,000) 24/07/2014 (3,006) (0.00%)9
USD 297,939 JPY (30,500,000) 24/07/2014 (3,202) (0.00%)1
CZK 7,263,189 USD (365,989) 23/07/2014 (3,557) (0.00%)5
USD 379,421 NZD (439,000) 23/07/2014 (4,462) (0.00%)3
INR 41,209,600 USD (685,000) 22/08/2014 (5,097) (0.00%)8
USD 407,980 GBP (242,500) 24/07/2014 (6,365) (0.00%)1
USD 1,066,277 AUD (1,140,000) 23/07/2014 (7,563) (0.00%)4
USD 694,871 MYR (2,260,000) 24/07/2014 (8,813) (0.00%)2
USD 1,562,212 EUR (1,148,000) 07/07/2014 (9,064) (0.00%)1
DKK 4,963,051 USD (923,745) 23/07/2014 (12,177) (0.00%)4
USD 2,255,115 JPY (229,600,000) 22/08/2014 (12,293) (0.00%)4
EUR 873,000 USD (1,209,301) 24/07/2014 (14,229) (0.00%)9
NOK 3,461,000 USD (577,859) 23/07/2014 (14,371) (0.00%)6
USD 525,572 AUD (574,000) 24/07/2014 (15,072) (0.00%)9
EUR 1,701,694 CHF (2,079,462) 22/08/2014 (16,088) (0.00%)3
USD 696,849 AUD (760,000) 22/08/2014 (17,523) (0.00%)4
USD 1,214,625 TRY (2,626,000) 23/07/2014 (18,479) (0.00%)5
USD 1,438,939 AUD (1,551,000) 22/08/2014 (18,944) (0.00%)4
CNY 42,337,715 USD (6,831,970) 22/08/2014 (24,497) (0.01%)3
CHF 2,965,493 USD (3,376,386) 23/07/2014 (31,356) (0.01%)3
SEK 10,241,000 USD (1,565,494) 23/07/2014 (34,515) (0.01%)4
USD 8,215,973 EUR (6,050,000) 07/07/2014 (64,706) (0.02%)3
Total Forward Contracts
(365,741) (0.09%)
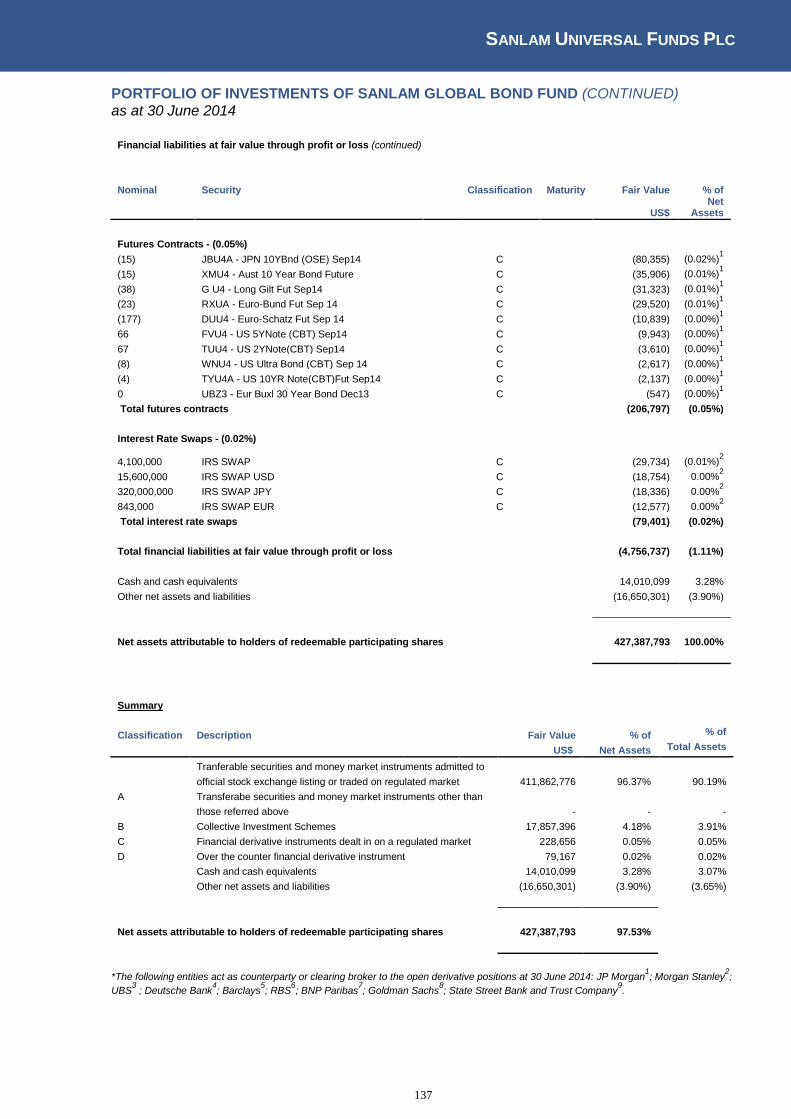
SANLAM UNIVERSAL FUNDS PLC
137
PORTFOLIO OF INVESTMENTS OF SANLAM GLOBAL BOND FUND (CONTINUED) as at 30 June 2014
Financial liabilities at fair value through profit or loss (continued)
Nominal Security
Classification Maturity Fair Value % of
US$ Net
Assets
Futures Contracts - (0.05%) (15) JBU4A - JPN 10YBnd (OSE) Sep14
C
(80,355) (0.02%)1
(15) XMU4 - Aust 10 Year Bond Future
C
(35,906) (0.01%)1
(38) G U4 - Long Gilt Fut Sep14
C
(31,323) (0.01%)1
(23) RXUA - Euro-Bund Fut Sep 14
C
(29,520) (0.01%)1
(177) DUU4 - Euro-Schatz Fut Sep 14
C
(10,839) (0.00%)1
66 FVU4 - US 5YNote (CBT) Sep14
C
(9,943) (0.00%)1
67 TUU4 - US 2YNote(CBT) Sep14
C
(3,610) (0.00%)1
(8) WNU4 - US Ultra Bond (CBT) Sep 14
C
(2,617) (0.00%)1
(4) TYU4A - US 10YR Note(CBT)Fut Sep14
C
(2,137) (0.00%)1
0 UBZ3 - Eur Buxl 30 Year Bond Dec13
C
(547) (0.00%)1
Total futures contracts
(206,797) (0.05%)
Interest Rate Swaps - (0.02%)
4,100,000 IRS SWAP
C
(29,734) (0.01%)2
15,600,000 IRS SWAP USD
C
(18,754) 0.00%2
320,000,000 IRS SWAP JPY
C
(18,336) 0.00%2
843,000 IRS SWAP EUR
C
(12,577) 0.00%2
Total interest rate swaps
(79,401) (0.02%)
Total financial liabilities at fair value through profit or loss
(4,756,737) (1.11%)
Cash and cash equivalents
14,010,099 3.28%
Other net assets and liabilities
(16,650,301) (3.90%)
Net assets attributable to holders of redeemable participating shares
427,387,793 100.00%
Summary
Classification Description
Fair Value % of % of
US$ Net Assets Total Assets
Tranferable securities and money market instruments admitted to
official stock exchange listing or traded on regulated market 411,862,776 96.37% 90.19%
A Transferabe securities and money market instruments other than
those referred above
- - -
B Collective Investment Schemes
17,857,396 4.18% 3.91%
C Financial derivative instruments dealt in on a regulated market 228,656 0.05% 0.05%
D Over the counter financial derivative instrument
79,167 0.02% 0.02%
Cash and cash equivalents
14,010,099 3.28% 3.07%
Other net assets and liabilities
(16,650,301) (3.90%) (3.65%)
Net assets attributable to holders of redeemable participating shares 427,387,793 97.53%
*The following entities act as counterparty or clearing broker to the open derivative positions at 30 June 2014: JP Morgan1; Morgan Stanley
2;
UBS3 ; Deutsche Bank
4; Barclays
5; RBS
6; BNP Paribas
7; Goldman Sachs
8; State Street Bank and Trust Company
9.

SANLAM UNIVERSAL FUNDS PLC
138
PORTFOLIO OF INVESTMENTS OF SANLAM GLOBAL FINANCIAL FUND as at 30 June 2014
Nominal Security
Classification Fair Value % of
US$ Net
Assets
Financial assets at fair value through profit or loss
Equity - 96.49%
Bermuda - 2.36% 892,224 Catlin Group Ltd
8,156,867 2.36%
Total Bermuda
8,156,867 2.36%
Brazil - 4.58% 366,600 Banco Abc Brasil SA
2,262,244 0.66%
1,344,500 Banco Daycoval SA
5,710,114 1.65%
316,030 Banco Itaú Holding Financeira SA
4,584,364 1.33%
820,600 Itausa Investimentos Itau SA
3,235,634 0.94%
Total Brazil
15,792,356 4.58%
Cayman Islands - 1.26% 4,000,000 DBA Telecommunication Asia Holdings Ltd
209,540 0.06%
126,100 Greenlight Capital Re Ltd
4,153,734 1.20%
Total Cayman
4,363,274 1.26%
Cyprus - 2.08% 1,094,392 TCS Group Holding Plc
7,168,268 2.08%
Total Cyprus
7,168,268 2.08%
Georgia - 1.03% 250,000 TBC Bank JSC
3,537,500 1.03%
Total Georgia
3,537,500 1.03%
Germany - 0.68% 154,003 ADC African Development Corp GmbH & KGaA
1,925,038 0.56%
41,205 IdB Holdings SA
436,971 0.13%
Total Germany
2,362,009 0.68%
Great Britain - 11.17% 1,609,249 Arrow Global Group Plc
6,324,800 1.83%
370,063 Bank of Georgia Holdings Plc
14,860,698 4.31%
760,778 Barclays Plc
2,766,465 0.80%
375,260 IG Group Holdings Plc
3,767,349 1.09%
852,491 Legal & General Group Plc
3,283,518 0.95%
483,658 Novae Group Plc
4,388,626 1.27%
364,300 Polar Capital Holdings Plc
3,153,075 0.91%
Total Great Britain
38,544,531 11.17%
India - 9.83% 209,502 Axis Bank Ltd
6,688,900 1.94%
396,679 Jammu & Kashmir Bank Ltd
10,310,024 2.99%
1,826,750 Power Finance Corp
9,334,358 2.71%
155,678 Shriram City Union Finance Ltd
3,798,440 1.10%
252,424 Shriram Transport Finance Co
3,801,270 1.10%
Total India
33,932,992 9.83%

SANLAM UNIVERSAL FUNDS PLC
139
PORTFOLIO OF INVESTMENTS OF SANLAM GLOBAL FINANCIAL FUND (CONTINUED) as at 30 June 2014
Nominal Security
Classification Fair Value % of
US$ Net
Assets
Financial assets at fair value through profit or loss (continued)
Indonesia - 10.97% 11,572,000 Adira Dinamika Multi Finance Tbk
11,079,055 3.21%
67,200,200 Bank Bukopin Tbk
3,542,819 1.03%
10,405,400 Bank Rakyat Indonesia
9,062,485 2.63%
38,281,700 Clipan Finance Indonesia
1,378,852 0.40%
21,566,000 Panin Sekuritas Tbk
9,368,612 2.71%
99,691,400 Bank Pembangunan Daerah Jawa Timur Tbk
3,430,965 0.99%
Total Indonesia
37,862,788 10.97%
Korea (South) - 4.70% 683,117 DGB Financial Group Inc
10,229,638 2.96%
581,310 Korean Reinsurance Co
6,004,497 1.74%
Total Korea (South)
16,234,135 4.70%
Netherlands - 2.51% 617,400 ING Groep NV
8,667,931 2.51%
Total Netherlands
8,667,931 2.51%
Norway - 1.82% 1,087,900 Sparebanken Nord-Norge
6,293,255 1.82%
Total Norway
6,293,255 1.82%
Russia - 4.36% 1,484,570 Sberbank of Russia ADR
15,038,694 4.36%
Total Russia
15,038,694 4.36%
Thailand - 0.82% 2,249,130 Tisco Financial Group Pcl
2,841,561 0.82%
Total Thailand
2,841,561 0.82%
Turkey - 7.59% 10,464,102 IS Yatirim Menkul
6,120,801 1.77%
851,000 Turkiye Garanti Bankasi
3,327,888 0.96%
534,000 Turkiye Halk Bankasi
4,005,189 1.16%
15,596,076 Turkiye Sinai Kalkin
12,727,587 3.69%
Total Turkey
26,181,465 7.59%
United States of America - 30.71% 312,300 American International Group Inc
17,045,334 4.94%
553,500 Bank of America Corp
8,507,295 2.47%
124,200 BB&T Corp
4,897,206 1.42%
115,430 Berkshire Hathaway Inc
14,608,821 4.23%
311,800 Citigroup Inc
14,685,780 4.26%
22,000 Credicorp
3,420,340 0.99%
466,000 Fifth Third Bancorp
9,949,100 2.88%
187,600 JP Morgan Chase & Co
10,809,512 3.13%
61,000 PNC Financial Services Group Inc
5,432,050 1.57%
59,800 Prosperity Bancshares
3,743,480 1.08%
297,500 US Bancorp
12,887,700 3.73%
Total United States of America
105,986,618 30.71%
Total Equity
332,964,244 96.49%
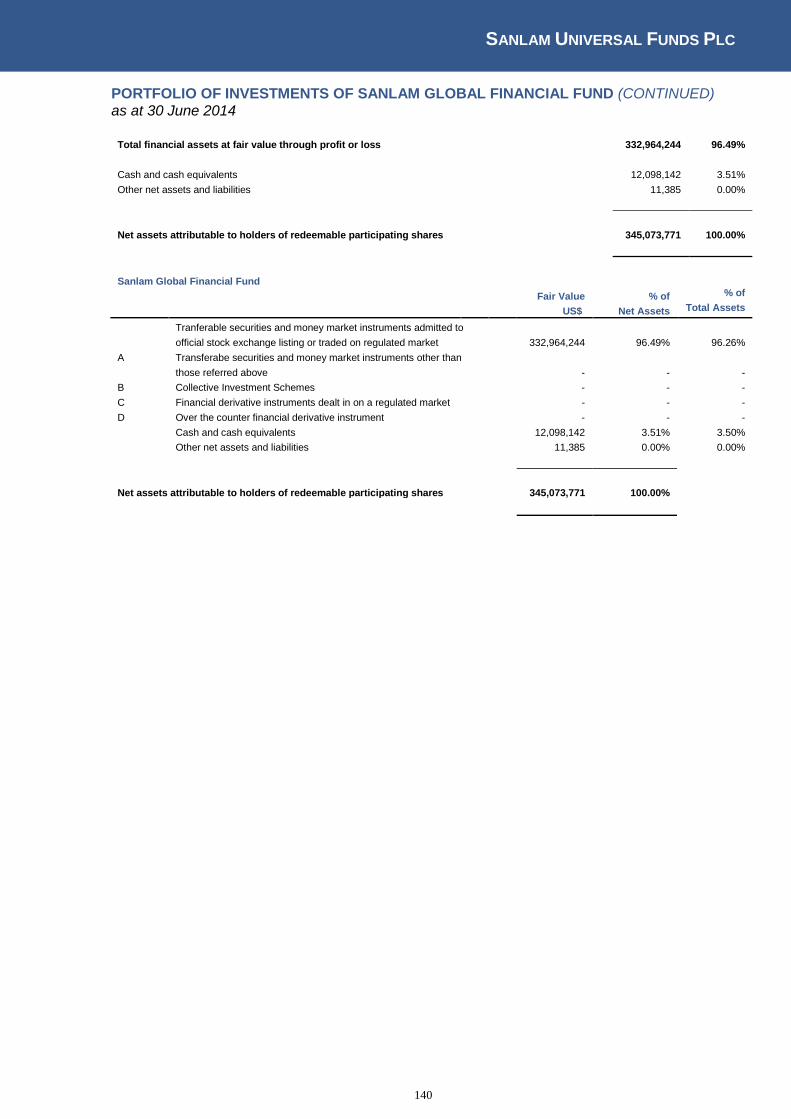
SANLAM UNIVERSAL FUNDS PLC
140
PORTFOLIO OF INVESTMENTS OF SANLAM GLOBAL FINANCIAL FUND (CONTINUED) as at 30 June 2014
Total financial assets at fair value through profit or loss 332,964,244 96.49%
Cash and cash equivalents
12,098,142 3.51%
Other net assets and liabilities
11,385 0.00%
Net assets attributable to holders of redeemable participating shares
345,073,771 100.00%
Sanlam Global Financial Fund
Fair Value % of % of
US$ Net Assets Total Assets
Tranferable securities and money market instruments admitted to
official stock exchange listing or traded on regulated market
332,964,244 96.49% 96.26%
A Transferabe securities and money market instruments other than
those referred above
- - -
B Collective Investment Schemes
- - -
C Financial derivative instruments dealt in on a regulated market - - -
D Over the counter financial derivative instrument
- - -
Cash and cash equivalents
12,098,142 3.51% 3.50%
Other net assets and liabilities
11,385 0.00% 0.00%
Net assets attributable to holders of redeemable participating shares 345,073,771 100.00%
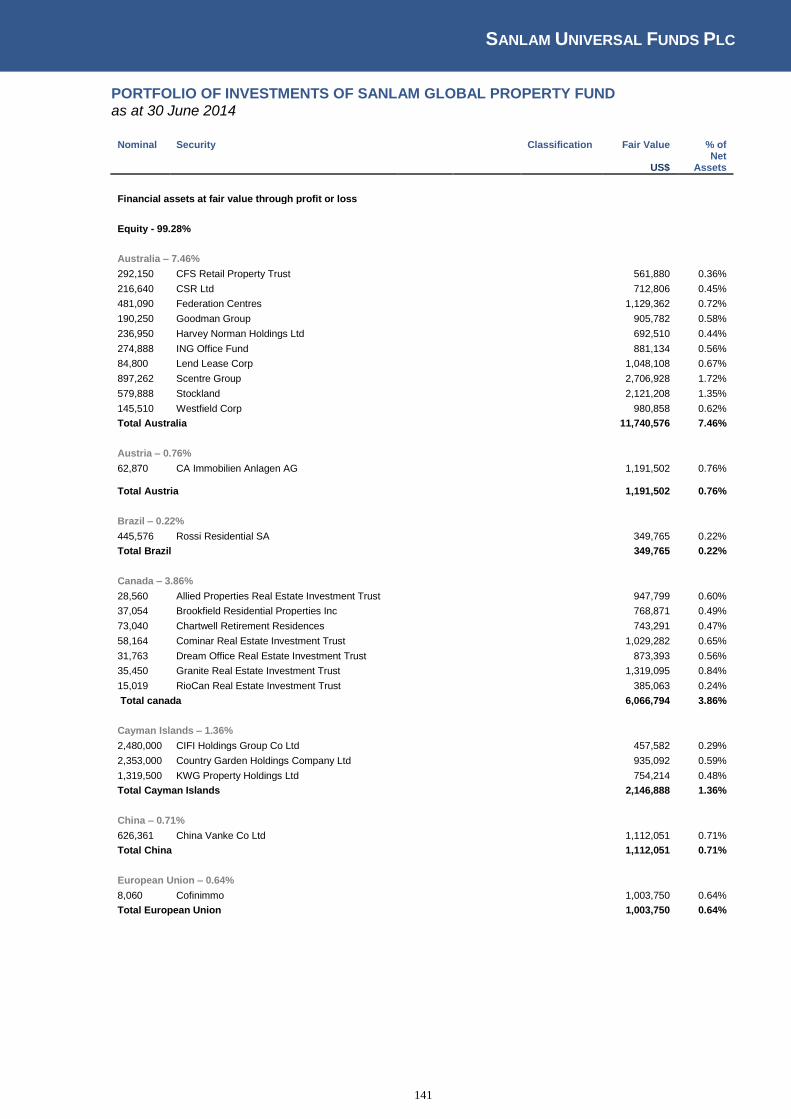
SANLAM UNIVERSAL FUNDS PLC
141
PORTFOLIO OF INVESTMENTS OF SANLAM GLOBAL PROPERTY FUND as at 30 June 2014
Nominal Security
Classification Fair Value % of
US$ Net
Assets
Financial assets at fair value through profit or loss
Equity - 99.28%
Australia – 7.46% 292,150 CFS Retail Property Trust
561,880 0.36%
216,640 CSR Ltd
712,806 0.45%
481,090 Federation Centres
1,129,362 0.72%
190,250 Goodman Group
905,782 0.58%
236,950 Harvey Norman Holdings Ltd
692,510 0.44%
274,888 ING Office Fund
881,134 0.56%
84,800 Lend Lease Corp
1,048,108 0.67%
897,262 Scentre Group
2,706,928 1.72%
579,888 Stockland
2,121,208 1.35%
145,510 Westfield Corp
980,858 0.62%
Total Australia
11,740,576 7.46%
Austria – 0.76% 62,870 CA Immobilien Anlagen AG
1,191,502 0.76%
Total Austria
1,191,502 0.76%
Brazil – 0.22% 445,576 Rossi Residential SA
349,765 0.22%
Total Brazil
349,765 0.22%
Canada – 3.86% 28,560 Allied Properties Real Estate Investment Trust
947,799 0.60%
37,054 Brookfield Residential Properties Inc
768,871 0.49%
73,040 Chartwell Retirement Residences
743,291 0.47%
58,164 Cominar Real Estate Investment Trust
1,029,282 0.65%
31,763 Dream Office Real Estate Investment Trust
873,393 0.56%
35,450 Granite Real Estate Investment Trust
1,319,095 0.84%
15,019 RioCan Real Estate Investment Trust
385,063 0.24%
Total canada
6,066,794 3.86%
Cayman Islands – 1.36% 2,480,000 CIFI Holdings Group Co Ltd
457,582 0.29%
2,353,000 Country Garden Holdings Company Ltd
935,092 0.59%
1,319,500 KWG Property Holdings Ltd
754,214 0.48%
Total Cayman Islands
2,146,888 1.36%
China – 0.71% 626,361 China Vanke Co Ltd
1,112,051 0.71%
Total China
1,112,051 0.71%
European Union – 0.64% 8,060 Cofinimmo
1,003,750 0.64%
Total European Union
1,003,750 0.64%
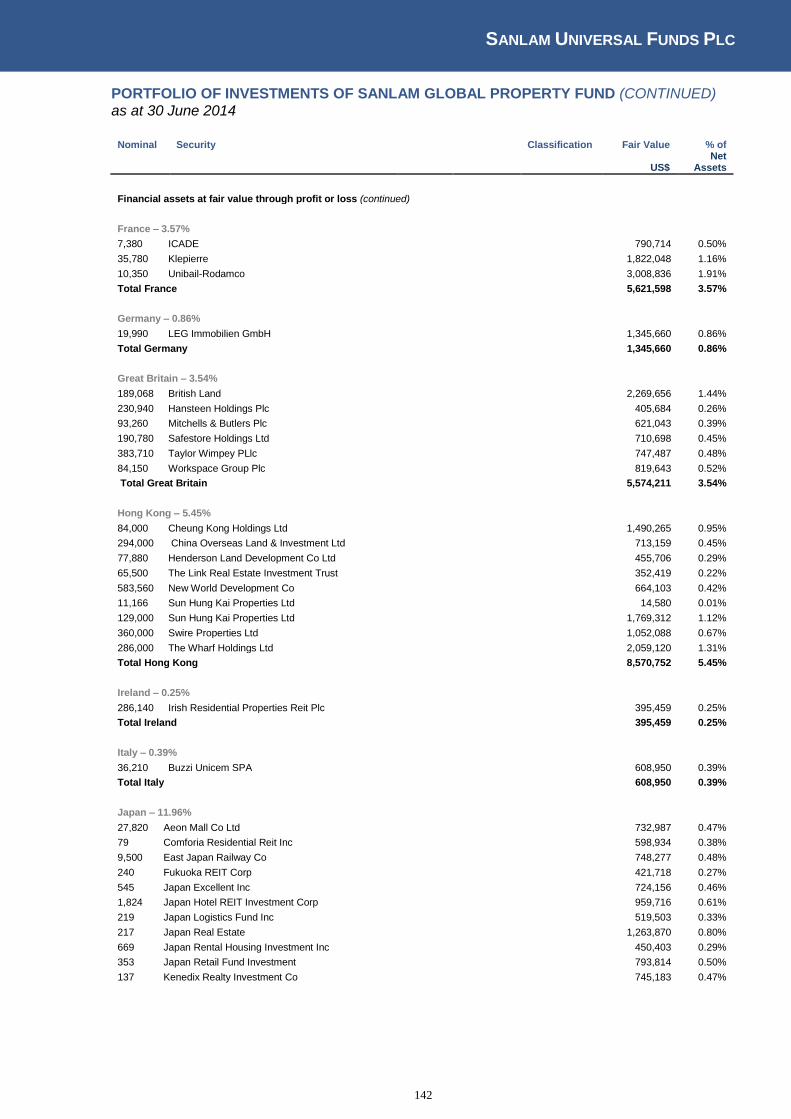
SANLAM UNIVERSAL FUNDS PLC
142
PORTFOLIO OF INVESTMENTS OF SANLAM GLOBAL PROPERTY FUND (CONTINUED) as at 30 June 2014
Nominal Security
Classification Fair Value % of
US$ Net
Assets
Financial assets at fair value through profit or loss (continued)
France – 3.57% 7,380 ICADE
790,714 0.50%
35,780 Klepierre
1,822,048 1.16%
10,350 Unibail-Rodamco
3,008,836 1.91%
Total France
5,621,598 3.57%
Germany – 0.86% 19,990 LEG Immobilien GmbH
1,345,660 0.86%
Total Germany
1,345,660 0.86%
Great Britain – 3.54% 189,068 British Land
2,269,656 1.44%
230,940 Hansteen Holdings Plc
405,684 0.26%
93,260 Mitchells & Butlers Plc
621,043 0.39%
190,780 Safestore Holdings Ltd
710,698 0.45%
383,710 Taylor Wimpey PLlc
747,487 0.48%
84,150 Workspace Group Plc
819,643 0.52%
Total Great Britain
5,574,211 3.54%
Hong Kong – 5.45% 84,000 Cheung Kong Holdings Ltd
1,490,265 0.95%
294,000 China Overseas Land & Investment Ltd
713,159 0.45%
77,880 Henderson Land Development Co Ltd
455,706 0.29%
65,500 The Link Real Estate Investment Trust
352,419 0.22%
583,560 New World Development Co
664,103 0.42%
11,166 Sun Hung Kai Properties Ltd
14,580 0.01%
129,000 Sun Hung Kai Properties Ltd
1,769,312 1.12%
360,000 Swire Properties Ltd
1,052,088 0.67%
286,000 The Wharf Holdings Ltd
2,059,120 1.31%
Total Hong Kong
8,570,752 5.45%
Ireland – 0.25% 286,140 Irish Residential Properties Reit Plc
395,459 0.25%
Total Ireland
395,459 0.25%
Italy – 0.39% 36,210 Buzzi Unicem SPA
608,950 0.39%
Total Italy
608,950 0.39%
Japan – 11.96% 27,820 Aeon Mall Co Ltd
732,987 0.47%
79 Comforia Residential Reit Inc
598,934 0.38%
9,500 East Japan Railway Co
748,277 0.48%
240 Fukuoka REIT Corp
421,718 0.27%
545 Japan Excellent Inc
724,156 0.46%
1,824 Japan Hotel REIT Investment Corp
959,716 0.61%
219 Japan Logistics Fund Inc
519,503 0.33%
217 Japan Real Estate
1,263,870 0.80%
669 Japan Rental Housing Investment Inc
450,403 0.29%
353 Japan Retail Fund Investment
793,814 0.50%
137 Kenedix Realty Investment Co
745,183 0.47%
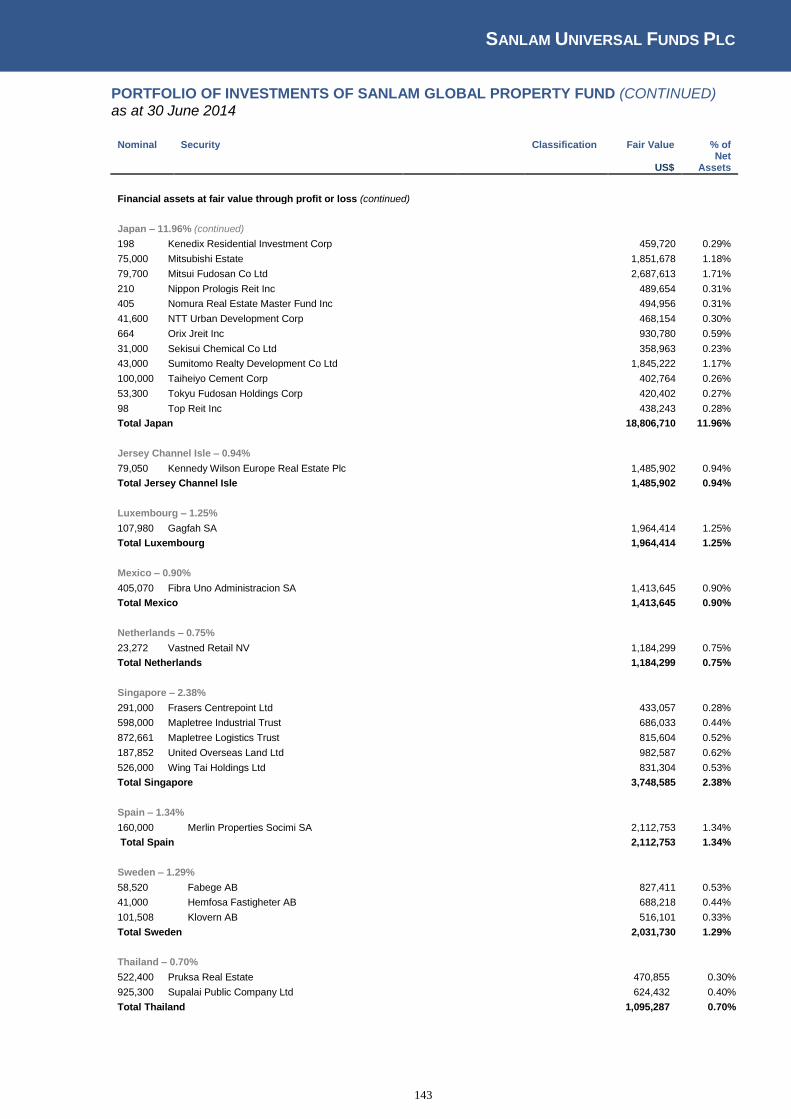
SANLAM UNIVERSAL FUNDS PLC
143
PORTFOLIO OF INVESTMENTS OF SANLAM GLOBAL PROPERTY FUND (CONTINUED) as at 30 June 2014
Nominal Security
Classification Fair Value % of
US$ Net
Assets
Financial assets at fair value through profit or loss (continued)
Japan – 11.96% (continued) 198 Kenedix Residential Investment Corp
459,720 0.29%
75,000 Mitsubishi Estate
1,851,678 1.18%
79,700 Mitsui Fudosan Co Ltd
2,687,613 1.71%
210 Nippon Prologis Reit Inc
489,654 0.31%
405 Nomura Real Estate Master Fund Inc
494,956 0.31%
41,600 NTT Urban Development Corp
468,154 0.30%
664 Orix Jreit Inc
930,780 0.59%
31,000 Sekisui Chemical Co Ltd
358,963 0.23%
43,000 Sumitomo Realty Development Co Ltd
1,845,222 1.17%
100,000 Taiheiyo Cement Corp
402,764 0.26%
53,300 Tokyu Fudosan Holdings Corp
420,402 0.27%
98 Top Reit Inc
438,243 0.28%
Total Japan
18,806,710 11.96%
Jersey Channel Isle – 0.94% 79,050 Kennedy Wilson Europe Real Estate Plc
1,485,902 0.94%
Total Jersey Channel Isle
1,485,902 0.94%
Luxembourg – 1.25% 107,980 Gagfah SA
1,964,414 1.25%
Total Luxembourg
1,964,414 1.25%
Mexico – 0.90% 405,070 Fibra Uno Administracion SA
1,413,645 0.90%
Total Mexico
1,413,645 0.90%
Netherlands – 0.75% 23,272 Vastned Retail NV
1,184,299 0.75%
Total Netherlands
1,184,299 0.75%
Singapore – 2.38% 291,000 Frasers Centrepoint Ltd
433,057 0.28%
598,000 Mapletree Industrial Trust
686,033 0.44%
872,661 Mapletree Logistics Trust
815,604 0.52%
187,852 United Overseas Land Ltd
982,587 0.62%
526,000 Wing Tai Holdings Ltd
831,304 0.53%
Total Singapore
3,748,585 2.38%
Spain – 1.34% 160,000 Merlin Properties Socimi SA
2,112,753 1.34%
Total Spain
2,112,753 1.34%
Sweden – 1.29% 58,520 Fabege AB
827,411 0.53%
41,000 Hemfosa Fastigheter AB
688,218 0.44%
101,508 Klovern AB
516,101 0.33%
Total Sweden
2,031,730 1.29%
Thailand – 0.70%
522,400 Pruksa Real Estate
470,855 0.30%
925,300 Supalai Public Company Ltd
624,432 0.40%
Total Thailand
1,095,287 0.70%
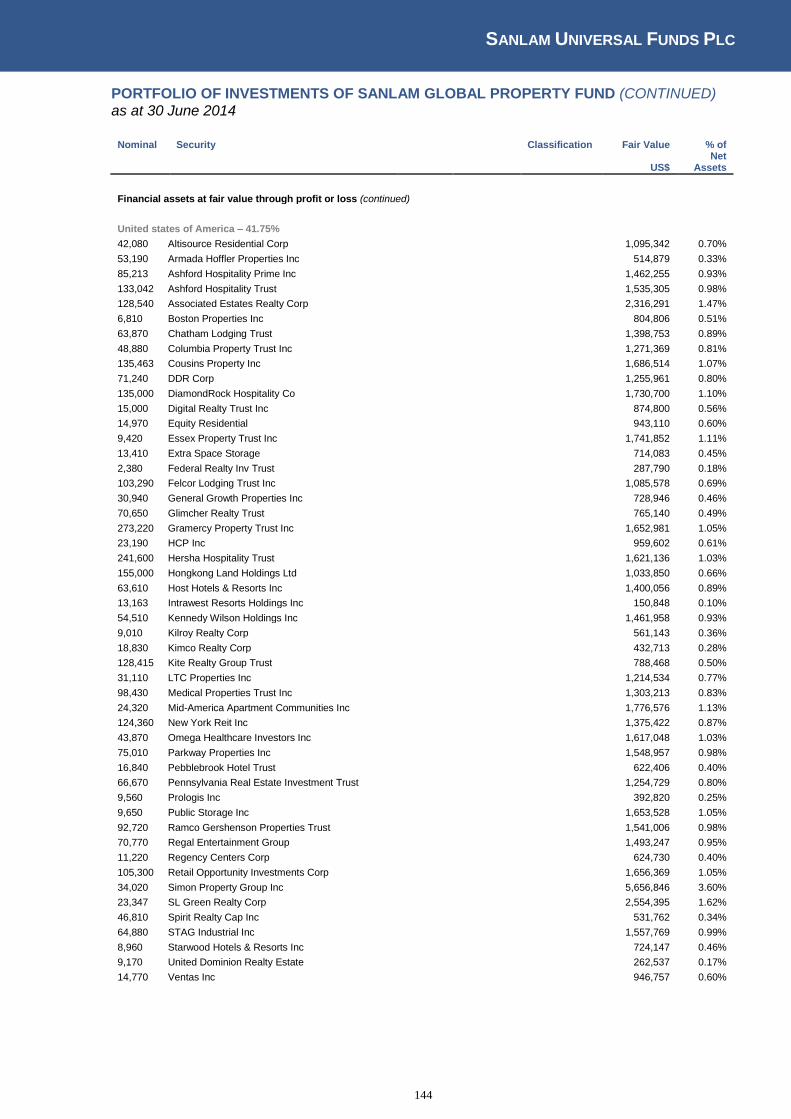
SANLAM UNIVERSAL FUNDS PLC
144
PORTFOLIO OF INVESTMENTS OF SANLAM GLOBAL PROPERTY FUND (CONTINUED) as at 30 June 2014
Nominal Security
Classification Fair Value % of
US$ Net
Assets
Financial assets at fair value through profit or loss (continued)
United states of America – 41.75% 42,080 Altisource Residential Corp
1,095,342 0.70%
53,190 Armada Hoffler Properties Inc
514,879 0.33%
85,213 Ashford Hospitality Prime Inc
1,462,255 0.93%
133,042 Ashford Hospitality Trust
1,535,305 0.98%
128,540 Associated Estates Realty Corp
2,316,291 1.47%
6,810 Boston Properties Inc
804,806 0.51%
63,870 Chatham Lodging Trust
1,398,753 0.89%
48,880 Columbia Property Trust Inc
1,271,369 0.81%
135,463 Cousins Property Inc
1,686,514 1.07%
71,240 DDR Corp
1,255,961 0.80%
135,000 DiamondRock Hospitality Co
1,730,700 1.10%
15,000 Digital Realty Trust Inc
874,800 0.56%
14,970 Equity Residential
943,110 0.60%
9,420 Essex Property Trust Inc
1,741,852 1.11%
13,410 Extra Space Storage
714,083 0.45%
2,380 Federal Realty Inv Trust
287,790 0.18%
103,290 Felcor Lodging Trust Inc
1,085,578 0.69%
30,940 General Growth Properties Inc
728,946 0.46%
70,650 Glimcher Realty Trust
765,140 0.49%
273,220 Gramercy Property Trust Inc
1,652,981 1.05%
23,190 HCP Inc
959,602 0.61%
241,600 Hersha Hospitality Trust
1,621,136 1.03%
155,000 Hongkong Land Holdings Ltd
1,033,850 0.66%
63,610 Host Hotels & Resorts Inc
1,400,056 0.89%
13,163 Intrawest Resorts Holdings Inc
150,848 0.10%
54,510 Kennedy Wilson Holdings Inc
1,461,958 0.93%
9,010 Kilroy Realty Corp
561,143 0.36%
18,830 Kimco Realty Corp
432,713 0.28%
128,415 Kite Realty Group Trust
788,468 0.50%
31,110 LTC Properties Inc
1,214,534 0.77%
98,430 Medical Properties Trust Inc
1,303,213 0.83%
24,320 Mid-America Apartment Communities Inc
1,776,576 1.13%
124,360 New York Reit Inc
1,375,422 0.87%
43,870 Omega Healthcare Investors Inc
1,617,048 1.03%
75,010 Parkway Properties Inc
1,548,957 0.98%
16,840 Pebblebrook Hotel Trust
622,406 0.40%
66,670 Pennsylvania Real Estate Investment Trust
1,254,729 0.80%
9,560 Prologis Inc
392,820 0.25%
9,650 Public Storage Inc
1,653,528 1.05%
92,720 Ramco Gershenson Properties Trust
1,541,006 0.98%
70,770 Regal Entertainment Group
1,493,247 0.95%
11,220 Regency Centers Corp
624,730 0.40%
105,300 Retail Opportunity Investments Corp
1,656,369 1.05%
34,020 Simon Property Group Inc
5,656,846 3.60%
23,347 SL Green Realty Corp
2,554,395 1.62%
46,810 Spirit Realty Cap Inc
531,762 0.34%
64,880 STAG Industrial Inc
1,557,769 0.99%
8,960 Starwood Hotels & Resorts Inc
724,147 0.46%
9,170 United Dominion Realty Estate
262,537 0.17%
14,770 Ventas Inc
946,757 0.60%

SANLAM UNIVERSAL FUNDS PLC
145
PORTFOLIO OF INVESTMENTS OF SANLAM GLOBAL PROPERTY FUND (CONTINUED) as at 30 June 2014
Nominal Security
Classification Fair Value % of
US$ Net
Assets
Financial assets at fair value through profit or loss (continued)
United states of America – 41.75% (continued)
5,570 Vornado Realty Trust
594,486 0.38%
94,320 Washington Prime Group Inc
1,767,557 1.12%
21,900 Weingarten Realty Investors
719,196 0.46%
Total United States of America
65,666,266 41.75%
Virgin Islands – 6.95% 5,870,794 Mas Real Estate Inc
10,925,397 6.95%
Total Virgin Islands
10,925,397 6.95%
Total Equity
156,162,944 99.28%
Derivative Financial Instruments*
Forward Contracts – 0.02% D
Buy Buy Sell Sell Maturity Fair Value % of
Currency Amount Currency Amount US$ Net
Assets
SEK 4,671,000 USD (697,063) 17/09/2014 1,900 0.00%1
JPY 152,610,000 USD (1,500,971) 17/09/2014 6,397 0.00%1
NZD 876,000 USD (739,177) 17/09/2014 22,754 0.01%1
Total Forward Contracts
31,052 0.02%
Total financial assets at fair value through profit or loss
156,193,996 99.30%
Financial liabilities at fair value through profit or loss
Derivative Financal Instruments*
Forward Contracts- (0.17)%
D
Buy Buy Sell Sell Maturity Fair Value % of
Currency Amount Currency Amount US$ Net
Assets
NOK 24,299,000 USD (4,053,051) 17/09/2014 (105,415) (0.07%)1
USD 2,380,675 AUD (2,603,000) 17/09/2014 (61,692) (0.04%)1
USD 1,566,425 GBP (935,000) 17/09/2014 (30,415) (0.02%)1
USD 2,058,250 EUR (1,519,000) 17/09/2014 (21,573) (0.01%)1
USD 1,026,329 CAD (1,118,000) 17/09/2014 (21,164) (0.01%)1
USD 2,015,059 AUD (2,167,000) 17/09/2014 (18,214) (0.01%1
SEK 19,575,000 USD (2,941,258) 17/09/2014 (12,076) (0.01%)1
USD 557,529 EUR (410,000) 17/09/2014 (3,845) (0.00%)1
Total Forward Contracts
(274,395) (0.17%)
Total financial liabilities at fair value through profit or loss
(274,395) (0.17%)
Cash and cash equivalents
1,220,230 0.77%
Other net assets and liabilities
153,914 0.10%
Net assets attributable to holders of redeemable participating shares
157,293,745 100.00%
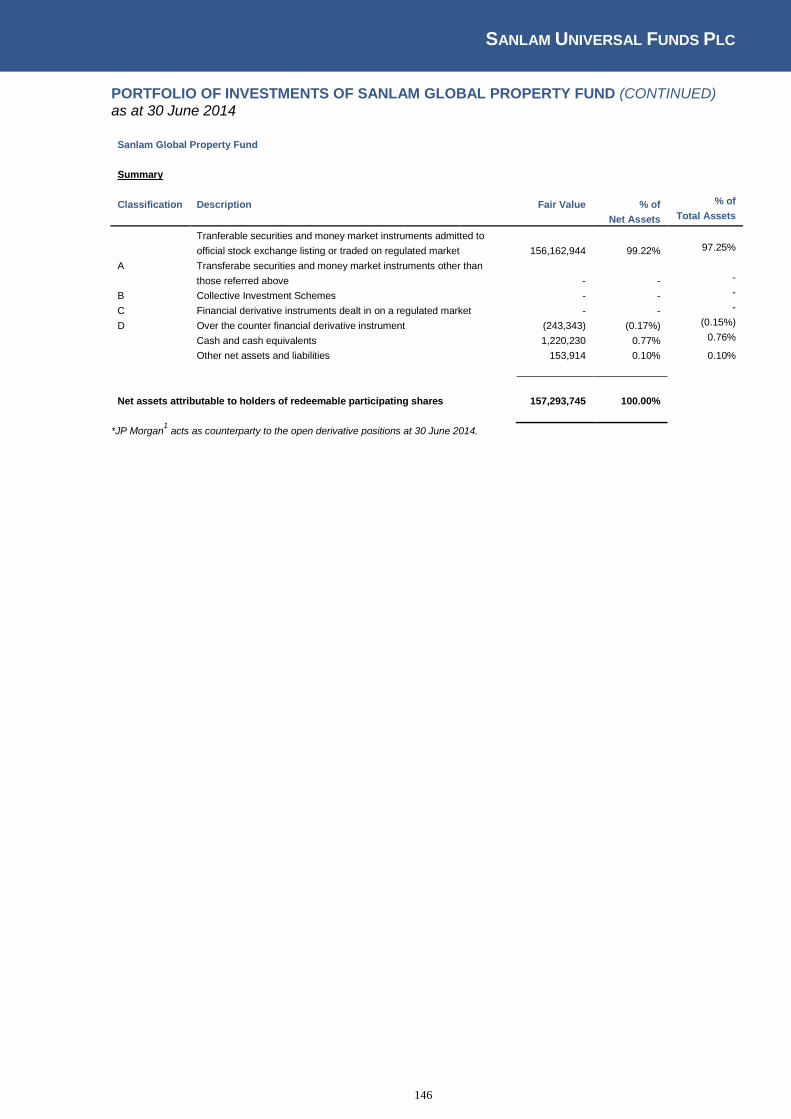
SANLAM UNIVERSAL FUNDS PLC
146
PORTFOLIO OF INVESTMENTS OF SANLAM GLOBAL PROPERTY FUND (CONTINUED) as at 30 June 2014
Sanlam Global Property Fund
Summary
Classification Description
Fair Value % of % of
Net Assets Total Assets
Tranferable securities and money market instruments admitted to
official stock exchange listing or traded on regulated market
156,162,944 99.22% 97.25%
A Transferabe securities and money market instruments other than
those referred above
- - -
B Collective Investment Schemes
- - -
C Financial derivative instruments dealt in on a regulated market - - -
D Over the counter financial derivative instrument
(243,343) (0.17%) (0.15%)
Cash and cash equivalents
1,220,230 0.77% 0.76%
Other net assets and liabilities
153,914 0.10% 0.10%
Net assets attributable to holders of redeemable participating shares 157,293,745 100.00%
*JP Morgan1 acts as counterparty to the open derivative positions at 30 June 2014.
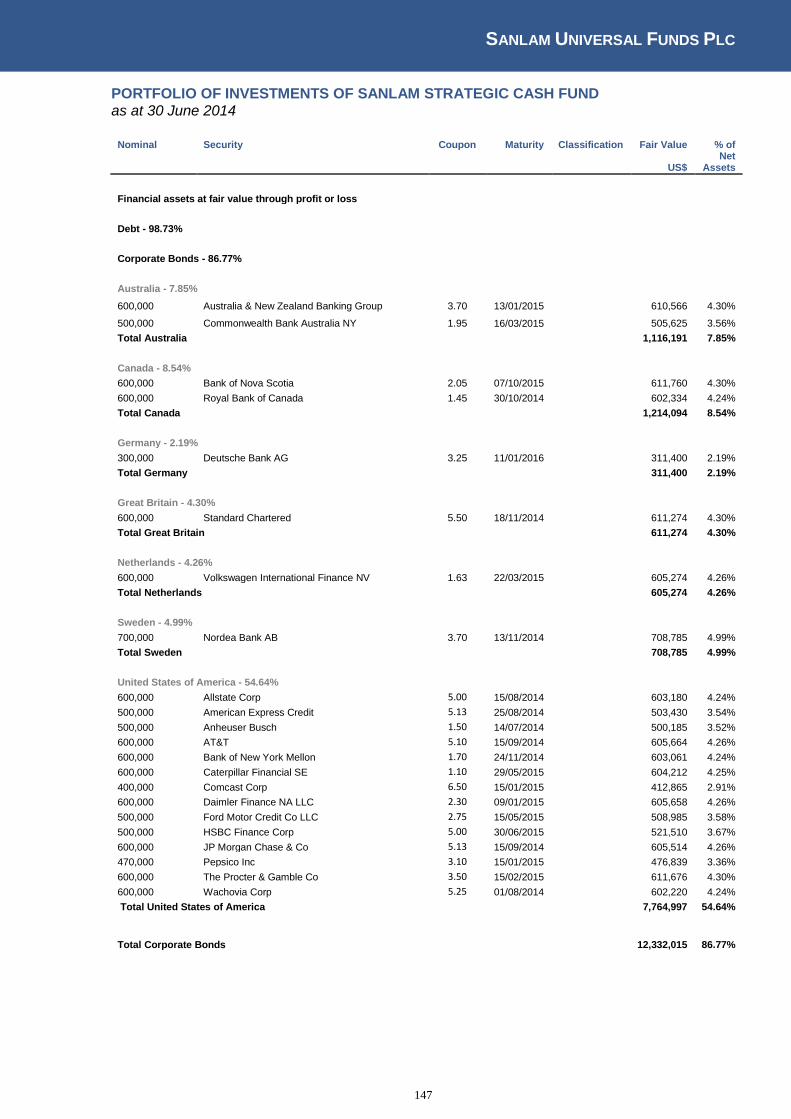
SANLAM UNIVERSAL FUNDS PLC
147
PORTFOLIO OF INVESTMENTS OF SANLAM STRATEGIC CASH FUND as at 30 June 2014
Nominal Security Coupon Maturity Classification Fair Value % of
US$ Net
Assets
Financial assets at fair value through profit or loss
Debt - 98.73%
Corporate Bonds - 86.77%
Australia - 7.85%
600,000 Australia & New Zealand Banking Group 3.70 13/01/2015
610,566 4.30%
500,000 Commonwealth Bank Australia NY 1.95 16/03/2015
505,625 3.56%
Total Australia
1,116,191 7.85%
Canada - 8.54%
600,000 Bank of Nova Scotia 2.05 07/10/2015
611,760 4.30%
600,000 Royal Bank of Canada 1.45 30/10/2014
602,334 4.24%
Total Canada
1,214,094 8.54%
Germany - 2.19%
300,000 Deutsche Bank AG 3.25 11/01/2016
311,400 2.19%
Total Germany
311,400 2.19%
Great Britain - 4.30%
600,000 Standard Chartered 5.50 18/11/2014
611,274 4.30%
Total Great Britain
611,274 4.30%
Netherlands - 4.26%
600,000 Volkswagen International Finance NV 1.63 22/03/2015
605,274 4.26%
Total Netherlands
605,274 4.26%
Sweden - 4.99%
700,000 Nordea Bank AB 3.70 13/11/2014
708,785 4.99%
Total Sweden
708,785 4.99%
United States of America - 54.64%
600,000 Allstate Corp 5.00 15/08/2014
603,180 4.24%
500,000 American Express Credit 5.13 25/08/2014
503,430 3.54%
500,000 Anheuser Busch 1.50 14/07/2014
500,185 3.52%
600,000 AT&T 5.10 15/09/2014
605,664 4.26%
600,000 Bank of New York Mellon 1.70 24/11/2014
603,061 4.24%
600,000 Caterpillar Financial SE 1.10 29/05/2015
604,212 4.25%
400,000 Comcast Corp 6.50 15/01/2015
412,865 2.91%
600,000 Daimler Finance NA LLC 2.30 09/01/2015
605,658 4.26%
500,000 Ford Motor Credit Co LLC 2.75 15/05/2015
508,985 3.58%
500,000 HSBC Finance Corp 5.00 30/06/2015
521,510 3.67%
600,000 JP Morgan Chase & Co 5.13 15/09/2014
605,514 4.26%
470,000 Pepsico Inc 3.10 15/01/2015
476,839 3.36%
600,000 The Procter & Gamble Co 3.50 15/02/2015
611,676 4.30%
600,000 Wachovia Corp 5.25 01/08/2014
602,220 4.24%
Total United States of America
7,764,997 54.64%
Total Corporate Bonds
12,332,015 86.77%
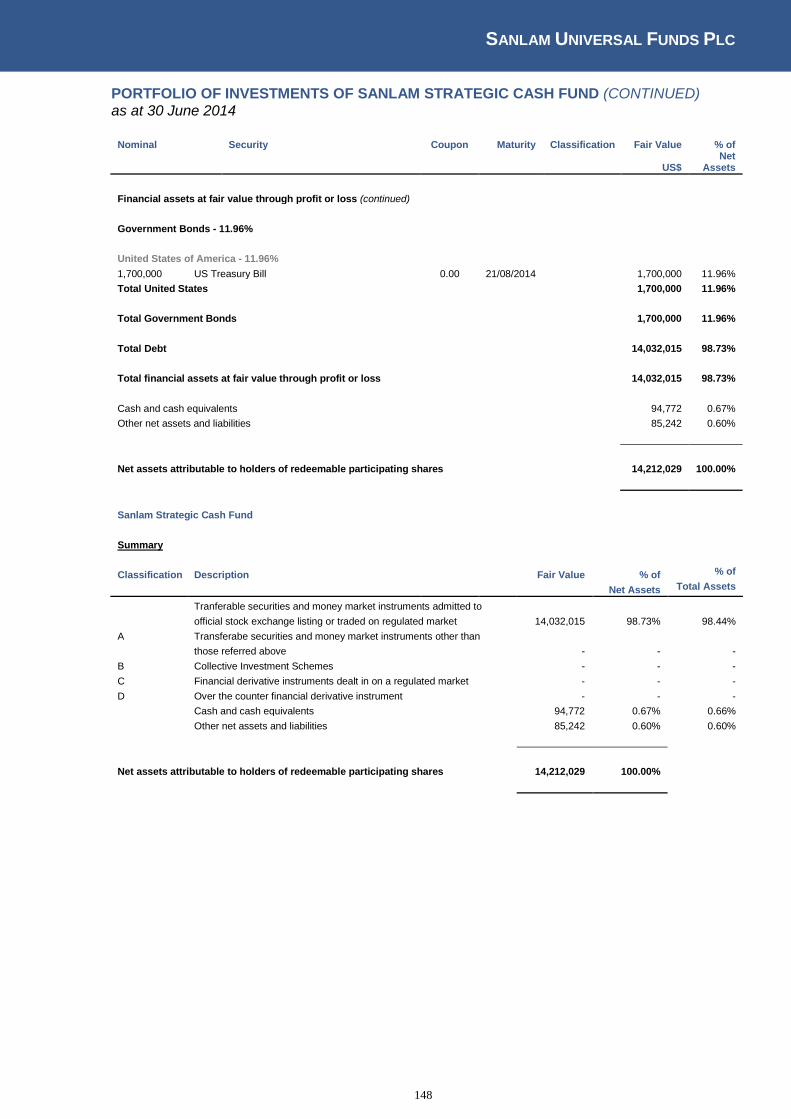
SANLAM UNIVERSAL FUNDS PLC
148
PORTFOLIO OF INVESTMENTS OF SANLAM STRATEGIC CASH FUND (CONTINUED) as at 30 June 2014
Nominal Security Coupon Maturity Classification Fair Value % of
US$ Net
Assets
Financial assets at fair value through profit or loss (continued)
Government Bonds - 11.96%
United States of America - 11.96% 1,700,000 US Treasury Bill 0.00 21/08/2014
1,700,000 11.96%
Total United States
1,700,000 11.96%
Total Government Bonds
1,700,000 11.96%
Total Debt
14,032,015 98.73%
Total financial assets at fair value through profit or loss
14,032,015 98.73%
Cash and cash equivalents
94,772 0.67%
Other net assets and liabilities
85,242 0.60%
Net assets attributable to holders of redeemable participating shares
14,212,029 100.00%
Sanlam Strategic Cash Fund
Summary
Classification Description
Fair Value % of % of
Net Assets Total Assets
Tranferable securities and money market instruments admitted to
official stock exchange listing or traded on regulated market 14,032,015 98.73% 98.44%
A Transferabe securities and money market instruments other than
those referred above
- - -
B Collective Investment Schemes
- - -
C Financial derivative instruments dealt in on a regulated market - - -
D Over the counter financial derivative instrument
- - -
Cash and cash equivalents
94,772 0.67% 0.66%
Other net assets and liabilities
85,242 0.60% 0.60%
Net assets attributable to holders of redeemable participating shares 14,212,029 100.00%
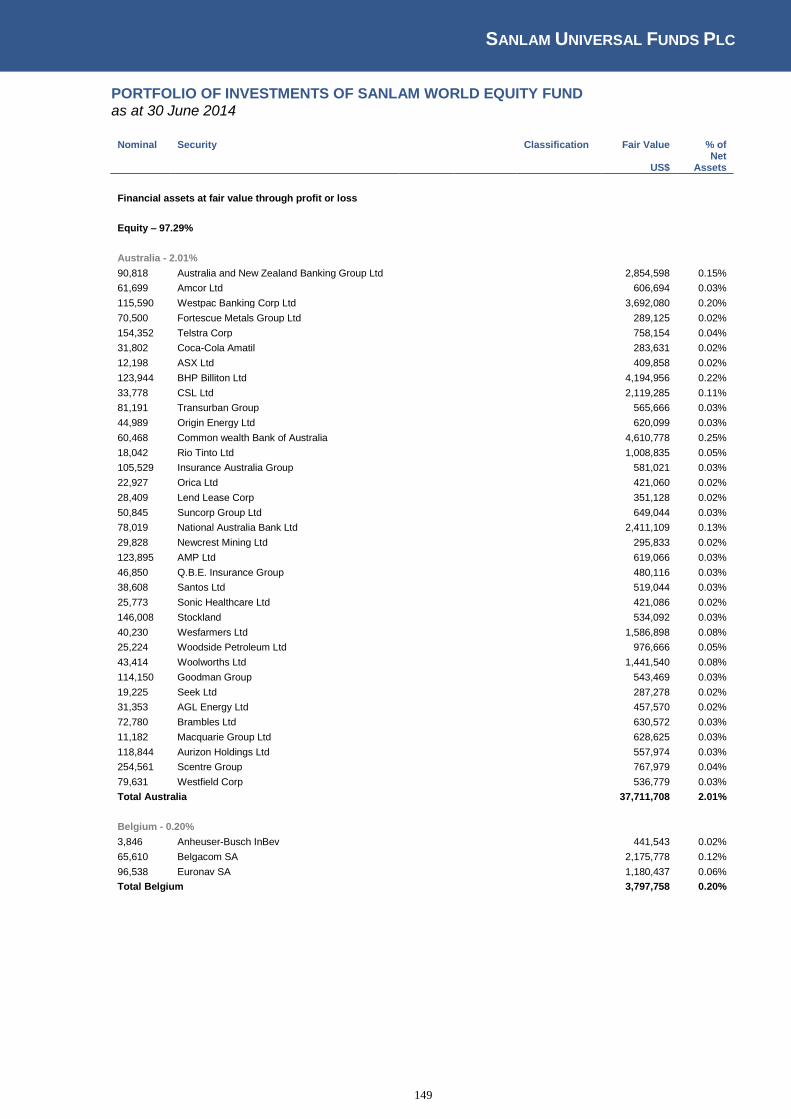
SANLAM UNIVERSAL FUNDS PLC
149
PORTFOLIO OF INVESTMENTS OF SANLAM WORLD EQUITY FUND as at 30 June 2014
Nominal Security
Classification Fair Value % of
US$ Net
Assets
Financial assets at fair value through profit or loss
Equity – 97.29%
Australia - 2.01% 90,818 Australia and New Zealand Banking Group Ltd
2,854,598 0.15%
61,699 Amcor Ltd
606,694 0.03%
115,590 Westpac Banking Corp Ltd
3,692,080 0.20%
70,500 Fortescue Metals Group Ltd
289,125 0.02%
154,352 Telstra Corp
758,154 0.04%
31,802 Coca-Cola Amatil
283,631 0.02%
12,198 ASX Ltd
409,858 0.02%
123,944 BHP Billiton Ltd
4,194,956 0.22%
33,778 CSL Ltd
2,119,285 0.11%
81,191 Transurban Group
565,666 0.03%
44,989 Origin Energy Ltd
620,099 0.03%
60,468 Common wealth Bank of Australia
4,610,778 0.25%
18,042 Rio Tinto Ltd
1,008,835 0.05%
105,529 Insurance Australia Group
581,021 0.03%
22,927 Orica Ltd
421,060 0.02%
28,409 Lend Lease Corp
351,128 0.02%
50,845 Suncorp Group Ltd
649,044 0.03%
78,019 National Australia Bank Ltd
2,411,109 0.13%
29,828 Newcrest Mining Ltd
295,833 0.02%
123,895 AMP Ltd
619,066 0.03%
46,850 Q.B.E. Insurance Group
480,116 0.03%
38,608 Santos Ltd
519,044 0.03%
25,773 Sonic Healthcare Ltd
421,086 0.02%
146,008 Stockland
534,092 0.03%
40,230 Wesfarmers Ltd
1,586,898 0.08%
25,224 Woodside Petroleum Ltd
976,666 0.05%
43,414 Woolworths Ltd
1,441,540 0.08%
114,150 Goodman Group
543,469 0.03%
19,225 Seek Ltd
287,278 0.02%
31,353 AGL Energy Ltd
457,570 0.02%
72,780 Brambles Ltd
630,572 0.03%
11,182 Macquarie Group Ltd
628,625 0.03%
118,844 Aurizon Holdings Ltd
557,974 0.03%
254,561 Scentre Group
767,979 0.04%
79,631 Westfield Corp
536,779 0.03%
Total Australia
37,711,708 2.01%
Belgium - 0.20% 3,846 Anheuser-Busch InBev
441,543 0.02%
65,610 Belgacom SA
2,175,778 0.12%
96,538 Euronav SA
1,180,437 0.06%
Total Belgium
3,797,758 0.20%
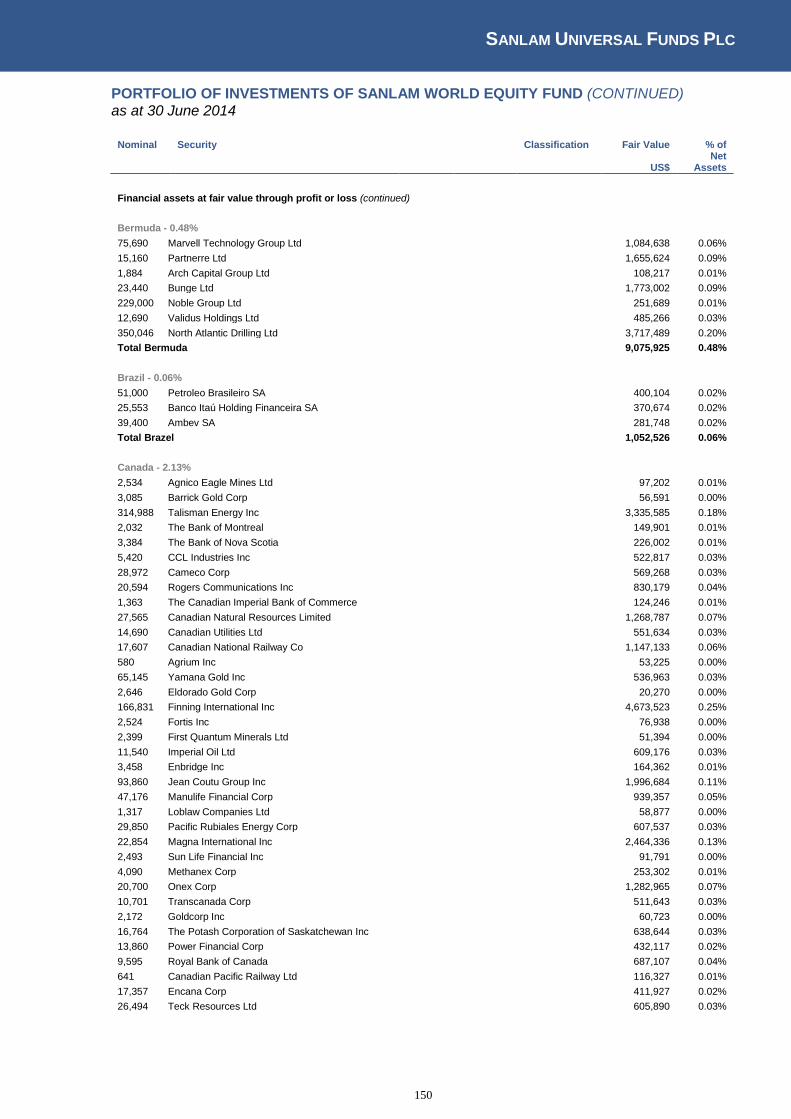
SANLAM UNIVERSAL FUNDS PLC
150
PORTFOLIO OF INVESTMENTS OF SANLAM WORLD EQUITY FUND (CONTINUED) as at 30 June 2014
Nominal Security
Classification Fair Value % of
US$ Net
Assets
Financial assets at fair value through profit or loss (continued)
Bermuda - 0.48% 75,690 Marvell Technology Group Ltd
1,084,638 0.06%
15,160 Partnerre Ltd
1,655,624 0.09%
1,884 Arch Capital Group Ltd
108,217 0.01%
23,440 Bunge Ltd
1,773,002 0.09%
229,000 Noble Group Ltd
251,689 0.01%
12,690 Validus Holdings Ltd
485,266 0.03%
350,046 North Atlantic Drilling Ltd
3,717,489 0.20%
Total Bermuda
9,075,925 0.48%
Brazil - 0.06% 51,000 Petroleo Brasileiro SA
400,104 0.02%
25,553 Banco Itaú Holding Financeira SA
370,674 0.02%
39,400 Ambev SA
281,748 0.02%
Total Brazel
1,052,526 0.06%
Canada - 2.13% 2,534 Agnico Eagle Mines Ltd
97,202 0.01%
3,085 Barrick Gold Corp
56,591 0.00%
314,988 Talisman Energy Inc
3,335,585 0.18%
2,032 The Bank of Montreal
149,901 0.01%
3,384 The Bank of Nova Scotia
226,002 0.01%
5,420 CCL Industries Inc
522,817 0.03%
28,972 Cameco Corp
569,268 0.03%
20,594 Rogers Communications Inc
830,179 0.04%
1,363 The Canadian Imperial Bank of Commerce
124,246 0.01%
27,565 Canadian Natural Resources Limited
1,268,787 0.07%
14,690 Canadian Utilities Ltd
551,634 0.03%
17,607 Canadian National Railway Co
1,147,133 0.06%
580 Agrium Inc
53,225 0.00%
65,145 Yamana Gold Inc
536,963 0.03%
2,646 Eldorado Gold Corp
20,270 0.00%
166,831 Finning International Inc
4,673,523 0.25%
2,524 Fortis Inc
76,938 0.00%
2,399 First Quantum Minerals Ltd
51,394 0.00%
11,540 Imperial Oil Ltd
609,176 0.03%
3,458 Enbridge Inc
164,362 0.01%
93,860 Jean Coutu Group Inc
1,996,684 0.11%
47,176 Manulife Financial Corp
939,357 0.05%
1,317 Loblaw Companies Ltd
58,877 0.00%
29,850 Pacific Rubiales Energy Corp
607,537 0.03%
22,854 Magna International Inc
2,464,336 0.13%
2,493 Sun Life Financial Inc
91,791 0.00%
4,090 Methanex Corp
253,302 0.01%
20,700 Onex Corp
1,282,965 0.07%
10,701 Transcanada Corp
511,643 0.03%
2,172 Goldcorp Inc
60,723 0.00%
16,764 The Potash Corporation of Saskatchewan Inc
638,644 0.03%
13,860 Power Financial Corp
432,117 0.02%
9,595 Royal Bank of Canada
687,107 0.04%
641 Canadian Pacific Railway Ltd
116,327 0.01%
17,357 Encana Corp
411,927 0.02%
26,494 Teck Resources Ltd
605,890 0.03%
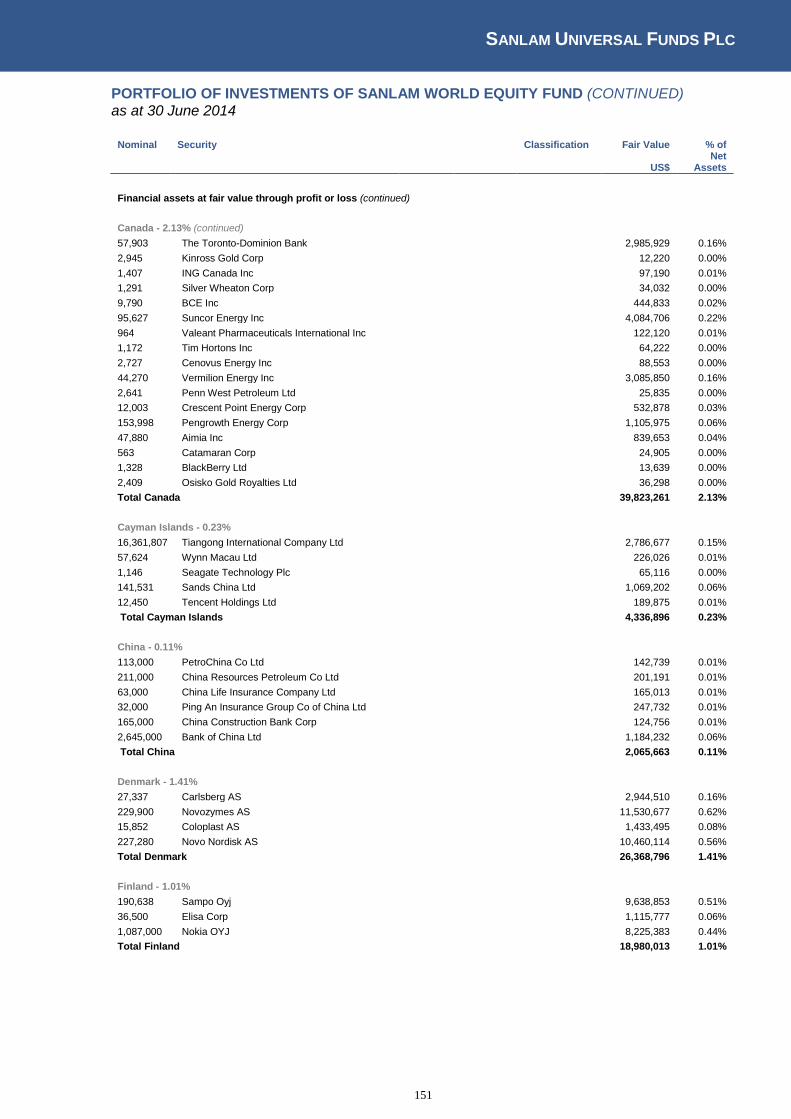
SANLAM UNIVERSAL FUNDS PLC
151
PORTFOLIO OF INVESTMENTS OF SANLAM WORLD EQUITY FUND (CONTINUED) as at 30 June 2014
Nominal Security
Classification Fair Value % of
US$ Net
Assets
Financial assets at fair value through profit or loss (continued)
Canada - 2.13% (continued)
57,903 The Toronto-Dominion Bank
2,985,929 0.16%
2,945 Kinross Gold Corp
12,220 0.00%
1,407 ING Canada Inc
97,190 0.01%
1,291 Silver Wheaton Corp
34,032 0.00%
9,790 BCE Inc
444,833 0.02%
95,627 Suncor Energy Inc
4,084,706 0.22%
964 Valeant Pharmaceuticals International Inc
122,120 0.01%
1,172 Tim Hortons Inc
64,222 0.00%
2,727 Cenovus Energy Inc
88,553 0.00%
44,270 Vermilion Energy Inc
3,085,850 0.16%
2,641 Penn West Petroleum Ltd
25,835 0.00%
12,003 Crescent Point Energy Corp
532,878 0.03%
153,998 Pengrowth Energy Corp
1,105,975 0.06%
47,880 Aimia Inc
839,653 0.04%
563 Catamaran Corp
24,905 0.00%
1,328 BlackBerry Ltd
13,639 0.00%
2,409 Osisko Gold Royalties Ltd
36,298 0.00%
Total Canada
39,823,261 2.13%
Cayman Islands - 0.23% 16,361,807 Tiangong International Company Ltd
2,786,677 0.15%
57,624 Wynn Macau Ltd
226,026 0.01%
1,146 Seagate Technology Plc
65,116 0.00%
141,531 Sands China Ltd
1,069,202 0.06%
12,450 Tencent Holdings Ltd
189,875 0.01%
Total Cayman Islands
4,336,896 0.23%
China - 0.11% 113,000 PetroChina Co Ltd
142,739 0.01%
211,000 China Resources Petroleum Co Ltd
201,191 0.01%
63,000 China Life Insurance Company Ltd
165,013 0.01%
32,000 Ping An Insurance Group Co of China Ltd
247,732 0.01%
165,000 China Construction Bank Corp
124,756 0.01%
2,645,000 Bank of China Ltd
1,184,232 0.06%
Total China
2,065,663 0.11%
Denmark - 1.41% 27,337 Carlsberg AS
2,944,510 0.16%
229,900 Novozymes AS
11,530,677 0.62%
15,852 Coloplast AS
1,433,495 0.08%
227,280 Novo Nordisk AS
10,460,114 0.56%
Total Denmark
26,368,796 1.41%
Finland - 1.01% 190,638 Sampo Oyj
9,638,853 0.51%
36,500 Elisa Corp
1,115,777 0.06%
1,087,000 Nokia OYJ
8,225,383 0.44%
Total Finland
18,980,013 1.01%
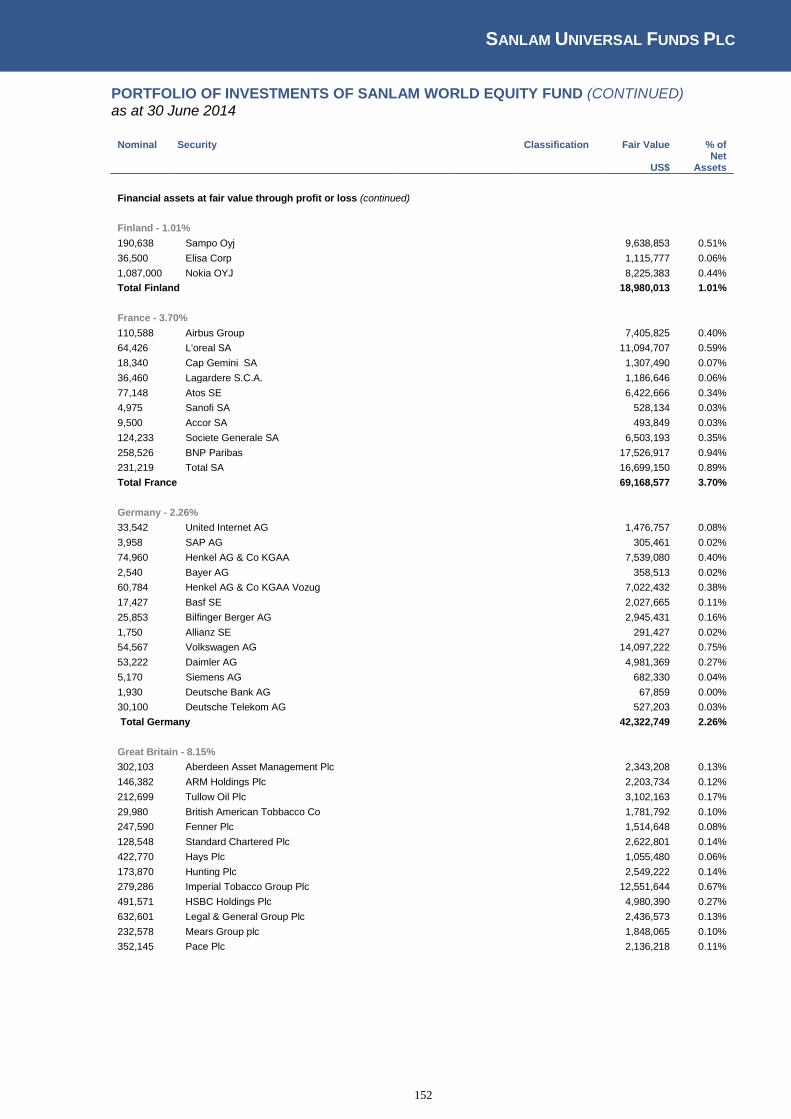
SANLAM UNIVERSAL FUNDS PLC
152
PORTFOLIO OF INVESTMENTS OF SANLAM WORLD EQUITY FUND (CONTINUED) as at 30 June 2014
Nominal Security
Classification Fair Value % of
US$ Net
Assets
Financial assets at fair value through profit or loss (continued)
Finland - 1.01% 190,638 Sampo Oyj
9,638,853 0.51%
36,500 Elisa Corp
1,115,777 0.06%
1,087,000 Nokia OYJ
8,225,383 0.44%
Total Finland
18,980,013 1.01%
France - 3.70% 110,588 Airbus Group
7,405,825 0.40%
64,426 L'oreal SA
11,094,707 0.59%
18,340 Cap Gemini SA
1,307,490 0.07%
36,460 Lagardere S.C.A.
1,186,646 0.06%
77,148 Atos SE
6,422,666 0.34%
4,975 Sanofi SA
528,134 0.03%
9,500 Accor SA
493,849 0.03%
124,233 Societe Generale SA
6,503,193 0.35%
258,526 BNP Paribas
17,526,917 0.94%
231,219 Total SA
16,699,150 0.89%
Total France
69,168,577 3.70%
Germany - 2.26% 33,542 United Internet AG
1,476,757 0.08%
3,958 SAP AG
305,461 0.02%
74,960 Henkel AG & Co KGAA
7,539,080 0.40%
2,540 Bayer AG
358,513 0.02%
60,784 Henkel AG & Co KGAA Vozug
7,022,432 0.38%
17,427 Basf SE
2,027,665 0.11%
25,853 Bilfinger Berger AG
2,945,431 0.16%
1,750 Allianz SE
291,427 0.02%
54,567 Volkswagen AG
14,097,222 0.75%
53,222 Daimler AG
4,981,369 0.27%
5,170 Siemens AG
682,330 0.04%
1,930 Deutsche Bank AG
67,859 0.00%
30,100 Deutsche Telekom AG
527,203 0.03%
Total Germany
42,322,749 2.26%
Great Britain - 8.15% 302,103 Aberdeen Asset Management Plc
2,343,208 0.13%
146,382 ARM Holdings Plc
2,203,734 0.12%
212,699 Tullow Oil Plc
3,102,163 0.17%
29,980 British American Tobbacco Co
1,781,792 0.10%
247,590 Fenner Plc
1,514,648 0.08%
128,548 Standard Chartered Plc
2,622,801 0.14%
422,770 Hays Plc
1,055,480 0.06%
173,870 Hunting Plc
2,549,222 0.14%
279,286 Imperial Tobacco Group Plc
12,551,644 0.67%
491,571 HSBC Holdings Plc
4,980,390 0.27%
632,601 Legal & General Group Plc
2,436,573 0.13%
232,578 Mears Group plc
1,848,065 0.10%
352,145 Pace Plc
2,136,218 0.11%

SANLAM UNIVERSAL FUNDS PLC
153
PORTFOLIO OF INVESTMENTS OF SANLAM WORLD EQUITY FUND (CONTINUED) as at 30 June 2014
Nominal Security
Classification Fair Value % of
US$ Net
Assets
Financial assets at fair value through profit or loss (continued)
Great Britain - 8.15% (continued)
31,010 Associated British Foods Plc
1,615,678 0.09%
289,382 Prudential Corp
6,631,259 0.35%
109,962 Rio Tinto Plc
5,841,027 0.31%
163,020 BP Plc
1,434,364 0.08%
511,302 DS Smith Plc
2,418,462 0.13%
365,470 BG Group Plc
7,712,841 0.41%
139,540 Tesco Plc
677,670 0.04%
45,660 Weir Group Plc
2,043,464 0.11%
786,856 GKN Plc
4,882,218 0.26%
3,376,349 Barclays Plc
12,277,633 0.66%
270,950 William Hill Plc
1,518,653 0.08%
19,680 Next Plc
2,177,512 0.12%
1,231,091 ITV Plc
3,748,811 0.20%
278,000 Genting Singapore Plc
296,623 0.02%
207,580 Cobham Plc
1,107,779 0.06%
87,034 Petrofac Ltd
1,789,164 0.10%
210,008 Qinetiq Plc
742,134 0.04%
228,754 Investec Plc
2,106,945 0.11%
91,400 Experian Group Ltd
1,543,117 0.08%
438,720 BBA Aviation Plc
2,316,550 0.12%
371,024 Avanti Communications Group Plc
1,604,051 0.09%
59,800 Capita Group Plc
1,170,044 0.06%
38,994 Reckitt Benckiser Group Plc
3,398,315 0.18%
271,721 Reed Elsevier Plc
4,364,623 0.23%
99,686 Shire Plc
7,784,775 0.42%
469,734 OPG Power Ventures Plc
814,730 0.04%
235,401 Novae Group Plc
2,135,987 0.11%
57,535 Betfair Group Plc
1,006,764 0.05%
957 Ensco Plc
53,180 0.00%
889 Mead Johnson Nutrition Co
82,828 0.00%
34,306 Aon Plc
3,090,628 0.17%
163,186 Rolls-Royce Holdings Plc
2,980,961 0.16%
28,379 Johnson Matthey Plc
1,503,330 0.08%
203,779 Tungsten Corp Plc
1,006,359 0.05%
50,070 Rowan Companies Plc
1,598,735 0.09%
33,730 Intercontinental Hotels Group Plc
1,395,426 0.07%
313,000 Crest Nicholson Holdings
1,844,197 0.10%
1,813 Liberty Global Plc
80,171 0.00%
762 Liberty Global Plc
32,240 0.00%
18,780 Noble Corp Plc
630,257 0.03%
2,352,587 Vodafone Group Plc
7,839,277 0.42%
285,849 Patisserie Holdings Ltd
969,601 0.05%
410,800 OneSavings Bank Plc
1,161,781 0.06%
360,978 AA Plc
1,529,777 0.08%
116,688 Quindell Plc
458,617 0.02%
19,149,404 Rolls Royce Holdings Plc
32,723 0.00%
Total Great Britain
152,577,219 8.15%
Greece – 0.00% 1,900 OPAP SA
33,799 0.00%
Total Greece
33,799 0.00%
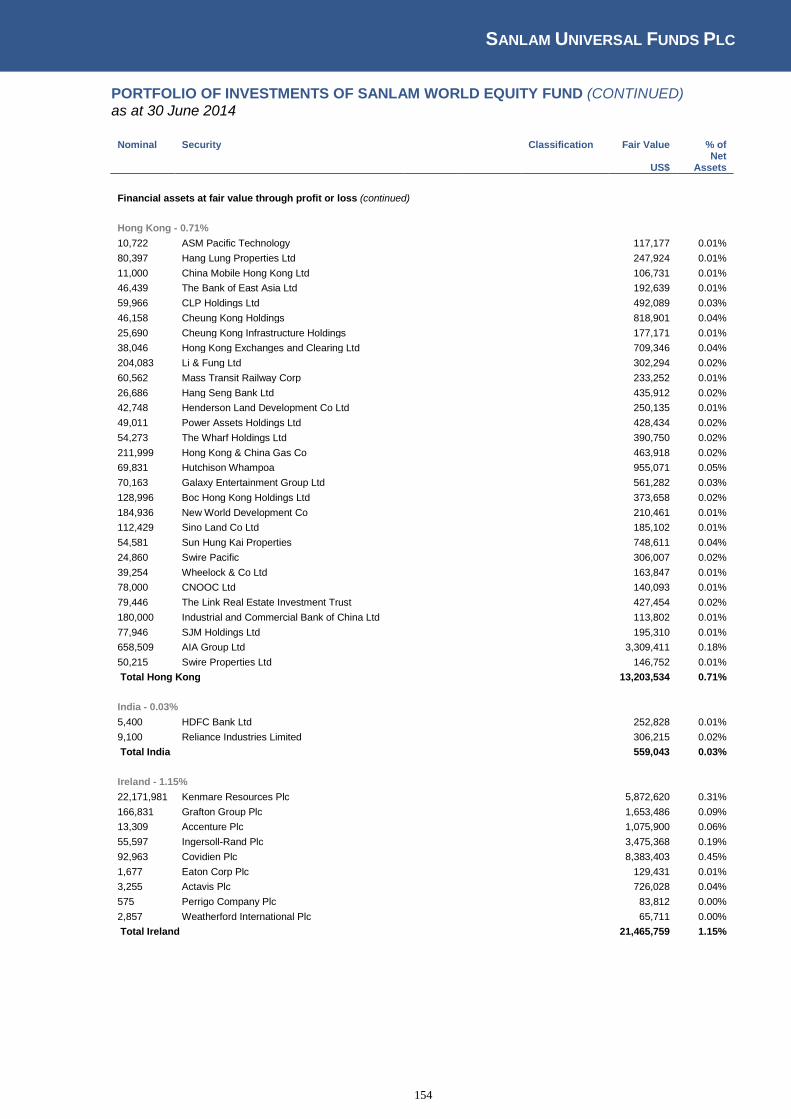
SANLAM UNIVERSAL FUNDS PLC
154
PORTFOLIO OF INVESTMENTS OF SANLAM WORLD EQUITY FUND (CONTINUED) as at 30 June 2014
Nominal Security
Classification Fair Value % of
US$ Net
Assets
Financial assets at fair value through profit or loss (continued)
Hong Kong - 0.71% 10,722 ASM Pacific Technology
117,177 0.01%
80,397 Hang Lung Properties Ltd
247,924 0.01%
11,000 China Mobile Hong Kong Ltd
106,731 0.01%
46,439 The Bank of East Asia Ltd
192,639 0.01%
59,966 CLP Holdings Ltd
492,089 0.03%
46,158 Cheung Kong Holdings
818,901 0.04%
25,690 Cheung Kong Infrastructure Holdings
177,171 0.01%
38,046 Hong Kong Exchanges and Clearing Ltd
709,346 0.04%
204,083 Li & Fung Ltd
302,294 0.02%
60,562 Mass Transit Railway Corp
233,252 0.01%
26,686 Hang Seng Bank Ltd
435,912 0.02%
42,748 Henderson Land Development Co Ltd
250,135 0.01%
49,011 Power Assets Holdings Ltd
428,434 0.02%
54,273 The Wharf Holdings Ltd
390,750 0.02%
211,999 Hong Kong & China Gas Co
463,918 0.02%
69,831 Hutchison Whampoa
955,071 0.05%
70,163 Galaxy Entertainment Group Ltd
561,282 0.03%
128,996 Boc Hong Kong Holdings Ltd
373,658 0.02%
184,936 New World Development Co
210,461 0.01%
112,429 Sino Land Co Ltd
185,102 0.01%
54,581 Sun Hung Kai Properties
748,611 0.04%
24,860 Swire Pacific
306,007 0.02%
39,254 Wheelock & Co Ltd
163,847 0.01%
78,000 CNOOC Ltd
140,093 0.01%
79,446 The Link Real Estate Investment Trust
427,454 0.02%
180,000 Industrial and Commercial Bank of China Ltd
113,802 0.01%
77,946 SJM Holdings Ltd
195,310 0.01%
658,509 AIA Group Ltd
3,309,411 0.18%
50,215 Swire Properties Ltd
146,752 0.01%
Total Hong Kong
13,203,534 0.71%
India - 0.03% 5,400 HDFC Bank Ltd
252,828 0.01%
9,100 Reliance Industries Limited
306,215 0.02%
Total India
559,043 0.03%
Ireland - 1.15% 22,171,981 Kenmare Resources Plc
5,872,620 0.31%
166,831 Grafton Group Plc
1,653,486 0.09%
13,309 Accenture Plc
1,075,900 0.06%
55,597 Ingersoll-Rand Plc
3,475,368 0.19%
92,963 Covidien Plc
8,383,403 0.45%
1,677 Eaton Corp Plc
129,431 0.01%
3,255 Actavis Plc
726,028 0.04%
575 Perrigo Company Plc
83,812 0.00%
2,857 Weatherford International Plc
65,711 0.00%
Total Ireland
21,465,759 1.15%

SANLAM UNIVERSAL FUNDS PLC
155
PORTFOLIO OF INVESTMENTS OF SANLAM WORLD EQUITY FUND (CONTINUED) as at 30 June 2014
Nominal Security
Classification Fair Value % of
US$ Net
Assets
Financial assets at fair value through profit or loss (continued)
Israel - 0.03% 9,080 Teva Pharmaceutical Industries Ltd
475,974 0.03%
Total Israel
475,974 0.03%
Italy - 2.14% 21,680 Assicurazioni Generali SpA
474,955 0.03%
3,130,195 Intesa Sanpaolo SpA
9,662,999 0.52%
289,690 Enel SpA
1,686,291 0.09%
353,183 ENI-Ente Nazionale Idrocarburi SpA
9,655,988 0.52%
1,799,130 HERA SpA
5,120,677 0.27%
114,460 Unione Di Banche Italiane SpA
989,857 0.05%
80,000 EI Towers SpA
4,324,028 0.23%
185,767 Azimut Holding SpA
4,783,983 0.26%
314,530 Terna SpA
1,657,867 0.09%
69,448 Unicredit SpA
581,109 0.03%
173,460 Cerved Information Solutions SpA
1,172,540 0.06%
Total Italy
40,110,294 2.14%
Japan - 7.08% 8,000 Ajinomoto Co Inc
125,410 0.01%
24,000 All Nippon Airways Co Ltd
56,624 0.00%
500 Aeon Credit Service Co Ltd
13,075 0.00%
25,700 Acom Co Ltd
122,284 0.01%
600 Asahi Breweries Ltd
18,835 0.00%
5,300 Asics Corp
123,632 0.01%
27,000 Hiroshima Bank Ltd
129,003 0.01%
3,000 Bank of Kyoto Ltd
27,275 0.00%
91,300 Yahoo Japan Corp
421,801 0.02%
2,500 NTT Data Corp
96,002 0.01%
14,000 NTT Communications Corp
239,368 0.01%
4,100 Brother Industries Ltd
71,032 0.00%
18,500 Canon Inc
601,935 0.03%
800 Casio Computer Co Ltd
11,609 0.00%
6,500 Central Japan Railway Co
927,196 0.05%
18,100 Chubu Electric Power Co Inc
224,955 0.01%
15,400 Chugoku Electric Power Co
210,097 0.01%
7,300 Chugai Pharmaceutical Co Ltd
205,740 0.01%
24,500 Rakuten Inc
316,589 0.02%
17,800 KDDI Corp
1,085,747 0.06%
20,500 Daito Trust Construction Co Ltd
2,410,217 0.13%
6,500 Daikin Industries Ltd
410,148 0.02%
6,800 Dainippon Pharmaceutical Co Ltd
78,203 0.00%
133,800 Daiwa Securities Group Inc
1,158,367 0.06%
20,700 Mitsubishi UFJ Lease & Finance Co Ltd
118,928 0.01%
2,000 Don Quijote Co Ltd
111,550 0.01%
11,400 East Japan Railway Co
897,933 0.05%
5,400 SBI Holdings Inc
66,101 0.00%
3,100 Fast Retailing Co Ltd
1,019,970 0.05%

SANLAM UNIVERSAL FUNDS PLC
156
PORTFOLIO OF INVESTMENTS OF SANLAM WORLD EQUITY FUND (CONTINUED) as at 30 June 2014
Nominal Security
Classification Fair Value % of
US$ Net
Assets
Financial assets at fair value through profit or loss (continued)
Japan - 7.08% (continued)
471,300 Mitsubishi UFJ Holdings Inc
2,889,213 0.15%
24,000 Fuji Electric Holdings Co Ltd
113,722 0.01%
65,000 Fuji Heavy Industries Ltd
1,799,852 0.10%
10,800 Fujifilm Holdings Corp
301,185 0.02%
5,100 Fanuc Ltd
879,536 0.05%
46,000 Fujitsu Ltd
344,659 0.02%
2,700 Nomura Research Institute
85,025 0.00%
10 Japan Real Estate
58,243 0.00%
20,000 Gunma Bank Ltd
118,263 0.01%
24,000 Hachijuni Bank Ltd
148,549 0.01%
42,000 Hankyu Holdings Inc
239,645 0.01%
4,400 Dentsu Inc
179,171 0.01%
15,400 Resona Holdings Inc
89,694 0.00%
100 Hisamitsu Pharmaceutical Co
4,472 0.00%
123,000 Hitachi Ltd
900,948 0.05%
9,700 Hokkaido Electric Power Co
74,976 0.00%
87,000 Chuo Mitsui Trust Holdings Inc
397,641 0.02%
12,600 The Hokuriku Electric Power Co
167,046 0.01%
300,815 Honda Motor Co
10,503,284 0.56%
12,100 Hoya Pentax HD Corp
402,059 0.02%
13,000 The Ishikawajima-Harima
60,573 0.00%
473,000 Isuzu Motors Ltd
3,128,430 0.17%
16,600 Iyo Bank Ltd
167,803 0.01%
1,000 JGC Corp
30,385 0.00%
26,000 Japan Tobacco International
947,858 0.05%
32,000 Joyo Bank Ltd/The
170,582 0.01%
186,800 Aeon Co Ltd
2,297,658 0.12%
10,000 Kamigumi Co Ltd
92,004 0.00%
25,200 Kansai Electric Power Co
237,572 0.01%
91,200 Kao Corp
3,589,481 0.19%
127,154 K's Holdings Corp
3,687,843 0.20%
18,000 Keikyu Corp
161,698 0.01%
3,880 Keyence Corp
1,692,760 0.09%
3,000 Kinden Corp
29,171 0.00%
24,000 Kinki Nippon Railway Co Ltd
87,423 0.00%
104,100 Komatsu Ltd
2,417,011 0.13%
1,700 Konami Corp
37,575 0.00%
111,500 Konica Minolta Inc
1,101,792 0.06%
2,700 JTEKT Corp
45,498 0.00%
15,000 Kubota Corp
212,636 0.01%
1,000 Kyowa Hakko Kogyo Co Ltd
13,534 0.00%
21,000 The Kyūshū Electric Power Co
236,535 0.01%
21,200 Tokio Marine Holdings Inc
697,319 0.04%
20 Japan Prime Realty Investment Corp
71,767 0.00%
2,200 Aeon Mall Co Ltd
57,964 0.00%
600 Makita Electric Works
37,078 0.00%
37,200 Sumitomo Mitsui Financial Group Inc
1,558,507 0.08%
102,000 Marubeni Corp
746,120 0.04%
73,200 Panasonic Corp
891,696 0.05%
1,145,700 Mizuho Financial Group Inc
2,352,474 0.13%
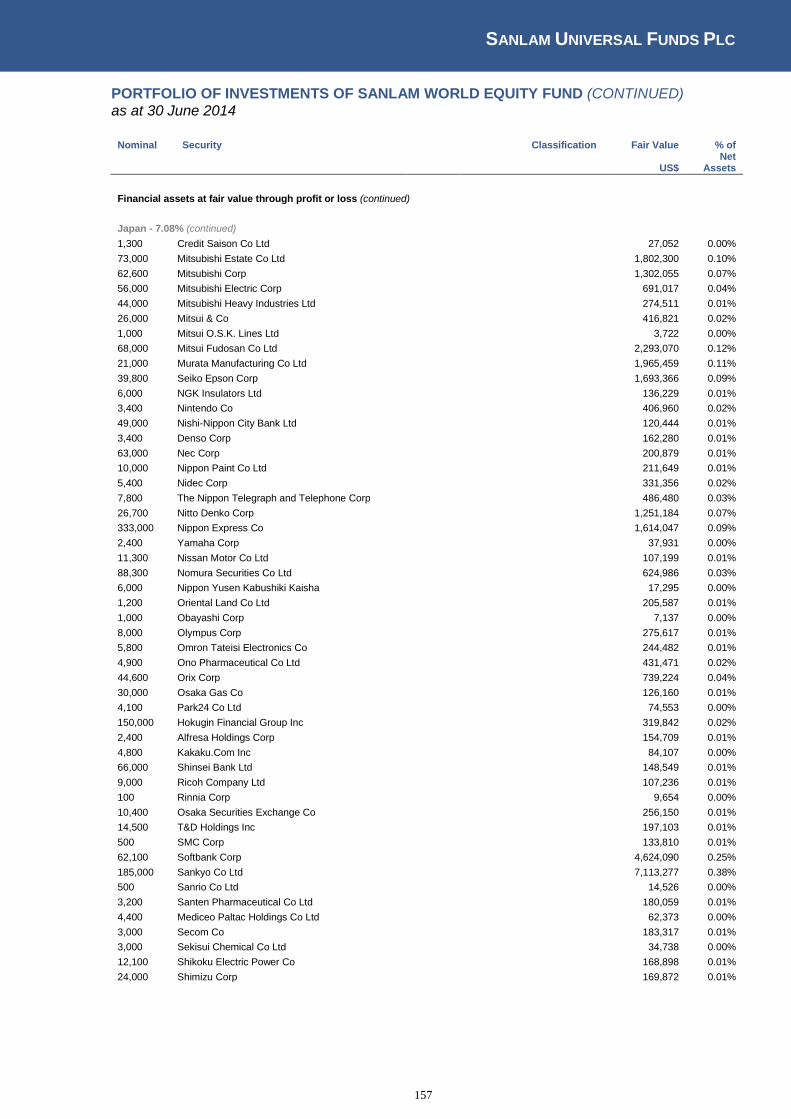
SANLAM UNIVERSAL FUNDS PLC
157
PORTFOLIO OF INVESTMENTS OF SANLAM WORLD EQUITY FUND (CONTINUED) as at 30 June 2014
Nominal Security
Classification Fair Value % of
US$ Net
Assets
Financial assets at fair value through profit or loss (continued)
Japan - 7.08% (continued)
1,300 Credit Saison Co Ltd
27,052 0.00%
73,000 Mitsubishi Estate Co Ltd
1,802,300 0.10%
62,600 Mitsubishi Corp
1,302,055 0.07%
56,000 Mitsubishi Electric Corp
691,017 0.04%
44,000 Mitsubishi Heavy Industries Ltd
274,511 0.01%
26,000 Mitsui & Co
416,821 0.02%
1,000 Mitsui O.S.K. Lines Ltd
3,722 0.00%
68,000 Mitsui Fudosan Co Ltd
2,293,070 0.12%
21,000 Murata Manufacturing Co Ltd
1,965,459 0.11%
39,800 Seiko Epson Corp
1,693,366 0.09%
6,000 NGK Insulators Ltd
136,229 0.01%
3,400 Nintendo Co
406,960 0.02%
49,000 Nishi-Nippon City Bank Ltd
120,444 0.01%
3,400 Denso Corp
162,280 0.01%
63,000 Nec Corp
200,879 0.01%
10,000 Nippon Paint Co Ltd
211,649 0.01%
5,400 Nidec Corp
331,356 0.02%
7,800 The Nippon Telegraph and Telephone Corp
486,480 0.03%
26,700 Nitto Denko Corp
1,251,184 0.07%
333,000 Nippon Express Co
1,614,047 0.09%
2,400 Yamaha Corp
37,931 0.00%
11,300 Nissan Motor Co Ltd
107,199 0.01%
88,300 Nomura Securities Co Ltd
624,986 0.03%
6,000 Nippon Yusen Kabushiki Kaisha
17,295 0.00%
1,200 Oriental Land Co Ltd
205,587 0.01%
1,000 Obayashi Corp
7,137 0.00%
8,000 Olympus Corp
275,617 0.01%
5,800 Omron Tateisi Electronics Co
244,482 0.01%
4,900 Ono Pharmaceutical Co Ltd
431,471 0.02%
44,600 Orix Corp
739,224 0.04%
30,000 Osaka Gas Co
126,160 0.01%
4,100 Park24 Co Ltd
74,553 0.00%
150,000 Hokugin Financial Group Inc
319,842 0.02%
2,400 Alfresa Holdings Corp
154,709 0.01%
4,800 Kakaku.Com Inc
84,107 0.00%
66,000 Shinsei Bank Ltd
148,549 0.01%
9,000 Ricoh Company Ltd
107,236 0.01%
100 Rinnia Corp
9,654 0.00%
10,400 Osaka Securities Exchange Co
256,150 0.01%
14,500 T&D Holdings Inc
197,103 0.01%
500 SMC Corp
133,810 0.01%
62,100 Softbank Corp
4,624,090 0.25%
185,000 Sankyo Co Ltd
7,113,277 0.38%
500 Sanrio Co Ltd
14,526 0.00%
3,200 Santen Pharmaceutical Co Ltd
180,059 0.01%
4,400 Mediceo Paltac Holdings Co Ltd
62,373 0.00%
3,000 Secom Co
183,317 0.01%
3,000 Sekisui Chemical Co Ltd
34,738 0.00%
12,100 Shikoku Electric Power Co
168,898 0.01%
24,000 Shimizu Corp
169,872 0.01%
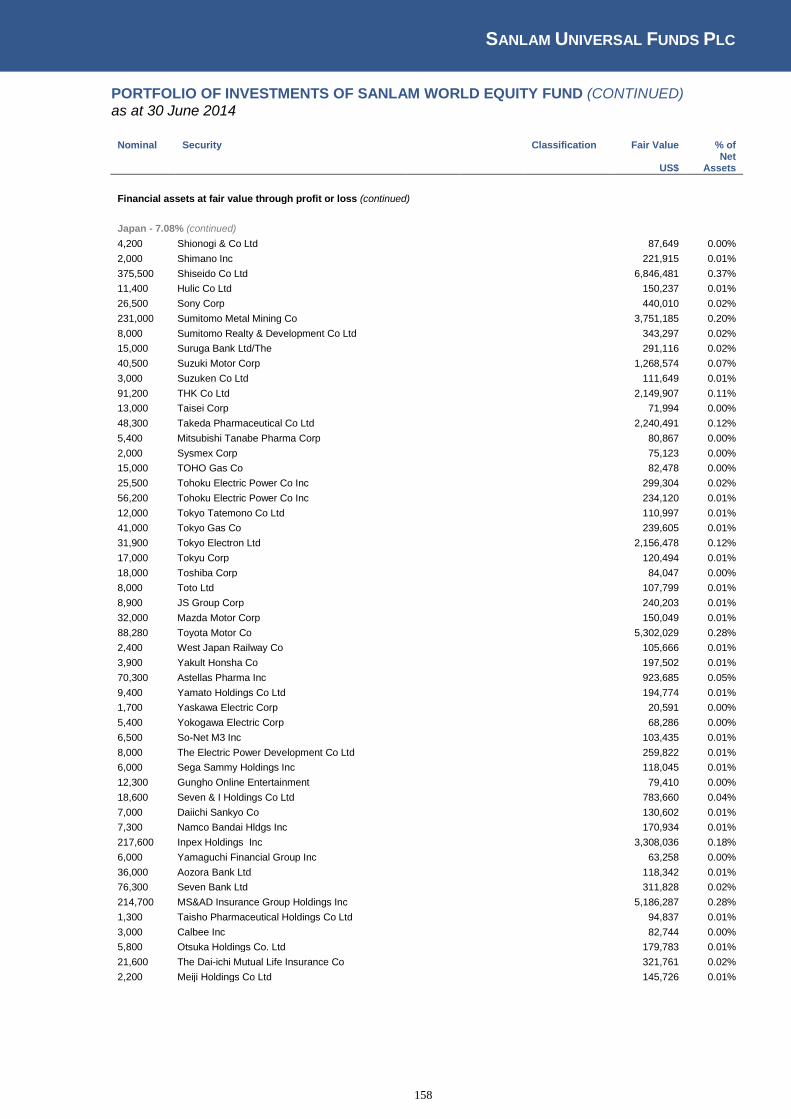
SANLAM UNIVERSAL FUNDS PLC
158
PORTFOLIO OF INVESTMENTS OF SANLAM WORLD EQUITY FUND (CONTINUED) as at 30 June 2014
Nominal Security
Classification Fair Value % of
US$ Net
Assets
Financial assets at fair value through profit or loss (continued)
Japan - 7.08% (continued)
4,200 Shionogi & Co Ltd
87,649 0.00%
2,000 Shimano Inc
221,915 0.01%
375,500 Shiseido Co Ltd
6,846,481 0.37%
11,400 Hulic Co Ltd
150,237 0.01%
26,500 Sony Corp
440,010 0.02%
231,000 Sumitomo Metal Mining Co
3,751,185 0.20%
8,000 Sumitomo Realty & Development Co Ltd
343,297 0.02%
15,000 Suruga Bank Ltd/The
291,116 0.02%
40,500 Suzuki Motor Corp
1,268,574 0.07%
3,000 Suzuken Co Ltd
111,649 0.01%
91,200 THK Co Ltd
2,149,907 0.11%
13,000 Taisei Corp
71,994 0.00%
48,300 Takeda Pharmaceutical Co Ltd
2,240,491 0.12%
5,400 Mitsubishi Tanabe Pharma Corp
80,867 0.00%
2,000 Sysmex Corp
75,123 0.00%
15,000 TOHO Gas Co
82,478 0.00%
25,500 Tohoku Electric Power Co Inc
299,304 0.02%
56,200 Tohoku Electric Power Co Inc
234,120 0.01%
12,000 Tokyo Tatemono Co Ltd
110,997 0.01%
41,000 Tokyo Gas Co
239,605 0.01%
31,900 Tokyo Electron Ltd
2,156,478 0.12%
17,000 Tokyu Corp
120,494 0.01%
18,000 Toshiba Corp
84,047 0.00%
8,000 Toto Ltd
107,799 0.01%
8,900 JS Group Corp
240,203 0.01%
32,000 Mazda Motor Corp
150,049 0.01%
88,280 Toyota Motor Co
5,302,029 0.28%
2,400 West Japan Railway Co
105,666 0.01%
3,900 Yakult Honsha Co
197,502 0.01%
70,300 Astellas Pharma Inc
923,685 0.05%
9,400 Yamato Holdings Co Ltd
194,774 0.01%
1,700 Yaskawa Electric Corp
20,591 0.00%
5,400 Yokogawa Electric Corp
68,286 0.00%
6,500 So-Net M3 Inc
103,435 0.01%
8,000 The Electric Power Development Co Ltd
259,822 0.01%
6,000 Sega Sammy Holdings Inc
118,045 0.01%
12,300 Gungho Online Entertainment
79,410 0.00%
18,600 Seven & I Holdings Co Ltd
783,660 0.04%
7,000 Daiichi Sankyo Co
130,602 0.01%
7,300 Namco Bandai Hldgs Inc
170,934 0.01%
217,600 Inpex Holdings Inc
3,308,036 0.18%
6,000 Yamaguchi Financial Group Inc
63,258 0.00%
36,000 Aozora Bank Ltd
118,342 0.01%
76,300 Seven Bank Ltd
311,828 0.02%
214,700 MS&AD Insurance Group Holdings Inc
5,186,287 0.28%
1,300 Taisho Pharmaceutical Holdings Co Ltd
94,837 0.01%
3,000 Calbee Inc
82,744 0.00%
5,800 Otsuka Holdings Co. Ltd
179,783 0.01%
21,600 The Dai-ichi Mutual Life Insurance Co
321,761 0.02%
2,200 Meiji Holdings Co Ltd
145,726 0.01%

SANLAM UNIVERSAL FUNDS PLC
159
PORTFOLIO OF INVESTMENTS OF SANLAM WORLD EQUITY FUND (CONTINUED) as at 30 June 2014
Nominal Security
Classification Fair Value % of
US$ Net
Assets
Financial assets at fair value through profit or loss (continued)
Japan - 7.08% (continued)
13,500 NKSJ Holdings Inc
363,554 0.02%
31,700 Japan Airlines Co Ltd
1,752,419 0.09%
8,700 Iida Group Holdings Co Ltd
132,175 0.01%
Total Japan
132,575,649 7.08%
Jersey Channel Isle - 0.53% 569,042 Glencore Plc
3,165,612 0.17%
2,266 Delphi Automotive Plc
155,765 0.01%
306,060 WPP Plc
6,663,029 0.36%
Total Jersey Channel Isle
9,984,406 0.53%
Korea (South) - 0.44% 7,800 Shinhan Financial Group Ltd
361,207 0.02%
980 Hyundai Motor Co
222,311 0.01%
181 Samsung Electronics Co Ltd
236,517 0.01%
7,081 Samsung Electronics Co Ltd
7,419,130 0.40%
Total Korea (South)
8,239,165 0.44%
Liberia - 0.06% 19,230 Royal Caribbean Cruises Ltd
1,069,188 0.06%
Total Liberia
1,069,188 0.06%
Marshall Islands - 0.19% 938,760 Navios Maritime Acquisition Corp
3,482,800 0.19%
Total Marshall Islands
3,482,800 0.19%
Mexico - 0.01% 238,300 America Movil SAB de CV
247,085 0.01%
Total Mexico
247,085 0.01%
Netherlands - 2.54% 4,450 Core Laboratories Inc
743,417 0.04%
132,574 Schlumberger Ltd
15,637,103 0.84%
158,431 Aegon NV
1,381,827 0.07%
361,409 ING Groep NV
5,073,969 0.27%
39,906 Heineken NV
2,862,988 0.15%
69,383 Gemalto NV
7,187,046 0.38%
7,900 Unilever NV
345,436 0.02%
63,722 LyondellBasell Industries NV
6,222,453 0.33%
85,957 ASML Holding NV
7,999,364 0.43%
Total Netherlands
47,453,603 2.54%
Norway - 0.37% 126,820 Statoil ASA
3,893,379 0.21%
169,820 Gjensidige Forsikring ASA
3,043,964 0.16%
Total Norway
6,937,343 0.37%
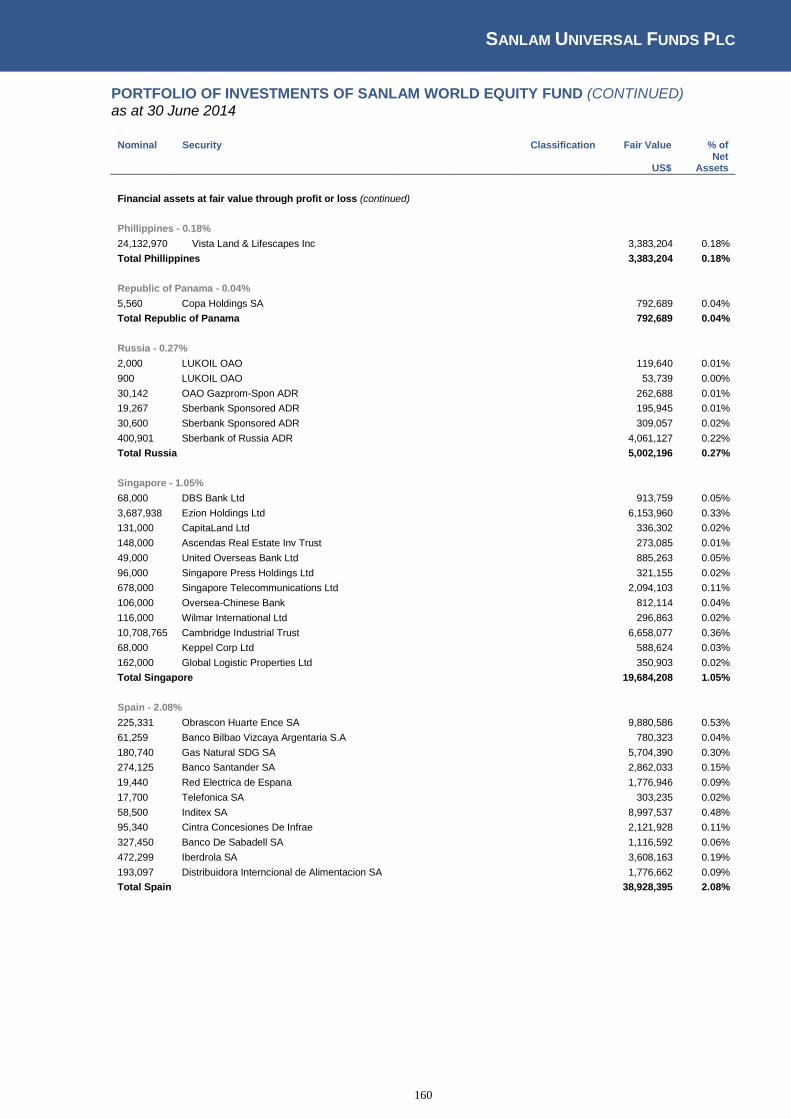
SANLAM UNIVERSAL FUNDS PLC
160
PORTFOLIO OF INVESTMENTS OF SANLAM WORLD EQUITY FUND (CONTINUED) as at 30 June 2014
Nominal Security
Classification Fair Value % of
US$ Net
Assets
Financial assets at fair value through profit or loss (continued)
Phillippines - 0.18% 24,132,970 Vista Land & Lifescapes Inc
3,383,204 0.18%
Total Phillippines
3,383,204 0.18%
Republic of Panama - 0.04% 5,560 Copa Holdings SA
792,689 0.04%
Total Republic of Panama
792,689 0.04%
Russia - 0.27% 2,000 LUKOIL OAO
119,640 0.01%
900 LUKOIL OAO
53,739 0.00%
30,142 OAO Gazprom-Spon ADR
262,688 0.01%
19,267 Sberbank Sponsored ADR
195,945 0.01%
30,600 Sberbank Sponsored ADR
309,057 0.02%
400,901 Sberbank of Russia ADR
4,061,127 0.22%
Total Russia
5,002,196 0.27%
Singapore - 1.05% 68,000 DBS Bank Ltd
913,759 0.05%
3,687,938 Ezion Holdings Ltd
6,153,960 0.33%
131,000 CapitaLand Ltd
336,302 0.02%
148,000 Ascendas Real Estate Inv Trust
273,085 0.01%
49,000 United Overseas Bank Ltd
885,263 0.05%
96,000 Singapore Press Holdings Ltd
321,155 0.02%
678,000 Singapore Telecommunications Ltd
2,094,103 0.11%
106,000 Oversea-Chinese Bank
812,114 0.04%
116,000 Wilmar International Ltd
296,863 0.02%
10,708,765 Cambridge Industrial Trust
6,658,077 0.36%
68,000 Keppel Corp Ltd
588,624 0.03%
162,000 Global Logistic Properties Ltd
350,903 0.02%
Total Singapore
19,684,208 1.05%
Spain - 2.08% 225,331 Obrascon Huarte Ence SA
9,880,586 0.53%
61,259 Banco Bilbao Vizcaya Argentaria S.A
780,323 0.04%
180,740 Gas Natural SDG SA
5,704,390 0.30%
274,125 Banco Santander SA
2,862,033 0.15%
19,440 Red Electrica de Espana
1,776,946 0.09%
17,700 Telefonica SA
303,235 0.02%
58,500 Inditex SA
8,997,537 0.48%
95,340 Cintra Concesiones De Infrae
2,121,928 0.11%
327,450 Banco De Sabadell SA
1,116,592 0.06%
472,299 Iberdrola SA
3,608,163 0.19%
193,097 Distribuidora Interncional de Alimentacion SA
1,776,662 0.09%
Total Spain
38,928,395 2.08%

SANLAM UNIVERSAL FUNDS PLC
161
PORTFOLIO OF INVESTMENTS OF SANLAM WORLD EQUITY FUND (CONTINUED) as at 30 June 2014
Nominal Security
Classification Fair Value % of
US$ Net
Assets
Financial assets at fair value through profit or loss (continued)
Sweden - 0.89% 686,981 Skandinaviska Enskilda Banken SEB
9,173,855 0.49%
89,240 Securitas AB
1,057,583 0.06%
76,540 Skanska AB
1,745,476 0.09%
36,710 Atlas Copco AB
1,060,040 0.06%
80,036 Tyco International Ltd
3,649,642 0.19%
Total Sweden
16,686,596 0.89%
Switzerland - 3.46% 12,835 Syngenta AG
4,781,099 0.26%
1,202 Sika AG
4,915,363 0.26%
54,614 Novartis AG
4,945,871 0.26%
88,269 Roche Holding AG
26,330,383 1.41%
77,092 Adecco SA
6,346,810 0.34%
72,840 Clariant AG
1,426,077 0.08%
27,040 Nestle SA
2,095,013 0.11%
40,000 Implenia AG
2,693,132 0.14%
403,483 UBS AG
7,403,483 0.40%
1,020 ACE Ltd
105,774 0.01%
8,750 Garmin Ltd
532,875 0.03%
17,590 Swiss RE AG
1,565,187 0.08%
8,641 TE Connectivity Ltd
534,359 0.03%
48,940 Coca-Cola HBC AG
1,122,308 0.06%
Total Switzerland
64,797,734 3.46%
Taiwan - 0.08% 87,830 Delta Electronics Inc
639,582 0.03%
28,300 MediaTek Inc
478,489 0.03%
107,000 Taiwan Semiconductor Manufacturing Co Ltd
453,177 0.02%
Total Taiwan
1,571,248 0.08%
United States of America - 52.20% 94,872 Verizon Communications Inc
4,648,728 0.25%
22,339 Amazon.Com Inc
7,255,260 0.39%
65,214 Abbott Laboratories
2,667,253 0.14%
112,056 AES Corp
1,742,471 0.09%
46,749 International Business Machines Corp
8,474,191 0.45%
1,889 Adobe Systems Inc
136,688 0.01%
787 Air Products & Chemicals Inc
101,224 0.01%
884 Allergan Inc
149,590 0.01%
10,992 Du Pont De Nemours and Co
719,316 0.04%
2,013 Allstate Corp
118,203 0.01%
66,525 Honeywell International Inc
6,183,499 0.33%
2,305 Altera Corp
80,122 0.00%
99,857 Alcoa Inc
1,486,871 0.08%
55,410 Amgen Corp
6,558,882 0.35%
14,849 Amerada Hess Corp
1,468,418 0.08%
77,727 American Express Co
7,373,960 0.39%
1,575 Aflac Inc
98,044 0.01%
160,993 American International Group Inc
8,786,998 0.47%
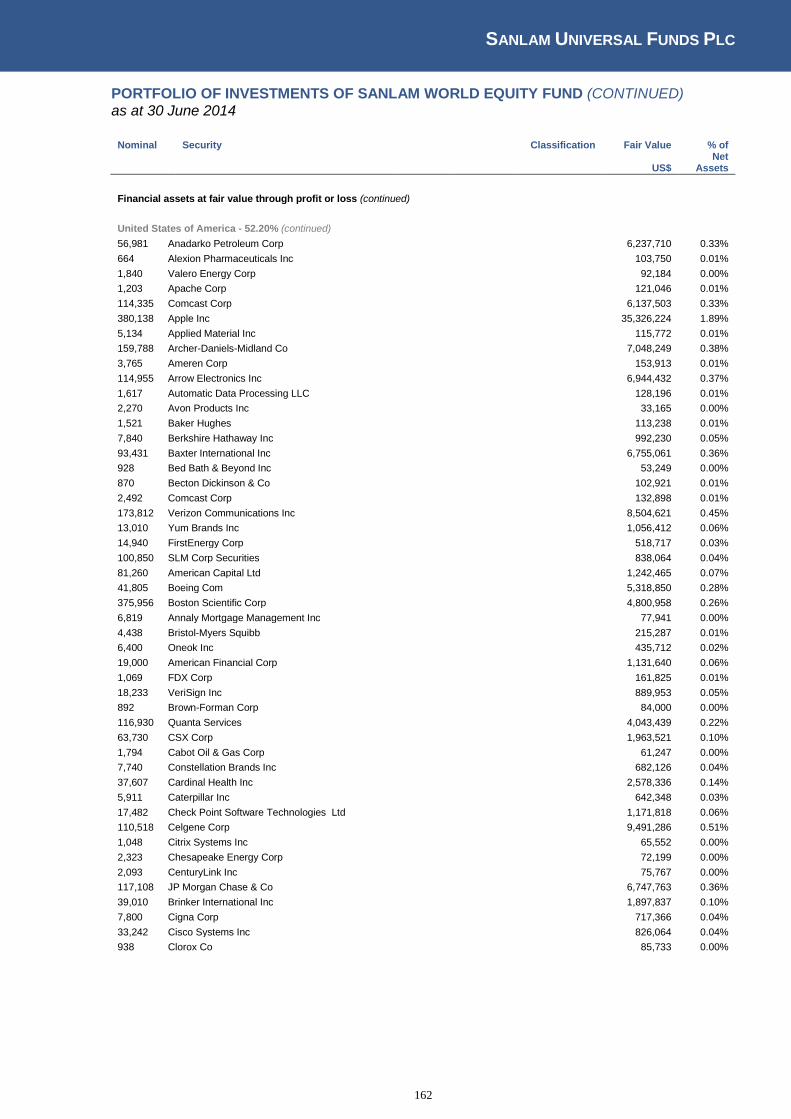
SANLAM UNIVERSAL FUNDS PLC
162
PORTFOLIO OF INVESTMENTS OF SANLAM WORLD EQUITY FUND (CONTINUED) as at 30 June 2014
Nominal Security
Classification Fair Value % of
US$ Net
Assets
Financial assets at fair value through profit or loss (continued)
United States of America - 52.20% (continued)
56,981 Anadarko Petroleum Corp
6,237,710 0.33%
664 Alexion Pharmaceuticals Inc
103,750 0.01%
1,840 Valero Energy Corp
92,184 0.00%
1,203 Apache Corp
121,046 0.01%
114,335 Comcast Corp
6,137,503 0.33%
380,138 Apple Inc
35,326,224 1.89%
5,134 Applied Material Inc
115,772 0.01%
159,788 Archer-Daniels-Midland Co
7,048,249 0.38%
3,765 Ameren Corp
153,913 0.01%
114,955 Arrow Electronics Inc
6,944,432 0.37%
1,617 Automatic Data Processing LLC
128,196 0.01%
2,270 Avon Products Inc
33,165 0.00%
1,521 Baker Hughes
113,238 0.01%
7,840 Berkshire Hathaway Inc
992,230 0.05%
93,431 Baxter International Inc
6,755,061 0.36%
928 Bed Bath & Beyond Inc
53,249 0.00%
870 Becton Dickinson & Co
102,921 0.01%
2,492 Comcast Corp
132,898 0.01%
173,812 Verizon Communications Inc
8,504,621 0.45%
13,010 Yum Brands Inc
1,056,412 0.06%
14,940 FirstEnergy Corp
518,717 0.03%
100,850 SLM Corp Securities
838,064 0.04%
81,260 American Capital Ltd
1,242,465 0.07%
41,805 Boeing Com
5,318,850 0.28%
375,956 Boston Scientific Corp
4,800,958 0.26%
6,819 Annaly Mortgage Management Inc
77,941 0.00%
4,438 Bristol-Myers Squibb
215,287 0.01%
6,400 Oneok Inc
435,712 0.02%
19,000 American Financial Corp
1,131,640 0.06%
1,069 FDX Corp
161,825 0.01%
18,233 VeriSign Inc
889,953 0.05%
892 Brown-Forman Corp
84,000 0.00%
116,930 Quanta Services
4,043,439 0.22%
63,730 CSX Corp
1,963,521 0.10%
1,794 Cabot Oil & Gas Corp
61,247 0.00%
7,740 Constellation Brands Inc
682,126 0.04%
37,607 Cardinal Health Inc
2,578,336 0.14%
5,911 Caterpillar Inc
642,348 0.03%
17,482 Check Point Software Technologies Ltd
1,171,818 0.06%
110,518 Celgene Corp
9,491,286 0.51%
1,048 Citrix Systems Inc
65,552 0.00%
2,323 Chesapeake Energy Corp
72,199 0.00%
2,093 CenturyLink Inc
75,767 0.00%
117,108 JP Morgan Chase & Co
6,747,763 0.36%
39,010 Brinker International Inc
1,897,837 0.10%
7,800 Cigna Corp
717,366 0.04%
33,242 Cisco Systems Inc
826,064 0.04%
938 Clorox Co
85,733 0.00%
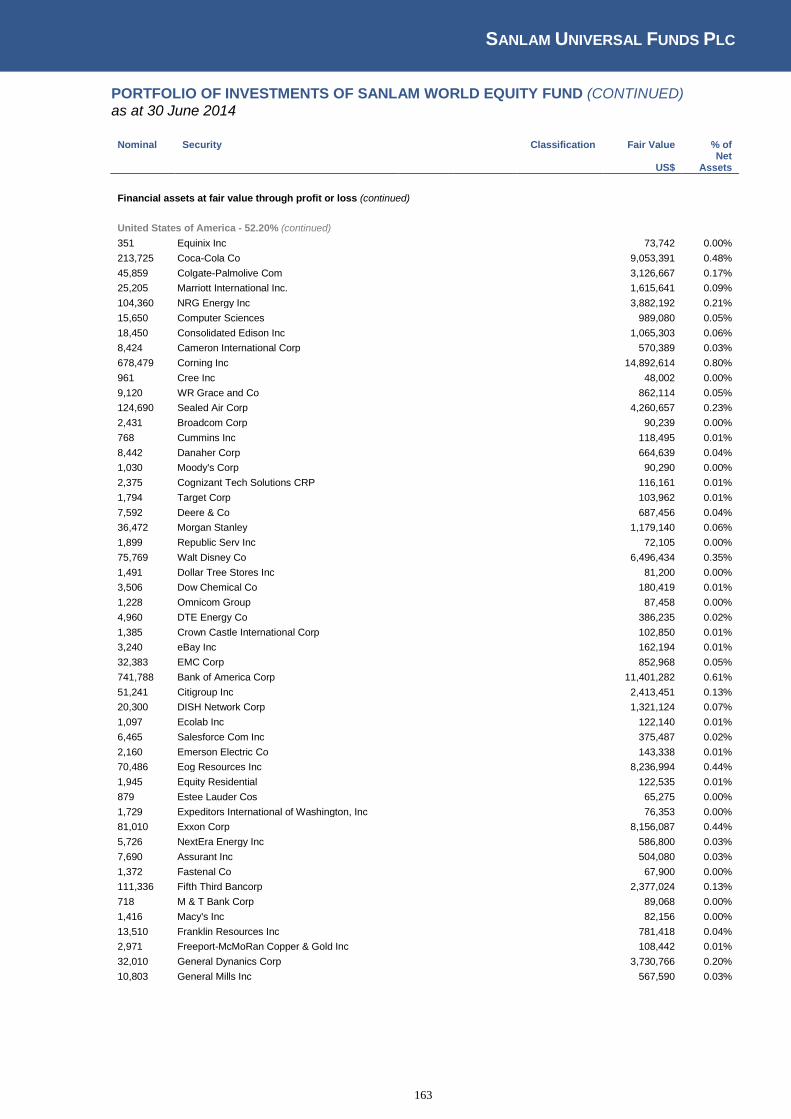
SANLAM UNIVERSAL FUNDS PLC
163
PORTFOLIO OF INVESTMENTS OF SANLAM WORLD EQUITY FUND (CONTINUED) as at 30 June 2014
Nominal Security
Classification Fair Value % of
US$ Net
Assets
Financial assets at fair value through profit or loss (continued)
United States of America - 52.20% (continued) 351 Equinix Inc
73,742 0.00%
213,725 Coca-Cola Co
9,053,391 0.48%
45,859 Colgate-Palmolive Com
3,126,667 0.17%
25,205 Marriott International Inc.
1,615,641 0.09%
104,360 NRG Energy Inc
3,882,192 0.21%
15,650 Computer Sciences
989,080 0.05%
18,450 Consolidated Edison Inc
1,065,303 0.06%
8,424 Cameron International Corp
570,389 0.03%
678,479 Corning Inc
14,892,614 0.80%
961 Cree Inc
48,002 0.00%
9,120 WR Grace and Co
862,114 0.05%
124,690 Sealed Air Corp
4,260,657 0.23%
2,431 Broadcom Corp
90,239 0.00%
768 Cummins Inc
118,495 0.01%
8,442 Danaher Corp
664,639 0.04%
1,030 Moody's Corp
90,290 0.00%
2,375 Cognizant Tech Solutions CRP
116,161 0.01%
1,794 Target Corp
103,962 0.01%
7,592 Deere & Co
687,456 0.04%
36,472 Morgan Stanley
1,179,140 0.06%
1,899 Republic Serv Inc
72,105 0.00%
75,769 Walt Disney Co
6,496,434 0.35%
1,491 Dollar Tree Stores Inc
81,200 0.00%
3,506 Dow Chemical Co
180,419 0.01%
1,228 Omnicom Group
87,458 0.00%
4,960 DTE Energy Co
386,235 0.02%
1,385 Crown Castle International Corp
102,850 0.01%
3,240 eBay Inc
162,194 0.01%
32,383 EMC Corp
852,968 0.05%
741,788 Bank of America Corp
11,401,282 0.61%
51,241 Citigroup Inc
2,413,451 0.13%
20,300 DISH Network Corp
1,321,124 0.07%
1,097 Ecolab Inc
122,140 0.01%
6,465 Salesforce Com Inc
375,487 0.02%
2,160 Emerson Electric Co
143,338 0.01%
70,486 Eog Resources Inc
8,236,994 0.44%
1,945 Equity Residential
122,535 0.01%
879 Estee Lauder Cos
65,275 0.00%
1,729 Expeditors International of Washington, Inc
76,353 0.00%
81,010 Exxon Corp
8,156,087 0.44%
5,726 NextEra Energy Inc
586,800 0.03%
7,690 Assurant Inc
504,080 0.03%
1,372 Fastenal Co
67,900 0.00%
111,336 Fifth Third Bancorp
2,377,024 0.13%
718 M & T Bank Corp
89,068 0.00%
1,416 Macy's Inc
82,156 0.00%
13,510 Franklin Resources Inc
781,418 0.04%
2,971 Freeport-McMoRan Copper & Gold Inc
108,442 0.01%
32,010 General Dynanics Corp
3,730,766 0.20%
10,803 General Mills Inc
567,590 0.03%

SANLAM UNIVERSAL FUNDS PLC
164
PORTFOLIO OF INVESTMENTS OF SANLAM WORLD EQUITY FUND (CONTINUED) as at 30 June 2014
Nominal Security
Classification Fair Value % of
US$ Net
Assets
Financial assets at fair value through profit or loss (continued)
United States of America - 52.20% (continued) 1,564 Genuine Parts Co
137,319 0.01%
244,224 Gilead Sciences Inc
20,248,612 1.08%
9,605 Mckesson Corp
1,788,547 0.10%
284,266 Nvidia Corp
5,270,292 0.28%
53,048 General Electric Co
1,394,101 0.07%
3,700 Infosys Technologies Ltd
198,949 0.01%
158,074 Halliburton Co
11,224,835 0.60%
32,591 Goldman Sachs Group Inc
5,457,037 0.29%
48,200 Harris Corp
3,651,150 0.20%
2,281 HCP Inc
94,388 0.01%
9,169 Hershey Foods Corp
892,786 0.05%
487,610 Hewlett Packard Co
16,422,705 0.88%
447 F5 Networks Inc
49,814 0.00%
2,120 Juniper Networks Inc
52,025 0.00%
28,300 Unum Group
983,708 0.05%
111,211 Home Depot
9,003,643 0.48%
9,338 Humana Inc
1,192,649 0.06%
10,340 Biogen Idec Inc
3,260,305 0.17%
14,600 Idex Corp
1,178,804 0.06%
102,798 Illinois Tool Works Inc
9,000,993 0.48%
1,531 Intuit Inc
123,291 0.01%
152,083 Intel Corp
4,699,365 0.25%
40,800 International Flavors & Fragrances Inc
4,254,624 0.23%
1,811 International Paper Co
91,401 0.00%
18,230 Incyte Corp
1,028,901 0.05%
151,177 Johnson & Johnson
15,816,138 0.85%
2,238 Johnson Controls Inc
111,743 0.01%
26,170 Kla-Tencor Corp
1,900,989 0.10%
1,451 Devon Energy Corp
115,209 0.01%
61,600 Kellogg Co
4,047,120 0.22%
14,375 Kimberley Clark Corp
1,598,788 0.09%
15,405 Blackrock Inc
4,923,438 0.26%
1,146 Kohls Corp
60,371 0.00%
41,867 Kroger Co
2,069,486 0.11%
57,040 LAM Research Corp
3,854,763 0.21%
128,494 Lilly (Eli) & Co
7,988,472 0.43%
127,510 Linear Technology Corp
6,001,896 0.32%
58,630 United Parcel Service Inc
6,018,956 0.32%
1,454 Agilent Technologies Inc
83,518 0.00%
1,076 Lockheed Martin Corp
172,945 0.01%
24,556 Carnival Corp
924,533 0.05%
40,700 Range Resources Corp
3,538,865 0.19%
75,802 Lowes Com
3,637,738 0.19%
2,182 Dominion Resources Inc
156,057 0.01%
2,290 MGM Resorts International
60,456 0.00%
11,593 McDonald's Corp
1,167,879 0.06%
23,816 McGraw-Hill Cos Inc
1,977,442 0.11%
689 Manpower Inc
58,462 0.00%
5,118 Host Hotels & Resorts Inc
112,647 0.01%
41,309 Marsh & McLennan Cos
2,140,632 0.11%
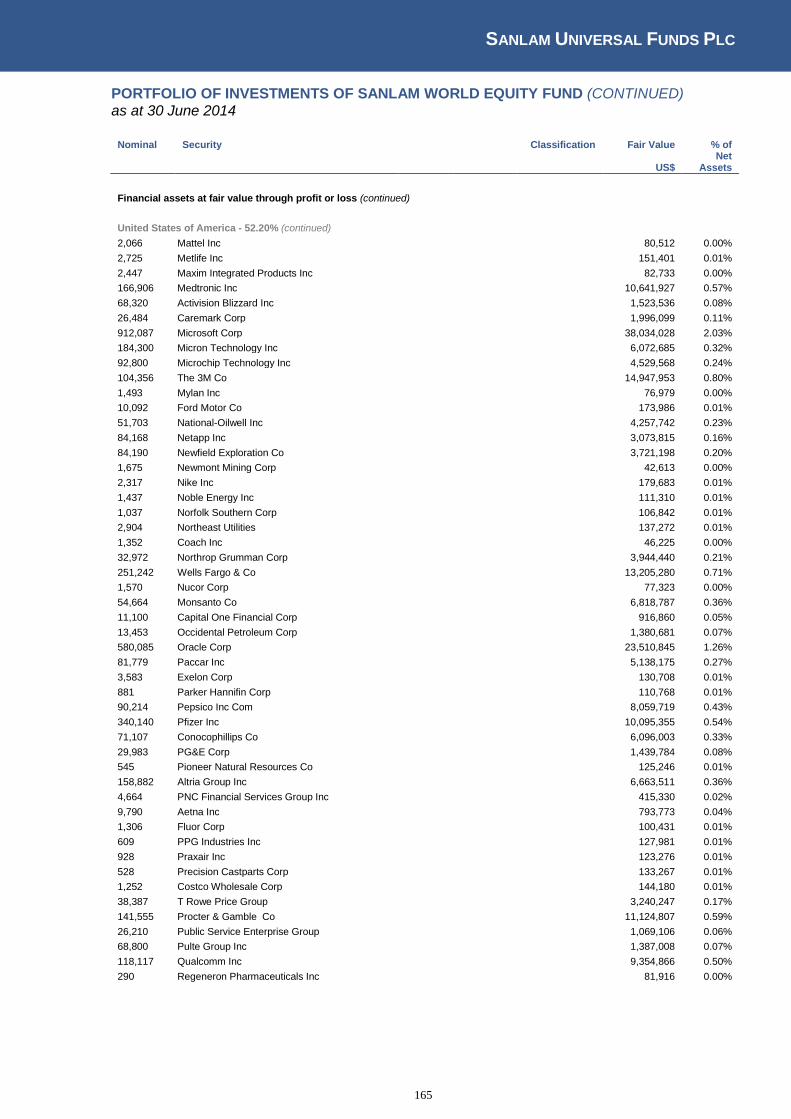
SANLAM UNIVERSAL FUNDS PLC
165
PORTFOLIO OF INVESTMENTS OF SANLAM WORLD EQUITY FUND (CONTINUED) as at 30 June 2014
Nominal Security
Classification Fair Value % of
US$ Net
Assets
Financial assets at fair value through profit or loss (continued)
United States of America - 52.20% (continued) 2,066 Mattel Inc
80,512 0.00%
2,725 Metlife Inc
151,401 0.01%
2,447 Maxim Integrated Products Inc
82,733 0.00%
166,906 Medtronic Inc
10,641,927 0.57%
68,320 Activision Blizzard Inc
1,523,536 0.08%
26,484 Caremark Corp
1,996,099 0.11%
912,087 Microsoft Corp
38,034,028 2.03%
184,300 Micron Technology Inc
6,072,685 0.32%
92,800 Microchip Technology Inc
4,529,568 0.24%
104,356 The 3M Co
14,947,953 0.80%
1,493 Mylan Inc
76,979 0.00%
10,092 Ford Motor Co
173,986 0.01%
51,703 National-Oilwell Inc
4,257,742 0.23%
84,168 Netapp Inc
3,073,815 0.16%
84,190 Newfield Exploration Co
3,721,198 0.20%
1,675 Newmont Mining Corp
42,613 0.00%
2,317 Nike Inc
179,683 0.01%
1,437 Noble Energy Inc
111,310 0.01%
1,037 Norfolk Southern Corp
106,842 0.01%
2,904 Northeast Utilities
137,272 0.01%
1,352 Coach Inc
46,225 0.00%
32,972 Northrop Grumman Corp
3,944,440 0.21%
251,242 Wells Fargo & Co
13,205,280 0.71%
1,570 Nucor Corp
77,323 0.00%
54,664 Monsanto Co
6,818,787 0.36%
11,100 Capital One Financial Corp
916,860 0.05%
13,453 Occidental Petroleum Corp
1,380,681 0.07%
580,085 Oracle Corp
23,510,845 1.26%
81,779 Paccar Inc
5,138,175 0.27%
3,583 Exelon Corp
130,708 0.01%
881 Parker Hannifin Corp
110,768 0.01%
90,214 Pepsico Inc Com
8,059,719 0.43%
340,140 Pfizer Inc
10,095,355 0.54%
71,107 Conocophillips Co
6,096,003 0.33%
29,983 PG&E Corp
1,439,784 0.08%
545 Pioneer Natural Resources Co
125,246 0.01%
158,882 Altria Group Inc
6,663,511 0.36%
4,664 PNC Financial Services Group Inc
415,330 0.02%
9,790 Aetna Inc
793,773 0.04%
1,306 Fluor Corp
100,431 0.01%
609 PPG Industries Inc
127,981 0.01%
928 Praxair Inc
123,276 0.01%
528 Precision Castparts Corp
133,267 0.01%
1,252 Costco Wholesale Corp
144,180 0.01%
38,387 T Rowe Price Group
3,240,247 0.17%
141,555 Procter & Gamble Co
11,124,807 0.59%
26,210 Public Service Enterprise Group
1,069,106 0.06%
68,800 Pulte Group Inc
1,387,008 0.07%
118,117 Qualcomm Inc
9,354,866 0.50%
290 Regeneron Pharmaceuticals Inc
81,916 0.00%
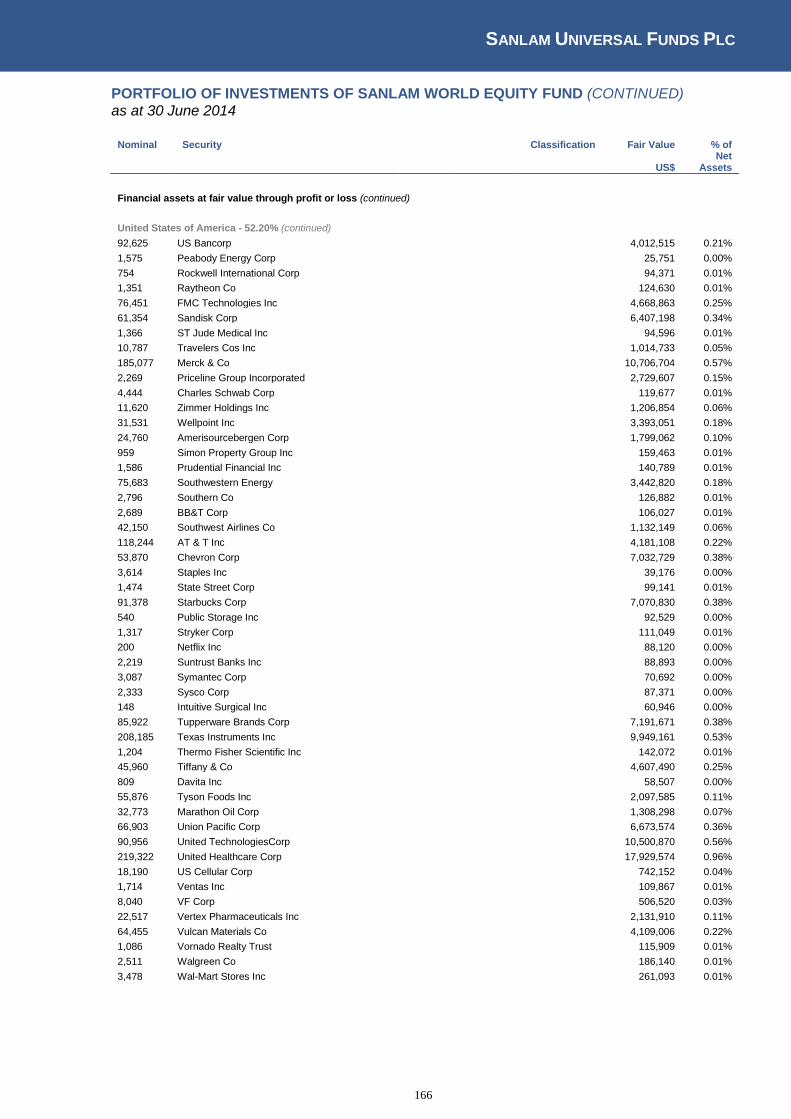
SANLAM UNIVERSAL FUNDS PLC
166
PORTFOLIO OF INVESTMENTS OF SANLAM WORLD EQUITY FUND (CONTINUED) as at 30 June 2014
Nominal Security
Classification Fair Value % of
US$ Net
Assets
Financial assets at fair value through profit or loss (continued)
United States of America - 52.20% (continued) 92,625 US Bancorp
4,012,515 0.21%
1,575 Peabody Energy Corp
25,751 0.00%
754 Rockwell International Corp
94,371 0.01%
1,351 Raytheon Co
124,630 0.01%
76,451 FMC Technologies Inc
4,668,863 0.25%
61,354 Sandisk Corp
6,407,198 0.34%
1,366 ST Jude Medical Inc
94,596 0.01%
10,787 Travelers Cos Inc
1,014,733 0.05%
185,077 Merck & Co
10,706,704 0.57%
2,269 Priceline Group Incorporated
2,729,607 0.15%
4,444 Charles Schwab Corp
119,677 0.01%
11,620 Zimmer Holdings Inc
1,206,854 0.06%
31,531 Wellpoint Inc
3,393,051 0.18%
24,760 Amerisourcebergen Corp
1,799,062 0.10%
959 Simon Property Group Inc
159,463 0.01%
1,586 Prudential Financial Inc
140,789 0.01%
75,683 Southwestern Energy
3,442,820 0.18%
2,796 Southern Co
126,882 0.01%
2,689 BB&T Corp
106,027 0.01%
42,150 Southwest Airlines Co
1,132,149 0.06%
118,244 AT & T Inc
4,181,108 0.22%
53,870 Chevron Corp
7,032,729 0.38%
3,614 Staples Inc
39,176 0.00%
1,474 State Street Corp
99,141 0.01%
91,378 Starbucks Corp
7,070,830 0.38%
540 Public Storage Inc
92,529 0.00%
1,317 Stryker Corp
111,049 0.01%
200 Netflix Inc
88,120 0.00%
2,219 Suntrust Banks Inc
88,893 0.00%
3,087 Symantec Corp
70,692 0.00%
2,333 Sysco Corp
87,371 0.00%
148 Intuitive Surgical Inc
60,946 0.00%
85,922 Tupperware Brands Corp
7,191,671 0.38%
208,185 Texas Instruments Inc
9,949,161 0.53%
1,204 Thermo Fisher Scientific Inc
142,072 0.01%
45,960 Tiffany & Co
4,607,490 0.25%
809 Davita Inc
58,507 0.00%
55,876 Tyson Foods Inc
2,097,585 0.11%
32,773 Marathon Oil Corp
1,308,298 0.07%
66,903 Union Pacific Corp
6,673,574 0.36%
90,956 United TechnologiesCorp
10,500,870 0.56%
219,322 United Healthcare Corp
17,929,574 0.96%
18,190 US Cellular Corp
742,152 0.04%
1,714 Ventas Inc
109,867 0.01%
8,040 VF Corp
506,520 0.03%
22,517 Vertex Pharmaceuticals Inc
2,131,910 0.11%
64,455 Vulcan Materials Co
4,109,006 0.22%
1,086 Vornado Realty Trust
115,909 0.01%
2,511 Walgreen Co
186,140 0.01%
3,478 Wal-Mart Stores Inc
261,093 0.01%

SANLAM UNIVERSAL FUNDS PLC
167
PORTFOLIO OF INVESTMENTS OF SANLAM WORLD EQUITY FUND (CONTINUED) as at 30 June 2014
Nominal Security
Classification Fair Value % of
US$ Net
Assets
Financial assets at fair value through profit or loss (continued)
United States of America - 52.20% (continued) 575 JM Smucker Co
61,278 0.00%
72,290 Western Digital Corp
6,672,367 0.36%
512 Whirlpool Corp
71,281 0.00%
1,379 Whole Foods Market Inc
53,271 0.00%
1,279 CME Group Inc
90,745 0.00%
2,424 The Williams Companies Inc
141,101 0.01%
1,075 Carmax Inc
55,911 0.00%
4,415 Xerox Corp
54,923 0.00%
103,307 Yahoo Inc
3,629,175 0.19%
53,303 TJX Cos Inc
2,833,054 0.15%
80,234 Autoliv Inc
8,578,674 0.46%
48,430 Genworth Financial Inc
842,682 0.05%
8,127 Regions Financial Corp
86,309 0.00%
21,479 Google Inc
12,558,127 0.67%
70,039 Las Vegas Sands Corp
5,338,373 0.29%
117,174 VeriFone Holdings Inc
4,306,145 0.23%
292 CF Industries Holdings Inc
70,235 0.00%
1,056 Ameriprise Financial Inc
126,720 0.01%
12,990 Fidelity National Financial Inc
425,552 0.02%
162,237 Viacom Inc
14,070,815 0.75%
1,903 CBS Corp
118,252 0.01%
169 Chipotle Mexican Grill Inc
100,134 0.01%
21,510 Transdigm Group Incorporated
3,597,763 0.19%
96,939 Mastercard Inc
7,122,108 0.38%
1,239 Starwood Hotels & Resorts Worldwide Inc
100,136 0.01%
2,177 Liberty Media Corp
63,917 0.00%
18,240 Ocwen Financial Corp
676,704 0.04%
18,307 Hanesbrands Inc
1,802,141 0.10%
3,476 Western Union Co
60,274 0.00%
49,850 First Solar Inc
3,542,341 0.19%
13,120 Spirit AeroSystems Holdings Inc
442,144 0.02%
2,895 Spectra Energy Corp
122,980 0.01%
68,585 People's United Financial Inc
1,040,434 0.06%
127,700 Delta Air Lines Inc
4,944,544 0.26%
57,238 Discover Financial Services Inc
3,547,611 0.19%
634 Concho Resources Inc
91,613 0.00%
3,294 Bank New York Mellon Corp
123,459 0.01%
956 Teradata Corp
38,431 0.00%
185,610 Calpine Corp
4,419,374 0.24%
65,003 Philip Morris International Inc
5,480,403 0.29%
32,116 Visa Inc
6,767,162 0.36%
2,660 American Water Works Co Inc
131,537 0.01%
3,484 American Capital Agency Corp
81,560 0.00%
9,360 Colfax Corp
697,694 0.04%
1,745 Lorillard Inc
106,393 0.01%
889 Discovery Communications Inc
64,533 0.00%
40,242 Marathon Petroleum Corp
3,141,693 0.17%
9,417 The Mosiac Co
465,671 0.02%
39,394 Kinder Morgan Inc
1,428,426 0.08%
750 PVH Corp
87,450 0.00%
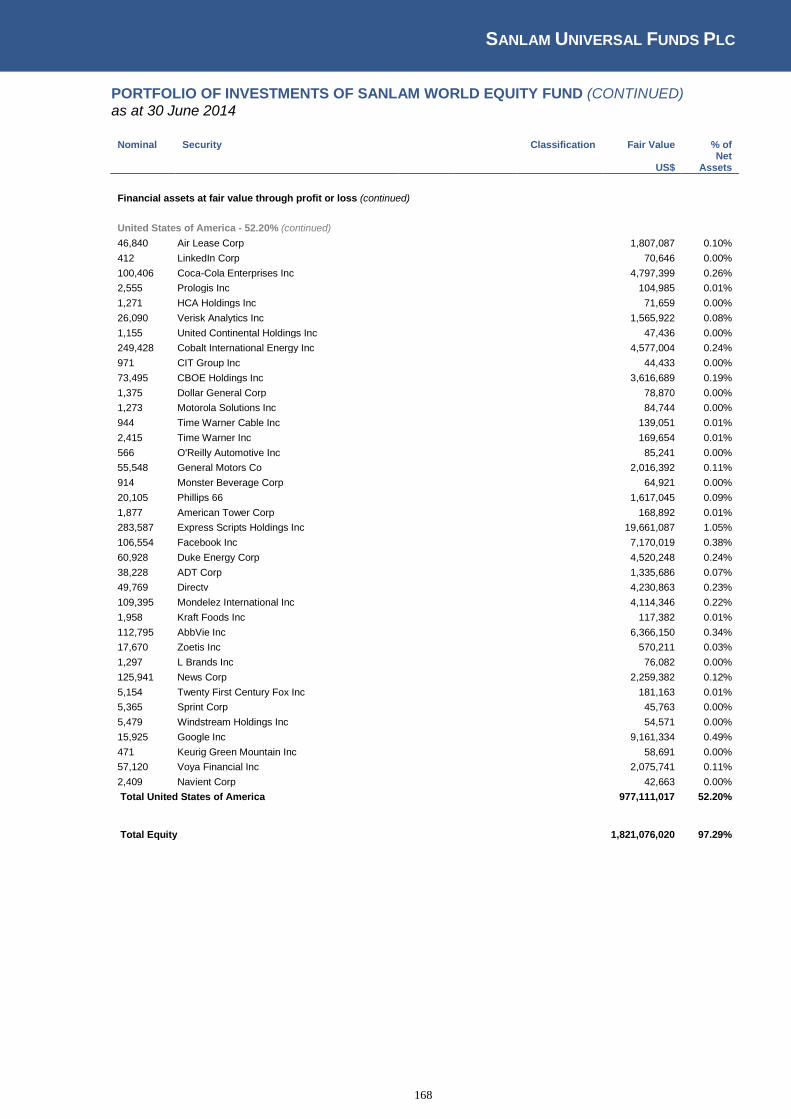
SANLAM UNIVERSAL FUNDS PLC
168
PORTFOLIO OF INVESTMENTS OF SANLAM WORLD EQUITY FUND (CONTINUED) as at 30 June 2014
Nominal Security
Classification Fair Value % of
US$ Net
Assets
Financial assets at fair value through profit or loss (continued)
United States of America - 52.20% (continued) 46,840 Air Lease Corp
1,807,087 0.10%
412 LinkedIn Corp
70,646 0.00%
100,406 Coca-Cola Enterprises Inc
4,797,399 0.26%
2,555 Prologis Inc
104,985 0.01%
1,271 HCA Holdings Inc
71,659 0.00%
26,090 Verisk Analytics Inc
1,565,922 0.08%
1,155 United Continental Holdings Inc
47,436 0.00%
249,428 Cobalt International Energy Inc
4,577,004 0.24%
971 CIT Group Inc
44,433 0.00%
73,495 CBOE Holdings Inc
3,616,689 0.19%
1,375 Dollar General Corp
78,870 0.00%
1,273 Motorola Solutions Inc
84,744 0.00%
944 Time Warner Cable Inc
139,051 0.01%
2,415 Time Warner Inc
169,654 0.01%
566 O'Reilly Automotive Inc
85,241 0.00%
55,548 General Motors Co
2,016,392 0.11%
914 Monster Beverage Corp
64,921 0.00%
20,105 Phillips 66
1,617,045 0.09%
1,877 American Tower Corp
168,892 0.01%
283,587 Express Scripts Holdings Inc
19,661,087 1.05%
106,554 Facebook Inc
7,170,019 0.38%
60,928 Duke Energy Corp
4,520,248 0.24%
38,228 ADT Corp
1,335,686 0.07%
49,769 Directv
4,230,863 0.23%
109,395 Mondelez International Inc
4,114,346 0.22%
1,958 Kraft Foods Inc
117,382 0.01%
112,795 AbbVie Inc
6,366,150 0.34%
17,670 Zoetis Inc
570,211 0.03%
1,297 L Brands Inc
76,082 0.00%
125,941 News Corp
2,259,382 0.12%
5,154 Twenty First Century Fox Inc
181,163 0.01%
5,365 Sprint Corp
45,763 0.00%
5,479 Windstream Holdings Inc
54,571 0.00%
15,925 Google Inc
9,161,334 0.49%
471 Keurig Green Mountain Inc
58,691 0.00%
57,120 Voya Financial Inc
2,075,741 0.11%
2,409 Navient Corp
42,663 0.00%
Total United States of America
977,111,017 52.20%
Total Equity
1,821,076,020 97.29%

SANLAM UNIVERSAL FUNDS PLC
169
PORTFOLIO OF INVESTMENTS OF SANLAM WORLD EQUITY FUND (CONTINUED) as at 30 June 2014
Nominal Security
Classification Fair Value % of
US$ Net
Assets
Financial assets at fair value through profit or loss (continued)
Exchange Traded Funds - 0.48% 1,528,000 PSigma American Growth AP
3,737,490 0.20%
2,540,000 PSigma Global Equity Fund
5,167,676 0.28%
Total Exchange traded funds
8,905,166 0.48%
Total financial assets at fair value through profit or loss
1,829,981,186 97.77%
Cash and cash equivalents
35,824,454 1.91%
Other net assets and liabilities
5,923,998 0.32%
Net assets attributable to holders of redeemable participating shares
1,871,729,638 100.00%
Sanlam World Equity Fund
Summary
Classification Description
Fair Value % of % of
US$ Net Assets Total Assets
Tranferable securities and money market instruments admitted to
official stock exchange listing or traded on regulated market
1,829,981,186 97.77% 97.68%
A Transferabe securities and money market instruments other than
those referred above
- - -
B Collective Investment Schemes
- - -
C Financial derivative instruments dealt in on a regulated market - - -
D Over the counter financial derivative instrument
- - -
Cash and cash equivalents
35,824,454 1.91% 1.91%
Other net assets and liabilities
5,923,998 0.32% 0.32%
Net assets attributable to holders of redeemable participating shares 1,871,729,638 100.00%

SANLAM UNIVERSAL FUNDS PLC
170
PORTFOLIO OF INVESTMENTS OF SANLAM WORLD EQUITY TRACKER FUND as at 30 June 2014
Nominal Security
Classification Fair Value % of
US$ Net
Assets
Financial assets at fair value through profit or loss
Equity - 98.66%
Australia - 3.13% 28,553 Amcor Ltd
280,765 0.06%
47,994 AMP Ltd
239,812 0.05%
37,628 Australia and New Zealand Banking Group Ltd
1,182,726 0.25%
34,443 BHP Billiton Ltd
1,165,742 0.24%
32,507 Brambles Ltd
281,644 0.06%
23,725 Common wealth Bank of Australia
1,809,068 0.38%
6,909 Crown Resorts Ltd
98,486 0.02%
5,310 CSL Ltd
333,158 0.07%
174,101 Dexus Property Group
182,193 0.04%
43,416 Insurance Australia Group
239,040 0.05%
27,651 Lend Lease Corp
341,760 0.07%
5,158 Macquarie Group Ltd
289,970 0.06%
190,939 Mirvac Group
321,322 0.07%
33,634 National Australia Bank Ltd
1,039,429 0.22%
11,624 Newcrest Mining Ltd
115,287 0.02%
8,631 Orica Ltd
158,510 0.03%
27,800 Origin Energy Ltd
383,177 0.08%
26,764 Q.B.E. Insurance Group
274,275 0.06%
9,809 Rio Tinto Ltd
548,479 0.12%
18,201 Santos Ltd
244,693 0.05%
93,012 Scentre Group
280,606 0.06%
20,529 Sonic Healthcare Ltd
335,408 0.07%
17,478 Suncorp Group Ltd
223,109 0.05%
72,066 Sydney Airport
286,715 0.06%
37,648 Tabcorp Hldgs Ltd
119,258 0.03%
76,212 Telstra Corp
374,342 0.08%
54,957 Toll Holdings Ltd
264,241 0.06%
20,478 Transurban Group
142,672 0.03%
19,839 Wesfarmers Ltd
782,561 0.16%
29,361 Westfield Corp
197,918 0.04%
40,651 Westpac Banking Corp Ltd
1,298,441 0.27%
12,517 Woodside Petroleum Ltd
484,655 0.10%
18,597 Woolworths Ltd
617,504 0.13%
Total Australia
14,936,966 3.13%
Austria – 0.06% 4,472 Erste Group Bank AG
144,538 0.03%
3,650 OMV AG
164,819 0.03%
Total Austria
309,357 0.06%
Belgium – 0.50% 7,903 Ageas NV
315,071 0.07%
10,470 Anheuser-Busch InBev
1,202,015 0.25%
1,072 Delhaize Group
72,479 0.02%
5,512 Groupe Bruxelles Lambert SA
572,394 0.12%
4,100 KBC Bankverzekeringsholding
223,009 0.05%
Total Belgium
2,384,968 0.50%
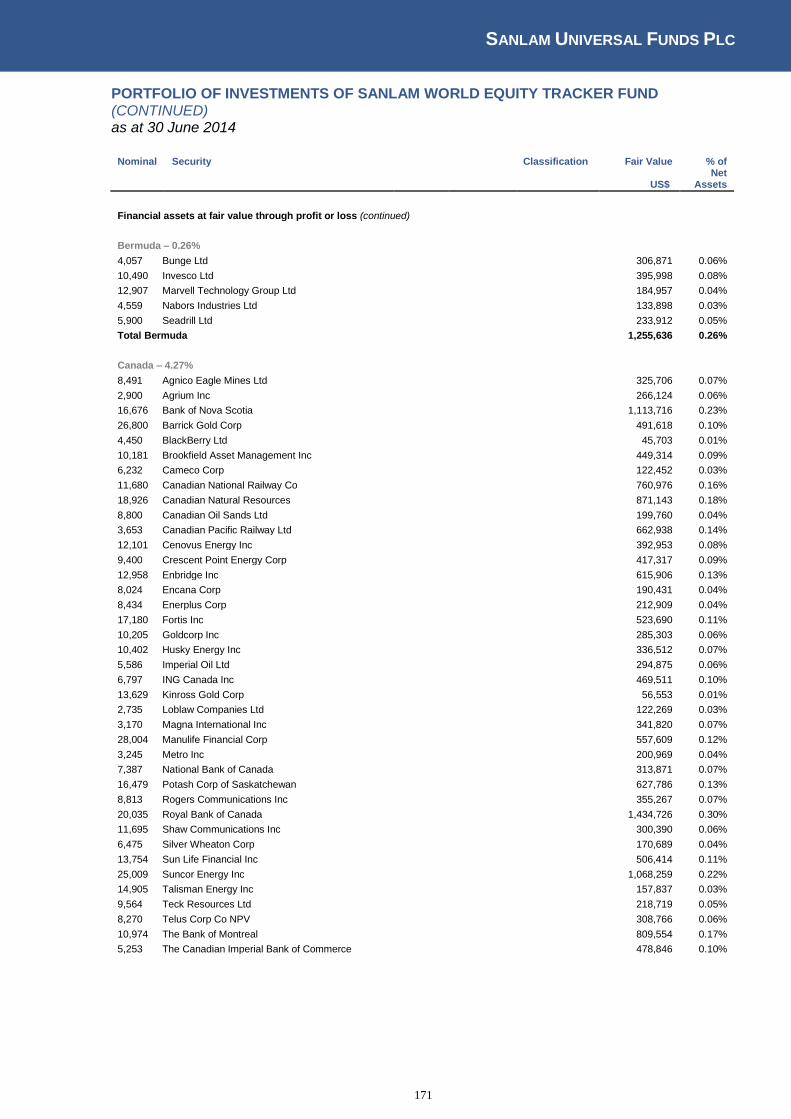
SANLAM UNIVERSAL FUNDS PLC
171
PORTFOLIO OF INVESTMENTS OF SANLAM WORLD EQUITY TRACKER FUND (CONTINUED) as at 30 June 2014
Nominal Security
Classification Fair Value % of
US$ Net
Assets
Financial assets at fair value through profit or loss (continued)
Bermuda – 0.26% 4,057 Bunge Ltd
306,871 0.06%
10,490 Invesco Ltd
395,998 0.08%
12,907 Marvell Technology Group Ltd
184,957 0.04%
4,559 Nabors Industries Ltd
133,898 0.03%
5,900 Seadrill Ltd
233,912 0.05%
Total Bermuda
1,255,636 0.26%
Canada – 4.27% 8,491 Agnico Eagle Mines Ltd
325,706 0.07%
2,900 Agrium Inc
266,124 0.06%
16,676 Bank of Nova Scotia
1,113,716 0.23%
26,800 Barrick Gold Corp
491,618 0.10%
4,450 BlackBerry Ltd
45,703 0.01%
10,181 Brookfield Asset Management Inc
449,314 0.09%
6,232 Cameco Corp
122,452 0.03%
11,680 Canadian National Railway Co
760,976 0.16%
18,926 Canadian Natural Resources
871,143 0.18%
8,800 Canadian Oil Sands Ltd
199,760 0.04%
3,653 Canadian Pacific Railway Ltd
662,938 0.14%
12,101 Cenovus Energy Inc
392,953 0.08%
9,400 Crescent Point Energy Corp
417,317 0.09%
12,958 Enbridge Inc
615,906 0.13%
8,024 Encana Corp
190,431 0.04%
8,434 Enerplus Corp
212,909 0.04%
17,180 Fortis Inc
523,690 0.11%
10,205 Goldcorp Inc
285,303 0.06%
10,402 Husky Energy Inc
336,512 0.07%
5,586 Imperial Oil Ltd
294,875 0.06%
6,797 ING Canada Inc
469,511 0.10%
13,629 Kinross Gold Corp
56,553 0.01%
2,735 Loblaw Companies Ltd
122,269 0.03%
3,170 Magna International Inc
341,820 0.07%
28,004 Manulife Financial Corp
557,609 0.12%
3,245 Metro Inc
200,969 0.04%
7,387 National Bank of Canada
313,871 0.07%
16,479 Potash Corp of Saskatchewan
627,786 0.13%
8,813 Rogers Communications Inc
355,267 0.07%
20,035 Royal Bank of Canada
1,434,726 0.30%
11,695 Shaw Communications Inc
300,390 0.06%
6,475 Silver Wheaton Corp
170,689 0.04%
13,754 Sun Life Financial Inc
506,414 0.11%
25,009 Suncor Energy Inc
1,068,259 0.22%
14,905 Talisman Energy Inc
157,837 0.03%
9,564 Teck Resources Ltd
218,719 0.05%
8,270 Telus Corp Co NPV
308,766 0.06%
10,974 The Bank of Montreal
809,554 0.17%
5,253 The Canadian Imperial Bank of Commerce
478,846 0.10%
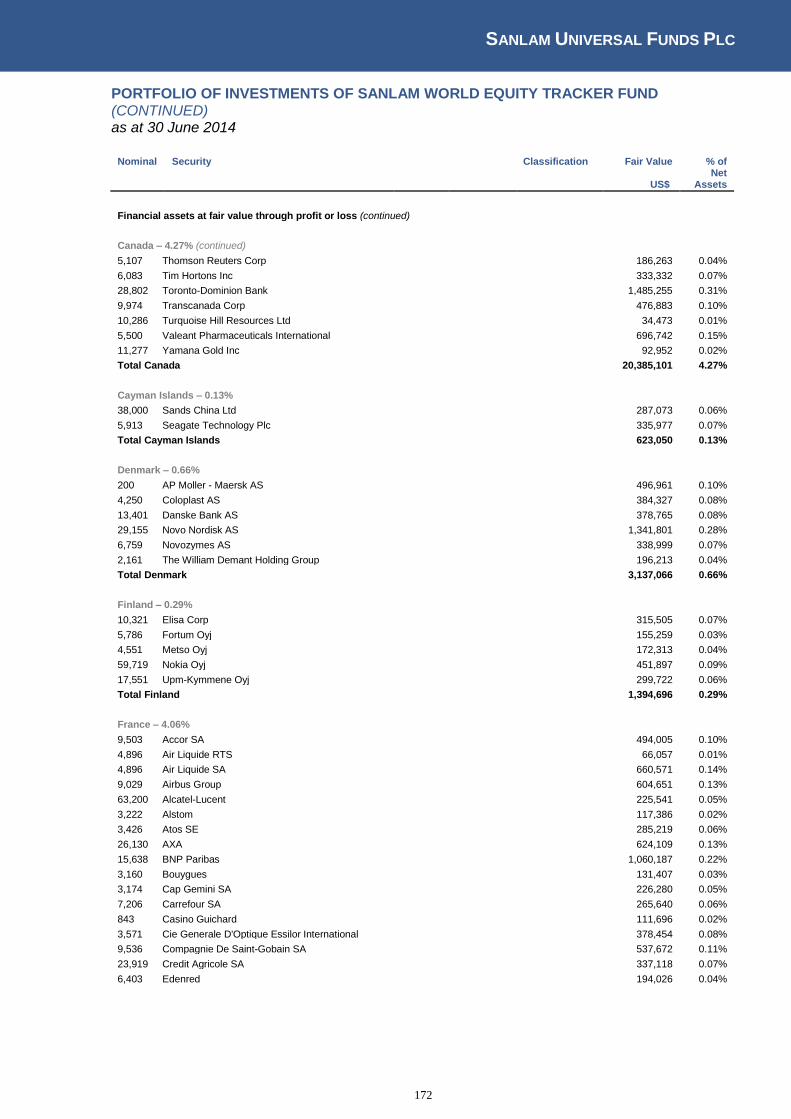
SANLAM UNIVERSAL FUNDS PLC
172
PORTFOLIO OF INVESTMENTS OF SANLAM WORLD EQUITY TRACKER FUND (CONTINUED) as at 30 June 2014
Nominal Security
Classification Fair Value % of
US$ Net
Assets
Financial assets at fair value through profit or loss (continued)
Canada – 4.27% (continued) 5,107 Thomson Reuters Corp
186,263 0.04%
6,083 Tim Hortons Inc
333,332 0.07%
28,802 Toronto-Dominion Bank
1,485,255 0.31%
9,974 Transcanada Corp
476,883 0.10%
10,286 Turquoise Hill Resources Ltd
34,473 0.01%
5,500 Valeant Pharmaceuticals International
696,742 0.15%
11,277 Yamana Gold Inc
92,952 0.02%
Total Canada
20,385,101 4.27%
Cayman Islands – 0.13% 38,000 Sands China Ltd
287,073 0.06%
5,913 Seagate Technology Plc
335,977 0.07%
Total Cayman Islands
623,050 0.13%
Denmark – 0.66% 200 AP Moller - Maersk AS
496,961 0.10%
4,250 Coloplast AS
384,327 0.08%
13,401 Danske Bank AS
378,765 0.08%
29,155 Novo Nordisk AS
1,341,801 0.28%
6,759 Novozymes AS
338,999 0.07%
2,161 The William Demant Holding Group
196,213 0.04%
Total Denmark
3,137,066 0.66%
Finland – 0.29% 10,321 Elisa Corp
315,505 0.07%
5,786 Fortum Oyj
155,259 0.03%
4,551 Metso Oyj
172,313 0.04%
59,719 Nokia Oyj
451,897 0.09%
17,551 Upm-Kymmene Oyj
299,722 0.06%
Total Finland
1,394,696 0.29%
France – 4.06% 9,503 Accor SA
494,005 0.10%
4,896 Air Liquide RTS
66,057 0.01%
4,896 Air Liquide SA
660,571 0.14%
9,029 Airbus Group
604,651 0.13%
63,200 Alcatel-Lucent
225,541 0.05%
3,222 Alstom
117,386 0.02%
3,426 Atos SE
285,219 0.06%
26,130 AXA
624,109 0.13%
15,638 BNP Paribas
1,060,187 0.22%
3,160 Bouygues
131,407 0.03%
3,174 Cap Gemini SA
226,280 0.05%
7,206 Carrefour SA
265,640 0.06%
843 Casino Guichard
111,696 0.02%
3,571 Cie Generale D'Optique Essilor International
378,454 0.08%
9,536 Compagnie De Saint-Gobain SA
537,672 0.11%
23,919 Credit Agricole SA
337,118 0.07%
6,403 Edenred
194,026 0.04%
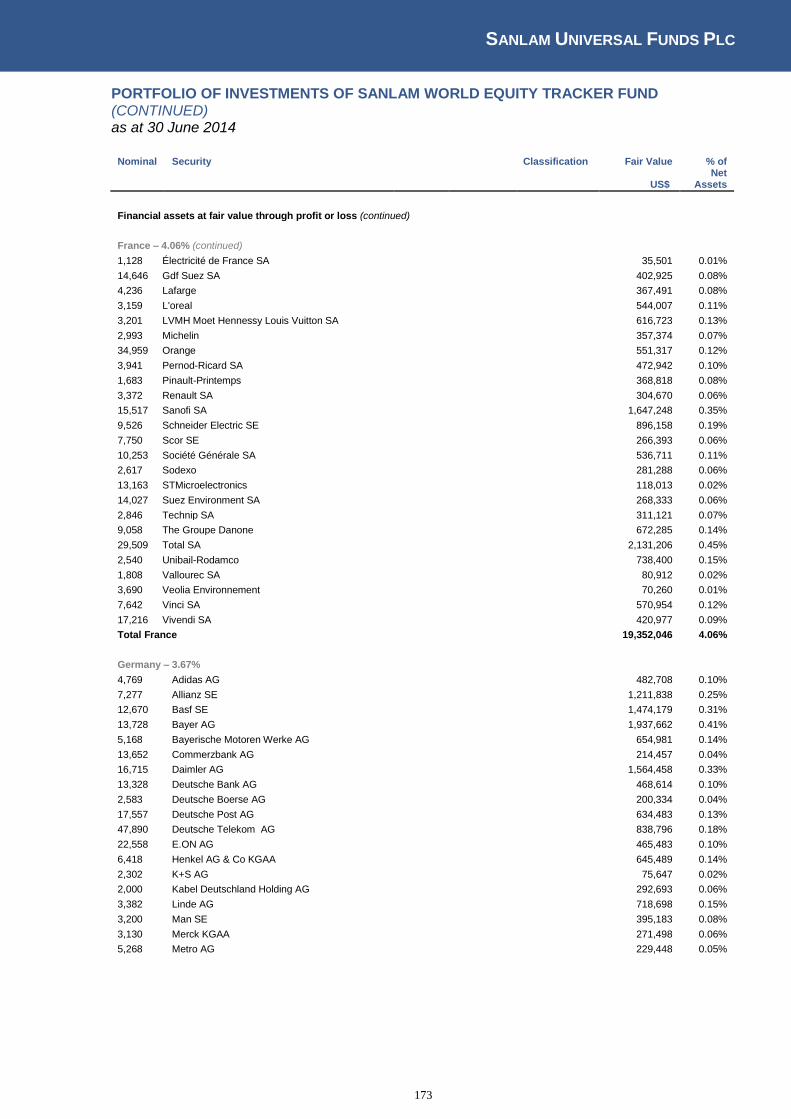
SANLAM UNIVERSAL FUNDS PLC
173
PORTFOLIO OF INVESTMENTS OF SANLAM WORLD EQUITY TRACKER FUND (CONTINUED) as at 30 June 2014
Nominal Security
Classification Fair Value % of
US$ Net
Assets
Financial assets at fair value through profit or loss (continued)
France – 4.06% (continued) 1,128 Électricité de France SA
35,501 0.01%
14,646 Gdf Suez SA
402,925 0.08%
4,236 Lafarge
367,491 0.08%
3,159 L'oreal
544,007 0.11%
3,201 LVMH Moet Hennessy Louis Vuitton SA
616,723 0.13%
2,993 Michelin
357,374 0.07%
34,959 Orange
551,317 0.12%
3,941 Pernod-Ricard SA
472,942 0.10%
1,683 Pinault-Printemps
368,818 0.08%
3,372 Renault SA
304,670 0.06%
15,517 Sanofi SA
1,647,248 0.35%
9,526 Schneider Electric SE
896,158 0.19%
7,750 Scor SE
266,393 0.06%
10,253 Société Générale SA
536,711 0.11%
2,617 Sodexo
281,288 0.06%
13,163 STMicroelectronics
118,013 0.02%
14,027 Suez Environment SA
268,333 0.06%
2,846 Technip SA
311,121 0.07%
9,058 The Groupe Danone
672,285 0.14%
29,509 Total SA
2,131,206 0.45%
2,540 Unibail-Rodamco
738,400 0.15%
1,808 Vallourec SA
80,912 0.02%
3,690 Veolia Environnement
70,260 0.01%
7,642 Vinci SA
570,954 0.12%
17,216 Vivendi SA
420,977 0.09%
Total France
19,352,046 4.06%
Germany – 3.67% 4,769 Adidas AG
482,708 0.10%
7,277 Allianz SE
1,211,838 0.25%
12,670 Basf SE
1,474,179 0.31%
13,728 Bayer AG
1,937,662 0.41%
5,168 Bayerische Motoren Werke AG
654,981 0.14%
13,652 Commerzbank AG
214,457 0.04%
16,715 Daimler AG
1,564,458 0.33%
13,328 Deutsche Bank AG
468,614 0.10%
2,583 Deutsche Boerse AG
200,334 0.04%
17,557 Deutsche Post AG
634,483 0.13%
47,890 Deutsche Telekom AG
838,796 0.18%
22,558 E.ON AG
465,483 0.10%
6,418 Henkel AG & Co KGAA
645,489 0.14%
2,302 K+S AG
75,647 0.02%
2,000 Kabel Deutschland Holding AG
292,693 0.06%
3,382 Linde AG
718,698 0.15%
3,200 Man SE
395,183 0.08%
3,130 Merck KGAA
271,498 0.06%
5,268 Metro AG
229,448 0.05%
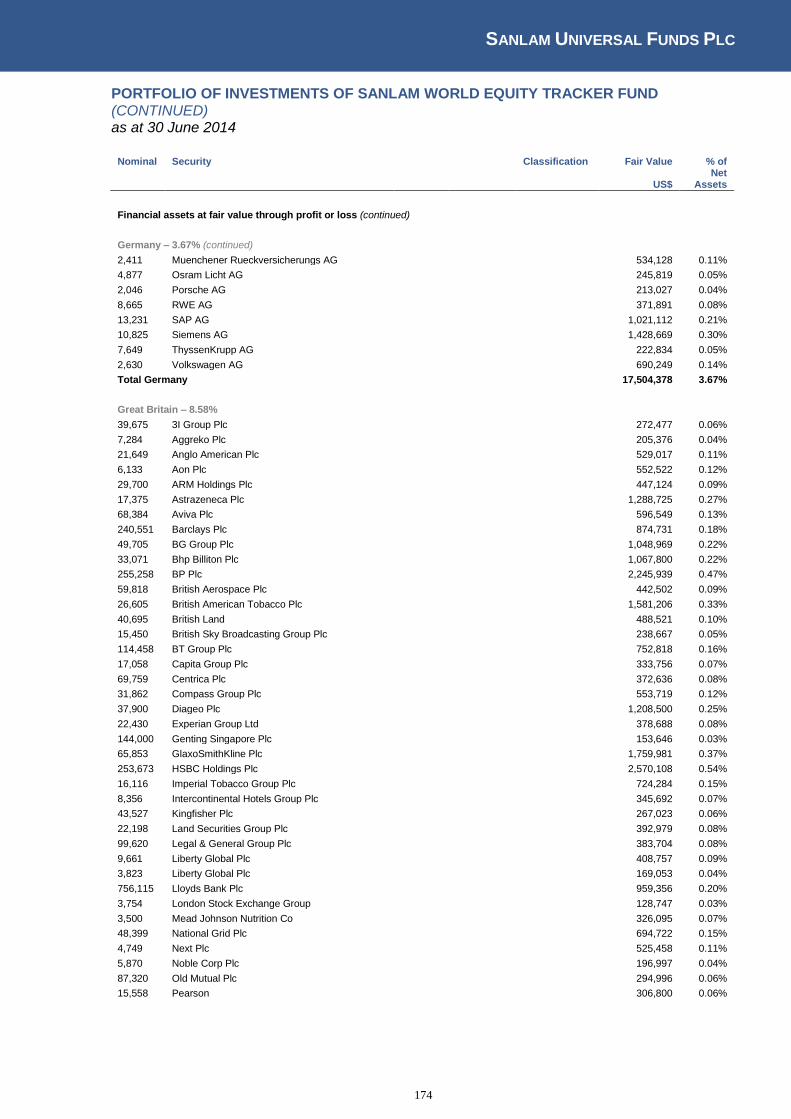
SANLAM UNIVERSAL FUNDS PLC
174
PORTFOLIO OF INVESTMENTS OF SANLAM WORLD EQUITY TRACKER FUND (CONTINUED) as at 30 June 2014
Nominal Security
Classification Fair Value % of
US$ Net
Assets
Financial assets at fair value through profit or loss (continued)
Germany – 3.67% (continued) 2,411 Muenchener Rueckversicherungs AG
534,128 0.11%
4,877 Osram Licht AG
245,819 0.05%
2,046 Porsche AG
213,027 0.04%
8,665 RWE AG
371,891 0.08%
13,231 SAP AG
1,021,112 0.21%
10,825 Siemens AG
1,428,669 0.30%
7,649 ThyssenKrupp AG
222,834 0.05%
2,630 Volkswagen AG
690,249 0.14%
Total Germany
17,504,378 3.67%
Great Britain – 8.58% 39,675 3I Group Plc
272,477 0.06%
7,284 Aggreko Plc
205,376 0.04%
21,649 Anglo American Plc
529,017 0.11%
6,133 Aon Plc
552,522 0.12%
29,700 ARM Holdings Plc
447,124 0.09%
17,375 Astrazeneca Plc
1,288,725 0.27%
68,384 Aviva Plc
596,549 0.13%
240,551 Barclays Plc
874,731 0.18%
49,705 BG Group Plc
1,048,969 0.22%
33,071 Bhp Billiton Plc
1,067,800 0.22%
255,258 BP Plc
2,245,939 0.47%
59,818 British Aerospace Plc
442,502 0.09%
26,605 British American Tobacco Plc
1,581,206 0.33%
40,695 British Land
488,521 0.10%
15,450 British Sky Broadcasting Group Plc
238,667 0.05%
114,458 BT Group Plc
752,818 0.16%
17,058 Capita Group Plc
333,756 0.07%
69,759 Centrica Plc
372,636 0.08%
31,862 Compass Group Plc
553,719 0.12%
37,900 Diageo Plc
1,208,500 0.25%
22,430 Experian Group Ltd
378,688 0.08%
144,000 Genting Singapore Plc
153,646 0.03%
65,853 GlaxoSmithKline Plc
1,759,981 0.37%
253,673 HSBC Holdings Plc
2,570,108 0.54%
16,116 Imperial Tobacco Group Plc
724,284 0.15%
8,356 Intercontinental Hotels Group Plc
345,692 0.07%
43,527 Kingfisher Plc
267,023 0.06%
22,198 Land Securities Group Plc
392,979 0.08%
99,620 Legal & General Group Plc
383,704 0.08%
9,661 Liberty Global Plc
408,757 0.09%
3,823 Liberty Global Plc
169,053 0.04%
756,115 Lloyds Bank Plc
959,356 0.20%
3,754 London Stock Exchange Group
128,747 0.03%
3,500 Mead Johnson Nutrition Co
326,095 0.07%
48,399 National Grid Plc
694,722 0.15%
4,749 Next Plc
525,458 0.11%
5,870 Noble Corp Plc
196,997 0.04%
87,320 Old Mutual Plc
294,996 0.06%
15,558 Pearson
306,800 0.06%
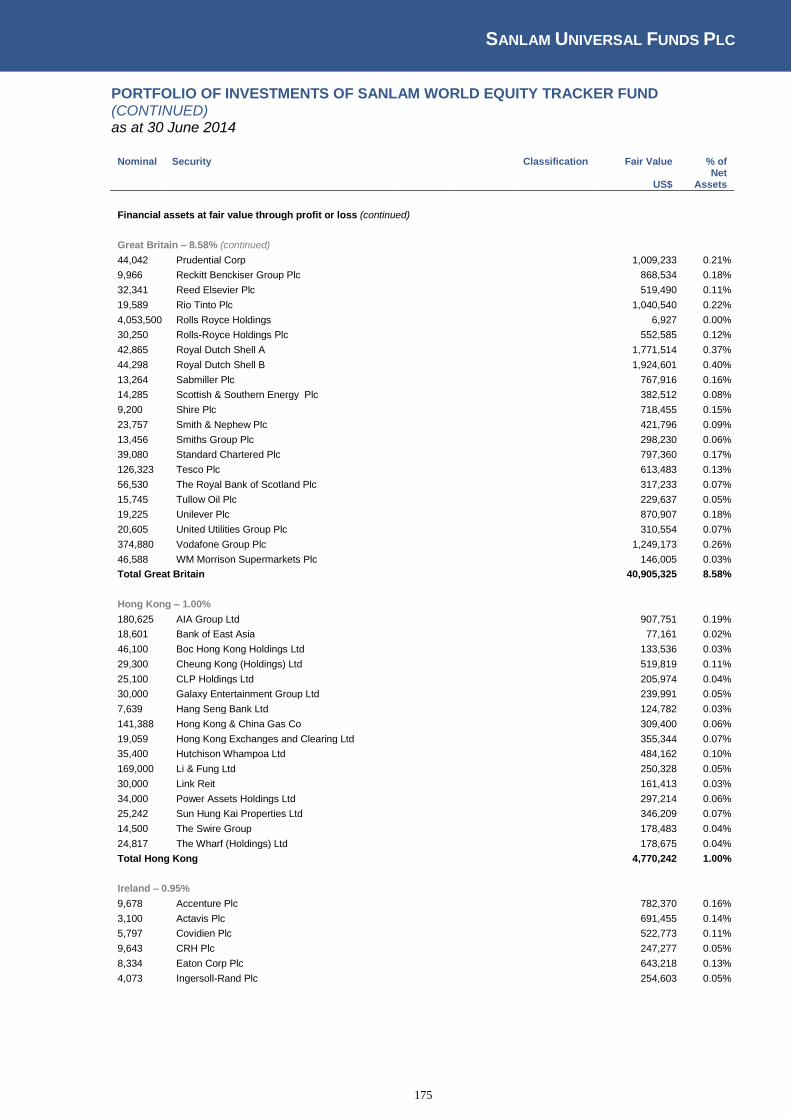
SANLAM UNIVERSAL FUNDS PLC
175
PORTFOLIO OF INVESTMENTS OF SANLAM WORLD EQUITY TRACKER FUND (CONTINUED) as at 30 June 2014
Nominal Security
Classification Fair Value % of
US$ Net
Assets
Financial assets at fair value through profit or loss (continued)
Great Britain – 8.58% (continued) 44,042 Prudential Corp
1,009,233 0.21%
9,966 Reckitt Benckiser Group Plc
868,534 0.18%
32,341 Reed Elsevier Plc
519,490 0.11%
19,589 Rio Tinto Plc
1,040,540 0.22%
4,053,500 Rolls Royce Holdings
6,927 0.00%
30,250 Rolls-Royce Holdings Plc
552,585 0.12%
42,865 Royal Dutch Shell A
1,771,514 0.37%
44,298 Royal Dutch Shell B
1,924,601 0.40%
13,264 Sabmiller Plc
767,916 0.16%
14,285 Scottish & Southern Energy Plc
382,512 0.08%
9,200 Shire Plc
718,455 0.15%
23,757 Smith & Nephew Plc
421,796 0.09%
13,456 Smiths Group Plc
298,230 0.06%
39,080 Standard Chartered Plc
797,360 0.17%
126,323 Tesco Plc
613,483 0.13%
56,530 The Royal Bank of Scotland Plc
317,233 0.07%
15,745 Tullow Oil Plc
229,637 0.05%
19,225 Unilever Plc
870,907 0.18%
20,605 United Utilities Group Plc
310,554 0.07%
374,880 Vodafone Group Plc
1,249,173 0.26%
46,588 WM Morrison Supermarkets Plc
146,005 0.03%
Total Great Britain
40,905,325 8.58%
Hong Kong – 1.00% 180,625 AIA Group Ltd
907,751 0.19%
18,601 Bank of East Asia
77,161 0.02%
46,100 Boc Hong Kong Holdings Ltd
133,536 0.03%
29,300 Cheung Kong (Holdings) Ltd
519,819 0.11%
25,100 CLP Holdings Ltd
205,974 0.04%
30,000 Galaxy Entertainment Group Ltd
239,991 0.05%
7,639 Hang Seng Bank Ltd
124,782 0.03%
141,388 Hong Kong & China Gas Co
309,400 0.06%
19,059 Hong Kong Exchanges and Clearing Ltd
355,344 0.07%
35,400 Hutchison Whampoa Ltd
484,162 0.10%
169,000 Li & Fung Ltd
250,328 0.05%
30,000 Link Reit
161,413 0.03%
34,000 Power Assets Holdings Ltd
297,214 0.06%
25,242 Sun Hung Kai Properties Ltd
346,209 0.07%
14,500 The Swire Group
178,483 0.04%
24,817 The Wharf (Holdings) Ltd
178,675 0.04%
Total Hong Kong
4,770,242 1.00%
Ireland – 0.95% 9,678 Accenture Plc
782,370 0.16%
3,100 Actavis Plc
691,455 0.14%
5,797 Covidien Plc
522,773 0.11%
9,643 CRH Plc
247,277 0.05%
8,334 Eaton Corp Plc
643,218 0.13%
4,073 Ingersoll-Rand Plc
254,603 0.05%
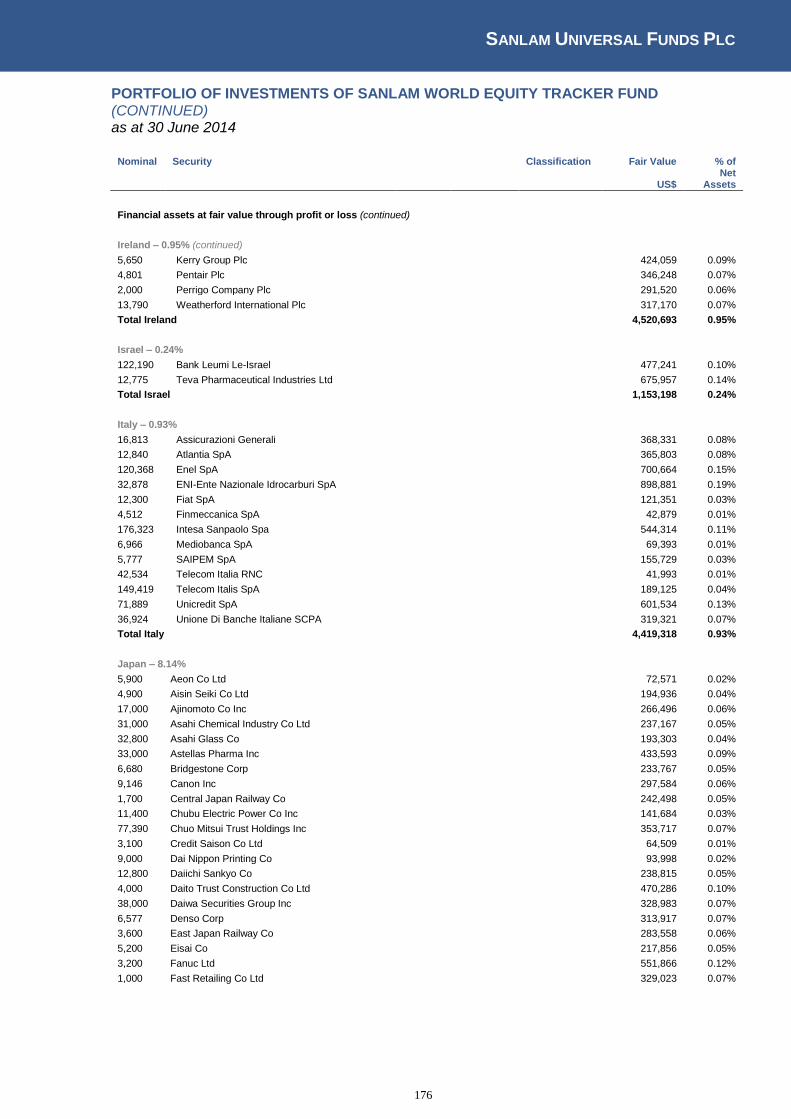
SANLAM UNIVERSAL FUNDS PLC
176
PORTFOLIO OF INVESTMENTS OF SANLAM WORLD EQUITY TRACKER FUND (CONTINUED) as at 30 June 2014
Nominal Security
Classification Fair Value % of
US$ Net
Assets
Financial assets at fair value through profit or loss (continued)
Ireland – 0.95% (continued)
5,650 Kerry Group Plc
424,059 0.09%
4,801 Pentair Plc
346,248 0.07%
2,000 Perrigo Company Plc
291,520 0.06%
13,790 Weatherford International Plc
317,170 0.07%
Total Ireland
4,520,693 0.95%
Israel – 0.24% 122,190 Bank Leumi Le-Israel
477,241 0.10%
12,775 Teva Pharmaceutical Industries Ltd
675,957 0.14%
Total Israel
1,153,198 0.24%
Italy – 0.93% 16,813 Assicurazioni Generali
368,331 0.08%
12,840 Atlantia SpA
365,803 0.08%
120,368 Enel SpA
700,664 0.15%
32,878 ENI-Ente Nazionale Idrocarburi SpA
898,881 0.19%
12,300 Fiat SpA
121,351 0.03%
4,512 Finmeccanica SpA
42,879 0.01%
176,323 Intesa Sanpaolo Spa
544,314 0.11%
6,966 Mediobanca SpA
69,393 0.01%
5,777 SAIPEM SpA
155,729 0.03%
42,534 Telecom Italia RNC
41,993 0.01%
149,419 Telecom Italis SpA
189,125 0.04%
71,889 Unicredit SpA
601,534 0.13%
36,924 Unione Di Banche Italiane SCPA
319,321 0.07%
Total Italy
4,419,318 0.93%
Japan – 8.14% 5,900 Aeon Co Ltd
72,571 0.02%
4,900 Aisin Seiki Co Ltd
194,936 0.04%
17,000 Ajinomoto Co Inc
266,496 0.06%
31,000 Asahi Chemical Industry Co Ltd
237,167 0.05%
32,800 Asahi Glass Co
193,303 0.04%
33,000 Astellas Pharma Inc
433,593 0.09%
6,680 Bridgestone Corp
233,767 0.05%
9,146 Canon Inc
297,584 0.06%
1,700 Central Japan Railway Co
242,498 0.05%
11,400 Chubu Electric Power Co Inc
141,684 0.03%
77,390 Chuo Mitsui Trust Holdings Inc
353,717 0.07%
3,100 Credit Saison Co Ltd
64,509 0.01%
9,000 Dai Nippon Printing Co
93,998 0.02%
12,800 Daiichi Sankyo Co
238,815 0.05%
4,000 Daito Trust Construction Co Ltd
470,286 0.10%
38,000 Daiwa Securities Group Inc
328,983 0.07%
6,577 Denso Corp
313,917 0.07%
3,600 East Japan Railway Co
283,558 0.06%
5,200 Eisai Co
217,856 0.05%
3,200 Fanuc Ltd
551,866 0.12%
1,000 Fast Retailing Co Ltd
329,023 0.07%

SANLAM UNIVERSAL FUNDS PLC
177
PORTFOLIO OF INVESTMENTS OF SANLAM WORLD EQUITY TRACKER FUND (CONTINUED) as at 30 June 2014
Nominal Security
Classification Fair Value % of
US$ Net
Assets
Financial assets at fair value through profit or loss (continued)
Japan – 8.14% (continued)
15,000 Fuji Heavy Industries Ltd
415,350 0.09%
13,000 Fuji Photo Film Co
362,537 0.08%
37,721 Fujitsu Ltd
282,628 0.06%
68,000 Hitachi Ltd
498,085 0.10%
21,500 Honda Motor Co
750,696 0.16%
7,100 Hoya Pentax HD Corp
235,919 0.05%
15,880 Isetan Mitsukoshi Holdings Ltd
206,926 0.04%
25,200 Itochu Corp
323,645 0.07%
17,400 Japan Tobacco International
634,336 0.13%
8,600 JFE Holdings Inc
177,518 0.04%
48,340 JX Holdings Inc
258,640 0.05%
20,700 Kamigumi Co
190,448 0.04%
11,100 Kansai Electric Power Co
104,645 0.02%
19,000 Kansai Paint Co Ltd
317,542 0.07%
12,751 Kao Corp
501,858 0.11%
8,000 KDDI Corp
487,976 0.10%
32,411 Keikyu Corp
291,155 0.06%
29,000 Keisei Electric Railway Co
288,855 0.06%
1,184 Keyence Corp
516,554 0.11%
61,000 Kinki Nippon Railway Co Ltd
222,201 0.05%
21,000 Kirin Holdings Co Ltd
303,287 0.06%
134,000 Kobe Steel Ltd
201,066 0.04%
12,500 Komatsu Ltd
290,227 0.06%
6,500 Konica Minolta Inc
64,230 0.01%
25,000 Kubota Corp
354,393 0.07%
12,155 Kurita Water Industries Ltd
281,617 0.06%
5,200 Kyocera Corp
246,808 0.05%
23,000 Marubeni Corp
168,243 0.04%
37,000 Mazda Motor Corp
173,495 0.04%
22,000 Mitsubishi Chemical Holdings Corp
97,512 0.02%
16,300 Mitsubishi Corp
339,034 0.07%
42,500 Mitsubishi Electric Corp
524,432 0.11%
19,950 Mitsubishi Estate
492,546 0.10%
41,000 Mitsubishi Gas
262,270 0.05%
39,700 Mitsubishi Heavy Industries
247,684 0.05%
21,931 Mitsubishi Motors Corp
242,042 0.05%
12,200 Mitsubishi Tanabe Pharma Corp
182,699 0.04%
171,200 Mitsubishi UFJ Holdings Inc
1,049,508 0.22%
23,300 Mitsui & Co
373,536 0.08%
13,100 Mitsui Fudosan Co Ltd
441,753 0.09%
42,000 Mitsui O.S.K. Lines Ltd
156,308 0.03%
283,800 Mizuho Financial Group Inc
582,729 0.12%
11,500 MS&AD Insurance Group Holdings Inc
277,794 0.06%
4,500 Murata Manufacturing Co Ltd
421,170 0.09%
97,000 Nec Corp
309,289 0.06%
8,000 NGK Spark Plug Co Ltd
225,706 0.05%
7,600 Nidec Corp
466,353 0.10%
6,100 Nikon Corp
96,046 0.02%
1,600 Nintendo Co
191,510 0.04%

SANLAM UNIVERSAL FUNDS PLC
178
PORTFOLIO OF INVESTMENTS OF SANLAM WORLD EQUITY TRACKER FUND (CONTINUED) as at 30 June 2014
Nominal Security
Classification Fair Value % of
US$ Net
Assets
Financial assets at fair value through profit or loss (continued)
Japan – 8.14% (continued)
126,690 Nippon Steel Corp
405,208 0.08%
4,700 Nippon TeL & Tel
293,135 0.06%
36,500 Nissan Motor Co Ltd
346,264 0.07%
6,400 Nitori Holdings Co Ltd
350,010 0.07%
3,400 Nitto Denko Corp
159,327 0.03%
13,250 NKSJ Holdings Inc
356,821 0.07%
42,300 Nomura Securities Co Ltd
299,399 0.06%
28,200 NTT Mobile Communications
482,156 0.10%
20,720 Obayashi Corp
147,883 0.03%
2,800 Ono Pharmaceutical Co Ltd
246,555 0.05%
33,700 Orix Corp
558,562 0.12%
37,461 Panasonic Corp
456,336 0.10%
37,985 Resona Holdings Inc
221,235 0.05%
15,000 Ricoh Co Ltd
178,727 0.04%
3,300 Secom Co
201,649 0.04%
4,300 Sega Sammy Holdings Inc
84,599 0.02%
9,668 Seven & I Holdings Co
407,335 0.09%
28,000 Sharp Corp
89,832 0.02%
2,900 Shimano Inc
321,777 0.07%
5,200 Shin-Etsu Chemical Co
316,107 0.07%
4,000 Shionogi & Co Ltd
83,475 0.02%
17,000 Shiseido Co
309,961 0.06%
18,000 Shizuoka Bank
194,571 0.04%
13,600 Softbank Corp
1,012,683 0.21%
11,670 Sony Corp
193,770 0.04%
50,000 Sumitomo Chemical Co
189,042 0.04%
16,000 Sumitomo Corp
216,071 0.05%
12,000 Sumitomo Electric Industries Ltd
168,806 0.04%
32,000 Sumitomo Heavy Industries Ltd
152,261 0.03%
19,100 Sumitomo Mitsui Financial Group Inc
800,201 0.17%
7,000 Sumitomo Realty & Development Co Ltd
300,385 0.06%
8,900 Suzuki Motor Corp
278,773 0.06%
10,600 T&D Holdings Inc
144,089 0.03%
14,030 Takeda Pharmaceutical Co Ltd
650,809 0.14%
10,800 Terumo Corp
241,481 0.05%
22,000 The Bank of Yokohama Ltd
126,614 0.03%
29,350 The Chiba Bank Ltd
207,159 0.04%
49,430 The Joyo Bank Ltd
263,497 0.06%
11,000 Toho Co
258,006 0.05%
22,100 Tohoku Electric Power Co
259,397 0.05%
7,200 Tokio Marine Holdings Inc
236,825 0.05%
24,600 Tokyo Electric Power Co
102,480 0.02%
4,400 Tokyo Electron Ltd
297,445 0.06%
36,755 Tokyo Gas Co
214,797 0.05%
34,000 Tokyu Corp
240,987 0.05%
27,000 Tokyu Fudosan Holdings Corp
212,962 0.04%
20,000 Toray Inds Inc
131,491 0.03%
61,800 Toshiba Corp
288,563 0.06%
38,010 Toyota Motor Co
2,282,851 0.48%
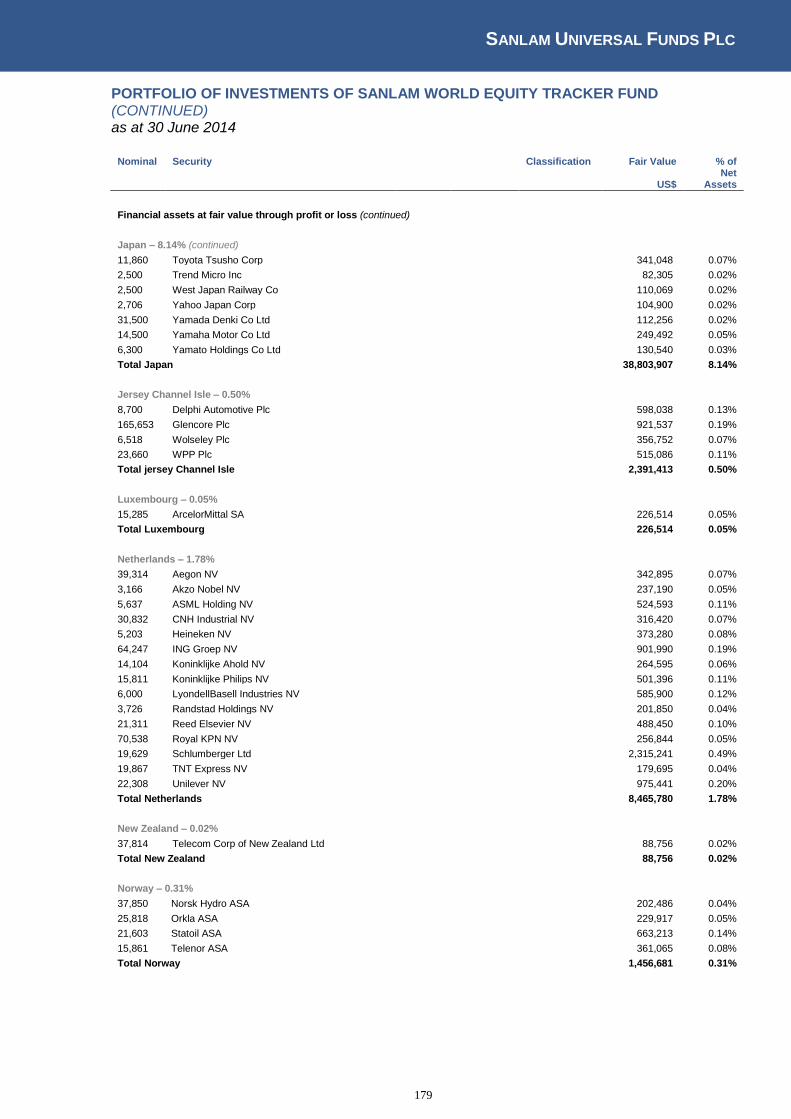
SANLAM UNIVERSAL FUNDS PLC
179
PORTFOLIO OF INVESTMENTS OF SANLAM WORLD EQUITY TRACKER FUND (CONTINUED) as at 30 June 2014
Nominal Security
Classification Fair Value % of
US$ Net
Assets
Financial assets at fair value through profit or loss (continued)
Japan – 8.14% (continued)
11,860 Toyota Tsusho Corp
341,048 0.07%
2,500 Trend Micro Inc
82,305 0.02%
2,500 West Japan Railway Co
110,069 0.02%
2,706 Yahoo Japan Corp
104,900 0.02%
31,500 Yamada Denki Co Ltd
112,256 0.02%
14,500 Yamaha Motor Co Ltd
249,492 0.05%
6,300 Yamato Holdings Co Ltd
130,540 0.03%
Total Japan
38,803,907 8.14%
Jersey Channel Isle – 0.50% 8,700 Delphi Automotive Plc
598,038 0.13%
165,653 Glencore Plc
921,537 0.19%
6,518 Wolseley Plc
356,752 0.07%
23,660 WPP Plc
515,086 0.11%
Total jersey Channel Isle
2,391,413 0.50%
Luxembourg – 0.05% 15,285 ArcelorMittal SA
226,514 0.05%
Total Luxembourg
226,514 0.05%
Netherlands – 1.78% 39,314 Aegon NV
342,895 0.07%
3,166 Akzo Nobel NV
237,190 0.05%
5,637 ASML Holding NV
524,593 0.11%
30,832 CNH Industrial NV
316,420 0.07%
5,203 Heineken NV
373,280 0.08%
64,247 ING Groep NV
901,990 0.19%
14,104 Koninklijke Ahold NV
264,595 0.06%
15,811 Koninklijke Philips NV
501,396 0.11%
6,000 LyondellBasell Industries NV
585,900 0.12%
3,726 Randstad Holdings NV
201,850 0.04%
21,311 Reed Elsevier NV
488,450 0.10%
70,538 Royal KPN NV
256,844 0.05%
19,629 Schlumberger Ltd
2,315,241 0.49%
19,867 TNT Express NV
179,695 0.04%
22,308 Unilever NV
975,441 0.20%
Total Netherlands
8,465,780 1.78%
New Zealand – 0.02% 37,814 Telecom Corp of New Zealand Ltd
88,756 0.02%
Total New Zealand
88,756 0.02%
Norway – 0.31% 37,850 Norsk Hydro ASA
202,486 0.04%
25,818 Orkla ASA
229,917 0.05%
21,603 Statoil ASA
663,213 0.14%
15,861 Telenor ASA
361,065 0.08%
Total Norway
1,456,681 0.31%

SANLAM UNIVERSAL FUNDS PLC
180
PORTFOLIO OF INVESTMENTS OF SANLAM WORLD EQUITY TRACKER FUND (CONTINUED) as at 30 June 2014
Nominal Security
Classification Fair Value % of
US$ Net
Assets
Financial assets at fair value through profit or loss (continued)
Portugal – 0.09% 84,304 Energias De Portugal SA
422,674 0.09%
Total Portugal
422,674 0.09%
Singapore – 0.64% 134,850 CapitaLand Ltd
346,185 0.07%
32,562 DBS Bank Ltd
437,556 0.09%
26,291 Flextronics International Ltd
291,041 0.06%
38,400 Keppel Corp Ltd
332,400 0.07%
74,000 Singapore Press Holdings Ltd
247,557 0.05%
125,900 Singapore Telecommunications Ltd
388,861 0.08%
49,408 The Oversea-Chinese Banking Corp
378,537 0.08%
28,691 United Overseas Bank Ltd
518,348 0.11%
42,000 Wilmar International Ltd
107,485 0.02%
Total Singapore
3,047,970 0.64%
Spain – 1.50% 5,196 ACS, Actividades de Construcción y Servicios SA
237,475 0.05%
10,700 Amadeus IT Holding SA
441,002 0.09%
96,910 Banco Bilbao Viscaya SA
1,234,449 0.26%
48,266 Banco Popular Espanol SA
322,302 0.07%
156,880 Banco Santander SA
1,637,923 0.34%
113,500 Bankia SA
219,918 0.05%
19,632 Distribuidora Interncional de Alimentacion SA
180,632 0.04%
85,952 Iberdrola SA
656,637 0.14%
2,967 Inditex SA
456,337 0.10%
4,803 Red Electrica de Espana
439,026 0.09%
12,512 Repsol SA
329,750 0.07%
58,232 Telefonica SA
997,625 0.21%
Total Spain
7,153,076 1.50%
Sweden – 1.24% 17,400 Atlas Copco AB
464,454 0.10%
8,120 Getinge AB
213,224 0.04%
12,816 Hennes & Mauritz AB
559,617 0.12%
43,492 Nordea Bank AB
613,305 0.13%
16,273 Sandvik AB
222,174 0.05%
20,140 Securitas AB
238,679 0.05%
33,600 Skandinaviska Enskilda Banken SEB
448,690 0.09%
21,500 Skanska AB
490,302 0.10%
10,900 SKF AB
277,912 0.06%
7,969 Svenska Handelsbanken AB
389,798 0.08%
18,500 Swedbank AB
490,220 0.10%
4,749 Swedish Match AB
164,758 0.03%
48,941 Telefonaktiebolaget LM Ericsson
590,978 0.12%
30,913 Teliasonera AB
225,635 0.05%
5,839 Tyco International Ltd
266,258 0.06%
19,966 Volvo AB
274,834 0.06%
Total Sweden
5,930,838 1.24%
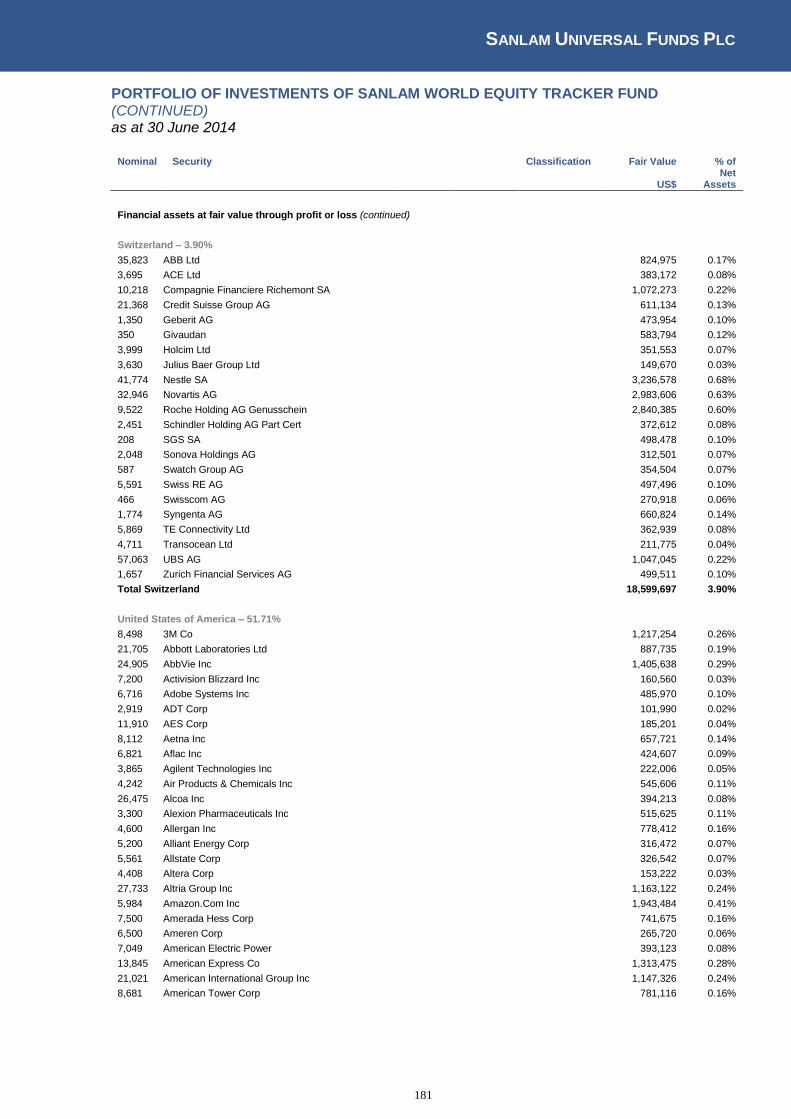
SANLAM UNIVERSAL FUNDS PLC
181
PORTFOLIO OF INVESTMENTS OF SANLAM WORLD EQUITY TRACKER FUND (CONTINUED) as at 30 June 2014
Nominal Security
Classification Fair Value % of
US$ Net
Assets
Financial assets at fair value through profit or loss (continued)
Switzerland – 3.90% 35,823 ABB Ltd
824,975 0.17%
3,695 ACE Ltd
383,172 0.08%
10,218 Compagnie Financiere Richemont SA
1,072,273 0.22%
21,368 Credit Suisse Group AG
611,134 0.13%
1,350 Geberit AG
473,954 0.10%
350 Givaudan
583,794 0.12%
3,999 Holcim Ltd
351,553 0.07%
3,630 Julius Baer Group Ltd
149,670 0.03%
41,774 Nestle SA
3,236,578 0.68%
32,946 Novartis AG
2,983,606 0.63%
9,522 Roche Holding AG Genusschein
2,840,385 0.60%
2,451 Schindler Holding AG Part Cert
372,612 0.08%
208 SGS SA
498,478 0.10%
2,048 Sonova Holdings AG
312,501 0.07%
587 Swatch Group AG
354,504 0.07%
5,591 Swiss RE AG
497,496 0.10%
466 Swisscom AG
270,918 0.06%
1,774 Syngenta AG
660,824 0.14%
5,869 TE Connectivity Ltd
362,939 0.08%
4,711 Transocean Ltd
211,775 0.04%
57,063 UBS AG
1,047,045 0.22%
1,657 Zurich Financial Services AG
499,511 0.10%
Total Switzerland
18,599,697 3.90%
United States of America – 51.71% 8,498 3M Co
1,217,254 0.26%
21,705 Abbott Laboratories Ltd
887,735 0.19%
24,905 AbbVie Inc
1,405,638 0.29%
7,200 Activision Blizzard Inc
160,560 0.03%
6,716 Adobe Systems Inc
485,970 0.10%
2,919 ADT Corp
101,990 0.02%
11,910 AES Corp
185,201 0.04%
8,112 Aetna Inc
657,721 0.14%
6,821 Aflac Inc
424,607 0.09%
3,865 Agilent Technologies Inc
222,006 0.05%
4,242 Air Products & Chemicals Inc
545,606 0.11%
26,475 Alcoa Inc
394,213 0.08%
3,300 Alexion Pharmaceuticals Inc
515,625 0.11%
4,600 Allergan Inc
778,412 0.16%
5,200 Alliant Energy Corp
316,472 0.07%
5,561 Allstate Corp
326,542 0.07%
4,408 Altera Corp
153,222 0.03%
27,733 Altria Group Inc
1,163,122 0.24%
5,984 Amazon.Com Inc
1,943,484 0.41%
7,500 Amerada Hess Corp
741,675 0.16%
6,500 Ameren Corp
265,720 0.06%
7,049 American Electric Power
393,123 0.08%
13,845 American Express Co
1,313,475 0.28%
21,021 American International Group Inc
1,147,326 0.24%
8,681 American Tower Corp
781,116 0.16%
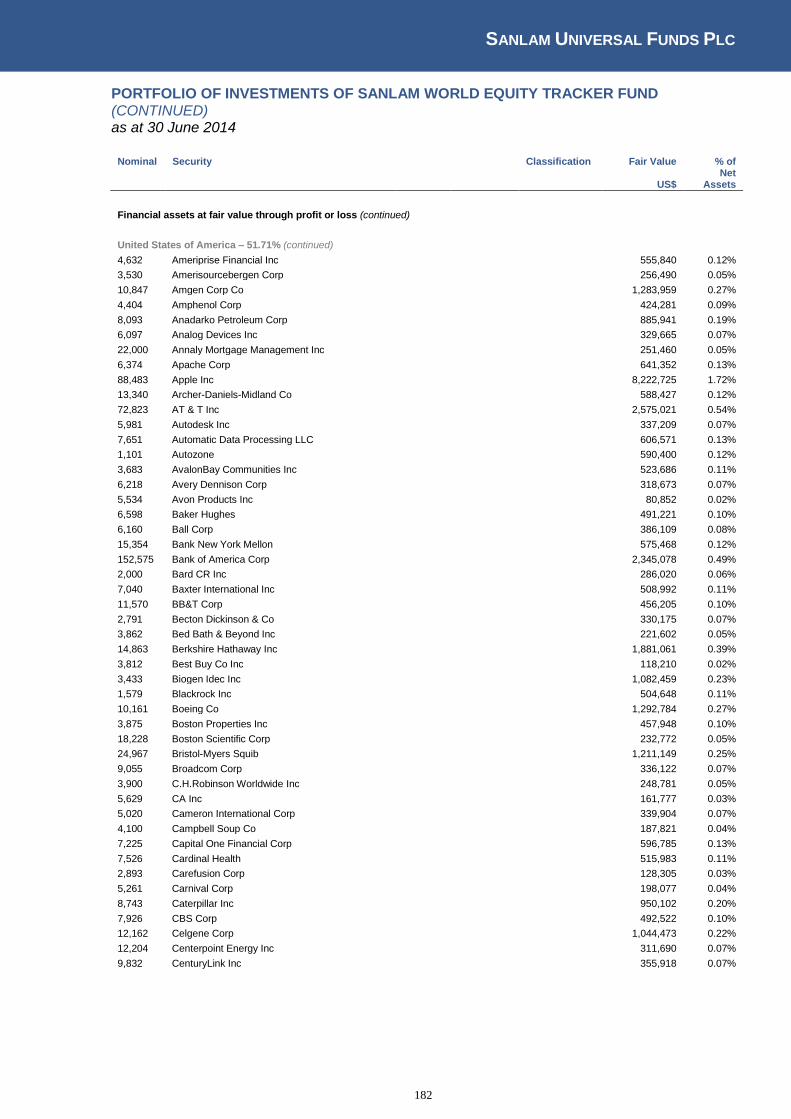
SANLAM UNIVERSAL FUNDS PLC
182
PORTFOLIO OF INVESTMENTS OF SANLAM WORLD EQUITY TRACKER FUND (CONTINUED) as at 30 June 2014
Nominal Security
Classification Fair Value % of
US$ Net
Assets
Financial assets at fair value through profit or loss (continued)
United States of America – 51.71% (continued)
4,632 Ameriprise Financial Inc
555,840 0.12%
3,530 Amerisourcebergen Corp
256,490 0.05%
10,847 Amgen Corp Co
1,283,959 0.27%
4,404 Amphenol Corp
424,281 0.09%
8,093 Anadarko Petroleum Corp
885,941 0.19%
6,097 Analog Devices Inc
329,665 0.07%
22,000 Annaly Mortgage Management Inc
251,460 0.05%
6,374 Apache Corp
641,352 0.13%
88,483 Apple Inc
8,222,725 1.72%
13,340 Archer-Daniels-Midland Co
588,427 0.12%
72,823 AT & T Inc
2,575,021 0.54%
5,981 Autodesk Inc
337,209 0.07%
7,651 Automatic Data Processing LLC
606,571 0.13%
1,101 Autozone
590,400 0.12%
3,683 AvalonBay Communities Inc
523,686 0.11%
6,218 Avery Dennison Corp
318,673 0.07%
5,534 Avon Products Inc
80,852 0.02%
6,598 Baker Hughes
491,221 0.10%
6,160 Ball Corp
386,109 0.08%
15,354 Bank New York Mellon
575,468 0.12%
152,575 Bank of America Corp
2,345,078 0.49%
2,000 Bard CR Inc
286,020 0.06%
7,040 Baxter International Inc
508,992 0.11%
11,570 BB&T Corp
456,205 0.10%
2,791 Becton Dickinson & Co
330,175 0.07%
3,862 Bed Bath & Beyond Inc
221,602 0.05%
14,863 Berkshire Hathaway Inc
1,881,061 0.39%
3,812 Best Buy Co Inc
118,210 0.02%
3,433 Biogen Idec Inc
1,082,459 0.23%
1,579 Blackrock Inc
504,648 0.11%
10,161 Boeing Co
1,292,784 0.27%
3,875 Boston Properties Inc
457,948 0.10%
18,228 Boston Scientific Corp
232,772 0.05%
24,967 Bristol-Myers Squib
1,211,149 0.25%
9,055 Broadcom Corp
336,122 0.07%
3,900 C.H.Robinson Worldwide Inc
248,781 0.05%
5,629 CA Inc
161,777 0.03%
5,020 Cameron International Corp
339,904 0.07%
4,100 Campbell Soup Co
187,821 0.04%
7,225 Capital One Financial Corp
596,785 0.13%
7,526 Cardinal Health
515,983 0.11%
2,893 Carefusion Corp
128,305 0.03%
5,261 Carnival Corp
198,077 0.04%
8,743 Caterpillar Inc
950,102 0.20%
7,926 CBS Corp
492,522 0.10%
12,162 Celgene Corp
1,044,473 0.22%
12,204 Centerpoint Energy Inc
311,690 0.07%
9,832 CenturyLink Inc
355,918 0.07%

SANLAM UNIVERSAL FUNDS PLC
183
PORTFOLIO OF INVESTMENTS OF SANLAM WORLD EQUITY TRACKER FUND (CONTINUED) as at 30 June 2014
Nominal Security
Classification Fair Value % of
US$ Net
Assets
Financial assets at fair value through profit or loss (continued)
United States of America – 51.71% (continued)
20,291 Charles Schwab Corp
546,437 0.11%
12,733 Chesapeake Energy Corp
395,742 0.08%
23,740 Chevron Corp
3,099,257 0.65%
800 Chipotle Mexican Grill Inc
474,008 0.10%
3,332 Chubb Corp
307,110 0.06%
5,086 Cigna Corp
467,759 0.10%
2,219 Cincinnati Financial Corp
106,601 0.02%
75,446 Cisco Systems
1,874,833 0.39%
41,488 Citigroup Inc
1,954,085 0.41%
22,490 Citizens Communications Co
131,342 0.03%
3,286 Citrix Systems Inc
205,539 0.04%
3,349 Clorox Co
306,099 0.06%
4,735 CME Group Inc
335,948 0.07%
5,103 Coach Inc
174,472 0.04%
54,924 Coca-Cola Co
2,326,581 0.49%
9,672 Cognizant Tech Solutions Corp
473,058 0.10%
13,250 Colgate-Palmolive Co
903,385 0.19%
23,874 Comcast Corp
1,281,556 0.27%
12,141 Comcast Corp-Special
647,480 0.14%
1,799 Comerica Inc
90,238 0.02%
4,761 Computer Sciences
300,895 0.06%
9,594 Conagra Foods Inc
284,750 0.06%
2,400 Concho Resources Inc
346,800 0.07%
17,220 Conocophillips Co
1,476,271 0.31%
5,647 Consol Energy Inc
260,157 0.05%
4,319 Consolidated Edison Inc
249,379 0.05%
3,999 Constellation Brands Inc
352,432 0.07%
19,623 Corning Inc
430,725 0.09%
6,349 Costco Wholesale Corp
731,151 0.15%
5,812 Crown Castle Intl Corp
431,599 0.09%
17,116 CSX Corp
527,344 0.11%
2,700 Cummins Inc
416,583 0.09%
17,328 CVS Caremark Corp
1,306,011 0.27%
7,392 Danaher Corp
581,972 0.12%
2,181 Darden Restuarants Inc
100,915 0.02%
5,374 Deere & Co
486,616 0.10%
3,508 Dentsply International Inc
166,104 0.03%
8,650 Devon Energy Corp
686,810 0.14%
8,018 Directv
681,610 0.14%
9,968 Discover Financial Services Inc
617,817 0.13%
8,000 Dominion Resources Inc
572,160 0.12%
4,964 Dover Corp
451,476 0.09%
18,439 Dow Chemical Co
948,871 0.20%
10,349 DR Horton Inc
254,378 0.05%
5,514 Dr Pepper Snapple Group Inc
323,010 0.07%
3,965 DTE Energy Co
308,755 0.06%
13,436 Du Pont De Nemours and Co
879,252 0.18%
8,121 Duke Energy Corp
602,497 0.13%
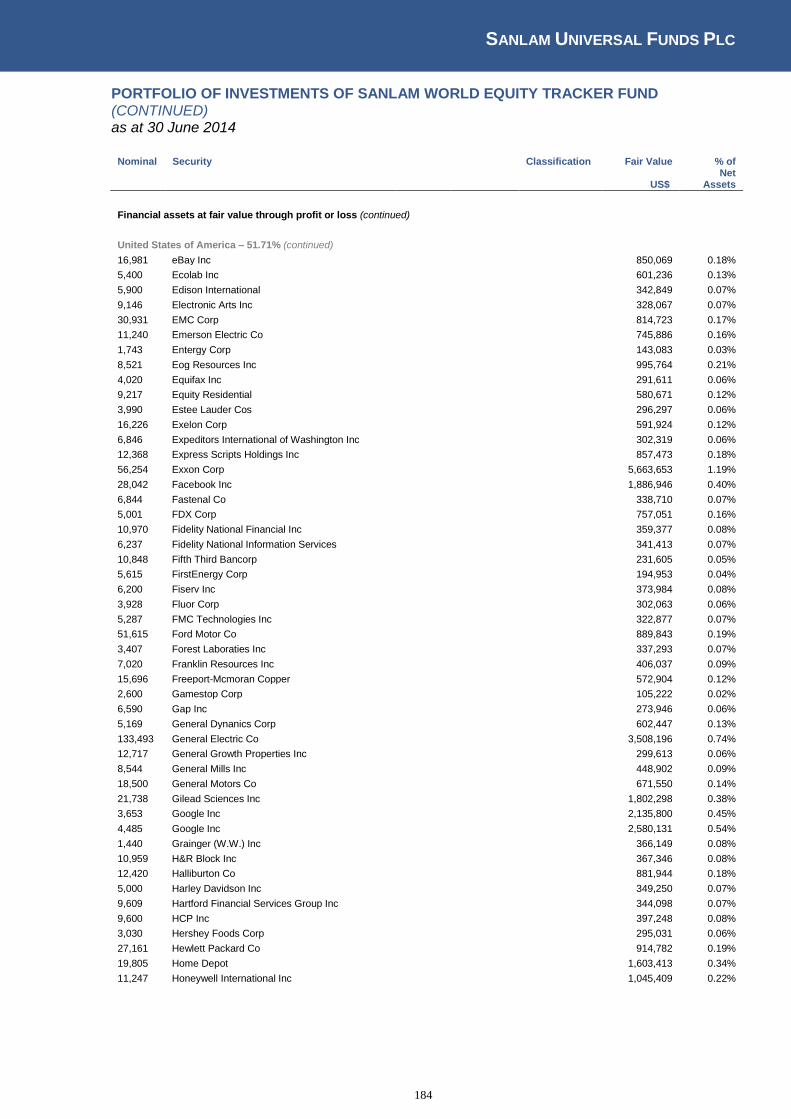
SANLAM UNIVERSAL FUNDS PLC
184
PORTFOLIO OF INVESTMENTS OF SANLAM WORLD EQUITY TRACKER FUND (CONTINUED) as at 30 June 2014
Nominal Security
Classification Fair Value % of
US$ Net
Assets
Financial assets at fair value through profit or loss (continued)
United States of America – 51.71% (continued)
16,981 eBay Inc
850,069 0.18%
5,400 Ecolab Inc
601,236 0.13%
5,900 Edison International
342,849 0.07%
9,146 Electronic Arts Inc
328,067 0.07%
30,931 EMC Corp
814,723 0.17%
11,240 Emerson Electric Co
745,886 0.16%
1,743 Entergy Corp
143,083 0.03%
8,521 Eog Resources Inc
995,764 0.21%
4,020 Equifax Inc
291,611 0.06%
9,217 Equity Residential
580,671 0.12%
3,990 Estee Lauder Cos
296,297 0.06%
16,226 Exelon Corp
591,924 0.12%
6,846 Expeditors International of Washington Inc
302,319 0.06%
12,368 Express Scripts Holdings Inc
857,473 0.18%
56,254 Exxon Corp
5,663,653 1.19%
28,042 Facebook Inc
1,886,946 0.40%
6,844 Fastenal Co
338,710 0.07%
5,001 FDX Corp
757,051 0.16%
10,970 Fidelity National Financial Inc
359,377 0.08%
6,237 Fidelity National Information Services
341,413 0.07%
10,848 Fifth Third Bancorp
231,605 0.05%
5,615 FirstEnergy Corp
194,953 0.04%
6,200 Fiserv Inc
373,984 0.08%
3,928 Fluor Corp
302,063 0.06%
5,287 FMC Technologies Inc
322,877 0.07%
51,615 Ford Motor Co
889,843 0.19%
3,407 Forest Laboraties Inc
337,293 0.07%
7,020 Franklin Resources Inc
406,037 0.09%
15,696 Freeport-Mcmoran Copper
572,904 0.12%
2,600 Gamestop Corp
105,222 0.02%
6,590 Gap Inc
273,946 0.06%
5,169 General Dynanics Corp
602,447 0.13%
133,493 General Electric Co
3,508,196 0.74%
12,717 General Growth Properties Inc
299,613 0.06%
8,544 General Mills Inc
448,902 0.09%
18,500 General Motors Co
671,550 0.14%
21,738 Gilead Sciences Inc
1,802,298 0.38%
3,653 Google Inc
2,135,800 0.45%
4,485 Google Inc
2,580,131 0.54%
1,440 Grainger (W.W.) Inc
366,149 0.08%
10,959 H&R Block Inc
367,346 0.08%
12,420 Halliburton Co
881,944 0.18%
5,000 Harley Davidson Inc
349,250 0.07%
9,609 Hartford Financial Services Group Inc
344,098 0.07%
9,600 HCP Inc
397,248 0.08%
3,030 Hershey Foods Corp
295,031 0.06%
27,161 Hewlett Packard Co
914,782 0.19%
19,805 Home Depot
1,603,413 0.34%
11,247 Honeywell International Inc
1,045,409 0.22%

SANLAM UNIVERSAL FUNDS PLC
185
PORTFOLIO OF INVESTMENTS OF SANLAM WORLD EQUITY TRACKER FUND (CONTINUED) as at 30 June 2014
Nominal Security
Classification Fair Value % of
US$ Net
Assets
Financial assets at fair value through profit or loss (continued)
United States of America – 51.71% (continued)
7,356 Hospira Inc
377,878 0.08%
13,649 Host Hotels & Resorts Inc
300,414 0.06%
17,567 Hudson City Bancorp Inc
172,684 0.04%
2,215 Humana Inc
282,900 0.06%
5,305 Illinois Tool Works Inc
464,506 0.10%
1,695 Illumina Inc
302,625 0.06%
63,340 Intel Corp
1,957,206 0.41%
1,955 Intercontinental Exchange Inc
369,300 0.08%
13,274 International Business Machines Corp
2,406,178 0.50%
2,363 International Flavors & Fragrances Inc
246,414 0.05%
7,356 International Paper Co
371,257 0.08%
5,722 Intuit Inc
460,793 0.10%
511 Intuitive Surgical Inc
210,427 0.04%
3,350 Jacobs Engineering Group Inc
178,488 0.04%
38,083 Johnson & Johnson
3,984,243 0.84%
12,576 Johnson Controls Inc
627,920 0.13%
44,672 JP Morgan Chase & Co
2,574,001 0.54%
6,342 Juniper Networks Inc
155,633 0.03%
7,220 Kellogg Co
474,354 0.10%
1,600 Keurig Green Mountain Inc
199,376 0.04%
16,024 Keycorp
229,624 0.05%
5,160 Kimberley Clark Corp Co
573,895 0.12%
7,700 Kimco Realty Corp
176,946 0.04%
10,584 Kinder Morgan Inc
383,776 0.08%
4,343 Kla-Tencor Corp
315,476 0.07%
3,068 Kohls Corp
161,622 0.03%
6,904 Kraft Foods Inc
413,895 0.09%
6,643 Kroger Co
328,363 0.07%
5,228 L Brands Inc
306,674 0.06%
3,665 L-3 Communications Holdings Inc
442,549 0.09%
3,835 LAM Research Corp
259,169 0.05%
7,030 Las Vegas Sands Corp
535,827 0.11%
994 Legg Mason Inc
51,002 0.01%
11,900 Leucadia National Corp
312,018 0.07%
13,313 Liberty Media Corp
390,870 0.08%
11,980 Lilly (Eli) & Co
744,797 0.16%
6,693 Lincoln National Corp
344,288 0.07%
6,800 Linear Technology Corp
320,076 0.07%
1,500 LinkedIn Corp
257,205 0.05%
4,931 Lockheed Martin Corp co
792,560 0.17%
7,300 Loews Corp
321,273 0.07%
7,200 Lorillard Inc
438,984 0.09%
17,339 Lowes Co
832,099 0.17%
2,347 M & T Bank Corp
291,145 0.06%
8,125 Macy's Inc
471,413 0.10%
3,890 Manpower Inc
330,067 0.07%
11,501 Marathon Oil Corp
459,120 0.10%
5,400 Marathon Petroleum Corp
421,578 0.09%
7,141 Marriott International Inc
457,738 0.10%
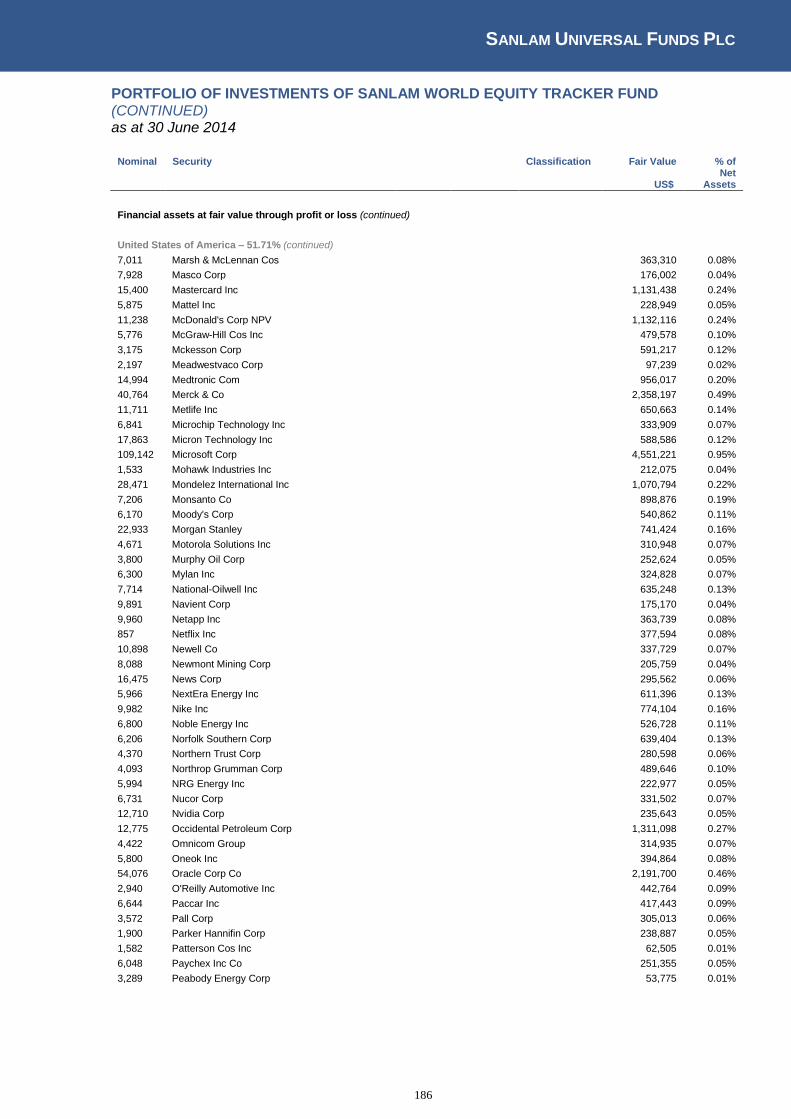
SANLAM UNIVERSAL FUNDS PLC
186
PORTFOLIO OF INVESTMENTS OF SANLAM WORLD EQUITY TRACKER FUND (CONTINUED) as at 30 June 2014
Nominal Security
Classification Fair Value % of
US$ Net
Assets
Financial assets at fair value through profit or loss (continued)
United States of America – 51.71% (continued)
7,011 Marsh & McLennan Cos
363,310 0.08%
7,928 Masco Corp
176,002 0.04%
15,400 Mastercard Inc
1,131,438 0.24%
5,875 Mattel Inc
228,949 0.05%
11,238 McDonald's Corp NPV
1,132,116 0.24%
5,776 McGraw-Hill Cos Inc
479,578 0.10%
3,175 Mckesson Corp
591,217 0.12%
2,197 Meadwestvaco Corp
97,239 0.02%
14,994 Medtronic Com
956,017 0.20%
40,764 Merck & Co
2,358,197 0.49%
11,711 Metlife Inc
650,663 0.14%
6,841 Microchip Technology Inc
333,909 0.07%
17,863 Micron Technology Inc
588,586 0.12%
109,142 Microsoft Corp
4,551,221 0.95%
1,533 Mohawk Industries Inc
212,075 0.04%
28,471 Mondelez International Inc
1,070,794 0.22%
7,206 Monsanto Co
898,876 0.19%
6,170 Moody's Corp
540,862 0.11%
22,933 Morgan Stanley
741,424 0.16%
4,671 Motorola Solutions Inc
310,948 0.07%
3,800 Murphy Oil Corp
252,624 0.05%
6,300 Mylan Inc
324,828 0.07%
7,714 National-Oilwell Inc
635,248 0.13%
9,891 Navient Corp
175,170 0.04%
9,960 Netapp Inc
363,739 0.08%
857 Netflix Inc
377,594 0.08%
10,898 Newell Co
337,729 0.07%
8,088 Newmont Mining Corp
205,759 0.04%
16,475 News Corp
295,562 0.06%
5,966 NextEra Energy Inc
611,396 0.13%
9,982 Nike Inc
774,104 0.16%
6,800 Noble Energy Inc
526,728 0.11%
6,206 Norfolk Southern Corp
639,404 0.13%
4,370 Northern Trust Corp
280,598 0.06%
4,093 Northrop Grumman Corp
489,646 0.10%
5,994 NRG Energy Inc
222,977 0.05%
6,731 Nucor Corp
331,502 0.07%
12,710 Nvidia Corp
235,643 0.05%
12,775 Occidental Petroleum Corp
1,311,098 0.27%
4,422 Omnicom Group
314,935 0.07%
5,800 Oneok Inc
394,864 0.08%
54,076 Oracle Corp Co
2,191,700 0.46%
2,940 O'Reilly Automotive Inc
442,764 0.09%
6,644 Paccar Inc
417,443 0.09%
3,572 Pall Corp
305,013 0.06%
1,900 Parker Hannifin Corp
238,887 0.05%
1,582 Patterson Cos Inc
62,505 0.01%
6,048 Paychex Inc Co
251,355 0.05%
3,289 Peabody Energy Corp
53,775 0.01%
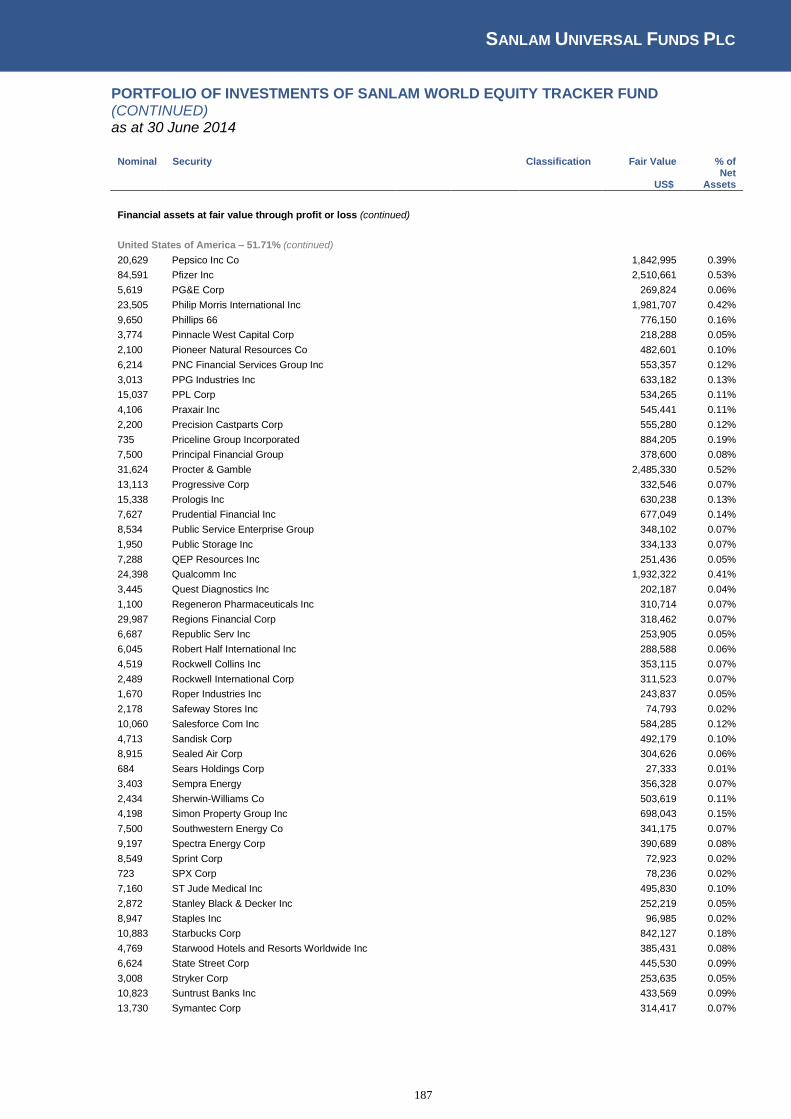
SANLAM UNIVERSAL FUNDS PLC
187
PORTFOLIO OF INVESTMENTS OF SANLAM WORLD EQUITY TRACKER FUND (CONTINUED) as at 30 June 2014
Nominal Security
Classification Fair Value % of
US$ Net
Assets
Financial assets at fair value through profit or loss (continued)
United States of America – 51.71% (continued)
20,629 Pepsico Inc Co
1,842,995 0.39%
84,591 Pfizer Inc
2,510,661 0.53%
5,619 PG&E Corp
269,824 0.06%
23,505 Philip Morris International Inc
1,981,707 0.42%
9,650 Phillips 66
776,150 0.16%
3,774 Pinnacle West Capital Corp
218,288 0.05%
2,100 Pioneer Natural Resources Co
482,601 0.10%
6,214 PNC Financial Services Group Inc
553,357 0.12%
3,013 PPG Industries Inc
633,182 0.13%
15,037 PPL Corp
534,265 0.11%
4,106 Praxair Inc
545,441 0.11%
2,200 Precision Castparts Corp
555,280 0.12%
735 Priceline Group Incorporated
884,205 0.19%
7,500 Principal Financial Group
378,600 0.08%
31,624 Procter & Gamble
2,485,330 0.52%
13,113 Progressive Corp
332,546 0.07%
15,338 Prologis Inc
630,238 0.13%
7,627 Prudential Financial Inc
677,049 0.14%
8,534 Public Service Enterprise Group
348,102 0.07%
1,950 Public Storage Inc
334,133 0.07%
7,288 QEP Resources Inc
251,436 0.05%
24,398 Qualcomm Inc
1,932,322 0.41%
3,445 Quest Diagnostics Inc
202,187 0.04%
1,100 Regeneron Pharmaceuticals Inc
310,714 0.07%
29,987 Regions Financial Corp
318,462 0.07%
6,687 Republic Serv Inc
253,905 0.05%
6,045 Robert Half International Inc
288,588 0.06%
4,519 Rockwell Collins Inc
353,115 0.07%
2,489 Rockwell International Corp
311,523 0.07%
1,670 Roper Industries Inc
243,837 0.05%
2,178 Safeway Stores Inc
74,793 0.02%
10,060 Salesforce Com Inc
584,285 0.12%
4,713 Sandisk Corp
492,179 0.10%
8,915 Sealed Air Corp
304,626 0.06%
684 Sears Holdings Corp
27,333 0.01%
3,403 Sempra Energy
356,328 0.07%
2,434 Sherwin-Williams Co
503,619 0.11%
4,198 Simon Property Group Inc
698,043 0.15%
7,500 Southwestern Energy Co
341,175 0.07%
9,197 Spectra Energy Corp
390,689 0.08%
8,549 Sprint Corp
72,923 0.02%
723 SPX Corp
78,236 0.02%
7,160 ST Jude Medical Inc
495,830 0.10%
2,872 Stanley Black & Decker Inc
252,219 0.05%
8,947 Staples Inc
96,985 0.02%
10,883 Starbucks Corp
842,127 0.18%
4,769 Starwood Hotels and Resorts Worldwide Inc
385,431 0.08%
6,624 State Street Corp
445,530 0.09%
3,008 Stryker Corp
253,635 0.05%
10,823 Suntrust Banks Inc
433,569 0.09%
13,730 Symantec Corp
314,417 0.07%
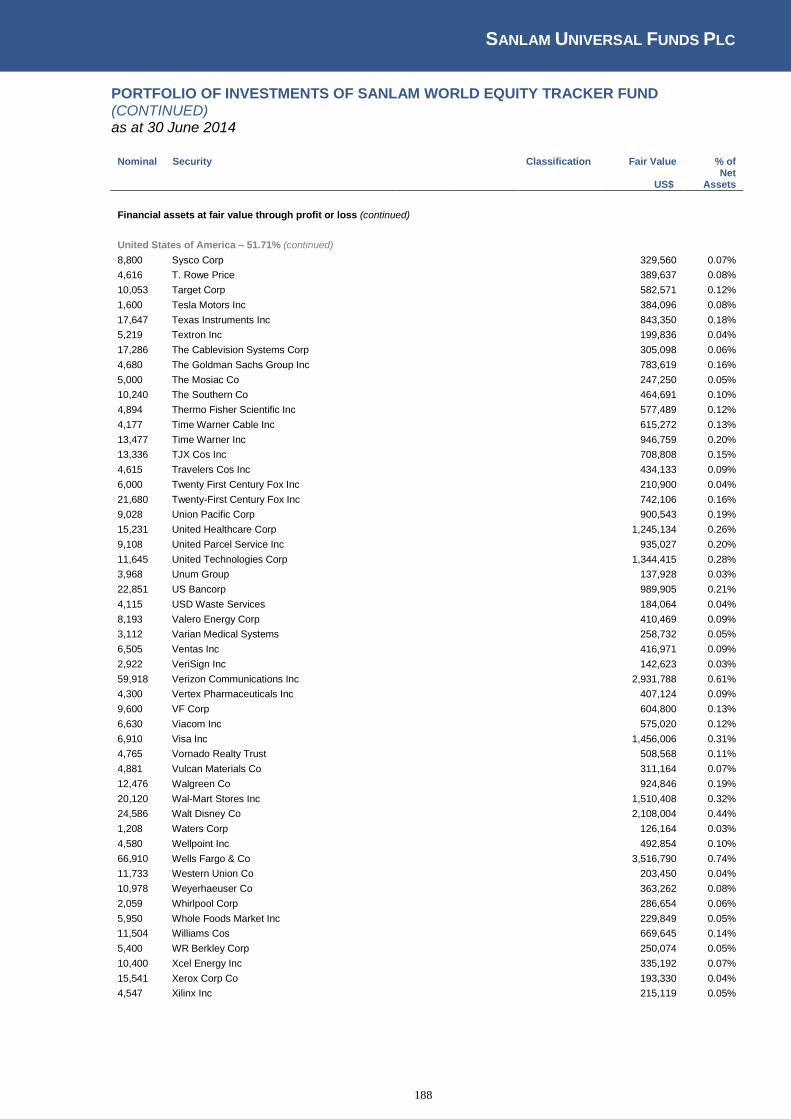
SANLAM UNIVERSAL FUNDS PLC
188
PORTFOLIO OF INVESTMENTS OF SANLAM WORLD EQUITY TRACKER FUND (CONTINUED) as at 30 June 2014
Nominal Security
Classification Fair Value % of
US$ Net
Assets
Financial assets at fair value through profit or loss (continued)
United States of America – 51.71% (continued)
8,800 Sysco Corp
329,560 0.07%
4,616 T. Rowe Price
389,637 0.08%
10,053 Target Corp
582,571 0.12%
1,600 Tesla Motors Inc
384,096 0.08%
17,647 Texas Instruments Inc
843,350 0.18%
5,219 Textron Inc
199,836 0.04%
17,286 The Cablevision Systems Corp
305,098 0.06%
4,680 The Goldman Sachs Group Inc
783,619 0.16%
5,000 The Mosiac Co
247,250 0.05%
10,240 The Southern Co
464,691 0.10%
4,894 Thermo Fisher Scientific Inc
577,489 0.12%
4,177 Time Warner Cable Inc
615,272 0.13%
13,477 Time Warner Inc
946,759 0.20%
13,336 TJX Cos Inc
708,808 0.15%
4,615 Travelers Cos Inc
434,133 0.09%
6,000 Twenty First Century Fox Inc
210,900 0.04%
21,680 Twenty-First Century Fox Inc
742,106 0.16%
9,028 Union Pacific Corp
900,543 0.19%
15,231 United Healthcare Corp
1,245,134 0.26%
9,108 United Parcel Service Inc
935,027 0.20%
11,645 United Technologies Corp
1,344,415 0.28%
3,968 Unum Group
137,928 0.03%
22,851 US Bancorp
989,905 0.21%
4,115 USD Waste Services
184,064 0.04%
8,193 Valero Energy Corp
410,469 0.09%
3,112 Varian Medical Systems
258,732 0.05%
6,505 Ventas Inc
416,971 0.09%
2,922 VeriSign Inc
142,623 0.03%
59,918 Verizon Communications Inc
2,931,788 0.61%
4,300 Vertex Pharmaceuticals Inc
407,124 0.09%
9,600 VF Corp
604,800 0.13%
6,630 Viacom Inc
575,020 0.12%
6,910 Visa Inc
1,456,006 0.31%
4,765 Vornado Realty Trust
508,568 0.11%
4,881 Vulcan Materials Co
311,164 0.07%
12,476 Walgreen Co
924,846 0.19%
20,120 Wal-Mart Stores Inc
1,510,408 0.32%
24,586 Walt Disney Co
2,108,004 0.44%
1,208 Waters Corp
126,164 0.03%
4,580 Wellpoint Inc
492,854 0.10%
66,910 Wells Fargo & Co
3,516,790 0.74%
11,733 Western Union Co
203,450 0.04%
10,978 Weyerhaeuser Co
363,262 0.08%
2,059 Whirlpool Corp
286,654 0.06%
5,950 Whole Foods Market Inc
229,849 0.05%
11,504 Williams Cos
669,645 0.14%
5,400 WR Berkley Corp
250,074 0.05%
10,400 Xcel Energy Inc
335,192 0.07%
15,541 Xerox Corp Co
193,330 0.04%
4,547 Xilinx Inc
215,119 0.05%
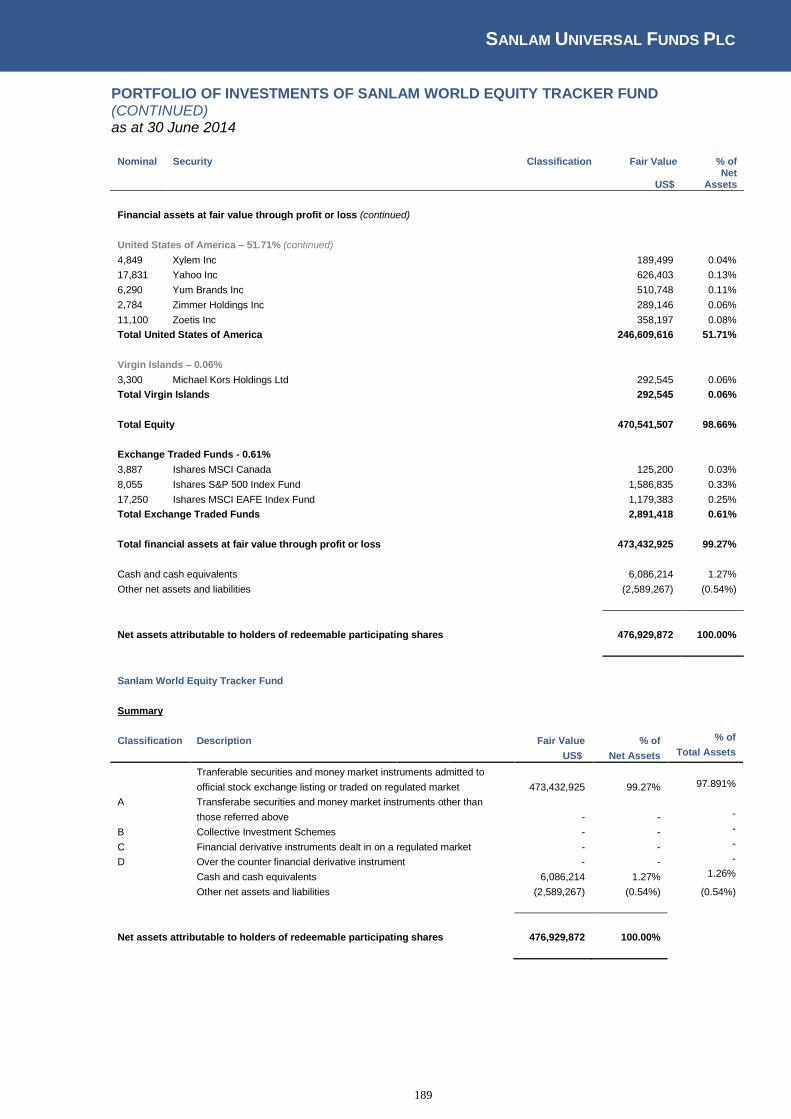
SANLAM UNIVERSAL FUNDS PLC
189
PORTFOLIO OF INVESTMENTS OF SANLAM WORLD EQUITY TRACKER FUND (CONTINUED) as at 30 June 2014
Nominal Security
Classification Fair Value % of
US$ Net
Assets
Financial assets at fair value through profit or loss (continued)
United States of America – 51.71% (continued)
4,849 Xylem Inc
189,499 0.04%
17,831 Yahoo Inc
626,403 0.13%
6,290 Yum Brands Inc
510,748 0.11%
2,784 Zimmer Holdings Inc
289,146 0.06%
11,100 Zoetis Inc
358,197 0.08%
Total United States of America
246,609,616 51.71%
Virgin Islands – 0.06% 3,300 Michael Kors Holdings Ltd
292,545 0.06%
Total Virgin Islands
292,545 0.06%
Total Equity
470,541,507 98.66%
Exchange Traded Funds - 0.61% 3,887 Ishares MSCI Canada
125,200 0.03%
8,055 Ishares S&P 500 Index Fund
1,586,835 0.33%
17,250 Ishares MSCI EAFE Index Fund
1,179,383 0.25%
Total Exchange Traded Funds
2,891,418 0.61%
Total financial assets at fair value through profit or loss
473,432,925 99.27%
Cash and cash equivalents
6,086,214 1.27%
Other net assets and liabilities
(2,589,267) (0.54%)
Net assets attributable to holders of redeemable participating shares
476,929,872 100.00%
Sanlam World Equity Tracker Fund
Summary
Classification Description
Fair Value % of % of
US$ Net Assets Total Assets
Tranferable securities and money market instruments admitted to
official stock exchange listing or traded on regulated market
473,432,925 99.27% 97.891%
A Transferabe securities and money market instruments other than
those referred above
- - -
B Collective Investment Schemes
- - -
C Financial derivative instruments dealt in on a regulated market - - -
D Over the counter financial derivative instrument
- - -
Cash and cash equivalents
6,086,214 1.27% 1.26%
Other net assets and liabilities
(2,589,267) (0.54%) (0.54%)
Net assets attributable to holders of redeemable participating shares 476,929,872 100.00%
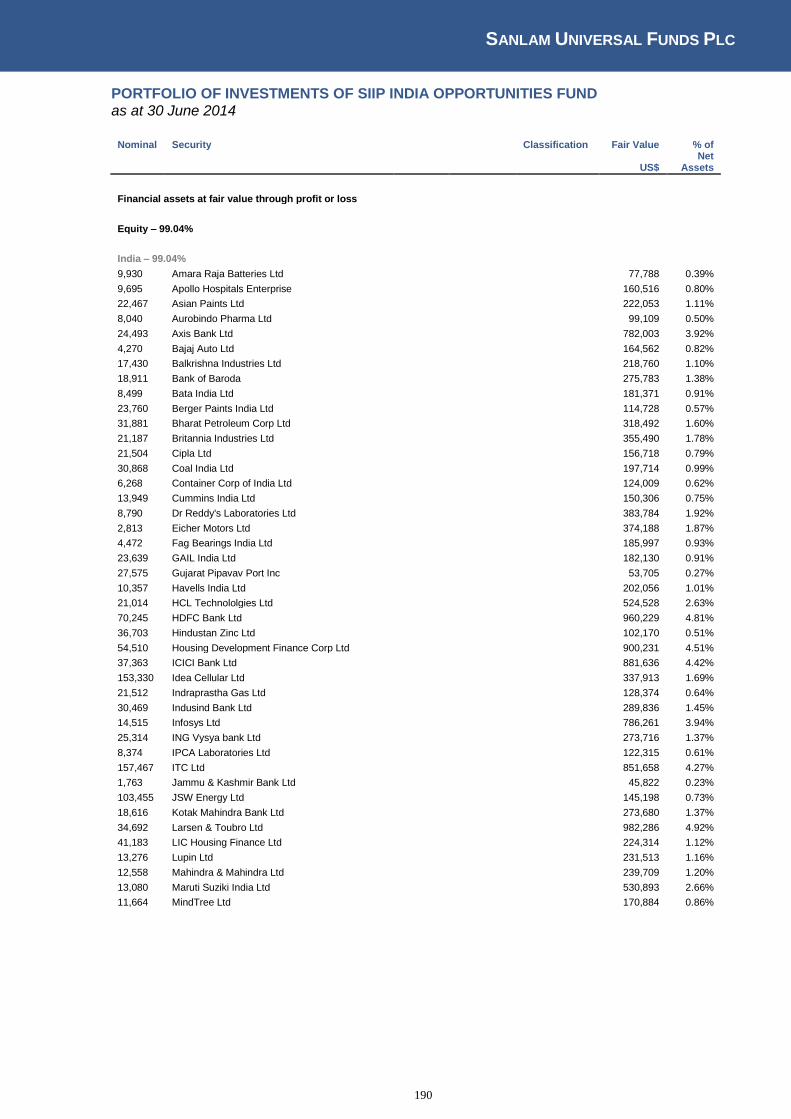
SANLAM UNIVERSAL FUNDS PLC
190
PORTFOLIO OF INVESTMENTS OF SIIP INDIA OPPORTUNITIES FUND as at 30 June 2014
Nominal Security
Classification Fair Value % of
US$ Net
Assets
Financial assets at fair value through profit or loss
Equity – 99.04%
India – 99.04% 9,930 Amara Raja Batteries Ltd
77,788 0.39%
9,695 Apollo Hospitals Enterprise
160,516 0.80%
22,467 Asian Paints Ltd
222,053 1.11%
8,040 Aurobindo Pharma Ltd
99,109 0.50%
24,493 Axis Bank Ltd
782,003 3.92%
4,270 Bajaj Auto Ltd
164,562 0.82%
17,430 Balkrishna Industries Ltd
218,760 1.10%
18,911 Bank of Baroda
275,783 1.38%
8,499 Bata India Ltd
181,371 0.91%
23,760 Berger Paints India Ltd
114,728 0.57%
31,881 Bharat Petroleum Corp Ltd
318,492 1.60%
21,187 Britannia Industries Ltd
355,490 1.78%
21,504 Cipla Ltd
156,718 0.79%
30,868 Coal India Ltd
197,714 0.99%
6,268 Container Corp of India Ltd
124,009 0.62%
13,949 Cummins India Ltd
150,306 0.75%
8,790 Dr Reddy's Laboratories Ltd
383,784 1.92%
2,813 Eicher Motors Ltd
374,188 1.87%
4,472 Fag Bearings India Ltd
185,997 0.93%
23,639 GAIL India Ltd
182,130 0.91%
27,575 Gujarat Pipavav Port Inc
53,705 0.27%
10,357 Havells India Ltd
202,056 1.01%
21,014 HCL Technololgies Ltd
524,528 2.63%
70,245 HDFC Bank Ltd
960,229 4.81%
36,703 Hindustan Zinc Ltd
102,170 0.51%
54,510 Housing Development Finance Corp Ltd
900,231 4.51%
37,363 ICICI Bank Ltd
881,636 4.42%
153,330 Idea Cellular Ltd
337,913 1.69%
21,512 Indraprastha Gas Ltd
128,374 0.64%
30,469 Indusind Bank Ltd
289,836 1.45%
14,515 Infosys Ltd
786,261 3.94%
25,314 ING Vysya bank Ltd
273,716 1.37%
8,374 IPCA Laboratories Ltd
122,315 0.61%
157,467 ITC Ltd
851,658 4.27%
1,763 Jammu & Kashmir Bank Ltd
45,822 0.23%
103,455 JSW Energy Ltd
145,198 0.73%
18,616 Kotak Mahindra Bank Ltd
273,680 1.37%
34,692 Larsen & Toubro Ltd
982,286 4.92%
41,183 LIC Housing Finance Ltd
224,314 1.12%
13,276 Lupin Ltd
231,513 1.16%
12,558 Mahindra & Mahindra Ltd
239,709 1.20%
13,080 Maruti Suziki India Ltd
530,893 2.66%
11,664 MindTree Ltd
170,884 0.86%
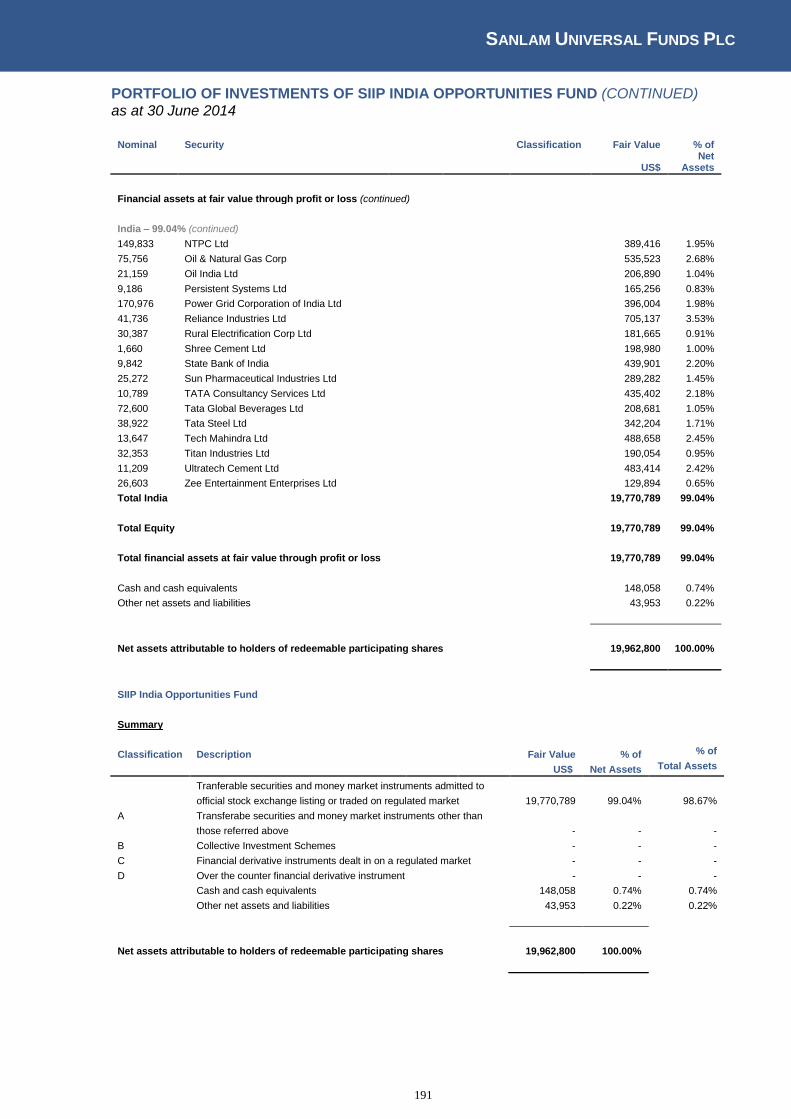
SANLAM UNIVERSAL FUNDS PLC
191
PORTFOLIO OF INVESTMENTS OF SIIP INDIA OPPORTUNITIES FUND (CONTINUED) as at 30 June 2014
Nominal Security
Classification Fair Value % of
US$ Net
Assets
Financial assets at fair value through profit or loss (continued)
India – 99.04% (continued) 149,833 NTPC Ltd
389,416 1.95%
75,756 Oil & Natural Gas Corp
535,523 2.68%
21,159 Oil India Ltd
206,890 1.04%
9,186 Persistent Systems Ltd
165,256 0.83%
170,976 Power Grid Corporation of India Ltd
396,004 1.98%
41,736 Reliance Industries Ltd
705,137 3.53%
30,387 Rural Electrification Corp Ltd
181,665 0.91%
1,660 Shree Cement Ltd
198,980 1.00%
9,842 State Bank of India
439,901 2.20%
25,272 Sun Pharmaceutical Industries Ltd
289,282 1.45%
10,789 TATA Consultancy Services Ltd
435,402 2.18%
72,600 Tata Global Beverages Ltd
208,681 1.05%
38,922 Tata Steel Ltd
342,204 1.71%
13,647 Tech Mahindra Ltd
488,658 2.45%
32,353 Titan Industries Ltd
190,054 0.95%
11,209 Ultratech Cement Ltd
483,414 2.42%
26,603 Zee Entertainment Enterprises Ltd
129,894 0.65%
Total India
19,770,789 99.04%
Total Equity
19,770,789 99.04%
Total financial assets at fair value through profit or loss
19,770,789 99.04%
Cash and cash equivalents
148,058 0.74%
Other net assets and liabilities
43,953 0.22%
Net assets attributable to holders of redeemable participating shares
19,962,800 100.00%
SIIP India Opportunities Fund
Summary
Classification Description
Fair Value % of % of
US$ Net Assets Total Assets
Tranferable securities and money market instruments admitted to
official stock exchange listing or traded on regulated market 19,770,789 99.04% 98.67%
A Transferabe securities and money market instruments other than
those referred above
- - -
B Collective Investment Schemes
- - -
C Financial derivative instruments dealt in on a regulated market - - -
D Over the counter financial derivative instrument
- - -
Cash and cash equivalents
148,058 0.74% 0.74%
Other net assets and liabilities
43,953 0.22% 0.22%
Net assets attributable to holders of redeemable participating shares 19,962,800 100.00%

SANLAM UNIVERSAL FUNDS PLC
192
PORTFOLIO OF INVESTMENTS OF SIM GLOBAL EQUITY INCOME FUND as at 30 June 2014
Nominal Security
Classification Fair Value % of
US$ Net
Assets
Financial assets at fair value through profit or loss
Equity – 96.23%
Australia – 2.13% 174,512 Tattersall's Ltd
537,998 2.13%
Total Australia
537,998 2.13%
Bermuda – 2.50% 69,127 Catlin Group Ltd
631,971 2.50%
Total Bermuda
631,971 2.50%
Finland – 1.88% 12,205 Nokiaan Renkaat OYJ
475,975 1.88%
Total Finland
475,975 1.88%
France – 8.17% 6,783 Sanofi-Aventis
720,067 2.85%
16,690 Scor SE
573,690 2.27%
10,663 Total SA
770,106 3.05%
Total France
2,063,863 8.17%
Great Britain – 41.95% 73,052 Amlin Plc
584,341 2.31%
9,207 Astrazeneca Plc
682,894 2.70%
27,815 Bhp Billiton Plc
898,094 3.56%
73,024 BP Plc
642,516 2.54%
16,445 British American Tobbacco Plc
977,370 3.87%
26,986 GlaxoSmithKline Plc
721,225 2.86%
66,035 IG Group Holdings Plc
662,945 2.62%
22,830 Imperial Tobacco Group Plc
1,026,024 4.06%
265,970 Legal & General Group Plc
1,024,430 4.06%
42,297 Micro Focus International Plc
627,372 2.48%
12,531 Royal Dutch Shell Plc
518,524 2.05%
86,129 Sainsbury Plc
464,349 1.84%
80,702 Tesco Plc
391,926 1.55%
16,020 Unilever Plc
725,718 2.87%
194,628 Vodafone Group Plc
648,538 2.57%
Total Great Britain
10,596,266 41.95%
Israel – 2.17% 63,875 Israel Chemicals Ltd
547,771 2.17%
Total Israel
547,771 2.17%
Netherlands – 2.88% 38,749 Koninklijke Ahold NV
726,941 2.88%
Total Netherlands
726,941 2.88%
Singapore – 3.05% 249,823 Singapore Telecommunications Ltd
771,616 3.05%
Total Singapore
771,616 3.05%
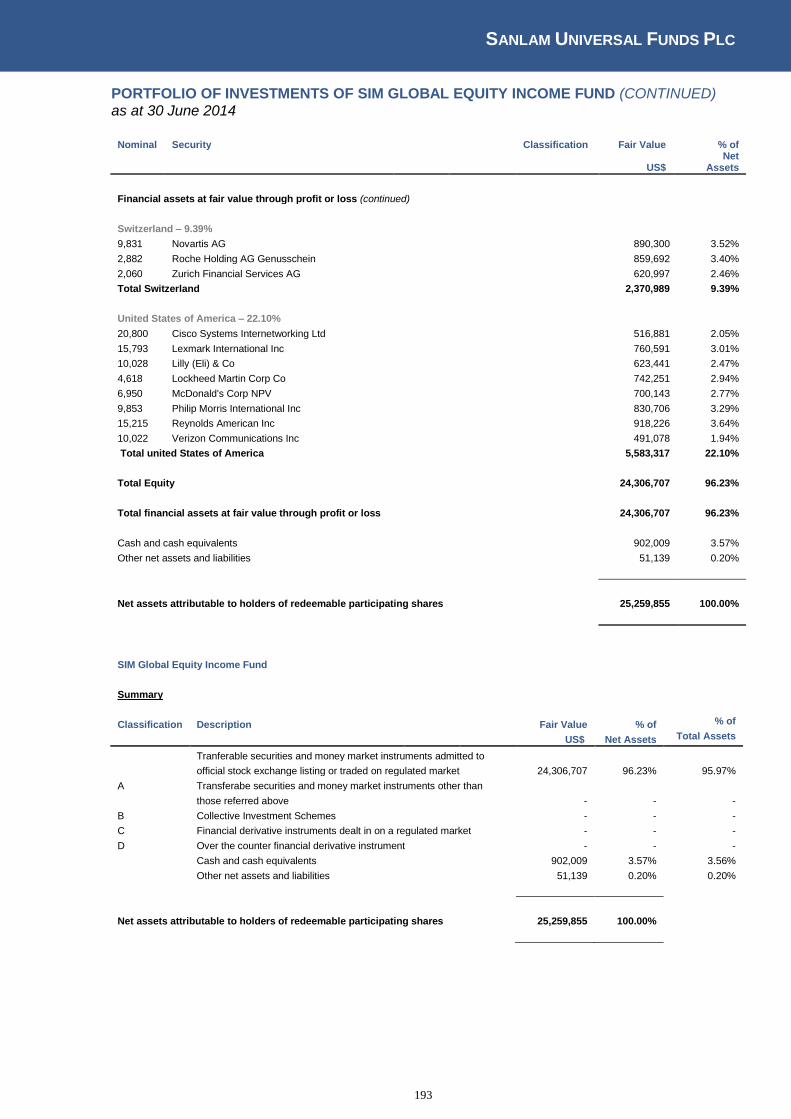
SANLAM UNIVERSAL FUNDS PLC
193
PORTFOLIO OF INVESTMENTS OF SIM GLOBAL EQUITY INCOME FUND (CONTINUED) as at 30 June 2014
Nominal Security
Classification Fair Value % of
US$ Net
Assets
Financial assets at fair value through profit or loss (continued)
Switzerland – 9.39% 9,831 Novartis AG
890,300 3.52%
2,882 Roche Holding AG Genusschein
859,692 3.40%
2,060 Zurich Financial Services AG
620,997 2.46%
Total Switzerland
2,370,989 9.39%
United States of America – 22.10% 20,800 Cisco Systems Internetworking Ltd
516,881 2.05%
15,793 Lexmark International Inc
760,591 3.01%
10,028 Lilly (Eli) & Co
623,441 2.47%
4,618 Lockheed Martin Corp Co
742,251 2.94%
6,950 McDonald's Corp NPV
700,143 2.77%
9,853 Philip Morris International Inc
830,706 3.29%
15,215 Reynolds American Inc
918,226 3.64%
10,022 Verizon Communications Inc
491,078 1.94%
Total united States of America
5,583,317 22.10%
Total Equity
24,306,707 96.23%
Total financial assets at fair value through profit or loss
24,306,707 96.23%
Cash and cash equivalents
902,009 3.57%
Other net assets and liabilities
51,139 0.20%
Net assets attributable to holders of redeemable participating shares
25,259,855 100.00%
SIM Global Equity Income Fund
Summary
Classification Description
Fair Value % of % of
US$ Net Assets Total Assets
Tranferable securities and money market instruments admitted to
official stock exchange listing or traded on regulated market 24,306,707 96.23% 95.97%
A Transferabe securities and money market instruments other than
those referred above
- - -
B Collective Investment Schemes
- - -
C Financial derivative instruments dealt in on a regulated market - - -
D Over the counter financial derivative instrument
- - -
Cash and cash equivalents
902,009 3.57% 3.56%
Other net assets and liabilities
51,139 0.20% 0.20%
Net assets attributable to holders of redeemable participating shares 25,259,855 100.00%

SANLAM UNIVERSAL FUNDS PLC
194
PORTFOLIO OF INVESTMENTS OF SPI STRATEGIC INVESTMENT GRADE BOND FUND as at 30 June 2014
Nominal Security Coupon Maturity Classification Fair
Value % of
GBP Net
Assets
Financial assets at fair value through profit or loss
Debt - 91.76%
France - 5.46% 1,000,000 Credit Agricole SA F/R 26102049 8.13 26/10/2049
1,154,370 1.90%
500,000 Electricite De France F/R 29072049 6.00 29/07/2049
533,923 0.88%
1,420,000 Societe Generale F/R Perpetual 8.88 16/06/2050
1,622,400 2.68%
Total France
3,310,692 5.46%
Germany - 4.58% 100,000 Deutsche Bank AG FR 7.13 30/04/2047
100,630 0.17%
1,000,000 Munich Re Finance FR 6.63 26/05/2042
1,150,830 1.90%
1,400,000 RWE AG 7.00 31/12/2049
1,522,080 2.51%
Total Germany
2,773,540 4.58%
Great Britain - 65.11% 1,000,000 Aviva Plc 6.63 03/06/2041
1,124,505 1.85%
29,000 Aviva Plc 9.50 20/06/2016
33,249 0.05%
900,000 Aviva Plc 6.13 29/09/2050
966,555 1.59%
270,000 Bank of Scotland Plc 7.28 30/05/2049
312,904 0.52%
870,000 Barclays Bank Plc 6.37 15/12/2049
911,778 1.50%
1,000,000 Barclays Bank Plc 5.75 14/09/2026
1,093,320 1.80%
1,900,000 Barclays Bank Plc 14.00 15/06/2019
2,599,295 4.29%
490,890 Canary Wharf Finance II Plc 6.46 22/10/2033
563,918 0.93%
10,000 Compass Group Plc 7.00 08/12/2014
10,259 0.02%
1,000,000 The Co-operative Group 7.50 08/07/2026
1,077,970 1.78%
1,800,000 Coventry Building Society 6.38 01/11/2049
1,800,207 2.97%
2,000,000 Coventry Building Society 6.09 29/06/2090
2,059,300 3.40%
500,000 Direct Line Insurance 9.25 27/04/2042
637,295 1.05%
1,000,000 Friends Life Group Plc 12.00 21/05/2021
1,336,410 2.20%
388,000 Friends Life Group Plc 8.25 21/04/2022
440,250 0.73%
1,000,000 Friends Life Holdings Plc 6.88 21/11/2050
1,056,285 1.74%
450,000 Friends Life Holdings Plc 6.29 30/06/2050
458,529 0.76%
8,000 Hammerson Plc 6.00 23/02/2026
9,430 0.02%
1,500,000 HSBC Bank Plc 6.00 29/03/2040
1,704,038 2.81%
10,000 HSBC Bank Plc 6.50 07/07/2023
11,775 0.02%
26,000 ILB British Telecom Plc 3.50 25/04/2025
48,658 0.08%
1,761,000 Investec Bank Plc 9.63 17/02/2022
2,068,330 3.41%
1,514,000 LBG Capital 15.00 21/12/2019
2,207,215 3.64%
1,000,000 Liverpool Victoria Friendly Society Ltd 6.50 22/05/2043
1,015,755 1.68%
900,000 Lloyds Bank Plc 13.00 22/01/2049
1,510,736 2.49%
1,294,000 Nationwide Building Society 6.00 15/12/2016
1,365,331 2.25%
12,530 Nationwide Building Society 10.25 20/06/2050
1,623,286 2.68%
1,000,000 Old Mutual 6.38 24/03/2050
1,046,770 1.73%
57,000 Pearson Plc 7.00 27/10/2014
58,061 0.10%
11,000 Prudential plc 6.88 20/01/2023
13,709 0.02%
1,000,000 RL Finance Bonds Plc 6.13 30/11/2043
1,048,395 1.73%
40,000 Rolls-Royce Plc 7.38 14/06/2016
44,452 0.07%
6,000 Safeway Ltd 6.50 05/08/2014
6,028 0.01%
1,000,000 Scottish Widows Plc 7.00 16/06/2043
1,155,495 1.91%
4,000 Segro Plc 6.25 30/09/2015
4,219 0.01%
70,000 Severn Trent Utilities Finance Plc 5.25 08/12/2014
71,259 0.12%
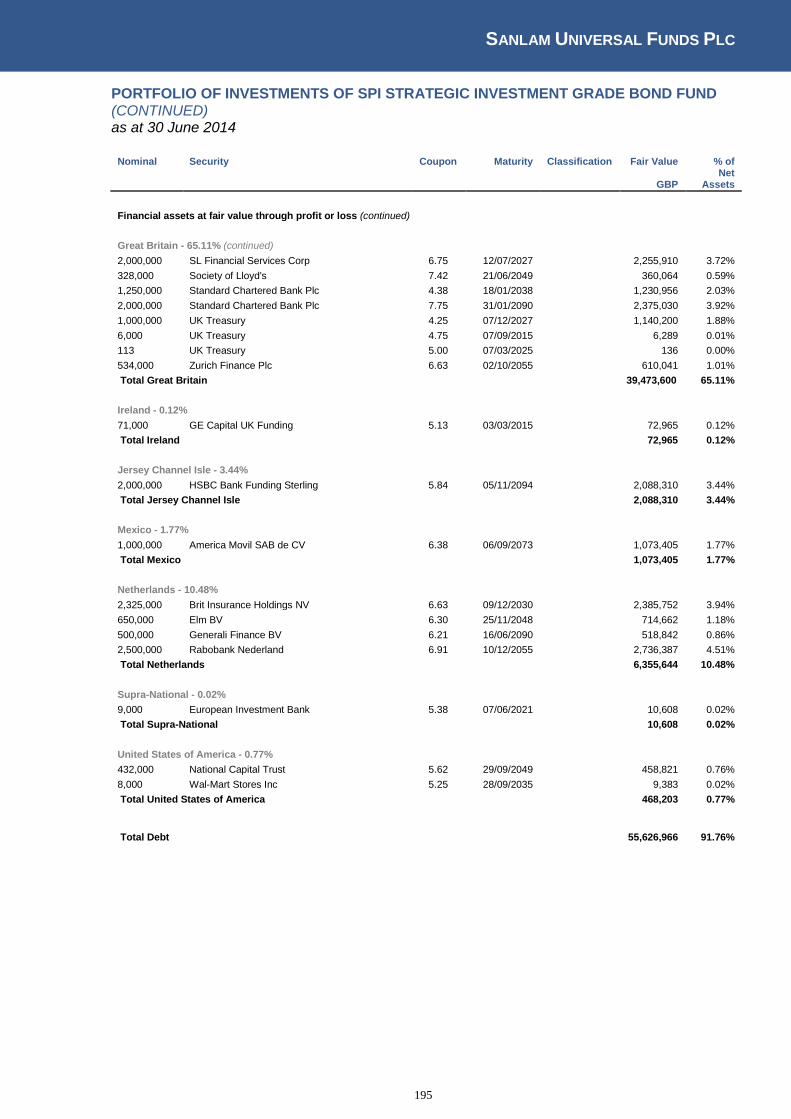
SANLAM UNIVERSAL FUNDS PLC
195
PORTFOLIO OF INVESTMENTS OF SPI STRATEGIC INVESTMENT GRADE BOND FUND (CONTINUED) as at 30 June 2014
Nominal Security Coupon Maturity Classification Fair Value % of
GBP Net
Assets
Financial assets at fair value through profit or loss (continued)
Great Britain - 65.11% (continued)
2,000,000 SL Financial Services Corp 6.75 12/07/2027
2,255,910 3.72%
328,000 Society of Lloyd's 7.42 21/06/2049
360,064 0.59%
1,250,000 Standard Chartered Bank Plc 4.38 18/01/2038
1,230,956 2.03%
2,000,000 Standard Chartered Bank Plc 7.75 31/01/2090
2,375,030 3.92%
1,000,000 UK Treasury 4.25 07/12/2027
1,140,200 1.88%
6,000 UK Treasury 4.75 07/09/2015
6,289 0.01%
113 UK Treasury 5.00 07/03/2025
136 0.00%
534,000 Zurich Finance Plc 6.63 02/10/2055
610,041 1.01%
Total Great Britain
39,473,600 65.11%
Ireland - 0.12% 71,000 GE Capital UK Funding 5.13 03/03/2015
72,965 0.12%
Total Ireland
72,965 0.12%
Jersey Channel Isle - 3.44% 2,000,000 HSBC Bank Funding Sterling 5.84 05/11/2094
2,088,310 3.44%
Total Jersey Channel Isle
2,088,310 3.44%
Mexico - 1.77% 1,000,000 America Movil SAB de CV 6.38 06/09/2073
1,073,405 1.77%
Total Mexico
1,073,405 1.77%
Netherlands - 10.48% 2,325,000 Brit Insurance Holdings NV 6.63 09/12/2030
2,385,752 3.94%
650,000 Elm BV 6.30 25/11/2048
714,662 1.18%
500,000 Generali Finance BV 6.21 16/06/2090
518,842 0.86%
2,500,000 Rabobank Nederland 6.91 10/12/2055
2,736,387 4.51%
Total Netherlands
6,355,644 10.48%
Supra-National - 0.02% 9,000 European Investment Bank 5.38 07/06/2021
10,608 0.02%
Total Supra-National
10,608 0.02%
United States of America - 0.77% 432,000 National Capital Trust 5.62 29/09/2049
458,821 0.76%
8,000 Wal-Mart Stores Inc 5.25 28/09/2035
9,383 0.02%
Total United States of America
468,203 0.77%
Total Debt
55,626,966 91.76%
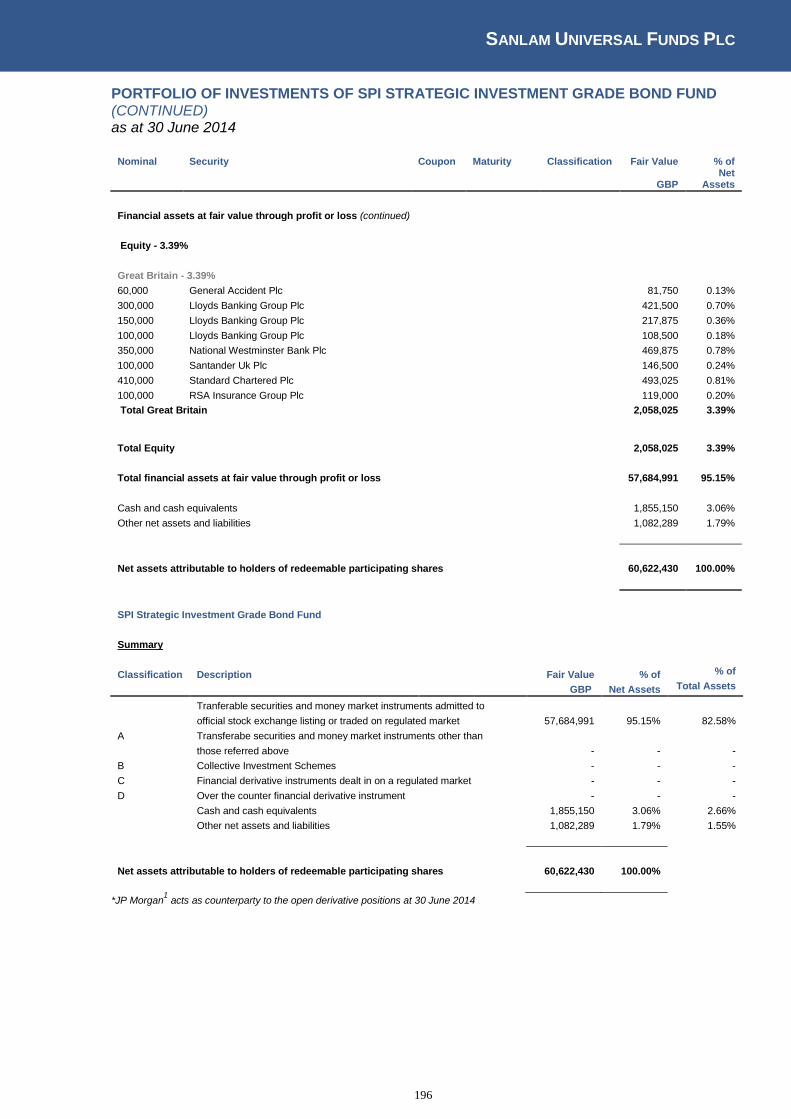
SANLAM UNIVERSAL FUNDS PLC
196
PORTFOLIO OF INVESTMENTS OF SPI STRATEGIC INVESTMENT GRADE BOND FUND (CONTINUED) as at 30 June 2014
Nominal Security Coupon Maturity Classification Fair Value % of
GBP Net
Assets
Financial assets at fair value through profit or loss (continued)
Equity - 3.39%
Great Britain - 3.39% 60,000 General Accident Plc
81,750 0.13%
300,000 Lloyds Banking Group Plc
421,500 0.70%
150,000 Lloyds Banking Group Plc
217,875 0.36%
100,000 Lloyds Banking Group Plc
108,500 0.18%
350,000 National Westminster Bank Plc
469,875 0.78%
100,000 Santander Uk Plc
146,500 0.24%
410,000 Standard Chartered Plc
493,025 0.81%
100,000 RSA Insurance Group Plc
119,000 0.20%
Total Great Britain
2,058,025 3.39%
Total Equity
2,058,025 3.39%
Total financial assets at fair value through profit or loss
57,684,991 95.15%
Cash and cash equivalents
1,855,150 3.06%
Other net assets and liabilities
1,082,289 1.79%
Net assets attributable to holders of redeemable participating shares
60,622,430 100.00%
SPI Strategic Investment Grade Bond Fund
Summary
Classification Description
Fair Value % of % of
GBP Net Assets Total Assets
Tranferable securities and money market instruments admitted to
official stock exchange listing or traded on regulated market
57,684,991 95.15% 82.58%
A Transferabe securities and money market instruments other than
those referred above
- - -
B Collective Investment Schemes
- - -
C Financial derivative instruments dealt in on a regulated market - - -
D Over the counter financial derivative instrument
- - -
Cash and cash equivalents
1,855,150 3.06% 2.66%
Other net assets and liabilities
1,082,289 1.79% 1.55%
Net assets attributable to holders of redeemable participating shares 60,622,430 100.00%
*JP Morgan1 acts as counterparty to the open derivative positions at 30 June 2014
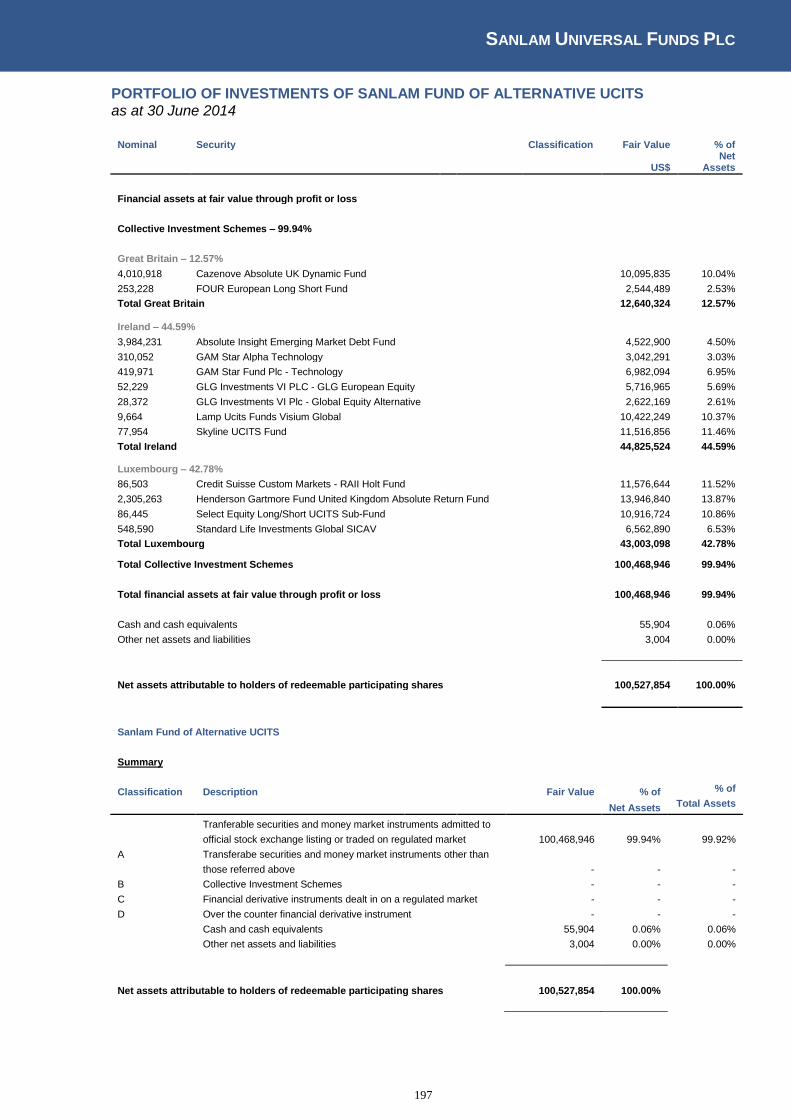
SANLAM UNIVERSAL FUNDS PLC
197
PORTFOLIO OF INVESTMENTS OF SANLAM FUND OF ALTERNATIVE UCITS as at 30 June 2014
Nominal Security
Classification Fair Value % of
US$ Net
Assets
Financial assets at fair value through profit or loss
Collective Investment Schemes – 99.94%
Great Britain – 12.57% 4,010,918 Cazenove Absolute UK Dynamic Fund
10,095,835 10.04%
253,228 FOUR European Long Short Fund
2,544,489 2.53%
Total Great Britain
12,640,324 12.57%
Ireland – 44.59% 3,984,231 Absolute Insight Emerging Market Debt Fund
4,522,900 4.50%
310,052 GAM Star Alpha Technology
3,042,291 3.03%
419,971 GAM Star Fund Plc - Technology
6,982,094 6.95%
52,229 GLG Investments VI PLC - GLG European Equity
5,716,965 5.69%
28,372 GLG Investments VI Plc - Global Equity Alternative
2,622,169 2.61%
9,664 Lamp Ucits Funds Visium Global
10,422,249 10.37%
77,954 Skyline UCITS Fund
11,516,856 11.46%
Total Ireland
44,825,524 44.59%
Luxembourg – 42.78% 86,503 Credit Suisse Custom Markets - RAII Holt Fund
11,576,644 11.52%
2,305,263 Henderson Gartmore Fund United Kingdom Absolute Return Fund
13,946,840 13.87%
86,445 Select Equity Long/Short UCITS Sub-Fund
10,916,724 10.86%
548,590 Standard Life Investments Global SICAV
6,562,890 6.53%
Total Luxembourg
43,003,098 42.78%
Total Collective Investment Schemes
100,468,946 99.94%
Total financial assets at fair value through profit or loss
100,468,946 99.94%
Cash and cash equivalents
55,904 0.06%
Other net assets and liabilities
3,004 0.00%
Net assets attributable to holders of redeemable participating shares
100,527,854 100.00%
Sanlam Fund of Alternative UCITS
Summary
Classification Description
Fair Value % of % of
Net Assets Total Assets
Tranferable securities and money market instruments admitted to
official stock exchange listing or traded on regulated market
100,468,946 99.94% 99.92%
A Transferabe securities and money market instruments other than
those referred above
- - -
B Collective Investment Schemes
- - -
C Financial derivative instruments dealt in on a regulated market - - -
D Over the counter financial derivative instrument
- - -
Cash and cash equivalents
55,904 0.06% 0.06%
Other net assets and liabilities
3,004 0.00% 0.00%
Net assets attributable to holders of redeemable participating shares 100,527,854 100.00%

SANLAM UNIVERSAL FUNDS PLC
198
PORTFOLIO OF INVESTMENTS OF SANLAM ACCEL INCOME FUND as at 30 June 2014
Nominal Security
Classification Fair Value % of
GBP Net
Assets
Financial assets at fair value through profit or loss
Collective Investment Schemes - 95.13%
Great Britain - 79.79% 1,458,353 Artemis Global Income Fund
B 1,123,223 4.56%
348,770 Artemis Income Fund
B 751,042 3.05%
910,598 Artemis Strategic Bond Fund
B 505,564 2.05%
1,317,159 Cazenove Strategic Bond Fund
B 1,339,551 5.44%
1,162,949 Fidelity Enhanced Income Fund
B 1,297,851 5.27%
851,956 Fidelity Institutional Funds ICVC - UK Corp
B 1,020,643 4.14%
496,906 Henderson UK & Europe Funds - Strategic Bond
B 686,227 2.78%
154,491 Henderson UK & Europe Funds - UK Equity Income
B 1,064,601 4.32%
967,127 Invesco Perpetual Fixed Interest Corporate Bond
B 1,143,628 4.64%
1,192,601 JPMorgan Fund ICVC - Sterling Corporate Bond
B 1,355,987 5.50%
992,927 Jupiter Strategic Bond - II
B 667,843 2.71%
422,660 Kames ICVC - High Yield Bond Fund
B 439,821 1.78%
1,250,743 Kames ICVC - Sterling Corporate Bond Fund
B 1,299,647 5.27%
1,361,733 Lazard Investment Funds - Global Equity Income
B 1,421,649 5.77%
845,018 M&G Corporate Bond
B 327,613 1.33%
97,603 M&G Short Dated Coporate Bond Fund
B 1,000,929 4.06%
552,736 Mellon Investments Funds - Newton Global High
B 624,205 2.53%
1,026,614 PFS Chelverton UK Equity Fund
B 1,074,874 4.36%
1,969,483 Schroder Income Maximiser Fund
B 1,072,581 4.35%
591,501 Schroder UK Alph Fund
B 1,009,692 4.10%
266,219 Trojan Investment Funds - Trojan Income Fund
B 432,845 1.76%
Total Great Britain
19,660,016 79.79%
Ireland - 13.92% 2,404 Muzinich Emerging Markets Short Duration Fund
B 249,952 1.01%
1,052,807 SPI Strategic Investment Grade Bond Fund
B 1,093,761 4.44%
8,443 Vanguard Investment Series - UK Government Bond
B 954,455 3.87%
6,571 Veritas Funds Plc - Global Equity Income Fund
B 1,132,505 4.60%
Total Ireland
3,430,673 13.92%
Luxembourg - 1.42% 3,490 Airlie Select US High Yield Account
B 350,733 1.42%
Total Luxembourg
350,733 1.42%
Total Collective Investment Schemes
23,441,422 95.13%
Total financial assets at fair value through profit or loss
23,441,422 95.13%
Cash and cash equivalents
2,003,004 8.13%
Other net assets and liabilities
(803,597) (3.26%)
Net assets attributable to holders of redeemable participating shares
24,640,829 100.00%

SANLAM UNIVERSAL FUNDS PLC
199
PORTFOLIO OF INVESTMENTS OF SANLAM ACCEL INCOME FUND (CONTINUED) as at 30 June 2014
Sanlam Accel Income Fund
Summary
Classification Description
Fair Value % of % of
Net Assets Total Assets
Tranferable securities and money market instruments admitted to
official stock exchange listing or traded on regulated market - - -
A Transferabe securities and money market instruments other than - - -
those referred above
- - -
B Collective Investment Schemes
23,441,422 95.13% 91.27% C Financial derivative instruments dealt in on a regulated market - - -
D Over the counter financial derivative instrument - - -
Cash and cash equivalents
2,003,004 8.13% 7.80%
Other net assets and liabilities
(803,597) (3.26%) (3.13%)
Net assets attributable to holders of redeemable participating shares 24,640,829 100.00%
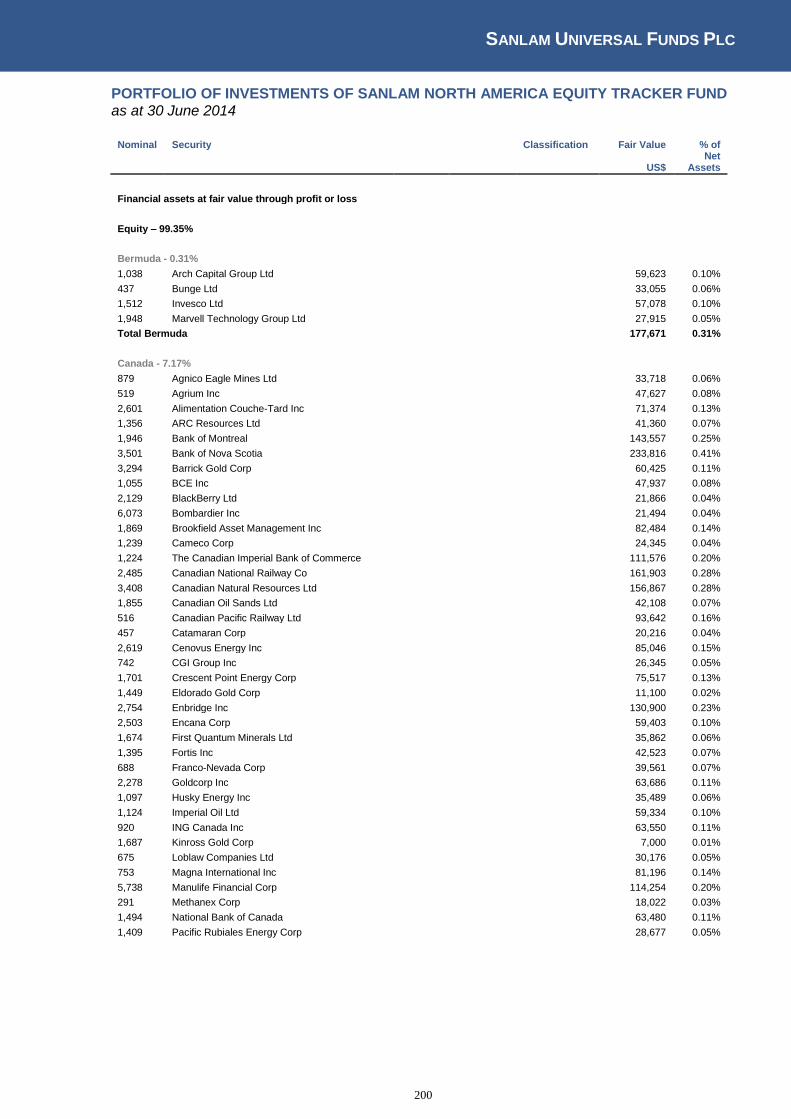
SANLAM UNIVERSAL FUNDS PLC
200
PORTFOLIO OF INVESTMENTS OF SANLAM NORTH AMERICA EQUITY TRACKER FUND as at 30 June 2014
Nominal Security
Classification Fair Value % of
US$ Net
Assets
Financial assets at fair value through profit or loss
Equity – 99.35%
Bermuda - 0.31% 1,038 Arch Capital Group Ltd
59,623 0.10%
437 Bunge Ltd
33,055 0.06%
1,512 Invesco Ltd
57,078 0.10%
1,948 Marvell Technology Group Ltd
27,915 0.05%
Total Bermuda
177,671 0.31%
Canada - 7.17% 879 Agnico Eagle Mines Ltd
33,718 0.06%
519 Agrium Inc
47,627 0.08%
2,601 Alimentation Couche-Tard Inc
71,374 0.13%
1,356 ARC Resources Ltd
41,360 0.07%
1,946 Bank of Montreal
143,557 0.25%
3,501 Bank of Nova Scotia
233,816 0.41%
3,294 Barrick Gold Corp
60,425 0.11%
1,055 BCE Inc
47,937 0.08%
2,129 BlackBerry Ltd
21,866 0.04%
6,073 Bombardier Inc
21,494 0.04%
1,869 Brookfield Asset Management Inc
82,484 0.14%
1,239 Cameco Corp
24,345 0.04%
1,224 The Canadian Imperial Bank of Commerce
111,576 0.20%
2,485 Canadian National Railway Co
161,903 0.28%
3,408 Canadian Natural Resources Ltd
156,867 0.28%
1,855 Canadian Oil Sands Ltd
42,108 0.07%
516 Canadian Pacific Railway Ltd
93,642 0.16%
457 Catamaran Corp
20,216 0.04%
2,619 Cenovus Energy Inc
85,046 0.15%
742 CGI Group Inc
26,345 0.05%
1,701 Crescent Point Energy Corp
75,517 0.13%
1,449 Eldorado Gold Corp
11,100 0.02%
2,754 Enbridge Inc
130,900 0.23%
2,503 Encana Corp
59,403 0.10%
1,674 First Quantum Minerals Ltd
35,862 0.06%
1,395 Fortis Inc
42,523 0.07%
688 Franco-Nevada Corp
39,561 0.07%
2,278 Goldcorp Inc
63,686 0.11%
1,097 Husky Energy Inc
35,489 0.06%
1,124 Imperial Oil Ltd
59,334 0.10%
920 ING Canada Inc
63,550 0.11%
1,687 Kinross Gold Corp
7,000 0.01%
675 Loblaw Companies Ltd
30,176 0.05%
753 Magna International Inc
81,196 0.14%
5,738 Manulife Financial Corp
114,254 0.20%
291 Methanex Corp
18,022 0.03%
1,494 National Bank of Canada
63,480 0.11%
1,409 Pacific Rubiales Energy Corp
28,677 0.05%

SANLAM UNIVERSAL FUNDS PLC
201
PORTFOLIO OF INVESTMENTS OF SANLAM NORTH AMERICA EQUITY TRACKER FUND (CONTINUED) as at 30 June 2014
Nominal Security
Classification Fair Value % of
US$ Net
Assets
Financial assets at fair value through profit or loss (continued)
Canada - 7.17% (continued)
1,767 Pembina Pipeline Corp
76,158 0.13%
1,794 Penn West Petroleum Ltd
17,549 0.03%
2,558 The Potash Corporation of Saskatchewan Inc
97,450 0.17%
1,410 Power Corp of Canada
39,248 0.07%
1,358 Rogers Communications Inc
54,743 0.10%
4,083 Royal Bank of Canada
292,388 0.51%
1,804 Shaw Communications Inc
46,336 0.08%
853 Silver Wheaton Corp
22,486 0.04%
540 SNC Lavalin Group Inc
28,450 0.05%
2,297 Sun Life Financial Inc
84,574 0.15%
4,425 Suncor Energy Inc
189,014 0.33%
2,821 Talisman Energy Inc
29,873 0.05%
1,385 Teck Resources Ltd
31,673 0.06%
1,103 Thomson Reuters Corp
40,229 0.07%
648 Tim Hortons Inc
35,509 0.06%
5,221 Toronto-Dominion Bank
269,235 0.47%
2,143 Transcanada Corp
102,462 0.18%
945 Valeant Pharmaceuticals International Inc
119,713 0.21%
2,739 Yamana Gold Inc
22,576 0.04%
Total Canada
4,087,102 7.17%
Cayman Islands - 0.15% 418 Herbalife Ltd
26,978 0.05%
1,048 Seagate Technology Plc
59,547 0.10%
Total Cayman Islands
86,525 0.15%
Great Britain - 0.56% 1,019 Aon Plc
91,802 0.16%
611 Ensco Plc
33,953 0.06%
1,133 Liberty Global Plc
50,101 0.09%
1,009 Liberty Global Plc
42,691 0.07%
681 Mead Johnson Nutrition Co
63,449 0.11%
1,037 Noble Corp Plc
34,802 0.06%
Total Great Britain
316,798 0.56%
Ireland - 1.42% 1,874 Accenture Plc
151,494 0.27%
527 Actavis Plc
117,547 0.21%
1,381 Covidien Plc
124,539 0.22%
1,412 Eaton Corp Plc
108,978 0.19%
921 Ingersoll-Rand Plc
57,572 0.10%
705 Pentair Plc
50,845 0.09%
443 Perrigo Company Plc
64,572 0.11%
2,398 Weatherford International Plc
55,154 0.10%
591 Willis Group Holdings Plc
25,590 0.04%
1,671 XL Group Plc
54,692 0.10%
Total Ireland
810,983 1.42%

SANLAM UNIVERSAL FUNDS PLC
202
PORTFOLIO OF INVESTMENTS OF SANLAM NORTH AMERICA EQUITY TRACKER FUND (CONTINUED) as at 30 June 2014
Nominal Security
Classification Fair Value % of
US$ Net
Assets
Financial assets at fair value through profit or loss (continued)
Jersey Channel Isle - 0.13% 1,062 Delphi Automotive Plc
73,002 0.13%
Total Jersey Channel Isle
73,002 0.13%
Netherlands - 1.05% 138 Core Laboratories Inc
23,054 0.04%
1,375 LyondellBasell Industries NV
134,269 0.24%
3,747 Schlumberger Ltd
441,959 0.78%
Total Netherlands
599,282 1.05%
Singapore - 0.11% 847 Avago Technologies Ltd
61,043 0.11%
Total Singapore
61,043 0.11%
Sweden - 0.14% 1,702 Tyco International Ltd
77,611 0.14%
Total Sweden
77,611 0.14%
Switzerland - 0.33% 962 ACE Ltd
99,759 0.18%
1,387 TE Connectivity Ltd
85,772 0.15%
Total Switzerland
185,531 0.33%
United States of America - 87.89% 1,757 3M Company
251,673 0.44%
4,419 Abbott Laboratories
180,737 0.32%
4,538 AbbVie Inc
256,125 0.45%
1,715 Activision Blizzard Inc
38,245 0.07%
1,431 Adobe Systems Inc
103,547 0.18%
834 ADT Corp
29,140 0.05%
2,222 AES Corp
34,552 0.06%
1,007 Aetna Inc
81,648 0.14%
183 Affiliated Managers Group Inc
37,588 0.07%
1,325 Aflac Inc
82,481 0.14%
373 AGCO Corp
20,970 0.04%
1,109 Agilent Technologies Inc
63,701 0.11%
592 Air Products & Chemicals Inc
76,143 0.13%
709 Akamai Technologies Inc
43,292 0.08%
3,313 Alcoa Inc
49,331 0.09%
596 Alexion Pharmaceuticals Inc
93,125 0.16%
872 Allergan Inc
147,560 0.26%
177 Alliance Data Systems Corp
49,781 0.09%
1,488 Allstate Corp
87,375 0.15%
926 Altera Corp
32,188 0.06%
5,546 Altria Group Inc
232,599 0.41%
1,115 Amazon.Com Inc
362,130 0.64%
962 Amerada Hess Corp
95,132 0.17%
1,278 Ameren Corp
52,245 0.09%
1,560 American Capital Agency Corp
36,520 0.06%
1,552 American Electric Power
86,555 0.15%
2,742 American Express Co
260,134 0.46%
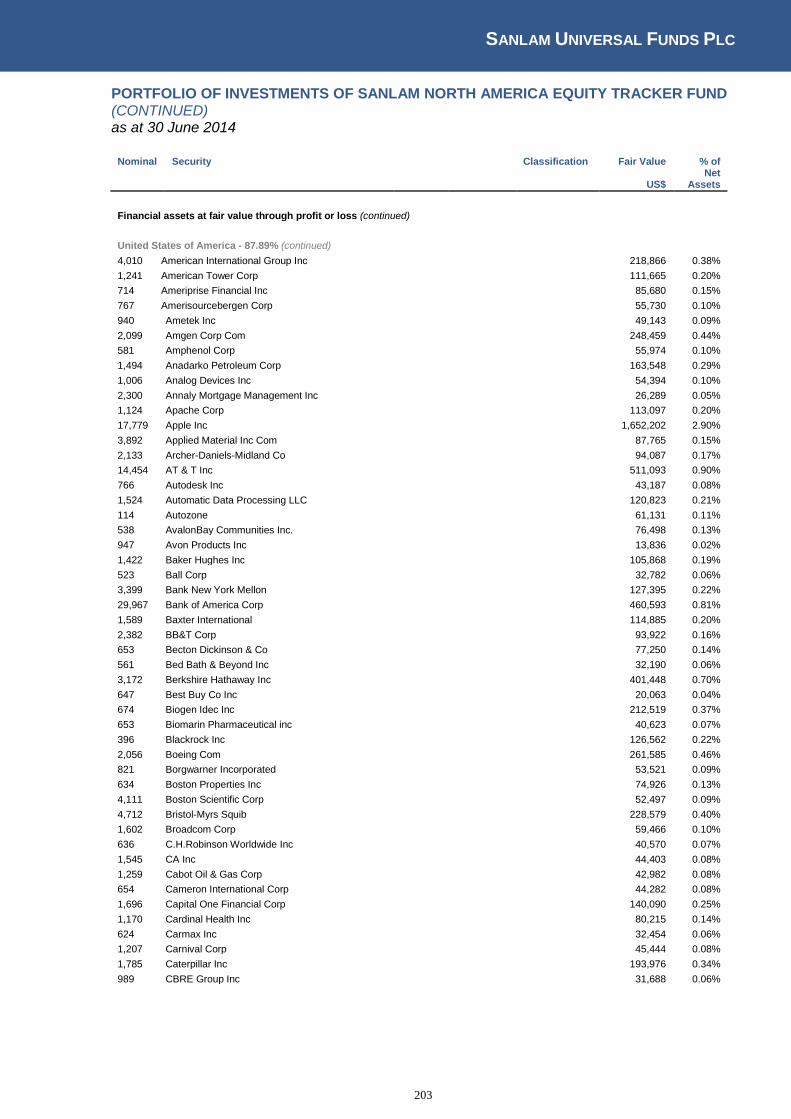
SANLAM UNIVERSAL FUNDS PLC
203
PORTFOLIO OF INVESTMENTS OF SANLAM NORTH AMERICA EQUITY TRACKER FUND (CONTINUED) as at 30 June 2014
Nominal Security
Classification Fair Value % of
US$ Net
Assets
Financial assets at fair value through profit or loss (continued)
United States of America - 87.89% (continued)
4,010 American International Group Inc
218,866 0.38%
1,241 American Tower Corp
111,665 0.20%
714 Ameriprise Financial Inc
85,680 0.15%
767 Amerisourcebergen Corp
55,730 0.10%
940 Ametek Inc
49,143 0.09%
2,099 Amgen Corp Com
248,459 0.44%
581 Amphenol Corp
55,974 0.10%
1,494 Anadarko Petroleum Corp
163,548 0.29%
1,006 Analog Devices Inc
54,394 0.10%
2,300 Annaly Mortgage Management Inc
26,289 0.05%
1,124 Apache Corp
113,097 0.20%
17,779 Apple Inc
1,652,202 2.90%
3,892 Applied Material Inc Com
87,765 0.15%
2,133 Archer-Daniels-Midland Co
94,087 0.17%
14,454 AT & T Inc
511,093 0.90%
766 Autodesk Inc
43,187 0.08%
1,524 Automatic Data Processing LLC
120,823 0.21%
114 Autozone
61,131 0.11%
538 AvalonBay Communities Inc.
76,498 0.13%
947 Avon Products Inc
13,836 0.02%
1,422 Baker Hughes Inc
105,868 0.19%
523 Ball Corp
32,782 0.06%
3,399 Bank New York Mellon
127,395 0.22%
29,967 Bank of America Corp
460,593 0.81%
1,589 Baxter International
114,885 0.20%
2,382 BB&T Corp
93,922 0.16%
653 Becton Dickinson & Co
77,250 0.14%
561 Bed Bath & Beyond Inc
32,190 0.06%
3,172 Berkshire Hathaway Inc
401,448 0.70%
647 Best Buy Co Inc
20,063 0.04%
674 Biogen Idec Inc
212,519 0.37%
653 Biomarin Pharmaceutical inc
40,623 0.07%
396 Blackrock Inc
126,562 0.22%
2,056 Boeing Com
261,585 0.46%
821 Borgwarner Incorporated
53,521 0.09%
634 Boston Properties Inc
74,926 0.13%
4,111 Boston Scientific Corp
52,497 0.09%
4,712 Bristol-Myrs Squib
228,579 0.40%
1,602 Broadcom Corp
59,466 0.10%
636 C.H.Robinson Worldwide Inc
40,570 0.07%
1,545 CA Inc
44,403 0.08%
1,259 Cabot Oil & Gas Corp
42,982 0.08%
654 Cameron International Corp
44,282 0.08%
1,696 Capital One Financial Corp
140,090 0.25%
1,170 Cardinal Health Inc
80,215 0.14%
624 Carmax Inc
32,454 0.06%
1,207 Carnival Corp
45,444 0.08%
1,785 Caterpillar Inc
193,976 0.34%
989 CBRE Group Inc
31,688 0.06%
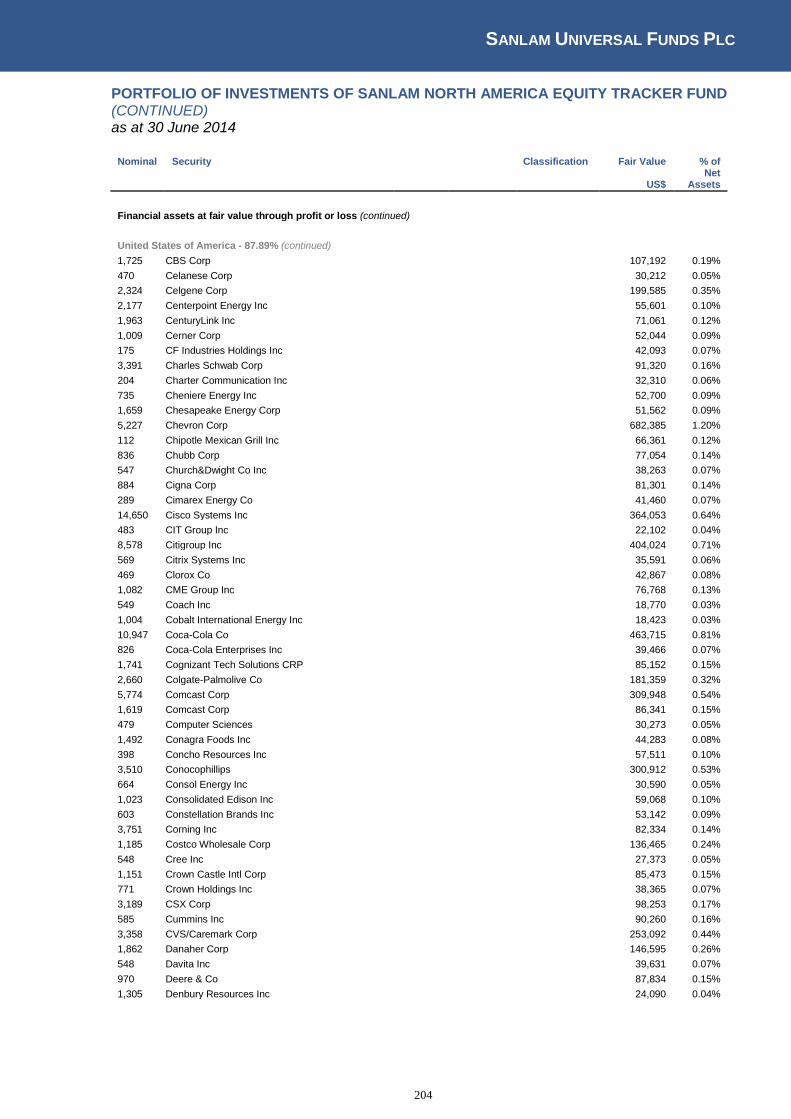
SANLAM UNIVERSAL FUNDS PLC
204
PORTFOLIO OF INVESTMENTS OF SANLAM NORTH AMERICA EQUITY TRACKER FUND (CONTINUED) as at 30 June 2014
Nominal Security
Classification Fair Value % of
US$ Net
Assets
Financial assets at fair value through profit or loss (continued)
United States of America - 87.89% (continued)
1,725 CBS Corp
107,192 0.19%
470 Celanese Corp
30,212 0.05%
2,324 Celgene Corp
199,585 0.35%
2,177 Centerpoint Energy Inc
55,601 0.10%
1,963 CenturyLink Inc
71,061 0.12%
1,009 Cerner Corp
52,044 0.09%
175 CF Industries Holdings Inc
42,093 0.07%
3,391 Charles Schwab Corp
91,320 0.16%
204 Charter Communication Inc
32,310 0.06%
735 Cheniere Energy Inc
52,700 0.09%
1,659 Chesapeake Energy Corp
51,562 0.09%
5,227 Chevron Corp
682,385 1.20%
112 Chipotle Mexican Grill Inc
66,361 0.12%
836 Chubb Corp
77,054 0.14%
547 Church&Dwight Co Inc
38,263 0.07%
884 Cigna Corp
81,301 0.14%
289 Cimarex Energy Co
41,460 0.07%
14,650 Cisco Systems Inc
364,053 0.64%
483 CIT Group Inc
22,102 0.04%
8,578 Citigroup Inc
404,024 0.71%
569 Citrix Systems Inc
35,591 0.06%
469 Clorox Co
42,867 0.08%
1,082 CME Group Inc
76,768 0.13%
549 Coach Inc
18,770 0.03%
1,004 Cobalt International Energy Inc
18,423 0.03%
10,947 Coca-Cola Co
463,715 0.81%
826 Coca-Cola Enterprises Inc
39,466 0.07%
1,741 Cognizant Tech Solutions CRP
85,152 0.15%
2,660 Colgate-Palmolive Co
181,359 0.32%
5,774 Comcast Corp
309,948 0.54%
1,619 Comcast Corp
86,341 0.15%
479 Computer Sciences
30,273 0.05%
1,492 Conagra Foods Inc
44,283 0.08%
398 Concho Resources Inc
57,511 0.10%
3,510 Conocophillips
300,912 0.53%
664 Consol Energy Inc
30,590 0.05%
1,023 Consolidated Edison Inc
59,068 0.10%
603 Constellation Brands Inc
53,142 0.09%
3,751 Corning Inc
82,334 0.14%
1,185 Costco Wholesale Corp
136,465 0.24%
548 Cree Inc
27,373 0.05%
1,151 Crown Castle Intl Corp
85,473 0.15%
771 Crown Holdings Inc
38,365 0.07%
3,189 CSX Corp
98,253 0.17%
585 Cummins Inc
90,260 0.16%
3,358 CVS/Caremark Corp
253,092 0.44%
1,862 Danaher Corp
146,595 0.26%
548 Davita Inc
39,631 0.07%
970 Deere & Co
87,834 0.15%
1,305 Denbury Resources Inc
24,090 0.04%

SANLAM UNIVERSAL FUNDS PLC
205
PORTFOLIO OF INVESTMENTS OF SANLAM NORTH AMERICA EQUITY TRACKER FUND (CONTINUED) as at 30 June 2014
Nominal Security
Classification Fair Value % of
US$ Net
Assets
Financial assets at fair value through profit or loss (continued)
United States of America - 87.89% (continued)
1,075 Devon Energy Corp
85,355 0.15%
1,390 Directv Group
118,164 0.21%
1,534 Discover Financial Services
95,077 0.17%
762 Discovery Communications Inc
56,601 0.10%
677 DISH Network Corp
44,059 0.08%
924 Dollar General Corp
53,001 0.09%
673 Dollar Tree Stores Inc
36,652 0.06%
1,692 Dominion Resources Inc
121,012 0.21%
609 Dover Corp
55,389 0.10%
3,568 Dow Chemical Co
183,609 0.32%
791 DR Horton Inc
19,443 0.03%
798 Dr Pepper Snapple Group Inc
46,747 0.08%
772 DTE Energy Co
60,116 0.11%
2,721 Du Pont De Nemours
178,062 0.31%
1,943 Duke Energy Corp
144,151 0.25%
526 Eastman Chemical Co
45,946 0.08%
3,544 eBay Inc
177,413 0.31%
915 Ecolab Inc
101,876 0.18%
1,125 Edison International
65,374 0.11%
347 Edwards Lifesciences Corp
29,786 0.05%
960 Electronic Arts Inc
34,435 0.06%
6,067 EMC Corp
159,805 0.28%
2,118 Emerson Electric Co
140,550 0.25%
644 Entergy Corp
52,866 0.09%
1,635 Eog Resources Inc
191,066 0.34%
168 Equinix Inc
35,295 0.06%
521 Equitable Resources Inc
55,695 0.10%
1,336 Equity Residential
84,168 0.15%
736 Estee Lauder Cos
54,655 0.10%
2,312 Exelon Corp
84,342 0.15%
845 Expeditors International of Washington Inc
37,315 0.07%
2,302 Express Scripts Holdings Inc
159,598 0.28%
12,111 Exxon Corp
1,219,335 2.14%
208 F5 Networks
23,180 0.04%
5,371 Facebook Inc
361,415 0.63%
304 Family Dollar Stores Inc
20,107 0.04%
875 Fastenal Co
43,304 0.08%
945 FDX Corp
143,054 0.25%
1,086 Fidelity National Information Services
59,448 0.10%
3,159 Fifth Third Bancorp
67,445 0.12%
1,225 FirstEnergy Corp
42,532 0.07%
938 Fiserv Inc
56,580 0.10%
635 Fluor Corp
48,832 0.09%
511 FMC Corp
36,378 0.06%
718 FMC Technologies Inc
43,848 0.08%
10,495 Ford Motor Co
180,934 0.32%
758 Forest Laboraties Inc
75,042 0.13%
300 Fossil Group Inc
31,356 0.06%
1,332 Franklin Resources Inc
77,043 0.14%
3,184 Freeport-Mcmoran Copper
116,216 0.20%
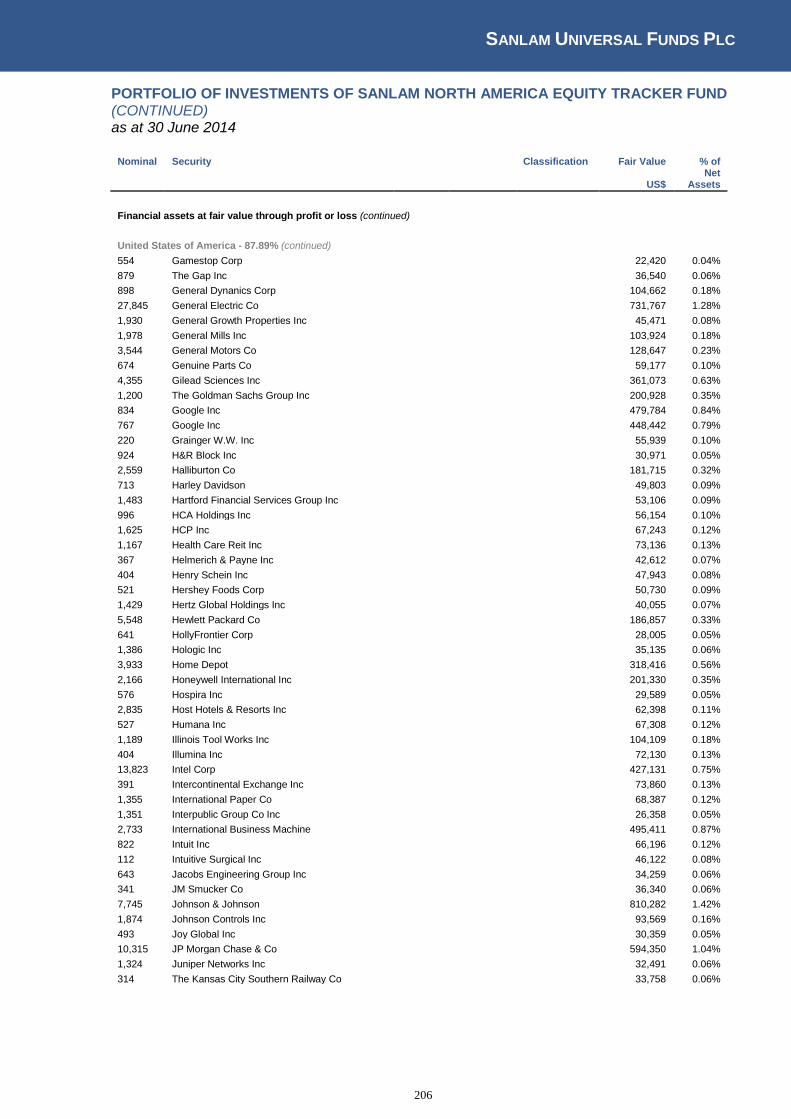
SANLAM UNIVERSAL FUNDS PLC
206
PORTFOLIO OF INVESTMENTS OF SANLAM NORTH AMERICA EQUITY TRACKER FUND (CONTINUED) as at 30 June 2014
Nominal Security
Classification Fair Value % of
US$ Net
Assets
Financial assets at fair value through profit or loss (continued)
United States of America - 87.89% (continued)
554 Gamestop Corp
22,420 0.04%
879 The Gap Inc
36,540 0.06%
898 General Dynanics Corp
104,662 0.18%
27,845 General Electric Co
731,767 1.28%
1,930 General Growth Properties Inc
45,471 0.08%
1,978 General Mills Inc
103,924 0.18%
3,544 General Motors Co
128,647 0.23%
674 Genuine Parts Co
59,177 0.10%
4,355 Gilead Sciences Inc
361,073 0.63%
1,200 The Goldman Sachs Group Inc
200,928 0.35%
834 Google Inc
479,784 0.84%
767 Google Inc
448,442 0.79%
220 Grainger W.W. Inc
55,939 0.10%
924 H&R Block Inc
30,971 0.05%
2,559 Halliburton Co
181,715 0.32%
713 Harley Davidson
49,803 0.09%
1,483 Hartford Financial Services Group Inc
53,106 0.09%
996 HCA Holdings Inc
56,154 0.10%
1,625 HCP Inc
67,243 0.12%
1,167 Health Care Reit Inc
73,136 0.13%
367 Helmerich & Payne Inc
42,612 0.07%
404 Henry Schein Inc
47,943 0.08%
521 Hershey Foods Corp
50,730 0.09%
1,429 Hertz Global Holdings Inc
40,055 0.07%
5,548 Hewlett Packard Co
186,857 0.33%
641 HollyFrontier Corp
28,005 0.05%
1,386 Hologic Inc
35,135 0.06%
3,933 Home Depot
318,416 0.56%
2,166 Honeywell International Inc
201,330 0.35%
576 Hospira Inc
29,589 0.05%
2,835 Host Hotels & Resorts Inc
62,398 0.11%
527 Humana Inc
67,308 0.12%
1,189 Illinois Tool Works Inc
104,109 0.18%
404 Illumina Inc
72,130 0.13%
13,823 Intel Corp
427,131 0.75%
391 Intercontinental Exchange Inc
73,860 0.13%
1,355 International Paper Co
68,387 0.12%
1,351 Interpublic Group Co Inc
26,358 0.05%
2,733 International Business Machine
495,411 0.87%
822 Intuit Inc
66,196 0.12%
112 Intuitive Surgical Inc
46,122 0.08%
643 Jacobs Engineering Group Inc
34,259 0.06%
341 JM Smucker Co
36,340 0.06%
7,745 Johnson & Johnson
810,282 1.42%
1,874 Johnson Controls Inc
93,569 0.16%
493 Joy Global Inc
30,359 0.05%
10,315 JP Morgan Chase & Co
594,350 1.04%
1,324 Juniper Networks Inc
32,491 0.06%
314 The Kansas City Southern Railway Co
33,758 0.06%

SANLAM UNIVERSAL FUNDS PLC
207
PORTFOLIO OF INVESTMENTS OF SANLAM NORTH AMERICA EQUITY TRACKER FUND (CONTINUED) as at 30 June 2014
Nominal Security
Classification Fair Value % of
US$ Net
Assets
Financial assets at fair value through profit or loss (continued)
United States of America - 87.89% (continued)
744 KBR Inc
17,744 0.03%
875 Kellogg Co
57,488 0.10%
373 Keurig Green Mountain Inc
46,480 0.08%
3,407 Keycorp
48,822 0.09%
1,114 Kimberley Clark Corp
123,898 0.22%
2,029 Kimco Realty Corp
46,626 0.08%
2,134 Kinder Morgan Inc
77,379 0.14%
534 Kla-Tencor Corp
38,790 0.07%
577 Kohls Corp
30,396 0.05%
1,705 Kraft Foods Inc
102,215 0.18%
1,520 Kroger Co
75,134 0.13%
717 L Brands Inc
42,059 0.07%
252 Laboratory Corp of America Holdings
25,805 0.05%
485 LAM Research Corp
32,776 0.06%
1,231 Las Vegas Sands Corp
93,827 0.16%
556 Lennar Corp
23,341 0.04%
817 Leucadia National Corp
21,422 0.04%
244 Liberty Media Corp
33,350 0.06%
1,520 Liberty Media-Interactive
44,627 0.08%
2,837 Lilly (Eli) & Co
176,376 0.31%
943 Lincoln National Corp
48,508 0.09%
860 Linear Technology Corp
40,480 0.07%
331 LinkedIn Corp
56,757 0.10%
1,207 LKQ Corp
32,215 0.06%
868 Lockheed Martin Corp
139,514 0.24%
982 Loews Corp
43,218 0.08%
1,238 Lorillard Inc
75,481 0.13%
3,002 Lowes Com
144,066 0.25%
248 Lululemon Athletica Inc
10,039 0.02%
512 M & T Bank Corp
63,514 0.11%
772 Macerich Co
51,531 0.09%
1,179 Macy's Inc
68,406 0.12%
415 Manpower Inc
35,213 0.06%
2,197 Marathon Oil Corp
87,704 0.15%
904 Marathon Petroleum Corp
70,575 0.12%
748 Marriott International Inc
47,947 0.08%
1,878 Marsh & McLennan Co
97,318 0.17%
1,024 Masco Corp
22,733 0.04%
2,974 Mastercard Inc
218,500 0.38%
1,179 Mattel Inc
45,946 0.08%
875 Maxim Integrated Products
29,584 0.05%
2,721 McDonald's Corp
274,114 0.48%
935 McGraw-Hill Cos Inc
77,633 0.14%
680 Mckesson Corp
126,623 0.22%
2,838 Medtronic Com
180,951 0.32%
8,227 Merck & Co
475,932 0.84%
2,671 Metlife Inc
148,401 0.26%
1,002 MGM Resorts International
26,453 0.05%
2,974 Micron Technology Inc
97,993 0.17%
22,198 Microsoft Corp
925,657 1.62%
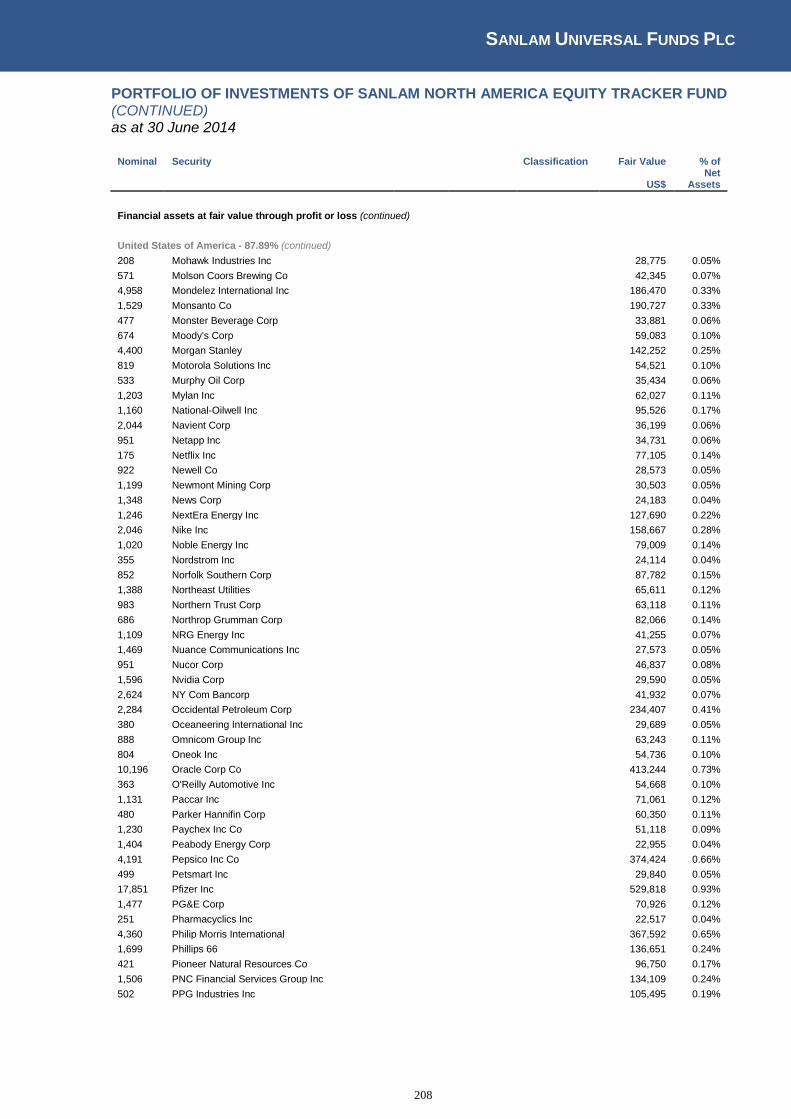
SANLAM UNIVERSAL FUNDS PLC
208
PORTFOLIO OF INVESTMENTS OF SANLAM NORTH AMERICA EQUITY TRACKER FUND (CONTINUED) as at 30 June 2014
Nominal Security
Classification Fair Value % of
US$ Net
Assets
Financial assets at fair value through profit or loss (continued)
United States of America - 87.89% (continued)
208 Mohawk Industries Inc
28,775 0.05%
571 Molson Coors Brewing Co
42,345 0.07%
4,958 Mondelez International Inc
186,470 0.33%
1,529 Monsanto Co
190,727 0.33%
477 Monster Beverage Corp
33,881 0.06%
674 Moody's Corp
59,083 0.10%
4,400 Morgan Stanley
142,252 0.25%
819 Motorola Solutions Inc
54,521 0.10%
533 Murphy Oil Corp
35,434 0.06%
1,203 Mylan Inc
62,027 0.11%
1,160 National-Oilwell Inc
95,526 0.17%
2,044 Navient Corp
36,199 0.06%
951 Netapp Inc
34,731 0.06%
175 Netflix Inc
77,105 0.14%
922 Newell Co
28,573 0.05%
1,199 Newmont Mining Corp
30,503 0.05%
1,348 News Corp
24,183 0.04%
1,246 NextEra Energy Inc
127,690 0.22%
2,046 Nike Inc
158,667 0.28%
1,020 Noble Energy Inc
79,009 0.14%
355 Nordstrom Inc
24,114 0.04%
852 Norfolk Southern Corp
87,782 0.15%
1,388 Northeast Utilities
65,611 0.12%
983 Northern Trust Corp
63,118 0.11%
686 Northrop Grumman Corp
82,066 0.14%
1,109 NRG Energy Inc
41,255 0.07%
1,469 Nuance Communications Inc
27,573 0.05%
951 Nucor Corp
46,837 0.08%
1,596 Nvidia Corp
29,590 0.05%
2,624 NY Com Bancorp
41,932 0.07%
2,284 Occidental Petroleum Corp
234,407 0.41%
380 Oceaneering International Inc
29,689 0.05%
888 Omnicom Group Inc
63,243 0.11%
804 Oneok Inc
54,736 0.10%
10,196 Oracle Corp Co
413,244 0.73%
363 O'Reilly Automotive Inc
54,668 0.10%
1,131 Paccar Inc
71,061 0.12%
480 Parker Hannifin Corp
60,350 0.11%
1,230 Paychex Inc Co
51,118 0.09%
1,404 Peabody Energy Corp
22,955 0.04%
4,191 Pepsico Inc Co
374,424 0.66%
499 Petsmart Inc
29,840 0.05%
17,851 Pfizer Inc
529,818 0.93%
1,477 PG&E Corp
70,926 0.12%
251 Pharmacyclics Inc
22,517 0.04%
4,360 Philip Morris International
367,592 0.65%
1,699 Phillips 66
136,651 0.24%
421 Pioneer Natural Resources Co
96,750 0.17%
1,506 PNC Financial Services Group Inc
134,109 0.24%
502 PPG Industries Inc
105,495 0.19%

SANLAM UNIVERSAL FUNDS PLC
209
PORTFOLIO OF INVESTMENTS OF SANLAM NORTH AMERICA EQUITY TRACKER FUND (CONTINUED) as at 30 June 2014
Nominal Security
Classification Fair Value % of
US$ Net
Assets
Financial assets at fair value through profit or loss (continued)
United States of America - 87.89% (continued)
2,247 PPL Corp
79,836 0.14%
908 Praxair Inc
120,619 0.21%
475 Precision Castparts Corp
119,890 0.21%
152 Priceline Group Incorporated
182,856 0.32%
1,089 The Principal Financial Group
54,973 0.10%
7,573 Procter & Gamble Co
595,162 1.04%
2,220 Progressive Corp
56,299 0.10%
1,907 Prologis Inc
78,359 0.14%
1,415 Prudential Financial Inc
125,610 0.22%
1,749 Public Service Enterprise Group
71,342 0.13%
435 Public Storage Inc
74,537 0.13%
1,347 Pulte Group Inc
27,156 0.05%
351 PVH Corp
40,927 0.07%
937 QEP Resources Inc
32,326 0.06%
4,761 Qualcomm Inc
377,071 0.66%
873 Quanta Services
30,188 0.05%
402 Quest Diagnostics Inc
23,593 0.04%
232 Ralph Lauren Corp
37,280 0.07%
551 Range Resources Corp
47,909 0.08%
1,024 Raytheon Co
94,464 0.17%
889 Realty Income Corp
39,489 0.07%
626 Red Hat Inc
34,599 0.06%
244 Regeneron Pharmaceuticals Inc
68,923 0.12%
4,575 Regions Financial Corp
48,587 0.09%
1,001 Republic Serv Inc
38,008 0.07%
1,150 Reynolds American Inc
69,403 0.12%
355 Rock Tenn Co
37,484 0.07%
560 Rockwell Collins
43,758 0.08%
503 Rockwell International Corp
62,955 0.11%
379 Roper Industries Inc
55,338 0.10%
666 Ross Stores Inc
44,043 0.08%
681 Safeway Stores Inc Co
23,386 0.04%
1,839 Salesforce Com Inc
106,808 0.19%
744 Sandisk Corp
77,696 0.14%
480 SBA Communications Corp
49,104 0.09%
824 Sempra Energy
86,281 0.15%
320 Sherwin-Williams Co
66,211 0.12%
458 Sigma-Aldrich Corp
46,478 0.08%
901 Simon Property Group Inc
149,818 0.26%
7,349 Sirius XM Holdings Inc
25,428 0.04%
2,470 Southern Co
112,089 0.20%
1,150 Southwestern Energy Co
52,314 0.09%
2,231 Spectra Energy Corp
94,772 0.17%
3,586 Sprint Corp
30,589 0.05%
989 ST Jude Medical Inc
68,488 0.12%
509 Stanley Black & Decker Inc
44,700 0.08%
2,628 Staples Inc
28,488 0.05%
2,237 Starbucks Corp
173,099 0.30%
549 Starwood Hotels and Resorts Worldwide Inc
44,370 0.08%
1,346 State Street Corp
90,532 0.16%
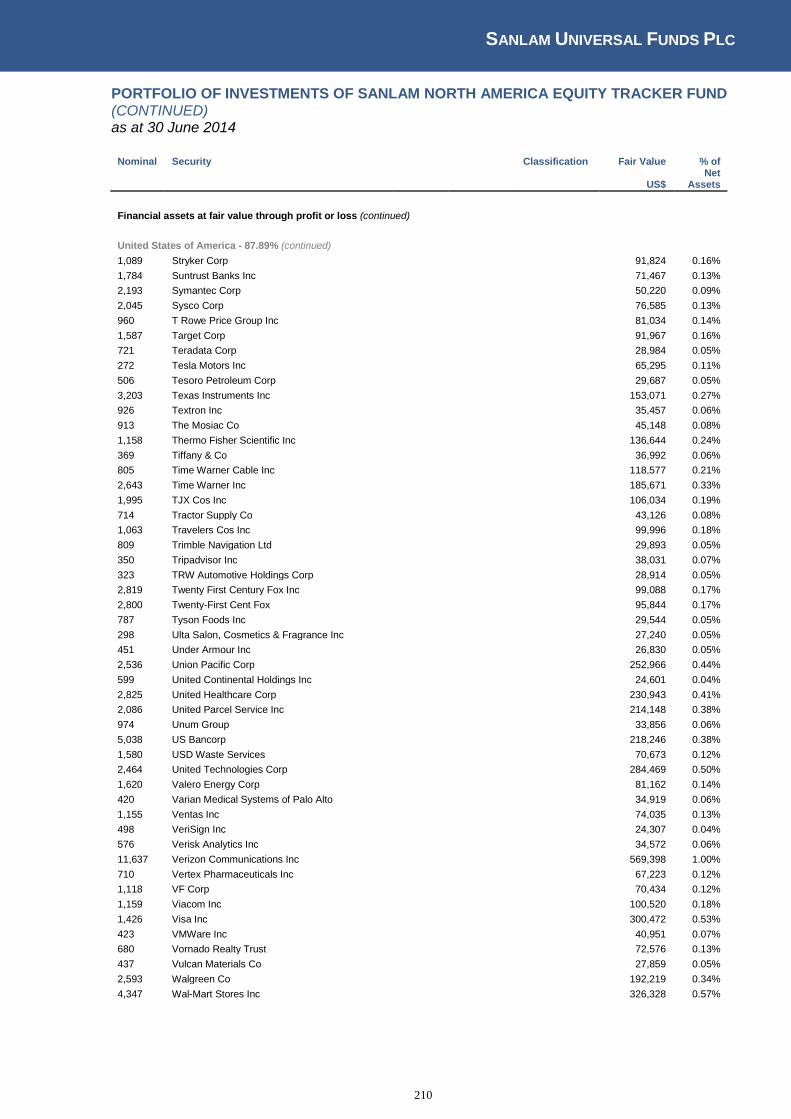
SANLAM UNIVERSAL FUNDS PLC
210
PORTFOLIO OF INVESTMENTS OF SANLAM NORTH AMERICA EQUITY TRACKER FUND (CONTINUED) as at 30 June 2014
Nominal Security
Classification Fair Value % of
US$ Net
Assets
Financial assets at fair value through profit or loss (continued)
United States of America - 87.89% (continued)
1,089 Stryker Corp
91,824 0.16%
1,784 Suntrust Banks Inc
71,467 0.13%
2,193 Symantec Corp
50,220 0.09%
2,045 Sysco Corp
76,585 0.13%
960 T Rowe Price Group Inc
81,034 0.14%
1,587 Target Corp
91,967 0.16%
721 Teradata Corp
28,984 0.05%
272 Tesla Motors Inc
65,295 0.11%
506 Tesoro Petroleum Corp
29,687 0.05%
3,203 Texas Instruments Inc
153,071 0.27%
926 Textron Inc
35,457 0.06%
913 The Mosiac Co
45,148 0.08%
1,158 Thermo Fisher Scientific Inc
136,644 0.24%
369 Tiffany & Co
36,992 0.06%
805 Time Warner Cable Inc
118,577 0.21%
2,643 Time Warner Inc
185,671 0.33%
1,995 TJX Cos Inc
106,034 0.19%
714 Tractor Supply Co
43,126 0.08%
1,063 Travelers Cos Inc
99,996 0.18%
809 Trimble Navigation Ltd
29,893 0.05%
350 Tripadvisor Inc
38,031 0.07%
323 TRW Automotive Holdings Corp
28,914 0.05%
2,819 Twenty First Century Fox Inc
99,088 0.17%
2,800 Twenty-First Cent Fox
95,844 0.17%
787 Tyson Foods Inc
29,544 0.05%
298 Ulta Salon, Cosmetics & Fragrance Inc
27,240 0.05%
451 Under Armour Inc
26,830 0.05%
2,536 Union Pacific Corp
252,966 0.44%
599 United Continental Holdings Inc
24,601 0.04%
2,825 United Healthcare Corp
230,943 0.41%
2,086 United Parcel Service Inc
214,148 0.38%
974 Unum Group
33,856 0.06%
5,038 US Bancorp
218,246 0.38%
1,580 USD Waste Services
70,673 0.12%
2,464 United Technologies Corp
284,469 0.50%
1,620 Valero Energy Corp
81,162 0.14%
420 Varian Medical Systems of Palo Alto
34,919 0.06%
1,155 Ventas Inc
74,035 0.13%
498 VeriSign Inc
24,307 0.04%
576 Verisk Analytics Inc
34,572 0.06%
11,637 Verizon Communications Inc
569,398 1.00%
710 Vertex Pharmaceuticals Inc
67,223 0.12%
1,118 VF Corp
70,434 0.12%
1,159 Viacom Inc
100,520 0.18%
1,426 Visa Inc
300,472 0.53%
423 VMWare Inc
40,951 0.07%
680 Vornado Realty Trust
72,576 0.13%
437 Vulcan Materials Co
27,859 0.05%
2,593 Walgreen Co
192,219 0.34%
4,347 Wal-Mart Stores Inc
326,328 0.57%

SANLAM UNIVERSAL FUNDS PLC
211
PORTFOLIO OF INVESTMENTS OF SANLAM NORTH AMERICA EQUITY TRACKER FUND (CONTINUED) as at 30 June 2014
Nominal Security
Classification Fair Value % of
US$ Net
Assets
Financial assets at fair value through profit or loss (continued)
United States of America - 87.89% (continued)
4,702 Walt Disney Co
403,149 0.71%
273 Waters Corp
28,512 0.05%
888 Wellpoint Inc
95,558 0.17%
13,656 Wells Fargo & Co
717,758 1.26%
742 Western Digital Corp
68,487 0.12%
1,640 Western Union Co
28,438 0.05%
1,830 Weyerhaeuser Co
60,555 0.11%
230 Whirlpool Corp
32,021 0.06%
1,033 Whole Foods Market Inc
39,905 0.07%
2,024 Williams Cos
117,816 0.21%
3,157 Windstream Holdings Inc
31,444 0.06%
318 Workday Inc
28,575 0.05%
725 WR Berkley Corp
33,575 0.06%
423 Wyndham Worldwide Corp
32,029 0.06%
237 Wynn Resorts Ltd
49,191 0.09%
1,988 Xcel Energy Inc
64,072 0.11%
3,395 Xerox Corp Co
42,234 0.07%
839 Xilinx Inc
39,693 0.07%
2,907 Yahoo Inc
102,123 0.18%
1,285 Yum Brands Inc
104,342 0.18%
586 Zimmer Holdings Inc
60,861 0.11%
1,476 Zoetis Inc
47,631 0.08%
Total United States of America
50,071,830 87.89%
Virgin Islands - 0.09% 593 Michael Kors Holdings Ltd
52,569 0.09%
Total Virgin Islands
52,569 0.09%
Total Equity
56,599,947 99.35%
Total financial assets at fair value through profit or loss
56,599,947 99.35%
Cash and cash equivalents
811,760 1.42%
Other net assets and liabilities
(438,724) (0.77%)
Net assets attributable to holders of redeemable participating shares
56,972,983 100.00%
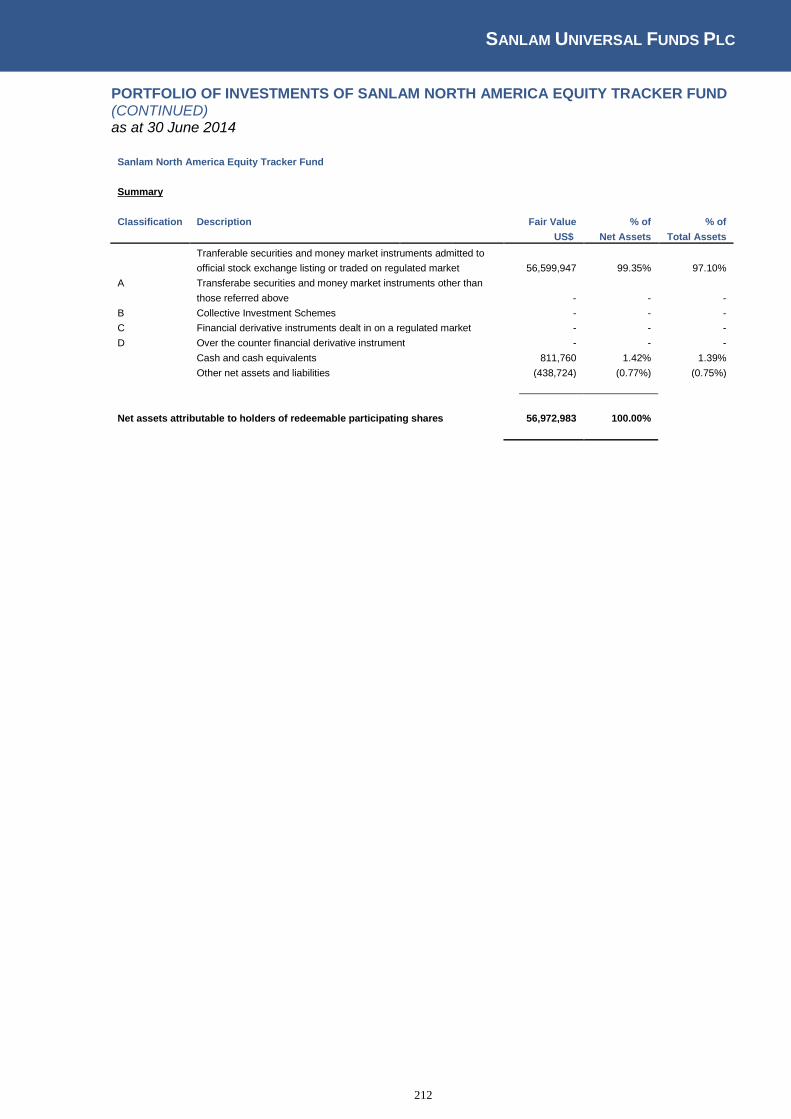
SANLAM UNIVERSAL FUNDS PLC
212
PORTFOLIO OF INVESTMENTS OF SANLAM NORTH AMERICA EQUITY TRACKER FUND (CONTINUED) as at 30 June 2014
Sanlam North America Equity Tracker Fund
Summary
Classification Description
Fair Value % of % of
US$ Net Assets Total Assets
Tranferable securities and money market instruments admitted to
official stock exchange listing or traded on regulated market
56,599,947 99.35% 97.10%
A Transferabe securities and money market instruments other than
those referred above
- - -
B Collective Investment Schemes
- - -
C Financial derivative instruments dealt in on a regulated market - - -
D Over the counter financial derivative instrument
- - -
Cash and cash equivalents
811,760 1.42% 1.39%
Other net assets and liabilities
(438,724) (0.77%) (0.75%)
Net assets attributable to holders of redeemable participating shares 56,972,983 100.00%

SANLAM UNIVERSAL FUNDS PLC
213
PORTFOLIO OF INVESTMENTS OF SANLAM UK EQUITY TRACKER FUND as at 30 June 2014
Nominal Security
Classification Fair Value % of
GBP Net
Assets
Financial assets at fair value through profit or loss
Equity - 98.78%
Great Britain - 94.67% 23,688 3I Group Plc
95,202 0.25%
22,154 Aberdeen Asset Management Plc
100,557 0.26%
4,031 Admiral Group Plc
62,440 0.16%
5,193 Aggreko Plc
85,685 0.22%
7,256 Amec Plc
88,160 0.23%
30,532 Anglo American Plc
436,608 1.14%
8,073 Antofagasta Plc
61,597 0.16%
30,724 ARM Holdings Plc
270,678 0.71%
1,108 Asos Plc
32,797 0.09%
7,788 Associated British Foods Plc
237,456 0.62%
27,693 Astrazeneca Plc
1,202,015 3.13%
65,843 Aviva Plc
336,129 0.88%
11,577 Babcock Intl Group Plc
134,525 0.35%
359,034 Barclays Plc
764,024 1.99%
74,776 BG Group Plc
923,484 2.41%
46,279 Bhp Billiton Plc
874,442 2.28%
406,554 BP Plc
2,093,347 5.46%
68,666 British Aerospace Plc
297,255 0.78%
41,482 British American Tobacco Plc
1,442,744 3.76%
21,649 The British Land Co Plc
152,084 0.40%
22,657 British Sky Broadcasting Group Plc
204,819 0.53%
173,598 BT Group Plc
668,179 1.74%
7,699 Bunzl Plc
124,878 0.33%
10,129 Burberry Group Plc
150,213 0.39%
14,866 Capita Group Plc
170,216 0.44%
4,539 Carnival Plc
100,221 0.26%
112,900 Centrica Plc
352,925 0.92%
23,290 Cobham Plc
72,735 0.19%
39,883 Compass Group Plc
405,610 1.06%
2,763 Croda Internationa Plc
60,814 0.16%
55,126 Diageo Plc
1,028,651 2.68%
30,317 Direct Line Insurance Group Plc
81,795 0.21%
3,251 Easyjet Plc
44,376 0.12%
21,797 Experian Group Ltd
215,354 0.56%
4,564 Fresnillo Plc
39,798 0.10%
31,677 G4S Plc
80,840 0.21%
37,624 GKN Plc
136,613 0.36%
106,995 GlaxoSmithKline Plc
1,673,402 4.36%
14,420 Hammerson Plc
83,636 0.22%
4,894 Hargreaves LansdownPlc
60,588 0.16%
414,718 HSBC Holdings Plc
2,458,863 6.41%
11,260 Icap Plc
42,788 0.11%
6,634 IMI Plc
98,648 0.26%
20,966 Imperial Tobacco Group Plc
551,406 1.44%
8,674 Inmarsat Plc
64,838 0.17%
6,036 Intercontinental Hotels Group Plc
146,132 0.38%
3,850 Intertek Group Plc
105,837 0.28%
18,114 Intu Properties Plc
56,443 0.15%
11,172 Investec Plc
60,217 0.16%
87,217 ITV Plc
155,421 0.41%
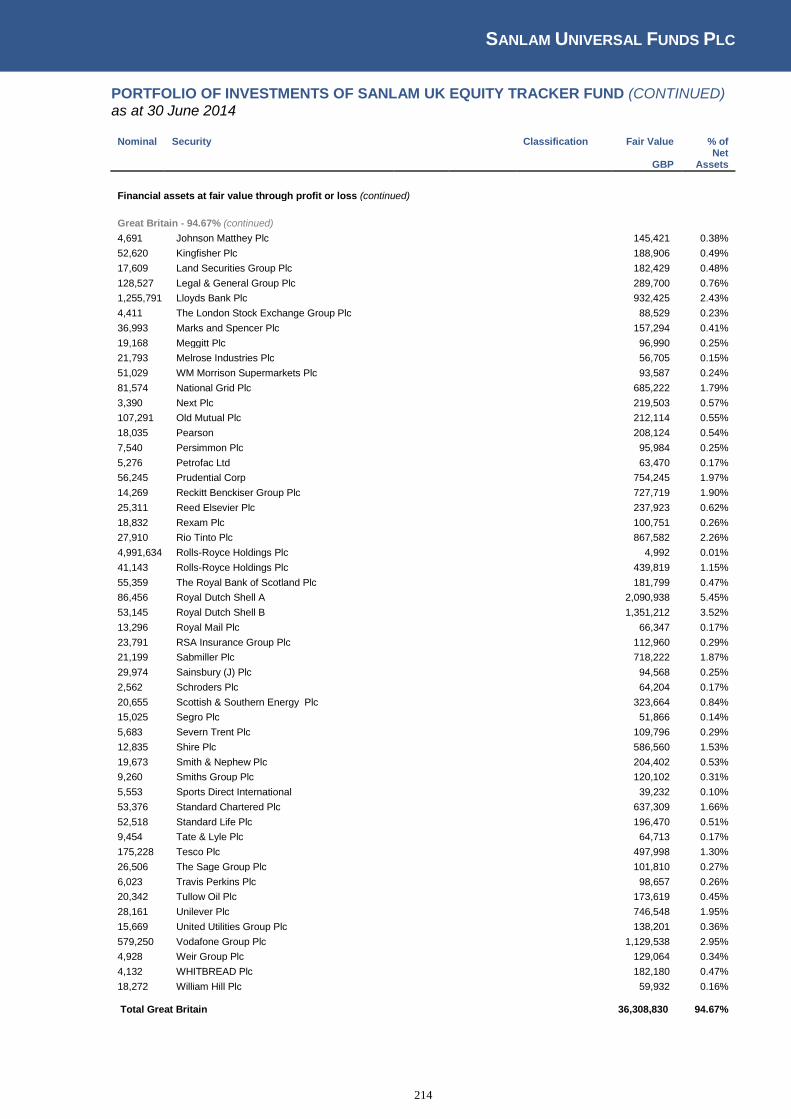
SANLAM UNIVERSAL FUNDS PLC
214
PORTFOLIO OF INVESTMENTS OF SANLAM UK EQUITY TRACKER FUND (CONTINUED) as at 30 June 2014
Nominal Security
Classification Fair Value % of
GBP Net
Assets
Financial assets at fair value through profit or loss (continued)
Great Britain - 94.67% (continued) 4,691 Johnson Matthey Plc
145,421 0.38%
52,620 Kingfisher Plc
188,906 0.49%
17,609 Land Securities Group Plc
182,429 0.48%
128,527 Legal & General Group Plc
289,700 0.76%
1,255,791 Lloyds Bank Plc
932,425 2.43%
4,411 The London Stock Exchange Group Plc
88,529 0.23%
36,993 Marks and Spencer Plc
157,294 0.41%
19,168 Meggitt Plc
96,990 0.25%
21,793 Melrose Industries Plc
56,705 0.15%
51,029 WM Morrison Supermarkets Plc
93,587 0.24%
81,574 National Grid Plc
685,222 1.79%
3,390 Next Plc
219,503 0.57%
107,291 Old Mutual Plc
212,114 0.55%
18,035 Pearson
208,124 0.54%
7,540 Persimmon Plc
95,984 0.25%
5,276 Petrofac Ltd
63,470 0.17%
56,245 Prudential Corp
754,245 1.97%
14,269 Reckitt Benckiser Group Plc
727,719 1.90%
25,311 Reed Elsevier Plc
237,923 0.62%
18,832 Rexam Plc
100,751 0.26%
27,910 Rio Tinto Plc
867,582 2.26%
4,991,634 Rolls-Royce Holdings Plc
4,992 0.01%
41,143 Rolls-Royce Holdings Plc
439,819 1.15%
55,359 The Royal Bank of Scotland Plc
181,799 0.47%
86,456 Royal Dutch Shell A
2,090,938 5.45%
53,145 Royal Dutch Shell B
1,351,212 3.52%
13,296 Royal Mail Plc
66,347 0.17%
23,791 RSA Insurance Group Plc
112,960 0.29%
21,199 Sabmiller Plc
718,222 1.87%
29,974 Sainsbury (J) Plc
94,568 0.25%
2,562 Schroders Plc
64,204 0.17%
20,655 Scottish & Southern Energy Plc
323,664 0.84%
15,025 Segro Plc
51,866 0.14%
5,683 Severn Trent Plc
109,796 0.29%
12,835 Shire Plc
586,560 1.53%
19,673 Smith & Nephew Plc
204,402 0.53%
9,260 Smiths Group Plc
120,102 0.31%
5,553 Sports Direct International
39,232 0.10%
53,376 Standard Chartered Plc
637,309 1.66%
52,518 Standard Life Plc
196,470 0.51%
9,454 Tate & Lyle Plc
64,713 0.17%
175,228 Tesco Plc
497,998 1.30%
26,506 The Sage Group Plc
101,810 0.27%
6,023 Travis Perkins Plc
98,657 0.26%
20,342 Tullow Oil Plc
173,619 0.45%
28,161 Unilever Plc
746,548 1.95%
15,669 United Utilities Group Plc
138,201 0.36%
579,250 Vodafone Group Plc
1,129,538 2.95%
4,928 Weir Group Plc
129,064 0.34%
4,132 WHITBREAD Plc
182,180 0.47%
18,272 William Hill Plc
59,932 0.16%
Total Great Britain
36,308,830 94.67%

SANLAM UNIVERSAL FUNDS PLC
215
PORTFOLIO OF INVESTMENTS OF SANLAM UK EQUITY TRACKER FUND (CONTINUED) as at 30 June 2014
Nominal Security
Classification Fair Value % of
GBP Net
Assets
Financial assets at fair value through profit or loss (continued)
Guernsey Channel Island - 0.24% 29,017 Friends Life Group Ltd
91,491 0.24%
Total Guernsey Channel Island
91,491 0.24%
Jersey Channel Isle - 3.47% 234,263 Glencore Plc
762,643 1.99%
5,857 Wolseley Plc
187,600 0.49%
29,791 WPP Plc
379,537 0.99%
Total Jersey Channel Isle
1,329,780 3.47%
Switzerland - 0.14% 4,136 Coca-Cola HBC AG
55,505 0.14%
Total Switzerland
55,505 0.14%
United States of America - 0.27% 2,097 Randgold Resources
102,187 0.27%
Total United States of America
102,187 0.27%
Total Equity
37,887,249 98.78%
Total financial assets at fair value through profit or loss
37,887,249 98.78%
Cash and cash equivalents
246,108 0.64%
Other net assets and liabilities
220,857 0.58%
Net assets attributable to holders of redeemable participating shares
38,354,214 100.00%
Sanlam UK Equity Tracker Fund
Summary
Classification Description
Fair Value % of % of
GBP Net Assets Total Assets
Tranferable securities and money market instruments admitted to
official stock exchange listing or traded on regulated market
37,887,249 98.78% 93.10%
A Transferabe securities and money market instruments other than
those referred above
- - -
B Collective Investment Schemes
- - -
C Financial derivative instruments dealt in on a regulated market - - -
D Over the counter financial derivative instrument
- - -
Cash and cash equivalents
246,108 0.64% 0.64%
Other net assets and liabilities
220,857 0.58% 0.54%
Net assets attributable to holders of redeemable participating shares 38,354,214 100.00%

SANLAM UNIVERSAL FUNDS PLC
216
PORTFOLIO OF INVESTMENTS OF SANLAM EUROPE (EX UK) EQUITY TRACKER FUND as at 30 June 2014
Nominal Security
Classification Fair Value % of
EUR Net
Assets
Financial assets at fair value through profit or loss
Equity - 99.77%
Austria - 0.55% 1,789 Andritz AG
75,505 0.10%
4,933 Erste Group Bank AG
116,517 0.15%
30,943 Immofinanz AG
79,833 0.10%
2,863 OMV AG
94,479 0.12%
1,861 Voestalpine AG
64,679 0.08%
Total Austria
431,013 0.55%
Belgium - 2.64% 4,421 Ageas NV
128,806 0.17%
13,421 Anheuser-Busch InBev
1,126,022 1.44%
2,473 Belgacom SA
59,933 0.08%
2,135 Delhaize Group
105,490 0.14%
1,944 Groupe Bruxelles Lambert SA
147,530 0.19%
4,081 KBC Bankverzekeringsholding
162,220 0.21%
958 Solvay SA
120,421 0.15%
2,249 UCB SA
139,056 0.18%
1,946 Umicore NV
66,028 0.08%
Total Belgium
2,055,506 2.64%
Bermuda - 0.24% 6,475 Seadrill Ltd
187,602 0.24%
Total Bermuda
187,602 0.24%
Denmark - 3.25% 157 AP Moller Maersk AS
269,924 0.35%
1,846 Carlsberg AS
145,309 0.19%
1,824 Coloplast AS
120,541 0.15%
11,630 Danske Bank AS
240,221 0.31%
4,084 DSV AS
97,292 0.12%
33,716 Novo Nordisk AS
1,133,991 1.45%
4,627 Novozymes AS
169,595 0.22%
1,895 Pandora AS
106,184 0.14%
16,330 TDC AS
123,502 0.16%
3,521 Vestas Wind Systems AS
129,813 0.17%
Total Denmark
2,536,372 3.25%
European Union - 0.18% 7,555 Premiere AG
50,830 0.07%
5,247 REXEL SA
89,619 0.11%
Total European Union
140,449 0.18%
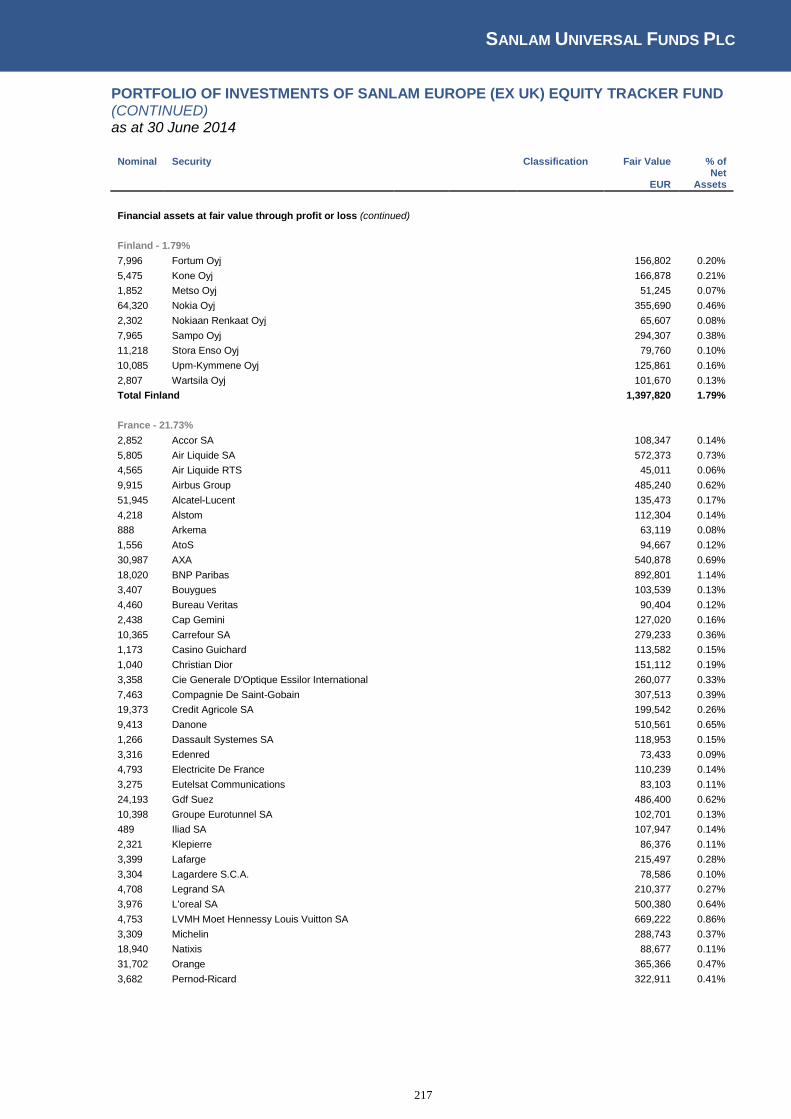
SANLAM UNIVERSAL FUNDS PLC
217
PORTFOLIO OF INVESTMENTS OF SANLAM EUROPE (EX UK) EQUITY TRACKER FUND (CONTINUED) as at 30 June 2014
Nominal Security
Classification Fair Value % of
EUR Net
Assets
Financial assets at fair value through profit or loss (continued)
Finland - 1.79% 7,996 Fortum Oyj
156,802 0.20%
5,475 Kone Oyj
166,878 0.21%
1,852 Metso Oyj
51,245 0.07%
64,320 Nokia Oyj
355,690 0.46%
2,302 Nokiaan Renkaat Oyj
65,607 0.08%
7,965 Sampo Oyj
294,307 0.38%
11,218 Stora Enso Oyj
79,760 0.10%
10,085 Upm-Kymmene Oyj
125,861 0.16%
2,807 Wartsila Oyj
101,670 0.13%
Total Finland
1,397,820 1.79%
France - 21.73% 2,852 Accor SA
108,347 0.14%
5,805 Air Liquide SA
572,373 0.73%
4,565 Air Liquide RTS
45,011 0.06%
9,915 Airbus Group
485,240 0.62%
51,945 Alcatel-Lucent
135,473 0.17%
4,218 Alstom
112,304 0.14%
888 Arkema
63,119 0.08%
1,556 AtoS
94,667 0.12%
30,987 AXA
540,878 0.69%
18,020 BNP Paribas
892,801 1.14%
3,407 Bouygues
103,539 0.13%
4,460 Bureau Veritas
90,404 0.12%
2,438 Cap Gemini
127,020 0.16%
10,365 Carrefour SA
279,233 0.36%
1,173 Casino Guichard
113,582 0.15%
1,040 Christian Dior
151,112 0.19%
3,358 Cie Generale D'Optique Essilor International
260,077 0.33%
7,463 Compagnie De Saint-Gobain
307,513 0.39%
19,373 Credit Agricole SA
199,542 0.26%
9,413 Danone
510,561 0.65%
1,266 Dassault Systemes SA
118,953 0.15%
3,316 Edenred
73,433 0.09%
4,793 Electricite De France
110,239 0.14%
3,275 Eutelsat Communications
83,103 0.11%
24,193 Gdf Suez
486,400 0.62%
10,398 Groupe Eurotunnel SA
102,701 0.13%
489 Iliad SA
107,947 0.14%
2,321 Klepierre
86,376 0.11%
3,399 Lafarge
215,497 0.28%
3,304 Lagardere S.C.A.
78,586 0.10%
4,708 Legrand SA
210,377 0.27%
3,976 L'oreal SA
500,380 0.64%
4,753 LVMH Moet Hennessy Louis Vuitton SA
669,222 0.86%
3,309 Michelin
288,743 0.37%
18,940 Natixis
88,677 0.11%
31,702 Orange
365,366 0.47%
3,682 Pernod-Ricard
322,911 0.41%
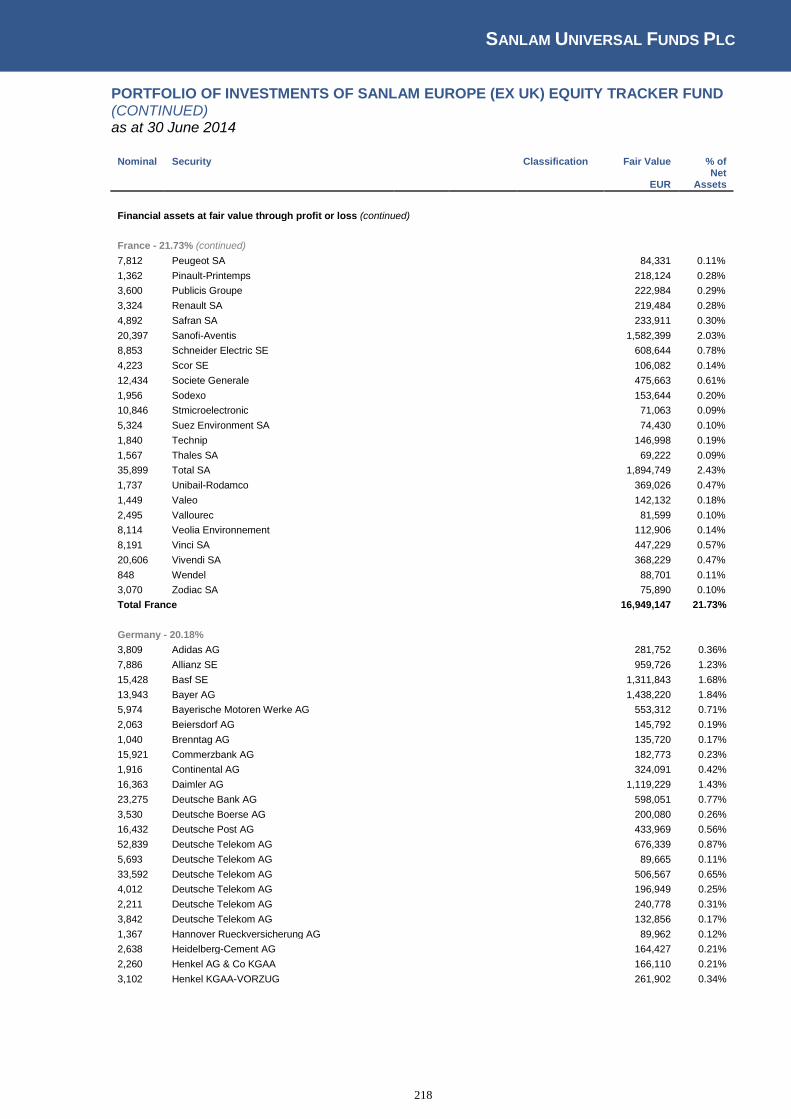
SANLAM UNIVERSAL FUNDS PLC
218
PORTFOLIO OF INVESTMENTS OF SANLAM EUROPE (EX UK) EQUITY TRACKER FUND (CONTINUED) as at 30 June 2014
Nominal Security
Classification Fair Value % of
EUR Net
Assets
Financial assets at fair value through profit or loss (continued)
France - 21.73% (continued)
7,812 Peugeot SA
84,331 0.11%
1,362 Pinault-Printemps
218,124 0.28%
3,600 Publicis Groupe
222,984 0.29%
3,324 Renault SA
219,484 0.28%
4,892 Safran SA
233,911 0.30%
20,397 Sanofi-Aventis
1,582,399 2.03%
8,853 Schneider Electric SE
608,644 0.78%
4,223 Scor SE
106,082 0.14%
12,434 Societe Generale
475,663 0.61%
1,956 Sodexo
153,644 0.20%
10,846 Stmicroelectronic
71,063 0.09%
5,324 Suez Environment SA
74,430 0.10%
1,840 Technip
146,998 0.19%
1,567 Thales SA
69,222 0.09%
35,899 Total SA
1,894,749 2.43%
1,737 Unibail-Rodamco
369,026 0.47%
1,449 Valeo
142,132 0.18%
2,495 Vallourec
81,599 0.10%
8,114 Veolia Environnement
112,906 0.14%
8,191 Vinci SA
447,229 0.57%
20,606 Vivendi SA
368,229 0.47%
848 Wendel
88,701 0.11%
3,070 Zodiac SA
75,890 0.10%
Total France
16,949,147 21.73%
Germany - 20.18% 3,809 Adidas AG
281,752 0.36%
7,886 Allianz SE
959,726 1.23%
15,428 Basf SE
1,311,843 1.68%
13,943 Bayer AG
1,438,220 1.84%
5,974 Bayerische Motoren Werke AG
553,312 0.71%
2,063 Beiersdorf AG
145,792 0.19%
1,040 Brenntag AG
135,720 0.17%
15,921 Commerzbank AG
182,773 0.23%
1,916 Continental AG
324,091 0.42%
16,363 Daimler AG
1,119,229 1.43%
23,275 Deutsche Bank AG
598,051 0.77%
3,530 Deutsche Boerse AG
200,080 0.26%
16,432 Deutsche Post AG
433,969 0.56%
52,839 Deutsche Telekom AG
676,339 0.87%
5,693 Deutsche Telekom AG
89,665 0.11%
33,592 Deutsche Telekom AG
506,567 0.65%
4,012 Deutsche Telekom AG
196,949 0.25%
2,211 Deutsche Telekom AG
240,778 0.31%
3,842 Deutsche Telekom AG
132,856 0.17%
1,367 Hannover Rueckversicherung AG
89,962 0.12%
2,638 Heidelberg-Cement AG
164,427 0.21%
2,260 Henkel AG & Co KGAA
166,110 0.21%
3,102 Henkel KGAA-VORZUG
261,902 0.34%

SANLAM UNIVERSAL FUNDS PLC
219
PORTFOLIO OF INVESTMENTS OF SANLAM EUROPE (EX UK) EQUITY TRACKER FUND (CONTINUED) as at 30 June 2014
Nominal Security
Classification Fair Value % of
EUR Net
Assets
Financial assets at fair value through profit or loss (continued)
Germany - 20.18% (continued)
21,164 Infineon Technologies AG
193,206 0.25%
2,985 K+S AG
71,685 0.09%
725 Kabel Deutschland Holding AG
77,539 0.10%
1,718 Lanxess
84,689 0.11%
3,105 Linde AG
482,207 0.62%
3,909 Lufthansa AG
61,293 0.08%
671 MAN SE
60,558 0.08%
2,502 Merck KGAA
158,602 0.20%
2,556 Metro AG
81,357 0.10%
3,034 Muenchener Rueckversicherungs AG
491,205 0.63%
1,400 Osram Licht AG
51,569 0.07%
2,534 Porsche AG
192,812 0.25%
4,414 Prosieben Sat 1 Media AG
143,609 0.18%
5,121 Qiagen NV
90,642 0.12%
8,160 RWE AG
255,938 0.33%
15,457 SAP AG
871,775 1.12%
13,306 Siemens AG
1,283,364 1.65%
7,875 ThyssenKrupp AG
167,659 0.21%
2,637 United Internet AG
84,845 0.11%
482 Volkswagen AG
91,002 0.12%
2,804 Volkswagen
537,807 0.69%
Total Germany
15,743,476 20.18%
Ireland - 0.63% 424,681 Bank of Ireland
104,896 0.13%
13,259 CRH Plc
248,474 0.32%
2,536 Kerry Group Plc
139,100 0.18%
Total Ireland
492,470 0.63%
Italy - 5.29% 21,027 Assicurazioni Generali SpA
336,642 0.43%
8,521 Atlantia SpA
177,407 0.23%
6,419 Banco Popolare Societa Cooperativa
77,221 0.10%
40,566 Enel Green Power SpA
83,890 0.11%
111,859 Enel SpA
475,848 0.61%
44,522 ENI-Ente Nazionale Idrocarburi SpA
889,550 1.14%
17,019 Fiat SpA
122,707 0.16%
216,191 Intesa Sanpaolo SpA
487,727 0.63%
2,943 Luxottica Group SpA
124,401 0.16%
11,079 Mediobanca SpA
80,655 0.10%
3,537 Prysmian SpA
58,361 0.07%
4,809 Saipem
94,737 0.12%
38,939 Snam Rete Gas
171,332 0.22%
111,518 Telecom Italia RNC
80,460 0.10%
188,297 Telecom Italis SpA
174,175 0.22%
32,620 Terna SpA
125,652 0.16%
76,880 Unicredit SpA
470,121 0.60%
15,512 Unione Di Banche Italiane SpA
98,036 0.13%
Total Italy
4,128,922 5.29%
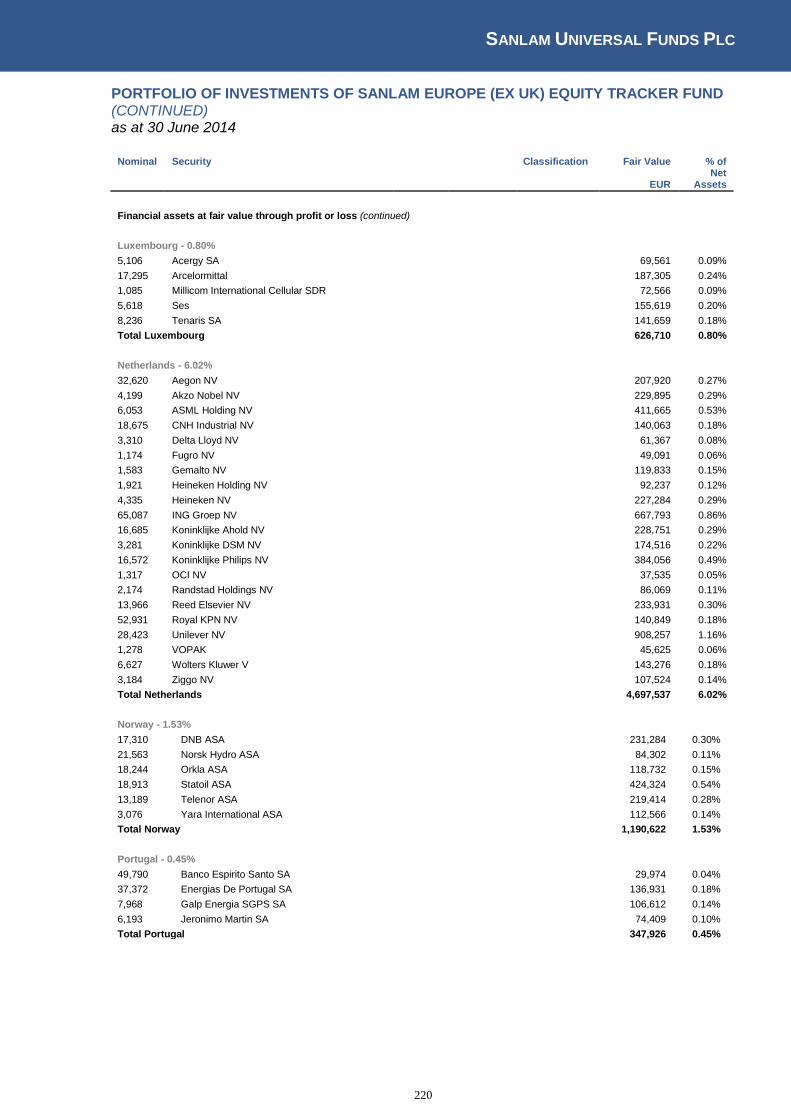
SANLAM UNIVERSAL FUNDS PLC
220
PORTFOLIO OF INVESTMENTS OF SANLAM EUROPE (EX UK) EQUITY TRACKER FUND (CONTINUED) as at 30 June 2014
Nominal Security
Classification Fair Value % of
EUR Net
Assets
Financial assets at fair value through profit or loss (continued)
Luxembourg - 0.80% 5,106 Acergy SA
69,561 0.09%
17,295 Arcelormittal
187,305 0.24%
1,085 Millicom International Cellular SDR
72,566 0.09%
5,618 Ses
155,619 0.20%
8,236 Tenaris SA
141,659 0.18%
Total Luxembourg
626,710 0.80%
Netherlands - 6.02% 32,620 Aegon NV
207,920 0.27%
4,199 Akzo Nobel NV
229,895 0.29%
6,053 ASML Holding NV
411,665 0.53%
18,675 CNH Industrial NV
140,063 0.18%
3,310 Delta Lloyd NV
61,367 0.08%
1,174 Fugro NV
49,091 0.06%
1,583 Gemalto NV
119,833 0.15%
1,921 Heineken Holding NV
92,237 0.12%
4,335 Heineken NV
227,284 0.29%
65,087 ING Groep NV
667,793 0.86%
16,685 Koninklijke Ahold NV
228,751 0.29%
3,281 Koninklijke DSM NV
174,516 0.22%
16,572 Koninklijke Philips NV
384,056 0.49%
1,317 OCI NV
37,535 0.05%
2,174 Randstad Holdings NV
86,069 0.11%
13,966 Reed Elsevier NV
233,931 0.30%
52,931 Royal KPN NV
140,849 0.18%
28,423 Unilever NV
908,257 1.16%
1,278 VOPAK
45,625 0.06%
6,627 Wolters Kluwer V
143,276 0.18%
3,184 Ziggo NV
107,524 0.14%
Total Netherlands
4,697,537 6.02%
Norway - 1.53% 17,310 DNB ASA
231,284 0.30%
21,563 Norsk Hydro ASA
84,302 0.11%
18,244 Orkla ASA
118,732 0.15%
18,913 Statoil ASA
424,324 0.54%
13,189 Telenor ASA
219,414 0.28%
3,076 Yara International ASA
112,566 0.14%
Total Norway
1,190,622 1.53%
Portugal - 0.45% 49,790 Banco Espirito Santo SA
29,974 0.04%
37,372 Energias De Portugal SA
136,931 0.18%
7,968 Galp Energia SGPS SA
106,612 0.14%
6,193 Jeronimo Martin SA
74,409 0.10%
Total Portugal
347,926 0.45%

SANLAM UNIVERSAL FUNDS PLC
221
PORTFOLIO OF INVESTMENTS OF SANLAM EUROPE (EX UK) EQUITY TRACKER FUND (CONTINUED) as at 30 June 2014
Nominal Security
Classification Fair Value % of
EUR Net
Assets
Financial assets at fair value through profit or loss (continued)
Spain - 8.04% 8,498 Abertis Infraestruct
142,809 0.18%
3,420 ACS Actividades Cons Y Serv
114,228 0.15%
6,836 Amadeus IT Holding SA
205,900 0.26%
100,232 Banco Bilbao Viscaya SA
933,060 1.20%
58,819 Banco De Sabadell SA
146,577 0.19%
28,491 Banco Popular Espanol SA
139,036 0.18%
199,776 Banco Santander SA
1,524,291 1.95%
76,757 Bankia SA
108,688 0.14%
8,474 Cintra Concesiones De Infrae
137,830 0.18%
34,042 Criteria Caixacorp SA
153,427 0.20%
10,718 Distribuidora Interncional de Alimentacion SA
72,068 0.09%
3,335 Enagas
78,373 0.10%
6,866 Gas Natural SDG SA
158,364 0.20%
2,453 Grifols SA
97,912 0.13%
83,328 Iberdrola SA
465,220 0.60%
3,837 Inditex SA
431,279 0.55%
17,745 International Consolidated Airlines Group SA
82,177 0.11%
1,830 Red Electrica de Espana
122,244 0.16%
15,097 Repsol SA
290,768 0.37%
69,283 Telefonica SA
867,423 1.11%
Total Spain
6,271,674 8.04%
Sweden - 6.65% 5,624 Alfa Laval AB
105,836 0.14%
6,133 Assa Abloy AB
227,880 0.29%
17,538 Atlas Copco AB
342,115 0.44%
6,291 Boliden AB
66,653 0.09%
5,039 Electrolux AB
93,065 0.12%
8,430 Elekta AB
78,307 0.10%
4,165 Getinge AB
79,927 0.10%
15,981 Hennes & Mauritz AB
509,966 0.65%
5,188 Hexagon AB
122,124 0.16%
8,350 Investor AB
228,768 0.29%
4,570 Kinnevik Investment AB
142,236 0.18%
3,410 Lundin Petroleum AB
50,383 0.06%
51,086 Nordea Bank AB
526,463 0.67%
19,208 Sandvik AB
191,649 0.25%
27,723 Skandinaviska Enskilda Banken SEB
270,549 0.35%
6,822 Skanska AB
113,694 0.15%
6,849 SKF AB
127,616 0.16%
396 Sulzer AG
40,601 0.05%
9,510 Svenska cellulosa AB
180,940 0.23%
8,574 Svenska Handelsbanken
306,491 0.39%
15,208 Swedbank AB
294,503 0.38%
4,009 Swedish Match AB
101,643 0.13%
6,063 Tele2 AB
52,145 0.07%
51,114 Telefonaktiebolaget LM Ericsson
451,062 0.58%
39,957 Teliasonera
213,136 0.27%
26,495 Volvo AB
266,527 0.34%
Total Sweden
5,184,279 6.65%

SANLAM UNIVERSAL FUNDS PLC
222
PORTFOLIO OF INVESTMENTS OF SANLAM EUROPE (EX UK) EQUITY TRACKER FUND (CONTINUED) as at 30 June 2014
Nominal Security
Classification Fair Value % of
EUR Net
Assets
Financial assets at fair value through profit or loss (continued)
Switzerland - 19.79% 36,715 ABB Ltd
617,904 0.79%
1,769 Actelion Ltd
163,585 0.21%
2,950 Adecco SA
177,487 0.23%
1,731 Aryzta AG
119,839 0.15%
1,281 Baloise Holding
110,328 0.14%
40 Barry Callebaut AG
39,725 0.05%
8,877 Compagnie Financiere Richemont SA
680,776 0.87%
25,112 Credit Suisse Group AG
524,871 0.67%
739 Geberit AG
189,603 0.24%
151 Givaudan AG
184,063 0.24%
3,986 Holcim Ltd
256,080 0.33%
4,271 Julius Baer Group Ltd
128,694 0.16%
1,071 Kuehne & Nagel International AG
104,158 0.13%
3 Lindt and Spruengli AG
135,446 0.17%
1,078 Lonza AG
85,737 0.11%
54,012 Nestle SA
3,058,221 3.92%
38,890 Novartis AG
2,573,803 3.30%
410 Partners Group Holding AG
81,910 0.11%
11,930 roche holding AG genusschein
2,600,686 3.33%
1,149 Schindler Holding Part Cert
127,653 0.16%
102 SGS SA
178,641 0.23%
39 Sika AG Bearer
116,551 0.15%
1,032 Sonova Holdings AG
115,080 0.15%
510 Swatch Group AG
225,088 0.29%
1,003 Swatch Group AG
81,425 0.10%
595 Swiss Life Holding AG
103,128 0.13%
1,507 Swiss Prime Site AG
91,290 0.12%
5,931 Swiss RE AG
385,680 0.49%
426 Swisscom AG
180,992 0.23%
1,553 Syngenta AG
422,768 0.54%
6,352 Transocean Ltd
208,675 0.27%
60,963 UBS AG
817,477 1.05%
2,497 Zurich Financial Services AG
550,097 0.71%
Total Switzerland
15,437,461 19.79%
Total Equity
77,818,979 99.77%
Total financial assets at fair value through profit or loss
77,818,979 99.77%
Cash and cash equivalents
530,002 0.68%
Other net assets and liabilities
(348,127) (0.45%)
Net assets attributable to holders of redeemable participating shares
78,001,854 100.00%
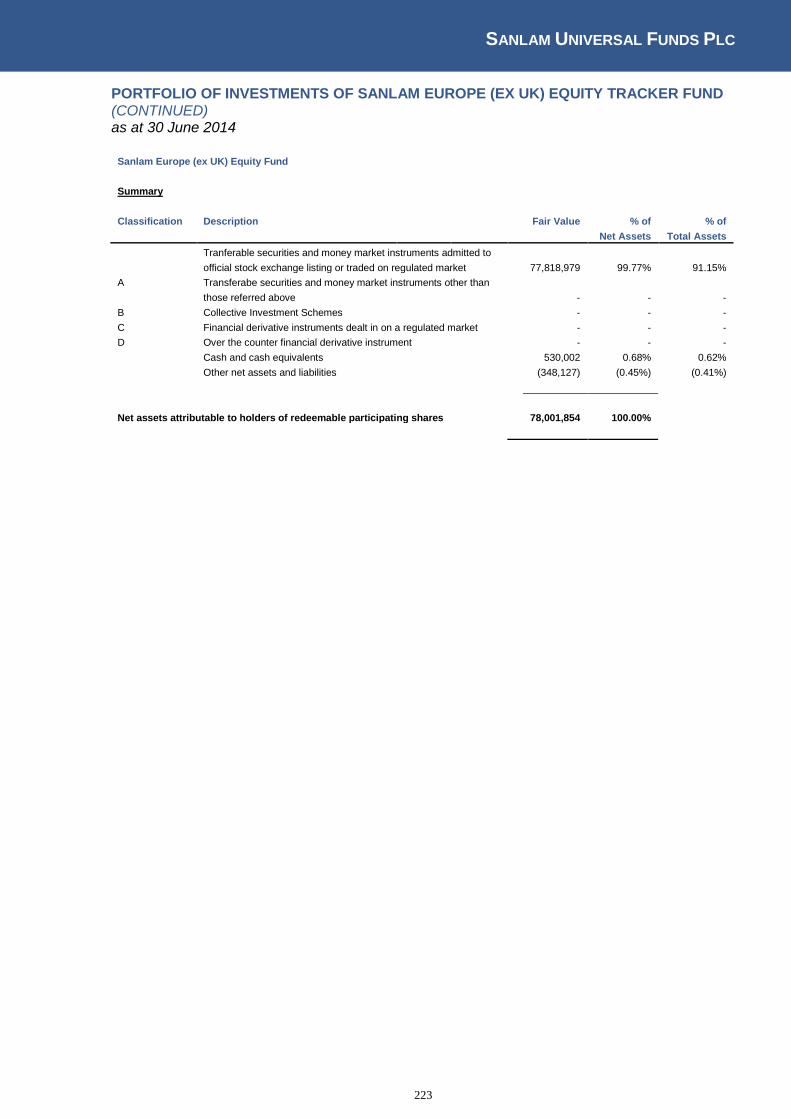
SANLAM UNIVERSAL FUNDS PLC
223
PORTFOLIO OF INVESTMENTS OF SANLAM EUROPE (EX UK) EQUITY TRACKER FUND (CONTINUED) as at 30 June 2014
Sanlam Europe (ex UK) Equity Fund
Summary
Classification Description
Fair Value % of % of
Net Assets Total Assets
Tranferable securities and money market instruments admitted to
official stock exchange listing or traded on regulated market
77,818,979 99.77% 91.15%
A Transferabe securities and money market instruments other than
those referred above
- - -
B Collective Investment Schemes
- - -
C Financial derivative instruments dealt in on a regulated market - - -
D Over the counter financial derivative instrument
- - -
Cash and cash equivalents
530,002 0.68% 0.62%
Other net assets and liabilities
(348,127) (0.45%) (0.41%)
Net assets attributable to holders of redeemable participating shares 78,001,854 100.00%
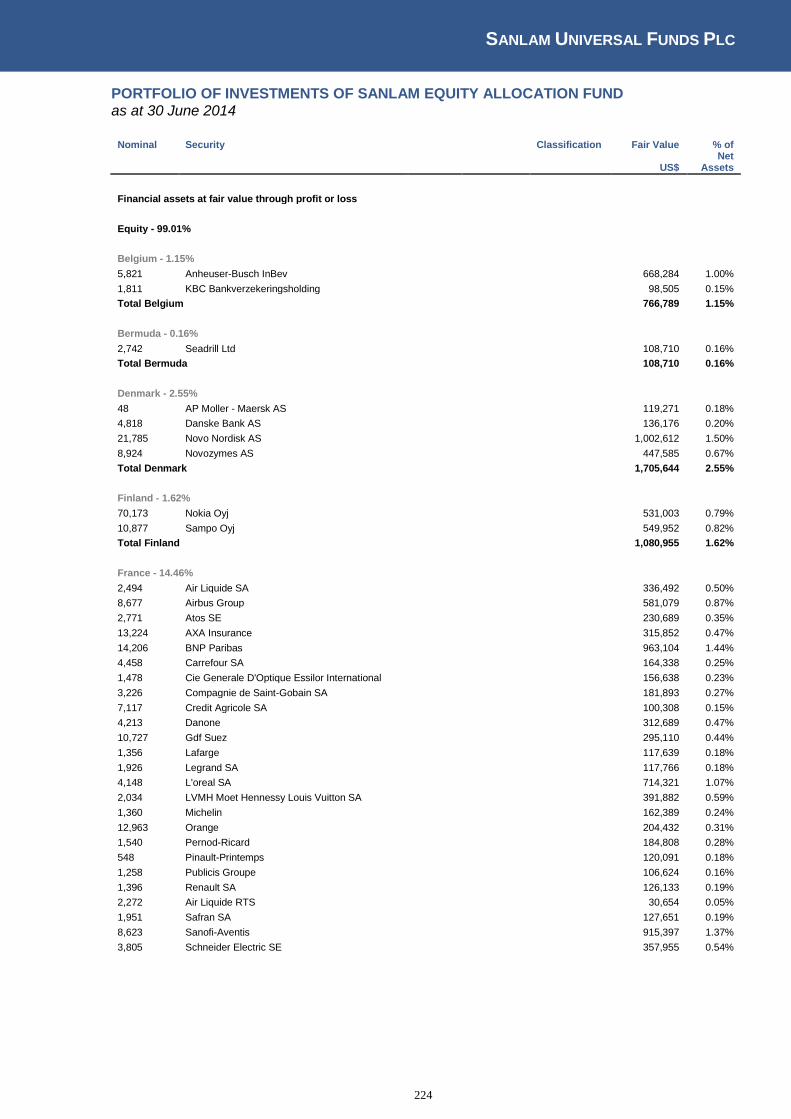
SANLAM UNIVERSAL FUNDS PLC
224
PORTFOLIO OF INVESTMENTS OF SANLAM EQUITY ALLOCATION FUND as at 30 June 2014
Nominal Security
Classification Fair Value % of
US$ Net
Assets
Financial assets at fair value through profit or loss
Equity - 99.01%
Belgium - 1.15% 5,821 Anheuser-Busch InBev
668,284 1.00%
1,811 KBC Bankverzekeringsholding
98,505 0.15%
Total Belgium
766,789 1.15%
Bermuda - 0.16% 2,742 Seadrill Ltd
108,710 0.16%
Total Bermuda
108,710 0.16%
Denmark - 2.55% 48 AP Moller - Maersk AS
119,271 0.18%
4,818 Danske Bank AS
136,176 0.20%
21,785 Novo Nordisk AS
1,002,612 1.50%
8,924 Novozymes AS
447,585 0.67%
Total Denmark
1,705,644 2.55%
Finland - 1.62% 70,173 Nokia Oyj
531,003 0.79%
10,877 Sampo Oyj
549,952 0.82%
Total Finland
1,080,955 1.62%
France - 14.46% 2,494 Air Liquide SA
336,492 0.50%
8,677 Airbus Group
581,079 0.87%
2,771 Atos SE
230,689 0.35%
13,224 AXA Insurance
315,852 0.47%
14,206 BNP Paribas
963,104 1.44%
4,458 Carrefour SA
164,338 0.25%
1,478 Cie Generale D'Optique Essilor International
156,638 0.23%
3,226 Compagnie de Saint-Gobain SA
181,893 0.27%
7,117 Credit Agricole SA
100,308 0.15%
4,213 Danone
312,689 0.47%
10,727 Gdf Suez
295,110 0.44%
1,356 Lafarge
117,639 0.18%
1,926 Legrand SA
117,766 0.18%
4,148 L'oreal SA
714,321 1.07%
2,034 LVMH Moet Hennessy Louis Vuitton SA
391,882 0.59%
1,360 Michelin
162,389 0.24%
12,963 Orange
204,432 0.31%
1,540 Pernod-Ricard
184,808 0.28%
548 Pinault-Printemps
120,091 0.18%
1,258 Publicis Groupe
106,624 0.16%
1,396 Renault SA
126,133 0.19%
2,272 Air Liquide RTS
30,654 0.05%
1,951 Safran SA
127,651 0.19%
8,623 Sanofi-Aventis
915,397 1.37%
3,805 Schneider Electric SE
357,955 0.54%
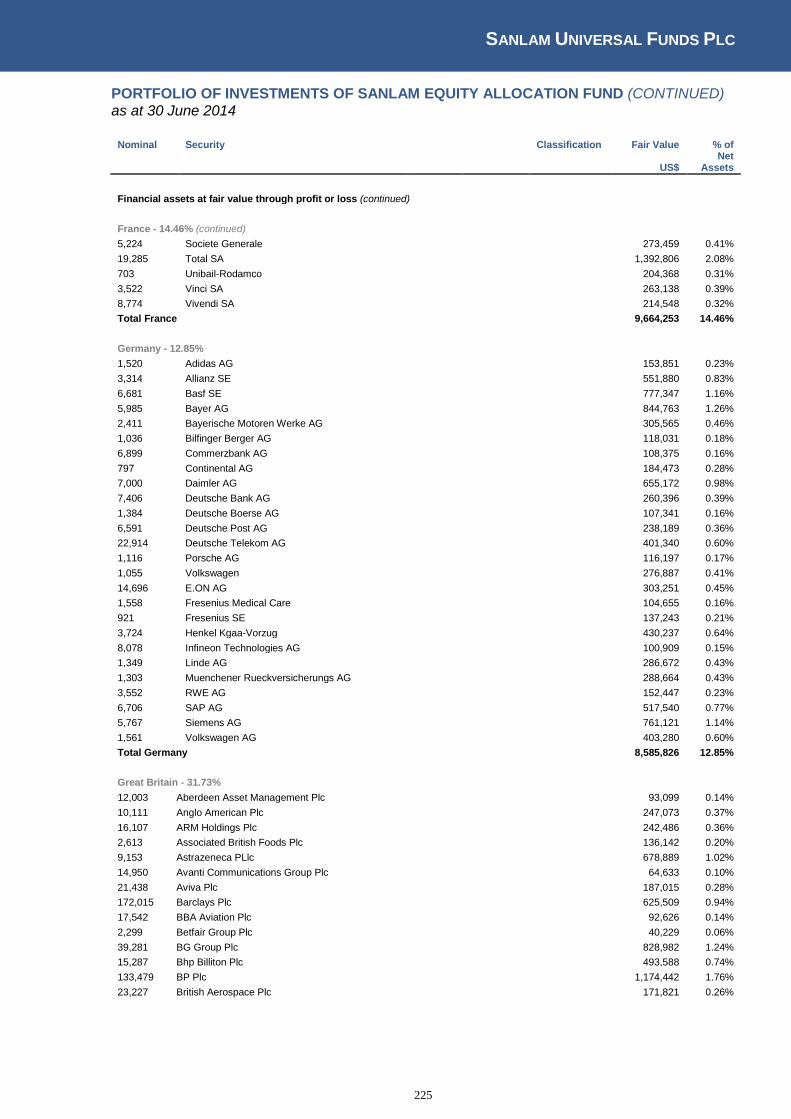
SANLAM UNIVERSAL FUNDS PLC
225
PORTFOLIO OF INVESTMENTS OF SANLAM EQUITY ALLOCATION FUND (CONTINUED) as at 30 June 2014
Nominal Security
Classification Fair Value % of
US$ Net
Assets
Financial assets at fair value through profit or loss (continued)
France - 14.46% (continued)
5,224 Societe Generale
273,459 0.41%
19,285 Total SA
1,392,806 2.08%
703 Unibail-Rodamco
204,368 0.31%
3,522 Vinci SA
263,138 0.39%
8,774 Vivendi SA
214,548 0.32%
Total France
9,664,253 14.46%
Germany - 12.85% 1,520 Adidas AG
153,851 0.23%
3,314 Allianz SE
551,880 0.83%
6,681 Basf SE
777,347 1.16%
5,985 Bayer AG
844,763 1.26%
2,411 Bayerische Motoren Werke AG
305,565 0.46%
1,036 Bilfinger Berger AG
118,031 0.18%
6,899 Commerzbank AG
108,375 0.16%
797 Continental AG
184,473 0.28%
7,000 Daimler AG
655,172 0.98%
7,406 Deutsche Bank AG
260,396 0.39%
1,384 Deutsche Boerse AG
107,341 0.16%
6,591 Deutsche Post AG
238,189 0.36%
22,914 Deutsche Telekom AG
401,340 0.60%
1,116 Porsche AG
116,197 0.17%
1,055 Volkswagen
276,887 0.41%
14,696 E.ON AG
303,251 0.45%
1,558 Fresenius Medical Care
104,655 0.16%
921 Fresenius SE
137,243 0.21%
3,724 Henkel Kgaa-Vorzug
430,237 0.64%
8,078 Infineon Technologies AG
100,909 0.15%
1,349 Linde AG
286,672 0.43%
1,303 Muenchener Rueckversicherungs AG
288,664 0.43%
3,552 RWE AG
152,447 0.23%
6,706 SAP AG
517,540 0.77%
5,767 Siemens AG
761,121 1.14%
1,561 Volkswagen AG
403,280 0.60%
Total Germany
8,585,826 12.85%
Great Britain - 31.73% 12,003 Aberdeen Asset Management Plc
93,099 0.14%
10,111 Anglo American Plc
247,073 0.37%
16,107 ARM Holdings Plc
242,486 0.36%
2,613 Associated British Foods Plc
136,142 0.20%
9,153 Astrazeneca PLlc
678,889 1.02%
14,950 Avanti Communications Group Plc
64,633 0.10%
21,438 Aviva Plc
187,015 0.28%
172,015 Barclays Plc
625,509 0.94%
17,542 BBA Aviation Plc
92,626 0.14%
2,299 Betfair Group Plc
40,229 0.06%
39,281 BG Group Plc
828,982 1.24%
15,287 Bhp Billiton Plc
493,588 0.74%
133,479 BP Plc
1,174,442 1.76%
23,227 British Aerospace Plc
171,821 0.26%
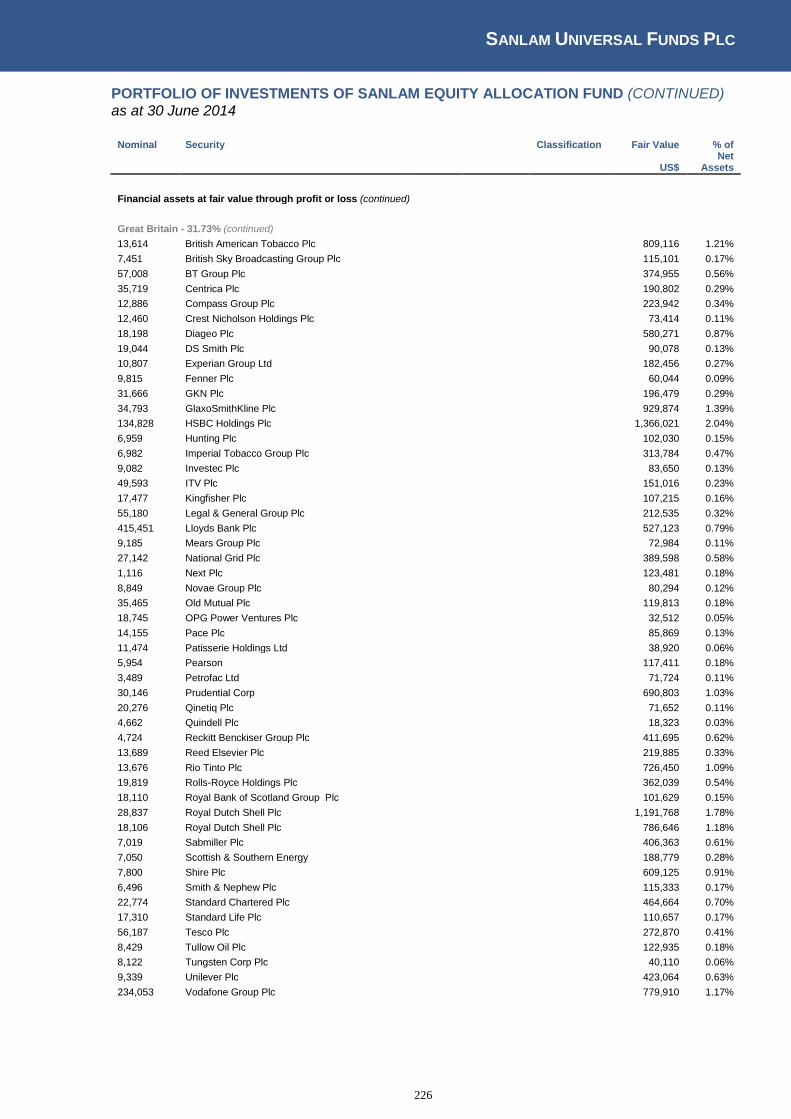
SANLAM UNIVERSAL FUNDS PLC
226
PORTFOLIO OF INVESTMENTS OF SANLAM EQUITY ALLOCATION FUND (CONTINUED) as at 30 June 2014
Nominal Security
Classification Fair Value % of
US$ Net
Assets
Financial assets at fair value through profit or loss (continued)
Great Britain - 31.73% (continued)
13,614 British American Tobacco Plc
809,116 1.21%
7,451 British Sky Broadcasting Group Plc
115,101 0.17%
57,008 BT Group Plc
374,955 0.56%
35,719 Centrica Plc
190,802 0.29%
12,886 Compass Group Plc
223,942 0.34%
12,460 Crest Nicholson Holdings Plc
73,414 0.11%
18,198 Diageo Plc
580,271 0.87%
19,044 DS Smith Plc
90,078 0.13%
10,807 Experian Group Ltd
182,456 0.27%
9,815 Fenner Plc
60,044 0.09%
31,666 GKN Plc
196,479 0.29%
34,793 GlaxoSmithKline Plc
929,874 1.39%
134,828 HSBC Holdings Plc
1,366,021 2.04%
6,959 Hunting Plc
102,030 0.15%
6,982 Imperial Tobacco Group Plc
313,784 0.47%
9,082 Investec Plc
83,650 0.13%
49,593 ITV Plc
151,016 0.23%
17,477 Kingfisher Plc
107,215 0.16%
55,180 Legal & General Group Plc
212,535 0.32%
415,451 Lloyds Bank Plc
527,123 0.79%
9,185 Mears Group Plc
72,984 0.11%
27,142 National Grid Plc
389,598 0.58%
1,116 Next Plc
123,481 0.18%
8,849 Novae Group Plc
80,294 0.12%
35,465 Old Mutual Plc
119,813 0.18%
18,745 OPG Power Ventures Plc
32,512 0.05%
14,155 Pace Plc
85,869 0.13%
11,474 Patisserie Holdings Ltd
38,920 0.06%
5,954 Pearson
117,411 0.18%
3,489 Petrofac Ltd
71,724 0.11%
30,146 Prudential Corp
690,803 1.03%
20,276 Qinetiq Plc
71,652 0.11%
4,662 Quindell Plc
18,323 0.03%
4,724 Reckitt Benckiser Group Plc
411,695 0.62%
13,689 Reed Elsevier Plc
219,885 0.33%
13,676 Rio Tinto Plc
726,450 1.09%
19,819 Rolls-Royce Holdings Plc
362,039 0.54%
18,110 Royal Bank of Scotland Group Plc
101,629 0.15%
28,837 Royal Dutch Shell Plc
1,191,768 1.78%
18,106 Royal Dutch Shell Plc
786,646 1.18%
7,019 Sabmiller Plc
406,363 0.61%
7,050 Scottish & Southern Energy
188,779 0.28%
7,800 Shire Plc
609,125 0.91%
6,496 Smith & Nephew Plc
115,333 0.17%
22,774 Standard Chartered Plc
464,664 0.70%
17,310 Standard Life Plc
110,657 0.17%
56,187 Tesco Plc
272,870 0.41%
8,429 Tullow Oil Plc
122,935 0.18%
8,122 Tungsten Corp Plc
40,110 0.06%
9,339 Unilever Plc
423,064 0.63%
234,053 Vodafone Group Plc
779,910 1.17%
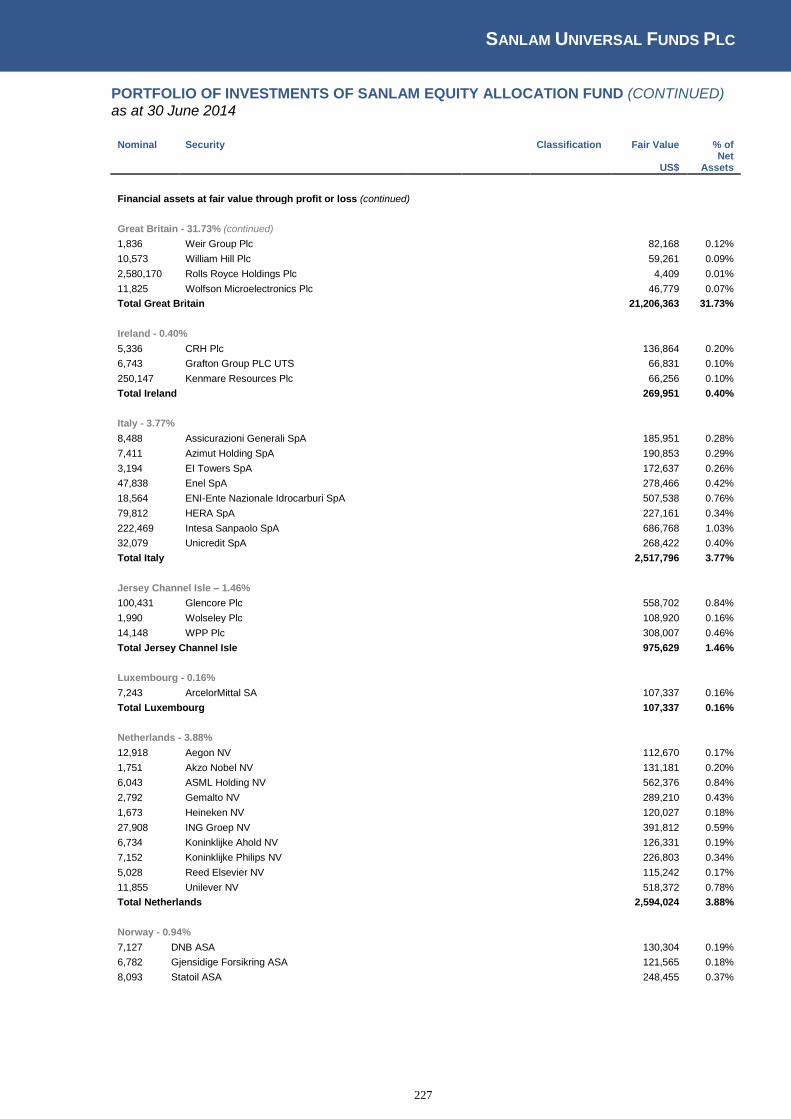
SANLAM UNIVERSAL FUNDS PLC
227
PORTFOLIO OF INVESTMENTS OF SANLAM EQUITY ALLOCATION FUND (CONTINUED) as at 30 June 2014
Nominal Security
Classification Fair Value % of
US$ Net
Assets
Financial assets at fair value through profit or loss (continued)
Great Britain - 31.73% (continued)
1,836 Weir Group Plc
82,168 0.12%
10,573 William Hill Plc
59,261 0.09%
2,580,170 Rolls Royce Holdings Plc
4,409 0.01%
11,825 Wolfson Microelectronics Plc
46,779 0.07%
Total Great Britain
21,206,363 31.73%
Ireland - 0.40% 5,336 CRH Plc
136,864 0.20%
6,743 Grafton Group PLC UTS
66,831 0.10%
250,147 Kenmare Resources Plc
66,256 0.10%
Total Ireland
269,951 0.40%
Italy - 3.77% 8,488 Assicurazioni Generali SpA
185,951 0.28%
7,411 Azimut Holding SpA
190,853 0.29%
3,194 EI Towers SpA
172,637 0.26%
47,838 Enel SpA
278,466 0.42%
18,564 ENI-Ente Nazionale Idrocarburi SpA
507,538 0.76%
79,812 HERA SpA
227,161 0.34%
222,469 Intesa Sanpaolo SpA
686,768 1.03%
32,079 Unicredit SpA
268,422 0.40%
Total Italy
2,517,796 3.77%
Jersey Channel Isle – 1.46% 100,431 Glencore Plc
558,702 0.84%
1,990 Wolseley Plc
108,920 0.16%
14,148 WPP Plc
308,007 0.46%
Total Jersey Channel Isle
975,629 1.46%
Luxembourg - 0.16% 7,243 ArcelorMittal SA
107,337 0.16%
Total Luxembourg
107,337 0.16%
Netherlands - 3.88% 12,918 Aegon NV
112,670 0.17%
1,751 Akzo Nobel NV
131,181 0.20%
6,043 ASML Holding NV
562,376 0.84%
2,792 Gemalto NV
289,210 0.43%
1,673 Heineken NV
120,027 0.18%
27,908 ING Groep NV
391,812 0.59%
6,734 Koninklijke Ahold NV
126,331 0.19%
7,152 Koninklijke Philips NV
226,803 0.34%
5,028 Reed Elsevier NV
115,242 0.17%
11,855 Unilever NV
518,372 0.78%
Total Netherlands
2,594,024 3.88%
Norway - 0.94%
7,127 DNB ASA
130,304 0.19%
6,782 Gjensidige Forsikring ASA
121,565 0.18%
8,093 Statoil ASA
248,455 0.37%
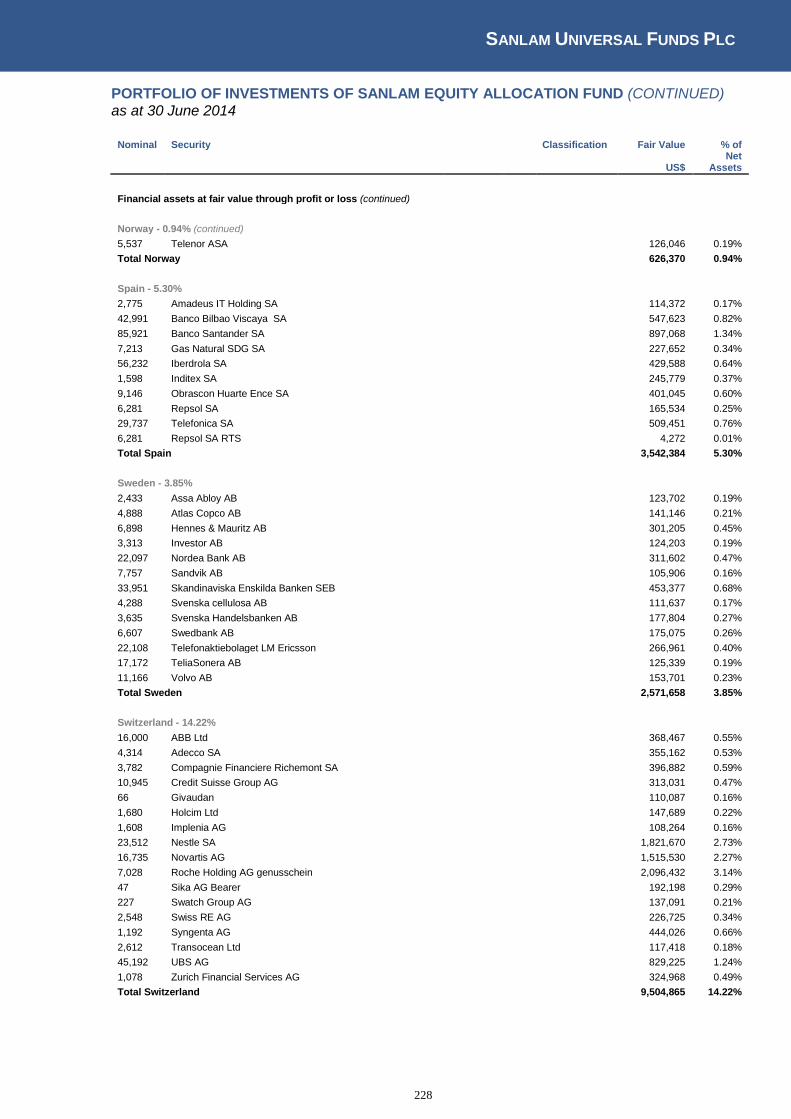
SANLAM UNIVERSAL FUNDS PLC
228
PORTFOLIO OF INVESTMENTS OF SANLAM EQUITY ALLOCATION FUND (CONTINUED) as at 30 June 2014
Nominal Security
Classification Fair Value % of
US$ Net
Assets
Financial assets at fair value through profit or loss (continued)
Norway - 0.94% (continued) 5,537 Telenor ASA
126,046 0.19%
Total Norway
626,370 0.94%
Spain - 5.30% 2,775 Amadeus IT Holding SA
114,372 0.17%
42,991 Banco Bilbao Viscaya SA
547,623 0.82%
85,921 Banco Santander SA
897,068 1.34%
7,213 Gas Natural SDG SA
227,652 0.34%
56,232 Iberdrola SA
429,588 0.64%
1,598 Inditex SA
245,779 0.37%
9,146 Obrascon Huarte Ence SA
401,045 0.60%
6,281 Repsol SA
165,534 0.25%
29,737 Telefonica SA
509,451 0.76%
6,281 Repsol SA RTS
4,272 0.01%
Total Spain
3,542,384 5.30%
Sweden - 3.85% 2,433 Assa Abloy AB
123,702 0.19%
4,888 Atlas Copco AB
141,146 0.21%
6,898 Hennes & Mauritz AB
301,205 0.45%
3,313 Investor AB
124,203 0.19%
22,097 Nordea Bank AB
311,602 0.47%
7,757 Sandvik AB
105,906 0.16%
33,951 Skandinaviska Enskilda Banken SEB
453,377 0.68%
4,288 Svenska cellulosa AB
111,637 0.17%
3,635 Svenska Handelsbanken AB
177,804 0.27%
6,607 Swedbank AB
175,075 0.26%
22,108 Telefonaktiebolaget LM Ericsson
266,961 0.40%
17,172 TeliaSonera AB
125,339 0.19%
11,166 Volvo AB
153,701 0.23%
Total Sweden
2,571,658 3.85%
Switzerland - 14.22% 16,000 ABB Ltd
368,467 0.55%
4,314 Adecco SA
355,162 0.53%
3,782 Compagnie Financiere Richemont SA
396,882 0.59%
10,945 Credit Suisse Group AG
313,031 0.47%
66 Givaudan
110,087 0.16%
1,680 Holcim Ltd
147,689 0.22%
1,608 Implenia AG
108,264 0.16%
23,512 Nestle SA
1,821,670 2.73%
16,735 Novartis AG
1,515,530 2.27%
7,028 Roche Holding AG genusschein
2,096,432 3.14%
47 Sika AG Bearer
192,198 0.29%
227 Swatch Group AG
137,091 0.21%
2,548 Swiss RE AG
226,725 0.34%
1,192 Syngenta AG
444,026 0.66%
2,612 Transocean Ltd
117,418 0.18%
45,192 UBS AG
829,225 1.24%
1,078 Zurich Financial Services AG
324,968 0.49%
Total Switzerland
9,504,865 14.22%

SANLAM UNIVERSAL FUNDS PLC
229
PORTFOLIO OF INVESTMENTS OF SANLAM EQUITY ALLOCATION FUND (CONTINUED) as at 30 June 2014
Nominal Security
Classification Fair Value % of
US$ Net
Assets
Financial assets at fair value through profit or loss (continued)
United States of America - 0.51% 3,219 Autoliv Inc
344,178 0.51%
Total United States of America
344,178 0.51%
Total Equity
66,172,732 99.01%
Total financial assets at fair value through profit or loss
66,172,732 99.01%
Cash and cash equivalents
554,020 0.83%
Other net assets and liabilities
109,232 0.16%
Net assets attributable to holders of redeemable participating shares
66,835,984 100.00%
Sanlam Equity Allocation Fund
Summary
Classification Description
Fair Value % of % of
US$ Net Assets Total Assets
Tranferable securities and money market instruments admitted to
official stock exchange listing or traded on regulated market
66,172,732 99.01% 98.94%
A Transferabe securities and money market instruments other than
those referred above
- - -
B Collective Investment Schemes
- - -
C Financial derivative instruments dealt in on a regulated market - - -
D Over the counter financial derivative instrument
- - -
Cash and cash equivalents
554,020 0.83% 0.83%
Other net assets and liabilities
109,232 0.16% 0.16%
Net assets attributable to holders of redeemable participating shares 66,835,984 100.00%
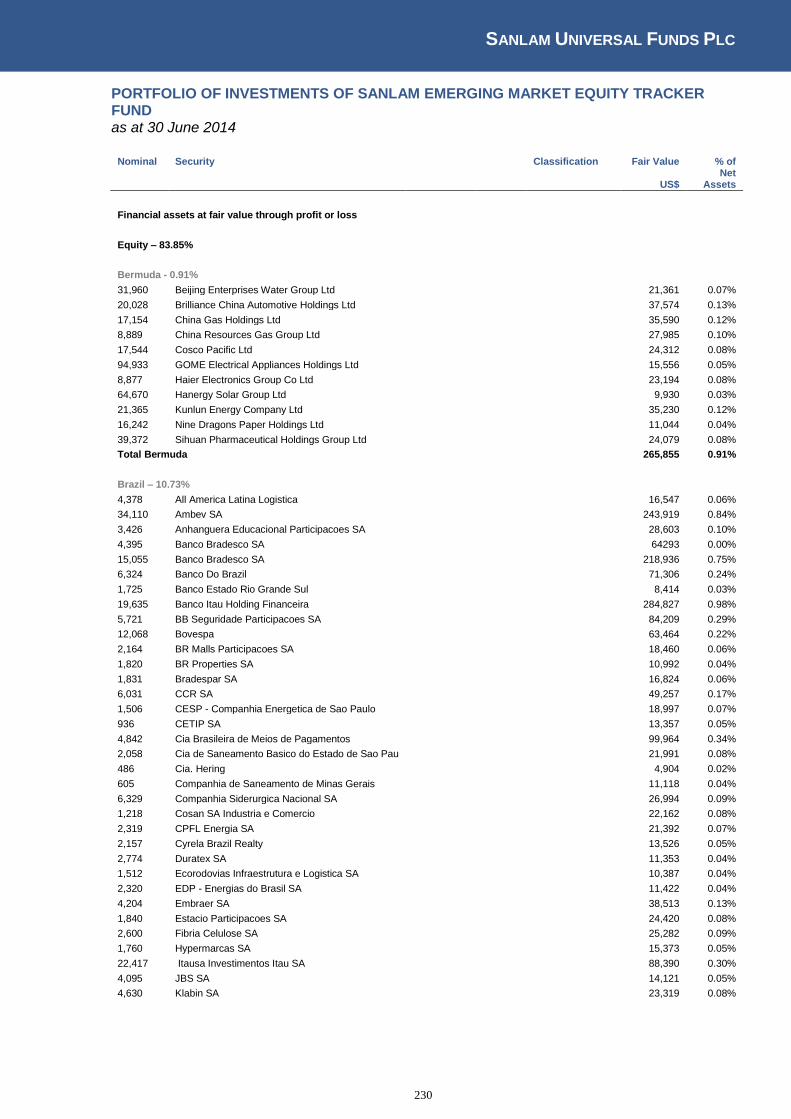
SANLAM UNIVERSAL FUNDS PLC
230
PORTFOLIO OF INVESTMENTS OF SANLAM EMERGING MARKET EQUITY TRACKER FUND as at 30 June 2014
Nominal Security
Classification Fair Value % of
US$ Net
Assets
Financial assets at fair value through profit or loss
Equity – 83.85%
Bermuda - 0.91% 31,960 Beijing Enterprises Water Group Ltd
21,361 0.07%
20,028 Brilliance China Automotive Holdings Ltd
37,574 0.13%
17,154 China Gas Holdings Ltd
35,590 0.12%
8,889 China Resources Gas Group Ltd
27,985 0.10%
17,544 Cosco Pacific Ltd
24,312 0.08%
94,933 GOME Electrical Appliances Holdings Ltd
15,556 0.05%
8,877 Haier Electronics Group Co Ltd
23,194 0.08%
64,670 Hanergy Solar Group Ltd
9,930 0.03%
21,365 Kunlun Energy Company Ltd
35,230 0.12%
16,242 Nine Dragons Paper Holdings Ltd
11,044 0.04%
39,372 Sihuan Pharmaceutical Holdings Group Ltd
24,079 0.08%
Total Bermuda
265,855 0.91%
Brazil – 10.73% 4,378 All America Latina Logistica
16,547 0.06%
34,110 Ambev SA
243,919 0.84%
3,426 Anhanguera Educacional Participacoes SA
28,603 0.10%
4,395 Banco Bradesco SA
64293 0.00%
15,055 Banco Bradesco SA
218,936 0.75%
6,324 Banco Do Brazil
71,306 0.24%
1,725 Banco Estado Rio Grande Sul
8,414 0.03%
19,635 Banco Itau Holding Financeira
284,827 0.98%
5,721 BB Seguridade Participacoes SA
84,209 0.29%
12,068 Bovespa
63,464 0.22%
2,164 BR Malls Participacoes SA
18,460 0.06%
1,820 BR Properties SA
10,992 0.04%
1,831 Bradespar SA
16,824 0.06%
6,031 CCR SA
49,257 0.17%
1,506 CESP - Companhia Energetica de Sao Paulo
18,997 0.07%
936 CETIP SA
13,357 0.05%
4,842 Cia Brasileira de Meios de Pagamentos
99,964 0.34%
2,058 Cia de Saneamento Basico do Estado de Sao Pau
21,991 0.08%
486 Cia. Hering
4,904 0.02%
605 Companhia de Saneamento de Minas Gerais
11,118 0.04%
6,329 Companhia Siderurgica Nacional SA
26,994 0.09%
1,218 Cosan SA Industria e Comercio
22,162 0.08%
2,319 CPFL Energia SA
21,392 0.07%
2,157 Cyrela Brazil Realty
13,526 0.05%
2,774 Duratex SA
11,353 0.04%
1,512 Ecorodovias Infraestrutura e Logistica SA
10,387 0.04%
2,320 EDP - Energias do Brasil SA
11,422 0.04%
4,204 Embraer SA
38,513 0.13%
1,840 Estacio Participacoes SA
24,420 0.08%
2,600 Fibria Celulose SA
25,282 0.09%
1,760 Hypermarcas SA
15,373 0.05%
22,417 Itausa Investimentos Itau SA
88,390 0.30%
4,095 JBS SA
14,121 0.05%
4,630 Klabin SA
23,319 0.08%
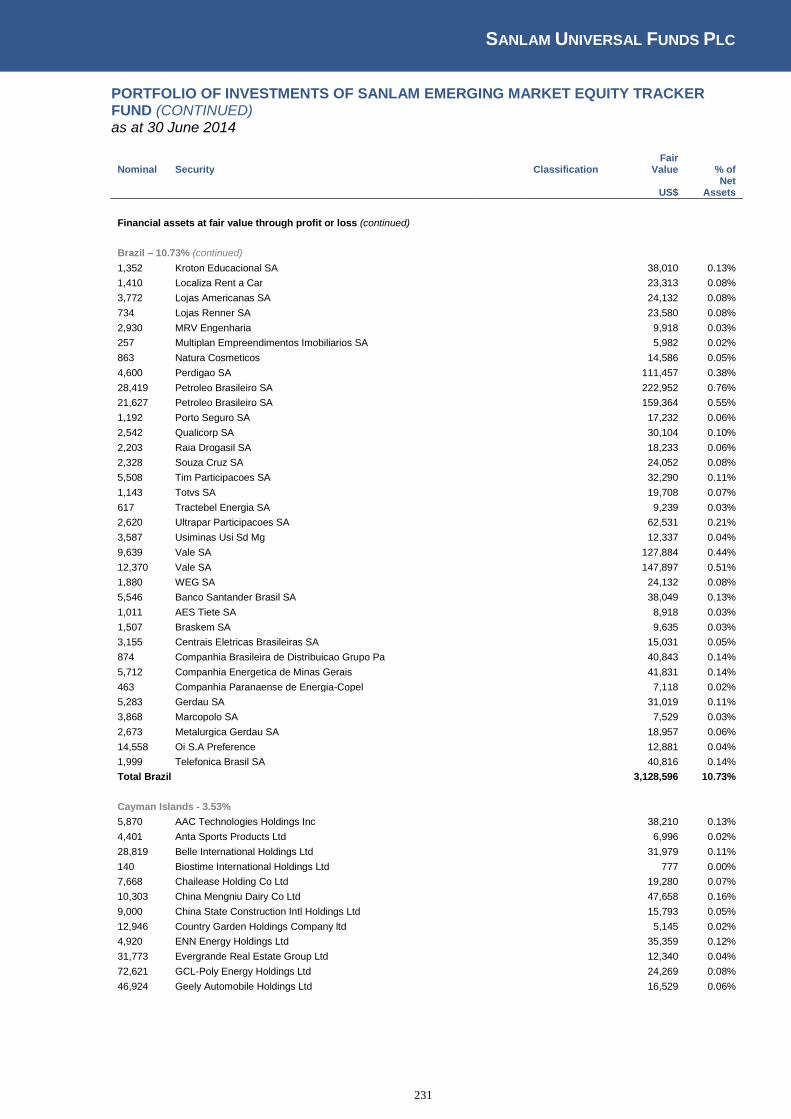
SANLAM UNIVERSAL FUNDS PLC
231
PORTFOLIO OF INVESTMENTS OF SANLAM EMERGING MARKET EQUITY TRACKER FUND (CONTINUED) as at 30 June 2014
Nominal Security
Classification Fair
Value % of
US$ Net
Assets
Financial assets at fair value through profit or loss (continued)
Brazil – 10.73% (continued) 1,352 Kroton Educacional SA
38,010 0.13%
1,410 Localiza Rent a Car
23,313 0.08%
3,772 Lojas Americanas SA
24,132 0.08%
734 Lojas Renner SA
23,580 0.08%
2,930 MRV Engenharia
9,918 0.03%
257 Multiplan Empreendimentos Imobiliarios SA
5,982 0.02%
863 Natura Cosmeticos
14,586 0.05%
4,600 Perdigao SA
111,457 0.38%
28,419 Petroleo Brasileiro SA
222,952 0.76%
21,627 Petroleo Brasileiro SA
159,364 0.55%
1,192 Porto Seguro SA
17,232 0.06%
2,542 Qualicorp SA
30,104 0.10%
2,203 Raia Drogasil SA
18,233 0.06%
2,328 Souza Cruz SA
24,052 0.08%
5,508 Tim Participacoes SA
32,290 0.11%
1,143 Totvs SA
19,708 0.07%
617 Tractebel Energia SA
9,239 0.03%
2,620 Ultrapar Participacoes SA
62,531 0.21%
3,587 Usiminas Usi Sd Mg
12,337 0.04%
9,639 Vale SA
127,884 0.44%
12,370 Vale SA
147,897 0.51%
1,880 WEG SA
24,132 0.08%
5,546 Banco Santander Brasil SA
38,049 0.13%
1,011 AES Tiete SA
8,918 0.03%
1,507 Braskem SA
9,635 0.03%
3,155 Centrais Eletricas Brasileiras SA
15,031 0.05%
874 Companhia Brasileira de Distribuicao Grupo Pa
40,843 0.14%
5,712 Companhia Energetica de Minas Gerais
41,831 0.14%
463 Companhia Paranaense de Energia-Copel
7,118 0.02%
5,283 Gerdau SA
31,019 0.11%
3,868 Marcopolo SA
7,529 0.03%
2,673 Metalurgica Gerdau SA
18,957 0.06%
14,558 Oi S.A Preference
12,881 0.04%
1,999 Telefonica Brasil SA
40,816 0.14%
Total Brazil
3,128,596 10.73%
Cayman Islands - 3.53% 5,870 AAC Technologies Holdings Inc
38,210 0.13%
4,401 Anta Sports Products Ltd
6,996 0.02%
28,819 Belle International Holdings Ltd
31,979 0.11%
140 Biostime International Holdings Ltd
777 0.00%
7,668 Chailease Holding Co Ltd
19,280 0.07%
10,303 China Mengniu Dairy Co Ltd
47,658 0.16%
9,000 China State Construction Intl Holdings Ltd
15,793 0.05%
12,946 Country Garden Holdings Company ltd
5,145 0.02%
4,920 ENN Energy Holdings Ltd
35,359 0.12%
31,773 Evergrande Real Estate Group Ltd
12,340 0.04%
72,621 GCL-Poly Energy Holdings Ltd
24,269 0.08%
46,924 Geely Automobile Holdings Ltd
16,529 0.06%
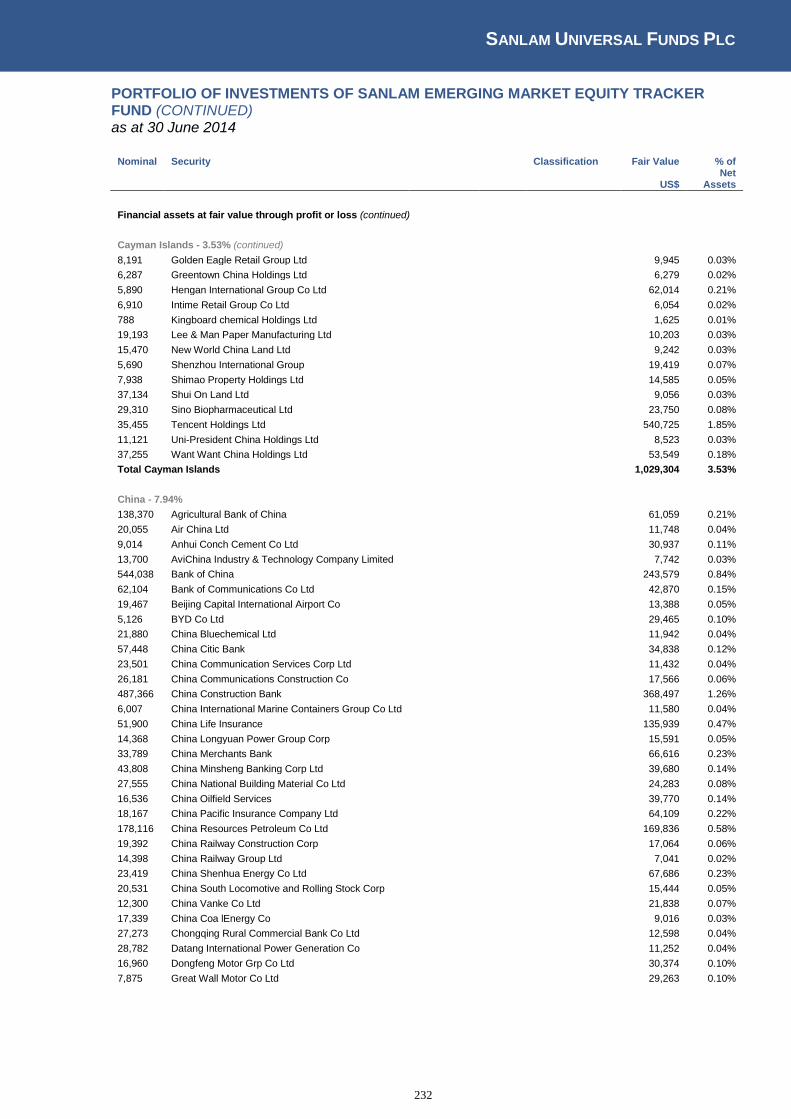
SANLAM UNIVERSAL FUNDS PLC
232
PORTFOLIO OF INVESTMENTS OF SANLAM EMERGING MARKET EQUITY TRACKER FUND (CONTINUED) as at 30 June 2014
Nominal Security
Classification Fair Value % of
US$ Net
Assets
Financial assets at fair value through profit or loss (continued)
Cayman Islands - 3.53% (continued)
8,191 Golden Eagle Retail Group Ltd
9,945 0.03%
6,287 Greentown China Holdings Ltd
6,279 0.02%
5,890 Hengan International Group Co Ltd
62,014 0.21%
6,910 Intime Retail Group Co Ltd
6,054 0.02%
788 Kingboard chemical Holdings Ltd
1,625 0.01%
19,193 Lee & Man Paper Manufacturing Ltd
10,203 0.03%
15,470 New World China Land Ltd
9,242 0.03%
5,690 Shenzhou International Group
19,419 0.07%
7,938 Shimao Property Holdings Ltd
14,585 0.05%
37,134 Shui On Land Ltd
9,056 0.03%
29,310 Sino Biopharmaceutical Ltd
23,750 0.08%
35,455 Tencent Holdings Ltd
540,725 1.85%
11,121 Uni-President China Holdings Ltd
8,523 0.03%
37,255 Want Want China Holdings Ltd
53,549 0.18%
Total Cayman Islands
1,029,304 3.53%
China - 7.94% 138,370 Agricultural Bank of China
61,059 0.21%
20,055 Air China Ltd
11,748 0.04%
9,014 Anhui Conch Cement Co Ltd
30,937 0.11%
13,700 AviChina Industry & Technology Company Limited
7,742 0.03%
544,038 Bank of China
243,579 0.84%
62,104 Bank of Communications Co Ltd
42,870 0.15%
19,467 Beijing Capital International Airport Co
13,388 0.05%
5,126 BYD Co Ltd
29,465 0.10%
21,880 China Bluechemical Ltd
11,942 0.04%
57,448 China Citic Bank
34,838 0.12%
23,501 China Communication Services Corp Ltd
11,432 0.04%
26,181 China Communications Construction Co
17,566 0.06%
487,366 China Construction Bank
368,497 1.26%
6,007 China International Marine Containers Group Co Ltd
11,580 0.04%
51,900 China Life Insurance
135,939 0.47%
14,368 China Longyuan Power Group Corp
15,591 0.05%
33,789 China Merchants Bank
66,616 0.23%
43,808 China Minsheng Banking Corp Ltd
39,680 0.14%
27,555 China National Building Material Co Ltd
24,283 0.08%
16,536 China Oilfield Services
39,770 0.14%
18,167 China Pacific Insurance Company Ltd
64,109 0.22%
178,116 China Resources Petroleum Co Ltd
169,836 0.58%
19,392 China Railway Construction Corp
17,064 0.06%
14,398 China Railway Group Ltd
7,041 0.02%
23,419 China Shenhua Energy Co Ltd
67,686 0.23%
20,531 China South Locomotive and Rolling Stock Corp
15,444 0.05%
12,300 China Vanke Co Ltd
21,838 0.07%
17,339 China Coa lEnergy Co
9,016 0.03%
27,273 Chongqing Rural Commercial Bank Co Ltd
12,598 0.04%
28,782 Datang International Power Generation Co
11,252 0.04%
16,960 Dongfeng Motor Grp Co Ltd
30,374 0.10%
7,875 Great Wall Motor Co Ltd
29,263 0.10%

SANLAM UNIVERSAL FUNDS PLC
233
PORTFOLIO OF INVESTMENTS OF SANLAM EMERGING MARKET EQUITY TRACKER FUND (CONTINUED) as at 30 June 2014
Nominal Security
Classification Fair Value % of
US$ Net
Assets
Financial assets at fair value through profit or loss (continued)
China - 7.94% (continued)
10,024 Guangzhou Automobile Group Co Ltd
11,614 0.04%
8,746 Guangzhou R&F Properties Co Ltd
10,799 0.04%
11,519 Haitong Securiies Co Ltd
17,865 0.06%
16,778 Huaneng Power International Inc
18,942 0.06%
11,600 Inner Mongolia Yitai Coal Co
14,848 0.05%
12,471 Jiangsu Express Co Ltd
14,755 0.05%
10,339 Jiangxi Copper Co Ltd
16,355 0.06%
12,904 Longfor Properties Co Ltd
15,900 0.05%
6,699 New China Life Insurance Co Ltd
22,214 0.08%
52,256 People's Insurance Company of China Holdings Co
20,632 0.07%
148,248 PetroChina Co Ltd
187,263 0.64%
19,680 PICC Property & Casual Co Ltd
29,811 0.10%
14,207 Ping An Insurance Group Co of China Ltd
109,985 0.38%
15,815 Shandong Weigao Group Medical Polymer Co
15,447 0.05%
32,161 Shanghai Electric Group Co Ltd
12,947 0.04%
6,236 Shanghai Pharmaceuticals Holding Co Ltd
12,970 0.04%
27,975 Sino-Ocean Land Holdings
14,185 0.05%
5,137 Sinopharm Group Co
14,217 0.05%
3,597 Tsingtao Brewery Co Ltd
28,125 0.10%
3,559 Yanzhou Coal Mining Co
2,691 0.01%
17,042 Zhejiang Expressway Co Ltd
17,261 0.06%
5,171 Zhuzhou CSR Times Electric Co Ltd
15,713 0.05%
4,997 Zijin Mining Group Co Ltd
1,135 0.00%
15,517 Zoomlion Heavy Industry Science & Technology Development Co Ltd
9,610 0.03%
2,964 ZTE Corp
5,844 0.02%
Total China
2,315,171 7.94%
Colombia - 0.96% 1,240 Almacenes Exito SA
20,826 0.07%
3,158 Bancolombia SA
46,157 0.16%
4,408 Cementos Argos SA
27,692 0.09%
799 Corporacion Financiera Colombiana SA
16,282 0.06%
30,211 Ecopetrol SA
54,754 0.19%
1,339 Grupo Argos SA
16,084 0.06%
1,259 Grupo de Inversiones Suramericana SA
26,699 0.09%
3,898 Interconexion Electrica SA ESP
18,998 0.07%
8,460 Isagen SA ESP
13,939 0.05%
430 Banco Davivienda S.A.
6,929 0.02%
1,347 Grupo Argos SA
16,037 0.05%
800 Grupo de Inversiones Suramericana
16,923 0.06%
Total Colombia
281,320 0.96%
Czechoslovakia - 0.28% 1,220 Cez
36,819 0.13%
117 Komercni Banka as
26,906 0.09%
1,213 Telefonica 02 Czech Republic
17,185 0.06%
Total Czechoslovakia
80,910 0.28%

SANLAM UNIVERSAL FUNDS PLC
234
PORTFOLIO OF INVESTMENTS OF SANLAM EMERGING MARKET EQUITY TRACKER FUND (CONTINUED) as at 30 June 2014
Nominal Security
Classification Fair Value % of
US$
Net Assets
Financial assets at fair value through profit or loss (continued)
Egypt - 0.19% (continued) 6,347 Commercial International Bank
31,601 0.11%
32,994 Global Telecom Holding
23,672 0.08%
Total Egypt
55,273 0.19%
Greece - 0.70% 27,530 Alpha Bank A.E.
25,616 0.09%
54,040 Eurobank Ergasias SA
27,286 0.09%
1,590 Hellenic Telecommunications Organization SA
23,498 0.08%
539 Jumbo SA
8,821 0.03%
11,030 National Bank of Greece
40,298 0.14%
1,580 OPAP SA
28,106 0.10%
14,170 Piraeus Bank SA
31,411 0.11%
1,220 Public Power Corp
18,848 0.06%
Total Greece
203,884 0.70%
Hong Kong - 5.31% 14,147 Agile Properties Holdings Ltd
9,966 0.03%
3,700 Beijing Enterprises Holdings Ltd
35,017 0.12%
33,872 China Cosco Holdings Co Ltd
13,199 0.05%
15,580 China Everbright International Ltd
22,274 0.08%
10,871 China Everbright Ltd
14,616 0.05%
9,265 China Insurance International
16,593 0.06%
7,331 China Merchants Holdings Intlernational
22,891 0.08%
41,612 China Mobile Hong Kong Ltd
403,755 1.38%
28,852 China Overseas Land & Investments Ltd
69,987 0.24%
12,635 China Resources Energy
35,866 0.12%
6,181 China Resources Enterprise Ltd
17,147 0.06%
10,319 China Resources Land Ltd
18,880 0.06%
98,896 China Telecom Corp Ltd
48,361 0.17%
35,208 China Unicom Hong Kong Ltd
54,423 0.19%
15,290 Citic Pacific
26,791 0.09%
124,456 CNOOC Ltd
223,530 0.77%
8,628 Fosun International Ltd
11,466 0.04%
33,750 Franshion Properties China Ltd
8,884 0.03%
33,597 Fushan International Energy Group Ltd
6,893 0.02%
12,048 Guangdong Investment Ltd
13,897 0.05%
497,049 Industrial and Commercial Bank of China Ltd
314,251 1.08%
45,403 Lenovo Group Ltd
61,980 0.21%
18,560 Poly Hong Kong Investment Ltd
7,735 0.03%
3,259 Shanghai Industrial Holdings Ltd
9,924 0.03%
12,189 Sun Art Retail Group Ltd
13,950 0.05%
13,052 Tingyi (Cayman Islands) Holding Corp
36,544 0.13%
55,037 Yuexiu Property Company Ltd
10,510 0.04%
5,077 Weichai Power Co Ltd
19,619 0.07%
Total Hong Kong
1,548,949 5.31%
Hungary - 0.26% 267 Mol Magyar Olaj- es Gazipari Nryt
14,289 0.05%
1,850 OTP Bank Nyrt
35,578 0.12%
1,410 Richter Gedeon Nyrt
27,066 0.09%
Total Hungary
76,933 0.26%
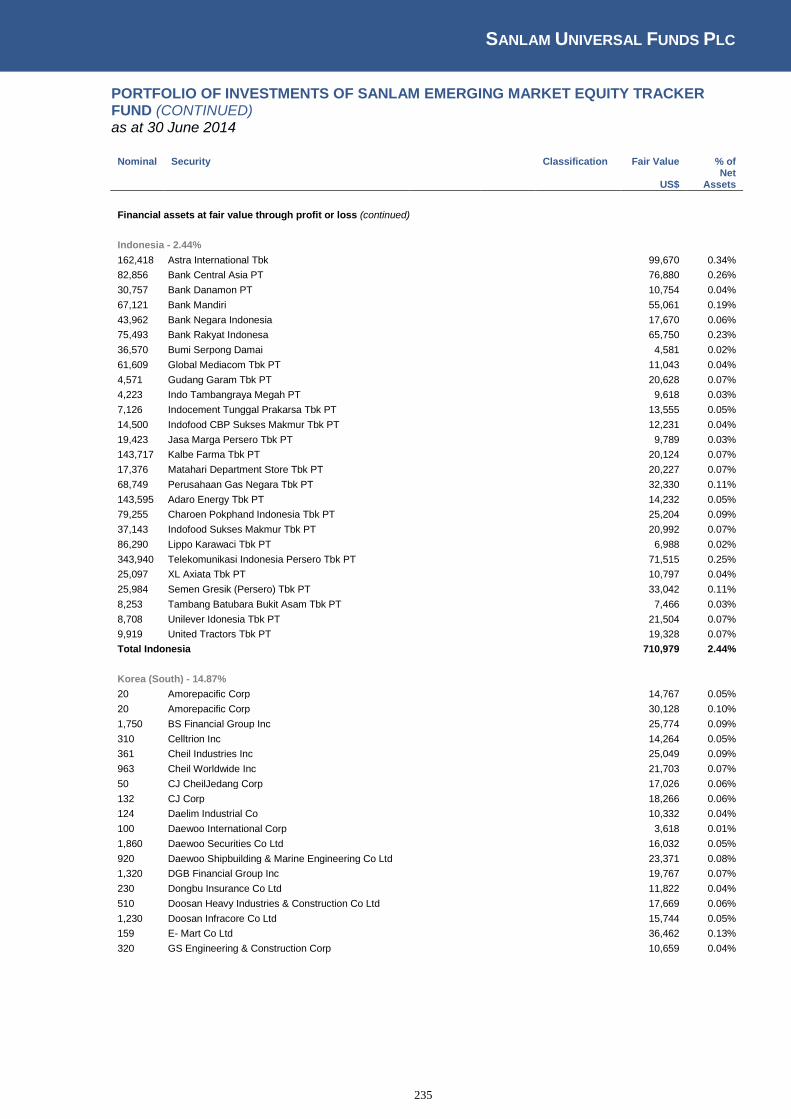
SANLAM UNIVERSAL FUNDS PLC
235
PORTFOLIO OF INVESTMENTS OF SANLAM EMERGING MARKET EQUITY TRACKER FUND (CONTINUED) as at 30 June 2014
Nominal Security
Classification Fair Value % of
US$ Net
Assets
Financial assets at fair value through profit or loss (continued)
Indonesia - 2.44% 162,418 Astra International Tbk
99,670 0.34%
82,856 Bank Central Asia PT
76,880 0.26%
30,757 Bank Danamon PT
10,754 0.04%
67,121 Bank Mandiri
55,061 0.19%
43,962 Bank Negara Indonesia
17,670 0.06%
75,493 Bank Rakyat Indonesa
65,750 0.23%
36,570 Bumi Serpong Damai
4,581 0.02%
61,609 Global Mediacom Tbk PT
11,043 0.04%
4,571 Gudang Garam Tbk PT
20,628 0.07%
4,223 Indo Tambangraya Megah PT
9,618 0.03%
7,126 Indocement Tunggal Prakarsa Tbk PT
13,555 0.05%
14,500 Indofood CBP Sukses Makmur Tbk PT
12,231 0.04%
19,423 Jasa Marga Persero Tbk PT
9,789 0.03%
143,717 Kalbe Farma Tbk PT
20,124 0.07%
17,376 Matahari Department Store Tbk PT
20,227 0.07%
68,749 Perusahaan Gas Negara Tbk PT
32,330 0.11%
143,595 Adaro Energy Tbk PT
14,232 0.05%
79,255 Charoen Pokphand Indonesia Tbk PT
25,204 0.09%
37,143 Indofood Sukses Makmur Tbk PT
20,992 0.07%
86,290 Lippo Karawaci Tbk PT
6,988 0.02%
343,940 Telekomunikasi Indonesia Persero Tbk PT
71,515 0.25%
25,097 XL Axiata Tbk PT
10,797 0.04%
25,984 Semen Gresik (Persero) Tbk PT
33,042 0.11%
8,253 Tambang Batubara Bukit Asam Tbk PT
7,466 0.03%
8,708 Unilever Idonesia Tbk PT
21,504 0.07%
9,919 United Tractors Tbk PT
19,328 0.07%
Total Indonesia
710,979 2.44%
Korea (South) - 14.87% 20 Amorepacific Corp
14,767 0.05%
20 Amorepacific Corp
30,128 0.10%
1,750 BS Financial Group Inc
25,774 0.09%
310 Celltrion Inc
14,264 0.05%
361 Cheil Industries Inc
25,049 0.09%
963 Cheil Worldwide Inc
21,703 0.07%
50 CJ CheilJedang Corp
17,026 0.06%
132 CJ Corp
18,266 0.06%
124 Daelim Industrial Co
10,332 0.04%
100 Daewoo International Corp
3,618 0.01%
1,860 Daewoo Securities Co Ltd
16,032 0.05%
920 Daewoo Shipbuilding & Marine Engineering Co Ltd
23,371 0.08%
1,320 DGB Financial Group Inc
19,767 0.07%
230 Dongbu Insurance Co Ltd
11,822 0.04%
510 Doosan Heavy Industries & Construction Co Ltd
17,669 0.06%
1,230 Doosan Infracore Co Ltd
15,744 0.05%
159 E- Mart Co Ltd
36,462 0.13%
320 GS Engineering & Construction Corp
10,659 0.04%
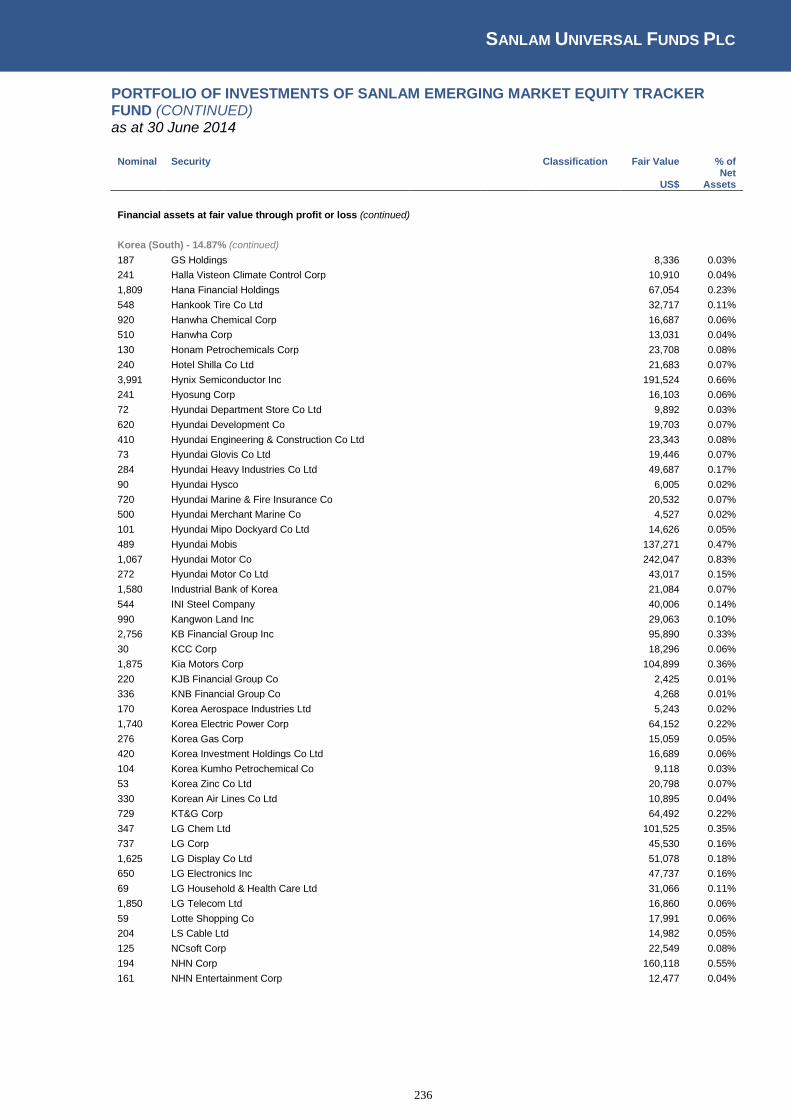
SANLAM UNIVERSAL FUNDS PLC
236
PORTFOLIO OF INVESTMENTS OF SANLAM EMERGING MARKET EQUITY TRACKER FUND (CONTINUED) as at 30 June 2014
Nominal Security
Classification Fair Value % of
US$ Net
Assets
Financial assets at fair value through profit or loss (continued)
Korea (South) - 14.87% (continued)
187 GS Holdings
8,336 0.03%
241 Halla Visteon Climate Control Corp
10,910 0.04%
1,809 Hana Financial Holdings
67,054 0.23%
548 Hankook Tire Co Ltd
32,717 0.11%
920 Hanwha Chemical Corp
16,687 0.06%
510 Hanwha Corp
13,031 0.04%
130 Honam Petrochemicals Corp
23,708 0.08%
240 Hotel Shilla Co Ltd
21,683 0.07%
3,991 Hynix Semiconductor Inc
191,524 0.66%
241 Hyosung Corp
16,103 0.06%
72 Hyundai Department Store Co Ltd
9,892 0.03%
620 Hyundai Development Co
19,703 0.07%
410 Hyundai Engineering & Construction Co Ltd
23,343 0.08%
73 Hyundai Glovis Co Ltd
19,446 0.07%
284 Hyundai Heavy Industries Co Ltd
49,687 0.17%
90 Hyundai Hysco
6,005 0.02%
720 Hyundai Marine & Fire Insurance Co
20,532 0.07%
500 Hyundai Merchant Marine Co
4,527 0.02%
101 Hyundai Mipo Dockyard Co Ltd
14,626 0.05%
489 Hyundai Mobis
137,271 0.47%
1,067 Hyundai Motor Co
242,047 0.83%
272 Hyundai Motor Co Ltd
43,017 0.15%
1,580 Industrial Bank of Korea
21,084 0.07%
544 INI Steel Company
40,006 0.14%
990 Kangwon Land Inc
29,063 0.10%
2,756 KB Financial Group Inc
95,890 0.33%
30 KCC Corp
18,296 0.06%
1,875 Kia Motors Corp
104,899 0.36%
220 KJB Financial Group Co
2,425 0.01%
336 KNB Financial Group Co
4,268 0.01%
170 Korea Aerospace Industries Ltd
5,243 0.02%
1,740 Korea Electric Power Corp
64,152 0.22%
276 Korea Gas Corp
15,059 0.05%
420 Korea Investment Holdings Co Ltd
16,689 0.06%
104 Korea Kumho Petrochemical Co
9,118 0.03%
53 Korea Zinc Co Ltd
20,798 0.07%
330 Korean Air Lines Co Ltd
10,895 0.04%
729 KT&G Corp
64,492 0.22%
347 LG Chem Ltd
101,525 0.35%
737 LG Corp
45,530 0.16%
1,625 LG Display Co Ltd
51,078 0.18%
650 LG Electronics Inc
47,737 0.16%
69 LG Household & Health Care Ltd
31,066 0.11%
1,850 LG Telecom Ltd
16,860 0.06%
59 Lotte Shopping Co
17,991 0.06%
204 LS Cable Ltd
14,982 0.05%
125 NCsoft Corp
22,549 0.08%
194 NHN Corp
160,118 0.55%
161 NHN Entertainment Corp
12,477 0.04%
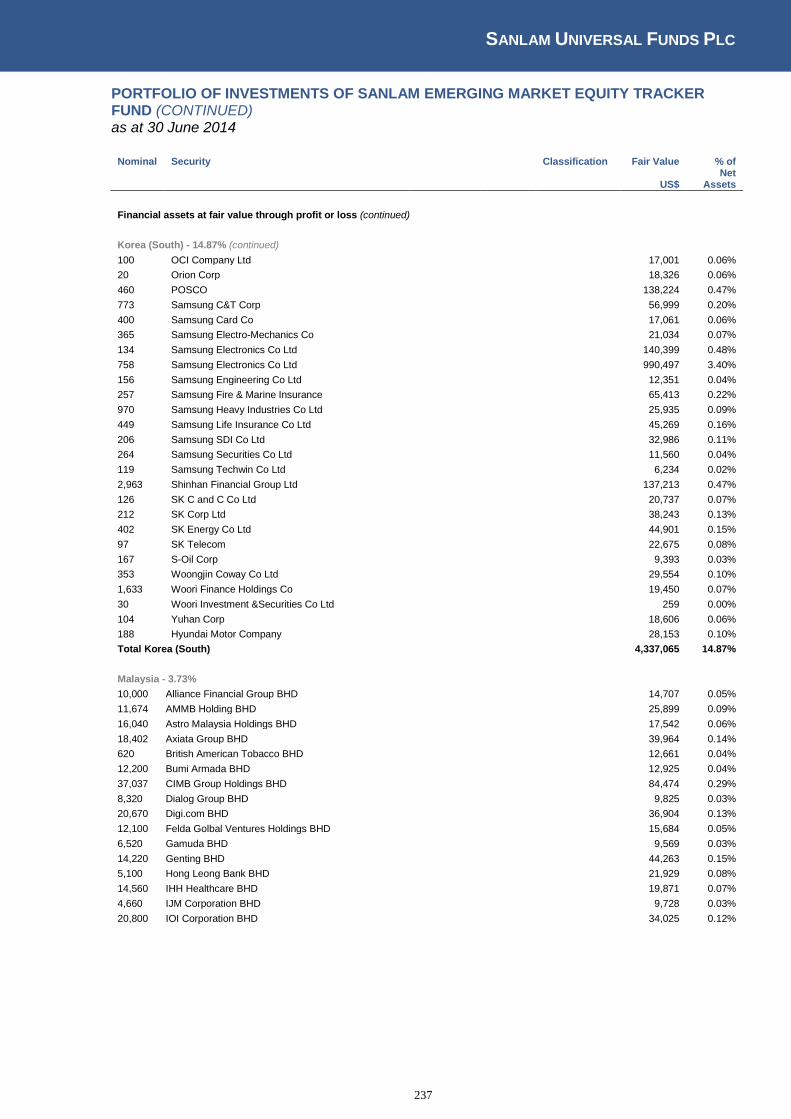
SANLAM UNIVERSAL FUNDS PLC
237
PORTFOLIO OF INVESTMENTS OF SANLAM EMERGING MARKET EQUITY TRACKER FUND (CONTINUED) as at 30 June 2014
Nominal Security
Classification Fair Value % of
US$ Net
Assets
Financial assets at fair value through profit or loss (continued)
Korea (South) - 14.87% (continued)
100 OCI Company Ltd
17,001 0.06%
20 Orion Corp
18,326 0.06%
460 POSCO
138,224 0.47%
773 Samsung C&T Corp
56,999 0.20%
400 Samsung Card Co
17,061 0.06%
365 Samsung Electro-Mechanics Co
21,034 0.07%
134 Samsung Electronics Co Ltd
140,399 0.48%
758 Samsung Electronics Co Ltd
990,497 3.40%
156 Samsung Engineering Co Ltd
12,351 0.04%
257 Samsung Fire & Marine Insurance
65,413 0.22%
970 Samsung Heavy Industries Co Ltd
25,935 0.09%
449 Samsung Life Insurance Co Ltd
45,269 0.16%
206 Samsung SDI Co Ltd
32,986 0.11%
264 Samsung Securities Co Ltd
11,560 0.04%
119 Samsung Techwin Co Ltd
6,234 0.02%
2,963 Shinhan Financial Group Ltd
137,213 0.47%
126 SK C and C Co Ltd
20,737 0.07%
212 SK Corp Ltd
38,243 0.13%
402 SK Energy Co Ltd
44,901 0.15%
97 SK Telecom
22,675 0.08%
167 S-Oil Corp
9,393 0.03%
353 Woongjin Coway Co Ltd
29,554 0.10%
1,633 Woori Finance Holdings Co
19,450 0.07%
30 Woori Investment &Securities Co Ltd
259 0.00%
104 Yuhan Corp
18,606 0.06%
188 Hyundai Motor Company
28,153 0.10%
Total Korea (South)
4,337,065 14.87%
Malaysia - 3.73% 10,000 Alliance Financial Group BHD
14,707 0.05%
11,674 AMMB Holding BHD
25,899 0.09%
16,040 Astro Malaysia Holdings BHD
17,542 0.06%
18,402 Axiata Group BHD
39,964 0.14%
620 British American Tobacco BHD
12,661 0.04%
12,200 Bumi Armada BHD
12,925 0.04%
37,037 CIMB Group Holdings BHD
84,474 0.29%
8,320 Dialog Group BHD
9,825 0.03%
20,670 Digi.com BHD
36,904 0.13%
12,100 Felda Golbal Ventures Holdings BHD
15,684 0.05%
6,520 Gamuda BHD
9,569 0.03%
14,220 Genting BHD
44,263 0.15%
5,100 Hong Leong Bank BHD
21,929 0.08%
14,560 IHH Healthcare BHD
19,871 0.07%
4,660 IJM Corporation BHD
9,728 0.03%
20,800 IOI Corporation BHD
34,025 0.12%

SANLAM UNIVERSAL FUNDS PLC
238
PORTFOLIO OF INVESTMENTS OF SANLAM EMERGING MARKET EQUITY TRACKER FUND (CONTINUED) as at 30 June 2014
Nominal Security
Classification Fair Value % of
US$ Net
Assets
Financial assets at fair value through profit or loss (continued)
Malaysia - 3.73% (continued)
9,686 IOI Properties Group Sdn BHD
7,605 0.03%
3,190 Kuala Lumpur Kepong BHD
24,054 0.08%
4,000 Lafarge Malayan Cement BHD
12,276 0.04%
30,740 Malayan Banking BHD
94,153 0.32%
10,880 Maxis BHD
22,883 0.08%
4,140 MISC BHD
8,385 0.03%
1,980 Perlis Plantations Group BHD
9,340 0.03%
19,883 Petronas Chemicals Group BHD
41,942 0.14%
4,427 Petronas Gas BHD
33,795 0.12%
19,860 Public Bank BHD
121,162 0.42%
21,280 Resorts World BHD
27,848 0.10%
6,000 RHB Capital BHD
15,984 0.05%
21,290 SapuraKencana Petroleum BHD
29,055 0.10%
22,357 SIME DARBY BHD
67,362 0.23%
10,000 Telekom Malaysia BHD
19,786 0.07%
19,620 Tenaga Nasionl BHD
74,460 0.26%
15,400 UEM Land Holdings BHD
9,741 0.03%
5,000 UMW Holdings BHD
17,013 0.06%
47,300 YTL Corp BHD
23,875 0.08%
18,520 Airasia BHD
13,272 0.05%
1,986 Public Bank Berhad RTS
3,403 0.01%
Total Malaysia
1,087,364 3.73%
Mexico – 5.06% 20,899 Alfa SAB de CV
57,855 0.20%
237,402 America Movil SAB de CV
246,154 0.84%
2,949 Arca Continental SAB de CV
19,985 0.07%
2,596 Coca-Cola Femsa SAB de CV
29,455 0.10%
10,068 Compartamos SAB de CV
19,404 0.07%
1,690 El Puerto de Liverpool SAB de CV
20,013 0.07%
16,360 Fibra Uno Administracion SAB de CV
57,094 0.20%
14,219 Fomento Economico Mexicano SAB DE CV
133,281 0.46%
3,340 Genomma Lab International SAB de CV
9,061 0.03%
1,940 Gruma SAB de CV
23,218 0.08%
2,923 Grupo Aeroportuario del Pacifico SAB de CV
19,739 0.07%
851 Grupo Aeroportuario del Sureste SAB de CV
10,821 0.04%
10,779 Grupo Bimbo SAB de CV
31,635 0.11%
2,951 Grupo Carso SAB de CV
15,351 0.05%
18,122 Grupo Financiero Banorte SAB de CV
129,630 0.44%
16,033 Grupo Financiero Inbursa SAB de CV
47,561 0.16%
11,396 Grupo Financiero Santander Mexico SAB de CV
30,256 0.10%
28,593 Grupo Mexico SAB de CV
95,289 0.33%

SANLAM UNIVERSAL FUNDS PLC
239
PORTFOLIO OF INVESTMENTS OF SANLAM EMERGING MARKET EQUITY TRACKER FUND (CONTINUED) as at 30 June 2014
Nominal Security
Classification Fair Value % of
US$ Net Assets
Financial assets at fair value through profit or loss (continued)
Mexico – 5.06% (continued)
18,375 Grupo Televisa SAB de CV
126,086 0.43%
80 Industrias CH SAB de CV
452 0.00%
887 Industrias Penoles SAB de CV
22,183 0.08%
9,393 Kimberly-Clark de Mexico SAB de CV
26,292 0.09%
5,907 Mexichem SAB de CV
24,444 0.08%
5,864 Minera Frisco SAB de CV
11,555 0.04%
5,670 OHL Mexico SAB de CV
17,401 0.06%
2,400 Promotora y operadora de inf
32,071 0.11%
38,839 Walmart De Mexico
103,896 0.36%
79,555 Cemex SAB de CV
105,364 0.36%
2,673 Controladora Comercial Mexican SAB de C.V.
10,017 0.03%
Total Mexico
1,475,563 5.06%
Peru - 0.07% 1,670 Compania de Minas Buenaventura SAA
19,723 0.07%
Total Peru
19,723 0.07%
Phillippines - 0.99% 8,930 Aboitiz Equity Ventures Inc
11,455 0.04%
18,900 Aboitiz Power Corp
15,867 0.05%
21,000 Alliance Global Group Inc
13,998 0.05%
1,750 Ayala Corp
25,956 0.09%
31,050 Ayala Land Inc
21,693 0.07%
7,050 Bank of Philippine Islands
14,696 0.05%
13,769 BDO Unibank Inc
29,490 0.10%
8,350 DMCI Holdings Inc
14,154 0.05%
305 Globe Telecom Inc
11,179 0.04%
3,010 International Container Terminal Services Inc
7,653 0.03%
10,900 JG Summit Holdings Inc
12,796 0.04%
4,240 Jollibee Foods Corp
17,094 0.06%
420 Philippine Long Distance Telephone Co
28,747 0.10%
715 SM Investments Corp
13,365 0.05%
64,800 SM Prime Holdings Inc
23,542 0.08%
7,650 Universal Robina Corp
27,039 0.09%
Total Phillippines
288,724 0.99%
Poland - 1.51% 405 Bank Handlowy w Warszawie SA
15,970 0.05%
882 Bank Pekao SA
50,493 0.17%
242 Bank Zachodni WBK SA
29,405 0.10%
676 Eurocash SA
8,951 0.03%
269 Grupa Azoty SA
6,421 0.02%
896 KGHM Polska Miedz SA
36,719 0.13%
111 MBANK SA
18,459 0.06%
7,051 PGE SA
50,268 0.17%
2,363 Polski Koncern Naftowy Orlen SA
31,903 0.11%
11,951 Polskie Gornictwo Naftowe i Gazownictwo SA
20,661 0.07%
6,383 Powszechna Kasa Oszczednosci Bank Polski SA
79,241 0.27%
484 Powszechny Zaklad Ubezpieczen SA
70,724 0.24%
6,895 Telekomunikacja SA
22,024 0.08%
Total Poland
441,239 1.51%
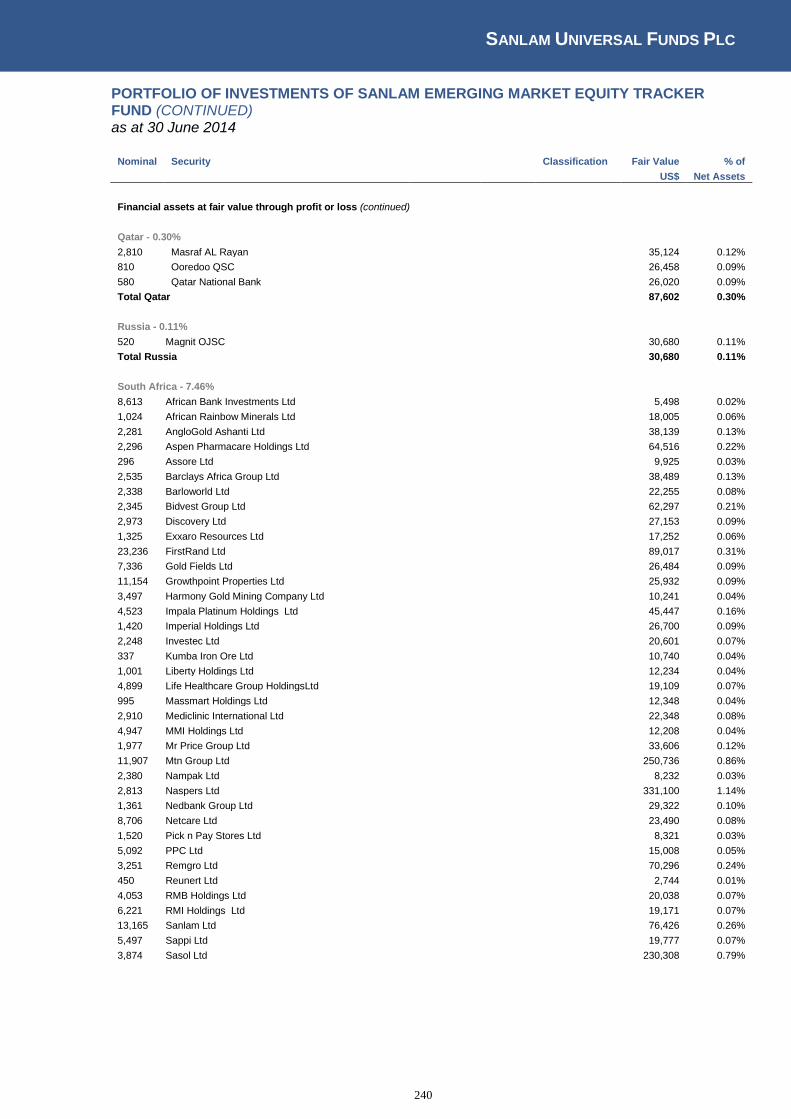
SANLAM UNIVERSAL FUNDS PLC
240
PORTFOLIO OF INVESTMENTS OF SANLAM EMERGING MARKET EQUITY TRACKER FUND (CONTINUED) as at 30 June 2014
Nominal Security
Classification Fair Value % of
US$ Net Assets
Financial assets at fair value through profit or loss (continued)
Qatar - 0.30% 2,810 Masraf AL Rayan
35,124 0.12%
810 Ooredoo QSC
26,458 0.09%
580 Qatar National Bank
26,020 0.09%
Total Qatar
87,602 0.30%
Russia - 0.11% 520 Magnit OJSC
30,680 0.11%
Total Russia
30,680 0.11%
South Africa - 7.46% 8,613 African Bank Investments Ltd
5,498 0.02%
1,024 African Rainbow Minerals Ltd
18,005 0.06%
2,281 AngloGold Ashanti Ltd
38,139 0.13%
2,296 Aspen Pharmacare Holdings Ltd
64,516 0.22%
296 Assore Ltd
9,925 0.03%
2,535 Barclays Africa Group Ltd
38,489 0.13%
2,338 Barloworld Ltd
22,255 0.08%
2,345 Bidvest Group Ltd
62,297 0.21%
2,973 Discovery Ltd
27,153 0.09%
1,325 Exxaro Resources Ltd
17,252 0.06%
23,236 FirstRand Ltd
89,017 0.31%
7,336 Gold Fields Ltd
26,484 0.09%
11,154 Growthpoint Properties Ltd
25,932 0.09%
3,497 Harmony Gold Mining Company Ltd
10,241 0.04%
4,523 Impala Platinum Holdings Ltd
45,447 0.16%
1,420 Imperial Holdings Ltd
26,700 0.09%
2,248 Investec Ltd
20,601 0.07%
337 Kumba Iron Ore Ltd
10,740 0.04%
1,001 Liberty Holdings Ltd
12,234 0.04%
4,899 Life Healthcare Group HoldingsLtd
19,109 0.07%
995 Massmart Holdings Ltd
12,348 0.04%
2,910 Mediclinic International Ltd
22,348 0.08%
4,947 MMI Holdings Ltd
12,208 0.04%
1,977 Mr Price Group Ltd
33,606 0.12%
11,907 Mtn Group Ltd
250,736 0.86%
2,380 Nampak Ltd
8,232 0.03%
2,813 Naspers Ltd
331,100 1.14%
1,361 Nedbank Group Ltd
29,322 0.10%
8,706 Netcare Ltd
23,490 0.08%
1,520 Pick n Pay Stores Ltd
8,321 0.03%
5,092 PPC Ltd
15,008 0.05%
3,251 Remgro Ltd
70,296 0.24%
450 Reunert Ltd
2,744 0.01%
4,053 RMB Holdings Ltd
20,038 0.07%
6,221 RMI Holdings Ltd
19,171 0.07%
13,165 Sanlam Ltd
76,426 0.26%
5,497 Sappi Ltd
19,777 0.07%
3,874 Sasol Ltd
230,308 0.79%
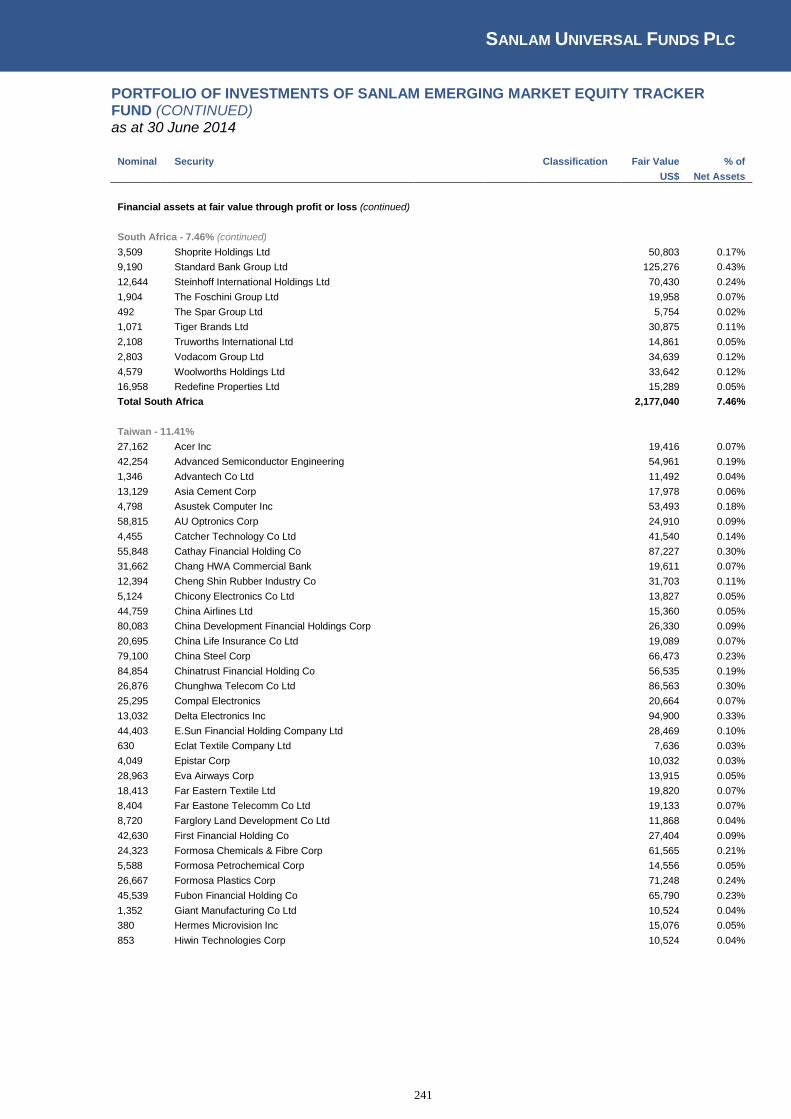
SANLAM UNIVERSAL FUNDS PLC
241
PORTFOLIO OF INVESTMENTS OF SANLAM EMERGING MARKET EQUITY TRACKER FUND (CONTINUED) as at 30 June 2014
Nominal Security
Classification Fair Value % of
US$ Net Assets
Financial assets at fair value through profit or loss (continued)
South Africa - 7.46% (continued)
3,509 Shoprite Holdings Ltd
50,803 0.17%
9,190 Standard Bank Group Ltd
125,276 0.43%
12,644 Steinhoff International Holdings Ltd
70,430 0.24%
1,904 The Foschini Group Ltd
19,958 0.07%
492 The Spar Group Ltd
5,754 0.02%
1,071 Tiger Brands Ltd
30,875 0.11%
2,108 Truworths International Ltd
14,861 0.05%
2,803 Vodacom Group Ltd
34,639 0.12%
4,579 Woolworths Holdings Ltd
33,642 0.12%
16,958 Redefine Properties Ltd
15,289 0.05%
Total South Africa
2,177,040 7.46%
Taiwan - 11.41% 27,162 Acer Inc
19,416 0.07%
42,254 Advanced Semiconductor Engineering
54,961 0.19%
1,346 Advantech Co Ltd
11,492 0.04%
13,129 Asia Cement Corp
17,978 0.06%
4,798 Asustek Computer Inc
53,493 0.18%
58,815 AU Optronics Corp
24,910 0.09%
4,455 Catcher Technology Co Ltd
41,540 0.14%
55,848 Cathay Financial Holding Co
87,227 0.30%
31,662 Chang HWA Commercial Bank
19,611 0.07%
12,394 Cheng Shin Rubber Industry Co
31,703 0.11%
5,124 Chicony Electronics Co Ltd
13,827 0.05%
44,759 China Airlines Ltd
15,360 0.05%
80,083 China Development Financial Holdings Corp
26,330 0.09%
20,695 China Life Insurance Co Ltd
19,089 0.07%
79,100 China Steel Corp
66,473 0.23%
84,854 Chinatrust Financial Holding Co
56,535 0.19%
26,876 Chunghwa Telecom Co Ltd
86,563 0.30%
25,295 Compal Electronics
20,664 0.07%
13,032 Delta Electronics Inc
94,900 0.33%
44,403 E.Sun Financial Holding Company Ltd
28,469 0.10%
630 Eclat Textile Company Ltd
7,636 0.03%
4,049 Epistar Corp
10,032 0.03%
28,963 Eva Airways Corp
13,915 0.05%
18,413 Far Eastern Textile Ltd
19,820 0.07%
8,404 Far Eastone Telecomm Co Ltd
19,133 0.07%
8,720 Farglory Land Development Co Ltd
11,868 0.04%
42,630 First Financial Holding Co
27,404 0.09%
24,323 Formosa Chemicals & Fibre Corp
61,565 0.21%
5,588 Formosa Petrochemical Corp
14,556 0.05%
26,667 Formosa Plastics Corp
71,248 0.24%
45,539 Fubon Financial Holding Co
65,790 0.23%
1,352 Giant Manufacturing Co Ltd
10,524 0.04%
380 Hermes Microvision Inc
15,076 0.05%
853 Hiwin Technologies Corp
10,524 0.04%

SANLAM UNIVERSAL FUNDS PLC
242
PORTFOLIO OF INVESTMENTS OF SANLAM EMERGING MARKET EQUITY TRACKER FUND (CONTINUED) as at 30 June 2014
Nominal Security
Classification Fair Value % of
US$ Net Assets
Financial assets at fair value through profit or loss (continued)
Taiwan - 11.41% (continued)
78,969 Hon Hai Precision Industry Co Ltd
264,393 0.91%
1,700 Hotai Motor CoLtd
21,685 0.07%
3,355 HTC Corp
15,501 0.05%
28,810 Hua Nan Financial Holdings Co Ltd
18,038 0.06%
69,089 Innolux Display Corp
32,384 0.11%
15,300 Inotera Memories Inc
27,815 0.10%
16,540 Inventec Co Ltd
15,838 0.05%
661 Largan Precision Co Ltd
52,670 0.18%
14,269 Lite On Tecno Corp
23,815 0.08%
9,759 MediaTek Inc
165,003 0.57%
71,777 Mega Financial Holding Co Ltd
59,718 0.20%
2,034 Merida Industry Co Ltd
13,484 0.05%
34,093 Nan Ya Plastics Corp
82,071 0.28%
4,650 Novatek Microelectronics Ltd
22,886 0.08%
13,961 Pegatron Corp
26,643 0.09%
2,000 Phison Electronics Corp
16,104 0.06%
21,078 Pou Chen Corp
25,370 0.09%
8,109 Powertech Technology Inc
14,661 0.05%
3,860 President Chain Store Corp
30,887 0.11%
18,306 Quanta Computer Inc
53,322 0.18%
1,816 Radiant Opto-Electronics Corp
7,783 0.03%
5,176 Realtek Semi-conductor Corp
16,394 0.06%
7,195 Ruentex Development Co Ltd
13,032 0.04%
6,092 Ruentex Industries Ltd
15,746 0.05%
67,740 Hon Hai Precision Industry Co Ltd
20,888 0.07%
21,524 Siliconware Precision Industries Co
35,347 0.12%
1,423 Simplo Technology Co Ltd
8,814 0.03%
63,707 Sinopac Financial Holdings Co Ltd
28,687 0.10%
4,656 Synnex Technology International Corp
7,841 0.03%
52,604 Taishin Financial Holdings Co Ltd
26,947 0.09%
24,258 Taiwan Cement Corp
36,710 0.13%
30,298 Taiwan Cooperative Financial Holding Co
17,346 0.06%
9,932 Taiwan Fertilizer Co
19,686 0.07%
13,042 Taiwan Mobile Co Ltd
40,347 0.14%
168,224 Taiwan Semiconductor Manufacturing Co Ltd
712,479 2.44%
21,187 TECO Electric & Machinery Co Ltd
24,366 0.08%
7,148 TSRC Corp
10,099 0.03%
15,358 Unimicron Technology Corp
14,860 0.05%
30,887 Uni-President Enterprises Corp
55,429 0.19%
8,021 Wistron Corp
7,318 0.03%
5,496 WPG Holdings Ltd
7,563 0.03%
53,409 Yuanta Financial Holdings Co Ltd
28,879 0.10%
11,040 Yulon Motor Co Ltd
17,964 0.06%
8,499 Foxconn Technology Co Ltd
20,602 0.07%
Total Taiwan
3,327,047 11.41%
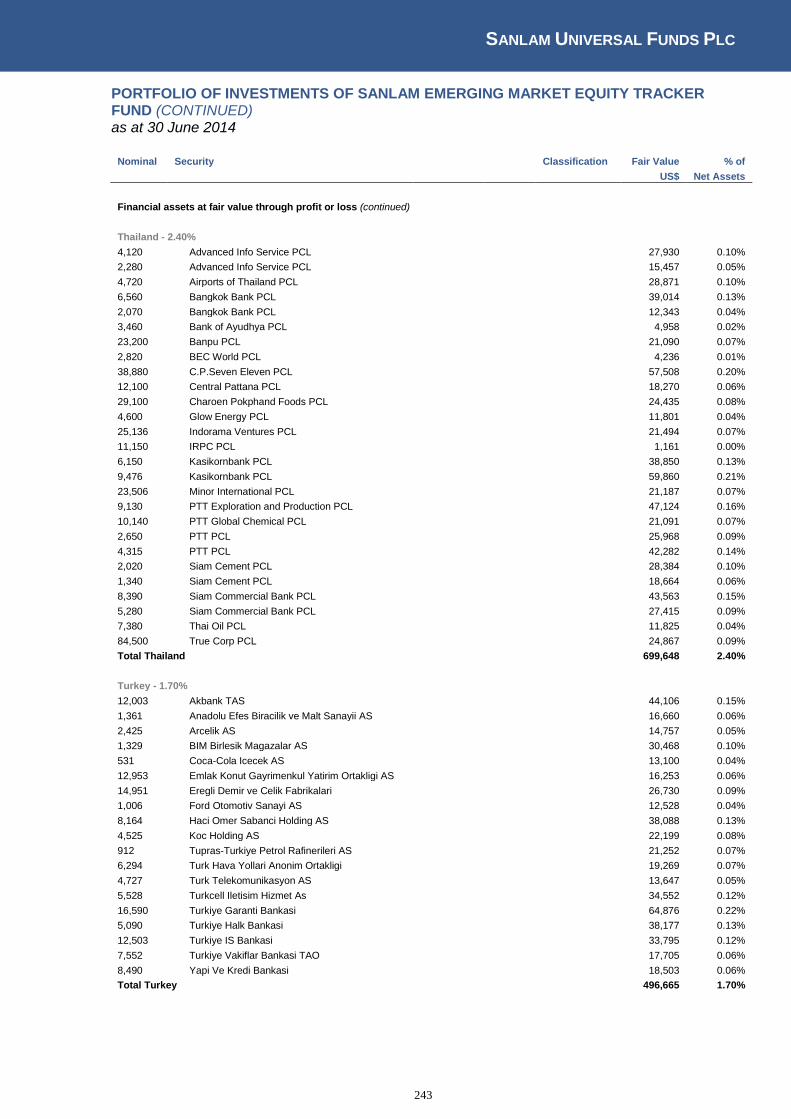
SANLAM UNIVERSAL FUNDS PLC
243
PORTFOLIO OF INVESTMENTS OF SANLAM EMERGING MARKET EQUITY TRACKER FUND (CONTINUED) as at 30 June 2014
Nominal Security
Classification Fair Value % of
US$ Net Assets
Financial assets at fair value through profit or loss (continued)
Thailand - 2.40% 4,120 Advanced Info Service PCL
27,930 0.10%
2,280 Advanced Info Service PCL
15,457 0.05%
4,720 Airports of Thailand PCL
28,871 0.10%
6,560 Bangkok Bank PCL
39,014 0.13%
2,070 Bangkok Bank PCL
12,343 0.04%
3,460 Bank of Ayudhya PCL
4,958 0.02%
23,200 Banpu PCL
21,090 0.07%
2,820 BEC World PCL
4,236 0.01%
38,880 C.P.Seven Eleven PCL
57,508 0.20%
12,100 Central Pattana PCL
18,270 0.06%
29,100 Charoen Pokphand Foods PCL
24,435 0.08%
4,600 Glow Energy PCL
11,801 0.04%
25,136 Indorama Ventures PCL
21,494 0.07%
11,150 IRPC PCL
1,161 0.00%
6,150 Kasikornbank PCL
38,850 0.13%
9,476 Kasikornbank PCL
59,860 0.21%
23,506 Minor International PCL
21,187 0.07%
9,130 PTT Exploration and Production PCL
47,124 0.16%
10,140 PTT Global Chemical PCL
21,091 0.07%
2,650 PTT PCL
25,968 0.09%
4,315 PTT PCL
42,282 0.14%
2,020 Siam Cement PCL
28,384 0.10%
1,340 Siam Cement PCL
18,664 0.06%
8,390 Siam Commercial Bank PCL
43,563 0.15%
5,280 Siam Commercial Bank PCL
27,415 0.09%
7,380 Thai Oil PCL
11,825 0.04%
84,500 True Corp PCL
24,867 0.09%
Total Thailand
699,648 2.40%
Turkey - 1.70% 12,003 Akbank TAS
44,106 0.15%
1,361 Anadolu Efes Biracilik ve Malt Sanayii AS
16,660 0.06%
2,425 Arcelik AS
14,757 0.05%
1,329 BIM Birlesik Magazalar AS
30,468 0.10%
531 Coca-Cola Icecek AS
13,100 0.04%
12,953 Emlak Konut Gayrimenkul Yatirim Ortakligi AS
16,253 0.06%
14,951 Eregli Demir ve Celik Fabrikalari
26,730 0.09%
1,006 Ford Otomotiv Sanayi AS
12,528 0.04%
8,164 Haci Omer Sabanci Holding AS
38,088 0.13%
4,525 Koc Holding AS
22,199 0.08%
912 Tupras-Turkiye Petrol Rafinerileri AS
21,252 0.07%
6,294 Turk Hava Yollari Anonim Ortakligi
19,269 0.07%
4,727 Turk Telekomunikasyon AS
13,647 0.05%
5,528 Turkcell Iletisim Hizmet As
34,552 0.12%
16,590 Turkiye Garanti Bankasi
64,876 0.22%
5,090 Turkiye Halk Bankasi
38,177 0.13%
12,503 Turkiye IS Bankasi
33,795 0.12%
7,552 Turkiye Vakiflar Bankasi TAO
17,705 0.06%
8,490 Yapi Ve Kredi Bankasi
18,503 0.06%
Total Turkey
496,665 1.70%

SANLAM UNIVERSAL FUNDS PLC
244
PORTFOLIO OF INVESTMENTS OF SANLAM EMERGING MARKET EQUITY TRACKER FUND (CONTINUED) as at 30 June 2014
Nominal Security
Classification Fair Value % of
US$ Net
Assets
Financial assets at fair value through profit or loss (continued)
United Arab Emirates - 0.51% 10,830 Abu Dhabi Commercial Bank
20,817 0.07%
32,540 Aldar Properties PJSC
27,464 0.09%
1,540 DP World Ltd
30,338 0.10%
20,310 Dubai Financial Market
14,432 0.05%
12,730 Emaar Properties
29,148 0.10%
6,530 National Bank of Abu Dhabi
25,245 0.09%
Total United Arab Emirates
147,444 0.51%
United States of America - 0.50% 451 Credicorp
70,117 0.24%
1,089 Southern Copper Corp
33,073 0.11%
82,761 United MicroElectronics Corp
41,426 0.14%
Total United States of America
144,616 0.50%
Total Equity
24,457,594 83.86%
Exchange Traded Funds - 13.75% 10,159 iShares MSCI Chile Capped Investable Market I
460,914 1.58%
66,632 iShares MSCI India Index Fund
1,981,303 6.79%
77,505 iShares MSCI Russia Capped Index Fund
1,567,926 5.38%
Total Exchange Traded Funds
4,010,143 13.75%
Derivative Financial Instruments*
Forward Contracts - 0.00%
D
Buy Currency Buy Amount Sell Currency Sell Amount Maturity Fair Value % of
US$ Net Assets
USD 8,340 ZAR (8,318) 07/07/2014 23 0.00%1
USD 8,314 ZAR (8,291) 07/07/2014 22 0.00%1
Total Forwards
45 0.00%1
Total financial assets at fair value through profit or loss
28,467,782 97.61%
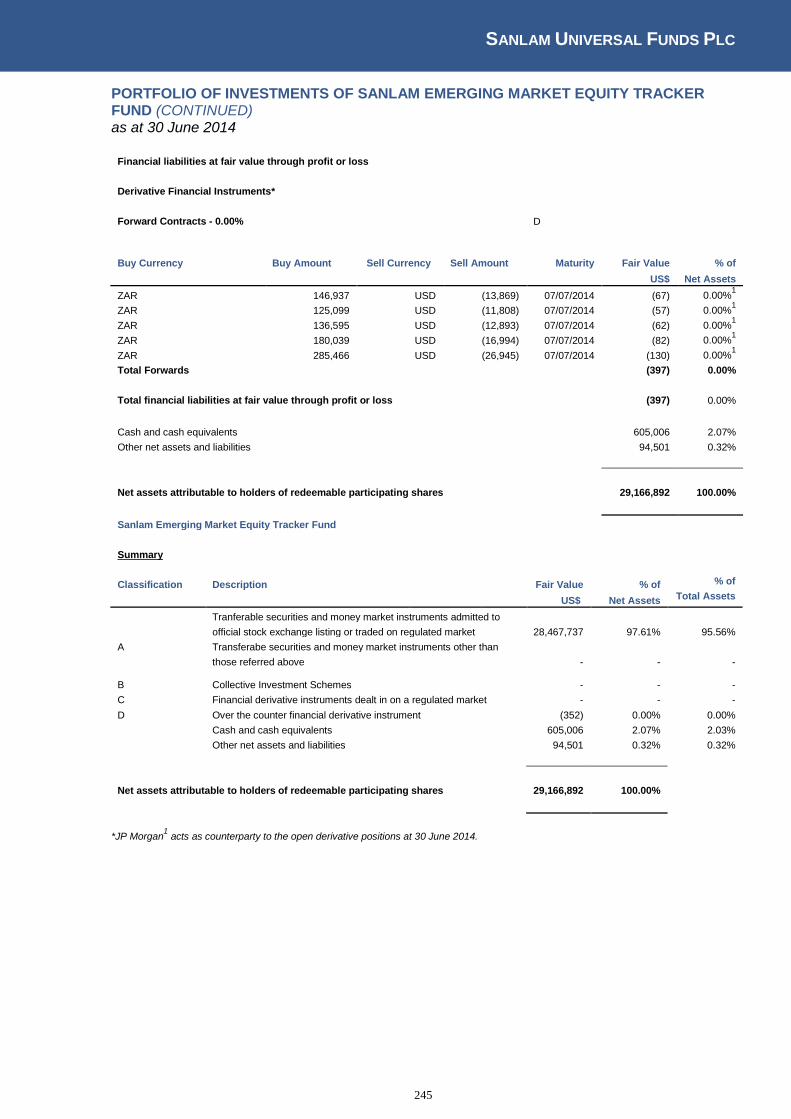
SANLAM UNIVERSAL FUNDS PLC
245
PORTFOLIO OF INVESTMENTS OF SANLAM EMERGING MARKET EQUITY TRACKER FUND (CONTINUED) as at 30 June 2014
Financial liabilities at fair value through profit or loss
Derivative Financial Instruments*
Forward Contracts - 0.00%
D
Buy Currency Buy Amount Sell Currency Sell Amount Maturity Fair Value % of
US$ Net Assets
ZAR 146,937 USD (13,869) 07/07/2014 (67) 0.00%1
ZAR 125,099 USD (11,808) 07/07/2014 (57) 0.00%1
ZAR 136,595 USD (12,893) 07/07/2014 (62) 0.00%1
ZAR 180,039 USD (16,994) 07/07/2014 (82) 0.00%1
ZAR 285,466 USD (26,945) 07/07/2014 (130) 0.00%1
Total Forwards
(397) 0.00%
Total financial liabilities at fair value through profit or loss
(397) 0.00%
Cash and cash equivalents
605,006 2.07%
Other net assets and liabilities
94,501 0.32%
Net assets attributable to holders of redeemable participating shares
29,166,892 100.00%
Sanlam Emerging Market Equity Tracker Fund
Summary
Classification Description
Fair Value % of % of
US$ Net Assets Total Assets
Tranferable securities and money market instruments admitted to
official stock exchange listing or traded on regulated market 28,467,737 97.61% 95.56%
A Transferabe securities and money market instruments other than
those referred above
- - -
B Collective Investment Schemes
- - -
C Financial derivative instruments dealt in on a regulated market - - -
D Over the counter financial derivative instrument
(352) 0.00% 0.00%
Cash and cash equivalents
605,006 2.07% 2.03%
Other net assets and liabilities
94,501 0.32% 0.32%
Net assets attributable to holders of redeemable participating shares 29,166,892 100.00%
*JP Morgan1 acts as counterparty to the open derivative positions at 30 June 2014.

SANLAM UNIVERSAL FUNDS PLC
246
PORTFOLIO OF INVESTMENTS OF SANLAM P2STRATEGIES GLOBAL FUND as at 30 June 2014
Nominal Security
Classification Maturity Fair
Value % of
US$ Net Assets
Financial assets at fair value through profit or loss
Collective Investment Schemes - 94.61% 12,679,121 Sanlam World Equity Tracker Fund
B
23,717,563 94.61%
Total Collective Investment Schemes
23,717,563 94.61%
Derivative Financal Instruments*
Nominal Security
Classification Maturity Fair Value % of
US$ Net Assets
Futures - 0.01% (3) VGU4A - Euro STOXX 50 Sep 14
C 19/09/2014 1,681 0.01%
0 Z M4A - FTSE100 IDX Fut Jun 14
C 20/06/2014 388 0.00%
(3) Z U4A - FTSE 100 Idx Fut Sep 14
C 19/09/2014 613 0.00%
Total Futures
2,682 0.01%
Forward Contracts - 0.13%
D
Buy Buy Sell Sell Maturity Fair Value % of
Currency Amount Currency Amount US$ Net Assets
GBP 113 USD (192) 18/07/2014 1 0.00%1
GBP 2,590,880 USD (4,394,228) 18/07/2014 32,879 0.13%1
GBP 3,414 USD (5,797) 18/07/2014 37 0.00%1
GBP 3,653 USD (6,212) 18/07/2014 30 0.00%1
GBP 2,614 USD (4,439) 18/07/2014 28 0.00%1
GBP 349 USD (593) 18/07/2014 3 0.00%1
Total Forward contracts
32,977 0.13%
Total financial assets at fair value through profit or loss
23,753,222 94.75%
Financial liabilities at fair value through profit or loss
Derivative Financal Instruments*
Nominal Security
Classification Maturity Fair Value % of
US$ Net Assets
Futures (1) NKU4 - Nikkei 225 (OSE) Sep14
C 11/09/2014 (1,362) (0.01%)
2
(6) ESU4 - S&P500 Emini Fut Sep14
C 19/09/2014 (6,976) (0.03%)2
Total Futures
(8,338) (0.03%)
Total financial liabilities at fair value through profit or loss
(8,338) (0.03%)
Cash and cash equivalents
1,332,505 5.31%
Other net assets and liabilities
(7,492) (0.03%)
Net assets attributable to holders of redeemable participating shares
25,069,897 100.00%
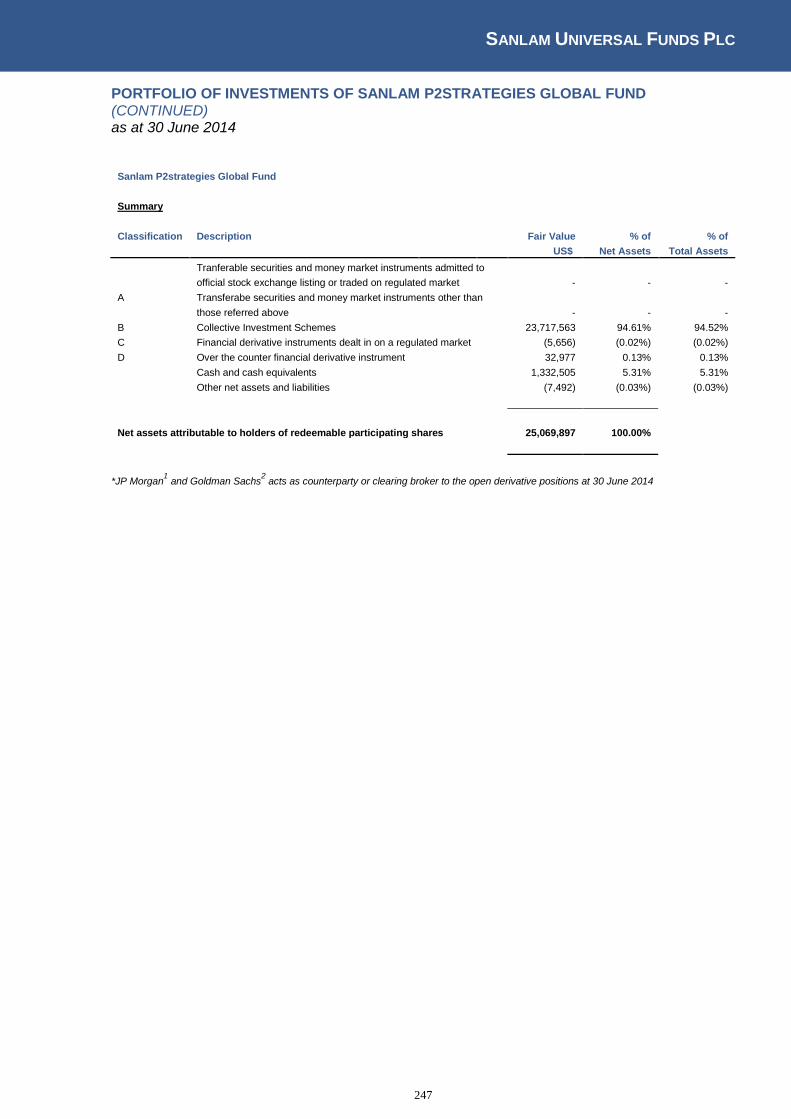
SANLAM UNIVERSAL FUNDS PLC
247
PORTFOLIO OF INVESTMENTS OF SANLAM P2STRATEGIES GLOBAL FUND (CONTINUED) as at 30 June 2014
Sanlam P2strategies Global Fund
Summary
Classification Description
Fair Value % of % of
US$ Net Assets Total Assets
Tranferable securities and money market instruments admitted to
official stock exchange listing or traded on regulated market
- - -
A Transferabe securities and money market instruments other than
those referred above
- - -
B Collective Investment Schemes
23,717,563 94.61% 94.52%
C Financial derivative instruments dealt in on a regulated market (5,656) (0.02%) (0.02%)
D Over the counter financial derivative instrument
32,977 0.13% 0.13%
Cash and cash equivalents
1,332,505 5.31% 5.31%
Other net assets and liabilities
(7,492) (0.03%) (0.03%)
Net assets attributable to holders of redeemable participating shares 25,069,897 100.00%
*JP Morgan1 and Goldman Sachs
2 acts as counterparty or clearing broker to the open derivative positions at 30 June 2014

SANLAM UNIVERSAL FUNDS PLC
248
PORTFOLIO OF INVESTMENTS OF SANLAM P2STRATEGIES UK FUND as at 30 June 2014
Nominal Security
Maturity Classification Fair Value % of
GBP Net
Assets
Financial assets at fair value through profit or loss
Collective Investment Schemes – 92.04%
13,414,578 Sanlam UK EquityTracker Fund
B 14,030,307 92.04%
Collective Investment Schemes
14,030,307 92.04%
Derivative Financal Instruments
Forward Contracts- 0.00%
D
Buy Buy Sell Sell Maturity Fair Value % of
Currency Amount Currency Amount GBP Net
Assets
GBP 56,032 USD (95,151) 18/07/2014
348 0.00%
1
Total Forward Contracts
348 0.00%
Nominal Security
Classification Maturity Fair Value % of
GBP Net
Assets
Futures Contracts -0.01 % (11) Z U4A - FTSE 100 Idx Fut Sep14
C 19/09/2014 825 0.01%2
Total Futures Contracts
825 0.01%
Total financial assets at fair value through profit or loss
14,031,480 92.05%
Financial liabilities at fair value through profit or loss
Derivative Financal Instruments*
Forward Contracts- (0.28%)
D
Buy Buy Sell Sell Maturity Fair Value % of
Currency Amount Currency Amount GBP Net
Assets
USD 9,593,898 GBP (5,656,656) 18/07/2014 (42,135) (0.28%)1
USD 15,800 GBP (9,305) 18/07/2014 (58) (0.00%)1
USD 2,229 GBP (1,314) 18/07/2014 (10) (0.00%)1
USD 23,000 GBP (13,582) 18/07/2014 (122) (0.00%)1
USD 42,146 GBP (24,710) 18/07/2014 (45) (0.00%)1
USD 7,054 GBP (4,145) 18/07/2014 (17) (0.00%)1
USD 2,097 GBP (1,233) 18/07/2014 (6) (0.00%)1
USD 16,821 GBP (9,912) 18/07/2014 (68) (0.00%)1
USD 51,667 GBP (30,383) 18/07/2014 (147) (0.00%)1
USD 15,511 GBP (9,116) 18/07/2014 (39) (0.00%)1
Total Forward Contracts
(42,648) (0.28%)
Total financial liabilities at fair value through profit or loss
(42,648) (0.28%)
Cash and cash equivalents
1,241,482 8.15%
Other net assets and liabilities
12,628 0.08%
Net assets attributable to holders of redeemable participating shares
15,242,942 100.00%

SANLAM UNIVERSAL FUNDS PLC
249
PORTFOLIO OF INVESTMENTS OF SANLAM P2STRATEGIES UK FUND (CONTINUED) as at 30 June 2014
Sanlam P2strategies UK Fund
Summary
Classification Description
Fair Value % of % of
GBP Net Assets Total Assets
Tranferable securities and money market instruments admitted to
official stock exchange listing or traded on regulated market - - -
A Transferabe securities and money market instruments other than
those referred above
- - -
B Collective Investment Schemes
14,030,307 92.04% 91.73%
C Financial derivative instruments dealt in on a regulated market 825 0.01% 0.01%
D Over the counter financial derivative instrument
(42,300) (0.28%) (0.28%)
Cash and cash equivalents
1,241,482 8.15% 8.12%
Other net assets and liabilities
12,628 0.08% 0.08
Net assets attributable to holders of redeemable participating shares 15,242,942 100.00%
*JP Morgan1 and Goldman Sachs
2 acts as counterparty or clearing broker to the open derivative positions at 30 June 2014
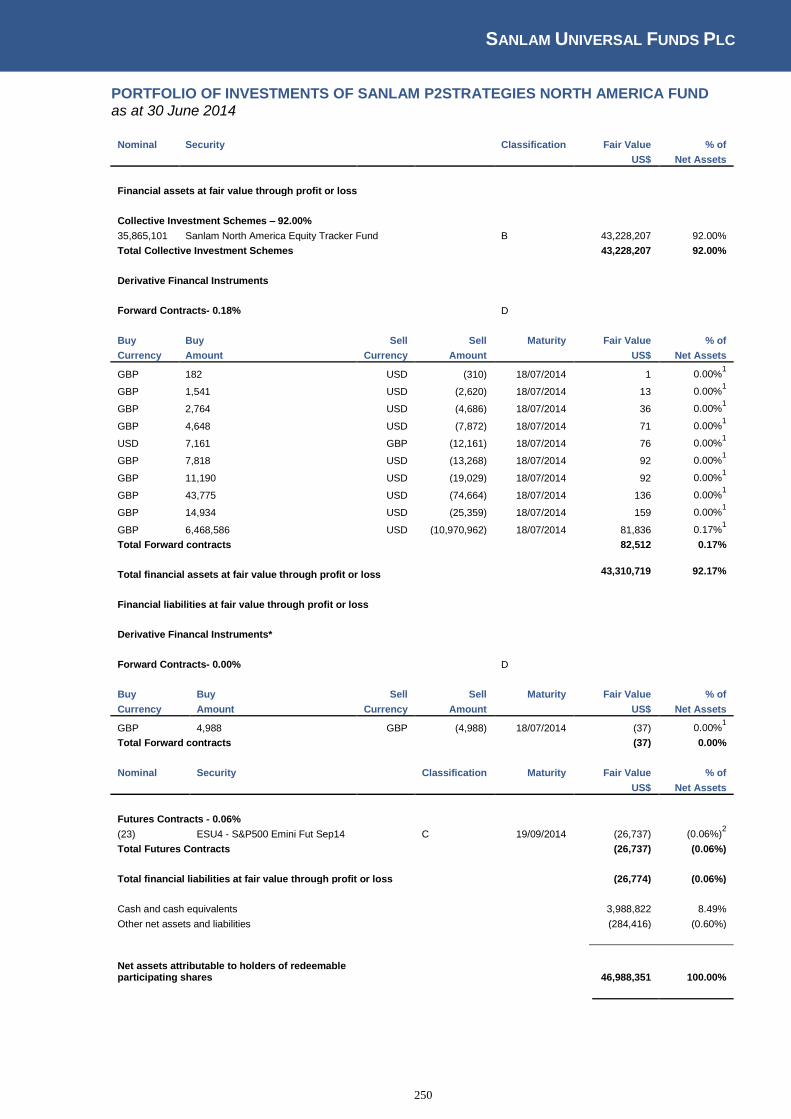
SANLAM UNIVERSAL FUNDS PLC
250
PORTFOLIO OF INVESTMENTS OF SANLAM P2STRATEGIES NORTH AMERICA FUND as at 30 June 2014
Nominal Security
Classification Fair Value % of
US$ Net Assets
Financial assets at fair value through profit or loss
Collective Investment Schemes – 92.00% 35,865,101 Sanlam North America Equity Tracker Fund
B 43,228,207 92.00%
Total Collective Investment Schemes
43,228,207 92.00%
Derivative Financal Instruments
Forward Contracts- 0.18%
D
Buy Buy Sell Sell Maturity Fair Value % of
Currency Amount Currency Amount US$ Net Assets
GBP 182 USD (310) 18/07/2014 1 0.00%1
GBP 1,541 USD (2,620) 18/07/2014 13 0.00%1
GBP 2,764 USD (4,686) 18/07/2014 36 0.00%1
GBP 4,648 USD (7,872) 18/07/2014 71 0.00%1
USD 7,161 GBP (12,161) 18/07/2014 76 0.00%1
GBP 7,818 USD (13,268) 18/07/2014 92 0.00%1
GBP 11,190 USD (19,029) 18/07/2014 92 0.00%1
GBP 43,775 USD (74,664) 18/07/2014 136 0.00%1
GBP 14,934 USD (25,359) 18/07/2014 159 0.00%1
GBP 6,468,586 USD (10,970,962) 18/07/2014 81,836 0.17%1
Total Forward contracts
82,512 0.17%
Total financial assets at fair value through profit or loss
43,310,719 92.17%
Financial liabilities at fair value through profit or loss
Derivative Financal Instruments*
Forward Contracts- 0.00%
D
Buy Buy Sell Sell Maturity Fair Value % of
Currency Amount Currency Amount US$ Net Assets
GBP 4,988 GBP (4,988) 18/07/2014 (37) 0.00%1
Total Forward contracts
(37) 0.00%
Nominal Security
Classification Maturity Fair Value % of
US$ Net Assets
Futures Contracts - 0.06% (23) ESU4 - S&P500 Emini Fut Sep14
C 19/09/2014 (26,737) (0.06%)2
Total Futures Contracts
(26,737) (0.06%)
Total financial liabilities at fair value through profit or loss
(26,774) (0.06%)
Cash and cash equivalents
3,988,822 8.49%
Other net assets and liabilities
(284,416) (0.60%)
Net assets attributable to holders of redeemable participating shares
46,988,351 100.00%

SANLAM UNIVERSAL FUNDS PLC
251
PORTFOLIO OF INVESTMENTS OF SANLAM P2STRATEGIES NORTH AMERICA FUND (CONTINUED) as at 30 June 2014
Sanlam P2strategies North America Fund
Summary
Classification Description
Fair Value % of % of
US$ Net Assets Total Assets
Tranferable securities and money market instruments admitted to
official stock exchange listing or traded on regulated market
- - -
A Transferabe securities and money market instruments other than
those referred above
- - -
B Collective Investment Schemes
43,228,207 92.00% 91.38%
C Financial derivative instruments dealt in on a regulated market (26,737) (0.06%) (0.06%)
D Over the counter financial derivative instrument
82,475 0.17% 0.17%
Cash and cash equivalents
3,988,822 8.49% 8.43%
Other net assets and liabilities
(284,416) (0.60%) (0.60%)
Net assets attributable to holders of redeemable participating shares 46,988,351 100.00%
*JP Morgan1 and Goldman Sachs
2 acts as counterparty or clearing broker to the open derivative positions at 30 June 2014

SANLAM UNIVERSAL FUNDS PLC
252
PORTFOLIO OF INVESTMENTS OF SANLAM P2STRATEGIES EMERGING MARKET FUND as at 30 June 2014
Nominal Security
Classification Fair Value % of
US$ Net
Assets
Financial assets at fair value through profit or loss
Collective Investment Schemes - 89.53% 13,381,626 Sanlam Emerging MarketEquity Tracker Fund B 13,962,388 89.53%
Total Collective Investment Schemes
13,962,389 89.53%
Forward Contracts - 0.11%
D
Buy Buy Sell Sell Maturity Fair Value % of
Currency Amount Currency Amount US$ Net
Assets
GBP 56 USD (96) 18/07/2014 0 0.00%1
GBP 108 USD (183) 18/07/2014 1 0.00%1
GBP 707 USD (1,200) 18/07/2014 5 0.00%1
GBP 1,604 USD (2,728) 03/07/2014 8 0.00%1
GBP 1,901 USD (3,234) 04/07/2014 9 0.00%1
GBP 1,178 USD (1,994) 18/07/2014 11 0.00%1
GBP 2,499 USD (4,244) 18/07/2014 15 0.00%1
GBP 3,726 USD (6,336) 18/07/2014 18 0.00%1
GBP 11,169 USD (19,049) 18/07/2014 20 0.00%1
GBP 4,504 USD (7,649) 18/07/2014 28 0.00%1
GBP 7,127 USD (12,127) 18/07/2014 30 0.00%1
GBP 18,597 USD (31,562) 01/07/2014 125 0.00%1
GBP 2,265,490 USD (3,842,355) 18/07/2014 16,824 0.11%1
Total Forward Contracts
17,095 0.11%
Total financial assets at fair value through profit or loss
13,979,484 89.64%
Financial liabilities at fair value through profit or loss
Derivative Financal Instruments*
D
Nominal Security
Classification Maturity Fair Value % of
US$ Net
Assets
Futures Contracts - 0.02% (15) MESU4 - Mini MSCI Emg Mkt Sep 14 C 19/09/2014 (2,625) (0.02%)
2
Total Futures Contracts
(2,625) (0.02%)

SANLAM UNIVERSAL FUNDS PLC
253
PORTFOLIO OF INVESTMENTS OF SANLAM P2STRATEGIES EMERGING MARKET FUND (CONTINUED) as at 30 June 2014
Financial liabilities at fair value through profit or loss (continued)
Forward Contracts - 0.00%
D
Buy Buy Sell Sell Maturity Fair Value % of
Currency Amount Currency Amount US$ Net
Assets
USD 10,347 GBP (10,347) 18/07/2014 (71) (0.00%)1
USD 8,249 GBP (8,249) 01/07/2014 (56) (0.00%)1
USD 2,499 GBP (2,499) 02/07/2014 (15) (0.00%)1
USD 1,661 GBP (1,661) 03/07/2014 (8) (0.00%)1
USD 1,186 GBP (1,186) 18/07/2014 (5) (0.00%)1
USD 715 GBP (715) 04/07/2014 (3) (0.00%)1
Total Forward Contracts
(158) (0.00%)
Total financial liabilities at fair value through profit or loss (2,783) (0.02%)
Cash and cash equivalents
1,678,586 10.76%
Other net assets and liabilities
(60,620) (0.38%)
Net assets attributable to holders of redeemable participating shares 15,594,667 100.00%
Sanlam P2strategies Emerging Market Fund
Summary
Classification Description
Fair Value % of % of
US$ Net Assets Total Assets
Tranferable securities and money market instruments admitted to
official stock exchange listing or traded on regulated market
- - -
A Transferabe securities and money market instruments other than
those referred above
- - -
B Collective Investment Schemes
13,962,389 89.53% 89.13%
C Financial derivative instruments dealt in on a regulated market (2,625) (0.02%) (0.02%)
D Over the counter financial derivative instrument
16,937 0.11% 0.11%
Cash and cash equivalents
1,678,586 10.76% 10.71%
Other net assets and liabilities
(60,620) (0.38%) (0.38%)
Net assets attributable to holders of redeemable participating shares 15,594,667 100.00%
*JP Morgan1 and Goldman Sachs
2 acts as counterparty or clearing broker to the open derivative positions at 30 June 2014
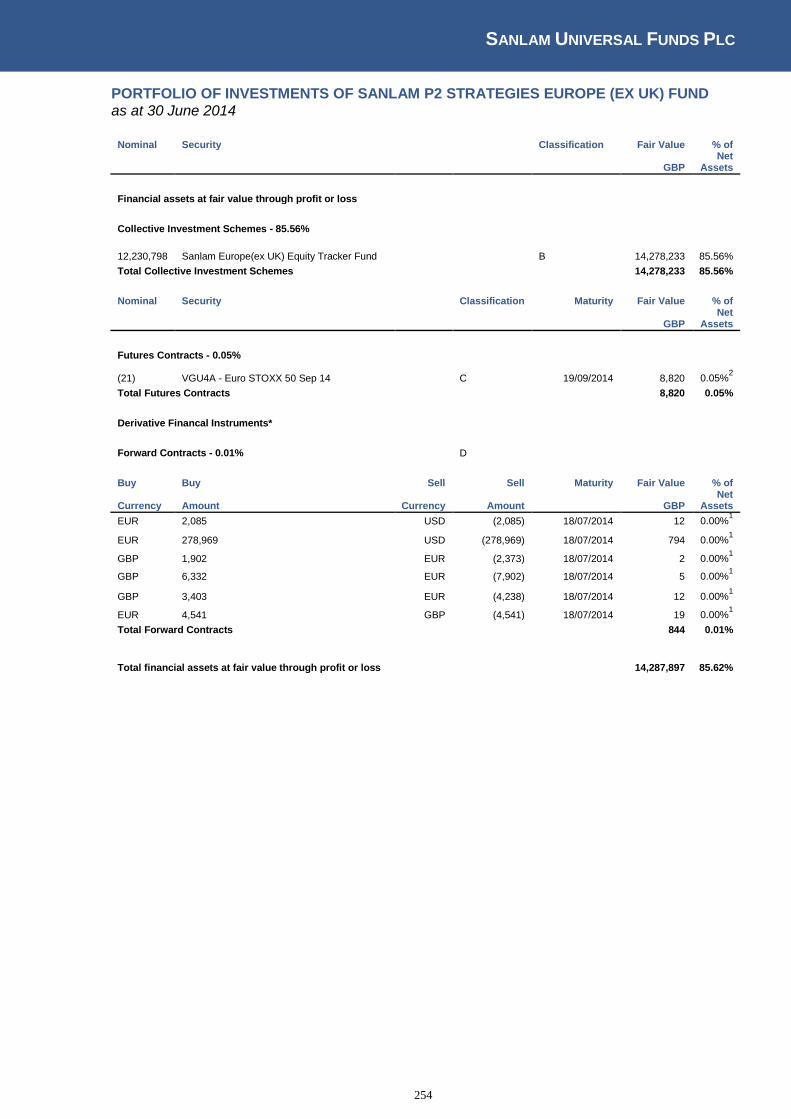
SANLAM UNIVERSAL FUNDS PLC
254
PORTFOLIO OF INVESTMENTS OF SANLAM P2 STRATEGIES EUROPE (EX UK) FUND as at 30 June 2014
Nominal Security
Classification Fair Value % of
GBP Net
Assets
Financial assets at fair value through profit or loss
Collective Investment Schemes - 85.56%
12,230,798 Sanlam Europe(ex UK) Equity Tracker Fund
B 14,278,233 85.56%
Total Collective Investment Schemes
14,278,233 85.56%
Nominal Security
Classification Maturity Fair Value % of
GBP Net
Assets
Futures Contracts - 0.05%
(21) VGU4A - Euro STOXX 50 Sep 14
C 19/09/2014
8,820 0.05%2
Total Futures Contracts
8,820 0.05%
Derivative Financal Instruments*
Forward Contracts - 0.01%
D
Buy Buy Sell Sell Maturity Fair Value % of
Currency Amount Currency Amount GBP Net
Assets
EUR 2,085 USD (2,085) 18/07/2014 12 0.00%1
EUR 278,969 USD (278,969) 18/07/2014 794 0.00%1
GBP 1,902 EUR (2,373) 18/07/2014 2 0.00%1
GBP 6,332 EUR (7,902) 18/07/2014 5 0.00%1
GBP 3,403 EUR (4,238) 18/07/2014 12 0.00%1
EUR 4,541 GBP (4,541) 18/07/2014 19 0.00%1
Total Forward Contracts
844 0.01%
Total financial assets at fair value through profit or loss
14,287,897 85.62%
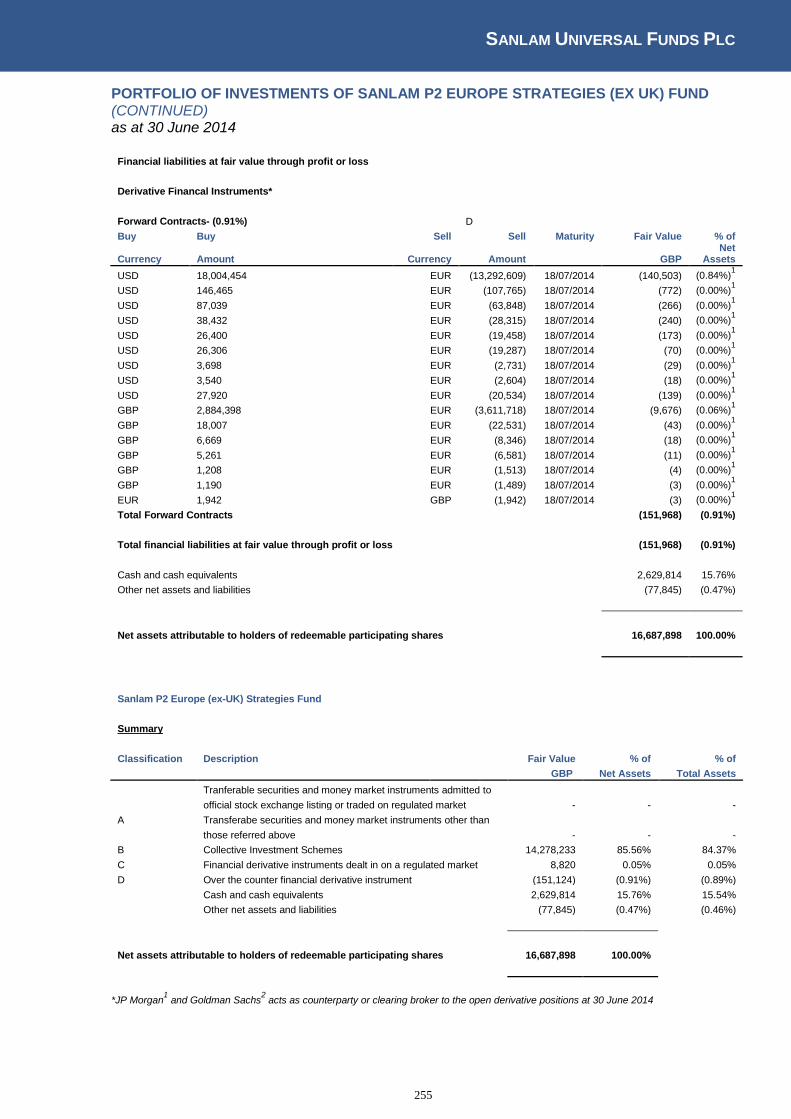
SANLAM UNIVERSAL FUNDS PLC
255
PORTFOLIO OF INVESTMENTS OF SANLAM P2 EUROPE STRATEGIES (EX UK) FUND (CONTINUED) as at 30 June 2014
Financial liabilities at fair value through profit or loss
Derivative Financal Instruments*
Forward Contracts- (0.91%)
D Buy Buy Sell Sell Maturity Fair Value % of
Currency Amount Currency Amount GBP Net
Assets
USD 18,004,454 EUR (13,292,609) 18/07/2014 (140,503) (0.84%)1
USD 146,465 EUR (107,765) 18/07/2014 (772) (0.00%)1
USD 87,039 EUR (63,848) 18/07/2014 (266) (0.00%)1
USD 38,432 EUR (28,315) 18/07/2014 (240) (0.00%)1
USD 26,400 EUR (19,458) 18/07/2014 (173) (0.00%)1
USD 26,306 EUR (19,287) 18/07/2014 (70) (0.00%)1
USD 3,698 EUR (2,731) 18/07/2014 (29) (0.00%)1
USD 3,540 EUR (2,604) 18/07/2014 (18) (0.00%)1
USD 27,920 EUR (20,534) 18/07/2014 (139) (0.00%)1
GBP 2,884,398 EUR (3,611,718) 18/07/2014 (9,676) (0.06%)1
GBP 18,007 EUR (22,531) 18/07/2014 (43) (0.00%)1
GBP 6,669 EUR (8,346) 18/07/2014 (18) (0.00%)1
GBP 5,261 EUR (6,581) 18/07/2014 (11) (0.00%)1
GBP 1,208 EUR (1,513) 18/07/2014 (4) (0.00%)1
GBP 1,190 EUR (1,489) 18/07/2014 (3) (0.00%)1
EUR 1,942 GBP (1,942) 18/07/2014 (3) (0.00%)1
Total Forward Contracts
(151,968) (0.91%)
Total financial liabilities at fair value through profit or loss
(151,968) (0.91%)
Cash and cash equivalents
2,629,814 15.76%
Other net assets and liabilities
(77,845) (0.47%)
Net assets attributable to holders of redeemable participating shares
16,687,898 100.00%
Sanlam P2 Europe (ex-UK) Strategies Fund
Summary
Classification Description
Fair Value % of % of
GBP Net Assets Total Assets
Tranferable securities and money market instruments admitted to
official stock exchange listing or traded on regulated market
- - -
A Transferabe securities and money market instruments other than
those referred above
- - -
B Collective Investment Schemes
14,278,233 85.56% 84.37%
C Financial derivative instruments dealt in on a regulated market 8,820 0.05% 0.05%
D Over the counter financial derivative instrument
(151,124) (0.91%) (0.89%)
Cash and cash equivalents
2,629,814 15.76% 15.54%
Other net assets and liabilities
(77,845) (0.47%) (0.46%)
Net assets attributable to holders of redeemable participating shares 16,687,898 100.00%
*JP Morgan1 and Goldman Sachs
2 acts as counterparty or clearing broker to the open derivative positions at 30 June 2014

SANLAM UNIVERSAL FUNDS PLC
256
PORTFOLIO OF INVESTMENTS OF SANLAM S&P AFRICA TRACKER FUND as at 30 June 2014
Nominal Security
Classification Fair Value % of
US$ Net
Assets
Financial assets at fair value through profit or loss
Equity - 99.88%
Bermuda - 0.74% 100,200 African Minerals Ltd
119,000 0.31%
14,988 Kosmos Energy Ltd
168,315 0.44%
Total Bermuda
287,315 0.74%
Botswana - 0.76% 330,600 First National Bank of Botswana Ltd
130,579 0.34%
633,500 Letshego Holdings Ltd
162,497 0.42%
Total Botswana
293,076 0.76%
Canada - 11.28% 69,602 Africa Oil Corp
476,995 1.24%
131,270 First Quantum Minerals Ltd
2,812,224 7.29%
85,716 Nevsun Resources Ltd
321,878 0.83%
117,995 Semafo Inc
554,971 1.44%
24,676 TransGlobe Energy Corp
185,556 0.48%
Total Canada
4,351,624 11.28%
Cayman Islands - 0.34% 101,200 Lekoil Ltd
131,429 0.34%
Total Cayman Islands
131,429 0.34%
Egypt - 11.62% 385,061 Commercial International Bank
1,917,200 4.97%
187,202 EFG-Hermes Holding SAE
401,104 1.04%
235,038 Egypt Kuwait Holding Co
246,790 0.64%
1,080,031 Global Telecom Holding SAE
774,893 2.01%
440,830 Talaat Moustafa Group Holding
526,522 1.36%
36,186 Etablissements Maurel Et Prom
619,688 1.61%
Total Egypt
4,486,197 11.62%
Ghana - 0.77% 30,424 Ecobank Ghana Ltd
66,732 0.17%
82,012 Ghana Commercial Bank Ltd
132,289 0.34%
11,625 Standard Chartered Bank Ghana
62,621 0.16%
6,932 Unilever Ghana Ltd
36,330 0.09%
Total Ghana
297,972 0.77%
Great Britain - 7.68% 352,800 Afren Plc
874,163 2.27%
97,400 Ophir Energy Plc
366,665 0.95%
118,200 Tullow Oil Plc
1,723,918 4.47%
Total Great Britain
2,964,746 7.68%
Ivory Coast - 1.89% 3,233,899 Ecobank Transnational Inc
335,198 0.87%
8,597 Sonatel
392,884 1.02%
Total Ivory Coast
728,082 1.89%
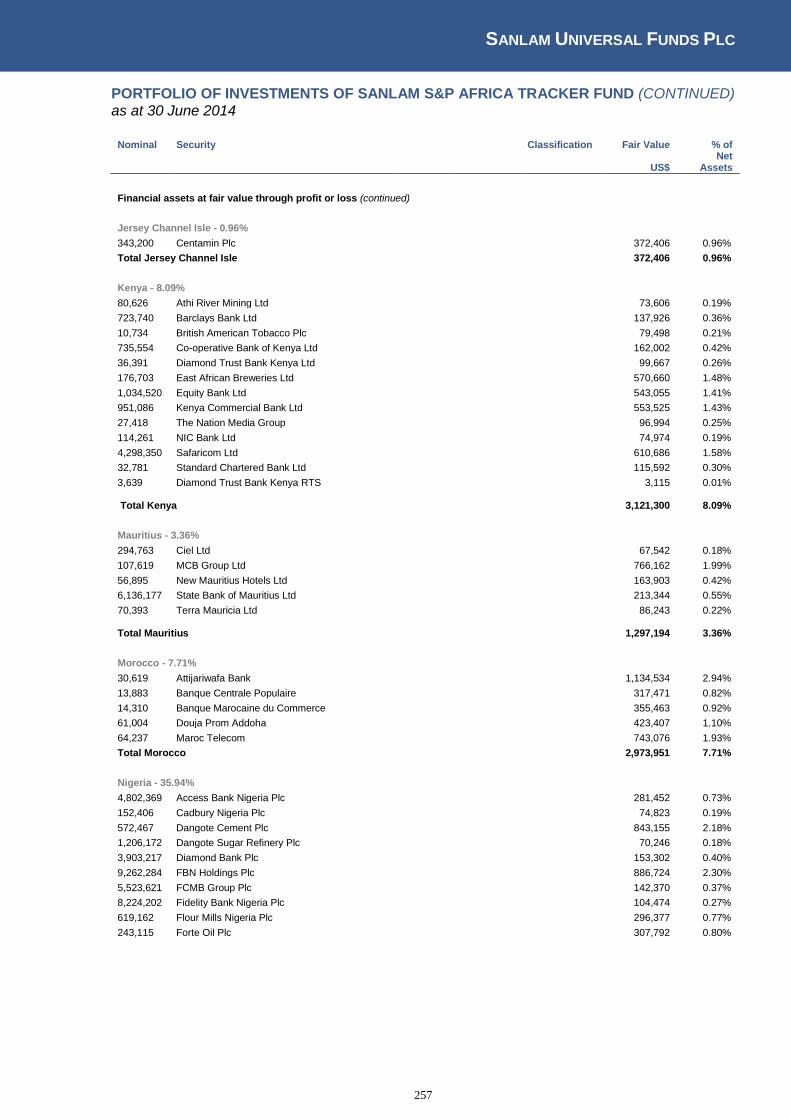
SANLAM UNIVERSAL FUNDS PLC
257
PORTFOLIO OF INVESTMENTS OF SANLAM S&P AFRICA TRACKER FUND (CONTINUED) as at 30 June 2014
Nominal Security
Classification Fair Value % of
US$ Net
Assets
Financial assets at fair value through profit or loss (continued)
Jersey Channel Isle - 0.96% 343,200 Centamin Plc
372,406 0.96%
Total Jersey Channel Isle
372,406 0.96%
Kenya - 8.09% 80,626 Athi River Mining Ltd
73,606 0.19%
723,740 Barclays Bank Ltd
137,926 0.36%
10,734 British American Tobacco Plc
79,498 0.21%
735,554 Co-operative Bank of Kenya Ltd
162,002 0.42%
36,391 Diamond Trust Bank Kenya Ltd
99,667 0.26%
176,703 East African Breweries Ltd
570,660 1.48%
1,034,520 Equity Bank Ltd
543,055 1.41%
951,086 Kenya Commercial Bank Ltd
553,525 1.43%
27,418 The Nation Media Group
96,994 0.25%
114,261 NIC Bank Ltd
74,974 0.19%
4,298,350 Safaricom Ltd
610,686 1.58%
32,781 Standard Chartered Bank Ltd
115,592 0.30%
3,639 Diamond Trust Bank Kenya RTS
3,115 0.01%
Total Kenya
3,121,300 8.09%
Mauritius - 3.36% 294,763 Ciel Ltd
67,542 0.18%
107,619 MCB Group Ltd
766,162 1.99%
56,895 New Mauritius Hotels Ltd
163,903 0.42%
6,136,177 State Bank of Mauritius Ltd
213,344 0.55%
70,393 Terra Mauricia Ltd
86,243 0.22%
Total Mauritius
1,297,194 3.36%
Morocco - 7.71% 30,619 Attijariwafa Bank
1,134,534 2.94%
13,883 Banque Centrale Populaire
317,471 0.82%
14,310 Banque Marocaine du Commerce
355,463 0.92%
61,004 Douja Prom Addoha
423,407 1.10%
64,237 Maroc Telecom
743,076 1.93%
Total Morocco
2,973,951 7.71%
Nigeria - 35.94% 4,802,369 Access Bank Nigeria Plc
281,452 0.73%
152,406 Cadbury Nigeria Plc
74,823 0.19%
572,467 Dangote Cement Plc
843,155 2.18%
1,206,172 Dangote Sugar Refinery Plc
70,246 0.18%
3,903,217 Diamond Bank Plc
153,302 0.40%
9,262,284 FBN Holdings Plc
886,724 2.30%
5,523,621 FCMB Group Plc
142,370 0.37%
8,224,202 Fidelity Bank Nigeria Plc
104,474 0.27%
619,162 Flour Mills Nigeria Plc
296,377 0.77%
243,115 Forte Oil Plc
307,792 0.80%

SANLAM UNIVERSAL FUNDS PLC
258
PORTFOLIO OF INVESTMENTS OF SANLAM S&P AFRICA TRACKER FUND (CONTINUED) as at 30 June 2014
Nominal Security
Classification Fair Value % of
US$ Net
Assets
Financial assets at fair value through profit or loss (continued)
Nigeria - 35.94% (continued)
167,508 Glaxo Smith Kline Consumer Nigeria Plc
65,790 0.17%
8,272,932 Guaranty Trust Bank Plc
1,469,783 3.81%
465,343 Guinness Nigeria Plc
571,148 1.48%
163,175 Julius Berger Nigeria Plc
76,556 0.20%
212,994 Nestle Foods Nigeria Plc
1,503,180 3.90%
2,336,953 Nigerian Breweries Plc
2,466,600 6.39%
1,353,876 Oando Plc
243,025 0.63%
880,197 PZ Cussons Nigeria Plc
202,021 0.52%
84,400 Seplat Petroleum Development Co
376,425 0.98%
3,752,172 Skye Bank Plc
75,988 0.20%
1,192,127 Stanbic IBTC Holding Co
190,214 0.49%
4,448,760 Sterling Bank Plc
64,157 0.17%
10,034,051 Transnational Corporation of Nigeria Plc
310,966 0.81%
1,290,386 UAC of Nigeria Plc
490,972 1.27%
1,270,760 Unilever Nigeria Plc
421,117 1.09%
8,702,625 United Bank for Africa Plc
411,231 1.07%
705,739 The West African Portland Cement Co Plc
480,743 1.25%
8,376,880 Zenith Bank Ltd
1,287,762 3.34%
Total Nigeria
13,868,393 35.94%
Tunisia - 0.53% 19,342 Banque De Tunisie
112,701 0.29%
2,412 Banque International Arabe de Tunisie
90,355 0.23%
Total Tunisia
203,056 0.53%
United States of America - 8.02% 56,646 Cobalt International Energy Inc
1,039,454 2.69%
24,700 Randgold Resources Ltd
2,056,786 5.33%
Total United States of America
3,096,240 8.02%
Zambia - 0.19% 78,698 Zambian Breweries Plc
71,828 0.19%
Total Zambia
71,828 0.19%
Total Equity
38,544,809 99.88%
Total financial assets at fair value through profit or loss
38,544,809 99.88%
Cash and cash equivalents
10,791 0.02%
Other net assets and liabilities
36,713 0.10%
Net assets attributable to holders of redeemable participating shares
38,592,313 100.00%

SANLAM UNIVERSAL FUNDS PLC
259
PORTFOLIO OF INVESTMENTS OF SANLAM S&P AFRICA TRACKER FUND (CONTINUED) as at 30 June 2014
Sanlam S&P Africa Tracker Fund
Summary
Classification Description
Fair Value % of % of
US$ Net Assets Total Assets
Tranferable securities and money market instruments admitted to
official stock exchange listing or traded on regulated market 38,544,809 99.88% 99.48%
A Transferabe securities and money market instruments other than
those referred above
- - -
B Collective Investment Schemes
- - -
C Financial derivative instruments dealt in on a regulated market - - -
D Over the counter financial derivative instrument
Cash and cash equivalents
10,791 0.02% 0.02%
Other net assets and liabilities
36,713 0.10% 0.09%
Net assets attributable to holders of redeemable participating shares 38,592,313 100.00%
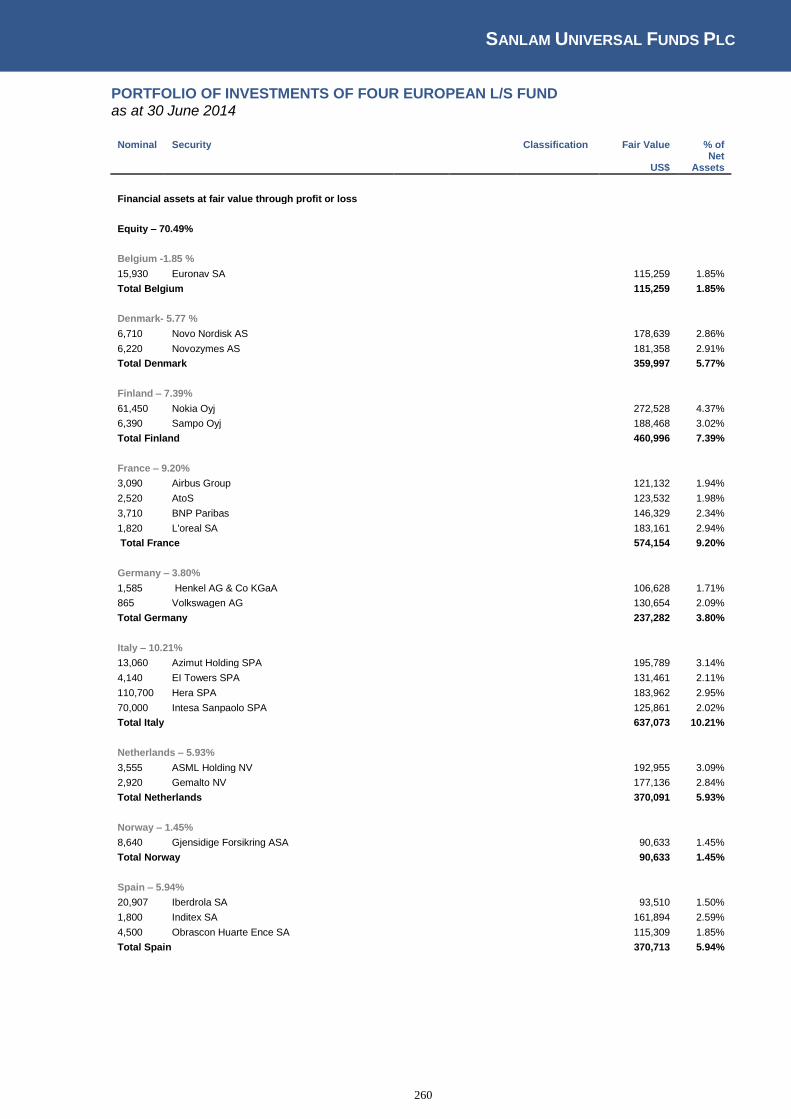
SANLAM UNIVERSAL FUNDS PLC
260
PORTFOLIO OF INVESTMENTS OF FOUR EUROPEAN L/S FUND as at 30 June 2014
Nominal Security
Classification Fair Value % of
US$ Net
Assets
Financial assets at fair value through profit or loss
Equity – 70.49%
Belgium -1.85 % 15,930 Euronav SA
115,259 1.85%
Total Belgium
115,259 1.85%
Denmark- 5.77 % 6,710 Novo Nordisk AS
178,639 2.86%
6,220 Novozymes AS
181,358 2.91%
Total Denmark
359,997 5.77%
Finland – 7.39% 61,450 Nokia Oyj
272,528 4.37%
6,390 Sampo Oyj
188,468 3.02%
Total Finland
460,996 7.39%
France – 9.20% 3,090 Airbus Group
121,132 1.94%
2,520 AtoS
123,532 1.98%
3,710 BNP Paribas
146,329 2.34%
1,820 L'oreal SA
183,161 2.94%
Total France
574,154 9.20%
Germany – 3.80% 1,585 Henkel AG & Co KGaA
106,628 1.71%
865 Volkswagen AG
130,654 2.09%
Total Germany
237,282 3.80%
Italy – 10.21% 13,060 Azimut Holding SPA
195,789 3.14%
4,140 EI Towers SPA
131,461 2.11%
110,700 Hera SPA
183,962 2.95%
70,000 Intesa Sanpaolo SPA
125,861 2.02%
Total Italy
637,073 10.21%
Netherlands – 5.93% 3,555 ASML Holding NV
192,955 3.09%
2,920 Gemalto NV
177,136 2.84%
Total Netherlands
370,091 5.93%
Norway – 1.45% 8,640 Gjensidige Forsikring ASA
90,633 1.45%
Total Norway
90,633 1.45%
Spain – 5.94% 20,907 Iberdrola SA
93,510 1.50%
1,800 Inditex SA
161,894 2.59%
4,500 Obrascon Huarte Ence SA
115,309 1.85%
Total Spain
370,713 5.94%

SANLAM UNIVERSAL FUNDS PLC
261
PORTFOLIO OF INVESTMENTS OF FOUR EUROPEAN L/S FUND (CONTINUED) as at 30 June 2014
Nominal Security
Classification Fair Value % of
US$ Net
Assets
Financial assets at fair value through profit or loss (continued)
Sweden – 2.30% 18,480 Skandinaviska Enskilda Banken AB
143,882 2.30%
Total Sweden
143,882 2.30%
Switzerland – 12.24% 10,080 AFG Arbonia Forster Holding AG
198,582 3.18%
3,250 Implenia AG
126,876 2.03%
1,430 roche holding AG Genusschein
249,213 3.99%
45 Sika AG
106,917 1.71%
380 Syngenta AG
82,024 1.31%
Total Switzerland
763,612 12.24%
United States of America – 4.41% 4,440 Autoliv Inc
275,469 4.41%
Total United States of America
275,469 4.41%
Total Equity
4,399,161 70.49%
Derivative financial instruments*
Equity Swaps – 0.26% (4,500) SKF AB CFD
B 274 0.00%1
(2,100) SEB SA CFD
B 370 0.01%1
(4,300) Atlas Copco AB CFD
B 674 0.01%1
(2,650) Osram Licht AG CFD
B 2,654 0.04%1
(16,000) Domino's Pizza Group Plc CFD
B 6,001 0.10%1
(580) Iliad SA CFD
B 6,018 0.10%1
Total equity Swaps
15,991 0.26%
Forward Contracts – 1.02%
D
Buy Buy Sell Sell Maturity Fair Value % of
Currency Amount Currency Amount US$ Net
Assets
USD 6,586,303 EUR
10,950,000 03/07/2014
63,841 1.02%
1
Total forward contracts
63,841 1.02%
Total financial assets at fair value
4,478,993 71.77%
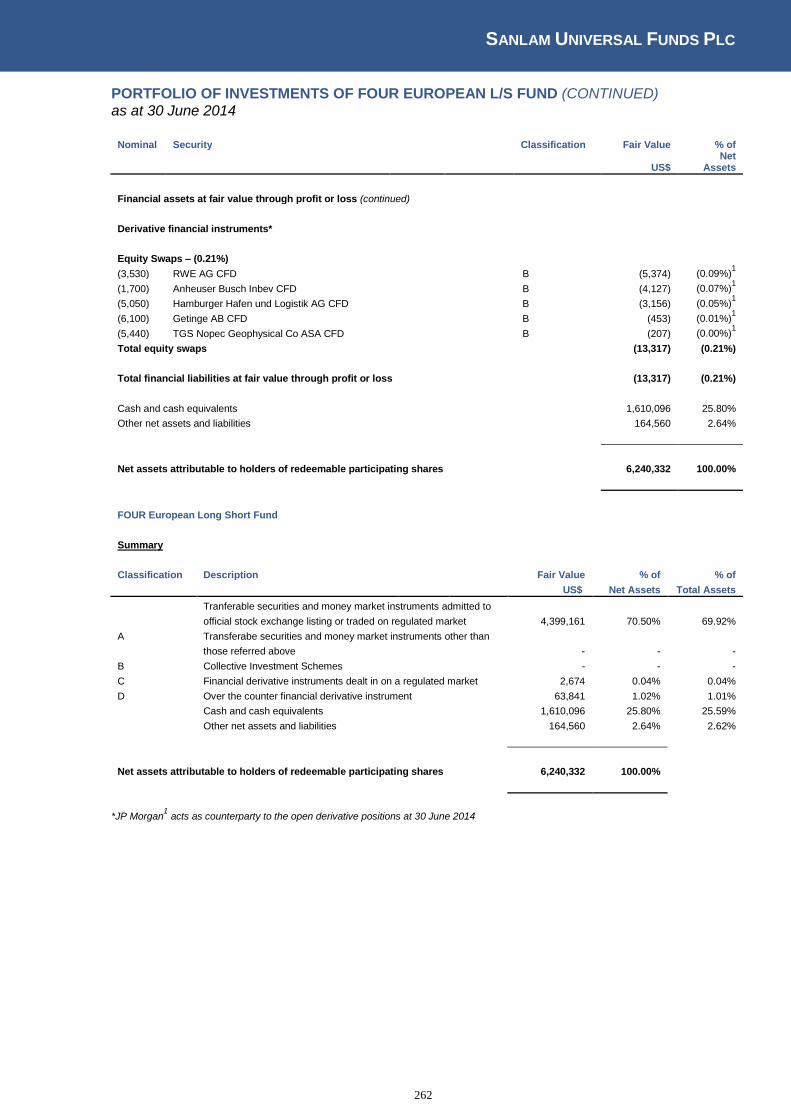
SANLAM UNIVERSAL FUNDS PLC
262
PORTFOLIO OF INVESTMENTS OF FOUR EUROPEAN L/S FUND (CONTINUED) as at 30 June 2014
Nominal Security
Classification Fair Value % of
US$ Net
Assets
Financial assets at fair value through profit or loss (continued)
Derivative financial instruments*
Equity Swaps – (0.21%) (3,530) RWE AG CFD
B (5,374) (0.09%)1
(1,700) Anheuser Busch Inbev CFD
B (4,127) (0.07%)1
(5,050) Hamburger Hafen und Logistik AG CFD
B (3,156) (0.05%)1
(6,100) Getinge AB CFD
B (453) (0.01%)1
(5,440) TGS Nopec Geophysical Co ASA CFD
B (207) (0.00%)1
Total equity swaps
(13,317) (0.21%)
Total financial liabilities at fair value through profit or loss
(13,317) (0.21%)
Cash and cash equivalents
1,610,096 25.80%
Other net assets and liabilities
164,560 2.64%
Net assets attributable to holders of redeemable participating shares
6,240,332 100.00%
FOUR European Long Short Fund
Summary
Classification Description
Fair Value % of % of
US$ Net Assets Total Assets
Tranferable securities and money market instruments admitted to
official stock exchange listing or traded on regulated market
4,399,161 70.50% 69.92%
A Transferabe securities and money market instruments other than
those referred above
- - -
B Collective Investment Schemes
- - -
C Financial derivative instruments dealt in on a regulated market 2,674 0.04% 0.04%
D Over the counter financial derivative instrument 63,841 1.02% 1.01%
Cash and cash equivalents
1,610,096 25.80% 25.59%
Other net assets and liabilities
164,560 2.64% 2.62%
Net assets attributable to holders of redeemable participating shares 6,240,332 100.00%
*JP Morgan1 acts as counterparty to the open derivative positions at 30 June 2014

SANLAM UNIVERSAL FUNDS PLC
263
PORTFOLIO OF INVESTMENTS OF SPI GLOBAL HIGH QUALITY FUND as at 30 June 2014
Nominal Security
Classification Fair Value % of
US$ Net
Assets
Financial assets at fair value through profit or loss
Equity – 94.74%
Belgium – 4.39% 12,584 Anheuser-Busch InBev
845,447 4.39%
Total Belgium
845,447 4.39%
France – 4.23% 7,223 LVMH Moet Hennessy Louis Vuitton SA
814,378 4.23%
Total France
814,378 4.23%
Great Britain – 22.66% 23,205 British American Tobacco Plc
807,070 4.19%
44,675 Burberry Group Plc
662,530 3.44%
44,987 Diageo Plc
839,457 4.36%
21,553 Imperial Tobacco Group Plc
566,844 2.94%
24,141 Intertek Group Plc
663,636 3.45%
31,107 Unilever Plc
824,647 4.28%
Total Great Britain
4,364,184 22.66%
Ireland – 3.44% 13,989 Accenture Plc
661,787 3.44%
Total Ireland
661,787 3.44%
Korea (South) – 3.84% 1,957 Samsung Electronics Co Ltd
739,823 3.84%
Total Korea (South)
739,823 3.84%
Switzerland – 6.64% 16,584 Nestle SA
751,923 3.90%
2,420 Syngenta AG
527,535 2.74%
Total Switzerland
1,279,458 6.64%
United States of America – 49.53% 20,166 American International Group Inc
644,106 3.34%
13,500 Automatic Data Processing LLC
626,328 3.25%
33,665 Coca-Cola Co
834,524 4.33%
19,321 Colgate-Palmolive Co
770,887 4.00%
5,500 International Business Machines Corp
583,436 3.03%
7,301 Johnson & Johnson
446,994 2.32%
20,284 Mastercard Inc
872,103 4.53%
12,472 McDonald's Corp
735,262 3.82%
37,153 Microsoft Corp
906,639 4.71%
31,733 Oracle Corp Co
752,648 3.91%
15,882 Philip Morris International Inc
783,589 4.07%
20,526 Procter & Gamble Co
944,009 4.90%
13,443 Yum Brands Inc
638,788 3.32%
Total United States of America
9,539,313 49.53%
Total Equity
18,244,390 94.74%
Total financial assets at fair value through profit or loss
18,244,390 94.74%
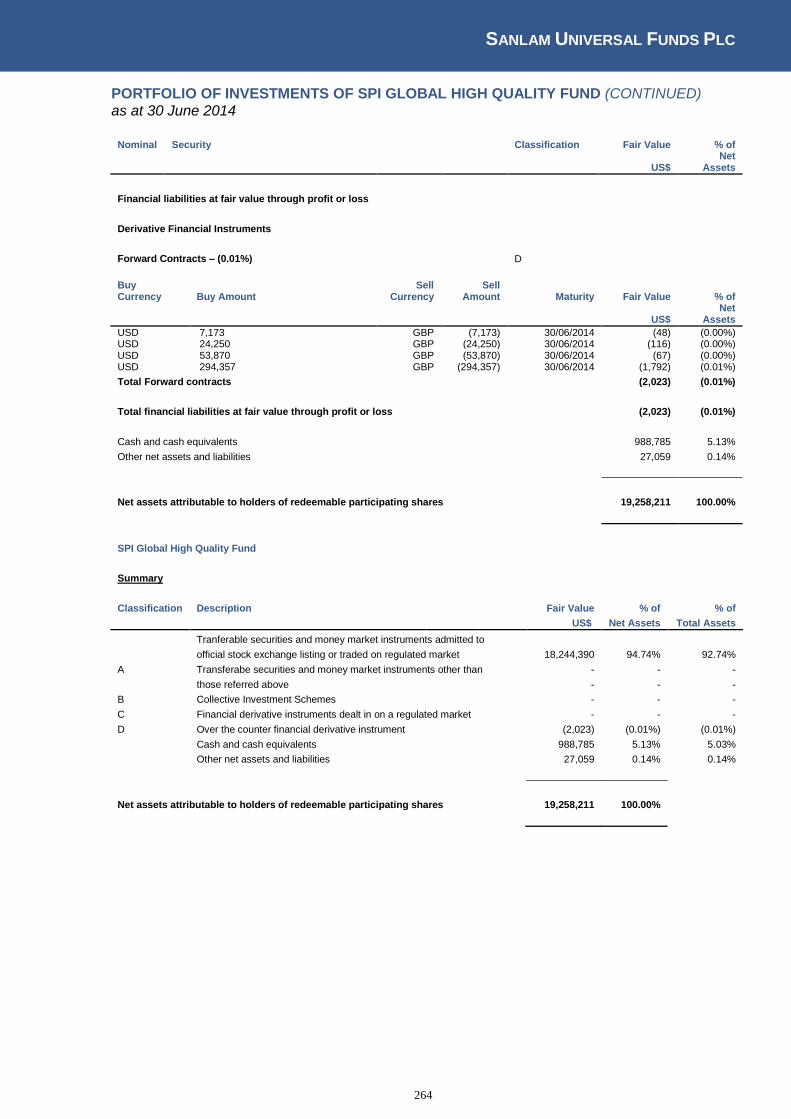
SANLAM UNIVERSAL FUNDS PLC
264
PORTFOLIO OF INVESTMENTS OF SPI GLOBAL HIGH QUALITY FUND (CONTINUED) as at 30 June 2014
Nominal Security
Classification Fair Value % of
US$ Net
Assets
Financial liabilities at fair value through profit or loss
Derivative Financial Instruments
Forward Contracts – (0.01%)
D
Buy Currency Buy Amount
Sell Currency
Sell Amount Maturity Fair Value % of
US$ Net
Assets
USD 7,173 GBP (7,173) 30/06/2014 (48) (0.00%) USD 24,250 GBP (24,250) 30/06/2014 (116) (0.00%) USD 53,870 GBP (53,870) 30/06/2014 (67) (0.00%) USD 294,357 GBP (294,357) 30/06/2014 (1,792) (0.01%)
Total Forward contracts
(2,023) (0.01%)
Total financial liabilities at fair value through profit or loss
(2,023) (0.01%)
Cash and cash equivalents
988,785 5.13%
Other net assets and liabilities
27,059 0.14%
Net assets attributable to holders of redeemable participating shares
19,258,211 100.00%
SPI Global High Quality Fund
Summary
Classification Description
Fair Value % of % of
US$ Net Assets Total Assets
Tranferable securities and money market instruments admitted to
official stock exchange listing or traded on regulated market
18,244,390 94.74% 92.74%
A Transferabe securities and money market instruments other than - - -
those referred above
- - -
B Collective Investment Schemes
- - -
C Financial derivative instruments dealt in on a regulated market - - -
D Over the counter financial derivative instrument
(2,023) (0.01%) (0.01%)
Cash and cash equivalents
988,785 5.13% 5.03%
Other net assets and liabilities
27,059 0.14% 0.14%
Net assets attributable to holders of redeemable participating shares 19,258,211 100.00%
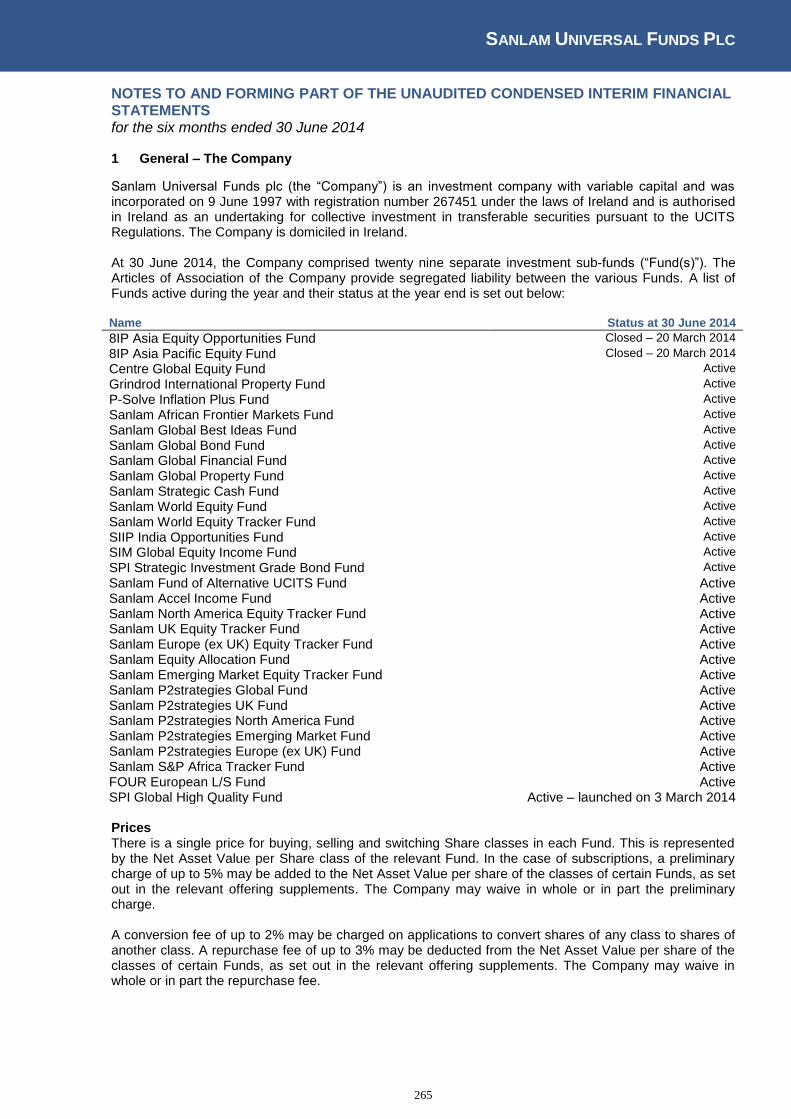
SANLAM UNIVERSAL FUNDS PLC
265
NOTES TO AND FORMING PART OF THE UNAUDITED CONDENSED INTERIM FINANCIAL STATEMENTS for the six months ended 30 June 2014 1 General – The Company
Sanlam Universal Funds plc (the “Company”) is an investment company with variable capital and was incorporated on 9 June 1997 with registration number 267451 under the laws of Ireland and is authorised in Ireland as an undertaking for collective investment in transferable securities pursuant to the UCITS Regulations. The Company is domiciled in Ireland. At 30 June 2014, the Company comprised twenty nine separate investment sub-funds (“Fund(s)”). The Articles of Association of the Company provide segregated liability between the various Funds. A list of Funds active during the year and their status at the year end is set out below:
Name Status at 30 June 2014
8IP Asia Equity Opportunities Fund Closed – 20 March 2014
8IP Asia Pacific Equity Fund Closed – 20 March 2014
Centre Global Equity Fund Active
Grindrod International Property Fund Active
P-Solve Inflation Plus Fund Active
Sanlam African Frontier Markets Fund Active
Sanlam Global Best Ideas Fund Active
Sanlam Global Bond Fund Active
Sanlam Global Financial Fund Active
Sanlam Global Property Fund Active
Sanlam Strategic Cash Fund Active
Sanlam World Equity Fund Active
Sanlam World Equity Tracker Fund Active
SIIP India Opportunities Fund Active
SIM Global Equity Income Fund Active
SPI Strategic Investment Grade Bond Fund Active
Sanlam Fund of Alternative UCITS Fund Active Sanlam Accel Income Fund Active Sanlam North America Equity Tracker Fund Active Sanlam UK Equity Tracker Fund Active Sanlam Europe (ex UK) Equity Tracker Fund Active Sanlam Equity Allocation Fund Active Sanlam Emerging Market Equity Tracker Fund Active Sanlam P2strategies Global Fund Active Sanlam P2strategies UK Fund Active Sanlam P2strategies North America Fund Active Sanlam P2strategies Emerging Market Fund Active Sanlam P2strategies Europe (ex UK) Fund Active Sanlam S&P Africa Tracker Fund Active FOUR European L/S Fund Active SPI Global High Quality Fund Active – launched on 3 March 2014 Prices There is a single price for buying, selling and switching Share classes in each Fund. This is represented by the Net Asset Value per Share class of the relevant Fund. In the case of subscriptions, a preliminary charge of up to 5% may be added to the Net Asset Value per share of the classes of certain Funds, as set out in the relevant offering supplements. The Company may waive in whole or in part the preliminary charge. A conversion fee of up to 2% may be charged on applications to convert shares of any class to shares of another class. A repurchase fee of up to 3% may be deducted from the Net Asset Value per share of the classes of certain Funds, as set out in the relevant offering supplements. The Company may waive in whole or in part the repurchase fee.

SANLAM UNIVERSAL FUNDS PLC
266
NOTES TO AND FORMING PART OF THE UNAUDITED CONDENSED INTERIM FINANCIAL STATEMENTS (CONTINUED) for the six months ended 30 June 2014 1 General – The Company (continued)
Dealing The Dealing Day is, except where otherwise clarified in the Prospectus or sub-fund supplement, any day other than Saturday or Sunday on which banks are open for business in Dublin or London. The valuation point is, except where otherwise clarified in the Prospectus or sub-fund supplement, the close of business in each relevant market on the business day immediately preceding a dealing day. Shares Applications for shares must be sent so as to arrive at the Administrator’s office no later than 4.00pm (Irish time) on the business day preceding the relevant dealing day, or such later time as the Directors may from time to time permit or is disclosed in the supplement. Applications which are received late, or Funds which are not cleared by the relevant time, will be held over and invested at the next dealing day. Requests for repurchases should be sent so as to arrive at the Administrator’s office by post, facsimile or telex by no later than 4.00pm on the business day preceding the relevant dealing day or such other time disclosed in the supplement. As at 30 June 2014, the following Share classes were admitted to the official list of the Irish Stock Exchange.
Fund Share Class Launched
Centre Global Equity Fund A 21 December 2006
B 21 December 2006
C 21 December 2006
Grindrod International Property Fund Non distributing 17 November 2010 P-Solve Inflation Plus Fund A 23 December 2005 B 1 March 2004 B (Accumulation) 20 September 2013
Sanlam African Frontier Markets Fund A 6 January 2009
A (GBP) 6 January 2009
C 6 January 2009
C (GBP) 6 January 2009
D 1 March 2010
G 21 January 2013
H 6 August 2013
Sanlam Global Best Ideas Fund A 4 September 2006
A (EUR) 22 February 2011
A (GBP) 20 December 2007
B 4 September 2006
C 4 September 2006
C (GBP) 3 November 2008
D 22 February 2011
F 27 July 2011
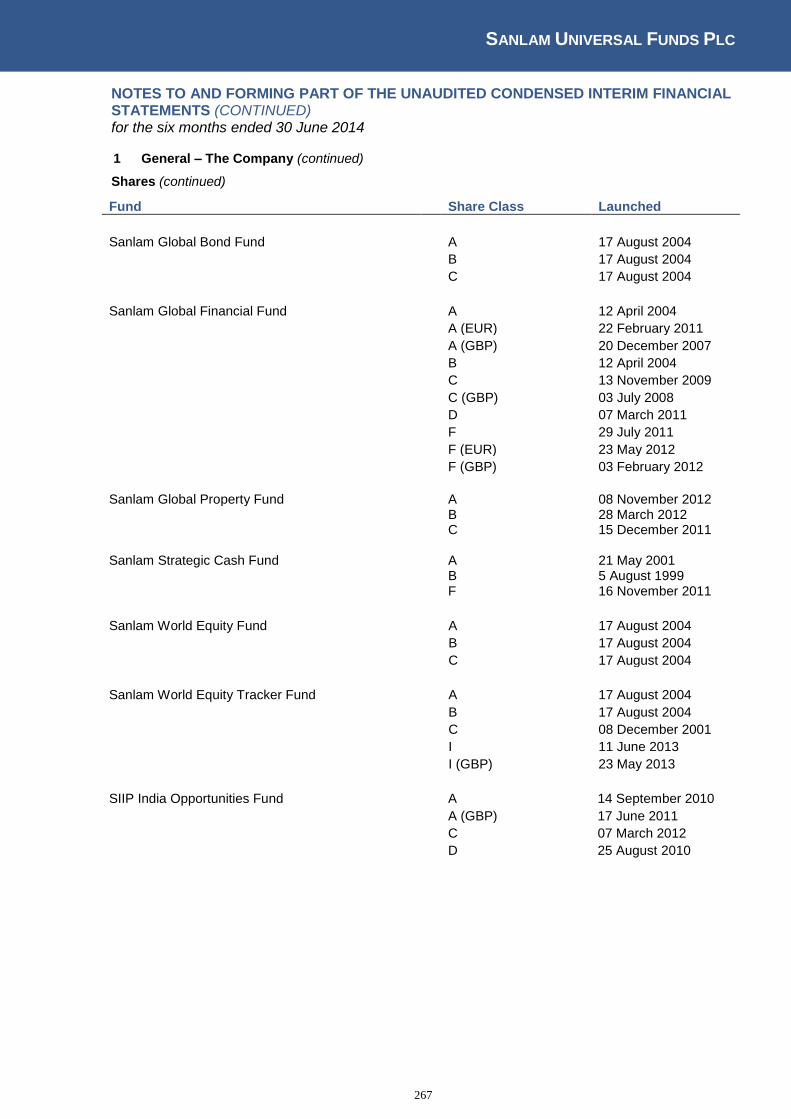
SANLAM UNIVERSAL FUNDS PLC
267
NOTES TO AND FORMING PART OF THE UNAUDITED CONDENSED INTERIM FINANCIAL STATEMENTS (CONTINUED) for the six months ended 30 June 2014 1 General – The Company (continued)
Shares (continued)
Fund Share Class Launched
Sanlam Global Bond Fund A 17 August 2004
B 17 August 2004
C 17 August 2004
Sanlam Global Financial Fund A 12 April 2004
A (EUR) 22 February 2011
A (GBP) 20 December 2007
B 12 April 2004
C 13 November 2009
C (GBP) 03 July 2008
D 07 March 2011
F 29 July 2011
F (EUR) 23 May 2012
F (GBP) 03 February 2012
Sanlam Global Property Fund A 08 November 2012 B 28 March 2012 C 15 December 2011 Sanlam Strategic Cash Fund A 21 May 2001 B 5 August 1999 F 16 November 2011
Sanlam World Equity Fund A 17 August 2004
B 17 August 2004
C 17 August 2004
Sanlam World Equity Tracker Fund A 17 August 2004
B 17 August 2004
C 08 December 2001
I 11 June 2013
I (GBP) 23 May 2013
SIIP India Opportunities Fund A 14 September 2010
A (GBP) 17 June 2011
C 07 March 2012
D 25 August 2010
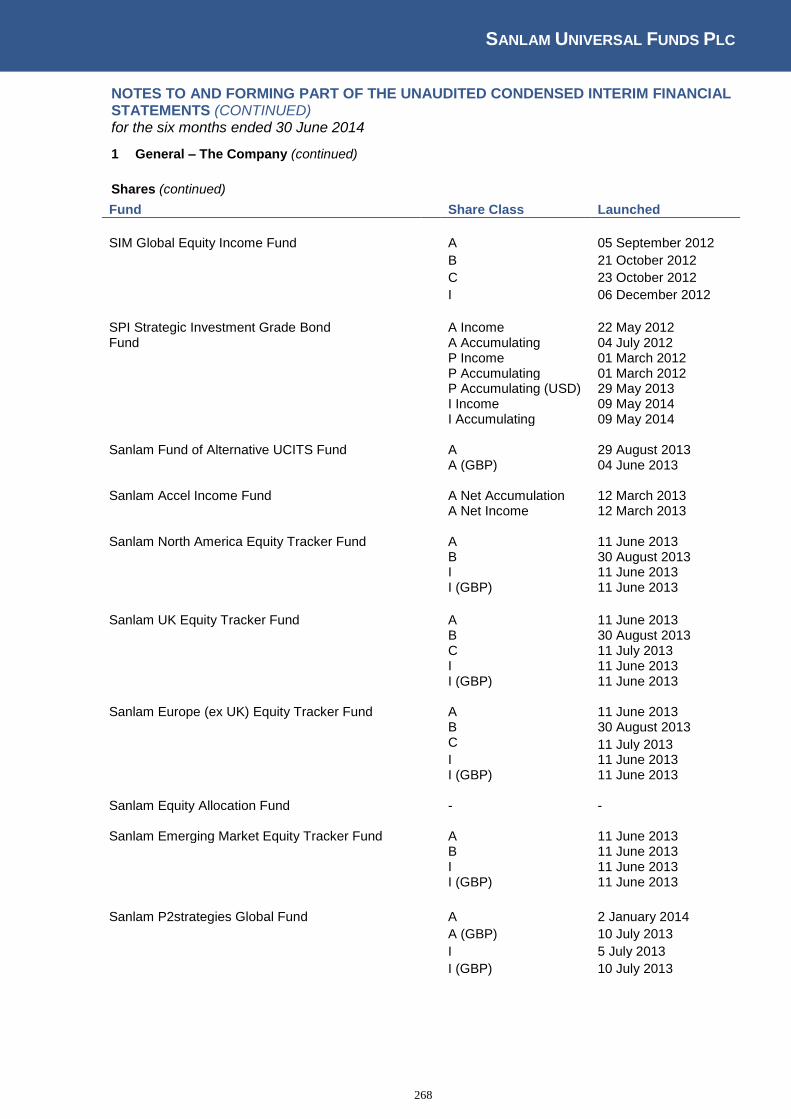
SANLAM UNIVERSAL FUNDS PLC
268
NOTES TO AND FORMING PART OF THE UNAUDITED CONDENSED INTERIM FINANCIAL STATEMENTS (CONTINUED) for the six months ended 30 June 2014
1 General – The Company (continued)
Shares (continued)
Fund Share Class Launched
SIM Global Equity Income Fund A 05 September 2012
B 21 October 2012
C 23 October 2012
I 06 December 2012
SPI Strategic Investment Grade Bond A Income 22 May 2012 Fund A Accumulating 04 July 2012 P Income 01 March 2012 P Accumulating 01 March 2012 P Accumulating (USD) 29 May 2013 I Income 09 May 2014 I Accumulating 09 May 2014 Sanlam Fund of Alternative UCITS Fund A 29 August 2013 A (GBP) 04 June 2013 Sanlam Accel Income Fund A Net Accumulation 12 March 2013 A Net Income 12 March 2013 Sanlam North America Equity Tracker Fund A 11 June 2013 B 30 August 2013 I 11 June 2013 I (GBP) 11 June 2013
Sanlam UK Equity Tracker Fund A 11 June 2013 B 30 August 2013 C 11 July 2013 I 11 June 2013 I (GBP) 11 June 2013 Sanlam Europe (ex UK) Equity Tracker Fund A 11 June 2013 B 30 August 2013 C 11 July 2013 I 11 June 2013 I (GBP) 11 June 2013 Sanlam Equity Allocation Fund - - Sanlam Emerging Market Equity Tracker Fund A 11 June 2013 B 11 June 2013 I 11 June 2013 I (GBP) 11 June 2013
Sanlam P2strategies Global Fund A 2 January 2014
A (GBP) 10 July 2013
I 5 July 2013
I (GBP) 10 July 2013
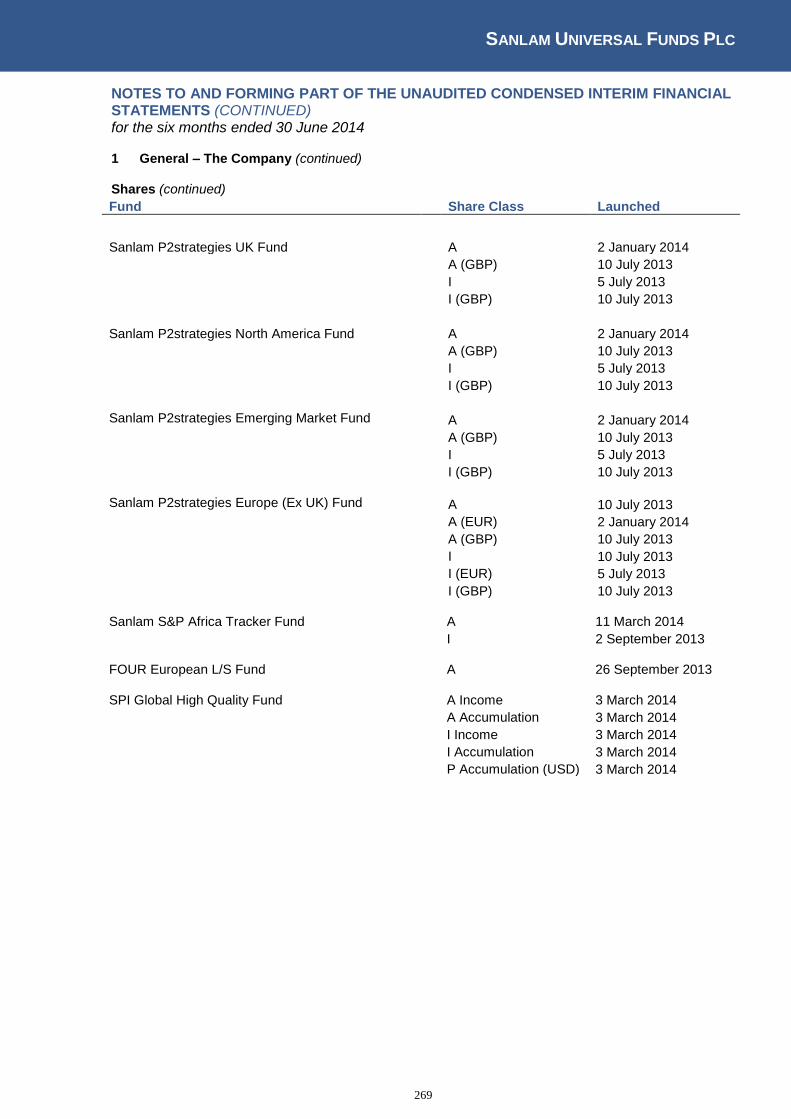
SANLAM UNIVERSAL FUNDS PLC
269
NOTES TO AND FORMING PART OF THE UNAUDITED CONDENSED INTERIM FINANCIAL STATEMENTS (CONTINUED) for the six months ended 30 June 2014 1 General – The Company (continued) Shares (continued)
Fund Share Class Launched
Sanlam P2strategies UK Fund A 2 January 2014
A (GBP) 10 July 2013
I 5 July 2013
I (GBP) 10 July 2013
Sanlam P2strategies North America Fund A 2 January 2014
A (GBP) 10 July 2013
I 5 July 2013
I (GBP) 10 July 2013
Sanlam P2strategies Emerging Market Fund A 2 January 2014 A (GBP) 10 July 2013 I 5 July 2013 I (GBP) 10 July 2013 Sanlam P2strategies Europe (Ex UK) Fund A 10 July 2013 A (EUR) 2 January 2014 A (GBP) 10 July 2013 I 10 July 2013 I (EUR) 5 July 2013 I (GBP) 10 July 2013 Sanlam S&P Africa Tracker Fund A 11 March 2014 I 2 September 2013 FOUR European L/S Fund A 26 September 2013 SPI Global High Quality Fund A Income 3 March 2014 A Accumulation 3 March 2014 I Income 3 March 2014 I Accumulation 3 March 2014 P Accumulation (USD) 3 March 2014
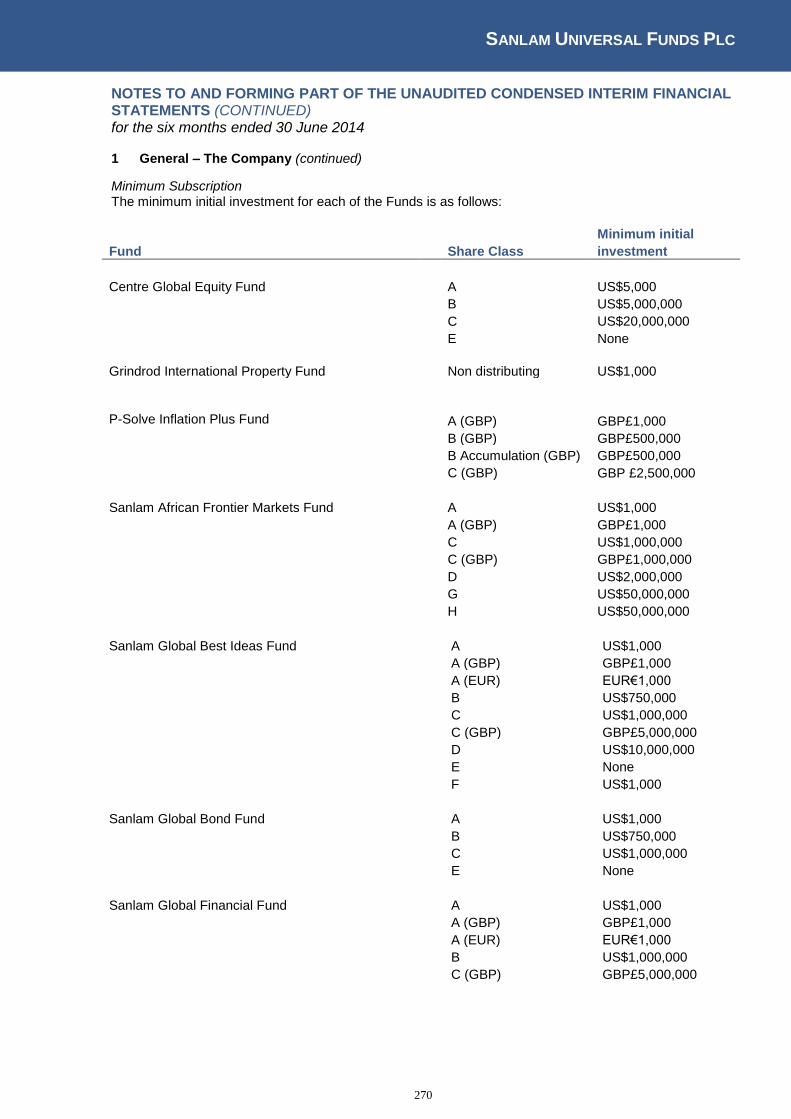
SANLAM UNIVERSAL FUNDS PLC
270
NOTES TO AND FORMING PART OF THE UNAUDITED CONDENSED INTERIM FINANCIAL STATEMENTS (CONTINUED) for the six months ended 30 June 2014 1 General – The Company (continued)
Minimum Subscription The minimum initial investment for each of the Funds is as follows:
Minimum initial
Fund Share Class investment
Centre Global Equity Fund A US$5,000
B US$5,000,000
C US$20,000,000
E None
Grindrod International Property Fund Non distributing US$1,000
P-Solve Inflation Plus Fund A (GBP) GBP£1,000
B (GBP) GBP£500,000 B Accumulation (GBP) GBP£500,000
C (GBP) GBP £2,500,000
Sanlam African Frontier Markets Fund A US$1,000
A (GBP) GBP£1,000
C US$1,000,000
C (GBP) GBP£1,000,000
D US$2,000,000
G US$50,000,000
H US$50,000,000
Sanlam Global Best Ideas Fund A US$1,000
A (GBP) GBP£1,000
A (EUR) EUR€1,000
B US$750,000
C US$1,000,000
C (GBP) GBP£5,000,000
D US$10,000,000
E None
F US$1,000
Sanlam Global Bond Fund A US$1,000
B US$750,000
C US$1,000,000
E None
Sanlam Global Financial Fund A US$1,000
A (GBP) GBP£1,000
A (EUR) EUR€1,000
B US$1,000,000
C (GBP) GBP£5,000,000
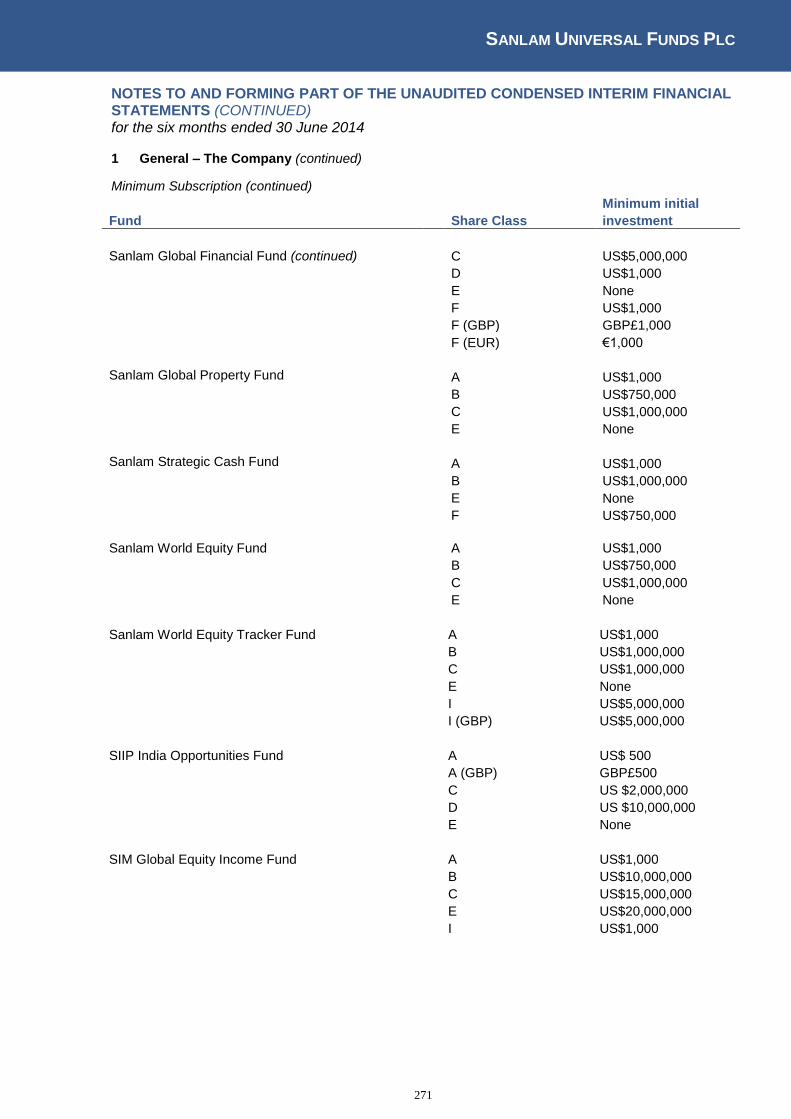
SANLAM UNIVERSAL FUNDS PLC
271
NOTES TO AND FORMING PART OF THE UNAUDITED CONDENSED INTERIM FINANCIAL STATEMENTS (CONTINUED) for the six months ended 30 June 2014 1 General – The Company (continued)
Minimum Subscription (continued)
Minimum initial
Fund Share Class investment
Sanlam Global Financial Fund (continued) C US$5,000,000
D US$1,000
E None
F US$1,000
F (GBP) GBP£1,000
F (EUR) €1,000
Sanlam Global Property Fund A US$1,000 B US$750,000 C US$1,000,000 E None
Sanlam Strategic Cash Fund A US$1,000 B US$1,000,000 E None F US$750,000
Sanlam World Equity Fund A US$1,000
B US$750,000
C US$1,000,000
E None
Sanlam World Equity Tracker Fund A US$1,000
B US$1,000,000
C US$1,000,000
E None
I US$5,000,000
I (GBP) US$5,000,000
SIIP India Opportunities Fund A US$ 500
A (GBP) GBP£500
C US $2,000,000
D US $10,000,000
E None
SIM Global Equity Income Fund A US$1,000
B US$10,000,000
C US$15,000,000
E US$20,000,000
I US$1,000
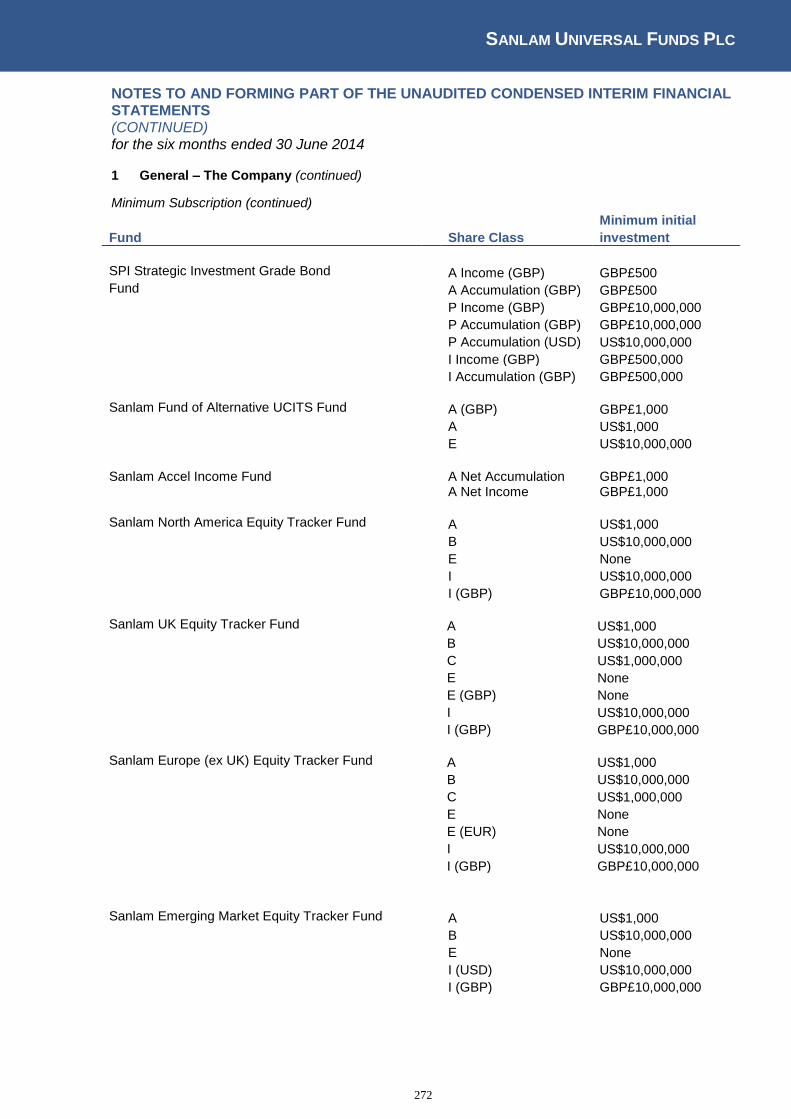
SANLAM UNIVERSAL FUNDS PLC
272
NOTES TO AND FORMING PART OF THE UNAUDITED CONDENSED INTERIM FINANCIAL STATEMENTS (CONTINUED) for the six months ended 30 June 2014 1 General – The Company (continued)
Minimum Subscription (continued)
Minimum initial
Fund Share Class investment
SPI Strategic Investment Grade Bond A Income (GBP) GBP£500 Fund A Accumulation (GBP) GBP£500 P Income (GBP) GBP£10,000,000 P Accumulation (GBP) GBP£10,000,000 P Accumulation (USD) US$10,000,000 I Income (GBP) GBP£500,000 I Accumulation (GBP) GBP£500,000 Sanlam Fund of Alternative UCITS Fund A (GBP) GBP£1,000 A US$1,000 E US$10,000,000
Sanlam Accel Income Fund A Net Accumulation GBP£1,000 A Net Income GBP£1,000 Sanlam North America Equity Tracker Fund A US$1,000 B US$10,000,000 E None I US$10,000,000 I (GBP) GBP£10,000,000 Sanlam UK Equity Tracker Fund A US$1,000 B US$10,000,000 C US$1,000,000 E None E (GBP) None I US$10,000,000 I (GBP) GBP£10,000,000 Sanlam Europe (ex UK) Equity Tracker Fund A US$1,000 B US$10,000,000 C US$1,000,000 E None E (EUR) None I US$10,000,000 I (GBP) GBP£10,000,000 Sanlam Emerging Market Equity Tracker Fund A US$1,000 B US$10,000,000 E None I (USD) US$10,000,000 I (GBP) GBP£10,000,000
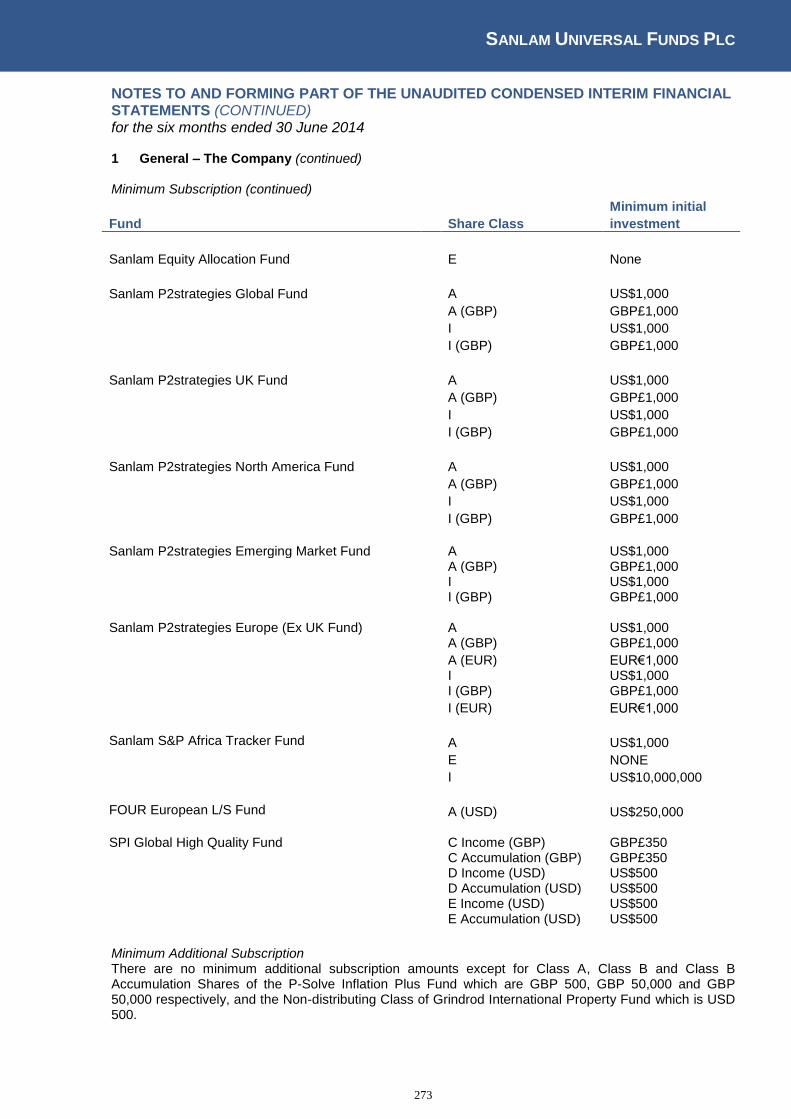
SANLAM UNIVERSAL FUNDS PLC
273
NOTES TO AND FORMING PART OF THE UNAUDITED CONDENSED INTERIM FINANCIAL STATEMENTS (CONTINUED) for the six months ended 30 June 2014 1 General – The Company (continued)
Minimum Subscription (continued)
Minimum initial
Fund Share Class investment
Sanlam Equity Allocation Fund E None
Sanlam P2strategies Global Fund A US$1,000
A (GBP) GBP£1,000
I US$1,000
I (GBP) GBP£1,000
Sanlam P2strategies UK Fund A US$1,000
A (GBP) GBP£1,000
I US$1,000
I (GBP) GBP£1,000
Sanlam P2strategies North America Fund A US$1,000
A (GBP) GBP£1,000
I US$1,000
I (GBP) GBP£1,000
Sanlam P2strategies Emerging Market Fund A US$1,000 A (GBP) GBP£1,000 I US$1,000 I (GBP) GBP£1,000 Sanlam P2strategies Europe (Ex UK Fund) A US$1,000 A (GBP) GBP£1,000 A (EUR) EUR€1,000 I US$1,000 I (GBP) GBP£1,000 I (EUR) EUR€1,000 Sanlam S&P Africa Tracker Fund A US$1,000 E NONE I US$10,000,000 FOUR European L/S Fund A (USD) US$250,000 SPI Global High Quality Fund C Income (GBP) GBP£350 C Accumulation (GBP) GBP£350 D Income (USD) US$500 D Accumulation (USD) US$500 E Income (USD) US$500 E Accumulation (USD) US$500
Minimum Additional Subscription There are no minimum additional subscription amounts except for Class A, Class B and Class B Accumulation Shares of the P-Solve Inflation Plus Fund which are GBP 500, GBP 50,000 and GBP 50,000 respectively, and the Non-distributing Class of Grindrod International Property Fund which is USD 500.
SANLAM UNIVERSAL FUNDS PLC
274
NOTES TO AND FORMING PART OF THE UNAUDITED CONDENSED INTERIM FINANCIAL STATEMENTS (CONTINUED) for the six months ended 30 June 2014
2 Significant accounting policies
The financial statements are prepared in accordance with the UCITS Notices, and IAS 34 Interim Financial
Reporting.
There have been no changes to the significant accounting policies since the last audited financial
statements at 31 December 2013. (a) Standards, interpretations and amendments to published standards that are not yet effective
The following new standards, amendments to standards and interpretations that may be relevant to
investment funds have been issued to date and are not yet effective for these financial statements of the
Company for the period ended 30 June 2014, and have not been applied nor early adopted in preparing
these financial statements:
Standard:
Narrative:
Effective date
Annual periods
beginning on or after
IFRS 9 Financial Instruments: Classification and
Measurement
1 January 2018
IFRS 9 Financial Instruments (“IFRS 9”) IFRS 9, issued on 24 July 2014 is the International Acounting Standard Board’s (“IASB”) replacement of IAS 39 Financial Instruments: Recognition and Measurement. IFRS 9 includes requirements for recognition and measurement, impairment, derecognition and general hedge accounting.
The IASB completed its project to replace IAS 39 in phases, adding to the standard in each phase. The
complete standard issued on 24 July 2014 includes requirements previously issued and additional
amendments to incorporate a new expected loss impairment model and to introduce limited amendments
to the classification and measurement requirements for financial assets. This version of IFRS 9
supersedes all previous versions and is mandatorily effective for periods beginning on or after 1 January
2018 with early adoption permitted (subject to local endorsement requirements). For a limited period,
previous versions of IFRS 9 may be adopted early if not already done so provided the relevant date of
initial application is before 1 February 2015.
IFRS 9 uses business models and contractual cash flow characteristics to determine whether a financial
asset is measured at amortised cost, fair value through profit or loss or fair value through other
comprehensive income, replacing the four category classification in IAS 39. The approach is also based
on how an entity manages its financial instruments (its business model) and the contractual cash flow
characteristics of the financial assets. Most of the requirements for financial liabilities were carried forward
unchanged from IAS 39. However, some changes were made to the fair value option for financial liabilities
to address the issue of own credit risk.
IFRS 9 introduces a substantially-reformed model for hedge accounting with enhanced disclosures about
risk management activity.
As part of IFRS 9 the IASB has introduced a new, expected loss impairment model that will require more
timely recognition of expected credit losses. Specifically, the new Standard requires entities to account for
expected credit losses from when financial instruments are first recognised and it lowers the threshold for
recognition of full lifetime expected losses.
The Directors are currently assessing the impact of IFRS 9 on the financial statements of the Company.
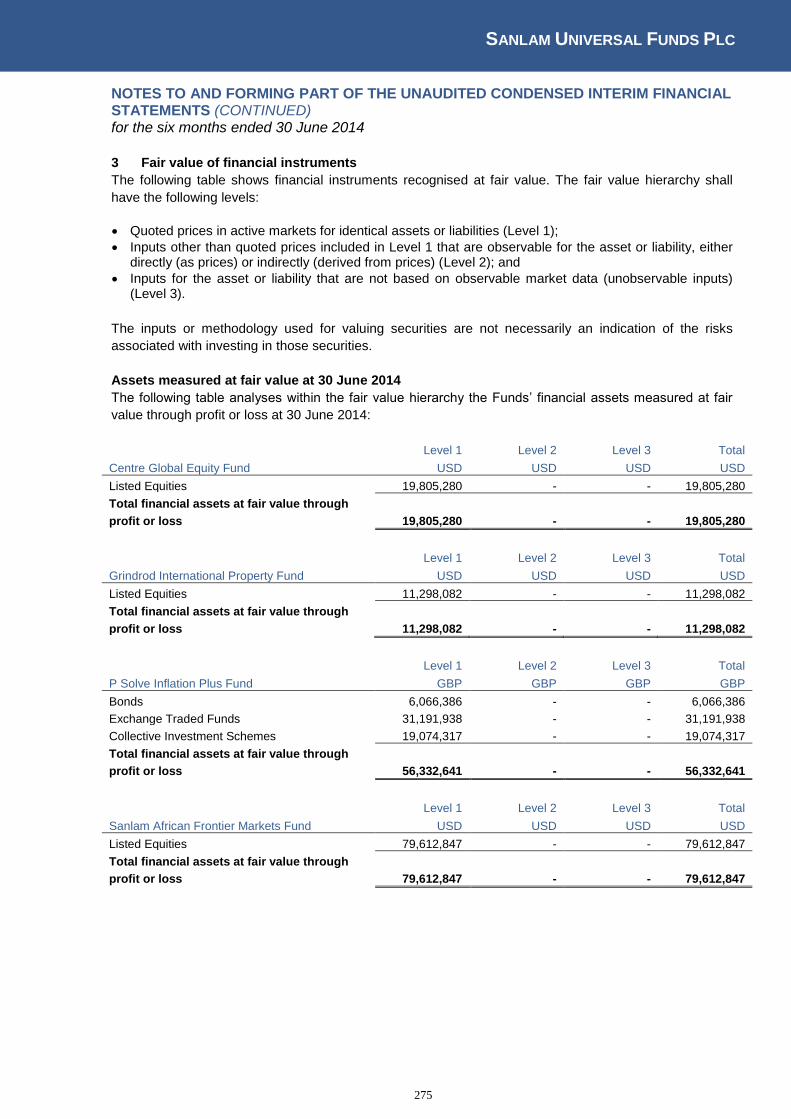
SANLAM UNIVERSAL FUNDS PLC
275
NOTES TO AND FORMING PART OF THE UNAUDITED CONDENSED INTERIM FINANCIAL STATEMENTS (CONTINUED) for the six months ended 30 June 2014
3 Fair value of financial instruments
The following table shows financial instruments recognised at fair value. The fair value hierarchy shall
have the following levels:
Quoted prices in active markets for identical assets or liabilities (Level 1);
Inputs other than quoted prices included in Level 1 that are observable for the asset or liability, either directly (as prices) or indirectly (derived from prices) (Level 2); and
Inputs for the asset or liability that are not based on observable market data (unobservable inputs) (Level 3).
The inputs or methodology used for valuing securities are not necessarily an indication of the risks
associated with investing in those securities.
Assets measured at fair value at 30 June 2014
The following table analyses within the fair value hierarchy the Funds’ financial assets measured at fair
value through profit or loss at 30 June 2014:
Centre Global Equity Fund
Level 1 Level 2 Level 3 Total
USD USD USD USD
Listed Equities 19,805,280 - - 19,805,280
Total financial assets at fair value through
profit or loss 19,805,280 - - 19,805,280
Grindrod International Property Fund
Level 1 Level 2 Level 3 Total
USD USD USD USD
Listed Equities 11,298,082 - - 11,298,082
Total financial assets at fair value through
profit or loss 11,298,082 - - 11,298,082
P Solve Inflation Plus Fund
Level 1 Level 2 Level 3 Total
GBP GBP GBP GBP
Bonds 6,066,386 - - 6,066,386
Exchange Traded Funds 31,191,938 - - 31,191,938
Collective Investment Schemes 19,074,317 - - 19,074,317
Total financial assets at fair value through
profit or loss 56,332,641 - - 56,332,641
Sanlam African Frontier Markets Fund
Level 1 Level 2 Level 3 Total
USD USD USD USD
Listed Equities 79,612,847 - - 79,612,847
Total financial assets at fair value through
profit or loss 79,612,847 - - 79,612,847
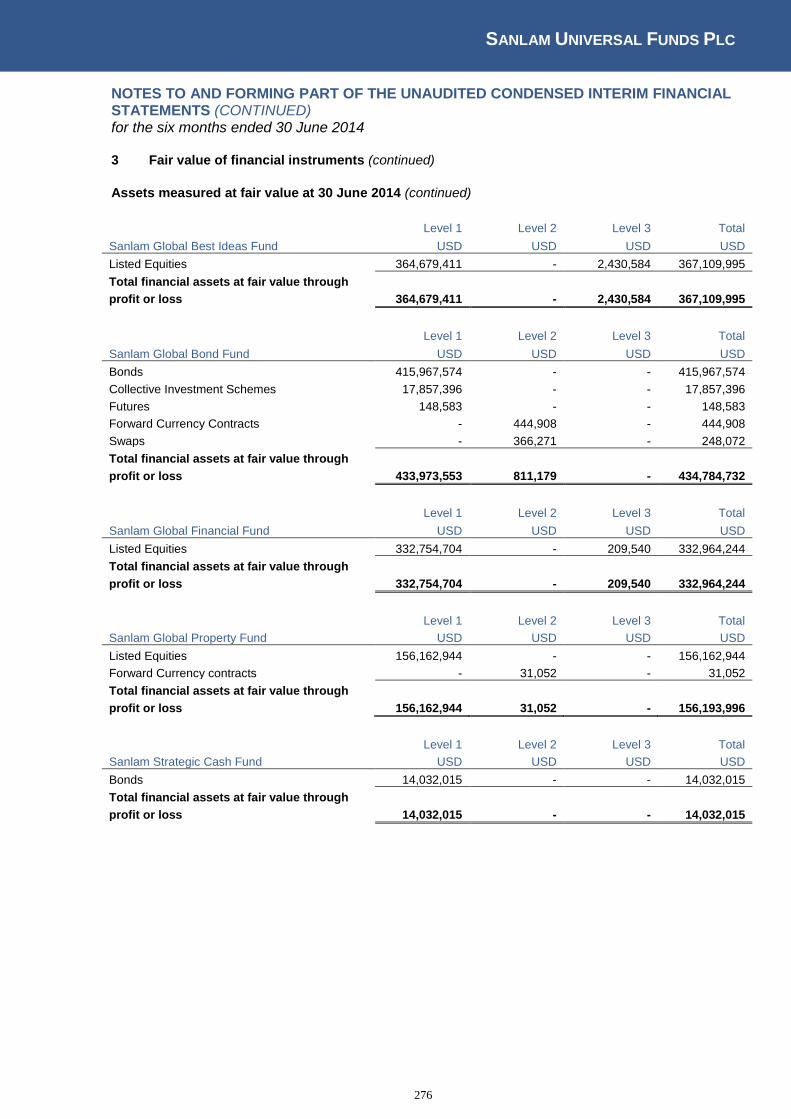
SANLAM UNIVERSAL FUNDS PLC
276
NOTES TO AND FORMING PART OF THE UNAUDITED CONDENSED INTERIM FINANCIAL STATEMENTS (CONTINUED) for the six months ended 30 June 2014 3 Fair value of financial instruments (continued)
Assets measured at fair value at 30 June 2014 (continued)
Sanlam Global Best Ideas Fund
Level 1 Level 2 Level 3 Total
USD USD USD USD
Listed Equities 364,679,411 - 2,430,584 367,109,995
Total financial assets at fair value through
profit or loss 364,679,411 - 2,430,584 367,109,995
Sanlam Global Bond Fund
Level 1 Level 2 Level 3 Total
USD USD USD USD
Bonds 415,967,574 - - 415,967,574
Collective Investment Schemes 17,857,396 - - 17,857,396
Futures 148,583 - - 148,583
Forward Currency Contracts - 444,908 - 444,908
Swaps - 366,271 - 248,072
Total financial assets at fair value through
profit or loss 433,973,553 811,179 - 434,784,732
Sanlam Global Financial Fund
Level 1 Level 2 Level 3 Total
USD USD USD USD
Listed Equities 332,754,704 - 209,540 332,964,244
Total financial assets at fair value through
profit or loss 332,754,704 - 209,540 332,964,244
Level 1 Level 2 Level 3 Total
Sanlam Global Property Fund USD USD USD USD
Listed Equities 156,162,944 - - 156,162,944
Forward Currency contracts - 31,052 - 31,052
Total financial assets at fair value through
profit or loss 156,162,944 31,052 - 156,193,996
Level 1 Level 2 Level 3 Total
Sanlam Strategic Cash Fund USD USD USD USD
Bonds 14,032,015 - - 14,032,015
Total financial assets at fair value through
profit or loss 14,032,015 - - 14,032,015

SANLAM UNIVERSAL FUNDS PLC
277
NOTES TO AND FORMING PART OF THE UNAUDITED CONDENSED INTERIM FINANCIAL STATEMENTS (CONTINUED) for the six months ended 30 June 2014 3 Fair value of financial instruments (continued)
Assets measured at fair value at 30 June 2014 (continued)
Sanlam World Equity Fund
Level 1 Level 2 Level 3 Total
USD USD USD USD
Listed Equities 1,821,076,020 - - 1,821,076,020
Exchange traded funds 8,905,166 - - 8,905,166
Total financial assets at fair value through
profit or loss 1,829,981,186 - - 1,829,981,186
Sanlam World Equity Tracker Fund
Level 1 Level 2 Level 3 Total
USD USD USD USD
Listed Equities 470,544,584 - 6,923 470,541,507
Exchange Traded Funds 2,891,418 - - 2,891,418
Total financial assets at fair value through
profit or loss 473,426,002 - 6,923 473,432,925
SIIP India Opportunities Fund
Level 1 Level 2 Level 3 Total
USD USD USD USD
Listed Equities 19,770,789 - - 19,770,789
Total financial assets at fair value through
profit or loss 19,770,789 - - 19,770,789
Level 1 Level 2 Level 3 Total
SIM Global Equity Income Fund USD USD USD USD
Listed Equities 24,306,707 - - 24,306,707
Total financial assets at fair value through
profit or loss 24,306,707 - - 24,306,707
SPI Strategic Investment Grade Bond Fund
Level 1 Level 2 Level 3 Total
GBP GBP GBP GBP
Listed Equities 2,058,025 - - 2,058,025
Bonds 55,626,966 - - 55,626,966
Total financial assets at fair value through
profit or loss 57,684,991 - - 57,684,991
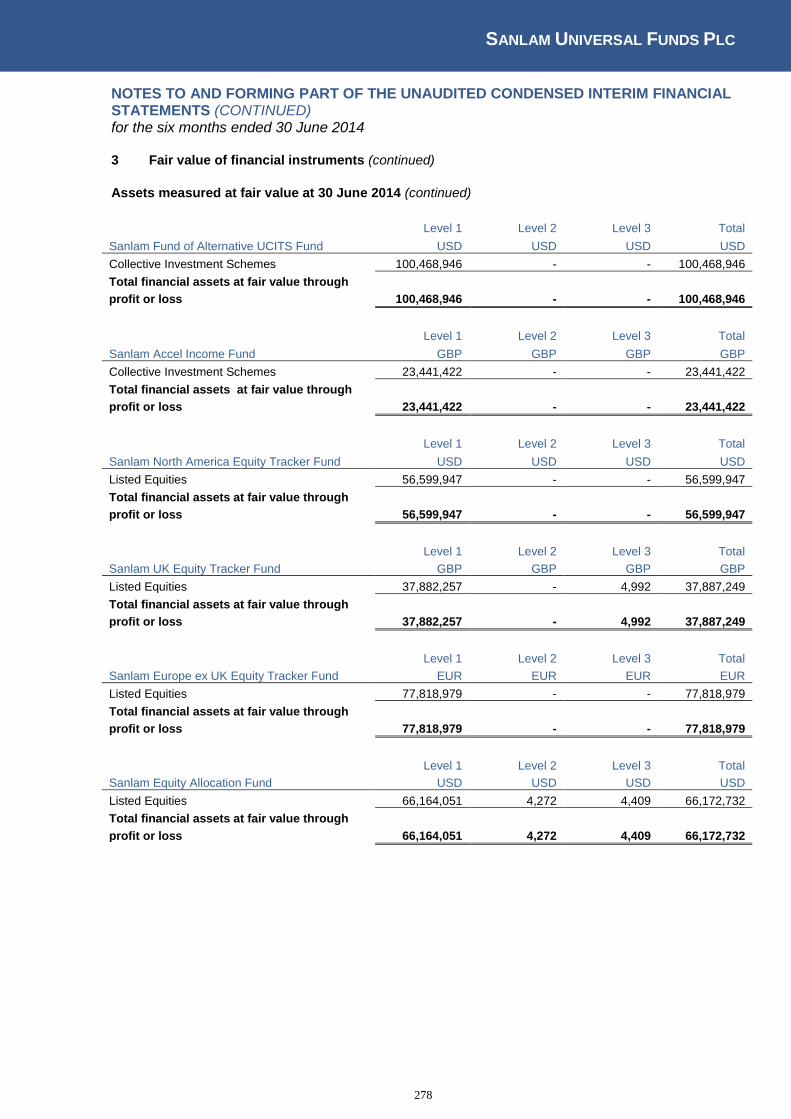
SANLAM UNIVERSAL FUNDS PLC
278
NOTES TO AND FORMING PART OF THE UNAUDITED CONDENSED INTERIM FINANCIAL STATEMENTS (CONTINUED) for the six months ended 30 June 2014 3 Fair value of financial instruments (continued)
Assets measured at fair value at 30 June 2014 (continued)
Sanlam Fund of Alternative UCITS Fund
Level 1 Level 2 Level 3 Total
USD USD USD USD
Collective Investment Schemes 100,468,946 - - 100,468,946
Total financial assets at fair value through
profit or loss 100,468,946 - - 100,468,946
Sanlam Accel Income Fund
Level 1 Level 2 Level 3 Total
GBP GBP GBP GBP
Collective Investment Schemes 23,441,422 - - 23,441,422
Total financial assets at fair value through
profit or loss 23,441,422 - - 23,441,422
Sanlam North America Equity Tracker Fund
Level 1 Level 2 Level 3 Total
USD USD USD USD
Listed Equities 56,599,947 - - 56,599,947
Total financial assets at fair value through
profit or loss 56,599,947 - - 56,599,947
Level 1 Level 2 Level 3 Total
Sanlam UK Equity Tracker Fund GBP GBP GBP GBP
Listed Equities 37,882,257 - 4,992 37,887,249
Total financial assets at fair value through
profit or loss 37,882,257 - 4,992 37,887,249
Level 1 Level 2 Level 3 Total
Sanlam Europe ex UK Equity Tracker Fund EUR EUR EUR EUR
Listed Equities 77,818,979 - - 77,818,979
Total financial assets at fair value through
profit or loss 77,818,979 - - 77,818,979
Level 1 Level 2 Level 3 Total
Sanlam Equity Allocation Fund USD USD USD USD
Listed Equities 66,164,051 4,272 4,409 66,172,732
Total financial assets at fair value through
profit or loss 66,164,051 4,272 4,409 66,172,732
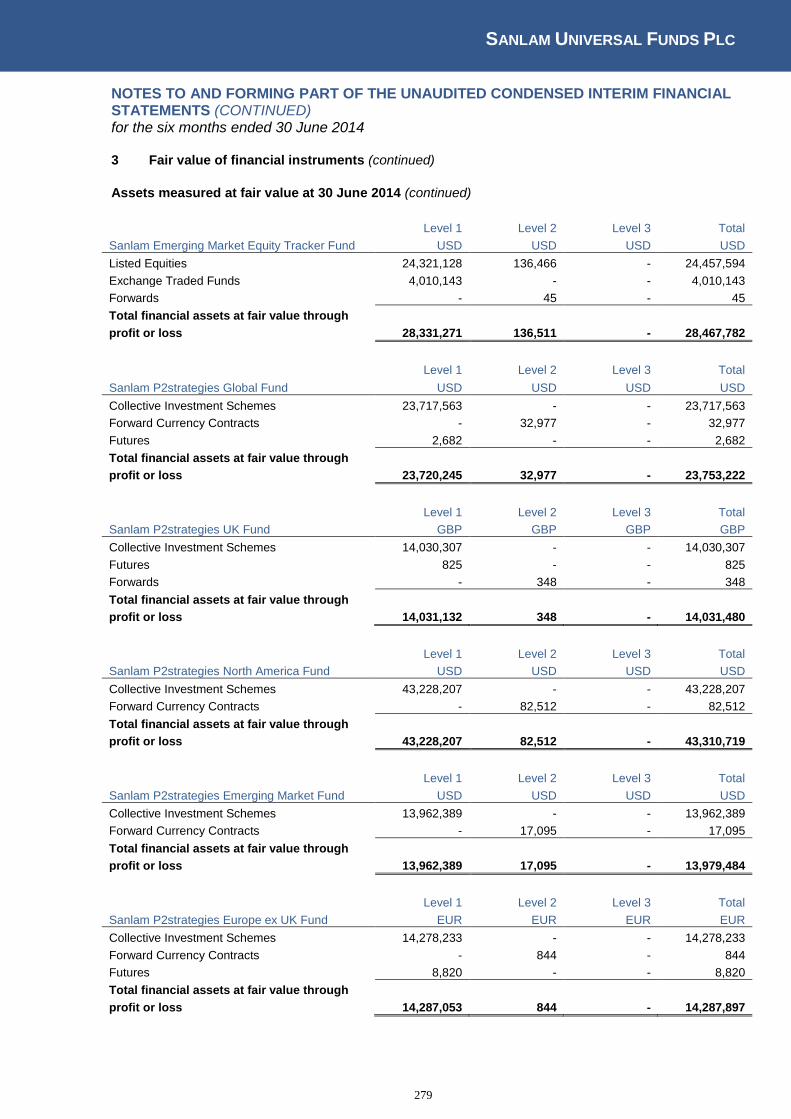
SANLAM UNIVERSAL FUNDS PLC
279
NOTES TO AND FORMING PART OF THE UNAUDITED CONDENSED INTERIM FINANCIAL STATEMENTS (CONTINUED) for the six months ended 30 June 2014 3 Fair value of financial instruments (continued)
Assets measured at fair value at 30 June 2014 (continued)
Level 1 Level 2 Level 3 Total
Sanlam Emerging Market Equity Tracker Fund USD USD USD USD
Listed Equities 24,321,128 136,466 - 24,457,594
Exchange Traded Funds 4,010,143 - - 4,010,143
Forwards - 45 - 45
Total financial assets at fair value through
profit or loss 28,331,271 136,511 - 28,467,782
Sanlam P2strategies Global Fund
Level 1 Level 2 Level 3 Total
USD USD USD USD
Collective Investment Schemes 23,717,563 - - 23,717,563
Forward Currency Contracts - 32,977 - 32,977
Futures 2,682 - - 2,682
Total financial assets at fair value through
profit or loss 23,720,245 32,977 - 23,753,222
Level 1 Level 2 Level 3 Total
Sanlam P2strategies UK Fund GBP GBP GBP GBP
Collective Investment Schemes 14,030,307 - - 14,030,307
Futures 825 - - 825
Forwards - 348 - 348
Total financial assets at fair value through
profit or loss 14,031,132 348 - 14,031,480
Level 1 Level 2 Level 3 Total
Sanlam P2strategies North America Fund USD USD USD USD
Collective Investment Schemes 43,228,207 - - 43,228,207
Forward Currency Contracts - 82,512 - 82,512
Total financial assets at fair value through
profit or loss 43,228,207 82,512 - 43,310,719
Level 1 Level 2 Level 3 Total
Sanlam P2strategies Emerging Market Fund USD USD USD USD
Collective Investment Schemes 13,962,389 - - 13,962,389
Forward Currency Contracts - 17,095 - 17,095
Total financial assets at fair value through
profit or loss 13,962,389 17,095 - 13,979,484
Level 1 Level 2 Level 3 Total
Sanlam P2strategies Europe ex UK Fund EUR EUR EUR EUR
Collective Investment Schemes 14,278,233 - - 14,278,233
Forward Currency Contracts - 844 - 844
Futures 8,820 - - 8,820
Total financial assets at fair value through
profit or loss 14,287,053 844 - 14,287,897
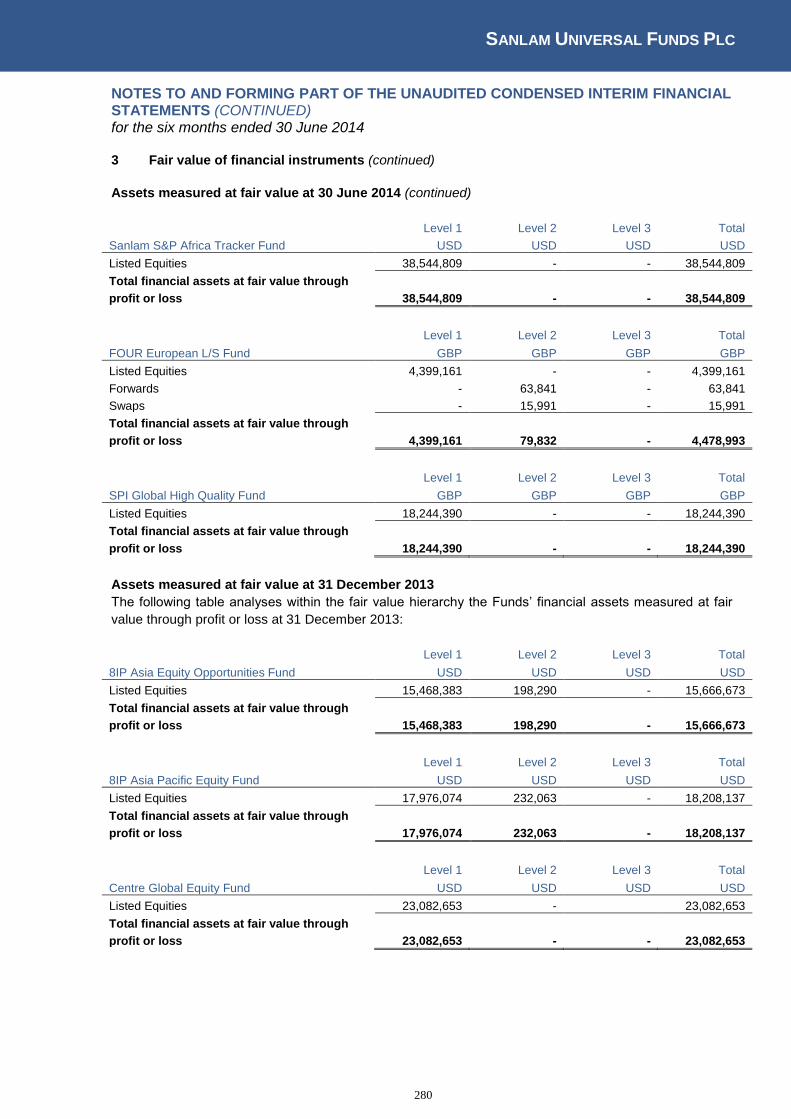
SANLAM UNIVERSAL FUNDS PLC
280
NOTES TO AND FORMING PART OF THE UNAUDITED CONDENSED INTERIM FINANCIAL STATEMENTS (CONTINUED) for the six months ended 30 June 2014 3 Fair value of financial instruments (continued)
Assets measured at fair value at 30 June 2014 (continued)
Level 1 Level 2 Level 3 Total
Sanlam S&P Africa Tracker Fund USD USD USD USD
Listed Equities 38,544,809 - - 38,544,809
Total financial assets at fair value through
profit or loss 38,544,809 - - 38,544,809
FOUR European L/S Fund
Level 1 Level 2 Level 3 Total
GBP GBP GBP GBP
Listed Equities 4,399,161 - - 4,399,161
Forwards - 63,841 - 63,841
Swaps - 15,991 - 15,991
Total financial assets at fair value through
profit or loss 4,399,161 79,832 - 4,478,993
SPI Global High Quality Fund
Level 1 Level 2 Level 3 Total
GBP GBP GBP GBP
Listed Equities 18,244,390 - - 18,244,390
Total financial assets at fair value through
profit or loss 18,244,390 - - 18,244,390
Assets measured at fair value at 31 December 2013
The following table analyses within the fair value hierarchy the Funds’ financial assets measured at fair
value through profit or loss at 31 December 2013:
8IP Asia Equity Opportunities Fund
Level 1 Level 2 Level 3 Total
USD USD USD USD
Listed Equities 15,468,383 198,290 - 15,666,673
Total financial assets at fair value through
profit or loss 15,468,383 198,290 - 15,666,673
8IP Asia Pacific Equity Fund
Level 1 Level 2 Level 3 Total
USD USD USD USD
Listed Equities 17,976,074 232,063 - 18,208,137
Total financial assets at fair value through
profit or loss 17,976,074 232,063 - 18,208,137
Centre Global Equity Fund
Level 1 Level 2 Level 3 Total
USD USD USD USD
Listed Equities 23,082,653 - 23,082,653
Total financial assets at fair value through
profit or loss 23,082,653 - - 23,082,653

SANLAM UNIVERSAL FUNDS PLC
281
NOTES TO AND FORMING PART OF THE UNAUDITED CONDENSED INTERIM FINANCIAL STATEMENTS (CONTINUED) for the six months ended 30 June 2014 3 Fair value of financial instruments (continued) Assets measured at fair value at 31 December 2013 (continued)
Grindrod International Property Fund
Level 1 Level 2 Level 3 Total
USD USD USD USD
Listed Equities 10,179,642 - - 10,179,642
Total financial assets at fair value through
profit or loss 10,179,642 - - 10,179,642
P Solve Inflation Plus Fund
Level 1 Level 2 Level 3 Total
GBP GBP GBP GBP
Bonds 2,477,354 - - 2,477,354
Exchange Traded Funds 34,687,123 - - 34,687,123
Collective Investment Schemes 16,551,682 - - 16,551,682
Total financial assets at fair value through
profit or loss 53,716,159 - - 53,716,159
Sanlam African Frontier Markets Fund
Level 1 Level 2 Level 3 Total
USD USD USD USD
Listed Equities 75,453,601 - - 75,453,601
Total financial assets at fair value through
profit or loss 75,453,601 - - 75,453,601
Sanlam Global Best Ideas Fund
Level 1 Level 2 Level 3 Total
USD USD USD USD
Listed Equities 403,833,801 - 6,043,876 409,877,677
Total financial assets at fair value through
profit or loss 403,833,801 - 6,043,876 409,877,677
Sanlam Global Bond Fund
Level 1 Level 2 Level 3 Total
USD USD USD USD
Bonds 382,960,228 - - 382,960,228
Collective Investment Schemes 19,995,600 - - 19,995,600
Futures 517,984 - - 517,984
Forward Currency Contracts - 558,017 - 558,017
Swaps - 129,688 - 129,688
Total financial assets at fair value through
profit or loss 403,473,812 687,705 - 404,161,517
Sanlam Global Financial Find
Level 1 Level 2 Level 3 Total
USD USD USD USD
Listed Equities 322,735,319 2,343 521,042 323,258,704
Forward Currency Contracts - 706 - 706
Total financial assets at fair value through
profit or loss 322,735,319 3,049 521,042 323,259,410

SANLAM UNIVERSAL FUNDS PLC
282
NOTES TO AND FORMING PART OF THE UNAUDITED CONDENSED INTERIM FINANCIAL STATEMENTS (CONTINUED) for the six months ended 30 June 2014 3 Fair value of financial instruments (continued) Assets measured at fair value at 31 December 2013 (continued)
Level 1 Level 2 Level 3 Total
Sanlam Global Property Fund USD USD USD USD
Listed Equities 151,637,957 484,164 - 152,122,141
Forward Currency contracts - 255,521 - 255,521
Total financial assets at fair value through
profit or loss 151,637,957 739,705 - 152,377,662
Sanlam Global Financial Find
Level 1 Level 2 Level 3 Total
USD USD USD USD
Listed Equities 322,735,319 2,343 521,042 323,258,704
Forward Currency Contracts - 706 - 706
Total financial assets at fair value through
profit or loss 322,735,319 3,049 521,042 323,259,410
Level 1 Level 2 Level 3 Total
Sanlam Global Property Fund USD USD USD USD
Listed Equities 151,637,957 484,164 - 152,122,141
Forward Currency contracts - 255,521 - 255,521
Total financial assets at fair value through
profit or loss 151,637,957 739,705 - 152,377,662
Level 1 Level 2 Level 3 Total
Sanlam Strategic Cash Fund USD USD USD USD
Bonds 20,829,491 - - 20,829,491
Total financial assets at fair value through
profit or loss 20,829,491 - - 20,829,491
Sanlam World Equity Fund
Level 1 Level 2 Level 3 Total
USD USD USD USD
Listed Equities 1,629,190,133 1,250,042 - 1,630,440,175
Total financial assets at fair value through
profit or loss 1,629,190,133 1,250,042 - 1,630,440,175
Sanlam World Equity Tracker Fund
Level 1 Level 2 Level 3 Total
USD USD USD USD
Listed Equities 433,988,584 18,102 4,280 434,010,876
Exchange Traded Funds 37,235,566 - - 37,235,566
Total financial assets at fair value through
profit or loss 471,224,150 18,102 4,280 471,246,442
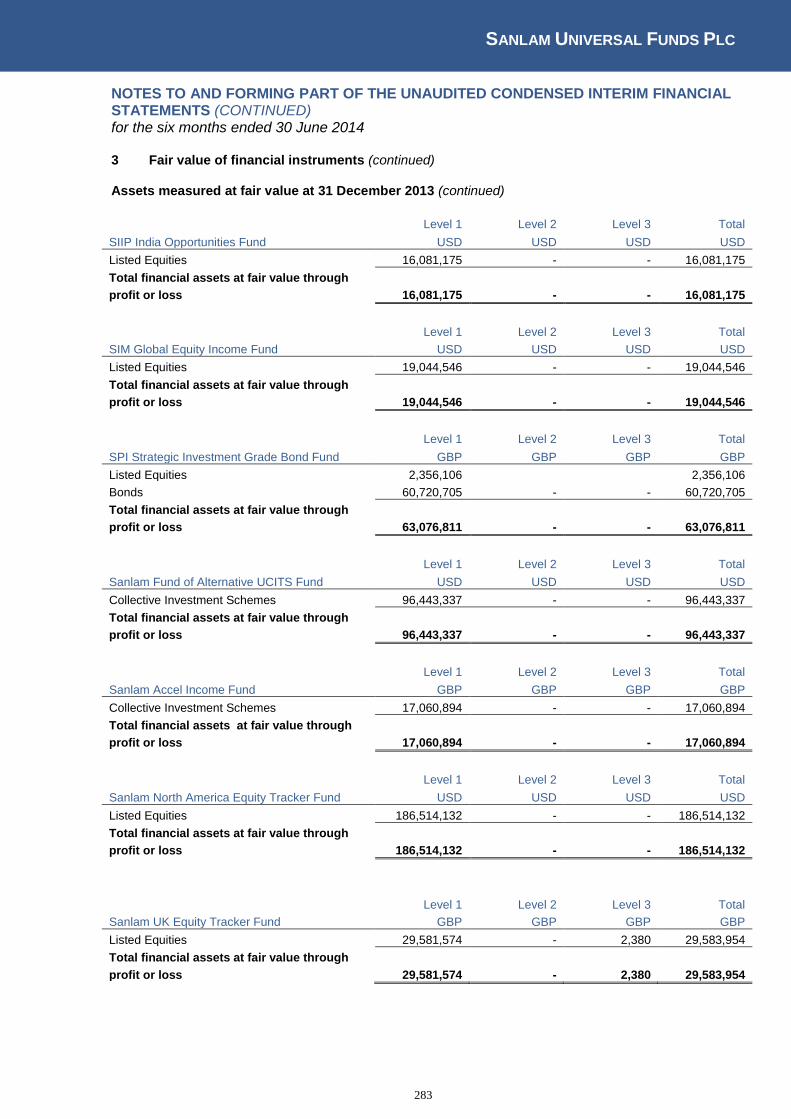
SANLAM UNIVERSAL FUNDS PLC
283
NOTES TO AND FORMING PART OF THE UNAUDITED CONDENSED INTERIM FINANCIAL STATEMENTS (CONTINUED) for the six months ended 30 June 2014 3 Fair value of financial instruments (continued) Assets measured at fair value at 31 December 2013 (continued)
SIIP India Opportunities Fund
Level 1 Level 2 Level 3 Total
USD USD USD USD
Listed Equities 16,081,175 - - 16,081,175
Total financial assets at fair value through
profit or loss 16,081,175 - - 16,081,175
Level 1 Level 2 Level 3 Total
SIM Global Equity Income Fund USD USD USD USD
Listed Equities 19,044,546 - - 19,044,546
Total financial assets at fair value through
profit or loss 19,044,546 - - 19,044,546
SPI Strategic Investment Grade Bond Fund
Level 1 Level 2 Level 3 Total
GBP GBP GBP GBP
Listed Equities 2,356,106 2,356,106
Bonds 60,720,705 - - 60,720,705
Total financial assets at fair value through
profit or loss 63,076,811 - - 63,076,811
Sanlam Fund of Alternative UCITS Fund
Level 1 Level 2 Level 3 Total
USD USD USD USD
Collective Investment Schemes 96,443,337 - - 96,443,337
Total financial assets at fair value through
profit or loss 96,443,337 - - 96,443,337
Sanlam Accel Income Fund
Level 1 Level 2 Level 3 Total
GBP GBP GBP GBP
Collective Investment Schemes 17,060,894 - - 17,060,894
Total financial assets at fair value through
profit or loss 17,060,894 - - 17,060,894
Sanlam North America Equity Tracker Fund
Level 1 Level 2 Level 3 Total
USD USD USD USD
Listed Equities 186,514,132 - - 186,514,132
Total financial assets at fair value through
profit or loss 186,514,132 - - 186,514,132
Level 1 Level 2 Level 3 Total
Sanlam UK Equity Tracker Fund GBP GBP GBP GBP
Listed Equities 29,581,574 - 2,380 29,583,954
Total financial assets at fair value through
profit or loss 29,581,574 - 2,380 29,583,954

SANLAM UNIVERSAL FUNDS PLC
284
NOTES TO AND FORMING PART OF THE UNAUDITED CONDENSED INTERIM FINANCIAL STATEMENTS (CONTINUED) for the six months ended 30 June 2014 3 Fair value of financial instruments (continued) Assets measured at fair value at 31 December 2013 (continued)
Level 1 Level 2 Level 3 Total
Sanlam Europe ex UK Equity Tracker Fund EUR EUR EUR EUR
Listed Equities 58,634,291 5,558 - 58,639,849
Total financial assets at fair value through
profit or loss 58,634,291 5,558 - 58,639,849
Level 1 Level 2 Level 3 Total
Sanlam Equity Allocation Fund USD USD USD USD
Listed Equities 65,639,042 4,275 1,877 65,645,194
Total financial assets at fair value through
profit or loss 65,639,042 4,275 1,877 65,645,194
Level 1 Level 2 Level 3 Total
Sanlam Emerging Market Equity Tracker Fund USD USD USD USD
Listed Equities 34,623,129 164,667 - 34,787,796
Exchange Traded Funds 5,950,207 - - 5,950,207
Total financial assets at fair value through
profit or loss 40,573,336 164,667 - 40,738,003
Sanlam P2strategies Global Fund
Level 1 Level 2 Level 3 Total
USD USD USD USD
Collective Investment Schemes 13,313,412 - - 13,313,412
Forward Currency Contracts - 45,879 - 45,879
Total financial assets at fair value through
profit or loss 13,313,412 45,879 - 13,359,291
Level 1 Level 2 Level 3 Total
Sanlam P2strategies UK Fund GBP GBP GBP GBP
Collective Investment Schemes 7,353,582 - - 7,353,582
Total financial assets at fair value through
profit or loss 7,353,582 - - 7,353,582
Level 1 Level 2 Level 3 Total
Sanlam P2strategies North America Fund USD USD USD USD
Collective Investment Schemes 19,881,936 - - 19,881,936
Forward Currency Contracts - 67,064 - 67,064
Total financial assets at fair value through
profit or loss 19,881,936 67,064 - 19,949,000
Level 1 Level 2 Level 3 Total
Sanlam P2strategies Emerging Market Fund USD USD USD USD
Collective Investment Schemes 16,764,847 - - 16,764,847
Forward Currency Contracts - 48,200 - 48,200
Total financial assets at fair value through
profit or loss 16,764,847 48,200 - 16,813,047
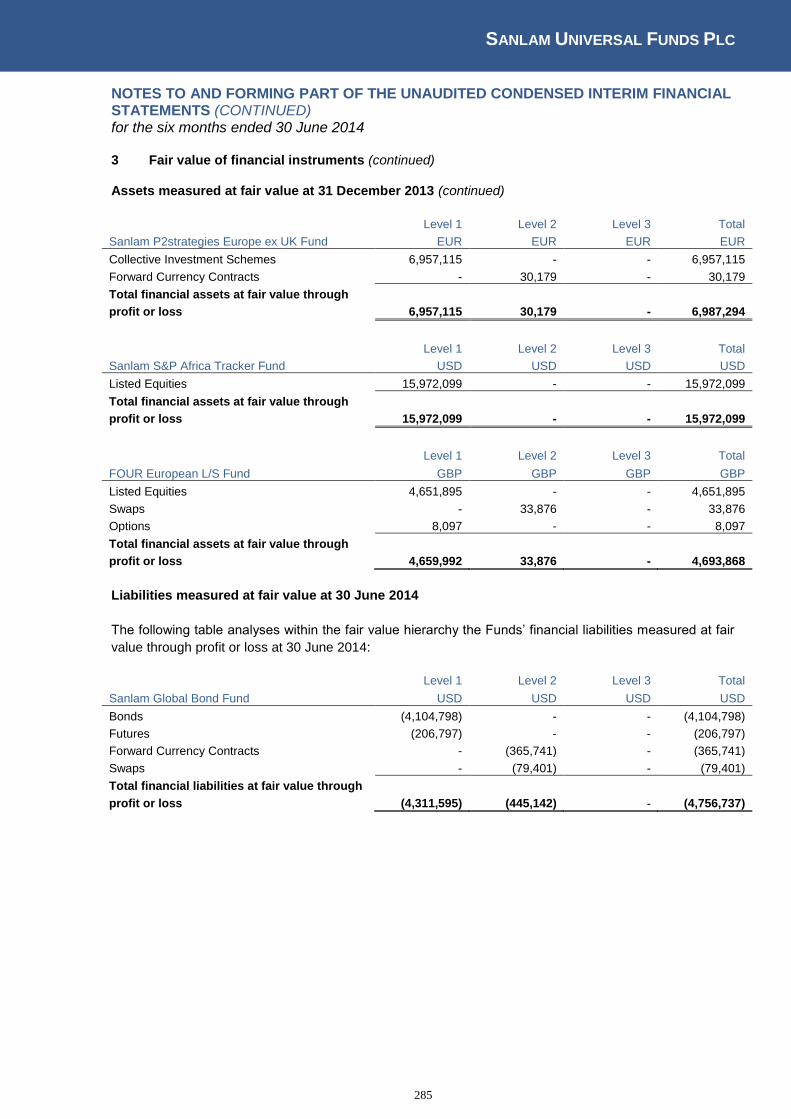
SANLAM UNIVERSAL FUNDS PLC
285
NOTES TO AND FORMING PART OF THE UNAUDITED CONDENSED INTERIM FINANCIAL STATEMENTS (CONTINUED) for the six months ended 30 June 2014 3 Fair value of financial instruments (continued) Assets measured at fair value at 31 December 2013 (continued)
Level 1 Level 2 Level 3 Total
Sanlam P2strategies Europe ex UK Fund EUR EUR EUR EUR
Collective Investment Schemes 6,957,115 - - 6,957,115
Forward Currency Contracts - 30,179 - 30,179
Total financial assets at fair value through
profit or loss 6,957,115 30,179 - 6,987,294
Level 1 Level 2 Level 3 Total
Sanlam S&P Africa Tracker Fund USD USD USD USD
Listed Equities 15,972,099 - - 15,972,099
Total financial assets at fair value through
profit or loss 15,972,099 - - 15,972,099
FOUR European L/S Fund
Level 1 Level 2 Level 3 Total
GBP GBP GBP GBP
Listed Equities 4,651,895 - - 4,651,895
Swaps - 33,876 - 33,876
Options 8,097 - - 8,097
Total financial assets at fair value through
profit or loss 4,659,992 33,876 - 4,693,868
Liabilities measured at fair value at 30 June 2014
The following table analyses within the fair value hierarchy the Funds’ financial liabilities measured at fair
value through profit or loss at 30 June 2014:
Sanlam Global Bond Fund
Level 1 Level 2 Level 3 Total
USD USD USD USD
Bonds (4,104,798) - - (4,104,798)
Futures (206,797) - - (206,797)
Forward Currency Contracts - (365,741) - (365,741)
Swaps - (79,401) - (79,401)
Total financial liabilities at fair value through
profit or loss (4,311,595) (445,142) - (4,756,737)
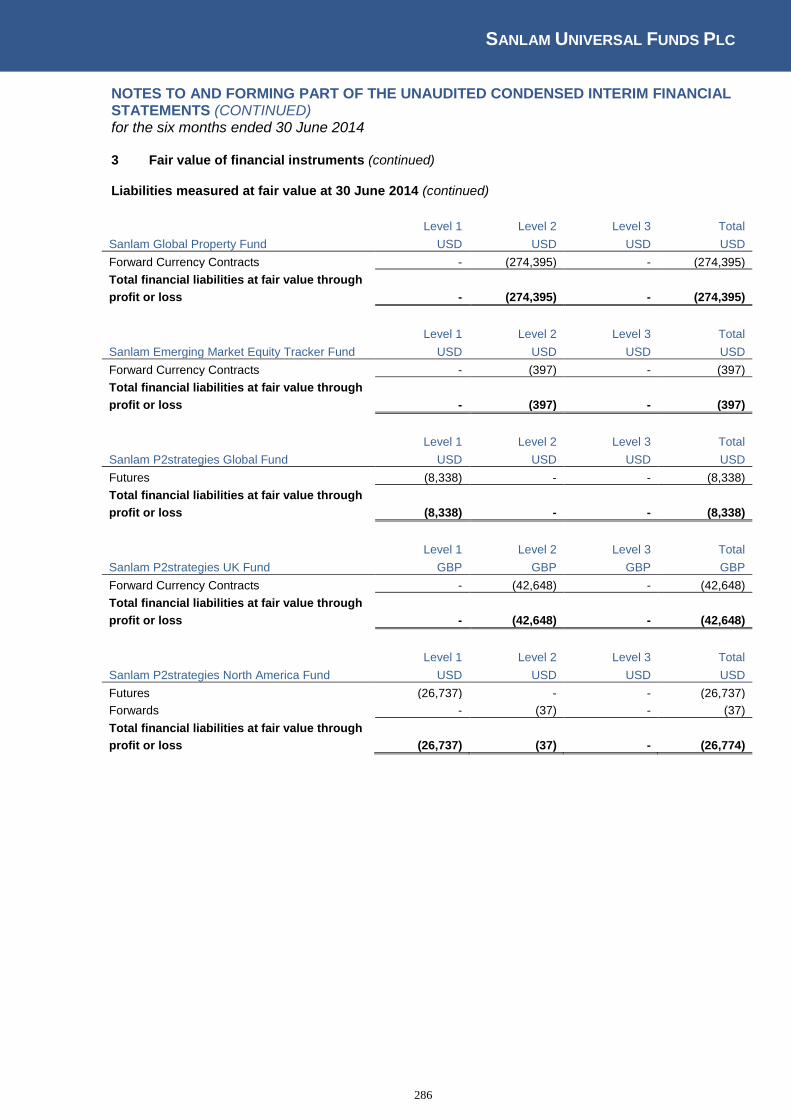
SANLAM UNIVERSAL FUNDS PLC
286
NOTES TO AND FORMING PART OF THE UNAUDITED CONDENSED INTERIM FINANCIAL STATEMENTS (CONTINUED) for the six months ended 30 June 2014 3 Fair value of financial instruments (continued) Liabilities measured at fair value at 30 June 2014 (continued)
Sanlam Global Property Fund
Level 1 Level 2 Level 3 Total
USD USD USD USD
Forward Currency Contracts - (274,395) - (274,395)
Total financial liabilities at fair value through
profit or loss - (274,395) - (274,395)
Sanlam Emerging Market Equity Tracker Fund
Level 1 Level 2 Level 3 Total
USD USD USD USD
Forward Currency Contracts - (397) - (397)
Total financial liabilities at fair value through
profit or loss - (397) - (397)
Sanlam P2strategies Global Fund
Level 1 Level 2 Level 3 Total
USD USD USD USD
Futures (8,338) - - (8,338)
Total financial liabilities at fair value through
profit or loss (8,338) - - (8,338)
Sanlam P2strategies UK Fund
Level 1 Level 2 Level 3 Total
GBP GBP GBP GBP
Forward Currency Contracts - (42,648) - (42,648)
Total financial liabilities at fair value through
profit or loss - (42,648) - (42,648)
Sanlam P2strategies North America Fund
Level 1 Level 2 Level 3 Total
USD USD USD USD
Futures (26,737) - - (26,737)
Forwards - (37) - (37)
Total financial liabilities at fair value through
profit or loss (26,737) (37) - (26,774)
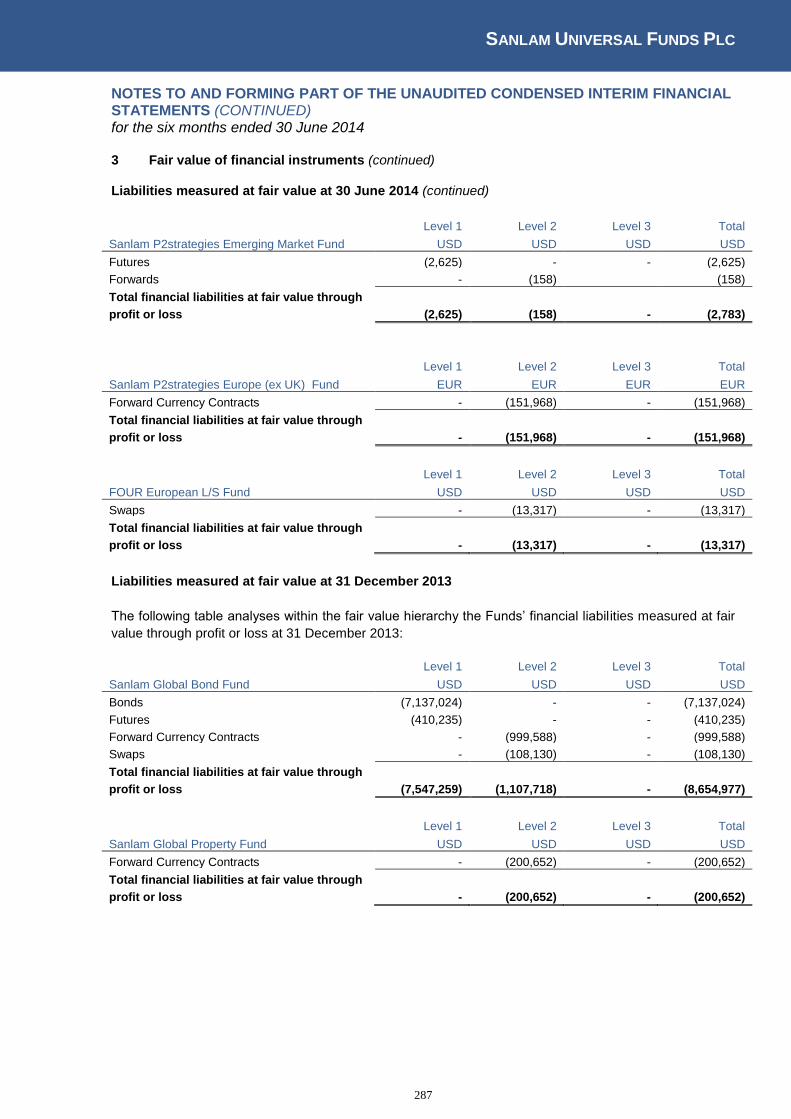
SANLAM UNIVERSAL FUNDS PLC
287
NOTES TO AND FORMING PART OF THE UNAUDITED CONDENSED INTERIM FINANCIAL STATEMENTS (CONTINUED) for the six months ended 30 June 2014 3 Fair value of financial instruments (continued) Liabilities measured at fair value at 30 June 2014 (continued)
Sanlam P2strategies Emerging Market Fund
Level 1 Level 2 Level 3 Total
USD USD USD USD
Futures (2,625) - - (2,625)
Forwards - (158) (158)
Total financial liabilities at fair value through
profit or loss (2,625) (158) - (2,783)
Sanlam P2strategies Europe (ex UK) Fund
Level 1 Level 2 Level 3 Total
EUR EUR EUR EUR
Forward Currency Contracts - (151,968) - (151,968)
Total financial liabilities at fair value through
profit or loss - (151,968) - (151,968)
FOUR European L/S Fund
Level 1 Level 2 Level 3 Total
USD USD USD USD
Swaps - (13,317) - (13,317)
Total financial liabilities at fair value through
profit or loss - (13,317) - (13,317)
Liabilities measured at fair value at 31 December 2013
The following table analyses within the fair value hierarchy the Funds’ financial liabilities measured at fair
value through profit or loss at 31 December 2013:
Sanlam Global Bond Fund
Level 1 Level 2 Level 3 Total
USD USD USD USD
Bonds (7,137,024) - - (7,137,024)
Futures (410,235) - - (410,235)
Forward Currency Contracts - (999,588) - (999,588)
Swaps - (108,130) - (108,130)
Total financial liabilities at fair value through
profit or loss (7,547,259) (1,107,718) - (8,654,977)
Sanlam Global Property Fund
Level 1 Level 2 Level 3 Total
USD USD USD USD
Forward Currency Contracts - (200,652) - (200,652)
Total financial liabilities at fair value through
profit or loss - (200,652) - (200,652)
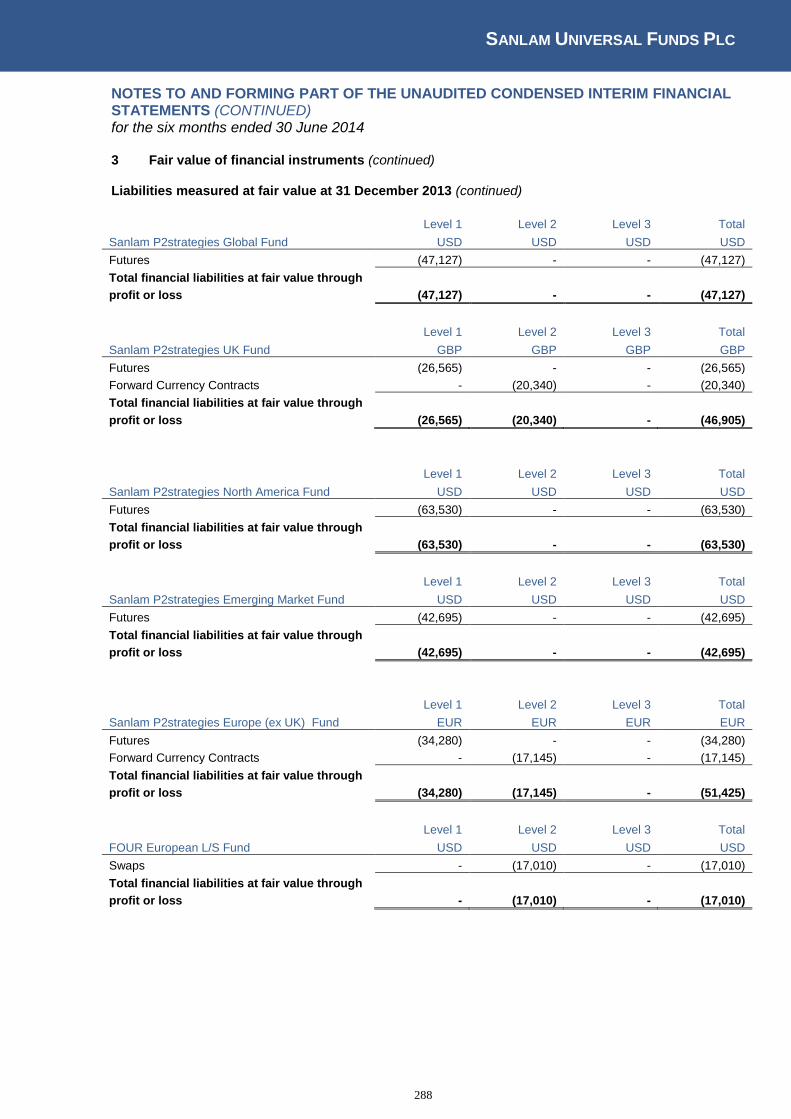
SANLAM UNIVERSAL FUNDS PLC
288
NOTES TO AND FORMING PART OF THE UNAUDITED CONDENSED INTERIM FINANCIAL STATEMENTS (CONTINUED) for the six months ended 30 June 2014 3 Fair value of financial instruments (continued) Liabilities measured at fair value at 31 December 2013 (continued)
Sanlam P2strategies Global Fund
Level 1 Level 2 Level 3 Total
USD USD USD USD
Futures (47,127) - - (47,127)
Total financial liabilities at fair value through
profit or loss (47,127) - - (47,127)
Sanlam P2strategies UK Fund
Level 1 Level 2 Level 3 Total
GBP GBP GBP GBP
Futures (26,565) - - (26,565)
Forward Currency Contracts - (20,340) - (20,340)
Total financial liabilities at fair value through
profit or loss (26,565) (20,340) - (46,905)
Sanlam P2strategies North America Fund
Level 1 Level 2 Level 3 Total
USD USD USD USD
Futures (63,530) - - (63,530)
Total financial liabilities at fair value through
profit or loss (63,530) - - (63,530)
Sanlam P2strategies Emerging Market Fund
Level 1 Level 2 Level 3 Total
USD USD USD USD
Futures (42,695) - - (42,695)
Total financial liabilities at fair value through
profit or loss (42,695) - - (42,695)
Sanlam P2strategies Europe (ex UK) Fund
Level 1 Level 2 Level 3 Total
EUR EUR EUR EUR
Futures (34,280) - - (34,280)
Forward Currency Contracts - (17,145) - (17,145)
Total financial liabilities at fair value through
profit or loss (34,280) (17,145) - (51,425)
FOUR European L/S Fund
Level 1 Level 2 Level 3 Total
USD USD USD USD
Swaps - (17,010) - (17,010)
Total financial liabilities at fair value through
profit or loss - (17,010) - (17,010)

SANLAM UNIVERSAL FUNDS PLC
289
NOTES TO AND FORMING PART OF THE UNAUDITED CONDENSED INTERIM FINANCIAL STATEMENTS (CONTINUED) for the six months ended 30 June 2014 3 Fair value of financial instruments (continued)
Investments whose values are based on quoted market prices in active markets, and therefore classified
within level 1, include active listed equities, exchange traded derivatives, government bonds, corporate
bonds, mortgage backed securities and collective investment schemes. The Fund does not adjust the
quoted price for these instruments nor does it apply a discount to securities where the volume traded in
the market is low to the Fund’s holding.
Financial instruments that trade in markets that are not considered to be active but are valued based on
quoted market prices, dealer quotations or alternative pricing sources supported by observable inputs are
classified within level 2. Over-the-counter derivatives such as futures and forward currency contracts are
classified within level 2. As level 2 investments include positions that are not traded in active markets
and/or are subject to transfer restrictions, valuations may be adjusted to reflect illiquidity and/or non-
transferability, which are generally based on available market information.
Investments classified within level 3 have significant unobservable inputs, as they trade infrequently.
Level 3 instruments include illiquid government bonds and illiquid corporate bonds.
Significant transfers between levels 1, 2 and 3
There were no significant transfers between levels during the period ended 30 June 2014
The following table shows significant transfers between level 1 and level 3 of the fair value hierarchy for
financial assets recognised at fair value for the year ended 31 December 2013:
Sanlam Global Best Ideas Fund - 2013
Financial assets held for trading:
Transfer from level
1 to level 3
Equities 34,088,309
Level 3 Assets measured at fair value reconciliation
The following tables show a reconciliation of all movements in the fair value of financial instruments
categorised within Level 3 between 1 January and 30 June 2014:
Sanlam Global Best Ideas Fund
Investment in securities
2014 2013
Balance as at 1 January 6,043,876 3,828,149
Realised gains/(losses) (10,823,630) 2,339,641
Change in unrealised 7,531,800 (30,831,177)
Gross Purchases - -
Gross Sales (321,462) (3,381,046)
Transfers in and out of level 3 - 34,088,309
Balance as at 30 June/31 December 2,430,584 6,043,876
Total unrealised gains and losses for the year included in profit or
loss for level 3 assets held at period/year end (18,308,304) (25,840,105)

SANLAM UNIVERSAL FUNDS PLC
290
NOTES TO AND FORMING PART OF THE UNAUDITED CONDENSED INTERIM FINANCIAL STATEMENTS (CONTINUED) for the six months ended 30 June 2014 3 Fair value of financial instruments (continued)
Level 3 Assets measured at fair value reconciliation (continued)
The level 3 position held by the Sanlam Global Best Ideas Fund at 30 June 2014 end is DBA Telecommunications Asia. At the period end, DBA Telecommunications Asia is valued at USD 2,430,584.
Shares in DBA Telecommunications Asia have been suspended since June 2013 and the position was
written down by 50% on 17 December 2013 with a further writedown of 30% on 22 May 2014 pending
further news and financial information from the company.
For the purpose of IFRS 7 for the reconciliation showing the change in fair value due to a change in inputs used, changes to one or more of the inputs to reasonably alternative assumptions, is irrelevant in this case and would result in this position (possibly) being written down to zero.
Sanlam Global Financial Fund
Investment in securities
2014 2013
Balance as at 1 January 521,042 -
Realised gains/(losses) - -
Change in unrealised (311,502) (942,364)
Gross Purchases - 1,463,406
Gross Sales - -
Transfers in and out of level 3 - -
Balance as at 30 June/31 December 209,540 521,042
Total unrealised gains and losses for the year included in profit or
loss for level 3 assets held at period/year end (1,253,865) (942,364)
The level 3 position held by the Sanlam Global Financial Fund at 30 June 2014 is DBA Telecommunications Asia which is valued at USD 209,540. Shares in DBA Telecommunications Asia have been suspended since June 2013 and the position was written down by 50% on 17 December 2013 with a further writedown of 30% on 22 May 2014 pending further news and financial information from the company.
For the purpose of IFRS 7 for the reconciliation showing the change in fair value due to a change in inputs
used, changes to one or more of the inputs to reasonably alternative assumptions, is irrelevant in this
case and would result in this position (possibly) being written down to zero.
Sanlam World Equity Tracker Fund
Investment in securities
2014 2013
Balance as at 1 January 4,280 3,712
Realised gains/(losses) - -
Change in unrealised 2,643 568
Gross Purchases - -
Gross Sales - -
Transfers in and out of level 3 - -
Balance as at 30 June/31 December 6,923 4,280
Total unrealised gains and losses for the year included in profit or loss
for level 3 assets held at period/year end 6,923 4,280

SANLAM UNIVERSAL FUNDS PLC
291
NOTES TO AND FORMING PART OF THE UNAUDITED CONDENSED INTERIM FINANCIAL STATEMENTS (CONTINUED) for the six months ended 30 June 2014 3 Fair value of financial instruments (continued)
Level 3 Assets measured at fair value reconciliation (continued)
The level 3 position held by the Sanlam World Equity Tracker Fund at 30 June 2014 and 31 December 2013 year end is Rolls-Royce Group - C Shares which is valued at USD 6,293 (2012: USD 4,280). This security is thinly traded and is classified as level 3 due to its trading status.
For the purpose of IFRS 7 for the reconciliation showing the change in fair value due to a change in inputs
used, changes to one or more of the inputs to reasonably alternative assumptions, is irrelevant in this
case and would result in this position (possibly) being written down to zero.
Sanlam UK Equity Tracker Fund
Investment in securities
2014 2013
Balance as at 1 January 2,380 -
Realised gains/(losses) - -
Change in unrealised 2,612 2,380
Gross Purchases - -
Gross Sales - -
Transfers in and out of level 3 - -
Balance as at 30 June/31 December 4,992 2,380
Total unrealised gains and losses for the year included in profit or loss
for level 3 assets held at period/year end 4,992 2,380
The level 3 position held by the Sanlam UK Equity Tracker Fund at 30 June 2014 and 31 December 2013 is Rolls-Royce Group - C Shares which is valued at USD 4,922 (2013: USD 2,380). This security is thinly traded and is classified as level 3 due to its trading status.
For the purpose of IFRS 7 for the reconciliation showing the change in fair value due to a change in inputs
used, changes to one or more of the inputs to reasonably alternative assumptions, is irrelevant in this
case and would result in this position (possibly) being written down to zero.
Sanlam Equity Allocation Fund
Investment in securities
2014 2013
Balance as at 1 January 1,877 -
Realised gains/(losses) - -
Change in unrealised 2,532 1,877
Gross Purchases - -
Gross Sales - -
Transfers in and out of level 3 - -
Balance as at 30 June/31 December 4,409 1,877
Total unrealised gains and losses for the year included in profit or loss
for level 3 assets held at period/year end 4,409 1,877
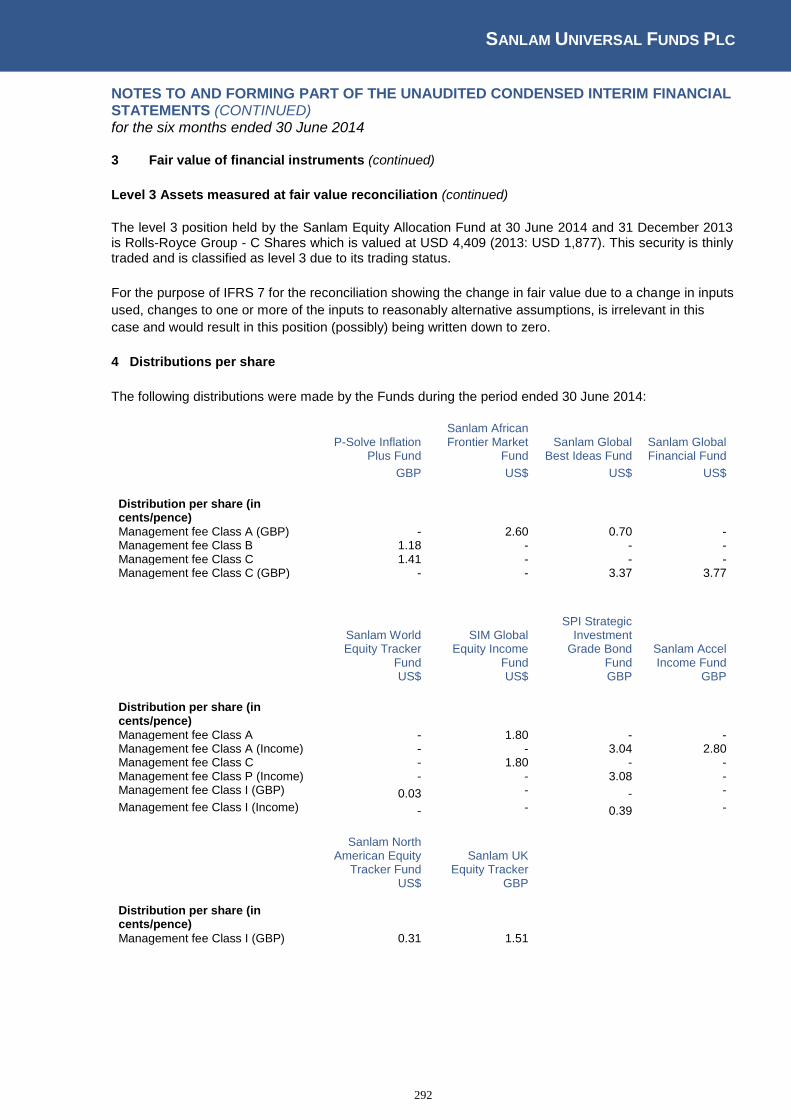
SANLAM UNIVERSAL FUNDS PLC
292
NOTES TO AND FORMING PART OF THE UNAUDITED CONDENSED INTERIM FINANCIAL STATEMENTS (CONTINUED) for the six months ended 30 June 2014 3 Fair value of financial instruments (continued)
Level 3 Assets measured at fair value reconciliation (continued)
The level 3 position held by the Sanlam Equity Allocation Fund at 30 June 2014 and 31 December 2013 is Rolls-Royce Group - C Shares which is valued at USD 4,409 (2013: USD 1,877). This security is thinly traded and is classified as level 3 due to its trading status.
For the purpose of IFRS 7 for the reconciliation showing the change in fair value due to a change in inputs
used, changes to one or more of the inputs to reasonably alternative assumptions, is irrelevant in this
case and would result in this position (possibly) being written down to zero.
4 Distributions per share
The following distributions were made by the Funds during the period ended 30 June 2014:
P-Solve Inflation
Plus Fund
Sanlam African Frontier Market
Fund Sanlam Global
Best Ideas Fund Sanlam Global Financial Fund
GBP US$ US$ US$
Distribution per share (in cents/pence)
Management fee Class A (GBP) - 2.60 0.70 - Management fee Class B 1.18 - - - Management fee Class C 1.41 - - - Management fee Class C (GBP) - - 3.37 3.77
Sanlam World Equity Tracker
Fund
SIM Global Equity Income
Fund
SPI Strategic Investment
Grade Bond Fund
Sanlam Accel Income Fund
US$ US$ GBP GBP
Distribution per share (in cents/pence)
Management fee Class A - 1.80 - - Management fee Class A (Income) - - 3.04 2.80 Management fee Class C - 1.80 - - Management fee Class P (Income) - - 3.08 - Management fee Class I (GBP) 0.03 - - -
Management fee Class I (Income) - - 0.39 -
Sanlam North American Equity
Tracker Fund Sanlam UK
Equity Tracker US$ GBP
Distribution per share (in cents/pence) Management fee Class I (GBP) 0.31 1.51
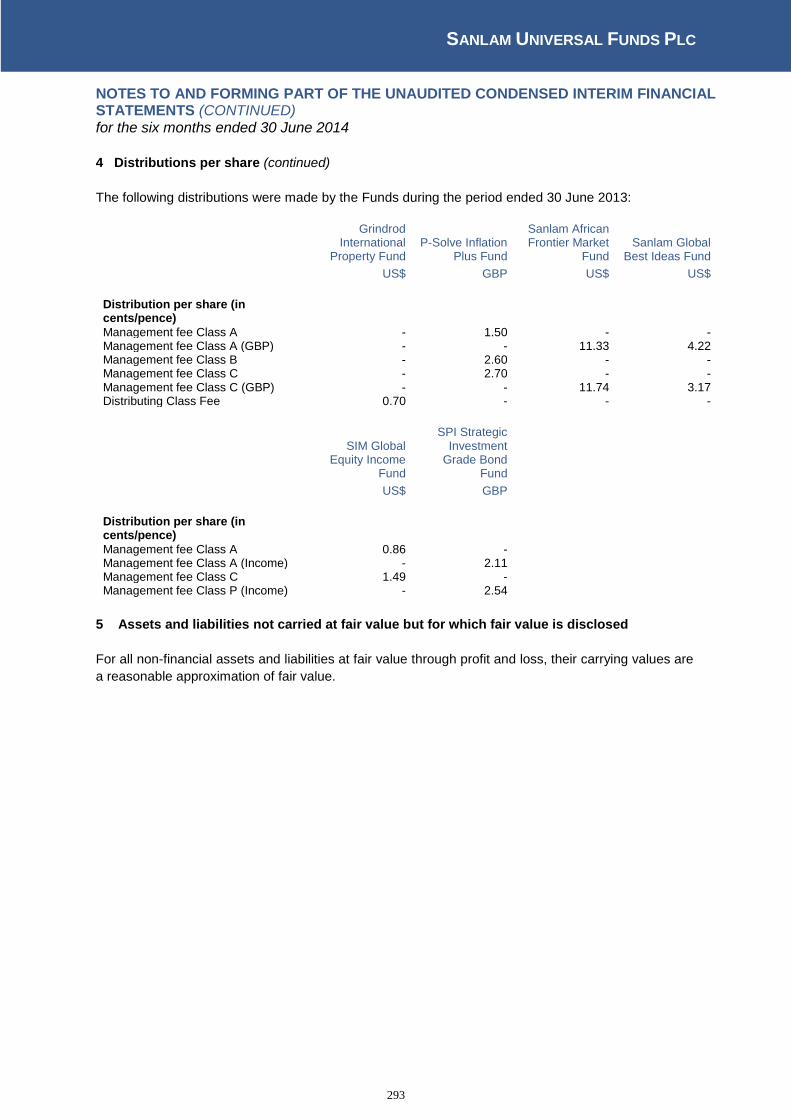
SANLAM UNIVERSAL FUNDS PLC
293
NOTES TO AND FORMING PART OF THE UNAUDITED CONDENSED INTERIM FINANCIAL STATEMENTS (CONTINUED) for the six months ended 30 June 2014
4 Distributions per share (continued)
The following distributions were made by the Funds during the period ended 30 June 2013:
Grindrod International
Property Fund P-Solve Inflation
Plus Fund
Sanlam African Frontier Market
Fund Sanlam Global
Best Ideas Fund
US$ GBP US$ US$
Distribution per share (in cents/pence)
Management fee Class A - 1.50 - - Management fee Class A (GBP) - - 11.33 4.22 Management fee Class B - 2.60 - - Management fee Class C - 2.70 - - Management fee Class C (GBP) - - 11.74 3.17 Distributing Class Fee 0.70 - - -
SIM Global
Equity Income Fund
SPI Strategic Investment
Grade Bond Fund
US$ GBP
Distribution per share (in cents/pence)
Management fee Class A 0.86 - Management fee Class A (Income) - 2.11 Management fee Class C 1.49 - Management fee Class P (Income) - 2.54
5 Assets and liabilities not carried at fair value but for which fair value is disclosed
For all non-financial assets and liabilities at fair value through profit and loss, their carrying values are
a reasonable approximation of fair value.

SANLAM UNIVERSAL FUNDS PLC
294
NOTES TO AND FORMING PART OF THE UNAUDITED CONDENSED INTERIM FINANCIAL STATEMENTS (CONTINUED) for the six months ended 30 June 2014
6 Exchange rates
The following year ended USD exchange rates have been used in this report:
1 USD = 30 June 2014 31 December 2013 30 June 2013
AED 3.6730 - -
AUD 1.0607 1.1179 -
BRL 2.2039 2.3621 -
BWP 8.8107 8.7785 8.5547
CAD 1.0652 1.0625 -
CHF 0.8867 0.8892 0.9440
CNY - 6.0559 -
COP 1,881.4998 1932.0001 -
CZK 20.0466 19.8630 -
DKK 5.4451 5.4140 -
EGP 7.1501 6.9479 -
EUR 0.7308 0.7253 0.7676
GBP 0.5852 0.6039 0.6540
GHS 3.3601 2.3750 2.0180
HKD 7.7503 7.7537 -
HUF 226.0900 215.5500 -
IDR 11,855.0006 12,170.9996 9,935.7814
ILS 3.4283 3.4707 -
INR 60.1000 61.8475 59.8002
JPY 101.3000 105.1100 98.0666
KES 87.6300 86.3000 84.6278
KRW 1,011.6900 1052.9800 -
MAD 8.2125 8.1637 -
MUR 30.2000 30.0000 30.0177
MXN 12.9718 13.0970 -
MYR 3.2094 3.2815 3.1673
NAD 10.6369 - -
NGN 162.9500 160.4900 160.7846
NOK 6.1368 6.0679 -
NZD 1.1418 1.2147 -
PHP 43.6550 44.3900 -
PLN 3.0368 3.0619 -
QAR 3.6401 - -
SEK 6.6872 6.4223 -
SGD 1.2465 1.2625 -
THB 32.4520 32.7410 -
TND 1.6819 1.6456 -
TRY 2.1199 2.1480 -
TWD 29.8680 29.8127 -
XOF 481.2900 - -
ZMW 6.3000 - -
ZAR 10.6369 - -
The following average USD exchange rates have been used in this report:
1 USD = 30 June 2014 31 December 2013 30 June 2013
EUR 0.7297 0.7781 0.7614
GBP 0.5997 0.6381 0.6477
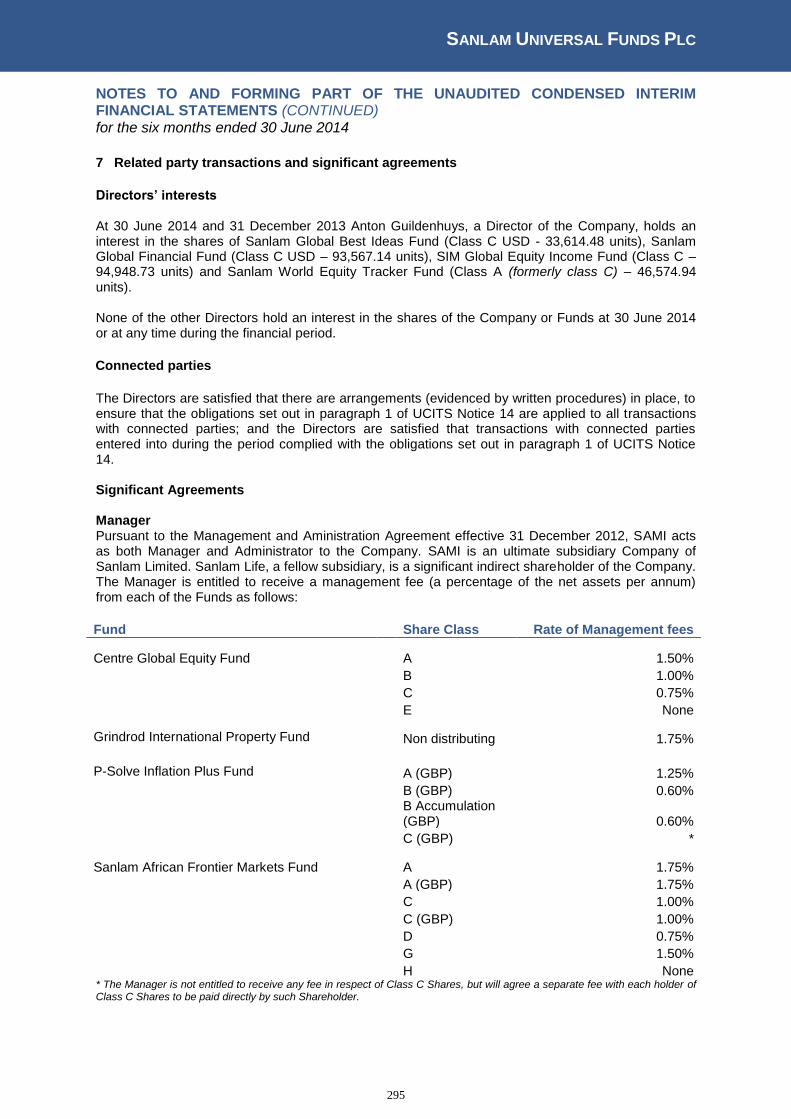
SANLAM UNIVERSAL FUNDS PLC
295
NOTES TO AND FORMING PART OF THE UNAUDITED CONDENSED INTERIM FINANCIAL STATEMENTS (CONTINUED) for the six months ended 30 June 2014
7 Related party transactions and significant agreements
Directors’ interests At 30 June 2014 and 31 December 2013 Anton Guildenhuys, a Director of the Company, holds an interest in the shares of Sanlam Global Best Ideas Fund (Class C USD - 33,614.48 units), Sanlam Global Financial Fund (Class C USD – 93,567.14 units), SIM Global Equity Income Fund (Class C – 94,948.73 units) and Sanlam World Equity Tracker Fund (Class A (formerly class C) – 46,574.94 units). None of the other Directors hold an interest in the shares of the Company or Funds at 30 June 2014 or at any time during the financial period.
Connected parties
The Directors are satisfied that there are arrangements (evidenced by written procedures) in place, to ensure that the obligations set out in paragraph 1 of UCITS Notice 14 are applied to all transactions with connected parties; and the Directors are satisfied that transactions with connected parties entered into during the period complied with the obligations set out in paragraph 1 of UCITS Notice 14. Significant Agreements Manager Pursuant to the Management and Aministration Agreement effective 31 December 2012, SAMI acts as both Manager and Administrator to the Company. SAMI is an ultimate subsidiary Company of Sanlam Limited. Sanlam Life, a fellow subsidiary, is a significant indirect shareholder of the Company. The Manager is entitled to receive a management fee (a percentage of the net assets per annum) from each of the Funds as follows:
Fund Share Class Rate of Management fees
Centre Global Equity Fund A 1.50%
B 1.00%
C 0.75%
E None Grindrod International Property Fund Non distributing 1.75%
P-Solve Inflation Plus Fund A (GBP) 1.25% B (GBP) 0.60% B Accumulation
(GBP) 0.60% C (GBP) *
Sanlam African Frontier Markets Fund A 1.75%
A (GBP) 1.75%
C 1.00%
C (GBP) 1.00%
D 0.75%
G 1.50%
H None * The Manager is not entitled to receive any fee in respect of Class C Shares, but will agree a separate fee with each holder of Class C Shares to be paid directly by such Shareholder.
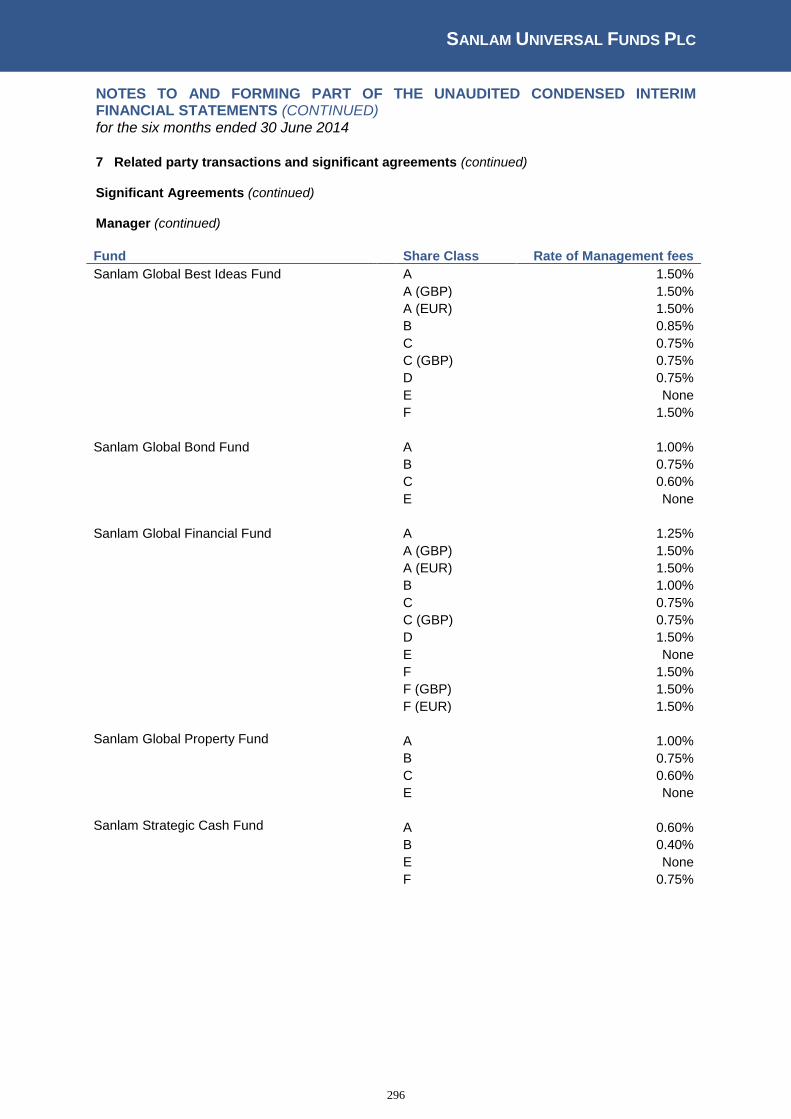
SANLAM UNIVERSAL FUNDS PLC
296
NOTES TO AND FORMING PART OF THE UNAUDITED CONDENSED INTERIM FINANCIAL STATEMENTS (CONTINUED) for the six months ended 30 June 2014
7 Related party transactions and significant agreements (continued)
Significant Agreements (continued)
Manager (continued)
Fund Share Class Rate of Management fees
Sanlam Global Best Ideas Fund A 1.50%
A (GBP) 1.50%
A (EUR) 1.50%
B 0.85%
C 0.75%
C (GBP) 0.75%
D 0.75%
E None
F 1.50%
Sanlam Global Bond Fund A 1.00%
B 0.75%
C 0.60%
E None
Sanlam Global Financial Fund A 1.25%
A (GBP) 1.50%
A (EUR) 1.50%
B 1.00%
C 0.75%
C (GBP) 0.75%
D 1.50%
E None
F 1.50%
F (GBP) 1.50%
F (EUR) 1.50%
Sanlam Global Property Fund A 1.00% B 0.75% C 0.60% E None Sanlam Strategic Cash Fund A 0.60% B 0.40% E None F 0.75%

SANLAM UNIVERSAL FUNDS PLC
297
NOTES TO AND FORMING PART OF THE UNAUDITED CONDENSED INTERIM FINANCIAL STATEMENTS (CONTINUED) for the six months ended 30 June 2014
7 Related party transactions and significant agreements (continued)
Significant Agreements (continued)
Manager (continued)
Fund Share Class Rate of Management fees
Sanlam World Equity Fund A 1.50%
B 0.85%
C 0.75%
E None
Sanlam World Equity Tracker Fund A 0.50%
B 0.40%
C 0.75%
E None
I 0.30%
I (GBP) 0.30%
SIIP India Opportunities Fund A 1.50%
A (GBP) 1.50%
C 0.75%
D 0.75%
E None
SIM Global Equity Income Fund A 1.25%
B 1.00%
C 0.75%
E None
I 1.25%
SPI Strategic Investment Grade Bond A Income (GBP) 1.00% Fund A Accumulation (GBP) 1.00% P Income (GBP) 0.15% P Accumulation (GBP) 0.15% P Accumulation 0.15% I Income (GBP) 0.15% I Accumulation (GBP) 0.15% Sanlam Fund of Alternative UCITS Fund A 0.75% A (GBP) 0.75% E None
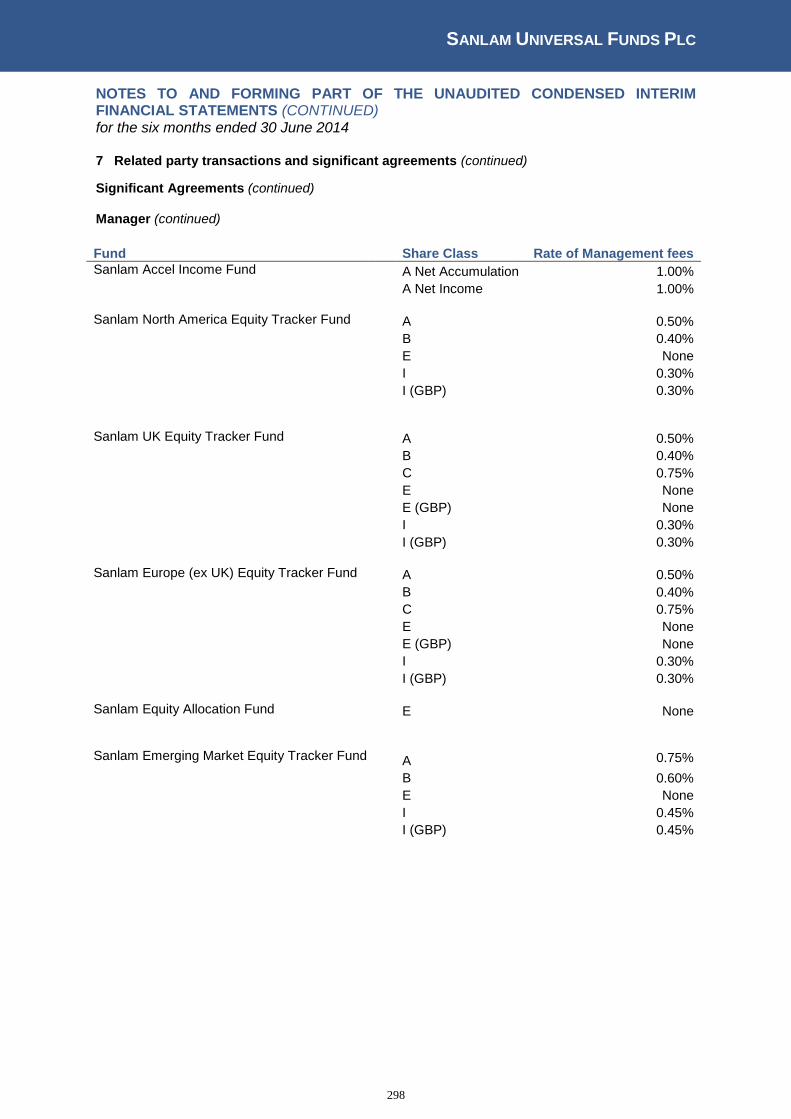
SANLAM UNIVERSAL FUNDS PLC
298
NOTES TO AND FORMING PART OF THE UNAUDITED CONDENSED INTERIM FINANCIAL STATEMENTS (CONTINUED) for the six months ended 30 June 2014
7 Related party transactions and significant agreements (continued)
Significant Agreements (continued)
Manager (continued)
Fund Share Class Rate of Management fees
Sanlam Accel Income Fund A Net Accumulation 1.00% A Net Income 1.00% Sanlam North America Equity Tracker Fund A 0.50% B 0.40% E None I 0.30% I (GBP) 0.30% Sanlam UK Equity Tracker Fund A 0.50% B 0.40% C 0.75% E None E (GBP) None I 0.30% I (GBP) 0.30% Sanlam Europe (ex UK) Equity Tracker Fund A 0.50% B 0.40% C 0.75% E None E (GBP) None I 0.30% I (GBP) 0.30% Sanlam Equity Allocation Fund E None
Sanlam Emerging Market Equity Tracker Fund A 0.75%
B 0.60% E None I 0.45% I (GBP) 0.45%

SANLAM UNIVERSAL FUNDS PLC
299
NOTES TO AND FORMING PART OF THE UNAUDITED CONDENSED INTERIM FINANCIAL STATEMENTS (CONTINUED) for the six months ended 30 June 2014
7 Related party transactions and significant agreements (continued)
Significant Agreements (continued)
Manager (continued)
Fund Share Class Rate of Management fees
Sanlam P2strategies Global Fund A 1.25% A (GBP) 1.25% I 0.75% I (GBP) 0.75% Sanlam P2strategies UK Fund A 1.25% A (GBP) 1.25% I 0.75% I (GBP) 0.75% Sanlam P2strategies North America Fund A 1.25% A (GBP) 1.25% I 0.75% I (GBP) 0.75% Sanlam P2strategies Emerging Market Fund A 1.25% A (GBP) 1.25% I 0.75% I (GBP) 0.75%
Sanlam P2strategies Europe (ex UK) Fund A 1.25% A (GBP) 1.25% A (EUR) 1.25% I 0.75% I (GBP) 0.75% I (EUR) 0.75%
Sanlam S&P Africa Tracker Fund A 1.00% E None I 0.30% FOUR European L/S Fund A (USD) 1.50% SPI Global High Quality Fund C Income (GBP) 0.55% C Accumulation
(GBP) 0.55% D Income (USD) 0.75% D Accumulation
(USD) 0.75% E Income (USD) 1.25% E Accumulation
(USD) 1.25% Performance Fee For certain share classes of the Centre Global Equity Fund, SIIP India Opportunities Fund, Sanlam Global Property Fund, Sanlam Global Financial Fund, Sanlam Global Best Ideas Fund, Sanlam African Frontier Markets Fund, and FOUR European L/S Fund the Manager shall also be entitled to receive out of the assets of the Funds a performance fee in respect of each performance period.
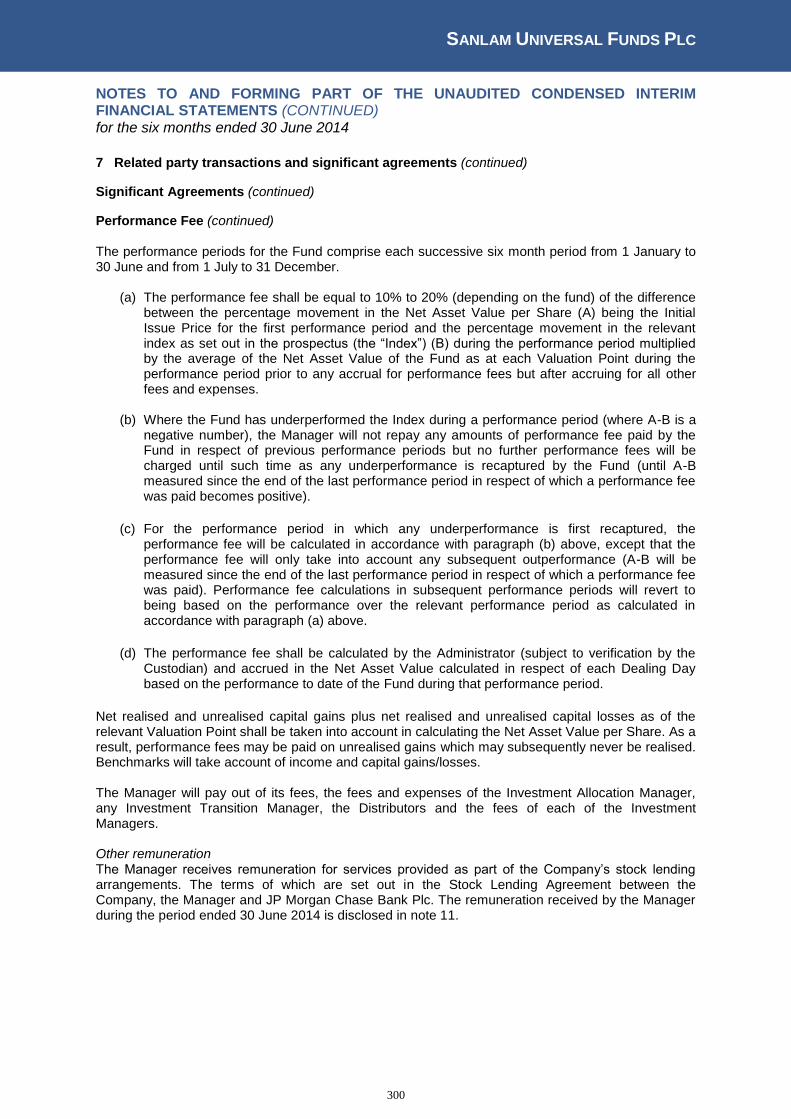
SANLAM UNIVERSAL FUNDS PLC
300
NOTES TO AND FORMING PART OF THE UNAUDITED CONDENSED INTERIM FINANCIAL STATEMENTS (CONTINUED) for the six months ended 30 June 2014
7 Related party transactions and significant agreements (continued)
Significant Agreements (continued)
Performance Fee (continued) The performance periods for the Fund comprise each successive six month period from 1 January to 30 June and from 1 July to 31 December.
(a) The performance fee shall be equal to 10% to 20% (depending on the fund) of the difference between the percentage movement in the Net Asset Value per Share (A) being the Initial Issue Price for the first performance period and the percentage movement in the relevant index as set out in the prospectus (the “Index”) (B) during the performance period multiplied by the average of the Net Asset Value of the Fund as at each Valuation Point during the performance period prior to any accrual for performance fees but after accruing for all other fees and expenses.
(b) Where the Fund has underperformed the Index during a performance period (where A-B is a negative number), the Manager will not repay any amounts of performance fee paid by the Fund in respect of previous performance periods but no further performance fees will be charged until such time as any underperformance is recaptured by the Fund (until A-B measured since the end of the last performance period in respect of which a performance fee was paid becomes positive).
(c) For the performance period in which any underperformance is first recaptured, the
performance fee will be calculated in accordance with paragraph (b) above, except that the performance fee will only take into account any subsequent outperformance (A-B will be measured since the end of the last performance period in respect of which a performance fee was paid). Performance fee calculations in subsequent performance periods will revert to being based on the performance over the relevant performance period as calculated in accordance with paragraph (a) above.
(d) The performance fee shall be calculated by the Administrator (subject to verification by the
Custodian) and accrued in the Net Asset Value calculated in respect of each Dealing Day based on the performance to date of the Fund during that performance period.
Net realised and unrealised capital gains plus net realised and unrealised capital losses as of the relevant Valuation Point shall be taken into account in calculating the Net Asset Value per Share. As a result, performance fees may be paid on unrealised gains which may subsequently never be realised. Benchmarks will take account of income and capital gains/losses. The Manager will pay out of its fees, the fees and expenses of the Investment Allocation Manager, any Investment Transition Manager, the Distributors and the fees of each of the Investment Managers. Other remuneration The Manager receives remuneration for services provided as part of the Company’s stock lending arrangements. The terms of which are set out in the Stock Lending Agreement between the Company, the Manager and JP Morgan Chase Bank Plc. The remuneration received by the Manager during the period ended 30 June 2014 is disclosed in note 11.
SANLAM UNIVERSAL FUNDS PLC
301
NOTES TO AND FORMING PART OF THE UNAUDITED CONDENSED INTERIM FINANCIAL STATEMENTS (CONTINUED) for the six months ended 30 June 2014
7 Related party transactions and significant agreements (continued)
Significant Agreements (continued) Administrator
SAMI as the Administrator is a related party of the Company. In its role as Administrator, SAMI is entitled to receive out of the assets of each Fund an annual fee ranging from 0.025% - 0.035% of the net assets of the Fund. Certain Funds are also subject to a minimum annual fee and/or additional annual fee ranging from USD 10,000 – 25,000 per annum. In addition, the Administrator is entitled to receive its reasonable costs and expenses incurred in the performance of its duties as Administrator of the Company. These fees shall accrue and be calculated on each dealing day and shall be payable monthly in arrears.
Registrar and Transfer Agent
J.P. Morgan Administration Services (Ireland) Limited are the appointed Registrar and Transfer Agent to the Company. Transfer agency fees are charged at normal commercial rates.
Custodian The Custodian is not a related party to the Company or to the Administrator. The Custodian will be entitled to receive from the Company out of the assets of the Fund an annual fee which will not exceed 0.0012% of the net assets of the Fund (plus VAT, if any) subject to certain minimums per Sub-Fund together with reasonable costs and expenses incurred by the Custodian in the performance of its duties as Custodian of the Fund. These fees shall accrue and be calculated on each Dealing Day and shall be payable monthly in arrears. The Custodian shall also be entitled to be reimbursed out of the assets of the Fund all agreed transaction charges (which will be charged at normal commercial rates). Investment Managers and Investment Advisor
The Investment Managers and Investment Advisor are appointed and paid by the Manager. Sanlam International Investments Ltd, Four Capital Partners Ltd, Sanlam Investment Management (Pty) Ltd, Sanlam Private Investments (UK) Limited, Eight Investment Partners (Pty) Ltd, Centre Asset Management LLC, Principal Investment Management (Pty) Limited and P-Solve Investments Limited are related parties to the Fund and the Manager.
Distributors
The Distributors are appointed and paid by the Manager. Sanlam Collective Investments Limited, Sanlam Investment Management (Pty) Limited and P-Solve Investments Limited are related parties to the Fund and the Manager.
SANLAM UNIVERSAL FUNDS PLC
302
NOTES TO AND FORMING PART OF THE UNAUDITED CONDENSED INTERIM FINANCIAL STATEMENTS (CONTINUED) for the six months ended 30 June 2014
7 Related party transactions and significant agreements (continued)
Significant shareholders at the year-end
Shareholder Fund % held at
30/06/2014 % held at
31/12/2013
Northern Trust Fiduciary (Services) Ireland Ltd* 8IP Asia Equity Opportunities - 59.23% SBSA ITF Sanlam Asia Pacific*** 8IP Asia Equity Opportunities - 14.45% Northern Trust Fiduciary (Services) Ireland Ltd* 8IP Asia Pacific Equity Fund - 63.65% SBSA ITF Sanlam Asia Pacific*** 8IP Asia Pacific Equity Fund - 32.19% Agulhas Nominees (Pty) Ltd**** Centre Global Equity Fund 93.05% 91.61% Agulhas Nominees (Pty) Ltd**** Grindrod International Property Fund 41.87% 42.71% Grindrod Pension Fund Grindrod International Property Fund 16.37% 15.59% KAS Nominees P-Solve Inflation Plus Fund 83.16% 86.27% Sanlam Life Insurance Ltd** Sanlam African Frontier Markets Fund 52.88% 56.80% Sentinel Mining Industry Retirement Sanlam African Frontier Markets Fund 35.65% 36.22% Sanlam Life Insurance Ltd** Sanlam Global Best Ideas Fund 18.03% 17.25% SBSA ITF Sim Global Best Ideas*** Sanlam Global Best Ideas Fund 16.52% 14.26% Sanlam Man Global Sanlam Global Best Ideas Fund 34.66% 35.41% Sanlam Life and Pensions ** Sanlam Global Bond Fund 26.63% - Northern Trust Fiduciary (Services) Ireland Ltd* Sanlam Global Bond Fund - 26.26% Sanlam Life Insurance Ltd** Sanlam Global Bond Fund - 22.52% Sanlam Institutional ** Sanlam Global Bond Fund 33.95% 32.14% BIFM Global Sanlam Global Bond Fund 27.84% - Sentinel Mining Industry Retirement Sanlam Global Financial Fund 55.97% 57.77% Sanlam Life Insurance Ltd** Sanlam Global Property Fund 25.01% 24.12% Sanlam Life & Pensions ** Sanlam Global Property Fund 53.18% 47.29% Standard Bank of SA Ltd*** Sanlam Global Property Fund 11.08% 10.85% Glacier International Ltd Sanlam Strategic Cash Fund 38.51% - Sanlam Collective Investments Scheme**** Sanlam Strategic Cash Fund 16.04% - Sanlam Man Global Sanlam Strategic Cash Fund 35.50% 78.88% Sanlam Life Insurance Ltd** Sanlam World Equity Fund - 27.09% SBSA ITF SIM Balanced Fund Sanlam World Equity Fund - 14.57% Sanlam Man Global Sanlam World Equity Fund 72.74% 73.48% Sanlam Life Insurance Ltd** Sanlam World Equity Tracker Fund 31.61% - SBSA ITF Sim Balanced Fund*** Sanlam World Equity Tracker Fund 12.55% - SBSA ITF Symmetry Inflation Plus*** Sanlam World Equity Tracker Fund 12.32% - Northern Trust Fiduciary (Services) Ireland Ltd* SIIP India Opportunities Fund 63.60% 65.5% Standard Bank of South Africa*** SIIP India Opportunities Fund 34.86% 34.4% African Life Assurance Company** SIM Global Equity Income Fund 10.15% 12.23% Agulhas Nominees (Pty) Ltd**** SIM Global Equity Income Fund 23.25% 24.74% Fundsettle Nominees Ltd SIM Global Equity Income Fund 13.58% - SBSA ITF Sim Inflation Plus Fund*** SIM Global Equity Income Fund 11.18% 13.47% SBSA ITF Symmetry Inflation Plus*** SIM Global Equity Income Fund 10.79% 13.00% Principal Nominees Ltd**** SPI Strategic Investment Grade Bond Fund 88.27% 87.92% Somers Dublin Ltd Sanlam Fund of Alternative UCITS Fund 25.81% 26.34% Sanlam Life & Pensions ** Sanlam Fund of Alternative UCITS Fund 73.92% 72.62% Cofunds Nominees Limited Sanlam Accel Income Fund 88.76% 89.34% Sanlam Man Global Sanlam North America Equity Tracker Fund 20.24% 88.79% Chase Nominees Limited Sanlam North America Equity Tracker Fund 75.53% - Chase Nominees Limited Sanlam UK Equity Tracker 81.96% 23.93% SBSA ITF SIM Balanced Fund Sanlam UK Equity Tracker 6.98% 14.36% Chase Nominees Limited Sanlam Eur ex UK Equ Tracker 72.82% 111.55% SBSA ITF SIM Balanced Fund Sanlam Eur ex UK Equ Tracker 8.58% 14.47% Chase Nominees Limited Sanlam Equity Allocation Cl E USD Shares 87.86% 88.48% Sanlam Man Global Sanlam Equity Allocation Cl E USD Shares 11.84% 11.41%
Sanlam Man Global Sanlam Emerging Market Equity Tracker Fund - 48.14% Chase Nominees Limited Sanlam Emerging Market Equity Tracker Fund 47.44% 38.99% SIM Limited Pooled Segregated Sanlam Emerging Market Equity Tracker Fund 17.02% 10.55% SBSA ITF SIM Inflation Plus Fund Sanlam Emerging Market Equity Tracker Fund 13.44% - Somers Dublin Ltd Sanlam P2strategies Global Fund 32.04% 36.34%
SANLAM UNIVERSAL FUNDS PLC
303
NOTES TO AND FORMING PART OF THE UNAUDITED CONDENSED INTERIM FINANCIAL STATEMENTS (CONTINUED) for the six months ended 30 June 2014
7 Related party transactions and significant agreements (continued)
Significant shareholders at the year-end (continued)
Shareholder Fund
% held at 30/06/201
4 % held at
31/12/2013
Fundsettle Nominees Ltd Sanlam P2strategies Global Fund 53.75% 43.28% Cofunds Nominees Limited Sanlam P2strategies UK Fund 56.60% 29.29% Somers Dublin Ltd Sanlam P2strategies UK Fund 20.61% 40.33% Fundsettle Nominees Ltd Sanlam P2strategies UK Fund 22.72% 34.19%
Somers Dublin Ltd Sanlam P2strategies North America - 21.13%
Fundsettle Nominees Ltd Sanlam P2strategies North America 76.59% 46.16%
Cofunds Nominees Limited Sanlam P2strategies North America 21.13% - Fundsettle Nominees Ltd Sanlam P2strategies Emerging Market 77.24% 53.52% Cofunds Nominees Ltd Sanlam P2strategies Emerging Market 19.94% -
Somers Dublin Ltd Sanlam P2strategies Emerging Market - 26.73% Somers Dublin Ltd Sanlam P2strategies Europe ex UK 35.58% 45.00% Fundsettle Nominees Ltd Sanlam P2strategies Europe ex UK 43.59% 34.89% Cofunds Nominees Ltd Sanlam P2strategies Europe ex UK 19.35% - Sanlam Life Insurance Ltd** Sanlam S&P Africa Tracker Fund 52.07% 99.02% Municipal Gratuity Fund Sanlam S&P Africa Tracker Fund 42.06% -
Principal Nominee SPI Global High Quality Fund 89.37% -
Agulhas Nominees (Pty) Ltd**** SPI Global High Quality Fund 8.65% -
* At 31 December 2013 Northern Trust Fiduciary (Services) Ireland Limited held all of the Class E shares
in each of the Funds on behalf of some of the Funds of Sanlam Global Funds plc, Sanlam Qualifying
Investor Funds plc and Sanlam Investments and Pensions.
** These significant shareholders are related parties to the Company and the Manager.
*** These are investments by South African Unit Trusts. These Unit Trusts are managed by related parties
to the Manager.
**** These are nominee accounts managed by the related parties of the Manager.
The Manager may have entered into special fee arrangements and/or rebate agreements with some of the significant shareholders. These rebates are paid from the profits of the manager.
Management Fees
A summary of fees earned by the Manager during the year and outstanding accrued fees as at 30 June 2014 follows:
8IP Asia Equity
Opportunities
Fund
8IP Asia Pacific Equity
Fund
Centre Global
Equity Fund
Grindrod International
Property Fund
USD USD USD USD
Fees incurred during the period ended 30/6/2014
Class A Management Fees (899) (2,258) (135,440) -
Class A (GBP) Management Fees (1) - - -
Class B Management Fees - - (19,224) -
Class C Management Fees (28) - (228) -
Class D Management Fees (3,651) (9,284) - -
Non-distributing Class Management Fees - - - (96,181)
(4,579) (11,542) (154,892) (96,181)
Fees accrued at 30/06/2014
Class A Management Fees - - (42,975) -
Class B Management Fees - - (6,388) -
Class C Management Fees - - (81) -
Non-distributing Class Management Fees - - - (33,322)
- - (49,444) (33,322)
SANLAM UNIVERSAL FUNDS PLC
304
NOTES TO AND FORMING PART OF THE UNAUDITED CONDENSED INTERIM FINANCIAL STATEMENTS (CONTINUED) for the six months ended 30 June 2014
7 Related party transactions and significant agreements (continued)
Management Fees (continued)
A summary of fees earned by the Manager during the year and outstanding accrued fees as at 30 June 2014 follows (continued):
P-Solve Inflation Plus
Fund
Sanlam African
Frontier Markets
Fund
Sanlam Global Best Ideas Fund
Sanlam Global Bond
Fund
GBP USD USD USD
Fees incurred during the period ended 30/06/2014 Class A Management Fees (193) (767) (371,559) (406)
Class A (EUR) Management Fees - - (2) -
Class A (GBP) Management Fees - (1,005) (948) -
Class B Management Fees (22,579) - (295,920) (2,809) Class B (Accumulation) Management Fees (5,153) - - -
Class C Management Fees - (527) (289,456) (455,754)
Class C (GBP) Management Fees - (2) (489) -
Class D Management Fees - (166,639) (90,154) -
Class F Management Fees - - (128) -
Class F (GBP) Management Fees (156) -
Class G Management Fees - (213,340) -
(27,925) (382,280) (1,048,812) (458,969)
Fees accrued at 30/06/2014
Class A Management Fees (66) (404) (109,209) (138)
Class A (EUR) Management Fees - - (1) -
Class A (GBP) Management Fees - (375) (326) -
Class B Management Fees (7,747) - (96,864) (394) Class B (Accumulation) Management Fees (1,967) - - -
Class C Management Fees - (172) (98,021) (153,660)
Class C (GBP) Management Fees - (1) (169) -
Class D Management Fees - (57,522) (31,291) -
Class F Management Fees - - (44) -
Class F (GBP) Management Fees - - (25) -
Class G Management Fees - (73,679) - -
(9,780) (132,153) (335,950) (154,192)
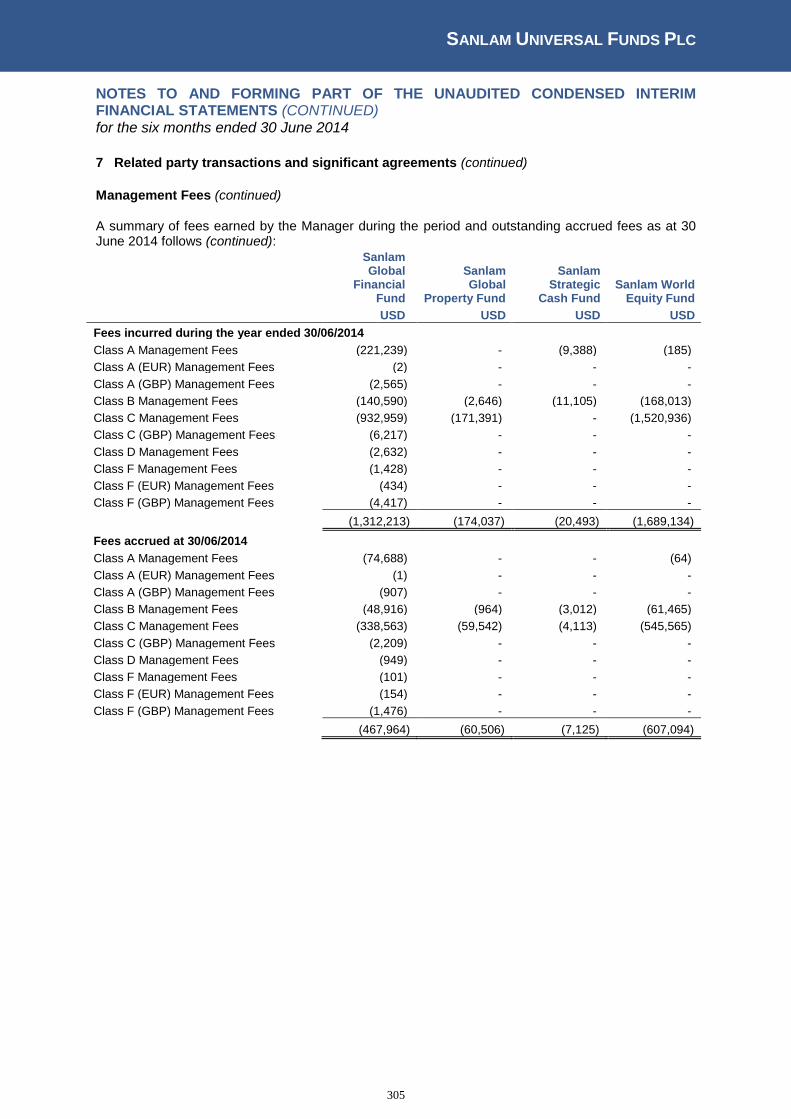
SANLAM UNIVERSAL FUNDS PLC
305
NOTES TO AND FORMING PART OF THE UNAUDITED CONDENSED INTERIM FINANCIAL STATEMENTS (CONTINUED) for the six months ended 30 June 2014
7 Related party transactions and significant agreements (continued)
Management Fees (continued)
A summary of fees earned by the Manager during the period and outstanding accrued fees as at 30 June 2014 follows (continued):
Sanlam Global
Financial Fund
Sanlam Global
Property Fund
Sanlam Strategic
Cash Fund Sanlam World
Equity Fund
USD USD USD USD
Fees incurred during the year ended 30/06/2014 Class A Management Fees (221,239) - (9,388) (185)
Class A (EUR) Management Fees (2) - - -
Class A (GBP) Management Fees (2,565) - - -
Class B Management Fees (140,590) (2,646) (11,105) (168,013)
Class C Management Fees (932,959) (171,391) - (1,520,936)
Class C (GBP) Management Fees (6,217) - - -
Class D Management Fees (2,632) - - -
Class F Management Fees (1,428) - - -
Class F (EUR) Management Fees (434) - - -
Class F (GBP) Management Fees (4,417) - - -
(1,312,213) (174,037) (20,493) (1,689,134)
Fees accrued at 30/06/2014
Class A Management Fees (74,688) - - (64)
Class A (EUR) Management Fees (1) - - -
Class A (GBP) Management Fees (907) - - -
Class B Management Fees (48,916) (964) (3,012) (61,465)
Class C Management Fees (338,563) (59,542) (4,113) (545,565)
Class C (GBP) Management Fees (2,209) - - -
Class D Management Fees (949) - - -
Class F Management Fees (101) - - -
Class F (EUR) Management Fees (154) - - -
Class F (GBP) Management Fees (1,476) - - -
(467,964) (60,506) (7,125) (607,094)

SANLAM UNIVERSAL FUNDS PLC
306
NOTES TO AND FORMING PART OF THE UNAUDITED CONDENSED INTERIM FINANCIAL STATEMENTS (CONTINUED) for the six months ended 30 June 2014
7 Related party transactions and significant agreements (continued)
Management Fees (continued)
A summary of fees earned by the Manager during the period and outstanding accrued fees as at 30 June 2014 follows (continued):
Sanlam
World Equity
Tracker Fund
SIIP India
Opportunities
Fund
SIM Global Equity Income
Fund
SPI Strategic Investment
Grade Bond Fund
USD USD USD GBP
Fees incurred during the year ended 30/06/2014 Class A Management Fees (418,973) (129) (50,413) -
Class A (GBP) Management Fees - (2) - -
Class A Accumulation Management Fees - - - (13,445)
Class A Income Management Fees - - - (14,892)
Class B Management Fees (78,733) - - -
Class C Management Fees (3,571) (22,489) (50,289) -
Class I Management Fees (391,351) - (3,589) -
Class I (GBP) Management Fees (219) - - -
Class P Income Management Fees - - - (78,376)
Class P Accumulation Management Fees - - - (20,291)
(892,847) (22,620) (104,291) (127,004)
Fees accrued at 30/06/2014
Class A Management Fees (153,389) (47) (20,499) -
Class A (GBP) Management Fees (1) - -
Class A Accumulation Management Fees - - - (10,172)
Class A Income Management Fees - - - (12,406)
Class B Management Fees (24,213) - - -
Class C Management Fees (1,091) (8,258) (17,936) -
Class I Management Fees (130,767) - (1,412) -
Class I (GBP) Management Fees (162) - - -
Class P Income Management Fees - - - (64,472)
Class P Accumulation Management Fees - - - (16,601
(309,622) (8,306) (39,847) (103,651)
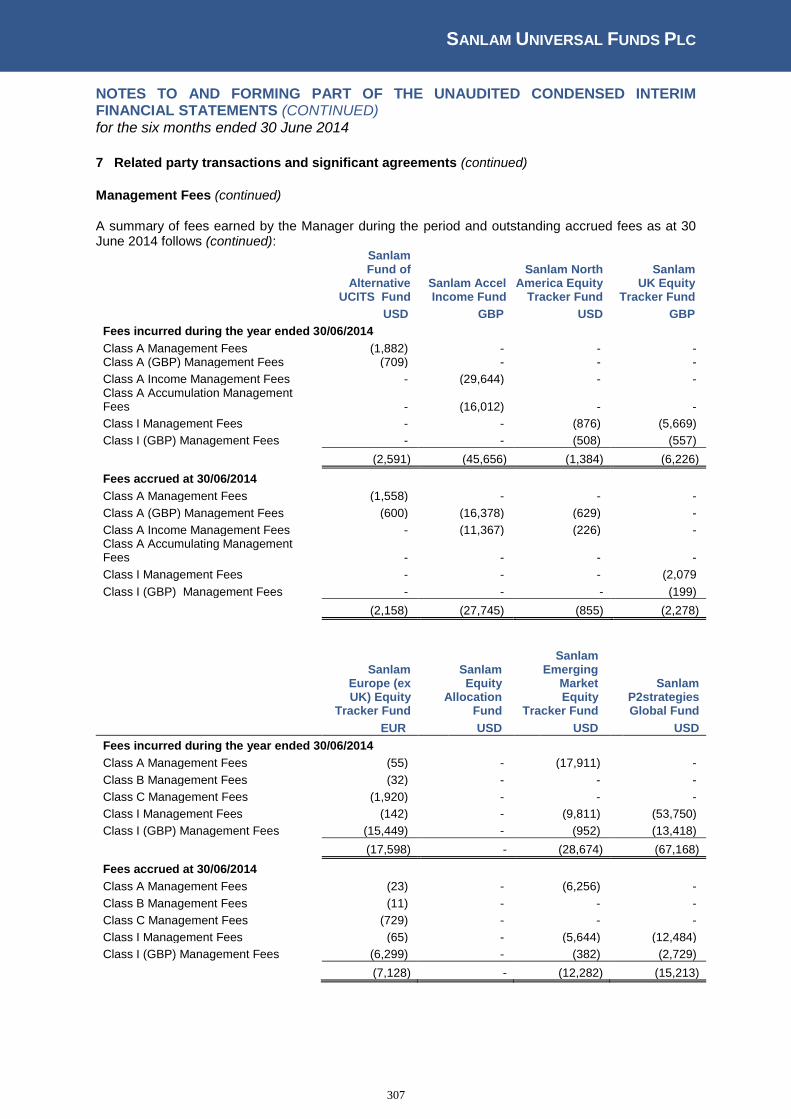
SANLAM UNIVERSAL FUNDS PLC
307
NOTES TO AND FORMING PART OF THE UNAUDITED CONDENSED INTERIM FINANCIAL STATEMENTS (CONTINUED) for the six months ended 30 June 2014
7 Related party transactions and significant agreements (continued)
Management Fees (continued) A summary of fees earned by the Manager during the period and outstanding accrued fees as at 30 June 2014 follows (continued):
Sanlam Fund of
Alternative UCITS Fund
Sanlam Accel Income Fund
Sanlam North America Equity
Tracker Fund
Sanlam UK Equity
Tracker Fund
USD GBP USD GBP
Fees incurred during the year ended 30/06/2014
Class A Management Fees (1,882) - - - Class A (GBP) Management Fees (709) - - -
Class A Income Management Fees - (29,644) - - Class A Accumulation Management Fees - (16,012) - -
Class I Management Fees - - (876) (5,669)
Class I (GBP) Management Fees - - (508) (557)
(2,591) (45,656) (1,384) (6,226)
Fees accrued at 30/06/2014
Class A Management Fees (1,558) - - -
Class A (GBP) Management Fees (600) (16,378) (629) -
Class A Income Management Fees - (11,367) (226) - Class A Accumulating Management Fees - - - -
Class I Management Fees - - - (2,079
Class I (GBP) Management Fees - - - (199)
(2,158) (27,745) (855) (2,278)
Sanlam Europe (ex UK) Equity
Tracker Fund
Sanlam Equity
Allocation Fund
Sanlam Emerging
Market Equity
Tracker Fund
Sanlam P2strategies Global Fund
EUR USD USD USD
Fees incurred during the year ended 30/06/2014
Class A Management Fees (55) - (17,911) -
Class B Management Fees (32) - - -
Class C Management Fees (1,920) - - -
Class I Management Fees (142) - (9,811) (53,750)
Class I (GBP) Management Fees (15,449) - (952) (13,418)
(17,598) - (28,674) (67,168)
Fees accrued at 30/06/2014
Class A Management Fees (23) - (6,256) -
Class B Management Fees (11) - - -
Class C Management Fees (729) - - -
Class I Management Fees (65) - (5,644) (12,484)
Class I (GBP) Management Fees (6,299) - (382) (2,729)
(7,128) - (12,282) (15,213)

SANLAM UNIVERSAL FUNDS PLC
308
NOTES TO AND FORMING PART OF THE UNAUDITED CONDENSED INTERIM FINANCIAL STATEMENTS (CONTINUED) for the six months ended 30 June 2014
7 Related party transactions and significant agreements (continued)
Management Fees (continued)
A summary of fees earned by the Manager during the period and outstanding accrued fees as at 30 June 2014 follows (continued):
Sanlam P2strategies
UK Fund
Sanlam P2 Strategies
North America
Fund
Sanlam P2 Strategies Emerging
Market Fund
Sanlam P2 Strategies
Europe (ex UK) Fund
GBP USD USD EUR
Fees incurred during the year ended 30/06/2014
Class I Management Fees (11,044) (107,546) (45,108) (27,408)
Class I (GBP) Management Fees (33,632) (28,426) (10,129) (9,324)
Class I (EUR) Management Fees - - - (6,297)
(44,676) (135,972) (55,237) (43,029)
Fees accrued at 30/06/2014
Class I Management Fees (3,489) (21,509) (7,040) (8,081)
Class I (GBP) Management Fees (5,884) (6,807) (2,382) (2,216)
Class I (EUR) Management Fees - - - (14)
(9,373) (28,316) (9,422) (10,311)
Sanlam S&P
Africa Tracker
Fund
FOUR European L/S Fund
SPI Global High Quality
Fund
USD GBP GBP
Fees incurred during the year ended 30/06/2014
Class A Management Fees (49,984) (46,817) -
Class C Income Management Fees - - (29,035)
Class C Accumulation Management Fees - - (286)
Class D Accumulation Management Fees - - (696)
Class E Accumulation Management Fees - - (1,975)
Class I Management Fees (29,162) - -
(79,146) (46,817) (31,992)
Fees accrued at 30/06/2014
Class A Management Fees (26,824) (15,926) -
Class C Income Management Fees - - (29,035)
Class C Accumulation Management Fees - - (286)
Class D Accumulation Management Fees - - (696)
Class E Accumulation Management Fees - - (1,975)
Class I Management Fees (10,327) - -
(37,151) (15,926) (31,992)
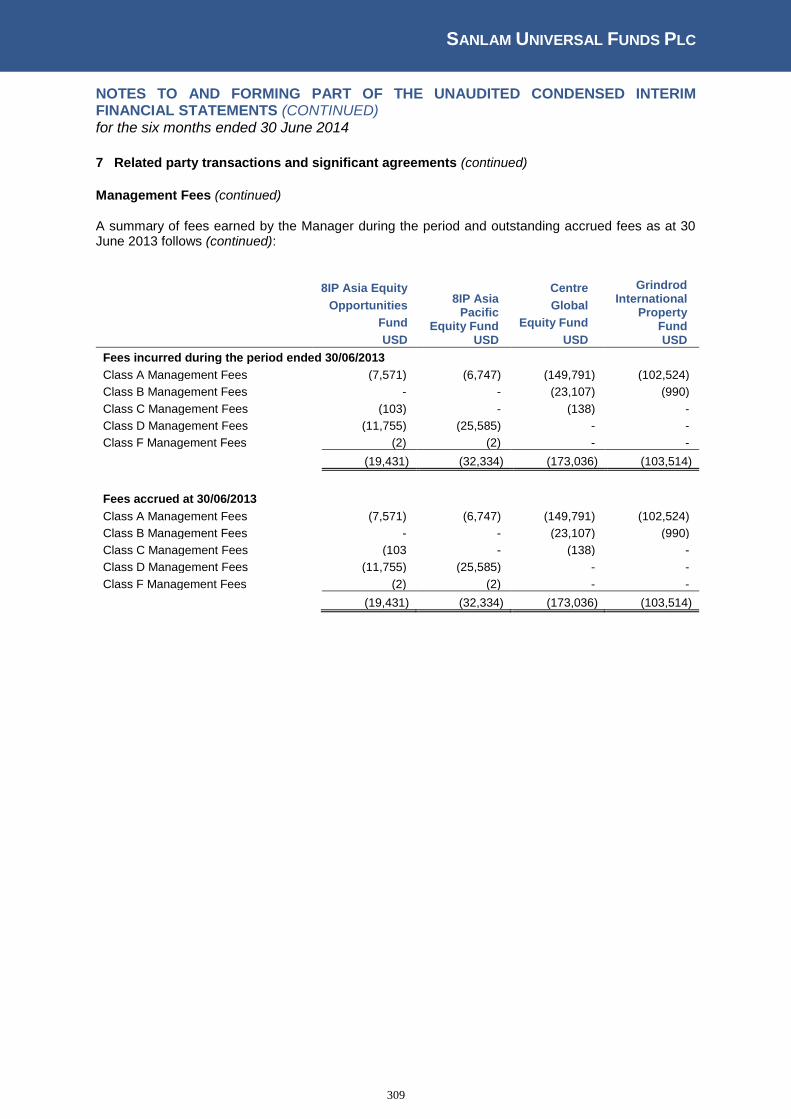
SANLAM UNIVERSAL FUNDS PLC
309
NOTES TO AND FORMING PART OF THE UNAUDITED CONDENSED INTERIM FINANCIAL STATEMENTS (CONTINUED) for the six months ended 30 June 2014
7 Related party transactions and significant agreements (continued)
Management Fees (continued)
A summary of fees earned by the Manager during the period and outstanding accrued fees as at 30 June 2013 follows (continued):
8IP Asia Equity
Opportunities
Fund
USD
8IP Asia Pacific
Equity Fund USD
Centre
Global
Equity Fund
USD
Grindrod International
Property Fund USD
Fees incurred during the period ended 30/06/2013
Class A Management Fees (7,571) (6,747) (149,791) (102,524)
Class B Management Fees - - (23,107) (990)
Class C Management Fees (103) - (138) -
Class D Management Fees (11,755) (25,585) - -
Class F Management Fees (2) (2) - -
(19,431) (32,334) (173,036) (103,514)
Fees accrued at 30/06/2013
Class A Management Fees (7,571) (6,747) (149,791) (102,524)
Class B Management Fees - - (23,107) (990)
Class C Management Fees (103 - (138) -
Class D Management Fees (11,755) (25,585) - -
Class F Management Fees (2) (2) - -
(19,431) (32,334) (173,036) (103,514)
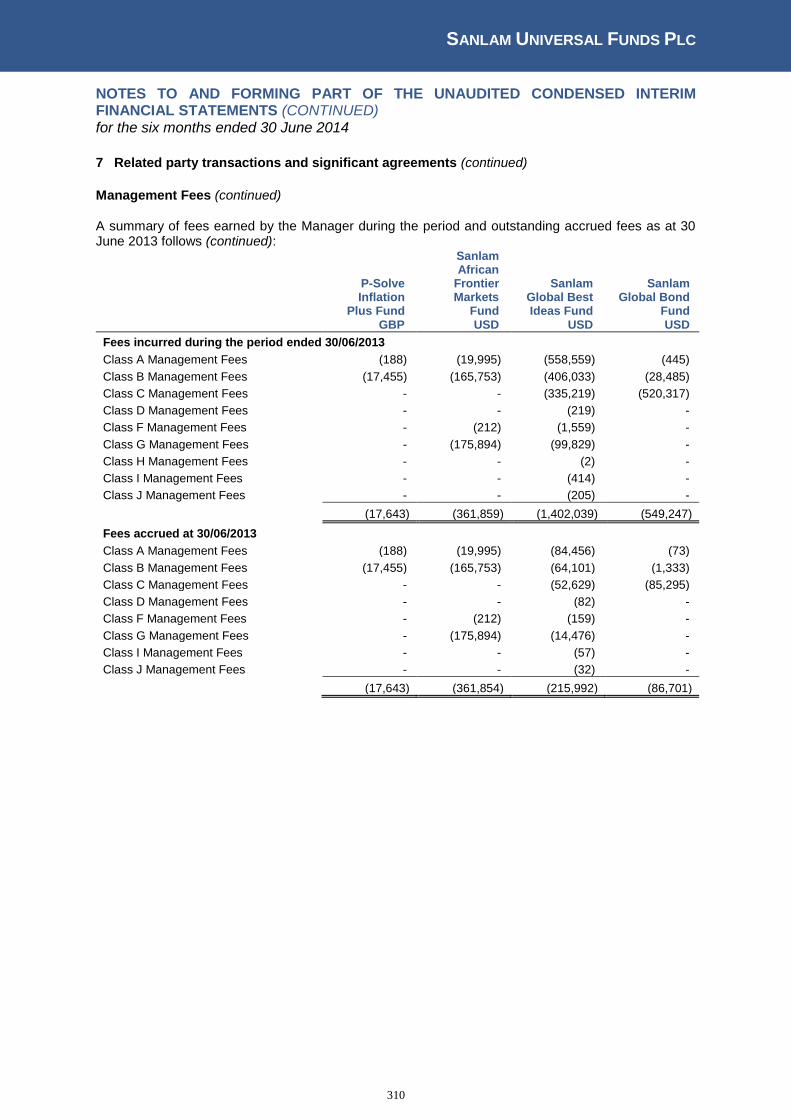
SANLAM UNIVERSAL FUNDS PLC
310
NOTES TO AND FORMING PART OF THE UNAUDITED CONDENSED INTERIM FINANCIAL STATEMENTS (CONTINUED) for the six months ended 30 June 2014
7 Related party transactions and significant agreements (continued)
Management Fees (continued)
A summary of fees earned by the Manager during the period and outstanding accrued fees as at 30 June 2013 follows (continued):
P-Solve Inflation
Plus Fund GBP
Sanlam African Frontier
Markets Fund USD
Sanlam Global Best Ideas Fund
USD
Sanlam Global Bond
Fund USD
Fees incurred during the period ended 30/06/2013 Class A Management Fees (188) (19,995) (558,559) (445)
Class B Management Fees (17,455) (165,753) (406,033) (28,485)
Class C Management Fees - - (335,219) (520,317)
Class D Management Fees - - (219) -
Class F Management Fees - (212) (1,559) -
Class G Management Fees - (175,894) (99,829) -
Class H Management Fees - - (2) -
Class I Management Fees - - (414) -
Class J Management Fees - - (205) -
(17,643) (361,859) (1,402,039) (549,247)
Fees accrued at 30/06/2013
Class A Management Fees (188) (19,995) (84,456) (73)
Class B Management Fees (17,455) (165,753) (64,101) (1,333)
Class C Management Fees - - (52,629) (85,295)
Class D Management Fees - - (82) -
Class F Management Fees - (212) (159) -
Class G Management Fees - (175,894) (14,476) -
Class I Management Fees - - (57) -
Class J Management Fees - - (32) -
(17,643) (361,854) (215,992) (86,701)
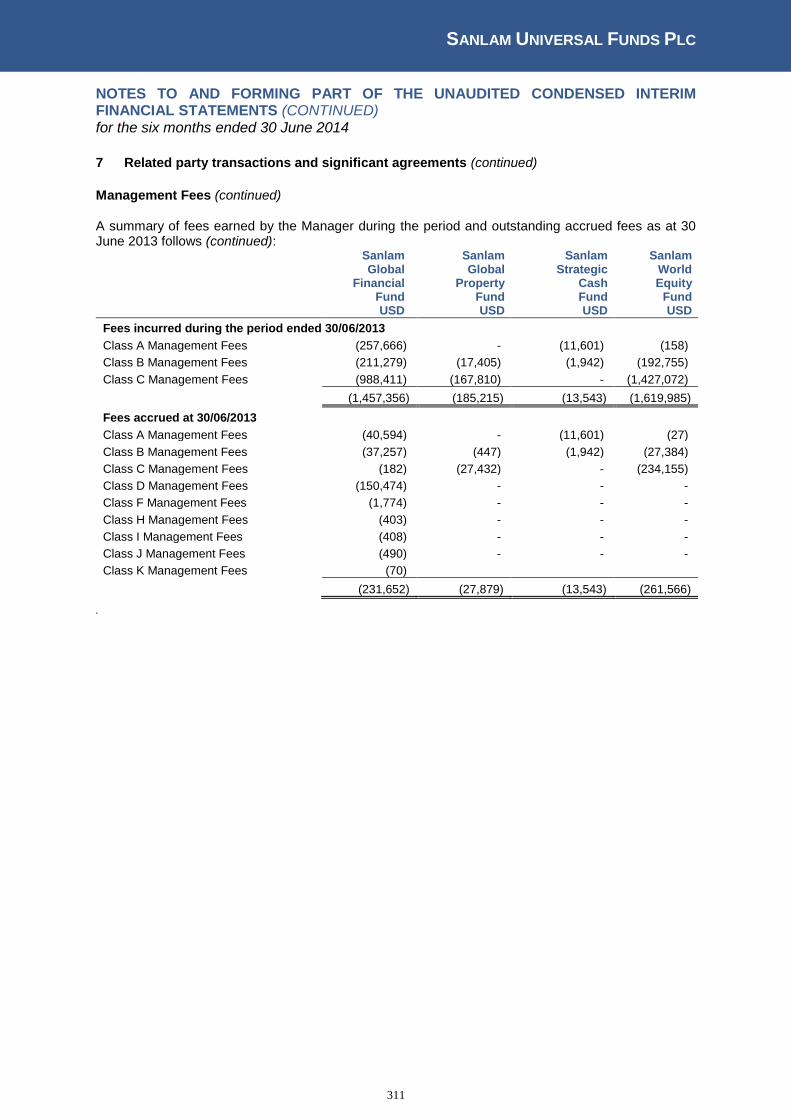
SANLAM UNIVERSAL FUNDS PLC
311
NOTES TO AND FORMING PART OF THE UNAUDITED CONDENSED INTERIM FINANCIAL STATEMENTS (CONTINUED) for the six months ended 30 June 2014
7 Related party transactions and significant agreements (continued)
Management Fees (continued)
A summary of fees earned by the Manager during the period and outstanding accrued fees as at 30 June 2013 follows (continued):
Sanlam Global
Financial Fund USD
Sanlam Global
Property Fund USD
Sanlam Strategic
Cash Fund USD
Sanlam World Equity
Fund USD
Fees incurred during the period ended 30/06/2013 Class A Management Fees (257,666) - (11,601) (158)
Class B Management Fees (211,279) (17,405) (1,942) (192,755)
Class C Management Fees (988,411) (167,810) - (1,427,072)
(1,457,356) (185,215) (13,543) (1,619,985)
Fees accrued at 30/06/2013
Class A Management Fees (40,594) - (11,601) (27)
Class B Management Fees (37,257) (447) (1,942) (27,384)
Class C Management Fees (182) (27,432) - (234,155)
Class D Management Fees (150,474) - - -
Class F Management Fees (1,774) - - -
Class H Management Fees (403) - - -
Class I Management Fees (408) - - -
Class J Management Fees (490) - - -
Class K Management Fees (70)
(231,652) (27,879) (13,543) (261,566)
.
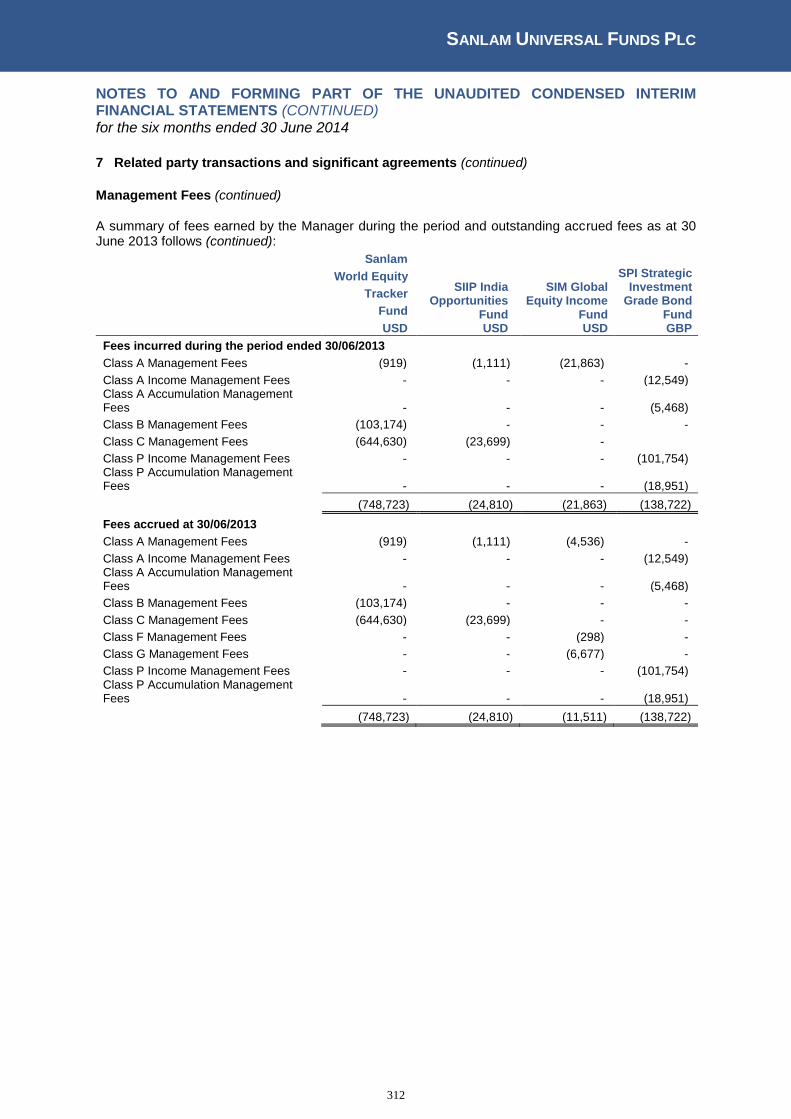
SANLAM UNIVERSAL FUNDS PLC
312
NOTES TO AND FORMING PART OF THE UNAUDITED CONDENSED INTERIM FINANCIAL STATEMENTS (CONTINUED) for the six months ended 30 June 2014
7 Related party transactions and significant agreements (continued)
Management Fees (continued)
A summary of fees earned by the Manager during the period and outstanding accrued fees as at 30 June 2013 follows (continued):
Sanlam
World Equity
Tracker
Fund
USD
SIIP India Opportunities
Fund USD
SIM Global Equity Income
Fund USD
SPI Strategic Investment
Grade Bond Fund GBP
Fees incurred during the period ended 30/06/2013 Class A Management Fees (919) (1,111) (21,863) -
Class A Income Management Fees - - - (12,549) Class A Accumulation Management Fees - - - (5,468)
Class B Management Fees (103,174) - - -
Class C Management Fees (644,630) (23,699) -
Class P Income Management Fees - - - (101,754) Class P Accumulation Management Fees - - - (18,951)
(748,723) (24,810) (21,863) (138,722)
Fees accrued at 30/06/2013
Class A Management Fees (919) (1,111) (4,536) -
Class A Income Management Fees - - - (12,549) Class A Accumulation Management Fees - - - (5,468)
Class B Management Fees (103,174) - - -
Class C Management Fees (644,630) (23,699) - -
Class F Management Fees - - (298) -
Class G Management Fees - - (6,677) -
Class P Income Management Fees - - - (101,754) Class P Accumulation Management Fees - - - (18,951)
(748,723) (24,810) (11,511) (138,722)
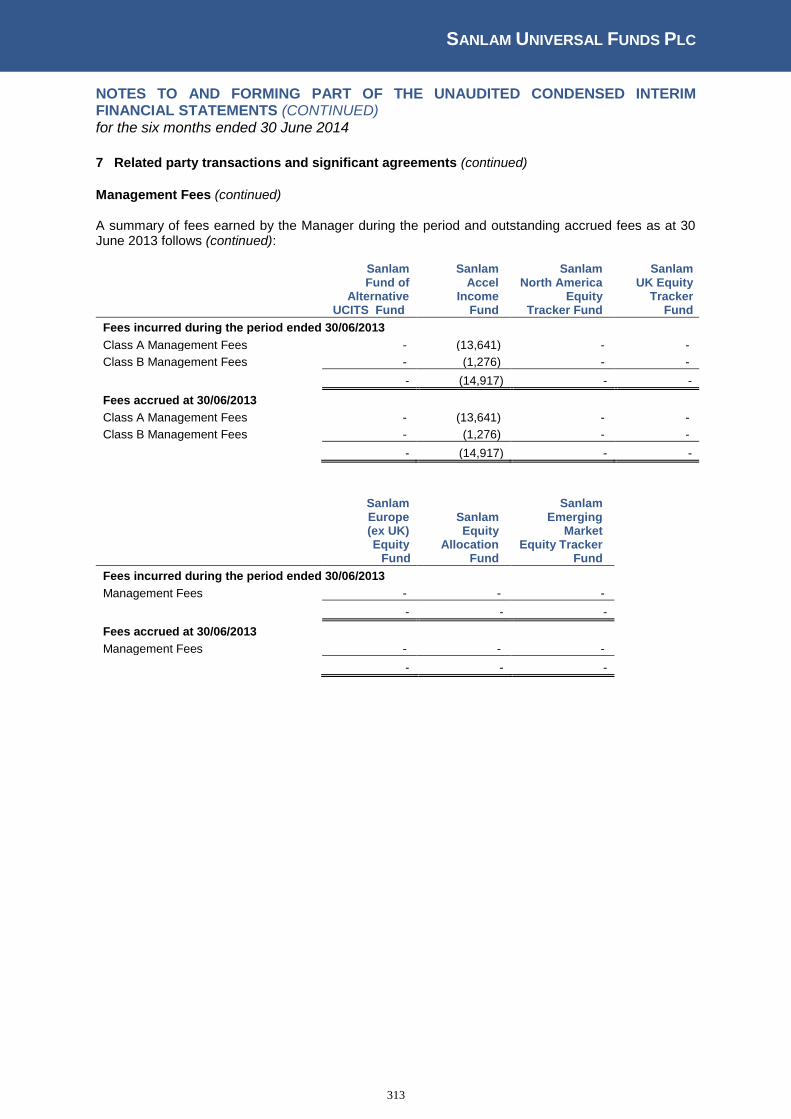
SANLAM UNIVERSAL FUNDS PLC
313
NOTES TO AND FORMING PART OF THE UNAUDITED CONDENSED INTERIM FINANCIAL STATEMENTS (CONTINUED) for the six months ended 30 June 2014
7 Related party transactions and significant agreements (continued)
Management Fees (continued)
A summary of fees earned by the Manager during the period and outstanding accrued fees as at 30 June 2013 follows (continued):
Sanlam Fund of
Alternative UCITS Fund
Sanlam Accel
Income Fund
Sanlam North America
Equity Tracker Fund
Sanlam UK Equity
Tracker Fund
Fees incurred during the period ended 30/06/2013 Class A Management Fees - (13,641) - -
Class B Management Fees - (1,276) - -
- (14,917) - -
Fees accrued at 30/06/2013
Class A Management Fees - (13,641) - -
Class B Management Fees - (1,276) - -
- (14,917) - -
Sanlam Europe (ex UK) Equity
Fund
Sanlam Equity
Allocation Fund
Sanlam Emerging
Market Equity Tracker
Fund
Fees incurred during the period ended 30/06/2013 Management Fees - - -
- - -
Fees accrued at 30/06/2013
Management Fees - - -
- - -
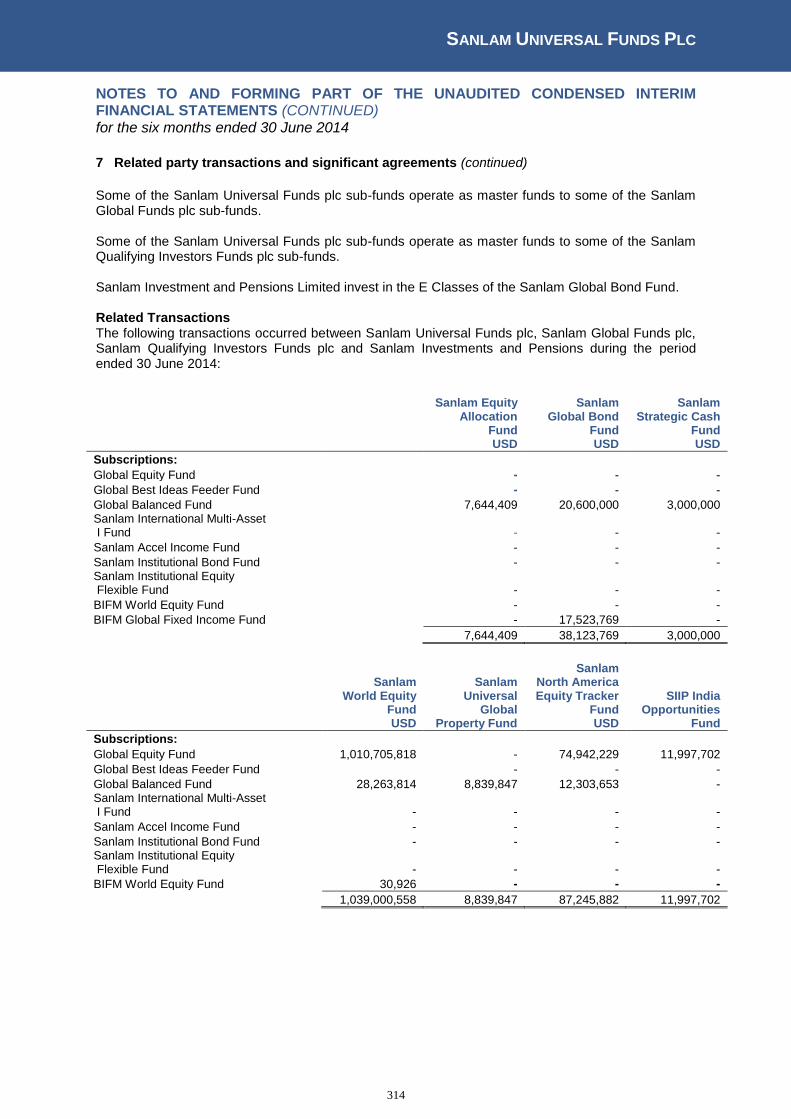
SANLAM UNIVERSAL FUNDS PLC
314
NOTES TO AND FORMING PART OF THE UNAUDITED CONDENSED INTERIM FINANCIAL STATEMENTS (CONTINUED) for the six months ended 30 June 2014
7 Related party transactions and significant agreements (continued)
Some of the Sanlam Universal Funds plc sub-funds operate as master funds to some of the Sanlam Global Funds plc sub-funds. Some of the Sanlam Universal Funds plc sub-funds operate as master funds to some of the Sanlam Qualifying Investors Funds plc sub-funds. Sanlam Investment and Pensions Limited invest in the E Classes of the Sanlam Global Bond Fund. Related Transactions The following transactions occurred between Sanlam Universal Funds plc, Sanlam Global Funds plc, Sanlam Qualifying Investors Funds plc and Sanlam Investments and Pensions during the period ended 30 June 2014:
Sanlam Equity Allocation
Fund USD
Sanlam Global Bond
Fund USD
Sanlam Strategic Cash
Fund USD
Subscriptions:
Global Equity Fund - - -
Global Best Ideas Feeder Fund - - -
Global Balanced Fund 7,644,409 20,600,000 3,000,000 Sanlam International Multi-Asset I Fund - - -
Sanlam Accel Income Fund - - -
Sanlam Institutional Bond Fund - - - Sanlam Institutional Equity Flexible Fund - - -
BIFM World Equity Fund - - -
BIFM Global Fixed Income Fund - 17,523,769 -
7,644,409 38,123,769 3,000,000
Sanlam World Equity
Fund USD
Sanlam Universal
Global Property Fund
Sanlam North America Equity Tracker
Fund USD
SIIP India Opportunities
Fund
Subscriptions:
Global Equity Fund 1,010,705,818 - 74,942,229 11,997,702
Global Best Ideas Feeder Fund - - -
Global Balanced Fund 28,263,814 8,839,847 12,303,653 - Sanlam International Multi-Asset I Fund - - - -
Sanlam Accel Income Fund - - - -
Sanlam Institutional Bond Fund - - - - Sanlam Institutional Equity Flexible Fund - - - -
BIFM World Equity Fund 30,926 - - -
1,039,000,558 8,839,847 87,245,882 11,997,702
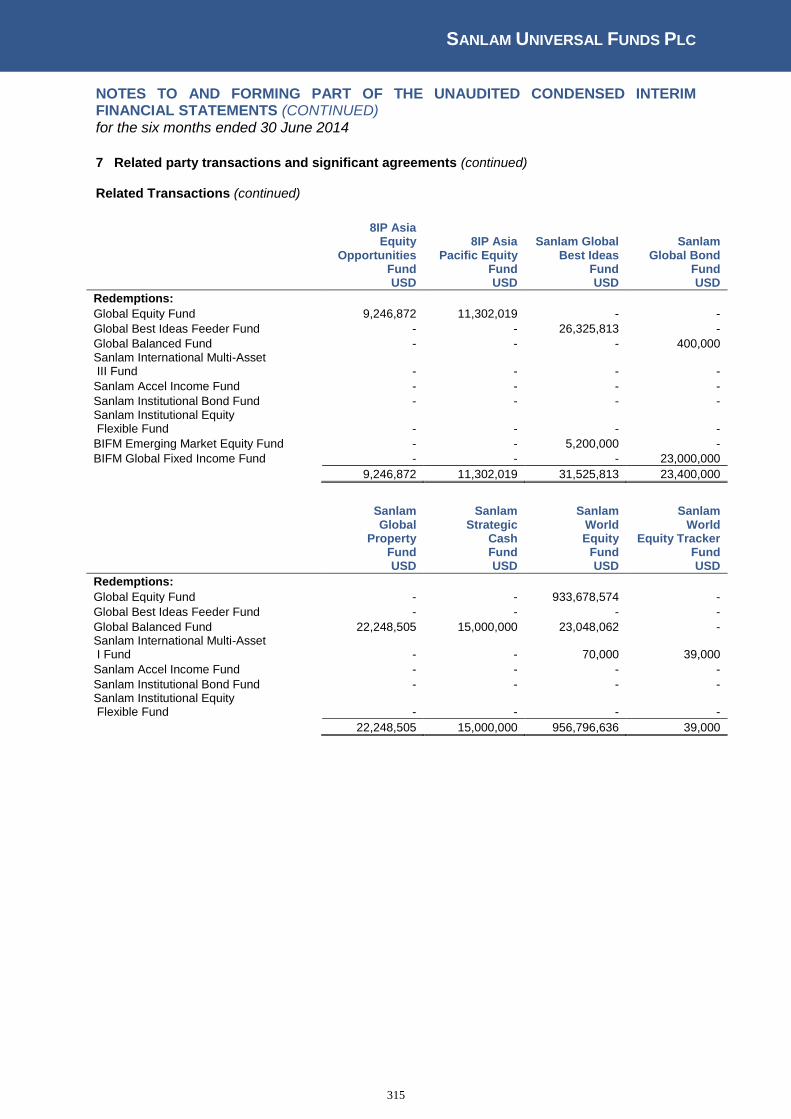
SANLAM UNIVERSAL FUNDS PLC
315
NOTES TO AND FORMING PART OF THE UNAUDITED CONDENSED INTERIM FINANCIAL STATEMENTS (CONTINUED) for the six months ended 30 June 2014
7 Related party transactions and significant agreements (continued)
Related Transactions (continued)
8IP Asia
Equity Opportunities
Fund USD
8IP Asia Pacific Equity
Fund USD
Sanlam Global Best Ideas
Fund USD
Sanlam Global Bond
Fund USD
Redemptions:
Global Equity Fund 9,246,872 11,302,019 - -
Global Best Ideas Feeder Fund - - 26,325,813 -
Global Balanced Fund - - - 400,000 Sanlam International Multi-Asset III Fund - - - -
Sanlam Accel Income Fund - - - -
Sanlam Institutional Bond Fund - - - - Sanlam Institutional Equity Flexible Fund - - - -
BIFM Emerging Market Equity Fund - - 5,200,000 -
BIFM Global Fixed Income Fund - - - 23,000,000
9,246,872 11,302,019 31,525,813 23,400,000
Sanlam
Global Property
Fund USD
Sanlam Strategic
Cash Fund USD
Sanlam World Equity
Fund USD
Sanlam World
Equity Tracker Fund USD
Redemptions:
Global Equity Fund - - 933,678,574 -
Global Best Ideas Feeder Fund - - - -
Global Balanced Fund 22,248,505 15,000,000 23,048,062 - Sanlam International Multi-Asset I Fund - - 70,000 39,000
Sanlam Accel Income Fund - - - -
Sanlam Institutional Bond Fund - - - - Sanlam Institutional Equity Flexible Fund - - - -
22,248,505 15,000,000 956,796,636 39,000
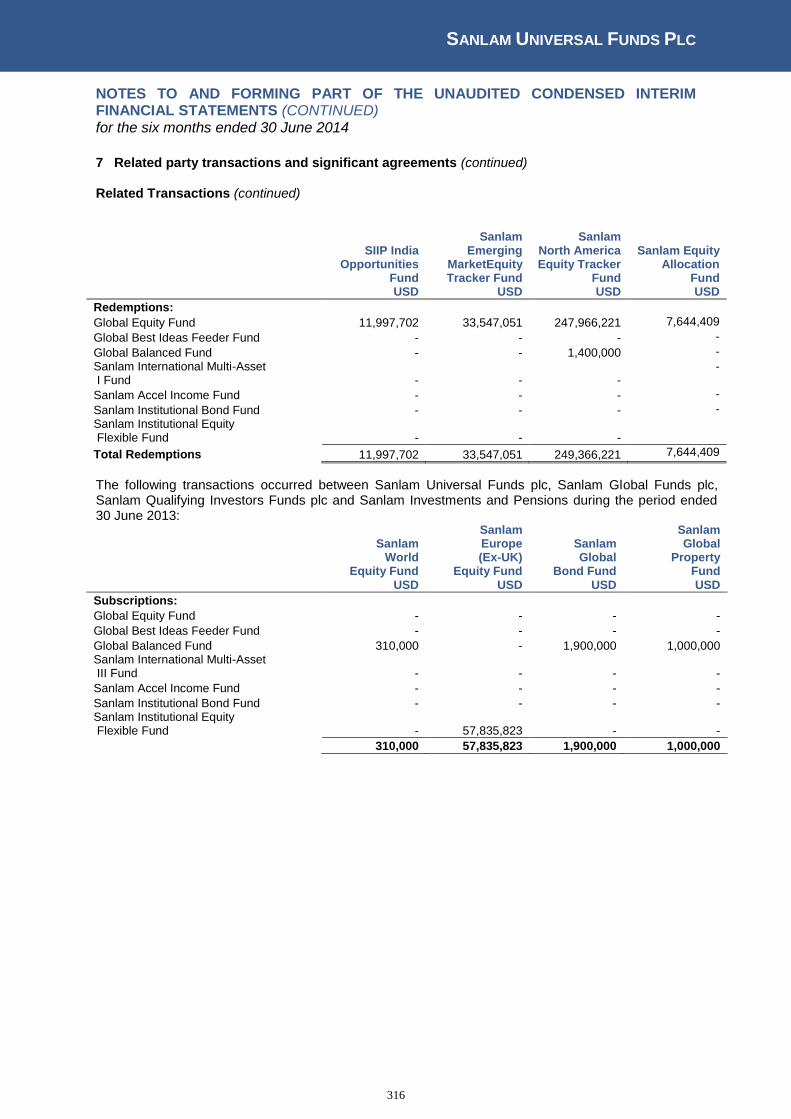
SANLAM UNIVERSAL FUNDS PLC
316
NOTES TO AND FORMING PART OF THE UNAUDITED CONDENSED INTERIM FINANCIAL STATEMENTS (CONTINUED) for the six months ended 30 June 2014
7 Related party transactions and significant agreements (continued)
Related Transactions (continued)
SIIP India Opportunities
Fund USD
Sanlam Emerging
MarketEquity Tracker Fund
USD
Sanlam North America Equity Tracker
Fund USD
Sanlam Equity Allocation
Fund USD
Redemptions:
Global Equity Fund 11,997,702 33,547,051 247,966,221 7,644,409
Global Best Ideas Feeder Fund - - - -
Global Balanced Fund - - 1,400,000 -
Sanlam International Multi-Asset I Fund - - -
-
Sanlam Accel Income Fund - - - -
Sanlam Institutional Bond Fund - - - -
Sanlam Institutional Equity Flexible Fund - - -
Total Redemptions 11,997,702 33,547,051 249,366,221 7,644,409
The following transactions occurred between Sanlam Universal Funds plc, Sanlam Global Funds plc, Sanlam Qualifying Investors Funds plc and Sanlam Investments and Pensions during the period ended 30 June 2013:
Sanlam World
Equity Fund USD
Sanlam Europe (Ex-UK)
Equity Fund USD
Sanlam Global
Bond Fund USD
Sanlam Global
Property Fund USD
Subscriptions:
Global Equity Fund - - - -
Global Best Ideas Feeder Fund - - - -
Global Balanced Fund 310,000 - 1,900,000 1,000,000 Sanlam International Multi-Asset III Fund - - - -
Sanlam Accel Income Fund - - - -
Sanlam Institutional Bond Fund - - - - Sanlam Institutional Equity Flexible Fund - 57,835,823 - -
310,000 57,835,823 1,900,000 1,000,000

SANLAM UNIVERSAL FUNDS PLC
317
NOTES TO AND FORMING PART OF THE UNAUDITED CONDENSED INTERIM FINANCIAL STATEMENTS (CONTINUED) for the six months ended 30 June 2014
7 Related party transactions and significant agreements (continued)
Related Transactions (continued)
Sanlam Equity Allocation
Fund USD
Sanlam North America Equity
Tracker Fund USD
SPI Strategic Investment
Grade Bond Fund USD
Sanlam Strategic
Cash Fund USD
Subscriptions:
Global Equity Fund - 88,221,089 - -
Global Best Ideas Feeder Fund - - - -
Global Balanced Fund - - - 7,650,000 Sanlam International Multi-Asset III Fund - - - -
Sanlam Accel Income Fund - - 963,000 -
Sanlam Institutional Bond Fund - - - - Sanlam Institutional Equity Flexible Fund 67,464,401 - - -
67,464,401 88,221,089 963,000 7,650,000
Sanlam UK Equity
Tracker Fund USD
Sanlam Emerging
Market Equity Tracker
Fund USD
Subscriptions:
Global Equity Fund - 35,000,000
Global Best Ideas Feeder Fund - -
Global Balanced Fund - - Sanlam International Multi-Asset III Fund - -
Sanlam Accel Income Fund - -
Sanlam Institutional Bond Fund - - Sanlam Institutional Equity Flexible Fund 30,343,711 -
30,343,711 35,000,000
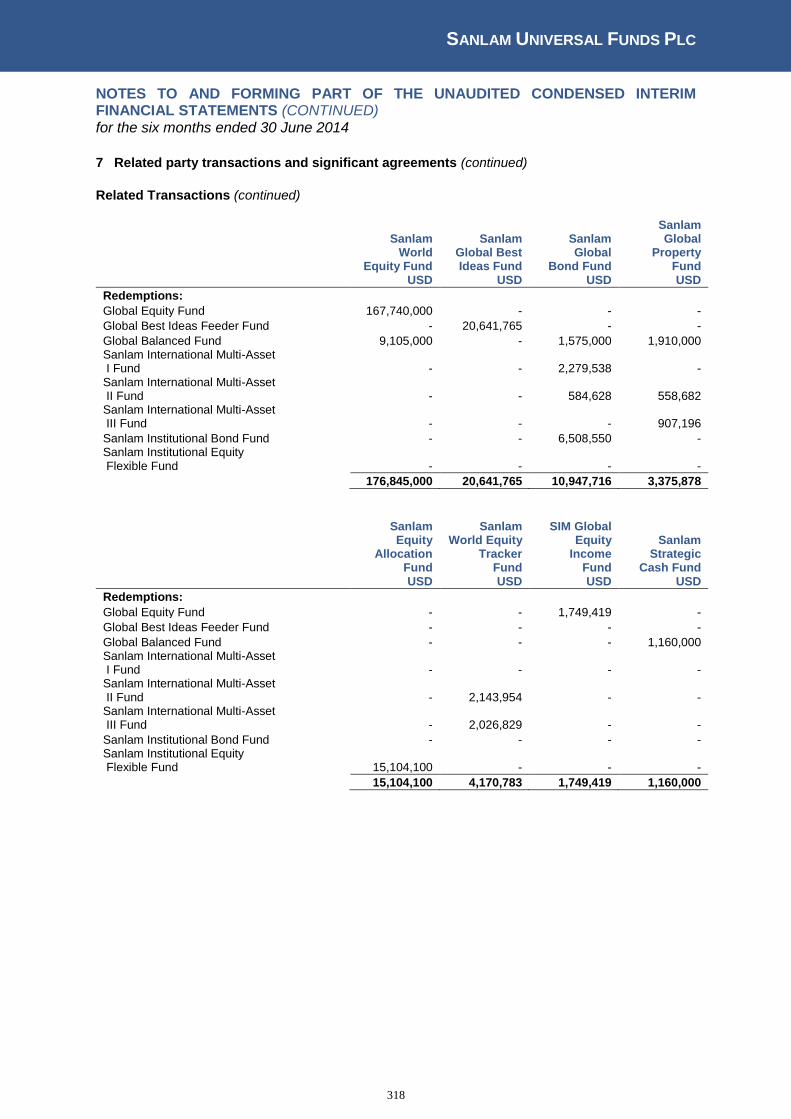
SANLAM UNIVERSAL FUNDS PLC
318
NOTES TO AND FORMING PART OF THE UNAUDITED CONDENSED INTERIM FINANCIAL STATEMENTS (CONTINUED) for the six months ended 30 June 2014
7 Related party transactions and significant agreements (continued)
Related Transactions (continued)
Sanlam World
Equity Fund USD
Sanlam Global Best Ideas Fund
USD
Sanlam Global
Bond Fund USD
Sanlam Global
Property Fund USD
Redemptions:
Global Equity Fund 167,740,000 - - -
Global Best Ideas Feeder Fund - 20,641,765 - -
Global Balanced Fund 9,105,000 - 1,575,000 1,910,000 Sanlam International Multi-Asset I Fund - - 2,279,538 - Sanlam International Multi-Asset II Fund - - 584,628 558,682 Sanlam International Multi-Asset III Fund - - - 907,196
Sanlam Institutional Bond Fund - - 6,508,550 - Sanlam Institutional Equity Flexible Fund - - - -
176,845,000 20,641,765 10,947,716 3,375,878
Sanlam Equity
Allocation Fund USD
Sanlam World Equity
Tracker Fund USD
SIM Global Equity
Income Fund USD
Sanlam Strategic
Cash Fund USD
Redemptions:
Global Equity Fund - - 1,749,419 -
Global Best Ideas Feeder Fund - - - -
Global Balanced Fund - - - 1,160,000 Sanlam International Multi-Asset I Fund - - - - Sanlam International Multi-Asset II Fund - 2,143,954 - - Sanlam International Multi-Asset III Fund - 2,026,829 - -
Sanlam Institutional Bond Fund - - - - Sanlam Institutional Equity Flexible Fund 15,104,100 - - -
15,104,100 4,170,783 1,749,419 1,160,000
SANLAM UNIVERSAL FUNDS PLC
319
NOTES TO AND FORMING PART OF THE UNAUDITED CONDENSED INTERIM FINANCIAL STATEMENTS (CONTINUED) for the six months ended 30 June 2014
8 Efficient portfolio management
The Funds may enter into forward foreign currency contracts for efficient portfolio management. Forward foreign currency exchange contracts are used to hedge against anticipated future changes in exchange rates which otherwise might either adversely affect the value of the Fund’s portfolio securities or adversely affect the price of securities which the Funds intend to purchase at a later date. The Funds may also enter into futures contracts for efficient portfolio management. The primary purposes for which the Funds use futures contracts are cash equalisation, hedging and return enhancement. The purpose of cash equalisation is to expose uninvested cash within the Funds to equity market-like returns and ensure that the Funds’ liquid assets are utilised as though invested in the markets.
Hedging is used by the Funds to limit or control risks, such as adverse movements in exchange rates and interest returns. Return enhancement can be accomplished through the use of futures in the Funds. Interest rate swaps are used for hedging against adverse movements in interest rates. By purchasing certain instruments, the Funds may more effectively achieve the desired portfolio characteristics that assist the Funds in meeting their investment objectives. Details of the net unrealised gain/(loss) on open forward foreign currency exchange contracts, if any, is disclosed in the PORTFOLIO OF INVESTMENTS of each Fund.
9 Soft commissions
During the period Investment Manager and connected persons to the Sanlam World Equity Fund have entered into soft commission arrangements with brokers in respect of which certain goods and services used to support the investment decision process were received. The Investment Manager and connected persons do not make direct payment for these services but do transact an agreed amount of business with the brokers on behalf of the Company and commission is paid on these transactions. The goods and services utilised for the Company include computer hardware and software used for economic and political analysis, portfolio analysis including valuation and performance measurement, market analysis, data and quotation services and investment related publications. The Investment Manager considers these arrangements are to the benefit of the Company and has satisfied itself that it obtains best execution on behalf of the Company and the brokerage rates are not in excess of customary institutional full service brokerage rates.
10 Contingent and cross liability of funds
The Directors are not aware of any such existing or contingent liability at 30 June 2014. The Company’s amended Articles provide for segregated liability between the various Funds. These provisions, and the Fund’s application of them may not yet have been fully tested by Irish or foreign courts. Accordingly, while the liabilities of one Fund will not generally impact on or be paid out of the assets of another Fund, it is not entirely free from doubt that the assets of any Fund are protected from the liabilities of other Funds of the Company. As at 30 June 2014 and 31 December 2013 there was no cross liabilities held between the Funds.
11 Stock lending activities
The Company has entered into arrangements whereby it transfers securities to a counterparty, in return for which it is agreed that securities of the same kind and amount should be transferred back to the Company at a later date. The arrangement has the substance of a loan of the Company’s securities in return for collateral. The collateral held is in a form required by the Central Bank of Ireland. Stock lending activities are conducted through JP Morgan Bank Plc, London in accordance with the terms of the Stock Lending Agreement, dated 12 March 2004, between the Company, the Manager and JP Morgan Bank Plc.

SANLAM UNIVERSAL FUNDS PLC
320
NOTES TO AND FORMING PART OF THE UNAUDITED CONDENSED INTERIM FINANCIAL STATEMENTS (CONTINUED) for the six months ended 30 June 2014
11 Stock lending activities (continued)
Aggregate income arising from stock lending activities consists of fees charged to counterparty, where the counterparty has provided collateral other than cash, plus net realised income derived from investments of cash collateral less any rebate payable to counterparty on cash collateral less any commissions or similar transaction costs. The tables below disclose the income arising from stock lending activities, the costs and fees incurred, the exposure at the reporting date and the amount of collateral held. Effective from 1 September 2014 the Funds will retain a higher proportion of securities lending income. The type of collateral held at the reporting date is cash (44.34%) or high quality government bonds (56.66%).
The counterparties to the Funds’ stock lending activities are Citigroup, Credit Suisse, Deutsche Bank,
HSBC, ING, JP Morgan, Merrill Lynch, Morgan Stanley, Nomura and UBS
The Funds incurred the following costs and fees in relation to stock lending activities for the period
ended 30 June 2014:
8IP Asia
Equity
Opportunities
Fund
USD
8IP Asia
Pacific
Equity Fund
USD
Centre Global
Equity Fund
USD
Grindod
International
Property
Fund
USD
P-Solve
Inflation Plus
Fund
GBP
Sanlam
African
Frontiers
Market Fund
USD
Stock lending
agent fees 18 42 1,442 315 938 -
Manager fees 82 209 3,678 803 2,392 -
Sanlam
Global
Best Ideas
Fund
USD
Sanlam
Global
Bond Fund
USD
Sanlam
Global
Financial
Fund
USD
Sanlam
Global
Property
Fund
USD
Sanlam
Global
Cash Fund
USD
Sanlam World
Equity Fund
USD
Stock lending
agent fees 26,217 3,053 3,128 8,100 12 131,127
Manager fees 66,853 7,789 7,977 20,654 29 334,377
Sanlam
World Equity
Tracker Fund
USD
SIIP India
Opportunities
Fund
USD
SIM Global
Equity
Income Fund
USD
SPI Strategic
Investment
Grade Bond
Fund
GBP
Sanlam Fund
of Alternative
UCITS Fund
USD
Sanlam Accel
Income Fund
GBP
Stock lending
agent fees 36,631 - 1,402 3,030 - -
Manager fees 93,400 - 3,575 7,728 - -
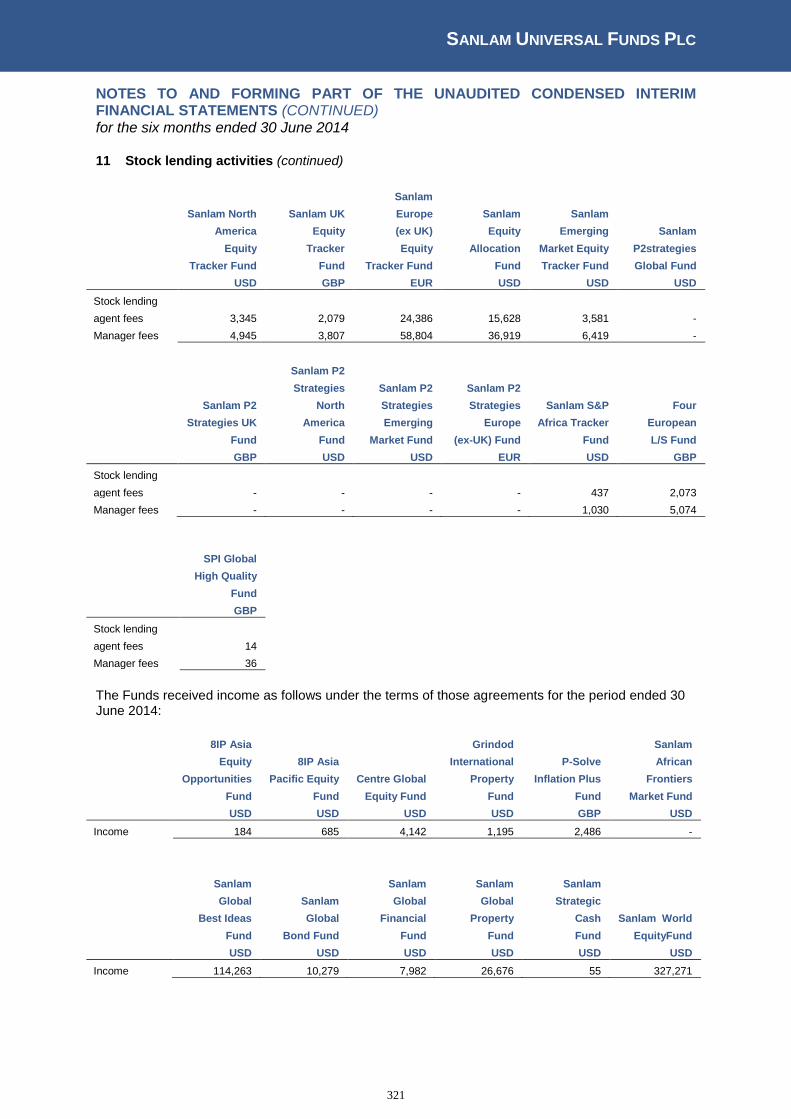
SANLAM UNIVERSAL FUNDS PLC
321
NOTES TO AND FORMING PART OF THE UNAUDITED CONDENSED INTERIM FINANCIAL STATEMENTS (CONTINUED) for the six months ended 30 June 2014
11 Stock lending activities (continued)
Sanlam North
America
Equity
Tracker Fund
USD
Sanlam UK
Equity
Tracker
Fund
GBP
Sanlam
Europe
(ex UK)
Equity
Tracker Fund
EUR
Sanlam
Equity
Allocation
Fund
USD
Sanlam
Emerging
Market Equity
Tracker Fund
USD
Sanlam
P2strategies
Global Fund
USD
Stock lending
agent fees 3,345 2,079 24,386 15,628 3,581 -
Manager fees 4,945 3,807 58,804 36,919 6,419 -
Sanlam P2
Strategies UK
Fund
GBP
Sanlam P2
Strategies
North
America
Fund
USD
Sanlam P2
Strategies
Emerging
Market Fund
USD
Sanlam P2
Strategies
Europe
(ex-UK) Fund
EUR
Sanlam S&P
Africa Tracker
Fund
USD
Four
European
L/S Fund
GBP
Stock lending
agent fees - - - - 437 2,073
Manager fees - - - - 1,030 5,074
SPI Global
High Quality
Fund
GBP
Stock lending
agent fees 14
Manager fees 36
The Funds received income as follows under the terms of those agreements for the period ended 30 June 2014:
8IP Asia
Equity
Opportunities
Fund
USD
8IP Asia
Pacific Equity
Fund
USD
Centre Global
Equity Fund
USD
Grindod
International
Property
Fund
USD
P-Solve
Inflation Plus
Fund
GBP
Sanlam
African
Frontiers
Market Fund
USD
Income 184 685 4,142 1,195 2,486 -
Sanlam
Global
Best Ideas
Fund
USD
Sanlam
Global
Bond Fund
USD
Sanlam
Global
Financial
Fund
USD
Sanlam
Global
Property
Fund
USD
Sanlam
Strategic
Cash
Fund
USD
Sanlam World
EquityFund
USD
Income 114,263 10,279 7,982 26,676 55 327,271
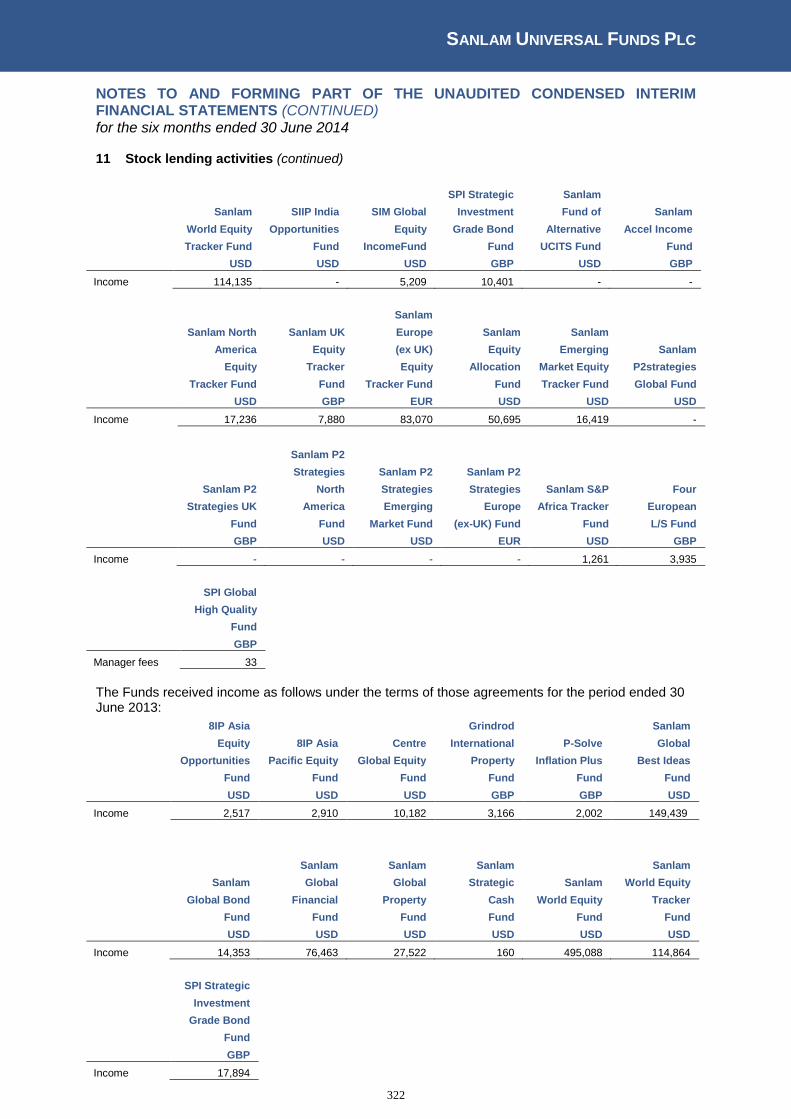
SANLAM UNIVERSAL FUNDS PLC
322
NOTES TO AND FORMING PART OF THE UNAUDITED CONDENSED INTERIM FINANCIAL STATEMENTS (CONTINUED) for the six months ended 30 June 2014 11 Stock lending activities (continued)
Sanlam
World Equity
Tracker Fund
USD
SIIP India
Opportunities
Fund
USD
SIM Global
Equity
IncomeFund
USD
SPI Strategic
Investment
Grade Bond
Fund
GBP
Sanlam
Fund of
Alternative
UCITS Fund
USD
Sanlam
Accel Income
Fund
GBP
Income 114,135 - 5,209 10,401 - -
Sanlam North
America
Equity
Tracker Fund
USD
Sanlam UK
Equity
Tracker
Fund
GBP
Sanlam
Europe
(ex UK)
Equity
Tracker Fund
EUR
Sanlam
Equity
Allocation
Fund
USD
Sanlam
Emerging
Market Equity
Tracker Fund
USD
Sanlam
P2strategies
Global Fund
USD
Income 17,236 7,880 83,070 50,695 16,419 -
Sanlam P2
Strategies UK
Fund
GBP
Sanlam P2
Strategies
North
America
Fund
USD
Sanlam P2
Strategies
Emerging
Market Fund
USD
Sanlam P2
Strategies
Europe
(ex-UK) Fund
EUR
Sanlam S&P
Africa Tracker
Fund
USD
Four
European
L/S Fund
GBP
Income - - - - 1,261 3,935
SPI Global
High Quality
Fund
GBP
Manager fees 33
The Funds received income as follows under the terms of those agreements for the period ended 30 June 2013:
8IP Asia
Equity
Opportunities
Fund
USD
8IP Asia
Pacific Equity
Fund
USD
Centre
Global Equity
Fund
USD
Grindrod
International
Property
Fund
GBP
P-Solve
Inflation Plus
Fund
GBP
Sanlam
Global
Best Ideas
Fund
USD
Income 2,517 2,910 10,182 3,166 2,002 149,439
Sanlam
Global Bond
Fund
USD
Sanlam
Global
Financial
Fund
USD
Sanlam
Global
Property
Fund
USD
Sanlam
Strategic
Cash
Fund
USD
Sanlam
World Equity
Fund
USD
Sanlam
World Equity
Tracker
Fund
USD
Income 14,353 76,463 27,522 160 495,088 114,864
SPI Strategic
Investment
Grade Bond
Fund
GBP
Income 17,894
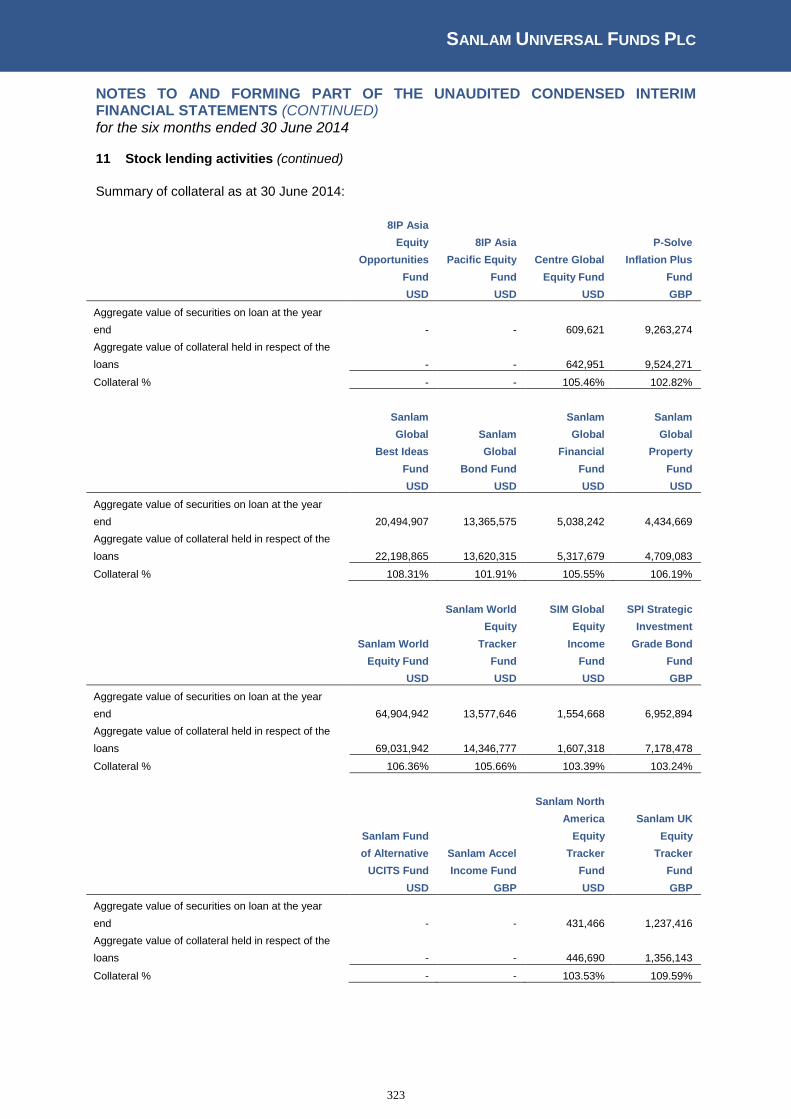
SANLAM UNIVERSAL FUNDS PLC
323
NOTES TO AND FORMING PART OF THE UNAUDITED CONDENSED INTERIM FINANCIAL STATEMENTS (CONTINUED) for the six months ended 30 June 2014 11 Stock lending activities (continued)
Summary of collateral as at 30 June 2014:
8IP Asia
Equity
Opportunities
Fund
USD
8IP Asia
Pacific Equity
Fund
USD
Centre Global
Equity Fund
USD
P-Solve
Inflation Plus
Fund
GBP
Aggregate value of securities on loan at the year
end - - 609,621 9,263,274
Aggregate value of collateral held in respect of the
loans - - 642,951 9,524,271
Collateral % - - 105.46% 102.82%
Sanlam
Global
Best Ideas
Fund
USD
Sanlam
Global
Bond Fund
USD
Sanlam
Global
Financial
Fund
USD
Sanlam
Global
Property
Fund
USD
Aggregate value of securities on loan at the year
end 20,494,907 13,365,575 5,038,242 4,434,669
Aggregate value of collateral held in respect of the
loans 22,198,865 13,620,315 5,317,679 4,709,083
Collateral % 108.31% 101.91% 105.55% 106.19%
Sanlam World
Equity Fund
USD
Sanlam World
Equity
Tracker
Fund
USD
SIM Global
Equity
Income
Fund
USD
SPI Strategic
Investment
Grade Bond
Fund
GBP
Aggregate value of securities on loan at the year
end 64,904,942 13,577,646 1,554,668 6,952,894
Aggregate value of collateral held in respect of the
loans 69,031,942 14,346,777 1,607,318 7,178,478
Collateral % 106.36% 105.66% 103.39% 103.24%
Sanlam Fund
of Alternative
UCITS Fund
USD
Sanlam Accel
Income Fund
GBP
Sanlam North
America
Equity
Tracker
Fund
USD
Sanlam UK
Equity
Tracker
Fund
GBP
Aggregate value of securities on loan at the year
end - - 431,466 1,237,416
Aggregate value of collateral held in respect of the
loans - - 446,690 1,356,143
Collateral % - - 103.53% 109.59%
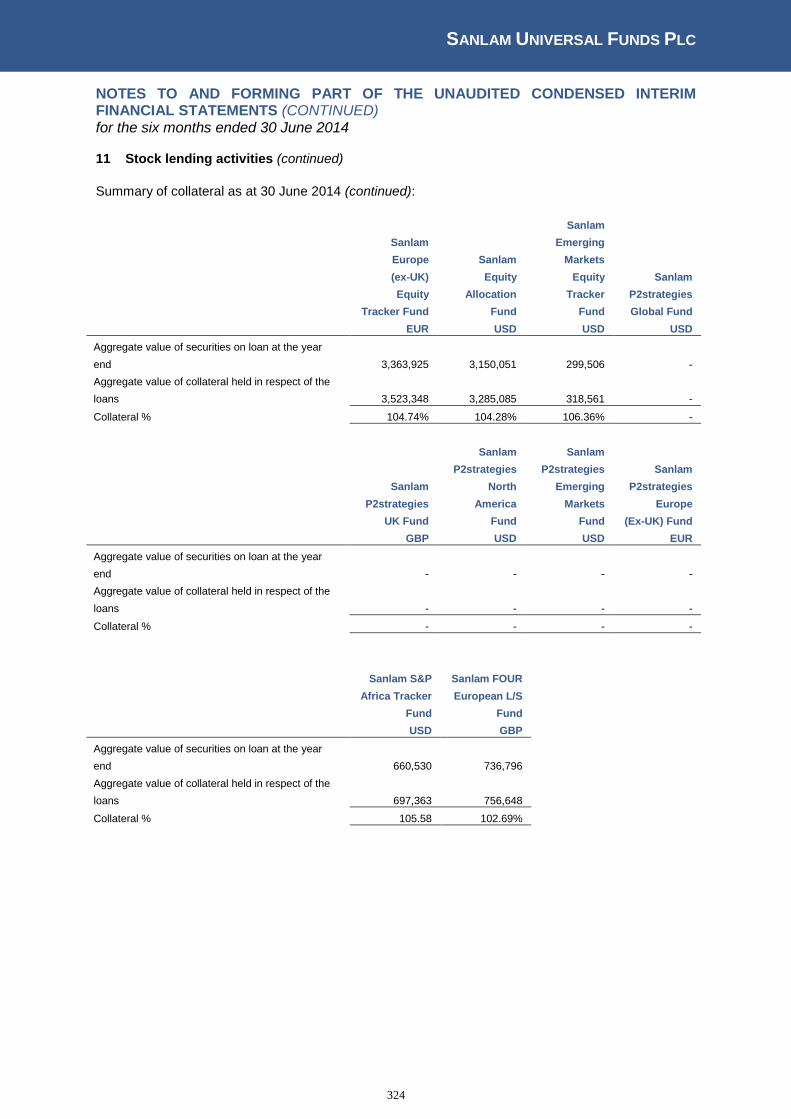
SANLAM UNIVERSAL FUNDS PLC
324
NOTES TO AND FORMING PART OF THE UNAUDITED CONDENSED INTERIM FINANCIAL STATEMENTS (CONTINUED) for the six months ended 30 June 2014 11 Stock lending activities (continued)
Summary of collateral as at 30 June 2014 (continued):
Sanlam
Europe
(ex-UK)
Equity
Tracker Fund
EUR
Sanlam
Equity
Allocation
Fund
USD
Sanlam
Emerging
Markets
Equity
Tracker
Fund
USD
Sanlam
P2strategies
Global Fund
USD
Aggregate value of securities on loan at the year
end 3,363,925 3,150,051 299,506 -
Aggregate value of collateral held in respect of the
loans 3,523,348 3,285,085 318,561 -
Collateral % 104.74% 104.28% 106.36% -
Sanlam
P2strategies
UK Fund
GBP
Sanlam
P2strategies
North
America
Fund
USD
Sanlam
P2strategies
Emerging
Markets
Fund
USD
Sanlam
P2strategies
Europe
(Ex-UK) Fund
EUR
Aggregate value of securities on loan at the year
end - - - -
Aggregate value of collateral held in respect of the
loans - - - -
Collateral % - - - -
Sanlam S&P
Africa Tracker
Fund
USD
Sanlam FOUR
European L/S
Fund
GBP
Aggregate value of securities on loan at the year
end 660,530 736,796
Aggregate value of collateral held in respect of the
loans 697,363 756,648
Collateral % 105.58 102.69%
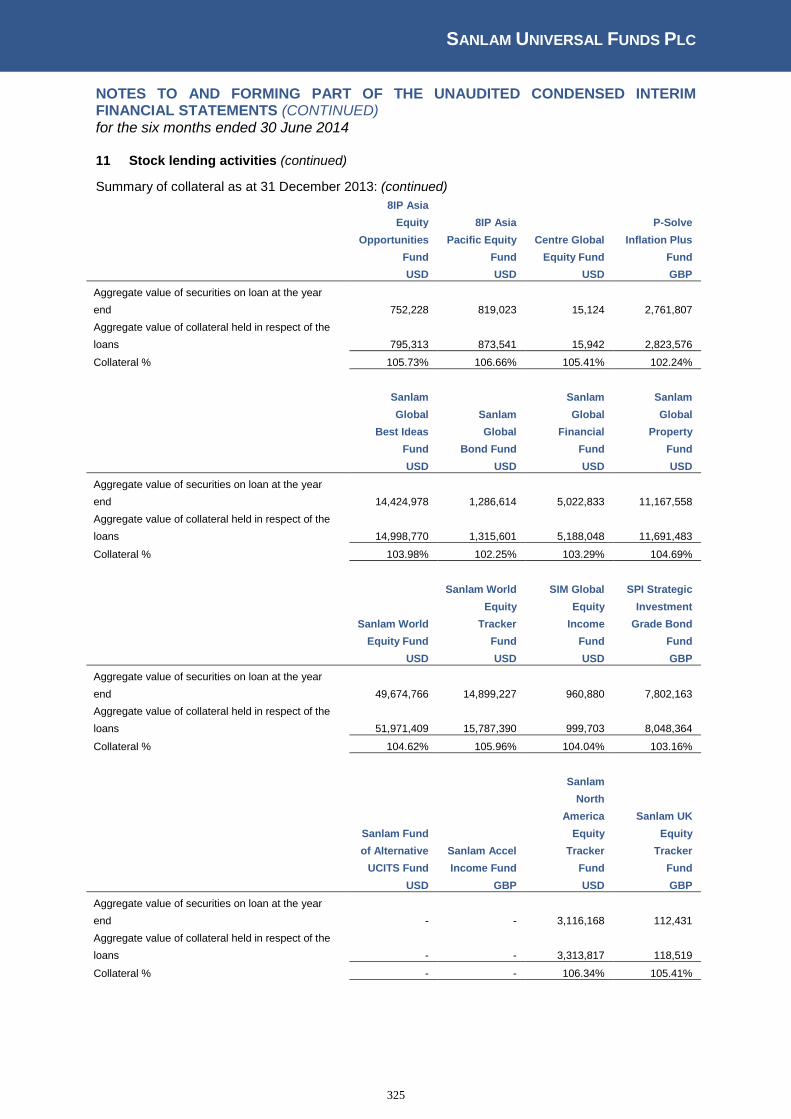
SANLAM UNIVERSAL FUNDS PLC
325
NOTES TO AND FORMING PART OF THE UNAUDITED CONDENSED INTERIM FINANCIAL STATEMENTS (CONTINUED) for the six months ended 30 June 2014
11 Stock lending activities (continued)
Summary of collateral as at 31 December 2013: (continued)
8IP Asia
Equity
Opportunities
Fund
USD
8IP Asia
Pacific Equity
Fund
USD
Centre Global
Equity Fund
USD
P-Solve
Inflation Plus
Fund
GBP
Aggregate value of securities on loan at the year
end 752,228 819,023 15,124 2,761,807
Aggregate value of collateral held in respect of the
loans 795,313 873,541 15,942 2,823,576
Collateral % 105.73% 106.66% 105.41% 102.24%
Sanlam
Global
Best Ideas
Fund
USD
Sanlam
Global
Bond Fund
USD
Sanlam
Global
Financial
Fund
USD
Sanlam
Global
Property
Fund
USD
Aggregate value of securities on loan at the year
end 14,424,978 1,286,614 5,022,833 11,167,558
Aggregate value of collateral held in respect of the
loans 14,998,770 1,315,601 5,188,048 11,691,483
Collateral % 103.98% 102.25% 103.29% 104.69%
Sanlam World
Equity Fund
USD
Sanlam World
Equity
Tracker
Fund
USD
SIM Global
Equity
Income
Fund
USD
SPI Strategic
Investment
Grade Bond
Fund
GBP
Aggregate value of securities on loan at the year
end 49,674,766 14,899,227 960,880 7,802,163
Aggregate value of collateral held in respect of the
loans 51,971,409 15,787,390 999,703 8,048,364
Collateral % 104.62% 105.96% 104.04% 103.16%
Sanlam Fund
of Alternative
UCITS Fund
USD
Sanlam Accel
Income Fund
GBP
Sanlam
North
America
Equity
Tracker
Fund
USD
Sanlam UK
Equity
Tracker
Fund
GBP
Aggregate value of securities on loan at the year
end - - 3,116,168 112,431
Aggregate value of collateral held in respect of the
loans - - 3,313,817 118,519
Collateral % - - 106.34% 105.41%
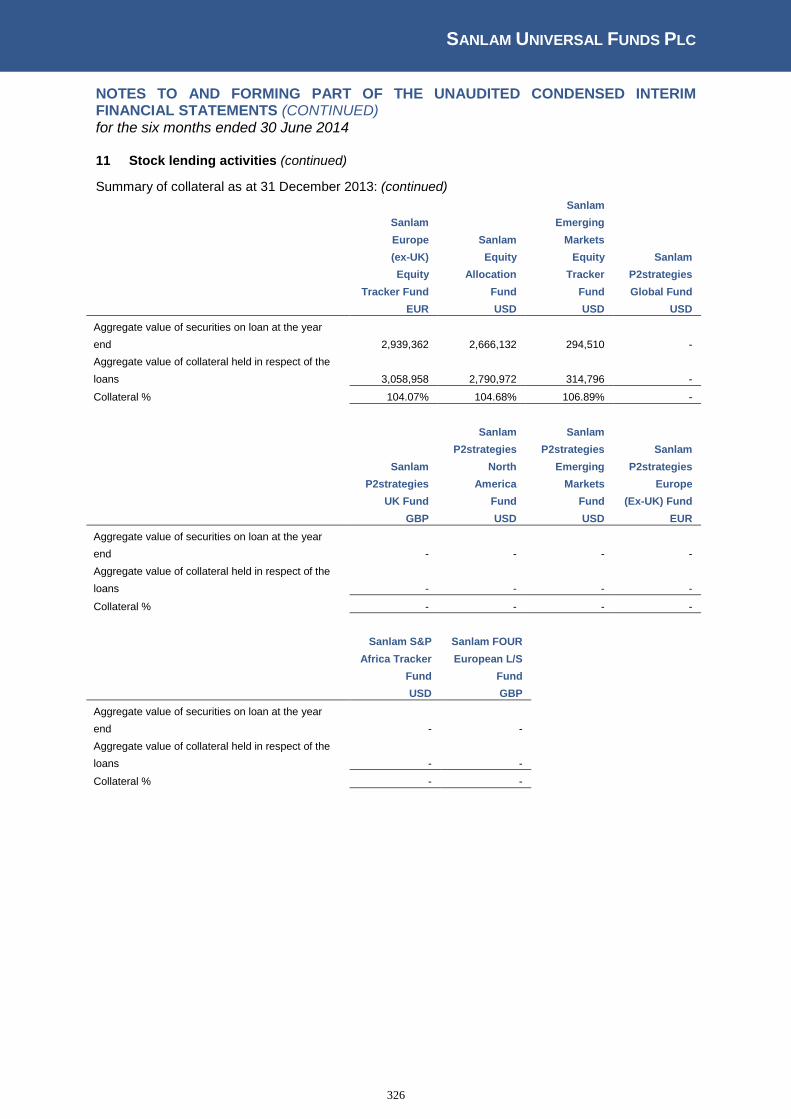
SANLAM UNIVERSAL FUNDS PLC
326
NOTES TO AND FORMING PART OF THE UNAUDITED CONDENSED INTERIM FINANCIAL STATEMENTS (CONTINUED) for the six months ended 30 June 2014
11 Stock lending activities (continued)
Summary of collateral as at 31 December 2013: (continued)
Sanlam
Europe
(ex-UK)
Equity
Tracker Fund
EUR
Sanlam
Equity
Allocation
Fund
USD
Sanlam
Emerging
Markets
Equity
Tracker
Fund
USD
Sanlam
P2strategies
Global Fund
USD
Aggregate value of securities on loan at the year
end 2,939,362 2,666,132 294,510 -
Aggregate value of collateral held in respect of the
loans 3,058,958 2,790,972 314,796 -
Collateral % 104.07% 104.68% 106.89% -
Sanlam
P2strategies
UK Fund
GBP
Sanlam
P2strategies
North
America
Fund
USD
Sanlam
P2strategies
Emerging
Markets
Fund
USD
Sanlam
P2strategies
Europe
(Ex-UK) Fund
EUR
Aggregate value of securities on loan at the year
end - - - -
Aggregate value of collateral held in respect of the
loans - - - -
Collateral % - - - -
Sanlam S&P
Africa Tracker
Fund
USD
Sanlam FOUR
European L/S
Fund
GBP
Aggregate value of securities on loan at the year
end - -
Aggregate value of collateral held in respect of the
loans - -
Collateral % - -
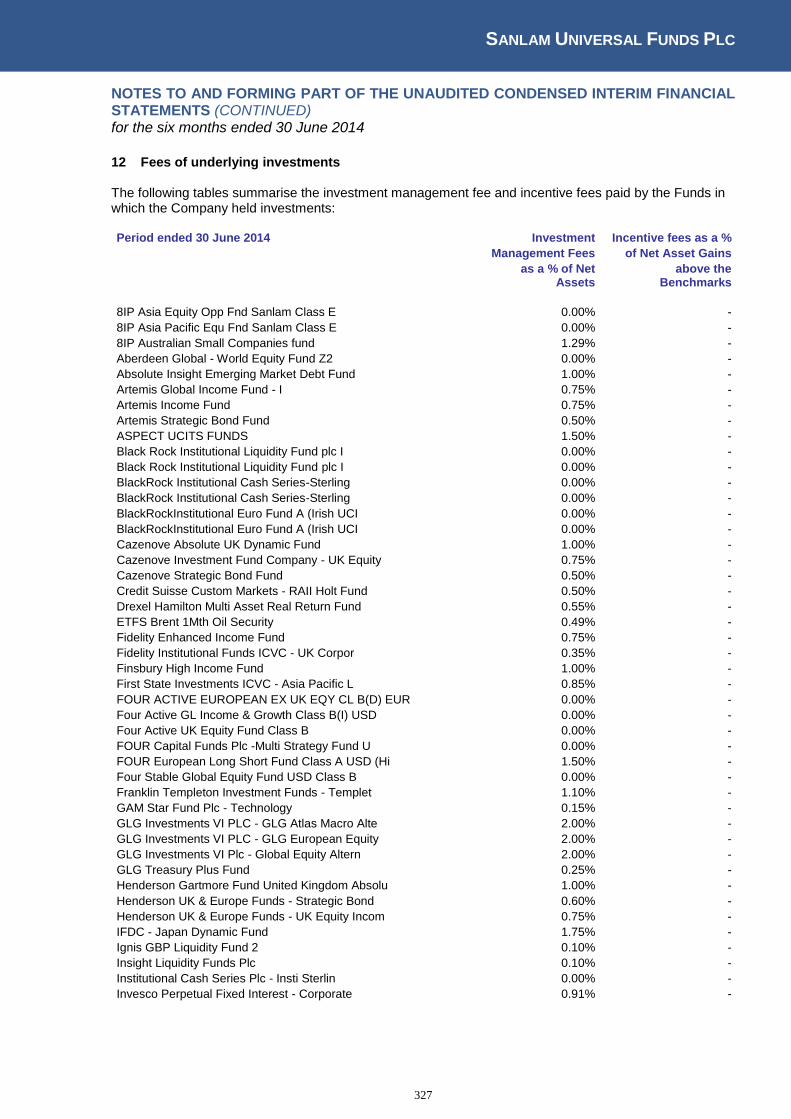
SANLAM UNIVERSAL FUNDS PLC
327
NOTES TO AND FORMING PART OF THE UNAUDITED CONDENSED INTERIM FINANCIAL STATEMENTS (CONTINUED) for the six months ended 30 June 2014
12 Fees of underlying investments
The following tables summarise the investment management fee and incentive fees paid by the Funds in which the Company held investments: Period ended 30 June 2014 Investment Incentive fees as a %
Management Fees of Net Asset Gains
as a % of Net Assets
above the Benchmarks
8IP Asia Equity Opp Fnd Sanlam Class E 0.00% -
8IP Asia Pacific Equ Fnd Sanlam Class E 0.00% -
8IP Australian Small Companies fund 1.29% -
Aberdeen Global - World Equity Fund Z2 0.00% -
Absolute Insight Emerging Market Debt Fund 1.00% -
Artemis Global Income Fund - I 0.75% -
Artemis Income Fund 0.75% -
Artemis Strategic Bond Fund 0.50% -
ASPECT UCITS FUNDS 1.50% -
Black Rock Institutional Liquidity Fund plc I 0.00% -
Black Rock Institutional Liquidity Fund plc I 0.00% -
BlackRock Institutional Cash Series-Sterling 0.00% -
BlackRock Institutional Cash Series-Sterling 0.00% -
BlackRockInstitutional Euro Fund A (Irish UCI 0.00% -
BlackRockInstitutional Euro Fund A (Irish UCI 0.00% -
Cazenove Absolute UK Dynamic Fund 1.00% -
Cazenove Investment Fund Company - UK Equity 0.75% -
Cazenove Strategic Bond Fund 0.50% -
Credit Suisse Custom Markets - RAII Holt Fund 0.50% -
Drexel Hamilton Multi Asset Real Return Fund 0.55% -
ETFS Brent 1Mth Oil Security 0.49% -
Fidelity Enhanced Income Fund 0.75% -
Fidelity Institutional Funds ICVC - UK Corpor 0.35% -
Finsbury High Income Fund 1.00% -
First State Investments ICVC - Asia Pacific L 0.85% -
FOUR ACTIVE EUROPEAN EX UK EQY CL B(D) EUR 0.00% -
Four Active GL Income & Growth Class B(I) USD 0.00% -
Four Active UK Equity Fund Class B 0.00% -
FOUR Capital Funds Plc -Multi Strategy Fund U 0.00% -
FOUR European Long Short Fund Class A USD (Hi 1.50% -
Four Stable Global Equity Fund USD Class B 0.00% -
Franklin Templeton Investment Funds - Templet 1.10% -
GAM Star Fund Plc - Technology 0.15% -
GLG Investments VI PLC - GLG Atlas Macro Alte 2.00% -
GLG Investments VI PLC - GLG European Equity 2.00% -
GLG Investments VI Plc - Global Equity Altern 2.00% -
GLG Treasury Plus Fund 0.25% -
Henderson Gartmore Fund United Kingdom Absolu 1.00% -
Henderson UK & Europe Funds - Strategic Bond 0.60% -
Henderson UK & Europe Funds - UK Equity Incom 0.75% -
IFDC - Japan Dynamic Fund 1.75% -
Ignis GBP Liquidity Fund 2 0.10% -
Insight Liquidity Funds Plc 0.10% -
Institutional Cash Series Plc - Insti Sterlin 0.00% -
Invesco Perpetual Fixed Interest - Corporate 0.91% -

SANLAM UNIVERSAL FUNDS PLC
328
NOTES TO AND FORMING PART OF THE UNAUDITED CONDENSED INTERIM FINANCIAL STATEMENTS (CONTINUED) for the six months ended 30 June 2014
12 Fees of underlying investments (continued) Period ended 30 June 2014 (continued) Investment Incentive fees as a %
Management Fees of Net Asset Gains
as a % of Net Assets
above the Benchmarks
Invesco Perpetual Fixed Interest - Corporate 0.91% -
iShares Core MSCI Emerging Markets ETF 0.18% -
iShares Developed Markets Property Yield Fund 0.59% -
iShares DJ Stoxx Global Select Dividend 100 0.46% -
iShares Global Inflation Linked Government Bo 0.00% -
IShares III Plc Barclays Capital Emerging Mar 0.50% -
iShares MSCI All Peru Capped 0.74% -
iShares MSCI China ETF 0.61% -
iShares MSCI Europe Ex-UK 0.00% -
iShares MSCI Japan Monthly GBP Hedged 0.64% -
iShares MSCI South Korea Index Fund 0.59% -
iShares MSCI World Islamic 0.60% -
iShares MSCI World UCITS ETF 0.00% -
iShares MSCI World UCITS ETF 0.40% -
Ishares S&P 500 Index Fund 0.00% -
iShares S&P SmallCap 600 0.00% -
JPMorgan Fund ICVC - Sterling Corporate Bond 0.50% -
Jupiter Strategic Bond - II 0.50% -
Kames ICVC - High Yield Bond Fund 1.00% -
Kames ICVC - Sterling Corporate Bond Fund 0.75% -
Lamp Ucits Funds Visium Global MA1 USD 2.20% -
Lazard Investment Funds - Global Equity Incom 0.75% -
Lyxor ETF Eastern Europe 0.50% -
M&G Corporate Bond 0.50% -
Mellon Investments Funds - Newton Global High 0.75% -
New Europe Property Investment Plc 1.00% -
PFS Chelverton UK Equity Fund 0.75% -
PIMCO Funds Global Investoes Series Plc - Unc 1.25% -
PIMCO Global Investors 0.89% -
Pimco Global Investors Series - Global High Y 0.55% -
Pimco-Hi Yield Bond 0.55% -
PSigma American Growth-I Acc 0.75% -
PSigma Global Equity Fund 0.75% -
PSigma Income Fund 0.75% -
Sanlam Emerging MarketEquity Tracker Fund Cla 0.00% -
Sanlam Emerging MarketEquity Tracker Fund Cla 0.00% -
Sanlam Equity Allocation Fund Class E 0.00% -
Sanlam Equity Allocation Fund Class E 0.00% -
Sanlam Europe (ex UK) Equity Tracker Fund Cla 0.00% -
Sanlam Europe(ex UK) Equity Tracker Fund Clas 0.00% -
Sanlam Global Best Ideas Universal Fund Class 0.00% -
Sanlam Global Best Ideas Universal Fund E 0.00% -
Sanlam Global Bond Fund class C 0.60% -
Sanlam Global Bond Fund class E 0.00% -
Sanlam Global Bond Fund class E 0.00% -
Sanlam North America Equity Tracker Fund Clas 0.00% -
Sanlam North America Equity Tracker Fund Clas 0.00% -
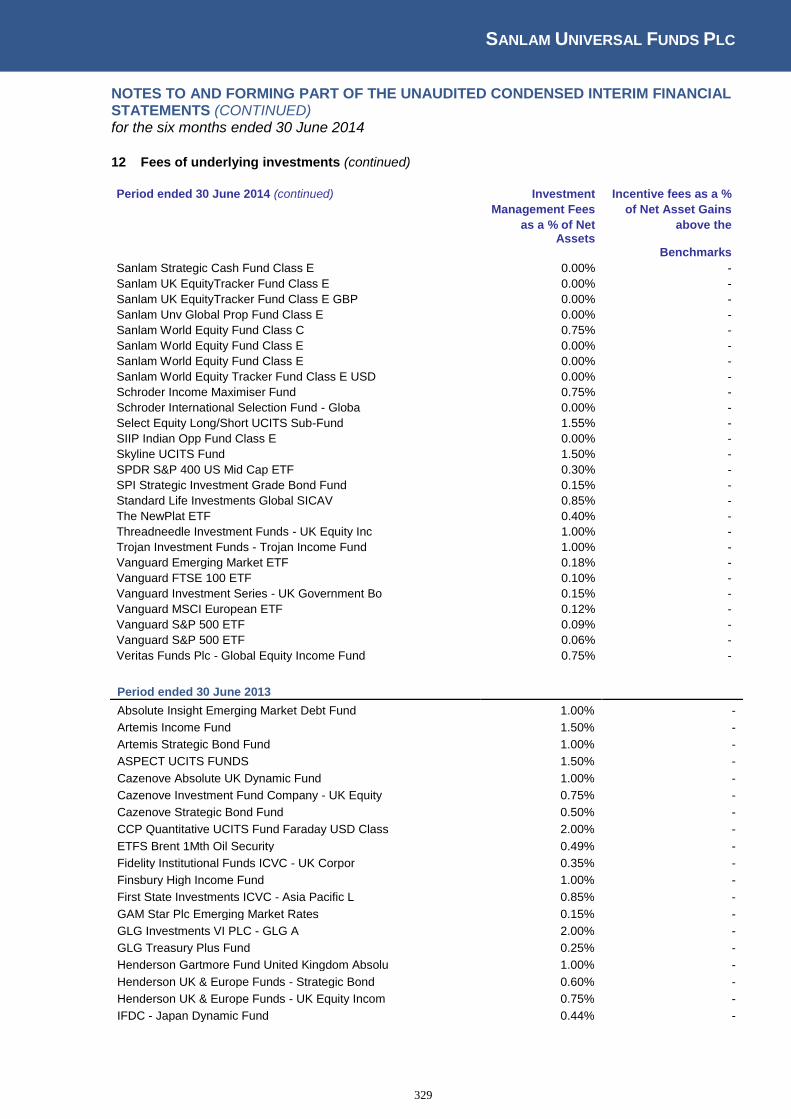
SANLAM UNIVERSAL FUNDS PLC
329
NOTES TO AND FORMING PART OF THE UNAUDITED CONDENSED INTERIM FINANCIAL STATEMENTS (CONTINUED) for the six months ended 30 June 2014
12 Fees of underlying investments (continued)
Period ended 30 June 2014 (continued) Investment Incentive fees as a %
Management Fees of Net Asset Gains
as a % of Net Assets
above the
Benchmarks
Sanlam Strategic Cash Fund Class E 0.00% -
Sanlam UK EquityTracker Fund Class E 0.00% -
Sanlam UK EquityTracker Fund Class E GBP 0.00% -
Sanlam Unv Global Prop Fund Class E 0.00% -
Sanlam World Equity Fund Class C 0.75% -
Sanlam World Equity Fund Class E 0.00% -
Sanlam World Equity Fund Class E 0.00% -
Sanlam World Equity Tracker Fund Class E USD 0.00% -
Schroder Income Maximiser Fund 0.75% -
Schroder International Selection Fund - Globa 0.00% -
Select Equity Long/Short UCITS Sub-Fund 1.55% -
SIIP Indian Opp Fund Class E 0.00% -
Skyline UCITS Fund 1.50% -
SPDR S&P 400 US Mid Cap ETF 0.30% -
SPI Strategic Investment Grade Bond Fund 0.15% -
Standard Life Investments Global SICAV 0.85% -
The NewPlat ETF 0.40% -
Threadneedle Investment Funds - UK Equity Inc 1.00% -
Trojan Investment Funds - Trojan Income Fund 1.00% -
Vanguard Emerging Market ETF 0.18% -
Vanguard FTSE 100 ETF 0.10% -
Vanguard Investment Series - UK Government Bo 0.15% -
Vanguard MSCI European ETF 0.12% -
Vanguard S&P 500 ETF 0.09% -
Vanguard S&P 500 ETF 0.06% -
Veritas Funds Plc - Global Equity Income Fund 0.75% -
Period ended 30 June 2013
Absolute Insight Emerging Market Debt Fund 1.00% -
Artemis Income Fund 1.50% -
Artemis Strategic Bond Fund 1.00% -
ASPECT UCITS FUNDS 1.50% -
Cazenove Absolute UK Dynamic Fund 1.00% -
Cazenove Investment Fund Company - UK Equity 0.75% -
Cazenove Strategic Bond Fund 0.50% -
CCP Quantitative UCITS Fund Faraday USD Class 2.00% -
ETFS Brent 1Mth Oil Security 0.49% -
Fidelity Institutional Funds ICVC - UK Corpor 0.35% -
Finsbury High Income Fund 1.00% -
First State Investments ICVC - Asia Pacific L 0.85% -
GAM Star Plc Emerging Market Rates 0.15% -
GLG Investments VI PLC - GLG A 2.00% -
GLG Treasury Plus Fund 0.25% -
Henderson Gartmore Fund United Kingdom Absolu 1.00% -
Henderson UK & Europe Funds - Strategic Bond 0.60% -
Henderson UK & Europe Funds - UK Equity Incom 0.75% -
IFDC - Japan Dynamic Fund 0.44% -
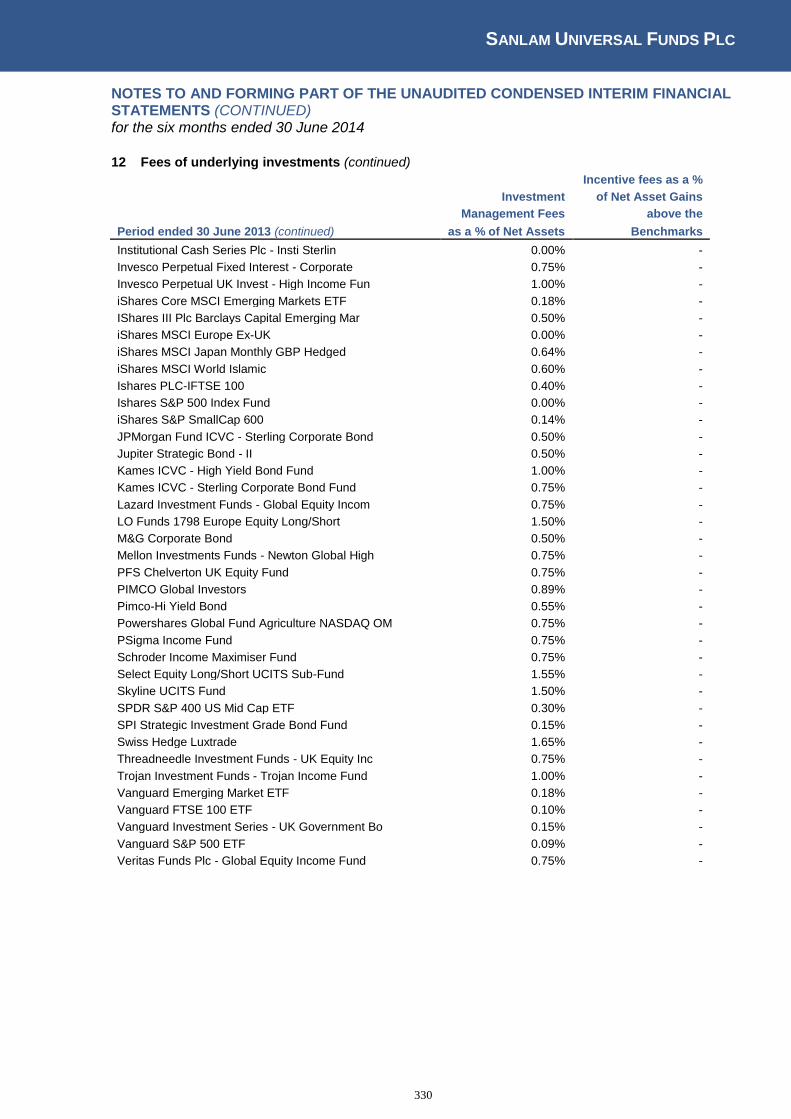
SANLAM UNIVERSAL FUNDS PLC
330
NOTES TO AND FORMING PART OF THE UNAUDITED CONDENSED INTERIM FINANCIAL STATEMENTS (CONTINUED) for the six months ended 30 June 2014
12 Fees of underlying investments (continued)
Incentive fees as a %
Investment of Net Asset Gains
Management Fees above the
Period ended 30 June 2013 (continued) as a % of Net Assets Benchmarks
Institutional Cash Series Plc - Insti Sterlin 0.00% -
Invesco Perpetual Fixed Interest - Corporate 0.75% -
Invesco Perpetual UK Invest - High Income Fun 1.00% -
iShares Core MSCI Emerging Markets ETF 0.18% -
IShares III Plc Barclays Capital Emerging Mar 0.50% -
iShares MSCI Europe Ex-UK 0.00% -
iShares MSCI Japan Monthly GBP Hedged 0.64% -
iShares MSCI World Islamic 0.60% -
Ishares PLC-IFTSE 100 0.40% -
Ishares S&P 500 Index Fund 0.00% -
iShares S&P SmallCap 600 0.14% -
JPMorgan Fund ICVC - Sterling Corporate Bond 0.50% -
Jupiter Strategic Bond - II 0.50% -
Kames ICVC - High Yield Bond Fund 1.00% -
Kames ICVC - Sterling Corporate Bond Fund 0.75% -
Lazard Investment Funds - Global Equity Incom 0.75% -
LO Funds 1798 Europe Equity Long/Short 1.50% -
M&G Corporate Bond 0.50% -
Mellon Investments Funds - Newton Global High 0.75% -
PFS Chelverton UK Equity Fund 0.75% -
PIMCO Global Investors 0.89% -
Pimco-Hi Yield Bond 0.55% -
Powershares Global Fund Agriculture NASDAQ OM 0.75% -
PSigma Income Fund 0.75% -
Schroder Income Maximiser Fund 0.75% -
Select Equity Long/Short UCITS Sub-Fund 1.55% -
Skyline UCITS Fund 1.50% -
SPDR S&P 400 US Mid Cap ETF 0.30% -
SPI Strategic Investment Grade Bond Fund 0.15% -
Swiss Hedge Luxtrade 1.65% -
Threadneedle Investment Funds - UK Equity Inc 0.75% -
Trojan Investment Funds - Trojan Income Fund 1.00% -
Vanguard Emerging Market ETF 0.18% -
Vanguard FTSE 100 ETF 0.10% -
Vanguard Investment Series - UK Government Bo 0.15% -
Vanguard S&P 500 ETF 0.09% -
Veritas Funds Plc - Global Equity Income Fund 0.75% -

SANLAM UNIVERSAL FUNDS PLC
331
NOTES TO AND FORMING PART OF THE UNAUDITED CONDENSED INTERIM FINANCIAL STATEMENTS (CONTINUED) for the six months ended 30 June 2014
13 Net asset value per share
8IP Asia Equity Opportunities Fund
Period Ended Year Ended Period Ended
30/06/2014 31/12/2013 30/06/2013
Share class A
Net Asset Value - USD 351,669 USD 823,721
Number of Shares in Issue - 439,803 1,089,002
Net asset value per share for financial statement purposes - USD 0.7996 USD 0.7570
Add: Valuation adjustment - - -
Net asset value per share for shareholder dealing - USD 0.7996 USD 0.7570
Share class A (GBP)
Net Asset Value - GBP 76 GBP 79
Number of Shares in Issue - 100 100
Net asset value per share for financial statement purposes - GBP 0.7595 GBP0.7854
Add: Valuation adjustment - - -
Net asset value per share for shareholder dealing - GBP 0.7595 GBP0.7854
Share class C
Net Asset Value - USD 17,839 USD 25,158
Number of Shares in Issue - 18,337 27,441
Net asset value per share for financial statement purposes - USD 0.9728 USD 0.9175
Add: Valuation adjustment - - -
Net asset value per share for shareholder dealing - USD 0.9728 USD 0.9175
Share class D
Net Asset Value - USD 2,300,314 USD 2,890,502
Number of Shares in Issue - 2,743,460 3,657,230
Net asset value per share for financial statement purposes - USD 0.8385 USD 0.7909
Add: Valuation adjustment - - -
Net asset value per share for shareholder dealing - USD 0.8385 USD 0.7909
Share class E
Net Asset Value - USD 13,189,766 USD 14,795,922
Number of Shares in Issue - 15,486,215 18,505,763
Net asset value per share for financial statement purposes - USD 0.8517 USD 0.8001
Add: Valuation adjustment - - -
Net asset value per share for shareholder dealing - USD 0.8517 USD 0.8001

SANLAM UNIVERSAL FUNDS PLC
332
NOTES TO AND FORMING PART OF THE UNAUDITED CONDENSED INTERIM FINANCIAL STATEMENTS (CONTINUED) for the six months ended 30 June 2014
13 Net asset value per share (continued)
8IP Asia Pacific Equity Fund
Period Ended Year Ended Period Ended
30/06/2014 31/12/2013 30/06/2013
Share class A
Net Asset Value - USD 735,771 USD 850,678
Number of Shares in Issue - 686,249 873,953
Net asset value per share for financial statement purposes - USD 1.0722 USD 0.9735
Add: Valuation adjustment - - -
Net asset value per share for shareholder dealing - USD 1.0722 USD 0.9735
Share class A (GBP)
Net Asset Value - GBP 90 GBP 90
Number of Shares in Issue - 100 100
Net asset value per share for financial statement purposes - GBP 0.9049 GBP 0.8995
Add: Valuation adjustment - - -
Net asset value per share for shareholder dealing - GBP 0.9049 GBP 0.8995
Share class D
Net Asset Value - USD 5,891,975 USD 4,690,896
Number of Shares in Issue - 5,272,513 4,641,340
Net asset value per share for financial statement purposes - USD 1.1175 USD 1.0107
Add: Valuation adjustment - - -
Net asset value per share for shareholder dealing - USD 1.1175 USD 1.0107
Share class E
Net Asset Value - USD 11,652,448 USD 12,244,925
Number of Shares in Issue - 11,428,974 13,331,259
Net asset value per share for financial statement purposes - USD 1.0196 USD 0.9185
Add: Valuation adjustment - - -
Net asset value per share for shareholder dealing - USD 1.0196 USD 0.9185

SANLAM UNIVERSAL FUNDS PLC
333
NOTES TO AND FORMING PART OF THE UNAUDITED CONDENSED INTERIM FINANCIAL STATEMENTS (CONTINUED) for the six months ended 30 June 2014
13 Net asset value per share (continued)
Centre Global Equity Fund
Period Ended Year Ended Period Ended
30/06/2014 31/12/2013 30/06/2013
Share class A
Net Asset Value USD 16,418,620 USD 19,833,561 USD 19,264,459
Number of Shares in Issue 16,617,566 20,318,060 22,501,120
Net asset value per share for financial statement purposes USD0.9880 USD 0.9762 USD 0.8562
Add: Valuation adjustment - - -
Net asset value per share for shareholder dealing USD 0.9880 USD 0.9762 USD 0.8562
Share class B
Net Asset Value USD 3,884,037 USD 4,078,162 USD 4,501,389
Number of Shares in Issue 3,812,292 4,061,608 5,124,384
Net asset value per share for financial statement purposes USD 1.0188 USD 1.0041 USD 0.8785
Add: Valuation adjustment - - -
Net asset value per share for shareholder dealing USD 1.0188 USD 1.0041 USD 0.8785
Share class C
Net Asset Value USD 65,516 USD 40,985 USD 35,812
Number of Shares in Issue 61,147 38,863 38,863
Net asset value per share for financial statement purposes USD 1.0715 USD 1.0546 USD 0.9216
Add: Valuation adjustment - - -
Net asset value per share for shareholder dealing USD 1.0715 USD 1.0546 USD 0.9216
Share class E
Net Asset Value USD 110 USD 108 USD 94
Number of Shares in Issue 100 100 100
Net asset value per share for financial statement purposes USD 1.0990 USD 1.0760 USD 0.9355
Add: Valuation adjustment - - -
Net asset value per share for shareholder dealing USD 1.0990 USD 1.076 USD 0.9355
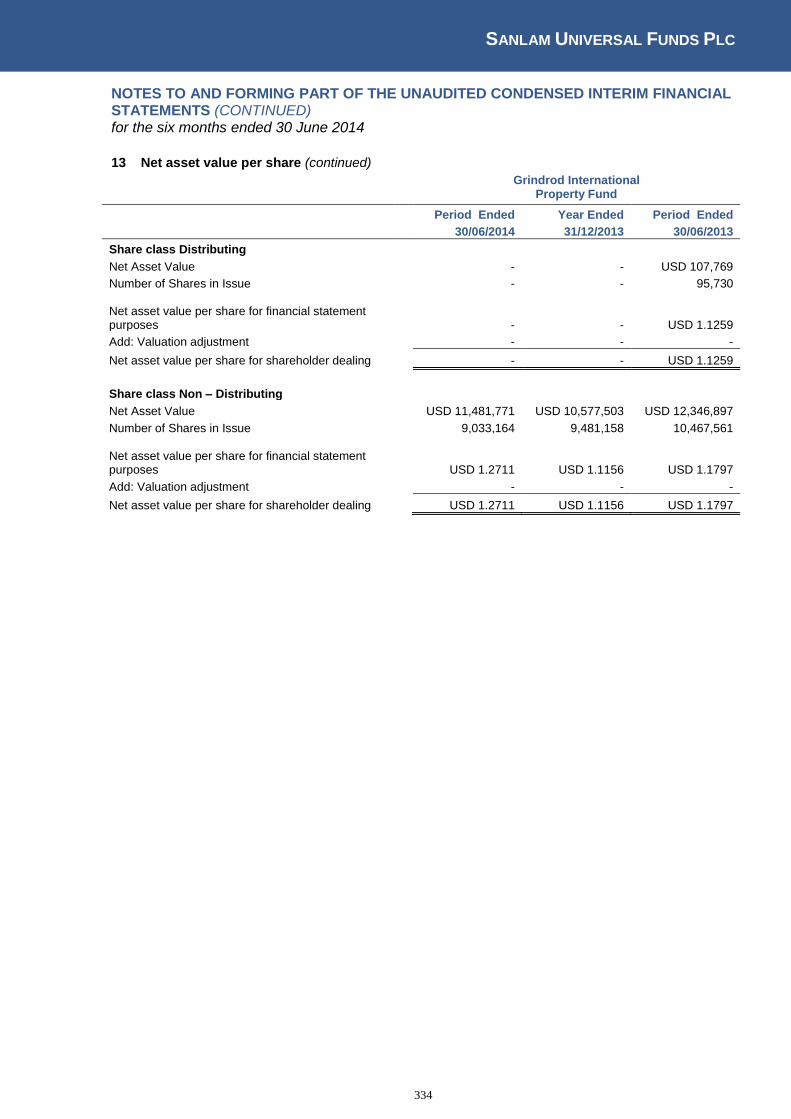
SANLAM UNIVERSAL FUNDS PLC
334
NOTES TO AND FORMING PART OF THE UNAUDITED CONDENSED INTERIM FINANCIAL STATEMENTS (CONTINUED) for the six months ended 30 June 2014
13 Net asset value per share (continued)
Grindrod International
Property Fund
Period Ended Year Ended Period Ended
30/06/2014 31/12/2013 30/06/2013
Share class Distributing
Net Asset Value - - USD 107,769
Number of Shares in Issue - - 95,730
Net asset value per share for financial statement purposes - - USD 1.1259
Add: Valuation adjustment - - -
Net asset value per share for shareholder dealing - - USD 1.1259
Share class Non – Distributing
Net Asset Value USD 11,481,771 USD 10,577,503 USD 12,346,897
Number of Shares in Issue 9,033,164 9,481,158 10,467,561
Net asset value per share for financial statement purposes USD 1.2711 USD 1.1156 USD 1.1797
Add: Valuation adjustment - - -
Net asset value per share for shareholder dealing USD 1.2711 USD 1.1156 USD 1.1797
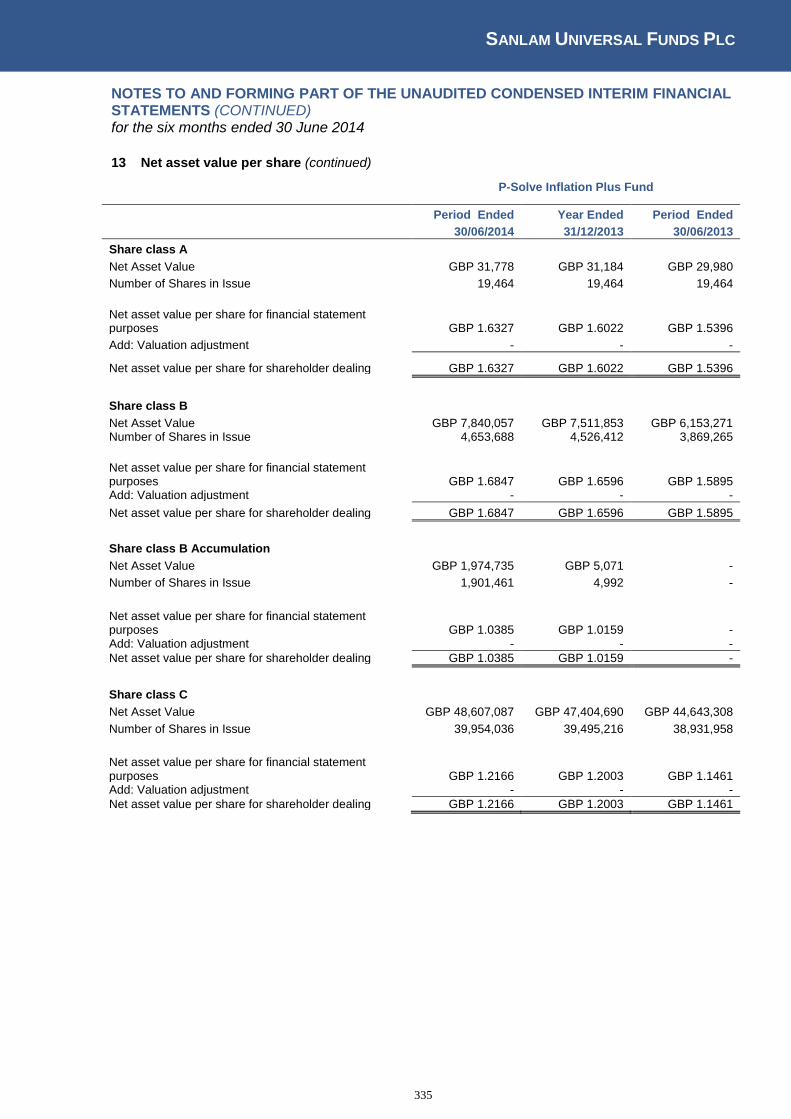
SANLAM UNIVERSAL FUNDS PLC
335
NOTES TO AND FORMING PART OF THE UNAUDITED CONDENSED INTERIM FINANCIAL STATEMENTS (CONTINUED) for the six months ended 30 June 2014
13 Net asset value per share (continued)
P-Solve Inflation Plus Fund
Period Ended Year Ended Period Ended
30/06/2014 31/12/2013 30/06/2013
Share class A
Net Asset Value GBP 31,778 GBP 31,184 GBP 29,980
Number of Shares in Issue 19,464 19,464 19,464
Net asset value per share for financial statement purposes GBP 1.6327 GBP 1.6022 GBP 1.5396
Add: Valuation adjustment - - -
Net asset value per share for shareholder dealing GBP 1.6327 GBP 1.6022 GBP 1.5396
Share class B
Net Asset Value GBP 7,840,057 GBP 7,511,853 GBP 6,153,271 Number of Shares in Issue 4,653,688 4,526,412 3,869,265
Net asset value per share for financial statement purposes GBP 1.6847 GBP 1.6596 GBP 1.5895 Add: Valuation adjustment - - -
Net asset value per share for shareholder dealing GBP 1.6847 GBP 1.6596 GBP 1.5895
Share class B Accumulation
Net Asset Value GBP 1,974,735 GBP 5,071 -
Number of Shares in Issue 1,901,461 4,992 -
Net asset value per share for financial statement purposes GBP 1.0385 GBP 1.0159 - Add: Valuation adjustment - - -
Net asset value per share for shareholder dealing GBP 1.0385 GBP 1.0159 -
Share class C
Net Asset Value GBP 48,607,087 GBP 47,404,690 GBP 44,643,308
Number of Shares in Issue 39,954,036 39,495,216 38,931,958
Net asset value per share for financial statement purposes GBP 1.2166 GBP 1.2003 GBP 1.1461 Add: Valuation adjustment - - -
Net asset value per share for shareholder dealing GBP 1.2166 GBP 1.2003 GBP 1.1461
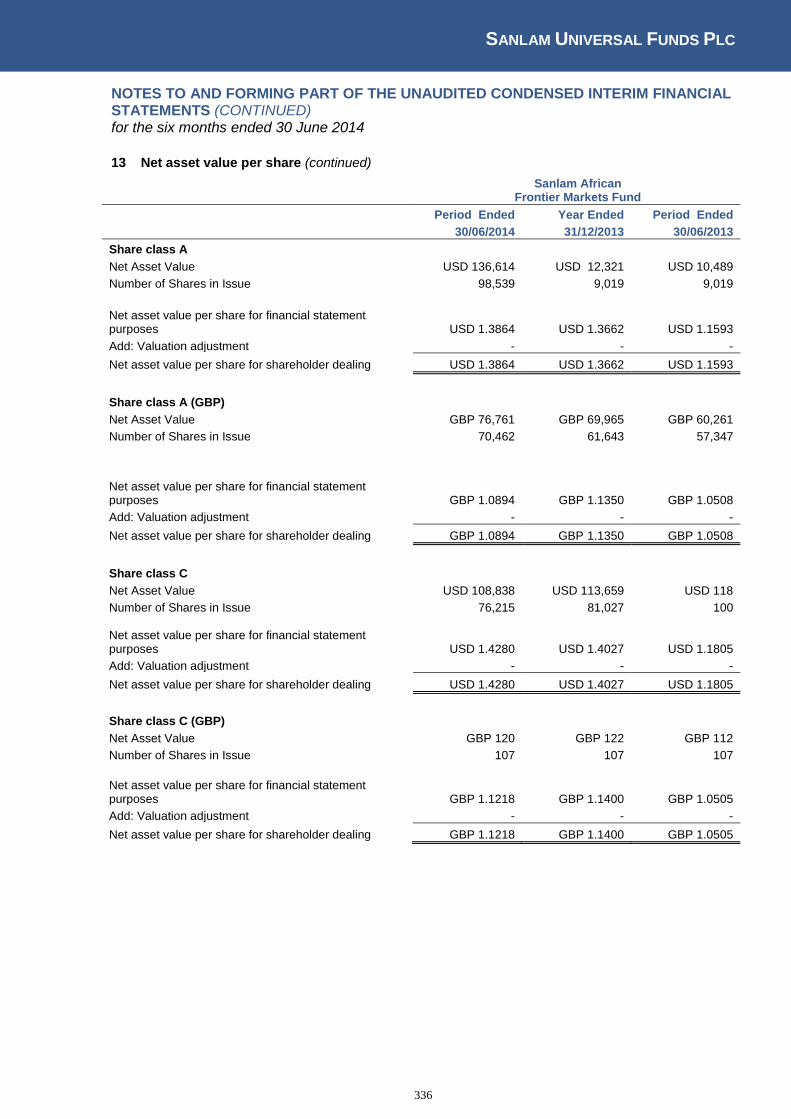
SANLAM UNIVERSAL FUNDS PLC
336
NOTES TO AND FORMING PART OF THE UNAUDITED CONDENSED INTERIM FINANCIAL STATEMENTS (CONTINUED) for the six months ended 30 June 2014
13 Net asset value per share (continued)
Sanlam African
Frontier Markets Fund
Period Ended Year Ended Period Ended
30/06/2014 31/12/2013 30/06/2013
Share class A
Net Asset Value USD 136,614 USD 12,321 USD 10,489
Number of Shares in Issue 98,539 9,019 9,019
Net asset value per share for financial statement purposes USD 1.3864 USD 1.3662 USD 1.1593
Add: Valuation adjustment - - -
Net asset value per share for shareholder dealing USD 1.3864 USD 1.3662 USD 1.1593
Share class A (GBP)
Net Asset Value GBP 76,761 GBP 69,965 GBP 60,261
Number of Shares in Issue 70,462 61,643 57,347
Net asset value per share for financial statement purposes GBP 1.0894 GBP 1.1350 GBP 1.0508
Add: Valuation adjustment - - -
Net asset value per share for shareholder dealing GBP 1.0894 GBP 1.1350 GBP 1.0508
Share class C
Net Asset Value USD 108,838 USD 113,659 USD 118
Number of Shares in Issue 76,215 81,027 100
Net asset value per share for financial statement purposes USD 1.4280 USD 1.4027 USD 1.1805
Add: Valuation adjustment - - -
Net asset value per share for shareholder dealing USD 1.4280 USD 1.4027 USD 1.1805
Share class C (GBP)
Net Asset Value GBP 120 GBP 122 GBP 112
Number of Shares in Issue 107 107 107
Net asset value per share for financial statement purposes GBP 1.1218 GBP 1.1400 GBP 1.0505
Add: Valuation adjustment - - -
Net asset value per share for shareholder dealing GBP 1.1218 GBP 1.1400 GBP 1.0505

SANLAM UNIVERSAL FUNDS PLC
337
NOTES TO AND FORMING PART OF THE UNAUDITED CONDENSED INTERIM FINANCIAL STATEMENTS (CONTINUED) for the six months ended 30 June 2014
13 Net asset value per share (continued)
Sanlam African Frontier Markets Fund (continued)
Period Ended Year Ended Period Ended
30/06/2014 31/12/2013 30/06/2013
Share class D
Net Asset Value USD 46,163,762 USD 45,622,582 USD 39,240,295
Number of Shares in Issue 34,935,450 35,194,757 35,880,864
Net asset value per share for financial statement purposes USD 1.3214 USD 1.2963 USD 1.0937
Add: Valuation adjustment - - -
Net asset value per share for shareholder dealing USD 1.3214 USD 1.2963 USD 1.0937
Share class G
Net Asset Value USD 29,545,640 USD 29,092,184 USD28,041,017
Number of Shares in Issue 24,899,057 24,899,057 28,336,496
Net asset value per share for financial statement purposes USD 1.1866 USD 1.1684 USD 0.9896
Add: Valuation adjustment - - -
Net asset value per share for shareholder dealing USD 1.1866 USD 1.1684 USD 0.9896
Share class H
Net Asset Value USD 6,384,969 USD 4,041,848 -
Number of Shares in Issue 5,531,397 3,582,597 -
- Net asset value per share for financial statement purposes USD 1.1543 USD 1.1282 -
Add: Valuation adjustment - - -
Net asset value per share for shareholder dealing USD 1.1543 USD 1.1282 -
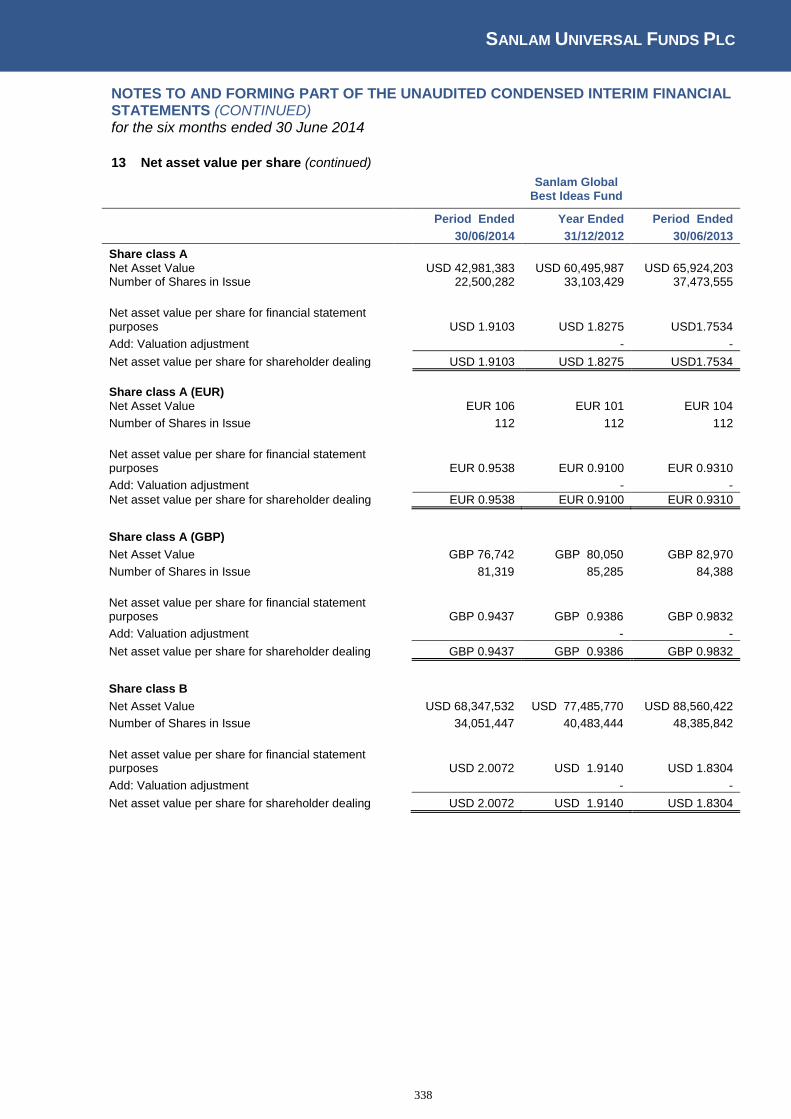
SANLAM UNIVERSAL FUNDS PLC
338
NOTES TO AND FORMING PART OF THE UNAUDITED CONDENSED INTERIM FINANCIAL STATEMENTS (CONTINUED) for the six months ended 30 June 2014
13 Net asset value per share (continued)
Sanlam Global Best Ideas Fund
Period Ended Year Ended Period Ended
30/06/2014 31/12/2012 30/06/2013
Share class A
Net Asset Value USD 42,981,383 USD 60,495,987 USD 65,924,203 Number of Shares in Issue 22,500,282 33,103,429 37,473,555
Net asset value per share for financial statement purposes USD 1.9103 USD 1.8275 USD1.7534
Add: Valuation adjustment - -
Net asset value per share for shareholder dealing USD 1.9103 USD 1.8275 USD1.7534
Share class A (EUR)
Net Asset Value EUR 106 EUR 101 EUR 104
Number of Shares in Issue 112 112 112
Net asset value per share for financial statement purposes EUR 0.9538 EUR 0.9100 EUR 0.9310
Add: Valuation adjustment - -
Net asset value per share for shareholder dealing EUR 0.9538 EUR 0.9100 EUR 0.9310
Share class A (GBP)
Net Asset Value GBP 76,742 GBP 80,050 GBP 82,970
Number of Shares in Issue 81,319 85,285 84,388
Net asset value per share for financial statement purposes GBP 0.9437 GBP 0.9386 GBP 0.9832
Add: Valuation adjustment - -
Net asset value per share for shareholder dealing GBP 0.9437 GBP 0.9386 GBP 0.9832
Share class B
Net Asset Value USD 68,347,532 USD 77,485,770 USD 88,560,422
Number of Shares in Issue 34,051,447 40,483,444 48,385,842
Net asset value per share for financial statement purposes USD 2.0072 USD 1.9140 USD 1.8304
Add: Valuation adjustment - -
Net asset value per share for shareholder dealing USD 2.0072 USD 1.9140 USD 1.8304

SANLAM UNIVERSAL FUNDS PLC
339
NOTES TO AND FORMING PART OF THE UNAUDITED CONDENSED INTERIM FINANCIAL STATEMENTS (CONTINUED) for the six months ended 30 June 2014
13 Net asset value per share (continued)
Share class C (GBP)
Net Asset Value GBP 80,166 GBP 78,854 GBP 78,781
Number of Shares in Issue 58,585 57,175 54,471
Net asset value per share for financial statement purposes GBP 1.3684 GBP 1.3792 GBP 1.4392
Add: Valuation adjustment - - -
Net asset value per share for shareholder dealing GBP 1.3684 GBP 1.3792 GBP 1.4392
Share class D
Net Asset Value USD 25,187,307 USD 24,038,605 USD 22,976,553
Number of Shares in Issue 24,070,820 24,103,305 24,103,305
Net asset value per share for financial statement purposes USD 1.0464 USD 0.9973 USD 0.9533
Add: Valuation adjustment - - -
Net asset value per share for shareholder dealing USD 1.0464 USD 0.9973 USD 0.9533
Share class E
Net Asset Value USD 162,669,390 USD 179,531,609 USD 175,152,400
Number of Shares in Issue 134,869,066 156,778,767 160,661,902
Net asset value per share for financial statement purposes USD 1.2061 USD 1.1451 USD 1.0902
Add: Valuation adjustment - - -
Net asset value per share for shareholder dealing USD 1.2061 USD 1.1451 USD 1.0902
Sanlam Global
Best Ideas Fund (continued)
Period Ended Year Ended Period Ended
30/06/2014 31/12/2013 30/06/2013
Share class C
Net Asset Value USD 78,968,036 USD 83,004,801 USD 83,495,441
Number of Shares in Issue 38,986,185 42,995,334 45,250,709
Net asset value per share for financial statement purposes USD 2.0255 USD 1.9306 USD 1.8453
Add: Valuation adjustment - - -
Net asset value per share for shareholder dealing USD 2.0255 USD 1.9306 USD 1.8453
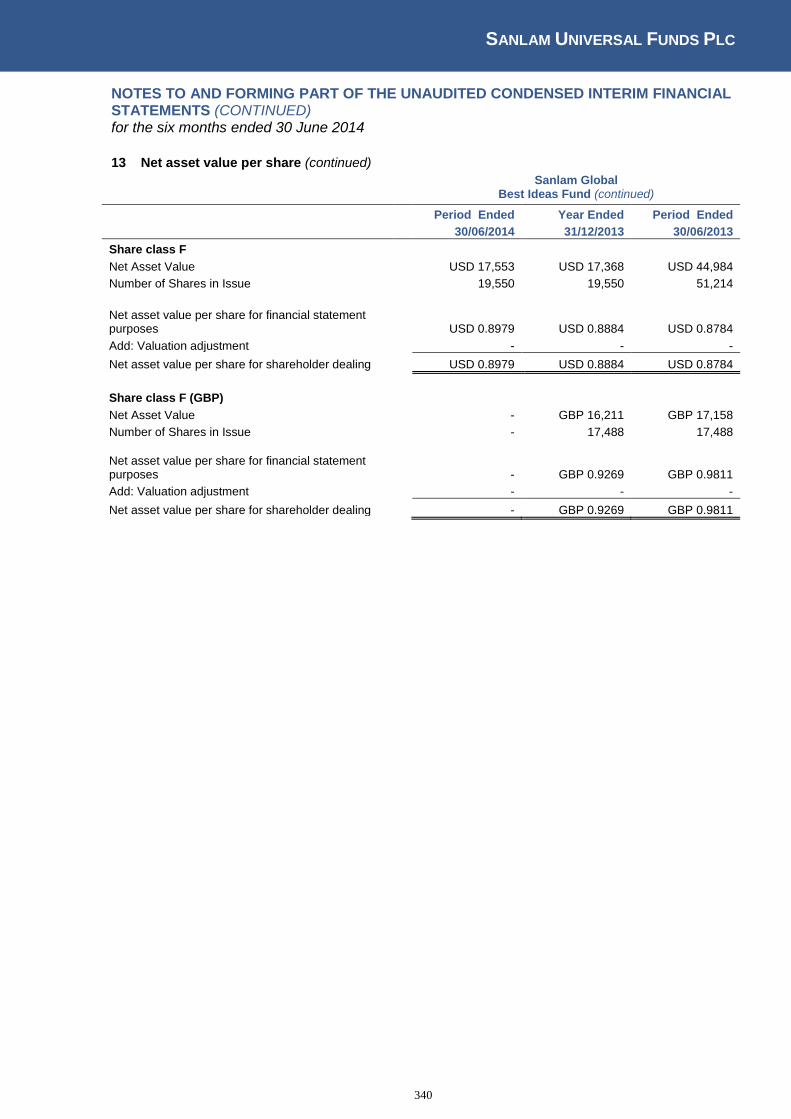
SANLAM UNIVERSAL FUNDS PLC
340
NOTES TO AND FORMING PART OF THE UNAUDITED CONDENSED INTERIM FINANCIAL STATEMENTS (CONTINUED) for the six months ended 30 June 2014
13 Net asset value per share (continued)
Sanlam Global
Best Ideas Fund (continued)
Period Ended Year Ended Period Ended
30/06/2014 31/12/2013 30/06/2013
Share class F
Net Asset Value USD 17,553 USD 17,368 USD 44,984
Number of Shares in Issue 19,550 19,550 51,214
Net asset value per share for financial statement purposes USD 0.8979 USD 0.8884 USD 0.8784
Add: Valuation adjustment - - -
Net asset value per share for shareholder dealing USD 0.8979 USD 0.8884 USD 0.8784
Share class F (GBP)
Net Asset Value - GBP 16,211 GBP 17,158
Number of Shares in Issue - 17,488 17,488
Net asset value per share for financial statement purposes - GBP 0.9269 GBP 0.9811
Add: Valuation adjustment - - -
Net asset value per share for shareholder dealing - GBP 0.9269 GBP 0.9811

SANLAM UNIVERSAL FUNDS PLC
341
NOTES TO AND FORMING PART OF THE UNAUDITED CONDENSED INTERIM FINANCIAL STATEMENTS (CONTINUED) for the six months ended 30 June 2014
13 Net asset value per share (continued)
Sanlam Global
Bond Fund
Period Ended Year Ended Period Ended
30/06/2014 31/12/2013 30/06/2013
Share class A
Net Asset Value USD 83,516 USD 80,066 USD 87,138
Number of Shares in Issue 58,859 59,041 65,608
Net asset value per share for financial statement purposes USD 1.4189 USD 1.3561 USD 1.3282
Add: Valuation adjustment - - -
Net asset value per share for shareholder dealing USD 1.4189 USD 1.3561 USD 1.3282
Share class B
Net Asset Value USD 314,287 USD 2,174,008 USD 2,128,836
Number of Shares in Issue 220,206 1,595,563 1,597,284
Net asset value per share for financial statement purposes USD 1.4272 USD 1.3625 USD 1.3328
Add: Valuation adjustment - - -
Net asset value per share for shareholder dealing USD 1.4272 USD 1.3625 USD 1.3328
Share class C
Net Asset Value USD 164,851,011 USD 170,924,307 USD 170,279,905
Number of Shares in Issue 116,260,886 126,377,185 128,808,399
Net asset value per share for financial statement purposes USD 1.4179 USD 1.3525 USD 1.3220
Add: Valuation adjustment - - -
Net asset value per share for shareholder dealing USD 1.4179 USD 1.3525 USD 1.3220
Share class E
Net Asset Value USD 262,140,678 USD 233,214,887 USD 186,455,816
Number of Shares in Issue 175,917,817 164,589,421 135,054,171
Net asset value per share for financial statement purposes USD 1.4901 USD 1.4169 USD 1.3806
Add: Valuation adjustment - - -
Net asset value per share for shareholder dealing USD 1.4901 USD 1.4169 USD 1.3806

SANLAM UNIVERSAL FUNDS PLC
342
NOTES TO AND FORMING PART OF THE UNAUDITED CONDENSED INTERIM FINANCIAL STATEMENTS (CONTINUED) for the six months ended 30 June 2014
13 Net asset value per share (continued)
Sanlam Global Financial Fund
Period Ended Year Ended Period Ended
30/06/2014 31/12/2013 30/06/2013
Share class A
Net Asset Value USD 35,690,340 USD 38,260,474 USD 38,388,302
Number of Shares in Issue 1,254,191 1,465,727 1,547,170
Net asset value per share for financial statement purposes USD 28.4569 USD 26.1034 USD 24.8138
Add: Valuation adjustment - - -
Net asset value per share for shareholder dealing USD 28.4569 USD 26.1034 USD 24.8138
Share class A (EUR)
Net Asset Value EUR 114 EUR 105 EUR 106
Number of Shares in Issue 99 99 99
Net asset value per share for financial statement purposes EUR 1.1571 EUR 1.0596 EUR 1.0752
Add: Valuation adjustment - - -
Net asset value per share for shareholder dealing EUR 1.1571 EUR 1.0596 EUR 1.0752
Share class A (GBP)
Net Asset Value GBP 214,670 GBP 193,339 GBP 338,090
Number of Shares in Issue 166,566 158,279 266,350
Net asset value per share for financial statement purposes GBP 1.2888 GBP 1.2215 GBP 1.2694
Add: Valuation adjustment - - -
Net asset value per share for shareholder dealing GBP 1.2888 GBP 1.2215 GBP 1.2694
Share class B
Net Asset Value USD 30,882,914 USD 31,133,012 USD 44,103,850
Number of Shares in Issue 1,124,214 1,237,029 1,845,951
Net asset value per share for financial statement purposes USD 27.4707 USD 25.1676 USD 23.8937
Add: Valuation adjustment - - -
Net asset value per share for shareholder dealing USD 27.4707 USD 25.1676 USD 23.8937
Share class C
Net Asset Value USD 275,278,060 USD 255,413,316 USD 237,416,462
Number of Shares in Issue 167,833,678 170,183,933 166,846,583
Net asset value per share for financial statement purposes USD 1.6402 USD 1.5008 USD 1.4230
Add: Valuation adjustment - - -
Net asset value per share for shareholder dealing USD 1.6402 USD 1.5008 USD 1.4230
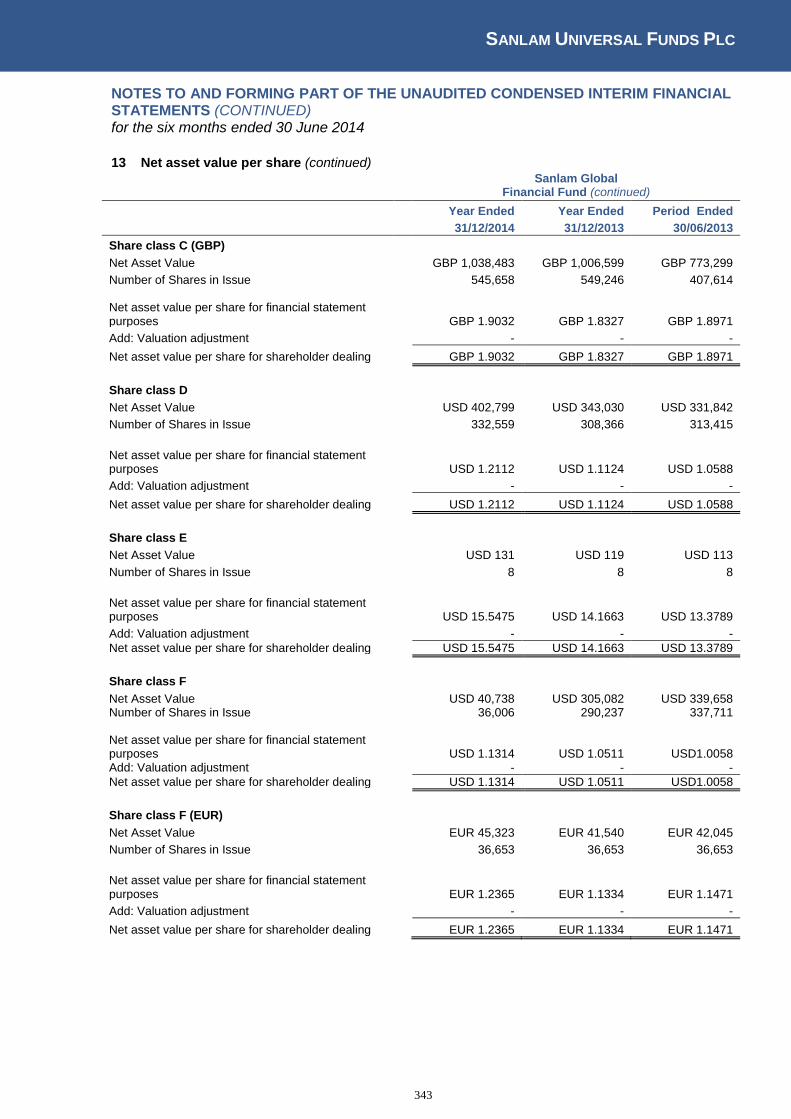
SANLAM UNIVERSAL FUNDS PLC
343
NOTES TO AND FORMING PART OF THE UNAUDITED CONDENSED INTERIM FINANCIAL STATEMENTS (CONTINUED) for the six months ended 30 June 2014
13 Net asset value per share (continued)
Sanlam Global
Financial Fund (continued)
Year Ended Year Ended Period Ended
31/12/2014 31/12/2013 30/06/2013
Share class C (GBP)
Net Asset Value GBP 1,038,483 GBP 1,006,599 GBP 773,299
Number of Shares in Issue 545,658 549,246 407,614
Net asset value per share for financial statement purposes GBP 1.9032 GBP 1.8327 GBP 1.8971
Add: Valuation adjustment - - -
Net asset value per share for shareholder dealing GBP 1.9032 GBP 1.8327 GBP 1.8971
Share class D
Net Asset Value USD 402,799 USD 343,030 USD 331,842
Number of Shares in Issue 332,559 308,366 313,415
Net asset value per share for financial statement purposes USD 1.2112 USD 1.1124 USD 1.0588
Add: Valuation adjustment - - -
Net asset value per share for shareholder dealing USD 1.2112 USD 1.1124 USD 1.0588
Share class E
Net Asset Value USD 131 USD 119 USD 113
Number of Shares in Issue 8 8 8
Net asset value per share for financial statement purposes USD 15.5475 USD 14.1663 USD 13.3789
Add: Valuation adjustment - - -
Net asset value per share for shareholder dealing USD 15.5475 USD 14.1663 USD 13.3789
Share class F
Net Asset Value USD 40,738 USD 305,082 USD 339,658 Number of Shares in Issue 36,006 290,237 337,711
Net asset value per share for financial statement purposes USD 1.1314 USD 1.0511 USD1.0058 Add: Valuation adjustment - - -
Net asset value per share for shareholder dealing USD 1.1314 USD 1.0511 USD1.0058
Share class F (EUR)
Net Asset Value EUR 45,323 EUR 41,540 EUR 42,045
Number of Shares in Issue 36,653 36,653 36,653
Net asset value per share for financial statement purposes EUR 1.2365 EUR 1.1334 EUR 1.1471
Add: Valuation adjustment - - -
Net asset value per share for shareholder dealing EUR 1.2365 EUR 1.1334 EUR 1.1471

SANLAM UNIVERSAL FUNDS PLC
344
NOTES TO AND FORMING PART OF THE UNAUDITED CONDENSED INTERIM FINANCIAL STATEMENTS (CONTINUED) for the six months ended 30 June 2014
13 Net asset value per share (continued) Sanlam Global
Financial Fund (continued)
Period Ended Year Ended Period Ended 30/06/2014 31/12/2013 30/06/2013
Share class F (GBP)
Net Asset Value GBP 349,677 GBP 313,471 GBP 258,668
Number of Shares in Issue 300,167 282,883 224,284
Net asset value per share for financial statement purposes GBP 1.1650 GBP 1.1082 GBP 1.1533
Add: Valuation adjustment - - -
Net asset value per share for shareholder dealing GBP 1.1650 GBP 1.1082 GBP 1.1533
Sanlam Global Property Fund
Period Ended Year Ended Period Ended
30/06/2014 31/12/2013 30/06/2013
Share class A
Net Asset Value USD 124 USD 111 USD 108
Number of Shares in Issue 100 100 100
Net asset value per share for financial statement purposes USD 1.2375 USD 1.1086 USD 1.0801
Add: Valuation adjustment - - -
Net asset value per share for shareholder dealing USD 1.2375 USD 1.1086 USD 1.0801
Share class B
Net Asset Value USD 788,282 USD 601,088 USD 750,777
Number of Shares in Issue 599,676 508,363 649,285
Net asset value per share for financial statement purposes USD 1.3145 USD 1.1824 USD 1.1564
Add: Valuation adjustment - - -
Net asset value per share for shareholder dealing USD 1.3145 USD 1.1824 USD 1.1564
Share class C
Net Asset Value USD 72,704,788 USD 67,153,720 USD 65,571,447
Number of Shares in Issue 47,226,725 48,554,677 48,541,320
Net asset value per share for financial statement purposes USD 1.5395 USD 1.3831 USD 1.3509
Add: Valuation adjustment - - -
Net asset value per share for shareholder dealing USD 1.5395 USD 1.3831 USD 1.3509
Share class E
Net Asset Value USD 83,799,279 USD 85,961,129 USD 85,359,546
Number of Shares in Issue 61,447,434 70,345,037 71,708,172
Net asset value per share for financial statement purposes USD 1.3638 USD 1.2220 USD 1.1094
Add: Valuation adjustment - - -
Net asset value per share for shareholder dealing USD 1.3638 USD 1.2220 USD 1.1904
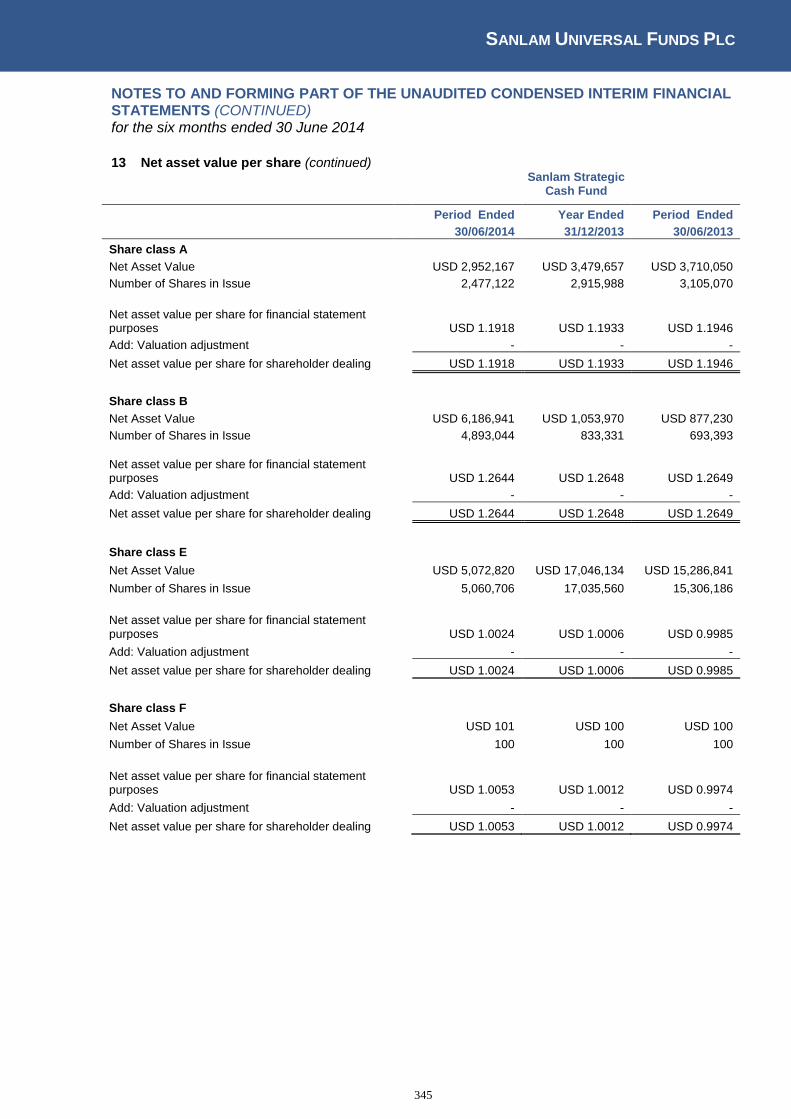
SANLAM UNIVERSAL FUNDS PLC
345
NOTES TO AND FORMING PART OF THE UNAUDITED CONDENSED INTERIM FINANCIAL STATEMENTS (CONTINUED) for the six months ended 30 June 2014
13 Net asset value per share (continued)
Sanlam Strategic Cash Fund
Period Ended Year Ended Period Ended
30/06/2014 31/12/2013 30/06/2013
Share class A
Net Asset Value USD 2,952,167 USD 3,479,657 USD 3,710,050
Number of Shares in Issue 2,477,122 2,915,988 3,105,070
Net asset value per share for financial statement purposes USD 1.1918 USD 1.1933 USD 1.1946
Add: Valuation adjustment - - -
Net asset value per share for shareholder dealing USD 1.1918 USD 1.1933 USD 1.1946
Share class B
Net Asset Value USD 6,186,941 USD 1,053,970 USD 877,230
Number of Shares in Issue 4,893,044 833,331 693,393
Net asset value per share for financial statement purposes USD 1.2644 USD 1.2648 USD 1.2649
Add: Valuation adjustment - - -
Net asset value per share for shareholder dealing USD 1.2644 USD 1.2648 USD 1.2649
Share class E
Net Asset Value USD 5,072,820 USD 17,046,134 USD 15,286,841
Number of Shares in Issue 5,060,706 17,035,560 15,306,186
Net asset value per share for financial statement purposes USD 1.0024 USD 1.0006 USD 0.9985
Add: Valuation adjustment - - -
Net asset value per share for shareholder dealing USD 1.0024 USD 1.0006 USD 0.9985
Share class F
Net Asset Value USD 101 USD 100 USD 100
Number of Shares in Issue 100 100 100
Net asset value per share for financial statement purposes USD 1.0053 USD 1.0012 USD 0.9974
Add: Valuation adjustment - - -
Net asset value per share for shareholder dealing USD 1.0053 USD 1.0012 USD 0.9974
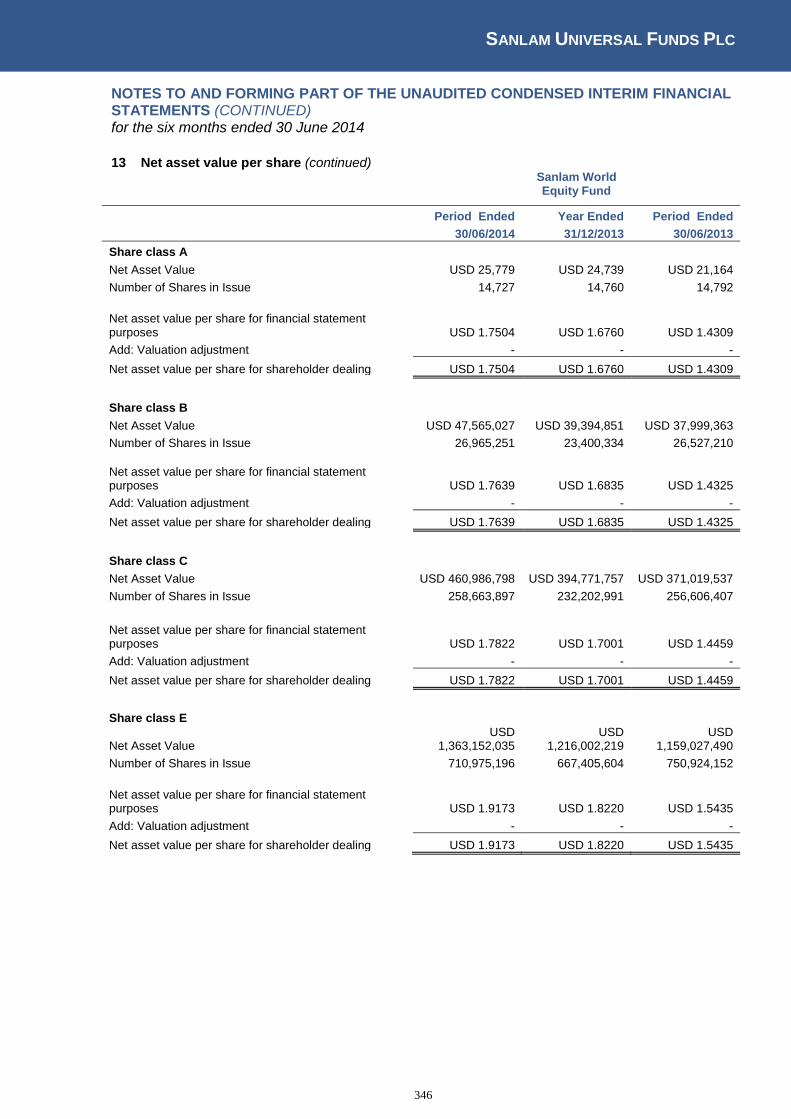
SANLAM UNIVERSAL FUNDS PLC
346
NOTES TO AND FORMING PART OF THE UNAUDITED CONDENSED INTERIM FINANCIAL STATEMENTS (CONTINUED) for the six months ended 30 June 2014
13 Net asset value per share (continued)
Sanlam World Equity Fund
Period Ended Year Ended Period Ended
30/06/2014 31/12/2013 30/06/2013
Share class A
Net Asset Value USD 25,779 USD 24,739 USD 21,164
Number of Shares in Issue 14,727 14,760 14,792
Net asset value per share for financial statement purposes USD 1.7504 USD 1.6760 USD 1.4309
Add: Valuation adjustment - - -
Net asset value per share for shareholder dealing USD 1.7504 USD 1.6760 USD 1.4309
Share class B
Net Asset Value USD 47,565,027 USD 39,394,851 USD 37,999,363
Number of Shares in Issue 26,965,251 23,400,334 26,527,210
Net asset value per share for financial statement purposes USD 1.7639 USD 1.6835 USD 1.4325
Add: Valuation adjustment - - -
Net asset value per share for shareholder dealing USD 1.7639 USD 1.6835 USD 1.4325
Share class C
Net Asset Value USD 460,986,798 USD 394,771,757 USD 371,019,537
Number of Shares in Issue 258,663,897 232,202,991 256,606,407
Net asset value per share for financial statement purposes USD 1.7822 USD 1.7001 USD 1.4459
Add: Valuation adjustment - - -
Net asset value per share for shareholder dealing USD 1.7822 USD 1.7001 USD 1.4459
Share class E
Net Asset Value USD
1,363,152,035 USD
1,216,002,219 USD
1,159,027,490
Number of Shares in Issue 710,975,196 667,405,604 750,924,152
Net asset value per share for financial statement purposes USD 1.9173 USD 1.8220 USD 1.5435
Add: Valuation adjustment - - -
Net asset value per share for shareholder dealing USD 1.9173 USD 1.8220 USD 1.5435
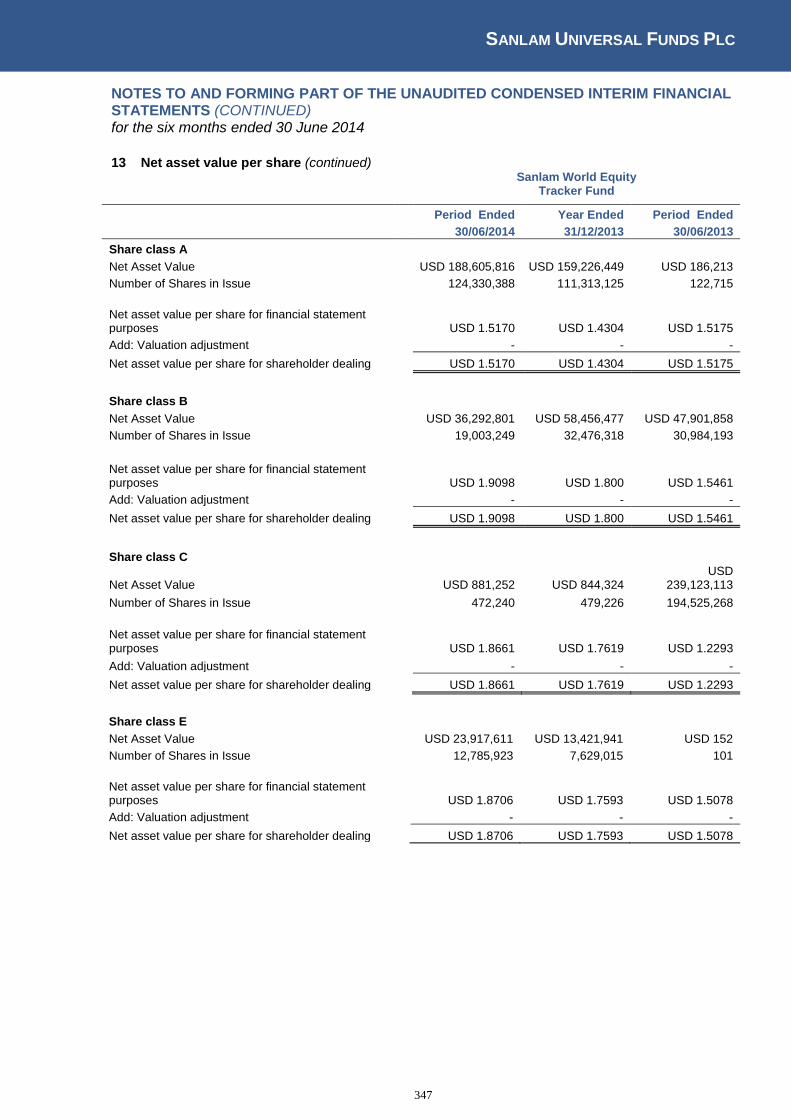
SANLAM UNIVERSAL FUNDS PLC
347
NOTES TO AND FORMING PART OF THE UNAUDITED CONDENSED INTERIM FINANCIAL STATEMENTS (CONTINUED) for the six months ended 30 June 2014
13 Net asset value per share (continued)
Sanlam World Equity Tracker Fund
Period Ended Year Ended Period Ended
30/06/2014 31/12/2013 30/06/2013
Share class A
Net Asset Value USD 188,605,816 USD 159,226,449 USD 186,213
Number of Shares in Issue 124,330,388 111,313,125 122,715
Net asset value per share for financial statement purposes USD 1.5170 USD 1.4304 USD 1.5175
Add: Valuation adjustment - - -
Net asset value per share for shareholder dealing USD 1.5170 USD 1.4304 USD 1.5175
Share class B
Net Asset Value USD 36,292,801 USD 58,456,477 USD 47,901,858
Number of Shares in Issue 19,003,249 32,476,318 30,984,193
Net asset value per share for financial statement purposes USD 1.9098 USD 1.800 USD 1.5461
Add: Valuation adjustment - - -
Net asset value per share for shareholder dealing USD 1.9098 USD 1.800 USD 1.5461
Share class C
Net Asset Value USD 881,252 USD 844,324 USD
239,123,113
Number of Shares in Issue 472,240 479,226 194,525,268
Net asset value per share for financial statement purposes USD 1.8661 USD 1.7619 USD 1.2293
Add: Valuation adjustment - - -
Net asset value per share for shareholder dealing USD 1.8661 USD 1.7619 USD 1.2293
Share class E
Net Asset Value USD 23,917,611 USD 13,421,941 USD 152
Number of Shares in Issue 12,785,923 7,629,015 101
Net asset value per share for financial statement purposes USD 1.8706 USD 1.7593 USD 1.5078
Add: Valuation adjustment - - -
Net asset value per share for shareholder dealing USD 1.8706 USD 1.7593 USD 1.5078
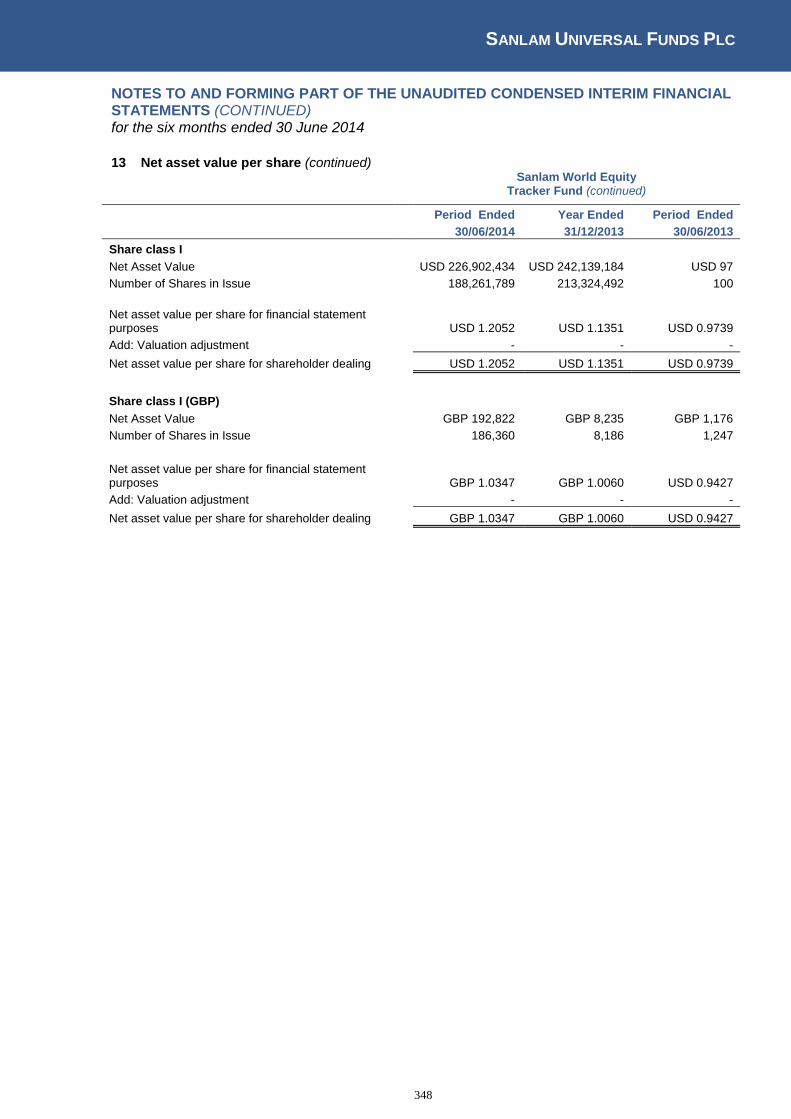
SANLAM UNIVERSAL FUNDS PLC
348
NOTES TO AND FORMING PART OF THE UNAUDITED CONDENSED INTERIM FINANCIAL STATEMENTS (CONTINUED) for the six months ended 30 June 2014
13 Net asset value per share (continued)
Sanlam World Equity Tracker Fund (continued)
Period Ended Year Ended Period Ended
30/06/2014 31/12/2013 30/06/2013
Share class I
Net Asset Value USD 226,902,434 USD 242,139,184 USD 97
Number of Shares in Issue 188,261,789 213,324,492 100
Net asset value per share for financial statement purposes USD 1.2052 USD 1.1351 USD 0.9739
Add: Valuation adjustment - - -
Net asset value per share for shareholder dealing USD 1.2052 USD 1.1351 USD 0.9739
Share class I (GBP)
Net Asset Value GBP 192,822 GBP 8,235 GBP 1,176
Number of Shares in Issue 186,360 8,186 1,247
Net asset value per share for financial statement purposes GBP 1.0347 GBP 1.0060 USD 0.9427
Add: Valuation adjustment - - -
Net asset value per share for shareholder dealing GBP 1.0347 GBP 1.0060 USD 0.9427
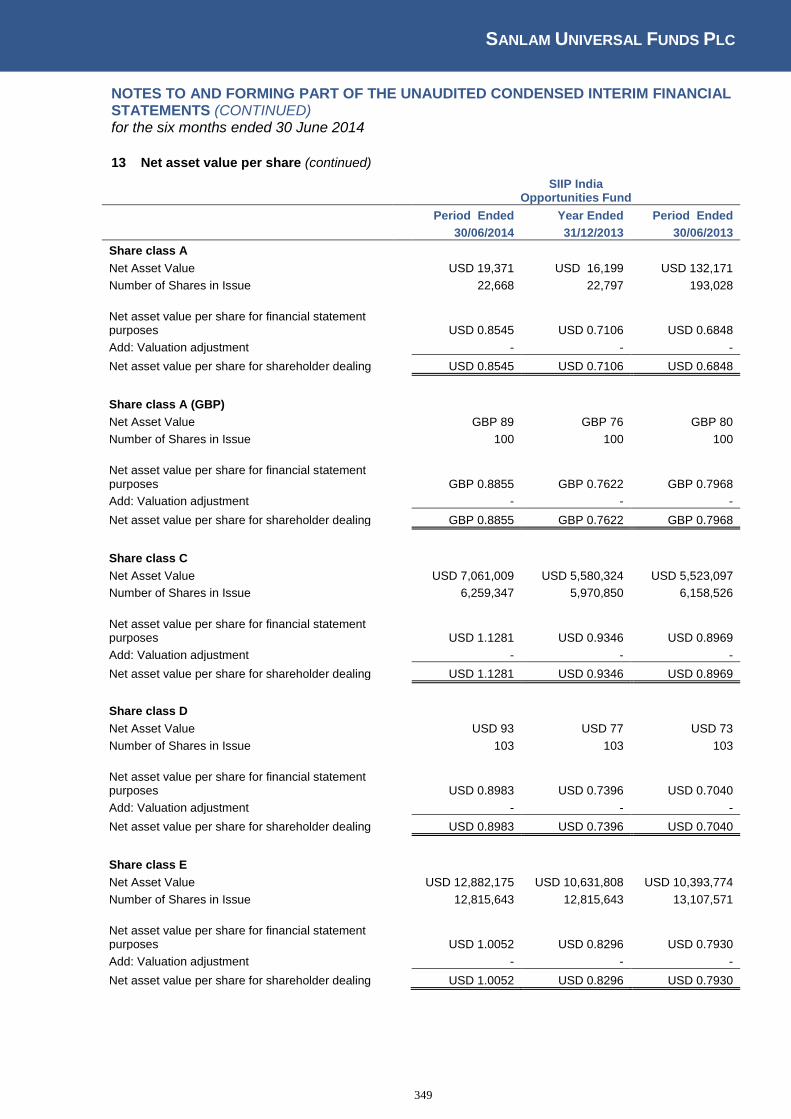
SANLAM UNIVERSAL FUNDS PLC
349
NOTES TO AND FORMING PART OF THE UNAUDITED CONDENSED INTERIM FINANCIAL STATEMENTS (CONTINUED) for the six months ended 30 June 2014
13 Net asset value per share (continued)
SIIP India
Opportunities Fund
Period Ended Year Ended Period Ended
30/06/2014 31/12/2013 30/06/2013
Share class A
Net Asset Value USD 19,371 USD 16,199 USD 132,171
Number of Shares in Issue 22,668 22,797 193,028
Net asset value per share for financial statement purposes USD 0.8545 USD 0.7106 USD 0.6848
Add: Valuation adjustment - - -
Net asset value per share for shareholder dealing USD 0.8545 USD 0.7106 USD 0.6848
Share class A (GBP)
Net Asset Value GBP 89 GBP 76 GBP 80
Number of Shares in Issue 100 100 100
Net asset value per share for financial statement purposes GBP 0.8855 GBP 0.7622 GBP 0.7968
Add: Valuation adjustment - - -
Net asset value per share for shareholder dealing GBP 0.8855 GBP 0.7622 GBP 0.7968
Share class C
Net Asset Value USD 7,061,009 USD 5,580,324 USD 5,523,097
Number of Shares in Issue 6,259,347 5,970,850 6,158,526
Net asset value per share for financial statement purposes USD 1.1281 USD 0.9346 USD 0.8969
Add: Valuation adjustment - - -
Net asset value per share for shareholder dealing USD 1.1281 USD 0.9346 USD 0.8969
Share class D
Net Asset Value USD 93 USD 77 USD 73
Number of Shares in Issue 103 103 103
Net asset value per share for financial statement purposes USD 0.8983 USD 0.7396 USD 0.7040
Add: Valuation adjustment - - -
Net asset value per share for shareholder dealing USD 0.8983 USD 0.7396 USD 0.7040
Share class E
Net Asset Value USD 12,882,175 USD 10,631,808 USD 10,393,774
Number of Shares in Issue 12,815,643 12,815,643 13,107,571
Net asset value per share for financial statement purposes USD 1.0052 USD 0.8296 USD 0.7930
Add: Valuation adjustment - - -
Net asset value per share for shareholder dealing USD 1.0052 USD 0.8296 USD 0.7930
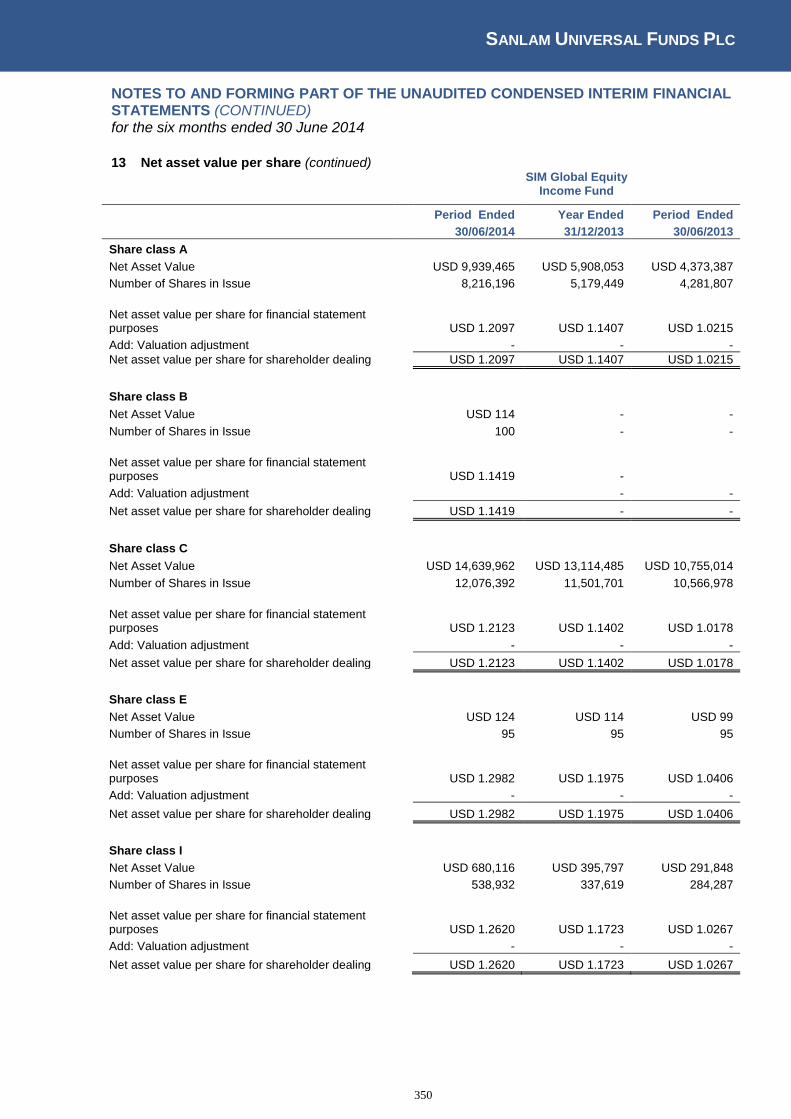
SANLAM UNIVERSAL FUNDS PLC
350
NOTES TO AND FORMING PART OF THE UNAUDITED CONDENSED INTERIM FINANCIAL STATEMENTS (CONTINUED) for the six months ended 30 June 2014
13 Net asset value per share (continued)
SIM Global Equity Income Fund
Period Ended Year Ended Period Ended
30/06/2014 31/12/2013 30/06/2013
Share class A
Net Asset Value USD 9,939,465 USD 5,908,053 USD 4,373,387
Number of Shares in Issue 8,216,196 5,179,449 4,281,807
Net asset value per share for financial statement purposes USD 1.2097 USD 1.1407 USD 1.0215
Add: Valuation adjustment - - -
Net asset value per share for shareholder dealing USD 1.2097 USD 1.1407 USD 1.0215
Share class B
Net Asset Value USD 114 - -
Number of Shares in Issue 100 - -
Net asset value per share for financial statement purposes USD 1.1419 -
Add: Valuation adjustment - -
Net asset value per share for shareholder dealing USD 1.1419 - -
Share class C
Net Asset Value USD 14,639,962 USD 13,114,485 USD 10,755,014
Number of Shares in Issue 12,076,392 11,501,701 10,566,978
Net asset value per share for financial statement purposes USD 1.2123 USD 1.1402 USD 1.0178
Add: Valuation adjustment - - -
Net asset value per share for shareholder dealing USD 1.2123 USD 1.1402 USD 1.0178
Share class E
Net Asset Value USD 124 USD 114 USD 99
Number of Shares in Issue 95 95 95
Net asset value per share for financial statement purposes USD 1.2982 USD 1.1975 USD 1.0406
Add: Valuation adjustment - - -
Net asset value per share for shareholder dealing USD 1.2982 USD 1.1975 USD 1.0406
Share class I
Net Asset Value USD 680,116 USD 395,797 USD 291,848
Number of Shares in Issue 538,932 337,619 284,287
Net asset value per share for financial statement purposes USD 1.2620 USD 1.1723 USD 1.0267
Add: Valuation adjustment - - -
Net asset value per share for shareholder dealing USD 1.2620 USD 1.1723 USD 1.0267
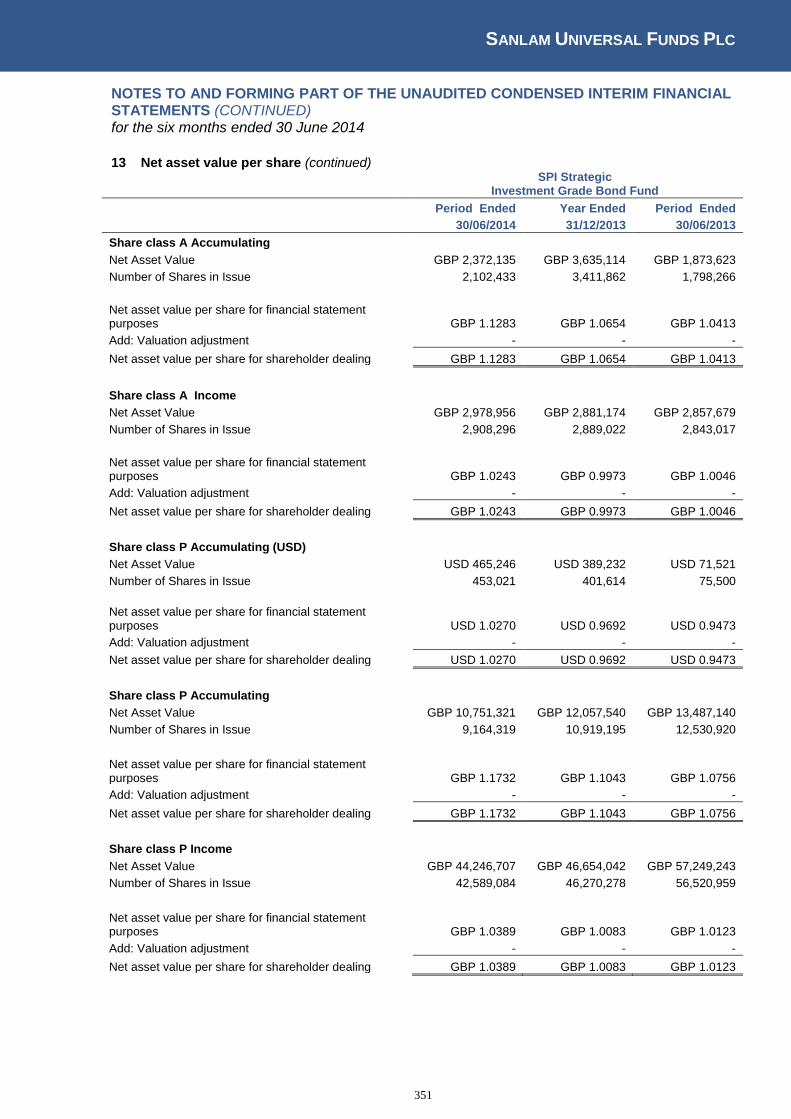
SANLAM UNIVERSAL FUNDS PLC
351
NOTES TO AND FORMING PART OF THE UNAUDITED CONDENSED INTERIM FINANCIAL STATEMENTS (CONTINUED) for the six months ended 30 June 2014
13 Net asset value per share (continued)
SPI Strategic Investment Grade Bond Fund
Period Ended Year Ended Period Ended
30/06/2014 31/12/2013 30/06/2013
Share class A Accumulating
Net Asset Value GBP 2,372,135 GBP 3,635,114 GBP 1,873,623
Number of Shares in Issue 2,102,433 3,411,862 1,798,266
Net asset value per share for financial statement purposes GBP 1.1283 GBP 1.0654 GBP 1.0413
Add: Valuation adjustment - - -
Net asset value per share for shareholder dealing GBP 1.1283 GBP 1.0654 GBP 1.0413
Share class A Income
Net Asset Value GBP 2,978,956 GBP 2,881,174 GBP 2,857,679
Number of Shares in Issue 2,908,296 2,889,022 2,843,017
Net asset value per share for financial statement purposes GBP 1.0243 GBP 0.9973 GBP 1.0046
Add: Valuation adjustment - - -
Net asset value per share for shareholder dealing GBP 1.0243 GBP 0.9973 GBP 1.0046
Share class P Accumulating (USD)
Net Asset Value USD 465,246 USD 389,232 USD 71,521
Number of Shares in Issue 453,021 401,614 75,500
Net asset value per share for financial statement purposes USD 1.0270 USD 0.9692 USD 0.9473
Add: Valuation adjustment - - -
Net asset value per share for shareholder dealing USD 1.0270 USD 0.9692 USD 0.9473
Share class P Accumulating
Net Asset Value GBP 10,751,321 GBP 12,057,540 GBP 13,487,140
Number of Shares in Issue 9,164,319 10,919,195 12,530,920
Net asset value per share for financial statement purposes GBP 1.1732 GBP 1.1043 GBP 1.0756
Add: Valuation adjustment - - -
Net asset value per share for shareholder dealing GBP 1.1732 GBP 1.1043 GBP 1.0756
Share class P Income
Net Asset Value GBP 44,246,707 GBP 46,654,042 GBP 57,249,243
Number of Shares in Issue 42,589,084 46,270,278 56,520,959
Net asset value per share for financial statement purposes GBP 1.0389 GBP 1.0083 GBP 1.0123
Add: Valuation adjustment - - -
Net asset value per share for shareholder dealing GBP 1.0389 GBP 1.0083 GBP 1.0123
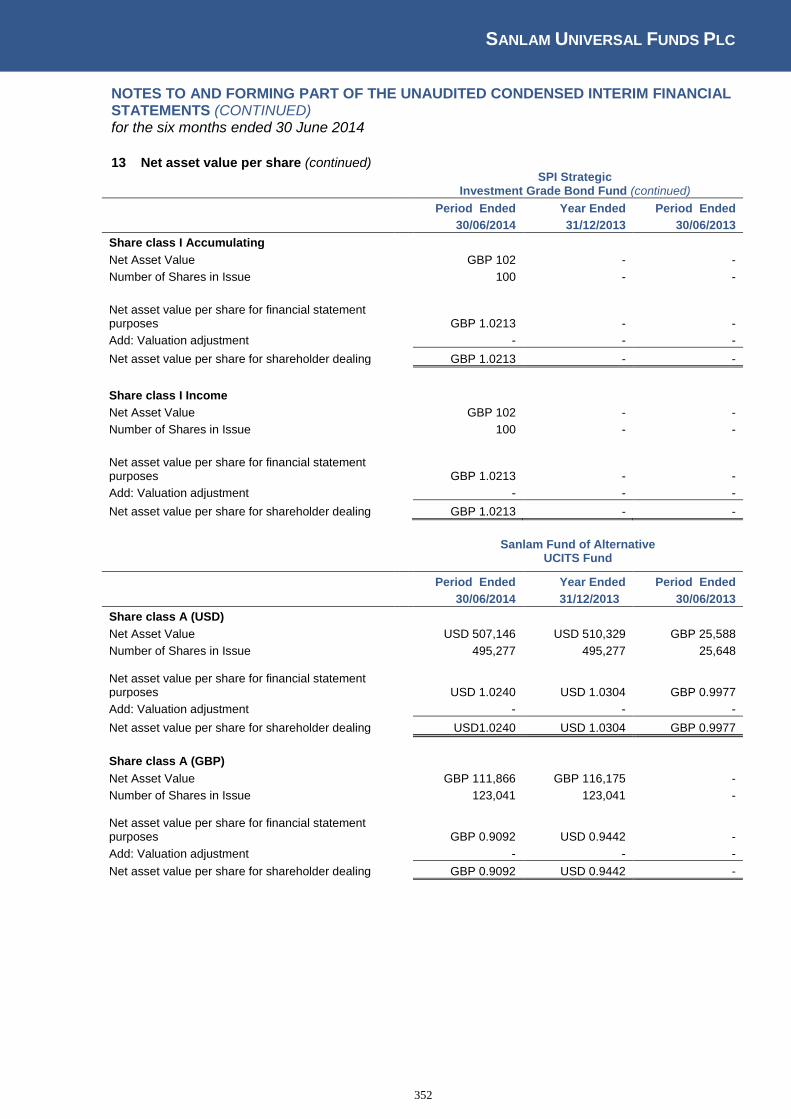
SANLAM UNIVERSAL FUNDS PLC
352
NOTES TO AND FORMING PART OF THE UNAUDITED CONDENSED INTERIM FINANCIAL STATEMENTS (CONTINUED) for the six months ended 30 June 2014
13 Net asset value per share (continued)
SPI Strategic Investment Grade Bond Fund (continued)
Period Ended Year Ended Period Ended
30/06/2014 31/12/2013 30/06/2013
Share class I Accumulating
Net Asset Value GBP 102 - -
Number of Shares in Issue 100 - -
Net asset value per share for financial statement purposes GBP 1.0213 - -
Add: Valuation adjustment - - -
Net asset value per share for shareholder dealing GBP 1.0213 - -
Share class I Income
Net Asset Value GBP 102 - -
Number of Shares in Issue 100 - -
Net asset value per share for financial statement purposes GBP 1.0213 - -
Add: Valuation adjustment - - -
Net asset value per share for shareholder dealing GBP 1.0213 - -
Sanlam Fund of Alternative UCITS Fund
Period Ended Year Ended Period Ended
30/06/2014 31/12/2013 30/06/2013
Share class A (USD)
Net Asset Value USD 507,146 USD 510,329 GBP 25,588
Number of Shares in Issue 495,277 495,277 25,648
Net asset value per share for financial statement purposes USD 1.0240 USD 1.0304 GBP 0.9977
Add: Valuation adjustment - - -
Net asset value per share for shareholder dealing USD1.0240 USD 1.0304 GBP 0.9977
Share class A (GBP)
Net Asset Value GBP 111,866 GBP 116,175 -
Number of Shares in Issue 123,041 123,041 - Net asset value per share for financial statement purposes GBP 0.9092 USD 0.9442 -
Add: Valuation adjustment - - -
Net asset value per share for shareholder dealing GBP 0.9092 USD 0.9442 -
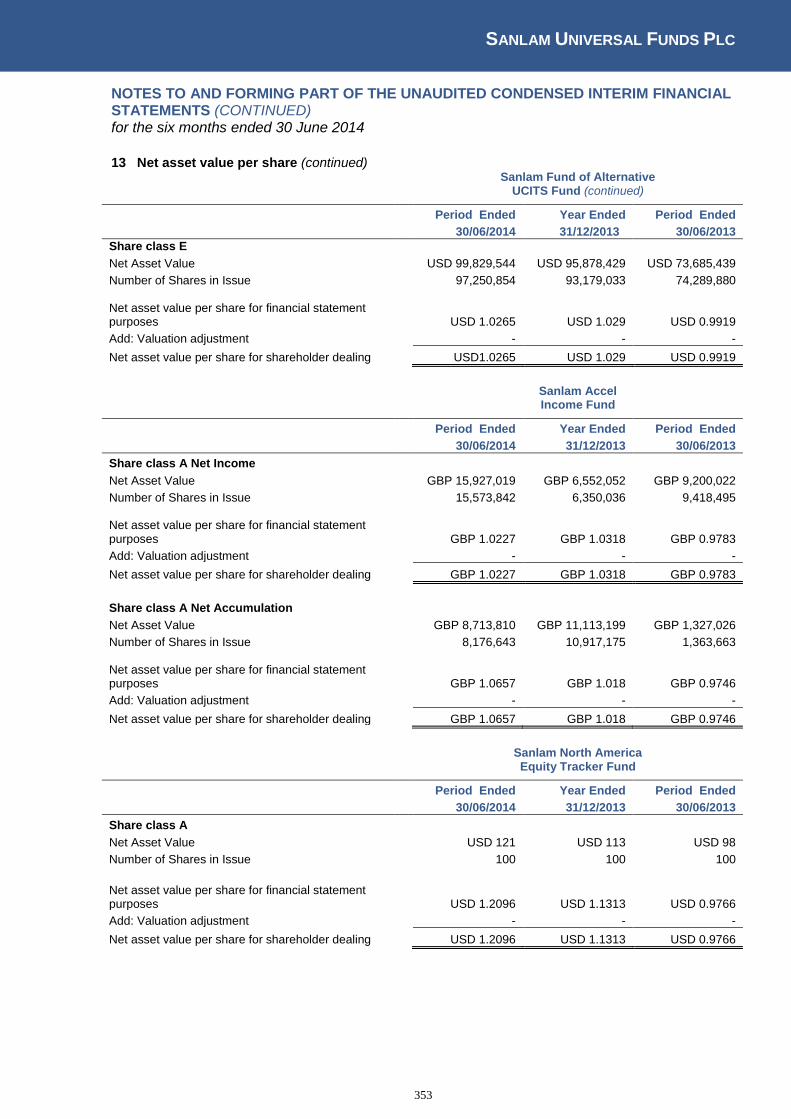
SANLAM UNIVERSAL FUNDS PLC
353
NOTES TO AND FORMING PART OF THE UNAUDITED CONDENSED INTERIM FINANCIAL STATEMENTS (CONTINUED) for the six months ended 30 June 2014
13 Net asset value per share (continued)
Sanlam Fund of Alternative UCITS Fund (continued)
Period Ended Year Ended Period Ended
30/06/2014 31/12/2013 30/06/2013
Share class E
Net Asset Value USD 99,829,544 USD 95,878,429 USD 73,685,439
Number of Shares in Issue 97,250,854 93,179,033 74,289,880
Net asset value per share for financial statement purposes USD 1.0265 USD 1.029 USD 0.9919
Add: Valuation adjustment - - -
Net asset value per share for shareholder dealing USD1.0265 USD 1.029 USD 0.9919
Sanlam Accel Income Fund
Period Ended Year Ended Period Ended
30/06/2014 31/12/2013 30/06/2013
Share class A Net Income
Net Asset Value GBP 15,927,019 GBP 6,552,052 GBP 9,200,022
Number of Shares in Issue 15,573,842 6,350,036 9,418,495
Net asset value per share for financial statement purposes GBP 1.0227 GBP 1.0318 GBP 0.9783
Add: Valuation adjustment - - -
Net asset value per share for shareholder dealing GBP 1.0227 GBP 1.0318 GBP 0.9783
Share class A Net Accumulation
Net Asset Value GBP 8,713,810 GBP 11,113,199 GBP 1,327,026
Number of Shares in Issue 8,176,643 10,917,175 1,363,663
Net asset value per share for financial statement purposes GBP 1.0657 GBP 1.018 GBP 0.9746
Add: Valuation adjustment - - -
Net asset value per share for shareholder dealing GBP 1.0657 GBP 1.018 GBP 0.9746
Sanlam North America Equity Tracker Fund
Period Ended Year Ended Period Ended
30/06/2014 31/12/2013 30/06/2013
Share class A
Net Asset Value USD 121 USD 113 USD 98
Number of Shares in Issue 100 100 100
Net asset value per share for financial statement purposes USD 1.2096 USD 1.1313 USD 0.9766
Add: Valuation adjustment - - -
Net asset value per share for shareholder dealing USD 1.2096 USD 1.1313 USD 0.9766
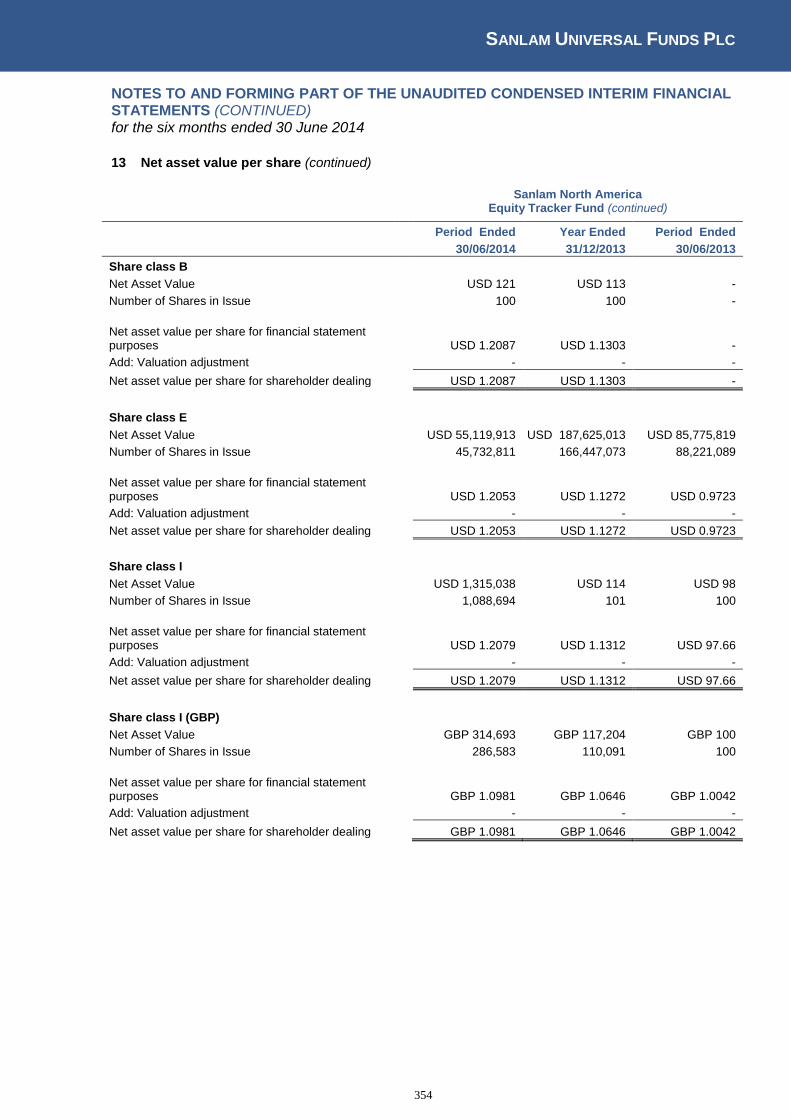
SANLAM UNIVERSAL FUNDS PLC
354
NOTES TO AND FORMING PART OF THE UNAUDITED CONDENSED INTERIM FINANCIAL STATEMENTS (CONTINUED) for the six months ended 30 June 2014
13 Net asset value per share (continued)
Sanlam North America Equity Tracker Fund (continued)
Period Ended Year Ended Period Ended
30/06/2014 31/12/2013 30/06/2013
Share class B
Net Asset Value USD 121 USD 113 -
Number of Shares in Issue 100 100 -
Net asset value per share for financial statement purposes USD 1.2087 USD 1.1303 -
Add: Valuation adjustment - - -
Net asset value per share for shareholder dealing USD 1.2087 USD 1.1303 -
Share class E
Net Asset Value USD 55,119,913 USD 187,625,013 USD 85,775,819
Number of Shares in Issue 45,732,811 166,447,073 88,221,089
Net asset value per share for financial statement purposes USD 1.2053 USD 1.1272 USD 0.9723
Add: Valuation adjustment - - -
Net asset value per share for shareholder dealing USD 1.2053 USD 1.1272 USD 0.9723
Share class I
Net Asset Value USD 1,315,038 USD 114 USD 98
Number of Shares in Issue 1,088,694 101 100
Net asset value per share for financial statement purposes USD 1.2079 USD 1.1312 USD 97.66
Add: Valuation adjustment - - -
Net asset value per share for shareholder dealing USD 1.2079 USD 1.1312 USD 97.66
Share class I (GBP)
Net Asset Value GBP 314,693 GBP 117,204 GBP 100
Number of Shares in Issue 286,583 110,091 100
Net asset value per share for financial statement purposes GBP 1.0981 GBP 1.0646 GBP 1.0042
Add: Valuation adjustment - - -
Net asset value per share for shareholder dealing GBP 1.0981 GBP 1.0646 GBP 1.0042
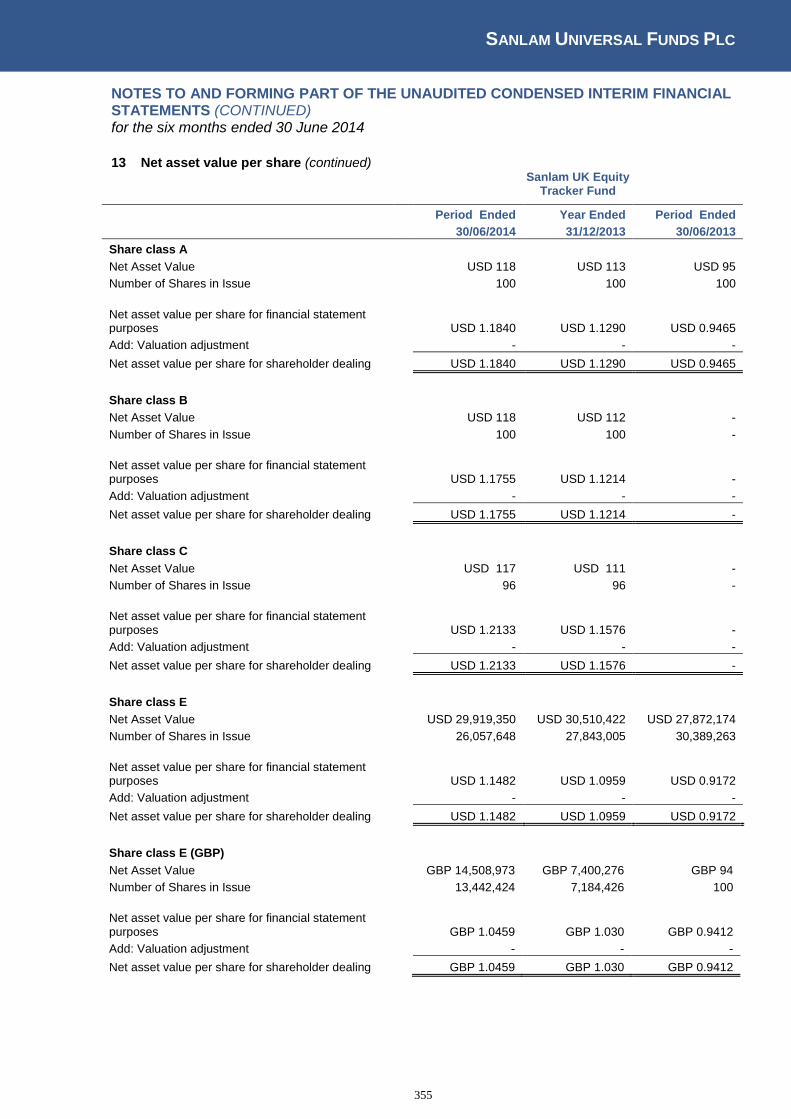
SANLAM UNIVERSAL FUNDS PLC
355
NOTES TO AND FORMING PART OF THE UNAUDITED CONDENSED INTERIM FINANCIAL STATEMENTS (CONTINUED) for the six months ended 30 June 2014
13 Net asset value per share (continued)
Sanlam UK Equity Tracker Fund
Period Ended Year Ended Period Ended
30/06/2014 31/12/2013 30/06/2013
Share class A
Net Asset Value USD 118 USD 113 USD 95
Number of Shares in Issue 100 100 100
Net asset value per share for financial statement purposes USD 1.1840 USD 1.1290 USD 0.9465
Add: Valuation adjustment - - -
Net asset value per share for shareholder dealing USD 1.1840 USD 1.1290 USD 0.9465
Share class B
Net Asset Value USD 118 USD 112 -
Number of Shares in Issue 100 100 -
Net asset value per share for financial statement purposes USD 1.1755 USD 1.1214 -
Add: Valuation adjustment - - -
Net asset value per share for shareholder dealing USD 1.1755 USD 1.1214 -
Share class C
Net Asset Value USD 117 USD 111 -
Number of Shares in Issue 96 96 -
Net asset value per share for financial statement purposes USD 1.2133 USD 1.1576 -
Add: Valuation adjustment - - -
Net asset value per share for shareholder dealing USD 1.2133 USD 1.1576 -
Share class E
Net Asset Value USD 29,919,350 USD 30,510,422 USD 27,872,174
Number of Shares in Issue 26,057,648 27,843,005 30,389,263
Net asset value per share for financial statement purposes USD 1.1482 USD 1.0959 USD 0.9172
Add: Valuation adjustment - - -
Net asset value per share for shareholder dealing USD 1.1482 USD 1.0959 USD 0.9172
Share class E (GBP) Net Asset Value GBP 14,508,973 GBP 7,400,276 GBP 94
Number of Shares in Issue 13,442,424 7,184,426 100
Net asset value per share for financial statement purposes GBP 1.0459 GBP 1.030 GBP 0.9412
Add: Valuation adjustment - - -
Net asset value per share for shareholder dealing GBP 1.0459 GBP 1.030 GBP 0.9412
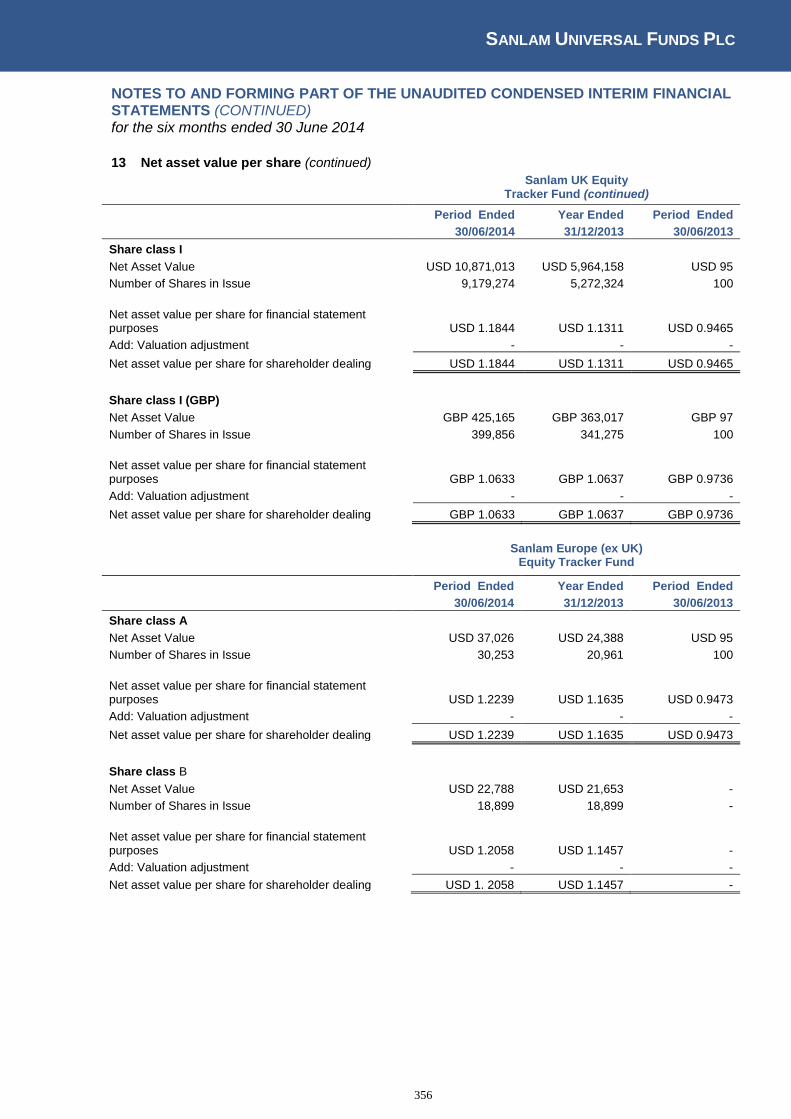
SANLAM UNIVERSAL FUNDS PLC
356
NOTES TO AND FORMING PART OF THE UNAUDITED CONDENSED INTERIM FINANCIAL STATEMENTS (CONTINUED) for the six months ended 30 June 2014
13 Net asset value per share (continued)
Sanlam UK Equity
Tracker Fund (continued)
Period Ended Year Ended Period Ended
30/06/2014 31/12/2013 30/06/2013
Share class I
Net Asset Value USD 10,871,013 USD 5,964,158 USD 95
Number of Shares in Issue 9,179,274 5,272,324 100
Net asset value per share for financial statement purposes USD 1.1844 USD 1.1311 USD 0.9465
Add: Valuation adjustment - - -
Net asset value per share for shareholder dealing USD 1.1844 USD 1.1311 USD 0.9465
Share class I (GBP)
Net Asset Value GBP 425,165 GBP 363,017 GBP 97
Number of Shares in Issue 399,856 341,275 100
Net asset value per share for financial statement purposes GBP 1.0633 GBP 1.0637 GBP 0.9736
Add: Valuation adjustment - - -
Net asset value per share for shareholder dealing GBP 1.0633 GBP 1.0637 GBP 0.9736
Sanlam Europe (ex UK) Equity Tracker Fund
Period Ended Year Ended Period Ended
30/06/2014 31/12/2013 30/06/2013
Share class A
Net Asset Value USD 37,026 USD 24,388 USD 95
Number of Shares in Issue 30,253 20,961 100
Net asset value per share for financial statement purposes USD 1.2239 USD 1.1635 USD 0.9473
Add: Valuation adjustment - - -
Net asset value per share for shareholder dealing USD 1.2239 USD 1.1635 USD 0.9473
Share class B
Net Asset Value USD 22,788 USD 21,653 -
Number of Shares in Issue 18,899 18,899 -
Net asset value per share for financial statement purposes USD 1.2058 USD 1.1457 -
Add: Valuation adjustment - - -
Net asset value per share for shareholder dealing USD 1. 2058 USD 1.1457 -
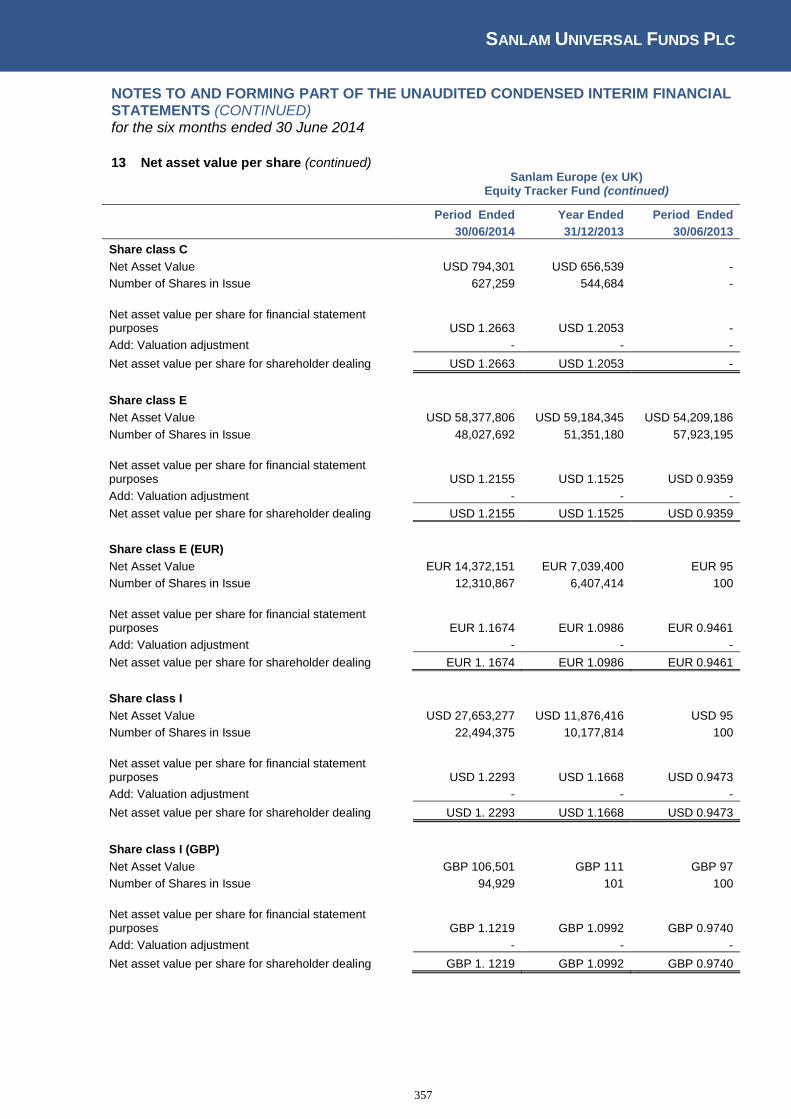
SANLAM UNIVERSAL FUNDS PLC
357
NOTES TO AND FORMING PART OF THE UNAUDITED CONDENSED INTERIM FINANCIAL STATEMENTS (CONTINUED) for the six months ended 30 June 2014
13 Net asset value per share (continued)
Sanlam Europe (ex UK) Equity Tracker Fund (continued)
Period Ended Year Ended Period Ended
30/06/2014 31/12/2013 30/06/2013
Share class C
Net Asset Value USD 794,301 USD 656,539 -
Number of Shares in Issue 627,259 544,684 -
Net asset value per share for financial statement purposes USD 1.2663 USD 1.2053 -
Add: Valuation adjustment - - -
Net asset value per share for shareholder dealing USD 1.2663 USD 1.2053 -
Share class E
Net Asset Value USD 58,377,806 USD 59,184,345 USD 54,209,186
Number of Shares in Issue 48,027,692 51,351,180 57,923,195
Net asset value per share for financial statement purposes USD 1.2155 USD 1.1525 USD 0.9359
Add: Valuation adjustment - - -
Net asset value per share for shareholder dealing USD 1.2155 USD 1.1525 USD 0.9359
Share class E (EUR)
Net Asset Value EUR 14,372,151 EUR 7,039,400 EUR 95
Number of Shares in Issue 12,310,867 6,407,414 100
Net asset value per share for financial statement purposes EUR 1.1674 EUR 1.0986 EUR 0.9461
Add: Valuation adjustment - - -
Net asset value per share for shareholder dealing EUR 1. 1674 EUR 1.0986 EUR 0.9461
Share class I
Net Asset Value USD 27,653,277 USD 11,876,416 USD 95
Number of Shares in Issue 22,494,375 10,177,814 100
Net asset value per share for financial statement purposes USD 1.2293 USD 1.1668 USD 0.9473
Add: Valuation adjustment - - -
Net asset value per share for shareholder dealing USD 1. 2293 USD 1.1668 USD 0.9473
Share class I (GBP)
Net Asset Value GBP 106,501 GBP 111 GBP 97
Number of Shares in Issue 94,929 101 100
Net asset value per share for financial statement purposes GBP 1.1219 GBP 1.0992 GBP 0.9740
Add: Valuation adjustment - - -
Net asset value per share for shareholder dealing GBP 1. 1219 GBP 1.0992 GBP 0.9740
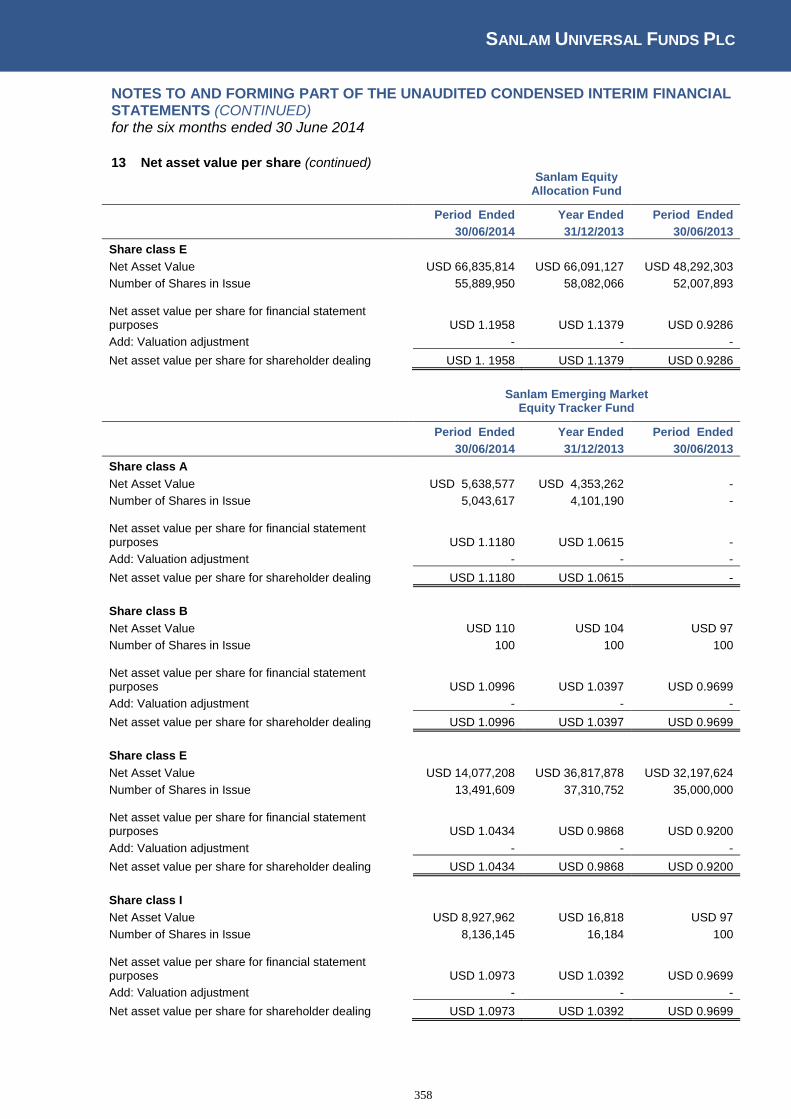
SANLAM UNIVERSAL FUNDS PLC
358
NOTES TO AND FORMING PART OF THE UNAUDITED CONDENSED INTERIM FINANCIAL STATEMENTS (CONTINUED) for the six months ended 30 June 2014
13 Net asset value per share (continued)
Sanlam Equity Allocation Fund
Period Ended Year Ended Period Ended
30/06/2014 31/12/2013 30/06/2013
Share class E
Net Asset Value USD 66,835,814 USD 66,091,127 USD 48,292,303
Number of Shares in Issue 55,889,950 58,082,066 52,007,893
Net asset value per share for financial statement purposes USD 1.1958 USD 1.1379 USD 0.9286
Add: Valuation adjustment - - -
Net asset value per share for shareholder dealing USD 1. 1958 USD 1.1379 USD 0.9286
Sanlam Emerging Market Equity Tracker Fund
Period Ended Year Ended Period Ended
30/06/2014 31/12/2013 30/06/2013
Share class A
Net Asset Value USD 5,638,577 USD 4,353,262 -
Number of Shares in Issue 5,043,617 4,101,190 -
Net asset value per share for financial statement purposes USD 1.1180 USD 1.0615 -
Add: Valuation adjustment - - -
Net asset value per share for shareholder dealing USD 1.1180 USD 1.0615 -
Share class B
Net Asset Value USD 110 USD 104 USD 97
Number of Shares in Issue 100 100 100
Net asset value per share for financial statement purposes USD 1.0996 USD 1.0397 USD 0.9699
Add: Valuation adjustment - - -
Net asset value per share for shareholder dealing USD 1.0996 USD 1.0397 USD 0.9699
Share class E
Net Asset Value USD 14,077,208 USD 36,817,878 USD 32,197,624
Number of Shares in Issue 13,491,609 37,310,752 35,000,000
Net asset value per share for financial statement purposes USD 1.0434 USD 0.9868 USD 0.9200
Add: Valuation adjustment - - -
Net asset value per share for shareholder dealing USD 1.0434 USD 0.9868 USD 0.9200
Share class I
Net Asset Value USD 8,927,962 USD 16,818 USD 97
Number of Shares in Issue 8,136,145 16,184 100
Net asset value per share for financial statement purposes USD 1.0973 USD 1.0392 USD 0.9699
Add: Valuation adjustment - - -
Net asset value per share for shareholder dealing USD 1.0973 USD 1.0392 USD 0.9699
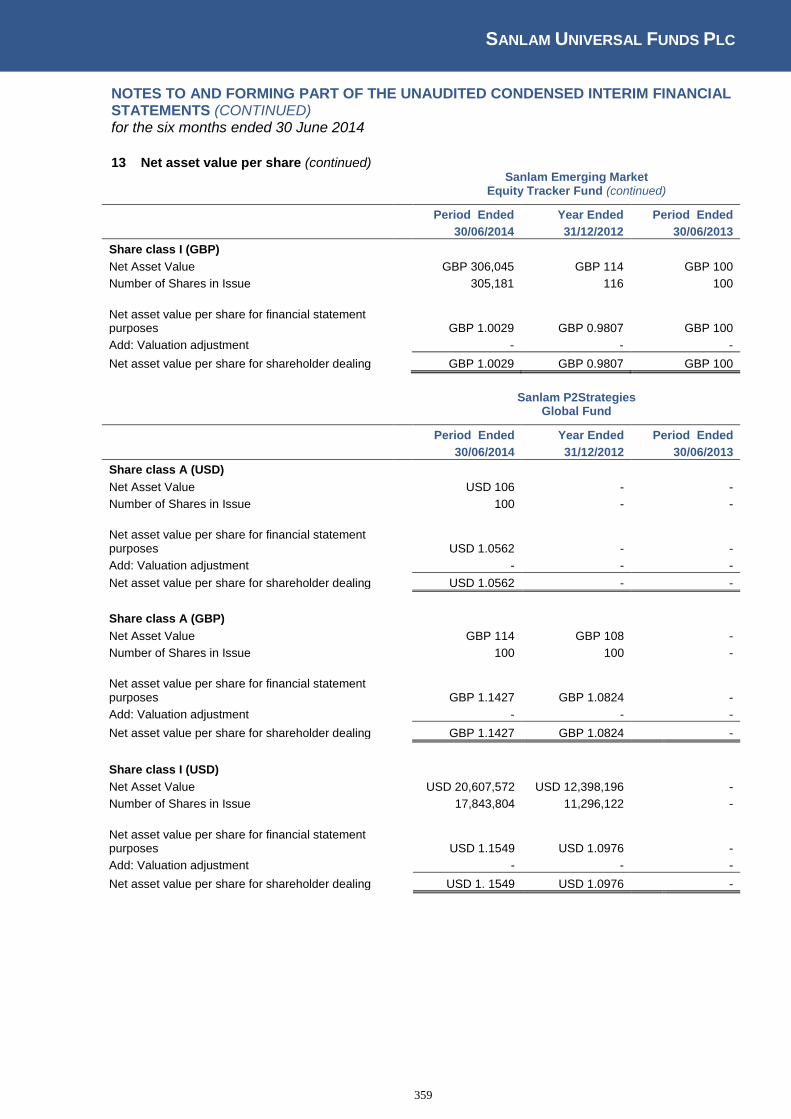
SANLAM UNIVERSAL FUNDS PLC
359
NOTES TO AND FORMING PART OF THE UNAUDITED CONDENSED INTERIM FINANCIAL STATEMENTS (CONTINUED) for the six months ended 30 June 2014
13 Net asset value per share (continued)
Sanlam Emerging Market Equity Tracker Fund (continued)
Period Ended Year Ended Period Ended
30/06/2014 31/12/2012 30/06/2013
Share class I (GBP)
Net Asset Value GBP 306,045 GBP 114 GBP 100
Number of Shares in Issue 305,181 116 100
Net asset value per share for financial statement purposes GBP 1.0029 GBP 0.9807 GBP 100
Add: Valuation adjustment - - -
Net asset value per share for shareholder dealing GBP 1.0029 GBP 0.9807 GBP 100
Sanlam P2Strategies Global Fund
Period Ended Year Ended Period Ended
30/06/2014 31/12/2012 30/06/2013
Share class A (USD)
Net Asset Value USD 106 - -
Number of Shares in Issue 100 - -
Net asset value per share for financial statement purposes USD 1.0562 - -
Add: Valuation adjustment - - -
Net asset value per share for shareholder dealing USD 1.0562 - -
Share class A (GBP)
Net Asset Value GBP 114 GBP 108 -
Number of Shares in Issue 100 100 -
Net asset value per share for financial statement purposes GBP 1.1427 GBP 1.0824 -
Add: Valuation adjustment - - -
Net asset value per share for shareholder dealing GBP 1.1427 GBP 1.0824 -
Share class I (USD)
Net Asset Value USD 20,607,572 USD 12,398,196 -
Number of Shares in Issue 17,843,804 11,296,122 -
Net asset value per share for financial statement purposes USD 1.1549 USD 1.0976 -
Add: Valuation adjustment - - -
Net asset value per share for shareholder dealing USD 1. 1549 USD 1.0976 -
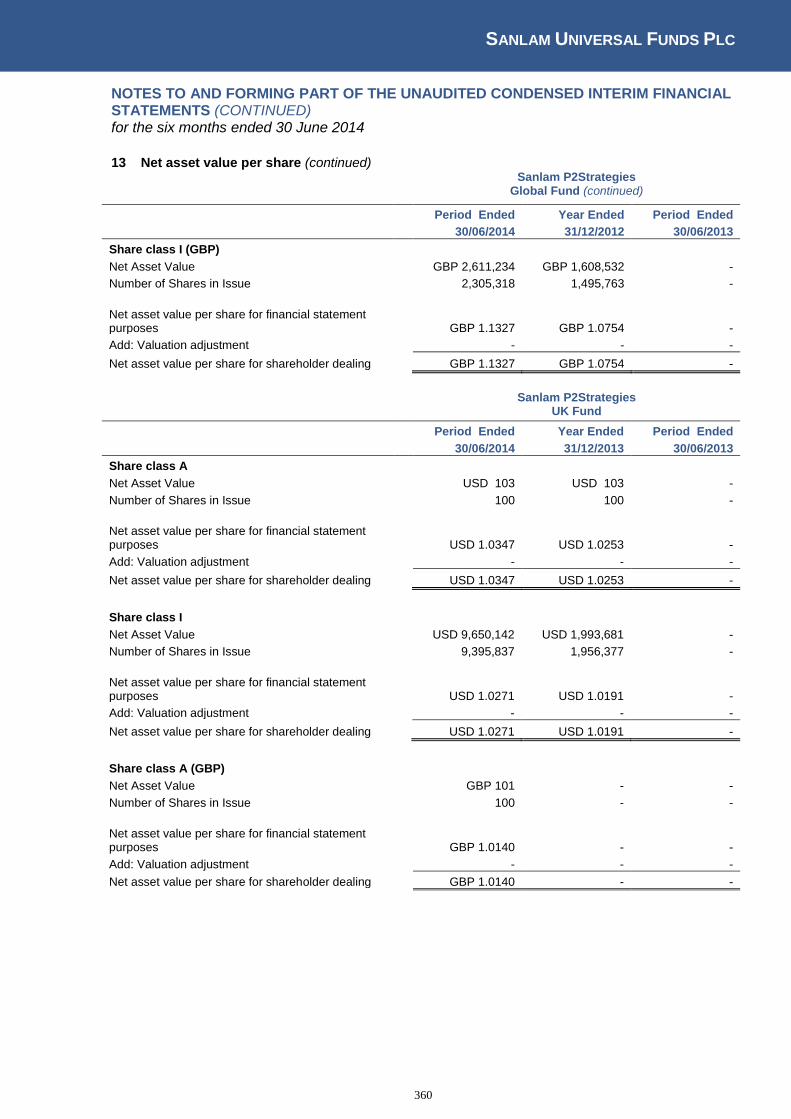
SANLAM UNIVERSAL FUNDS PLC
360
NOTES TO AND FORMING PART OF THE UNAUDITED CONDENSED INTERIM FINANCIAL STATEMENTS (CONTINUED) for the six months ended 30 June 2014
13 Net asset value per share (continued)
Sanlam P2Strategies Global Fund (continued)
Period Ended Year Ended Period Ended
30/06/2014 31/12/2012 30/06/2013
Share class I (GBP)
Net Asset Value GBP 2,611,234 GBP 1,608,532 -
Number of Shares in Issue 2,305,318 1,495,763 -
Net asset value per share for financial statement purposes GBP 1.1327 GBP 1.0754 -
Add: Valuation adjustment - - -
Net asset value per share for shareholder dealing GBP 1.1327 GBP 1.0754 -
Sanlam P2Strategies UK Fund
Period Ended Year Ended Period Ended
30/06/2014 31/12/2013 30/06/2013
Share class A
Net Asset Value USD 103 USD 103 -
Number of Shares in Issue 100 100 -
Net asset value per share for financial statement purposes USD 1.0347 USD 1.0253 -
Add: Valuation adjustment - - -
Net asset value per share for shareholder dealing USD 1.0347 USD 1.0253 -
Share class I
Net Asset Value USD 9,650,142 USD 1,993,681 -
Number of Shares in Issue 9,395,837 1,956,377 -
Net asset value per share for financial statement purposes USD 1.0271 USD 1.0191 -
Add: Valuation adjustment - - -
Net asset value per share for shareholder dealing USD 1.0271 USD 1.0191 -
Share class A (GBP)
Net Asset Value GBP 101 - -
Number of Shares in Issue 100 - -
Net asset value per share for financial statement purposes GBP 1.0140 - -
Add: Valuation adjustment - - -
Net asset value per share for shareholder dealing GBP 1.0140 - -

SANLAM UNIVERSAL FUNDS PLC
361
NOTES TO AND FORMING PART OF THE UNAUDITED CONDENSED INTERIM FINANCIAL STATEMENTS (CONTINUED) for the six months ended 30 June 2014
13 Net asset value per share (continued)
Sanlam P2Strategies UK Fund (continued)
Period Ended Year Ended Period Ended
30/06/2014 31/12/2013 30/06/2013
Share class I (GBP)
Net Asset Value GBP 9,596,003 GBP 7,278,473 -
Number of Shares in Issue 9,011,279 6,905,104 -
Net asset value per share for financial statement purposes GBP 1.0649 GBP 1.0541 -
Add: Valuation adjustment - - -
Net asset value per share for shareholder dealing GBP 1. 0649 GBP 1.0541 -
Sanlam P2Strategies North America Fund
Period Ended Year Ended Period Ended
30/06/2014 31/12/2013 30/06/2013
Share class A (USD)
Net Asset Value USD 104 - -
Number of Shares in Issue 100 - -
Net asset value per share for financial statement purposes USD 1.0409 - -
Add: Valuation adjustment - - -
Net asset value per share for shareholder dealing USD 1. 0409 - -
Share class A (GBP)
Net Asset Value GBP 113 GBP 108 -
Number of Shares in Issue 100 100 -
Net asset value per share for financial statement purposes GBP 1.1256 GBP 1.0816 -
Add: Valuation adjustment - - -
Net asset value per share for shareholder dealing GBP 1.1256 GBP 1.0816 -
Share class I (USD)
Net Asset Value USD 35,661,555 USD 21,847,081 -
Number of Shares in Issue 31,308,651 19,884,340 -
Net asset value per share for financial statement purposes USD 1.1390 USD 1.0987 -
Add: Valuation adjustment - - -
Net asset value per share for shareholder dealing USD 1.1390 USD 1.0987 -
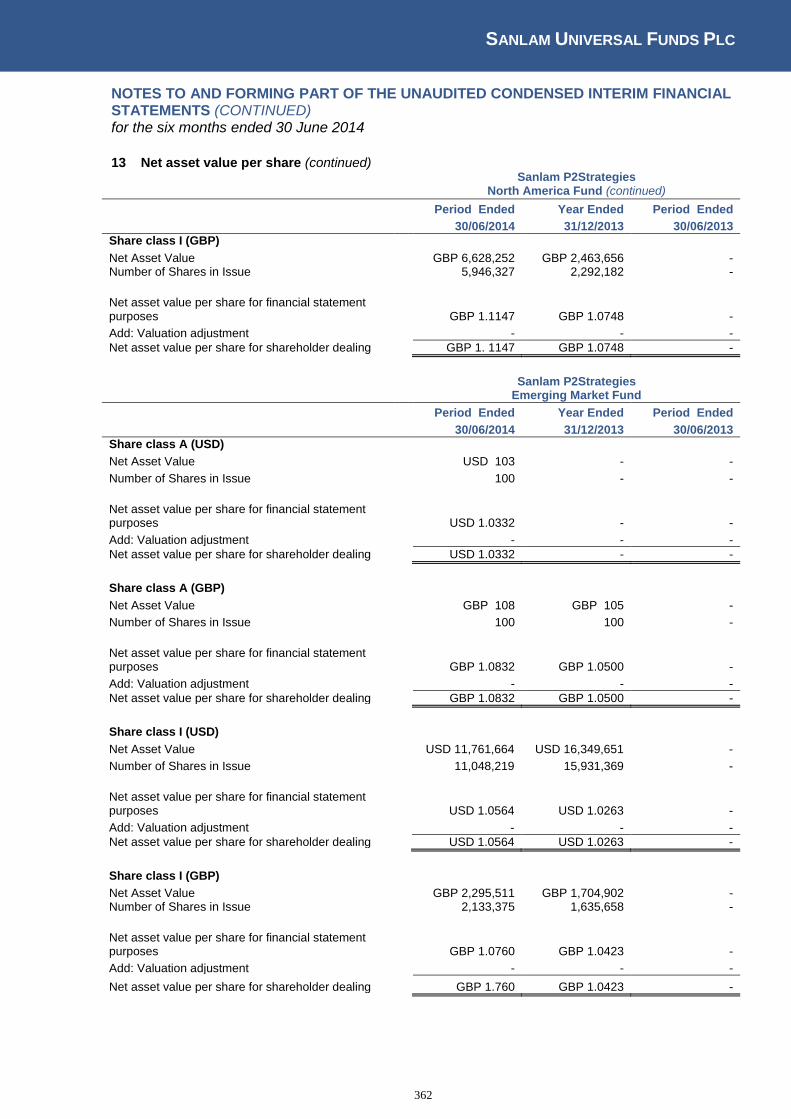
SANLAM UNIVERSAL FUNDS PLC
362
NOTES TO AND FORMING PART OF THE UNAUDITED CONDENSED INTERIM FINANCIAL STATEMENTS (CONTINUED) for the six months ended 30 June 2014
13 Net asset value per share (continued)
Sanlam P2Strategies North America Fund (continued)
Period Ended Year Ended Period Ended
30/06/2014 31/12/2013 30/06/2013
Share class I (GBP)
Net Asset Value GBP 6,628,252 GBP 2,463,656 - Number of Shares in Issue 5,946,327 2,292,182 -
Net asset value per share for financial statement purposes GBP 1.1147 GBP 1.0748 -
Add: Valuation adjustment - - -
Net asset value per share for shareholder dealing GBP 1. 1147 GBP 1.0748 -
Sanlam P2Strategies Emerging Market Fund
Period Ended Year Ended Period Ended
30/06/2014 31/12/2013 30/06/2013
Share class A (USD)
Net Asset Value USD 103 - -
Number of Shares in Issue 100 - -
Net asset value per share for financial statement purposes USD 1.0332 - -
Add: Valuation adjustment - - -
Net asset value per share for shareholder dealing USD 1.0332 - -
Share class A (GBP)
Net Asset Value GBP 108 GBP 105 -
Number of Shares in Issue 100 100 -
Net asset value per share for financial statement purposes GBP 1.0832 GBP 1.0500 -
Add: Valuation adjustment - - -
Net asset value per share for shareholder dealing GBP 1.0832 GBP 1.0500 -
Share class I (USD)
Net Asset Value USD 11,761,664 USD 16,349,651 -
Number of Shares in Issue 11,048,219 15,931,369 -
Net asset value per share for financial statement purposes USD 1.0564 USD 1.0263 -
Add: Valuation adjustment - - -
Net asset value per share for shareholder dealing USD 1.0564 USD 1.0263 -
Share class I (GBP)
Net Asset Value GBP 2,295,511 GBP 1,704,902 - Number of Shares in Issue 2,133,375 1,635,658 -
Net asset value per share for financial statement purposes GBP 1.0760 GBP 1.0423 -
Add: Valuation adjustment - - -
Net asset value per share for shareholder dealing GBP 1.760 GBP 1.0423 -
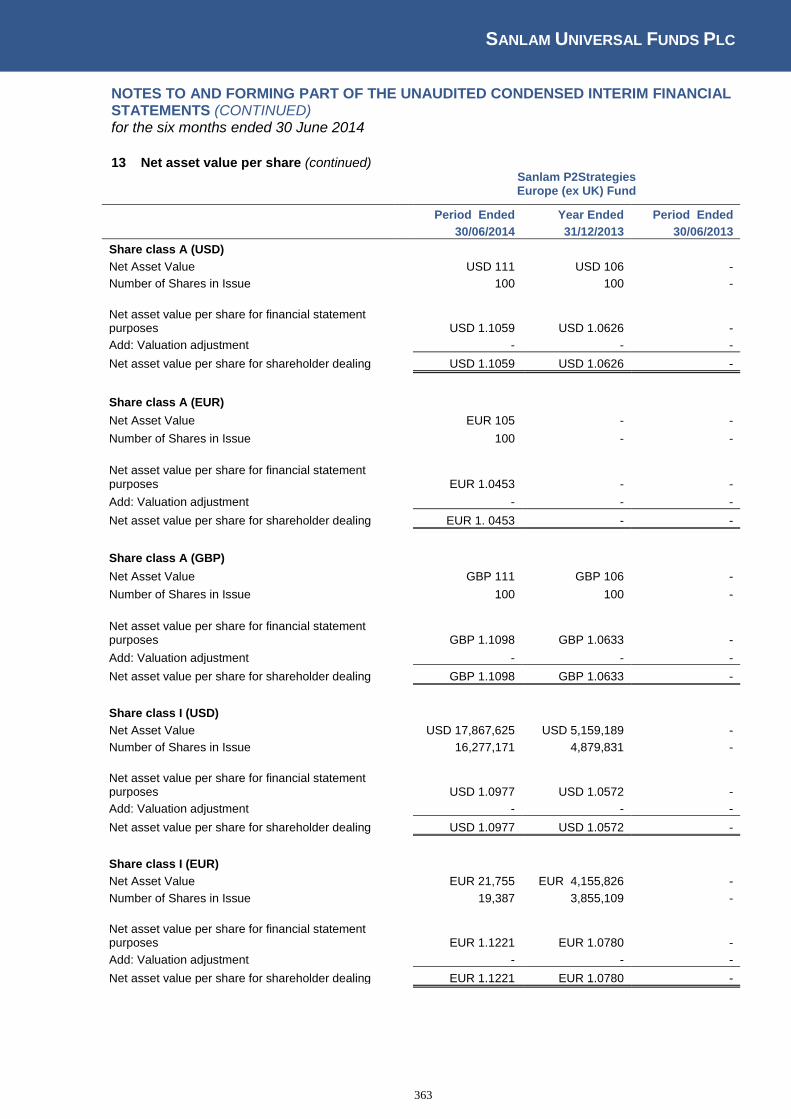
SANLAM UNIVERSAL FUNDS PLC
363
NOTES TO AND FORMING PART OF THE UNAUDITED CONDENSED INTERIM FINANCIAL STATEMENTS (CONTINUED) for the six months ended 30 June 2014
13 Net asset value per share (continued)
Sanlam P2Strategies Europe (ex UK) Fund
Period Ended Year Ended Period Ended
30/06/2014 31/12/2013 30/06/2013
Share class A (USD)
Net Asset Value USD 111 USD 106 -
Number of Shares in Issue 100 100 -
Net asset value per share for financial statement purposes USD 1.1059 USD 1.0626 -
Add: Valuation adjustment - - -
Net asset value per share for shareholder dealing USD 1.1059 USD 1.0626 -
Share class A (EUR)
Net Asset Value EUR 105 - -
Number of Shares in Issue 100 - -
Net asset value per share for financial statement purposes EUR 1.0453 - -
Add: Valuation adjustment - - -
Net asset value per share for shareholder dealing EUR 1. 0453 - -
Share class A (GBP)
Net Asset Value GBP 111 GBP 106 -
Number of Shares in Issue 100 100 -
Net asset value per share for financial statement purposes GBP 1.1098 GBP 1.0633 -
Add: Valuation adjustment - - -
Net asset value per share for shareholder dealing GBP 1.1098 GBP 1.0633 -
Share class I (USD)
Net Asset Value USD 17,867,625 USD 5,159,189 -
Number of Shares in Issue 16,277,171 4,879,831 -
Net asset value per share for financial statement purposes USD 1.0977 USD 1.0572 -
Add: Valuation adjustment - - -
Net asset value per share for shareholder dealing USD 1.0977 USD 1.0572 -
Share class I (EUR)
Net Asset Value EUR 21,755 EUR 4,155,826 -
Number of Shares in Issue 19,387 3,855,109 -
Net asset value per share for financial statement purposes EUR 1.1221 EUR 1.0780 -
Add: Valuation adjustment - - -
Net asset value per share for shareholder dealing EUR 1.1221 EUR 1.0780 -
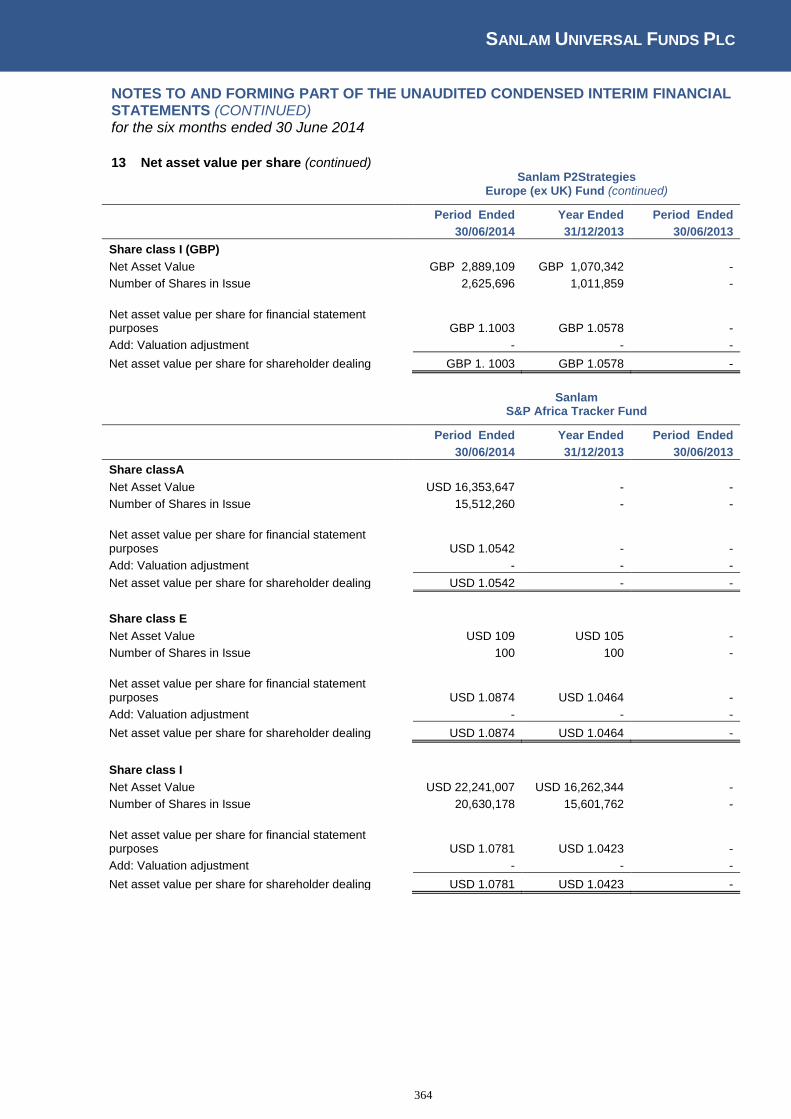
SANLAM UNIVERSAL FUNDS PLC
364
NOTES TO AND FORMING PART OF THE UNAUDITED CONDENSED INTERIM FINANCIAL STATEMENTS (CONTINUED) for the six months ended 30 June 2014
13 Net asset value per share (continued)
Sanlam P2Strategies Europe (ex UK) Fund (continued)
Period Ended Year Ended Period Ended
30/06/2014 31/12/2013 30/06/2013
Share class I (GBP)
Net Asset Value GBP 2,889,109 GBP 1,070,342 -
Number of Shares in Issue 2,625,696 1,011,859 -
Net asset value per share for financial statement purposes GBP 1.1003 GBP 1.0578 -
Add: Valuation adjustment - - -
Net asset value per share for shareholder dealing GBP 1. 1003 GBP 1.0578 -
Sanlam S&P Africa Tracker Fund
Period Ended Year Ended Period Ended
30/06/2014 31/12/2013 30/06/2013
Share classA
Net Asset Value USD 16,353,647 - -
Number of Shares in Issue 15,512,260 - -
Net asset value per share for financial statement purposes USD 1.0542 - -
Add: Valuation adjustment - - -
Net asset value per share for shareholder dealing USD 1.0542 - -
Share class E
Net Asset Value USD 109 USD 105 -
Number of Shares in Issue 100 100 -
Net asset value per share for financial statement purposes USD 1.0874 USD 1.0464 -
Add: Valuation adjustment - - -
Net asset value per share for shareholder dealing USD 1.0874 USD 1.0464 -
Share class I
Net Asset Value USD 22,241,007 USD 16,262,344 -
Number of Shares in Issue 20,630,178 15,601,762 -
Net asset value per share for financial statement purposes USD 1.0781 USD 1.0423 -
Add: Valuation adjustment - - -
Net asset value per share for shareholder dealing USD 1.0781 USD 1.0423 -
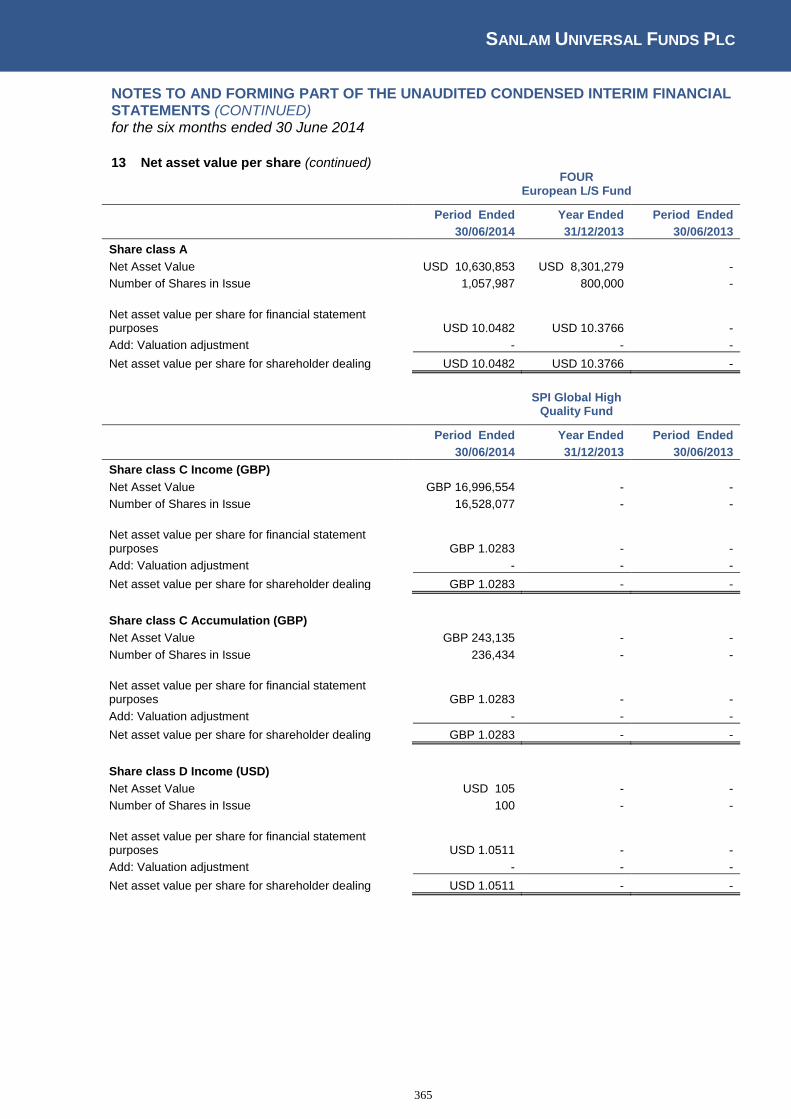
SANLAM UNIVERSAL FUNDS PLC
365
NOTES TO AND FORMING PART OF THE UNAUDITED CONDENSED INTERIM FINANCIAL STATEMENTS (CONTINUED) for the six months ended 30 June 2014
13 Net asset value per share (continued)
FOUR European L/S Fund
Period Ended Year Ended Period Ended
30/06/2014 31/12/2013 30/06/2013
Share class A
Net Asset Value USD 10,630,853 USD 8,301,279 -
Number of Shares in Issue 1,057,987 800,000 -
Net asset value per share for financial statement purposes USD 10.0482 USD 10.3766 -
Add: Valuation adjustment - - -
Net asset value per share for shareholder dealing USD 10.0482 USD 10.3766 -
SPI Global High Quality Fund
Period Ended Year Ended Period Ended
30/06/2014 31/12/2013 30/06/2013
Share class C Income (GBP)
Net Asset Value GBP 16,996,554 - -
Number of Shares in Issue 16,528,077 - -
Net asset value per share for financial statement purposes GBP 1.0283 - -
Add: Valuation adjustment - - -
Net asset value per share for shareholder dealing GBP 1.0283 - -
Share class C Accumulation (GBP)
Net Asset Value GBP 243,135 - -
Number of Shares in Issue 236,434 - -
Net asset value per share for financial statement purposes GBP 1.0283 - -
Add: Valuation adjustment - - -
Net asset value per share for shareholder dealing GBP 1.0283 - -
Share class D Income (USD)
Net Asset Value USD 105 - -
Number of Shares in Issue 100 - -
Net asset value per share for financial statement purposes USD 1.0511 - -
Add: Valuation adjustment - - -
Net asset value per share for shareholder dealing USD 1.0511 - -

SANLAM UNIVERSAL FUNDS PLC
366
NOTES TO AND FORMING PART OF THE UNAUDITED CONDENSED INTERIM FINANCIAL STATEMENTS (CONTINUED) for the six months ended 30 June 2014
13 Net asset value per share (continued)
SPI Global High Quality Fund (continued)
Period Ended Year Ended Period Ended
30/06/2014 31/12/2013 30/06/2013
Share class D Accumulation (USD)
Net Asset Value USD 1,070,883 - -
Number of Shares in Issue 1,020,394 - -
Net asset value per share for financial statement purposes USD 1.0496 - -
Add: Valuation adjustment - - -
Net asset value per share for shareholder dealing USD 1.0496 - -
Share class E Income (USD)
Net Asset Value USD 105 - -
Number of Shares in Issue 100 - -
Net asset value per share for financial statement purposes USD 1.0511 - -
Add: Valuation adjustment - - -
Net asset value per share for shareholder dealing USD 1.0511 - -
Share class E Accumulation (USD)
Net Asset Value USD 2,378,303 - -
Number of Shares in Issue 2,270,809 - -
Net asset value per share for financial statement purposes USD 1.0473 - -
Add: Valuation adjustment - - -
Net asset value per share for shareholder dealing USD 1.0473 - -

SANLAM UNIVERSAL FUNDS PLC
367
NOTES TO AND FORMING PART OF THE UNAUDITED CONDENSED INTERIM FINANCIAL STATEMENTS (CONTINUED) for the six months ended 30 June 2014
14 Significant events during the period
During the period the following Funds launched/closed:
Name Status
SPI High Quality Fund Active – launched 3 March 2014 8IP Asia Equity Opportunities Fund Closed – 20 March 2014 8IP Asia Pacific Equity Fund Closed – 20 March 2014
The following new or revised offering supplements were issued during the period:
Fund Name Date of revised offering supplement
Sanlam Emerging Markets Equity Tracker Fund 25 March 2014 Sanlam World Equity Fund 14 January 2014 Sanlam P2strategies Emerging Market Fund 25 February 2014 Sanlam P2strategies Europe (ex UK) Fund 12 May 2014 Sanlam P2strategies Global Fund 25 February 2014 Sanlam P2strategies North America Fund 25 February 2014 Sanlam P2strategies UK Fund 25 February 2014
There were no other significant events during the period.
15 Index Tracking The Company has six index-tracking Funds in existence at 30 June 2014 and 31 December 2013. The following table details the benchmark index name and the size of the tracking error as at 30 June 2014 for each index-tracking Fund.
Fund name Benchmark index name
Realised Tracking
Error
%
Sanlam World Equity Tracker Fund MSCI World 0.15%
Sanlam North America Equity Tracker Fund MSCI North America (0.25%)
Sanlam UK Equity Tracker Fund MSCI UK 0.33%
Sanlam Europe (ex UK) Equity Tracker Fund MSCI Europe ex UK (0.04%)
Sanlam Emerging Markets Equity Tracker Fund MSCI Emerging Markets (0.39%)
Sanlam S&P Africa Tracker Fund S&P Africa ex SA Custom (1.17%)
The following table details the benchmark index name and the size of the tracking error as at 31 December 2013 for each index-tracking Fund.
Fund name Benchmark index name
Realised Tracking
Error
%
Sanlam World Equity Tracker Fund MSCI World 0.78%
Sanlam North America Equity Tracker Fund MSCI North America 0.20%
Sanlam UK Equity Tracker Fund MSCI UK 0.52%
Sanlam Europe (ex UK) Equity Tracker Fund MSCI Europe ex UK 0.47%
Sanlam Emerging Markets Equity Tracker Fund MSCI Emerging Markets 0.92%
Sanlam S&P Africa Tracker Fund S&P Africa ex SA Custom 1.34%
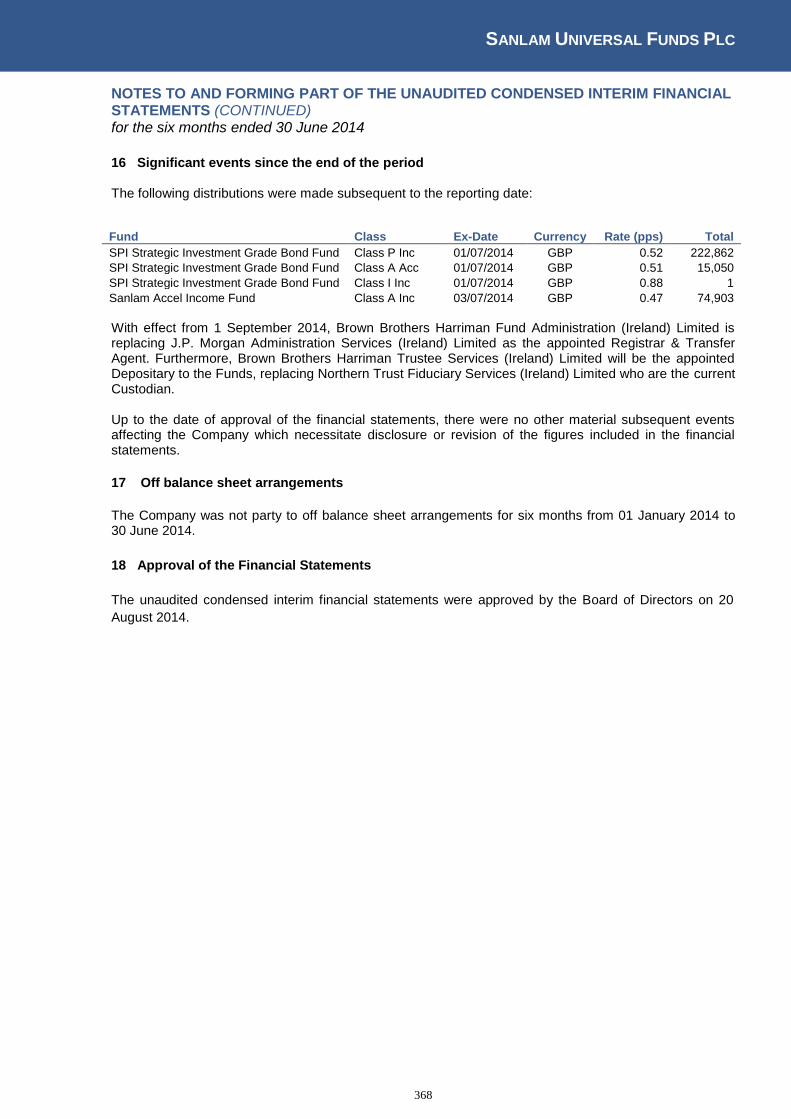
SANLAM UNIVERSAL FUNDS PLC
368
NOTES TO AND FORMING PART OF THE UNAUDITED CONDENSED INTERIM FINANCIAL STATEMENTS (CONTINUED) for the six months ended 30 June 2014
16 Significant events since the end of the period The following distributions were made subsequent to the reporting date: Fund Class Ex-Date Currency Rate (pps) Total
SPI Strategic Investment Grade Bond Fund Class P Inc 01/07/2014 GBP 0.52 222,862
SPI Strategic Investment Grade Bond Fund Class A Acc 01/07/2014 GBP 0.51 15,050
SPI Strategic Investment Grade Bond Fund Class I Inc 01/07/2014 GBP 0.88 1
Sanlam Accel Income Fund Class A Inc 03/07/2014 GBP 0.47 74,903
With effect from 1 September 2014, Brown Brothers Harriman Fund Administration (Ireland) Limited is replacing J.P. Morgan Administration Services (Ireland) Limited as the appointed Registrar & Transfer Agent. Furthermore, Brown Brothers Harriman Trustee Services (Ireland) Limited will be the appointed Depositary to the Funds, replacing Northern Trust Fiduciary Services (Ireland) Limited who are the current Custodian. Up to the date of approval of the financial statements, there were no other material subsequent events affecting the Company which necessitate disclosure or revision of the figures included in the financial statements.
17 Off balance sheet arrangements
The Company was not party to off balance sheet arrangements for six months from 01 January 2014 to 30 June 2014.
18 Approval of the Financial Statements
The unaudited condensed interim financial statements were approved by the Board of Directors on 20
August 2014.
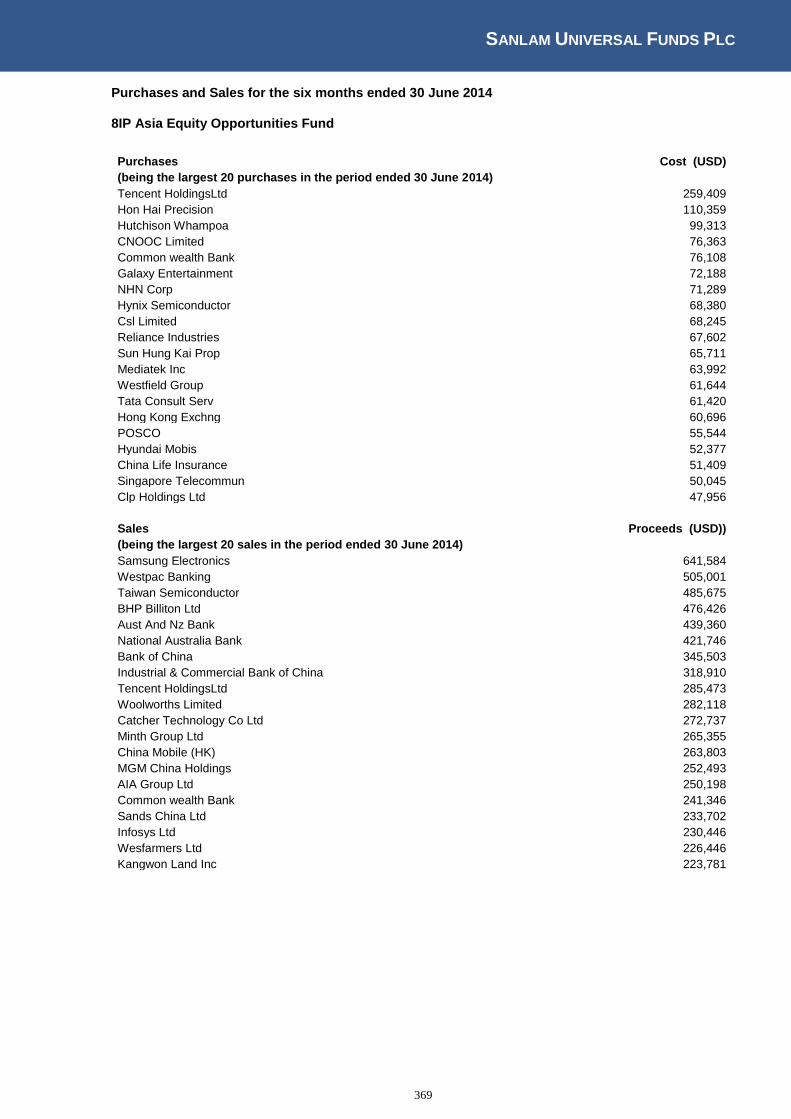
SANLAM UNIVERSAL FUNDS PLC
369
Purchases and Sales for the six months ended 30 June 2014 8IP Asia Equity Opportunities Fund
Purchases
Cost (USD)
(being the largest 20 purchases in the period ended 30 June 2014)
Tencent HoldingsLtd
259,409
Hon Hai Precision
110,359
Hutchison Whampoa
99,313
CNOOC Limited
76,363
Common wealth Bank
76,108
Galaxy Entertainment
72,188
NHN Corp
71,289
Hynix Semiconductor
68,380
Csl Limited
68,245
Reliance Industries
67,602
Sun Hung Kai Prop
65,711
Mediatek Inc
63,992
Westfield Group
61,644
Tata Consult Serv
61,420
Hong Kong Exchng
60,696
POSCO
55,544
Hyundai Mobis
52,377
China Life Insurance
51,409
Singapore Telecommun
50,045
Clp Holdings Ltd
47,956
Sales
Proceeds (USD))
(being the largest 20 sales in the period ended 30 June 2014)
Samsung Electronics
641,584
Westpac Banking
505,001
Taiwan Semiconductor
485,675
BHP Billiton Ltd
476,426
Aust And Nz Bank
439,360
National Australia Bank
421,746
Bank of China
345,503
Industrial & Commercial Bank of China
318,910
Tencent HoldingsLtd
285,473
Woolworths Limited
282,118
Catcher Technology Co Ltd
272,737
Minth Group Ltd
265,355
China Mobile (HK)
263,803
MGM China Holdings
252,493
AIA Group Ltd
250,198
Common wealth Bank
241,346
Sands China Ltd
233,702
Infosys Ltd
230,446
Wesfarmers Ltd
226,446
Kangwon Land Inc
223,781

SANLAM UNIVERSAL FUNDS PLC
370
Purchases and Sales for the six months ended 30 June 2014 (continued) 8IP Asia Pacific Equity Fund
Purchases
Cost (USD)
(being the largest 20 purchases in the period ended 30 June 2014) TencentHoldingsLtd
188,953
Common wealth Bank
173,267
China Mobile (HK)
162,844
AIA Group Ltd
153,540
Csl Limited
91,039
KDDI Corp
84,881
Hutchison Whampoa
73,528
Infosys Ltd
72,948
Hitachi ORD
70,117
CNOOC Limited
67,664
Mitsui Fudosan Co
65,286
Mitsubishi Estate
65,246
Fanuc Ltd
64,490
Singapore Telecommun
64,398
DBS Bank Ltd
61,006
Panasonic Corp
60,803
Aust And Nz Bank
60,116
Westfield Group
59,762
Wesfarmers Ltd
55,669
Galaxy Entertainment
54,014
Sales
Proceeds (USD)
(being the largest 20 sales in the period ended 30 June 2014)
China South City
585,045
Toyota Motor Co
550,491
Westpac Banking
522,706
Samsung Electronics
498,072
Catcher Technology Co Ltd
470,201
Softbank Corp
433,422
Taiwan Semiconductor
402,273
TPG Telecom Ltd
393,262
Nat Australia Bank
383,883
Mitsubishi UFJ Holdings
367,891
Takeda Pharmaceutical
346,624
NCsoft Corp
318,293
Honda Motor Co
299,016
Sumitomo Mitsui Fin
286,761
China Insurance International
275,705
Samsung Electronics
269,204
Mitsubishi Corp
265,274
Softbank Corp
257,409
Mitsub Elec Corp
256,643
BHP Billiton Ltd
251,713
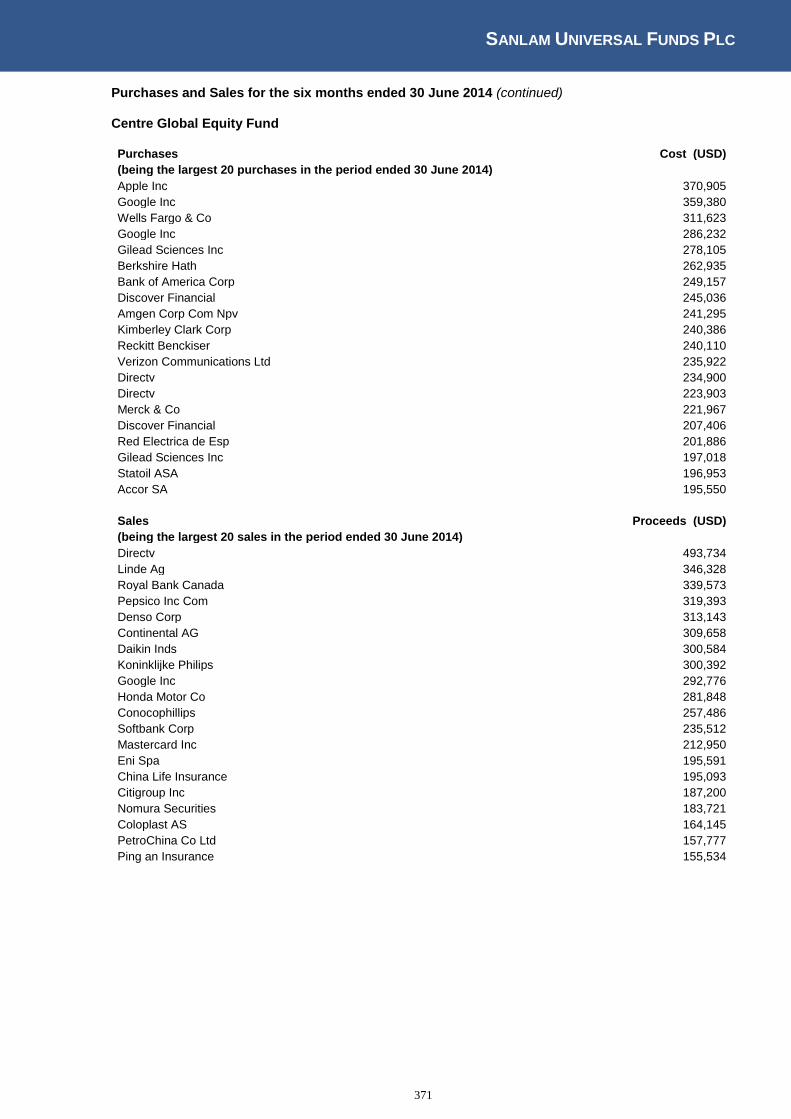
SANLAM UNIVERSAL FUNDS PLC
371
Purchases and Sales for the six months ended 30 June 2014 (continued) Centre Global Equity Fund
Purchases
Cost (USD)
(being the largest 20 purchases in the period ended 30 June 2014) Apple Inc
370,905
Google Inc
359,380
Wells Fargo & Co
311,623
Google Inc
286,232
Gilead Sciences Inc
278,105
Berkshire Hath
262,935
Bank of America Corp
249,157
Discover Financial
245,036
Amgen Corp Com Npv
241,295
Kimberley Clark Corp
240,386
Reckitt Benckiser
240,110
Verizon Communications Ltd
235,922
Directv
234,900
Directv
223,903
Merck & Co
221,967
Discover Financial
207,406
Red Electrica de Esp
201,886
Gilead Sciences Inc
197,018
Statoil ASA
196,953
Accor SA
195,550
Sales
Proceeds (USD)
(being the largest 20 sales in the period ended 30 June 2014)
Directv
493,734
Linde Ag
346,328
Royal Bank Canada
339,573
Pepsico Inc Com
319,393
Denso Corp
313,143
Continental AG
309,658
Daikin Inds
300,584
Koninklijke Philips
300,392
Google Inc
292,776
Honda Motor Co
281,848
Conocophillips
257,486
Softbank Corp
235,512
Mastercard Inc
212,950
Eni Spa
195,591
China Life Insurance
195,093
Citigroup Inc
187,200
Nomura Securities
183,721
Coloplast AS
164,145
PetroChina Co Ltd
157,777
Ping an Insurance
155,534
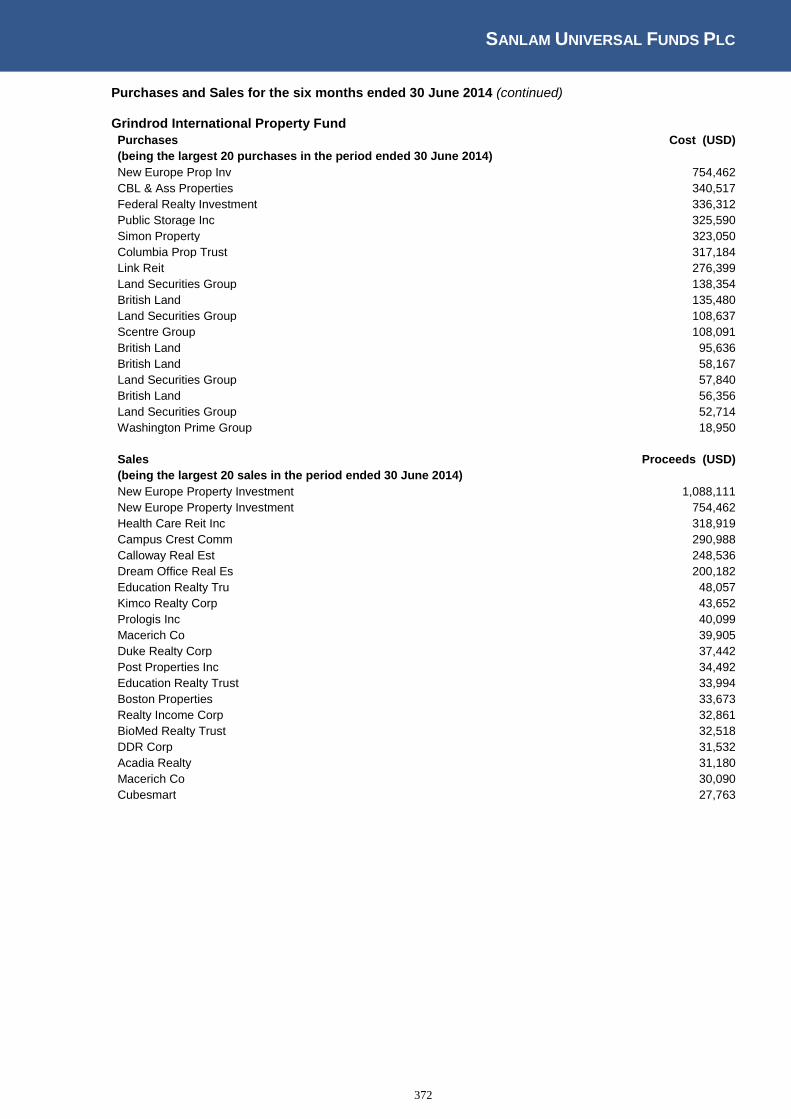
SANLAM UNIVERSAL FUNDS PLC
372
Purchases and Sales for the six months ended 30 June 2014 (continued) Grindrod International Property Fund
Purchases
Cost (USD)
(being the largest 20 purchases in the period ended 30 June 2014)
New Europe Prop Inv
754,462
CBL & Ass Properties
340,517
Federal Realty Investment
336,312
Public Storage Inc
325,590
Simon Property
323,050
Columbia Prop Trust
317,184
Link Reit
276,399
Land Securities Group
138,354
British Land
135,480
Land Securities Group
108,637
Scentre Group
108,091
British Land
95,636
British Land
58,167
Land Securities Group
57,840
British Land
56,356
Land Securities Group
52,714
Washington Prime Group
18,950
Sales
Proceeds (USD)
(being the largest 20 sales in the period ended 30 June 2014)
New Europe Property Investment
1,088,111
New Europe Property Investment
754,462
Health Care Reit Inc
318,919
Campus Crest Comm
290,988
Calloway Real Est
248,536
Dream Office Real Es
200,182
Education Realty Tru
48,057
Kimco Realty Corp
43,652
Prologis Inc
40,099
Macerich Co
39,905
Duke Realty Corp
37,442
Post Properties Inc
34,492
Education Realty Trust
33,994
Boston Properties
33,673
Realty Income Corp
32,861
BioMed Realty Trust
32,518
DDR Corp
31,532
Acadia Realty
31,180
Macerich Co
30,090
Cubesmart
27,763

SANLAM UNIVERSAL FUNDS PLC
373
Purchases and Sales for the six months ended 30 June 2014 (continued) P-Solve Inflation Plus Fund
Purchases Coupon Maturity Cost (USD)
(being the largest 20 purchases in the period ended 30 June 2014)
Pimco-Hi Yield Bond
1,709,410
UK Treasury 1.75% 07/09/2022 1,134,479
South Africa 8.75% 21/12/2014 1,118,880
UK Treasury 2.75% 07/09/2024 1,105,948
Vanguard S&P500 ETF
697,963
Finsbury High Inc F
520,600
Pimco-Hi Yield Bond
506,500
Finsbury High Inc F
429,907
iShares MSCI Jap Mon
335,448
Vanguard Emerg ETF
316,775
IShares III Plc
300,528
First State Asia Pac
258,800
iShares Core MSCI Em
247,290
Vanguard S&P 500 ETF
222,127
iShares MSCI Jap Mon
212,378
Pimco-Hi Yield Bond
204,000
Australia 4% 21/10/2014 172,245
iShares MSCI Jap Mon
134,034
IShares III Plc
125,567
Vangrd FTSE 100 ETF
110,125
Sales
Proceeds (USD)
(being the largest 20 sales in the period ended 30 June 2014)
iShares S&P SmallCap
2,342,398
SPDR S&P 400 US Mid
1,148,561
Ishares S&P 500 I/F
1,097,896
Ignis GBP Liquid 2
981,650
Institu Cash Series
978,436
Ishares S&P 500 I/F
817,645
Ishares S&P 500 I/F
754,483
Vangrd FTSE 100 ETF
428,906

SANLAM UNIVERSAL FUNDS PLC
374
Purchases and Sales for the six months ended 30 June 2014 (continued) Sanlam African Frontier Markets Fund
Purchases
Cost (USD)
(being the largest 20 purchases in the period ended 30 June 2014)
Attijariwafa Bank
1,667,322
Econet Wireless Zim
1,646,865
Eastern Tobacco
1,505,769
Sonatel
1,028,173
MCB Group Ltd
923,429
Credit Agricole Egypt
750,746
Global Telecom Holdings
743,554
GlaxSmitKlin Nigeria
718,051
Nestle Foods Nigeria
712,278
Commercial International Bank
674,198
Douja Proma Addoha
667,010
Sonatel
579,676
Global Telecom Holding
523,408
Attijariwafa Bank
512,434
Suez Cement
480,119
Co-operative Bank
458,115
Zenith Bank Ltd
446,741
Commercial International Bank
391,373
Douja Proma Addoha
353,280
Co-operative Bank
346,667
Sales
Proceeds (USD)
(being the largest 20 sales in the period ended 30 June 2014)
Nestle Foods Nigeria
2,016,500
Diamond Bank Plc
1,721,814
Safaricom Ltd
1,495,078
Dangote Flour Mills
1,354,025
Global Telecom Holdings
1,341,170
Attijariwafa Bank
802,847
Econet Wireless Zim
802,071
Commercial International Bank
705,161
Access Bank PLC
639,025
Juhayna Food Industrial
587,667
Telecom Egypt
445,928
FBN Holdings Plc
444,960
FBN Holdings Plc
430,979
FBN Holdings Plc
328,320
Juhayna Food Industrial
299,808
ElSwedy Cables
236,127
Juhayna Food Industrial
208,527
ElSwedy Cables
206,163
ElSwedy Cables
158,372
Attijariwafa Bank
147,361
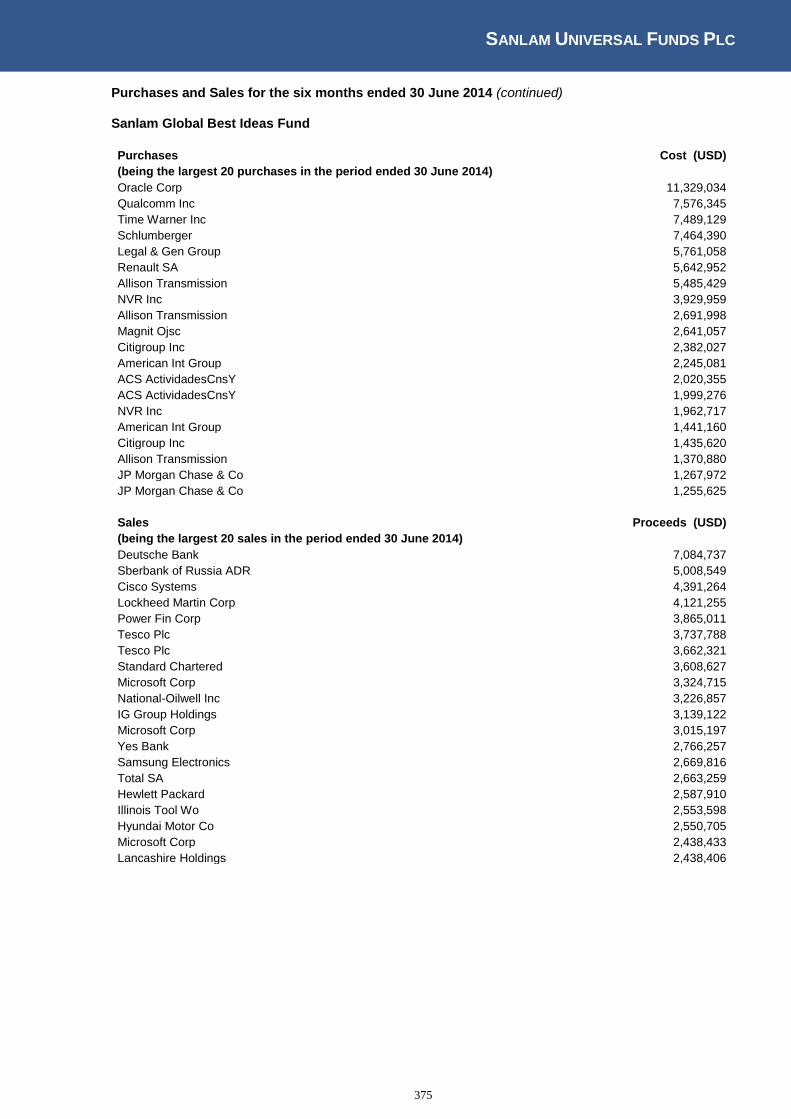
SANLAM UNIVERSAL FUNDS PLC
375
Purchases and Sales for the six months ended 30 June 2014 (continued) Sanlam Global Best Ideas Fund
Purchases
Cost (USD)
(being the largest 20 purchases in the period ended 30 June 2014)
Oracle Corp
11,329,034
Qualcomm Inc
7,576,345
Time Warner Inc
7,489,129
Schlumberger
7,464,390
Legal & Gen Group
5,761,058
Renault SA
5,642,952
Allison Transmission
5,485,429
NVR Inc
3,929,959
Allison Transmission
2,691,998
Magnit Ojsc
2,641,057
Citigroup Inc
2,382,027
American Int Group
2,245,081
ACS ActividadesCnsY
2,020,355
ACS ActividadesCnsY
1,999,276
NVR Inc
1,962,717
American Int Group
1,441,160
Citigroup Inc
1,435,620
Allison Transmission
1,370,880
JP Morgan Chase & Co
1,267,972
JP Morgan Chase & Co
1,255,625
Sales
Proceeds (USD)
(being the largest 20 sales in the period ended 30 June 2014)
Deutsche Bank
7,084,737
Sberbank of Russia ADR
5,008,549
Cisco Systems
4,391,264
Lockheed Martin Corp
4,121,255
Power Fin Corp
3,865,011
Tesco Plc
3,737,788
Tesco Plc
3,662,321
Standard Chartered
3,608,627
Microsoft Corp
3,324,715
National-Oilwell Inc
3,226,857
IG Group Holdings
3,139,122
Microsoft Corp
3,015,197
Yes Bank
2,766,257
Samsung Electronics
2,669,816
Total SA
2,663,259
Hewlett Packard
2,587,910
Illinois Tool Wo
2,553,598
Hyundai Motor Co
2,550,705
Microsoft Corp
2,438,433
Lancashire Holdings
2,438,406
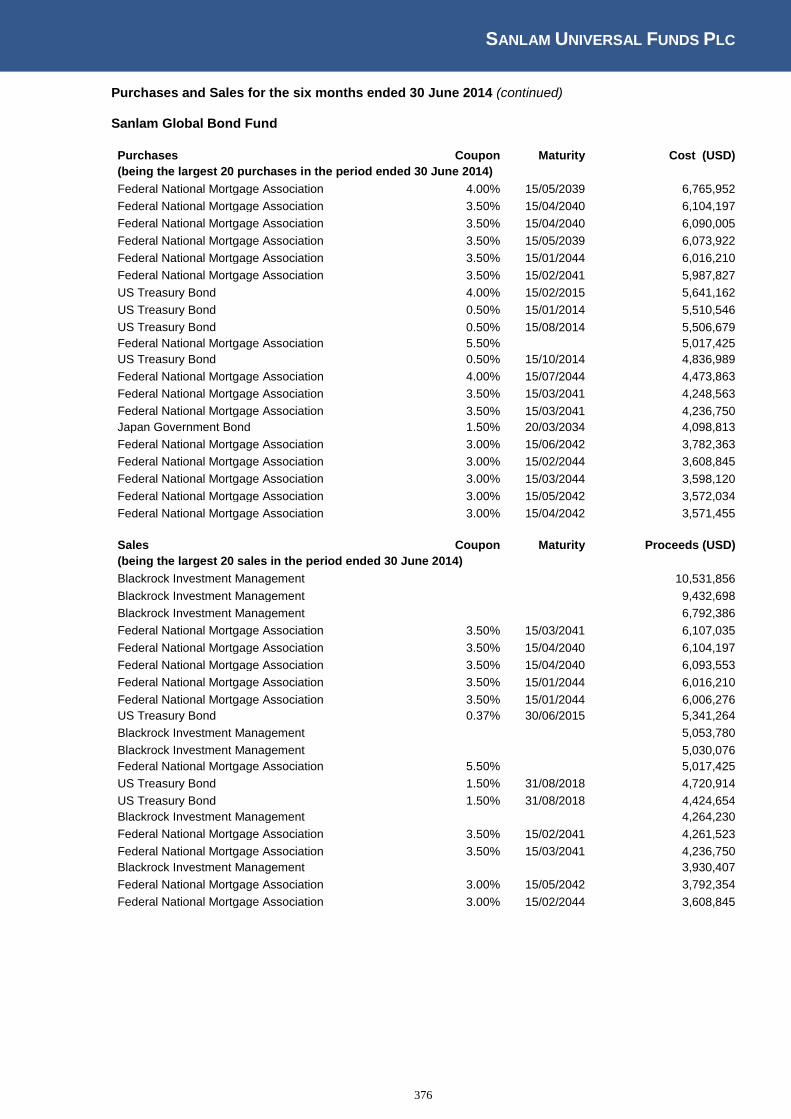
SANLAM UNIVERSAL FUNDS PLC
376
Purchases and Sales for the six months ended 30 June 2014 (continued) Sanlam Global Bond Fund
Purchases Coupon Maturity Cost (USD)
(being the largest 20 purchases in the period ended 30 June 2014)
Federal National Mortgage Association 4.00% 15/05/2039 6,765,952
Federal National Mortgage Association 3.50% 15/04/2040 6,104,197
Federal National Mortgage Association 3.50% 15/04/2040 6,090,005
Federal National Mortgage Association 3.50% 15/05/2039 6,073,922
Federal National Mortgage Association 3.50% 15/01/2044 6,016,210
Federal National Mortgage Association 3.50% 15/02/2041 5,987,827
US Treasury Bond 4.00% 15/02/2015 5,641,162
US Treasury Bond 0.50% 15/01/2014 5,510,546
US Treasury Bond 0.50% 15/08/2014 5,506,679
Federal National Mortgage Association 5.50%
5,017,425
US Treasury Bond 0.50% 15/10/2014 4,836,989
Federal National Mortgage Association 4.00% 15/07/2044 4,473,863
Federal National Mortgage Association 3.50% 15/03/2041 4,248,563
Federal National Mortgage Association 3.50% 15/03/2041 4,236,750
Japan Government Bond 1.50% 20/03/2034 4,098,813
Federal National Mortgage Association 3.00% 15/06/2042 3,782,363
Federal National Mortgage Association 3.00% 15/02/2044 3,608,845
Federal National Mortgage Association 3.00% 15/03/2044 3,598,120
Federal National Mortgage Association 3.00% 15/05/2042 3,572,034
Federal National Mortgage Association 3.00% 15/04/2042 3,571,455
Sales Coupon Maturity Proceeds (USD)
(being the largest 20 sales in the period ended 30 June 2014)
Blackrock Investment Management
10,531,856
Blackrock Investment Management
9,432,698
Blackrock Investment Management
6,792,386
Federal National Mortgage Association 3.50% 15/03/2041 6,107,035
Federal National Mortgage Association 3.50% 15/04/2040 6,104,197
Federal National Mortgage Association 3.50% 15/04/2040 6,093,553
Federal National Mortgage Association 3.50% 15/01/2044 6,016,210
Federal National Mortgage Association 3.50% 15/01/2044 6,006,276
US Treasury Bond 0.37% 30/06/2015 5,341,264
Blackrock Investment Management
5,053,780
Blackrock Investment Management
5,030,076
Federal National Mortgage Association 5.50%
5,017,425
US Treasury Bond 1.50% 31/08/2018 4,720,914
US Treasury Bond 1.50% 31/08/2018 4,424,654
Blackrock Investment Management
4,264,230
Federal National Mortgage Association 3.50% 15/02/2041 4,261,523
Federal National Mortgage Association 3.50% 15/03/2041 4,236,750
Blackrock Investment Management
3,930,407
Federal National Mortgage Association 3.00% 15/05/2042 3,792,354
Federal National Mortgage Association 3.00% 15/02/2044 3,608,845

SANLAM UNIVERSAL FUNDS PLC
377
Purchases and Sales for the six months ended 30 June 2014 (continued) Sanlam Global Financial Fund
Purchases
Cost (USD)
(being the largest 20 purchases in the period ended 30 June 2014)
Fifth Third Banc
4,245,909
Pnc Financial Se
3,443,030
Credicorp
3,415,755
Fifth Third Banc
3,400,210
TBC Bank JSC
3,250,000
Itausa-Investment It
3,231,467
Berkshire Hath
3,219,109
Sberbank of Russia ADR
3,005,223
Krung Thai Bank Pubic
2,276,842
Turkiye Halk
2,266,768
Arrow Global Group
2,179,005
TCS Group Holding Reg
1,971,733
Citigroup Inc
1,938,859
Turkiye Garanti Bank
1,738,522
Turkiye Garanti Bank
1,716,011
Pnc Financial Se
1,710,436
Turkiye Halk
1,709,113
Bank of America Corp
1,662,840
China Construction Bank
1,639,348
Legal & Gen Group
1,541,084
Sales
Proceeds (USD)
(being the largest 20 sales in the period ended 30 June 2014)
Standard Chartered
7,607,623
Power Fin Corp
6,050,677
Renaissancere Hldgs
5,671,178
Turkiye Halk
5,374,553
China Construction Bank
3,888,926
Raiffeisen International Bank
3,686,243
Bank Rakyat Indonesia
3,425,083
Barclays Plc
3,260,449
Yes Bank
3,087,189
Krung Thai Bank Public
3,040,539
China Construction Bank
2,918,137
Deutsche Bank
2,815,807
Renaissancere Holdings
2,707,571
Barclays Plc
2,507,683
Catlin Group Ltd
2,448,609
LancashireHoldings
2,315,372
Bank of Georgia
2,244,824
Barclays Plc
2,164,006
Deutsche Bank
2,088,895
Raiffeisen International Bank
2,008,899

SANLAM UNIVERSAL FUNDS PLC
378
Purchases and Sales for the six months ended 30 June 2014 (continued) Sanlam Global Property Fund
Purchases
Cost (USD)
(being the largest 20 purchases in the period ended 30 June 2014)
Mas Real Estate Inc
8,839,847
Merlin Properties
2,176,466
WP Carey Inc
1,657,396
Omega Healthcare Investment
1,441,981
Kennedy Wilson Europe
1,427,716
Extra Space Storage
787,827
New York Reit Inc
722,035
East Japan Railway
715,989
Safestore Holdings Ltd
691,482
Hemfosa Fastigheter
622,935
Fibra Uno Administra
593,554
Gagfah SA
587,073
Goodman Group
557,496
Glimcher Realty Trust
557,373
Mitsui Fudosan Co
555,125
Federal Realty Investment
550,847
Columbia Prop Trust
538,624
Spirit Realty Cap
519,025
Scentre Group
507,583
Westfield Retail Trust
490,737
Sales
Proceeds (USD)
(being the largest 20 sales in the period ended 30 June 2014)
Spirit Realty Cap
1,341,316
Simon Property
1,272,801
Geo Group Inc
1,201,076
Westfield Group
1,116,139
Northstar Realty Finance
1,098,613
Starwood Property
959,610
Mitsui Fudosan Co
946,274
Land Securities Group
932,116
Sun Hung Kai Property
930,569
Avalonbay Commun
913,469
Mitsubishi Estate
906,351
Health Care Reit Inc
864,129
Land Securities Group
827,870
Simon Property
743,592
Prologis Inc
721,346
Unibail-Rodamco
719,430
Intercontinental Hot
662,392
Hopewell Holdings
649,373
Correct Corp of Amer
572,353
Icade
559,338
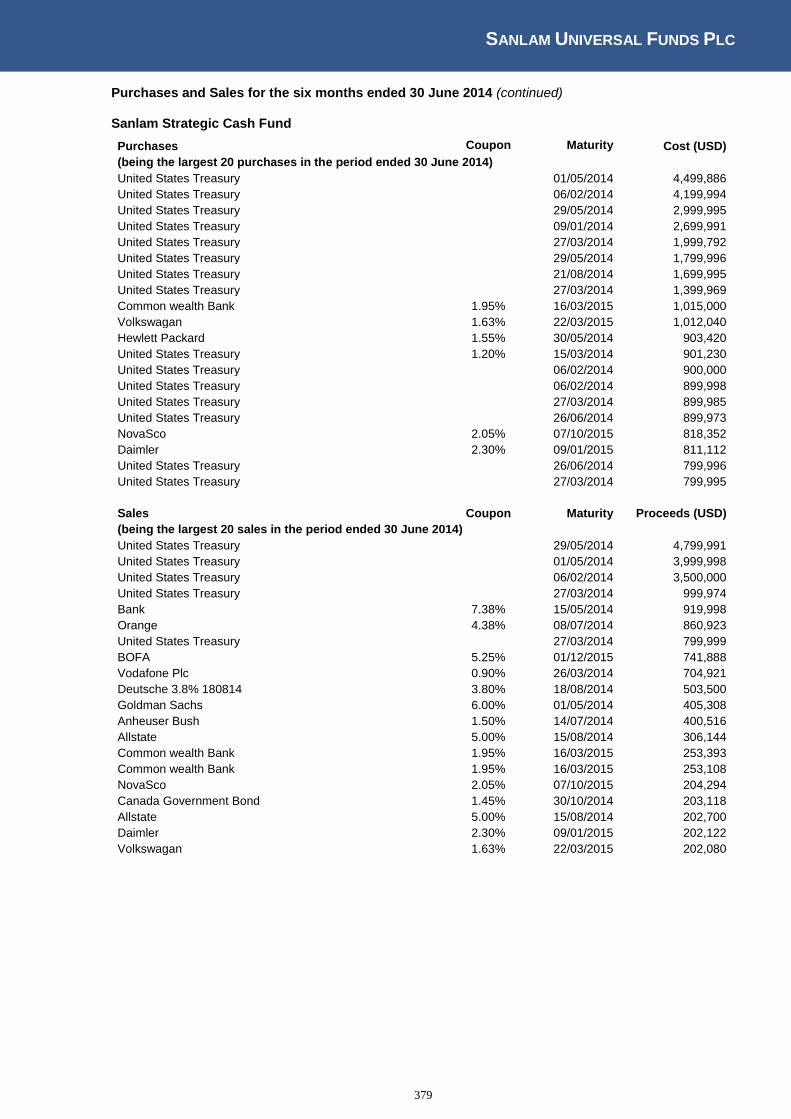
SANLAM UNIVERSAL FUNDS PLC
379
Purchases and Sales for the six months ended 30 June 2014 (continued) Sanlam Strategic Cash Fund
Purchases Coupon Maturity Cost (USD)
(being the largest 20 purchases in the period ended 30 June 2014)
United States Treasury
01/05/2014 4,499,886
United States Treasury
06/02/2014 4,199,994
United States Treasury
29/05/2014 2,999,995
United States Treasury
09/01/2014 2,699,991
United States Treasury
27/03/2014 1,999,792
United States Treasury
29/05/2014 1,799,996
United States Treasury
21/08/2014 1,699,995
United States Treasury
27/03/2014 1,399,969
Common wealth Bank 1.95% 16/03/2015 1,015,000
Volkswagan 1.63% 22/03/2015 1,012,040
Hewlett Packard 1.55% 30/05/2014 903,420
United States Treasury 1.20% 15/03/2014 901,230
United States Treasury
06/02/2014 900,000
United States Treasury
06/02/2014 899,998
United States Treasury
27/03/2014 899,985
United States Treasury
26/06/2014 899,973
NovaSco 2.05% 07/10/2015 818,352
Daimler 2.30% 09/01/2015 811,112
United States Treasury
26/06/2014 799,996
United States Treasury
27/03/2014 799,995
Sales Coupon Maturity Proceeds (USD)
(being the largest 20 sales in the period ended 30 June 2014)
United States Treasury
29/05/2014 4,799,991
United States Treasury
01/05/2014 3,999,998
United States Treasury
06/02/2014 3,500,000
United States Treasury
27/03/2014 999,974
Bank 7.38% 15/05/2014 919,998
Orange 4.38% 08/07/2014 860,923
United States Treasury
27/03/2014 799,999
BOFA 5.25% 01/12/2015 741,888
Vodafone Plc 0.90% 26/03/2014 704,921
Deutsche 3.8% 180814 3.80% 18/08/2014 503,500
Goldman Sachs 6.00% 01/05/2014 405,308
Anheuser Bush 1.50% 14/07/2014 400,516
Allstate 5.00% 15/08/2014 306,144
Common wealth Bank 1.95% 16/03/2015 253,393
Common wealth Bank 1.95% 16/03/2015 253,108
NovaSco 2.05% 07/10/2015 204,294
Canada Government Bond 1.45% 30/10/2014 203,118
Allstate 5.00% 15/08/2014 202,700
Daimler 2.30% 09/01/2015 202,122
Volkswagan 1.63% 22/03/2015 202,080

SANLAM UNIVERSAL FUNDS PLC
380
Purchases and Sales for the six months ended 30 June 2014 (continued) Sanlam World Equity Tracker Fund
Purchases
Cost (USD)
(being the largest 20 purchases in the period ended 30 June 2014)
Ishares S&P 500 Index Fund
3,758,605
Ishares MSCI EAFE Index Fund
2,640,695
Ishares S&P 500 Index Fund
2,611,526
Ishares S&P 500 Index Fund
1,939,041
Ishares MSCI EAFE Index Fund
1,884,234
Ishares S&P 500 Index Fund
1,864,959
Ishares S&P 500 Index Fund
1,684,638
Ishares MSCI EAFE Index Fund
1,582,486
Ishares MSCI EAFE Index Fund
1,553,156
Ishares S&P 500 Index Fund
1,550,910
Google Inc
1,415,342
Ishares MSCI EAFE Index Fund
1,407,079
Ishares S&P 500 Index Fund
1,200,180
Ishares MSCI EAFE Index Fund
1,102,098
Ishares S&P 500 Index Fund
1,025,758
Ishares S&P 500 Index Fund
974,590
Ishares MSCI EAFE Index Fund
878,991
Ishares S&P 500 Index Fund
869,618
Ishares MSCI EAFE Index Fund
753,359
Ishares MSCI EAFE Index Fund
715,906
Sales
Proceeds (USD)
(being the largest 20 sales in the period ended 30 June 2014)
Ishares S&P 500 Index Fund
23,072,677
Ishares MSCI EAFE Index Fund
17,487,098
Ishares S&P 500 Index Fund
9,840,282
Ishares S&P 500 Index Fund
7,938,857
Ishares MSCI EAFE Index Fund
7,496,824
Ishares MSCI EAFE Index Fund
5,912,644
Ishares MSCI Canada
1,775,767
Ishares S&P 500 Index Fund
1,036,903
Verizon Communi INC
855,372
Ishares S&P 500 Index Fund
784,006
Ishares MSCI Canada
741,126
Ishares MSCI EAFE Index Fund
686,355
Ishares S&P 500 Index Fund
634,834
Ishares MSCI Canada
617,950
Ishares MSCI EAFE Index Fund
588,344
Ishares S&P 500 Index Fund
558,008
Ishares MSCI EAFE Index Fund
551,256
Ishares S&P 500 Index Fund
546,539
Ishares S&P 500 Index Fund
518,067
Exxon Corp
494,518

SANLAM UNIVERSAL FUNDS PLC
381
Purchases and Sales for the six months ended 30 June 2014 (continued) Sanlam World Equity Fund
Purchases
Cost (USD)
(being the largest 20 purchases in the period ended 30 June 2014)
Google Inc
5,849,721
UTD Technologies
5,648,453
Novo Nordisk AS
5,612,620
PSigma Glbl Equity
5,009,692
Celgene Corp
4,822,740
Priceline Group Inc
4,631,479
Illinois Tool Works
4,211,629
FMCTechnologies Inc
4,195,222
Halliburton Co
4,181,698
Softbank Corp
3,959,248
HSBC Holdings
3,889,676
Vulcan Materials
3,856,608
Linear Tech Corp
3,826,075
Samsung Electronics
3,822,743
NRG Energy Inc
3,725,631
Apple Inc
3,725,216
Las Vegas Sands Corp
3,668,616
Archer-Daniels
3,608,838
Range Resources Co
3,570,949
PSigma American Growth
3,554,122
Sales
Cost (USD)
(being the largest 20 sales in the period ended 30 June 2014)
Biogen Idec Inc
5,496,213
UBS AG
4,764,557
Toyota Motor Co
4,733,630
Electrolux
4,628,461
Novartis
4,467,303
Coca-Cola Co
4,391,962
Celgene Corp
4,125,332
Samsung Electronics
4,052,883
State St Corp
4,014,991
Softbank Corp
3,959,248
Oracle Corp
3,936,236
Priceline Group Inc
3,886,281
Bank New York Mellon
3,840,337
Samsung Electronics
3,822,743
HCA Holdings Inc
3,822,691
Urban Outfitters Inc
3,686,940
Costco Wholesale
3,639,240
Harley Davidson
3,573,620
Sumitomo Mitsui Finance
3,506,983
Reckitt Benckiser
3,501,767
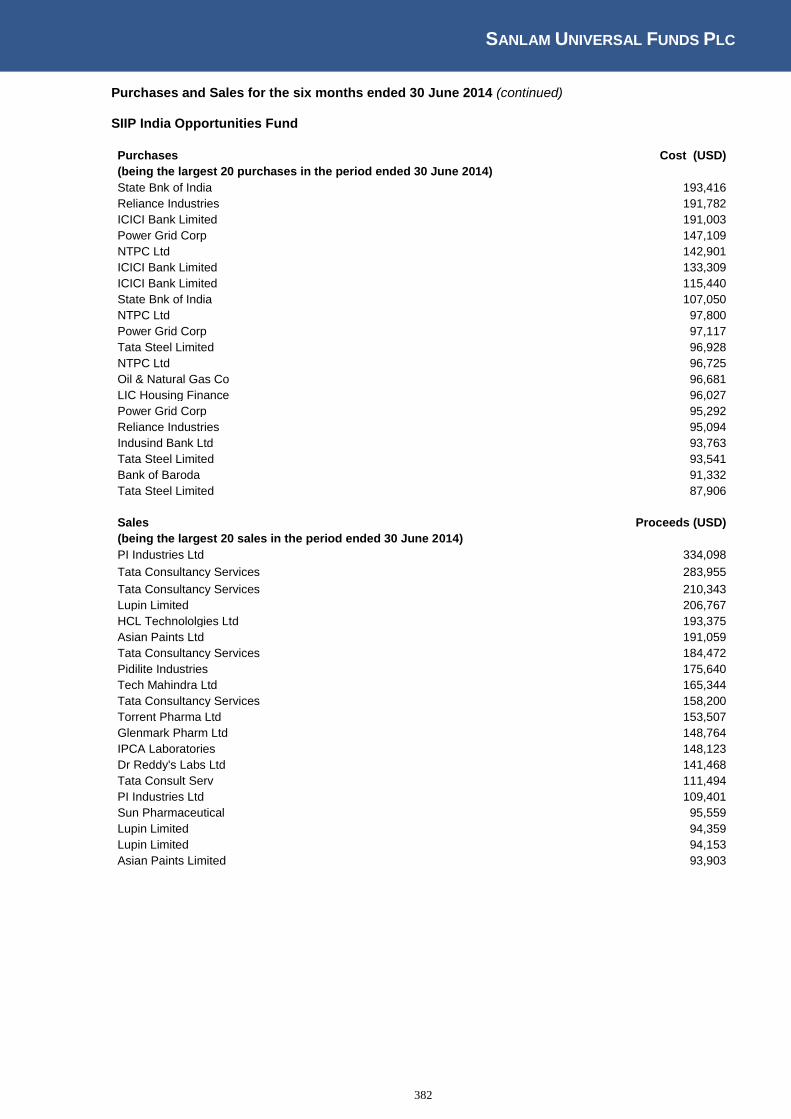
SANLAM UNIVERSAL FUNDS PLC
382
Purchases and Sales for the six months ended 30 June 2014 (continued) SIIP India Opportunities Fund
Purchases
Cost (USD)
(being the largest 20 purchases in the period ended 30 June 2014)
State Bnk of India
193,416
Reliance Industries
191,782
ICICI Bank Limited
191,003
Power Grid Corp
147,109
NTPC Ltd
142,901
ICICI Bank Limited
133,309
ICICI Bank Limited
115,440
State Bnk of India
107,050
NTPC Ltd
97,800
Power Grid Corp
97,117
Tata Steel Limited
96,928
NTPC Ltd
96,725
Oil & Natural Gas Co
96,681
LIC Housing Finance
96,027
Power Grid Corp
95,292
Reliance Industries
95,094
Indusind Bank Ltd
93,763
Tata Steel Limited
93,541
Bank of Baroda
91,332
Tata Steel Limited
87,906
Sales
Proceeds (USD)
(being the largest 20 sales in the period ended 30 June 2014)
PI Industries Ltd
334,098
Tata Consultancy Services
283,955
Tata Consultancy Services
210,343
Lupin Limited
206,767
HCL Technololgies Ltd
193,375
Asian Paints Ltd
191,059
Tata Consultancy Services
184,472
Pidilite Industries
175,640
Tech Mahindra Ltd
165,344
Tata Consultancy Services
158,200
Torrent Pharma Ltd
153,507
Glenmark Pharm Ltd
148,764
IPCA Laboratories
148,123
Dr Reddy's Labs Ltd
141,468
Tata Consult Serv
111,494
PI Industries Ltd
109,401
Sun Pharmaceutical
95,559
Lupin Limited
94,359
Lupin Limited
94,153
Asian Paints Limited
93,903
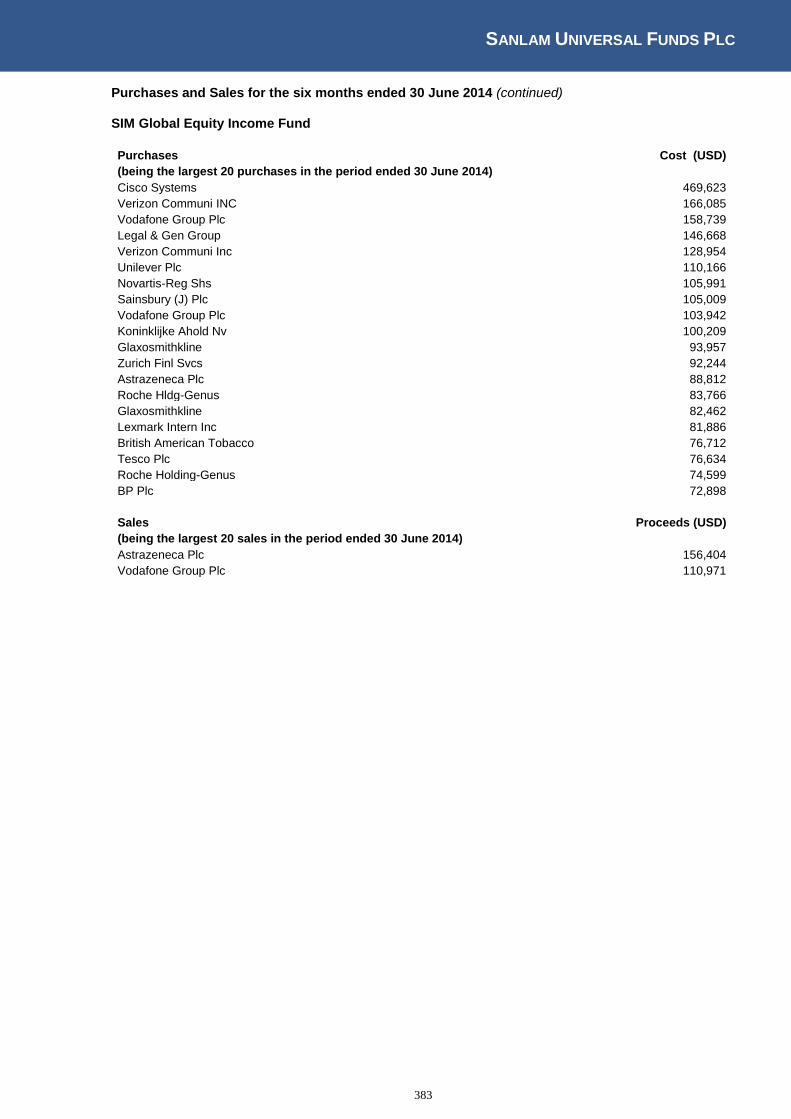
SANLAM UNIVERSAL FUNDS PLC
383
Purchases and Sales for the six months ended 30 June 2014 (continued) SIM Global Equity Income Fund
Purchases
Cost (USD)
(being the largest 20 purchases in the period ended 30 June 2014)
Cisco Systems
469,623
Verizon Communi INC 166,085
Vodafone Group Plc
158,739
Legal & Gen Group
146,668
Verizon Communi Inc 128,954
Unilever Plc
110,166
Novartis-Reg Shs
105,991
Sainsbury (J) Plc
105,009
Vodafone Group Plc
103,942
Koninklijke Ahold Nv
100,209
Glaxosmithkline
93,957
Zurich Finl Svcs
92,244
Astrazeneca Plc
88,812
Roche Hldg-Genus
83,766
Glaxosmithkline
82,462
Lexmark Intern Inc
81,886
British American Tobacco
76,712
Tesco Plc
76,634
Roche Holding-Genus
74,599
BP Plc
72,898
Sales
Proceeds (USD)
(being the largest 20 sales in the period ended 30 June 2014)
Astrazeneca Plc
156,404
Vodafone Group Plc
110,971
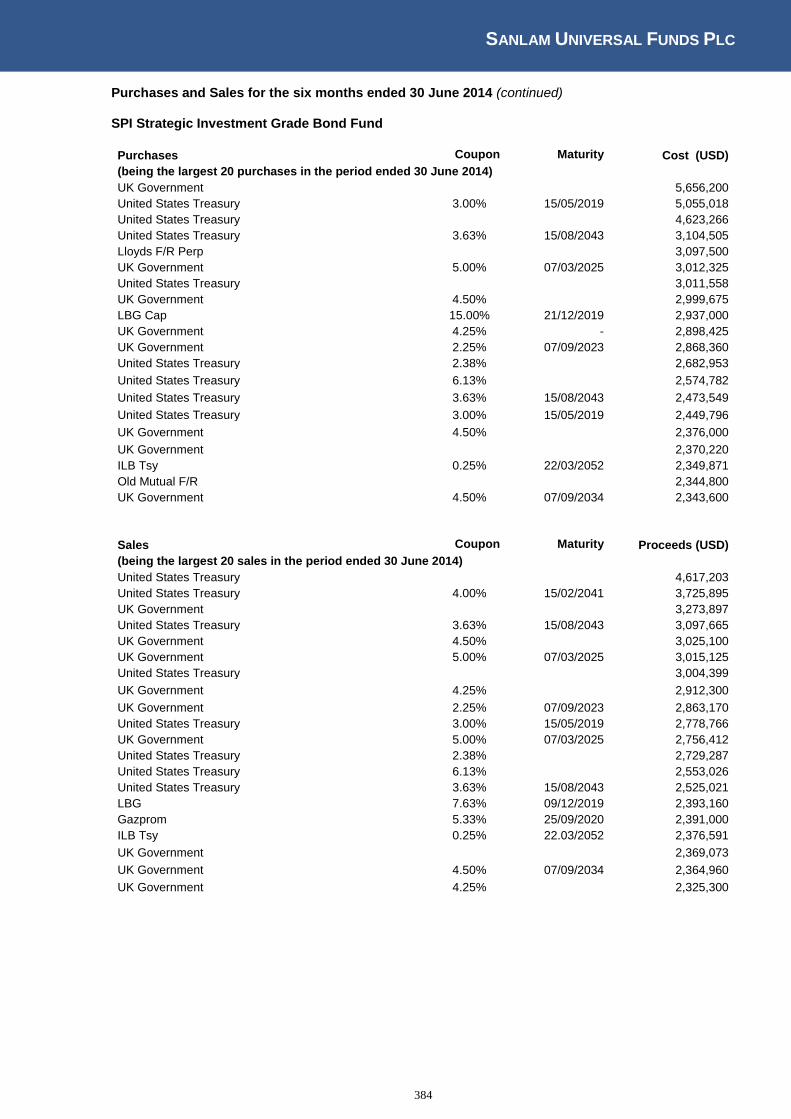
SANLAM UNIVERSAL FUNDS PLC
384
Purchases and Sales for the six months ended 30 June 2014 (continued) SPI Strategic Investment Grade Bond Fund
Purchases Coupon Maturity Cost (USD)
(being the largest 20 purchases in the period ended 30 June 2014) UK Government
5,656,200
United States Treasury 3.00% 15/05/2019 5,055,018
United States Treasury
4,623,266
United States Treasury 3.63% 15/08/2043 3,104,505
Lloyds F/R Perp
3,097,500
UK Government 5.00% 07/03/2025 3,012,325
United States Treasury
3,011,558
UK Government 4.50%
2,999,675
LBG Cap 15.00% 21/12/2019 2,937,000
UK Government 4.25% - 2,898,425
UK Government 2.25% 07/09/2023 2,868,360
United States Treasury 2.38%
2,682,953
United States Treasury 6.13%
2,574,782
United States Treasury 3.63% 15/08/2043 2,473,549
United States Treasury 3.00% 15/05/2019 2,449,796
UK Government 4.50% 2,376,000
UK Government
2,370,220
ILB Tsy 0.25% 22/03/2052 2,349,871
Old Mutual F/R
2,344,800
UK Government 4.50% 07/09/2034 2,343,600
Sales Coupon Maturity Proceeds (USD)
(being the largest 20 sales in the period ended 30 June 2014) United States Treasury
4,617,203
United States Treasury 4.00% 15/02/2041 3,725,895
UK Government
3,273,897
United States Treasury 3.63% 15/08/2043 3,097,665
UK Government 4.50%
3,025,100
UK Government 5.00% 07/03/2025 3,015,125
United States Treasury
3,004,399
UK Government 4.25%
2,912,300
UK Government 2.25% 07/09/2023 2,863,170
United States Treasury 3.00% 15/05/2019 2,778,766
UK Government 5.00% 07/03/2025 2,756,412
United States Treasury 2.38% 2,729,287
United States Treasury 6.13% 2,553,026
United States Treasury 3.63% 15/08/2043 2,525,021
LBG 7.63% 09/12/2019 2,393,160
Gazprom 5.33% 25/09/2020 2,391,000
ILB Tsy 0.25% 22.03/2052 2,376,591
UK Government
2,369,073
UK Government 4.50% 07/09/2034 2,364,960
UK Government 4.25%
2,325,300
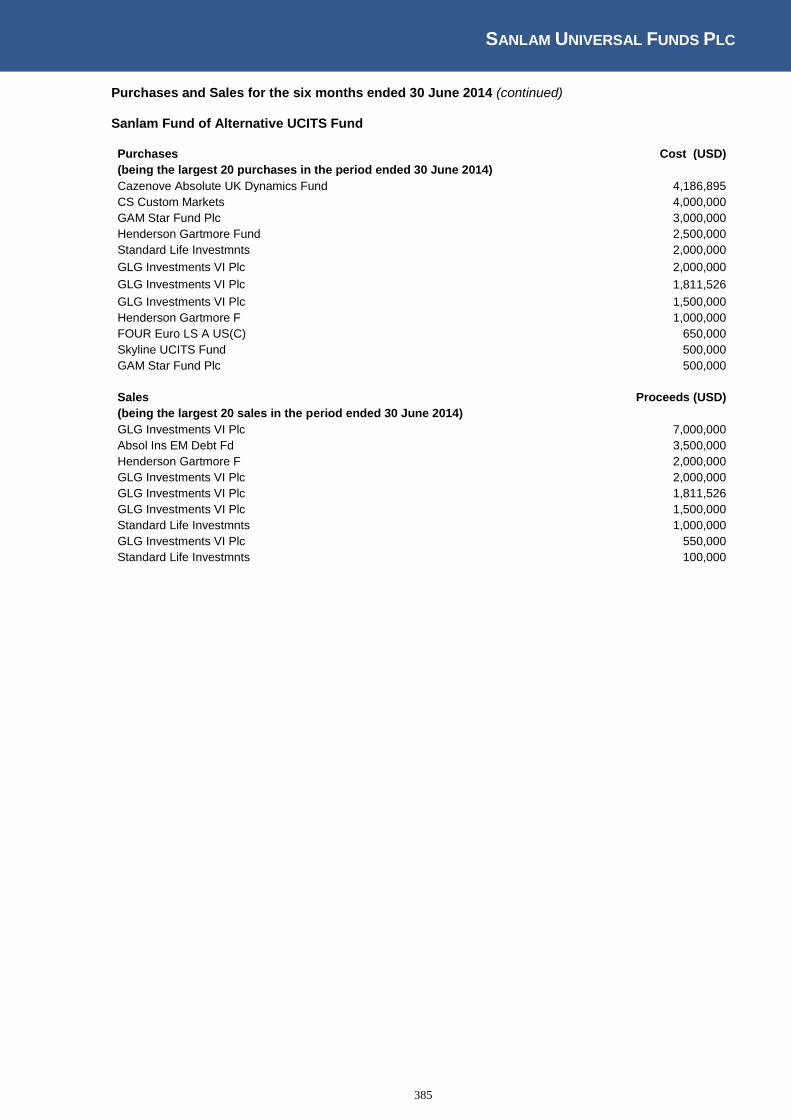
SANLAM UNIVERSAL FUNDS PLC
385
Purchases and Sales for the six months ended 30 June 2014 (continued) Sanlam Fund of Alternative UCITS Fund
Purchases
Cost (USD)
(being the largest 20 purchases in the period ended 30 June 2014)
Cazenove Absolute UK Dynamics Fund
4,186,895
CS Custom Markets
4,000,000
GAM Star Fund Plc
3,000,000
Henderson Gartmore Fund
2,500,000
Standard Life Investmnts
2,000,000
GLG Investments VI Plc
2,000,000
GLG Investments VI Plc
1,811,526
GLG Investments VI Plc
1,500,000
Henderson Gartmore F
1,000,000
FOUR Euro LS A US(C)
650,000
Skyline UCITS Fund
500,000
GAM Star Fund Plc
500,000
Sales
Proceeds (USD)
(being the largest 20 sales in the period ended 30 June 2014)
GLG Investments VI Plc
7,000,000
Absol Ins EM Debt Fd
3,500,000
Henderson Gartmore F
2,000,000
GLG Investments VI Plc
2,000,000
GLG Investments VI Plc
1,811,526
GLG Investments VI Plc
1,500,000
Standard Life Investmnts
1,000,000
GLG Investments VI Plc
550,000
Standard Life Investmnts
100,000

SANLAM UNIVERSAL FUNDS PLC
386
Purchases and Sales for the six months ended 30 June 2014 (continued) Sanlam Accel Income Fund
Purchases
Cost (USD)
(being the largest 20 purchases in the period ended 30 June 2014)
M&G Sht Dated Corp Bond
500,000
M&G Sht Dated Corp Bond
500,000
Artemis Global Income Fund
400,000
JPM Fd - Corp Bond Fd
300,000
JPM Fd - Corp Bond Fd
300,000
Kames Ster Corp Bond
300,000
Cazenove Strategic Bond Fund
250,000
Cazenove Strategic Bond Fund
250,000
Veritas Funds Global Equity Income
250,000
Kames Ster Corp Bond
250,000
Fidelity Enhanced Income
250,000
Muzin Emerging Markets Share
250,000
Henderson UK Equity Income
200,000
Lazard Investment Fund Global Equity
200,000
Kames Ster Corp Bond
200,000
Henderson UK Equity Income
150,000
Schroder UK Alpha Fund
150,000
PFS Chel UK Equity
150,000
Invesco Perp Corp Bond
150,000
JPM Fd - Corp Bond Fund
150,000
JPM Fd - Corp Bond Fund
150,000
Sales
Proceeds (USD)
(being the largest 20 sales in the period ended 30 June 2014)
Mellon Investment Fund Inccome Fund
300,000
Vanguard UK Governemnt Bond
150,000
M&G Corp Bond
150,000
Jupiter Strategic Bond
150,000
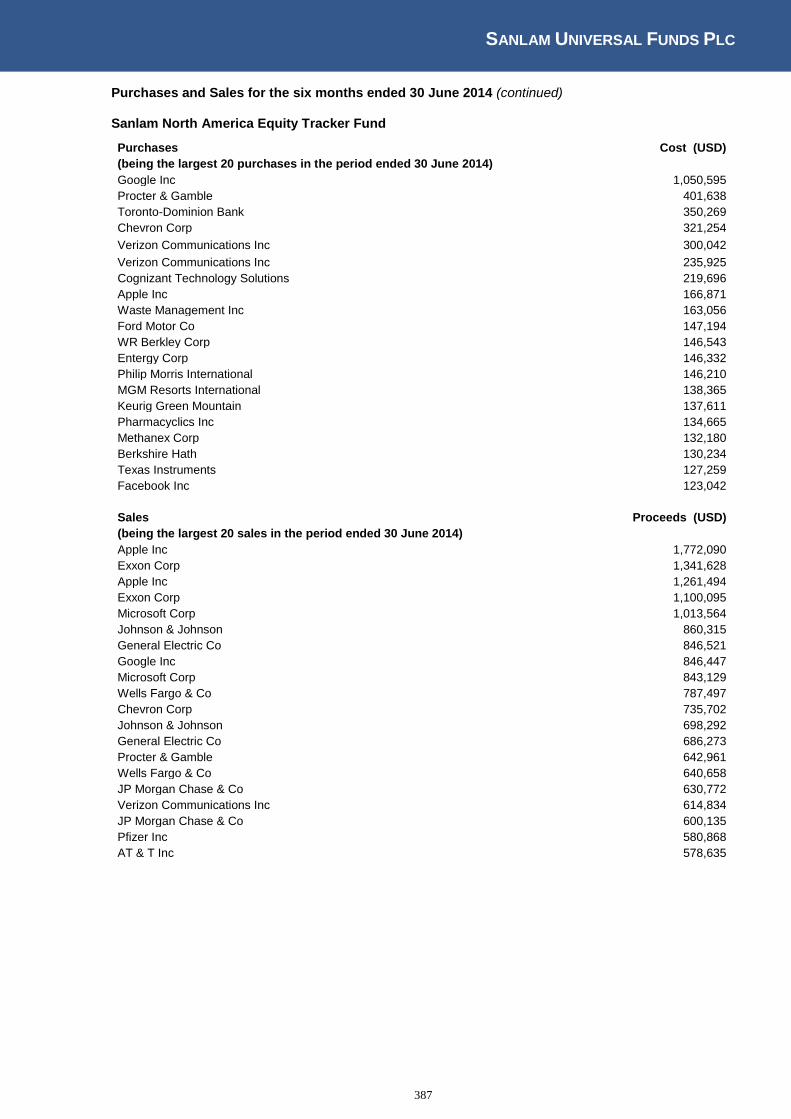
SANLAM UNIVERSAL FUNDS PLC
387
Purchases and Sales for the six months ended 30 June 2014 (continued) Sanlam North America Equity Tracker Fund
Purchases
Cost (USD)
(being the largest 20 purchases in the period ended 30 June 2014)
Google Inc
1,050,595
Procter & Gamble
401,638
Toronto-Dominion Bank
350,269
Chevron Corp
321,254
Verizon Communications Inc
300,042
Verizon Communications Inc
235,925
Cognizant Technology Solutions
219,696
Apple Inc
166,871
Waste Management Inc
163,056
Ford Motor Co
147,194
WR Berkley Corp
146,543
Entergy Corp
146,332
Philip Morris International
146,210
MGM Resorts International
138,365
Keurig Green Mountain
137,611
Pharmacyclics Inc
134,665
Methanex Corp
132,180
Berkshire Hath
130,234
Texas Instruments
127,259
Facebook Inc
123,042
Sales
Proceeds (USD)
(being the largest 20 sales in the period ended 30 June 2014)
Apple Inc
1,772,090
Exxon Corp
1,341,628
Apple Inc
1,261,494
Exxon Corp
1,100,095
Microsoft Corp
1,013,564
Johnson & Johnson
860,315
General Electric Co
846,521
Google Inc
846,447
Microsoft Corp
843,129
Wells Fargo & Co
787,497
Chevron Corp
735,702
Johnson & Johnson
698,292
General Electric Co
686,273
Procter & Gamble
642,961
Wells Fargo & Co
640,658
JP Morgan Chase & Co
630,772
Verizon Communications Inc
614,834
JP Morgan Chase & Co
600,135
Pfizer Inc
580,868
AT & T Inc
578,635

SANLAM UNIVERSAL FUNDS PLC
388
Purchases and Sales for the six months ended 30 June 2014 (continued) Sanlam UK Equity Tracker Fund
Purchases
Cost (USD)
(being the largest 20 purchases in the period ended 30 June 2014)
HSBC Holdings
354,257
Royal Dutch Shell
287,652
BP Plc
282,302
Verizon Communi Inc
264,660
Glaxosmithkline
229,394
British American Tobacco
200,735
Astrazeneca Plc
190,022
Royal Dutch Shell
185,370
Vodafone Group Plc
174,892
HSBC Holdings
152,209
Diageo
142,786
Bhp Billiton Plc
132,327
BP Plc
129,010
Bg Group Plc
125,021
Rio Tinto Plc
123,950
Royal Dutch Shell
121,010
Lloyds Bank Plc
113,991
Barclays Plc
112,588
Glaxosmithkline
111,984
Prudential Corp
108,410
Sales
Proceeds (USD)
(being the largest 20 sales in the period ended 30 June 2014)
Verizon Communications Inc
641,005
HSBC Holdings
379,154
BP Plc
311,749
Royal Dutch Shell
278,423
Glaxosmithkline
270,381
Vodafone Group Plc
257,361
British American Tobacco
217,237
Royal Dutch Shell
210,494
Vodafone Group Plc
194,016
Astrazeneca Plc
187,894
Diageo
159,565
Bg Group Plc
137,267
Lloyds Bank Plc
135,865
Bhp Billiton Plc
132,591
Rio Tinto Plc
125,334
Barclays Plc
117,156
National Grid Plc
111,908
Prudential Corp Ord
108,663
Glencore Plc
106,966
Unilever Plc
102,123
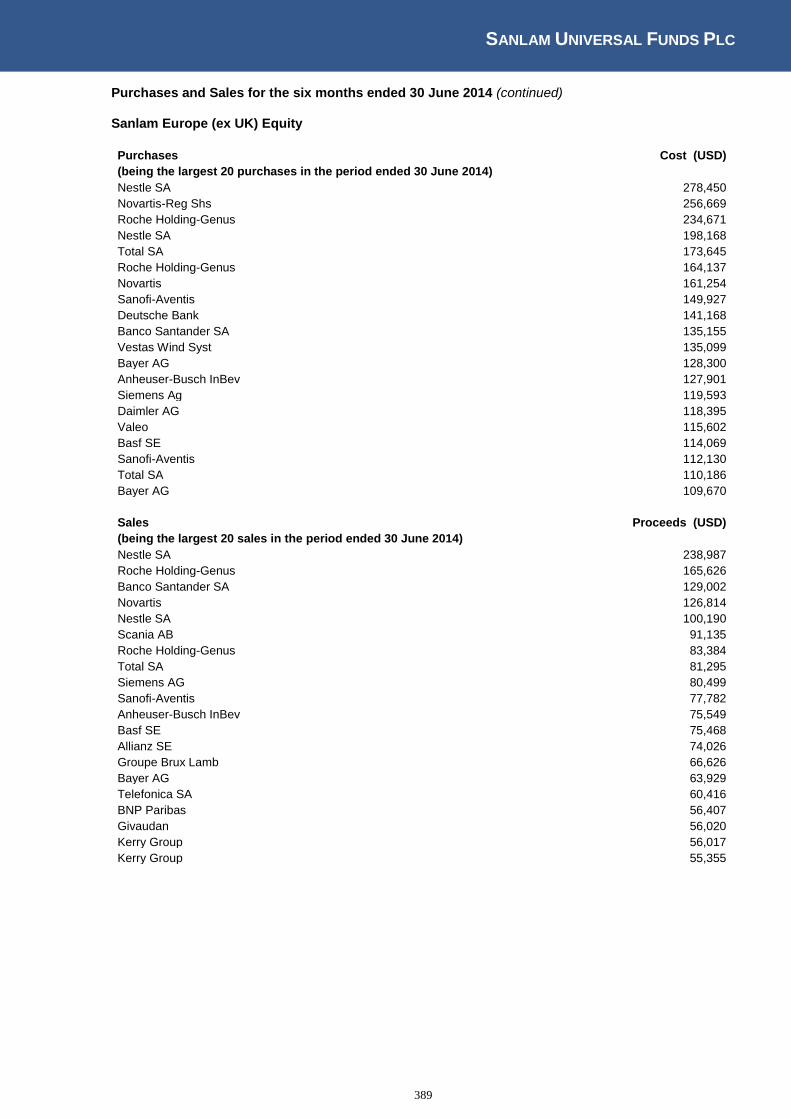
SANLAM UNIVERSAL FUNDS PLC
389
Purchases and Sales for the six months ended 30 June 2014 (continued) Sanlam Europe (ex UK) Equity
Purchases
Cost (USD)
(being the largest 20 purchases in the period ended 30 June 2014)
Nestle SA
278,450
Novartis-Reg Shs
256,669
Roche Holding-Genus
234,671
Nestle SA
198,168
Total SA
173,645
Roche Holding-Genus
164,137
Novartis
161,254
Sanofi-Aventis
149,927
Deutsche Bank
141,168
Banco Santander SA
135,155
Vestas Wind Syst
135,099
Bayer AG
128,300
Anheuser-Busch InBev
127,901
Siemens Ag
119,593
Daimler AG
118,395
Valeo
115,602
Basf SE
114,069
Sanofi-Aventis
112,130
Total SA
110,186
Bayer AG
109,670
Sales
Proceeds (USD)
(being the largest 20 sales in the period ended 30 June 2014)
Nestle SA
238,987
Roche Holding-Genus
165,626
Banco Santander SA
129,002
Novartis
126,814
Nestle SA
100,190
Scania AB
91,135
Roche Holding-Genus
83,384
Total SA
81,295
Siemens AG
80,499
Sanofi-Aventis
77,782
Anheuser-Busch InBev
75,549
Basf SE
75,468
Allianz SE
74,026
Groupe Brux Lamb
66,626
Bayer AG
63,929
Telefonica SA
60,416
BNP Paribas
56,407
Givaudan
56,020
Kerry Group
56,017
Kerry Group
55,355

SANLAM UNIVERSAL FUNDS PLC
390
Purchases and Sales for the six months ended 30 June 2014 (continued) Sanlam Equity Allocation Fund
Purchases
Cost (USD)
(being the largest 20 purchases in the period ended 30 June 2014)
Verizon Communi Inc
333,198
Zurich Financial Services
305,712
Novo Nordisk AS
271,446
EI Towers SPA
134,459
Implenia AG
118,807
Lafarge
108,878
Givaudan
108,082
Seadrill Ltd
104,752
Swisscom
104,490
Royal Bank of Scotland
104,321
Adecco SA
101,408
Smith & Nephew
100,955
Credit Agricole SA
99,666
SGS SA
99,012
Infineon Technology
98,035
Kone OYJ
97,635
Seadrill Ltd
97,231
Infineon Tech
97,066
Smith & Nephew
96,655
Swisscom
95,953
Sales
Cost (USD)
(being the largest 20 sales in the period ended 30 June 2014)
Verizon Communi INC
530,527
Zurich Financial Services
340,721
Glaxosmithkline
257,986
Electrolux
227,880
Vodafone Group Plc
209,632
MTU Aero Engines AG
118,476
MTU Aero Engines AG
114,958
Smith & Nephew
104,599
Lafarge
102,349
Swisscom
101,362
Seadrill Ltd
101,322
Swisscom
98,906
Henkel AG & Co KGAA
98,181
SGS SA
96,414
Kone OYJ
95,545
Kone OYJ
94,501
Seadrill Ltd
92,906
Infineon Tech
88,921
Getinge AB
87,702
Nokia Oyj
73,624
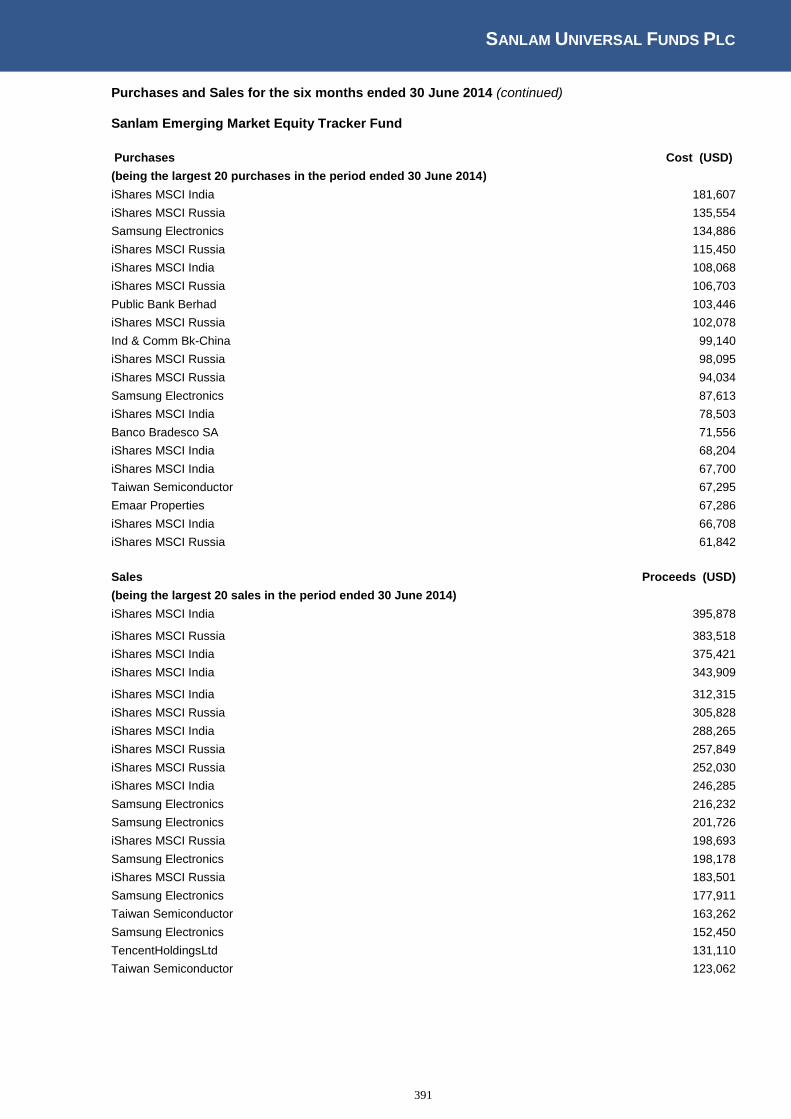
SANLAM UNIVERSAL FUNDS PLC
391
Purchases and Sales for the six months ended 30 June 2014 (continued) Sanlam Emerging Market Equity Tracker Fund
Purchases
Cost (USD)
(being the largest 20 purchases in the period ended 30 June 2014)
iShares MSCI India
181,607
iShares MSCI Russia
135,554
Samsung Electronics
134,886
iShares MSCI Russia
115,450
iShares MSCI India
108,068
iShares MSCI Russia
106,703
Public Bank Berhad
103,446
iShares MSCI Russia
102,078
Ind & Comm Bk-China
99,140
iShares MSCI Russia
98,095
iShares MSCI Russia
94,034
Samsung Electronics
87,613
iShares MSCI India
78,503
Banco Bradesco SA
71,556
iShares MSCI India
68,204
iShares MSCI India
67,700
Taiwan Semiconductor
67,295
Emaar Properties
67,286
iShares MSCI India
66,708
iShares MSCI Russia
61,842
Sales
Proceeds (USD)
(being the largest 20 sales in the period ended 30 June 2014)
iShares MSCI India
395,878
iShares MSCI Russia
383,518
iShares MSCI India
375,421
iShares MSCI India
343,909
iShares MSCI India
312,315
iShares MSCI Russia
305,828
iShares MSCI India
288,265
iShares MSCI Russia
257,849
iShares MSCI Russia
252,030
iShares MSCI India
246,285
Samsung Electronics
216,232
Samsung Electronics
201,726
iShares MSCI Russia
198,693
Samsung Electronics
198,178
iShares MSCI Russia
183,501
Samsung Electronics
177,911
Taiwan Semiconductor
163,262
Samsung Electronics
152,450
TencentHoldingsLtd
131,110
Taiwan Semiconductor
123,062

SANLAM UNIVERSAL FUNDS PLC
392
Purchases and Sales for the six months ended 30 June 2014 (continued) Sanlam P2strategies Global Fund
Purchases
Cost (USD)
(being the largest 20 purchases in the period ended 30 June 2014)
Sanlam World Equity Tracker Fund
2,584,245
Sanlam World Equity Tracker Fund
979,355
Sanlam World Equity Tracker Fund
900,000
Sanlam World Equity Tracker Fund
711,553
Sanlam World Equity Tracker Fund
707,707
Sanlam World Equity Tracker Fund
560,658
Sanlam World Equity Tracker Fund
315,625
Sanlam World Equity Tracker Fund
310,400
Sanlam World Equity Tracker Fund
300,941
Sanlam World Equity Tracker Fund
182,472
Sanlam World Equity Tracker Fund
150,245
Sanlam World Equity Tracker Fund
145,004
Sanlam World Equity Tracker Fund
129,362
Sanlam World Equity Tracker Fund
128,913
Sanlam World Equity Tracker Fund
113,025
Sanlam World Equity Tracker Fund
108,891
Sanlam World Equity Tracker Fund
108,748
Sanlam World Equity Tracker Fund
105,664
Sanlam World Equity Tracker Fund
104,738
Sanlam World Equity Tracker Fund
89,925
Sales
Proceeds (USD)
(being the largest 20 sales in the period ended 30 June 2014)
Sanlam World Equity Tracker Fund
691,959
Sanlam World Equity Tracker Fund
371,983
Sanlam World Equity Tracker Fund
307,220
Sanlam World Equity Tracker Fund
217,578
Sanlam World Equity Tracker Fund
150,889
Sanlam World Equity Tracker Fund
69,693
Sanlam World Equity Tracker Fund
69,222
Sanlam World Equity Tracker Fund
66,145
Sanlam World Equity Tracker Fund
64,842
Sanlam World Equity Tracker Fund
47,294
Sanlam World Equity Tracker Fund
40,621
Sanlam World Equity Tracker Fund
26,651
Sanlam World Equity Tracker Fund
22,711
Sanlam World Equity Tracker Fund
22,445
Sanlam World Equity Tracker Fund
19,468
Sanlam World Equity Tracker Fund
18,095
Sanlam World Equity Tracker Fund
17,896
Sanlam World Equity Tracker Fund
15,461
Sanlam World Equity Tracker Fund
14,389
Sanlam World Equity Tracker Fund
13,605
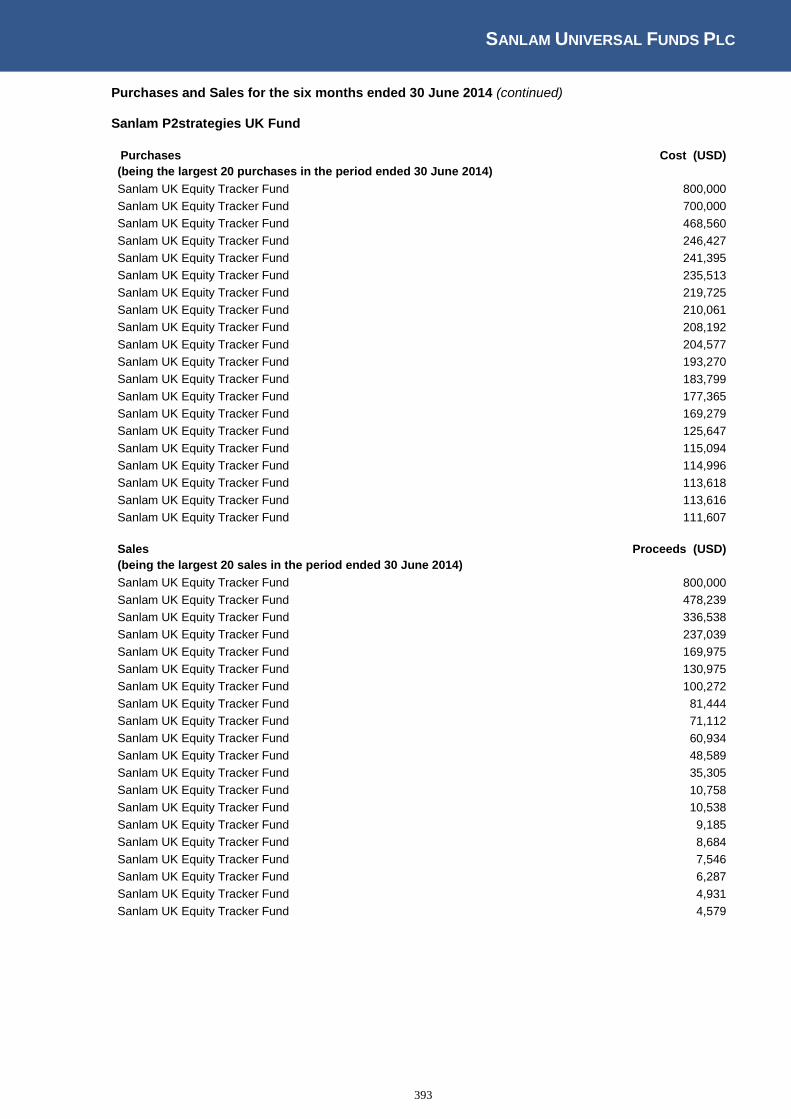
SANLAM UNIVERSAL FUNDS PLC
393
Purchases and Sales for the six months ended 30 June 2014 (continued) Sanlam P2strategies UK Fund
Purchases
Cost (USD)
(being the largest 20 purchases in the period ended 30 June 2014)
Sanlam UK Equity Tracker Fund
800,000
Sanlam UK Equity Tracker Fund
700,000
Sanlam UK Equity Tracker Fund
468,560
Sanlam UK Equity Tracker Fund
246,427
Sanlam UK Equity Tracker Fund
241,395
Sanlam UK Equity Tracker Fund
235,513
Sanlam UK Equity Tracker Fund
219,725
Sanlam UK Equity Tracker Fund
210,061
Sanlam UK Equity Tracker Fund
208,192
Sanlam UK Equity Tracker Fund
204,577
Sanlam UK Equity Tracker Fund
193,270
Sanlam UK Equity Tracker Fund
183,799
Sanlam UK Equity Tracker Fund
177,365
Sanlam UK Equity Tracker Fund
169,279
Sanlam UK Equity Tracker Fund
125,647
Sanlam UK Equity Tracker Fund
115,094
Sanlam UK Equity Tracker Fund
114,996
Sanlam UK Equity Tracker Fund
113,618
Sanlam UK Equity Tracker Fund
113,616
Sanlam UK Equity Tracker Fund
111,607
Sales
Proceeds (USD)
(being the largest 20 sales in the period ended 30 June 2014)
Sanlam UK Equity Tracker Fund
800,000
Sanlam UK Equity Tracker Fund
478,239
Sanlam UK Equity Tracker Fund
336,538
Sanlam UK Equity Tracker Fund
237,039
Sanlam UK Equity Tracker Fund
169,975
Sanlam UK Equity Tracker Fund
130,975
Sanlam UK Equity Tracker Fund
100,272
Sanlam UK Equity Tracker Fund
81,444
Sanlam UK Equity Tracker Fund
71,112
Sanlam UK Equity Tracker Fund
60,934
Sanlam UK Equity Tracker Fund
48,589
Sanlam UK Equity Tracker Fund
35,305
Sanlam UK Equity Tracker Fund
10,758
Sanlam UK Equity Tracker Fund
10,538
Sanlam UK Equity Tracker Fund
9,185
Sanlam UK Equity Tracker Fund
8,684
Sanlam UK Equity Tracker Fund
7,546
Sanlam UK Equity Tracker Fund
6,287
Sanlam UK Equity Tracker Fund
4,931
Sanlam UK Equity Tracker Fund
4,579
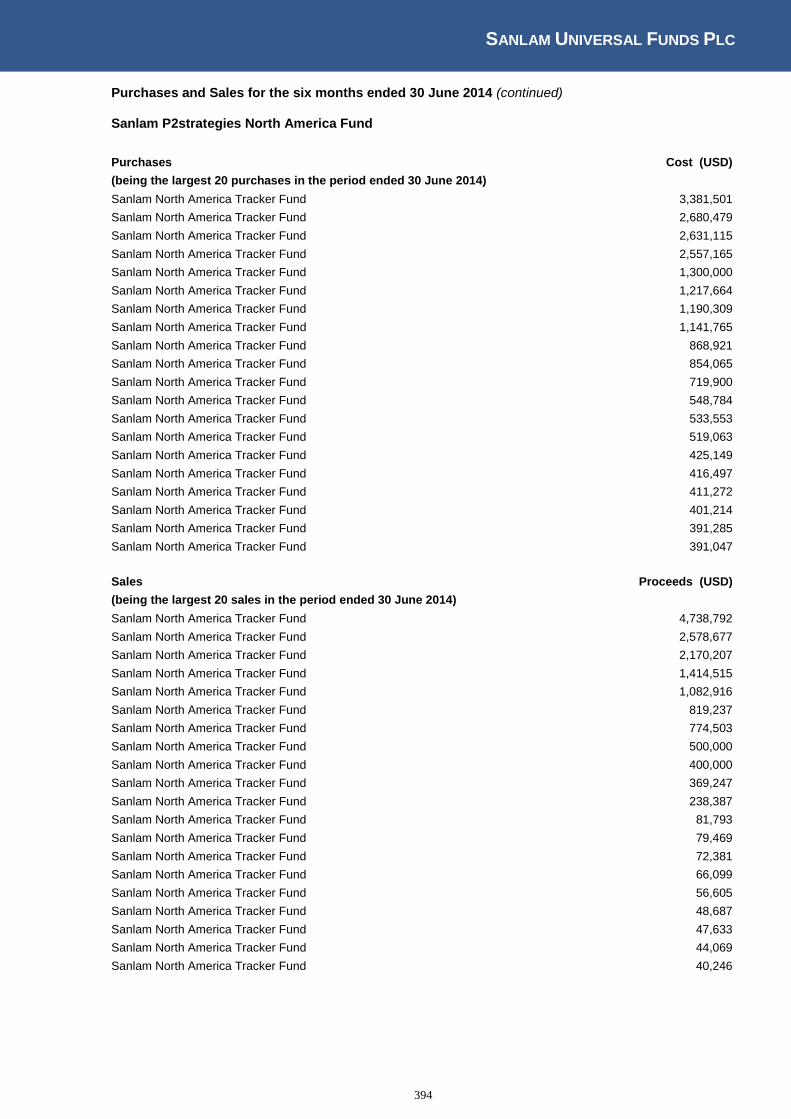
SANLAM UNIVERSAL FUNDS PLC
394
Purchases and Sales for the six months ended 30 June 2014 (continued) Sanlam P2strategies North America Fund
Purchases
Cost (USD)
(being the largest 20 purchases in the period ended 30 June 2014)
Sanlam North America Tracker Fund
3,381,501
Sanlam North America Tracker Fund
2,680,479
Sanlam North America Tracker Fund
2,631,115
Sanlam North America Tracker Fund
2,557,165
Sanlam North America Tracker Fund
1,300,000
Sanlam North America Tracker Fund
1,217,664
Sanlam North America Tracker Fund
1,190,309
Sanlam North America Tracker Fund
1,141,765
Sanlam North America Tracker Fund
868,921
Sanlam North America Tracker Fund
854,065
Sanlam North America Tracker Fund
719,900
Sanlam North America Tracker Fund
548,784
Sanlam North America Tracker Fund
533,553
Sanlam North America Tracker Fund
519,063
Sanlam North America Tracker Fund
425,149
Sanlam North America Tracker Fund
416,497
Sanlam North America Tracker Fund
411,272
Sanlam North America Tracker Fund
401,214
Sanlam North America Tracker Fund
391,285
Sanlam North America Tracker Fund
391,047
Sales
Proceeds (USD)
(being the largest 20 sales in the period ended 30 June 2014)
Sanlam North America Tracker Fund
4,738,792
Sanlam North America Tracker Fund
2,578,677
Sanlam North America Tracker Fund
2,170,207
Sanlam North America Tracker Fund
1,414,515
Sanlam North America Tracker Fund
1,082,916
Sanlam North America Tracker Fund
819,237
Sanlam North America Tracker Fund
774,503
Sanlam North America Tracker Fund
500,000
Sanlam North America Tracker Fund
400,000
Sanlam North America Tracker Fund
369,247
Sanlam North America Tracker Fund
238,387
Sanlam North America Tracker Fund
81,793
Sanlam North America Tracker Fund
79,469
Sanlam North America Tracker Fund
72,381
Sanlam North America Tracker Fund
66,099
Sanlam North America Tracker Fund
56,605
Sanlam North America Tracker Fund
48,687
Sanlam North America Tracker Fund
47,633
Sanlam North America Tracker Fund
44,069
Sanlam North America Tracker Fund
40,246
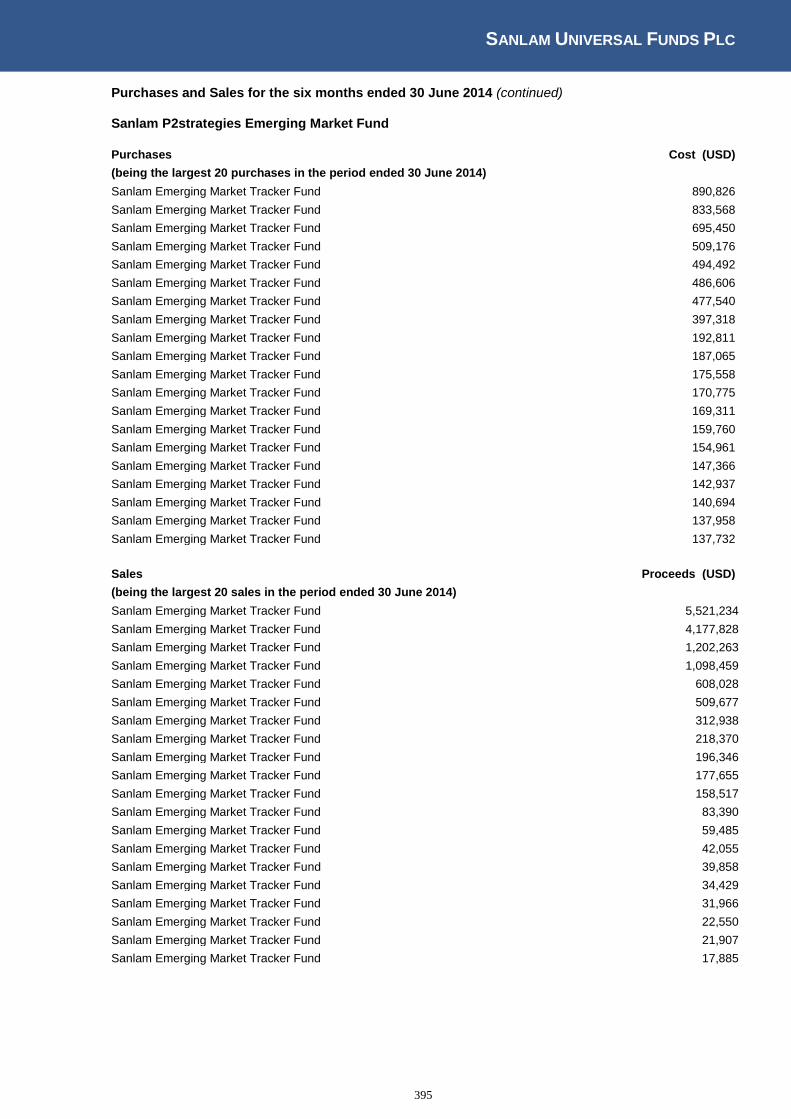
SANLAM UNIVERSAL FUNDS PLC
395
Purchases and Sales for the six months ended 30 June 2014 (continued) Sanlam P2strategies Emerging Market Fund
Purchases
Cost (USD)
(being the largest 20 purchases in the period ended 30 June 2014)
Sanlam Emerging Market Tracker Fund
890,826
Sanlam Emerging Market Tracker Fund
833,568
Sanlam Emerging Market Tracker Fund
695,450
Sanlam Emerging Market Tracker Fund
509,176
Sanlam Emerging Market Tracker Fund
494,492
Sanlam Emerging Market Tracker Fund
486,606
Sanlam Emerging Market Tracker Fund
477,540
Sanlam Emerging Market Tracker Fund
397,318
Sanlam Emerging Market Tracker Fund
192,811
Sanlam Emerging Market Tracker Fund
187,065
Sanlam Emerging Market Tracker Fund
175,558
Sanlam Emerging Market Tracker Fund
170,775
Sanlam Emerging Market Tracker Fund
169,311
Sanlam Emerging Market Tracker Fund
159,760
Sanlam Emerging Market Tracker Fund
154,961
Sanlam Emerging Market Tracker Fund
147,366
Sanlam Emerging Market Tracker Fund
142,937
Sanlam Emerging Market Tracker Fund
140,694
Sanlam Emerging Market Tracker Fund
137,958
Sanlam Emerging Market Tracker Fund
137,732
Sales
Proceeds (USD)
(being the largest 20 sales in the period ended 30 June 2014)
Sanlam Emerging Market Tracker Fund
5,521,234
Sanlam Emerging Market Tracker Fund
4,177,828
Sanlam Emerging Market Tracker Fund
1,202,263
Sanlam Emerging Market Tracker Fund
1,098,459
Sanlam Emerging Market Tracker Fund
608,028
Sanlam Emerging Market Tracker Fund
509,677
Sanlam Emerging Market Tracker Fund
312,938
Sanlam Emerging Market Tracker Fund
218,370
Sanlam Emerging Market Tracker Fund
196,346
Sanlam Emerging Market Tracker Fund
177,655
Sanlam Emerging Market Tracker Fund
158,517
Sanlam Emerging Market Tracker Fund
83,390
Sanlam Emerging Market Tracker Fund
59,485
Sanlam Emerging Market Tracker Fund
42,055
Sanlam Emerging Market Tracker Fund
39,858
Sanlam Emerging Market Tracker Fund
34,429
Sanlam Emerging Market Tracker Fund
31,966
Sanlam Emerging Market Tracker Fund
22,550
Sanlam Emerging Market Tracker Fund
21,907
Sanlam Emerging Market Tracker Fund
17,885
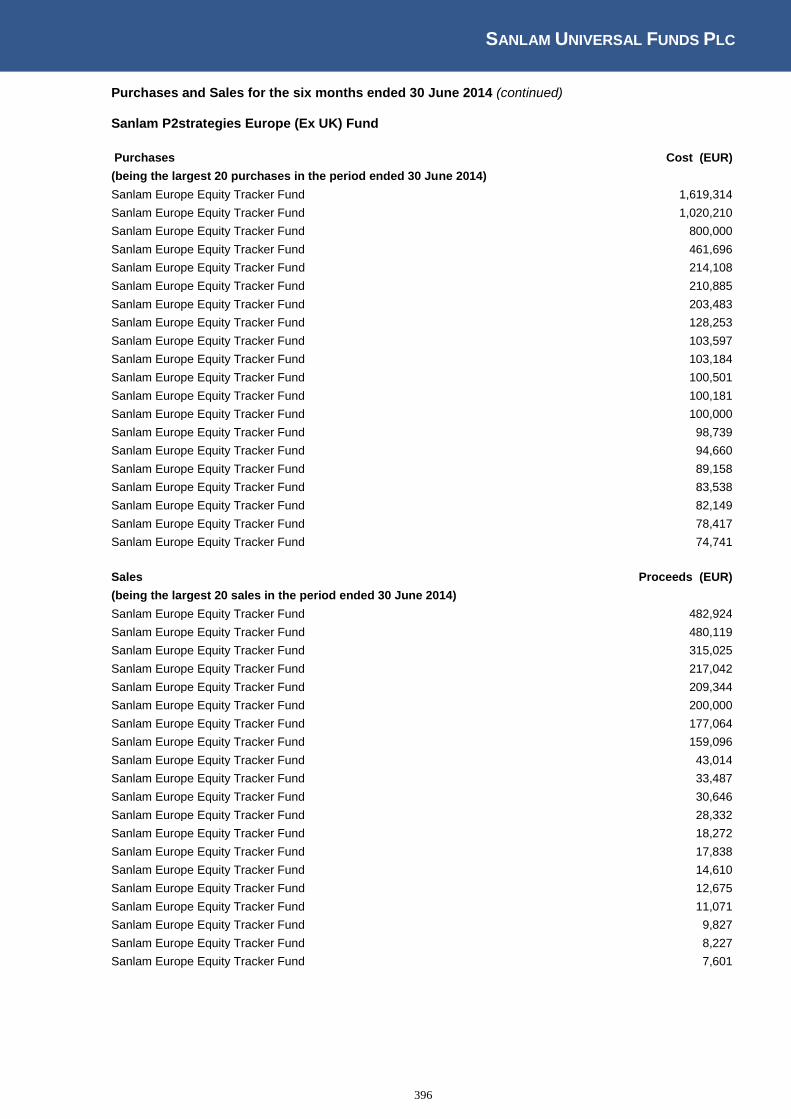
SANLAM UNIVERSAL FUNDS PLC
396
Purchases and Sales for the six months ended 30 June 2014 (continued) Sanlam P2strategies Europe (Ex UK) Fund
Purchases
Cost (EUR)
(being the largest 20 purchases in the period ended 30 June 2014)
Sanlam Europe Equity Tracker Fund
1,619,314
Sanlam Europe Equity Tracker Fund
1,020,210
Sanlam Europe Equity Tracker Fund
800,000
Sanlam Europe Equity Tracker Fund
461,696
Sanlam Europe Equity Tracker Fund
214,108
Sanlam Europe Equity Tracker Fund
210,885
Sanlam Europe Equity Tracker Fund
203,483
Sanlam Europe Equity Tracker Fund
128,253
Sanlam Europe Equity Tracker Fund
103,597
Sanlam Europe Equity Tracker Fund
103,184
Sanlam Europe Equity Tracker Fund
100,501
Sanlam Europe Equity Tracker Fund
100,181
Sanlam Europe Equity Tracker Fund
100,000
Sanlam Europe Equity Tracker Fund
98,739
Sanlam Europe Equity Tracker Fund
94,660
Sanlam Europe Equity Tracker Fund
89,158
Sanlam Europe Equity Tracker Fund
83,538
Sanlam Europe Equity Tracker Fund
82,149
Sanlam Europe Equity Tracker Fund
78,417
Sanlam Europe Equity Tracker Fund
74,741
Sales
Proceeds (EUR)
(being the largest 20 sales in the period ended 30 June 2014)
Sanlam Europe Equity Tracker Fund
482,924
Sanlam Europe Equity Tracker Fund
480,119
Sanlam Europe Equity Tracker Fund
315,025
Sanlam Europe Equity Tracker Fund
217,042
Sanlam Europe Equity Tracker Fund
209,344
Sanlam Europe Equity Tracker Fund
200,000
Sanlam Europe Equity Tracker Fund
177,064
Sanlam Europe Equity Tracker Fund
159,096
Sanlam Europe Equity Tracker Fund
43,014
Sanlam Europe Equity Tracker Fund
33,487
Sanlam Europe Equity Tracker Fund
30,646
Sanlam Europe Equity Tracker Fund
28,332
Sanlam Europe Equity Tracker Fund
18,272
Sanlam Europe Equity Tracker Fund
17,838
Sanlam Europe Equity Tracker Fund
14,610
Sanlam Europe Equity Tracker Fund
12,675
Sanlam Europe Equity Tracker Fund
11,071
Sanlam Europe Equity Tracker Fund
9,827
Sanlam Europe Equity Tracker Fund
8,227
Sanlam Europe Equity Tracker Fund
7,601
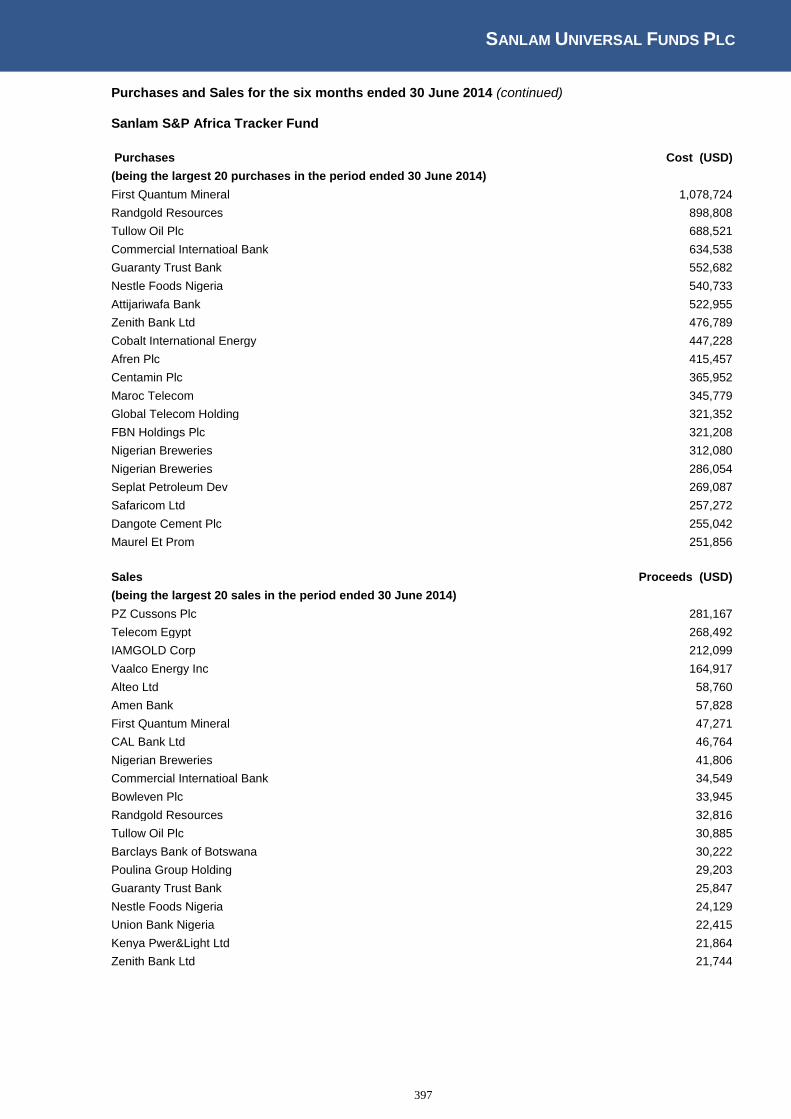
SANLAM UNIVERSAL FUNDS PLC
397
Purchases and Sales for the six months ended 30 June 2014 (continued) Sanlam S&P Africa Tracker Fund
Purchases
Cost (USD)
(being the largest 20 purchases in the period ended 30 June 2014)
First Quantum Mineral
1,078,724
Randgold Resources
898,808
Tullow Oil Plc
688,521
Commercial Internatioal Bank
634,538
Guaranty Trust Bank
552,682
Nestle Foods Nigeria
540,733
Attijariwafa Bank
522,955
Zenith Bank Ltd
476,789
Cobalt International Energy
447,228
Afren Plc
415,457
Centamin Plc
365,952
Maroc Telecom
345,779
Global Telecom Holding
321,352
FBN Holdings Plc
321,208
Nigerian Breweries
312,080
Nigerian Breweries
286,054
Seplat Petroleum Dev
269,087
Safaricom Ltd
257,272
Dangote Cement Plc
255,042
Maurel Et Prom
251,856
Sales
Proceeds (USD)
(being the largest 20 sales in the period ended 30 June 2014)
PZ Cussons Plc
281,167
Telecom Egypt
268,492
IAMGOLD Corp
212,099
Vaalco Energy Inc
164,917
Alteo Ltd
58,760
Amen Bank
57,828
First Quantum Mineral
47,271
CAL Bank Ltd
46,764
Nigerian Breweries
41,806
Commercial Internatioal Bank
34,549
Bowleven Plc
33,945
Randgold Resources
32,816
Tullow Oil Plc
30,885
Barclays Bank of Botswana
30,222
Poulina Group Holding
29,203
Guaranty Trust Bank
25,847
Nestle Foods Nigeria
24,129
Union Bank Nigeria
22,415
Kenya Pwer&Light Ltd
21,864
Zenith Bank Ltd
21,744
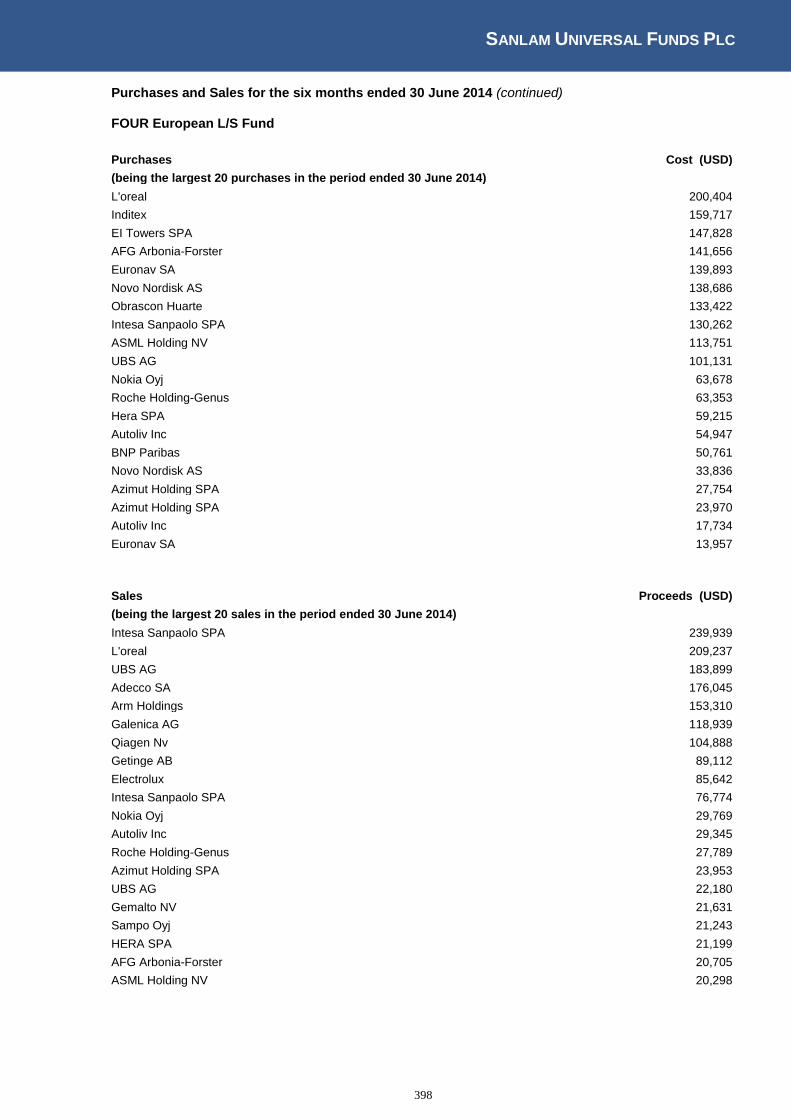
SANLAM UNIVERSAL FUNDS PLC
398
Purchases and Sales for the six months ended 30 June 2014 (continued) FOUR European L/S Fund
Purchases
Cost (USD)
(being the largest 20 purchases in the period ended 30 June 2014)
L'oreal
200,404
Inditex
159,717
EI Towers SPA
147,828
AFG Arbonia-Forster
141,656
Euronav SA
139,893
Novo Nordisk AS
138,686
Obrascon Huarte
133,422
Intesa Sanpaolo SPA
130,262
ASML Holding NV
113,751
UBS AG
101,131
Nokia Oyj
63,678
Roche Holding-Genus
63,353
Hera SPA
59,215
Autoliv Inc
54,947
BNP Paribas
50,761
Novo Nordisk AS
33,836
Azimut Holding SPA
27,754
Azimut Holding SPA
23,970
Autoliv Inc
17,734
Euronav SA
13,957
Sales
Proceeds (USD)
(being the largest 20 sales in the period ended 30 June 2014)
Intesa Sanpaolo SPA
239,939
L'oreal
209,237
UBS AG
183,899
Adecco SA
176,045
Arm Holdings
153,310
Galenica AG
118,939
Qiagen Nv
104,888
Getinge AB
89,112
Electrolux
85,642
Intesa Sanpaolo SPA
76,774
Nokia Oyj
29,769
Autoliv Inc
29,345
Roche Holding-Genus
27,789
Azimut Holding SPA
23,953
UBS AG
22,180
Gemalto NV
21,631
Sampo Oyj
21,243
HERA SPA
21,199
AFG Arbonia-Forster
20,705
ASML Holding NV
20,298

SANLAM UNIVERSAL FUNDS PLC
399
Purchases and Sales for the six months ended 30 June 2014 (continued) SPI Global High Quality Fund
Purchases
Cost (USD)
(being the largest 20 purchases in the period ended 30 June 2014)
McDonald's Corp NPV
509,428
Coca-Cola Co.
500,937
Philip Morris International
479,363
American Int Group
473,283
Procter & Gamble
466,088
Microsoft Corp
377,374
Samsung Electronics
369,632
Mastercard Inc
366,687
Microsoft Corp
363,946
Unilever Plc
353,103
Unilever Plc
316,707
Anheuser-Busch InBev
307,984
Anheuser-Busch InBev
307,488
Oracle Corp
302,157
British American Tobacco
291,935
International Business Machine
276,059
Colgate-Palmolive Co
260,749
Accenture Plc
246,880
Burberry Group Plc
245,313
Imperial Tobacco
244,240

SANLAM UNIVERSAL FUNDS PLC
400
Issued by
Sanlam Asset Management (Ireland) Limited Beech Hill House Beech Hill Road Dublin 4 Ireland
Related Documents