Barclays PLC Q3 2016 Financial Results 27 October 2016

Welcome message from author
This document is posted to help you gain knowledge. Please leave a comment to let me know what you think about it! Share it to your friends and learn new things together.
Transcript

Barclays PLC Q3 2016 Financial Results
27 October 2016

Jes Staley Barclays Group Chief Executive Officer

Tushar Morzaria Barclays Group Finance Director

4 | Barclays Q3 2016 Financial Results | 27 October 2016
Our strategy is on track with encouraging progress in Q316
Continued focus on reducing cost: Core cost: income ratio of 56%2. On track for £12.8bn 2016 Core cost guidance – £13.0bn when adjusted for FX3
Robust capital ratios: CET1 ratio of 11.6% despite c.20bps pension deficit headwind – on track for end-state capital requirements
Progress on HoldCo transition: Q3 HoldCo issuance of £4.9bn equivalent and continuation of liability management exercises, including redemption of $750m Series 2 preference shares
Non-Core rundown momentum: Strong progress on business disposals with good pipeline for Q4. RWAs reduced to £44bn despite adverse FX movements – on track to close Non-Core in 2017
Double digit Core returns: Underlying Core RoTE of 10.4%, with Barclays UK 21.1% and Barclays International 10.0%1
1 RoTE excluding notable items. Core RoTE includes Head Office | 2 Excluding notable items | 3 Excluding conduct and litigation, and other notable items. Assuming average USD exchange rate of 1.30 for H216 |
A Results Slide 4

5 | Barclays Q3 2016 Financial Results | 27 October 2016
Three months ended (£m) Sep-16 Sep-15 % change
Income 5,446 5,481 (1%)
Impairment (789) (429) (84%)
– Operating expenses (3,581) (3,552) (1%)
– Litigation and conduct (741) (699) (6%)
Total operating expenses (4,322) (4,251) (2%)
Other net income/(expenses) 502 (182)
Profit before tax (PBT) 837 619 35% Tax charge (328) (133)
Profit after tax – continuing operations 509 486 5%
Attributable profit 414 417 (1%)
Performance measures
Return on average tangible equity (RoTE) 3.6% 3.6%
Cost: income ratio 79% 78%
Loan loss rate (LLR) 66bps 37bps
Basic earnings per share 2.6p 2.6p
Sep-16 Jun-16 Risk weighted assets (RWA) £373.4bn £366.3bn
Notable items (£m) Sep-16 Sep-15 – Own credit (264) 195 Income
– Provisions for UK customer redress (600) (290) Litigation and conduct
– Provisions for ongoing investigations and litigation including Foreign Exchange
- (270) Litigation and conduct
– Loss on sale relating to sale of Portuguese retail business
- (201) Other net expenses
Total (864) (566)
Performance excluding notable items
Three months ended (£m) Sep-16 Sep-15 % change
Profit before tax (PBT) 1,701 1,185 44%
Attributable profit 1,221 787 55%
Return on average tangible equity (RoTE) 10.1% 6.7%
Statutory Group financials – Q316 Diversified by geography and consumer/wholesale mix
Diversified income by product2
1 H116 income split. Excludes income from Africa Banking treated as a discontinued operation | 2 Q316 Core income split. Excludes Head Office income of £(189)m and Non-Core income of £(159)m |
Diversified income by geography1
54%
10%
31%
2% 3%
17%
10%
7%
24%
24%
18%
UK
Europe
Americas
Africa and Middle East
Asia
Personal Banking
Barclaycard Consumer UK
Wealth, Entrepreneurs & Business Banking
Markets
Banking
Consumer, Cards & Payments
A Results Slide 5

6 | Barclays Q3 2016 Financial Results | 27 October 2016
Core: Underlying Return on Tangible Equity of 10.4%
Profit/(loss) before tax (£m) Sep-16 Sep-15 % change
– Barclays UK 675 793 (15%)
– Barclays International 1,085 893 22%
– Head Office 35 (146)
Core 1,795 1,541 16%
Business performance excluding notable items
Three months ended (£m) Sep-16 Sep-15 % change
Income 5,869 5,070 16%
Impairment (769) (388) (98%)
– Operating expenses (3,270) (3,094) (6%)
– Litigation and conduct (39) (60) 35%
Total operating expenses (3,309) (3,154) (5%)
Profit before tax (PBT) 1,795 1,541 16%
Attributable profit 1,064 1,048 2%
Performance measures excluding notable items
Return on average tangible equity (RoTE) 10.4% 11.3%
Average allocated tangible equity1 £42.1bn £37.7bn
Cost: income ratio 56% 62%
Loan loss rate (LLR) 74bps 39bps
Basic earnings per share 6.5p 6.4p
Sep-16 Jun-16
Risk weighted assets (RWA)1 £329.5bn £319.6bn
Notable items (£m) Sep-16 Sep-15
– Own credit (264) 195
– Provisions for UK customer redress (600) (290)
– Provisions for ongoing investigations and litigation including Foreign Exchange
- (69)
Total (864) (164)
• PBT increased 16% to £1.8bn reflecting significantly positive cost: income jaws and the benefit of USD and EUR appreciation against GBP
• Income grew 16% to £5.9bn, with strong growth in Barclays International
• Impairment increased to £769m mostly due to a one-off charge of £320m to reflect a more conservative approach to impairment coverage in UK and US credit card portfolios − Delinquency rates remained broadly stable
• Total operating expenses increased 5% to £3.3bn, while the cost: income ratio improved to 56%
• Generated Core RoTE of 10.4%, on a higher tangible equity base − Average allocated tangible equity increased by £4.4bn since Q315
Barclays UK – RoTE of 21.1% • Income growth of 4%, with higher NIM and increased customer deposits
• Cost reduction of 1% generated positive jaws and a cost: income ratio of 47%
Barclays International – RoTE of 10.0% • Income growth of 19% outstripped increased costs of 12%, generating positive
cost: income jaws and 22% increase in PBT
• Performance demonstrated benefit of diversification across consumer lending and wholesale banking, and geographic markets, benefitting from weaker GBP
Q316 performance metrics
1 Risk weighted assets and average allocated tangible equity for Africa Banking are included within Core |
A Results Slide 6

7 | Barclays Q3 2016 Financial Results | 27 October 2016
Generating a consistently strong Core RoTE on an increasing tangible equity base
7.1%
13.4% 14.0%
11.3%
6.3%
10.7% 11.0% 10.4%
Q414 Q115 Q215 Q315 Q415 Q116 Q216 Q316
34.6 36.3 36.4 37.7 38.3 39.6 40.7 42.1
Q414 Q115 Q215 Q315 Q415 Q116 Q216 Q316
Core average tangible equity (excluding notable items) (£bn)
Core return on average tangible equity (excluding notable items)
22% increase
in average tangible
equity since Q414
10.7%
RoTE excluding notable items and UK bank levy RoTE excluding notable items
Barclays UK 21.1%
Barclays International 10.0%
– Corporate & Investment Bank 9.2%
– Consumer, Cards & Payments 14.8%
9.8%
A Results Slide 7

8 | Barclays Q3 2016 Financial Results | 27 October 2016
Barclays UK: Return on Tangible Equity of 21.1%
Business performance excluding notable items
Three months ended (£m) Sep-16 Sep-15 % change
Income 1,943 1,874 4%
Impairment (350) (154)
– Operating expenses (904) (925) 2%
– Litigation and conduct (14) (3)
Total operating expenses (918) (928) 1%
Profit before tax (PBT) 675 793 (15%)
Attributable profit 454 599 (24%)
Performance measures excluding notable items
Return on average tangible equity (RoTE) 21.1% 25.8%
Average allocated tangible equity £8.7bn £9.3bn
Cost: income ratio 47% 50%
Loan loss rate (LLR) 82bps 36bps
Net interest margin (NIM) 3.72% 3.54%
Sep-16 Jun-16
Loans and advances to customers £166.6bn £166.0bn
Customer deposits £185.5bn £181.7bn
Risk weighted assets (RWA) £67.4bn £67.1bn
Notable items (£m) Sep-16 Sep-15
– Provisions for UK customer redress (600) (73)
Personal Banking
• Strong deposit growth of £8.8bn year on year to £137.2bn and improved re-pricing strategies drove increased net interest income
• Maintained strict pricing discipline and consistently prudent underwriting criteria, while driving growth through deeper customer engagement
Barclaycard Consumer UK • Steady growth in loans and advances, up 2% year on year to £16.2bn
• Stable underlying impairment trends, reflected in broadly flat 30 day and 90 day arrears rates at 2.0% and 1.0% respectively
Wealth, Entrepreneurs & Business Banking • Income increased 7% as strong deposit growth of 7% to £48.3bn in Wealth was
partially offset by declining fee income due to reduced transactional appetite from investors
• RoTE was 21.1%, with income growth and a reduction in costs generating positive cost: income jaws
• Income increased by 4% to £1.9bn, driven by 5% growth in net interest income − NIM increased to 3.72%, including Treasury contributions
• Impairment increased to £350m primarily due to a £200m one-off charge to reflect a more conservative approach to impairment coverage in Barclaycard Consumer UK − Underlying impairment and delinquencies remained stable
• Costs decreased by 1% to £0.9bn, reducing the cost: income ratio to 47% − Savings from strategic cost programmes were partially offset by structural
reform implementation costs
Q316 performance metrics
Key drivers/highlights
A Results Slide 8

9 | Barclays Q3 2016 Financial Results | 27 October 2016
Barclays UK: Resilient NIM and prudent growth in balances
Income (£m) – Three months ended Sep-16 Sep-15 % change
Net interest income (NII) 1,569 1,499 5%
– Net interest margin (NIM) 3.72% 3.54%
Non-interest income 374 375 -
Total income 1,943 1,874 4%
Stable income
• NII increased by 5% to £1.6bn while NIM increased to 3.72%, including Treasury contributions, despite the base rate cut to 25bps in August − Improvement in deposit margins and growth in customer deposits
• Non-interest income remained flat at £374m − Impact of EU interchange fee regulation was offset by gains from a
debt sale in Barclaycard Consumer UK
3.60% 3.54% 3.54% 3.58% 3.62% 3.56% 3.72%
Q115 Q215 Q315 Q415 Q116 Q216 Q316
Net Interest Margin (NIM)
Loans and advances to customers (£bn) Customer deposits (£bn)
164.3 166.7 166.6
Sep-14 Sep-15 Sep-16
Growth in balances
• Consistently strong deposit growth, despite repricing initiatives
• Prudent growth in loans and advances, focused on remortgage and lower LTV segments, and unsecured loans to existing customers
• LDR of 90%, reflecting strong funding position and prudent risk appetite
Estimated NIM sensitivity
BoE base rate FY16 FY17 range
0.25% High 350bps 350 – 360bps
0.10% 340 – 350bps
165.9 173.4
185.5
Sep-14 Sep-15 Sep-16
A Results Slide 9

10 | Barclays Q3 2016 Financial Results | 27 October 2016
Digitally originated and fulfilled unsecured lending has a cost: income ratio in the low 20s
Annual cumulative unsecured lending – originated and fulfilled digitally
YTD 2016 2015 2014
Barclays UK: Growth through leadership in digital banking
0.0
0.2
0.4
0.6
0.8
1.0
1.2
1.4
1.6
1.8
Jan Feb Mar Apr May Jun Jul Aug Sep Oct Nov Dec
£1bn loans digitally by:
Sep 2015 Jun 2016 Dec 2014
Significant growth in digital banking – year-on-year
1.1m People Barclays has
helped since April 2013
5.5m Mobile Banking
users
+22% Barclays Mobile Banking
£0.9bn Payments
in 2016 YTD
+14% Pingit
£23.5bn Monthly average
in 2016 YTD
+28% Payments & transfers
137m Monthly average
in 2016 YTD
+25% Digital log-ins
9.2m Digitally active
customers
+7% Digital
£1.7bn unsecured lending originated and fulfilled
digitally so far in 2016
£bn
A Results Slide 10

11 | Barclays Q3 2016 Financial Results | 27 October 2016
Barclays International: RoTE of 10.0%
• RoTE of 10.0% demonstrated the benefit of diversification across consumer lending and wholesale banking, and geographic markets
− High proportion of USD and EUR earnings benefitted from a weaker GBP
• Income grew by 19% to £3.9bn and NIM improved to 5.12%, including Treasury contributions
• Impairment increased £185m primarily due to a one-off charge to reflect a more conservative approach to impairment coverage in the US cards portfolio
• Generated positive cost: income jaws, despite cost increase of 12% to £2.4bn − Restructuring costs of £150m in CIB from reduction in real estate, and
structural reform implementation costs, more than offset efficiency savings
• PBT increased by 22% driven by encouraging CIB performance and growth in CC&P
Business performance excluding notable items
Three months ended (£m) Sep-16 Sep-15 % change
– Corporate & Investment Bank (CIB) 2,795 2,374 18%
– Consumer, Cards & Payments (CC&P) 1,056 849 24%
Income 3,851 3,223 19%
Impairment (420) (235) (79%)
– Operating expenses (2,337) (2,059) (14%)
– Litigation and conduct (17) (45) 62%
Total operating expenses (2,354) (2,104) (12%)
Profit before tax (PBT) 1,085 893 22%
Attributable profit 623 584 7%
Performance measures excluding notable items
Return on average tangible equity (RoTE) 10.0% 9.6%
Average allocated tangible equity £25.7bn £24.7bn
Cost: income ratio 61% 65%
Loan loss rate (LLR) 71bps 42bps
Net interest margin (NIM)1 5.12% 4.62%
Sep-16 Jun-16
Risk weighted assets (RWA) £214.6bn £209.3bn
Notable items (£m) Sep-16 Sep-15
– Provisions for UK customer redress - (218)
– Provisions for ongoing investigations and litigation including Foreign Exchange - (39)
Q316 performance metrics
Q316 Income by product (£m)
Consumer, Cards
& Payments
+24% Markets
+29%
Banking
+7%
1 Excludes Investment Banking related balances |
1,408
1,386
1,056
A Results Slide 11

12 | Barclays Q3 2016 Financial Results | 27 October 2016
Business performance excluding notable items
Three months ended (£m) Sep-16 Sep-15 % change
Markets 1,408 1,094 29%
– Credit 333 191 74%
– Equities 461 416 11%
– Macro 614 487 26%
Banking 1,386 1,297 7%
– Banking fees 644 501 29%
– Corporate lending 284 377 (25%)
– Transactional banking 458 419 9%
Income1 2,795 2,374 18%
Impairment (38) (75) 49%
Total operating expenses (1,872) (1,685) (11%)
Profit before tax (PBT) 885 613 44%
Performance measures excluding notable items
Return on average tangible equity (RoTE) 9.2% 7.5%
Sep-16 Jun-16
Risk weighted assets (RWA) £182.5bn £178.4bn
Barclays International: Corporate & Investment Bank: RoTE of 9.2%
• Encouraging performance as 44% PBT increase generated an RoTE of 9.2%. Income, costs and RWAs were impacted by USD and EUR appreciation against GBP
• Strongest quarterly performance in Banking and Credit over the past 2.5 years2 drove an 18% increase in income to £2.8bn, with a strong performance across most products
• Impairment charges of £38m arose from a number of single name exposures
• Delivered positive cost: income jaws, despite costs increasing 11% primarily due to increased real estate restructuring and structural reform implementation costs
Markets income +29% Second highest performance since Q1142
• Credit increased 74%, recording its highest quarter since Q114, reflecting increased client activity
• Macro increased 26% driven by strong performances in Rates
• Equities increased 11% driven by gains in the US cash business and increased client balances in Equity Finance
Banking income +7%
Highest performance since Q1142
• Banking fees increased 29%, primarily driven by debt underwriting which outperformed, recording its highest quarter since Q114 − Ranked #1 in completed Healthcare M&A 2016 YTD3
− Bookrunner on the top 5 global Investment Grade bond offerings and 3 of the top 5 High Yield bond offerings
• Transactional banking printed its highest quarter since Q114 as higher deposits partially offset margin and base rate compression
Q316 performance metrics
Key drivers/highlights
1 Includes Other income | 2 Data pre-2014 was not restated following resegmentation in Q116 | 3 Dealogic data |
A Results Slide 12

13 | Barclays Q3 2016 Financial Results | 27 October 2016
67.2 74.7
Q315 Q316
Barclays International: Consumer, Cards & Payments: RoTE of 14.8%
Business performance excluding notable items
Three months ended (£m) Sep-16 Sep-15 % change
Income 1,056 849 24%
Impairment (382) (160)
Total operating expenses (482) (421) (14%)
Profit before tax (PBT) 200 278 (28%)
Performance measures excluding notable items
Return on average tangible equity (RoTE) 14.8% 24.7%
30.6 36.8
Sep-15 Sep-16
Loans and advances to banks and customers (£bn)
20%
11%
Total card spend and payments processed (£bn)
Customer deposits (£bn)
39.8 48.3
Sep-15 Sep-16
21%
Q316 performance metrics
Key drivers/highlights
1 Includes balance transfers |
Barclaycard US • Loans and advances to customers increased 31% to £19.2bn, while the
customer base grew 3% to 13.7m
• Card spend value of £14.6bn in Q316, up 28% vs. Q3151
• Stronger than expected JetBlue performance from both the acquired portfolio and new customers
Barclaycard Germany • c.12% growth in customers since Q315, to over 1.1m
• 28% growth in net loans and advances to £2.9bn
Barclaycard Business Solutions • Payment Solutions business processed payments to the value of £56.5bn in
Q316, up 8% on Q315
• Point of Sale Finance loans and advances grew 4% to £3.9bn
Wealth International • Strong client asset growth of £4.8bn, including 10% increase in deposits
• RoTE was 14.8%, benefitting from USD and EUR appreciation against GBP
• Continued growth in Barclaycard US, Barclaycard Germany, Barclaycard Business Solutions and Wealth International drove a 24% improvement in income
• Impairment increased by £222m, primarily driven by a £120m one-off impairment charge to reflect a more conservative approach to impairment coverage − Excluding this, impairment increase was driven by 20% L&A growth together
with some shift in business mix, while underlying delinquency rates were well controlled
• Delivered positive cost: income jaws and an improved cost: income ratio of 46%, despite 14% increase in costs to £482m
• PBT declined 28% to £200m
A Results Slide 13

14 | Barclays Q3 2016 Financial Results | 27 October 2016
Non-Core: Continued good rundown momentum
Business performance excluding notable items
Three months ended (£m) Sep-16 Jun-16 Mar-16
– Businesses 181 181 196
– Securities and loans (34) (363) (402)
– Of which: ESHLA (12) (50) (374)
– Derivatives (306) (162) (36)
Income (159) (344) (242)
Impairment (20) (26) (29)
– Operating expenses (311) (368) (489)
– Litigation and conduct (102) (27) (66)
Total operating expenses (413) (395) (555)
Other net income/(expenses) 498 (324) 11
Loss before tax (94) (1,089) (815)
Attributable profit/(loss) 72 (887) (603)
Performance measures excluding notable items
Average allocated tangible equity £7.6bn £7.9bn £9.0bn
Period end allocated tangible equity £7.2bn £7.8bn £8.5bn
Basic earnings/(loss) per share 0.5p (5.2)p (3.6)p
Risk weighted assets (RWA) £43.9bn £46.7bn £50.9bn
Material one-off items (£m) Sep-16 Jun-16 Mar-16
– Impairment of French retail business assets held for sale
(35) (372) -
– Restructure of ESHLA loans with LOBO features
- (182) -
– Gain on Index business sale 535 - -
Q316 performance metrics
Key drivers/highlights
• Loss before tax decreased to £94m in the quarter mainly due to Other net income of £498m
− £535m gain on sale of Barclays Risk Analytics and Index Solutions
− Materially lower impairment of £35m associated with the valuation of the French retail banking operations1 (Q216: £372m)
• Income improved to an expense of £159m largely driven by the non-recurrence of a £182m one-off loss in Q216 due to the ESHLA portfolio restructuring
• Total operating expenses increased to £413m due to higher litigation and conduct
− Including restructuring costs of £39m in Q316. On track to meet £400m guidance for FY16, with total of £302m in the year to date
• Management actions reduced RWAs by c.£4bn mainly reflecting reductions in the derivatives portfolio
− Offset by FX headwinds of c.£1bn
• Non-Core rundown on track to close by year-end 2017
• Continued good momentum with sale of businesses in particular
− Completed sale of Barclays Risk Analytics and Index Solutions business
− Completed sale of the Italian branch network, resulting in an RWA reduction of £0.6bn
− Announced sale of Barclays Egypt in early October, with an expected RWA reduction of c.£2bn upon completion
− Strong pipeline for completion of business sales in Q416
1 Barclays has entered into exclusive discussions with AnaCap Financial Partners for the potential sale of our French Retail Banking operations including our network of 74 branches, life insurance business, and wealth and investment management operations. A decision to sell will only be taken after completion of a required works council consultation |
A Results Slide 14

15 | Barclays Q3 2016 Financial Results | 27 October 2016
Priority is to close Non-Core in 2017
10 9 8 8
19 17
10 10
Dec-13 Jun-16 Sep-16 2017
Guidance
Businesses Derivatives Securities and loans Operational risk plus DTAs
• Continued good execution of the Non-Core rundown while preserving capital − Net RWA reduction of c.£3bn in Q316
• Strong pipeline of business disposals, delivering c.£4bn of RWA reductions on completion − Announced sales of Wealth Asia, Southern European Cards and Barclays
Egypt businesses
− Exclusive negotiations for the potential sale of France Retail2
• Confidence in derivatives rundown, with strong pipeline for Q416
c.20
110
47 44
1 Dec-13 RWAs are on a pre-restatement basis. Jun-16, Sep-16 and 2017 Guidance are on a post-restatement basis i.e. inclusive of £8bn of RWAs added to Non–Core in Q116 | 2 Barclays has entered into exclusive discussions with AnaCap Financial Partners for the potential sale of our French Retail Banking operations including our network of 74 branches, life insurance business, and wealth and investment management operations. A decision to sell will only be taken after completion of a required works council consultation | 3 Assuming USD exchange rate of 1.22 and EUR exchange rate of 1.12, as at close 26 October 2016 |
Quarterly income (£m)
215
(68)
(242) (344)
(159) Q315 Q415
(374)
Q116 181
(34)
(306)
Q316 Q216
RWAs (£bn)1
• Businesses income of £181m – will reduce as announced disposals complete
• Securities and loans income improved to an expense of £34m mainly due to the non-recurrence of the Q2 LOBO restructuring impact and the non-recurrence of losses on the disposal of securities − ESHLA portfolio fair value losses were £12m (Q216: £50m), reflecting
reduced volatility
• Derivatives income reduced to an expense of £306m principally reflecting the active rundown of the portfolios and some fair value movements
Businesses Securities and loans Derivatives Total
Assuming current USD and EUR FX rates3 at time of closure, would
translate to c.£23bn
Management actions c.£4bn
FX headwinds c.£(1)bn
A Results Slide 15

16 | Barclays Q3 2016 Financial Results | 27 October 2016
No
n-C
ore
clo
sed
1,299 971
(309) (800)-
(900)
FY14 FY15
Q316
YTD
FY16
Guidance
FY17
Guidance
FY18
Guidance
Non-Core rundown guidance
Income (£m)
Income ex. ESHLA FV
Businesses Securities and loans Derivatives
£558m £(363)m £(504)m
Costs (£m)
ESHLA FV (156) (359) (436) ESHLA FV volatility reduced
following LOBO loan restructuring
Business disposals1
(761) (468) 128 Gain on sale of Wealth Asia, Southern
European Cards and Barclays Egypt businesses expected in Q416
Other net income/(expense) (£m)
1 Included gains/(losses) on business disposals treated as notable items in FY14 and FY15, and an impairment charge relating to the assets of the French Retail and Wealth and Investment Management businesses and sale of Barclays Risk Analytics and Index Solutions in Q316 YTD | 2 Excluding notable items. Based on an average USD exchange rate of 1.34 and EUR exchange rate of 1.21, set as at 30 June 2016 |
Income guidance
• Cost guidance of £400m-£500m2 in 2017, excluding notable items
• Expect costs to be significantly lower in 2018, reducing drag on Group returns after Non-Core is closed in 2017
Costs guidance
• Likely to reach lower end of £800m-£900m FY16 income guidance, subject to completion of certain transactions
• Expect significantly lower negative income in 2017 and lower still in 2018
3,014
2,546
c.600
400
FY14 FY15 FY16
Guidance
FY17
Guidance
FY18
Guidance
£1,363 of costs incurred in Q3 YTD
Total operating expenses Restructuring costs Costs transferred from Core
2017 cost guidance:
£400m-£500m2
No
n-C
ore
clo
sed
A Results Slide 16

17 | Barclays Q3 2016 Financial Results | 27 October 2016
Underlying stable trends reflect prudent approach to credit risk management
Prudent risk management Retail CRL % of Gross L&A
• Remain well-positioned, having maintained a consistently prudent risk
appetite since the financial crisis
• Comprehensive review of impairment models across Barclaycard led to
further refinements to impairment assumptions in Q316
− One-off charge of £320m in Q316 across UK and US cards portfolios to
reflect a more conservative approach to impairment coverage
• Underlying UK and US credit card delinquency rates remain well controlled
− Barclaycard Consumer UK 30 and 90 day delinquency rates improved to
2.0% and 1.0% respectively
− Barclaycard US 30 and 90 day delinquency rates increased modestly to
2.4% and 1.1% respectively
• Strong retail CRL coverage ratios provide significant protection
1.5%
3.3%
1.7% 1.4%
3.7%
1.8%
Barclays UK Barclays International Core
CRL coverage
L&As
CRLs 2,218 1,115
30,328 155,559
3,333
185,887
70% 72% 104% 116%
79% 86%
Dec-15
Sep-16
Breakdown by delinquency bucket – UK and US Cards
0%
5%
10%
15%
Q3 07 Q3 08 Q3 09 Q3 10 Q3 11 Q3 12 Q3 13 Q3 14 Q3 15 Q3 16
0%
5%
10%
15%
Q3 08 Q3 09 Q3 10 Q3 11 Q3 12 Q3 13 Q3 14 Q3 15 Q3 16
Barclaycard Consumer UK Barclaycard US 30 day delinquency 90 day delinquency
A Results Slide 17

18 | Barclays Q3 2016 Financial Results | 27 October 2016
Continued focus on cost discipline and efficiency
On track for Core cost guidance in 2016, with further cost efficiencies expected over time
19.5 17.6
16.6 12.8
2013 2014 2015 2016
Core Guidance
Group cost: income ratio in
a reasonable timeframe
Core Non-Core Group
<60% Africa Banking treated as a discontinued operation1
Group cost progression and Core guidance (£bn)
Total operating expenses, excluding conduct and litigation, and other notable items
£13.0bn adjusted for FX, assuming
average USD exchange rate of
1.30 for H216
1 Africa Banking meets the requirements for presentation as a discontinued operation, and as such, its results are presented on the face of the Group income statement representing profit after tax in respect of discontinued operation |
Cost initiatives
Real estate • Reduction in real estate footprint,
resulting in structurally lower annual costs
Headcount • Headcount management in place
since Q415, leading to net reduction of c.14,000
Operations & Technology • Continued focus on digitisation
and automation
• Decommissioned over 500 applications in 2016, representing c.9% of total Group applications
Targeting
A Results Slide 18

19 | Barclays Q3 2016 Financial Results | 27 October 2016
96%
124% 133%
124% 125%
Dec-13 Dec-14 Dec-15 Jun-16 Sep-16
Good progress in TLAC funding and liability management and strong liquidity metrics
• Liquidity pool of £157bn (June 2016: £149bn)
− Quality of the pool remains high with the majority held in cash, deposits with central banks and high quality government bonds
• Although not a requirement, the liquidity pool exceeded wholesale funding maturing in less than one year by £87bn
LCR3 well above minimum requirements TLAC/MREL at 18.4% as of Sep-161,2
• Strong progress with HoldCo transition in 2016, with £11bn issued YTD across senior and subordinated instruments in a range of currencies. In Q316, Barclays successfully issued AT1, Tier 2 and senior debt
• Continued to retire legacy OpCo senior debt and capital instruments during 2016 as part of Barclays’ ongoing liability management
− £5.3bn equivalent of senior instruments across 10 instruments
− £2.2bn of capital instruments across 10 securities, including the Series 2 and 4 USD preference shares
100%
Future minimum regulatory requirement
1 Instruments assumed to qualify for MREL/TLAC is based on Barclays’ understanding of current regulatory proposals which are subject to change including (i)“FSB’s Total Loss-absorbing Capacity (TLAC) Term Sheet”, published on 9 November 2015, (ii)“The Bank of England’s approach to setting a minimum requirement for own funds and eligible liabilities – consultation on a proposed Statement of Policy” published on 11 December 2015 , and (iii) “The minimum requirement for own funds and eligible liabilities (MREL) – buffers and Threshold Conditions” consultation published by the Bank of England on 11 December 2015. Actuals will depend on the Bank of England’s implementation of the final rules | 2 Issuance balances based on FX rate on 30 September 2016 for debt accounted instruments and historical transaction rates for equity accounted instruments. December 2015 column shown as reported at that date. The sum of the balances therefore does not correspond to the aggregate September 2016 position | 3 Liquidity Coverage Ratio estimated based on the CRD IV rules as implemented by the European Commission delegated act |
Dec-15
Spot HoldCo MREL/TLAC
9M
2016 YTD
Sep-16
Spot HoldCo MREL/TLAC
CET1 AT1 Tier 2 Senior Unsecured
HoldCo Snr: 4.1% (£15.4bn)
T2: 1.0% (£3.6bn)
AT1: 1.7% (£6.4bn)
CET1:
11.6%
(£43.2bn)
CET1:
11.4%
(£40.7bn)
AT1: 1.5% (£5.3bn)
T2: 0.5% (£1.8bn)
HoldCo Snr: 1.7% (£6.2bn)
18.4%
15.1%
£11bn HoldCo issuance

20 | Barclays Q3 2016 Financial Results | 27 October 2016
CET1 ratio progression impacted by one-off items
• CET1 ratio stable at 11.6% as at September 2016, an improvement of 250bps since December 2013
− Significant capital accretion in Q316 offset by c.20bps impact from the pension deficit and the £600m of provisions for UK customer redress
• Expect c.100bps2 increase in CET1 ratio from the regulatory deconsolidation of BAGL and Non-Core disposals
Fully Loaded CET1 ratio1
1 Based on Barclays interpretation of the final CRD IV text and latest EBA technical standard | 2 Implementation of Barclays’ intentions is subject to, amongst other things, regulatory approval. The realisation of these plans and their intended benefits is subject to significant execution risks, including in relation to market factors, separation arrangements and costs, and there can be no assurance the intended benefits will be achieved on any proposed timetable or at all |
Conduct and litigation
BAGL selldown and Non-Core disposals2
Organic capital accretion 250bps
9.1%
10.3%
11.4% 11.6% 11.6% 10.9%
0.4% c.100bps
Dec-13 Dec-14 Dec-15 Jun-16 Pensions
deficit impact
Provisions
for UK
customer redress
Organic
capital
growth/other
movements
Sep-16
• Discount rate fell from 2.79% to 2.31%
• Defined UK pension scheme moved into deficit of £1.1bn in Q316
• CET1 ratio reduction of c.20bps
RWAs 396 358 366 373
A Results Slide 20

21 | Barclays Q3 2016 Financial Results | 27 October 2016
Our strategy is on track with encouraging progress
Core business delivering double digit returns on a materially higher equity base
Non-Core closure on track in 2017, with continued good rundown momentum
Continued focus on costs in Core and Non-Core, progressing towards Group cost: income ratio target of <60%
Resilience from high asset quality across our portfolios and prudent risk management, plus benefits from business and geographic diversification
Capital strength provides additional flexibility to drive Core returns and reduce Non-Core drag
Expect Group RoTE to converge with Core RoTE in a reasonable timeframe

Barclays PLC Q3 2016 Financial Results
27 October 2016

Appendices
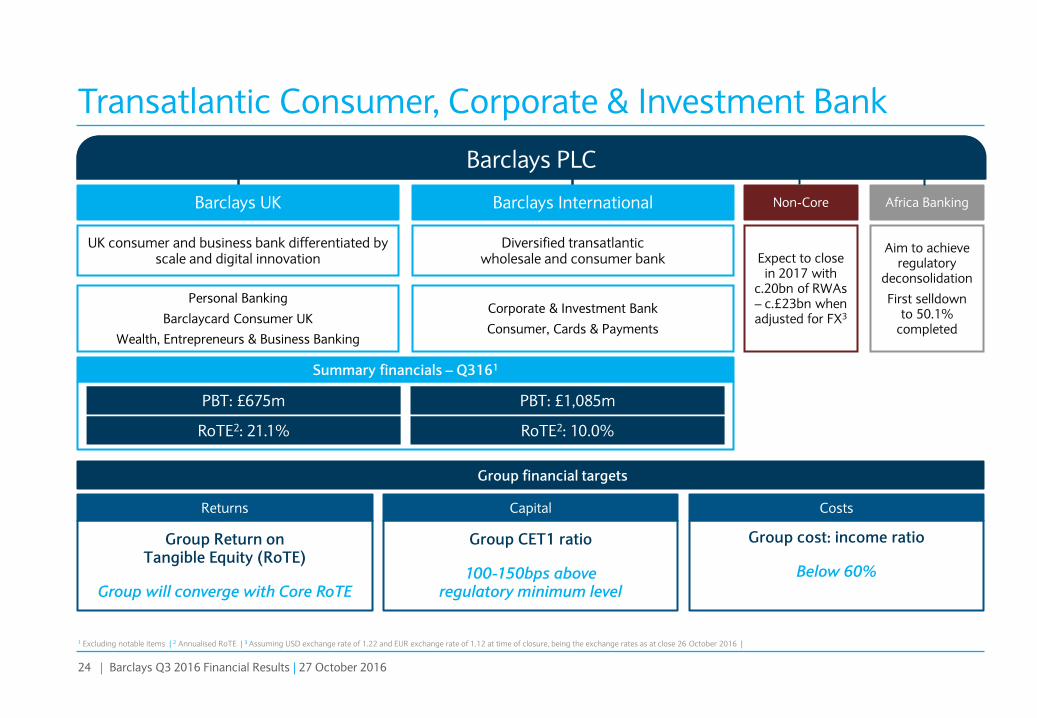
24 | Barclays Q3 2016 Financial Results | 27 October 2016
Africa Banking
Aim to achieve regulatory
deconsolidation
First selldown to 50.1%
completed
Non-Core
Expect to close in 2017 with
c.20bn of RWAs – c.£23bn when adjusted for FX3
Transatlantic Consumer, Corporate & Investment Bank
Barclays PLC1 Barclays PLC
Barclays International Barclays UK
UK consumer and business bank differentiated by scale and digital innovation
Corporate & Investment Bank
Consumer, Cards & Payments
Personal Banking
Barclaycard Consumer UK
Wealth, Entrepreneurs & Business Banking
Diversified transatlantic wholesale and consumer bank
Summary financials – Q3161
PBT: £1,085m PBT: £675m
RoTE2: 10.0% RoTE2: 21.1%
1 Excluding notable items | 2 Annualised RoTE | 3 Assuming USD exchange rate of 1.22 and EUR exchange rate of 1.12 at time of closure, being the exchange rates as at close 26 October 2016 |
Group CET1 ratio
100-150bps above regulatory minimum level
Capital
Group Return on Tangible Equity (RoTE)
Group will converge with Core RoTE
Returns Costs
Group cost: income ratio
Below 60%
Group financial targets
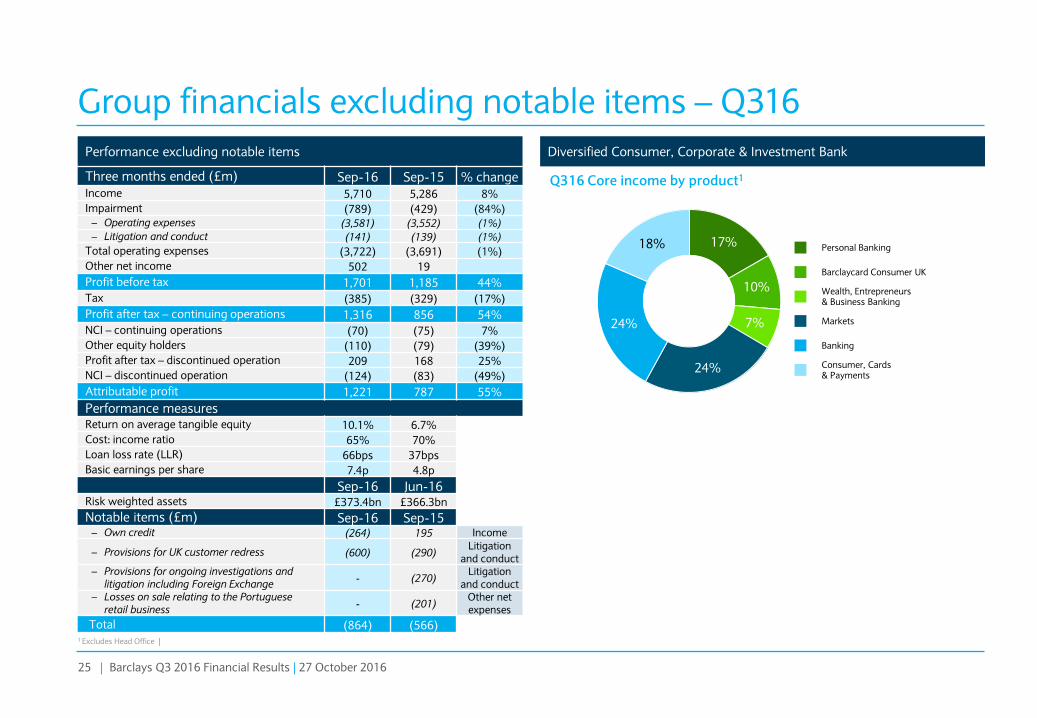
25 | Barclays Q3 2016 Financial Results | 27 October 2016
Performance excluding notable items
Three months ended (£m) Sep-16 Sep-15 % change Income 5,710 5,286 8%
Impairment (789) (429) (84%) – Operating expenses (3,581) (3,552) (1%)
– Litigation and conduct (141) (139) (1%)
Total operating expenses (3,722) (3,691) (1%)
Other net income 502 19
Profit before tax 1,701 1,185 44%
Tax (385) (329) (17%)
Profit after tax – continuing operations 1,316 856 54%
NCI – continuing operations (70) (75) 7%
Other equity holders (110) (79) (39%)
Profit after tax – discontinued operation 209 168 25%
NCI – discontinued operation (124) (83) (49%)
Attributable profit 1,221 787 55%
Performance measures Return on average tangible equity 10.1% 6.7%
Cost: income ratio 65% 70%
Loan loss rate (LLR) 66bps 37bps
Basic earnings per share 7.4p 4.8p
Sep-16 Jun-16 Risk weighted assets £373.4bn £366.3bn
Notable items (£m) Sep-16 Sep-15 – Own credit (264) 195 Income
– Provisions for UK customer redress (600) (290) Litigation
and conduct – Provisions for ongoing investigations and
litigation including Foreign Exchange - (270)
Litigation and conduct
– Losses on sale relating to the Portuguese retail business
- (201) Other net expenses
Total (864) (566)
Group financials excluding notable items – Q316
Diversified Consumer, Corporate & Investment Bank
1 Excludes Head Office |
Q316 Core income by product1
17%
10%
7%
24%
24%
18% Personal Banking
Barclaycard Consumer UK
Wealth, Entrepreneurs & Business Banking
Markets
Banking
Consumer, Cards & Payments
A Results Slide 25

26 | Barclays Q3 2016 Financial Results | 27 October 2016
Core income and margins – Q316
Income1 (£m) – Three months ended Sep-16 Sep-15 % change
– Barclays UK 1,569 1,499 5%
– Barclays International2 1,139 947 20%
– Other3 10 111 (91%)
Net interest income (NII) 2,718 2,557 6%
– Of which: structural hedge contribution 364 332 10%
Non-interest income 3,151 2,513 25%
Total Core income 5,869 5,070 16%
• Barclays UK NII increased 5% to £1.6bn due to deposit repricing initiatives and Treasury contributions
− NIM increased to 3.72%
• Barclays International2 NII increased 20% due to balance growth in CC&P and Treasury contributions
− NIM increased to 5.12%
• Combined NIM increased to 4.21%
• Net structural hedge contribution remained broadly stable year on year
• Non-interest income increased 25% to £3.2bn driven by growth in CIB Markets and Banking income
Net Interest Margin (%) Net Interest Income (£m)
1,499 1,509 1,501 1,476 1,569
947 965 974 1,000 1,139
2,446 2,474 2,475 2,476
2,708
Q315 Q415 Q116 Q216 Q316
Barclays UK Barclays International Combined
3.54 3.58 3.62 3.56 3.72
4.62 4.59 4.61 4.75 5.12
3.89 3.91 3.95 3.96 4.21
Q315 Q415 Q116 Q216 Q316
Barclays UK Barclays International Combined2 2
1 Excluding notable items | 2 Excludes investment banking related balances | 3 Other includes Investment Banking related balances and Head Office |
A Results Slide 26

27 | Barclays Q3 2016 Financial Results | 27 October 2016
Barclays UK and Barclays International analysis
Split of income (£m)1 Split of impairment (£m)2
Split of customer deposits (£bn) Split of loans and advances to customers (£bn)
Split of income (£m)1
Barclays UK – Q316 Barclays International – Q316
970
561
412 47
291
12
135
16
15
137
48
Personal Banking Wealth, Entrepreneurs & Business Banking Barclaycard Consumer UK Consumer, Cards & Payments Banking Markets
970
1 Excluding notable items | 2 Includes one-off charge in Barclaycard Consumer UK, taken to reflect a more conservative approach to providing for anticipated delinquencies |
1,408
1,386
1,056

28 | Barclays Q3 2016 Financial Results | 27 October 2016
Head Office and Africa Banking summary financials – Q316
• Head Office PBT represents the net income from Treasury operations and reduced structural reform implementations costs in Q316 as they are now allocated to the businesses
• Africa Banking profit after tax and non-controlling interests presented in the Group income statement as a discontinued operation
• Tangible equity and risk weighted assets of Africa Banking included within Head Office
• BAGL local reported net asset value (which excludes Barclays goodwill on acquisition) as at 30 June 2016 was £4.7bn
Africa Banking – Three months ended (£m) Sep-16 Sep-15 % change
Income 982 822 19%
Impairment (96) (66) (45%)
Total operating expenses (598) (515) (16%)
Profit before tax 290 242 20%
Profit after tax3 209 167 24%
Sep-16 Jun-16
Risk weighted assets £39.9bn £36.1bn
Business performance excluding notable items
Head Office – Three months ended (£m) Sep-16 Sep-15
Income 75 (26)
Impairment 1 1
– Operating expenses (29) (110)
– Litigation and conduct (8) (13)
Total operating expenses (37) (123)
Profit/(Loss) before tax (PBT) 35 (146)
Performance measures excluding notable items
Average allocated tangible equity1,2 £7.7bn £3.6bn
Sep-16 Jun-16
Risk weighted assets2 £47.5bn £43.2bn
Notable items – Three months ended (£m) Sep-16 Sep-15
– Own credit (264) 195
– Provisions for ongoing investigations and litigation including Foreign Exchange
- (29)
1 Based on risk weighted assets and capital deductions in Head Office plus the residual balance of average tangible ordinary shareholders’ equity | 2 Includes Africa Banking tangible equity and risk weighted assets | 3 Included in Group income statement as profit after tax in respect of discontinued operation and non-controlling interests in respect of discontinued operation |
A Results Slide 28

29 | Barclays Q3 2016 Financial Results | 27 October 2016
Breakdown of RoTE by business – Q316
6.7%
11.3%
25.8%
9.6% 7.5%
24.7%
10.1% 10.4%
21.1%
10.0% 9.2%
14.8%
Group Core Barclays UK Barclays International Corporate &
Investment Bank
Consumer, Cards
& Payments
Q315 Q316
47.9
37.7
9.3
24.7 21.7
3.1
49.7
42.1
8.7
25.7 21.9
3.7
Group Core Barclays UK Barclays International Corporate &
Investment Bank
Consumer, Cards
& Payments
2
2
1 Excluding notable items | 2 Including Head Office |
Return on average tangible equity (%)1
Average allocated tangible equity (£bn)1

30 | Barclays Q3 2016 Financial Results | 27 October 2016
289
287
6 4
4
1 1 6
Jun-16 Profit after tax
excluding PPI
PPI Dividends
paid
Redemption
of preference
shares
Currency
translation
reserve
Pension
movements
within reserves
Sep-16
Tangible Net Asset Value movements – Q316
TNAV (pence per share) – Jun-16 to Sep-16
• TNAV declined modestly by 2p per share in the quarter to 287p − £0.9bn of profit after tax excluding PPI
contributed 6p
− £0.6bn PPI charge reduced TNAV by 4p
− Payment of the interim dividend reduced TNAV by 1p
− Redemption of preference shares had a negative 1p impact
− Depreciation of GBP against all major currencies, especially the USD, had a positive impact on the currency translation reserve, resulting in a 4p improvement
− Pension remeasurements had a 6p negative impact as the UKRF, the Group’s main pension scheme, moved to a £1.1bn deficit
− Other items had a negligible net impact on TNAV1
Q316 highlights
1 Other items include the net impact of employee share schemes, intangible assets, cash flow hedge reserve and other reserve movements |

31 | Barclays Q3 2016 Financial Results | 27 October 2016
Common Equity Tier 1 capital progression – Q316
Q316 CET1 capital movement (£bn) – positives Q316 CET1 capital movement (£bn) – negatives
CET1 capital increased £0.8bn to £43.2bn, key positive movements being:
• £0.8bn of profits generated during the period
• £0.7bn increase in the currency translation reserve
• £0.2bn increase in minority interests
• £0.4bn reduction in additional value adjustments (PVA) deductions
Partially offset by:
• £0.2bn of dividends paid and foreseen
• £0.8bn due to the net impact of retirement benefits
1 Net of movements in own credit | 2 Bridge does not cast across due to rounding differences |
CET1 capital (£bn)
42.4
43.2 0.8
0.8
0.2 0.4
0.2 0.8 0.2
Jun-16 Profit for
the period
Dividends
paid and
foreseen
Other
qualifying
reserves
Net impact of
retirement
benefits
Minority
interests
PVA Other Sep-161
2

Fixed Income Slides

33 | Barclays Q3 2016 Financial Results | 27 October 2016
4.5% 4.5%
2.2% 2.2%
0.5%
2.0% 0.6%
2.5%
Jan-16 Fully phased-in
illustration
Key regulatory variables potentially impacting future minimum CET1 levels
CRD IV buffers De-risking and management actions with aim to reduce the G-SIB buffer
Potential future introductions of or variations in country-specific countercyclical buffers (CCyBs)
Pillar 2A requirements2
• Barclays’ 2016 P2A requirement as per the PRA’s Individual Capital Guidance (ICG) is 3.9%, of which 2.2% is required to be held in CET1 form
Despite 2016 increase, expect partial shift into Pillar 1 over time
RWA developments Expect further RWA reduction pre any Basel recalibration. Full deconsolidation
of BAGL on a regulatory and accounting basis and further BNC reductions towards 2017 target implies RWAs in “low £300bns”7
• While RWAs might increase due to Basel driven rule changes, this should be at least partially offset by reductions in Pillar 2A requirements
Managing evolving future minimum CET1 levels
CET1 minimum levels and internal management buffer • As capital buffers and RWAs will evolve over time, we manage our CET1
position to maintain a prudent internal management buffer over future minimum levels to guard against mandatory distribution restrictions3
• The management buffer is prudently calibrated, intended to absorb fluctuations in the CET1 ratio, cover against event risk and stress, and to ensure management actions can be taken in sufficient time to avoid breaching mandatory distribution restrictions in stress event
Sep-16 CET1
11.6%
7.8%
11.2% c.1-1.5%
Management buffer
Future CET1 ratio1 = Regulatory minimum level +
c.1-1.5% management buffer
Shifts in CRD IV buffers
Reduction as P1 RWAs recalibrated
7.2%
Capital Conservation Buffer (CCB)
Minimum CRD IV CET1 requirement
G-SIB buffer
Mandatory distribution restrictions hurdle3
2016 Pillar 2A CET1 requirement2 BoE stress test systemic reference point for 2016 tests4
Current buffer: 3.8%
8.7%
Illustrative evolution of minimum CET1 requirements and buffers1
Stress buffer5 (including management buffer): c.4% Previous stress tests6: • 2014 ‘stress-loss’: 160bps • 2015 ‘stress-loss’: 290bps
1 This illustration is based on Barclays’ interpretation of current regulation and regulatory proposals, which are subject to change, and is not a forecast of Barclays’ results of operations or capital position or otherwise. This illustration is also based on certain assumptions, which cannot be assured and are subject to change, including: holding constant the P2A at 2016 level despite it being subject to at least annual review; and assumed CRD IV buffers, which are subject to change | 2 Point in time assessment made at least annually by the PRA to reflect idiosyncratic risks not fully captured under Pillar 1. The 2016 total Pillar 2A requirement of 3.9% is split as follows: 2.2% in CET1 form (56% of total requirement), 0.7% in AT1 form (19% of total requirement), and 1.0% in T2 form (25% of total requirement) | 3 CRD IV rules on mandatory distribution restrictions apply from 1 January 2016 onwards based on transitional CET1 requirements. As per CRD Art. 141, restrictions on discretionary distributions would apply in case of a breach of the Combined Buffer Requirement as defined in CRD Art 128(6) | 4 Based on Barclays’ understanding of “The Bank of England’s approach to stress testing the UK banking system” published in October 2015 , which is subject to change, and “Stress testing the UK banking system: key elements of the 2016 stress test”, published March 2016. Stress test hurdle rates for 2016 tests comprise the minimum CRD IV CET1 requirement and the CET1 component of Pillar 2A. For G-SIBs, the ‘systemic reference point’ also includes the applicable phased-in G-SIB buffer. Thereafter, the hurdle rates are subject to changes in Pillar 2A which is a point in time assessment updated annually | 5 Indication based on capital buffers that can be used in stress tests. This should not be interpreted as an indication of Barclays’ 2016 Pillar 2B and/or future PRA buffer which remains confidential between the BoE and the respective banks it regulates | 6 Market derived stress-losses based on applicable year-end CET1 ratios against low-point stress outcomes | 7 Implementation of Barclays’ intentions is subject to, amongst other things, regulatory approval. The realisation of these plans and their intended benefits is subject to significant execution risks, including in relation to market factors, separation arrangements and costs, and there can be no assurance the intended benefits will be achieved on any proposed timetable or at all |
B Fixed Income Slide 33

34 | Barclays Q3 2016 Financial Results | 27 October 2016
Managing capital position for regulatory minimum levels and stress testing
Barclays’ expected systemic reference points for 2016 BoE stress test1,2
Future CET1 ratio1 = Regulatory minimum level +
c.1-1.5% management buffer
• For the 2016 BoE stress tests, the stress test systemic reference point will include the minimum CRD IV CET 1 requirement, P2A, and a phased-in G-SIB buffer
• The stressed capital ratio for each year over the stress test horizon will be measured against the respective applicable stress test systemic reference point
• Barclays’ fully phased-in stress buffer is expected to be c.4% when including the management buffer, providing ample headroom should future stress losses be higher than experienced to date
4.5% 4.5% 4.5% 4.5%
2.2% 2.2% 2.2% 2.2%
0.5% 1.0% 1.5% 2.0% 0.6%
1.3% 1.9%
2.5%
Jan-16 Jan-17 Jan-18 Jan-19
Sep 16 CET1
11.6%
c.1-1.5% Management buffer
7.2% 7.7% 8.2%
8.7%
7.8% 9.0%
10.1%
11.2%
Stress buffer5 (including management buffer): c.4% Previous stress tests6: • 2014 ‘stress-loss’: 160bps • 2015 ‘stress-loss’: 290bps
Capital Conservation Buffer (CCB)
Minimum CRD IV CET1 requirement
G-SIB buffer
Mandatory distribution restrictions hurdle4
2016 Pillar 2A CET1 requirement3 BoE stress test systemic reference point for 2016 tests2
1 This illustration is based on Barclays’ interpretation of current regulation and regulatory proposals, which are subject to change, and is not a forecast of Barclays’ results of operations or capital position or otherwise. This illustration is also based on certain assumptions, which cannot be assured and are subject to change, including: holding constant the P2A at 2016 level despite it being subject to at least annual review; and assumed CRD IV buffers, which are subject to change | 2 Based on Barclays’ understanding of “The Bank of England’s approach to stress testing the UK banking system” published in October 2015 , which is subject to change, and “Stress testing the UK banking system: key elements of the 2016 stress test”, published March 2016. Stress test hurdle rates for 2016 tests comprise the minimum CRD IV CET1 requirement and the CET1 component of Pillar 2A. For G-SIBs, the ‘systemic reference point’ also includes the applicable phased-in G-SIB buffer. Thereafter, the hurdle rates are subject to changes in Pillar 2A which is a point in time assessment updated annually | 3 Point in time assessment made at least annually by the PRA to reflect idiosyncratic risks not fully captured under Pillar 1. The 2016 total Pillar 2A requirement of 3.9% is split as follows: 2.2% in CET1 form (56% of total requirement), 0.7% in AT1 form (19% of total requirement), and 1.0% in T2 form (25% of total requirement) | 4 CRD IV rules on mandatory distribution restrictions apply from 1 January 2016 onwards based on transitional CET1 requirements. As per CRD Art. 141, restrictions on discretionary distributions would apply in case of a breach of the Combined Buffer Requirement as defined in CRD Art 128(6) | 5 24 Indication based on capital buffers that can be used in stress tests. This should not be interpreted as an indication of Barclays’ 2016 Pillar 2B and/or future PRA buffer which remains confidential between the BoE and the respective banks it regulates | 6 Market derived stress-losses based on applicable year-end CET1 ratios against low-point stress outcomes |
B Fixed Income Slide 34

35 | Barclays Q3 2016 Financial Results | 27 October 2016
Continued strong leverage position
Leverage ratio1 Highlights
Q316
• Leverage ratio of 4.2% as at 30 September 2016, an improvement of c.120bps since
December 2013
• The ratio remained flat over the quarter as the underlying profit generation of our core
business and the $1.5bn AT1 issuance offset the adverse move in the pensions
re-measurement reserve, provision for UK customer redress and increase in
leverage exposure
• The £30bn increase in leverage exposure mainly reflects balance sheet movements
including the impact of weakening GBP against major currencies, and an increase in SFTs
• Core drove £44bn of the increase which was partially offset by a decrease of £14bn in
BNC although this would have been larger excluding currency impacts
• We expect to grow the leverage ratio further over time, maintaining the ratio comfortably
above future minimum requirements
Regulatory developments
• From 1 January 2016, Barclays is required to also calculate an average
leverage ratio based on the average capital measure divided by the average exposure
measure for the quarter. As at 30 September 2016, the average leverage ratio was 4.2%2
• The average leverage ratio remains well in excess of the expected minimum
end-state requirement for Barclays, expected to be below 4%
• In August 2016, the PRA implemented the Financial Policy Committee’s recommendation
to allow firms to exclude claims on the central bank from the calculation of the
leverage exposure measure, as long these are matched by deposits denominated in the
same currency
• The impact of the FPC’s recommendations would have been an improvement to the
headroom of c.20bps for the reported leverage ratio and c.10bps for the average
leverage ratio
1 The leverage ratio has been calculated in accordance with the requirements of CRR which was amended effective from Jan 2015. The leverage calculation uses the end-point CRR definition of Tier 1 capital for the numerator and the CRR definition of leverage exposure. This is broadly consistent with the BCBS 270 definition, which was the basis of Dec-14 comparatives. Dec-13 not comparable to the estimates as of Dec-14 onwards due to different basis of preparation | 2 For further detail on calculation, see page 35 in the Barclays PLC Q3 2016 Results Announcement |
3.0%
3.7%
4.5%
4.2% 4.2%
Dec-13 Dec-14 Dec-15 Jun-16 Sep-16
1,365 1,233 1,028 1,155 1,185
c.120bps
Leverage exposure (£bn)
B Fixed Income Slide 35
36 | Barclays Q3 2016 Financial Results | 27 October 2016
Jun-16BoE Transitional
MREL/TLAC
Jun-16Spot HoldCoMREL/TLAC
Illustrative1 Jan 2022MREL/TLAC
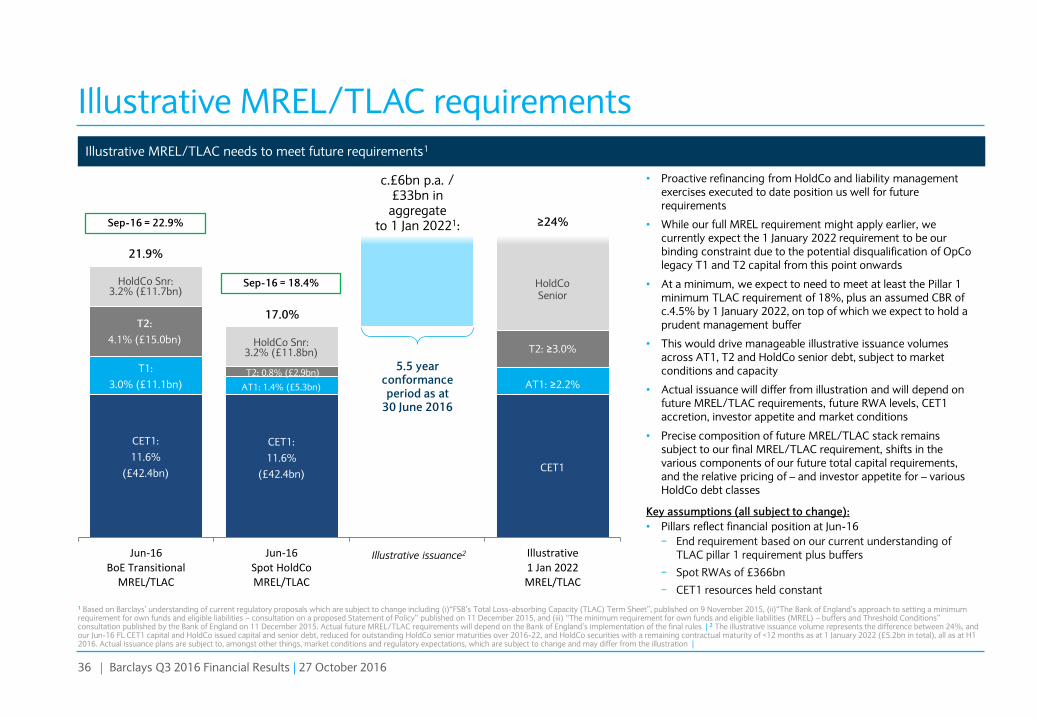
Illustrative MREL/TLAC requirements
Illustrative MREL/TLAC needs to meet future requirements1
• Proactive refinancing from HoldCo and liability management exercises executed to date position us well for future requirements
• While our full MREL requirement might apply earlier, we currently expect the 1 January 2022 requirement to be our binding constraint due to the potential disqualification of OpCo legacy T1 and T2 capital from this point onwards
• At a minimum, we expect to need to meet at least the Pillar 1 minimum TLAC requirement of 18%, plus an assumed CBR of c.4.5% by 1 January 2022, on top of which we expect to hold a prudent management buffer
• This would drive manageable illustrative issuance volumes across AT1, T2 and HoldCo senior debt, subject to market conditions and capacity
• Actual issuance will differ from illustration and will depend on future MREL/TLAC requirements, future RWA levels, CET1 accretion, investor appetite and market conditions
• Precise composition of future MREL/TLAC stack remains subject to our final MREL/TLAC requirement, shifts in the various components of our future total capital requirements, and the relative pricing of – and investor appetite for – various HoldCo debt classes
Key assumptions (all subject to change):
• Pillars reflect financial position at Jun-16
− End requirement based on our current understanding of TLAC pillar 1 requirement plus buffers
− Spot RWAs of £366bn
− CET1 resources held constant
Illustrative issuance2
HoldCo Snr: 3.2% (£11.7bn)
T2:
4.1% (£15.0bn)
T1:
3.0% (£11.1bn)
CET1:
11.6%
(£42.4bn)
HoldCo Senior
T2: ≥3.0%
AT1: ≥2.2%
CET1
c.£6bn p.a. / £33bn in aggregate
to 1 Jan 20221:
5.5 year conformance period as at
30 June 2016
21.9%
T2: 0.8% (£2.9bn)
AT1: 1.4% (£5.3bn)
17.0%
CET1:
11.6%
(£42.4bn)
≥24%
HoldCo Snr: 3.2% (£11.8bn)
Sep-16 = 22.9%
Sep-16 = 18.4%
1 Based on Barclays’ understanding of current regulatory proposals which are subject to change including (i)“FSB’s Total Loss-absorbing Capacity (TLAC) Term Sheet”, published on 9 November 2015, (ii)“The Bank of England’s approach to setting a minimum requirement for own funds and eligible liabilities – consultation on a proposed Statement of Policy” published on 11 December 2015, and (iii) “The minimum requirement for own funds and eligible liabilities (MREL) – buffers and Threshold Conditions” consultation published by the Bank of England on 11 December 2015. Actual future MREL/TLAC requirements will depend on the Bank of England’s implementation of the final rules | 2 The illustrative issuance volume represents the difference between 24%, and our Jun-16 FL CET1 capital and HoldCo issued capital and senior debt, reduced for outstanding HoldCo senior maturities over 2016-22, and HoldCo securities with a remaining contractual maturity of <12 months as at 1 January 2022 (£5.2bn in total), all as at H1 2016. Actual issuance plans are subject to, amongst other things, market conditions and regulatory expectations, which are subject to change and may differ from the illustration |
B Fixed Income Slide 36

37 | Barclays Q3 2016 Financial Results | 27 October 2016
Progress on structural reform of Group legal structure
• Successfully launched 1st July 2016
• Holds all existing US subsidiaries
• Compliant with all minimum requirements
Barclays PLC1
UK consumer and business bank2 differentiated by scale and digital innovation
Barclays UK
Formation of the UK Ring-fenced Bank
prior to 1 January 2019
Div
isio
na
l c
on
stru
cts
Barclays International
Diversified transatlantic wholesale and consumer bank
Fu
ture
le
ga
l e
nti
ty
co
nst
ruc
ts
Multiple entities
US IHC
To be transferred under Barclays PLC
Group Service Company
Integrated under current management structures to
provide critical service to BUK and BI to deliver operational
continuity
Barclays Bank PLC (and subsidiaries)
1 Illustration of Barclays business divisions in preparation for regulatory ring-fencing. Plans are subject to internal and regulatory approvals and may change | 2 Including corporates with less than or equal to £6.5m equivalent turnover, subject to some specific exceptions |
Delivering entities with strong returns and well balanced funding profiles
Well capitalised entities with strong balance sheets and asset quality
Our objective is to maintain solid investment grade ratings

38 | Barclays Q3 2016 Financial Results | 27 October 2016
Anticipated funding sources of future UK ring-fenced bank and Barclays Bank PLC (and subsidiaries)
Funding sources: Sep-16 LDR: 90%
• Deposit funding:
− Retail deposits
− Business banking deposits
• Term funding:
− Equity, debt capital and term senior unsecured debt downstreamed from B PLC (Internal MREL/TLAC)
− Secured funding (e.g. covered bonds and ABS)
• Other operating funding:
− Short-term funding (e.g. CD/CP)
Funding sources: Sep-16 LDR: 92%
• Deposit funding:
− Mid and large corporate deposits
− Delaware deposits
− International wealth customer deposits
• Term funding:
− Equity, debt capital and term senior unsecured debt downstreamed from B PLC (Internal MREL/TLAC)
− Residual outstanding BB PLC externally issued debt capital and senior unsecured debt (including structured notes)
− Secured funding (e.g. ABS)
• Other operating funding (externally issued):
− Short-term funding (e.g. CD/CP)
Barclays International
UK consumer and business bank2 differentiated by scale and digital innovation
Barclays UK
Barclays PLC1
Diversified transatlantic wholesale and consumer bank
Formation of the UK Ring-fenced Bank prior to 1 January 2019
Div
isio
na
l c
on
stru
cts
Barclays Bank PLC (and subsidiaries)
Le
ga
l e
nti
ty c
on
stru
cts
1 Illustration of Barclays business divisions in preparation for regulatory ring-fencing. Plans are subject to internal and regulatory approvals and may change | 2 Including corporates with less than or equal to £6.5m equivalent turnover, subject to some specific exceptions |
B Fixed Income Slide 38

39 | Barclays Q3 2016 Financial Results | 27 October 2016
Disclaimer Important Notice The information, statements and opinions contained in this presentation do not constitute a public offer under any applicable legislation, an offer to sell or solicitation of any offer to buy any securities or financial instruments, or any advice or recommendation with respect to such securities or other financial instruments.
Forward-looking Statements This document contains certain forward-looking statements within the meaning of Section 21E of the US Securities Exchange Act of 1934, as amended, and Section 27A of the US Securities Act of 1933, as amended, with respect to the Group. Barclays cautions readers that no forward-looking statement is a guarantee of future performance and that actual results or other financial condition or performance measures could differ materially from those contained in the forward-looking statements. These forward-looking statements can be identified by the fact that they do not relate only to historical or current facts. Forward-looking statements sometimes use words such as ‘may’, ‘will’, ‘seek’, ‘continue’, ‘aim’, ‘anticipate’, ‘target’, ‘projected’, ‘expect’, ‘estimate’, ‘intend’, ‘plan’, ‘goal’, ‘believe’, ‘achieve’ or other words of similar meaning. Examples of forward-looking statements include, among others, statements or guidance regarding the Group’s future financial position, income growth, assets, impairment charges, provisions, notable items, business strategy, capital, leverage and other regulatory ratios, payment of dividends (including dividend pay-out ratios and expected payment strategies), projected levels of growth in the banking and financial markets, projected costs or savings, original and revised commitments and targets in connection with the strategic cost programme and the Group Strategy Update, rundown of assets and businesses within Barclays Non-Core, sell down of the Group’s interest in Barclays Africa Group Limited, estimates of capital expenditures and plans and objectives for future operations, projected employee numbers and other statements that are not historical fact. By their nature, forward-looking statements involve risk and uncertainty because they relate to future events and circumstances. These may be affected by changes in legislation, the development of standards and interpretations under International Financial Reporting Standards, evolving practices with regard to the interpretation and application of accounting and regulatory standards, the outcome of current and future legal proceedings and regulatory investigations, future levels of conduct provisions, future levels of notable items, the policies and actions of governmental and regulatory authorities, geopolitical risks and the impact of competition. In addition, factors including (but not limited to) the following may have an effect: capital, leverage and other regulatory rules (including with regard to the future structure of the Group) applicable to past, current and future periods; UK, US, Africa, Eurozone and global macroeconomic and business conditions; the effects of continued volatility in credit markets; market related risks such as changes in interest rates and foreign exchange rates; effects of changes in valuation of credit market exposures; changes in valuation of issued securities; volatility in capital markets; changes in credit ratings of any entities within the Group or any securities issued by such entities; the potential for one or more countries exiting the Eurozone; the implications of the results of the 23 June 2016 referendum in the United Kingdom and the disruption that may result in the UK and globally from the withdrawal of the United Kingdom from the European Union; the implementation of the strategic cost programme; and the success of future acquisitions, disposals and other strategic transactions. A number of these influences and factors are beyond the Group’s control. As a result, the Group’s actual future results, dividend payments, and capital and leverage ratios may differ materially from the plans, goals, expectations and guidance set forth in the Group’s forward-looking statements. Additional risks and factors which may impact the Group’s future financial condition and performance are identified in our filings with the SEC (including, without limitation, our annual report on form 20-F for the fiscal year ended 31 December 2015), which are available on the SEC’s website at www.sec.gov. Subject to our obligations under the applicable laws and regulations of the United Kingdom and the United States in relation to disclosure and ongoing information, we undertake no obligation to update publicly or revise any forward looking statements, whether as a result of new information, future events or otherwise.
Related Documents