Barclays Capital Global Financial Services Conference Vikram Pandit Chief Executive Officer Chief Executive Officer September 16, 2009

Welcome message from author
This document is posted to help you gain knowledge. Please leave a comment to let me know what you think about it! Share it to your friends and learn new things together.
Transcript
Barclays Capital Global Financial Services ConferenceVikram PanditChief Executive OfficerChief Executive Officer
September 16, 2009

Agenda
Citigroup – Progress over the last 18 months
Citi Holdings– Brokerage and Asset Management
L l C L di– Local Consumer Lending– Special Asset Pool
CiticorpCiticorp– Institutional Clients Group – Regional Consumer Banking
Looking Ahead
Q&A
1

Progress Over The Last 18 Months
375$15 7
$B ‘000
Expenses Headcount
(23)% (26)% Smith375279
$15.7$12.0 Quarterly
run-rate down ~$4B
Smith Barney
accounted for 20.5K
of the reduction
4Q'07 2Q'094Q'07 2Q'09
$2.2$1 8
$T
62%71%
Assets Structural Liquidity (1)
(16)%
$1.8 62%Down
>$500B from peak
2(1) Structural Liquidity is deposits, long-term debt and stockholders’ equity as a percent of assets.
4Q'07 2Q'09 4Q'07 2Q'09
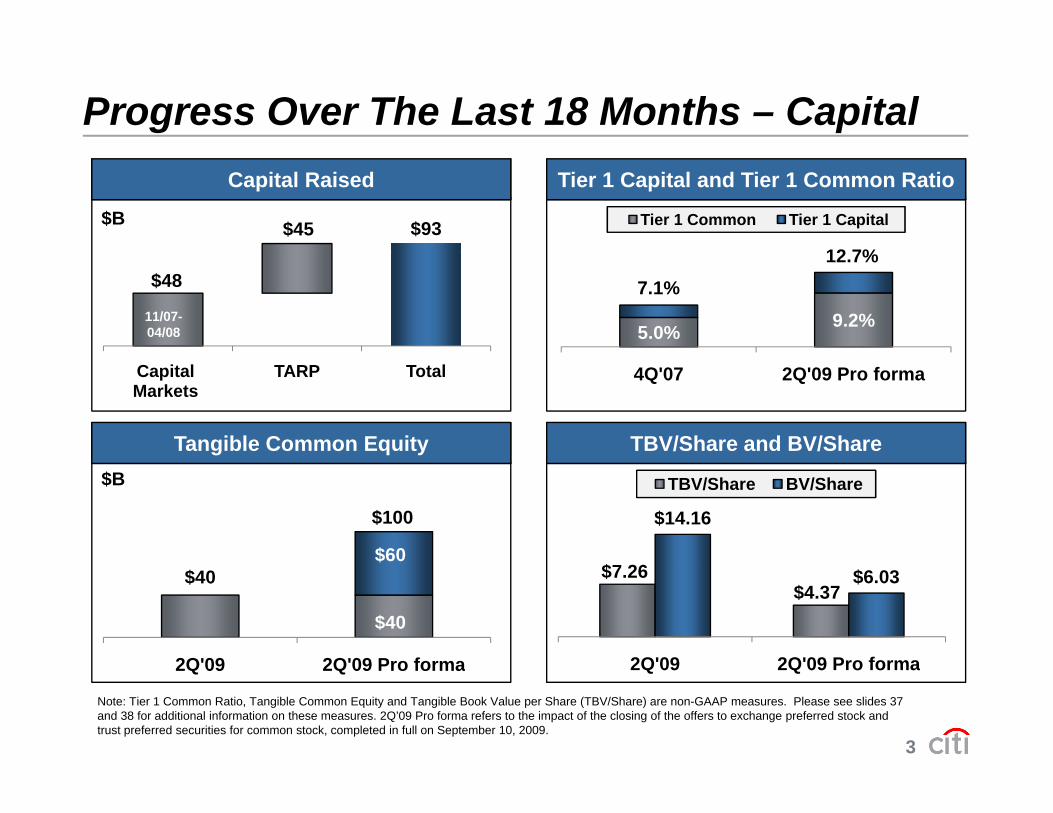
Progress Over The Last 18 Months – Capital
Tier 1 Common Tier 1 Capital
Tier 1 Capital and Tier 1 Common Ratio
12 7%$93$45
Capital Raised
$B
5.0% 9.2%
7.1%12.7%
$48
11/07-04/08
4Q'07 2Q'09 Pro forma
Tangible Common Equity TBV/Share and BV/Share
CapitalMarkets
TARP Total
$100
$B
$14.16
TBV/Share BV/Share
$60$40
2Q'09 2Q'09 Pro forma
$7.26$4.37
$6.03
2Q'09 2Q'09 Pro forma
$40
$60
3
Note: Tier 1 Common Ratio, Tangible Common Equity and Tangible Book Value per Share (TBV/Share) are non-GAAP measures. Please see slides 37 and 38 for additional information on these measures. 2Q’09 Pro forma refers to the impact of the closing of the offers to exchange preferred stock and trust preferred securities for common stock, completed in full on September 10, 2009.
2Q 09 2Q 09 Pro forma 2Q 09 2Q 09 Pro forma

Progress Over The Last 18 Months
Formed new management team
Strengthened risk function
Restructured corporate governance
– Added 7 new directors with strong financiali iservices expertise
4
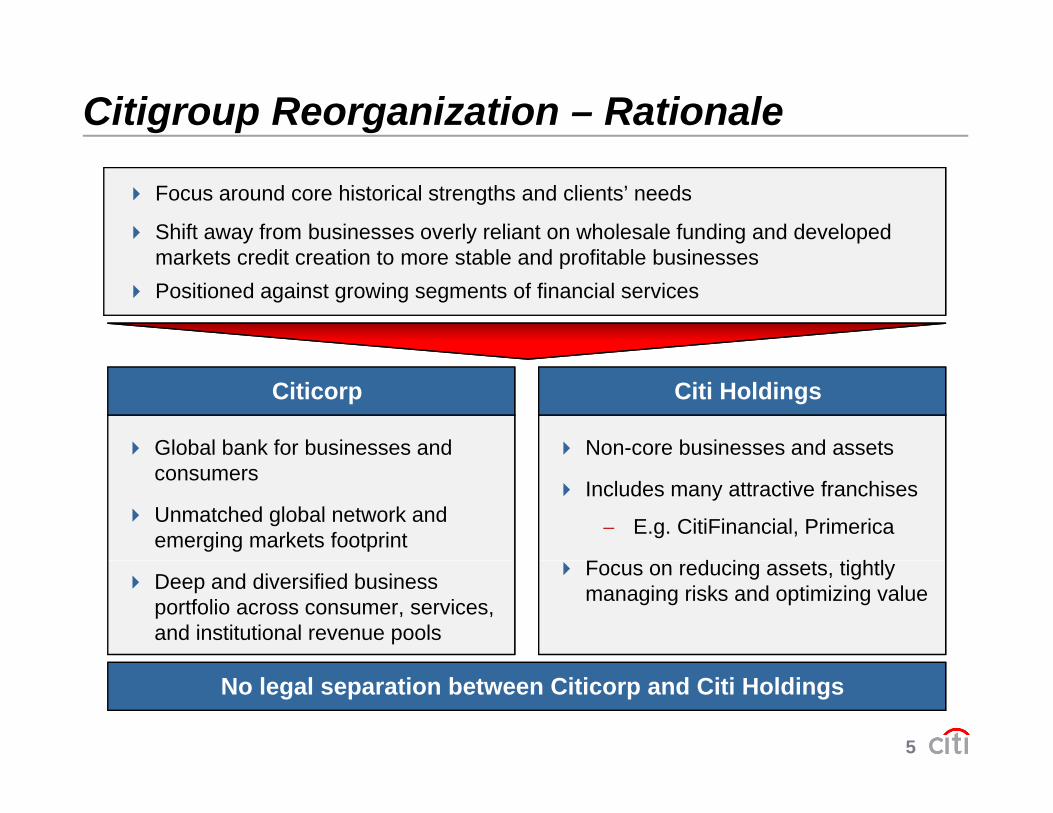
Citigroup Reorganization – Rationale
Focus around core historical strengths and clients’ needs
Shift away from businesses overly reliant on wholesale funding and developed k t dit ti t t bl d fit bl b imarkets credit creation to more stable and profitable businesses
Positioned against growing segments of financial services
Global bank for businesses and Non-core businesses and assets
Citicorp Citi Holdings
consumers
Unmatched global network and emerging markets footprint
Includes many attractive franchises
− E.g. CitiFinancial, Primerica
F d i t ti htlDeep and diversified business portfolio across consumer, services, and institutional revenue pools
Focus on reducing assets, tightly managing risks and optimizing value
5
No legal separation between Citicorp and Citi Holdings
$B
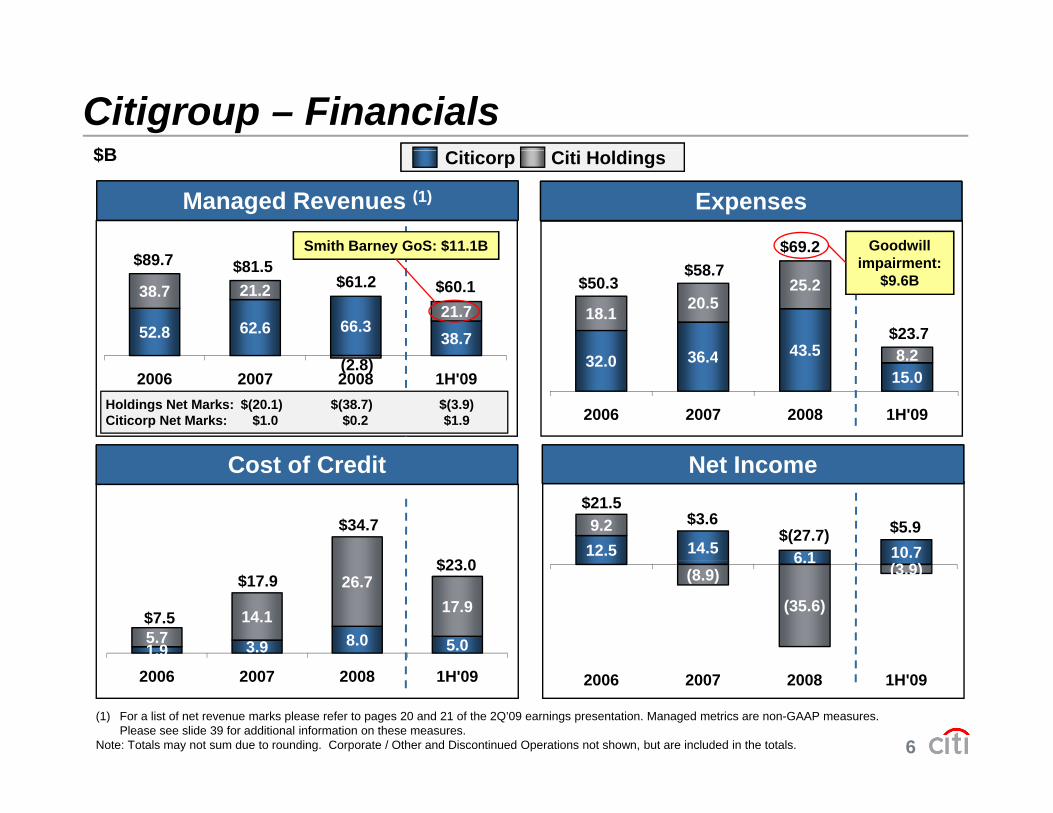
Citigroup – Financials
Managed Revenues (1)
$B
ExpensesSmith Barney GoS: $11.1B
$$69.2
Citicorp Citi Holdings
Goodwill
52.8 62.6 66.338.7
38.7 21.2 21.7
32 0 36 4 43.5
18.1 20.525.2
8 2
y$81.5$89.7
$61.2 $60.1$58.7
$50.3
$
$23.7
impairment: $9.6B
(2.8)2006 2007 2008 1H'09
Holdings Net Marks: $(20.1) $(38.7) $(3.9)Citicorp Net Marks: $1.0 $0.2 $1.9
32.0 36.4 43.515.08.2
2006 2007 2008 1H'09
C t f C dit N t I
12.5 14.5 6 1 10.79.2
Cost of Credit Net Income
$34.7
$23 0
$3.6$21.5
$(27.7) $5.9
6.1(8.9)
(35.6)
(3.9)
1.9 3.9 8.0 5.05.714.1
26.717.9
$17.9
$7.5
$23.0
6
(1) For a list of net revenue marks please refer to pages 20 and 21 of the 2Q’09 earnings presentation. Managed metrics are non-GAAP measures. Please see slide 39 for additional information on these measures.
Note: Totals may not sum due to rounding. Corporate / Other and Discontinued Operations not shown, but are included in the totals.
2006 2007 2008 1H'092006 2007 2008 1H'09

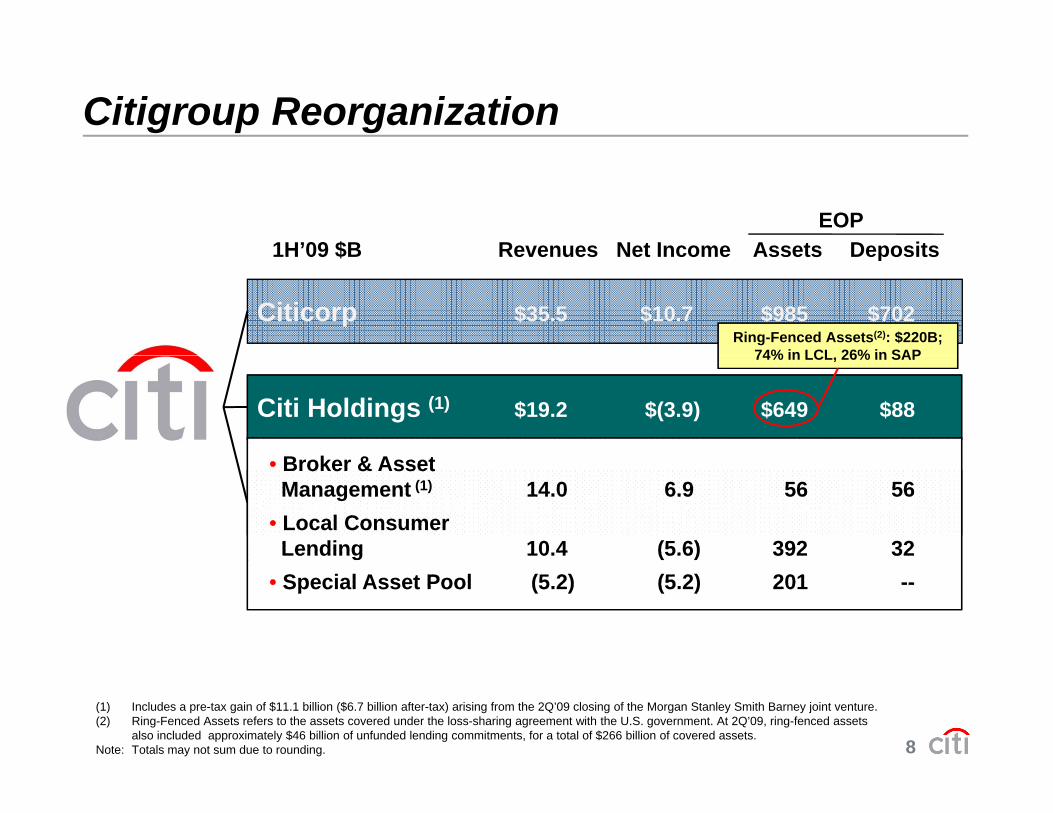
Citigroup Reorganization
EOP1H’09 $B Revenues Net Income Assets Deposits
Citicorp $35.5 $10.7 $985 $702
1H 09 $B Revenues Net Income Assets Deposits
Citi Holdings (1) $19.2 $(3.9) $649 $88
Corporate / Other $(0.2) $(0.7) $213 $15
7(1) Includes a pre-tax gain of $11.1 billion ($6.7 billion after-tax) arising from the 2Q’09 closing of the Morgan Stanley Smith Barney joint venture.
Citigroup Reorganization
EOP1H’09 $B Revenues Net Income Assets Deposits
Citicorp $35.5 $10.7 $985 $702Ring-Fenced Assets(2): $220B;
74% in LCL 26% in SAP
1H 09 $B Revenues Net Income Assets Deposits
Citi Holdings (1) $19.2 $(3.9) $649 $88
74% in LCL, 26% in SAP
B k & A tB k & A t
Corporate / Other $(0.2) $(0.7) $213 $15
• Broker & AssetManagement (1) 14.0 6.9 56 56
• Local ConsumerLending 10.4 (5.6) 392 32
• Broker & AssetManagement (1) 14.0 6.9 56 56
• Local ConsumerLending 10.4 (5.6) 392 32
• Special Asset Pool (5.2) (5.2) 201 --• Special Asset Pool (5.2) (5.2) 201 --
8
(1) Includes a pre-tax gain of $11.1 billion ($6.7 billion after-tax) arising from the 2Q’09 closing of the Morgan Stanley Smith Barney joint venture.(2) Ring-Fenced Assets refers to the assets covered under the loss-sharing agreement with the U.S. government. At 2Q’09, ring-fenced assets
also included approximately $46 billion of unfunded lending commitments, for a total of $266 billion of covered assets.Note: Totals may not sum due to rounding.

Citi Holdings
Businesses and assets not core t t t
EOP Assets ($B)
to our strategy
– Many attractive franchises (e.g. MSSB, Nikko, CitiFinancial, Primerica) 898
833
$(249)B
Primerica)
Main drivers of asset reduction: dispositions and run-off
833775
715662 649
– Closed or signed 32 dispositions since December 2007
No legal separation fromNo legal separation from Citigroup
1Q'08 2Q'08 3Q'08 4Q'08 1Q'09 2Q'09
9

Citi Holdings – Financials
$38.7
$21 7
Managed Revenues(1)
$20 5$25.2
Expenses$B Smith Barney GoS: $11.1B
(2)$B
$21.2
($2.8)
$21.7 $18.1
$20.5
$8.2
2006 2007 2008 1H'09
2006 2007 2008 1H'09
Cost of Credit Net Income
Net Marks: $(20.1) $(38.7) $(3.9)
12.75 1
NCL LLR $9.2
($3.9)$14 1
$26.7
$17.9
$B$B(3)
5.2 7.214.1 12.80.5
6.85.1
2006 2007 2008 1H'09
($8.9)
($35.6)
($3.9)
2006 2007 2008 1H'09
$5.7
$14.1
10
2006 2007 2008 1H'09
(1) For a list of net revenue marks please refer to page 21 of the 2Q’09 earnings presentation. Managed metrics are non-GAAP measures. Please see slide 39 for additional information on these measures. (2) Fourth quarter 2008 expenses included a $3.0 billion goodwill impairment charge. (3) LLR includes provisions for benefits and claims, provision for unfunded lending commitments and credit reserve builds/releases. Note: Totals may not sum due to rounding.
2006 2007 2008 1H'09
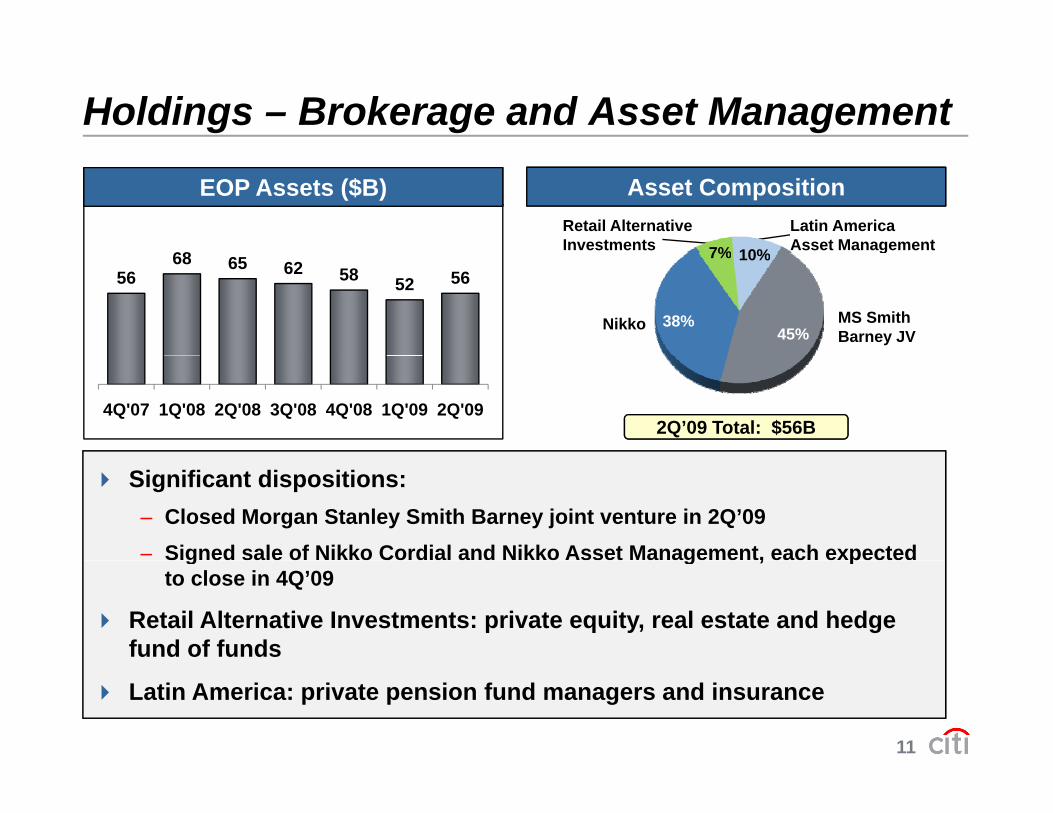
Holdings – Brokerage and Asset Management
Asset Composition
68
EOP Assets ($B)Retail Alternative Investments
Latin America Asset Management7% 10%
5668 65 62 58 52 56
MS Smith Barney JV
Nikko
g
45%38%
7% 10%
4Q'07 1Q'08 2Q'08 3Q'08 4Q'08 1Q'09 2Q'092Q’09 Total: $56B
Significant dispositions: – Closed Morgan Stanley Smith Barney joint venture in 2Q’09– Signed sale of Nikko Cordial and Nikko Asset Management, each expected g g , p
to close in 4Q’09
Retail Alternative Investments: private equity, real estate and hedge fund of funds
11
Latin America: private pension fund managers and insurance
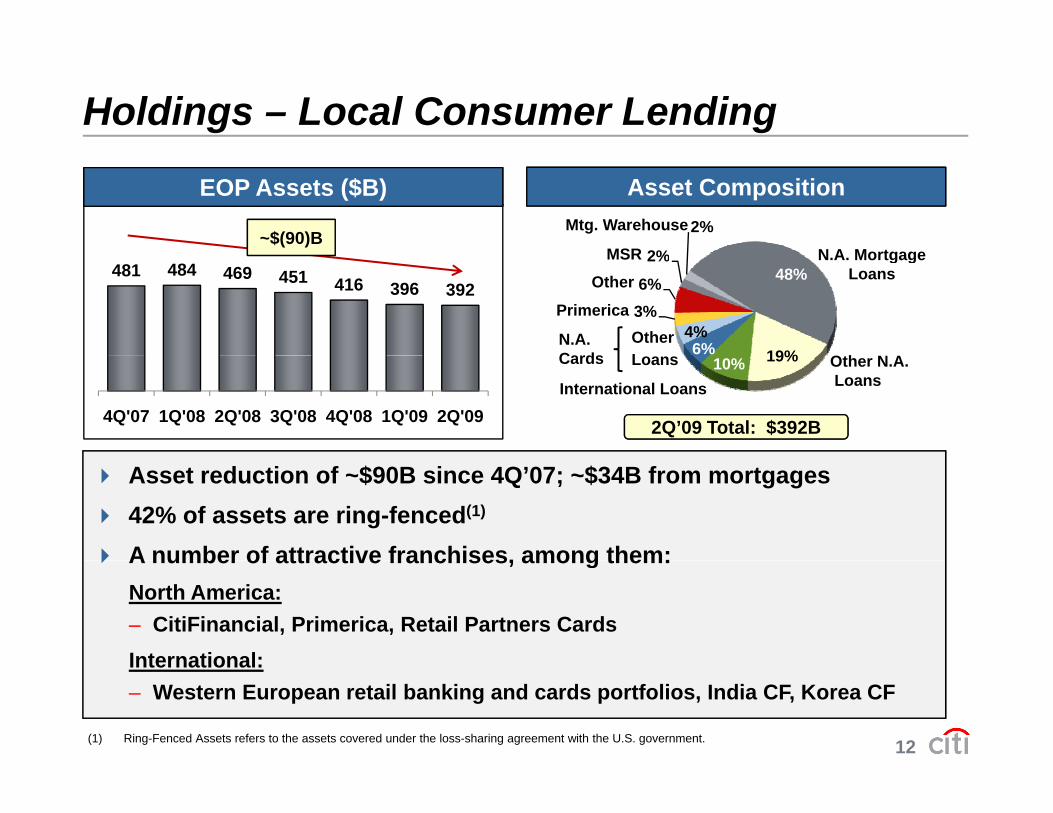
Holdings – Local Consumer Lending
Asset CompositionEOP Assets ($B)
2%
2%
N A MortgageMSR
Mtg. Warehouse~$(90)B
481 484 469 451 416 396 39248%
19%6%4%
3%6%
2% N.A. Mortgage Loans
Other
Other
Oth N A
Primerica
MSR
LN.A. Cards
4Q'07 1Q'08 2Q'08 3Q'08 4Q'08 1Q'09 2Q'09
19%10%International Loans
2Q’09 Total: $392B
Other N.A.Loans
LoansCards
Asset reduction of ~$90B since 4Q’07; ~$34B from mortgages42% of assets are ring-fenced(1)
A number of attractive franchises, among them:A number of attractive franchises, among them:North America:– CitiFinancial, Primerica, Retail Partners CardsInternational:
12
International: – Western European retail banking and cards portfolios, India CF, Korea CF
(1) Ring-Fenced Assets refers to the assets covered under the loss-sharing agreement with the U.S. government.

Holdings – Special Asset Pool
Asset CompositionEOP Assets ($B)
Equity
OtherConsumer & SMEs7%
4% 3%$(150)B
351 346299
262 241 214 201
Securities at AFS/HTM
Monolines
Equity
Loans, leases& Letters of
Highly Lev Fi C it
SIVs 32%
22%21%2%
1%
8%7%
4Q'07 1Q'08 2Q'08 3Q'08 4Q'08 1Q'09 2Q'09 2Q’09 Total: $201B
Marked to Market
& Letters of Credit at HFI/HFS
Fin. Commit. 21%
Asset reduction of $150B since 4Q’0728% of assets are ring-fenced(1)
Corporate securities prime and non-US MBS represent over 50% ofCorporate securities, prime and non US MBS represent over 50% of Securities at AFS/HTMIncludes $49 billion of loans, leases and LCs at HFI/HFS with $4B of reserves against them
13(1) Ring-Fenced Assets refers to the assets covered under the loss-sharing agreement with the U.S. government.
gMarked to market securities at 29% of face value

Citigroup Reorganization
EOP1H’09 $B Revenues Net Income Assets Deposits1H 09 $B Revenues Net Income Assets Deposits
Citicorp $35.5 $10.7 $985 $702
Citi Holdings (1) $19.2 $(3.5) $649 $88• Regional Consumer
Banking 11.4 0.8 198 274
• Securities & Banking 19 3 8 1 724 118
• Regional ConsumerBanking 11.4 0.8 198 274
• Securities & Banking 19 3 8 1 724 118
Corporate / Other $(0.2) $(0.7) $213 $15
Securities & Banking 19.3 8.1 724 118
• Transaction Services 4.9 1.9 63 310
Securities & Banking 19.3 8.1 724 118
• Transaction Services 4.9 1.9 63 310
14Note: Totals may not sum due to rounding.

Citicorp – Financials
$52.8$62.6 $66.3
$38 7
Managed Revenues (1)
$36 4$43.5
Expenses$B (2)$B
$38.7
2006 2007 2008 1H'09
$32.0$36.4
$15.0
2006 2007 2008 1H'09
Net Income
Net Marks: $(1.0) $0.2 $1.9
Cost of Credit
$12.5$14.5
$10.7
et co e
3.0NCL LLR
Cost o C ed t
$8.0
$5.0
(3)
$B $B
$6.1
2006 2007 2008 1H'09
1.7 2.74.9
2.80.21.2 2.2
2006 2007 2008 1H'09
$1.9
$3.9
15
(1) For a list of net revenue marks please refer to page 20 of the 2Q’09 earnings presentation. Managed metrics are non-GAAP measures. Please see slide 39 for additional information on these measures. (2) Fourth quarter 2008 expenses included a $6.5 billion goodwill impairment charge. (3) LLR includes provisions for benefits and claims, provision for unfunded lending commitments and credit reserve builds/releases. Note: Totals may not sum due to rounding.
2006 2007 2008 1H'092006 2007 2008 1H'09

Citicorp – Unparalleled Global Network
59% 62% 44% Developed
$36B $985B $702B7%
2%
2006-2012E GDP CAGR(1)
(1) Source: IMF
41% 38% 56%
1H'09 Revenues 2Q'09 Assets 2Q'09 Deposits
Emerging 2%
Emerging Developed
Physicalyinfrastructure
Serving clients/no physicalinfrastructure
16

Citicorp – Institutional Clients Group
Global network – presence in over 100 markets– Market leader in Emerging Markets
T di fl i i– Trading floors in 75 countries– Leading global corporate client franchise
Physicalyinfrastructure
Serving clients/no physicalinfrastructure
17
Trading floor

Citicorp – Transaction Services
Solid Financial Performance
30%2Q’04-2Q’09 CAGRTreasury and Trade Solutions
Global, scale driven business
20% 20%
9%
30%Liquidity & Investments Payments Receivables
Supply Chain IntegrationTrade FinanceTrade Services
Avg. Deposits
Revenues Expenses Net Income
Information ServicesWholesale Card Solutions
Trade ServicesFI OutsourcingExport & Agency Finance (1)
Asset light, high return business driven by fees & depositsLow volatility, annuity-type
Securities and Fund Services
Custody & ClearingSecurities Finance
Fund ServicesInvestment revenues
– Revenue from >100 countries– Top 3,000 clients: >95% of revenues
Scale business underpinned by
Securities FinanceMiddle Office Outsourcing (risk, compliance, attribution,
Investment Administration ServicesCapital Markets Support and Post-
18
Scale business underpinned by technology and infrastructureperformance)
Issuer ServicesClosing Servicing
(1) Includes other customer liability balances.

Citicorp – Securities and Banking
F i k dj t d fit bilit d t tiFocus on risk-adjusted profitability and greater execution discipline
Refocus on client flow business, and capture market share inRefocus on client flow business, and capture market share in a resized client base
Leverage global footprint and emerging markets leadership
Invest to close product gaps– Equities, prime brokerage, commodities, G10 rates, private banking
Continue upgrading talent, technology and automation
19
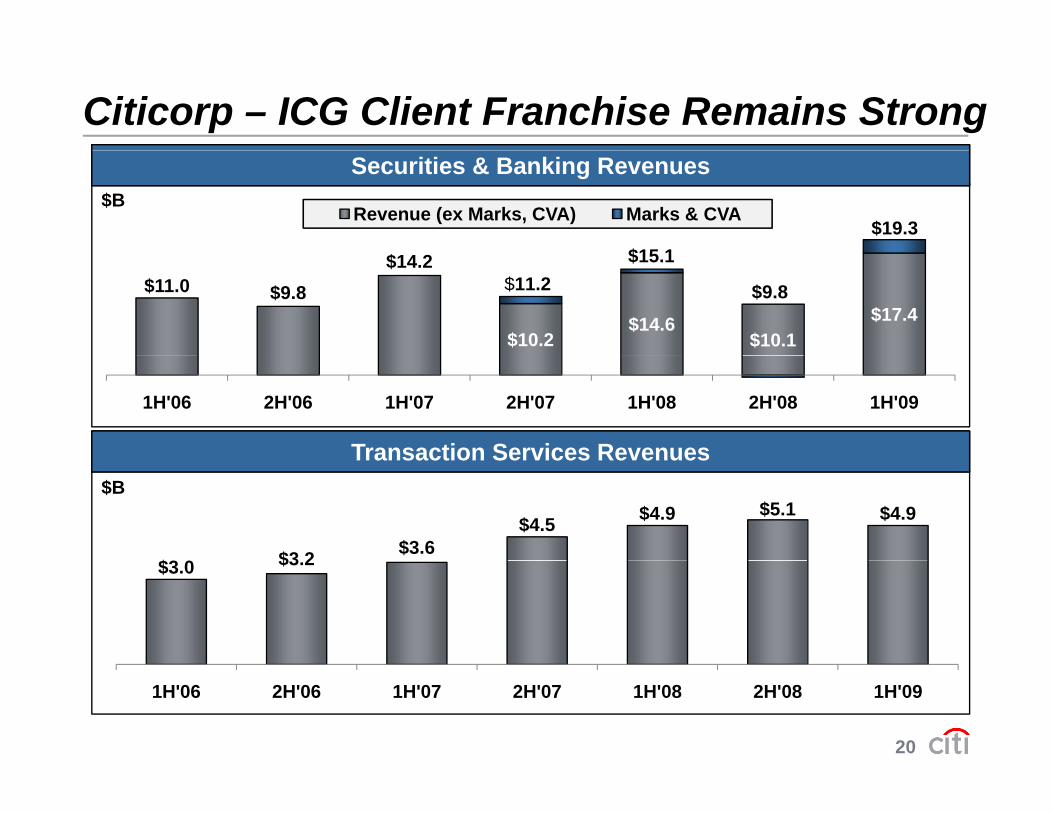
Citicorp – ICG Client Franchise Remains Strong
$B$B Revenue (ex Marks, CVA) Marks & CVA
$15 1$19.3
$B
Securities & Banking Revenues
$11.0 $9.8$14.2
$10.2$14.6
$10.1$17.4
$11.2$15.1
$9.8
1H'06 2H'06 1H'07 2H'07 1H'08 2H'08 1H'09
Transaction Services Revenues
$3 0 $3 2 $3.6$4.5 $4.9 $5.1 $4.9
$B
Transaction Services Revenues
$3.0 $3.2
20
1H'06 2H'06 1H'07 2H'07 1H'08 2H'08 1H'09
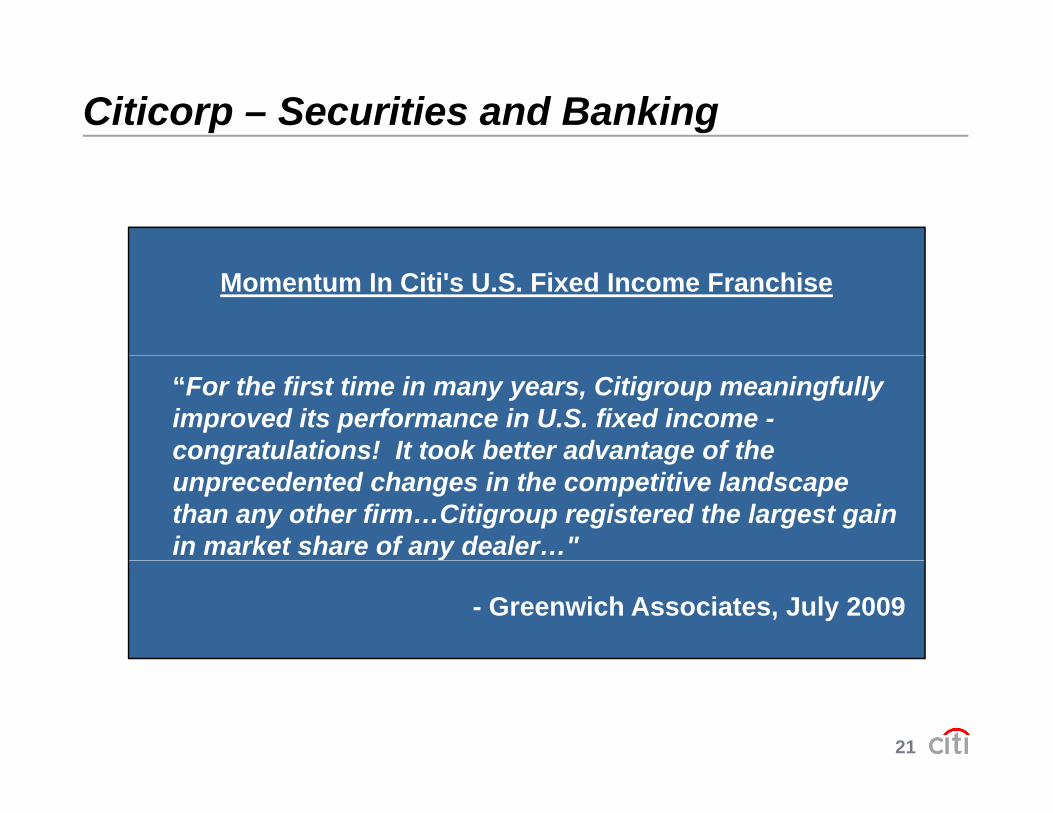
Citicorp – Securities and Banking
Momentum In Citi's U.S. Fixed Income Franchise
“For the first time in many years, Citigroup meaningfully improved its performance in U.S. fixed income -congratulations! It took better advantage of thecongratulations! It took better advantage of the unprecedented changes in the competitive landscape than any other firm…Citigroup registered the largest gain in market share of any dealer…"
- Greenwich Associates, July 2009
21

Citicorp – Regional Consumer Banking
N th
Presence in 38 Countries60% of Revenues(1) from Emerging Markets
EMEANorth
America
Asia
Latin
1H’09 Managed Revenues $14 5B1H’09 Managed
Revenues $14 5B2Q’09 Avg. Managed
Loans $186B2Q’09 Avg. Managed
Loans $186B
America
2Q’09 Avg. Deposits $268B
2Q’09 Avg. Deposits $268BRevenues $14.5BRevenues $14.5B Loans $186BLoans $186B
22%48%
25%
33%47% 33%
51%
$268B$268B
22(1) 1H’09 GAAP Regional Consumer Banking revenues.Note: Managed metrics are non-GAAP measures. Please see slide 39 for additional information on these measures.
5% 5%15%3%
13%

Citicorp – North America Consumer Banking
CardsRetail Banking
1H’09 Managed Revenues: $5.1B
2Q’09 A M d L $80 4B
1H’09 Revenues: $1.8B2Q’09 Avg Loans: $7 2B 2Q’09 Avg. Managed Loans: $80.4B
2Q’09 EOP Open Accounts: 25MM
3rd largest issuer of cards in US
2Q 09 Avg. Loans: $7.2B2Q’09 Avg. Deposits: $135.7BPresence in 9 of top 10 MSAs, skewed towards savers and
23
3rd largest issuer of cards in USinvestors
Note: Managed metrics are non-GAAP measures. Please see slide 39 for additional information on these measures.

Citicorp – International Consumer BankingLargely Focused on Emerging Markets
2Q’09 RCB Net Credit Margin / Avg. Loans (1) 2Q’09 EOP Deposits $135Bn
6.6%
11.3%
$37
$89Citigold: ~53% of deposits
Citigold
$5 $8
$59
EMEA LatAm AsiaN.A. International(2)
$9
Compete across all client and Citigold offering
Mass Market Target Market
Compete across all client and product segments
Main countries include Mexico, Korea, Poland, Taiwan
Citigold offering
Critical mass and branch density in a few key cities
24
Korea, Poland, Taiwan
(1) Net Credit Margin is total revenues net of interest expense, less net credit losses and policy benefits and claims.(2) Managed basis.

Looking Ahead
Profitability
TARP Repayment
T lTalent
25

Citigroup – Net Revenue Marks($B)
(6 6) (6.4)
1.0 0.8 0.8 2.6 2.7
(0.8)0.2
($B)
(17.2)(13.7)
(6.6)(12.1)
(4.9)
(0.3)
(2.9)
( )
(12 9)
(6.9) (3.8)(2.2)
HoldingsCiticorp
Citigroup(16.4)
(12.9)(15.0)
4Q'07 1Q'08 2Q'08 3Q'08 4Q'08 1Q'09 2Q'09
Citigroup
Citi experienced an outsized share of industry mark-to market losses
Significant progress on de levering and de risking the balance sheetSignificant progress on de-levering and de-risking the balance sheet
Key risk exposures(1) have fallen over 50% since their 4Q’07 peak
26
Accretion from prior non-credit marks running at ~$0.5B per quarter
(1) For a list of key risk exposures, see page 19 of the 2Q’09 earnings presentation.

Citigroup – Provisions(1)
($B)
4.27%4.82%
5.60%
($B)
LLR(2)NCLsLLR ratio
4 1 2 84.1
6.6 3.04.31.37% 1.40% 1.64% 2.07% 2.31% 2.78%
3.35%
4.97.7
5.9 7.19.1
12.712.710.3
1.9 1.9 2.5 3.6 3.6 4.3 4.9 6.1 7.3 8.40.9 0.6
2.44.1 2.2 2.8
1Q'07 2Q'07 3Q'07 4Q'07 1Q'08 2Q'08 3Q'08 4Q'08 1Q'09 2Q'09
2.8 2.64.9
$35.9B in allowance for loan losses at the end of 2Q’09
Mortgages main driver of credit costs, but option ARMs are immaterial(3)
Early signs of moderating delinquencies across consumer portfolios
27
(1) Provisions for Credit Losses and for Benefits and Claims. (2) LLR includes policyholder benefits and claims, provisions for unfunded lending commitments, and credit builds/releases. (3) Option ARMs represent less than 0.5% of the total consumer real estate portfolio. Note: Totals may not sum due to rounding.
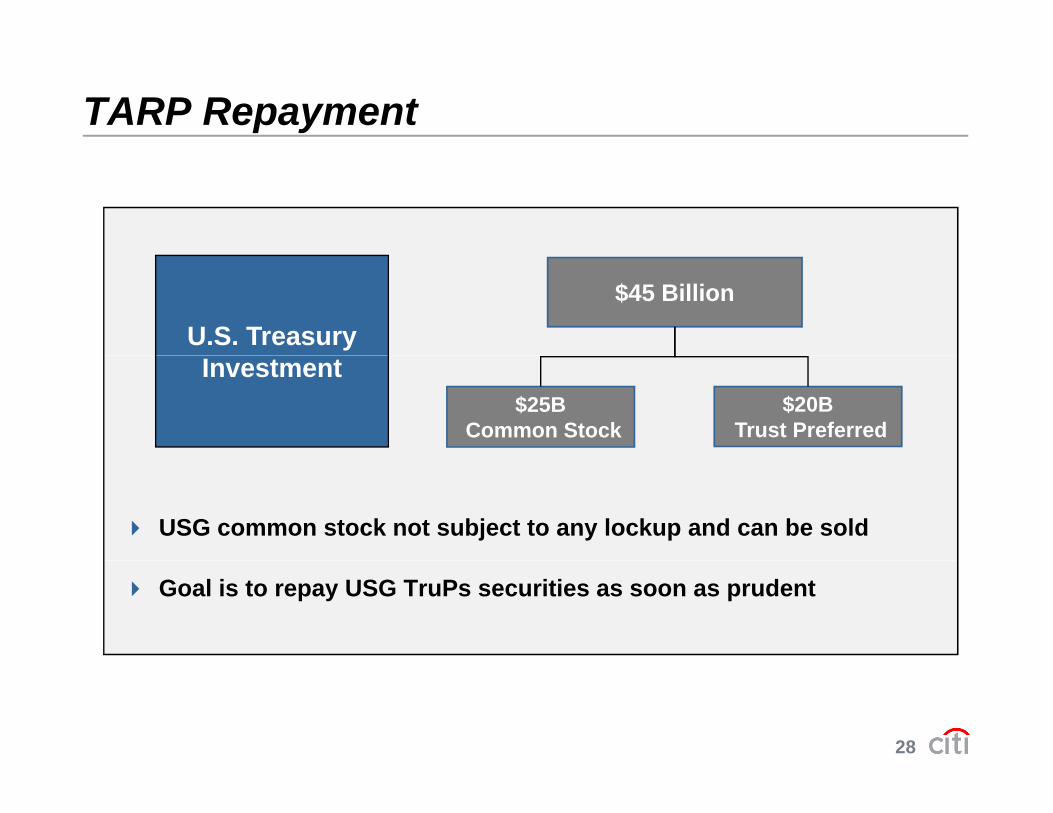
TARP Repayment
U.S. Treasury$45 Billion
Investment$25B
Common Stock$20B
Trust Preferred
USG common stock not subject to any lockup and can be sold
Goal is to repay USG TruPs securities as soon as prudent
28
Wrap-up
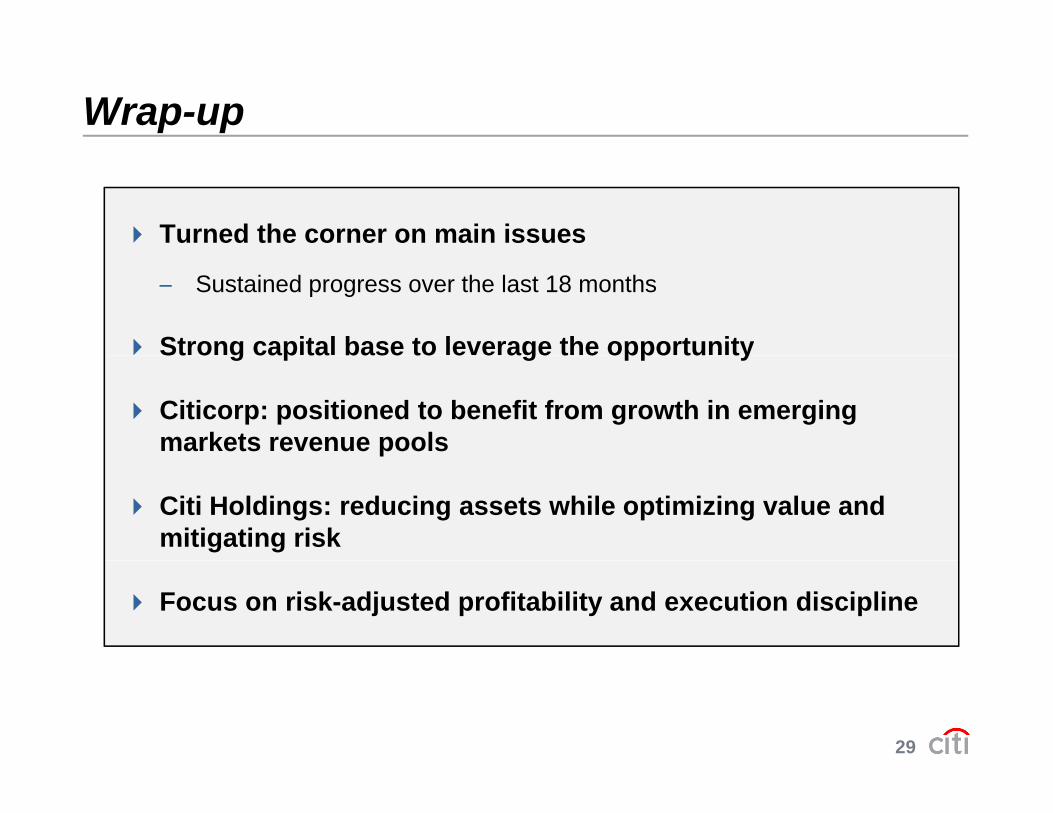
Turned the corner on main issues
– Sustained progress over the last 18 months
Strong capital base to leverage the opportunitySt o g cap ta base to e e age t e oppo tu ty
Citicorp: positioned to benefit from growth in emerging markets revenue pools
Citi Holdings: reducing assets while optimizing value and mitigating risk
Focus on risk-adjusted profitability and execution discipline
29
Barclays Financial Services Conference
Q&AQ

Appendix
31
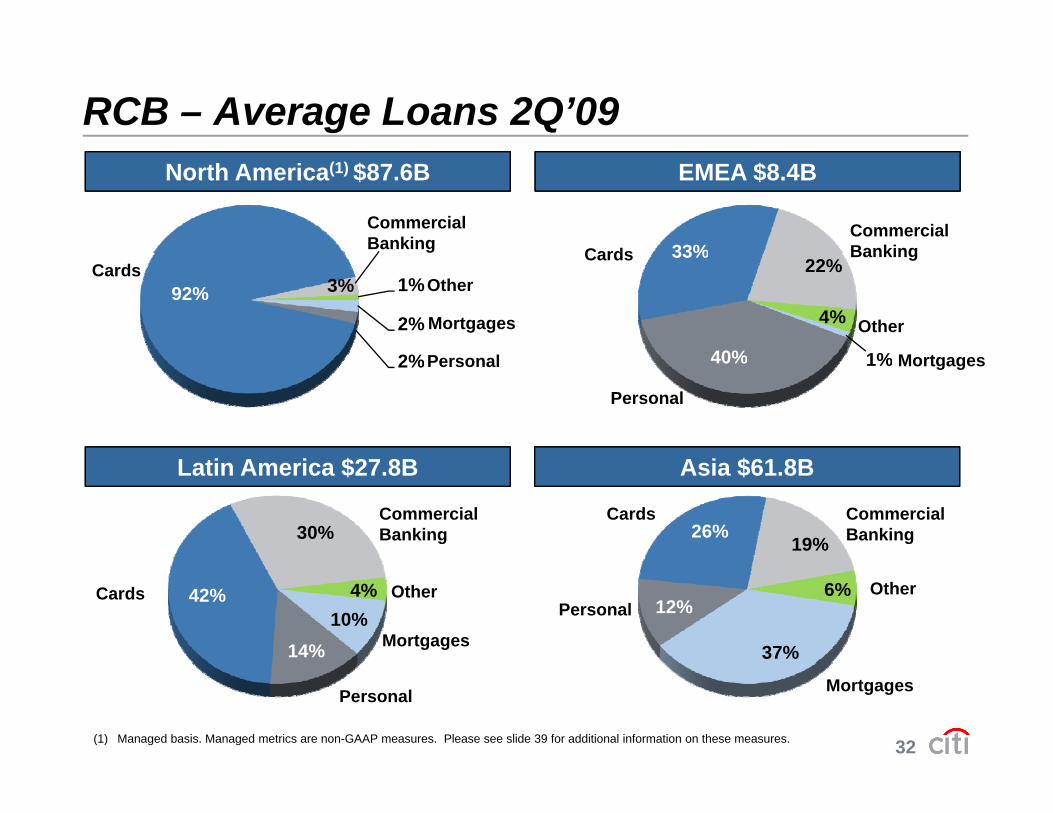
RCB – Average Loans 2Q’09North America(1) $87.6B
Commercial Banking
EMEA $8.4B
33%Commercial BankingCards
2%
2%
92% 3% 1%Other
Mortgages
Cards
P l 1%40%
33%22%
4%
Banking
M t
Cards
Other
2%
$ $
Personal 1%40%
Personal
Mortgages
Latin America $27.8B Asia $61.8B
30% 26%19%
Commercial Banking
CardsCommercial Banking
10%14%
42% 4%
37%
12%6%
PersonalOther
Mortgages
Cards Other
32(1) Managed basis. Managed metrics are non-GAAP measures. Please see slide 39 for additional information on these measures.
MortgagesPersonal

Holdings – LCL Loan Composition
Average % Avg. % of Total 2Q’09 Loans Loans NCL 1H’09 90+
$B Ring-fenced(1) Ratio NCLs DPD%
N.A. Loans $290.4 58% 5.77% 81.4% 5.26%• First mortgages 134.8 66 3.97 24.7 7.90• Second mortgages 56.9 94 7.78 20.4 3.24
$B Ring fenced Ratio NCLs DPD%
• Student 26.6 -- 0.41 0.5 3.24• Cards (Retail Partners) 22.8 6 14.99 18.4 3.71• Personal & Other 20.4 10 11.17 11.4 3.06• Auto 16.8 81 5.68 5.6 1.49• Commercial Real Estate 11.2 93 1.40 0.5 1.57
International $40.4 -- 9.69% 18.6% 3.81%• EMEA 28.3 -- 7.37 9.5 4.37• Asia 11.8 -- 14.88 8.8 2.46• Latin America 0.3 -- 22.56 0.4 2.61
Total $330.8 51% 6.26% 100% 5.08%
33(1) Ring-Fenced refers to the loans covered under the loss-sharing agreement with the U.S. government. Note: Totals may not sum due to rounding.
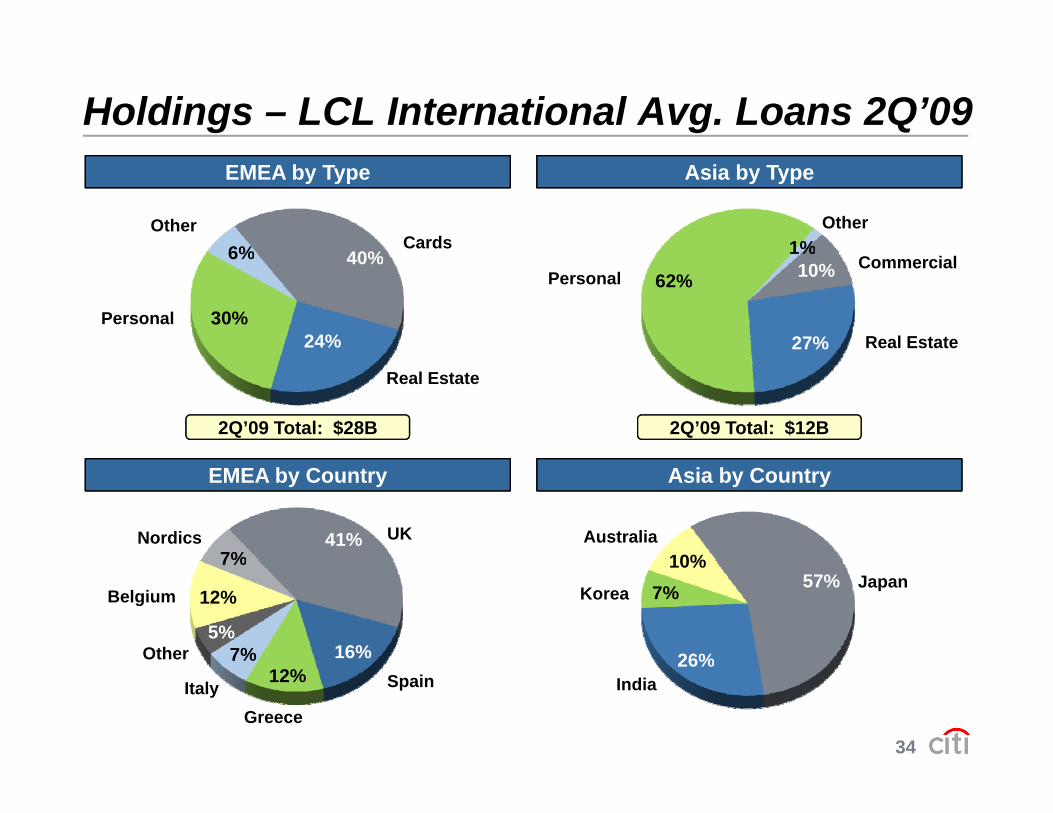
Holdings – LCL International Avg. Loans 2Q’09
40%6%Other
EMEA by Type Asia by Type
Cards 1%Other
40%
24%30%
6%
Personal
10%
27%
62%
1%Commercial
Personal
Real Estate
Real Estate
2Q’09 Total: $28B 2Q’09 Total: $12B
41%7%
UK
Asia by Country
10%Australia
EMEA by Country
Nordics
16%7%5%
12%
7%57%
26%
7%10%
JapanBelgium
Other
Korea
34
12%
Greece
Spain26%
IndiaItaly

Holdings – SAP Assets
Securities at AFS/HTM (2) $64.7 28% $84.3 77%Corporates 17.1 5 17.9 96
Total % of Assets Face Mark (%2Q’09 $B Ring-fenced(1) Value of Face)
Prime and Non-U.S. MBS 16.2 34 21.1 77Auction Rate Securities 8.3 15 11.2 74Alt-A mortgages 9.5 99 18.1 52Government Agencies 6.2 -- 6.1 100Other Securities 7.4 31 9.8 75
Loan leases & LC at HFI/HFS (3) $44 6 NM NM NMLoan, leases & LC at HFI/HFS ( ) $44.6 NM NM NMCorporates 28.2 36 30.1 94Commercial Real Estate 15.8 62 17.2 92Other 4.7 -- 5.0 95Loan Loss Reserves (4.1) NM NM NM
Mark to Market $42.1 10% NM NMSSubprime securities 8.0 -- 24.5 32Other Securities 8.4 8 31.5 27Derivatives 10.8 -- NM NMLoans, Leases and Letters of Credit 7.8 32 13.1 59Repurchase agreements 7.3 -- NM NM
Highly Lev Fin Commitments $4 6 28% $8 1 57%Highly Lev. Fin. Commitments $4.6 28% $8.1 57%Equities (excludes ARS and AFS) 13.8 -- NM NMSIVs 16.2 37 21.3 76Monolines 1.7 -- NM NMConsumer and Other (4) 13.2 NM NM NM
35(1) Ring-Fenced Assets refers to the assets covered under the loss-sharing agreement with the U.S. government. (2) AFS accounts for approximately 1/3 of the total. (3) HFS accounts for approximately $1.37B of the total. (4) Includes $6.1B of Small Business Banking & Finance loans.Note: Totals may not sum due to rounding.
Total $201.0

Holdings – SIV Assets
2Q’09 Total Average Credit Quality(1) %$B AAA/AA A/B C/Other of Face
Financial Inst. Debt $6.3 14% 25% 0% 76%
Structured FinanceMBS 3 4 15 4 2 69MBS 3.4 15 4 2 69CBOs/CLOs/CDOs 1.0 3 3 -- 61CMBS 1.1 6 0 -- 88
Student loans 2.4 15 -- -- 88
Credit Cards 1.4 9 -- -- 93
Others 0.6 1 1 1 68Total Structured Finance $9.9 49% 8% 4% 77%
Total $16.2 63% 33% 4% 76%
(1) Credit ratings based on Moody’s ratings of the book values of credit exposures, including credit derivatives, as of June 30, 2009.
36
( ) g y g p g
Note: The SIVs had no direct exposure to U.S. subprime assets and had approximately $21 million of indirect exposure to subprime assets through CDOs. In order to complete the wind-down of the Structured Investment Vehicles (SIVs), Citi purchased the assets that remained in the SIVs at fair value, with a trade date of November 18, 2008. Totals may not sum due to rounding.
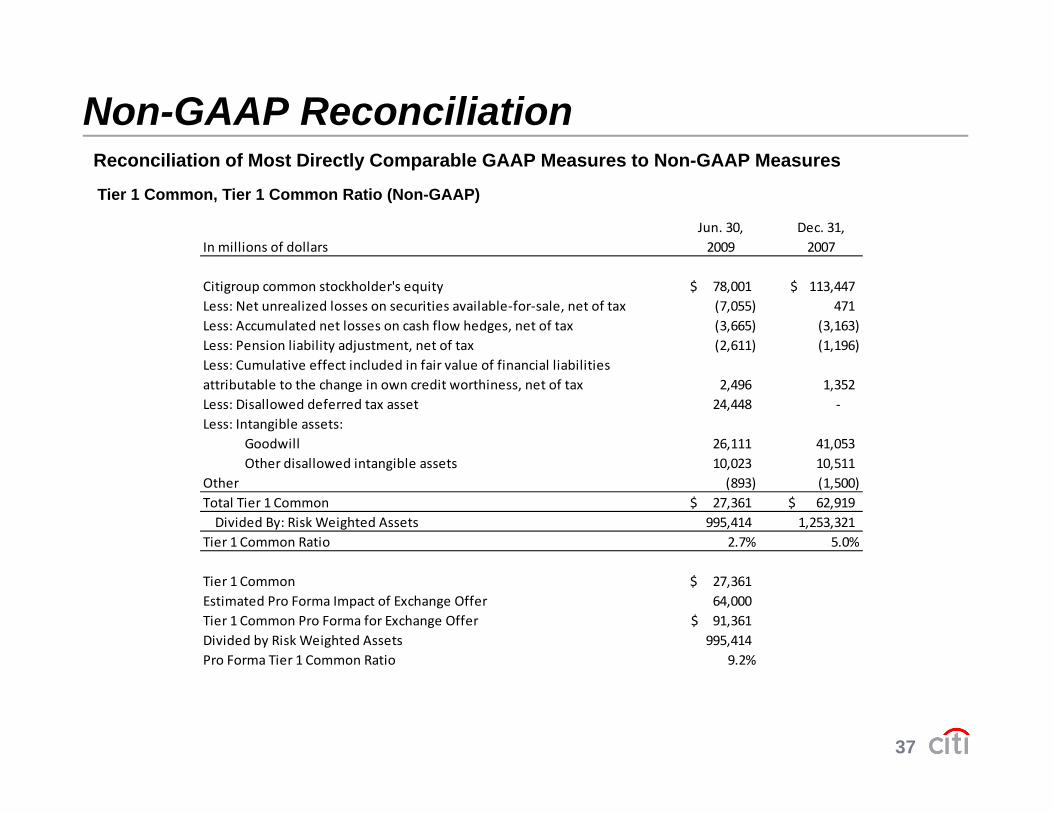
Non-GAAP ReconciliationReconciliation of Most Directly Comparable GAAP Measures to Non-GAAP Measures
Tier 1 Common, Tier 1 Common Ratio (Non-GAAP)
In millions of dollarsJun. 30, 2009
Dec. 31, 2007
Citigroup common stockholder's equity 78,001$ 113,447$ Less: Net unrealized losses on securities available‐for‐sale, net of tax (7,055) 471 Less: Accumulated net losses on cash flow hedges, net of tax (3,665) (3,163) Less: Pension liability adjustment, net of tax (2,611) (1,196) Less: Cumulative effect included in fair value of financial liabilities attributable to the change in own credit worthiness, net of tax 2,496 1,352 Less: Disallowed deferred tax asset 24,448 ‐ Less: Intangible assets: Goodwill 26,111 41,053
h d ll d bl Other disallowed intangible assets 10,023 10,511 Other (893) (1,500) Total Tier 1 Common 27,361$ 62,919$ Divided By: Risk Weighted Assets 995,414 1,253,321 Tier 1 Common Ratio 2.7% 5.0%
Tier 1 Common 27,361$ Estimated Pro Forma Impact of Exchange Offer 64,000 Tier 1 Common Pro Forma for Exchange Offer 91,361$ Divided by Risk Weighted Assets 995,414 Pro Forma Tier 1 Common Ratio 9.2%
37
Pro Forma Tier 1 Common Ratio 9.2%

R ili ti f M t Di tl C bl GAAP M t N GAAP M
Non-GAAP ReconciliationReconciliation of Most Directly Comparable GAAP Measures to Non-GAAP MeasuresTangible Common Equity, Tangible Book Value per Share (Non-GAAP)
In millions of dollars (except book value per share) Jun. 30, 2009
Total Citigroup Stockholders' Equity 152,302$ g p q y ,$Less: Preferred Stock 74,301 Common Equity 78,001 Less: Goodwill ‐ as reported 25,578 Intangible Assets (other than MSRs) ‐ as reported 10,098
Goodwill and Intangible Assets ‐ Recorded as Assets of Discontinued Operations Held for Sale 3,618 Less: Related Net Deferred Tax Liabilities 1,296
Tangible Common Equity (TCE) 40,003$
Approximate increase to Common Equity and TCE from the Exchange Offer 60 000$Approximate increase to Common Equity and TCE from the Exchange Offer 60,000$
Approximate TCE (reflecting the impact of the Exchange Offer) 100,003$
Approximate Common Equity (reflecting the impact of the Exchange Offer) 138,001$
Common Shares Outstanding at June 30, 2009 ‐‐ As Reported 5,508
A i t i t C Sh O t t di f th E h Off 17 372Approximate increase to Common Shares Outstanding from the Exchange Offer 17,372
Approximate Common Shares Outstanding (reflecting the impact of the Exchange Offer) 22,880
Book Value per Common Share at June 30, 2009 ‐ As Reported 14.16$
Approximate Book Value per Common Share at June 30, 2009 ‐ Reflecting the Exchange Offer 6.03$
38
Tangible Book Value per Common Share at June 30, 2009 7.26$
Approximate Tangible Book Value per Common Share at June 30, 2009 ‐ Reflecting the Exchange Offer 4.37$

Non-GAAP ReconciliationReconciliation of Most Directly Comparable GAAP Measures to Non-GAAP Measures
Managed Revenues (Non-GAAP)
In billions of dollars 1H'09 FY 2008 FY 2007 FY 2006GAAP RevenuesCiticorp 35.5$ 60.6$ 60.1$ 50.3$ Citi Holdings 19.2 (6.7) 19.5 37.9 Corporate/Other (0.2) (2.3) (2.3) (1.9) Total Citigroup 54.5$ 51.6$ 77.3$ 86.3$
Impact of SecuritizationCiticorp 3.1$ 5.7$ 2.5$ 2.5$ Citi Holdings 2.5 3.9 1.7 0.8 Total Citigroup 5.6$ 9.6$ 4.2$ 3.3$
Managed Revenues Citicorp 38.7$ 66.3$ 62.6$ 52.8$ Citi Holdings 21.7 (2.8) 21.2 38.7 Corporate/Other (0.2) (2.3) (2.3) (1.9) Total Citigroup 60.1$ 61.2$ 81.5$ 89.7$
North America RCB Average Managed Loans (Non-GAAP)
In billions of dollarsJun. 30, 2009
GAAP Average Loans 18 9$
39
GAAP Average Loans 18.9$ Impact of Securitization 68.7 Average Managed Loans 87.6$
Certain statements in this document are “forward-looking
statements” within the meaning of the Private Securities Litigation
Reform Act. These statements are based on management’s
current expectations and are subject to uncertainty and changes in
circumstances. Actual results may differ materially from those y y
included in these statements due to a variety of factors. More
information about these factors is contained in Citigroup’s filingsinformation about these factors is contained in Citigroup s filings
with the U.S. Securities and Exchange Commission.
40
Related Documents