This slide is part of a presentation by Morgan Stanley and is intended to be viewed as part of that presentation. The presentation is based on information generally available to the public and does not contain any material, non-public information. The presentation has not been updated since it was originally presented. Barclays Capital Financial Services Conference Ruth Porat, Executive Vice President and Chief Financial Officer September 11, 2012

Welcome message from author
This document is posted to help you gain knowledge. Please leave a comment to let me know what you think about it! Share it to your friends and learn new things together.
Transcript

This slide is part of a presentation by Morgan Stanley and is intended to be viewed as part of that presentation. The presentation is based on information generally available to the public and does not contain any material, non-public information. The presentation has not been updated since it was originally presented.
Barclays Capital Financial Services Conference
Ruth Porat, Executive Vice President andChief Financial Officer
September 11, 2012
EPS\Internal\Amanda Smith - 602237062 9/11/2012
This slide is part of a presentation by Morgan Stanley and is intended to be viewed as part of that presentation. The presentation is based on information generally available to the public and does not contain any material, non-public information. The presentation has not been updated since it was originally presented.
2
Notice
The information provided herein may include certain non-GAAP financial measures. The reconciliation of such measures to the comparable GAAP figures are included in the Company’s Annual Report on Form 10-K, Quarterly Reports on Form 10-Q and the Company’s Current Reports on Form 8-K, as applicable, including any amendments thereto, which are available on www.morganstanley.com.
This presentation may contain forward-looking statements. You are cautioned not to place undue reliance on forward-looking statements, which speak only as of the date on which they are made, which reflect management’s current estimates, projections, expectations or beliefs and which are subject to risks and uncertainties that may cause actual results to differ materially. For a discussion of risks and uncertainties that may affect the future results of the Company, please see the Company’s Annual Report on Form 10-K, the Company’s Quarterly Reports on Form 10-Q and the Company’s Current Reports on Form 8-K, as applicable, including any amendments thereto. This presentation is not an offer to buy or sell any security.
Please note this presentation is available at www.morganstanley.com.
EPS\Internal\Amanda Smith - 602237062 9/11/2012
This slide is part of a presentation by Morgan Stanley and is intended to be viewed as part of that presentation. The presentation is based on information generally available to the public and does not contain any material, non-public information. The presentation has not been updated since it was originally presented.
3
11%16%
39%
48%
50%31%
0%5%
2007 1H 2012
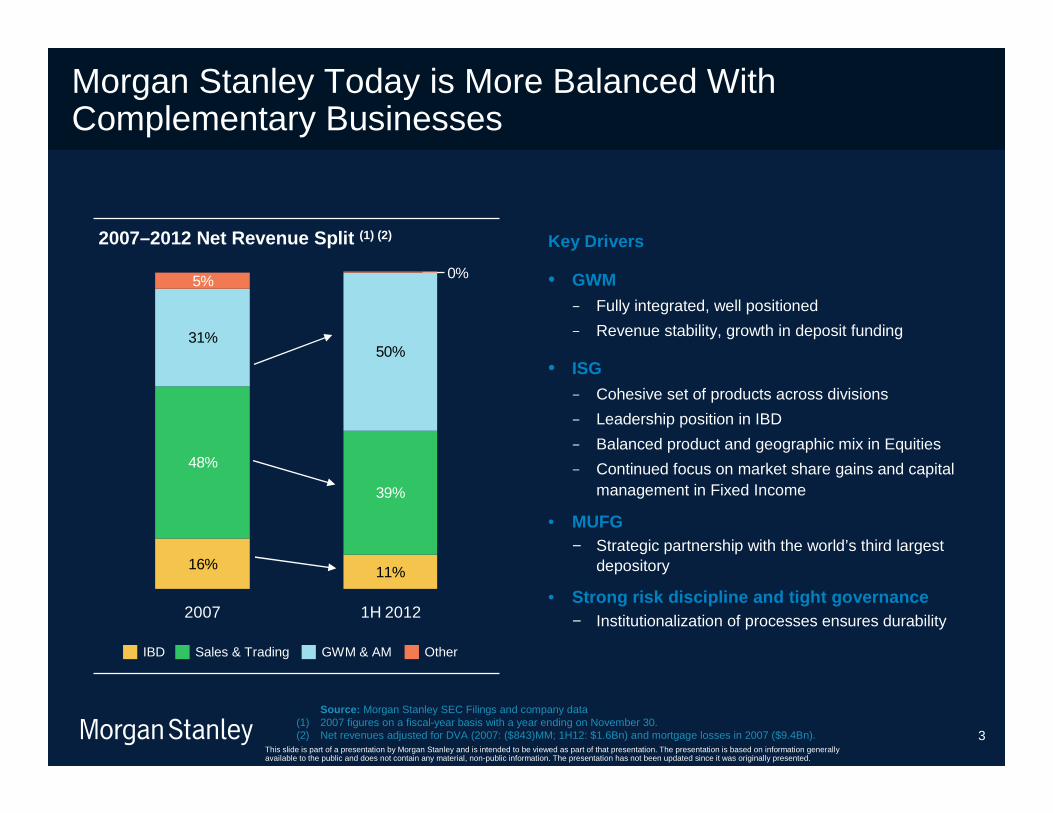
Morgan Stanley Today is More Balanced With Complementary Businesses
IBD GWM & AMSales & Trading
2007–2012 Net Revenue Split (1) (2)
Source: Morgan Stanley SEC Filings and company data(1) 2007 figures on a fiscal-year basis with a year ending on November 30. (2) Net revenues adjusted for DVA (2007: ($843)MM; 1H12: $1.6Bn) and mortgage losses in 2007 ($9.4Bn).
Other
Key Drivers
• GWM− Fully integrated, well positioned
− Revenue stability, growth in deposit funding
• ISG− Cohesive set of products across divisions
− Leadership position in IBD
− Balanced product and geographic mix in Equities
− Continued focus on market share gains and capital management in Fixed Income
• MUFG − Strategic partnership with the world’s third largest
depository
• Strong risk discipline and tight governance− Institutionalization of processes ensures durability
EPS\Internal\Amanda Smith - 602237062 9/11/2012
This slide is part of a presentation by Morgan Stanley and is intended to be viewed as part of that presentation. The presentation is based on information generally available to the public and does not contain any material, non-public information. The presentation has not been updated since it was originally presented.
4
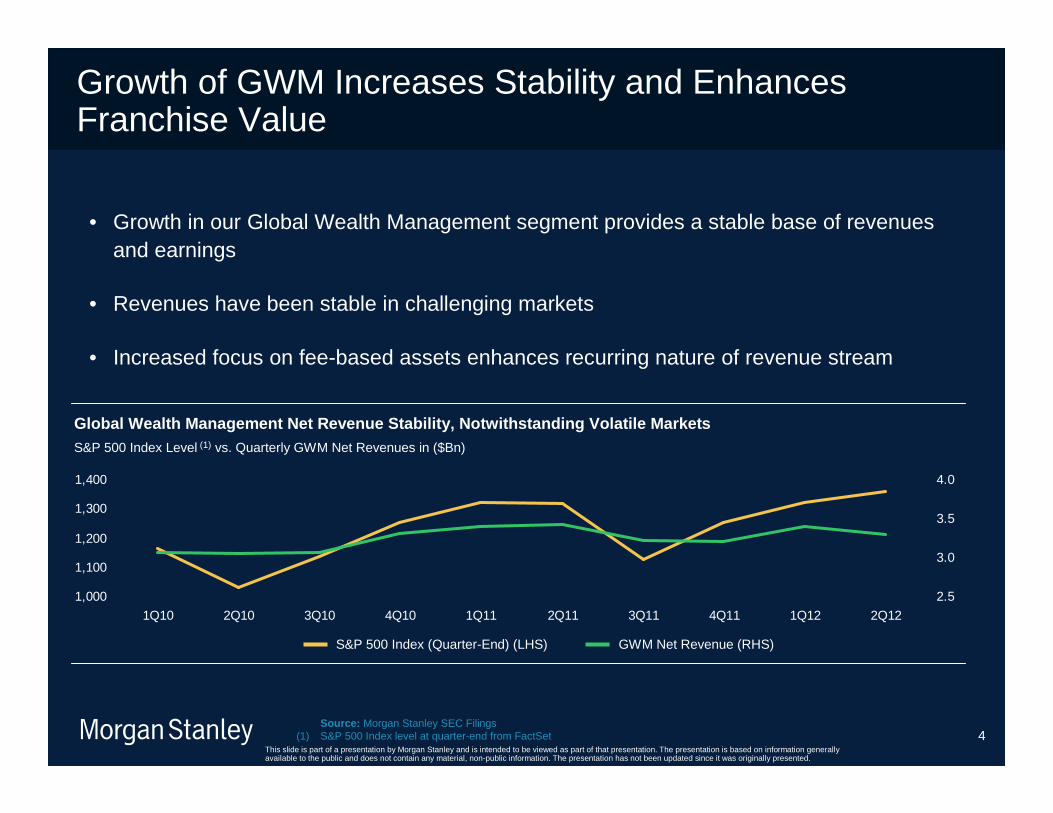
Growth of GWM Increases Stability and Enhances Franchise Value
Global Wealth Management Net Revenue Stability, Not withstanding Volatile MarketsS&P 500 Index Level (1) vs. Quarterly GWM Net Revenues in ($Bn)
1,000
1,100
1,200
1,300
1,400
1Q10 2Q10 3Q10 4Q10 1Q11 2Q11 3Q11 4Q11 1Q12 2Q12
2.5
3.0
3.5
4.0
GWM Net Revenue (RHS)S&P 500 Index (Quarter-End) (LHS)
• Growth in our Global Wealth Management segment provides a stable base of revenues and earnings
• Revenues have been stable in challenging markets
• Increased focus on fee-based assets enhances recurring nature of revenue stream
Source: Morgan Stanley SEC Filings(1) S&P 500 Index level at quarter-end from FactSet
EPS\Internal\Amanda Smith - 602237062 9/11/2012
This slide is part of a presentation by Morgan Stanley and is intended to be viewed as part of that presentation. The presentation is based on information generally available to the public and does not contain any material, non-public information. The presentation has not been updated since it was originally presented.
5
1 2 3 4 5
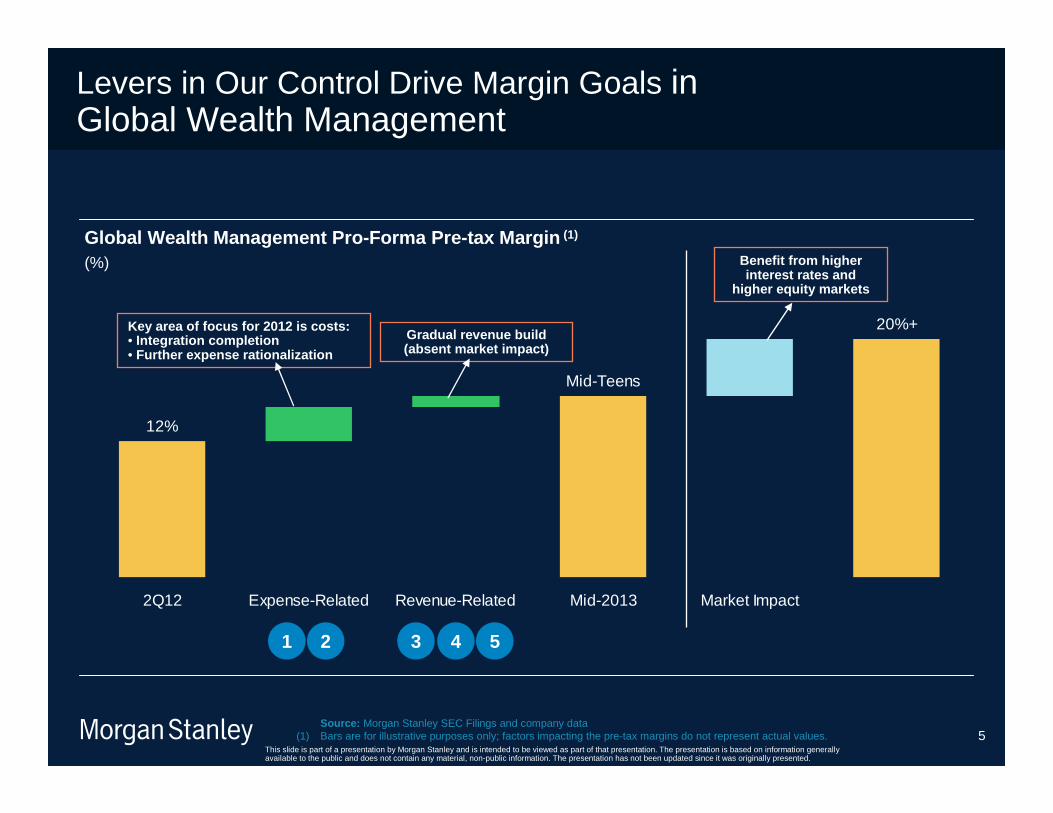
Levers in Our Control Drive Margin Goals in Global Wealth Management
Global Wealth Management Pro-Forma Pre-tax Margin (1)
(%)
12%
Mid-Teens
20%+
2Q12 Expense-Related Revenue-Related Mid-2013 Market Impact
Benefit from higher interest rates and
higher equity markets
Source: Morgan Stanley SEC Filings and company data(1) Bars are for illustrative purposes only; factors impacting the pre-tax margins do not represent actual values.
Key area of focus for 2012 is costs:• Integration completion• Further expense rationalization
Gradual revenue build (absent market impact)
EPS\Internal\Amanda Smith - 602237062 9/11/2012
This slide is part of a presentation by Morgan Stanley and is intended to be viewed as part of that presentation. The presentation is based on information generally available to the public and does not contain any material, non-public information. The presentation has not been updated since it was originally presented.
6
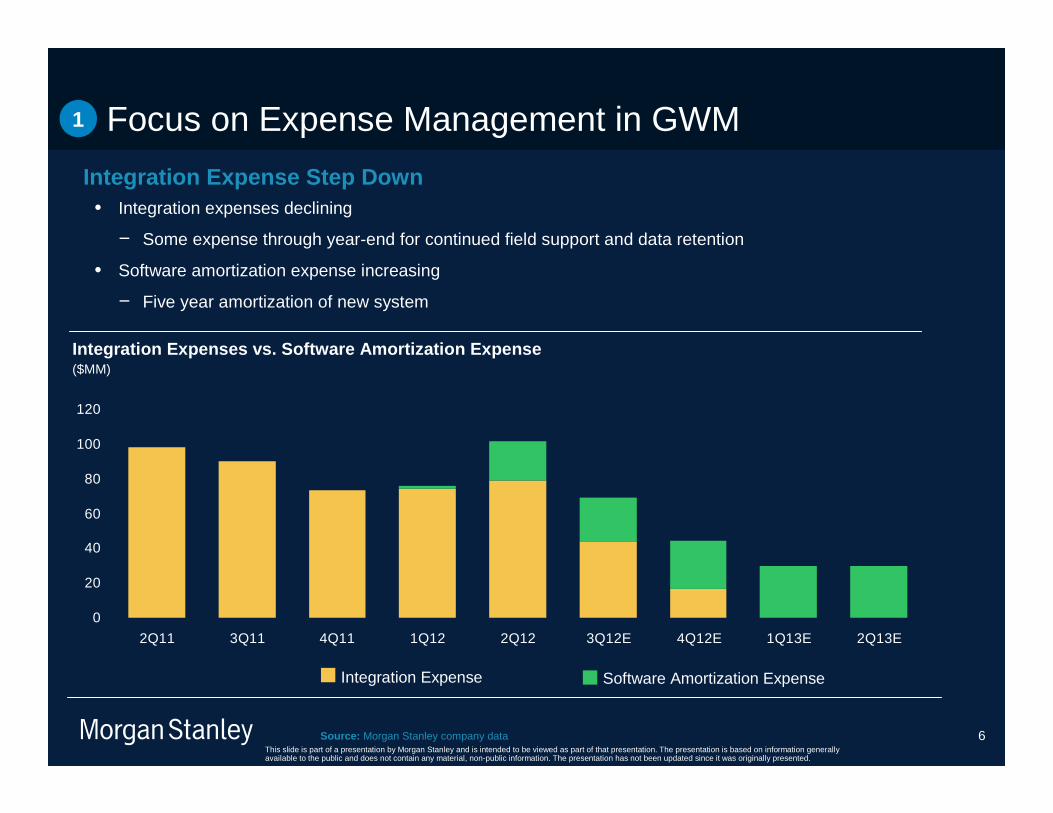
Integration Expense Step Down
0
20
40
60
80
100
120
2Q11 3Q11 4Q11 1Q12 2Q12 3Q12E 4Q12E 1Q13E 2Q13E
Focus on Expense Management in GWM
Integration Expenses vs. Software Amortization Expe nse ($MM)
1
Integration Expense Software Amortization Expense
• Integration expenses declining
− Some expense through year-end for continued field support and data retention
• Software amortization expense increasing
− Five year amortization of new system
Source: Morgan Stanley company data
EPS\Internal\Amanda Smith - 602237062 9/11/2012
This slide is part of a presentation by Morgan Stanley and is intended to be viewed as part of that presentation. The presentation is based on information generally available to the public and does not contain any material, non-public information. The presentation has not been updated since it was originally presented.
7
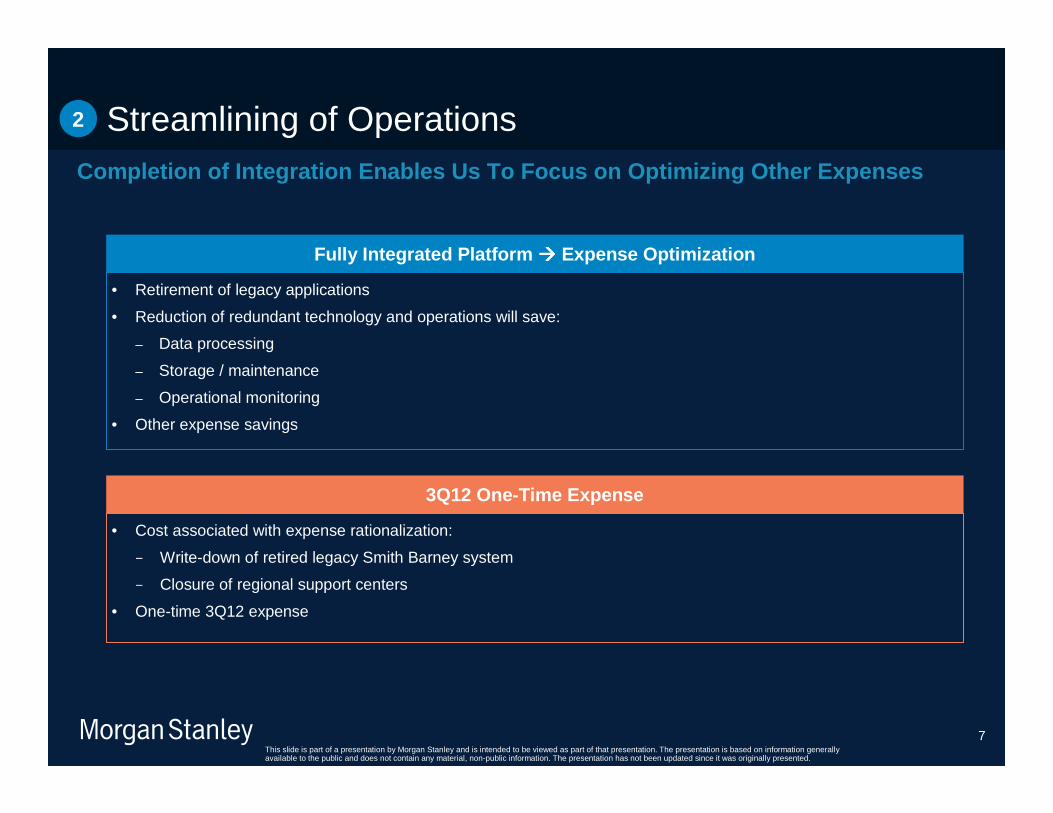
• Cost associated with expense rationalization:
− Write-down of retired legacy Smith Barney system
− Closure of regional support centers
• One-time 3Q12 expense
3Q12 One-Time Expense
• Retirement of legacy applications
• Reduction of redundant technology and operations will save:
– Data processing
– Storage / maintenance
– Operational monitoring
• Other expense savings
Fully Integrated Platform ���� Expense Optimization
Streamlining of OperationsCompletion of Integration Enables Us To Focus on Op timizing Other Expenses
2
EPS\Internal\Amanda Smith - 602237062 9/11/2012
This slide is part of a presentation by Morgan Stanley and is intended to be viewed as part of that presentation. The presentation is based on information generally available to the public and does not contain any material, non-public information. The presentation has not been updated since it was originally presented.
8
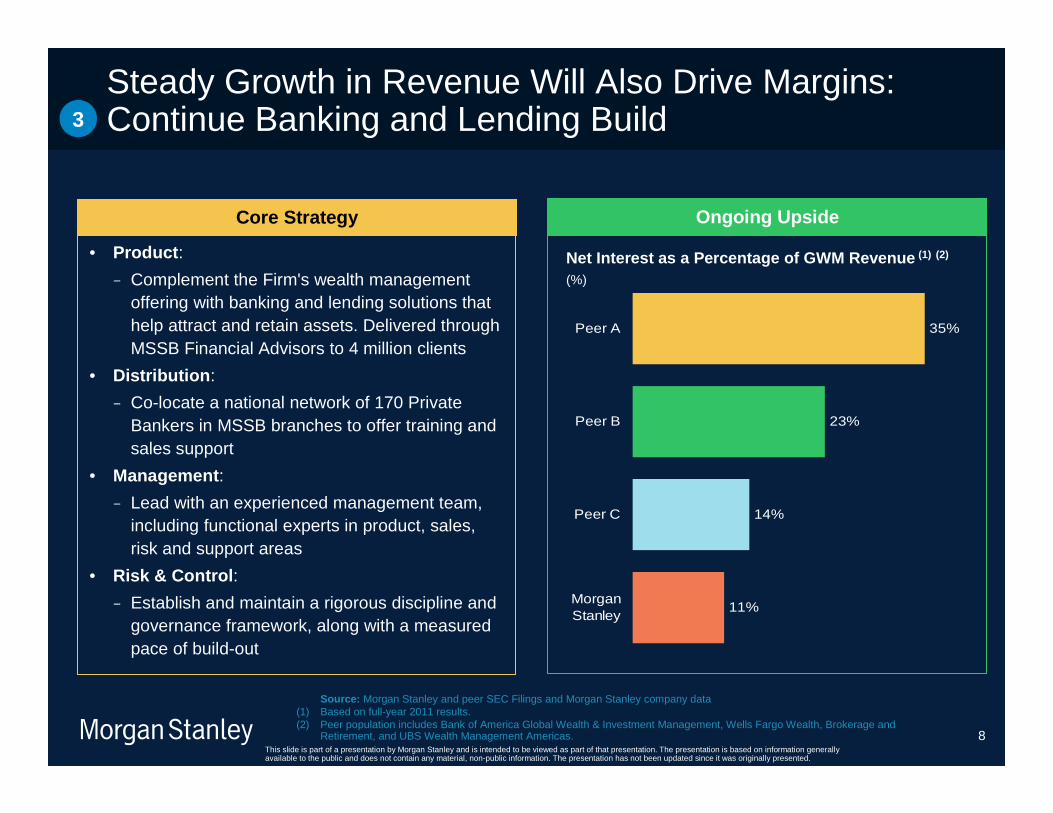
Steady Growth in Revenue Will Also Drive Margins: Continue Banking and Lending Build3
• Product :
− Complement the Firm's wealth management offering with banking and lending solutions that help attract and retain assets. Delivered through MSSB Financial Advisors to 4 million clients
• Distribution :
− Co-locate a national network of 170 Private Bankers in MSSB branches to offer training and sales support
• Management :
− Lead with an experienced management team, including functional experts in product, sales, risk and support areas
• Risk & Control :
− Establish and maintain a rigorous discipline and governance framework, along with a measured pace of build-out
Core Strategy
11%
14%
23%
35%
MorganStanley
Peer C
Peer B
Peer A
Ongoing Upside
Source: Morgan Stanley and peer SEC Filings and Morgan Stanley company data(1) Based on full-year 2011 results.(2) Peer population includes Bank of America Global Wealth & Investment Management, Wells Fargo Wealth, Brokerage and
Retirement, and UBS Wealth Management Americas.
Net Interest as a Percentage of GWM Revenue (1) (2)
(%)
EPS\Internal\Amanda Smith - 602237062 9/11/2012
This slide is part of a presentation by Morgan Stanley and is intended to be viewed as part of that presentation. The presentation is based on information generally available to the public and does not contain any material, non-public information. The presentation has not been updated since it was originally presented.
9
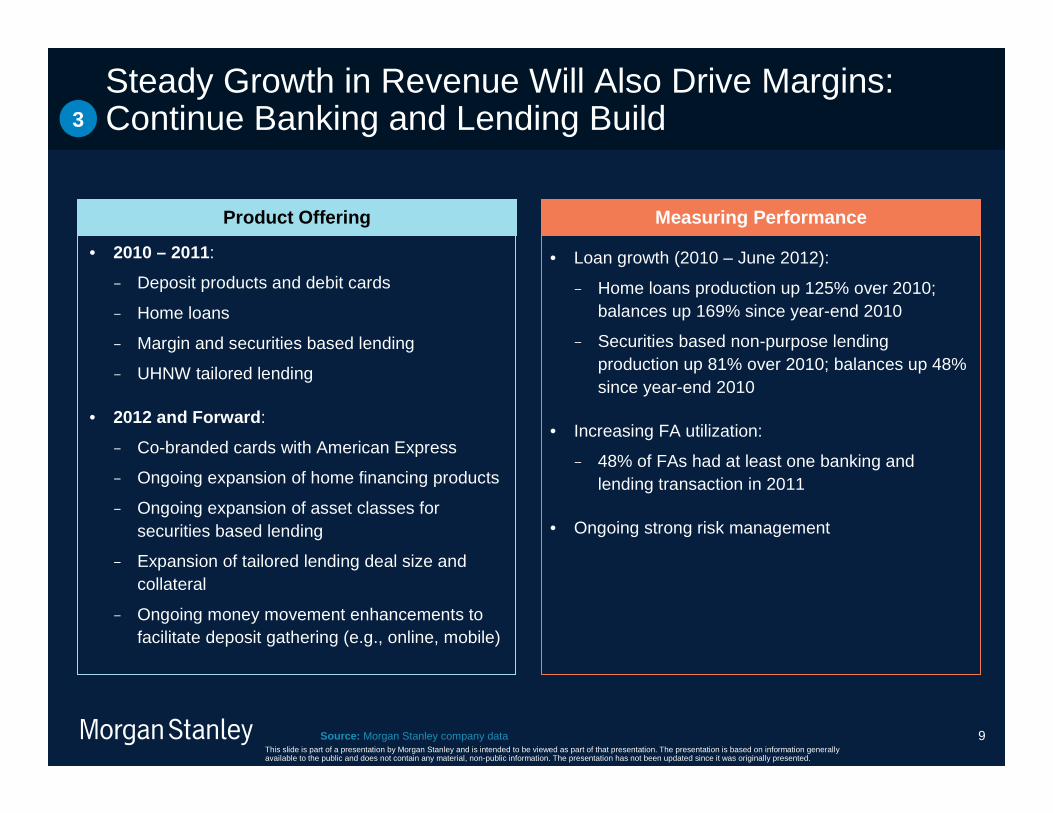
Steady Growth in Revenue Will Also Drive Margins: Continue Banking and Lending Build
Source: Morgan Stanley company data
• Loan growth (2010 – June 2012):
− Home loans production up 125% over 2010; balances up 169% since year-end 2010
− Securities based non-purpose lending production up 81% over 2010; balances up 48% since year-end 2010
• Increasing FA utilization:
− 48% of FAs had at least one banking and lending transaction in 2011
• Ongoing strong risk management
Measuring Performance
• 2010 – 2011:
− Deposit products and debit cards
− Home loans
− Margin and securities based lending
− UHNW tailored lending
• 2012 and Forward :
− Co-branded cards with American Express
− Ongoing expansion of home financing products
− Ongoing expansion of asset classes for securities based lending
− Expansion of tailored lending deal size and collateral
− Ongoing money movement enhancements to facilitate deposit gathering (e.g., online, mobile)
Product Offering
3
EPS\Internal\Amanda Smith - 602237062 9/11/2012
This slide is part of a presentation by Morgan Stanley and is intended to be viewed as part of that presentation. The presentation is based on information generally available to the public and does not contain any material, non-public information. The presentation has not been updated since it was originally presented.
10
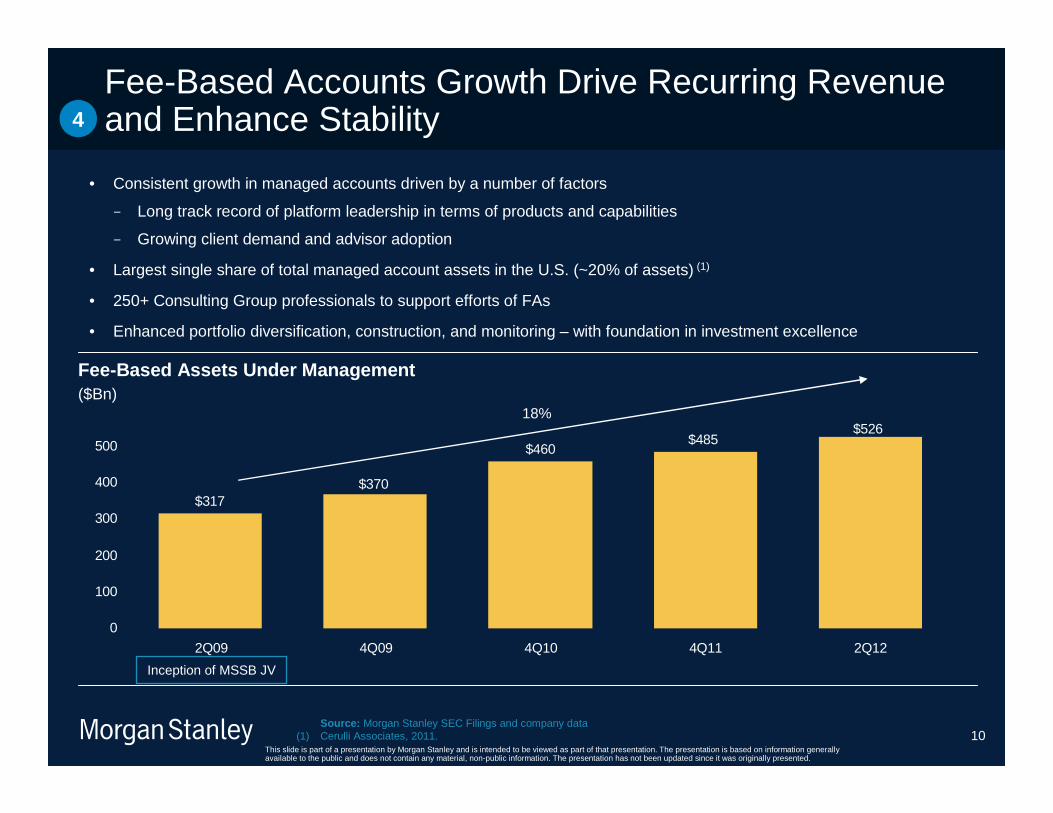
Fee-Based Accounts Growth Drive Recurring Revenue and Enhance Stability
$526$485
$460
$370$317
0
100
200
300
400
500
2Q09 4Q09 4Q10 4Q11 2Q12
Fee-Based Assets Under Management($Bn)
• Consistent growth in managed accounts driven by a number of factors
− Long track record of platform leadership in terms of products and capabilities
− Growing client demand and advisor adoption
• Largest single share of total managed account assets in the U.S. (~20% of assets) (1)
• 250+ Consulting Group professionals to support efforts of FAs
• Enhanced portfolio diversification, construction, and monitoring – with foundation in investment excellence
18%
Inception of MSSB JV
Source: Morgan Stanley SEC Filings and company data(1) Cerulli Associates, 2011.
4
EPS\Internal\Amanda Smith - 602237062 9/11/2012
This slide is part of a presentation by Morgan Stanley and is intended to be viewed as part of that presentation. The presentation is based on information generally available to the public and does not contain any material, non-public information. The presentation has not been updated since it was originally presented.
11
Effective Collaboration With Institutional Businesses5
EPS\Internal\Amanda Smith - 602237062 9/11/2012
This slide is part of a presentation by Morgan Stanley and is intended to be viewed as part of that presentation. The presentation is based on information generally available to the public and does not contain any material, non-public information. The presentation has not been updated since it was originally presented.
12
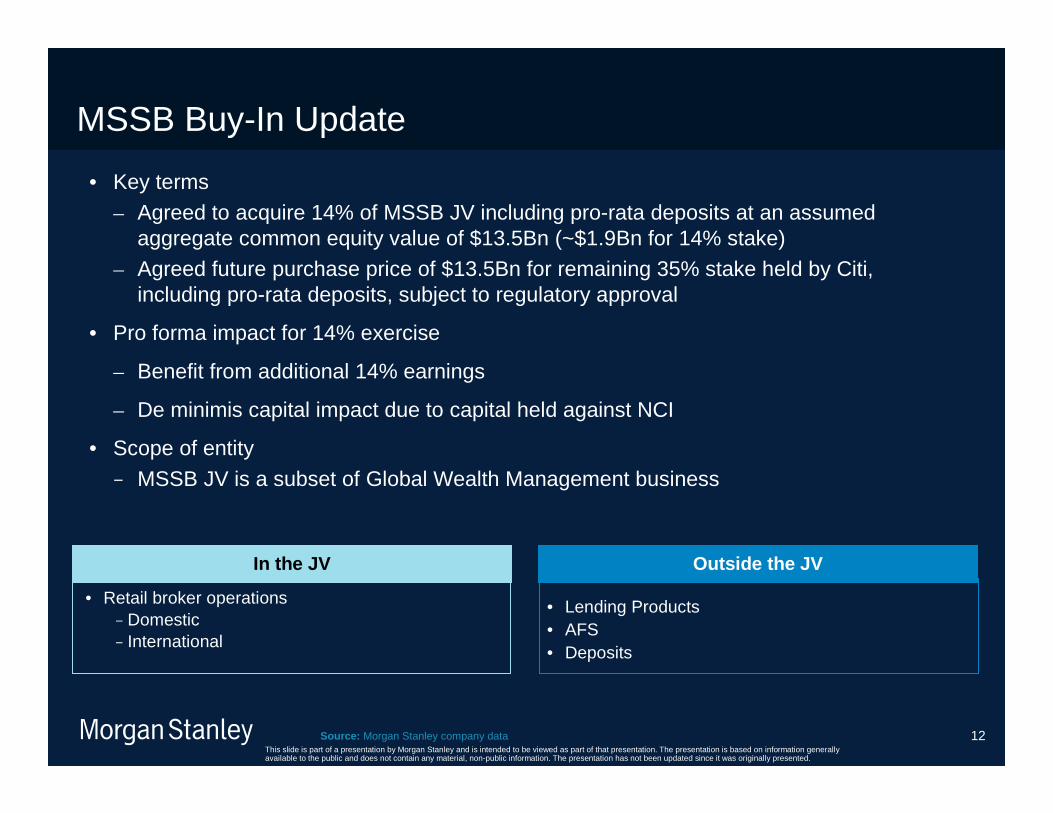
MSSB Buy-In Update
• Key terms– Agreed to acquire 14% of MSSB JV including pro-rata deposits at an assumed
aggregate common equity value of $13.5Bn (~$1.9Bn for 14% stake)– Agreed future purchase price of $13.5Bn for remaining 35% stake held by Citi,
including pro-rata deposits, subject to regulatory approval
• Pro forma impact for 14% exercise
– Benefit from additional 14% earnings
– De minimis capital impact due to capital held against NCI
• Scope of entity
− MSSB JV is a subset of Global Wealth Management business
• Lending Products• AFS• Deposits
Outside the JV
• Retail broker operations− Domestic− International
In the JV
Source: Morgan Stanley company data
EPS\Internal\Amanda Smith - 602237062 9/11/2012
This slide is part of a presentation by Morgan Stanley and is intended to be viewed as part of that presentation. The presentation is based on information generally available to the public and does not contain any material, non-public information. The presentation has not been updated since it was originally presented.
13
Cohesive Product Suite in Institutional Securities
A • Cross-asset class focus enhances insight and execution
B • Operating leverage benefits from technology
C • Ongoing capital optimization is long-term accretive
Institutional Securities: Leading position in Inves tment Banking, Equities, Commodities and Credit Products and momentum in Rat es and FX from more broadly leveraging our technology investments
EPS\Internal\Amanda Smith - 602237062 9/11/2012
This slide is part of a presentation by Morgan Stanley and is intended to be viewed as part of that presentation. The presentation is based on information generally available to the public and does not contain any material, non-public information. The presentation has not been updated since it was originally presented.
14
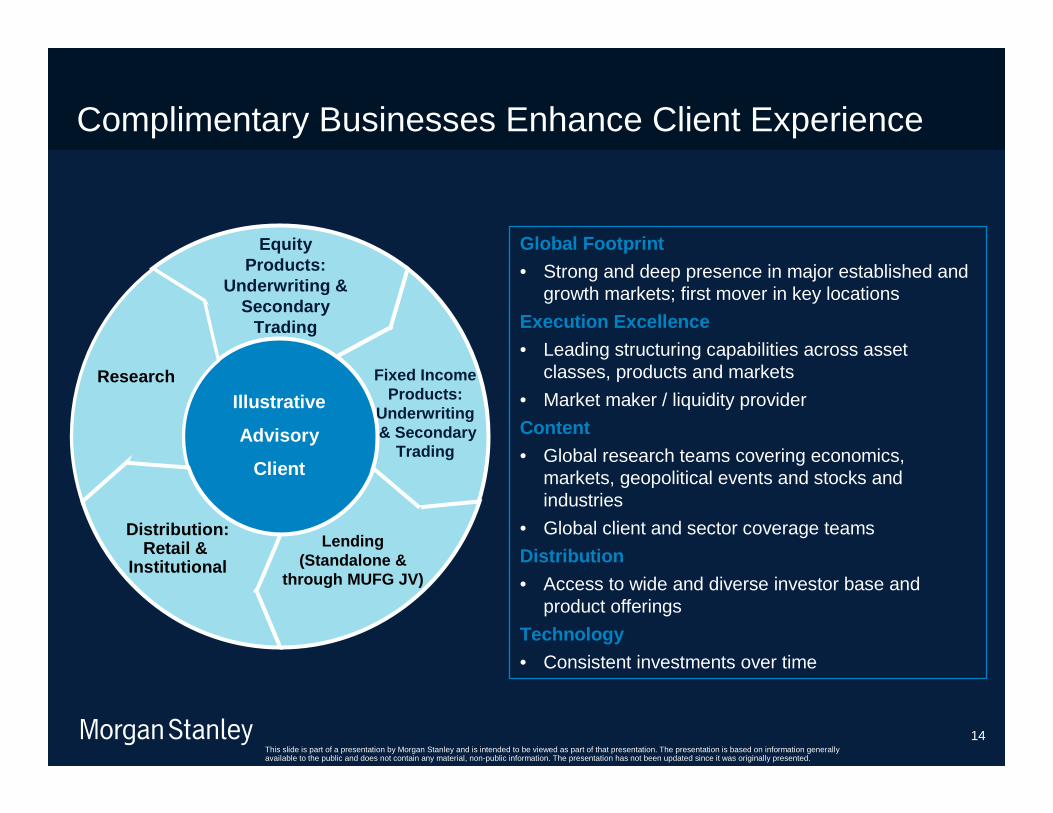
Complimentary Businesses Enhance Client Experience
Global Footprint
• Strong and deep presence in major established and growth markets; first mover in key locations
Execution Excellence
• Leading structuring capabilities across asset classes, products and markets
• Market maker / liquidity provider
Content
• Global research teams covering economics, markets, geopolitical events and stocks and industries
• Global client and sector coverage teams
Distribution
• Access to wide and diverse investor base and product offerings
Technology
• Consistent investments over time
Lending(Standalone &
through MUFG JV)
Distribution: Retail &
Institutional
Equity Products:
Underwriting & Secondary
Trading
Illustrative
Advisory
Client
Fixed IncomeProducts:
Underwriting& Secondary
Trading
Research
EPS\Internal\Amanda Smith - 602237062 9/11/2012
This slide is part of a presentation by Morgan Stanley and is intended to be viewed as part of that presentation. The presentation is based on information generally available to the public and does not contain any material, non-public information. The presentation has not been updated since it was originally presented.
15
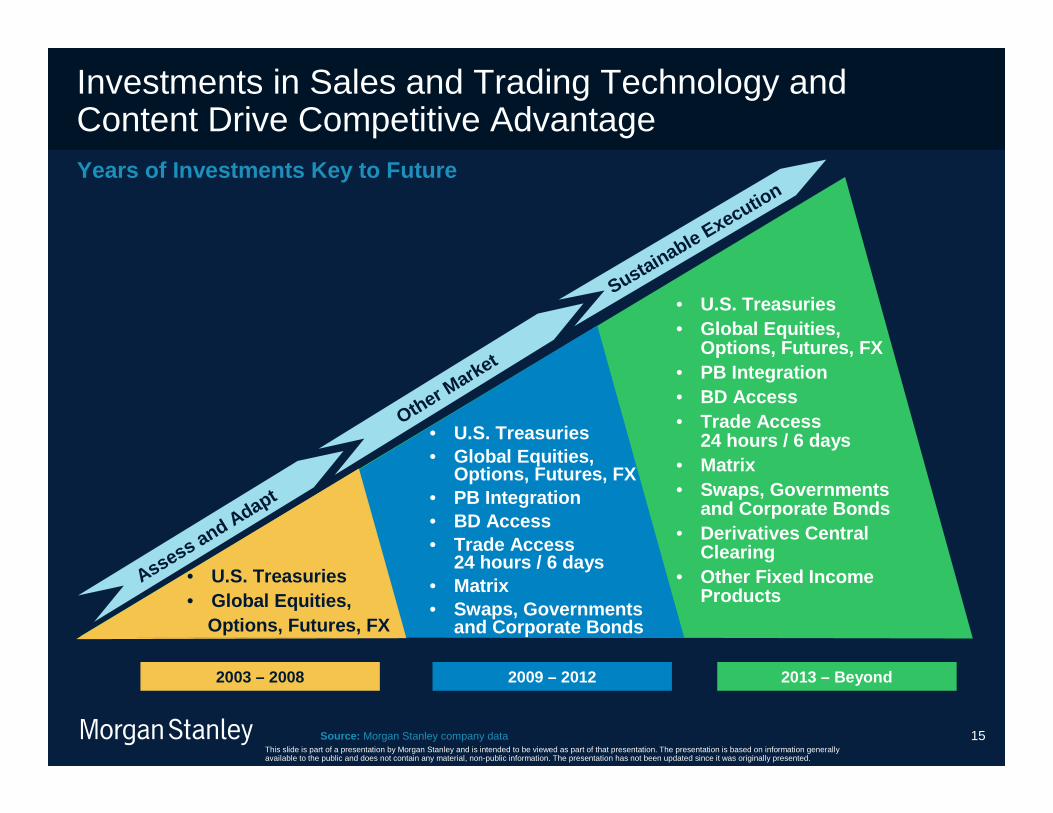
Investments in Sales and Trading Technology and Content Drive Competitive AdvantageYears of Investments Key to Future
2003 – 2008
• U.S. Treasuries• Global Equities,
Options, Futures, FX• PB Integration• BD Access• Trade Access
24 hours / 6 days• Matrix• Swaps, Governments
and Corporate Bonds
• U.S. Treasuries• Global Equities,
Options, Futures, FX
• U.S. Treasuries• Global Equities,
Options, Futures, FX• PB Integration• BD Access• Trade Access
24 hours / 6 days• Matrix• Swaps, Governments
and Corporate Bonds• Derivatives Central
Clearing• Other Fixed Income
Products
Sustainable Execution
Other Market
Assess and Adapt
2009 – 2012 2013 – Beyond
Source: Morgan Stanley company data
EPS\Internal\Amanda Smith - 602237062 9/11/2012
This slide is part of a presentation by Morgan Stanley and is intended to be viewed as part of that presentation. The presentation is based on information generally available to the public and does not contain any material, non-public information. The presentation has not been updated since it was originally presented.
16
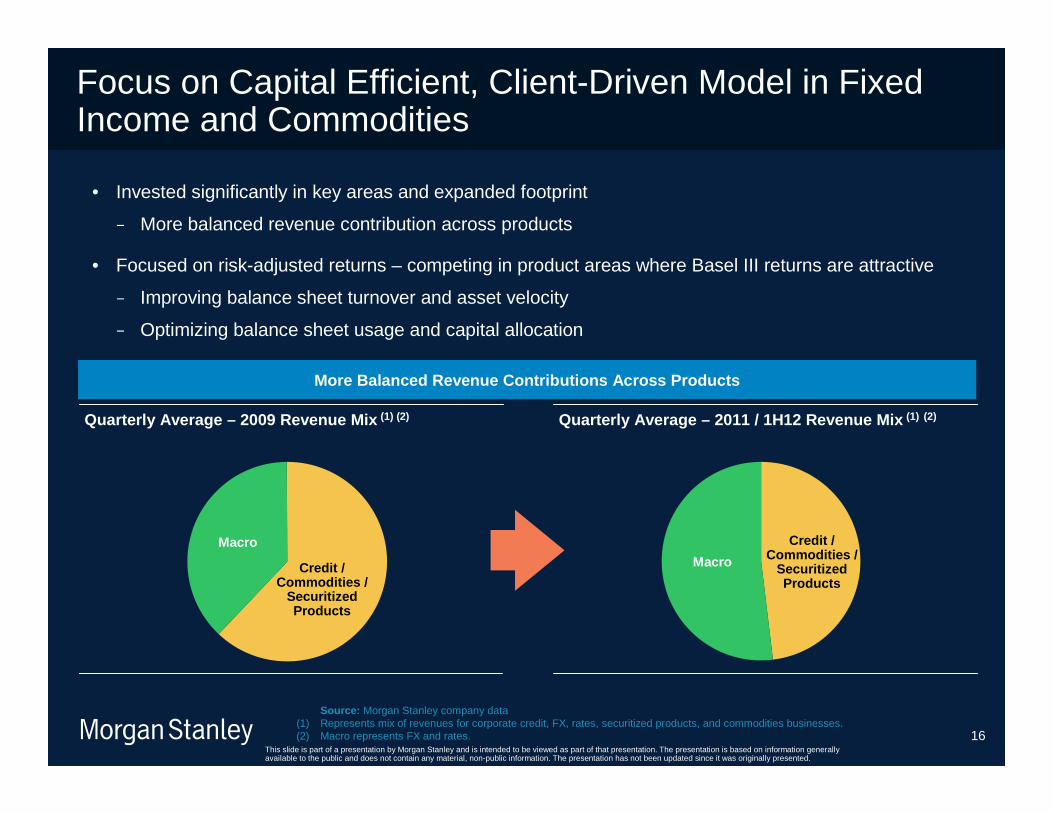
Focus on Capital Efficient, Client-Driven Model in Fixed Income and Commodities
Quarterly Average – 2009 Revenue Mix (1) (2) Quarterly Average – 2011 / 1H12 Revenue Mix (1) (2)
• Invested significantly in key areas and expanded footprint
− More balanced revenue contribution across products
• Focused on risk-adjusted returns – competing in product areas where Basel III returns are attractive
− Improving balance sheet turnover and asset velocity
− Optimizing balance sheet usage and capital allocation
More Balanced Revenue Contributions Across Products
Macro
Credit / Commodities /
Securitized Products
Macro
Credit / Commodities /
Securitized Products
Source: Morgan Stanley company data(1) Represents mix of revenues for corporate credit, FX, rates, securitized products, and commodities businesses.(2) Macro represents FX and rates.
EPS\Internal\Amanda Smith - 602237062 9/11/2012
This slide is part of a presentation by Morgan Stanley and is intended to be viewed as part of that presentation. The presentation is based on information generally available to the public and does not contain any material, non-public information. The presentation has not been updated since it was originally presented.
17
Source: Morgan Stanley company data(1) The Company estimates its risk-weighted assets based on a preliminary analysis of the Basel III guidelines published to date and
other factors. This is a preliminary estimate and may change based on final rules to be issued by the Federal Reserve.
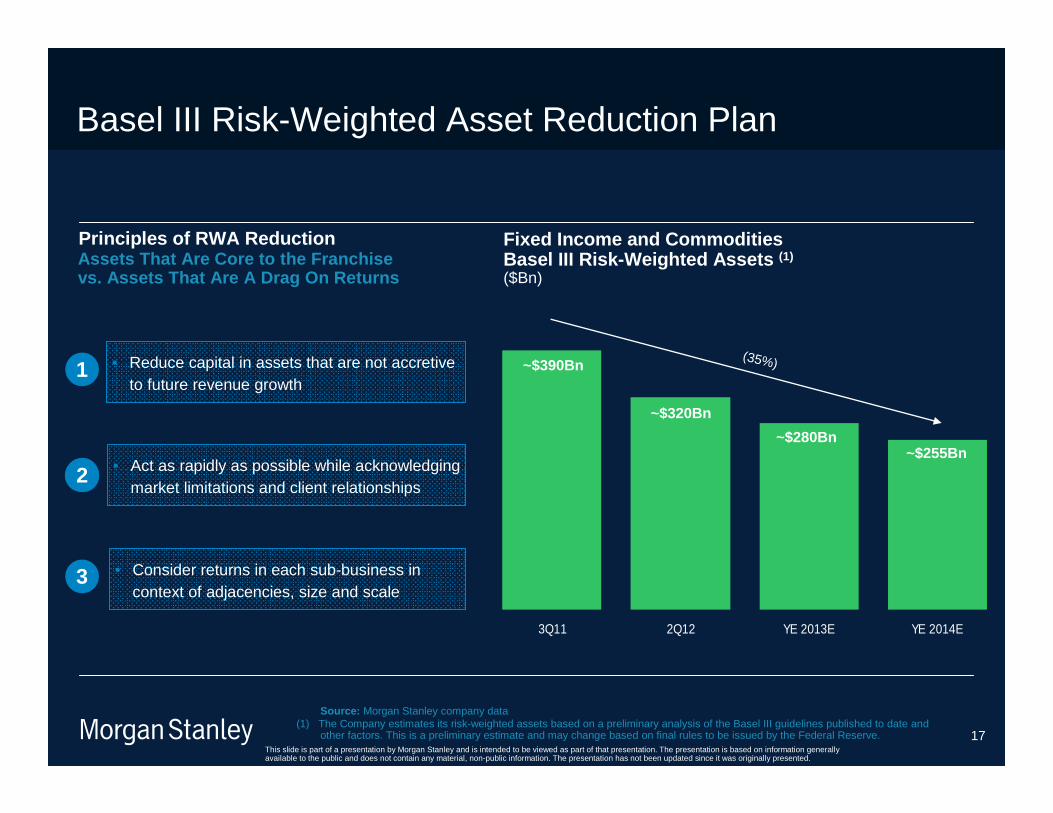
Basel III Risk-Weighted Asset Reduction Plan
3Q11 2Q12 YE 2013E YE 2014E
~$390Bn
~$320Bn
~$280Bn~$255Bn
Fixed Income and CommoditiesBasel III Risk-Weighted Assets (1)
(35%)
($Bn)
• Reduce capital in assets that are not accretive to future revenue growth
• Act as rapidly as possible while acknowledging market limitations and client relationships
• Consider returns in each sub-business in context of adjacencies, size and scale
1
2
3
Assets That Are Core to the Franchise vs. Assets That Are A Drag On Returns
Principles of RWA Reduction
EPS\Internal\Amanda Smith - 602237062 9/11/2012
This slide is part of a presentation by Morgan Stanley and is intended to be viewed as part of that presentation. The presentation is based on information generally available to the public and does not contain any material, non-public information. The presentation has not been updated since it was originally presented.
18
2010 - 2011 1H12
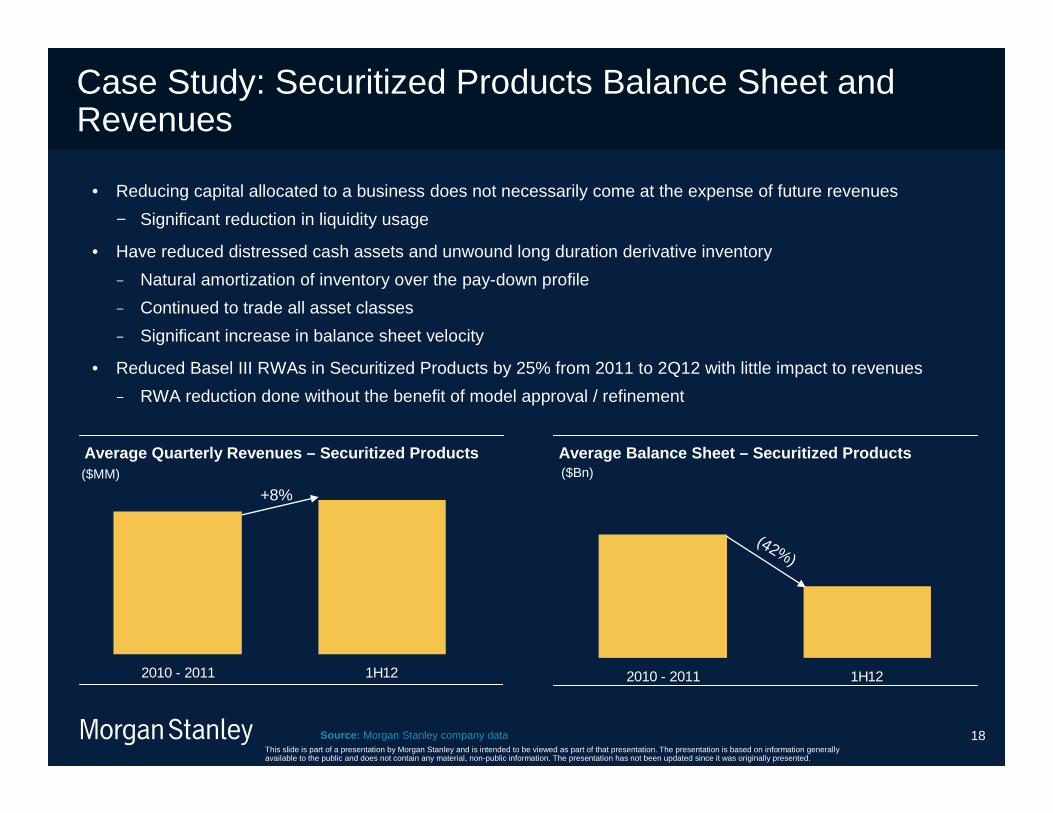
Case Study: Securitized Products Balance Sheet and Revenues
2010 - 2011 1H12
• Reducing capital allocated to a business does not necessarily come at the expense of future revenues
− Significant reduction in liquidity usage
• Have reduced distressed cash assets and unwound long duration derivative inventory
− Natural amortization of inventory over the pay-down profile
− Continued to trade all asset classes
− Significant increase in balance sheet velocity
• Reduced Basel III RWAs in Securitized Products by 25% from 2011 to 2Q12 with little impact to revenues
− RWA reduction done without the benefit of model approval / refinement
Average Quarterly Revenues – Securitized Products Average Balance Sheet – Securitized Products ($MM) ($Bn)
Source: Morgan Stanley company data
+8%
(42%)
EPS\Internal\Amanda Smith - 602237062 9/11/2012
This slide is part of a presentation by Morgan Stanley and is intended to be viewed as part of that presentation. The presentation is based on information generally available to the public and does not contain any material, non-public information. The presentation has not been updated since it was originally presented.
19
11%16%
39%
48%
50%31%
0%5%
2007 1H 2012
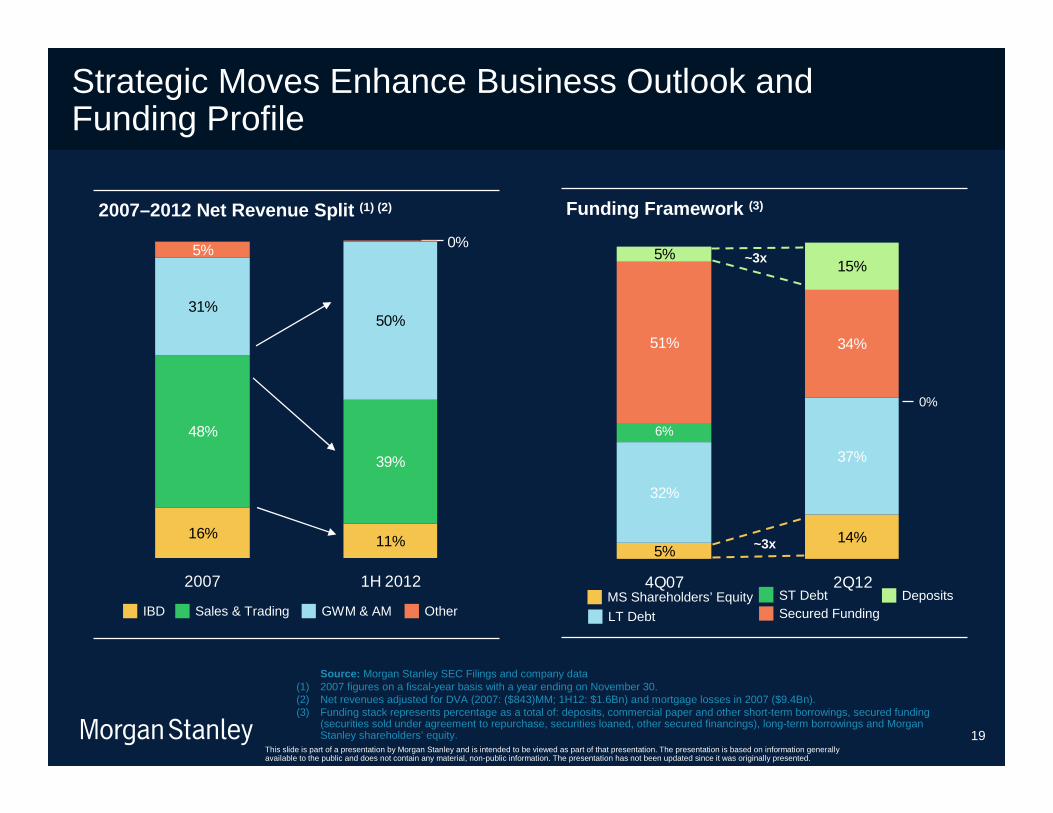
Strategic Moves Enhance Business Outlook and Funding Profile
IBD GWM & AMSales & Trading
2007–2012 Net Revenue Split (1) (2)
Source: Morgan Stanley SEC Filings and company data(1) 2007 figures on a fiscal-year basis with a year ending on November 30. (2) Net revenues adjusted for DVA (2007: ($843)MM; 1H12: $1.6Bn) and mortgage losses in 2007 ($9.4Bn).(3) Funding stack represents percentage as a total of: deposits, commercial paper and other short-term borrowings, secured funding
(securities sold under agreement to repurchase, securities loaned, other secured financings), long-term borrowings and Morgan Stanley shareholders’ equity.
Other
5%14%
32%
37%
51% 34%
5%15%
6%
0%
4Q07 2Q12MS Shareholders’ Equity
LT Debt
ST Debt
Funding Framework (3)
DepositsSecured Funding
~3x
~3x
EPS\Internal\Amanda Smith - 602237062 9/11/2012
This slide is part of a presentation by Morgan Stanley and is intended to be viewed as part of that presentation. The presentation is based on information generally available to the public and does not contain any material, non-public information. The presentation has not been updated since it was originally presented.
20
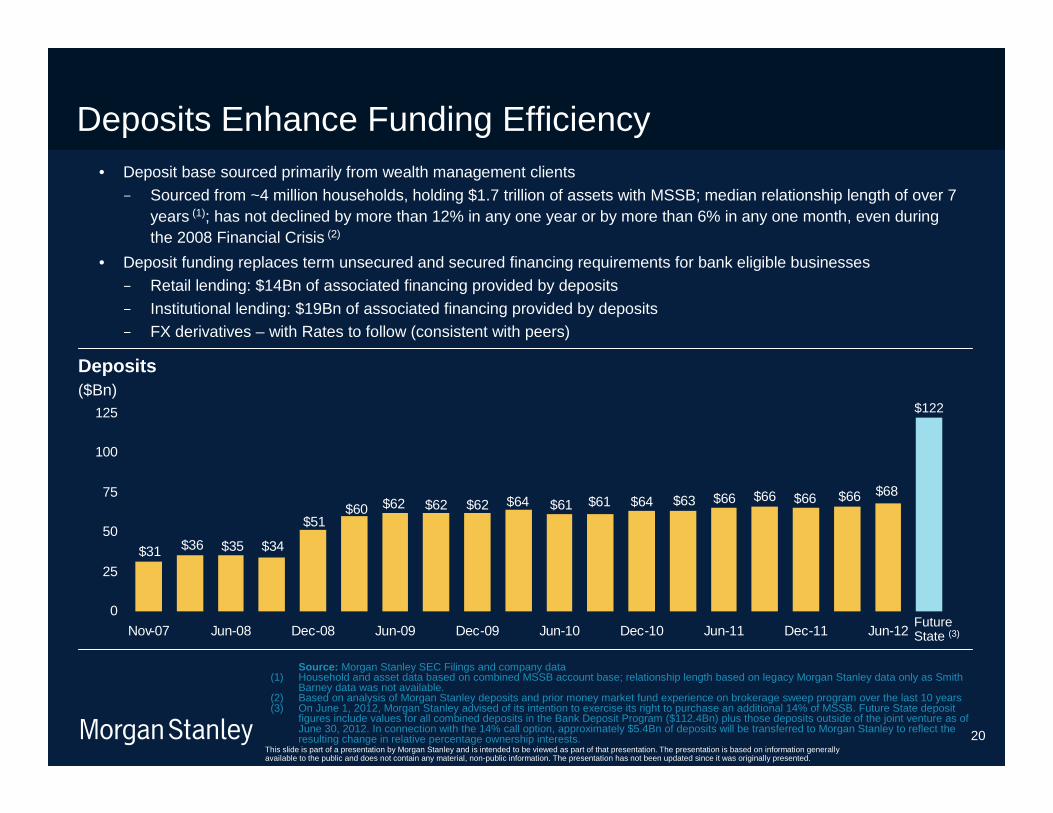
• Deposit base sourced primarily from wealth management clients
− Sourced from ~4 million households, holding $1.7 trillion of assets with MSSB; median relationship length of over 7 years (1); has not declined by more than 12% in any one year or by more than 6% in any one month, even during the 2008 Financial Crisis (2)
• Deposit funding replaces term unsecured and secured financing requirements for bank eligible businesses
− Retail lending: $14Bn of associated financing provided by deposits
− Institutional lending: $19Bn of associated financing provided by deposits− FX derivatives – with Rates to follow (consistent with peers)
Deposits Enhance Funding Efficiency
$31 $36 $35 $34
$51$60 $62 $62 $62 $64 $61 $61 $64 $63 $66 $66 $66 $66 $68
0
25
50
75
100
125
Nov-07 Jun-08 Dec-08 Jun-09 Dec-09 Jun-10 Dec-10 Jun-11 Dec-11 Jun-12
Source: Morgan Stanley SEC Filings and company data(1) Household and asset data based on combined MSSB account base; relationship length based on legacy Morgan Stanley data only as Smith
Barney data was not available.(2) Based on analysis of Morgan Stanley deposits and prior money market fund experience on brokerage sweep program over the last 10 years(3) On June 1, 2012, Morgan Stanley advised of its intention to exercise its right to purchase an additional 14% of MSSB. Future State deposit
figures include values for all combined deposits in the Bank Deposit Program ($112.4Bn) plus those deposits outside of the joint venture as of June 30, 2012. In connection with the 14% call option, approximately $5.4Bn of deposits will be transferred to Morgan Stanley to reflect the resulting change in relative percentage ownership interests.
Deposits($Bn)
FutureState (3)
$122
EPS\Internal\Amanda Smith - 602237062 9/11/2012
This slide is part of a presentation by Morgan Stanley and is intended to be viewed as part of that presentation. The presentation is based on information generally available to the public and does not contain any material, non-public information. The presentation has not been updated since it was originally presented.
21
100
120
140
160
180
200
1Q 2Q 3Q 4Q 1Q 2Q 3Q 4Q 1Q 2Q
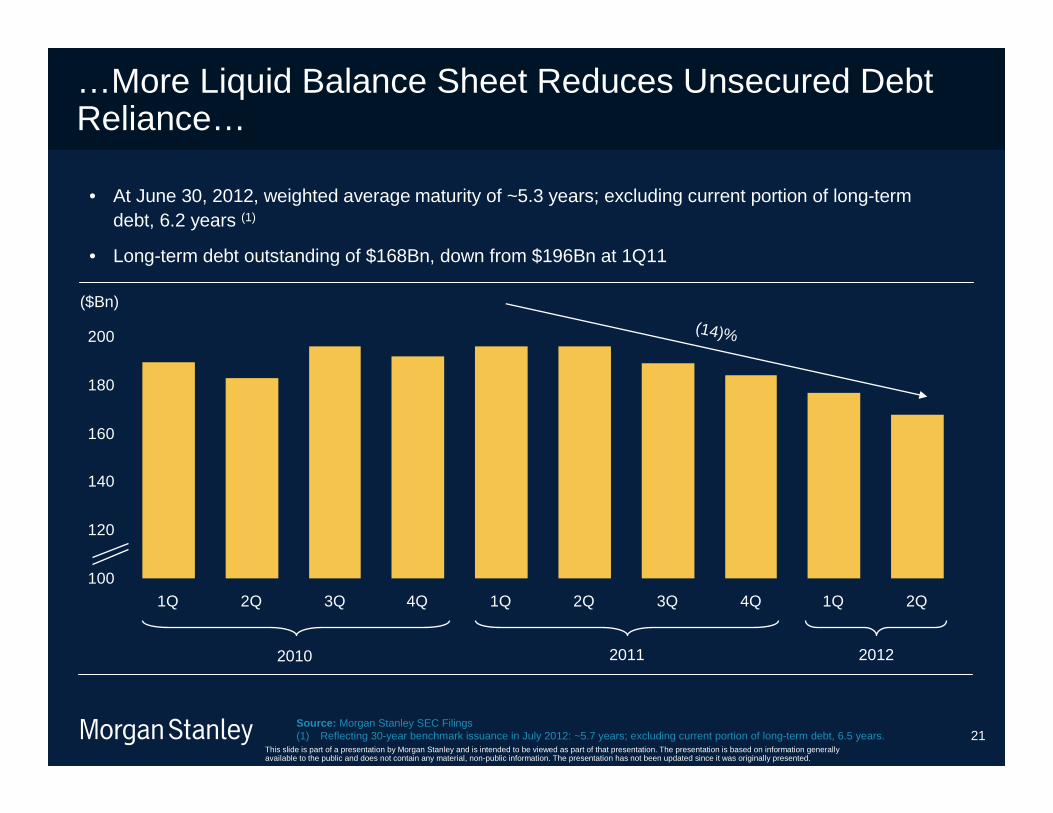
…More Liquid Balance Sheet Reduces Unsecured Debt Reliance…
Source: Morgan Stanley SEC Filings(1) Reflecting 30-year benchmark issuance in July 2012: ~5.7 years; excluding current portion of long-term debt, 6.5 years.
• At June 30, 2012, weighted average maturity of ~5.3 years; excluding current portion of long-term debt, 6.2 years (1)
• Long-term debt outstanding of $168Bn, down from $196Bn at 1Q11
($Bn)
2010 2011 2012
(14)%
EPS\Internal\Amanda Smith - 602237062 9/11/2012
This slide is part of a presentation by Morgan Stanley and is intended to be viewed as part of that presentation. The presentation is based on information generally available to the public and does not contain any material, non-public information. The presentation has not been updated since it was originally presented.
22
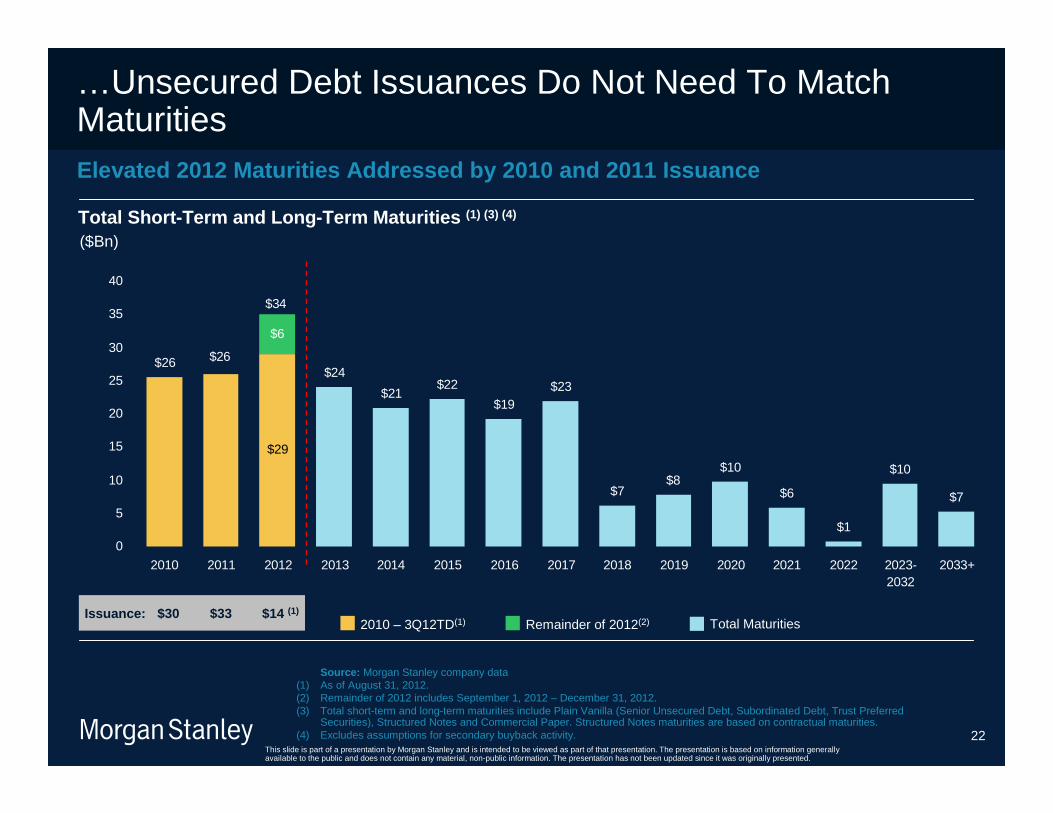
$19$23
$7$8
$10
$6
$1
$10
$7
$29
$6
$22$21
$24
$34
$26$26
0
5
10
15
20
25
30
35
40
2010 2011 2012 2013 2014 2015 2016 2017 2018 2019 2020 2021 2022 2023-2032
2033+
…Unsecured Debt Issuances Do Not Need To Match Maturities
Source: Morgan Stanley company data(1) As of August 31, 2012.(2) Remainder of 2012 includes September 1, 2012 – December 31, 2012.(3) Total short-term and long-term maturities include Plain Vanilla (Senior Unsecured Debt, Subordinated Debt, Trust Preferred
Securities), Structured Notes and Commercial Paper. Structured Notes maturities are based on contractual maturities.(4) Excludes assumptions for secondary buyback activity.
Elevated 2012 Maturities Addressed by 2010 and 2011 Issuance
($Bn)
2010 – 3Q12TD(1) Remainder of 2012(2) Total Maturities
Total Short-Term and Long-Term Maturities (1) (3) (4)
Issuance: $33 $14 (1)$30
EPS\Internal\Amanda Smith - 602237062 9/11/2012
This slide is part of a presentation by Morgan Stanley and is intended to be viewed as part of that presentation. The presentation is based on information generally available to the public and does not contain any material, non-public information. The presentation has not been updated since it was originally presented.
23
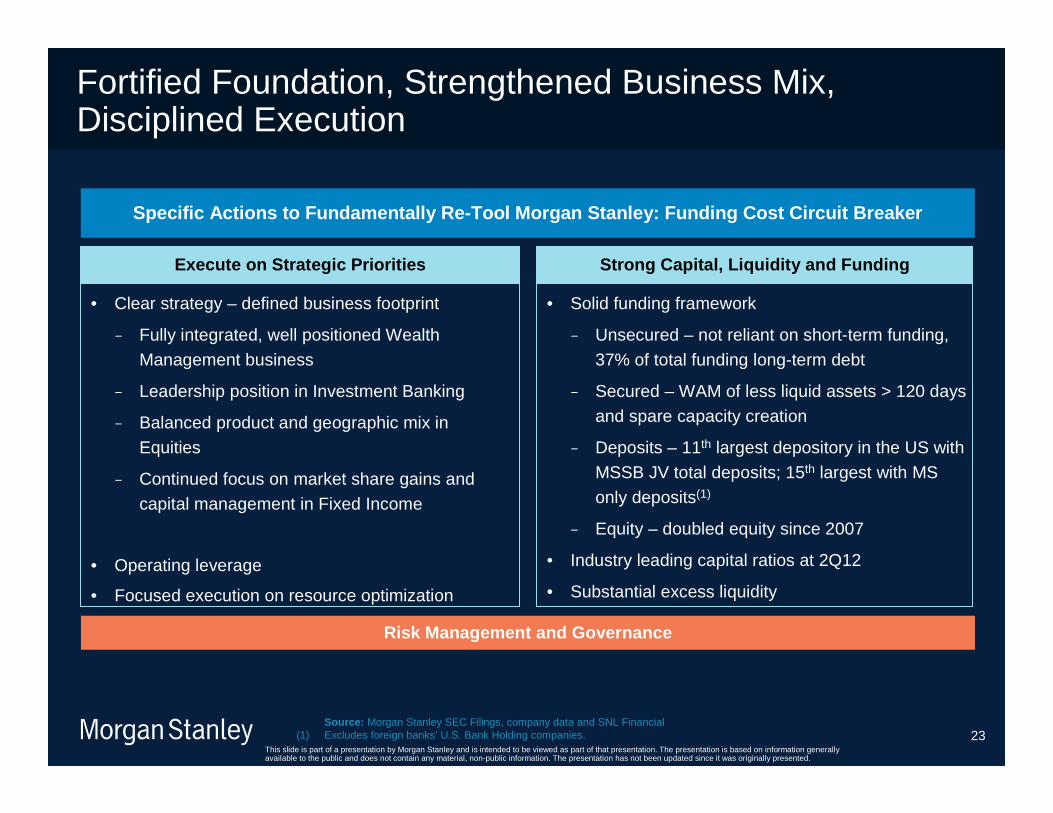
Fortified Foundation, Strengthened Business Mix, Disciplined Execution
Specific Actions to Fundamentally Re-Tool Morgan St anley: Funding Cost Circuit Breaker
• Clear strategy – defined business footprint
− Fully integrated, well positioned Wealth Management business
− Leadership position in Investment Banking
− Balanced product and geographic mix in Equities
− Continued focus on market share gains and capital management in Fixed Income
• Operating leverage
• Focused execution on resource optimization
• Solid funding framework
− Unsecured – not reliant on short-term funding, 37% of total funding long-term debt
− Secured – WAM of less liquid assets > 120 days and spare capacity creation
− Deposits – 11th largest depository in the US with MSSB JV total deposits; 15th largest with MS only deposits(1)
− Equity – doubled equity since 2007
• Industry leading capital ratios at 2Q12
• Substantial excess liquidity
Execute on Strategic Priorities Strong Capital, Liquidity and Funding
Risk Management and Governance
Source: Morgan Stanley SEC Filings, company data and SNL Financial(1) Excludes foreign banks’ U.S. Bank Holding companies.
This slide is part of a presentation by Morgan Stanley and is intended to be viewed as part of that presentation. The presentation is based on information generally available to the public and does not contain any material, non-public information. The presentation has not been updated since it was originally presented.
Barclays Capital Financial Services Conference
Ruth Porat, Executive Vice President andChief Financial Officer
September 11, 2012
Related Documents