Ballast Water Sampling and Analysis Workshop COMPLETE Workshop 08-10 May 2019, Hamburg, Germany Katja Broeg, German Federal Maritime and Hydrographic Agency, BSH

Welcome message from author
This document is posted to help you gain knowledge. Please leave a comment to let me know what you think about it! Share it to your friends and learn new things together.
Transcript

Ballast Water Sampling and Analysis Workshop
COMPLETE Workshop
08-10 May 2019, Hamburg, Germany
Katja Broeg, German Federal Maritime and Hydrographic Agency, BSH

CONTENT
Summary
Invitation
Agenda
Workshop Material
Questionnaire: Challenges for the participating countries
List of Participants

1
SUMMARY Participants from administrations and scientific sectors of seven Baltic Sea countries who are going
to perform ballast water sampling and analysis met in a COMPLETE workshop organised in
Hamburg at the beginning of May. For the first time, knowledge and practical hands-on exercises
for all stages from planning and sampling to analysis were included in one seminar, which was
supervised by the internationally recognised scientists Dr. Matej David and Dr. Stephan Gollasch.
Starting with background knowledge on sampling and analysis tools and methods, the participants
got the opportunity to carry out practical work in a laboratory and on board the TUI cruise liner
„Mein Schiff 5“. All sections of the workshop took place right at the Elbe River, opposite to the
Port of Hamburg that celebrated its 830th birthday in parallel. The gathered expertise will be
further distributed by the participants, who also brought in their experience and questions
concerning the further development of all ballast water issues. The materials of the workshop are
provided by the COMPLETE project. In addition, a documentary on the practical exercises
combined with interviews with the experts will be prepared.
Figure 1: Dr. Stephan Gollasch demonstrates the refractometer for measuring the salinity. This device is used for monitoring the D-1 standard (ballast water exchange).

2
Figure 2: Big interest for the investigation of the pankton sample. For many prticipants the first visual contact with the small water organisms which are in the centre of the BWMC.
Figure 3: Viable of dead? This is the question which must be answered for the evaluation of the D-2 standard. All which is glowing here due to staining with a flourescent dye, is living.

3
Figure 4: For others a place to relax, for many of the participants of the workshop the place of their first active ballast water sampling practice.
Figure 5: Participants from seven Baltic Sea countries will spread their gathered knowledge further #BalticComplete


08/05/2019 1 www.balticcomplete.com
Workshop on sampling and analysis of ballast water
Dr. Matej David and Dr. Stephan Gollasch
Programme
Wednesday, 8th
May 2019 morning: arrival of participants
Theme: BW Sampling
13:30-14:00 Arrival of participants and set-up in the meeting room
Introduction of participants
14:00-14:45 Ballast water sampling under the BWM Convention
14:45-15:30
Ballast water sampling (BWS) recommendations for compliance monitoring and
enforcement (CME) under the BWM Convention (ballast water exchange standard (D-1),
ballast water performance standard (D-2), indicative and detailed sampling, in-tank and at
discharge sampling, introduction of sampling gear, representativeness, sample volumes,
timing, number of samples
15:30-16:00 Coffee Break
16:00-17:00 Ballast water sampling recommendations for compliance control under the BWM
Convention - continues
Thursday, 9th
May 2019 Day 2
Theme: BW Sampling - Summary
09:00-09:15 Questions and answers from previous day
09:15-10:30 Selecting vessels and tanks for BWS for CME
10:30-11:00 Coffee break
Theme: BW Sample Analysis - Theory
11:00-11:15 Ballast water sample handling and transfer to the laboratory
11:15-11:30 Sample analysis procedures or techniques used to test for compliance with D-1
11:30-12:00 Practical handling of D-1 compliance tools
12:00-14:00 Lunch Break
14:00-15:30 Sample analysis procedures or techniques used to test for compliance with D-2, indicative
and detailed sample processing, introduction of sample analysis methods
15:30-16:00 Coffee break
16:00-16:45 Discussion
16:45-17:00 Planning of next day.

08/05/2019 2 www.balticcomplete.com
Friday, 10th
May 2019 Day 3
BW Sampling - Practical Part The test vessel is in walking distance to the meeting venue
09:00-09:15 Questions and answers from previous day
09:15 Split in two groups
Group 1 (ca. 10 participants)
Group 2 (ca. 10 participants)
09:30-12:00
Leave meeting venue for vessel visit Sampling for D-1 and D-2 compliance on a
ship
in tank sampling,
in-line sampling,
using D-1 analysis tools on board Dr. Matej David
Practical sample analysis for D-2 in the
laboratory Familiarization with microscopes Dr. Stephan Gollasch
12:00-13:30 Lunch break
13:30-16:00
Practical sample analysis for D-2 in the
laboratory Familiarization with microscopes Dr. Stephan Gollasch
Leave meeting venue for vessel visit Sampling for D-1 and D-2 compliance on a
ship
in tank sampling,
in-line sampling,
using D-1 analysis tools on board Dr. Matej David
16:00-17:00 Debrief of the vessel visit and the sampling on board Discussion Closing of meeting
Departure of participants

© 2002 By Default!
A Free sample background from www.powerpointbackgrounds.com
Slide 1

© 2002 By Default!
A Free sample background from www.powerpointbackgrounds.com
Slide 2
➢BWM Convention articles relevant for Ballast Water Sampling (BWS)
➢BWS requirements under BWM Convention
➢Consequence of non-compliance
➢BWS under G2 Guidelines
➢BWS Guidance
➢BWS under PSC Gudelines
➢Conclusions
OUTLINE

© 2002 By Default!
A Free sample background from www.powerpointbackgrounds.com
Slide 3
BWM Convention➢Article 9 Inspection of Ships
➢Article 10 Detection of Violations and Control of Ships

© 2002 By Default!
A Free sample background from www.powerpointbackgrounds.com
Slide 4
➢Tier 1:
➢ valid certificate
➢ check BW record book
➢ BWS, conducted according to G2
BWM Convention & BWS Compliance control (Article 9)
➢ no undue delay because of
samples analysis
➢ no prevention of discharge
before having results of BWS

© 2002 By Default!
A Free sample background from www.powerpointbackgrounds.com
Slide 5
➢ no valid certificate; or
➢ clear grounds…
➢ Paragraph 2
(Article 9.2)
➢ BWMS not correspond to certificate
➢ crew not familiar with BWM
procedures or not implemented
➢ Consequences?
➢ Tier 2: detailed inspection

© 2002 By Default!
A Free sample background from www.powerpointbackgrounds.com
Slide 6
Consequence?
Article 9.3
➢ In the circumstances given in paragraph 2 of this Article, the Party carrying out the inspection shall take such steps as will ensure that the ship shall not discharge Ballast Water until it can do so without presenting a threat of harm to the environment, human health, property or resources.

© 2002 By Default!
A Free sample background from www.powerpointbackgrounds.com
Slide 7
➢ indicative test shown “high”
organism load – clear indication or
grounds
➢ detailed sampling inspection
(in a previous port) – failed compliance
BWS was conducted
➢ Consequences?

© 2002 By Default!
A Free sample background from www.powerpointbackgrounds.com
Slide 8
Article 10.3
➢ If the sampling described in Article 9.1(c) leads to a result, or supports information received from another port or offshore terminal, indicating that the ship poses a threat to the environment, human health, property or resources, the Party in whose waters the ship is operating shall prohibit such ship from discharging Ballast Water until the threat is removed.
Consequence?

© 2002 By Default!
A Free sample background from www.powerpointbackgrounds.com
Slide 9
…but what to do with such vessel?
➢ no discharge
➢ port reception facility
➢ designated discharge/contingency area
➢ if none of these?
…how such vessel can prove again to be
compliant?

© 2002 By Default!
A Free sample background from www.powerpointbackgrounds.com
Slide 10
BWS UNDER THE
G2 GUIDELINES

© 2002 By Default!
A Free sample background from www.powerpointbackgrounds.com
Slide 11
Indicative test (G2, 6.3)
➢ Prior to testing for compliance with the D-2
standard, it is recommended that, as a first step, an
indicative analysis of ballast water discharge may be
undertaken to establish whether a ship is potentially
compliant or non-compliant.
➢ Such a test could help the Party identify immediate
mitigation measures, within their existing powers, to
avoid any additional impact from a possible non-
compliant ballast water discharge from the ship.

© 2002 By Default!
A Free sample background from www.powerpointbackgrounds.com
Slide 12
➢ the sampling protocol should result in samples that are representative of the whole discharge of ballast water from any single tank or any combination of tanks being discharged;
➢ the sampling protocol should take account of the potential for a suspended sediment load in the discharge to affect sample results;
➢ the sampling protocol should provide for samples to be taken at appropriate discharge points;
➢ the quantity and quality of samples taken should be sufficient to demonstrate whether the ballast water being discharged meets with the relevant standard;
BWS for compliance (G2, 6.2) -
Detailed test

© 2002 By Default!
A Free sample background from www.powerpointbackgrounds.com
Slide 13
G2 continues…➢ sampling should be undertaken in a safe and
practical manner;
➢ samples should be concentrated to a manageable size;
➢ samples should be taken, sealed and stored to ensure that they can be used to test for compliance with the Convention;
➢ samples should be fully analysed within test method holding time limit using an accredited laboratory; and
➢ samples should be transported, handled and stored with the consideration of the chain of custody.

© 2002 By Default!
A Free sample background from www.powerpointbackgrounds.com
Slide 14
WHERE CAN WE SAMPLE?
➢ In-tank ➢ In-line (at discharge)
➢ Which sampling point is appropriate?
➢ Sampling pointsavailability?

© 2002 By Default!
A Free sample background from www.powerpointbackgrounds.com
Slide 15
BALLAST WATER SAMPLING
THAT IS
REPRESENTATIVE
OF THE
WHOLE DISCHARGE
➢ probably the biggest challenge…
➢many questions and issuess… how to do it?

© 2002 By Default!
A Free sample background from www.powerpointbackgrounds.com
Slide 16
➢How to sample for D-1?
➢How to sample for D-2?
➢What is a representative sample?
➢What should be the sample volume?
➢How many samples to take?
➢Where to take samples?
➢When to take samples?
➢Which sampling gear to use?
➢ …
Clear guidance needed how
to do BWS for CME!

© 2002 By Default!
A Free sample background from www.powerpointbackgrounds.com
Slide 17
BWS GUIDANCE

© 2002 By Default!
A Free sample background from www.powerpointbackgrounds.com
Slide 18
BWM.2/Circ.42 Guidance on ballast watersampling and analysis for trial use inaccordance with the BWM Convention andGuidelines (G2) (2013, rev.1 2015)
➢ list of sample analysis protocols,methodologies and approaches for D-1 and D-2 standards compliance tests
➢ 2 - 3 year trial period for reviewing, improvingand standardizing the BWM Circular
➢ recommendations for a trial period duringwhich sampling experience is gained

© 2002 By Default!
A Free sample background from www.powerpointbackgrounds.com
Slide 19
CME UNDER THE
PSC GUIDELINES
(“G15”)

© 2002 By Default!
A Free sample background from www.powerpointbackgrounds.com
Slide 20
➢ PSC Guidelinesadopted at MEPC67(Oct 2014)
➢ Provide basicguidance for PSCinspection to verifycompliance with therequirements of theBWM Convention
Guidelines for Port State Control
under the BWM Convention

© 2002 By Default!
A Free sample background from www.powerpointbackgrounds.com
Slide 21
1 - "initial inspection" documentation check (IBWMC,
BWMP, BWRB), visual check of equipment,
ensuring that an officer has been nominated for
BWM on the ship, crew familiar to operate BWMS
if clear grounds… then…
2 - "more detailed inspection" where the operation of
the BWMS is checked and the PSCO clarifies
whether the BWMS has been operated adequately,
may result in sampling
3 - "indicative analysis", sampling for compliance with
D-2, no undue delay because of analysis
4 - "detailed analysis", sampling for compliance with
D-2, no undue delay while waiting for sample
analysis results
Four-stage inspection

© 2002 By Default!
A Free sample background from www.powerpointbackgrounds.com
Slide 22
Four-stage inspection
order?➢ BWS under the BWM Convention as Tier 1
➢ BWS under G15 as third step as part of/or triggeredby a (more) detailed inspection
➢ conflict ?... BW discharge not allowed when Tier 2 =detailed inspection (Art. 9.2)! Art9.3 …ship shall notdischarge when Art. 9.2 conditions = detailed BWScan’t be conducted.
“Compromise”?:
1.1.1 These Guidelines… …are not intended to limit the
rights the port State has in verifying compliance with
the BWM Convention.

© 2002 By Default!
A Free sample background from www.powerpointbackgrounds.com
Slide 23
As an alternative to warning, detention or exclusion of the
ship:
➢ retention of all ballast water on board;
➢ require the ship to undertake any repairs required tothe BWMS;
➢ permit the ship to proceed to exchange ballast water ina location acceptable to the port State;
➢ allow the ship to discharge ballast to another ship or toan appropriate shipboard or land-based receptionfacility; or
➢ allow the ship to manage the ballast water or a portionof it in accordance with a method acceptable to the portState.
➢ notify the ship and the flag State of the violation
Control actions
when non-compliant

© 2002 By Default!
A Free sample background from www.powerpointbackgrounds.com
Slide 24
➢ BWM Convention introduces BWS as one ofthe methods for CME
➢ G2 Guidelines do not describe BWS in detail
➢ Correct BWS for CME is very important alsobecause of possible consequences for vesselsand environment
➢ BWS Guidance introduces a transitional periodimportant also for PSC to test and introducereliable BWS process for CME
➢ PSC Guidance introduces four step process,but there may be some implementationissues/conflicts
CONCLUSIONS

© 2002 By Default!
A Free sample background from www.powerpointbackgrounds.com
Slide 25
MORE INFO IN THE NEW BOOK:
David, M., Gollasch, S. (eds.) 2015. Global
Maritime Transport and Ballast Water
Management – Issues and Solutions.
Springer Science and Business media
For more in information please visit:
http://www.springer.com/environment/environme
ntal+management/book/978-94-017-9366-7
The second edition of the book is in preparation with different new
subjects and lessons learnt important for the implementation of the
BWM Convention. Publication is expected in 2019.

© 2002 By Default!
A Free sample background from www.powerpointbackgrounds.com
Slide 26
Dr. Stephan Gollasch
www.gollaschconsulting.de/
Prof. Dr. Matej David
www.davidconsult.eu/

THANK YOU
FOR THE
ATTENTION!
QUESTIONS
?

© 2002 By Default!
A Free sample background from www.powerpointbackgrounds.com
Slide 28

© 2002 By Default!
A Free sample background from www.powerpointbackgrounds.com
Slide 1

© 2002 By Default!
A Free sample background from www.powerpointbackgrounds.com
Slide 2
➢D-1 sampling background and recommendations
➢D-2 sampling background and recommendations
➢Sampling gear and sampling point arrangements
➢Personal protective equipment
➢Conclusions
OUTLINE

© 2002 By Default!
A Free sample background from www.powerpointbackgrounds.com
Slide 3
Recommendations based on:➢Test voyage 2009
➢Test voyages 2010
➢Test voyage 2012
➢ BALMAS 2013-2016

© 2002 By Default!
A Free sample background from www.powerpointbackgrounds.com
Slide 4
➢ More than 1500 samples taken during more then 150 shipboard tests for type approval of >20different BWMS which were conducted by S. Gollasch and M. David over the past 12 years
Experience summarised in the study for WWF (March 2013):➢ Ballast water sampling for
compliance monitoring -Ratification of the Ballast Water Management Convention (MEPC 65/2/17)

© 2002 By Default!
A Free sample background from www.powerpointbackgrounds.com
Slide 5
SAMPLING FOR D-1

© 2002 By Default!
A Free sample background from www.powerpointbackgrounds.com
Slide 6
SAMPLING PURPOSECompliance with D-1 standard - Ballast Water Exchange
Standard
CHECK IF REQUIRED MANAGEMENT WAS CONDUCTED!
Regulation D-1
➢ BWE efficiency of at least 95 % volumetric exchange
Regulation B-4.1
➢ BWE >200 NM from the nearest land & water depth of at
least 200 m; …IF NOT POSSIBLE THEN
➢ BWE > 50 NM from the nearest land & water depth 200 m;

© 2002 By Default!
A Free sample background from www.powerpointbackgrounds.com
Slide 7
Samping Guidance

© 2002 By Default!
A Free sample background from www.powerpointbackgrounds.com
Slide 8
What to do in terms of
sampling?➢ Salinity check
➢ Small quantity needed
Where to sample?➢ In-tank
➢ In-line (at discharge) – sampling point needed…

© 2002 By Default!
A Free sample background from www.powerpointbackgrounds.com
Slide 9
SALINITY CHECK
Basic principle:
➢ Salinity at “open sea” ~ and >35 psu
➢ If vessel conducts BWE according tho the BWM Convention (95% exchange >50NM & 200m), ballast water should always have salinity >30 psu
➢ Method mainly limited to vessels that ballasted in low salinity areas.

© 2002 By Default!
A Free sample background from www.powerpointbackgrounds.com
Slide 10
16,1
17,2
19,2
15
16
17
18
19
20
10 14 16
Salin
ity [
psu
]
Depth [m]
In-tank sampling
Ballast water sampled from 3 different depths - different salinity measured
➢ Salinity stratification identified!

© 2002 By Default!
A Free sample background from www.powerpointbackgrounds.com
Slide 11
In-line sampling
Ballast water sampled in 5 sequences during the discharge -different salinity measured
➢ Salinity stratification identified!
31,6
28,5
17,1
6,4 6,0
0
5
10
15
20
25
30
35
10 20 50 65 70
Sa
lin
ity [
ps
u]
Time [min.]

© 2002 By Default!
A Free sample background from www.powerpointbackgrounds.com
Slide 12
IN-TANK
Recommended sampling approach for D-1
Sampling point Equipment Water
volume
Number of samples
Sounding pipe,
manhole or air
vent
Column sampler
or pump
> 50 ml 1 integrated sample
from possibly whole
water column
Sounding pipe,
manhole or air
vent
Column spot
sampler or
pump
> 50 ml 1 integrated sample
from 3 different
depths

© 2002 By Default!
A Free sample background from www.powerpointbackgrounds.com
Slide 13
IN-LINE to be conducted if in-tank sampling not possible!
Sampling point Equipment Water volume Number of
samples
In-line Sampling jar or
bottle
> 50 ml 1 sample as soon
as possible* during
the discharge
* note:
➢ important to take it as soon as possible to prevent possible
discharge non-compliant water
➢ more samples may be taken with ~10 min delay to identify if
salinity is droping throught the time of discharge

© 2002 By Default!
A Free sample background from www.powerpointbackgrounds.com
Slide 14
D-2 SAMPLING

© 2002 By Default!
A Free sample background from www.powerpointbackgrounds.com
Slide 15
SAMPLING PURPOSECompliance with D-2 standard - Ballast Water Performance
Standard
➢ <10 organisms > 50 µm/m³
➢ <10 organisms <50 & > 10µm/ml
➢ Indicator microbes➢ Escherichia coli <250 cfu in 100 ml
➢ Enterococci <100 cfu in 100 ml
➢ Vibrio cholerae <1 in 100 ml
CHECK FOR THE CONCENTRATION OF VIABLE ORGANISMS AND BACTERIA (CFU) BEING DISCHARGED!

© 2002 By Default!
A Free sample background from www.powerpointbackgrounds.com
Slide 16
INDICATIVE SAMPLING
D-2

© 2002 By Default!
A Free sample background from www.powerpointbackgrounds.com
Slide 17
WHERE TO SAMPLE?
➢ Sample in-tank (avoid discharge of BW)
➢ No in-tank sampling points installed on vessel
➢ Sampling possible also in-line (discharge started, indication still faster then detailed test)
SAMPLING PURPOSE➢ Recommended prior to detailed sampling to avoid any
additional impact from a possible non-compliant BW➢ In case tanks have direct discharge to the environment

© 2002 By Default!
A Free sample background from www.powerpointbackgrounds.com
Slide 18
TESTS OF BWS & A
➢ BALMAS testing of different sampling approaches for the D1 and indicative D-2 CME test using BBE 10 cells
➢ Sampling over time for salinity and organisms concentrations from three different depths + microscop counts

© 2002 By Default!
A Free sample background from www.powerpointbackgrounds.com
Slide 19

© 2002 By Default!
A Free sample background from www.powerpointbackgrounds.com
Slide 20
BBE
mean
Salinity Tempera
ture
day 1 tank 1 BW top 42.7
BW middle 84.3
BW bottom 91.7
intank mixed 86.3
tank 2 BW top 226.3
BW middle 255.3
BW bottom 552.3
intank mixed 345.3
day 2 tank 1 BW top 24.7 32.1 15.7
BW middle 51.3 32.2 14.1
BW bottom 80.7 32.6 13.9
intank mixed 56.0
tank 2 BW top 173.0 32.4 13.8
BW middle 250.0 32.4 13.0
BW bottom 558.0 33.6 12.9
intank mixed 342.3
day 3 tank 1 BW top 35.7 32.3 14.7
BW middle 54.7 32.3 14.1
BW bottom 71.7 32.2 13.6
intank mixed 56.0
tank 2 BW top 237.7 32.4 14.3
BW middle 301.0 32.4 14.3
BW bottom 570.7 32.3 14.0
intank mixed 385.3
day 4 tank 1 BW top 44.0 31.9 8.5
BW middle 57.0 32.0 7.4
BW bottom 63.0 32.0 6.7
intank mixed 46.3
tank 2 BW top 444.3 32.2 8.7
BW middle 498.0 32.2 7.5
BW bottom 682.7 32.2 6.7
intank mixed 521.7

© 2002 By Default!
A Free sample background from www.powerpointbackgrounds.com
Slide 21
INDICATIVE SAMPLINGAPPROACHES
Principle 1: Prevent possible non-compliant discharge
➢ Only one group of organisms is enough to indicate/identify non-compliance!
➢ Phytoplankton indicative analysis tools (PAM based) are practical for onboard use and need low water quantity
➢ Zooplankton sample may be concentrated onboard and brought to a laboratory for fast analysis
➢ no appropriate indicative analysis tool for bacteria?
Principle 2: Indicative test may be followed/expanded in the detailed test
➢ Possibly sample as it would be the first part of the detailed test (include all groups of organisms)

© 2002 By Default!
A Free sample background from www.powerpointbackgrounds.com
Slide 22
PRINCIPLE 1Organism
group
Sampling point Equipment Water volume
[litre]
Number of samples
< 50 and > 10
micrometres
Sounding pipe,
manhole or air
vent
Column
sampler or
pump
> 50 ml 1 integrated sample
from possibly the
whole water column or
from 3 different depths
Sounding pipe,
manhole or air
vent
Column spot
sampler or
pump
> 50 ml 1 integrated sample
from 3 different depths
IN
SUMMARY
-
IN-TANK

© 2002 By Default!
A Free sample background from www.powerpointbackgrounds.com
Slide 23
IN
SUMMARY
-
IN-TANK
Organism
group
Sampling point Equipment Water volume
[litre]
Number of samples
> 50
micrometres
Manhole Plankton net 300 - 500 1 integrated sample
from possibly the
whole water column
Manhole, sounding pipe
or air vent
Pump 100 1 integrated sample
from possibly the
whole water column or
from 3 different depths
< 50 and > 10
micrometres
Manhole, sounding pipe,
manhole or air vent
Pump or water
column sampler
5 – 6
(1 enough)
1 integrated sample
from possibly the
whole water column or
from 3 different depths
Manhole, sounding pipe,
manhole or air vent
Pump or point-
source sampler
5 – 6
(1 enough)
1 integrated sample
from 3 different depths
Indicator
microbes
Manhole, sounding pipe,
manhole or air vent
Pump or water
column sampler
1 1 integrated sample
from possibly the
whole water column
Manhole, sounding pipe,
manhole or air vent
Pump or point-
source sampler
1 1 integrated sample
from 3 different depths

© 2002 By Default!
A Free sample background from www.powerpointbackgrounds.com
Slide 24
PRINCIPLE 2

© 2002 By Default!
A Free sample background from www.powerpointbackgrounds.com
Slide 25
IN
SUMMARY
-
IN-LINE
Organism
group
Sampling
point
Equipment Water
volume
[litre]
Number of samples
> 50
micrometres
In-line Plankton net 300 – 500 1 sequential sample of ca.
10 minute duration,
avoiding the very
beginning and very end of
the tank discharge event
< 50 and >
10
micrometres
In-line Sampling jar and
bucket
5 – 6 1 continuous drip sample
may be simultaneously
collected during sampling
of organism group > 50
micrometres
Indicator
microbes
In-line Bucket, sampling
jar and bottle
1 1 continuous drip sample
may be sub-sampled from
the bucket

© 2002 By Default!
A Free sample background from www.powerpointbackgrounds.com
Slide 26
DETAILED SAMPLING-
COMPLIANCE CONTROL SAMPLING

© 2002 By Default!
A Free sample background from www.powerpointbackgrounds.com
Slide 27
SAMPLE REPRESENTATIVENESS IS KEY
➢ Where to sample?
➢ When should sampling start and end?
➢ How long to sample?
➢ How many samples to take?
➢ How much volume to sample?
SAMPLING PURPOSE➢ Identify / accertain if the vessel is in compliance with the
requirements of the BWM Convention D-2 standard – i.e., viable organisms concentrations in the discharged water

© 2002 By Default!
A Free sample background from www.powerpointbackgrounds.com
Slide 28
Compliance Control Sampling
➢ Voyages on commercial vessels
➢ Water flow split equally (untreated water)
– split 1 sample taken over entire pumping time
(OET), i.e. the whole discharge
– split 2 sequential samples in ca.
beginning, middle and end of the
pumping
event

© 2002 By Default!
A Free sample background from www.powerpointbackgrounds.com
Slide 29
TEST VOYAGE 2009 (BSH)5 min. 10 min. 15 min. 5 min. 75 min.
TEST VOYAGES 2010 (EMSA)
Blue = sampling time
White = no sampling

© 2002 By Default!
A Free sample background from www.powerpointbackgrounds.com
Slide 30
TEST VOYAGE 2012 (BSH)
➢Continuous sequences (no time gap
between sequences)
➢OET
➢ 4 tests

© 2002 By Default!
A Free sample background from www.powerpointbackgrounds.com
Slide 31
➢ Organisms patchiness occurs
➢ No trend identified
➢ Similar results OET and sequences
TEST VOYAGE 2009 (BSH)

© 2002 By Default!
A Free sample background from www.powerpointbackgrounds.com
Slide 32
➢ Organisms patchiness occurs
➢ No trend identified
➢ Much higher concentrations in the sequencial samples
TEST VOYAGE 2009 (BSH)

© 2002 By Default!
A Free sample background from www.powerpointbackgrounds.com
Slide 33
➢ Organisms patchiness occurs
➢ No trend identified
➢ Similar concentration of organisms in sequances and OET
TEST VOYAGES 2010 (EMSA)
70 70
51
169
26
79
144
246
122
95
112
56
23
114
186
0
50
100
150
200
250
300
DISCH, S1
DISCH, S2
DISCH, S3
DISCH, OET
DISCH, S1
DISCH, S2
DISCH, S3
DISCH, OET
DISCH, S1
DISCH, S2
DISCH, S3
DISCH, OET
DISCH, S1
DISCH, S2
DISCH, S3
DISCH, OET
1 2 4 5
Sequences number organisms
10 - 50 µm / ml
Over entire timenumber
organisms10 - 50 µm / ml

© 2002 By Default!
A Free sample background from www.powerpointbackgrounds.com
Slide 34
➢ Organisms patchiness occurs
➢ Rise of organism concentration from beginning to the end
➢ Higher organisms concentration in sequences vs. OET
TEST VOYAGES 2010 (EMSA)
18671956
2459
982
1368
1679
1190
1524
970
1259
2111
2667
1153
268
10681218
0
500
1000
1500
2000
2500
3000
DISCH, S1
DISCH, S2
DISCH, S3
DISCH, OET
DISCH, S1
DISCH, S2
DISCH, S3
DISCH, OET
DISCH, S1
DISCH, S2
DISCH, S3
DISCH, OET
DISCH, S1
DISCH, S2
DISCH, S3
DISCH, OET
1 2 4 5
Sequences number organisms
50 µm and above / m3
Over entire time number
organisms 50 µm and above / m3

© 2002 By Default!
A Free sample background from www.powerpointbackgrounds.com
Slide 35
➢ Higher concentrations in the OET samples
➢ Highest concentration varied
TEST VOYAGE 2012 (BSH)

© 2002 By Default!
A Free sample background from www.powerpointbackgrounds.com
Slide 36
➢ Higher concentrations in the sequencial samples vs. OET
➢ Highest concentration in end sequence
TEST VOYAGE 2012 (BSH)

© 2002 By Default!
A Free sample background from www.powerpointbackgrounds.com
Slide 37
STUDY COMPARISONOrganisms Study 2009 Study 2010 Study 2012
< 50 and > 10 µm
- Distribution
- Organism numbers
- Comparison
sequences/OET
Patchy
No trend per
sequence number
Similar numbers
Patchy
No trend per
sequence number
Similar numbers
Patchy
No trend per
sequence number
In OET higher
numbers
> 50 µm
- Distribution
- Organism numbers
- Comparison
sequences/OET
Patchy
No trend per
sequence number
In sequences much
higher numbers
Patchy
Increase towards
last sequence
In sequences much
higher numbers
Patchy
Highest
concentration in
last sequence
In sequences much
higher numbers

© 2002 By Default!
A Free sample background from www.powerpointbackgrounds.com
Slide 38
WHERE TO SAMPLE?

© 2002 By Default!
A Free sample background from www.powerpointbackgrounds.com
Slide 39
➢ Sample in-line (at discharge) as this representsdischarge of organisms to the environment
➢ In-tank sampling represents potential to be discharged (organisms may remain in tank with remaining water) therefore it is difficult to prove discharge standard (need to reveal very high org. numbers – e.g. 1000 org. sampled from a tank of 100 m3)
➢ Sampling point needs to be installed on vessel
➢ Sampling bin and discharge provided on vessel (more about under “sampling arrangements”)
WHERE TO SAMPLE?

© 2002 By Default!
A Free sample background from www.powerpointbackgrounds.com
Slide 40
WHEN SHOULD SAMPLING
START AND END?

© 2002 By Default!
A Free sample background from www.powerpointbackgrounds.com
Slide 41
Homogeneity of organism concentrations
in the dischargeOrganisms < 50 and > 10 – sequences compared
70 70
51
20 16
8879
144
246
122
95
112
0
50
100
150
200
250
300
S1 S2 S3 S1 S2 S3 S1 S2 S3 S1 S2 S3
1 2 4 5
Discharge sequences number
organisms 10 - 50 µm / ml
➢Organisms patchiness occurs
➢ No pattern identified

© 2002 By Default!
A Free sample background from www.powerpointbackgrounds.com
Slide 42
Organisms > 50 – sequences compared
Homogeneity of organism concentrations
in the discharge
➢ Organisms patchiness occurs
➢ Rise of organism concentration from beginning to the end
18671956
2459
982
1368
1679
1190
1524
970
1259
2111
2667
0
500
1000
1500
2000
2500
3000
S1 S2 S3 S1 S2 S3 S1 S2 S3 S1 S2 S3
1 2 4 5
Discharge sequences number
organisms 50 µm and above / m3

© 2002 By Default!
A Free sample background from www.powerpointbackgrounds.com
Slide 43
Organisms > 50 & < 50 and > 10 – sequences compared
➢ Clear tank organisms patchiness
➢ BW sampling results clearly impacted by tank patchiness!
Homogeneity of organism concentrations
in the discharge
18671956
2459
982
1368
1679
1190
1524
970
1259
2111
2667
700 700
510
200 160
880790
1444
2457
1222
951
1123
0
500
1000
1500
2000
2500
3000
S1 S2 S3 S1 S2 S3 S1 S2 S3 S1 S2 S3
1 2 4 5
Discharge sequences number
organisms 50 µm and above / m3
Discharge sequences 10 x number
organisms 10 - 50 µm / ml

© 2002 By Default!
A Free sample background from www.powerpointbackgrounds.com
Slide 44
Sampling timing
➢Do not start sampling during first 5 minutes after start of BW discharge
➢Do not sample in the last 5 minutes before end of discharge
Reasoning:
➢High patchiness of organisms during that sampling times; and
➢More sediment present in that sampling periods what may negatively affect organisms survival in the sample and sample processing.

© 2002 By Default!
A Free sample background from www.powerpointbackgrounds.com
Slide 45
HOW LONG TO SAMPLE?

© 2002 By Default!
A Free sample background from www.powerpointbackgrounds.com
Slide 46
BW sampling Over Entire Time vs.
Sequential ➢Organisms < 50 and > 10 – sequences compared
➢Similar results OET and Sequences
75
60 6370 70
51
9 717 16
9
2620 16
88
193
212217
79
144
246
122
157163
122
95
112
77
56
3123
47
230
114
223
186
0
50
100
150
200
250
300
UP
T, S
1
UP
T, S
2
UP
T, S
3
UP
T, O
ET
DIS
CH
, S1
DIS
CH
, S2
DIS
CH
, S3
DIS
CH
, OET
UP
T, S
1
UP
T, S
2
UP
T, S
3
UP
T, O
ET
DIS
CH
, S1
DIS
CH
, S2
DIS
CH
, S3
DIS
CH
, OET
UP
T, S
1
UP
T, S
2
UP
T, S
3
UP
T, O
ET
UP
T, S
1
UP
T, S
2
UP
T, S
3
UP
T, O
ET
DIS
CH
, S1
DIS
CH
, S2
DIS
CH
, S3
DIS
CH
, OET
UP
T, S
1
UP
T, S
2
UP
T, S
3
UP
T, O
ET
DIS
CH
, S1
DIS
CH
, S2
DIS
CH
, S3
DIS
CH
, OET
1 1 2 2 3 4 4 5 5
Sequences number organisms
10 - 50 µm / ml
Over entire timenumber
organisms10 - 50 µm / ml

© 2002 By Default!
A Free sample background from www.powerpointbackgrounds.com
Slide 47
Organisms > 50 – sequences compared
➢Much higher concentrations in the sequence samples
➢ Longer time & higher volume sampling negatively impacts
5096
45044237
18671956
2459
16891911
1067
386737
982 9821368
1679
24292762
2143
11901524
970
8370
4593
7444
1259
2111
2667
2004
1153373 268 749
1701
1068
2688
1218
0
1000
2000
3000
4000
5000
6000
7000
8000
9000
UP
T, S
1
UP
T, S
2
UP
T, S
3
UP
T, O
ET
DIS
CH
, S1
DIS
CH
, S2
DIS
CH
, S3
DIS
CH
, OET
UP
T, S
1
UP
T, S
2
UP
T, S
3
UP
T, O
ET
DIS
CH
, S1
DIS
CH
, S2
DIS
CH
, S3
DIS
CH
, OET
UP
T, S
1
UP
T, S
2
UP
T, S
3
UP
T, O
ET
UP
T, S
1
UP
T, S
2
UP
T, S
3
UP
T, O
ET
DIS
CH
, S1
DIS
CH
, S2
DIS
CH
, S3
DIS
CH
, OET
UP
T, S
1
UP
T, S
2
UP
T, S
3
UP
T, O
ET
DIS
CH
, S1
DIS
CH
, S2
DIS
CH
, S3
DIS
CH
, OET
1 1 2 2 3 4 4 5 5
Sequences number organisms
50 µm and above / m3
Over entire time number
organisms 50 µm and above / m3
BW sampling Over Entire Time vs.
Sequential

© 2002 By Default!
A Free sample background from www.powerpointbackgrounds.com
Slide 48
Representativeness (…of the whole discharge of ballast water from any single tank or any combination of tanks = ?
…representative sample in diversity, concentration and viability of organisms)
“STATISTICAL”
representativeness
“BIOLOGICAL”
representativeness
?

© 2002 By Default!
A Free sample background from www.powerpointbackgrounds.com
Slide 49
Sampled time
STATISTICAL
representativeness
BIOLOGICAL
representativeness
lower higher
➢missing diversity
➢ higher patchiness
representative
lower higher
➢ low confidence
empty e.g. 10.000 m3
➢ high confidence
➢ more stress
➢ organisms die
representative

© 2002 By Default!
A Free sample background from www.powerpointbackgrounds.com
Slide 50
➢ “BIOLOGICAL” representativeness is crucial!
➢ Statistical representativeness also to be considered

© 2002 By Default!
A Free sample background from www.powerpointbackgrounds.com
Slide 51
Sampling time duration
➢Recommended sampling time is ~10 minutes
Reasoning:
➢ Longer sampling time negatively affects survival of organisms > 50, hence sample is underestimating “real” organisms concentration; and
➢Shorter sampling times are still representativein organisms group < 50 and > 10.

© 2002 By Default!
A Free sample background from www.powerpointbackgrounds.com
Slide 52
HOW MANY SAMPLES TO TAKE?

© 2002 By Default!
A Free sample background from www.powerpointbackgrounds.com
Slide 53
Organisms > 50 & < 50 and > 10 – sequences compared
➢ Clear tank organisms patchiness
➢ BW sampling results clearly impacted by tank patchiness!
Homogeneity of organism concentrations
in the discharge
18671956
2459
982
1368
1679
1190
1524
970
1259
2111
2667
700 700
510
200 160
880790
1444
2457
1222
951
1123
0
500
1000
1500
2000
2500
3000
S1 S2 S3 S1 S2 S3 S1 S2 S3 S1 S2 S3
1 2 4 5
Discharge sequences number
organisms 50 µm and above / m3
Discharge sequences 10 x number
organisms 10 - 50 µm / ml

© 2002 By Default!
A Free sample background from www.powerpointbackgrounds.com
Slide 54
“Instantaneous” sampling vs. “Average”Definition of instantaneous sampling:
➢ “one-point-in-time” sampling
➢Shorter sampling time than OET
Definition of average sampling:
➢Average of two or more instantaneous samples, or
➢OET sampling

© 2002 By Default!
A Free sample background from www.powerpointbackgrounds.com
Slide 55
Organisms < 50 and > 10 – 3 sequences vs. OET compared
“Instantaneous” sampling vs. “Average”
Test No. Sample type Total
number
organisms
10 - 50
µm / ml
Difference
between
sequence
and OET
(%)
DISCH, 3 SEQ AV 64 14
DISCH, OET 56
DISCH, 3 SEQ AV 41 -12
DISCH, OET 47
DISCH, 3 SEQ AV 156 38
DISCH, OET 114
DISCH, 3 SEQ AV 110 -41
DISCH, OET 186
4
5
1
2
Result:
➢ Similar probability to sample higher or lower concentration
➢ Similar difference in organism concentrations sampled

© 2002 By Default!
A Free sample background from www.powerpointbackgrounds.com
Slide 56
Organisms < 50 and > 10 – 2 sequences vs. OET compared
“Instantaneous” sampling vs.
“Average”
Test No. Sample type Total
number
organisms
10 - 50
µm / ml
Difference
between
sequence
and OET
(%)
DISCH, S1 70 25
DISCH, S2 70 25
DISCH, S3 51 -9
DISCH, 2 SEQ AV 61 8
DISCH, OET 56
DISCH, S1 20 -57
DISCH, S2 16 -66
DISCH, S3 88 87
DISCH, 2 SEQ AV 52 11
DISCH, OET 47
DISCH, S1 79 -30
DISCH, S2 144 27
DISCH, S3 246 116
DISCH, 2 SEQ AV 162 43
DISCH, OET 114
DISCH, S1 122 -34
DISCH, S2 95 -49
DISCH, S3 112 -40
DISCH, 2 SEQ AV 109 -42
DISCH, OET 186
2
4
5
1
Method – Middle concentration sequence excluded
Result:
➢ Similar probability to sample higher or lower concentration
➢ Similar difference in concentrations sampled

© 2002 By Default!
A Free sample background from www.powerpointbackgrounds.com
Slide 57
Organisms < 50 and > 10 – 2 sequences vs. OET compared
“Instantaneous” sampling vs.
“Average”
Test No. Sample type Total
number
organisms
10 - 50
µm / ml
Difference
between
sequence
and OET
(%)
DISCH, S1 70 25
DISCH, S2 70 25
DISCH, S3 51 -9
DISCH, 2 SEQ AV 61 8
DISCH, OET 56
DISCH, S1 20 -57
DISCH, S2 16 -66
DISCH, S3 88 87
DISCH, 2 SEQ AV 18 -62
DISCH, OET 47
DISCH, S1 79 -30
DISCH, S2 144 27
DISCH, S3 246 116
DISCH, 2 SEQ AV 195 72
DISCH, OET 114
DISCH, S1 122 -34
DISCH, S2 95 -49
DISCH, S3 112 -40
DISCH, 2 SEQ AV 109 -42
DISCH, OET 186
1
2
4
5
Method – beginning or end
sequence excluded
Result:
➢ Similar probability to
sample higher or lower
concentration
➢ Similar difference in
concentrations sampled

© 2002 By Default!
A Free sample background from www.powerpointbackgrounds.com
Slide 58
Organisms > 50 – 3 sequences vs. OET compared
Result:
➢Always much higher organism concentration in sequences average
“Instantaneous” sampling vs.
“Average”
Test No. Sample type Discharge
sequences
number
organisms
50 µm and
above / m3
Difference
between
sequence
and OET
(%)
DISCH, 3 SEQ AV 2094 82
DISCH, OET 1153
DISCH, 3 SEQ AV 1343 79
DISCH, OET 749
DISCH, 3 SEQ AV 1228 15
DISCH, OET 1068
DISCH, 3 SEQ AV 2012 65
DISCH, OET 1218
4
5
1
2

© 2002 By Default!
A Free sample background from www.powerpointbackgrounds.com
Slide 59
Organisms > 50 – 2 sequences vs. OET compared
“Instantaneous” sampling vs.
“Average”
Method - Second highest
sequence excluded
Result:
➢Always much higher
organism concentration
in sequences average
Test No. Sample type Total
number
organisms
10 - 50
µm / ml
Difference
between
sequence
and OET
(%)
DISCH, S1 1867 62
DISCH, S2 1956 70
DISCH, S3 2459 113
DISCH, 2 SEQ AV 2163 88
DISCH, OET 1153
DISCH, S1 982 31
DISCH, S2 1368 83
DISCH, S3 1679 124
DISCH, 2 SEQ AV 1331 78
DISCH, OET 749
DISCH, S1 1190 11
DISCH, S2 1524 43
DISCH, S3 970 -9
DISCH, 2 SEQ AV 1247 17
DISCH, OET 1068
DISCH, S1 1259 3
DISCH, S2 2111 73
DISCH, S3 2667 119
DISCH, 2 SEQ AV 1685 38
DISCH, OET 12185
1
2
4

© 2002 By Default!
A Free sample background from www.powerpointbackgrounds.com
Slide 60
Organisms > 50 – 2 sequences vs. OET compared
Method – beginning or end
sequence excluded
Result:
➢Always much higher
organism concentration
in sequences average
“Instantaneous” sampling vs.
“Average”
Test No. Sample type Total
number
organisms
10 - 50
µm / ml
Difference
between
sequence
and OET
(%)
DISCH, S1 1867 62
DISCH, S2 1956 70
DISCH, S3 2459 113
DISCH, 2 SEQ AV 2207 92
DISCH, OET 1153
DISCH, S1 982 31
DISCH, S2 1368 83
DISCH, S3 1679 124
DISCH, 2 SEQ AV 1175 57
DISCH, OET 749
DISCH, S1 1190 11
DISCH, S2 1524 43
DISCH, S3 970 -9
DISCH, 2 SEQ AV 1247 17
DISCH, OET 1068
DISCH, S1 1259 3
DISCH, S2 2111 73
DISCH, S3 2667 119
DISCH, 2 SEQ AV 1685 38
DISCH, OET 12185
1
2
4

© 2002 By Default!
A Free sample background from www.powerpointbackgrounds.com
Slide 61
Number of samples
➢Two or more samples to be taken
➢ If more than one BW source, than at least one sample taken from each BW source
Reasoning:
➢Average of two random samples shown to be representative, but more samples may be taken; and
➢As sample needs to be representative of whole discharge, if BW is loaded in different areas, BW water from each area needs to be sampled.

© 2002 By Default!
A Free sample background from www.powerpointbackgrounds.com
Slide 62
HOW MUCH VOLUME TO SAMPLE?

© 2002 By Default!
A Free sample background from www.powerpointbackgrounds.com
Slide 63
Sampled volume
STATISTICAL
representativeness
BIOLOGICAL
representativeness
lower higher
➢ missing diversity
➢ higher patchiness
representative
lower higher
➢ low confidence
e.g., 3x300-
500 litres
e.g., ~5.000 m3
empty e.g. 10.000 m3
➢ high confidence
➢ more stress
➢ organisms die
representative

© 2002 By Default!
A Free sample background from www.powerpointbackgrounds.com
Slide 64
➢ “BIOLOGICAL” representativeness is crucial!
➢ Statistical representativeness also to be considered

© 2002 By Default!
A Free sample background from www.powerpointbackgrounds.com
Slide 65
Sampled quantity
➢For organisms > 50; 300 – 500 litres of sample filtered and concentrated to ca. 5 litres fortransport / 100 ml for analysis
➢For organisms < 50 and > 10; 5 – 6 litres of continuous drip sample during sampling, subsample of ca. 100 ml for transport
➢For bacteria; 1 litre separated from thecontinuous drip sample
Reasoning:
➢Suggested methods and quantities showedbest results, concentrated sample easy tocarry

© 2002 By Default!
A Free sample background from www.powerpointbackgrounds.com
Slide 66
IN
SUMMARY
-
IN-LINE
Organism
group
Sampling
point
Equipment Water volume
[litre]
Number of samples
> 50
micrometres
In-line Plankton
net
300 – 500 in each
sequence
2 (or more) sequential
samples of ca. 10 minute
duration each, avoiding the
very beginning and very end
of the tank discharge event
< 50 and >
10
micrometres
In-line Sampling jar
and bucket
5 – 6 in each
sequence
2 (or more) continuous drip
sequential samples collected
at the same time as for
organism group > 50
micrometres
Indicator
microbes
In-line Bucket,
sampling jar
and bottle
1 in each
sequence
2 (or more) continuous drip
sequential samples sub-
sampled from the bucket

© 2002 By Default!
A Free sample background from www.powerpointbackgrounds.com
Slide 67
IN-TANK
SAMPLING GEAR
AND
(NO) SAMPLING POINT
ARRANGEMENTS

© 2002 By Default!
A Free sample background from www.powerpointbackgrounds.com
Slide 68

© 2002 By Default!
A Free sample background from www.powerpointbackgrounds.com
Slide 69

© 2002 By Default!
A Free sample background from www.powerpointbackgrounds.com
Slide 70

© 2002 By Default!
A Free sample background from www.powerpointbackgrounds.com
Slide 71
AVAILABILITY AND ACCESS OF SAMPLING POINTS
➢ sounding pipes should be on all tanks, but this is not the case
➢ air-vents are on all tanks, but is difficult to remove thecover
➢ manholes are on all tanks, but very frequently are not accessible because of cargo operation, cargo loadedon top, rusty bolts…
➢ tank hatches on few vessels, mainly tankers

© 2002 By Default!
A Free sample background from www.powerpointbackgrounds.com
Slide 72
IN-LINE
SAMPLING GEAR
AND
SAMPLING POINT ARRANGEMENTS
© 2002 By Default!
A Free sample background from www.powerpointbackgrounds.com
Slide 73

© 2002 By Default!
A Free sample background from www.powerpointbackgrounds.com
Slide 74

© 2002 By Default!
A Free sample background from www.powerpointbackgrounds.com
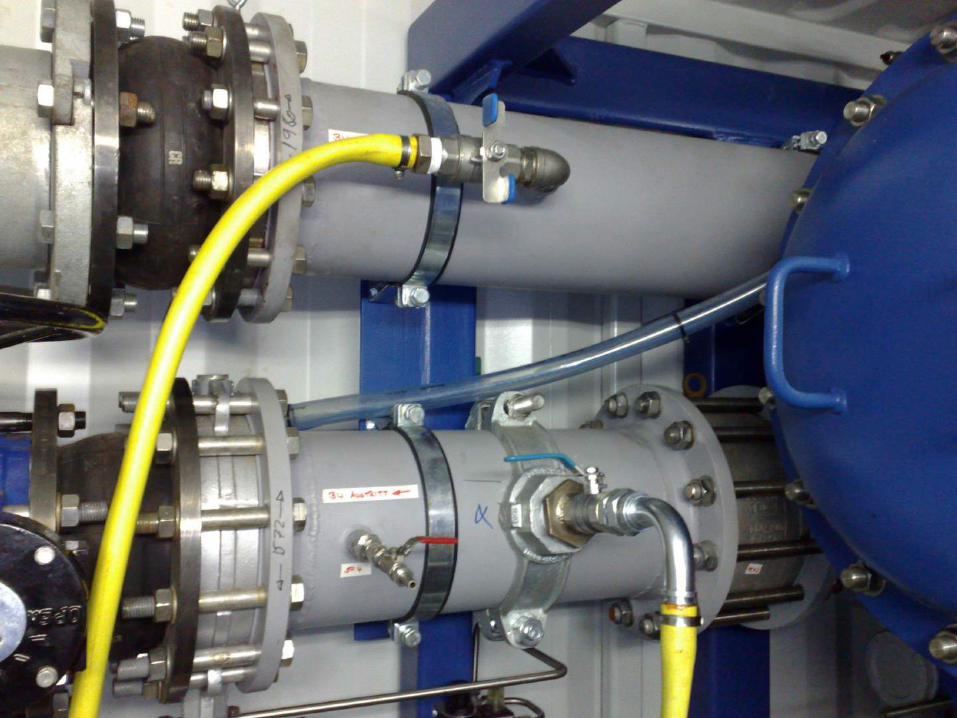
Slide 75
FLOW
METER
INFLOW
OUTFLOW
~ 2-2.5 m
~ 1m

© 2002 By Default!
A Free sample background from www.powerpointbackgrounds.com
Slide 76

© 2002 By Default!
A Free sample background from www.powerpointbackgrounds.com
Slide 77
PERSONAL PROTECTIVE
EQUIPMENT (PPE) IS
VERY IMPORTANT!

© 2002 By Default!
A Free sample background from www.powerpointbackgrounds.com
Slide 78
➢ chosen according to the sampling point
and local regulations
➢ avoid affecting the sample
➢ avoid infection

© 2002 By Default!
A Free sample background from www.powerpointbackgrounds.com
Slide 79
➢ BWS for CME is a complex process
➢ Different approaches and tools are available
➢ Organisms are patchy distributed in tanks what influences BWS results
➢ Very important is to chose the right approach and tools for the purpose of sampling (D-1, D-2, indicative, detailed)
➢ Methods and tools for BWS CME exist, Type Approval methods may be used
➢ New methods and tools may be developing
➢ New methods and tools need to be tested and compared first before use for CME
CONCLUSIONS

© 2002 By Default!
A Free sample background from www.powerpointbackgrounds.com
Slide 80
LITERATURE

© 2002 By Default!
A Free sample background from www.powerpointbackgrounds.com
Slide 81
LITERATURE
➢ Gollasch, S. & David, M. 2009. Results of an onboard
ballast water sampling study and initial considerations how to
take representative samples for compliance control with the D-
2 Standard of the Ballast Water Management Convention.
Report of research study for BSH, Hamburg, Germany, 11 pp.
➢ Gollasch, S. & David, M. 2010. Testing Sample
Representativeness of a Ballast Water Discharge and
developing methods for Indicative Analysis. Final report of
research study undertaken for the European Maritime Safety
Agency (EMSA), Lisbon, Portugal, 124 pp.
➢ Gollasch, S. & David, M. 2013. Recommendations for
Representative Ballast Water Sampling. Final report of
research study for BSH, Hamburg, Germany. 28 pp.

© 2002 By Default!
A Free sample background from www.powerpointbackgrounds.com
Slide 82
SUMMARY OF STUDY TEST VOYAGES + SHIPBOARD BWMS TESTS EXPERIENCE:
Report containing recommendations based on all studies andshipboard tests experience:
➢David, M. 2013. Ballast water sampling for compliance monitoring - Ratification of the Ballast Water Management Convention. Final report of research study for WWF International. Project number 10000675 - PO1368. 66 pp.
http://www.wwf.de/fileadmin/fm-wwf/Publikationen-PDF/Study_Silent_Invasion.pdf

© 2002 By Default!
A Free sample background from www.powerpointbackgrounds.com
Slide 83
MORE INFO IN THE NEW BOOK:
David, M., Gollasch, S. (eds.) 2015. Global
Maritime Transport and Ballast Water
Management – Issues and Solutions.
Springer Science and Business media
For more in information please visit:
http://www.springer.com/environment/environme
ntal+management/book/978-94-017-9366-7
The second edition of the book is in preparation with different new
subjects and lessons learnt important for the implementation of the
BWM Convention. Publication is expected in 2019.

© 2002 By Default!
A Free sample background from www.powerpointbackgrounds.com
Slide 84
ACKNOWLEDGEMENTS

© 2002 By Default!
A Free sample background from www.powerpointbackgrounds.com
Slide 85
Ballast Water Management System for
Adriatic Sea Protection – BALMAS
http://www.balmas.eu/
ACKNOWLEDGEMENTS

© 2002 By Default!
A Free sample background from www.powerpointbackgrounds.com
Slide 86
Dr. Stephan Gollasch
www.gollaschconsulting.de/
Prof. Dr. Matej David
www.davidconsult.eu/

© 2002 By Default!
A Free sample background from www.powerpointbackgrounds.com
Slide 87

THANK YOU
FOR THE
ATTENTION!
QUESTIONS
?

© 2002 By Default!
A Free sample background from www.powerpointbackgrounds.com
Slide 89

© 2002 By Default!
A Free sample background from www.powerpointbackgrounds.com
Slide 1
© 2002 By Default!
A Free sample background from www.powerpointbackgrounds.com
Slide 2
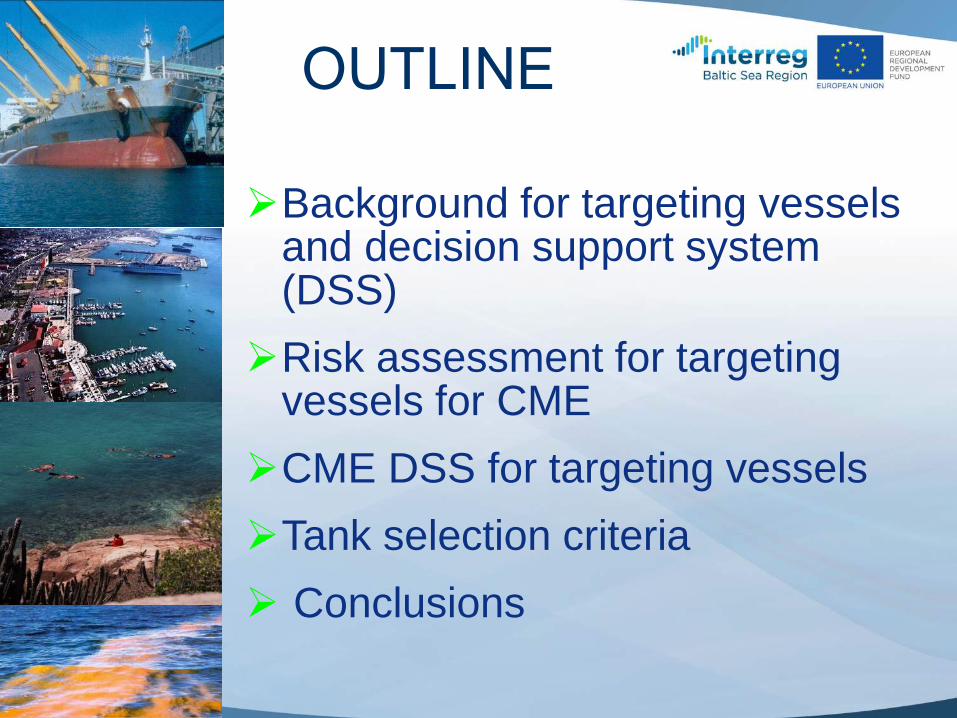
➢Background for targeting vessels and decision support system(DSS)
➢Risk assessment for targeting vessels for CME
➢CME DSS for targeting vessels
➢Tank selection criteria
➢ Conclusions
OUTLINE

© 2002 By Default!
A Free sample background from www.powerpointbackgrounds.com
Slide 3
➢ if there is no system to select vessels for BWM purpose inspection, the “critical” / “high risk” vessels would not be checked and may not be compliant, and instead “low risk” vessels couldbe checked
➢ level of risk posed by ballast water to bedischarged is a very important triggering element
➢ BWM Convention has some triggering elements in Article 9
➢ other triggering elements, e.g., information about non-compliance from previous port
➢ DSS may support PSC decision-making in this complex process
BACKGROUND

© 2002 By Default!
A Free sample background from www.powerpointbackgrounds.com
Slide 4
DSS to support CME
RA DSS BWM
Required
data input
CME
feedback
-
corrections

© 2002 By Default!
A Free sample background from www.powerpointbackgrounds.com
Slide 5
RA for TARGETING
VESSELS FOR CME
LEVEL OF RISK POSED BY BALLAST
WATER TO BE DISCHARGED?

© 2002 By Default!
A Free sample background from www.powerpointbackgrounds.com
Slide 6
MAIN GOALS:
➢ RA for each vessel arrival
➢ identify high risk vessels to enable CMEmeasures
➢ identify low risk vessels may lessen CMEmeasures
RA for BWM DSS
NEED FOR INFORMATION:
➢ ballast water to be discharged (donorport/area?), ballast water reporting needed
➢ salinity and presence of harmful aquatic organisms and pathogens (HAOP) in thedonor port

© 2002 By Default!
A Free sample background from www.powerpointbackgrounds.com
Slide 7
➢ data reliability (need for monitoring in ports)
➢ compare environmental compatibility (salinity)of the ballast water source area with the ballast water recipient area
➢ check the presence of HAOP in the ballast water donor area
➢ low risk assessed when very high environmental incompatibility and when no HAOP are present
➢ when no high environmental incompatibility and HAOP present, different levels of risk are triggered by different HAOP profiles, e.g., human pathogens, target species, harmful algae
RA principles

© 2002 By Default!
A Free sample background from www.powerpointbackgrounds.com
Slide 8
RA model
David, M., Gollasch, S. (eds.) 2015. Global Maritime
Transport and Ballast Water Management – Issues and
Solutions. Springer Science and Business media

© 2002 By Default!
A Free sample background from www.powerpointbackgrounds.com
Slide 9
DSS for TARGETING
VESSELS FOR CME

© 2002 By Default!
A Free sample background from www.powerpointbackgrounds.com
Slide 10
➢ vessel randomly selected under regular BWM verification process
➢ vessel selected for PSC inspection under separate process
➢ vessel not trustworthy
➢ ballast water discharge assessment(BWDA) dissagrees substanially withballast water reporting form (BWRF)
Triggering elements for
BWMC Tier1
(includes BWS)

© 2002 By Default!
A Free sample background from www.powerpointbackgrounds.com
Slide 11
➢ BWM Convention triggering elements (in port):
• no valid certificate
• condition of vessel or equipment don't
correspond with BWMS certificate
• master and that master and crew are not
familiar with BWM procedures/ not
implemented these
➢ PSA received notification that vessel is foundnon-compliant with D-2 standard in a previous port?
➢ Was any BW intended for discharge identified as extreme risk?
Triggering
elements for BWMC Tier2
Is it appropriate to conduct BWS for CME
under/after Tier2?

© 2002 By Default!
A Free sample background from www.powerpointbackgrounds.com
Slide 12
➢ OK as part of Tier 1
Discharge of ballast water not allowed when:
➢ no valid certificate
➢ condition of vessel or equipment don't correspond with BWMS certificate
➢ master and that master and crew are not familiar with BWM procedures/ not implemented these
➢ not when high or extreme risk is posed by theballast water to be discharged
When it is appropriate to
conduct BWS for CME
(detailed D2 test)?

© 2002 By Default!
A Free sample background from www.powerpointbackgrounds.com
Slide 13
CME model
David, M., Gollasch, S. (eds.) 2015. Global Maritime
Transport and Ballast Water Management – Issues and
Solutions. Springer Science and Business media
Was vessel
randomly selected under
regular BWM verification
process?
YES
Was vessel selected
for PSC inspection under
separate process?
IF
SUSPICIOUS
THEN
YES
Was vessel in
trustworthiness procedure
selected as "not
trustworthy"?
YES
Did BWDA model
disagree with BWRF? NO NO NO NO
YES
Vessel is
CLEAR TO PROCEED
until results from BWS analyses
are obtained.
PSC inscpection process as appropriate:
- interview master and BWM responsible
crew
- verify validity of BWMS certificate
- verify BWRB
- BWS for D-1 or D-2 (indicative and/or
detailed)
Proceed to
YES PSA
received notification
that vessel is found
non-compliant with D-2
standard in a
previous port?
NO
Was any BW
intended for discharge
identified as "extreme
risk"?
Proceed to
NO
YES
Clear grounds
that condition of vessel or
equipment don't
correspond with BWMS
certificate?
REGULAR
INSPECTION
Clear grounds
that master and crew
are not familiar with BWM
procedures and have not
implemented
these?
NO
Is vessel carrying
valid BWMS certificate?
YES
YES
NO
DETAILED
INSPECTION
PSC inscpection process as appropriate:
- interview master and BWM responsible
crew
- inspection of all needed documents and
log books
- inspection of vessel (BWMS)
- indicative BWS (without BW discharge)
YES
YESProceed to
YES
BWS was
conducted and results
confirmed
non-compliance?
Vessel
SHALL NOT DISCHARGE BW
until compliance
is confirmed.
NO
YES
NO
PSA DECISION 6:
Is vessel selected for
CME process?
NO

© 2002 By Default!
A Free sample background from www.powerpointbackgrounds.com
Slide 14
TANK SELECTION
WHICH TANK TO SAMPLE (FIRST)?

© 2002 By Default!
A Free sample background from www.powerpointbackgrounds.com
Slide 15
Such an assessment may consider
the following elements, but may not
be limited to:
➢the environmental compatibility of the ballast water donor area with the ballast water recipient area
➢the potential presence of HAOP in the ballast water donor area
➢if appropriate, the presence of target species in the ballast water donor area, and
➢the in-tank holding time
Tank selection criteria

© 2002 By Default!
A Free sample background from www.powerpointbackgrounds.com
Slide 16
➢ the higher the risk identified, the higher the priority
➢ give priority to tank(s) from anotherbiogeografical area with with higher environmental compatibility with the discharge area
➢ give priority to the tanks with ballast water origin area where HAOP or target species are present
➢ give priority to tanks with shorter in-tank holding time
➢ give priority to tanks to be dischargedfirst
Some priority principles

© 2002 By Default!
A Free sample background from www.powerpointbackgrounds.com
Slide 17
➢ for in-tank sampling accesibility, the ease of the sampling access point may be used as an additional criterion to identify the tank to be sampled, considering also that ballast water in some tanks may not be accessible at all for in-tank sampling
➢ for in-line sampling the tank(s) which is(are) currently being discharged when PSC comes on board may be sampled first
• to enable stop of discharge if needed
• not to wait until the »targeted tank« is ready
to be discharged
Some additional
considerations

© 2002 By Default!
A Free sample background from www.powerpointbackgrounds.com
Slide 18
➢A system is needed for selection of vessels and tanks for CME for the purpose of the BWM Convention
➢Important to have a regional PSC approach implemented (MoU)
➢Risk assessment is an important tool to support the CME process
➢DSS for targeting vessels eases the PSC decision-making process
CONCLUSIONS

© 2002 By Default!
A Free sample background from www.powerpointbackgrounds.com
Slide 19
Vectors of Change in Oceans and
Seas Marine Life, Impact on
Economic Sectors - VECTORS
http://www.marine-vectors.eu/
ACKNOWLEDGEMENT

© 2002 By Default!
A Free sample background from www.powerpointbackgrounds.com
Slide 20
ACKNOWLEDGEMENT
Ballast Water Management System
for Adriatic Sea Protection –
BALMAS
http://www.balmas.eu/

© 2002 By Default!
A Free sample background from www.powerpointbackgrounds.com
Slide 21
MORE INFO IN THE NEW BOOK:
David, M., Gollasch, S. (eds.) 2015. Global
Maritime Transport and Ballast Water
Management – Issues and Solutions.
Springer Science and Business media
For more in information please visit:
http://www.springer.com/environment/environme
ntal+management/book/978-94-017-9366-7
The second edition of the book is in preparation with different new
subjects and lessons learnt important for the implementation of the
BWM Convention. Publication is expected in 2019.

© 2002 By Default!
A Free sample background from www.powerpointbackgrounds.com
Slide 22
Dr. Stephan Gollasch
www.gollaschconsulting.de/
Prof. Dr. Matej David
www.davidconsult.eu/

THANK YOU
FOR THE ATTENTION!
QUESTIONS
?

© 2002 By Default!
A Free sample background from www.powerpointbackgrounds.com
Slide 24


• Recommendations for
– Sample labelling
– Sample transport to the laboratory
– Chain of custody
– Sample handling in the laboratory
Outline

• Document sampling event details
• Label bottle (not lid)
– Sample ID code
• Date, start/end time
– D-2 organism group
– Sampling point
– Water volume sampled
– Preservative (if used)
• Secure label with transparent
tape or put samples separately
in bags
Sample Labelling

• Transport sample to lab as soon as possible
• Shipment may also be needed when
analysis requires special lab (Cholera)
– Styrofoam box
– Cooling / heating elements if needed
• Ship sample in controlled conditions
• Document temperature with
temperature loggers
• Sample shipment temperature
– Plankton - slightly cooler than sampling temperature
– Abiotic – according to standard method (ISO etc.)
Sample Transfer to Laboratory

• Documentation of sample shipment
• Record of
– Sampling event details
– Purpose of shipment
(which analysis is needed)
– Sample types
– Number of samples
• All involved to sign
• Cholera = C samples
Chain of Custody

• After sample arrived, if not yet done on board
– Fill 1 L bottle for bacteria analysis
– Fill 2 x 100 ml bottles with phytoplankton
sample and add preservative to one
– Empty cod-end into filter
(30 µm mesh)
– Wash filter mesh content into jar
– Fill wash bottle with filtered
water
– Bring wash bottle and jar
to microscopist
Sample Handling

• Label samples that they can clearly be identified
and are not mixed
• Transport samples to laboratory as soon as
possible
• Document sample transport conditions and
involved persons (chain of custody)
• Handle sample for all D-2 organism groups
• Very well clean all gear to avoid organism
„contamination“ with the next samples
Summary


• Sampling purpose
• D-1 standard
• Possible methods for compliance checks
Outline

• Compliance with D-1
Ballast Water Exchange (BWE)
– 200 m depth, 200 nm from nearest land
– 200 m depth, 50 nm from nearest land
– Designated areas
Sampling Purpose

• Tracers of human activity
– Presence of e.g. Nitrogen or Phosphorous may
indicate nearshore BWE (river run-off in urban areas),
colored dissolved organic matter (CDOM)
• Coastal species
– Harpacticoid copepods, barnacles
• Sediment
• High sediment load may indicate near-shore BWE, but
re-suspension from tank bottom occurs
• Salinity
If salinity is below 30 psu it is unlikely that it was
exchanged at sea
D-1 (Ballast Water Exchange)

D-1 (Ballast Water Exchange)

• Conductivity sensor
– easy to calibrate (with freshwater)
– portable
– dip-stick method
• Refractometer
– easy to calibrate
(with freshwater)
– portable (pocket-size)
– a few drops of water are sufficient
Tools for D-1 Compliance Checks

• Methods exist to proof D-1compliance
• We recommend to measure water salinity, but
– BWE in coastal/port areas in high-salinity
environments (above 30 psu) will results in
compliance but water does not originate from mid-
ocean (non-compliance with D-1); or
– BWE in designated ballast water exchange areas
(within 50 nm from nearest land) may result in less
salinity than the mid-ocean water. Here the BWE
would be compliant, but salinity measurements alone
would show non-compliance
• Origin of BWE must be known
Conclusions

Stephan Gollasch
GoConsult, Hamburg, Germany
www.gollaschconsulting.de
Matej David
Dr. Matej David Consult d.o.o.
Korte, Slovenia
www.davidconsult.eu
Contacts
><((((°> GoConsult


• Sampling purpose
• D-2 standard
• Ballast water biology
• Indicative vs detailed analysis
• Organisms detection methods
• Viability
• Minimum dimension
Outline

• Compliance with D-2 (Ballast Water Performance Standard)
– <10 viable organisms/m³ >50 µm
– <10 viable organisms/ml <50 & > 10µm
– Indicator microbes
• Escherichia coli <250 cfu in 100 ml
• Enterococci <100 cfu in 100 ml
• Vibrio cholerae <1 cfu in 100 ml or in 1 gr ww
zooplankton
(Cfu=Colony forming units)
Sampling Purpose

Ballast Water Biology
• Almost all types
of organisms
• Dominant are
crustaceans,
mollusks, worms
and phytoplankton
• 15 cm long fishes
found in tanks
• Harmful algae
• Pathogens

Ballast Water Biology

• Indicative analysis
– A „quick and dirty“ check
for gross exceedance;
e.g., 100s organisms =
non-compliance
• Detailed analysis
– A detailed analysis;
e.g., 10 organisms =
non-compliance
Two Different Approaches

• EMSA Study
2010
• Interreg IV B
Ballast Water
Opportunity
2012
• BALMAS
2014
• BSH ReBaT
Project 2016
www.bsh.de
Summaries of Organism Detection
Methods

• An evaluation of the following
was done:
– Accuracy
– Reliability
– Time to a result
– Expertise
– Portability
– Costs
– Use on board
or in lab
Possible analysis methods

Indicative Analysis Methods
D-2 organism groups
-Viable organisms less than 50 and greater than or equal to 10 micrometers in minimum dimension
12 methods considered
-Viable organisms greater than or equal to 50 micrometers in minimum dimension
10 methods considered
-Methods for bacteria analysis
13 methods considered

Organisms <50 and ≥10 µm in minimum dimension
Presence/absence (biomass, no counts)
-e.g. DNA, ATP, Chlorophyll a methods deliver results in less than 60 minutes
Viability and estimated counts
-Pulse-amplitude modulated (PAM) fluorometry, portable
-Flow cameras or flow cytometry (< 60 minutes, not portable, viability stain needed)
Indicative Analysis Methods

Organisms <50 and ≥10 µm in minimum dimension
Best compromise:
Pulse-Amplitude Modulated (PAM) fluorometry
-portable, easy to use, low expertise needed
-viability in less than 10 minutes onboard (by PSC)
Indicative Analysis Methods

-PAM measures phytoplankton biomass and viability
-No direct counts („estimated numbers“)
-Clear relation of biomass and viability measurements with organism numbers
-Suitable tool to show that D-2 was not met
-Detection limit is 1 org / ml (calculated) 0
50
100
150
200
250
300
0 0,1 0,2 0,3 0,4 0,5 0,6 0,7 0,8
Organism viability
Nu
mb
er
of
sm
all
er
org
an
ism
s /
ml Total number of smaller
organisms
Pulse-Amplitude Modulated Fluorometry (PAM)

Indicative Analysis Methods Organisms ≥50 µm in minimum dimension
Presence/absence methods (no counts)
-e.g. DNA, ATP methods deliver results in less than 60 minutes
Counts (no viability)
-Hand-held flow cameras results in less than 30 minutes
Best compromise: Stereomicroscope (counts & viability) in laboratory
-results in less than 20 minutes
-portable, easy to use, but high expertise needed

Indicative Analysis Methods
D-2 Bacteria
Presence/absence methods (no cfu and/or counts)
-e.g. DNA, ATP methods deliver results in less than 60 minutes
All methods to determine cfu require incubation time of >6 hours

-Start with one method to evaluate one organism group in D-2
-Should this show presence or high numbers, take result as indication of a failure to meet D-2
-Should this show absence or low numbers, continue with second (and third) D-2 organism group to confirm results
-The easiest to start with may be the analysis for phytoplankton (Pulse-Amplitude Modulated fluorometry) on board and if needed followed by zooplankton (stereomicroscope) in laboratory
Indicative Analysis Methods
Suggestions

Indicative Analysis Approach
Organisms <50 - ≥10 µm
(PAM) on board
Organisms ≥50 µm
(stereomicroscope) lab
D-2 met
D-2 met
D-2 compliance
action
D-2 non-compliance
action
D-2 not met
D-2 not met

-Ballast Water Monitoring A/S, Denmark. Fluorescence
-Ballast Water Checker, China. PAM fluorescence
-BallastWISE, Denmark. Movements and fluorescence
-P. Counter, Republic of Korea. Fluorescence and image
processing
-ChemChrome V6 (CV6), France. Stain
-Ballast Eye, Japan. FDA
-Integrated Ballast Testing,
Spain. Image cytometry
-B-QUA, Canada. ATP
-Aquatools, France. ATP
Indicative Analysis Methods Recent
Developments

• Work according to good laboratory practice standards
• Most accurate analysis technologies should be used
• At best consider living samples
• Keep time between sample taking and sample analysis
as short as possible
• Unlikely to have one detailed sample processing
standard world-wide
Detailed Analysis

• IMO Code G8 - Definition: “Viable organisms means
organisms that have the ability to successfully generate
new individuals in order to reproduce the species.”
• How to proof this?
• Imagine
– You only have one individual and no breeding mate
– You only have females in your sample
– You have species which reproduce once a year
Viability Problem

• IMO Code G8 – Sample Analysis: “Viability may be
established by assessing the presence of one or more
essential characteristics of life, such as structural
integrity, metabolism, reproduction, motility or response
to stimuli”
– structural integrity = complete organisms plus
– metabolism = organ activity, heartbeats or
– reproduction = new generation or
– motility = movements or
– response to stimuli = poking
Viability Solution

• Phytoplankton
– viability stain Fluorescein DiAcetate (FDA)
– 5-ChloroMethylFluorescein DiAcetate (CMFDA)
• Zooplankton
– initiate movement with light under stereomicroscope
– gentle poking with a needle
• Bacteria
– colony forming means viable
Viability

• Stains living phytoplankton
– Cell-permeant esterase substrate documents
enzymatic activity (needed to activate its
fluorescence) and cell-membrane integrity (needed
for retention of fluorescent product in cell)
– Problem with UV treated
water
Viability Stain Fluorescein
DiAcetate (FDA)

• Look at the organisms from all axes
• Select the smallest axes
• Measure the smallest dimension
• Not always possible!
• Use smallest visible axis
Minimum Dimension

• IMO G2: The "Minimum Dimension" of an organism
based upon the dimensions of that organism's body,
ignoring, e.g., spines, flagellae or antenna.
• The minimum dimension
should be the smallest part of
the "body", i.e. the smallest
dimension between main
body surfaces of an individual
when looked at from all
perspectives.
Minimum Dimension Issues

• Never fully accurate when using filters to separate D-2
organism size classes
• Problems “organism damage” and “minimum dimension”
– Organisms with long spines are
caught in filter although their
minimum dimension was smaller
– Colonies caught although individual
may be smaller than filter mesh
– Spaghetti in pasta drainer never
slip through although the would fit
through the holes
Problems with Filtration
www.kochwiki.org

• Several algae form colonies or chains
• What if a colony or chain is above 50 µm in minimum
dimension and the single individual below 50 µm?
• Measure and count the single individual
– Because D-2 refers to viable organisms and it is the
individual being viable and not the colony
Colony vs. Single Organisms
200 µm
40 µm

• Suggested methods
– Organisms <50 and ≥10 µm
• Phytoplankton - Epifluorescence microscope
• Zooplankton – Microscope
– Organisms ≥50 µm
• Phytoplankton - Microscope
• Zooplankton – Stereomicroscope
– Bacteria
• Selective media
• Consider routine bacteria analysis methods
(drinking / bathing water quality standards)
Detailed Analysis

D-2 organism <50 and ≥10 µm
-Epifluorescence microscopy
-Fluorescein diacetate (FDA)
-1 ml Sedgewick-Rafter chamber with grid of 1000 squares
-Grid lines = 10-15 µm
-Count vertical transects
Sedgwick-Rafter
chamber
Detailed Analysis Methods

D-2 organisms ≥ 50 µm
-Microscopic analysis
-Stains don´t work 100%
-Living dead judgement by a scientist
-50 µm beads or mesh for size
Stephan
counting
chamber
Detailed Analysis Methods

D-2 methods for bacteria
-colony forming units to identify
-not all bacteria form colonies
-incubation needed
-selective media
Detailed Analysis Methods

-Consider to equip a van with organism detection technology
-Drive from vessel to vessel in a port
-Send sampling team onboard and deliver the samples as soon as possible to van for analysis
-In this scenario the organism detection tools would not need to be carried onboard
-Sampling team “only” to board the vessel, no need to bring organism detection team on board as well
Analysis Methods
Suggestions

Analysis Methods, Summary Organism Indicative
≥ 50 µm Stereomicroscope
(in laboratory)
< 50 and ≥ 10 µm PAM
(on board method)
Bacteria Developing
Organism Detailed
≥ 50 µm Stereomicroscope
(needle for poking)
< 50 and ≥ 10 µm Epifluorescence
microscope with
CM/FDA stain
Bacteria Selective media

• Methods exist to proof D-2 compliance
• New methods need to be validated
• Harmonized approach needed, not that one vessel is
compliant in one port, but not in another because of
different sample processing methods used
• An indicative sample analysis may be followed by a
detailed analysis of the same sample
Conclusions

Stephan Gollasch
GoConsult, Hamburg, Germany
www.gollaschconsulting.de
Matej David
Dr. Matej David Consult d.o.o.
Korte, Slovenia
www.davidconsult.eu
Contacts
><((((°> GoConsult


1
QUESTIONNAIRE
1. Are you planning future Ballast Water testing in your country?
Latvia: Latvian Institute of Aquatic Ecology will be responsible for ballast water sampling, analysis
and environmental risk assessment for the granting of exemptions.
Estonia: Ballast Water testing will be conducted for the first time in 2019.
Finland: Not at the moment. Finland has conducted a sampling study, where four different
indicative sampling devices have been tested. The results were compared to detailed analysis. The
report will be published soon.
Denmark: Denmark is currently planning how to implement ballast water sampling and analysis
according to IMO regulations.
Germany: Yes, Germany is implementing a project for ballast water sampling and analysis. The aim
of this project is to find devices that deliver representative results and are easy to use during ship
surveys conducted by PSCOs or Water Police officers.
2. Are there already concrete plans?
Latvia: Based on the Latvian Law of “International convention for the control and management of Ships' ballast water and sediments, 2004”, entry into force on 04.07.2018, there are responsible institutions nominated, but there is no concrete plan for coordinated actions. Estonia: Planned is taking samples for microbes (incubation + genetics) and check the water in tank for compliance with D-1. Finland: No concrete plans yet. However, Finland plans to purchase indicative analysis devices in the near future. Denmark: So far only desktop draft plans – but planning is in progress. Germany: Yes, the first training on indicative analysis for Water Police officers will start in July. In August there will be tests on different sampling methods. After August tests of different methods for sampling and analysis on board during compliance control will be performed.
3. Which institutions/administrations are involved?
Latvia: Since the Law of “International convention for the control and management of Ships' ballast water and sediments, 2004” is in force, the Ministry of Transport and the Ministry of Environmental Protection and Regional Development coordinate the fulfillment of obligations under the Convention. The other responsible institutions are: Ministry of Education and Science,

2
The State Environmental Service of the Republic of Latvia, Maritime administration of Latvia, Latvian Institute of Aquatic Ecology and coast Guard Service of Latvian Naval Forces. Estonia: The Ministry of the Environment is funding the applied research project on testing the microbiology in ballast water. The Marine Ecology Lab of the Department of Marine Systems (TalTech) and microbiologists from the University of Tartu will be involved. Finland: Finnish Transport and Communications Agency is responsible for PSC inspection in Finland. Consultative help can be asked from Finnish Environment Institute (SYKE). Denmark: The Danish Maritime Authority in relation to PSC (Paris MOU: certificate, journal and plan) and The Danish Environmental Protection Agency in relation to BW sampling and analysis and the subsequent verification of the results for compliance or non-compliance. It is expected that PSC will notify EPA if there is suspicion of non-compliance. Germany: The Federal Maritime and Hydrographic Agency, the Water Police departments of different German Federal States as well as the German Social Accident Insurance Institution for Commercial Transport, Postal Logistics and Telecommunication (Ship Safety Division, BG Verkehr).
4. Do you need additional information/consulting to do so?
Latvia: At the moment further co-operation within the national institutions in the country is necessary, as there are no clear schemes of coordinated actions. Estonia: Might need the informational support e.g. on sampling or analyzing the samples/results. Finland: An International Standard for representative sampling is necessary to conduct future inspections. Denmark: For now no, but perhaps in a year or so from now a follow-up-workshop or a just a simpler questionnaire could be beneficial to do for all involved parties to share experiences and knowledge on the logistical and practical challenges involved in CME. Especially regarding the costs involved for sampling and analysis as well as man hours involved. Germany: No, not for now.
5. Are there co-operations with other countries concerning testing?
Latvia: At the moment there are no co-operations with other countries concerning testing. Estonia: At the moment there is no foreign partner concerning testing, but Estonia is open for collaboration and exchange of the experience. Finland: No Denmark: So far not. However, Denmark is of course willing to share experiences and to collaborate with other countries if relevant to align testing procedures.

3
Germany: No, there are no co-operations but an exchange of information.
6. From your experience and perspective: What are the most important aspects which have to be clarified, problems which have to be solved regarding BWMC compliance monitoring?
Latvia: Co-operation within the responsible and involved authorities regarding vessel inspection, sample collection, reporting. Granting of exemptions becomes more and more urgent issue within the next few months. Estonia: The problem and its solving have to be internationally accepted and monitoring of the ballast water have to be developed, in collaboration with different stakeholders and research institutions, approved methods and standardized techniques (e.g. instruments for testing the compliance) for routinely held monitoring in the different regional seas (e.g. Baltic Sea). Finland: - Taking representative sample for detecting the ≥ 50 µm size fraction is difficult in practice. - Availability of laboratories for detailed analysis is unclear. - At the moment we do not have laboratories in Finland, which could analyze toxicogenic Vibrio cholera (01 and 0139) from sea water sample. Denmark: Equipment and methods for BW sampling and the required resource competency for BW sampling and indicative analysis are our main bottlenecks. Subsequently, what resources are available (need to be available) to carry out the whole testing procedure? In more detail: How it is possible to obtain an effective and sound testing procedure including BW sampling and analysis which must be done by experienced and competent authority/technicians. Furthermore, they need to be able to move out to different parts of the country with short notice (also outside normal office working hours) with the relevant and required equipment for sampling and analysis of the samples taken (keeping in mind that only two of the three size groups can currently be verified with existing methods). And finally, how to go through all this without delaying the vessel. Germany: For the German project on the experience building phase the equipment for sampling and analysis needs to be light in weight and easy to use while providing representative and reliable data within a short additional time during the regular surveys by water way police officers or PSCOs.

1
PARTICIPANTS Estonia Toomas Mironov Estonian Environmental
Research Centre
Ivan Kuprijanov Marine Systems Institute at
Tallinn University of Technology
Finland Jukka Huhtanen Finnish Transport and
Communications Agency
Juha Suomalainen Finnish Transport and
Communications Agency
Germany Mike Meklenburg BG Verkehr, Ship Safety Division
Sebastian Seibel Water Police Mecklenburg-
Vorpommern
Octavio Marin Maritime and Hydrographic
Agency
Lithuania Greta Sriebalienė Marine Research Institute,
Klaipėda University
Paulius Petrošius Environmental Protection
Agency, marine monitoring
department
Eglė Šupinienė Environmental Protection
Agency, marine monitoring
department
Poland Grzegorz Siemiński Maritime Office in Gdynia
Piotr Prokop Maritime Office in Szczecin
Denmark Kim Lundgreen Danish EPA
Latvia Ieva Barda Latvian Institute of Aquatic
Ecology
Ieva Putna-Nimane Latvian Institute of Aquatic
Ecology
Related Documents