bae Streetcar Economic Development Study PRELIMINARY FINDINGS Presentation December 10, 2008

Welcome message from author
This document is posted to help you gain knowledge. Please leave a comment to let me know what you think about it! Share it to your friends and learn new things together.
Transcript
bae
Streetcar Economic Development Study PRELIMINARY FINDINGS Presentation
December 10, 2008

bae
Overview of Scope
1. Background Review, Corridor Tour
2. Team: BAE; Warren & Associates; Integra Realty Resources
3. Assess value premium for system financing
• Interview stakeholders (property owners, developers, CDCs, institutions)
• Literature review
• Limited literature on streetcars
• Need to borrow from light rail studies
• Case studies (both quantitative and qualitative)
• Little Rock, AR
• Seattle, WA
• Memphis, TN
• Portland, OR
Portland Streetcar
bae
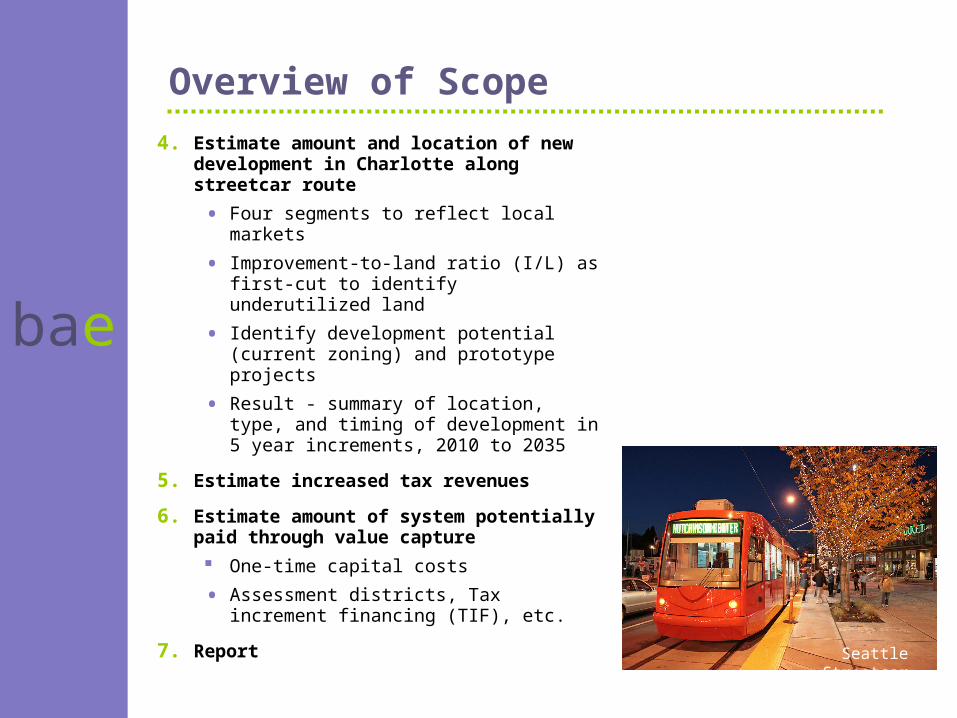
4. Estimate amount and location of new development in Charlotte along streetcar route
• Four segments to reflect local markets
• Improvement-to-land ratio (I/L) as first-cut to identify underutilized land
• Identify development potential (current zoning) and prototype projects
• Result - summary of location, type, and timing of development in 5 year increments, 2010 to 2035
5. Estimate increased tax revenues
6. Estimate amount of system potentially paid through value capture
One-time capital costs
• Assessment districts, Tax increment financing (TIF), etc.
7. Report
Overview of Scope
Seattle Streetcar

bae
Streetcar Corridor and SegmentsStreetcar Corridor and Segments

bae
Federal Small Starts – strict cost rules have led to only 3 approvals. May be revised with SAFETEA-LU reauthorization
• Proposals to consider economic development benefits when reviewing
• Approved extension to date: Portland (after multiple tries)
• Approved new systems to date: Fort Lauderdale, FL; Tucson, AZ
State and regional capital improvement programs funded through various sources
• Most common are gasoline and sales taxes
Multiple local sources typical – taxes, parking, surcharges
• General funds, sales taxes parking meters, parking garages, surcharges at served public arenas and venues (Portland, Ore: 8 sources)
Institutional or private donations because of benefits received
• Ohio State contributing $12.5 million to Columbus streetcar. Cincinnati raising $30 million in donations; Grand Rapids $50 million
Overview of Streetcar Financing ToolsOverview of Streetcar Financing Tools
bae
Value Capture: Literature ReviewValue Capture: Literature Review
bae
Local land-value based sources to capture transit’s enhancement to real estate value
• Tax Increment financing (TIF) – capture increment (growth) in taxes above a baseline amount. Can be pledged for repayment of bonds
• Assessment Districts, e.g., Local Improvement District (LID), Municipal Service District (MSD) etc. – direct tax assessment on area receiving “benefit”; bondable
• Can be based on benefit by lineal foot of frontage, sq. ft. in walkable zone Can be based on benefit by lineal foot of frontage, sq. ft. in walkable zone (LID); or as added rate onto property tax rate (MSD)(LID); or as added rate onto property tax rate (MSD)
• Development Impact Fee or Service District Charge – broadly used, typically require “nexus” study linking fee to benefit received
• Charlotte has transportation impact fees. Equity issue for those who pay vs. Charlotte has transportation impact fees. Equity issue for those who pay vs. those who don’t but still get benefitsthose who don’t but still get benefits
• Joint Development –publicly owned developed to benefit from increased land value. Streetcars typically have less land available for this
• North Carolina law only provides for TIF, MSD, TAD, impact fees. Legislative approval likely needed for additional tools
Overview of Streetcar Financing ToolsOverview of Streetcar Financing Tools
bae
Value Capture: Primary ResearchValue Capture: Primary Research
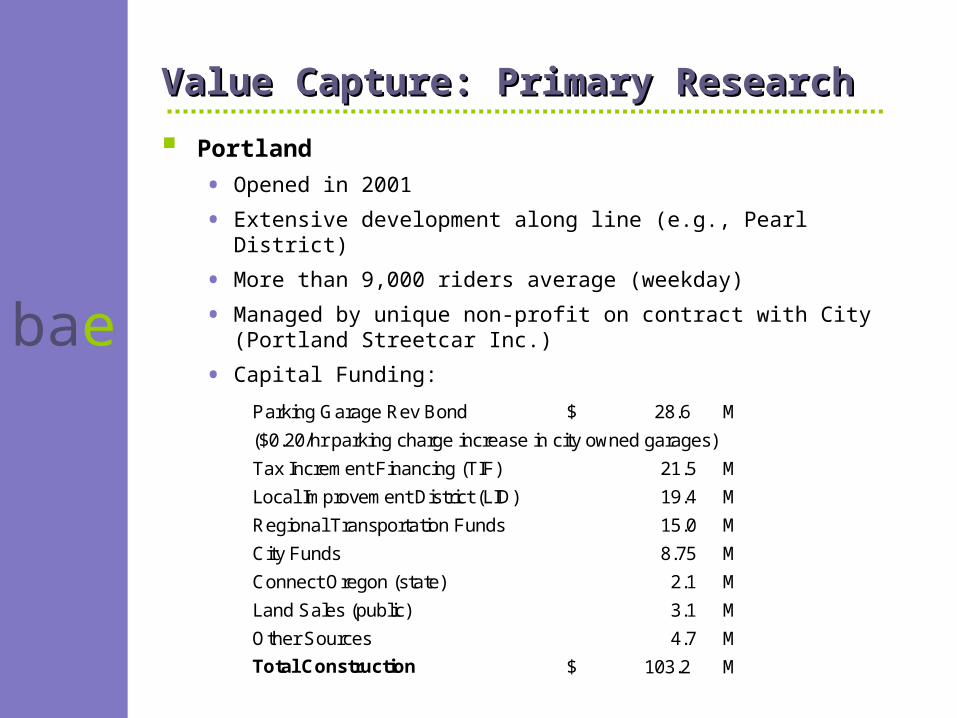
Portland
• Opened in 2001
• Extensive development along line (e.g., Pearl District)
• More than 9,000 riders average (weekday)
• Managed by unique non-profit on contract with City (Portland Streetcar Inc.)
• Capital Funding:Portland Streetcar Funding
Parking Garage Rev Bond 28.6$ M
($0.20/hr parking charge increase in city owned garages)
Tax Increment Financing (TIF) 21.5 M
Local Improvement District (LID) 19.4 M
Regional Transportation Funds 15.0 M
City Funds 8.75 M
Connect Oregon (state) 2.1 M
Land Sales (public) 3.1 M
Other Sources 4.7 M
Total Construction 103.2$ M

bae
Value Capture: Primary ResearchValue Capture: Primary Research
Portland, cont’d
• Extensive analysis of impact on amount and timing of development, not land value increases
• 2005 report for Portland Streetcar, Inc. analyzed new development patterns as a result of downtown Westside streetcar
• Most of the downtown area has FAR more than double long-term market Most of the downtown area has FAR more than double long-term market potentialpotential
• Between 1997 and 2004, density of new development was greatly increased – total of 4.6 million sq. ft. near streetcar
• Density greatest within 1 block of streetcar – built to 90% of FAR post-1997; pre-1997 existing development only at 34% of FAR
• Sites within 1-block had 19% of neighborhood development pre-1997; captured 55% of all new development in their neighborhoods post-1997
• Net result: less intensively developed area was built up to average density elsewhere in the downtown area

bae
Value Capture: Primary ResearchValue Capture: Primary Research
Seattle
• 1.3 miles through South Lake Union (bio-tech corridor near downtown)
• Part of larger initiative to develop South Lake Union neighborhood (substantial recent investment in Fred Kettering Cancer Research Center, lofts, retail, office, R & D)
• Opened in Dec 2007
• Ridership has surpassed projections (~ 350,000 a year, need full year of operations to get to average)
• Total cost $50.5 M
• $25 M funded by Local Improvement District (LID)$25 M funded by Local Improvement District (LID)
• Balance from public sources (local, state, federal)Balance from public sources (local, state, federal)
• Funding works well due to major property owners (U of W, Vulcan)Funding works well due to major property owners (U of W, Vulcan)
• Value capture analysis not feasible due to recent opening (one year)
• Appraiser study to calculate LID benefit effectively assumes transit value premium that is created is 1.3% of baseline assessed value

bae
Value Capture: Primary ResearchValue Capture: Primary Research
Memphis
• Original line opened in 1993 along riverfront as part of riverfront redevelopment
• Expanded in late 1990s, and again in 2003 (Madison Street line, runs perpendicular to river, through downtown). Refurbishes historic (“heritage”) trolley cars
• Total system now 7+ route miles. Ridership – more than 3,200 per day
• Frequent headways are key to high use (peak hour headways - 10-12 minutes)Frequent headways are key to high use (peak hour headways - 10-12 minutes)
• Most recent extension serves growing medical/bio-tech corridor
• $1 B development by 5 hospitals, U of TN research facilities, U of Memphis $1 B development by 5 hospitals, U of TN research facilities, U of Memphis Law SchoolLaw School
• 450 new housing units nearby + more in area (related to strong real estate 450 new housing units nearby + more in area (related to strong real estate market as well)market as well)
• Transit Authority believes streetcar established Class A amenity due to development pattern with bio-tech R & D at/near streetcar, creating vibrant urban environment
• Multiple funding sourcesMultiple funding sources
• BAE looked at 2002, 2008 tax appraisal data for Madison Street line. Land value for commercial land increased 70% in value
• Residential properties increased 780% due to condo building boom (vs 24% City-wide; Residential properties increased 780% due to condo building boom (vs 24% City-wide; however, existing commercial buildings decreased in value (vs. City-wide 17% increase)however, existing commercial buildings decreased in value (vs. City-wide 17% increase)
bae
Value Capture: Primary ResearchValue Capture: Primary Research
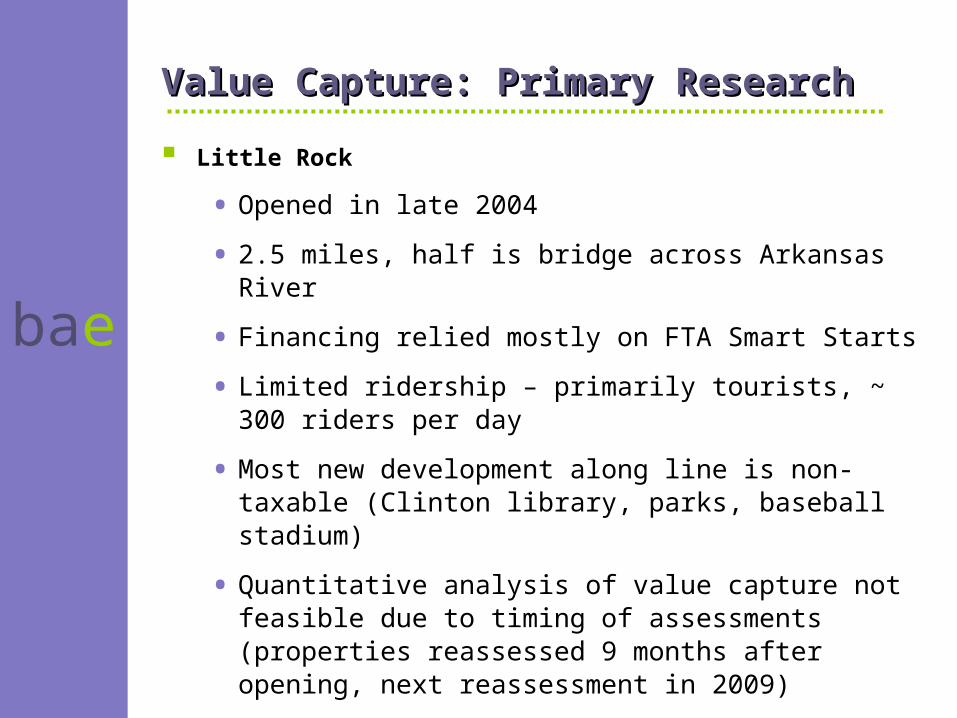
Little Rock
• Opened in late 2004
• 2.5 miles, half is bridge across Arkansas River
• Financing relied mostly on FTA Smart Starts
• Limited ridership – primarily tourists, ~ 300 riders per day
• Most new development along line is non-taxable (Clinton library, parks, baseball stadium)
• Quantitative analysis of value capture not feasible due to timing of assessments (properties reassessed 9 months after opening, next reassessment in 2009)
bae
Charlotte’s Light Rail ExperienceCharlotte’s Light Rail Experience
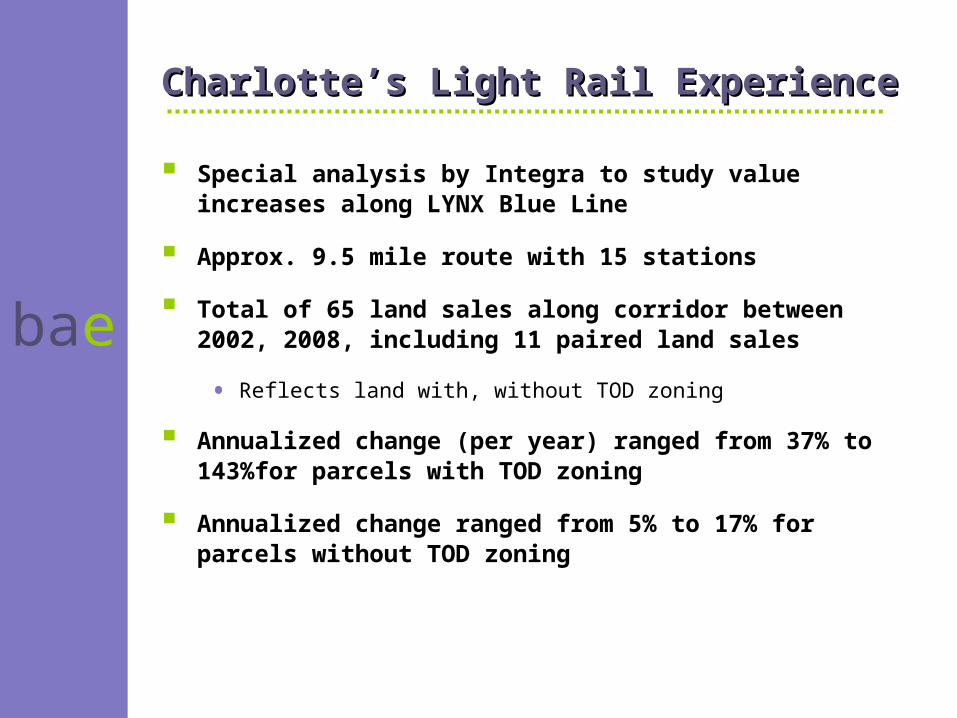
Special analysis by Integra to study value increases along LYNX Blue Line
Approx. 9.5 mile route with 15 stations
Total of 65 land sales along corridor between 2002, 2008, including 11 paired land sales
• Reflects land with, without TOD zoning
Annualized change (per year) ranged from 37% to 143%for parcels with TOD zoning
Annualized change ranged from 5% to 17% for parcels without TOD zoning

bae
Local developers, property owners, brokers, community members on interest in streetcar, link to economic development
Blue Line has convinced people of transit benefits and value that accrues to land
• Transit entitlements for greater density attractive to developers. However, developers caution transit is an amenity, not a demand generator
• Amenities can enhance project success, developer returns
Streetcar seen as critical to east/west corridor economic development, so competes with NoDa and South End
• Developers have acquired sites and paid prices that have a streetcar premium “built-in” – up to $50 per sq. ft. of land
• Affects ability to do redevelopment, attract equity and debt investment
Support for both TIF and MSD; institutions opposed to LID
Expect Gold Rush line replacement by streetcar continues fare-free zone
Charlotte Stakeholder InterviewsCharlotte Stakeholder Interviews

bae
Most of the corridor is subject to an Area or other plan completed since 2000
Downtown segment has same zoning controls as rest of downtown, allowing tall, dense development
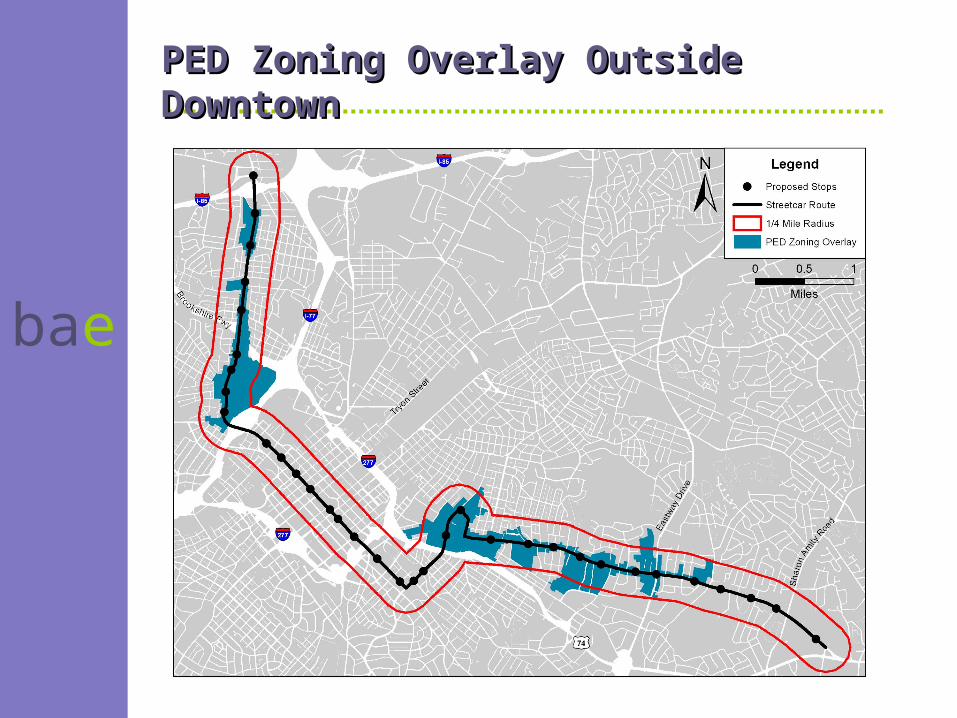
PED zoning overlay applied to many parcels outside Downtown allows moderate density mixed-use development
• More flexible on mix of uses, other requirements
• Starts with 40’ base height, allows height increases at ration of 1’ height for each 10’ distance from adjacent residential
• Maximum height limit of 100’
• Reduced parking requirements, flexibility in how can be met – a key factor for enhancing development feasibility
Streetcar Corridor OverviewStreetcar Corridor Overview
bae
PED Zoning Overlay Outside DowntownPED Zoning Overlay Outside Downtown

bae
Streetcar corridor is fully developed, so new projects are either redevelopment or infill development
These types of projects can face numerous challenges
• Finding or assembling large enough parcels
• New development can create enough additional value to justify risks, giving up existing income from property, etc.
• Potential complex issues – infrastructure, environmental remediation
• Challenges of neighbor and other public acceptance
A big plus is increasing premium by residents and businesses on convenient locations closer to downtown areas
• Particularly older nearby areas with high quality or historic building stock, unique character, etc.
• Increasing emphasis on quality of place and experience
Infill Development PotentialInfill Development Potential

bae
Evaluated entire corridor to identify underimproved properties most likely to redevelop or have infill development
Based on PED, other applicable zoning, calculated “development potential” for opportunity sites
Corridor sites with greatest potential in next 25 years could support 10,000 – 20,000 new dwelling units in all segments; 500,000 - 1 million sq. ft. commercial outside Downtown
• Sites with longer-term potential (25+ years) could accommodate 5,000 – 10,000 new dwelling units, 200,000 – 400,00 sq. ft. commercial
• New development – does not include renovation of existing buildings
• Residential range affected by rate Charlotte supports future development at greater densities compared to lower density past, present
Estimating Development CapacityEstimating Development Capacity

bae
Infill site analysis answers question of how much development might fit in the streetcar corridor
Market analysis seeks to answer the question of how much development activity is likely to occur
Challenge in looking at market potential is, except Downtown, historical trends show modest development activity
• Midtown area, esp. Elizabeth Avenue, now showing strong development interest, proposed projects. Initial phases being constructed
Can look to experience of other cities, including Charlotte, on how transit has helped accelerate development
While not market-based, can look to future regional growth projections to think about how to capture a larger share
Market Support for DevelopmentMarket Support for Development

bae
Work with Warren & Associates to consider alternatives
Started with Centralina COG projections for growth 2010 – 2035 for local areas around streetcar corridor segments
• Used this to define a “baseline scenario”
• Aside from Downtown, higher growth than historical and recent trends based on supportive policies, public investment, etc.
Assess portion of local area potential each segment captures
• Further allocate residential by ownership vs. for-sale, product type
• Office space based on employment growth, adjusted for proportion of office employment in various economic sectors
• Retail based on household growth, spending patterns
Also created an “accelerated scenario” assuming corridor captures .5% more of growth in 9-County region
• Rapid growth, multiple corridors limit share growth
• Likely upper limit for region 1% - 2%; chose more modest figure to not overestimate TIF and MSD potential
Projecting Market SupportProjecting Market Support
bae
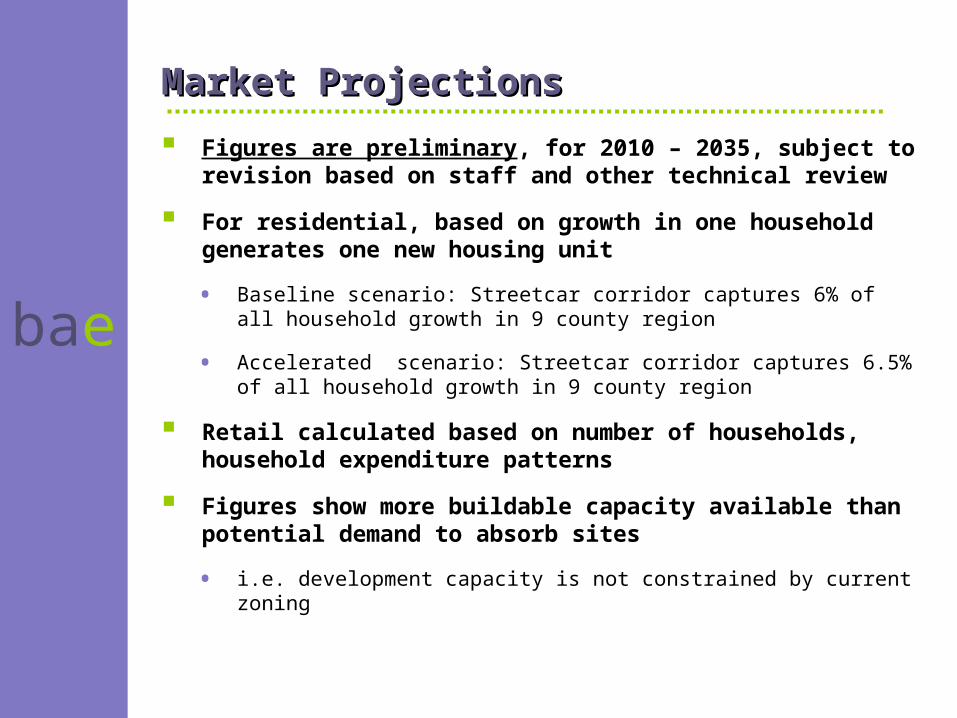
Figures are preliminary, for 2010 – 2035, subject to revision based on staff and other technical review
For residential, based on growth in one household generates one new housing unit
• Baseline scenario: Streetcar corridor captures 6% of all household growth in 9 county region
• Accelerated scenario: Streetcar corridor captures 6.5% of all household growth in 9 county region
Retail calculated based on number of households, household expenditure patterns
Figures show more buildable capacity available than potential demand to absorb sites
• i.e. development capacity is not constrained by current zoning
Market ProjectionsMarket Projections
bae
Market ProjectionsMarket Projections
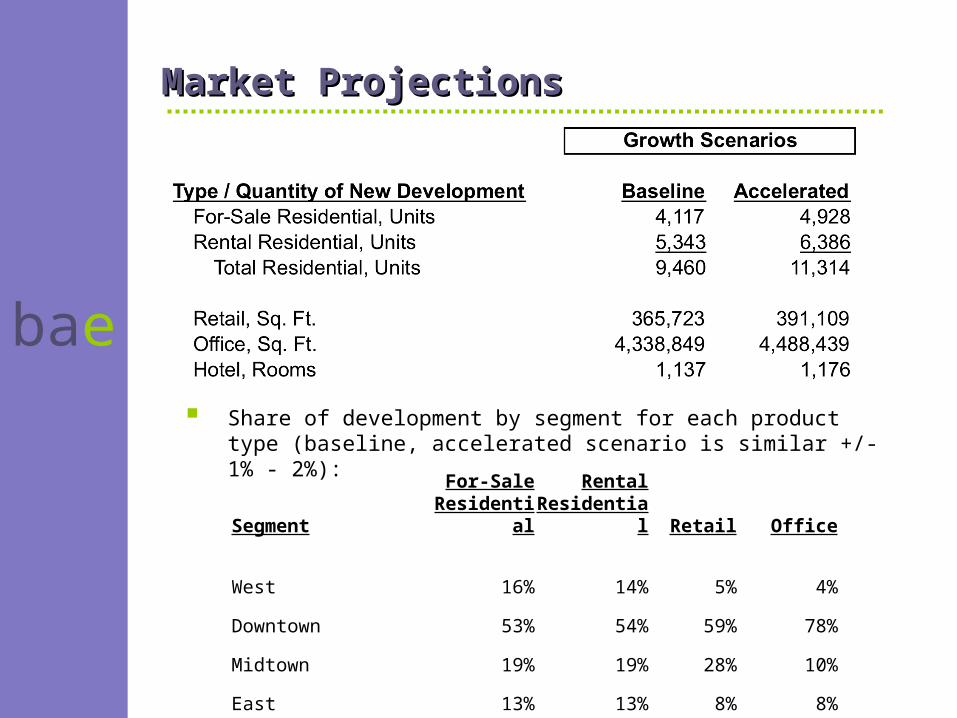
Share of development by segment for each product type (baseline, accelerated scenario is similar +/- 1% - 2%):
SegmentFor-Sale
ResidentialRental
Residential Retail Office
West 16% 14% 5% 4%
Downtown 53% 54% 59% 78%
Midtown 19% 19% 28% 10%
East 13% 13% 8% 8%

bae
NC Constitution recently amended to allow “district-based” Tax Increment Finance (TIF), limited state-wide experience
• Previously limited to “synthetic TIF” -- essentially repayment of developer-advanced funding for public improvements
• Once district is ok’d, baseline assessed valuation is set, City collects its share, $.46/$100 on increases in valuation (excludes County share)
• Does not provide funding for increased public service costs
Municipal Service District (MSD)
• Collected as additional rate on property tax. For 4 existing Downtown MSD’s, rates vary from .017% to .056% (latter is South End)
• For Downtown MSD’s in streetcar corridor, added MSD rate of approx..04% combined with existing MSD would match South End rate
No other sources modeled – not allowed / no policy direction
Critical Infrastructure Needs Assessment District legislation would include exempt properties
Funding Sources for Value AnalysisFunding Sources for Value Analysis

bae
Three scenarios created that combine multiple variables for development, TOD premium, appreciation, other investment
• “Low” – baseline growth, low appreciation, no TOD premium
• “Medium” – baseline growth, historic appreciation, modest residential reinvestment, 5% TOD premium
• “High” – accelerated growth, historic appreciation, modest residential reinvestment, 10% TOD premium
Existing assessed value for corridor properties used to set assessed value
• TIF is increment, next reassessment cycle expected before setting base value, so doesn’t affect calculation of increment
To identify MSD rate to calculate receipts, assumed three potential rates based on current Downtown MSD rates
• Modeled .02%, .04%, .06%
• Only .06% rate would set a new peak rate for Downtown MSD’s
Scenarios for ModelingScenarios for Modeling

bae
Created year-by-year cash flow model for 2010 – 2035 to calculate annual and cumulative increase in TIF, MSD
Model is linked to parcel database, assumptions to allow modeling of multiple scenarios
• Assumes no TIF, MSD collected from tax-exempt properties (CPCC, Presbyterian, Johnson C. Smith University, Johnson & Wales, churches)
Incorporates market projections, current market values
• Calculated in constant 2008 dollars
Answer provides input to consideration of potential bonding or other financing tools
Have not attempted to estimate potential bonding
• Needs depend on project timing and cost. May require interim borrowing from other City accounts, or credit guarantees
• Bonding costs, underwriting requirements will mean that total increment is not available for bonding, financing improvements
ModelModel
bae
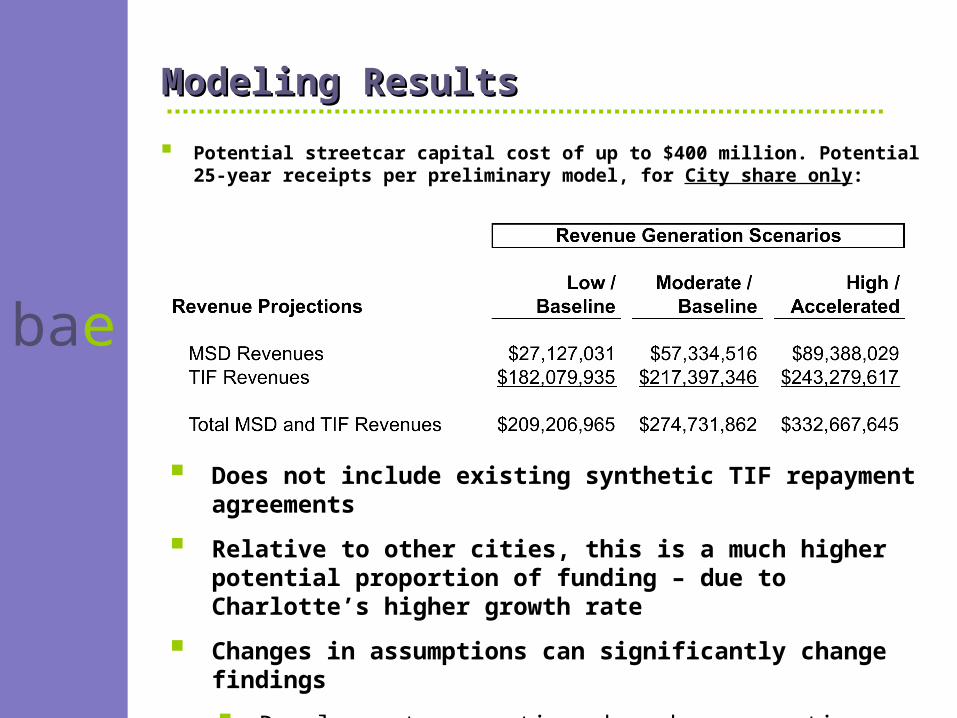
Potential streetcar capital cost of up to $400 million. Potential 25-year receipts per preliminary model, for City share only:
Modeling ResultsModeling Results
Does not include existing synthetic TIF repayment agreements
Relative to other cities, this is a much higher potential proportion of funding – due to Charlotte’s higher growth rate
Changes in assumptions can significantly change findings
Development assumptions based on proactive public policy and supporting actions to stimulate revitalization
bae
Submit draft report for review
Technical, policy, other review by City staff
Following submittal of consolidated comments, revise report and model runs as needed
Final report produced in January for consideration by Advisory Committee, City Council
Next StepsNext Steps

bae
Discussion
Related Documents