INTERIM REPORT APR-JUN 2010

Welcome message from author
This document is posted to help you gain knowledge. Please leave a comment to let me know what you think about it! Share it to your friends and learn new things together.
Transcript
i n t e r i m r e p o r t a p r - j u n
2010

2 the Quarter in Brief
Aspiro Becomes a Pure Growth Company
The Quarter in Brief• Net sales for the second quarter were SEK 114.5 m
(SEK 114.2 m). Sales from continuing operations were SEK 84.0 m (SEK 72.0 m).
• Second-quarter EBITDA was SEK 4.1 m (SEK 5.2 m). EBITDA for continuing operations was SEK -10.5 m (SEK -5.3 m).
• The profit/loss after tax for the second quarter was SEK -1.3 m (SEK 4.9 m). The profit/loss after tax for continu-ing operations was SEK -11.0 m (SEK -1.4 m).
• Aspiro sold its Mobile Entertainment business segment to Lobus Mobil Holding AB. The purchase price amounts to SEK 42 m, plus a potential additional purchase price subject to an earn-out model. From 1 July, Lobus Mobil Holding AB is conducting all the operations of Mobile Entertainment in Norway, Denmark and Sweden.
• Aspiro launched its WiMP music streaming service for Telenor in Denmark. WiMP was a nominee for an inter-national Meffy Award in London.
• Aspiro has signed an agreement with publisher Cappe-len Damm to develop a new streaming service for audio books. Aspiro expects the service to be launched in Norway during the autumn.
• High growth in the Mobile TV business segment. The services Aspiro delivers to T-Mobile were nominees for Meffy Awards.
• High growth in Mobile Solutions. Aspiro signed a micro-payment agreement with Norwegian marketplace Finn.no, with delivery start-up in the third quarter.
Outlook• Aspiro is increasing its focus on the Music and Mobile
TV business segments.• In the Mobile Solutions business segment, going for-
ward, the focus will be on increasing profitability. Aspiro will focus on scalable services and consider cost-cutting measures.
”We took a big step in our strategic repositioning through the sale of Mobile Entertainment. This divestment also highlights the potential of our music and TV services, and for our business solutions. We expect to be able to keep achieving high growth, especially in our Music and Mobile TV business segments, where we’re experiencing strong de-mand for our services,” commented Gunnar Sellæg, CEO.
Key FiguresAPR-JUN 2010
(2009)JAN-JUN 2010
(2009)
Net sales, SEK m 114.5 (114.2) 219.6 (226.7)
EBITDA, SEK m 4.1 (5.2) 5.2 (1.5)
Earnings after tax, SEK m –1.3 (4.9) –5.5 (–2.4)
Basic earnings per share, SEK –0.01 (0.03) –0.02 (–0.01)
Diluted earnings per share, SEK –0.01 (0.03) –0.02 (–0.01)
Return on equity, % –0.40 (1.68) –1.61 (–0.81)
Return on capital employed, % –0.73 (0.40) –2.30 (–2.02)
Operating margin, % –2.0 (0.7) –3.2 (–3.5)
Cash flow from operating activities per share, SEK –0.01 (–0.05) 0.03 (–0.07)
This information is mandatory for Aspiro AB (publ) to publish pursuant to the Swedish Securities Exchange and Clearing Operations Act and/or the Swedish Financial Instruments Trading Act. This information was submitted for publication at 8:30 a.m. on 12 August 2010.
About Aspiro Aspiro has unique positioning as the world’s only provider of complete TV and music streaming services for partners that want to put their own branding on the service.Aspiro has over ten years’ experience in mobile technology and retail in northern Europe, and delivers services to partners worldwide like T-Mobile, Telefónica O2, Tele-nor, 3, TeliaSonera, Tele2, the BBC, Aftonbladet, mBlox, TVNorge, Entel and VG. Aspiro is listed on Nasdaq OMX Nordic Exchange Stockholm and has a local presence in all the Nordic and Baltic countries. Sales in 2009 were SEK 441 m and the company has some 140 employees.
Key Figures Continuing operations
APR-JUN 2010(2009)
JAN-JUN 2010(2009)
Net Sales, SEK m 84.0 (72.0) 156.0 (141.7)
EBITDA, SEK m –10.5 (–5.3) –24.7 (–15.3)
Earnings after tax, SEK m –11.0 (–1.4) –25.1 (–12.0)
Basic earnings per share, SEK –0.06 (–0.01) –0.13 (–0.06)
Diluted earnings per share, SEK –0.06 (–0.01) –0.13 (–0.06)
Operating margin, % –18.1 (–11.3) –21.4 (–15.1)
A Statement by Gunnar Sellæg 3
A Statement by Gunnar Sellæg
“Aspiro is now undergoing arguably the biggest change in its history. We’re divesting one of our former core seg-ments, Mobile Entertainment, with its products like ringto-nes, mobile games and graphics. This business segment, which was strongly associated with Aspiro for many years, has had a negative trend in recent years. Since we started the sales process, we’ve been working hard on rationali-zing its operations, which have been very successful.
Aspiro has always had the objective of being a growth company. For a long time, we’ve seen great potential in our premium services, which we mainly built up in music and TV. Now that these segments are our core business, their potential is even clearer. Through the divestment, Aspiro has become a more focused and concentrated growth company. We will be continuing to invest in our WiMP music service, TV streaming to mobiles and compu-ters, and on business solutions.
In the second quarter, sales in music, TV and business solutions kept rising. We also secured international recog-nition for two of our services, through nominations for a
Meffy Award. The first was for our WiMP music streaming service and the second for the mobile TV services we deliver to T-Mobile.
In the music segment, we had a very successful launch in Denmark, and we’ve also started to see the results from our Norwegian service, which got fully underway. Going forward, we will be focusing on starting up the service on more markets, and expanding our user base on existing markets.
In Mobile TV, we’ll also be focusing on extra sales to current customers, attracting new customers and on consoli-dating our deliveries further. Mobile Solutions also achie-ved very positive growth in the second quarter, and our new agreement with Norwegian market place Finn.no will start up in the third quarter. Because our services in Mobile Solutions have low margins, we’ll be focusing on scalable services and we will also be reviewing the cost-cutting measures we can implement to improve profitability,” com-mented Gunnar Sellæg, Aspiro’s CEO.
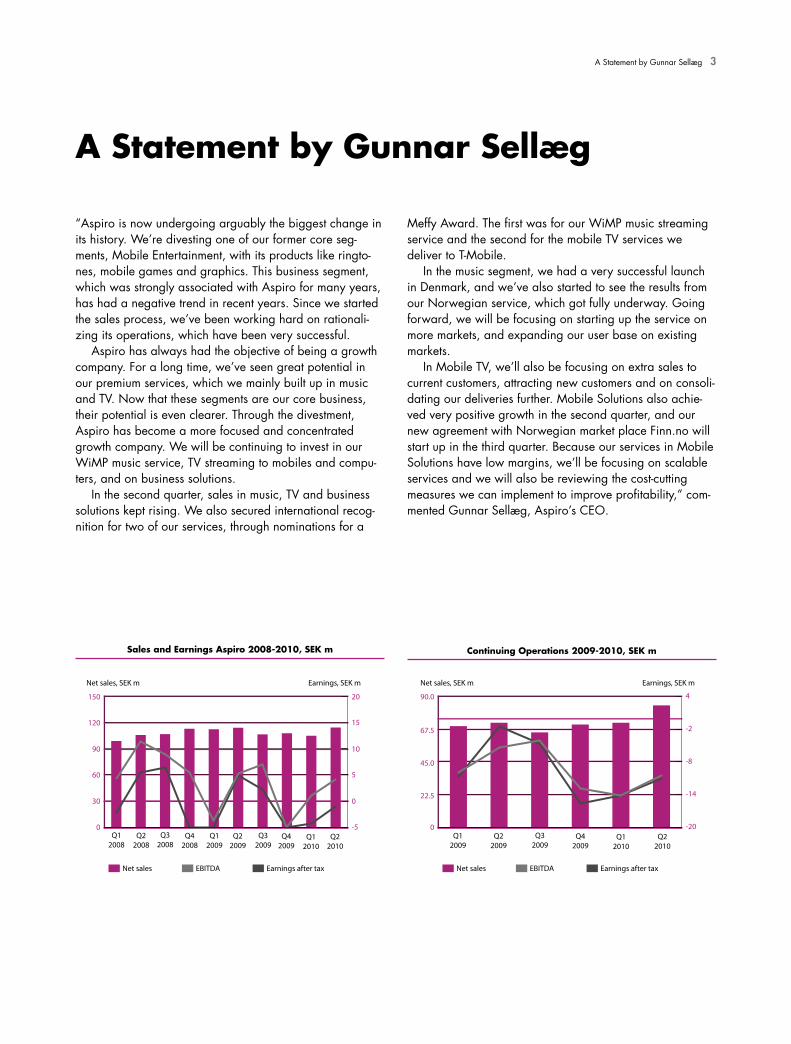
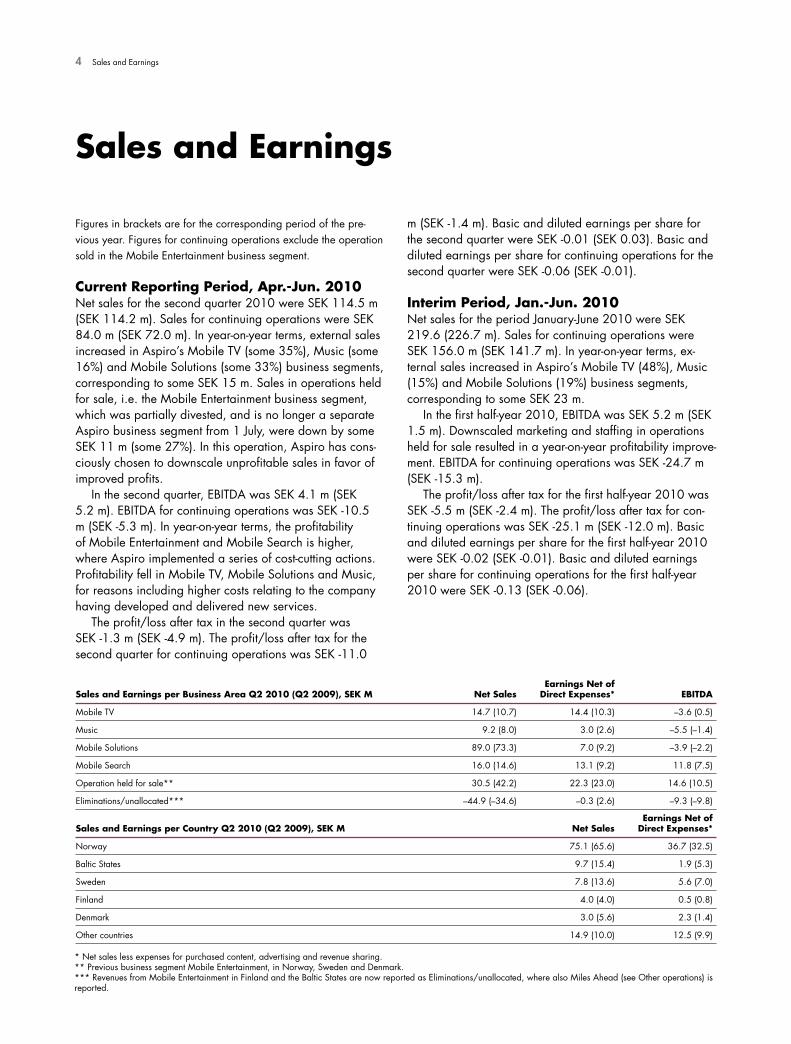
Sales and Earnings Aspiro 2008-2010, SEK m Continuing Operations 2009-2010, SEK m
0
22.5
45.0
67.5
90.0
-20
-14
-8
-2
4
Net sales, SEK m Earnings, SEK m
Net sales EBITDA Earnings after tax
Q12009
Q22009
Q32009
Q42009
Q12010
Q22010
0
30
60
90
120
150
-5
0
5
10
15
20
Net sales, SEK m Earnings, SEK m
Net sales EBITDA Earnings after tax
Q12009
Q22009
Q32009
Q42009
Q12010
Q22010
Q12008
Q22008
Q32008
Q42008
4 Sales and Earnings
Sales and Earnings
Figures in brackets are for the corresponding period of the pre-vious year. Figures for continuing operations exclude the operation sold in the Mobile Entertainment business segment.
Current Reporting Period, Apr.-Jun. 2010Net sales for the second quarter 2010 were SEK 114.5 m (SEK 114.2 m). Sales for continuing operations were SEK 84.0 m (SEK 72.0 m). In year-on-year terms, external sales increased in Aspiro’s Mobile TV (some 35%), Music (some 16%) and Mobile Solutions (some 33%) business segments, corresponding to some SEK 15 m. Sales in operations held for sale, i.e. the Mobile Entertainment business segment, which was partially divested, and is no longer a separate Aspiro business segment from 1 July, were down by some SEK 11 m (some 27%). In this operation, Aspiro has cons-ciously chosen to downscale unprofitable sales in favor of improved profits.
In the second quarter, EBITDA was SEK 4.1 m (SEK 5.2 m). EBITDA for continuing operations was SEK -10.5 m (SEK -5.3 m). In year-on-year terms, the profitability of Mobile Entertainment and Mobile Search is higher, where Aspiro implemented a series of cost-cutting actions. Profitability fell in Mobile TV, Mobile Solutions and Music, for reasons including higher costs relating to the company having developed and delivered new services.
The profit/loss after tax in the second quarter was SEK -1.3 m (SEK -4.9 m). The profit/loss after tax for the second quarter for continuing operations was SEK -11.0
Sales and Earnings per Business Area Q2 2010 (Q2 2009), SEK M Net SalesEarnings Net of
Direct Expenses* EBITDA
Mobile TV 14.7 (10.7) 14.4 (10.3) –3.6 (0.5)
Music 9.2 (8.0) 3.0 (2.6) –5.5 (–1.4)
Mobile Solutions 89.0 (73.3) 7.0 (9.2) –3.9 (–2.2)
Mobile Search 16.0 (14.6) 13.1 (9.2) 11.8 (7.5)
Operation held for sale** 30.5 (42.2) 22.3 (23.0) 14.6 (10.5)
Eliminations/unallocated*** –44.9 (–34.6) –0.3 (2.6) –9.3 (–9.8)
Sales and Earnings per Country Q2 2010 (Q2 2009), SEK M Net SalesEarnings Net of
Direct Expenses*
Norway 75.1 (65.6) 36.7 (32.5)
Baltic States 9.7 (15.4) 1.9 (5.3)
Sweden 7.8 (13.6) 5.6 (7.0)
Finland 4.0 (4.0) 0.5 (0.8)
Denmark 3.0 (5.6) 2.3 (1.4)
Other countries 14.9 (10.0) 12.5 (9.9)
m (SEK -1.4 m). Basic and diluted earnings per share for the second quarter were SEK -0.01 (SEK 0.03). Basic and diluted earnings per share for continuing operations for the second quarter were SEK -0.06 (SEK -0.01).
Interim Period, Jan.-Jun. 2010Net sales for the period January-June 2010 were SEK 219.6 (226.7 m). Sales for continuing operations were SEK 156.0 m (SEK 141.7 m). In year-on-year terms, ex-ternal sales increased in Aspiro’s Mobile TV (48%), Music (15%) and Mobile Solutions (19%) business segments, corresponding to some SEK 23 m.
In the first half-year 2010, EBITDA was SEK 5.2 m (SEK 1.5 m). Downscaled marketing and staffing in operations held for sale resulted in a year-on-year profitability improve-ment. EBITDA for continuing operations was SEK -24.7 m (SEK -15.3 m).
The profit/loss after tax for the first half-year 2010 was SEK -5.5 m (SEK -2.4 m). The profit/loss after tax for con-tinuing operations was SEK -25.1 m (SEK -12.0 m). Basic and diluted earnings per share for the first half-year 2010 were SEK -0.02 (SEK -0.01). Basic and diluted earnings per share for continuing operations for the first half-year 2010 were SEK -0.13 (SEK -0.06).
* Net sales less expenses for purchased content, advertising and revenue sharing.** Previous business segment Mobile Entertainment, in Norway, Sweden and Denmark.*** Revenues from Mobile Entertainment in Finland and the Baltic States are now reported as Eliminations/unallocated, where also Miles Ahead (see Other operations) is reported.
Business Areas, Progress and Division of Sales 5
Progress by Business SegmentSEK m Q2 2010 Q1 2010 Q4 2009 Q3 2009 Q2 2009 Q1 2009 Q4 2008 Q3 2008 Q2 2008 Q1 2008
Net Sales
Mobile TV 14.7 11.2 13.1 11.9 10.7 6.5 7.0 5.2 5.8 4,5
Music 9.2 6.8 7.1 7.1 8.0 6.0 4.7 5.1 5.0 3,2
Mobile Solutions 89.0 81.8 78.1 71.1 73.3 76.7 79.5 76.8 78.8 70,0
Mobile Search 16.0 12.6 13.7 14.6 14.6 13.2 13.9 16.8 16.0 12,2
Operation held for sale 30.5 33.0 37.2 41.3 42.2 42.8 51.9 52.2 55.6 60,2
Eliminations/unallocated –44.9 –40.4 –41.2 –39.3 –34.6 –32.7 –43.3 –49.2 –55.3 –51,1
Earnings Net of Direct Expenses
Mobile TV 14.4 10.2 12.5 11.0 10.3 5.9 6.2 4.7 5.1 3,7
Music 3.0 2.4 2.3 3.1 2.6 0.6 0.7 0.7 0.7 0,6
Mobile Solutions 7.0 8.6 6.3 8.5 9.2 8.8 7.2 7.4 6.1 5,2
Mobile Search 13.1 10.1 8.6 10.4 9.2 10.3 8.5 14.4 15.3 8,0
Operation held for sale 22.3 24.6 20.0 22.7 23.0 19.3 24.3 24.5 28.7 29,1
Eliminations/unallocated –0.3 0.4 3.4 2.2 2.6 14.3 9.1 2.8 1.6 3,6
EBITDA
Mobile TV –3.6 –5.9 –3.9 –0.5 0.5 –4.1 –0.3 –0.4 0.3 –0,7
Music –5.5 –4.4 –3.1 –0.6 –1.4 –3.8 –3.6 –2.3 –2.3 –2,4
Mobile Solutions –3.9 –2.4 –4.8 –3.4 –2.2 –2.7 –4.6 –1.7 –1.1 –2,0
Mobile Search 11.8 8.7 7.2 9.2 7.5 9.4 9.1 13.7 14.0 6,6
Operation held for sale 14.6 15.3 4.3 10.9 10.5 6.3 8.9 6.9 8.5 9,1
Eliminations/unallocated –9.3 –10.2 –8.1 –8.6 –9.7 –8.8 –4.1 –7.2 –7.9 –6,3
Division of External and Internal Expenses and Revenues
April - June Mobile TV MusicMobile
Solutions Mobile SearchOperation held for sale
Eliminations/unallocated Total
SEK m 2010 2009 2010 2009 2010 2009 2010 2009 2010 2009 2010 2009 2010 2009
External net sales 14.48 10.70 9.24 7.95 40.48 30.46 16.02 14.58 30.54 42.01 3.78 8.48 114.54 114.18
Internal net sales 0.20 0.00 0.00 0.00 48.51 42.87 0.00 0.00 0.00 0.16 –48.71 –43.03 0.00 0.00
Other operating revenues 0.81 0.11 –0.01 0.00 0.03 0.09 0.00 0.00 0.03 0.01 0.49 0.98 1.35 1.19
External direct expenses –1.05 –0.46 –6.24 –5.32 –36.32 –23.68 –2.47 –5.09 –7.91 –18.29 –2.38 –5.65 –56.37 –58.49
Internal direct expenses –0.01 –0.04 –0.04 –0.05 –45.73 –40.54 –0.41 –0.27 –0.32 –0.86 46.51 41.76 0.00 0.00
Earnings net of direct expenses 14.43 10.31 2.95 2.58 6.97 9.20 13.14 9.22 22.34 23.03 –0.31 2.54 59.52 56.88
Indirect operating expenses –17.98 –9.77 –8.48 –3.98 –10.84 –11.38 –1.39 –1.72 –7.73 –12.54 –9.01 –12.33 –55.43 –51.72
EBITDA –3.55 0.54 –5.53 –1.40 –3.87 –2.18 11.75 7.50 14.61 10.49 –9.32 –9.79 4.09 5.16
Depreciation, amortization and impairment –6.35 –4.40
Operating profit/loss –2.26 0.76
Financial income and expenses 0.08 –0.08
Profit/loss before tax –2.18 0.68
Tax 0.91 4.24
Net profit/loss –1.27 4.92
6 Operations
Operations
Mobile TV
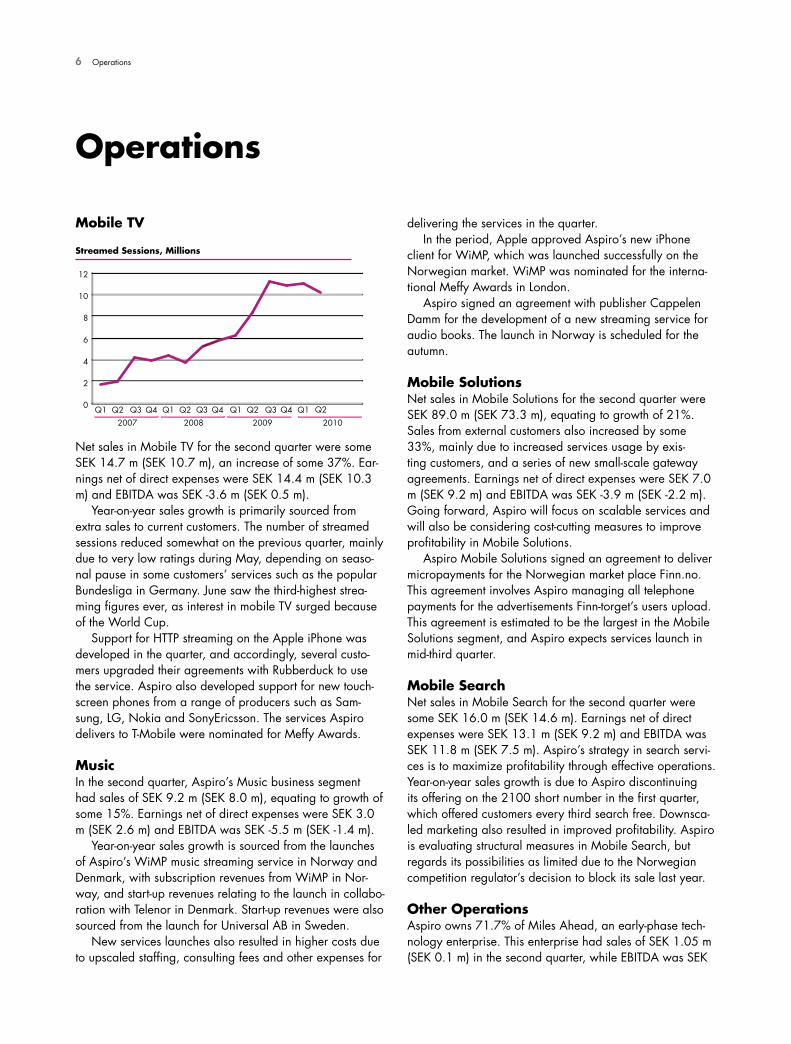
Net sales in Mobile TV for the second quarter were some SEK 14.7 m (SEK 10.7 m), an increase of some 37%. Ear-nings net of direct expenses were SEK 14.4 m (SEK 10.3 m) and EBITDA was SEK -3.6 m (SEK 0.5 m).
Year-on-year sales growth is primarily sourced from extra sales to current customers. The number of streamed sessions reduced somewhat on the previous quarter, mainly due to very low ratings during May, depending on seaso-nal pause in some customers’ services such as the popular Bundesliga in Germany. June saw the third-highest strea-ming figures ever, as interest in mobile TV surged because of the World Cup.
Support for HTTP streaming on the Apple iPhone was developed in the quarter, and accordingly, several custo-mers upgraded their agreements with Rubberduck to use the service. Aspiro also developed support for new touch-screen phones from a range of producers such as Sam-sung, LG, Nokia and SonyEricsson. The services Aspiro delivers to T-Mobile were nominated for Meffy Awards.
MusicIn the second quarter, Aspiro’s Music business segment had sales of SEK 9.2 m (SEK 8.0 m), equating to growth of some 15%. Earnings net of direct expenses were SEK 3.0 m (SEK 2.6 m) and EBITDA was SEK -5.5 m (SEK -1.4 m).
Year-on-year sales growth is sourced from the launches of Aspiro’s WiMP music streaming service in Norway and Denmark, with subscription revenues from WiMP in Nor-way, and start-up revenues relating to the launch in collabo-ration with Telenor in Denmark. Start-up revenues were also sourced from the launch for Universal AB in Sweden.
New services launches also resulted in higher costs due to upscaled staffing, consulting fees and other expenses for
delivering the services in the quarter.In the period, Apple approved Aspiro’s new iPhone
client for WiMP, which was launched successfully on the Norwegian market. WiMP was nominated for the interna-tional Meffy Awards in London.
Aspiro signed an agreement with publisher Cappelen Damm for the development of a new streaming service for audio books. The launch in Norway is scheduled for the autumn.
Mobile SolutionsNet sales in Mobile Solutions for the second quarter were SEK 89.0 m (SEK 73.3 m), equating to growth of 21%. Sales from external customers also increased by some 33%, mainly due to increased services usage by exis-ting customers, and a series of new small-scale gateway agreements. Earnings net of direct expenses were SEK 7.0 m (SEK 9.2 m) and EBITDA was SEK -3.9 m (SEK -2.2 m). Going forward, Aspiro will focus on scalable services and will also be considering cost-cutting measures to improve profitability in Mobile Solutions.
Aspiro Mobile Solutions signed an agreement to deliver micropayments for the Norwegian market place Finn.no. This agreement involves Aspiro managing all telephone payments for the advertisements Finn-torget’s users upload. This agreement is estimated to be the largest in the Mobile Solutions segment, and Aspiro expects services launch in mid-third quarter.
Mobile SearchNet sales in Mobile Search for the second quarter were some SEK 16.0 m (SEK 14.6 m). Earnings net of direct expenses were SEK 13.1 m (SEK 9.2 m) and EBITDA was SEK 11.8 m (SEK 7.5 m). Aspiro’s strategy in search servi-ces is to maximize profitability through effective operations. Year-on-year sales growth is due to Aspiro discontinuing its offering on the 2100 short number in the first quarter, which offered customers every third search free. Downsca-led marketing also resulted in improved profitability. Aspiro is evaluating structural measures in Mobile Search, but regards its possibilities as limited due to the Norwegian competition regulator’s decision to block its sale last year.
Other OperationsAspiro owns 71.7% of Miles Ahead, an early-phase tech-nology enterprise. This enterprise had sales of SEK 1.05 m (SEK 0.1 m) in the second quarter, while EBITDA was SEK
Streamed Sessions, Millions
0
2
4
6
8
10
12
2010
Q1
2009
Q1 Q2 Q3 Q4
2008
Q1 Q2 Q3 Q4
2007
Q1 Q2 Q3 Q4 Q2
Operations 7
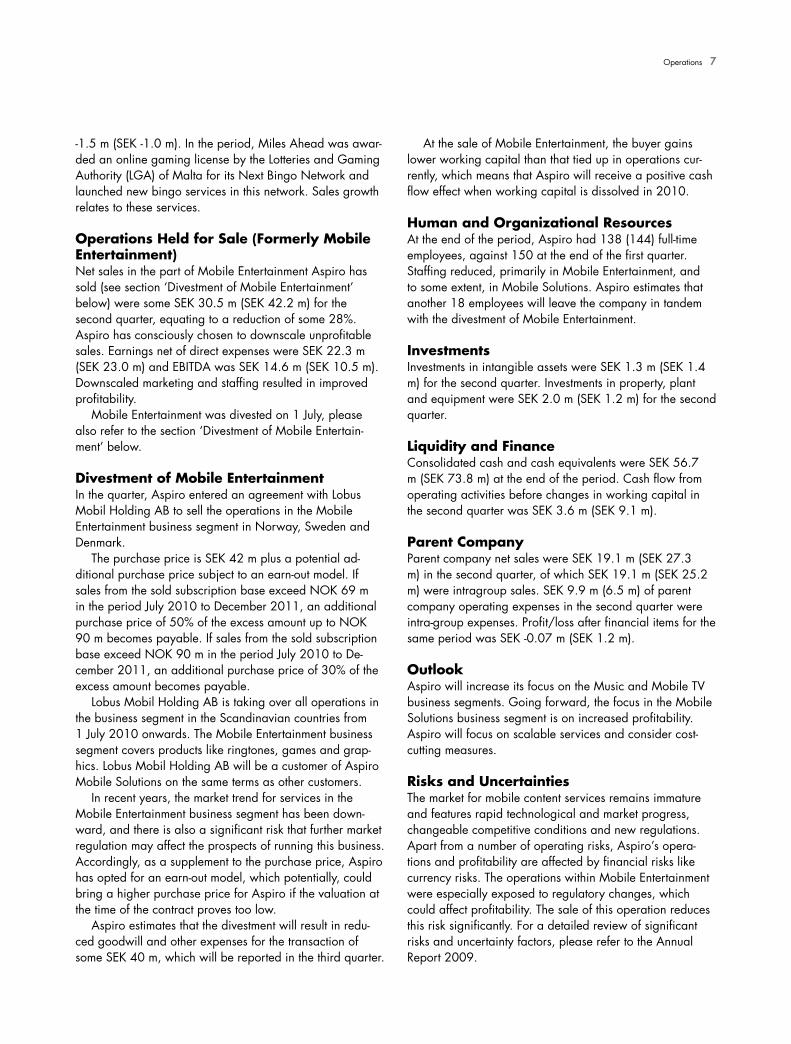
-1.5 m (SEK -1.0 m). In the period, Miles Ahead was awar-ded an online gaming license by the Lotteries and Gaming Authority (LGA) of Malta for its Next Bingo Network and launched new bingo services in this network. Sales growth relates to these services.
Operations Held for Sale (Formerly Mobile Entertainment)Net sales in the part of Mobile Entertainment Aspiro has sold (see section ‘Divestment of Mobile Entertainment’ below) were some SEK 30.5 m (SEK 42.2 m) for the second quarter, equating to a reduction of some 28%. Aspiro has consciously chosen to downscale unprofitable sales. Earnings net of direct expenses were SEK 22.3 m (SEK 23.0 m) and EBITDA was SEK 14.6 m (SEK 10.5 m). Downscaled marketing and staffing resulted in improved profitability.
Mobile Entertainment was divested on 1 July, please also refer to the section ‘Divestment of Mobile Entertain-ment’ below.
Divestment of Mobile EntertainmentIn the quarter, Aspiro entered an agreement with Lobus Mobil Holding AB to sell the operations in the Mobile Entertainment business segment in Norway, Sweden and Denmark.
The purchase price is SEK 42 m plus a potential ad-ditional purchase price subject to an earn-out model. If sales from the sold subscription base exceed NOK 69 m in the period July 2010 to December 2011, an additional purchase price of 50% of the excess amount up to NOK 90 m becomes payable. If sales from the sold subscription base exceed NOK 90 m in the period July 2010 to De-cember 2011, an additional purchase price of 30% of the excess amount becomes payable.
Lobus Mobil Holding AB is taking over all operations in the business segment in the Scandinavian countries from 1 July 2010 onwards. The Mobile Entertainment business segment covers products like ringtones, games and grap-hics. Lobus Mobil Holding AB will be a customer of Aspiro Mobile Solutions on the same terms as other customers.
In recent years, the market trend for services in the Mobile Entertainment business segment has been down-ward, and there is also a significant risk that further market regulation may affect the prospects of running this business. Accordingly, as a supplement to the purchase price, Aspiro has opted for an earn-out model, which potentially, could bring a higher purchase price for Aspiro if the valuation at the time of the contract proves too low.
Aspiro estimates that the divestment will result in redu-ced goodwill and other expenses for the transaction of some SEK 40 m, which will be reported in the third quarter.
At the sale of Mobile Entertainment, the buyer gains lower working capital than that tied up in operations cur-rently, which means that Aspiro will receive a positive cash flow effect when working capital is dissolved in 2010.
Human and Organizational ResourcesAt the end of the period, Aspiro had 138 (144) full-time employees, against 150 at the end of the first quarter. Staffing reduced, primarily in Mobile Entertainment, and to some extent, in Mobile Solutions. Aspiro estimates that another 18 employees will leave the company in tandem with the divestment of Mobile Entertainment.
InvestmentsInvestments in intangible assets were SEK 1.3 m (SEK 1.4 m) for the second quarter. Investments in property, plant and equipment were SEK 2.0 m (SEK 1.2 m) for the second quarter.
Liquidity and FinanceConsolidated cash and cash equivalents were SEK 56.7 m (SEK 73.8 m) at the end of the period. Cash flow from operating activities before changes in working capital in the second quarter was SEK 3.6 m (SEK 9.1 m).
Parent CompanyParent company net sales were SEK 19.1 m (SEK 27.3 m) in the second quarter, of which SEK 19.1 m (SEK 25.2 m) were intragroup sales. SEK 9.9 m (6.5 m) of parent company operating expenses in the second quarter were intra-group expenses. Profit/loss after financial items for the same period was SEK -0.07 m (SEK 1.2 m).
OutlookAspiro will increase its focus on the Music and Mobile TV business segments. Going forward, the focus in the Mobile Solutions business segment is on increased profitability .Aspiro will focus on scalable services and consider cost-cutting measures.
Risks and UncertaintiesThe market for mobile content services remains immature and features rapid technological and market progress, changeable competitive conditions and new regulations. Apart from a number of operating risks, Aspiro’s opera-tions and profitability are affected by financial risks like currency risks. The operations within Mobile Entertainment were especially exposed to regulatory changes, which could affect profitability. The sale of this operation reduces this risk significantly. For a detailed review of significant risks and uncertainty factors, please refer to the Annual Report 2009.
8 Investor Relations
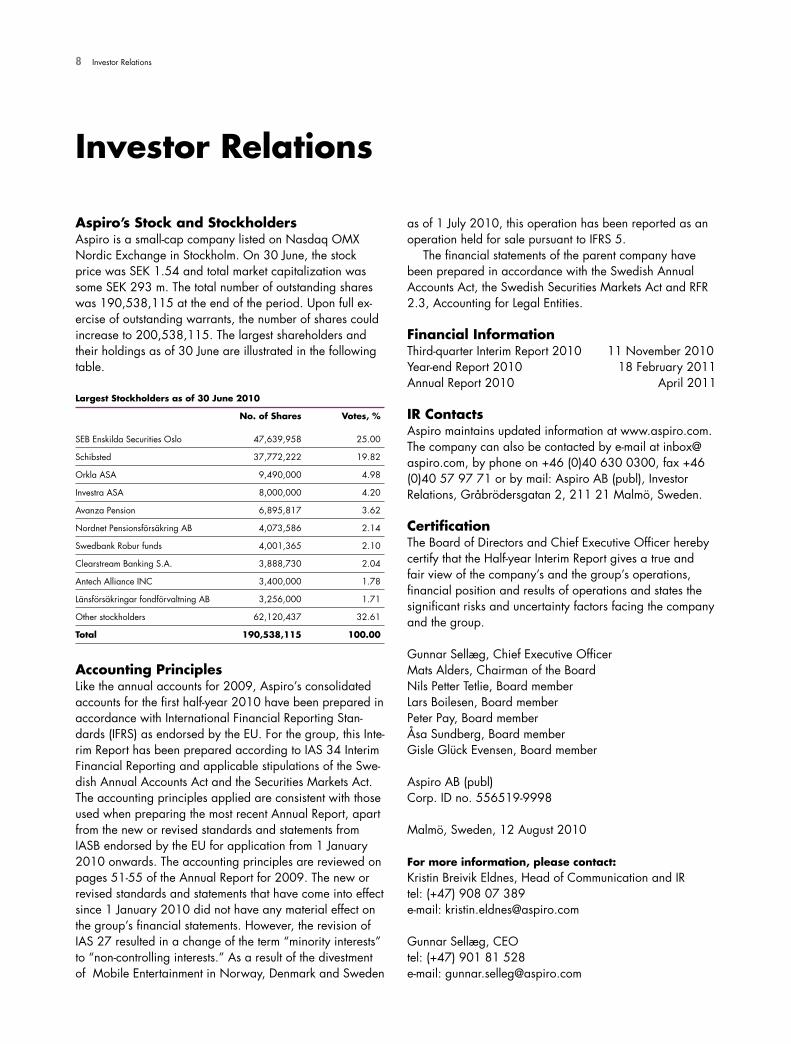
Aspiro’s Stock and StockholdersAspiro is a small-cap company listed on Nasdaq OMX Nordic Exchange in Stockholm. On 30 June, the stock price was SEK 1.54 and total market capitalization was some SEK 293 m. The total number of outstanding shares was 190,538,115 at the end of the period. Upon full ex-ercise of outstanding warrants, the number of shares could increase to 200,538,115. The largest shareholders and their holdings as of 30 June are illustrated in the following table.
Investor Relations
Accounting PrinciplesLike the annual accounts for 2009, Aspiro’s consolidated accounts for the first half-year 2010 have been prepared in accordance with International Financial Reporting Stan-dards (IFRS) as endorsed by the EU. For the group, this Inte-rim Report has been prepared according to IAS 34 Interim Financial Reporting and applicable stipulations of the Swe-dish Annual Accounts Act and the Securities Markets Act. The accounting principles applied are consistent with those used when preparing the most recent Annual Report, apart from the new or revised standards and statements from IASB endorsed by the EU for application from 1 January 2010 onwards. The accounting principles are reviewed on pages 51-55 of the Annual Report for 2009. The new or revised standards and statements that have come into effect since 1 January 2010 did not have any material effect on the group’s financial statements. However, the revision of IAS 27 resulted in a change of the term “minority interests” to “non-controlling interests.” As a result of the divestment of Mobile Entertainment in Norway, Denmark and Sweden
Largest Stockholders as of 30 June 2010
No. of Shares Votes, %
SEB Enskilda Securities Oslo 47,639,958 25.00
Schibsted 37,772,222 19.82
Orkla ASA 9,490,000 4.98
Investra ASA 8,000,000 4.20
Avanza Pension 6,895,817 3.62
Nordnet Pensionsförsäkring AB 4,073,586 2.14
Swedbank Robur funds 4,001,365 2.10
Clearstream Banking S.A. 3,888,730 2.04
Antech Alliance INC 3,400,000 1.78
Länsförsäkringar fondförvaltning AB 3,256,000 1.71
Other stockholders 62,120,437 32.61
Total 190,538,115 100.00
as of 1 July 2010, this operation has been reported as an operation held for sale pursuant to IFRS 5.
The financial statements of the parent company have been prepared in accordance with the Swedish Annual Accounts Act, the Swedish Securities Markets Act and RFR 2.3, Accounting for Legal Entities.
Financial InformationThird-quarter Interim Report 2010 11 November 2010Year-end Report 2010 18 February 2011Annual Report 2010 April 2011
IR ContactsAspiro maintains updated information at www.aspiro.com. The company can also be contacted by e-mail at [email protected], by phone on +46 (0)40 630 0300, fax +46 (0)40 57 97 71 or by mail: Aspiro AB (publ), Investor Relations, Gråbrödersgatan 2, 211 21 Malmö, Sweden.
CertificationThe Board of Directors and Chief Executive Officer hereby certify that the Half-year Interim Report gives a true and fair view of the company’s and the group’s operations, financial position and results of operations and states the significant risks and uncertainty factors facing the company and the group.
Gunnar Sellæg, Chief Executive OfficerMats Alders, Chairman of the BoardNils Petter Tetlie, Board memberLars Boilesen, Board memberPeter Pay, Board memberÅsa Sundberg, Board memberGisle Gluck Evensen, Board member
Aspiro AB (publ)Corp. ID no. 556519-9998
Malmö, Sweden, 12 August 2010
For more information, please contact:Kristin Breivik Eldnes, Head of Communication and IRtel: (+47) 908 07 389e-mail: [email protected]
Gunnar Sellæg, CEOtel: (+47) 901 81 528e-mail: [email protected]

Brief Financial Summary 9
SEK 000 Q2 2010 Q1 2010 Q4 2009 Q3 2009 Q2 2009 Q1 2009 Q4 2008 Q3 2008 Q2 2008 Q1 2008
Net sales, SEK m 114.5 105.0 108.0 106.7 114.2 112.5 113.7 106.9 105.9 99.0
Net sales, continuing operations, SEK m 84.0 72.0 70.8 65.4 72.0 69.7 n/a n/a n/a n/a
EBITDA, MSEK 4.1 1.1 –8.4 7.0 5.2 –3.7 5.4 9.0 11.5 4.3
EBITDA, continuing operations, SEK m –10.5 –14.1 –12.8 –4.0 –5.3 –9.9 n/a n/a n/a n/a
Operating profit/loss, SEK m –2.3 –4.7 –14.3 1.8 0.8 –8.7 –206.1 4.0 7.0 0.1
Operating profit/loss, continuing operations, SEK m –15.2 –18.3 –17.1 –7.5 –8.1 –13.3 n/a n/a n/a n/a
Profit/loss before tax, SEK m –2.2 –4.9 –14.0 1.5 0.7 –8.0 –200.0 5.5 8.0 –0.8
Profit/loss before tax, continuing operations, SEK m –15.1 –18.4 –16.8 –7.8 –8.1 –12.5 n/a n/a n/a n/a
Profit/loss after tax, SEK m –1.3 –4.2 –13.5 2.2 4.9 –7.3 –216.1 6.4 5.4 –2.1
Profit/loss after tax, continuing operations, SEK m –11.0 –14.2 –15.6 –4.7 –1.4 –10.6 n/a n/a n/a n/a
Equity/assets ratio, % 72 73 71 77 76 71 71 80 82 83
Return on equity, % –0.40 –1.20 –4.61 0.89 1.68 –2.37 –53.63 1.26 1.07 –0.42
Return on capital employed, % –0.73 –1.57 –4.61 0.66 0.40 –2.44 –49.72 1.12 1.54 0.11
Cash flow from operating activities, per share, SEK –0.01 0.04 –0.02 0.01 –0.05 –0.02 0.00 0.10 0.02 0.06
Operating margin, % –2.0 –4.5 –13.2 1.7 0.7 –7.7 –181.3 3.7 6.6 0.1
Operating margin, continuing operations, % –18.1 –25.4 –24.2 –11.5 –11.3 –19.1 n/a n/a n/a n/a
Basic earnings per share, SEK –0.01 –0.02 –0.07 0.01 0.03 –0.04 –1.13 0.03 0.03 –0.01
Basic earnings per share, continuing operations, SEK –0.06 –0.07 –0.08 –0.02 –0.01 –0.05 n/a n/a n/a n/a
Diluted earnings per share, SEK –0.01 –0.02 –0.07 0.01 0.03 –0.04 –1.13 0.03 0.03 –0.01
Diluted earnings per share, continuing operations, SEK –0.06 –0.07 –0.08 –0.02 –0.01 –0.05 n/a n/a n/a n/a
Average number of outstanding shares, 000 190,538 190,538 190,538 190,538 190,538 190,538 190,538 190,538 190,538 190,538
Average number of outstanding shares and potential shares, 000 200,538 200,538 200,538 200,538 195,538 199,438 199,438 199,438 203,438 203,438
Brief Financial Summary
Definitions of Key Figures
EBITDAEarnings before interest, taxes, depreciations and amortizations.
Equity/assets ratioEquity (including minority) as a percentage of total assets.
Return on equityProfit/loss after tax as a percentage of average equity.
Return on capital employedProfit/loss before tax plus financial expenses as a percentage of average capital employed.
Capital employedTotal assets less non interest-bearing liabilities including deferred tax liabilities.
Cash flow from operating activities per shareCash flow from operating activities divided by the average number of outstanding shares.
Operating marginOperating profit/loss as a percentage of net sales.
Earnings per shareProfit/loss after tax divided by the average number of outstanding shares.
Average number of outstanding sharesWeighted average number of outstanding shares in the period.
Average number of outstanding shares and potential sharesWeighted average number of outstanding shares and potential shares in the period.
10 Income Statement
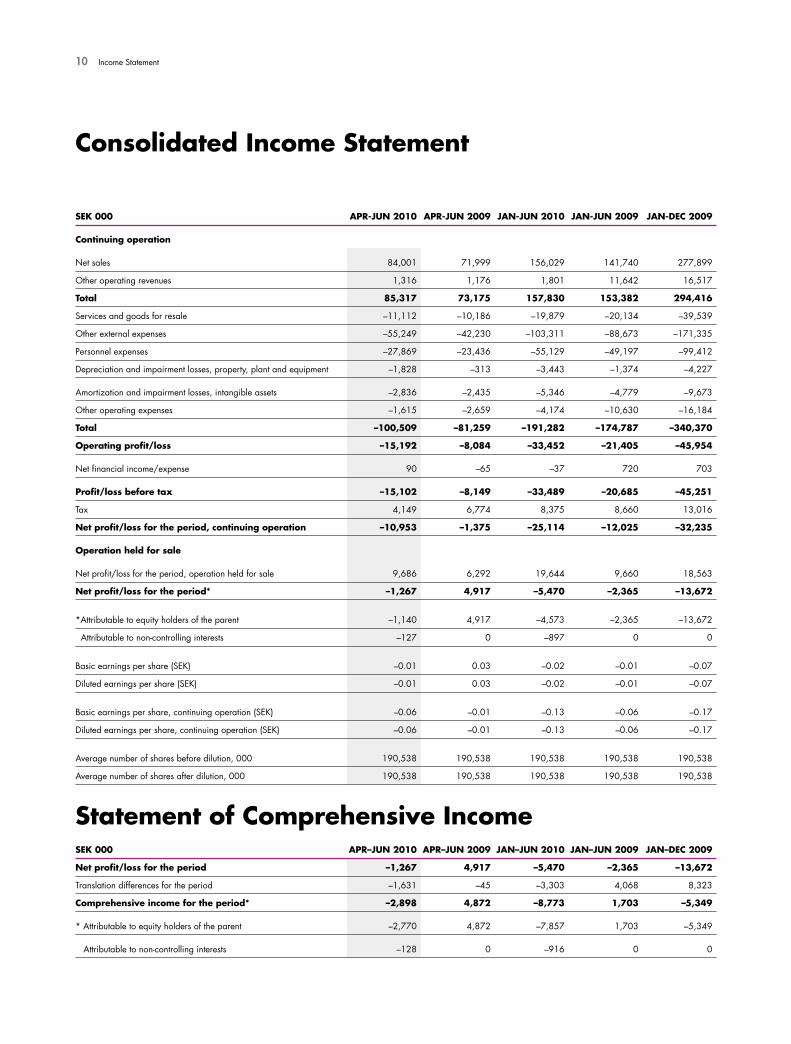
Consolidated Income Statement
SEK 000 APR-JUN 2010 APR-JUN 2009 JAN-JUN 2010 JAN-JUN 2009 JAN-DEC 2009
Continuing operation
Net sales 84,001 71,999 156,029 141,740 277,899
Other operating revenues 1,316 1,176 1,801 11,642 16,517
Total 85,317 73,175 157,830 153,382 294,416
Services and goods for resale –11,112 –10,186 –19,879 –20,134 –39,539
Other external expenses –55,249 –42,230 –103,311 –88,673 –171,335
Personnel expenses –27,869 –23,436 –55,129 –49,197 –99,412
Depreciation and impairment losses, property, plant and equipment –1,828 –313 –3,443 –1,374 –4,227
Amortization and impairment losses, intangible assets –2,836 –2,435 –5,346 –4,779 –9,673
Other operating expenses –1,615 –2,659 –4,174 –10,630 –16,184
Total –100,509 –81,259 –191,282 –174,787 –340,370
Operating profit/loss –15,192 –8,084 –33,452 –21,405 –45,954
Net financial income/expense 90 –65 –37 720 703
Profit/loss before tax –15,102 –8,149 –33,489 –20,685 –45,251
Tax 4,149 6,774 8,375 8,660 13,016
Net profit/loss for the period, continuing operation –10,953 –1,375 –25,114 –12,025 –32,235
Operation held for sale
Net profit/loss for the period, operation held for sale 9,686 6,292 19,644 9,660 18,563
Net profit/loss for the period* –1,267 4,917 –5,470 –2,365 –13,672
*Attributable to equity holders of the parent –1,140 4,917 –4,573 –2,365 –13,672
Attributable to non-controlling interests –127 0 –897 0 0
Basic earnings per share (SEK) –0.01 0.03 –0.02 –0.01 –0.07
Diluted earnings per share (SEK) –0.01 0.03 –0.02 –0.01 –0.07
Basic earnings per share, continuing operation (SEK) –0.06 –0.01 –0.13 –0.06 –0.17
Diluted earnings per share, continuing operation (SEK) –0.06 –0.01 –0.13 –0.06 –0.17
Average number of shares before dilution, 000 190,538 190,538 190,538 190,538 190,538
Average number of shares after dilution, 000 190,538 190,538 190,538 190,538 190,538
Statement of Comprehensive IncomeSEK 000 APR–JUN 2010 APR–JUN 2009 JAN–JUN 2010 JAN–JUN 2009 JAN–DEC 2009
Net profit/loss for the period –1,267 4,917 –5,470 –2,365 –13,672
Translation differences for the period –1,631 –45 –3,303 4,068 8,323
Comprehensive income for the period* –2,898 4,872 –8,773 1,703 –5,349
* Attributable to equity holders of the parent –2,770 4,872 –7,857 1,703 –5,349
Attributable to non-controlling interests –128 0 –916 0 0
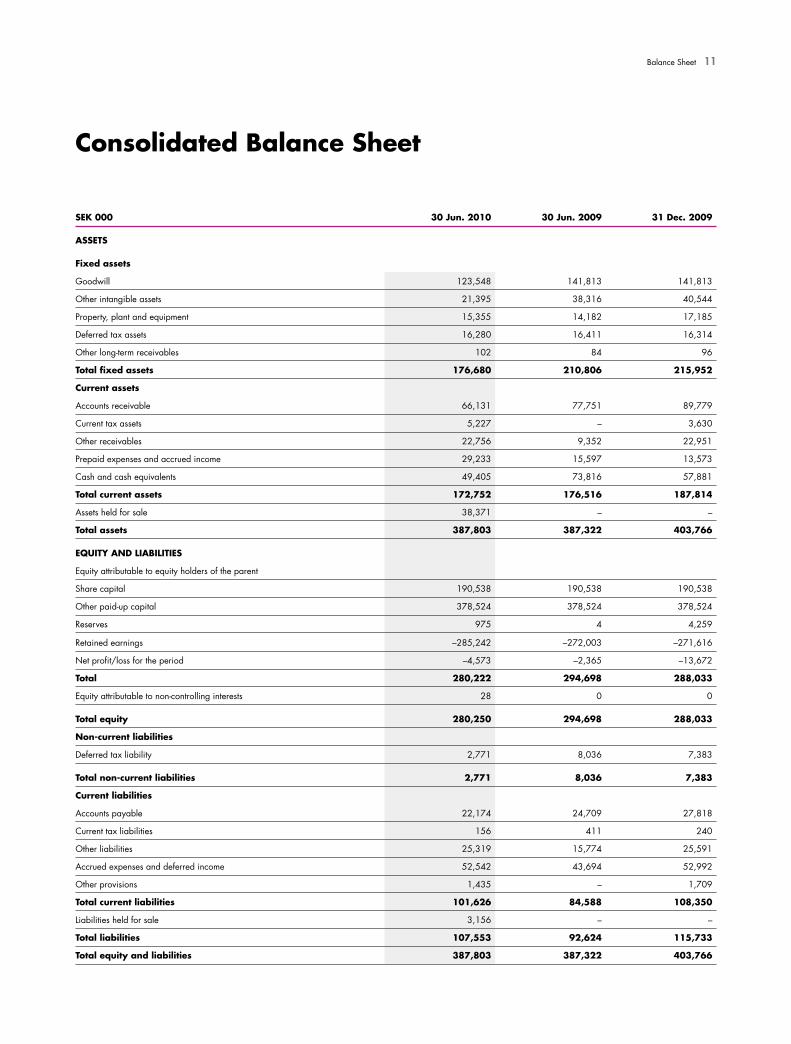
Balance Sheet 11
SEK 000 30 Jun. 2010 30 Jun. 2009 31 Dec. 2009
ASSETS
Fixed assets
Goodwill 123,548 141,813 141,813
Other intangible assets 21,395 38,316 40,544
Property, plant and equipment 15,355 14,182 17,185
Deferred tax assets 16,280 16,411 16,314
Other long-term receivables 102 84 96
Total fixed assets 176,680 210,806 215,952
Current assets
Accounts receivable 66,131 77,751 89,779
Current tax assets 5,227 – 3,630
Other receivables 22,756 9,352 22,951
Prepaid expenses and accrued income 29,233 15,597 13,573
Cash and cash equivalents 49,405 73,816 57,881
Total current assets 172,752 176,516 187,814
Assets held for sale 38,371 – –
Total assets 387,803 387,322 403,766
EQUITY AND LIABILITIES
Equity attributable to equity holders of the parent
Share capital 190,538 190,538 190,538
Other paid-up capital 378,524 378,524 378,524
Reserves 975 4 4,259
Retained earnings –285,242 –272,003 –271,616
Net profit/loss for the period –4,573 –2,365 –13,672
Total 280,222 294,698 288,033
Equity attributable to non-controlling interests 28 0 0
Total equity 280,250 294,698 288,033
Non-current liabilities
Deferred tax liability 2,771 8,036 7,383
Total non-current liabilities 2,771 8,036 7,383
Current liabilities
Accounts payable 22,174 24,709 27,818
Current tax liabilities 156 411 240
Other liabilities 25,319 15,774 25,591
Accrued expenses and deferred income 52,542 43,694 52,992
Other provisions 1,435 – 1,709
Total current liabilities 101,626 84,588 108,350
Liabilities held for sale 3,156 – –
Total liabilities 107,553 92,624 115,733
Total equity and liabilities 387,803 387,322 403,766
Consolidated Balance Sheet
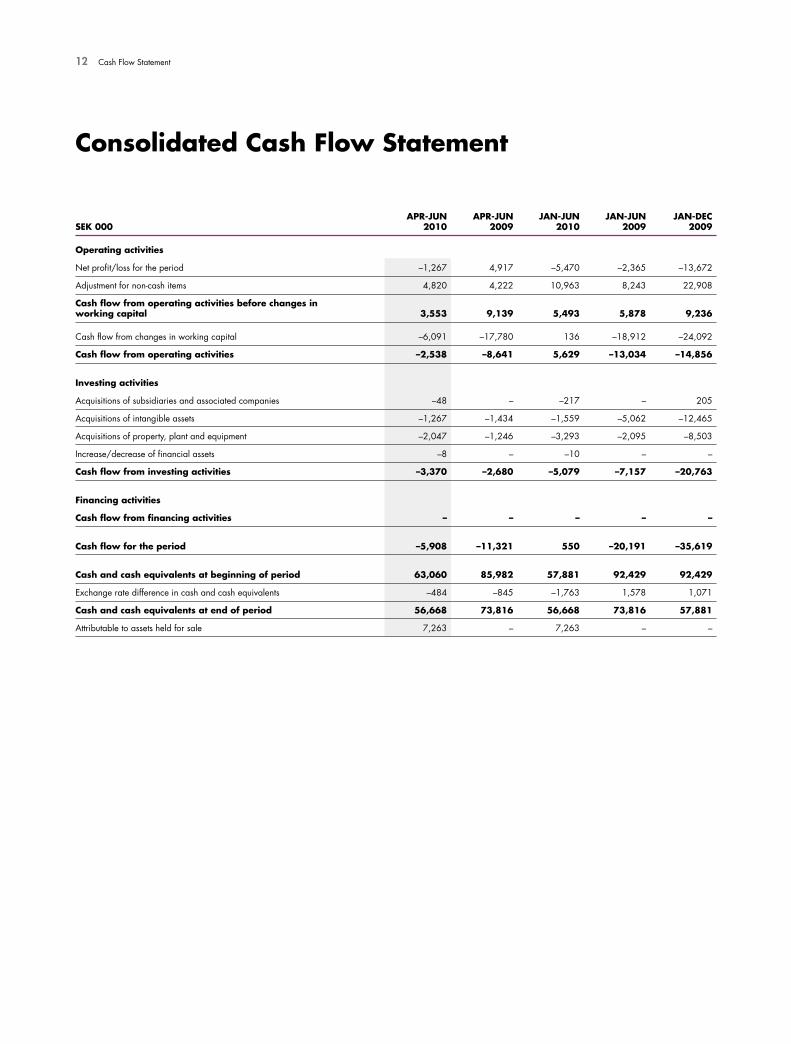
12 Cash Flow Statement
SEK 000APR-JUN
2010APR-JUN
2009JAN-JUN
2010JAN-JUN
2009JAN-DEC
2009
Operating activities
Net profit/loss for the period –1,267 4,917 –5,470 –2,365 –13,672
Adjustment for non-cash items 4,820 4,222 10,963 8,243 22,908
Cash flow from operating activities before changes in working capital 3,553 9,139 5,493 5,878 9,236
Cash flow from changes in working capital –6,091 –17,780 136 –18,912 –24,092
Cash flow from operating activities –2,538 –8,641 5,629 –13,034 –14,856
Investing activities
Acquisitions of subsidiaries and associated companies –48 – –217 – 205
Acquisitions of intangible assets –1,267 –1,434 –1,559 –5,062 –12,465
Acquisitions of property, plant and equipment –2,047 –1,246 –3,293 –2,095 –8,503
Increase/decrease of financial assets –8 – –10 – –
Cash flow from investing activities –3,370 –2,680 –5,079 –7,157 –20,763
Financing activities
Cash flow from financing activities – – – – –
Cash flow for the period –5,908 –11,321 550 –20,191 –35,619
Cash and cash equivalents at beginning of period 63,060 85,982 57,881 92,429 92,429
Exchange rate difference in cash and cash equivalents –484 –845 –1,763 1,578 1,071
Cash and cash equivalents at end of period 56,668 73,816 56,668 73,816 57,881
Attributable to assets held for sale 7,263 – 7,263 – –
Consolidated Cash Flow Statement

Quarterly Income Statement 13
SEK 000 Q2 2010 Q1 2010 Q4 2009 Q3 2009 Q2 2009 Q1 2009 Q4 2008 Q3 2008 Q2 2008 Q1 2008
Continuing operation
Net sales 84,001 72,028 70,766 65,393 71,999 69,741 113,686 106,905 105,940 99,043
Other operating income 1,316 485 3,501 1,374 1,176 10,466 6,235 2,493 1,900 976
Total 85,317 72,513 74,267 66,767 73,175 80,207 119,921 109,398 107,840 100,019
Services and goods for resale –11,112 –8,767 –10,117 –9,288 –10,186 –9,948 –16,343 –16,534 –14,940 –15,970
Other external expenses –55,249 –48,062 –48,832 –33,830 –42,230 –46,443 –61,916 –49,719 –48,422 –45,487
Personnel expenses –27,869 –27,260 –25,805 –24,410 –23,436 –25,761 –33,667 –33,219 –31,562 –32,526
Depreciation, amortization and impairment losses:
property, plant and equipment –1,828 –1,615 –1,622 –1,231 –313 –1,061 –1,523 –1,562 –1,268 –1,044
intangible assets –2,836 –2,510 –2,601 –2,293 –2,435 –2,344 –209,992 –3,460 –3,229 –3,201
Profit/loss from participation in as-sociated companies – – – – – – – –80 –36 –111
Other operating expenses –1,615 –2,559 –2,355 –3,199 –2,659 –7,971 –2,549 –844 –1,404 –1,618
Total –100,509 –90,773 –91,332 –74,251 –81,259 –93,528 –325,990 –105,418 –100,861 –99,957
Operating profit/loss –15,192 –18,260 –17,065 –7,484 –8,084 –13,321 –206,069 3,980 6,979 62
Net financial income/expense 90 –127 306 –323 –65 785 6,253 1,548 989 –908
Profit/loss after tax –15,102 –18,387 –16,759 –7,807 –8,149 –12,536 –199,816 5,528 7,968 –846
Tax 4,149 4,226 1,201 3,155 6,774 1,886 –16,250 866 –2,606 –1,226
Profit/loss for the period conti-nuing operation –10,953 –14,161 –15,558 –4,652 –1,375 –10,650 –216,066 6,394 5,362 –2,072
Operation held for sale
Profit/loss for the period operation held for sale 9,686 9,958 2,051 6,852 6,292 3,368 n/a n/a n/a n/a
Profit/loss for the period –1,267 –4,203 –13,507 2,200 4,917 –7,282 –216,066 6,394 5,362 –2,072
Quarterly Income Statement
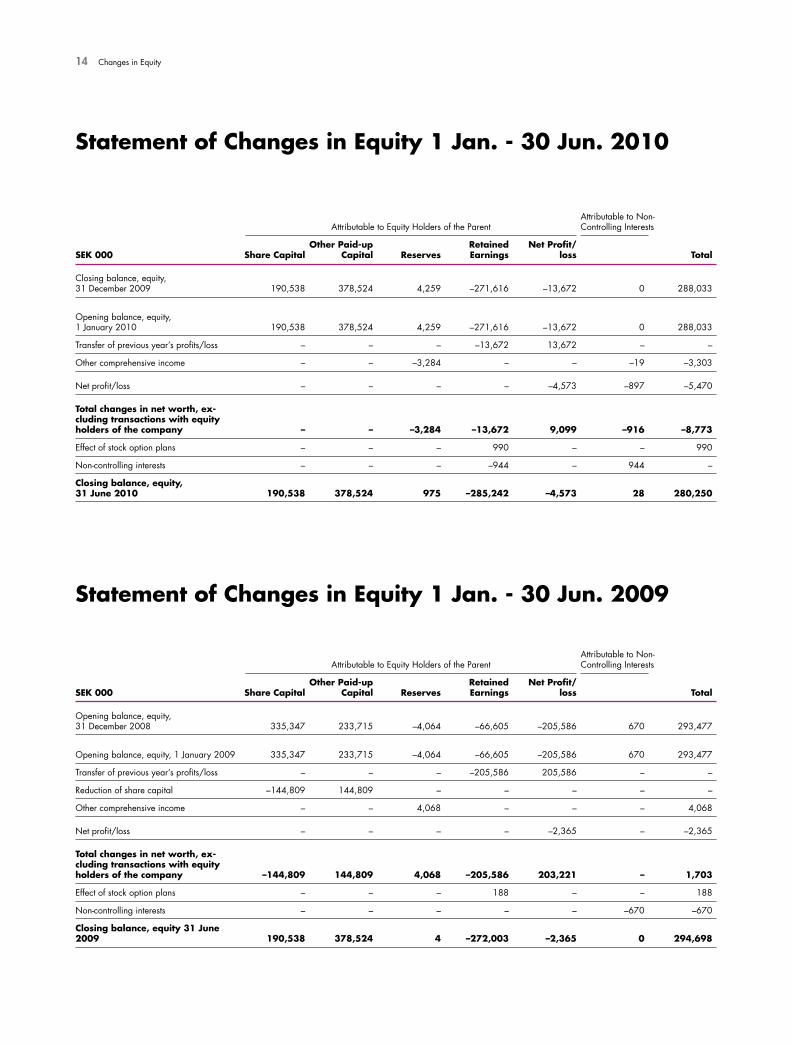
14 Changes in Equity
Attributable to Equity Holders of the ParentAttributable to Non- Controlling Interests
SEK 000 Share CapitalOther Paid-up
Capital ReservesRetained Earnings
Net Profit/loss Total
Closing balance, equity, 31 December 2009 190,538 378,524 4,259 –271,616 –13,672 0 288,033
Opening balance, equity, 1 January 2010 190,538 378,524 4,259 –271,616 –13,672 0 288,033
Transfer of previous year’s profits/loss – – – –13,672 13,672 – –
Other comprehensive income – – –3,284 – – –19 –3,303
Net profit/loss – – – – –4,573 –897 –5,470
Total changes in net worth, ex-cluding transactions with equity holders of the company – – –3,284 –13,672 9,099 –916 –8,773
Effect of stock option plans – – – 990 – – 990
Non-controlling interests – – – –944 – 944 –
Closing balance, equity, 31 June 2010 190,538 378,524 975 –285,242 –4,573 28 280,250
Statement of Changes in Equity 1 Jan. - 30 Jun. 2010
Attributable to Equity Holders of the ParentAttributable to Non- Controlling Interests
SEK 000 Share CapitalOther Paid-up
Capital ReservesRetained Earnings
Net Profit/loss Total
Opening balance, equity, 31 December 2008 335,347 233,715 –4,064 –66,605 –205,586 670 293,477
Opening balance, equity, 1 January 2009 335,347 233,715 –4,064 –66,605 –205,586 670 293,477
Transfer of previous year’s profits/loss – – – –205,586 205,586 – –
Reduction of share capital –144,809 144,809 – – – – –
Other comprehensive income – – 4,068 – – – 4,068
Net profit/loss – – – – –2,365 – –2,365
Total changes in net worth, ex-cluding transactions with equity holders of the company –144,809 144,809 4,068 –205,586 203,221 – 1,703
Effect of stock option plans – – – 188 – – 188
Non-controlling interests – – – – – –670 –670
Closing balance, equity 31 June 2009 190,538 378,524 4 –272,003 –2,365 0 294,698
Statement of Changes in Equity 1 Jan. - 30 Jun. 2009

Operation Held for Sale 15
Operation Held for Sale
In the income statement, the profit/loss from Entertainment in Denmark, Norway and Sweden has been reported as profit/loss from operations held for sale and the group-external assets and liabilities relating to this business segment have been reported as held for sale. Of the group’s cash and cash equivalents as of 30 June 2010, SEK 7,263,000 relate to assets for sale. Because it is not possible to accurately relate working capital to the operation held for sale, no comprehensive cash flow statement can be prepared for this operation.In principle, cash flow from operating activities before changes in working capital is consistent with the operation’s EBITDA (earnings before interest, taxes, depreciation and amortization). The cash flow of the investing activities is negligible.
Income Statement from Operation Held for Sale
SEK 000 Q2 2010 Q1 2010 Q4 2009 Q3 2009 Q2 2009 Q1 2009JAN-JUN
2010JAN-JUN
2009JAN-DEC
2009
Net sales 30,540 32,981 37,239 41,309 42,175 42,781 63,521 84,956 163,504
Other operating revenues 33 35 58 41 9 4 68 13 112
Total 30,573 33,016 37,297 41,350 42,184 42,785 63,589 84,969 163,616
Services and goods for resale –3,612 –3,584 –5,490 –5,806 –6,175 –8,642 –7,196 –14,817 –26,113
Other external expenses –6,840 –7,114 –14,936 –16,119 –16,915 –16,176 –13,954 –33,091 –64,146
Personnel expenses –5,342 –7,002 –12,427 –8,323 –8,529 –11,681 –12,344 –20,210 –40,960
Depreciation, amortization and impairment losses:
property, plant and equipment –195 –240 –272 –275 –293 –340 –435 –633 –1,180
intangible assets –1,489 –1,516 –1,383 –1,331 –1,360 –1,324 –3,005 –2,684 –5,398
Other operating expenses –161 –39 –12 –192 –72 –36 –200 –108 –312
Total –17,639 –19,495 –34,520 –32,046 –33,344 –38,199 –37,134 –71,543 –138,109
Operating profit/loss 12,934 13,521 2,777 9,304 8,840 4,586 26,455 13,426 25,507
Net financial income/expense –8 –9 6 –7 –15 –16 –17 –31 –32
Profit/loss before tax 12,926 13,512 2,783 9,297 8,825 4,570 26,438 13,395 25,475
Tax –3,240 –3,554 –732 –2,445 –2,533 –1,202 –6,794 –3,735 –6,912
Net profit/loss for the period 9,686 9,958 2,051 6,852 6,292 3,368 19,644 9,660 18,563
SEK 000 30 Jun. 2010
Intangible assets 30,381
Property, plant and equipment 727
Cash and cash equivalents 7,263
Total assets 38,371
Assets held for sale
SEK 000 30 Jun. 2010
Deferred tax liability 3,156
Total liabilities 3,156
Liabilities held for sale

16 Parent Company
SEK 000JAN-JUN
2010JAN-JUN
2009JAN-DEC
2009
Net sales 42,405 58,707 111,530
Other operating revenues 411 5,491 8,007
Total 42,816 64,198 119,537
Services and goods for resale –12,620 –28,631 –51,893
Other external expenses –16,517 –20,919 –36,336
Personnel expenses –3,370 –3,686 –6,632
Depreciation and impairment losses, property, plant and equipment –167 –166 –337
Amortization and impairment losses, intangible assets –348 –237 –517
Other operating expenses –1,712 –4,941 –6,645
Total –34,734 –58,580 –102,360
Operating profit/loss 8,082 5,618 17,177
Net financial income/expense 203 630 –37,439
Profit/loss before tax 8,285 6,248 –20,262
Tax on profit/loss for the period – – –
Profit/loss for the period 8,285 6,248 –20,262
Parent Company Income Statement Parent Company Balance Sheet
SEK 00030 Jun.
201030 Jun.
200931 Dec.
2009
ASSETS
Fixed assets
Intangible assets 2,517 2,325 2,501
Property, plant and equipment 391 589 475
Participation in group companies 153,092 183,474 149,227
Participation in associated com-panies 6,070 – 3,927
Receivables from group companies 0 0 0
Deferred tax assets 15,000 15,000 15,000
Total fixed assets 177,070 201,388 171,130
Current assets
Accounts receivables 387 2,641 781
Receivables, group companies 91,926 61,835 71,417
Other receivables 584 627 1,277
Prepaid expenses and accrued income 2,913 418 813
Cash and bank balances 18,913 20,872 21,316
Total current assets 114,723 86,393 95,604
Total assets 291,793 287,781 266,734
EQUITY AND LIABILITIES
Share capital 190,538 190,538 190,538
Statutory reserves 16,162 16,162 16,162
Share premium reserve 1,335 1,335 1,335
Retained earnings 13,661 33,923 33,923
Profit/loss for the period 8,285 6,248 –20,262
Total equity 229,981 248,206 221,696
Non-current liabilities
Liabilities to group companies 310 310 310
Total non-current liabilities 310 310 310
Current liabilities
Accounts payable 1,939 6,427 5,672
Liabilities to group companies 48,421 17,035 25,191
Other liabilities 175 518 640
Accrued expenses and deferred income 10,967 15,285 13,225
Total non-current liabilities 61,502 39,265 44,728
Total equity and liabilities 291,793 287,781 266,734
Review 17
Review
IntroductionI have conducted a summary review of this Interim Report for Aspiro AB (publ) for 1 January 2010 to 30 June 2010. The Board of Directors and Chief Executive Officer are responsible for preparing and presenting this Interim Report pursuant to IAS 34 and the Swedish Annual Accounts Act. My responsibility is to state a conclusion on this Interim Report based on my review.
Orientation and Scope of ReviewI have conducted my review pursuant to SÖG 2410, the applicable standard for reviews conducted by the company’s auditors. A review consists of making inquiries, primarily to individuals responsible for financial and accounting issues, conducting an analytical review and taking other review measures. A review has a differing orientation and significantly less scope than the orientation and scope of an audit pursuant to the RS Swedish auditing standard and generally accepted auditing practice otherwise. The review measures taken in a review do not enable me to attain sufficient certainty for me to state that I am aware of all significant circumstances that would have been identified if an audit had been conducted. Ac-cordingly, the stated conclusion of a review does not have the certainty of the stated conclusion based on an audit.
ConclusionBased on my review, no circumstances have arisen that give me reason to consider that essentially, for the group’s part, the Interim Report has not been prepared pursuant to IAS 34 and the Swedish Annual Accounts Act and, for the parent company’s part, pursuant to the Swedish Annual Accounts Act.
Malmö, Sweden, 12 August 2010
Johan ThuressonAuthorized Public Accountant, Ernst & Young
NorwayAspiroØvre Slottsgate 25P. O. Box 8710 YoungstorgetN-0028 OsloTel: +47 452 86 900Fax: +47 22 37 36 59
Rubberduck Media LabØvre Slottsgate 25P. O. Box 8710 YoungstorgetN-0028 OsloTel: +47 452 86 900Fax: +47 22 37 36 59
SwedenAspiro AB (publ)Gråbrödersgatan 2SE-211 21 MalmöTel: +46 40 630 03 00Fax: +46 40 57 97 71
Aspiro ABÖstermalmsgatan 87DSE-114 59 StockholmTel: +46 40 630 03 00Fax: +46 8 441 19 10
FinlandAspiro Mobile Finland OySinikalliontie 10FI-02630 Espoo, FinlandTel: +358 9 7511 5000Fax: +358 9 7511 5050
DenmarkAspiro Denmark A/SNørregade 7B,DK-1165 København KTel: +45 70 80 78 73
EstoniaAspiro Baltics ASMaakri 23AEE-10145 Tallinn, EstoniaTel: +372 6662350Fax: +372 6662351
LatviaAspiro Latvia SIAKalnciema street 33-4 LV-1046 Riga, LatviaTel : +371 67226177Fax: +371 67226176
LithuaniaUAB Aspiro LithuaniaA.Goštauto g. 40BLT-01112 Vilnius, LithuaniaTel/Fax: +370 5 260 4433
Aspiro AB (publ), Investor Relations, Gråbrödersgatan 2, SE-211 21 Malmö, www.aspiro.com
Related Documents