VAMSEE MODUGULA [email protected] BUILDING A COMMODITY BASED FREIGHT MODEL IN CARGO : LOS ANGELES EXAMPLE

Welcome message from author
This document is posted to help you gain knowledge. Please leave a comment to let me know what you think about it! Share it to your friends and learn new things together.
Transcript

VAMSEE MODUGULA [email protected]
BUILDING A COMMODITY BASED FREIGHT MODEL IN CARGO : LOS ANGELES EXAMPLE

CITILABS – THE COMPANYDevelops software for the modeling of
transportation systems
OfficesFlorida USA
Paris, Milan EuropeBeijing, Mumbai Asia
3000 cities on 6 continents in more than 70 countries

WHO USES OUR
PRODUCTS
North America: Los Angeles, Houston, Miami, Orlando, Washington. Atlanta, San
Francisco, Minneapolis, St. Louis, Tampa, Baltimore, Pittsburgh, Cincinnati, Sacramento
Europe: Dublin, London, Manchester, Glasgow, Liverpool, Oslo, Paris, Lyon,
Nice, Strasbourg, Valencia, Seville, Milan, Venice
Asia-Pacific: Taipei, Melbourne, Adelaide, Perth, Brisbane, Seoul, Beijing, Bangkok,
Hong Kong, Singapore, Kuala Lumpur, Manila, Jakarta, Delhi
Major engineering firms: AECOM, PB, Jacobs, Wilbur Smith, URS, PBSJ, Parsons

WHO USES OUR
PRODUCTS
Educational Institutions: IITs, NITs, SPA, Engineering Colleges
Research: CRRI, ISRO, CSTEP
Government DMRC, Dimts, MOUD, UMTC, PMC, RITES
Major engineering firms: AECOM, PB, Jacobs, Wilbur Smith, Systra MVA, GMR, L&T Ramboll,
Halcrow, Feedback Ventures, Mott MacDonald,

Comprehensive and Integrated
Wh
y C
ub
e is
the B
est Tra
nsp
orta
tion
Mod
elin
g
Syste
mCube 6
The only system that covers all facets of transportation modeling• people• goods• land use• region-wide traffic
simulation• multi-modal
microsimulation

6
Background
• Significant growth in goods movement in the Los Angeles region required improved models to evaluate impacts
• Models needed to address different potential improvements– Higher capacity intermodal rail terminals– Truck-only lanes– Extended working hours at the ports– Short-haul shuttles from ports to inland freight facilities

7
Objectives
• Components of the freight model should include– Long-haul freight from commodity flows– Short-haul freight from socioeconomic data in the
region and warehouse and distribution centers– Service truck movements
• Recognize trends in labor productivity, imports, and exports
• Integrate with passenger models

8
Modeling Process

9
Data Requirements• Detailed Socio-economic data • Reliable Commodity Flow Data• Origin-Destination Surveys to calibrate Trip
Distribution• Port Data• Data on TLNs (Intermodal Terminals,
distribution Centers, Warehouses)• Truck Classification Counts

10
Study Area• Within 5 county SCAG region – zip
codes• Remainder of California – counties• Remainder of USA – states• 4 external zones; 2 each for Canada
and Mexico

11
Truck Networks

12
Rail Networks

13
Truck Time Functions• LTL Time = Time+40 hrs for loading / unloading• TL Times – Drive 11 hrs between rest periods of 10
hrs

14
Model Descriptions – Tonnage Generation• Commodities were grouped into 14 categories• Productions based on tonnage rate per
employee• Consumptions based on input-output matrix• Port trips added from the Port’s models • Trends in production efficiencies, imports and
exports
15
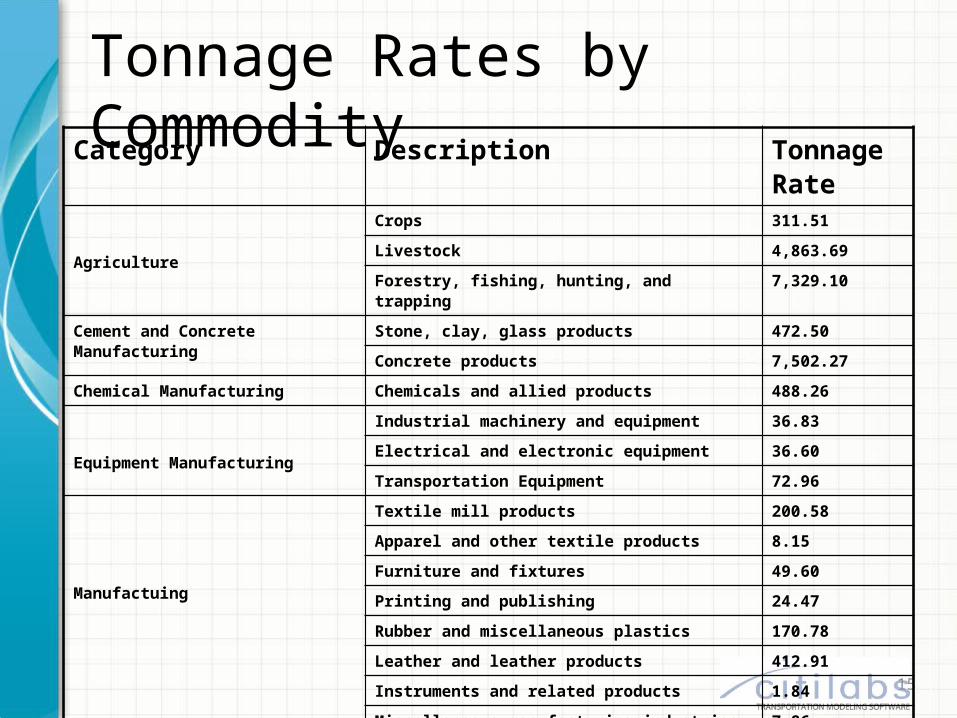
Tonnage Rates by CommodityCategory Description Tonnage
Rate
Agriculture
Crops 311.51
Livestock 4,863.69
Forestry, fishing, hunting, and trapping 7,329.10
Cement and Concrete Manufacturing Stone, clay, glass products 472.50
Concrete products 7,502.27
Chemical Manufacturing Chemicals and allied products 488.26
Equipment Manufacturing
Industrial machinery and equipment 36.83
Electrical and electronic equipment 36.60
Transportation Equipment 72.96
Manufactuing
Textile mill products 200.58
Apparel and other textile products 8.15
Furniture and fixtures 49.60
Printing and publishing 24.47
Rubber and miscellaneous plastics 170.78
Leather and leather products 412.91
Instruments and related products 1.84
Miscellaneous manufacturing industries 7.86

16
Commodity ClassesAgriculture Mining and Fuels
Cement and Concrete Manufacturing Motor Freight Transportation
Chemical Manufacturing Nonmetallic Minerals
Equipment Manufacturing Other Transportation
Food Manufacturing Paper and Wood Products Manufacturing
Manufacturing Petroleum
Metals Manufacturing Wholesale Trade

17
Outbound Tonnage Produced by Commodity Group
Agriculture8%
Cement and Concrete Manufacturing11%
Chemical Manufacturing5%
Equipment Manufacturing3%
Food Manufacturing11%
Manufacturing5%
Metals Manufacturing5%Mining and Fuels
0%
Motor Freight Transportation11%
Nonmetallic Minerals17%
Other Transportation9%
Paper and Wood Products Manufacturing4%
Petroleum8%
Wholesale Trade3%

18
Model Descriptions – Tonnage Distribution• Trips split into short-haul and Long Haul • All short-haul trips are assumed to be truck
trips• Short trip distribution based on a gravity
model• Long trips are distributed using a joint
distribution and mode choice model.

19
Trip Distribution Validation for Short-Haul Trips
Commodity Group
0
10
20
30
40
50
60
70
80Average Trip Length (in Miles)
ITMS Short-HaulModel Short-Haul
Agriculture Chemical Manufacturing
Equipment Manufacturing
Food Manufacturing
Manufacturing
Metals Manufacturing
Mining and Fuels
Motor Freight Transportation
Nonmetallic Minerals
Other Transportation
Paper and Wood Products Manufacturing
Petroleum
Wholesale Trade
Cement and Concrete Manufacturing

20
Model Descriptions – Mode Choice / Service • Estimates Truck and Rail Trips • Based on a multinomial logit model• Three independent variables, time, distance
and highway generalized cost• Applied for 3 distance classes
– <500, 500-1500 ; >1500 miles
• Service Model– Estimates safety, utility, public / personal vehicles

21
Model Descriptions – Transport Logistics Node Model• Estimates direct and non-direct trips• Includes intermodal terminals, warehouses,
distribution centers etc.• Model Outputs are
– Direct flows from origin to destination– Flows from origin to the TLN– Flows from the TLN to destination

22
Transport Logistics Node Model
Internal Area External Area External Zone TLNStudy Area
Define location of TLN
Define service area of TLN
Partitions into Long-Haul Direct Flows by mode
Partitions into Long-Haul TLN Flows and Short-Haul TLN Flows by mode

23
Vehicle Model
• Converts tons to trucks• Parameters to influence empty trucks• Standard Vehicle Model to generate direct O-D
flows• Touring vehicle model that simulates multi-
point pick-up and drop off

24
Touring Vehicle Model
• Performed on TLN’s and user-specified zones
Internal Area External Area External Zone TLNStudy Area
Generated tour from a TLN and back doing pickups and drop-offs

25
Assignment Validation – External CordonsGateway Routes Count
Volumes Truck Model Volumes
% Difference
San Diego / Mexico
I-8, I-15, I-5 26,058 24,436 -6%
Rest of CA US-101, I-5, CA-14, US-395
29,698 31,840 7%
Arizona I-8, I-15, I-40, I-10
25,534 27,133 6%
Total 81,291 83,409 3%

26
Assignment Validation – ScreenlinesScreenline Dir Number of
Counts Truck Counts
Model Volumes
% Diff
1 N-S 18 51,277 54,718 7%
2 E-W 28 96,480 91,096 -6%
3 N-S 18 70,323 53,375 -24%
4 E-W 12 71,266 56,140 -21%
5 E-W 23 77,268 74,714 -3%
6 E-W 13 78,972 86,753 10%
7 N-S 20 47,733 25,909 -46%
8 E-W 14 64,199 60,048 -6%
10 E-W 8 19,356 20,397 5%
11 E-W 8 16,278 18,389 13%
12 E-W 5 19,064 18,617 -2%
13 N-S 6 17,291 14,349 -17%
18 N-S 4 29,958 31,331 5%
Total 191 700,699 644,421 -8%

27
Assignment at Key Freight CorridorsCorridor Dir Counts Model Diff % Diff
I-15 – S/O I-10 N-S 17,000 13,272
(3,728)
-22%
I -15 – N/O Sr - 138 N-S 14,855 13,877
(978)
-7%
I-15 San Diego / LA County
N-S 5,388 11,503 6,115
113%
I-15 San Bernardino / Nevada State Line
N-S 7,780 13,093
5,313
68%
TOTAL I-15 N-S 45,023 51,744
(3,072)
-7%
I-215 - Betw I-10 & Wash'
N-S 10,267 8,224
(2,043)
-20%

28
2030 Model – Tonnage Generation Change in Labor Productivity
Commodity Group GrowthAgriculture 1.43%
Cement and Concrete 0.66%
Chemical Manufacturing 1.85%
Equipment Manufacturing 2.55%
Food Manufacturing 1.47%
Manufacturing 3.39%
Metals Manufacturing 2.12%
Mining and Fuels 0.93%
Motor freight transportation 1.18%
Nonmetallic minerals 1.88%
Other transportation 1.93%
Paper and Wood Products 1.71%
Petroleum 2.57%
Wholesale Trade 3.94%

29
2030 Model – Tonnage Generation Change in Imports and Exports
Region / State Exports Imports
Remainder of CA -8% -1%
Sacramento -1% 0%
San Francisco Bay Area -4% 0%
San Diego -2% 4%
Florida 1% 0%
Illinois 1% 0%
Iowa 0% -1%
Arkansas 0% -1%
Texas 2% -2%
Colorado 0% 2%
Arizona 1% 7%
Utah 1% 0%
Nevada 2% -3%
Washington 1% -2%
Oregon 1% 0%
Mexico 0% 2%

30
2030 – Growth in Autos and Trucks
Mode 2003 2030 Growth % Growth
Drive Alone 25,645,643 35,513,032 9,867,389 38%
Shared Ride 2 6,241,877 8,515,208 2,273,331 36%
Shared Ride 3 3,685,651 4,947,531 1,261,880 34%
Total Auto 35,573,171 48,975,771 13,402,600 38%
Trucks 679,220 905,052 225,832 33%
All Vehicles 36,252,391 49,880,823 13,628,432 38%

31
2030 Assignments – GrowthScreenline Dir 2003
Trucks2030 Trucks
% Growth
1 N-S 54,676 68,491 25%
2 E-W 83,465 100,315 20%
3 N-S 52,029 55,234 6%
4 E-W 59,106 76,667 30%
5 E-W 77,044 86,608 12%
6 E-W 88,740 135,735 53%
7 N-S 31,930 45,009 41%
8 E-W 61,168 99,557 63%
10 E-W 23,023 30,105 31%
11 E-W 18,058 25,173 39%
12 E-W 18,224 28,515 56%
13 N-S 16,291 25,738 58%
18 N-S 31,030 39,680 28%
Total 656,818 867,425 32%

32
Summary
• Developed and tested for one of the most complex freight transportation system in the US
• Multimodal tool useful for freight investment decisions
• TLN and service models provide accurate accounting of truck trips
• Use of changes in labor productivity and trends • Model can evaluate a wider range of alternatives
Related Documents