Avoided Gas Supply Costs in New York AUTHORS Dr. Carl V. Swanson, Rick Hornby, and Jennifer Kallay PREPARED FOR KeySpan Energy Delivery

Welcome message from author
This document is posted to help you gain knowledge. Please leave a comment to let me know what you think about it! Share it to your friends and learn new things together.
Transcript

Avoided Gas Costs in New York Synapse Energy Economics and Swanson Energy Group September 2007
Avoided Gas Supply Costs in New York
AUTHORS
Dr. Carl V. Swanson, Rick Hornby, and Jennifer Kallay PREPARED FOR
KeySpan Energy Delivery

Avoided Gas Costs in New York Synapse Energy Economics and Swanson Energy Group September 2007
TABLE OF CONTENTS
1. INTRODUCTION 1
A. Background to Report 1
2. NATURAL GAS PRICE FORECAST 1
A. Overview of KEDNY-KEDLI 1
B. Forecast Commodity Price of Gas 2
C. Forecast of High and Low Gas Prices at the Henry Hub 8
D. Representation of Volatility in Gas Commodity Prices 10
3. SECTOR SPECIFIC AVOIDED NATURAL GAS COST FORECAST 1
A. Cost to Supply Natural Gas to LDCs 1
B. Summary of the Avoided Cost Analysis 2
C. Representation of KEDNY-KEDLI 2
D. Avoided Cost of Gas from Each of the Three Sources 3
E. Avoided Cost Forecast by Seasonal Cost Periods 8
F. Avoided Costs by End-Use 10
Avoided Gas Costs in New York Page 1-1 Synapse Energy Economics and Swanson Energy Group September 2007
1. Introduction
A. Background to Report This 2007 Avoided-Gas-Supply-Cost (AGSC) report provides projections of marginal natural gas supply costs which will be avoided due to savings in natural gas resulting from energy efficiency programs offered to customers of Keyspan Energy Delivery New York (KEDNY) and Keyspan Energy Delivery Long Island (KEDLI). These projections were developed in order to support energy efficiency program decision-making and regulatory filings during 2008 and 2009. The program administrators will use these projections in their efficiency program decision-making and regulatory filings in 2008 and 2009.
The 2007 AGSC report provides detailed projections for the sixteen year period 2007 through 2022 and projections of end-use avoided gas supply costs for the period 2023 through 2040 based on escalation rates. All values are reported in 2007$ unless noted otherwise.
The 2007 AGSC Study was sponsored by KeySpan Energy Delivery New York.
This report was prepared by a project team consisting of contractors from Synapse Energy Economics (Synapse) and Swanson Energy Group. Carl Swanson led the analysis of avoided natural gas costs. Jennifer Kallay provided research and analytic support including data collection, literature searches, spreadsheet analyses, documentation, and drafting. Rick Hornby served as project manager and editor.
B. Organization of Report The report is organized as follows: • Chapter 2 - Projection of wholesale natural gas prices at the Henry Hub in Louisiana and
as delivered to KEDNY and KEDLI for the period 2007 through 2022.
• Chapter 3 - Projection of avoided natural gas costs by retail end-use sector for the period 2007 through 2040.

Avoided Gas Costs in New York Page 2-1 Synapse Energy Economics and Swanson Energy Group September 2007
2. Natural Gas Price Forecast This chapter provides a projection of natural gas prices for KEDNY-KEDLI as well as a projection of avoided natural gas costs by retail end-use sector.
A. Overview of KEDNY-KEDLI The state of New York receives its natural gas from a diverse range of sources, including the Gulf region of the United States and western Canada.
KEDNY-KEDLI use five basic supply resources to meet the sendout requirements of their customers. These resources are (1) gas delivered directly from producing areas via long-haul pipelines year-round; (2) gas withdrawn from underground storage facilities, most of which are located in Pennsylvania, New York, and West Virginia, and delivered by pipeline; (3) spot purchases of gas in the Southwest and delivered by pipeline during the winter months of November through March; (4) peaking and cogeneration supplies delivered to the city gate; and (5) gas stored as liquefied natural gas (LNG) in KEDNY and KEDLI LNG facilities.
Because of the large seasonal temperature changes in the New York metropolitan area and Long Island and the amount of heating load, natural gas use is seasonal. On average and based on total throughput in New York State, about twice as much gas is used in January as in the low gas usage month of October. There is considerable summer natural gas consumption for electricity generation. Since generators often receive gas directly from pipelines, the local distribution companies (LDCs) have a much greater swing of gas load. For example, the firm and temperature-controlled throughput for KEDNY and KEDLI in January is typically about six times the amount used during the summer months of June, July, August, or September. Because of these large swings in monthly gas load, KEDNY-KEDLI typically fill their underground storage and LNG tanks during the summer months and remove gas during the winter months to serve their large winter customer load.
A more extensive discussion of the New York gas industry and gas supply is published by the Northeast Gas Association (NEGA).1
1 Northeast Gas Association, “Statistical Guide to the Northeast U.S. Natural Gas Industry 2006” (NEGA Statistics
2006).
Avoided Gas Costs in New York Page 2-2 Synapse Energy Economics and Swanson Energy Group September 2007
B. Forecast Commodity Price of Gas
Development of Henry Hub Natural Gas Price Forecast The forecasted commodity price of gas for KEDNY-KEDLI begins with a forecast of the price of gas at the Henry Hub (HH), the most relevant pricing point for US gas supply costs. Henry Hub natural gas prices make a good starting point for the forecast for numerous reasons, including: the North American natural gas market is highly integrated, the Henry Hub is located in the US Gulf Coast area which is the dominant producing region of the United States, the Henry Hub is the most liquid trading hub with the longest history of public trading on the New York Mercantile Exchange (“NYMEX”), and market prices of gas produced in other regions of the United States and Canada reflect Henry Hub prices with an adjustment for their location – referred to as a basis differential. A basis differential is defined as the natural gas price in a market location minus the gas price at the Henry Hub.
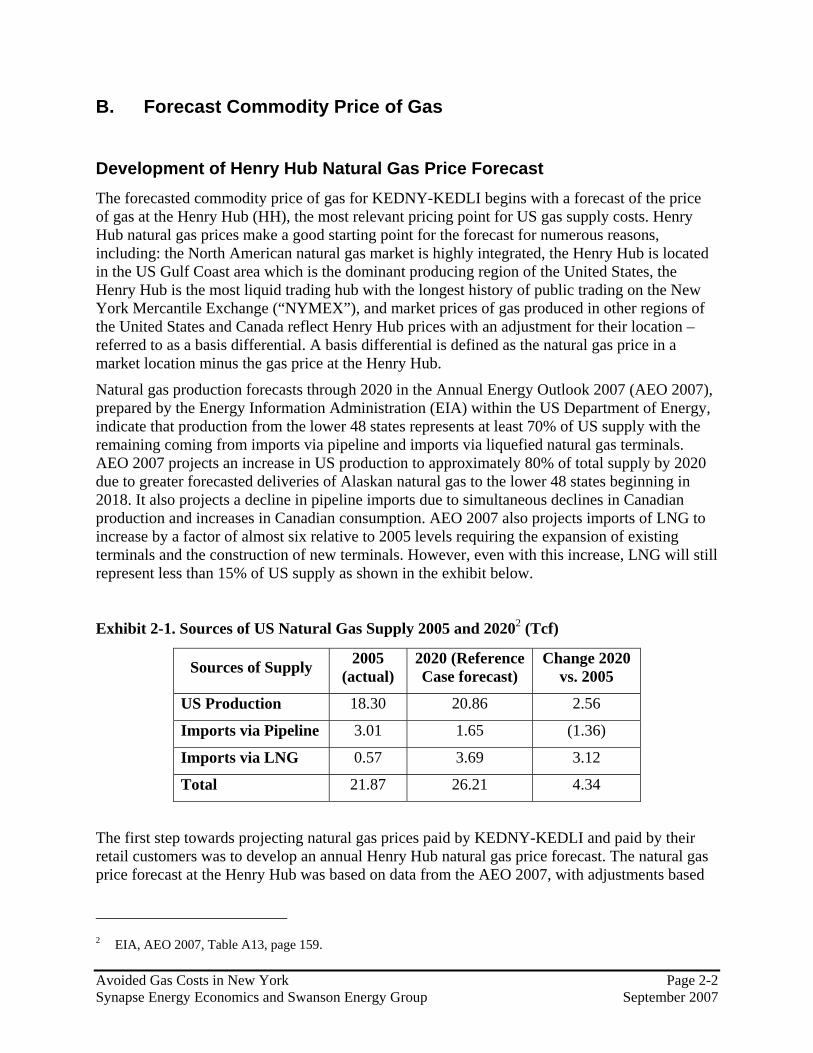
Natural gas production forecasts through 2020 in the Annual Energy Outlook 2007 (AEO 2007), prepared by the Energy Information Administration (EIA) within the US Department of Energy, indicate that production from the lower 48 states represents at least 70% of US supply with the remaining coming from imports via pipeline and imports via liquefied natural gas terminals. AEO 2007 projects an increase in US production to approximately 80% of total supply by 2020 due to greater forecasted deliveries of Alaskan natural gas to the lower 48 states beginning in 2018. It also projects a decline in pipeline imports due to simultaneous declines in Canadian production and increases in Canadian consumption. AEO 2007 also projects imports of LNG to increase by a factor of almost six relative to 2005 levels requiring the expansion of existing terminals and the construction of new terminals. However, even with this increase, LNG will still represent less than 15% of US supply as shown in the exhibit below.
Exhibit 2-1. Sources of US Natural Gas Supply 2005 and 20202 (Tcf)
Sources of Supply 2005 (actual)
2020 (Reference Case forecast)
Change 2020 vs. 2005
US Production 18.30 20.86 2.56
Imports via Pipeline 3.01 1.65 (1.36)
Imports via LNG 0.57 3.69 3.12
Total 21.87 26.21 4.34
The first step towards projecting natural gas prices paid by KEDNY-KEDLI and paid by their retail customers was to develop an annual Henry Hub natural gas price forecast. The natural gas price forecast at the Henry Hub was based on data from the AEO 2007, with adjustments based
2 EIA, AEO 2007, Table A13, page 159.

Avoided Gas Costs in New York Page 2-3 Synapse Energy Economics and Swanson Energy Group September 2007
on our analyses described below.3 The AEO 2007 was the optimal starting point because it is public, transparent, and incorporates the long-term feedback mechanisms of energy prices upon supply, demand, and competition among fuels. AEO 2007 is comprised of 34 different forecast cases, each incorporating different assumptions.4 The most likely case is called a Reference Case. The Reference Case assumes US economic growth of 2.9% per year and oil and gas prices that decline from current levels and then begin a slow rise. By 2030, the AEO 2007 expects the Reference Case average crude oil price to be about $59.00 per barrel and the US wellhead natural gas price to be $5.80 per Mcf in 2005 dollars.
A review of the Henry Hub natural gas prices in AEO 2007 found that none of the AEO forecasts of Henry Hub gas prices over the long-term were supportable. A major source of disagreement with the AEO 2007 forecasting was with the EIA’s assumptions about technological progress in oil and gas finding. As indicated in Exhibit 2-2, the AEO Reference Case assumes that, relative to actual experience over the past ten years,
• the success rate of oil and gas drilling will improve at a slower pace,
• the finding rates for gas will improve at a faster pace, and
• the costs of drilling wells will decline at a faster pace.
Exhibit 2-2. Comparison of AEO 2007 Assumptions about Improvements in Gas Finding Productivity and Drilling Costs (Reference Case) with Actual Data from 1994 to 2004
Forecast Actual
units (a) (b)Success Rates of Oil and Gas Drilling (Annual Improvement)
Exploratory Wells % per year 0.5 to 1.0 5.0Development Wells % per year 0.5 1.1
Finding Rates for Gas, Improvement (Mcf found per successful gas well foot drilled)Exploratory Wells % per year 0.0 to 3.0 -12.4Development Wells % per year 1.0 -4.9
Reduction in Drilling CostsExploratory Wells % per year 0.9 to 1.0 -8.3Development Wells % per year 0.9 to 1.0 -9.5
(a) Assumptions to the Annual Energy Outlook 2007, Table 53, page 102.(b) EIA Annual Energy Review 2005; Tables 4.6, 4.7 and 4.8;
EIA Performance Profiles of Major Energy Producers 2005.
1994-96 to 2003-2004
AEO 2007 Reference Case
Average Annual Improvement
3 AEO 2007 prices are expressed in 2005$. Those prices are converted into 2007$ using the indexes and
conversion factors specified as major assumptions. 4 See AEO 2007 Appendix E and especially Table E1, page 212.
Avoided Gas Costs in New York Page 2-4 Synapse Energy Economics and Swanson Energy Group September 2007
For the reasons presented below, we agree with the EIA’s projections that the success rate of drilling will improve at a slower pace but we disagree that finding rates will improve and drilling costs will decline.
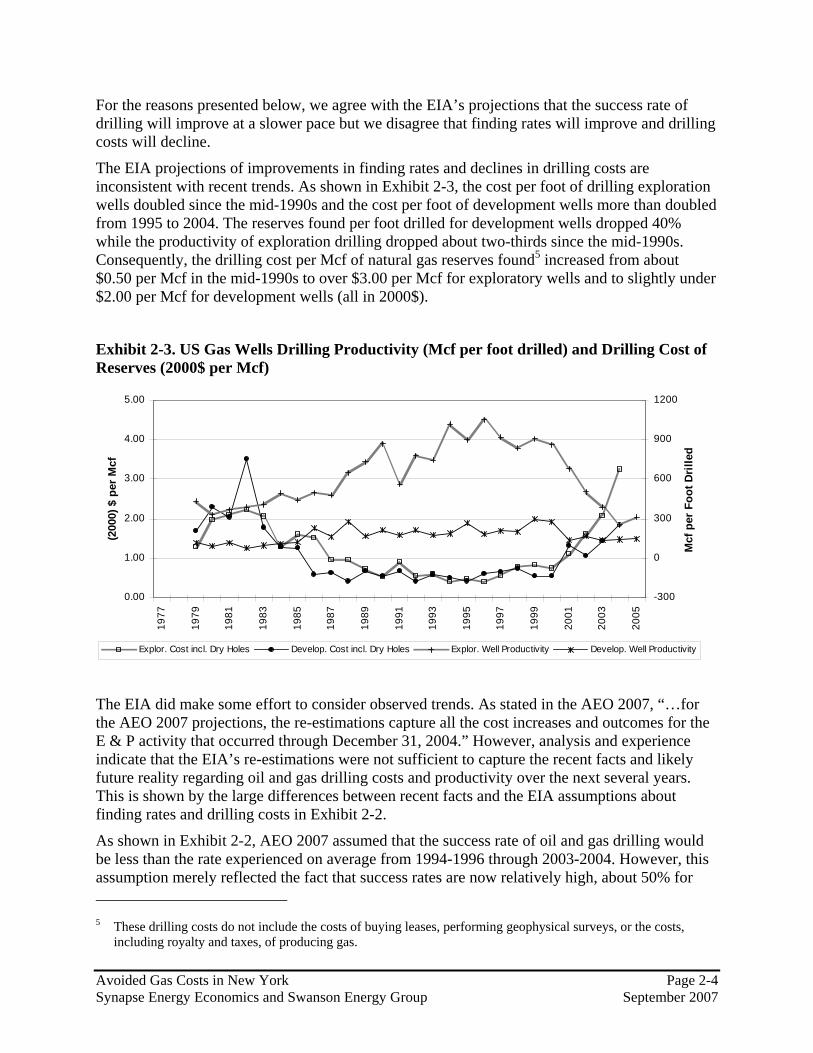
The EIA projections of improvements in finding rates and declines in drilling costs are inconsistent with recent trends. As shown in Exhibit 2-3, the cost per foot of drilling exploration wells doubled since the mid-1990s and the cost per foot of development wells more than doubled from 1995 to 2004. The reserves found per foot drilled for development wells dropped 40% while the productivity of exploration drilling dropped about two-thirds since the mid-1990s. Consequently, the drilling cost per Mcf of natural gas reserves found5 increased from about $0.50 per Mcf in the mid-1990s to over $3.00 per Mcf for exploratory wells and to slightly under $2.00 per Mcf for development wells (all in 2000$).
Exhibit 2-3. US Gas Wells Drilling Productivity (Mcf per foot drilled) and Drilling Cost of Reserves (2000$ per Mcf)
0.00
1.00
2.00
3.00
4.00
5.00
1977
1979
1981
1983
1985
1987
1989
1991
1993
1995
1997
1999
2001
2003
2005
(200
0) $
per
Mcf
-300
0
300
600
900
1200
Mcf
per
Foo
t Dri
lled
Explor. Cost incl. Dry Holes Develop. Cost incl. Dry Holes Explor. Well Productivity Develop. Well Productivity
The EIA did make some effort to consider observed trends. As stated in the AEO 2007, “…for the AEO 2007 projections, the re-estimations capture all the cost increases and outcomes for the E & P activity that occurred through December 31, 2004.” However, analysis and experience indicate that the EIA’s re-estimations were not sufficient to capture the recent facts and likely future reality regarding oil and gas drilling costs and productivity over the next several years. This is shown by the large differences between recent facts and the EIA assumptions about finding rates and drilling costs in Exhibit 2-2.
As shown in Exhibit 2-2, AEO 2007 assumed that the success rate of oil and gas drilling would be less than the rate experienced on average from 1994-1996 through 2003-2004. However, this assumption merely reflected the fact that success rates are now relatively high, about 50% for 5 These drilling costs do not include the costs of buying leases, performing geophysical surveys, or the costs,
including royalty and taxes, of producing gas.

Avoided Gas Costs in New York Page 2-5 Synapse Energy Economics and Swanson Energy Group September 2007
exploratory wells and about 90% for development wells. It is true that oil and gas drilling technology is improving and there have been a higher percentage of successful wells over time as evidence of this trend (Exhibit 2-3 provides more detail). North America is now experiencing a gas drilling boom similar to that of the late 1970s and early 1980s. After the drilling boom of the late 1970s and early 1980s, drilling costs did decrease and drilling productivity did increase and such may happen again. Thus, it is also reasonable to expect that as the number of drilling rigs and experienced crews grows to fill the demand and as technology and knowledge improves in finding and developing non-conventional gas reservoirs, declining drilling costs and increasing productivity of drilling could be experienced in the future.
However, one cannot ignore the reduced finding rate and greater costs of finding gas; it is simply becoming increasing difficult and expensive to extend existing reservoirs and find new ones. New reservoirs are smaller, deeper in the sea, in more remote areas, and have less permeability in the reservoirs. Thus, although technology is improving, the data show that the difficulty in accessing new or extended reservoirs for gas is offsetting any gains made through technological improvements.
In addition, the increase in the number of wells and footage drilled has led to price increases for drilling. These increases have been further exacerbated by price increases for drilling materials (i.e., steel) caused by worldwide economic growth. In short, further strong improvement in success rates, especially for development wells, will be difficult. AEO 2007’s assumed improvements in finding rates of 0 to 3% per year and reductions in drilling costs of about 1% per year are not consistent with the actual rates experienced on average from 1994-1996 through 2003-2004. To the contrary, finding rates over that period fell sharply and drilling costs escalated sharply.
Fortunately, AEO 2007 provided alternate scenarios including the Oil and Gas Slow Technology Case and the Oil and Gas Rapid Technology Case. The AEO 2007 Oil and Gas Rapid Technology Case had 50% more rapid cost reduction and drilling productivity improvement than the Reference Case. Conversely, the AEO 2007 Oil and Gas Slow Technology Case assumed that cost and drilling productivity improvement were 50% less than the Reference Case. The Oil and Gas Slow Technology Case represents a more reasonable starting point than the Reference Case. In the Oil and Gas Slow Technology Case, the EIA continues to assume that technological progress will reduce drilling costs and increase drilling productivity year after year, contrary to the actual trends shown in the exhibit above. The recent direction and pace of changes in productivity improvements and drilling cost reductions are negative, not the small but positive numbers assumed by the EIA, even in its Slow Technology Case. Therefore, the Henry Hub gas price forecast in this study began with the AEO 2007 Oil and Gas Slow Technology Case forecast, and then made adjustments to reflect the assumption that drilling costs would continue to increase or remain high and finding productivity per foot drilled would continue to fall or remain at current low levels for a while.
In order to develop a forecast that captures the effects of both technological progress and declining productivity and increasing costs of drilling for and finding natural gas, this forecast starts with the gas price forecast in the Slow Technology Case in the AEO 2007 and adds to this price the difference in the price between the AEO 2007 Oil and Gas Slow Technology Case and the AEO 2007 Oil and Gas Rapid Technology Case. The difference in the two cases represents the difference in the rates of decline in drilling costs and improvement in drilling productivity. This difference, when added to the prices from the Slow Technology Case, provided a reasonable

Avoided Gas Costs in New York Page 2-6 Synapse Energy Economics and Swanson Energy Group September 2007
representation of the reality of increasing drilling costs and declining drilling productivity in the recent past and near future. The result is representative of the Henry Hub natural gas price under “a less than Slow Technology Case.” In other words, the Henry Hub natural gas price under “a less than Slow Technology Case” will be above the Slow Technology Case forecast price by the same differential as the Henry Hub natural gas price under the “Rapid Technology Case” is below the Slow Technology Case forecast price. A forecast that provides a reasonable reflection of the likely price impacts of increasing drilling costs and declining drilling productivity was developed by adding the price differential to the Slow Technology Case forecast price.
As a check on the validity of this forecast, the forecast prices for 2007-2012 were compared to the Henry Hub futures prices from NYMEX.6 Annual averages using actual monthly NYMEX prices for January through March 2007 and NYMEX futures prices for April 2007 through December 20127 were calculated. This comparison indicated that near-term prices forecast under the methodology outlined above for 2007 through 2012 were, on average, 98% of the Henry Hub futures prices as of mid-March 20078 when expressed in 2007$. Although this is a modest discrepancy, it was determined that the optimal approach would be to use a combination of Henry Hub futures prices in the near-term (2007-2012) and projections derived from the AEO 2007 Oil and Gas Slow Technology Case described above in the long-term (2013-2022).
Annual Henry Hub Natural Gas Price Forecast The AGSC 2007 Henry Hub annual natural gas price forecast is shown in the exhibit below relative to the actual Henry Hub prices from 1992 through 2006. Actual Henry Hub prices were in the $3.00/MMBtu (2007$) range from 1992 through 1999, and have increased steadily since then. The AGSC 2007 forecast projects that prices decline to the $6.00 to $7.00/MMBtu range, and then stabilize at that level through 2022.
6 The futures market represents the consensus of market participants who do have a reasonable knowledge of near-
term market and industry facts. See the paper by Adam Sieminski, “Varying Views on the Future of the Natural Gas Market: Secrets of Energy Price Forecasting,” 2007 EIA Energy Outlook, Modeling and Data Conference, Washington DC, March 28, 2007. Available at www.eia.doe.gov/oiaf/aeo/conf/index.htm.
7 As of May 2, 2007. 8 NYMEX ClearPort market prices as of May 2, 2007.

Avoided Gas Costs in New York Page 2-7 Synapse Energy Economics and Swanson Energy Group September 2007
Exhibit 2-4. Annual Actual and Forecast Henry Hub Natural Gas Prices (2007$/MMBtu)
Annual Actual Henry Hub Gas Pricesvs. 2007 AESC Forecast (2007$/MMBtu)
$0.00
$1.00
$2.00
$3.00
$4.00
$5.00
$6.00
$7.00
$8.00
$9.00
$10.00
1992
1994
1996
1998
2000
2002
2004
2006
2008
2010
2012
2014
2016
2018
2020
2022
Years
Gas
Pric
es (2
007$
/MM
Btu
)
Annual Actual HH
2007 AGSC Annual Forecasted HH
The AGSC 2007 forecast is approximately 9% higher than the AEO 2007 Reference Case on average over the forecast period as shown in the exhibit below.
Exhibit 2-5. Comparison of Henry Hub Gas Price Forecasts (2007$/MMBtu)
Comparison of Henry Hub Gas Price Forecasts (2007$/MMBtu)
$0.00
$1.00
$2.00
$3.00
$4.00
$5.00
$6.00
$7.00
$8.00
$9.00
2007 2008 2009 2010 2011 2012 2013 2014 2015 2016 2017 2018 2019 2020 2021 2022
Years
Gas
Pric
es (2
007$
/MM
Btu
)
2007 AESC Annual HH Forecast
2007 AEO Reference Case

Avoided Gas Costs in New York Page 2-8 Synapse Energy Economics and Swanson Energy Group September 2007
As indicated in Exhibits 2-4 and 2-5, our forecast of the Henry Hub natural gas price is almost $1.00 per MMBtu higher in 2008 than in 2007, and then it declines to the year 2013. The projected “bump” in 2008 and the projected decline thereafter are both driven by the market expectations regarding demand and supply over the next few years.
The higher price in 2008 is a direct reflection of the value that the NYMEX futures market (as of May 2, 2007) placed on Henry Hub gas in 2008 as compared to 2007. The market’s expectations of a higher price for gas deliveries a year in the future has its origin in the effects of Hurricane Katrina, which landed on the Gulf Coast on August 29, 2005 and drove up gas prices in the following months dramatically. Prior to that experience, the NYMEX gas futures “year-out” price was generally the same as the “near-month” price. However, since Katrina, NYMEX year-out prices have been generally higher than near-month prices by about $2.00 per MMBtu in 2006 and $1.00 per MMBtu in 2007.
This price spread is based upon the expectation among gas futures traders that 2008 prices will be higher than 2007 prices for several reasons. The market is expecting continued declines in imports from Canada due to declines in Canadian gas production,9 interruptions in US production due to an active hurricane season in the Atlantic this summer and fall, increased gas consumption due to higher than normal summer temperatures in the United States and high oil prices, decreases in LNG imports due to increases in demand for LNG in Europe to meet winter demand, and increased US consumption this winter due to a return to average temperatures after the recent warmer than normal winters.
There are several reasons for the decline in the NYMEX gas futures prices for the out years beyond 2008. Some agree with the view of AEO 2007 that gas prices will decline from the near term level due to increasing supply resulting from technological improvements in finding and producing gas in North America. Others may believe that LNG imports will moderate the North American gas price. Finally, futures prices tend to decline in the out years to reflect the risk of holding long positions in gas futures.
C. Forecast of High and Low Gas Prices at the Henry Hub In this section higher and lower gas price cases are presented. Similar to the base price forecast, these forecasts were derived from various price cases presented in AEO 2007. The volatility of those prices is also discussed.
(a) Higher Price Case
The AGSC 2007 higher price case represents a future with the same slow technological progress in finding oil and gas as in the AGSC 2007 base forecast, and fewer oil and gas resources than expected in the AEO 2007 reference case. We developed the AGSC 2007 higher price case by adding to the prices from the AGSC 2007 base forecast a projection of the incremental price impact of a lower projection of natural gas resources. We drew that projected incremental price impact from an analysis of AEO 2007 forecasts for various cases.
9 Canada’s National Energy Board, “2007 Summer Energy Outlook” expects 2007 gas production in Canada to
decline about 500 million cubic feet per day from 2006 production.

Avoided Gas Costs in New York Page 2-9 Synapse Energy Economics and Swanson Energy Group September 2007
In addition to its Reference Case, AEO 2007 presents summary results for 33 additional cases. These cases have widely varying assumptions about economic growth, oil and gas resources, energy efficiency in consuming sectors, and technological development in the various energy supply sectors.10 The AEO 2007 case, which produced the highest oil and gas prices, is called the “high price case.” In that case, the quantity of oil and gas resources11 in the United States and worldwide is assumed to be 15 percent less than in the Reference Case. This assumption produces a crude oil price of $100/bbl in 2030 compared with the Reference Case price of $59/bbl in 2030 (all in 2005$).
The difference between the Henry Hub natural gas price forecast under the AEO 2007 high price case and the AEO 2007 Reference Case is a measure of the impact of the 15 percent reduction in the available oil and natural gas resources. That difference is $0.63/MMBtu (2005$) in 2010 and $0.75/MMBtu (2005$) in 2020. We used that differential to develop the AGSC 2007 higher price case. Specifically, the AGSC 2007 higher gas price case equals the AGSC 2007 base forecast price in each year plus the difference between the AEO 2007 high price case and Reference Case in that year. The resulting AGSC 2007 higher price forecast is shown in Exhibit 2-6.
Exhibit 2-6. Forecast Range of Average Henry Hub Natural Gas Prices
0.00
1.00
2.00
3.00
4.00
5.00
6.00
7.00
8.00
9.00
10.00
2007
2008
2009
2010
2011
2012
2013
2014
2015
2016
2017
2018
2019
2020
2021
2022
2007
$ p
er M
MBt
u
Base Price Upper Price Lower Price
(b) Lower Price Case
For the AGSC 2007 lower price case, shown in Exhibit 2-6, we use the AEO 2007 “low price case” forecast. That case assumes future levels of oil and natural gas resources 15 percent higher than under the AEO 2007 Reference Case. In addition to higher levels of oil and gas resources,
10 AEO 2007 Appendix E, Exhibit E1. 11 Resources are proved reserves plus potential, possible and speculative resources that are recoverable under
adequate economic conditions and current or foreseeable technology.
Avoided Gas Costs in New York Page 2-10 Synapse Energy Economics and Swanson Energy Group September 2007
the AEO 2007 low price case differs from the AGSC 2007 base price forecast in that it assumes new oil and gas reserves will be found more easily and at less cost.
D. Representation of Volatility in Gas Commodity Prices The AGSC 2007 natural gas prices forecast (base case, upper case, and lower case) should be viewed as expected average annual prices. In contrast, actual gas prices are volatile. Thus, it is reasonable to expect actual prices to vary around these expected annual average prices. The upper and lower price cases are not intended to show the range of volatility of gas prices. Gas prices have changed by a factor of two or more during a year and they can stay above or below the “expected” price for periods longer than a year.
Pindyck argues that oil, coal, and natural gas prices tend to move toward long-run total marginal cost.12 This behavior is consistent with the forecast of an average price but with the expectation that the actual price will vary around the average price in a random manner with an annual standard deviation of 11% to 14% even while tending to move to the average. However, Pindyck suggests that the movement of oil and gas prices to a long-run marginal cost is slow and can take up to a decade.13
Thus, assuming that the AGSC 2007 base price forecast is correct, one should expect that the random movements in gas prices could send the gas price above the upper gas price shown in the exhibit above for several months or in some cases for more than a year. For example, in 2015 the base price forecast is $6.25 per MMBtu (in 2007$). A 12% random increase in that year would make the price $7.00, which is slightly greater than the $6.98 in the higher price forecast. Similarly, random movements could result in actual gas prices below the forecast price. Random movements could move prices in different directions from year to year, above and below the prices forecast for those years.
Price spikes are an example of price volatility. From time to time, the daily spot or even the monthly price of natural gas spikes. In New England and in other gas consuming areas there have been daily price spikes during very cold weather. In addition, natural gas prices have increased for longer periods. The recent example of Hurricane Katrina in 2005 is illustrative. Katrina hit the Gulf Coast on August 29, 2005. One month earlier on July 29, 2005 the NYMEX gas futures contract for September 2005 delivery was priced at $7.885 per MMBtu. On December 13, 2005 the NYMEX January 2006 gas futures contract settlement price was $15.378. Six months after Katrina struck the Gulf Coast, that is, on March 1, 2006, the April 2006 gas futures contract was priced at $6.733 per MMBtu. Subsequently 2006 experienced few hurricanes and on September 27, 2006 the October 2006 gas futures contract closed at $4.210 per MMBtu. But these prices were short lived and on March 1, 2007 the April 2007 gas futures contract settled at a price of $7.288. In this example a shock that removed 5 Bcf per day of natural gas supply produced a strong increase in prices, but prices quickly reversed to more typical levels and in less than a year gas futures price fell temporarily to a level less than one- 12 Robert S. Pindyck, “The Long-Run Evolution of Energy Prices,” The Energy Journal, Vol. 20, No. 2 pages 1-27
(1999). 13 Pindyck shows that the random variation is similar to a geometric Brownian motion with an annual standard
deviation of 11 to 14 percent for natural gas, but with a slow movement back toward a mean, which is related to the long-run total marginal cost of the resource, pages 24-25 and 6.

Avoided Gas Costs in New York Page 2-11 Synapse Energy Economics and Swanson Energy Group September 2007
third of the December 2005 peak. Such shocks and gas price volatility should be expected in the future. Nonetheless, the AGSC 2007 base gas price forecast should be viewed as an average or expected Henry Hub gas price forecast.
An adjustment to the gas price forecast was not developed for price spikes for several reasons. First, there is little, if any, analytical work publicly available on this issue. Second, the prices should be used as the basis for avoided energy supply costs in evaluating the economic value of long-term investments in energy efficiency. It is not anticipated that the levelized price of gas over the long-term (e.g., 10 to 20 years) would be materially different if one estimated increases from an occasional one to three day price spike during a cold snap or even the type of several month gas price increase following Hurricane Katrina in the fall of 2005. Reasonably high gas prices are already being forecast for the future, and it is believed that investment decisions are unlikely to be affected by accounting for price spikes. Moreover, it is also possible that gas prices could fall below the levels of this forecast (a US recession could lead to a drop in natural gas prices).

Avoided Gas Costs in New York Page 3-1 Synapse Energy Economics and Swanson Energy Group September 2007
3. Sector Specific Avoided Natural Gas Cost Forecast
Chapter 3 forecasts the avoided costs of natural gas saved by energy efficiency programs for two local distribution companies, which are KeySpan Energy Delivery New York (KEDNY) and KeySpan Energy Delivery Long Island (KEDLI). The forecasts of avoided costs are (1) gas delivered to KEDNY-KEDLI for the period 2007 through 2022 and (2) the avoided cost of gas at the retail level delivered to end-users of gas at these two LDCs for the period 2007 through 2040. The avoided costs are the weighted average cost of the marginal natural gas supply sources during specified seasonal and peak-day costing periods. They are expressed in 2007 dollars per dekatherm (DT).14
A. Cost to Supply Natural Gas to LDCs The cost of gas delivered to an LDC using pipeline transportation and storage facilities consists of four basic components:
• the cost of the gas commodity, which in this study is purchased at the Henry Hub in Louisiana;
• the fixed demand cost of holding pipeline transportation capacity and of storage and withdrawal capacity;
• the usage (volumetric) charges for transporting gas on a pipeline and for storage injections and withdrawals; and
• the fraction (percentage) of volumes of gas received by a pipeline or storage facility that is retained by the facility for compressor fuel and losses. This fuel and loss retention increases the cost of gas above the Henry Hub price because a greater volume of gas must be purchased at the Henry Hub than is delivered to the LDC. In the analysis that follows, the fuel and loss retention is represented as the ratio of the volumes of gas purchased at the Henry Hub to the volumes of gas delivered to the LDC.
KEDNY-KEDLI have arranged for a winter (November - March) transportation service to deliver gas to them from the Southwest. The gas is purchased on the spot market.
The LDCs own the LNG tanks and accompanying liquefaction and vaporization facilities.
Because of the significantly increased level of winter season requirements and the variation in winter day requirements according to temperature, KEDNY-KEDLI develop a portfolio among the five gas supply resources in order to optimize reliability and cost. Generally, long-haul pipeline transportation is used to meet customer gas requirements each month of the year and to refill underground storage and LNG tanks during the summer months (May – October). Much of the increased winter (November – April)15 gas demand from customers is met by transporting gas from the underground storage facilities, located in Pennsylvania, New York, and West 14 One DT is one million BTU. 15 In the United States gas industry winter is typically defined as November through March and summer as April
through October. For our analysis of KEDNY-KEDLI we include April as part of the winter.

Avoided Gas Costs in New York Page 3-2 Synapse Energy Economics and Swanson Energy Group September 2007
Virginia to the LDC in New York.16 In the case of KEDNY-KEDLI, winter transportation also meets the winter sendout requirement. LNG facilities meet daily peaking requirements during the heaviest demand period, December through April.
B. Summary of the Avoided Cost Analysis The avoided cost of gas to a LDC is the cost of the marginal source of supply for the relevant cost period. For this analysis, because efficiency improvement is a long-term effect, the avoided cost is the long-run cost that we estimate an LDC can avoid. The long-run avoided cost is both the short-run variable costs and also some, but not all, of the long-term fixed costs of gas supply sources. In this analysis we compute the marginal cost (avoided cost) for each month and for the peak day. The avoided cost in a given month is the cost of delivering one DT of gas to the LDC in that month via the three major resources: year-around, long-haul transportation; underground storage; and spot gas purchases transported by winter transportation service. For each of the winter months (November through April) when gas is supplied by the three resources, the marginal cost is the weighted average of the costs for each supply source depending upon the fraction of total volumes of sendout provided by each source. By computing the weighted average we assume that the LDCs have optimized the mix of supply sources and thus both fixed and variable costs are avoided in the mix of all three of the supply sources for a long-term efficiency improvement.17
We assume that the marginal source of gas to KEDNY-KEDLI from the Henry Hub is transportation and underground storage on Transcontinental Gas Pipe Line Corporation (Transco), which is a major pipeline and underground storage supplier of gas from the Henry Hub region to KEDNY-KEDLI.
C. Representation of KEDNY-KEDLI For this avoided cost analysis we represent KEDNY-KEDLI by gas sources each month and the fraction of storage refill in each of the summer months, May through October. The characteristics of KEDNY-KEDLI are shown in Exhibit 3-1.
16 LDCs acquire pipeline and storage services through a portfolio of contracts with natural gas transportation and
storage companies that have terms, conditions and rates that are regulated by the U.S. Federal Energy Regulatory Commission (FERC).
17 In a short-run marginal cost analysis only variable costs can be adjusted and thus the avoided cost is determined by the one supply source which has the highest variable cost.

Avoided Gas Costs in New York Page 3-3 Synapse Energy Economics and Swanson Energy Group September 2007
JUL AUG SEP OCT NOV DEC JAN FEB MAR APR MAY JUN
Fractions of LDC Send-out by Source by MonthPipeline Deliveries, Long-haul 1.0000 1.0000 1.0000 1.0000 0.7638 0.5203 0.4069 0.4380 0.5570 0.8678 1.0000 1.0000Underground Storage 0.0000 0.0000 0.0000 0.0000 0.0988 0.3416 0.4744 0.4382 0.2807 0.1322 0.0000 0.0000Spot Gas Purchases 0.0000 0.0000 0.0000 0.0000 0.1374 0.1381 0.1187 0.1238 0.1623 0.0000 0.0000 0.0000
Total 1.0000 1.0000 1.0000 1.0000 1.0000 1.0000 1.0000 1.0000 1.0000 1.0000 1.0000 1.0000
Fraction of Annual Sendout each Month 0.02956 0.02767 0.02708 0.04496 0.09568 0.15711 0.18279 0.15831 0.13372 0.07398 0.03855 0.03059
Monthly Sendout as a Fraction of Peak Month0.1617 0.1514 0.1481 0.2460 0.5234 0.8595 1.0000 0.8661 0.7315 0.4047 0.2109 0.1674
Fraction of Underground Storage Injection b 0.1685 0.1685 0.1630 0.1685 0.0000 0.0000 0.0000 0.0000 0.0000 0.0000 0.1685 0.1630
Sources:(a) Original data from Cost of Gas Adjustment filings as combined and edited for this project.
Exhibit 3-1COMBINED KEYSPAN NEW YORK AND KEYSPAN LONG ISLAND
MONTHLY CHARACTERISTICS OF SEND-OUT BY SOURCE, PEAK MONTH AND STORAGE INJECTION
D. Avoided Cost of Gas from Each of the Three Sources As described above, the avoided cost (marginal cost) consists of the commodity cost of gas, the demand charges of pipeline transportation and storage which can be avoided, the volumetric cash costs of pipeline transportation and storage, and the fuel and loss retention for the various services of bringing gas to a LDC. The avoided cost is represented as 2007 $ per dekatherm.
Commodity Cost Inputs
For this avoided cost analysis we assume the marginal cost of the gas commodity is the monthly price of gas at the Henry Hub. Our forecast of Henry Hub annual average prices is presented in Exhibits 2-4, 2-5 and 3-4.
Pipeline Rates
As described above, we assume the marginal source of gas to New York City LDCs is transportation and storage on Transco. The cost for transportation and underground storage is set by the rates and the fuel and loss retention percentages charged by Transco, which are shown in Exhibit 3-2. We assume that these rates and retention percentages will persist for the forecast period, 2008 – 2022.

Avoided Gas Costs in New York Page 3-4 Synapse Energy Economics and Swanson Energy Group September 2007
Demand Usage Fuel & Loss (c)$/DT/month $/DT percent
Transcontinental Gas Pipe Line Corp.Transportation: FT
Zone 3 to 6 (a) 11.18080 0.02655 4.05%Gathering; Henry Gas Plant IT feeder (b) 0.05132 0.38%ACA unit rate (b) 0.00160
Total 11.18080 0.07947 4.43%
FT Transportation from StorageZone 6 to 6 (a) 2.89920 0.00492 0.79%ACA unit rate 0.00160
Total 2.89920 0.00652 0.79%
Underground Storage: GSS (d)Demand ($/DT/day) 0.10836Storage Capacity ($/DT/day) 0.00061Injection 0.04033 2.52%Withdrawal 0.03968
Liquefied Natural Gas Storage Service (d)Demand ($/DT/day) 0.03754Storage Capacity ($/DT/day) 0.00723Injection 1.52791 16.04%Withdrawal 1.52791
(a) TGPL Tariff Sheet No. 40 (Effective April 1, 2006) and No. 40.02 (effective April 1, 2007).(b) Assumes a "Conversion Buyer" (Sheet No. 164; effective March 1, 2007), and
TGPL Tariff Sheet No. 33 (Effective March 1, 2007) and No. 33E (Effective March 1, 2007).(c) TGPL Tariff Sheet No. 44 (effective April 1, 2006).(d) TGPL Tariff Sheet No. 27 (effective April 1, 2007) and No. 29 (effective November 1, 2006).
Exhibit 3-2Pipeline Rates for Transportation and Storage
(a) Long-haul Pipeline “Cash” Costs
Gas is delivered to the LDC each month by pipelines from producing areas; in this analysis assumed to be the Henry Hub (HH). By “cash cost” we mean the avoided cost of transportation arising from pipeline usage charges, which are paid for each DT of gas transported, and the demand charges allocated to that month, which pay for the reservation of pipeline capacity whether used or not.18 The avoided commodity cost of gas purchased is the price of gas at the Henry Hub that month multiplied by the ratio of the Henry Hub volume purchased to one DT of gas delivered to the LDC. Because of the retention of gas for fuel and loss in both transportation 18 Rate Schedules assumed for the long-haul transportation: Transco, FT-1 from zone 3 to zone 6 and zone 6 to zone
6 for delivery of gas from underground storage.

Avoided Gas Costs in New York Page 3-5 Synapse Energy Economics and Swanson Energy Group September 2007
and storage, more than one dekatherm of gas must be purchased at the HH in order to deliver one dekatherm to the LDC.
This ratio of gas volumes purchased at the HH to one DT of gas delivered to the LDC is established by the fuel and loss retention percentages of the various pipeline transportation and storage services used between the HH and the LDC. For example, assume that the gas is transported by two pipelines: A and B from the HH to the LDC. The fuel and loss percentage is 6 percent for A (Fa) and 4 percent for pipeline B (Fb). The fuel and loss amount taken by the pipeline is based on the volumes received by the pipeline (R) while the demand and usage charges are based on the volume of gas delivered by the pipeline (D). In order to compute the ratio of gas received to that delivered we use the following equations:
(1) D = R – FR
(2) D = R(1-F)
(3) R/D = 1/(1-F)
For pipeline A; Ra/Da = 1/(1-.06) = 1.0638; or Ra = 1.0638 Da
For pipeline B; Rb/Db = 1/(1-.04) = 1.0417; or Rb = 1.0417 Db
Since Db is the amount delivered to the LDC, we want to compute Ra/Db or the ratio of the amount to be purchased in the field to the amount delivered to the LDC.
Since: Rb = Da
Ra = 1.0638 Da = (1.0638)Rb = (1.0638)(1.0417)Db
Thus: Ra/Db = (1.0638)(1.0417) = 1.1082
Or: 1.1082 DTs of natural gas must be purchased for each DT delivered to the LDC.
Exhibit 3-3 shows the avoided costs by gas source and pipeline route for January and June.

Avoided Gas Costs in New York Page 3-6 Synapse Energy Economics and Swanson Energy Group September 2007
January Juneunits
Pipeline Long-haul to LDCTotal Demand Cost of Gas Delivered to LDC 2007 $/DT $0.353 $0.000Total Usage Cash Cost of Gas delivered to LDC 2007 $/DT $0.079 $0.079Ratio of Gas Purchased at HH to Gas Delivered to LDC fraction 1.046 1.046
Delivered From Underground StorageTotal Demand Cost of Gas Delivered to LDC from UG Storage 2007 $/DT $1.108Total Cash cost for refill + Usage Cost of Gas delivered to LDC 2007 $/DT $0.774Ratio of Gas Purchased to Gas Delivered to LDC fraction 1.082
Spot Purchases of GasRatio of delivered price to NYMEX price fraction 1.170
Peak Day in January From Transco's LNG serviceDemand Cost of Gas delivered for one day per year 2007 $/DT $51.703Pipeline Cash Commodity Cost of Gas Delivered to LDC 2007 $/DT $3.182Ratio of Gas Purchased at HH to Gas Delivered to LDC fraction 1.256
Based on pipeline rates effective June 20,2007
Exhibit 3-3COMPARISON OF AVOIDED COSTS OF DELIVERING ONE DEKATHERM OF GAS
TO KEDNY-KEDLIFROM THREE SOURCES OF NATURAL GAS and PEAK DAY
via Transcontinental Gas Pipe Line
Summer.
LDCs use a portion of their long-haul pipeline transportation in the summer to transport gas directly to the LDC from the HH for sendout. They use another portion to transport gas to fill underground, and in the case of KEDNY-KEDLI to liquefy gas and fill LNG storage. Consequently, a corresponding portion of the costs of demand and usage charges and the fuel and loss fraction for pipeline transportation from the HH to refill storage are allocated to the avoided cost of underground storage and LNG storage. Since KEDNY-KEDLI use almost all of their pipeline capacity in the summer, unlike some other LDCs that contract for gas year-round but use only part of it in the summer so that it can be used in the winter, we do not allocate any pipeline capacity demand charges in the summer to the avoided cost of pipeline capacity in the winter.
We assume that there is no avoided demand cost for long-haul pipeline capacity in the summer months (May – October). The assumption that demand charges cannot be avoided in the summer is supported by the basis differentials in the summer between the Henry Hub and New York City area, which are only enough to cover the usage charges and fuel, but there is little or no amount remaining to pay for demand charges. This means that an LDC would continue to pay the full demand charge in each summer month even if the gas requirements of customers were reduced due to energy efficiency in the summer; thus the LDC would not avoid the summer pipeline demand charges.

Avoided Gas Costs in New York Page 3-7 Synapse Energy Economics and Swanson Energy Group September 2007
Winter. The percentage use of the long-haul transportation capacity in the winter varies from about 79 percent in April to 100 percent in December. The total pipeline transportation demand charges for the six winter months are allocated to each of the winter months according to the use of the capacity by month. The cost of unused capacity in any month, such as April, is allocated to those months in which the capacity is used. As a result, the avoided transportation demand cost varies among the six winter months with the month of heaviest use, December, receiving the largest allocation of demand charges.
(b) Underground Storage
Natural gas is delivered to the LDC from underground storage during the six winter months of November through April as shown in Exhibit 3-1. The avoided cost of underground storage supply for one DT in January is shown in Exhibit 3-3.
The avoided cost of underground storage includes the cost of buying gas at the Henry Hub, pipeline demand and usage charges to bring gas to the storage facility, the cost of injection, the demand cost of storage capacity, the demand and variable costs of withdrawing gas from storage, and the demand and variable costs of transporting gas to the LDC from underground storage.19
The cost of gas injected into storage is the cost of buying gas at the Henry Hub, as adjusted for fuel and loss retention, plus the cost of transportation to underground storage including both demand and usage costs at 100% load factor. The cost of the gas injected into storage is less than the average cost of gas for a year, 0.941 of the annual cost, because gas is purchased for injection during the summer months when the price of gas is less than average.
Since the demand charges for the withdrawal of gas from storage and transportation to the LDC are levied 12 months a year, we allocate the full year of those withdrawal and transportation demand charges to the six winter months. Then we allocate these demand charges to each of the six winter months by the use of the capacity in each month. As shown in Exhibit 3-1, January is the peak sendout month; the other winter months, especially November and April experience less sendout. Thus, the demand cost of unused capacity of storage withdrawal and of transportation capacity from underground storage to the LDC in November and April is assigned to the sendout during December through March based on usage each month. Similarly the unused capacity during December, February, and March is assigned to the cost of withdrawing and transporting gas to the LDC in January.
(c) Spot Gas Purchases
A considerable portion of the November through March sendout of KEDNY-KEDLI comes from spot gas purchases that are transported to New York City in what are called “New Shared Assets”. From the data in the filing we determined that the cost of these gas purchases delivered to New York City is approximately 17 percent greater than the price of gas at the Henry Hub during any month. This is the formula we used to estimate the cost of the spot gas purchases delivered to KEDNY-KEDLI.
19 Rate schedules used in the calculation for the Transco route are: Transco, FT-1 zone 3 to zone 6; storage on
Transco in Rate Schedule GSS and transportation to the LDC using Transco Rate Schedule FT, zone 6 to zone 6.
Avoided Gas Costs in New York Page 3-8 Synapse Energy Economics and Swanson Energy Group September 2007
(d) Peak-Day Sendout Avoided Cost
KEDNY-KEDLI meet peak-day sendout requirements with vaporized LNG from the LNG facilities owned by the two LDCs. However, we do not estimate the peak-day avoided cost based on these LNG facilities. The major portion of the cost of an LNG gasification, storage and vaporization facility is the capital cost of constructing it. These LNG facilities have large economies of scale and they are constructed to meet future growth needs. Thus they are “lumpy” investments; they cannot be easily readjusted in size. Consequently, a modest reduction in peak day demand for gas by end-users will not reduce the capital costs of the LNG facility; only the variable costs will be avoided, which are modest. This modest cost, which excludes fixed costs, did not properly capture the high avoided costs that were expected for peak day service.
Hence peak-day avoided costs were estimated based on the costs of underground storage. It was assumed that underground storage and transportation capacity to KEDNY-KEDLI was needed to meet a one-day peak even though the demand charges are generally paid for 12 months. Thus, in calculating the peak-day avoided cost, the demand charges for all 12 months were allocated to the one-day peak.20
E. Avoided Cost Forecast by Seasonal Cost Periods The avoided cost of natural gas by costing period is the average of the avoided cost in each of the months that comprise the costing period. As described earlier, the avoided cost in any month is the weighted average of the avoided cost of gas delivered to the LDC from each of the three sources: long-haul pipeline, underground storage, and spot gas purchases. The weightings each month are shown in Exhibit 3-1.21
The avoided cost forecast by seasonal cost periods for KEDNY-KEDLI is shown in Exhibit 3-4. Also shown is the annual Henry Hub forecast price of natural gas. Other than for the peak-day, the commodity cost of gas based on the Henry Hub price is the largest component of the avoided cost.
20 As a check to our estimate of the peak-day avoided cost, we estimated the cost of using Transco’s LNG storage
facility and transporting the gas to KEDNY-KEDLI. That avoided cost was $63.97 per DT for 2007, which compares with our estimated peak-day cost from underground storage of $83.28 per DT. These are similar and confirm the reasonability of the peak-day avoided cost estimate.
21 The summer periods all fall within a single calendar year; thus, the commodity cost of gas is based on the Henry Hub price for that calendar year. However, the winter periods span calendar years. The majority of gas delivered in the winter is from LNG and underground storage, which was purchased during the previous summer. Thus, we assume that the commodity cost of gas is based on the Henry Hub price from the year in which the winter delivery period begins.

Avoided Gas Costs in New York Page 3-9 Synapse Energy Economics and Swanson Energy Group September 2007
Peak 3 5 6 7 5 6 7 9Year Day Months Months Months Months Months Months Months Months Annual
Dec-Feb Nov-Mar Nov-Apr Oct-Apr May-Sep May-Oct Apr-Oct Mar-Nov Average
2007 83.28 9.46 9.28 9.06 8.89 7.63 7.67 7.71 8.00 8.36 7.712008 84.24 10.50 10.32 10.08 9.90 8.54 8.59 8.63 8.95 9.34 8.652009 83.74 9.95 9.77 9.54 9.37 8.06 8.11 8.15 8.45 8.83 8.162010 83.21 9.38 9.20 8.98 8.82 7.56 7.60 7.65 7.93 8.29 7.652011 82.76 8.88 8.70 8.49 8.34 7.12 7.16 7.21 7.48 7.83 7.202012 82.41 8.51 8.33 8.13 7.97 6.79 6.83 6.87 7.14 7.48 6.862013 81.78 7.82 7.64 7.45 7.30 6.18 6.22 6.26 6.51 6.84 6.242014 81.84 7.88 7.70 7.51 7.36 6.24 6.28 6.32 6.57 6.90 6.302015 81.79 7.83 7.65 7.47 7.32 6.20 6.23 6.28 6.52 6.85 6.252016 81.93 7.98 7.80 7.61 7.46 6.33 6.37 6.41 6.66 6.99 6.392017 82.18 8.25 8.08 7.88 7.73 6.57 6.61 6.65 6.91 7.25 6.642018 82.11 8.17 7.99 7.80 7.65 6.50 6.54 6.58 6.83 7.17 6.562019 82.06 8.12 7.94 7.75 7.60 6.45 6.49 6.53 6.79 7.12 6.522020 82.18 8.25 8.07 7.88 7.73 6.57 6.61 6.65 6.91 7.24 6.632021 82.28 8.37 8.19 7.99 7.83 6.67 6.71 6.75 7.01 7.35 6.732022 82.54 8.64 8.46 8.26 8.10 6.91 6.95 6.99 7.26 7.61 6.98
LEVELIZED Years
2008-12 5 83.29 9.47 9.29 9.07 8.90 7.63 7.68 7.72 8.01 8.37 7.722008-17 10 82.63 8.75 8.57 8.36 8.21 7.00 7.05 7.09 7.36 7.71 7.08
2008-2022 15 82.51 8.62 8.44 8.24 8.08 6.89 6.93 6.97 7.24 7.58 6.96
Average 08-22 15 82.47 8.57 8.39 8.19 8.03 6.85 6.89 6.93 7.19 7.54 6.92
(a) Real (constant $) riskless annual rate of return 2.2165%
Annual Henry Hub
KEDNY - KEDLI(2007$/Dekatherm)
WINTER SUMMER
Exhibit 3-4AVOIDED COSTS OF GAS DELIVERED TO KEDNY-KEDLI
BY SEASON AND COST PERIODGas Delivered via Transcontinental Gas Pipe Line
The levelized avoided cost is the cost for which the present value at the real riskless rate of return of 2.2165 percent has the same present value as the estimated avoided costs for the periods shown at the same rate of return. The average cost is the simple average over the period 2008 through 2022.

Avoided Gas Costs in New York Page 3-10 Synapse Energy Economics and Swanson Energy Group September 2007
F. Avoided Costs by End-Use The avoided costs to an LDC by seasonal costing periods are presented above. The end-use avoided costs are provided in Exhibit 3-5 below, which shows the cross walk of end uses to the seasonal cost periods.
Exhibit 3-5
End-Use Consumption Avoidable Cost Cross Walk
End-Use Types Period Months
Commercial and Industrial, non-heating Annual Jan - Dec
Commercial and industrial, heating 5 month Nov – Mar
Existing residential heating 3 month Dec – Feb
New residential heating 5 month Nov – Mar
Residential domestic hot water Annual Jan - Dec
All commercial and industrial 6 month Nov – Apr
All residential 6 month Nov – Apr
All retail end uses 5 month Nov - Mar
Avoided Gas Costs for each End Use Sector Based on studies performed by the KeySpan LDCs in New England, the incremental cost of distribution is approximately one-half of the embedded cost. We measure the embedded cost as the difference between the city-gate price of gas in New York State and the price charged each of the different retail customer types: residential, commercial, and industrial in New York.22
Exhibit 3-6 shows the estimated avoidable LDC costs for New York state, measured as 2007$ per DT, by each of the customer end-use types listed in Exhibit 3-5.
22 The city-gate gas prices and the prices charged to each retail customer type are reported by the Energy
Information Administration for each state each year.

Avoided Gas Costs in New York Page 3-11 Synapse Energy Economics and Swanson Energy Group September 2007
Average City Gate 2001-05 6.20Ave. Residential Margin 6.84Avoidable 3.42Ave. Commercial Margin 4.03Avoidable 2.02Ave. Industrial Margin 2.09Avoidable 1.04Ave. Commercial and Industrial 3.67Avoidable 1.83All retail avoidable LDC margin 2.58
Source: Energy Information Administration
Exhibit 3-6Estimated Avoidable LDC Margins 2001-2005 Average
New York(2007 $ per DT)
Exhibit 3-7 shows the total avoided costs by the various retail end-use types for KEDNY-KEDLI. The avoided cost for each retail end-use type for the period 2007 through 2022 is the sum of the avoided cost of gas delivered to an LDC (Exhibit 3-4) for the cost period associated with the end-use type (see Exhibit 3-5 for the cost period associated with each end-use type) plus the avoided LDC margin for the associated end-use type as shown in Exhibit 3-6.
For the period 2023 through 2040 the retail avoided cost is increased each year by 1 percent.

Avoided Gas Costs in New York Page 3-12 Synapse Energy Economics and Swanson Energy Group September 2007
ALLExisting New Hot Non RETAILHeating Heating Water All Heating Heating All
Year 3-mon. 5-mon. annual 6-mon. annual 5-mon. 6-mon. 5-mon.
2007 12.88 12.70 11.79 12.48 10.20 11.11 10.89 11.852008 13.92 13.74 12.76 13.50 11.17 12.15 11.91 12.892009 13.38 13.19 12.25 12.96 10.66 11.60 11.38 12.352010 12.80 12.62 11.71 12.40 10.13 11.03 10.81 11.782011 12.30 12.12 11.25 11.92 9.66 10.54 10.33 11.282012 11.93 11.75 10.90 11.55 9.31 10.16 9.96 10.902013 11.24 11.06 10.26 10.87 8.67 9.47 9.29 10.222014 11.30 11.12 10.32 10.94 8.73 9.54 9.35 10.282015 11.25 11.07 10.27 10.89 8.68 9.49 9.30 10.232016 11.40 11.22 10.41 11.03 8.82 9.64 9.45 10.382017 11.68 11.50 10.67 11.30 9.08 9.91 9.71 10.652018 11.59 11.41 10.59 11.22 9.00 9.83 9.63 10.572019 11.54 11.36 10.54 11.17 8.95 9.78 9.58 10.522020 11.67 11.50 10.67 11.30 9.08 9.91 9.71 10.652021 11.79 11.61 10.77 11.41 9.18 10.02 9.82 10.762022 12.06 11.88 11.03 11.68 9.44 10.30 10.09 11.042023 12.18 12.00 11.14 11.80 9.53 10.40 10.19 11.152024 12.31 12.12 11.25 11.92 9.63 10.50 10.30 11.262025 12.43 12.24 11.36 12.04 9.73 10.61 10.40 11.372026 12.55 12.37 11.48 12.16 9.82 10.71 10.50 11.492027 12.68 12.49 11.59 12.28 9.92 10.82 10.61 11.602028 12.81 12.62 11.71 12.40 10.02 10.93 10.71 11.722029 12.93 12.74 11.82 12.52 10.12 11.04 10.82 11.842030 13.06 12.87 11.94 12.65 10.22 11.15 10.93 11.952031 13.19 13.00 12.06 12.78 10.32 11.26 11.04 12.072032 13.33 13.13 12.18 12.90 10.43 11.37 11.15 12.192033 13.46 13.26 12.30 13.03 10.53 11.49 11.26 12.322034 13.59 13.39 12.43 13.16 10.64 11.60 11.37 12.442035 13.73 13.53 12.55 13.29 10.74 11.72 11.49 12.562036 13.87 13.66 12.68 13.43 10.85 11.83 11.60 12.692037 14.01 13.80 12.80 13.56 10.96 11.95 11.72 12.822038 14.15 13.94 12.93 13.70 11.07 12.07 11.84 12.942039 14.29 14.07 13.06 13.83 11.18 12.19 11.95 13.072040 14.43 14.22 13.19 13.97 11.29 12.32 12.07 13.20
LEVELIZED Years2008-2040 33 12.57 12.38 11.49 12.17 9.83 10.72 10.51 11.502009-2040 32 12.51 12.32 11.43 12.11 9.77 10.66 10.45 11.442008-2012 5 12.89 12.71 11.80 12.49 10.21 11.12 10.90 11.862008-2017 10 12.17 11.99 11.13 11.79 9.54 10.40 10.20 11.152008-2022 15 12.04 11.86 11.00 11.66 9.42 10.27 10.07 11.01
Real (constant $) riskless annual rate of return in %: 2.2165%
Exhibit 3-7AVOIDED COSTS OF GAS DELIVERED TO RETAIL CUSTOMERS
BY END USEGas Delivered via Transcontinental Gas Pipe Line
(2007$/Dekatherm)
RESIDENTIAL COMMERCIAL & INDUSTRIAL
KEDNY - KEDLI
Related Documents