avivainvestors.com AVIVA INVESTORS SOCIÉTÉ D’INVESTISSEMENT À CAPITAL VARIABLE (SICAV) ANNUAL REPORT AND AUDITED FINANCIAL STATEMENTS R.C.S. Luxembourg B 32.640 31 December 2021

Welcome message from author
This document is posted to help you gain knowledge. Please leave a comment to let me know what you think about it! Share it to your friends and learn new things together.
Transcript
avivainvestors.com
AVIVA INVESTORSSOCIÉTÉ D’INVESTISSEMENT ÀCAPITAL VARIABLE (SICAV)
ANNUAL REPORT AND AUDITED FINANCIAL STATEMENTS
R.C.S. Luxembourg B 32.64031 December 2021

Aviva Investors Société d’investissement à capital variable (SICAV)
Annual Report and audited financial statements avivainvestors.com 2
Contents
Director’s Report 3
Manager’s Market Review 9
Management and Administration 10
Audit Report 11
Notes on the portfolio of investments disclosure 14
Aviva Investors - Asian Equity Income Fund 15
Aviva Investors - Climate Transition Global Credit Fund 17
Aviva Investors - Climate Transition Global Equity Fund 22
Aviva Investors - Climate Transition European Equity Fund 24
Aviva Investors - Emerging Markets Bond Fund 26
Aviva Investors - Emerging Markets Corporate Bond Fund 32
Aviva Investors - Emerging Markets Equity Income Fund 37
Aviva Investors - Emerging Markets Equity Small Cap Fund 40
Aviva Investors - Emerging Markets Local Currency Bond Fund 42
Aviva Investors - European Corporate Bond Fund 47
Aviva Investors - European Equity Fund 51
Aviva Investors - European Equity Income Fund 53
Aviva Investors - Global Sovereign Bond Fund 55
Aviva Investors - Global Convertibles Absolute Return Fund 64
Aviva Investors - Global Convertibles Fund 67
Aviva Investors - Global Emerging Markets Equity Unconstrained Fund 71
Aviva Investors - Global Emerging Markets Index Fund 73
Aviva Investors - Global Equity Endurance Fund 93
Aviva Investors - Global High Yield Bond Fund 94
Aviva Investors - Global Investment Grade Corporate Bond Fund 103
Aviva Investors - Multi-Strategy Target Return Fund 109
Aviva Investors - Natural Capital Transition Global Equity Fund 125
Aviva Investors - Short Duration Global High Yield Bond Fund 127
Aviva Investors - Social Transition Global Equity Fund 133
Aviva Investors - Sustainable Income & Growth Fund 135
Aviva Investors - UK Listed Equity High Alpha Fund 138
Aviva Investors - US Equity Income Fund 139
Combined Statement of Net Assets 140
Statistical Information 147
Combined Statement of Operations and Changes in Net Assets 154
Notes to the Financial Statements 163
Other Information - Unaudited 171
Information for Investors in Switzerland - Unaudited 185
This report does not constitute an offer of shares. Subscriptions are only valid if made on the basis of the current prospectus and the Key Investor Information Documents (“KIID”) supplemented by the last available annual report and the latest semi-annual report if published after such an annual report. Investors are hereby urged to read the entire prospectus, particularly the description of special risks. Past performance is not necessarily indicative of future returns. Copies of the prospectus, KIID, annual report, semi-annual report and details of changes in investments for the sub-funds are available free of charge from the registered office of the Fund, 2 rue du Fort Bourbon, L-1249 Luxembourg, Grand Duchy of Luxembourg.
Aviva Investors Société d’investissement à capital variable (SICAV)
avivainvestors.com Annual Report and audited financial statements 3
DIRECTOR’S REPORT
Dear Shareholders,
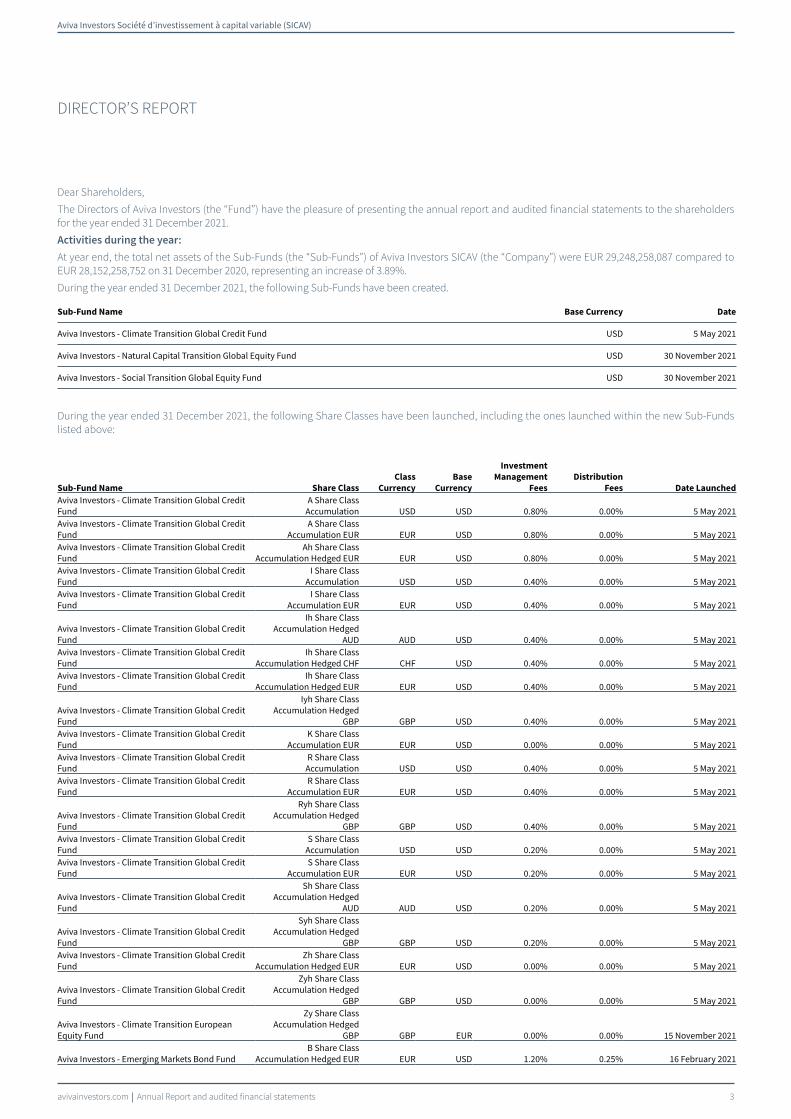
The Directors of Aviva Investors (the “Fund”) have the pleasure of presenting the annual report and audited financial statements to the shareholders for the year ended 31 December 2021.
Activities during the year:
At year end, the total net assets of the Sub-Funds (the “Sub-Funds”) of Aviva Investors SICAV (the “Company”) were EUR 29,248,258,087 compared to EUR 28,152,258,752 on 31 December 2020, representing an increase of 3.89%.
During the year ended 31 December 2021, the following Sub-Funds have been created.
Sub-Fund Name Base Currency Date
Aviva Investors - Climate Transition Global Credit Fund USD 5 May 2021
Aviva Investors - Natural Capital Transition Global Equity Fund USD 30 November 2021
Aviva Investors - Social Transition Global Equity Fund USD 30 November 2021
During the year ended 31 December 2021, the following Share Classes have been launched, including the ones launched within the new Sub-Funds listed above:
Sub-Fund Name Share Class
Class
Currency
Base
Currency
Investment
Management
Fees
Distribution
Fees Date Launched
Aviva Investors - Climate Transition Global Credit Fund
A Share Class Accumulation USD USD 0.80% 0.00% 5 May 2021
Aviva Investors - Climate Transition Global Credit Fund
A Share Class Accumulation EUR EUR USD 0.80% 0.00% 5 May 2021
Aviva Investors - Climate Transition Global Credit Fund
Ah Share Class Accumulation Hedged EUR EUR USD 0.80% 0.00% 5 May 2021
Aviva Investors - Climate Transition Global Credit Fund
I Share Class Accumulation USD USD 0.40% 0.00% 5 May 2021
Aviva Investors - Climate Transition Global Credit Fund
I Share Class Accumulation EUR EUR USD 0.40% 0.00% 5 May 2021
Aviva Investors - Climate Transition Global Credit Fund
Ih Share Class Accumulation Hedged
AUD AUD USD 0.40% 0.00% 5 May 2021Aviva Investors - Climate Transition Global Credit Fund
Ih Share Class Accumulation Hedged CHF CHF USD 0.40% 0.00% 5 May 2021
Aviva Investors - Climate Transition Global Credit Fund
Ih Share Class Accumulation Hedged EUR EUR USD 0.40% 0.00% 5 May 2021
Aviva Investors - Climate Transition Global Credit Fund
Iyh Share Class Accumulation Hedged
GBP GBP USD 0.40% 0.00% 5 May 2021Aviva Investors - Climate Transition Global Credit Fund
K Share Class Accumulation EUR EUR USD 0.00% 0.00% 5 May 2021
Aviva Investors - Climate Transition Global Credit Fund
R Share Class Accumulation USD USD 0.40% 0.00% 5 May 2021
Aviva Investors - Climate Transition Global Credit Fund
R Share Class Accumulation EUR EUR USD 0.40% 0.00% 5 May 2021
Aviva Investors - Climate Transition Global Credit Fund
Ryh Share Class Accumulation Hedged
GBP GBP USD 0.40% 0.00% 5 May 2021Aviva Investors - Climate Transition Global Credit Fund
S Share Class Accumulation USD USD 0.20% 0.00% 5 May 2021
Aviva Investors - Climate Transition Global Credit Fund
S Share Class Accumulation EUR EUR USD 0.20% 0.00% 5 May 2021
Aviva Investors - Climate Transition Global Credit Fund
Sh Share Class Accumulation Hedged
AUD AUD USD 0.20% 0.00% 5 May 2021
Aviva Investors - Climate Transition Global Credit Fund
Syh Share Class Accumulation Hedged
GBP GBP USD 0.20% 0.00% 5 May 2021Aviva Investors - Climate Transition Global Credit Fund
Zh Share Class Accumulation Hedged EUR EUR USD 0.00% 0.00% 5 May 2021
Aviva Investors - Climate Transition Global Credit Fund
Zyh Share Class Accumulation Hedged
GBP GBP USD 0.00% 0.00% 5 May 2021
Aviva Investors - Climate Transition European Equity Fund
Zy Share Class Accumulation Hedged
GBP GBP EUR 0.00% 0.00% 15 November 2021
Aviva Investors - Emerging Markets Bond FundB Share Class
Accumulation Hedged EUR EUR USD 1.20% 0.25% 16 February 2021

Aviva Investors Société d’investissement à capital variable (SICAV)
avivainvestors.com Annual Report and audited financial statements 4
DIRECTOR’S REPORT (CONTINUED)
Sub-Fund Name Share Class
Class
Currency
Base
Currency
Investment
Management
Fees
Distribution
Fees Date Launched
Aviva Investors - Emerging Markets Bond FundK Share Class
Accumulation Hedged EUR EUR USD 0.35% 0.00% 8 January 2021Aviva Investors - Emerging Markets Corporate Bond Fund
Iq Share Class Dividend Hedged EUR EUR USD 0.80% 0.00% 15 November 2021
Aviva Investors - Emerging Markets Corporate Bond Fund
K Share Class Accumulation Hedged EUR EUR USD 0.37% 0.00% 26 February 2021
Aviva Investors - Global Convertibles Absolute Return Fund
Ay Share Class Accumulation USD USD 1.50% 0.00% 2 March 2021
Aviva Investors - Global Convertibles Fund
Ay Share Class Accumulation Hedged
SGD SGD USD 1.20% 0.00% 3 March 2021Aviva Investors - Global Emerging Markets Equity Unconstrained Fund
Z Share Class Accumulation EUR EUR USD 0.00% 0.00% 16 April 2021
Aviva Investors - Global Emerging Markets Index Fund
Z Share Class Accumulation EUR EUR USD 0.00% 0.00% 16 April 2021
Aviva Investors - Global Equity Endurance FundI Share Class
Accumulation EUR EUR USD 0.75% 0.00% 16 June 2021
Aviva Investors - Global High Yield Bond Fund
Ih Share Class Accumulation Hedged
USD USD USD 0.60% 0.00% 30 June 2021Aviva Investors - Multi-Strategy Target Return Fund Iq Share Class Dividend EUR EUR 0.75% 0.00% 4 August 2021
Aviva Investors - Multi-Strategy Target Return FundZq Share Class Dividend
Hedged GBP GBP EUR 0.00% 0.00% 27 September 2021Aviva Investors - Natural Capital Transition Global Equity Fund
A Share Class Accumulation USD USD 1.50% 0.00% 30 November 2021
Aviva Investors - Natural Capital Transition Global Equity Fund
A Share Class Accumulation EUR EUR USD 1.50% 0.00% 30 November 2021
Aviva Investors - Natural Capital Transition Global Equity Fund
I Share Class Accumulation USD USD 0.375% 0.00% 30 November 2021
Aviva Investors - Natural Capital Transition Global Equity Fund
I Share Class Accumulation EUR EUR USD 0.375% 0.00% 30 November 2021
Aviva Investors - Natural Capital Transition Global Equity Fund
Iy Share Class Accumulation Hedged
GBP GBP USD 0.375% 0.00% 30 November 2021Aviva Investors - Natural Capital Transition Global Equity Fund
R Share Class Accumulation USD USD 0.375% 0.00% 30 November 2021
Aviva Investors - Natural Capital Transition Global Equity Fund
R Share Class Accumulation EUR EUR USD 0.375% 0.00% 30 November 2021
Aviva Investors - Natural Capital Transition Global Equity Fund
Ry Share Class Accumulation Hedged
GBP GBP USD 0.375% 0.00% 30 November 2021Aviva Investors - Natural Capital Transition Global Equity Fund
S Share Class Accumulation USD USD 0.38% 0.00% 30 November 2021
Aviva Investors - Natural Capital Transition Global Equity Fund
S Share Class Accumulation EUR EUR USD 0.38% 0.00% 30 November 2021
Aviva Investors - Natural Capital Transition Global Equity Fund
Zy Share Class Accumulation GBP GBP USD 0.00% 0.00% 30 November 2021
Aviva Investors - Natural Capital Transition Global Equity Fund
Zy Share Class Accumulation Hedged
GBP GBP USD 0.00% 0.00% 30 November 2021Aviva Investors - Social Transition Global Equity Fund
A Share Class Accumulation USD USD 1.50% 0.00% 30 November 2021
Aviva Investors - Social Transition Global Equity Fund
A Share Class Accumulation EUR EUR USD 1.50% 0.00% 30 November 2021
Aviva Investors - Social Transition Global Equity Fund
I Share Class Accumulation USD USD 0.375% 0.00% 30 November 2021
Aviva Investors - Social Transition Global Equity Fund
I Share Class Accumulation EUR EUR USD 0.375% 0.00% 30 November 2021
Aviva Investors - Social Transition Global Equity Fund
Iy Share Class Accumulation Hedged
GBP GBP USD 0.375% 0.00% 30 November 2021Aviva Investors - Social Transition Global Equity Fund
R Share Class Accumulation USD USD 0.375% 0.00% 30 November 2021
Aviva Investors - Social Transition Global Equity Fund
R Share Class Accumulation EUR EUR USD 0.375% 0.00% 30 November 2021
Aviva Investors - Social Transition Global Equity Fund
Ry Share Class Accumulation Hedged
GBP GBP USD 0.375% 0.00% 30 November 2021Aviva Investors - Social Transition Global Equity Fund
S Share Class Accumulation USD USD 0.38% 0.00% 30 November 2021
Aviva Investors - Social Transition Global Equity Fund
S Share Class Accumulation EUR EUR USD 0.38% 0.00% 30 November 2021
Aviva Investors Société d’investissement à capital variable (SICAV)
avivainvestors.com Annual Report and audited financial statements 5
DIRECTOR’S REPORT (CONTINUED)
Sub-Fund Name Share Class
Class
Currency
Base
Currency
Investment
Management
Fees
Distribution
Fees Date Launched
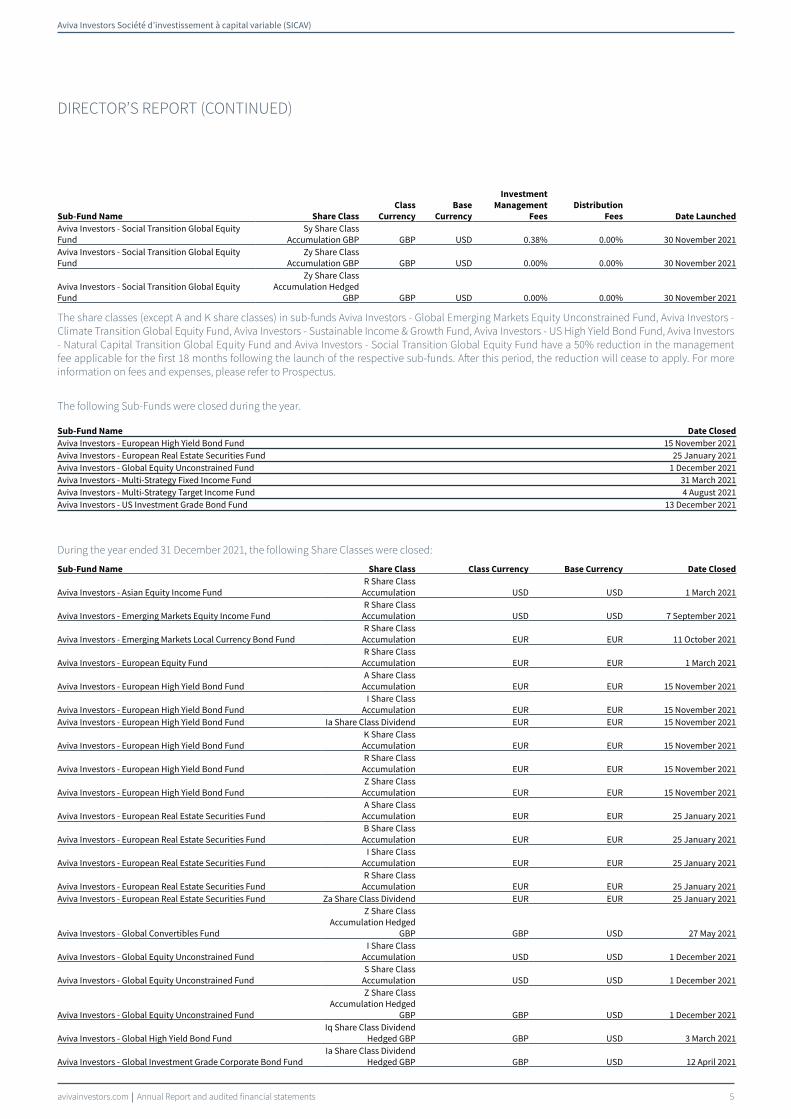
Aviva Investors - Social Transition Global Equity Fund
Sy Share Class Accumulation GBP GBP USD 0.38% 0.00% 30 November 2021
Aviva Investors - Social Transition Global Equity Fund
Zy Share Class Accumulation GBP GBP USD 0.00% 0.00% 30 November 2021
Aviva Investors - Social Transition Global Equity Fund
Zy Share Class Accumulation Hedged
GBP GBP USD 0.00% 0.00% 30 November 2021
The share classes (except A and K share classes) in sub-funds Aviva Investors - Global Emerging Markets Equity Unconstrained Fund, Aviva Investors - Climate Transition Global Equity Fund, Aviva Investors - Sustainable Income & Growth Fund, Aviva Investors - US High Yield Bond Fund, Aviva Investors - Natural Capital Transition Global Equity Fund and Aviva Investors - Social Transition Global Equity Fund have a 50% reduction in the managementfee applicable for the first 18 months following the launch of the respective sub-funds. After this period, the reduction will cease to apply. For moreinformation on fees and expenses, please refer to Prospectus.
The following Sub-Funds were closed during the year.
Sub-Fund Name Date Closed
Aviva Investors - European High Yield Bond Fund 15 November 2021Aviva Investors - European Real Estate Securities Fund 25 January 2021Aviva Investors - Global Equity Unconstrained Fund 1 December 2021Aviva Investors - Multi-Strategy Fixed Income Fund 31 March 2021Aviva Investors - Multi-Strategy Target Income Fund 4 August 2021Aviva Investors - US Investment Grade Bond Fund 13 December 2021
During the year ended 31 December 2021, the following Share Classes were closed:
Sub-Fund Name Share Class Class Currency Base Currency Date Closed
Aviva Investors - Asian Equity Income FundR Share Class
Accumulation USD USD 1 March 2021
Aviva Investors - Emerging Markets Equity Income FundR Share Class
Accumulation USD USD 7 September 2021
Aviva Investors - Emerging Markets Local Currency Bond FundR Share Class
Accumulation EUR EUR 11 October 2021
Aviva Investors - European Equity FundR Share Class
Accumulation EUR EUR 1 March 2021
Aviva Investors - European High Yield Bond FundA Share Class
Accumulation EUR EUR 15 November 2021
Aviva Investors - European High Yield Bond FundI Share Class
Accumulation EUR EUR 15 November 2021Aviva Investors - European High Yield Bond Fund Ia Share Class Dividend EUR EUR 15 November 2021
Aviva Investors - European High Yield Bond FundK Share Class
Accumulation EUR EUR 15 November 2021
Aviva Investors - European High Yield Bond FundR Share Class
Accumulation EUR EUR 15 November 2021
Aviva Investors - European High Yield Bond FundZ Share Class
Accumulation EUR EUR 15 November 2021
Aviva Investors - European Real Estate Securities FundA Share Class
Accumulation EUR EUR 25 January 2021
Aviva Investors - European Real Estate Securities FundB Share Class Accumulation EUR EUR 25 January 2021
Aviva Investors - European Real Estate Securities FundI Share Class
Accumulation EUR EUR 25 January 2021
Aviva Investors - European Real Estate Securities FundR Share Class
Accumulation EUR EUR 25 January 2021Aviva Investors - European Real Estate Securities Fund Za Share Class Dividend EUR EUR 25 January 2021
Aviva Investors - Global Convertibles Fund
Z Share Class Accumulation Hedged
GBP GBP USD 27 May 2021
Aviva Investors - Global Equity Unconstrained FundI Share Class
Accumulation USD USD 1 December 2021
Aviva Investors - Global Equity Unconstrained FundS Share Class
Accumulation USD USD 1 December 2021
Aviva Investors - Global Equity Unconstrained Fund
Z Share Class Accumulation Hedged
GBP GBP USD 1 December 2021
Aviva Investors - Global High Yield Bond FundIq Share Class Dividend
Hedged GBP GBP USD 3 March 2021
Aviva Investors - Global Investment Grade Corporate Bond FundIa Share Class Dividend
Hedged GBP GBP USD 12 April 2021
Aviva Investors Société d’investissement à capital variable (SICAV)
avivainvestors.com Annual Report and audited financial statements 6
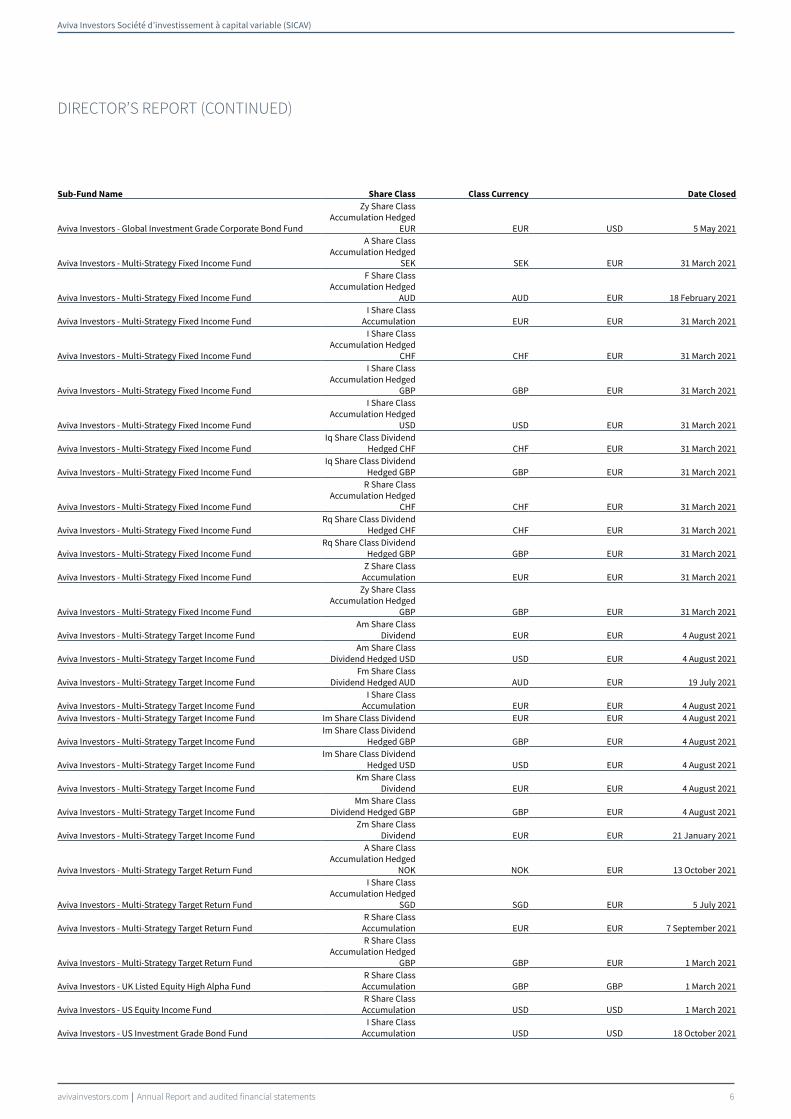
DIRECTOR’S REPORT (CONTINUED)
Sub-Fund Name Share Class Class Currency Date Closed
Aviva Investors - Global Investment Grade Corporate Bond Fund
Zy Share Class Accumulation Hedged
EUR EUR USD 5 May 2021
Aviva Investors - Multi-Strategy Fixed Income Fund
A Share Class Accumulation Hedged
SEK SEK EUR 31 March 2021
Aviva Investors - Multi-Strategy Fixed Income Fund
F Share Class Accumulation Hedged
AUD AUD EUR 18 February 2021
Aviva Investors - Multi-Strategy Fixed Income FundI Share Class
Accumulation EUR EUR 31 March 2021
Aviva Investors - Multi-Strategy Fixed Income Fund
I Share Class Accumulation Hedged
CHF CHF EUR 31 March 2021
Aviva Investors - Multi-Strategy Fixed Income Fund
I Share Class Accumulation Hedged
GBP GBP EUR 31 March 2021
Aviva Investors - Multi-Strategy Fixed Income Fund
I Share Class Accumulation Hedged
USD USD EUR 31 March 2021
Aviva Investors - Multi-Strategy Fixed Income FundIq Share Class Dividend
Hedged CHF CHF EUR 31 March 2021
Aviva Investors - Multi-Strategy Fixed Income FundIq Share Class Dividend
Hedged GBP GBP EUR 31 March 2021
Aviva Investors - Multi-Strategy Fixed Income Fund
R Share Class Accumulation Hedged
CHF CHF EUR 31 March 2021
Aviva Investors - Multi-Strategy Fixed Income FundRq Share Class Dividend
Hedged CHF CHF EUR 31 March 2021
Aviva Investors - Multi-Strategy Fixed Income FundRq Share Class Dividend
Hedged GBP GBP EUR 31 March 2021
Aviva Investors - Multi-Strategy Fixed Income FundZ Share Class
Accumulation EUR EUR 31 March 2021
Aviva Investors - Multi-Strategy Fixed Income Fund
Zy Share Class Accumulation Hedged
GBP GBP EUR 31 March 2021
Aviva Investors - Multi-Strategy Target Income FundAm Share Class
Dividend EUR EUR 4 August 2021
Aviva Investors - Multi-Strategy Target Income FundAm Share Class
Dividend Hedged USD USD EUR 4 August 2021
Aviva Investors - Multi-Strategy Target Income FundFm Share Class
Dividend Hedged AUD AUD EUR 19 July 2021
Aviva Investors - Multi-Strategy Target Income FundI Share Class
Accumulation EUR EUR 4 August 2021Aviva Investors - Multi-Strategy Target Income Fund Im Share Class Dividend EUR EUR 4 August 2021
Aviva Investors - Multi-Strategy Target Income FundIm Share Class Dividend
Hedged GBP GBP EUR 4 August 2021
Aviva Investors - Multi-Strategy Target Income FundIm Share Class Dividend
Hedged USD USD EUR 4 August 2021
Aviva Investors - Multi-Strategy Target Income FundKm Share Class
Dividend EUR EUR 4 August 2021
Aviva Investors - Multi-Strategy Target Income FundMm Share Class
Dividend Hedged GBP GBP EUR 4 August 2021
Aviva Investors - Multi-Strategy Target Income FundZm Share Class
Dividend EUR EUR 21 January 2021
Aviva Investors - Multi-Strategy Target Return Fund
A Share Class Accumulation Hedged
NOK NOK EUR 13 October 2021
Aviva Investors - Multi-Strategy Target Return Fund
I Share Class Accumulation Hedged
SGD SGD EUR 5 July 2021
Aviva Investors - Multi-Strategy Target Return FundR Share Class
Accumulation EUR EUR 7 September 2021
Aviva Investors - Multi-Strategy Target Return Fund
R Share Class Accumulation Hedged
GBP GBP EUR 1 March 2021
Aviva Investors - UK Listed Equity High Alpha FundR Share Class
Accumulation GBP GBP 1 March 2021
Aviva Investors - US Equity Income FundR Share Class
Accumulation USD USD 1 March 2021
Aviva Investors - US Investment Grade Bond FundI Share Class
Accumulation USD USD 18 October 2021
Aviva Investors Société d’investissement à capital variable (SICAV)
avivainvestors.com Annual Report and audited financial statements 7
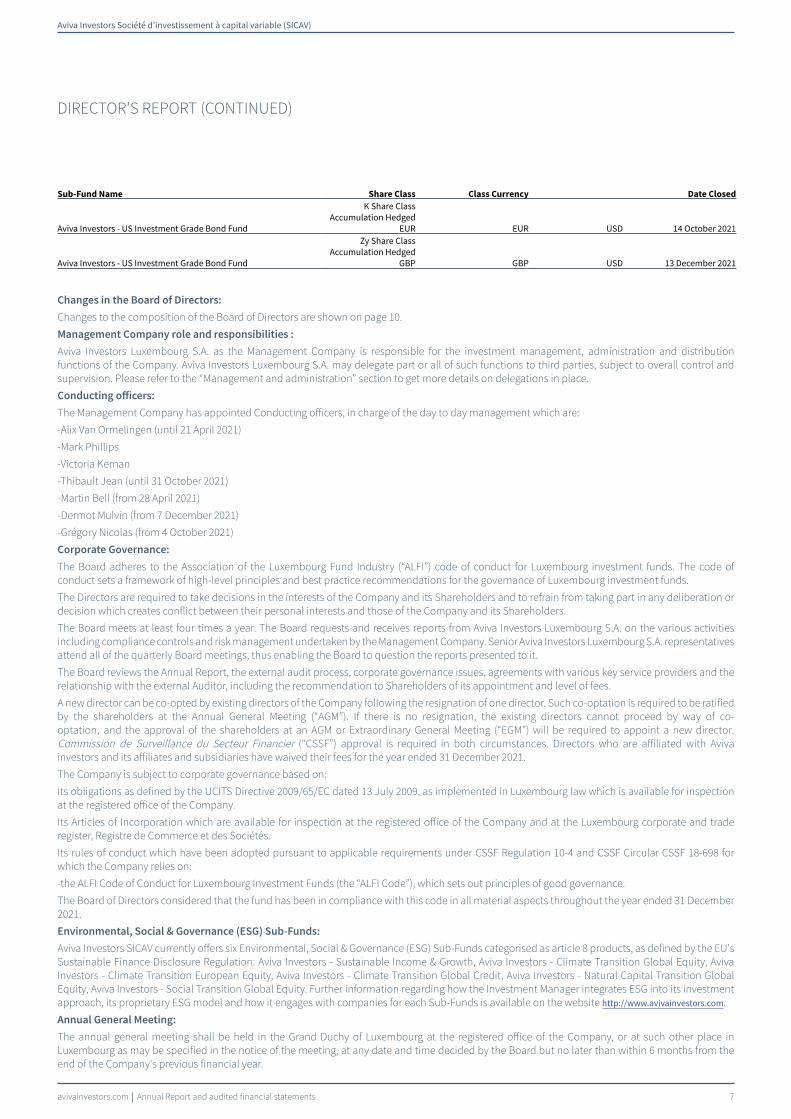
DIRECTOR’S REPORT (CONTINUED)
Sub-Fund Name Share Class Class Currency Date Closed
Aviva Investors - US Investment Grade Bond Fund
K Share Class Accumulation Hedged
EUR EUR USD 14 October 2021
Aviva Investors - US Investment Grade Bond Fund
Zy Share Class Accumulation Hedged
GBP GBP USD 13 December 2021
Changes in the Board of Directors:
Changes to the composition of the Board of Directors are shown on page 10.
Management Company role and responsibilities :
Aviva Investors Luxembourg S.A. as the Management Company is responsible for the investment management, administration and distribution functions of the Company. Aviva Investors Luxembourg S.A. may delegate part or all of such functions to third parties, subject to overall control and supervision. Please refer to the “Management and administration” section to get more details on delegations in place.
Conducting officers:
The Management Company has appointed Conducting officers, in charge of the day to day management which are:
-Alix Van Ormelingen (until 21 April 2021)
-Mark Phillips
-Victoria Kernan
-Thibault Jean (until 31 October 2021)
-Martin Bell (from 28 April 2021)
-Dermot Mulvin (from 7 December 2021)
-Grégory Nicolas (from 4 October 2021)
Corporate Governance:
The Board adheres to the Association of the Luxembourg Fund Industry (“ALFI”) code of conduct for Luxembourg investment funds. The code of conduct sets a framework of high-level principles and best practice recommendations for the governance of Luxembourg investment funds.
The Directors are required to take decisions in the interests of the Company and its Shareholders and to refrain from taking part in any deliberation or decision which creates conflict between their personal interests and those of the Company and its Shareholders.
The Board meets at least four times a year. The Board requests and receives reports from Aviva Investors Luxembourg S.A. on the various activities including compliance controls and risk management undertaken by the Management Company. Senior Aviva Investors Luxembourg S.A. representatives attend all of the quarterly Board meetings, thus enabling the Board to question the reports presented to it.
The Board reviews the Annual Report, the external audit process, corporate governance issues, agreements with various key service providers and the relationship with the external Auditor, including the recommendation to Shareholders of its appointment and level of fees.
A new director can be co-opted by existing directors of the Company following the resignation of one director. Such co-optation is required to be ratified by the shareholders at the Annual General Meeting (“AGM”). If there is no resignation, the existing directors cannot proceed by way of co-optation, and the approval of the shareholders at an AGM or Extraordinary General Meeting (“EGM”) will be required to appoint a new director. Commission de Surveillance du Secteur Financier (“CSSF”) approval is required in both circumstances. Directors who are affiliated with Aviva investors and its affiliates and subsidiaries have waived their fees for the year ended 31 December 2021.
The Company is subject to corporate governance based on:
Its obligations as defined by the UCITS Directive 2009/65/EC dated 13 July 2009, as implemented in Luxembourg law which is available for inspection at the registered office of the Company.
Its Articles of Incorporation which are available for inspection at the registered office of the Company and at the Luxembourg corporate and trade register, Registre de Commerce et des Sociétés.
Its rules of conduct which have been adopted pursuant to applicable requirements under CSSF Regulation 10-4 and CSSF Circular CSSF 18-698 for which the Company relies on:
-the ALFI Code of Conduct for Luxembourg Investment Funds (the “ALFI Code”), which sets out principles of good governance.
The Board of Directors considered that the fund has been in compliance with this code in all material aspects throughout the year ended 31 December 2021.
Environmental, Social & Governance (ESG) Sub-Funds:
Aviva Investors SICAV currently offers six Environmental, Social & Governance (ESG) Sub-Funds categorised as article 8 products, as defined by the EU's Sustainable Finance Disclosure Regulation: Aviva Investors - Sustainable Income & Growth, Aviva Investors - Climate Transition Global Equity, Aviva Investors - Climate Transition European Equity, Aviva Investors - Climate Transition Global Credit, Aviva Investors - Natural Capital Transition Global Equity, Aviva Investors - Social Transition Global Equity. Further information regarding how the Investment Manager integrates ESG into its investment approach, its proprietary ESG model and how it engages with companies for each Sub-Funds is available on the website http://www.avivainvestors.com.
Annual General Meeting:
The annual general meeting shall be held in the Grand Duchy of Luxembourg at the registered office of the Company, or at such other place in Luxembourg as may be specified in the notice of the meeting, at any date and time decided by the Board but no later than within 6 months from the end of the Company's previous financial year.

Aviva Investors Société d’investissement à capital variable (SICAV)
avivainvestors.com Annual Report and audited financial statements 8
DIRECTOR’S REPORT (CONTINUED)
Significant Events:
At the beginning of January 2020, global financial markets have experienced and continue to experience significant volatility resulting from the spread of a novel coronavirus known as COVID-19. The outbreak of COVID-19 has resulted in travel and border restrictions, quarantines, supply chain disruptions, lower consumer demand and general market uncertainty. The effects of COVID-19 have and continue to adversely affect the global economy, the economies of certain nations and individual issuers, all of which may negatively impact the Fund's performance.
Effective from 1 April 2021, Westwood Management Corp, is replaced by Aviva Investors Americas LLC, as sub-investment manager of Aviva Investors -Global Convertibles Absolute Return Fund and Aviva Investors - Global Convertibles Fund.
By Circular Resolution as at 27 November 2020, the Board of Directors of the Company decided to liquidate the Sub-Fund Aviva Investors - European Real Estate Securities Fund following its NAV falling under the minimum level for the Sub-Fund to be managed efficiently and in accordance with Article 27 of the Fund's Article of Incorporation. The final NAV was dated 25 January 2021.
By Circular Resolution as at 17 March 2021, the Board of Directors of the Company decided to liquidate the Sub-Fund Aviva Investors - Multi-Strategy Fixed Income Fund in accordance with Article 27 of the Fund's Article of Incorporation. The final NAV was dated 31 March 2021.
By Circular Resolution as at 30 June 2021, the Board of Directors of the Company decided to liquidate the Sub-Fund Aviva Investors - Multi-Strategy Target Income Fund in accordance with Article 27 of the Fund's Article of Incorporation. The final NAV was dated 4 August 2021.
By Circular Resolution as at 10 November 2021, the Board of Directors of the Company decided to liquidate the Sub-Fund Aviva Investors – European High Yield Bond Fund in accordance with Article 27 of the Fund's Article of Incorporation. The final NAV was dated 15 November 2021.
By Circular Resolution as at 8 October 2021, the Board of Directors of the Company decided to liquidate the Sub-Fund Aviva Investors – Global Equity Unconstrained Fund in accordance with Article 27 of the Fund's Article of Incorporation. The final NAV was dated 1 December 2021.
By Circular Resolution as at 5 November 2021, the Board of Directors of the Company decided to liquidate the Sub-Fund Aviva Investors – US Investment Grade Bond Fund in accordance with Article 27 of the Fund's Article of Incorporation. The final NAV was dated 13 December 2021.
On February 24, 2022, Russian troops invaded neighbouring Ukraine.
Since then, as a response, numerous countries have imposed several rounds of economic sanctions. The indirect impact of those are increased commodity prices due to resource supply challenges (such as food, gas or minerals), inflation, etc.
Additionally, the Moscow exchange closed on February 25th 2022 and has only been reopened with major limitation on trading hours and investor type at the time of writing.
The Management Company performs oversight on the effects this crisis has and may have on the funds.
The Board of Directors
Luxembourg, 29 April 2022
The information stated in the report is historical and is not representative of future results.

Aviva Investors Société d’investissement à capital variable (SICAV)
avivainvestors.com Annual Report and audited financial statements 9
MANAGER’S MARKET REVIEW
2021 MARKET REVIEW
Despite the persistence of the Covid-19 pandemic, global equities enjoyed strong performance in 2021. The world’s developed economies in particular adjusted well to the disrupted environment, with the roll-outs of mass vaccination programmes offering a pathway to a return to normality. Rates of growth were higher than expected in many economies, despite the onset of accelerating inflation amid stubborn supply chain blockages and the sporadic reinstatement of Covid-driven social restrictions.
Forecast-beating corporate earnings were the key driver of equity returns, while the maintenance of huge monetary and fiscal stimulus programmes created a firm underpinning for markets. It was, in the first half of the year at least, a period of attractive gains for companies geared into the theme of reopening economies, and US technology stocks in particular. The energy sector was another notable winner as the oil price rebounded from the lows suffered in 2020. As the year progressed, however, there were signs of a shift in market leadership as slow but steady ‘value’ stocks began to gain ascendancy over ‘growth’ shares.
At the regional level, the US led the way as the economy sustained its strong momentum, boosted by the injection of massive fiscal stimulus. European stocks prospered from clear evidence that growth was recovering from the 2020 crisis, with manufacturing output rallying and the service sector getting back on its feet.
Returns from emerging markets were nevertheless disappointing and, in some countries, negative. Developing nations by and large were less successful in their Covid vaccination programmes, while the stuttering Chinese economy dampened investor sentiment towards Asia. Latin America saw political machinations, particularly in Brazil, while Turkey suffered a financial crisis and a plunging currency.
It was a year of negative performance by bonds. With the valuations of sovereign markets so stretched, yields were highly sensitive to hints by central banks that monetary policy tightening would be accelerated to combat the sharp rise in inflation. In the event, sharp sell-offs in March and September following central bank statements pulled returns down in what would have otherwise been a reasonable year. The weak performance of sovereign bonds represented an unwelcome headwind for corporate debt. Despite spreads narrowing for much of the year thanks to strong corporate earnings, higher-quality corporate bond total returns were also pulled negative. Only high-yield bonds kept their head above water as default rates remained negligible.

Aviva Investors Société d’investissement à capital variable (SICAV)
avivainvestors.com Annual Report and audited financial statements 10
MANAGEMENT AND ADMINISTRATION
REGISTERED OFFICE
2, rue du Fort BourbonL-1249 LuxembourgGrand Duchy of Luxembourg
BOARD OF DIRECTORS
DIRECTORS
Hanna Duer (until 31 March 2021)Independent Director370, route de LongwyL-1940 LuxembourgGrand Duchy of Luxembourg
Denise Voss (from 25 June 2021)Independent Director11, rue Gabriel LippmannL-4119 Esch-sur-AlzetteGrand Duchy of Luxembourg
Jacques ElvingerPartnerElvinger Hoss PrussenSociété anonyme2, Place Winston ChurchillL-1340 LuxembourgGrand Duchy of Luxembourg
Kunal Oak (until 25 June 2021)Product Strategy DirectorAviva Investors Global Services LimitedSt Helen's, 1 UndershaftLondon, EC3P 3DQUnited Kingdom
Martin Bell Head of Investment OversightAviva Investors Global Services LimitedSt Helen's, 1 Undershaft,London, EC3P 3DQ,United Kingdom
Mark Phillips (until 30 July 2021)Managing Director2, rue Du Fort BourbonL-1249 Luxembourg Grand Duchy of Luxembourg
Cindy Joller (from 18 August 2021)Senior Manager – Legal & Corporate2, rue du Fort BourbonL-1249 LuxembourgGrand Duchy of Luxembourg
Jonathan Rudling (from 13 July 2021 – until 13 December 2021)Head of Client Solutions – Strategy & ResearchAviva Investors Global Services Limited St Helen's, 1 Undershaft, London, EC3P 3DQ, United Kingdom
REPRESENTATIVE AND PAYING AGENT
IN SWITZERLAND
BNP Paribas Securities Services, ParisSuccursale de ZurichSelnaustrasse 168002 ZurichSwitzerland
MANAGEMENT COMPANY AND
DOMICILIARY AGENT
Aviva Investors Luxembourg S.A. 2, rue du Fort BourbonL-1249 Luxembourg Grand Duchy of Luxembourg
INVESTMENT MANAGER(*)
Aviva Investors Global Services Limited St Helen’s, 1 UndershaftLondon, EC3P 3DQ United Kingdom
SUB-INVESTMENT MANAGER(**)
for the Sub-Fund Aviva Investors –US Equity Income FundRiver Road Asset Management LLCThe Meidinger Tower462, South Fourth Street, Suite 1600Louisville, KY40202United States of America
for the Sub-Funds Aviva Investors –European Corporate Bond Fund, Aviva Investors – Climate TransitionEuropean Equity Fund (until 1 October 2021) and Aviva Investors – European Equity Income FundAbeille Asset Management S.A.14 Rue Roquépine, 75008 Paris France
for the Sub-Funds Aviva Investors –Global High Yield Bond Fund, AvivaInvestors – Short Duration Global HighYield Bond Fund, Aviva Investors –US Investment Grade Bond Fund, Aviva Investors Americas LLC 225 West Wacker Drive Suite 2250 Chicago, IL 60606 United States of America
for the Sub-Funds Aviva Investors –Global Convertibles Absolute ReturnFund and Aviva Investors – GlobalConvertibles FundWestwood Management Corp.(until 30 March 2021)200, Crescent Court, Suite 1200Dallas, TX 75201United States of America
Aviva Investors Americas LLC (from 1 April 2021)225 West Wacker Drive Suite 2250 Chicago, IL 60606 United States of America
for the Sub-Fund Aviva Investors – Emerging Markets Local Currency Bond FundAviva Investors Asia Pte Limited (AIAPL) (until 31 July 2021)1 Raffles Quay,#27-13 South TowerSingapore 048583
REGISTRAR AND TRANSFER AGENT(*)
RBC Investor Services Bank S.A.14, Porte de FranceL-4360 Esch-sur-AlzetteGrand Duchy of Luxembourg
ADMINISTRATOR AND LISTING
AGENT(*)
J.P. Morgan SE (formerly, J.P. Morgan Bank Luxembourg S.A.)6, route de TrèvesL-2633 SenningerbergGrand Duchy of Luxembourg
DEPOSITARY
J.P. Morgan SE (formerly, J.P. Morgan Bank Luxembourg S.A.)6, route de TrèvesL-2633 SenningerbergGrand Duchy of Luxembourg
AUDITOR
PricewaterhouseCoopersSociété coopérative2, rue Gerhard MercatorL-2182 LuxembourgGrand Duchy of Luxembourg
LEGAL ADVISER
Elvinger Hoss PrussenSociété anonyme2, Place Winston ChurchillL-1340 LuxembourgGrand Duchy of Luxembourg
(*) Subject to the responsibility and oversight of Aviva Investors Luxembourg S.A.
(**) Subject to the responsibility and oversight of Aviva Investors Global Services Limited.

PricewaterhouseCoopers, Société coopérative, 2 rue Gerhard Mercator, B.P. 1443, L-1014 LuxembourgT : +352 494848 1, F : +352 494848 2900, www.pwc.lu
Cabinet de révision agréé. Expert-comptable (autorisation gouvernementale n°10028256)R.C.S. Luxembourg B 65 477 - TVA LU25482518
Audit report
To the Shareholders ofAviva Investors
Our opinion
In our opinion, the accompanying financial statements give a true and fair view of the financial position of Aviva Investors (the “Fund”) and of each of its sub-funds as at 31 December 2021, and of the results of their operations and changes in their net assets for the year then ended in accordance with Luxembourg legal and regulatory requirements relating to the preparation and presentation of the financial statements.
What we have audited
The Fund’s financial statements comprise:
• the combined statement of net assets as at 31 December 2021;• the portfolio of investments and other net assets as at 31 December 2021;• the combined statement of operations and changes in net assets for the year then ended; and• the notes to the financial statements, which include a summary of significant accounting policies.
Basis for opinion
We conducted our audit in accordance with the Law of 23 July 2016 on the audit profession (Law of 23 July 2016) and with International Standards on Auditing (ISAs) as adopted for Luxembourg by the “Commission de Surveillance du Secteur Financier” (CSSF). Our responsibilities under the Law of 23 July 2016 and ISAs as adopted for Luxembourg by the CSSF are further described in the “Responsibilities of the “Réviseur d’entreprises agréé” for the audit of the financial statements” section of our report.
We believe that the audit evidence we have obtained is sufficient and appropriate to provide a basis for our opinion.
We are independent of the Fund in accordance with the International Code of Ethics for Professional Accountants, including International Independence Standards, issued by the International Ethics Standards Board for Accountants (IESBA Code) as adopted for Luxembourg by the CSSF together with the ethical requirements that are relevant to our audit of the financial statements. We have fulfilled our other ethical responsibilities under those ethical requirements.
Other information
The Board of Directors of the Fund is responsible for the other information. The other information comprises the information stated in the annual report but does not include the financial statements and our audit report thereon.
Our opinion on the financial statements does not cover the other information and we do not express any form of assurance conclusion thereon.

12
In connection with our audit of the financial statements, our responsibility is to read the other information identified above and, in doing so, consider whether the other information is materially inconsistent with the financial statements or our knowledge obtained in the audit, or otherwise appears to be materially misstated. If, based on the work we have performed, we conclude that there is a material misstatement of this other information, we are required to report that fact. We have nothing to report in this regard.
Responsibilities of the Board of Directors of the Fund for the financial statements
The Board of Directors of the Fund is responsible for the preparation and fair presentation of the financial statements in accordance with Luxembourg legal and regulatory requirements relating to the preparation and presentation of the financial statements, and for such internal control as the Board of Directors of the Fund determines is necessary to enable the preparation of financial statements that are free from material misstatement, whether due to fraud or error.
In preparing the financial statements, the Board of Directors of the Fund is responsible for assessing the Fund’s and each of its sub-funds' ability to continue as a going concern, disclosing, as applicable, matters related to going concern and using the going concern basis of accounting unless the Board of Directors of the Fund either intends to liquidate the Fund or close any of its sub-funds or to cease operations, or has no realistic alternative but to do so.
Responsibilities of the “Réviseur d’entreprises agréé” for the audit of the financial statements
The objectives of our audit are to obtain reasonable assurance about whether the financial statements as a whole are free from material misstatement, whether due to fraud or error, and to issue an audit report that includes our opinion. Reasonable assurance is a high level of assurance, but is not a guarantee that an audit conducted in accordance with the Law of 23 July 2016 and with ISAs as adopted for Luxembourg by the CSSF will always detect a material misstatement when it exists. Misstatements can arise from fraud or error and are considered material if, individually or in the aggregate, they could reasonably be expected to influence the economic decisions of users taken on the basis of these financial statements.
As part of an audit in accordance with the Law of 23 July 2016 and with ISAs as adopted for Luxembourg by the CSSF, we exercise professional judgment and maintain professional scepticism throughout the audit. We also:
• identify and assess the risks of material misstatement of the financial statements, whether due to fraud or error, design and perform audit procedures responsive to those risks, and obtain audit evidence that is sufficient and appropriate to provide a basis for our opinion. The risk of not detecting a material misstatement resulting from fraud is higher than for one resulting from error, as fraud may involve collusion, forgery, intentional omissions, misrepresentations, or the override of internal control;
• obtain an understanding of internal control relevant to the audit in order to design audit procedures that are appropriate in the circumstances, but not for the purpose of expressing an opinion on the effectiveness of the Fund’s internal control;
• evaluate the appropriateness of accounting policies used and the reasonableness of accounting estimates and related disclosures made by the Board of Directors of the Fund;
13
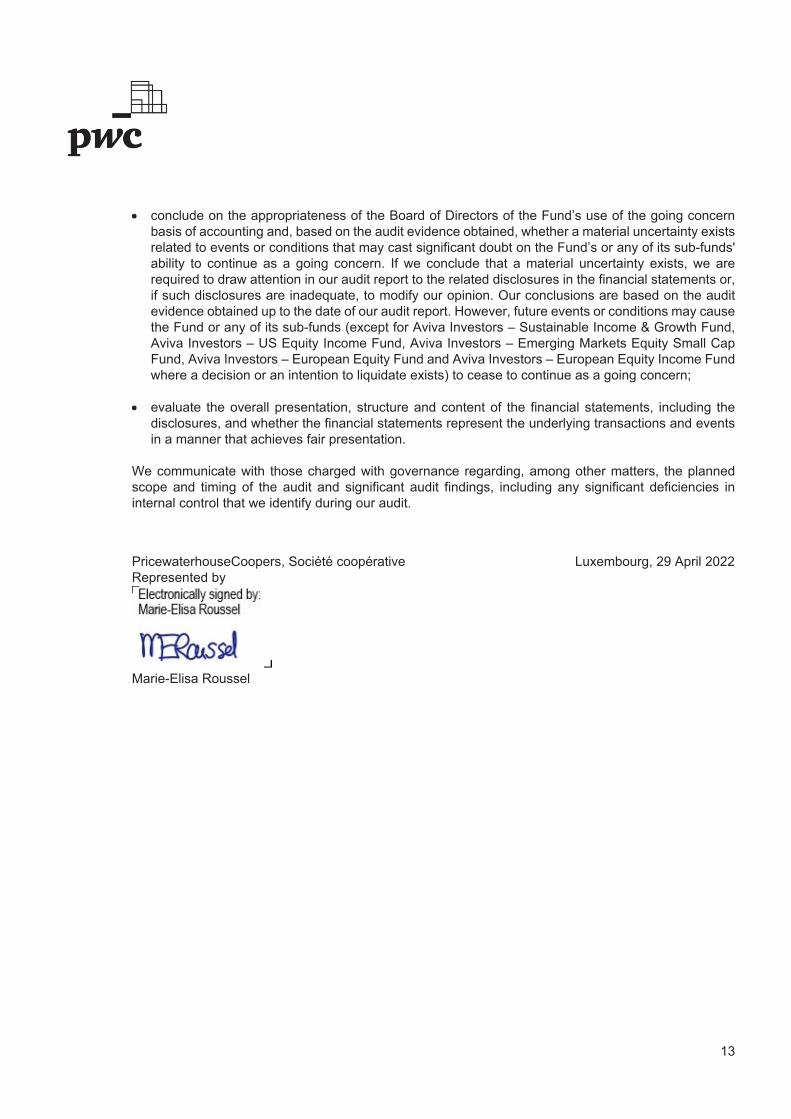
• conclude on the appropriateness of the Board of Directors of the Fund’s use of the going concern basis of accounting and, based on the audit evidence obtained, whether a material uncertainty exists related to events or conditions that may cast significant doubt on the Fund’s or any of its sub-funds' ability to continue as a going concern. If we conclude that a material uncertainty exists, we are required to draw attention in our audit report to the related disclosures in the financial statements or, if such disclosures are inadequate, to modify our opinion. Our conclusions are based on the audit evidence obtained up to the date of our audit report. However, future events or conditions may cause the Fund or any of its sub-funds (except for Aviva Investors – Sustainable Income & Growth Fund, Aviva Investors – US Equity Income Fund, Aviva Investors – Emerging Markets Equity Small Cap Fund, Aviva Investors – European Equity Fund and Aviva Investors – European Equity Income Fund where a decision or an intention to liquidate exists) to cease to continue as a going concern;
• evaluate the overall presentation, structure and content of the financial statements, including the disclosures, and whether the financial statements represent the underlying transactions and events in a manner that achieves fair presentation.
We communicate with those charged with governance regarding, among other matters, the planned scope and timing of the audit and significant audit findings, including any significant deficiencies in internal control that we identify during our audit.
PricewaterhouseCoopers, Société coopérativeRepresented by@esig
@esigMarie-Elisa Roussel
Luxembourg, 29 April 2022

Aviva Investors Société d’investissement à capital variable (SICAV)
avivainvestors.com Annual Report and audited financial statements 14
NOTES ON THE PORTFOLIO OF INVESTMENTS DISCLOSURE:
Please note that the Portfolio of Investments and Other Net Assets has been prepared based on the country of incorporation of each position. To ensure consistency within this report, the same approach has been applied to all categories of investments. A disclosure based on country of risk could lead to a different geographical classification. Investments in China are shown with the suffix 'A' or 'H' which signifies:
China A-Shares
Companies incorporated in mainland China and which are traded in the mainland A-Share markets.
China H-Shares
Companies incorporated in mainland China and listed in Hong Kong and other foreign stock exchanges.
Please also note that the geographical allocation of the portfolios excludes derivatives exposure.
Aviva Investors Société d’investissement à capital variable (SICAV)
avivainvestors.com Annual Report and audited financial statements 15
The accompanying notes form an integral part of these financial statements.
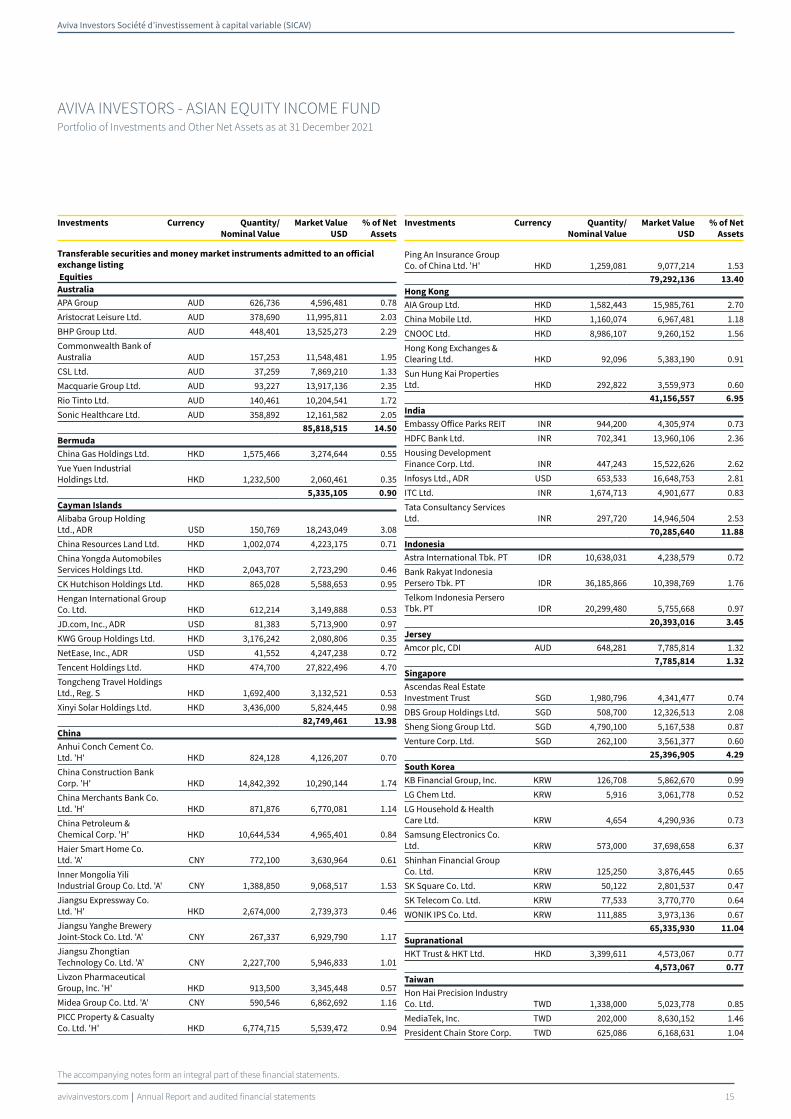
AVIVA INVESTORS - ASIAN EQUITY INCOME FUNDPortfolio of Investments and Other Net Assets as at 31 December 2021
Investments Currency Quantity/
Nominal Value
Market Value
USD
% of Net
Assets0
Transferable securities and money market instruments admitted to an official
exchange listing
Equities
Australia
APA Group AUD 626,736 4,596,481 0.78
Aristocrat Leisure Ltd. AUD 378,690 11,995,811 2.03
BHP Group Ltd. AUD 448,401 13,525,273 2.29
Commonwealth Bank of Australia AUD 157,253 11,548,481 1.95
CSL Ltd. AUD 37,259 7,869,210 1.33
Macquarie Group Ltd. AUD 93,227 13,917,136 2.35
Rio Tinto Ltd. AUD 140,461 10,204,541 1.72
Sonic Healthcare Ltd. AUD 358,892 12,161,582 2.05
85,818,515 14.50
Bermuda
China Gas Holdings Ltd. HKD 1,575,466 3,274,644 0.55
Yue Yuen Industrial Holdings Ltd. HKD 1,232,500 2,060,461 0.35
5,335,105 0.90
Cayman Islands
Alibaba Group Holding Ltd., ADR USD 150,769 18,243,049 3.08
China Resources Land Ltd. HKD 1,002,074 4,223,175 0.71
China Yongda Automobiles Services Holdings Ltd. HKD 2,043,707 2,723,290 0.46
CK Hutchison Holdings Ltd. HKD 865,028 5,588,653 0.95
Hengan International Group Co. Ltd. HKD 612,214 3,149,888 0.53
JD.com, Inc., ADR USD 81,383 5,713,900 0.97
KWG Group Holdings Ltd. HKD 3,176,242 2,080,806 0.35
NetEase, Inc., ADR USD 41,552 4,247,238 0.72
Tencent Holdings Ltd. HKD 474,700 27,822,496 4.70
Tongcheng Travel Holdings Ltd., Reg. S HKD 1,692,400 3,132,521 0.53
Xinyi Solar Holdings Ltd. HKD 3,436,000 5,824,445 0.98
82,749,461 13.98
China
Anhui Conch Cement Co. Ltd. 'H' HKD 824,128 4,126,207 0.70
China Construction Bank Corp. 'H' HKD 14,842,392 10,290,144 1.74
China Merchants Bank Co. Ltd. 'H' HKD 871,876 6,770,081 1.14
China Petroleum & Chemical Corp. 'H' HKD 10,644,534 4,965,401 0.84
Haier Smart Home Co. Ltd. 'A' CNY 772,100 3,630,964 0.61
Inner Mongolia Yili Industrial Group Co. Ltd. 'A' CNY 1,388,850 9,068,517 1.53
Jiangsu Expressway Co. Ltd. 'H' HKD 2,674,000 2,739,373 0.46
Jiangsu Yanghe Brewery Joint-Stock Co. Ltd. 'A' CNY 267,337 6,929,790 1.17
Jiangsu Zhongtian Technology Co. Ltd. 'A' CNY 2,227,700 5,946,833 1.01
Livzon Pharmaceutical Group, Inc. 'H' HKD 913,500 3,345,448 0.57
Midea Group Co. Ltd. 'A' CNY 590,546 6,862,692 1.16
PICC Property & Casualty Co. Ltd. 'H' HKD 6,774,715 5,539,472 0.94
Investments Currency Quantity/
Nominal Value
Market Value
USD
% of Net
Assets0
Ping An Insurance Group Co. of China Ltd. 'H' HKD 1,259,081 9,077,214 1.53
79,292,136 13.40
Hong Kong
AIA Group Ltd. HKD 1,582,443 15,985,761 2.70
China Mobile Ltd. HKD 1,160,074 6,967,481 1.18
CNOOC Ltd. HKD 8,986,107 9,260,152 1.56
Hong Kong Exchanges & Clearing Ltd. HKD 92,096 5,383,190 0.91
Sun Hung Kai Properties Ltd. HKD 292,822 3,559,973 0.60
41,156,557 6.95
India
Embassy Office Parks REIT INR 944,200 4,305,974 0.73
HDFC Bank Ltd. INR 702,341 13,960,106 2.36
Housing Development Finance Corp. Ltd. INR 447,243 15,522,626 2.62
Infosys Ltd., ADR USD 653,533 16,648,753 2.81
ITC Ltd. INR 1,674,713 4,901,677 0.83
Tata Consultancy Services Ltd. INR 297,720 14,946,504 2.53
70,285,640 11.88
Indonesia
Astra International Tbk. PT IDR 10,638,031 4,238,579 0.72
Bank Rakyat Indonesia Persero Tbk. PT IDR 36,185,866 10,398,769 1.76
Telkom Indonesia Persero Tbk. PT IDR 20,299,480 5,755,668 0.97
20,393,016 3.45
Jersey
Amcor plc, CDI AUD 648,281 7,785,814 1.32
7,785,814 1.32
Singapore
Ascendas Real Estate Investment Trust SGD 1,980,796 4,341,477 0.74
DBS Group Holdings Ltd. SGD 508,700 12,326,513 2.08
Sheng Siong Group Ltd. SGD 4,790,100 5,167,538 0.87
Venture Corp. Ltd. SGD 262,100 3,561,377 0.60
25,396,905 4.29
South Korea
KB Financial Group, Inc. KRW 126,708 5,862,670 0.99
LG Chem Ltd. KRW 5,916 3,061,778 0.52
LG Household & Health Care Ltd. KRW 4,654 4,290,936 0.73
Samsung Electronics Co. Ltd. KRW 573,000 37,698,658 6.37
Shinhan Financial Group Co. Ltd. KRW 125,250 3,876,445 0.65
SK Square Co. Ltd. KRW 50,122 2,801,537 0.47
SK Telecom Co. Ltd. KRW 77,533 3,770,770 0.64
WONIK IPS Co. Ltd. KRW 111,885 3,973,136 0.67
65,335,930 11.04
Supranational
HKT Trust & HKT Ltd. HKD 3,399,611 4,573,067 0.77
4,573,067 0.77
Taiwan
Hon Hai Precision Industry Co. Ltd. TWD 1,338,000 5,023,778 0.85
MediaTek, Inc. TWD 202,000 8,630,152 1.46
President Chain Store Corp. TWD 625,086 6,168,631 1.04

Aviva Investors Société d’investissement à capital variable (SICAV)
avivainvestors.com Annual Report and audited financial statements 16
AVIVA INVESTORS - ASIAN EQUITY INCOME FUND (CONTINUED)Portfolio of Investments and Other Net Assets as at 31 December 2021
The accompanying notes form an integral part of these financial statements.
Investments Currency Quantity/
Nominal Value
Market Value
USD
% of Net
Assets0
Taiwan Semiconductor Manufacturing Co. Ltd. TWD 2,529,314 56,044,146 9.47
Tripod Technology Corp. TWD 798,000 3,572,137 0.61
Yageo Corp. TWD 279,000 4,812,830 0.81
84,251,674 14.24
Thailand
Thai Beverage PCL SGD 7,743,600 3,804,228 0.64
3,804,228 0.64
Total Equities 576,178,048 97.36
Total Transferable securities and money market
instruments admitted to an official exchange listing 576,178,048 97.36
Units of authorised UCITS or other collective investment undertakings
Collective Investment Schemes - UCITS
Ireland
Aviva Investors US Dollar Liquidity Fund - Class 3 Income shares USD† USD 15,000,000 15,000,000 2.53
15,000,000 2.53
Total Collective Investment Schemes - UCITS 15,000,000 2.53
Total Units of authorised UCITS or other collective
investment undertakings 15,000,000 2.53
Total Investments 591,178,048 99.89
Cash 60,500 0.01
Other assets/(liabilities) 566,597 0.10
Total net assets 591,805,145 100.00 †Related Party Fund.
Geographic Allocation of Portfolio % of Net Assets
Australia 14.50Taiwan 14.24Cayman Islands 13.98China 13.40India 11.88South Korea 11.04Hong Kong 6.95Singapore 4.29Indonesia 3.45Ireland 2.53Jersey 1.32Bermuda 0.90Supranational 0.77Thailand 0.64Total investments 99.89
Cash and other assets/(liabilities) 0.11Total 100.00
Aviva Investors Société d’investissement à capital variable (SICAV)
avivainvestors.com Annual Report and audited financial statements 17
The accompanying notes form an integral part of these financial statements.
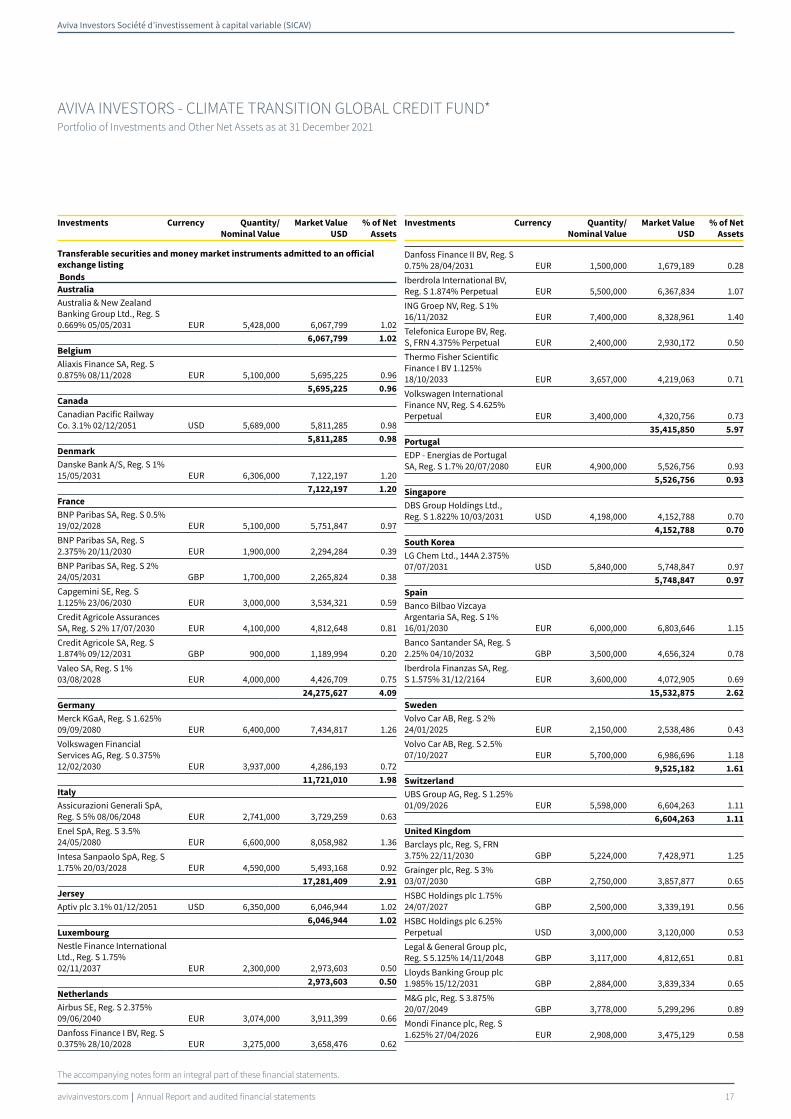
AVIVA INVESTORS - CLIMATE TRANSITION GLOBAL CREDIT FUND*Portfolio of Investments and Other Net Assets as at 31 December 2021
Investments Currency Quantity/
Nominal Value
Market Value
USD
% of Net
Assets0
Transferable securities and money market instruments admitted to an official
exchange listing
Bonds
Australia
Australia & New Zealand Banking Group Ltd., Reg. S 0.669% 05/05/2031 EUR 5,428,000 6,067,799 1.02
6,067,799 1.02
Belgium
Aliaxis Finance SA, Reg. S 0.875% 08/11/2028 EUR 5,100,000 5,695,225 0.96
5,695,225 0.96
Canada
Canadian Pacific Railway Co. 3.1% 02/12/2051 USD 5,689,000 5,811,285 0.98
5,811,285 0.98
Denmark
Danske Bank A/S, Reg. S 1% 15/05/2031 EUR 6,306,000 7,122,197 1.20
7,122,197 1.20
France
BNP Paribas SA, Reg. S 0.5% 19/02/2028 EUR 5,100,000 5,751,847 0.97
BNP Paribas SA, Reg. S 2.375% 20/11/2030 EUR 1,900,000 2,294,284 0.39
BNP Paribas SA, Reg. S 2% 24/05/2031 GBP 1,700,000 2,265,824 0.38
Capgemini SE, Reg. S 1.125% 23/06/2030 EUR 3,000,000 3,534,321 0.59
Credit Agricole Assurances SA, Reg. S 2% 17/07/2030 EUR 4,100,000 4,812,648 0.81
Credit Agricole SA, Reg. S 1.874% 09/12/2031 GBP 900,000 1,189,994 0.20
Valeo SA, Reg. S 1% 03/08/2028 EUR 4,000,000 4,426,709 0.75
24,275,627 4.09
Germany
Merck KGaA, Reg. S 1.625% 09/09/2080 EUR 6,400,000 7,434,817 1.26
Volkswagen Financial Services AG, Reg. S 0.375% 12/02/2030 EUR 3,937,000 4,286,193 0.72
11,721,010 1.98
Italy
Assicurazioni Generali SpA, Reg. S 5% 08/06/2048 EUR 2,741,000 3,729,259 0.63
Enel SpA, Reg. S 3.5% 24/05/2080 EUR 6,600,000 8,058,982 1.36
Intesa Sanpaolo SpA, Reg. S 1.75% 20/03/2028 EUR 4,590,000 5,493,168 0.92
17,281,409 2.91
Jersey
Aptiv plc 3.1% 01/12/2051 USD 6,350,000 6,046,944 1.02
6,046,944 1.02
Luxembourg
Nestle Finance International Ltd., Reg. S 1.75% 02/11/2037 EUR 2,300,000 2,973,603 0.50
2,973,603 0.50
Netherlands
Airbus SE, Reg. S 2.375% 09/06/2040 EUR 3,074,000 3,911,399 0.66
Danfoss Finance I BV, Reg. S 0.375% 28/10/2028 EUR 3,275,000 3,658,476 0.62
Investments Currency Quantity/
Nominal Value
Market Value
USD
% of Net
Assets0
Danfoss Finance II BV, Reg. S 0.75% 28/04/2031 EUR 1,500,000 1,679,189 0.28
Iberdrola International BV, Reg. S 1.874% Perpetual EUR 5,500,000 6,367,834 1.07
ING Groep NV, Reg. S 1% 16/11/2032 EUR 7,400,000 8,328,961 1.40
Telefonica Europe BV, Reg. S, FRN 4.375% Perpetual EUR 2,400,000 2,930,172 0.50
Thermo Fisher Scientific Finance I BV 1.125% 18/10/2033 EUR 3,657,000 4,219,063 0.71
Volkswagen International Finance NV, Reg. S 4.625% Perpetual EUR 3,400,000 4,320,756 0.73
35,415,850 5.97
Portugal
EDP - Energias de Portugal SA, Reg. S 1.7% 20/07/2080 EUR 4,900,000 5,526,756 0.93
5,526,756 0.93
Singapore
DBS Group Holdings Ltd., Reg. S 1.822% 10/03/2031 USD 4,198,000 4,152,788 0.70
4,152,788 0.70
South Korea
LG Chem Ltd., 144A 2.375% 07/07/2031 USD 5,840,000 5,748,847 0.97
5,748,847 0.97
Spain
Banco Bilbao Vizcaya Argentaria SA, Reg. S 1% 16/01/2030 EUR 6,000,000 6,803,646 1.15
Banco Santander SA, Reg. S 2.25% 04/10/2032 GBP 3,500,000 4,656,324 0.78
Iberdrola Finanzas SA, Reg. S 1.575% 31/12/2164 EUR 3,600,000 4,072,905 0.69
15,532,875 2.62
Sweden
Volvo Car AB, Reg. S 2% 24/01/2025 EUR 2,150,000 2,538,486 0.43
Volvo Car AB, Reg. S 2.5% 07/10/2027 EUR 5,700,000 6,986,696 1.18
9,525,182 1.61
Switzerland
UBS Group AG, Reg. S 1.25% 01/09/2026 EUR 5,598,000 6,604,263 1.11
6,604,263 1.11
United Kingdom
Barclays plc, Reg. S, FRN 3.75% 22/11/2030 GBP 5,224,000 7,428,971 1.25
Grainger plc, Reg. S 3% 03/07/2030 GBP 2,750,000 3,857,877 0.65
HSBC Holdings plc 1.75% 24/07/2027 GBP 2,500,000 3,339,191 0.56
HSBC Holdings plc 6.25% Perpetual USD 3,000,000 3,120,000 0.53
Legal & General Group plc, Reg. S 5.125% 14/11/2048 GBP 3,117,000 4,812,651 0.81
Lloyds Banking Group plc 1.985% 15/12/2031 GBP 2,884,000 3,839,334 0.65
M&G plc, Reg. S 3.875% 20/07/2049 GBP 3,778,000 5,299,296 0.89
Mondi Finance plc, Reg. S 1.625% 27/04/2026 EUR 2,908,000 3,475,129 0.58

Aviva Investors Société d’investissement à capital variable (SICAV)
avivainvestors.com Annual Report and audited financial statements 18
AVIVA INVESTORS - CLIMATE TRANSITION GLOBAL CREDIT FUND* (CONTINUED)Portfolio of Investments and Other Net Assets as at 31 December 2021
The accompanying notes form an integral part of these financial statements.
Investments Currency Quantity/
Nominal Value
Market Value
USD
% of Net
Assets0
NatWest Group plc 4.445% 08/05/2030 USD 3,100,000 3,483,858 0.59
NatWest Group plc, Reg. S, FRN 3.622% 14/08/2030 GBP 4,398,000 6,190,129 1.04
NatWest Group plc, Reg. S 2.105% 28/11/2031 GBP 1,300,000 1,729,833 0.29
Prudential plc, Reg. S 2.95% 03/11/2033 USD 4,891,000 4,846,296 0.82
Prudential plc, Reg. S 6.125% 19/12/2031 GBP 1,037,000 1,846,438 0.31
Prudential plc, Reg. S 4.875% 31/12/2164 USD 4,548,000 4,639,938 0.78
Tesco Corporate Treasury Services plc, Reg. S 2.75% 27/04/2030 GBP 3,000,000 4,202,376 0.71
Tesco Property Finance 4 plc, Reg. S 5.801% 13/10/2040 GBP 2,103,262 3,687,494 0.62
Unilever plc, Reg. S 1.5% 11/06/2039 EUR 2,602,000 3,208,374 0.54
Vodafone Group plc, Reg. S 3.375% 08/08/2049 GBP 3,091,000 4,664,066 0.79
73,671,251 12.41
United States of America
AbbVie, Inc. 4.5% 14/05/2035 USD 3,323,000 3,969,603 0.67
Anheuser-Busch Cos. LLC 4.7% 01/02/2036 USD 7,098,000 8,574,913 1.45
AT&T, Inc. 5.25% 01/03/2037 USD 4,950,000 6,111,440 1.03
AT&T, Inc. 5.45% 01/03/2047 USD 4,550,000 5,938,814 1.00
Capital One Financial Corp. 3.2% 05/02/2025 USD 5,997,000 6,290,651 1.06
Chubb INA Holdings, Inc. 2.7% 13/03/2023 USD 4,004,000 4,099,080 0.69
CVS Health Corp. 1.875% 28/02/2031 USD 5,145,000 4,939,062 0.83
General Electric Co. 6.75% 15/03/2032 USD 1,470,000 2,006,403 0.34
General Motors Financial Co., Inc. 4.35% 17/01/2027 USD 3,283,000 3,620,874 0.61
Goldman Sachs Group, Inc. (The) 3.625% 20/02/2024 USD 1,923,000 2,018,656 0.34
Goldman Sachs Group, Inc. (The) 2.6% 07/02/2030 USD 2,137,000 2,174,466 0.37
Hewlett Packard Enterprise Co. 6.2% 15/10/2035 USD 4,939,000 6,471,798 1.09
Home Depot, Inc. (The) 4.5% 06/12/2048 USD 3,666,000 4,735,351 0.80
Kansas City Southern 3% 15/05/2023 USD 3,148,000 3,221,784 0.54
Mastercard, Inc. 3.65% 01/06/2049 USD 3,542,000 4,095,294 0.69
Republic Services, Inc. 1.45% 15/02/2031 USD 4,675,000 4,351,130 0.73
salesforce.com, Inc. 1.95% 15/07/2031 USD 5,000,000 4,953,766 0.83
T-Mobile USA, Inc. 4.375% 15/04/2040 USD 4,600,000 5,245,058 0.88
Union Pacific Corp. 3.2% 20/05/2041 USD 1,400,000 1,486,213 0.25
Union Pacific Corp. 2.95% 10/03/2052 USD 3,731,000 3,770,083 0.64
Investments Currency Quantity/
Nominal Value
Market Value
USD
% of Net
Assets0
UnitedHealth Group, Inc. 4.625% 15/11/2041 USD 3,790,000 4,760,047 0.80
US Treasury 0.875% 30/09/2026 USD 8,000,000 7,862,187 1.32
US Treasury 1.75% 15/08/2041 USD 7,000,000 6,750,625 1.14
US Treasury 1.875% 15/02/2051 USD 13,353,500 13,154,241 2.22
Verizon Communications, Inc. 2.55% 21/03/2031 USD 2,850,000 2,881,115 0.49
Verizon Communications, Inc. 3.375% 27/10/2036 GBP 2,050,000 3,168,766 0.53
VMware, Inc. 2.2% 15/08/2031 USD 5,879,000 5,769,109 0.97
WRKCo, Inc. 3.9% 01/06/2028 USD 5,248,000 5,750,149 0.97
Xylem, Inc. 2.25% 30/01/2031 USD 5,956,000 5,907,640 1.00
144,078,318 24.28
Total Bonds 387,251,229 65.26
Total Transferable securities and money market
instruments admitted to an official exchange listing 387,251,229 65.26
Transferable securities and money market instruments dealt in on another
regulated market
Bonds
Australia
Newcrest Finance Pty. Ltd., 144A 3.25% 13/05/2030 USD 5,525,000 5,790,759 0.98
5,790,759 0.98
Canada
Bell Telephone Co. 3.8% 21/08/2028 CAD 3,492,000 2,974,011 0.50
Bell Telephone Co. of Canada 3.5% 30/09/2050 CAD 2,850,000 2,145,543 0.36
Royal Bank of Canada 2.609% 01/11/2024 CAD 3,367,000 2,714,622 0.46
7,834,176 1.32
France
Air Liquide Finance SA, 144A 2.5% 27/09/2026 USD 3,616,000 3,749,745 0.63
3,749,745 0.63
Hong Kong
AIA Group Ltd., 144A 3.9% 06/04/2028 USD 2,200,000 2,431,209 0.41
2,431,209 0.41
Netherlands
Siemens Financieringsmaatschappij NV, 144A 2.875% 11/03/2041 USD 5,633,000 5,727,940 0.96
5,727,940 0.96
Supranational
NXP BV, 144A 2.65% 15/02/2032 USD 7,200,000 7,226,683 1.22
7,226,683 1.22
United States of America
AbbVie, Inc. 4.75% 15/03/2045 USD 3,778,000 4,703,548 0.79
Amazon.com, Inc. 4.05% 22/08/2047 USD 3,861,000 4,677,473 0.79
Amazon.com, Inc. 3.1% 12/05/2051 USD 2,184,000 2,331,750 0.39
Apple, Inc. 3.85% 04/05/2043 USD 4,074,000 4,785,025 0.81

Aviva Investors Société d’investissement à capital variable (SICAV)
avivainvestors.com Annual Report and audited financial statements 19
AVIVA INVESTORS - CLIMATE TRANSITION GLOBAL CREDIT FUND* (CONTINUED)Portfolio of Investments and Other Net Assets as at 31 December 2021
The accompanying notes form an integral part of these financial statements.
Investments Currency Quantity/
Nominal Value
Market Value
USD
% of Net
Assets0
Bank of America Corp. 2.015% 13/02/2026 USD 3,204,000 3,248,673 0.55
Bank of America Corp. 1.734% 22/07/2027 USD 5,554,000 5,518,917 0.93
Bank of America Corp. 3.97% 05/03/2029 USD 3,983,000 4,360,243 0.73
Bank of America Corp. 2.572% 20/10/2032 USD 5,800,000 5,826,486 0.98
Baxter International, Inc., 144A 2.539% 01/02/2032 USD 6,000,000 6,064,095 1.02
Baxter International, Inc. 3.95% 01/04/2030 USD 2,252,000 2,508,707 0.42
Brambles USA, Inc., 144A 4.125% 23/10/2025 USD 4,145,000 4,488,148 0.76
Bristol-Myers Squibb Co. 4.625% 15/05/2044 USD 3,130,000 3,991,401 0.67
Citigroup, Inc., FRN 3.352% 24/04/2025 USD 4,165,000 4,352,208 0.73
Citigroup, Inc. 2.572% 03/06/2031 USD 3,031,000 3,059,328 0.52
Citigroup, Inc. 2.52% 03/11/2032 USD 5,750,000 5,746,960 0.97
Comcast Corp. 3.75% 01/04/2040 USD 6,050,000 6,758,015 1.14
eBay, Inc. 2.6% 10/05/2031 USD 4,906,000 4,957,872 0.84
eBay, Inc. 4% 15/07/2042 USD 2,000,000 2,223,669 0.37
Goldman Sachs Group, Inc. (The) 2.383% 21/07/2032 USD 6,199,000 6,106,771 1.03
Goldman Sachs Group, Inc. (The) 2.65% 21/10/2032 USD 4,386,000 4,408,656 0.74
International Flavors & Fragrances, Inc., 144A 2.3% 01/11/2030 USD 4,500,000 4,414,211 0.74
Metropolitan Life Global Funding I, 144A 2.95% 09/04/2030 USD 5,574,000 5,881,768 0.99
Micron Technology, Inc. 2.703% 15/04/2032 USD 6,100,000 6,117,446 1.03
Microsoft Corp. 4.2% 03/11/2035 USD 3,283,000 4,012,842 0.68
Microsoft Corp. 4.25% 06/02/2047 USD 1,366,000 1,764,563 0.30
Morgan Stanley 2.72% 22/07/2025 USD 5,790,000 5,971,625 1.01
Morgan Stanley 1.512% 20/07/2027 USD 4,271,000 4,206,237 0.71
Morgan Stanley, FRN 2.699% 22/01/2031 USD 3,704,000 3,792,015 0.64
Mylan, Inc. 4.55% 15/04/2028 USD 4,178,000 4,679,160 0.79
Mylan, Inc. 5.2% 15/04/2048 USD 3,735,000 4,620,682 0.78
Nestle Holdings, Inc., 144A 2.5% 14/09/2041 USD 2,171,000 2,135,551 0.36
T-Mobile USA, Inc. 3.5% 15/04/2031 USD 6,450,000 6,719,159 1.13
144,433,204 24.34
Total Bonds 177,193,716 29.86
Total Transferable securities and money market
instruments dealt in on another regulated market 177,193,716 29.86
Investments Currency Quantity/
Nominal Value
Market Value
USD
% of Net
Assets0
Units of authorised UCITS or other collective investment undertakings
Collective Investment Schemes - UCITS
Ireland
Aviva Investors US Dollar Liquidity Fund - Class 3 Income shares USD† USD 23,400,000 23,400,000 3.94
23,400,000 3.94
Total Collective Investment Schemes - UCITS 23,400,000 3.94
Total Units of authorised UCITS or other collective
investment undertakings 23,400,000 3.94
Total Investments 587,844,945 99.06
Cash 2,337,234 0.39
Other assets/(liabilities) 3,237,477 0.55
Total net assets 593,419,656 100.00
†Related Party Fund.
Aviva Investors Société d’investissement à capital variable (SICAV)
avivainvestors.com Annual Report and audited financial statements 20
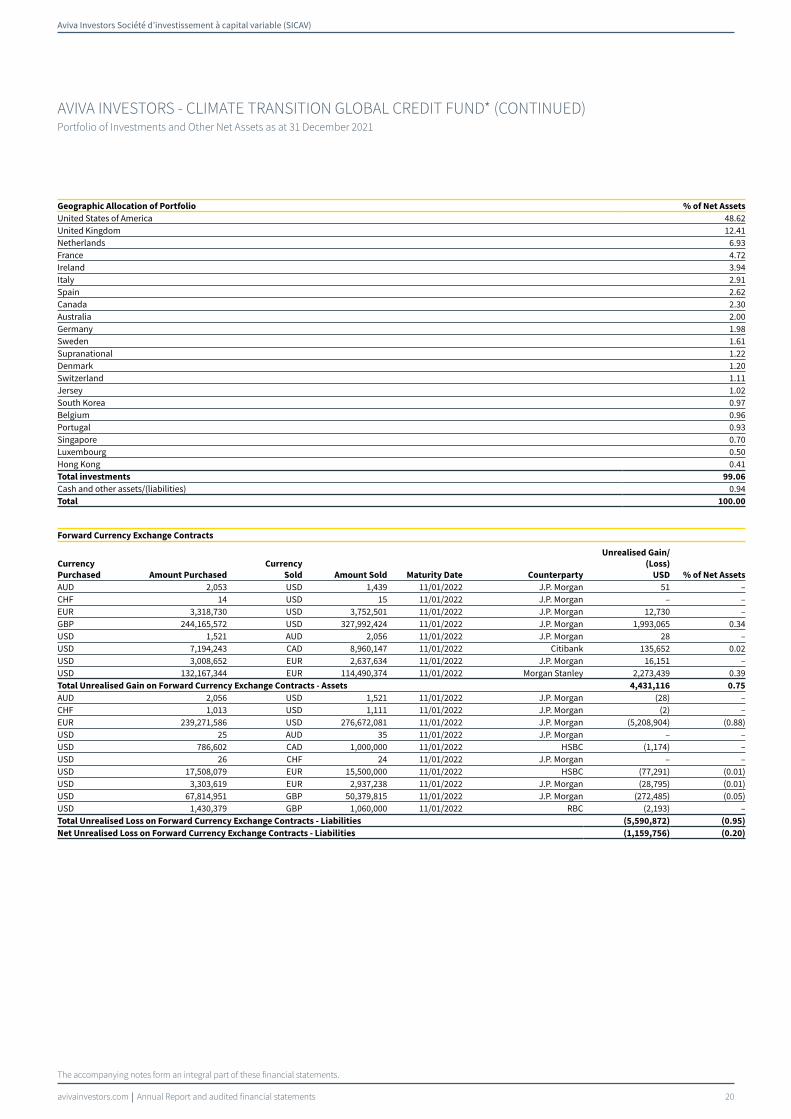
AVIVA INVESTORS - CLIMATE TRANSITION GLOBAL CREDIT FUND* (CONTINUED)Portfolio of Investments and Other Net Assets as at 31 December 2021
The accompanying notes form an integral part of these financial statements.
Geographic Allocation of Portfolio % of Net Assets
United States of America 48.62United Kingdom 12.41Netherlands 6.93France 4.72Ireland 3.94Italy 2.91Spain 2.62Canada 2.30Australia 2.00Germany 1.98Sweden 1.61Supranational 1.22Denmark 1.20Switzerland 1.11Jersey 1.02South Korea 0.97Belgium 0.96Portugal 0.93Singapore 0.70Luxembourg 0.50Hong Kong 0.41Total investments 99.06
Cash and other assets/(liabilities) 0.94Total 100.00
Forward Currency Exchange Contracts
Currency
Purchased Amount Purchased
Currency
Sold Amount Sold Maturity Date Counterparty
Unrealised Gain/
(Loss)
USD % of Net Assets
AUD 2,053 USD 1,439 11/01/2022 J.P. Morgan 51 –CHF 14 USD 15 11/01/2022 J.P. Morgan – –EUR 3,318,730 USD 3,752,501 11/01/2022 J.P. Morgan 12,730 –GBP 244,165,572 USD 327,992,424 11/01/2022 J.P. Morgan 1,993,065 0.34USD 1,521 AUD 2,056 11/01/2022 J.P. Morgan 28 –USD 7,194,243 CAD 8,960,147 11/01/2022 Citibank 135,652 0.02USD 3,008,652 EUR 2,637,634 11/01/2022 J.P. Morgan 16,151 –USD 132,167,344 EUR 114,490,374 11/01/2022 Morgan Stanley 2,273,439 0.39Total Unrealised Gain on Forward Currency Exchange Contracts - Assets 4,431,116 0.75
AUD 2,056 USD 1,521 11/01/2022 J.P. Morgan (28) –CHF 1,013 USD 1,111 11/01/2022 J.P. Morgan (2) –EUR 239,271,586 USD 276,672,081 11/01/2022 J.P. Morgan (5,208,904) (0.88)USD 25 AUD 35 11/01/2022 J.P. Morgan – –USD 786,602 CAD 1,000,000 11/01/2022 HSBC (1,174) –USD 26 CHF 24 11/01/2022 J.P. Morgan – –USD 17,508,079 EUR 15,500,000 11/01/2022 HSBC (77,291) (0.01)USD 3,303,619 EUR 2,937,238 11/01/2022 J.P. Morgan (28,795) (0.01)USD 67,814,951 GBP 50,379,815 11/01/2022 J.P. Morgan (272,485) (0.05)USD 1,430,379 GBP 1,060,000 11/01/2022 RBC (2,193) –Total Unrealised Loss on Forward Currency Exchange Contracts - Liabilities (5,590,872) (0.95)
Net Unrealised Loss on Forward Currency Exchange Contracts - Liabilities (1,159,756) (0.20)
Aviva Investors Société d’investissement à capital variable (SICAV)
avivainvestors.com Annual Report and audited financial statements 21
AVIVA INVESTORS - CLIMATE TRANSITION GLOBAL CREDIT FUND* (CONTINUED)Portfolio of Investments and Other Net Assets as at 31 December 2021
The accompanying notes form an integral part of these financial statements.
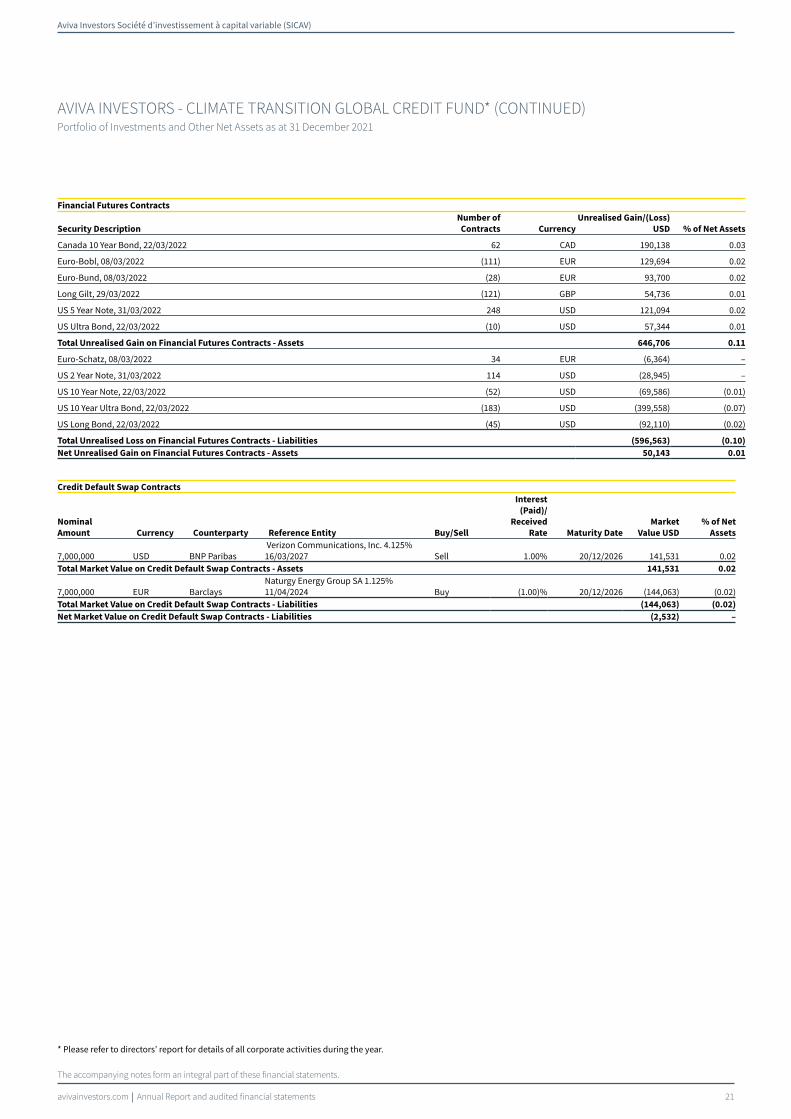
Financial Futures Contracts
Security Description
Number of
Contracts Currency
Unrealised Gain/(Loss)
USD % of Net Assets
Canada 10 Year Bond, 22/03/2022 62 CAD 190,138 0 .03
Euro-Bobl, 08/03/2022 (111) EUR 129,694 0 .02
Euro-Bund, 08/03/2022 (28) EUR 93,700 0 .02
Long Gilt, 29/03/2022 (121) GBP 54,736 0 .01
US 5 Year Note, 31/03/2022 248 USD 121,094 0 .02
US Ultra Bond, 22/03/2022 (10) USD 57,344 0 .01
Total Unrealised Gain on Financial Futures Contracts - Assets 646,706 0.11
Euro-Schatz, 08/03/2022 34 EUR (6,364) –
US 2 Year Note, 31/03/2022 114 USD (28,945) –
US 10 Year Note, 22/03/2022 (52) USD (69,586) (0 .01)
US 10 Year Ultra Bond, 22/03/2022 (183) USD (399,558) (0 .07)
US Long Bond, 22/03/2022 (45) USD (92,110) (0 .02)
Total Unrealised Loss on Financial Futures Contracts - Liabilities (596,563) (0.10)
Net Unrealised Gain on Financial Futures Contracts - Assets 50,143 0.01
Credit Default Swap Contracts
Nominal
Amount Currency Counterparty Reference Entity Buy/Sell
Interest
(Paid)/
Received
Rate Maturity Date
Market
Value USD
% of Net
Assets
7,000,000 USD BNP Paribas Verizon Communications, Inc. 4.125% 16/03/2027 Sell 1.00% 20/12/2026 141,531 0.02
Total Market Value on Credit Default Swap Contracts - Assets 141,531 0.02
7,000,000 EUR Barclays Naturgy Energy Group SA 1.125% 11/04/2024 Buy (1.00)% 20/12/2026 (144,063) (0.02)
Total Market Value on Credit Default Swap Contracts - Liabilities (144,063) (0.02)
Net Market Value on Credit Default Swap Contracts - Liabilities (2,532) –
* Please refer to directors’ report for details of all corporate activities during the year.

Aviva Investors Société d’investissement à capital variable (SICAV)
avivainvestors.com Annual Report and audited financial statements 22
The accompanying notes form an integral part of these financial statements.
AVIVA INVESTORS - CLIMATE TRANSITION GLOBAL EQUITY FUNDPortfolio of Investments and Other Net Assets as at 31 December 2021
Investments Currency Quantity/
Nominal Value
Market Value
USD
% of Net
Assets0
Transferable securities and money market instruments admitted to an official
exchange listing
Equities
Belgium
KBC Group NV EUR 33,160 2,835,873 2.05
2,835,873 2.05
Cayman Islands
China Conch Venture Holdings Ltd. HKD 391,000 1,908,974 1.38
Xinyi Solar Holdings Ltd. HKD 1,552,000 2,628,923 1.91
4,537,897 3.29
China
Ping An Insurance Group Co. of China Ltd. 'H' HKD 483,310 3,481,386 2.52
3,481,386 2.52
Denmark
Vestas Wind Systems A/S DKK 67,407 2,058,054 1.49
2,058,054 1.49
Finland
Neste OYJ EUR 44,573 2,189,366 1.59
2,189,366 1.59
France
Alstom SA EUR 76,446 2,705,627 1.96
AXA SA EUR 120,052 3,565,653 2.58
Bureau Veritas SA EUR 86,376 2,863,559 2.08
Capgemini SE EUR 15,326 3,746,577 2.71
Sanofi EUR 24,915 2,503,543 1.81
Schneider Electric SE EUR 17,764 3,475,062 2.52
18,860,021 13.66
Germany
Infineon Technologies AG EUR 64,001 2,953,064 2.14
Siemens Energy AG EUR 86,078 2,200,434 1.59
Volkswagen AG Preference EUR 9,042 1,820,013 1.32
6,973,511 5.05
Ireland
Allegion plc USD 25,973 3,412,722 2.47
Medtronic plc USD 28,233 2,948,090 2.14
Trane Technologies plc USD 9,892 1,986,017 1.44
8,346,829 6.05
Italy
Prysmian SpA EUR 108,654 4,081,587 2.96
4,081,587 2.96
Japan
Daikin Industries Ltd. JPY 13,600 3,084,974 2.23
Murata Manufacturing Co. Ltd. JPY 35,700 2,842,307 2.06
5,927,281 4.29
Jersey
Aptiv plc USD 7,767 1,272,584 0.92
1,272,584 0.92
Netherlands
STMicroelectronics NV EUR 62,049 3,053,746 2.21
3,053,746 2.21
South Korea
LG Chem Ltd. KRW 4,445 2,301,297 1.67
2,301,297 1.67
Spain
Acciona SA EUR 19,602 3,739,003 2.71
EDP Renovaveis SA EUR 98,326 2,440,474 1.77
6,179,477 4.48
Investments Currency Quantity/
Nominal Value
Market Value
USD
% of Net
Assets0
United Kingdom
RELX plc GBP 98,035 3,179,863 2.30
Unilever plc GBP 58,892 3,140,125 2.28
6,319,988 4.58
United States of America
Alphabet, Inc. 'A' USD 1,267 3,690,017 2.67
American Tower Corp., REIT USD 14,234 4,138,393 3.00
Becton Dickinson and Co. USD 5,672 1,438,306 1.04
Comcast Corp. 'A' USD 65,016 3,291,435 2.38
Equinix, Inc., REIT USD 2,709 2,295,282 1.66
Eversource Energy USD 34,070 3,097,644 2.24
Home Depot, Inc. (The) USD 7,990 3,283,291 2.38
Hubbell, Inc. USD 13,529 2,808,756 2.04
IQVIA Holdings, Inc. USD 2,729 771,597 0.56
Itron, Inc. USD 28,163 1,919,590 1.39
Merck & Co., Inc. USD 33,269 2,570,529 1.86
Moody's Corp. USD 9,128 3,572,791 2.59
Motorola Solutions, Inc. USD 13,541 3,669,476 2.66
PTC, Inc. USD 21,725 2,643,389 1.92
Thermo Fisher Scientific, Inc. USD 3,863 2,575,752 1.87
Trimble, Inc. USD 32,192 2,823,399 2.05
Union Pacific Corp. USD 13,863 3,459,442 2.51
UnitedHealth Group, Inc. USD 9,756 4,919,951 3.56
Watts Water Technologies, Inc. 'A' USD 12,960 2,500,438 1.81
Xylem, Inc. USD 25,078 2,984,658 2.16
58,454,136 42.35
Total Equities 136,873,033 99.16
Total Transferable securities and money market
instruments admitted to an official exchange listing 136,873,033 99.16
Total Investments 136,873,033 99.16
Cash 1,059,216 0.77
Other assets/(liabilities) 100,676 0.07
Total net assets 138,032,925 100.00
Aviva Investors Société d’investissement à capital variable (SICAV)
avivainvestors.com Annual Report and audited financial statements 23
AVIVA INVESTORS - CLIMATE TRANSITION GLOBAL EQUITY FUND (CONTINUED)Portfolio of Investments and Other Net Assets as at 31 December 2021
The accompanying notes form an integral part of these financial statements.
Geographic Allocation of Portfolio % of Net Assets
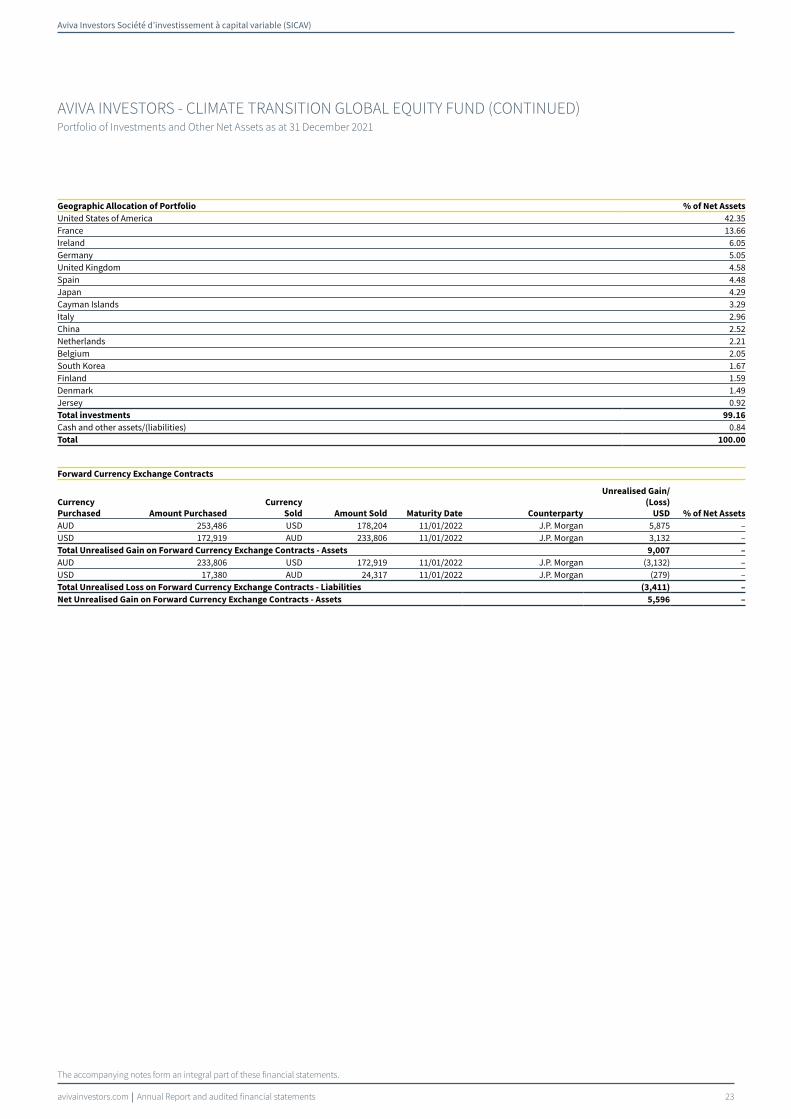
United States of America 42.35France 13.66Ireland 6.05Germany 5.05United Kingdom 4.58Spain 4.48Japan 4.29Cayman Islands 3.29Italy 2.96China 2.52Netherlands 2.21Belgium 2.05South Korea 1.67Finland 1.59Denmark 1.49Jersey 0.92Total investments 99.16
Cash and other assets/(liabilities) 0.84Total 100.00
Forward Currency Exchange Contracts
Currency
Purchased Amount Purchased
Currency
Sold Amount Sold Maturity Date Counterparty
Unrealised Gain/
(Loss)
USD % of Net Assets
AUD 253,486 USD 178,204 11/01/2022 J.P. Morgan 5,875 –USD 172,919 AUD 233,806 11/01/2022 J.P. Morgan 3,132 –Total Unrealised Gain on Forward Currency Exchange Contracts - Assets 9,007 –
AUD 233,806 USD 172,919 11/01/2022 J.P. Morgan (3,132) –USD 17,380 AUD 24,317 11/01/2022 J.P. Morgan (279) –Total Unrealised Loss on Forward Currency Exchange Contracts - Liabilities (3,411) –
Net Unrealised Gain on Forward Currency Exchange Contracts - Assets 5,596 –

Aviva Investors Société d’investissement à capital variable (SICAV)
avivainvestors.com Annual Report and audited financial statements 24
The accompanying notes form an integral part of these financial statements.
AVIVA INVESTORS - CLIMATE TRANSITION EUROPEAN EQUITY FUNDPortfolio of Investments and Other Net Assets as at 31 December 2021
Investments Currency Quantity/
Nominal Value
Market Value
EUR
% of Net
Assets0
Transferable securities and money market instruments admitted to an official
exchange listing
Equities
Belgium
KBC Group NV EUR 140,287 10,576,237 2.37
Umicore SA EUR 72,777 2,599,594 0.58
13,175,831 2.95
Denmark
Novozymes A/S 'B' DKK 120,981 8,772,122 1.97
Vestas Wind Systems A/S DKK 201,496 5,423,250 1.21
14,195,372 3.18
Finland
Neste OYJ EUR 204,707 8,863,813 1.99
Stora Enso OYJ 'R' EUR 437,868 7,078,136 1.58
15,941,949 3.57
France
Air Liquide SA EUR 44,943 6,887,964 1.54
Alstom SA EUR 291,521 9,095,455 2.04
AXA SA EUR 249,072 6,521,328 1.46
Bouygues SA EUR 142,673 4,489,206 1.01
Bureau Veritas SA EUR 266,444 7,786,826 1.74
Cie de Saint-Gobain EUR 189,937 11,750,452 2.63
Cie Generale des Etablissements Michelin SCA EUR 61,407 8,864,100 1.99
Credit Agricole SA EUR 926,029 11,621,664 2.60
Danone SA EUR 137,092 7,484,538 1.68
L'Oreal SA EUR 20,068 8,366,851 1.87
Neoen SA, Reg. S EUR 87,703 3,339,730 0.75
Sanofi EUR 135,144 11,971,056 2.68
Schneider Electric SE EUR 57,538 9,922,428 2.22
SPIE SA EUR 405,677 9,229,152 2.07
Valeo SA EUR 240,543 6,394,836 1.43
Voltalia SA EUR 81,288 1,597,309 0.36
125,322,895 28.07
Germany
adidas AG EUR 32,965 8,362,396 1.87
Covestro AG, Reg. S EUR 117,799 6,385,884 1.43
Evonik Industries AG EUR 220,490 6,286,170 1.41
Infineon Technologies AG EUR 169,050 6,876,109 1.54
SAP SE EUR 90,884 11,300,516 2.53
Siemens AG EUR 61,412 9,344,450 2.09
Siemens Energy AG EUR 171,489 3,864,505 0.87
Volkswagen AG EUR 14,623 3,791,744 0.85
56,211,774 12.59
Italy
Intesa Sanpaolo SpA EUR 4,382,117 9,964,934 2.23
Prysmian SpA EUR 261,180 8,648,976 1.94
18,613,910 4.17
Jersey
Ferguson plc GBP 57,248 8,936,593 2.00
8,936,593 2.00
Luxembourg
Befesa SA, Reg. S EUR 93,071 6,245,064 1.40
6,245,064 1.40
Netherlands
Arcadis NV EUR 229,707 9,744,171 2.18
ASML Holding NV EUR 22,563 15,946,400 3.57
Boskalis Westminster EUR 314,260 8,073,339 1.81
Investments Currency Quantity/
Nominal Value
Market Value
EUR
% of Net
Assets0
Corbion NV EUR 188,249 7,812,334 1.75
Koninklijke Philips NV EUR 71,900 2,355,444 0.53
STMicroelectronics NV EUR 153,904 6,677,125 1.50
50,608,813 11.34
Norway
Mowi ASA NOK 177,587 3,698,317 0.83
TOMRA Systems ASA NOK 129,261 8,142,171 1.82
11,840,488 2.65
Spain
Acciona SA EUR 53,647 9,020,743 2.02
EDP Renovaveis SA EUR 194,959 4,265,703 0.96
Siemens Gamesa Renewable Energy SA EUR 211,639 4,460,292 1.00
17,746,738 3.98
Switzerland
Nestle SA CHF 175,938 21,635,289 4.85
Novartis AG CHF 160,962 12,467,514 2.79
34,102,803 7.64
United Kingdom
AstraZeneca plc GBP 143,380 14,820,594 3.32
Biffa plc, Reg. S GBP 2,745,250 11,717,247 2.62
Ceres Power Holdings plc GBP 192,753 2,284,402 0.51
Intermediate Capital Group plc GBP 308,402 8,063,253 1.81
Pennon Group plc GBP 328,774 4,577,029 1.03
Prudential plc GBP 511,182 7,763,509 1.74
Tesco plc GBP 1,960,339 6,771,920 1.52
Unilever plc GBP 133,019 6,252,385 1.40
62,250,339 13.95
Total Equities 435,192,569 97.49
Total Transferable securities and money market
instruments admitted to an official exchange listing 435,192,569 97.49
Total Investments 435,192,569 97.49
Cash 10,343,590 2.32
Other assets/(liabilities) 850,497 0.19
Total net assets 446,386,656 100.00

Aviva Investors Société d’investissement à capital variable (SICAV)
avivainvestors.com Annual Report and audited financial statements 25
AVIVA INVESTORS - CLIMATE TRANSITION EUROPEAN EQUITY FUND (CONTINUED)Portfolio of Investments and Other Net Assets as at 31 December 2021
The accompanying notes form an integral part of these financial statements.
Geographic Allocation of Portfolio % of Net Assets
France 28.07United Kingdom 13.95Germany 12.59Netherlands 11.34Switzerland 7.64Italy 4.17Spain 3.98Finland 3.57Denmark 3.18Belgium 2.95Norway 2.65Jersey 2.00Luxembourg 1.40Total investments 97.49
Cash and other assets/(liabilities) 2.51Total 100.00
Forward Currency Exchange Contracts
Currency
Purchased Amount Purchased
Currency
Sold Amount Sold Maturity Date Counterparty
Unrealised Gain/
(Loss)
EUR % of Net Assets
GBP 32,792,425 EUR 38,846,632 11/01/2022 J.P. Morgan 216,237 0.05Total Unrealised Gain on Forward Currency Exchange Contracts - Assets 216,237 0.05
EUR 3,505,119 GBP 2,977,620 11/01/2022 J.P. Morgan (41,870) (0.01)Total Unrealised Loss on Forward Currency Exchange Contracts - Liabilities (41,870) (0.01)
Net Unrealised Gain on Forward Currency Exchange Contracts - Assets 174,367 0.04

Aviva Investors Société d’investissement à capital variable (SICAV)
avivainvestors.com Annual Report and audited financial statements 26
The accompanying notes form an integral part of these financial statements.
AVIVA INVESTORS - EMERGING MARKETS BOND FUNDPortfolio of Investments and Other Net Assets as at 31 December 2021
Investments Currency Quantity/
Nominal Value
Market Value
USD
% of Net
Assets0
Transferable securities and money market instruments admitted to an official
exchange listing
Bonds
Angola
Angola Government Bond, Reg. S 8% 26/11/2029 USD 20,000,000 19,792,000 0.50
Angola Government Bond, Reg. S 9.125% 26/11/2049 USD 10,000,000 9,626,750 0.25
29,418,750 0.75
Argentina
Argentina Government Bond, STEP 0.5% 09/07/2030 USD 20,000,000 7,030,000 0.18
Argentina Government Bond, STEP 1.125% 09/07/2035 USD 80,000,000 25,500,000 0.65
Argentina Government Bond, STEP 2.5% 09/07/2041 USD 35,000,000 12,407,500 0.31
Argentina Government Bond, STEP 1.125% 09/07/2046 USD 70,000,000 22,627,500 0.58
67,565,000 1.72
Benin
Benin Government International Bond, Reg. S 4.95% 22/01/2035 EUR 20,000,000 21,737,216 0.55
21,737,216 0.55
Brazil
Brazil Government Bond 4.75% 14/01/2050 USD 20,000,000 17,770,000 0.45
17,770,000 0.45
Canada
Petronas Energy Canada Ltd., Reg. S 2.112% 23/03/2028 USD 25,000,000 25,033,473 0.64
25,033,473 0.64
Cayman Islands
KSA Sukuk Ltd., Reg. S 3.628% 20/04/2027 USD 70,000,000 75,985,350 1.93
KSA Sukuk Ltd., Reg. S 2.25% 17/05/2031 USD 37,288,000 37,024,262 0.94
QNB Finance Ltd., Reg. S 1.625% 22/09/2025 USD 40,209,000 39,992,877 1.02
SA Global Sukuk Ltd., Reg. S 2.694% 17/06/2031 USD 18,720,000 18,871,257 0.48
Sharjah Sukuk Program Ltd., Reg. S 3.854% 03/04/2026 USD 29,000,000 30,695,485 0.78
Sharjah Sukuk Program Ltd., Reg. S 3.234% 23/10/2029 USD 15,000,000 15,214,770 0.39
217,784,001 5.54
Chile
Chile Government Bond 2.55% 27/07/2033 USD 30,000,000 29,281,875 0.75
Chile Government Bond 3.1% 07/05/2041 USD 30,000,000 29,415,000 0.75
Chile Government Bond 3.1% 22/01/2061 USD 42,000,000 38,960,460 0.99
Chile Government Bond 3.25% 21/09/2071 USD 26,659,000 24,766,211 0.63
122,423,546 3.12
Investments Currency Quantity/
Nominal Value
Market Value
USD
% of Net
Assets0
Colombia
Colombia Government Bond 3.875% 25/04/2027 USD 47,500,000 47,832,500 1.22
Colombia Government Bond 3.25% 22/04/2032 USD 40,000,000 36,060,000 0.92
Colombia Government Bond 5% 15/06/2045 USD 20,000,000 18,105,000 0.46
Colombia Government Bond 3.875% 15/02/2061 USD 85,000,000 65,369,473 1.66
167,366,973 4.26
Croatia
Hrvatska Elektroprivreda, Reg. S 5.875% 23/10/2022 USD 46,189,000 47,795,592 1.22
47,795,592 1.22
Dominican Republic
Dominican Republic Government Bond, Reg. S 5.5% 27/01/2025 USD 15,000,000 16,252,650 0.41
Dominican Republic Government Bond, Reg. S 4.5% 30/01/2030 USD 28,000,000 28,525,000 0.73
Dominican Republic Government Bond, Reg. S 4.875% 23/09/2032 USD 37,000,000 37,693,750 0.96
Dominican Republic Government Bond, Reg. S 5.875% 30/01/2060 USD 25,000,000 24,093,750 0.61
106,565,150 2.71
Ecuador
Ecuador Government Bond, STEP, Reg. S 5% 31/07/2030 USD 15,000,000 12,468,750 0.32
Ecuador Government Bond, STEP, Reg. S 1% 31/07/2035 USD 48,000,000 31,740,000 0.81
Ecuador Government Bond, STEP, Reg. S 0.5% 31/07/2040 USD 23,000,000 13,526,875 0.34
57,735,625 1.47
Egypt
Egypt Government Bond, Reg. S 5.875% 16/02/2031 USD 10,000,000 8,892,900 0.23
Egypt Government Bond, Reg. S 7.3% 30/09/2033 USD 5,000,000 4,617,900 0.12
Egypt Government Bond, Reg. S 8.5% 31/01/2047 USD 5,000,000 4,446,890 0.11
Egypt Government Bond, Reg. S 8.875% 29/05/2050 USD 20,000,000 18,216,200 0.46
Egypt Government Bond, Reg. S 8.75% 30/09/2051 USD 20,000,000 17,945,600 0.46
54,119,490 1.38
El Salvador
El Salvador Government Bond, Reg. S 7.65% 15/06/2035 USD 7,000,000 4,035,360 0.10
El Salvador Government Bond, Reg. S 7.125% 20/01/2050 USD 58,750,000 32,385,938 0.83
36,421,298 0.93
Gabon
Gabon Government Bond, Reg. S 7% 24/11/2031 USD 25,000,000 24,562,500 0.63
24,562,500 0.63
Ghana
Ghana Government Bond, Reg. S 7.625% 16/05/2029 USD 10,000,000 8,365,000 0.21

Aviva Investors Société d’investissement à capital variable (SICAV)
avivainvestors.com Annual Report and audited financial statements 27
AVIVA INVESTORS - EMERGING MARKETS BOND FUND (CONTINUED)Portfolio of Investments and Other Net Assets as at 31 December 2021
The accompanying notes form an integral part of these financial statements.
Investments Currency Quantity/
Nominal Value
Market Value
USD
% of Net
Assets0
Ghana Government Bond, Reg. S 8.625% 07/04/2034 USD 10,000,000 8,157,180 0.21
Ghana Government Bond, Reg. S 7.875% 11/02/2035 USD 15,000,000 11,812,875 0.30
28,335,055 0.72
Hong Kong
CNAC HK Finbridge Co. Ltd., Reg. S 3.375% 19/06/2024 USD 26,800,000 27,769,904 0.71
CNAC HK Finbridge Co. Ltd., Reg. S 3% 22/09/2030 USD 35,000,000 35,487,725 0.90
63,257,629 1.61
Indonesia
Indonesia Government Bond 4.1% 24/04/2028 USD 16,000,000 17,872,833 0.45
Indonesia Government Bond 4.35% 11/01/2048 USD 17,000,000 19,461,269 0.50
Indonesia Government Bond 3.2% 23/09/2061 USD 10,000,000 9,626,726 0.24
Indonesia Government Bond 3.35% 12/03/2071 USD 20,000,000 19,429,497 0.49
Indonesia Government Bond, Reg. S 4.75% 08/01/2026 USD 15,000,000 16,769,175 0.43
Indonesia Government Bond, Reg. S 4.35% 08/01/2027 USD 30,000,000 33,445,500 0.85
Indonesia Government Bond, Reg. S 3.85% 18/07/2027 USD 20,000,000 21,907,630 0.56
Indonesia Government Bond, Reg. S 4.75% 18/07/2047 USD 12,346,000 14,953,625 0.38
Pertamina Persero PT, Reg. S 4.875% 03/05/2022 USD 17,000,000 17,236,496 0.44
Pertamina Persero PT, Reg. S 1.4% 09/02/2026 USD 31,000,000 30,181,120 0.77
Pertamina Persero PT, Reg. S 4.15% 25/02/2060 USD 42,000,000 42,307,815 1.08
Perusahaan Penerbit SBSN Indonesia III, Reg. S 4.4% 01/03/2028 USD 20,000,000 22,603,400 0.58
265,795,086 6.77
Ireland
Gtlk Europe Capital DAC, Reg. S 4.8% 26/02/2028 USD 20,000,000 20,107,040 0.51
Gtlk Europe Capital DAC, Reg. S 4.349% 27/02/2029 USD 17,000,000 16,571,600 0.42
36,678,640 0.93
Ivory Coast
Ivory Coast Government Bond, Reg. S 5.875% 17/10/2031 EUR 15,000,000 17,519,619 0.45
Ivory Coast Government Bond, Reg. S 4.875% 30/01/2032 EUR 60,000,000 65,679,103 1.67
Ivory Coast Government Bond, Reg. S 6.125% 15/06/2033 USD 25,000,000 26,394,750 0.67
109,593,472 2.79
Jersey
Galaxy Pipeline Assets Bidco Ltd., Reg. S 2.16% 31/03/2034 USD 20,000,000 19,643,754 0.50
Investments Currency Quantity/
Nominal Value
Market Value
USD
% of Net
Assets0
Galaxy Pipeline Assets Bidco Ltd., Reg. S 2.625% 31/03/2036 USD 27,300,000 26,742,305 0.68
46,386,059 1.18
Kazakhstan
KazMunayGas National Co. JSC, Reg. S 4.75% 24/04/2025 USD 30,000,000 32,664,180 0.83
KazMunayGas National Co. JSC, Reg. S 4.75% 19/04/2027 USD 15,000,000 16,593,000 0.42
49,257,180 1.25
Kenya
Kenya Government Bond, Reg. S 6.875% 24/06/2024 USD 45,000,000 47,653,380 1.21
Kenya Government Bond, Reg. S 7% 22/05/2027 USD 35,000,000 37,046,100 0.94
Kenya Government Bond, Reg. S 7.25% 28/02/2028 USD 20,000,000 21,577,200 0.55
106,276,680 2.70
Lebanon
Lebanon Government Bond, Reg. S 6.65% 22/04/2024^ USD 7,952,000 856,828 0.02
Lebanon Government Bond, Reg. S 6.6% 27/11/2026^ USD 10,000,000 1,080,000 0.03
Lebanon Government Bond, Reg. S 7% 23/03/2032^ USD 15,000,000 1,624,500 0.04
3,561,328 0.09
Malaysia
Petronas Capital Ltd., Reg. S 2.48% 28/01/2032 USD 50,000,000 50,242,108 1.28
50,242,108 1.28
Mexico
Mexico Government Bond 2.659% 24/05/2031 USD 20,000,000 19,520,200 0.50
Mexico Government Bond 4.28% 14/08/2041 USD 30,000,000 31,050,000 0.79
Mexico Government Bond 3.771% 24/05/2061 USD 50,000,000 45,857,750 1.17
Petroleos Mexicanos 6.75% 21/09/2047 USD 65,000,000 57,653,375 1.47
Petroleos Mexicanos 7.69% 23/01/2050 USD 16,000,000 15,471,600 0.39
Petroleos Mexicanos 6.95% 28/01/2060 USD 46,400,000 41,318,040 1.05
210,870,965 5.37
Morocco
Morocco Government Bond, Reg. S 4% 15/12/2050 USD 28,000,000 25,480,000 0.65
25,480,000 0.65
Netherlands
Petrobras Global Finance BV 5.999% 27/01/2028 USD 20,000,000 21,835,500 0.56
21,835,500 0.56
Nigeria
Nigeria Government Bond, Reg. S 6.125% 28/09/2028 USD 22,000,000 21,300,290 0.54
Nigeria Government Bond, Reg. S 7.875% 16/02/2032 USD 25,000,000 24,698,250 0.63
Nigeria Government Bond, Reg. S 7.375% 28/09/2033 USD 35,000,000 33,452,300 0.85
Nigeria Government Bond, Reg. S 7.625% 28/11/2047 USD 7,000,000 6,284,460 0.16
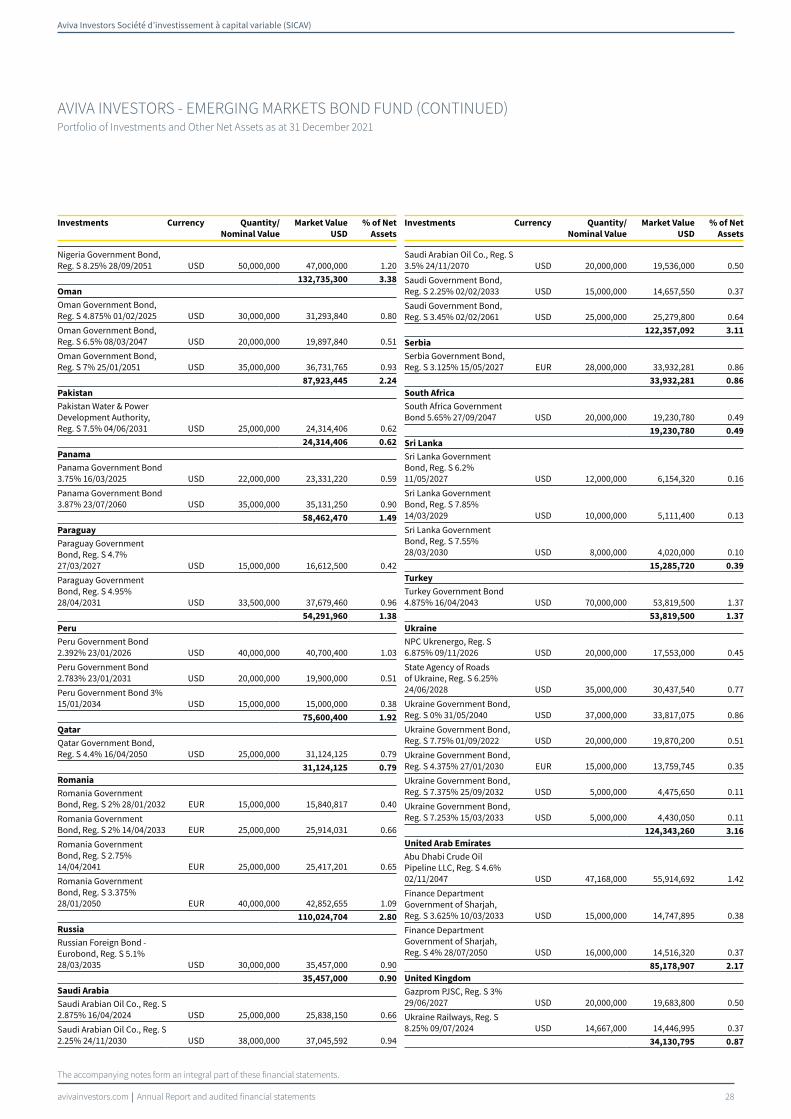
Aviva Investors Société d’investissement à capital variable (SICAV)
avivainvestors.com Annual Report and audited financial statements 28
AVIVA INVESTORS - EMERGING MARKETS BOND FUND (CONTINUED)Portfolio of Investments and Other Net Assets as at 31 December 2021
The accompanying notes form an integral part of these financial statements.
Investments Currency Quantity/
Nominal Value
Market Value
USD
% of Net
Assets0
Nigeria Government Bond, Reg. S 8.25% 28/09/2051 USD 50,000,000 47,000,000 1.20
132,735,300 3.38
Oman
Oman Government Bond, Reg. S 4.875% 01/02/2025 USD 30,000,000 31,293,840 0.80
Oman Government Bond, Reg. S 6.5% 08/03/2047 USD 20,000,000 19,897,840 0.51
Oman Government Bond, Reg. S 7% 25/01/2051 USD 35,000,000 36,731,765 0.93
87,923,445 2.24
Pakistan
Pakistan Water & Power Development Authority, Reg. S 7.5% 04/06/2031 USD 25,000,000 24,314,406 0.62
24,314,406 0.62
Panama
Panama Government Bond 3.75% 16/03/2025 USD 22,000,000 23,331,220 0.59
Panama Government Bond 3.87% 23/07/2060 USD 35,000,000 35,131,250 0.90
58,462,470 1.49
Paraguay
Paraguay Government Bond, Reg. S 4.7% 27/03/2027 USD 15,000,000 16,612,500 0.42
Paraguay Government Bond, Reg. S 4.95% 28/04/2031 USD 33,500,000 37,679,460 0.96
54,291,960 1.38
Peru
Peru Government Bond 2.392% 23/01/2026 USD 40,000,000 40,700,400 1.03
Peru Government Bond 2.783% 23/01/2031 USD 20,000,000 19,900,000 0.51
Peru Government Bond 3% 15/01/2034 USD 15,000,000 15,000,000 0.38
75,600,400 1.92
Qatar
Qatar Government Bond, Reg. S 4.4% 16/04/2050 USD 25,000,000 31,124,125 0.79
31,124,125 0.79
Romania
Romania Government Bond, Reg. S 2% 28/01/2032 EUR 15,000,000 15,840,817 0.40
Romania Government Bond, Reg. S 2% 14/04/2033 EUR 25,000,000 25,914,031 0.66
Romania Government Bond, Reg. S 2.75% 14/04/2041 EUR 25,000,000 25,417,201 0.65
Romania Government Bond, Reg. S 3.375% 28/01/2050 EUR 40,000,000 42,852,655 1.09
110,024,704 2.80
Russia
Russian Foreign Bond - Eurobond, Reg. S 5.1% 28/03/2035 USD 30,000,000 35,457,000 0.90
35,457,000 0.90
Saudi Arabia
Saudi Arabian Oil Co., Reg. S 2.875% 16/04/2024 USD 25,000,000 25,838,150 0.66
Saudi Arabian Oil Co., Reg. S 2.25% 24/11/2030 USD 38,000,000 37,045,592 0.94
Investments Currency Quantity/
Nominal Value
Market Value
USD
% of Net
Assets0
Saudi Arabian Oil Co., Reg. S 3.5% 24/11/2070 USD 20,000,000 19,536,000 0.50
Saudi Government Bond, Reg. S 2.25% 02/02/2033 USD 15,000,000 14,657,550 0.37
Saudi Government Bond, Reg. S 3.45% 02/02/2061 USD 25,000,000 25,279,800 0.64
122,357,092 3.11
Serbia
Serbia Government Bond, Reg. S 3.125% 15/05/2027 EUR 28,000,000 33,932,281 0.86
33,932,281 0.86
South Africa
South Africa Government Bond 5.65% 27/09/2047 USD 20,000,000 19,230,780 0.49
19,230,780 0.49
Sri Lanka
Sri Lanka Government Bond, Reg. S 6.2% 11/05/2027 USD 12,000,000 6,154,320 0.16
Sri Lanka Government Bond, Reg. S 7.85% 14/03/2029 USD 10,000,000 5,111,400 0.13
Sri Lanka Government Bond, Reg. S 7.55% 28/03/2030 USD 8,000,000 4,020,000 0.10
15,285,720 0.39
Turkey
Turkey Government Bond 4.875% 16/04/2043 USD 70,000,000 53,819,500 1.37
53,819,500 1.37
Ukraine
NPC Ukrenergo, Reg. S 6.875% 09/11/2026 USD 20,000,000 17,553,000 0.45
State Agency of Roads of Ukraine, Reg. S 6.25% 24/06/2028 USD 35,000,000 30,437,540 0.77
Ukraine Government Bond, Reg. S 0% 31/05/2040 USD 37,000,000 33,817,075 0.86
Ukraine Government Bond, Reg. S 7.75% 01/09/2022 USD 20,000,000 19,870,200 0.51
Ukraine Government Bond, Reg. S 4.375% 27/01/2030 EUR 15,000,000 13,759,745 0.35
Ukraine Government Bond, Reg. S 7.375% 25/09/2032 USD 5,000,000 4,475,650 0.11
Ukraine Government Bond, Reg. S 7.253% 15/03/2033 USD 5,000,000 4,430,050 0.11
124,343,260 3.16
United Arab Emirates
Abu Dhabi Crude Oil Pipeline LLC, Reg. S 4.6% 02/11/2047 USD 47,168,000 55,914,692 1.42
Finance Department Government of Sharjah, Reg. S 3.625% 10/03/2033 USD 15,000,000 14,747,895 0.38
Finance Department Government of Sharjah, Reg. S 4% 28/07/2050 USD 16,000,000 14,516,320 0.37
85,178,907 2.17
United Kingdom
Gazprom PJSC, Reg. S 3% 29/06/2027 USD 20,000,000 19,683,800 0.50
Ukraine Railways, Reg. S 8.25% 09/07/2024 USD 14,667,000 14,446,995 0.37
34,130,795 0.87
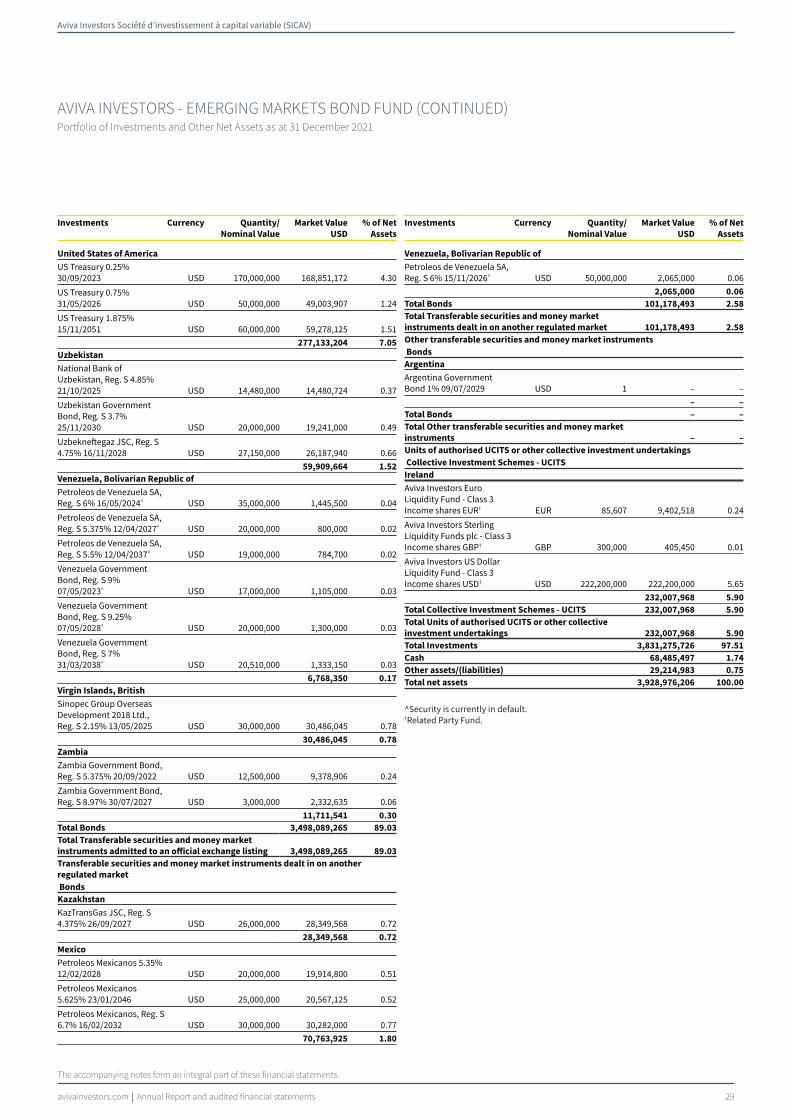
Aviva Investors Société d’investissement à capital variable (SICAV)
avivainvestors.com Annual Report and audited financial statements 29
AVIVA INVESTORS - EMERGING MARKETS BOND FUND (CONTINUED)Portfolio of Investments and Other Net Assets as at 31 December 2021
The accompanying notes form an integral part of these financial statements.
Investments Currency Quantity/
Nominal Value
Market Value
USD
% of Net
Assets0
United States of America
US Treasury 0.25% 30/09/2023 USD 170,000,000 168,851,172 4.30
US Treasury 0.75% 31/05/2026 USD 50,000,000 49,003,907 1.24
US Treasury 1.875% 15/11/2051 USD 60,000,000 59,278,125 1.51
277,133,204 7.05
Uzbekistan
National Bank of Uzbekistan, Reg. S 4.85% 21/10/2025 USD 14,480,000 14,480,724 0.37
Uzbekistan Government Bond, Reg. S 3.7% 25/11/2030 USD 20,000,000 19,241,000 0.49
Uzbekneftegaz JSC, Reg. S 4.75% 16/11/2028 USD 27,150,000 26,187,940 0.66
59,909,664 1.52
Venezuela, Bolivarian Republic of
Petroleos de Venezuela SA, Reg. S 6% 16/05/2024^ USD 35,000,000 1,445,500 0.04
Petroleos de Venezuela SA, Reg. S 5.375% 12/04/2027^ USD 20,000,000 800,000 0.02
Petroleos de Venezuela SA, Reg. S 5.5% 12/04/2037^ USD 19,000,000 784,700 0.02
Venezuela Government Bond, Reg. S 9% 07/05/2023^ USD 17,000,000 1,105,000 0.03
Venezuela Government Bond, Reg. S 9.25% 07/05/2028^ USD 20,000,000 1,300,000 0.03
Venezuela Government Bond, Reg. S 7% 31/03/2038^ USD 20,510,000 1,333,150 0.03
6,768,350 0.17
Virgin Islands, British
Sinopec Group Overseas Development 2018 Ltd., Reg. S 2.15% 13/05/2025 USD 30,000,000 30,486,045 0.78
30,486,045 0.78
Zambia
Zambia Government Bond, Reg. S 5.375% 20/09/2022 USD 12,500,000 9,378,906 0.24
Zambia Government Bond, Reg. S 8.97% 30/07/2027 USD 3,000,000 2,332,635 0.06
11,711,541 0.30
Total Bonds 3,498,089,265 89.03
Total Transferable securities and money market
instruments admitted to an official exchange listing 3,498,089,265 89.03
Transferable securities and money market instruments dealt in on another
regulated market
Bonds
Kazakhstan
KazTransGas JSC, Reg. S 4.375% 26/09/2027 USD 26,000,000 28,349,568 0.72
28,349,568 0.72
Mexico
Petroleos Mexicanos 5.35% 12/02/2028 USD 20,000,000 19,914,800 0.51
Petroleos Mexicanos 5.625% 23/01/2046 USD 25,000,000 20,567,125 0.52
Petroleos Mexicanos, Reg. S 6.7% 16/02/2032 USD 30,000,000 30,282,000 0.77
70,763,925 1.80
Investments Currency Quantity/
Nominal Value
Market Value
USD
% of Net
Assets0
Venezuela, Bolivarian Republic of
Petroleos de Venezuela SA, Reg. S 6% 15/11/2026^ USD 50,000,000 2,065,000 0.06
2,065,000 0.06
Total Bonds 101,178,493 2.58
Total Transferable securities and money market
instruments dealt in on another regulated market 101,178,493 2.58
Other transferable securities and money market instruments
Bonds
Argentina
Argentina Government Bond 1% 09/07/2029 USD 1 – –
– –
Total Bonds – –
Total Other transferable securities and money market
instruments – –
Units of authorised UCITS or other collective investment undertakings
Collective Investment Schemes - UCITS
Ireland
Aviva Investors Euro Liquidity Fund - Class 3 Income shares EUR† EUR 85,607 9,402,518 0.24
Aviva Investors Sterling Liquidity Funds plc - Class 3 Income shares GBP† GBP 300,000 405,450 0.01
Aviva Investors US Dollar Liquidity Fund - Class 3 Income shares USD† USD 222,200,000 222,200,000 5.65
232,007,968 5.90
Total Collective Investment Schemes - UCITS 232,007,968 5.90
Total Units of authorised UCITS or other collective
investment undertakings 232,007,968 5.90
Total Investments 3,831,275,726 97.51
Cash 68,485,497 1.74
Other assets/(liabilities) 29,214,983 0.75
Total net assets 3,928,976,206 100.00
^Security is currently in default.†Related Party Fund.

Aviva Investors Société d’investissement à capital variable (SICAV)
avivainvestors.com Annual Report and audited financial statements 30
AVIVA INVESTORS - EMERGING MARKETS BOND FUND (CONTINUED)Portfolio of Investments and Other Net Assets as at 31 December 2021
The accompanying notes form an integral part of these financial statements.
Geographic Allocation of Portfolio % of Net Assets
Mexico 7.17United States of America 7.05Ireland 6.83Indonesia 6.77Cayman Islands 5.54Colombia 4.26Nigeria 3.38Ukraine 3.16Chile 3.12Saudi Arabia 3.11Romania 2.80Ivory Coast 2.79Dominican Republic 2.71Kenya 2.70Oman 2.24United Arab Emirates 2.17Kazakhstan 1.97Peru 1.92Argentina 1.72Hong Kong 1.61Uzbekistan 1.52Panama 1.49Ecuador 1.47Paraguay 1.38Egypt 1.38Turkey 1.37Malaysia 1.28Croatia 1.22Jersey 1.18El Salvador 0.93Russia 0.90United Kingdom 0.87Serbia 0.86Qatar 0.79Virgin Islands, British 0.78Angola 0.75Ghana 0.72Morocco 0.65Canada 0.64Gabon 0.63Pakistan 0.62Netherlands 0.56Benin 0.55South Africa 0.49Brazil 0.45Sri Lanka 0.39Zambia 0.30Venezuela, Bolivarian Republic of 0.23Lebanon 0.09Total investments 97.51
Cash and other assets/(liabilities) 2.49Total 100.00

Aviva Investors Société d’investissement à capital variable (SICAV)
avivainvestors.com Annual Report and audited financial statements 31
AVIVA INVESTORS - EMERGING MARKETS BOND FUND (CONTINUED)Portfolio of Investments and Other Net Assets as at 31 December 2021
The accompanying notes form an integral part of these financial statements.
Forward Currency Exchange Contracts
Currency
Purchased Amount Purchased
Currency
Sold Amount Sold Maturity Date Counterparty
Unrealised Gain/
(Loss)
USD % of Net Assets
CHF 571,668 USD 618,647 11/01/2022 J.P. Morgan 7,065 –EUR 10,454,217 USD 11,801,985 11/01/2022 J.P. Morgan 58,742 –GBP 1,877,849,622 USD 2,535,272,357 11/01/2022 J.P. Morgan 2,608,475 0.07USD 2,183 CHF 1,990 11/01/2022 J.P. Morgan 5 –USD 6,382,222 EUR 5,595,778 11/01/2022 J.P. Morgan 33,588 –Total Unrealised Gain on Forward Currency Exchange Contracts - Assets 2,707,875 0.07
CHF 16,117,992 USD 17,678,794 11/01/2022 J.P. Morgan (37,059) –EUR 641,301,773 USD 741,464,836 11/01/2022 J.P. Morgan (13,882,344) (0.35)GBP 4,410,000 USD 5,967,042 11/01/2022 J.P. Morgan (7,005) –USD 5,616,617 CHF 5,179,315 11/01/2022 J.P. Morgan (52,334) –USD 38,961,984 EUR 34,481,993 11/01/2022 J.P. Morgan (159,215) –USD 290,799,626 EUR 258,102,183 16/03/2022 J.P. Morgan (2,415,451) (0.06)USD 80,074,388 GBP 59,975,689 11/01/2022 J.P. Morgan (981,704) (0.03)USD 88,421,993 MXN 1,894,794,890 16/03/2022 HSBC (3,418,584) (0.09)USD 58,070,864 THB 1,947,116,055 16/03/2022 Citibank (617,385) (0.02)USD 57,993,032 THB 1,947,116,055 16/03/2022 Goldman Sachs (695,217) (0.02)Total Unrealised Loss on Forward Currency Exchange Contracts - Liabilities (22,266,298) (0.57)
Net Unrealised Loss on Forward Currency Exchange Contracts - Liabilities (19,558,423) (0.50)
Financial Futures Contracts
Security Description
Number of
Contracts Currency
Unrealised Gain/(Loss)
USD % of Net Assets
Euro-Buxl 30 Year Bond, 08/03/2022 (250) EUR 2,649,912 0 .07
Total Unrealised Gain on Financial Futures Contracts - Assets 2,649,912 0.07
Net Unrealised Gain on Financial Futures Contracts - Assets 2,649,912 0.07

Aviva Investors Société d’investissement à capital variable (SICAV)
avivainvestors.com Annual Report and audited financial statements 32
The accompanying notes form an integral part of these financial statements.
AVIVA INVESTORS - EMERGING MARKETS CORPORATE BOND FUNDPortfolio of Investments and Other Net Assets as at 31 December 2021
Investments Currency Quantity/
Nominal Value
Market Value
USD
% of Net
Assets0
Transferable securities and money market instruments admitted to an official
exchange listing
Bonds
Argentina
YPF SA, Reg. S 6.95% 21/07/2027 USD 5,000,000 3,278,500 0.31
YPF SA, Reg. S 8.5% 27/06/2029 USD 4,000,000 2,789,700 0.26
6,068,200 0.57
Austria
Klabin Austria GmbH, Reg. S 7% 03/04/2049 USD 7,350,000 8,485,446 0.79
8,485,446 0.79
Bermuda
Inkia Energy Ltd., Reg. S 5.875% 09/11/2027 USD 8,462,000 8,812,369 0.82
Ooredoo International Finance Ltd., Reg. S 3.25% 21/02/2023 USD 8,300,000 8,518,531 0.80
17,330,900 1.62
Brazil
Light Servicos de Eletricidade SA, Reg. S 4.375% 18/06/2026 USD 9,000,000 9,032,850 0.85
9,032,850 0.85
Canada
MEGlobal Canada ULC, Reg. S 5% 18/05/2025 USD 14,000,000 15,300,810 1.43
15,300,810 1.43
Cayman Islands
Agile Group Holdings Ltd., Reg. S 5.5% 21/04/2025 USD 7,500,000 4,445,625 0.42
Anton Oilfield Services Group, Reg. S 7.5% 02/12/2022 USD 11,000,000 10,422,777 0.98
Central China Real Estate Ltd., Reg. S 7.65% 27/08/2023 USD 8,000,000 5,280,000 0.49
China Evergrande Group, Reg. S 8.75% 28/06/2025 USD 2,800,000 441,000 0.04
CIFI Holdings Group Co. Ltd., Reg. S 6% 16/07/2025 USD 3,000,000 2,910,000 0.27
Kaisa Group Holdings Ltd., Reg. S 11.95% 22/10/2022 USD 8,000,000 2,160,000 0.20
Kaisa Group Holdings Ltd., Reg. S 9.95% 23/07/2025 USD 1,700,000 450,500 0.04
Logan Group Co. Ltd., Reg. S 5.25% 23/02/2023 USD 1,500,000 1,458,750 0.14
Rakfunding Cayman Ltd., Reg. S 4.125% 09/04/2024 USD 6,903,000 7,292,398 0.68
SA Global Sukuk Ltd., Reg. S 1.602% 17/06/2026 USD 5,000,000 4,928,750 0.46
Sands China Ltd. 5.125% 08/08/2025 USD 4,000,000 4,200,700 0.39
Tencent Holdings Ltd., Reg. S 3.595% 19/01/2028 USD 5,000,000 5,310,022 0.50
Termocandelaria Power Ltd., Reg. S 7.875% 30/01/2029 USD 6,606,350 6,619,728 0.62
55,920,250 5.23
Colombia
Banco de Bogota SA, Reg. S 5.375% 19/02/2023 USD 7,025,000 7,261,532 0.68
Investments Currency Quantity/
Nominal Value
Market Value
USD
% of Net
Assets0
Ecopetrol SA 5.375% 26/06/2026 USD 8,000,000 8,427,440 0.79
Ecopetrol SA 4.625% 02/11/2031 USD 4,500,000 4,383,045 0.41
Oleoducto Central SA, Reg. S 4% 14/07/2027 USD 7,065,000 7,033,207 0.66
27,105,224 2.54
Hong Kong
Bank of East Asia Ltd. (The), Reg. S, FRN 4% 29/05/2030 USD 8,700,000 8,980,793 0.84
China CITIC Bank International Ltd., Reg. S, FRN 4.625% 28/02/2029 USD 7,758,000 8,114,582 0.76
17,095,375 1.60
India
Adani Ports & Special Economic Zone Ltd., Reg. S 4.2% 04/08/2027 USD 3,000,000 3,116,116 0.29
Power Finance Corp. Ltd., Reg. S 1.841% 21/09/2028 EUR 9,500,000 10,756,468 1.01
13,872,584 1.30
Ireland
Aragvi Finance International DAC, Reg. S 8.45% 29/04/2026 USD 12,257,000 12,608,040 1.18
Credit Bank of Moscow, Reg. S 7.625% 31/12/2164 USD 10,000,000 9,315,600 0.87
Credit Bank of Moscow, Reg. S 3.875% 21/09/2026 USD 10,000,000 9,472,500 0.89
Lukoil Capital DAC, Reg. S 2.8% 26/04/2027 USD 12,000,000 11,838,132 1.11
Lukoil Capital DAC, Reg. S 3.6% 26/10/2031 USD 7,500,000 7,329,000 0.69
PIK Securities DAC, Reg. S 5.625% 19/11/2026 USD 7,000,000 6,969,340 0.65
57,532,612 5.39
Israel
Delek Overriding Royalty Leviathan Ltd., Reg. S, 144A 7.494% 30/12/2023 USD 8,000,000 8,273,600 0.78
Leviathan Bond Ltd., Reg. S, 144A 6.5% 30/06/2027 USD 5,644,000 6,070,461 0.57
Leviathan Bond Ltd., Reg. S, 144A 6.75% 30/06/2030 USD 3,500,000 3,771,810 0.35
18,115,871 1.70
Jersey
Galaxy Pipeline Assets Bidco Ltd., Reg. S 2.16% 31/03/2034 USD 10,000,000 9,821,877 0.92
Galaxy Pipeline Assets Bidco Ltd., Reg. S 2.625% 31/03/2036 USD 7,500,000 7,346,787 0.69
17,168,664 1.61
Luxembourg
Mexico Remittances Funding Fiduciary Estate Management Sarl, Reg. S 4.875% 15/01/2028 USD 8,065,000 7,533,396 0.70
MHP Lux SA, Reg. S 6.25% 19/09/2029 USD 7,000,000 6,636,000 0.62
Millicom International Cellular SA, Reg. S 5.125% 15/01/2028 USD 6,300,000 6,540,124 0.61

Aviva Investors Société d’investissement à capital variable (SICAV)
avivainvestors.com Annual Report and audited financial statements 33
AVIVA INVESTORS - EMERGING MARKETS CORPORATE BOND FUND (CONTINUED)Portfolio of Investments and Other Net Assets as at 31 December 2021
The accompanying notes form an integral part of these financial statements.
Investments Currency Quantity/
Nominal Value
Market Value
USD
% of Net
Assets0
Sberbank of Russia, Reg. S 5.125% 29/10/2022 USD 5,300,000 5,407,442 0.51
26,116,962 2.44
Mauritius
Greenko Power II Ltd., Reg. S 4.3% 13/12/2028 USD 10,650,000 10,849,687 1.02
Network i2i Ltd., Reg. S 3.975% 31/12/2164 USD 10,000,000 10,041,900 0.94
20,891,587 1.96
Mexico
America Movil SAB de CV 3.625% 22/04/2029 USD 7,000,000 7,573,058 0.71
Banco Mercantil del Norte SA, Reg. S, FRN 6.75% Perpetual USD 4,100,000 4,251,351 0.40
Total Play Telecomunicaciones SA de CV, Reg. S 6.375% 20/09/2028 USD 10,000,000 9,493,750 0.89
21,318,159 2.00
Morocco
OCP SA, Reg. S 4.5% 22/10/2025 USD 13,000,000 13,747,266 1.29
13,747,266 1.29
Netherlands
IHS Netherlands Holdco BV, Reg. S 8% 18/09/2027 USD 8,000,000 8,492,080 0.80
Minejesa Capital BV, Reg. S 5.625% 10/08/2037 USD 7,500,000 7,848,825 0.73
Petrobras Global Finance BV 5.999% 27/01/2028 USD 7,500,000 8,188,313 0.77
Prosus NV, Reg. S 2.031% 03/08/2032 EUR 9,038,000 10,180,348 0.95
Teva Pharmaceutical Finance Netherlands III BV 6% 15/04/2024 USD 3,000,000 3,146,100 0.29
Teva Pharmaceutical Finance Netherlands III BV 5.125% 09/05/2029 USD 7,000,000 6,908,580 0.65
Vivo Energy Investments BV, Reg. S 5.125% 24/09/2027 USD 13,000,000 13,633,750 1.28
58,397,996 5.47
Oman
Bank Muscat SAOG, Reg. S 4.875% 14/03/2023 USD 10,000,000 10,275,840 0.96
National Bank of Oman SAOG, Reg. S 5.625% 25/09/2023 USD 7,275,000 7,597,974 0.71
17,873,814 1.67
Peru
Banco de Credito del Peru, Reg. S 4.65% 17/09/2024 PEN 14,611,000 3,589,413 0.34
Banco Internacional del Peru SAA Interbank, Reg. S, FRN 6.625% 19/03/2029 USD 7,230,000 7,630,289 0.71
11,219,702 1.05
Philippines
International Container Terminal Services, Inc., Reg. S 4.75% 17/06/2030 USD 6,500,000 7,120,250 0.67
7,120,250 0.67
Saudi Arabia
Saudi Arabian Oil Co., Reg. S 2.25% 24/11/2030 USD 10,000,000 9,748,840 0.91
Investments Currency Quantity/
Nominal Value
Market Value
USD
% of Net
Assets0
Saudi Arabian Oil Co., Reg. S 3.25% 24/11/2050 USD 5,000,000 4,884,475 0.46
Saudi Arabian Oil Co., Reg. S 3.5% 24/11/2070 USD 7,000,000 6,837,600 0.64
21,470,915 2.01
Singapore
Temasek Financial I Ltd., Reg. S 2.5% 06/10/2070 USD 14,750,000 13,723,462 1.28
13,723,462 1.28
South Africa
Absa Group Ltd., Reg. S 6.375% Perpetual USD 12,250,000 12,505,167 1.17
12,505,167 1.17
Spain
AI Candelaria Spain SLU, Reg. S 7.5% 15/12/2028 USD 6,909,000 7,394,392 0.69
7,394,392 0.69
Thailand
Bangkok Bank PCL, Reg. S 3.466% 23/09/2036 USD 7,120,000 7,139,954 0.67
7,139,954 0.67
Turkey
Aydem Yenilenebilir Enerji A/S, Reg. S 7.75% 02/02/2027 USD 5,500,000 4,509,065 0.42
Limak Iskenderun Uluslararasi Liman Isletmeciligi A/S, Reg. S 9.5% 10/07/2036 USD 8,000,000 7,415,136 0.69
Zorlu Yenilenebilir Enerji A/S, Reg. S 9% 01/06/2026 USD 5,000,000 4,152,850 0.39
16,077,051 1.50
Ukraine
State Agency of Roads of Ukraine, Reg. S 6.25% 24/06/2028 USD 10,000,000 8,696,440 0.81
8,696,440 0.81
United Arab Emirates
Abu Dhabi Crude Oil Pipeline LLC, Reg. S 4.6% 02/11/2047 USD 10,635,000 12,607,122 1.18
Emirates NBD Bank PJSC, Reg. S, FRN 6.125% Perpetual USD 5,000,000 5,250,875 0.49
Emirates NBD Bank PJSC, Reg. S 6.125% 31/12/2164 USD 7,000,000 7,519,225 0.70
Tabreed Sukuk Spc Ltd., Reg. S 5.5% 31/10/2025 USD 6,880,000 7,785,580 0.73
33,162,802 3.10
United Kingdom
Energean plc, Reg. S 6.5% 30/04/2027 USD 6,000,000 5,982,780 0.56
Gazprom PJSC, Reg. S 3.5% 14/07/2031 USD 8,000,000 7,736,992 0.72
NAK Naftogaz Ukraine, Reg. S 7.125% 19/07/2024 EUR 6,700,000 6,887,813 0.65
Prudential plc, Reg. S 2.95% 03/11/2033 USD 12,165,000 12,050,953 1.13
Vedanta Resources Ltd., Reg. S 7.125% 31/05/2023 USD 1,500,000 1,448,325 0.14
Vedanta Resources Ltd., Reg. S 6.125% 09/08/2024 USD 1,500,000 1,306,875 0.12
35,413,738 3.32
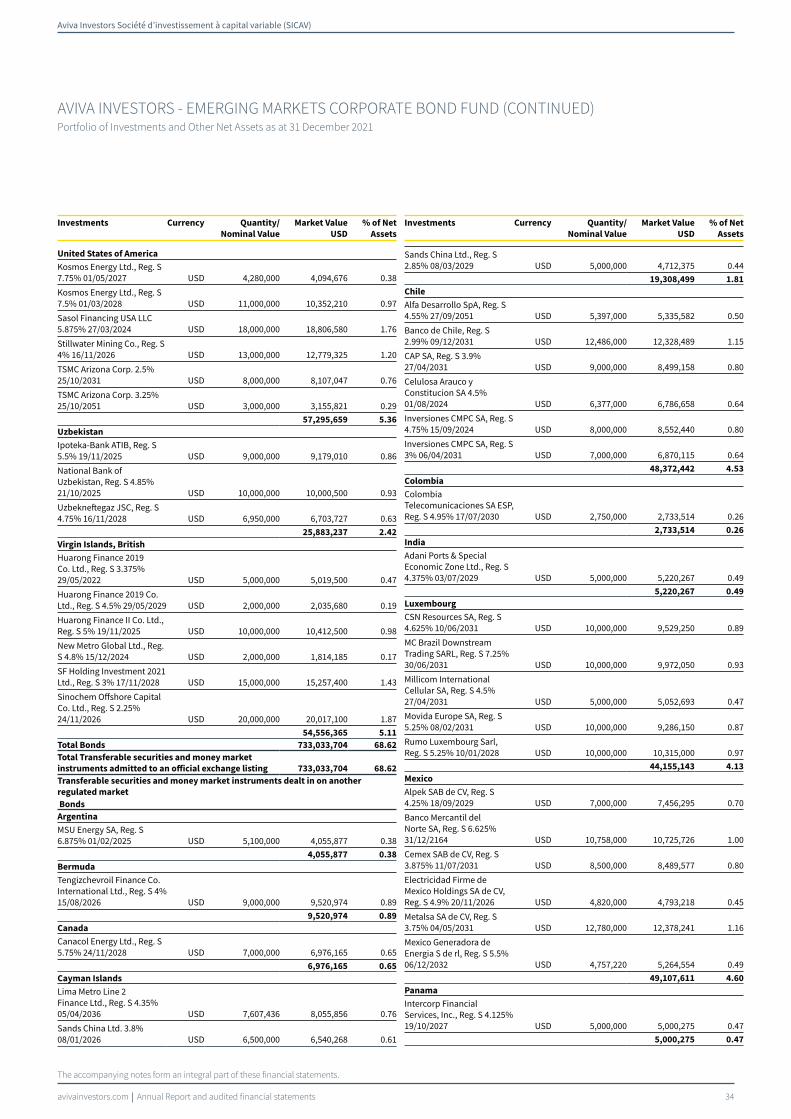
Aviva Investors Société d’investissement à capital variable (SICAV)
avivainvestors.com Annual Report and audited financial statements 34
AVIVA INVESTORS - EMERGING MARKETS CORPORATE BOND FUND (CONTINUED)Portfolio of Investments and Other Net Assets as at 31 December 2021
The accompanying notes form an integral part of these financial statements.
Investments Currency Quantity/
Nominal Value
Market Value
USD
% of Net
Assets0
United States of America
Kosmos Energy Ltd., Reg. S 7.75% 01/05/2027 USD 4,280,000 4,094,676 0.38
Kosmos Energy Ltd., Reg. S 7.5% 01/03/2028 USD 11,000,000 10,352,210 0.97
Sasol Financing USA LLC 5.875% 27/03/2024 USD 18,000,000 18,806,580 1.76
Stillwater Mining Co., Reg. S 4% 16/11/2026 USD 13,000,000 12,779,325 1.20
TSMC Arizona Corp. 2.5% 25/10/2031 USD 8,000,000 8,107,047 0.76
TSMC Arizona Corp. 3.25% 25/10/2051 USD 3,000,000 3,155,821 0.29
57,295,659 5.36
Uzbekistan
Ipoteka-Bank ATIB, Reg. S 5.5% 19/11/2025 USD 9,000,000 9,179,010 0.86
National Bank of Uzbekistan, Reg. S 4.85% 21/10/2025 USD 10,000,000 10,000,500 0.93
Uzbekneftegaz JSC, Reg. S 4.75% 16/11/2028 USD 6,950,000 6,703,727 0.63
25,883,237 2.42
Virgin Islands, British
Huarong Finance 2019 Co. Ltd., Reg. S 3.375% 29/05/2022 USD 5,000,000 5,019,500 0.47
Huarong Finance 2019 Co. Ltd., Reg. S 4.5% 29/05/2029 USD 2,000,000 2,035,680 0.19
Huarong Finance II Co. Ltd., Reg. S 5% 19/11/2025 USD 10,000,000 10,412,500 0.98
New Metro Global Ltd., Reg. S 4.8% 15/12/2024 USD 2,000,000 1,814,185 0.17
SF Holding Investment 2021 Ltd., Reg. S 3% 17/11/2028 USD 15,000,000 15,257,400 1.43
Sinochem Offshore Capital Co. Ltd., Reg. S 2.25% 24/11/2026 USD 20,000,000 20,017,100 1.87
54,556,365 5.11
Total Bonds 733,033,704 68.62
Total Transferable securities and money market
instruments admitted to an official exchange listing 733,033,704 68.62
Transferable securities and money market instruments dealt in on another
regulated market
Bonds
Argentina
MSU Energy SA, Reg. S 6.875% 01/02/2025 USD 5,100,000 4,055,877 0.38
4,055,877 0.38
Bermuda
Tengizchevroil Finance Co. International Ltd., Reg. S 4% 15/08/2026 USD 9,000,000 9,520,974 0.89
9,520,974 0.89
Canada
Canacol Energy Ltd., Reg. S 5.75% 24/11/2028 USD 7,000,000 6,976,165 0.65
6,976,165 0.65
Cayman Islands
Lima Metro Line 2 Finance Ltd., Reg. S 4.35% 05/04/2036 USD 7,607,436 8,055,856 0.76
Sands China Ltd. 3.8% 08/01/2026 USD 6,500,000 6,540,268 0.61
Investments Currency Quantity/
Nominal Value
Market Value
USD
% of Net
Assets0
Sands China Ltd., Reg. S 2.85% 08/03/2029 USD 5,000,000 4,712,375 0.44
19,308,499 1.81
Chile
Alfa Desarrollo SpA, Reg. S 4.55% 27/09/2051 USD 5,397,000 5,335,582 0.50
Banco de Chile, Reg. S 2.99% 09/12/2031 USD 12,486,000 12,328,489 1.15
CAP SA, Reg. S 3.9% 27/04/2031 USD 9,000,000 8,499,158 0.80
Celulosa Arauco y Constitucion SA 4.5% 01/08/2024 USD 6,377,000 6,786,658 0.64
Inversiones CMPC SA, Reg. S 4.75% 15/09/2024 USD 8,000,000 8,552,440 0.80
Inversiones CMPC SA, Reg. S 3% 06/04/2031 USD 7,000,000 6,870,115 0.64
48,372,442 4.53
Colombia
Colombia Telecomunicaciones SA ESP, Reg. S 4.95% 17/07/2030 USD 2,750,000 2,733,514 0.26
2,733,514 0.26
India
Adani Ports & Special Economic Zone Ltd., Reg. S 4.375% 03/07/2029 USD 5,000,000 5,220,267 0.49
5,220,267 0.49
Luxembourg
CSN Resources SA, Reg. S 4.625% 10/06/2031 USD 10,000,000 9,529,250 0.89
MC Brazil Downstream Trading SARL, Reg. S 7.25% 30/06/2031 USD 10,000,000 9,972,050 0.93
Millicom International Cellular SA, Reg. S 4.5% 27/04/2031 USD 5,000,000 5,052,693 0.47
Movida Europe SA, Reg. S 5.25% 08/02/2031 USD 10,000,000 9,286,150 0.87
Rumo Luxembourg Sarl, Reg. S 5.25% 10/01/2028 USD 10,000,000 10,315,000 0.97
44,155,143 4.13
Mexico
Alpek SAB de CV, Reg. S 4.25% 18/09/2029 USD 7,000,000 7,456,295 0.70
Banco Mercantil del Norte SA, Reg. S 6.625% 31/12/2164 USD 10,758,000 10,725,726 1.00
Cemex SAB de CV, Reg. S 3.875% 11/07/2031 USD 8,500,000 8,489,577 0.80
Electricidad Firme de Mexico Holdings SA de CV, Reg. S 4.9% 20/11/2026 USD 4,820,000 4,793,218 0.45
Metalsa SA de CV, Reg. S 3.75% 04/05/2031 USD 12,780,000 12,378,241 1.16
Mexico Generadora de Energia S de rl, Reg. S 5.5% 06/12/2032 USD 4,757,220 5,264,554 0.49
49,107,611 4.60
Panama
Intercorp Financial Services, Inc., Reg. S 4.125% 19/10/2027 USD 5,000,000 5,000,275 0.47
5,000,275 0.47
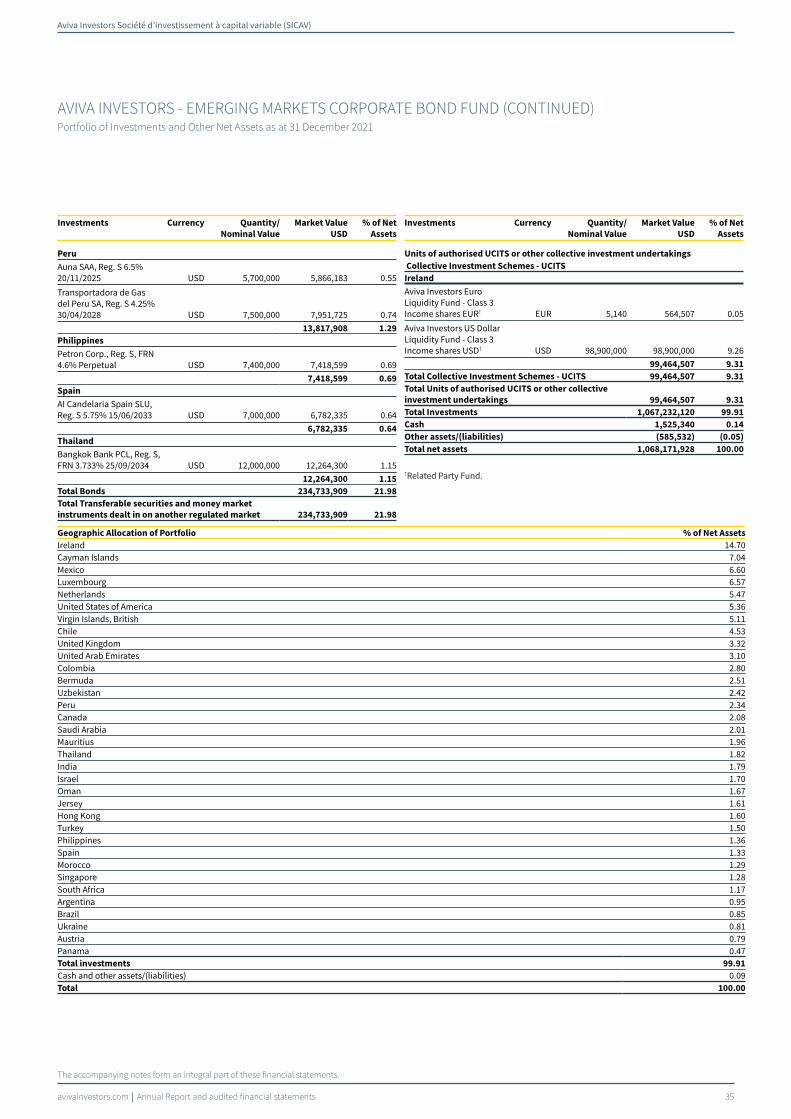
Aviva Investors Société d’investissement à capital variable (SICAV)
avivainvestors.com Annual Report and audited financial statements 35
AVIVA INVESTORS - EMERGING MARKETS CORPORATE BOND FUND (CONTINUED)Portfolio of Investments and Other Net Assets as at 31 December 2021
The accompanying notes form an integral part of these financial statements.
Investments Currency Quantity/
Nominal Value
Market Value
USD
% of Net
Assets0
Peru
Auna SAA, Reg. S 6.5% 20/11/2025 USD 5,700,000 5,866,183 0.55
Transportadora de Gas del Peru SA, Reg. S 4.25% 30/04/2028 USD 7,500,000 7,951,725 0.74
13,817,908 1.29
Philippines
Petron Corp., Reg. S, FRN 4.6% Perpetual USD 7,400,000 7,418,599 0.69
7,418,599 0.69
Spain
AI Candelaria Spain SLU, Reg. S 5.75% 15/06/2033 USD 7,000,000 6,782,335 0.64
6,782,335 0.64
Thailand
Bangkok Bank PCL, Reg. S, FRN 3.733% 25/09/2034 USD 12,000,000 12,264,300 1.15
12,264,300 1.15
Total Bonds 234,733,909 21.98
Total Transferable securities and money market
instruments dealt in on another regulated market 234,733,909 21.98
Investments Currency Quantity/
Nominal Value
Market Value
USD
% of Net
Assets0
Units of authorised UCITS or other collective investment undertakings
Collective Investment Schemes - UCITS
Ireland
Aviva Investors Euro Liquidity Fund - Class 3 Income shares EUR† EUR 5,140 564,507 0.05
Aviva Investors US Dollar Liquidity Fund - Class 3 Income shares USD† USD 98,900,000 98,900,000 9.26
99,464,507 9.31
Total Collective Investment Schemes - UCITS 99,464,507 9.31
Total Units of authorised UCITS or other collective
investment undertakings 99,464,507 9.31
Total Investments 1,067,232,120 99.91
Cash 1,525,340 0.14
Other assets/(liabilities) (585,532) (0.05)
Total net assets 1,068,171,928 100.00
†Related Party Fund.
Geographic Allocation of Portfolio % of Net Assets
Ireland 14.70Cayman Islands 7.04Mexico 6.60Luxembourg 6.57Netherlands 5.47United States of America 5.36Virgin Islands, British 5.11Chile 4.53United Kingdom 3.32United Arab Emirates 3.10Colombia 2.80Bermuda 2.51Uzbekistan 2.42Peru 2.34Canada 2.08Saudi Arabia 2.01Mauritius 1.96Thailand 1.82India 1.79Israel 1.70Oman 1.67Jersey 1.61Hong Kong 1.60Turkey 1.50Philippines 1.36Spain 1.33Morocco 1.29Singapore 1.28South Africa 1.17Argentina 0.95Brazil 0.85Ukraine 0.81Austria 0.79Panama 0.47Total investments 99.91
Cash and other assets/(liabilities) 0.09Total 100.00

Aviva Investors Société d’investissement à capital variable (SICAV)
avivainvestors.com Annual Report and audited financial statements 36
AVIVA INVESTORS - EMERGING MARKETS CORPORATE BOND FUND (CONTINUED)Portfolio of Investments and Other Net Assets as at 31 December 2021
The accompanying notes form an integral part of these financial statements.
Forward Currency Exchange Contracts
Currency
Purchased Amount Purchased
Currency
Sold Amount Sold Maturity Date Counterparty
Unrealised Gain/
(Loss)
USD % of Net Assets
EUR 1,180,930 USD 1,332,693 11/01/2022 J.P. Morgan 7,119 –GBP 405,074,831 USD 547,036,845 11/01/2022 J.P. Morgan 414,685 0.04USD 1,537,469 EUR 1,328,879 11/01/2022 J.P. Morgan 29,803 –Total Unrealised Gain on Forward Currency Exchange Contracts - Assets 451,607 0.04
EUR 433,532,835 USD 500,991,239 11/01/2022 J.P. Morgan (9,130,911) (0.85)GBP 2,628,000 USD 3,555,618 11/01/2022 J.P. Morgan (3,922) –USD 5,480,696 EUR 4,861,809 11/01/2022 J.P. Morgan (35,220) –USD 28,186,726 EUR 25,017,417 16/03/2022 J.P. Morgan (234,126) (0.02)USD 4,242,194 GBP 3,179,156 11/01/2022 J.P. Morgan (54,380) (0.01)USD 24,302,051 MXN 520,768,660 16/03/2022 HSBC (939,570) (0.09)USD 3,920,020 PEN 16,078,748 16/03/2022 HSBC (98,534) (0.01)USD 7,953,668 THB 266,686,473 16/03/2022 Citibank (84,560) (0.01)USD 7,943,007 THB 266,686,474 16/03/2022 Goldman Sachs (95,220) (0.01)Total Unrealised Loss on Forward Currency Exchange Contracts - Liabilities (10,676,443) (1.00)
Net Unrealised Loss on Forward Currency Exchange Contracts - Liabilities (10,224,836) (0.96)
Financial Futures Contracts
Security Description
Number of
Contracts Currency
Unrealised Gain/(Loss)
USD % of Net Assets
US 10 Year Note, 22/03/2022 (187) USD 27,758 –
Total Unrealised Gain on Financial Futures Contracts - Assets 27,758 –
Net Unrealised Gain on Financial Futures Contracts - Assets 27,758 –

Aviva Investors Société d’investissement à capital variable (SICAV)
avivainvestors.com Annual Report and audited financial statements 37
The accompanying notes form an integral part of these financial statements.
AVIVA INVESTORS - EMERGING MARKETS EQUITY INCOME FUNDPortfolio of Investments and Other Net Assets as at 31 December 2021
Investments Currency Quantity/
Nominal Value
Market Value
USD
% of Net
Assets0
Transferable securities and money market instruments admitted to an official
exchange listing
Equities
Bermuda
China Oriental Group Co. Ltd. HKD 19,270,000 5,820,679 0.37
5,820,679 0.37
Brazil
Americanas SA BRL 683,494 3,865,153 0.25
Banco do Brasil SA BRL 1,755,770 9,095,155 0.58
Cyrela Brazil Realty SA Empreendimentos e Participacoes BRL 1,870,529 5,300,666 0.34
Itau Unibanco Holding SA Preference BRL 1,168,244 4,392,738 0.28
Lojas Americanas SA Preference BRL 3,797,217 4,018,562 0.26
Minerva SA BRL 4,364,762 8,294,168 0.53
Petroleo Brasileiro SA Preference BRL 1,694,242 8,654,768 0.55
Telefonica Brasil SA, ADR USD 1,005,998 8,686,793 0.55
Vale SA BRL 1,258,234 17,625,622 1.12
Vibra Energia SA BRL 1,742,013 6,690,909 0.43
76,624,534 4.89
Cayman Islands
Alibaba Group Holding Ltd., ADR USD 365,141 44,182,061 2.82
Alibaba Group Holding Ltd. HKD 261,288 3,988,454 0.26
Autohome, Inc., ADR USD 305,025 9,050,092 0.58
Baidu, Inc., ADR USD 38,900 5,824,108 0.37
Chailease Holding Co. Ltd. TWD 2,246,650 21,285,464 1.36
China Conch Venture Holdings Ltd. HKD 3,605,500 17,604,774 1.12
China Hongqiao Group Ltd. HKD 8,578,000 9,091,265 0.58
China Medical System Holdings Ltd. HKD 4,257,328 7,113,987 0.45
China Yongda Automobiles Services Holdings Ltd. HKD 10,110,861 13,472,974 0.86
JD.com, Inc., ADR USD 366,218 25,712,166 1.64
KWG Group Holdings Ltd. HKD 8,984,188 5,885,683 0.38
KWG Living Group Holdings Ltd., Reg. S HKD 8,796,784 3,616,534 0.23
NetEase, Inc., ADR USD 130,883 13,378,206 0.86
Sands China Ltd. HKD 4,483,214 10,458,950 0.67
Shenzhou International Group Holdings Ltd. HKD 855,200 16,427,267 1.05
Tencent Holdings Ltd. HKD 1,092,321 64,021,690 4.09
Tongcheng Travel Holdings Ltd., Reg. S HKD 6,462,800 11,962,216 0.76
Topsports International Holdings Ltd., Reg. S HKD 9,596,000 9,730,045 0.62
Xinyi Solar Holdings Ltd. HKD 8,166,000 13,842,379 0.88
XP, Inc. BRL 221,459 6,370,877 0.41
313,019,192 19.99
Chile
Banco de Chile CLP 80,366,796 6,306,247 0.40
6,306,247 0.40
China
Anhui Conch Cement Co. Ltd. 'H' HKD 966,806 4,840,561 0.31
Investments Currency Quantity/
Nominal Value
Market Value
USD
% of Net
Assets0
China Construction Bank Corp. 'H' HKD 39,441,322 27,344,440 1.75
China Longyuan Power Group Corp. Ltd. 'H' HKD 6,895,000 16,108,450 1.03
China Merchants Bank Co. Ltd. 'H' HKD 2,692,606 20,907,974 1.33
China Petroleum & Chemical Corp. 'H' HKD 27,382,222 12,773,102 0.82
China Telecom Corp. Ltd. 'H' HKD 21,549,744 7,159,710 0.46
ENN Natural Gas Co. Ltd. 'A' CNY 3,637,916 10,513,628 0.67
Haier Smart Home Co. Ltd. 'A' CNY 3,376,020 15,876,450 1.01
Jiangsu Zhongtian Technology Co. Ltd. 'A' CNY 7,314,187 19,525,181 1.25
Livzon Pharmaceutical Group, Inc. 'H' HKD 3,651,900 13,374,103 0.85
NARI Technology Co. Ltd. 'A' CNY 2,020,073 12,726,716 0.81
Ping An Insurance Group Co. of China Ltd. 'H' HKD 3,065,656 22,101,529 1.41
183,251,844 11.70
Hong Kong
CNOOC Ltd. HKD 16,986,992 17,505,036 1.12
Hong Kong Exchanges & Clearing Ltd. HKD 185,151 10,822,435 0.69
28,327,471 1.81
India
Ashok Leyland Ltd. INR 9,813,149 16,164,055 1.03
Embassy Office Parks REIT INR 2,540,224 11,584,557 0.74
HDFC Bank Ltd. INR 804,603 15,992,721 1.02
Housing Development Finance Corp. Ltd. INR 716,129 24,854,951 1.59
Infosys Ltd. INR 842,270 21,418,079 1.37
ITC Ltd. INR 4,156,988 12,166,987 0.78
102,181,350 6.53
Indonesia
Bank Rakyat Indonesia Persero Tbk. PT IDR 49,869,508 14,331,051 0.92
Indah Kiat Pulp & Paper Tbk. PT IDR 12,987,300 7,132,344 0.46
Surya Citra Media Tbk. PT IDR 352,067,300 8,015,909 0.51
Telkom Indonesia Persero Tbk. PT IDR 40,397,455 11,454,201 0.73
40,933,505 2.62
Malaysia
Malayan Banking Bhd. MYR 3,801,525 7,578,132 0.48
Sunway Bhd. MYR 20,966,982 8,723,850 0.56
Sunway Bhd. MYR 3,854,196 1,377,095 0.09
17,679,077 1.13
Mauritius
MakeMyTrip Ltd. USD 734,698 21,023,383 1.34
21,023,383 1.34
Mexico
Grupo Mexico SAB de CV 'B' MXN 3,722,737 16,303,157 1.04
Macquarie Mexico Real Estate Management SA de CV, REIT, Reg. S MXN 6,921,336 8,809,264 0.56
25,112,421 1.60
Poland
Bank Polska Kasa Opieki SA PLN 603,013 18,199,115 1.16
18,199,115 1.16

Aviva Investors Société d’investissement à capital variable (SICAV)
avivainvestors.com Annual Report and audited financial statements 38
AVIVA INVESTORS - EMERGING MARKETS EQUITY INCOME FUND (CONTINUED)Portfolio of Investments and Other Net Assets as at 31 December 2021
The accompanying notes form an integral part of these financial statements.
Investments Currency Quantity/
Nominal Value
Market Value
USD
% of Net
Assets0
Russia
Detsky Mir PJSC, Reg. S RUB 5,871,961 9,782,774 0.63
LUKOIL PJSC, ADR USD 267,302 23,805,916 1.52
Sberbank of Russia PJSC RUB 4,573,839 17,914,401 1.14
United Co. RUSAL International PJSC HKD 6,104,000 5,882,902 0.38
United Co. RUSAL International PJSC RUB 6,112,581 5,975,002 0.38
63,360,995 4.05
South Africa
Absa Group Ltd. ZAR 2,018,310 19,290,830 1.23
Impala Platinum Holdings Ltd. ZAR 652,477 9,176,160 0.59
Life Healthcare Group Holdings Ltd. ZAR 4,934,618 7,415,359 0.47
Pick n Pay Stores Ltd. ZAR 2,722,406 8,915,407 0.57
44,797,756 2.86
South Korea
Hyundai Motor Co. KRW 156,975 27,608,129 1.76
Innocean Worldwide, Inc. KRW 170,475 7,926,993 0.51
KB Financial Group, Inc. KRW 315,219 14,584,910 0.93
LG Chem Ltd. KRW 36,789 19,039,848 1.22
Macquarie Korea Infrastructure Fund KRW 1,096,077 12,930,520 0.83
POSCO KRW 57,997 13,392,111 0.85
Samsung Electronics Co. Ltd. KRW 1,491,114 98,102,961 6.27
SK Hynix, Inc. KRW 287,103 31,481,844 2.01
SK Square Co. Ltd. KRW 89,607 5,008,525 0.32
SK Telecom Co. Ltd. KRW 138,612 6,741,310 0.43
236,817,151 15.13
Taiwan
Chicony Electronics Co. Ltd. TWD 3,010,595 8,938,170 0.57
Hon Hai Precision Industry Co. Ltd. TWD 7,532,786 28,283,295 1.81
Huaku Development Co. Ltd. TWD 3,010,115 9,918,706 0.63
Lite-On Technology Corp. TWD 4,191,187 9,628,163 0.61
MediaTek, Inc. TWD 993,000 42,424,460 2.71
Mega Financial Holding Co. Ltd. TWD 6,973,780 8,954,573 0.57
Sinbon Electronics Co. Ltd. TWD 2,373,685 24,236,899 1.55
Taiwan Semiconductor Manufacturing Co. Ltd. TWD 5,522,357 122,363,528 7.82
Tripod Technology Corp. TWD 3,370,000 15,085,339 0.96
Yageo Corp. TWD 698,000 12,040,699 0.77
281,873,832 18.00
Thailand
Indorama Ventures PCL THB 12,263,300 15,926,963 1.02
Kasikornbank PCL THB 2,850,900 12,146,174 0.77
Quality Houses PCL THB 66,713,033 4,520,534 0.29
Thai Beverage PCL SGD 28,548,800 14,025,279 0.90
46,618,950 2.98
United Kingdom
Standard Chartered plc HKD 1,652,800 9,816,612 0.63
9,816,612 0.63
Total Equities 1,521,764,114 97.19
Total Transferable securities and money market
instruments admitted to an official exchange listing 1,521,764,114 97.19
Investments Currency Quantity/
Nominal Value
Market Value
USD
% of Net
Assets0
Units of authorised UCITS or other collective investment undertakings
Collective Investment Schemes - UCITS
Ireland
Aviva Investors US Dollar Liquidity Fund - Class 3 Income shares USD† USD 39,500,000 39,500,000 2.52
39,500,000 2.52
Total Collective Investment Schemes - UCITS 39,500,000 2.52
Total Units of authorised UCITS or other collective
investment undertakings 39,500,000 2.52
Total Investments 1,561,264,114 99.71
Cash 608,080 0.04
Other assets/(liabilities) 3,889,041 0.25
Total net assets 1,565,761,235 100.00
†Related Party Fund.
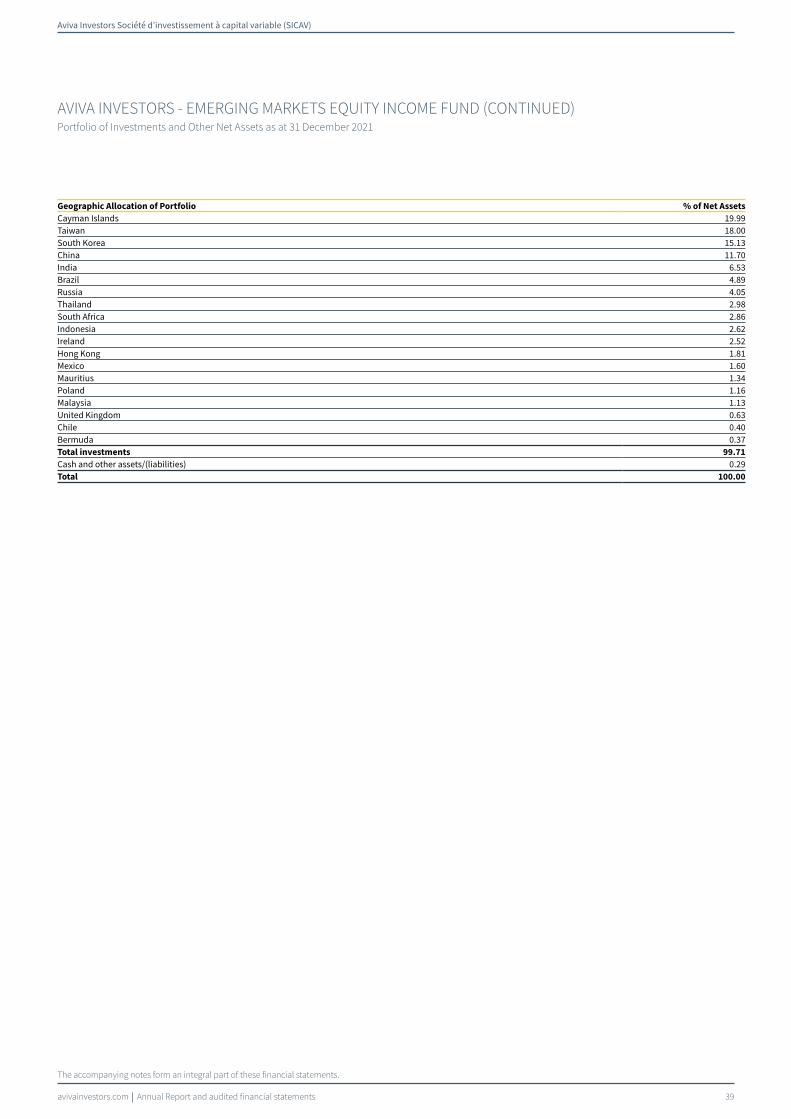
Aviva Investors Société d’investissement à capital variable (SICAV)
avivainvestors.com Annual Report and audited financial statements 39
AVIVA INVESTORS - EMERGING MARKETS EQUITY INCOME FUND (CONTINUED)Portfolio of Investments and Other Net Assets as at 31 December 2021
The accompanying notes form an integral part of these financial statements.
Geographic Allocation of Portfolio % of Net Assets
Cayman Islands 19.99Taiwan 18.00South Korea 15.13China 11.70India 6.53Brazil 4.89Russia 4.05Thailand 2.98South Africa 2.86Indonesia 2.62Ireland 2.52Hong Kong 1.81Mexico 1.60Mauritius 1.34Poland 1.16Malaysia 1.13United Kingdom 0.63Chile 0.40Bermuda 0.37Total investments 99.71
Cash and other assets/(liabilities) 0.29Total 100.00
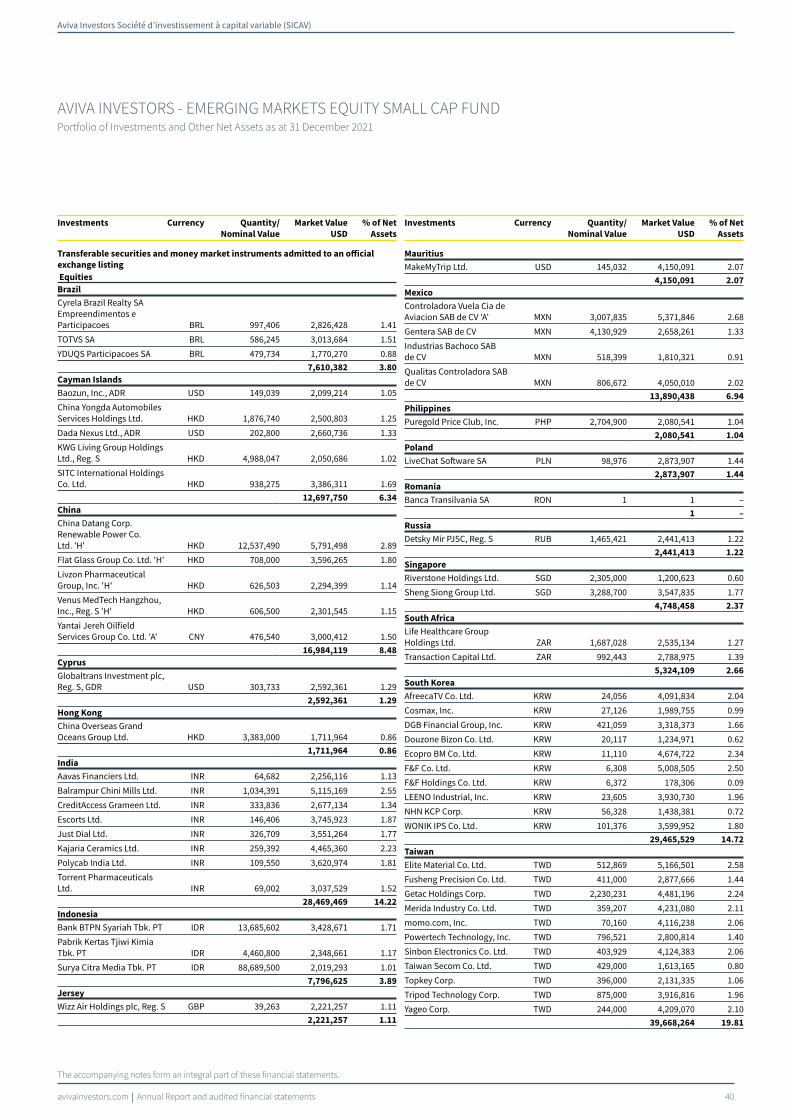
Aviva Investors Société d’investissement à capital variable (SICAV)
avivainvestors.com Annual Report and audited financial statements 40
The accompanying notes form an integral part of these financial statements.
AVIVA INVESTORS - EMERGING MARKETS EQUITY SMALL CAP FUNDPortfolio of Investments and Other Net Assets as at 31 December 2021
Investments Currency Quantity/
Nominal Value
Market Value
USD
% of Net
Assets0
Transferable securities and money market instruments admitted to an official
exchange listing
Equities
Brazil
Cyrela Brazil Realty SA Empreendimentos e Participacoes BRL 997,406 2,826,428 1.41
TOTVS SA BRL 586,245 3,013,684 1.51
YDUQS Participacoes SA BRL 479,734 1,770,270 0.88
7,610,382 3.80
Cayman Islands
Baozun, Inc., ADR USD 149,039 2,099,214 1.05
China Yongda Automobiles Services Holdings Ltd. HKD 1,876,740 2,500,803 1.25
Dada Nexus Ltd., ADR USD 202,800 2,660,736 1.33
KWG Living Group Holdings Ltd., Reg. S HKD 4,988,047 2,050,686 1.02
SITC International Holdings Co. Ltd. HKD 938,275 3,386,311 1.69
12,697,750 6.34
China
China Datang Corp. Renewable Power Co. Ltd. 'H' HKD 12,537,490 5,791,498 2.89
Flat Glass Group Co. Ltd. 'H' HKD 708,000 3,596,265 1.80
Livzon Pharmaceutical Group, Inc. 'H' HKD 626,503 2,294,399 1.14
Venus MedTech Hangzhou, Inc., Reg. S 'H' HKD 606,500 2,301,545 1.15
Yantai Jereh Oilfield Services Group Co. Ltd. 'A' CNY 476,540 3,000,412 1.50
16,984,119 8.48
Cyprus
Globaltrans Investment plc, Reg. S, GDR USD 303,733 2,592,361 1.29
2,592,361 1.29
Hong Kong
China Overseas Grand Oceans Group Ltd. HKD 3,383,000 1,711,964 0.86
1,711,964 0.86
India
Aavas Financiers Ltd. INR 64,682 2,256,116 1.13
Balrampur Chini Mills Ltd. INR 1,034,391 5,115,169 2.55
CreditAccess Grameen Ltd. INR 333,836 2,677,134 1.34
Escorts Ltd. INR 146,406 3,745,923 1.87
Just Dial Ltd. INR 326,709 3,551,264 1.77
Kajaria Ceramics Ltd. INR 259,392 4,465,360 2.23
Polycab India Ltd. INR 109,550 3,620,974 1.81
Torrent Pharmaceuticals Ltd. INR 69,002 3,037,529 1.52
28,469,469 14.22
Indonesia
Bank BTPN Syariah Tbk. PT IDR 13,685,602 3,428,671 1.71
Pabrik Kertas Tjiwi Kimia Tbk. PT IDR 4,460,800 2,348,661 1.17
Surya Citra Media Tbk. PT IDR 88,689,500 2,019,293 1.01
7,796,625 3.89
Jersey
Wizz Air Holdings plc, Reg. S GBP 39,263 2,221,257 1.11
2,221,257 1.11
Investments Currency Quantity/
Nominal Value
Market Value
USD
% of Net
Assets0
Mauritius
MakeMyTrip Ltd. USD 145,032 4,150,091 2.07
4,150,091 2.07
Mexico
Controladora Vuela Cia de Aviacion SAB de CV 'A' MXN 3,007,835 5,371,846 2.68
Gentera SAB de CV MXN 4,130,929 2,658,261 1.33
Industrias Bachoco SAB de CV MXN 518,399 1,810,321 0.91
Qualitas Controladora SAB de CV MXN 806,672 4,050,010 2.02
13,890,438 6.94
Philippines
Puregold Price Club, Inc. PHP 2,704,900 2,080,541 1.04
2,080,541 1.04
Poland
LiveChat Software SA PLN 98,976 2,873,907 1.44
2,873,907 1.44
Romania
Banca Transilvania SA RON 1 1 –
1 –
Russia
Detsky Mir PJSC, Reg. S RUB 1,465,421 2,441,413 1.22
2,441,413 1.22
Singapore
Riverstone Holdings Ltd. SGD 2,305,000 1,200,623 0.60
Sheng Siong Group Ltd. SGD 3,288,700 3,547,835 1.77
4,748,458 2.37
South Africa
Life Healthcare Group Holdings Ltd. ZAR 1,687,028 2,535,134 1.27
Transaction Capital Ltd. ZAR 992,443 2,788,975 1.39
5,324,109 2.66
South Korea
AfreecaTV Co. Ltd. KRW 24,056 4,091,834 2.04
Cosmax, Inc. KRW 27,126 1,989,755 0.99
DGB Financial Group, Inc. KRW 421,059 3,318,373 1.66
Douzone Bizon Co. Ltd. KRW 20,117 1,234,971 0.62
Ecopro BM Co. Ltd. KRW 11,110 4,674,722 2.34
F&F Co. Ltd. KRW 6,308 5,008,505 2.50
F&F Holdings Co. Ltd. KRW 6,372 178,306 0.09
LEENO Industrial, Inc. KRW 23,605 3,930,730 1.96
NHN KCP Corp. KRW 56,328 1,438,381 0.72
WONIK IPS Co. Ltd. KRW 101,376 3,599,952 1.80
29,465,529 14.72
Taiwan
Elite Material Co. Ltd. TWD 512,869 5,166,501 2.58
Fusheng Precision Co. Ltd. TWD 411,000 2,877,666 1.44
Getac Holdings Corp. TWD 2,230,231 4,481,196 2.24
Merida Industry Co. Ltd. TWD 359,207 4,231,080 2.11
momo.com, Inc. TWD 70,160 4,116,238 2.06
Powertech Technology, Inc. TWD 796,521 2,800,814 1.40
Sinbon Electronics Co. Ltd. TWD 403,929 4,124,383 2.06
Taiwan Secom Co. Ltd. TWD 429,000 1,613,165 0.80
Topkey Corp. TWD 396,000 2,131,335 1.06
Tripod Technology Corp. TWD 875,000 3,916,816 1.96
Yageo Corp. TWD 244,000 4,209,070 2.10
39,668,264 19.81

Aviva Investors Société d’investissement à capital variable (SICAV)
avivainvestors.com Annual Report and audited financial statements 41
AVIVA INVESTORS - EMERGING MARKETS EQUITY SMALL CAP FUND (CONTINUED)Portfolio of Investments and Other Net Assets as at 31 December 2021
The accompanying notes form an integral part of these financial statements.
Investments Currency Quantity/
Nominal Value
Market Value
USD
% of Net
Assets0
Turkey
Ford Otomotiv Sanayi A/S TRY 113,869 2,036,545 1.02
2,036,545 1.02
Vietnam
Asia Commercial Bank JSC VND 3,526,875 5,315,380 2.66
5,315,380 2.66
Total Equities 192,078,603 95.94
Warrants
China
Jiangsu Yanghe Brewery Joint-Stock Co. 28/02/2022 USD 164,854 3,868,710 1.93
3,868,710 1.93
Total Warrants 3,868,710 1.93
Total Transferable securities and money market
instruments admitted to an official exchange listing 195,947,313 97.87
Investments Currency Quantity/
Nominal Value
Market Value
USD
% of Net
Assets0
Units of authorised UCITS or other collective investment undertakings
Collective Investment Schemes - UCITS
Ireland
Aviva Investors US Dollar Liquidity Fund - Class 3 Income shares USD† USD 3,900,000 3,900,000 1.95
3,900,000 1.95
Total Collective Investment Schemes - UCITS 3,900,000 1.95
Total Units of authorised UCITS or other collective
investment undertakings 3,900,000 1.95
Total Investments 199,847,313 99.82
Cash 179,485 0.09
Other assets/(liabilities) 184,983 0.09
Total net assets 200,211,781 100.00
†Related Party Fund.
Geographic Allocation of Portfolio % of Net Assets
Taiwan 19.81South Korea 14.72India 14.22China 10.41Mexico 6.94Cayman Islands 6.34Indonesia 3.89Brazil 3.80South Africa 2.66Vietnam 2.66Singapore 2.37Mauritius 2.07Ireland 1.95Poland 1.44Cyprus 1.29Russia 1.22Jersey 1.11Philippines 1.04Turkey 1.02Hong Kong 0.86Romania –Total investments 99.82
Cash and other assets/(liabilities) 0.18Total 100.00

Aviva Investors Société d’investissement à capital variable (SICAV)
avivainvestors.com Annual Report and audited financial statements 42
The accompanying notes form an integral part of these financial statements.
AVIVA INVESTORS - EMERGING MARKETS LOCAL CURRENCY BOND FUNDPortfolio of Investments and Other Net Assets as at 31 December 2021
Investments Currency Quantity/
Nominal Value
Market Value
EUR
% of Net
Assets0
Transferable securities and money market instruments admitted to an official
exchange listing
Bonds
Benin
Benin Government International Bond, Reg. S 4.95% 22/01/2035 EUR 8,800,000 8,431,368 0.61
8,431,368 0.61
Brazil
Brazil Letras do Tesouro Nacional 0% 01/07/2023 BRL 9,800,000 13,178,847 0.95
Brazil Notas do Tesouro Nacional 10% 01/01/2029 BRL 4,100,000 6,284,249 0.45
Brazil Notas do Tesouro Nacional 10% 01/01/2031 BRL 50,000 7,591,699 0.55
Brazil Notas do Tesouro Nacional 10% 01/01/2023 BRL 15,999,900 24,931,980 1.79
Brazil Notas do Tesouro Nacional 10% 01/01/2025 BRL 24,000,000 37,429,911 2.69
89,416,686 6.43
Chile
Bonos de la Tesoreria de la Republica en pesos 4.5% 01/03/2026 CLP 7,000,000,000 6,975,655 0.50
Bonos de la Tesoreria de la Republica en pesos 6% 01/01/2043 CLP 8,500,000,000 9,272,687 0.67
Bonos de la Tesoreria de la Republica en pesos, Reg. S, 144A 5% 01/10/2028 CLP 5,000,000,000 5,007,323 0.36
21,255,665 1.53
China
China Development Bank 2.89% 22/06/2025 CNY 200,000,000 27,912,227 2.01
China Development Bank 3.45% 20/09/2029 CNY 100,000,000 14,230,513 1.02
China Government Bond 3.02% 22/10/2025 CNY 250,000,000 35,241,698 2.53
China Government Bond 3.27% 19/11/2030 CNY 212,000,000 30,419,149 2.19
China Government Bond 3.39% 16/03/2050 CNY 83,020,000 11,483,611 0.83
119,287,198 8.58
Colombia
Colombia Government Bond 7.5% 26/08/2026 COP 115,000,000,000 24,747,897 1.78
Colombia Government Bond 5.75% 03/11/2027 COP 19,273,900,000 3,772,745 0.27
Colombia Government Bond 6% 28/04/2028 COP 65,741,000,000 12,880,209 0.93
Colombia Government Bond 7.75% 18/09/2030 COP 40,000,000,000 8,458,623 0.61
Colombia Government Bond 6.25% 09/07/2036 COP 8,871,200,000 1,584,441 0.11
51,443,915 3.70
Czech Republic
Czech Republic Government Bond 2.75% 23/07/2029 CZK 335,000,000 13,220,306 0.95
Czech Republic Government Bond 2% 13/10/2033 CZK 150,000,000 5,538,480 0.40
Czech Republic Government Bond, Reg. S 0.95% 15/05/2030 CZK 525,000,000 18,036,347 1.30
36,795,133 2.65
Investments Currency Quantity/
Nominal Value
Market Value
EUR
% of Net
Assets0
Dominican Republic
Dominican Republic Government Bond, Reg. S 8.9% 15/02/2023 DOP 125,000,000 1,998,446 0.14
Dominican Republic Government Bond, Reg. S 9.75% 05/06/2026 DOP 125,000,000 2,143,272 0.16
Dominican Republic Government Bond, Reg. S 4.5% 30/01/2030 USD 9,750,000 8,756,160 0.63
12,897,878 0.93
Hungary
Hungary Government Bond 6.75% 22/10/2028 HUF 2,221,050,000 6,791,591 0.49
Hungary Government Bond 2% 23/05/2029 HUF 1,761,900,000 4,030,753 0.29
Hungary Government Bond 3% 21/08/2030 HUF 2,000,000,000 4,838,006 0.35
Hungary Government Bond 3% 25/04/2041 HUF 2,500,000,000 5,294,685 0.38
20,955,035 1.51
Indonesia
Indonesia Government Bond 8.25% 15/05/2029 IDR 338,000,000,000 23,329,347 1.68
Indonesia Government Bond 6.5% 15/02/2031 IDR 177,000,000,000 11,055,980 0.79
Indonesia Government Bond 8.75% 15/05/2031 IDR 300,000,000,000 21,406,259 1.54
Indonesia Government Bond 8.375% 15/03/2034 IDR 50,000,000,000 3,473,541 0.25
Indonesia Government Bond 7.5% 15/06/2035 IDR 150,000,000,000 9,727,807 0.70
Indonesia Government Bond 8.25% 15/05/2036 IDR 100,000,000,000 6,874,767 0.49
Indonesia Treasury 5.5% 15/04/2026 IDR 699,405,000,000 43,924,808 3.16
119,792,509 8.61
Ivory Coast
Ivory Coast Government Bond, Reg. S 6.125% 15/06/2033 USD 9,158,000 8,523,533 0.61
8,523,533 0.61
Kenya
Kenya Government Bond, Reg. S 7.25% 28/02/2028 USD 8,783,000 8,353,134 0.60
8,353,134 0.60
Mexico
Mexican Bonos 8% 05/09/2024 MXN 180,000,000 7,927,580 0.57
Mexican Bonos 10% 05/12/2024 MXN 600,000,000 27,821,448 2.00
Mexican Bonos 5.75% 05/03/2026 MXN 1,072,035,200 43,765,045 3.15
Mexican Bonos 7.5% 03/06/2027 MXN 58,143,400 2,524,731 0.18
Mexican Bonos 8.5% 31/05/2029 MXN 280,000,000 12,830,538 0.92
Mexican Bonos 7.75% 29/05/2031 MXN 200,000,000 8,754,680 0.63
Mexican Bonos 8.5% 18/11/2038 MXN 218,630,000 9,968,124 0.72
Mexican Bonos 8% 07/11/2047 MXN 450,000,000 19,327,562 1.39
132,919,708 9.56

Aviva Investors Société d’investissement à capital variable (SICAV)
avivainvestors.com Annual Report and audited financial statements 43
AVIVA INVESTORS - EMERGING MARKETS LOCAL CURRENCY BOND FUND (CONTINUED)Portfolio of Investments and Other Net Assets as at 31 December 2021
The accompanying notes form an integral part of these financial statements.
Investments Currency Quantity/
Nominal Value
Market Value
EUR
% of Net
Assets0
Oman
Oman Government Bond, Reg. S 5.625% 17/01/2028 USD 9,482,000 8,881,173 0.64
8,881,173 0.64
Peru
Banco de Credito del Peru, Reg. S 4.65% 17/09/2024 PEN 15,544,000 3,366,260 0.24
Peru Government Bond 6.15% 12/08/2032 PEN 50,000,000 11,176,011 0.80
Peru Government Bond, Reg. S 6.95% 12/08/2031 PEN 50,000,000 11,912,653 0.86
26,454,924 1.90
Philippines
Philippine Government Bond 3.9% 26/11/2022 PHP 100,000,000 1,715,676 0.12
1,715,676 0.12
Poland
Poland Government Bond 0.75% 25/04/2025 PLN 30,000,000 5,948,621 0.43
Poland Government Bond 3.25% 25/07/2025 PLN 60,778,000 13,054,886 0.94
Poland Government Bond 0.25% 25/10/2026 PLN 126,800,000 23,283,632 1.67
Poland Government Bond 2.75% 25/10/2029 PLN 68,592,000 13,984,682 1.00
Poland Government Bond 1.25% 25/10/2030 PLN 60,000,000 10,796,604 0.78
67,068,425 4.82
Romania
Romania Government Bond 3.65% 28/07/2025 RON 30,000,000 5,879,382 0.42
Romania Government Bond 3.65% 24/09/2031 RON 60,000,000 10,724,928 0.77
Romania Government Bond, Reg. S 3.375% 28/01/2050 EUR 13,257,000 12,520,004 0.90
29,124,314 2.09
Russia
Russian Federal Bond - OFZ 7% 16/08/2023 RUB 600,000,000 6,932,432 0.50
Russian Federal Bond - OFZ 7.4% 17/07/2024 RUB 1,725,000,000 19,964,740 1.44
Russian Federal Bond - OFZ 4.5% 16/07/2025 RUB 1,400,000,000 14,634,236 1.05
Russian Federal Bond - OFZ 6.9% 23/05/2029 RUB 600,000,000 6,533,381 0.47
Russian Federal Bond - OFZ 7.65% 10/04/2030 RUB 1,900,000,000 21,586,737 1.55
Russian Federal Bond - OFZ 5.9% 12/03/2031 RUB 434,497,000 4,349,560 0.31
Russian Federal Bond - OFZ 8.5% 17/09/2031 RUB 723,498,000 8,673,543 0.62
Russian Federal Bond - OFZ 7.25% 10/05/2034 RUB 481,364,000 5,244,701 0.38
87,919,330 6.32
Serbia
Serbia Treasury 4.5% 20/08/2032 RSD 400,000,000 3,509,308 0.25
3,509,308 0.25
South Africa
South Africa Government Bond 10.5% 21/12/2026 ZAR 300,728,533 18,363,907 1.32
South Africa Government Bond 8% 31/01/2030 ZAR 254,567,518 12,967,067 0.93
Investments Currency Quantity/
Nominal Value
Market Value
EUR
% of Net
Assets0
South Africa Government Bond 7% 28/02/2031 ZAR 116,406,096 5,417,916 0.39
South Africa Government Bond 8.25% 31/03/2032 ZAR 167,855,670 8,360,984 0.60
South Africa Government Bond 6.25% 31/03/2036 ZAR 336,628,268 12,998,187 0.94
South Africa Government Bond 8.5% 31/01/2037 ZAR 618,051,159 28,831,806 2.07
South Africa Government Bond 8.75% 28/02/2048 ZAR 226,614,348 10,420,210 0.75
97,360,077 7.00
Turkey
Turkey Government Bond 10.6% 11/02/2026 TRY 220,000,000 9,641,053 0.69
9,641,053 0.69
Ukraine
Ukraine Government Bond, Reg. S 4.375% 27/01/2030 EUR 8,864,000 7,167,874 0.52
7,167,874 0.52
Uruguay
Uruguay Government Bond, Reg. S 9.875% 20/06/2022 UYU 141,590,000 2,827,121 0.20
2,827,121 0.20
Uzbekistan
Uzbekistan Government Bond, Reg. S 3.9% 19/10/2031 USD 10,064,000 8,520,483 0.61
8,520,483 0.61
Total Bonds 980,261,520 70.48
Total Transferable securities and money market
instruments admitted to an official exchange listing 980,261,520 70.48
Transferable securities and money market instruments dealt in on another
regulated market
Bonds
Malaysia
Malaysia Government Bond 3.955% 15/09/2025 MYR 20,000,000 4,381,030 0.31
Malaysia Government Bond 4.07% 30/09/2026 MYR 30,000,000 6,592,975 0.47
Malaysia Government Bond 3.9% 30/11/2026 MYR 38,530,000 8,446,882 0.61
Malaysia Government Bond 3.733% 15/06/2028 MYR 50,000,000 10,804,805 0.78
Malaysia Government Bond 3.885% 15/08/2029 MYR 150,000,000 32,498,687 2.34
Malaysia Government Bond 4.127% 15/04/2032 MYR 58,000,000 12,746,273 0.92
Malaysia Government Bond 4.762% 07/04/2037 MYR 32,000,000 7,389,870 0.53
Malaysia Government Bond 4.065% 15/06/2050 MYR 24,390,000 5,057,776 0.36
87,918,298 6.32
Thailand
Thailand Government Bond 3.85% 12/12/2025 THB 300,000,000 8,815,965 0.64
Thailand Government Bond 2.125% 17/12/2026 THB 220,000,000 6,079,207 0.44
Thailand Government Bond 2.875% 17/12/2028 THB 350,000,000 10,011,848 0.72
Thailand Government Bond 4.875% 22/06/2029 THB 900,000,000 28,945,394 2.08
Thailand Government Bond 1.6% 17/12/2029 THB 450,000,000 11,733,718 0.84

Aviva Investors Société d’investissement à capital variable (SICAV)
avivainvestors.com Annual Report and audited financial statements 44
AVIVA INVESTORS - EMERGING MARKETS LOCAL CURRENCY BOND FUND (CONTINUED)Portfolio of Investments and Other Net Assets as at 31 December 2021
The accompanying notes form an integral part of these financial statements.
Investments Currency Quantity/
Nominal Value
Market Value
EUR
% of Net
Assets0
Thailand Government Bond 2% 17/12/2031 THB 380,000,000 10,194,158 0.73
Thailand Government Bond 3.775% 25/06/2032 THB 250,000,000 7,783,831 0.56
Thailand Government Bond 1.6% 17/06/2035 THB 250,000,000 6,158,528 0.44
Thailand Government Bond 3.4% 17/06/2036 THB 300,000,000 8,893,854 0.64
98,616,503 7.09
Total Bonds 186,534,801 13.41
Total Transferable securities and money market
instruments dealt in on another regulated market 186,534,801 13.41
Units of authorised UCITS or other collective investment undertakings
Collective Investment Schemes - UCITS
Ireland
Aviva Investors Euro Liquidity Fund - Class 3 Income shares EUR† EUR 69,213 6,701,402 0.48
Investments Currency Quantity/
Nominal Value
Market Value
EUR
% of Net
Assets0
Aviva Investors Sterling Liquidity Funds plc - Class 3 Income shares GBP† GBP 100,000 119,140 0.01
Aviva Investors US Dollar Liquidity Fund - Class 3 Income shares USD† USD 146,300,000 128,969,132 9.28
135,789,674 9.77
Total Collective Investment Schemes - UCITS 135,789,674 9.77
Total Units of authorised UCITS or other collective
investment undertakings 135,789,674 9.77
Total Investments 1,302,585,995 93.66
Cash 65,148,444 4.68
Other assets/(liabilities) 23,049,012 1.66
Total net assets 1,390,783,451 100.00
†Related Party Fund.
Geographic Allocation of Portfolio % of Net Assets
Ireland 9.77Mexico 9.56Indonesia 8.61China 8.58Thailand 7.09South Africa 7.00Brazil 6.43Russia 6.32Malaysia 6.32Poland 4.82Colombia 3.70Czech Republic 2.65Romania 2.09Peru 1.90Chile 1.53Hungary 1.51Dominican Republic 0.93Turkey 0.69Oman 0.64Ivory Coast 0.61Uzbekistan 0.61Benin 0.61Kenya 0.60Ukraine 0.52Serbia 0.25Uruguay 0.20Philippines 0.12Total investments 93.66
Cash and other assets/(liabilities) 6.34Total 100.00

Aviva Investors Société d’investissement à capital variable (SICAV)
avivainvestors.com Annual Report and audited financial statements 45
AVIVA INVESTORS - EMERGING MARKETS LOCAL CURRENCY BOND FUND (CONTINUED)Portfolio of Investments and Other Net Assets as at 31 December 2021
The accompanying notes form an integral part of these financial statements.
Forward Currency Exchange Contracts
Currency
Purchased Amount Purchased
Currency
Sold Amount Sold Maturity Date Counterparty
Unrealised Gain/
(Loss)
EUR % of Net Assets
BRL 116,448,804 USD 20,166,740 16/03/2022 Goldman Sachs 332,377 0.02BRL 2,647,645 USD 456,275 16/03/2022 HSBC 9,535 –BRL 62,273,345 USD 10,901,815 16/03/2022 Merrill Lynch 74,542 0.01CNH 120,757,295 USD 18,831,541 16/03/2022 HSBC 65,523 0.01CZK 676,545,776 USD 29,742,499 16/03/2022 HSBC 812,061 0.06
EUR 5,000,000 USD 5,666,348 16/03/2022Canadian Imperial Bank of
Commerce 12,204 –EUR 4,970,000 USD 5,600,057 16/03/2022 UBS 40,557 –HUF 8,962,382,781 USD 27,298,088 16/03/2022 Citibank 10,066 –IDR 410,430,589,603 USD 28,280,622 16/03/2022 RBS 335,351 0.03MXN 272,760,202 USD 12,757,501 16/03/2022 Goldman Sachs 407,701 0.03MXN 574,480,156 USD 26,841,423 16/03/2022 HSBC 883,406 0.06MXN 68,401,667 USD 3,164,164 24/03/2022 RBC 128,400 0.01MYR 49,372,148 USD 11,642,727 16/03/2022 HSBC 176,339 0.01MYR 88,984,643 USD 20,973,735 16/03/2022 Standard Chartered 326,834 0.02PEN 6,975,352 USD 1,724,438 16/03/2022 Goldman Sachs 16,644 –PEN 3,139,359 USD 773,051 16/03/2022 RBS 10,182 –PLN 140,367,455 USD 34,199,105 16/03/2022 HSBC 294,853 0.02PLN 1,272,654 USD 308,217 16/03/2022 Morgan Stanley 4,304 –RON 1,360,707 USD 308,388 16/03/2022 HSBC 1,271 –RON 122,856,245 USD 27,673,121 16/03/2022 Societe Generale 265,116 0.02THB 129,863,823 USD 3,897,240 16/03/2022 Standard Chartered 14,964 –TRY 46,156,471 USD 3,206,457 16/03/2022 Standard Chartered 71,701 0.01UAH 76,183,930 USD 2,702,516 16/03/2022 Morgan Stanley 14,570 –USD 24,331,516 CLP 20,640,424,670 16/03/2022 Goldman Sachs 323,247 0.02USD 29,760,336 COP 117,217,036,139 16/03/2022 Morgan Stanley 1,047,372 0.08USD 6,952,893 MXN 143,574,496 24/03/2022 Goldman Sachs 4,492 –USD 22,253,166 ZAR 358,709,904 16/03/2022 Merrill Lynch 23,438 –Total Unrealised Gain on Forward Currency Exchange Contracts - Assets 5,707,050 0.41
CLP 25,744,489,686 USD 30,007,612 16/03/2022 Standard Chartered (103,262) (0.01)HUF 290,000,000 USD 886,172 16/03/2022 Morgan Stanley (2,205) –RUB 1,670,870,597 USD 22,104,387 16/03/2022 HSBC (140,877) (0.01)USD 533,780 CZK 12,000,000 16/03/2022 HSBC (8,918) –USD 51,664,961 EUR 45,850,453 16/03/2022 J.P. Morgan (372,433) (0.03)USD 4,519,308 EUR 4,000,000 16/03/2022 UBS (21,885) –USD 309,235 MXN 6,504,561 16/03/2022 UBS (5,317) –USD 31,766,771 MXN 679,898,988 24/03/2022 RBS (998,512) (0.07)USD 12,976,517 THB 435,102,620 16/03/2022 Citibank (121,438) (0.01)USD 12,959,125 THB 435,102,621 16/03/2022 Goldman Sachs (136,748) (0.01)USD 20,551,104 THB 687,290,576 24/03/2022 HSBC (143,950) (0.01)
USD 7,754,809 ZAR 126,498,532 16/03/2022Canadian Imperial Bank of
Commerce (73,367) (0.01)USD 11,377,391 ZAR 187,132,950 16/03/2022 RBC (191,737) (0.01)ZAR 196,378,545 USD 12,236,284 16/03/2022 Citibank (60,025) (0.01)ZAR 126,734,191 USD 7,905,497 16/03/2022 HSBC (46,423) –ZAR 196,378,545 USD 12,229,115 16/03/2022 UBS (53,715) –Total Unrealised Loss on Forward Currency Exchange Contracts - Liabilities (2,480,812) (0.18)
Net Unrealised Gain on Forward Currency Exchange Contracts - Assets 3,226,238 0.23
Financial Futures Contracts
Security Description
Number of
Contracts Currency
Unrealised Gain/(Loss)
EUR % of Net Assets
US 10 Year Note, 22/03/2022 (723) USD (881,601) (0 .06)
US Ultra Bond, 22/03/2022 100 USD (658,013) (0 .05)
Total Unrealised Loss on Financial Futures Contracts - Liabilities (1,539,614) (0.11)
Net Unrealised Loss on Financial Futures Contracts - Liabilities (1,539,614) (0.11)
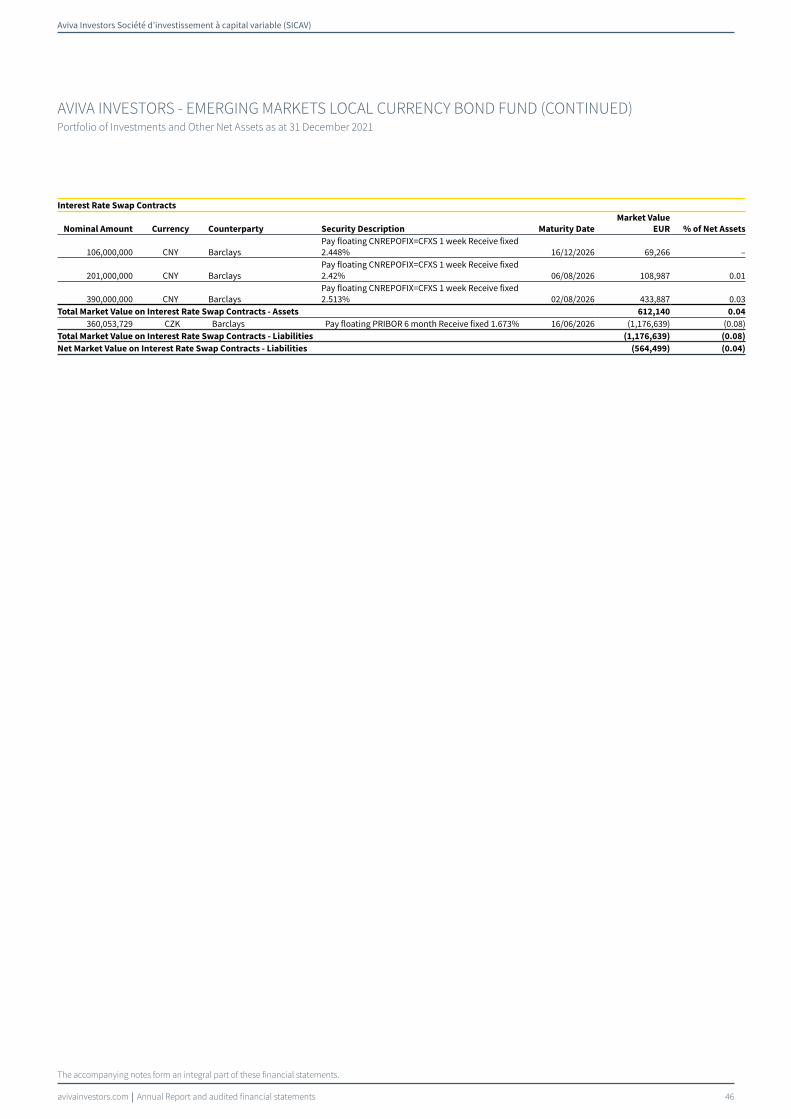
Aviva Investors Société d’investissement à capital variable (SICAV)
avivainvestors.com Annual Report and audited financial statements 46
AVIVA INVESTORS - EMERGING MARKETS LOCAL CURRENCY BOND FUND (CONTINUED)Portfolio of Investments and Other Net Assets as at 31 December 2021
The accompanying notes form an integral part of these financial statements.
Interest Rate Swap Contracts
Nominal Amount Currency Counterparty Security Description Maturity Date
Market Value
EUR % of Net Assets
106,000,000 CNY Barclays Pay floating CNREPOFIX=CFXS 1 week Receive fixed 2.448% 16/12/2026 69,266 –
201,000,000 CNY Barclays Pay floating CNREPOFIX=CFXS 1 week Receive fixed 2.42% 06/08/2026 108,987 0.01
390,000,000 CNY Barclays Pay floating CNREPOFIX=CFXS 1 week Receive fixed 2.513% 02/08/2026 433,887 0.03
Total Market Value on Interest Rate Swap Contracts - Assets 612,140 0.04
360,053,729 CZK Barclays Pay floating PRIBOR 6 month Receive fixed 1.673% 16/06/2026 (1,176,639) (0.08)Total Market Value on Interest Rate Swap Contracts - Liabilities (1,176,639) (0.08)
Net Market Value on Interest Rate Swap Contracts - Liabilities (564,499) (0.04)

Aviva Investors Société d’investissement à capital variable (SICAV)
avivainvestors.com Annual Report and audited financial statements 47
The accompanying notes form an integral part of these financial statements.
AVIVA INVESTORS - EUROPEAN CORPORATE BOND FUNDPortfolio of Investments and Other Net Assets as at 31 December 2021
Investments Currency Quantity/
Nominal Value
Market Value
EUR
% of Net
Assets0
Transferable securities and money market instruments admitted to an official
exchange listing
Bonds
Australia
Aurizon Network Pty. Ltd., Reg. S 3.125% 01/06/2026 EUR 400,000 444,002 1.05
444,002 1.05
Austria
UNIQA Insurance Group AG, Reg. S 1.375% 09/07/2030 EUR 200,000 209,684 0.50
209,684 0.50
Belgium
Ageas SA/NV, Reg. S, FRN 3.875% Perpetual EUR 600,000 619,114 1.46
Anheuser-Busch InBev SA, Reg. S 2.25% 01/07/2027 EUR 400,000 416,075 0.98
KBC Group NV, Reg. S 0.625% 07/12/2031 EUR 300,000 295,087 0.70
1,330,276 3.14
Cayman Islands
UPCB Finance VII Ltd., Reg. S 3.625% 15/06/2029 EUR 300,000 307,310 0.73
307,310 0.73
Denmark
Danske Bank A/S, Reg. S, FRN 0.5% 27/08/2025 EUR 267,000 269,029 0.63
Danske Bank A/S, Reg. S 1.375% 24/05/2022 EUR 28,000 28,197 0.07
Orsted A/S, Reg. S 2.25% 24/11/3017 EUR 200,000 208,000 0.49
505,226 1.19
France
AXA SA, Reg. S, FRN 3.875% Perpetual EUR 200,000 222,882 0.53
Banque Federative du Credit Mutuel SA, Reg. S 1.75% 15/03/2029 EUR 200,000 215,165 0.51
Banque Federative du Credit Mutuel SA, Reg. S 1.875% 18/06/2029 EUR 300,000 317,049 0.75
BNP Paribas SA, Reg. S, FRN 0.5% 15/07/2025 EUR 200,000 202,142 0.48
BNP Paribas SA, Reg. S 2.125% 23/01/2027 EUR 200,000 213,360 0.50
BNP Paribas SA, Reg. S 0.25% 13/04/2027 EUR 500,000 494,645 1.17
BNP Paribas SA, Reg. S 0.5% 19/02/2028 EUR 200,000 198,842 0.47
Caisse Nationale de Reassurance Mutuelle Agricole Groupama, Reg. S 3.375% 24/09/2028 EUR 300,000 335,358 0.79
Credit Agricole Assurances SA, Reg. S 1.5% 06/10/2031 EUR 500,000 492,847 1.16
Credit Agricole SA, Reg. S 0.375% 20/04/2028 EUR 300,000 295,773 0.70
Credit Logement SA, Reg. S, FRN 1.35% 28/11/2029 EUR 400,000 409,765 0.97
Credit Mutuel Arkea SA, Reg. S, FRN 1.875% 25/10/2029 EUR 200,000 206,549 0.49
Credit Mutuel Arkea SA, Reg. S 3.25% 01/06/2026 EUR 300,000 333,214 0.79
Engie SA, Reg. S 0.375% 21/06/2027 EUR 300,000 300,953 0.71
Investments Currency Quantity/
Nominal Value
Market Value
EUR
% of Net
Assets0
EssilorLuxottica SA, Reg. S 0.75% 27/11/2031 EUR 200,000 205,200 0.48
Orange SA, Reg. S, FRN 5.25% Perpetual EUR 300,000 329,782 0.78
Safran SA, Reg. S 0.75% 17/03/2031 EUR 300,000 298,657 0.71
Schneider Electric SE, Reg. S 1.5% 15/01/2028 EUR 400,000 429,265 1.01
Societe Generale SA, Reg. S 0.875% 22/09/2028 EUR 200,000 201,861 0.48
Societe Generale SA, Reg. S 1.125% 23/01/2025 EUR 300,000 309,179 0.73
TotalEnergies SE, Reg. S 1.625% Perpetual EUR 273,000 271,294 0.64
Veolia Environnement SA, Reg. S 2.25% Perpetual EUR 700,000 712,929 1.69
6,996,711 16.54
Germany
Allianz SE, Reg. S, FRN 4.75% Perpetual EUR 400,000 432,000 1.02
Bayer AG, Reg. S, FRN 2.375% 12/11/2079 EUR 200,000 200,375 0.47
Daimler AG, Reg. S 0.75% 10/09/2030 EUR 130,000 133,906 0.32
Infineon Technologies AG, Reg. S 2% 24/06/2032 EUR 200,000 218,281 0.52
Merck Financial Services GmbH, Reg. S 0.875% 05/07/2031 EUR 400,000 415,746 0.98
Merck KGaA, Reg. S 1.625% 09/09/2080 EUR 200,000 204,815 0.48
O2 Telefonica Deutschland Finanzierungs GmbH, Reg. S 1.75% 05/07/2025 EUR 400,000 420,057 0.99
Volkswagen Financial Services AG, Reg. S 0.125% 12/02/2027 EUR 400,000 391,680 0.93
Volkswagen Financial Services AG, Reg. S 0.375% 12/02/2030 EUR 342,000 328,227 0.78
Vonovia SE, Reg. S 0.25% 01/09/2028 EUR 200,000 194,792 0.46
Vonovia SE, Reg. S 0.75% 01/09/2032 EUR 400,000 387,552 0.92
3,327,431 7.87
Hong Kong
AIA Group Ltd., Reg. S 0.88% 09/09/2033 EUR 200,000 197,133 0.47
197,133 0.47
Ireland
Ryanair DAC, Reg. S 0.875% 25/05/2026 EUR 119,000 119,134 0.28
119,134 0.28
Italy
Assicurazioni Generali SpA, Reg. S 1.713% 30/06/2032 EUR 261,000 257,831 0.61
ASTM SpA, Reg. S 1% 25/11/2026 EUR 155,000 155,564 0.37
Enel SpA, Reg. S 1.375% Perpetual EUR 325,000 317,820 0.75
Eni SpA, Reg. S 4% Perpetual EUR 298,000 297,073 0.70
FCA Bank SpA, Reg. S 0.5% 13/09/2024 EUR 250,000 252,291 0.60

Aviva Investors Société d’investissement à capital variable (SICAV)
avivainvestors.com Annual Report and audited financial statements 48
AVIVA INVESTORS - EUROPEAN CORPORATE BOND FUND (CONTINUED)Portfolio of Investments and Other Net Assets as at 31 December 2021
The accompanying notes form an integral part of these financial statements.
Investments Currency Quantity/
Nominal Value
Market Value
EUR
% of Net
Assets0
Intesa Sanpaolo SpA, Reg. S 4.375% 12/07/2029 EUR 300,000 322,962 0.76
Intesa Sanpaolo SpA, Reg. S 6.625% 13/09/2023 EUR 420,000 462,752 1.10
Intesa Sanpaolo SpA, Reg. S 0.75% 16/03/2028 EUR 247,000 246,715 0.58
UniCredit SpA, Reg. S 2.2% 22/07/2027 EUR 300,000 316,593 0.75
2,629,601 6.22
Luxembourg
Bevco Lux Sarl, Reg. S 1.5% 16/09/2027 EUR 165,000 172,368 0.41
Bevco Lux Sarl, Reg. S 1% 16/01/2030 EUR 129,000 126,649 0.30
Blackstone Property Partners Europe Holdings Sarl, Reg. S 1.625% 20/04/2030 EUR 154,000 154,275 0.37
CBRE Global Investors Open-Ended Fund SCA SICAV-SIF Pan European Core Fund, Reg. S 0.5% 27/01/2028 EUR 196,000 191,205 0.45
CK Hutchison Group Telecom Finance SA, Reg. S 1.125% 17/10/2028 EUR 375,000 381,031 0.90
John Deere Cash Management SARL, Reg. S 1.65% 13/06/2039 EUR 300,000 338,682 0.80
Medtronic Global Holdings SCA 1% 02/07/2031 EUR 600,000 619,624 1.47
Medtronic Global Holdings SCA 1.375% 15/10/2040 EUR 319,000 318,921 0.75
Segro Capital Sarl, REIT, Reg. S 0.5% 22/09/2031 EUR 198,000 191,045 0.45
SELP Finance Sarl, REIT, Reg. S 0.875% 27/05/2029 EUR 249,000 244,032 0.58
Traton Finance Luxembourg SA, Reg. S 0.75% 24/03/2029 EUR 400,000 394,642 0.93
3,132,474 7.41
Netherlands
ABN AMRO Bank NV, Reg. S 2.875% 18/01/2028 EUR 200,000 205,616 0.49
ABN AMRO Bank NV, Reg. S, FRN 4.375% Perpetual EUR 200,000 214,625 0.51
Adecco International Financial Services BV, Reg. S 1% 21/03/2082 EUR 129,000 127,386 0.30
Airbus SE, Reg. S 1.375% 09/06/2026 EUR 282,000 294,563 0.70
Akelius Residential Property Financing BV, Reg. S 1.125% 11/01/2029 EUR 200,000 197,140 0.47
Brenntag Finance BV, Reg. S 0.5% 06/10/2029 EUR 200,000 198,479 0.47
Cooperatieve Rabobank UA, Reg. S 3.1% 31/12/2164 EUR 200,000 199,625 0.47
Enel Finance International NV, Reg. S 0.375% 17/06/2027 EUR 352,000 350,904 0.83
EXOR NV, Reg. S 1.75% 18/01/2028 EUR 300,000 319,214 0.75
Investments Currency Quantity/
Nominal Value
Market Value
EUR
% of Net
Assets0
Heimstaden Bostad Treasury BV, Reg. S 0.75% 06/09/2029 EUR 200,000 191,561 0.45
Iberdrola International BV, Reg. S 1.825% Perpetual EUR 200,000 199,025 0.47
Iberdrola International BV, Reg. S 1.874% Perpetual EUR 200,000 204,127 0.48
Iberdrola International BV, Reg. S, FRN 1.875% Perpetual EUR 500,000 510,780 1.21
ING Groep NV, Reg. S, FRN 1.625% 26/09/2029 EUR 300,000 308,330 0.73
ING Groep NV, Reg. S, FRN 4.25% 26/05/2031 EUR 200,000 209,535 0.50
ING Groep NV, Reg. S 0.875% 09/06/2032 EUR 100,000 99,408 0.23
LeasePlan Corp. NV, Reg. S 0.25% 07/09/2026 EUR 423,000 417,757 0.99
Nationale-Nederlanden Bank NV (The) Netherlands 0.5% 21/09/2028 EUR 300,000 297,211 0.70
Naturgy Finance BV, Reg. S, FRN 4.125% Perpetual EUR 100,000 103,465 0.24
Stellantis NV, Reg. S 3.75% 29/03/2024 EUR 100,000 108,023 0.25
Stellantis NV, Reg. S 0.75% 18/01/2029 EUR 287,000 283,586 0.67
Telefonica Europe BV, Reg. S, FRN 5.875% Perpetual EUR 300,000 329,625 0.78
Volkswagen International Finance NV, Reg. S, FRN 3.375% Perpetual EUR 300,000 317,025 0.75
Wolters Kluwer NV, Reg. S 0.75% 03/07/2030 EUR 289,000 290,476 0.69
5,977,486 14.13
Norway
Aker BP ASA, Reg. S 2.25% 12/05/2029 EUR 184,000 183,167 0.43
183,167 0.43
Portugal
Caixa Geral de Depositos SA, Reg. S 0.375% 21/09/2027 EUR 200,000 196,754 0.46
EDP - Energias de Portugal SA, Reg. S 1.875% 02/08/2081 EUR 200,000 198,485 0.47
395,239 0.93
Spain
Banco Bilbao Vizcaya Argentaria SA, Reg. S 1% 21/06/2026 EUR 200,000 205,064 0.48
Banco de Sabadell SA, Reg. S 1.625% 07/03/2024 EUR 500,000 514,674 1.22
Banco de Sabadell SA, Reg. S 5.625% 06/05/2026 EUR 200,000 229,575 0.54
Banco Santander SA, Reg. S 0.5% 24/03/2027 EUR 300,000 299,436 0.71
Banco Santander SA, Reg. S 1.375% 05/01/2026 EUR 500,000 519,658 1.23
Bankinter SA, Reg. S 0.875% 08/07/2026 EUR 400,000 406,142 0.96
CaixaBank SA, Reg. S 0.375% 18/11/2026 EUR 200,000 199,097 0.47
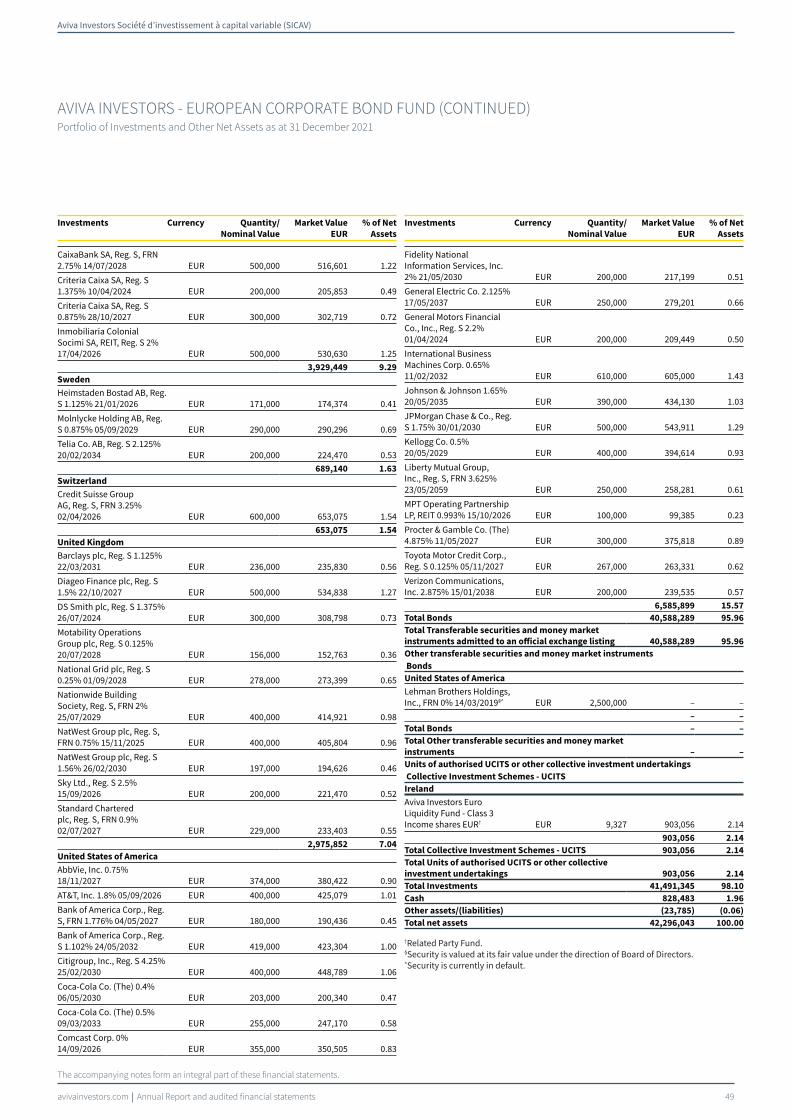
Aviva Investors Société d’investissement à capital variable (SICAV)
avivainvestors.com Annual Report and audited financial statements 49
AVIVA INVESTORS - EUROPEAN CORPORATE BOND FUND (CONTINUED)Portfolio of Investments and Other Net Assets as at 31 December 2021
The accompanying notes form an integral part of these financial statements.
Investments Currency Quantity/
Nominal Value
Market Value
EUR
% of Net
Assets0
CaixaBank SA, Reg. S, FRN 2.75% 14/07/2028 EUR 500,000 516,601 1.22
Criteria Caixa SA, Reg. S 1.375% 10/04/2024 EUR 200,000 205,853 0.49
Criteria Caixa SA, Reg. S 0.875% 28/10/2027 EUR 300,000 302,719 0.72
Inmobiliaria Colonial Socimi SA, REIT, Reg. S 2% 17/04/2026 EUR 500,000 530,630 1.25
3,929,449 9.29
Sweden
Heimstaden Bostad AB, Reg. S 1.125% 21/01/2026 EUR 171,000 174,374 0.41
Molnlycke Holding AB, Reg. S 0.875% 05/09/2029 EUR 290,000 290,296 0.69
Telia Co. AB, Reg. S 2.125% 20/02/2034 EUR 200,000 224,470 0.53
689,140 1.63
Switzerland
Credit Suisse Group AG, Reg. S, FRN 3.25% 02/04/2026 EUR 600,000 653,075 1.54
653,075 1.54
United Kingdom
Barclays plc, Reg. S 1.125% 22/03/2031 EUR 236,000 235,830 0.56
Diageo Finance plc, Reg. S 1.5% 22/10/2027 EUR 500,000 534,838 1.27
DS Smith plc, Reg. S 1.375% 26/07/2024 EUR 300,000 308,798 0.73
Motability Operations Group plc, Reg. S 0.125% 20/07/2028 EUR 156,000 152,763 0.36
National Grid plc, Reg. S 0.25% 01/09/2028 EUR 278,000 273,399 0.65
Nationwide Building Society, Reg. S, FRN 2% 25/07/2029 EUR 400,000 414,921 0.98
NatWest Group plc, Reg. S, FRN 0.75% 15/11/2025 EUR 400,000 405,804 0.96
NatWest Group plc, Reg. S 1.56% 26/02/2030 EUR 197,000 194,626 0.46
Sky Ltd., Reg. S 2.5% 15/09/2026 EUR 200,000 221,470 0.52
Standard Chartered plc, Reg. S, FRN 0.9% 02/07/2027 EUR 229,000 233,403 0.55
2,975,852 7.04
United States of America
AbbVie, Inc. 0.75% 18/11/2027 EUR 374,000 380,422 0.90
AT&T, Inc. 1.8% 05/09/2026 EUR 400,000 425,079 1.01
Bank of America Corp., Reg. S, FRN 1.776% 04/05/2027 EUR 180,000 190,436 0.45
Bank of America Corp., Reg. S 1.102% 24/05/2032 EUR 419,000 423,304 1.00
Citigroup, Inc., Reg. S 4.25% 25/02/2030 EUR 400,000 448,789 1.06
Coca-Cola Co. (The) 0.4% 06/05/2030 EUR 203,000 200,340 0.47
Coca-Cola Co. (The) 0.5% 09/03/2033 EUR 255,000 247,170 0.58
Comcast Corp. 0% 14/09/2026 EUR 355,000 350,505 0.83
Investments Currency Quantity/
Nominal Value
Market Value
EUR
% of Net
Assets0
Fidelity National Information Services, Inc. 2% 21/05/2030 EUR 200,000 217,199 0.51
General Electric Co. 2.125% 17/05/2037 EUR 250,000 279,201 0.66
General Motors Financial Co., Inc., Reg. S 2.2% 01/04/2024 EUR 200,000 209,449 0.50
International Business Machines Corp. 0.65% 11/02/2032 EUR 610,000 605,000 1.43
Johnson & Johnson 1.65% 20/05/2035 EUR 390,000 434,130 1.03
JPMorgan Chase & Co., Reg. S 1.75% 30/01/2030 EUR 500,000 543,911 1.29
Kellogg Co. 0.5% 20/05/2029 EUR 400,000 394,614 0.93
Liberty Mutual Group, Inc., Reg. S, FRN 3.625% 23/05/2059 EUR 250,000 258,281 0.61
MPT Operating Partnership LP, REIT 0.993% 15/10/2026 EUR 100,000 99,385 0.23
Procter & Gamble Co. (The) 4.875% 11/05/2027 EUR 300,000 375,818 0.89
Toyota Motor Credit Corp., Reg. S 0.125% 05/11/2027 EUR 267,000 263,331 0.62
Verizon Communications, Inc. 2.875% 15/01/2038 EUR 200,000 239,535 0.57
6,585,899 15.57
Total Bonds 40,588,289 95.96
Total Transferable securities and money market
instruments admitted to an official exchange listing 40,588,289 95.96
Other transferable securities and money market instruments
Bonds
United States of America
Lehman Brothers Holdings, Inc., FRN 0% 14/03/2019§^ EUR 2,500,000 – –
– –
Total Bonds – –
Total Other transferable securities and money market
instruments – –
Units of authorised UCITS or other collective investment undertakings
Collective Investment Schemes - UCITS
Ireland
Aviva Investors Euro Liquidity Fund - Class 3 Income shares EUR† EUR 9,327 903,056 2.14
903,056 2.14
Total Collective Investment Schemes - UCITS 903,056 2.14
Total Units of authorised UCITS or other collective
investment undertakings 903,056 2.14
Total Investments 41,491,345 98.10
Cash 828,483 1.96
Other assets/(liabilities) (23,785) (0.06)
Total net assets 42,296,043 100.00 †Related Party Fund.§Security is valued at its fair value under the direction of Board of Directors.^Security is currently in default.
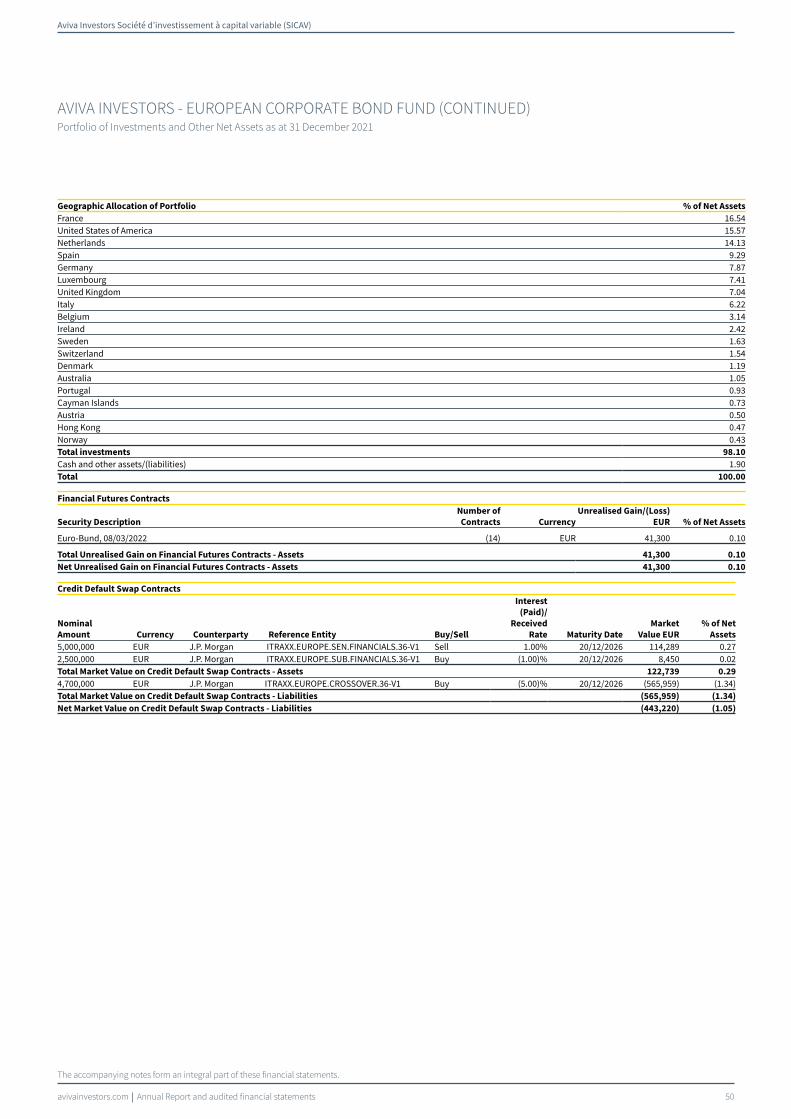
Aviva Investors Société d’investissement à capital variable (SICAV)
avivainvestors.com Annual Report and audited financial statements 50
AVIVA INVESTORS - EUROPEAN CORPORATE BOND FUND (CONTINUED)Portfolio of Investments and Other Net Assets as at 31 December 2021
The accompanying notes form an integral part of these financial statements.
Geographic Allocation of Portfolio % of Net Assets
France 16.54United States of America 15.57Netherlands 14.13Spain 9.29Germany 7.87Luxembourg 7.41United Kingdom 7.04Italy 6.22Belgium 3.14Ireland 2.42Sweden 1.63Switzerland 1.54Denmark 1.19Australia 1.05Portugal 0.93Cayman Islands 0.73Austria 0.50Hong Kong 0.47Norway 0.43Total investments 98.10
Cash and other assets/(liabilities) 1.90Total 100.00
Financial Futures Contracts
Security Description
Number of
Contracts Currency
Unrealised Gain/(Loss)
EUR % of Net Assets
Euro-Bund, 08/03/2022 (14) EUR 41,300 0 .10
Total Unrealised Gain on Financial Futures Contracts - Assets 41,300 0.10
Net Unrealised Gain on Financial Futures Contracts - Assets 41,300 0.10
Credit Default Swap Contracts
Nominal
Amount Currency Counterparty Reference Entity Buy/Sell
Interest
(Paid)/
Received
Rate Maturity Date
Market
Value EUR
% of Net
Assets
5,000,000 EUR J.P. Morgan ITRAXX.EUROPE.SEN.FINANCIALS.36-V1 Sell 1.00% 20/12/2026 114,289 0.272,500,000 EUR J.P. Morgan ITRAXX.EUROPE.SUB.FINANCIALS.36-V1 Buy (1.00)% 20/12/2026 8,450 0.02Total Market Value on Credit Default Swap Contracts - Assets 122,739 0.29
4,700,000 EUR J.P. Morgan ITRAXX.EUROPE.CROSSOVER.36-V1 Buy (5.00)% 20/12/2026 (565,959) (1.34)Total Market Value on Credit Default Swap Contracts - Liabilities (565,959) (1.34)
Net Market Value on Credit Default Swap Contracts - Liabilities (443,220) (1.05)

Aviva Investors Société d’investissement à capital variable (SICAV)
avivainvestors.com Annual Report and audited financial statements 51
The accompanying notes form an integral part of these financial statements.
AVIVA INVESTORS - EUROPEAN EQUITY FUNDPortfolio of Investments and Other Net Assets as at 31 December 2021
Investments Currency Quantity/
Nominal Value
Market Value
EUR
% of Net
Assets0
Transferable securities and money market instruments admitted to an official
exchange listing
Equities
Austria
BAWAG Group AG, Reg. S EUR 25,216 1,361,034 1.88
1,361,034 1.88
Belgium
Anheuser-Busch InBev SA EUR 29,189 1,553,293 2.14
KBC Group NV EUR 19,818 1,494,079 2.06
3,047,372 4.20
Bermuda
Conduit Holdings Ltd. GBP 110,256 569,441 0.79
569,441 0.79
Denmark
Orsted A/S, Reg. S DKK 8,622 968,706 1.34
968,706 1.34
Finland
Neste OYJ EUR 26,608 1,152,126 1.59
1,152,126 1.59
France
AXA SA EUR 62,184 1,628,133 2.25
Bureau Veritas SA EUR 39,645 1,158,625 1.60
Danone SA EUR 14,089 769,189 1.06
EssilorLuxottica SA EUR 9,016 1,687,795 2.33
Faurecia SE EUR 21,586 901,647 1.24
LVMH Moet Hennessy Louis Vuitton SE EUR 1,424 1,034,892 1.43
Pernod Ricard SA EUR 5,642 1,193,001 1.65
Sanofi EUR 16,969 1,503,114 2.07
Schneider Electric SE EUR 10,485 1,808,138 2.49
11,684,534 16.12
Germany
Covestro AG, Reg. S EUR 22,522 1,220,917 1.69
Evonik Industries AG EUR 41,814 1,192,117 1.65
Fresenius SE & Co. KGaA EUR 29,159 1,031,500 1.42
Muenchener Rueckversicherungs-Gesellschaft AG EUR 6,446 1,679,183 2.32
SAP SE EUR 18,489 2,298,922 3.17
Siemens AG EUR 12,830 1,952,213 2.69
Siemens Energy AG EUR 49,863 1,123,663 1.55
10,498,515 14.49
Ireland
Kerry Group plc 'A' EUR 7,580 860,141 1.19
860,141 1.19
Italy
Nexi SpA, Reg. S EUR 79,005 1,104,688 1.52
Prysmian SpA EUR 40,255 1,333,044 1.84
2,437,732 3.36
Luxembourg
Global Fashion Group SA EUR 67,400 299,593 0.42
InPost SA EUR 61,902 654,242 0.90
953,835 1.32
Netherlands
ASML Holding NV EUR 5,113 3,613,613 4.99
Prosus NV EUR 15,759 1,158,917 1.60
QIAGEN NV EUR 37,516 1,840,535 2.54
Stellantis NV EUR 82,479 1,375,914 1.90
STMicroelectronics NV EUR 32,833 1,424,460 1.96
Investments Currency Quantity/
Nominal Value
Market Value
EUR
% of Net
Assets0
Wolters Kluwer NV EUR 18,841 1,940,623 2.68
11,354,062 15.67
Portugal
EDP - Energias de Portugal SA EUR 283,632 1,370,652 1.89
1,370,652 1.89
Spain
Amadeus IT Group SA 'A' EUR 21,764 1,297,787 1.79
Industria de Diseno Textil SA EUR 36,668 1,045,955 1.44
2,343,742 3.23
Sweden
Volvo AB 'B' SEK 71,240 1,450,984 2.00
1,450,984 2.00
Switzerland
Alcon, Inc. CHF 25,153 1,959,419 2.70
Lonza Group AG CHF 2,596 1,907,584 2.63
Nestle SA CHF 14,044 1,727,006 2.38
Novartis AG CHF 28,779 2,229,114 3.08
7,823,123 10.79
United Kingdom
Anglo American plc GBP 45,813 1,647,136 2.27
AstraZeneca plc GBP 21,169 2,188,151 3.02
Biffa plc, Reg. S GBP 285,183 1,217,215 1.68
BP plc GBP 409,279 1,611,933 2.22
DS Smith plc GBP 224,813 1,029,719 1.42
London Stock Exchange Group plc GBP 16,935 1,399,028 1.93
Oxford Nanopore Technologies plc GBP 19,399 161,206 0.22
Phoenix Group Holdings plc GBP 163,590 1,272,899 1.76
QinetiQ Group plc GBP 321,057 1,017,852 1.40
St James's Place plc GBP 63,818 1,280,392 1.77
THG plc GBP 392,403 1,070,595 1.48
13,896,126 19.17
Total Equities 71,772,125 99.03
Total Transferable securities and money market
instruments admitted to an official exchange listing 71,772,125 99.03
Units of authorised UCITS or other collective investment undertakings
Collective Investment Schemes - UCITS
Ireland
Aviva Investors Euro Liquidity Fund - Class 3 Income shares EUR† EUR 1,063 102,968 0.14
Aviva Investors Sterling Liquidity Funds plc - Class 3 Income shares GBP† GBP 200,000 238,280 0.33
341,248 0.47
Total Collective Investment Schemes - UCITS 341,248 0.47
Total Units of authorised UCITS or other collective
investment undertakings 341,248 0.47
Total Investments 72,113,373 99.50
Cash 250,034 0.34
Other assets/(liabilities) 113,274 0.16
Total net assets 72,476,681 100.00
†Related Party Fund.
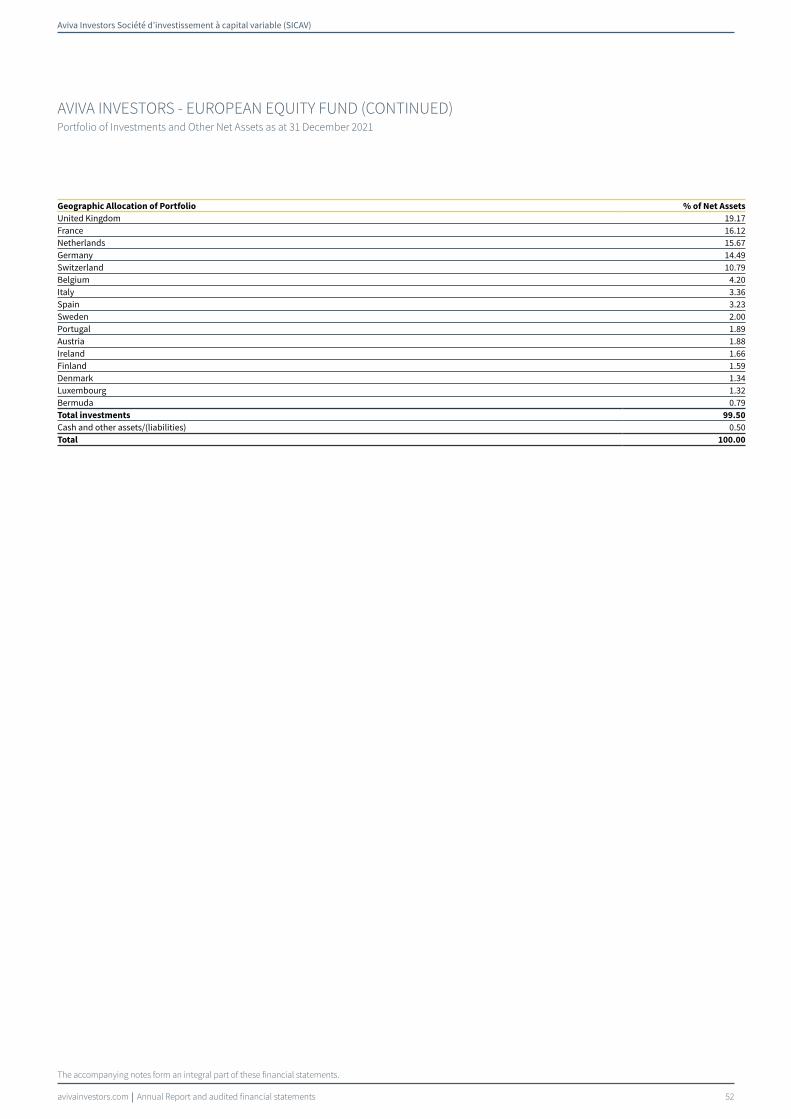
Aviva Investors Société d’investissement à capital variable (SICAV)
avivainvestors.com Annual Report and audited financial statements 52
AVIVA INVESTORS - EUROPEAN EQUITY FUND (CONTINUED)Portfolio of Investments and Other Net Assets as at 31 December 2021
The accompanying notes form an integral part of these financial statements.
Geographic Allocation of Portfolio % of Net Assets
United Kingdom 19.17France 16.12Netherlands 15.67Germany 14.49Switzerland 10.79Belgium 4.20Italy 3.36Spain 3.23Sweden 2.00Portugal 1.89Austria 1.88Ireland 1.66Finland 1.59Denmark 1.34Luxembourg 1.32Bermuda 0.79Total investments 99.50
Cash and other assets/(liabilities) 0.50Total 100.00
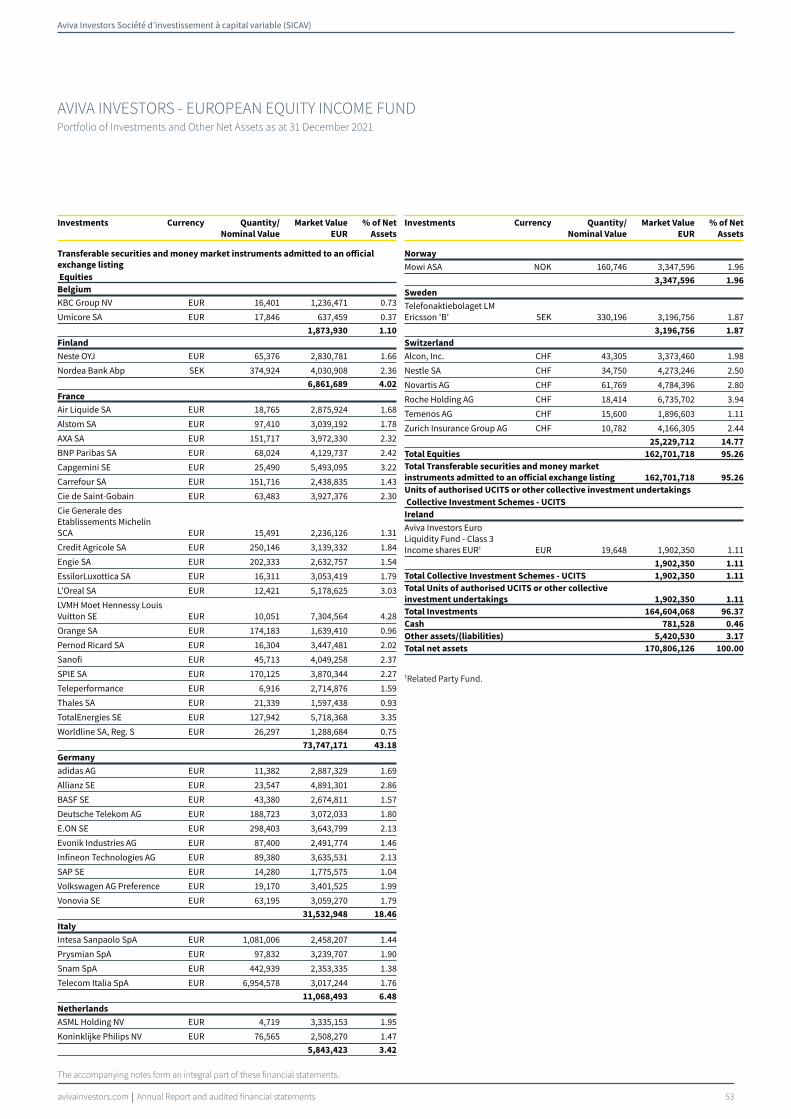
Aviva Investors Société d’investissement à capital variable (SICAV)
avivainvestors.com Annual Report and audited financial statements 53
The accompanying notes form an integral part of these financial statements.
AVIVA INVESTORS - EUROPEAN EQUITY INCOME FUNDPortfolio of Investments and Other Net Assets as at 31 December 2021
Investments Currency Quantity/
Nominal Value
Market Value
EUR
% of Net
Assets0
Transferable securities and money market instruments admitted to an official
exchange listing
Equities
Belgium
KBC Group NV EUR 16,401 1,236,471 0.73
Umicore SA EUR 17,846 637,459 0.37
1,873,930 1.10
Finland
Neste OYJ EUR 65,376 2,830,781 1.66
Nordea Bank Abp SEK 374,924 4,030,908 2.36
6,861,689 4.02
France
Air Liquide SA EUR 18,765 2,875,924 1.68
Alstom SA EUR 97,410 3,039,192 1.78
AXA SA EUR 151,717 3,972,330 2.32
BNP Paribas SA EUR 68,024 4,129,737 2.42
Capgemini SE EUR 25,490 5,493,095 3.22
Carrefour SA EUR 151,716 2,438,835 1.43
Cie de Saint-Gobain EUR 63,483 3,927,376 2.30
Cie Generale des Etablissements Michelin SCA EUR 15,491 2,236,126 1.31
Credit Agricole SA EUR 250,146 3,139,332 1.84
Engie SA EUR 202,333 2,632,757 1.54
EssilorLuxottica SA EUR 16,311 3,053,419 1.79
L'Oreal SA EUR 12,421 5,178,625 3.03
LVMH Moet Hennessy Louis Vuitton SE EUR 10,051 7,304,564 4.28
Orange SA EUR 174,183 1,639,410 0.96
Pernod Ricard SA EUR 16,304 3,447,481 2.02
Sanofi EUR 45,713 4,049,258 2.37
SPIE SA EUR 170,125 3,870,344 2.27
Teleperformance EUR 6,916 2,714,876 1.59
Thales SA EUR 21,339 1,597,438 0.93
TotalEnergies SE EUR 127,942 5,718,368 3.35
Worldline SA, Reg. S EUR 26,297 1,288,684 0.75
73,747,171 43.18
Germany
adidas AG EUR 11,382 2,887,329 1.69
Allianz SE EUR 23,547 4,891,301 2.86
BASF SE EUR 43,380 2,674,811 1.57
Deutsche Telekom AG EUR 188,723 3,072,033 1.80
E.ON SE EUR 298,403 3,643,799 2.13
Evonik Industries AG EUR 87,400 2,491,774 1.46
Infineon Technologies AG EUR 89,380 3,635,531 2.13
SAP SE EUR 14,280 1,775,575 1.04
Volkswagen AG Preference EUR 19,170 3,401,525 1.99
Vonovia SE EUR 63,195 3,059,270 1.79
31,532,948 18.46
Italy
Intesa Sanpaolo SpA EUR 1,081,006 2,458,207 1.44
Prysmian SpA EUR 97,832 3,239,707 1.90
Snam SpA EUR 442,939 2,353,335 1.38
Telecom Italia SpA EUR 6,954,578 3,017,244 1.76
11,068,493 6.48
Netherlands
ASML Holding NV EUR 4,719 3,335,153 1.95
Koninklijke Philips NV EUR 76,565 2,508,270 1.47
5,843,423 3.42
Investments Currency Quantity/
Nominal Value
Market Value
EUR
% of Net
Assets0
Norway
Mowi ASA NOK 160,746 3,347,596 1.96
3,347,596 1.96
Sweden
Telefonaktiebolaget LM Ericsson 'B' SEK 330,196 3,196,756 1.87
3,196,756 1.87
Switzerland
Alcon, Inc. CHF 43,305 3,373,460 1.98
Nestle SA CHF 34,750 4,273,246 2.50
Novartis AG CHF 61,769 4,784,396 2.80
Roche Holding AG CHF 18,414 6,735,702 3.94
Temenos AG CHF 15,600 1,896,603 1.11
Zurich Insurance Group AG CHF 10,782 4,166,305 2.44
25,229,712 14.77
Total Equities 162,701,718 95.26
Total Transferable securities and money market
instruments admitted to an official exchange listing 162,701,718 95.26
Units of authorised UCITS or other collective investment undertakings
Collective Investment Schemes - UCITS
Ireland
Aviva Investors Euro Liquidity Fund - Class 3 Income shares EUR† EUR 19,648 1,902,350 1.11
1,902,350 1.11
Total Collective Investment Schemes - UCITS 1,902,350 1.11
Total Units of authorised UCITS or other collective
investment undertakings 1,902,350 1.11
Total Investments 164,604,068 96.37
Cash 781,528 0.46
Other assets/(liabilities) 5,420,530 3.17
Total net assets 170,806,126 100.00
†Related Party Fund.
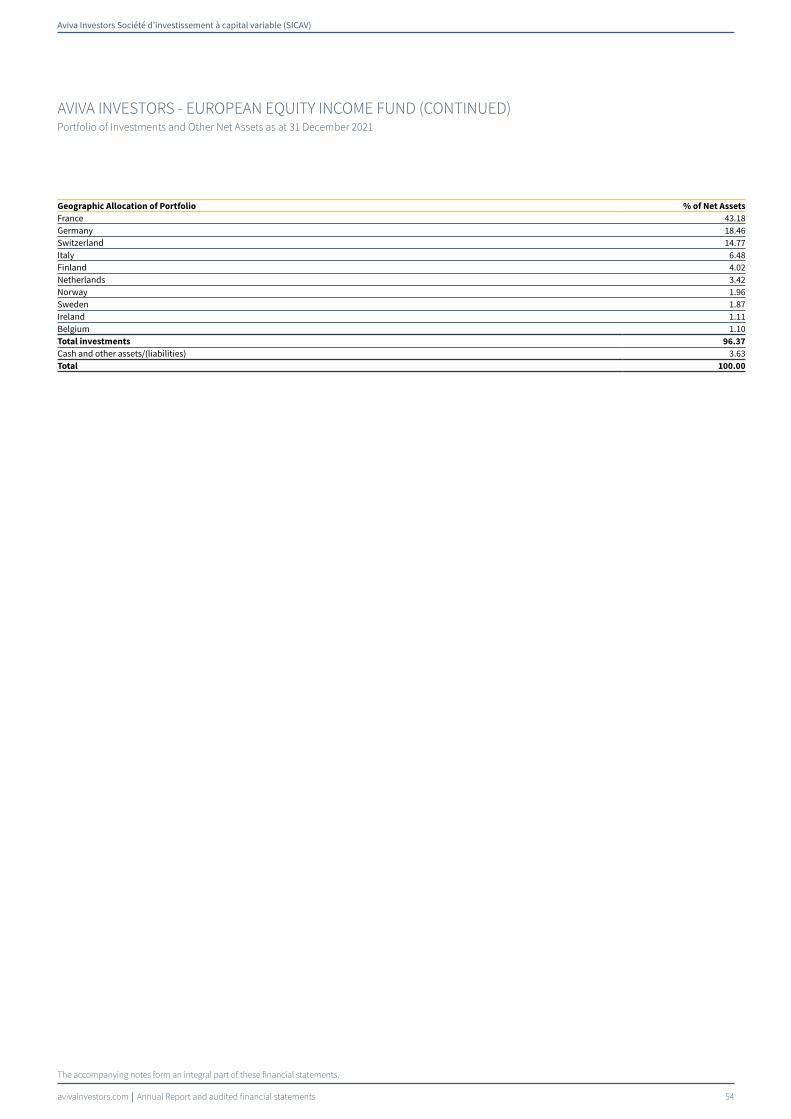
Aviva Investors Société d’investissement à capital variable (SICAV)
avivainvestors.com Annual Report and audited financial statements 54
AVIVA INVESTORS - EUROPEAN EQUITY INCOME FUND (CONTINUED)Portfolio of Investments and Other Net Assets as at 31 December 2021
The accompanying notes form an integral part of these financial statements.
Geographic Allocation of Portfolio % of Net Assets
France 43.18Germany 18.46Switzerland 14.77Italy 6.48Finland 4.02Netherlands 3.42Norway 1.96Sweden 1.87Ireland 1.11Belgium 1.10Total investments 96.37
Cash and other assets/(liabilities) 3.63Total 100.00

Aviva Investors Société d’investissement à capital variable (SICAV)
avivainvestors.com Annual Report and audited financial statements 55
The accompanying notes form an integral part of these financial statements.
AVIVA INVESTORS - GLOBAL SOVEREIGN BOND FUNDPortfolio of Investments and Other Net Assets as at 31 December 2021
Investments Currency Quantity/
Nominal Value
Market Value
EUR
% of Net
Assets0
Transferable securities and money market instruments admitted to an official
exchange listing
Bonds
Australia
Australia Government Bond, Reg. S 0.5% 21/09/2026 AUD 51,626,000 31,773,394 0.59
Australia Government Bond, Reg. S 1% 21/12/2030 AUD 66,001,000 39,995,862 0.74
Australia Government Bond, Reg. S 4.5% 21/04/2033 AUD 4,448,000 3,661,631 0.07
Australia Government Bond, Reg. S 1.75% 21/06/2051 AUD 3,507,000 1,948,153 0.04
77,379,040 1.44
Austria
Austria Government Bond, Reg. S, 144A 0.5% 20/04/2027 EUR 10,372,000 10,825,858 0.20
Austria Government Bond, Reg. S, 144A 0% 20/02/2030 EUR 16,426,000 16,436,020 0.31
Austria Government Bond, Reg. S, 144A 2.4% 23/05/2034 EUR 166,000 210,799 0.01
Austria Government Bond, Reg. S, 144A 4.15% 15/03/2037 EUR 2,847,000 4,489,483 0.08
Austria Government Bond, Reg. S, 144A 0% 20/10/2040 EUR 1,733,000 1,586,534 0.03
Austria Government Bond, Reg. S, 144A 0.75% 20/03/2051 EUR 1,085,000 1,119,002 0.02
Austria Government Bond, Reg. S, 144A 2.1% 20/09/2117 EUR 2,116,000 3,282,973 0.06
37,950,669 0.71
Belgium
Belgium Government Bond, Reg. S, 144A 0.2% 22/10/2023 EUR 331,000 335,905 0.01
Belgium Government Bond, Reg. S, 144A 0.8% 22/06/2027 EUR 12,359,204 13,120,284 0.24
Belgium Government Bond, Reg. S, 144A 1% 22/06/2031 EUR 29,821,952 32,327,592 0.60
Belgium Government Bond, Reg. S, 144A 1.25% 22/04/2033 EUR 4,859,630 5,443,194 0.10
Belgium Government Bond, Reg. S, 144A 0.4% 22/06/2040 EUR 1,541,000 1,467,847 0.03
Belgium Government Bond, Reg. S, 144A 4.25% 28/03/2041 EUR 1,804,000 2,974,760 0.06
Belgium Government Bond, Reg. S, 144A 1.6% 22/06/2047 EUR 4,084,147 4,769,516 0.09
Belgium Government Bond, Reg. S, 144A 2.15% 22/06/2066 EUR 3,161,962 4,406,738 0.08
64,845,836 1.21
Benin
Benin Government International Bond, Reg. S 4.95% 22/01/2035 EUR 12,996,000 12,459,330 0.23
12,459,330 0.23
Investments Currency Quantity/
Nominal Value
Market Value
EUR
% of Net
Assets0
Canada
Canada Government Bond 1.5% 01/06/2026 CAD 55,512,000 39,133,713 0.73
Canada Government Bond 2.25% 01/06/2029 CAD 232,000 172,395 –
Canada Government Bond 1.25% 01/06/2030 CAD 36,552,000 25,252,610 0.47
Canada Government Bond 2% 01/12/2051 CAD 18,000,000 13,480,708 0.25
78,039,426 1.45
China
China Government Bond 3.03% 11/03/2026 CNY 1,147,440,000 161,234,035 3.00
China Government Bond 3.27% 19/11/2030 CNY 856,490,000 122,248,623 2.27
China Government Bond 3.81% 14/09/2050 CNY 365,430,000 54,049,718 1.00
337,532,376 6.27
Czech Republic
Czech Republic Government Bond 2.75% 23/07/2029 CZK 3,900,000 153,968 –
Czech Republic Government Bond, Reg. S 0.95% 15/05/2030 CZK 115,890,000 3,982,954 0.08
4,136,922 0.08
Denmark
Denmark Government Bond 1.75% 15/11/2025 DKK 75,735,115 11,030,286 0.20
Denmark Government Bond 4.5% 15/11/2039 DKK 21,967,157 5,247,020 0.10
16,277,306 0.30
Dominican Republic
Dominican Republic Government Bond, Reg. S 4.5% 30/01/2030 USD 12,864,000 11,540,142 0.21
11,540,142 0.21
Finland
Finland Government Bond, Reg. S, 144A 0.875% 15/09/2025 EUR 10,714,000 11,261,207 0.21
Finland Government Bond, Reg. S, 144A 0.125% 15/09/2031 EUR 10,006,000 10,057,691 0.19
21,318,898 0.40
France
France Government Bond OAT, Reg. S, 144A 1.75% 25/06/2039 EUR 1,814,000 2,192,527 0.04
France Government Bond OAT, Reg. S, 144A 0.5% 25/05/2040 EUR 11,322,445 11,067,158 0.21
France Government Bond OAT, Reg. S, 144A 2% 25/05/2048 EUR 370,807 477,139 0.01
France Government Bond OAT, Reg. S, 144A 1.5% 25/05/2050 EUR 31,992,364 37,150,365 0.69
France Government Bond OAT, Reg. S 0% 25/03/2024 EUR 193,210,903 195,716,848 3.64
France Government Bond OAT, Reg. S 0% 25/11/2030 EUR 804,053 796,629 0.01
France Government Bond OAT, Reg. S 1.5% 25/05/2031 EUR 70,113 79,126 –
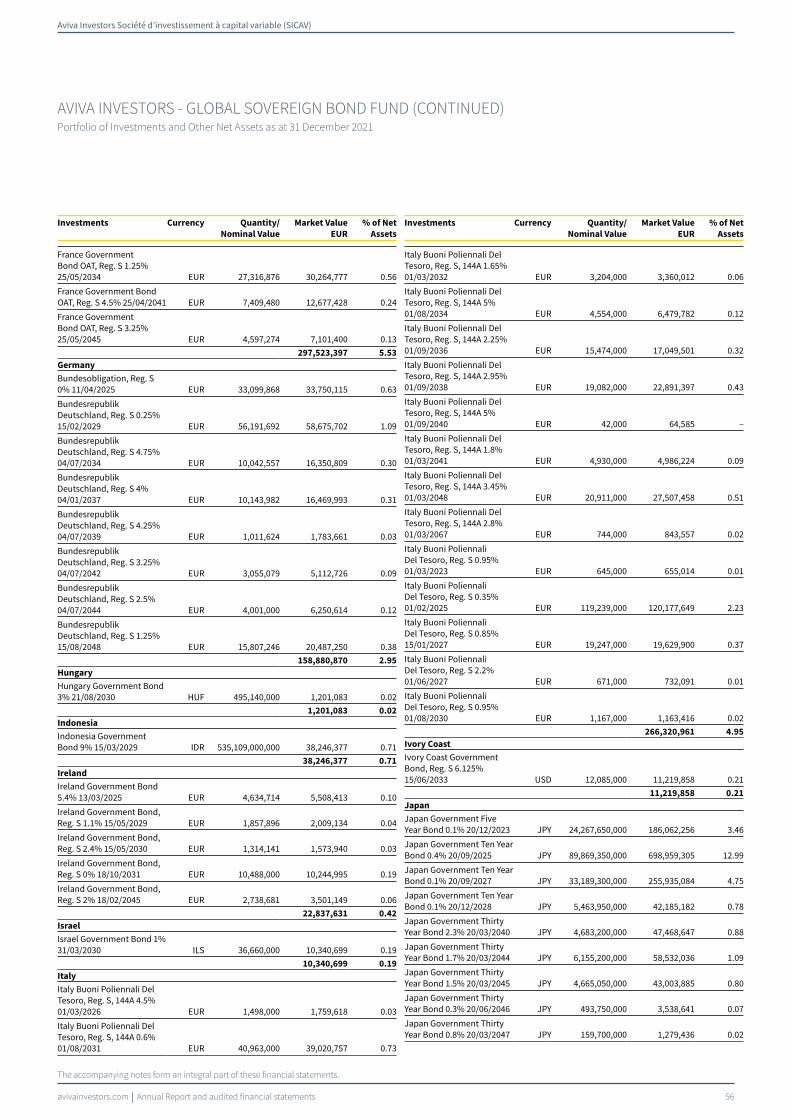
Aviva Investors Société d’investissement à capital variable (SICAV)
avivainvestors.com Annual Report and audited financial statements 56
AVIVA INVESTORS - GLOBAL SOVEREIGN BOND FUND (CONTINUED)Portfolio of Investments and Other Net Assets as at 31 December 2021
The accompanying notes form an integral part of these financial statements.
Investments Currency Quantity/
Nominal Value
Market Value
EUR
% of Net
Assets0
France Government Bond OAT, Reg. S 1.25% 25/05/2034 EUR 27,316,876 30,264,777 0.56
France Government Bond OAT, Reg. S 4.5% 25/04/2041 EUR 7,409,480 12,677,428 0.24
France Government Bond OAT, Reg. S 3.25% 25/05/2045 EUR 4,597,274 7,101,400 0.13
297,523,397 5.53
Germany
Bundesobligation, Reg. S 0% 11/04/2025 EUR 33,099,868 33,750,115 0.63
Bundesrepublik Deutschland, Reg. S 0.25% 15/02/2029 EUR 56,191,692 58,675,702 1.09
Bundesrepublik Deutschland, Reg. S 4.75% 04/07/2034 EUR 10,042,557 16,350,809 0.30
Bundesrepublik Deutschland, Reg. S 4% 04/01/2037 EUR 10,143,982 16,469,993 0.31
Bundesrepublik Deutschland, Reg. S 4.25% 04/07/2039 EUR 1,011,624 1,783,661 0.03
Bundesrepublik Deutschland, Reg. S 3.25% 04/07/2042 EUR 3,055,079 5,112,726 0.09
Bundesrepublik Deutschland, Reg. S 2.5% 04/07/2044 EUR 4,001,000 6,250,614 0.12
Bundesrepublik Deutschland, Reg. S 1.25% 15/08/2048 EUR 15,807,246 20,487,250 0.38
158,880,870 2.95
Hungary
Hungary Government Bond 3% 21/08/2030 HUF 495,140,000 1,201,083 0.02
1,201,083 0.02
Indonesia
Indonesia Government Bond 9% 15/03/2029 IDR 535,109,000,000 38,246,377 0.71
38,246,377 0.71
Ireland
Ireland Government Bond 5.4% 13/03/2025 EUR 4,634,714 5,508,413 0.10
Ireland Government Bond, Reg. S 1.1% 15/05/2029 EUR 1,857,896 2,009,134 0.04
Ireland Government Bond, Reg. S 2.4% 15/05/2030 EUR 1,314,141 1,573,940 0.03
Ireland Government Bond, Reg. S 0% 18/10/2031 EUR 10,488,000 10,244,995 0.19
Ireland Government Bond, Reg. S 2% 18/02/2045 EUR 2,738,681 3,501,149 0.06
22,837,631 0.42
Israel
Israel Government Bond 1% 31/03/2030 ILS 36,660,000 10,340,699 0.19
10,340,699 0.19
Italy
Italy Buoni Poliennali Del Tesoro, Reg. S, 144A 4.5% 01/03/2026 EUR 1,498,000 1,759,618 0.03
Italy Buoni Poliennali Del Tesoro, Reg. S, 144A 0.6% 01/08/2031 EUR 40,963,000 39,020,757 0.73
Investments Currency Quantity/
Nominal Value
Market Value
EUR
% of Net
Assets0
Italy Buoni Poliennali Del Tesoro, Reg. S, 144A 1.65% 01/03/2032 EUR 3,204,000 3,360,012 0.06
Italy Buoni Poliennali Del Tesoro, Reg. S, 144A 5% 01/08/2034 EUR 4,554,000 6,479,782 0.12
Italy Buoni Poliennali Del Tesoro, Reg. S, 144A 2.25% 01/09/2036 EUR 15,474,000 17,049,501 0.32
Italy Buoni Poliennali Del Tesoro, Reg. S, 144A 2.95% 01/09/2038 EUR 19,082,000 22,891,397 0.43
Italy Buoni Poliennali Del Tesoro, Reg. S, 144A 5% 01/09/2040 EUR 42,000 64,585 –
Italy Buoni Poliennali Del Tesoro, Reg. S, 144A 1.8% 01/03/2041 EUR 4,930,000 4,986,224 0.09
Italy Buoni Poliennali Del Tesoro, Reg. S, 144A 3.45% 01/03/2048 EUR 20,911,000 27,507,458 0.51
Italy Buoni Poliennali Del Tesoro, Reg. S, 144A 2.8% 01/03/2067 EUR 744,000 843,557 0.02
Italy Buoni Poliennali Del Tesoro, Reg. S 0.95% 01/03/2023 EUR 645,000 655,014 0.01
Italy Buoni Poliennali Del Tesoro, Reg. S 0.35% 01/02/2025 EUR 119,239,000 120,177,649 2.23
Italy Buoni Poliennali Del Tesoro, Reg. S 0.85% 15/01/2027 EUR 19,247,000 19,629,900 0.37
Italy Buoni Poliennali Del Tesoro, Reg. S 2.2% 01/06/2027 EUR 671,000 732,091 0.01
Italy Buoni Poliennali Del Tesoro, Reg. S 0.95% 01/08/2030 EUR 1,167,000 1,163,416 0.02
266,320,961 4.95
Ivory Coast
Ivory Coast Government Bond, Reg. S 6.125% 15/06/2033 USD 12,085,000 11,219,858 0.21
11,219,858 0.21
Japan
Japan Government Five Year Bond 0.1% 20/12/2023 JPY 24,267,650,000 186,062,256 3.46
Japan Government Ten Year Bond 0.4% 20/09/2025 JPY 89,869,350,000 698,959,305 12.99
Japan Government Ten Year Bond 0.1% 20/09/2027 JPY 33,189,300,000 255,935,084 4.75
Japan Government Ten Year Bond 0.1% 20/12/2028 JPY 5,463,950,000 42,185,182 0.78
Japan Government Thirty Year Bond 2.3% 20/03/2040 JPY 4,683,200,000 47,468,647 0.88
Japan Government Thirty Year Bond 1.7% 20/03/2044 JPY 6,155,200,000 58,532,036 1.09
Japan Government Thirty Year Bond 1.5% 20/03/2045 JPY 4,665,050,000 43,003,885 0.80
Japan Government Thirty Year Bond 0.3% 20/06/2046 JPY 493,750,000 3,538,641 0.07
Japan Government Thirty Year Bond 0.8% 20/03/2047 JPY 159,700,000 1,279,436 0.02
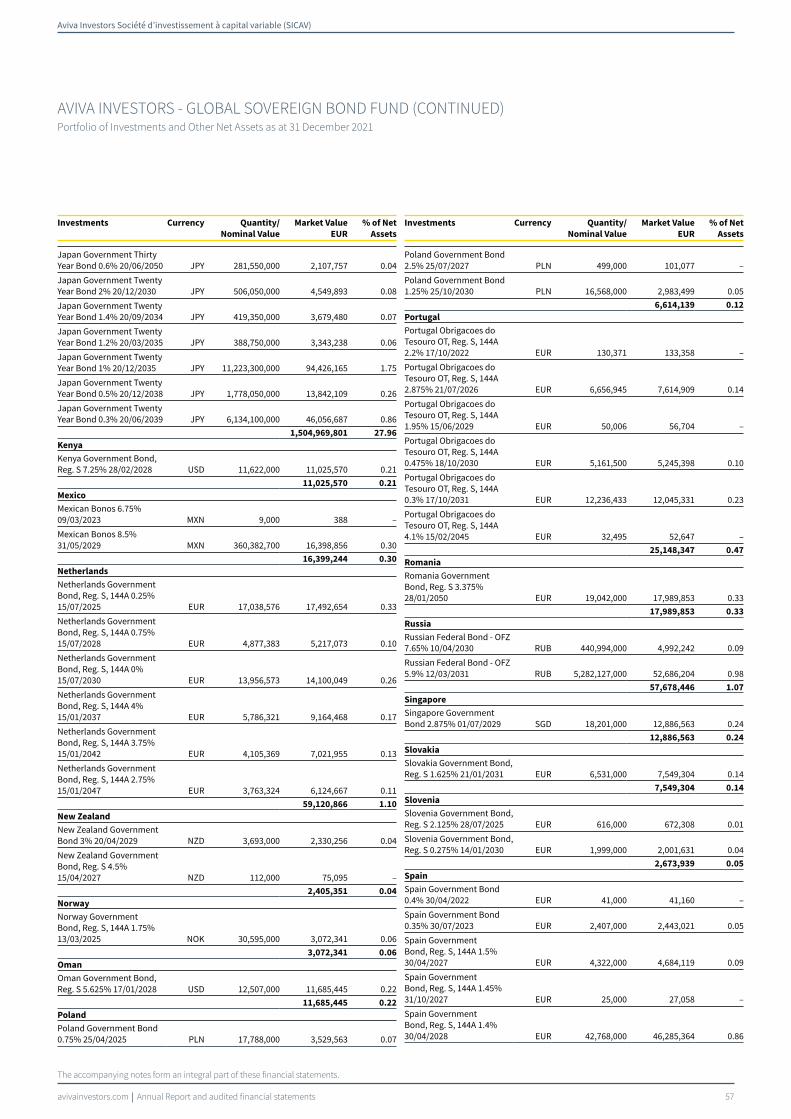
Aviva Investors Société d’investissement à capital variable (SICAV)
avivainvestors.com Annual Report and audited financial statements 57
AVIVA INVESTORS - GLOBAL SOVEREIGN BOND FUND (CONTINUED)Portfolio of Investments and Other Net Assets as at 31 December 2021
The accompanying notes form an integral part of these financial statements.
Investments Currency Quantity/
Nominal Value
Market Value
EUR
% of Net
Assets0
Japan Government Thirty Year Bond 0.6% 20/06/2050 JPY 281,550,000 2,107,757 0.04
Japan Government Twenty Year Bond 2% 20/12/2030 JPY 506,050,000 4,549,893 0.08
Japan Government Twenty Year Bond 1.4% 20/09/2034 JPY 419,350,000 3,679,480 0.07
Japan Government Twenty Year Bond 1.2% 20/03/2035 JPY 388,750,000 3,343,238 0.06
Japan Government Twenty Year Bond 1% 20/12/2035 JPY 11,223,300,000 94,426,165 1.75
Japan Government Twenty Year Bond 0.5% 20/12/2038 JPY 1,778,050,000 13,842,109 0.26
Japan Government Twenty Year Bond 0.3% 20/06/2039 JPY 6,134,100,000 46,056,687 0.86
1,504,969,801 27.96
Kenya
Kenya Government Bond, Reg. S 7.25% 28/02/2028 USD 11,622,000 11,025,570 0.21
11,025,570 0.21
Mexico
Mexican Bonos 6.75% 09/03/2023 MXN 9,000 388 –
Mexican Bonos 8.5% 31/05/2029 MXN 360,382,700 16,398,856 0.30
16,399,244 0.30
Netherlands
Netherlands Government Bond, Reg. S, 144A 0.25% 15/07/2025 EUR 17,038,576 17,492,654 0.33
Netherlands Government Bond, Reg. S, 144A 0.75% 15/07/2028 EUR 4,877,383 5,217,073 0.10
Netherlands Government Bond, Reg. S, 144A 0% 15/07/2030 EUR 13,956,573 14,100,049 0.26
Netherlands Government Bond, Reg. S, 144A 4% 15/01/2037 EUR 5,786,321 9,164,468 0.17
Netherlands Government Bond, Reg. S, 144A 3.75% 15/01/2042 EUR 4,105,369 7,021,955 0.13
Netherlands Government Bond, Reg. S, 144A 2.75% 15/01/2047 EUR 3,763,324 6,124,667 0.11
59,120,866 1.10
New Zealand
New Zealand Government Bond 3% 20/04/2029 NZD 3,693,000 2,330,256 0.04
New Zealand Government Bond, Reg. S 4.5% 15/04/2027 NZD 112,000 75,095 –
2,405,351 0.04
Norway
Norway Government Bond, Reg. S, 144A 1.75% 13/03/2025 NOK 30,595,000 3,072,341 0.06
3,072,341 0.06
Oman
Oman Government Bond, Reg. S 5.625% 17/01/2028 USD 12,507,000 11,685,445 0.22
11,685,445 0.22
Poland
Poland Government Bond 0.75% 25/04/2025 PLN 17,788,000 3,529,563 0.07
Investments Currency Quantity/
Nominal Value
Market Value
EUR
% of Net
Assets0
Poland Government Bond 2.5% 25/07/2027 PLN 499,000 101,077 –
Poland Government Bond 1.25% 25/10/2030 PLN 16,568,000 2,983,499 0.05
6,614,139 0.12
Portugal
Portugal Obrigacoes do Tesouro OT, Reg. S, 144A 2.2% 17/10/2022 EUR 130,371 133,358 –
Portugal Obrigacoes do Tesouro OT, Reg. S, 144A 2.875% 21/07/2026 EUR 6,656,945 7,614,909 0.14
Portugal Obrigacoes do Tesouro OT, Reg. S, 144A 1.95% 15/06/2029 EUR 50,006 56,704 –
Portugal Obrigacoes do Tesouro OT, Reg. S, 144A 0.475% 18/10/2030 EUR 5,161,500 5,245,398 0.10
Portugal Obrigacoes do Tesouro OT, Reg. S, 144A 0.3% 17/10/2031 EUR 12,236,433 12,045,331 0.23
Portugal Obrigacoes do Tesouro OT, Reg. S, 144A 4.1% 15/02/2045 EUR 32,495 52,647 –
25,148,347 0.47
Romania
Romania Government Bond, Reg. S 3.375% 28/01/2050 EUR 19,042,000 17,989,853 0.33
17,989,853 0.33
Russia
Russian Federal Bond - OFZ 7.65% 10/04/2030 RUB 440,994,000 4,992,242 0.09
Russian Federal Bond - OFZ 5.9% 12/03/2031 RUB 5,282,127,000 52,686,204 0.98
57,678,446 1.07
Singapore
Singapore Government Bond 2.875% 01/07/2029 SGD 18,201,000 12,886,563 0.24
12,886,563 0.24
Slovakia
Slovakia Government Bond, Reg. S 1.625% 21/01/2031 EUR 6,531,000 7,549,304 0.14
7,549,304 0.14
Slovenia
Slovenia Government Bond, Reg. S 2.125% 28/07/2025 EUR 616,000 672,308 0.01
Slovenia Government Bond, Reg. S 0.275% 14/01/2030 EUR 1,999,000 2,001,631 0.04
2,673,939 0.05
Spain
Spain Government Bond 0.4% 30/04/2022 EUR 41,000 41,160 –
Spain Government Bond 0.35% 30/07/2023 EUR 2,407,000 2,443,021 0.05
Spain Government Bond, Reg. S, 144A 1.5% 30/04/2027 EUR 4,322,000 4,684,119 0.09
Spain Government Bond, Reg. S, 144A 1.45% 31/10/2027 EUR 25,000 27,058 –
Spain Government Bond, Reg. S, 144A 1.4% 30/04/2028 EUR 42,768,000 46,285,364 0.86

Aviva Investors Société d’investissement à capital variable (SICAV)
avivainvestors.com Annual Report and audited financial statements 58
AVIVA INVESTORS - GLOBAL SOVEREIGN BOND FUND (CONTINUED)Portfolio of Investments and Other Net Assets as at 31 December 2021
The accompanying notes form an integral part of these financial statements.
Investments Currency Quantity/
Nominal Value
Market Value
EUR
% of Net
Assets0
Spain Government Bond, Reg. S, 144A 1.4% 30/07/2028 EUR 26,000 28,205 –
Spain Government Bond, Reg. S, 144A 1.95% 30/07/2030 EUR 1,679,000 1,903,271 0.03
Spain Government Bond, Reg. S, 144A 1.25% 31/10/2030 EUR 39,526,000 42,387,607 0.79
Spain Government Bond, Reg. S, 144A 2.35% 30/07/2033 EUR 5,295,000 6,290,100 0.12
Spain Government Bond, Reg. S, 144A 4.9% 30/07/2040 EUR 2,153,000 3,579,741 0.07
Spain Government Bond, Reg. S, 144A 1.2% 31/10/2040 EUR 9,533,000 9,636,814 0.18
Spain Government Bond, Reg. S, 144A 5.15% 31/10/2044 EUR 7,061,000 12,726,026 0.24
Spain Government Bond, Reg. S, 144A 2.7% 31/10/2048 EUR 9,586,000 12,601,852 0.23
Spain Government Bond, Reg. S, 144A 3.45% 30/07/2066 EUR 1,967,000 2,970,680 0.05
145,605,018 2.71
Sweden
Sweden Government Bond, Reg. S, 144A 0.75% 12/11/2029 SEK 26,950,000 2,738,283 0.05
Sweden Government Bond, Reg. S 1% 12/11/2026 SEK 895,000 90,923 –
2,829,206 0.05
Switzerland
Switzerland Government Bond, Reg. S 1.25% 28/05/2026 CHF 703,000 729,026 0.01
Switzerland Government Bond, Reg. S 0.5% 27/05/2030 CHF 9,057,000 9,261,741 0.17
Switzerland Government Bond, Reg. S 2.25% 22/06/2031 CHF 2,607,000 3,093,101 0.06
Switzerland Government Bond, Reg. S 0.5% 24/05/2055 CHF 923,000 1,073,987 0.02
14,157,855 0.26
Ukraine
Ukraine Government Bond, Reg. S 4.375% 27/01/2030 EUR 11,592,000 9,369,234 0.17
9,369,234 0.17
United Kingdom
UK Treasury, Reg. S 2.25% 07/09/2023 GBP 511,934 626,629 0.01
UK Treasury, Reg. S 1.5% 22/07/2026 GBP 17,083,637 21,056,387 0.39
UK Treasury, Reg. S 4.25% 07/12/2027 GBP 44,323,547 63,335,054 1.18
UK Treasury, Reg. S 4.75% 07/12/2030 GBP 6,269,473 9,928,076 0.19
UK Treasury, Reg. S 4.25% 07/06/2032 GBP 6,567,832 10,341,407 0.19
Investments Currency Quantity/
Nominal Value
Market Value
EUR
% of Net
Assets0
UK Treasury, Reg. S 4.25% 07/03/2036 GBP 17,572,457 29,588,017 0.55
UK Treasury, Reg. S 4.75% 07/12/2038 GBP 5,386,821 10,002,413 0.19
UK Treasury, Reg. S 4.25% 07/09/2039 GBP 5,948,709 10,602,213 0.20
UK Treasury, Reg. S 4.25% 07/12/2040 GBP 11,108,239 20,141,885 0.37
UK Treasury, Reg. S 3.25% 22/01/2044 GBP 6,206,000 10,334,182 0.19
UK Treasury, Reg. S 3.5% 22/01/2045 GBP 13,447,000 23,450,490 0.44
UK Treasury, Reg. S 1.5% 22/07/2047 GBP 39,763,285 50,788,476 0.94
UK Treasury, Reg. S 0.625% 22/10/2050 GBP 1,485,472 1,555,353 0.03
UK Treasury, Reg. S 2.5% 22/07/2065 GBP 21,110,935 38,963,072 0.72
300,713,654 5.59
United States of America
US Treasury 0.5% 31/03/2025 USD 390,710,700 337,962,654 6.28
US Treasury 0.25% 30/09/2025 USD 105,757,900 90,081,404 1.67
US Treasury 0.75% 31/08/2026 USD 483,978,100 416,277,771 7.74
US Treasury 2.25% 15/08/2027 USD 49,410,800 45,606,726 0.85
US Treasury 2.375% 15/05/2029 USD 169,356,000 158,813,135 2.95
US Treasury 4.375% 15/05/2040 USD 28,492,800 35,087,100 0.65
US Treasury 1.875% 15/02/2041 USD 78,756,700 68,535,323 1.27
US Treasury 4.375% 15/05/2041 USD 17,863,400 22,146,151 0.41
US Treasury 3% 15/11/2044 USD 5,059,800 5,314,539 0.10
US Treasury 2.5% 15/02/2046 USD 62,025,400 60,328,797 1.12
US Treasury 3% 15/02/2047 USD 728,800 776,958 0.02
US Treasury 2.75% 15/08/2047 USD 737,900 756,192 0.01
US Treasury 1.25% 15/05/2050 USD 89,924,100 67,263,180 1.25
US Treasury Inflation Indexed 0.133% 15/10/2024 USD 200 203 –
US Treasury Inflation Indexed 0.129% 15/01/2031 USD 100 104 –
1,308,950,237 24.32
Uzbekistan
Uzbekistan Government Bond, Reg. S 3.9% 19/10/2031 USD 13,189,000 11,133,293 0.21
11,133,293 0.21
Total Bonds 5,000,028,527 92.90
Total Transferable securities and money market
instruments admitted to an official exchange listing 5,000,028,527 92.90
Transferable securities and money market instruments dealt in on another
regulated market
Bonds
Malaysia
Malaysia Government Bond 3.795% 30/09/2022 MYR 51,000 10,899 –
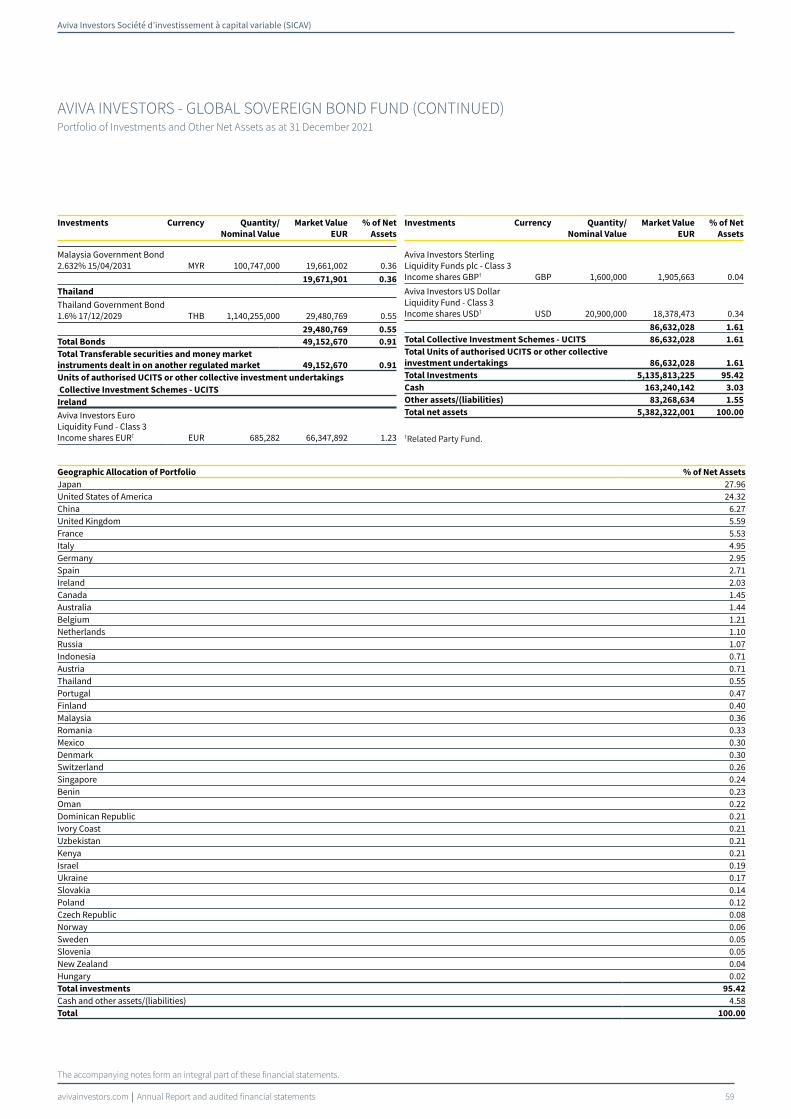
Aviva Investors Société d’investissement à capital variable (SICAV)
avivainvestors.com Annual Report and audited financial statements 59
AVIVA INVESTORS - GLOBAL SOVEREIGN BOND FUND (CONTINUED)Portfolio of Investments and Other Net Assets as at 31 December 2021
The accompanying notes form an integral part of these financial statements.
Investments Currency Quantity/
Nominal Value
Market Value
EUR
% of Net
Assets0
Malaysia Government Bond 2.632% 15/04/2031 MYR 100,747,000 19,661,002 0.36
19,671,901 0.36
Thailand
Thailand Government Bond 1.6% 17/12/2029 THB 1,140,255,000 29,480,769 0.55
29,480,769 0.55
Total Bonds 49,152,670 0.91
Total Transferable securities and money market
instruments dealt in on another regulated market 49,152,670 0.91
Units of authorised UCITS or other collective investment undertakings
Collective Investment Schemes - UCITS
Ireland
Aviva Investors Euro Liquidity Fund - Class 3 Income shares EUR† EUR 685,282 66,347,892 1.23
Investments Currency Quantity/
Nominal Value
Market Value
EUR
% of Net
Assets0
Aviva Investors Sterling Liquidity Funds plc - Class 3 Income shares GBP† GBP 1,600,000 1,905,663 0.04
Aviva Investors US Dollar Liquidity Fund - Class 3 Income shares USD† USD 20,900,000 18,378,473 0.34
86,632,028 1.61
Total Collective Investment Schemes - UCITS 86,632,028 1.61
Total Units of authorised UCITS or other collective
investment undertakings 86,632,028 1.61
Total Investments 5,135,813,225 95.42
Cash 163,240,142 3.03
Other assets/(liabilities) 83,268,634 1.55
Total net assets 5,382,322,001 100.00
†Related Party Fund.
Geographic Allocation of Portfolio % of Net Assets
Japan 27.96United States of America 24.32China 6.27United Kingdom 5.59France 5.53Italy 4.95Germany 2.95Spain 2.71Ireland 2.03Canada 1.45Australia 1.44Belgium 1.21Netherlands 1.10Russia 1.07Indonesia 0.71Austria 0.71Thailand 0.55Portugal 0.47Finland 0.40Malaysia 0.36Romania 0.33Mexico 0.30Denmark 0.30Switzerland 0.26Singapore 0.24Benin 0.23Oman 0.22Dominican Republic 0.21Ivory Coast 0.21Uzbekistan 0.21Kenya 0.21Israel 0.19Ukraine 0.17Slovakia 0.14Poland 0.12Czech Republic 0.08Norway 0.06Sweden 0.05Slovenia 0.05New Zealand 0.04Hungary 0.02Total investments 95.42
Cash and other assets/(liabilities) 4.58Total 100.00

Aviva Investors Société d’investissement à capital variable (SICAV)
avivainvestors.com Annual Report and audited financial statements 60
AVIVA INVESTORS - GLOBAL SOVEREIGN BOND FUND (CONTINUED)Portfolio of Investments and Other Net Assets as at 31 December 2021
The accompanying notes form an integral part of these financial statements.
Forward Currency Exchange Contracts
Currency
Purchased Amount Purchased
Currency
Sold Amount Sold Maturity Date Counterparty
Unrealised Gain/
(Loss)
EUR % of Net Assets
AUD 2,418,358 EUR 1,533,084 19/01/2022 Morgan Stanley 12,651 –AUD 104,670,302 EUR 66,782,768 19/01/2022 RBC 119,083 –AUD 5,037,384 USD 3,602,271 16/03/2022 Standard Chartered 53,443 –CLP 51,091,441,627 USD 58,263,704 16/03/2022 Standard Chartered 923,045 0.02
EUR 13,845,828 AUD 21,590,012 19/01/2022Canadian Imperial Bank of
Commerce 46,195 –EUR 20,748,691 AUD 32,218,194 19/01/2022 Merrill Lynch 155,870 –EUR 64,413 AUD 100,080 19/01/2022 UBS 445 –EUR 6,388,820 CAD 9,132,230 19/01/2022 Morgan Stanley 33,368 –EUR 3,694,838 CNH 26,616,174 19/01/2022 HSBC 18,838 –EUR 8 GBP 7 11/01/2022 J.P. Morgan – –EUR 1,525,568 HUF 550,416,500 19/01/2022 Goldman Sachs 34,813 –EUR 76,114,289 JPY 9,945,070,119 19/01/2022 Citibank 185,680 –EUR 1,030,238,790 JPY 132,918,730,126 19/01/2022 Merrill Lynch 15,431,043 0.29EUR 126,620,892 JPY 16,420,589,774 19/01/2022 UBS 1,252,994 0.02EUR 4,599,280 NOK 45,683,884 19/01/2022 Goldman Sachs 46,400 –EUR 1,269,153 NZD 2,059,298 19/01/2022 Goldman Sachs 29,958 –EUR 2,122,982 NZD 3,438,072 19/01/2022 Merrill Lynch 54,103 –EUR 152,333,268 RUB 12,906,477,505 19/01/2022 Goldman Sachs 1,433,800 0.03EUR 3,744,685 RUB 317,257,291 19/01/2022 UBS 35,388 –EUR 8,823,512 SEK 89,631,871 19/01/2022 Citibank 119,620 –EUR 1,596,630 SEK 16,343,384 19/01/2022 Goldman Sachs 9,571 –EUR 3,853,446 SEK 39,044,389 19/01/2022 HSBC 61,959 –EUR 2,121,916 SEK 21,167,624 19/01/2022 Morgan Stanley 66,390 –EUR 4,960,086 THB 184,949,937 19/01/2022 BNP Paribas 93,491 –EUR 1,592,141 THB 60,373,713 19/01/2022 Standard Chartered 3,525 –EUR 5,853,770 USD 6,630,029 19/01/2022 Barclays 25,410 –EUR 2,120,742 USD 2,404,659 19/01/2022 Goldman Sachs 6,843 –EUR 103,329,661 USD 117,162,186 19/01/2022 Morgan Stanley 334,124 0.01EUR 6,860,431 USD 7,766,646 19/01/2022 Standard Chartered 32,888 –EUR 1,256,559 ZAR 21,770,142 19/01/2022 J.P. Morgan 60,024 –GBP 4,594,483,145 EUR 5,374,519,436 11/01/2022 J.P. Morgan 96,864,262 1.80GBP 985,457 EUR 1,163,832 19/01/2022 RBC 9,489 –ILS 110,064 EUR 29,388 19/01/2022 UBS 1,701 –
JPY 223,018,895 EUR 1,685,423 19/01/2022Canadian Imperial Bank of
Commerce 17,281 –
MXN 1,276,018,897 USD 59,879,721 16/03/2022Canadian Imperial Bank of
Commerce 1,490,118 0.03NZD 28,232,166 EUR 16,894,654 19/01/2022 UBS 94,214 –NZD 176,801,847 USD 119,732,509 16/03/2022 UBS 1,034,776 0.02PLN 7,797,524 EUR 1,682,835 19/01/2022 HSBC 16,257 –PLN 165,680 EUR 35,502 19/01/2022 Morgan Stanley 600 –PLN 5,802,982 EUR 1,261,126 19/01/2022 UBS 3,353 –SGD 33,056 EUR 21,294 19/01/2022 UBS 259 –THB 84,169,476 EUR 2,162,806 19/01/2022 Merrill Lynch 51,949 –USD 872,530 CLP 727,353,326 19/01/2022 Goldman Sachs 17,985 –USD 7,007,365 CLP 5,762,156,104 19/01/2022 Morgan Stanley 226,086 0.01USD 104,336,683 CLP 88,506,622,396 16/03/2022 Goldman Sachs 1,391,236 0.03USD 57,735,178 COP 232,845,971,294 16/03/2022 RBC 859,216 0.02USD 13,418,860 EUR 11,585,697 19/01/2022 Barclays 210,623 –
USD 14,226,735 EUR 12,203,903 19/01/2022Canadian Imperial Bank of
Commerce 302,609 0.01USD 7,936,595 EUR 6,844,400 19/01/2022 Morgan Stanley 132,543 –USD 54,954,166 EUR 47,523,553 19/01/2022 UBS 785,838 0.02USD 4,279,919 KRW 5,038,767,417 19/01/2022 BNP Paribas 43,414 –USD 1,174,015 RUB 88,442,594 16/03/2022 UBS 8,582 –USD 2,958,865 ZAR 47,436,239 16/03/2022 Morgan Stanley 14,033 –Total Unrealised Gain on Forward Currency Exchange Contracts - Assets 124,257,386 2.31

Aviva Investors Société d’investissement à capital variable (SICAV)
avivainvestors.com Annual Report and audited financial statements 61
AVIVA INVESTORS - GLOBAL SOVEREIGN BOND FUND (CONTINUED)Portfolio of Investments and Other Net Assets as at 31 December 2021
The accompanying notes form an integral part of these financial statements.
Forward Currency Exchange Contracts (continued)
Currency
Purchased Amount Purchased
Currency
Sold Amount Sold Maturity Date Counterparty
Unrealised Gain/
(Loss)
EUR % of Net Assets
AUD 12,369,282 EUR 8,008,366 19/01/2022 Merrill Lynch (102,324) –CAD 1,212,223 EUR 844,355 19/01/2022 J.P. Morgan (725) –CLP 6,185,889,109 USD 7,527,481 19/01/2022 Goldman Sachs (246,944) (0.01)CLP 37,415,180,769 USD 43,612,520 16/03/2022 Standard Chartered (153,793) –DKK 2,313,887 EUR 311,145 19/01/2022 HSBC (32) –EUR 6,882,248 AUD 11,002,265 19/01/2022 Standard Chartered (150,042) –EUR 219,478,844 AUD 347,351,169 19/01/2022 UBS (2,536,720) (0.05)EUR 2,533,598 CAD 3,645,091 19/01/2022 HSBC (3,153) –EUR 61,510,362 CAD 89,421,981 19/01/2022 RBC (721,651) (0.01)EUR 6,888,257 CAD 9,941,023 19/01/2022 UBS (30,062) –
EUR 7,657,623 CHF 8,209,343 19/01/2022Canadian Imperial Bank of
Commerce (265,949) (0.01)EUR 6,067,027 CHF 6,399,213 19/01/2022 Morgan Stanley (109,426) –
EUR 34,069,937 CNH 253,252,202 19/01/2022Canadian Imperial Bank of
Commerce (907,107) (0.02)EUR 23,870,106 CNH 177,818,581 19/01/2022 Goldman Sachs (688,686) (0.01)EUR 269,646,889 CNH 2,026,448,889 19/01/2022 HSBC (10,229,023) (0.19)EUR 4,570,574 CZK 116,870,126 19/01/2022 UBS (124,454) –EUR 13,032,321 DKK 96,951,908 19/01/2022 RBC (3,338) –EUR 3,378,048 DKK 25,132,326 19/01/2022 UBS (1,117) –EUR 93,409,798 GBP 78,961,827 11/01/2022 J.P. Morgan (622,640) (0.01)EUR 213,304,529 GBP 181,284,042 19/01/2022 Barclays (2,538,824) (0.05)
EUR 762,575 GBP 648,722 19/01/2022Canadian Imperial Bank of
Commerce (9,817) –EUR 20,249,252 GBP 17,102,982 19/01/2022 Goldman Sachs (114,178) –EUR 14,903,896 GBP 12,766,513 19/01/2022 RBC (296,378) (0.01)EUR 62,480,892 GBP 53,121,653 19/01/2022 UBS (767,674) (0.02)EUR 5,067,349 ILS 18,951,757 19/01/2022 Citibank (285,785) (0.01)EUR 4,604,015 ILS 17,190,382 19/01/2022 Goldman Sachs (251,598) (0.01)EUR 173,790,088 JPY 22,882,511,602 19/01/2022 BNP Paribas (913,282) (0.02)EUR 116,829,566 JPY 15,561,635,096 19/01/2022 Goldman Sachs (1,980,385) (0.04)
EUR 3,022,083 MXN 73,186,924 19/01/2022Canadian Imperial Bank of
Commerce (113,566) –EUR 12,079,009 MXN 289,584,902 19/01/2022 RBC (328,078) (0.01)EUR 832,448 MXN 19,827,339 19/01/2022 UBS (17,042) –EUR 24,881,479 NZD 41,586,852 19/01/2022 Goldman Sachs (143,648) –EUR 1,147,027 PLN 5,290,260 19/01/2022 Barclays (5,729) –EUR 8,740,317 PLN 40,180,523 19/01/2022 HSBC (15,079) –
EUR 12,997,554 SGD 20,452,133 19/01/2022Canadian Imperial Bank of
Commerce (337,356) (0.01)EUR 11,642,357 THB 452,039,570 19/01/2022 Citibank (252,177) (0.01)EUR 13,008,727 THB 510,306,847 19/01/2022 Goldman Sachs (418,996) (0.01)EUR 45,810,259 USD 53,204,763 19/01/2022 Barclays (961,258) (0.02)
EUR 117,254,009 USD 135,044,988 19/01/2022Canadian Imperial Bank of
Commerce (1,462,033) (0.03)EUR 4,084,516 USD 4,654,390 19/01/2022 Citibank (7,090) –EUR 4,210,697 USD 4,912,379 19/01/2022 J.P. Morgan (107,703) –EUR 995,789,320 USD 1,153,298,296 19/01/2022 Merrill Lynch (18,058,078) (0.34)EUR 99,228,407 USD 114,919,715 19/01/2022 Morgan Stanley (1,795,807) (0.03)EUR 131,446,908 USD 153,241,099 19/01/2022 UBS (3,265,065) (0.06)KRW 2,856,918,599 USD 2,421,877 19/01/2022 Barclays (20,409) –NOK 8,209,202 EUR 842,025 19/01/2022 Goldman Sachs (23,892) –NOK 12,441,164 EUR 1,273,179 19/01/2022 Morgan Stanley (33,286) –NZD 8,865,057 EUR 5,422,408 19/01/2022 UBS (87,809) –RUB 3,724,082,656 EUR 44,807,032 19/01/2022 Barclays (1,265,942) (0.02)RUB 4,357,293,407 EUR 52,142,895 19/01/2022 J.P. Morgan (1,198,456) (0.02)RUB 132,664,023 EUR 1,575,277 19/01/2022 Standard Chartered (24,201) –RUB 3,499,255,433 USD 46,292,571 16/03/2022 HSBC (201,119) –SEK 16,847,181 EUR 1,686,487 19/01/2022 Goldman Sachs (50,506) –SEK 18,712,894 EUR 1,880,826 19/01/2022 Merrill Lynch (63,671) –SEK 42,203,714 EUR 4,209,830 19/01/2022 UBS (111,549) –USD 123,361,115 AUD 173,238,581 16/03/2022 UBS (2,297,241) (0.04)USD 5,401,221 EUR 4,764,644 19/01/2022 Merrill Lynch (16,510) –USD 1,313,719 IDR 18,873,898,997 19/01/2022 BNP Paribas (10,966) –USD 31,650,762 IDR 453,966,875,774 19/01/2022 HSBC (217,726) –USD 11,723,008 IDR 168,049,322,043 19/01/2022 RBC (74,850) –

Aviva Investors Société d’investissement à capital variable (SICAV)
avivainvestors.com Annual Report and audited financial statements 62
AVIVA INVESTORS - GLOBAL SOVEREIGN BOND FUND (CONTINUED)Portfolio of Investments and Other Net Assets as at 31 December 2021
The accompanying notes form an integral part of these financial statements.
Forward Currency Exchange Contracts (continued)
Currency
Purchased Amount Purchased
Currency
Sold Amount Sold Maturity Date Counterparty
Unrealised Gain/
(Loss)
EUR % of Net Assets
USD 1,327,434 KRW 1,582,301,373 19/01/2022 Goldman Sachs (933) –USD 59,546,358 MXN 1,276,018,897 16/03/2022 HSBC (1,782,839) (0.03)USD 12,283,925 MYR 51,273,102 19/01/2022 Barclays (13,263) –USD 10,579,401 MYR 44,438,773 19/01/2022 Morgan Stanley (70,541) –USD 45,073,499 THB 1,511,314,420 16/03/2022 Citibank (136,909) –USD 45,013,088 THB 1,511,314,420 16/03/2022 Goldman Sachs (189,955) –USD 42,093,450 ZAR 678,525,362 16/03/2022 Merrill Lynch (1,230) –ZAR 28,461,768 EUR 1,580,834 19/01/2022 J.P. Morgan (16,513) –Total Unrealised Loss on Forward Currency Exchange Contracts - Liabilities (59,254,128) (1.10)
Net Unrealised Gain on Forward Currency Exchange Contracts - Assets 65,003,258 1.21
Financial Futures Contracts
Security Description
Number of
Contracts Currency
Unrealised Gain/(Loss)
EUR % of Net Assets
3 Month Eurodollar, 18/12/2023 (6,189) USD 1,076,341 0 .02
US Long Bond, 22/03/2022 112 USD 178,509 –
US Ultra Bond, 22/03/2022 318 USD 908,811 0 .02
Total Unrealised Gain on Financial Futures Contracts - Assets 2,163,661 0.04
Euro-Bobl, 08/03/2022 537 EUR (606,810) (0 .01)
Euro-OAT, 08/03/2022 431 EUR (1,361,960) (0 .02)
Japan 10 Year Bond, 14/03/2022 202 JPY (478,182) (0 .01)
Korea 10 Year Bond, 15/03/2022 1,228 KRW (1,020,552) (0 .02)
Long Gilt, 29/03/2022 205 GBP (42,729) –
US 10 Year Note, 22/03/2022 (2,252) USD (3,013,335) (0 .06)
US 10 Year Ultra Bond, 22/03/2022 (917) USD (1,789,126) (0 .03)
Total Unrealised Loss on Financial Futures Contracts - Liabilities (8,312,694) (0 .15)
Net Unrealised Loss on Financial Futures Contracts - Liabilities (6,149,033) (0.11)

Aviva Investors Société d’investissement à capital variable (SICAV)
avivainvestors.com Annual Report and audited financial statements 63
AVIVA INVESTORS - GLOBAL SOVEREIGN BOND FUND (CONTINUED)Portfolio of Investments and Other Net Assets as at 31 December 2021
The accompanying notes form an integral part of these financial statements.
Interest Rate Swap Contracts
Nominal Amount Currency Counterparty Security Description Maturity Date
Market Value
EUR % of Net Assets
338 EUR Barclays Pay floating EURIBOR 6 month Receive fixed 1.533% 27/03/2039 23 –
4,047,000 EUR Barclays Pay fixed 0.47% Receive floating EURIBOR 6 month 01/10/2051 1,334 –
135,000,000 CNY Barclays Pay floating CNREPOFIX=CFXS 1 week Receive fixed 2.445% 09/08/2026 79,041 –
109,845,000 CNY Barclays Pay floating CNREPOFIX=CFXS 1 week Receive fixed 2.49% 11/11/2026 90,893 –
125,026,000 CNY Barclays Pay floating CNREPOFIX=CFXS 1 week Receive fixed 2.495% 30/09/2026 102,331 –
90,888,000 CNY Barclays Pay floating CNREPOFIX=CFXS 1 week Receive fixed 2.54% 18/11/2026 103,730 –
5,714,000 USD Barclays Pay floating LIBOR 3 month Receive fixed 1.808% 01/10/2051 143,658 –
116,862,209 CNY Barclays Pay floating CNREPOFIX=CFXS 1 week Receive fixed 2.56% 05/11/2026 150,496 –
108,025,000 CNY Barclays Pay floating CNREPOFIX=CFXS 1 week Receive fixed 2.66% 20/10/2026 209,562 –
6,000,000 EUR Barclays Pay fixed 0.34% Receive floating EURIBOR 6 month 21/07/2051 216,103 –
522,780,000 CNY Barclays Pay floating CNREPOFIX=CFXS 1 week Receive fixed 2.42% 06/08/2026 230,165 –
86,713,000 USD Barclays Pay fixed 1.431% Receive floating LIBOR 3 month 06/07/2031 242,732 0.0125,950,000 USD Barclays Pay fixed 1.31% Receive floating LIBOR 3 month 21/07/2031 348,060 0.01
521,890,000 CNY Barclays Pay floating CNREPOFIX=CFXS 1 week Receive fixed 2.471% 04/08/2026 380,467 0.01
35,025,000 USD Barclays Pay floating LIBOR 3 month Receive fixed 1.741% 06/07/2051 489,939 0.0141,300,000 NZD Barclays Pay fixed 1.923% Receive floating BBR 3 month 10/08/2031 1,349,408 0.0362,000,000 NZD Barclays Pay fixed 1.993% Receive floating BBR 3 month 20/05/2031 1,943,823 0.04
Total Market Value on Interest Rate Swap Contracts - Assets 6,081,765 0.11
601,672,000 SEK Barclays Pay floating STIBOR 3 month Receive fixed 0.62% 19/07/2031 (1,613,186) (0.03)
66,825,000 EUR Barclays Pay floating EURIBOR 6 month Receive fixed 0.087% 06/07/2031 (1,019,707) (0.02)
24,755,000 EUR Barclays Pay floating EURIBOR 6 month Receive fixed (0.008)% 21/07/2031 (625,276) (0.01)
11,548,000 EUR Barclays Pay floating EURIBOR 6 month Receive fixed 0.153% 01/10/2031 (136,809)
–
23,918,000 EUR Barclays Pay fixed 0.472% Receive floating EURIBOR 6 month 06/07/2051 (46,408)
–
7,760,000 USD Barclays Pay floating LIBOR 3 month Receive fixed 1.651% 21/07/2051 (44,662) –14,510,000 USD Barclays Pay fixed 1.537% Receive floating LIBOR 3 month 01/10/2031 (31,291) –
328 USD Barclays Pay fixed 1.649% Receive floating LIBOR 3 month 10/12/2024 (4) –Total Market Value on Interest Rate Swap Contracts - Liabilities (3,517,343) (0.06)
Net Market Value on Interest Rate Swap Contracts - Assets 2,564,422 0.05
Inflation Rate Swap Contracts
Nominal Amount Currency Counterparty Security Description Maturity Date
Market Value
EUR % of Net Assets
2,132,000 GBP Barclays Pay fixed 3.5 Receive floating UKRPI 1 month 15/01/2029 163,705 –Total Market Value on Inflation Rate Swap Contracts - Assets 163,705 –
2,132,000 GBP Barclays Pay floating UKRPI 1 month Receive fixed 3.5% 15/01/2029 (163,705) –Total Market Value on Inflation Rate Swap Contracts - Liabilities (163,705) –

Aviva Investors Société d’investissement à capital variable (SICAV)
avivainvestors.com Annual Report and audited financial statements 64
The accompanying notes form an integral part of these financial statements.
AVIVA INVESTORS - GLOBAL CONVERTIBLES ABSOLUTE RETURN FUNDPortfolio of Investments and Other Net Assets as at 31 December 2021
Investments Currency Quantity/
Nominal Value
Market Value
USD
% of Net
Assets0
Transferable securities and money market instruments admitted to an official
exchange listing
Convertible Bonds
Australia
Afterpay Ltd., Reg. S 0% 12/03/2026 AUD 21,000,000 15,132,197 1.15
15,132,197 1.15
Austria
ams AG, Reg. S 0.875% 28/09/2022 USD 14,000,000 13,797,793 1.05
13,797,793 1.05
Belgium
Akka Technologies, Reg. S 3.5% 31/12/2164 EUR 10,000,000 11,454,635 0.87
11,454,635 0.87
Bermuda
Luye Pharma Group Ltd., Reg. S 1.5% 09/07/2024 USD 16,000,000 16,096,000 1.23
16,096,000 1.23
Canada
Lithium Americas Corp., 144A 1.75% 15/01/2027 USD 10,200,000 9,770,712 0.74
9,770,712 0.74
Cayman Islands
China Overseas Finance Investment Cayman V Ltd., Reg. S 0% 05/01/2023 USD 20,000,000 23,620,000 1.80
Meituan, Reg. S 0% 27/04/2027 USD 15,000,000 14,238,750 1.08
Microport Scientific Corp., Reg. S 0% 11/06/2026 USD 15,000,000 12,465,000 0.95
Poseidon Finance 1 Ltd., Reg. S 0% 01/02/2025 USD 12,000,000 13,203,000 1.01
Sino Biopharmaceutical Ltd., Reg. S 0% 17/02/2025 EUR 16,000,000 17,394,611 1.32
80,921,361 6.16
Malaysia
Cerah Capital Ltd., Reg. S 0% 08/08/2024 USD 14,600,000 15,081,800 1.15
15,081,800 1.15
New Zealand
Xero Investments Ltd., Reg. S 0% 02/12/2025 USD 14,000,000 13,860,000 1.05
13,860,000 1.05
Virgin Islands, British
Best Path Global Ltd., Reg. S 0% 01/06/2022 HKD 150,000,000 18,874,338 1.44
CP Foods Capital Ltd., Reg. S 0.5% 18/06/2025 USD 13,800,000 14,079,450 1.07
Link CB Ltd., REIT, Reg. S 1.6% 03/04/2024 HKD 86,000,000 11,058,451 0.84
Shanghai Port Group BVI Holding Co. Ltd., Reg. S 0% 09/08/2022 USD 8,000,000 8,842,000 0.67
Strategic International Group Ltd., Reg. S 0% 29/06/2025 EUR 15,000,000 15,949,230 1.22
Viva Biotech Investment Management Ltd., Reg. S 1% 30/12/2025 USD 15,000,000 12,499,604 0.95
81,303,073 6.19
Total Convertible Bonds 257,417,571 19.59
Total Transferable securities and money market
instruments admitted to an official exchange listing 257,417,571 19.59
Investments Currency Quantity/
Nominal Value
Market Value
USD
% of Net
Assets0
Transferable securities and money market instruments dealt in on another
regulated market
Convertible Bonds
Bermuda
Jazz Investments I Ltd. 1.5% 15/08/2024 USD 40,000,000 39,982,385 3.04
39,982,385 3.04
Cayman Islands
Avadel Finance Cayman Ltd., 144A 4.5% 01/02/2023 USD 6,000,000 6,249,968 0.48
JOYY, Inc. 1.375% 15/06/2026 USD 20,000,000 17,911,233 1.36
NIO, Inc., 144A 0% 01/02/2026 USD 20,000,000 17,549,618 1.34
Theravance Biopharma, Inc. 3.25% 01/11/2023 USD 15,100,000 14,577,598 1.11
Trip.com Group Ltd., Reg. S 1.5% 01/07/2027 USD 7,600,000 8,663,531 0.66
64,951,948 4.95
Jersey
Encore Capital Europe Finance Ltd. 4.5% 01/09/2023 USD 5,000,000 7,471,960 0.57
7,471,960 0.57
United Kingdom
GSK Finance No. 3 plc, 144A 0% 22/06/2023 USD 7,330,000 7,195,103 0.55
7,195,103 0.55
United States of America
Amyris, Inc., 144A 1.5% 15/11/2026 USD 10,875,000 9,139,147 0.70
Apollo Commercial Real Estate Finance, Inc., REIT 4.75% 23/08/2022 USD 20,000,000 20,146,262 1.53
Apollo Commercial Real Estate Finance, Inc., REIT 5.375% 15/10/2023 USD 7,500,000 7,635,473 0.58
Ares Capital Corp. 3.75% 01/02/2022 USD 7,500,000 8,377,529 0.64
Array Technologies, Inc., 144A 1% 01/12/2028 USD 9,690,000 9,205,644 0.70
Avaya Holdings Corp. 2.25% 15/06/2023 USD 26,000,000 27,725,386 2.11
Beauty Health Co. (The), 144A 1.25% 01/10/2026 USD 15,000,000 15,914,012 1.21
Beyond Meat, Inc., 144A 0% 15/03/2027 USD 35,500,000 24,753,978 1.88
Blackline, Inc., 144A 0% 15/03/2026 USD 7,150,000 6,684,833 0.51
Blackstone Mortgage Trust, Inc., REIT 4.375% 05/05/2022 USD 17,633,000 17,796,217 1.35
Bridgebio Pharma, Inc., 144A 2.25% 01/02/2029 USD 46,200,000 26,287,784 2.00
Confluent, Inc., 144A 0% 15/01/2027 USD 35,000,000 38,064,537 2.90
DocuSign, Inc., 144A 0% 15/01/2024 USD 50,000,000 48,266,965 3.67
Dropbox, Inc., 144A 0% 01/03/2028 USD 20,000,000 19,733,900 1.50
Fastly, Inc., 144A 0% 15/03/2026 USD 20,000,000 16,409,885 1.25
Fisker, Inc., 144A 2.5% 15/09/2026 USD 25,000,000 26,088,270 1.99
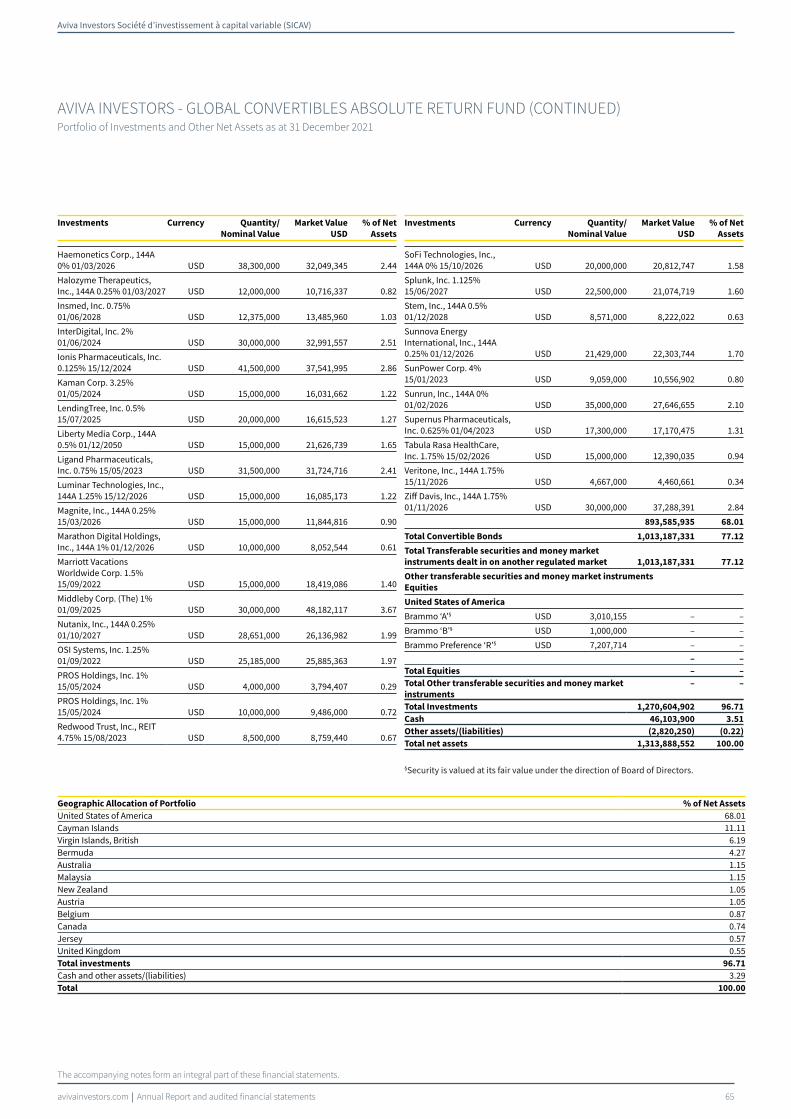
Aviva Investors Société d’investissement à capital variable (SICAV)
avivainvestors.com Annual Report and audited financial statements 65
AVIVA INVESTORS - GLOBAL CONVERTIBLES ABSOLUTE RETURN FUND (CONTINUED)Portfolio of Investments and Other Net Assets as at 31 December 2021
The accompanying notes form an integral part of these financial statements.
Investments Currency Quantity/
Nominal Value
Market Value
USD
% of Net
Assets0
Haemonetics Corp., 144A 0% 01/03/2026 USD 38,300,000 32,049,345 2.44
Halozyme Therapeutics, Inc., 144A 0.25% 01/03/2027 USD 12,000,000 10,716,337 0.82
Insmed, Inc. 0.75% 01/06/2028 USD 12,375,000 13,485,960 1.03
InterDigital, Inc. 2% 01/06/2024 USD 30,000,000 32,991,557 2.51
Ionis Pharmaceuticals, Inc. 0.125% 15/12/2024 USD 41,500,000 37,541,995 2.86
Kaman Corp. 3.25% 01/05/2024 USD 15,000,000 16,031,662 1.22
LendingTree, Inc. 0.5% 15/07/2025 USD 20,000,000 16,615,523 1.27
Liberty Media Corp., 144A 0.5% 01/12/2050 USD 15,000,000 21,626,739 1.65
Ligand Pharmaceuticals, Inc. 0.75% 15/05/2023 USD 31,500,000 31,724,716 2.41
Luminar Technologies, Inc., 144A 1.25% 15/12/2026 USD 15,000,000 16,085,173 1.22
Magnite, Inc., 144A 0.25% 15/03/2026 USD 15,000,000 11,844,816 0.90
Marathon Digital Holdings, Inc., 144A 1% 01/12/2026 USD 10,000,000 8,052,544 0.61
Marriott Vacations Worldwide Corp. 1.5% 15/09/2022 USD 15,000,000 18,419,086 1.40
Middleby Corp. (The) 1% 01/09/2025 USD 30,000,000 48,182,117 3.67
Nutanix, Inc., 144A 0.25% 01/10/2027 USD 28,651,000 26,136,982 1.99
OSI Systems, Inc. 1.25% 01/09/2022 USD 25,185,000 25,885,363 1.97
PROS Holdings, Inc. 1% 15/05/2024 USD 4,000,000 3,794,407 0.29
PROS Holdings, Inc. 1% 15/05/2024 USD 10,000,000 9,486,000 0.72
Redwood Trust, Inc., REIT 4.75% 15/08/2023 USD 8,500,000 8,759,440 0.67
Investments Currency Quantity/
Nominal Value
Market Value
USD
% of Net
Assets0
SoFi Technologies, Inc., 144A 0% 15/10/2026 USD 20,000,000 20,812,747 1.58
Splunk, Inc. 1.125% 15/06/2027 USD 22,500,000 21,074,719 1.60
Stem, Inc., 144A 0.5% 01/12/2028 USD 8,571,000 8,222,022 0.63
Sunnova Energy International, Inc., 144A 0.25% 01/12/2026 USD 21,429,000 22,303,744 1.70
SunPower Corp. 4% 15/01/2023 USD 9,059,000 10,556,902 0.80
Sunrun, Inc., 144A 0% 01/02/2026 USD 35,000,000 27,646,655 2.10
Supernus Pharmaceuticals, Inc. 0.625% 01/04/2023 USD 17,300,000 17,170,475 1.31
Tabula Rasa HealthCare, Inc. 1.75% 15/02/2026 USD 15,000,000 12,390,035 0.94
Veritone, Inc., 144A 1.75% 15/11/2026 USD 4,667,000 4,460,661 0.34
Ziff Davis, Inc., 144A 1.75% 01/11/2026 USD 30,000,000 37,288,391 2.84
893,585,935 68.01
Total Convertible Bonds 1,013,187,331 77.12
Total Transferable securities and money market
instruments dealt in on another regulated market 1,013,187,331 77.12
Other transferable securities and money market instruments
Equities
United States of America
Brammo ‘A’§ USD 3,010,155 – –
Brammo ‘B’§ USD 1,000,000 – –
Brammo Preference ‘R’§ USD 7,207,714 – –
– –
Total Equities – –
Total Other transferable securities and money market
instruments
– –
Total Investments 1,270,604,902 96.71
Cash 46,103,900 3.51
Other assets/(liabilities) (2,820,250) (0.22)
Total net assets 1,313,888,552 100.00
§Security is valued at its fair value under the direction of Board of Directors.
Geographic Allocation of Portfolio % of Net Assets
United States of America 68.01Cayman Islands 11.11Virgin Islands, British 6.19Bermuda 4.27Australia 1.15Malaysia 1.15New Zealand 1.05Austria 1.05Belgium 0.87Canada 0.74Jersey 0.57United Kingdom 0.55Total investments 96.71
Cash and other assets/(liabilities) 3.29Total 100.00

Aviva Investors Société d’investissement à capital variable (SICAV)
avivainvestors.com Annual Report and audited financial statements 66
AVIVA INVESTORS - GLOBAL CONVERTIBLES ABSOLUTE RETURN FUND (CONTINUED)Portfolio of Investments and Other Net Assets as at 31 December 2021
The accompanying notes form an integral part of these financial statements.
Forward Currency Exchange Contracts
Currency
Purchased Amount Purchased
Currency
Sold Amount Sold Maturity Date Counterparty
Unrealised Gain/
(Loss)
USD % of Net Assets
CHF 729,614 USD 800,060 11/01/2022 J.P. Morgan 846 –EUR 37,977,794 USD 42,929,322 11/01/2022 J.P. Morgan 264,912 0.02GBP 777,394,219 USD 1,049,964,025 11/01/2022 J.P. Morgan 2,961,989 0.23HKD 107,652,550 USD 13,804,019 18/01/2022 Standard Chartered 4,463 –USD 217,544 EUR 187,987 11/01/2022 J.P. Morgan 3,737 –Total Unrealised Gain on Forward Currency Exchange Contracts - Assets 3,235,947 0.25
EUR 209,849,592 USD 242,647,441 11/01/2022 J.P. Morgan (3,973,959) (0.30)GBP 13,590 USD 18,465 11/01/2022 J.P. Morgan (58) –USD 10,516,748 AUD 14,720,000 18/01/2022 Merrill Lynch (185,866) (0.02)USD 4,057,999 AUD 5,680,000 18/01/2022 Standard Chartered (71,814) (0.01)USD 30,874 CHF 28,500 11/01/2022 J.P. Morgan (412) –USD 20,551,767 EUR 18,178,320 11/01/2022 J.P. Morgan (123,436) (0.01)USD 44,207,628 EUR 39,200,000 18/01/2022 Citibank (383,250) (0.03)USD 65,553,596 GBP 49,212,948 11/01/2022 J.P. Morgan (1,101,895) (0.08)USD 29,482,852 HKD 230,000,000 18/01/2022 Goldman Sachs (19,013) –Total Unrealised Loss on Forward Currency Exchange Contracts - Liabilities (5,859,703) (0.45)
Net Unrealised Loss on Forward Currency Exchange Contracts - Liabilities (2,623,756) (0.20)
Option Purchased Contracts
Quantity Security Description Currency Counterparty
Market Value
USD % of Net Assets
300 Russell 2000 Emini Index, Put, 2,050.000, 31/01/2022 USD J.P. Morgan 319,500 0.02Total Market Value on Option Purchased Contracts - Assets 319,500 0.02
Total Return Swap on Contracts for Difference
Contract Description Currency Maturity Date Counterparty
Market Value
USD % of Net Assets
Receive performance of the underlying global basket of 5 Chinese convertible arbitrage positions. Long the convertible bonds and short the underlying equities, mainly in the information technology sector. Pay weighted average financing (HIBOR HKD 1 MONTH) on that same basket USD 17/01/2022 Nomura 559,704 0.04Receive performance of the underlying global basket of 48 American convertible arbitrage positions. Long the convertible bonds and short the underlying equities, mainly in the Information Technology sector. Pay weighted average financing (OBFR) on that same basket USD 18/01/2022 BNP Paribas 3,923,769 0.30
Total Market Value on Total Return Swap on Contracts for Difference - Assets 4,483,473 0.34
Receive performance of the underlying global basket of 44 American convertible arbitrage positions. Long the convertible bonds and short the underlying equities, mainly in the information technology and healthcare sectors. Pay weighted average financing (LIBOR) on that same basket USD 20/06/2023 Citigroup (6,022,981) (0.46)
Total Market Value on Total Return Swap on Contracts for Difference - Liabilities (6,022,981) (0.46)
Net Market Value on Total Return Swap on Contracts for Difference - Liabilities (1,539,508) (0.12)

Aviva Investors Société d’investissement à capital variable (SICAV)
avivainvestors.com Annual Report and audited financial statements 67
The accompanying notes form an integral part of these financial statements.
AVIVA INVESTORS - GLOBAL CONVERTIBLES FUNDPortfolio of Investments and Other Net Assets as at 31 December 2021
Investments Currency Quantity/
Nominal Value
Market Value
USD
% of Net
Assets0
Transferable securities and money market instruments admitted to an official
exchange listing
Convertible Bonds
Canada
Lithium Americas Corp., 144A 1.75% 15/01/2027 USD 6,800,000 6,583,080 1.50
6,583,080 1.50
Cayman Islands
China Education Group Holdings Ltd., Reg. S 2% 28/03/2024 HKD 30,000,000 4,316,159 0.98
Kingsoft Corp. Ltd., Reg. S 0.625% 29/04/2025 HKD 45,000,000 6,921,435 1.58
Meituan, Reg. S 0% 27/04/2027 USD 4,000,000 3,797,000 0.86
15,034,594 3.42
France
Neoen SA, Reg. S 2% 02/06/2025 EUR 7,500,000 4,573,998 1.04
Safran SA, Reg. S 0.875% 15/05/2027 EUR 6,493,800 10,075,650 2.29
Schneider Electric SE, Reg. S 0% 15/06/2026 EUR 3,000,000 7,652,811 1.74
Selena Sarl, Reg. S 0% 25/06/2025 EUR 7,000,000 10,125,731 2.30
32,428,190 7.37
Germany
Delivery Hero SE, Reg. S 0.875% 15/07/2025 EUR 4,000,000 4,401,765 1.00
RAG-Stiftung, Reg. S 0% 16/03/2023 EUR 7,000,000 8,187,471 1.86
Zalando SE, Reg. S 0.05% 06/08/2025 EUR 5,000,000 6,203,572 1.41
18,792,808 4.27
India
Bharti Airtel Ltd., 144A 1.5% 17/02/2025 USD 4,000,000 5,214,000 1.18
5,214,000 1.18
Italy
Nexi SpA, Reg. S 1.75% 24/04/2027 EUR 7,000,000 8,881,143 2.02
8,881,143 2.02
Japan
SBI Holdings, Inc., Reg. S 0% 25/07/2025 JPY 750,000,000 7,706,394 1.75
7,706,394 1.75
Netherlands
America Movil BV, Reg. S 0% 02/03/2024 EUR 6,000,000 7,019,385 1.60
Just Eat Takeaway.com NV, Reg. S 1.25% 30/04/2026 EUR 5,000,000 5,069,926 1.15
QIAGEN NV, Reg. S 1% 13/11/2024 USD 6,000,000 7,824,859 1.78
STMicroelectronics NV, Reg. S 0% 04/08/2025 USD 6,000,000 7,919,700 1.80
Swiss Re Ltd., Reg. S 3.25% 13/06/2024 USD 5,000,000 5,546,500 1.26
33,380,370 7.59
New Zealand
Xero Investments Ltd., Reg. S 0% 02/12/2025 USD 6,000,000 5,940,000 1.35
5,940,000 1.35
Investments Currency Quantity/
Nominal Value
Market Value
USD
% of Net
Assets0
Singapore
Singapore Airlines Ltd., Reg. S 1.625% 03/12/2025 SGD 7,000,000 5,593,554 1.27
5,593,554 1.27
South Korea
Kakao Corp., Reg. S 0% 28/04/2023 USD 3,000,000 3,634,500 0.83
3,634,500 0.83
Spain
Audax Renovables SA, Reg. S 2.75% 30/11/2025 EUR 3,200,000 3,105,479 0.70
Cellnex Telecom SA, Reg. S 0.5% 05/07/2028 EUR 5,000,000 7,594,556 1.73
10,700,035 2.43
United States of America
JPMorgan Chase Bank NA 0% 07/08/2022 USD 5,000,000 5,658,750 1.29
JPMorgan Chase Bank NA, Reg. S 0% 18/02/2024 EUR 5,000,000 6,573,021 1.49
12,231,771 2.78
Total Convertible Bonds 166,120,439 37.76
Total Transferable securities and money market
instruments admitted to an official exchange listing 166,120,439 37.76
Transferable securities and money market instruments dealt in on another
regulated market
Convertible Bonds
Canada
SSR Mining, Inc. 2.5% 01/04/2039 USD 4,000,000 4,962,500 1.13
4,962,500 1.13
Cayman Islands
NIO, Inc., 144A 0% 01/02/2026 USD 5,000,000 4,379,017 1.00
Sea Ltd. 0.25% 15/09/2026 USD 7,000,000 6,428,459 1.46
10,807,476 2.46
Israel
Nice Ltd. 0% 15/09/2025 USD 5,500,000 6,738,969 1.53
6,738,969 1.53
Japan
Relo Group, Inc., Reg. S 0% 17/12/2027 JPY 450,000,000 3,842,770 0.87
Ship Healthcare Holdings, Inc., Reg. S 0% 13/12/2023 JPY 400,000,000 3,927,600 0.89
7,770,370 1.76
United States of America
Air Transport Services Group, Inc. 1.125% 15/10/2024 USD 5,000,000 5,609,077 1.27
Airbnb, Inc., 144A 0% 15/03/2026 USD 9,000,000 8,864,642 2.01
Akamai Technologies, Inc. 0.375% 01/09/2027 USD 10,500,000 12,319,127 2.80
Amyris, Inc., 144A 1.5% 15/11/2026 USD 6,500,000 5,567,738 1.27
Array Technologies, Inc., 144A 1% 01/12/2028 USD 4,560,000 4,453,208 1.01
Bentley Systems, Inc., 144A 0.125% 15/01/2026 USD 6,600,000 6,857,374 1.56
BioMarin Pharmaceutical, Inc. 1.25% 15/05/2027 USD 5,000,000 5,267,365 1.20
Bridgebio Pharma, Inc. 2.5% 15/03/2027 USD 4,000,000 2,727,781 0.62
Ceridian HCM Holding, Inc., 144A 0.25% 15/03/2026 USD 6,000,000 6,307,809 1.43
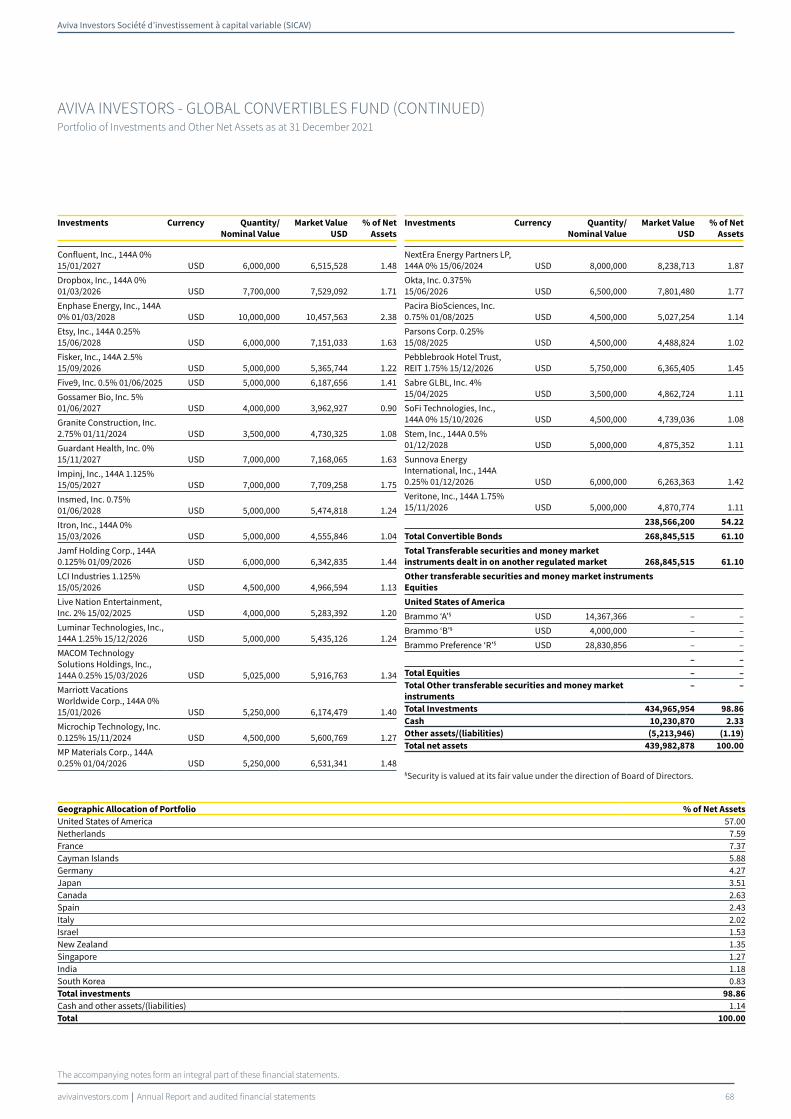
Aviva Investors Société d’investissement à capital variable (SICAV)
avivainvestors.com Annual Report and audited financial statements 68
AVIVA INVESTORS - GLOBAL CONVERTIBLES FUND (CONTINUED)Portfolio of Investments and Other Net Assets as at 31 December 2021
The accompanying notes form an integral part of these financial statements.
Investments Currency Quantity/
Nominal Value
Market Value
USD
% of Net
Assets0
Confluent, Inc., 144A 0% 15/01/2027 USD 6,000,000 6,515,528 1.48
Dropbox, Inc., 144A 0% 01/03/2026 USD 7,700,000 7,529,092 1.71
Enphase Energy, Inc., 144A 0% 01/03/2028 USD 10,000,000 10,457,563 2.38
Etsy, Inc., 144A 0.25% 15/06/2028 USD 6,000,000 7,151,033 1.63
Fisker, Inc., 144A 2.5% 15/09/2026 USD 5,000,000 5,365,744 1.22
Five9, Inc. 0.5% 01/06/2025 USD 5,000,000 6,187,656 1.41
Gossamer Bio, Inc. 5% 01/06/2027 USD 4,000,000 3,962,927 0.90
Granite Construction, Inc. 2.75% 01/11/2024 USD 3,500,000 4,730,325 1.08
Guardant Health, Inc. 0% 15/11/2027 USD 7,000,000 7,168,065 1.63
Impinj, Inc., 144A 1.125% 15/05/2027 USD 7,000,000 7,709,258 1.75
Insmed, Inc. 0.75% 01/06/2028 USD 5,000,000 5,474,818 1.24
Itron, Inc., 144A 0% 15/03/2026 USD 5,000,000 4,555,846 1.04
Jamf Holding Corp., 144A 0.125% 01/09/2026 USD 6,000,000 6,342,835 1.44
LCI Industries 1.125% 15/05/2026 USD 4,500,000 4,966,594 1.13
Live Nation Entertainment, Inc. 2% 15/02/2025 USD 4,000,000 5,283,392 1.20
Luminar Technologies, Inc., 144A 1.25% 15/12/2026 USD 5,000,000 5,435,126 1.24
MACOM Technology Solutions Holdings, Inc., 144A 0.25% 15/03/2026 USD 5,025,000 5,916,763 1.34
Marriott Vacations Worldwide Corp., 144A 0% 15/01/2026 USD 5,250,000 6,174,479 1.40
Microchip Technology, Inc. 0.125% 15/11/2024 USD 4,500,000 5,600,769 1.27
MP Materials Corp., 144A 0.25% 01/04/2026 USD 5,250,000 6,531,341 1.48
Investments Currency Quantity/
Nominal Value
Market Value
USD
% of Net
Assets0
NextEra Energy Partners LP, 144A 0% 15/06/2024 USD 8,000,000 8,238,713 1.87
Okta, Inc. 0.375% 15/06/2026 USD 6,500,000 7,801,480 1.77
Pacira BioSciences, Inc. 0.75% 01/08/2025 USD 4,500,000 5,027,254 1.14
Parsons Corp. 0.25% 15/08/2025 USD 4,500,000 4,488,824 1.02
Pebblebrook Hotel Trust, REIT 1.75% 15/12/2026 USD 5,750,000 6,365,405 1.45
Sabre GLBL, Inc. 4% 15/04/2025 USD 3,500,000 4,862,724 1.11
SoFi Technologies, Inc., 144A 0% 15/10/2026 USD 4,500,000 4,739,036 1.08
Stem, Inc., 144A 0.5% 01/12/2028 USD 5,000,000 4,875,352 1.11
Sunnova Energy International, Inc., 144A 0.25% 01/12/2026 USD 6,000,000 6,263,363 1.42
Veritone, Inc., 144A 1.75% 15/11/2026 USD 5,000,000 4,870,774 1.11
238,566,200 54.22
Total Convertible Bonds 268,845,515 61.10
Total Transferable securities and money market
instruments dealt in on another regulated market 268,845,515 61.10
Other transferable securities and money market instruments
Equities
United States of America
Brammo ‘A’§ USD 14,367,366 – –
Brammo ‘B’§ USD 4,000,000 – –
Brammo Preference ‘R’§ USD 28,830,856 – –
– –
Total Equities – –
Total Other transferable securities and money market
instruments
– –
Total Investments 434,965,954 98.86
Cash 10,230,870 2.33
Other assets/(liabilities) (5,213,946) (1.19)
Total net assets 439,982,878 100.00
§Security is valued at its fair value under the direction of Board of Directors.
Geographic Allocation of Portfolio % of Net Assets
United States of America 57.00Netherlands 7.59France 7.37Cayman Islands 5.88Germany 4.27Japan 3.51Canada 2.63Spain 2.43Italy 2.02Israel 1.53New Zealand 1.35Singapore 1.27India 1.18South Korea 0.83Total investments 98.86
Cash and other assets/(liabilities) 1.14Total 100.00

Aviva Investors Société d’investissement à capital variable (SICAV)
avivainvestors.com Annual Report and audited financial statements 69
AVIVA INVESTORS - GLOBAL CONVERTIBLES FUND (CONTINUED)Portfolio of Investments and Other Net Assets as at 31 December 2021
The accompanying notes form an integral part of these financial statements.
Forward Currency Exchange Contracts
Currency
Purchased Amount Purchased
Currency
Sold Amount Sold Maturity Date Counterparty
Unrealised Gain/
(Loss)
USD % of Net Assets
AUD 281 CHF 181 12/01/2022 J.P. Morgan 7 –AUD 745,648 EUR 469,663 12/01/2022 J.P. Morgan 8,619 –AUD 19,920 GBP 10,539 12/01/2022 J.P. Morgan 223 –AUD 36,273 SGD 35,481 12/01/2022 J.P. Morgan 36 –AUD 3,726 USD 2,651 12/01/2022 J.P. Morgan 55 –CHF 4,755 AUD 7,023 12/01/2022 J.P. Morgan 105 –CHF 365,295 EUR 348,846 12/01/2022 J.P. Morgan 4,051 –CHF 10,925 GBP 8,809 12/01/2022 J.P. Morgan 53 –CHF 10,247 HKD 87,318 12/01/2022 J.P. Morgan 20 –CHF 29,633 JPY 3,667,743 12/01/2022 J.P. Morgan 563 –CHF 22,568 USD 24,463 12/01/2022 J.P. Morgan 239 –CNH 726,555 EUR 100,079 12/01/2022 J.P. Morgan 682 –CNH 8,367 GBP 960 12/01/2022 J.P. Morgan 18 –CNH 5,139 USD 803 12/01/2022 J.P. Morgan 5 –EUR 2,914,443 AUD 4,551,405 12/01/2022 J.P. Morgan 1,435 –EUR 32,758 CHF 33,903 12/01/2022 J.P. Morgan 57 –EUR 1,792 CNH 12,914 12/01/2022 J.P. Morgan 3 –EUR 46,417 GBP 38,938 12/01/2022 J.P. Morgan 39 –EUR 442,634 HKD 3,902,518 12/01/2022 J.P. Morgan 1,779 –EUR 1,716,364 JPY 220,485,211 12/01/2022 J.P. Morgan 31,330 0.01EUR 135,901 TWD 4,262,561 12/01/2022 J.P. Morgan 273 –EUR 14,345,047 USD 16,193,249 12/01/2022 J.P. Morgan 82,120 0.02GBP 288,937 AUD 528,224 12/01/2022 J.P. Morgan 6,901 –GBP 12,335 CHF 15,172 12/01/2022 J.P. Morgan 64 –GBP 1,731 CNH 14,722 12/01/2022 J.P. Morgan 25 –GBP 7,083,454 EUR 8,288,780 12/01/2022 J.P. Morgan 168,990 0.04GBP 105,761 HKD 1,102,893 12/01/2022 J.P. Morgan 1,511 –GBP 1,771,046 JPY 271,153,848 12/01/2022 J.P. Morgan 37,233 0.01GBP 9,111 SGD 16,535 12/01/2022 J.P. Morgan 55 –GBP 10,014 TWD 366,775 12/01/2022 J.P. Morgan 290 –GBP 1,560,677 USD 2,081,003 12/01/2022 J.P. Morgan 28,220 0.01HKD 22,867 EUR 2,579 12/01/2022 J.P. Morgan 6 –HKD 14,503 GBP 1,372 12/01/2022 J.P. Morgan 5 –HKD 17,944 USD 2,300 12/01/2022 J.P. Morgan 1 –JPY 13,580,488 EUR 103,447 12/01/2022 J.P. Morgan 646 –JPY 136,316 USD 1,182 12/01/2022 J.P. Morgan 3 –SGD 37,020 AUD 37,479 12/01/2022 J.P. Morgan 229 –SGD 366 CHF 247 12/01/2022 J.P. Morgan 1 –SGD 648 CNH 3,050 12/01/2022 J.P. Morgan 1 –SGD 1,142,276 EUR 740,223 12/01/2022 J.P. Morgan 7,032 –SGD 60,906 GBP 33,255 12/01/2022 J.P. Morgan 212 –SGD 78,051 HKD 448,010 12/01/2022 J.P. Morgan 417 –SGD 219,951 JPY 18,483,497 12/01/2022 J.P. Morgan 2,447 –SGD 50,551 TWD 1,032,644 12/01/2022 J.P. Morgan 190 –SGD 2,169,884 USD 1,598,120 12/01/2022 J.P. Morgan 10,590 –TWD 14,787,631 EUR 469,553 12/01/2022 J.P. Morgan 1,224 –USD 41,671 AUD 56,223 12/01/2022 J.P. Morgan 842 –USD 19,870 CHF 18,139 12/01/2022 J.P. Morgan 16 –USD 2,368,958 EUR 2,057,750 12/01/2022 J.P. Morgan 34,310 0.01USD 117,537 GBP 86,651 12/01/2022 J.P. Morgan 429 –USD 87,978 HKD 685,104 12/01/2022 J.P. Morgan 128 –USD 282,562 JPY 31,972,855 12/01/2022 J.P. Morgan 4,721 –USD 12,625 SGD 17,011 12/01/2022 J.P. Morgan 13 –Total Unrealised Gain on Forward Currency Exchange Contracts - Assets 438,464 0.10

Aviva Investors Société d’investissement à capital variable (SICAV)
avivainvestors.com Annual Report and audited financial statements 70
AVIVA INVESTORS - GLOBAL CONVERTIBLES FUND (CONTINUED)Portfolio of Investments and Other Net Assets as at 31 December 2021
The accompanying notes form an integral part of these financial statements.
Forward Currency Exchange Contracts (continued)
Currency
Purchased Amount Purchased
Currency
Sold Amount Sold Maturity Date Counterparty
Unrealised Gain/
(Loss)
USD % of Net Assets
AUD 186 CHF 125 12/01/2022 J.P. Morgan (2) –AUD 154,580 EUR 99,185 12/01/2022 J.P. Morgan (277) –AUD 17,136 GBP 9,254 12/01/2022 J.P. Morgan (62) –AUD 1,138 SGD 1,122 12/01/2022 J.P. Morgan (5) –AUD 976 USD 712 12/01/2022 J.P. Morgan (4) –CHF 125 AUD 190 12/01/2022 J.P. Morgan (1) –CHF 623 CNH 4,379 12/01/2022 J.P. Morgan (7) –CHF 863 EUR 833 12/01/2022 J.P. Morgan (1) –CHF 4,537 GBP 3,695 12/01/2022 J.P. Morgan (28) –CHF 13,469 SGD 20,005 12/01/2022 J.P. Morgan (89) –CHF 1,938 TWD 58,924 12/01/2022 J.P. Morgan (7) –CHF 270,867 USD 296,726 12/01/2022 J.P. Morgan (244) –CNH 4,692 EUR 652 12/01/2022 J.P. Morgan (2) –CNH 39,134 GBP 4,601 12/01/2022 J.P. Morgan (66) –CNH 22,579 SGD 4,831 12/01/2022 J.P. Morgan (32) –EUR 596,808 AUD 935,755 12/01/2022 J.P. Morgan (2,420) –EUR 1,711,261 CHF 1,809,853 12/01/2022 J.P. Morgan (39,470) (0.01)EUR 460,951 CNH 3,425,260 12/01/2022 J.P. Morgan (15,538) –EUR 6,117,747 GBP 5,226,558 12/01/2022 J.P. Morgan (122,610) (0.03)EUR 6,909,612 HKD 62,319,624 12/01/2022 J.P. Morgan (151,817) (0.03)EUR 19,573,119 JPY 2,565,352,167 12/01/2022 J.P. Morgan (85,693) (0.02)EUR 1,634,249 SGD 2,543,554 12/01/2022 J.P. Morgan (31,581) (0.01)EUR 4,523,853 TWD 145,148,561 12/01/2022 J.P. Morgan (108,526) (0.02)EUR 195,570,580 USD 226,740,479 12/01/2022 J.P. Morgan (4,853,196) (1.10)GBP 2,212 AUD 4,141 12/01/2022 J.P. Morgan (18) –GBP 131,512 CHF 162,762 12/01/2022 J.P. Morgan (417) –GBP 37,178 CNH 323,353 12/01/2022 J.P. Morgan (592) –GBP 53,452 EUR 63,719 12/01/2022 J.P. Morgan (55) –GBP 505,374 HKD 5,335,017 12/01/2022 J.P. Morgan (1,104) –GBP 113,867 SGD 207,933 12/01/2022 J.P. Morgan (269) –GBP 371,378 TWD 13,966,454 12/01/2022 J.P. Morgan (2,400) –GBP 15,932,768 USD 21,600,613 12/01/2022 J.P. Morgan (67,811) (0.02)HKD 5,411 CHF 638 12/01/2022 J.P. Morgan (5) –HKD 10,396,928 EUR 1,177,157 12/01/2022 J.P. Morgan (2,367) –HKD 425,304 GBP 41,119 12/01/2022 J.P. Morgan (1,035) –HKD 438,057 SGD 77,000 12/01/2022 J.P. Morgan (914) –HKD 24,812 USD 3,183 12/01/2022 J.P. Morgan (1) –JPY 435,751 CHF 3,522 12/01/2022 J.P. Morgan (68) –JPY 565,400,233 EUR 4,388,014 12/01/2022 J.P. Morgan (65,213) (0.02)JPY 33,878,540 GBP 222,283 12/01/2022 J.P. Morgan (6,010) –JPY 17,999,614 SGD 217,146 12/01/2022 J.P. Morgan (4,573) –JPY 3,452,153 USD 30,291 12/01/2022 J.P. Morgan (292) –SGD 17,830 CHF 12,161 12/01/2022 J.P. Morgan (92) –SGD 4,240 CNH 20,018 12/01/2022 J.P. Morgan (4) –SGD 12,268 GBP 6,761 12/01/2022 J.P. Morgan (41) –SGD 326 TWD 6,706 12/01/2022 J.P. Morgan (1) –SGD 23,536 USD 17,467 12/01/2022 J.P. Morgan (18) –TWD 1,014,969 SGD 50,212 12/01/2022 J.P. Morgan (577) –USD 5,672 AUD 7,903 12/01/2022 J.P. Morgan (66) –USD 38,910 CHF 35,897 12/01/2022 J.P. Morgan (381) –USD 6,214 CNH 39,869 12/01/2022 J.P. Morgan (54) –USD 47,008,573 EUR 41,555,026 12/01/2022 J.P. Morgan (138,251) (0.03)USD 2,730,573 GBP 2,048,918 12/01/2022 J.P. Morgan (38,496) (0.01)USD 9,721 HKD 75,844 12/01/2022 J.P. Morgan (4) –USD 1,581,561 SGD 2,166,948 12/01/2022 J.P. Morgan (24,972) (0.01)USD 57,893 TWD 1,605,425 12/01/2022 J.P. Morgan (77) –Total Unrealised Loss on Forward Currency Exchange Contracts - Liabilities (5,767,856) (1.31)
Net Unrealised Loss on Forward Currency Exchange Contracts - Liabilities (5,329,392) (1.21)
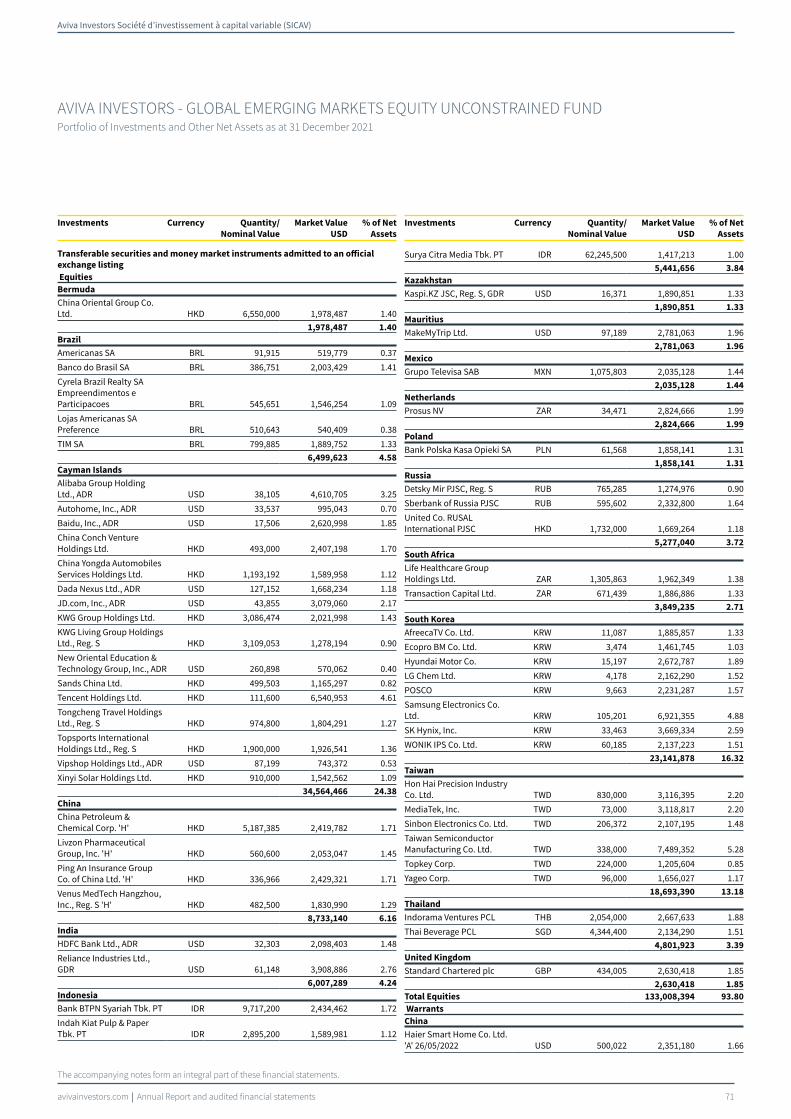
Aviva Investors Société d’investissement à capital variable (SICAV)
avivainvestors.com Annual Report and audited financial statements 71
The accompanying notes form an integral part of these financial statements.
AVIVA INVESTORS - GLOBAL EMERGING MARKETS EQUITY UNCONSTRAINED FUNDPortfolio of Investments and Other Net Assets as at 31 December 2021
Investments Currency Quantity/
Nominal Value
Market Value
USD
% of Net
Assets0
Transferable securities and money market instruments admitted to an official
exchange listing
Equities
Bermuda
China Oriental Group Co. Ltd. HKD 6,550,000 1,978,487 1.40
1,978,487 1.40
Brazil
Americanas SA BRL 91,915 519,779 0.37
Banco do Brasil SA BRL 386,751 2,003,429 1.41
Cyrela Brazil Realty SA Empreendimentos e Participacoes BRL 545,651 1,546,254 1.09
Lojas Americanas SA Preference BRL 510,643 540,409 0.38
TIM SA BRL 799,885 1,889,752 1.33
6,499,623 4.58
Cayman Islands
Alibaba Group Holding Ltd., ADR USD 38,105 4,610,705 3.25
Autohome, Inc., ADR USD 33,537 995,043 0.70
Baidu, Inc., ADR USD 17,506 2,620,998 1.85
China Conch Venture Holdings Ltd. HKD 493,000 2,407,198 1.70
China Yongda Automobiles Services Holdings Ltd. HKD 1,193,192 1,589,958 1.12
Dada Nexus Ltd., ADR USD 127,152 1,668,234 1.18
JD.com, Inc., ADR USD 43,855 3,079,060 2.17
KWG Group Holdings Ltd. HKD 3,086,474 2,021,998 1.43
KWG Living Group Holdings Ltd., Reg. S HKD 3,109,053 1,278,194 0.90
New Oriental Education & Technology Group, Inc., ADR USD 260,898 570,062 0.40
Sands China Ltd. HKD 499,503 1,165,297 0.82
Tencent Holdings Ltd. HKD 111,600 6,540,953 4.61
Tongcheng Travel Holdings Ltd., Reg. S HKD 974,800 1,804,291 1.27
Topsports International Holdings Ltd., Reg. S HKD 1,900,000 1,926,541 1.36
Vipshop Holdings Ltd., ADR USD 87,199 743,372 0.53
Xinyi Solar Holdings Ltd. HKD 910,000 1,542,562 1.09
34,564,466 24.38
China
China Petroleum & Chemical Corp. 'H' HKD 5,187,385 2,419,782 1.71
Livzon Pharmaceutical Group, Inc. 'H' HKD 560,600 2,053,047 1.45
Ping An Insurance Group Co. of China Ltd. 'H' HKD 336,966 2,429,321 1.71
Venus MedTech Hangzhou, Inc., Reg. S 'H' HKD 482,500 1,830,990 1.29
8,733,140 6.16
India
HDFC Bank Ltd., ADR USD 32,303 2,098,403 1.48
Reliance Industries Ltd., GDR USD 61,148 3,908,886 2.76
6,007,289 4.24
Indonesia
Bank BTPN Syariah Tbk. PT IDR 9,717,200 2,434,462 1.72
Indah Kiat Pulp & Paper Tbk. PT IDR 2,895,200 1,589,981 1.12
Investments Currency Quantity/
Nominal Value
Market Value
USD
% of Net
Assets0
Surya Citra Media Tbk. PT IDR 62,245,500 1,417,213 1.00
5,441,656 3.84
Kazakhstan
Kaspi.KZ JSC, Reg. S, GDR USD 16,371 1,890,851 1.33
1,890,851 1.33
Mauritius
MakeMyTrip Ltd. USD 97,189 2,781,063 1.96
2,781,063 1.96
Mexico
Grupo Televisa SAB MXN 1,075,803 2,035,128 1.44
2,035,128 1.44
Netherlands
Prosus NV ZAR 34,471 2,824,666 1.99
2,824,666 1.99
Poland
Bank Polska Kasa Opieki SA PLN 61,568 1,858,141 1.31
1,858,141 1.31
Russia
Detsky Mir PJSC, Reg. S RUB 765,285 1,274,976 0.90
Sberbank of Russia PJSC RUB 595,602 2,332,800 1.64
United Co. RUSAL International PJSC HKD 1,732,000 1,669,264 1.18
5,277,040 3.72
South Africa
Life Healthcare Group Holdings Ltd. ZAR 1,305,863 1,962,349 1.38
Transaction Capital Ltd. ZAR 671,439 1,886,886 1.33
3,849,235 2.71
South Korea
AfreecaTV Co. Ltd. KRW 11,087 1,885,857 1.33
Ecopro BM Co. Ltd. KRW 3,474 1,461,745 1.03
Hyundai Motor Co. KRW 15,197 2,672,787 1.89
LG Chem Ltd. KRW 4,178 2,162,290 1.52
POSCO KRW 9,663 2,231,287 1.57
Samsung Electronics Co. Ltd. KRW 105,201 6,921,355 4.88
SK Hynix, Inc. KRW 33,463 3,669,334 2.59
WONIK IPS Co. Ltd. KRW 60,185 2,137,223 1.51
23,141,878 16.32
Taiwan
Hon Hai Precision Industry Co. Ltd. TWD 830,000 3,116,395 2.20
MediaTek, Inc. TWD 73,000 3,118,817 2.20
Sinbon Electronics Co. Ltd. TWD 206,372 2,107,195 1.48
Taiwan Semiconductor Manufacturing Co. Ltd. TWD 338,000 7,489,352 5.28
Topkey Corp. TWD 224,000 1,205,604 0.85
Yageo Corp. TWD 96,000 1,656,027 1.17
18,693,390 13.18
Thailand
Indorama Ventures PCL THB 2,054,000 2,667,633 1.88
Thai Beverage PCL SGD 4,344,400 2,134,290 1.51
4,801,923 3.39
United Kingdom
Standard Chartered plc GBP 434,005 2,630,418 1.85
2,630,418 1.85
Total Equities 133,008,394 93.80
Warrants
China
Haier Smart Home Co. Ltd. 'A' 26/05/2022 USD 500,022 2,351,180 1.66
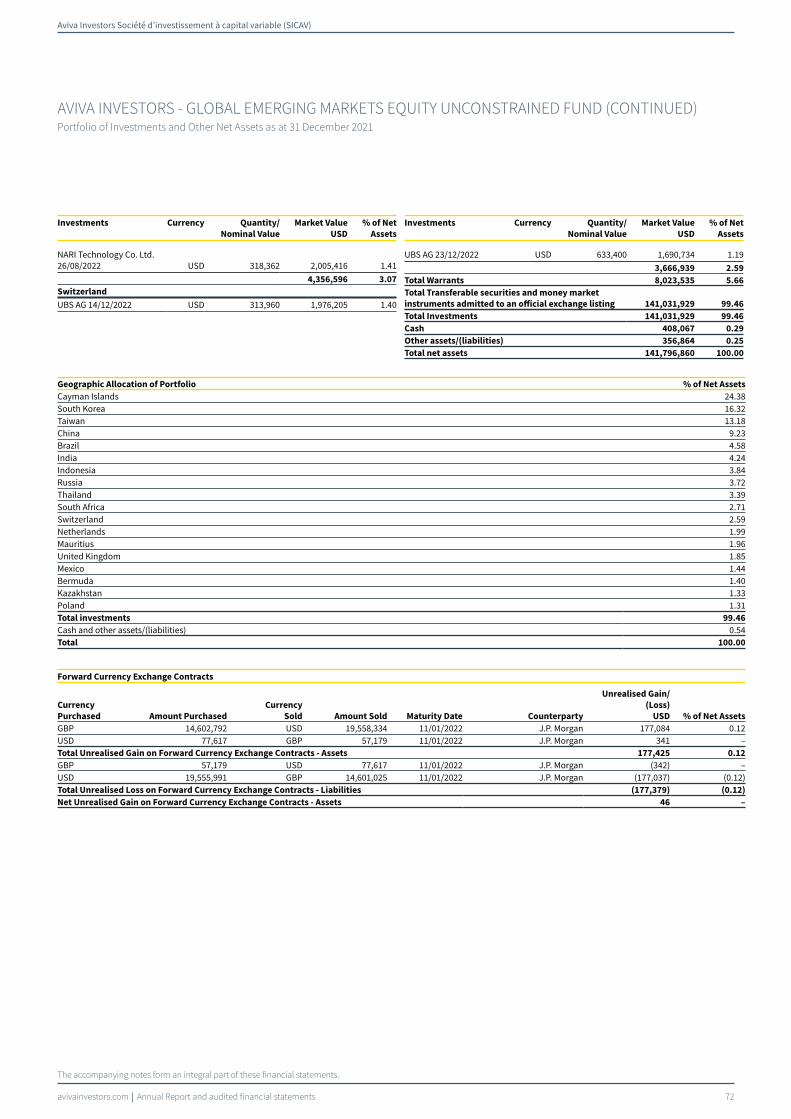
Aviva Investors Société d’investissement à capital variable (SICAV)
avivainvestors.com Annual Report and audited financial statements 72
AVIVA INVESTORS - GLOBAL EMERGING MARKETS EQUITY UNCONSTRAINED FUND (CONTINUED)Portfolio of Investments and Other Net Assets as at 31 December 2021
The accompanying notes form an integral part of these financial statements.
Investments Currency Quantity/
Nominal Value
Market Value
USD
% of Net
Assets0
NARI Technology Co. Ltd. 26/08/2022 USD 318,362 2,005,416 1.41
4,356,596 3.07
Switzerland
UBS AG 14/12/2022 USD 313,960 1,976,205 1.40
Investments Currency Quantity/
Nominal Value
Market Value
USD
% of Net
Assets0
UBS AG 23/12/2022 USD 633,400 1,690,734 1.19
3,666,939 2.59
Total Warrants 8,023,535 5.66
Total Transferable securities and money market
instruments admitted to an official exchange listing 141,031,929 99.46
Total Investments 141,031,929 99.46
Cash 408,067 0.29
Other assets/(liabilities) 356,864 0.25
Total net assets 141,796,860 100.00
Geographic Allocation of Portfolio % of Net Assets
Cayman Islands 24.38South Korea 16.32Taiwan 13.18China 9.23Brazil 4.58India 4.24Indonesia 3.84Russia 3.72Thailand 3.39South Africa 2.71Switzerland 2.59Netherlands 1.99Mauritius 1.96United Kingdom 1.85Mexico 1.44Bermuda 1.40Kazakhstan 1.33Poland 1.31Total investments 99.46
Cash and other assets/(liabilities) 0.54Total 100.00
Forward Currency Exchange Contracts
Currency
Purchased Amount Purchased
Currency
Sold Amount Sold Maturity Date Counterparty
Unrealised Gain/
(Loss)
USD % of Net Assets
GBP 14,602,792 USD 19,558,334 11/01/2022 J.P. Morgan 177,084 0.12USD 77,617 GBP 57,179 11/01/2022 J.P. Morgan 341 –Total Unrealised Gain on Forward Currency Exchange Contracts - Assets 177,425 0.12
GBP 57,179 USD 77,617 11/01/2022 J.P. Morgan (342) –USD 19,555,991 GBP 14,601,025 11/01/2022 J.P. Morgan (177,037) (0.12)Total Unrealised Loss on Forward Currency Exchange Contracts - Liabilities (177,379) (0.12)
Net Unrealised Gain on Forward Currency Exchange Contracts - Assets 46 –
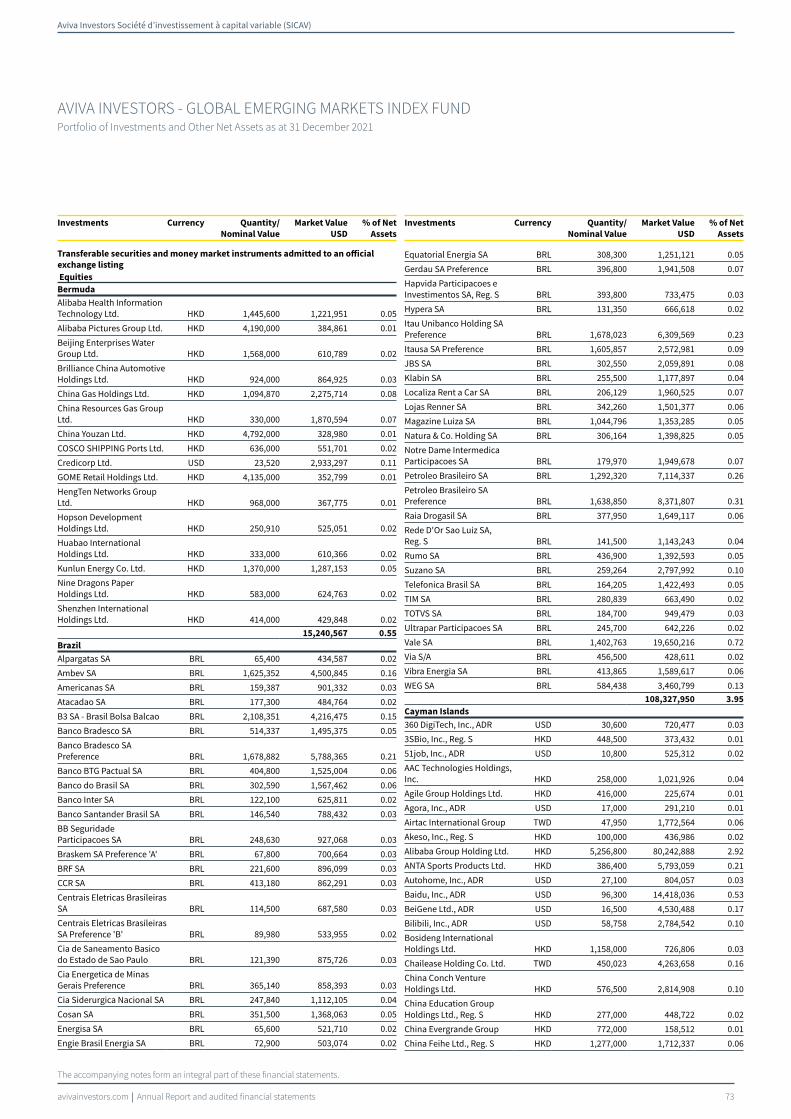
Aviva Investors Société d’investissement à capital variable (SICAV)
avivainvestors.com Annual Report and audited financial statements 73
The accompanying notes form an integral part of these financial statements.
AVIVA INVESTORS - GLOBAL EMERGING MARKETS INDEX FUNDPortfolio of Investments and Other Net Assets as at 31 December 2021
Investments Currency Quantity/
Nominal Value
Market Value
USD
% of Net
Assets0
Transferable securities and money market instruments admitted to an official
exchange listing
Equities
Bermuda
Alibaba Health Information Technology Ltd. HKD 1,445,600 1,221,951 0.05
Alibaba Pictures Group Ltd. HKD 4,190,000 384,861 0.01
Beijing Enterprises Water Group Ltd. HKD 1,568,000 610,789 0.02
Brilliance China Automotive Holdings Ltd. HKD 924,000 864,925 0.03
China Gas Holdings Ltd. HKD 1,094,870 2,275,714 0.08
China Resources Gas Group Ltd. HKD 330,000 1,870,594 0.07
China Youzan Ltd. HKD 4,792,000 328,980 0.01
COSCO SHIPPING Ports Ltd. HKD 636,000 551,701 0.02
Credicorp Ltd. USD 23,520 2,933,297 0.11
GOME Retail Holdings Ltd. HKD 4,135,000 352,799 0.01
HengTen Networks Group Ltd. HKD 968,000 367,775 0.01
Hopson Development Holdings Ltd. HKD 250,910 525,051 0.02
Huabao International Holdings Ltd. HKD 333,000 610,366 0.02
Kunlun Energy Co. Ltd. HKD 1,370,000 1,287,153 0.05
Nine Dragons Paper Holdings Ltd. HKD 583,000 624,763 0.02
Shenzhen International Holdings Ltd. HKD 414,000 429,848 0.02
15,240,567 0.55
Brazil
Alpargatas SA BRL 65,400 434,587 0.02
Ambev SA BRL 1,625,352 4,500,845 0.16
Americanas SA BRL 159,387 901,332 0.03
Atacadao SA BRL 177,300 484,764 0.02
B3 SA - Brasil Bolsa Balcao BRL 2,108,351 4,216,475 0.15
Banco Bradesco SA BRL 514,337 1,495,375 0.05
Banco Bradesco SA Preference BRL 1,678,882 5,788,365 0.21
Banco BTG Pactual SA BRL 404,800 1,525,004 0.06
Banco do Brasil SA BRL 302,590 1,567,462 0.06
Banco Inter SA BRL 122,100 625,811 0.02
Banco Santander Brasil SA BRL 146,540 788,432 0.03
BB Seguridade Participacoes SA BRL 248,630 927,068 0.03
Braskem SA Preference 'A' BRL 67,800 700,664 0.03
BRF SA BRL 221,600 896,099 0.03
CCR SA BRL 413,180 862,291 0.03
Centrais Eletricas Brasileiras SA BRL 114,500 687,580 0.03
Centrais Eletricas Brasileiras SA Preference 'B' BRL 89,980 533,955 0.02
Cia de Saneamento Basico do Estado de Sao Paulo BRL 121,390 875,726 0.03
Cia Energetica de Minas Gerais Preference BRL 365,140 858,393 0.03
Cia Siderurgica Nacional SA BRL 247,840 1,112,105 0.04
Cosan SA BRL 351,500 1,368,063 0.05
Energisa SA BRL 65,600 521,710 0.02
Engie Brasil Energia SA BRL 72,900 503,074 0.02
Investments Currency Quantity/
Nominal Value
Market Value
USD
% of Net
Assets0
Equatorial Energia SA BRL 308,300 1,251,121 0.05
Gerdau SA Preference BRL 396,800 1,941,508 0.07
Hapvida Participacoes e Investimentos SA, Reg. S BRL 393,800 733,475 0.03
Hypera SA BRL 131,350 666,618 0.02
Itau Unibanco Holding SA Preference BRL 1,678,023 6,309,569 0.23
Itausa SA Preference BRL 1,605,857 2,572,981 0.09
JBS SA BRL 302,550 2,059,891 0.08
Klabin SA BRL 255,500 1,177,897 0.04
Localiza Rent a Car SA BRL 206,129 1,960,525 0.07
Lojas Renner SA BRL 342,260 1,501,377 0.06
Magazine Luiza SA BRL 1,044,796 1,353,285 0.05
Natura & Co. Holding SA BRL 306,164 1,398,825 0.05
Notre Dame Intermedica Participacoes SA BRL 179,970 1,949,678 0.07
Petroleo Brasileiro SA BRL 1,292,320 7,114,337 0.26
Petroleo Brasileiro SA Preference BRL 1,638,850 8,371,807 0.31
Raia Drogasil SA BRL 377,950 1,649,117 0.06
Rede D'Or Sao Luiz SA, Reg. S BRL 141,500 1,143,243 0.04
Rumo SA BRL 436,900 1,392,593 0.05
Suzano SA BRL 259,264 2,797,992 0.10
Telefonica Brasil SA BRL 164,205 1,422,493 0.05
TIM SA BRL 280,839 663,490 0.02
TOTVS SA BRL 184,700 949,479 0.03
Ultrapar Participacoes SA BRL 245,700 642,226 0.02
Vale SA BRL 1,402,763 19,650,216 0.72
Via S/A BRL 456,500 428,611 0.02
Vibra Energia SA BRL 413,865 1,589,617 0.06
WEG SA BRL 584,438 3,460,799 0.13
108,327,950 3.95
Cayman Islands
360 DigiTech, Inc., ADR USD 30,600 720,477 0.03
3SBio, Inc., Reg. S HKD 448,500 373,432 0.01
51job, Inc., ADR USD 10,800 525,312 0.02
AAC Technologies Holdings, Inc. HKD 258,000 1,021,926 0.04
Agile Group Holdings Ltd. HKD 416,000 225,674 0.01
Agora, Inc., ADR USD 17,000 291,210 0.01
Airtac International Group TWD 47,950 1,772,564 0.06
Akeso, Inc., Reg. S HKD 100,000 436,986 0.02
Alibaba Group Holding Ltd. HKD 5,256,800 80,242,888 2.92
ANTA Sports Products Ltd. HKD 386,400 5,793,059 0.21
Autohome, Inc., ADR USD 27,100 804,057 0.03
Baidu, Inc., ADR USD 96,300 14,418,036 0.53
BeiGene Ltd., ADR USD 16,500 4,530,488 0.17
Bilibili, Inc., ADR USD 58,758 2,784,542 0.10
Bosideng International Holdings Ltd. HKD 1,158,000 726,806 0.03
Chailease Holding Co. Ltd. TWD 450,023 4,263,658 0.16
China Conch Venture Holdings Ltd. HKD 576,500 2,814,908 0.10
China Education Group Holdings Ltd., Reg. S HKD 277,000 448,722 0.02
China Evergrande Group HKD 772,000 158,512 0.01
China Feihe Ltd., Reg. S HKD 1,277,000 1,712,337 0.06
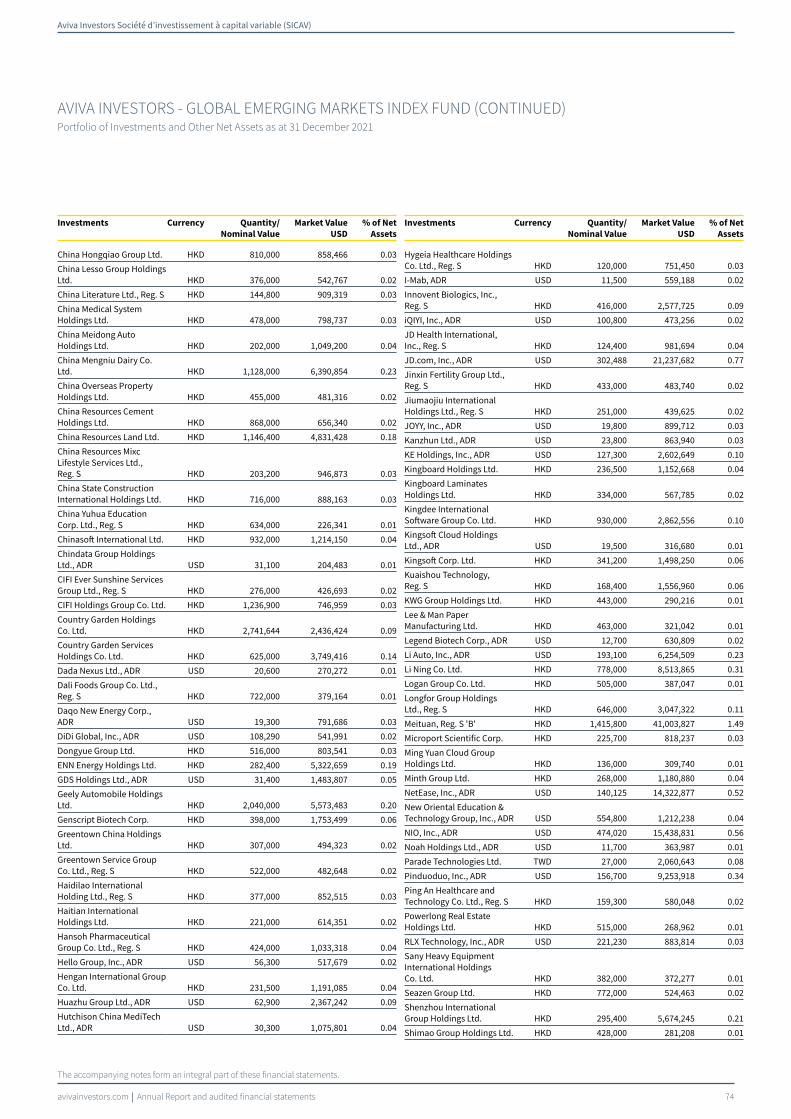
Aviva Investors Société d’investissement à capital variable (SICAV)
avivainvestors.com Annual Report and audited financial statements 74
AVIVA INVESTORS - GLOBAL EMERGING MARKETS INDEX FUND (CONTINUED)Portfolio of Investments and Other Net Assets as at 31 December 2021
The accompanying notes form an integral part of these financial statements.
Investments Currency Quantity/
Nominal Value
Market Value
USD
% of Net
Assets0
China Hongqiao Group Ltd. HKD 810,000 858,466 0.03
China Lesso Group Holdings Ltd. HKD 376,000 542,767 0.02
China Literature Ltd., Reg. S HKD 144,800 909,319 0.03
China Medical System Holdings Ltd. HKD 478,000 798,737 0.03
China Meidong Auto Holdings Ltd. HKD 202,000 1,049,200 0.04
China Mengniu Dairy Co. Ltd. HKD 1,128,000 6,390,854 0.23
China Overseas Property Holdings Ltd. HKD 455,000 481,316 0.02
China Resources Cement Holdings Ltd. HKD 868,000 656,340 0.02
China Resources Land Ltd. HKD 1,146,400 4,831,428 0.18
China Resources Mixc Lifestyle Services Ltd., Reg. S HKD 203,200 946,873 0.03
China State Construction International Holdings Ltd. HKD 716,000 888,163 0.03
China Yuhua Education Corp. Ltd., Reg. S HKD 634,000 226,341 0.01
Chinasoft International Ltd. HKD 932,000 1,214,150 0.04
Chindata Group Holdings Ltd., ADR USD 31,100 204,483 0.01
CIFI Ever Sunshine Services Group Ltd., Reg. S HKD 276,000 426,693 0.02
CIFI Holdings Group Co. Ltd. HKD 1,236,900 746,959 0.03
Country Garden Holdings Co. Ltd. HKD 2,741,644 2,436,424 0.09
Country Garden Services Holdings Co. Ltd. HKD 625,000 3,749,416 0.14
Dada Nexus Ltd., ADR USD 20,600 270,272 0.01
Dali Foods Group Co. Ltd., Reg. S HKD 722,000 379,164 0.01
Daqo New Energy Corp., ADR USD 19,300 791,686 0.03
DiDi Global, Inc., ADR USD 108,290 541,991 0.02
Dongyue Group Ltd. HKD 516,000 803,541 0.03
ENN Energy Holdings Ltd. HKD 282,400 5,322,659 0.19
GDS Holdings Ltd., ADR USD 31,400 1,483,807 0.05
Geely Automobile Holdings Ltd. HKD 2,040,000 5,573,483 0.20
Genscript Biotech Corp. HKD 398,000 1,753,499 0.06
Greentown China Holdings Ltd. HKD 307,000 494,323 0.02
Greentown Service Group Co. Ltd., Reg. S HKD 522,000 482,648 0.02
Haidilao International Holding Ltd., Reg. S HKD 377,000 852,515 0.03
Haitian International Holdings Ltd. HKD 221,000 614,351 0.02
Hansoh Pharmaceutical Group Co. Ltd., Reg. S HKD 424,000 1,033,318 0.04
Hello Group, Inc., ADR USD 56,300 517,679 0.02
Hengan International Group Co. Ltd. HKD 231,500 1,191,085 0.04
Huazhu Group Ltd., ADR USD 62,900 2,367,242 0.09
Hutchison China MediTech Ltd., ADR USD 30,300 1,075,801 0.04
Investments Currency Quantity/
Nominal Value
Market Value
USD
% of Net
Assets0
Hygeia Healthcare Holdings Co. Ltd., Reg. S HKD 120,000 751,450 0.03
I-Mab, ADR USD 11,500 559,188 0.02
Innovent Biologics, Inc., Reg. S HKD 416,000 2,577,725 0.09
iQIYI, Inc., ADR USD 100,800 473,256 0.02
JD Health International, Inc., Reg. S HKD 124,400 981,694 0.04
JD.com, Inc., ADR USD 302,488 21,237,682 0.77
Jinxin Fertility Group Ltd., Reg. S HKD 433,000 483,740 0.02
Jiumaojiu International Holdings Ltd., Reg. S HKD 251,000 439,625 0.02
JOYY, Inc., ADR USD 19,800 899,712 0.03
Kanzhun Ltd., ADR USD 23,800 863,940 0.03
KE Holdings, Inc., ADR USD 127,300 2,602,649 0.10
Kingboard Holdings Ltd. HKD 236,500 1,152,668 0.04
Kingboard Laminates Holdings Ltd. HKD 334,000 567,785 0.02
Kingdee International Software Group Co. Ltd. HKD 930,000 2,862,556 0.10
Kingsoft Cloud Holdings Ltd., ADR USD 19,500 316,680 0.01
Kingsoft Corp. Ltd. HKD 341,200 1,498,250 0.06
Kuaishou Technology, Reg. S HKD 168,400 1,556,960 0.06
KWG Group Holdings Ltd. HKD 443,000 290,216 0.01
Lee & Man Paper Manufacturing Ltd. HKD 463,000 321,042 0.01
Legend Biotech Corp., ADR USD 12,700 630,809 0.02
Li Auto, Inc., ADR USD 193,100 6,254,509 0.23
Li Ning Co. Ltd. HKD 778,000 8,513,865 0.31
Logan Group Co. Ltd. HKD 505,000 387,047 0.01
Longfor Group Holdings Ltd., Reg. S HKD 646,000 3,047,322 0.11
Meituan, Reg. S 'B' HKD 1,415,800 41,003,827 1.49
Microport Scientific Corp. HKD 225,700 818,237 0.03
Ming Yuan Cloud Group Holdings Ltd. HKD 136,000 309,740 0.01
Minth Group Ltd. HKD 268,000 1,180,880 0.04
NetEase, Inc., ADR USD 140,125 14,322,877 0.52
New Oriental Education & Technology Group, Inc., ADR USD 554,800 1,212,238 0.04
NIO, Inc., ADR USD 474,020 15,438,831 0.56
Noah Holdings Ltd., ADR USD 11,700 363,987 0.01
Parade Technologies Ltd. TWD 27,000 2,060,643 0.08
Pinduoduo, Inc., ADR USD 156,700 9,253,918 0.34
Ping An Healthcare and Technology Co. Ltd., Reg. S HKD 159,300 580,048 0.02
Powerlong Real Estate Holdings Ltd. HKD 515,000 268,962 0.01
RLX Technology, Inc., ADR USD 221,230 883,814 0.03
Sany Heavy Equipment International Holdings Co. Ltd. HKD 382,000 372,277 0.01
Seazen Group Ltd. HKD 772,000 524,463 0.02
Shenzhou International Group Holdings Ltd. HKD 295,400 5,674,245 0.21
Shimao Group Holdings Ltd. HKD 428,000 281,208 0.01
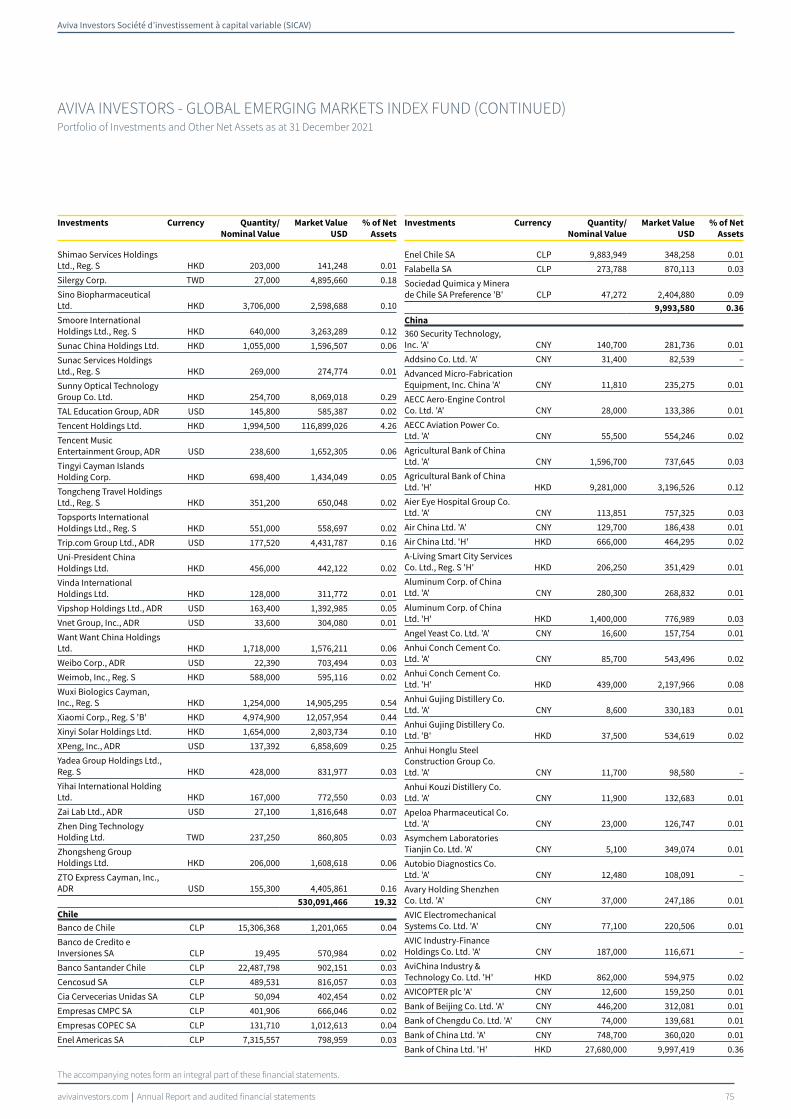
Aviva Investors Société d’investissement à capital variable (SICAV)
avivainvestors.com Annual Report and audited financial statements 75
AVIVA INVESTORS - GLOBAL EMERGING MARKETS INDEX FUND (CONTINUED)Portfolio of Investments and Other Net Assets as at 31 December 2021
The accompanying notes form an integral part of these financial statements.
Investments Currency Quantity/
Nominal Value
Market Value
USD
% of Net
Assets0
Shimao Services Holdings Ltd., Reg. S HKD 203,000 141,248 0.01
Silergy Corp. TWD 27,000 4,895,660 0.18
Sino Biopharmaceutical Ltd. HKD 3,706,000 2,598,688 0.10
Smoore International Holdings Ltd., Reg. S HKD 640,000 3,263,289 0.12
Sunac China Holdings Ltd. HKD 1,055,000 1,596,507 0.06
Sunac Services Holdings Ltd., Reg. S HKD 269,000 274,774 0.01
Sunny Optical Technology Group Co. Ltd. HKD 254,700 8,069,018 0.29
TAL Education Group, ADR USD 145,800 585,387 0.02
Tencent Holdings Ltd. HKD 1,994,500 116,899,026 4.26
Tencent Music Entertainment Group, ADR USD 238,600 1,652,305 0.06
Tingyi Cayman Islands Holding Corp. HKD 698,400 1,434,049 0.05
Tongcheng Travel Holdings Ltd., Reg. S HKD 351,200 650,048 0.02
Topsports International Holdings Ltd., Reg. S HKD 551,000 558,697 0.02
Trip.com Group Ltd., ADR USD 177,520 4,431,787 0.16
Uni-President China Holdings Ltd. HKD 456,000 442,122 0.02
Vinda International Holdings Ltd. HKD 128,000 311,772 0.01
Vipshop Holdings Ltd., ADR USD 163,400 1,392,985 0.05
Vnet Group, Inc., ADR USD 33,600 304,080 0.01
Want Want China Holdings Ltd. HKD 1,718,000 1,576,211 0.06
Weibo Corp., ADR USD 22,390 703,494 0.03
Weimob, Inc., Reg. S HKD 588,000 595,116 0.02
Wuxi Biologics Cayman, Inc., Reg. S HKD 1,254,000 14,905,295 0.54
Xiaomi Corp., Reg. S 'B' HKD 4,974,900 12,057,954 0.44
Xinyi Solar Holdings Ltd. HKD 1,654,000 2,803,734 0.10
XPeng, Inc., ADR USD 137,392 6,858,609 0.25
Yadea Group Holdings Ltd., Reg. S HKD 428,000 831,977 0.03
Yihai International Holding Ltd. HKD 167,000 772,550 0.03
Zai Lab Ltd., ADR USD 27,100 1,816,648 0.07
Zhen Ding Technology Holding Ltd. TWD 237,250 860,805 0.03
Zhongsheng Group Holdings Ltd. HKD 206,000 1,608,618 0.06
ZTO Express Cayman, Inc., ADR USD 155,300 4,405,861 0.16
530,091,466 19.32
Chile
Banco de Chile CLP 15,306,368 1,201,065 0.04
Banco de Credito e Inversiones SA CLP 19,495 570,984 0.02
Banco Santander Chile CLP 22,487,798 902,151 0.03
Cencosud SA CLP 489,531 816,057 0.03
Cia Cervecerias Unidas SA CLP 50,094 402,454 0.02
Empresas CMPC SA CLP 401,906 666,046 0.02
Empresas COPEC SA CLP 131,710 1,012,613 0.04
Enel Americas SA CLP 7,315,557 798,959 0.03
Investments Currency Quantity/
Nominal Value
Market Value
USD
% of Net
Assets0
Enel Chile SA CLP 9,883,949 348,258 0.01
Falabella SA CLP 273,788 870,113 0.03
Sociedad Quimica y Minera de Chile SA Preference 'B' CLP 47,272 2,404,880 0.09
9,993,580 0.36
China
360 Security Technology, Inc. 'A' CNY 140,700 281,736 0.01
Addsino Co. Ltd. 'A' CNY 31,400 82,539 –
Advanced Micro-Fabrication Equipment, Inc. China 'A' CNY 11,810 235,275 0.01
AECC Aero-Engine Control Co. Ltd. 'A' CNY 28,000 133,386 0.01
AECC Aviation Power Co. Ltd. 'A' CNY 55,500 554,246 0.02
Agricultural Bank of China Ltd. 'A' CNY 1,596,700 737,645 0.03
Agricultural Bank of China Ltd. 'H' HKD 9,281,000 3,196,526 0.12
Aier Eye Hospital Group Co. Ltd. 'A' CNY 113,851 757,325 0.03
Air China Ltd. 'A' CNY 129,700 186,438 0.01
Air China Ltd. 'H' HKD 666,000 464,295 0.02
A-Living Smart City Services Co. Ltd., Reg. S 'H' HKD 206,250 351,429 0.01
Aluminum Corp. of China Ltd. 'A' CNY 280,300 268,832 0.01
Aluminum Corp. of China Ltd. 'H' HKD 1,400,000 776,989 0.03
Angel Yeast Co. Ltd. 'A' CNY 16,600 157,754 0.01
Anhui Conch Cement Co. Ltd. 'A' CNY 85,700 543,496 0.02
Anhui Conch Cement Co. Ltd. 'H' HKD 439,000 2,197,966 0.08
Anhui Gujing Distillery Co. Ltd. 'A' CNY 8,600 330,183 0.01
Anhui Gujing Distillery Co. Ltd. 'B' HKD 37,500 534,619 0.02
Anhui Honglu Steel Construction Group Co. Ltd. 'A' CNY 11,700 98,580 –
Anhui Kouzi Distillery Co. Ltd. 'A' CNY 11,900 132,683 0.01
Apeloa Pharmaceutical Co. Ltd. 'A' CNY 23,000 126,747 0.01
Asymchem Laboratories Tianjin Co. Ltd. 'A' CNY 5,100 349,074 0.01
Autobio Diagnostics Co. Ltd. 'A' CNY 12,480 108,091 –
Avary Holding Shenzhen Co. Ltd. 'A' CNY 37,000 247,186 0.01
AVIC Electromechanical Systems Co. Ltd. 'A' CNY 77,100 220,506 0.01
AVIC Industry-Finance Holdings Co. Ltd. 'A' CNY 187,000 116,671 –
AviChina Industry & Technology Co. Ltd. 'H' HKD 862,000 594,975 0.02
AVICOPTER plc 'A' CNY 12,600 159,250 0.01
Bank of Beijing Co. Ltd. 'A' CNY 446,200 312,081 0.01
Bank of Chengdu Co. Ltd. 'A' CNY 74,000 139,681 0.01
Bank of China Ltd. 'A' CNY 748,700 360,020 0.01
Bank of China Ltd. 'H' HKD 27,680,000 9,997,419 0.36

Aviva Investors Société d’investissement à capital variable (SICAV)
avivainvestors.com Annual Report and audited financial statements 76
AVIVA INVESTORS - GLOBAL EMERGING MARKETS INDEX FUND (CONTINUED)Portfolio of Investments and Other Net Assets as at 31 December 2021
The accompanying notes form an integral part of these financial statements.
Investments Currency Quantity/
Nominal Value
Market Value
USD
% of Net
Assets0
Bank of Communications Co. Ltd. 'A' CNY 836,600 607,743 0.02
Bank of Communications Co. Ltd. 'H' HKD 3,127,400 1,891,414 0.07
Bank of Hangzhou Co. Ltd. 'A' CNY 125,100 252,182 0.01
Bank of Jiangsu Co. Ltd. 'A' CNY 314,790 288,554 0.01
Bank of Nanjing Co. Ltd. 'A' CNY 208,400 293,671 0.01
Bank of Ningbo Co. Ltd. 'A' CNY 140,910 848,958 0.03
Bank of Shanghai Co. Ltd. 'A' CNY 302,750 340,112 0.01
Baoshan Iron & Steel Co. Ltd. 'A' CNY 477,300 537,381 0.02
BBMG Corp. 'A' CNY 172,100 77,065 –
Beijing BDStar Navigation Co. Ltd. 'A' CNY 9,300 57,445 –
Beijing Capital International Airport Co. Ltd. 'H' HKD 668,000 407,914 0.02
Beijing Dabeinong Technology Group Co. Ltd. 'A' CNY 88,300 145,878 0.01
Beijing E-Hualu Information Technology Co. Ltd. 'A' CNY 12,720 70,753 –
Beijing Enlight Media Co. Ltd. 'A' CNY 58,600 118,440 –
Beijing Kingsoft Office Software, Inc. 'A' CNY 8,610 358,619 0.01
Beijing New Building Materials plc 'A' CNY 41,100 231,685 0.01
Beijing Originwater Technology Co. Ltd. 'A' CNY 63,514 71,842 –
Beijing Roborock Technology Co. Ltd. 'A' CNY 1,390 177,809 0.01
Beijing Shiji Information Technology Co. Ltd. 'A' CNY 26,040 117,682 –
Beijing Shunxin Agriculture Co. Ltd. 'A' CNY 14,000 84,077 –
Beijing Sinnet Technology Co. Ltd. 'A' CNY 33,200 77,551 –
Beijing Tiantan Biological Products Corp. Ltd. 'A' CNY 24,960 113,878 –
Beijing United Information Technology Co. Ltd. 'A' CNY 10,000 169,223 0.01
Beijing Wantai Biological Pharmacy Enterprise Co. Ltd. 'A' CNY 8,400 292,866 0.01
Beijing Yuanliu Hongyuan Electronic Technology Co. Ltd. 'A' CNY 5,000 141,172 0.01
Beijing-Shanghai High Speed Railway Co. Ltd. 'A' CNY 872,200 664,228 0.02
Betta Pharmaceuticals Co. Ltd. 'A' CNY 8,000 100,500 –
BGI Genomics Co. Ltd. 'A' CNY 7,100 98,093 –
BOC International China Co. Ltd. 'A' CNY 41,200 87,164 –
BOE Technology Group Co. Ltd. 'A' CNY 804,100 638,731 0.02
BYD Co. Ltd. 'A' CNY 38,900 1,642,416 0.06
BYD Co. Ltd. 'H' HKD 274,000 9,382,427 0.34
By-health Co. Ltd. 'A' CNY 31,800 135,015 0.01
C&S Paper Co. Ltd. 'A' CNY 25,900 68,124 –
Investments Currency Quantity/
Nominal Value
Market Value
USD
% of Net
Assets0
Caitong Securities Co. Ltd. 'A' CNY 76,500 133,915 0.01
CanSino Biologics, Inc. 'A' CNY 1,690 79,748 –
CanSino Biologics, Inc., Reg. S 'H' HKD 27,200 629,587 0.02
CGN Power Co. Ltd., Reg. S 'H' HKD 3,767,000 1,148,144 0.04
Chacha Food Co. Ltd. 'A' CNY 10,000 96,472 –
Changchun High & New Technology Industry Group, Inc. 'A' CNY 8,500 363,123 0.01
Changjiang Securities Co. Ltd. 'A' CNY 137,300 162,797 0.01
Changzhou Xingyu Automotive Lighting Systems Co. Ltd. 'A' CNY 5,900 189,612 0.01
Chaozhou Three-Circle Group Co. Ltd. 'A' CNY 38,700 271,550 0.01
Chifeng Jilong Gold Mining Co. Ltd. 'A' CNY 31,600 74,101 –
China Baoan Group Co. Ltd. 'A' CNY 53,900 122,362 –
China Bohai Bank Co. Ltd., Reg. S 'H' HKD 1,076,000 415,411 0.02
China Cinda Asset Management Co. Ltd. 'H' HKD 3,021,000 548,578 0.02
China CITIC Bank Corp. Ltd. 'H' HKD 3,171,600 1,373,910 0.05
China Communications Services Corp. Ltd. 'H' HKD 830,400 404,086 0.02
China Construction Bank Corp. 'A' CNY 187,800 173,129 0.01
China Construction Bank Corp. 'H' HKD 33,474,000 23,207,330 0.85
China CSSC Holdings Ltd. 'A' CNY 95,900 374,112 0.01
China Eastern Airlines Corp. Ltd. 'A' CNY 225,900 183,774 0.01
China Everbright Bank Co. Ltd. 'A' CNY 861,800 449,541 0.02
China Everbright Bank Co. Ltd. 'H' HKD 1,117,000 394,858 0.01
China Galaxy Securities Co. Ltd. 'A' CNY 85,000 149,607 0.01
China Galaxy Securities Co. Ltd. 'H' HKD 1,252,500 718,870 0.03
China Great Wall Securities Co. Ltd. 'A' CNY 67,300 137,091 0.01
China Greatwall Technology Group Co. Ltd. 'A' CNY 62,800 139,879 0.01
China Huarong Asset Management Co. Ltd., Reg. S 'H' HKD 3,014,000 394,209 0.01
China International Capital Corp. Ltd. 'A' CNY 21,100 162,817 0.01
China International Capital Corp. Ltd., Reg. S 'H' HKD 507,200 1,398,215 0.05
China Jushi Co. Ltd. 'A' CNY 84,623 242,587 0.01
China Life Insurance Co. Ltd. 'A' CNY 57,800 273,724 0.01
China Life Insurance Co. Ltd. 'H' HKD 2,658,000 4,408,114 0.16
China Longyuan Power Group Corp. Ltd. 'H' HKD 1,186,000 2,770,794 0.10

Aviva Investors Société d’investissement à capital variable (SICAV)
avivainvestors.com Annual Report and audited financial statements 77
AVIVA INVESTORS - GLOBAL EMERGING MARKETS INDEX FUND (CONTINUED)Portfolio of Investments and Other Net Assets as at 31 December 2021
The accompanying notes form an integral part of these financial statements.
Investments Currency Quantity/
Nominal Value
Market Value
USD
% of Net
Assets0
China Merchants Bank Co. Ltd. 'A' CNY 439,700 3,370,132 0.12
China Merchants Bank Co. Ltd. 'H' HKD 1,351,531 10,494,582 0.38
China Merchants Securities Co. Ltd. 'A' CNY 163,280 453,628 0.02
China Merchants Shekou Industrial Zone Holdings Co. Ltd. 'A' CNY 168,900 354,958 0.01
China Minsheng Banking Corp. Ltd. 'A' CNY 739,300 454,499 0.02
China Minsheng Banking Corp. Ltd. 'H' HKD 2,069,160 790,713 0.03
China Molybdenum Co. Ltd. 'A' CNY 376,500 330,889 0.01
China Molybdenum Co. Ltd. 'H' HKD 1,187,000 627,633 0.02
China National Building Material Co. Ltd. 'H' HKD 1,382,000 1,695,891 0.06
China National Chemical Engineering Co. Ltd. 'A' CNY 120,300 226,962 0.01
China National Medicines Corp. Ltd. 'A' CNY 15,400 76,434 –
China National Nuclear Power Co. Ltd. 'A' CNY 294,700 384,784 0.01
China Northern Rare Earth Group High-Tech Co. Ltd. 'A' CNY 76,100 548,365 0.02
China Oilfield Services Ltd. 'H' HKD 628,000 549,292 0.02
China Pacific Insurance Group Co. Ltd. 'A' CNY 142,000 605,888 0.02
China Pacific Insurance Group Co. Ltd. 'H' HKD 936,500 2,537,332 0.09
China Petroleum & Chemical Corp. 'A' CNY 663,200 441,975 0.02
China Petroleum & Chemical Corp. 'H' HKD 8,659,600 4,039,481 0.15
China Railway Group Ltd. 'A' CNY 424,000 387,014 0.01
China Railway Group Ltd. 'H' HKD 1,428,000 752,733 0.03
China Railway Signal & Communication Corp. Ltd. 'A' CNY 153,990 120,546 –
China Resources Sanjiu Medical & Pharmaceutical Co. Ltd. 'A' CNY 18,000 96,970 –
China Shenhua Energy Co. Ltd. 'A' CNY 137,300 486,366 0.02
China Shenhua Energy Co. Ltd. 'H' HKD 1,199,500 2,819,916 0.10
China Southern Airlines Co. Ltd. 'A' CNY 270,100 289,597 0.01
China Southern Airlines Co. Ltd. 'H' HKD 608,000 364,964 0.01
China State Construction Engineering Corp. Ltd. 'A' CNY 873,400 687,852 0.03
China Suntien Green Energy Corp. Ltd. 'H' HKD 615,000 480,537 0.02
China Tourism Group Duty Free Corp. Ltd. 'A' CNY 42,200 1,456,961 0.05
China Tower Corp. Ltd., Reg. S 'H' HKD 14,770,000 1,619,839 0.06
Investments Currency Quantity/
Nominal Value
Market Value
USD
% of Net
Assets0
China TransInfo Technology Co. Ltd. 'A' CNY 29,900 70,402 –
China United Network Communications Ltd. 'A' CNY 595,300 368,676 0.01
China Vanke Co. Ltd. 'A' CNY 201,800 627,240 0.02
China Vanke Co. Ltd. 'H' HKD 608,800 1,416,098 0.05
China Yangtze Power Co. Ltd. 'A' CNY 484,700 1,730,173 0.06
China Zheshang Bank Co. Ltd. 'A' CNY 348,000 191,923 0.01
Chongqing Brewery Co. Ltd. 'A' CNY 9,779 232,876 0.01
Chongqing Changan Automobile Co. Ltd. 'A' CNY 132,860 317,700 0.01
Chongqing Fuling Zhacai Group Co. Ltd. 'A' CNY 16,200 96,441 –
Chongqing Rural Commercial Bank Co. Ltd. 'A' CNY 161,100 97,722 –
Chongqing Zhifei Biological Products Co. Ltd. 'A' CNY 33,800 663,227 0.02
CITIC Securities Co. Ltd. 'A' CNY 227,000 943,227 0.03
CITIC Securities Co. Ltd. 'H' HKD 772,500 2,020,457 0.07
Contemporary Amperex Technology Co. Ltd. 'A' CNY 49,900 4,616,182 0.17
COSCO SHIPPING Energy Transportation Co. Ltd. 'A' CNY 76,500 71,208 –
COSCO SHIPPING Holdings Co. Ltd. 'A' CNY 262,640 772,712 0.03
COSCO SHIPPING Holdings Co. Ltd. 'H' HKD 1,198,900 2,331,839 0.09
CRRC Corp. Ltd. 'A' CNY 506,700 486,373 0.02
CRRC Corp. Ltd. 'H' HKD 1,539,000 662,847 0.02
CSC Financial Co. Ltd. 'A' CNY 96,800 445,657 0.02
Daan Gene Co. Ltd. 'A' CNY 27,360 86,329 –
DaShenLin Pharmaceutical Group Co. Ltd. 'A' CNY 15,000 99,401 –
DHC Software Co. Ltd. 'A' CNY 65,300 80,154 –
Dong-E-E-Jiao Co. Ltd. 'A' CNY 10,700 82,093 –
Dongfang Electric Corp. Ltd. 'A' CNY 57,400 193,509 0.01
Dongfeng Motor Group Co. Ltd. 'H' HKD 964,000 801,991 0.03
Dongxing Securities Co. Ltd. 'A' CNY 57,900 105,918 –
East Money Information Co. Ltd. 'A' CNY 220,256 1,286,421 0.05
Ecovacs Robotics Co. Ltd. 'A' CNY 9,900 235,298 0.01
ENN Natural Gas Co. Ltd. 'A' CNY 35,200 101,729 –
Eve Energy Co. Ltd. 'A' CNY 40,517 753,626 0.03
Everbright Securities Co. Ltd. 'A' CNY 76,900 180,727 0.01
Fangda Carbon New Material Co. Ltd. 'A' CNY 78,022 132,783 0.01
FAW Jiefang Group Co. Ltd. CNY 58,400 94,561 –
Fiberhome Telecommunication Technologies Co. Ltd. 'A' CNY 23,300 65,902 –
First Capital Securities Co. Ltd. 'A' CNY 82,700 95,257 –
Flat Glass Group Co. Ltd. 'A' CNY 30,700 280,147 0.01

Aviva Investors Société d’investissement à capital variable (SICAV)
avivainvestors.com Annual Report and audited financial statements 78
AVIVA INVESTORS - GLOBAL EMERGING MARKETS INDEX FUND (CONTINUED)Portfolio of Investments and Other Net Assets as at 31 December 2021
The accompanying notes form an integral part of these financial statements.
Investments Currency Quantity/
Nominal Value
Market Value
USD
% of Net
Assets0
Flat Glass Group Co. Ltd. 'H' HKD 133,000 675,570 0.03
Focus Media Information Technology Co. Ltd. 'A' CNY 307,100 396,004 0.01
Foshan Haitian Flavouring & Food Co. Ltd. 'A' CNY 74,800 1,237,116 0.05
Founder Securities Co. Ltd. 'A' CNY 162,100 200,103 0.01
Foxconn Industrial Internet Co. Ltd. 'A' CNY 153,400 287,597 0.01
Fu Jian Anjoy Foods Co. Ltd. 'A' CNY 5,200 139,832 0.01
Fujian Sunner Development Co. Ltd. 'A' CNY 25,100 95,437 –
Fuyao Glass Industry Group Co. Ltd. 'A' CNY 41,700 309,355 0.01
Fuyao Glass Industry Group Co. Ltd., Reg. S 'H' HKD 213,600 1,104,981 0.04
Ganfeng Lithium Co. Ltd. 'A' CNY 24,600 552,695 0.02
Ganfeng Lithium Co. Ltd., Reg. S 'H' HKD 92,800 1,460,311 0.05
G-bits Network Technology Xiamen Co. Ltd. 'A' CNY 1,500 99,672 –
GCL System Integration Technology Co. Ltd. 'A' CNY 101,100 60,531 –
GEM Co. Ltd. 'A' CNY 98,300 160,178 0.01
Gemdale Corp. 'A' CNY 110,600 225,612 0.01
GF Securities Co. Ltd. 'A' CNY 123,600 478,372 0.02
GF Securities Co. Ltd. 'H' HKD 392,800 749,396 0.03
Giant Network Group Co. Ltd. 'A' CNY 33,200 62,508 –
Gigadevice Semiconductor Beijing, Inc. 'A' CNY 12,432 343,956 0.01
Ginlong Technologies Co. Ltd. 'A' CNY 5,200 189,458 0.01
GoerTek, Inc. 'A' CNY 75,000 638,492 0.02
Gotion High-tech Co. Ltd. 'A' CNY 25,300 203,763 0.01
Great Wall Motor Co. Ltd. 'A' CNY 46,600 356,144 0.01
Great Wall Motor Co. Ltd. 'H' HKD 1,107,000 3,805,484 0.14
Greenland Holdings Corp. Ltd. 'A' CNY 181,495 124,088 –
GRG Banking Equipment Co. Ltd. 'A' CNY 49,300 92,433 –
Guangdong Haid Group Co. Ltd. 'A' CNY 34,600 399,215 0.01
Guangdong Kinlong Hardware Products Co. Ltd. 'A' CNY 6,100 174,225 0.01
Guanghui Energy Co. Ltd. 'A' CNY 132,600 136,368 0.01
Guangzhou Automobile Group Co. Ltd. 'H' HKD 1,044,400 1,029,848 0.04
Guangzhou Baiyunshan Pharmaceutical Holdings Co. Ltd. 'A' CNY 29,000 156,136 0.01
Guangzhou Haige Communications Group, Inc. Co. 'A' CNY 48,800 83,869 –
Guangzhou Kingmed Diagnostics Group Co. Ltd. 'A' CNY 11,300 198,074 0.01
Guangzhou R&F Properties Co. Ltd. 'H' HKD 594,000 222,053 0.01
Investments Currency Quantity/
Nominal Value
Market Value
USD
% of Net
Assets0
Guangzhou Shiyuan Electronic Technology Co. Ltd. 'A' CNY 13,900 178,016 0.01
Guangzhou Tinci Materials Technology Co. Ltd. 'A' CNY 20,080 362,356 0.01
Guangzhou Yuexiu Financial Holdings Group Co. Ltd. 'A' CNY 45,090 61,765 –
Guolian Securities Co. Ltd. 'A' CNY 42,400 93,175 –
Guosen Securities Co. Ltd. 'A' CNY 135,261 244,753 0.01
Guotai Junan Securities Co. Ltd. 'A' CNY 168,600 474,512 0.02
Guoyuan Securities Co. Ltd. 'A' CNY 87,100 105,602 –
Haier Smart Home Co. Ltd. 'A' CNY 131,400 617,936 0.02
Haier Smart Home Co. Ltd. 'H' HKD 805,600 3,400,500 0.12
Haitong Securities Co. Ltd. 'A' CNY 205,800 397,185 0.01
Haitong Securities Co. Ltd. 'H' HKD 968,800 856,812 0.03
Hang Zhou Great Star Industrial Co. Ltd. 'A' CNY 21,200 101,791 –
Hangzhou First Applied Material Co. Ltd. 'A' CNY 19,720 405,479 0.02
Hangzhou Oxygen Plant Group Co. Ltd. CNY 20,700 97,810 –
Hangzhou Robam Appliances Co. Ltd. 'A' CNY 16,400 93,096 –
Hangzhou Silan Microelectronics Co. Ltd. 'A' CNY 26,900 229,428 0.01
Hangzhou Tigermed Consulting Co. Ltd. 'A' CNY 7,400 148,802 0.01
Hangzhou Tigermed Consulting Co. Ltd., Reg. S 'H' HKD 43,300 546,602 0.02
Hefei Meiya Optoelectronic Technology, Inc. 'A' CNY 13,500 79,565 –
Heilongjiang Agriculture Co. Ltd. 'A' CNY 36,400 83,417 –
Henan Shuanghui Investment & Development Co. Ltd. 'A' CNY 60,800 302,118 0.01
Hengli Petrochemical Co. Ltd. 'A' CNY 122,160 441,674 0.02
Hengyi Petrochemical Co. Ltd. 'A' CNY 78,460 131,045 0.01
Hesteel Co. Ltd. 'A' CNY 211,200 81,589 –
Hithink RoyalFlush Information Network Co. Ltd. 'A' CNY 11,200 254,782 0.01
Hongfa Technology Co. Ltd. 'A' CNY 15,900 186,709 0.01
Huadian Power International Corp. Ltd. 'A' CNY 139,000 116,908 –
Huadong Medicine Co. Ltd. 'A' CNY 33,840 214,028 0.01
Huafon Chemical Co. Ltd. 'A' CNY 93,900 154,179 0.01
Huagong Tech Co. Ltd. 'A' CNY 19,500 85,431 –
Hualan Biological Engineering, Inc. 'A' CNY 38,500 176,694 0.01
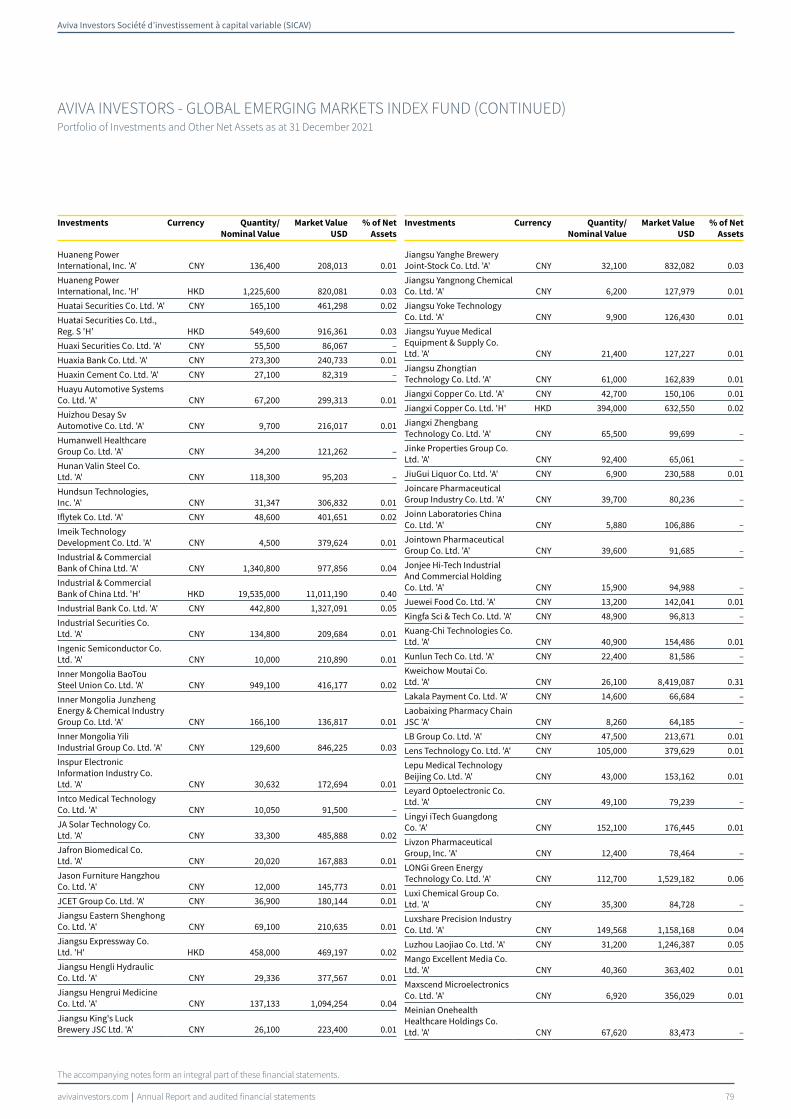
Aviva Investors Société d’investissement à capital variable (SICAV)
avivainvestors.com Annual Report and audited financial statements 79
AVIVA INVESTORS - GLOBAL EMERGING MARKETS INDEX FUND (CONTINUED)Portfolio of Investments and Other Net Assets as at 31 December 2021
The accompanying notes form an integral part of these financial statements.
Investments Currency Quantity/
Nominal Value
Market Value
USD
% of Net
Assets0
Huaneng Power International, Inc. 'A' CNY 136,400 208,013 0.01
Huaneng Power International, Inc. 'H' HKD 1,225,600 820,081 0.03
Huatai Securities Co. Ltd. 'A' CNY 165,100 461,298 0.02
Huatai Securities Co. Ltd., Reg. S 'H' HKD 549,600 916,361 0.03
Huaxi Securities Co. Ltd. 'A' CNY 55,500 86,067 –
Huaxia Bank Co. Ltd. 'A' CNY 273,300 240,733 0.01
Huaxin Cement Co. Ltd. 'A' CNY 27,100 82,319 –
Huayu Automotive Systems Co. Ltd. 'A' CNY 67,200 299,313 0.01
Huizhou Desay Sv Automotive Co. Ltd. 'A' CNY 9,700 216,017 0.01
Humanwell Healthcare Group Co. Ltd. 'A' CNY 34,200 121,262 –
Hunan Valin Steel Co. Ltd. 'A' CNY 118,300 95,203 –
Hundsun Technologies, Inc. 'A' CNY 31,347 306,832 0.01
Iflytek Co. Ltd. 'A' CNY 48,600 401,651 0.02
Imeik Technology Development Co. Ltd. 'A' CNY 4,500 379,624 0.01
Industrial & Commercial Bank of China Ltd. 'A' CNY 1,340,800 977,856 0.04
Industrial & Commercial Bank of China Ltd. 'H' HKD 19,535,000 11,011,190 0.40
Industrial Bank Co. Ltd. 'A' CNY 442,800 1,327,091 0.05
Industrial Securities Co. Ltd. 'A' CNY 134,800 209,684 0.01
Ingenic Semiconductor Co. Ltd. 'A' CNY 10,000 210,890 0.01
Inner Mongolia BaoTou Steel Union Co. Ltd. 'A' CNY 949,100 416,177 0.02
Inner Mongolia Junzheng Energy & Chemical Industry Group Co. Ltd. 'A' CNY 166,100 136,817 0.01
Inner Mongolia Yili Industrial Group Co. Ltd. 'A' CNY 129,600 846,225 0.03
Inspur Electronic Information Industry Co. Ltd. 'A' CNY 30,632 172,694 0.01
Intco Medical Technology Co. Ltd. 'A' CNY 10,050 91,500 –
JA Solar Technology Co. Ltd. 'A' CNY 33,300 485,888 0.02
Jafron Biomedical Co. Ltd. 'A' CNY 20,020 167,883 0.01
Jason Furniture Hangzhou Co. Ltd. 'A' CNY 12,000 145,773 0.01
JCET Group Co. Ltd. 'A' CNY 36,900 180,144 0.01
Jiangsu Eastern Shenghong Co. Ltd. 'A' CNY 69,100 210,635 0.01
Jiangsu Expressway Co. Ltd. 'H' HKD 458,000 469,197 0.02
Jiangsu Hengli Hydraulic Co. Ltd. 'A' CNY 29,336 377,567 0.01
Jiangsu Hengrui Medicine Co. Ltd. 'A' CNY 137,133 1,094,254 0.04
Jiangsu King's Luck Brewery JSC Ltd. 'A' CNY 26,100 223,400 0.01
Investments Currency Quantity/
Nominal Value
Market Value
USD
% of Net
Assets0
Jiangsu Yanghe Brewery Joint-Stock Co. Ltd. 'A' CNY 32,100 832,082 0.03
Jiangsu Yangnong Chemical Co. Ltd. 'A' CNY 6,200 127,979 0.01
Jiangsu Yoke Technology Co. Ltd. 'A' CNY 9,900 126,430 0.01
Jiangsu Yuyue Medical Equipment & Supply Co. Ltd. 'A' CNY 21,400 127,227 0.01
Jiangsu Zhongtian Technology Co. Ltd. 'A' CNY 61,000 162,839 0.01
Jiangxi Copper Co. Ltd. 'A' CNY 42,700 150,106 0.01
Jiangxi Copper Co. Ltd. 'H' HKD 394,000 632,550 0.02
Jiangxi Zhengbang Technology Co. Ltd. 'A' CNY 65,500 99,699 –
Jinke Properties Group Co. Ltd. 'A' CNY 92,400 65,061 –
JiuGui Liquor Co. Ltd. 'A' CNY 6,900 230,588 0.01
Joincare Pharmaceutical Group Industry Co. Ltd. 'A' CNY 39,700 80,236 –
Joinn Laboratories China Co. Ltd. 'A' CNY 5,880 106,886 –
Jointown Pharmaceutical Group Co. Ltd. 'A' CNY 39,600 91,685 –
Jonjee Hi-Tech Industrial And Commercial Holding Co. Ltd. 'A' CNY 15,900 94,988 –
Juewei Food Co. Ltd. 'A' CNY 13,200 142,041 0.01
Kingfa Sci & Tech Co. Ltd. 'A' CNY 48,900 96,813 –
Kuang-Chi Technologies Co. Ltd. 'A' CNY 40,900 154,486 0.01
Kunlun Tech Co. Ltd. 'A' CNY 22,400 81,586 –
Kweichow Moutai Co. Ltd. 'A' CNY 26,100 8,419,087 0.31
Lakala Payment Co. Ltd. 'A' CNY 14,600 66,684 –
Laobaixing Pharmacy Chain JSC 'A' CNY 8,260 64,185 –
LB Group Co. Ltd. 'A' CNY 47,500 213,671 0.01
Lens Technology Co. Ltd. 'A' CNY 105,000 379,629 0.01
Lepu Medical Technology Beijing Co. Ltd. 'A' CNY 43,000 153,162 0.01
Leyard Optoelectronic Co. Ltd. 'A' CNY 49,100 79,239 –
Lingyi iTech Guangdong Co. 'A' CNY 152,100 176,445 0.01
Livzon Pharmaceutical Group, Inc. 'A' CNY 12,400 78,464 –
LONGi Green Energy Technology Co. Ltd. 'A' CNY 112,700 1,529,182 0.06
Luxi Chemical Group Co. Ltd. 'A' CNY 35,300 84,728 –
Luxshare Precision Industry Co. Ltd. 'A' CNY 149,568 1,158,168 0.04
Luzhou Laojiao Co. Ltd. 'A' CNY 31,200 1,246,387 0.05
Mango Excellent Media Co. Ltd. 'A' CNY 40,360 363,402 0.01
Maxscend Microelectronics Co. Ltd. 'A' CNY 6,920 356,029 0.01
Meinian Onehealth Healthcare Holdings Co. Ltd. 'A' CNY 67,620 83,473 –

Aviva Investors Société d’investissement à capital variable (SICAV)
avivainvestors.com Annual Report and audited financial statements 80
AVIVA INVESTORS - GLOBAL EMERGING MARKETS INDEX FUND (CONTINUED)Portfolio of Investments and Other Net Assets as at 31 December 2021
The accompanying notes form an integral part of these financial statements.
Investments Currency Quantity/
Nominal Value
Market Value
USD
% of Net
Assets0
Metallurgical Corp. of China Ltd. 'A' CNY 357,400 215,680 0.01
Ming Yang Smart Energy Group Ltd. 'A' CNY 40,600 166,706 0.01
Montage Technology Co. Ltd. 'A' CNY 13,320 175,771 0.01
Muyuan Foods Co. Ltd. 'A' CNY 112,138 941,445 0.03
Nanjing King-Friend Biochemical Pharmaceutical Co. Ltd. 'A' CNY 25,611 169,277 0.01
Nanjing Securities Co. Ltd. 'A' CNY 69,500 108,435 –
NARI Technology Co. Ltd. 'A' CNY 118,840 748,707 0.03
National Silicon Industry Group Co. Ltd. 'A' CNY 43,170 175,440 0.01
NAURA Technology Group Co. Ltd. 'A' CNY 9,700 529,713 0.02
NavInfo Co. Ltd. 'A' CNY 39,200 98,181 –
New China Life Insurance Co. Ltd. 'A' CNY 43,400 265,488 0.01
New China Life Insurance Co. Ltd. 'H' HKD 312,200 833,783 0.03
New Hope Liuhe Co. Ltd. 'A' CNY 104,500 250,334 0.01
Ninestar Corp. 'A' CNY 22,300 167,657 0.01
Ningbo Joyson Electronic Corp. 'A' CNY 26,600 91,982 –
Ningbo Tuopu Group Co. Ltd. 'A' CNY 23,600 196,749 0.01
Ningxia Baofeng Energy Group Co. Ltd. 'A' CNY 130,300 356,071 0.01
Nongfu Spring Co. Ltd., Reg. S 'H' HKD 620,000 4,089,844 0.15
Northeast Securities Co. Ltd. 'A' CNY 47,900 66,142 –
Offshore Oil Engineering Co. Ltd. 'A' CNY 86,300 62,536 –
OFILM Group Co. Ltd. 'A' CNY 69,900 106,835 –
Oppein Home Group, Inc. 'A' CNY 10,460 243,124 0.01
Orient Securities Co. Ltd. 'A' CNY 135,600 314,625 0.01
Ovctek China, Inc. 'A' CNY 17,680 159,837 0.01
Pangang Group Vanadium Titanium & Resources Co. Ltd. 'A' CNY 170,900 104,623 –
People's Insurance Co. Group of China Ltd. (The) 'A' CNY 111,500 82,373 –
People's Insurance Co. Group of China Ltd. (The) 'H' HKD 2,945,000 890,024 0.03
Perfect World Co. Ltd. 'A' CNY 41,400 132,496 0.01
PetroChina Co. Ltd. 'A' CNY 455,600 352,389 0.01
PetroChina Co. Ltd. 'H' HKD 7,494,600 3,330,985 0.12
Pharmaron Beijing Co. Ltd. 'A' CNY 13,900 308,981 0.01
Pharmaron Beijing Co. Ltd., Reg. S 'H' HKD 47,100 727,176 0.03
PICC Property & Casualty Co. Ltd. 'H' HKD 2,451,216 2,004,282 0.07
Ping An Bank Co. Ltd. 'A' CNY 409,500 1,062,270 0.04
Ping An Insurance Group Co. of China Ltd. 'A' CNY 232,200 1,844,653 0.07
Ping An Insurance Group Co. of China Ltd. 'H' HKD 2,204,000 15,889,510 0.58
Investments Currency Quantity/
Nominal Value
Market Value
USD
% of Net
Assets0
Poly Developments and Holdings Group Co. Ltd. 'A' CNY 256,600 630,836 0.02
Postal Savings Bank of China Co. Ltd. 'A' CNY 553,700 443,933 0.02
Postal Savings Bank of China Co. Ltd., Reg. S 'H' HKD 2,821,000 1,981,685 0.07
Power Construction Corp. of China Ltd. 'A' CNY 344,500 438,306 0.02
Proya Cosmetics Co. Ltd. 'A' CNY 3,909 128,150 0.01
Qingdao Rural Commercial Bank Corp. 'A' CNY 108,500 65,986 –
Raytron Technology Co. Ltd. 'A' CNY 9,540 118,004 –
RiseSun Real Estate Development Co. Ltd. 'A' CNY 90,700 62,012 –
Riyue Heavy Industry Co. Ltd. 'A' CNY 18,000 93,332 –
Rongsheng Petrochemical Co. Ltd. 'A' CNY 215,850 617,570 0.02
SAIC Motor Corp. Ltd. 'A' CNY 162,200 527,192 0.02
Sailun Group Co. Ltd. 'A' CNY 65,700 153,092 0.01
Sangfor Technologies, Inc. 'A' CNY 8,100 243,107 0.01
Sany Heavy Industry Co. Ltd. 'A' CNY 181,900 652,738 0.02
Satellite Chemical Co. Ltd. 'A' CNY 35,000 220,487 0.01
SDIC Capital Co. Ltd. 'A' CNY 129,628 167,779 0.01
SDIC Power Holdings Co. Ltd. 'A' CNY 137,200 247,602 0.01
Sealand Securities Co. Ltd. 'A' CNY 110,110 71,319 –
Seazen Holdings Co. Ltd. 'A' CNY 51,900 237,938 0.01
SF Holding Co. Ltd. 'A' CNY 97,100 1,052,932 0.04
SG Micro Corp. 'A' CNY 4,650 226,068 0.01
Shaanxi Coal Industry Co. Ltd. 'A' CNY 208,200 400,052 0.02
Shandong Buchang Pharmaceuticals Co. Ltd. 'A' CNY 23,480 77,938 –
Shandong Gold Mining Co. Ltd. 'A' CNY 76,356 226,016 0.01
Shandong Gold Mining Co. Ltd., Reg. S 'H' HKD 223,500 382,391 0.01
Shandong Hualu Hengsheng Chemical Co. Ltd. 'A' CNY 42,490 209,251 0.01
Shandong Linglong Tyre Co. Ltd. 'A' CNY 27,100 155,869 0.01
Shandong Nanshan Aluminum Co. Ltd. 'A' CNY 237,700 176,034 0.01
Shandong Sun Paper Industry JSC Ltd. 'A' CNY 51,600 93,334 –
Shandong Weigao Group Medical Polymer Co. Ltd. 'H' HKD 888,400 1,108,485 0.04
Shanghai Bairun Investment Holding Group Co. Ltd. 'A' CNY 16,020 150,905 0.01
Shanghai Baosight Software Co. Ltd. 'A' CNY 21,840 209,078 0.01
Shanghai Baosight Software Co. Ltd. 'B' USD 136,100 657,392 0.02
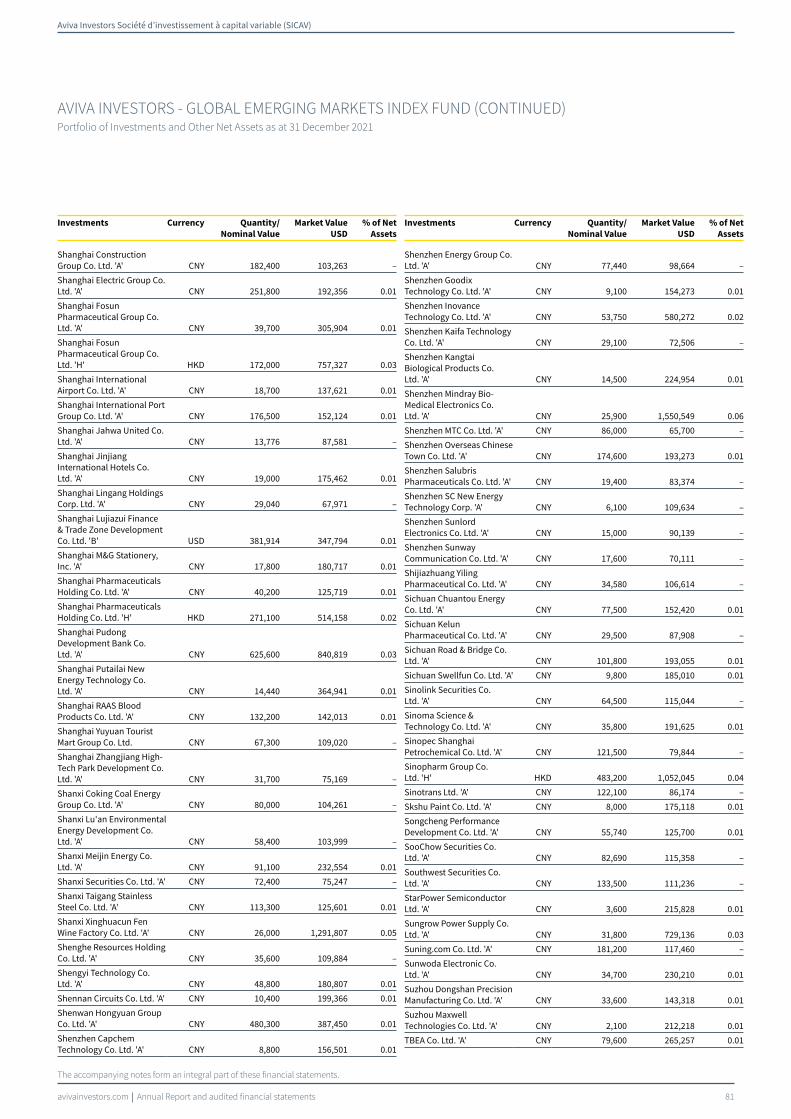
Aviva Investors Société d’investissement à capital variable (SICAV)
avivainvestors.com Annual Report and audited financial statements 81
AVIVA INVESTORS - GLOBAL EMERGING MARKETS INDEX FUND (CONTINUED)Portfolio of Investments and Other Net Assets as at 31 December 2021
The accompanying notes form an integral part of these financial statements.
Investments Currency Quantity/
Nominal Value
Market Value
USD
% of Net
Assets0
Shanghai Construction Group Co. Ltd. 'A' CNY 182,400 103,263 –
Shanghai Electric Group Co. Ltd. 'A' CNY 251,800 192,356 0.01
Shanghai Fosun Pharmaceutical Group Co. Ltd. 'A' CNY 39,700 305,904 0.01
Shanghai Fosun Pharmaceutical Group Co. Ltd. 'H' HKD 172,000 757,327 0.03
Shanghai International Airport Co. Ltd. 'A' CNY 18,700 137,621 0.01
Shanghai International Port Group Co. Ltd. 'A' CNY 176,500 152,124 0.01
Shanghai Jahwa United Co. Ltd. 'A' CNY 13,776 87,581 –
Shanghai Jinjiang International Hotels Co. Ltd. 'A' CNY 19,000 175,462 0.01
Shanghai Lingang Holdings Corp. Ltd. 'A' CNY 29,040 67,971 –
Shanghai Lujiazui Finance & Trade Zone Development Co. Ltd. 'B' USD 381,914 347,794 0.01
Shanghai M&G Stationery, Inc. 'A' CNY 17,800 180,717 0.01
Shanghai Pharmaceuticals Holding Co. Ltd. 'A' CNY 40,200 125,719 0.01
Shanghai Pharmaceuticals Holding Co. Ltd. 'H' HKD 271,100 514,158 0.02
Shanghai Pudong Development Bank Co. Ltd. 'A' CNY 625,600 840,819 0.03
Shanghai Putailai New Energy Technology Co. Ltd. 'A' CNY 14,440 364,941 0.01
Shanghai RAAS Blood Products Co. Ltd. 'A' CNY 132,200 142,013 0.01
Shanghai Yuyuan Tourist Mart Group Co. Ltd. CNY 67,300 109,020 –
Shanghai Zhangjiang High-Tech Park Development Co. Ltd. 'A' CNY 31,700 75,169 –
Shanxi Coking Coal Energy Group Co. Ltd. 'A' CNY 80,000 104,261 –
Shanxi Lu'an Environmental Energy Development Co. Ltd. 'A' CNY 58,400 103,999 –
Shanxi Meijin Energy Co. Ltd. 'A' CNY 91,100 232,554 0.01
Shanxi Securities Co. Ltd. 'A' CNY 72,400 75,247 –
Shanxi Taigang Stainless Steel Co. Ltd. 'A' CNY 113,300 125,601 0.01
Shanxi Xinghuacun Fen Wine Factory Co. Ltd. 'A' CNY 26,000 1,291,807 0.05
Shenghe Resources Holding Co. Ltd. 'A' CNY 35,600 109,884 –
Shengyi Technology Co. Ltd. 'A' CNY 48,800 180,807 0.01
Shennan Circuits Co. Ltd. 'A' CNY 10,400 199,366 0.01
Shenwan Hongyuan Group Co. Ltd. 'A' CNY 480,300 387,450 0.01
Shenzhen Capchem Technology Co. Ltd. 'A' CNY 8,800 156,501 0.01
Investments Currency Quantity/
Nominal Value
Market Value
USD
% of Net
Assets0
Shenzhen Energy Group Co. Ltd. 'A' CNY 77,440 98,664 –
Shenzhen Goodix Technology Co. Ltd. 'A' CNY 9,100 154,273 0.01
Shenzhen Inovance Technology Co. Ltd. 'A' CNY 53,750 580,272 0.02
Shenzhen Kaifa Technology Co. Ltd. 'A' CNY 29,100 72,506 –
Shenzhen Kangtai Biological Products Co. Ltd. 'A' CNY 14,500 224,954 0.01
Shenzhen Mindray Bio-Medical Electronics Co. Ltd. 'A' CNY 25,900 1,550,549 0.06
Shenzhen MTC Co. Ltd. 'A' CNY 86,000 65,700 –
Shenzhen Overseas Chinese Town Co. Ltd. 'A' CNY 174,600 193,273 0.01
Shenzhen Salubris Pharmaceuticals Co. Ltd. 'A' CNY 19,400 83,374 –
Shenzhen SC New Energy Technology Corp. 'A' CNY 6,100 109,634 –
Shenzhen Sunlord Electronics Co. Ltd. 'A' CNY 15,000 90,139 –
Shenzhen Sunway Communication Co. Ltd. 'A' CNY 17,600 70,111 –
Shijiazhuang Yiling Pharmaceutical Co. Ltd. 'A' CNY 34,580 106,614 –
Sichuan Chuantou Energy Co. Ltd. 'A' CNY 77,500 152,420 0.01
Sichuan Kelun Pharmaceutical Co. Ltd. 'A' CNY 29,500 87,908 –
Sichuan Road & Bridge Co. Ltd. 'A' CNY 101,800 193,055 0.01
Sichuan Swellfun Co. Ltd. 'A' CNY 9,800 185,010 0.01
Sinolink Securities Co. Ltd. 'A' CNY 64,500 115,044 –
Sinoma Science & Technology Co. Ltd. 'A' CNY 35,800 191,625 0.01
Sinopec Shanghai Petrochemical Co. Ltd. 'A' CNY 121,500 79,844 –
Sinopharm Group Co. Ltd. 'H' HKD 483,200 1,052,045 0.04
Sinotrans Ltd. 'A' CNY 122,100 86,174 –
Skshu Paint Co. Ltd. 'A' CNY 8,000 175,118 0.01
Songcheng Performance Development Co. Ltd. 'A' CNY 55,740 125,700 0.01
SooChow Securities Co. Ltd. 'A' CNY 82,690 115,358 –
Southwest Securities Co. Ltd. 'A' CNY 133,500 111,236 –
StarPower Semiconductor Ltd. 'A' CNY 3,600 215,828 0.01
Sungrow Power Supply Co. Ltd. 'A' CNY 31,800 729,136 0.03
Suning.com Co. Ltd. 'A' CNY 181,200 117,460 –
Sunwoda Electronic Co. Ltd. 'A' CNY 34,700 230,210 0.01
Suzhou Dongshan Precision Manufacturing Co. Ltd. 'A' CNY 33,600 143,318 0.01
Suzhou Maxwell Technologies Co. Ltd. 'A' CNY 2,100 212,218 0.01
TBEA Co. Ltd. 'A' CNY 79,600 265,257 0.01

Aviva Investors Société d’investissement à capital variable (SICAV)
avivainvestors.com Annual Report and audited financial statements 82
AVIVA INVESTORS - GLOBAL EMERGING MARKETS INDEX FUND (CONTINUED)Portfolio of Investments and Other Net Assets as at 31 December 2021
The accompanying notes form an integral part of these financial statements.
Investments Currency Quantity/
Nominal Value
Market Value
USD
% of Net
Assets0
TCL Technology Group Corp. 'A' CNY 292,100 283,364 0.01
Thunder Software Technology Co. Ltd. 'A' CNY 8,000 174,322 0.01
Tianfeng Securities Co. Ltd. 'A' CNY 183,600 116,862 –
Tianjin 712 Communication & Broadcasting Co. Ltd. 'A' CNY 15,300 104,198 –
Tianjin Zhonghuan Semiconductor Co. Ltd. 'A' CNY 60,000 394,074 0.01
Tianma Microelectronics Co. Ltd. 'A' CNY 49,300 100,962 –
Tianshui Huatian Technology Co. Ltd. 'A' CNY 54,200 108,447 –
Toly Bread Co. Ltd. 'A' CNY 20,300 90,760 –
TongFu Microelectronics Co. Ltd. 'A' CNY 26,800 81,921 –
Tongkun Group Co. Ltd. 'A' CNY 51,400 171,272 0.01
Tongling Nonferrous Metals Group Co. Ltd. 'A' CNY 211,400 115,607 –
Tongwei Co. Ltd. 'A' CNY 95,000 672,736 0.02
Topchoice Medical Corp. 'A' CNY 6,800 213,189 0.01
Topsec Technologies Group, Inc. 'A' CNY 22,900 69,096 –
Transfar Zhilian Co. Ltd. 'A' CNY 63,600 87,015 –
TravelSky Technology Ltd. 'H' HKD 324,000 544,689 0.02
Tsingtao Brewery Co. Ltd. 'A' CNY 15,100 235,226 0.01
Tsingtao Brewery Co. Ltd. 'H' HKD 186,000 1,736,288 0.06
Unigroup Guoxin Microelectronics Co. Ltd. 'A' CNY 12,800 453,211 0.02
Unisplendour Corp. Ltd. 'A' CNY 61,348 220,624 0.01
Universal Scientific Industrial Shanghai Co. Ltd. 'A' CNY 30,300 76,687 –
Venus MedTech Hangzhou, Inc., Reg. S 'H' HKD 75,000 284,610 0.01
Walvax Biotechnology Co. Ltd. 'A' CNY 32,600 288,704 0.01
Wanhua Chemical Group Co. Ltd. 'A' CNY 66,900 1,063,568 0.04
Weichai Power Co. Ltd. 'A' CNY 141,200 397,602 0.01
Weichai Power Co. Ltd. 'H' HKD 690,200 1,355,391 0.05
Weihai Guangwei Composites Co. Ltd. 'A' CNY 10,300 136,851 0.01
Wens Foodstuffs Group Co. Ltd. 'A' CNY 132,720 402,093 0.02
Western Securities Co. Ltd. 'A' CNY 112,600 143,073 0.01
Will Semiconductor Co. Ltd. Shanghai 'A' CNY 16,600 811,638 0.03
Wingtech Technology Co. Ltd. 'A' CNY 26,000 529,010 0.02
Winning Health Technology Group Co. Ltd. 'A' CNY 45,110 118,936 –
Wuchan Zhongda Group Co. Ltd. 'A' CNY 105,300 98,244 –
Wuhan Guide Infrared Co. Ltd. 'A' CNY 47,956 182,727 0.01
Investments Currency Quantity/
Nominal Value
Market Value
USD
% of Net
Assets0
Wuhu Sanqi Interactive Entertainment Network Technology Group Co. Ltd. 'A' CNY 47,300 201,075 0.01
Wuhu Token Science Co. Ltd. 'A' CNY 48,300 100,959 –
Wuliangye Yibin Co. Ltd. 'A' CNY 83,200 2,913,273 0.11
WUS Printed Circuit Kunshan Co. Ltd. 'A' CNY 40,370 105,351 –
WuXi AppTec Co. Ltd. 'A' CNY 54,140 1,010,139 0.04
WuXi AppTec Co. Ltd., Reg. S 'H' HKD 121,834 2,107,950 0.08
Wuxi Lead Intelligent Equipment Co. Ltd. 'A' CNY 16,800 196,598 0.01
Wuxi Shangji Automation Co. Ltd. 'A' CNY 5,900 155,040 0.01
XCMG Construction Machinery Co. Ltd. 'A' CNY 163,100 153,895 0.01
Xiamen C & D, Inc. 'A' CNY 58,111 82,889 –
Xiamen Intretech, Inc. 'A' CNY 12,580 67,402 –
Xiamen Tungsten Co. Ltd. 'A' CNY 28,000 99,733 –
Xinjiang Goldwind Science & Technology Co. Ltd. 'A' CNY 73,600 190,819 0.01
Xinjiang Goldwind Science & Technology Co. Ltd. 'H' HKD 268,150 524,807 0.02
Yankuang Energy Group Co. Ltd. 'A' CNY 52,200 193,225 0.01
Yankuang Energy Group Co. Ltd. 'H' HKD 540,000 1,075,297 0.04
Yantai Eddie Precision Machinery Co. Ltd. 'A' CNY 15,843 79,559 –
Yantai Jereh Oilfield Services Group Co. Ltd. 'A' CNY 19,100 120,258 –
Yealink Network Technology Corp. Ltd. 'A' CNY 19,300 247,403 0.01
Yifeng Pharmacy Chain Co. Ltd. 'A' CNY 13,832 119,958 –
Yihai Kerry Arawana Holdings Co. Ltd. 'A' CNY 26,700 264,361 0.01
Yintai Gold Co. Ltd. 'A' CNY 55,300 76,436 –
Yonghui Superstores Co. Ltd. 'A' CNY 185,500 118,063 –
Yonyou Network Technology Co. Ltd. 'A' CNY 64,214 362,485 0.01
Youngor Group Co. Ltd. 'A' CNY 98,700 107,081 –
YTO Express Group Co. Ltd. 'A' CNY 60,000 157,052 0.01
Yuan Longping High-tech Agriculture Co. Ltd. 'A' CNY 25,700 94,152 –
Yunda Holding Co. Ltd. 'A' CNY 57,370 184,754 0.01
Yunnan Aluminium Co. Ltd. 'A' CNY 63,700 111,917 –
Yunnan Baiyao Group Co. Ltd. 'A' CNY 27,000 444,530 0.02
Yunnan Energy New Material Co. Ltd. CNY 19,000 749,171 0.03
Zhangzhou Pientzehuang Pharmaceutical Co. Ltd. 'A' CNY 12,700 873,711 0.03
Zhefu Holding Group Co. Ltd. 'A' CNY 99,700 111,726 –
Zhejiang Century Huatong Group Co. Ltd. 'A' CNY 159,720 210,933 0.01

Aviva Investors Société d’investissement à capital variable (SICAV)
avivainvestors.com Annual Report and audited financial statements 83
AVIVA INVESTORS - GLOBAL EMERGING MARKETS INDEX FUND (CONTINUED)Portfolio of Investments and Other Net Assets as at 31 December 2021
The accompanying notes form an integral part of these financial statements.
Investments Currency Quantity/
Nominal Value
Market Value
USD
% of Net
Assets0
Zhejiang China Commodities City Group Co. Ltd. 'A' CNY 122,300 93,238 –
Zhejiang Chint Electrics Co. Ltd. 'A' CNY 44,800 379,932 0.01
Zhejiang Dahua Technology Co. Ltd. 'A' CNY 63,200 233,581 0.01
Zhejiang Dingli Machinery Co. Ltd. 'A' CNY 10,360 130,841 0.01
Zhejiang Expressway Co. Ltd. 'H' HKD 534,000 476,498 0.02
Zhejiang HangKe Technology, Inc. Co. 'A' CNY 8,543 144,617 0.01
Zhejiang Huahai Pharmaceutical Co. Ltd. 'A' CNY 28,930 98,568 –
Zhejiang Huayou Cobalt Co. Ltd. 'A' CNY 25,280 438,773 0.02
Zhejiang Jingsheng Mechanical & Electrical Co. Ltd. 'A' CNY 25,400 277,826 0.01
Zhejiang Jiuzhou Pharmaceutical Co. Ltd. 'A' CNY 15,400 136,279 0.01
Zhejiang Juhua Co. Ltd. 'A' CNY 54,600 110,836 –
Zhejiang Longsheng Group Co. Ltd. 'A' CNY 67,700 134,694 0.01
Zhejiang NHU Co. Ltd. 'A' CNY 54,440 266,535 0.01
Zhejiang Sanhua Intelligent Controls Co. Ltd. 'A' CNY 76,530 304,867 0.01
Zhejiang Semir Garment Co. Ltd. 'A' CNY 32,400 39,410 –
Zhejiang Supor Co. Ltd. 'A' CNY 10,900 106,940 –
Zhejiang Weixing New Building Materials Co. Ltd. 'A' CNY 31,300 119,796 –
Zhejiang Wolwo Bio-Pharmaceutical Co. Ltd. 'A' CNY 10,400 93,569 –
Zheshang Securities Co. Ltd. 'A' CNY 94,400 195,698 0.01
ZhongAn Online P&C Insurance Co. Ltd., Reg. S 'H' HKD 171,800 597,938 0.02
Zhongji Innolight Co. Ltd. 'A' CNY 17,200 115,006 –
Zhongtai Securities Co. Ltd. 'A' CNY 121,300 190,208 0.01
Zhuzhou CRRC Times Electric Co. Ltd. 'H' HKD 194,400 1,128,077 0.04
Zhuzhou Kibing Group Co. Ltd. 'A' CNY 66,000 177,650 0.01
Zijin Mining Group Co. Ltd. 'A' CNY 430,300 657,168 0.02
Zijin Mining Group Co. Ltd. 'H' HKD 2,049,000 2,443,827 0.09
Zoomlion Heavy Industry Science and Technology Co. Ltd. 'A' CNY 137,300 154,794 0.01
Zoomlion Heavy Industry Science and Technology Co. Ltd. 'H' HKD 477,700 300,040 0.01
ZTE Corp. 'A' CNY 81,400 429,183 0.02
ZTE Corp. 'H' HKD 268,424 736,222 0.03
317,049,362 11.55
Colombia
Bancolombia SA COP 86,370 732,129 0.03
Bancolombia SA Preference COP 152,199 1,194,781 0.04
Investments Currency Quantity/
Nominal Value
Market Value
USD
% of Net
Assets0
Ecopetrol SA COP 1,762,683 1,160,902 0.04
Grupo de Inversiones Suramericana SA COP 81,378 599,438 0.02
Interconexion Electrica SA ESP COP 157,391 862,943 0.03
4,550,193 0.16
Cyprus
Ozon Holdings plc, ADR RUB 18,090 559,266 0.02
TCS Group Holding plc, Reg. S, GDR RUB 41,630 3,392,297 0.12
3,951,563 0.14
Czech Republic
CEZ A/S CZK 55,890 2,101,473 0.08
Komercni Banka A/S CZK 26,320 1,117,244 0.04
Moneta Money Bank A/S, Reg. S CZK 127,790 547,551 0.02
3,766,268 0.14
Egypt
Commercial International Bank Egypt SAE EGP 579,908 1,943,887 0.07
Eastern Co. SAE EGP 361,720 245,217 0.01
Fawry for Banking & Payment Technology Services SAE EGP 174,010 142,598 –
2,331,702 0.08
Greece
Alpha Services and Holdings SA EUR 746,570 909,988 0.03
Eurobank Ergasias Services and Holdings SA EUR 899,070 911,983 0.03
Hellenic Telecommunications Organization SA EUR 81,610 1,511,547 0.06
JUMBO SA EUR 38,872 556,707 0.02
OPAP SA EUR 72,780 1,028,700 0.04
Public Power Corp. SA EUR 74,630 796,639 0.03
5,715,564 0.21
Hong Kong
Beijing Enterprises Holdings Ltd. HKD 179,500 620,246 0.02
BYD Electronic International Co. Ltd. HKD 240,000 877,957 0.03
China Everbright Environment Group Ltd. HKD 1,309,444 1,051,618 0.04
China Jinmao Holdings Group Ltd. HKD 2,028,000 628,726 0.02
China Merchants Port Holdings Co. Ltd. HKD 520,200 945,552 0.03
China Overseas Land & Investment Ltd. HKD 1,360,400 3,220,025 0.12
China Power International Development Ltd. HKD 1,361,000 917,655 0.03
China Resources Beer Holdings Co. Ltd. HKD 522,266 4,275,951 0.16
China Resources Power Holdings Co. Ltd. HKD 688,000 2,303,612 0.08
China Taiping Insurance Holdings Co. Ltd. HKD 574,480 789,858 0.03
China Traditional Chinese Medicine Holdings Co. Ltd. HKD 952,000 631,785 0.02
CITIC Ltd. HKD 2,073,000 2,049,310 0.07

Aviva Investors Société d’investissement à capital variable (SICAV)
avivainvestors.com Annual Report and audited financial statements 84
AVIVA INVESTORS - GLOBAL EMERGING MARKETS INDEX FUND (CONTINUED)Portfolio of Investments and Other Net Assets as at 31 December 2021
The accompanying notes form an integral part of these financial statements.
Investments Currency Quantity/
Nominal Value
Market Value
USD
% of Net
Assets0
CSPC Pharmaceutical Group Ltd. HKD 3,208,560 3,487,850 0.13
Far East Horizon Ltd. HKD 580,000 515,977 0.02
Fosun International Ltd. HKD 893,000 961,791 0.04
Guangdong Investment Ltd. HKD 1,044,000 1,326,494 0.05
Hua Hong Semiconductor Ltd., Reg. S HKD 180,000 990,928 0.04
Lenovo Group Ltd. HKD 2,582,000 2,970,190 0.11
MMG Ltd. HKD 1,048,000 335,484 0.01
Sinotruk Hong Kong Ltd. HKD 260,500 400,711 0.01
Sun Art Retail Group Ltd. HKD 711,000 285,952 0.01
Wharf Holdings Ltd. (The) HKD 491,000 1,515,746 0.06
Yuexiu Property Co. Ltd. HKD 518,600 457,591 0.02
31,561,009 1.15
Hungary
MOL Hungarian Oil & Gas plc HUF 141,870 1,094,691 0.04
OTP Bank Nyrt. HUF 77,974 3,978,754 0.14
Richter Gedeon Nyrt. HUF 48,400 1,295,009 0.05
6,368,454 0.23
India
ACC Ltd. INR 27,120 808,813 0.03
Adani Enterprises Ltd. INR 95,710 2,195,786 0.08
Adani Green Energy Ltd. INR 136,100 2,428,954 0.09
Adani Ports & Special Economic Zone Ltd. INR 182,355 1,787,572 0.07
Adani Total Gas Ltd. INR 95,210 2,214,151 0.08
Adani Transmission Ltd. INR 95,710 2,234,984 0.08
Ambuja Cements Ltd. INR 249,705 1,266,555 0.05
Apollo Hospitals Enterprise Ltd. INR 35,030 2,364,451 0.09
Asian Paints Ltd. INR 133,554 6,067,698 0.22
Aurobindo Pharma Ltd. INR 104,073 1,023,368 0.04
Avenue Supermarts Ltd., Reg. S INR 56,370 3,530,470 0.13
Axis Bank Ltd. INR 789,737 7,205,849 0.26
Bajaj Auto Ltd. INR 23,752 1,036,921 0.04
Bajaj Finance Ltd. INR 94,544 8,849,965 0.32
Bajaj Finserv Ltd. INR 13,257 2,925,921 0.11
Balkrishna Industries Ltd. INR 29,790 927,884 0.03
Bandhan Bank Ltd., Reg. S INR 228,850 774,978 0.03
Berger Paints India Ltd. INR 87,630 909,412 0.03
Bharat Electronics Ltd. INR 432,760 1,219,825 0.04
Bharat Forge Ltd. INR 79,986 749,201 0.03
Bharat Petroleum Corp. Ltd. INR 311,276 1,610,890 0.06
Bharti Airtel Ltd. INR 28,526 134,794 –
Bharti Airtel Ltd. INR 812,617 7,468,790 0.27
Biocon Ltd. INR 145,230 709,923 0.03
Britannia Industries Ltd. INR 37,734 1,830,328 0.07
Cholamandalam Investment and Finance Co. Ltd. INR 145,650 1,018,170 0.04
Cipla Ltd. INR 171,888 2,180,724 0.08
Coal India Ltd. INR 552,695 1,085,590 0.04
Colgate-Palmolive India Ltd. INR 43,480 865,042 0.03
Container Corp. of India Ltd. INR 86,365 712,034 0.03
Dabur India Ltd. INR 219,739 1,709,115 0.06
Divi's Laboratories Ltd. INR 45,958 2,887,045 0.11
Investments Currency Quantity/
Nominal Value
Market Value
USD
% of Net
Assets0
DLF Ltd. INR 222,280 1,167,985 0.04
Dr Reddy's Laboratories Ltd. INR 41,350 2,723,113 0.10
Eicher Motors Ltd. INR 47,580 1,654,082 0.06
GAIL India Ltd. INR 552,058 958,231 0.03
Godrej Consumer Products Ltd. INR 127,119 1,651,507 0.06
Godrej Properties Ltd. INR 25,000 628,155 0.02
Grasim Industries Ltd. INR 91,158 1,989,162 0.07
Havells India Ltd. INR 89,503 1,676,304 0.06
HCL Technologies Ltd. INR 375,866 6,662,386 0.24
HDFC Asset Management Co. Ltd., Reg. S INR 19,030 625,814 0.02
HDFC Life Insurance Co. Ltd., Reg. S INR 288,210 2,516,506 0.09
Hero MotoCorp Ltd. INR 41,724 1,380,339 0.05
Hindalco Industries Ltd. INR 547,484 3,489,798 0.13
Hindustan Petroleum Corp. Ltd. INR 226,757 890,287 0.03
Hindustan Unilever Ltd. INR 286,254 9,073,404 0.33
Housing Development Finance Corp. Ltd. INR 594,330 20,627,628 0.75
ICICI Bank Ltd. INR 1,775,897 17,650,441 0.64
ICICI Lombard General Insurance Co. Ltd., Reg. S INR 80,131 1,508,816 0.06
ICICI Prudential Life Insurance Co. Ltd., Reg. S INR 127,530 960,652 0.04
Indian Oil Corp. Ltd. INR 668,822 1,001,063 0.04
Indian Railway Catering & Tourism Corp. Ltd. INR 50,000 558,318 0.02
Indraprastha Gas Ltd. INR 100,030 631,219 0.02
Indus Towers Ltd. INR 223,315 742,989 0.03
Info Edge India Ltd. INR 26,710 1,999,221 0.07
Infosys Ltd. INR 1,186,021 30,159,322 1.10
InterGlobe Aviation Ltd., Reg. S INR 34,207 924,560 0.03
ITC Ltd. INR 1,023,495 2,995,643 0.11
JSW Steel Ltd. INR 291,768 2,568,033 0.09
Jubilant Foodworks Ltd. INR 28,290 1,363,308 0.05
Kotak Mahindra Bank Ltd. INR 193,260 4,667,647 0.17
Larsen & Toubro Infotech Ltd., Reg. S INR 18,440 1,812,977 0.07
Larsen & Toubro Ltd. INR 239,582 6,102,075 0.22
Lupin Ltd. INR 80,583 1,028,309 0.04
Mahindra & Mahindra Ltd. INR 301,344 3,386,622 0.12
Marico Ltd. INR 184,533 1,271,192 0.05
Maruti Suzuki India Ltd. INR 46,997 4,684,156 0.17
Mindtree Ltd. INR 23,200 1,487,661 0.05
Motherson Sumi Systems Ltd. INR 439,692 1,307,481 0.05
Mphasis Ltd. INR 15,000 684,143 0.02
MRF Ltd. INR 650 636,686 0.02
Muthoot Finance Ltd. INR 42,740 857,455 0.03
Nestle India Ltd. INR 11,683 3,087,491 0.11
NTPC Ltd. INR 1,687,636 2,820,186 0.10
Oil & Natural Gas Corp. Ltd. INR 875,806 1,674,105 0.06
Page Industries Ltd. INR 1,994 1,084,984 0.04
Petronet LNG Ltd. INR 266,411 774,378 0.03
PI Industries Ltd. INR 29,990 1,222,247 0.04
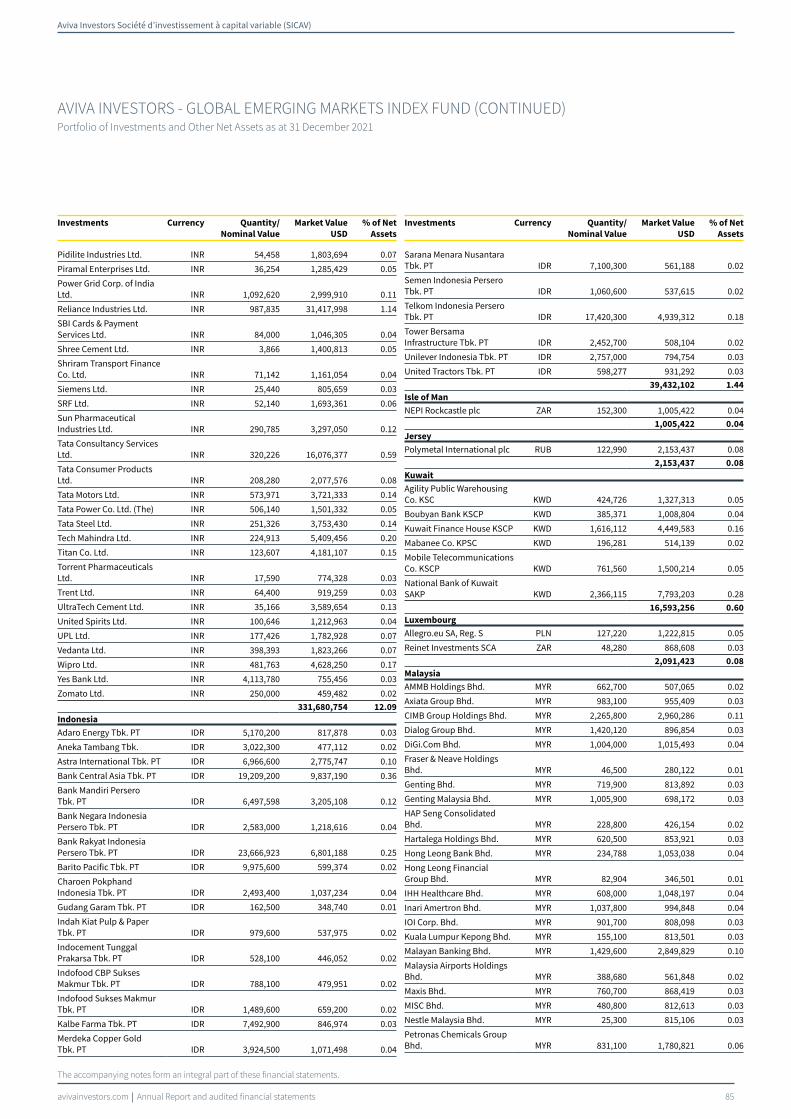
Aviva Investors Société d’investissement à capital variable (SICAV)
avivainvestors.com Annual Report and audited financial statements 85
AVIVA INVESTORS - GLOBAL EMERGING MARKETS INDEX FUND (CONTINUED)Portfolio of Investments and Other Net Assets as at 31 December 2021
The accompanying notes form an integral part of these financial statements.
Investments Currency Quantity/
Nominal Value
Market Value
USD
% of Net
Assets0
Pidilite Industries Ltd. INR 54,458 1,803,694 0.07
Piramal Enterprises Ltd. INR 36,254 1,285,429 0.05
Power Grid Corp. of India Ltd. INR 1,092,620 2,999,910 0.11
Reliance Industries Ltd. INR 987,835 31,417,998 1.14
SBI Cards & Payment Services Ltd. INR 84,000 1,046,305 0.04
Shree Cement Ltd. INR 3,866 1,400,813 0.05
Shriram Transport Finance Co. Ltd. INR 71,142 1,161,054 0.04
Siemens Ltd. INR 25,440 805,659 0.03
SRF Ltd. INR 52,140 1,693,361 0.06
Sun Pharmaceutical Industries Ltd. INR 290,785 3,297,050 0.12
Tata Consultancy Services Ltd. INR 320,226 16,076,377 0.59
Tata Consumer Products Ltd. INR 208,280 2,077,576 0.08
Tata Motors Ltd. INR 573,971 3,721,333 0.14
Tata Power Co. Ltd. (The) INR 506,140 1,501,332 0.05
Tata Steel Ltd. INR 251,326 3,753,430 0.14
Tech Mahindra Ltd. INR 224,913 5,409,456 0.20
Titan Co. Ltd. INR 123,607 4,181,107 0.15
Torrent Pharmaceuticals Ltd. INR 17,590 774,328 0.03
Trent Ltd. INR 64,400 919,259 0.03
UltraTech Cement Ltd. INR 35,166 3,589,654 0.13
United Spirits Ltd. INR 100,646 1,212,963 0.04
UPL Ltd. INR 177,426 1,782,928 0.07
Vedanta Ltd. INR 398,393 1,823,266 0.07
Wipro Ltd. INR 481,763 4,628,250 0.17
Yes Bank Ltd. INR 4,113,780 755,456 0.03
Zomato Ltd. INR 250,000 459,482 0.02
331,680,754 12.09
Indonesia
Adaro Energy Tbk. PT IDR 5,170,200 817,878 0.03
Aneka Tambang Tbk. IDR 3,022,300 477,112 0.02
Astra International Tbk. PT IDR 6,966,600 2,775,747 0.10
Bank Central Asia Tbk. PT IDR 19,209,200 9,837,190 0.36
Bank Mandiri Persero Tbk. PT IDR 6,497,598 3,205,108 0.12
Bank Negara Indonesia Persero Tbk. PT IDR 2,583,000 1,218,616 0.04
Bank Rakyat Indonesia Persero Tbk. PT IDR 23,666,923 6,801,188 0.25
Barito Pacific Tbk. PT IDR 9,975,600 599,374 0.02
Charoen Pokphand Indonesia Tbk. PT IDR 2,493,400 1,037,234 0.04
Gudang Garam Tbk. PT IDR 162,500 348,740 0.01
Indah Kiat Pulp & Paper Tbk. PT IDR 979,600 537,975 0.02
Indocement Tunggal Prakarsa Tbk. PT IDR 528,100 446,052 0.02
Indofood CBP Sukses Makmur Tbk. PT IDR 788,100 479,951 0.02
Indofood Sukses Makmur Tbk. PT IDR 1,489,600 659,200 0.02
Kalbe Farma Tbk. PT IDR 7,492,900 846,974 0.03
Merdeka Copper Gold Tbk. PT IDR 3,924,500 1,071,498 0.04
Investments Currency Quantity/
Nominal Value
Market Value
USD
% of Net
Assets0
Sarana Menara Nusantara Tbk. PT IDR 7,100,300 561,188 0.02
Semen Indonesia Persero Tbk. PT IDR 1,060,600 537,615 0.02
Telkom Indonesia Persero Tbk. PT IDR 17,420,300 4,939,312 0.18
Tower Bersama Infrastructure Tbk. PT IDR 2,452,700 508,104 0.02
Unilever Indonesia Tbk. PT IDR 2,757,000 794,754 0.03
United Tractors Tbk. PT IDR 598,277 931,292 0.03
39,432,102 1.44
Isle of Man
NEPI Rockcastle plc ZAR 152,300 1,005,422 0.04
1,005,422 0.04
Jersey
Polymetal International plc RUB 122,990 2,153,437 0.08
2,153,437 0.08
Kuwait
Agility Public Warehousing Co. KSC KWD 424,726 1,327,313 0.05
Boubyan Bank KSCP KWD 385,371 1,008,804 0.04
Kuwait Finance House KSCP KWD 1,616,112 4,449,583 0.16
Mabanee Co. KPSC KWD 196,281 514,139 0.02
Mobile Telecommunications Co. KSCP KWD 761,560 1,500,214 0.05
National Bank of Kuwait SAKP KWD 2,366,115 7,793,203 0.28
16,593,256 0.60
Luxembourg
Allegro.eu SA, Reg. S PLN 127,220 1,222,815 0.05
Reinet Investments SCA ZAR 48,280 868,608 0.03
2,091,423 0.08
Malaysia
AMMB Holdings Bhd. MYR 662,700 507,065 0.02
Axiata Group Bhd. MYR 983,100 955,409 0.03
CIMB Group Holdings Bhd. MYR 2,265,800 2,960,286 0.11
Dialog Group Bhd. MYR 1,420,120 896,854 0.03
DiGi.Com Bhd. MYR 1,004,000 1,015,493 0.04
Fraser & Neave Holdings Bhd. MYR 46,500 280,122 0.01
Genting Bhd. MYR 719,900 813,892 0.03
Genting Malaysia Bhd. MYR 1,005,900 698,172 0.03
HAP Seng Consolidated Bhd. MYR 228,800 426,154 0.02
Hartalega Holdings Bhd. MYR 620,500 853,921 0.03
Hong Leong Bank Bhd. MYR 234,788 1,053,038 0.04
Hong Leong Financial Group Bhd. MYR 82,904 346,501 0.01
IHH Healthcare Bhd. MYR 608,000 1,048,197 0.04
Inari Amertron Bhd. MYR 1,037,800 994,848 0.04
IOI Corp. Bhd. MYR 901,700 808,098 0.03
Kuala Lumpur Kepong Bhd. MYR 155,100 813,501 0.03
Malayan Banking Bhd. MYR 1,429,600 2,849,829 0.10
Malaysia Airports Holdings Bhd. MYR 388,680 561,848 0.02
Maxis Bhd. MYR 760,700 868,419 0.03
MISC Bhd. MYR 480,800 812,613 0.03
Nestle Malaysia Bhd. MYR 25,300 815,106 0.03
Petronas Chemicals Group Bhd. MYR 831,100 1,780,821 0.06

Aviva Investors Société d’investissement à capital variable (SICAV)
avivainvestors.com Annual Report and audited financial statements 86
AVIVA INVESTORS - GLOBAL EMERGING MARKETS INDEX FUND (CONTINUED)Portfolio of Investments and Other Net Assets as at 31 December 2021
The accompanying notes form an integral part of these financial statements.
Investments Currency Quantity/
Nominal Value
Market Value
USD
% of Net
Assets0
Petronas Dagangan Bhd. MYR 106,200 522,525 0.02
Petronas Gas Bhd. MYR 282,100 1,199,236 0.04
PPB Group Bhd. MYR 229,660 938,283 0.03
Press Metal Aluminium Holdings Bhd. MYR 1,118,600 1,548,966 0.06
Public Bank Bhd. MYR 5,067,450 5,078,113 0.18
QL Resources Bhd. MYR 396,900 435,943 0.02
RHB Bank Bhd. MYR 647,250 837,822 0.03
Sime Darby Bhd. MYR 983,500 546,633 0.02
Sime Darby Plantation Bhd. MYR 617,300 559,921 0.02
Telekom Malaysia Bhd. MYR 352,600 466,166 0.02
Tenaga Nasional Bhd. MYR 797,300 1,790,764 0.07
Top Glove Corp. Bhd. MYR 1,847,200 1,130,917 0.04
Westports Holdings Bhd. MYR 368,600 359,637 0.01
37,575,113 1.37
Mexico
Alfa SAB de CV 'A' MXN 500,000 375,008 0.01
America Movil SAB de CV MXN 11,885,330 12,656,629 0.46
Arca Continental SAB de CV MXN 157,230 1,008,884 0.04
Becle SAB de CV MXN 194,700 493,848 0.02
Cemex SAB de CV MXN 5,269,077 3,607,912 0.13
Coca-Cola Femsa SAB de CV MXN 188,350 1,029,768 0.04
Fibra Uno Administracion SA de CV, REIT MXN 1,139,520 1,207,876 0.04
Fomento Economico Mexicano SAB de CV MXN 677,060 5,260,177 0.19
Gruma SAB de CV 'B' MXN 74,100 952,724 0.04
Grupo Aeroportuario del Pacifico SAB de CV 'B' MXN 127,430 1,768,285 0.06
Grupo Aeroportuario del Sureste SAB de CV 'B' MXN 71,950 1,484,601 0.05
Grupo Bimbo SAB de CV MXN 545,150 1,689,136 0.06
Grupo Carso SAB de CV 'A1' MXN 163,700 511,198 0.02
Grupo Financiero Banorte SAB de CV 'O' MXN 903,270 5,941,801 0.22
Grupo Financiero Inbursa SAB de CV 'O' MXN 803,680 974,772 0.04
Grupo Mexico SAB de CV 'B' MXN 1,083,972 4,747,090 0.17
Grupo Televisa SAB MXN 832,320 1,574,524 0.06
Industrias Penoles SAB de CV MXN 50,510 586,509 0.02
Kimberly-Clark de Mexico SAB de CV 'A' MXN 543,810 832,282 0.03
Megacable Holdings SAB de CV MXN 104,800 352,216 0.01
Orbia Advance Corp. SAB de CV MXN 376,524 971,301 0.04
Promotora y Operadora de Infraestructura SAB de CV MXN 82,600 633,298 0.02
Telesites SAB de CV MXN 411,100 418,911 0.02
Wal-Mart de Mexico SAB de CV MXN 1,823,400 6,832,078 0.25
55,910,828 2.04
Netherlands
X5 Retail Group NV, Reg. S, GDR USD 42,320 1,119,364 0.04
Yandex NV 'A' RUB 106,170 6,474,954 0.24
7,594,318 0.28
Investments Currency Quantity/
Nominal Value
Market Value
USD
% of Net
Assets0
Peru
Cia de Minas Buenaventura SAA, ADR USD 74,690 551,586 0.02
551,586 0.02
Philippines
Aboitiz Equity Ventures, Inc. PHP 715,510 761,941 0.03
AC Energy Corp. PHP 2,691,100 577,883 0.02
Ayala Corp. PHP 100,032 1,620,881 0.06
Ayala Land, Inc. PHP 2,816,560 1,967,905 0.07
Bank of the Philippine Islands PHP 651,723 1,172,597 0.04
BDO Unibank, Inc. PHP 704,884 1,662,198 0.06
Globe Telecom, Inc. PHP 8,700 568,986 0.02
GT Capital Holdings, Inc. PHP 34,149 360,995 0.01
International Container Terminal Services, Inc. PHP 368,280 1,429,882 0.05
JG Summit Holdings, Inc. PHP 1,079,221 1,124,985 0.04
Jollibee Foods Corp. PHP 158,350 671,730 0.02
Manila Electric Co. PHP 80,530 466,903 0.02
Metro Pacific Investments Corp. PHP 4,346,700 331,645 0.01
Metropolitan Bank & Trust Co. PHP 655,295 703,793 0.03
PLDT, Inc. PHP 24,185 854,612 0.03
SM Investments Corp. PHP 86,435 1,592,794 0.06
SM Prime Holdings, Inc. PHP 3,518,375 2,326,039 0.09
Universal Robina Corp. PHP 315,130 795,286 0.03
18,991,055 0.69
Poland
Bank Polska Kasa Opieki SA PLN 65,481 1,976,236 0.07
CD Projekt SA PLN 25,430 1,210,428 0.04
Cyfrowy Polsat SA PLN 89,050 764,916 0.03
Dino Polska SA, Reg. S PLN 17,410 1,577,071 0.06
KGHM Polska Miedz SA PLN 50,223 1,731,260 0.06
LPP SA PLN 402 1,709,136 0.06
Orange Polska SA PLN 215,135 450,814 0.02
PGE Polska Grupa Energetyczna SA PLN 298,875 595,503 0.02
Polski Koncern Naftowy ORLEN SA PLN 106,959 1,964,742 0.07
Polskie Gornictwo Naftowe i Gazownictwo SA PLN 615,771 959,782 0.04
Powszechna Kasa Oszczednosci Bank Polski SA PLN 304,579 3,385,006 0.12
Powszechny Zaklad Ubezpieczen SA PLN 215,440 1,882,809 0.07
Santander Bank Polska SA PLN 12,850 1,105,369 0.04
19,313,072 0.70
Qatar
Barwa Real Estate Co. QAR 685,840 585,818 0.02
Commercial Bank PSQC (The) QAR 709,270 1,305,069 0.05
Industries Qatar QSC QAR 526,480 2,235,479 0.08
Masraf Al Rayan QSC QAR 1,316,630 1,715,850 0.06
Mesaieed Petrochemical Holding Co. QAR 1,567,140 921,948 0.03
Ooredoo QPSC QAR 247,680 473,116 0.02
Qatar Electricity & Water Co. QSC QAR 157,640 716,545 0.03
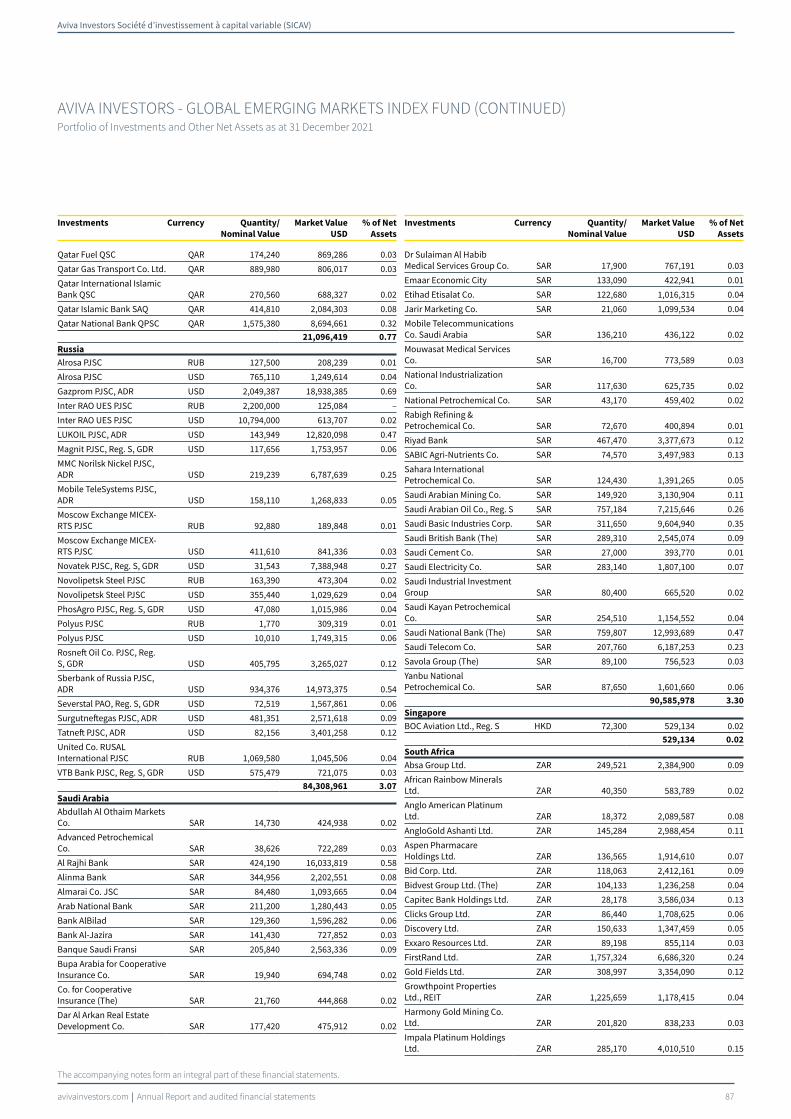
Aviva Investors Société d’investissement à capital variable (SICAV)
avivainvestors.com Annual Report and audited financial statements 87
AVIVA INVESTORS - GLOBAL EMERGING MARKETS INDEX FUND (CONTINUED)Portfolio of Investments and Other Net Assets as at 31 December 2021
The accompanying notes form an integral part of these financial statements.
Investments Currency Quantity/
Nominal Value
Market Value
USD
% of Net
Assets0
Qatar Fuel QSC QAR 174,240 869,286 0.03
Qatar Gas Transport Co. Ltd. QAR 889,980 806,017 0.03
Qatar International Islamic Bank QSC QAR 270,560 688,327 0.02
Qatar Islamic Bank SAQ QAR 414,810 2,084,303 0.08
Qatar National Bank QPSC QAR 1,575,380 8,694,661 0.32
21,096,419 0.77
Russia
Alrosa PJSC RUB 127,500 208,239 0.01
Alrosa PJSC USD 765,110 1,249,614 0.04
Gazprom PJSC, ADR USD 2,049,387 18,938,385 0.69
Inter RAO UES PJSC RUB 2,200,000 125,084 –
Inter RAO UES PJSC USD 10,794,000 613,707 0.02
LUKOIL PJSC, ADR USD 143,949 12,820,098 0.47
Magnit PJSC, Reg. S, GDR USD 117,656 1,753,957 0.06
MMC Norilsk Nickel PJSC, ADR USD 219,239 6,787,639 0.25
Mobile TeleSystems PJSC, ADR USD 158,110 1,268,833 0.05
Moscow Exchange MICEX-RTS PJSC RUB 92,880 189,848 0.01
Moscow Exchange MICEX-RTS PJSC USD 411,610 841,336 0.03
Novatek PJSC, Reg. S, GDR USD 31,543 7,388,948 0.27
Novolipetsk Steel PJSC RUB 163,390 473,304 0.02
Novolipetsk Steel PJSC USD 355,440 1,029,629 0.04
PhosAgro PJSC, Reg. S, GDR USD 47,080 1,015,986 0.04
Polyus PJSC RUB 1,770 309,319 0.01
Polyus PJSC USD 10,010 1,749,315 0.06
Rosneft Oil Co. PJSC, Reg. S, GDR USD 405,795 3,265,027 0.12
Sberbank of Russia PJSC, ADR USD 934,376 14,973,375 0.54
Severstal PAO, Reg. S, GDR USD 72,519 1,567,861 0.06
Surgutneftegas PJSC, ADR USD 481,351 2,571,618 0.09
Tatneft PJSC, ADR USD 82,156 3,401,258 0.12
United Co. RUSAL International PJSC RUB 1,069,580 1,045,506 0.04
VTB Bank PJSC, Reg. S, GDR USD 575,479 721,075 0.03
84,308,961 3.07
Saudi Arabia
Abdullah Al Othaim Markets Co. SAR 14,730 424,938 0.02
Advanced Petrochemical Co. SAR 38,626 722,289 0.03
Al Rajhi Bank SAR 424,190 16,033,819 0.58
Alinma Bank SAR 344,956 2,202,551 0.08
Almarai Co. JSC SAR 84,480 1,093,665 0.04
Arab National Bank SAR 211,200 1,280,443 0.05
Bank AlBilad SAR 129,360 1,596,282 0.06
Bank Al-Jazira SAR 141,430 727,852 0.03
Banque Saudi Fransi SAR 205,840 2,563,336 0.09
Bupa Arabia for Cooperative Insurance Co. SAR 19,940 694,748 0.02
Co. for Cooperative Insurance (The) SAR 21,760 444,868 0.02
Dar Al Arkan Real Estate Development Co. SAR 177,420 475,912 0.02
Investments Currency Quantity/
Nominal Value
Market Value
USD
% of Net
Assets0
Dr Sulaiman Al Habib Medical Services Group Co. SAR 17,900 767,191 0.03
Emaar Economic City SAR 133,090 422,941 0.01
Etihad Etisalat Co. SAR 122,680 1,016,315 0.04
Jarir Marketing Co. SAR 21,060 1,099,534 0.04
Mobile Telecommunications Co. Saudi Arabia SAR 136,210 436,122 0.02
Mouwasat Medical Services Co. SAR 16,700 773,589 0.03
National Industrialization Co. SAR 117,630 625,735 0.02
National Petrochemical Co. SAR 43,170 459,402 0.02
Rabigh Refining & Petrochemical Co. SAR 72,670 400,894 0.01
Riyad Bank SAR 467,470 3,377,673 0.12
SABIC Agri-Nutrients Co. SAR 74,570 3,497,983 0.13
Sahara International Petrochemical Co. SAR 124,430 1,391,265 0.05
Saudi Arabian Mining Co. SAR 149,920 3,130,904 0.11
Saudi Arabian Oil Co., Reg. S SAR 757,184 7,215,646 0.26
Saudi Basic Industries Corp. SAR 311,650 9,604,940 0.35
Saudi British Bank (The) SAR 289,310 2,545,074 0.09
Saudi Cement Co. SAR 27,000 393,770 0.01
Saudi Electricity Co. SAR 283,140 1,807,100 0.07
Saudi Industrial Investment Group SAR 80,400 665,520 0.02
Saudi Kayan Petrochemical Co. SAR 254,510 1,154,552 0.04
Saudi National Bank (The) SAR 759,807 12,993,689 0.47
Saudi Telecom Co. SAR 207,760 6,187,253 0.23
Savola Group (The) SAR 89,100 756,523 0.03
Yanbu National Petrochemical Co. SAR 87,650 1,601,660 0.06
90,585,978 3.30
Singapore
BOC Aviation Ltd., Reg. S HKD 72,300 529,134 0.02
529,134 0.02
South Africa
Absa Group Ltd. ZAR 249,521 2,384,900 0.09
African Rainbow Minerals Ltd. ZAR 40,350 583,789 0.02
Anglo American Platinum Ltd. ZAR 18,372 2,089,587 0.08
AngloGold Ashanti Ltd. ZAR 145,284 2,988,454 0.11
Aspen Pharmacare Holdings Ltd. ZAR 136,565 1,914,610 0.07
Bid Corp. Ltd. ZAR 118,063 2,412,161 0.09
Bidvest Group Ltd. (The) ZAR 104,133 1,236,258 0.04
Capitec Bank Holdings Ltd. ZAR 28,178 3,586,034 0.13
Clicks Group Ltd. ZAR 86,440 1,708,625 0.06
Discovery Ltd. ZAR 150,633 1,347,459 0.05
Exxaro Resources Ltd. ZAR 89,198 855,114 0.03
FirstRand Ltd. ZAR 1,757,324 6,686,320 0.24
Gold Fields Ltd. ZAR 308,997 3,354,090 0.12
Growthpoint Properties Ltd., REIT ZAR 1,225,659 1,178,415 0.04
Harmony Gold Mining Co. Ltd. ZAR 201,820 838,233 0.03
Impala Platinum Holdings Ltd. ZAR 285,170 4,010,510 0.15

Aviva Investors Société d’investissement à capital variable (SICAV)
avivainvestors.com Annual Report and audited financial statements 88
AVIVA INVESTORS - GLOBAL EMERGING MARKETS INDEX FUND (CONTINUED)Portfolio of Investments and Other Net Assets as at 31 December 2021
The accompanying notes form an integral part of these financial statements.
Investments Currency Quantity/
Nominal Value
Market Value
USD
% of Net
Assets0
Kumba Iron Ore Ltd. ZAR 23,470 675,682 0.02
Mr Price Group Ltd. ZAR 91,700 1,144,887 0.04
MTN Group Ltd. ZAR 587,225 6,274,059 0.23
MultiChoice Group ZAR 132,397 1,011,017 0.04
Naspers Ltd. 'N' ZAR 75,401 11,682,177 0.43
Nedbank Group Ltd. ZAR 158,593 1,736,822 0.06
Northam Platinum Holdings Ltd. ZAR 123,570 1,620,189 0.06
Old Mutual Ltd. ZAR 1,595,820 1,305,135 0.05
Rand Merchant Investment Holdings Ltd. ZAR 259,580 729,394 0.03
Remgro Ltd. ZAR 182,144 1,495,243 0.05
Sanlam Ltd. ZAR 658,905 2,445,382 0.09
Sasol Ltd. ZAR 196,745 3,188,535 0.12
Shoprite Holdings Ltd. ZAR 177,047 2,311,715 0.08
Sibanye Stillwater Ltd. ZAR 961,680 2,955,266 0.11
SPAR Group Ltd. (The) ZAR 68,417 713,688 0.03
Standard Bank Group Ltd. ZAR 451,104 3,952,559 0.14
Tiger Brands Ltd. ZAR 58,250 658,497 0.02
Vodacom Group Ltd. ZAR 222,968 1,878,297 0.07
Woolworths Holdings Ltd. ZAR 357,817 1,161,041 0.04
84,114,144 3.06
South Korea
Alteogen, Inc. KRW 8,905 565,161 0.02
Amorepacific Corp. KRW 11,070 1,554,885 0.06
AMOREPACIFIC Group KRW 10,010 373,079 0.01
BGF retail Co. Ltd. KRW 2,734 333,796 0.01
Celltrion Healthcare Co. Ltd. KRW 29,661 2,000,741 0.07
Celltrion Pharm, Inc. KRW 5,375 561,357 0.02
Celltrion, Inc. KRW 34,280 5,713,216 0.21
Cheil Worldwide, Inc. KRW 24,150 464,227 0.02
CJ CheilJedang Corp. KRW 2,911 947,787 0.03
CJ Corp. KRW 5,062 354,514 0.01
CJ ENM Co. Ltd. KRW 3,728 434,430 0.02
CJ Logistics Corp. KRW 3,163 334,200 0.01
Coway Co. Ltd. KRW 19,068 1,193,702 0.04
DB Insurance Co. Ltd. KRW 15,970 724,275 0.03
Doosan Bobcat, Inc. KRW 17,460 598,371 0.02
Doosan Heavy Industries & Construction Co. Ltd. KRW 108,530 1,859,098 0.07
Douzone Bizon Co. Ltd. KRW 6,050 371,406 0.01
Ecopro BM Co. Ltd. KRW 3,850 1,619,953 0.06
E-MART, Inc. KRW 6,653 843,073 0.03
F&F Co. Ltd. KRW 1,210 960,731 0.04
Green Cross Corp. KRW 1,810 332,117 0.01
GS Engineering & Construction Corp. KRW 22,554 751,607 0.03
GS Holdings Corp. KRW 16,507 542,624 0.02
Hana Financial Group, Inc. KRW 105,595 3,733,640 0.14
Hankook Tire & Technology Co. Ltd. KRW 25,343 846,125 0.03
Hanmi Pharm Co. Ltd. KRW 2,403 556,439 0.02
Hanon Systems KRW 64,460 730,148 0.03
Hanwha Solutions Corp. KRW 44,421 1,326,762 0.05
HLB, Inc. KRW 31,712 926,456 0.03
HMM Co. Ltd. KRW 91,110 2,057,749 0.08
Hotel Shilla Co. Ltd. KRW 10,900 713,311 0.03
Investments Currency Quantity/
Nominal Value
Market Value
USD
% of Net
Assets0
HYBE Co. Ltd. KRW 4,790 1,405,854 0.05
Hyundai Engineering & Construction Co. Ltd. KRW 27,416 1,023,680 0.04
Hyundai Glovis Co. Ltd. KRW 6,507 920,028 0.03
Hyundai Heavy Industries Holdings Co. Ltd. KRW 16,665 751,684 0.03
Hyundai Mobis Co. Ltd. KRW 23,099 4,945,762 0.18
Hyundai Motor Co. Preference KRW 7,997 661,983 0.02
Hyundai Motor Co. Preference KRW 12,441 1,053,171 0.04
Hyundai Motor Co. KRW 48,340 8,501,844 0.31
Hyundai Steel Co. KRW 30,988 1,067,624 0.04
Iljin Materials Co. Ltd. KRW 8,120 919,370 0.03
Industrial Bank of Korea KRW 91,617 794,778 0.03
Kakao Corp. KRW 109,580 10,365,601 0.38
KakaoBank Corp. KRW 18,040 895,721 0.03
Kangwon Land, Inc. KRW 32,820 661,872 0.02
KB Financial Group, Inc. KRW 137,497 6,361,867 0.23
Kia Corp. KRW 90,685 6,261,323 0.23
Korea Aerospace Industries Ltd. KRW 24,860 677,652 0.02
Korea Electric Power Corp. KRW 90,310 1,679,396 0.06
Korea Investment Holdings Co. Ltd. KRW 14,252 966,734 0.04
Korea Shipbuilding & Offshore Engineering Co. Ltd. KRW 13,694 1,089,461 0.04
Korea Zinc Co. Ltd. KRW 3,032 1,303,843 0.05
Korean Air Lines Co. Ltd. KRW 61,162 1,507,099 0.06
Krafton, Inc. KRW 7,750 2,999,363 0.11
KT&G Corp. KRW 39,549 2,628,168 0.10
Kumho Petrochemical Co. Ltd. KRW 6,492 905,641 0.03
L&F Co. Ltd. KRW 7,910 1,472,391 0.05
LG Chem Ltd. Preference KRW 2,729 658,014 0.02
LG Chem Ltd. KRW 16,391 8,483,029 0.31
LG Corp. KRW 30,424 2,068,848 0.08
LG Display Co. Ltd. KRW 81,800 1,692,897 0.06
LG Electronics, Inc. KRW 36,636 4,256,243 0.16
LG Household & Health Care Ltd. Preference KRW 730 376,393 0.01
LG Household & Health Care Ltd. KRW 3,192 2,942,988 0.11
LG Innotek Co. Ltd. KRW 4,924 1,506,723 0.06
LG Uplus Corp. KRW 67,840 776,778 0.03
Lotte Chemical Corp. KRW 6,127 1,118,764 0.04
Lotte Shopping Co. Ltd. KRW 3,978 291,790 0.01
Meritz Securities Co. Ltd. KRW 106,450 461,151 0.02
Mirae Asset Securities Co. Ltd. KRW 99,086 720,485 0.03
NAVER Corp. KRW 43,370 13,786,007 0.50
NCSoft Corp. KRW 5,849 3,161,622 0.12
Netmarble Corp., Reg. S KRW 7,460 782,320 0.03
NH Investment & Securities Co. Ltd. KRW 50,644 530,970 0.02
Orion Corp. KRW 8,347 724,405 0.03
Pan Ocean Co. Ltd. KRW 93,320 424,350 0.02
Pearl Abyss Corp. KRW 10,590 1,230,569 0.04

Aviva Investors Société d’investissement à capital variable (SICAV)
avivainvestors.com Annual Report and audited financial statements 89
AVIVA INVESTORS - GLOBAL EMERGING MARKETS INDEX FUND (CONTINUED)Portfolio of Investments and Other Net Assets as at 31 December 2021
The accompanying notes form an integral part of these financial statements.
Investments Currency Quantity/
Nominal Value
Market Value
USD
% of Net
Assets0
POSCO KRW 26,477 6,113,815 0.22
POSCO Chemical Co. Ltd. KRW 11,074 1,335,311 0.05
S-1 Corp. KRW 5,935 368,548 0.01
Samsung Biologics Co. Ltd., Reg. S KRW 5,880 4,465,646 0.16
Samsung C&T Corp. KRW 29,582 2,965,303 0.11
Samsung Electro-Mechanics Co. Ltd. KRW 20,011 3,316,270 0.12
Samsung Electronics Co. Ltd. Preference KRW 284,940 17,063,751 0.62
Samsung Electronics Co. Ltd. KRW 1,653,750 108,803,064 3.96
Samsung Engineering Co. Ltd. KRW 54,410 1,044,524 0.04
Samsung Fire & Marine Insurance Co. Ltd. KRW 10,827 1,843,222 0.07
Samsung Heavy Industries Co. Ltd. KRW 218,237 1,039,569 0.04
Samsung Life Insurance Co. Ltd. KRW 24,868 1,340,398 0.05
Samsung SDI Co. Ltd. KRW 19,657 10,824,849 0.39
Samsung SDS Co. Ltd. KRW 11,217 1,476,973 0.05
Samsung Securities Co. Ltd. KRW 21,320 804,329 0.03
SD Biosensor, Inc. KRW 12,720 598,551 0.02
Seegene, Inc. KRW 11,940 612,442 0.02
Shin Poong Pharmaceutical Co. Ltd. KRW 10,130 271,508 0.01
Shinhan Financial Group Co. Ltd. KRW 152,849 4,730,625 0.17
SK Biopharmaceuticals Co. Ltd. KRW 9,740 795,472 0.03
SK Bioscience Co. Ltd. KRW 5,890 1,114,957 0.04
SK Chemicals Co. Ltd. KRW 4,025 504,555 0.02
SK Hynix, Inc. KRW 189,067 20,731,855 0.76
SK IE Technology Co. Ltd., Reg. S KRW 6,270 883,372 0.03
SK Innovation Co. Ltd. KRW 18,063 3,622,984 0.13
SK Square Co. Ltd. KRW 5,908 330,224 0.01
SK Telecom Co. Ltd. KRW 10,927 531,428 0.02
SK, Inc. KRW 14,780 3,115,054 0.11
SKC Co. Ltd. KRW 7,330 1,070,624 0.04
S-Oil Corp. KRW 15,996 1,150,040 0.04
Woori Financial Group, Inc. KRW 177,815 1,902,109 0.07
Yuhan Corp. KRW 18,268 953,121 0.03
347,865,729 12.68
Taiwan
Accton Technology Corp. TWD 175,000 1,641,479 0.06
Acer, Inc. TWD 1,031,000 1,129,767 0.04
Advantech Co. Ltd. TWD 134,845 1,929,259 0.07
ASE Technology Holding Co. Ltd. TWD 1,143,878 4,391,368 0.16
Asia Cement Corp. TWD 758,064 1,211,175 0.04
ASMedia Technology, Inc. TWD 10,000 653,841 0.02
Asustek Computer, Inc. TWD 243,281 3,298,253 0.12
AU Optronics Corp. TWD 2,848,000 2,350,289 0.09
Catcher Technology Co. Ltd. TWD 239,000 1,351,127 0.05
Cathay Financial Holding Co. Ltd. TWD 2,750,901 6,195,646 0.23
Investments Currency Quantity/
Nominal Value
Market Value
USD
% of Net
Assets0
Chang Hwa Commercial Bank Ltd. TWD 1,499,186 917,382 0.03
Cheng Shin Rubber Industry Co. Ltd. TWD 614,607 800,061 0.03
China Development Financial Holding Corp. TWD 480,742 166,237 0.01
China Development Financial Holding Corp. TWD 5,164,507 3,251,013 0.12
China Steel Corp. TWD 4,107,712 5,226,363 0.19
Chunghwa Telecom Co. Ltd. TWD 1,316,602 5,520,283 0.20
Compal Electronics, Inc. TWD 1,415,000 1,235,777 0.05
CTBC Financial Holding Co. Ltd. TWD 6,447,491 6,035,181 0.22
Delta Electronics, Inc. TWD 678,246 6,748,838 0.25
E.Sun Financial Holding Co. Ltd. TWD 4,183,885 4,234,945 0.15
Eclat Textile Co. Ltd. TWD 64,624 1,470,302 0.05
eMemory Technology, Inc. TWD 22,000 1,730,838 0.06
Evergreen Marine Corp. Taiwan Ltd. TWD 874,612 4,470,593 0.16
Far Eastern New Century Corp. TWD 1,045,606 1,101,245 0.04
Far EasTone Telecommunications Co. Ltd. TWD 501,000 1,167,179 0.04
Feng TAY Enterprise Co. Ltd. TWD 149,568 1,246,967 0.05
First Financial Holding Co. Ltd. TWD 3,609,934 3,190,651 0.12
Formosa Chemicals & Fibre Corp. TWD 1,223,880 3,567,479 0.13
Formosa Petrochemical Corp. TWD 398,000 1,374,649 0.05
Formosa Plastics Corp. TWD 1,329,400 4,992,183 0.18
Foxconn Technology Co. Ltd. TWD 307,163 717,435 0.03
Fubon Financial Holding Co. Ltd. TWD 2,621,600 7,212,265 0.26
Giant Manufacturing Co. Ltd. TWD 102,000 1,274,040 0.05
Globalwafers Co. Ltd. TWD 76,000 2,429,089 0.09
Hiwin Technologies Corp. TWD 96,745 1,066,850 0.04
Hon Hai Precision Industry Co. Ltd. TWD 4,320,414 16,221,826 0.59
Hotai Motor Co. Ltd. TWD 104,000 2,296,532 0.08
Hua Nan Financial Holdings Co. Ltd. TWD 2,969,944 2,272,011 0.08
Innolux Corp. TWD 3,285,492 2,314,135 0.08
Inventec Corp. TWD 897,615 807,583 0.03
Largan Precision Co. Ltd. TWD 35,000 3,103,916 0.11
Lite-On Technology Corp. TWD 744,925 1,711,272 0.06
MediaTek, Inc. TWD 522,932 22,341,498 0.81
Mega Financial Holding Co. Ltd. TWD 3,787,072 4,862,730 0.18
Micro-Star International Co. Ltd. TWD 230,000 1,326,418 0.05
momo.com, Inc. TWD 16,000 938,709 0.03
Nan Ya Plastics Corp. TWD 1,794,494 5,523,149 0.20
Nan Ya Printed Circuit Board Corp. TWD 79,000 1,622,579 0.06
Nanya Technology Corp. TWD 436,000 1,228,602 0.05
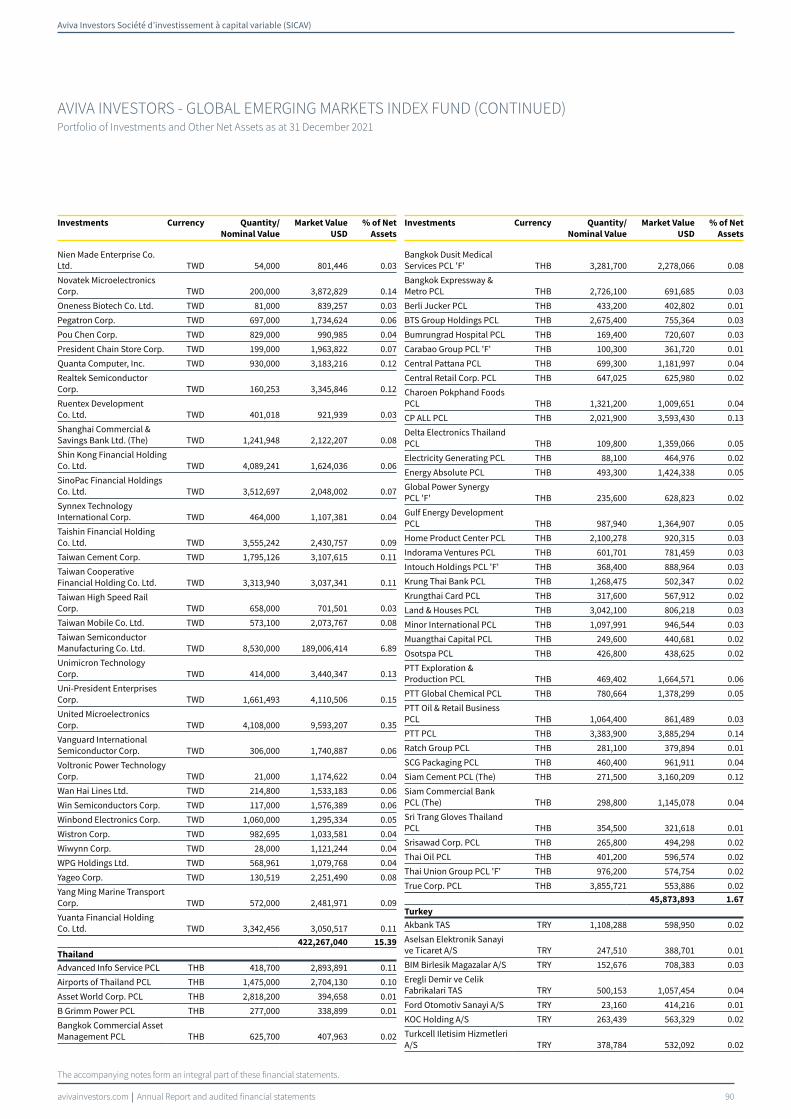
Aviva Investors Société d’investissement à capital variable (SICAV)
avivainvestors.com Annual Report and audited financial statements 90
AVIVA INVESTORS - GLOBAL EMERGING MARKETS INDEX FUND (CONTINUED)Portfolio of Investments and Other Net Assets as at 31 December 2021
The accompanying notes form an integral part of these financial statements.
Investments Currency Quantity/
Nominal Value
Market Value
USD
% of Net
Assets0
Nien Made Enterprise Co. Ltd. TWD 54,000 801,446 0.03
Novatek Microelectronics Corp. TWD 200,000 3,872,829 0.14
Oneness Biotech Co. Ltd. TWD 81,000 839,257 0.03
Pegatron Corp. TWD 697,000 1,734,624 0.06
Pou Chen Corp. TWD 829,000 990,985 0.04
President Chain Store Corp. TWD 199,000 1,963,822 0.07
Quanta Computer, Inc. TWD 930,000 3,183,216 0.12
Realtek Semiconductor Corp. TWD 160,253 3,345,846 0.12
Ruentex Development Co. Ltd. TWD 401,018 921,939 0.03
Shanghai Commercial & Savings Bank Ltd. (The) TWD 1,241,948 2,122,207 0.08
Shin Kong Financial Holding Co. Ltd. TWD 4,089,241 1,624,036 0.06
SinoPac Financial Holdings Co. Ltd. TWD 3,512,697 2,048,002 0.07
Synnex Technology International Corp. TWD 464,000 1,107,381 0.04
Taishin Financial Holding Co. Ltd. TWD 3,555,242 2,430,757 0.09
Taiwan Cement Corp. TWD 1,795,126 3,107,615 0.11
Taiwan Cooperative Financial Holding Co. Ltd. TWD 3,313,940 3,037,341 0.11
Taiwan High Speed Rail Corp. TWD 658,000 701,501 0.03
Taiwan Mobile Co. Ltd. TWD 573,100 2,073,767 0.08
Taiwan Semiconductor Manufacturing Co. Ltd. TWD 8,530,000 189,006,414 6.89
Unimicron Technology Corp. TWD 414,000 3,440,347 0.13
Uni-President Enterprises Corp. TWD 1,661,493 4,110,506 0.15
United Microelectronics Corp. TWD 4,108,000 9,593,207 0.35
Vanguard International Semiconductor Corp. TWD 306,000 1,740,887 0.06
Voltronic Power Technology Corp. TWD 21,000 1,174,622 0.04
Wan Hai Lines Ltd. TWD 214,800 1,533,183 0.06
Win Semiconductors Corp. TWD 117,000 1,576,389 0.06
Winbond Electronics Corp. TWD 1,060,000 1,295,334 0.05
Wistron Corp. TWD 982,695 1,033,581 0.04
Wiwynn Corp. TWD 28,000 1,121,244 0.04
WPG Holdings Ltd. TWD 568,961 1,079,768 0.04
Yageo Corp. TWD 130,519 2,251,490 0.08
Yang Ming Marine Transport Corp. TWD 572,000 2,481,971 0.09
Yuanta Financial Holding Co. Ltd. TWD 3,342,456 3,050,517 0.11
422,267,040 15.39
Thailand
Advanced Info Service PCL THB 418,700 2,893,891 0.11
Airports of Thailand PCL THB 1,475,000 2,704,130 0.10
Asset World Corp. PCL THB 2,818,200 394,658 0.01
B Grimm Power PCL THB 277,000 338,899 0.01
Bangkok Commercial Asset Management PCL THB 625,700 407,963 0.02
Investments Currency Quantity/
Nominal Value
Market Value
USD
% of Net
Assets0
Bangkok Dusit Medical Services PCL 'F' THB 3,281,700 2,278,066 0.08
Bangkok Expressway & Metro PCL THB 2,726,100 691,685 0.03
Berli Jucker PCL THB 433,200 402,802 0.01
BTS Group Holdings PCL THB 2,675,400 755,364 0.03
Bumrungrad Hospital PCL THB 169,400 720,607 0.03
Carabao Group PCL 'F' THB 100,300 361,720 0.01
Central Pattana PCL THB 699,300 1,181,997 0.04
Central Retail Corp. PCL THB 647,025 625,980 0.02
Charoen Pokphand Foods PCL THB 1,321,200 1,009,651 0.04
CP ALL PCL THB 2,021,900 3,593,430 0.13
Delta Electronics Thailand PCL THB 109,800 1,359,066 0.05
Electricity Generating PCL THB 88,100 464,976 0.02
Energy Absolute PCL THB 493,300 1,424,338 0.05
Global Power Synergy PCL 'F' THB 235,600 628,823 0.02
Gulf Energy Development PCL THB 987,940 1,364,907 0.05
Home Product Center PCL THB 2,100,278 920,315 0.03
Indorama Ventures PCL THB 601,701 781,459 0.03
Intouch Holdings PCL 'F' THB 368,400 888,964 0.03
Krung Thai Bank PCL THB 1,268,475 502,347 0.02
Krungthai Card PCL THB 317,600 567,912 0.02
Land & Houses PCL THB 3,042,100 806,218 0.03
Minor International PCL THB 1,097,991 946,544 0.03
Muangthai Capital PCL THB 249,600 440,681 0.02
Osotspa PCL THB 426,800 438,625 0.02
PTT Exploration & Production PCL THB 469,402 1,664,571 0.06
PTT Global Chemical PCL THB 780,664 1,378,299 0.05
PTT Oil & Retail Business PCL THB 1,064,400 861,489 0.03
PTT PCL THB 3,383,900 3,885,294 0.14
Ratch Group PCL THB 281,100 379,894 0.01
SCG Packaging PCL THB 460,400 961,911 0.04
Siam Cement PCL (The) THB 271,500 3,160,209 0.12
Siam Commercial Bank PCL (The) THB 298,800 1,145,078 0.04
Sri Trang Gloves Thailand PCL THB 354,500 321,618 0.01
Srisawad Corp. PCL THB 265,800 494,298 0.02
Thai Oil PCL THB 401,200 596,574 0.02
Thai Union Group PCL 'F' THB 976,200 574,754 0.02
True Corp. PCL THB 3,855,721 553,886 0.02
45,873,893 1.67
Turkey
Akbank TAS TRY 1,108,288 598,950 0.02
Aselsan Elektronik Sanayi ve Ticaret A/S TRY 247,510 388,701 0.01
BIM Birlesik Magazalar A/S TRY 152,676 708,383 0.03
Eregli Demir ve Celik Fabrikalari TAS TRY 500,153 1,057,454 0.04
Ford Otomotiv Sanayi A/S TRY 23,160 414,216 0.01
KOC Holding A/S TRY 263,439 563,329 0.02
Turkcell Iletisim Hizmetleri A/S TRY 378,784 532,092 0.02
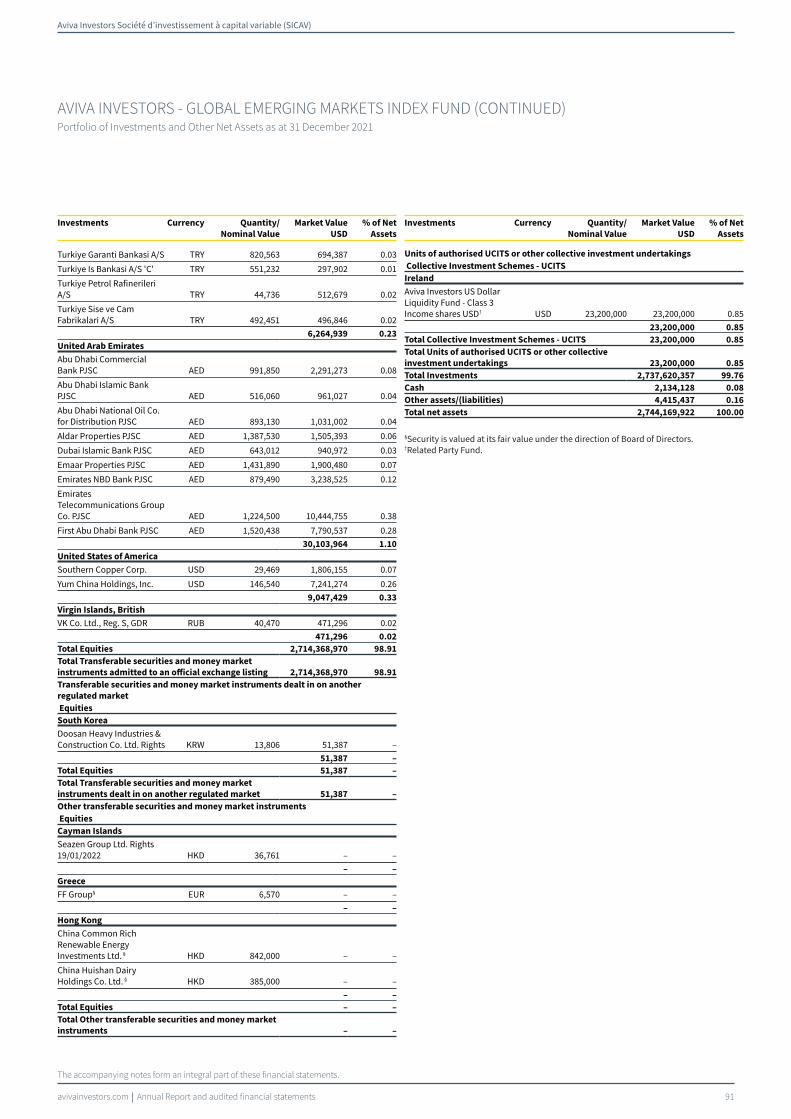
Aviva Investors Société d’investissement à capital variable (SICAV)
avivainvestors.com Annual Report and audited financial statements 91
AVIVA INVESTORS - GLOBAL EMERGING MARKETS INDEX FUND (CONTINUED)Portfolio of Investments and Other Net Assets as at 31 December 2021
The accompanying notes form an integral part of these financial statements.
Investments Currency Quantity/
Nominal Value
Market Value
USD
% of Net
Assets0
Turkiye Garanti Bankasi A/S TRY 820,563 694,387 0.03
Turkiye Is Bankasi A/S 'C' TRY 551,232 297,902 0.01
Turkiye Petrol Rafinerileri A/S TRY 44,736 512,679 0.02
Turkiye Sise ve Cam Fabrikalari A/S TRY 492,451 496,846 0.02
6,264,939 0.23
United Arab Emirates
Abu Dhabi Commercial Bank PJSC AED 991,850 2,291,273 0.08
Abu Dhabi Islamic Bank PJSC AED 516,060 961,027 0.04
Abu Dhabi National Oil Co. for Distribution PJSC AED 893,130 1,031,002 0.04
Aldar Properties PJSC AED 1,387,530 1,505,393 0.06
Dubai Islamic Bank PJSC AED 643,012 940,972 0.03
Emaar Properties PJSC AED 1,431,890 1,900,480 0.07
Emirates NBD Bank PJSC AED 879,490 3,238,525 0.12
Emirates Telecommunications Group Co. PJSC AED 1,224,500 10,444,755 0.38
First Abu Dhabi Bank PJSC AED 1,520,438 7,790,537 0.28
30,103,964 1.10
United States of America
Southern Copper Corp. USD 29,469 1,806,155 0.07
Yum China Holdings, Inc. USD 146,540 7,241,274 0.26
9,047,429 0.33
Virgin Islands, British
VK Co. Ltd., Reg. S, GDR RUB 40,470 471,296 0.02
471,296 0.02
Total Equities 2,714,368,970 98.91
Total Transferable securities and money market
instruments admitted to an official exchange listing 2,714,368,970 98.91
Transferable securities and money market instruments dealt in on another
regulated market
Equities
South Korea
Doosan Heavy Industries & Construction Co. Ltd. Rights KRW 13,806 51,387 –
51,387 –
Total Equities 51,387 –
Total Transferable securities and money market
instruments dealt in on another regulated market 51,387 –
Other transferable securities and money market instruments
Equities
Cayman Islands
Seazen Group Ltd. Rights 19/01/2022 HKD 36,761 – –
– –
Greece
FF Group§ EUR 6,570 – –
– –
Hong Kong
China Common Rich Renewable Energy Investments Ltd. § HKD 842,000 – –
China Huishan Dairy Holdings Co. Ltd. § HKD 385,000 – –
– –
Total Equities – –
Total Other transferable securities and money market
instruments – –
Investments Currency Quantity/
Nominal Value
Market Value
USD
% of Net
Assets0
Units of authorised UCITS or other collective investment undertakings
Collective Investment Schemes - UCITS
Ireland
Aviva Investors US Dollar Liquidity Fund - Class 3 Income shares USD† USD 23,200,000 23,200,000 0.85
23,200,000 0.85
Total Collective Investment Schemes - UCITS 23,200,000 0.85
Total Units of authorised UCITS or other collective
investment undertakings 23,200,000 0.85
Total Investments 2,737,620,357 99.76
Cash 2,134,128 0.08
Other assets/(liabilities) 4,415,437 0.16
Total net assets 2,744,169,922 100.00
§Security is valued at its fair value under the direction of Board of Directors.†Related Party Fund.

Aviva Investors Société d’investissement à capital variable (SICAV)
avivainvestors.com Annual Report and audited financial statements 92
AVIVA INVESTORS - GLOBAL EMERGING MARKETS INDEX FUND (CONTINUED)Portfolio of Investments and Other Net Assets as at 31 December 2021
The accompanying notes form an integral part of these financial statements.
Geographic Allocation of Portfolio % of Net Assets
Cayman Islands 19.32Taiwan 15.39South Korea 12.68India 12.09China 11.55Brazil 3.95Saudi Arabia 3.30Russia 3.07South Africa 3.06Mexico 2.04Thailand 1.67Indonesia 1.44Malaysia 1.37Hong Kong 1.15United Arab Emirates 1.10Ireland 0.85Qatar 0.77Poland 0.70Philippines 0.69Kuwait 0.60Bermuda 0.55Chile 0.36United States of America 0.33Netherlands 0.28Hungary 0.23Turkey 0.23Greece 0.21Colombia 0.16Cyprus 0.14Czech Republic 0.14Egypt 0.08Jersey 0.08Luxembourg 0.08Isle of Man 0.04Peru 0.02Singapore 0.02Virgin Islands, British 0.02Total investments 99.76
Cash and other assets/(liabilities) 0.24Total 100.00
Financial Futures Contracts
Security Description
Number of
Contracts Currency
Unrealised Gain/(Loss)
USD % of Net Assets
MSCI Emerging Markets Index, 18/03/2022 421 USD 511,180 0 .02
Total Unrealised Gain on Financial Futures Contracts - Assets 511,180 0.02
Net Unrealised Gain on Financial Futures Contracts - Assets 511,180 0.02
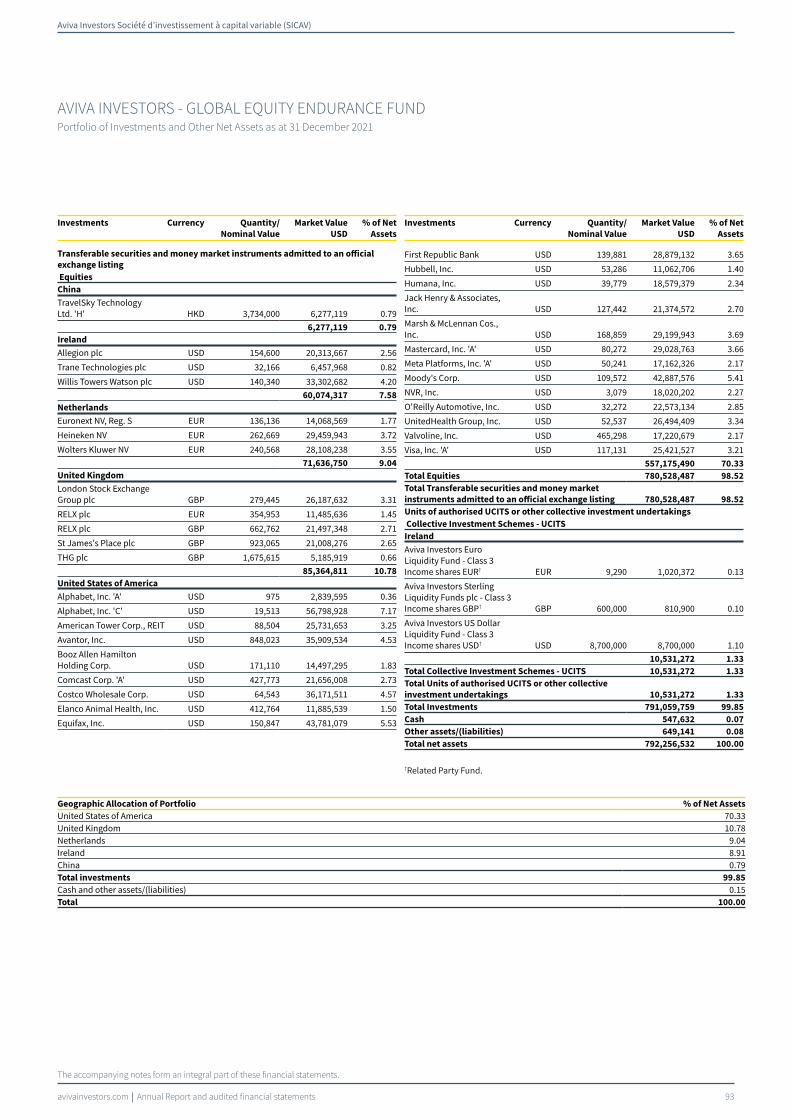
Aviva Investors Société d’investissement à capital variable (SICAV)
avivainvestors.com Annual Report and audited financial statements 93
The accompanying notes form an integral part of these financial statements.
AVIVA INVESTORS - GLOBAL EQUITY ENDURANCE FUNDPortfolio of Investments and Other Net Assets as at 31 December 2021
Investments Currency Quantity/
Nominal Value
Market Value
USD
% of Net
Assets0
Transferable securities and money market instruments admitted to an official
exchange listing
Equities
China
TravelSky Technology Ltd. 'H' HKD 3,734,000 6,277,119 0.79
6,277,119 0.79
Ireland
Allegion plc USD 154,600 20,313,667 2.56
Trane Technologies plc USD 32,166 6,457,968 0.82
Willis Towers Watson plc USD 140,340 33,302,682 4.20
60,074,317 7.58
Netherlands
Euronext NV, Reg. S EUR 136,136 14,068,569 1.77
Heineken NV EUR 262,669 29,459,943 3.72
Wolters Kluwer NV EUR 240,568 28,108,238 3.55
71,636,750 9.04
United Kingdom
London Stock Exchange Group plc GBP 279,445 26,187,632 3.31
RELX plc EUR 354,953 11,485,636 1.45
RELX plc GBP 662,762 21,497,348 2.71
St James's Place plc GBP 923,065 21,008,276 2.65
THG plc GBP 1,675,615 5,185,919 0.66
85,364,811 10.78
United States of America
Alphabet, Inc. 'A' USD 975 2,839,595 0.36
Alphabet, Inc. 'C' USD 19,513 56,798,928 7.17
American Tower Corp., REIT USD 88,504 25,731,653 3.25
Avantor, Inc. USD 848,023 35,909,534 4.53
Booz Allen Hamilton Holding Corp. USD 171,110 14,497,295 1.83
Comcast Corp. 'A' USD 427,773 21,656,008 2.73
Costco Wholesale Corp. USD 64,543 36,171,511 4.57
Elanco Animal Health, Inc. USD 412,764 11,885,539 1.50
Equifax, Inc. USD 150,847 43,781,079 5.53
Investments Currency Quantity/
Nominal Value
Market Value
USD
% of Net
Assets0
First Republic Bank USD 139,881 28,879,132 3.65
Hubbell, Inc. USD 53,286 11,062,706 1.40
Humana, Inc. USD 39,779 18,579,379 2.34
Jack Henry & Associates, Inc. USD 127,442 21,374,572 2.70
Marsh & McLennan Cos., Inc. USD 168,859 29,199,943 3.69
Mastercard, Inc. 'A' USD 80,272 29,028,763 3.66
Meta Platforms, Inc. 'A' USD 50,241 17,162,326 2.17
Moody's Corp. USD 109,572 42,887,576 5.41
NVR, Inc. USD 3,079 18,020,202 2.27
O'Reilly Automotive, Inc. USD 32,272 22,573,134 2.85
UnitedHealth Group, Inc. USD 52,537 26,494,409 3.34
Valvoline, Inc. USD 465,298 17,220,679 2.17
Visa, Inc. 'A' USD 117,131 25,421,527 3.21
557,175,490 70.33
Total Equities 780,528,487 98.52
Total Transferable securities and money market
instruments admitted to an official exchange listing 780,528,487 98.52
Units of authorised UCITS or other collective investment undertakings
Collective Investment Schemes - UCITS
Ireland
Aviva Investors Euro Liquidity Fund - Class 3 Income shares EUR† EUR 9,290 1,020,372 0.13
Aviva Investors Sterling Liquidity Funds plc - Class 3 Income shares GBP† GBP 600,000 810,900 0.10
Aviva Investors US Dollar Liquidity Fund - Class 3 Income shares USD† USD 8,700,000 8,700,000 1.10
10,531,272 1.33
Total Collective Investment Schemes - UCITS 10,531,272 1.33
Total Units of authorised UCITS or other collective
investment undertakings 10,531,272 1.33
Total Investments 791,059,759 99.85
Cash 547,632 0.07
Other assets/(liabilities) 649,141 0.08
Total net assets 792,256,532 100.00
†Related Party Fund.
Geographic Allocation of Portfolio % of Net Assets
United States of America 70.33United Kingdom 10.78Netherlands 9.04Ireland 8.91China 0.79Total investments 99.85
Cash and other assets/(liabilities) 0.15Total 100.00

Aviva Investors Société d’investissement à capital variable (SICAV)
avivainvestors.com Annual Report and audited financial statements 94
The accompanying notes form an integral part of these financial statements.
AVIVA INVESTORS - GLOBAL HIGH YIELD BOND FUNDPortfolio of Investments and Other Net Assets as at 31 December 2021
Investments Currency Quantity/
Nominal Value
Market Value
USD
% of Net
Assets0
Transferable securities and money market instruments admitted to an official
exchange listing
Bonds
France
Accor SA, Reg. S 2.375% 29/11/2028 EUR 6,200,000 7,059,530 0.19
Altice France SA, 144A 5.5% 15/01/2028 USD 8,030,000 7,972,064 0.21
Altice France SA, 144A 5.5% 15/10/2029 USD 375,000 370,014 0.01
Altice France SA, Reg. S 4.25% 15/10/2029 EUR 27,491,000 31,077,089 0.83
Chrome Bidco SASU, Reg. S 3.5% 31/05/2028 EUR 8,394,000 9,623,061 0.26
Constellium SE, Reg. S 3.125% 15/07/2029 EUR 7,994,000 9,028,787 0.24
Getlink SE, Reg. S 3.5% 30/10/2025 EUR 7,400,000 8,665,123 0.23
Iliad Holding SASU, Reg. S 5.125% 15/10/2026 EUR 15,589,000 18,512,780 0.50
Parts Europe SA, Reg. S 4.056% 20/07/2027 EUR 8,046,000 9,187,233 0.25
Renault SA, Reg. S 2.5% 02/06/2027 EUR 16,800,000 19,150,013 0.51
Renault SA, Reg. S 2.5% 01/04/2028 EUR 7,600,000 8,601,364 0.23
Rexel SA, Reg. S 2.125% 15/12/2028 EUR 4,625,000 5,290,001 0.14
Rubis Terminal Infra SAS, Reg. S 5.625% 15/05/2025 EUR 8,300,000 9,821,391 0.26
Valeo SA, Reg. S 1% 03/08/2028 EUR 11,800,000 13,058,792 0.35
Veolia Environnement SA, Reg. S 2% 31/12/2164 EUR 3,200,000 3,617,343 0.10
161,034,585 4.31
Germany
Deutsche Bank AG, Reg. S 4.5% 31/12/2164 EUR 28,000,000 32,060,414 0.86
Deutsche Pfandbriefbank AG, Reg. S, FRN 2.875% 28/06/2027 EUR 8,700,000 9,927,521 0.26
IHO Verwaltungs GmbH, 144A 6% 15/05/2027 USD 10,095,000 10,431,668 0.28
Mahle GmbH, Reg. S 2.375% 14/05/2028 EUR 10,000,000 11,052,968 0.30
Renk AG, Reg. S 5.75% 15/07/2025 EUR 8,519,000 10,052,750 0.27
Tele Columbus AG, Reg. S 3.875% 02/05/2025 EUR 11,005,000 12,351,211 0.33
TUI Cruises GmbH, Reg. S 6.5% 15/05/2026 EUR 11,424,000 12,934,858 0.35
ZF Finance GmbH, Reg. S 2.25% 03/05/2028 EUR 7,700,000 8,723,318 0.23
107,534,708 2.88
Guernsey
Summit Properties Ltd., Reg. S 2% 31/01/2025 EUR 9,000,000 10,027,161 0.27
10,027,161 0.27
Italy
Almaviva-The Italian Innovation Co. SpA, Reg. S 4.875% 30/10/2026 EUR 8,884,000 10,128,221 0.27
Investments Currency Quantity/
Nominal Value
Market Value
USD
% of Net
Assets0
Banca Monte dei Paschi di Siena SpA, Reg. S 5.375% 18/01/2028 EUR 5,000,000 4,499,558 0.12
Bormioli Pharma Spa, Reg. S, FRN 3.5% 15/11/2024 EUR 9,000,000 9,965,935 0.27
Fabric BC SpA, Reg. S, FRN 4.125% 30/11/2024 EUR 9,682,759 11,015,616 0.29
Gamma Bidco SpA, Reg. S 5.125% 15/07/2025 EUR 15,297,000 17,524,401 0.47
Guala Closures SpA, Reg. S 3.25% 15/06/2028 EUR 12,597,000 14,075,295 0.38
Infrastrutture Wireless Italiane SpA, Reg. S 1.75% 19/04/2031 EUR 1,000,000 1,127,283 0.03
Intesa Sanpaolo SpA, Reg. S 3.75% Perpetual EUR 19,628,000 22,056,247 0.59
Leather 2 SpA, Reg. S 4.5% 30/09/2028 EUR 2,243,000 2,555,546 0.07
Libra Groupco SpA, Reg. S 5% 15/05/2027 EUR 5,874,000 6,780,623 0.18
Nexi SpA, Reg. S 1.625% 30/04/2026 EUR 20,267,000 22,865,893 0.61
Paganini Bidco SpA, Reg. S 4.25% 30/10/2028 EUR 11,985,000 13,692,752 0.37
Rimini Bidco SpA, Reg. S 5.25% 14/12/2026 EUR 27,600,000 30,804,031 0.82
167,091,401 4.47
Jersey
Avis Budget Finance plc, Reg. S 4.75% 30/01/2026 EUR 7,000,000 8,119,325 0.22
8,119,325 0.22
Luxembourg
ADLER Group SA, Reg. S 1.875% 14/01/2026 EUR 16,400,000 15,673,728 0.42
ADLER Group SA, Reg. S 2.25% 27/04/2027 EUR 9,000,000 8,601,436 0.23
Altice Financing SA, 144A 5.75% 15/08/2029 USD 325,000 322,243 0.01
Altice Financing SA, Reg. S 4.25% 15/08/2029 EUR 16,484,000 18,341,031 0.49
B&M European Value Retail SA, Reg. S 3.625% 15/07/2025 GBP 8,600,000 11,879,534 0.32
B&M European Value Retail SA, Reg. S 4% 15/11/2028 GBP 9,822,000 13,360,451 0.36
Consolidated Energy Finance SA, Reg. S 5% 15/10/2028 EUR 10,000,000 10,883,332 0.29
Dana Financing Luxembourg Sarl, Reg. S 3% 15/07/2029 EUR 6,869,000 7,896,664 0.21
SES SA, Reg. S 2.875% Perpetual EUR 8,803,000 10,029,635 0.27
Signa Development Finance SCS, Reg. S 5.5% 23/07/2026 EUR 12,100,000 12,415,165 0.33
109,403,219 2.93
Netherlands
Dufry One BV, Reg. S 3.375% 15/04/2028 EUR 8,820,000 9,698,821 0.26
Energizer Gamma Acquisition BV, Reg. S 3.5% 30/06/2029 EUR 8,292,000 9,129,264 0.24

Aviva Investors Société d’investissement à capital variable (SICAV)
avivainvestors.com Annual Report and audited financial statements 95
AVIVA INVESTORS - GLOBAL HIGH YIELD BOND FUND (CONTINUED)Portfolio of Investments and Other Net Assets as at 31 December 2021
The accompanying notes form an integral part of these financial statements.
Investments Currency Quantity/
Nominal Value
Market Value
USD
% of Net
Assets0
Repsol International Finance BV, Reg. S 2.5% Perpetual EUR 8,700,000 9,859,138 0.26
Telefonica Europe BV, Reg. S 2.88% 31/12/2164 EUR 16,500,000 18,646,462 0.50
Trivium Packaging Finance BV, 144A 5.5% 15/08/2026 USD 5,300,000 5,517,777 0.15
Trivium Packaging Finance BV, 144A 8.5% 15/08/2027 USD 5,100,000 5,398,350 0.14
UPC Holding BV, Reg. S 3.875% 15/06/2029 EUR 8,000,000 9,281,043 0.25
WP/AP Telecom Holdings IV BV, Reg. S 3.75% 15/01/2029 EUR 20,000,000 22,971,194 0.62
Ziggo Bond Co. BV, Reg. S 3.375% 28/02/2030 EUR 4,600,000 5,101,836 0.14
95,603,885 2.56
Spain
Banco de Sabadell SA, Reg. S 5.625% 06/05/2026 EUR 7,100,000 9,245,098 0.25
Cellnex Telecom SA, Reg. S 1.75% 23/10/2030 EUR 10,900,000 11,907,345 0.32
Grifols SA, Reg. S 3.2% 01/05/2025 EUR 8,000,000 9,094,760 0.24
International Consolidated Airlines Group SA, Reg. S 2.75% 25/03/2025 EUR 8,400,000 9,346,458 0.25
Via Celere Desarrollos Inmobiliarios SA, Reg. S 5.25% 01/04/2026 EUR 7,201,000 8,419,987 0.22
48,013,648 1.28
Supranational
Allied Universal Holdco LLC, Reg. S 3.625% 01/06/2028 EUR 15,026,000 16,725,596 0.45
Ardagh Metal Packaging Finance USA LLC, Reg. S 2% 01/09/2028 EUR 4,664,000 5,248,078 0.14
Ardagh Packaging Finance plc, 144A 5.25% 15/08/2027 USD 6,100,000 6,144,988 0.16
28,118,662 0.75
Sweden
Castellum AB, Reg. S 3.125% Perpetual EUR 18,254,000 19,842,456 0.53
Heimstaden AB, Reg. S 6.658% Perpetual EUR 5,700,000 6,609,730 0.18
Heimstaden Bostad AB, Reg. S 3.625% Perpetual EUR 14,974,000 16,906,251 0.45
Samhallsbyggnadsbolaget i Norden AB, Reg. S 2.625% Perpetual EUR 10,500,000 11,593,550 0.31
54,951,987 1.47
United Kingdom
BCP V Modular Services Finance II plc, Reg. S 4.75% 30/11/2028 EUR 14,552,000 16,707,188 0.45
Bellis Acquisition Co. plc, Reg. S 4.5% 16/02/2026 GBP 4,757,000 6,442,426 0.17
Constellation Automotive Financing plc, Reg. S 4.875% 15/07/2027 GBP 9,518,000 12,702,460 0.34
Drax Finco plc, 144A 6.625% 01/11/2025 USD 16,638,000 17,174,409 0.46
Iron Mountain UK plc, REIT, Reg. S 3.875% 15/11/2025 GBP 13,800,000 18,805,314 0.50
Investments Currency Quantity/
Nominal Value
Market Value
USD
% of Net
Assets0
Jaguar Land Rover Automotive plc, Reg. S 4.5% 15/07/2028 EUR 3,158,000 3,658,884 0.10
Maison Finco plc, Reg. S 6% 31/10/2027 GBP 11,905,000 16,417,433 0.44
Pinewood Finance Co. Ltd., Reg. S 3.625% 15/11/2027 GBP 11,202,000 15,125,499 0.40
Pinnacle Bidco plc, Reg. S 6.375% 15/02/2025 GBP 5,900,000 8,084,288 0.22
Premier Foods Finance plc, Reg. S 3.5% 15/10/2026 GBP 8,737,000 11,734,255 0.31
Punch Finance plc, Reg. S 6.125% 30/06/2026 GBP 5,653,000 7,620,929 0.20
Sherwood Financing plc, Reg. S 6% 15/11/2026 GBP 16,470,000 22,275,788 0.60
Stonegate Pub Co. Financing 2019 plc, Reg. S 8.25% 31/07/2025 GBP 1,900,000 2,615,612 0.07
159,364,485 4.26
United States of America
American Axle & Manufacturing, Inc. 5% 01/10/2029 USD 16,330,000 16,044,715 0.43
Centene Corp. 2.45% 15/07/2028 USD 4,145,000 4,089,208 0.11
Centene Corp. 2.5% 01/03/2031 USD 1,855,000 1,808,959 0.05
Cogent Communications Group, Inc., Reg. S 4.375% 30/06/2024 EUR 8,000,000 9,256,541 0.25
Dana, Inc. 4.25% 01/09/2030 USD 140,000 142,132 –
Dana, Inc. 4.5% 15/02/2032 USD 9,155,000 9,145,982 0.25
DCP Midstream Operating LP 3.25% 15/02/2032 USD 12,625,000 12,771,639 0.34
Delta Air Lines, Inc. 3.75% 28/10/2029 USD 17,960,000 18,178,853 0.49
EnLink Midstream LLC 5.375% 01/06/2029 USD 8,525,000 8,731,135 0.23
Ford Motor Credit Co. LLC 5.584% 18/03/2024 USD 25,162,000 27,143,633 0.73
Ford Motor Credit Co. LLC 2.7% 10/08/2026 USD 5,700,000 5,757,000 0.15
Ford Motor Credit Co. LLC 4.125% 17/08/2027 USD 19,910,000 21,477,713 0.58
Ford Motor Credit Co. LLC 4% 13/11/2030 USD 12,965,000 13,943,598 0.37
Genesis Energy LP 6.5% 01/10/2025 USD 2,105,000 2,088,097 0.06
Genesis Energy LP 6.25% 15/05/2026 USD 5,940,000 5,797,678 0.16
Genesis Energy LP 8% 15/01/2027 USD 9,870,000 10,102,340 0.27
HCA, Inc. 5.375% 01/02/2025 USD 7,285,000 8,015,685 0.21
HCA, Inc. 7.69% 15/06/2025 USD 485,000 573,555 0.02
HCA, Inc. 3.5% 01/09/2030 USD 20,070,000 21,251,621 0.57
Hecla Mining Co. 7.25% 15/02/2028 USD 7,400,000 7,938,646 0.21
MGIC Investment Corp. 5.25% 15/08/2028 USD 7,530,000 7,917,155 0.21
MGM Growth Properties Operating Partnership LP, REIT 5.625% 01/05/2024 USD 115,000 123,048 –
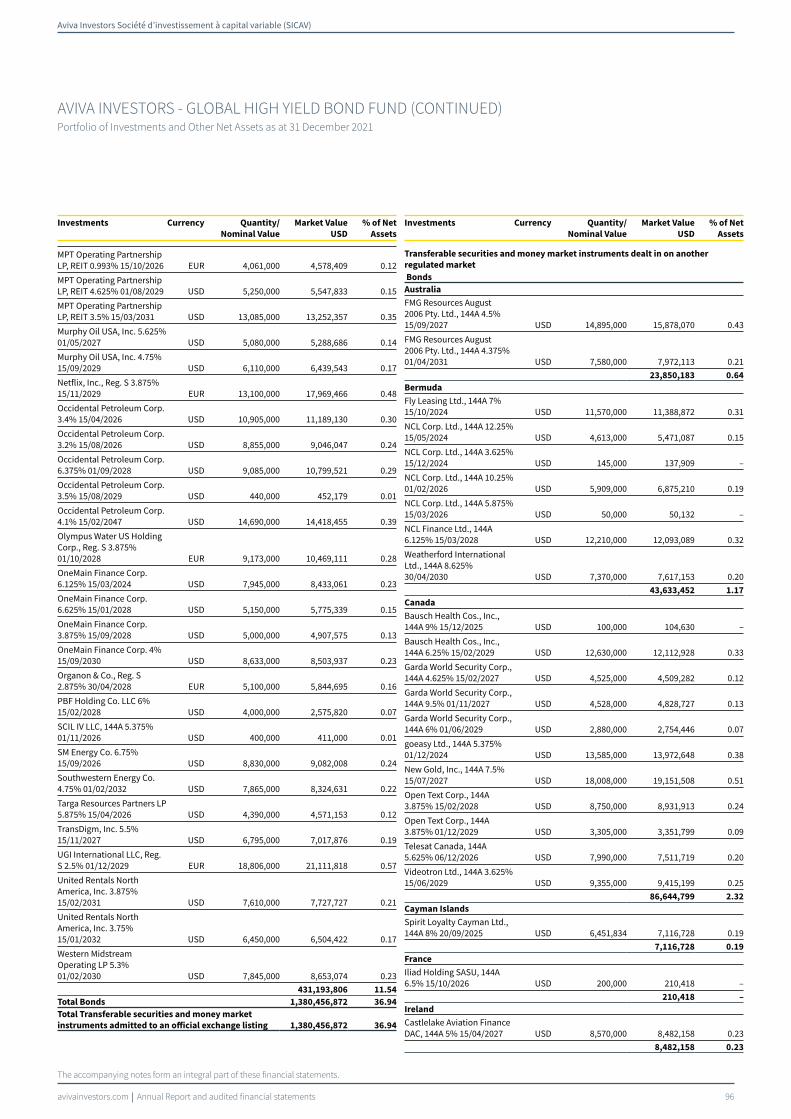
Aviva Investors Société d’investissement à capital variable (SICAV)
avivainvestors.com Annual Report and audited financial statements 96
AVIVA INVESTORS - GLOBAL HIGH YIELD BOND FUND (CONTINUED)Portfolio of Investments and Other Net Assets as at 31 December 2021
The accompanying notes form an integral part of these financial statements.
Investments Currency Quantity/
Nominal Value
Market Value
USD
% of Net
Assets0
MPT Operating Partnership LP, REIT 0.993% 15/10/2026 EUR 4,061,000 4,578,409 0.12
MPT Operating Partnership LP, REIT 4.625% 01/08/2029 USD 5,250,000 5,547,833 0.15
MPT Operating Partnership LP, REIT 3.5% 15/03/2031 USD 13,085,000 13,252,357 0.35
Murphy Oil USA, Inc. 5.625% 01/05/2027 USD 5,080,000 5,288,686 0.14
Murphy Oil USA, Inc. 4.75% 15/09/2029 USD 6,110,000 6,439,543 0.17
Netflix, Inc., Reg. S 3.875% 15/11/2029 EUR 13,100,000 17,969,466 0.48
Occidental Petroleum Corp. 3.4% 15/04/2026 USD 10,905,000 11,189,130 0.30
Occidental Petroleum Corp. 3.2% 15/08/2026 USD 8,855,000 9,046,047 0.24
Occidental Petroleum Corp. 6.375% 01/09/2028 USD 9,085,000 10,799,521 0.29
Occidental Petroleum Corp. 3.5% 15/08/2029 USD 440,000 452,179 0.01
Occidental Petroleum Corp. 4.1% 15/02/2047 USD 14,690,000 14,418,455 0.39
Olympus Water US Holding Corp., Reg. S 3.875% 01/10/2028 EUR 9,173,000 10,469,111 0.28
OneMain Finance Corp. 6.125% 15/03/2024 USD 7,945,000 8,433,061 0.23
OneMain Finance Corp. 6.625% 15/01/2028 USD 5,150,000 5,775,339 0.15
OneMain Finance Corp. 3.875% 15/09/2028 USD 5,000,000 4,907,575 0.13
OneMain Finance Corp. 4% 15/09/2030 USD 8,633,000 8,503,937 0.23
Organon & Co., Reg. S 2.875% 30/04/2028 EUR 5,100,000 5,844,695 0.16
PBF Holding Co. LLC 6% 15/02/2028 USD 4,000,000 2,575,820 0.07
SCIL IV LLC, 144A 5.375% 01/11/2026 USD 400,000 411,000 0.01
SM Energy Co. 6.75% 15/09/2026 USD 8,830,000 9,082,008 0.24
Southwestern Energy Co. 4.75% 01/02/2032 USD 7,865,000 8,324,631 0.22
Targa Resources Partners LP 5.875% 15/04/2026 USD 4,390,000 4,571,153 0.12
TransDigm, Inc. 5.5% 15/11/2027 USD 6,795,000 7,017,876 0.19
UGI International LLC, Reg. S 2.5% 01/12/2029 EUR 18,806,000 21,111,818 0.57
United Rentals North America, Inc. 3.875% 15/02/2031 USD 7,610,000 7,727,727 0.21
United Rentals North America, Inc. 3.75% 15/01/2032 USD 6,450,000 6,504,422 0.17
Western Midstream Operating LP 5.3% 01/02/2030 USD 7,845,000 8,653,074 0.23
431,193,806 11.54
Total Bonds 1,380,456,872 36.94
Total Transferable securities and money market
instruments admitted to an official exchange listing 1,380,456,872 36.94
Investments Currency Quantity/
Nominal Value
Market Value
USD
% of Net
Assets0
Transferable securities and money market instruments dealt in on another
regulated market
Bonds
Australia
FMG Resources August 2006 Pty. Ltd., 144A 4.5% 15/09/2027 USD 14,895,000 15,878,070 0.43
FMG Resources August 2006 Pty. Ltd., 144A 4.375% 01/04/2031 USD 7,580,000 7,972,113 0.21
23,850,183 0.64
Bermuda
Fly Leasing Ltd., 144A 7% 15/10/2024 USD 11,570,000 11,388,872 0.31
NCL Corp. Ltd., 144A 12.25% 15/05/2024 USD 4,613,000 5,471,087 0.15
NCL Corp. Ltd., 144A 3.625% 15/12/2024 USD 145,000 137,909 –
NCL Corp. Ltd., 144A 10.25% 01/02/2026 USD 5,909,000 6,875,210 0.19
NCL Corp. Ltd., 144A 5.875% 15/03/2026 USD 50,000 50,132 –
NCL Finance Ltd., 144A 6.125% 15/03/2028 USD 12,210,000 12,093,089 0.32
Weatherford International Ltd., 144A 8.625% 30/04/2030 USD 7,370,000 7,617,153 0.20
43,633,452 1.17
Canada
Bausch Health Cos., Inc., 144A 9% 15/12/2025 USD 100,000 104,630 –
Bausch Health Cos., Inc., 144A 6.25% 15/02/2029 USD 12,630,000 12,112,928 0.33
Garda World Security Corp., 144A 4.625% 15/02/2027 USD 4,525,000 4,509,282 0.12
Garda World Security Corp., 144A 9.5% 01/11/2027 USD 4,528,000 4,828,727 0.13
Garda World Security Corp., 144A 6% 01/06/2029 USD 2,880,000 2,754,446 0.07
goeasy Ltd., 144A 5.375% 01/12/2024 USD 13,585,000 13,972,648 0.38
New Gold, Inc., 144A 7.5% 15/07/2027 USD 18,008,000 19,151,508 0.51
Open Text Corp., 144A 3.875% 15/02/2028 USD 8,750,000 8,931,913 0.24
Open Text Corp., 144A 3.875% 01/12/2029 USD 3,305,000 3,351,799 0.09
Telesat Canada, 144A 5.625% 06/12/2026 USD 7,990,000 7,511,719 0.20
Videotron Ltd., 144A 3.625% 15/06/2029 USD 9,355,000 9,415,199 0.25
86,644,799 2.32
Cayman Islands
Spirit Loyalty Cayman Ltd., 144A 8% 20/09/2025 USD 6,451,834 7,116,728 0.19
7,116,728 0.19
France
Iliad Holding SASU, 144A 6.5% 15/10/2026 USD 200,000 210,418 –
210,418 –
Ireland
Castlelake Aviation Finance DAC, 144A 5% 15/04/2027 USD 8,570,000 8,482,158 0.23
8,482,158 0.23

Aviva Investors Société d’investissement à capital variable (SICAV)
avivainvestors.com Annual Report and audited financial statements 97
AVIVA INVESTORS - GLOBAL HIGH YIELD BOND FUND (CONTINUED)Portfolio of Investments and Other Net Assets as at 31 December 2021
The accompanying notes form an integral part of these financial statements.
Investments Currency Quantity/
Nominal Value
Market Value
USD
% of Net
Assets0
Liberia
Royal Caribbean Cruises Ltd., 144A 10.875% 01/06/2023 USD 3,440,000 3,762,551 0.10
Royal Caribbean Cruises Ltd., 144A 11.5% 01/06/2025 USD 2,112,000 2,368,112 0.06
Royal Caribbean Cruises Ltd., 144A 5.5% 01/04/2028 USD 2,850,000 2,883,402 0.08
9,014,065 0.24
Netherlands
Alcoa Nederland Holding BV, 144A 5.5% 15/12/2027 USD 8,710,000 9,320,833 0.25
OI European Group BV, 144A 4.75% 15/02/2030 USD 6,630,000 6,729,516 0.18
16,050,349 0.43
Panama
Carnival Corp., 144A 4% 01/08/2028 USD 11,645,000 11,581,360 0.31
Carnival Corp., 144A 6% 01/05/2029 USD 9,735,000 9,717,574 0.26
21,298,934 0.57
Supranational
American Airlines, Inc., 144A 5.5% 20/04/2026 USD 3,450,000 3,592,934 0.09
American Airlines, Inc., 144A 5.75% 20/04/2029 USD 8,020,000 8,586,573 0.23
Canpack SA, 144A 3.875% 15/11/2029 USD 10,045,000 9,821,649 0.26
Connect Finco SARL, 144A 6.75% 01/10/2026 USD 24,090,000 25,357,134 0.68
Endo Dac, 144A 5.875% 15/10/2024 USD 5,600,000 5,518,576 0.15
Endo Dac, 144A 9.5% 31/07/2027 USD 6,885,000 7,015,539 0.19
59,892,405 1.60
United Kingdom
International Game Technology plc, 144A 4.125% 15/04/2026 USD 11,545,000 11,906,474 0.32
11,906,474 0.32
United States of America
Acadia Healthcare Co., Inc., 144A 5% 15/04/2029 USD 4,550,000 4,682,041 0.13
AdaptHealth LLC, 144A 4.625% 01/08/2029 USD 5,780,000 5,788,757 0.15
AdaptHealth LLC, 144A 5.125% 01/03/2030 USD 9,800,000 9,986,298 0.27
Aethon United BR LP, 144A 8.25% 15/02/2026 USD 10,250,000 11,022,440 0.29
Albertsons Cos., Inc., 144A 3.5% 15/02/2023 USD 55,000 56,021 –
Albertsons Cos., Inc., 144A 5.875% 15/02/2028 USD 7,890,000 8,374,288 0.22
Albertsons Cos., Inc., 144A 3.5% 15/03/2029 USD 14,845,000 14,884,785 0.40
Alliance Data Systems Corp., 144A 7% 15/01/2026 USD 10,580,000 11,120,585 0.30
Allied Universal Holdco LLC, 144A 6.625% 15/07/2026 USD 8,360,000 8,788,659 0.24
Allied Universal Holdco LLC, 144A 9.75% 15/07/2027 USD 12,005,000 12,858,856 0.34
American Airlines Group, Inc., 144A 5% 01/06/2022 USD 2,400,000 2,397,048 0.06
Investments Currency Quantity/
Nominal Value
Market Value
USD
% of Net
Assets0
American Airlines, Inc., 144A 11.75% 15/07/2025 USD 8,785,000 10,839,328 0.29
Antero Midstream Partners LP, 144A 5.75% 01/03/2027 USD 12,395,000 12,856,714 0.34
Antero Midstream Partners LP, 144A 5.75% 15/01/2028 USD 135,000 141,272 –
Antero Midstream Partners LP, 144A 5.375% 15/06/2029 USD 8,560,000 8,959,624 0.24
Antero Resources Corp., 144A 7.625% 01/02/2029 USD 8,151,000 9,060,529 0.24
Antero Resources Corp., 144A 5.375% 01/03/2030 USD 13,890,000 14,879,454 0.40
Apache Corp. 4.25% 15/01/2030 USD 3,235,000 3,521,734 0.09
Aramark Services, Inc., 144A 6.375% 01/05/2025 USD 7,610,000 7,962,153 0.21
Aramark Services, Inc., 144A 5% 01/02/2028 USD 2,445,000 2,531,810 0.07
Archrock Partners LP, 144A 6.875% 01/04/2027 USD 8,950,000 9,406,450 0.25
Archrock Partners LP, 144A 6.25% 01/04/2028 USD 15,390,000 16,069,315 0.43
Asbury Automotive Group, Inc., 144A 4.625% 15/11/2029 USD 2,460,000 2,510,233 0.07
Asbury Automotive Group, Inc., 144A 5% 15/02/2032 USD 820,000 852,148 0.02
Asbury Automotive Group, Inc. 4.5% 01/03/2028 USD 5,483,000 5,586,821 0.15
Asbury Automotive Group, Inc. 4.75% 01/03/2030 USD 4,341,000 4,418,118 0.12
Ascent Resources Utica Holdings LLC, 144A 7% 01/11/2026 USD 2,860,000 2,902,800 0.08
ASGN, Inc., 144A 4.625% 15/05/2028 USD 8,925,000 9,229,566 0.25
Ashton Woods USA LLC, 144A 4.625% 01/08/2029 USD 10,100,000 9,989,052 0.27
Ashton Woods USA LLC, 144A 4.625% 01/04/2030 USD 4,245,000 4,203,930 0.11
At Home Group, Inc., 144A 7.125% 15/07/2029 USD 7,900,000 7,802,474 0.21
Atkore, Inc., 144A 4.25% 01/06/2031 USD 13,800,000 14,164,803 0.38
Audacy Capital Corp., 144A 6.5% 01/05/2027 USD 16,345,000 16,184,819 0.43
Audacy Capital Corp., 144A 6.75% 31/03/2029 USD 2,490,000 2,436,141 0.07
Bausch Health Americas, Inc., 144A 8.5% 31/01/2027 USD 9,715,000 10,214,788 0.27
Block, Inc., 144A 2.75% 01/06/2026 USD 13,425,000 13,458,630 0.36
Block, Inc., 144A 3.5% 01/06/2031 USD 3,345,000 3,434,412 0.09
Brink's Co. (The), 144A 4.625% 15/10/2027 USD 10,613,000 10,943,436 0.29
BroadStreet Partners, Inc., 144A 5.875% 15/04/2029 USD 11,375,000 11,163,482 0.30
Builders FirstSource, Inc., 144A 5% 01/03/2030 USD 2,060,000 2,212,285 0.06
Builders FirstSource, Inc., 144A 4.25% 01/02/2032 USD 9,020,000 9,397,126 0.25

Aviva Investors Société d’investissement à capital variable (SICAV)
avivainvestors.com Annual Report and audited financial statements 98
AVIVA INVESTORS - GLOBAL HIGH YIELD BOND FUND (CONTINUED)Portfolio of Investments and Other Net Assets as at 31 December 2021
The accompanying notes form an integral part of these financial statements.
Investments Currency Quantity/
Nominal Value
Market Value
USD
% of Net
Assets0
Burford Capital Global Finance LLC, 144A 6.25% 15/04/2028 USD 8,420,000 8,937,493 0.24
Caesars Entertainment, Inc., 144A 6.25% 01/07/2025 USD 6,555,000 6,892,124 0.18
Caesars Entertainment, Inc., 144A 4.625% 15/10/2029 USD 12,260,000 12,285,685 0.33
Caesars Resort Collection LLC, 144A 5.75% 01/07/2025 USD 2,420,000 2,538,386 0.07
Calpine Corp., 144A 4.625% 01/02/2029 USD 8,265,000 8,122,553 0.22
Carriage Services, Inc., 144A 4.25% 15/05/2029 USD 6,885,000 6,861,006 0.18
CCO Holdings LLC, 144A 4.75% 01/03/2030 USD 29,990,000 31,242,832 0.84
CCO Holdings LLC, 144A 4.25% 15/01/2034 USD 6,415,000 6,322,865 0.17
Centene Corp. 4.25% 15/12/2027 USD 7,620,000 7,957,033 0.21
Centene Corp. 4.625% 15/12/2029 USD 9,615,000 10,340,740 0.28
Centene Corp. 3.375% 15/02/2030 USD 1,680,000 1,720,597 0.05
Central Garden & Pet Co. 4.125% 15/10/2030 USD 8,270,000 8,354,561 0.22
Century Communities, Inc., 144A 3.875% 15/08/2029 USD 13,745,000 13,867,812 0.37
Century Communities, Inc. 6.75% 01/06/2027 USD 5,225,000 5,491,475 0.15
Change Healthcare Holdings LLC, 144A 5.75% 01/03/2025 USD 7,500,000 7,573,425 0.20
Cheniere Energy Partners LP, 144A 3.25% 31/01/2032 USD 11,885,000 12,057,332 0.32
Cheniere Energy Partners LP 4.5% 01/10/2029 USD 9,145,000 9,709,521 0.26
Chesapeake Energy Corp., 144A 5.5% 01/02/2026 USD 8,135,000 8,571,768 0.23
Cinemark USA, Inc., 144A 5.25% 15/07/2028 USD 2,445,000 2,397,836 0.06
Clarivate Science Holdings Corp., 144A 3.875% 01/07/2028 USD 9,440,000 9,506,222 0.25
Clarivate Science Holdings Corp., 144A 4.875% 01/07/2029 USD 5,555,000 5,650,824 0.15
Clear Channel Outdoor Holdings, Inc., 144A 7.5% 01/06/2029 USD 9,115,000 9,791,515 0.26
Clearway Energy Operating LLC, 144A 3.75% 15/02/2031 USD 6,670,000 6,686,675 0.18
Coeur Mining, Inc., 144A 5.125% 15/02/2029 USD 11,175,000 10,283,123 0.28
CommScope, Inc., 144A 8.25% 01/03/2027 USD 3,210,000 3,286,173 0.09
CommScope, Inc., 144A 4.75% 01/09/2029 USD 9,765,000 9,721,595 0.26
Community Health Systems, Inc., 144A 8% 15/12/2027 USD 2,020,000 2,184,408 0.06
Community Health Systems, Inc., 144A 6.875% 01/04/2028 USD 2,500,000 2,428,537 0.07
Investments Currency Quantity/
Nominal Value
Market Value
USD
% of Net
Assets0
Community Health Systems, Inc., 144A 6% 15/01/2029 USD 3,800,000 4,057,754 0.11
Community Health Systems, Inc., 144A 6.875% 15/04/2029 USD 10,810,000 11,029,227 0.30
Community Health Systems, Inc., 144A 6.125% 01/04/2030 USD 5,850,000 5,800,363 0.16
Comstock Resources, Inc., 144A 5.875% 15/01/2030 USD 13,195,000 13,546,713 0.36
Consolidated Communications, Inc., 144A 5% 01/10/2028 USD 4,615,000 4,668,165 0.12
Consolidated Communications, Inc., 144A 6.5% 01/10/2028 USD 6,975,000 7,341,187 0.20
Coty, Inc., 144A 6.5% 15/04/2026 USD 9,100,000 9,361,898 0.25
Coty, Inc., 144A 4.75% 15/01/2029 USD 15,590,000 15,867,190 0.42
CQP Holdco LP, 144A 5.5% 15/06/2031 USD 8,100,000 8,467,092 0.23
Crowdstrike Holdings, Inc. 3% 15/02/2029 USD 7,170,000 7,109,449 0.19
CSC Holdings LLC, 144A 5.5% 15/04/2027 USD 4,640,000 4,802,122 0.13
CSC Holdings LLC, 144A 4.125% 01/12/2030 USD 12,190,000 11,920,235 0.32
CSC Holdings LLC, 144A 4.625% 01/12/2030 USD 5,770,000 5,469,614 0.15
CVR Partners LP, 144A 9.25% 15/06/2023 USD 1,878,000 1,893,550 0.05
DaVita, Inc., 144A 4.625% 01/06/2030 USD 17,635,000 18,085,751 0.48
Directv Financing LLC, 144A 5.875% 15/08/2027 USD 13,855,000 14,212,320 0.38
DISH DBS Corp., 144A 5.25% 01/12/2026 USD 2,735,000 2,787,307 0.07
DISH DBS Corp., 144A 5.75% 01/12/2028 USD 4,875,000 4,920,703 0.13
Domtar Corp., 144A 6.75% 01/10/2028 USD 14,115,000 14,512,831 0.39
DT Midstream, Inc., 144A 4.375% 15/06/2031 USD 11,115,000 11,576,717 0.31
Dycom Industries, Inc., 144A 4.5% 15/04/2029 USD 11,835,000 12,076,671 0.32
Endeavor Energy Resources LP, 144A 6.625% 15/07/2025 USD 12,154,000 12,873,699 0.34
Endeavor Energy Resources LP, 144A 5.75% 30/01/2028 USD 13,520,000 14,343,165 0.38
Forestar Group, Inc., 144A 3.85% 15/05/2026 USD 7,535,000 7,561,900 0.20
Frontier Communications Corp. 'A1', 144A 5.875% 15/10/2027 USD 8,640,000 9,150,149 0.24
Frontier Communications Holdings LLC, 144A 6.75% 01/05/2029 USD 2,315,000 2,399,567 0.06
Glatfelter Corp., 144A 4.75% 15/11/2029 USD 6,850,000 7,074,200 0.19
Gray Escrow II, Inc., 144A 5.375% 15/11/2031 USD 8,220,000 8,459,901 0.23
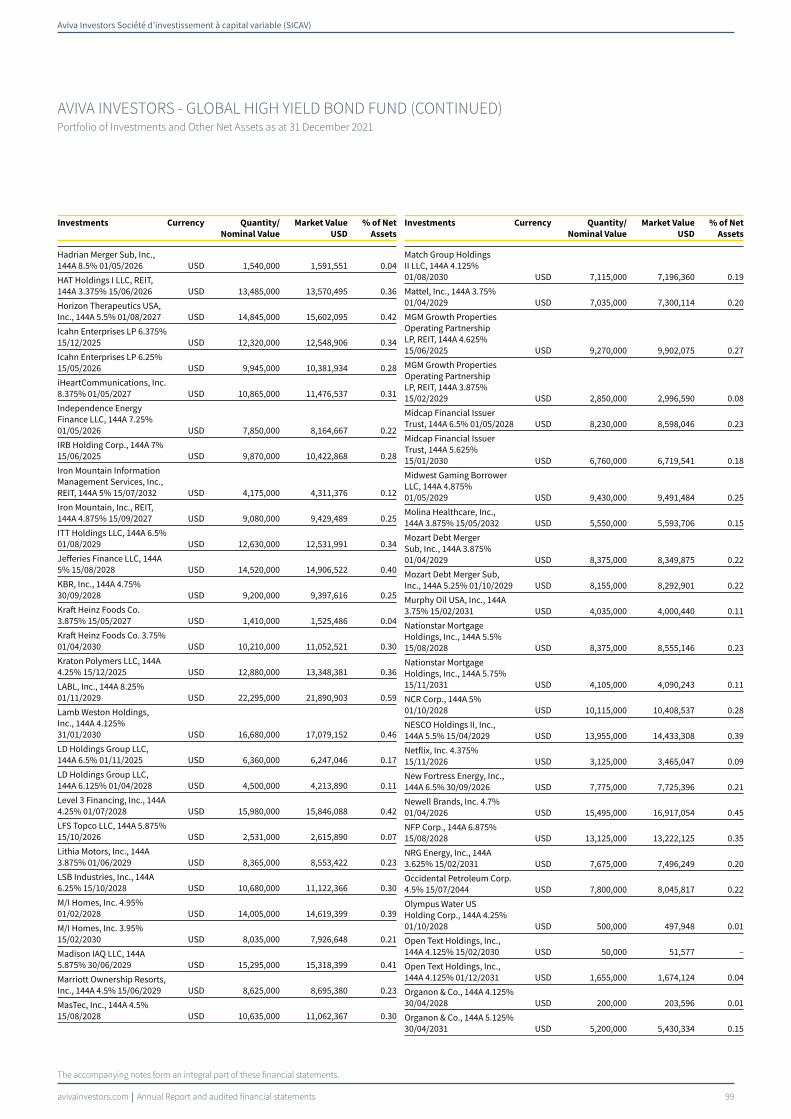
Aviva Investors Société d’investissement à capital variable (SICAV)
avivainvestors.com Annual Report and audited financial statements 99
AVIVA INVESTORS - GLOBAL HIGH YIELD BOND FUND (CONTINUED)Portfolio of Investments and Other Net Assets as at 31 December 2021
The accompanying notes form an integral part of these financial statements.
Investments Currency Quantity/
Nominal Value
Market Value
USD
% of Net
Assets0
Hadrian Merger Sub, Inc., 144A 8.5% 01/05/2026 USD 1,540,000 1,591,551 0.04
HAT Holdings I LLC, REIT, 144A 3.375% 15/06/2026 USD 13,485,000 13,570,495 0.36
Horizon Therapeutics USA, Inc., 144A 5.5% 01/08/2027 USD 14,845,000 15,602,095 0.42
Icahn Enterprises LP 6.375% 15/12/2025 USD 12,320,000 12,548,906 0.34
Icahn Enterprises LP 6.25% 15/05/2026 USD 9,945,000 10,381,934 0.28
iHeartCommunications, Inc. 8.375% 01/05/2027 USD 10,865,000 11,476,537 0.31
Independence Energy Finance LLC, 144A 7.25% 01/05/2026 USD 7,850,000 8,164,667 0.22
IRB Holding Corp., 144A 7% 15/06/2025 USD 9,870,000 10,422,868 0.28
Iron Mountain Information Management Services, Inc., REIT, 144A 5% 15/07/2032 USD 4,175,000 4,311,376 0.12
Iron Mountain, Inc., REIT, 144A 4.875% 15/09/2027 USD 9,080,000 9,429,489 0.25
ITT Holdings LLC, 144A 6.5% 01/08/2029 USD 12,630,000 12,531,991 0.34
Jefferies Finance LLC, 144A 5% 15/08/2028 USD 14,520,000 14,906,522 0.40
KBR, Inc., 144A 4.75% 30/09/2028 USD 9,200,000 9,397,616 0.25
Kraft Heinz Foods Co. 3.875% 15/05/2027 USD 1,410,000 1,525,486 0.04
Kraft Heinz Foods Co. 3.75% 01/04/2030 USD 10,210,000 11,052,521 0.30
Kraton Polymers LLC, 144A 4.25% 15/12/2025 USD 12,880,000 13,348,381 0.36
LABL, Inc., 144A 8.25% 01/11/2029 USD 22,295,000 21,890,903 0.59
Lamb Weston Holdings, Inc., 144A 4.125% 31/01/2030 USD 16,680,000 17,079,152 0.46
LD Holdings Group LLC, 144A 6.5% 01/11/2025 USD 6,360,000 6,247,046 0.17
LD Holdings Group LLC, 144A 6.125% 01/04/2028 USD 4,500,000 4,213,890 0.11
Level 3 Financing, Inc., 144A 4.25% 01/07/2028 USD 15,980,000 15,846,088 0.42
LFS Topco LLC, 144A 5.875% 15/10/2026 USD 2,531,000 2,615,890 0.07
Lithia Motors, Inc., 144A 3.875% 01/06/2029 USD 8,365,000 8,553,422 0.23
LSB Industries, Inc., 144A 6.25% 15/10/2028 USD 10,680,000 11,122,366 0.30
M/I Homes, Inc. 4.95% 01/02/2028 USD 14,005,000 14,619,399 0.39
M/I Homes, Inc. 3.95% 15/02/2030 USD 8,035,000 7,926,648 0.21
Madison IAQ LLC, 144A 5.875% 30/06/2029 USD 15,295,000 15,318,399 0.41
Marriott Ownership Resorts, Inc., 144A 4.5% 15/06/2029 USD 8,625,000 8,695,380 0.23
MasTec, Inc., 144A 4.5% 15/08/2028 USD 10,635,000 11,062,367 0.30
Investments Currency Quantity/
Nominal Value
Market Value
USD
% of Net
Assets0
Match Group Holdings II LLC, 144A 4.125% 01/08/2030 USD 7,115,000 7,196,360 0.19
Mattel, Inc., 144A 3.75% 01/04/2029 USD 7,035,000 7,300,114 0.20
MGM Growth Properties Operating Partnership LP, REIT, 144A 4.625% 15/06/2025 USD 9,270,000 9,902,075 0.27
MGM Growth Properties Operating Partnership LP, REIT, 144A 3.875% 15/02/2029 USD 2,850,000 2,996,590 0.08
Midcap Financial Issuer Trust, 144A 6.5% 01/05/2028 USD 8,230,000 8,598,046 0.23
Midcap Financial Issuer Trust, 144A 5.625% 15/01/2030 USD 6,760,000 6,719,541 0.18
Midwest Gaming Borrower LLC, 144A 4.875% 01/05/2029 USD 9,430,000 9,491,484 0.25
Molina Healthcare, Inc., 144A 3.875% 15/05/2032 USD 5,550,000 5,593,706 0.15
Mozart Debt Merger Sub, Inc., 144A 3.875% 01/04/2029 USD 8,375,000 8,349,875 0.22
Mozart Debt Merger Sub, Inc., 144A 5.25% 01/10/2029 USD 8,155,000 8,292,901 0.22
Murphy Oil USA, Inc., 144A 3.75% 15/02/2031 USD 4,035,000 4,000,440 0.11
Nationstar Mortgage Holdings, Inc., 144A 5.5% 15/08/2028 USD 8,375,000 8,555,146 0.23
Nationstar Mortgage Holdings, Inc., 144A 5.75% 15/11/2031 USD 4,105,000 4,090,243 0.11
NCR Corp., 144A 5% 01/10/2028 USD 10,115,000 10,408,537 0.28
NESCO Holdings II, Inc., 144A 5.5% 15/04/2029 USD 13,955,000 14,433,308 0.39
Netflix, Inc. 4.375% 15/11/2026 USD 3,125,000 3,465,047 0.09
New Fortress Energy, Inc., 144A 6.5% 30/09/2026 USD 7,775,000 7,725,396 0.21
Newell Brands, Inc. 4.7% 01/04/2026 USD 15,495,000 16,917,054 0.45
NFP Corp., 144A 6.875% 15/08/2028 USD 13,125,000 13,222,125 0.35
NRG Energy, Inc., 144A 3.625% 15/02/2031 USD 7,675,000 7,496,249 0.20
Occidental Petroleum Corp. 4.5% 15/07/2044 USD 7,800,000 8,045,817 0.22
Olympus Water US Holding Corp., 144A 4.25% 01/10/2028 USD 500,000 497,948 0.01
Open Text Holdings, Inc., 144A 4.125% 15/02/2030 USD 50,000 51,577 –
Open Text Holdings, Inc., 144A 4.125% 01/12/2031 USD 1,655,000 1,674,124 0.04
Organon & Co., 144A 4.125% 30/04/2028 USD 200,000 203,596 0.01
Organon & Co., 144A 5.125% 30/04/2031 USD 5,200,000 5,430,334 0.15

Aviva Investors Société d’investissement à capital variable (SICAV)
avivainvestors.com Annual Report and audited financial statements 100
AVIVA INVESTORS - GLOBAL HIGH YIELD BOND FUND (CONTINUED)Portfolio of Investments and Other Net Assets as at 31 December 2021
The accompanying notes form an integral part of these financial statements.
Investments Currency Quantity/
Nominal Value
Market Value
USD
% of Net
Assets0
Owens-Brockway Glass Container, Inc., 144A 5.375% 15/01/2025 USD 7,325,000 7,570,717 0.20
Owens-Brockway Glass Container, Inc., 144A 6.625% 13/05/2027 USD 2,615,000 2,761,440 0.07
Owens-Brockway Glass Container, Inc., 144A 5.875% 15/08/2023 USD 10,665,000 11,182,412 0.30
Post Holdings, Inc., 144A 5.625% 15/01/2028 USD 2,700,000 2,846,313 0.08
PRA Group, Inc., 144A 5% 01/10/2029 USD 7,110,000 7,138,511 0.19
Premier Entertainment Sub LLC, 144A 5.625% 01/09/2029 USD 3,225,000 3,181,156 0.09
Premier Entertainment Sub LLC, 144A 5.875% 01/09/2031 USD 6,495,000 6,527,475 0.17
Radiology Partners, Inc., 144A 9.25% 01/02/2028 USD 10,685,000 11,235,651 0.30
Range Resources Corp. 8.25% 15/01/2029 USD 10,805,000 12,066,430 0.32
Raptor Acquisition Corp., 144A 4.875% 01/11/2026 USD 14,155,000 14,385,019 0.38
Rattler Midstream LP, 144A 5.625% 15/07/2025 USD 8,215,000 8,551,815 0.23
Resolute Forest Products, Inc., 144A 4.875% 01/03/2026 USD 11,150,000 11,348,916 0.30
RLJ Lodging Trust LP, REIT, 144A 3.75% 01/07/2026 USD 7,960,000 8,012,178 0.21
ROBLOX Corp., 144A 3.875% 01/05/2030 USD 14,385,000 14,615,304 0.39
Rockcliff Energy II LLC, 144A 5.5% 15/10/2029 USD 7,350,000 7,616,437 0.20
Scientific Games International, Inc., 144A 5% 15/10/2025 USD 10,080,000 10,382,652 0.28
Scientific Games International, Inc., 144A 7% 15/05/2028 USD 16,355,000 17,445,224 0.47
Scripps Escrow II, Inc., 144A 3.875% 15/01/2029 USD 15,050,000 14,979,340 0.40
SeaWorld Parks & Entertainment, Inc., 144A 5.25% 15/08/2029 USD 8,205,000 8,367,131 0.22
Select Medical Corp., 144A 6.25% 15/08/2026 USD 9,000,000 9,541,215 0.26
Service Properties Trust, REIT 7.5% 15/09/2025 USD 9,215,000 9,994,731 0.27
Service Properties Trust, REIT 4.75% 01/10/2026 USD 200,000 193,717 0.01
Service Properties Trust, REIT 4.95% 15/02/2027 USD 4,000,000 3,854,300 0.10
Service Properties Trust, REIT 5.5% 15/12/2027 USD 4,355,000 4,475,365 0.12
Sirius XM Radio, Inc., 144A 3.125% 01/09/2026 USD 2,100,000 2,103,370 0.06
Sirius XM Radio, Inc., 144A 4% 15/07/2028 USD 16,740,000 16,862,537 0.45
Sirius XM Radio, Inc., 144A 3.875% 01/09/2031 USD 4,764,000 4,679,320 0.13
Investments Currency Quantity/
Nominal Value
Market Value
USD
% of Net
Assets0
Sizzling Platter LLC, 144A 8.5% 28/11/2025 USD 10,870,000 11,194,904 0.30
Sonic Automotive, Inc., 144A 4.625% 15/11/2029 USD 4,065,000 4,110,508 0.11
Sonic Automotive, Inc., 144A 4.875% 15/11/2031 USD 4,065,000 4,110,548 0.11
Spanish Broadcasting System, Inc., 144A 9.75% 01/03/2026 USD 6,050,000 6,230,230 0.17
Sprint Corp. 7.875% 15/09/2023 USD 2,555,000 2,820,835 0.08
Sprint Corp. 7.125% 15/06/2024 USD 16,765,000 18,798,008 0.50
Standard Industries, Inc., 144A 4.375% 15/07/2030 USD 9,860,000 10,074,701 0.27
Station Casinos LLC, 144A 4.5% 15/02/2028 USD 9,525,000 9,590,913 0.26
Stericycle, Inc., 144A 5.375% 15/07/2024 USD 7,010,000 7,157,455 0.19
Stericycle, Inc., 144A 3.875% 15/01/2029 USD 7,460,000 7,359,103 0.20
StoneX Group, Inc., 144A 8.625% 15/06/2025 USD 7,892,000 8,391,445 0.22
Summit Materials LLC, 144A 6.5% 15/03/2027 USD 6,168,000 6,408,984 0.17
Summit Materials LLC, 144A 5.25% 15/01/2029 USD 1,915,000 2,001,577 0.05
Sunoco LP, 144A 4.5% 30/04/2030 USD 8,645,000 8,809,385 0.24
Sunoco LP 4.5% 15/05/2029 USD 6,415,000 6,525,466 0.17
SWF Escrow Issuer Corp., 144A 6.5% 01/10/2029 USD 16,870,000 16,239,231 0.43
Targa Resources Partners LP, 144A 4% 15/01/2032 USD 14,055,000 14,711,790 0.39
Targa Resources Partners LP 4.875% 01/02/2031 USD 10,675,000 11,610,984 0.31
Tenet Healthcare Corp., 144A 6.25% 01/02/2027 USD 6,520,000 6,757,035 0.18
Tenet Healthcare Corp., 144A 5.125% 01/11/2027 USD 2,340,000 2,443,054 0.07
Tenet Healthcare Corp., 144A 4.625% 15/06/2028 USD 4,190,000 4,311,280 0.12
Tenet Healthcare Corp., 144A 6.125% 01/10/2028 USD 11,395,000 12,058,816 0.32
Tenneco, Inc., 144A 5.125% 15/04/2029 USD 11,170,000 10,934,816 0.29
T-Mobile USA, Inc. 2.625% 15/04/2026 USD 10,860,000 10,928,472 0.29
T-Mobile USA, Inc. 2.625% 15/02/2029 USD 4,265,000 4,208,403 0.11
TransDigm, Inc. 4.875% 01/05/2029 USD 9,520,000 9,575,264 0.26
TriNet Group, Inc., 144A 3.5% 01/03/2029 USD 12,710,000 12,680,576 0.34
United Airlines, Inc., 144A 4.625% 15/04/2029 USD 11,455,000 11,836,795 0.32
Uniti Group LP, REIT, 144A 4.75% 15/04/2028 USD 5,330,000 5,304,762 0.14
Uniti Group LP, REIT, 144A 6% 15/01/2030 USD 8,115,000 7,820,831 0.21
USA Compression Partners LP 6.875% 01/09/2027 USD 980,000 1,036,154 0.03

Aviva Investors Société d’investissement à capital variable (SICAV)
avivainvestors.com Annual Report and audited financial statements 101
AVIVA INVESTORS - GLOBAL HIGH YIELD BOND FUND (CONTINUED)Portfolio of Investments and Other Net Assets as at 31 December 2021
The accompanying notes form an integral part of these financial statements.
Investments Currency Quantity/
Nominal Value
Market Value
USD
% of Net
Assets0
Venture Global Calcasieu Pass LLC, 144A 3.875% 01/11/2033 USD 6,360,000 6,718,513 0.18
Verscend Escrow Corp., 144A 9.75% 15/08/2026 USD 7,720,000 8,215,239 0.22
Viasat, Inc., 144A 5.625% 15/09/2025 USD 11,140,000 11,209,346 0.30
VICI Properties LP, REIT, 144A 4.125% 15/08/2030 USD 8,465,000 8,966,382 0.24
Vine Energy Holdings LLC, 144A 6.75% 15/04/2029 USD 7,845,000 8,535,399 0.23
Vistra Operations Co. LLC, 144A 5.625% 15/02/2027 USD 7,790,000 8,033,554 0.22
Wabash National Corp., 144A 4.5% 15/10/2028 USD 10,645,000 10,764,756 0.29
WESCO Distribution, Inc., 144A 7.25% 15/06/2028 USD 8,040,000 8,787,238 0.24
Windstream Escrow LLC, 144A 7.75% 15/08/2028 USD 5,415,000 5,750,622 0.15
Zayo Group Holdings, Inc., 144A 4% 01/03/2027 USD 21,735,000 21,325,187 0.57
Zayo Group Holdings, Inc., 144A 6.125% 01/03/2028 USD 5,315,000 5,243,407 0.14
1,887,068,443 50.50
Total Bonds 2,175,168,408 58.21
Total Transferable securities and money market
instruments dealt in on another regulated market 2,175,168,408 58.21
Investments Currency Quantity/
Nominal Value
Market Value
USD
% of Net
Assets0
Other transferable securities and money market instruments
Equities
United States of America
Westmoreland Coal Co. 01/01/2022§ USD 15,951,869 – –
– –
Total Equities – –
Total Other transferable securities and money market
instruments – –
Units of authorised UCITS or other collective investment undertakings
Collective Investment Schemes - UCITS
Ireland
Aviva Investors US Dollar Liquidity Fund - Class 3 Income shares USD† USD 103,400,000 103,400,000 2.77
103,400,000 2.77
Total Collective Investment Schemes - UCITS 103,400,000 2.77
Total Units of authorised UCITS or other collective
investment undertakings 103,400,000 2.77
Total Investments 3,659,025,280 97.92
Cash 41,946,373 1.12
Other assets/(liabilities) 35,937,160 0.96
Total net assets 3,736,908,813 100.00
§Security is valued at its fair value under the direction of Board of Directors.†Related Party Fund.
Geographic Allocation of Portfolio % of Net Assets
United States of America 62.04United Kingdom 4.58Italy 4.47France 4.31Ireland 3.00Netherlands 2.99Luxembourg 2.93Germany 2.88Supranational 2.35Canada 2.32Sweden 1.47Spain 1.28Bermuda 1.17Australia 0.64Panama 0.57Guernsey 0.27Liberia 0.24Jersey 0.22Cayman Islands 0.19Total investments 97.92
Cash and other assets/(liabilities) 2.08Total 100.00
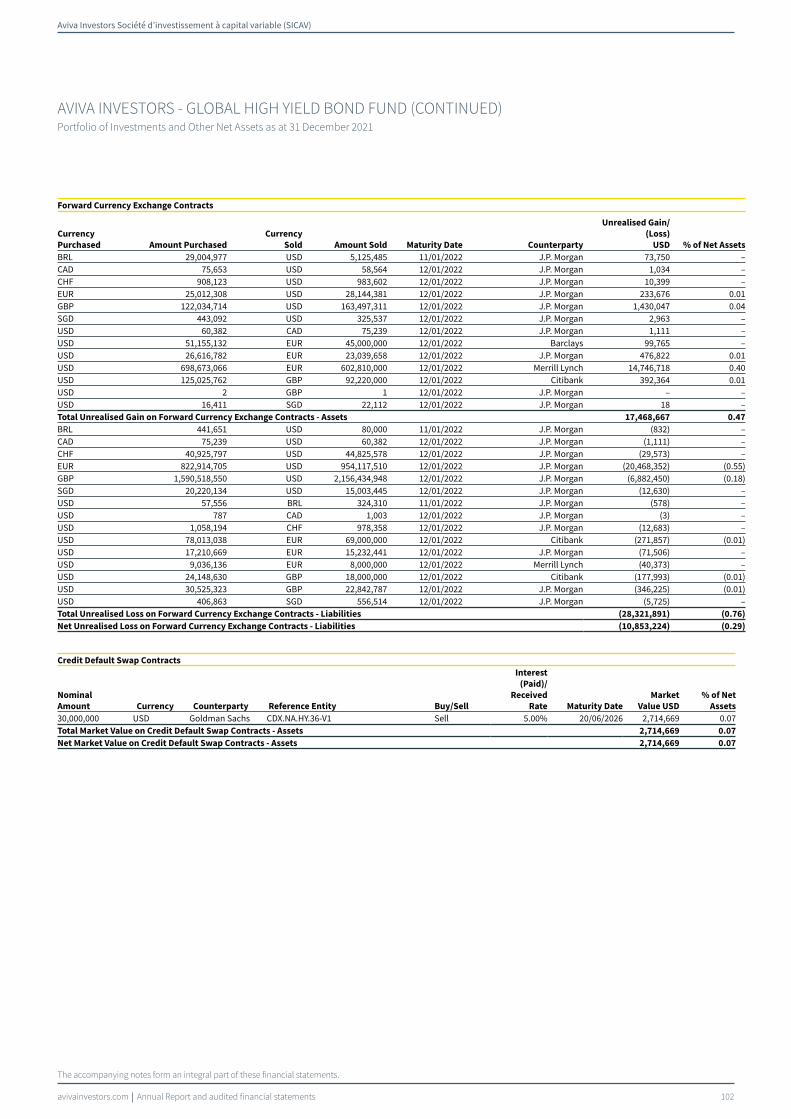
Aviva Investors Société d’investissement à capital variable (SICAV)
avivainvestors.com Annual Report and audited financial statements 102
AVIVA INVESTORS - GLOBAL HIGH YIELD BOND FUND (CONTINUED)Portfolio of Investments and Other Net Assets as at 31 December 2021
The accompanying notes form an integral part of these financial statements.
Forward Currency Exchange Contracts
Currency
Purchased Amount Purchased
Currency
Sold Amount Sold Maturity Date Counterparty
Unrealised Gain/
(Loss)
USD % of Net Assets
BRL 29,004,977 USD 5,125,485 11/01/2022 J.P. Morgan 73,750 –CAD 75,653 USD 58,564 12/01/2022 J.P. Morgan 1,034 –CHF 908,123 USD 983,602 12/01/2022 J.P. Morgan 10,399 –EUR 25,012,308 USD 28,144,381 12/01/2022 J.P. Morgan 233,676 0.01GBP 122,034,714 USD 163,497,311 12/01/2022 J.P. Morgan 1,430,047 0.04SGD 443,092 USD 325,537 12/01/2022 J.P. Morgan 2,963 –USD 60,382 CAD 75,239 12/01/2022 J.P. Morgan 1,111 –USD 51,155,132 EUR 45,000,000 12/01/2022 Barclays 99,765 –USD 26,616,782 EUR 23,039,658 12/01/2022 J.P. Morgan 476,822 0.01USD 698,673,066 EUR 602,810,000 12/01/2022 Merrill Lynch 14,746,718 0.40USD 125,025,762 GBP 92,220,000 12/01/2022 Citibank 392,364 0.01USD 2 GBP 1 12/01/2022 J.P. Morgan – –USD 16,411 SGD 22,112 12/01/2022 J.P. Morgan 18 –Total Unrealised Gain on Forward Currency Exchange Contracts - Assets 17,468,667 0.47
BRL 441,651 USD 80,000 11/01/2022 J.P. Morgan (832) –CAD 75,239 USD 60,382 12/01/2022 J.P. Morgan (1,111) –CHF 40,925,797 USD 44,825,578 12/01/2022 J.P. Morgan (29,573) –EUR 822,914,705 USD 954,117,510 12/01/2022 J.P. Morgan (20,468,352) (0.55)GBP 1,590,518,550 USD 2,156,434,948 12/01/2022 J.P. Morgan (6,882,450) (0.18)SGD 20,220,134 USD 15,003,445 12/01/2022 J.P. Morgan (12,630) –USD 57,556 BRL 324,310 11/01/2022 J.P. Morgan (578) –USD 787 CAD 1,003 12/01/2022 J.P. Morgan (3) –USD 1,058,194 CHF 978,358 12/01/2022 J.P. Morgan (12,683) –USD 78,013,038 EUR 69,000,000 12/01/2022 Citibank (271,857) (0.01)USD 17,210,669 EUR 15,232,441 12/01/2022 J.P. Morgan (71,506) –USD 9,036,136 EUR 8,000,000 12/01/2022 Merrill Lynch (40,373) –USD 24,148,630 GBP 18,000,000 12/01/2022 Citibank (177,993) (0.01)USD 30,525,323 GBP 22,842,787 12/01/2022 J.P. Morgan (346,225) (0.01)USD 406,863 SGD 556,514 12/01/2022 J.P. Morgan (5,725) –Total Unrealised Loss on Forward Currency Exchange Contracts - Liabilities (28,321,891) (0.76)
Net Unrealised Loss on Forward Currency Exchange Contracts - Liabilities (10,853,224) (0.29)
Credit Default Swap Contracts
Nominal
Amount Currency Counterparty Reference Entity Buy/Sell
Interest
(Paid)/
Received
Rate Maturity Date
Market
Value USD
% of Net
Assets
30,000,000 USD Goldman Sachs CDX.NA.HY.36-V1 Sell 5.00% 20/06/2026 2,714,669 0.07Total Market Value on Credit Default Swap Contracts - Assets 2,714,669 0.07
Net Market Value on Credit Default Swap Contracts - Assets 2,714,669 0.07

Aviva Investors Société d’investissement à capital variable (SICAV)
avivainvestors.com Annual Report and audited financial statements 103
The accompanying notes form an integral part of these financial statements.
AVIVA INVESTORS - GLOBAL INVESTMENT GRADE CORPORATE BOND FUNDPortfolio of Investments and Other Net Assets as at 31 December 2021
Investments Currency Quantity/
Nominal Value
Market Value
USD
% of Net
Assets0
Transferable securities and money market instruments admitted to an official
exchange listing
Bonds
Australia
Westfield America Management Ltd., REIT, Reg. S 2.625% 30/03/2029 GBP 12,000,000 16,326,332 0.30
16,326,332 0.30
Belgium
Anheuser-Busch InBev SA, Reg. S 1.125% 01/07/2027 EUR 10,000,000 11,799,696 0.22
Anheuser-Busch InBev SA/NV, Reg. S 2.75% 17/03/2036 EUR 7,450,000 10,018,122 0.19
21,817,818 0.41
Canada
Canadian Pacific Railway Co. 3% 02/12/2041 USD 7,380,000 7,496,985 0.14
Cenovus Energy, Inc. 2.65% 15/01/2032 USD 8,690,000 8,461,672 0.16
Toronto-Dominion Bank (The) 2.496% 02/12/2024 CAD 10,000,000 8,053,819 0.15
VW Credit Canada, Inc. 1.2% 25/09/2023 CAD 10,000,000 7,844,565 0.14
31,857,041 0.59
Cayman Islands
Vale Overseas Ltd. 3.75% 08/07/2030 USD 32,395,000 33,585,192 0.63
33,585,192 0.63
Chile
Chile Government Bond 2.55% 27/07/2033 USD 25,000,000 24,401,563 0.46
24,401,563 0.46
Colombia
Ecopetrol SA 4.125% 16/01/2025 USD 27,500,000 27,976,163 0.52
Ecopetrol SA 6.875% 29/04/2030 USD 10,000,000 11,161,450 0.21
39,137,613 0.73
Denmark
Danske Bank A/S, Reg. S 2.25% 14/01/2028 GBP 23,800,000 32,355,036 0.60
32,355,036 0.60
Germany
HOWOGE Wohnungs-baugesellschaft mbH, Reg. S 0.625% 01/11/2028 EUR 10,800,000 12,293,546 0.23
Vonovia SE, Reg. S 0.375% 16/06/2027 EUR 7,000,000 7,858,744 0.15
20,152,290 0.38
Hong Kong
Bank of East Asia Ltd. (The), Reg. S, FRN 4% 29/05/2030 USD 22,026,000 22,736,889 0.42
22,736,889 0.42
Ireland
AerCap Ireland Capital DAC 3% 29/10/2028 USD 15,134,000 15,361,968 0.29
15,361,968 0.29
Israel
Israel Electric Corp. Ltd., Reg. S 6.875% 21/06/2023 USD 11,000,000 11,883,300 0.22
11,883,300 0.22
Italy
Enel SpA, Reg. S 1.875% Perpetual EUR 10,368,000 11,425,468 0.22
Investments Currency Quantity/
Nominal Value
Market Value
USD
% of Net
Assets0
Eni SpA, Reg. S 2% Perpetual EUR 10,000,000 11,308,520 0.21
Eni SpA, Reg. S 2.75% Perpetual EUR 10,522,000 11,950,508 0.22
Eni SpA, Reg. S 3.375% Perpetual EUR 17,000,000 20,275,199 0.38
54,959,695 1.03
Luxembourg
Aroundtown SA, Reg. S 0.375% 15/04/2027 EUR 19,700,000 21,828,694 0.41
Blackstone Property Partners Europe Holdings Sarl, Reg. S 2% 20/10/2025 GBP 24,000,000 32,296,057 0.60
Blackstone Property Partners Europe Holdings Sarl, Reg. S 1.625% 20/04/2030 EUR 13,720,000 15,591,443 0.29
CK Hutchison Group Telecom Finance SA, Reg. S 2% 17/10/2027 GBP 9,800,000 13,226,311 0.25
CK Hutchison Group Telecom Finance SA, Reg. S 1.5% 17/10/2031 EUR 25,800,000 29,772,766 0.56
Logicor Financing Sarl, Reg. S 0.75% 15/07/2024 EUR 15,000,000 17,223,802 0.32
Logicor Financing Sarl, Reg. S 1.625% 15/07/2027 EUR 20,620,000 24,269,478 0.45
Logicor Financing Sarl, Reg. S 0.875% 14/01/2031 EUR 20,200,000 21,787,656 0.41
175,996,207 3.29
Netherlands
Abertis Infraestructuras Finance BV, Reg. S 3.248% Perpetual EUR 9,800,000 11,355,904 0.21
Akelius Residential Property Financing BV, Reg. S 0.75% 22/02/2030 EUR 16,110,000 17,307,299 0.32
Heimstaden Bostad Treasury BV 1.375% 03/03/2027 EUR 10,000,000 11,625,069 0.22
Iberdrola International BV, Reg. S 2.25% Perpetual EUR 10,200,000 11,821,759 0.22
ING Groep NV, Reg. S, FRN 2.125% 26/05/2031 EUR 30,000,000 35,653,846 0.67
Upjohn Finance BV, Reg. S 1.908% 23/06/2032 EUR 32,046,000 38,080,058 0.71
Volkswagen Financial Services NV, Reg. S 2.125% 27/06/2024 GBP 10,400,000 14,249,331 0.27
Vonovia Finance BV, Reg. S 1.625% 07/10/2039 EUR 12,600,000 14,167,508 0.26
154,260,774 2.88
Norway
Aker BP ASA, Reg. S 1.125% 12/05/2029 EUR 31,500,000 35,571,134 0.66
35,571,134 0.66
Spain
Banco Santander SA, Reg. S 2.25% 04/10/2032 GBP 31,200,000 41,507,803 0.78
Banco Santander SA, Reg. S 1.75% 17/02/2027 GBP 20,000,000 26,807,732 0.50
68,315,535 1.28

Aviva Investors Société d’investissement à capital variable (SICAV)
avivainvestors.com Annual Report and audited financial statements 104
AVIVA INVESTORS - GLOBAL INVESTMENT GRADE CORPORATE BOND FUND (CONTINUED)Portfolio of Investments and Other Net Assets as at 31 December 2021
The accompanying notes form an integral part of these financial statements.
Investments Currency Quantity/
Nominal Value
Market Value
USD
% of Net
Assets0
Supranational
Allied Universal Holdco LLC, Reg. S 4.875% 01/06/2028 GBP 8,767,000 11,530,169 0.22
11,530,169 0.22
Sweden
Heimstaden Bostad AB, Reg. S 3.248% 31/12/2164 EUR 10,000,000 11,393,429 0.21
11,393,429 0.21
Switzerland
Credit Suisse Group AG, Reg. S, FRN 1% 24/06/2027 EUR 18,658,000 21,449,024 0.40
21,449,024 0.40
United Arab Emirates
First Abu Dhabi Bank PJSC, Reg. S 0.125% 16/02/2026 EUR 36,268,000 40,981,240 0.77
First Abu Dhabi Bank PJSC, Reg. S 1.125% 07/09/2026 GBP 25,287,000 33,473,759 0.62
74,454,999 1.39
United Kingdom
Barclays plc, Reg. S, FRN 3.375% 02/04/2025 EUR 26,955,000 32,801,184 0.61
Barclays plc, Reg. S 1.106% 12/05/2032 EUR 24,815,000 27,961,825 0.52
Barclays plc, Reg. S 4% 26/06/2029 AUD 2,750,000 2,082,002 0.04
HSBC Holdings plc 1.75% 24/07/2027 GBP 14,500,000 19,367,309 0.36
Imperial Brands Finance plc, Reg. S 2.125% 12/02/2027 EUR 8,367,000 9,972,189 0.19
NatWest Group plc, Reg. S 2.875% 19/09/2026 GBP 25,000,000 35,032,571 0.66
NatWest Group plc, Reg. S 0.78% 26/02/2030 EUR 18,242,000 20,444,025 0.38
NatWest Group plc, Reg. S 2.105% 28/11/2031 GBP 37,507,000 49,904,259 0.93
Pinewood Finance Co. Ltd., Reg. S 3.625% 15/11/2027 GBP 8,298,000 11,204,373 0.21
SSE plc, Reg. S 3.74% Perpetual GBP 6,119,000 8,497,249 0.16
Standard Chartered plc, Reg. S, FRN 2.5% 09/09/2030 EUR 44,351,000 52,767,868 0.99
Standard Chartered plc, Reg. S 1.2% 23/09/2031 EUR 15,506,000 17,562,203 0.33
Tesco Property Finance 4 plc, Reg. S 11.601% 13/10/2040 GBP 19,579,354 34,327,044 0.64
Vodafone Group plc, Reg. S 2.625% 27/08/2080 EUR 20,000,000 23,141,351 0.43
Vodafone Group plc, Reg. S 2.5% 24/05/2039 EUR 5,000,000 6,421,521 0.12
Vodafone Group plc, Reg. S 3.375% 08/08/2049 GBP 5,000,000 7,544,591 0.14
359,031,564 6.71
United States of America
Ally Financial, Inc. 1.45% 02/10/2023 USD 15,900,000 15,957,671 0.30
Altria Group, Inc. 4.4% 14/02/2026 USD 17,371,000 19,131,638 0.36
Altria Group, Inc. 4.8% 14/02/2029 USD 7,337,000 8,280,215 0.15
American International Group, Inc. 3.9% 01/04/2026 USD 15,000,000 16,280,041 0.30
Investments Currency Quantity/
Nominal Value
Market Value
USD
% of Net
Assets0
American International Group, Inc. 3.4% 30/06/2030 USD 30,000,000 32,464,617 0.61
American International Group, Inc. 4.5% 16/07/2044 USD 11,825,000 14,481,520 0.27
Arthur J Gallagher & Co. 2.4% 09/11/2031 USD 42,430,000 41,767,348 0.78
AT&T, Inc. 1.7% 25/03/2026 USD 5,445,000 5,424,637 0.10
AT&T, Inc. 2.75% 01/06/2031 USD 25,000,000 25,517,314 0.48
Bank of America Corp. 3.95% 21/04/2025 USD 15,000,000 16,051,481 0.30
Bank of America Corp., Reg. S 0.583% 24/08/2028 EUR 28,854,000 32,694,585 0.61
Bank of America Corp., Reg. S 1.667% 02/06/2029 GBP 37,271,000 49,773,843 0.93
BAT Capital Corp. 2.259% 25/03/2028 USD 45,500,000 44,381,972 0.83
Berkshire Hathaway Energy Co. 3.8% 15/07/2048 USD 15,000,000 16,712,862 0.31
Berkshire Hathaway Finance Corp. 2.85% 15/10/2050 USD 12,005,000 11,815,759 0.22
Boeing Co. (The) 1.433% 04/02/2024 USD 28,380,000 28,356,059 0.53
Boeing Co. (The) 2.196% 04/02/2026 USD 20,000,000 20,000,333 0.37
Boeing Co. (The) 2.7% 01/02/2027 USD 30,890,000 31,447,391 0.59
Boeing Co. (The) 5.15% 01/05/2030 USD 10,435,000 12,186,522 0.23
Choice Hotels International, Inc. 3.7% 15/01/2031 USD 21,105,000 22,455,952 0.42
Citigroup, Inc. 3.7% 12/01/2026 USD 68,502,000 74,132,410 1.39
Consumers Energy Co. 2.5% 01/05/2060 USD 4,285,000 3,756,662 0.07
CVS Health Corp. 3% 15/08/2026 USD 14,580,000 15,400,124 0.29
Danaher Corp. 2.8% 10/12/2051 USD 15,000,000 14,728,537 0.28
Delta Air Lines, Inc. 2.9% 28/10/2024 USD 20,185,000 20,521,830 0.38
Duke Energy Carolinas LLC 3.2% 15/08/2049 USD 20,000,000 20,682,694 0.39
Duke Energy Carolinas LLC 3.45% 15/04/2051 USD 15,000,000 16,468,313 0.31
Duke Energy Corp. 3.3% 15/06/2041 USD 27,640,000 27,974,520 0.52
Energy Transfer LP 5.15% 15/03/2045 USD 20,000,000 22,592,039 0.42
Energy Transfer LP 5% 15/05/2050 USD 10,000,000 11,452,333 0.21
Entergy Louisiana LLC 3.1% 15/06/2041 USD 10,000,000 10,271,419 0.19
Essential Utilities, Inc. 2.4% 01/05/2031 USD 17,375,000 17,286,694 0.32
Exxon Mobil Corp. 3.482% 19/03/2030 USD 25,000,000 27,360,797 0.51
Exxon Mobil Corp. 3.567% 06/03/2045 USD 13,980,000 15,150,019 0.28
Florida Power & Light Co. 3.15% 01/10/2049 USD 15,000,000 16,026,018 0.30
Ford Motor Credit Co. LLC 2.748% 14/06/2024 GBP 18,407,000 25,076,276 0.47

Aviva Investors Société d’investissement à capital variable (SICAV)
avivainvestors.com Annual Report and audited financial statements 105
AVIVA INVESTORS - GLOBAL INVESTMENT GRADE CORPORATE BOND FUND (CONTINUED)Portfolio of Investments and Other Net Assets as at 31 December 2021
The accompanying notes form an integral part of these financial statements.
Investments Currency Quantity/
Nominal Value
Market Value
USD
% of Net
Assets0
General Motors Financial Co., Inc. 5.25% 01/03/2026 USD 31,989,000 35,920,795 0.67
Goldman Sachs Group, Inc. (The) 3.5% 01/04/2025 USD 30,000,000 31,770,586 0.59
Goldman Sachs Group, Inc. (The) 4.25% 21/10/2025 USD 30,000,000 32,758,408 0.61
Goldman Sachs Group, Inc. (The) 3.5% 16/11/2026 USD 20,000,000 21,334,077 0.40
Goldman Sachs Group, Inc. (The) 3.85% 26/01/2027 USD 41,000,000 44,108,879 0.82
Hewlett Packard Enterprise Co. 4.45% 02/10/2023 USD 30,075,000 31,753,020 0.59
Hewlett Packard Enterprise Co. 1.45% 01/04/2024 USD 30,500,000 30,718,361 0.57
HP, Inc. 3% 17/06/2027 USD 22,695,000 23,896,216 0.45
Jefferies Group LLC 4.85% 15/01/2027 USD 17,995,000 20,437,611 0.38
Jefferies Group LLC 2.625% 15/10/2031 USD 34,110,000 33,730,172 0.63
Johnson & Johnson 2.1% 01/09/2040 USD 43,300,000 40,939,243 0.77
JPMorgan Chase & Co. 3.3% 01/04/2026 USD 20,000,000 21,347,333 0.40
JPMorgan Chase & Co., Reg. S, FRN 1.001% 25/07/2031 EUR 23,000,000 26,478,813 0.49
JPMorgan Chase & Co., Reg. S 0.597% 17/02/2033 EUR 10,000,000 10,957,067 0.20
Martin Marietta Materials, Inc. 2.4% 15/07/2031 USD 34,685,000 34,550,071 0.65
Mastercard, Inc. 3.85% 26/03/2050 USD 7,169,000 8,591,874 0.16
Morgan Stanley 0.495% 26/10/2029 EUR 25,467,000 28,393,544 0.53
Morgan Stanley 1.102% 29/04/2033 EUR 19,608,000 22,267,933 0.42
Morgan Stanley 4% 23/07/2025 USD 10,000,000 10,850,714 0.20
Morgan Stanley 3.125% 27/07/2026 USD 20,000,000 21,217,377 0.40
MPT Operating Partnership LP, REIT 2.5% 24/03/2026 GBP 10,000,000 13,489,902 0.25
NextEra Energy Capital Holdings, Inc. 2.44% 15/01/2032 USD 19,695,000 19,728,135 0.37
NIKE, Inc. 3.375% 27/03/2050 USD 15,000,000 16,933,077 0.32
Omnicom Group, Inc. 2.6% 01/08/2031 USD 9,600,000 9,733,044 0.18
Oracle Corp. 2.8% 01/04/2027 USD 20,000,000 20,642,957 0.39
Oracle Corp. 3.95% 25/03/2051 USD 16,640,000 17,285,149 0.32
Pacific Gas and Electric Co. 1.75% 16/06/2022 USD 42,615,000 42,615,316 0.80
Pacific Gas and Electric Co. 2.1% 01/08/2027 USD 16,375,000 15,849,187 0.30
Phillips 66 Partners LP 4.9% 01/10/2046 USD 4,920,000 5,986,566 0.11
Raytheon Technologies Corp. 4.125% 16/11/2028 USD 20,000,000 22,384,035 0.42
Raytheon Technologies Corp. 2.15% 18/05/2030 EUR 13,000,000 16,229,671 0.30
Investments Currency Quantity/
Nominal Value
Market Value
USD
% of Net
Assets0
Raytheon Technologies Corp. 4.5% 01/06/2042 USD 32,785,000 40,646,099 0.76
Republic Services, Inc. 1.45% 15/02/2031 USD 30,405,000 28,298,632 0.53
Roper Technologies, Inc. 2.95% 15/09/2029 USD 20,000,000 20,700,381 0.39
Roper Technologies, Inc. 2% 30/06/2030 USD 16,815,000 16,178,752 0.30
salesforce.com, Inc. 2.9% 15/07/2051 USD 18,505,000 18,806,528 0.35
Simon Property Group LP, REIT 3.5% 01/09/2025 USD 10,000,000 10,669,917 0.20
Simon Property Group LP, REIT 1.75% 01/02/2028 USD 28,490,000 27,964,403 0.52
Sysco Corp. 2.45% 14/12/2031 USD 10,000,000 10,035,656 0.19
Sysco Corp. 6.6% 01/04/2050 USD 6,473,000 10,065,703 0.19
Thermo Fisher Scientific, Inc. 1.875% 01/10/2049 EUR 3,000,000 3,498,544 0.07
T-Mobile USA, Inc. 3.875% 15/04/2030 USD 36,820,000 40,323,182 0.75
Travelers Cos., Inc. (The) 4.1% 04/03/2049 USD 11,000,000 13,323,421 0.25
TSMC Arizona Corp. 2.5% 25/10/2031 USD 15,385,000 15,590,865 0.29
Union Pacific Corp. 3.2% 20/05/2041 USD 52,385,000 55,610,909 1.04
UnitedHealth Group, Inc. 3.05% 15/05/2041 USD 20,000,000 20,861,488 0.39
Verizon Communications, Inc. 0.875% 19/03/2032 EUR 12,775,000 14,388,088 0.27
Verizon Communications, Inc. 1.125% 19/09/2035 EUR 25,000,000 27,723,708 0.52
Verizon Communications, Inc. 1.85% 18/05/2040 EUR 10,000,000 11,913,088 0.22
Verizon Communications, Inc. 3.4% 22/03/2041 USD 25,000,000 26,221,930 0.49
Verizon Communications, Inc. 2.875% 20/11/2050 USD 17,505,000 16,511,850 0.31
Waste Management, Inc. 1.5% 15/03/2031 USD 21,000,000 19,790,290 0.37
Wells Fargo & Co. 3% 22/04/2026 USD 20,000,000 21,038,777 0.39
Wells Fargo & Co. 3% 23/10/2026 USD 20,000,000 21,036,791 0.39
Westlake Chemical Corp. 1.625% 17/07/2029 EUR 16,053,000 18,886,164 0.35
2,047,046,744 38.24
Total Bonds 3,283,624,316 61.34
Total Transferable securities and money market
instruments admitted to an official exchange listing 3,283,624,316 61.34
Transferable securities and money market instruments dealt in on another
regulated market
Bonds
Australia
Australia & New Zealand Banking Group Ltd., 144A 2.57% 25/11/2035 USD 5,090,000 4,877,656 0.09
Commonwealth Bank of Australia, 144A 2.688% 11/03/2031 USD 46,205,000 45,466,974 0.85
50,344,630 0.94

Aviva Investors Société d’investissement à capital variable (SICAV)
avivainvestors.com Annual Report and audited financial statements 106
AVIVA INVESTORS - GLOBAL INVESTMENT GRADE CORPORATE BOND FUND (CONTINUED)Portfolio of Investments and Other Net Assets as at 31 December 2021
The accompanying notes form an integral part of these financial statements.
Investments Currency Quantity/
Nominal Value
Market Value
USD
% of Net
Assets0
Canada
Algonquin Power Co. 4.09% 17/02/2027 CAD 7,657,000 6,524,961 0.12
AltaGas Ltd. 2.075% 30/05/2028 CAD 15,000,000 11,395,729 0.21
Bell Telephone Co. 3.35% 12/03/2025 CAD 15,000,000 12,315,216 0.23
Bell Telephone Co. 2.5% 14/05/2030 CAD 34,000,000 26,441,342 0.49
Bell Telephone Co. of Canada 3.35% 22/03/2023 CAD 5,000,000 4,017,284 0.08
Bell Telephone Co. of Canada 3% 17/03/2031 CAD 10,000,000 7,979,965 0.15
Canadian Natural Resources Ltd. 2.5% 17/01/2028 CAD 8,000,000 6,291,408 0.12
Capital Power Corp. 4.284% 18/09/2024 CAD 20,000,000 16,632,004 0.31
Cenovus Energy, Inc. 3.5% 07/02/2028 CAD 1,000,000 822,122 0.02
Cenovus Energy, Inc. 3.5% 07/02/2028 CAD 10,000,000 8,221,222 0.15
Enbridge, Inc. 3.19% 05/12/2022 CAD 10,000,000 8,010,737 0.15
Enbridge, Inc. 3.94% 30/06/2023 CAD 10,000,000 8,111,672 0.15
EPCOR Utilities, Inc. 3.554% 27/11/2047 CAD 5,000,000 4,268,783 0.08
Honda Canada Finance, Inc. 2.537% 01/03/2023 CAD 5,000,000 3,999,830 0.07
Inter Pipeline Ltd. 3.983% 25/11/2031 CAD 10,000,000 8,073,514 0.15
Royal Bank of Canada 2.609% 01/11/2024 CAD 10,000,000 8,062,436 0.15
TELUS Corp. 3.15% 19/02/2030 CAD 10,000,000 8,148,599 0.15
Toronto-Dominion Bank (The) 1.943% 13/03/2025 CAD 10,000,000 7,920,881 0.15
TransCanada PipeLines Ltd. 3.8% 05/04/2027 CAD 10,000,000 8,415,706 0.16
165,653,411 3.09
Netherlands
Deutsche Telekom International Finance BV, 144A 4.375% 21/06/2028 USD 10,974,000 12,256,305 0.23
Enel Finance International NV, 144A 1.375% 12/07/2026 USD 28,165,000 27,469,914 0.51
39,726,219 0.74
Supranational
Allied Universal Holdco LLC, 144A 4.625% 01/06/2028 USD 20,000,000 19,865,100 0.37
Delta Air Lines, Inc., 144A 4.75% 20/10/2028 USD 25,000,000 27,334,684 0.51
47,199,784 0.88
Switzerland
UBS Group AG, 144A 4.125% 24/09/2025 USD 34,000,000 36,755,254 0.69
36,755,254 0.69
United Kingdom
BAE Systems plc, 144A 1.9% 15/02/2031 USD 36,920,000 35,060,805 0.65
Royalty Pharma plc 3.35% 02/09/2051 USD 16,000,000 15,287,681 0.29
50,348,486 0.94
Investments Currency Quantity/
Nominal Value
Market Value
USD
% of Net
Assets0
United States of America
7-Eleven, Inc., 144A 0.8% 10/02/2024 USD 15,324,000 15,159,497 0.28
AbbVie, Inc. 4.05% 21/11/2039 USD 20,780,000 23,798,871 0.44
Alphabet, Inc. 1.9% 15/08/2040 USD 13,445,000 12,209,946 0.23
Amazon.com, Inc. 2.875% 12/05/2041 USD 68,535,000 70,959,509 1.33
Amazon.com, Inc. 4.05% 22/08/2047 USD 26,107,000 31,627,765 0.59
Apple, Inc. 3.85% 04/05/2043 USD 25,000,000 29,363,186 0.55
Arch Capital Finance LLC 4.011% 15/12/2026 USD 18,074,000 19,854,901 0.37
AT&T, Inc. 2.55% 01/12/2033 USD 28,022,000 27,347,013 0.51
AT&T, Inc. 3.1% 01/02/2043 USD 20,000,000 19,389,115 0.36
AT&T, Inc. 5.1% 25/11/2048 CAD 11,223,000 10,395,381 0.19
Bank of America Corp. 3.301% 24/04/2024 CAD 25,000,000 20,156,089 0.38
Bank of America Corp., FRN 3.559% 23/04/2027 USD 69,160,000 74,031,800 1.38
Bank of America Corp. 3.97% 05/03/2029 USD 60,000,000 65,682,795 1.23
Bank of America Corp. 1.898% 23/07/2031 USD 20,005,000 19,188,401 0.36
Bank of America Corp. 3.311% 22/04/2042 USD 47,150,000 49,411,509 0.92
Bayer US Finance LLC, 144A 3.375% 08/10/2024 USD 32,275,000 33,766,677 0.63
Berkshire Hathaway Energy Co. 2.85% 15/05/2051 USD 28,815,000 27,651,832 0.52
Berry Global, Inc., 144A 4.875% 15/07/2026 USD 33,760,000 34,966,245 0.65
Broadcom, Inc., 144A 2.45% 15/02/2031 USD 19,400,000 19,018,923 0.36
Charter Communications Operating LLC 3.75% 15/02/2028 USD 15,000,000 16,077,941 0.30
Charter Communications Operating LLC 3.5% 01/03/2042 USD 15,415,000 15,011,049 0.28
Charter Communications Operating LLC 3.9% 01/06/2052 USD 12,000,000 12,014,440 0.22
Cheniere Energy Partners LP, 144A 3.25% 31/01/2032 USD 18,000,000 18,261,000 0.34
Citigroup, Inc., FRN 3.887% 10/01/2028 USD 71,680,000 77,795,933 1.45
Comcast Corp. 2.65% 01/02/2030 USD 40,000,000 41,504,840 0.78
Comcast Corp. 3.75% 01/04/2040 USD 20,000,000 22,340,547 0.42
Dell International LLC, 144A 3.375% 15/12/2041 USD 7,000,000 6,919,834 0.13
Devon Energy Corp., 144A 5.25% 15/09/2024 USD 13,000,000 14,076,359 0.26
Devon Energy Corp., 144A 4.5% 15/01/2030 USD 11,229,000 12,025,947 0.23
Discovery Communications LLC 4.65% 15/05/2050 USD 10,000,000 11,724,074 0.22
eBay, Inc. 3.65% 10/05/2051 USD 10,815,000 11,741,008 0.22

Aviva Investors Société d’investissement à capital variable (SICAV)
avivainvestors.com Annual Report and audited financial statements 107
AVIVA INVESTORS - GLOBAL INVESTMENT GRADE CORPORATE BOND FUND (CONTINUED)Portfolio of Investments and Other Net Assets as at 31 December 2021
The accompanying notes form an integral part of these financial statements.
Investments Currency Quantity/
Nominal Value
Market Value
USD
% of Net
Assets0
Electronic Arts, Inc. 2.95% 15/02/2051 USD 11,799,000 11,101,943 0.21
Energy Transfer LP 5.875% 15/01/2024 USD 32,961,000 35,587,452 0.67
Energy Transfer LP 5.5% 01/06/2027 USD 48,565,000 55,406,761 1.04
Goldman Sachs Group, Inc. (The), FRN 3.272% 29/09/2025 USD 30,803,000 32,313,453 0.60
Goldman Sachs Group, Inc. (The) 1.431% 09/03/2027 USD 26,440,000 25,923,405 0.48
Goldman Sachs Group, Inc. (The) 1.542% 10/09/2027 USD 17,757,000 17,416,222 0.33
Goldman Sachs Group, Inc. (The) 1.948% 21/10/2027 USD 25,000,000 24,945,306 0.47
JPMorgan Chase & Co. 2.083% 22/04/2026 USD 25,000,000 25,402,559 0.47
JPMorgan Chase & Co., FRN 3.702% 06/05/2030 USD 40,855,000 44,675,362 0.83
JPMorgan Chase & Co. 1.764% 19/11/2031 USD 25,615,000 24,295,912 0.45
JPMorgan Chase & Co. 1.953% 04/02/2032 USD 23,390,000 22,542,473 0.42
JPMorgan Chase & Co. 3.157% 22/04/2042 USD 41,010,000 42,683,925 0.80
Microsoft Corp. 2.921% 17/03/2052 USD 24,383,000 25,888,393 0.48
Morgan Stanley 0.985% 10/12/2026 USD 61,430,000 59,611,149 1.11
Morgan Stanley 1.779% 04/08/2027 CAD 40,000,000 30,800,693 0.58
Morgan Stanley, FRN 4.431% 23/01/2030 USD 30,000,000 34,205,983 0.64
Newmont Corp. 2.6% 15/07/2032 USD 20,000,000 20,001,870 0.37
Nordstrom, Inc. 4.25% 01/08/2031 USD 20,000,000 19,680,300 0.37
Pacific Gas and Electric Co. 3.15% 01/01/2026 USD 21,400,000 21,918,995 0.41
Targa Resources Partners LP, 144A 4% 15/01/2032 USD 9,925,000 10,388,795 0.19
T-Mobile USA, Inc., 144A 2.7% 15/03/2032 USD 11,470,000 11,551,241 0.22
T-Mobile USA, Inc. 3.375% 15/04/2029 USD 16,595,000 16,942,831 0.32
Utah Acquisition Sub, Inc. 3.95% 15/06/2026 USD 7,142,000 7,711,740 0.14
Venture Global Calcasieu Pass LLC, 144A 3.875% 01/11/2033 USD 13,735,000 14,509,242 0.27
Verizon Communications, Inc. 4.329% 21/09/2028 USD 14,925,000 16,962,370 0.32
Verizon Communications, Inc. 3.625% 16/05/2050 CAD 15,000,000 11,685,608 0.22
Verizon Communications, Inc. 4.05% 22/03/2051 CAD 5,000,000 4,183,235 0.08
VICI Properties LP, REIT, 144A 4.25% 01/12/2026 USD 8,130,000 8,425,241 0.16
Wells Fargo & Co., FRN 2.164% 11/02/2026 USD 24,229,000 24,613,143 0.46
Investments Currency Quantity/
Nominal Value
Market Value
USD
% of Net
Assets0
WRKCo, Inc. 4% 15/03/2028 USD 14,685,000 16,242,471 0.30
1,581,090,500 29.54
Total Bonds 1,971,118,284 36.82
Total Transferable securities and money market
instruments dealt in on another regulated market 1,971,118,284 36.82
Units of authorised UCITS or other collective investment undertakings
Collective Investment Schemes - UCITS
Ireland
Aviva Investors Euro Liquidity Fund - Class 3 Income shares EUR† EUR 162,118 17,806,033 0.33
Aviva Investors Sterling Liquidity Funds plc - Class 3 Income shares GBP† GBP 900,000 1,216,350 0.02
Aviva Investors US Dollar Liquidity Fund - Class 3 Income shares USD† USD 34,000,000 34,000,000 0.64
53,022,383 0.99
Total Collective Investment Schemes - UCITS 53,022,383 0.99
Total Units of authorised UCITS or other collective
investment undertakings 53,022,383 0.99
Total Investments 5,307,764,983 99.15
Cash 13,249,504 0.25
Other assets/(liabilities) 32,278,324 0.60
Total net assets 5,353,292,811 100.00
†Related Party Fund.

Aviva Investors Société d’investissement à capital variable (SICAV)
avivainvestors.com Annual Report and audited financial statements 108
AVIVA INVESTORS - GLOBAL INVESTMENT GRADE CORPORATE BOND FUND (CONTINUED)Portfolio of Investments and Other Net Assets as at 31 December 2021
The accompanying notes form an integral part of these financial statements.
Geographic Allocation of Portfolio % of Net Assets
United States of America 67.78United Kingdom 7.65Canada 3.68Netherlands 3.62Luxembourg 3.29United Arab Emirates 1.39Ireland 1.28Spain 1.28Australia 1.24Supranational 1.10Switzerland 1.09Italy 1.03Colombia 0.73Norway 0.66Cayman Islands 0.63Denmark 0.60Chile 0.46Hong Kong 0.42Belgium 0.41Germany 0.38Israel 0.22Sweden 0.21Total investments 99.15
Cash and other assets/(liabilities) 0.85Total 100.00
Forward Currency Exchange Contracts
Currency
Purchased Amount Purchased
Currency
Sold Amount Sold Maturity Date Counterparty
Unrealised Gain/
(Loss)
USD % of Net Assets
EUR 14,198,616 USD 16,037,424 11/01/2022 J.P. Morgan 71,474 –GBP 3,880,703,128 USD 5,240,218,044 11/01/2022 J.P. Morgan 4,484,180 0.09USD 253,364,740 CAD 319,669,000 11/01/2022 J.P. Morgan 1,537,099 0.03USD 36,545,917 EUR 31,725,423 11/01/2022 J.P. Morgan 552,157 0.01USD 144,179,733 GBP 106,564,874 11/01/2022 J.P. Morgan 159,175 –Total Unrealised Gain on Forward Currency Exchange Contracts - Assets 6,804,085 0.13
EUR 33,659,584 USD 38,781,760 11/01/2022 J.P. Morgan (593,617) (0.01)GBP 27,501,890 USD 37,332,605 11/01/2022 J.P. Morgan (164,283) –USD 2,147,048 AUD 3,000,000 11/01/2022 Merrill Lynch (31,515) –USD 7,736,469 CAD 10,000,000 11/01/2022 Citibank (141,294) –USD 449,367,849 EUR 397,250,000 11/01/2022 HSBC (1,328,152) (0.03)USD 15,246,330 EUR 13,501,040 11/01/2022 J.P. Morgan (71,140) –USD 456,143,435 EUR 403,750,000 11/01/2022 UBS (1,927,077) (0.04)USD 455,600,079 GBP 343,875,000 11/01/2022 Citibank (9,140,953) (0.17)USD 436,765,744 GBP 324,916,306 11/01/2022 J.P. Morgan (2,352,946) (0.05)USD 6,647,850 GBP 5,000,000 11/01/2022 UBS (109,562) –Total Unrealised Loss on Forward Currency Exchange Contracts - Liabilities (15,860,539) (0.30)
Net Unrealised Loss on Forward Currency Exchange Contracts - Liabilities (9,056,454) (0.17)
Financial Futures Contracts
Security Description
Number of
Contracts Currency
Unrealised Gain/(Loss)
USD % of Net Assets
Australia 10 Year Bond, 15/03/2022 82 AUD 8,615 –
Euro-Bund, 08/03/2022 (217) EUR 728,102 0 .01
Euro-Buxl 30 Year Bond, 08/03/2022 (22) EUR 230,597 0 .01
US 10 Year Ultra Bond, 22/03/2022 (98) USD 160,576 –
Total Unrealised Gain on Financial Futures Contracts - Assets 1,127,890 0.02
Canada 10 Year Bond, 22/03/2022 (130) CAD (399,838) (0 .01)
Euro-Bobl, 08/03/2022 497 EUR (581,483) (0 .01)
Japan 10 Year Bond, 14/03/2022 29 JPY (78,118) –
Swiss Fed Bond, 08/03/2022 64 CHF (122,796) –
Total Unrealised Loss on Financial Futures Contracts - Liabilities (1,182,235) (0.02)
Net Unrealised Loss on Financial Futures Contracts - Liabilities (54,345) –

Aviva Investors Société d’investissement à capital variable (SICAV)
avivainvestors.com Annual Report and audited financial statements 109
The accompanying notes form an integral part of these financial statements.
AVIVA INVESTORS - MULTI-STRATEGY TARGET RETURN FUNDPortfolio of Investments and Other Net Assets as at 31 December 2021
Investments Currency Quantity/
Nominal Value
Market Value
EUR
% of Net
Assets0
Transferable securities and money market instruments admitted to an official
exchange listing
Equities
Austria
OMV AG EUR 7,875 394,144 0.03
394,144 0.03
Belgium
Etablissements Franz Colruyt NV EUR 7,907 295,050 0.03
Sofina SA EUR 829 358,211 0.03
653,261 0.06
Bermuda
China Oriental Group Co. Ltd. HKD 766,000 203,467 0.02
Enstar Group Ltd. USD 745 162,201 0.01
Essent Group Ltd. USD 11,601 464,519 0.04
830,187 0.07
Brazil
Americanas SA BRL 10,283 51,137 –
Banco do Brasil SA BRL 22,686 103,344 0.01
Cyrela Brazil Realty SA Empreendimentos e Participacoes BRL 28,909 72,042 0.01
Itau Unibanco Holding SA Preference BRL 45,339 149,920 0.01
Lojas Americanas SA Preference BRL 57,133 53,172 –
Minerva SA BRL 83,097 138,862 0.01
Neoenergia SA BRL 52,287 133,809 0.01
Petroleo Brasileiro SA, ADR Preference USD 9,755 86,682 0.01
Telefonica Brasil SA BRL 12,002 91,433 0.01
TIM SA BRL 50,758 105,455 0.01
Vale SA BRL 14,699 181,075 0.02
YDUQS Participacoes SA BRL 16,504 53,557 –
1,220,488 0.10
Cayman Islands
Alibaba Group Holding Ltd., ADR USD 7,950 830,793 0.07
Autohome, Inc., ADR USD 3,233 83,739 0.01
Baidu, Inc., ADR USD 2,194 286,993 0.02
Chailease Holding Co. Ltd. TWD 30,150 252,265 0.02
China Conch Venture Holdings Ltd. HKD 49,000 210,432 0.02
China Hongqiao Group Ltd. HKD 158,000 147,023 0.01
China Yongda Automobiles Services Holdings Ltd. HKD 92,726 108,666 0.01
CIMC Enric Holdings Ltd. HKD 132,931 169,876 0.02
Dada Nexus Ltd., ADR USD 10,286 118,806 0.01
Fabrinet USD 4,737 493,632 0.04
Hengan International Group Co. Ltd. HKD 18,764 84,921 0.01
JD.com, Inc., ADR USD 4,643 286,186 0.02
KWG Group Holdings Ltd. HKD 197,163 113,304 0.01
KWG Living Group Holdings Ltd., Reg. S HKD 237,681 85,921 0.01
Meituan, Reg. S 'B' HKD 5,200 132,259 0.01
NetEase, Inc., ADR USD 1,547 138,423 0.01
New Oriental Education & Technology Group, Inc., ADR USD 14,848 27,354 –
NIO, Inc., ADR USD 3,480 96,991 0.01
Investments Currency Quantity/
Nominal Value
Market Value
EUR
% of Net
Assets0
Sands China Ltd. HKD 32,002 65,477 0.01
Shenzhou International Group Holdings Ltd. HKD 10,500 177,231 0.02
Tencent Holdings Ltd. HKD 24,200 1,246,582 0.11
Texhong Textile Group Ltd. HKD 197,500 228,554 0.02
Tongcheng Travel Holdings Ltd., Reg. S HKD 87,600 142,477 0.01
Topsports International Holdings Ltd., Reg. S HKD 168,000 149,791 0.01
Xinyi Solar Holdings Ltd. HKD 88,000 131,117 0.01
XP, Inc. BRL 879 22,237 –
5,831,050 0.50
China
Anhui Conch Cement Co. Ltd. 'H' HKD 16,958 74,644 0.01
Bank of China Ltd. 'H' HKD 738,215 234,388 0.02
BYD Co. Ltd. 'H' HKD 2,000 60,185 0.01
China Construction Bank Corp. 'H' HKD 639,058 389,592 0.03
China Datang Corp. Renewable Power Co. Ltd. 'H' HKD 373,077 151,277 0.01
China Merchants Bank Co. Ltd. 'H' HKD 27,737 189,352 0.02
China National Accord Medicines Corp. Ltd. 'A' CNY 14,563 74,314 0.01
China Petroleum & Chemical Corp. 'H' HKD 386,165 158,326 0.01
Haier Smart Home Co. Ltd. 'A' CNY 62,600 258,121 0.02
Jiangsu Zhongtian Technology Co. Ltd. 'A' CNY 97,600 228,454 0.02
Livzon Pharmaceutical Group, Inc. 'H' HKD 62,620 201,648 0.02
NARI Technology Co. Ltd. 'A' CNY 53,200 293,864 0.02
PICC Property & Casualty Co. Ltd. 'H' HKD 160,000 115,047 0.01
Ping An Insurance Group Co. of China Ltd. 'H' HKD 42,992 272,399 0.02
Venus MedTech Hangzhou, Inc., Reg. S 'H' HKD 37,000 123,320 0.01
Yantai Jereh Oilfield Services Group Co. Ltd. 'A' CNY 25,000 137,991 0.01
2,962,922 0.25
Denmark
AP Moller - Maersk A/S 'B' DKK 137 433,054 0.03
Coloplast A/S 'B' DKK 2,265 351,814 0.03
Genmab A/S DKK 931 329,399 0.03
GN Store Nord A/S DKK 1,905 105,731 0.01
Netcompany Group A/S, Reg. S DKK 3,427 324,727 0.03
Novo Nordisk A/S 'B' DKK 3,440 341,568 0.03
Novozymes A/S 'B' DKK 4,994 362,049 0.03
Pandora A/S DKK 2,824 311,273 0.02
Royal Unibrew A/S DKK 3,213 319,245 0.03
SimCorp A/S DKK 3,371 325,335 0.03
3,204,195 0.27
Finland
Kone OYJ 'B' EUR 5,504 347,302 0.03
Neste OYJ EUR 2,108 91,276 0.01
Nokia OYJ EUR 73,273 408,754 0.03
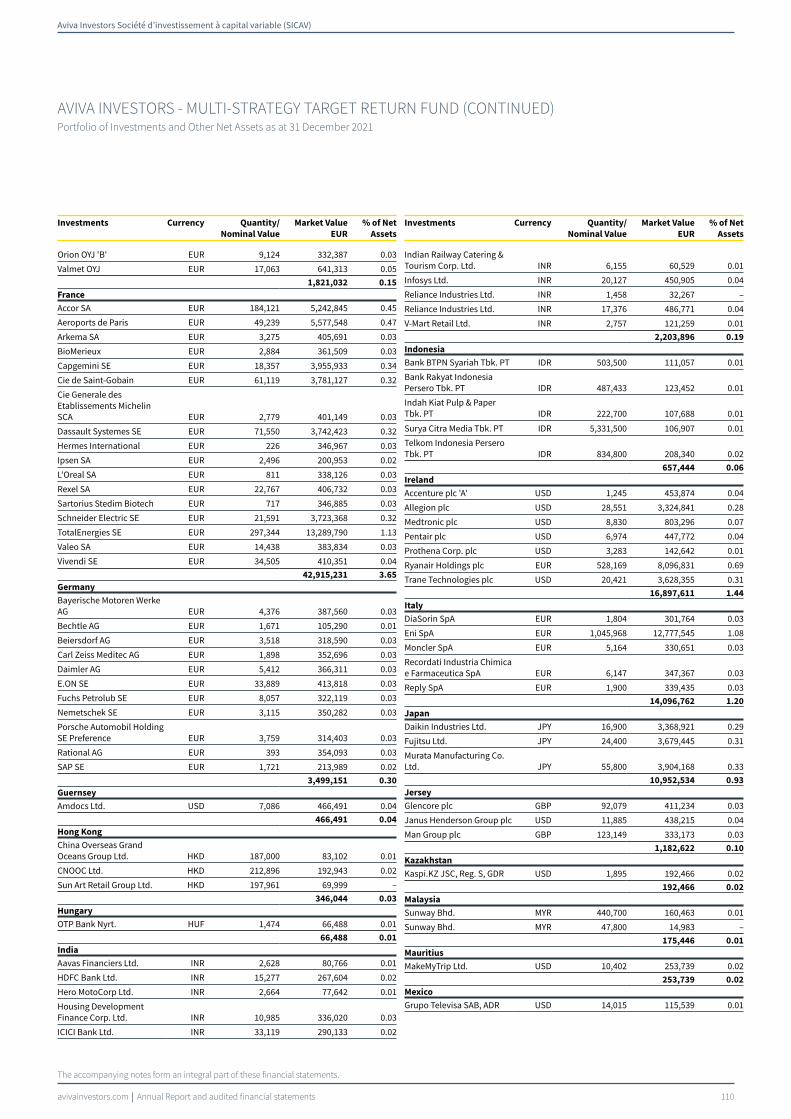
Aviva Investors Société d’investissement à capital variable (SICAV)
avivainvestors.com Annual Report and audited financial statements 110
AVIVA INVESTORS - MULTI-STRATEGY TARGET RETURN FUND (CONTINUED)Portfolio of Investments and Other Net Assets as at 31 December 2021
The accompanying notes form an integral part of these financial statements.
Investments Currency Quantity/
Nominal Value
Market Value
EUR
% of Net
Assets0
Orion OYJ 'B' EUR 9,124 332,387 0.03
Valmet OYJ EUR 17,063 641,313 0.05
1,821,032 0.15
France
Accor SA EUR 184,121 5,242,845 0.45
Aeroports de Paris EUR 49,239 5,577,548 0.47
Arkema SA EUR 3,275 405,691 0.03
BioMerieux EUR 2,884 361,509 0.03
Capgemini SE EUR 18,357 3,955,933 0.34
Cie de Saint-Gobain EUR 61,119 3,781,127 0.32
Cie Generale des Etablissements Michelin SCA EUR 2,779 401,149 0.03
Dassault Systemes SE EUR 71,550 3,742,423 0.32
Hermes International EUR 226 346,967 0.03
Ipsen SA EUR 2,496 200,953 0.02
L'Oreal SA EUR 811 338,126 0.03
Rexel SA EUR 22,767 406,732 0.03
Sartorius Stedim Biotech EUR 717 346,885 0.03
Schneider Electric SE EUR 21,591 3,723,368 0.32
TotalEnergies SE EUR 297,344 13,289,790 1.13
Valeo SA EUR 14,438 383,834 0.03
Vivendi SE EUR 34,505 410,351 0.04
42,915,231 3.65
Germany
Bayerische Motoren Werke AG EUR 4,376 387,560 0.03
Bechtle AG EUR 1,671 105,290 0.01
Beiersdorf AG EUR 3,518 318,590 0.03
Carl Zeiss Meditec AG EUR 1,898 352,696 0.03
Daimler AG EUR 5,412 366,311 0.03
E.ON SE EUR 33,889 413,818 0.03
Fuchs Petrolub SE EUR 8,057 322,119 0.03
Nemetschek SE EUR 3,115 350,282 0.03
Porsche Automobil Holding SE Preference EUR 3,759 314,403 0.03
Rational AG EUR 393 354,093 0.03
SAP SE EUR 1,721 213,989 0.02
3,499,151 0.30
Guernsey
Amdocs Ltd. USD 7,086 466,491 0.04
466,491 0.04
Hong Kong
China Overseas Grand Oceans Group Ltd. HKD 187,000 83,102 0.01
CNOOC Ltd. HKD 212,896 192,943 0.02
Sun Art Retail Group Ltd. HKD 197,961 69,999 –
346,044 0.03
Hungary
OTP Bank Nyrt. HUF 1,474 66,488 0.01
66,488 0.01
India
Aavas Financiers Ltd. INR 2,628 80,766 0.01
HDFC Bank Ltd. INR 15,277 267,604 0.02
Hero MotoCorp Ltd. INR 2,664 77,642 0.01
Housing Development Finance Corp. Ltd. INR 10,985 336,020 0.03
ICICI Bank Ltd. INR 33,119 290,133 0.02
Investments Currency Quantity/
Nominal Value
Market Value
EUR
% of Net
Assets0
Indian Railway Catering & Tourism Corp. Ltd. INR 6,155 60,529 0.01
Infosys Ltd. INR 20,127 450,905 0.04
Reliance Industries Ltd. INR 1,458 32,267 –
Reliance Industries Ltd. INR 17,376 486,771 0.04
V-Mart Retail Ltd. INR 2,757 121,259 0.01
2,203,896 0.19
Indonesia
Bank BTPN Syariah Tbk. PT IDR 503,500 111,057 0.01
Bank Rakyat Indonesia Persero Tbk. PT IDR 487,433 123,452 0.01
Indah Kiat Pulp & Paper Tbk. PT IDR 222,700 107,688 0.01
Surya Citra Media Tbk. PT IDR 5,331,500 106,907 0.01
Telkom Indonesia Persero Tbk. PT IDR 834,800 208,340 0.02
657,444 0.06
Ireland
Accenture plc 'A' USD 1,245 453,874 0.04
Allegion plc USD 28,551 3,324,841 0.28
Medtronic plc USD 8,830 803,296 0.07
Pentair plc USD 6,974 447,772 0.04
Prothena Corp. plc USD 3,283 142,642 0.01
Ryanair Holdings plc EUR 528,169 8,096,831 0.69
Trane Technologies plc USD 20,421 3,628,355 0.31
16,897,611 1.44
Italy
DiaSorin SpA EUR 1,804 301,764 0.03
Eni SpA EUR 1,045,968 12,777,545 1.08
Moncler SpA EUR 5,164 330,651 0.03
Recordati Industria Chimica e Farmaceutica SpA EUR 6,147 347,367 0.03
Reply SpA EUR 1,900 339,435 0.03
14,096,762 1.20
Japan
Daikin Industries Ltd. JPY 16,900 3,368,921 0.29
Fujitsu Ltd. JPY 24,400 3,679,445 0.31
Murata Manufacturing Co. Ltd. JPY 55,800 3,904,168 0.33
10,952,534 0.93
Jersey
Glencore plc GBP 92,079 411,234 0.03
Janus Henderson Group plc USD 11,885 438,215 0.04
Man Group plc GBP 123,149 333,173 0.03
1,182,622 0.10
Kazakhstan
Kaspi.KZ JSC, Reg. S, GDR USD 1,895 192,466 0.02
192,466 0.02
Malaysia
Sunway Bhd. MYR 440,700 160,463 0.01
Sunway Bhd. MYR 47,800 14,983 –
175,446 0.01
Mauritius
MakeMyTrip Ltd. USD 10,402 253,739 0.02
253,739 0.02
Mexico
Grupo Televisa SAB, ADR USD 14,015 115,539 0.01

Aviva Investors Société d’investissement à capital variable (SICAV)
avivainvestors.com Annual Report and audited financial statements 111
AVIVA INVESTORS - MULTI-STRATEGY TARGET RETURN FUND (CONTINUED)Portfolio of Investments and Other Net Assets as at 31 December 2021
The accompanying notes form an integral part of these financial statements.
Investments Currency Quantity/
Nominal Value
Market Value
EUR
% of Net
Assets0
Macquarie Mexico Real Estate Management SA de CV, REIT, Reg. S MXN 97,207 109,538 0.01
225,077 0.02
Netherlands
Adyen NV, Reg. S EUR 132 305,151 0.03
ASM International NV EUR 884 343,566 0.03
ASML Holding NV EUR 477 337,120 0.03
BE Semiconductor Industries NV EUR 4,408 330,159 0.03
EXOR NV EUR 5,038 397,750 0.03
Prosus NV ZAR 3,740 269,848 0.02
STMicroelectronics NV EUR 5,193 227,285 0.02
2,210,879 0.19
Norway
Aker BP ASA NOK 13,188 357,377 0.03
Equinor ASA NOK 564,022 13,270,715 1.13
Nordic Semiconductor ASA NOK 12,349 366,597 0.03
TOMRA Systems ASA NOK 5,848 368,030 0.03
Yara International ASA NOK 8,961 397,600 0.03
14,760,319 1.25
Philippines
Puregold Price Club, Inc. PHP 235,110 160,048 0.01
160,048 0.01
Poland
Bank Polska Kasa Opieki SA PLN 7,186 191,316 0.02
CD Projekt SA PLN 8,484 356,232 0.03
547,548 0.05
Russia
Detsky Mir PJSC, Reg. S RUB 84,036 122,974 0.01
LUKOIL PJSC, ADR USD 2,953 231,265 0.02
Sberbank of Russia PJSC, ADR USD 16,827 237,120 0.02
United Co. RUSAL International PJSC HKD 268,000 227,012 0.02
818,371 0.07
Singapore
Riverstone Holdings Ltd. SGD 108,000 49,487 –
49,487 –
South Africa
Absa Group Ltd. ZAR 10,585 89,082 0.01
Life Healthcare Group Holdings Ltd. ZAR 99,463 131,606 0.01
Naspers Ltd. 'N' ZAR 466 63,572 0.01
Pick n Pay Stores Ltd. ZAR 33,787 97,425 0.01
Transaction Capital Ltd. ZAR 69,690 172,442 0.01
554,127 0.05
South Korea
AfreecaTV Co. Ltd. KRW 1,429 213,899 0.02
Cosmax, Inc. KRW 1,607 103,837 0.01
Ecopro BM Co. Ltd. KRW 627 232,299 0.02
Hyundai Motor Co. KRW 1,956 302,766 0.02
KB Financial Group, Inc. KRW 5,806 236,432 0.02
LG Chem Ltd. KRW 589 268,173 0.02
NAVER Corp. KRW 453 126,918 0.01
POSCO KRW 1,111 225,800 0.02
Samsung Electronics Co. Ltd. KRW 23,851 1,382,351 0.12
SK Hynix, Inc. KRW 4,137 400,129 0.03
SK Square Co. Ltd. KRW 1,490 73,241 0.01
Investments Currency Quantity/
Nominal Value
Market Value
EUR
% of Net
Assets0
SK Telecom Co. Ltd. KRW 2,305 98,639 0.01
WONIK IPS Co. Ltd. KRW 6,809 212,931 0.02
3,877,415 0.33
Spain
Amadeus IT Group SA 'A' EUR 94,541 5,637,480 0.48
International Consolidated Airlines Group SA GBP 6,283,753 10,662,736 0.90
16,300,216 1.38
Sweden
Boliden AB SEK 10,588 359,411 0.03
Electrolux AB 'B' SEK 19,205 407,750 0.03
Epiroc AB 'A' SEK 15,157 338,956 0.03
EQT AB SEK 6,881 329,379 0.03
Evolution AB, Reg. S SEK 2,513 313,733 0.02
Hexagon AB 'B' SEK 24,641 343,312 0.03
Hexpol AB SEK 30,969 365,304 0.03
Industrivarden AB 'A' SEK 11,784 330,766 0.03
Indutrade AB SEK 9,043 243,289 0.02
Kinnevik AB 'B' SEK 10,025 315,495 0.03
Lifco AB 'B' SEK 8,524 223,779 0.02
Lundin Energy AB SEK 10,919 345,035 0.03
Thule Group AB, Reg. S SEK 6,633 354,004 0.03
Trelleborg AB 'B' SEK 18,878 435,736 0.04
4,705,949 0.40
Switzerland
Belimo Holding AG CHF 426 238,252 0.02
Bucher Industries AG CHF 778 338,708 0.03
Dufry AG CHF 125,309 5,459,050 0.46
EMS-Chemie Holding AG CHF 368 363,504 0.03
Garmin Ltd. USD 3,655 437,623 0.04
Kuehne + Nagel International AG CHF 1,223 347,545 0.03
Logitech International SA CHF 4,675 346,961 0.03
Partners Group Holding AG CHF 227 331,301 0.03
Roche Holding AG CHF 962 352,037 0.03
Schindler Holding AG CHF 1,420 336,513 0.03
Straumann Holding AG CHF 181 338,318 0.03
Tecan Group AG CHF 649 348,095 0.03
UBS Group AG CHF 24,566 389,475 0.03
VAT Group AG, Reg. S CHF 788 345,495 0.03
9,972,877 0.85
Taiwan
Hon Hai Precision Industry Co. Ltd. TWD 142,000 470,506 0.04
MediaTek, Inc. TWD 129,000 4,868,828 0.41
Mega Financial Holding Co. Ltd. TWD 113,000 127,769 0.01
Sinbon Electronics Co. Ltd. TWD 26,628 239,935 0.02
Taiwan Semiconductor Manufacturing Co. Ltd. TWD 101,000 1,975,834 0.17
Topkey Corp. TWD 26,000 123,336 0.01
Tripod Technology Corp. TWD 57,000 225,098 0.02
Yageo Corp. TWD 288,000 4,386,879 0.37
12,418,185 1.05
Thailand
Bangkok Bank PCL THB 32,800 104,691 0.01
Indorama Ventures PCL THB 211,500 240,099 0.02

Aviva Investors Société d’investissement à capital variable (SICAV)
avivainvestors.com Annual Report and audited financial statements 112
AVIVA INVESTORS - MULTI-STRATEGY TARGET RETURN FUND (CONTINUED)Portfolio of Investments and Other Net Assets as at 31 December 2021
The accompanying notes form an integral part of these financial statements.
Investments Currency Quantity/
Nominal Value
Market Value
EUR
% of Net
Assets0
Thai Beverage PCL SGD 428,800 185,296 0.01
530,086 0.04
United Kingdom
Ashmore Group plc GBP 88,563 307,058 0.03
Auto Trader Group plc, Reg. S GBP 41,589 366,602 0.03
Barratt Developments plc GBP 85,753 764,176 0.06
Bellway plc GBP 8,712 346,622 0.03
Berkeley Group Holdings plc GBP 2,120 120,670 0.01
BP plc GBP 3,220,853 12,681,395 1.08
Centrica plc GBP 489,762 416,961 0.04
easyJet plc GBP 2,056,550 13,645,786 1.16
Evraz plc GBP 54,337 389,858 0.03
Games Workshop Group plc GBP 2,858 339,293 0.03
Halma plc GBP 9,209 351,095 0.03
Hargreaves Lansdown plc GBP 19,192 310,303 0.03
Howden Joinery Group plc GBP 31,220 335,960 0.03
IG Group Holdings plc GBP 35,037 339,477 0.03
Persimmon plc GBP 10,308 351,006 0.03
Rightmove plc GBP 38,646 366,850 0.03
Rotork plc GBP 78,578 334,582 0.03
Royal Dutch Shell plc 'A' EUR 636,798 12,295,933 1.04
Royal Mail plc GBP 67,391 406,704 0.03
Softcat plc GBP 15,350 330,181 0.03
Spectris plc GBP 7,547 329,439 0.03
Spirax-Sarco Engineering plc GBP 1,763 336,966 0.03
SSE plc GBP 20,756 407,529 0.03
Standard Chartered plc HKD 27,550 143,795 0.01
Taylor Wimpey plc GBP 176,569 369,235 0.03
46,387,476 3.94
United States of America
A O Smith Corp. USD 6,728 508,091 0.04
A10 Networks, Inc. USD 22,576 329,051 0.03
Abbott Laboratories USD 6,002 742,861 0.06
AbbVie, Inc. USD 3,499 416,622 0.04
ABIOMED, Inc. USD 1,593 503,311 0.04
Acuity Brands, Inc. USD 19,782 3,682,597 0.31
Acushnet Holdings Corp. USD 9,759 455,898 0.04
Adobe, Inc. USD 2,521 1,257,485 0.11
Allegro MicroSystems, Inc. USD 15,944 507,258 0.04
Alphabet, Inc. 'A' USD 373 950,391 0.08
Alphabet, Inc. 'C' USD 935 2,379,757 0.20
Amazon.com, Inc. USD 2,361 6,923,728 0.59
Amedisys, Inc. USD 3,225 458,950 0.04
American Public Education, Inc. USD 7,527 147,171 0.01
American Software, Inc. 'A' USD 13,038 299,581 0.03
AMERISAFE, Inc. USD 9,564 452,423 0.04
AMETEK, Inc. USD 3,777 488,466 0.04
ANSYS, Inc. USD 1,329 468,603 0.04
Apple, Inc. USD 15,368 2,400,135 0.20
Arista Networks, Inc. USD 4,273 540,118 0.05
Artisan Partners Asset Management, Inc. 'A' USD 10,984 460,001 0.04
ASGN, Inc. USD 2,801 304,016 0.03
Investments Currency Quantity/
Nominal Value
Market Value
EUR
% of Net
Assets0
Aspen Technology, Inc. USD 3,516 470,882 0.04
AT&T, Inc. USD 46,855 1,013,777 0.09
Atrion Corp. USD 730 455,030 0.04
Autodesk, Inc. USD 16,881 4,175,643 0.36
Aviat Networks, Inc. USD 17,006 479,210 0.04
Axcelis Technologies, Inc. USD 5,644 370,245 0.03
Badger Meter, Inc. USD 4,920 460,958 0.04
Balchem Corp. USD 3,238 479,763 0.04
Bank of America Corp. USD 36,756 1,437,822 0.12
Berkshire Hathaway, Inc. 'B' USD 6,817 1,792,130 0.15
Bio-Rad Laboratories, Inc. 'A' USD 691 459,316 0.04
Bio-Techne Corp. USD 732 333,204 0.03
Blueprint Medicines Corp. USD 1,692 159,484 0.01
Boot Barn Holdings, Inc. USD 4,556 492,899 0.04
Booz Allen Hamilton Holding Corp. USD 51,096 3,809,285 0.32
Brady Corp. 'A' USD 10,030 475,658 0.04
Bristol-Myers Squibb Co. USD 7,364 403,783 0.03
Broadcom, Inc. USD 7,147 4,182,365 0.36
Brunswick Corp. USD 1,858 164,634 0.01
Cadence Design Systems, Inc. USD 2,917 478,065 0.04
Calix, Inc. USD 7,924 557,265 0.05
Cargurus, Inc. USD 14,565 430,661 0.04
Catalyst Pharmaceuticals, Inc. USD 79,814 475,501 0.04
Cavco Industries, Inc. USD 1,839 512,994 0.04
Cerner Corp. USD 7,069 577,449 0.05
ChannelAdvisor Corp. USD 20,079 435,233 0.04
Chemed Corp. USD 1,083 504,245 0.04
Chevron Corp. USD 2,948 304,197 0.03
Cincinnati Financial Corp. USD 1,418 142,099 0.01
Cintas Corp. USD 1,181 460,031 0.04
Cirrus Logic, Inc. USD 6,296 509,654 0.04
Cisco Systems, Inc. USD 2,473 137,818 0.01
Citigroup, Inc. USD 13,020 691,244 0.06
Clearfield, Inc. USD 8,356 620,381 0.05
Coca-Cola Co. (The) USD 12,907 672,079 0.06
Cognex Corp. USD 6,525 446,198 0.04
Cohen & Steers, Inc. USD 5,553 451,804 0.04
Columbia Sportswear Co. USD 5,175 443,575 0.04
Comcast Corp. 'A' USD 29,917 1,324,588 0.11
Comfort Systems USA, Inc. USD 5,511 479,329 0.04
Copart, Inc. USD 3,472 462,715 0.04
Corcept Therapeutics, Inc. USD 26,411 460,195 0.04
CorVel Corp. USD 2,781 509,112 0.04
Costco Wholesale Corp. USD 799 398,889 0.03
CRA International, Inc. USD 3,707 303,956 0.03
Cummins, Inc. USD 745 142,878 0.01
Deckers Outdoor Corp. USD 1,326 427,207 0.04
Dick's Sporting Goods, Inc. USD 2,758 278,819 0.02
Diodes, Inc. USD 5,080 491,003 0.04
Dolby Laboratories, Inc. 'A' USD 5,926 496,326 0.04
Donaldson Co., Inc. USD 8,770 456,893 0.04
Dorman Products, Inc. USD 4,781 475,262 0.04
Eli Lilly & Co. USD 4,009 973,360 0.08

Aviva Investors Société d’investissement à capital variable (SICAV)
avivainvestors.com Annual Report and audited financial statements 113
AVIVA INVESTORS - MULTI-STRATEGY TARGET RETURN FUND (CONTINUED)Portfolio of Investments and Other Net Assets as at 31 December 2021
The accompanying notes form an integral part of these financial statements.
Investments Currency Quantity/
Nominal Value
Market Value
EUR
% of Net
Assets0
EPAM Systems, Inc. USD 791 465,387 0.04
ePlus, Inc. USD 6,334 300,436 0.03
Erie Indemnity Co. 'A' USD 2,551 432,483 0.04
Ethan Allen Interiors, Inc. USD 21,668 501,020 0.04
Evercore, Inc. 'A' USD 3,583 427,994 0.04
ExlService Holdings, Inc. USD 3,982 506,627 0.04
eXp World Holdings, Inc. USD 13,198 390,764 0.03
Expeditors International of Washington, Inc. USD 4,064 480,036 0.04
Exponent, Inc. USD 4,401 452,078 0.04
Exxon Mobil Corp. USD 21,878 1,177,106 0.10
F5, Inc. USD 1,529 329,128 0.03
FactSet Research Systems, Inc. USD 1,140 487,392 0.04
Fastenal Co. USD 8,658 487,831 0.04
Federated Hermes, Inc. USD 15,068 498,071 0.04
Figs, Inc. 'A' USD 16,950 410,857 0.04
First American Financial Corp. USD 6,950 478,103 0.04
Fortinet, Inc. USD 1,591 502,987 0.04
Franklin Electric Co., Inc. USD 5,778 479,967 0.04
FTI Consulting, Inc. USD 2,392 322,716 0.03
Generac Holdings, Inc. USD 1,290 399,211 0.03
Gentex Corp. USD 14,787 453,219 0.04
Gentherm, Inc. USD 6,309 481,913 0.04
Globus Medical, Inc. 'A' USD 7,482 474,862 0.04
Graco, Inc. USD 6,768 479,688 0.04
Grand Canyon Education, Inc. USD 6,546 493,512 0.04
Hamilton Lane, Inc. 'A' USD 4,938 450,182 0.04
Healthcare Services Group, Inc. USD 28,478 445,877 0.04
HEICO Corp. USD 3,672 465,845 0.04
HEICO Corp. 'A' USD 4,065 459,529 0.04
Henry Schein, Inc. USD 4,594 313,242 0.03
Home Depot, Inc. (The) USD 2,725 994,402 0.08
Houlihan Lokey, Inc. USD 4,902 446,361 0.04
HP, Inc. USD 15,776 522,375 0.04
Hubbell, Inc. USD 18,508 3,390,665 0.29
ICU Medical, Inc. USD 2,276 475,054 0.04
IDEX Corp. USD 2,258 469,023 0.04
IDT Corp. 'B' USD 10,205 396,238 0.03
Incyte Corp. USD 5,213 336,700 0.03
Innospec, Inc. USD 5,976 475,290 0.04
Innoviva, Inc. USD 31,613 479,810 0.04
Insteel Industries, Inc. USD 12,986 454,544 0.04
Intel Corp. USD 26,685 1,208,709 0.10
IPG Photonics Corp. USD 3,174 480,398 0.04
iRobot Corp. USD 2,175 125,944 0.01
Jack Henry & Associates, Inc. USD 3,251 477,215 0.04
John B Sanfilippo & Son, Inc. USD 6,053 480,722 0.04
Johnson & Johnson USD 4,373 657,700 0.06
Johnson Outdoors, Inc. 'A' USD 1,604 132,021 0.01
JPMorgan Chase & Co. USD 19,391 2,699,854 0.23
Kinsale Capital Group, Inc. USD 2,652 554,432 0.05
Investments Currency Quantity/
Nominal Value
Market Value
EUR
% of Net
Assets0
Kulicke & Soffa Industries, Inc. USD 9,091 484,089 0.04
Laboratory Corp. of America Holdings USD 1,812 500,666 0.04
Lancaster Colony Corp. USD 3,234 470,596 0.04
Landstar System, Inc. USD 2,976 468,199 0.04
LeMaitre Vascular, Inc. USD 10,298 454,409 0.04
Lennar Corp. 'A' USD 4,874 497,879 0.04
Lennar Corp. 'B' USD 5,979 502,684 0.04
Liquidity Services, Inc. USD 23,814 462,166 0.04
Littelfuse, Inc. USD 1,124 311,270 0.03
LKQ Corp. USD 6,119 322,926 0.03
Louisiana-Pacific Corp. USD 7,619 524,895 0.04
Lululemon Athletica, Inc. USD 1,210 416,467 0.04
Lumentum Holdings, Inc. USD 39,226 3,646,825 0.31
Manhattan Associates, Inc. USD 3,247 443,764 0.04
ManTech International Corp. 'A' USD 6,930 445,008 0.04
Marcus & Millichap, Inc. USD 11,032 499,700 0.04
MarketAxess Holdings, Inc. USD 1,348 487,779 0.04
Masimo Corp. USD 1,828 470,342 0.04
Mastercard, Inc. 'A' USD 5,693 1,798,962 0.15
Matson, Inc. USD 1,987 157,368 0.01
McDonald's Corp. USD 703 165,689 0.01
Medifast, Inc. USD 2,521 463,964 0.04
Medpace Holdings, Inc. USD 2,493 476,820 0.04
Merck & Co., Inc. USD 16,573 1,116,987 0.10
Meta Platforms, Inc. 'A' USD 15,527 4,592,221 0.39
Methode Electronics, Inc. USD 4,002 173,090 0.02
Microsoft Corp. USD 31,473 9,306,427 0.79
MKS Instruments, Inc. USD 3,354 514,042 0.04
Moelis & Co. 'A' USD 8,045 442,079 0.04
Monolithic Power Systems, Inc. USD 997 432,795 0.04
Morningstar, Inc. USD 1,655 497,919 0.04
Motorola Solutions, Inc. USD 16,986 4,057,476 0.35
Movado Group, Inc. USD 4,402 162,036 0.01
Mueller Industries, Inc. USD 9,312 485,949 0.04
MYR Group, Inc. USD 4,729 460,321 0.04
Neogen Corp. USD 12,433 496,413 0.04
Netflix, Inc. USD 2,906 1,539,794 0.13
NETGEAR, Inc. USD 18,360 471,432 0.04
Neurocrine Biosciences, Inc. USD 4,151 310,978 0.03
New York Times Co. (The) 'A' USD 10,847 460,750 0.04
NIKE, Inc. 'B' USD 8,384 1,228,921 0.10
NMI Holdings, Inc. 'A' USD 8,266 158,858 0.01
Nordson Corp. USD 1,996 448,117 0.04
Nucor Corp. USD 4,650 466,717 0.04
NVIDIA Corp. USD 6,803 1,759,795 0.15
NVR, Inc. USD 97 503,797 0.04
Old Dominion Freight Line, Inc. USD 1,499 472,432 0.04
ON24, Inc. USD 20,333 310,305 0.03
Onto Innovation, Inc. USD 3,852 342,927 0.03
Open Lending Corp. 'A' USD 8,166 161,460 0.01
Oracle Corp. USD 4,783 366,779 0.03
Oshkosh Corp. USD 4,747 470,693 0.04
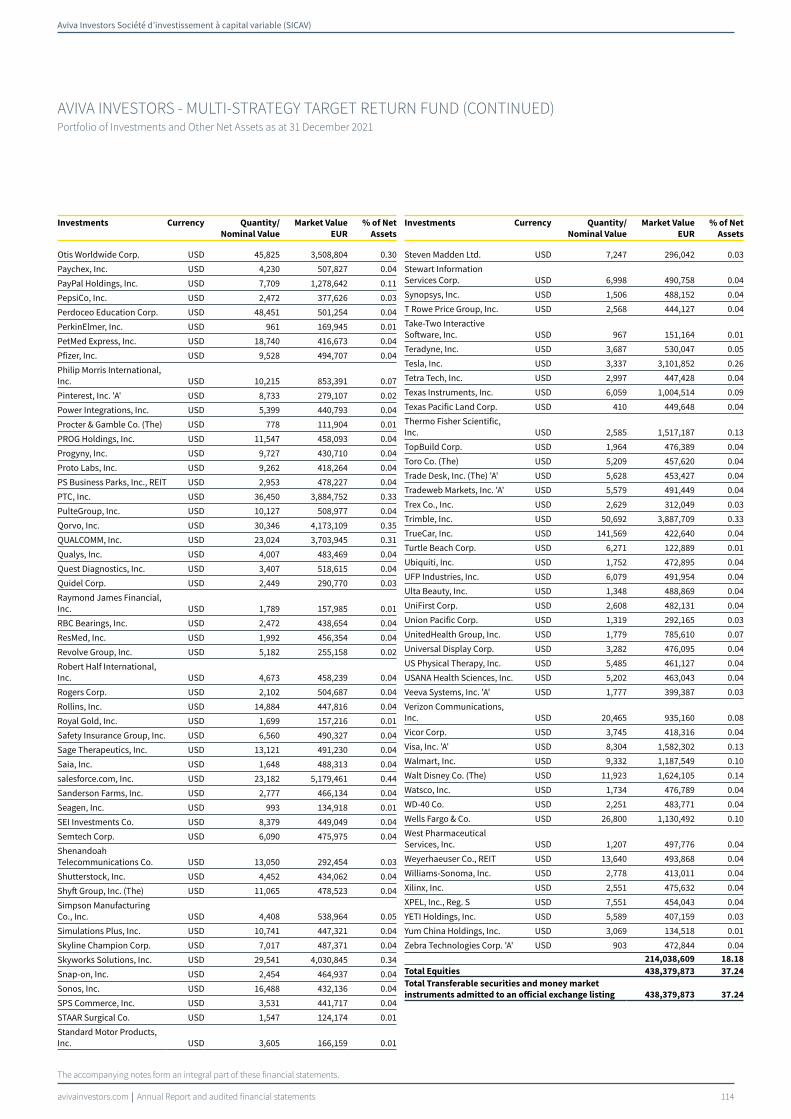
Aviva Investors Société d’investissement à capital variable (SICAV)
avivainvestors.com Annual Report and audited financial statements 114
AVIVA INVESTORS - MULTI-STRATEGY TARGET RETURN FUND (CONTINUED)Portfolio of Investments and Other Net Assets as at 31 December 2021
The accompanying notes form an integral part of these financial statements.
Investments Currency Quantity/
Nominal Value
Market Value
EUR
% of Net
Assets0
Otis Worldwide Corp. USD 45,825 3,508,804 0.30
Paychex, Inc. USD 4,230 507,827 0.04
PayPal Holdings, Inc. USD 7,709 1,278,642 0.11
PepsiCo, Inc. USD 2,472 377,626 0.03
Perdoceo Education Corp. USD 48,451 501,254 0.04
PerkinElmer, Inc. USD 961 169,945 0.01
PetMed Express, Inc. USD 18,740 416,673 0.04
Pfizer, Inc. USD 9,528 494,707 0.04
Philip Morris International, Inc. USD 10,215 853,391 0.07
Pinterest, Inc. 'A' USD 8,733 279,107 0.02
Power Integrations, Inc. USD 5,399 440,793 0.04
Procter & Gamble Co. (The) USD 778 111,904 0.01
PROG Holdings, Inc. USD 11,547 458,093 0.04
Progyny, Inc. USD 9,727 430,710 0.04
Proto Labs, Inc. USD 9,262 418,264 0.04
PS Business Parks, Inc., REIT USD 2,953 478,227 0.04
PTC, Inc. USD 36,450 3,884,752 0.33
PulteGroup, Inc. USD 10,127 508,977 0.04
Qorvo, Inc. USD 30,346 4,173,109 0.35
QUALCOMM, Inc. USD 23,024 3,703,945 0.31
Qualys, Inc. USD 4,007 483,469 0.04
Quest Diagnostics, Inc. USD 3,407 518,615 0.04
Quidel Corp. USD 2,449 290,770 0.03
Raymond James Financial, Inc. USD 1,789 157,985 0.01
RBC Bearings, Inc. USD 2,472 438,654 0.04
ResMed, Inc. USD 1,992 456,354 0.04
Revolve Group, Inc. USD 5,182 255,158 0.02
Robert Half International, Inc. USD 4,673 458,239 0.04
Rogers Corp. USD 2,102 504,687 0.04
Rollins, Inc. USD 14,884 447,816 0.04
Royal Gold, Inc. USD 1,699 157,216 0.01
Safety Insurance Group, Inc. USD 6,560 490,327 0.04
Sage Therapeutics, Inc. USD 13,121 491,230 0.04
Saia, Inc. USD 1,648 488,313 0.04
salesforce.com, Inc. USD 23,182 5,179,461 0.44
Sanderson Farms, Inc. USD 2,777 466,134 0.04
Seagen, Inc. USD 993 134,918 0.01
SEI Investments Co. USD 8,379 449,049 0.04
Semtech Corp. USD 6,090 475,975 0.04
Shenandoah Telecommunications Co. USD 13,050 292,454 0.03
Shutterstock, Inc. USD 4,452 434,062 0.04
Shyft Group, Inc. (The) USD 11,065 478,523 0.04
Simpson Manufacturing Co., Inc. USD 4,408 538,964 0.05
Simulations Plus, Inc. USD 10,741 447,321 0.04
Skyline Champion Corp. USD 7,017 487,371 0.04
Skyworks Solutions, Inc. USD 29,541 4,030,845 0.34
Snap-on, Inc. USD 2,454 464,937 0.04
Sonos, Inc. USD 16,488 432,136 0.04
SPS Commerce, Inc. USD 3,531 441,717 0.04
STAAR Surgical Co. USD 1,547 124,174 0.01
Standard Motor Products, Inc. USD 3,605 166,159 0.01
Investments Currency Quantity/
Nominal Value
Market Value
EUR
% of Net
Assets0
Steven Madden Ltd. USD 7,247 296,042 0.03
Stewart Information Services Corp. USD 6,998 490,758 0.04
Synopsys, Inc. USD 1,506 488,152 0.04
T Rowe Price Group, Inc. USD 2,568 444,127 0.04
Take-Two Interactive Software, Inc. USD 967 151,164 0.01
Teradyne, Inc. USD 3,687 530,047 0.05
Tesla, Inc. USD 3,337 3,101,852 0.26
Tetra Tech, Inc. USD 2,997 447,428 0.04
Texas Instruments, Inc. USD 6,059 1,004,514 0.09
Texas Pacific Land Corp. USD 410 449,648 0.04
Thermo Fisher Scientific, Inc. USD 2,585 1,517,187 0.13
TopBuild Corp. USD 1,964 476,389 0.04
Toro Co. (The) USD 5,209 457,620 0.04
Trade Desk, Inc. (The) 'A' USD 5,628 453,427 0.04
Tradeweb Markets, Inc. 'A' USD 5,579 491,449 0.04
Trex Co., Inc. USD 2,629 312,049 0.03
Trimble, Inc. USD 50,692 3,887,709 0.33
TrueCar, Inc. USD 141,569 422,640 0.04
Turtle Beach Corp. USD 6,271 122,889 0.01
Ubiquiti, Inc. USD 1,752 472,895 0.04
UFP Industries, Inc. USD 6,079 491,954 0.04
Ulta Beauty, Inc. USD 1,348 488,869 0.04
UniFirst Corp. USD 2,608 482,131 0.04
Union Pacific Corp. USD 1,319 292,165 0.03
UnitedHealth Group, Inc. USD 1,779 785,610 0.07
Universal Display Corp. USD 3,282 476,095 0.04
US Physical Therapy, Inc. USD 5,485 461,127 0.04
USANA Health Sciences, Inc. USD 5,202 463,043 0.04
Veeva Systems, Inc. 'A' USD 1,777 399,387 0.03
Verizon Communications, Inc. USD 20,465 935,160 0.08
Vicor Corp. USD 3,745 418,316 0.04
Visa, Inc. 'A' USD 8,304 1,582,302 0.13
Walmart, Inc. USD 9,332 1,187,549 0.10
Walt Disney Co. (The) USD 11,923 1,624,105 0.14
Watsco, Inc. USD 1,734 476,789 0.04
WD-40 Co. USD 2,251 483,771 0.04
Wells Fargo & Co. USD 26,800 1,130,492 0.10
West Pharmaceutical Services, Inc. USD 1,207 497,776 0.04
Weyerhaeuser Co., REIT USD 13,640 493,868 0.04
Williams-Sonoma, Inc. USD 2,778 413,011 0.04
Xilinx, Inc. USD 2,551 475,632 0.04
XPEL, Inc., Reg. S USD 7,551 454,043 0.04
YETI Holdings, Inc. USD 5,589 407,159 0.03
Yum China Holdings, Inc. USD 3,069 134,518 0.01
Zebra Technologies Corp. 'A' USD 903 472,844 0.04
214,038,609 18.18
Total Equities 438,379,873 37.24
Total Transferable securities and money market
instruments admitted to an official exchange listing 438,379,873 37.24

Aviva Investors Société d’investissement à capital variable (SICAV)
avivainvestors.com Annual Report and audited financial statements 115
AVIVA INVESTORS - MULTI-STRATEGY TARGET RETURN FUND (CONTINUED)Portfolio of Investments and Other Net Assets as at 31 December 2021
The accompanying notes form an integral part of these financial statements.
Investments Currency Quantity/
Nominal Value
Market Value
EUR
% of Net
Assets0
Transferable securities and money market instruments dealt in on another
regulated market
Certificates of Deposit
France
Natixis SA 0.53% 17/01/2022 EUR 25,000,000 25,000,000 2.12
Natixis SA 0.58% 31/01/2022 EUR 15,000,000 15,000,000 1.28
40,000,000 3.40
Japan
MUFG Bank Ltd. 0.58% 07/01/2022 EUR 45,000,000 45,000,000 3.82
Sumitomo Mitsui Banking Corp. 0.58% 14/01/2022 EUR 25,000,000 25,000,000 2.12
Sumitomo Mitsui Banking Corp. 0.59% 14/02/2022 EUR 30,000,000 30,000,000 2.55
100,000,000 8.49
United Kingdom
Goldman Sachs International Bank 0.51% 28/04/2022 EUR 15,000,000 15,000,000 1.28
Standard Chartered Bank 0.56% 01/02/2022 EUR 25,000,000 25,000,000 2.12
40,000,000 3.40
Total Certificates of Deposit 180,000,000 15.29
Commercial Papers
Cayman Islands
Chesham Finance Ltd. 0.49% 06/01/2022 EUR 50,000,000 50,000,000 4.25
50,000,000 4.25
France
LMA SA 0.57% 06/01/2022 EUR 15,000,000 15,000,000 1.28
LMA SA 0.56% 01/03/2022 EUR 25,000,000 25,000,000 2.12
40,000,000 3.40
Spain
Banco Santander SA 0.58% 03/02/2022 EUR 30,000,000 30,000,000 2.55
30,000,000 2.55
Total Commercial Papers 120,000,000 10.20
Total Transferable securities and money market
instruments dealt in on another regulated market 300,000,000 25.49
Units of authorised UCITS or other collective investment undertakings
Collective Investment Schemes - UCITS
Ireland
Aviva Investors Euro Liquidity Fund - Class 3 Income shares EUR† EUR 623,672 60,382,968 5.13
60,382,968 5.13
Total Collective Investment Schemes - UCITS 60,382,968 5.13
Exchange Traded Funds
Ireland
iShares Physical Gold ETC USD 1,903,598 59,395,372 5.04
59,395,372 5.04
United Kingdom
UBS ETC EUR 5,440 5,505,280 0.47
5,505,280 0.47
Total Exchange Traded Funds 64,900,652 5.51
Total Units of authorised UCITS or other collective
investment undertakings 125,283,620 10.64
Total Investments 863,663,493 73.37
Cash 302,992,616 25.74
Other assets/(liabilities) 10,498,433 0.89
Total net assets 1,177,154,542 100.00 †Related Party Fund

Aviva Investors Société d’investissement à capital variable (SICAV)
avivainvestors.com Annual Report and audited financial statements 116
AVIVA INVESTORS - MULTI-STRATEGY TARGET RETURN FUND (CONTINUED)Portfolio of Investments and Other Net Assets as at 31 December 2021
The accompanying notes form an integral part of these financial statements.
Geographic Allocation of Portfolio % of Net Assets
United States of America 18.18Ireland 11.61France 10.45Japan 9.42United Kingdom 7.81Cayman Islands 4.75Spain 3.93Norway 1.25Italy 1.20Taiwan 1.05Switzerland 0.85Sweden 0.40South Korea 0.33Germany 0.30Denmark 0.27China 0.25Netherlands 0.19India 0.19Finland 0.15Brazil 0.10Jersey 0.10Bermuda 0.07Russia 0.07Indonesia 0.06Belgium 0.06South Africa 0.05Poland 0.05Thailand 0.04Guernsey 0.04Austria 0.03Hong Kong 0.03Mauritius 0.02Mexico 0.02Kazakhstan 0.02Malaysia 0.01Philippines 0.01Hungary 0.01Singapore –Total investments 73.37
Cash and other assets/(liabilities) 26.63Total 100.00

Aviva Investors Société d’investissement à capital variable (SICAV)
avivainvestors.com Annual Report and audited financial statements 117
AVIVA INVESTORS - MULTI-STRATEGY TARGET RETURN FUND (CONTINUED)Portfolio of Investments and Other Net Assets as at 31 December 2021
The accompanying notes form an integral part of these financial statements.
Forward Currency Exchange Contracts
Currency
Purchased Amount Purchased
Currency
Sold Amount Sold Maturity Date Counterparty
Unrealised Gain/
(Loss)
EUR % of Net Assets
AUD 6,778,728 EUR 4,275,865 11/01/2022 J.P. Morgan 57,471 –CAD 29,142,835 EUR 20,240,546 11/01/2022 J.P. Morgan 44,565 –CAD 17,971,000 EUR 12,494,681 21/01/2022 Morgan Stanley 11,445 –CHF 11,711,116 EUR 11,113,458 11/01/2022 J.P. Morgan 189,471 0.02CHF 149,000 EUR 142,986 21/01/2022 Citibank 829 –EUR 203,035 AUD 316,829 11/01/2022 J.P. Morgan 501 –EUR 76,804 CAD 109,336 11/01/2022 J.P. Morgan 700 –EUR 405,407 DKK 3,015,000 21/01/2022 Merrill Lynch 25 –EUR 149,136 DKK 1,109,000 21/01/2022 Morgan Stanley 25 –EUR 22,941 GBP 19,263 11/01/2022 J.P. Morgan 1 –EUR 2,342,072 GBP 1,967,000 21/01/2022 Morgan Stanley 200 –EUR 1,116,575 JPY 144,749,000 21/01/2022 Standard Chartered 11,473 –EUR 441,302 NOK 4,292,000 21/01/2022 J.P. Morgan 13,593 –EUR 220,399 NOK 2,146,000 21/01/2022 Merrill Lynch 6,545 –EUR 79,875 NOK 791,000 21/01/2022 Morgan Stanley 1,049 –EUR 8,545,878 NOK 83,801,191 21/01/2022 UBS 194,867 0.02EUR 117,214 NZD 194,370 11/01/2022 J.P. Morgan 218 –EUR 60,711 SEK 621,078 11/01/2022 J.P. Morgan 394 –EUR 1,164,814 SEK 11,929,000 21/01/2022 Merrill Lynch 6,453 –EUR 2,607,372 SEK 26,052,000 21/01/2022 Morgan Stanley 77,603 0.01EUR 1,214,262 SEK 12,162,000 21/01/2022 UBS 33,276 –EUR 693,857 USD 784,341 11/01/2022 J.P. Morgan 4,239 –
EUR 7,011,186 USD 7,947,000 21/01/2022Canadian Imperial Bank of
Commerce 25,390 –EUR 25,177,431 USD 28,559,485 21/01/2022 Citibank 72,267 0.01EUR 29,931 USD 34,000 21/01/2022 Morgan Stanley 43 –EUR 6,459,305 USD 7,341,000 21/01/2022 UBS 6,212 –GBP 278,664,172 EUR 325,711,068 11/01/2022 J.P. Morgan 6,138,797 0.52
GBP 37,000 EUR 43,661 21/01/2022Canadian Imperial Bank of
Commerce 390 –GBP 7,472,000 EUR 8,712,666 21/01/2022 J.P. Morgan 183,351 0.02GBP 78,000 EUR 91,597 21/01/2022 Standard Chartered 1,268 –GBP 3,059,000 EUR 3,605,331 21/01/2022 UBS 36,655 –KRW 5,039,622,000 USD 4,230,000 04/01/2022 RBS 8,292 –NOK 491,000 EUR 48,380 21/01/2022 UBS 550 –NOK 122,316,000 SEK 125,449,736 21/01/2022 Merrill Lynch 7,365 –NOK 122,316,000 SEK 125,441,296 21/01/2022 Morgan Stanley 8,185 –NZD 242,376 EUR 145,547 11/01/2022 J.P. Morgan 345 –PLN 135,000 EUR 28,839 21/01/2022 Morgan Stanley 572 –PLN 34,000 EUR 7,325 21/01/2022 UBS 82 –SAR 152,578,461 USD 37,069,597 18/01/2022 BNP Paribas 3,136,952 0.27SAR 114,433,847 USD 27,802,198 24/01/2022 BNP Paribas 2,352,231 0.20SAR 37,908,296 USD 9,267,399 24/01/2022 J.P. Morgan 728,752 0.06SAR 77,168,173 USD 18,870,523 07/02/2022 Standard Chartered 1,478,067 0.13SAR 77,427,647 USD 18,870,524 09/02/2022 Standard Chartered 1,538,671 0.13SAR 38,577,012 USD 9,435,262 14/02/2022 Societe Generale 737,169 0.06SAR 61,706,156 USD 15,121,834 15/02/2022 BNP Paribas 1,153,100 0.10SAR 43,143,496 USD 10,585,283 15/02/2022 Societe Generale 795,280 0.07SAR 36,882,152 USD 9,073,100 16/02/2022 J.P. Morgan 658,712 0.06SAR 43,141,379 USD 10,585,283 16/02/2022 Societe Generale 794,752 0.07SAR 54,461,282 USD 13,391,021 22/02/2022 J.P. Morgan 978,217 0.08SAR 27,219,930 USD 6,695,511 22/02/2022 Standard Chartered 486,602 0.04SAR 54,371,563 USD 13,391,021 02/03/2022 BNP Paribas 956,903 0.08SAR 17,421,612 USD 4,285,127 07/03/2022 J.P. Morgan 311,453 0.03SAR 27,217,252 USD 6,695,511 07/03/2022 Societe Generale 485,706 0.04SAR 57,882,550 USD 14,500,000 30/03/2022 Standard Chartered 802,931 0.07SAR 56,932,400 USD 14,000,000 08/06/2022 Standard Chartered 1,016,714 0.09SAR 100,510,000 USD 25,000,000 15/08/2022 Standard Chartered 1,541,293 0.13SEK 6,444 EUR 624 11/01/2022 J.P. Morgan 2 –SEK 9,602,555 NOK 9,348,000 21/01/2022 Morgan Stanley 899 –SGD 531,298 EUR 340,163 11/01/2022 J.P. Morgan 6,323 –USD 456,226 CAD 563,000 21/01/2022 Morgan Stanley 9,249 –USD 23,150,265 EUR 20,021,518 11/01/2022 J.P. Morgan 332,959 0.03USD 1,117,800 EUR 954,477 21/01/2022 Goldman Sachs 28,123 –USD 28,540,000 KRW 33,856,573,588 04/01/2022 Goldman Sachs 52,041 –
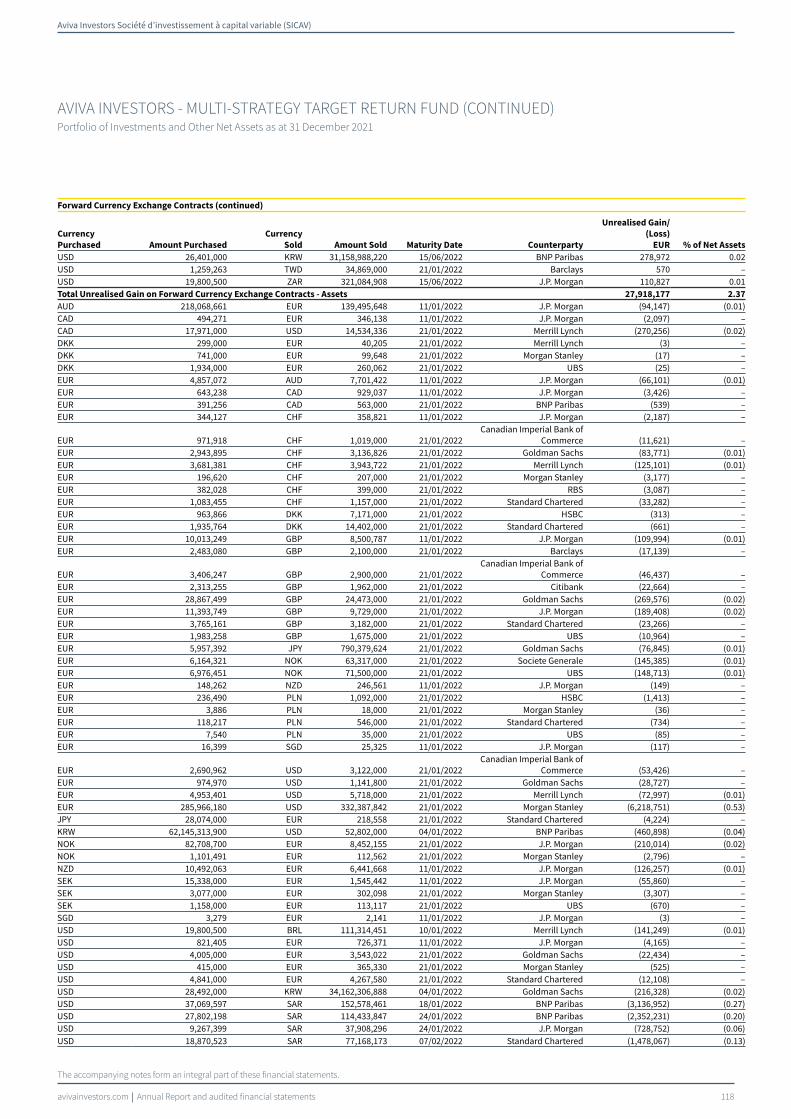
Aviva Investors Société d’investissement à capital variable (SICAV)
avivainvestors.com Annual Report and audited financial statements 118
AVIVA INVESTORS - MULTI-STRATEGY TARGET RETURN FUND (CONTINUED)Portfolio of Investments and Other Net Assets as at 31 December 2021
The accompanying notes form an integral part of these financial statements.
Forward Currency Exchange Contracts (continued)
Currency
Purchased Amount Purchased
Currency
Sold Amount Sold Maturity Date Counterparty
Unrealised Gain/
(Loss)
EUR % of Net Assets
USD 26,401,000 KRW 31,158,988,220 15/06/2022 BNP Paribas 278,972 0.02USD 1,259,263 TWD 34,869,000 21/01/2022 Barclays 570 –USD 19,800,500 ZAR 321,084,908 15/06/2022 J.P. Morgan 110,827 0.01Total Unrealised Gain on Forward Currency Exchange Contracts - Assets 27,918,177 2.37
AUD 218,068,661 EUR 139,495,648 11/01/2022 J.P. Morgan (94,147) (0.01)CAD 494,271 EUR 346,138 11/01/2022 J.P. Morgan (2,097) –CAD 17,971,000 USD 14,534,336 21/01/2022 Merrill Lynch (270,256) (0.02)DKK 299,000 EUR 40,205 21/01/2022 Merrill Lynch (3) –DKK 741,000 EUR 99,648 21/01/2022 Morgan Stanley (17) –DKK 1,934,000 EUR 260,062 21/01/2022 UBS (25) –EUR 4,857,072 AUD 7,701,422 11/01/2022 J.P. Morgan (66,101) (0.01)EUR 643,238 CAD 929,037 11/01/2022 J.P. Morgan (3,426) –EUR 391,256 CAD 563,000 21/01/2022 BNP Paribas (539) –EUR 344,127 CHF 358,821 11/01/2022 J.P. Morgan (2,187) –
EUR 971,918 CHF 1,019,000 21/01/2022Canadian Imperial Bank of
Commerce (11,621) –EUR 2,943,895 CHF 3,136,826 21/01/2022 Goldman Sachs (83,771) (0.01)EUR 3,681,381 CHF 3,943,722 21/01/2022 Merrill Lynch (125,101) (0.01)EUR 196,620 CHF 207,000 21/01/2022 Morgan Stanley (3,177) –EUR 382,028 CHF 399,000 21/01/2022 RBS (3,087) –EUR 1,083,455 CHF 1,157,000 21/01/2022 Standard Chartered (33,282) –EUR 963,866 DKK 7,171,000 21/01/2022 HSBC (313) –EUR 1,935,764 DKK 14,402,000 21/01/2022 Standard Chartered (661) –EUR 10,013,249 GBP 8,500,787 11/01/2022 J.P. Morgan (109,994) (0.01)EUR 2,483,080 GBP 2,100,000 21/01/2022 Barclays (17,139) –
EUR 3,406,247 GBP 2,900,000 21/01/2022Canadian Imperial Bank of
Commerce (46,437) –EUR 2,313,255 GBP 1,962,000 21/01/2022 Citibank (22,664) –EUR 28,867,499 GBP 24,473,000 21/01/2022 Goldman Sachs (269,576) (0.02)EUR 11,393,749 GBP 9,729,000 21/01/2022 J.P. Morgan (189,408) (0.02)EUR 3,765,161 GBP 3,182,000 21/01/2022 Standard Chartered (23,266) –EUR 1,983,258 GBP 1,675,000 21/01/2022 UBS (10,964) –EUR 5,957,392 JPY 790,379,624 21/01/2022 Goldman Sachs (76,845) (0.01)EUR 6,164,321 NOK 63,317,000 21/01/2022 Societe Generale (145,385) (0.01)EUR 6,976,451 NOK 71,500,000 21/01/2022 UBS (148,713) (0.01)EUR 148,262 NZD 246,561 11/01/2022 J.P. Morgan (149) –EUR 236,490 PLN 1,092,000 21/01/2022 HSBC (1,413) –EUR 3,886 PLN 18,000 21/01/2022 Morgan Stanley (36) –EUR 118,217 PLN 546,000 21/01/2022 Standard Chartered (734) –EUR 7,540 PLN 35,000 21/01/2022 UBS (85) –EUR 16,399 SGD 25,325 11/01/2022 J.P. Morgan (117) –
EUR 2,690,962 USD 3,122,000 21/01/2022Canadian Imperial Bank of
Commerce (53,426) –EUR 974,970 USD 1,141,800 21/01/2022 Goldman Sachs (28,727) –EUR 4,953,401 USD 5,718,000 21/01/2022 Merrill Lynch (72,997) (0.01)EUR 285,966,180 USD 332,387,842 21/01/2022 Morgan Stanley (6,218,751) (0.53)JPY 28,074,000 EUR 218,558 21/01/2022 Standard Chartered (4,224) –KRW 62,145,313,900 USD 52,802,000 04/01/2022 BNP Paribas (460,898) (0.04)NOK 82,708,700 EUR 8,452,155 21/01/2022 J.P. Morgan (210,014) (0.02)NOK 1,101,491 EUR 112,562 21/01/2022 Morgan Stanley (2,796) –NZD 10,492,063 EUR 6,441,668 11/01/2022 J.P. Morgan (126,257) (0.01)SEK 15,338,000 EUR 1,545,442 11/01/2022 J.P. Morgan (55,860) –SEK 3,077,000 EUR 302,098 21/01/2022 Morgan Stanley (3,307) –SEK 1,158,000 EUR 113,117 21/01/2022 UBS (670) –SGD 3,279 EUR 2,141 11/01/2022 J.P. Morgan (3) –USD 19,800,500 BRL 111,314,451 10/01/2022 Merrill Lynch (141,249) (0.01)USD 821,405 EUR 726,371 11/01/2022 J.P. Morgan (4,165) –USD 4,005,000 EUR 3,543,022 21/01/2022 Goldman Sachs (22,434) –USD 415,000 EUR 365,330 21/01/2022 Morgan Stanley (525) –USD 4,841,000 EUR 4,267,580 21/01/2022 Standard Chartered (12,108) –USD 28,492,000 KRW 34,162,306,888 04/01/2022 Goldman Sachs (216,328) (0.02)USD 37,069,597 SAR 152,578,461 18/01/2022 BNP Paribas (3,136,952) (0.27)USD 27,802,198 SAR 114,433,847 24/01/2022 BNP Paribas (2,352,231) (0.20)USD 9,267,399 SAR 37,908,296 24/01/2022 J.P. Morgan (728,752) (0.06)USD 18,870,523 SAR 77,168,173 07/02/2022 Standard Chartered (1,478,067) (0.13)

Aviva Investors Société d’investissement à capital variable (SICAV)
avivainvestors.com Annual Report and audited financial statements 119
AVIVA INVESTORS - MULTI-STRATEGY TARGET RETURN FUND (CONTINUED)Portfolio of Investments and Other Net Assets as at 31 December 2021
The accompanying notes form an integral part of these financial statements.
Forward Currency Exchange Contracts (continued)
Currency
Purchased Amount Purchased
Currency
Sold Amount Sold Maturity Date Counterparty
Unrealised Gain/
(Loss)
EUR % of Net Assets
USD 18,870,524 SAR 77,427,647 09/02/2022 Standard Chartered (1,538,671) (0.13)USD 9,435,262 SAR 38,577,012 14/02/2022 Societe Generale (737,169) (0.06)USD 15,121,834 SAR 61,706,156 15/02/2022 BNP Paribas (1,153,100) (0.10)USD 10,585,283 SAR 43,143,496 15/02/2022 Societe Generale (795,280) (0.07)USD 9,073,100 SAR 36,882,152 16/02/2022 J.P. Morgan (658,712) (0.06)USD 10,585,283 SAR 43,141,379 16/02/2022 Societe Generale (794,752) (0.07)USD 13,391,021 SAR 54,461,282 22/02/2022 J.P. Morgan (978,217) (0.08)USD 6,695,511 SAR 27,219,930 22/02/2022 Standard Chartered (486,602) (0.04)USD 13,391,021 SAR 54,371,563 02/03/2022 BNP Paribas (956,903) (0.08)USD 4,285,127 SAR 17,421,612 07/03/2022 J.P. Morgan (311,453) (0.03)USD 6,695,511 SAR 27,217,252 07/03/2022 Societe Generale (485,706) (0.04)USD 14,500,000 SAR 57,882,550 30/03/2022 Standard Chartered (802,931) (0.07)USD 14,000,000 SAR 56,932,400 08/06/2022 Standard Chartered (1,016,714) (0.09)USD 25,000,000 SAR 100,510,000 15/08/2022 Standard Chartered (1,541,293) (0.13)USD 7,130,123 TWD 198,688,000 21/01/2022 BNP Paribas (36,589) –Total Unrealised Loss on Forward Currency Exchange Contracts - Liabilities (29,387,569) (2.49)
Net Unrealised Loss on Forward Currency Exchange Contracts - Liabilities (1,469,392) (0.12)
Financial Futures Contracts
Security Description
Number of
Contracts Currency
Unrealised Gain/(Loss)
EUR % of Net Assets
MSCI Emerging Markets Index, 18/03/2022 (1,112) USD 222,101 0.02XAV Health Care Index, 18/03/2022 590 USD 3,605,786 0.30Total Unrealised Gain on Financial Futures Contracts - Assets 3,827,887 0.32
MSCI World Index, 18/03/2022 (1,130) USD (2,290,705) (0.19)Russell 2000 Emini Index, 18/03/2022 (933) USD (1,241,470) (0.11)S&P 500 Emini Index, 18/03/2022 (3) USD (17,250) –STOXX Europe 600 Index, 18/03/2022 (3,830) EUR (2,360,840) (0.20)Total Unrealised Loss on Financial Futures Contracts - Liabilities (5,910,265) (0.50)
Net Unrealised Loss on Financial Futures Contracts - Liabilities (2,082,378) (0.18)
Credit Default Swap Contracts
Nominal
Amount Currency Counterparty Reference Entity Buy/Sell
Interest
(Paid)/
Received
Rate Maturity Date
Market
Value EUR
% of Net
Assets
12,176,000 USD J.P. Morgan CDX.NA.HY.37-V1 Sell 5.00% 20/12/2026 994,859 0.0810,583,000 EUR J.P. Morgan ITRAXX.EUROPE.CROSSOVER.36-V1 Sell 5.00% 20/12/2026 1,274,509 0.11
Total Market Value on Credit Default Swap Contracts - Assets 2,269,368 0.19
Net Market Value on Credit Default Swap Contracts - Assets 2,269,368 0.19ok
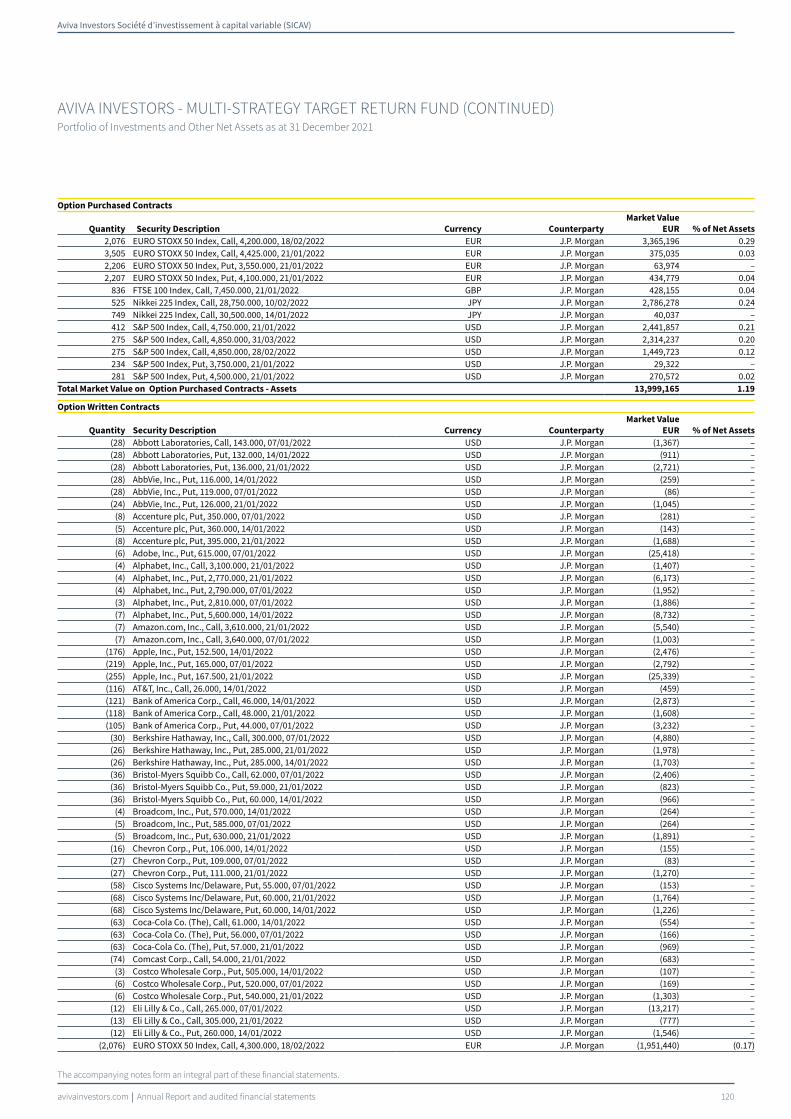
Aviva Investors Société d’investissement à capital variable (SICAV)
avivainvestors.com Annual Report and audited financial statements 120
AVIVA INVESTORS - MULTI-STRATEGY TARGET RETURN FUND (CONTINUED)Portfolio of Investments and Other Net Assets as at 31 December 2021
The accompanying notes form an integral part of these financial statements.
Option Purchased Contracts
Quantity Security Description Currency Counterparty
Market Value
EUR % of Net Assets
2,076 EURO STOXX 50 Index, Call, 4,200.000, 18/02/2022 EUR J.P. Morgan 3,365,196 0.293,505 EURO STOXX 50 Index, Call, 4,425.000, 21/01/2022 EUR J.P. Morgan 375,035 0.032,206 EURO STOXX 50 Index, Put, 3,550.000, 21/01/2022 EUR J.P. Morgan 63,974 –2,207 EURO STOXX 50 Index, Put, 4,100.000, 21/01/2022 EUR J.P. Morgan 434,779 0.04
836 FTSE 100 Index, Call, 7,450.000, 21/01/2022 GBP J.P. Morgan 428,155 0.04525 Nikkei 225 Index, Call, 28,750.000, 10/02/2022 JPY J.P. Morgan 2,786,278 0.24749 Nikkei 225 Index, Call, 30,500.000, 14/01/2022 JPY J.P. Morgan 40,037 –412 S&P 500 Index, Call, 4,750.000, 21/01/2022 USD J.P. Morgan 2,441,857 0.21275 S&P 500 Index, Call, 4,850.000, 31/03/2022 USD J.P. Morgan 2,314,237 0.20275 S&P 500 Index, Call, 4,850.000, 28/02/2022 USD J.P. Morgan 1,449,723 0.12234 S&P 500 Index, Put, 3,750.000, 21/01/2022 USD J.P. Morgan 29,322 –281 S&P 500 Index, Put, 4,500.000, 21/01/2022 USD J.P. Morgan 270,572 0.02
Total Market Value on Option Purchased Contracts - Assets 13,999,165 1.19
Option Written Contracts
Quantity Security Description Currency Counterparty
Market Value
EUR % of Net Assets
(28) Abbott Laboratories, Call, 143.000, 07/01/2022 USD J.P. Morgan (1,367) –(28) Abbott Laboratories, Put, 132.000, 14/01/2022 USD J.P. Morgan (911) –(28) Abbott Laboratories, Put, 136.000, 21/01/2022 USD J.P. Morgan (2,721) –(28) AbbVie, Inc., Put, 116.000, 14/01/2022 USD J.P. Morgan (259) –(28) AbbVie, Inc., Put, 119.000, 07/01/2022 USD J.P. Morgan (86) –(24) AbbVie, Inc., Put, 126.000, 21/01/2022 USD J.P. Morgan (1,045) –
(8) Accenture plc, Put, 350.000, 07/01/2022 USD J.P. Morgan (281) –(5) Accenture plc, Put, 360.000, 14/01/2022 USD J.P. Morgan (143) –(8) Accenture plc, Put, 395.000, 21/01/2022 USD J.P. Morgan (1,688) –(6) Adobe, Inc., Put, 615.000, 07/01/2022 USD J.P. Morgan (25,418) –(4) Alphabet, Inc., Call, 3,100.000, 21/01/2022 USD J.P. Morgan (1,407) –(4) Alphabet, Inc., Put, 2,770.000, 21/01/2022 USD J.P. Morgan (6,173) –(4) Alphabet, Inc., Put, 2,790.000, 07/01/2022 USD J.P. Morgan (1,952) –(3) Alphabet, Inc., Put, 2,810.000, 07/01/2022 USD J.P. Morgan (1,886) –(7) Alphabet, Inc., Put, 5,600.000, 14/01/2022 USD J.P. Morgan (8,732) –(7) Amazon.com, Inc., Call, 3,610.000, 21/01/2022 USD J.P. Morgan (5,540) –(7) Amazon.com, Inc., Call, 3,640.000, 07/01/2022 USD J.P. Morgan (1,003) –
(176) Apple, Inc., Put, 152.500, 14/01/2022 USD J.P. Morgan (2,476) –(219) Apple, Inc., Put, 165.000, 07/01/2022 USD J.P. Morgan (2,792) –(255) Apple, Inc., Put, 167.500, 21/01/2022 USD J.P. Morgan (25,339) –(116) AT&T, Inc., Call, 26.000, 14/01/2022 USD J.P. Morgan (459) –(121) Bank of America Corp., Call, 46.000, 14/01/2022 USD J.P. Morgan (2,873) –(118) Bank of America Corp., Call, 48.000, 21/01/2022 USD J.P. Morgan (1,608) –(105) Bank of America Corp., Put, 44.000, 07/01/2022 USD J.P. Morgan (3,232) –
(30) Berkshire Hathaway, Inc., Call, 300.000, 07/01/2022 USD J.P. Morgan (4,880) –(26) Berkshire Hathaway, Inc., Put, 285.000, 21/01/2022 USD J.P. Morgan (1,978) –(26) Berkshire Hathaway, Inc., Put, 285.000, 14/01/2022 USD J.P. Morgan (1,703) –(36) Bristol-Myers Squibb Co., Call, 62.000, 07/01/2022 USD J.P. Morgan (2,406) –(36) Bristol-Myers Squibb Co., Put, 59.000, 21/01/2022 USD J.P. Morgan (823) –(36) Bristol-Myers Squibb Co., Put, 60.000, 14/01/2022 USD J.P. Morgan (966) –
(4) Broadcom, Inc., Put, 570.000, 14/01/2022 USD J.P. Morgan (264) –(5) Broadcom, Inc., Put, 585.000, 07/01/2022 USD J.P. Morgan (264) –(5) Broadcom, Inc., Put, 630.000, 21/01/2022 USD J.P. Morgan (1,891) –
(16) Chevron Corp., Put, 106.000, 14/01/2022 USD J.P. Morgan (155) –(27) Chevron Corp., Put, 109.000, 07/01/2022 USD J.P. Morgan (83) –(27) Chevron Corp., Put, 111.000, 21/01/2022 USD J.P. Morgan (1,270) –(58) Cisco Systems Inc/Delaware, Put, 55.000, 07/01/2022 USD J.P. Morgan (153) –(68) Cisco Systems Inc/Delaware, Put, 60.000, 21/01/2022 USD J.P. Morgan (1,764) –(68) Cisco Systems Inc/Delaware, Put, 60.000, 14/01/2022 USD J.P. Morgan (1,226) –(63) Coca-Cola Co. (The), Call, 61.000, 14/01/2022 USD J.P. Morgan (554) –(63) Coca-Cola Co. (The), Put, 56.000, 07/01/2022 USD J.P. Morgan (166) –(63) Coca-Cola Co. (The), Put, 57.000, 21/01/2022 USD J.P. Morgan (969) –(74) Comcast Corp., Call, 54.000, 21/01/2022 USD J.P. Morgan (683) –
(3) Costco Wholesale Corp., Put, 505.000, 14/01/2022 USD J.P. Morgan (107) –(6) Costco Wholesale Corp., Put, 520.000, 07/01/2022 USD J.P. Morgan (169) –(6) Costco Wholesale Corp., Put, 540.000, 21/01/2022 USD J.P. Morgan (1,303) –
(12) Eli Lilly & Co., Call, 265.000, 07/01/2022 USD J.P. Morgan (13,217) –(13) Eli Lilly & Co., Call, 305.000, 21/01/2022 USD J.P. Morgan (777) –(12) Eli Lilly & Co., Put, 260.000, 14/01/2022 USD J.P. Morgan (1,546) –
(2,076) EURO STOXX 50 Index, Call, 4,300.000, 18/02/2022 EUR J.P. Morgan (1,951,440) (0.17)

Aviva Investors Société d’investissement à capital variable (SICAV)
avivainvestors.com Annual Report and audited financial statements 121
AVIVA INVESTORS - MULTI-STRATEGY TARGET RETURN FUND (CONTINUED)Portfolio of Investments and Other Net Assets as at 31 December 2021
The accompanying notes form an integral part of these financial statements.
Option Written Contracts (continued)
Quantity Security Description Currency Counterparty
Market Value
EUR % of Net Assets
(3,505) EURO STOXX 50 Index, Call, 4,475.000, 21/01/2022 EUR J.P. Morgan (161,230) (0.02)(2,207) EURO STOXX 50 Index, Put, 3,850.000, 21/01/2022 EUR J.P. Morgan (152,283) (0.01)
(692) EURO STOXX 50 Index, Put, 4,000.000, 18/02/2022 EUR J.P. Morgan (251,196) (0.02)(701) EURO STOXX 50 Index, Put, 4,200.000, 21/01/2022 EUR J.P. Morgan (231,330) (0.02)
(69) Exxon Mobil Corp., Call, 63.000, 14/01/2022 USD J.P. Morgan (2,427) –(69) Exxon Mobil Corp., Call, 66.000, 21/01/2022 USD J.P. Morgan (789) –(59) Exxon Mobil Corp., Put, 60.000, 07/01/2022 USD J.P. Morgan (1,712) –
(836) FTSE 100 Index, Call, 7,500.000, 21/01/2022 GBP J.P. Morgan (253,906) (0.02)(209) FTSE 100 Index, Put, 7,250.000, 21/01/2022 GBP J.P. Morgan (100,816) (0.01)
(17) Home Depot, Inc. (The), Call, 410.000, 14/01/2022 USD J.P. Morgan (13,641) –(14) Home Depot, Inc. (The), Put, 385.000, 21/01/2022 USD J.P. Morgan (1,120) –(14) Home Depot, Inc. (The), Put, 390.000, 07/01/2022 USD J.P. Morgan (351) –(66) Intel Corp., Call, 53.000, 14/01/2022 USD J.P. Morgan (1,944) –(66) Intel Corp., Call, 54.000, 07/01/2022 USD J.P. Morgan (261) –(66) Intel Corp., Call, 56.500, 21/01/2022 USD J.P. Morgan (348) –(43) Johnson & Johnson, Put, 165.000, 21/01/2022 USD J.P. Morgan (2,288) –(43) Johnson & Johnson, Put, 165.000, 14/01/2022 USD J.P. Morgan (1,664) –(43) Johnson & Johnson, Put, 165.000, 07/01/2022 USD J.P. Morgan (586) –(48) JPMorgan Chase & Co., Call, 165.000, 14/01/2022 USD J.P. Morgan (2,174) –(48) JPMorgan Chase & Co., Call, 165.000, 07/01/2022 USD J.P. Morgan (338) –(48) JPMorgan Chase & Co., Call, 167.500, 21/01/2022 USD J.P. Morgan (1,836) –(14) Mastercard, Inc., Call, 375.000, 14/01/2022 USD J.P. Morgan (1,890) –(14) Mastercard, Inc., Call, 380.000, 07/01/2022 USD J.P. Morgan (308) –(12) McDonald's Corp., Put, 250.000, 14/01/2022 USD J.P. Morgan (227) –(10) McDonald's Corp., Put, 250.000, 07/01/2022 USD J.P. Morgan (92) –(10) McDonald's Corp., Put, 257.500, 21/01/2022 USD J.P. Morgan (690) –(22) Medtronic plc, Call, 112.000, 21/01/2022 USD J.P. Morgan (232) –(41) Merck & Co., Inc., Call, 83.000, 21/01/2022 USD J.P. Morgan (469) –(41) Merck & Co., Inc., Call, 83.000, 14/01/2022 USD J.P. Morgan (270) –(38) Meta Platforms, Inc., Call, 355.000, 14/01/2022 USD J.P. Morgan (5,681) –(38) Meta Platforms, Inc., Call, 370.000, 21/01/2022 USD J.P. Morgan (3,024) –(38) Meta Platforms, Inc., Call, 370.000, 07/01/2022 USD J.P. Morgan (384) –
(122) Microsoft Corp., Call, 345.000, 14/01/2022 USD J.P. Morgan (20,598) –(105) Microsoft Corp., Put, 320.000, 07/01/2022 USD J.P. Morgan (4,201) –(105) Microsoft Corp., Put, 322.500, 21/01/2022 USD J.P. Morgan (21,421) –
(7) Netflix, Inc., Call, 665.000, 21/01/2022 USD J.P. Morgan (2,893) –(20) NIKE, Inc., Call, 180.000, 07/01/2022 USD J.P. Morgan (62) –(20) NIKE, Inc., Call, 185.000, 21/01/2022 USD J.P. Morgan (290) –
(525) Nikkei 225 Index, Call, 29,250.000, 10/02/2022 JPY J.P. Morgan (1,723,884) (0.15)(749) Nikkei 225 Index, Call, 31,000.000, 14/01/2022 JPY J.P. Morgan (17,159) –(105) Nikkei 225 Index, Put, 27,250.000, 10/02/2022 JPY J.P. Morgan (216,488) (0.02)(107) Nikkei 225 Index, Put, 30,000.000, 14/01/2022 JPY J.P. Morgan (1,009,093) (0.09)
(32) NVIDIA Corp., Put, 270.000, 07/01/2022 USD J.P. Morgan (2,293) –(32) NVIDIA Corp., Put, 290.000, 21/01/2022 USD J.P. Morgan (28,843) –(25) Oracle Corp., Put, 89.000, 21/01/2022 USD J.P. Morgan (6,760) –
(8) Oracle Corp., Put, 93.000, 14/01/2022 USD J.P. Morgan (4,414) –(25) Oracle Corp., Put, 93.000, 07/01/2022 USD J.P. Morgan (13,520) –(19) PayPal Holdings, Inc., Call, 205.000, 14/01/2022 USD J.P. Morgan (1,420) –(19) PayPal Holdings, Inc., Call, 210.000, 21/01/2022 USD J.P. Morgan (1,504) –(19) PayPal Holdings, Inc., Call, 210.000, 07/01/2022 USD J.P. Morgan (251) –
(9) PepsiCo, Inc., Put, 160.000, 14/01/2022 USD J.P. Morgan (214) –(19) PepsiCo, Inc., Put, 165.000, 21/01/2022 USD J.P. Morgan (610) –(19) PepsiCo, Inc., Put, 165.000, 07/01/2022 USD J.P. Morgan (175) –(91) Pfizer, Inc., Put, 50.000, 07/01/2022 USD J.P. Morgan (160) –(91) Pfizer, Inc., Put, 54.000, 21/01/2022 USD J.P. Morgan (2,441) –(91) Pfizer, Inc., Put, 55.000, 14/01/2022 USD J.P. Morgan (2,161) –(25) Philip Morris International, Inc., Call, 96.000, 07/01/2022 USD J.P. Morgan (857) –(25) Philip Morris International, Inc., Call, 97.000, 14/01/2022 USD J.P. Morgan (1,132) –(25) Philip Morris International, Inc., Call, 98.000, 21/01/2022 USD J.P. Morgan (945) –(39) Procter & Gamble Co. (The), Put, 148.000, 14/01/2022 USD J.P. Morgan (549) –(39) Procter & Gamble Co. (The), Put, 155.000, 21/01/2022 USD J.P. Morgan (2,092) –(39) Procter & Gamble Co. (The), Put, 155.000, 07/01/2022 USD J.P. Morgan (377) –
(412) S&P 500 Index, Call, 4,800.000, 21/01/2022 USD J.P. Morgan (1,344,108) (0.12)(275) S&P 500 Index, Call, 4,900.000, 31/03/2022 USD J.P. Morgan (1,724,191) (0.15)(275) S&P 500 Index, Call, 4,900.000, 28/02/2022 USD J.P. Morgan (949,151) (0.08)(281) S&P 500 Index, Put, 4,200.000, 21/01/2022 USD J.P. Morgan (92,662) (0.01)

Aviva Investors Société d’investissement à capital variable (SICAV)
avivainvestors.com Annual Report and audited financial statements 122
AVIVA INVESTORS - MULTI-STRATEGY TARGET RETURN FUND (CONTINUED)Portfolio of Investments and Other Net Assets as at 31 December 2021
The accompanying notes form an integral part of these financial statements.
Option Written Contracts (continued)
Quantity Security Description Currency Counterparty
Market Value
EUR % of Net Assets
(75) S&P 500 Index, Put, 4,650.000, 21/01/2022 USD J.P. Morgan (160,592) (0.02)(55) S&P 500 Index, Put, 4,700.000, 31/03/2022 USD J.P. Morgan (613,986) (0.05)(55) S&P 500 Index, Put, 4,700.000, 28/02/2022 USD J.P. Morgan (417,868) (0.04)(10) Tesla, Inc., Put, 900.000, 07/01/2022 USD J.P. Morgan (1,332) –(10) Tesla, Inc., Put, 1,020.000, 21/01/2022 USD J.P. Morgan (35,768) –(15) Texas Instruments, Inc., Call, 195.000, 14/01/2022 USD J.P. Morgan (1,108) –(15) Texas Instruments, Inc., Call, 205.000, 21/01/2022 USD J.P. Morgan (224) –(15) Texas Instruments, Inc., Call, 205.000, 07/01/2022 USD J.P. Morgan (112) –(10) Union Pacific Corp., Call, 250.000, 14/01/2022 USD J.P. Morgan (4,133) –
(9) Union Pacific Corp., Put, 235.000, 21/01/2022 USD J.P. Morgan (783) –(10) Union Pacific Corp., Put, 240.000, 07/01/2022 USD J.P. Morgan (132) –
(5) UnitedHealth Group, Inc., Put, 450.000, 14/01/2022 USD J.P. Morgan (404) –(12) UnitedHealth Group, Inc., Put, 450.000, 07/01/2022 USD J.P. Morgan (543) –(15) UnitedHealth Group, Inc., Put, 475.000, 21/01/2022 USD J.P. Morgan (3,706) –(67) Verizon Communications, Inc., Put, 53.000, 14/01/2022 USD J.P. Morgan (11,194) –(27) Visa, Inc., Call, 225.000, 14/01/2022 USD J.P. Morgan (1,971) –(27) Visa, Inc., Call, 230.000, 07/01/2022 USD J.P. Morgan (214) –(27) Visa, Inc., Put, 215.000, 21/01/2022 USD J.P. Morgan (8,547) –(23) Walmart, Inc., Call, 148.000, 14/01/2022 USD J.P. Morgan (1,294) –(23) Walmart, Inc., Call, 149.000, 07/01/2022 USD J.P. Morgan (303) –(23) Walmart, Inc., Call, 150.000, 21/01/2022 USD J.P. Morgan (1,042) –(29) Walt Disney Co. (The), Call, 155.000, 14/01/2022 USD J.P. Morgan (7,077) –(29) Walt Disney Co. (The), Call, 160.000, 07/01/2022 USD J.P. Morgan (1,097) –(29) Walt Disney Co. (The), Call, 165.000, 21/01/2022 USD J.P. Morgan (1,785) –(67) Wells Fargo & Co., Call, 51.000, 14/01/2022 USD J.P. Morgan (1,296) –(67) Wells Fargo & Co., Call, 53.000, 21/01/2022 USD J.P. Morgan (678) –(67) Wells Fargo & Co., Call, 53.000, 07/01/2022 USD J.P. Morgan (88) –
Total Market Value on Option Written Contracts - Liabilities (11,759,851) (1.00)
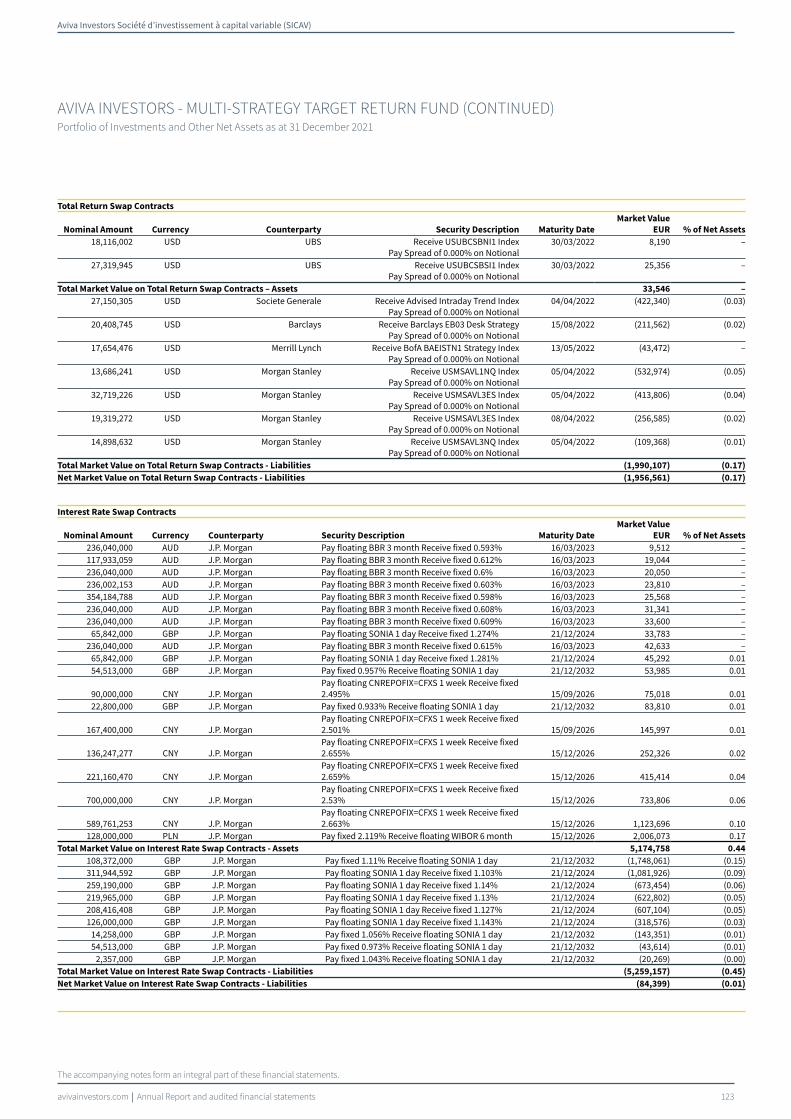
Aviva Investors Société d’investissement à capital variable (SICAV)
avivainvestors.com Annual Report and audited financial statements 123
AVIVA INVESTORS - MULTI-STRATEGY TARGET RETURN FUND (CONTINUED)Portfolio of Investments and Other Net Assets as at 31 December 2021
The accompanying notes form an integral part of these financial statements.
Total Return Swap Contracts
Nominal Amount Currency Counterparty Security Description Maturity Date
Market Value
EUR % of Net Assets
18,116,002 USD UBS Receive USUBCSBNI1 Index Pay Spread of 0.000% on Notional
30/03/2022 8,190 –
27,319,945 USD UBS Receive USUBCSBSI1 Index Pay Spread of 0.000% on Notional
30/03/2022 25,356 –
Total Market Value on Total Return Swap Contracts – Assets 33,546 –
27,150,305 USD Societe Generale Receive Advised Intraday Trend Index Pay Spread of 0.000% on Notional
04/04/2022 (422,340) (0.03)
20,408,745 USD Barclays Receive Barclays EB03 Desk Strategy Pay Spread of 0.000% on Notional
15/08/2022 (211,562) (0.02)
17,654,476 USD Merrill Lynch Receive BofA BAEISTN1 Strategy Index Pay Spread of 0.000% on Notional
13/05/2022 (43,472) –
13,686,241 USD Morgan Stanley Receive USMSAVL1NQ Index Pay Spread of 0.000% on Notional
05/04/2022 (532,974) (0.05)
32,719,226 USD Morgan Stanley Receive USMSAVL3ES Index Pay Spread of 0.000% on Notional
05/04/2022 (413,806) (0.04)
19,319,272 USD Morgan Stanley Receive USMSAVL3ES Index Pay Spread of 0.000% on Notional
08/04/2022 (256,585) (0.02)
14,898,632 USD Morgan Stanley Receive USMSAVL3NQ Index Pay Spread of 0.000% on Notional
05/04/2022 (109,368) (0.01)
Total Market Value on Total Return Swap Contracts - Liabilities (1,990,107) (0.17)
Net Market Value on Total Return Swap Contracts - Liabilities (1,956,561) (0.17)
Interest Rate Swap Contracts
Nominal Amount Currency Counterparty Security Description Maturity Date
Market Value
EUR % of Net Assets
236,040,000 AUD J.P. Morgan Pay floating BBR 3 month Receive fixed 0.593% 16/03/2023 9,512 –117,933,059 AUD J.P. Morgan Pay floating BBR 3 month Receive fixed 0.612% 16/03/2023 19,044 –236,040,000 AUD J.P. Morgan Pay floating BBR 3 month Receive fixed 0.6% 16/03/2023 20,050 –236,002,153 AUD J.P. Morgan Pay floating BBR 3 month Receive fixed 0.603% 16/03/2023 23,810 –354,184,788 AUD J.P. Morgan Pay floating BBR 3 month Receive fixed 0.598% 16/03/2023 25,568 –236,040,000 AUD J.P. Morgan Pay floating BBR 3 month Receive fixed 0.608% 16/03/2023 31,341 –236,040,000 AUD J.P. Morgan Pay floating BBR 3 month Receive fixed 0.609% 16/03/2023 33,600 –
65,842,000 GBP J.P. Morgan Pay floating SONIA 1 day Receive fixed 1.274% 21/12/2024 33,783 –236,040,000 AUD J.P. Morgan Pay floating BBR 3 month Receive fixed 0.615% 16/03/2023 42,633 –
65,842,000 GBP J.P. Morgan Pay floating SONIA 1 day Receive fixed 1.281% 21/12/2024 45,292 0.0154,513,000 GBP J.P. Morgan Pay fixed 0.957% Receive floating SONIA 1 day 21/12/2032 53,985 0.01
90,000,000 CNY J.P. Morgan Pay floating CNREPOFIX=CFXS 1 week Receive fixed 2.495% 15/09/2026 75,018 0.01
22,800,000 GBP J.P. Morgan Pay fixed 0.933% Receive floating SONIA 1 day 21/12/2032 83,810 0.01
167,400,000 CNY J.P. Morgan Pay floating CNREPOFIX=CFXS 1 week Receive fixed 2.501% 15/09/2026 145,997 0.01
136,247,277 CNY J.P. Morgan Pay floating CNREPOFIX=CFXS 1 week Receive fixed 2.655% 15/12/2026 252,326 0.02
221,160,470 CNY J.P. Morgan Pay floating CNREPOFIX=CFXS 1 week Receive fixed 2.659% 15/12/2026 415,414 0.04
700,000,000 CNY J.P. Morgan Pay floating CNREPOFIX=CFXS 1 week Receive fixed 2.53% 15/12/2026 733,806 0.06
589,761,253 CNY J.P. Morgan Pay floating CNREPOFIX=CFXS 1 week Receive fixed 2.663% 15/12/2026 1,123,696 0.10
128,000,000 PLN J.P. Morgan Pay fixed 2.119% Receive floating WIBOR 6 month 15/12/2026 2,006,073 0.17Total Market Value on Interest Rate Swap Contracts - Assets 5,174,758 0.44
108,372,000 GBP J.P. Morgan Pay fixed 1.11% Receive floating SONIA 1 day 21/12/2032 (1,748,061) (0.15)311,944,592 GBP J.P. Morgan Pay floating SONIA 1 day Receive fixed 1.103% 21/12/2024 (1,081,926) (0.09)259,190,000 GBP J.P. Morgan Pay floating SONIA 1 day Receive fixed 1.14% 21/12/2024 (673,454) (0.06)219,965,000 GBP J.P. Morgan Pay floating SONIA 1 day Receive fixed 1.13% 21/12/2024 (622,802) (0.05)208,416,408 GBP J.P. Morgan Pay floating SONIA 1 day Receive fixed 1.127% 21/12/2024 (607,104) (0.05)126,000,000 GBP J.P. Morgan Pay floating SONIA 1 day Receive fixed 1.143% 21/12/2024 (318,576) (0.03)
14,258,000 GBP J.P. Morgan Pay fixed 1.056% Receive floating SONIA 1 day 21/12/2032 (143,351) (0.01)54,513,000 GBP J.P. Morgan Pay fixed 0.973% Receive floating SONIA 1 day 21/12/2032 (43,614) (0.01)
2,357,000 GBP J.P. Morgan Pay fixed 1.043% Receive floating SONIA 1 day 21/12/2032 (20,269) (0.00)Total Market Value on Interest Rate Swap Contracts - Liabilities (5,259,157) (0.45)
Net Market Value on Interest Rate Swap Contracts - Liabilities (84,399) (0.01)

Aviva Investors Société d’investissement à capital variable (SICAV)
avivainvestors.com Annual Report and audited financial statements 124
AVIVA INVESTORS - MULTI-STRATEGY TARGET RETURN FUND (CONTINUED)Portfolio of Investments and Other Net Assets as at 31 December 2021
The accompanying notes form an integral part of these financial statements.
Equity Variance Swap Contracts
Nominal Amount Currency Counterparty Security Description Maturity Date
Market Value
EUR % of Net Assets
159,749,100 USD Societe Generale S&P 500 Index 18/03/2022 4,407,137 0.37162,210,000 USD Barclays S&P 500 Index 17/06/2022 3,531,566 0.30
97,932,400 USD Merrill Lynch S&P 500 Index 14/04/2022 2,482,507 0.2168,600,100 USD Societe Generale S&P 500 Index 14/04/2022 1,771,094 0.1577,422,600 USD Goldman Sachs S&P 500 Index 16/09/2022 77,340 0.01
Total Market Value on Equity Variance Swap Contracts - Assets 12,269,644 1.04
31,829,000 USD Goldman Sachs S&P 500 Index 14/04/2022 (139,333) (0.01)Total Market Value on Equity Variance Swap Contracts - Liabilities (139,333) (0.01)
Net Market Value on Equity Variance Swap Contracts - Assets 12,130,311 1.03

Aviva Investors Société d’investissement à capital variable (SICAV)
avivainvestors.com Annual Report and audited financial statements 125
The accompanying notes form an integral part of these financial statements.
AVIVA INVESTORS - NATURAL CAPITAL TRANSITION GLOBAL EQUITY FUND*Portfolio of Investments and Other Net Assets as at 31 December 2021
Investments Currency Quantity/
Nominal Value
Market Value
USD
% of Net
Assets0
Transferable securities and money market instruments admitted to an official
exchange listing
Equities
Brazil
Natura & Co. Holding SA, ADR USD 45,830 426,219 1.43
426,219 1.43
China
BYD Co. Ltd. 'H' HKD 7,500 256,585 0.86
256,585 0.86
Finland
Stora Enso OYJ 'R' EUR 33,900 621,633 2.08
621,633 2.08
France
AXA SA EUR 21,380 635,005 2.13
BNP Paribas SA EUR 11,840 815,400 2.73
Bureau Veritas SA EUR 23,000 762,502 2.56
Cie de Saint-Gobain EUR 9,120 640,027 2.14
Kering SA EUR 960 769,273 2.58
3,622,207 12.14
Germany
adidas AG EUR 3,070 883,435 2.96
Infineon Technologies AG EUR 19,520 900,670 3.02
Muenchener Rueckversicherungs-Gesellschaft AG EUR 3,270 966,305 3.24
Siemens AG EUR 5,470 944,162 3.16
3,694,572 12.38
Ireland
Kerry Group plc 'A' EUR 4,770 614,012 2.06
614,012 2.06
Japan
Kubota Corp. JPY 41,900 930,419 3.12
930,419 3.12
Netherlands
Koninklijke DSM NV EUR 4,030 905,281 3.03
905,281 3.03
South Korea
Hyundai Motor Co. KRW 3,570 628,357 2.10
628,357 2.10
Switzerland
Novartis AG CHF 7,360 646,685 2.17
646,685 2.17
Taiwan
Taiwan Semiconductor Manufacturing Co. Ltd., ADR USD 4,910 593,251 1.99
593,251 1.99
United Kingdom
AstraZeneca plc GBP 6,680 783,271 2.63
National Grid plc GBP 43,800 627,475 2.10
Severn Trent plc GBP 15,180 605,215 2.03
2,015,961 6.76
United States of America
Abbott Laboratories USD 6,870 969,804 3.25
Alphabet, Inc. 'A' USD 252 733,926 2.46
Ball Corp. USD 6,180 590,932 1.98
Beyond Meat, Inc. USD 3,930 265,530 0.89
Crown Holdings, Inc. USD 8,110 890,194 2.98
Danimer Scientific, Inc. USD 20,740 180,023 0.60
Darling Ingredients, Inc. USD 4,140 284,832 0.96
Microsoft Corp. USD 3,050 1,028,994 3.45
Investments Currency Quantity/
Nominal Value
Market Value
USD
% of Net
Assets0
Moody's Corp. USD 2,210 865,016 2.90
NVIDIA Corp. USD 1,320 392,469 1.32
ON Semiconductor Corp. USD 6,970 477,097 1.60
salesforce.com, Inc. USD 2,960 754,548 2.53
Sherwin-Williams Co. (The) USD 2,630 919,908 3.08
Tetra Tech, Inc. USD 3,100 522,800 1.75
Thermo Fisher Scientific, Inc. USD 1,360 906,814 3.04
Trex Co., Inc. USD 3,300 438,537 1.47
Trimble, Inc. USD 8,470 742,861 2.49
Union Pacific Corp. USD 3,670 915,830 3.07
Waste Management, Inc. USD 5,270 872,264 2.92
Watts Water Technologies, Inc. 'A' USD 3,020 582,664 1.95
Zoetis, Inc. USD 3,280 806,732 2.70
14,141,775 47.39
Total Equities 29,096,957 97.51
Total Transferable securities and money market
instruments admitted to an official exchange listing 29,096,957 97.51
Total Investments 29,096,957 97.51
Cash 710,691 2.38
Other assets/(liabilities) 32,381 0.11
Total net assets 29,840,029 100.00
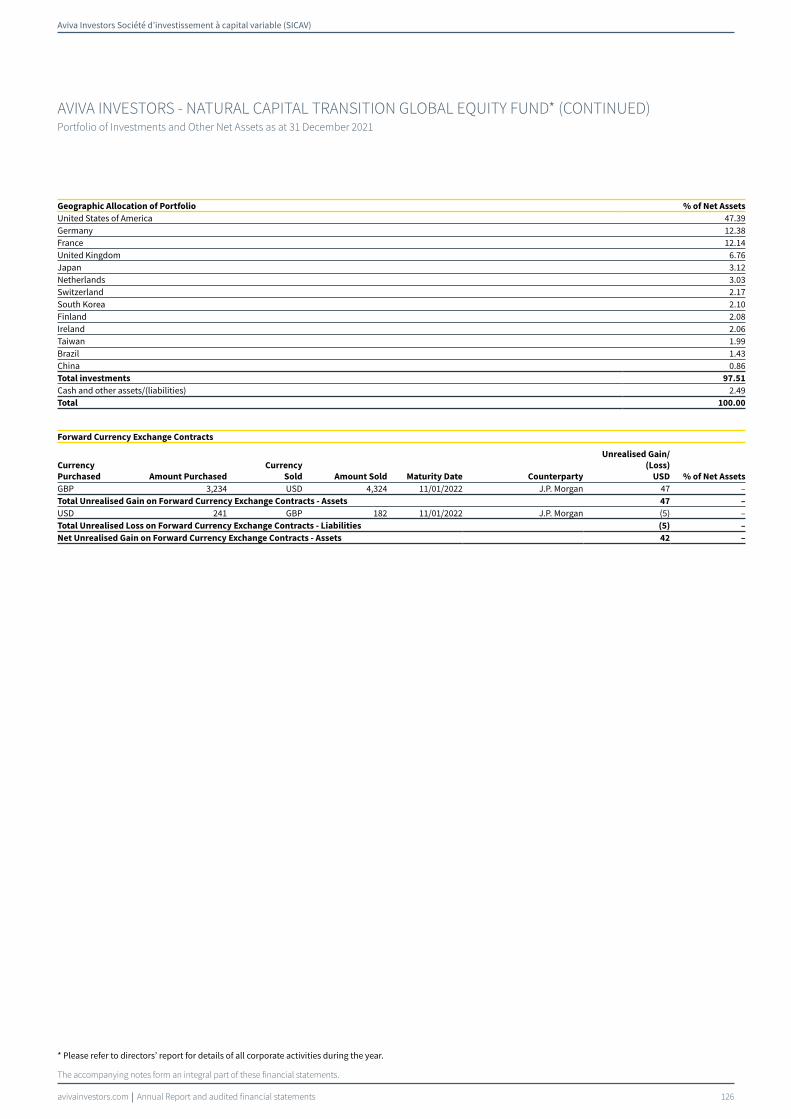
Aviva Investors Société d’investissement à capital variable (SICAV)
avivainvestors.com Annual Report and audited financial statements 126
AVIVA INVESTORS - NATURAL CAPITAL TRANSITION GLOBAL EQUITY FUND* (CONTINUED)Portfolio of Investments and Other Net Assets as at 31 December 2021
The accompanying notes form an integral part of these financial statements.
Geographic Allocation of Portfolio % of Net Assets
United States of America 47.39Germany 12.38France 12.14United Kingdom 6.76Japan 3.12Netherlands 3.03Switzerland 2.17South Korea 2.10Finland 2.08Ireland 2.06Taiwan 1.99Brazil 1.43China 0.86Total investments 97.51
Cash and other assets/(liabilities) 2.49Total 100.00
Forward Currency Exchange Contracts
Currency
Purchased Amount Purchased
Currency
Sold Amount Sold Maturity Date Counterparty
Unrealised Gain/
(Loss)
USD % of Net Assets
GBP 3,234 USD 4,324 11/01/2022 J.P. Morgan 47 –Total Unrealised Gain on Forward Currency Exchange Contracts - Assets 47 –
USD 241 GBP 182 11/01/2022 J.P. Morgan (5) –Total Unrealised Loss on Forward Currency Exchange Contracts - Liabilities (5) –
Net Unrealised Gain on Forward Currency Exchange Contracts - Assets 42 –
* Please refer to directors’ report for details of all corporate activities during the year.
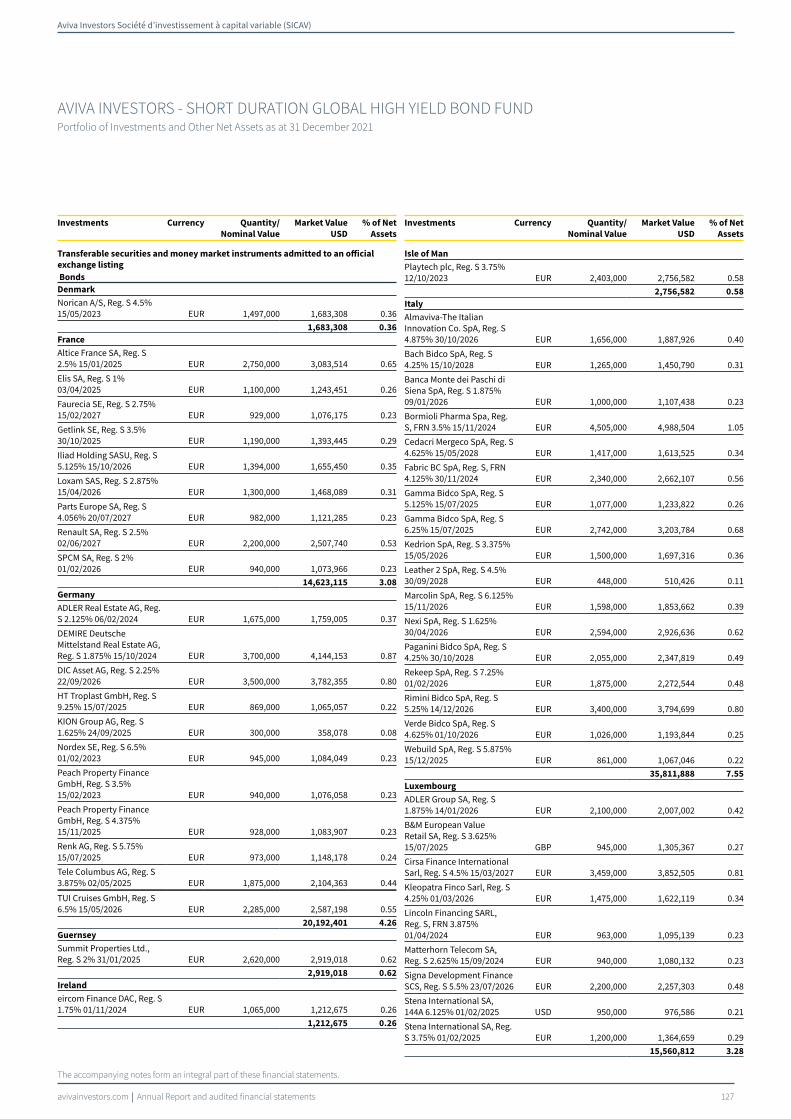
Aviva Investors Société d’investissement à capital variable (SICAV)
avivainvestors.com Annual Report and audited financial statements 127
The accompanying notes form an integral part of these financial statements.
AVIVA INVESTORS - SHORT DURATION GLOBAL HIGH YIELD BOND FUNDPortfolio of Investments and Other Net Assets as at 31 December 2021
Investments Currency Quantity/
Nominal Value
Market Value
USD
% of Net
Assets0
Transferable securities and money market instruments admitted to an official
exchange listing
Bonds
Denmark
Norican A/S, Reg. S 4.5% 15/05/2023 EUR 1,497,000 1,683,308 0.36
1,683,308 0.36
France
Altice France SA, Reg. S 2.5% 15/01/2025 EUR 2,750,000 3,083,514 0.65
Elis SA, Reg. S 1% 03/04/2025 EUR 1,100,000 1,243,451 0.26
Faurecia SE, Reg. S 2.75% 15/02/2027 EUR 929,000 1,076,175 0.23
Getlink SE, Reg. S 3.5% 30/10/2025 EUR 1,190,000 1,393,445 0.29
Iliad Holding SASU, Reg. S 5.125% 15/10/2026 EUR 1,394,000 1,655,450 0.35
Loxam SAS, Reg. S 2.875% 15/04/2026 EUR 1,300,000 1,468,089 0.31
Parts Europe SA, Reg. S 4.056% 20/07/2027 EUR 982,000 1,121,285 0.23
Renault SA, Reg. S 2.5% 02/06/2027 EUR 2,200,000 2,507,740 0.53
SPCM SA, Reg. S 2% 01/02/2026 EUR 940,000 1,073,966 0.23
14,623,115 3.08
Germany
ADLER Real Estate AG, Reg. S 2.125% 06/02/2024 EUR 1,675,000 1,759,005 0.37
DEMIRE Deutsche Mittelstand Real Estate AG, Reg. S 1.875% 15/10/2024 EUR 3,700,000 4,144,153 0.87
DIC Asset AG, Reg. S 2.25% 22/09/2026 EUR 3,500,000 3,782,355 0.80
HT Troplast GmbH, Reg. S 9.25% 15/07/2025 EUR 869,000 1,065,057 0.22
KION Group AG, Reg. S 1.625% 24/09/2025 EUR 300,000 358,078 0.08
Nordex SE, Reg. S 6.5% 01/02/2023 EUR 945,000 1,084,049 0.23
Peach Property Finance GmbH, Reg. S 3.5% 15/02/2023 EUR 940,000 1,076,058 0.23
Peach Property Finance GmbH, Reg. S 4.375% 15/11/2025 EUR 928,000 1,083,907 0.23
Renk AG, Reg. S 5.75% 15/07/2025 EUR 973,000 1,148,178 0.24
Tele Columbus AG, Reg. S 3.875% 02/05/2025 EUR 1,875,000 2,104,363 0.44
TUI Cruises GmbH, Reg. S 6.5% 15/05/2026 EUR 2,285,000 2,587,198 0.55
20,192,401 4.26
Guernsey
Summit Properties Ltd., Reg. S 2% 31/01/2025 EUR 2,620,000 2,919,018 0.62
2,919,018 0.62
Ireland
eircom Finance DAC, Reg. S 1.75% 01/11/2024 EUR 1,065,000 1,212,675 0.26
1,212,675 0.26
Investments Currency Quantity/
Nominal Value
Market Value
USD
% of Net
Assets0
Isle of Man
Playtech plc, Reg. S 3.75% 12/10/2023 EUR 2,403,000 2,756,582 0.58
2,756,582 0.58
Italy
Almaviva-The Italian Innovation Co. SpA, Reg. S 4.875% 30/10/2026 EUR 1,656,000 1,887,926 0.40
Bach Bidco SpA, Reg. S 4.25% 15/10/2028 EUR 1,265,000 1,450,790 0.31
Banca Monte dei Paschi di Siena SpA, Reg. S 1.875% 09/01/2026 EUR 1,000,000 1,107,438 0.23
Bormioli Pharma Spa, Reg. S, FRN 3.5% 15/11/2024 EUR 4,505,000 4,988,504 1.05
Cedacri Mergeco SpA, Reg. S 4.625% 15/05/2028 EUR 1,417,000 1,613,525 0.34
Fabric BC SpA, Reg. S, FRN 4.125% 30/11/2024 EUR 2,340,000 2,662,107 0.56
Gamma Bidco SpA, Reg. S 5.125% 15/07/2025 EUR 1,077,000 1,233,822 0.26
Gamma Bidco SpA, Reg. S 6.25% 15/07/2025 EUR 2,742,000 3,203,784 0.68
Kedrion SpA, Reg. S 3.375% 15/05/2026 EUR 1,500,000 1,697,316 0.36
Leather 2 SpA, Reg. S 4.5% 30/09/2028 EUR 448,000 510,426 0.11
Marcolin SpA, Reg. S 6.125% 15/11/2026 EUR 1,598,000 1,853,662 0.39
Nexi SpA, Reg. S 1.625% 30/04/2026 EUR 2,594,000 2,926,636 0.62
Paganini Bidco SpA, Reg. S 4.25% 30/10/2028 EUR 2,055,000 2,347,819 0.49
Rekeep SpA, Reg. S 7.25% 01/02/2026 EUR 1,875,000 2,272,544 0.48
Rimini Bidco SpA, Reg. S 5.25% 14/12/2026 EUR 3,400,000 3,794,699 0.80
Verde Bidco SpA, Reg. S 4.625% 01/10/2026 EUR 1,026,000 1,193,844 0.25
Webuild SpA, Reg. S 5.875% 15/12/2025 EUR 861,000 1,067,046 0.22
35,811,888 7.55
Luxembourg
ADLER Group SA, Reg. S 1.875% 14/01/2026 EUR 2,100,000 2,007,002 0.42
B&M European Value Retail SA, Reg. S 3.625% 15/07/2025 GBP 945,000 1,305,367 0.27
Cirsa Finance International Sarl, Reg. S 4.5% 15/03/2027 EUR 3,459,000 3,852,505 0.81
Kleopatra Finco Sarl, Reg. S 4.25% 01/03/2026 EUR 1,475,000 1,622,119 0.34
Lincoln Financing SARL, Reg. S, FRN 3.875% 01/04/2024 EUR 963,000 1,095,139 0.23
Matterhorn Telecom SA, Reg. S 2.625% 15/09/2024 EUR 940,000 1,080,132 0.23
Signa Development Finance SCS, Reg. S 5.5% 23/07/2026 EUR 2,200,000 2,257,303 0.48
Stena International SA, 144A 6.125% 01/02/2025 USD 950,000 976,586 0.21
Stena International SA, Reg. S 3.75% 01/02/2025 EUR 1,200,000 1,364,659 0.29
15,560,812 3.28
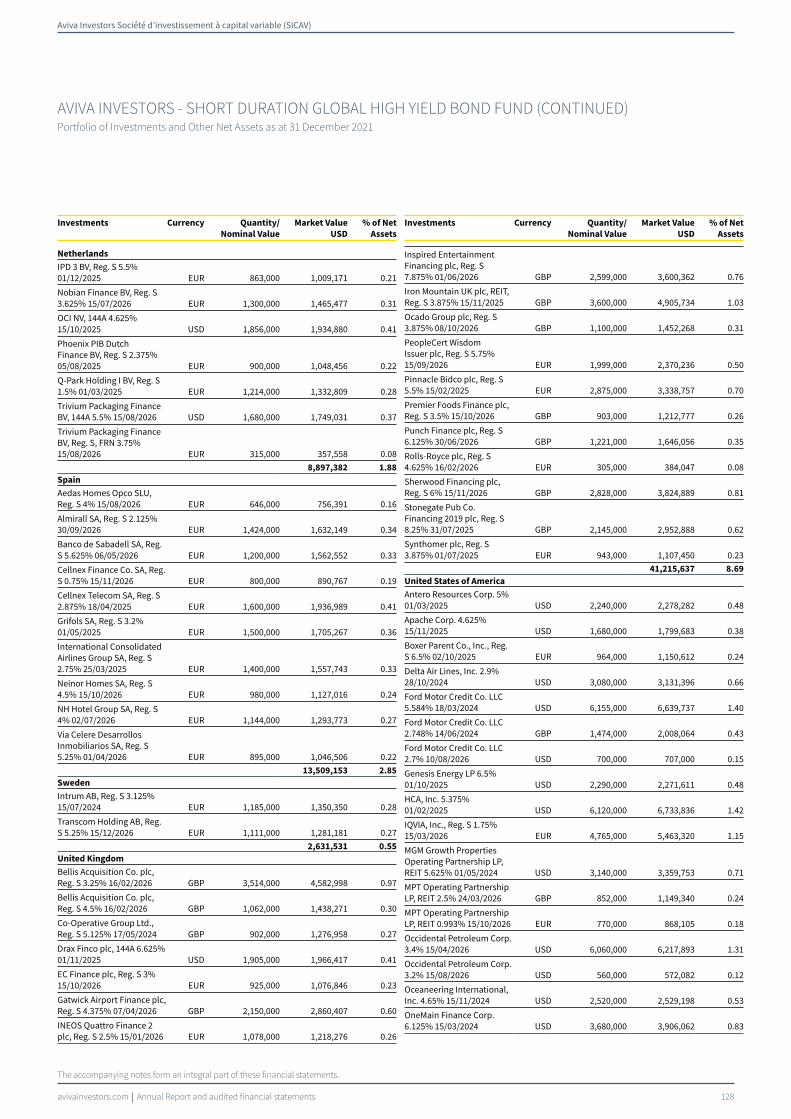
Aviva Investors Société d’investissement à capital variable (SICAV)
avivainvestors.com Annual Report and audited financial statements 128
AVIVA INVESTORS - SHORT DURATION GLOBAL HIGH YIELD BOND FUND (CONTINUED)Portfolio of Investments and Other Net Assets as at 31 December 2021
The accompanying notes form an integral part of these financial statements.
Investments Currency Quantity/
Nominal Value
Market Value
USD
% of Net
Assets0
Netherlands
IPD 3 BV, Reg. S 5.5% 01/12/2025 EUR 863,000 1,009,171 0.21
Nobian Finance BV, Reg. S 3.625% 15/07/2026 EUR 1,300,000 1,465,477 0.31
OCI NV, 144A 4.625% 15/10/2025 USD 1,856,000 1,934,880 0.41
Phoenix PIB Dutch Finance BV, Reg. S 2.375% 05/08/2025 EUR 900,000 1,048,456 0.22
Q-Park Holding I BV, Reg. S 1.5% 01/03/2025 EUR 1,214,000 1,332,809 0.28
Trivium Packaging Finance BV, 144A 5.5% 15/08/2026 USD 1,680,000 1,749,031 0.37
Trivium Packaging Finance BV, Reg. S, FRN 3.75% 15/08/2026 EUR 315,000 357,558 0.08
8,897,382 1.88
Spain
Aedas Homes Opco SLU, Reg. S 4% 15/08/2026 EUR 646,000 756,391 0.16
Almirall SA, Reg. S 2.125% 30/09/2026 EUR 1,424,000 1,632,149 0.34
Banco de Sabadell SA, Reg. S 5.625% 06/05/2026 EUR 1,200,000 1,562,552 0.33
Cellnex Finance Co. SA, Reg. S 0.75% 15/11/2026 EUR 800,000 890,767 0.19
Cellnex Telecom SA, Reg. S 2.875% 18/04/2025 EUR 1,600,000 1,936,989 0.41
Grifols SA, Reg. S 3.2% 01/05/2025 EUR 1,500,000 1,705,267 0.36
International Consolidated Airlines Group SA, Reg. S 2.75% 25/03/2025 EUR 1,400,000 1,557,743 0.33
Neinor Homes SA, Reg. S 4.5% 15/10/2026 EUR 980,000 1,127,016 0.24
NH Hotel Group SA, Reg. S 4% 02/07/2026 EUR 1,144,000 1,293,773 0.27
Via Celere Desarrollos Inmobiliarios SA, Reg. S 5.25% 01/04/2026 EUR 895,000 1,046,506 0.22
13,509,153 2.85
Sweden
Intrum AB, Reg. S 3.125% 15/07/2024 EUR 1,185,000 1,350,350 0.28
Transcom Holding AB, Reg. S 5.25% 15/12/2026 EUR 1,111,000 1,281,181 0.27
2,631,531 0.55
United Kingdom
Bellis Acquisition Co. plc, Reg. S 3.25% 16/02/2026 GBP 3,514,000 4,582,998 0.97
Bellis Acquisition Co. plc, Reg. S 4.5% 16/02/2026 GBP 1,062,000 1,438,271 0.30
Co-Operative Group Ltd., Reg. S 5.125% 17/05/2024 GBP 902,000 1,276,958 0.27
Drax Finco plc, 144A 6.625% 01/11/2025 USD 1,905,000 1,966,417 0.41
EC Finance plc, Reg. S 3% 15/10/2026 EUR 925,000 1,076,846 0.23
Gatwick Airport Finance plc, Reg. S 4.375% 07/04/2026 GBP 2,150,000 2,860,407 0.60
INEOS Quattro Finance 2 plc, Reg. S 2.5% 15/01/2026 EUR 1,078,000 1,218,276 0.26
Investments Currency Quantity/
Nominal Value
Market Value
USD
% of Net
Assets0
Inspired Entertainment Financing plc, Reg. S 7.875% 01/06/2026 GBP 2,599,000 3,600,362 0.76
Iron Mountain UK plc, REIT, Reg. S 3.875% 15/11/2025 GBP 3,600,000 4,905,734 1.03
Ocado Group plc, Reg. S 3.875% 08/10/2026 GBP 1,100,000 1,452,268 0.31
PeopleCert Wisdom Issuer plc, Reg. S 5.75% 15/09/2026 EUR 1,999,000 2,370,236 0.50
Pinnacle Bidco plc, Reg. S 5.5% 15/02/2025 EUR 2,875,000 3,338,757 0.70
Premier Foods Finance plc, Reg. S 3.5% 15/10/2026 GBP 903,000 1,212,777 0.26
Punch Finance plc, Reg. S 6.125% 30/06/2026 GBP 1,221,000 1,646,056 0.35
Rolls-Royce plc, Reg. S 4.625% 16/02/2026 EUR 305,000 384,047 0.08
Sherwood Financing plc, Reg. S 6% 15/11/2026 GBP 2,828,000 3,824,889 0.81
Stonegate Pub Co. Financing 2019 plc, Reg. S 8.25% 31/07/2025 GBP 2,145,000 2,952,888 0.62
Synthomer plc, Reg. S 3.875% 01/07/2025 EUR 943,000 1,107,450 0.23
41,215,637 8.69
United States of America
Antero Resources Corp. 5% 01/03/2025 USD 2,240,000 2,278,282 0.48
Apache Corp. 4.625% 15/11/2025 USD 1,680,000 1,799,683 0.38
Boxer Parent Co., Inc., Reg. S 6.5% 02/10/2025 EUR 964,000 1,150,612 0.24
Delta Air Lines, Inc. 2.9% 28/10/2024 USD 3,080,000 3,131,396 0.66
Ford Motor Credit Co. LLC 5.584% 18/03/2024 USD 6,155,000 6,639,737 1.40
Ford Motor Credit Co. LLC 2.748% 14/06/2024 GBP 1,474,000 2,008,064 0.43
Ford Motor Credit Co. LLC 2.7% 10/08/2026 USD 700,000 707,000 0.15
Genesis Energy LP 6.5% 01/10/2025 USD 2,290,000 2,271,611 0.48
HCA, Inc. 5.375% 01/02/2025 USD 6,120,000 6,733,836 1.42
IQVIA, Inc., Reg. S 1.75% 15/03/2026 EUR 4,765,000 5,463,320 1.15
MGM Growth Properties Operating Partnership LP, REIT 5.625% 01/05/2024 USD 3,140,000 3,359,753 0.71
MPT Operating Partnership LP, REIT 2.5% 24/03/2026 GBP 852,000 1,149,340 0.24
MPT Operating Partnership LP, REIT 0.993% 15/10/2026 EUR 770,000 868,105 0.18
Occidental Petroleum Corp. 3.4% 15/04/2026 USD 6,060,000 6,217,893 1.31
Occidental Petroleum Corp. 3.2% 15/08/2026 USD 560,000 572,082 0.12
Oceaneering International, Inc. 4.65% 15/11/2024 USD 2,520,000 2,529,198 0.53
OneMain Finance Corp. 6.125% 15/03/2024 USD 3,680,000 3,906,062 0.83

Aviva Investors Société d’investissement à capital variable (SICAV)
avivainvestors.com Annual Report and audited financial statements 129
AVIVA INVESTORS - SHORT DURATION GLOBAL HIGH YIELD BOND FUND (CONTINUED)Portfolio of Investments and Other Net Assets as at 31 December 2021
The accompanying notes form an integral part of these financial statements.
Investments Currency Quantity/
Nominal Value
Market Value
USD
% of Net
Assets0
PBF Holding Co. LLC 7.25% 15/06/2025 USD 650,000 462,176 0.10
SCIL IV LLC, Reg. S 4.375% 01/11/2026 EUR 1,283,000 1,483,608 0.31
Tenet Healthcare Corp. 6.75% 15/06/2023 USD 2,485,000 2,658,851 0.56
55,390,609 11.68
Total Bonds 216,404,111 45.64
Total Transferable securities and money market
instruments admitted to an official exchange listing 216,404,111 45.64
Transferable securities and money market instruments dealt in on another
regulated market
Bonds
Australia
FMG Resources August 2006 Pty. Ltd., 144A 5.125% 15/05/2024 USD 5,885,000 6,244,220 1.32
6,244,220 1.32
Bermuda
Fly Leasing Ltd., 144A 7% 15/10/2024 USD 5,800,000 5,709,201 1.20
NCL Corp. Ltd., 144A 12.25% 15/05/2024 USD 1,215,000 1,441,008 0.30
NCL Corp. Ltd., 144A 10.25% 01/02/2026 USD 841,000 978,516 0.21
NCL Corp. Ltd., 144A 5.875% 15/03/2026 USD 575,000 576,512 0.12
8,705,237 1.83
Canada
Bausch Health Cos., Inc., 144A 6.125% 15/04/2025 USD 6,334,000 6,460,838 1.36
Bombardier, Inc., 144A 7.125% 15/06/2026 USD 1,840,000 1,917,280 0.40
goeasy Ltd., 144A 5.375% 01/12/2024 USD 1,000,000 1,028,535 0.22
goeasy Ltd., 144A 4.375% 01/05/2026 USD 2,225,000 2,274,629 0.48
New Gold, Inc., 144A 6.375% 15/05/2025 USD 1,869,000 1,923,983 0.41
Telesat Canada, 144A 5.625% 06/12/2026 USD 2,330,000 2,190,526 0.46
Videotron Ltd., 144A 5.375% 15/06/2024 USD 2,970,000 3,180,974 0.67
18,976,765 4.00
Cayman Islands
Spirit Loyalty Cayman Ltd., 144A 8% 20/09/2025 USD 1,436,144 1,584,146 0.33
1,584,146 0.33
Ireland
Castlelake Aviation Finance DAC, 144A 5% 15/04/2027 USD 1,185,000 1,172,854 0.25
1,172,854 0.25
Liberia
Royal Caribbean Cruises Ltd., 144A 10.875% 01/06/2023 USD 345,000 377,349 0.08
Royal Caribbean Cruises Ltd., 144A 11.5% 01/06/2025 USD 668,000 749,005 0.16
1,126,354 0.24
Luxembourg
Nielsen Co. Luxembourg SARL (The), 144A 5% 01/02/2025 USD 2,350,000 2,389,950 0.50
2,389,950 0.50
Investments Currency Quantity/
Nominal Value
Market Value
USD
% of Net
Assets0
Netherlands
Clear Channel International BV, 144A 6.625% 01/08/2025 USD 3,000,000 3,123,015 0.66
3,123,015 0.66
Panama
Carnival Corp., 144A 7.625% 01/03/2026 USD 2,150,000 2,261,510 0.48
2,261,510 0.48
Supranational
American Airlines, Inc., 144A 5.5% 20/04/2026 USD 2,110,000 2,197,417 0.47
Ardagh Packaging Finance plc, 144A 5.25% 30/04/2025 USD 2,985,000 3,085,102 0.65
Connect Finco SARL, 144A 6.75% 01/10/2026 USD 2,805,000 2,952,543 0.62
Endo Dac, 144A 5.875% 15/10/2024 USD 400,000 394,184 0.08
Endo Dac, 144A 9.5% 31/07/2027 USD 975,000 993,486 0.21
9,622,732 2.03
United Kingdom
International Game Technology plc, 144A 4.125% 15/04/2026 USD 2,025,000 2,088,403 0.44
2,088,403 0.44
United States of America
Aethon United BR LP, 144A 8.25% 15/02/2026 USD 2,905,000 3,123,921 0.66
Albertsons Cos., Inc., 144A 3.5% 15/02/2023 USD 1,015,000 1,033,833 0.22
Albertsons Cos., Inc., 144A 3.25% 15/03/2026 USD 2,000,000 2,039,610 0.43
Alliance Data Systems Corp., 144A 7% 15/01/2026 USD 1,680,000 1,765,840 0.37
Allied Universal Holdco LLC, 144A 6.625% 15/07/2026 USD 3,000,000 3,153,825 0.67
American Airlines Group, Inc., 144A 5% 01/06/2022 USD 1,500,000 1,498,155 0.32
American Airlines, Inc., 144A 11.75% 15/07/2025 USD 985,000 1,215,337 0.26
Antero Resources Corp., 144A 8.375% 15/07/2026 USD 1,000,000 1,139,840 0.24
Aramark Services, Inc., 144A 6.375% 01/05/2025 USD 2,760,000 2,887,719 0.61
Arconic Corp., 144A 6% 15/05/2025 USD 1,975,000 2,068,812 0.44
Ascent Resources Utica Holdings LLC, 144A 7% 01/11/2026 USD 910,000 923,618 0.19
Block, Inc., 144A 2.75% 01/06/2026 USD 4,505,000 4,516,285 0.95
Boyd Gaming Corp., 144A 8.625% 01/06/2025 USD 757,000 812,049 0.17
Brink's Co. (The), 144A 5.5% 15/07/2025 USD 575,000 598,575 0.13
Caesars Entertainment, Inc., 144A 6.25% 01/07/2025 USD 1,935,000 2,034,517 0.43
Caesars Resort Collection LLC, 144A 5.75% 01/07/2025 USD 375,000 393,345 0.08
Carvana Co., 144A 5.625% 01/10/2025 USD 2,350,000 2,352,937 0.50
Change Healthcare Holdings LLC, 144A 5.75% 01/03/2025 USD 2,500,000 2,524,475 0.53

Aviva Investors Société d’investissement à capital variable (SICAV)
avivainvestors.com Annual Report and audited financial statements 130
AVIVA INVESTORS - SHORT DURATION GLOBAL HIGH YIELD BOND FUND (CONTINUED)Portfolio of Investments and Other Net Assets as at 31 December 2021
The accompanying notes form an integral part of these financial statements.
Investments Currency Quantity/
Nominal Value
Market Value
USD
% of Net
Assets0
Chesapeake Energy Corp., 144A 5.5% 01/02/2026 USD 1,200,000 1,264,428 0.27
CommScope, Inc., 144A 6% 01/03/2026 USD 1,680,000 1,732,660 0.37
Community Health Systems, Inc., 144A 6.625% 15/02/2025 USD 3,000,000 3,108,405 0.66
Coty, Inc., 144A 6.5% 15/04/2026 USD 1,900,000 1,954,682 0.41
CSC Holdings LLC, 144A 5.5% 15/04/2027 USD 1,000,000 1,034,940 0.22
CSC Holdings LLC 5.875% 15/09/2022 USD 2,905,000 2,980,574 0.63
CVR Partners LP, 144A 9.25% 15/06/2023 USD 1,109,000 1,118,182 0.24
Dave & Buster's, Inc., 144A 7.625% 01/11/2025 USD 1,528,000 1,630,781 0.34
DISH DBS Corp., 144A 5.25% 01/12/2026 USD 780,000 794,917 0.17
Endeavor Energy Resources LP, 144A 6.625% 15/07/2025 USD 4,487,000 4,752,698 1.00
Flex Acquisition Co., Inc., 144A 6.875% 15/01/2025 USD 3,195,000 3,202,157 0.68
Forestar Group, Inc., 144A 3.85% 15/05/2026 USD 2,480,000 2,488,854 0.52
Hadrian Merger Sub, Inc., 144A 8.5% 01/05/2026 USD 343,000 354,482 0.07
HAT Holdings I LLC, REIT, 144A 3.375% 15/06/2026 USD 3,640,000 3,663,078 0.77
Hilton Domestic Operating Co., Inc., 144A 5.375% 01/05/2025 USD 2,595,000 2,703,043 0.57
Horizon Therapeutics USA, Inc., 144A 5.5% 01/08/2027 USD 1,870,000 1,965,370 0.41
Icahn Enterprises LP 4.75% 15/09/2024 USD 4,820,000 4,995,038 1.05
Independence Energy Finance LLC, 144A 7.25% 01/05/2026 USD 2,415,000 2,511,805 0.53
IRB Holding Corp., 144A 7% 15/06/2025 USD 1,775,000 1,874,427 0.40
Kraton Polymers LLC, 144A 4.25% 15/12/2025 USD 1,725,000 1,787,730 0.38
LD Holdings Group LLC, 144A 6.5% 01/11/2025 USD 2,955,000 2,902,519 0.61
LFS Topco LLC, 144A 5.875% 15/10/2026 USD 523,000 540,541 0.11
Live Nation Entertainment, Inc., 144A 4.875% 01/11/2024 USD 1,795,000 1,819,340 0.38
Mattel, Inc., 144A 3.375% 01/04/2026 USD 1,035,000 1,064,554 0.22
Mattel, Inc. 3.15% 15/03/2023 USD 5,258,000 5,368,129 1.13
MGM Growth Properties Operating Partnership LP, REIT, 144A 4.625% 15/06/2025 USD 3,095,000 3,306,033 0.70
Molina Healthcare, Inc., 144A 3.875% 15/05/2032 USD 760,000 765,985 0.16
New Fortress Energy, Inc., 144A 6.5% 30/09/2026 USD 2,150,000 2,136,283 0.45
Newell Brands, Inc. 4.7% 01/04/2026 USD 1,680,000 1,834,182 0.39
Investments Currency Quantity/
Nominal Value
Market Value
USD
% of Net
Assets0
Novelis Corp., 144A 3.25% 15/11/2026 USD 1,470,000 1,484,590 0.31
Outfront Media Capital LLC, 144A 6.25% 15/06/2025 USD 1,525,000 1,587,548 0.33
Owens-Brockway Glass Container, Inc., 144A 5.375% 15/01/2025 USD 2,680,000 2,769,901 0.58
PRA Group, Inc., 144A 7.375% 01/09/2025 USD 2,556,000 2,718,319 0.57
PTC, Inc., 144A 3.625% 15/02/2025 USD 4,710,000 4,779,732 1.01
Range Resources Corp. 9.25% 01/02/2026 USD 2,240,000 2,420,858 0.51
Raptor Acquisition Corp., 144A 4.875% 01/11/2026 USD 2,425,000 2,464,406 0.52
Rattler Midstream LP, 144A 5.625% 15/07/2025 USD 2,830,000 2,946,030 0.62
Resolute Forest Products, Inc., 144A 4.875% 01/03/2026 USD 2,090,000 2,127,286 0.45
RLJ Lodging Trust LP, REIT, 144A 3.75% 01/07/2026 USD 2,570,000 2,586,846 0.55
Rocket Mortgage LLC, 144A 2.875% 15/10/2026 USD 2,335,000 2,320,616 0.49
RP Escrow Issuer LLC, 144A 5.25% 15/12/2025 USD 1,930,000 1,949,435 0.41
Scientific Games International, Inc., 144A 8.625% 01/07/2025 USD 1,680,000 1,795,416 0.38
Scientific Games International, Inc., 144A 5% 15/10/2025 USD 1,345,000 1,385,384 0.29
Select Medical Corp., 144A 6.25% 15/08/2026 USD 2,000,000 2,120,270 0.45
Service Properties Trust, REIT 7.5% 15/09/2025 USD 2,795,000 3,031,500 0.64
Sirius XM Radio, Inc., 144A 3.125% 01/09/2026 USD 2,360,000 2,363,788 0.50
Sizzling Platter LLC, 144A 8.5% 28/11/2025 USD 1,835,000 1,889,848 0.40
Spanish Broadcasting System, Inc., 144A 9.75% 01/03/2026 USD 870,000 895,917 0.19
Sprint Corp. 7.875% 15/09/2023 USD 6,840,000 7,551,668 1.59
Stericycle, Inc., 144A 5.375% 15/07/2024 USD 1,980,000 2,021,649 0.43
StoneX Group, Inc., 144A 8.625% 15/06/2025 USD 4,386,000 4,663,568 0.98
Tenet Healthcare Corp., 144A 4.625% 01/09/2024 USD 5,550,000 5,680,813 1.20
T-Mobile USA, Inc. 2.25% 15/02/2026 USD 4,235,000 4,248,870 0.90
T-Mobile USA, Inc. 2.625% 15/04/2026 USD 1,140,000 1,147,188 0.24
TransDigm, Inc., 144A 6.25% 15/03/2026 USD 2,000,000 2,081,280 0.44
United Airlines, Inc., 144A 4.375% 15/04/2026 USD 2,000,000 2,080,130 0.44
USA Compression Partners LP 6.875% 01/04/2026 USD 3,000,000 3,130,515 0.66
VICI Properties LP, REIT, 144A 4.25% 01/12/2026 USD 1,300,000 1,347,209 0.28

Aviva Investors Société d’investissement à capital variable (SICAV)
avivainvestors.com Annual Report and audited financial statements 131
AVIVA INVESTORS - SHORT DURATION GLOBAL HIGH YIELD BOND FUND (CONTINUED)Portfolio of Investments and Other Net Assets as at 31 December 2021
The accompanying notes form an integral part of these financial statements.
Investments Currency Quantity/
Nominal Value
Market Value
USD
% of Net
Assets0
Zayo Group Holdings, Inc., 144A 4% 01/03/2027 USD 2,760,000 2,707,960 0.57
180,037,050 37.97
Total Bonds 237,332,236 50.05
Total Transferable securities and money market
instruments dealt in on another regulated market 237,332,236 50.05
Investments Currency Quantity/
Nominal Value
Market Value
USD
% of Net
Assets0
Units of authorised UCITS or other collective investment undertakings
Collective Investment Schemes - UCITS
Ireland
Aviva Investors US Dollar Liquidity Fund - Class 3 Income shares USD† USD 11,700,000 11,700,000 2.47
11,700,000 2.47
Total Collective Investment Schemes - UCITS 11,700,000 2.47
Total Units of authorised UCITS or other collective
investment undertakings 11,700,000 2.47
Total Investments 465,436,347 98.16
Cash 2,761,806 0.58
Other assets/(liabilities) 5,963,378 1.26
Total net assets 474,161,531 100.00
†Related Party Fund.
Geographic Allocation of Portfolio % of Net Assets
United States of America 49.65United Kingdom 9.13Italy 7.55Germany 4.26Canada 4.00Luxembourg 3.78France 3.08Ireland 2.98Spain 2.85Netherlands 2.54Supranational 2.03Bermuda 1.83Australia 1.32Guernsey 0.62Isle of Man 0.58Sweden 0.55Panama 0.48Denmark 0.36Cayman Islands 0.33Liberia 0.24Total investments 98.16
Cash and other assets/(liabilities) 1.84Total 100.00

Aviva Investors Société d’investissement à capital variable (SICAV)
avivainvestors.com Annual Report and audited financial statements 132
AVIVA INVESTORS - SHORT DURATION GLOBAL HIGH YIELD BOND FUND (CONTINUED)Portfolio of Investments and Other Net Assets as at 31 December 2021
The accompanying notes form an integral part of these financial statements.
Forward Currency Exchange Contracts
Currency
Purchased Amount Purchased
Currency
Sold Amount Sold Maturity Date Counterparty
Unrealised Gain/
(Loss)
USD % of Net Assets
CHF 230,945 USD 251,098 12/01/2022 J.P. Morgan 1,688 –EUR 478,651 USD 540,899 12/01/2022 J.P. Morgan 2,161 –GBP 1,636 USD 2,189 12/01/2022 J.P. Morgan 22 –USD 4,211,194 EUR 3,698,182 12/01/2022 J.P. Morgan 15,372 –USD 118,301,886 EUR 102,070,000 12/01/2022 Merrill Lynch 2,496,968 0.53USD 31,358,120 GBP 23,130,000 12/01/2022 Citibank 98,410 0.02Total Unrealised Gain on Forward Currency Exchange Contracts - Assets 2,614,621 0.55
CHF 14,695,909 USD 16,096,390 12/01/2022 J.P. Morgan (10,741) –EUR 53,465,313 USD 61,990,616 12/01/2022 J.P. Morgan (1,330,813) (0.28)GBP 223,156 USD 302,585 12/01/2022 J.P. Morgan (995) –USD 100,711 CHF 93,870 12/01/2022 J.P. Morgan (2,036) –USD 6,773,868 EUR 5,984,772 12/01/2022 J.P. Morgan (16,237) –USD 6,784,388 EUR 6,000,000 12/01/2022 Merrill Lynch (22,994) (0.01)USD 5,640,882 EUR 5,000,000 12/01/2022 Morgan Stanley (31,937) (0.01)USD 871,902 EUR 770,000 12/01/2022 RBC (1,712) –USD 1,831 GBP 1,373 12/01/2022 J.P. Morgan (24) –USD 3,579,699 GBP 2,700,000 12/01/2022 Merrill Lynch (69,295) (0.01)Total Unrealised Loss on Forward Currency Exchange Contracts - Liabilities (1,486,784) (0.31)
Net Unrealised Gain on Forward Currency Exchange Contracts - Assets 1,127,837 0.24

Aviva Investors Société d’investissement à capital variable (SICAV)
avivainvestors.com Annual Report and audited financial statements 133
The accompanying notes form an integral part of these financial statements.
AVIVA INVESTORS - SOCIAL TRANSITION GLOBAL EQUITY FUND*Portfolio of Investments and Other Net Assets as at 31 December 2021
Investments Currency Quantity/
Nominal Value
Market Value
USD
% of Net
Assets0
Transferable securities and money market instruments admitted to an official
exchange listing
Equities
Denmark
Orsted A/S, Reg. S DKK 4,430 564,607 1.90
564,607 1.90
France
Danone SA EUR 9,210 570,389 1.92
L'Oreal SA EUR 1,620 766,181 2.59
Schneider Electric SE EUR 3,910 764,889 2.58
2,101,459 7.09
Germany
adidas AG EUR 3,140 903,579 3.04
SAP SE EUR 4,430 624,846 2.11
1,528,425 5.15
India
ICICI Bank Ltd., ADR USD 46,280 915,650 3.09
915,650 3.09
Indonesia
Bank BTPN Syariah Tbk. PT IDR 1,750,000 438,650 1.48
Bank Rakyat Indonesia Persero Tbk. PT IDR 3,291,500 947,352 3.19
1,386,002 4.67
Ireland
Trane Technologies plc USD 4,770 957,673 3.23
957,673 3.23
Italy
Enel SpA EUR 81,570 652,531 2.20
652,531 2.20
Jersey
Aptiv plc USD 5,070 830,694 2.80
830,694 2.80
Netherlands
NXP Semiconductors NV USD 3,460 799,122 2.69
QIAGEN NV EUR 17,240 959,452 3.24
Wolters Kluwer NV EUR 5,870 685,857 2.31
2,444,431 8.24
Spain
Acciona SA EUR 3,600 686,686 2.32
686,686 2.32
Investments Currency Quantity/
Nominal Value
Market Value
USD
% of Net
Assets0
Sweden
Telefonaktiebolaget LM Ericsson 'B' SEK 61,500 675,416 2.28
675,416 2.28
Switzerland
Lonza Group AG CHF 850 708,527 2.39
Novartis AG CHF 8,060 708,191 2.39
Roche Holding AG CHF 1,750 726,158 2.45
2,142,876 7.23
Taiwan
Taiwan Semiconductor Manufacturing Co. Ltd., ADR USD 6,080 734,616 2.48
734,616 2.48
United Kingdom
RELX plc GBP 18,721 607,234 2.05
SSE plc GBP 26,810 597,313 2.01
Unilever plc GBP 13,080 697,426 2.35
1,901,973 6.41
United States of America
Adobe, Inc. USD 1,300 737,731 2.49
Centene Corp. USD 11,040 923,827 3.12
Coursera, Inc. USD 16,730 409,885 1.38
Home Depot, Inc. (The) USD 3,210 1,319,069 4.45
Invitae Corp. USD 21,640 343,319 1.16
IQVIA Holdings, Inc. USD 3,880 1,097,031 3.70
Microsoft Corp. USD 4,678 1,578,240 5.32
PayPal Holdings, Inc. USD 3,460 661,033 2.23
salesforce.com, Inc. USD 3,850 981,423 3.31
United Rentals, Inc. USD 2,100 687,173 2.32
VF Corp. USD 11,110 812,252 2.74
Visa, Inc. 'A' USD 5,430 1,178,500 3.97
Xylem, Inc. USD 8,550 1,017,578 3.43
11,747,061 39.62
Total Equities 29,270,100 98.71
Total Transferable securities and money market
instruments admitted to an official exchange listing 29,270,100 98.71
Total Investments 29,270,100 98.71
Cash 380,696 1.28
Other assets/(liabilities) 2,302 0.01
Total net assets 29,653,098 100.00
Geographic Allocation of Portfolio % of Net Assets
United States of America 39.62Netherlands 8.24Switzerland 7.23France 7.09United Kingdom 6.41Germany 5.15Indonesia 4.67Ireland 3.23India 3.09Jersey 2.80Taiwan 2.48Spain 2.32Sweden 2.28Italy 2.20Denmark 1.90Total investments 98.71
Cash and other assets/(liabilities) 1.29Total 100.00
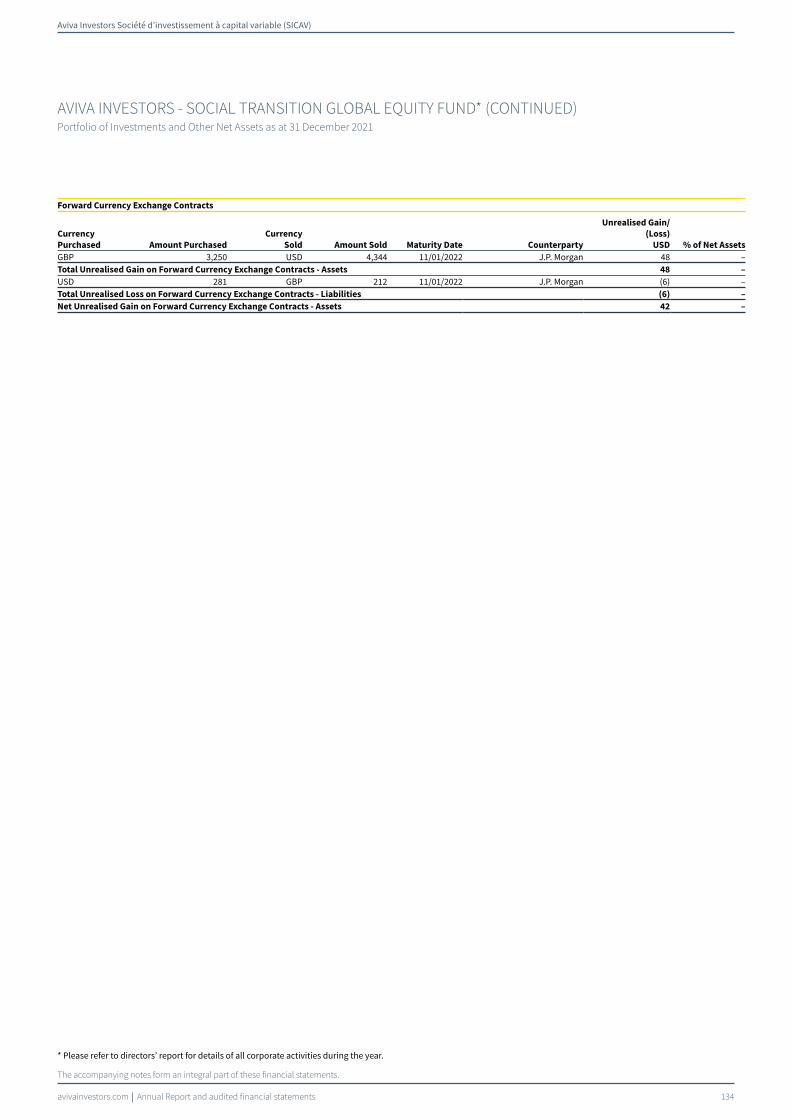
Aviva Investors Société d’investissement à capital variable (SICAV)
avivainvestors.com Annual Report and audited financial statements 134
AVIVA INVESTORS - SOCIAL TRANSITION GLOBAL EQUITY FUND* (CONTINUED)Portfolio of Investments and Other Net Assets as at 31 December 2021
The accompanying notes form an integral part of these financial statements.
Forward Currency Exchange Contracts
Currency
Purchased Amount Purchased
Currency
Sold Amount Sold Maturity Date Counterparty
Unrealised Gain/
(Loss)
USD % of Net Assets
GBP 3,250 USD 4,344 11/01/2022 J.P. Morgan 48 –Total Unrealised Gain on Forward Currency Exchange Contracts - Assets 48 –
USD 281 GBP 212 11/01/2022 J.P. Morgan (6) –Total Unrealised Loss on Forward Currency Exchange Contracts - Liabilities (6) –
Net Unrealised Gain on Forward Currency Exchange Contracts - Assets 42 –
* Please refer to directors’ report for details of all corporate activities during the year.

Aviva Investors Société d’investissement à capital variable (SICAV)
avivainvestors.com Annual Report and audited financial statements 135
The accompanying notes form an integral part of these financial statements.
AVIVA INVESTORS - SUSTAINABLE INCOME & GROWTH FUNDPortfolio of Investments and Other Net Assets as at 31 December 2021
Investments Currency Quantity/
Nominal Value
Market Value
USD
% of Net
Assets0
Transferable securities and money market instruments admitted to an official
exchange listing
Bonds
Cayman Islands
Termocandelaria Power Ltd., Reg. S 7.875% 30/01/2029 USD 360,750 361,480 1.00
361,480 1.00
Chile
Chile Government Bond 3.1% 22/01/2061 USD 329,000 305,190 0.85
305,190 0.85
Dominican Republic
Dominican Republic Government Bond, Reg. S 4.875% 23/09/2032 USD 628,000 639,775 1.78
639,775 1.78
Ghana
Ghana Government Bond, Reg. S 6.375% 11/02/2027 USD 534,000 452,002 1.25
452,002 1.25
Ivory Coast
Ivory Coast Government Bond, Reg. S 4.875% 30/01/2032 EUR 411,000 450,040 1.25
450,040 1.25
Kenya
Kenya Government Bond, Reg. S 7.25% 28/02/2028 USD 480,000 517,853 1.44
517,853 1.44
Mauritius
HTA Group Ltd., Reg. S 7% 18/12/2025 USD 438,000 457,929 1.27
457,929 1.27
Mexico
Banco Mercantil del Norte SA, Reg. S, FRN 6.75% Perpetual USD 450,000 466,612 1.29
466,612 1.29
Netherlands
IHS Netherlands Holdco BV, Reg. S 8% 18/09/2027 USD 280,000 297,223 0.83
Vivo Energy Investments BV, Reg. S 5.125% 24/09/2027 USD 351,000 368,111 1.02
665,334 1.85
Singapore
Continuum Energy Levanter Pte. Ltd., Reg. S 4.5% 09/02/2027 USD 342,413 350,545 0.97
350,545 0.97
South Africa
Absa Group Ltd., Reg. S 6.375% Perpetual USD 336,000 342,999 0.95
Standard Bank Group Ltd., Reg. S, FRN 5.95% 31/05/2029 USD 341,000 357,306 0.99
700,305 1.94
Turkey
Aydem Yenilenebilir Enerji A/S, Reg. S 7.75% 02/02/2027 USD 353,000 289,400 0.80
289,400 0.80
Investments Currency Quantity/
Nominal Value
Market Value
USD
% of Net
Assets0
Ukraine
State Agency of Roads of Ukraine, Reg. S 6.25% 24/06/2028 USD 235,000 204,367 0.57
Ukraine Government Bond, Reg. S 8.994% 01/02/2024 USD 575,000 575,803 1.60
780,170 2.17
United Arab Emirates
Emirates NBD Bank PJSC, Reg. S, FRN 6.125% Perpetual USD 393,000 412,719 1.15
412,719 1.15
United Kingdom
NAK Naftogaz Ukraine, Reg. S 7.625% 08/11/2026 USD 300,000 263,226 0.73
Ukraine Railways, Reg. S 8.25% 09/07/2024 USD 279,000 274,815 0.76
538,041 1.49
United States of America
Kosmos Energy Ltd., Reg. S 7.5% 01/03/2028 USD 200,000 188,222 0.52
188,222 0.52
Uzbekistan
Ipoteka-Bank ATIB, Reg. S 5.5% 19/11/2025 USD 200,000 203,978 0.57
203,978 0.57
Total Bonds 7,779,595 21.59
Equities
Australia
APA Group AUD 132,596 971,551 2.70
971,551 2.70
China
Ping An Insurance Group Co. of China Ltd. 'H' HKD 43,808 315,558 0.88
315,558 0.88
France
AXA SA EUR 3,458 102,706 0.28
102,706 0.28
Germany
adidas AG EUR 1,073 308,771 0.86
Allianz SE EUR 256 60,324 0.17
LEG Immobilien SE EUR 7,313 1,014,981 2.81
Vonovia SE EUR 17,180 943,445 2.62
2,327,521 6.46
Hong Kong
Link REIT HKD 92,380 812,616 2.25
812,616 2.25
India
HDFC Bank Ltd., ADR USD 4,775 310,184 0.86
310,184 0.86
Indonesia
Bank Rakyat Indonesia Persero Tbk. PT IDR 1,051,100 302,525 0.84
302,525 0.84
Ireland
Accenture plc 'A' USD 334 137,929 0.38
137,929 0.38
Japan
Nippon Telegraph & Telephone Corp. JPY 17,000 465,686 1.29
465,686 1.29
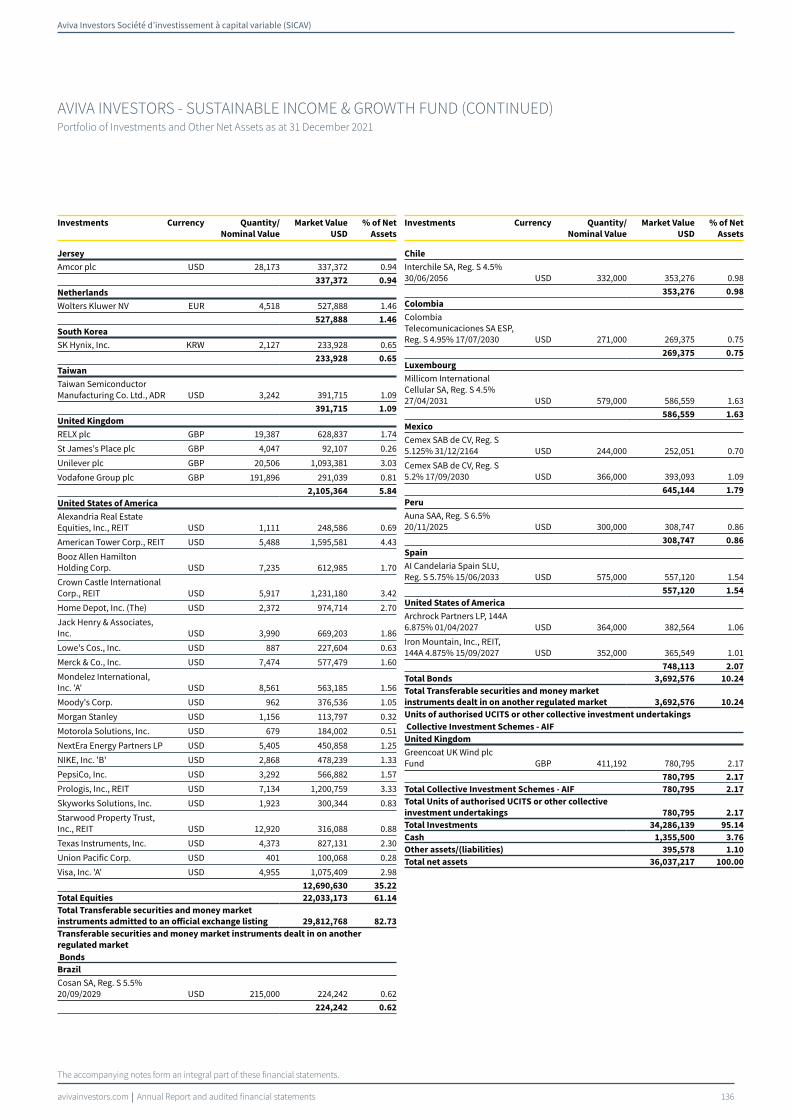
Aviva Investors Société d’investissement à capital variable (SICAV)
avivainvestors.com Annual Report and audited financial statements 136
AVIVA INVESTORS - SUSTAINABLE INCOME & GROWTH FUND (CONTINUED)Portfolio of Investments and Other Net Assets as at 31 December 2021
The accompanying notes form an integral part of these financial statements.
Investments Currency Quantity/
Nominal Value
Market Value
USD
% of Net
Assets0
Jersey
Amcor plc USD 28,173 337,372 0.94
337,372 0.94
Netherlands
Wolters Kluwer NV EUR 4,518 527,888 1.46
527,888 1.46
South Korea
SK Hynix, Inc. KRW 2,127 233,928 0.65
233,928 0.65
Taiwan
Taiwan Semiconductor Manufacturing Co. Ltd., ADR USD 3,242 391,715 1.09
391,715 1.09
United Kingdom
RELX plc GBP 19,387 628,837 1.74
St James's Place plc GBP 4,047 92,107 0.26
Unilever plc GBP 20,506 1,093,381 3.03
Vodafone Group plc GBP 191,896 291,039 0.81
2,105,364 5.84
United States of America
Alexandria Real Estate Equities, Inc., REIT USD 1,111 248,586 0.69
American Tower Corp., REIT USD 5,488 1,595,581 4.43
Booz Allen Hamilton Holding Corp. USD 7,235 612,985 1.70
Crown Castle International Corp., REIT USD 5,917 1,231,180 3.42
Home Depot, Inc. (The) USD 2,372 974,714 2.70
Jack Henry & Associates, Inc. USD 3,990 669,203 1.86
Lowe's Cos., Inc. USD 887 227,604 0.63
Merck & Co., Inc. USD 7,474 577,479 1.60
Mondelez International, Inc. 'A' USD 8,561 563,185 1.56
Moody's Corp. USD 962 376,536 1.05
Morgan Stanley USD 1,156 113,797 0.32
Motorola Solutions, Inc. USD 679 184,002 0.51
NextEra Energy Partners LP USD 5,405 450,858 1.25
NIKE, Inc. 'B' USD 2,868 478,239 1.33
PepsiCo, Inc. USD 3,292 566,882 1.57
Prologis, Inc., REIT USD 7,134 1,200,759 3.33
Skyworks Solutions, Inc. USD 1,923 300,344 0.83
Starwood Property Trust, Inc., REIT USD 12,920 316,088 0.88
Texas Instruments, Inc. USD 4,373 827,131 2.30
Union Pacific Corp. USD 401 100,068 0.28
Visa, Inc. 'A' USD 4,955 1,075,409 2.98
12,690,630 35.22
Total Equities 22,033,173 61.14
Total Transferable securities and money market
instruments admitted to an official exchange listing 29,812,768 82.73
Transferable securities and money market instruments dealt in on another
regulated market
Bonds
Brazil
Cosan SA, Reg. S 5.5% 20/09/2029 USD 215,000 224,242 0.62
224,242 0.62
Investments Currency Quantity/
Nominal Value
Market Value
USD
% of Net
Assets0
Chile
Interchile SA, Reg. S 4.5% 30/06/2056 USD 332,000 353,276 0.98
353,276 0.98
Colombia
Colombia Telecomunicaciones SA ESP, Reg. S 4.95% 17/07/2030 USD 271,000 269,375 0.75
269,375 0.75
Luxembourg
Millicom International Cellular SA, Reg. S 4.5% 27/04/2031 USD 579,000 586,559 1.63
586,559 1.63
Mexico
Cemex SAB de CV, Reg. S 5.125% 31/12/2164 USD 244,000 252,051 0.70
Cemex SAB de CV, Reg. S 5.2% 17/09/2030 USD 366,000 393,093 1.09
645,144 1.79
Peru
Auna SAA, Reg. S 6.5% 20/11/2025 USD 300,000 308,747 0.86
308,747 0.86
Spain
AI Candelaria Spain SLU, Reg. S 5.75% 15/06/2033 USD 575,000 557,120 1.54
557,120 1.54
United States of America
Archrock Partners LP, 144A 6.875% 01/04/2027 USD 364,000 382,564 1.06
Iron Mountain, Inc., REIT, 144A 4.875% 15/09/2027 USD 352,000 365,549 1.01
748,113 2.07
Total Bonds 3,692,576 10.24
Total Transferable securities and money market
instruments dealt in on another regulated market 3,692,576 10.24
Units of authorised UCITS or other collective investment undertakings
Collective Investment Schemes - AIF
United Kingdom
Greencoat UK Wind plc Fund GBP 411,192 780,795 2.17
780,795 2.17
Total Collective Investment Schemes - AIF 780,795 2.17
Total Units of authorised UCITS or other collective
investment undertakings 780,795 2.17
Total Investments 34,286,139 95.14
Cash 1,355,500 3.76
Other assets/(liabilities) 395,578 1.10
Total net assets 36,037,217 100.00

Aviva Investors Société d’investissement à capital variable (SICAV)
avivainvestors.com Annual Report and audited financial statements 137
AVIVA INVESTORS - SUSTAINABLE INCOME & GROWTH FUND (CONTINUED)Portfolio of Investments and Other Net Assets as at 31 December 2021
The accompanying notes form an integral part of these financial statements.
Geographic Allocation of Portfolio % of Net Assets
United States of America 37.81United Kingdom 9.50Germany 6.46Netherlands 3.31Mexico 3.08Australia 2.70Hong Kong 2.25Ukraine 2.17South Africa 1.94Chile 1.83Dominican Republic 1.78Luxembourg 1.63Spain 1.54Kenya 1.44Japan 1.29Mauritius 1.27Ghana 1.25Ivory Coast 1.25United Arab Emirates 1.15Taiwan 1.09Cayman Islands 1.00Singapore 0.97Jersey 0.94China 0.88India 0.86Peru 0.86Indonesia 0.84Turkey 0.80Colombia 0.75South Korea 0.65Brazil 0.62Uzbekistan 0.57Ireland 0.38France 0.28Total investments 95.14
Cash and other assets/(liabilities) 4.86Total 100.00
Forward Currency Exchange Contracts
Currency
Purchased Amount Purchased
Currency
Sold Amount Sold Maturity Date Counterparty
Unrealised Gain/
(Loss)
USD % of Net Assets
SGD 529,578 USD 391,703 11/01/2022 J.P. Morgan 919 –Total Unrealised Gain on Forward Currency Exchange Contracts - Assets 919 –
SGD 675 USD 501 11/01/2022 J.P. Morgan (1) –USD 40,254 SGD 55,070 11/01/2022 J.P. Morgan (574) –Total Unrealised Loss on Forward Currency Exchange Contracts - Liabilities (575) –
Net Unrealised Gain on Forward Currency Exchange Contracts - Assets 344 –
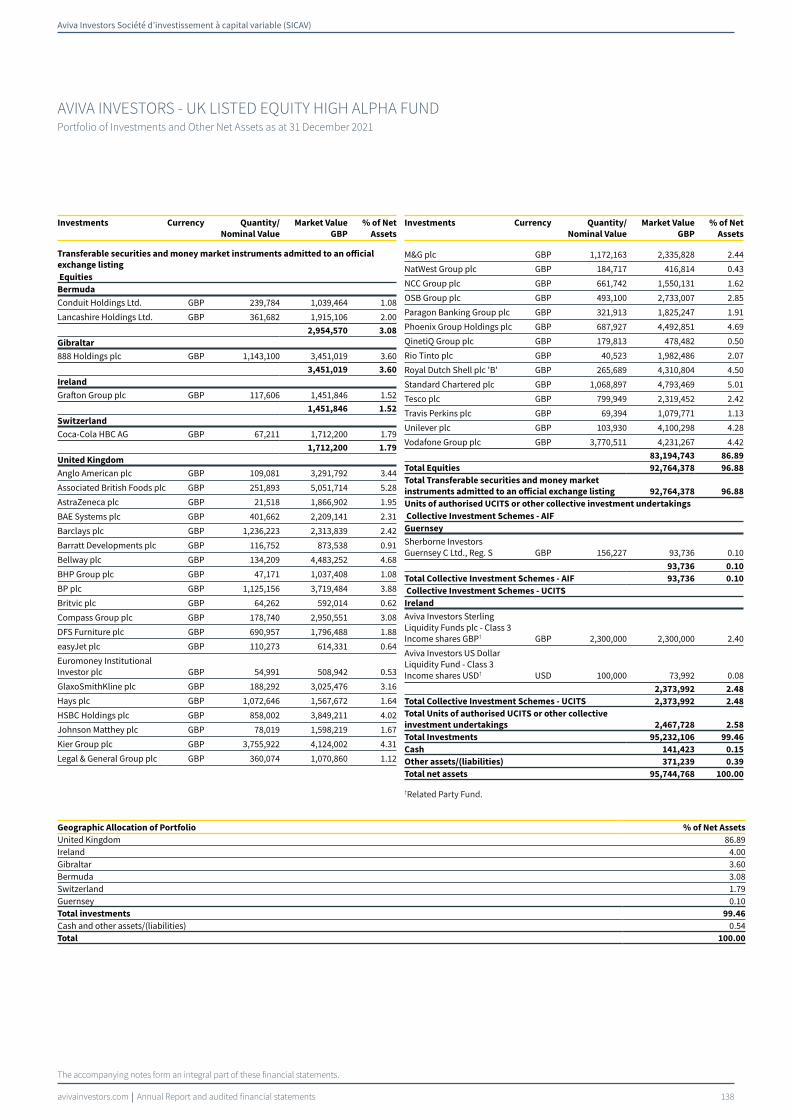
Aviva Investors Société d’investissement à capital variable (SICAV)
avivainvestors.com Annual Report and audited financial statements 138
The accompanying notes form an integral part of these financial statements.
AVIVA INVESTORS - UK LISTED EQUITY HIGH ALPHA FUNDPortfolio of Investments and Other Net Assets as at 31 December 2021
Investments Currency Quantity/
Nominal Value
Market Value
GBP
% of Net
Assets0
Transferable securities and money market instruments admitted to an official
exchange listing
Equities
Bermuda
Conduit Holdings Ltd. GBP 239,784 1,039,464 1.08
Lancashire Holdings Ltd. GBP 361,682 1,915,106 2.00
2,954,570 3.08
Gibraltar
888 Holdings plc GBP 1,143,100 3,451,019 3.60
3,451,019 3.60
Ireland
Grafton Group plc GBP 117,606 1,451,846 1.52
1,451,846 1.52
Switzerland
Coca-Cola HBC AG GBP 67,211 1,712,200 1.79
1,712,200 1.79
United Kingdom
Anglo American plc GBP 109,081 3,291,792 3.44
Associated British Foods plc GBP 251,893 5,051,714 5.28
AstraZeneca plc GBP 21,518 1,866,902 1.95
BAE Systems plc GBP 401,662 2,209,141 2.31
Barclays plc GBP 1,236,223 2,313,839 2.42
Barratt Developments plc GBP 116,752 873,538 0.91
Bellway plc GBP 134,209 4,483,252 4.68
BHP Group plc GBP 47,171 1,037,408 1.08
BP plc GBP 1,125,156 3,719,484 3.88
Britvic plc GBP 64,262 592,014 0.62
Compass Group plc GBP 178,740 2,950,551 3.08
DFS Furniture plc GBP 690,957 1,796,488 1.88
easyJet plc GBP 110,273 614,331 0.64
Euromoney Institutional Investor plc GBP 54,991 508,942 0.53
GlaxoSmithKline plc GBP 188,292 3,025,476 3.16
Hays plc GBP 1,072,646 1,567,672 1.64
HSBC Holdings plc GBP 858,002 3,849,211 4.02
Johnson Matthey plc GBP 78,019 1,598,219 1.67
Kier Group plc GBP 3,755,922 4,124,002 4.31
Legal & General Group plc GBP 360,074 1,070,860 1.12
Investments Currency Quantity/
Nominal Value
Market Value
GBP
% of Net
Assets0
M&G plc GBP 1,172,163 2,335,828 2.44
NatWest Group plc GBP 184,717 416,814 0.43
NCC Group plc GBP 661,742 1,550,131 1.62
OSB Group plc GBP 493,100 2,733,007 2.85
Paragon Banking Group plc GBP 321,913 1,825,247 1.91
Phoenix Group Holdings plc GBP 687,927 4,492,851 4.69
QinetiQ Group plc GBP 179,813 478,482 0.50
Rio Tinto plc GBP 40,523 1,982,486 2.07
Royal Dutch Shell plc 'B' GBP 265,689 4,310,804 4.50
Standard Chartered plc GBP 1,068,897 4,793,469 5.01
Tesco plc GBP 799,949 2,319,452 2.42
Travis Perkins plc GBP 69,394 1,079,771 1.13
Unilever plc GBP 103,930 4,100,298 4.28
Vodafone Group plc GBP 3,770,511 4,231,267 4.42
83,194,743 86.89
Total Equities 92,764,378 96.88
Total Transferable securities and money market
instruments admitted to an official exchange listing 92,764,378 96.88
Units of authorised UCITS or other collective investment undertakings
Collective Investment Schemes - AIF
Guernsey
Sherborne Investors Guernsey C Ltd., Reg. S GBP 156,227 93,736 0.10
93,736 0.10
Total Collective Investment Schemes - AIF 93,736 0.10
Collective Investment Schemes - UCITS
Ireland
Aviva Investors Sterling Liquidity Funds plc - Class 3 Income shares GBP† GBP 2,300,000 2,300,000 2.40
Aviva Investors US Dollar Liquidity Fund - Class 3 Income shares USD† USD 100,000 73,992 0.08
2,373,992 2.48
Total Collective Investment Schemes - UCITS 2,373,992 2.48
Total Units of authorised UCITS or other collective
investment undertakings 2,467,728 2.58
Total Investments 95,232,106 99.46
Cash 141,423 0.15
Other assets/(liabilities) 371,239 0.39
Total net assets 95,744,768 100.00 †Related Party Fund.
Geographic Allocation of Portfolio % of Net Assets
United Kingdom 86.89Ireland 4.00Gibraltar 3.60Bermuda 3.08Switzerland 1.79Guernsey 0.10Total investments 99.46
Cash and other assets/(liabilities) 0.54Total 100.00
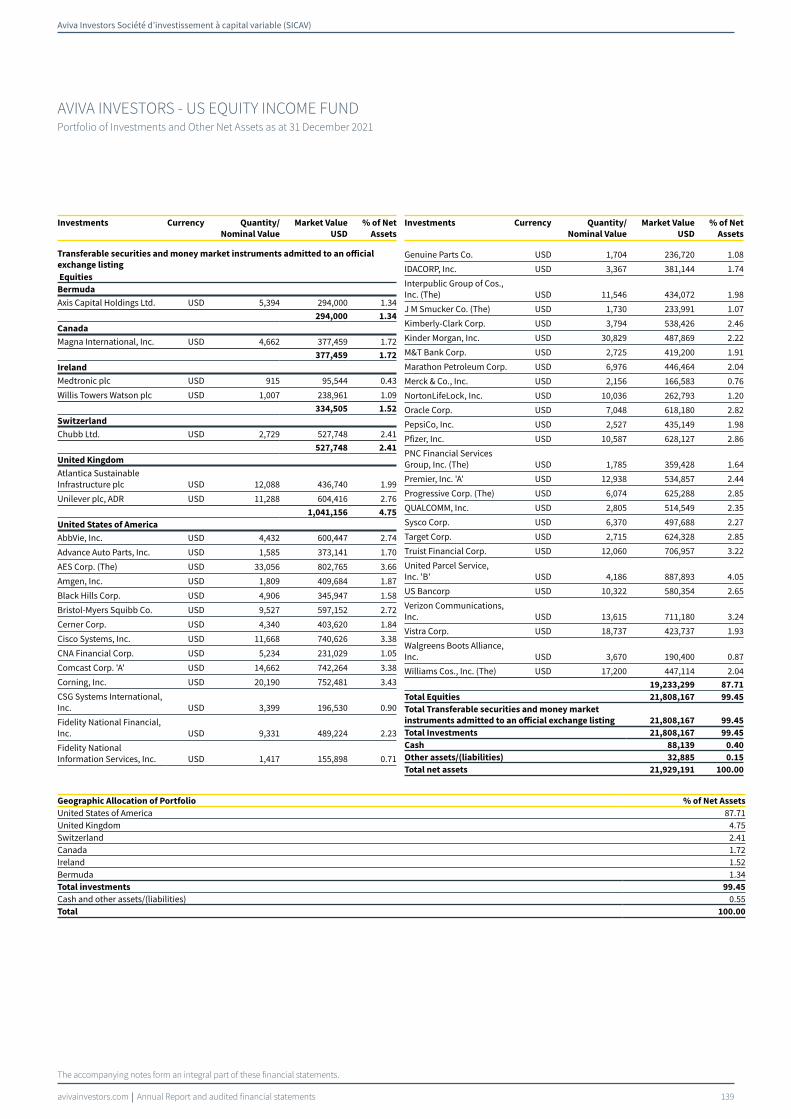
Aviva Investors Société d’investissement à capital variable (SICAV)
avivainvestors.com Annual Report and audited financial statements 139
The accompanying notes form an integral part of these financial statements.
AVIVA INVESTORS - US EQUITY INCOME FUNDPortfolio of Investments and Other Net Assets as at 31 December 2021
Investments Currency Quantity/
Nominal Value
Market Value
USD
% of Net
Assets0
Transferable securities and money market instruments admitted to an official
exchange listing
Equities
Bermuda
Axis Capital Holdings Ltd. USD 5,394 294,000 1.34
294,000 1.34
Canada
Magna International, Inc. USD 4,662 377,459 1.72
377,459 1.72
Ireland
Medtronic plc USD 915 95,544 0.43
Willis Towers Watson plc USD 1,007 238,961 1.09
334,505 1.52
Switzerland
Chubb Ltd. USD 2,729 527,748 2.41
527,748 2.41
United Kingdom
Atlantica Sustainable Infrastructure plc USD 12,088 436,740 1.99
Unilever plc, ADR USD 11,288 604,416 2.76
1,041,156 4.75
United States of America
AbbVie, Inc. USD 4,432 600,447 2.74
Advance Auto Parts, Inc. USD 1,585 373,141 1.70
AES Corp. (The) USD 33,056 802,765 3.66
Amgen, Inc. USD 1,809 409,684 1.87
Black Hills Corp. USD 4,906 345,947 1.58
Bristol-Myers Squibb Co. USD 9,527 597,152 2.72
Cerner Corp. USD 4,340 403,620 1.84
Cisco Systems, Inc. USD 11,668 740,626 3.38
CNA Financial Corp. USD 5,234 231,029 1.05
Comcast Corp. 'A' USD 14,662 742,264 3.38
Corning, Inc. USD 20,190 752,481 3.43
CSG Systems International, Inc. USD 3,399 196,530 0.90
Fidelity National Financial, Inc. USD 9,331 489,224 2.23
Fidelity National Information Services, Inc. USD 1,417 155,898 0.71
Investments Currency Quantity/
Nominal Value
Market Value
USD
% of Net
Assets0
Genuine Parts Co. USD 1,704 236,720 1.08
IDACORP, Inc. USD 3,367 381,144 1.74
Interpublic Group of Cos., Inc. (The) USD 11,546 434,072 1.98
J M Smucker Co. (The) USD 1,730 233,991 1.07
Kimberly-Clark Corp. USD 3,794 538,426 2.46
Kinder Morgan, Inc. USD 30,829 487,869 2.22
M&T Bank Corp. USD 2,725 419,200 1.91
Marathon Petroleum Corp. USD 6,976 446,464 2.04
Merck & Co., Inc. USD 2,156 166,583 0.76
NortonLifeLock, Inc. USD 10,036 262,793 1.20
Oracle Corp. USD 7,048 618,180 2.82
PepsiCo, Inc. USD 2,527 435,149 1.98
Pfizer, Inc. USD 10,587 628,127 2.86
PNC Financial Services Group, Inc. (The) USD 1,785 359,428 1.64
Premier, Inc. 'A' USD 12,938 534,857 2.44
Progressive Corp. (The) USD 6,074 625,288 2.85
QUALCOMM, Inc. USD 2,805 514,549 2.35
Sysco Corp. USD 6,370 497,688 2.27
Target Corp. USD 2,715 624,328 2.85
Truist Financial Corp. USD 12,060 706,957 3.22
United Parcel Service, Inc. 'B' USD 4,186 887,893 4.05
US Bancorp USD 10,322 580,354 2.65
Verizon Communications, Inc. USD 13,615 711,180 3.24
Vistra Corp. USD 18,737 423,737 1.93
Walgreens Boots Alliance, Inc. USD 3,670 190,400 0.87
Williams Cos., Inc. (The) USD 17,200 447,114 2.04
19,233,299 87.71
Total Equities 21,808,167 99.45
Total Transferable securities and money market
instruments admitted to an official exchange listing 21,808,167 99.45
Total Investments 21,808,167 99.45
Cash 88,139 0.40
Other assets/(liabilities) 32,885 0.15
Total net assets 21,929,191 100.00
Geographic Allocation of Portfolio % of Net Assets
United States of America 87.71United Kingdom 4.75Switzerland 2.41Canada 1.72Ireland 1.52Bermuda 1.34Total investments 99.45
Cash and other assets/(liabilities) 0.55Total 100.00
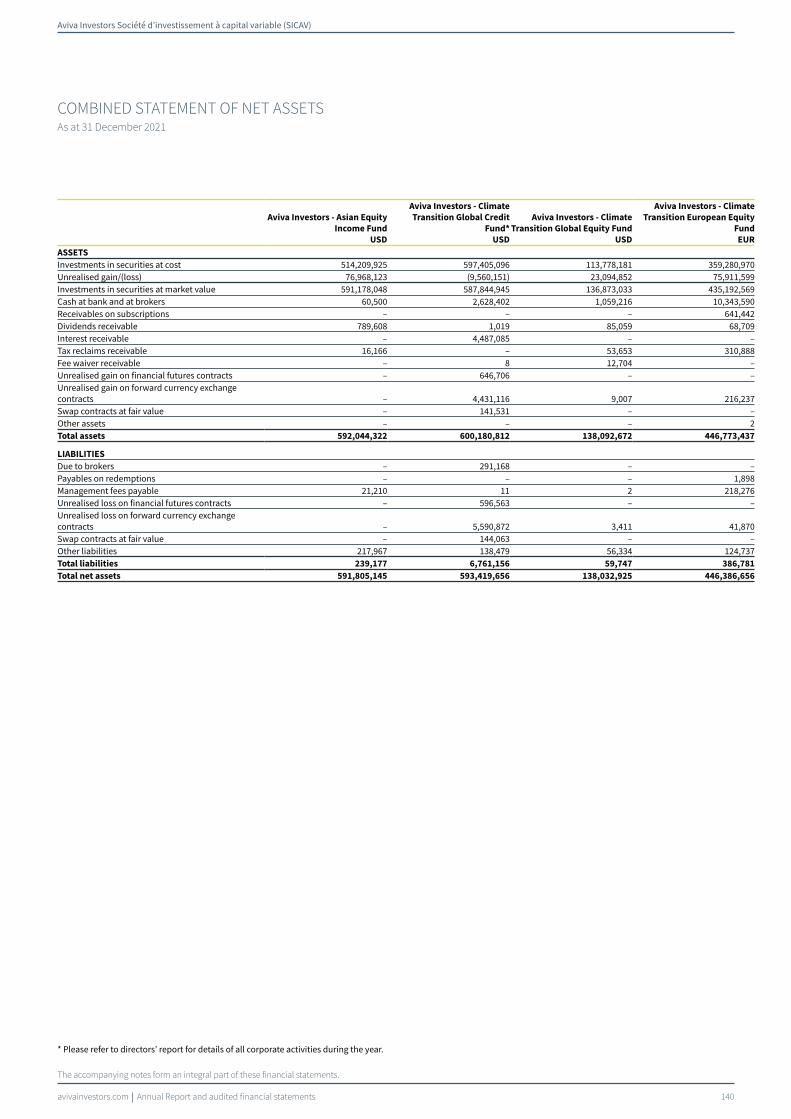
Aviva Investors Société d’investissement à capital variable (SICAV)
avivainvestors.com Annual Report and audited financial statements 140
COMBINED STATEMENT OF NET ASSETS As at 31 December 2021
The accompanying notes form an integral part of these financial statements.
Aviva Investors - Asian Equity
Income Fund
USD
Aviva Investors - Climate
Transition Global Credit
Fund*
USD
Aviva Investors - Climate
Transition Global Equity Fund
USD
Aviva Investors - Climate
Transition European Equity
Fund
EUR
ASSETS
Investments in securities at cost 514,209,925 597,405,096 113,778,181 359,280,970Unrealised gain/(loss) 76,968,123 (9,560,151) 23,094,852 75,911,599Investments in securities at market value 591,178,048 587,844,945 136,873,033 435,192,569Cash at bank and at brokers 60,500 2,628,402 1,059,216 10,343,590Receivables on subscriptions – – – 641,442Dividends receivable 789,608 1,019 85,059 68,709Interest receivable – 4,487,085 – –Tax reclaims receivable 16,166 – 53,653 310,888Fee waiver receivable – 8 12,704 –Unrealised gain on financial futures contracts – 646,706 – –Unrealised gain on forward currency exchange contracts – 4,431,116 9,007 216,237Swap contracts at fair value – 141,531 – –Other assets – – – 2Total assets 592,044,322 600,180,812 138,092,672 446,773,437
LIABILITIES
Due to brokers – 291,168 – –Payables on redemptions – – – 1,898Management fees payable 21,210 11 2 218,276Unrealised loss on financial futures contracts – 596,563 – –Unrealised loss on forward currency exchange contracts – 5,590,872 3,411 41,870Swap contracts at fair value – 144,063 – –Other liabilities 217,967 138,479 56,334 124,737Total liabilities 239,177 6,761,156 59,747 386,781
Total net assets 591,805,145 593,419,656 138,032,925 446,386,656
* Please refer to directors’ report for details of all corporate activities during the year.
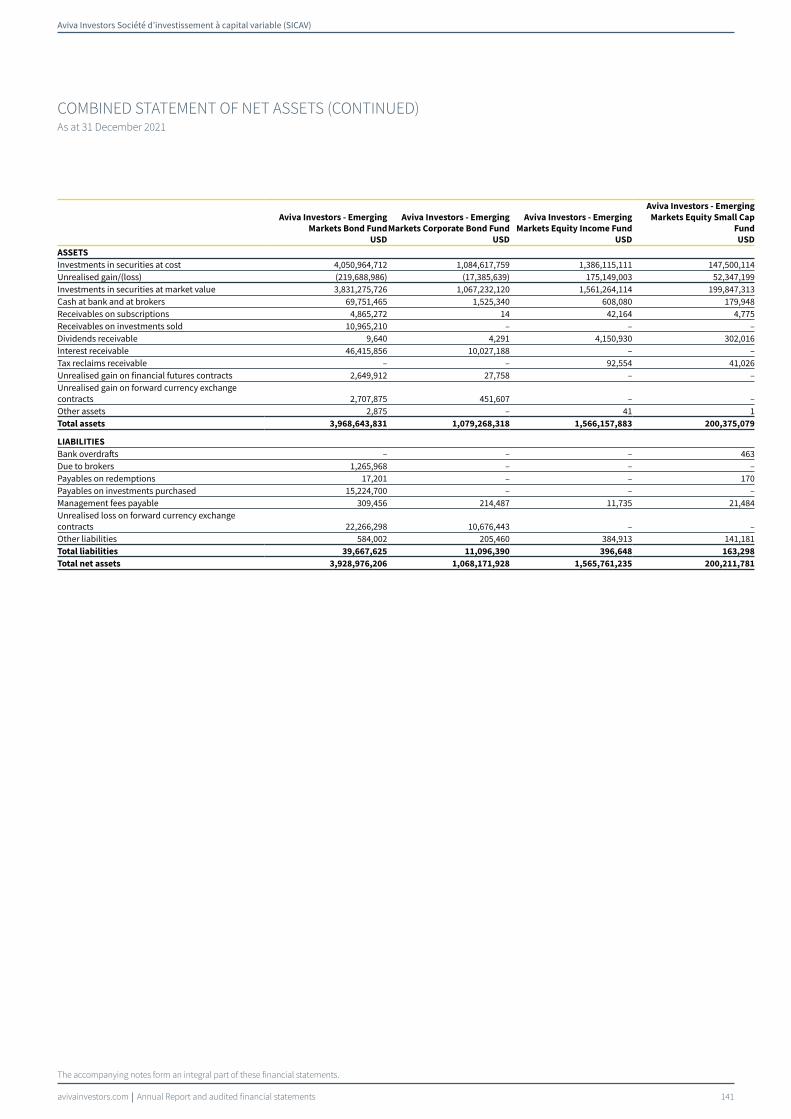
Aviva Investors Société d’investissement à capital variable (SICAV)
avivainvestors.com Annual Report and audited financial statements 141
COMBINED STATEMENT OF NET ASSETS (CONTINUED)As at 31 December 2021
The accompanying notes form an integral part of these financial statements.
Aviva Investors - Emerging
Markets Bond Fund
USD
Aviva Investors - Emerging
Markets Corporate Bond Fund
USD
Aviva Investors - Emerging
Markets Equity Income Fund
USD
Aviva Investors - Emerging
Markets Equity Small Cap
Fund
USD
ASSETS
Investments in securities at cost 4,050,964,712 1,084,617,759 1,386,115,111 147,500,114Unrealised gain/(loss) (219,688,986) (17,385,639) 175,149,003 52,347,199Investments in securities at market value 3,831,275,726 1,067,232,120 1,561,264,114 199,847,313Cash at bank and at brokers 69,751,465 1,525,340 608,080 179,948Receivables on subscriptions 4,865,272 14 42,164 4,775Receivables on investments sold 10,965,210 – – –Dividends receivable 9,640 4,291 4,150,930 302,016Interest receivable 46,415,856 10,027,188 – –Tax reclaims receivable – – 92,554 41,026Unrealised gain on financial futures contracts 2,649,912 27,758 – –Unrealised gain on forward currency exchange contracts 2,707,875 451,607 – –Other assets 2,875 – 41 1Total assets 3,968,643,831 1,079,268,318 1,566,157,883 200,375,079
LIABILITIES
Bank overdrafts – – – 463Due to brokers 1,265,968 – – –Payables on redemptions 17,201 – – 170Payables on investments purchased 15,224,700 – – –Management fees payable 309,456 214,487 11,735 21,484Unrealised loss on forward currency exchange contracts 22,266,298 10,676,443 – –Other liabilities 584,002 205,460 384,913 141,181Total liabilities 39,667,625 11,096,390 396,648 163,298
Total net assets 3,928,976,206 1,068,171,928 1,565,761,235 200,211,781
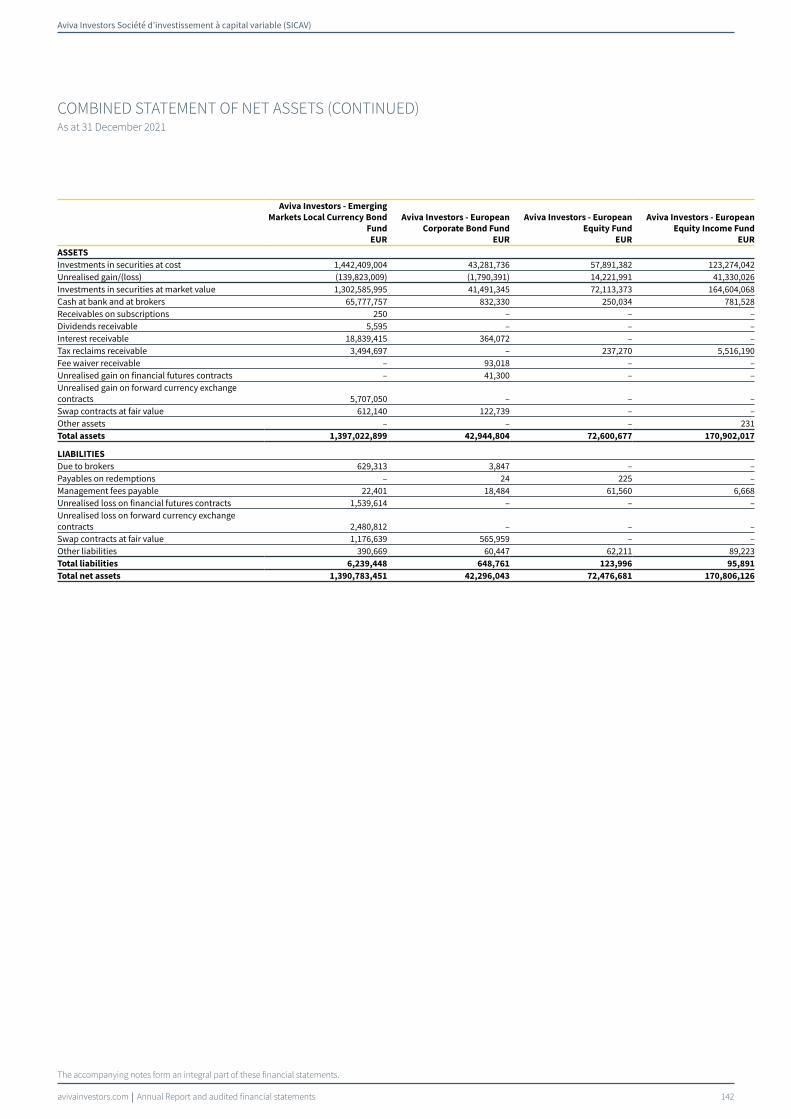
Aviva Investors Société d’investissement à capital variable (SICAV)
avivainvestors.com Annual Report and audited financial statements 142
COMBINED STATEMENT OF NET ASSETS (CONTINUED)As at 31 December 2021
The accompanying notes form an integral part of these financial statements.
Aviva Investors - Emerging
Markets Local Currency Bond
Fund
EUR
Aviva Investors - European
Corporate Bond Fund
EUR
Aviva Investors - European
Equity Fund
EUR
Aviva Investors - European
Equity Income Fund
EUR
ASSETS
Investments in securities at cost 1,442,409,004 43,281,736 57,891,382 123,274,042Unrealised gain/(loss) (139,823,009) (1,790,391) 14,221,991 41,330,026Investments in securities at market value 1,302,585,995 41,491,345 72,113,373 164,604,068Cash at bank and at brokers 65,777,757 832,330 250,034 781,528Receivables on subscriptions 250 – – –Dividends receivable 5,595 – – –Interest receivable 18,839,415 364,072 – –Tax reclaims receivable 3,494,697 – 237,270 5,516,190Fee waiver receivable – 93,018 – –Unrealised gain on financial futures contracts – 41,300 – –Unrealised gain on forward currency exchange contracts 5,707,050 – – –Swap contracts at fair value 612,140 122,739 – –Other assets – – – 231Total assets 1,397,022,899 42,944,804 72,600,677 170,902,017
LIABILITIES
Due to brokers 629,313 3,847 – –Payables on redemptions – 24 225 –Management fees payable 22,401 18,484 61,560 6,668Unrealised loss on financial futures contracts 1,539,614 – – –Unrealised loss on forward currency exchange contracts 2,480,812 – – –Swap contracts at fair value 1,176,639 565,959 – –Other liabilities 390,669 60,447 62,211 89,223Total liabilities 6,239,448 648,761 123,996 95,891
Total net assets 1,390,783,451 42,296,043 72,476,681 170,806,126

Aviva Investors Société d’investissement à capital variable (SICAV)
avivainvestors.com Annual Report and audited financial statements 143
COMBINED STATEMENT OF NET ASSETS (CONTINUED)As at 31 December 2021
The accompanying notes form an integral part of these financial statements.
Aviva Investors - Global
Sovereign Bond Fund
EUR
Aviva Investors - Global
Convertibles Absolute Return
Fund
USD
Aviva Investors - Global
Convertibles Fund
USD
Aviva Investors - Global
Emerging Markets Equity
Unconstrained Fund
USD
ASSETS
Investments in securities at cost 5,176,416,055 1,247,418,910 444,363,856 162,499,697Unrealised gain/(loss) (40,602,830) 23,185,992 (9,397,902) (21,467,768)Investments in securities at market value 5,135,813,225 1,270,604,902 434,965,954 141,031,929Cash at bank and at brokers 169,853,974 46,103,900 10,230,870 408,067Receivables on subscriptions – 122,027 167,687 –Dividends receivable 782 – – 352,824Interest receivable 22,186,045 3,557,547 542,646 –Tax reclaims receivable 80,805 107,977 63,726 13,867Fee waiver receivable – – – 56,132Options purchased contracts at fair value – 319,500 – –Unrealised gain on financial futures contracts 2,163,661 – – –Unrealised gain on forward currency exchange contracts 124,257,386 3,235,947 438,464 177,425Swap contracts at fair value 6,245,470 4,483,473 – –Other assets 8,544 391 861 –Total assets 5,460,609,892 1,328,535,664 446,410,208 142,040,244
LIABILITIES
Due to brokers 6,613,832 – – –Payables on redemptions – 22,556 99,943 –Management fees payable 1 211,902 260,876 2Performance fees payable – 2,204,641 – –Unrealised loss on financial futures contracts 8,312,694 – – –Unrealised loss on forward currency exchange contracts 59,254,128 5,859,703 5,767,856 177,379Swap contracts at fair value 3,681,048 6,022,981 – –Other liabilities 426,188 325,329 298,655 66,003Total liabilities 78,287,891 14,647,112 6,427,330 243,384
Total net assets 5,382,322,001 1,313,888,552 439,982,878 141,796,860
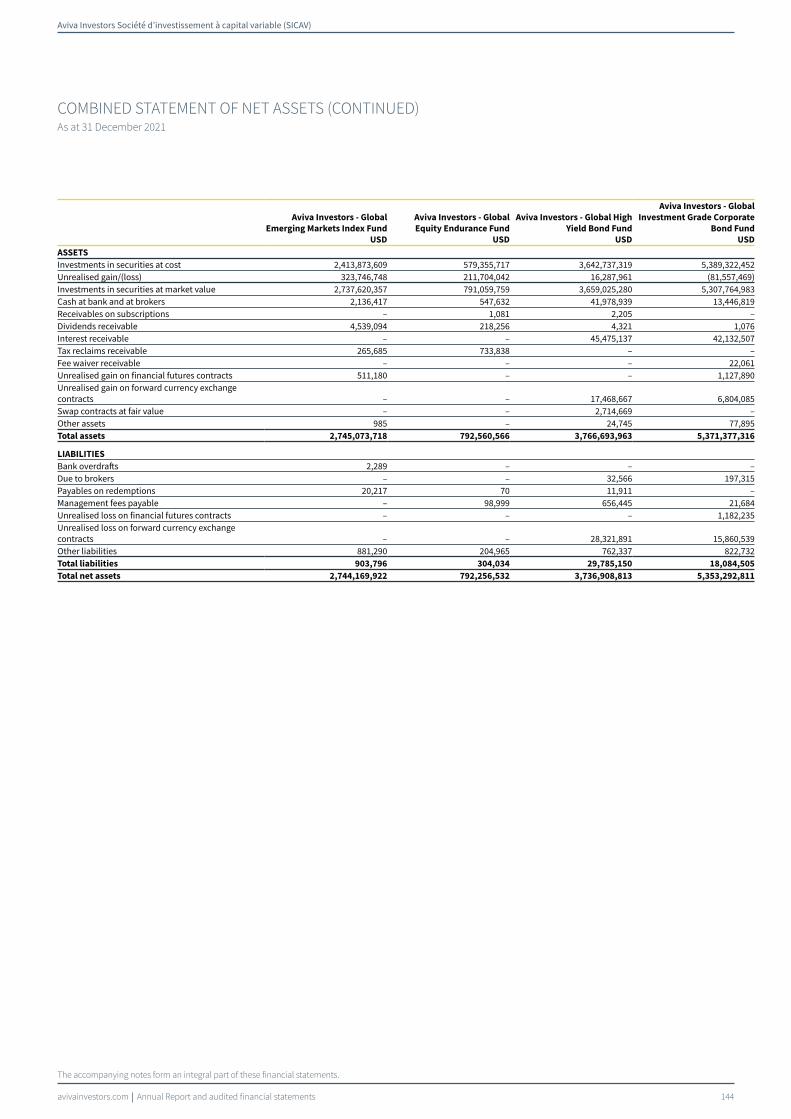
Aviva Investors Société d’investissement à capital variable (SICAV)
avivainvestors.com Annual Report and audited financial statements 144
COMBINED STATEMENT OF NET ASSETS (CONTINUED)As at 31 December 2021
The accompanying notes form an integral part of these financial statements.
Aviva Investors - Global
Emerging Markets Index Fund
USD
Aviva Investors - Global
Equity Endurance Fund
USD
Aviva Investors - Global High
Yield Bond Fund
USD
Aviva Investors - Global
Investment Grade Corporate
Bond Fund
USD
ASSETS
Investments in securities at cost 2,413,873,609 579,355,717 3,642,737,319 5,389,322,452Unrealised gain/(loss) 323,746,748 211,704,042 16,287,961 (81,557,469)Investments in securities at market value 2,737,620,357 791,059,759 3,659,025,280 5,307,764,983Cash at bank and at brokers 2,136,417 547,632 41,978,939 13,446,819Receivables on subscriptions – 1,081 2,205 –Dividends receivable 4,539,094 218,256 4,321 1,076Interest receivable – – 45,475,137 42,132,507Tax reclaims receivable 265,685 733,838 – –Fee waiver receivable – – – 22,061Unrealised gain on financial futures contracts 511,180 – – 1,127,890Unrealised gain on forward currency exchange contracts – – 17,468,667 6,804,085Swap contracts at fair value – – 2,714,669 –Other assets 985 – 24,745 77,895Total assets 2,745,073,718 792,560,566 3,766,693,963 5,371,377,316
LIABILITIES
Bank overdrafts 2,289 – – –Due to brokers – – 32,566 197,315Payables on redemptions 20,217 70 11,911 –Management fees payable – 98,999 656,445 21,684Unrealised loss on financial futures contracts – – – 1,182,235Unrealised loss on forward currency exchange contracts – – 28,321,891 15,860,539Other liabilities 881,290 204,965 762,337 822,732Total liabilities 903,796 304,034 29,785,150 18,084,505
Total net assets 2,744,169,922 792,256,532 3,736,908,813 5,353,292,811

Aviva Investors Société d’investissement à capital variable (SICAV)
avivainvestors.com Annual Report and audited financial statements 145
COMBINED STATEMENT OF NET ASSETS (CONTINUED)As at 31 December 2021
The accompanying notes form an integral part of these financial statements.
Aviva Investors - Multi-
Strategy Target Return Fund
EUR
Aviva Investors - Natural
Capital Transition Global
Equity Fund*
USD
Aviva Investors - Short
Duration Global High Yield
Bond Fund
USD
Aviva Investors - Social
Transition Global Equity
Fund*
USD
ASSETS
Investments in securities at cost 830,216,981 28,582,181 467,744,679 28,926,388Unrealised gain/(loss) 33,446,512 514,776 (2,308,332) 343,712Investments in securities at market value 863,663,493 29,096,957 465,436,347 29,270,100Cash at bank and at brokers 310,020,327 710,691 2,761,806 380,696Receivables on subscriptions 91,917 – 119,098 –Receivables on investments sold 13,810 – – –Dividends receivable 129,789 34,755 386 4,670Interest receivable – – 5,730,832 –Tax reclaims receivable 1,105,369 – – –Fee waiver receivable 312,711 1,817 – 1,819Options purchased contracts at fair value 13,999,165 – – –Unrealised gain on financial futures contracts 3,827,887 – – –Unrealised gain on forward currency exchange contracts 27,918,177 47 2,614,621 48Swap contracts at fair value 19,747,316 – – –Other assets 136,441 1 6,730 1Total assets 1,240,966,402 29,844,268 476,669,820 29,657,334
LIABILITIES
Due to brokers 7,027,711 – – –Payables on redemptions 1,293,565 – 587,987 –Payables on investments purchased 51,680 – – –Interest payable 8,227 – – –Management fees payable 349,033 5 186,918 5Options written contracts at fair value 11,759,851 – – –Unrealised loss on financial futures contracts 5,910,265 – – –Unrealised loss on forward currency exchange contracts 29,387,569 5 1,486,784 6Swap contracts at fair value 7,388,597 – – –Other liabilities 635,362 4,229 246,600 4,225Total liabilities 63,811,860 4,239 2,508,289 4,236
Total net assets 1,177,154,542 29,840,029 474,161,531 29,653,098
* Please refer to directors’ report for details of all corporate activities during the year.

Aviva Investors Société d’investissement à capital variable (SICAV)
avivainvestors.com Annual Report and audited financial statements 146
COMBINED STATEMENT OF NET ASSETS (CONTINUED)As at 31 December 2021
The accompanying notes form an integral part of these financial statements.
Aviva Investors - Sustainable
Income & Growth Fund
USD
Aviva Investors - UK Listed
Equity High Alpha Fund
GBP
Aviva Investors - US Equity
Income Fund
USD
Combined
EUR
ASSETS
Investments in securities at cost 31,568,980 92,019,694 17,073,361 27,843,083,574Unrealised gain/(loss) 2,717,159 3,212,412 4,734,806 470,863,398Investments in securities at market value 34,286,139 95,232,106 21,808,167 28,313,946,972Cash at bank and at brokers 1,355,500 141,423 88,139 730,776,522Receivables on subscriptions – 163 – 5,427,401Receivables on investments sold – – – 9,680,068Dividends receivable 49,048 414,395 18,631 10,012,595Interest receivable 194,333 – – 181,169,090Tax reclaims receivable 5,708 12,280 – 11,988,891Fee waiver receivable 223,475 – 93,527 768,520Options purchased contracts at fair value – – – 14,280,817Unrealised gain on financial futures contracts – – – 10,408,316Unrealised gain on forward currency exchange contracts 919 – – 191,896,897Swap contracts at fair value – – – 33,197,873Other assets – (1) – 246,177Total assets 36,115,122 95,800,366 22,008,464 29,513,800,139
LIABILITIES
Bank overdrafts – – – 2,426Due to brokers – – – 15,850,027Payables on redemptions – – – 1,965,730Payables on investments purchased – – – 13,472,844Interest payable – – – 8,228Management fees payable 23,225 4,820 26,178 2,502,212Performance fees payable – – – 1,943,477Options written contracts at fair value – – – 11,759,851Unrealised loss on financial futures contracts – – – 17,330,653Unrealised loss on forward currency exchange contracts 575 – – 175,802,475Swap contracts at fair value – – – 18,248,732Other liabilities 54,105 50,778 53,095 6,655,397Total liabilities 77,905 55,598 79,273 265,542,052
Total net assets 36,037,217 95,744,768 21,929,191 29,248,258,087

Aviva Investors Société d’investissement à capital variable (SICAV)
avivainvestors.com Annual Report and audited financial statements 147
STATISTICAL INFORMATION
e
Shares Outstanding
as at
31 December 2021
Nav per share
as at
31 December 2021
Nav per share
as at
31 December 2020
Nav per share
as at
31 December 2019
Aviva Investors - Asian Equity Income Fund
A Share Class Accumulation 770,461 17.7974 18.1276 15.8225B Share Class Accumulation 367,771 7.6685 7.8304 6.8518I Share Class Accumulation 1,191 444.1113 448.7773 388.6284R Share Class Accumulation – – 15.9446 13.8167Z Share Class Accumulation 4,674 1,764.6913 1,767.7234 1,517.4632Za Share Class Dividend GBP 356,289 1,149.5832 1,164.5509 1,062.3810Zy Share Class Accumulation GBP 5,270 1,817.1997 1,801.1703 1,598.1709Total net assets in USD 591,805,145 661,445,277 687,272,420
Aviva Investors - Climate Transition Global Credit Fund*
A Share Class Accumulation 100 10.0225 – –A Share Class Accumulation EUR 100 10.6501 – –Ah Share Class Accumulation Hedged EUR 100 10.0105 – –I Share Class Accumulation 10 100.9780 – –I Share Class Accumulation EUR 10 106.8813 – –Ih Share Class Accumulation Hedged AUD 10 100.7753 – –Ih Share Class Accumulation Hedged CHF 10 100.2830 – –Ih Share Class Accumulation Hedged EUR 10 100.4610 – –Iyh Share Class Accumulation Hedged GBP 10 100.7791 – –K Share Class Accumulation EUR 1 1,071.1578 – –R Share Class Accumulation 100 10.0994 – –R Share Class Accumulation EUR 100 10.6865 – –Ryh Share Class Accumulation Hedged GBP 2,030 10.0797 – –S Share Class Accumulation 10 100.9780 – –S Share Class Accumulation EUR 10 106.9113 – –Sh Share Class Accumulation Hedged AUD 10 101.1141 – –Syh Share Class Accumulation Hedged GBP 10 100.9456 – –Zh Share Class Accumulation Hedged EUR 235,665 1,006.2586 – –Zyh Share Class Accumulation Hedged GBP 237,432 1,010.8400 – –Total net assets in USD 593,419,656 – –
Aviva Investors - Climate Transition Global Equity Fund
A Share Class Accumulation 100 13.2126 11.8307 –F Share Class Accumulation Hedged AUD 1,949 117.5249 104.5252 –I Share Class Accumulation 10 133.6050 118.6370 –Z Share Class Accumulation EUR 27,655 1,393.3075 1,135.3723 –Z Share Class Accumulation GBP 54,329 1,282.3138 1,118.2476 –Total net assets in USD 138,032,925 116,462,989 –
Aviva Investors - Climate Transition European Equity Fund
A Share Class Accumulation 1,525,519 14.9397 12.7753 11.0237AFER Climat Share Class Dividend 671,787 134.2485 114.7366 –I Share Class Accumulation 303,414 152.2559 129.1661 110.5794K Share Class Accumulation 162,451 1,542.1027 1,301.3874 1,108.2873R Share Class Accumulation 100 15.9083 13.5008 11.5378Ry Share Class Accumulation GBP 70,832 14.3147 13.0017 10.5256Zy Share Class Accumulation Hedged GBP 30,145 988.1116 – –Total net assets in EUR 446,386,656 261,994,439 134,389,258
Aviva Investors - Emerging Markets Bond Fund
A Share Class Accumulation 105,663 15.4679 15.9990 15.0270A Share Class Accumulation Hedged EUR 5,200 11.8848 12.4289 11.8413B Share Class Accumulation 103,424 13.3175 13.8363 13.0284B Share Class Accumulation Hedged EUR 100 9.6612 – –Bm Share Class Dividend 1,426,999 8.6776 9.4724 9.4698Bm Share Class Dividend Hedged EUR 539,998 7.2668 8.0064 8.1159I Share Class Accumulation 199,941 311.0442 320.2986 298.9255I Share Class Accumulation Hedged CHF 15,727 114.5887 119.3965 113.0451I Share Class Accumulation Hedged EUR 1,548,847 142.7453 148.3147 140.4127Ia Share Class Dividend 17,201 100.8668 107.4688 100.4024K Share Class Accumulation EUR 27,208 1,382.0839 1,310.9334 1,332.8319K Share Class Accumulation Hedged EUR 161,023 972.6700 – –Kq Share Class Dividend Hedged EUR 132,825 899.0887 963.9070 949.9064Ra Share Class Dividend Hedged EUR 2,243,456 10.1341 10.8688 10.6853Ry Share Class Accumulation Hedged CHF 963,462 10.0934 10.5283 –V Share Class Accumulation 129,212 1,801.5743 1,841.8086 1,706.4933Z Share Class Accumulation 221,415 1,800.7018 1,840.9244 1,705.6740Z Share Class Accumulation Hedged GBP 279,573 1,568.0356 1,605.4422 1,514.1250Zq Share Class Dividend Hedged EUR 98,102 905.2119 970.2886 956.1512

Aviva Investors Société d’investissement à capital variable (SICAV)
avivainvestors.com Annual Report and audited financial statements 148
STATISTICAL INFORMATION (CONTINUED)
Shares Outstanding
as at
31 December 2021
Nav per share
as at
31 December 2021
Nav per share
as at
31 December 2020
Nav per share
as at
31 December 2019
Zy Share Class Accumulation Hedged GBP 1,030,935 1,346.0316 1,378.1905 1,300.1568Total net assets in USD 3,928,976,206 4,118,230,053 4,160,505,779
Aviva Investors - Emerging Markets Corporate Bond Fund
I Share Class Accumulation 286,468 129.1105 131.0037 118.4680I Share Class Accumulation Hedged EUR 841,965 131.8669 134.9903 124.0725Iq Share Class Dividend Hedged EUR 149,854 99.0311 – –K Share Class Accumulation Hedged EUR 10,021 988.0598 – –Kq Share Class Dividend Hedged EUR 262,124 969.6447 1,027.9080 983.6895Zy Share Class Accumulation Hedged EUR 33,410 1,137.1445 1,152.9156 1,050.2478Zy Share Class Accumulation Hedged GBP 348,506 1,158.6962 1,167.1896 1,062.4608Total net assets in USD 1,068,171,928 925,553,401 631,928,875
Aviva Investors - Emerging Markets Equity Income Fund
A Share Class Accumulation 56,072 11.7705 12.1722 11.3041B Share Class Accumulation 1,034,342 3.9609 4.1063 3.8229B Share Class Accumulation EUR 235,020 11.1588 10.6956 10.8885I Share Class Accumulation 1,883 425.6698 436.3063 401.5935R Share Class Accumulation – – 14.2736 13.1435Ra Share Class Dividend GBP 2,836 11.5754 11.9311 11.6073Z Share Class Accumulation 976 1,185.4002 1,203.2235 1,096.7441Z Share Class Accumulation EUR 5,690 1,205.8605 1,131.5767 1,127.8673Z Share Class Accumulation GBP 377,406 1,573.8971 1,580.6905 1,489.2597Zy Share Class Accumulation GBP 342,491 1,610.4792 1,617.4376 1,523.8813Total net assets in USD 1,565,761,235 1,257,885,169 1,391,272,024
Aviva Investors - Emerging Markets Equity Small Cap Fund
A Share Class Accumulation 313,461 16.6285 13.8036 12.0330B Share Class Accumulation 9,845 14.5889 12.1396 10.6090B Share Class Accumulation EUR 346,821 20.7449 15.9596 15.2512I Share Class Accumulation 12,140 248.2972 204.2742 176.4940I Share Class Accumulation EUR 10 135.8451 103.3498 97.4742M Share Class Accumulation 1 1,205.5796 987.4754 849.2006Ra Share Class Dividend GBP 7,000 16.8637 13.9062 12.6451Z Share Class Accumulation 16,509 1,826.1396 1,487.7776 1,272.9767Zy Share Class Accumulation 20,466 1,378.1240 1,122.8065 960.6990Zy Share Class Accumulation GBP 63,341 1,462.1102 1,178.6724 1,042.4137Total net assets in USD 200,211,781 206,767,666 217,323,175
Aviva Investors - Emerging Markets Local Currency Bond Fund
A Share Class Accumulation 1,147 14.5416 14.9798 16.2003Aa Share Class Dividend 27,636 7.4437 8.0071 9.0477B Share Class Accumulation 11,543 14.0716 14.5397 15.7637B Share Class Accumulation USD 102 9.6702 10.8020 10.7000Bm Share Class Dividend 309,003 4.7088 5.1942 6.0562I Share Class Accumulation 212,187 162.0532 165.9717 178.3479I Share Class Accumulation GBP 10 103.6822 113.4340 115.0127I Share Class Accumulation USD 71,190 102.4492 113.4860 111.5222Ia Share Class Dividend 15 67.2401 72.1291 81.0685Ia Share Class Dividend GBP 37 77.6742 89.4476 95.5008R Share Class Accumulation – – 11.1684 12.0056R Share Class Accumulation GBP 664 10.3421 11.3398 11.5020R Share Class Accumulation USD 100 10.7849 11.9405 11.7199Z Share Class Accumulation 24,379 1,269.8101 1,291.0826 1,377.3250Zy Share Class Accumulation GBP 789,431 1,400.4427 1,523.8240 1,536.6210Total net assets in EUR 1,390,783,451 1,430,488,642 1,685,124,071
Aviva Investors - European Corporate Bond Fund
A Share Class Accumulation 1,067,054 14.2472 14.4555 14.3312B Share Class Accumulation 995,787 3.6600 3.7139 3.6841Ba Share Class Dividend 164,362 1.8697 1.9065 1.8952I Share Class Accumulation 49,471 198.0255 200.0368 197.4026Z Share Class Accumulation 8,995 1,483.5388 1,491.8633 1,465.0668Total net assets in EUR 42,296,043 42,188,556 52,629,568
Aviva Investors - European Equity Fund
A Share Class Accumulation 1,383,965 17.0589 14.4319 14.6703B Share Class Accumulation 679,371 11.6972 9.9216 10.1108I Share Class Accumulation 116,482 308.8972 259.2998 261.4778R Share Class Accumulation – – 11.8024 11.9076Z Share Class Accumulation 1,849 2,672.2701 2,223.6930 2,223.0742Total net assets in EUR 72,476,681 95,235,875 140,713,834

Aviva Investors Société d’investissement à capital variable (SICAV)
avivainvestors.com Annual Report and audited financial statements 149
STATISTICAL INFORMATION (CONTINUED)
Shares Outstanding
as at
31 December 2021
Nav per share
as at
31 December 2021
Nav per share
as at
31 December 2020
Nav per share
as at
31 December 2019
Aviva Investors - European Equity Income Fund
A Share Class Accumulation 195,554 16.7944 14.1684 16.0040B Share Class Accumulation 134,469 13.6988 11.5864 13.1198I Share Class Accumulation 1,192 357.3858 299.1394 335.2217Za Share Class Dividend GBP 146,678 945.6431 855.4680 934.7720Total net assets in EUR 170,806,126 150,318,786 2,037,208,886
Aviva Investors - European High Yield Bond Fund*
A Share Class Accumulation – – 10.0414 10.1236I Share Class Accumulation – – 101.9470 101.4140Ia Share Class Dividend – – 101.6290 101.4140K Share Class Accumulation – – 1,016.3044 1,014.1692R Share Class Accumulation – – 10.1947 10.1414Z Share Class Accumulation – – 1,020.0497 1,014.4183Total net assets in EUR – 51,311,895 50,557,036
Aviva Investors - European Real Estate Securities Fund*
A Share Class Accumulation – – 11.6299 12.8330B Share Class Accumulation – – 14.5691 16.0878I Share Class Accumulation – – 344.6130 377.3628R Share Class Accumulation – – 11.9243 13.0593Za Share Class Dividend – – 1,394.0870 1,564.1690Total net assets in EUR – 18,359,725 42,496,821
Aviva Investors - Global Sovereign Bond Fund
I Share Class Accumulation 10 100.2050 103.1130 –Iy Share Class Accumulation Hedged GBP 10 98.1361 100.3276 –Z Share Class Accumulation Hedged GBP 3,123,474 1,446.7900 1,474.6513 1,392.0153Total net assets in EUR 5,382,322,001 2,007,098,385 127,015,421
Aviva Investors - Global Convertibles Absolute Return Fund
A Share Class Accumulation Hedged EUR 98,141 12.1454 12.1904 11.3991Ay Share Class Accumulation 100 9.7849 – –I Share Class Accumulation 297,224 163.6180 161.5907 147.6846I Share Class Accumulation Hedged CHF 2,319 111.8330 111.4819 103.7262I Share Class Accumulation Hedged EUR 1,491,619 143.6812 143.1167 132.9443I Share Class Accumulation Hedged GBP 10 118.2163 116.9794 108.4318Ia Share Class Dividend 27,773 126.9947 125.3149 114.5206Ia Share Class Dividend Hedged EUR 21,731 125.9483 125.3898 116.5315Ia Share Class Dividend Hedged GBP 171,037 146.4321 144.8976 134.4150R Share Class Accumulation 526,253 13.2053 13.0346 11.9172R Share Class Accumulation Hedged CHF 38,801 11.4818 11.4580 10.6448R Share Class Accumulation Hedged EUR 702,791 11.5430 11.4989 10.6736R Share Class Accumulation Hedged GBP 100 11.8164 11.6997 10.8439Ry Share Class Accumulation Hedged EUR 393,943 10.9811 10.9282 10.1569Ry Share Class Accumulation Hedged GBP 1,437 11.5496 11.4254 10.5003Z Share Class Accumulation Hedged GBP 345,737 1,589.2110 1,556.0053 1,419.1882Zy Share Class Accumulation Hedged GBP 135,426 1,164.0728 1,139.8442 1,034.7538Total net assets in USD 1,313,888,552 1,004,866,322 826,592,044
Aviva Investors - Global Convertibles Fund
A Share Class Accumulation 573,254 19.7243 20.0498 15.4147A Share Class Accumulation Hedged CHF 28,500 14.4800 14.4447 11.5393A Share Class Accumulation Hedged EUR 5,639,594 16.7641 16.7167 13.3320Aa Share Class Dividend GBP 2,366 25.4367 25.5823 20.3296Aa Share Class Dividend Hedged GBP 12,662 16.3979 16.2520 12.9147Ay Share Class Accumulation Hedged SGD 4,553 9.6519 – –B Share Class Accumulation 297,451 13.4507 13.7072 10.5647B Share Class Accumulation Hedged EUR 105,391 17.5893 17.5654 14.0342I Share Class Accumulation 118,476 322.1215 325.3532 248.5446I Share Class Accumulation Hedged EUR 308,469 178.1378 176.3302 139.3510Ia Share Class Dividend GBP 126,146 267.4363 268.6734 212.4468Ia Share Class Dividend Hedged GBP 86,226 185.2420 183.3199 144.9452Iy Share Class Accumulation Hedged EUR 37,430 132.6523 131.3192 104.0310Iy Share Class Accumulation Hedged GBP 34,077 134.9929 133.0011 105.2260Iy Share Class Accumulation Hedged USD 27,907 142.2657 139.4929 108.7174Kq Share Class Dividend Hedged EUR 78,041 1,395.5192 1,383.1506 1,099.3643Ra Share Class Dividend Hedged GBP 219,661 16.8690 16.6879 13.2432Z Share Class Accumulation 1,094 1,868.0887 1,873.1905 1,420.6475Z Share Class Accumulation Hedged EUR 176 1,934.3417 1,899.2313 1,493.2283Z Share Class Accumulation Hedged GBP – – 1,998.0685 1,564.5895

Aviva Investors Société d’investissement à capital variable (SICAV)
avivainvestors.com Annual Report and audited financial statements 150
STATISTICAL INFORMATION (CONTINUED)
Shares Outstanding
as at
31 December 2021
Nav per share
as at
31 December 2021
Nav per share
as at
31 December 2020
Nav per share
as at
31 December 2019
Total net assets in USD 439,982,878 391,820,572 505,953,717
Aviva Investors - Global Emerging Markets Equity Unconstrained Fund
I Share Class Accumulation 10 134.0380 134.7720 112.3520S Share Class Accumulation 10 134.0230 134.7230 112.3320Z Share Class Accumulation EUR 39,816 980.6573 – –Z Share Class Accumulation Hedged GBP 1 1,789.1084 1,312.3518 1,115.8148Zy Share Class Accumulation GBP 46,157 1,562.9458 1,548.3737 –Total net assets in USD 141,796,860 8,969,506 7,376,412
Aviva Investors - Global Emerging Markets Index Fund
I Share Class Accumulation 10 137.8670 142.2531 120.9697Z Share Class Accumulation 322,560 1,439.6779 1,480.5012 1,255.7256Z Share Class Accumulation EUR 1 982.2723 – –Zy Share Class Accumulation GBP 1,409,651 1,196.6475 1,217.6123 1,067.4796Total net assets in USD 2,744,169,922 2,476,036,862 2,142,574,503
Aviva Investors - Global Equity Endurance Fund
A Share Class Accumulation 2,757,414 22.1819 17.7304 14.9103I Share Class Accumulation 162,508 229.9837 182.3733 152.1906I Share Class Accumulation EUR 10 114.3356 – –Ry Share Class Accumulation GBP 40,651 21.2978 16.7177 14.4259Z Share Class Accumulation 240,986 1,898.1878 1,492.1246 1,234.3337Za Share Class Dividend GBP 93,457 1,861.4114 1,463.7671 1,269.4751Total net assets in USD 792,256,532 748,751,430 810,092,827
Aviva Investors - Global Equity Unconstrained Fund*
I Share Class Accumulation – – 131.3510 115.4200S Share Class Accumulation – – 131.2080 115.3840Z Share Class Accumulation Hedged GBP – – 1,275.6072 1,146.0342Total net assets in USD – 8,716,319 7,576,186
Aviva Investors - Global High Yield Bond Fund
A Share Class Accumulation 1,673,820 25.0281 24.2090 23.5776A Share Class Accumulation Hedged CHF 453,076 14.4816 14.1557 14.0286A Share Class Accumulation Hedged EUR 586,342 20.9848 20.4643 20.3011A Share Class Accumulation Hedged SGD 391,487 18.9292 18.3140 18.0028Am Share Class Dividend 8,073,851 8.9088 9.1207 9.4528Am Share Class Dividend Hedged GBP 193,614 11.9784 12.2893 13.0186Am Share Class Dividend Hedged SGD 1,394,219 9.1242 9.3423 9.7782B Share Class Accumulation Hedged EUR 43,130 15.8471 15.4974 15.4044Ba Share Class Dividend Hedged EUR 364,986 9.3507 9.4524 9.7776Bm Share Class Dividend 4,099,616 8.7510 8.9823 9.3335I Share Class Accumulation 167,011 273.1559 262.5257 254.0490I Share Class Accumulation Hedged CAD 363 206.3443 198.5659 195.9288I Share Class Accumulation Hedged EUR 829,824 229.0648 221.9951 218.8408I Share Class Accumulation Hedged GBP 10,127 157.8487 152.0302 150.5310Ia Share Class Dividend 44,254 108.3688 108.8587 110.3938Ia Share Class Dividend Hedged CHF 120,726 91.2316 92.3481 95.2675Ia Share Class Dividend Hedged EUR 116,979 93.7075 94.7076 97.9333Ia Share Class Dividend Hedged GBP 30,288 98.7388 99.1594 102.8175Ih Share Class Accumulation Hedged USD 56,241 93.3656 – –Iq Share Class Dividend Hedged GBP – – 97.5557 101.4298K Share Class Accumulation Hedged EUR 1 1,240.2634 1,196.1710 1,172.1273Kq Share Class Dividend Hedged EUR 41,590 885.2823 894.9347 921.9911M Share Class Accumulation 369,112 155.4514 149.0460 143.8807M Share Class Accumulation Hedged CHF 20,633 132.6015 128.4884 126.2001M Share Class Accumulation Hedged EUR 3,617,572 137.3417 132.7805 130.5691R Share Class Accumulation 2,164,880 14.2339 13.6859 13.2493R Share Class Accumulation Hedged CHF 1,674,063 12.3376 11.9867 11.8079R Share Class Accumulation Hedged EUR 1,704,959 12.6089 12.2235 12.0533R Share Class Accumulation Hedged SGD 100 14.0775 13.5292 13.1995Ra Share Class Dividend 556,267 11.0107 11.0607 11.2168Ra Share Class Dividend Hedged GBP 273,957 9.3736 9.4140 9.7646V Share Class Accumulation EUR 1 1,140.5967 1,005.8194 –V Share Class Accumulation Hedged EUR 37,463 1,054.5505 1,014.6951 –Z Share Class Accumulation 84,210 1,961.9163 1,872.0531 1,798.5276Z Share Class Accumulation Hedged GBP 887,636 1,836.6358 1,756.0950 1,726.4219Zq Share Class Dividend Hedged EUR 16 945.3708 949.0869 981.9290Zy Share Class Accumulation Hedged GBP 50,930 1,087.0449 1,039.2123 1,021.9644Total net assets in USD 3,736,908,813 6,188,092,961 5,151,371,505
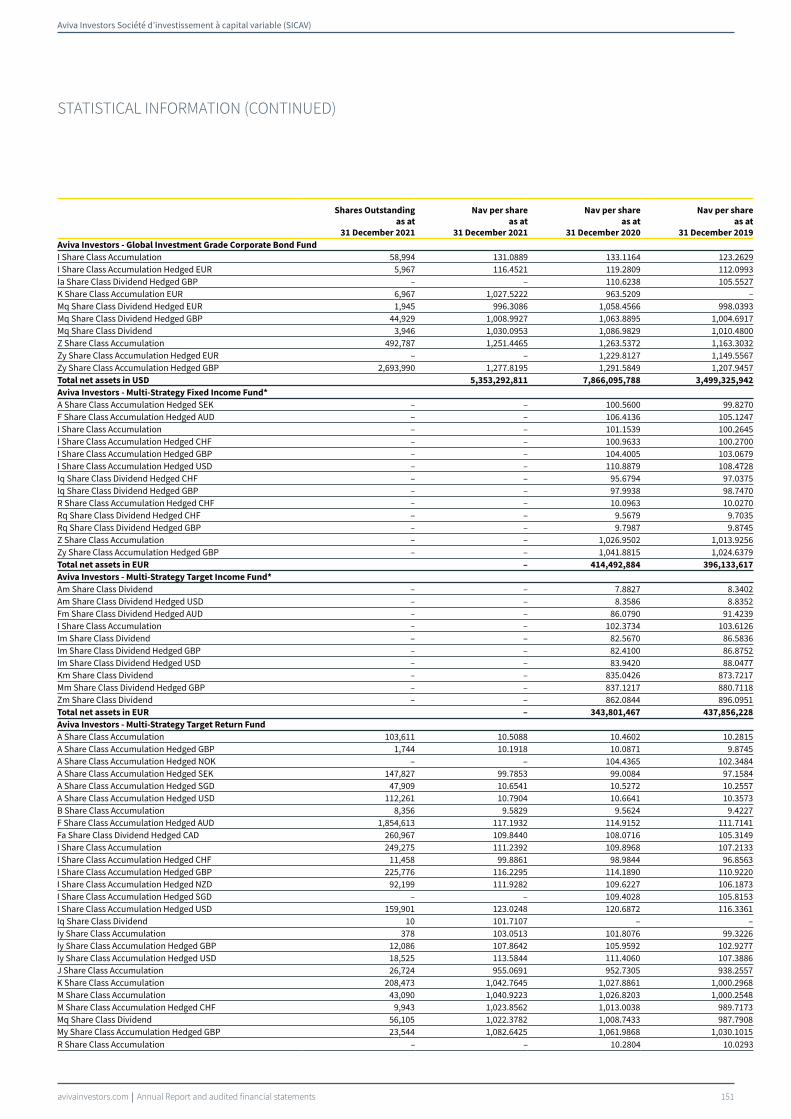
Aviva Investors Société d’investissement à capital variable (SICAV)
avivainvestors.com Annual Report and audited financial statements 151
STATISTICAL INFORMATION (CONTINUED)
Shares Outstanding
as at
31 December 2021
Nav per share
as at
31 December 2021
Nav per share
as at
31 December 2020
Nav per share
as at
31 December 2019
Aviva Investors - Global Investment Grade Corporate Bond Fund
I Share Class Accumulation 58,994 131.0889 133.1164 123.2629I Share Class Accumulation Hedged EUR 5,967 116.4521 119.2809 112.0993Ia Share Class Dividend Hedged GBP – – 110.6238 105.5527K Share Class Accumulation EUR 6,967 1,027.5222 963.5209 –Mq Share Class Dividend Hedged EUR 1,945 996.3086 1,058.4566 998.0393Mq Share Class Dividend Hedged GBP 44,929 1,008.9927 1,063.8895 1,004.6917Mq Share Class Dividend 3,946 1,030.0953 1,086.9829 1,010.4800Z Share Class Accumulation 492,787 1,251.4465 1,263.5372 1,163.3032Zy Share Class Accumulation Hedged EUR – – 1,229.8127 1,149.5567Zy Share Class Accumulation Hedged GBP 2,693,990 1,277.8195 1,291.5849 1,207.9457Total net assets in USD 5,353,292,811 7,866,095,788 3,499,325,942
Aviva Investors - Multi-Strategy Fixed Income Fund*
A Share Class Accumulation Hedged SEK – – 100.5600 99.8270F Share Class Accumulation Hedged AUD – – 106.4136 105.1247I Share Class Accumulation – – 101.1539 100.2645I Share Class Accumulation Hedged CHF – – 100.9633 100.2700I Share Class Accumulation Hedged GBP – – 104.4005 103.0679I Share Class Accumulation Hedged USD – – 110.8879 108.4728Iq Share Class Dividend Hedged CHF – – 95.6794 97.0375Iq Share Class Dividend Hedged GBP – – 97.9938 98.7470R Share Class Accumulation Hedged CHF – – 10.0963 10.0270Rq Share Class Dividend Hedged CHF – – 9.5679 9.7035Rq Share Class Dividend Hedged GBP – – 9.7987 9.8745Z Share Class Accumulation – – 1,026.9502 1,013.9256Zy Share Class Accumulation Hedged GBP – – 1,041.8815 1,024.6379Total net assets in EUR – 414,492,884 396,133,617
Aviva Investors - Multi-Strategy Target Income Fund*
Am Share Class Dividend – – 7.8827 8.3402Am Share Class Dividend Hedged USD – – 8.3586 8.8352Fm Share Class Dividend Hedged AUD – – 86.0790 91.4239I Share Class Accumulation – – 102.3734 103.6126Im Share Class Dividend – – 82.5670 86.5836Im Share Class Dividend Hedged GBP – – 82.4100 86.8752Im Share Class Dividend Hedged USD – – 83.9420 88.0477Km Share Class Dividend – – 835.0426 873.7217Mm Share Class Dividend Hedged GBP – – 837.1217 880.7118Zm Share Class Dividend – – 862.0844 896.0951Total net assets in EUR – 343,801,467 437,856,228
Aviva Investors - Multi-Strategy Target Return Fund
A Share Class Accumulation 103,611 10.5088 10.4602 10.2815A Share Class Accumulation Hedged GBP 1,744 10.1918 10.0871 9.8745A Share Class Accumulation Hedged NOK – – 104.4365 102.3484A Share Class Accumulation Hedged SEK 147,827 99.7853 99.0084 97.1584A Share Class Accumulation Hedged SGD 47,909 10.6541 10.5272 10.2557A Share Class Accumulation Hedged USD 112,261 10.7904 10.6641 10.3573B Share Class Accumulation 8,356 9.5829 9.5624 9.4227F Share Class Accumulation Hedged AUD 1,854,613 117.1932 114.9152 111.7141Fa Share Class Dividend Hedged CAD 260,967 109.8440 108.0716 105.3149I Share Class Accumulation 249,275 111.2392 109.8968 107.2133I Share Class Accumulation Hedged CHF 11,458 99.8861 98.9844 96.8563I Share Class Accumulation Hedged GBP 225,776 116.2295 114.1890 110.9220I Share Class Accumulation Hedged NZD 92,199 111.9282 109.6227 106.1873I Share Class Accumulation Hedged SGD – – 109.4028 105.8153I Share Class Accumulation Hedged USD 159,901 123.0248 120.6872 116.3361Iq Share Class Dividend 10 101.7107 – –Iy Share Class Accumulation 378 103.0513 101.8076 99.3226Iy Share Class Accumulation Hedged GBP 12,086 107.8642 105.9592 102.9277Iy Share Class Accumulation Hedged USD 18,525 113.5844 111.4060 107.3886J Share Class Accumulation 26,724 955.0691 952.7305 938.2557K Share Class Accumulation 208,473 1,042.7645 1,027.8861 1,000.2968M Share Class Accumulation 43,090 1,040.9223 1,026.8203 1,000.2548M Share Class Accumulation Hedged CHF 9,943 1,023.8562 1,013.0038 989.7173Mq Share Class Dividend 56,105 1,022.3782 1,008.7433 987.7908My Share Class Accumulation Hedged GBP 23,544 1,082.6425 1,061.9868 1,030.1015R Share Class Accumulation – – 10.2804 10.0293

Aviva Investors Société d’investissement à capital variable (SICAV)
avivainvestors.com Annual Report and audited financial statements 152
STATISTICAL INFORMATION (CONTINUED)
Shares Outstanding
as at
31 December 2021
Nav per share
as at
31 December 2021
Nav per share
as at
31 December 2020
Nav per share
as at
31 December 2019
R Share Class Accumulation Hedged CHF 4,950 10.1952 10.1023 9.8853R Share Class Accumulation Hedged GBP – – 10.6263 10.3569Ra Share Class Dividend Hedged GBP 8,404 10.4118 10.2461 10.0137Ry Share Class Accumulation 171,489 10.3112 10.1868 9.9381Ry Share Class Accumulation Hedged GBP 13,683 10.7776 10.5870 10.3136Ry Share Class Accumulation Hedged USD 22,002 11.5743 11.3550 10.9452Z Share Class Accumulation 237,999 1,178.6378 1,155.3575 1,118.0696Zq Share Class Dividend Hedged GBP 213,402 1,019.1192 – –Total net assets in EUR 1,177,154,542 1,223,718,498 1,737,398,768
Aviva Investors - Natural Capital Transition Global Equity Fund*
A Share Class Accumulation 100 10.1612 – –A Share Class Accumulation EUR 100 10.1996 – –I Share Class Accumulation 10 101.7550 – –I Share Class Accumulation EUR 10 102.0787 – –Iy Share Class Accumulation Hedged GBP 10 101.6256 – –R Share Class Accumulation 100 10.1755 – –R Share Class Accumulation EUR 100 10.2079 – –Ry Share Class Accumulation Hedged GBP 100 10.1626 – –S Share Class Accumulation 10 101.7720 – –S Share Class Accumulation EUR 10 102.0857 – –Zy Share Class Accumulation GBP 21,933 1,006.2329 – –Zy Share Class Accumulation Hedged GBP 1 1,016.8036 – –Total net assets in USD 29,840,029 – –
Aviva Investors - Short Duration Global High Yield Bond Fund
A Share Class Accumulation 2,651,324 12.7685 12.3604 12.0992A Share Class Accumulation Hedged EUR 277,802 10.4601 10.2105 10.1638Am Share Class Dividend 4,487,728 9.3809 9.5694 9.9201Ay Share Class Accumulation 49,260 11.3424 10.9804 10.7484Ay Share Class Accumulation Hedged EUR 2,100 10.5353 10.2847 10.2399I Share Class Accumulation 100,921 150.9509 145.4026 141.6346I Share Class Accumulation Hedged CHF 120,535 113.0723 110.0549 108.9982I Share Class Accumulation Hedged EUR 75,340 118.2237 114.7962 113.7695I Share Class Accumulation Hedged GBP 1,315 108.8910 105.1182 104.4128Ia Share Class Dividend Hedged EUR 188,802 82.4444 83.4486 86.7723Im Share Class Dividend 492,167 95.4864 96.9133 99.9623Iq Share Class Dividend Hedged CHF 5,064 95.4213 97.0428 100.6354Iy Share Class Accumulation 10 116.3210 111.7230 108.5380Iy Share Class Accumulation Hedged CHF 10 107.1638 104.0199 102.7216Iy Share Class Accumulation Hedged EUR 157 107.8030 104.7085 103.4687Kq Share Class Dividend Hedged EUR 22,580 834.4831 846.9369 875.8379M Share Class Accumulation 216,036 1,160.5617 1,115.5499 1,084.3095R Share Class Accumulation 598,869 11.4419 11.0270 10.7455R Share Class Accumulation Hedged CHF 69,100 10.5934 10.3139 10.2186R Share Class Accumulation Hedged EUR 45,870 10.7336 10.4272 10.3041Ry Share Class Accumulation 516,359 11.5312 11.1128 10.8292Ry Share Class Accumulation Hedged EUR 189,487 10.7305 10.4285 10.3346Ry Share Class Accumulation Hedged GBP 7,521 10.7015 10.3335 10.2670Total net assets in USD 474,161,531 778,068,696 939,723,355
Aviva Investors - Social Transition Global Equity Fund*
A Share Class Accumulation 100 10.0927 – –A Share Class Accumulation EUR 100 10.1354 – –I Share Class Accumulation 10 101.1180 – –I Share Class Accumulation EUR 10 101.4404 – –Iy Share Class Accumulation Hedged GBP 10 100.9752 – –R Share Class Accumulation 100 10.1118 – –R Share Class Accumulation EUR 100 10.1440 – –Ry Share Class Accumulation Hedged GBP 100 10.0975 – –S Share Class Accumulation 10 101.1350 – –S Share Class Accumulation EUR 10 101.4457 – –Sy Share Class Accumulation GBP 10 99.9682 – –Zy Share Class Accumulation GBP 21,933 999.8839 – –Zy Share Class Accumulation Hedged GBP 1 1,010.2331 – –Total net assets in USD 29,653,098 – –
Aviva Investors - Sustainable Income & Growth Fund
A Share Class Accumulation EUR 50,686 11.5133 9.7402 –A Share Class Accumulation Hedged SGD 4,369 11.8714 10.8731 10.7746

Aviva Investors Société d’investissement à capital variable (SICAV)
avivainvestors.com Annual Report and audited financial statements 153
STATISTICAL INFORMATION (CONTINUED)
Shares Outstanding
as at
31 December 2021
Nav per share
as at
31 December 2021
Nav per share
as at
31 December 2020
Nav per share
as at
31 December 2019
Aq Share Class Dividend Hedged SGD 40,421 10.5094 10.1236 10.6367I Share Class Accumulation 10 120.5780 109.1030 105.8760I Share Class Accumulation EUR 37,627 119.0101 99.5546 105.7993Iq Share Class Dividend 11 106.9109 101.6801 104.5364Iq Share Class Dividend EUR 11 105.7588 93.0760 104.7050R Share Class Accumulation EUR 100 11.9289 9.9885 10.6041Rq Share Class Dividend EUR 112 10.5773 9.3075 10.4706S Share Class Accumulation 10 120.5780 109.1030 105.8760S Share Class Accumulation EUR 10 119.2184 99.8329 105.9754Sq Share Class Dividend EUR 249,470 105.7683 92.9635 104.6416Z Share Class Accumulation 1 1,218.6700 1,097.1900 1,060.5700Total net assets in USD 36,037,217 30,975,273 29,909,109
Aviva Investors - UK Listed Equity High Alpha Fund
Aa Share Class Dividend 4,002 17.7933 13.9860 16.0707B Share Class Accumulation 260,331 7.1272 5.6101 6.2846I Share Class Accumulation 11,038 348.8417 271.7420 301.2546R Share Class Accumulation – – 11.3911 12.6334Z Share Class Accumulation 40,378 2,228.1335 1,720.6057 1,890.8258Total net assets in GBP 95,744,768 81,376,124 112,834,232
Aviva Investors - US Equity Income Fund
A Share Class Accumulation 1,177,299 17.1916 14.2266 14.5360I Share Class Accumulation 5,907 241.7377 198.5532 201.3312Ia Share Class Dividend 1,573 166.3458 139.0381 143.0847R Share Class Accumulation – – 13.4896 13.6801Total net assets in USD 21,929,191 17,849,132 20,592,453
Aviva Investors - US Investment Grade Bond Fund*
I Share Class Accumulation – – 106.6800 –K Share Class Accumulation Hedged EUR – – 1,036.4969 –Zy Share Class Accumulation Hedged GBP – – 1,064.7305 –Total net assets in USD – 213,888,298 –
– – – *Please refer directors’ report for the details of all corporate activities during the year.
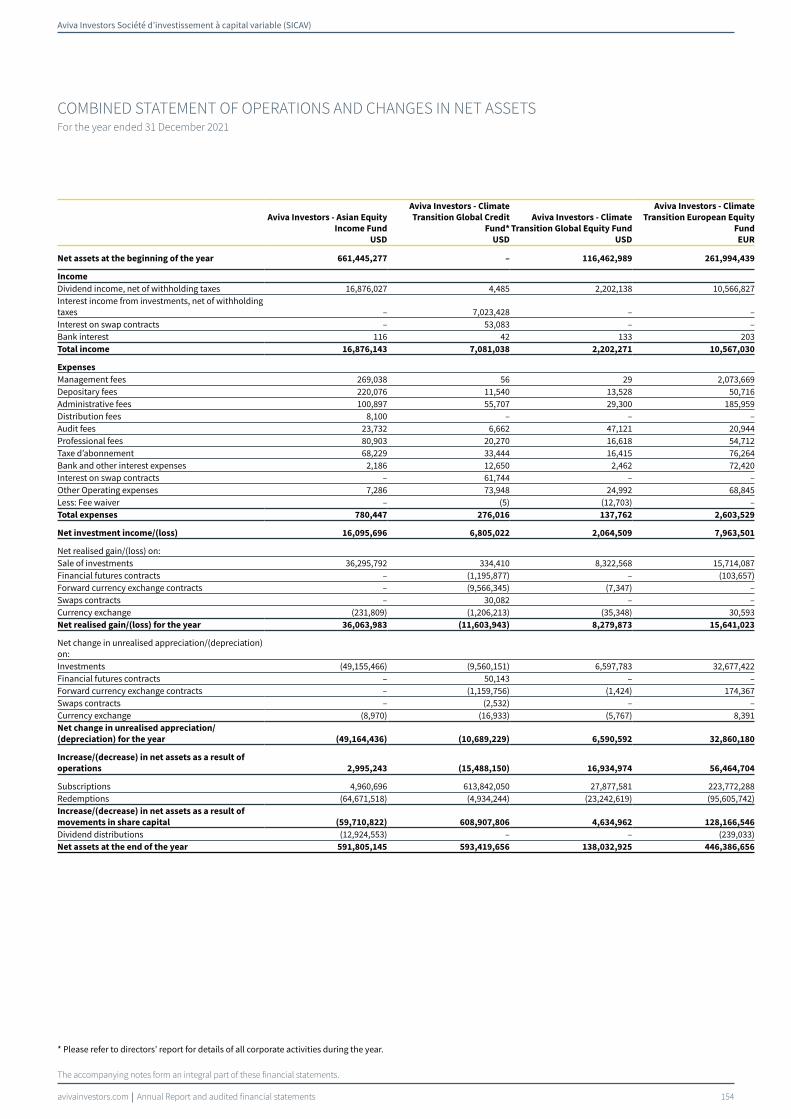
Aviva Investors Société d’investissement à capital variable (SICAV)
avivainvestors.com Annual Report and audited financial statements 154
COMBINED STATEMENT OF OPERATIONS AND CHANGES IN NET ASSETS For the year ended 31 December 2021
The accompanying notes form an integral part of these financial statements.
Aviva Investors - Asian Equity
Income Fund
USD
Aviva Investors - Climate
Transition Global Credit
Fund*
USD
Aviva Investors - Climate
Transition Global Equity Fund
USD
Aviva Investors - Climate
Transition European Equity
Fund
EUR
Net assets at the beginning of the year 661,445,277 – 116,462,989 261,994,439
Income
Dividend income, net of withholding taxes 16,876,027 4,485 2,202,138 10,566,827Interest income from investments, net of withholding taxes – 7,023,428 – –Interest on swap contracts – 53,083 – –Bank interest 116 42 133 203Total income 16,876,143 7,081,038 2,202,271 10,567,030
Expenses
Management fees 269,038 56 29 2,073,669Depositary fees 220,076 11,540 13,528 50,716Administrative fees 100,897 55,707 29,300 185,959Distribution fees 8,100 – – –Audit fees 23,732 6,662 47,121 20,944Professional fees 80,903 20,270 16,618 54,712Taxe d’abonnement 68,229 33,444 16,415 76,264Bank and other interest expenses 2,186 12,650 2,462 72,420Interest on swap contracts – 61,744 – –Other Operating expenses 7,286 73,948 24,992 68,845Less: Fee waiver – (5) (12,703) –Total expenses 780,447 276,016 137,762 2,603,529
Net investment income/(loss) 16,095,696 6,805,022 2,064,509 7,963,501
Net realised gain/(loss) on:Sale of investments 36,295,792 334,410 8,322,568 15,714,087Financial futures contracts – (1,195,877) – (103,657)Forward currency exchange contracts – (9,566,345) (7,347) –Swaps contracts – 30,082 – –Currency exchange (231,809) (1,206,213) (35,348) 30,593Net realised gain/(loss) for the year 36,063,983 (11,603,943) 8,279,873 15,641,023
Net change in unrealised appreciation/(depreciation) on: Investments (49,155,466) (9,560,151) 6,597,783 32,677,422Financial futures contracts – 50,143 – –Forward currency exchange contracts – (1,159,756) (1,424) 174,367Swaps contracts – (2,532) – –Currency exchange (8,970) (16,933) (5,767) 8,391Net change in unrealised appreciation/
(depreciation) for the year (49,164,436) (10,689,229) 6,590,592 32,860,180
Increase/(decrease) in net assets as a result of
operations 2,995,243 (15,488,150) 16,934,974 56,464,704
Subscriptions 4,960,696 613,842,050 27,877,581 223,772,288Redemptions (64,671,518) (4,934,244) (23,242,619) (95,605,742)Increase/(decrease) in net assets as a result of
movements in share capital (59,710,822) 608,907,806 4,634,962 128,166,546
Dividend distributions (12,924,553) – – (239,033)Net assets at the end of the year 591,805,145 593,419,656 138,032,925 446,386,656
* Please refer to directors’ report for details of all corporate activities during the year.
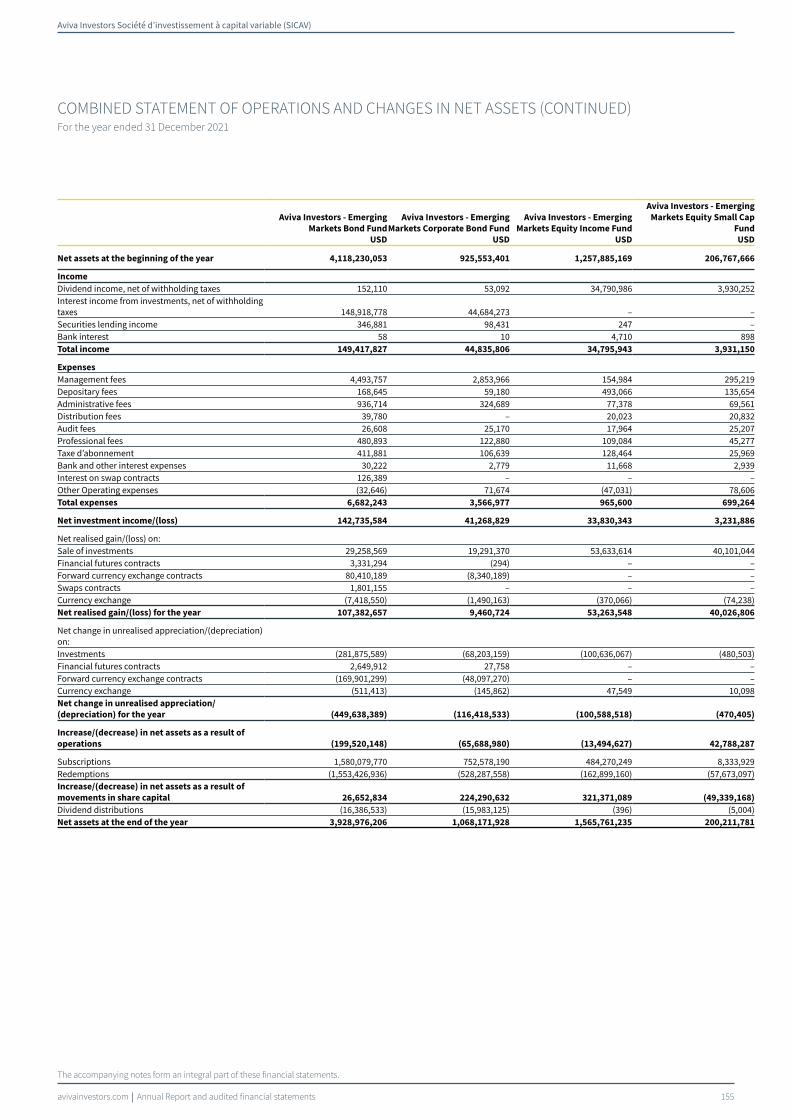
Aviva Investors Société d’investissement à capital variable (SICAV)
avivainvestors.com Annual Report and audited financial statements 155
COMBINED STATEMENT OF OPERATIONS AND CHANGES IN NET ASSETS (CONTINUED)For the year ended 31 December 2021
The accompanying notes form an integral part of these financial statements.
Aviva Investors - Emerging
Markets Bond Fund
USD
Aviva Investors - Emerging
Markets Corporate Bond Fund
USD
Aviva Investors - Emerging
Markets Equity Income Fund
USD
Aviva Investors - Emerging
Markets Equity Small Cap
Fund
USD
Net assets at the beginning of the year 4,118,230,053 925,553,401 1,257,885,169 206,767,666
Income
Dividend income, net of withholding taxes 152,110 53,092 34,790,986 3,930,252Interest income from investments, net of withholding taxes 148,918,778 44,684,273 – –Securities lending income 346,881 98,431 247 –Bank interest 58 10 4,710 898Total income 149,417,827 44,835,806 34,795,943 3,931,150
Expenses
Management fees 4,493,757 2,853,966 154,984 295,219Depositary fees 168,645 59,180 493,066 135,654Administrative fees 936,714 324,689 77,378 69,561Distribution fees 39,780 – 20,023 20,832Audit fees 26,608 25,170 17,964 25,207Professional fees 480,893 122,880 109,084 45,277Taxe d’abonnement 411,881 106,639 128,464 25,969Bank and other interest expenses 30,222 2,779 11,668 2,939Interest on swap contracts 126,389 – – –Other Operating expenses (32,646) 71,674 (47,031) 78,606Total expenses 6,682,243 3,566,977 965,600 699,264
Net investment income/(loss) 142,735,584 41,268,829 33,830,343 3,231,886
Net realised gain/(loss) on:Sale of investments 29,258,569 19,291,370 53,633,614 40,101,044Financial futures contracts 3,331,294 (294) – –Forward currency exchange contracts 80,410,189 (8,340,189) – –Swaps contracts 1,801,155 – – –Currency exchange (7,418,550) (1,490,163) (370,066) (74,238)Net realised gain/(loss) for the year 107,382,657 9,460,724 53,263,548 40,026,806
Net change in unrealised appreciation/(depreciation) on: Investments (281,875,589) (68,203,159) (100,636,067) (480,503)Financial futures contracts 2,649,912 27,758 – –Forward currency exchange contracts (169,901,299) (48,097,270) – –Currency exchange (511,413) (145,862) 47,549 10,098Net change in unrealised appreciation/
(depreciation) for the year (449,638,389) (116,418,533) (100,588,518) (470,405)
Increase/(decrease) in net assets as a result of
operations (199,520,148) (65,688,980) (13,494,627) 42,788,287
Subscriptions 1,580,079,770 752,578,190 484,270,249 8,333,929Redemptions (1,553,426,936) (528,287,558) (162,899,160) (57,673,097)Increase/(decrease) in net assets as a result of
movements in share capital 26,652,834 224,290,632 321,371,089 (49,339,168)
Dividend distributions (16,386,533) (15,983,125) (396) (5,004)Net assets at the end of the year 3,928,976,206 1,068,171,928 1,565,761,235 200,211,781

Aviva Investors Société d’investissement à capital variable (SICAV)
avivainvestors.com Annual Report and audited financial statements 156
COMBINED STATEMENT OF OPERATIONS AND CHANGES IN NET ASSETS (CONTINUED)For the year ended 31 December 2021
The accompanying notes form an integral part of these financial statements.
Aviva Investors - Emerging
Markets Local Currency Bond
Fund
EUR
Aviva Investors - European
Corporate Bond Fund
EUR
Aviva Investors - European
Equity Fund
EUR
Aviva Investors - European
Equity Income Fund
EUR
Net assets at the beginning of the year 1,430,488,642 42,188,556 95,235,875 150,318,786
Income
Dividend income, net of withholding taxes 97,430 – 2,602,806 1,971,762Interest income from investments, net of withholding taxes 69,312,646 760,159 – –Interest on swap contracts 122,419 50,556 – –Securities lending income 85,570 3,027 11,247 37,059Bank interest 921 160 541 1,157Total income 69,618,986 813,902 2,614,594 2,009,978
Expenses
Management fees 218,796 237,095 900,899 78,506Depositary fees 479,179 8,334 9,634 (7,884)Administrative fees 103,358 61,748 129,995 32,649Distribution fees 5,262 8,483 20,910 4,765Audit fees 21,991 20,605 20,014 20,769Professional fees 153,448 9,383 13,683 35,856Taxe d’abonnement 119,944 9,342 19,514 (12,499)Bank and other interest expenses 87,238 5,541 2,685 22,675Interest on swap contracts 39,912 160,514 – –Other Operating expenses 67,670 18,236 39,926 35,549Less: Fee waiver – (93,018) – –Total expenses 1,296,798 446,263 1,157,260 210,386
Net investment income/(loss) 68,322,188 367,639 1,457,334 1,799,592
Net realised gain/(loss) on:Sale of investments (57,672,666) 353,094 15,142,825 9,154,102Financial futures contracts 2,057,858 (21,664) – –Forward currency exchange contracts (13,113,708) – – –Swaps contracts (2,236,334) 636,384 – –Currency exchange 1,443,871 286 12,921 (3,770)Net realised gain/(loss) for the year (69,520,979) 968,100 15,155,746 9,150,332
Net change in unrealised appreciation/(depreciation) on: Investments (34,897,676) (1,287,097) (280,309) 18,426,052Financial futures contracts (1,517,214) 41,300 – –Forward currency exchange contracts 2,776,344 – – –Swaps contracts (1,111,696) (560,339) – –Currency exchange (3,287,723) 105 (1,772) 16,730Net change in unrealised appreciation/
(depreciation) for the year (38,037,965) (1,806,031) (282,081) 18,442,782
Increase/(decrease) in net assets as a result of
operations (39,236,756) (470,292) 16,330,999 29,392,706
Subscriptions 961,373,108 6,188,035 3,642,546 2,900,942Redemptions (961,704,711) (5,608,162) (42,732,739) (9,335,012)Increase/(decrease) in net assets as a result of
movements in share capital (331,603) 579,873 (39,090,193) (6,434,070)
Dividend distributions (136,832) (2,094) – (2,471,296)Net assets at the end of the year 1,390,783,451 42,296,043 72,476,681 170,806,126

Aviva Investors Société d’investissement à capital variable (SICAV)
avivainvestors.com Annual Report and audited financial statements 157
COMBINED STATEMENT OF OPERATIONS AND CHANGES IN NET ASSETS (CONTINUED)For the year ended 31 December 2021
The accompanying notes form an integral part of these financial statements.
Aviva Investors - European
High Yield Bond Fund*
EUR
Aviva Investors - European
Real Estate Securities Fund*
EUR
Aviva Investors - Global
Sovereign Bond Fund
EUR
Aviva Investors - Global
Convertibles Absolute Return
Fund
USD
Net assets at the beginning of the year 51,311,895 18,359,725 2,007,098,385 1,004,866,322
Income
Dividend income, net of withholding taxes – (46,920) 16,119 –Interest income from investments, net of withholding taxes 1,358,244 – 38,576,218 12,454,496Interest on swap contracts – – 1,010,199 –Securities lending income – 4,985 318,014 –Bank interest 56 484 5,298 4,591Total income 1,358,300 (41,451) 39,925,848 12,459,087
Expenses
Management fees 70,320 6,993 7 2,400,890Performance fees – – – 536,303Depositary fees 4,125 402 262,490 46,010Administrative fees 16,075 1,651 229,392 598,435Distribution fees – 1,038 – –Audit fees 17,105 1,506 21,991 28,766Professional fees 29,662 4,784 204,763 120,034Taxe d’abonnement 4,277 303 352,076 144,357Bank and other interest expenses 1,724 1,311 160,027 17,406Interest on swap contracts – – 682,748 13,999,239Other Operating expenses 17,887 (3,125) 170,233 173,958Less: Fee waiver (47,978) (5,323) – –Total expenses 113,197 9,540 2,083,727 18,065,398
Net investment income/(loss) 1,245,103 (50,991) 37,842,121 (5,606,311)
Net realised gain/(loss) on:Sale of investments 1,762,458 1,166,002 (5,702,673) 140,433,951Options contracts – – – (14,968,756)Financial futures contracts – – 15,590,052 17,492Forward currency exchange contracts (327,820) – 90,330,609 25,113,743Swaps contracts (2,880) – (4,306,032) (7,009,623)Currency exchange 159,039 (34,975) (4,848,613) (12,718,725)Net realised gain/(loss) for the year 1,590,797 1,131,027 91,063,343 130,868,082
Net change in unrealised appreciation/(depreciation) on: Investments (1,628,651) (1,285,309) (7,070,120) (97,736,799)Options contracts – – – (203,233)Financial futures contracts – – (7,434,383) –Forward currency exchange contracts (38,931) – 25,063,937 (38,213,795)Swaps contracts – – 3,404,762 6,092,323Currency exchange (4,087) 29,905 (3,720,114) (24,295)Net change in unrealised appreciation/
(depreciation) for the year (1,671,669) (1,255,404) 10,244,082 (130,085,799)
Increase/(decrease) in net assets as a result of
operations 1,164,231 (175,368) 139,149,546 (4,824,028)
Subscriptions 1,120,820 303,275 3,305,216,660 582,161,306Redemptions (53,596,910) (18,184,356) (69,142,590) (268,315,048)Increase/(decrease) in net assets as a result of
movements in share capital (52,476,090) (17,881,081) 3,236,074,070 313,846,258
Dividend distributions (36) (303,276) – –Net assets at the end of the year – – 5,382,322,001 1,313,888,552
* Please refer to directors’ report for details of all corporate activities during the year.

Aviva Investors Société d’investissement à capital variable (SICAV)
avivainvestors.com Annual Report and audited financial statements 158
COMBINED STATEMENT OF OPERATIONS AND CHANGES IN NET ASSETS (CONTINUED)For the year ended 31 December 2021
The accompanying notes form an integral part of these financial statements.
Aviva Investors - Global
Convertibles Fund
USD
Aviva Investors - Global
Emerging Markets Equity
Unconstrained Fund
USD
Aviva Investors - Global
Emerging Markets Index Fund
USD
Aviva Investors - Global
Equity Endurance Fund
USD
Net assets at the beginning of the year 391,820,572 8,969,506 2,476,036,862 748,751,430
Income
Dividend income, net of withholding taxes 56,306 2,056,443 56,340,741 7,257,538Interest income from investments, net of withholding taxes 2,930,723 – – –Securities lending income 56,117 – – –Bank interest 2,623 20 32,354 212Total income 3,045,769 2,056,463 56,373,095 7,257,750
Expenses
Management fees 2,805,749 16 4 901,763Depositary fees 92,247 30,826 1,629,697 55,408Administrative fees 447,802 30,704 303,191 216,051Distribution fees 15,999 – – –Audit fees 27,328 23,566 23,732 23,732Professional fees 80,324 18,495 326,286 79,519Taxe d’abonnement 72,754 11,733 270,395 106,710Bank and other interest expenses 61,832 4,654 21,014 1,967Other Operating expenses 206,346 37,740 134,285 36,517Less: Fee waiver – (56,131) – –Total expenses 3,810,381 101,603 2,708,604 1,421,667
Net investment income/(loss) (764,612) 1,954,860 53,664,491 5,836,083
Net realised gain/(loss) on:Sale of investments 38,056,315 8,547,611 50,230,107 123,650,891Financial futures contracts – (101,075) 904,471 –Forward currency exchange contracts (7,049,942) 153,758 (14,119) 3,398Currency exchange 1,457,524 (18,889) (1,163,296) 15,312Net realised gain/(loss) for the year 32,463,897 8,581,405 49,957,163 123,669,601
Net change in unrealised appreciation/(depreciation) on: Investments (43,602,235) (23,288,280) (172,561,447) 73,210,856Financial futures contracts – – 255,607 –Forward currency exchange contracts (13,396,210) (407,618) – –Currency exchange 38,368 (80) (5,896) (63,686)Net change in unrealised appreciation/
(depreciation) for the year (56,960,077) (23,695,978) (172,311,736) 73,147,170
Increase/(decrease) in net assets as a result of
operations (25,260,792) (13,159,713) (68,690,082) 202,652,854
Subscriptions 257,891,778 158,040,860 683,250,750 186,527,485Redemptions (183,305,034) (12,053,793) (346,427,608) (341,757,875)Increase/(decrease) in net assets as a result of
movements in share capital 74,586,744 145,987,067 336,823,142 (155,230,390)
Dividend distributions (1,163,646) – – (3,917,362)Net assets at the end of the year 439,982,878 141,796,860 2,744,169,922 792,256,532

Aviva Investors Société d’investissement à capital variable (SICAV)
avivainvestors.com Annual Report and audited financial statements 159
COMBINED STATEMENT OF OPERATIONS AND CHANGES IN NET ASSETS (CONTINUED)For the year ended 31 December 2021
The accompanying notes form an integral part of these financial statements.
Aviva Investors - Global
Equity Unconstrained Fund*
USD
Aviva Investors - Global High
Yield Bond Fund
USD
Aviva Investors - Global
Investment Grade Corporate
Bond Fund
USD
Aviva Investors - Multi-
Strategy Fixed Income Fund*
EUR
Net assets at the beginning of the year 8,716,319 6,188,092,961 7,866,095,788 414,492,884
Income
Dividend income, net of withholding taxes 91,416 58,235 58,114 –Interest income from investments, net of withholding taxes – 180,571,040 178,273,038 477,489Interest on swap contracts – 947,917 – 286,933Securities lending income – 436,102 – –Bank interest 33 18,828 9,343 153Total income 91,449 182,032,122 178,340,495 764,575
Expenses
Management fees 13 8,958,886 984,509 82,439Depositary fees 3,892 202,838 351,298 4,995Administrative fees 24,822 936,801 585,669 25,220Distribution fees – 101,065 – –Audit fees (23,517) 29,485 25,170 9,906Professional fees 55,229 453,354 543,143 20,723Taxe d’abonnement 768 472,664 702,458 8,400Bank and other interest expenses 258 293,908 11,349 152,829Interest on swap contracts – – – 98,116Other Operating expenses 14,075 (159,292) 294,958 4,499Less: Fee waiver (66,628) – (22,061) (9,700)Total expenses 8,912 11,289,709 3,476,493 397,427
Net investment income/(loss) 82,537 170,742,413 174,864,002 367,148
Net realised gain/(loss) on:Sale of investments 2,069,454 213,075,532 128,042,556 5,498,877Options contracts – – – 106,842Financial futures contracts – – 2,223,427 (304,464)Forward currency exchange contracts 164,828 165,119,530 364,379,684 17,873,325Swaps contracts – (248,375) 204,168 4,182,719Currency exchange (23,838) (24,570,753) 2,129,519 386,129Net realised gain/(loss) for the year 2,210,444 353,375,934 496,979,354 27,743,428
Net change in unrealised appreciation/(depreciation) on: Investments (1,355,582) (283,295,371) (503,338,791) (3,949,448)Options contracts – – – (209,152)Financial futures contracts – – (99,894) 342,820Forward currency exchange contracts (399,123) (189,101,524) (320,116,638) (8,818,947)Swaps contracts – 2,714,669 (47,753) (7,344,790)Currency exchange 246 (1,550,598) (769,253) (95,069)Net change in unrealised appreciation/
(depreciation) for the year (1,754,459) (471,232,824) (824,372,329) (20,074,586)
Increase/(decrease) in net assets as a result of
operations 538,522 52,885,523 (152,528,973) 8,035,990
Subscriptions – 1,456,757,522 733,762,643 3,528,748Redemptions (9,254,841) (3,931,357,332) (3,070,331,395) (426,057,618)Increase/(decrease) in net assets as a result of
movements in share capital (9,254,841) (2,474,599,810) (2,336,568,752) (422,528,870)
Dividend distributions – (29,469,861) (23,705,252) (4)Net assets at the end of the year – 3,736,908,813 5,353,292,811 –
* Please refer to directors’ report for details of all corporate activities during the year.
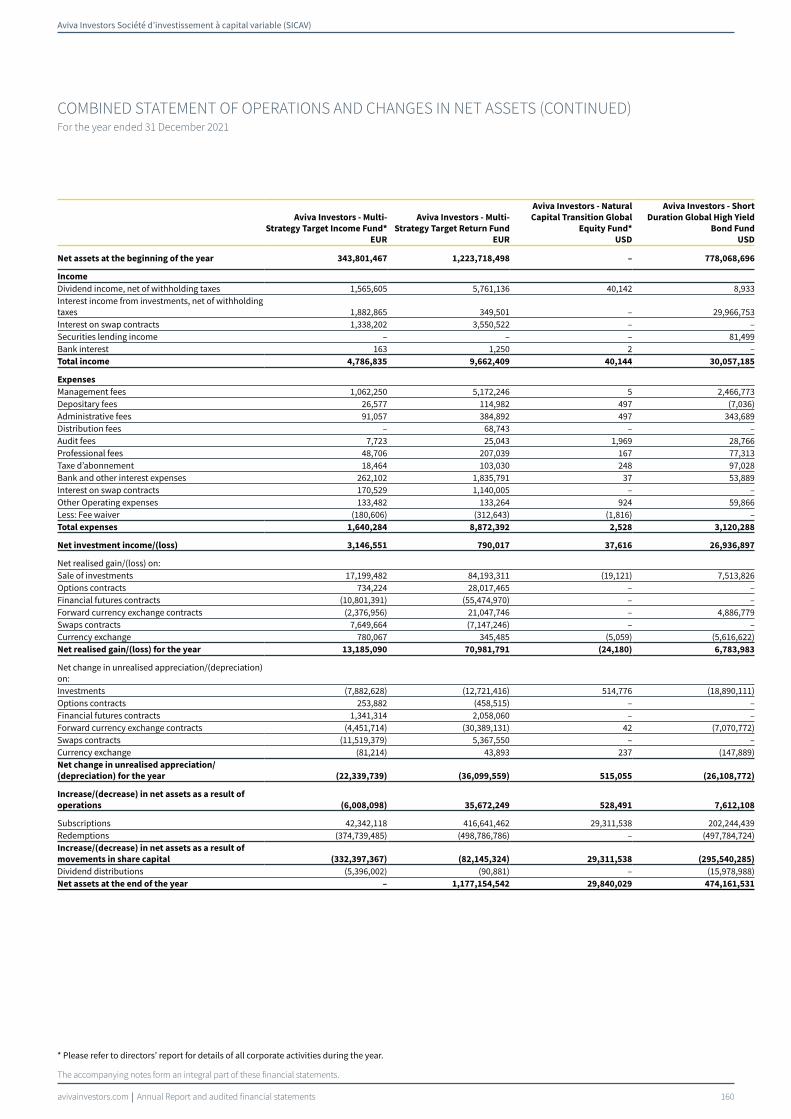
Aviva Investors Société d’investissement à capital variable (SICAV)
avivainvestors.com Annual Report and audited financial statements 160
COMBINED STATEMENT OF OPERATIONS AND CHANGES IN NET ASSETS (CONTINUED)For the year ended 31 December 2021
The accompanying notes form an integral part of these financial statements.
Aviva Investors - Multi-
Strategy Target Income Fund*
EUR
Aviva Investors - Multi-
Strategy Target Return Fund
EUR
Aviva Investors - Natural
Capital Transition Global
Equity Fund*
USD
Aviva Investors - Short
Duration Global High Yield
Bond Fund
USD
Net assets at the beginning of the year 343,801,467 1,223,718,498 – 778,068,696
Income
Dividend income, net of withholding taxes 1,565,605 5,761,136 40,142 8,933Interest income from investments, net of withholding taxes 1,882,865 349,501 – 29,966,753Interest on swap contracts 1,338,202 3,550,522 – –Securities lending income – – – 81,499Bank interest 163 1,250 2 –Total income 4,786,835 9,662,409 40,144 30,057,185
Expenses
Management fees 1,062,250 5,172,246 5 2,466,773Depositary fees 26,577 114,982 497 (7,036)Administrative fees 91,057 384,892 497 343,689Distribution fees – 68,743 – –Audit fees 7,723 25,043 1,969 28,766Professional fees 48,706 207,039 167 77,313Taxe d’abonnement 18,464 103,030 248 97,028Bank and other interest expenses 262,102 1,835,791 37 53,889Interest on swap contracts 170,529 1,140,005 – –Other Operating expenses 133,482 133,264 924 59,866Less: Fee waiver (180,606) (312,643) (1,816) –Total expenses 1,640,284 8,872,392 2,528 3,120,288
Net investment income/(loss) 3,146,551 790,017 37,616 26,936,897
Net realised gain/(loss) on:Sale of investments 17,199,482 84,193,311 (19,121) 7,513,826Options contracts 734,224 28,017,465 – –Financial futures contracts (10,801,391) (55,474,970) – –Forward currency exchange contracts (2,376,956) 21,047,746 – 4,886,779Swaps contracts 7,649,664 (7,147,246) – –Currency exchange 780,067 345,485 (5,059) (5,616,622)Net realised gain/(loss) for the year 13,185,090 70,981,791 (24,180) 6,783,983
Net change in unrealised appreciation/(depreciation) on: Investments (7,882,628) (12,721,416) 514,776 (18,890,111)Options contracts 253,882 (458,515) – –Financial futures contracts 1,341,314 2,058,060 – –Forward currency exchange contracts (4,451,714) (30,389,131) 42 (7,070,772)Swaps contracts (11,519,379) 5,367,550 – –Currency exchange (81,214) 43,893 237 (147,889)Net change in unrealised appreciation/
(depreciation) for the year (22,339,739) (36,099,559) 515,055 (26,108,772)
Increase/(decrease) in net assets as a result of
operations (6,008,098) 35,672,249 528,491 7,612,108
Subscriptions 42,342,118 416,641,462 29,311,538 202,244,439Redemptions (374,739,485) (498,786,786) – (497,784,724)Increase/(decrease) in net assets as a result of
movements in share capital (332,397,367) (82,145,324) 29,311,538 (295,540,285)
Dividend distributions (5,396,002) (90,881) – (15,978,988)Net assets at the end of the year – 1,177,154,542 29,840,029 474,161,531
* Please refer to directors’ report for details of all corporate activities during the year.
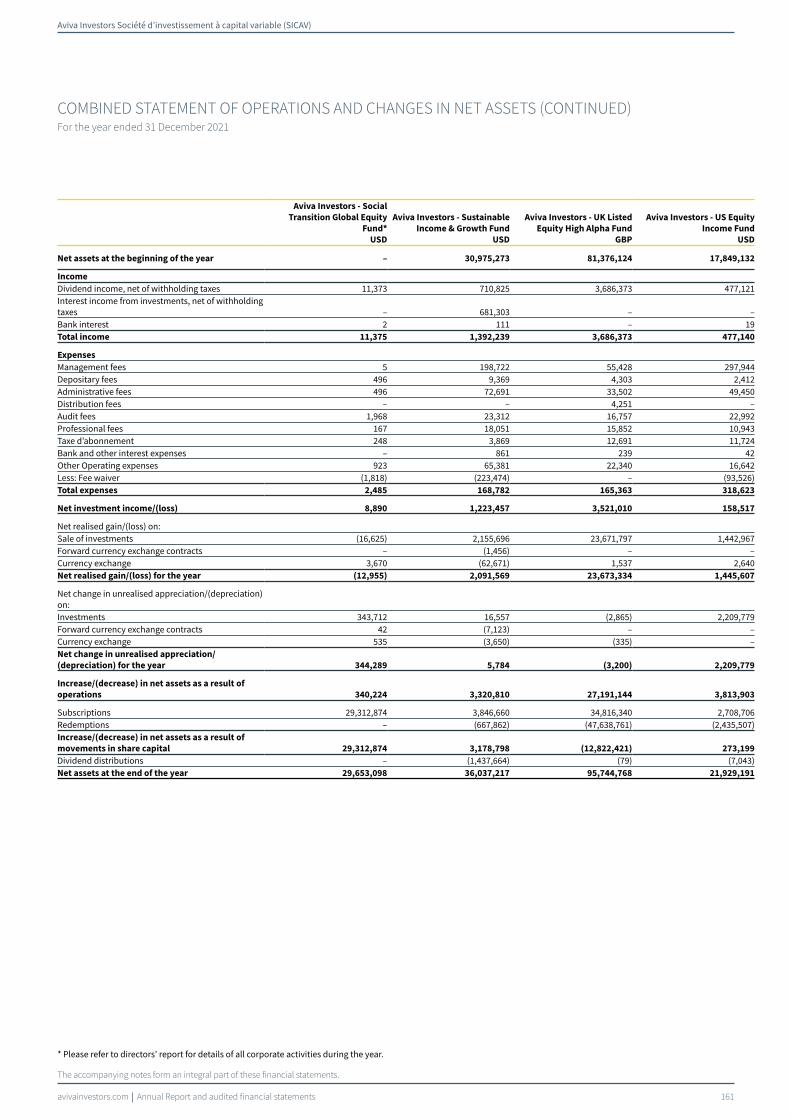
Aviva Investors Société d’investissement à capital variable (SICAV)
avivainvestors.com Annual Report and audited financial statements 161
COMBINED STATEMENT OF OPERATIONS AND CHANGES IN NET ASSETS (CONTINUED)For the year ended 31 December 2021
The accompanying notes form an integral part of these financial statements.
Aviva Investors - Social
Transition Global Equity
Fund*
USD
Aviva Investors - Sustainable
Income & Growth Fund
USD
Aviva Investors - UK Listed
Equity High Alpha Fund
GBP
Aviva Investors - US Equity
Income Fund
USD
Net assets at the beginning of the year – 30,975,273 81,376,124 17,849,132
Income
Dividend income, net of withholding taxes 11,373 710,825 3,686,373 477,121Interest income from investments, net of withholding taxes – 681,303 – –Bank interest 2 111 – 19Total income 11,375 1,392,239 3,686,373 477,140
Expenses
Management fees 5 198,722 55,428 297,944Depositary fees 496 9,369 4,303 2,412Administrative fees 496 72,691 33,502 49,450Distribution fees – – 4,251 –Audit fees 1,968 23,312 16,757 22,992Professional fees 167 18,051 15,852 10,943Taxe d’abonnement 248 3,869 12,691 11,724Bank and other interest expenses – 861 239 42Other Operating expenses 923 65,381 22,340 16,642Less: Fee waiver (1,818) (223,474) – (93,526)Total expenses 2,485 168,782 165,363 318,623
Net investment income/(loss) 8,890 1,223,457 3,521,010 158,517
Net realised gain/(loss) on:Sale of investments (16,625) 2,155,696 23,671,797 1,442,967Forward currency exchange contracts – (1,456) – –Currency exchange 3,670 (62,671) 1,537 2,640Net realised gain/(loss) for the year (12,955) 2,091,569 23,673,334 1,445,607
Net change in unrealised appreciation/(depreciation) on: Investments 343,712 16,557 (2,865) 2,209,779Forward currency exchange contracts 42 (7,123) – –Currency exchange 535 (3,650) (335) –Net change in unrealised appreciation/
(depreciation) for the year 344,289 5,784 (3,200) 2,209,779
Increase/(decrease) in net assets as a result of
operations 340,224 3,320,810 27,191,144 3,813,903
Subscriptions 29,312,874 3,846,660 34,816,340 2,708,706Redemptions – (667,862) (47,638,761) (2,435,507)Increase/(decrease) in net assets as a result of
movements in share capital 29,312,874 3,178,798 (12,822,421) 273,199
Dividend distributions – (1,437,664) (79) (7,043)Net assets at the end of the year 29,653,098 36,037,217 95,744,768 21,929,191
* Please refer to directors’ report for details of all corporate activities during the year.
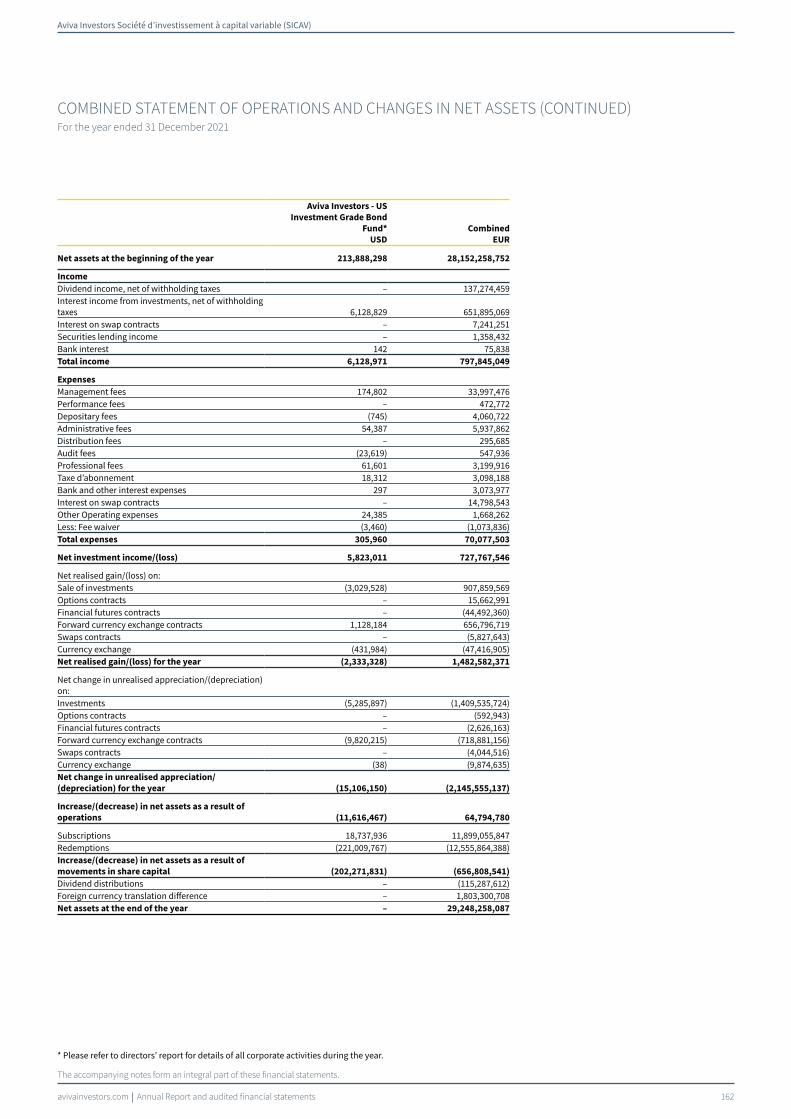
Aviva Investors Société d’investissement à capital variable (SICAV)
avivainvestors.com Annual Report and audited financial statements 162
COMBINED STATEMENT OF OPERATIONS AND CHANGES IN NET ASSETS (CONTINUED)For the year ended 31 December 2021
The accompanying notes form an integral part of these financial statements.
Aviva Investors - US
Investment Grade Bond
Fund*
USD
Combined
EUR
Net assets at the beginning of the year 213,888,298 28,152,258,752
Income
Dividend income, net of withholding taxes – 137,274,459Interest income from investments, net of withholding taxes 6,128,829 651,895,069Interest on swap contracts – 7,241,251Securities lending income – 1,358,432Bank interest 142 75,838Total income 6,128,971 797,845,049
Expenses
Management fees 174,802 33,997,476Performance fees – 472,772Depositary fees (745) 4,060,722Administrative fees 54,387 5,937,862Distribution fees – 295,685Audit fees (23,619) 547,936Professional fees 61,601 3,199,916Taxe d’abonnement 18,312 3,098,188Bank and other interest expenses 297 3,073,977Interest on swap contracts – 14,798,543Other Operating expenses 24,385 1,668,262Less: Fee waiver (3,460) (1,073,836)Total expenses 305,960 70,077,503
Net investment income/(loss) 5,823,011 727,767,546
Net realised gain/(loss) on:Sale of investments (3,029,528) 907,859,569Options contracts – 15,662,991Financial futures contracts – (44,492,360)Forward currency exchange contracts 1,128,184 656,796,719Swaps contracts – (5,827,643)Currency exchange (431,984) (47,416,905)Net realised gain/(loss) for the year (2,333,328) 1,482,582,371
Net change in unrealised appreciation/(depreciation) on: Investments (5,285,897) (1,409,535,724)Options contracts – (592,943)Financial futures contracts – (2,626,163)Forward currency exchange contracts (9,820,215) (718,881,156)Swaps contracts – (4,044,516)Currency exchange (38) (9,874,635)Net change in unrealised appreciation/
(depreciation) for the year (15,106,150) (2,145,555,137)
Increase/(decrease) in net assets as a result of
operations (11,616,467) 64,794,780
Subscriptions 18,737,936 11,899,055,847Redemptions (221,009,767) (12,555,864,388)Increase/(decrease) in net assets as a result of
movements in share capital (202,271,831) (656,808,541)
Dividend distributions – (115,287,612)Foreign currency translation difference – 1,803,300,708Net assets at the end of the year – 29,248,258,087
* Please refer to directors’ report for details of all corporate activities during the year.

Aviva Investors Société d’investissement à capital variable (SICAV)
avivainvestors.com Annual Report and audited financial statements 163
NOTES TO THE FINANCIAL STATEMENTSAs at 31 December 2021
1. GENERAL
1.1 THE COMPANY
Aviva Investors (the ”Fund”) is a Variable Capital Investment Company (Société d’Investissement à Capital Variable) established in the Grand Duchy of Luxembourg under Part I of the law of 17 December 2010, as amended (UCITS V). The Fund was incorporated in Luxembourg on 16 January 1990 for an unlimited period. The Fund operates as an open ended investment Fund.
The Company is structured to provide both institutional and individual investors with a choice of investment portfolios, each offering different investment objectives designed to meet specific risk expectations and diversification requirements.
As at 31 December 2021, the Fund comprises 27 active Sub-Funds.
Distributions are disclosed in the caption "Dividend distributions" in the Combined Statement of Operations and Changes in Net Assets.
1.2 THE SHARE CLASSES
The Board may issue A, B, F, I, J, K, L, M, R, S, V, Z and AFER Share Classes in any currency, as accumulation or distribution share classes, and which may be hedged or unhedged. Accumulation share classes with UK reporting status are designated with "y", distribution share classes are designated with “a”, “q” or “m” depending on the dividend distribution frequency, and hedged share classes are designated with “h”. The AFER Share Class is designed for individual investors subscribing an AFER insurance policy through Aviva affiliated companies, and is only available to the French market.
1.2.1 CURRENCY
Share Classes may be available in various currencies (each a “Class Currency”) other than the reference currency of the Sub-Fund. Where offered in a currency other than the reference currency of the relevant Sub-Fund, a Share Class is designated as such.
1.2.2 DIVIDEND POLICY
It is intended that all Share Classes with an “a”, “q” or “m” in the designation will distribute on an annual (a), quarterly (q) or monthly (m) basis if determined by the Board.
Payment is made in the currency in which the relevant Share Class is denominated.
1.2.3 HEDGED SHARE CLASSES
In accordance with the provisions of the current prospectus, the Fund may offer Share Classes in a Sub-Fund in a currency other than the Sub-Fund’s reference currency or in relation to the currencies in which the underlying assets of the Sub-Fund are denominated. The respective Sub-Fund has the ability to hedge such Share Classes in relation to the Sub-Fund’s reference currency. Where hedging of this kind is undertaken the latter is designated as such by a reference to “hedged” or (“h”). A Sub-Fund can also choose to manage currency exposure with a reference to a Benchmark. Because such a benchmark is only used as a point of reference, a Sub-Fund's exposure to any given currency may be different than that of its benchmark. The Sub-Fund will engage for the exclusive account of such Share Classes, in forward foreign exchange contracts, currency futures, currency options or currency swaps, in order to preserve the value of the Share Class in its reference currency against its value in the Sub-Fund’s currency or against the currencies in which the underlying assets of the Sub-Funds are denominated.
Where undertaken, the effects of this hedging is reflected in the Net Asset Value and, therefore, in the performance of the currency Classes. As a result, currency hedging may impact the Net Asset Value of one Class as compared to the Net Asset Value of a Class denominated in another currency. Any profit or loss resulting directly from the forward foreign exchange contracts, currency futures, currency options or currency swaps used to create the hedge is borne by the relevant currency Class in relation to which they have been incurred.
2. SUMMARY OF SIGNIFICANT ACCOUNTING POLICIES
The financial statements are prepared and presented in accordance with generally accepted accounting principles in Luxembourg for investment funds on a going concern basis. Sub-funds that have been liquidated during the year or are intended to be liquidated after the year end are prepared on a non-going concern basis. The preparation of financial statements requires management to make estimates and assumptions that may affect the amounts reported in the financial statements and the accompanying notes. Actual results may differ from those estimates.
2.1 FOREIGN CURRENCIES
The financial statements of each Sub-Fund of the Fund are expressed in the currency of the Sub-Fund and its accounting records are maintained in that currency. Assets and liabilities in other currencies are translated into the currency of the Sub-Fund using the exchange rate in effect at the year end date. Income and expenses in other currencies are translated into the currency of the Sub-Fund at the exchange rate in effect on the date of the transaction.
The resulting exchange differences are recorded in the Combined Statement of Operations and Changes in Net Assets within the caption “Foreign currency translation difference”.
The combined financial statements of the Fund represent the sum of the financial statements of each Sub-Fund. The combined financial statements are presented for information purposes only in EUR, each Sub-Fund using the exchange rates prevailing at the Balance Sheet date.
The exchange difference resulting from the translation of net assets at the beginning of the year using the year end rates is recognised in the Combined Statement of Operation and Changes in Net Assets within the caption “Foreign currency translation difference”.
Aviva Investors Société d’investissement à capital variable (SICAV)
avivainvestors.com Annual Report and audited financial statements 164
NOTES TO THE FINANCIAL STATEMENTS (CONTINUED)As at 31 December 2021
2.2 SWING PRICING
A Sub-Fund may suffer dilution of the Net Asset Value per Share due to investors buying or selling Shares at a price that does not reflect the dealing and other costs that arise when security trades are undertaken by the Investment Manager to accommodate cash inflows or outflows.
In order to counter this impact and protect the interests of shareholders, the NAV may be adjusted upward when there is strong demand to buy Sub-Fund Shares and downward when there is strong demand to redeem Sub-Fund Shares.
The adjustment may vary from Sub-Fund to Sub-Fund and will normally not exceed 2% of the original NAV per Share unless exceptional market conditions occur.
The thresholds where swing pricing is triggered are set by the Management Company, and may vary over time and from one Sub- Fund to another.
The swing pricing mechanism may be applied across all Sub-Funds and Share Classes.
The NAV per Share as disclosed in the statistical information is the published NAV per Share whereas the total net assets disclosed in the Combined Statement of Net Assets is the total net asset value excluding any year end swing adjustment.
As at the year end, no swing pricing was applied on the NAV per Share of the Sub-Funds.
2.3 VALUATION OF ASSETS
The value of the assets of the Fund is determined as follows:
(1) The value of any cash in hand or on deposit, bills and demand notes and accounts receivable, prepaid expenses, cash dividends and interest declared or accrued as aforesaid and not yet received shall be deemed to be the full amount thereof, unless in any case the same is unlikely to be received in full, in which case the value thereof shall be arrived at after making such discount as the Board of Directors may consider appropriate in such case to reflect the true value thereof;
(2) The value of securities, Money Market Instruments and/or financial derivative instruments which are quoted or dealt in on any stock exchange is based on the last available price provided that where securities, Money Market Instruments and/or financial derivative instruments are quoted on any stock exchange operating on the basis of separate bid and offer prices mid-market valuations may, as the Board may decide, be applied;
(3) In the event that any of the securities held in the Fund’s portfolio on the relevant dealing day are not quoted or dealt in on any stock exchange or regulated market or if, with respect to securities quoted or dealt in on any stock exchange or regulated market, the price as determined pursuant to sub-paragraphs (2) or (3) is not representative of the fair market value of the relevant securities, the value of such securities is determined based on the reasonably foreseeable sales price determined prudently and in good faith by or under the Board of Directors' supervision.
(4) Shares in open-ended UCIs and/or UCITS are valued on the basis of their last Net Asset Value, as reported by such undertakings.
(5) The financial derivative instruments which are not listed on any official stock exchange or traded on any other regulated market are valued in a reliable and verifiable manner on a daily basis and in accordance with market practice, as further detailed below.
(6) Futures
The Fund on behalf of a Sub-Fund may enter into financial futures contracts as part of its investment strategy. Upon entering into a futures contract, the Fund is required to deposit with a broker an amount (“initial margin”) equal to a certain percentage of the purchase price indicated in the futures contract. Initial margin is included as part of “Cash at bank and at brokers” in the Combined Statement of Net Assets. Subsequent payments (“variation margin”) are made or received by the Sub-Fund each day, depending on the daily fluctuations in the value of the underlying futures contracts. These subsequent payments are recorded for financial reporting purposes as unrealised result by the Sub-Fund. When entering into a closing transaction, the Sub-Fund will realise, for book purposes, a gain or loss equal to the difference between the values of the futures contract to sell and the futures contract to buy. Futures contracts are valued at the last sale price or, in the absence of a sale, the mean between the closing bid and asked quotation or if no bid or asked prices are available, at the last bid price. Certain risks may arise upon entering into futures contracts from the contingency of imperfect market conditions. Please refer to the Portfolio of Investments and Other Net Assets for the details of the contracts outstanding as at 31 December 2021. When a contract is closed, the Sub-Fund records a realised gain or loss equal to the difference between the proceeds from, or cost of, the closing transaction and the initial cost of the contract within the caption "Net realised gain/(loss) on financial futures contracts" in the Combined Statement of Operations and Changes in Net Assets.
(7) Forward currency exchange contracts
All Sub-Funds in connection with the portfolio purchases and sales of securities denominated in a foreign currency or Share Class hedging, may enter into forward currency exchange contracts for the purposes of hedging foreign currency exchange risks. Contracts are recorded at market value based on the forward exchange rate of the underlying currency on the valuation day. Certain risks may arise upon entering into these contracts from the potential inability of counterparties to meet the terms of their contracts. Please refer to the Portfolio of Investments and Other Net Assets for the details of the contracts outstanding as at 31 December 2021. When a contract is closed, the realised gain/(loss) is recorded within the caption “Net realised gain/(loss) on forward currency exchange contracts” in the Combined Statement of Operations and Changes in Net Assets. Unrealised gains or losses are recorded within the caption “Unrealised gain/(loss) on forward currency exchange contracts” in the Combined Statement of Net Assets.
(8) Swaps contracts
A swap is an agreement that obliges two parties to exchange a series of cashflows at specified intervals based upon or calculated by reference to changes in specified prices or rates for a specified amount of an underlying asset. The payment flows are usually netted against each other at the brokers’ level, with the difference being paid by one party to the other, if authorised by the dedicated International Swaps and Derivatives Associations agreements ("ISDA agreements"). Risks may arise as a result of the failure of counterparty to the swap contract to comply with the terms of the swap contract. The loss incurred by the failure of a counterparty is generally limited to the net payment to be received by the Fund, and/or the termination value at the end of the contract. Therefore, the Fund considers the creditworthiness of each counterparty to a swap contract in evaluating potential credit risk. Additionally, risks may arise from unanticipated movements in interest rates or in the value of the underlying securities or indices.
2. SUMMARY OF SIGNIFICANT ACCOUNTING POLICIES (CONTINUED)

Aviva Investors Société d’investissement à capital variable (SICAV)
avivainvestors.com Annual Report and audited financial statements 165
NOTES TO THE FINANCIAL STATEMENTS (CONTINUED)As at 31 December 2021
Financing leg proceeds received or paid on swap contracts are, respectively, included as part of “Income – Interest on swap contracts” and “Expenses– Interest on swap contracts” in the Combined Statement of Operations and Changes in Net Assets. Unrealised gains or losses on the remaining leg are recorded within the caption “Swap contracts at fair value” in the Combined Statement of Net Assets. The changes in unrealised gains or losses are included in the Combined Statement of Operations and Changes in Net Assets within the caption “Net changes in unrealised appreciation/(depreciation) on swap contracts”. When a contract is closed, the realised gains or losses are recorded within the caption “Net realised gain/(loss) on swap contracts” in the Combined Statement of Operations and Changes in Net Assets.
The cashflows received and paid by the Sub-Fund in connection with swap contracts are converted to present value on the valuation date corresponding to the maturity of these cashflows. The value of the swap contracts is the difference between these two present value conversions. Please refer to the Portfolio of Investments and Other Net Assets for the details of the contracts outstanding as at 31 December 2021.
(9) Options
Premiums paid by the Sub-Funds for purchased options are included in the Combined Statement of Net Assets as option purchased. If the option is allowed to expire, the Sub-Fund will lose the entire premium it paid and record a realised loss for the premium amount. Premiums paid for purchased options which are exercised or closed are added to the amounts paid or offset against the proceeds on the underlying investment transaction to determine the realised gain/loss to be booked.
Premiums received by the Sub-Funds for written options are included in the Combined Statement of Net Assets as option written. The Sub-Fund records a realised gain or loss on a written option based on whether the cost of the closing transaction exceeds the premium received.
The realised gain/losses and change in unrealised appreciation/(depreciation) on options are disclosed in the Combined Statement of Operations and Changes in Net Assets, respectively within the captions "Net realised gain/(loss) on options contracts" and "Net changes in unrealised appreciation/ (depreciation) on options contracts".
Options that are not traded on a regulated market or any other regulated market are valued at their liquidation value determined in accordance with the rules set in good faith by the Board of Directors according to standard criteria for each type of contract. Please refer to the Portfolio of Investments and Other Net Assets for the details of the options contracts outstanding and margin deposits as at 31 December 2021. The company can also use options on swaps (swaptions). The market value of these swaptions is shown in the caption "Options purchased contracts at fair value" or "Option written contracts at fair values”. For swaptions, the gross premiums to be paid on purchased options (to be received on written options) are included in the caption "Payable on investments purchased" ("Receivable on investments sold") in the Combined Statement of Net Assets.
(10) Fair value
Fair Market valuation: Aviva Investors Luxembourg has implemented a fair valuation process for Asia Pacific equities in order to protect the funds against market timing practices. In the case a market in which the Funds invest is closed at the time the funds' assets are valued, the latest available price may not reflect the fair value of the fund portfolio. In such circumstances, some investors could exploit this gap, which is considered as market timing and deemed "not acceptable" as per CSSF circular 04/146. To limit this, the fund should adjust the local closing price of the securities held to reflect the information available at valuation point. The adjustment amount is so included in the market value of securities in scope. At the time of this report, Sub-Funds included in this Fair market valuation process are Asian Equity Income Fund, Emerging Markets Equity Income Fund, Emerging Markets Equity Small Cap Fund, Global Emerging Markets Index Fund and Global Emerging Markets Equity Unconstrained Fund.
Fair valuation of individual positions: In face of difficult market conditions (e.g. no liquidity, lack of information on trades, etc.), prices obtained for certain investments source may not be representative of fair value. As a result, the Board of Directors of the Fund has implemented fair value techniques to estimate the fair value of these investment. Because of the inherent uncertainties in the fair valuation process, these estimated values may significantly differ from the values that may be ultimately recovered. At the time of this report, Sub-Funds included in this Fair market valuation process are listed below:
Sub-Fund Name Currency Number of Securities Market value
of fair valued
securities
% of Net Assets
Aviva Investors - European Corporate Bond Fund EUR 1 – –Aviva Investors - Global Convertibles Absolute Return Fund USD 3 – –Aviva Investors - Global Convertibles Fund USD 3 – –Aviva Investors - Global Emerging Markets Index Fund USD 3 – –Aviva Investors - Global High Yield Bond Fund USD 1 – –
2.4 TREATMENT OF INTEREST INCOME AND DIVIDENDS
Interest income is accrued on a daily basis. Dividend income is recorded on the ex-dividend date. Both are recorded net of withholding tax.
3. COLLATERAL
Several Sub-Funds received collateral to cover the unrealised results on OTC derivative instruments. Collateral is calculated and settled on a daily basis per counterparty. Cash collaterals cannot be sold, re-invested or pledged.o
Sub-fund name Currency Counterparty
Type of
collateral
Collateral
received
Collateral
pledged
Aviva Investors - Emerging Markets Local Currency Bond Fund EUR Goldman Sachs Cash 555,369 –Aviva Investors - Emerging Markets Local Currency Bond Fund EUR HSBC Cash 1,547,000 –
2. SUMMARY OF SIGNIFICANT ACCOUNTING POLICIES (CONTINUED)
2.3 VALUATION OF ASSETS (CONTINUED)
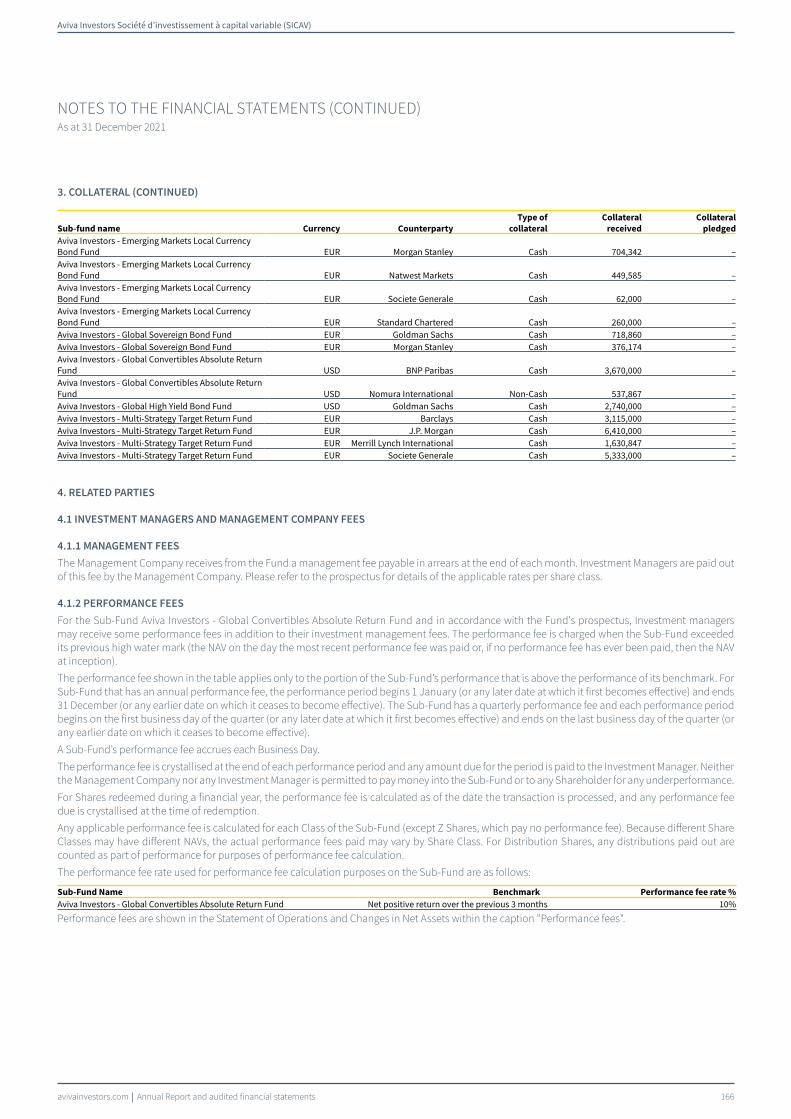
Aviva Investors Société d’investissement à capital variable (SICAV)
avivainvestors.com Annual Report and audited financial statements 166
NOTES TO THE FINANCIAL STATEMENTS (CONTINUED)As at 31 December 2021
o
Sub-fund name Currency Counterparty
Type of
collateral
Collateral
received
Collateral
pledged
Aviva Investors - Emerging Markets Local Currency Bond Fund EUR Morgan Stanley Cash 704,342 –Aviva Investors - Emerging Markets Local Currency Bond Fund EUR Natwest Markets Cash 449,585 –Aviva Investors - Emerging Markets Local Currency Bond Fund EUR Societe Generale Cash 62,000 –Aviva Investors - Emerging Markets Local Currency Bond Fund EUR Standard Chartered Cash 260,000 –Aviva Investors - Global Sovereign Bond Fund EUR Goldman Sachs Cash 718,860 –Aviva Investors - Global Sovereign Bond Fund EUR Morgan Stanley Cash 376,174 –Aviva Investors - Global Convertibles Absolute Return Fund USD BNP Paribas Cash 3,670,000 –Aviva Investors - Global Convertibles Absolute Return Fund USD Nomura International Non-Cash 537,867 –Aviva Investors - Global High Yield Bond Fund USD Goldman Sachs Cash 2,740,000 –Aviva Investors - Multi-Strategy Target Return Fund EUR Barclays Cash 3,115,000 –Aviva Investors - Multi-Strategy Target Return Fund EUR J.P. Morgan Cash 6,410,000 –Aviva Investors - Multi-Strategy Target Return Fund EUR Merrill Lynch International Cash 1,630,847 –Aviva Investors - Multi-Strategy Target Return Fund EUR Societe Generale Cash 5,333,000 –
4. RELATED PARTIES
4.1 INVESTMENT MANAGERS AND MANAGEMENT COMPANY FEES
4.1.1 MANAGEMENT FEES
The Management Company receives from the Fund a management fee payable in arrears at the end of each month. Investment Managers are paid out of this fee by the Management Company. Please refer to the prospectus for details of the applicable rates per share class.
4.1.2 PERFORMANCE FEES
For the Sub-Fund Aviva Investors - Global Convertibles Absolute Return Fund and in accordance with the Fund's prospectus, Investment managers may receive some performance fees in addition to their investment management fees. The performance fee is charged when the Sub-Fund exceeded its previous high water mark (the NAV on the day the most recent performance fee was paid or, if no performance fee has ever been paid, then the NAV at inception).
The performance fee shown in the table applies only to the portion of the Sub-Fund’s performance that is above the performance of its benchmark. For Sub-Fund that has an annual performance fee, the performance period begins 1 January (or any later date at which it first becomes effective) and ends 31 December (or any earlier date on which it ceases to become effective). The Sub-Fund has a quarterly performance fee and each performance period begins on the first business day of the quarter (or any later date at which it first becomes effective) and ends on the last business day of the quarter (or any earlier date on which it ceases to become effective).
A Sub-Fund’s performance fee accrues each Business Day.
The performance fee is crystallised at the end of each performance period and any amount due for the period is paid to the Investment Manager. Neither the Management Company nor any Investment Manager is permitted to pay money into the Sub-Fund or to any Shareholder for any underperformance.
For Shares redeemed during a financial year, the performance fee is calculated as of the date the transaction is processed, and any performance fee due is crystallised at the time of redemption.
Any applicable performance fee is calculated for each Class of the Sub-Fund (except Z Shares, which pay no performance fee). Because different Share Classes may have different NAVs, the actual performance fees paid may vary by Share Class. For Distribution Shares, any distributions paid out are counted as part of performance for purposes of performance fee calculation.
The performance fee rate used for performance fee calculation purposes on the Sub-Fund are as follows:
Sub-Fund Name Benchmark Performance fee rate %
Aviva Investors - Global Convertibles Absolute Return Fund Net positive return over the previous 3 months 10%
Performance fees are shown in the Statement of Operations and Changes in Net Assets within the caption "Performance fees".
3. COLLATERAL (CONTINUED)

Aviva Investors Société d’investissement à capital variable (SICAV)
avivainvestors.com Annual Report and audited financial statements 167
NOTES TO THE FINANCIAL STATEMENTS (CONTINUED)As at 31 December 2021
The Table below shows the performance fee charged for the year ended 31 December 2021 and the performance fee percentage of the average net assets value for each share class :
Sub-Funds and Share Classes
Sub Fund
currency
Performance
fee
Percentage of
average net assets
Aviva Investors - Global Convertibles Absolute Return Fund
A Share Class Accumulation Hedged EUR USD 2,667 0.14%Ay Share Class Accumulation* USD – 0.00%I Share Class Accumulation USD 129,668 0.23%I Share Class Accumulation Hedged CHF USD 400 0.14%I Share Class Accumulation Hedged EUR USD 296,260 0.15%I Share Class Accumulation Hedged GBP USD 3 0.18%Ia Share Class Dividend USD 7,669 0.21%Ia Share Class Dividend Hedged EUR USD 2,999 0.13%Ia Share Class Dividend Hedged GBP USD 62,971 0.19%R Share Class Accumulation USD 16,794 0.19%R Share Class Accumulation Hedged CHF USD 598 0.13%R Share Class Accumulation Hedged EUR USD 8,713 0.14%R Share Class Accumulation Hedged GBP USD 4 0.17%Ry Share Class Accumulation Hedged EUR USD 7,546 0.14%Ry Share Class Accumulation Hedged GBP USD 11 0.09%Z Share Class Accumulation Hedged GBP USD – 0.00%Zy Share Class Accumulation Hedged GBP USD – 0.00%
*Please refer to Directors’ report for details of all corporate activities during the year.
4.1.3 MANAGEMENT COMPANY FEES
DOMICILIARY FEES:
As remuneration for services rendered as domiciliary agent, the Management Company receives a fixed annual fee from Sub-Funds as per the Management Company service agreement. This fee is included in the Combined Statement of Operations and Changes in Net Assets within the caption "Other Operating expenses" and represents an amount of EUR 3,000 per year and per Sub-Fund, payable monthly in arrears.
SUPERVISORY DUTIES:
The Fund and its respective Sub-Funds pay a fee and reasonable out-of-pocket expenses of the Management Company for its supervisory role with regards to the delegated activities, overall responsibility for key decisions, compliance and risk management, up to 0.125% per annum of the aggregated average daily Net Asset Value per Share Class (except the class F,J, K,L,M, V and Z which are not subject to this fee). This fee is included in the Combined Statement of Operations and Changes in Net Assets within the caption "Other Operating expenses"
4.2 DISTRIBUTION FEES
The Distributor receives from the Fund a distribution fee, payable in arrears at the end of each month, calculated at the annual rate per annum of the aggregate average daily Net Asset Value per applicable Share Class, as detailed in the current prospectus.
5. DEPOSITARY FEES
The Fund and its respective Sub-Funds pay depositary fees to J.P. Morgan SE (formerly, J.P. Morgan Bank Luxembourg S.A.) in respect of its activities as Depositary (including safekeeping, supervision and transaction activities). The fees will vary in respect of each Sub-Fund depending on the value of the assets held by the Depositary and the volume of trading in that Sub-Fund and should not exceed a maximum of 0.20% per annum, payable monthly in arrears. This fee is included in the Combined Statement of Operations and Changes in Net Assets within the caption "Depositary fees".
6. REGISTRAR AND TRANSFER AGENCY FEES
The Fund pays fees to RBC Investor Services Bank S.A. in respect of its activities as Registrar and Transfer Agent (including maintenance of register, Shareholders services, transaction, dividend processing and commission handling activities). These fees are payable monthly in arrears.
The Fund pays the Registrar and Transfer Agent a fee and reasonable out-of-pocket expenses, not exceeding a maximum of 0.07% per annum of the aggregate average daily Net Asset Value per applicable Share Class. This fee is included in the Combined Statement of Operations and Changes in Net Assets within the caption "Other Operating expenses"
7. ADMINISTRATION FEES
The Fund pays the administrator fees for its services estimated to 0.05% per annum of the average NAV in period. Such fees are payable monthly. Actual rate charged is calculated based on several factors including number of share classes, and complexity of the Sub-Fund.
4. RELATED PARTIES (CONTINUED)
4.1 INVESTMENT MANAGERS AND MANAGEMENT COMPANY FEES (CONTINUED)
4.1.2 PERFORMANCE FEES (CONTINUED)

Aviva Investors Société d’investissement à capital variable (SICAV)
avivainvestors.com Annual Report and audited financial statements 168
NOTES TO THE FINANCIAL STATEMENTS (CONTINUED)As at 31 December 2021
8. DIRECTOR FEES
All internal directors have decided to waive their remuneration. The total remuneration paid to the external directors amounts to EUR 55,712 and is included within the caption "Professional fees”.
9. WAIVER FEES
In order to preserve investors from fluctuations in their operating and administrative expenses, the Management Company may decide to waive all or a part of their fees or to subsidise operating and administrative expenses of some Sub-Funds. Amounts waived are shown in the Combined Statement of Operations and Changes in Net Assets within the caption "Fee waiver".
10. TAXATION
Luxembourg taxe d'abonnementThe Fund is not liable to any Luxembourg income tax, but is liable in Luxembourg to a tax of 0.05% per annum of its net assets for the A, B, J and R Share Classes of all Sub-Funds that invest in non-money market related securities and 0.01% per annum of its net assets for the F, I, K, L, M, S, V and Z Share Classes of all Sub-Funds. Such tax is payable quarterly on the basis of the net assets of the respective Share Class at the end of the relevant quarter. For the Sub-Funds which are investing in Funds already subject to this tax, there will be no double taxation.
Dividends, interest and capital gains on investments held by the Fund may be subject to non-recoverable tax and withholding and capital gains taxes in the country of origin.
Witholding tax reclaims
The withholding tax reclaims receivable are disclosed in the Combined Statement of Net Assets. For Sub-Fund European Equity Income the balance of 5,516,190 Euros is composed of reclaims to the following countries: Denmark, Germany, Norway, Faroe Islands and Spain. The Board of Directors continuously monitors the recoverability of the reclaims in conjunction with the different tax authorities.
11. DIVIDEND DISTRIBUTION
Distributions are disclosed in the caption "Dividend distributions" in the Combined Statement of Operations and Changes in Net Assets.
12. SECURITIES LENDING
The Sub-Funds may lend portions of investments to third parties. In return the Sub-Funds receive a fee that is negotiated for each transaction. Such lending may only be effected in accordance with the terms of the Prospectus which reflects requirements of CSSF regulations. Securities are lent within the framework of a standardised lending system organised by a recognised securities clearing body or by a highly rated financial institution specialised in such activities.
During the year, 70% of any incremental income earned from securities lending was accrued to the applicable Sub-Fund, with the remaining 30% payable to the securities lending agent, Aviva Investors Global Services Limited (AIGSL), which arrange the transaction. The income earned from the securities lending program is shown in the respective Sub-Funds’ Combined Statement of Operations and Changes in Net Assets. The securities lending agent, AIGSL, is a related party to the Management Company. In addition, none of the counterparties are related parties.
The Sub-Funds with lending activity during the year are:
Fund Agent
Market
value of
securities on
loan in Fund
currency
Cash
collateral
in Fund
currency
Non cash
collateral
in Fund
currency
Total
collateral
in Fund
currency
Fund
currency
Lending
income
(gross)
in Fund
currency
Lending
agent fee
in Fund
currency
Lending
income (net)
in Fund
currency
Aviva Investors - Emerging Markets Bond Fund AIGSL 463,629,012 – 485,253,978 485,253,978 USD 495,544 148,663 346,881Aviva Investors - Emerging Markets Corporate Bond Fund AIGSL 57,230,188 – 59,786,688 59,786,688 USD 140,616 42,185 98,431Aviva Investors - Emerging Markets Equity Income Fund AIGSL – – – – USD 353 106 247Aviva Investors - Emerging Markets Local Currency Bond Fund AIGSL 73,642,256 – 75,625,551 75,625,551 EUR 122,243 36,673 85,570Aviva Investors - European Corporate Bond Fund AIGSL – – – – EUR 4,324 1,297 3,027Aviva Investors - European Equity Fund AIGSL – – – – EUR 16,067 4,820 11,247Aviva Investors - European Equity Income Fund AIGSL 8,528,720 – 8,742,250 8,742,250 EUR 52,941 15,882 37,059Aviva Investors - European Real Estate Securities Fund* AIGSL – – – – EUR 7,121 2,136 4,985Aviva Investors - Global Sovereign Bond Fund AIGSL 1,413,773,375 – 1,450,298,814 1,450,298,814 EUR 454,306 136,292 318,014Aviva Investors - Global Convertibles Absolute Return Fund AIGSL 37,992,682 – 39,078,889 39,078,889 USD – – –Aviva Investors - Global Convertibles Fund AIGSL 22,732,190 – 23,475,075 23,475,075 USD 80,167 24,050 56,117Aviva Investors - Global High Yield Bond Fund AIGSL 164,950,718 – 175,798,836 175,798,836 USD 623,003 186,901 436,102Aviva Investors - Global Investment Grade Corporate Bond Fund AIGSL 65,198,559 – 67,600,869 67,600,869 USD – – –Aviva Investors - Short Duration Global High Yield Bond Fund AIGSL 19,121,520 – 20,067,802 20,067,802 USD 116,427 34,928 81,499
*Please refer to Directors’ report for details of all corporate activities during the year.

Aviva Investors Société d’investissement à capital variable (SICAV)
avivainvestors.com Annual Report and audited financial statements 169
NOTES TO THE FINANCIAL STATEMENTS (CONTINUED)As at 31 December 2021
13. TRANSACTION COSTS
Transaction costs are incremental costs that are directly attributable to the acquisition, issue or disposal of a financial asset or financial liability. An incremental cost is one that would not have been incurred if the entity had not acquired, issued or disposed of the financial asset or liability. Transaction costs include transaction costs paid to custodians and sub-custodians, and identifiable brokerage charges, commissions, transaction related taxes and other market charges. For the year ended 31 December 2021, the Sub-Funds incurred transactions costs (included in the Depositary Fees caption) as detailed below:
Sub-Fund Name Base Currency Total
Aviva Investors - Asian Equity Income Fund USD 423,894Aviva Investors - Climate Transition Global Credit Fund* USD 1,588Aviva Investors - Climate Transition Global Equity Fund USD 104,738Aviva Investors - Climate Transition European Equity Fund EUR 579,548Aviva Investors - Emerging Markets Bond Fund USD 6,848Aviva Investors - Emerging Markets Corporate Bond Fund USD 4,921Aviva Investors - Emerging Markets Equity Income Fund USD 1,039,352Aviva Investors - Emerging Markets Equity Small Cap Fund USD 395,804Aviva Investors - Emerging Markets Local Currency Bond Fund EUR 7,688Aviva Investors - European Corporate Bond Fund EUR 1,458Aviva Investors - European Equity Fund EUR 123,652Aviva Investors - European Equity Income Fund EUR 40,787Aviva Investors - European High Yield Bond Fund* EUR 4,124Aviva Investors - European Real Estate Securities Fund* EUR 9,525Aviva Investors - Global Sovereign Bond Fund EUR 8,039Aviva Investors - Global Convertibles Absolute Return Fund USD 61,162Aviva Investors - Global Convertibles Fund USD 3,532Aviva Investors - Global Emerging Markets Equity Unconstrained Fund USD 260,469Aviva Investors - Global Emerging Markets Index Fund USD 1,639,336Aviva Investors - Global Equity Endurance Fund USD 547,119Aviva Investors - Global Equity Unconstrained Fund* USD 13,673Aviva Investors - Global High Yield Bond Fund USD 298,638Aviva Investors - Global Investment Grade Corporate Bond Fund USD 14,344Aviva Investors - Multi-Strategy Fixed Income Fund* EUR 1,074Aviva Investors - Multi-Strategy Target Income Fund* EUR 336,840Aviva Investors - Multi-Strategy Target Return Fund EUR 1,609,632Aviva Investors - Natural Capital Transition Global Equity Fund* USD 28,629Aviva Investors - Short Duration Global High Yield Bond Fund USD 9,445Aviva Investors - Social Transition Global Equity Fund* USD 20,793Aviva Investors - Sustainable Income & Growth Fund USD 46,658Aviva Investors - UK Listed Equity High Alpha Fund GBP 681,433Aviva Investors - US Equity Income Fund USD 5,913Aviva Investors - US Investment Grade Bond Fund* USD 3,718
*Please refer to Directors’ report for details of all corporate activities during the year.
Transaction costs for fixed income securities and financial derivatives are not separately identifiable. For those, transaction costs are included in the purchase and sale prices.
14. CROSS-INVESTMENT BETWEEN SUB-FUNDS
There are no cross holdings as at 31 December 2021.
15. EXCHANGE RATE
The exchange rates used to combine the Sub-Funds as at 31 December 2021 were: 0
Currency Rate
EUR = 1 GBP 0.8393USD 1.1344
16. SUBSEQUENT EVENTS
Effective 24 January 2022, J.P. Morgan Bank Luxembourg S.A. merged into J.P. Morgan AG which on the same date changed its name to J.P. Morgan SE. As from the merger date, J.P. Morgan SE, as legal successor of J.P. Morgan Bank Luxembourg S.A. continues to act as Depositary and Administrator and Listing agent through its Luxembourg Branch.
Effective 3 February 2022, the Board changed the investment objective and policy of the Aviva Investors – Emerging Markets Equity Income Fund, and consequently on the same date, changed the Sub-Fund’s name to Aviva Investors – Global Emerging Markets Core Fund.
Effective 9 February 2022, the Board changed the investment objective and policy of the Aviva Investors – UK Listed Equity High Alpha Fund, and consequently on the same date, changed the Sub-Fund’s name to Aviva Investors – UK Equity Unconstrained Fund.
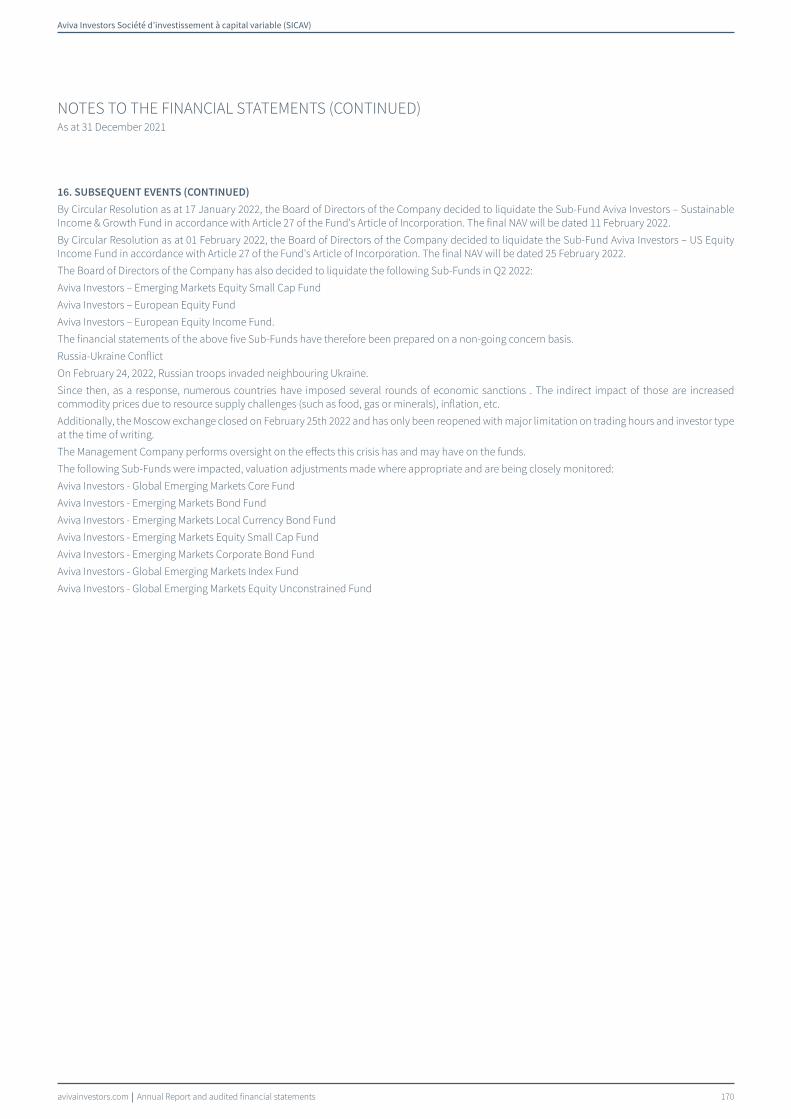
Aviva Investors Société d’investissement à capital variable (SICAV)
avivainvestors.com Annual Report and audited financial statements 170
NOTES TO THE FINANCIAL STATEMENTS (CONTINUED)As at 31 December 2021
By Circular Resolution as at 17 January 2022, the Board of Directors of the Company decided to liquidate the Sub-Fund Aviva Investors – Sustainable Income & Growth Fund in accordance with Article 27 of the Fund's Article of Incorporation. The final NAV will be dated 11 February 2022.
By Circular Resolution as at 01 February 2022, the Board of Directors of the Company decided to liquidate the Sub-Fund Aviva Investors – US Equity Income Fund in accordance with Article 27 of the Fund's Article of Incorporation. The final NAV will be dated 25 February 2022.
The Board of Directors of the Company has also decided to liquidate the following Sub-Funds in Q2 2022:
Aviva Investors – Emerging Markets Equity Small Cap Fund
Aviva Investors – European Equity Fund
Aviva Investors – European Equity Income Fund.
The financial statements of the above five Sub-Funds have therefore been prepared on a non-going concern basis.
Russia-Ukraine Conflict
On February 24, 2022, Russian troops invaded neighbouring Ukraine.
Since then, as a response, numerous countries have imposed several rounds of economic sanctions . The indirect impact of those are increased commodity prices due to resource supply challenges (such as food, gas or minerals), inflation, etc.
Additionally, the Moscow exchange closed on February 25th 2022 and has only been reopened with major limitation on trading hours and investor type at the time of writing.
The Management Company performs oversight on the effects this crisis has and may have on the funds.
The following Sub-Funds were impacted, valuation adjustments made where appropriate and are being closely monitored:
Aviva Investors - Global Emerging Markets Core Fund
Aviva Investors - Emerging Markets Bond Fund
Aviva Investors - Emerging Markets Local Currency Bond Fund
Aviva Investors - Emerging Markets Equity Small Cap Fund
Aviva Investors - Emerging Markets Corporate Bond Fund
Aviva Investors - Global Emerging Markets Index Fund
Aviva Investors - Global Emerging Markets Equity Unconstrained Fund
16. SUBSEQUENT EVENTS (CONTINUED)

Aviva Investors Société d’investissement à capital variable (SICAV)
avivainvestors.com Annual Report and audited financial statements 171
OTHER INFORMATION - UNAUDITEDAs at 31 December 2021
1. THE VAR & LEVERAGE
1.1 THE VAR
As at 31 December 2021, it has been determined to use the Value-at-Risk (VaR) approach for the following sub-funds to calculate global exposure. Please see details in the table below. All other sub-funds calculate global exposure using the commitment approach.
UCITS Sub-fundMethod
Profile Approach
Expected Level of
Leverage (as per
Prospectus)
Leverage Actual
Average 2021 High VaR Low VaR Av. VaR
VaR Benchmark
High
VaR Benchmark
Low
Av. VaR
Benchmark
Aviva Investors
Aviva Investors - Climate Transition Global Credit Fund Parametric
Relative VaRBM*2 500% 204.42% 3.02% 2.74% 2.91% 2.98% 2.72% 2.86%
Aviva Investors
Aviva Investors - Emerging Markets Local Currency Bond Fund Parametric
Relative VaRBM*2 400% 161.58% 6.92% 3.79% 5.18% 5.82% 3.87% 4.74%
Aviva Investors
Aviva Investors - European Corporate Bond Fund Parametric
Relative VaRBM*2 0% -150% 23.05% 2.68% 1.54% 1.97% 2.47% 1.57% 1.89%
Aviva Investors
Aviva Investors - Global Sovereign Bond Fund Parametric
Relative VaRBM*2 400% 388.04% 3.13% 1.64% 2.34% 2.40% 1.82% 2.07%
Aviva Investors
Aviva Investors - Global Convertibles Absolute Return Fund Monte Carlo
Absolute(10%) 300% 167.51% 4.76% 2.16% 3.16% – – –
Aviva Investors
Aviva Investors - Global Investment Grade Corporate Bond Fund Parametric
Relative VaRBM*2 200% 164.76% 3.99% 2.77% 3.23% 13.53% 2.72% 3.25%
Aviva Investors
Aviva Investors - Multi-Strategy Target Return Fund Monte Carlo
Absolute(6.7%) 700% 481.45% 5.52% 1.85% 3.70% – – –
The VaR risk model is based on the:
- Monte Carlo (CMC) simulation methodology. This method for calculating VaR contains no standard distribution assumptions and attempts to accurately capture extreme risk events. The approach models every security individually and their derivatives.
- Parametric Method: The Parametric VaR method calculates the standard deviation of the portfolio's returns and assumes a normal distribution of portfolio returns to show the maximum expected loss within a specified (99%) confidence interval.
There is a pricing function which supports full re-pricing of bonds and derivatives, covers multiple risk factors and uses 250 days
of factor returns.
The calculation of the absolute and relative VaR is carried out in accordance with the following parameters:
(a) one-tailed confidence interval of 99%
(b) holding period equivalent to 1 month (20 business days)
(c) effective observation period (history) of risk factors of at least 1 year (250 business days) unless a shorter observation period is justifed by a signifcant increase in price volatility (for instance extreme market conditions) – in practice AIGSL uses an effective observation period of 250 business days.
(d) quarterly data set updates, or more frequent when market prices are subject to material changes
(e) at least daily calculation
REFERENCE PORTFOLIO FOR RELATIVE VAR
A benchmark index is used for the calculation of the relative VaR on the 2 sub-funds below:
Aviva Investors - Emerging Markets Local Currency Bond Fund
J.P. Morgan GBI-EM Global Diversified Index
Aviva Investors – Global Sovereign Bond Fund
Barclays Capital Global Aggregate Index EUR hedged
Leverage Calculation
Leverage is the total amount of financial derivatives instruments (“FDI”) commitments out of a Sub Fund’s Total Net Assets.
It is calculated under the sum of notional’s approach to leverage calculation without any netting arrangements.
2. SECURITIES FINANCING TRANSACTIONS
As defined in Article 3 of Regulation (EU) 2015/2365, securities financing transactions include repurchase transactions, securities or commodities lending and securities or commodities borrowing, buy-sell back transactions or sell-buy back transactions and margin lending transactions and/or total return swaps. In accordance with Article 13 of the Regulation, the Fund's only involvement in and exposures related to Securities Lending transactions and Total Return Swaps for the reporting date 31 December 2021 and are detailed below.
GLOBAL DATA
Amount of securities on loan
The total value of securities on loan as a proportion of the Sub-Funds' total lendable assets, as at the reporting date is detailed below. Total lendable assets represents the aggregate value of asset types forming part of the Sub-Funds' securities lending programme.

Aviva Investors Société d’investissement à capital variable (SICAV)
avivainvestors.com Annual Report and audited financial statements 172
OTHER INFORMATION - UNAUDITED (CONTINUED)As at 31 December 2021
Sub-Fund
% of Total Lendable
Assets
Aviva Investors - Emerging Markets Bond Fund 15.39
Aviva Investors - Emerging Markets Corporate Bond Fund 6.67
Aviva Investors - Emerging Markets Local Currency Bond Fund 7.93
Aviva Investors - European Equity Income Fund 5.33
Aviva Investors - Global Sovereign Bond Fund 28.20
Aviva Investors - Global Convertibles Absolute Return Fund 3.04
Aviva Investors - Global Convertibles Fund 5.90
Aviva Investors - Global High Yield Bond Fund 4.84
Aviva Investors - Global Investment Grade Corporate Bond Fund 1.28
Aviva Investors - Short Duration Global High Yield Bond Fund 4.43
Amount of assets engaged in securities lending transactions
The following table represents the total value of assets engaged in securities lending as at the reporting date.
Sub-Fund
Sub-Fund
Currency
Market Value of
Securities on Loan (in Sub-Fund Currency) % of AUM
Aviva Investors - Emerging Markets Bond Fund USD 463,629,012 11.80
Aviva Investors - Emerging Markets Corporate Bond Fund USD 57,230,188 5.36
Aviva Investors - Emerging Markets Local Currency Bond Fund EUR 73,642,256 5.30
Aviva Investors - European Equity Income Fund EUR 8,528,720 4.99
Aviva Investors - Global Sovereign Bond Fund EUR 1,413,773,375 26.27
Aviva Investors - Global Convertibles Absolute Return Fund USD 37,992,682 2.89
Aviva Investors - Global Convertibles Fund USD 22,732,190 5.17
Aviva Investors - Global High Yield Bond Fund USD 164,950,718 4.41
Aviva Investors - Global Investment Grade Corporate Bond Fund USD 65,198,559 1.22
Aviva Investors - Short Duration Global High Yield Bond Fund USD 19,121,520 4.03
Amount of assets engaged in total return swap contracts
The following table represents the total value of assets engaged in total return swaps as at the reporting date.
Sub-Fund
Sub-Fund
Currency
Market Value of
Total Return Swaps
(in Sub-Fund Currency) % of AUM
Aviva Investors - Global Convertibles Absolute Return Fund USD (1,539,508) (0.12)
Aviva Investors - Multi-Strategy Target Return Fund EUR (1,956,561) (0.17)
CONCENTRATION DATA
Ten largest collateral issuers
The following table lists the ten largest issuers by value of non-cash collaterals received by the Sub-Funds across securities lending transactions as at the reporting date. Collateral received in relation to other SFT's and OTC derivative transactions (including total return swaps) are in the form of cash.
Issuer
Collateral Value
(in Sub-Fund Currency)
Aviva Investors - Emerging Markets Bond Fund USD
UK Treasury 234,663,590
Germany Government 123,095,807
France Government 77,065,776
US Treasury 10,898,602
European Investment Bank 10,678,672
Japan Government 10,359,528
Netherland Government 7,184,345
Denmark Government 6,514,523
European Union 3,240,853
2. SECURITIES FINANCING TRANSACTIONS (CONTINUED)
GLOBAL DATA (CONTINUED)
Amount of securities on loan (continued)
None of the counterparties are related parties to the Sub-Funds and the Management Company.
None of the counterparties are related parties to the Sub-Funds and the Management Company.
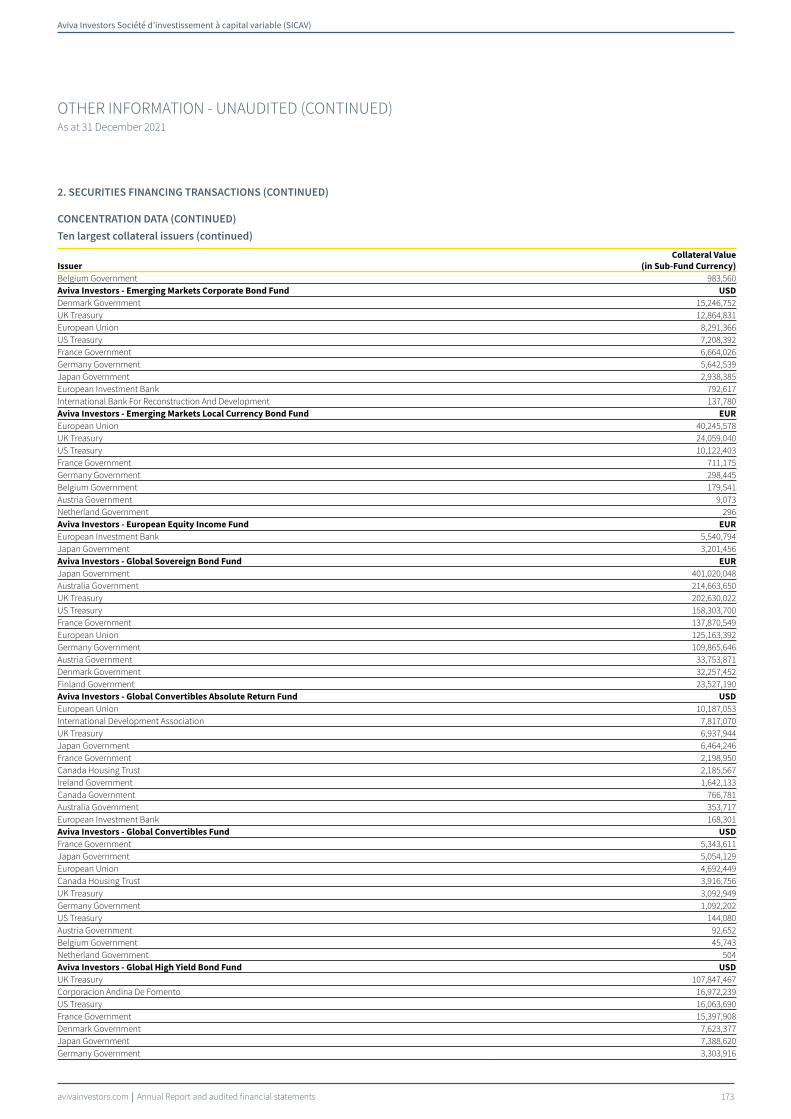
Aviva Investors Société d’investissement à capital variable (SICAV)
avivainvestors.com Annual Report and audited financial statements 173
OTHER INFORMATION - UNAUDITED (CONTINUED)As at 31 December 2021
Issuer
Collateral Value
(in Sub-Fund Currency)
Belgium Government 983,560
Aviva Investors - Emerging Markets Corporate Bond Fund USD
Denmark Government 15,246,752
UK Treasury 12,864,831
European Union 8,291,366
US Treasury 7,208,392
France Government 6,664,026
Germany Government 5,642,539
Japan Government 2,938,385
European Investment Bank 792,617
International Bank For Reconstruction And Development 137,780
Aviva Investors - Emerging Markets Local Currency Bond Fund EUR
European Union 40,245,578
UK Treasury 24,059,040
US Treasury 10,122,403
France Government 711,175
Germany Government 298,445
Belgium Government 179,541
Austria Government 9,073
Netherland Government 296
Aviva Investors - European Equity Income Fund EUR
European Investment Bank 5,540,794
Japan Government 3,201,456
Aviva Investors - Global Sovereign Bond Fund EUR
Japan Government 401,020,048
Australia Government 214,663,650
UK Treasury 202,630,022
US Treasury 158,303,700
France Government 137,870,549
European Union 125,163,392
Germany Government 109,865,646
Austria Government 33,753,871
Denmark Government 32,257,452
Finland Government 23,527,190
Aviva Investors - Global Convertibles Absolute Return Fund USD
European Union 10,187,053
International Development Association 7,817,070
UK Treasury 6,937,944
Japan Government 6,464,246
France Government 2,198,950
Canada Housing Trust 2,185,567
Ireland Government 1,642,133
Canada Government 766,781
Australia Government 353,717
European Investment Bank 168,301
Aviva Investors - Global Convertibles Fund USD
France Government 5,343,611
Japan Government 5,054,129
European Union 4,692,449
Canada Housing Trust 3,916,756
UK Treasury 3,092,949
Germany Government 1,092,202
US Treasury 144,080
Austria Government 92,652
Belgium Government 45,743
Netherland Government 504
Aviva Investors - Global High Yield Bond Fund USD
UK Treasury 107,847,467
Corporacion Andina De Fomento 16,972,239
US Treasury 16,063,690
France Government 15,397,908
Denmark Government 7,623,377
Japan Government 7,388,620
Germany Government 3,303,916
2. SECURITIES FINANCING TRANSACTIONS (CONTINUED)
CONCENTRATION DATA (CONTINUED)
Ten largest collateral issuers (continued)

Aviva Investors Société d’investissement à capital variable (SICAV)
avivainvestors.com Annual Report and audited financial statements 174
OTHER INFORMATION - UNAUDITED (CONTINUED)As at 31 December 2021
Issuer
Collateral Value
(in Sub-Fund Currency)
European Union 548,912
Netherland Government 291,817
Canada Housing Trust 216,618
Aviva Investors - Global Investment Grade Corporate Bond Fund USD
UK Treasury 46,801,757
European Union 12,165,654
Denmark Government 7,484,772
Belgium Government 673,990
Germany Government 338,213
Ireland Government 136,483
Aviva Investors - Short Duration Global High Yield Bond Fund USD
Canada Housing Trust 10,503,815
France Government 5,544,275
US Treasury 1,966,574
UK Treasury 1,463,680
Germany Government 338,213
International Bank For Reconstruction And Development 251,245
Counterparties
Securities Lending Transactions
The following table provides details of the counterparties (based on gross volume of outstanding transactions) in respect of securities lending transactions as at the reporting date.
Counterparty Country of Incorporation
Market Value of
Securities on Loan
(in Sub-Fund Currency)
Aviva Investors - Emerging Markets Bond Fund USD
BNP Paribas France 172,085,003
Nomura Japan 133,031,127
Zurich Cantonal Bank Switzerland 77,793,669
Merrill Lynch United States of America 32,438,129
Barclays Bank United Kingdom 22,016,180
J.P. Morgan United States of America 9,767,256
HSBC Bank United Kingdom 6,246,227
Credit Suisse United Kingdom 5,263,868
Morgan Stanley United States of America 2,550,836
UBS Switzerland 2,436,717
Aviva Investors - Emerging Markets Corporate Bond Fund USD
HSBC Bank United Kingdom 14,815,566
Nomura Japan 9,571,638
Zurich Cantonal Bank Switzerland 8,520,027
J.P. Morgan United States of America 7,128,675
Barclays Bank United Kingdom 5,473,358
BNP Paribas France 4,236,003
Goldman Sachs United States of America 4,191,882
Merrill Lynch United States of America 2,845,195
Credit Suisse United Kingdom 447,844
Aviva Investors - Emerging Markets Local Currency Bond Fund EUR
Goldman Sachs United States of America 39,263,971
Barclays Bank United Kingdom 22,971,537
J.P. Morgan United States of America 11,406,748
Aviva Investors - European Equity Income Fund EUR
Natixis France 8,528,720
Aviva Investors - Global Sovereign Bond Fund EUR
HSBC Bank United Kingdom 617,886,610
BNP Paribas France 244,751,221
Nomura Japan 232,497,627
Zurich Cantonal Bank Switzerland 158,591,172
National Australia Bank Australia 80,259,177
Royal Bank of Canada Canada 58,122,863
Scotiabank Canada 12,065,751
Credit Suisse United Kingdom 4,675,997
Goldman Sachs United States of America 2,070,710
Merrill Lynch United States of America 1,870,390
2. SECURITIES FINANCING TRANSACTIONS (CONTINUED)
CONCENTRATION DATA (CONTINUED)
Ten largest collateral issuers (continued)

Aviva Investors Société d’investissement à capital variable (SICAV)
avivainvestors.com Annual Report and audited financial statements 175
OTHER INFORMATION - UNAUDITED (CONTINUED)As at 31 December 2021
Counterparty Country of Incorporation
Market Value of
Securities on Loan
(in Sub-Fund Currency)
Barclays Bank United Kingdom 981,857
Aviva Investors - Global Convertibles Absolute Return Fund USD
UBS Switzerland 9,664,619
Credit Suisse United Kingdom 8,872,441
Goldman Sachs United States of America 7,996,946
Barclays Bank United Kingdom 5,793,509
Zurich Cantonal Bank Switzerland 5,665,167
Aviva Investors - Global Convertibles Fund USD
Goldman Sachs United States of America 7,737,378
Credit Suisse United Kingdom 4,553,283
UBS Switzerland 4,245,572
Nomura Japan 3,505,306
Zurich Cantonal Bank Switzerland 1,316,155
Citigroup Inc. United States of America 868,282
J.P. Morgan United States of America 506,214
Aviva Investors - Global High Yield Bond Fund USD
Barclays Bank United Kingdom 89,833,017
Credit Suisse United Kingdom 19,726,056
Goldman Sachs United States of America 16,748,807
J.P. Morgan United States of America 12,074,733
HSBC Bank United Kingdom 7,412,737
BNP Paribas France 7,267,524
UBS Switzerland 5,650,498
Nomura Japan 4,357,255
Zurich Cantonal Bank Switzerland 1,880,091
Aviva Investors - Global Investment Grade Corporate Bond Fund USD
Barclays Bank United Kingdom 28,861,988
Merrill Lynch United States of America 14,265,751
Goldman Sachs United States of America 11,868,930
HSBC Bank United Kingdom 7,226,076
BNP Paribas France 1,958,445
Zurich Cantonal Bank Switzerland 1,017,369
Aviva Investors - Short Duration Global High Yield Bond Fund USD
Goldman Sachs United States of America 10,247,241
Credit Suisse United Kingdom 4,648,395
J.P. Morgan United States of America 2,036,615
Barclays Bank United Kingdom 1,630,868
Zurich Cantonal Bank Switzerland 558,401
None of the counterparties are related parties to the Sub-Funds and the Management Company.
Total Return Swap Contracts
The following table provides details of the top ten counterparties (based on gross volume of outstanding transactions) in respect of total return swaps as at the reporting date.
Counterparty Country of Incorporation
Market Value of
Total Return Swaps
(in Sub-Fund Currency)
Aviva Investors - Global Convertibles Absolute Return Fund USD
BNP Paribas France 3,923,769
Nomura Japan 559,704
Citigroup United States of America (6,022,981)
Aviva Investors - Multi-Strategy Target Return Fund EUR
UBS Switzerland 33,546
Merrill Lynch United States of America (43,472)
Barclays United Kingdom (211,562)
Societe Generale France (422,340)
Morgan Stanley United States of America (1,312,733)
2. SECURITIES FINANCING TRANSACTIONS (CONTINUED)
CONCENTRATION DATA (CONTINUED)
Counterparties (continued)
Securities Lending Transactions (continued)
None of the counterparties are related parties to the Sub-Funds and the Management Company.

Aviva Investors Société d’investissement à capital variable (SICAV)
avivainvestors.com Annual Report and audited financial statements 176
OTHER INFORMATION - UNAUDITED (CONTINUED)As at 31 December 2021
AGGREGATE TRANSACTION DATA
The following table provides details of the country of incorporation (based on gross volume of outstanding transactions) in respect of securities lending transactions as at the reporting date.
Country of Incoporation
Market Value of
Securities on Loan (in
Sub-Fund Currency)
Aviva Investors - Emerging Markets Bond Fund USD
France 172,085,003
Japan 133,031,127
Switzerland 80,230,386
United States of America 44,756,221
United Kingdom 33,526,275
Aviva Investors - Emerging Markets Corporate Bond Fund USD
United Kingdom 20,736,768
United States of America 14,165,752
Japan 9,571,638
Switzerland 8,520,027
France 4,236,003
Aviva Investors - Emerging Markets Local Currency Bond Fund EUR
United States of America 50,670,719
United Kingdom 22,971,537
Aviva Investors - European Equity Income Fund EUR
France 8,528,720
Aviva Investors - Global Sovereign Bond Fund EUR
United Kingdom 623,544,464
France 244,751,221
Japan 232,497,627
Switzerland 158,591,172
Australia 80,259,177
Canada 70,188,614
United States of America 3,941,100
Aviva Investors - Global Convertibles Absolute Return Fund USD
Switzerland 15,329,786
United Kingdom 14,665,950
United States of America 7,996,946
Aviva Investors - Global Convertibles Fund USD
United States of America 9,111,874
Switzerland 5,561,727
United Kingdom 4,553,283
Japan 3,505,306
Aviva Investors - Global High Yield Bond Fund USD
United Kingdom 116,971,810
United States of America 28,823,540
Switzerland 7,530,589
France 7,267,524
Japan 4,357,255
Aviva Investors - Global Investment Grade Corporate Bond Fund USD
United Kingdom 36,088,064
United States of America 26,134,681
France 1,958,445
Switzerland 1,017,369
Aviva Investors - Short Duration Global High Yield Bond Fund USD
United States of America 12,283,856
United Kingdom 6,279,263
Switzerland 558,401
The following table provides details of the country of incorporation (based on gross volume of outstanding transactions) in respect of total return swaps as at the reporting date.
Country of Incoporation
Market Value of
Total Return Swaps (in
Sub-Fund Currency)
Aviva Investors - Global Convertibles Absolute Return Fund USD
France 3,923,769
Japan 559,704
United States of America (6,022,981)
2. SECURITIES FINANCING TRANSACTIONS (CONTINUED)
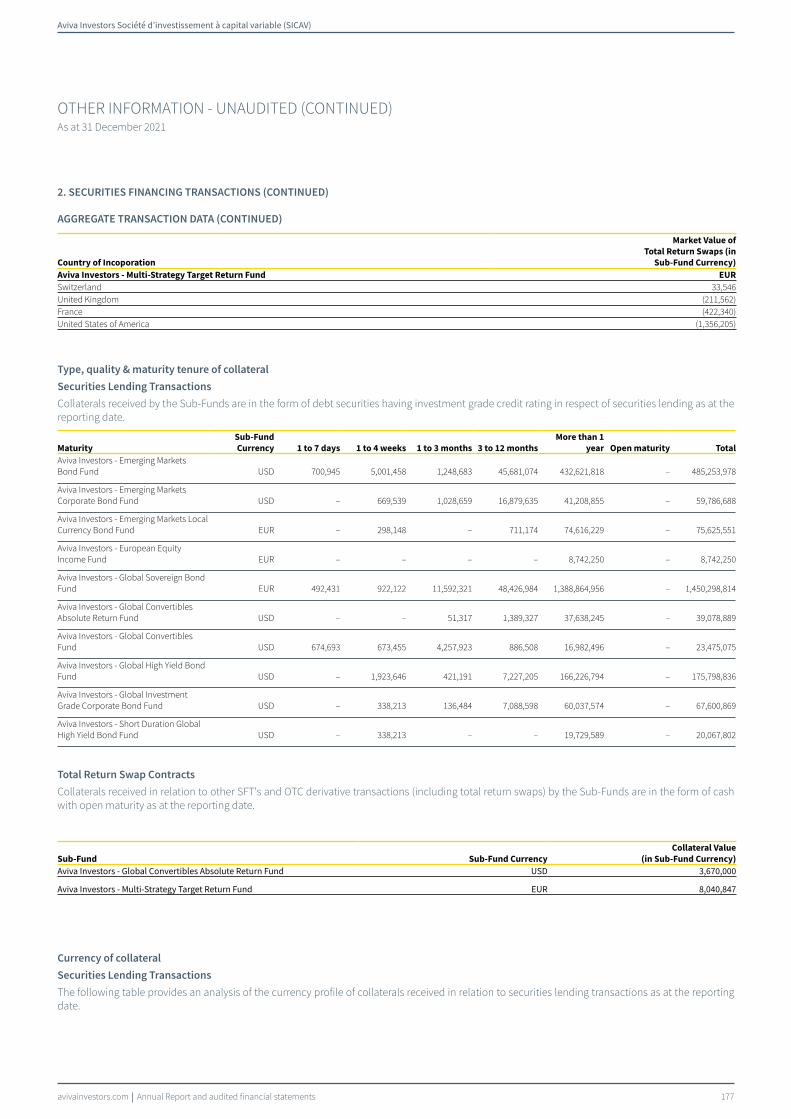
Aviva Investors Société d’investissement à capital variable (SICAV)
avivainvestors.com Annual Report and audited financial statements 177
OTHER INFORMATION - UNAUDITED (CONTINUED)As at 31 December 2021
Country of Incoporation
Market Value of
Total Return Swaps (in
Sub-Fund Currency)
Aviva Investors - Multi-Strategy Target Return Fund EUR
Switzerland 33,546
United Kingdom (211,562)
France (422,340)
United States of America (1,356,205)
Type, quality & maturity tenure of collateral
Securities Lending Transactions
Collaterals received by the Sub-Funds are in the form of debt securities having investment grade credit rating in respect of securities lending as at the reporting date.
Maturity
Sub-Fund
Currency 1 to 7 days 1 to 4 weeks 1 to 3 months 3 to 12 months
More than 1
year Open maturity Total
Aviva Investors - Emerging Markets Bond Fund USD 700,945 5,001,458 1,248,683 45,681,074 432,621,818 – 485,253,978
Aviva Investors - Emerging Markets Corporate Bond Fund USD – 669,539 1,028,659 16,879,635 41,208,855 – 59,786,688
Aviva Investors - Emerging Markets Local Currency Bond Fund EUR – 298,148 – 711,174 74,616,229 – 75,625,551
Aviva Investors - European Equity Income Fund EUR – – – – 8,742,250 – 8,742,250
Aviva Investors - Global Sovereign Bond Fund EUR 492,431 922,122 11,592,321 48,426,984 1,388,864,956 – 1,450,298,814
Aviva Investors - Global Convertibles Absolute Return Fund USD – – 51,317 1,389,327 37,638,245 – 39,078,889
Aviva Investors - Global Convertibles Fund USD 674,693 673,455 4,257,923 886,508 16,982,496 – 23,475,075
Aviva Investors - Global High Yield Bond Fund USD – 1,923,646 421,191 7,227,205 166,226,794 – 175,798,836
Aviva Investors - Global Investment Grade Corporate Bond Fund USD – 338,213 136,484 7,088,598 60,037,574 – 67,600,869
Aviva Investors - Short Duration Global High Yield Bond Fund USD – 338,213 – – 19,729,589 – 20,067,802
Total Return Swap Contracts
Collaterals received in relation to other SFT's and OTC derivative transactions (including total return swaps) by the Sub-Funds are in the form of cash with open maturity as at the reporting date.
Sub-Fund Sub-Fund Currency
Collateral Value
(in Sub-Fund Currency)
Aviva Investors - Global Convertibles Absolute Return Fund USD 3,670,000
Aviva Investors - Multi-Strategy Target Return Fund EUR 8,040,847
Currency of collateral
Securities Lending Transactions
The following table provides an analysis of the currency profile of collaterals received in relation to securities lending transactions as at the reporting date.
2. SECURITIES FINANCING TRANSACTIONS (CONTINUED)
AGGREGATE TRANSACTION DATA (CONTINUED)

Aviva Investors Société d’investissement à capital variable (SICAV)
avivainvestors.com Annual Report and audited financial statements 178
OTHER INFORMATION - UNAUDITED (CONTINUED)As at 31 December 2021
Collateral Value (in Sub-Fund Currency)
Sub-Fund
Sub-Fund
CurrencyAUD CAD DKK EUR GBP JPY USD Total
Aviva Investors - Emerging Markets Bond Fund USD 5,714 1,551 6,514,523 222,258,637 234,676,168 10,359,528 11,437,857 485,253,978
Aviva Investors - Emerging Markets Corporate Bond Fund USD – – 15,246,752 20,597,931 12,864,831 2,938,385 8,138,789 59,786,688
Aviva Investors - Emerging Markets Local Currency Bond Fund EUR – – – 41,444,108 24,059,040 – 10,122,403 75,625,551
Aviva Investors - European Equity Income Fund EUR – – – 5,540,794 – 3,201,456 – 8,742,250
Aviva Investors - Global Sovereign Bond Fund EUR 214,663,650 2,136,086 32,257,452 439,287,856 202,630,022 401,020,048 158,303,700 1,450,298,814
Aviva Investors - Global Convertibles Absolute Return Fund USD 353,717 2,952,348 – 22,059,314 7,106,245 6,464,246 143,019 39,078,889
Aviva Investors - Global Convertibles Fund USD – 3,916,756 – 11,267,161 3,092,949 5,054,129 144,080 23,475,075
Aviva Investors - Global High Yield Bond Fund USD 6,493 216,618 7,623,377 36,514,791 107,847,467 7,388,620 16,201,470 175,798,836
Aviva Investors - Global Investment Grade Corporate Bond Fund USD – – 7,484,772 13,314,340 46,801,757 – – 67,600,869
Aviva Investors - Short Duration Global High Yield Bond Fund USD – 10,503,815 – 5,882,488 1,463,680 – 2,217,819 20,067,802
Total Return Swap Contracts
The following table provides an analysis of the currency profile of collateral received in relation to SFT's and OTC derivative transactions (including total return swaps) as at the reporting date.
Collateral Value (in Sub-Fund Currency
Sub-Fund
Sub-Fund
CurrencyAUD CAD DKK EUR GBP JPY USD Total
Aviva Investors - Global Convertibles Absolute Return Fund USD – – – – – – 3,670,000 3,670,000
Aviva Investors - Multi-Strategy Target Return Fund EUR – – – 8,040,847 – – – 8,040,847
Maturity tenor of securities lending agreement and total return swap contracts
Securities Lending Transactions
The Fund's securities lending transactions have open maturity.
Maturity tenor of Total Return Swap Contracts
The following table provides an analysis of the maturity tenor of total return swaps contracts outstanding as at the reporting date.
Market Value Market Value
Maturity
Aviva Investors - Global Convertibles
Absolute Return Fund
USD
Aviva Investors - Multi-Strategy
Target Return Fund
EUR
1-4 Weeks 4,483,473 –1-3 Months – 33,5463-12 Months – 1,990,107more than 1 year (6,022,981) –
2. SECURITIES FINANCING TRANSACTIONS (CONTINUED)
AGGREGATE TRANSACTION DATA (CONTINUED)
Currency of collateral (continued)
Securities Lending Transactions (continued)

Aviva Investors Société d’investissement à capital variable (SICAV)
avivainvestors.com Annual Report and audited financial statements 179
OTHER INFORMATION - UNAUDITED (CONTINUED)As at 31 December 2021
The above maturity tenor analysis has been based on the contractual maturity date of the relevant Total Return Swaps.
Settlement and clearing
All Sub-Funds engaged in securities lending agreements utilise bi-lateral settlement and clearing with their respective counterparty.
OTC derivative transactions are entered into by the Fund under an International Swaps and Derivatives Associations, Inc. Master Agreement (“ISDA Master Agreement”) or similar agreement. An ISDA Master Agreement is a bilateral agreement between the Fund/s and a counterparty that governs OTC derivative transactions (including total return swaps) entered into by the parties. All OTC derivative transactions entered under an ISDA Master agreement are netted together for collateral purposes, therefore any collateral disclosures provided in this report are in respect of all OTC derivative transactions entered into by the Fund with the applicable TRS counterparties under the ISDA Master agreement, not just total return swaps.
Reuse of Collateral
Share of collateral received that is reused and reinvestment return
Collateral received in relation to security lending transactions and total return swap contracts cannot be sold, re-invested or pledged.
Safekeeping of Collateral
Collateral received
All collateral received by the Fund in respect of securities lending & total return swaps transactions as at the reporting date are held by J.P. Morgan SE (formerly, J.P. Morgan Bank Luxembourg S.A. )
Collateral granted
Collateral granted
Sub-Fund Sub-Fund Currency
Collateral Value
(in Sub-Fund Currency)
Aviva Investors - Emerging Markets Bond Fund USD 2,240,000
Aviva Investors - Global Sovereign Bond Fund EUR 18,478,992
Aviva Investors - Global Convertibles Absolute Return Fund USD 6,170,000
Aviva Investors - Global Investment Grade Corporate Bond Fund USD 8,596,000
Aviva Investors - Multi-Strategy Target Return Fund EUR 9,726,161
All collateral granted in respect of total return swaps as at the reporting date are held in segregated accounts.
Return and cost
The total income earned from securities lending transactions is split between the relevant Sub-Funds and the securities lending agent. Detail of this split is disclosed in note 12 to the financial statements.
All returns from total return swap contracts will accrue to the Sub-Funds and are not subject to any returns sharing arrangements with the Investment Manager or any other third parties.
3. REMUNERATION DISCLOSURE – UCITS
In line with the requirements of the Undertakings for Collective Investments in Transferable Securities Directive V (“UCITS V”), Aviva Investors Luxembourg (“AI LUX”) is subject to a remuneration policy which is consistent with the principles outlined in the European Securities and Markets Authority guidelines on sound remuneration policies under the UCITs directive.
Aviva Investors’ remuneration framework is based on a total reward approach and is designed to reflect the success or failure against a range of personal and company performance objectives.
There are four components of pay:
– Basic Salary – set within an appropriate market range, which is sufficient to allow the possibility, where performance so warrants, that an employee may receive no variable pay.
– Annual bonus – a discretionary short-term incentive plan where individuals may receive a bonus based on business and individual performance against targets. Where bonuses are equal to or greater than £75,000, a 3 year deferral with pro-rata vesting in Aviva funds and/or Aviva Group Plc shares occurs, following this a further holding period applies where regulation requires.
The extent to which each aspect of performance affects the overall payment level depends on the role and responsibilities of the individual. Performance is measured against a combination of individual, business unit, Aviva Investors and Group performance over an appropriate period.
º A rounded assessment of financial performance is made accounting for a range of financial considerations, including, but not limited to operating profit, investment performance and net flows. The assessment of Aviva Investors’ financial performance is
2. SECURITIES FINANCING TRANSACTIONS (CONTINUED)
AGGREGATE TRANSACTION DATA (CONTINUED)
Maturity tenor of securities lending agreement and total return swap contracts (continued)
Maturity tenor of Total Return Swap Contracts (continued)

Aviva Investors Société d’investissement à capital variable (SICAV)
avivainvestors.com Annual Report and audited financial statements 180
OTHER INFORMATION - UNAUDITED (CONTINUED)As at 31 December 2021
formed with reference to -:
■ Actual results vs. prior period results
■ Actual results vs. agreed plans
■ Actual results relative to competitors
■ Actual results vs., and progress towards, our long-term target ambition.
º The remuneration of employees in Control Functions (defined as Risk, Compliance and Audit) is determined independently of the financial results of Aviva Investors in order to reinforce the independence of these functions.
º The non-financial considerations include consideration of risk, conduct, culture, customer and employee engagement metrics, with Aviva values clearly underpinning all our decisions.
º The Performance assessment does not encourage risk taking outside the Aviva Investors stated risk appetite and includes mechanisms by which performance against risk and conduct related measures has a significant impact on the availability and size of business and individual variable awards.
º Through Aviva Investors’ Global Reward Framework, all investment employees should support responsible investment and integrate ESG considerations into their investment processes, including the consideration of Sustainability Risk. ESG metrics and research are embedded in the investment process and form part of the investment scorecard and annual risk attestation. The Chief Investment Officers and Investment Desk Heads consider how investment employees demonstrate their commitment to ESG processes as part of the determination of performance and pay outcomes.
– Long Term Incentive Awards (LTIA) – discretionary long-term incentive plan to align reward with long-term investment performance, Aviva Group and Shareholders, and with the additional intention to help retain key talent. Part of the long-term incentive plan is in Aviva Investors Funds and part is in Aviva Restricted Share Units (RSUs), for the AI CEO the RSUs have additional performance conditions of Total Shareholder Return and Solvency II Return on Equity. Vesting is after 3 years and awards for Identified Staff will be subject to a pre-vesting assessment of individual performance, behaviours, and alignment with the company values of Aviva Investors throughout the three-year performance period.
– Benefits in Kind – standard benefits are provided that are appropriate to the market.
Code Staff are not permitted to undertake personal hedging strategies in respect of any variable remuneration.
Aviva Investors believes in rewarding strong performance and achievement of our business and individual goals; however, the manner in which these goals are achieved is also important. We do not consider it appropriate to reward people who have engaged in inappropriate behaviour or conduct which is not in line with Aviva’s values and variable pay awards are subject to the Aviva Group Malus and Clawback Policy. As such, Aviva may decide that a Deferred Award which has not vested will lapse wholly or in part if they consider that:
– the participant or their team has, in the opinion of the Directors, engaged in misconduct which ought to result in the complete or partial forfeit or repayment of their award;
– there has been, in the opinion of the Directors, a material failure of risk management by reference to Group risk management standards, policies and procedures, taking into account the proximity of the participant to the failure of risk management in question and the level of the participant’s responsibility;
– there is, in the opinion of the Directors, a materially adverse misstatement of Aviva’s or the participant’s relevant business unit’s financial statements for which the participant has some responsibility;
– the participant participated in or was responsible for conduct which resulted in significant, or potentially significant, loss(es) to their relevant business unit, Aviva or any member of the Aviva Group;
– the participant failed to meet appropriate standards of fitness and propriety;
– there is evidence of misconduct or material error that would justify, or would have justified, had the participant still been employed, summary termination of their contract of employment; or
– any other circumstances required by local regulatory obligations to which any member of the Group or business unit is subject.
The remuneration policies are designed to ensure that any relevant conflicts of interest can be managed appropriately at all times and that the remuneration of its senior staff is in line with the risk policies and objectives of the Alternative Investment Funds (“AIF’s”) it manages, and takes into account the promotion of sound and effective risk management and the achievement of fair outcomes for all customers.
There were 7 Material Risk Takers remunerated from AI Lux as at the end of the 2021 performance year for AI Lux. Aggregate remuneration expenditure in respect of these staff for the 2021 performance year was €1.1 million.
3. REMUNERATION DISCLOSURE – UCITS (CONTINUED)

Aviva Investors Société d’investissement à capital variable (SICAV)
avivainvestors.com Annual Report and audited financial statements 181
OTHER INFORMATION - UNAUDITED (CONTINUED)As at 31 December 2021
Fixed remuneration represents 75% of this total, with 5% being pension/benefits and 15% variable remuneration.
Of the total variable pay (bonus and LTIP) made to Code staff, 0% was deferred.
AI Lux outsources fund management to Aviva Investors Global Services (AIGSL) Limited and other companies. AIGSL is covered under the UK implementation of CRD IV requirements and its fund managers provide services to other Group Companies and Clients.
There were 69 individuals identified as Material Risk Takers for AIGSL, the aggregate remuneration expenditure in respect of these staff for the 2021 performance year was £33.8m. This amount relates to total remuneration and not remuneration specifically apportioned to activities completed on behalf of AI Lux.
Fixed remuneration represents 36% of this total, with 5% being pension/benefits and 59% variable remuneration.
Of the total variable pay (bonus and LTIP) made to these staff, 62% was deferred.
4. ENVIRONMENTAL, SOCIAL & GOVERNANCE (ESG) SUB-FUNDS
Aviva Investors - Climate Transition Global Credit Fund
As a sustainable transition fund, the fund’s objective is to increase the value of the Shareholder’s investment over the long term (5 years or more), by investing in bonds of companies which are deemed to be responding to climate change effectively. To achieve this the fund excludes fossil fuel companies and has two investment sleeves: a Solutions sleeve, which allocates to stocks of companies whose goods and services provide solutions for climate change mitigation and adaptation; a Transition sleeve, which allocates to stocks of companies positively aligning to and orientating their business models to be resilient in a warmer climate and a low-carbon economy.
The fund is also subject to the Aviva Investors' Baseline ESG Exclusions Policy on Controversial Weapons and Civilian Firearms. Additionally, there are specific exclusions that are applicable to the specific fund in line with the funds’ prospectus.
The Manager actively engages with companies with the aim of influencing behaviour and helping to create competitive returns.
ESG is addressed using a quantitative tool coupled with qualitative research. As such, this helps provide a view towards how the fund’s environmental characteristics are being met. Investment recommendations are supported by this assessment, which aims to improve investment decisions, performance and client outcomes. Whilst ESG factors are integrated into the investment process, the Manager retains discretion over investment selection.
MSCI ESG Score - Although not embedded in the investment decision process, MSCI ESG scores are used for comparative purposes. Benchmark – Bloomberg Global Aggregate Corporate Index.
In Q3 of 2021, using MSCI ESG scoring (the higher the better), the portfolio scored 6.74 out of 10 while the benchmark scored 6.17 out of 10. Source: Aviva Investors and MSCI, as at 30 September 2021.
In Q4 2021, using MSCI ESG scoring (the higher the better), the portfolio scored 6.86 out of 10 while the benchmark scored 6.36 out of 10 Source: Aviva Investors and MSCI, as at 31 December 2021.
Weighted Carbon Intensity -Another assessment specific to the portfolio’s environmental objectives is carbon intensity. Carbon intensity is the industry standard for measuring greenhouses gas emissions associated with a portfolio. It is a measure of greenhouse gas emissions (scope 1 & 2) normalised by a company’s sales, which allows for the comparison of emissions between companies of different sizes. The lower the number the better.
As a percentage of market value coverage in Q3 2021 the portfolio was 101.36 and the benchmark was 239.88 Source: Aviva Investors and MSCI, as at 30 June 2021.
As a percentage of market value coverage In Q4 2021, the portfolio was 101.04 and the benchmark was 250.59. Source: Aviva Investors and MSCI, as at 31 December 2021.
MSCI Weighted Average Carbon Intensity (Tons CO2/$M Sales).
A portfolio’s Weighted Average Carbon Intensity is achieved by calculating the carbon intensity (Scope 1 + 2 Emissions / $M Sales) for each portfolio company and calculating the weighted average by portfolio weight.
At the company level, the carbon intensity (Scope 1 + 2 Emissions / $M Sales) represents the company's most recently reported or estimated Scope 1 + Scope 2 greenhouse gas emissions normalized by sales in USD, which allows for comparison between companies of different sizes. MSCI ESG Research collects company-specific direct (Scope 1) and indirect (Scope 2) greenhouse gas emissions data from company public documents and the Carbon Disclosure Project (CDP).
If a company does not report GHG emissions, then MSCI ESG Research uses a proprietary methodology to estimate Scope 1 and Scope 2 GHG emissions. The data is updated on an annual basis. Scope 1 emissions are those from sources owned or controlled by the company, typically direct combustion of fuel as in a furnace or vehicle. Scope 2 emissions are those caused by the generation of electricity purchased by the company. Scope 3 emissions include an array of indirect emissions resulting from activities such as business travel, distribution of products by third parties, and downstream use of a company's products (i.e. by customers). Most reports of Scope 3 emissions include only some portion of these.
ESG data for Benchmarks and Portfolios is reliant on: (i) data provided by third party data providers; and (ii) AI and third-party proprietary models. Data from third party data providers or used in our proprietary models may be incomplete, inaccurate or unavailable. As a result, there is a risk that AI may, from time to time, incorrectly assess a security, issuer or index. There is also a risk that AI, or the third-party data providers on which we may depend, may not interpret or apply the relevant ESG characteristics correctly.
The Sub-Fund’s performance is compared against the Bloomberg Global Aggregate Corporate Index (the “Benchmark” or the “Index”), however the reference benchmark is not aligned with all of the environmental or social characteristics promoted by the Sub-Fund. The Sub-Fund does not base its investment process upon the Index so will not hold every component in the Index and may also hold equities that do not form part of it.
3. REMUNERATION DISCLOSURE – UCITS (CONTINUED)
Aviva Investors Société d’investissement à capital variable (SICAV)
avivainvestors.com Annual Report and audited financial statements 182
OTHER INFORMATION - UNAUDITED (CONTINUED)As at 31 December 2021
Aviva Investors - Climate Transition Global Equity Fund
As a sustainable transition fund, the fund’s objective is to increase the value of the Shareholder’s investment over the long term (5 years or more), by investing in global equities of companies which are deemed to be responding to climate change effectively. To achieve this the fund excludes fossil fuel companies and has two investment sleeves: a Solutions sleeve, which allocates to stocks of companies whose goods and services provide solutions for climate change mitigation and adaptation; a Transition sleeve, which allocates to stocks of companies positively aligning to and orientating their business models to be resilient in a warmer climate and a low-carbon economy.
The fund is also subject to the Aviva Investors' Baseline ESG Exclusions Policy on Controversial Weapons and Civilian Firearms. Additionally, there are specific exclusions that are applicable to the specific fund in line with the funds’ prospectus.
The Manager actively engages with companies with the aim of influencing behaviour and helping to create competitive returns.
ESG is addressed using a quantitative tool coupled with qualitative research. As such, this helps provide a view towards how the fund’s environmental characteristics are being met. Investment recommendations are supported by this assessment, which aims to improve investment decisions, performance and client outcomes. Whilst ESG factors are integrated into the investment process, the Manager retains discretion over investment selection.
MSCI ESG Score - Although not embedded in the investment decision process, MSCI ESG scores are used for comparative purposes. Benchmark – MSCI All Countries World Index.
In Q1 of 2021, using MSCI ESG scoring (the higher the better), the portfolio scored 6.79 out of 10 while the benchmark scored 5.96 out of 10. Source: Aviva Investors and MSCI, as at 31 March 2021.
In Q2 of 2021, using MSCI ESG scoring (the higher the better), the portfolio scored 6.91 out of 10 while the benchmark scored 6.02 out of 10. Source: Aviva Investors and MSCI, as at 30 June 2021.
In Q3 of 2021, using MSCI ESG scoring (the higher the better), the portfolio scored 6.99 out of 10 while the benchmark scored 6.11 out of 10. Source: Aviva Investors and MSCI, as at 30 September 2021.
In Q4 2021, using MSCI ESG scoring (the higher the better), the portfolio scored 7.19 out of 10 while the benchmark scored 6.36 out of 10. Source: Aviva Investors and MSCI, as at 31 December 2021.
Weighted Carbon Intensity - Another assessment specific to the portfolio’s environmental objectives is carbon intensity. Carbon intensity is the industry standard for measuring greenhouses gas emissions associated with a portfolio. It is a measure of greenhouse gas emissions (scope 1 & 2) normalised by a company’s sales, which allows for the comparison of emissions between companies of different sizes. The lower the number the better.
As a percentage of market value coverage in Q1 2021 the portfolio was 93.23 and the benchmark was 151.71. Source: Aviva Investors and MSCI, as at 31 March 2021.
As a percentage of market value coverage in Q2 2021 the portfolio was 106.77and the benchmark was 150.88. Source: Aviva Investors and MSCI, as at 30 June 2021.
As a percentage of market value coverage in Q3 2021 the portfolio was 92.04 and the benchmark was 154.84. Source: Aviva Investors and MSCI, as at 30 September 2021.
As a percentage of market value coverage In Q4 2021, the portfolio was 85.83 and the benchmark was 151.64. Source: Aviva Investors and MSCI, as at 31 December 2021.
MSCI Weighted Average Carbon Intensity (Tons CO2/$M Sales).
A portfolio’s Weighted Average Carbon Intensity is achieved by calculating the carbon intensity (Scope 1 + 2 Emissions / $M Sales) for each portfolio company and calculating the weighted average by portfolio weight.
At the company level, the carbon intensity (Scope 1 + 2 Emissions / $M Sales) represents the company's most recently reported or estimated Scope 1 + Scope 2 greenhouse gas emissions normalized by sales in USD, which allows for comparison between companies of different sizes. MSCI ESG Research collects company-specific direct (Scope 1) and indirect (Scope 2) greenhouse gas emissions data from company public documents and the Carbon Disclosure Project (CDP).
If a company does not report GHG emissions, then MSCI ESG Research uses a proprietary methodology to estimate Scope 1 and Scope 2 GHG emissions. The data is updated on an annual basis. Scope 1 emissions are those from sources owned or controlled by the company, typically direct combustion of fuel as in a furnace or vehicle. Scope 2 emissions are those caused by the generation of electricity purchased by the company. Scope 3 emissions include an array of indirect emissions resulting from activities such as business travel, distribution of products by third parties, and downstream use of a company's products (i.e. by customers). Most reports of Scope 3 emissions include only some portion of these.
The Sub-Fund’s performance is compared against the MSCI All Countries World Index (the “Benchmark” or the “Index”), however the reference benchmark is not aligned with all of the environmental or social characteristics promoted by the Sub-Fund. The Sub-Fund does not base its investment process upon the Index so will not hold every component in the Index and may also hold equities that do not form part of it.
ESG data for Benchmarks and Portfolios is reliant on: (i) data provided by third party data providers; and (ii) AI and third-party proprietary models. Data from third party data providers or used in our proprietary models may be incomplete, inaccurate or unavailable. As a result, there is a risk that AI may, from time to time, incorrectly assess a security, issuer or index. There is also a risk that AI, or the third-party data providers on which we may depend, may not interpret or apply the relevant ESG characteristics correctly.
4. ENVIRONMENTAL, SOCIAL & GOVERNANCE (ESG) SUB-FUNDS (CONTINUED)
Aviva Investors Société d’investissement à capital variable (SICAV)
avivainvestors.com Annual Report and audited financial statements 183
OTHER INFORMATION - UNAUDITED (CONTINUED)As at 31 December 2021
Aviva Investors - Climate Transition European Equity Fund
As a sustainable transition fund, the fund’s objective is to increase the value of the Shareholder’s investment over the long term (5 years or more), by investing in European equities of companies which are deemed to be responding to climate change effectively. To achieve this the fund excludes fossil fuel companies and has two investment sleeves: a Solutions sleeve, which allocates to stocks of companies whose goods and services provide solutions for climate change mitigation and adaptation; a Transition sleeve, which allocates to stocks of companies positively aligning to and orientating their business models to be resilient in a warmer climate and a low-carbon economy.
The fund is also subject to the Aviva Investors' Baseline ESG Exclusions Policy on Controversial Weapons and Civilian Firearms. Additionally, there are specific exclusions that are applicable to the specific fund in line with the funds’ prospectus.
The Manager actively engages with companies with the aim of influencing behaviour and helping to create competitive returns.
ESG is addressed using a quantitative tool coupled with qualitative research. As such, this helps provide a view towards how the fund’s environmental characteristics are being met. Investment recommendations are supported by this assessment, which aims to improve investment decisions, performance and client outcomes. Whilst ESG factors are integrated into the investment process, the Manager retains discretion over investment selection.
MSCI ESG Score - Although not embedded in the investment decision process, MSCI ESG scores are used for comparative purposes. Benchmark – MSCI Europe Net TR.
In Q1 of 2021, using MSCI ESG scoring (the higher the better), the portfolio scored 7.27 out of 10 while the benchmark scored 7.35 out of 10. Source: Aviva Investors and MSCI, as at 31 March 2021.
In Q2 of 2021, using MSCI ESG scoring (the higher the better), the portfolio scored 7.50 out of 10 while the benchmark scored 7.47 out of 10. Source: Aviva Investors and MSCI, as at 30 June 2021.
In Q3 of 2021, using MSCI ESG scoring (the higher the better), the portfolio scored 7.65 out of 10 while the benchmark scored 7.53 out of 10. Source: Aviva Investors and MSCI, as at 30 September 2021.
In Q4 2021, using MSCI ESG scoring (the higher the better), the portfolio scored 7.92 out of 10 while the benchmark scored 7.63 out of 10 Source: Aviva Investors and MSCI, as at 31 December 2021.
Weighted Carbon Intensity - Another assessment specific to the portfolio’s environmental objectives is carbon intensity. Carbon intensity is the industry standard for measuring greenhouses gas emissions associated with a portfolio. It is a measure of greenhouse gas emissions (scope 1 & 2) normalised by a company’s sales, which allows for the comparison of emissions between companies of different sizes. The lower the number the better.
As a percentage of market value coverage in Q1 2021 the portfolio was 112.71 and the benchmark was 141.66. Source: Aviva Investors and MSCI, as at 31 March 2021.
As a percentage of market value coverage in Q2 2021 the portfolio was 104.77 and the benchmark was 131.51. Source: Aviva Investors and MSCI, as at 30 June 2021.
As a percentage of market value coverage in Q3 2021 the portfolio was 101.57 and the benchmark was 127.97. Source: Aviva Investors and MSCI, as at 30 September 2021.
As a percentage of market value coverage In Q4 2021, the portfolio was 89.78 and the benchmark was 122.92. Source: Aviva Investors and MSCI, as at 31 December 2021.
MSCI Weighted Average Carbon Intensity (Tons CO2/$M Sales).
A portfolio’s Weighted Average Carbon Intensity is achieved by calculating the carbon intensity (Scope 1 + 2 Emissions / $M Sales) for each portfolio company and calculating the weighted average by portfolio weight.
At the company level, the carbon intensity (Scope 1 + 2 Emissions / $M Sales) represents the company's most recently reported or estimated Scope 1 + Scope 2 greenhouse gas emissions normalized by sales in USD, which allows for comparison between companies of different sizes. MSCI ESG Research collects company-specific direct (Scope 1) and indirect (Scope 2) greenhouse gas emissions data from company public documents and the Carbon Disclosure Project (CDP).
If a company does not report GHG emissions, then MSCI ESG Research uses a proprietary methodology to estimate Scope 1 and Scope 2 GHG emissions. The data is updated on an annual basis. Scope 1 emissions are those from sources owned or controlled by the company, typically direct combustion of fuel as in a furnace or vehicle. Scope 2 emissions are those caused by the generation of electricity purchased by the company. Scope 3 emissions include an array of indirect emissions resulting from activities such as business travel, distribution of products by third parties, and downstream use of a company's products (i.e. by customers). Most reports of Scope 3 emissions include only some portion of these.
ESG data for Benchmarks and Portfolios is reliant on: (i) data provided by third party data providers; and (ii) AI and third-party proprietary models. Data from third party data providers or used in our proprietary models may be incomplete, inaccurate or unavailable. As a result, there is a risk that AI may, from time to time, incorrectly assess a security, issuer or index. There is also a risk that AI, or the third-party data providers on which we may depend, may not interpret or apply the relevant ESG characteristics correctly.
The Sub-Fund’s performance is compared against the MSCI Europe Net TR (the “Benchmark” or the “Index”), however the reference benchmark is not aligned with all of the environmental or social characteristics promoted by the Sub-Fund. The Sub-Fund does not base its investment process upon the Index so will not hold every component in the Index and may also hold equities that do not form part of it.
4. ENVIRONMENTAL, SOCIAL & GOVERNANCE (ESG) SUB-FUNDS (CONTINUED)
Aviva Investors Société d’investissement à capital variable (SICAV)
avivainvestors.com Annual Report and audited financial statements 184
OTHER INFORMATION - UNAUDITED (CONTINUED)As at 31 December 2021
Aviva Investors - Natural Capital Transition Global Equity Fund and Aviva Investors - Social Transition Global Equity Fund
We acknowledge that the provisions under Article 11 of the EU Sustainable Finance Regulation require Aviva Investors to include, in the product’s annual report, information on how each of the ESG characteristics promoted by that product have been met. Where a product or fund has transitioned to Article 8 during Q4 2021, there is unlikely to be a material update, or the necessary data, through which Aviva Investors could portray an accurate representation of how the ESG characteristics promoted by that fund or product have been met. For one month of 2021, we launched the Natural Capital and Social Transition Funds, which each invested in c.40 companies reflective of the solutions and transitions investment approach as detailed in the Aviva Investors Luxembourg SICAV Prospectus. Both sub funds benefit from the Aviva Investors’ sustainable transition exclusion policy, consisting of three levels of exclusions, which are designed to ensure that no significant harm is caused to people, natural capital or the climate. Aviva Investors will endeavour to meet the Periodic Reporting obligations outlined in the SFDR Regulatory Technical Standards, when these become effective from January 2023. The first annual report for these funds will cover 1stJanuary 2022 until 31st December 2022.
The investments underlying this financial product do not take into account the EU criteria for environmentally sustainable economic activities.
Aviva Investors - Sustainable Income & Growth Fund
The fund’s objective is to provide a yearly income yield of 5% with the potential for capital growth over the long term (5 years or more), by investing in a broad range of asset classes focussed on long-term sustainability. To achieve this, we select investments based on income and sustainability characteristics in line with the fund’s objectives.
At least 90% of the Fund’s investments (other than bonds issued by governments) are assessed according to our proprietary ESG model, which include specific exclusions related to coal, tobacco and controversial weapons. The Fund meets an overall threshold by reference to the ESG model. The approach is holistic in nature and integration of ESG factors in the investment process aims to identify leading and mature companies which are considered to offer superior earnings growth and sustainable dividends, whilst also demonstrating a sustainable business approach.
Investment decisions are supported by active engagements with these companies and use voting rights, with the intention of positively influencing company behaviour to contribute to competitive returns.
The constituents of the Index is screened using MSCI ESG Scores, with the bottom 20% of companies excluded from eligibility for the fund.
Companies ranked in the bottom 20% of the Benchmark* by MSCI® ESG Rating will be excluded from eligibility for investment by the Fund, and the Fund will need to meet an overall threshold by reference to the ESG model.
Benchmark*: Composite of 60% MSCI All Country World Index (Net) USD and 40% Bloomberg Global Aggregate Total Return Index Unhedged USD, however the reference benchmark is not aligned with all of the environmental or social characteristics promoted by the Fund. The Fund does not base its investment process upon the Composite Index so will not hold every component in the Composite Index and may also hold securities that do not form part of it.
MSCI ESG Score
In Q1 of 2021, using MSCI ESG scoring (the higher the better), the portfolio scored 6.15 out of 10 while the benchmark scored 6.32 out of 10. Source: Aviva Investors and MSCI, as at 31 March 2021.
In Q2 of 2021, using MSCI ESG scoring (the higher the better), the portfolio scored 6.41 out of 10 while the benchmark scored 5.68 out of 10. Source: Aviva Investors and MSCI, as at 30 June 2021.
In Q3 of 2021, using MSCI ESG scoring (the higher the better), the portfolio scored 6.58 out of 10 while the benchmark scored 5.62 out of 10. Source: Aviva Investors and MSCI, as at 30 September 2021.
In Q4 2021, using MSCI ESG scoring (the higher the better), the portfolio scored 6.36 out of 10 while the benchmark scored 5.82 out of 10 Source: Aviva Investors and MSCI, as at 31 December 2021.
ESG data for Benchmarks and Portfolios is reliant on: (i) data provided by third party data providers; and (ii) AI and third-party proprietary models. Data from third party data providers or used in our proprietary models may be incomplete, inaccurate or unavailable. As a result, there is a risk that AI may, from time to time, incorrectly assess a security, issuer or index. There is also a risk that AI, or the third-party data providers on which we may depend, may not interpret or apply the relevant ESG characteristics correctly.
The Sub-Fund’s performance is compared against the Composite of 60% MSCI All Country World Index (Net) USD and 40% Bloomberg Global Aggregate Total Return Index Unhedged USD. (the “Benchmark” or the “Index”), however the reference benchmark is not aligned with all of the environmental or social characteristics promoted by the Sub-Fund. The Sub-Fund does not base its investment process upon the Index so will not hold every component in the Index and may also hold equities that do not form part of it.
4. ENVIRONMENTAL, SOCIAL & GOVERNANCE (ESG) SUB-FUNDS (CONTINUED)

Aviva Investors Société d’investissement à capital variable (SICAV)
avivainvestors.com Annual Report and audited financial statements 185
INFORMATION FOR INVESTORS IN SWITZERLAND - UNAUDITEDAs at 31 December 2021
1. TOTAL EXPENSE RATIO (TER)
Sub-Fund Name Total expense ratio (%)
Aviva Investors - Asian Equity Income Fund
A Share Class Accumulation 1.74B Share Class Accumulation 1.99I Share Class Accumulation 0.94R Share Class Accumulation* 1.00Z Share Class Accumulation 0.07Za Share Class Dividend GBP 0.08Zy Share Class Accumulation GBP 0.08Aviva Investors - Climate Transition Global Credit Fund*
A Share Class Accumulation* 1.48A Share Class Accumulation EUR* 0.88Ah Share Class Accumulation Hedged EUR* 0.90I Share Class Accumulation* 0.40I Share Class Accumulation EUR* 0.34Ih Share Class Accumulation Hedged AUD* 0.49Ih Share Class Accumulation Hedged CHF* 0.38Ih Share Class Accumulation Hedged EUR* 0.35Iyh Share Class Accumulation Hedged GBP* 0.52K Share Class Accumulation EUR* 0.00R Share Class Accumulation* 0.38R Share Class Accumulation EUR* 0.37Ryh Share Class Accumulation Hedged GBP* 0.50S Share Class Accumulation* 0.40S Share Class Accumulation EUR* 0.30Sh Share Class Accumulation Hedged AUD* 0.00Syh Share Class Accumulation Hedged GBP* 0.26Zh Share Class Accumulation Hedged EUR* 0.08Zyh Share Class Accumulation Hedged GBP* 0.06Aviva Investors - Climate Transition Global Equity Fund
A Share Class Accumulation 1.69F Share Class Accumulation Hedged AUD 0.10I Share Class Accumulation 0.84Z Share Class Accumulation EUR 0.10Z Share Class Accumulation GBP 0.10Aviva Investors - Climate Transition European Equity Fund
A Share Class Accumulation 1.74AFER Climat Share Class Dividend* 1.39I Share Class Accumulation 0.95K Share Class Accumulation 0.43R Share Class Accumulation 1.00Ry Share Class Accumulation GBP 0.99Zy Share Class Accumulation Hedged GBP* 0.10Aviva Investors - Emerging Markets Bond Fund
A Share Class Accumulation 1.39A Share Class Accumulation Hedged EUR 1.42B Share Class Accumulation 1.65B Share Class Accumulation Hedged EUR* 1.60Bm Share Class Dividend 1.65Bm Share Class Dividend Hedged EUR 1.66I Share Class Accumulation 0.77I Share Class Accumulation Hedged CHF 0.77I Share Class Accumulation Hedged EUR 0.76Ia Share Class Dividend 0.76K Share Class Accumulation EUR 0.39K Share Class Accumulation Hedged EUR* 0.38Kq Share Class Dividend Hedged EUR 0.40Ra Share Class Dividend Hedged EUR 0.79Ry Share Class Accumulation Hedged CHF 0.80V Share Class Accumulation 0.04Z Share Class Accumulation 0.04Z Share Class Accumulation Hedged GBP 0.04Zq Share Class Dividend Hedged EUR 0.04Zy Share Class Accumulation Hedged GBP 0.03Aviva Investors - Emerging Markets Corporate Bond Fund
I Share Class Accumulation 0.97I Share Class Accumulation Hedged EUR 0.98Iq Share Class Dividend Hedged EUR* 0.95K Share Class Accumulation Hedged EUR* 0.42Kq Share Class Dividend Hedged EUR 0.42

Aviva Investors Société d’investissement à capital variable (SICAV)
avivainvestors.com Annual Report and audited financial statements 186
INFORMATION FOR INVESTORS IN SWITZERLAND - UNAUDITED (CONTINUED)As at 31 December 2021
Sub-Fund Name Total expense ratio (%)
Zy Share Class Accumulation Hedged EUR 0.04Zy Share Class Accumulation Hedged GBP 0.05Aviva Investors - Emerging Markets Equity Income Fund
A Share Class Accumulation 1.92B Share Class Accumulation 2.17B Share Class Accumulation EUR 2.17I Share Class Accumulation 1.04R Share Class Accumulation* 1.09Ra Share Class Dividend GBP 1.08Z Share Class Accumulation 0.06Z Share Class Accumulation EUR 0.03Z Share Class Accumulation GBP 0.06Zy Share Class Accumulation GBP 0.06Aviva Investors - Emerging Markets Equity Small Cap Fund
A Share Class Accumulation 2.04B Share Class Accumulation 2.29B Share Class Accumulation EUR 2.27I Share Class Accumulation 1.14I Share Class Accumulation EUR 1.18M Share Class Accumulation 0.71Ra Share Class Dividend GBP 1.17Z Share Class Accumulation 0.16Zy Share Class Accumulation 0.16Zy Share Class Accumulation GBP 0.17Aviva Investors - Emerging Markets Local Currency Bond Fund
A Share Class Accumulation 1.45Aa Share Class Dividend 1.44B Share Class Accumulation 1.68B Share Class Accumulation USD 1.70Bm Share Class Dividend 1.69I Share Class Accumulation 0.78I Share Class Accumulation GBP 0.62I Share Class Accumulation USD 0.80Ia Share Class Dividend 0.02Ia Share Class Dividend GBP 0.81R Share Class Accumulation* 0.85R Share Class Accumulation GBP 0.84R Share Class Accumulation USD 0.81Z Share Class Accumulation 0.07Zy Share Class Accumulation GBP 0.07Aviva Investors - European Corporate Bond Fund
A Share Class Accumulation 0.99B Share Class Accumulation 1.00Ba Share Class Dividend 1.00I Share Class Accumulation 0.55Z Share Class Accumulation 0.10Aviva Investors - European Equity Fund
A Share Class Accumulation 1.77B Share Class Accumulation 2.03I Share Class Accumulation 1.00R Share Class Accumulation* 1.08Z Share Class Accumulation 0.12Aviva Investors - European Equity Income Fund
A Share Class Accumulation 1.65B Share Class Accumulation 1.91I Share Class Accumulation 0.64Za Share Class Dividend GBP 0.06Aviva Investors - European High Yield Bond Fund*
A Share Class Accumulation* 1.32I Share Class Accumulation* 0.37Ia Share Class Dividend* 0.15K Share Class Accumulation* 0.43R Share Class Accumulation* 0.12Z Share Class Accumulation* 0.09Aviva Investors - European Real Estate Securities Fund*
A Share Class Accumulation* 1.60B Share Class Accumulation* 1.60I Share Class Accumulation* 0.85R Share Class Accumulation* 0.85
1. TOTAL EXPENSE RATIO (TER) (CONTINUED)

Aviva Investors Société d’investissement à capital variable (SICAV)
avivainvestors.com Annual Report and audited financial statements 187
INFORMATION FOR INVESTORS IN SWITZERLAND - UNAUDITED (CONTINUED)As at 31 December 2021
Sub-Fund Name Total expense ratio (%)
Za Share Class Dividend* 0.10Aviva Investors - Global Sovereign Bond Fund
I Share Class Accumulation 0.39Iy Share Class Accumulation Hedged GBP 0.34Z Share Class Accumulation Hedged GBP 0.04Aviva Investors - Global Convertibles Absolute Return Fund
A Share Class Accumulation Hedged EUR 1.86Ay Share Class Accumulation* 1.53I Share Class Accumulation 1.15I Share Class Accumulation Hedged CHF 1.06I Share Class Accumulation Hedged EUR 1.07I Share Class Accumulation Hedged GBP 1.09Ia Share Class Dividend 1.14Ia Share Class Dividend Hedged EUR 1.05Ia Share Class Dividend Hedged GBP 1.11R Share Class Accumulation 1.15R Share Class Accumulation Hedged CHF 1.10R Share Class Accumulation Hedged EUR 1.10R Share Class Accumulation Hedged GBP 1.14Ry Share Class Accumulation Hedged EUR 1.10Ry Share Class Accumulation Hedged GBP 1.05Z Share Class Accumulation Hedged GBP 0.05Zy Share Class Accumulation Hedged GBP 0.05Aviva Investors - Global Convertibles Fund
A Share Class Accumulation 1.48A Share Class Accumulation Hedged CHF 1.49A Share Class Accumulation Hedged EUR 1.46Aa Share Class Dividend GBP 1.51Aa Share Class Dividend Hedged GBP 1.48Ay Share Class Accumulation Hedged SGD* 1.47B Share Class Accumulation 1.73B Share Class Accumulation Hedged EUR 1.74I Share Class Accumulation 0.83I Share Class Accumulation Hedged EUR 0.84Ia Share Class Dividend GBP 0.84Ia Share Class Dividend Hedged GBP 0.84Iy Share Class Accumulation Hedged EUR 0.84Iy Share Class Accumulation Hedged GBP 0.85Iy Share Class Accumulation Hedged USD 0.85Kq Share Class Dividend Hedged EUR 0.45Ra Share Class Dividend Hedged GBP 0.88Z Share Class Accumulation 0.12Z Share Class Accumulation Hedged EUR 0.12Z Share Class Accumulation Hedged GBP* 0.14Aviva Investors - Global Emerging Markets Equity Unconstrained Fund
I Share Class Accumulation 0.54S Share Class Accumulation 0.52Z Share Class Accumulation EUR* 0.12Z Share Class Accumulation Hedged GBP 0.10Zy Share Class Accumulation GBP 0.10Aviva Investors - Global Emerging Markets Index Fund
I Share Class Accumulation 0.44Z Share Class Accumulation 0.10Z Share Class Accumulation EUR* 0.08Zy Share Class Accumulation GBP 0.10Aviva Investors - Global Equity Endurance Fund
A Share Class Accumulation 1.70I Share Class Accumulation 0.91I Share Class Accumulation EUR* 0.52Ry Share Class Accumulation GBP 0.95Z Share Class Accumulation 0.04Za Share Class Dividend GBP 0.05Aviva Investors - Global Equity Unconstrained Fund*
I Share Class Accumulation* 0.42S Share Class Accumulation* 0.52Z Share Class Accumulation Hedged GBP* 0.09Aviva Investors - Global High Yield Bond Fund
A Share Class Accumulation 1.39A Share Class Accumulation Hedged CHF 1.38
1. TOTAL EXPENSE RATIO (TER) (CONTINUED)

Aviva Investors Société d’investissement à capital variable (SICAV)
avivainvestors.com Annual Report and audited financial statements 188
INFORMATION FOR INVESTORS IN SWITZERLAND - UNAUDITED (CONTINUED)As at 31 December 2021
Sub-Fund Name Total expense ratio (%)
A Share Class Accumulation Hedged EUR 1.39A Share Class Accumulation Hedged SGD 1.39Am Share Class Dividend 1.39Am Share Class Dividend Hedged GBP 1.39Am Share Class Dividend Hedged SGD 1.39B Share Class Accumulation Hedged EUR 1.65Ba Share Class Dividend Hedged EUR 1.64Bm Share Class Dividend 1.64I Share Class Accumulation 0.76I Share Class Accumulation Hedged CAD 0.75I Share Class Accumulation Hedged EUR 0.75I Share Class Accumulation Hedged GBP 0.75Ia Share Class Dividend 0.75Ia Share Class Dividend Hedged CHF 0.75Ia Share Class Dividend Hedged EUR 0.76Ia Share Class Dividend Hedged GBP 0.75Ih Share Class Accumulation Hedged USD* 0.71Iq Share Class Dividend Hedged GBP* 0.78K Share Class Accumulation Hedged EUR 0.24Kq Share Class Dividend Hedged EUR 0.38M Share Class Accumulation 0.51M Share Class Accumulation Hedged CHF 0.51M Share Class Accumulation Hedged EUR 0.51R Share Class Accumulation 0.79R Share Class Accumulation Hedged CHF 0.79R Share Class Accumulation Hedged EUR 0.79R Share Class Accumulation Hedged SGD 0.73Ra Share Class Dividend 0.80Ra Share Class Dividend Hedged GBP 0.79V Share Class Accumulation EUR 0.00V Share Class Accumulation Hedged EUR 0.02Z Share Class Accumulation 0.02Z Share Class Accumulation Hedged GBP 0.02Zq Share Class Dividend Hedged EUR 0.06Zy Share Class Accumulation Hedged GBP 0.03Aviva Investors - Global Investment Grade Corporate Bond Fund
I Share Class Accumulation 0.61I Share Class Accumulation Hedged EUR 0.62Ia Share Class Dividend Hedged GBP* 0.62K Share Class Accumulation EUR 0.49Mq Share Class Dividend Hedged EUR 0.30Mq Share Class Dividend Hedged GBP 0.30Mq Share Class Dividend 0.30Z Share Class Accumulation 0.04Zy Share Class Accumulation Hedged EUR* 0.04Zy Share Class Accumulation Hedged GBP 0.04Aviva Investors - Multi-Strategy Fixed Income Fund*
A Share Class Accumulation Hedged SEK* 0.71F Share Class Accumulation Hedged AUD* 0.30I Share Class Accumulation* 0.48I Share Class Accumulation Hedged CHF* 0.28I Share Class Accumulation Hedged GBP* 0.47I Share Class Accumulation Hedged USD* 0.25Iq Share Class Dividend Hedged CHF* 0.27Iq Share Class Dividend Hedged GBP* 0.16R Share Class Accumulation Hedged CHF* 0.27Rq Share Class Dividend Hedged CHF* 0.27Rq Share Class Dividend Hedged GBP* 0.22Z Share Class Accumulation* 0.08Zy Share Class Accumulation Hedged GBP* 0.08Aviva Investors - Multi-Strategy Target Income Fund*
Am Share Class Dividend* 1.50Am Share Class Dividend Hedged USD* 1.50Fm Share Class Dividend Hedged AUD* 0.56I Share Class Accumulation* 0.80Im Share Class Dividend* 0.80Im Share Class Dividend Hedged GBP* 0.80Im Share Class Dividend Hedged USD* 0.80Km Share Class Dividend* 0.66
1. TOTAL EXPENSE RATIO (TER) (CONTINUED)
Aviva Investors Société d’investissement à capital variable (SICAV)
avivainvestors.com Annual Report and audited financial statements 189
INFORMATION FOR INVESTORS IN SWITZERLAND - UNAUDITED (CONTINUED)As at 31 December 2021
Sub-Fund Name Total expense ratio (%)
Mm Share Class Dividend Hedged GBP* 0.65Zm Share Class Dividend* 0.11Aviva Investors - Multi-Strategy Target Return Fund
A Share Class Accumulation 1.61A Share Class Accumulation Hedged GBP 1.60A Share Class Accumulation Hedged NOK* 1.60A Share Class Accumulation Hedged SEK 1.60A Share Class Accumulation Hedged SGD 1.60A Share Class Accumulation Hedged USD 1.60B Share Class Accumulation 1.85F Share Class Accumulation Hedged AUD 0.56Fa Share Class Dividend Hedged CAD 0.56I Share Class Accumulation 0.85I Share Class Accumulation Hedged CHF 0.85I Share Class Accumulation Hedged GBP 0.85I Share Class Accumulation Hedged NZD 0.85I Share Class Accumulation Hedged SGD* 0.85I Share Class Accumulation Hedged USD 0.85Iq Share Class Dividend* 0.77Iy Share Class Accumulation 0.85Iy Share Class Accumulation Hedged GBP 0.85Iy Share Class Accumulation Hedged USD 0.85J Share Class Accumulation 1.82K Share Class Accumulation 0.63M Share Class Accumulation 0.70M Share Class Accumulation Hedged CHF 0.70Mq Share Class Dividend 0.70My Share Class Accumulation Hedged GBP 0.70R Share Class Accumulation* 0.58R Share Class Accumulation Hedged CHF 0.85R Share Class Accumulation Hedged GBP* 0.14Ra Share Class Dividend Hedged GBP 0.85Ry Share Class Accumulation 0.85Ry Share Class Accumulation Hedged GBP 0.86Ry Share Class Accumulation Hedged USD 0.85Z Share Class Accumulation 0.07Zq Share Class Dividend Hedged GBP* 0.06Aviva Investors - Natural Capital Transition Global Equity Fund*
A Share Class Accumulation* 2.38A Share Class Accumulation EUR* 1.46I Share Class Accumulation* 0.60I Share Class Accumulation EUR* 0.48Iy Share Class Accumulation Hedged GBP* 0.43R Share Class Accumulation* 0.60R Share Class Accumulation EUR* 0.48Ry Share Class Accumulation Hedged GBP* 0.43S Share Class Accumulation* 0.40S Share Class Accumulation EUR* 0.39Zy Share Class Accumulation GBP* 0.10Zy Share Class Accumulation Hedged GBP* 0.00Aviva Investors - Short Duration Global High Yield Bond Fund
A Share Class Accumulation 1.11A Share Class Accumulation Hedged EUR 1.11Am Share Class Dividend 1.11Ay Share Class Accumulation 1.12Ay Share Class Accumulation Hedged EUR 1.13I Share Class Accumulation 0.63I Share Class Accumulation Hedged CHF 0.62I Share Class Accumulation Hedged EUR 0.63I Share Class Accumulation Hedged GBP 0.62Ia Share Class Dividend Hedged EUR 0.63Im Share Class Dividend 0.60Iq Share Class Dividend Hedged CHF 0.57Iy Share Class Accumulation 0.32Iy Share Class Accumulation Hedged CHF 0.32Iy Share Class Accumulation Hedged EUR 0.62Kq Share Class Dividend Hedged EUR 0.32M Share Class Accumulation 0.41R Share Class Accumulation 0.67
1. TOTAL EXPENSE RATIO (TER) (CONTINUED)

Aviva Investors Société d’investissement à capital variable (SICAV)
avivainvestors.com Annual Report and audited financial statements 190
INFORMATION FOR INVESTORS IN SWITZERLAND - UNAUDITED (CONTINUED)As at 31 December 2021
Sub-Fund Name Total expense ratio (%)
R Share Class Accumulation Hedged CHF 0.64R Share Class Accumulation Hedged EUR 0.60Ry Share Class Accumulation 0.66Ry Share Class Accumulation Hedged EUR 0.67Ry Share Class Accumulation Hedged GBP 0.66Aviva Investors - Social Transition Global Equity Fund*
A Share Class Accumulation* 2.62A Share Class Accumulation EUR* 1.48I Share Class Accumulation* 0.60I Share Class Accumulation EUR* 0.49Iy Share Class Accumulation Hedged GBP* 0.41R Share Class Accumulation* 0.60R Share Class Accumulation EUR* 0.49Ry Share Class Accumulation Hedged GBP* 0.41S Share Class Accumulation* 0.40S Share Class Accumulation EUR* 0.41Sy Share Class Accumulation GBP* 0.35Zy Share Class Accumulation GBP* 0.10Zy Share Class Accumulation Hedged GBP* 0.00Aviva Investors - Sustainable Income & Growth Fund
A Share Class Accumulation EUR 1.59A Share Class Accumulation Hedged SGD 1.59Aq Share Class Dividend Hedged SGD 1.60I Share Class Accumulation 0.51I Share Class Accumulation EUR 0.47Iq Share Class Dividend 0.50Iq Share Class Dividend EUR 0.60R Share Class Accumulation EUR 0.57Rq Share Class Dividend EUR 0.59S Share Class Accumulation 0.51S Share Class Accumulation EUR 0.59Sq Share Class Dividend EUR 0.47Z Share Class Accumulation 0.00Aviva Investors - UK Listed Equity High Alpha Fund
Aa Share Class Dividend 1.76B Share Class Accumulation 2.00I Share Class Accumulation 0.96R Share Class Accumulation* 0.96Z Share Class Accumulation 0.09Aviva Investors - US Equity Income Fund
A Share Class Accumulation 1.60I Share Class Accumulation 0.85Ia Share Class Dividend 0.85R Share Class Accumulation* 0.85Aviva Investors - US Investment Grade Bond Fund*
I Share Class Accumulation* 0.33K Share Class Accumulation Hedged EUR* 0.45Zy Share Class Accumulation Hedged GBP* 0.05
1. TOTAL EXPENSE RATIO (TER) (CONTINUED)
*Please refer to Directors’ report for details of all corporate activities during the year.Aviva Investors - TER was calculated in accordance with the applicable SFAMA guidelines. SFAMA and AMP (Asset Management Platform) have merged into AMAS (Asset Management Association Switzerland).

Aviva Investors Société d’investissement à capital variable (SICAV)
avivainvestors.com Annual Report and audited financial statements 191
INFORMATION FOR INVESTORS IN SWITZERLAND - UNAUDITED (CONTINUED)As at 31 December 2021
2.PERFORMANCE
ISIN Sub-Fund Name Share Class
Class
Currency
2021
in %
2020
in %
2019
in %
LU0274939718 Aviva Investors - Asian Equity Income Fund A Share Class Accumulation USD (1.82) 14.57 18.10LU0010019817 Aviva Investors - Asian Equity Income Fund B Share Class Accumulation USD (2.07) 14.28 17.80LU0160787940 Aviva Investors - Asian Equity Income Fund I Share Class Accumulation USD (1.04) 15.48 19.03LU1370700145 Aviva Investors - Asian Equity Income Fund R Share Class Accumulation USD – 15.40 18.97LU0560706995 Aviva Investors - Asian Equity Income Fund Z Share Class Accumulation USD (0.17) 16.49 20.08LU1660918704 Aviva Investors - Asian Equity Income Fund Za Share Class Dividend GBP GBP 0.88 12.68 16.28LU1360566621 Aviva Investors - Asian Equity Income Fund Zy Share Class Accumulation GBP GBP 0.89 12.70 16.32LU2299074091 Aviva Investors - Climate Transition Global Credit Fund A Share Class Accumulation USD – – –LU2299074174 Aviva Investors - Climate Transition Global Credit Fund A Share Class Accumulation EUR EUR – – –
LU2324722359 Aviva Investors - Climate Transition Global Credit FundAh Share Class Accumulation Hedged EUR EUR 0.11 – –
LU2299074257 Aviva Investors - Climate Transition Global Credit Fund I Share Class Accumulation USD – – –LU2299074331 Aviva Investors - Climate Transition Global Credit Fund I Share Class Accumulation EUR EUR 6.88 – –
LU2324722276 Aviva Investors - Climate Transition Global Credit FundIh Share Class Accumulation Hedged AUD AUD 0.78 – –
LU2324722193 Aviva Investors - Climate Transition Global Credit FundIh Share Class Accumulation Hedged CHF CHF 0.28 – –
LU2324721542 Aviva Investors - Climate Transition Global Credit FundIh Share Class Accumulation Hedged EUR EUR 0.46 – –
LU2324721625 Aviva Investors - Climate Transition Global Credit FundIyh Share Class Accumulation Hedged GBP GBP 0.78 – –
LU2299074760 Aviva Investors - Climate Transition Global Credit Fund K Share Class Accumulation EUR EUR 7.12 – –LU2299074414 Aviva Investors - Climate Transition Global Credit Fund R Share Class Accumulation USD 0.99 – –LU2299074505 Aviva Investors - Climate Transition Global Credit Fund R Share Class Accumulation EUR EUR 6.87 – –
LU2324721898 Aviva Investors - Climate Transition Global Credit FundRyh Share Class Accumulation Hedged GBP GBP 0.80 – –
LU2299074927 Aviva Investors - Climate Transition Global Credit Fund S Share Class Accumulation USD 0.98 – –LU2299074844 Aviva Investors - Climate Transition Global Credit Fund S Share Class Accumulation EUR EUR 6.91 – –
LU2325374267 Aviva Investors - Climate Transition Global Credit FundSh Share Class Accumulation Hedged AUD AUD 1.11 – –
LU2324721971 Aviva Investors - Climate Transition Global Credit FundSyh Share Class Accumulation Hedged GBP GBP 0.95 – –
LU2304375640 Aviva Investors - Climate Transition Global Credit FundZh Share Class Accumulation Hedged EUR EUR 0.63 – –
LU2299074687 Aviva Investors - Climate Transition Global Credit FundZyh Share Class Accumulation Hedged GBP GBP 1.08 – –
LU2157504429 Aviva Investors - Climate Transition Global Equity Fund A Share Class Accumulation USD 11.68 18.31 –
LU2226715402 Aviva Investors - Climate Transition Global Equity FundF Share Class Accumulation Hedged AUD AUD 12.44 4.53 –
LU2157504775 Aviva Investors - Climate Transition Global Equity Fund I Share Class Accumulation USD 12.62 18.64 –LU2230278900 Aviva Investors - Climate Transition Global Equity Fund Z Share Class Accumulation EUR EUR 22.72 13.54 –LU2230278736 Aviva Investors - Climate Transition Global Equity Fund Z Share Class Accumulation GBP GBP 14.67 11.82 –LU1985004537 Aviva Investors - Climate Transition European Equity Fund A Share Class Accumulation EUR 16.94 15.89 10.24LU2216001268 Aviva Investors - Climate Transition European Equity Fund AFER Climat Share Class Dividend EUR 17.35 14.74 –LU1985004701 Aviva Investors - Climate Transition European Equity Fund I Share Class Accumulation EUR 17.88 16.81 10.58LU1985004966 Aviva Investors - Climate Transition European Equity Fund K Share Class Accumulation EUR 18.50 17.42 10.83LU1985004883 Aviva Investors - Climate Transition European Equity Fund R Share Class Accumulation EUR 17.83 17.01 15.38LU2061970484 Aviva Investors - Climate Transition European Equity Fund Ry Share Class Accumulation GBP GBP 10.10 23.52 5.26
LU2401841411 Aviva Investors - Climate Transition European Equity FundZy Share Class Accumulation Hedged GBP GBP (1.19) – –
LU0274939478 Aviva Investors - Emerging Markets Bond Fund A Share Class Accumulation USD (3.32) 6.47 14.00
LU0401379044 Aviva Investors - Emerging Markets Bond FundA Share Class Accumulation Hedged EUR EUR (4.38) 4.96 10.62
LU0180621863 Aviva Investors - Emerging Markets Bond Fund B Share Class Accumulation USD (3.75) 6.20 13.71
LU0693856642 Aviva Investors - Emerging Markets Bond FundB Share Class Accumulation Hedged EUR EUR – – –
LU0206569211 Aviva Investors - Emerging Markets Bond Fund Bm Share Class Dividend USD (3.76) 6.21 13.71
LU0726752743 Aviva Investors - Emerging Markets Bond FundBm Share Class Dividend Hedged EUR EUR (4.62) 4.80 10.34
LU0180621947 Aviva Investors - Emerging Markets Bond Fund I Share Class Accumulation USD (2.89) 7.15 14.73
LU0923982770 Aviva Investors - Emerging Markets Bond FundI Share Class Accumulation Hedged CHF CHF (4.03) 5.62 10.85
LU0401379127 Aviva Investors - Emerging Markets Bond FundI Share Class Accumulation Hedged EUR EUR (3.76) 5.63 11.33
LU2086873879 Aviva Investors - Emerging Markets Bond Fund Ia Share Class Dividend USD (2.89) 7.15 0.40LU1329693706 Aviva Investors - Emerging Markets Bond Fund K Share Class Accumulation EUR EUR 5.43 (1.64) 17.36
LU1540968507 Aviva Investors - Emerging Markets Bond FundK Share Class Accumulation Hedged EUR EUR – – 11.75
LU1184721873 Aviva Investors - Emerging Markets Bond Fund Kq Share Class Dividend Hedged EUR EUR (3.38) 6.01 11.73LU1944462503 Aviva Investors - Emerging Markets Bond Fund Ra Share Class Dividend Hedged EUR EUR (3.78) 5.86 6.85

Aviva Investors Société d’investissement à capital variable (SICAV)
avivainvestors.com Annual Report and audited financial statements 192
INFORMATION FOR INVESTORS IN SWITZERLAND - UNAUDITED (CONTINUED)As at 31 December 2021
ISIN Sub-Fund Name Share Class
Class
Currency
2021
in %
2020
in %
2019
in %
LU2240326509 Aviva Investors - Emerging Markets Bond FundRy Share Class Accumulation Hedged CHF CHF (4.13) 5.28 –
LU0631496246 Aviva Investors - Emerging Markets Bond Fund V Share Class Accumulation USD (2.18) 7.93 15.56LU0560707613 Aviva Investors - Emerging Markets Bond Fund Z Share Class Accumulation USD (2.18) 7.93 15.56
LU0532757456 Aviva Investors - Emerging Markets Bond FundZ Share Class Accumulation Hedged GBP GBP (2.33) 6.03 13.38
LU0725747298 Aviva Investors - Emerging Markets Bond Fund Zq Share Class Dividend Hedged EUR EUR (3.02) 6.39 12.13
LU1329693888 Aviva Investors - Emerging Markets Bond FundZy Share Class Accumulation Hedged GBP GBP (2.33) 6.00 13.37
LU1550133976 Aviva Investors - Emerging Markets Corporate Bond Fund I Share Class Accumulation USD (1.45) 10.58 13.62
LU0654799310 Aviva Investors - Emerging Markets Corporate Bond FundI Share Class Accumulation Hedged EUR EUR (2.31) 8.80 10.24
LU2401842229 Aviva Investors - Emerging Markets Corporate Bond Fund Iq Share Class Dividend Hedged EUR EUR (0.97) – –
LU2301384355 Aviva Investors - Emerging Markets Corporate Bond FundK Share Class Accumulation Hedged EUR EUR – – –
LU1184721287 Aviva Investors - Emerging Markets Corporate Bond Fund Kq Share Class Dividend Hedged EUR EUR (1.77) 9.34 10.84
LU1989841595 Aviva Investors - Emerging Markets Corporate Bond FundZy Share Class Accumulation Hedged EUR EUR (1.37) 9.78 5.02
LU1985010260 Aviva Investors - Emerging Markets Corporate Bond FundZy Share Class Accumulation Hedged GBP GBP (0.73) 9.86 6.25
LU0274940138 Aviva Investors - Emerging Markets Equity Income Fund A Share Class Accumulation USD (3.30) 7.68 16.13LU0047882062 Aviva Investors - Emerging Markets Equity Income Fund B Share Class Accumulation USD (3.54) 7.41 15.83LU0280564351 Aviva Investors - Emerging Markets Equity Income Fund B Share Class Accumulation EUR EUR 4.33 (1.77) 18.05LU0160791975 Aviva Investors - Emerging Markets Equity Income Fund I Share Class Accumulation USD (2.44) 8.64 17.16LU1370700228 Aviva Investors - Emerging Markets Equity Income Fund R Share Class Accumulation USD – 8.60 17.12LU0965944704 Aviva Investors - Emerging Markets Equity Income Fund Ra Share Class Dividend GBP GBP (1.44) 5.05 13.42LU0560707704 Aviva Investors - Emerging Markets Equity Income Fund Z Share Class Accumulation USD (1.48) 9.71 18.31LU1229249047 Aviva Investors - Emerging Markets Equity Income Fund Z Share Class Accumulation EUR EUR 6.56 0.33 20.57LU1301384894 Aviva Investors - Emerging Markets Equity Income Fund Z Share Class Accumulation GBP GBP (0.43) 6.14 14.61LU1322428019 Aviva Investors - Emerging Markets Equity Income Fund Zy Share Class Accumulation GBP GBP (0.43) 6.14 14.61LU0300873303 Aviva Investors - Emerging Markets Equity Small Cap Fund A Share Class Accumulation USD 20.46 14.71 10.31LU0300873642 Aviva Investors - Emerging Markets Equity Small Cap Fund B Share Class Accumulation USD 20.18 14.43 10.03LU0280563387 Aviva Investors - Emerging Markets Equity Small Cap Fund B Share Class Accumulation EUR EUR 29.98 4.64 12.14LU0300874459 Aviva Investors - Emerging Markets Equity Small Cap Fund I Share Class Accumulation USD 21.55 15.74 11.30LU1588768256 Aviva Investors - Emerging Markets Equity Small Cap Fund I Share Class Accumulation EUR EUR 31.44 6.03 13.71LU1745489192 Aviva Investors - Emerging Markets Equity Small Cap Fund M Share Class Accumulation USD 22.09 16.28 11.71LU0965944613 Aviva Investors - Emerging Markets Equity Small Cap Fund Ra Share Class Dividend GBP GBP 22.79 11.91 7.74LU0560707456 Aviva Investors - Emerging Markets Equity Small Cap Fund Z Share Class Accumulation USD 22.74 16.87 12.39LU1653128485 Aviva Investors - Emerging Markets Equity Small Cap Fund Zy Share Class Accumulation USD 22.74 16.87 12.39LU1901216660 Aviva Investors - Emerging Markets Equity Small Cap Fund Zy Share Class Accumulation GBP GBP 24.05 13.07 8.87
LU0273494806Aviva Investors - Emerging Markets Local Currency Bond Fund A Share Class Accumulation EUR (2.93) (7.53) 15.41
LU1099408798Aviva Investors - Emerging Markets Local Currency Bond Fund Aa Share Class Dividend EUR (2.99) (7.53) 15.41
LU0273496686Aviva Investors - Emerging Markets Local Currency Bond Fund B Share Class Accumulation EUR (3.22) (7.76) 15.12
LU0490651758Aviva Investors - Emerging Markets Local Currency Bond Fund B Share Class Accumulation USD USD (10.48) 0.95 13.06
LU0274935138Aviva Investors - Emerging Markets Local Currency Bond Fund Bm Share Class Dividend EUR (3.22) (7.76) 15.12
LU0273498039Aviva Investors - Emerging Markets Local Currency Bond Fund I Share Class Accumulation EUR (2.36) (6.94) 16.15
LU1859008861Aviva Investors - Emerging Markets Local Currency Bond Fund I Share Class Accumulation GBP GBP (8.60) (1.37) 10.58
LU1600503905Aviva Investors - Emerging Markets Local Currency Bond Fund I Share Class Accumulation USD USD (9.73) 1.76 14.09
LU0861996451Aviva Investors - Emerging Markets Local Currency Bond Fund Ia Share Class Dividend EUR (1.56) (6.46) 16.15
LU0280564948Aviva Investors - Emerging Markets Local Currency Bond Fund Ia Share Class Dividend GBP GBP (8.79) (1.55) 10.38
LU1373243770Aviva Investors - Emerging Markets Local Currency Bond Fund R Share Class Accumulation EUR – (6.97) 16.10
LU1859008945Aviva Investors - Emerging Markets Local Currency Bond Fund R Share Class Accumulation GBP GBP (8.80) (1.41) 10.59
LU1859008788Aviva Investors - Emerging Markets Local Currency Bond Fund R Share Class Accumulation USD USD (9.68) 1.88 14.06
LU0560707969Aviva Investors - Emerging Markets Local Currency Bond Fund Z Share Class Accumulation EUR (1.65) (6.26) 17.00
LU1329465741Aviva Investors - Emerging Markets Local Currency Bond Fund Zy Share Class Accumulation GBP GBP (8.10) (0.83) 11.21
2.PERFORMANCE (CONTINUED)
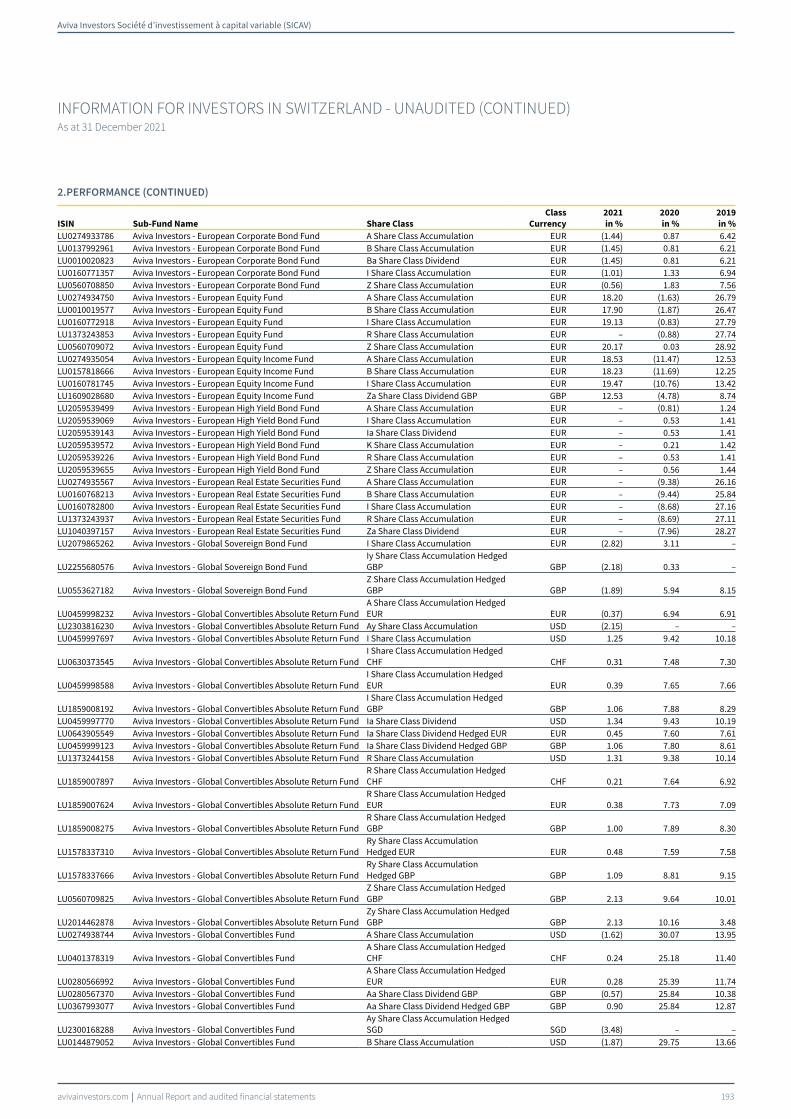
Aviva Investors Société d’investissement à capital variable (SICAV)
avivainvestors.com Annual Report and audited financial statements 193
INFORMATION FOR INVESTORS IN SWITZERLAND - UNAUDITED (CONTINUED)As at 31 December 2021
ISIN Sub-Fund Name Share Class
Class
Currency
2021
in %
2020
in %
2019
in %
LU0274933786 Aviva Investors - European Corporate Bond Fund A Share Class Accumulation EUR (1.44) 0.87 6.42LU0137992961 Aviva Investors - European Corporate Bond Fund B Share Class Accumulation EUR (1.45) 0.81 6.21LU0010020823 Aviva Investors - European Corporate Bond Fund Ba Share Class Dividend EUR (1.45) 0.81 6.21LU0160771357 Aviva Investors - European Corporate Bond Fund I Share Class Accumulation EUR (1.01) 1.33 6.94LU0560708850 Aviva Investors - European Corporate Bond Fund Z Share Class Accumulation EUR (0.56) 1.83 7.56LU0274934750 Aviva Investors - European Equity Fund A Share Class Accumulation EUR 18.20 (1.63) 26.79LU0010019577 Aviva Investors - European Equity Fund B Share Class Accumulation EUR 17.90 (1.87) 26.47LU0160772918 Aviva Investors - European Equity Fund I Share Class Accumulation EUR 19.13 (0.83) 27.79LU1373243853 Aviva Investors - European Equity Fund R Share Class Accumulation EUR – (0.88) 27.74LU0560709072 Aviva Investors - European Equity Fund Z Share Class Accumulation EUR 20.17 0.03 28.92LU0274935054 Aviva Investors - European Equity Income Fund A Share Class Accumulation EUR 18.53 (11.47) 12.53LU0157818666 Aviva Investors - European Equity Income Fund B Share Class Accumulation EUR 18.23 (11.69) 12.25LU0160781745 Aviva Investors - European Equity Income Fund I Share Class Accumulation EUR 19.47 (10.76) 13.42LU1609028680 Aviva Investors - European Equity Income Fund Za Share Class Dividend GBP GBP 12.53 (4.78) 8.74LU2059539499 Aviva Investors - European High Yield Bond Fund A Share Class Accumulation EUR – (0.81) 1.24LU2059539069 Aviva Investors - European High Yield Bond Fund I Share Class Accumulation EUR – 0.53 1.41LU2059539143 Aviva Investors - European High Yield Bond Fund Ia Share Class Dividend EUR – 0.53 1.41LU2059539572 Aviva Investors - European High Yield Bond Fund K Share Class Accumulation EUR – 0.21 1.42LU2059539226 Aviva Investors - European High Yield Bond Fund R Share Class Accumulation EUR – 0.53 1.41LU2059539655 Aviva Investors - European High Yield Bond Fund Z Share Class Accumulation EUR – 0.56 1.44LU0274935567 Aviva Investors - European Real Estate Securities Fund A Share Class Accumulation EUR – (9.38) 26.16LU0160768213 Aviva Investors - European Real Estate Securities Fund B Share Class Accumulation EUR – (9.44) 25.84LU0160782800 Aviva Investors - European Real Estate Securities Fund I Share Class Accumulation EUR – (8.68) 27.16LU1373243937 Aviva Investors - European Real Estate Securities Fund R Share Class Accumulation EUR – (8.69) 27.11LU1040397157 Aviva Investors - European Real Estate Securities Fund Za Share Class Dividend EUR – (7.96) 28.27LU2079865262 Aviva Investors - Global Sovereign Bond Fund I Share Class Accumulation EUR (2.82) 3.11 –
LU2255680576 Aviva Investors - Global Sovereign Bond FundIy Share Class Accumulation Hedged GBP GBP (2.18) 0.33 –
LU0553627182 Aviva Investors - Global Sovereign Bond FundZ Share Class Accumulation Hedged GBP GBP (1.89) 5.94 8.15
LU0459998232 Aviva Investors - Global Convertibles Absolute Return FundA Share Class Accumulation Hedged EUR EUR (0.37) 6.94 6.91
LU2303816230 Aviva Investors - Global Convertibles Absolute Return Fund Ay Share Class Accumulation USD (2.15) – –LU0459997697 Aviva Investors - Global Convertibles Absolute Return Fund I Share Class Accumulation USD 1.25 9.42 10.18
LU0630373545 Aviva Investors - Global Convertibles Absolute Return FundI Share Class Accumulation Hedged CHF CHF 0.31 7.48 7.30
LU0459998588 Aviva Investors - Global Convertibles Absolute Return FundI Share Class Accumulation Hedged EUR EUR 0.39 7.65 7.66
LU1859008192 Aviva Investors - Global Convertibles Absolute Return FundI Share Class Accumulation Hedged GBP GBP 1.06 7.88 8.29
LU0459997770 Aviva Investors - Global Convertibles Absolute Return Fund Ia Share Class Dividend USD 1.34 9.43 10.19LU0643905549 Aviva Investors - Global Convertibles Absolute Return Fund Ia Share Class Dividend Hedged EUR EUR 0.45 7.60 7.61LU0459999123 Aviva Investors - Global Convertibles Absolute Return Fund Ia Share Class Dividend Hedged GBP GBP 1.06 7.80 8.61LU1373244158 Aviva Investors - Global Convertibles Absolute Return Fund R Share Class Accumulation USD 1.31 9.38 10.14
LU1859007897 Aviva Investors - Global Convertibles Absolute Return FundR Share Class Accumulation Hedged CHF CHF 0.21 7.64 6.92
LU1859007624 Aviva Investors - Global Convertibles Absolute Return FundR Share Class Accumulation Hedged EUR EUR 0.38 7.73 7.09
LU1859008275 Aviva Investors - Global Convertibles Absolute Return FundR Share Class Accumulation Hedged GBP GBP 1.00 7.89 8.30
LU1578337310 Aviva Investors - Global Convertibles Absolute Return FundRy Share Class Accumulation Hedged EUR EUR 0.48 7.59 7.58
LU1578337666 Aviva Investors - Global Convertibles Absolute Return FundRy Share Class Accumulation Hedged GBP GBP 1.09 8.81 9.15
LU0560709825 Aviva Investors - Global Convertibles Absolute Return FundZ Share Class Accumulation Hedged GBP GBP 2.13 9.64 10.01
LU2014462878 Aviva Investors - Global Convertibles Absolute Return FundZy Share Class Accumulation Hedged GBP GBP 2.13 10.16 3.48
LU0274938744 Aviva Investors - Global Convertibles Fund A Share Class Accumulation USD (1.62) 30.07 13.95
LU0401378319 Aviva Investors - Global Convertibles FundA Share Class Accumulation Hedged CHF CHF 0.24 25.18 11.40
LU0280566992 Aviva Investors - Global Convertibles FundA Share Class Accumulation Hedged EUR EUR 0.28 25.39 11.74
LU0280567370 Aviva Investors - Global Convertibles Fund Aa Share Class Dividend GBP GBP (0.57) 25.84 10.38LU0367993077 Aviva Investors - Global Convertibles Fund Aa Share Class Dividend Hedged GBP GBP 0.90 25.84 12.87
LU2300168288 Aviva Investors - Global Convertibles FundAy Share Class Accumulation Hedged SGD SGD (3.48) – –
LU0144879052 Aviva Investors - Global Convertibles Fund B Share Class Accumulation USD (1.87) 29.75 13.66
2.PERFORMANCE (CONTINUED)

Aviva Investors Société d’investissement à capital variable (SICAV)
avivainvestors.com Annual Report and audited financial statements 194
INFORMATION FOR INVESTORS IN SWITZERLAND - UNAUDITED (CONTINUED)As at 31 December 2021
ISIN Sub-Fund Name Share Class
Class
Currency
2021
in %
2020
in %
2019
in %
LU0280567701 Aviva Investors - Global Convertibles FundB Share Class Accumulation Hedged EUR EUR 0.14 25.16 11.45
LU0160787601 Aviva Investors - Global Convertibles Fund I Share Class Accumulation USD (0.99) 30.90 14.68
LU0280568261 Aviva Investors - Global Convertibles FundI Share Class Accumulation Hedged EUR EUR 1.03 26.54 12.46
LU0280568428 Aviva Investors - Global Convertibles Fund Ia Share Class Dividend GBP GBP 0.06 26.64 11.08LU0367993150 Aviva Investors - Global Convertibles Fund Ia Share Class Dividend Hedged GBP GBP 1.56 26.65 13.47
LU1857279712 Aviva Investors - Global Convertibles FundIy Share Class Accumulation Hedged EUR EUR 1.02 26.23 12.45
LU1857279803 Aviva Investors - Global Convertibles FundIy Share Class Accumulation Hedged GBP GBP 1.50 26.40 13.49
LU1857279639 Aviva Investors - Global Convertibles FundIy Share Class Accumulation Hedged USD USD 1.99 28.31 15.93
LU1184721360 Aviva Investors - Global Convertibles Fund Kq Share Class Dividend Hedged EUR EUR 1.42 26.71 12.89LU0880135149 Aviva Investors - Global Convertibles Fund Ra Share Class Dividend Hedged GBP GBP 1.57 26.13 13.47LU0675046311 Aviva Investors - Global Convertibles Fund Z Share Class Accumulation USD (0.27) 31.85 15.51
LU0560710591 Aviva Investors - Global Convertibles FundZ Share Class Accumulation Hedged EUR EUR 1.85 27.19 13.26
LU0560710757 Aviva Investors - Global Convertibles FundZ Share Class Accumulation Hedged GBP GBP – 27.71 14.33
LU1985005260Aviva Investors - Global Emerging Markets Equity Unconstrained Fund I Share Class Accumulation USD (0.54) 19.96 12.35
LU1985005856Aviva Investors - Global Emerging Markets Equity Unconstrained Fund S Share Class Accumulation USD (0.52) 19.93 12.33
LU2328025536Aviva Investors - Global Emerging Markets Equity Unconstrained Fund Z Share Class Accumulation EUR EUR (1.93) – –
LU1985006318Aviva Investors - Global Emerging Markets Equity Unconstrained Fund
Z Share Class Accumulation Hedged GBP GBP 36.33 17.61 11.58
LU2137221318Aviva Investors - Global Emerging Markets Equity Unconstrained Fund Zy Share Class Accumulation GBP GBP 0.94 54.84 –
LU0514066991 Aviva Investors - Global Emerging Markets Index Fund I Share Class Accumulation USD (3.08) 17.59 17.19LU0537606781 Aviva Investors - Global Emerging Markets Index Fund Z Share Class Accumulation USD (2.76) 17.90 17.57LU2328003723 Aviva Investors - Global Emerging Markets Index Fund Z Share Class Accumulation EUR EUR (1.77) – –LU1806517998 Aviva Investors - Global Emerging Markets Index Fund Zy Share Class Accumulation GBP GBP (1.72) 14.06 13.89LU1401110231 Aviva Investors - Global Equity Endurance Fund A Share Class Accumulation USD 25.11 18.91 31.21LU1401110405 Aviva Investors - Global Equity Endurance Fund I Share Class Accumulation USD 26.11 19.83 32.08LU2351478669 Aviva Investors - Global Equity Endurance Fund I Share Class Accumulation EUR EUR 14.34 – –LU1529951995 Aviva Investors - Global Equity Endurance Fund Ry Share Class Accumulation GBP GBP 27.40 15.89 27.89LU1738492906 Aviva Investors - Global Equity Endurance Fund Z Share Class Accumulation USD 27.21 20.89 33.24LU1588768413 Aviva Investors - Global Equity Endurance Fund Za Share Class Dividend GBP GBP 28.57 16.94 30.86LU1985006748 Aviva Investors - Global Equity Unconstrained Fund I Share Class Accumulation USD – 13.80 15.42LU1985007399 Aviva Investors - Global Equity Unconstrained Fund S Share Class Accumulation USD – 13.71 15.38
LU1985007712 Aviva Investors - Global Equity Unconstrained FundZ Share Class Accumulation Hedged GBP GBP – 11.31 14.60
LU0367993317 Aviva Investors - Global High Yield Bond Fund A Share Class Accumulation USD 3.38 2.68 14.11
LU0693856568 Aviva Investors - Global High Yield Bond FundA Share Class Accumulation Hedged CHF CHF 2.30 0.91 10.22
LU0367993408 Aviva Investors - Global High Yield Bond FundA Share Class Accumulation Hedged EUR EUR 2.54 0.80 10.72
LU0520002626 Aviva Investors - Global High Yield Bond FundA Share Class Accumulation Hedged SGD SGD 3.36 1.73 13.20
LU0752094010 Aviva Investors - Global High Yield Bond Fund Am Share Class Dividend USD 3.38 2.68 14.11
LU0397833129 Aviva Investors - Global High Yield Bond FundAm Share Class Dividend Hedged GBP GBP 3.18 0.56 11.96
LU0520002972 Aviva Investors - Global High Yield Bond FundAm Share Class Dividend Hedged SGD SGD 3.37 1.72 13.19
LU0432679735 Aviva Investors - Global High Yield Bond FundB Share Class Accumulation Hedged EUR EUR 2.26 0.60 10.45
LU0641126270 Aviva Investors - Global High Yield Bond Fund Ba Share Class Dividend Hedged EUR EUR 2.26 0.53 10.40LU0562505817 Aviva Investors - Global High Yield Bond Fund Bm Share Class Dividend USD 3.12 2.42 13.83LU0367993663 Aviva Investors - Global High Yield Bond Fund I Share Class Accumulation USD 4.05 3.34 14.85
LU0497137546 Aviva Investors - Global High Yield Bond FundI Share Class Accumulation Hedged CAD CAD 3.92 1.35 13.84
LU0367993747 Aviva Investors - Global High Yield Bond FundI Share Class Accumulation Hedged EUR EUR 3.18 1.44 11.44
LU0766450869 Aviva Investors - Global High Yield Bond FundI Share Class Accumulation Hedged GBP GBP 3.83 1.00 12.72
LU0650814238 Aviva Investors - Global High Yield Bond Fund Ia Share Class Dividend USD 4.04 3.34 14.85LU0649528386 Aviva Investors - Global High Yield Bond Fund Ia Share Class Dividend Hedged CHF CHF 2.96 1.56 10.90LU0650813693 Aviva Investors - Global High Yield Bond Fund Ia Share Class Dividend Hedged EUR EUR 3.10 1.44 11.39
2.PERFORMANCE (CONTINUED)

Aviva Investors Société d’investissement à capital variable (SICAV)
avivainvestors.com Annual Report and audited financial statements 195
INFORMATION FOR INVESTORS IN SWITZERLAND - UNAUDITED (CONTINUED)As at 31 December 2021
ISIN Sub-Fund Name Share Class
Class
Currency
2021
in %
2020
in %
2019
in %
LU0397835769 Aviva Investors - Global High Yield Bond Fund Ia Share Class Dividend Hedged GBP GBP 3.80 0.95 12.64
LU2265834916 Aviva Investors - Global High Yield Bond FundIh Share Class Accumulation Hedged USD USD – – –
LU1318336952 Aviva Investors - Global High Yield Bond Fund Iq Share Class Dividend Hedged GBP GBP – 0.97 12.66
LU1391831341 Aviva Investors - Global High Yield Bond FundK Share Class Accumulation Hedged EUR EUR 3.69 2.05 11.87
LU1184721444 Aviva Investors - Global High Yield Bond Fund Kq Share Class Dividend Hedged EUR EUR 3.56 1.86 11.84LU0938923728 Aviva Investors - Global High Yield Bond Fund M Share Class Accumulation USD 4.30 3.59 15.13
LU0938924023 Aviva Investors - Global High Yield Bond FundM Share Class Accumulation Hedged CHF CHF 3.20 1.81 11.21
LU0938923561 Aviva Investors - Global High Yield Bond FundM Share Class Accumulation Hedged EUR EUR 3.44 1.69 11.70
LU1288964064 Aviva Investors - Global High Yield Bond Fund R Share Class Accumulation USD 4.00 3.30 14.80
LU1288964494 Aviva Investors - Global High Yield Bond FundR Share Class Accumulation Hedged CHF CHF 2.93 1.51 10.90
LU1288964650 Aviva Investors - Global High Yield Bond FundR Share Class Accumulation Hedged EUR EUR 3.15 1.41 11.39
LU1288964577 Aviva Investors - Global High Yield Bond FundR Share Class Accumulation Hedged SGD SGD 4.05 2.50 14.01
LU1288964148 Aviva Investors - Global High Yield Bond Fund Ra Share Class Dividend USD 4.00 3.30 14.80LU0880134928 Aviva Investors - Global High Yield Bond Fund Ra Share Class Dividend Hedged GBP GBP 3.77 0.87 12.59LU2243988677 Aviva Investors - Global High Yield Bond Fund V Share Class Accumulation EUR EUR 13.40 0.58 –
LU2255680659 Aviva Investors - Global High Yield Bond FundV Share Class Accumulation Hedged EUR EUR 3.93 1.47 –
LU0616814850 Aviva Investors - Global High Yield Bond Fund Z Share Class Accumulation USD 4.80 4.09 15.68
LU0553627935 Aviva Investors - Global High Yield Bond FundZ Share Class Accumulation Hedged GBP GBP 4.59 1.72 13.52
LU0725747025 Aviva Investors - Global High Yield Bond Fund Zq Share Class Dividend Hedged EUR EUR 4.18 2.19 12.23
LU2040493350 Aviva Investors - Global High Yield Bond FundZy Share Class Accumulation Hedged GBP GBP 4.60 1.69 2.20
LU1220879487Aviva Investors - Global Investment Grade Corporate Bond Fund I Share Class Accumulation USD (1.52) 7.99 12.51
LU1220879560Aviva Investors - Global Investment Grade Corporate Bond Fund
I Share Class Accumulation Hedged EUR EUR (2.37) 6.41 9.23
LU1991267417Aviva Investors - Global Investment Grade Corporate Bond Fund Ia Share Class Dividend Hedged GBP GBP – 6.32 5.55
LU2185864571Aviva Investors - Global Investment Grade Corporate Bond Fund K Share Class Accumulation EUR EUR 6.64 (3.65) –
LU2051219439Aviva Investors - Global Investment Grade Corporate Bond Fund
Mq Share Class Dividend Hedged EUR EUR (2.00) 6.72 (0.20)
LU2049639912Aviva Investors - Global Investment Grade Corporate Bond Fund
Mq Share Class Dividend Hedged GBP GBP (1.25) 6.63 0.47
LU2051219199Aviva Investors - Global Investment Grade Corporate Bond Fund Mq Share Class Dividend USD (1.22) 8.32 1.05
LU1600505272Aviva Investors - Global Investment Grade Corporate Bond Fund Z Share Class Accumulation USD (0.96) 8.62 13.16
LU1220879727Aviva Investors - Global Investment Grade Corporate Bond Fund
Zy Share Class Accumulation Hedged EUR EUR – 6.98 9.86
LU1220879990Aviva Investors - Global Investment Grade Corporate Bond Fund
Zy Share Class Accumulation Hedged GBP GBP (1.07) 6.92 11.21
LU1832527805 Aviva Investors - Multi-Strategy Fixed Income FundA Share Class Accumulation Hedged SEK SEK – 0.73 3.38
LU1718439281 Aviva Investors - Multi-Strategy Fixed Income FundF Share Class Accumulation Hedged AUD AUD – 1.23 5.67
LU1403771048 Aviva Investors - Multi-Strategy Fixed Income Fund I Share Class Accumulation EUR – 0.89 3.47
LU1812864319 Aviva Investors - Multi-Strategy Fixed Income FundI Share Class Accumulation Hedged CHF CHF – 0.69 3.12
LU1403771394 Aviva Investors - Multi-Strategy Fixed Income FundI Share Class Accumulation Hedged GBP GBP – 1.29 4.69
LU1403770743 Aviva Investors - Multi-Strategy Fixed Income FundI Share Class Accumulation Hedged USD USD – 2.23 6.64
LU1812864582 Aviva Investors - Multi-Strategy Fixed Income Fund Iq Share Class Dividend Hedged CHF CHF – 0.69 3.12LU1812864665 Aviva Investors - Multi-Strategy Fixed Income Fund Iq Share Class Dividend Hedged GBP GBP – 1.43 4.84
LU1812865043 Aviva Investors - Multi-Strategy Fixed Income FundR Share Class Accumulation Hedged CHF CHF – 0.69 3.12
LU1812865472 Aviva Investors - Multi-Strategy Fixed Income Fund Rq Share Class Dividend Hedged CHF CHF – 0.69 3.11
LU1812865555 Aviva Investors - Multi-Strategy Fixed Income FundRq Share Class Dividend Hedged GBP GBP – 1.43 4.83
LU1403771808 Aviva Investors - Multi-Strategy Fixed Income Fund Z Share Class Accumulation EUR – 1.28 3.79
2.PERFORMANCE (CONTINUED)
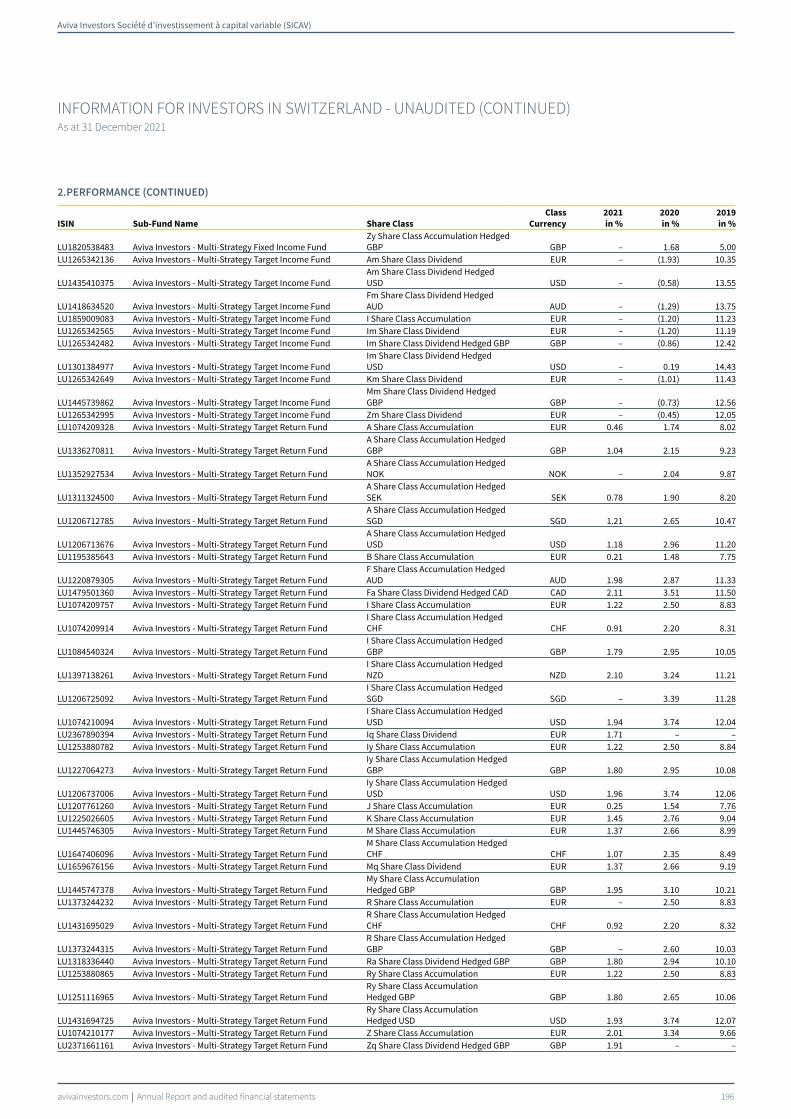
Aviva Investors Société d’investissement à capital variable (SICAV)
avivainvestors.com Annual Report and audited financial statements 196
INFORMATION FOR INVESTORS IN SWITZERLAND - UNAUDITED (CONTINUED)As at 31 December 2021
ISIN Sub-Fund Name Share Class
Class
Currency
2021
in %
2020
in %
2019
in %
LU1820538483 Aviva Investors - Multi-Strategy Fixed Income FundZy Share Class Accumulation Hedged GBP GBP – 1.68 5.00
LU1265342136 Aviva Investors - Multi-Strategy Target Income Fund Am Share Class Dividend EUR – (1.93) 10.35
LU1435410375 Aviva Investors - Multi-Strategy Target Income FundAm Share Class Dividend Hedged USD USD – (0.58) 13.55
LU1418634520 Aviva Investors - Multi-Strategy Target Income FundFm Share Class Dividend Hedged AUD AUD – (1.29) 13.75
LU1859009083 Aviva Investors - Multi-Strategy Target Income Fund I Share Class Accumulation EUR – (1.20) 11.23LU1265342565 Aviva Investors - Multi-Strategy Target Income Fund Im Share Class Dividend EUR – (1.20) 11.19LU1265342482 Aviva Investors - Multi-Strategy Target Income Fund Im Share Class Dividend Hedged GBP GBP – (0.86) 12.42
LU1301384977 Aviva Investors - Multi-Strategy Target Income FundIm Share Class Dividend Hedged USD USD – 0.19 14.43
LU1265342649 Aviva Investors - Multi-Strategy Target Income Fund Km Share Class Dividend EUR – (1.01) 11.43
LU1445739862 Aviva Investors - Multi-Strategy Target Income FundMm Share Class Dividend Hedged GBP GBP – (0.73) 12.56
LU1265342995 Aviva Investors - Multi-Strategy Target Income Fund Zm Share Class Dividend EUR – (0.45) 12.05LU1074209328 Aviva Investors - Multi-Strategy Target Return Fund A Share Class Accumulation EUR 0.46 1.74 8.02
LU1336270811 Aviva Investors - Multi-Strategy Target Return FundA Share Class Accumulation Hedged GBP GBP 1.04 2.15 9.23
LU1352927534 Aviva Investors - Multi-Strategy Target Return FundA Share Class Accumulation Hedged NOK NOK – 2.04 9.87
LU1311324500 Aviva Investors - Multi-Strategy Target Return FundA Share Class Accumulation Hedged SEK SEK 0.78 1.90 8.20
LU1206712785 Aviva Investors - Multi-Strategy Target Return FundA Share Class Accumulation Hedged SGD SGD 1.21 2.65 10.47
LU1206713676 Aviva Investors - Multi-Strategy Target Return FundA Share Class Accumulation Hedged USD USD 1.18 2.96 11.20
LU1195385643 Aviva Investors - Multi-Strategy Target Return Fund B Share Class Accumulation EUR 0.21 1.48 7.75
LU1220879305 Aviva Investors - Multi-Strategy Target Return FundF Share Class Accumulation Hedged AUD AUD 1.98 2.87 11.33
LU1479501360 Aviva Investors - Multi-Strategy Target Return Fund Fa Share Class Dividend Hedged CAD CAD 2.11 3.51 11.50LU1074209757 Aviva Investors - Multi-Strategy Target Return Fund I Share Class Accumulation EUR 1.22 2.50 8.83
LU1074209914 Aviva Investors - Multi-Strategy Target Return FundI Share Class Accumulation Hedged CHF CHF 0.91 2.20 8.31
LU1084540324 Aviva Investors - Multi-Strategy Target Return FundI Share Class Accumulation Hedged GBP GBP 1.79 2.95 10.05
LU1397138261 Aviva Investors - Multi-Strategy Target Return FundI Share Class Accumulation Hedged NZD NZD 2.10 3.24 11.21
LU1206725092 Aviva Investors - Multi-Strategy Target Return FundI Share Class Accumulation Hedged SGD SGD – 3.39 11.28
LU1074210094 Aviva Investors - Multi-Strategy Target Return FundI Share Class Accumulation Hedged USD USD 1.94 3.74 12.04
LU2367890394 Aviva Investors - Multi-Strategy Target Return Fund Iq Share Class Dividend EUR 1.71 – –LU1253880782 Aviva Investors - Multi-Strategy Target Return Fund Iy Share Class Accumulation EUR 1.22 2.50 8.84
LU1227064273 Aviva Investors - Multi-Strategy Target Return FundIy Share Class Accumulation Hedged GBP GBP 1.80 2.95 10.08
LU1206737006 Aviva Investors - Multi-Strategy Target Return FundIy Share Class Accumulation Hedged USD USD 1.96 3.74 12.06
LU1207761260 Aviva Investors - Multi-Strategy Target Return Fund J Share Class Accumulation EUR 0.25 1.54 7.76LU1225026605 Aviva Investors - Multi-Strategy Target Return Fund K Share Class Accumulation EUR 1.45 2.76 9.04LU1445746305 Aviva Investors - Multi-Strategy Target Return Fund M Share Class Accumulation EUR 1.37 2.66 8.99
LU1647406096 Aviva Investors - Multi-Strategy Target Return FundM Share Class Accumulation Hedged CHF CHF 1.07 2.35 8.49
LU1659676156 Aviva Investors - Multi-Strategy Target Return Fund Mq Share Class Dividend EUR 1.37 2.66 9.19
LU1445747378 Aviva Investors - Multi-Strategy Target Return FundMy Share Class Accumulation Hedged GBP GBP 1.95 3.10 10.21
LU1373244232 Aviva Investors - Multi-Strategy Target Return Fund R Share Class Accumulation EUR – 2.50 8.83
LU1431695029 Aviva Investors - Multi-Strategy Target Return FundR Share Class Accumulation Hedged CHF CHF 0.92 2.20 8.32
LU1373244315 Aviva Investors - Multi-Strategy Target Return FundR Share Class Accumulation Hedged GBP GBP – 2.60 10.03
LU1318336440 Aviva Investors - Multi-Strategy Target Return Fund Ra Share Class Dividend Hedged GBP GBP 1.80 2.94 10.10LU1253880865 Aviva Investors - Multi-Strategy Target Return Fund Ry Share Class Accumulation EUR 1.22 2.50 8.83
LU1251116965 Aviva Investors - Multi-Strategy Target Return FundRy Share Class Accumulation Hedged GBP GBP 1.80 2.65 10.06
LU1431694725 Aviva Investors - Multi-Strategy Target Return FundRy Share Class Accumulation Hedged USD USD 1.93 3.74 12.07
LU1074210177 Aviva Investors - Multi-Strategy Target Return Fund Z Share Class Accumulation EUR 2.01 3.34 9.66LU2371661161 Aviva Investors - Multi-Strategy Target Return Fund Zq Share Class Dividend Hedged GBP GBP 1.91 – –
2.PERFORMANCE (CONTINUED)

Aviva Investors Société d’investissement à capital variable (SICAV)
avivainvestors.com Annual Report and audited financial statements 197
INFORMATION FOR INVESTORS IN SWITZERLAND - UNAUDITED (CONTINUED)As at 31 December 2021
ISIN Sub-Fund Name Share Class
Class
Currency
2021
in %
2020
in %
2019
in %
LU2366405079Aviva Investors - Natural Capital Transition Global Equity Fund A Share Class Accumulation USD 1.61 – –
LU2366405236Aviva Investors - Natural Capital Transition Global Equity Fund A Share Class Accumulation EUR EUR 2.00 – –
LU2366405319Aviva Investors - Natural Capital Transition Global Equity Fund I Share Class Accumulation USD 1.76 – –
LU2366405582Aviva Investors - Natural Capital Transition Global Equity Fund I Share Class Accumulation EUR EUR 2.08 – –
LU2366405665Aviva Investors - Natural Capital Transition Global Equity Fund
Iy Share Class Accumulation Hedged GBP GBP 1.63 – –
LU2366405749Aviva Investors - Natural Capital Transition Global Equity Fund R Share Class Accumulation USD 1.76 – –
LU2366405822Aviva Investors - Natural Capital Transition Global Equity Fund R Share Class Accumulation EUR EUR 2.08 – –
LU2366406044Aviva Investors - Natural Capital Transition Global Equity Fund
Ry Share Class Accumulation Hedged GBP GBP 1.63 – –
LU2366406127Aviva Investors - Natural Capital Transition Global Equity Fund S Share Class Accumulation USD 1.77 – –
LU2366406473Aviva Investors - Natural Capital Transition Global Equity Fund S Share Class Accumulation EUR EUR 2.09 – –
LU2377011197Aviva Investors - Natural Capital Transition Global Equity Fund Zy Share Class Accumulation GBP GBP 0.62 – –
LU2366406556Aviva Investors - Natural Capital Transition Global Equity Fund
Zy Share Class Accumulation Hedged GBP GBP 1.68 – –
LU1088029878Aviva Investors - Short Duration Global High Yield Bond Fund A Share Class Accumulation USD 3.30 2.16 8.90
LU1738492658Aviva Investors - Short Duration Global High Yield Bond Fund
A Share Class Accumulation Hedged EUR EUR 2.44 0.46 5.69
LU1841485953Aviva Investors - Short Duration Global High Yield Bond Fund Am Share Class Dividend USD 3.30 2.16 8.90
LU1820082904Aviva Investors - Short Duration Global High Yield Bond Fund Ay Share Class Accumulation USD 3.30 2.16 8.95
LU1820083035Aviva Investors - Short Duration Global High Yield Bond Fund
Ay Share Class Accumulation Hedged EUR EUR 2.44 0.44 5.80
LU0747473022Aviva Investors - Short Duration Global High Yield Bond Fund I Share Class Accumulation USD 3.82 2.66 9.44
LU1044012950Aviva Investors - Short Duration Global High Yield Bond Fund
I Share Class Accumulation Hedged CHF CHF 2.74 0.97 5.63
LU1028903703Aviva Investors - Short Duration Global High Yield Bond Fund
I Share Class Accumulation Hedged EUR EUR 2.99 0.90 6.16
LU1859007467Aviva Investors - Short Duration Global High Yield Bond Fund
I Share Class Accumulation Hedged GBP GBP 3.59 0.68 7.47
LU0756178793Aviva Investors - Short Duration Global High Yield Bond Fund Ia Share Class Dividend Hedged EUR EUR 2.94 0.91 6.09
LU1841485870Aviva Investors - Short Duration Global High Yield Bond Fund Im Share Class Dividend USD 3.81 2.66 8.46
LU2026684295Aviva Investors - Short Duration Global High Yield Bond Fund Iq Share Class Dividend Hedged CHF CHF 2.99 1.25 0.64
LU1820083118Aviva Investors - Short Duration Global High Yield Bond Fund Iy Share Class Accumulation USD 4.12 2.93 9.76
LU1820083209Aviva Investors - Short Duration Global High Yield Bond Fund
Iy Share Class Accumulation Hedged CHF CHF 3.02 1.26 6.02
LU1820083381Aviva Investors - Short Duration Global High Yield Bond Fund
Iy Share Class Accumulation Hedged EUR EUR 2.96 1.20 6.50
LU1184721527Aviva Investors - Short Duration Global High Yield Bond Fund Kq Share Class Dividend Hedged EUR EUR 3.24 1.27 6.51
LU1820083464Aviva Investors - Short Duration Global High Yield Bond Fund M Share Class Accumulation USD 4.03 2.88 9.67
LU1859007202Aviva Investors - Short Duration Global High Yield Bond Fund R Share Class Accumulation USD 3.76 2.62 9.71
LU1859007384Aviva Investors - Short Duration Global High Yield Bond Fund
R Share Class Accumulation Hedged CHF CHF 2.71 0.93 5.82
LU1859007111Aviva Investors - Short Duration Global High Yield Bond Fund
R Share Class Accumulation Hedged EUR EUR 2.94 1.19 6.50
LU1820083548Aviva Investors - Short Duration Global High Yield Bond Fund Ry Share Class Accumulation USD 3.77 2.62 9.51
LU1820083621Aviva Investors - Short Duration Global High Yield Bond Fund
Ry Share Class Accumulation Hedged EUR EUR 2.90 0.91 6.37
LU1985010005Aviva Investors - Short Duration Global High Yield Bond Fund
Ry Share Class Accumulation Hedged GBP GBP 3.56 0.65 2.67
LU2366394281 Aviva Investors - Social Transition Global Equity Fund A Share Class Accumulation USD 0.93 – –
2.PERFORMANCE (CONTINUED)

Aviva Investors Société d’investissement à capital variable (SICAV)
avivainvestors.com Annual Report and audited financial statements 198
INFORMATION FOR INVESTORS IN SWITZERLAND - UNAUDITED (CONTINUED)As at 31 December 2021
ISIN Sub-Fund Name Share Class
Class
Currency
2021
in %
2020
in %
2019
in %
LU2366394448 Aviva Investors - Social Transition Global Equity Fund A Share Class Accumulation EUR EUR 1.35 – –LU2366394877 Aviva Investors - Social Transition Global Equity Fund I Share Class Accumulation USD 1.12 – –LU2366395098 Aviva Investors - Social Transition Global Equity Fund I Share Class Accumulation EUR EUR 1.44 – –
LU2366395254 Aviva Investors - Social Transition Global Equity FundIy Share Class Accumulation Hedged GBP GBP 0.98 – –
LU2366395411 Aviva Investors - Social Transition Global Equity Fund R Share Class Accumulation USD 1.12 – –LU2366395684 Aviva Investors - Social Transition Global Equity Fund R Share Class Accumulation EUR EUR 1.44 – –
LU2366395841 Aviva Investors - Social Transition Global Equity FundRy Share Class Accumulation Hedged GBP GBP 0.97 – –
LU2366396492 Aviva Investors - Social Transition Global Equity Fund S Share Class Accumulation USD 1.14 – –LU2366396658 Aviva Investors - Social Transition Global Equity Fund S Share Class Accumulation EUR EUR 1.45 – –LU2390840283 Aviva Investors - Social Transition Global Equity Fund Sy Share Class Accumulation GBP GBP (0.03) – –LU2377016311 Aviva Investors - Social Transition Global Equity Fund Zy Share Class Accumulation GBP GBP (0.01) – –
LU2366396815 Aviva Investors - Social Transition Global Equity FundZy Share Class Accumulation Hedged GBP GBP 1.02 – –
LU1985008017 Aviva Investors - Sustainable Income & Growth Fund A Share Class Accumulation EUR EUR 18.20 (2.60) –
LU2011222283 Aviva Investors - Sustainable Income & Growth FundA Share Class Accumulation Hedged SGD SGD 9.18 0.91 7.75
LU2011222101 Aviva Investors - Sustainable Income & Growth Fund Aq Share Class Dividend Hedged SGD SGD 9.17 0.89 6.37LU1985008363 Aviva Investors - Sustainable Income & Growth Fund I Share Class Accumulation USD 10.52 3.05 5.88LU1985008447 Aviva Investors - Sustainable Income & Growth Fund I Share Class Accumulation EUR EUR 19.54 (5.90) 5.80LU1985008520 Aviva Investors - Sustainable Income & Growth Fund Iq Share Class Dividend USD 10.51 3.05 5.87LU1985008793 Aviva Investors - Sustainable Income & Growth Fund Iq Share Class Dividend EUR EUR 19.40 (5.81) 4.71LU1985009098 Aviva Investors - Sustainable Income & Growth Fund R Share Class Accumulation EUR EUR 19.43 (5.81) 6.04LU1985009171 Aviva Investors - Sustainable Income & Growth Fund Rq Share Class Dividend EUR EUR 19.41 (5.81) 4.71LU1985009338 Aviva Investors - Sustainable Income & Growth Fund S Share Class Accumulation USD 10.52 3.05 5.88LU1985009411 Aviva Investors - Sustainable Income & Growth Fund S Share Class Accumulation EUR EUR 19.42 (5.80) 5.98LU2005032797 Aviva Investors - Sustainable Income & Growth Fund Sq Share Class Dividend EUR EUR 19.55 (5.86) 4.64LU1985009767 Aviva Investors - Sustainable Income & Growth Fund Z Share Class Accumulation USD 11.07 3.45 6.06LU0274937936 Aviva Investors - UK Listed Equity High Alpha Fund Aa Share Class Dividend GBP 27.36 (10.51) 16.98LU0010020310 Aviva Investors - UK Listed Equity High Alpha Fund B Share Class Accumulation GBP 27.04 (10.73) 16.69LU0160960752 Aviva Investors - UK Listed Equity High Alpha Fund I Share Class Accumulation GBP 28.37 (9.80) 17.91LU1370700061 Aviva Investors - UK Listed Equity High Alpha Fund R Share Class Accumulation GBP – (9.83) 17.86LU0560712530 Aviva Investors - UK Listed Equity High Alpha Fund Z Share Class Accumulation GBP 29.50 (9.00) 18.94LU0837066439 Aviva Investors - US Equity Income Fund A Share Class Accumulation USD 20.84 (2.13) 20.92LU0837066512 Aviva Investors - US Equity Income Fund I Share Class Accumulation USD 21.75 (1.38) 21.88LU0957618282 Aviva Investors - US Equity Income Fund Ia Share Class Dividend USD 21.75 (1.38) 21.88LU1373244406 Aviva Investors - US Equity Income Fund R Share Class Accumulation USD – (1.39) 21.83LU2144876831 Aviva Investors - US Investment Grade Bond Fund I Share Class Accumulation USD – 6.68 –
LU2144877300 Aviva Investors - US Investment Grade Bond FundK Share Class Accumulation Hedged EUR EUR – 3.65 –
LU2144877482 Aviva Investors - US Investment Grade Bond FundZy Share Class Accumulation Hedged GBP GBP – 6.47 –
2.PERFORMANCE (CONTINUED)
Past performance is not an indication of the current or future performance.The performance data does not take into account the commissions on the issue and redemption of Shares.Performance figures were calculated in accordance with the applicable SFAMA guidelines. SFAMA and AMP (Asset Management Platform) have merged into AMAS (AssetManagement Association Switzerland).

avivainvestors.com Annual Report and audited financial statements 199
Aviva Investors Luxembourg S.A.
PO Box 1375
L-1013 Luxembourg
Tel + (352) 40 28 20 1
www.avivainvestors.com
Registered address: 2, rue du Fort Bourbon,
L-1249 Luxembourg, Grand Duchy of Luxembourg.
R.C.S. Luxembourg B 25.708
Related Documents