Welcome message from author
This document is posted to help you gain knowledge. Please leave a comment to let me know what you think about it! Share it to your friends and learn new things together.
Transcript
* denotes no benchmark available

DANSKE INVEST SICAV
Société d'Investissement à Capital Variable
Annual Report, including Audited Financial Statements
as at December 31, 2020
R.C.S B161867
Subscriptions shall only be valid if made on the basis of the KIID (Key Investor Information Document) or the currentprospectus accompanied by the most recent Annual Report, including Audited Financial Statements as well as by theUnaudited Semi-Annual Report if published more recently than the most recent Annual Report, including AuditedFinancial Statements. No one is authorised to state other information than the one contained in the currentProspectus as well as in the documents herein mentioned, which are available to the public.
Table of contents
PageManagement and Administration 5Information to Shareholders 7Directors' Report 8Investment Manager's Report 10Report of the Réviseur d'Entreprises Agréé 13Statement of Net Assets 15Statement of Operations and Changes in Net Assets 42Statement of Changes in the Number of Shares 52Statistics 92China
Statement of Investments 108Geographical and Economic Portfolio Breakdowns 110
Danish BondStatement of Investments 111Geographical and Economic Portfolio Breakdowns 113
Danish Mortgage BondStatement of Investments 114Geographical and Economic Portfolio Breakdowns 117
Denmark FocusStatement of Investments 118Geographical and Economic Portfolio Breakdowns 119
Eastern EuropeStatement of Investments 120Geographical and Economic Portfolio Breakdowns 122
Emerging and Frontier MarketsStatement of Investments 123Geographical and Economic Portfolio Breakdowns 129
Emerging Markets Debt Hard CurrencyStatement of Investments 130Geographical and Economic Portfolio Breakdowns 144
Euro Sustainable High Yield Bond*Statement of Investments 145Geographical and Economic Portfolio Breakdowns 151
EuropeStatement of Investments 152Geographical and Economic Portfolio Breakdowns 154
Europe High DividendStatement of Investments 155Geographical and Economic Portfolio Breakdowns 157
Europe Small CapStatement of Investments 158Geographical and Economic Portfolio Breakdowns 161
European BondStatement of Investments 162Geographical and Economic Portfolio Breakdowns 166
European Corporate Sustainable BondStatement of Investments 167Geographical and Economic Portfolio Breakdowns 171
Euro Investment Grade Corporate BondStatement of Investments 172Geographical and Economic Portfolio Breakdowns 177
Global Emerging MarketsStatement of Investments 178Geographical and Economic Portfolio Breakdowns 182
Global Emerging Markets Small CapStatement of Investments 183Geographical and Economic Portfolio Breakdowns 186
Global Inflation Linked BondStatement of Investments 187Geographical and Economic Portfolio Breakdowns 190
Global Inflation Linked Bond Short DurationStatement of Investments 191Geographical and Economic Portfolio Breakdowns 193
DANSKE INVEST SICAV
3
* Please refer to Note 1.
Global Sustainable Future*Statement of Investments 194Geographical and Economic Portfolio Breakdowns 196
IndiaStatement of Investments 197Geographical and Economic Portfolio Breakdowns 198
JapanStatement of Investments 199Geographical and Economic Portfolio Breakdowns 201
Nordic Corporate BondStatement of Investments 202Geographical and Economic Portfolio Breakdowns 206
RussiaStatement of Investments 207Geographical and Economic Portfolio Breakdowns 209
SverigeStatement of Investments 210Geographical and Economic Portfolio Breakdowns 212
US High Yield BondStatement of Investments 213Geographical and Economic Portfolio Breakdowns 222
Notes to the Audited Financial Statements 223Information for Investors in Switzerland (unaudited) 243Unaudited Appendix 254
DANSKE INVEST SICAV
4
* Please refer to Note 1.
Table of contents (continued)

Management and Administration
BOARD OF DIRECTORS OF THE SICAV
Jan Stig RASMUSSEN (Chairperson)Independent Director11, rue De WeckerL-6795 GrevenmacherGrand Duchy of Luxembourg
Klaus EBERTExecutive Director (from February 4, 2020until December 31, 2020)Independent Director (from January 1, 2021)Danske Invest Management A/S, Luxembourg Branch100A, rue de la ValléeL-3591 DudelangeGrand Duchy of Luxembourg
Morten RASTENExecutive DirectorDanske Invest Management A/S17, Parallelvej2800-Kgs. LyngbyDenmark
Salla KOMULAINENIndependent Director52, rue de RodenbourgL-6950 OlingenGrand Duchy of Luxembourg
REGISTERED OFFICE OF THE SICAV
Danske Invest Management A/S, Luxembourg Branch13, rue Edward SteichenL-2540 LuxembourgGrand Duchy of Luxembourg
MANAGEMENT COMPANY
Danske Invest Management A/S17, Parallelvej2800-Kgs. LyngbyDenmark
LUXEMBOURG BRANCH
Danske Invest Management A/S, Luxembourg Branch13, rue Edward SteichenL-2540 LuxembourgGrand Duchy of Luxembourg
BOARD OF DIRECTORS OF THE MANAGEMENTCOMPANY
Glenn SÖDERHOLM (Chairman)Head of Banking NordicDanske Bank A/S2, Holmens Kanal1060 CopenhagenDenmark
Søren HVIDKJÆR (Vice Chairman)Department of FinanceCopenhagen Business SchoolSolbjergs Plads 3, A4.352000 FrederiksbergDenmark
Helle M BREINHOLTBreinholt Consulting A/SØstbanegade 3, 3 tv2100 Copenhagen ØDenmark
Bo HOLSEPartnerGorrissen Federspiel2, Silkeborgvej8000 Aarhus CDenmark
Jørgen A HORWITZDirector186E, Strandvejen2920 CharlottenlundDenmark
Lars Eigen MØLLERExecutive Vice PresidentDanske Bank A/S17, Parallelvej2800-Kgs. LyngbyDenmark
Agnete RAASHOU-NIELSENDirector8, Hauchsvej1825 Frederiksberg CDenmark
INVESTMENT MANAGERS
Danske Bank A/S17, Parallelvej2800-Kgs. LyngbyDenmark
Danske Invest Asset Management ASBryggetorget 40250 OsloNorway
SUB-INVESTMENT MANAGERS
FIL Pensions ManagementOakhill House130 Tonbridge RoadHildenborough, TonbridgeKent TN11 9DZUnited Kingdom
Allianz Global Investors Asia Pacific Limited27th floor, ICBC Tower3 Garden RoadCentralHong Kong
Sumitomo Mitsui DS Asset Management (UK) Limited(former name: Daiwa SB Investments (UK) Limited)5th floor,5 King William Street,London, EC4N 7DAUnited Kingdom
DANSKE INVEST SICAV
5
AQR Capital Management LLC2 Greenwich PlazaGreenwich, CT 06830U.S.A.
Loomis, Sayles & Company, LPOne Financial CenterBoston, MA 02111U.S.A.
SUB SUB-INVESTMENT MANAGERS
Fidelity Institutional Asset Management LLC900 Salem StreetSmithfieldRhode Island 02917U.S.A.
SUB-INVESTMENT ADVISORS
Aventicum Capital Management (Qatar) LLCTornado Tower - 32 floorWest Bay, P.O. Box 23146DohaQatar
Claritas Administração de Recursos Ltda.Avenida Brigadeiro Faria Lima, 4221, 4th floor04538-133, São PauloBrazil
Compass Group LLC 35East 57th Street,New York, NY 10022U.S.A.
Imara Asset Management LtdLevel 12, Nexteracom Tower 1Cybercity, EbeneMauritius
JK Capital Management LimitedSuite 1101, Chinachem Tower34-37 Connaught Road CentralHong Kong
Karma Capital Advisors Private LimitedFloor 12U, Suite I, Remi Commercio,Off Veera Desai Road, Andheri (W),Mumbai 400053India
Waverton Investment Management Limited16 Babmaes StreetLondon SW1Y 6AHUnited Kingdom
DEPOSITARY BANK AND PRINCIPALPAYING AGENT
RBC Investor Services Bank S.A.14, Porte de FranceL-4360 Esch-sur-AlzetteGrand Duchy of Luxembourg
CENTRAL ADMINISTRATION AGENT AND REGISTRARAGENT
RBC Investor Services Bank S.A.14, Porte de FranceL-4360 Esch-sur-AlzetteGrand Duchy of Luxembourg
LENDING AGENT
RBC Investor Services Trust155, Wellington Street West, 7th floorToronto, Ontario M5V 3L3Canada
AUDITOR
Deloitte AuditSociété à responsabilité limitée20, Boulevard de KockelscheuerL-1821 LuxembourgGrand Duchy of Luxembourg
DOMICILIARY AGENT
Danske Invest Management A/S, Luxembourg Branch13, rue Edward SteichenL-2540 LuxembourgGrand Duchy of Luxembourg
SWISS REPRESENTATIVE
Carnegie Fund Services S.A.11, rue du General - Dufour1204 GenevaSwitzerland
SWISS PAYING AGENT
Banque Cantonale de Geneve17, Quai de L'lle1204 GenevaSwitzerland
GERMAN INFORMATION AND PAYING AGENT
Danske Bank A/S,Zweigniederlassung HamburgGeorgsplatz 1Postfach 101522D-20099 HamburgGermany
AUSTRIAN INFORMATION AND PAYING AGENT
UniCredit Bank Austria AgP.O. Box 35A-1011 ViennaAustria
MAIN DISTRIBUTION AGENT
Danske Bank A/S17, Parallelvej2800-Kgs. LyngbyDenmark
DANSKE INVEST SICAV
6
Management and Administration (continued)
Information to Shareholders
Information about the Net Asset Value of the shares of each fund and about the subscription and redemption pricesis available at all times at the registered office of the SICAV.
Copies of the annual report, including audited financial statements and semi-annual reports may be obtained byshareholders from the registered office of the SICAV.
A detailed schedule of portfolio changes is available free of charge upon request at the registered office of the SICAV.
German Shareholders
The current prospectus, KIID, articles of association, Annual Report, including Audited Financial Statements andUnaudited Semi-Annual Reports and a list of changes in the portfolio are also available free of charge at the GermanInformation and Paying Agent. The address can be found on page 6 Management and Administration.
As from January 1, 2020, the following funds have constantly invested at least 51% of their net assets in equities,according to the German Investment Tax Act (Investmentsteuergesetz). Historical data is availableon www.danskeinvest.de. German tax residents may qualify for a partial tax exemption for investing in these funds.
ChinaDenmark FocusEastern EuropeEastern Europe Absolute*Eastern Europe ex. Russia*Emerging and Frontier MarketsEuropeEurope High DividendEurope Small CapGlobal Emerging MarketsGlobal Emerging Markets Small CapGlobal High Dividend*Global Sustainable Future*IndiaJapanRussia
Austrian Shareholders
The current prospectus, KIID, articles of association, Annual Report, including Audited Financial Statements andUnaudited Semi-Annual Reports and a list of changes in the portfolio are also available free of charge at the AustrianInformation and Paying Agent. The address can be found on page 6 Management and Administration.
Swiss Shareholders
The SICAV’s current prospectus, KIID, articles of incorporation, Annual Report, including Audited Financial Statementsand Unaudited Semi-Annual Reports – each in their respective latest version approved by the Swiss Financial MarketSupervisory Authority, and the net asset value per share as well as the subscription, redemption and possibleconversion price of shares and a list of change in the portfolio are available free of charge at the office of the SwissRepresentative.
All information available to shareholders at the head office of the Management Company is also available to thepublic free of charge, upon request from the Swiss Representative.
Swiss Representative:
Carnegie Fund Services S.A.11, rue du General - Dufour1204 Geneva, SWITZERLAND
* Please refer to Note 1.
DANSKE INVEST SICAV
7

Directors’ Report
Dear Shareholder,
We are pleased to present the SICAV’s 2020 annual report, of which our own board report forms a part. Our boardreport covers some of the main business activities of the SICAV.
ACTIVITY DURING THE YEAR
The SICAV’s fund range was consolidated
As the SICAV strives to keep its fund range relevant, efficient, and up to date, some funds were liquidated during theyear, and several funds were merged bringing the total range from 48 to 41 funds.
The coronavirus pandemic (COVID-19) was the overriding theme for the global economy throughout 2020. InFebruary and March 2020, when coronavirus infection rates took off, we saw global equity prices dropping morethan 30% – the most profound decline ever over so short a period. In the second quarter, when global governmentsand central banks stepped in with unprecedented fiscal support, the financial markets recovered strongly. We saw asignificant boost to economic activity in the summer and autumn.
In 2020 US equities generated more significant returns, being pushed up mainly by the IT sector, while Europeanequities gave negative returns in part because the coronavirus pandemic hit European economies harder than, forinstance, the US or China economies. Due to the high level of uncertainty in the spring, investors sought sanctuary inbonds, which resulted in rising bond prices and falling yields. However, compared to the start of 2020, yieldsgenerally ended the year lower, which helped lift bond prices and ensure positive returns on Danish governmentbonds and mortgage bonds.
Throughout the year, there was a focus on sustainability in the SICAV with the launch of a new sustainablepositioning of the funds. Some funds such as the Global Sustainable Future and the Euro Sustainable High Yield Bondwere re-launched. Subscriptions outpaced redemptions overall, with a net inflow for the SICAV of EUR 511 millionand a year-end overall net asset value for the SICAV of EUR 11.59 billion. More details about investment activityappear in the investment manager’s report.
The management company completed a successful internal merger
On January 1, 2020 the SICAV’s management company, Danske Invest Management Company, Luxembourg mergedinto Danske Invest Management A/S, Denmark and established a branch – Danske Invest Management A/S,Luxembourg Branch. The merger was designed to provide internal efficiencies and does not change the way theSICAV or its portfolios are managed or operated.
The board held five meetings
We had one meeting in addition to our regular quarterly meetings. All meetings were called and held in Luxembourg,and due to the COVID-19 pandemic, the directors attended these meetings virtually. We also signed 13 circularresolutions - an electronic means allowing approval of a resolution without a physical meeting (typically used forroutine matters only). Given the SICAV’s business scope and nature, we do not currently consider it necessary tohave any standing committees. All board-related matters, including audit and remuneration matters, are thereforeaddressed by the entire board.
The Annual General Meeting will be on April 16, 2021
The meeting will address the following matters as they relate to the completed 2020 financial year. Since we proposeno particular business and are unaware of any proposals from shareholders, we believe the meeting will include thefollowing routine matters only:
. adoption of financial statements and approval of the allocation of the results
. re-election of directors
. re-election of the auditor
. discharge of directors’ duties.
Based on our review of the information provided to us, we recommend that shareholders vote to support all boardproposals on the above matters, including Deloitte Luxembourg's re-election as the SICAV’s auditor. Boardcompensation includes remuneration (which is not paid to executive directors) and expense reimbursement.Compensation for 2020 can be found in the notes of the annual report. For clarity, the board compensation is anintegrated part of the operating and administrative fee paid by the funds; hence, it is carried by the managementcompany.
DANSKE INVEST SICAV
8
ONGOING POLICIES AND RESPONSIBILITIES
Review of accounts
We reviewed and discussed the SICAV’s 2020 accounts with the management company. We find them consistentwith the accounting documents and information provided to us. We believe the annual report and accounts are fair,balanced, and understandable and provide the information necessary for shareholders to assess the SICAV’s financialposition, performance, business model, and business strategy.
Internal controls
We have received and reviewed the management company’s formal quarterly reports on its activities andresponsibilities, including the activities of those to whom it has delegated certain functions, mainly the depositary,RBC Investor Services Bank SA. We believe these reports adequately document compliance with the internal controlswe, and the management company, have established as a way of ensuring that the SICAV meets the obligations toshareholders based on the prospectus, articles of incorporation and all relevant regulations. Should any materialissues arise concerning fund administration or accounting, the management company must inform us without delay.
Sustainability considerations
In 2020, several solutions and products were developed to contribute to a greener and more sustainable society. Weare pleased that the LuxFLAG ESG label was awarded to 18 of our funds. This underlines the fund’s strong foundationof integrating sustainability aspects in the entire investment process. This includes the initial screening of investmentopportunities, evaluating and managing the resulting investment opportunities and risks, and accurate disclosure.More details appear in the prospectus.
Active Ownership Policy
We believe it is important for the funds' portfolio managers to make responsible decisions when exercising votingrights for securities in the portfolios. In particular, we wish to encourage the funds to support company actions andpolicies consistent with sustainability, long-term value, and ESG characteristics. Accordingly, the SICAV has an ActiveOwnership Policy designed to provide a basis for protecting and promoting long-term value in portfolio companies.The policy is available at danskeinvest.com together with an active ownership report covering engagement andvoting during 2020.
Coronavirus
2020 was indeed a historic year characterised by one event - the COVID-19 pandemic. The outbreak of COVID-19resulted in supply chain disruptions, border and travel restrictions, quarantines and general market uncertainty. Thestrong monetary and fiscal support from local governments remained in place as we exited 2020. The effects ofCOVID-19 have and may continue to adversely affect the global economy with key risks being a resurgence of COVIDoutbreaks, setbacks in vaccination rollouts or new virus mutations. Despite uncertainty related to the timing andstrength of the economic recovery, the outlook is cautiously brighter.
In Closing
We wish to thank you, our shareholders, for your continued support to thank everyone involved in the managementof Danske Invest SICAV for their dedicated work during the past financial year. We look forward to continuing toprovide shareholders with the highest possible degree of satisfaction in the future.
Yours sincerely,
Jan Stig RASMUSSEN, ChairpersonOn behalf of the boardApril 15, 2021
The board has approved this Report from the SICAV’s Board of Directors (“the board” or “we”) of Danske Invest SICAV(“the SICAV”). The SICAV is part of Danske Invest, the brand name for funds managed by various fund managementcompanies within the Danske Bank Group. It is primarily domiciled in Luxembourg and the Nordic countries. DanskeBank Group sponsors the Danske Invest fund family, and each fund is managed according to the local regulations ofits domicile. The SICAV’s 2020 financial year was the same as the calendar year 2020. Except where the context mayindicate otherwise, terms used in this report have the same definitions as in the prospectus.
DANSKE INVEST SICAV
9
Directors’ Report (continued)
Investment Manager's Report for the year ended December 31, 2020Investment markets in 2020
Global economy
The global coronavirus pandemic was the overriding theme for the global economy in 2020. Extensive restrictionsand lockdowns around the world caused economic activity to fall off a cliff in spring 2020. Unemployment soared inmany countries, consumption slumped and companies became reluctant to invest. As a result, significant negativeeconomic growth was experienced by many countries and regions in 2020, including the EU and the US.
Central banks and politicians generally acted more quickly and with more comprehensive measures than during thefinancial crisis in 2008-2009, and this together with the gradual reopening of societies provided a major boost toeconomic activity in the course of the spring, summer and autumn. However, a resurgent virus in the latter monthsof 2020 prompted a second wave of restrictions and lockdowns – not least in Europe – resulting in a new economicdownturn.
Europe
Europe’s economy was hit harder by the corona crisis in 2020 than the US economy, not least due to more extensiverestrictions and lockdowns in many European countries both in the spring and towards the end of the year.Moreover, both fiscal and monetary policy stimuli were less aggressive in Europe than in the US, while Europe wassubject to additional uncertainty on the terms of the UK’s definitive exit from the EU at the end of 2020 (Brexit).
USA
The US economy was also hit hard by the corona crisis, though, as mentioned above, restrictions and lockdownswere generally less comprehensive and lengthy than those in Europe – though measures varied somewhat from stateto state. At the same time, the Fed and US politicians took greater and more resolute action in spring 2020 in termsof economic relief packages. However, November’s presidential election became an ever-increasing uncertaintyfactor over the summer and autumn and contributed to Democrats and Republicans being unable to agree a newrelief package to ensure continued support for struggling companies and the unemployed. A new package was onlypassed at the last minute in December 2020.
China
Just as China was the first country to go into lockdown because of the corona crisis, the country was also the first toease restrictions and stimulate a recovery in economic activity. The negative repercussions of the corona crisis havegenerally been less extensive and long lasting in China – not least, because the Chinese authorities have been quickto contain new virus outbreaks.
Equity markets
While the coronavirus led to a marked decline in earnings across many companies in 2020, global equities stillgenerated a return of 6.5%, though with considerable regional variation.
In February and March 2020, when coronavirus infection rates really took off and triggered restrictions andlockdowns around the world, global equity prices plunged more than 30% – the deepest decline ever over so short aperiod. Since then, economic relief packages on a historic scale from governments and central banks have helpedsupport the global economy and equity markets, while positive news on the development of corona vaccines in late2020 contributed to lifting market sentiment further.
The extremely accommodative monetary policies of the central banks have produced a great deal of liquidity thathas to be invested, while very low or negative yields on many bonds provide limited alternatives to equities forinvestors seeking an opportunity to earn a reasonable return, and this has lent further support to equity markets in2020.
Bond markets
2020 was characterised by low yields and further declines in interest rates, which meant that yields on many bondsremained negative at the end of 2020. The high level of uncertainty associated with the coronavirus caused investorsto seek sanctuary in bonds in February and early March 2020, which resulted in rising bond prices and falling yields.
While bond yields at the end of 2020 were above the lows of March, they were still considerably below the level atthe start of 2020. This was due in no small part to the extensive monetary policy easing that central banks enacted inthe spring to counter the corona crisis.
DANSKE INVEST SICAV
10
FX market
The EUR strengthened in 2020 against many other currencies, including USD and JPY, where strengthening mostlyoccurred in the latter half of the year. The USD and JPY typically act as safe-haven currencies in uncertain times, so asthe economy picked up in the second half of the year and expectations on the future grew more positive, investorsmoved out of safe-haven currencies, causing them to weaken. The USD was also weakened by the extremelyaccommodative US monetary policy prompted by the corona crisis and an easing of uncertainty related to the tradeconflict involving mainly the US and China. For investors in the Eurozone, the stronger EUR in 2020 eroded the returnon equities from many countries and regions. Looking at the Nordic currencies, the EUR also strengthened againstthe Norwegian krone (NOK), but weakened against the Swedish krona (SEK). The EUR weakened slightly against theDanish krone (DKK).
Expectations for 2021*
Global economy
We expect to see marked economic growth in 2021 as the rollout of corona vaccines presumably allows restrictionsand lockdowns to be gradually lifted, economic activity to increase, and some of the postponed consumption duringthe corona crisis to be recouped.
The very accommodative monetary policies of the central banks and fiscal relief packages in Europe and the US areadditional factors supporting our expectation of significant economic growth. Ultimately, however, growth for theyear will very much depend on how quickly and effectively the coronavirus vaccines are rolled out, so we cannormalise consumption, reduce unemployment and increase corporate appetite for investment – though, overall,there remains a great deal of uncertainty about growth in 2021.
The European economy, in particular, was still greatly hampered by restrictions and lockdowns at the start of 2021.Nevertheless, we expect higher growth in Europe than in the US in 2021 – and for that growth to be significantlyabove the average for Europe in recent years. Europe’s economy experienced a more severe setback than the US in2020, so Europe’s starting point is lower, and it has more catch-up potential from a normalisation of economicactivity. The latest round of European restrictions and lockdowns in autumn and winter 2020/21 has paralysed theservice sector in particular.
Equity markets
We expect a positive return from equities overall in 2021 as the global economy grows. However, we expect a lowerreturn than in 2020. Another positive factor is that we expect the ample liquidity supplied by the central banks to besupportive of the financial markets, and some of this liquidity can be expected to flow into equities and supportprices here. Given the very low or negative yields on many bonds, equities remain a necessary asset class forinvestors who want the opportunity to earn a reasonable, positive return.
Bond markets
Moving on to bond markets, we expect very modest returns here – and even negative returns on some bonds. Weexpect short rates in Denmark, Europe and the US to remain at their current low/negative levels. The EuropeanCentral Bank (ECB) and the US central bank (the Fed) have very clearly stated they are not considering hiking interestrates anytime soon.
At a more general level, the hunt for excess return in a low interest-rate environment could continue to supportinvestor demand for credit bonds, which provide the opportunity for higher returns than the most secure bondtypes, such as government bonds from developed markets. However, credit bonds must be expected tounderperform the more secure bond types during periods of high uncertainty and volatility in the financial markets.
FX market
Whereas the euro (EUR) and the Danish krone (DKK) generally strengthened in 2020, we expect these currencies toweaken in 2021 – including against the US dollar (USD), the British pound (GBP), the Japanese yen (JPY) and theChinese yuan (CNY). We expect the Norwegian krone (NOK) and Swedish krona (SEK) to trade around current levelsat the end of 2021.
* Note that the contents of this annual report are not a recommendation to buy or sell units in the SICAV and do notconstitute investment advice.
DANSKE INVEST SICAV
11
Investment Manager's Report for the year ended December 31, 2020 (continued)
Brexit
Europe avoided a hard Brexit when the UK and the EU agreed a trade and cooperation deal in December 2020 thatallowed European businesses to dodge a very chaotic situation from the New Year. Yet the deal leaves many looseends to be tied up that could trigger periods of uncertainty; such as the agreement mostly covers the trade in goodsand only to a minor extent the trade in services.
Coronavirus and Economic growth
Global growth in 2021 is heavily dependent on the rollout of vaccines against the coronavirus, and the risk here isthat the rollout takes longer than expected, so a full recovery in economic activity drags out. Worst-case scenario isthat the vaccines prove insufficiently effective in one way or another – for example, because mutations in the virusprompt the need to develop new vaccines, which would be time-consuming.
There will generally be a lot of focus on when and to what extent we will see a recovery in economic activity. Globalgrowth in 2021 remains mired in considerable uncertainty, and if the strength or pace of the expected upswingdisappoint, the negative fallout for the financial markets could be severe.
DANSKE INVEST SICAV
12
Investment Manager's Report for the year ended December 31, 2020 (continued)
Report of the Réviseur d'Entreprises Agréé
To the Shareholders ofDanske Invest SICAV
Report on the Audit of the Financial Statements
Opinion
We have audited the financial statements of Danske Invest SICAV (the "SICAV") and of each of its funds, whichcomprise the statement of net assets and the statement of investments and other net assets asat December 31, 2020 and the statement of operations and changes in net assets for the year then ended, andnotes to the financial statements, including a summary of significant accounting policies.
In our opinion, the accompanying financial statements give a true and fair view of the financial position of the SICAVand of each of its funds as at December 31, 2020, and of the results of their operations and changes in their netassets for the year then ended in accordance with Luxembourg legal and regulatory requirements relating to thepreparation and presentation of the financial statements.
Basis for Opinion
We conducted our audit in accordance with the Law of July 23, 2016 on the audit profession (Law of July 23, 2016)and with International Standards on Auditing (ISAs) as adopted for Luxembourg by the “Commission de Surveillancedu Secteur Financier” (CSSF). Our responsibilities under the Law of July 23, 2016 and ISAs as adopted for Luxembourgby the CSSF are further described in the “Responsibilities of the "réviseur d'entreprises agréé" for the Audit of theFinancial Statements” section of our report. We are also independent of the SICAV in accordance with theInternational Code of Ethics for Professional Accountants, including International Independence Standards, issued bythe International Ethics Standards Board for Accountants (IESBA Code) as adopted for Luxembourg by the CSSFtogether with the ethical requirements that are relevant to our audit of the financial statements, and have fulfilledour other ethical responsibilities under those ethical requirements. We believe that the audit evidence we haveobtained is sufficient and appropriate to provide a basis for our opinion.
Other Information
The Board of Directors of the SICAV is responsible for the other information. The other information comprises theinformation stated in the annual report but does not include the financial statements and our report of the "réviseurd'entreprises agréé" thereon.
Our opinion on the financial statements does not cover the other information and we do not express any form ofassurance conclusion thereon.
In connection with our audit of the financial statements, our responsibility is to read the other information and, indoing so, consider whether the other information is materially inconsistent with the financial statements or ourknowledge obtained in the audit or otherwise appears to be materially misstated. If, based on the work we haveperformed, we conclude that there is a material misstatement of this other information, we are required to reportthis fact. We have nothing to report in this regard.
Responsibilities of the Board of Directors of the SICAV for the Financial Statements
The Board of Directors of the SICAV is responsible for the preparation and fair presentation of the financialstatements in accordance with Luxembourg legal and regulatory requirements relating to the preparation andpresentation of the financial statements, and for such internal control as the Board of Directors of the SICAVdetermines is necessary to enable the preparation of financial statements that are free from material misstatement,whether due to fraud or error.
In preparing the financial statements, the Board of Directors of the SICAV is responsible for assessing the SICAV’sability to continue as a going concern, disclosing, as applicable, matters related to going concern and using the goingconcern basis of accounting unless the Board of Directors of the SICAV either intends to liquidate the SICAV or tocease operations, or has no realistic alternative but to do so.
13
Deloitte AuditSociété à responsabilité limitée20, Boulevard de KockelscheuerL-1821 LuxembourgGrand Duchy of Luxembourg
Tel: +352 451 451Fax: +352 451 452 992www.deloitte.lu
Responsibilities of the "réviseur d'entreprises agréé" for the Audit of the Financial Statements
The objectives of our audit are to obtain reasonable assurance about whether the financial statements as a wholeare free from material misstatement, whether due to fraud or error, and to issue a report of the "réviseurd'entreprises agréé" that includes our opinion. Reasonable assurance is a high level of assurance, but is not aguarantee that an audit conducted in accordance with the Law dated July 23, 2016 and with ISAs as adopted forLuxembourg by the CSSF will always detect a material misstatement when it exists. Misstatements can arise fromfraud or error and are considered material if, individually or in the aggregate, they could reasonably be expected toinfluence the economic decisions of users taken on the basis of these financial statements.
As part of an audit in accordance with the Law dated July 23, 2016 and with ISAs as adopted for Luxembourg by theCSSF, we exercise professional judgment and maintain professional skepticism throughout the audit. We also:
• Identify and assess the risks of material misstatement of the financial statements, whether due to fraud or error,design and perform audit procedures responsive to those risks, and obtain audit evidence that is sufficient andappropriate to provide a basis for our opinion. The risk of not detecting a material misstatement resulting from fraudis higher than for one resulting from error, as fraud may involve collusion, forgery, intentional omissions,misrepresentations, or the override of internal control.
• Obtain an understanding of internal control relevant to the audit in order to design audit procedures that areappropriate in the circumstances, but not for the purpose of expressing an opinion on the effectiveness of theSICAV’s internal control.
• Evaluate the appropriateness of accounting policies used and the reasonableness of accounting estimates andrelated disclosures made by the Board of Directors of the SICAV.
• Conclude on the appropriateness of the Board of Directors of the SICAV use of the going concern basis ofaccounting and, based on the audit evidence obtained, whether a material uncertainty exists related to events orconditions that may cast significant doubt on the SICAV’s ability to continue as a going concern. If we conclude that amaterial uncertainty exists, we are required to draw attention in our report of the "réviseur d'entreprises agréé" tothe related disclosures in the financial statements or, if such disclosures are inadequate, to modify our opinion. Ourconclusions are based on the audit evidence obtained up to the date of our report of the "réviseur d'entreprisesagréé".
• Evaluate the overall presentation, structure and content of the financial statements, including the disclosures, andwhether the financial statements represent the underlying transactions and events in a manner that achieves fairpresentation.
We communicate with those charged with governance regarding, among other matters, the planned scope andtiming of the audit and significant audit findings, including any significant deficiencies in internal control that weidentify during our audit.
For Deloitte Audit, Cabinet de révision agréé
Jean-Philippe Bachelet, réviseur d'entreprises agrééPartnerLuxembourg, April 15, 2021
14
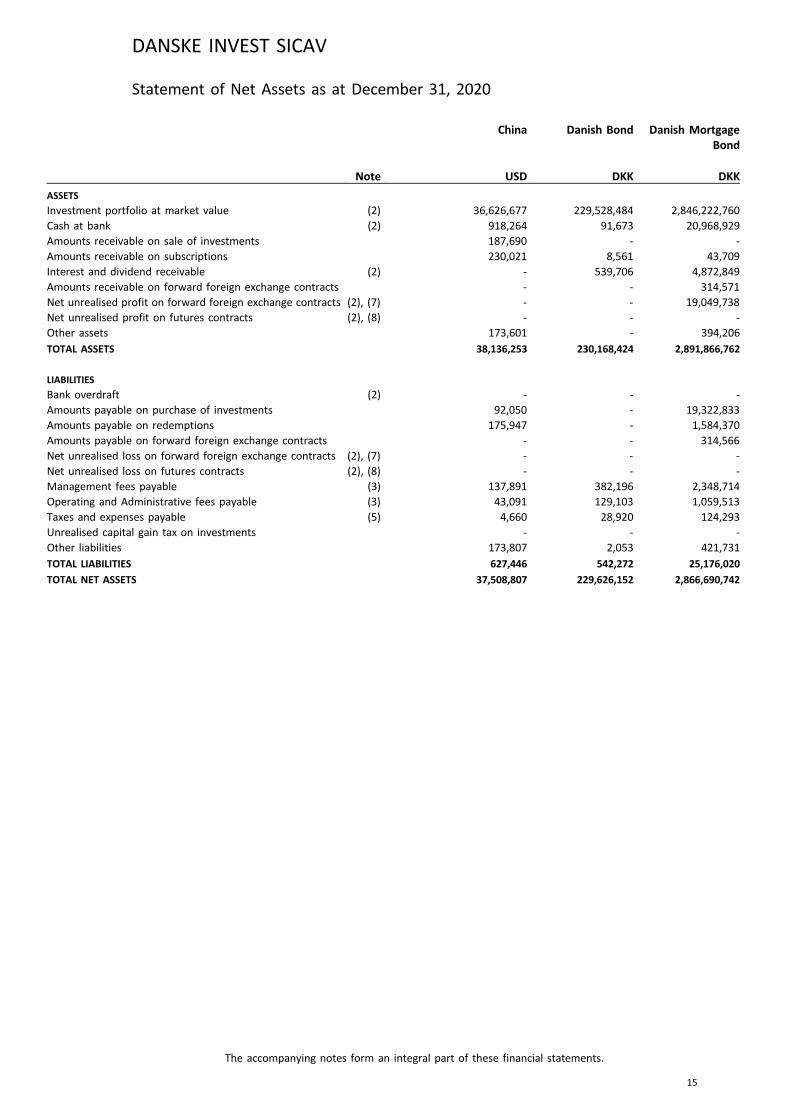
Statement of Net Assets as at December 31, 2020
China Danish Bond Danish MortgageBond
Note USD DKK DKK
ASSETS
Investment portfolio at market value (2) 36,626,677 229,528,484 2,846,222,760Cash at bank (2) 918,264 91,673 20,968,929Amounts receivable on sale of investments 187,690 - -Amounts receivable on subscriptions 230,021 8,561 43,709Interest and dividend receivable (2) - 539,706 4,872,849Amounts receivable on forward foreign exchange contracts - - 314,571Net unrealised profit on forward foreign exchange contracts (2), (7) - - 19,049,738Net unrealised profit on futures contracts (2), (8) - - -Other assets 173,601 - 394,206
TOTAL ASSETS 38,136,253 230,168,424 2,891,866,762
LIABILITIES
Bank overdraft (2) - - -Amounts payable on purchase of investments 92,050 - 19,322,833Amounts payable on redemptions 175,947 - 1,584,370Amounts payable on forward foreign exchange contracts - - 314,566Net unrealised loss on forward foreign exchange contracts (2), (7) - - -Net unrealised loss on futures contracts (2), (8) - - -Management fees payable (3) 137,891 382,196 2,348,714Operating and Administrative fees payable (3) 43,091 129,103 1,059,513Taxes and expenses payable (5) 4,660 28,920 124,293Unrealised capital gain tax on investments - - -Other liabilities 173,807 2,053 421,731
TOTAL LIABILITIES 627,446 542,272 25,176,020
TOTAL NET ASSETS 37,508,807 229,626,152 2,866,690,742
DANSKE INVEST SICAV
The accompanying notes form an integral part of these financial statements.
15
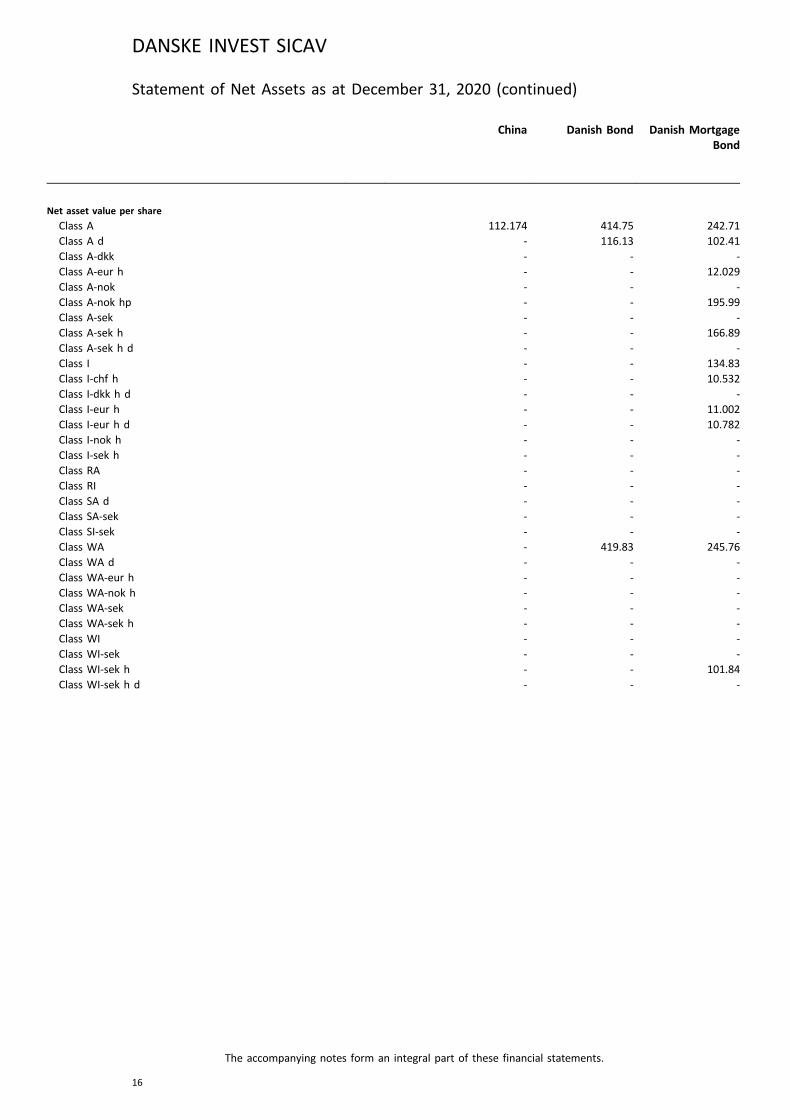
China Danish Bond Danish MortgageBond
Note USD DKK DKK
Net asset value per share
Class A 112.174 414.75 242.71Class A d - 116.13 102.41Class A-dkk - - -Class A-eur h - - 12.029Class A-nok - - -Class A-nok hp - - 195.99Class A-sek - - -Class A-sek h - - 166.89Class A-sek h d - - -Class I - - 134.83Class I-chf h - - 10.532Class I-dkk h d - - -Class I-eur h - - 11.002Class I-eur h d - - 10.782Class I-nok h - - -Class I-sek h - - -Class RA - - -Class RI - - -Class SA d - - -Class SA-sek - - -Class SI-sek - - -Class WA - 419.83 245.76Class WA d - - -Class WA-eur h - - -Class WA-nok h - - -Class WA-sek - - -Class WA-sek h - - -Class WI - - -Class WI-sek - - -Class WI-sek h - - 101.84Class WI-sek h d - - -
DANSKE INVEST SICAV
The accompanying notes form an integral part of these financial statements.
16
Statement of Net Assets as at December 31, 2020 (continued)
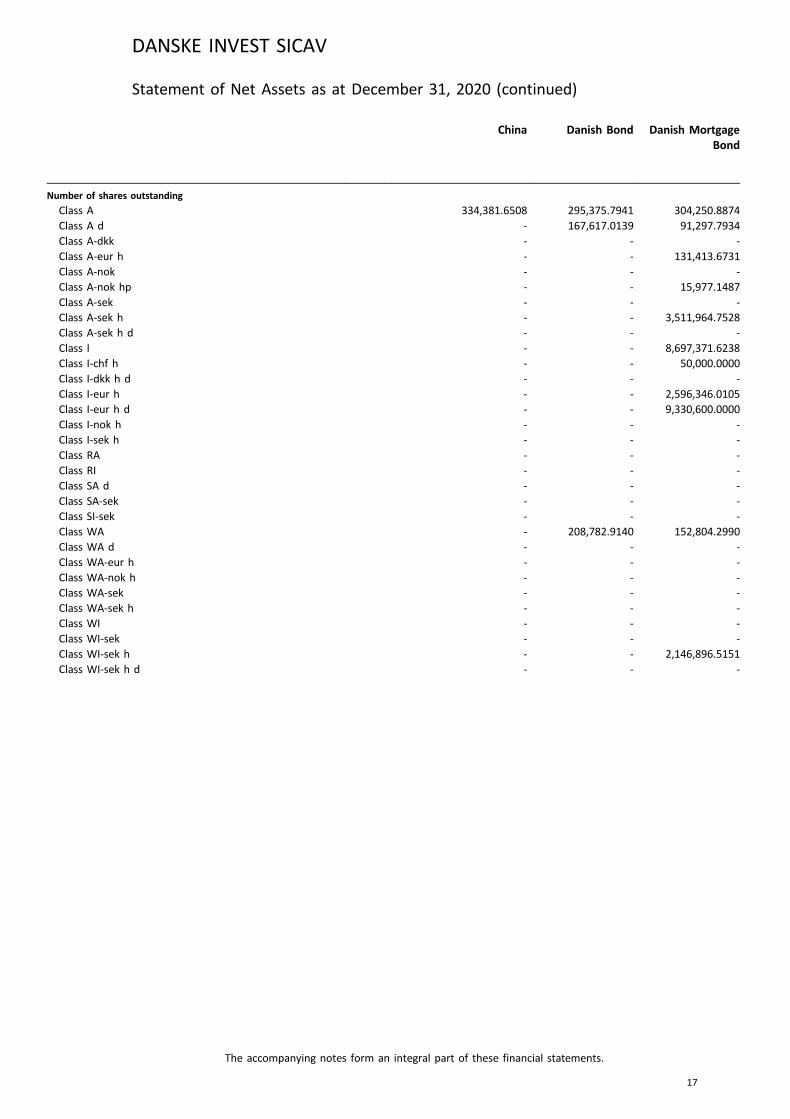
China Danish Bond Danish MortgageBond
Note USD DKK DKK
Number of shares outstanding
Class A 334,381.6508 295,375.7941 304,250.8874Class A d - 167,617.0139 91,297.7934Class A-dkk - - -Class A-eur h - - 131,413.6731Class A-nok - - -Class A-nok hp - - 15,977.1487Class A-sek - - -Class A-sek h - - 3,511,964.7528Class A-sek h d - - -Class I - - 8,697,371.6238Class I-chf h - - 50,000.0000Class I-dkk h d - - -Class I-eur h - - 2,596,346.0105Class I-eur h d - - 9,330,600.0000Class I-nok h - - -Class I-sek h - - -Class RA - - -Class RI - - -Class SA d - - -Class SA-sek - - -Class SI-sek - - -Class WA - 208,782.9140 152,804.2990Class WA d - - -Class WA-eur h - - -Class WA-nok h - - -Class WA-sek - - -Class WA-sek h - - -Class WI - - -Class WI-sek - - -Class WI-sek h - - 2,146,896.5151Class WI-sek h d - - -
DANSKE INVEST SICAV
The accompanying notes form an integral part of these financial statements.
17
Statement of Net Assets as at December 31, 2020 (continued)

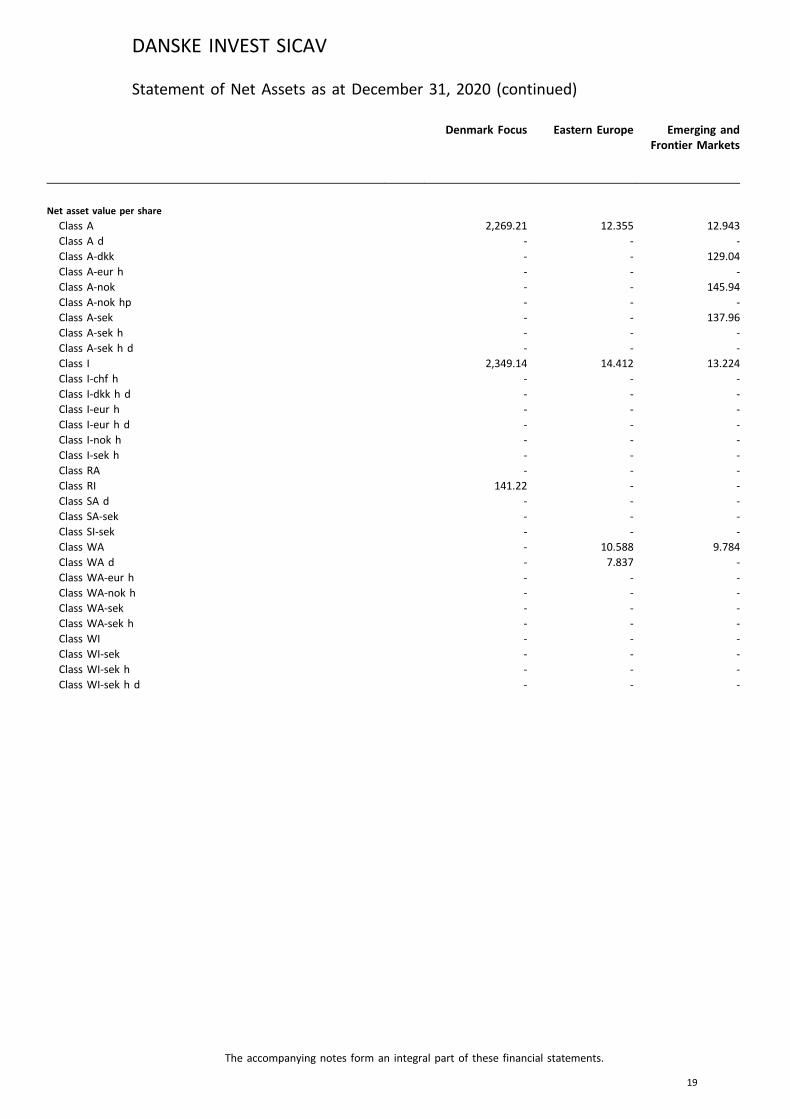
Denmark Focus Eastern Europe Emerging andFrontier Markets
Note DKK EUR EUR
ASSETS
Investment portfolio at market value (2) 448,638,859 8,945,489 53,901,855Cash at bank (2) 4,092,915 13,757 1,625,155Amounts receivable on sale of investments - 43,886 99,361Amounts receivable on subscriptions 123,114 16,247 878Interest and dividend receivable (2) - 13,234 14,795Amounts receivable on forward foreign exchange contracts - - -Net unrealised profit on forward foreign exchange contracts (2), (7) - - -Net unrealised profit on futures contracts (2), (8) - - -Other assets 3,283,671 40,122 1,516
TOTAL ASSETS 456,138,559 9,072,735 55,643,560
LIABILITIES
Bank overdraft (2) - - -Amounts payable on purchase of investments - 21,993 18,646Amounts payable on redemptions 17,848 21,760 523Amounts payable on forward foreign exchange contracts - - -Net unrealised loss on forward foreign exchange contracts (2), (7) - - -Net unrealised loss on futures contracts (2), (8) - - -Management fees payable (3) 1,134,790 32,471 213,734Operating and Administrative fees payable (3) 190,795 6,105 50,015Taxes and expenses payable (5) 25,789 1,108 1,580Unrealised capital gain tax on investments - - 16,956Other liabilities 8,385 38,903 1,903
TOTAL LIABILITIES 1,377,607 122,340 303,357
TOTAL NET ASSETS 454,760,952 8,950,395 55,340,203
DANSKE INVEST SICAV
The accompanying notes form an integral part of these financial statements.
18
Statement of Net Assets as at December 31, 2020 (continued)
Denmark Focus Eastern Europe Emerging andFrontier Markets
Note DKK EUR EUR
Net asset value per share
Class A 2,269.21 12.355 12.943Class A d - - -Class A-dkk - - 129.04Class A-eur h - - -Class A-nok - - 145.94Class A-nok hp - - -Class A-sek - - 137.96Class A-sek h - - -Class A-sek h d - - -Class I 2,349.14 14.412 13.224Class I-chf h - - -Class I-dkk h d - - -Class I-eur h - - -Class I-eur h d - - -Class I-nok h - - -Class I-sek h - - -Class RA - - -Class RI 141.22 - -Class SA d - - -Class SA-sek - - -Class SI-sek - - -Class WA - 10.588 9.784Class WA d - 7.837 -Class WA-eur h - - -Class WA-nok h - - -Class WA-sek - - -Class WA-sek h - - -Class WI - - -Class WI-sek - - -Class WI-sek h - - -Class WI-sek h d - - -
DANSKE INVEST SICAV
The accompanying notes form an integral part of these financial statements.
19
Statement of Net Assets as at December 31, 2020 (continued)
Denmark Focus Eastern Europe Emerging andFrontier Markets
Note DKK EUR EUR
Number of shares outstanding
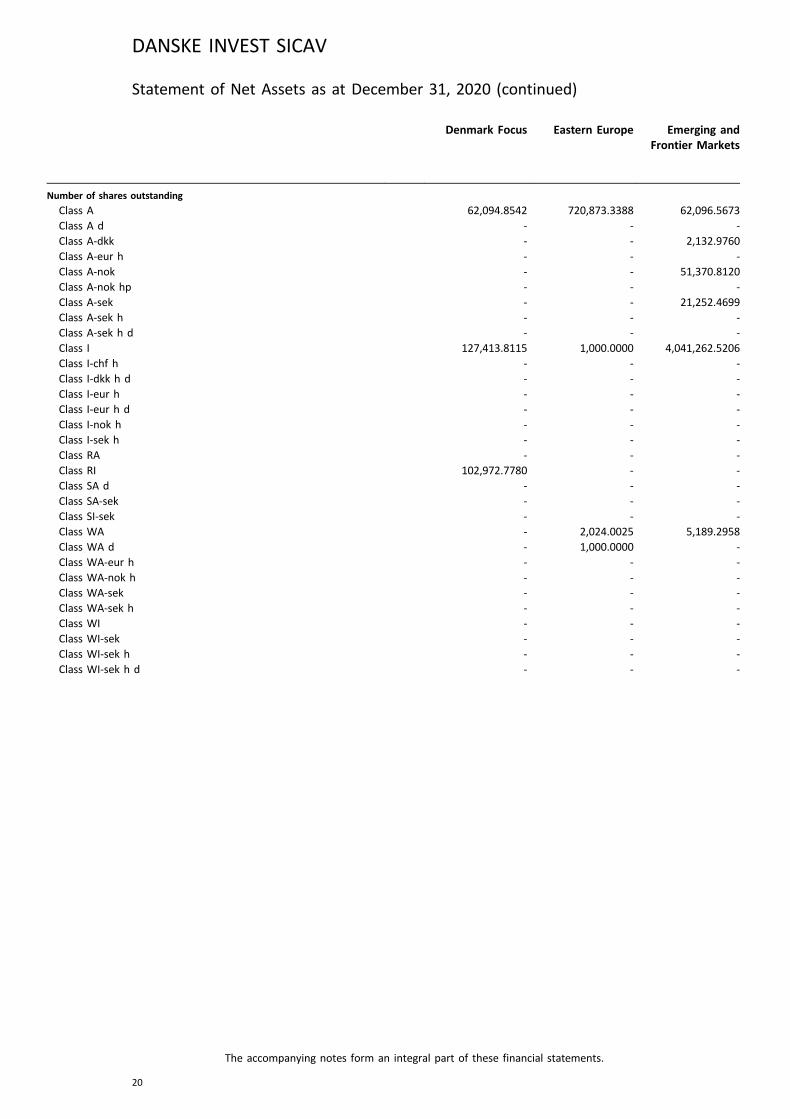
Class A 62,094.8542 720,873.3388 62,096.5673Class A d - - -Class A-dkk - - 2,132.9760Class A-eur h - - -Class A-nok - - 51,370.8120Class A-nok hp - - -Class A-sek - - 21,252.4699Class A-sek h - - -Class A-sek h d - - -Class I 127,413.8115 1,000.0000 4,041,262.5206Class I-chf h - - -Class I-dkk h d - - -Class I-eur h - - -Class I-eur h d - - -Class I-nok h - - -Class I-sek h - - -Class RA - - -Class RI 102,972.7780 - -Class SA d - - -Class SA-sek - - -Class SI-sek - - -Class WA - 2,024.0025 5,189.2958Class WA d - 1,000.0000 -Class WA-eur h - - -Class WA-nok h - - -Class WA-sek - - -Class WA-sek h - - -Class WI - - -Class WI-sek - - -Class WI-sek h - - -Class WI-sek h d - - -
DANSKE INVEST SICAV
The accompanying notes form an integral part of these financial statements.
20
Statement of Net Assets as at December 31, 2020 (continued)
Emerging MarketsDebt HardCurrency
Euro SustainableHigh Yield Bond*
Europe
Note USD EUR EUR
ASSETS
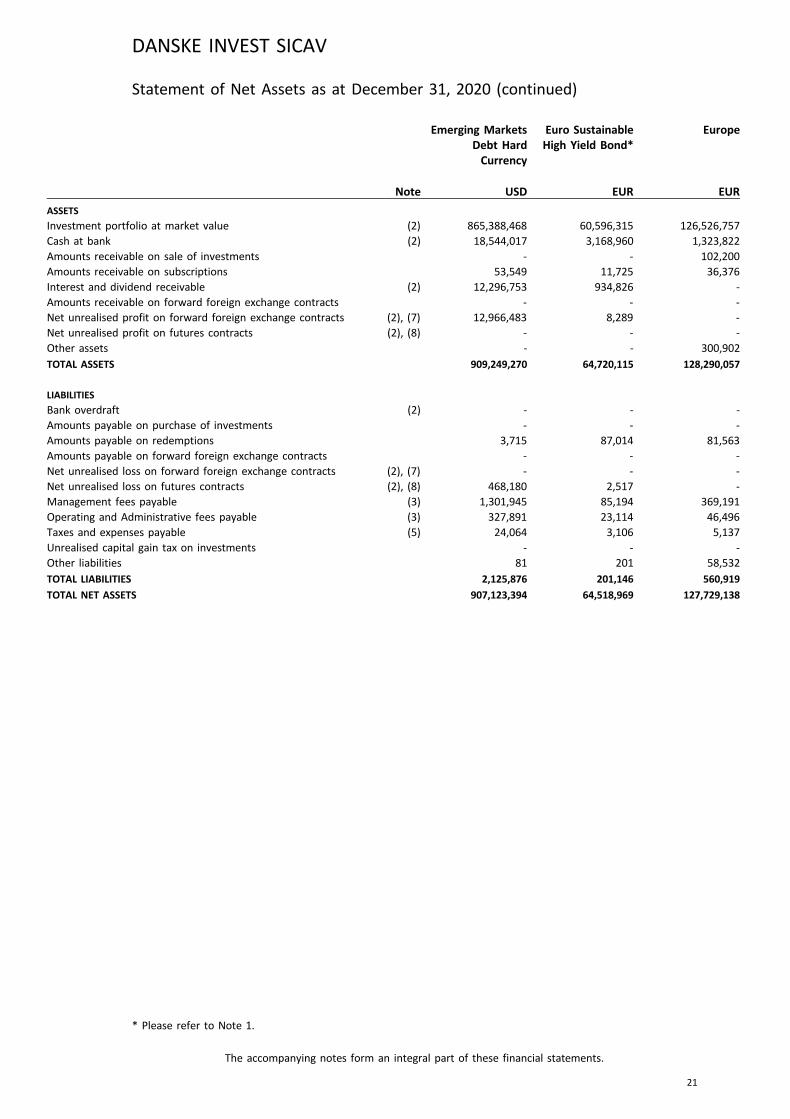
Investment portfolio at market value (2) 865,388,468 60,596,315 126,526,757Cash at bank (2) 18,544,017 3,168,960 1,323,822Amounts receivable on sale of investments - - 102,200Amounts receivable on subscriptions 53,549 11,725 36,376Interest and dividend receivable (2) 12,296,753 934,826 -Amounts receivable on forward foreign exchange contracts - - -Net unrealised profit on forward foreign exchange contracts (2), (7) 12,966,483 8,289 -Net unrealised profit on futures contracts (2), (8) - - -Other assets - - 300,902
TOTAL ASSETS 909,249,270 64,720,115 128,290,057
LIABILITIES
Bank overdraft (2) - - -Amounts payable on purchase of investments - - -Amounts payable on redemptions 3,715 87,014 81,563Amounts payable on forward foreign exchange contracts - - -Net unrealised loss on forward foreign exchange contracts (2), (7) - - -Net unrealised loss on futures contracts (2), (8) 468,180 2,517 -Management fees payable (3) 1,301,945 85,194 369,191Operating and Administrative fees payable (3) 327,891 23,114 46,496Taxes and expenses payable (5) 24,064 3,106 5,137Unrealised capital gain tax on investments - - -Other liabilities 81 201 58,532
TOTAL LIABILITIES 2,125,876 201,146 560,919
TOTAL NET ASSETS 907,123,394 64,518,969 127,729,138
DANSKE INVEST SICAV
The accompanying notes form an integral part of these financial statements.
21
Statement of Net Assets as at December 31, 2020 (continued)
* Please refer to Note 1.
Emerging MarketsDebt HardCurrency
Euro SustainableHigh Yield Bond*
Europe
Note USD EUR EUR
Net asset value per share
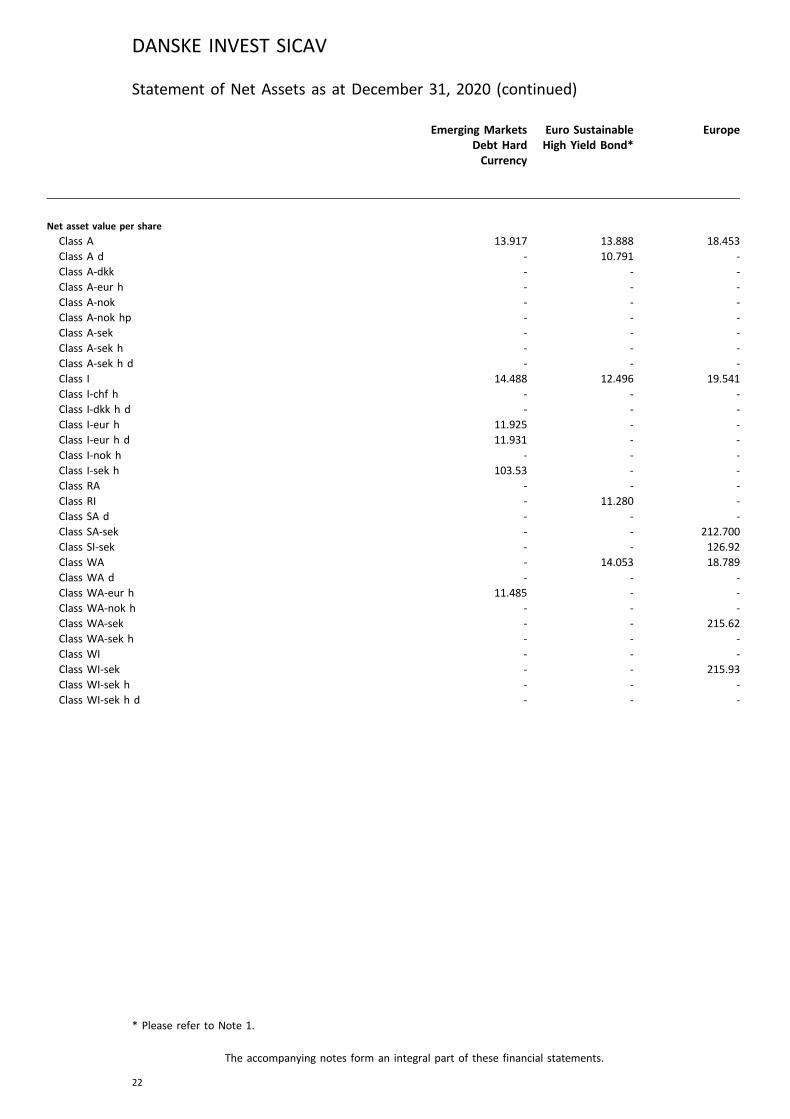
Class A 13.917 13.888 18.453Class A d - 10.791 -Class A-dkk - - -Class A-eur h - - -Class A-nok - - -Class A-nok hp - - -Class A-sek - - -Class A-sek h - - -Class A-sek h d - - -Class I 14.488 12.496 19.541Class I-chf h - - -Class I-dkk h d - - -Class I-eur h 11.925 - -Class I-eur h d 11.931 - -Class I-nok h - - -Class I-sek h 103.53 - -Class RA - - -Class RI - 11.280 -Class SA d - - -Class SA-sek - - 212.700Class SI-sek - - 126.92Class WA - 14.053 18.789Class WA d - - -Class WA-eur h 11.485 - -Class WA-nok h - - -Class WA-sek - - 215.62Class WA-sek h - - -Class WI - - -Class WI-sek - - 215.93Class WI-sek h - - -Class WI-sek h d - - -
DANSKE INVEST SICAV
The accompanying notes form an integral part of these financial statements.
22
Statement of Net Assets as at December 31, 2020 (continued)
* Please refer to Note 1.

Emerging MarketsDebt HardCurrency
Euro SustainableHigh Yield Bond*
Europe
Note USD EUR EUR
Number of shares outstanding
Class A 51,325.2156 610,084.0548 1,420,985.5482Class A d - 606.3348 -Class A-dkk - - -Class A-eur h - - -Class A-nok - - -Class A-nok hp - - -Class A-sek - - -Class A-sek h - - -Class A-sek h d - - -Class I 25,691,927.5722 3,719,740.8952 2,832,163.5942Class I-chf h - - -Class I-dkk h d - - -Class I-eur h 34,631,395.1961 - -Class I-eur h d 1,015,000.0000 - -Class I-nok h - - -Class I-sek h 277,114.4505 - -Class RA - - -Class RI - 288,922.4040 -Class SA d - - -Class SA-sek - - 1,000,265.5655Class SI-sek - - 1,668,143.3522Class WA - 448,313.1813 18,293.6006Class WA d - - -Class WA-eur h 751,110.2106 - -Class WA-nok h - - -Class WA-sek - - 13,451.0945Class WA-sek h - - -Class WI - - -Class WI-sek - - 157,228.4290Class WI-sek h - - -Class WI-sek h d - - -
DANSKE INVEST SICAV
The accompanying notes form an integral part of these financial statements.
23
Statement of Net Assets as at December 31, 2020 (continued)
* Please refer to Note 1.
Europe HighDividend
Europe Small Cap European Bond
Note EUR EUR EUR
ASSETS
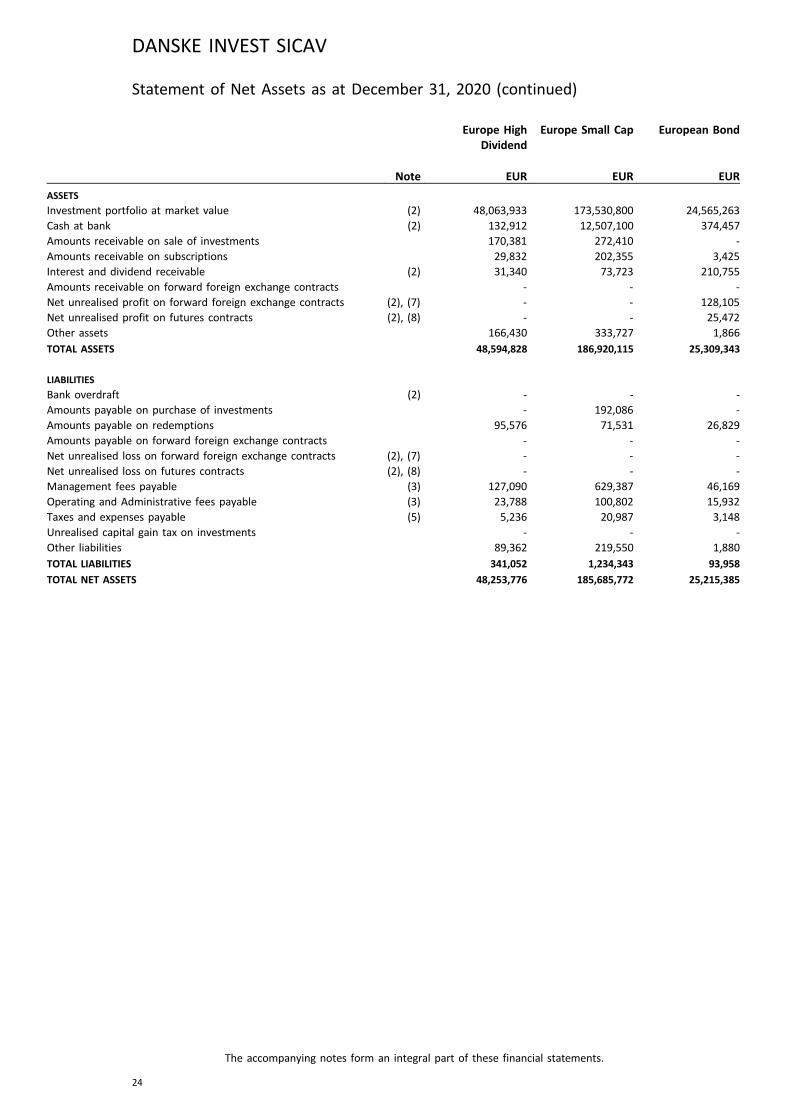
Investment portfolio at market value (2) 48,063,933 173,530,800 24,565,263Cash at bank (2) 132,912 12,507,100 374,457Amounts receivable on sale of investments 170,381 272,410 -Amounts receivable on subscriptions 29,832 202,355 3,425Interest and dividend receivable (2) 31,340 73,723 210,755Amounts receivable on forward foreign exchange contracts - - -Net unrealised profit on forward foreign exchange contracts (2), (7) - - 128,105Net unrealised profit on futures contracts (2), (8) - - 25,472Other assets 166,430 333,727 1,866
TOTAL ASSETS 48,594,828 186,920,115 25,309,343
LIABILITIES
Bank overdraft (2) - - -Amounts payable on purchase of investments - 192,086 -Amounts payable on redemptions 95,576 71,531 26,829Amounts payable on forward foreign exchange contracts - - -Net unrealised loss on forward foreign exchange contracts (2), (7) - - -Net unrealised loss on futures contracts (2), (8) - - -Management fees payable (3) 127,090 629,387 46,169Operating and Administrative fees payable (3) 23,788 100,802 15,932Taxes and expenses payable (5) 5,236 20,987 3,148Unrealised capital gain tax on investments - - -Other liabilities 89,362 219,550 1,880
TOTAL LIABILITIES 341,052 1,234,343 93,958
TOTAL NET ASSETS 48,253,776 185,685,772 25,215,385
DANSKE INVEST SICAV
The accompanying notes form an integral part of these financial statements.
24
Statement of Net Assets as at December 31, 2020 (continued)
Europe HighDividend
Europe Small Cap European Bond
Note EUR EUR EUR
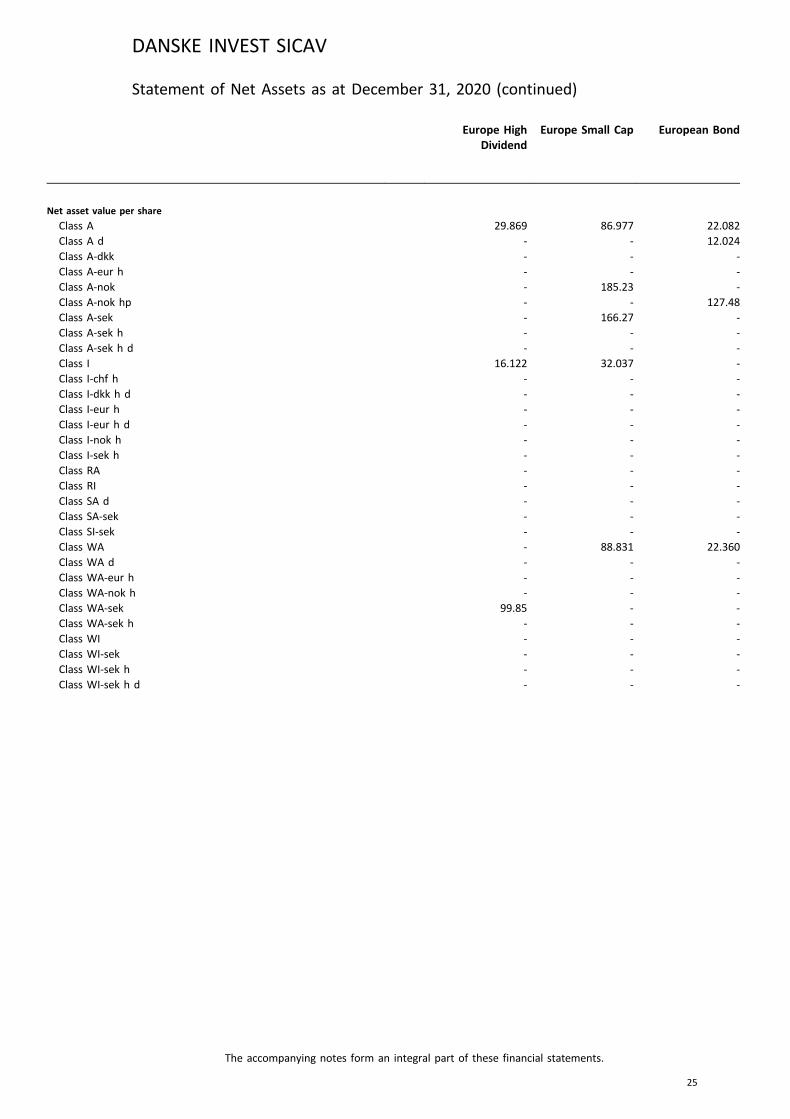
Net asset value per share
Class A 29.869 86.977 22.082Class A d - - 12.024Class A-dkk - - -Class A-eur h - - -Class A-nok - 185.23 -Class A-nok hp - - 127.48Class A-sek - 166.27 -Class A-sek h - - -Class A-sek h d - - -Class I 16.122 32.037 -Class I-chf h - - -Class I-dkk h d - - -Class I-eur h - - -Class I-eur h d - - -Class I-nok h - - -Class I-sek h - - -Class RA - - -Class RI - - -Class SA d - - -Class SA-sek - - -Class SI-sek - - -Class WA - 88.831 22.360Class WA d - - -Class WA-eur h - - -Class WA-nok h - - -Class WA-sek 99.85 - -Class WA-sek h - - -Class WI - - -Class WI-sek - - -Class WI-sek h - - -Class WI-sek h d - - -
DANSKE INVEST SICAV
The accompanying notes form an integral part of these financial statements.
25
Statement of Net Assets as at December 31, 2020 (continued)

Europe HighDividend
Europe Small Cap European Bond
Note EUR EUR EUR
Number of shares outstanding
Class A 400,128.2986 1,848,224.4861 519,826.1204Class A d - - 80,213.3582Class A-dkk - - -Class A-eur h - - -Class A-nok - 246.1538 -Class A-nok hp - - 651,654.7076Class A-sek - 21,329.6998 -Class A-sek h - - -Class A-sek h d - - -Class I 515,000.0000 490,640.5922 -Class I-chf h - - -Class I-dkk h d - - -Class I-eur h - - -Class I-eur h d - - -Class I-nok h - - -Class I-sek h - - -Class RA - - -Class RI - - -Class SA d - - -Class SA-sek - - -Class SI-sek - - -Class WA - 99,714.9334 216,545.8111Class WA d - - -Class WA-eur h - - -Class WA-nok h - - -Class WA-sek 2,823,017.3080 - -Class WA-sek h - - -Class WI - - -Class WI-sek - - -Class WI-sek h - - -Class WI-sek h d - - -
DANSKE INVEST SICAV
The accompanying notes form an integral part of these financial statements.
26
Statement of Net Assets as at December 31, 2020 (continued)
EuropeanCorporate
Sustainable Bond
Euro InvestmentGrade Corporate
Bond
Global EmergingMarkets
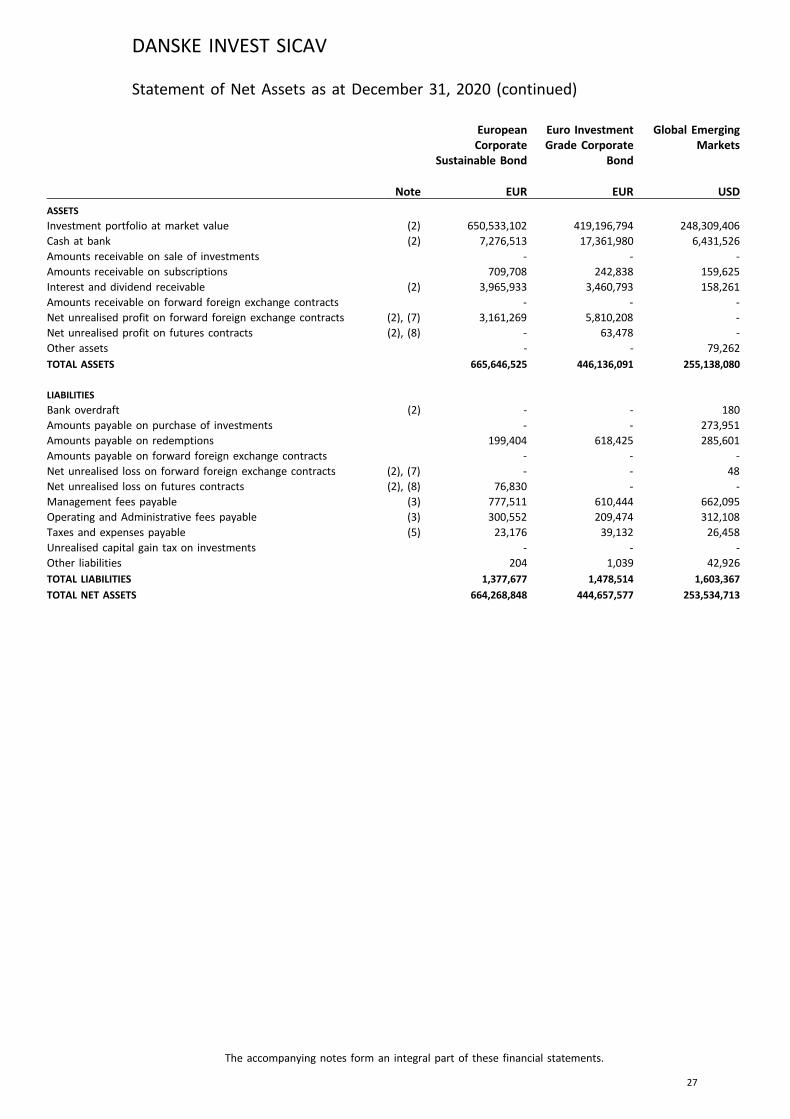
Note EUR EUR USD
ASSETS
Investment portfolio at market value (2) 650,533,102 419,196,794 248,309,406Cash at bank (2) 7,276,513 17,361,980 6,431,526Amounts receivable on sale of investments - - -Amounts receivable on subscriptions 709,708 242,838 159,625Interest and dividend receivable (2) 3,965,933 3,460,793 158,261Amounts receivable on forward foreign exchange contracts - - -Net unrealised profit on forward foreign exchange contracts (2), (7) 3,161,269 5,810,208 -Net unrealised profit on futures contracts (2), (8) - 63,478 -Other assets - - 79,262
TOTAL ASSETS 665,646,525 446,136,091 255,138,080
LIABILITIES
Bank overdraft (2) - - 180Amounts payable on purchase of investments - - 273,951Amounts payable on redemptions 199,404 618,425 285,601Amounts payable on forward foreign exchange contracts - - -Net unrealised loss on forward foreign exchange contracts (2), (7) - - 48Net unrealised loss on futures contracts (2), (8) 76,830 - -Management fees payable (3) 777,511 610,444 662,095Operating and Administrative fees payable (3) 300,552 209,474 312,108Taxes and expenses payable (5) 23,176 39,132 26,458Unrealised capital gain tax on investments - - -Other liabilities 204 1,039 42,926
TOTAL LIABILITIES 1,377,677 1,478,514 1,603,367
TOTAL NET ASSETS 664,268,848 444,657,577 253,534,713
DANSKE INVEST SICAV
The accompanying notes form an integral part of these financial statements.
27
Statement of Net Assets as at December 31, 2020 (continued)
EuropeanCorporate
Sustainable Bond
Euro InvestmentGrade Corporate
Bond
Global EmergingMarkets
Note EUR EUR USD
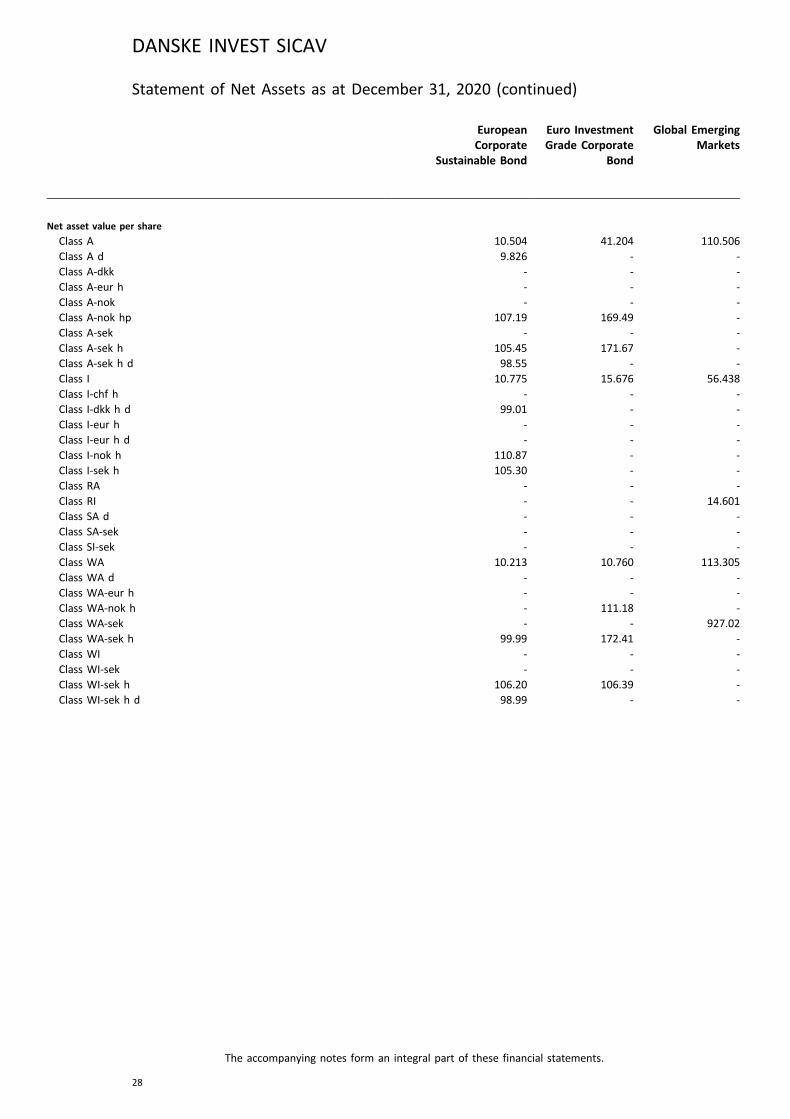
Net asset value per share
Class A 10.504 41.204 110.506Class A d 9.826 - -Class A-dkk - - -Class A-eur h - - -Class A-nok - - -Class A-nok hp 107.19 169.49 -Class A-sek - - -Class A-sek h 105.45 171.67 -Class A-sek h d 98.55 - -Class I 10.775 15.676 56.438Class I-chf h - - -Class I-dkk h d 99.01 - -Class I-eur h - - -Class I-eur h d - - -Class I-nok h 110.87 - -Class I-sek h 105.30 - -Class RA - - -Class RI - - 14.601Class SA d - - -Class SA-sek - - -Class SI-sek - - -Class WA 10.213 10.760 113.305Class WA d - - -Class WA-eur h - - -Class WA-nok h - 111.18 -Class WA-sek - - 927.02Class WA-sek h 99.99 172.41 -Class WI - - -Class WI-sek - - -Class WI-sek h 106.20 106.39 -Class WI-sek h d 98.99 - -
DANSKE INVEST SICAV
The accompanying notes form an integral part of these financial statements.
28
Statement of Net Assets as at December 31, 2020 (continued)
EuropeanCorporate
Sustainable Bond
Euro InvestmentGrade Corporate
Bond
Global EmergingMarkets
Note EUR EUR USD
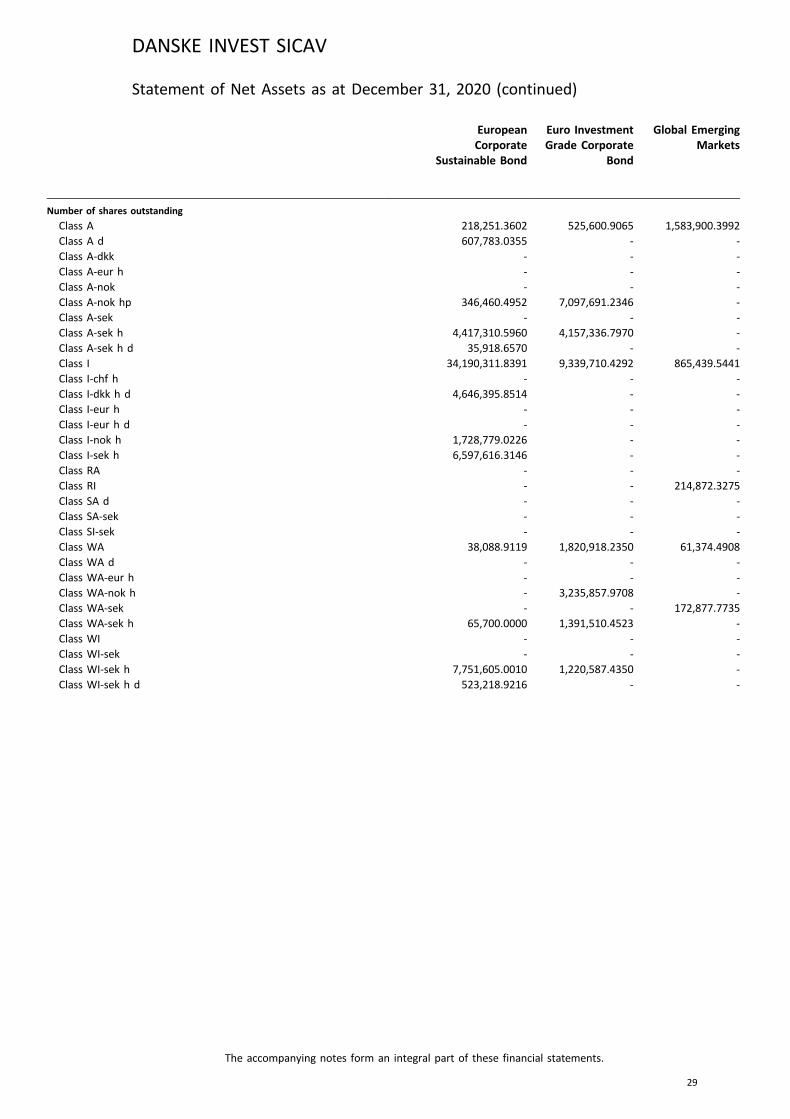
Number of shares outstanding
Class A 218,251.3602 525,600.9065 1,583,900.3992Class A d 607,783.0355 - -Class A-dkk - - -Class A-eur h - - -Class A-nok - - -Class A-nok hp 346,460.4952 7,097,691.2346 -Class A-sek - - -Class A-sek h 4,417,310.5960 4,157,336.7970 -Class A-sek h d 35,918.6570 - -Class I 34,190,311.8391 9,339,710.4292 865,439.5441Class I-chf h - - -Class I-dkk h d 4,646,395.8514 - -Class I-eur h - - -Class I-eur h d - - -Class I-nok h 1,728,779.0226 - -Class I-sek h 6,597,616.3146 - -Class RA - - -Class RI - - 214,872.3275Class SA d - - -Class SA-sek - - -Class SI-sek - - -Class WA 38,088.9119 1,820,918.2350 61,374.4908Class WA d - - -Class WA-eur h - - -Class WA-nok h - 3,235,857.9708 -Class WA-sek - - 172,877.7735Class WA-sek h 65,700.0000 1,391,510.4523 -Class WI - - -Class WI-sek - - -Class WI-sek h 7,751,605.0010 1,220,587.4350 -Class WI-sek h d 523,218.9216 - -
DANSKE INVEST SICAV
The accompanying notes form an integral part of these financial statements.
29
Statement of Net Assets as at December 31, 2020 (continued)
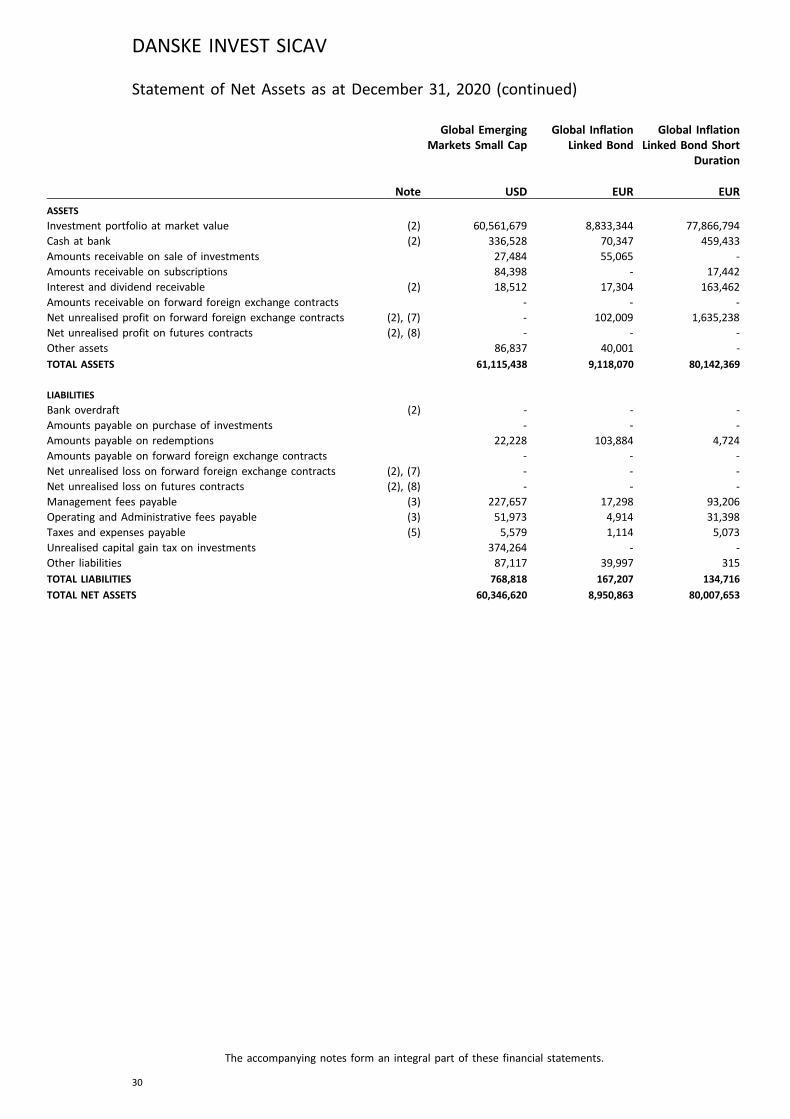
Global EmergingMarkets Small Cap
Global InflationLinked Bond
Global InflationLinked Bond Short
Duration
Note USD EUR EUR
ASSETS
Investment portfolio at market value (2) 60,561,679 8,833,344 77,866,794Cash at bank (2) 336,528 70,347 459,433Amounts receivable on sale of investments 27,484 55,065 -Amounts receivable on subscriptions 84,398 - 17,442Interest and dividend receivable (2) 18,512 17,304 163,462Amounts receivable on forward foreign exchange contracts - - -Net unrealised profit on forward foreign exchange contracts (2), (7) - 102,009 1,635,238Net unrealised profit on futures contracts (2), (8) - - -Other assets 86,837 40,001 -
TOTAL ASSETS 61,115,438 9,118,070 80,142,369
LIABILITIES
Bank overdraft (2) - - -Amounts payable on purchase of investments - - -Amounts payable on redemptions 22,228 103,884 4,724Amounts payable on forward foreign exchange contracts - - -Net unrealised loss on forward foreign exchange contracts (2), (7) - - -Net unrealised loss on futures contracts (2), (8) - - -Management fees payable (3) 227,657 17,298 93,206Operating and Administrative fees payable (3) 51,973 4,914 31,398Taxes and expenses payable (5) 5,579 1,114 5,073Unrealised capital gain tax on investments 374,264 - -Other liabilities 87,117 39,997 315
TOTAL LIABILITIES 768,818 167,207 134,716
TOTAL NET ASSETS 60,346,620 8,950,863 80,007,653
DANSKE INVEST SICAV
The accompanying notes form an integral part of these financial statements.
30
Statement of Net Assets as at December 31, 2020 (continued)
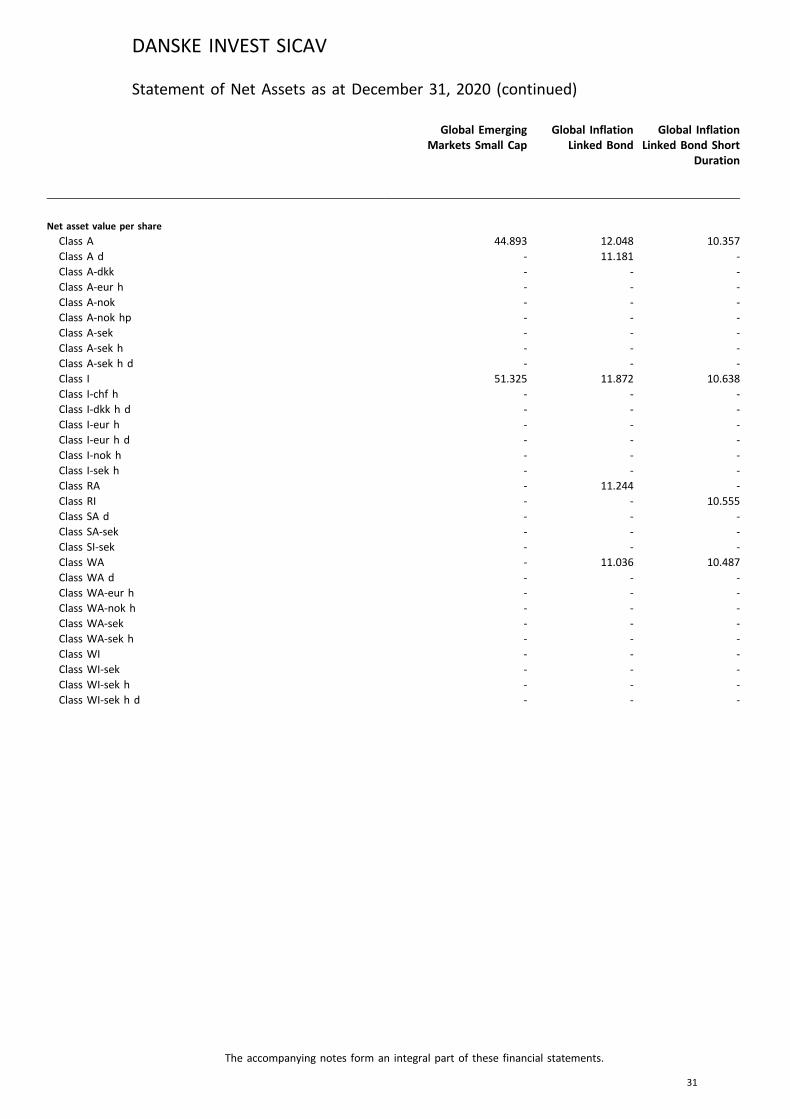
Global EmergingMarkets Small Cap
Global InflationLinked Bond
Global InflationLinked Bond Short
Duration
Note USD EUR EUR
Net asset value per share
Class A 44.893 12.048 10.357Class A d - 11.181 -Class A-dkk - - -Class A-eur h - - -Class A-nok - - -Class A-nok hp - - -Class A-sek - - -Class A-sek h - - -Class A-sek h d - - -Class I 51.325 11.872 10.638Class I-chf h - - -Class I-dkk h d - - -Class I-eur h - - -Class I-eur h d - - -Class I-nok h - - -Class I-sek h - - -Class RA - 11.244 -Class RI - - 10.555Class SA d - - -Class SA-sek - - -Class SI-sek - - -Class WA - 11.036 10.487Class WA d - - -Class WA-eur h - - -Class WA-nok h - - -Class WA-sek - - -Class WA-sek h - - -Class WI - - -Class WI-sek - - -Class WI-sek h - - -Class WI-sek h d - - -
DANSKE INVEST SICAV
The accompanying notes form an integral part of these financial statements.
31
Statement of Net Assets as at December 31, 2020 (continued)
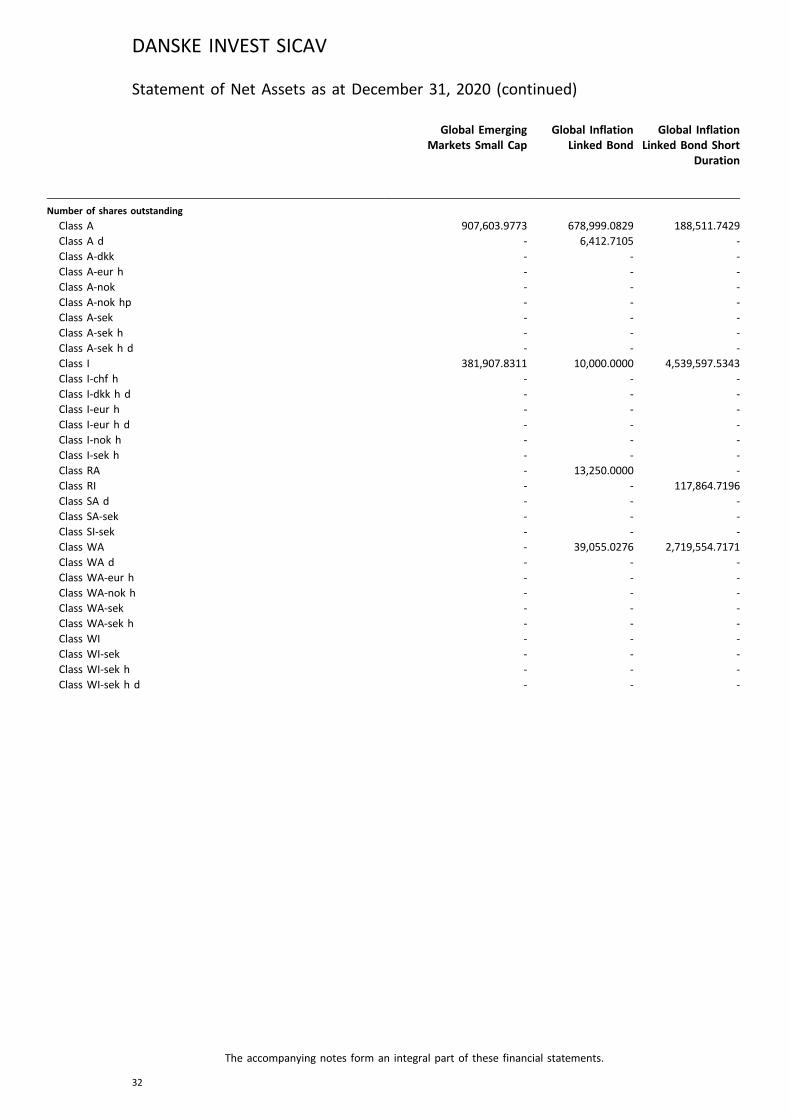
Global EmergingMarkets Small Cap
Global InflationLinked Bond
Global InflationLinked Bond Short
Duration
Note USD EUR EUR
Number of shares outstanding
Class A 907,603.9773 678,999.0829 188,511.7429Class A d - 6,412.7105 -Class A-dkk - - -Class A-eur h - - -Class A-nok - - -Class A-nok hp - - -Class A-sek - - -Class A-sek h - - -Class A-sek h d - - -Class I 381,907.8311 10,000.0000 4,539,597.5343Class I-chf h - - -Class I-dkk h d - - -Class I-eur h - - -Class I-eur h d - - -Class I-nok h - - -Class I-sek h - - -Class RA - 13,250.0000 -Class RI - - 117,864.7196Class SA d - - -Class SA-sek - - -Class SI-sek - - -Class WA - 39,055.0276 2,719,554.7171Class WA d - - -Class WA-eur h - - -Class WA-nok h - - -Class WA-sek - - -Class WA-sek h - - -Class WI - - -Class WI-sek - - -Class WI-sek h - - -Class WI-sek h d - - -
DANSKE INVEST SICAV
The accompanying notes form an integral part of these financial statements.
32
Statement of Net Assets as at December 31, 2020 (continued)
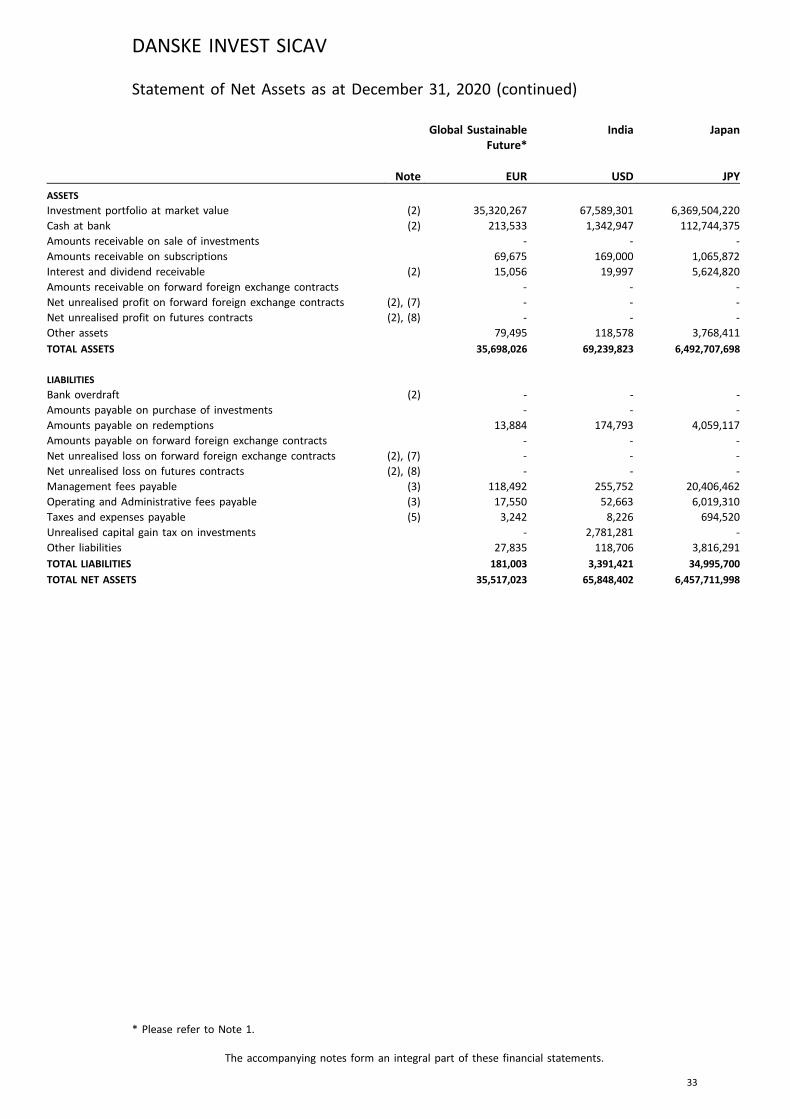
Global SustainableFuture*
India Japan
Note EUR USD JPY
ASSETS
Investment portfolio at market value (2) 35,320,267 67,589,301 6,369,504,220Cash at bank (2) 213,533 1,342,947 112,744,375Amounts receivable on sale of investments - - -Amounts receivable on subscriptions 69,675 169,000 1,065,872Interest and dividend receivable (2) 15,056 19,997 5,624,820Amounts receivable on forward foreign exchange contracts - - -Net unrealised profit on forward foreign exchange contracts (2), (7) - - -Net unrealised profit on futures contracts (2), (8) - - -Other assets 79,495 118,578 3,768,411
TOTAL ASSETS 35,698,026 69,239,823 6,492,707,698
LIABILITIES
Bank overdraft (2) - - -Amounts payable on purchase of investments - - -Amounts payable on redemptions 13,884 174,793 4,059,117Amounts payable on forward foreign exchange contracts - - -Net unrealised loss on forward foreign exchange contracts (2), (7) - - -Net unrealised loss on futures contracts (2), (8) - - -Management fees payable (3) 118,492 255,752 20,406,462Operating and Administrative fees payable (3) 17,550 52,663 6,019,310Taxes and expenses payable (5) 3,242 8,226 694,520Unrealised capital gain tax on investments - 2,781,281 -Other liabilities 27,835 118,706 3,816,291
TOTAL LIABILITIES 181,003 3,391,421 34,995,700
TOTAL NET ASSETS 35,517,023 65,848,402 6,457,711,998
DANSKE INVEST SICAV
The accompanying notes form an integral part of these financial statements.
33
Statement of Net Assets as at December 31, 2020 (continued)
* Please refer to Note 1.
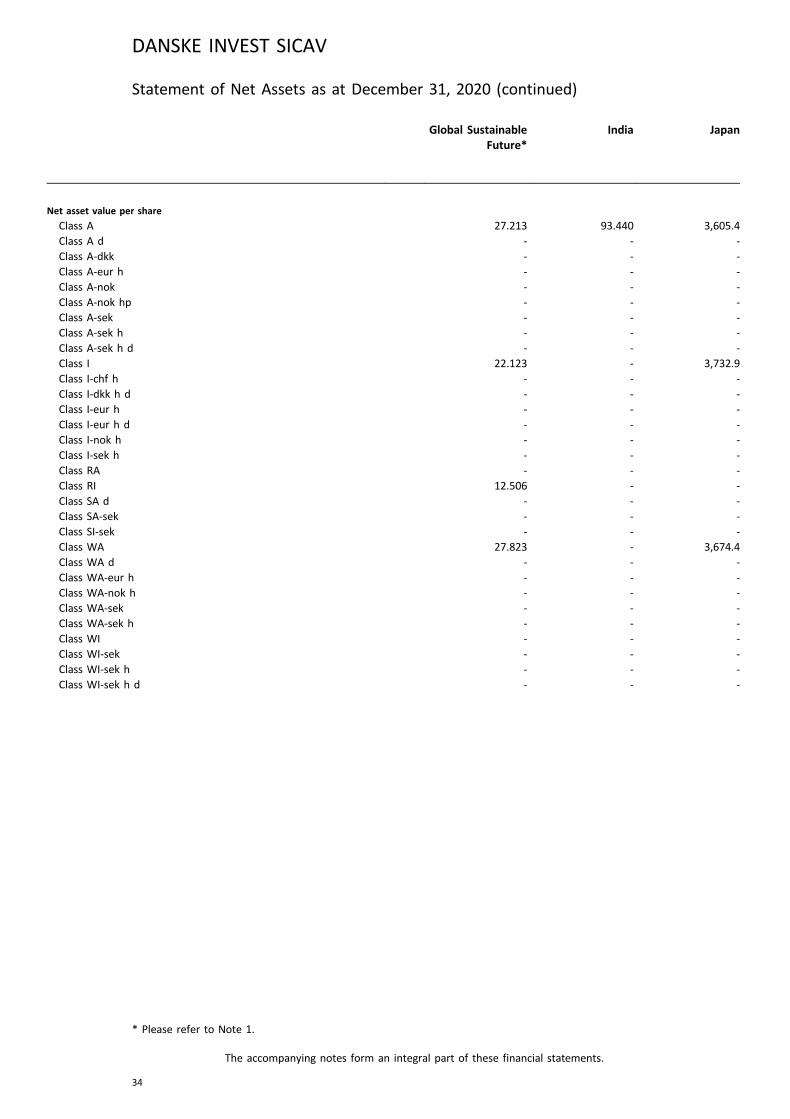
Global SustainableFuture*
India Japan
Note EUR USD JPY
Net asset value per share
Class A 27.213 93.440 3,605.4Class A d - - -Class A-dkk - - -Class A-eur h - - -Class A-nok - - -Class A-nok hp - - -Class A-sek - - -Class A-sek h - - -Class A-sek h d - - -Class I 22.123 - 3,732.9Class I-chf h - - -Class I-dkk h d - - -Class I-eur h - - -Class I-eur h d - - -Class I-nok h - - -Class I-sek h - - -Class RA - - -Class RI 12.506 - -Class SA d - - -Class SA-sek - - -Class SI-sek - - -Class WA 27.823 - 3,674.4Class WA d - - -Class WA-eur h - - -Class WA-nok h - - -Class WA-sek - - -Class WA-sek h - - -Class WI - - -Class WI-sek - - -Class WI-sek h - - -Class WI-sek h d - - -
DANSKE INVEST SICAV
The accompanying notes form an integral part of these financial statements.
34
Statement of Net Assets as at December 31, 2020 (continued)
* Please refer to Note 1.
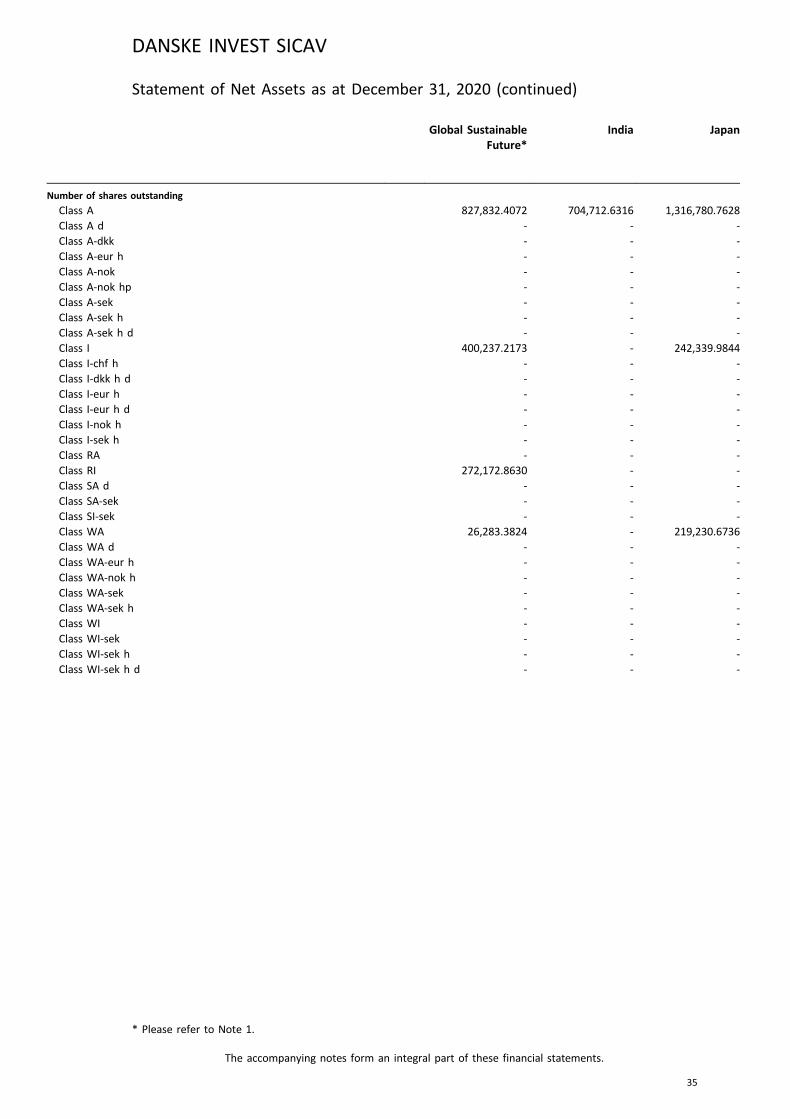
Global SustainableFuture*
India Japan
Note EUR USD JPY
Number of shares outstanding
Class A 827,832.4072 704,712.6316 1,316,780.7628Class A d - - -Class A-dkk - - -Class A-eur h - - -Class A-nok - - -Class A-nok hp - - -Class A-sek - - -Class A-sek h - - -Class A-sek h d - - -Class I 400,237.2173 - 242,339.9844Class I-chf h - - -Class I-dkk h d - - -Class I-eur h - - -Class I-eur h d - - -Class I-nok h - - -Class I-sek h - - -Class RA - - -Class RI 272,172.8630 - -Class SA d - - -Class SA-sek - - -Class SI-sek - - -Class WA 26,283.3824 - 219,230.6736Class WA d - - -Class WA-eur h - - -Class WA-nok h - - -Class WA-sek - - -Class WA-sek h - - -Class WI - - -Class WI-sek - - -Class WI-sek h - - -Class WI-sek h d - - -
DANSKE INVEST SICAV
The accompanying notes form an integral part of these financial statements.
35
Statement of Net Assets as at December 31, 2020 (continued)
* Please refer to Note 1.
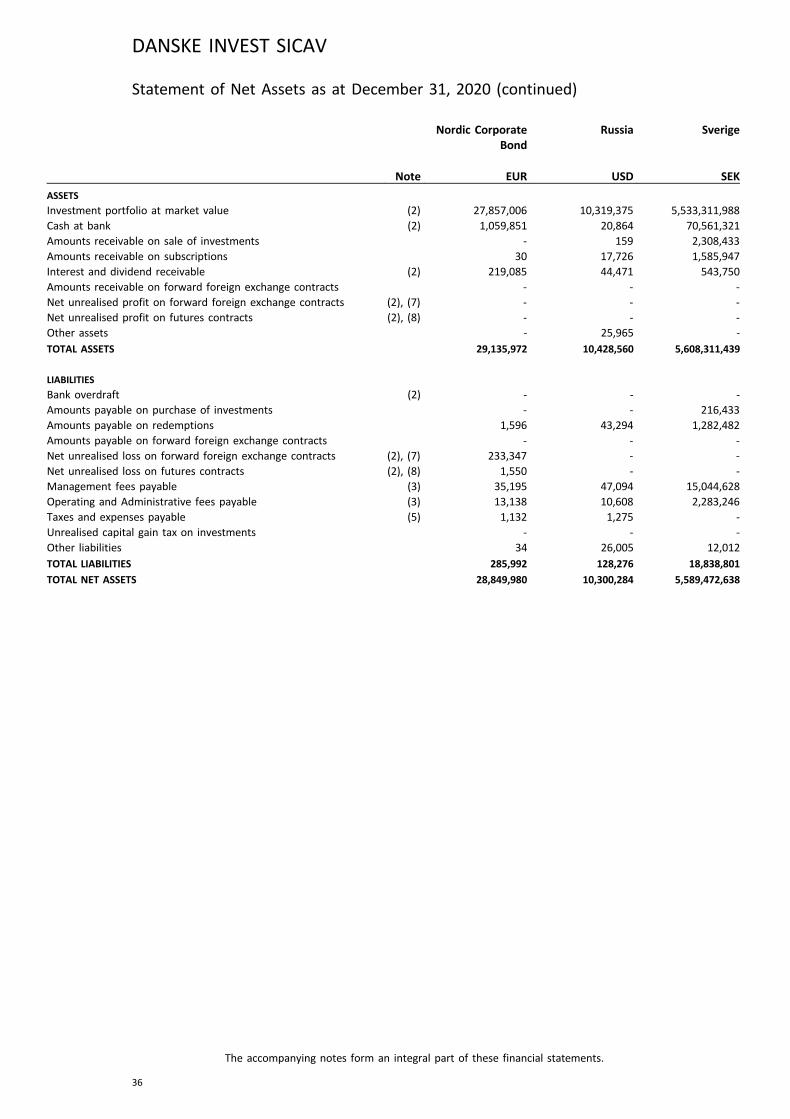
Nordic CorporateBond
Russia Sverige
Note EUR USD SEK
ASSETS
Investment portfolio at market value (2) 27,857,006 10,319,375 5,533,311,988Cash at bank (2) 1,059,851 20,864 70,561,321Amounts receivable on sale of investments - 159 2,308,433Amounts receivable on subscriptions 30 17,726 1,585,947Interest and dividend receivable (2) 219,085 44,471 543,750Amounts receivable on forward foreign exchange contracts - - -Net unrealised profit on forward foreign exchange contracts (2), (7) - - -Net unrealised profit on futures contracts (2), (8) - - -Other assets - 25,965 -
TOTAL ASSETS 29,135,972 10,428,560 5,608,311,439
LIABILITIES
Bank overdraft (2) - - -Amounts payable on purchase of investments - - 216,433Amounts payable on redemptions 1,596 43,294 1,282,482Amounts payable on forward foreign exchange contracts - - -Net unrealised loss on forward foreign exchange contracts (2), (7) 233,347 - -Net unrealised loss on futures contracts (2), (8) 1,550 - -Management fees payable (3) 35,195 47,094 15,044,628Operating and Administrative fees payable (3) 13,138 10,608 2,283,246Taxes and expenses payable (5) 1,132 1,275 -Unrealised capital gain tax on investments - - -Other liabilities 34 26,005 12,012
TOTAL LIABILITIES 285,992 128,276 18,838,801
TOTAL NET ASSETS 28,849,980 10,300,284 5,589,472,638
DANSKE INVEST SICAV
The accompanying notes form an integral part of these financial statements.
36
Statement of Net Assets as at December 31, 2020 (continued)
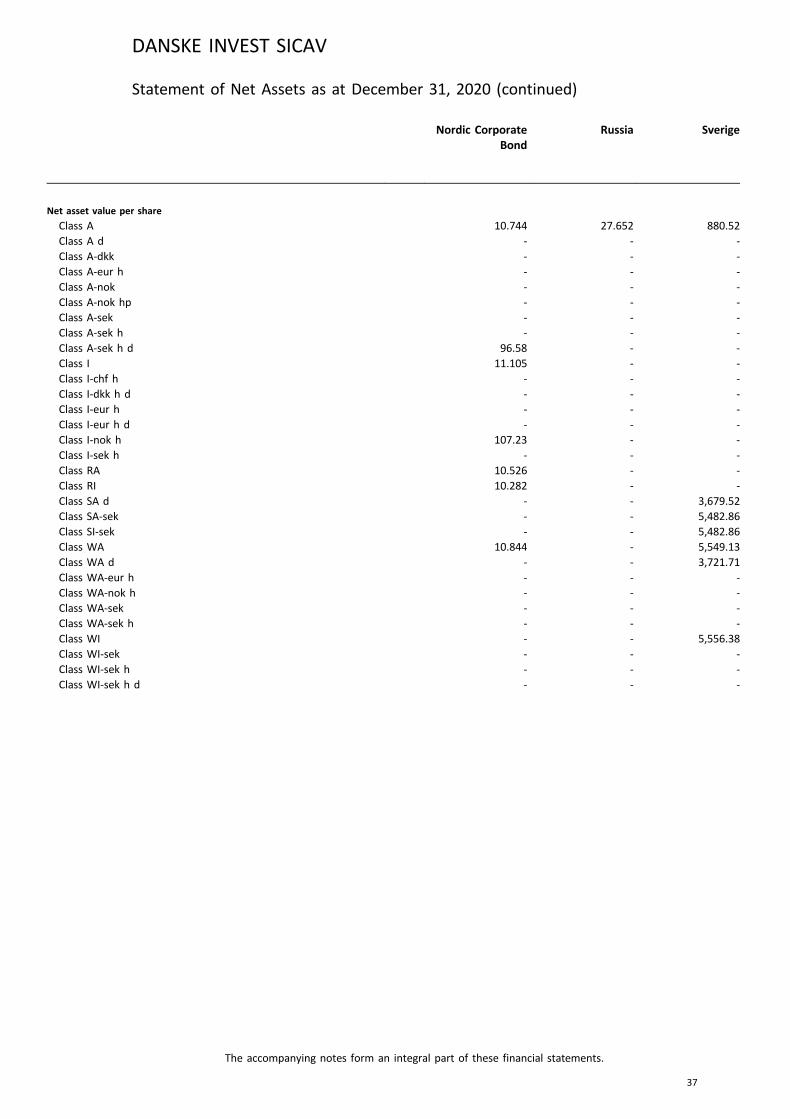
Nordic CorporateBond
Russia Sverige
Note EUR USD SEK
Net asset value per share
Class A 10.744 27.652 880.52Class A d - - -Class A-dkk - - -Class A-eur h - - -Class A-nok - - -Class A-nok hp - - -Class A-sek - - -Class A-sek h - - -Class A-sek h d 96.58 - -Class I 11.105 - -Class I-chf h - - -Class I-dkk h d - - -Class I-eur h - - -Class I-eur h d - - -Class I-nok h 107.23 - -Class I-sek h - - -Class RA 10.526 - -Class RI 10.282 - -Class SA d - - 3,679.52Class SA-sek - - 5,482.86Class SI-sek - - 5,482.86Class WA 10.844 - 5,549.13Class WA d - - 3,721.71Class WA-eur h - - -Class WA-nok h - - -Class WA-sek - - -Class WA-sek h - - -Class WI - - 5,556.38Class WI-sek - - -Class WI-sek h - - -Class WI-sek h d - - -
DANSKE INVEST SICAV
The accompanying notes form an integral part of these financial statements.
37
Statement of Net Assets as at December 31, 2020 (continued)
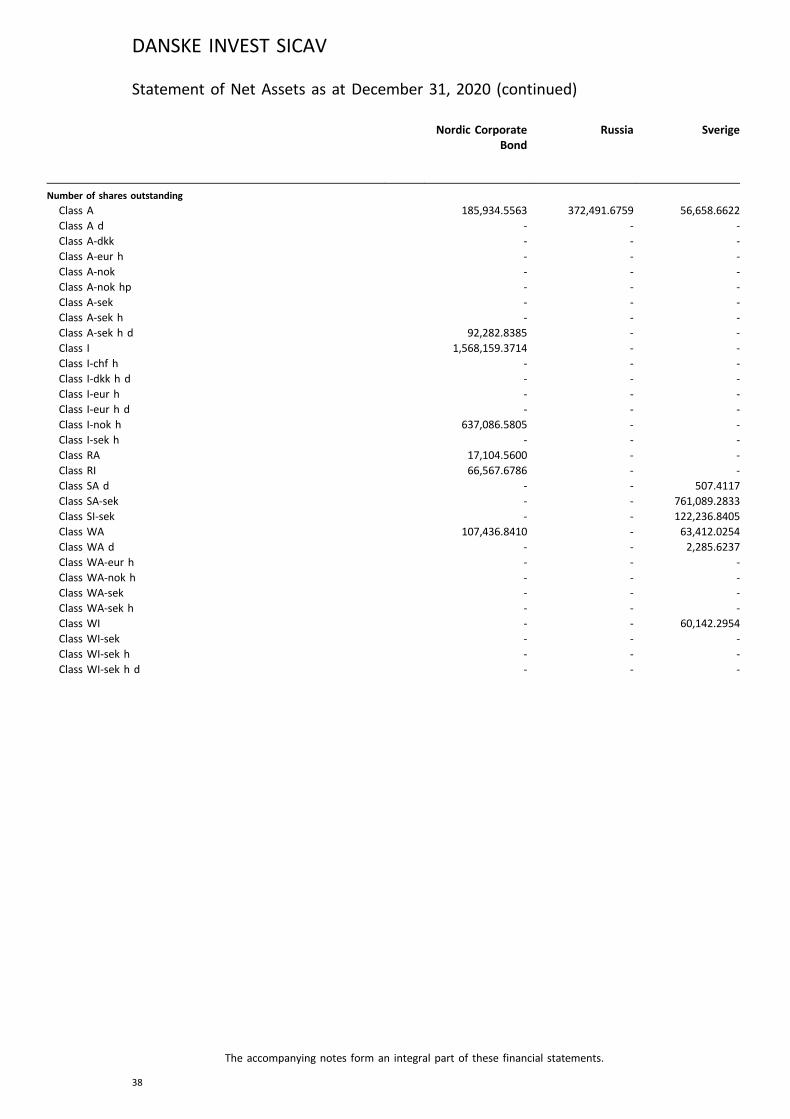
Nordic CorporateBond
Russia Sverige
Note EUR USD SEK
Number of shares outstanding
Class A 185,934.5563 372,491.6759 56,658.6622Class A d - - -Class A-dkk - - -Class A-eur h - - -Class A-nok - - -Class A-nok hp - - -Class A-sek - - -Class A-sek h - - -Class A-sek h d 92,282.8385 - -Class I 1,568,159.3714 - -Class I-chf h - - -Class I-dkk h d - - -Class I-eur h - - -Class I-eur h d - - -Class I-nok h 637,086.5805 - -Class I-sek h - - -Class RA 17,104.5600 - -Class RI 66,567.6786 - -Class SA d - - 507.4117Class SA-sek - - 761,089.2833Class SI-sek - - 122,236.8405Class WA 107,436.8410 - 63,412.0254Class WA d - - 2,285.6237Class WA-eur h - - -Class WA-nok h - - -Class WA-sek - - -Class WA-sek h - - -Class WI - - 60,142.2954Class WI-sek - - -Class WI-sek h - - -Class WI-sek h d - - -
DANSKE INVEST SICAV
The accompanying notes form an integral part of these financial statements.
38
Statement of Net Assets as at December 31, 2020 (continued)

US High Yield Bond Combined
Note USD EUR
ASSETS
Investment portfolio at market value (2) 31,244,523 8,869,809,544Cash at bank (2) 1,279,869 169,002,144Amounts receivable on sale of investments 66,991 1,204,070Amounts receivable on subscriptions - 2,951,579Interest and dividend receivable (2) 456,329 24,997,460Amounts receivable on forward foreign exchange contracts - 42,265Net unrealised profit on forward foreign exchange contracts (2), (7) 37,412 24,049,136Net unrealised profit on futures contracts (2), (8) - 88,950Other assets - 4,842,045
TOTAL ASSETS 33,085,124 9,096,987,193
LIABILITIES
Bank overdraft (2) - 147Amounts payable on purchase of investments 291,045 3,388,270Amounts payable on redemptions - 5,465,049Amounts payable on forward foreign exchange contracts - 42,264Net unrealised loss on forward foreign exchange contracts (2), (7) - 233,386Net unrealised loss on futures contracts (2), (8) - 464,133Management fees payable (3) 48,507 23,543,531Operating and Administrative fees payable (3) 12,344 6,691,240Taxes and expenses payable (5) 879 746,043Unrealised capital gain tax on investments - 2,599,975Other liabilities 147 3,931,785
TOTAL LIABILITIES 352,922 47,105,823
TOTAL NET ASSETS 32,732,202 9,049,881,370
DANSKE INVEST SICAV
The accompanying notes form an integral part of these financial statements.
39
Statement of Net Assets as at December 31, 2020 (continued)

US High Yield Bond
Note USD
Net asset value per share
Class A -Class A d -Class A-dkk -Class A-eur h -Class A-nok -Class A-nok hp -Class A-sek -Class A-sek h -Class A-sek h d -Class I 13.410Class I-chf h -Class I-dkk h d -Class I-eur h -Class I-eur h d -Class I-nok h -Class I-sek h -Class RA -Class RI -Class SA d -Class SA-sek -Class SI-sek -Class WA -Class WA d -Class WA-eur h 10.861Class WA-nok h -Class WA-sek -Class WA-sek h -Class WI -Class WI-sek -Class WI-sek h -Class WI-sek h d -
DANSKE INVEST SICAV
The accompanying notes form an integral part of these financial statements.
40
Statement of Net Assets as at December 31, 2020 (continued)
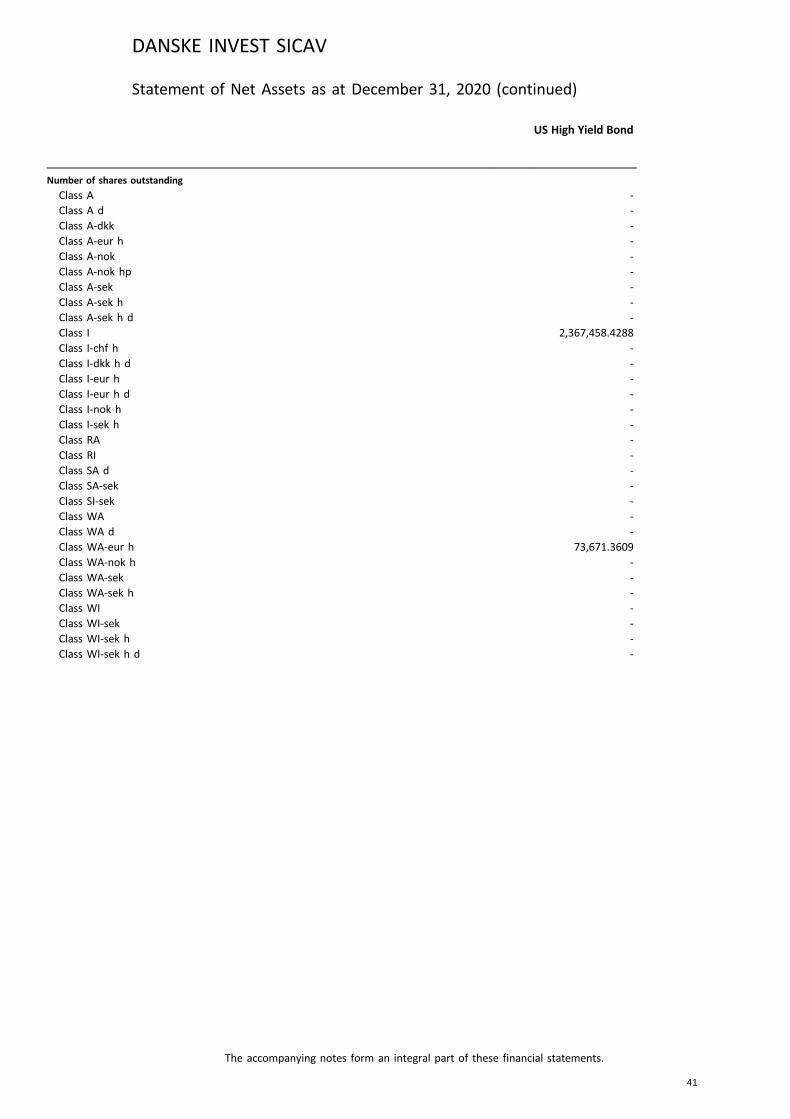
US High Yield Bond
Note USD
Number of shares outstanding
Class A -Class A d -Class A-dkk -Class A-eur h -Class A-nok -Class A-nok hp -Class A-sek -Class A-sek h -Class A-sek h d -Class I 2,367,458.4288Class I-chf h -Class I-dkk h d -Class I-eur h -Class I-eur h d -Class I-nok h -Class I-sek h -Class RA -Class RI -Class SA d -Class SA-sek -Class SI-sek -Class WA -Class WA d -Class WA-eur h 73,671.3609Class WA-nok h -Class WA-sek -Class WA-sek h -Class WI -Class WI-sek -Class WI-sek h -Class WI-sek h d -
DANSKE INVEST SICAV
The accompanying notes form an integral part of these financial statements.
41
Statement of Net Assets as at December 31, 2020 (continued)
Statement of Operations and Changesin Net Assets for the year/period ended December 31, 2020
China Danish Bond Danish MortgageBond
USD DKK DKK
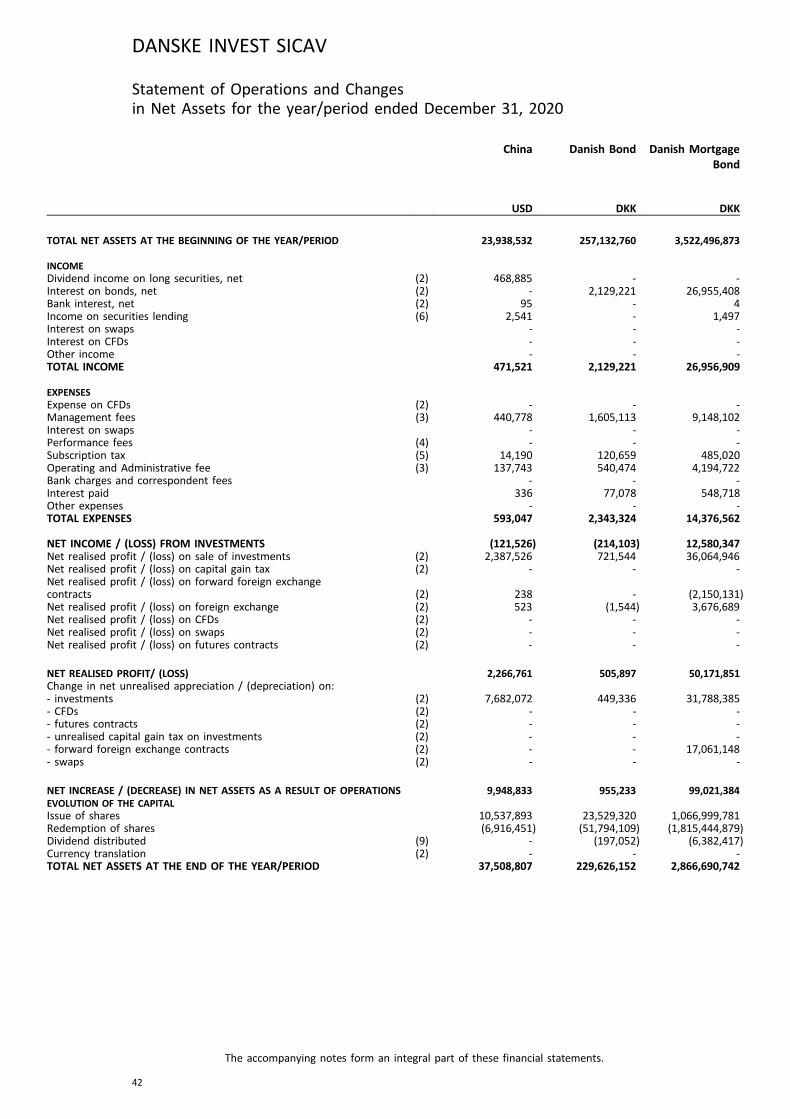
TOTAL NET ASSETS AT THE BEGINNING OF THE YEAR/PERIOD 23,938,532 257,132,760 3,522,496,873
INCOMEDividend income on long securities, net (2) 468,885 - -Interest on bonds, net (2) - 2,129,221 26,955,408Bank interest, net (2) 95 - 4Income on securities lending (6) 2,541 - 1,497Interest on swaps - - -Interest on CFDs - - -Other income - - -TOTAL INCOME 471,521 2,129,221 26,956,909
EXPENSESExpense on CFDs (2) - - -Management fees (3) 440,778 1,605,113 9,148,102Interest on swaps - - -Performance fees (4) - - -Subscription tax (5) 14,190 120,659 485,020Operating and Administrative fee (3) 137,743 540,474 4,194,722Bank charges and correspondent fees - - -Interest paid 336 77,078 548,718Other expenses - - -TOTAL EXPENSES 593,047 2,343,324 14,376,562
NET INCOME / (LOSS) FROM INVESTMENTS (121,526) (214,103) 12,580,347Net realised profit / (loss) on sale of investments (2) 2,387,526 721,544 36,064,946Net realised profit / (loss) on capital gain tax (2) - - -Net realised profit / (loss) on forward foreign exchangecontracts (2) 238 - (2,150,131)Net realised profit / (loss) on foreign exchange (2) 523 (1,544) 3,676,689Net realised profit / (loss) on CFDs (2) - - -Net realised profit / (loss) on swaps (2) - - -Net realised profit / (loss) on futures contracts (2) - - -
NET REALISED PROFIT/ (LOSS) 2,266,761 505,897 50,171,851Change in net unrealised appreciation / (depreciation) on:- investments (2) 7,682,072 449,336 31,788,385- CFDs (2) - - -- futures contracts (2) - - -- unrealised capital gain tax on investments (2) - - -- forward foreign exchange contracts (2) - - 17,061,148- swaps (2) - - -
NET INCREASE / (DECREASE) IN NET ASSETS AS A RESULT OF OPERATIONS 9,948,833 955,233 99,021,384EVOLUTION OF THE CAPITALIssue of shares 10,537,893 23,529,320 1,066,999,781Redemption of shares (6,916,451) (51,794,109) (1,815,444,879)Dividend distributed (9) - (197,052) (6,382,417)Currency translation (2) - - -TOTAL NET ASSETS AT THE END OF THE YEAR/PERIOD 37,508,807 229,626,152 2,866,690,742
DANSKE INVEST SICAV
The accompanying notes form an integral part of these financial statements.
42
Denmark Focus Eastern Europe Eastern EuropeAbsolute*
DKK EUR EUR
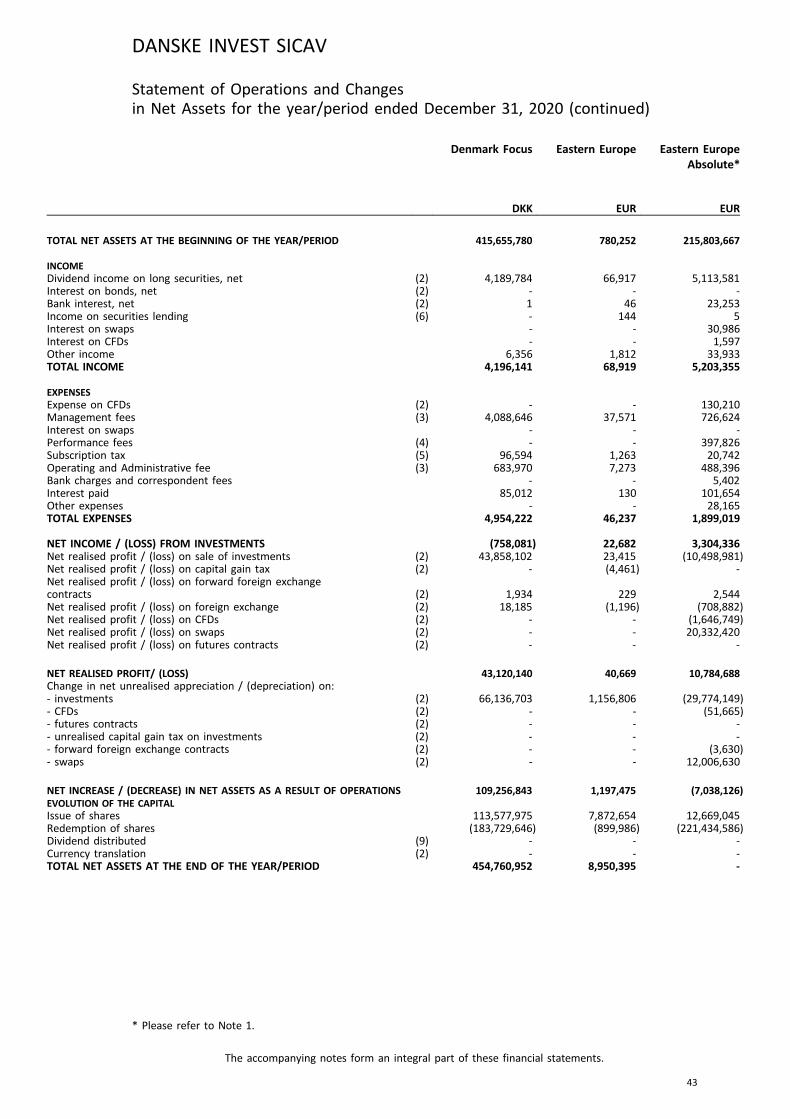
TOTAL NET ASSETS AT THE BEGINNING OF THE YEAR/PERIOD 415,655,780 780,252 215,803,667
INCOMEDividend income on long securities, net (2) 4,189,784 66,917 5,113,581Interest on bonds, net (2) - - -Bank interest, net (2) 1 46 23,253Income on securities lending (6) - 144 5Interest on swaps - - 30,986Interest on CFDs - - 1,597Other income 6,356 1,812 33,933TOTAL INCOME 4,196,141 68,919 5,203,355
EXPENSESExpense on CFDs (2) - - 130,210Management fees (3) 4,088,646 37,571 726,624Interest on swaps - - -Performance fees (4) - - 397,826Subscription tax (5) 96,594 1,263 20,742Operating and Administrative fee (3) 683,970 7,273 488,396Bank charges and correspondent fees - - 5,402Interest paid 85,012 130 101,654Other expenses - - 28,165TOTAL EXPENSES 4,954,222 46,237 1,899,019
NET INCOME / (LOSS) FROM INVESTMENTS (758,081) 22,682 3,304,336Net realised profit / (loss) on sale of investments (2) 43,858,102 23,415 (10,498,981)Net realised profit / (loss) on capital gain tax (2) - (4,461) -Net realised profit / (loss) on forward foreign exchangecontracts (2) 1,934 229 2,544Net realised profit / (loss) on foreign exchange (2) 18,185 (1,196) (708,882)Net realised profit / (loss) on CFDs (2) - - (1,646,749)Net realised profit / (loss) on swaps (2) - - 20,332,420Net realised profit / (loss) on futures contracts (2) - - -
NET REALISED PROFIT/ (LOSS) 43,120,140 40,669 10,784,688Change in net unrealised appreciation / (depreciation) on:- investments (2) 66,136,703 1,156,806 (29,774,149)- CFDs (2) - - (51,665)- futures contracts (2) - - -- unrealised capital gain tax on investments (2) - - -- forward foreign exchange contracts (2) - - (3,630)- swaps (2) - - 12,006,630
NET INCREASE / (DECREASE) IN NET ASSETS AS A RESULT OF OPERATIONS 109,256,843 1,197,475 (7,038,126)EVOLUTION OF THE CAPITALIssue of shares 113,577,975 7,872,654 12,669,045Redemption of shares (183,729,646) (899,986) (221,434,586)Dividend distributed (9) - - -Currency translation (2) - - -TOTAL NET ASSETS AT THE END OF THE YEAR/PERIOD 454,760,952 8,950,395 -
DANSKE INVEST SICAV
The accompanying notes form an integral part of these financial statements.
43
Statement of Operations and Changesin Net Assets for the year/period ended December 31, 2020 (continued)
* Please refer to Note 1.

Eastern Europeex. Russia*
Emerging andFrontier Markets
Emerging MarketsDebt HardCurrency
EUR EUR USD
TOTAL NET ASSETS AT THE BEGINNING OF THE YEAR/PERIOD 13,374,795 63,593,152 638,897,206
INCOMEDividend income on long securities, net (2) 188,647 1,226,652 -Interest on bonds, net (2) - 2,205 34,202,589Bank interest, net (2) 5 2,459 30,493Income on securities lending (6) 1 2,212 40,436Interest on swaps - - -Interest on CFDs - - -Other income 6,386 210 -TOTAL INCOME 195,039 1,233,738 34,273,518
EXPENSESExpense on CFDs (2) - - -Management fees (3) 124,954 828,820 4,177,332Interest on swaps - - -Performance fees (4) - - -Subscription tax (5) 3,270 5,865 74,778Operating and Administrative fee (3) 23,453 194,000 1,053,088Bank charges and correspondent fees - - 21,987Interest paid 388 4,932 -Other expenses - 6,259 -TOTAL EXPENSES 152,065 1,039,876 5,327,185
NET INCOME / (LOSS) FROM INVESTMENTS 42,974 193,862 28,946,333Net realised profit / (loss) on sale of investments (2) (1,543,937) 845,918 (16,017,656)Net realised profit / (loss) on capital gain tax (2) (63,996) (27,474) -Net realised profit / (loss) on forward foreign exchangecontracts (2) (7,196) (7,627) 25,050,616Net realised profit / (loss) on foreign exchange (2) (4,222) (268,580) (6,435,480)Net realised profit / (loss) on CFDs (2) - - -Net realised profit / (loss) on swaps (2) - - -Net realised profit / (loss) on futures contracts (2) - - 4,638,159
NET REALISED PROFIT/ (LOSS) (1,576,377) 736,099 36,181,972Change in net unrealised appreciation / (depreciation) on:- investments (2) (1,966,147) (460,986) 31,542,171- CFDs (2) - - -- futures contracts (2) - - 1,098,278- unrealised capital gain tax on investments (2) - (13,992) -- forward foreign exchange contracts (2) - - 9,126,427- swaps (2) - - -
NET INCREASE / (DECREASE) IN NET ASSETS AS A RESULT OF OPERATIONS (3,542,524) 261,121 77,948,848EVOLUTION OF THE CAPITALIssue of shares 817,190 596,735 270,199,529Redemption of shares (10,648,651) (9,110,805) (79,922,189)Dividend distributed (9) (810) - -Currency translation (2) - - -TOTAL NET ASSETS AT THE END OF THE YEAR/PERIOD - 55,340,203 907,123,394
DANSKE INVEST SICAV
The accompanying notes form an integral part of these financial statements.
44
Statement of Operations and Changesin Net Assets for the year/period ended December 31, 2020 (continued)
* Please refer to Note 1.

Euro SustainableHigh Yield Bond*
Europe Europe HighDividend
EUR EUR EUR
TOTAL NET ASSETS AT THE BEGINNING OF THE YEAR/PERIOD 52,484,886 80,532,868 73,337,840
INCOMEDividend income on long securities, net (2) - 1,629,801 1,715,256Interest on bonds, net (2) 2,162,805 - -Bank interest, net (2) 423 667 195Income on securities lending (6) 5,407 8,004 5,283Interest on swaps - - -Interest on CFDs - - -Other income 6,526 3,707 566TOTAL INCOME 2,175,161 1,642,179 1,721,300
EXPENSESExpense on CFDs (2) - - -Management fees (3) 301,721 982,646 569,034Interest on swaps - - -Performance fees (4) - - -Subscription tax (5) 10,980 17,913 19,662Operating and Administrative fee (3) 81,682 131,761 106,323Bank charges and correspondent fees 3,663 - -Interest paid 12,347 7,127 1,480Other expenses 465 - -TOTAL EXPENSES 410,858 1,139,447 696,499
NET INCOME / (LOSS) FROM INVESTMENTS 1,764,303 502,732 1,024,801Net realised profit / (loss) on sale of investments (2) (819,239) (1,100,983) (1,364,621)Net realised profit / (loss) on capital gain tax (2) - - -Net realised profit / (loss) on forward foreign exchangecontracts (2) 83,376 2,579 396Net realised profit / (loss) on foreign exchange (2) (39,095) (87,906) (33,278)Net realised profit / (loss) on CFDs (2) - - -Net realised profit / (loss) on swaps (2) - - -Net realised profit / (loss) on futures contracts (2) 35,872 - -
NET REALISED PROFIT/ (LOSS) 1,025,217 (683,578) (372,702)Change in net unrealised appreciation / (depreciation) on:- investments (2) 204,726 5,227,409 (5,892,865)- CFDs (2) - - -- futures contracts (2) (2,517) - -- unrealised capital gain tax on investments (2) - - -- forward foreign exchange contracts (2) 5,100 - -- swaps (2) - - -
NET INCREASE / (DECREASE) IN NET ASSETS AS A RESULT OF OPERATIONS 1,232,526 4,543,831 (6,265,567)EVOLUTION OF THE CAPITALIssue of shares 18,515,690 55,215,722 4,921,273Redemption of shares (7,713,794) (12,563,283) (23,739,770)Dividend distributed (9) (339) - -Currency translation (2) - - -TOTAL NET ASSETS AT THE END OF THE YEAR/PERIOD 64,518,969 127,729,138 48,253,776
DANSKE INVEST SICAV
The accompanying notes form an integral part of these financial statements.
45
Statement of Operations and Changesin Net Assets for the year/period ended December 31, 2020 (continued)
* Please refer to Note 1.
Europe Small Cap European Bond EuropeanCorporate
Sustainable Bond
EUR EUR EUR
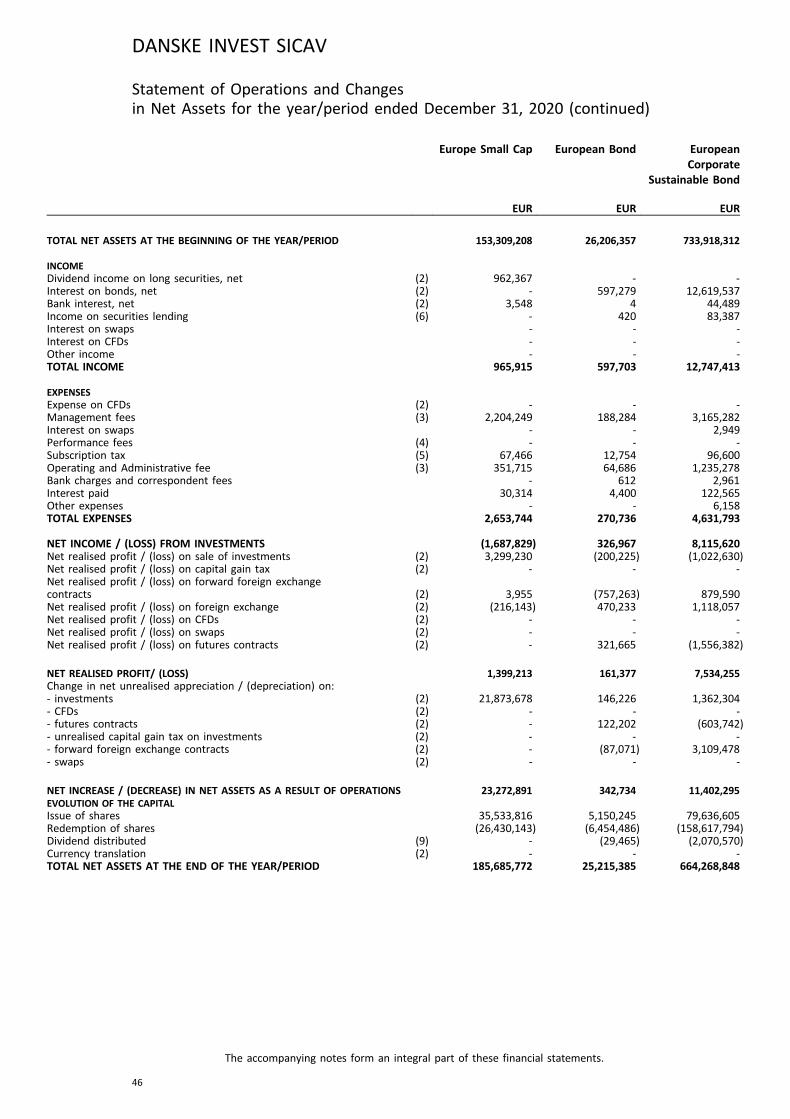
TOTAL NET ASSETS AT THE BEGINNING OF THE YEAR/PERIOD 153,309,208 26,206,357 733,918,312
INCOMEDividend income on long securities, net (2) 962,367 - -Interest on bonds, net (2) - 597,279 12,619,537Bank interest, net (2) 3,548 4 44,489Income on securities lending (6) - 420 83,387Interest on swaps - - -Interest on CFDs - - -Other income - - -TOTAL INCOME 965,915 597,703 12,747,413
EXPENSESExpense on CFDs (2) - - -Management fees (3) 2,204,249 188,284 3,165,282Interest on swaps - - 2,949Performance fees (4) - - -Subscription tax (5) 67,466 12,754 96,600Operating and Administrative fee (3) 351,715 64,686 1,235,278Bank charges and correspondent fees - 612 2,961Interest paid 30,314 4,400 122,565Other expenses - - 6,158TOTAL EXPENSES 2,653,744 270,736 4,631,793
NET INCOME / (LOSS) FROM INVESTMENTS (1,687,829) 326,967 8,115,620Net realised profit / (loss) on sale of investments (2) 3,299,230 (200,225) (1,022,630)Net realised profit / (loss) on capital gain tax (2) - - -Net realised profit / (loss) on forward foreign exchangecontracts (2) 3,955 (757,263) 879,590Net realised profit / (loss) on foreign exchange (2) (216,143) 470,233 1,118,057Net realised profit / (loss) on CFDs (2) - - -Net realised profit / (loss) on swaps (2) - - -Net realised profit / (loss) on futures contracts (2) - 321,665 (1,556,382)
NET REALISED PROFIT/ (LOSS) 1,399,213 161,377 7,534,255Change in net unrealised appreciation / (depreciation) on:- investments (2) 21,873,678 146,226 1,362,304- CFDs (2) - - -- futures contracts (2) - 122,202 (603,742)- unrealised capital gain tax on investments (2) - - -- forward foreign exchange contracts (2) - (87,071) 3,109,478- swaps (2) - - -
NET INCREASE / (DECREASE) IN NET ASSETS AS A RESULT OF OPERATIONS 23,272,891 342,734 11,402,295EVOLUTION OF THE CAPITALIssue of shares 35,533,816 5,150,245 79,636,605Redemption of shares (26,430,143) (6,454,486) (158,617,794)Dividend distributed (9) - (29,465) (2,070,570)Currency translation (2) - - -TOTAL NET ASSETS AT THE END OF THE YEAR/PERIOD 185,685,772 25,215,385 664,268,848
DANSKE INVEST SICAV
The accompanying notes form an integral part of these financial statements.
46
Statement of Operations and Changesin Net Assets for the year/period ended December 31, 2020 (continued)
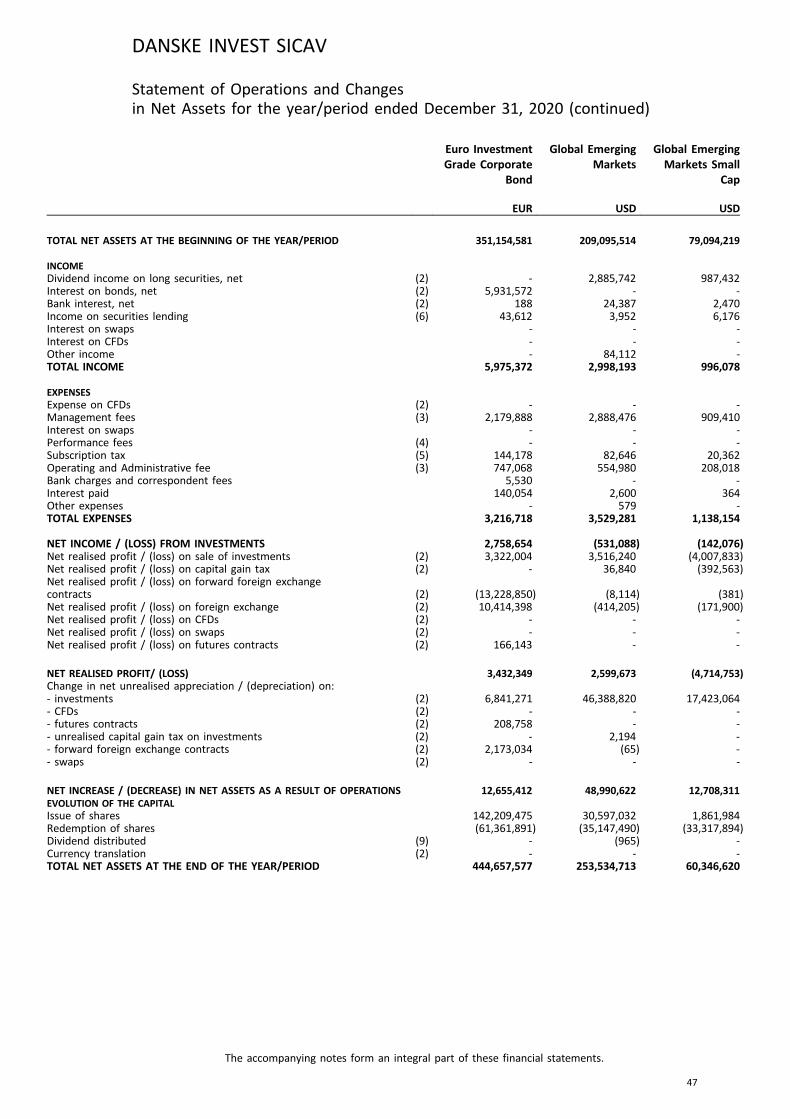
Euro InvestmentGrade Corporate
Bond
Global EmergingMarkets
Global EmergingMarkets Small
Cap
EUR USD USD
TOTAL NET ASSETS AT THE BEGINNING OF THE YEAR/PERIOD 351,154,581 209,095,514 79,094,219
INCOMEDividend income on long securities, net (2) - 2,885,742 987,432Interest on bonds, net (2) 5,931,572 - -Bank interest, net (2) 188 24,387 2,470Income on securities lending (6) 43,612 3,952 6,176Interest on swaps - - -Interest on CFDs - - -Other income - 84,112 -TOTAL INCOME 5,975,372 2,998,193 996,078
EXPENSESExpense on CFDs (2) - - -Management fees (3) 2,179,888 2,888,476 909,410Interest on swaps - - -Performance fees (4) - - -Subscription tax (5) 144,178 82,646 20,362Operating and Administrative fee (3) 747,068 554,980 208,018Bank charges and correspondent fees 5,530 - -Interest paid 140,054 2,600 364Other expenses - 579 -TOTAL EXPENSES 3,216,718 3,529,281 1,138,154
NET INCOME / (LOSS) FROM INVESTMENTS 2,758,654 (531,088) (142,076)Net realised profit / (loss) on sale of investments (2) 3,322,004 3,516,240 (4,007,833)Net realised profit / (loss) on capital gain tax (2) - 36,840 (392,563)Net realised profit / (loss) on forward foreign exchangecontracts (2) (13,228,850) (8,114) (381)Net realised profit / (loss) on foreign exchange (2) 10,414,398 (414,205) (171,900)Net realised profit / (loss) on CFDs (2) - - -Net realised profit / (loss) on swaps (2) - - -Net realised profit / (loss) on futures contracts (2) 166,143 - -
NET REALISED PROFIT/ (LOSS) 3,432,349 2,599,673 (4,714,753)Change in net unrealised appreciation / (depreciation) on:- investments (2) 6,841,271 46,388,820 17,423,064- CFDs (2) - - -- futures contracts (2) 208,758 - -- unrealised capital gain tax on investments (2) - 2,194 -- forward foreign exchange contracts (2) 2,173,034 (65) -- swaps (2) - - -
NET INCREASE / (DECREASE) IN NET ASSETS AS A RESULT OF OPERATIONS 12,655,412 48,990,622 12,708,311EVOLUTION OF THE CAPITALIssue of shares 142,209,475 30,597,032 1,861,984Redemption of shares (61,361,891) (35,147,490) (33,317,894)Dividend distributed (9) - (965) -Currency translation (2) - - -TOTAL NET ASSETS AT THE END OF THE YEAR/PERIOD 444,657,577 253,534,713 60,346,620
DANSKE INVEST SICAV
The accompanying notes form an integral part of these financial statements.
47
Statement of Operations and Changesin Net Assets for the year/period ended December 31, 2020 (continued)
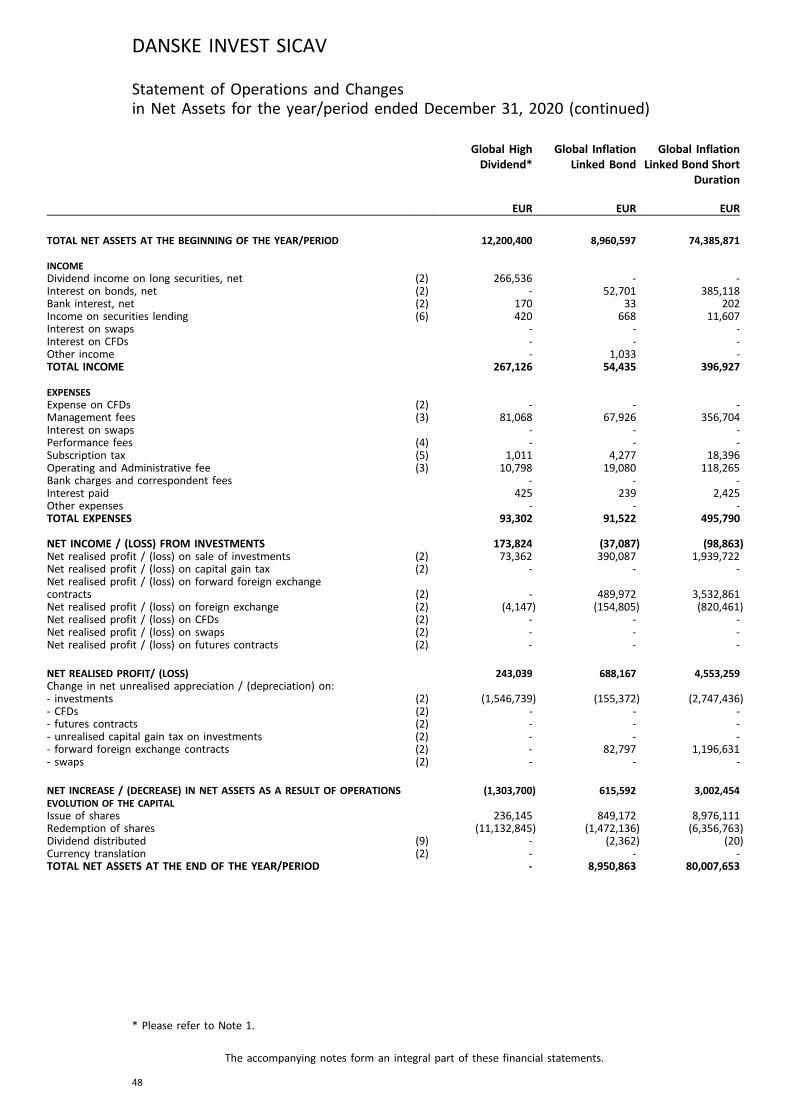
Global HighDividend*
Global InflationLinked Bond
Global InflationLinked Bond Short
Duration
EUR EUR EUR
TOTAL NET ASSETS AT THE BEGINNING OF THE YEAR/PERIOD 12,200,400 8,960,597 74,385,871
INCOMEDividend income on long securities, net (2) 266,536 - -Interest on bonds, net (2) - 52,701 385,118Bank interest, net (2) 170 33 202Income on securities lending (6) 420 668 11,607Interest on swaps - - -Interest on CFDs - - -Other income - 1,033 -TOTAL INCOME 267,126 54,435 396,927
EXPENSESExpense on CFDs (2) - - -Management fees (3) 81,068 67,926 356,704Interest on swaps - - -Performance fees (4) - - -Subscription tax (5) 1,011 4,277 18,396Operating and Administrative fee (3) 10,798 19,080 118,265Bank charges and correspondent fees - - -Interest paid 425 239 2,425Other expenses - - -TOTAL EXPENSES 93,302 91,522 495,790
NET INCOME / (LOSS) FROM INVESTMENTS 173,824 (37,087) (98,863)Net realised profit / (loss) on sale of investments (2) 73,362 390,087 1,939,722Net realised profit / (loss) on capital gain tax (2) - - -Net realised profit / (loss) on forward foreign exchangecontracts (2) - 489,972 3,532,861Net realised profit / (loss) on foreign exchange (2) (4,147) (154,805) (820,461)Net realised profit / (loss) on CFDs (2) - - -Net realised profit / (loss) on swaps (2) - - -Net realised profit / (loss) on futures contracts (2) - - -
NET REALISED PROFIT/ (LOSS) 243,039 688,167 4,553,259Change in net unrealised appreciation / (depreciation) on:- investments (2) (1,546,739) (155,372) (2,747,436)- CFDs (2) - - -- futures contracts (2) - - -- unrealised capital gain tax on investments (2) - - -- forward foreign exchange contracts (2) - 82,797 1,196,631- swaps (2) - - -
NET INCREASE / (DECREASE) IN NET ASSETS AS A RESULT OF OPERATIONS (1,303,700) 615,592 3,002,454EVOLUTION OF THE CAPITALIssue of shares 236,145 849,172 8,976,111Redemption of shares (11,132,845) (1,472,136) (6,356,763)Dividend distributed (9) - (2,362) (20)Currency translation (2) - - -TOTAL NET ASSETS AT THE END OF THE YEAR/PERIOD - 8,950,863 80,007,653
DANSKE INVEST SICAV
The accompanying notes form an integral part of these financial statements.
48
Statement of Operations and Changesin Net Assets for the year/period ended December 31, 2020 (continued)
* Please refer to Note 1.
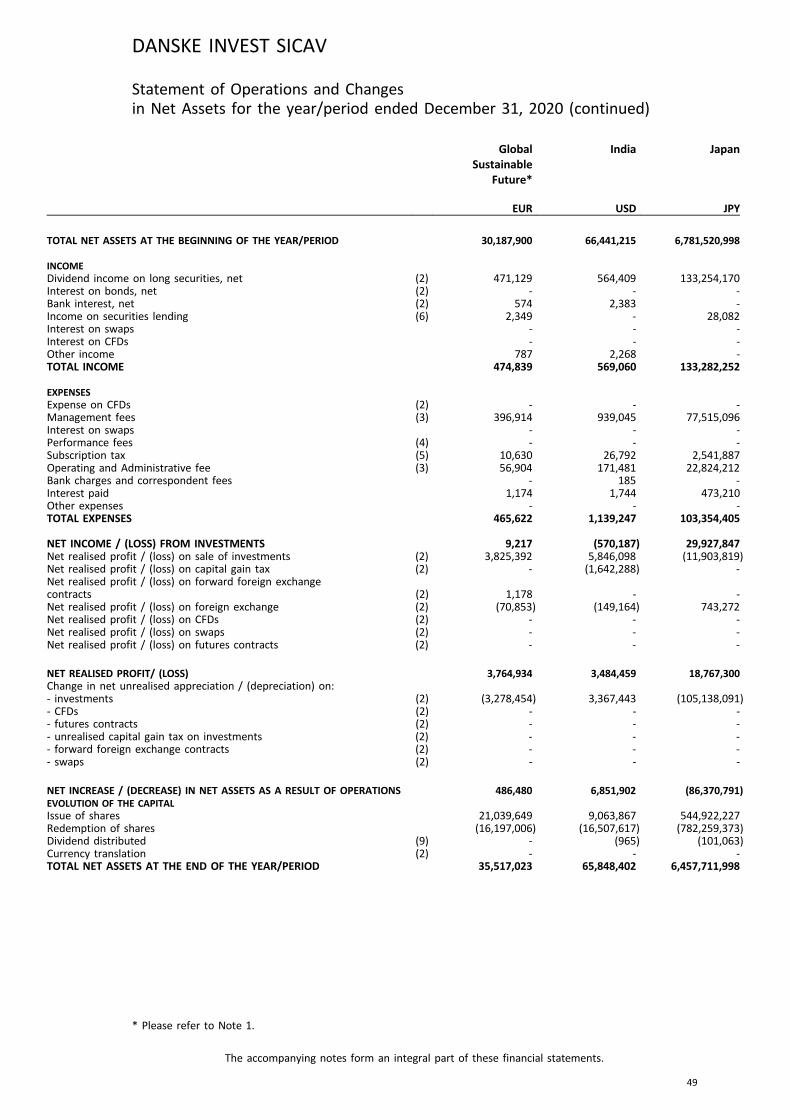
GlobalSustainable
Future*
India Japan
EUR USD JPY
TOTAL NET ASSETS AT THE BEGINNING OF THE YEAR/PERIOD 30,187,900 66,441,215 6,781,520,998
INCOMEDividend income on long securities, net (2) 471,129 564,409 133,254,170Interest on bonds, net (2) - - -Bank interest, net (2) 574 2,383 -Income on securities lending (6) 2,349 - 28,082Interest on swaps - - -Interest on CFDs - - -Other income 787 2,268 -TOTAL INCOME 474,839 569,060 133,282,252
EXPENSESExpense on CFDs (2) - - -Management fees (3) 396,914 939,045 77,515,096Interest on swaps - - -Performance fees (4) - - -Subscription tax (5) 10,630 26,792 2,541,887Operating and Administrative fee (3) 56,904 171,481 22,824,212Bank charges and correspondent fees - 185 -Interest paid 1,174 1,744 473,210Other expenses - - -TOTAL EXPENSES 465,622 1,139,247 103,354,405
NET INCOME / (LOSS) FROM INVESTMENTS 9,217 (570,187) 29,927,847Net realised profit / (loss) on sale of investments (2) 3,825,392 5,846,098 (11,903,819)Net realised profit / (loss) on capital gain tax (2) - (1,642,288) -Net realised profit / (loss) on forward foreign exchangecontracts (2) 1,178 - -Net realised profit / (loss) on foreign exchange (2) (70,853) (149,164) 743,272Net realised profit / (loss) on CFDs (2) - - -Net realised profit / (loss) on swaps (2) - - -Net realised profit / (loss) on futures contracts (2) - - -
NET REALISED PROFIT/ (LOSS) 3,764,934 3,484,459 18,767,300Change in net unrealised appreciation / (depreciation) on:- investments (2) (3,278,454) 3,367,443 (105,138,091)- CFDs (2) - - -- futures contracts (2) - - -- unrealised capital gain tax on investments (2) - - -- forward foreign exchange contracts (2) - - -- swaps (2) - - -
NET INCREASE / (DECREASE) IN NET ASSETS AS A RESULT OF OPERATIONS 486,480 6,851,902 (86,370,791)EVOLUTION OF THE CAPITALIssue of shares 21,039,649 9,063,867 544,922,227Redemption of shares (16,197,006) (16,507,617) (782,259,373)Dividend distributed (9) - (965) (101,063)Currency translation (2) - - -TOTAL NET ASSETS AT THE END OF THE YEAR/PERIOD 35,517,023 65,848,402 6,457,711,998
DANSKE INVEST SICAV
The accompanying notes form an integral part of these financial statements.
49
Statement of Operations and Changesin Net Assets for the year/period ended December 31, 2020 (continued)
* Please refer to Note 1.
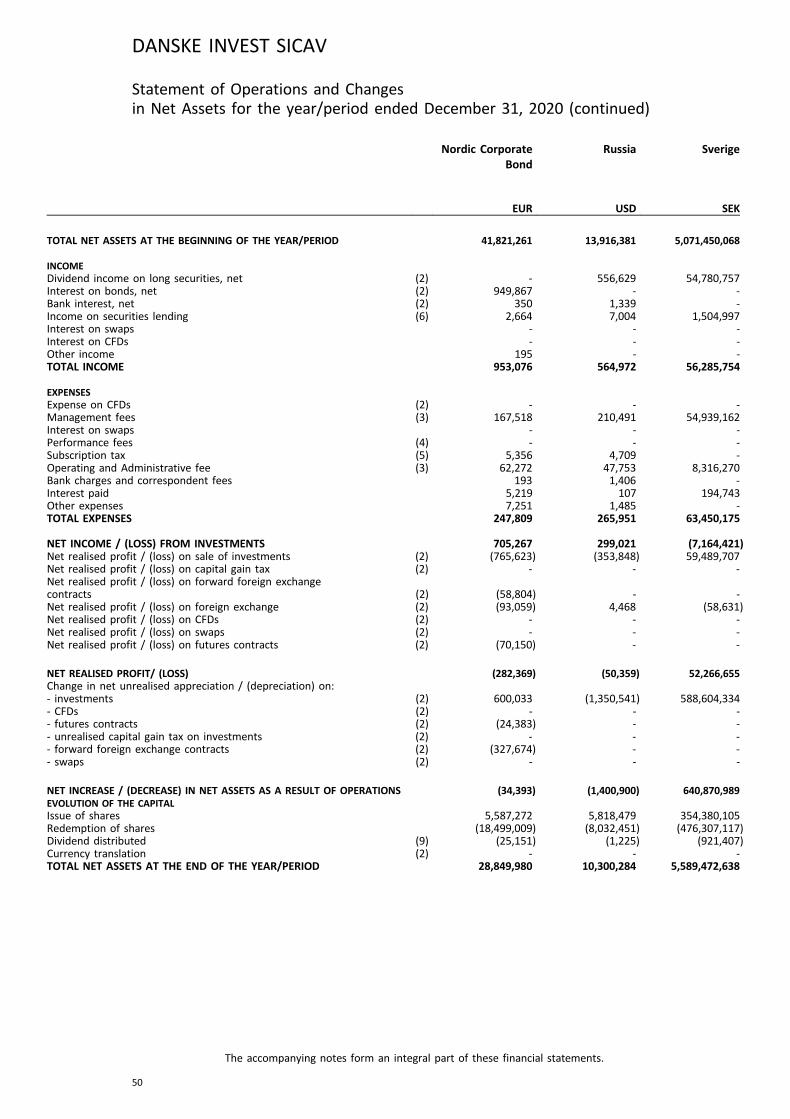
Nordic CorporateBond
Russia Sverige
EUR USD SEK
TOTAL NET ASSETS AT THE BEGINNING OF THE YEAR/PERIOD 41,821,261 13,916,381 5,071,450,068
INCOMEDividend income on long securities, net (2) - 556,629 54,780,757Interest on bonds, net (2) 949,867 - -Bank interest, net (2) 350 1,339 -Income on securities lending (6) 2,664 7,004 1,504,997Interest on swaps - - -Interest on CFDs - - -Other income 195 - -TOTAL INCOME 953,076 564,972 56,285,754
EXPENSESExpense on CFDs (2) - - -Management fees (3) 167,518 210,491 54,939,162Interest on swaps - - -Performance fees (4) - - -Subscription tax (5) 5,356 4,709 -Operating and Administrative fee (3) 62,272 47,753 8,316,270Bank charges and correspondent fees 193 1,406 -Interest paid 5,219 107 194,743Other expenses 7,251 1,485 -TOTAL EXPENSES 247,809 265,951 63,450,175
NET INCOME / (LOSS) FROM INVESTMENTS 705,267 299,021 (7,164,421)Net realised profit / (loss) on sale of investments (2) (765,623) (353,848) 59,489,707Net realised profit / (loss) on capital gain tax (2) - - -Net realised profit / (loss) on forward foreign exchangecontracts (2) (58,804) - -Net realised profit / (loss) on foreign exchange (2) (93,059) 4,468 (58,631)Net realised profit / (loss) on CFDs (2) - - -Net realised profit / (loss) on swaps (2) - - -Net realised profit / (loss) on futures contracts (2) (70,150) - -
NET REALISED PROFIT/ (LOSS) (282,369) (50,359) 52,266,655Change in net unrealised appreciation / (depreciation) on:- investments (2) 600,033 (1,350,541) 588,604,334- CFDs (2) - - -- futures contracts (2) (24,383) - -- unrealised capital gain tax on investments (2) - - -- forward foreign exchange contracts (2) (327,674) - -- swaps (2) - - -
NET INCREASE / (DECREASE) IN NET ASSETS AS A RESULT OF OPERATIONS (34,393) (1,400,900) 640,870,989EVOLUTION OF THE CAPITALIssue of shares 5,587,272 5,818,479 354,380,105Redemption of shares (18,499,009) (8,032,451) (476,307,117)Dividend distributed (9) (25,151) (1,225) (921,407)Currency translation (2) - - -TOTAL NET ASSETS AT THE END OF THE YEAR/PERIOD 28,849,980 10,300,284 5,589,472,638
DANSKE INVEST SICAV
The accompanying notes form an integral part of these financial statements.
50
Statement of Operations and Changesin Net Assets for the year/period ended December 31, 2020 (continued)
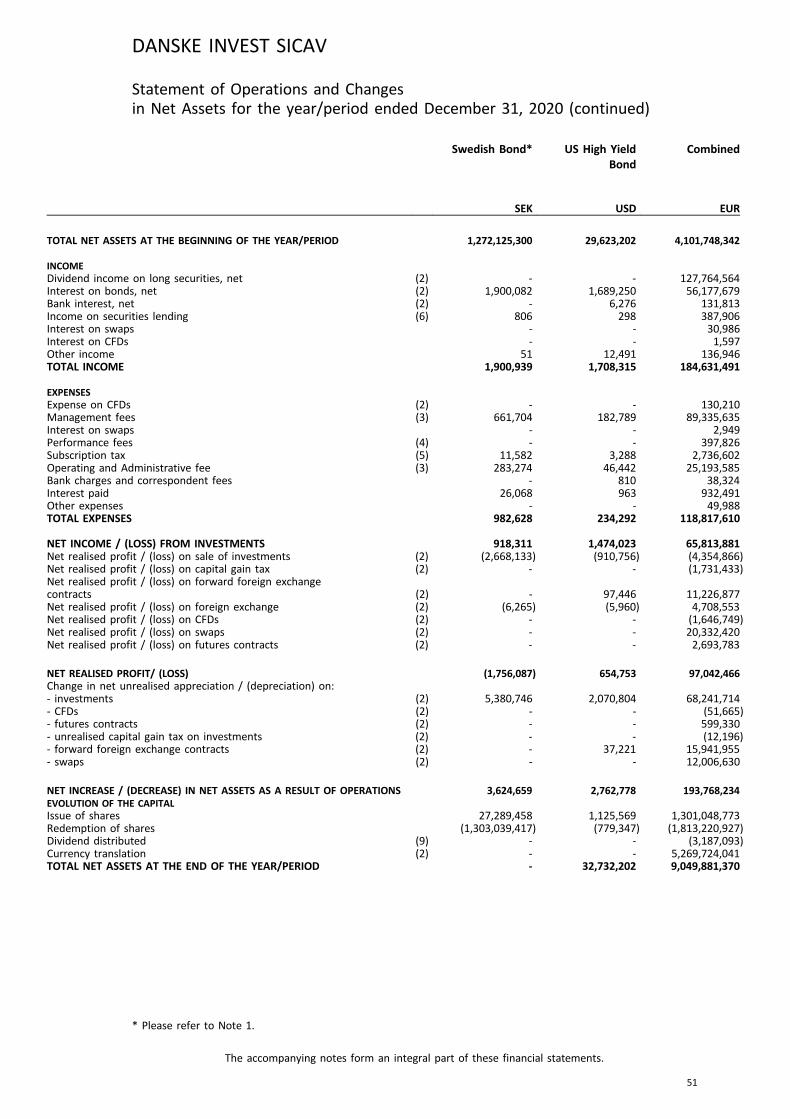
Swedish Bond* US High YieldBond
Combined
SEK USD EUR
TOTAL NET ASSETS AT THE BEGINNING OF THE YEAR/PERIOD 1,272,125,300 29,623,202 4,101,748,342
INCOMEDividend income on long securities, net (2) - - 127,764,564Interest on bonds, net (2) 1,900,082 1,689,250 56,177,679Bank interest, net (2) - 6,276 131,813Income on securities lending (6) 806 298 387,906Interest on swaps - - 30,986Interest on CFDs - - 1,597Other income 51 12,491 136,946TOTAL INCOME 1,900,939 1,708,315 184,631,491
EXPENSESExpense on CFDs (2) - - 130,210Management fees (3) 661,704 182,789 89,335,635Interest on swaps - - 2,949Performance fees (4) - - 397,826Subscription tax (5) 11,582 3,288 2,736,602Operating and Administrative fee (3) 283,274 46,442 25,193,585Bank charges and correspondent fees - 810 38,324Interest paid 26,068 963 932,491Other expenses - - 49,988TOTAL EXPENSES 982,628 234,292 118,817,610
NET INCOME / (LOSS) FROM INVESTMENTS 918,311 1,474,023 65,813,881Net realised profit / (loss) on sale of investments (2) (2,668,133) (910,756) (4,354,866)Net realised profit / (loss) on capital gain tax (2) - - (1,731,433)Net realised profit / (loss) on forward foreign exchangecontracts (2) - 97,446 11,226,877Net realised profit / (loss) on foreign exchange (2) (6,265) (5,960) 4,708,553Net realised profit / (loss) on CFDs (2) - - (1,646,749)Net realised profit / (loss) on swaps (2) - - 20,332,420Net realised profit / (loss) on futures contracts (2) - - 2,693,783
NET REALISED PROFIT/ (LOSS) (1,756,087) 654,753 97,042,466Change in net unrealised appreciation / (depreciation) on:- investments (2) 5,380,746 2,070,804 68,241,714- CFDs (2) - - (51,665)- futures contracts (2) - - 599,330- unrealised capital gain tax on investments (2) - - (12,196)- forward foreign exchange contracts (2) - 37,221 15,941,955- swaps (2) - - 12,006,630
NET INCREASE / (DECREASE) IN NET ASSETS AS A RESULT OF OPERATIONS 3,624,659 2,762,778 193,768,234EVOLUTION OF THE CAPITALIssue of shares 27,289,458 1,125,569 1,301,048,773Redemption of shares (1,303,039,417) (779,347) (1,813,220,927)Dividend distributed (9) - - (3,187,093)Currency translation (2) - - 5,269,724,041TOTAL NET ASSETS AT THE END OF THE YEAR/PERIOD - 32,732,202 9,049,881,370
DANSKE INVEST SICAV
The accompanying notes form an integral part of these financial statements.
51
Statement of Operations and Changesin Net Assets for the year/period ended December 31, 2020 (continued)
* Please refer to Note 1.
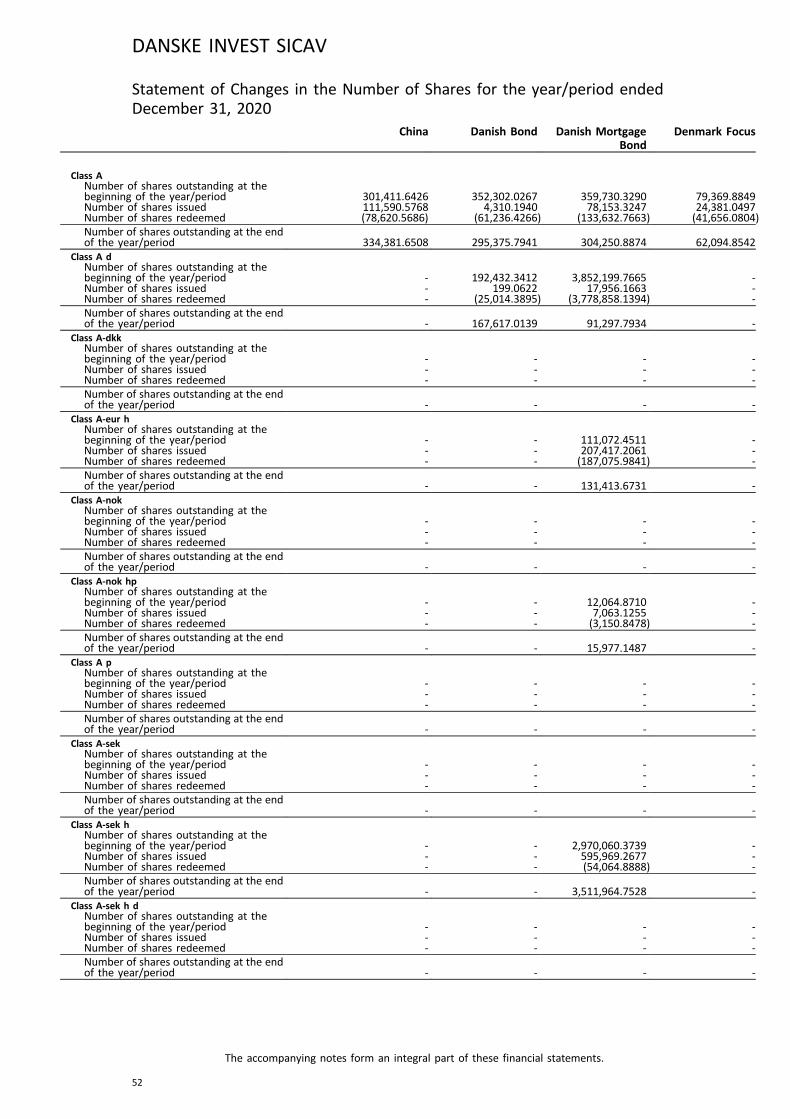
Statement of Changes in the Number of Shares for the year/period endedDecember 31, 2020
China Danish Bond Danish MortgageBond
Denmark Focus
Class ANumber of shares outstanding at thebeginning of the year/period 301,411.6426 352,302.0267 359,730.3290 79,369.8849Number of shares issued 111,590.5768 4,310.1940 78,153.3247 24,381.0497Number of shares redeemed (78,620.5686) (61,236.4266) (133,632.7663) (41,656.0804)Number of shares outstanding at the endof the year/period 334,381.6508 295,375.7941 304,250.8874 62,094.8542
Class A dNumber of shares outstanding at thebeginning of the year/period - 192,432.3412 3,852,199.7665 -Number of shares issued - 199.0622 17,956.1663 -Number of shares redeemed - (25,014.3895) (3,778,858.1394) -Number of shares outstanding at the endof the year/period - 167,617.0139 91,297.7934 -
Class A-dkkNumber of shares outstanding at thebeginning of the year/period - - - -Number of shares issued - - - -Number of shares redeemed - - - -Number of shares outstanding at the endof the year/period - - - -
Class A-eur hNumber of shares outstanding at thebeginning of the year/period - - 111,072.4511 -Number of shares issued - - 207,417.2061 -Number of shares redeemed - - (187,075.9841) -Number of shares outstanding at the endof the year/period - - 131,413.6731 -
Class A-nokNumber of shares outstanding at thebeginning of the year/period - - - -Number of shares issued - - - -Number of shares redeemed - - - -Number of shares outstanding at the endof the year/period - - - -
Class A-nok hpNumber of shares outstanding at thebeginning of the year/period - - 12,064.8710 -Number of shares issued - - 7,063.1255 -Number of shares redeemed - - (3,150.8478) -Number of shares outstanding at the endof the year/period - - 15,977.1487 -
Class A pNumber of shares outstanding at thebeginning of the year/period - - - -Number of shares issued - - - -Number of shares redeemed - - - -Number of shares outstanding at the endof the year/period - - - -
Class A-sekNumber of shares outstanding at thebeginning of the year/period - - - -Number of shares issued - - - -Number of shares redeemed - - - -Number of shares outstanding at the endof the year/period - - - -
Class A-sek hNumber of shares outstanding at thebeginning of the year/period - - 2,970,060.3739 -Number of shares issued - - 595,969.2677 -Number of shares redeemed - - (54,064.8888) -Number of shares outstanding at the endof the year/period - - 3,511,964.7528 -
Class A-sek h dNumber of shares outstanding at thebeginning of the year/period - - - -Number of shares issued - - - -Number of shares redeemed - - - -Number of shares outstanding at the endof the year/period - - - -
DANSKE INVEST SICAV
The accompanying notes form an integral part of these financial statements.
52

China Danish Bond Danish MortgageBond
Denmark Focus
Class A-sek hpNumber of shares outstanding at thebeginning of the year/period - - - -Number of shares issued - - - -Number of shares redeemed - - - -Number of shares outstanding at the endof the year/period - - - -
Class INumber of shares outstanding at thebeginning of the year/period - - 15,256,675.2814 141,999.5352Number of shares issued - - 1,358,526.0000 33,818.7960Number of shares redeemed - - (7,917,829.6576) (48,404.5197)Number of shares outstanding at the endof the year/period - - 8,697,371.6238 127,413.8115
Class I-chf hNumber of shares outstanding at thebeginning of the year/period - - 60,000.0000 -Number of shares issued - - - -Number of shares redeemed - - (10,000.0000) -Number of shares outstanding at the endof the year/period - - 50,000.0000 -
Class I-dkk h dNumber of shares outstanding at thebeginning of the year/period - - - -Number of shares issued - - - -Number of shares redeemed - - - -Number of shares outstanding at the endof the year/period - - - -
Class I-eur hNumber of shares outstanding at thebeginning of the year/period - - 4,695,864.5545 -Number of shares issued - - 372,259.5130 -Number of shares redeemed - - (2,471,778.0570) -Number of shares outstanding at the endof the year/period - - 2,596,346.0105 -
Class I-eur h dNumber of shares outstanding at thebeginning of the year/period - - 3,342,500.0000 -Number of shares issued - - 7,405,600.0000 -Number of shares redeemed - - (1,417,500.0000) -Number of shares outstanding at the endof the year/period - - 9,330,600.0000 -
Class I-nok hNumber of shares outstanding at thebeginning of the year/period - - - -Number of shares issued - - - -Number of shares redeemed - - - -Number of shares outstanding at the endof the year/period - - - -
Class I pNumber of shares outstanding at thebeginning of the year/period - - - -Number of shares issued - - - -Number of shares redeemed - - - -Number of shares outstanding at the endof the year/period - - - -
Class I-sek hNumber of shares outstanding at thebeginning of the year/period - - - -Number of shares issued - - - -Number of shares redeemed - - - -Number of shares outstanding at the endof the year/period - - - -
Class RANumber of shares outstanding at thebeginning of the year/period - - - 1,400.0000Number of shares issued - - - -Number of shares redeemed - - - (1,400.0000)Number of shares outstanding at the endof the year/period - - - -
DANSKE INVEST SICAV
The accompanying notes form an integral part of these financial statements.
53
Statement of Changes in the Number of Shares for the year/period endedDecember 31, 2020 (continued)
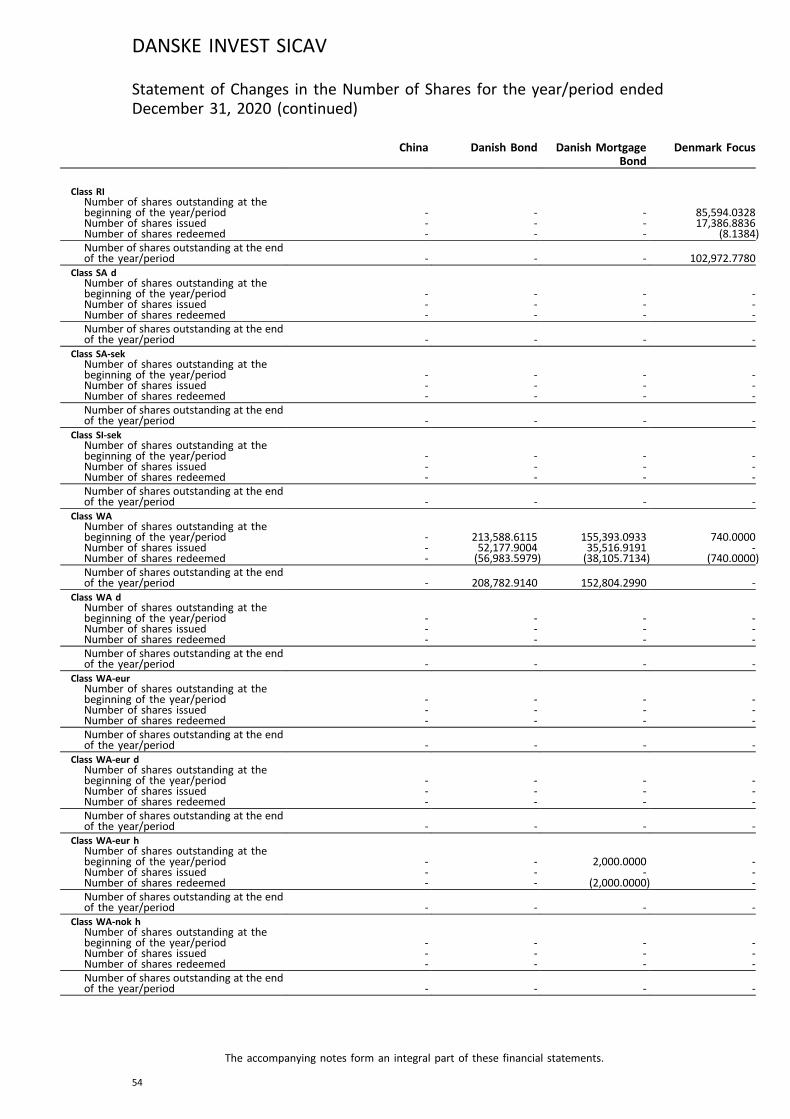
China Danish Bond Danish MortgageBond
Denmark Focus
Class RINumber of shares outstanding at thebeginning of the year/period - - - 85,594.0328Number of shares issued - - - 17,386.8836Number of shares redeemed - - - (8.1384)Number of shares outstanding at the endof the year/period - - - 102,972.7780
Class SA dNumber of shares outstanding at thebeginning of the year/period - - - -Number of shares issued - - - -Number of shares redeemed - - - -Number of shares outstanding at the endof the year/period - - - -
Class SA-sekNumber of shares outstanding at thebeginning of the year/period - - - -Number of shares issued - - - -Number of shares redeemed - - - -Number of shares outstanding at the endof the year/period - - - -
Class SI-sekNumber of shares outstanding at thebeginning of the year/period - - - -Number of shares issued - - - -Number of shares redeemed - - - -Number of shares outstanding at the endof the year/period - - - -
Class WANumber of shares outstanding at thebeginning of the year/period - 213,588.6115 155,393.0933 740.0000Number of shares issued - 52,177.9004 35,516.9191 -Number of shares redeemed - (56,983.5979) (38,105.7134) (740.0000)Number of shares outstanding at the endof the year/period - 208,782.9140 152,804.2990 -
Class WA dNumber of shares outstanding at thebeginning of the year/period - - - -Number of shares issued - - - -Number of shares redeemed - - - -Number of shares outstanding at the endof the year/period - - - -
Class WA-eurNumber of shares outstanding at thebeginning of the year/period - - - -Number of shares issued - - - -Number of shares redeemed - - - -Number of shares outstanding at the endof the year/period - - - -
Class WA-eur dNumber of shares outstanding at thebeginning of the year/period - - - -Number of shares issued - - - -Number of shares redeemed - - - -Number of shares outstanding at the endof the year/period - - - -
Class WA-eur hNumber of shares outstanding at thebeginning of the year/period - - 2,000.0000 -Number of shares issued - - - -Number of shares redeemed - - (2,000.0000) -Number of shares outstanding at the endof the year/period - - - -
Class WA-nok hNumber of shares outstanding at thebeginning of the year/period - - - -Number of shares issued - - - -Number of shares redeemed - - - -Number of shares outstanding at the endof the year/period - - - -
DANSKE INVEST SICAV
The accompanying notes form an integral part of these financial statements.
54
Statement of Changes in the Number of Shares for the year/period endedDecember 31, 2020 (continued)

China Danish Bond Danish MortgageBond
Denmark Focus
Class WA pNumber of shares outstanding at thebeginning of the year/period - - - -Number of shares issued - - - -Number of shares redeemed - - - -Number of shares outstanding at the endof the year/period - - - -
Class WA-sekNumber of shares outstanding at thebeginning of the year/period - - - -Number of shares issued - - - -Number of shares redeemed - - - -Number of shares outstanding at the endof the year/period - - - -
Class WA-sek hNumber of shares outstanding at thebeginning of the year/period - - - -Number of shares issued - - - -Number of shares redeemed - - - -Number of shares outstanding at the endof the year/period - - - -
Class WA-sek hpNumber of shares outstanding at thebeginning of the year/period - - - -Number of shares issued - - - -Number of shares redeemed - - - -Number of shares outstanding at the endof the year/period - - - -
Class WINumber of shares outstanding at thebeginning of the year/period - - - -Number of shares issued - - - -Number of shares redeemed - - - -Number of shares outstanding at the endof the year/period - - - -
Class WI pNumber of shares outstanding at thebeginning of the year/period - - - -Number of shares issued - - - -Number of shares redeemed - - - -Number of shares outstanding at the endof the year/period - - - -
Class WI-sekNumber of shares outstanding at thebeginning of the year/period - - - -Number of shares issued - - - -Number of shares redeemed - - - -Number of shares outstanding at the endof the year/period - - - -
Class WI-sek hNumber of shares outstanding at thebeginning of the year/period - - - -Number of shares issued - - 2,146,896.5151 -Number of shares redeemed - - - -Number of shares outstanding at the endof the year/period - - 2,146,896.5151 -
Class WI-sek h dNumber of shares outstanding at thebeginning of the year/period - - - -Number of shares issued - - - -Number of shares redeemed - - - -Number of shares outstanding at the endof the year/period - - - -
Class WI-sek hpNumber of shares outstanding at thebeginning of the year/period - - - -Number of shares issued - - - -Number of shares redeemed - - - -Number of shares outstanding at the endof the year/period - - - -
DANSKE INVEST SICAV
The accompanying notes form an integral part of these financial statements.
55
Statement of Changes in the Number of Shares for the year/period endedDecember 31, 2020 (continued)
China Danish Bond Danish MortgageBond
Denmark Focus
Class YNumber of shares outstanding at thebeginning of the year/period - - - -Number of shares issued - - - -Number of shares redeemed - - - -Number of shares outstanding at the endof the year/period - - - -
DANSKE INVEST SICAV
The accompanying notes form an integral part of these financial statements.
56
Statement of Changes in the Number of Shares for the year/period endedDecember 31, 2020 (continued)
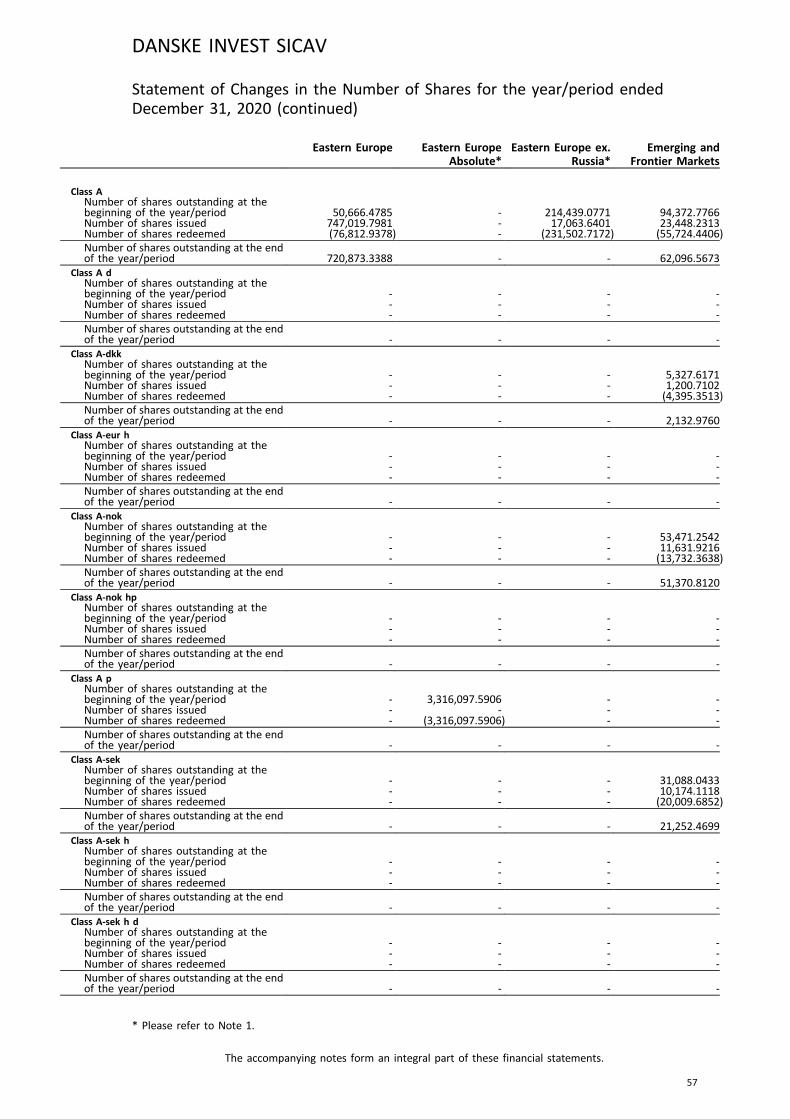
Eastern Europe Eastern EuropeAbsolute*
Eastern Europe ex.Russia*
Emerging andFrontier Markets
Class ANumber of shares outstanding at thebeginning of the year/period 50,666.4785 - 214,439.0771 94,372.7766Number of shares issued 747,019.7981 - 17,063.6401 23,448.2313Number of shares redeemed (76,812.9378) - (231,502.7172) (55,724.4406)Number of shares outstanding at the endof the year/period 720,873.3388 - - 62,096.5673
Class A dNumber of shares outstanding at thebeginning of the year/period - - - -Number of shares issued - - - -Number of shares redeemed - - - -Number of shares outstanding at the endof the year/period - - - -
Class A-dkkNumber of shares outstanding at thebeginning of the year/period - - - 5,327.6171Number of shares issued - - - 1,200.7102Number of shares redeemed - - - (4,395.3513)Number of shares outstanding at the endof the year/period - - - 2,132.9760
Class A-eur hNumber of shares outstanding at thebeginning of the year/period - - - -Number of shares issued - - - -Number of shares redeemed - - - -Number of shares outstanding at the endof the year/period - - - -
Class A-nokNumber of shares outstanding at thebeginning of the year/period - - - 53,471.2542Number of shares issued - - - 11,631.9216Number of shares redeemed - - - (13,732.3638)Number of shares outstanding at the endof the year/period - - - 51,370.8120
Class A-nok hpNumber of shares outstanding at thebeginning of the year/period - - - -Number of shares issued - - - -Number of shares redeemed - - - -Number of shares outstanding at the endof the year/period - - - -
Class A pNumber of shares outstanding at thebeginning of the year/period - 3,316,097.5906 - -Number of shares issued - - - -Number of shares redeemed - (3,316,097.5906) - -Number of shares outstanding at the endof the year/period - - - -
Class A-sekNumber of shares outstanding at thebeginning of the year/period - - - 31,088.0433Number of shares issued - - - 10,174.1118Number of shares redeemed - - - (20,009.6852)Number of shares outstanding at the endof the year/period - - - 21,252.4699
Class A-sek hNumber of shares outstanding at thebeginning of the year/period - - - -Number of shares issued - - - -Number of shares redeemed - - - -Number of shares outstanding at the endof the year/period - - - -
Class A-sek h dNumber of shares outstanding at thebeginning of the year/period - - - -Number of shares issued - - - -Number of shares redeemed - - - -Number of shares outstanding at the endof the year/period - - - -
DANSKE INVEST SICAV
The accompanying notes form an integral part of these financial statements.
57
Statement of Changes in the Number of Shares for the year/period endedDecember 31, 2020 (continued)
* Please refer to Note 1.
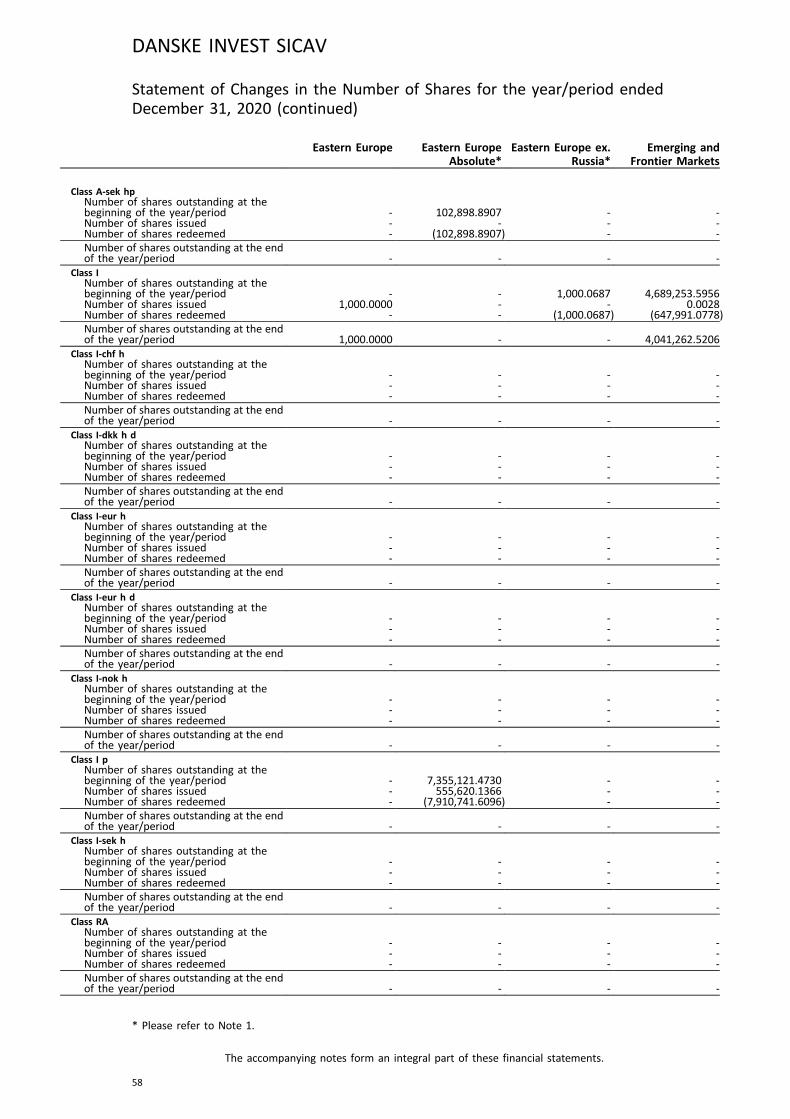
Eastern Europe Eastern EuropeAbsolute*
Eastern Europe ex.Russia*
Emerging andFrontier Markets
Class A-sek hpNumber of shares outstanding at thebeginning of the year/period - 102,898.8907 - -Number of shares issued - - - -Number of shares redeemed - (102,898.8907) - -Number of shares outstanding at the endof the year/period - - - -
Class INumber of shares outstanding at thebeginning of the year/period - - 1,000.0687 4,689,253.5956Number of shares issued 1,000.0000 - - 0.0028Number of shares redeemed - - (1,000.0687) (647,991.0778)Number of shares outstanding at the endof the year/period 1,000.0000 - - 4,041,262.5206
Class I-chf hNumber of shares outstanding at thebeginning of the year/period - - - -Number of shares issued - - - -Number of shares redeemed - - - -Number of shares outstanding at the endof the year/period - - - -
Class I-dkk h dNumber of shares outstanding at thebeginning of the year/period - - - -Number of shares issued - - - -Number of shares redeemed - - - -Number of shares outstanding at the endof the year/period - - - -
Class I-eur hNumber of shares outstanding at thebeginning of the year/period - - - -Number of shares issued - - - -Number of shares redeemed - - - -Number of shares outstanding at the endof the year/period - - - -
Class I-eur h dNumber of shares outstanding at thebeginning of the year/period - - - -Number of shares issued - - - -Number of shares redeemed - - - -Number of shares outstanding at the endof the year/period - - - -
Class I-nok hNumber of shares outstanding at thebeginning of the year/period - - - -Number of shares issued - - - -Number of shares redeemed - - - -Number of shares outstanding at the endof the year/period - - - -
Class I pNumber of shares outstanding at thebeginning of the year/period - 7,355,121.4730 - -Number of shares issued - 555,620.1366 - -Number of shares redeemed - (7,910,741.6096) - -Number of shares outstanding at the endof the year/period - - - -
Class I-sek hNumber of shares outstanding at thebeginning of the year/period - - - -Number of shares issued - - - -Number of shares redeemed - - - -Number of shares outstanding at the endof the year/period - - - -
Class RANumber of shares outstanding at thebeginning of the year/period - - - -Number of shares issued - - - -Number of shares redeemed - - - -Number of shares outstanding at the endof the year/period - - - -
DANSKE INVEST SICAV
The accompanying notes form an integral part of these financial statements.
58
Statement of Changes in the Number of Shares for the year/period endedDecember 31, 2020 (continued)
* Please refer to Note 1.
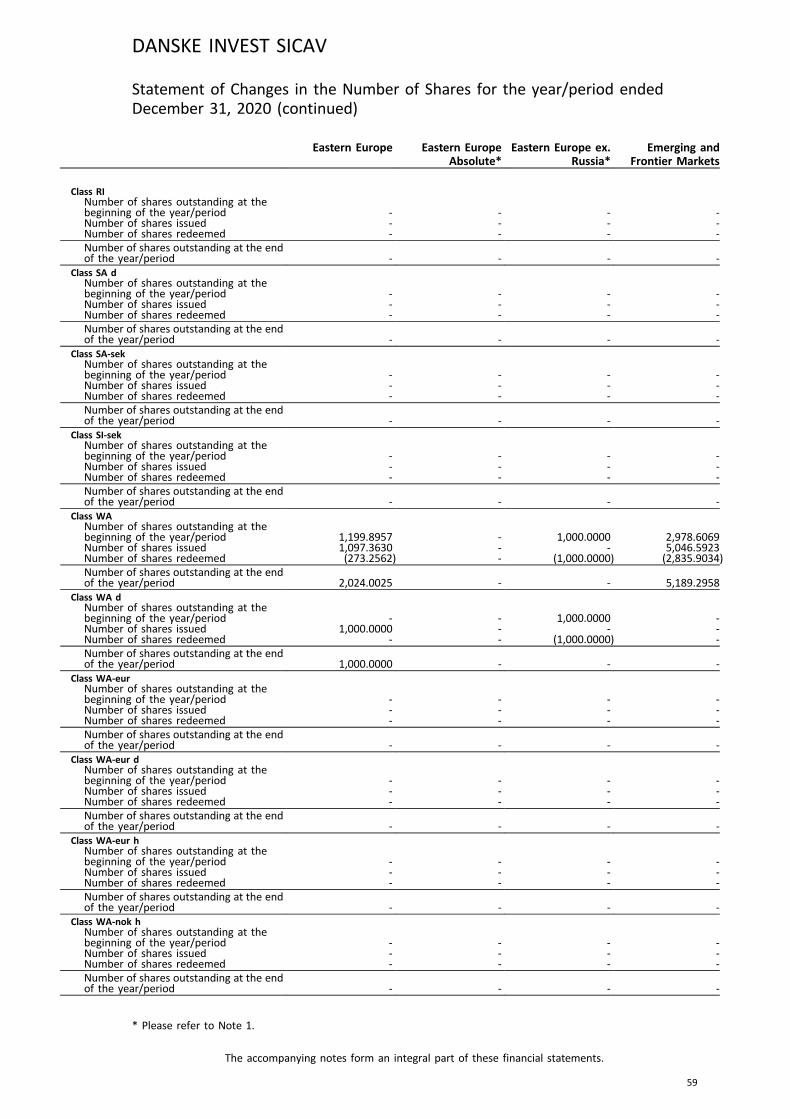
Eastern Europe Eastern EuropeAbsolute*
Eastern Europe ex.Russia*
Emerging andFrontier Markets
Class RINumber of shares outstanding at thebeginning of the year/period - - - -Number of shares issued - - - -Number of shares redeemed - - - -Number of shares outstanding at the endof the year/period - - - -
Class SA dNumber of shares outstanding at thebeginning of the year/period - - - -Number of shares issued - - - -Number of shares redeemed - - - -Number of shares outstanding at the endof the year/period - - - -
Class SA-sekNumber of shares outstanding at thebeginning of the year/period - - - -Number of shares issued - - - -Number of shares redeemed - - - -Number of shares outstanding at the endof the year/period - - - -
Class SI-sekNumber of shares outstanding at thebeginning of the year/period - - - -Number of shares issued - - - -Number of shares redeemed - - - -Number of shares outstanding at the endof the year/period - - - -
Class WANumber of shares outstanding at thebeginning of the year/period 1,199.8957 - 1,000.0000 2,978.6069Number of shares issued 1,097.3630 - - 5,046.5923Number of shares redeemed (273.2562) - (1,000.0000) (2,835.9034)Number of shares outstanding at the endof the year/period 2,024.0025 - - 5,189.2958
Class WA dNumber of shares outstanding at thebeginning of the year/period - - 1,000.0000 -Number of shares issued 1,000.0000 - - -Number of shares redeemed - - (1,000.0000) -Number of shares outstanding at the endof the year/period 1,000.0000 - - -
Class WA-eurNumber of shares outstanding at thebeginning of the year/period - - - -Number of shares issued - - - -Number of shares redeemed - - - -Number of shares outstanding at the endof the year/period - - - -
Class WA-eur dNumber of shares outstanding at thebeginning of the year/period - - - -Number of shares issued - - - -Number of shares redeemed - - - -Number of shares outstanding at the endof the year/period - - - -
Class WA-eur hNumber of shares outstanding at thebeginning of the year/period - - - -Number of shares issued - - - -Number of shares redeemed - - - -Number of shares outstanding at the endof the year/period - - - -
Class WA-nok hNumber of shares outstanding at thebeginning of the year/period - - - -Number of shares issued - - - -Number of shares redeemed - - - -Number of shares outstanding at the endof the year/period - - - -
DANSKE INVEST SICAV
The accompanying notes form an integral part of these financial statements.
59
Statement of Changes in the Number of Shares for the year/period endedDecember 31, 2020 (continued)
* Please refer to Note 1.
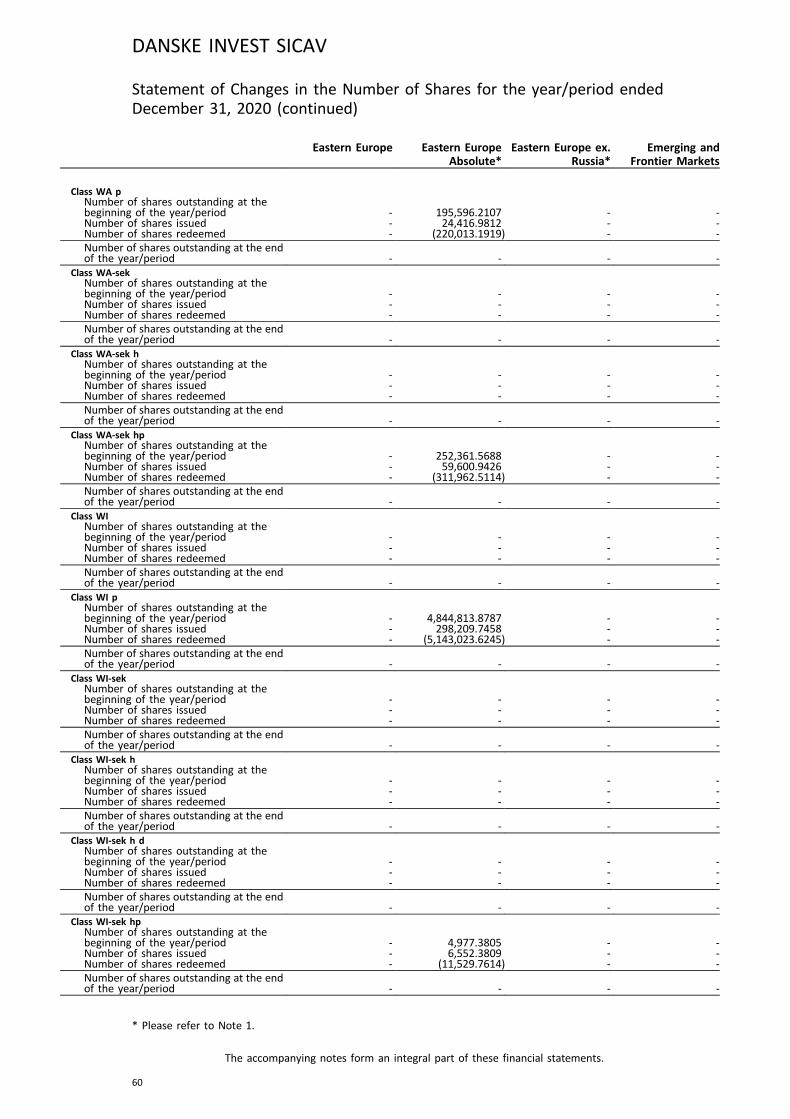
Eastern Europe Eastern EuropeAbsolute*
Eastern Europe ex.Russia*
Emerging andFrontier Markets
Class WA pNumber of shares outstanding at thebeginning of the year/period - 195,596.2107 - -Number of shares issued - 24,416.9812 - -Number of shares redeemed - (220,013.1919) - -Number of shares outstanding at the endof the year/period - - - -
Class WA-sekNumber of shares outstanding at thebeginning of the year/period - - - -Number of shares issued - - - -Number of shares redeemed - - - -Number of shares outstanding at the endof the year/period - - - -
Class WA-sek hNumber of shares outstanding at thebeginning of the year/period - - - -Number of shares issued - - - -Number of shares redeemed - - - -Number of shares outstanding at the endof the year/period - - - -
Class WA-sek hpNumber of shares outstanding at thebeginning of the year/period - 252,361.5688 - -Number of shares issued - 59,600.9426 - -Number of shares redeemed - (311,962.5114) - -Number of shares outstanding at the endof the year/period - - - -
Class WINumber of shares outstanding at thebeginning of the year/period - - - -Number of shares issued - - - -Number of shares redeemed - - - -Number of shares outstanding at the endof the year/period - - - -
Class WI pNumber of shares outstanding at thebeginning of the year/period - 4,844,813.8787 - -Number of shares issued - 298,209.7458 - -Number of shares redeemed - (5,143,023.6245) - -Number of shares outstanding at the endof the year/period - - - -
Class WI-sekNumber of shares outstanding at thebeginning of the year/period - - - -Number of shares issued - - - -Number of shares redeemed - - - -Number of shares outstanding at the endof the year/period - - - -
Class WI-sek hNumber of shares outstanding at thebeginning of the year/period - - - -Number of shares issued - - - -Number of shares redeemed - - - -Number of shares outstanding at the endof the year/period - - - -
Class WI-sek h dNumber of shares outstanding at thebeginning of the year/period - - - -Number of shares issued - - - -Number of shares redeemed - - - -Number of shares outstanding at the endof the year/period - - - -
Class WI-sek hpNumber of shares outstanding at thebeginning of the year/period - 4,977.3805 - -Number of shares issued - 6,552.3809 - -Number of shares redeemed - (11,529.7614) - -Number of shares outstanding at the endof the year/period - - - -
DANSKE INVEST SICAV
The accompanying notes form an integral part of these financial statements.
60
Statement of Changes in the Number of Shares for the year/period endedDecember 31, 2020 (continued)
* Please refer to Note 1.
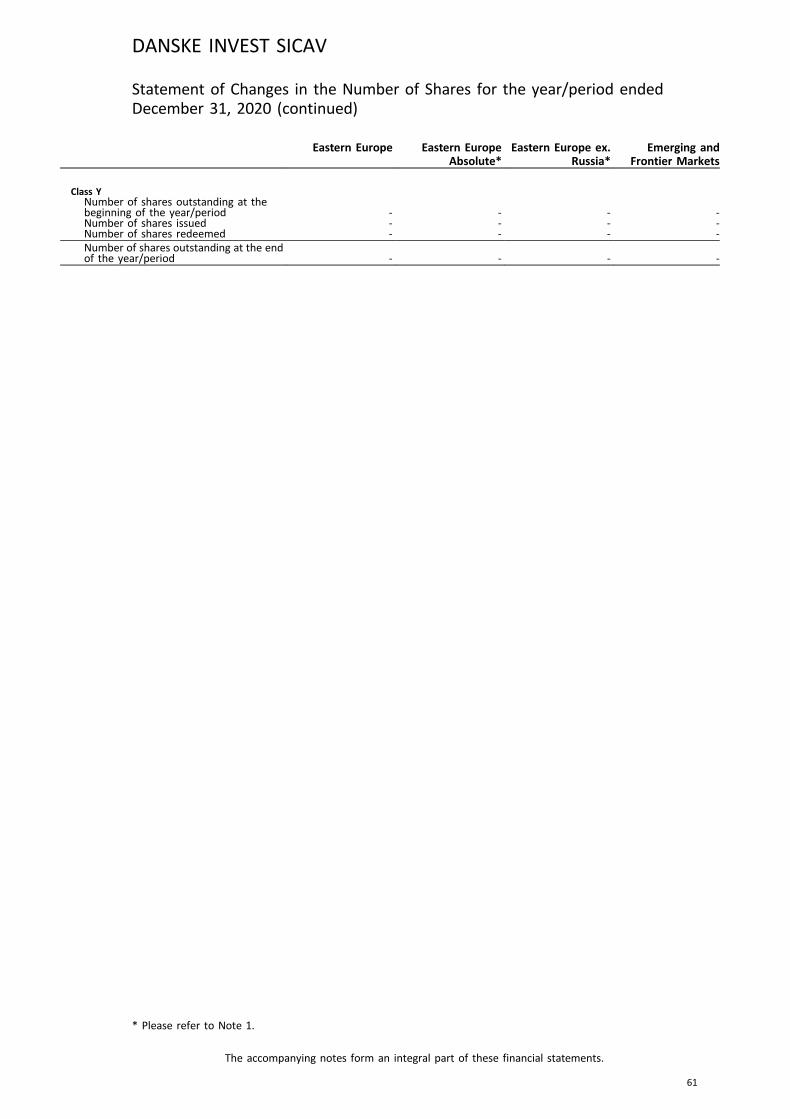
Eastern Europe Eastern EuropeAbsolute*
Eastern Europe ex.Russia*
Emerging andFrontier Markets
Class YNumber of shares outstanding at thebeginning of the year/period - - - -Number of shares issued - - - -Number of shares redeemed - - - -Number of shares outstanding at the endof the year/period - - - -
DANSKE INVEST SICAV
The accompanying notes form an integral part of these financial statements.
61
Statement of Changes in the Number of Shares for the year/period endedDecember 31, 2020 (continued)
* Please refer to Note 1.
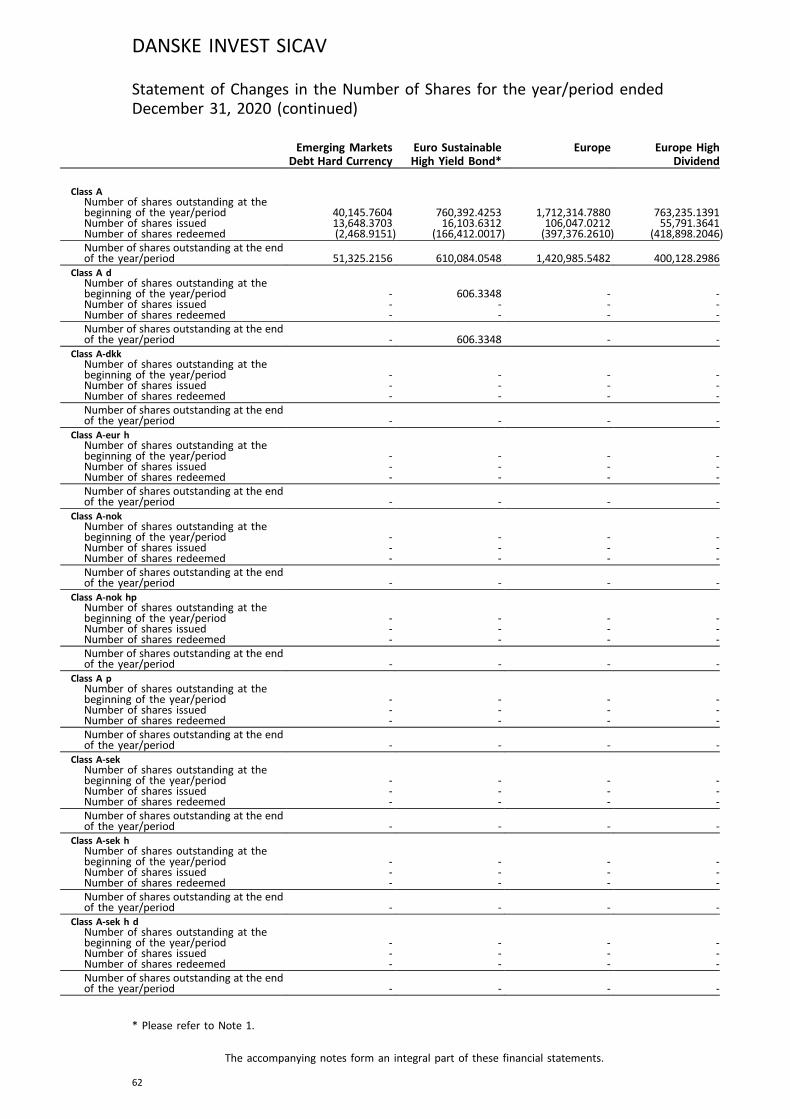
Emerging MarketsDebt Hard Currency
Euro SustainableHigh Yield Bond*
Europe Europe HighDividend
Class ANumber of shares outstanding at thebeginning of the year/period 40,145.7604 760,392.4253 1,712,314.7880 763,235.1391Number of shares issued 13,648.3703 16,103.6312 106,047.0212 55,791.3641Number of shares redeemed (2,468.9151) (166,412.0017) (397,376.2610) (418,898.2046)Number of shares outstanding at the endof the year/period 51,325.2156 610,084.0548 1,420,985.5482 400,128.2986
Class A dNumber of shares outstanding at thebeginning of the year/period - 606.3348 - -Number of shares issued - - - -Number of shares redeemed - - - -Number of shares outstanding at the endof the year/period - 606.3348 - -
Class A-dkkNumber of shares outstanding at thebeginning of the year/period - - - -Number of shares issued - - - -Number of shares redeemed - - - -Number of shares outstanding at the endof the year/period - - - -
Class A-eur hNumber of shares outstanding at thebeginning of the year/period - - - -Number of shares issued - - - -Number of shares redeemed - - - -Number of shares outstanding at the endof the year/period - - - -
Class A-nokNumber of shares outstanding at thebeginning of the year/period - - - -Number of shares issued - - - -Number of shares redeemed - - - -Number of shares outstanding at the endof the year/period - - - -
Class A-nok hpNumber of shares outstanding at thebeginning of the year/period - - - -Number of shares issued - - - -Number of shares redeemed - - - -Number of shares outstanding at the endof the year/period - - - -
Class A pNumber of shares outstanding at thebeginning of the year/period - - - -Number of shares issued - - - -Number of shares redeemed - - - -Number of shares outstanding at the endof the year/period - - - -
Class A-sekNumber of shares outstanding at thebeginning of the year/period - - - -Number of shares issued - - - -Number of shares redeemed - - - -Number of shares outstanding at the endof the year/period - - - -
Class A-sek hNumber of shares outstanding at thebeginning of the year/period - - - -Number of shares issued - - - -Number of shares redeemed - - - -Number of shares outstanding at the endof the year/period - - - -
Class A-sek h dNumber of shares outstanding at thebeginning of the year/period - - - -Number of shares issued - - - -Number of shares redeemed - - - -Number of shares outstanding at the endof the year/period - - - -
DANSKE INVEST SICAV
The accompanying notes form an integral part of these financial statements.
62
Statement of Changes in the Number of Shares for the year/period endedDecember 31, 2020 (continued)
* Please refer to Note 1.
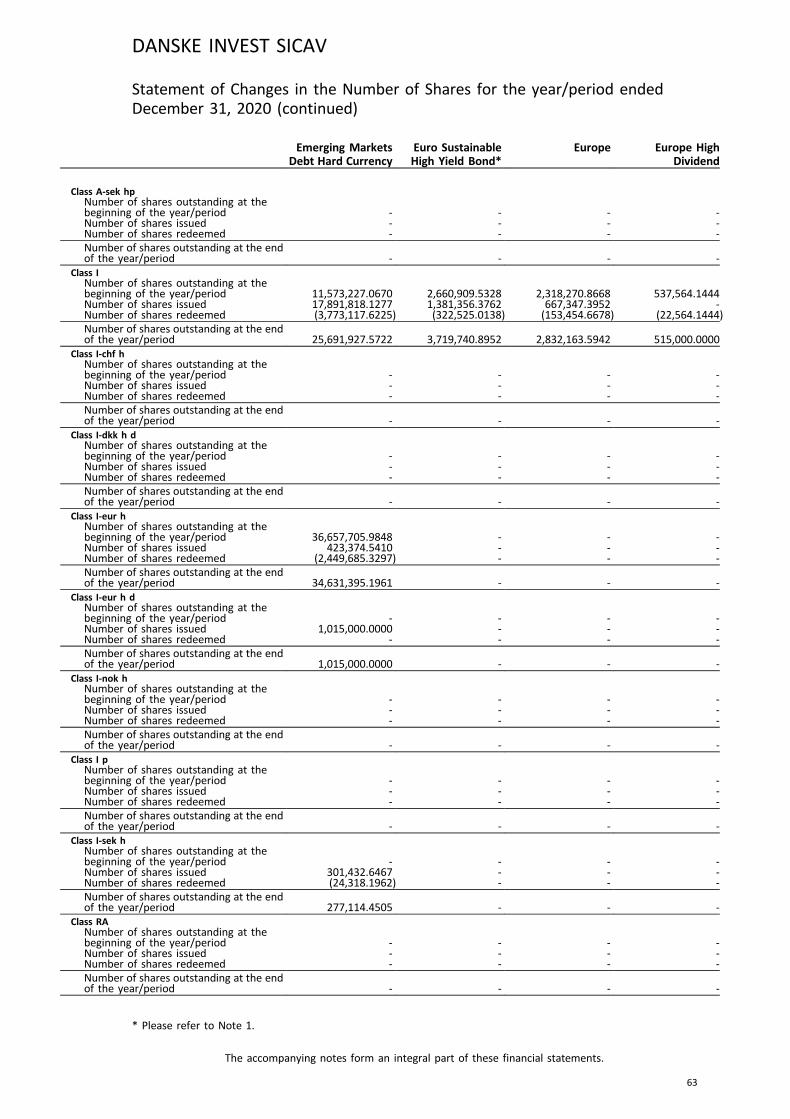
Emerging MarketsDebt Hard Currency
Euro SustainableHigh Yield Bond*
Europe Europe HighDividend
Class A-sek hpNumber of shares outstanding at thebeginning of the year/period - - - -Number of shares issued - - - -Number of shares redeemed - - - -Number of shares outstanding at the endof the year/period - - - -
Class INumber of shares outstanding at thebeginning of the year/period 11,573,227.0670 2,660,909.5328 2,318,270.8668 537,564.1444Number of shares issued 17,891,818.1277 1,381,356.3762 667,347.3952 -Number of shares redeemed (3,773,117.6225) (322,525.0138) (153,454.6678) (22,564.1444)Number of shares outstanding at the endof the year/period 25,691,927.5722 3,719,740.8952 2,832,163.5942 515,000.0000
Class I-chf hNumber of shares outstanding at thebeginning of the year/period - - - -Number of shares issued - - - -Number of shares redeemed - - - -Number of shares outstanding at the endof the year/period - - - -
Class I-dkk h dNumber of shares outstanding at thebeginning of the year/period - - - -Number of shares issued - - - -Number of shares redeemed - - - -Number of shares outstanding at the endof the year/period - - - -
Class I-eur hNumber of shares outstanding at thebeginning of the year/period 36,657,705.9848 - - -Number of shares issued 423,374.5410 - - -Number of shares redeemed (2,449,685.3297) - - -Number of shares outstanding at the endof the year/period 34,631,395.1961 - - -
Class I-eur h dNumber of shares outstanding at thebeginning of the year/period - - - -Number of shares issued 1,015,000.0000 - - -Number of shares redeemed - - - -Number of shares outstanding at the endof the year/period 1,015,000.0000 - - -
Class I-nok hNumber of shares outstanding at thebeginning of the year/period - - - -Number of shares issued - - - -Number of shares redeemed - - - -Number of shares outstanding at the endof the year/period - - - -
Class I pNumber of shares outstanding at thebeginning of the year/period - - - -Number of shares issued - - - -Number of shares redeemed - - - -Number of shares outstanding at the endof the year/period - - - -
Class I-sek hNumber of shares outstanding at thebeginning of the year/period - - - -Number of shares issued 301,432.6467 - - -Number of shares redeemed (24,318.1962) - - -Number of shares outstanding at the endof the year/period 277,114.4505 - - -
Class RANumber of shares outstanding at thebeginning of the year/period - - - -Number of shares issued - - - -Number of shares redeemed - - - -Number of shares outstanding at the endof the year/period - - - -
DANSKE INVEST SICAV
The accompanying notes form an integral part of these financial statements.
63
Statement of Changes in the Number of Shares for the year/period endedDecember 31, 2020 (continued)
* Please refer to Note 1.
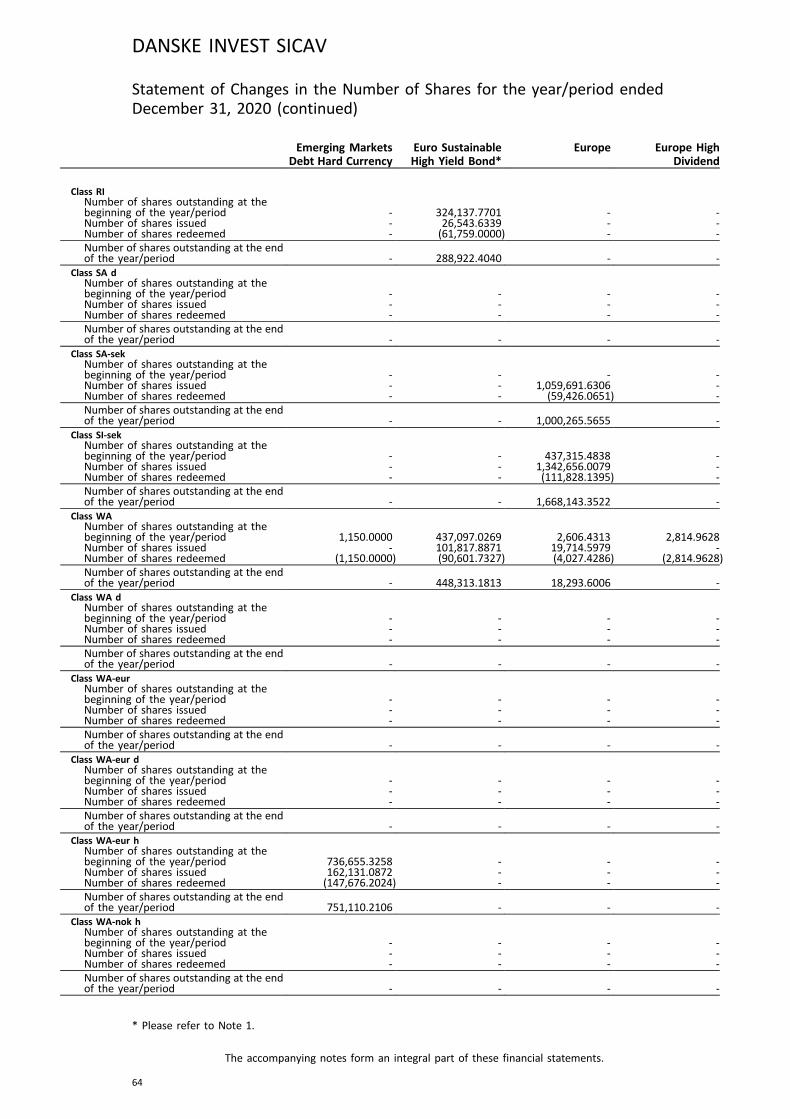
Emerging MarketsDebt Hard Currency
Euro SustainableHigh Yield Bond*
Europe Europe HighDividend
Class RINumber of shares outstanding at thebeginning of the year/period - 324,137.7701 - -Number of shares issued - 26,543.6339 - -Number of shares redeemed - (61,759.0000) - -Number of shares outstanding at the endof the year/period - 288,922.4040 - -
Class SA dNumber of shares outstanding at thebeginning of the year/period - - - -Number of shares issued - - - -Number of shares redeemed - - - -Number of shares outstanding at the endof the year/period - - - -
Class SA-sekNumber of shares outstanding at thebeginning of the year/period - - - -Number of shares issued - - 1,059,691.6306 -Number of shares redeemed - - (59,426.0651) -Number of shares outstanding at the endof the year/period - - 1,000,265.5655 -
Class SI-sekNumber of shares outstanding at thebeginning of the year/period - - 437,315.4838 -Number of shares issued - - 1,342,656.0079 -Number of shares redeemed - - (111,828.1395) -Number of shares outstanding at the endof the year/period - - 1,668,143.3522 -
Class WANumber of shares outstanding at thebeginning of the year/period 1,150.0000 437,097.0269 2,606.4313 2,814.9628Number of shares issued - 101,817.8871 19,714.5979 -Number of shares redeemed (1,150.0000) (90,601.7327) (4,027.4286) (2,814.9628)Number of shares outstanding at the endof the year/period - 448,313.1813 18,293.6006 -
Class WA dNumber of shares outstanding at thebeginning of the year/period - - - -Number of shares issued - - - -Number of shares redeemed - - - -Number of shares outstanding at the endof the year/period - - - -
Class WA-eurNumber of shares outstanding at thebeginning of the year/period - - - -Number of shares issued - - - -Number of shares redeemed - - - -Number of shares outstanding at the endof the year/period - - - -
Class WA-eur dNumber of shares outstanding at thebeginning of the year/period - - - -Number of shares issued - - - -Number of shares redeemed - - - -Number of shares outstanding at the endof the year/period - - - -
Class WA-eur hNumber of shares outstanding at thebeginning of the year/period 736,655.3258 - - -Number of shares issued 162,131.0872 - - -Number of shares redeemed (147,676.2024) - - -Number of shares outstanding at the endof the year/period 751,110.2106 - - -
Class WA-nok hNumber of shares outstanding at thebeginning of the year/period - - - -Number of shares issued - - - -Number of shares redeemed - - - -Number of shares outstanding at the endof the year/period - - - -
DANSKE INVEST SICAV
The accompanying notes form an integral part of these financial statements.
64
Statement of Changes in the Number of Shares for the year/period endedDecember 31, 2020 (continued)
* Please refer to Note 1.
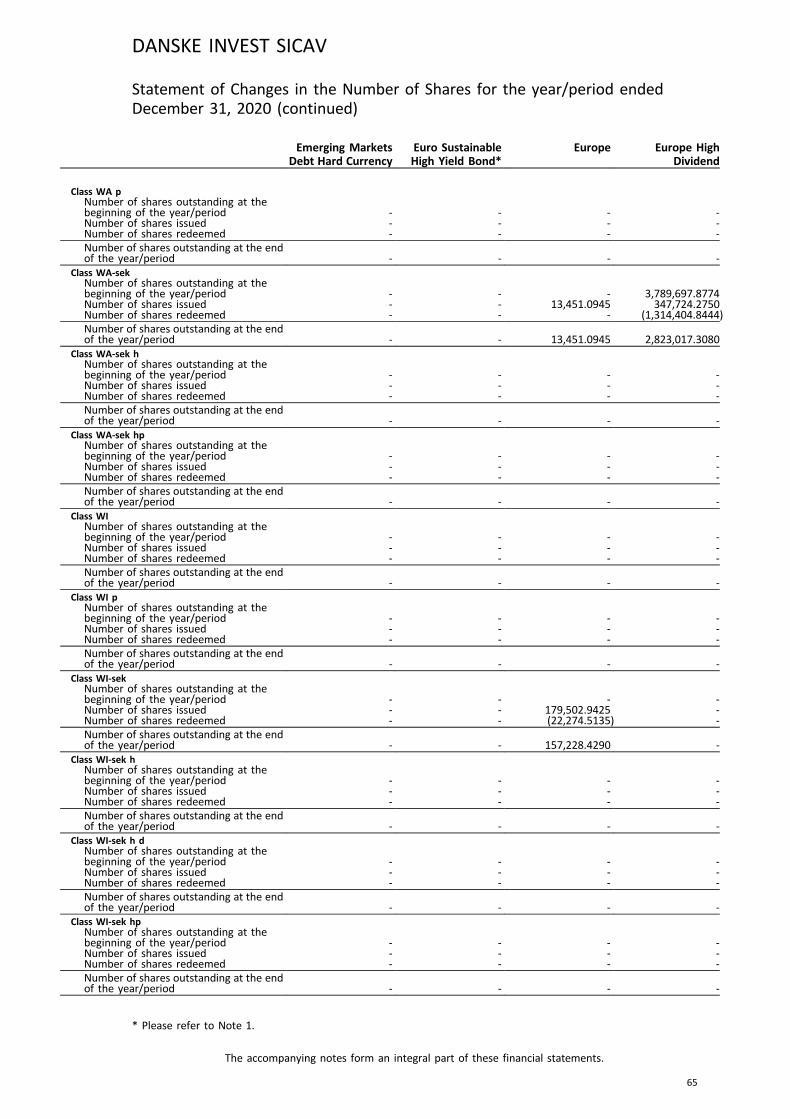
Emerging MarketsDebt Hard Currency
Euro SustainableHigh Yield Bond*
Europe Europe HighDividend
Class WA pNumber of shares outstanding at thebeginning of the year/period - - - -Number of shares issued - - - -Number of shares redeemed - - - -Number of shares outstanding at the endof the year/period - - - -
Class WA-sekNumber of shares outstanding at thebeginning of the year/period - - - 3,789,697.8774Number of shares issued - - 13,451.0945 347,724.2750Number of shares redeemed - - - (1,314,404.8444)Number of shares outstanding at the endof the year/period - - 13,451.0945 2,823,017.3080
Class WA-sek hNumber of shares outstanding at thebeginning of the year/period - - - -Number of shares issued - - - -Number of shares redeemed - - - -Number of shares outstanding at the endof the year/period - - - -
Class WA-sek hpNumber of shares outstanding at thebeginning of the year/period - - - -Number of shares issued - - - -Number of shares redeemed - - - -Number of shares outstanding at the endof the year/period - - - -
Class WINumber of shares outstanding at thebeginning of the year/period - - - -Number of shares issued - - - -Number of shares redeemed - - - -Number of shares outstanding at the endof the year/period - - - -
Class WI pNumber of shares outstanding at thebeginning of the year/period - - - -Number of shares issued - - - -Number of shares redeemed - - - -Number of shares outstanding at the endof the year/period - - - -
Class WI-sekNumber of shares outstanding at thebeginning of the year/period - - - -Number of shares issued - - 179,502.9425 -Number of shares redeemed - - (22,274.5135) -Number of shares outstanding at the endof the year/period - - 157,228.4290 -
Class WI-sek hNumber of shares outstanding at thebeginning of the year/period - - - -Number of shares issued - - - -Number of shares redeemed - - - -Number of shares outstanding at the endof the year/period - - - -
Class WI-sek h dNumber of shares outstanding at thebeginning of the year/period - - - -Number of shares issued - - - -Number of shares redeemed - - - -Number of shares outstanding at the endof the year/period - - - -
Class WI-sek hpNumber of shares outstanding at thebeginning of the year/period - - - -Number of shares issued - - - -Number of shares redeemed - - - -Number of shares outstanding at the endof the year/period - - - -
DANSKE INVEST SICAV
The accompanying notes form an integral part of these financial statements.
65
Statement of Changes in the Number of Shares for the year/period endedDecember 31, 2020 (continued)
* Please refer to Note 1.
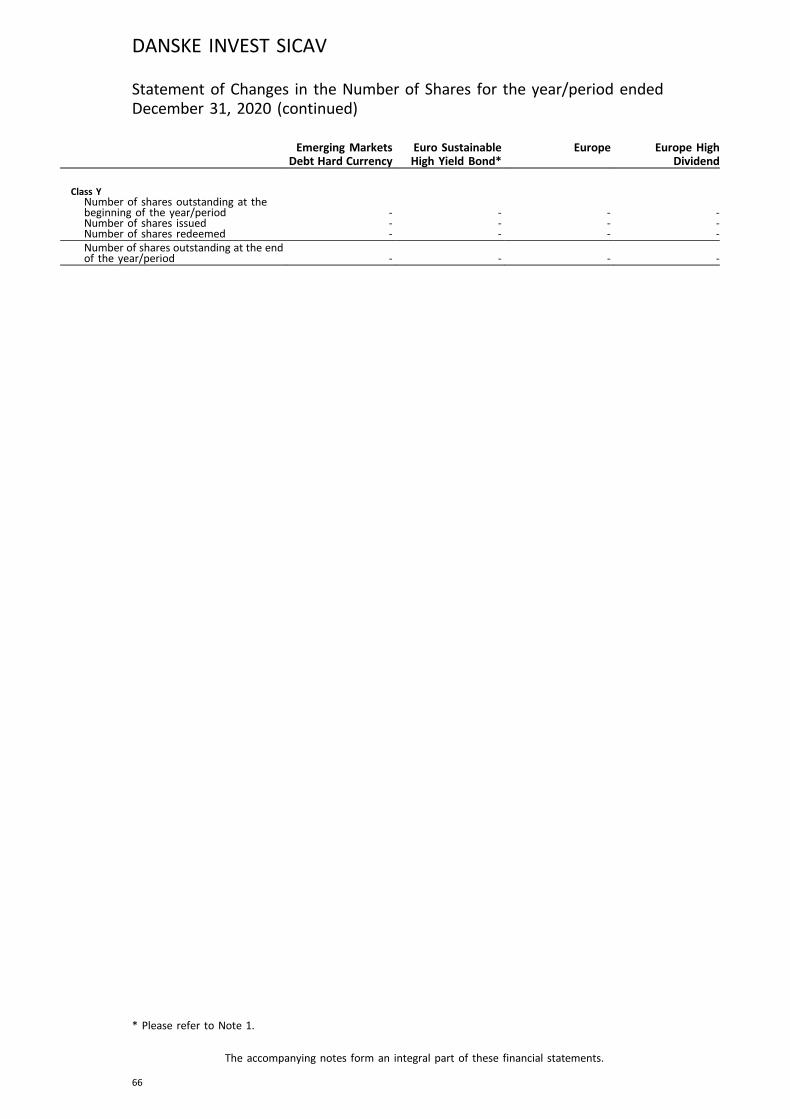
Emerging MarketsDebt Hard Currency
Euro SustainableHigh Yield Bond*
Europe Europe HighDividend
Class YNumber of shares outstanding at thebeginning of the year/period - - - -Number of shares issued - - - -Number of shares redeemed - - - -Number of shares outstanding at the endof the year/period - - - -
DANSKE INVEST SICAV
The accompanying notes form an integral part of these financial statements.
66
Statement of Changes in the Number of Shares for the year/period endedDecember 31, 2020 (continued)
* Please refer to Note 1.
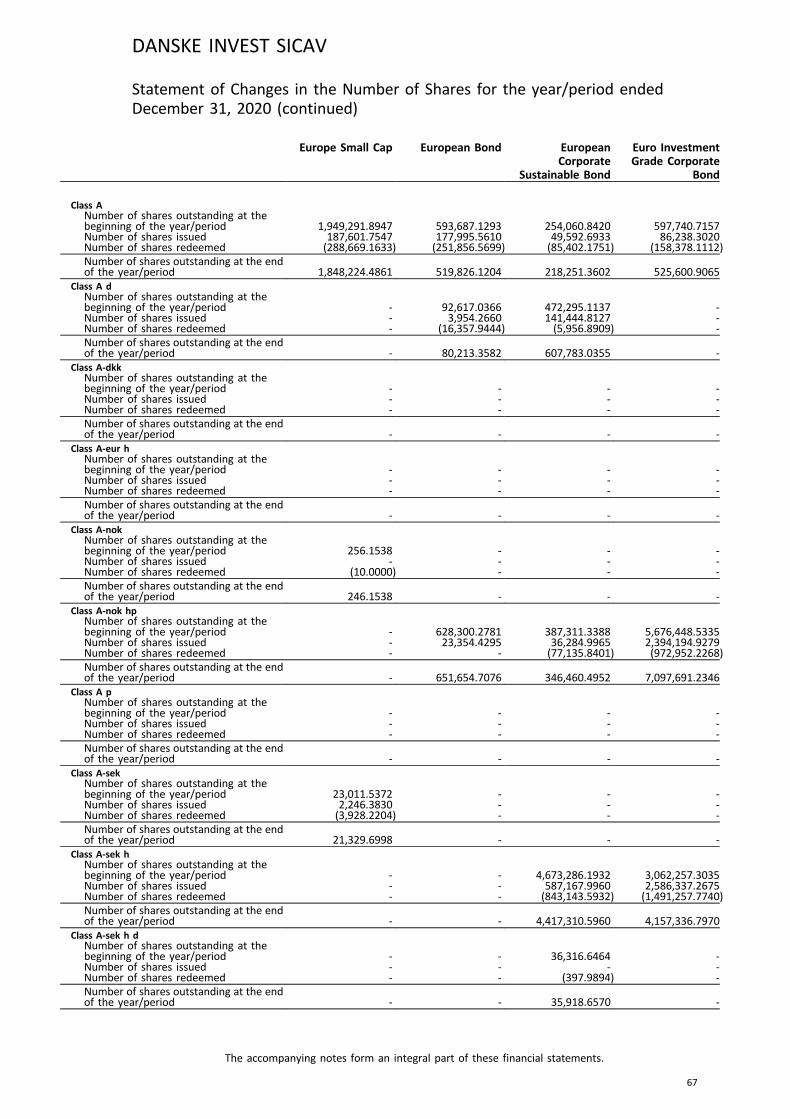
Europe Small Cap European Bond EuropeanCorporate
Sustainable Bond
Euro InvestmentGrade Corporate
Bond
Class ANumber of shares outstanding at thebeginning of the year/period 1,949,291.8947 593,687.1293 254,060.8420 597,740.7157Number of shares issued 187,601.7547 177,995.5610 49,592.6933 86,238.3020Number of shares redeemed (288,669.1633) (251,856.5699) (85,402.1751) (158,378.1112)Number of shares outstanding at the endof the year/period 1,848,224.4861 519,826.1204 218,251.3602 525,600.9065
Class A dNumber of shares outstanding at thebeginning of the year/period - 92,617.0366 472,295.1137 -Number of shares issued - 3,954.2660 141,444.8127 -Number of shares redeemed - (16,357.9444) (5,956.8909) -Number of shares outstanding at the endof the year/period - 80,213.3582 607,783.0355 -
Class A-dkkNumber of shares outstanding at thebeginning of the year/period - - - -Number of shares issued - - - -Number of shares redeemed - - - -Number of shares outstanding at the endof the year/period - - - -
Class A-eur hNumber of shares outstanding at thebeginning of the year/period - - - -Number of shares issued - - - -Number of shares redeemed - - - -Number of shares outstanding at the endof the year/period - - - -
Class A-nokNumber of shares outstanding at thebeginning of the year/period 256.1538 - - -Number of shares issued - - - -Number of shares redeemed (10.0000) - - -Number of shares outstanding at the endof the year/period 246.1538 - - -
Class A-nok hpNumber of shares outstanding at thebeginning of the year/period - 628,300.2781 387,311.3388 5,676,448.5335Number of shares issued - 23,354.4295 36,284.9965 2,394,194.9279Number of shares redeemed - - (77,135.8401) (972,952.2268)Number of shares outstanding at the endof the year/period - 651,654.7076 346,460.4952 7,097,691.2346
Class A pNumber of shares outstanding at thebeginning of the year/period - - - -Number of shares issued - - - -Number of shares redeemed - - - -Number of shares outstanding at the endof the year/period - - - -
Class A-sekNumber of shares outstanding at thebeginning of the year/period 23,011.5372 - - -Number of shares issued 2,246.3830 - - -Number of shares redeemed (3,928.2204) - - -Number of shares outstanding at the endof the year/period 21,329.6998 - - -
Class A-sek hNumber of shares outstanding at thebeginning of the year/period - - 4,673,286.1932 3,062,257.3035Number of shares issued - - 587,167.9960 2,586,337.2675Number of shares redeemed - - (843,143.5932) (1,491,257.7740)Number of shares outstanding at the endof the year/period - - 4,417,310.5960 4,157,336.7970
Class A-sek h dNumber of shares outstanding at thebeginning of the year/period - - 36,316.6464 -Number of shares issued - - - -Number of shares redeemed - - (397.9894) -Number of shares outstanding at the endof the year/period - - 35,918.6570 -
DANSKE INVEST SICAV
The accompanying notes form an integral part of these financial statements.
67
Statement of Changes in the Number of Shares for the year/period endedDecember 31, 2020 (continued)
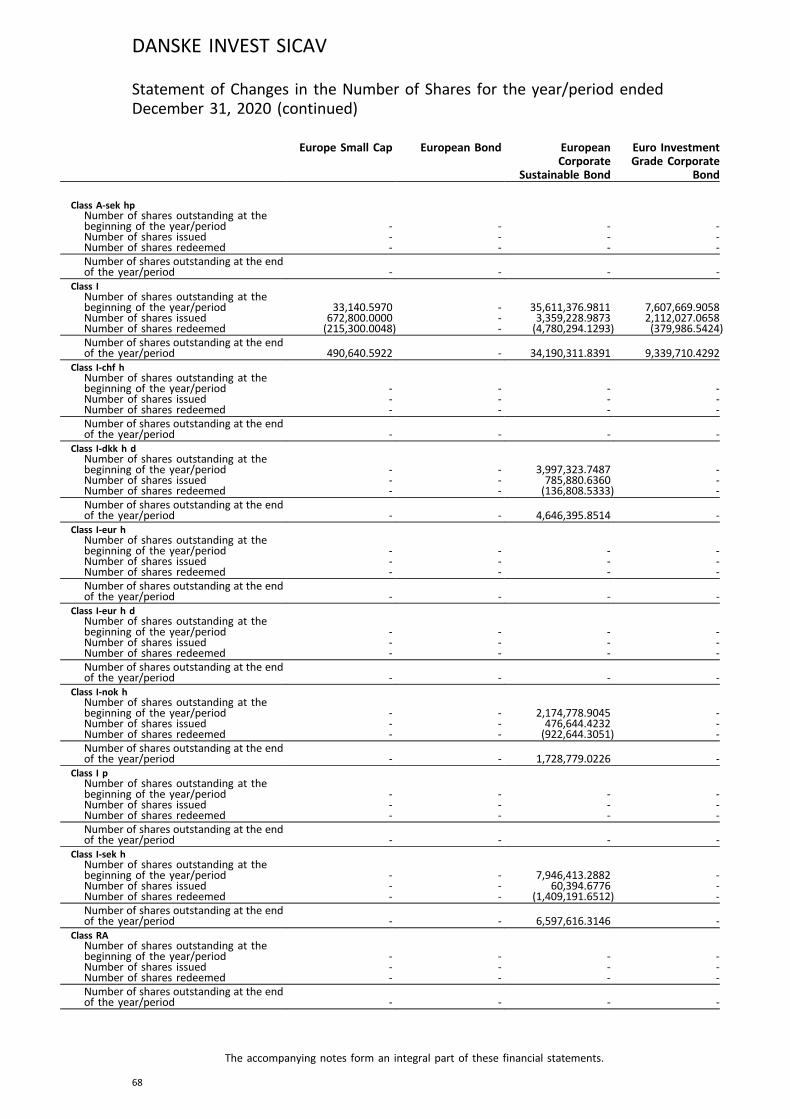
Europe Small Cap European Bond EuropeanCorporate
Sustainable Bond
Euro InvestmentGrade Corporate
Bond
Class A-sek hpNumber of shares outstanding at thebeginning of the year/period - - - -Number of shares issued - - - -Number of shares redeemed - - - -Number of shares outstanding at the endof the year/period - - - -
Class INumber of shares outstanding at thebeginning of the year/period 33,140.5970 - 35,611,376.9811 7,607,669.9058Number of shares issued 672,800.0000 - 3,359,228.9873 2,112,027.0658Number of shares redeemed (215,300.0048) - (4,780,294.1293) (379,986.5424)Number of shares outstanding at the endof the year/period 490,640.5922 - 34,190,311.8391 9,339,710.4292
Class I-chf hNumber of shares outstanding at thebeginning of the year/period - - - -Number of shares issued - - - -Number of shares redeemed - - - -Number of shares outstanding at the endof the year/period - - - -
Class I-dkk h dNumber of shares outstanding at thebeginning of the year/period - - 3,997,323.7487 -Number of shares issued - - 785,880.6360 -Number of shares redeemed - - (136,808.5333) -Number of shares outstanding at the endof the year/period - - 4,646,395.8514 -
Class I-eur hNumber of shares outstanding at thebeginning of the year/period - - - -Number of shares issued - - - -Number of shares redeemed - - - -Number of shares outstanding at the endof the year/period - - - -
Class I-eur h dNumber of shares outstanding at thebeginning of the year/period - - - -Number of shares issued - - - -Number of shares redeemed - - - -Number of shares outstanding at the endof the year/period - - - -
Class I-nok hNumber of shares outstanding at thebeginning of the year/period - - 2,174,778.9045 -Number of shares issued - - 476,644.4232 -Number of shares redeemed - - (922,644.3051) -Number of shares outstanding at the endof the year/period - - 1,728,779.0226 -
Class I pNumber of shares outstanding at thebeginning of the year/period - - - -Number of shares issued - - - -Number of shares redeemed - - - -Number of shares outstanding at the endof the year/period - - - -
Class I-sek hNumber of shares outstanding at thebeginning of the year/period - - 7,946,413.2882 -Number of shares issued - - 60,394.6776 -Number of shares redeemed - - (1,409,191.6512) -Number of shares outstanding at the endof the year/period - - 6,597,616.3146 -
Class RANumber of shares outstanding at thebeginning of the year/period - - - -Number of shares issued - - - -Number of shares redeemed - - - -Number of shares outstanding at the endof the year/period - - - -
DANSKE INVEST SICAV
The accompanying notes form an integral part of these financial statements.
68
Statement of Changes in the Number of Shares for the year/period endedDecember 31, 2020 (continued)
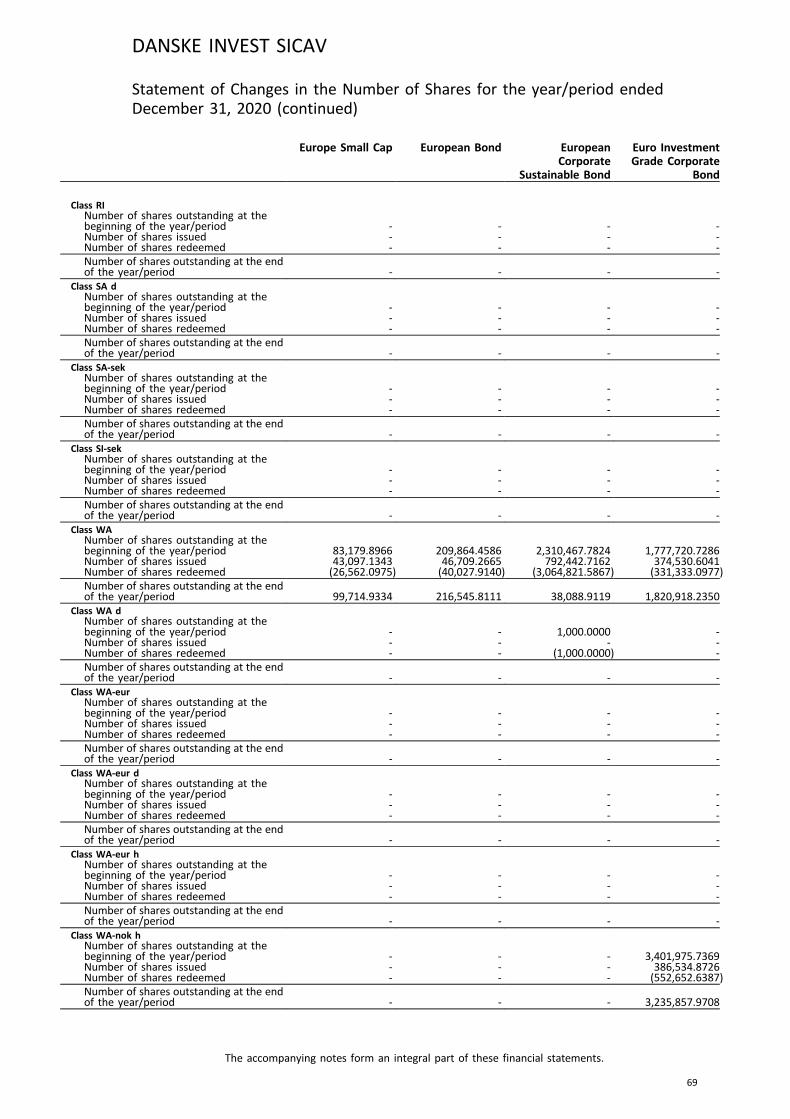
Europe Small Cap European Bond EuropeanCorporate
Sustainable Bond
Euro InvestmentGrade Corporate
Bond
Class RINumber of shares outstanding at thebeginning of the year/period - - - -Number of shares issued - - - -Number of shares redeemed - - - -Number of shares outstanding at the endof the year/period - - - -
Class SA dNumber of shares outstanding at thebeginning of the year/period - - - -Number of shares issued - - - -Number of shares redeemed - - - -Number of shares outstanding at the endof the year/period - - - -
Class SA-sekNumber of shares outstanding at thebeginning of the year/period - - - -Number of shares issued - - - -Number of shares redeemed - - - -Number of shares outstanding at the endof the year/period - - - -
Class SI-sekNumber of shares outstanding at thebeginning of the year/period - - - -Number of shares issued - - - -Number of shares redeemed - - - -Number of shares outstanding at the endof the year/period - - - -
Class WANumber of shares outstanding at thebeginning of the year/period 83,179.8966 209,864.4586 2,310,467.7824 1,777,720.7286Number of shares issued 43,097.1343 46,709.2665 792,442.7162 374,530.6041Number of shares redeemed (26,562.0975) (40,027.9140) (3,064,821.5867) (331,333.0977)Number of shares outstanding at the endof the year/period 99,714.9334 216,545.8111 38,088.9119 1,820,918.2350
Class WA dNumber of shares outstanding at thebeginning of the year/period - - 1,000.0000 -Number of shares issued - - - -Number of shares redeemed - - (1,000.0000) -Number of shares outstanding at the endof the year/period - - - -
Class WA-eurNumber of shares outstanding at thebeginning of the year/period - - - -Number of shares issued - - - -Number of shares redeemed - - - -Number of shares outstanding at the endof the year/period - - - -
Class WA-eur dNumber of shares outstanding at thebeginning of the year/period - - - -Number of shares issued - - - -Number of shares redeemed - - - -Number of shares outstanding at the endof the year/period - - - -
Class WA-eur hNumber of shares outstanding at thebeginning of the year/period - - - -Number of shares issued - - - -Number of shares redeemed - - - -Number of shares outstanding at the endof the year/period - - - -
Class WA-nok hNumber of shares outstanding at thebeginning of the year/period - - - 3,401,975.7369Number of shares issued - - - 386,534.8726Number of shares redeemed - - - (552,652.6387)Number of shares outstanding at the endof the year/period - - - 3,235,857.9708
DANSKE INVEST SICAV
The accompanying notes form an integral part of these financial statements.
69
Statement of Changes in the Number of Shares for the year/period endedDecember 31, 2020 (continued)
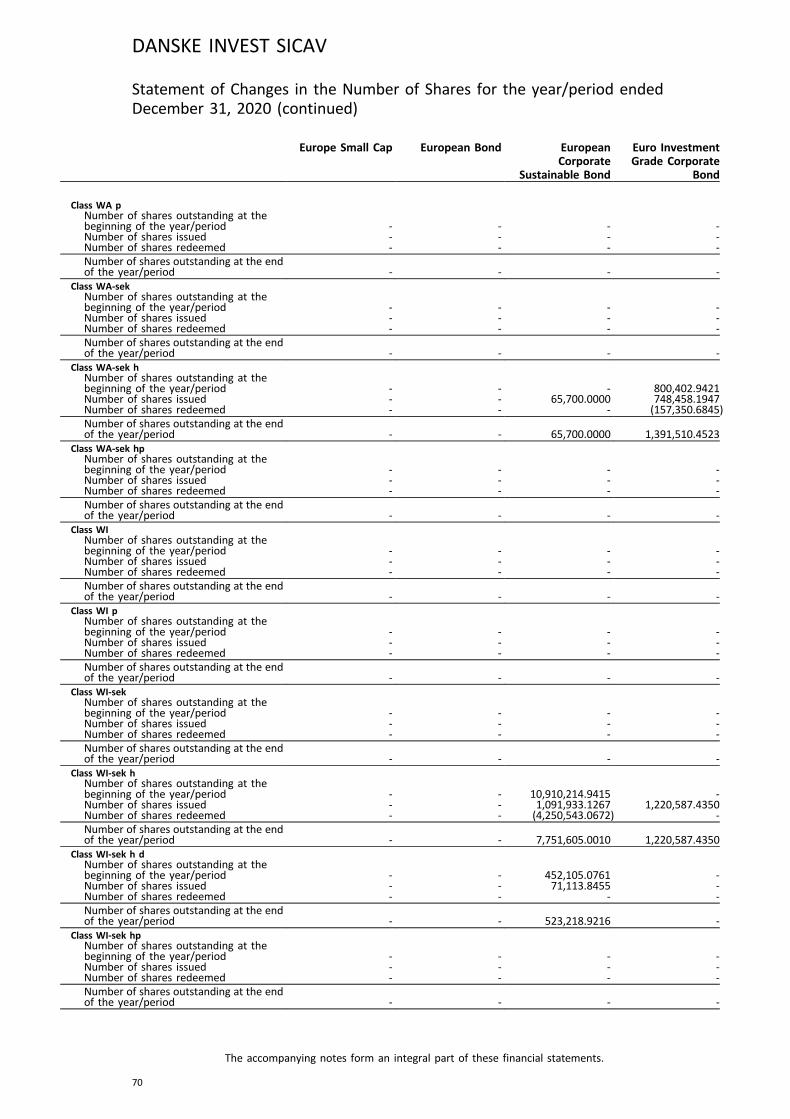
Europe Small Cap European Bond EuropeanCorporate
Sustainable Bond
Euro InvestmentGrade Corporate
Bond
Class WA pNumber of shares outstanding at thebeginning of the year/period - - - -Number of shares issued - - - -Number of shares redeemed - - - -Number of shares outstanding at the endof the year/period - - - -
Class WA-sekNumber of shares outstanding at thebeginning of the year/period - - - -Number of shares issued - - - -Number of shares redeemed - - - -Number of shares outstanding at the endof the year/period - - - -
Class WA-sek hNumber of shares outstanding at thebeginning of the year/period - - - 800,402.9421Number of shares issued - - 65,700.0000 748,458.1947Number of shares redeemed - - - (157,350.6845)Number of shares outstanding at the endof the year/period - - 65,700.0000 1,391,510.4523
Class WA-sek hpNumber of shares outstanding at thebeginning of the year/period - - - -Number of shares issued - - - -Number of shares redeemed - - - -Number of shares outstanding at the endof the year/period - - - -
Class WINumber of shares outstanding at thebeginning of the year/period - - - -Number of shares issued - - - -Number of shares redeemed - - - -Number of shares outstanding at the endof the year/period - - - -
Class WI pNumber of shares outstanding at thebeginning of the year/period - - - -Number of shares issued - - - -Number of shares redeemed - - - -Number of shares outstanding at the endof the year/period - - - -
Class WI-sekNumber of shares outstanding at thebeginning of the year/period - - - -Number of shares issued - - - -Number of shares redeemed - - - -Number of shares outstanding at the endof the year/period - - - -
Class WI-sek hNumber of shares outstanding at thebeginning of the year/period - - 10,910,214.9415 -Number of shares issued - - 1,091,933.1267 1,220,587.4350Number of shares redeemed - - (4,250,543.0672) -Number of shares outstanding at the endof the year/period - - 7,751,605.0010 1,220,587.4350
Class WI-sek h dNumber of shares outstanding at thebeginning of the year/period - - 452,105.0761 -Number of shares issued - - 71,113.8455 -Number of shares redeemed - - - -Number of shares outstanding at the endof the year/period - - 523,218.9216 -
Class WI-sek hpNumber of shares outstanding at thebeginning of the year/period - - - -Number of shares issued - - - -Number of shares redeemed - - - -Number of shares outstanding at the endof the year/period - - - -
DANSKE INVEST SICAV
The accompanying notes form an integral part of these financial statements.
70
Statement of Changes in the Number of Shares for the year/period endedDecember 31, 2020 (continued)
Europe Small Cap European Bond EuropeanCorporate
Sustainable Bond
Euro InvestmentGrade Corporate
Bond
Class YNumber of shares outstanding at thebeginning of the year/period - - - -Number of shares issued - - - -Number of shares redeemed - - - -Number of shares outstanding at the endof the year/period - - - -
DANSKE INVEST SICAV
The accompanying notes form an integral part of these financial statements.
71
Statement of Changes in the Number of Shares for the year/period endedDecember 31, 2020 (continued)
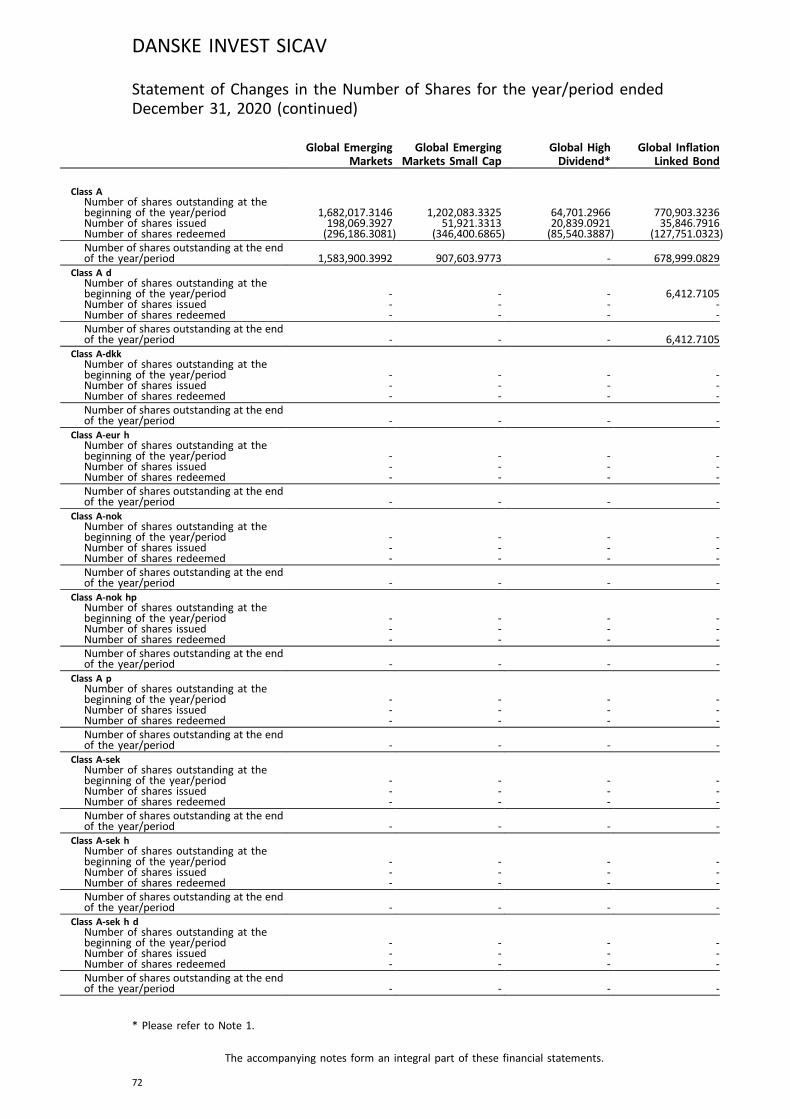
Global EmergingMarkets
Global EmergingMarkets Small Cap
Global HighDividend*
Global InflationLinked Bond
Class ANumber of shares outstanding at thebeginning of the year/period 1,682,017.3146 1,202,083.3325 64,701.2966 770,903.3236Number of shares issued 198,069.3927 51,921.3313 20,839.0921 35,846.7916Number of shares redeemed (296,186.3081) (346,400.6865) (85,540.3887) (127,751.0323)Number of shares outstanding at the endof the year/period 1,583,900.3992 907,603.9773 - 678,999.0829
Class A dNumber of shares outstanding at thebeginning of the year/period - - - 6,412.7105Number of shares issued - - - -Number of shares redeemed - - - -Number of shares outstanding at the endof the year/period - - - 6,412.7105
Class A-dkkNumber of shares outstanding at thebeginning of the year/period - - - -Number of shares issued - - - -Number of shares redeemed - - - -Number of shares outstanding at the endof the year/period - - - -
Class A-eur hNumber of shares outstanding at thebeginning of the year/period - - - -Number of shares issued - - - -Number of shares redeemed - - - -Number of shares outstanding at the endof the year/period - - - -
Class A-nokNumber of shares outstanding at thebeginning of the year/period - - - -Number of shares issued - - - -Number of shares redeemed - - - -Number of shares outstanding at the endof the year/period - - - -
Class A-nok hpNumber of shares outstanding at thebeginning of the year/period - - - -Number of shares issued - - - -Number of shares redeemed - - - -Number of shares outstanding at the endof the year/period - - - -
Class A pNumber of shares outstanding at thebeginning of the year/period - - - -Number of shares issued - - - -Number of shares redeemed - - - -Number of shares outstanding at the endof the year/period - - - -
Class A-sekNumber of shares outstanding at thebeginning of the year/period - - - -Number of shares issued - - - -Number of shares redeemed - - - -Number of shares outstanding at the endof the year/period - - - -
Class A-sek hNumber of shares outstanding at thebeginning of the year/period - - - -Number of shares issued - - - -Number of shares redeemed - - - -Number of shares outstanding at the endof the year/period - - - -
Class A-sek h dNumber of shares outstanding at thebeginning of the year/period - - - -Number of shares issued - - - -Number of shares redeemed - - - -Number of shares outstanding at the endof the year/period - - - -
DANSKE INVEST SICAV
The accompanying notes form an integral part of these financial statements.
72
Statement of Changes in the Number of Shares for the year/period endedDecember 31, 2020 (continued)
* Please refer to Note 1.
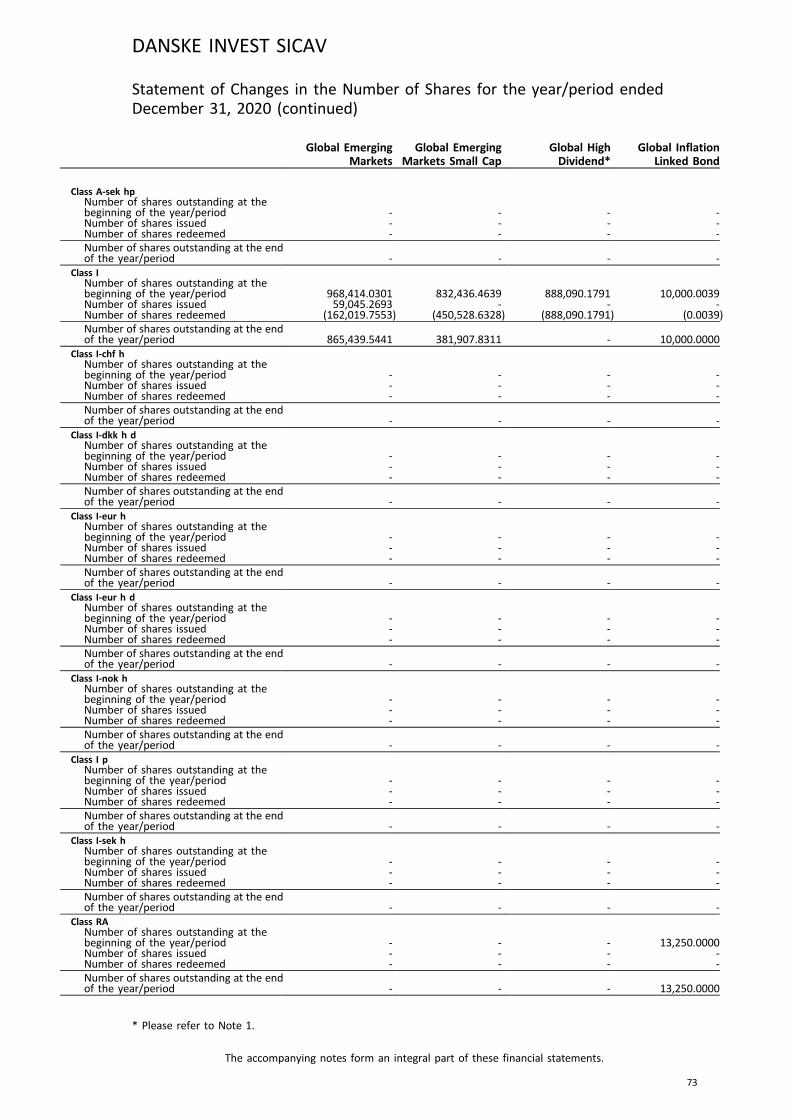
Global EmergingMarkets
Global EmergingMarkets Small Cap
Global HighDividend*
Global InflationLinked Bond
Class A-sek hpNumber of shares outstanding at thebeginning of the year/period - - - -Number of shares issued - - - -Number of shares redeemed - - - -Number of shares outstanding at the endof the year/period - - - -
Class INumber of shares outstanding at thebeginning of the year/period 968,414.0301 832,436.4639 888,090.1791 10,000.0039Number of shares issued 59,045.2693 - - -Number of shares redeemed (162,019.7553) (450,528.6328) (888,090.1791) (0.0039)Number of shares outstanding at the endof the year/period 865,439.5441 381,907.8311 - 10,000.0000
Class I-chf hNumber of shares outstanding at thebeginning of the year/period - - - -Number of shares issued - - - -Number of shares redeemed - - - -Number of shares outstanding at the endof the year/period - - - -
Class I-dkk h dNumber of shares outstanding at thebeginning of the year/period - - - -Number of shares issued - - - -Number of shares redeemed - - - -Number of shares outstanding at the endof the year/period - - - -
Class I-eur hNumber of shares outstanding at thebeginning of the year/period - - - -Number of shares issued - - - -Number of shares redeemed - - - -Number of shares outstanding at the endof the year/period - - - -
Class I-eur h dNumber of shares outstanding at thebeginning of the year/period - - - -Number of shares issued - - - -Number of shares redeemed - - - -Number of shares outstanding at the endof the year/period - - - -
Class I-nok hNumber of shares outstanding at thebeginning of the year/period - - - -Number of shares issued - - - -Number of shares redeemed - - - -Number of shares outstanding at the endof the year/period - - - -
Class I pNumber of shares outstanding at thebeginning of the year/period - - - -Number of shares issued - - - -Number of shares redeemed - - - -Number of shares outstanding at the endof the year/period - - - -
Class I-sek hNumber of shares outstanding at thebeginning of the year/period - - - -Number of shares issued - - - -Number of shares redeemed - - - -Number of shares outstanding at the endof the year/period - - - -
Class RANumber of shares outstanding at thebeginning of the year/period - - - 13,250.0000Number of shares issued - - - -Number of shares redeemed - - - -Number of shares outstanding at the endof the year/period - - - 13,250.0000
DANSKE INVEST SICAV
The accompanying notes form an integral part of these financial statements.
73
Statement of Changes in the Number of Shares for the year/period endedDecember 31, 2020 (continued)
* Please refer to Note 1.
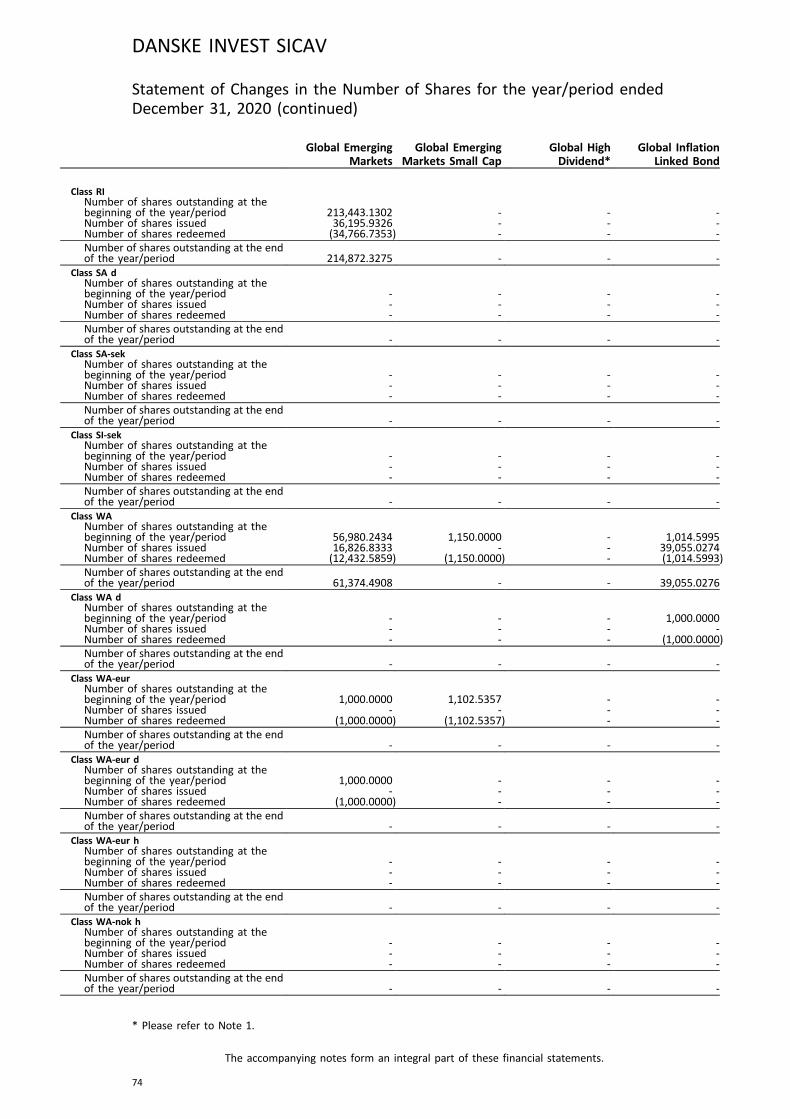
Global EmergingMarkets
Global EmergingMarkets Small Cap
Global HighDividend*
Global InflationLinked Bond
Class RINumber of shares outstanding at thebeginning of the year/period 213,443.1302 - - -Number of shares issued 36,195.9326 - - -Number of shares redeemed (34,766.7353) - - -Number of shares outstanding at the endof the year/period 214,872.3275 - - -
Class SA dNumber of shares outstanding at thebeginning of the year/period - - - -Number of shares issued - - - -Number of shares redeemed - - - -Number of shares outstanding at the endof the year/period - - - -
Class SA-sekNumber of shares outstanding at thebeginning of the year/period - - - -Number of shares issued - - - -Number of shares redeemed - - - -Number of shares outstanding at the endof the year/period - - - -
Class SI-sekNumber of shares outstanding at thebeginning of the year/period - - - -Number of shares issued - - - -Number of shares redeemed - - - -Number of shares outstanding at the endof the year/period - - - -
Class WANumber of shares outstanding at thebeginning of the year/period 56,980.2434 1,150.0000 - 1,014.5995Number of shares issued 16,826.8333 - - 39,055.0274Number of shares redeemed (12,432.5859) (1,150.0000) - (1,014.5993)Number of shares outstanding at the endof the year/period 61,374.4908 - - 39,055.0276
Class WA dNumber of shares outstanding at thebeginning of the year/period - - - 1,000.0000Number of shares issued - - - -Number of shares redeemed - - - (1,000.0000)Number of shares outstanding at the endof the year/period - - - -
Class WA-eurNumber of shares outstanding at thebeginning of the year/period 1,000.0000 1,102.5357 - -Number of shares issued - - - -Number of shares redeemed (1,000.0000) (1,102.5357) - -Number of shares outstanding at the endof the year/period - - - -
Class WA-eur dNumber of shares outstanding at thebeginning of the year/period 1,000.0000 - - -Number of shares issued - - - -Number of shares redeemed (1,000.0000) - - -Number of shares outstanding at the endof the year/period - - - -
Class WA-eur hNumber of shares outstanding at thebeginning of the year/period - - - -Number of shares issued - - - -Number of shares redeemed - - - -Number of shares outstanding at the endof the year/period - - - -
Class WA-nok hNumber of shares outstanding at thebeginning of the year/period - - - -Number of shares issued - - - -Number of shares redeemed - - - -Number of shares outstanding at the endof the year/period - - - -
DANSKE INVEST SICAV
The accompanying notes form an integral part of these financial statements.
74
Statement of Changes in the Number of Shares for the year/period endedDecember 31, 2020 (continued)
* Please refer to Note 1.

Global EmergingMarkets
Global EmergingMarkets Small Cap
Global HighDividend*
Global InflationLinked Bond
Class WA pNumber of shares outstanding at thebeginning of the year/period - - - -Number of shares issued - - - -Number of shares redeemed - - - -Number of shares outstanding at the endof the year/period - - - -
Class WA-sekNumber of shares outstanding at thebeginning of the year/period 117,385.4087 - - -Number of shares issued 76,566.2987 - - -Number of shares redeemed (21,073.9339) - - -Number of shares outstanding at the endof the year/period 172,877.7735 - - -
Class WA-sek hNumber of shares outstanding at thebeginning of the year/period - - - -Number of shares issued - - - -Number of shares redeemed - - - -Number of shares outstanding at the endof the year/period - - - -
Class WA-sek hpNumber of shares outstanding at thebeginning of the year/period - - - -Number of shares issued - - - -Number of shares redeemed - - - -Number of shares outstanding at the endof the year/period - - - -
Class WINumber of shares outstanding at thebeginning of the year/period - - - -Number of shares issued - - - -Number of shares redeemed - - - -Number of shares outstanding at the endof the year/period - - - -
Class WI pNumber of shares outstanding at thebeginning of the year/period - - - -Number of shares issued - - - -Number of shares redeemed - - - -Number of shares outstanding at the endof the year/period - - - -
Class WI-sekNumber of shares outstanding at thebeginning of the year/period - - - -Number of shares issued - - - -Number of shares redeemed - - - -Number of shares outstanding at the endof the year/period - - - -
Class WI-sek hNumber of shares outstanding at thebeginning of the year/period - - - -Number of shares issued - - - -Number of shares redeemed - - - -Number of shares outstanding at the endof the year/period - - - -
Class WI-sek h dNumber of shares outstanding at thebeginning of the year/period - - - -Number of shares issued - - - -Number of shares redeemed - - - -Number of shares outstanding at the endof the year/period - - - -
Class WI-sek hpNumber of shares outstanding at thebeginning of the year/period - - - -Number of shares issued - - - -Number of shares redeemed - - - -Number of shares outstanding at the endof the year/period - - - -
DANSKE INVEST SICAV
The accompanying notes form an integral part of these financial statements.
75
Statement of Changes in the Number of Shares for the year/period endedDecember 31, 2020 (continued)
* Please refer to Note 1.
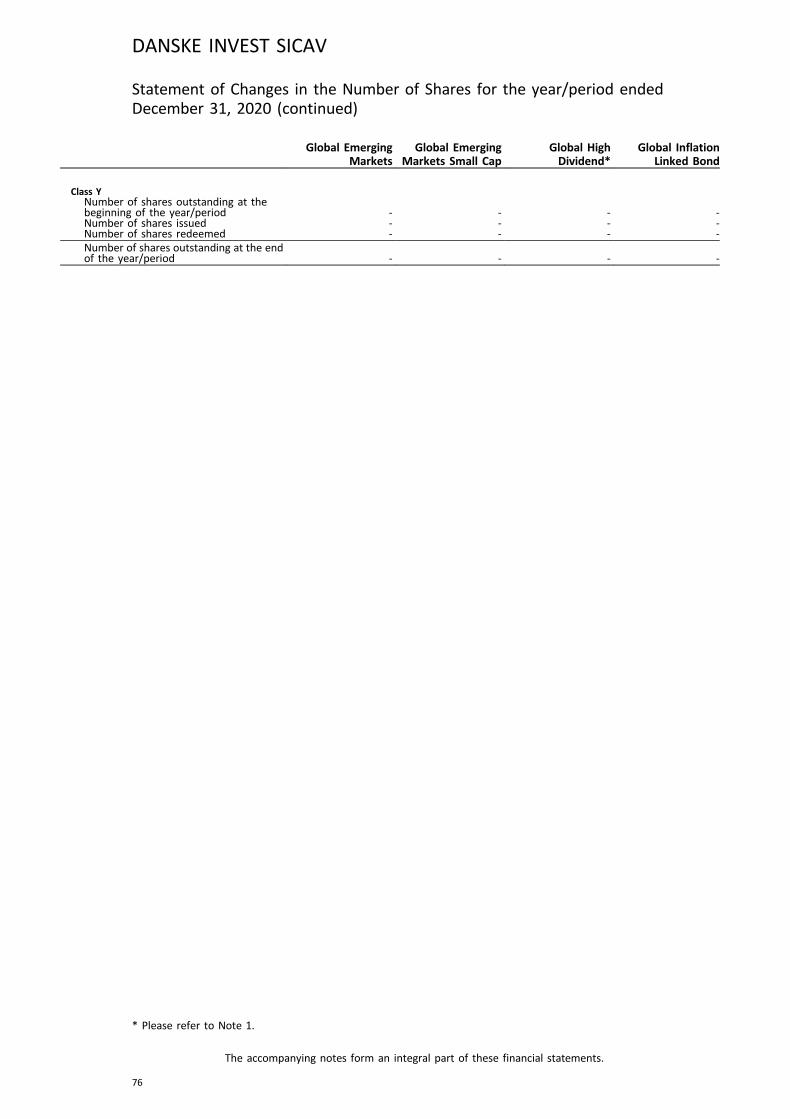
Global EmergingMarkets
Global EmergingMarkets Small Cap
Global HighDividend*
Global InflationLinked Bond
Class YNumber of shares outstanding at thebeginning of the year/period - - - -Number of shares issued - - - -Number of shares redeemed - - - -Number of shares outstanding at the endof the year/period - - - -
DANSKE INVEST SICAV
The accompanying notes form an integral part of these financial statements.
76
Statement of Changes in the Number of Shares for the year/period endedDecember 31, 2020 (continued)
* Please refer to Note 1.
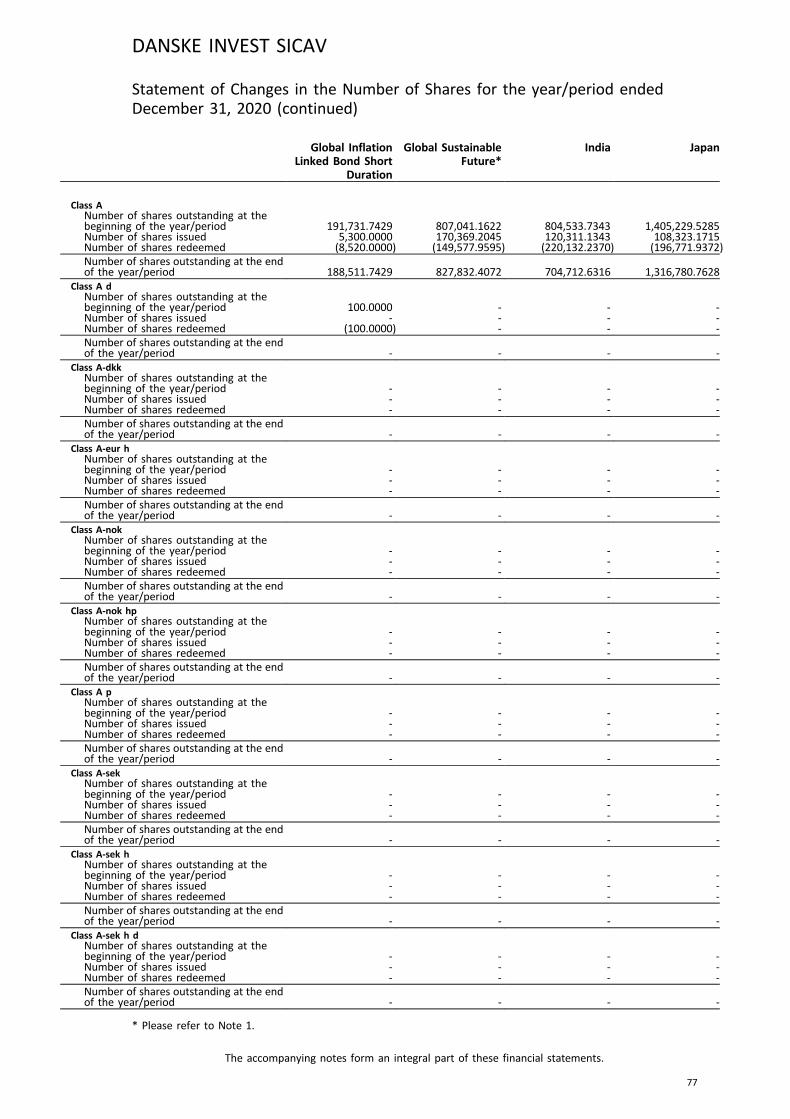
Global InflationLinked Bond Short
Duration
Global SustainableFuture*
India Japan
Class ANumber of shares outstanding at thebeginning of the year/period 191,731.7429 807,041.1622 804,533.7343 1,405,229.5285Number of shares issued 5,300.0000 170,369.2045 120,311.1343 108,323.1715Number of shares redeemed (8,520.0000) (149,577.9595) (220,132.2370) (196,771.9372)Number of shares outstanding at the endof the year/period 188,511.7429 827,832.4072 704,712.6316 1,316,780.7628
Class A dNumber of shares outstanding at thebeginning of the year/period 100.0000 - - -Number of shares issued - - - -Number of shares redeemed (100.0000) - - -Number of shares outstanding at the endof the year/period - - - -
Class A-dkkNumber of shares outstanding at thebeginning of the year/period - - - -Number of shares issued - - - -Number of shares redeemed - - - -Number of shares outstanding at the endof the year/period - - - -
Class A-eur hNumber of shares outstanding at thebeginning of the year/period - - - -Number of shares issued - - - -Number of shares redeemed - - - -Number of shares outstanding at the endof the year/period - - - -
Class A-nokNumber of shares outstanding at thebeginning of the year/period - - - -Number of shares issued - - - -Number of shares redeemed - - - -Number of shares outstanding at the endof the year/period - - - -
Class A-nok hpNumber of shares outstanding at thebeginning of the year/period - - - -Number of shares issued - - - -Number of shares redeemed - - - -Number of shares outstanding at the endof the year/period - - - -
Class A pNumber of shares outstanding at thebeginning of the year/period - - - -Number of shares issued - - - -Number of shares redeemed - - - -Number of shares outstanding at the endof the year/period - - - -
Class A-sekNumber of shares outstanding at thebeginning of the year/period - - - -Number of shares issued - - - -Number of shares redeemed - - - -Number of shares outstanding at the endof the year/period - - - -
Class A-sek hNumber of shares outstanding at thebeginning of the year/period - - - -Number of shares issued - - - -Number of shares redeemed - - - -Number of shares outstanding at the endof the year/period - - - -
Class A-sek h dNumber of shares outstanding at thebeginning of the year/period - - - -Number of shares issued - - - -Number of shares redeemed - - - -Number of shares outstanding at the endof the year/period - - - -
DANSKE INVEST SICAV
The accompanying notes form an integral part of these financial statements.
77
Statement of Changes in the Number of Shares for the year/period endedDecember 31, 2020 (continued)
* Please refer to Note 1.

Global InflationLinked Bond Short
Duration
Global SustainableFuture*
India Japan
Class A-sek hpNumber of shares outstanding at thebeginning of the year/period - - - -Number of shares issued - - - -Number of shares redeemed - - - -Number of shares outstanding at the endof the year/period - - - -
Class INumber of shares outstanding at thebeginning of the year/period 4,609,148.7853 218,561.6399 - 257,339.9844Number of shares issued 37,000.0000 682,513.0202 - -Number of shares redeemed (106,551.2510) (500,837.4428) - (15,000.0000)Number of shares outstanding at the endof the year/period 4,539,597.5343 400,237.2173 - 242,339.9844
Class I-chf hNumber of shares outstanding at thebeginning of the year/period - - - -Number of shares issued - - - -Number of shares redeemed - - - -Number of shares outstanding at the endof the year/period - - - -
Class I-dkk h dNumber of shares outstanding at thebeginning of the year/period - - - -Number of shares issued - - - -Number of shares redeemed - - - -Number of shares outstanding at the endof the year/period - - - -
Class I-eur hNumber of shares outstanding at thebeginning of the year/period - - - -Number of shares issued - - - -Number of shares redeemed - - - -Number of shares outstanding at the endof the year/period - - - -
Class I-eur h dNumber of shares outstanding at thebeginning of the year/period - - - -Number of shares issued - - - -Number of shares redeemed - - - -Number of shares outstanding at the endof the year/period - - - -
Class I-nok hNumber of shares outstanding at thebeginning of the year/period - - - -Number of shares issued - - - -Number of shares redeemed - - - -Number of shares outstanding at the endof the year/period - - - -
Class I pNumber of shares outstanding at thebeginning of the year/period - - - -Number of shares issued - - - -Number of shares redeemed - - - -Number of shares outstanding at the endof the year/period - - - -
Class I-sek hNumber of shares outstanding at thebeginning of the year/period - - - -Number of shares issued - - - -Number of shares redeemed - - - -Number of shares outstanding at the endof the year/period - - - -
Class RANumber of shares outstanding at thebeginning of the year/period - - - -Number of shares issued - - - -Number of shares redeemed - - - -Number of shares outstanding at the endof the year/period - - - -
DANSKE INVEST SICAV
The accompanying notes form an integral part of these financial statements.
78
Statement of Changes in the Number of Shares for the year/period endedDecember 31, 2020 (continued)
* Please refer to Note 1.
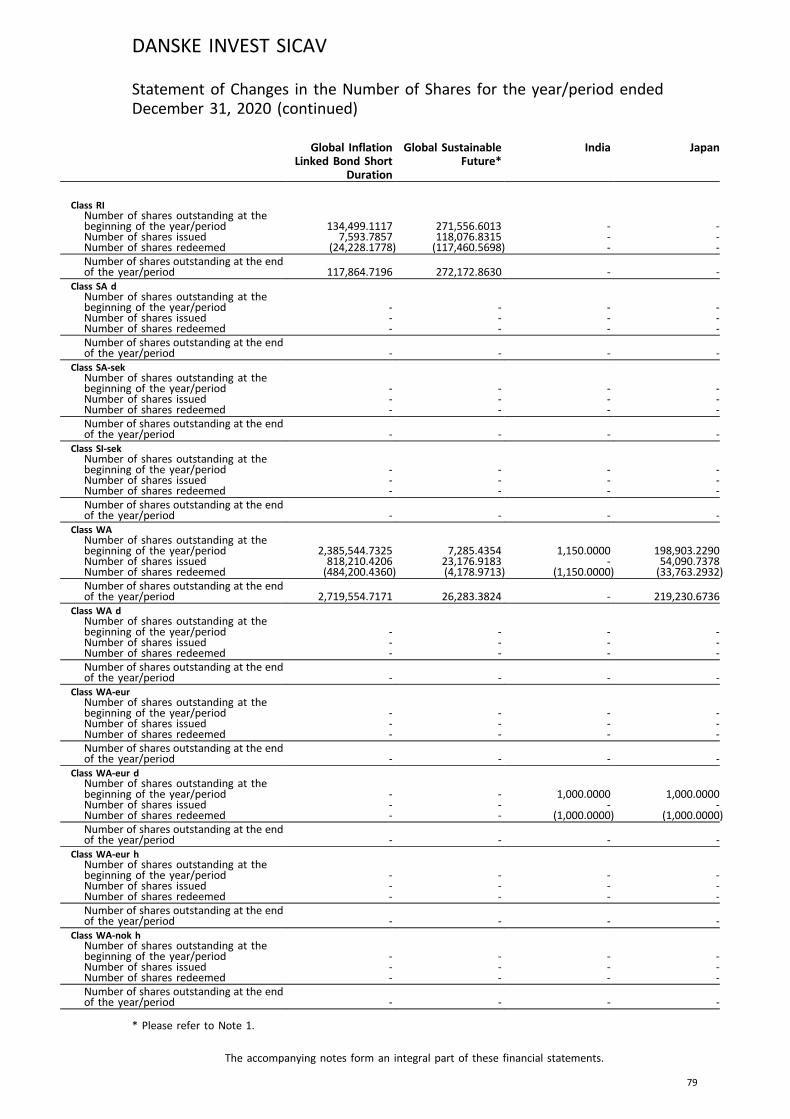
Global InflationLinked Bond Short
Duration
Global SustainableFuture*
India Japan
Class RINumber of shares outstanding at thebeginning of the year/period 134,499.1117 271,556.6013 - -Number of shares issued 7,593.7857 118,076.8315 - -Number of shares redeemed (24,228.1778) (117,460.5698) - -Number of shares outstanding at the endof the year/period 117,864.7196 272,172.8630 - -
Class SA dNumber of shares outstanding at thebeginning of the year/period - - - -Number of shares issued - - - -Number of shares redeemed - - - -Number of shares outstanding at the endof the year/period - - - -
Class SA-sekNumber of shares outstanding at thebeginning of the year/period - - - -Number of shares issued - - - -Number of shares redeemed - - - -Number of shares outstanding at the endof the year/period - - - -
Class SI-sekNumber of shares outstanding at thebeginning of the year/period - - - -Number of shares issued - - - -Number of shares redeemed - - - -Number of shares outstanding at the endof the year/period - - - -
Class WANumber of shares outstanding at thebeginning of the year/period 2,385,544.7325 7,285.4354 1,150.0000 198,903.2290Number of shares issued 818,210.4206 23,176.9183 - 54,090.7378Number of shares redeemed (484,200.4360) (4,178.9713) (1,150.0000) (33,763.2932)Number of shares outstanding at the endof the year/period 2,719,554.7171 26,283.3824 - 219,230.6736
Class WA dNumber of shares outstanding at thebeginning of the year/period - - - -Number of shares issued - - - -Number of shares redeemed - - - -Number of shares outstanding at the endof the year/period - - - -
Class WA-eurNumber of shares outstanding at thebeginning of the year/period - - - -Number of shares issued - - - -Number of shares redeemed - - - -Number of shares outstanding at the endof the year/period - - - -
Class WA-eur dNumber of shares outstanding at thebeginning of the year/period - - 1,000.0000 1,000.0000Number of shares issued - - - -Number of shares redeemed - - (1,000.0000) (1,000.0000)Number of shares outstanding at the endof the year/period - - - -
Class WA-eur hNumber of shares outstanding at thebeginning of the year/period - - - -Number of shares issued - - - -Number of shares redeemed - - - -Number of shares outstanding at the endof the year/period - - - -
Class WA-nok hNumber of shares outstanding at thebeginning of the year/period - - - -Number of shares issued - - - -Number of shares redeemed - - - -Number of shares outstanding at the endof the year/period - - - -
DANSKE INVEST SICAV
The accompanying notes form an integral part of these financial statements.
79
Statement of Changes in the Number of Shares for the year/period endedDecember 31, 2020 (continued)
* Please refer to Note 1.
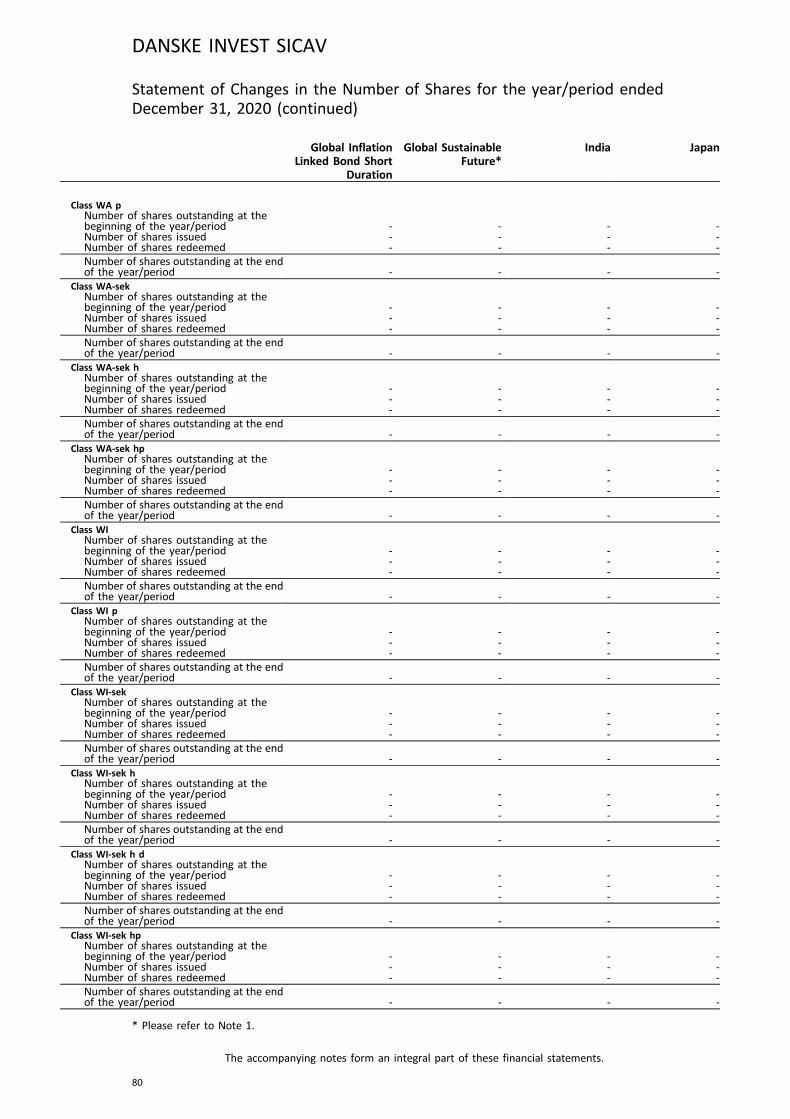
Global InflationLinked Bond Short
Duration
Global SustainableFuture*
India Japan
Class WA pNumber of shares outstanding at thebeginning of the year/period - - - -Number of shares issued - - - -Number of shares redeemed - - - -Number of shares outstanding at the endof the year/period - - - -
Class WA-sekNumber of shares outstanding at thebeginning of the year/period - - - -Number of shares issued - - - -Number of shares redeemed - - - -Number of shares outstanding at the endof the year/period - - - -
Class WA-sek hNumber of shares outstanding at thebeginning of the year/period - - - -Number of shares issued - - - -Number of shares redeemed - - - -Number of shares outstanding at the endof the year/period - - - -
Class WA-sek hpNumber of shares outstanding at thebeginning of the year/period - - - -Number of shares issued - - - -Number of shares redeemed - - - -Number of shares outstanding at the endof the year/period - - - -
Class WINumber of shares outstanding at thebeginning of the year/period - - - -Number of shares issued - - - -Number of shares redeemed - - - -Number of shares outstanding at the endof the year/period - - - -
Class WI pNumber of shares outstanding at thebeginning of the year/period - - - -Number of shares issued - - - -Number of shares redeemed - - - -Number of shares outstanding at the endof the year/period - - - -
Class WI-sekNumber of shares outstanding at thebeginning of the year/period - - - -Number of shares issued - - - -Number of shares redeemed - - - -Number of shares outstanding at the endof the year/period - - - -
Class WI-sek hNumber of shares outstanding at thebeginning of the year/period - - - -Number of shares issued - - - -Number of shares redeemed - - - -Number of shares outstanding at the endof the year/period - - - -
Class WI-sek h dNumber of shares outstanding at thebeginning of the year/period - - - -Number of shares issued - - - -Number of shares redeemed - - - -Number of shares outstanding at the endof the year/period - - - -
Class WI-sek hpNumber of shares outstanding at thebeginning of the year/period - - - -Number of shares issued - - - -Number of shares redeemed - - - -Number of shares outstanding at the endof the year/period - - - -
DANSKE INVEST SICAV
The accompanying notes form an integral part of these financial statements.
80
Statement of Changes in the Number of Shares for the year/period endedDecember 31, 2020 (continued)
* Please refer to Note 1.
Global InflationLinked Bond Short
Duration
Global SustainableFuture*
India Japan
Class YNumber of shares outstanding at thebeginning of the year/period - - - -Number of shares issued - - - -Number of shares redeemed - - - -Number of shares outstanding at the endof the year/period - - - -
DANSKE INVEST SICAV
The accompanying notes form an integral part of these financial statements.
81
Statement of Changes in the Number of Shares for the year/period endedDecember 31, 2020 (continued)
* Please refer to Note 1.
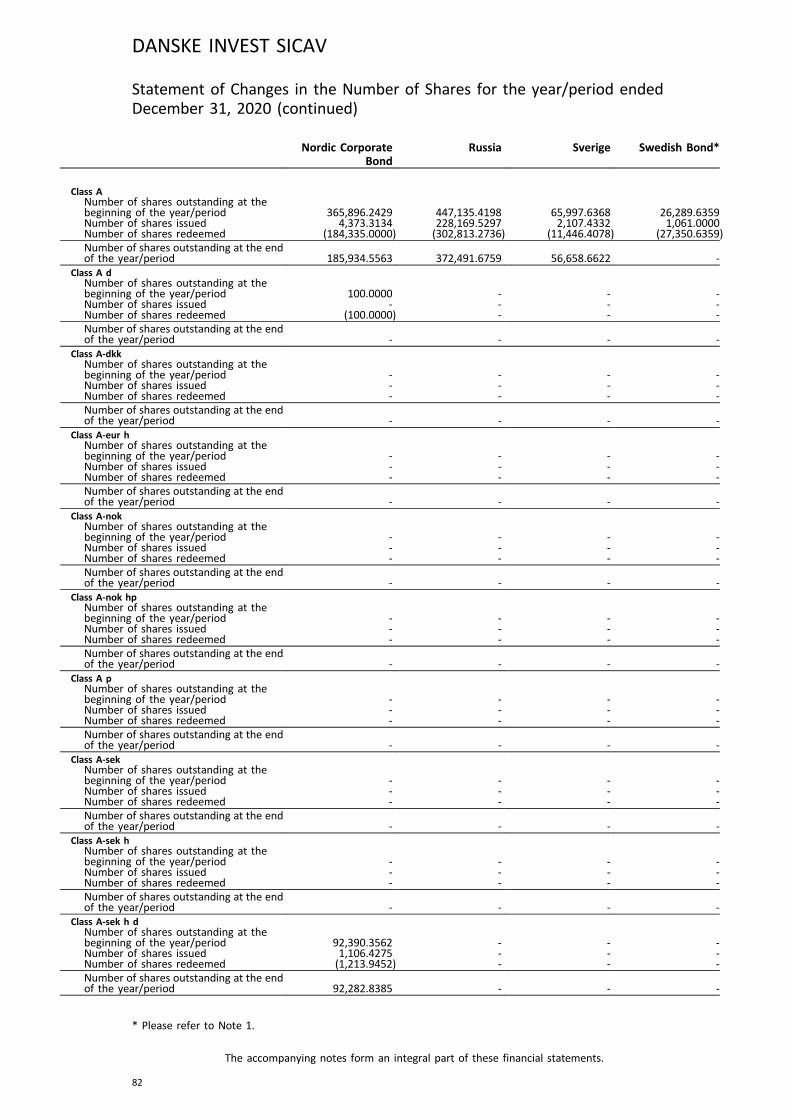
Nordic CorporateBond
Russia Sverige Swedish Bond*
Class ANumber of shares outstanding at thebeginning of the year/period 365,896.2429 447,135.4198 65,997.6368 26,289.6359Number of shares issued 4,373.3134 228,169.5297 2,107.4332 1,061.0000Number of shares redeemed (184,335.0000) (302,813.2736) (11,446.4078) (27,350.6359)Number of shares outstanding at the endof the year/period 185,934.5563 372,491.6759 56,658.6622 -
Class A dNumber of shares outstanding at thebeginning of the year/period 100.0000 - - -Number of shares issued - - - -Number of shares redeemed (100.0000) - - -Number of shares outstanding at the endof the year/period - - - -
Class A-dkkNumber of shares outstanding at thebeginning of the year/period - - - -Number of shares issued - - - -Number of shares redeemed - - - -Number of shares outstanding at the endof the year/period - - - -
Class A-eur hNumber of shares outstanding at thebeginning of the year/period - - - -Number of shares issued - - - -Number of shares redeemed - - - -Number of shares outstanding at the endof the year/period - - - -
Class A-nokNumber of shares outstanding at thebeginning of the year/period - - - -Number of shares issued - - - -Number of shares redeemed - - - -Number of shares outstanding at the endof the year/period - - - -
Class A-nok hpNumber of shares outstanding at thebeginning of the year/period - - - -Number of shares issued - - - -Number of shares redeemed - - - -Number of shares outstanding at the endof the year/period - - - -
Class A pNumber of shares outstanding at thebeginning of the year/period - - - -Number of shares issued - - - -Number of shares redeemed - - - -Number of shares outstanding at the endof the year/period - - - -
Class A-sekNumber of shares outstanding at thebeginning of the year/period - - - -Number of shares issued - - - -Number of shares redeemed - - - -Number of shares outstanding at the endof the year/period - - - -
Class A-sek hNumber of shares outstanding at thebeginning of the year/period - - - -Number of shares issued - - - -Number of shares redeemed - - - -Number of shares outstanding at the endof the year/period - - - -
Class A-sek h dNumber of shares outstanding at thebeginning of the year/period 92,390.3562 - - -Number of shares issued 1,106.4275 - - -Number of shares redeemed (1,213.9452) - - -Number of shares outstanding at the endof the year/period 92,282.8385 - - -
DANSKE INVEST SICAV
The accompanying notes form an integral part of these financial statements.
82
Statement of Changes in the Number of Shares for the year/period endedDecember 31, 2020 (continued)
* Please refer to Note 1.

Nordic CorporateBond
Russia Sverige Swedish Bond*
Class A-sek hpNumber of shares outstanding at thebeginning of the year/period - - - -Number of shares issued - - - -Number of shares redeemed - - - -Number of shares outstanding at the endof the year/period - - - -
Class INumber of shares outstanding at thebeginning of the year/period 2,696,868.5701 31,300.0000 - -Number of shares issued 42,008.5203 - - -Number of shares redeemed (1,170,717.7190) (31,300.0000) - -Number of shares outstanding at the endof the year/period 1,568,159.3714 - - -
Class I-chf hNumber of shares outstanding at thebeginning of the year/period - - - -Number of shares issued - - - -Number of shares redeemed - - - -Number of shares outstanding at the endof the year/period - - - -
Class I-dkk h dNumber of shares outstanding at thebeginning of the year/period - - - -Number of shares issued - - - -Number of shares redeemed - - - -Number of shares outstanding at the endof the year/period - - - -
Class I-eur hNumber of shares outstanding at thebeginning of the year/period - - - -Number of shares issued - - - -Number of shares redeemed - - - -Number of shares outstanding at the endof the year/period - - - -
Class I-eur h dNumber of shares outstanding at thebeginning of the year/period - - - -Number of shares issued - - - -Number of shares redeemed - - - -Number of shares outstanding at the endof the year/period - - - -
Class I-nok hNumber of shares outstanding at thebeginning of the year/period 523,942.0755 - - -Number of shares issued 480,968.6207 - - -Number of shares redeemed (367,824.1157) - - -Number of shares outstanding at the endof the year/period 637,086.5805 - - -
Class I pNumber of shares outstanding at thebeginning of the year/period - - - -Number of shares issued - - - -Number of shares redeemed - - - -Number of shares outstanding at the endof the year/period - - - -
Class I-sek hNumber of shares outstanding at thebeginning of the year/period - - - -Number of shares issued - - - -Number of shares redeemed - - - -Number of shares outstanding at the endof the year/period - - - -
Class RANumber of shares outstanding at thebeginning of the year/period 17,104.5600 - - -Number of shares issued - - - -Number of shares redeemed - - - -Number of shares outstanding at the endof the year/period 17,104.5600 - - -
DANSKE INVEST SICAV
The accompanying notes form an integral part of these financial statements.
83
Statement of Changes in the Number of Shares for the year/period endedDecember 31, 2020 (continued)
* Please refer to Note 1.

Nordic CorporateBond
Russia Sverige Swedish Bond*
Class RINumber of shares outstanding at thebeginning of the year/period 50,722.5460 - - -Number of shares issued 15,845.1326 - - -Number of shares redeemed - - - -Number of shares outstanding at the endof the year/period 66,567.6786 - - -
Class SA dNumber of shares outstanding at thebeginning of the year/period - - 511.3828 -Number of shares issued - - 92.3046 -Number of shares redeemed - - (96.2757) -Number of shares outstanding at the endof the year/period - - 507.4117 -
Class SA-sekNumber of shares outstanding at thebeginning of the year/period - - 778,295.5329 -Number of shares issued - - 36,013.6641 -Number of shares redeemed - - (53,219.9137) -Number of shares outstanding at the endof the year/period - - 761,089.2833 -
Class SI-sekNumber of shares outstanding at thebeginning of the year/period - - 127,536.2661 -Number of shares issued - - 8,634.7329 -Number of shares redeemed - - (13,934.1585) -Number of shares outstanding at the endof the year/period - - 122,236.8405 -
Class WANumber of shares outstanding at thebeginning of the year/period 105,610.7176 1,150.0000 42,007.8766 -Number of shares issued 24,964.2631 - 31,971.4908 -Number of shares redeemed (23,138.1397) (1,150.0000) (10,567.3420) -Number of shares outstanding at the endof the year/period 107,436.8410 - 63,412.0254 -
Class WA dNumber of shares outstanding at thebeginning of the year/period - - 2,794.8393 -Number of shares issued - - 305.4016 -Number of shares redeemed - - (814.6172) -Number of shares outstanding at the endof the year/period - - 2,285.6237 -
Class WA-eurNumber of shares outstanding at thebeginning of the year/period - - - -Number of shares issued - - - -Number of shares redeemed - - - -Number of shares outstanding at the endof the year/period - - - -
Class WA-eur dNumber of shares outstanding at thebeginning of the year/period - 1,000.0000 - -Number of shares issued - - - -Number of shares redeemed - (1,000.0000) - -Number of shares outstanding at the endof the year/period - - - -
Class WA-eur hNumber of shares outstanding at thebeginning of the year/period - - - -Number of shares issued - - - -Number of shares redeemed - - - -Number of shares outstanding at the endof the year/period - - - -
Class WA-nok hNumber of shares outstanding at thebeginning of the year/period - - - -Number of shares issued - - - -Number of shares redeemed - - - -Number of shares outstanding at the endof the year/period - - - -
DANSKE INVEST SICAV
The accompanying notes form an integral part of these financial statements.
84
Statement of Changes in the Number of Shares for the year/period endedDecember 31, 2020 (continued)
* Please refer to Note 1.
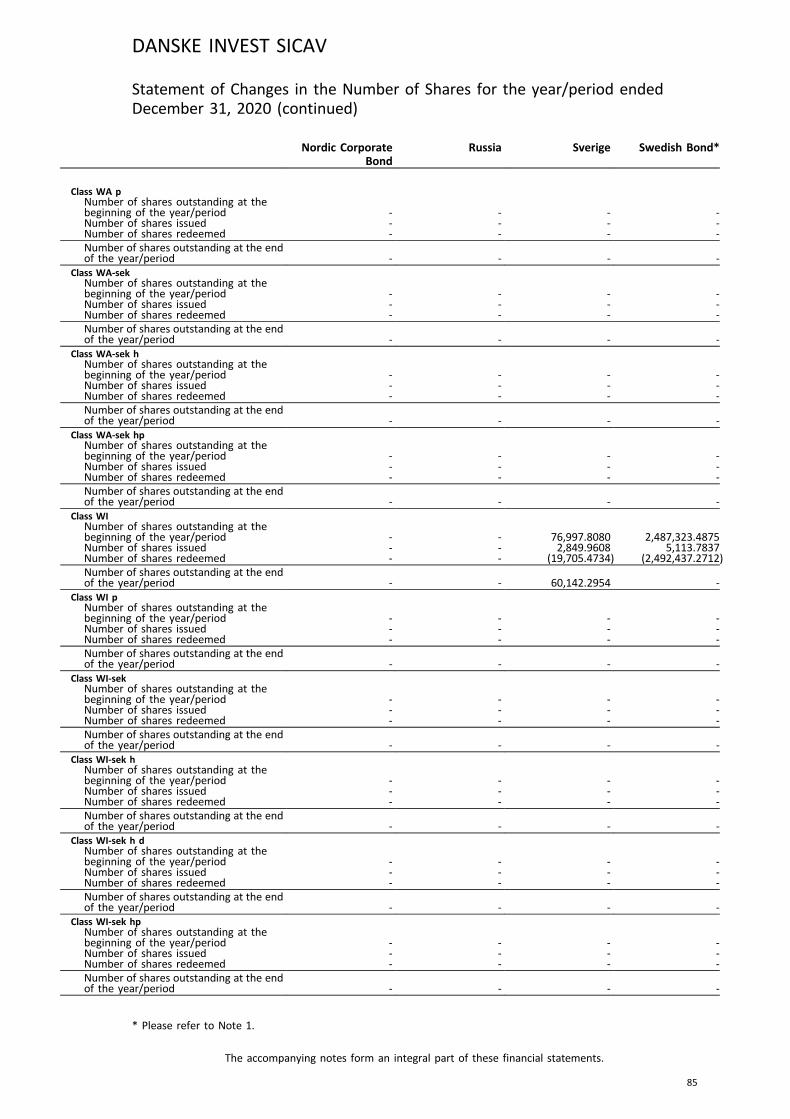
Nordic CorporateBond
Russia Sverige Swedish Bond*
Class WA pNumber of shares outstanding at thebeginning of the year/period - - - -Number of shares issued - - - -Number of shares redeemed - - - -Number of shares outstanding at the endof the year/period - - - -
Class WA-sekNumber of shares outstanding at thebeginning of the year/period - - - -Number of shares issued - - - -Number of shares redeemed - - - -Number of shares outstanding at the endof the year/period - - - -
Class WA-sek hNumber of shares outstanding at thebeginning of the year/period - - - -Number of shares issued - - - -Number of shares redeemed - - - -Number of shares outstanding at the endof the year/period - - - -
Class WA-sek hpNumber of shares outstanding at thebeginning of the year/period - - - -Number of shares issued - - - -Number of shares redeemed - - - -Number of shares outstanding at the endof the year/period - - - -
Class WINumber of shares outstanding at thebeginning of the year/period - - 76,997.8080 2,487,323.4875Number of shares issued - - 2,849.9608 5,113.7837Number of shares redeemed - - (19,705.4734) (2,492,437.2712)Number of shares outstanding at the endof the year/period - - 60,142.2954 -
Class WI pNumber of shares outstanding at thebeginning of the year/period - - - -Number of shares issued - - - -Number of shares redeemed - - - -Number of shares outstanding at the endof the year/period - - - -
Class WI-sekNumber of shares outstanding at thebeginning of the year/period - - - -Number of shares issued - - - -Number of shares redeemed - - - -Number of shares outstanding at the endof the year/period - - - -
Class WI-sek hNumber of shares outstanding at thebeginning of the year/period - - - -Number of shares issued - - - -Number of shares redeemed - - - -Number of shares outstanding at the endof the year/period - - - -
Class WI-sek h dNumber of shares outstanding at thebeginning of the year/period - - - -Number of shares issued - - - -Number of shares redeemed - - - -Number of shares outstanding at the endof the year/period - - - -
Class WI-sek hpNumber of shares outstanding at thebeginning of the year/period - - - -Number of shares issued - - - -Number of shares redeemed - - - -Number of shares outstanding at the endof the year/period - - - -
DANSKE INVEST SICAV
The accompanying notes form an integral part of these financial statements.
85
Statement of Changes in the Number of Shares for the year/period endedDecember 31, 2020 (continued)
* Please refer to Note 1.
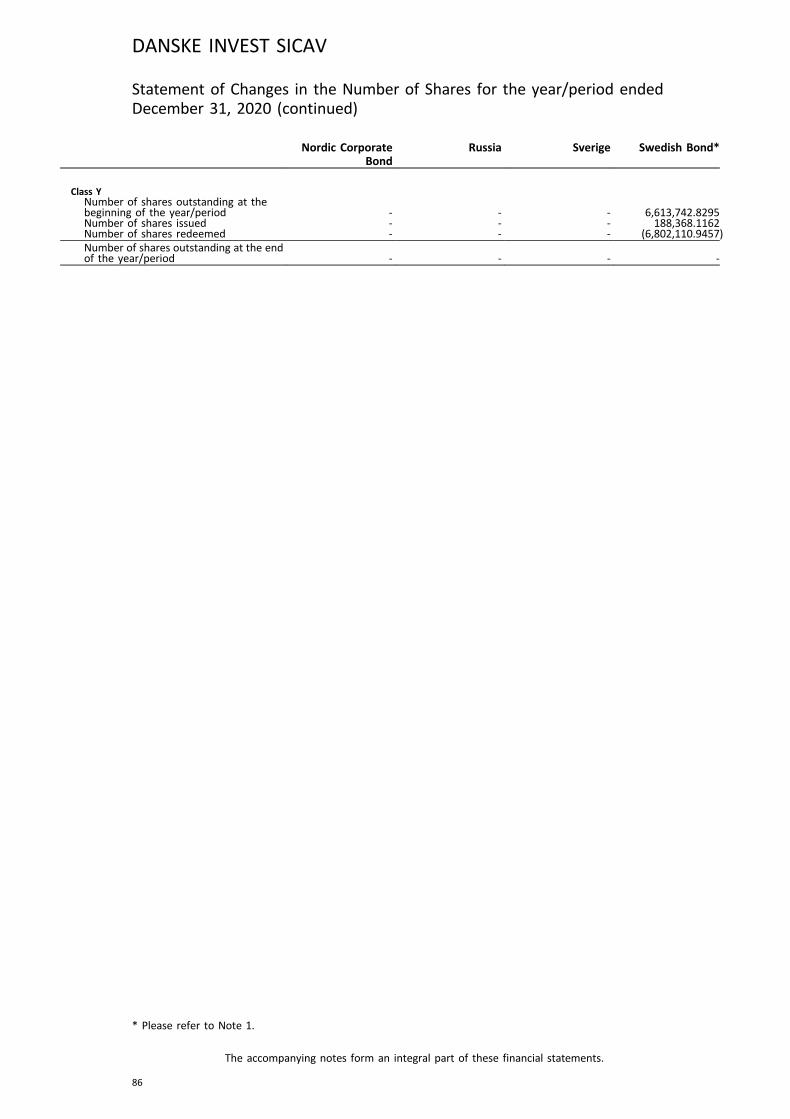
Nordic CorporateBond
Russia Sverige Swedish Bond*
Class YNumber of shares outstanding at thebeginning of the year/period - - - 6,613,742.8295Number of shares issued - - - 188,368.1162Number of shares redeemed - - - (6,802,110.9457)Number of shares outstanding at the endof the year/period - - - -
DANSKE INVEST SICAV
The accompanying notes form an integral part of these financial statements.
86
Statement of Changes in the Number of Shares for the year/period endedDecember 31, 2020 (continued)
* Please refer to Note 1.
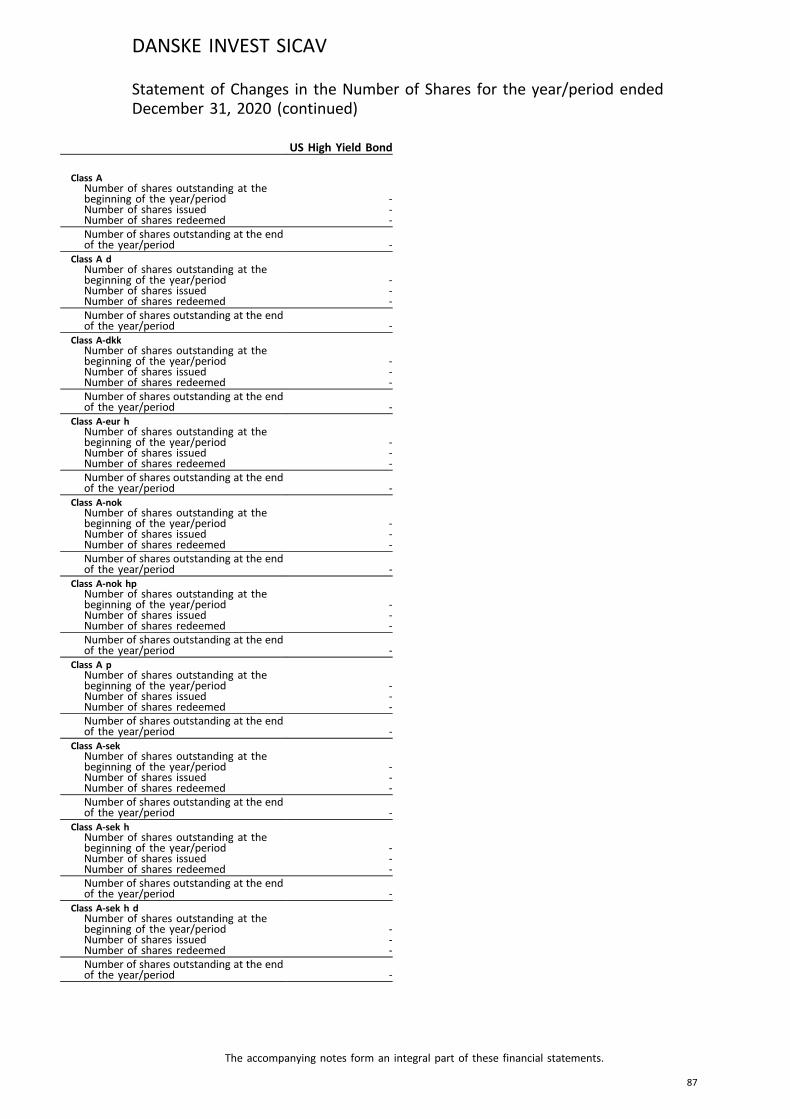
US High Yield Bond
Class ANumber of shares outstanding at thebeginning of the year/period -Number of shares issued -Number of shares redeemed -Number of shares outstanding at the endof the year/period -
Class A dNumber of shares outstanding at thebeginning of the year/period -Number of shares issued -Number of shares redeemed -Number of shares outstanding at the endof the year/period -
Class A-dkkNumber of shares outstanding at thebeginning of the year/period -Number of shares issued -Number of shares redeemed -Number of shares outstanding at the endof the year/period -
Class A-eur hNumber of shares outstanding at thebeginning of the year/period -Number of shares issued -Number of shares redeemed -Number of shares outstanding at the endof the year/period -
Class A-nokNumber of shares outstanding at thebeginning of the year/period -Number of shares issued -Number of shares redeemed -Number of shares outstanding at the endof the year/period -
Class A-nok hpNumber of shares outstanding at thebeginning of the year/period -Number of shares issued -Number of shares redeemed -Number of shares outstanding at the endof the year/period -
Class A pNumber of shares outstanding at thebeginning of the year/period -Number of shares issued -Number of shares redeemed -Number of shares outstanding at the endof the year/period -
Class A-sekNumber of shares outstanding at thebeginning of the year/period -Number of shares issued -Number of shares redeemed -Number of shares outstanding at the endof the year/period -
Class A-sek hNumber of shares outstanding at thebeginning of the year/period -Number of shares issued -Number of shares redeemed -Number of shares outstanding at the endof the year/period -
Class A-sek h dNumber of shares outstanding at thebeginning of the year/period -Number of shares issued -Number of shares redeemed -Number of shares outstanding at the endof the year/period -
DANSKE INVEST SICAV
The accompanying notes form an integral part of these financial statements.
87
Statement of Changes in the Number of Shares for the year/period endedDecember 31, 2020 (continued)
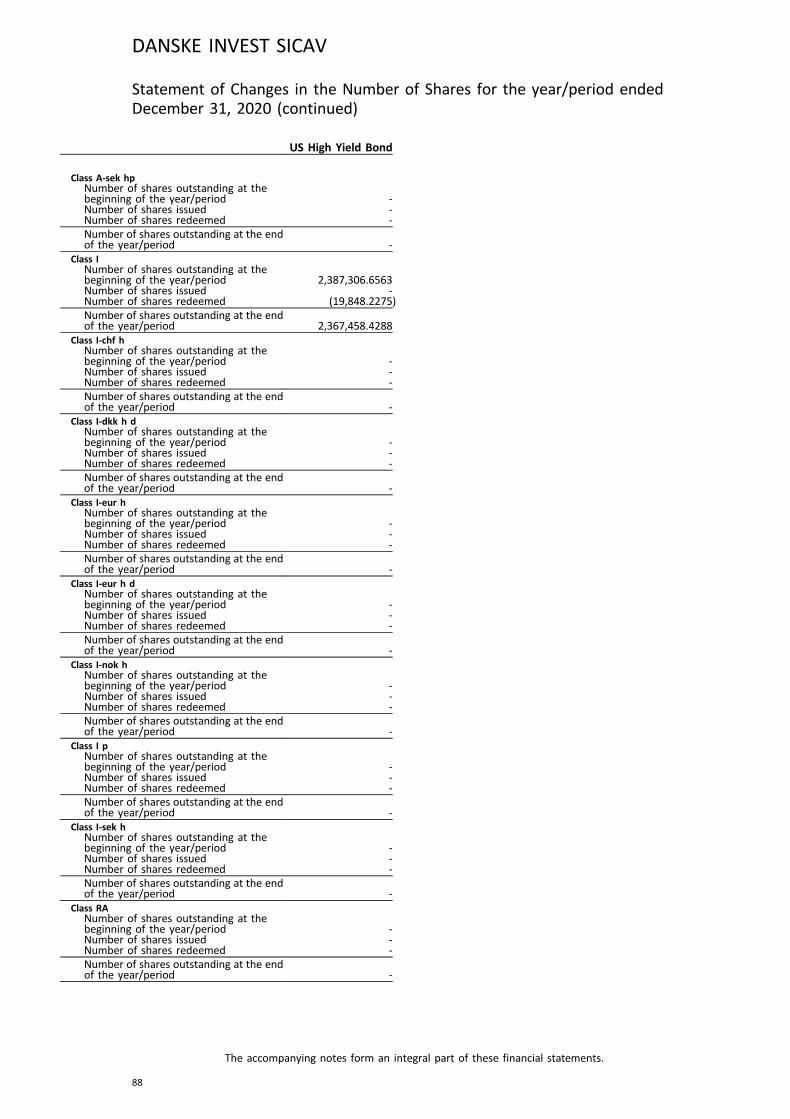
US High Yield Bond
Class A-sek hpNumber of shares outstanding at thebeginning of the year/period -Number of shares issued -Number of shares redeemed -Number of shares outstanding at the endof the year/period -
Class INumber of shares outstanding at thebeginning of the year/period 2,387,306.6563Number of shares issued -Number of shares redeemed (19,848.2275)Number of shares outstanding at the endof the year/period 2,367,458.4288
Class I-chf hNumber of shares outstanding at thebeginning of the year/period -Number of shares issued -Number of shares redeemed -Number of shares outstanding at the endof the year/period -
Class I-dkk h dNumber of shares outstanding at thebeginning of the year/period -Number of shares issued -Number of shares redeemed -Number of shares outstanding at the endof the year/period -
Class I-eur hNumber of shares outstanding at thebeginning of the year/period -Number of shares issued -Number of shares redeemed -Number of shares outstanding at the endof the year/period -
Class I-eur h dNumber of shares outstanding at thebeginning of the year/period -Number of shares issued -Number of shares redeemed -Number of shares outstanding at the endof the year/period -
Class I-nok hNumber of shares outstanding at thebeginning of the year/period -Number of shares issued -Number of shares redeemed -Number of shares outstanding at the endof the year/period -
Class I pNumber of shares outstanding at thebeginning of the year/period -Number of shares issued -Number of shares redeemed -Number of shares outstanding at the endof the year/period -
Class I-sek hNumber of shares outstanding at thebeginning of the year/period -Number of shares issued -Number of shares redeemed -Number of shares outstanding at the endof the year/period -
Class RANumber of shares outstanding at thebeginning of the year/period -Number of shares issued -Number of shares redeemed -Number of shares outstanding at the endof the year/period -
DANSKE INVEST SICAV
The accompanying notes form an integral part of these financial statements.
88
Statement of Changes in the Number of Shares for the year/period endedDecember 31, 2020 (continued)
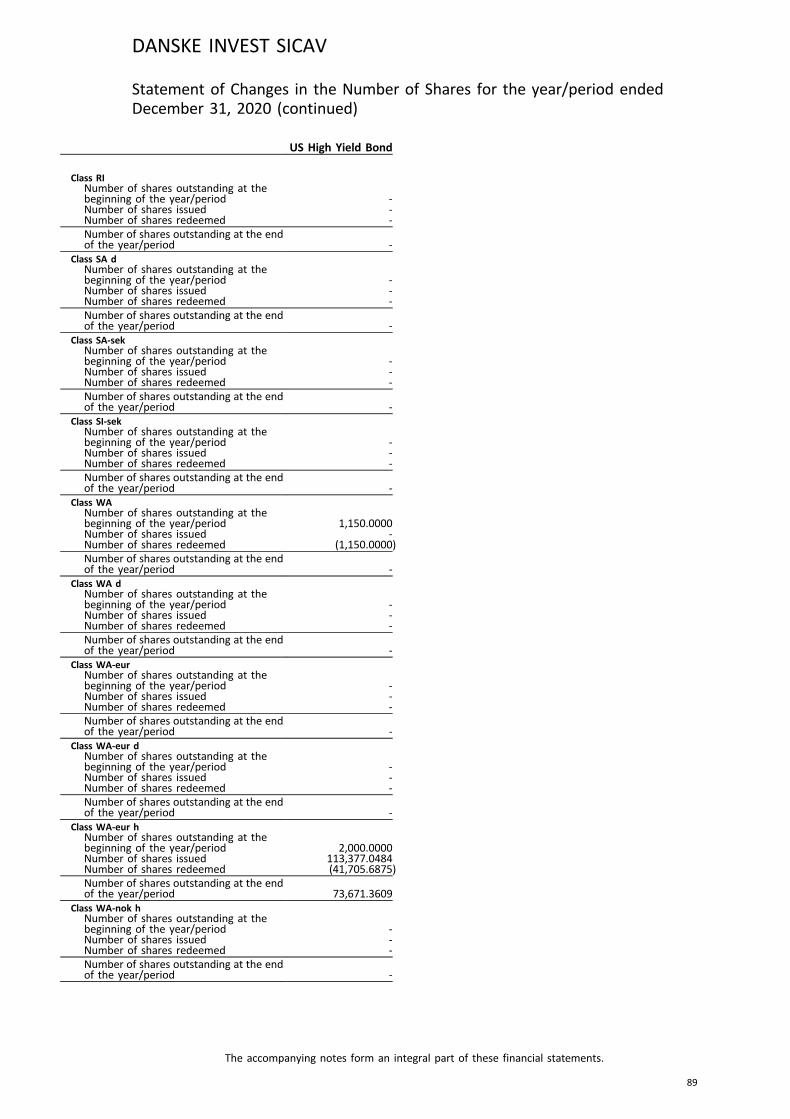
US High Yield Bond
Class RINumber of shares outstanding at thebeginning of the year/period -Number of shares issued -Number of shares redeemed -Number of shares outstanding at the endof the year/period -
Class SA dNumber of shares outstanding at thebeginning of the year/period -Number of shares issued -Number of shares redeemed -Number of shares outstanding at the endof the year/period -
Class SA-sekNumber of shares outstanding at thebeginning of the year/period -Number of shares issued -Number of shares redeemed -Number of shares outstanding at the endof the year/period -
Class SI-sekNumber of shares outstanding at thebeginning of the year/period -Number of shares issued -Number of shares redeemed -Number of shares outstanding at the endof the year/period -
Class WANumber of shares outstanding at thebeginning of the year/period 1,150.0000Number of shares issued -Number of shares redeemed (1,150.0000)Number of shares outstanding at the endof the year/period -
Class WA dNumber of shares outstanding at thebeginning of the year/period -Number of shares issued -Number of shares redeemed -Number of shares outstanding at the endof the year/period -
Class WA-eurNumber of shares outstanding at thebeginning of the year/period -Number of shares issued -Number of shares redeemed -Number of shares outstanding at the endof the year/period -
Class WA-eur dNumber of shares outstanding at thebeginning of the year/period -Number of shares issued -Number of shares redeemed -Number of shares outstanding at the endof the year/period -
Class WA-eur hNumber of shares outstanding at thebeginning of the year/period 2,000.0000Number of shares issued 113,377.0484Number of shares redeemed (41,705.6875)Number of shares outstanding at the endof the year/period 73,671.3609
Class WA-nok hNumber of shares outstanding at thebeginning of the year/period -Number of shares issued -Number of shares redeemed -Number of shares outstanding at the endof the year/period -
DANSKE INVEST SICAV
The accompanying notes form an integral part of these financial statements.
89
Statement of Changes in the Number of Shares for the year/period endedDecember 31, 2020 (continued)
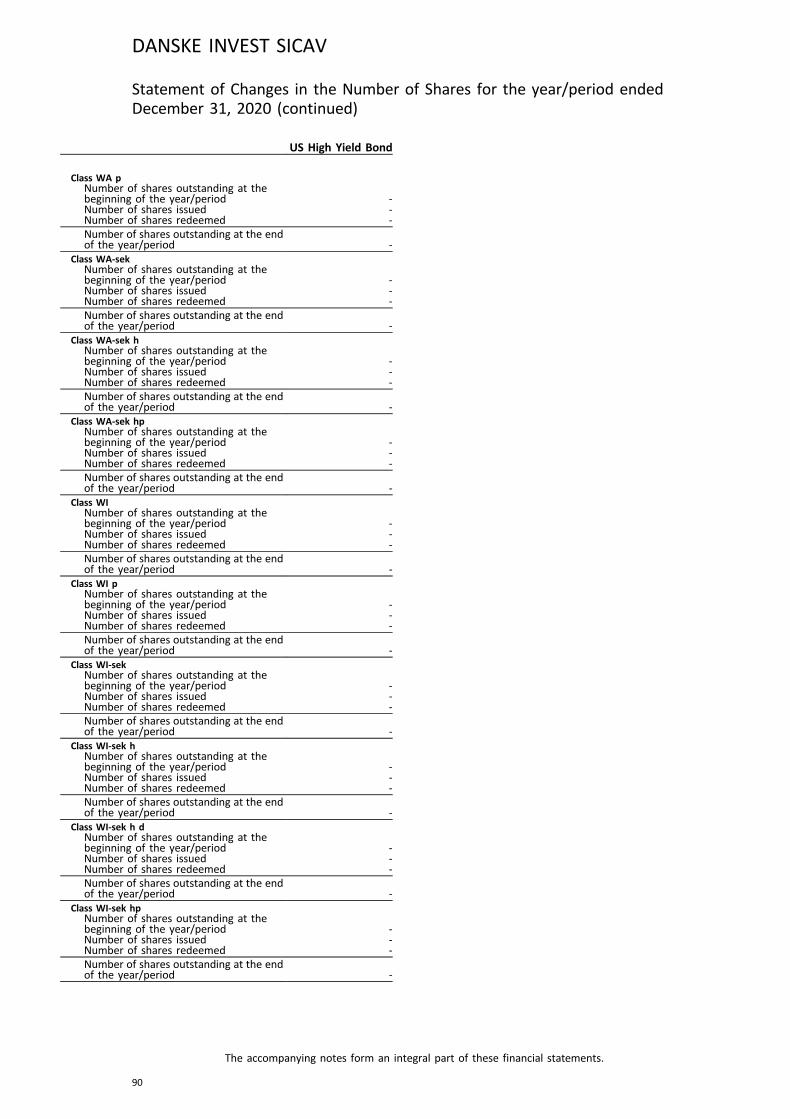
US High Yield Bond
Class WA pNumber of shares outstanding at thebeginning of the year/period -Number of shares issued -Number of shares redeemed -Number of shares outstanding at the endof the year/period -
Class WA-sekNumber of shares outstanding at thebeginning of the year/period -Number of shares issued -Number of shares redeemed -Number of shares outstanding at the endof the year/period -
Class WA-sek hNumber of shares outstanding at thebeginning of the year/period -Number of shares issued -Number of shares redeemed -Number of shares outstanding at the endof the year/period -
Class WA-sek hpNumber of shares outstanding at thebeginning of the year/period -Number of shares issued -Number of shares redeemed -Number of shares outstanding at the endof the year/period -
Class WINumber of shares outstanding at thebeginning of the year/period -Number of shares issued -Number of shares redeemed -Number of shares outstanding at the endof the year/period -
Class WI pNumber of shares outstanding at thebeginning of the year/period -Number of shares issued -Number of shares redeemed -Number of shares outstanding at the endof the year/period -
Class WI-sekNumber of shares outstanding at thebeginning of the year/period -Number of shares issued -Number of shares redeemed -Number of shares outstanding at the endof the year/period -
Class WI-sek hNumber of shares outstanding at thebeginning of the year/period -Number of shares issued -Number of shares redeemed -Number of shares outstanding at the endof the year/period -
Class WI-sek h dNumber of shares outstanding at thebeginning of the year/period -Number of shares issued -Number of shares redeemed -Number of shares outstanding at the endof the year/period -
Class WI-sek hpNumber of shares outstanding at thebeginning of the year/period -Number of shares issued -Number of shares redeemed -Number of shares outstanding at the endof the year/period -
DANSKE INVEST SICAV
The accompanying notes form an integral part of these financial statements.
90
Statement of Changes in the Number of Shares for the year/period endedDecember 31, 2020 (continued)
US High Yield Bond
Class YNumber of shares outstanding at thebeginning of the year/period -Number of shares issued -Number of shares redeemed -Number of shares outstanding at the endof the year/period -
DANSKE INVEST SICAV
The accompanying notes form an integral part of these financial statements.
91
Statement of Changes in the Number of Shares for the year/period endedDecember 31, 2020 (continued)

StatisticsChina Danish Bond Danish Mortgage
BondDenmark Focus
USD DKK DKK DKKTotal Net Asset Value
December 31, 2020 37,508,807 229,626,152 2,866,690,742 454,760,952December 31, 2019 23,938,532 257,132,760 3,522,496,873 415,655,780December 31, 2018 27,375,464 219,519,276 3,006,180,485 371,016,577
NAV per share at the end of the year/periodDecember 31, 2020
Class A 112.174 414.75 242.71 2,269.21Class A d - 116.13 102.41 -Class A-dkk - - - -Class A-eur - - - -Class A-eur h - - 12.029 -Class A-nok - - - -Class A-nok hp - - 195.99 -Class A-sek - - - -Class A-sek h - - 166.89 -Class A-sek h d - - - -Class I - - 134.83 2,349.14Class I-chf h - - 10.532 -Class I-dkk h d - - - -Class I-eur h - - 11.002 -Class I-eur h d - - 10.782 -Class I-nok h - - - -Class I-sek h - - - -Class RA - - - -Class RI - - - 141.22Class SA d - - - -Class SA-sek - - - -Class SI-sek - - - -Class WA - 419.83 245.76 -Class WA d - - - -Class WA-eur h - - - -Class WA-nok h - - - -Class WA-sek - - - -Class WA-sek h - - - -Class WI - - - -Class WI-sek - - - -Class WI-sek h - - 101.84 -Class WI-sek h d - - - -
December 31, 2019Class A 79.421 413.35 238.39 1,804.56Class A d - 116.92 101.62 -Class A-dkk - - - -Class A-eur h - - 11.789 -Class A-nok - - - -Class A-nok hp - - 189.60 -Class A p - - - -Class A-sek - - - -Class A-sek h - - 163.08 -Class A-sek hd - - - -Class A-sek hp - - - -Class I - - 131.45 1,849.71Class I-chf h - - 10.289 -Class I-dkk hd - - - -Class I-eur h - - 10.710 -Class I-eur hd - - 10.608 -Class I-nok h - - - -Class I p - - - -Class I-sek h - - - -Class RA - - - 111.12Class RI - - - 111.36Class SA - - - -Class SA d - - - -Class SI-sek - - - -Class WA - 416.74 240.43 111.26Class WA d - - - -Class WA-eur - - - -Class WA-eur d - - - -Class WA-eur h - - 10.400 -Class WA-nok h - - - -Class WA p - - - -Class WA-sek - - - -Class WA-sek h - - - -Class WA-sek hp - - - -Class WI - - - -Class WI p - - - -Class WI-sek dh - - - -
DANSKE INVEST SICAV
The accompanying notes form an integral part of these financial statements.
92
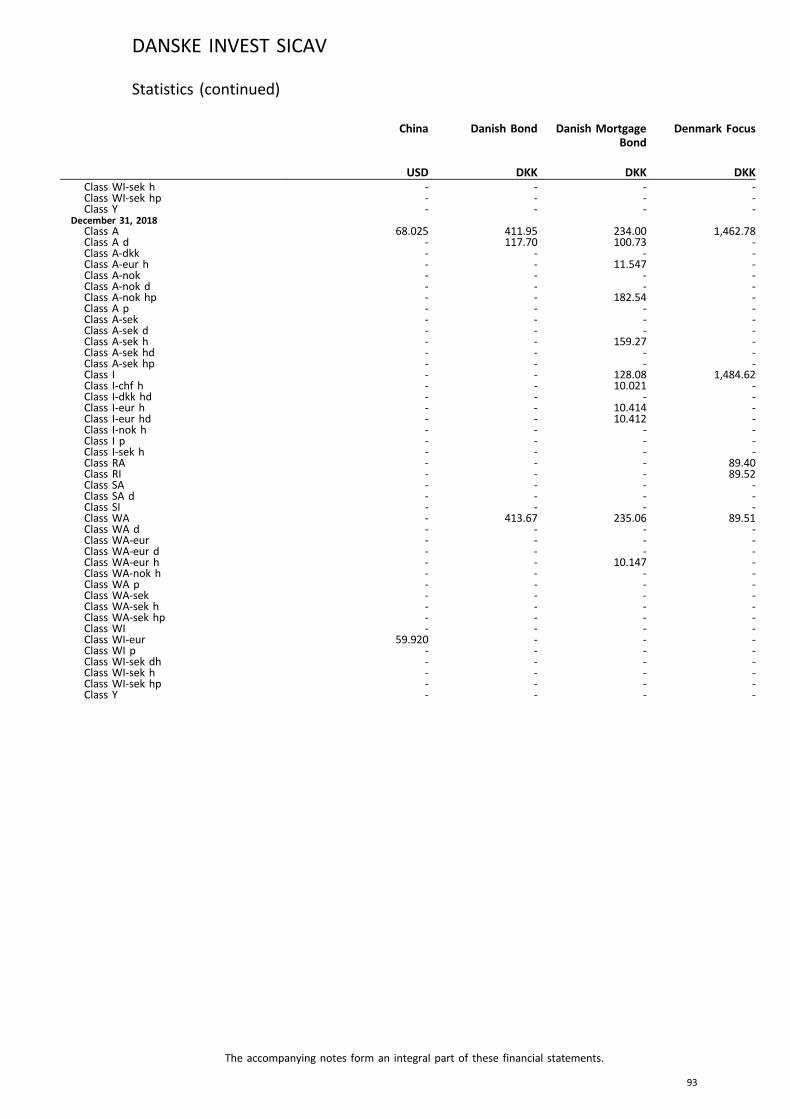
China Danish Bond Danish MortgageBond
Denmark Focus
USD DKK DKK DKKClass WI-sek h - - - -Class WI-sek hp - - - -Class Y - - - -
December 31, 2018Class A 68.025 411.95 234.00 1,462.78Class A d - 117.70 100.73 -Class A-dkk - - - -Class A-eur h - - 11.547 -Class A-nok - - - -Class A-nok d - - - -Class A-nok hp - - 182.54 -Class A p - - - -Class A-sek - - - -Class A-sek d - - - -Class A-sek h - - 159.27 -Class A-sek hd - - - -Class A-sek hp - - - -Class I - - 128.08 1,484.62Class I-chf h - - 10.021 -Class I-dkk hd - - - -Class I-eur h - - 10.414 -Class I-eur hd - - 10.412 -Class I-nok h - - - -Class I p - - - -Class I-sek h - - - -Class RA - - - 89.40Class RI - - - 89.52Class SA - - - -Class SA d - - - -Class SI - - - -Class WA - 413.67 235.06 89.51Class WA d - - - -Class WA-eur - - - -Class WA-eur d - - - -Class WA-eur h - - 10.147 -Class WA-nok h - - - -Class WA p - - - -Class WA-sek - - - -Class WA-sek h - - - -Class WA-sek hp - - - -Class WI - - - -Class WI-eur 59.920 - - -Class WI p - - - -Class WI-sek dh - - - -Class WI-sek h - - - -Class WI-sek hp - - - -Class Y - - - -
DANSKE INVEST SICAV
The accompanying notes form an integral part of these financial statements.
93
Statistics (continued)
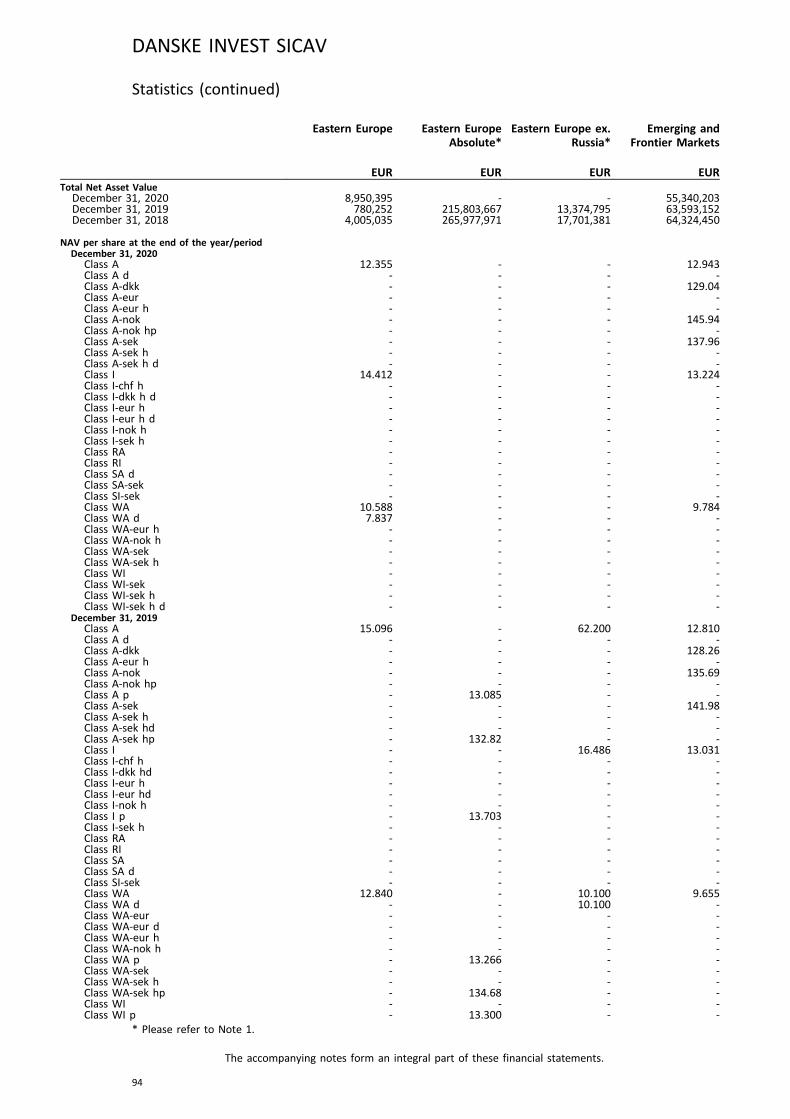
Eastern Europe Eastern EuropeAbsolute*
Eastern Europe ex.Russia*
Emerging andFrontier Markets
EUR EUR EUR EURTotal Net Asset Value
December 31, 2020 8,950,395 - - 55,340,203December 31, 2019 780,252 215,803,667 13,374,795 63,593,152December 31, 2018 4,005,035 265,977,971 17,701,381 64,324,450
NAV per share at the end of the year/periodDecember 31, 2020
Class A 12.355 - - 12.943Class A d - - - -Class A-dkk - - - 129.04Class A-eur - - - -Class A-eur h - - - -Class A-nok - - - 145.94Class A-nok hp - - - -Class A-sek - - - 137.96Class A-sek h - - - -Class A-sek h d - - - -Class I 14.412 - - 13.224Class I-chf h - - - -Class I-dkk h d - - - -Class I-eur h - - - -Class I-eur h d - - - -Class I-nok h - - - -Class I-sek h - - - -Class RA - - - -Class RI - - - -Class SA d - - - -Class SA-sek - - - -Class SI-sek - - - -Class WA 10.588 - - 9.784Class WA d 7.837 - - -Class WA-eur h - - - -Class WA-nok h - - - -Class WA-sek - - - -Class WA-sek h - - - -Class WI - - - -Class WI-sek - - - -Class WI-sek h - - - -Class WI-sek h d - - - -
December 31, 2019Class A 15.096 - 62.200 12.810Class A d - - - -Class A-dkk - - - 128.26Class A-eur h - - - -Class A-nok - - - 135.69Class A-nok hp - - - -Class A p - 13.085 - -Class A-sek - - - 141.98Class A-sek h - - - -Class A-sek hd - - - -Class A-sek hp - 132.82 - -Class I - - 16.486 13.031Class I-chf h - - - -Class I-dkk hd - - - -Class I-eur h - - - -Class I-eur hd - - - -Class I-nok h - - - -Class I p - 13.703 - -Class I-sek h - - - -Class RA - - - -Class RI - - - -Class SA - - - -Class SA d - - - -Class SI-sek - - - -Class WA 12.840 - 10.100 9.655Class WA d - - 10.100 -Class WA-eur - - - -Class WA-eur d - - - -Class WA-eur h - - - -Class WA-nok h - - - -Class WA p - 13.266 - -Class WA-sek - - - -Class WA-sek h - - - -Class WA-sek hp - 134.68 - -Class WI - - - -Class WI p - 13.300 - -
DANSKE INVEST SICAV
The accompanying notes form an integral part of these financial statements.
94
Statistics (continued)
* Please refer to Note 1.
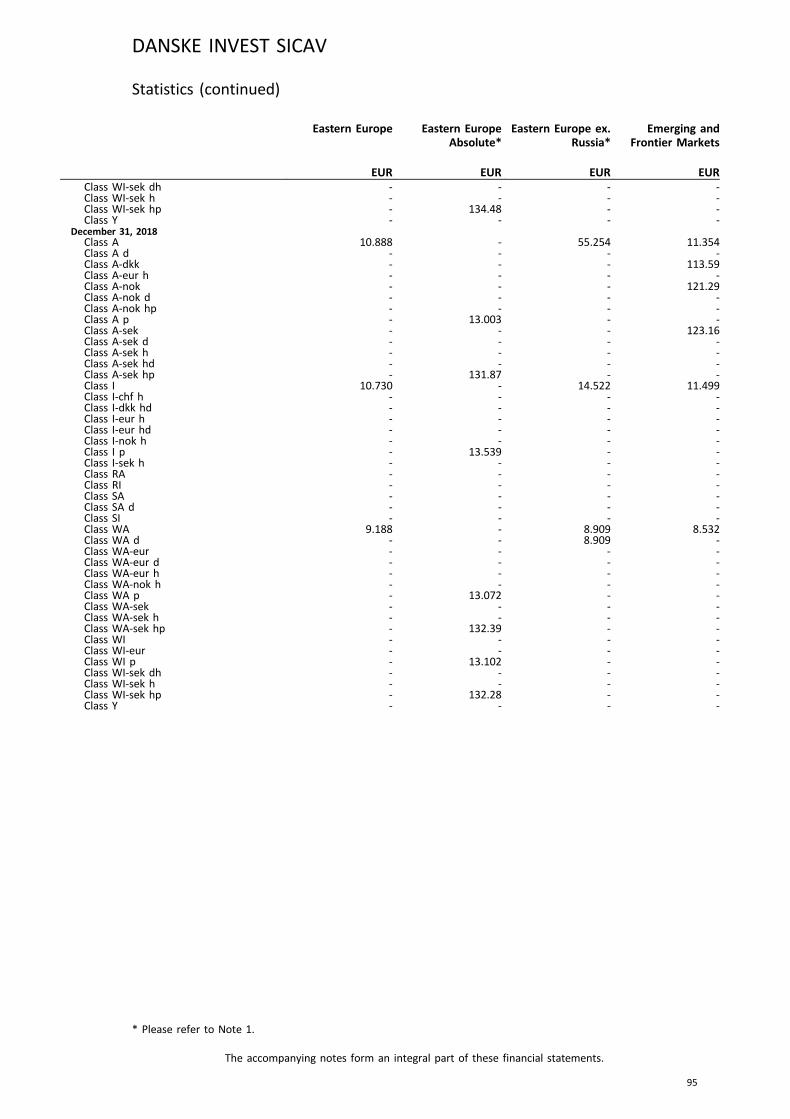
Eastern Europe Eastern EuropeAbsolute*
Eastern Europe ex.Russia*
Emerging andFrontier Markets
EUR EUR EUR EURClass WI-sek dh - - - -Class WI-sek h - - - -Class WI-sek hp - 134.48 - -Class Y - - - -
December 31, 2018Class A 10.888 - 55.254 11.354Class A d - - - -Class A-dkk - - - 113.59Class A-eur h - - - -Class A-nok - - - 121.29Class A-nok d - - - -Class A-nok hp - - - -Class A p - 13.003 - -Class A-sek - - - 123.16Class A-sek d - - - -Class A-sek h - - - -Class A-sek hd - - - -Class A-sek hp - 131.87 - -Class I 10.730 - 14.522 11.499Class I-chf h - - - -Class I-dkk hd - - - -Class I-eur h - - - -Class I-eur hd - - - -Class I-nok h - - - -Class I p - 13.539 - -Class I-sek h - - - -Class RA - - - -Class RI - - - -Class SA - - - -Class SA d - - - -Class SI - - - -Class WA 9.188 - 8.909 8.532Class WA d - - 8.909 -Class WA-eur - - - -Class WA-eur d - - - -Class WA-eur h - - - -Class WA-nok h - - - -Class WA p - 13.072 - -Class WA-sek - - - -Class WA-sek h - - - -Class WA-sek hp - 132.39 - -Class WI - - - -Class WI-eur - - - -Class WI p - 13.102 - -Class WI-sek dh - - - -Class WI-sek h - - - -Class WI-sek hp - 132.28 - -Class Y - - - -
DANSKE INVEST SICAV
The accompanying notes form an integral part of these financial statements.
95
Statistics (continued)
* Please refer to Note 1.

Emerging MarketsDebt Hard Currency
Euro SustainableHigh Yield Bond*
Europe Europe HighDividend
USD EUR EUR EURTotal Net Asset Value
December 31, 2020 907,123,394 64,518,969 127,729,138 48,253,776December 31, 2019 638,897,206 52,484,886 80,532,868 73,337,840December 31, 2018 239,407,384 51,518,776 96,852,170 96,986,471
NAV per share at the end of the year/periodDecember 31, 2020
Class A 13.917 13.888 18.453 29.869Class A d - 10.791 - -Class A-dkk - - - -Class A-eur - - - -Class A-eur h - - - -Class A-nok - - - -Class A-nok hp - - - -Class A-sek - - - -Class A-sek h - - - -Class A-sek h d - - - -Class I 14.488 12.496 19.541 16.122Class I-chf h - - - -Class I-dkk h d - - - -Class I-eur h 11.925 - - -Class I-eur h d 11.931 - - -Class I-nok h - - - -Class I-sek h 103.53 - - -Class RA - - - -Class RI - 11.280 - -Class SA d - - - -Class SA-sek - - 212.700 -Class SI-sek - - 126.92 -Class WA - 14.053 18.789 -Class WA d - - - -Class WA-eur h 11.485 - - -Class WA-nok h - - - -Class WA-sek - - 215.62 99.85Class WA-sek h - - - -Class WI - - - -Class WI-sek - - 215.93 -Class WI-sek h - - - -Class WI-sek h d - - - -
December 31, 2019Class A 13.174 13.663 18.098 31.839Class A d - 11.244 - -Class A-dkk - - - -Class A-eur h - - - -Class A-nok - - - -Class A-nok hp - - - -Class A p - - - -Class A-sek - - - -Class A-sek h - - - -Class A-sek hd - - - -Class A-sek hp - - - -Class I 13.614 12.209 19.023 17.042Class I-chf h - - - -Class I-dkk hd - - - -Class I-eur h 11.462 - - -Class I-eur hd - - - -Class I-nok h - - - -Class I p - - - -Class I-sek h - - - -Class RA - - - -Class RI - 11.049 - -Class SA - - - -Class SA d - - - -Class SI-sek - - 129.11 -Class WA 11.170 13.771 18.317 32.296Class WA d - - - -Class WA-eur - - - -Class WA-eur d - - - -Class WA-eur h 11.076 - - -Class WA-nok h - - - -Class WA p - - - -Class WA-sek - - - 109.90Class WA-sek h - - - -Class WA-sek hp - - - -Class WI - - - -Class WI p - - - -
DANSKE INVEST SICAV
The accompanying notes form an integral part of these financial statements.
96
Statistics (continued)
* Please refer to Note 1.
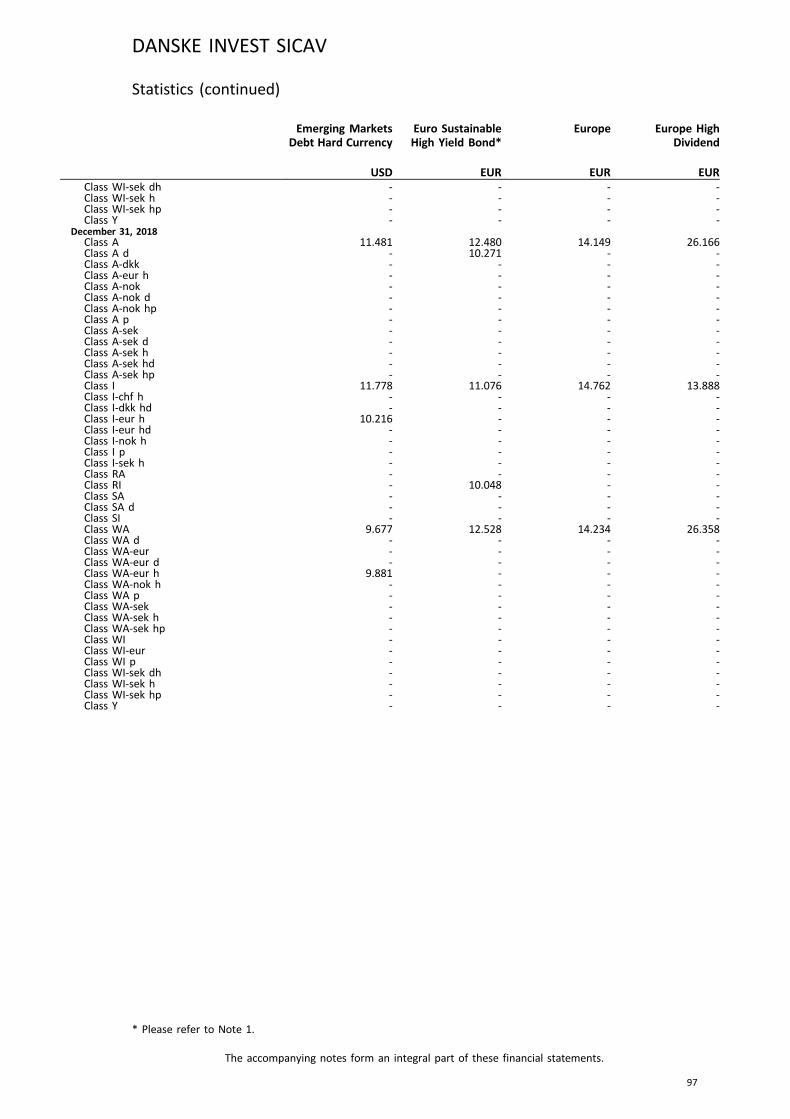
Emerging MarketsDebt Hard Currency
Euro SustainableHigh Yield Bond*
Europe Europe HighDividend
USD EUR EUR EURClass WI-sek dh - - - -Class WI-sek h - - - -Class WI-sek hp - - - -Class Y - - - -
December 31, 2018Class A 11.481 12.480 14.149 26.166Class A d - 10.271 - -Class A-dkk - - - -Class A-eur h - - - -Class A-nok - - - -Class A-nok d - - - -Class A-nok hp - - - -Class A p - - - -Class A-sek - - - -Class A-sek d - - - -Class A-sek h - - - -Class A-sek hd - - - -Class A-sek hp - - - -Class I 11.778 11.076 14.762 13.888Class I-chf h - - - -Class I-dkk hd - - - -Class I-eur h 10.216 - - -Class I-eur hd - - - -Class I-nok h - - - -Class I p - - - -Class I-sek h - - - -Class RA - - - -Class RI - 10.048 - -Class SA - - - -Class SA d - - - -Class SI - - - -Class WA 9.677 12.528 14.234 26.358Class WA d - - - -Class WA-eur - - - -Class WA-eur d - - - -Class WA-eur h 9.881 - - -Class WA-nok h - - - -Class WA p - - - -Class WA-sek - - - -Class WA-sek h - - - -Class WA-sek hp - - - -Class WI - - - -Class WI-eur - - - -Class WI p - - - -Class WI-sek dh - - - -Class WI-sek h - - - -Class WI-sek hp - - - -Class Y - - - -
DANSKE INVEST SICAV
The accompanying notes form an integral part of these financial statements.
97
Statistics (continued)
* Please refer to Note 1.
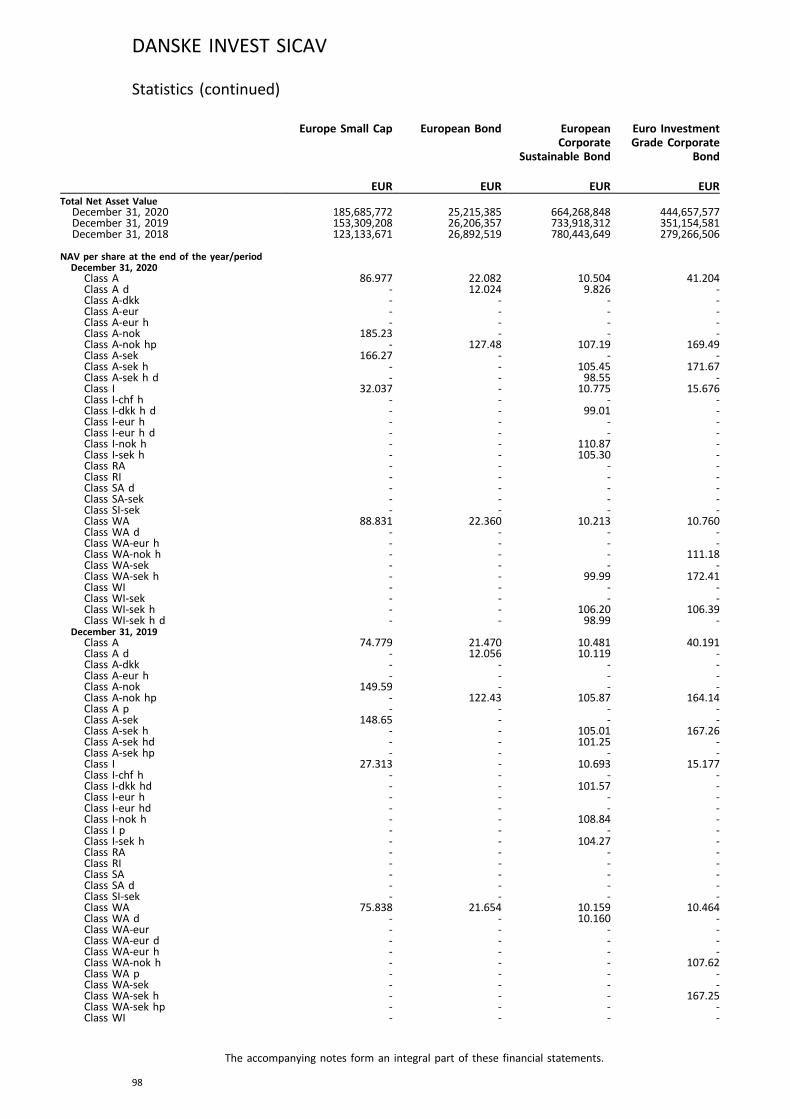
Europe Small Cap European Bond EuropeanCorporate
Sustainable Bond
Euro InvestmentGrade Corporate
Bond
EUR EUR EUR EURTotal Net Asset Value
December 31, 2020 185,685,772 25,215,385 664,268,848 444,657,577December 31, 2019 153,309,208 26,206,357 733,918,312 351,154,581December 31, 2018 123,133,671 26,892,519 780,443,649 279,266,506
NAV per share at the end of the year/periodDecember 31, 2020
Class A 86.977 22.082 10.504 41.204Class A d - 12.024 9.826 -Class A-dkk - - - -Class A-eur - - - -Class A-eur h - - - -Class A-nok 185.23 - - -Class A-nok hp - 127.48 107.19 169.49Class A-sek 166.27 - - -Class A-sek h - - 105.45 171.67Class A-sek h d - - 98.55 -Class I 32.037 - 10.775 15.676Class I-chf h - - - -Class I-dkk h d - - 99.01 -Class I-eur h - - - -Class I-eur h d - - - -Class I-nok h - - 110.87 -Class I-sek h - - 105.30 -Class RA - - - -Class RI - - - -Class SA d - - - -Class SA-sek - - - -Class SI-sek - - - -Class WA 88.831 22.360 10.213 10.760Class WA d - - - -Class WA-eur h - - - -Class WA-nok h - - - 111.18Class WA-sek - - - -Class WA-sek h - - 99.99 172.41Class WI - - - -Class WI-sek - - - -Class WI-sek h - - 106.20 106.39Class WI-sek h d - - 98.99 -
December 31, 2019Class A 74.779 21.470 10.481 40.191Class A d - 12.056 10.119 -Class A-dkk - - - -Class A-eur h - - - -Class A-nok 149.59 - - -Class A-nok hp - 122.43 105.87 164.14Class A p - - - -Class A-sek 148.65 - - -Class A-sek h - - 105.01 167.26Class A-sek hd - - 101.25 -Class A-sek hp - - - -Class I 27.313 - 10.693 15.177Class I-chf h - - - -Class I-dkk hd - - 101.57 -Class I-eur h - - - -Class I-eur hd - - - -Class I-nok h - - 108.84 -Class I p - - - -Class I-sek h - - 104.27 -Class RA - - - -Class RI - - - -Class SA - - - -Class SA d - - - -Class SI-sek - - - -Class WA 75.838 21.654 10.159 10.464Class WA d - - 10.160 -Class WA-eur - - - -Class WA-eur d - - - -Class WA-eur h - - - -Class WA-nok h - - - 107.62Class WA p - - - -Class WA-sek - - - -Class WA-sek h - - - 167.25Class WA-sek hp - - - -Class WI - - - -
DANSKE INVEST SICAV
The accompanying notes form an integral part of these financial statements.
98
Statistics (continued)

Europe Small Cap European Bond EuropeanCorporate
Sustainable Bond
Euro InvestmentGrade Corporate
Bond
EUR EUR EUR EURClass WI p - - - -Class WI-sek dh - - 101.34 -Class WI-sek h - - 105.41 -Class WI-sek hp - - - -Class Y - - - -
December 31, 2018Class A 56.225 20.399 10.114 38.076Class A d - 11.571 9.765 -Class A-dkk - - - -Class A-eur h - - - -Class A-nok - - - -Class A-nok d - - - -Class A-nok hp - 114.41 100.48 152.86Class A p - - - -Class A-sek - - - -Class A-sek d - - - -Class A-sek h - - 101.03 157.92Class A-sek hd - - 97.42 -Class A-sek hp - - - -Class I 20.365 - 10.268 14.272Class I-chf h - - - -Class I-dkk hd - - 97.74 -Class I-eur h - - - -Class I-eur hd - - - -Class I-nok h - - 102.73 -Class I p - - - -Class I-sek h - - 99.83 -Class RA - - - -Class RI - - - -Class SA - - - -Class SA d - - - -Class SI - - - -Class WA 56.625 20.491 9.774 9.884Class WA d - - 9.775 -Class WA-eur - - - -Class WA-eur d - - - -Class WA-eur h - - - -Class WA-nok h - - - 99.86Class WA p - - - -Class WA-sek - - - -Class WA-sek h - - 97.71 157.54Class WA-sek hp - - - -Class WI - - - -Class WI-eur - - - -Class WI p - - - -Class WI-sek dh - - 97.29 -Class WI-sek h - - 101.09 157.64Class WI-sek hp - - - -Class Y - - - -
DANSKE INVEST SICAV
The accompanying notes form an integral part of these financial statements.
99
Statistics (continued)

Global EmergingMarkets
Global EmergingMarkets Small Cap
Global HighDividend*
Global InflationLinked Bond
USD USD EUR EURTotal Net Asset Value
December 31, 2020 253,534,713 60,346,620 - 8,950,863December 31, 2019 209,095,514 79,094,219 12,200,400 8,960,597December 31, 2018 275,209,940 77,256,904 11,500,659 15,030,403
NAV per share at the end of the year/periodDecember 31, 2020
Class A 110.506 44.893 - 12.048Class A d - - - 11.181Class A-dkk - - - -Class A-eur - - - -Class A-eur h - - - -Class A-nok - - - -Class A-nok hp - - - -Class A-sek - - - -Class A-sek h - - - -Class A-sek h d - - - -Class I 56.438 51.325 - 11.872Class I-chf h - - - -Class I-dkk h d - - - -Class I-eur h - - - -Class I-eur h d - - - -Class I-nok h - - - -Class I-sek h - - - -Class RA - - - 11.244Class RI 14.601 - - -Class SA d - - - -Class SA-sek - - - -Class SI-sek - - - -Class WA 113.305 - - 11.036Class WA d - - - -Class WA-eur h - - - -Class WA-nok h - - - -Class WA-sek 927.02 - - -Class WA-sek h - - - -Class WI - - - -Class WI-sek - - - -Class WI-sek h - - - -Class WI-sek h d - - - -
December 31, 2019Class A 87.949 36.852 12.354 11.187Class A d - - - 10.694Class A-dkk - - - -Class A-eur h - - - -Class A-nok - - - -Class A-nok hp - - - -Class A p - - - -Class A-sek - - - -Class A-sek h - - - -Class A-sek hd - - - -Class A-sek hp - - - -Class I 44.496 41.736 12.838 10.975Class I-chf h - - - -Class I-dkk hd - - - -Class I-eur h - - - -Class I-eur hd - - - -Class I-nok h - - - -Class I p - - - -Class I-sek h - - - -Class RA - - - 10.399Class RI 11.523 - - -Class SA - - - -Class SA d - - - -Class SI-sek - - - -Class WA 89.456 9.960 - 10.206Class WA d - - - 10.207Class WA-eur 11.086 33.433 - -Class WA-eur d 11.086 - - -Class WA-eur h - - - -Class WA-nok h - - - -Class WA p - - - -Class WA-sek 834.53 - - -Class WA-sek h - - - -Class WA-sek hp - - - -Class WI - - - -Class WI p - - - -
DANSKE INVEST SICAV
The accompanying notes form an integral part of these financial statements.
100
Statistics (continued)
* Please refer to Note 1.

Global EmergingMarkets
Global EmergingMarkets Small Cap
Global HighDividend*
Global InflationLinked Bond
USD USD EUR EURClass WI-sek dh - - - -Class WI-sek h - - - -Class WI-sek hp - - - -Class Y - - - -
December 31, 2018Class A 74.563 32.697 10.378 10.700Class A d - - - 10.229Class A-dkk - - - -Class A-eur h - - - -Class A-nok - - 117.91 -Class A-nok d - - 117.63 -Class A-nok hp - - - -Class A p - - - -Class A-sek - - 116.47 -Class A-sek d - - 115.53 -Class A-sek h - - - 103.02Class A-sek hd - - - -Class A-sek hp - - - -Class I 37.370 36.685 10.694 10.451Class I-chf h - - - -Class I-dkk hd - - - -Class I-eur h - - - -Class I-eur hd - - - -Class I-nok h - - - -Class I p - - - -Class I-sek h - - - -Class RA - - - 9.906Class RI 9.688 - - -Class SA - - - -Class SA d - - - -Class SI - - - -Class WA 75.236 8.767 - 9.723Class WA d - - - 9.723Class WA-eur 9.138 28.842 - -Class WA-eur d 9.138 - - -Class WA-eur h - - - -Class WA-nok h - - - -Class WA p - - - -Class WA-sek 673.26 - - -Class WA-sek h - - - -Class WA-sek hp - - - -Class WI - - - -Class WI-eur - - - -Class WI p - - - -Class WI-sek dh - - - -Class WI-sek h - - - -Class WI-sek hp - - - -Class Y - - - -
DANSKE INVEST SICAV
The accompanying notes form an integral part of these financial statements.
101
Statistics (continued)
* Please refer to Note 1.
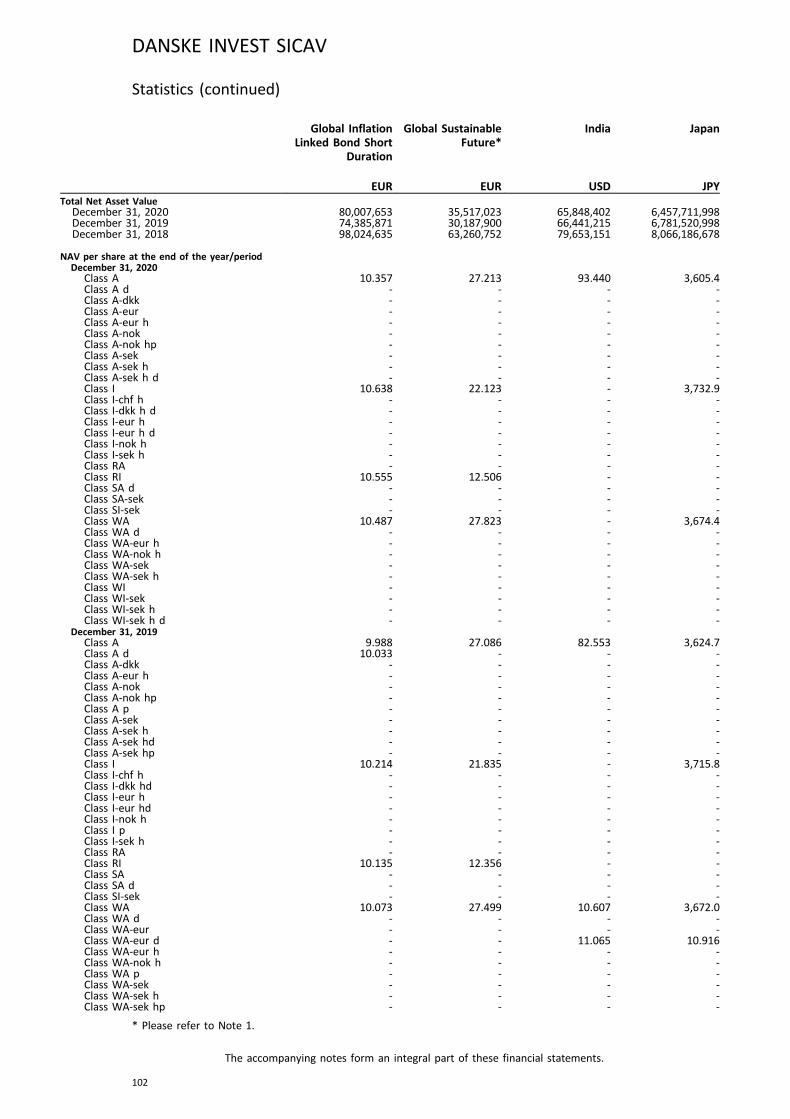
Global InflationLinked Bond Short
Duration
Global SustainableFuture*
India Japan
EUR EUR USD JPYTotal Net Asset Value
December 31, 2020 80,007,653 35,517,023 65,848,402 6,457,711,998December 31, 2019 74,385,871 30,187,900 66,441,215 6,781,520,998December 31, 2018 98,024,635 63,260,752 79,653,151 8,066,186,678
NAV per share at the end of the year/periodDecember 31, 2020
Class A 10.357 27.213 93.440 3,605.4Class A d - - - -Class A-dkk - - - -Class A-eur - - - -Class A-eur h - - - -Class A-nok - - - -Class A-nok hp - - - -Class A-sek - - - -Class A-sek h - - - -Class A-sek h d - - - -Class I 10.638 22.123 - 3,732.9Class I-chf h - - - -Class I-dkk h d - - - -Class I-eur h - - - -Class I-eur h d - - - -Class I-nok h - - - -Class I-sek h - - - -Class RA - - - -Class RI 10.555 12.506 - -Class SA d - - - -Class SA-sek - - - -Class SI-sek - - - -Class WA 10.487 27.823 - 3,674.4Class WA d - - - -Class WA-eur h - - - -Class WA-nok h - - - -Class WA-sek - - - -Class WA-sek h - - - -Class WI - - - -Class WI-sek - - - -Class WI-sek h - - - -Class WI-sek h d - - - -
December 31, 2019Class A 9.988 27.086 82.553 3,624.7Class A d 10.033 - - -Class A-dkk - - - -Class A-eur h - - - -Class A-nok - - - -Class A-nok hp - - - -Class A p - - - -Class A-sek - - - -Class A-sek h - - - -Class A-sek hd - - - -Class A-sek hp - - - -Class I 10.214 21.835 - 3,715.8Class I-chf h - - - -Class I-dkk hd - - - -Class I-eur h - - - -Class I-eur hd - - - -Class I-nok h - - - -Class I p - - - -Class I-sek h - - - -Class RA - - - -Class RI 10.135 12.356 - -Class SA - - - -Class SA d - - - -Class SI-sek - - - -Class WA 10.073 27.499 10.607 3,672.0Class WA d - - - -Class WA-eur - - - -Class WA-eur d - - 11.065 10.916Class WA-eur h - - - -Class WA-nok h - - - -Class WA p - - - -Class WA-sek - - - -Class WA-sek h - - - -Class WA-sek hp - - - -
DANSKE INVEST SICAV
The accompanying notes form an integral part of these financial statements.
102
Statistics (continued)
* Please refer to Note 1.
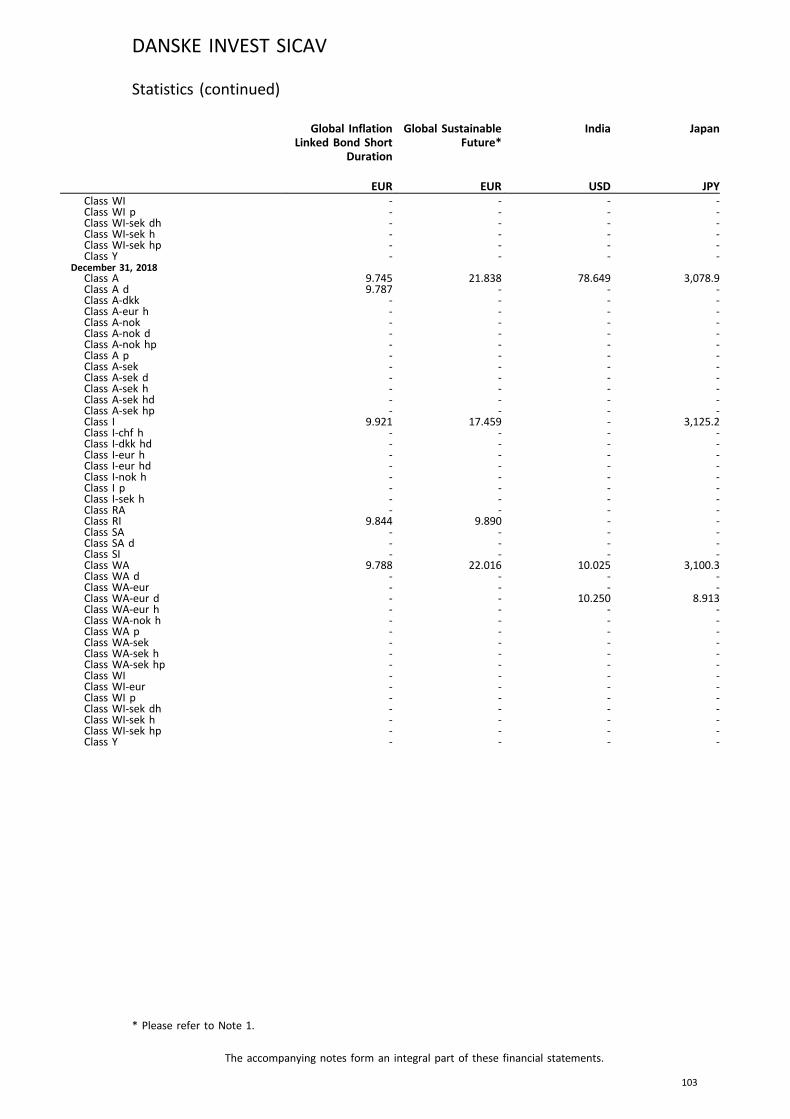
Global InflationLinked Bond Short
Duration
Global SustainableFuture*
India Japan
EUR EUR USD JPYClass WI - - - -Class WI p - - - -Class WI-sek dh - - - -Class WI-sek h - - - -Class WI-sek hp - - - -Class Y - - - -
December 31, 2018Class A 9.745 21.838 78.649 3,078.9Class A d 9.787 - - -Class A-dkk - - - -Class A-eur h - - - -Class A-nok - - - -Class A-nok d - - - -Class A-nok hp - - - -Class A p - - - -Class A-sek - - - -Class A-sek d - - - -Class A-sek h - - - -Class A-sek hd - - - -Class A-sek hp - - - -Class I 9.921 17.459 - 3,125.2Class I-chf h - - - -Class I-dkk hd - - - -Class I-eur h - - - -Class I-eur hd - - - -Class I-nok h - - - -Class I p - - - -Class I-sek h - - - -Class RA - - - -Class RI 9.844 9.890 - -Class SA - - - -Class SA d - - - -Class SI - - - -Class WA 9.788 22.016 10.025 3,100.3Class WA d - - - -Class WA-eur - - - -Class WA-eur d - - 10.250 8.913Class WA-eur h - - - -Class WA-nok h - - - -Class WA p - - - -Class WA-sek - - - -Class WA-sek h - - - -Class WA-sek hp - - - -Class WI - - - -Class WI-eur - - - -Class WI p - - - -Class WI-sek dh - - - -Class WI-sek h - - - -Class WI-sek hp - - - -Class Y - - - -
DANSKE INVEST SICAV
The accompanying notes form an integral part of these financial statements.
103
Statistics (continued)
* Please refer to Note 1.

Nordic CorporateBond
Russia Sverige Swedish Bond*
EUR USD SEK SEKTotal Net Asset Value
December 31, 2020 28,849,980 10,300,284 5,589,472,638 -December 31, 2019 41,821,261 13,916,381 5,071,450,068 1,272,125,300December 31, 2018 63,335,798 8,945,821 3,999,765,291 1,518,088,040
NAV per share at the end of the year/periodDecember 31, 2020
Class A 10.744 27.652 880.52 -Class A d - - - -Class A-dkk - - - -Class A-eur - - - -Class A-eur h - - - -Class A-nok - - - -Class A-nok hp - - - -Class A-sek - - - -Class A-sek h - - - -Class A-sek h d 96.58 - - -Class I 11.105 - - -Class I-chf h - - - -Class I-dkk h d - - - -Class I-eur h - - - -Class I-eur h d - - - -Class I-nok h 107.23 - - -Class I-sek h - - - -Class RA 10.526 - - -Class RI 10.282 - - -Class SA d - - 3,679.52 -Class SA-sek - - 5,482.86 -Class SI-sek - - 5,482.86 -Class WA 10.844 - 5,549.13 -Class WA d - - 3,721.71 -Class WA-eur h - - - -Class WA-nok h - - - -Class WA-sek - - - -Class WA-sek h - - - -Class WI - - 5,556.38 -Class WI-sek - - - -Class WI-sek h - - - -Class WI-sek h d - - - -
December 31, 2019Class A 10.689 29.292 786.68 247.22Class A d 10.619 - - -Class A-dkk - - - -Class A-eur h - - - -Class A-nok - - - -Class A-nok hp - - - -Class A p - - - -Class A-sek - - - -Class A-sek h - - - -Class A-sek hd 98.53 - - -Class A-sek hp - - - -Class I 10.988 25.164 - -Class I-chf h - - - -Class I-dkk hd - - - -Class I-eur h - - - -Class I-eur hd - - - -Class I-nok h 105.01 - - -Class I p - - - -Class I-sek h - - - -Class RA 10.440 - - -Class RI 10.194 - - -Class SA - - 4,881.37 -Class SA d - - 3,581.18 -Class SI-sek - - 4,881.37 -Class WA 10.755 13.542 4,920.58 -Class WA d - - 3,607.14 -Class WA-eur - - - -Class WA-eur d - 14.133 - -Class WA-eur h - - - -Class WA-nok h - - - -Class WA p - - - -Class WA-sek - - - -Class WA-sek h - - - -Class WA-sek hp - - - -Class WI - - 4,925.04 139.35Class WI p - - - -
DANSKE INVEST SICAV
The accompanying notes form an integral part of these financial statements.
104
Statistics (continued)
* Please refer to Note 1.
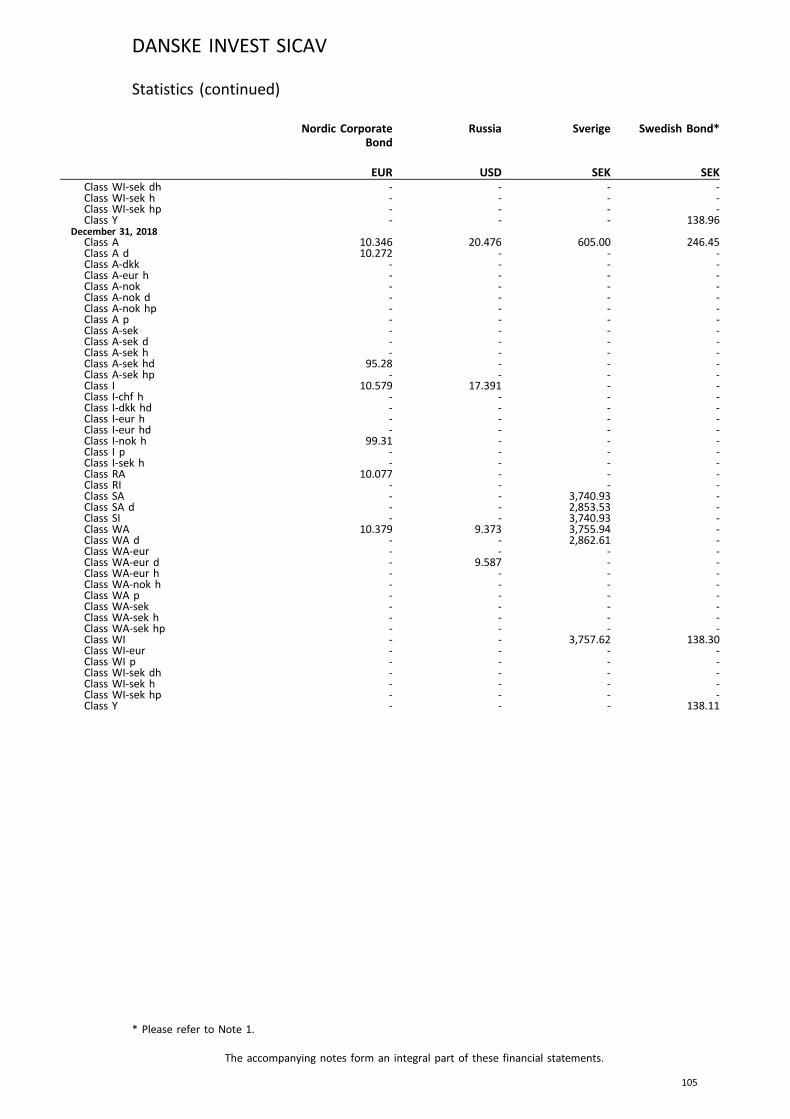
Nordic CorporateBond
Russia Sverige Swedish Bond*
EUR USD SEK SEKClass WI-sek dh - - - -Class WI-sek h - - - -Class WI-sek hp - - - -Class Y - - - 138.96
December 31, 2018Class A 10.346 20.476 605.00 246.45Class A d 10.272 - - -Class A-dkk - - - -Class A-eur h - - - -Class A-nok - - - -Class A-nok d - - - -Class A-nok hp - - - -Class A p - - - -Class A-sek - - - -Class A-sek d - - - -Class A-sek h - - - -Class A-sek hd 95.28 - - -Class A-sek hp - - - -Class I 10.579 17.391 - -Class I-chf h - - - -Class I-dkk hd - - - -Class I-eur h - - - -Class I-eur hd - - - -Class I-nok h 99.31 - - -Class I p - - - -Class I-sek h - - - -Class RA 10.077 - - -Class RI - - - -Class SA - - 3,740.93 -Class SA d - - 2,853.53 -Class SI - - 3,740.93 -Class WA 10.379 9.373 3,755.94 -Class WA d - - 2,862.61 -Class WA-eur - - - -Class WA-eur d - 9.587 - -Class WA-eur h - - - -Class WA-nok h - - - -Class WA p - - - -Class WA-sek - - - -Class WA-sek h - - - -Class WA-sek hp - - - -Class WI - - 3,757.62 138.30Class WI-eur - - - -Class WI p - - - -Class WI-sek dh - - - -Class WI-sek h - - - -Class WI-sek hp - - - -Class Y - - - 138.11
DANSKE INVEST SICAV
The accompanying notes form an integral part of these financial statements.
105
Statistics (continued)
* Please refer to Note 1.

US High Yield Bond
USDTotal Net Asset Value
December 31, 2020 32,732,202December 31, 2019 29,623,202December 31, 2018 25,394,338
NAV per share at the end of the year/periodDecember 31, 2020
Class A -Class A d -Class A-dkk -Class A-eur -Class A-eur h -Class A-nok -Class A-nok hp -Class A-sek -Class A-sek h -Class A-sek h d -Class I 13.41Class I-chf h -Class I-dkk h d -Class I-eur h -Class I-eur h d -Class I-nok h -Class I-sek h -Class RA -Class RI -Class SA d -Class SA-sek -Class SI-sek -Class WA -Class WA d -Class WA-eur h 10.861Class WA-nok h -Class WA-sek -Class WA-sek h -Class WI -Class WI-sek -Class WI-sek h -Class WI-sek h d -
December 31, 2019Class A -Class A d -Class A-dkk -Class A-eur h -Class A-nok -Class A-nok hp -Class A p -Class A-sek -Class A-sek h -Class A-sek hd -Class A-sek hp -Class I 12.394Class I-chf h -Class I-dkk hd -Class I-eur h -Class I-eur hd -Class I-nok h -Class I p -Class I-sek h -Class RA -Class RI -Class SA -Class SA d -Class SI-sek -Class WA 10.938Class WA d -Class WA-eur -Class WA-eur d -Class WA-eur h 10.265Class WA-nok h -Class WA p -Class WA-sek -Class WA-sek h -Class WA-sek hp -Class WI -Class WI p -Class WI-sek dh -
DANSKE INVEST SICAV
The accompanying notes form an integral part of these financial statements.
106
Statistics (continued)

US High Yield Bond
USDClass WI-sek h -Class WI-sek hp -Class Y -
December 31, 2018Class A -Class A d -Class A-dkk -Class A-eur h -Class A-nok -Class A-nok d -Class A-nok hp -Class A p -Class A-sek -Class A-sek d -Class A-sek h -Class A-sek hd -Class A-sek hp -Class I 10.988Class I-chf h -Class I-dkk hd -Class I-eur h -Class I-eur hd -Class I-nok h -Class I p -Class I-sek h -Class RA -Class RI -Class SA -Class SA d -Class SI -Class WA 9.715Class WA d -Class WA-eur -Class WA-eur d -Class WA-eur h 9.392Class WA-nok h -Class WA p -Class WA-sek -Class WA-sek h -Class WA-sek hp -Class WI -Class WI-eur -Class WI p -Class WI-sek dh -Class WI-sek h -Class WI-sek hp -Class Y -
DANSKE INVEST SICAV
The accompanying notes form an integral part of these financial statements.
107
Statistics (continued)
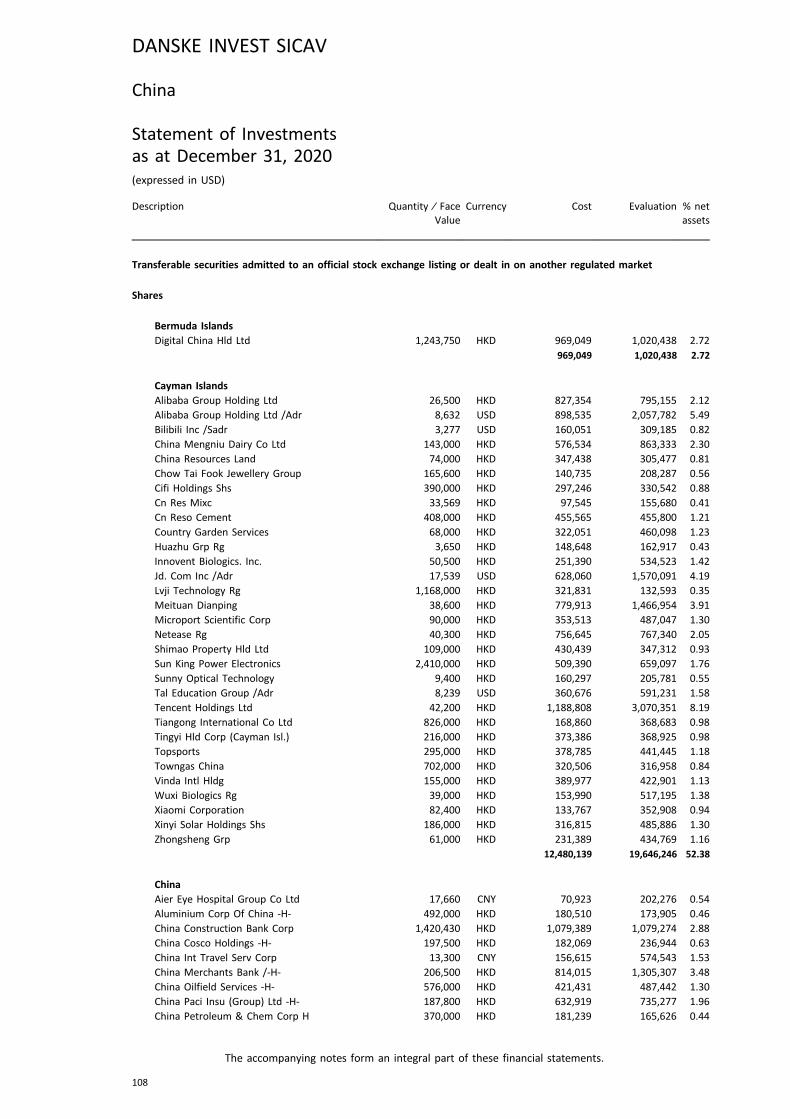
China
Statement of Investmentsas at December 31, 2020(expressed in USD)
Description Quantity ⁄ FaceValue
Currency Cost Evaluation % netassets
Transferable securities admitted to an official stock exchange listing or dealt in on another regulated market
Shares
Bermuda IslandsDigital China Hld Ltd 1,243,750 HKD 969,049 1,020,438 2.72
969,049 1,020,438 2.72
Cayman IslandsAlibaba Group Holding Ltd 26,500 HKD 827,354 795,155 2.12
Alibaba Group Holding Ltd /Adr 8,632 USD 898,535 2,057,782 5.49
Bilibili Inc /Sadr 3,277 USD 160,051 309,185 0.82
China Mengniu Dairy Co Ltd 143,000 HKD 576,534 863,333 2.30
China Resources Land 74,000 HKD 347,438 305,477 0.81
Chow Tai Fook Jewellery Group 165,600 HKD 140,735 208,287 0.56
Cifi Holdings Shs 390,000 HKD 297,246 330,542 0.88
Cn Res Mixc 33,569 HKD 97,545 155,680 0.41
Cn Reso Cement 408,000 HKD 455,565 455,800 1.21
Country Garden Services 68,000 HKD 322,051 460,098 1.23
Huazhu Grp Rg 3,650 HKD 148,648 162,917 0.43
Innovent Biologics. Inc. 50,500 HKD 251,390 534,523 1.42
Jd. Com Inc /Adr 17,539 USD 628,060 1,570,091 4.19
Lvji Technology Rg 1,168,000 HKD 321,831 132,593 0.35
Meituan Dianping 38,600 HKD 779,913 1,466,954 3.91
Microport Scientific Corp 90,000 HKD 353,513 487,047 1.30
Netease Rg 40,300 HKD 756,645 767,340 2.05
Shimao Property Hld Ltd 109,000 HKD 430,439 347,312 0.93
Sun King Power Electronics 2,410,000 HKD 509,390 659,097 1.76
Sunny Optical Technology 9,400 HKD 160,297 205,781 0.55
Tal Education Group /Adr 8,239 USD 360,676 591,231 1.58
Tencent Holdings Ltd 42,200 HKD 1,188,808 3,070,351 8.19
Tiangong International Co Ltd 826,000 HKD 168,860 368,683 0.98
Tingyi Hld Corp (Cayman Isl.) 216,000 HKD 373,386 368,925 0.98
Topsports 295,000 HKD 378,785 441,445 1.18
Towngas China 702,000 HKD 320,506 316,958 0.84
Vinda Intl Hldg 155,000 HKD 389,977 422,901 1.13
Wuxi Biologics Rg 39,000 HKD 153,990 517,195 1.38
Xiaomi Corporation 82,400 HKD 133,767 352,908 0.94
Xinyi Solar Holdings Shs 186,000 HKD 316,815 485,886 1.30
Zhongsheng Grp 61,000 HKD 231,389 434,769 1.16
12,480,139 19,646,246 52.38
ChinaAier Eye Hospital Group Co Ltd 17,660 CNY 70,923 202,276 0.54
Aluminium Corp Of China -H- 492,000 HKD 180,510 173,905 0.46
China Construction Bank Corp 1,420,430 HKD 1,079,389 1,079,274 2.88
China Cosco Holdings -H- 197,500 HKD 182,069 236,944 0.63
China Int Travel Serv Corp 13,300 CNY 156,615 574,543 1.53
China Merchants Bank /-H- 206,500 HKD 814,015 1,305,307 3.48
China Oilfield Services -H- 576,000 HKD 421,431 487,442 1.30
China Paci Insu (Group) Ltd -H- 187,800 HKD 632,919 735,277 1.96
China Petroleum & Chem Corp H 370,000 HKD 181,239 165,626 0.44
DANSKE INVEST SICAV
The accompanying notes form an integral part of these financial statements.
108
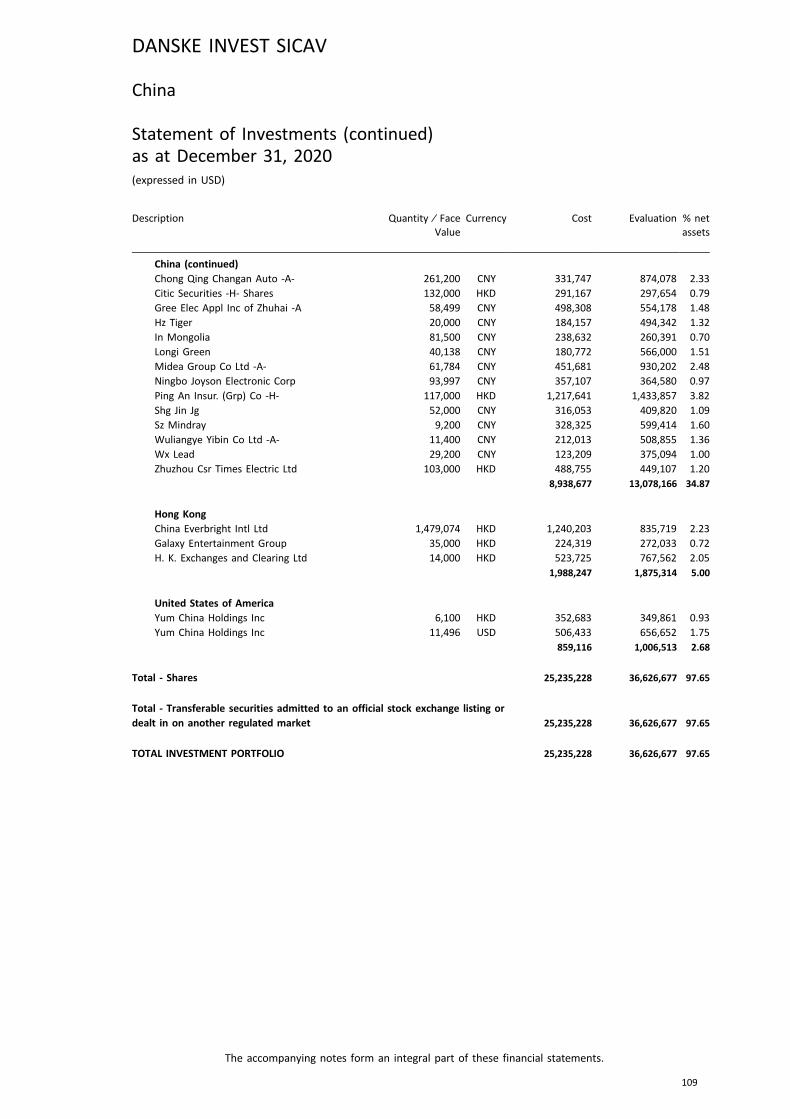
Description Quantity ⁄ FaceValue
Currency Cost Evaluation % netassets
China (continued)Chong Qing Changan Auto -A- 261,200 CNY 331,747 874,078 2.33
Citic Securities -H- Shares 132,000 HKD 291,167 297,654 0.79
Gree Elec Appl Inc of Zhuhai -A 58,499 CNY 498,308 554,178 1.48
Hz Tiger 20,000 CNY 184,157 494,342 1.32
In Mongolia 81,500 CNY 238,632 260,391 0.70
Longi Green 40,138 CNY 180,772 566,000 1.51
Midea Group Co Ltd -A- 61,784 CNY 451,681 930,202 2.48
Ningbo Joyson Electronic Corp 93,997 CNY 357,107 364,580 0.97
Ping An Insur. (Grp) Co -H- 117,000 HKD 1,217,641 1,433,857 3.82
Shg Jin Jg 52,000 CNY 316,053 409,820 1.09
Sz Mindray 9,200 CNY 328,325 599,414 1.60
Wuliangye Yibin Co Ltd -A- 11,400 CNY 212,013 508,855 1.36
Wx Lead 29,200 CNY 123,209 375,094 1.00
Zhuzhou Csr Times Electric Ltd 103,000 HKD 488,755 449,107 1.20
8,938,677 13,078,166 34.87
Hong KongChina Everbright Intl Ltd 1,479,074 HKD 1,240,203 835,719 2.23
Galaxy Entertainment Group 35,000 HKD 224,319 272,033 0.72
H. K. Exchanges and Clearing Ltd 14,000 HKD 523,725 767,562 2.05
1,988,247 1,875,314 5.00
United States of AmericaYum China Holdings Inc 6,100 HKD 352,683 349,861 0.93
Yum China Holdings Inc 11,496 USD 506,433 656,652 1.75
859,116 1,006,513 2.68
Total - Shares 25,235,228 36,626,677 97.65
Total - Transferable securities admitted to an official stock exchange listing ordealt in on another regulated market 25,235,228 36,626,677 97.65
TOTAL INVESTMENT PORTFOLIO 25,235,228 36,626,677 97.65
DANSKE INVEST SICAV
The accompanying notes form an integral part of these financial statements.
109
China
Statement of Investments (continued)as at December 31, 2020(expressed in USD)

China
Geographical and Economic Portfolio Breakdownsas at December 31, 2020(expressed as a percentage of net assets)
Geographical breakdown %
Cayman Islands 52.38China 34.87Hong Kong 5.00Bermuda Islands 2.72United States of America 2.68
97.65
Economic breakdown %
Internet Software 17.81Banks and Financial Institutions 8.41Other Services 7.96Electronics and Electrical Equipment 6.26Insurance 5.78Pharmaceuticals and Cosmetics 5.64Leisure 4.92Real Estate Companies 4.26Retail 4.19Automobile Industry 3.49Food and Distilleries 3.28Electronic Semiconductor 3.27Consumer Goods 2.31Forest Products and Paper Industry 2.23Transportation 2.16Healthcare Education & Social Services 2.12Petrol 1.74Biotechnology 1.38Tobacco and Spirits 1.36Construction, Building Material 1.21Mechanics, Machinery 1.20Mines, Heavy Industries 0.98Chemicals 0.97Public Services 0.84Graphic Art, Publishing 0.82Holding and Finance Companies 0.79Textile 0.70Clock and Watch-Making Industry 0.56Photography And Optics 0.55Non-Ferrous Metals 0.46
97.65
DANSKE INVEST SICAV
The accompanying notes form an integral part of these financial statements.
110
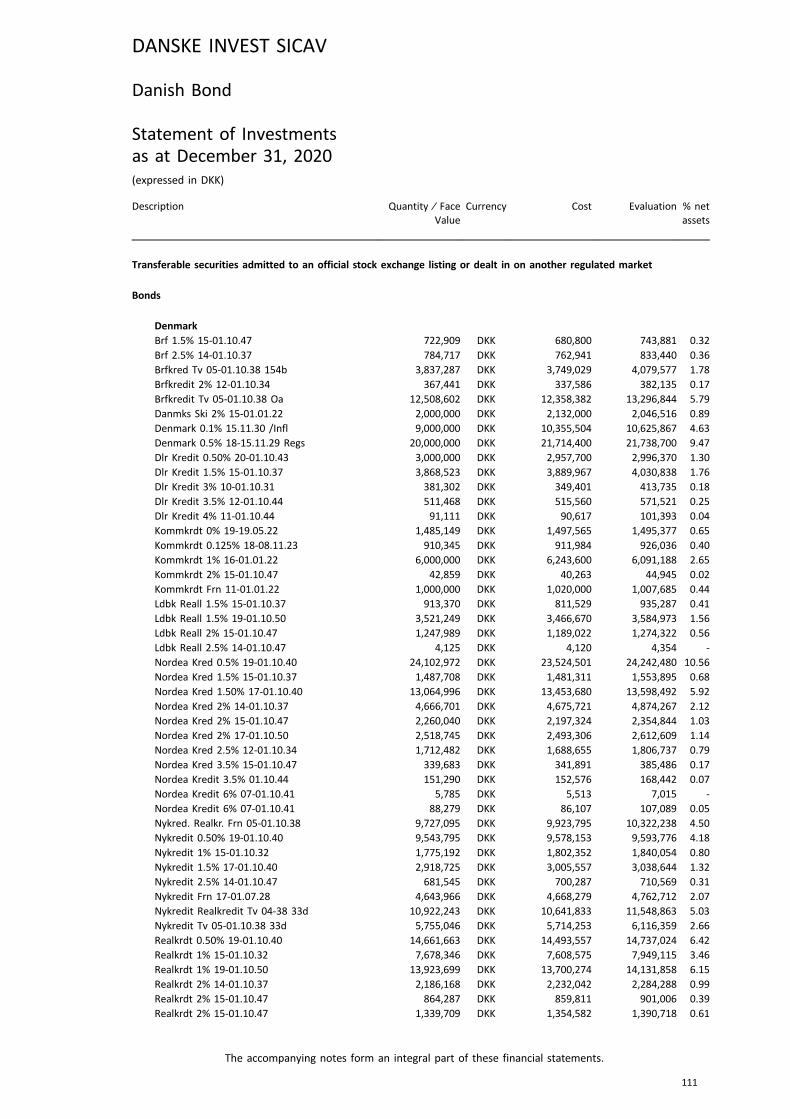
Danish Bond
Statement of Investmentsas at December 31, 2020(expressed in DKK)
Description Quantity ⁄ FaceValue
Currency Cost Evaluation % netassets
Transferable securities admitted to an official stock exchange listing or dealt in on another regulated market
Bonds
DenmarkBrf 1.5% 15-01.10.47 722,909 DKK 680,800 743,881 0.32
Brf 2.5% 14-01.10.37 784,717 DKK 762,941 833,440 0.36
Brfkred Tv 05-01.10.38 154b 3,837,287 DKK 3,749,029 4,079,577 1.78
Brfkredit 2% 12-01.10.34 367,441 DKK 337,586 382,135 0.17
Brfkredit Tv 05-01.10.38 Oa 12,508,602 DKK 12,358,382 13,296,844 5.79
Danmks Ski 2% 15-01.01.22 2,000,000 DKK 2,132,000 2,046,516 0.89
Denmark 0.1% 15.11.30 /Infl 9,000,000 DKK 10,355,504 10,625,867 4.63
Denmark 0.5% 18-15.11.29 Regs 20,000,000 DKK 21,714,400 21,738,700 9.47
Dlr Kredit 0.50% 20-01.10.43 3,000,000 DKK 2,957,700 2,996,370 1.30
Dlr Kredit 1.5% 15-01.10.37 3,868,523 DKK 3,889,967 4,030,838 1.76
Dlr Kredit 3% 10-01.10.31 381,302 DKK 349,401 413,735 0.18
Dlr Kredit 3.5% 12-01.10.44 511,468 DKK 515,560 571,521 0.25
Dlr Kredit 4% 11-01.10.44 91,111 DKK 90,617 101,393 0.04
Kommkrdt 0% 19-19.05.22 1,485,149 DKK 1,497,565 1,495,377 0.65
Kommkrdt 0.125% 18-08.11.23 910,345 DKK 911,984 926,036 0.40
Kommkrdt 1% 16-01.01.22 6,000,000 DKK 6,243,600 6,091,188 2.65
Kommkrdt 2% 15-01.10.47 42,859 DKK 40,263 44,945 0.02
Kommkrdt Frn 11-01.01.22 1,000,000 DKK 1,020,000 1,007,685 0.44
Ldbk Reall 1.5% 15-01.10.37 913,370 DKK 811,529 935,287 0.41
Ldbk Reall 1.5% 19-01.10.50 3,521,249 DKK 3,466,670 3,584,973 1.56
Ldbk Reall 2% 15-01.10.47 1,247,989 DKK 1,189,022 1,274,322 0.56
Ldbk Reall 2.5% 14-01.10.47 4,125 DKK 4,120 4,354 -
Nordea Kred 0.5% 19-01.10.40 24,102,972 DKK 23,524,501 24,242,480 10.56
Nordea Kred 1.5% 15-01.10.37 1,487,708 DKK 1,481,311 1,553,895 0.68
Nordea Kred 1.50% 17-01.10.40 13,064,996 DKK 13,453,680 13,598,492 5.92
Nordea Kred 2% 14-01.10.37 4,666,701 DKK 4,675,721 4,874,267 2.12
Nordea Kred 2% 15-01.10.47 2,260,040 DKK 2,197,324 2,354,844 1.03
Nordea Kred 2% 17-01.10.50 2,518,745 DKK 2,493,306 2,612,609 1.14
Nordea Kred 2.5% 12-01.10.34 1,712,482 DKK 1,688,655 1,806,737 0.79
Nordea Kred 3.5% 15-01.10.47 339,683 DKK 341,891 385,486 0.17
Nordea Kredit 3.5% 01.10.44 151,290 DKK 152,576 168,442 0.07
Nordea Kredit 6% 07-01.10.41 5,785 DKK 5,513 7,015 -
Nordea Kredit 6% 07-01.10.41 88,279 DKK 86,107 107,089 0.05
Nykred. Realkr. Frn 05-01.10.38 9,727,095 DKK 9,923,795 10,322,238 4.50
Nykredit 0.50% 19-01.10.40 9,543,795 DKK 9,578,153 9,593,776 4.18
Nykredit 1% 15-01.10.32 1,775,192 DKK 1,802,352 1,840,054 0.80
Nykredit 1.5% 17-01.10.40 2,918,725 DKK 3,005,557 3,038,644 1.32
Nykredit 2.5% 14-01.10.47 681,545 DKK 700,287 710,569 0.31
Nykredit Frn 17-01.07.28 4,643,966 DKK 4,668,279 4,762,712 2.07
Nykredit Realkredit Tv 04-38 33d 10,922,243 DKK 10,641,833 11,548,863 5.03
Nykredit Tv 05-01.10.38 33d 5,755,046 DKK 5,714,253 6,116,359 2.66
Realkrdt 0.50% 19-01.10.40 14,661,663 DKK 14,493,557 14,737,024 6.42
Realkrdt 1% 15-01.10.32 7,678,346 DKK 7,608,575 7,949,115 3.46
Realkrdt 1% 19-01.10.50 13,923,699 DKK 13,700,274 14,131,858 6.15
Realkrdt 2% 14-01.10.37 2,186,168 DKK 2,232,042 2,284,288 0.99
Realkrdt 2% 15-01.10.47 864,287 DKK 859,811 901,006 0.39
Realkrdt 2% 15-01.10.47 1,339,709 DKK 1,354,582 1,390,718 0.61
DANSKE INVEST SICAV
The accompanying notes form an integral part of these financial statements.
111

Description Quantity ⁄ FaceValue
Currency Cost Evaluation % netassets
Denmark (continued)Realkrdt 4% 07-01.10.31 162,661 DKK 169,493 180,552 0.08
Realkredit 3.5% 12-01.10.44 299,921 DKK 301,394 334,422 0.15
Realkredit 4% 05-01.10.28 7,060 DKK 7,455 7,625 -
Realkredit Dan. Frn 05-01.10.38 4,000,250 DKK 4,215,125 4,248,098 1.85
Realkredit Dk. 6% 93-01.10.26 A 66,902 DKK 68,956 74,199 0.03
Realkredit Tv 05-01.10.38 Oa 5,109,201 DKK 5,026,624 5,416,453 2.36
Totalkred Frn 04-01.10.38 /30 Ccf 926,754 DKK 969,385 979,307 0.43
Totalkredit 6% -01.04.24 S111 22,466 DKK 22,308 24,264 0.01
222,243,315 229,528,484 99.96
Total - Bonds 222,243,315 229,528,484 99.96
Total - Transferable securities admitted to an official stock exchange listing ordealt in on another regulated market 222,243,315 229,528,484 99.96
TOTAL INVESTMENT PORTFOLIO 222,243,315 229,528,484 99.96
DANSKE INVEST SICAV
The accompanying notes form an integral part of these financial statements.
112
Danish Bond
Statement of Investments (continued)as at December 31, 2020(expressed in DKK)

Danish Bond
Geographical and Economic Portfolio Breakdownsas at December 31, 2020(expressed as a percentage of net assets)
Geographical breakdown %
Denmark 99.96
99.96
Economic breakdown %
Mortgage and Funding Institutions 81.70States, Provinces and Municipalities 18.26
99.96
DANSKE INVEST SICAV
The accompanying notes form an integral part of these financial statements.
113
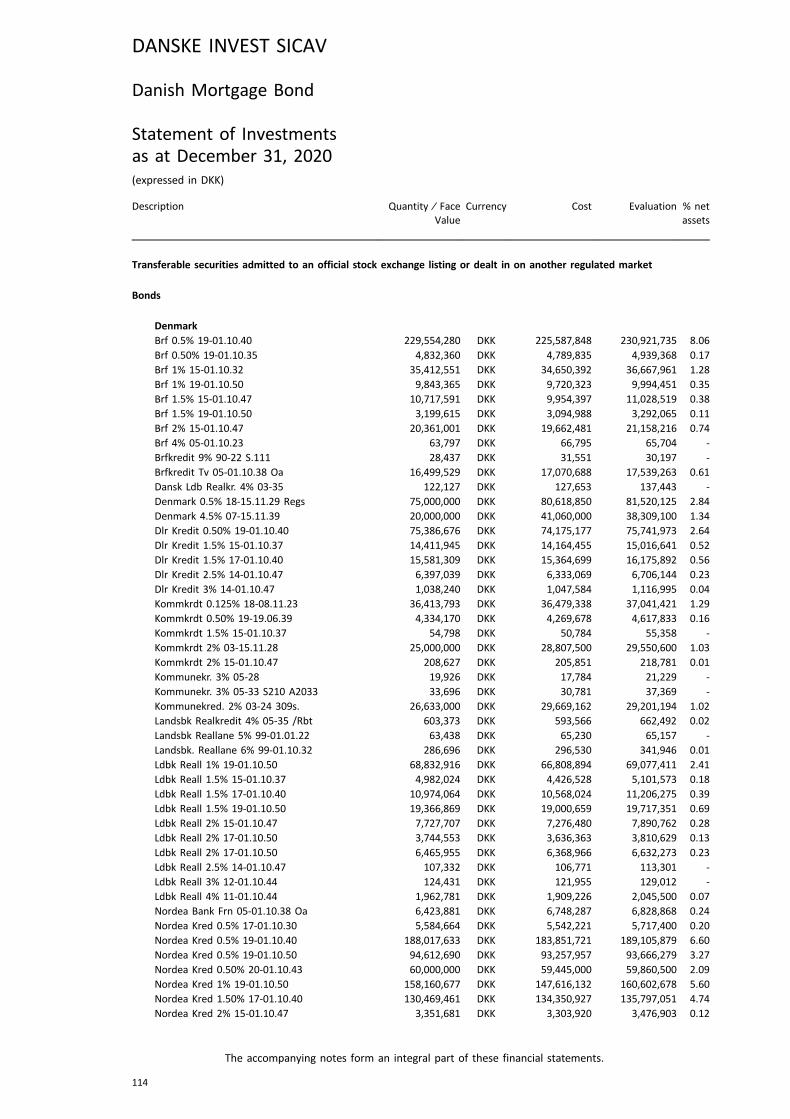
Danish Mortgage Bond
Statement of Investmentsas at December 31, 2020(expressed in DKK)
Description Quantity ⁄ FaceValue
Currency Cost Evaluation % netassets
Transferable securities admitted to an official stock exchange listing or dealt in on another regulated market
Bonds
DenmarkBrf 0.5% 19-01.10.40 229,554,280 DKK 225,587,848 230,921,735 8.06
Brf 0.50% 19-01.10.35 4,832,360 DKK 4,789,835 4,939,368 0.17
Brf 1% 15-01.10.32 35,412,551 DKK 34,650,392 36,667,961 1.28
Brf 1% 19-01.10.50 9,843,365 DKK 9,720,323 9,994,451 0.35
Brf 1.5% 15-01.10.47 10,717,591 DKK 9,954,397 11,028,519 0.38
Brf 1.5% 19-01.10.50 3,199,615 DKK 3,094,988 3,292,065 0.11
Brf 2% 15-01.10.47 20,361,001 DKK 19,662,481 21,158,216 0.74
Brf 4% 05-01.10.23 63,797 DKK 66,795 65,704 -
Brfkredit 9% 90-22 S.111 28,437 DKK 31,551 30,197 -
Brfkredit Tv 05-01.10.38 Oa 16,499,529 DKK 17,070,688 17,539,263 0.61
Dansk Ldb Realkr. 4% 03-35 122,127 DKK 127,653 137,443 -
Denmark 0.5% 18-15.11.29 Regs 75,000,000 DKK 80,618,850 81,520,125 2.84
Denmark 4.5% 07-15.11.39 20,000,000 DKK 41,060,000 38,309,100 1.34
Dlr Kredit 0.50% 19-01.10.40 75,386,676 DKK 74,175,177 75,741,973 2.64
Dlr Kredit 1.5% 15-01.10.37 14,411,945 DKK 14,164,455 15,016,641 0.52
Dlr Kredit 1.5% 17-01.10.40 15,581,309 DKK 15,364,699 16,175,892 0.56
Dlr Kredit 2.5% 14-01.10.47 6,397,039 DKK 6,333,069 6,706,144 0.23
Dlr Kredit 3% 14-01.10.47 1,038,240 DKK 1,047,584 1,116,995 0.04
Kommkrdt 0.125% 18-08.11.23 36,413,793 DKK 36,479,338 37,041,421 1.29
Kommkrdt 0.50% 19-19.06.39 4,334,170 DKK 4,269,678 4,617,833 0.16
Kommkrdt 1.5% 15-01.10.37 54,798 DKK 50,784 55,358 -
Kommkrdt 2% 03-15.11.28 25,000,000 DKK 28,807,500 29,550,600 1.03
Kommkrdt 2% 15-01.10.47 208,627 DKK 205,851 218,781 0.01
Kommunekr. 3% 05-28 19,926 DKK 17,784 21,229 -
Kommunekr. 3% 05-33 S210 A2033 33,696 DKK 30,781 37,369 -
Kommunekred. 2% 03-24 309s. 26,633,000 DKK 29,669,162 29,201,194 1.02
Landsbk Realkredit 4% 05-35 /Rbt 603,373 DKK 593,566 662,492 0.02
Landsbk Reallane 5% 99-01.01.22 63,438 DKK 65,230 65,157 -
Landsbk. Reallane 6% 99-01.10.32 286,696 DKK 296,530 341,946 0.01
Ldbk Reall 1% 19-01.10.50 68,832,916 DKK 66,808,894 69,077,411 2.41
Ldbk Reall 1.5% 15-01.10.37 4,982,024 DKK 4,426,528 5,101,573 0.18
Ldbk Reall 1.5% 17-01.10.40 10,974,064 DKK 10,568,024 11,206,275 0.39
Ldbk Reall 1.5% 19-01.10.50 19,366,869 DKK 19,000,659 19,717,351 0.69
Ldbk Reall 2% 15-01.10.47 7,727,707 DKK 7,276,480 7,890,762 0.28
Ldbk Reall 2% 17-01.10.50 3,744,553 DKK 3,636,363 3,810,629 0.13
Ldbk Reall 2% 17-01.10.50 6,465,955 DKK 6,368,966 6,632,273 0.23
Ldbk Reall 2.5% 14-01.10.47 107,332 DKK 106,771 113,301 -
Ldbk Reall 3% 12-01.10.44 124,431 DKK 121,955 129,012 -
Ldbk Reall 4% 11-01.10.44 1,962,781 DKK 1,909,226 2,045,500 0.07
Nordea Bank Frn 05-01.10.38 Oa 6,423,881 DKK 6,748,287 6,828,868 0.24
Nordea Kred 0.5% 17-01.10.30 5,584,664 DKK 5,542,221 5,717,400 0.20
Nordea Kred 0.5% 19-01.10.40 188,017,633 DKK 183,851,721 189,105,879 6.60
Nordea Kred 0.5% 19-01.10.50 94,612,690 DKK 93,257,957 93,666,279 3.27
Nordea Kred 0.50% 20-01.10.43 60,000,000 DKK 59,445,000 59,860,500 2.09
Nordea Kred 1% 19-01.10.50 158,160,677 DKK 147,616,132 160,602,678 5.60
Nordea Kred 1.50% 17-01.10.40 130,469,461 DKK 134,350,927 135,797,051 4.74
Nordea Kred 2% 15-01.10.47 3,351,681 DKK 3,303,920 3,476,903 0.12
DANSKE INVEST SICAV
The accompanying notes form an integral part of these financial statements.
114
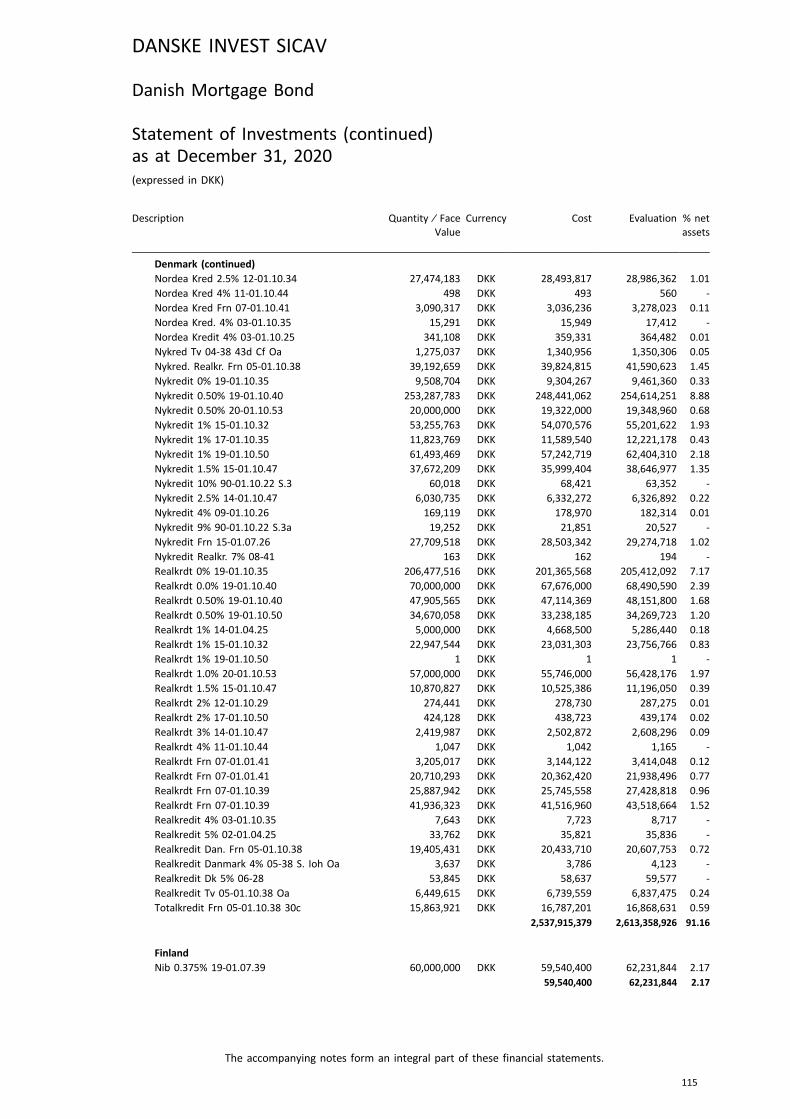
Description Quantity ⁄ FaceValue
Currency Cost Evaluation % netassets
Denmark (continued)Nordea Kred 2.5% 12-01.10.34 27,474,183 DKK 28,493,817 28,986,362 1.01
Nordea Kred 4% 11-01.10.44 498 DKK 493 560 -
Nordea Kred Frn 07-01.10.41 3,090,317 DKK 3,036,236 3,278,023 0.11
Nordea Kred. 4% 03-01.10.35 15,291 DKK 15,949 17,412 -
Nordea Kredit 4% 03-01.10.25 341,108 DKK 359,331 364,482 0.01
Nykred Tv 04-38 43d Cf Oa 1,275,037 DKK 1,340,956 1,350,306 0.05
Nykred. Realkr. Frn 05-01.10.38 39,192,659 DKK 39,824,815 41,590,623 1.45
Nykredit 0% 19-01.10.35 9,508,704 DKK 9,304,267 9,461,360 0.33
Nykredit 0.50% 19-01.10.40 253,287,783 DKK 248,441,062 254,614,251 8.88
Nykredit 0.50% 20-01.10.53 20,000,000 DKK 19,322,000 19,348,960 0.68
Nykredit 1% 15-01.10.32 53,255,763 DKK 54,070,576 55,201,622 1.93
Nykredit 1% 17-01.10.35 11,823,769 DKK 11,589,540 12,221,178 0.43
Nykredit 1% 19-01.10.50 61,493,469 DKK 57,242,719 62,404,310 2.18
Nykredit 1.5% 15-01.10.47 37,672,209 DKK 35,999,404 38,646,977 1.35
Nykredit 10% 90-01.10.22 S.3 60,018 DKK 68,421 63,352 -
Nykredit 2.5% 14-01.10.47 6,030,735 DKK 6,332,272 6,326,892 0.22
Nykredit 4% 09-01.10.26 169,119 DKK 178,970 182,314 0.01
Nykredit 9% 90-01.10.22 S.3a 19,252 DKK 21,851 20,527 -
Nykredit Frn 15-01.07.26 27,709,518 DKK 28,503,342 29,274,718 1.02
Nykredit Realkr. 7% 08-41 163 DKK 162 194 -
Realkrdt 0% 19-01.10.35 206,477,516 DKK 201,365,568 205,412,092 7.17
Realkrdt 0.0% 19-01.10.40 70,000,000 DKK 67,676,000 68,490,590 2.39
Realkrdt 0.50% 19-01.10.40 47,905,565 DKK 47,114,369 48,151,800 1.68
Realkrdt 0.50% 19-01.10.50 34,670,058 DKK 33,238,185 34,269,723 1.20
Realkrdt 1% 14-01.04.25 5,000,000 DKK 4,668,500 5,286,440 0.18
Realkrdt 1% 15-01.10.32 22,947,544 DKK 23,031,303 23,756,766 0.83
Realkrdt 1% 19-01.10.50 1 DKK 1 1 -
Realkrdt 1.0% 20-01.10.53 57,000,000 DKK 55,746,000 56,428,176 1.97
Realkrdt 1.5% 15-01.10.47 10,870,827 DKK 10,525,386 11,196,050 0.39
Realkrdt 2% 12-01.10.29 274,441 DKK 278,730 287,275 0.01
Realkrdt 2% 17-01.10.50 424,128 DKK 438,723 439,174 0.02
Realkrdt 3% 14-01.10.47 2,419,987 DKK 2,502,872 2,608,296 0.09
Realkrdt 4% 11-01.10.44 1,047 DKK 1,042 1,165 -
Realkrdt Frn 07-01.01.41 3,205,017 DKK 3,144,122 3,414,048 0.12
Realkrdt Frn 07-01.01.41 20,710,293 DKK 20,362,420 21,938,496 0.77
Realkrdt Frn 07-01.10.39 25,887,942 DKK 25,745,558 27,428,818 0.96
Realkrdt Frn 07-01.10.39 41,936,323 DKK 41,516,960 43,518,664 1.52
Realkredit 4% 03-01.10.35 7,643 DKK 7,723 8,717 -
Realkredit 5% 02-01.04.25 33,762 DKK 35,821 35,836 -
Realkredit Dan. Frn 05-01.10.38 19,405,431 DKK 20,433,710 20,607,753 0.72
Realkredit Danmark 4% 05-38 S. Ioh Oa 3,637 DKK 3,786 4,123 -
Realkredit Dk 5% 06-28 53,845 DKK 58,637 59,577 -
Realkredit Tv 05-01.10.38 Oa 6,449,615 DKK 6,739,559 6,837,475 0.24
Totalkredit Frn 05-01.10.38 30c 15,863,921 DKK 16,787,201 16,868,631 0.59
2,537,915,379 2,613,358,926 91.16
FinlandNib 0.375% 19-01.07.39 60,000,000 DKK 59,540,400 62,231,844 2.17
59,540,400 62,231,844 2.17
DANSKE INVEST SICAV
The accompanying notes form an integral part of these financial statements.
115
Danish Mortgage Bond
Statement of Investments (continued)as at December 31, 2020(expressed in DKK)

Description Quantity ⁄ FaceValue
Currency Cost Evaluation % netassets
LuxembourgEIB 0.0% 19-14.11.31 29,600,000 DKK 29,972,960 30,217,450 1.06
29,972,960 30,217,450 1.06
United States of AmericaIntl Bk Rec 0.20% 19-15.11.39 140,000,000 DKK 137,882,000 140,414,540 4.90
137,882,000 140,414,540 4.90
Total - Bonds 2,765,310,739 2,846,222,760 99.29
Total - Transferable securities admitted to an official stock exchange listing ordealt in on another regulated market 2,765,310,739 2,846,222,760 99.29
TOTAL INVESTMENT PORTFOLIO 2,765,310,739 2,846,222,760 99.29
DANSKE INVEST SICAV
The accompanying notes form an integral part of these financial statements.
116
Danish Mortgage Bond
Statement of Investments (continued)as at December 31, 2020(expressed in DKK)
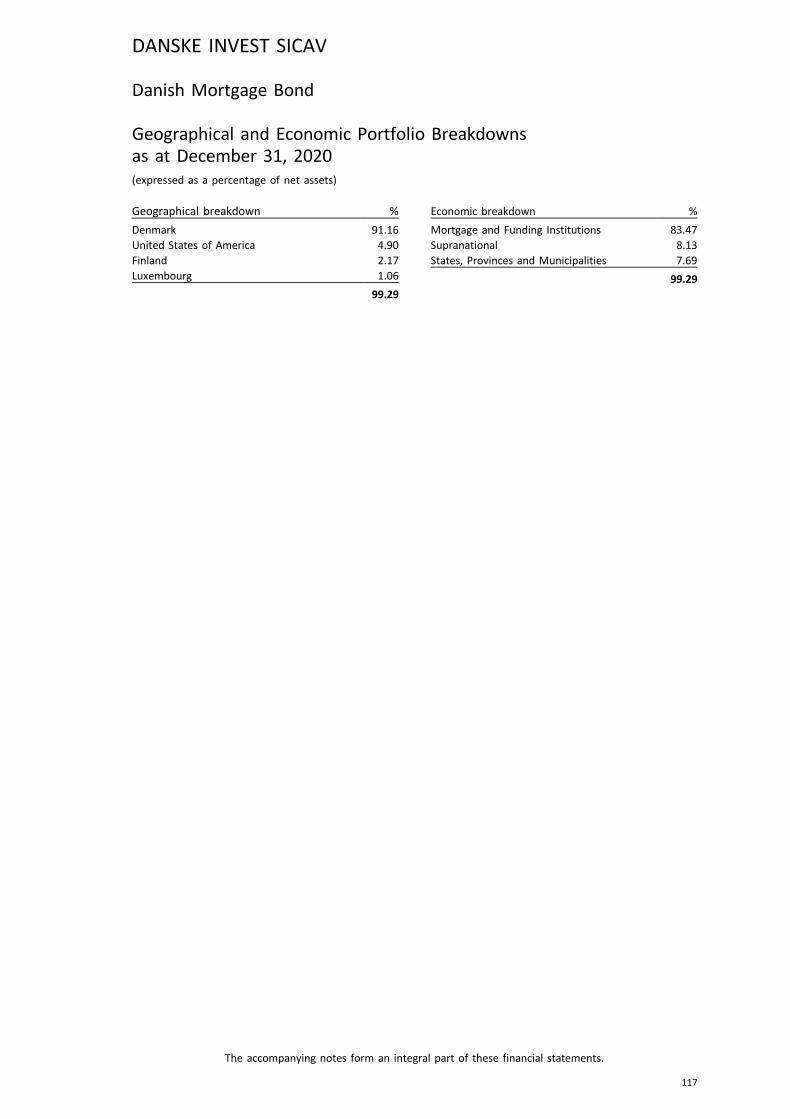
Danish Mortgage Bond
Geographical and Economic Portfolio Breakdownsas at December 31, 2020(expressed as a percentage of net assets)
Geographical breakdown %
Denmark 91.16United States of America 4.90Finland 2.17Luxembourg 1.06
99.29
Economic breakdown %
Mortgage and Funding Institutions 83.47Supranational 8.13States, Provinces and Municipalities 7.69
99.29
DANSKE INVEST SICAV
The accompanying notes form an integral part of these financial statements.
117

Denmark Focus
Statement of Investmentsas at December 31, 2020(expressed in DKK)
Description Quantity ⁄ FaceValue
Currency Cost Evaluation % netassets
Transferable securities admitted to an official stock exchange listing or dealt in on another regulated market
Shares
DenmarkA.P. Moeller-Maersk A /S A 256 DKK 1,891,743 3,238,400 0.71
A.P. Moeller-Maersk A /S B 2,499 DKK 24,929,011 33,973,905 7.47
Carlsberg A /S B 26,283 DKK 19,652,236 25,631,182 5.64
Christian Hansen Holding A /S 29,281 DKK 15,723,517 18,341,618 4.03
Coloplast -B- 23,097 DKK 15,599,554 21,470,971 4.72
Danske Bank As 170,518 DKK 31,318,738 17,162,637 3.77
Dfds A/S 35,291 DKK 8,657,198 9,712,083 2.14
Dsv Panalpina A /S 21,493 DKK 10,819,764 21,922,860 4.82
Genmab A /S 5,990 DKK 6,348,473 14,753,370 3.24
Gn Great Nordic Ltd 43,925 DKK 10,222,475 21,400,260 4.71
H. Lundbeck A /S 22,193 DKK 6,769,627 4,633,898 1.02
Iss A /S 78,933 DKK 11,823,605 8,319,538 1.83
Matas A /S 28,676 DKK 1,820,497 2,477,606 0.54
Netcompany Group A/S 27,757 DKK 6,366,039 17,278,733 3.80
Novo Nordisk A /S /-B- 98,742 DKK 31,940,218 42,128,274 9.26
Novozymes Shs -B- 19,180 DKK 5,992,019 6,703,410 1.47
Orphazyme A/S 56,130 DKK 3,962,674 3,766,323 0.83
Orsted 30,679 DKK 11,051,544 38,149,336 8.39
Pandora A /S 26,388 DKK 12,019,495 17,970,228 3.95
Per Aarsleff A/S 23,067 DKK 3,822,170 7,116,170 1.57
Rockwool International A /S B 1,717 DKK 2,862,288 3,911,326 0.86
Royal Unibrew A /S 23,537 DKK 9,249,796 16,631,244 3.66
Topdanmark A /S 34,724 DKK 10,120,106 9,174,081 2.02
Tryg A/S 90,209 DKK 15,091,719 17,329,149 3.81
Vestas Wind Systems As /Reg 21,485 DKK 11,320,130 30,927,657 6.80
William Demant Holding A /S 72,768 DKK 15,691,031 17,507,981 3.85
Zealand Pharma A /S 23,746 DKK 4,347,523 5,238,368 1.15
309,413,190 436,870,608 96.06
FinlandNordea Bank Abp 236,903 SEK 11,562,606 11,768,251 2.59
11,562,606 11,768,251 2.59
Total - Shares 320,975,796 448,638,859 98.65
Total - Transferable securities admitted to an official stock exchange listing ordealt in on another regulated market 320,975,796 448,638,859 98.65
TOTAL INVESTMENT PORTFOLIO 320,975,796 448,638,859 98.65
DANSKE INVEST SICAV
The accompanying notes form an integral part of these financial statements.
118
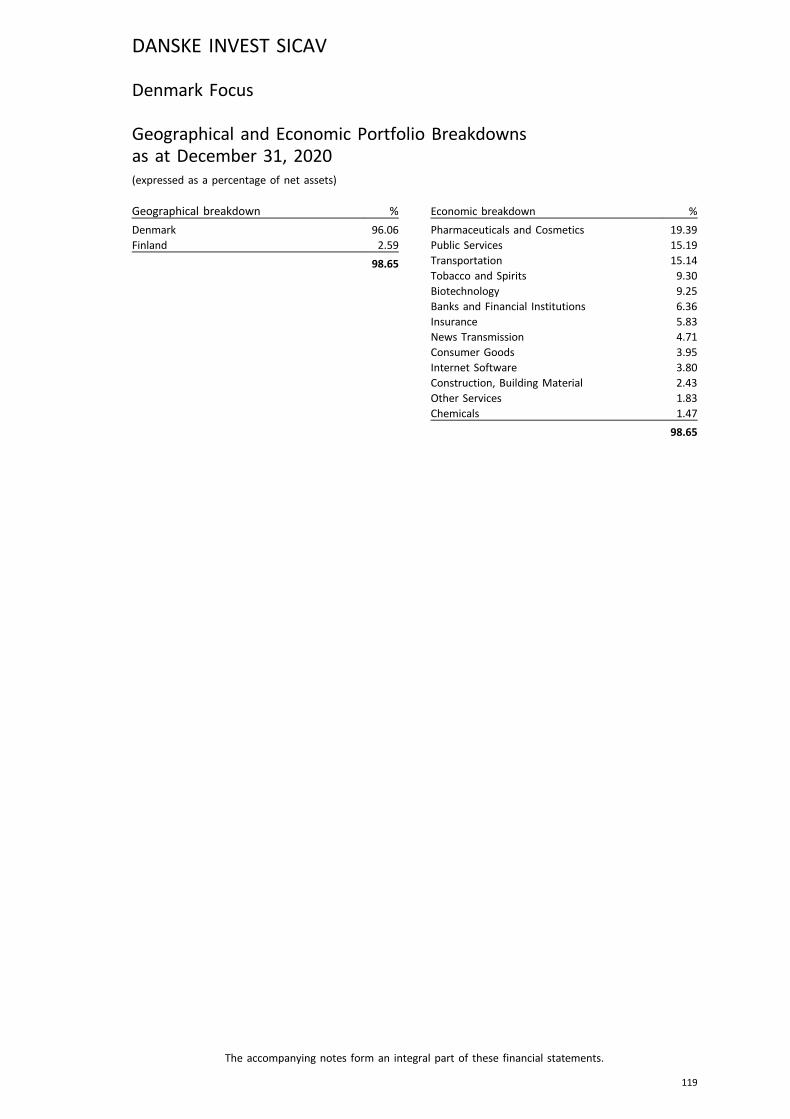
Denmark Focus
Geographical and Economic Portfolio Breakdownsas at December 31, 2020(expressed as a percentage of net assets)
Geographical breakdown %
Denmark 96.06Finland 2.59
98.65
Economic breakdown %
Pharmaceuticals and Cosmetics 19.39Public Services 15.19Transportation 15.14Tobacco and Spirits 9.30Biotechnology 9.25Banks and Financial Institutions 6.36Insurance 5.83News Transmission 4.71Consumer Goods 3.95Internet Software 3.80Construction, Building Material 2.43Other Services 1.83Chemicals 1.47
98.65
DANSKE INVEST SICAV
The accompanying notes form an integral part of these financial statements.
119

Eastern Europe
Statement of Investmentsas at December 31, 2020(expressed in EUR)
Description Quantity ⁄ FaceValue
Currency Cost Evaluation % netassets
Transferable securities admitted to an official stock exchange listing or dealt in on another regulated market
Shares
British Virgin IslandsMail. Ru Gr /Gdr 6,334 USD 150,246 137,567 1.54
150,246 137,567 1.54
Czech RepublicCez. Ceske Energeticke Zavody 5,018 CZK 81,827 98,490 1.10
81,827 98,490 1.10
GreeceEurobank Ergasias Sa 122,151 EUR 49,108 71,434 0.80
Jumbo Sa 4,360 EUR 64,412 62,435 0.70
Mytilineos /Reg 6,907 EUR 67,797 80,812 0.90
National Bank of Greece S.A 54,164 EUR 65,264 122,086 1.36
Opap 9,361 EUR 78,813 102,503 1.15
325,394 439,270 4.91
HungaryMol Hungarian Oil and Gas Plc 24,928 HUF 122,579 149,590 1.67
Otp Bank Ltd 7,980 HUF 230,541 292,134 3.26
353,120 441,724 4.93
JerseyPolymetal 13,491 GBP 248,251 254,410 2.84
248,251 254,410 2.84
KazakhstanHalyk Bank /Sgdr 10,056 USD 93,966 95,705 1.07
93,966 95,705 1.07
PolandAsseco Poland Sa 5,978 PLN 90,636 88,975 0.99
Cd Projekt Sa 2,122 PLN 174,344 127,400 1.42
Getback S.A 49,786 PLN - - -
Grupa Kety Sa 1,100 PLN 111,120 118,163 1.32
Kghm Polska Miedz Sa 4,204 PLN 110,971 168,144 1.88
Polski Koncern Naftowy Orlen 6,865 PLN 74,548 86,603 0.97
Powszechna Kasa Oszczed. Polski 40,573 PLN 214,405 254,676 2.85
Powszechny Zaklad Ubezpieczen 26,460 PLN 158,254 187,139 2.09
Santander Bank Polska S.A. 2,994 PLN 109,464 121,515 1.36
Wirtualna Polska Holding S.A. 6,577 PLN 100,870 133,684 1.49
1,144,612 1,286,299 14.37
RomaniaBanca Romana Pentru Dezvoltare 17,847 RON 46,934 54,463 0.61
46,934 54,463 0.61
DANSKE INVEST SICAV
The accompanying notes form an integral part of these financial statements.
120
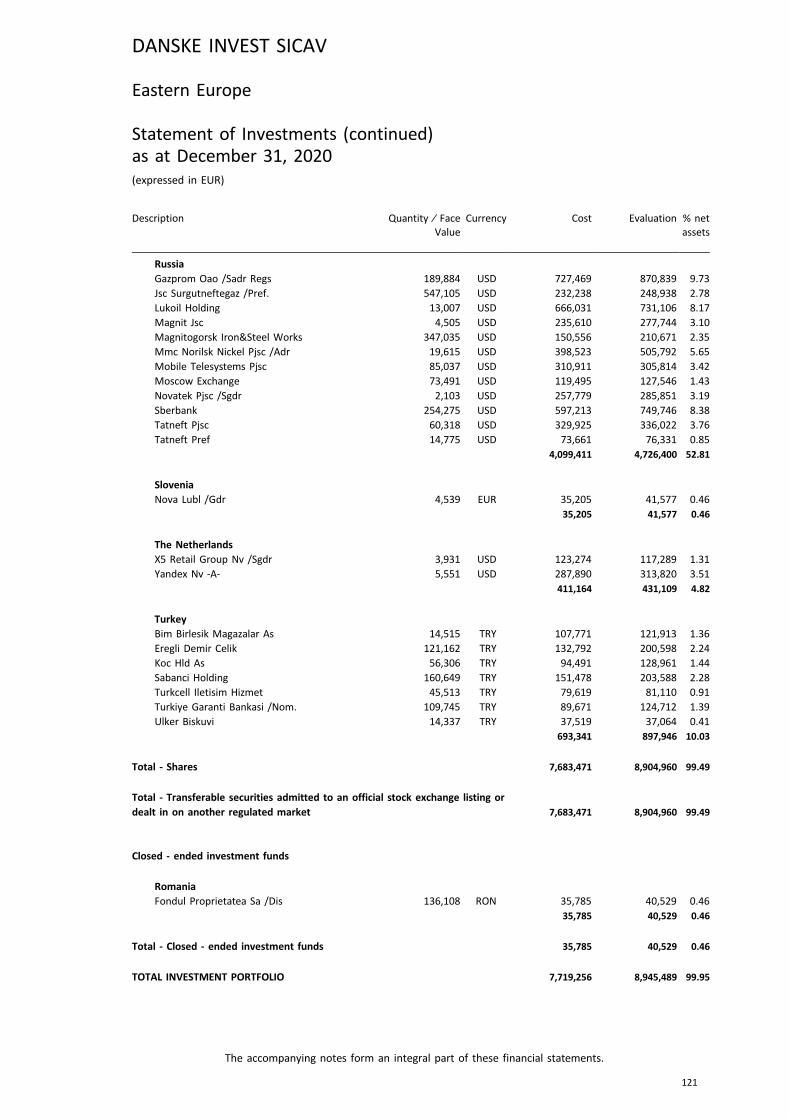
Description Quantity ⁄ FaceValue
Currency Cost Evaluation % netassets
RussiaGazprom Oao /Sadr Regs 189,884 USD 727,469 870,839 9.73
Jsc Surgutneftegaz /Pref. 547,105 USD 232,238 248,938 2.78
Lukoil Holding 13,007 USD 666,031 731,106 8.17
Magnit Jsc 4,505 USD 235,610 277,744 3.10
Magnitogorsk Iron&Steel Works 347,035 USD 150,556 210,671 2.35
Mmc Norilsk Nickel Pjsc /Adr 19,615 USD 398,523 505,792 5.65
Mobile Telesystems Pjsc 85,037 USD 310,911 305,814 3.42
Moscow Exchange 73,491 USD 119,495 127,546 1.43
Novatek Pjsc /Sgdr 2,103 USD 257,779 285,851 3.19
Sberbank 254,275 USD 597,213 749,746 8.38
Tatneft Pjsc 60,318 USD 329,925 336,022 3.76
Tatneft Pref 14,775 USD 73,661 76,331 0.85
4,099,411 4,726,400 52.81
SloveniaNova Lubl /Gdr 4,539 EUR 35,205 41,577 0.46
35,205 41,577 0.46
The NetherlandsX5 Retail Group Nv /Sgdr 3,931 USD 123,274 117,289 1.31
Yandex Nv -A- 5,551 USD 287,890 313,820 3.51
411,164 431,109 4.82
TurkeyBim Birlesik Magazalar As 14,515 TRY 107,771 121,913 1.36
Eregli Demir Celik 121,162 TRY 132,792 200,598 2.24
Koc Hld As 56,306 TRY 94,491 128,961 1.44
Sabanci Holding 160,649 TRY 151,478 203,588 2.28
Turkcell Iletisim Hizmet 45,513 TRY 79,619 81,110 0.91
Turkiye Garanti Bankasi /Nom. 109,745 TRY 89,671 124,712 1.39
Ulker Biskuvi 14,337 TRY 37,519 37,064 0.41
693,341 897,946 10.03
Total - Shares 7,683,471 8,904,960 99.49
Total - Transferable securities admitted to an official stock exchange listing ordealt in on another regulated market 7,683,471 8,904,960 99.49
Closed - ended investment funds
RomaniaFondul Proprietatea Sa /Dis 136,108 RON 35,785 40,529 0.46
35,785 40,529 0.46
Total - Closed - ended investment funds 35,785 40,529 0.46
TOTAL INVESTMENT PORTFOLIO 7,719,256 8,945,489 99.95
DANSKE INVEST SICAV
The accompanying notes form an integral part of these financial statements.
121
Eastern Europe
Statement of Investments (continued)as at December 31, 2020(expressed in EUR)
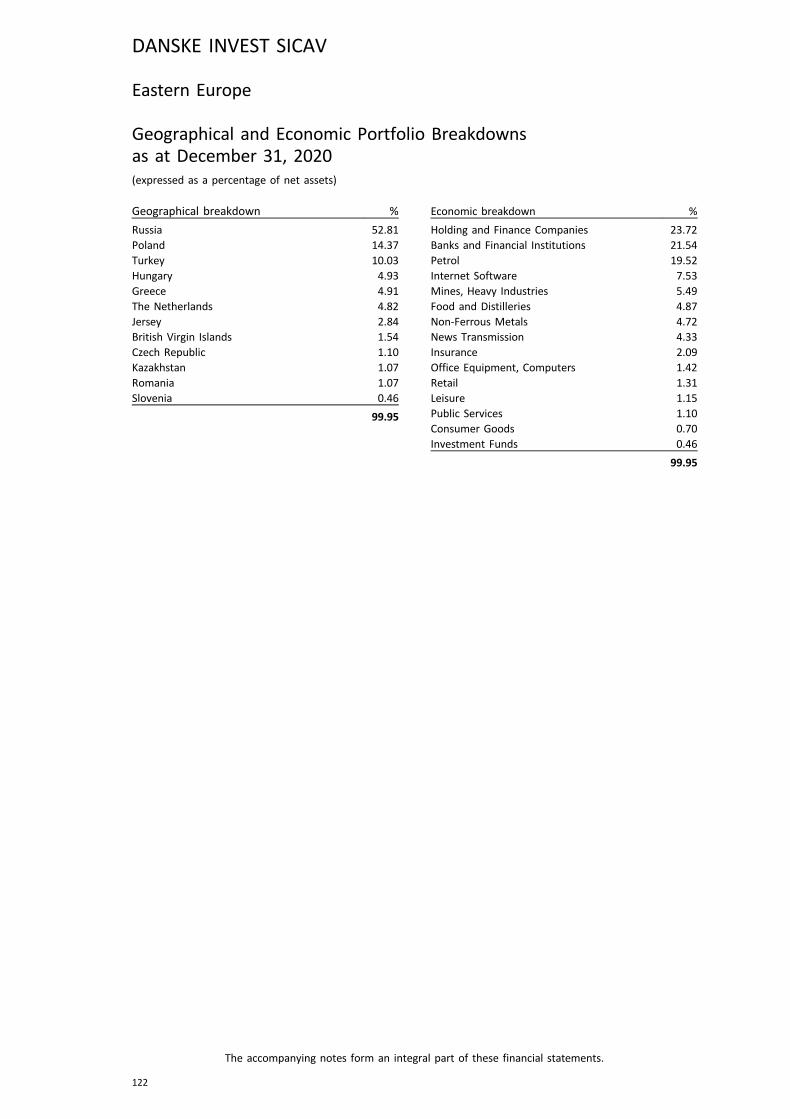
Eastern Europe
Geographical and Economic Portfolio Breakdownsas at December 31, 2020(expressed as a percentage of net assets)
Geographical breakdown %
Russia 52.81Poland 14.37Turkey 10.03Hungary 4.93Greece 4.91The Netherlands 4.82Jersey 2.84British Virgin Islands 1.54Czech Republic 1.10Kazakhstan 1.07Romania 1.07Slovenia 0.46
99.95
Economic breakdown %
Holding and Finance Companies 23.72Banks and Financial Institutions 21.54Petrol 19.52Internet Software 7.53Mines, Heavy Industries 5.49Food and Distilleries 4.87Non-Ferrous Metals 4.72News Transmission 4.33Insurance 2.09Office Equipment, Computers 1.42Retail 1.31Leisure 1.15Public Services 1.10Consumer Goods 0.70Investment Funds 0.46
99.95
DANSKE INVEST SICAV
The accompanying notes form an integral part of these financial statements.
122
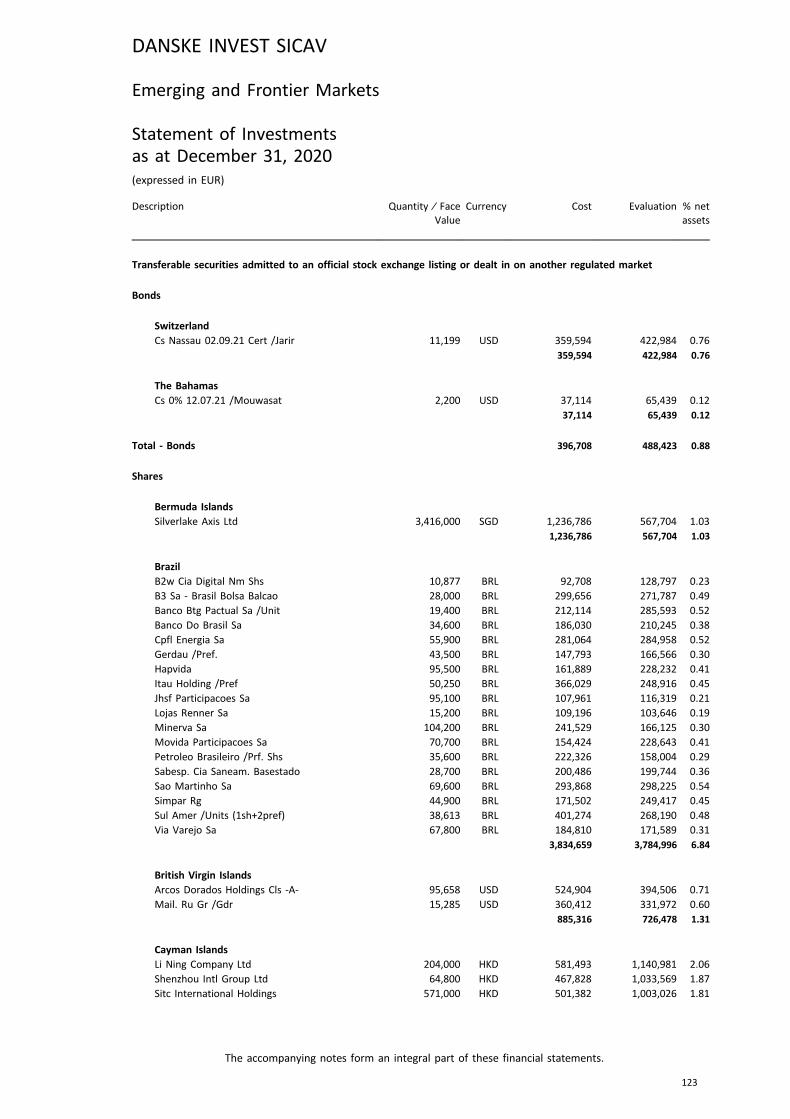
Emerging and Frontier Markets
Statement of Investmentsas at December 31, 2020(expressed in EUR)
Description Quantity ⁄ FaceValue
Currency Cost Evaluation % netassets
Transferable securities admitted to an official stock exchange listing or dealt in on another regulated market
Bonds
SwitzerlandCs Nassau 02.09.21 Cert /Jarir 11,199 USD 359,594 422,984 0.76
359,594 422,984 0.76
The BahamasCs 0% 12.07.21 /Mouwasat 2,200 USD 37,114 65,439 0.12
37,114 65,439 0.12
Total - Bonds 396,708 488,423 0.88
Shares
Bermuda IslandsSilverlake Axis Ltd 3,416,000 SGD 1,236,786 567,704 1.03
1,236,786 567,704 1.03
BrazilB2w Cia Digital Nm Shs 10,877 BRL 92,708 128,797 0.23
B3 Sa - Brasil Bolsa Balcao 28,000 BRL 299,656 271,787 0.49
Banco Btg Pactual Sa /Unit 19,400 BRL 212,114 285,593 0.52
Banco Do Brasil Sa 34,600 BRL 186,030 210,245 0.38
Cpfl Energia Sa 55,900 BRL 281,064 284,958 0.52
Gerdau /Pref. 43,500 BRL 147,793 166,566 0.30
Hapvida 95,500 BRL 161,889 228,232 0.41
Itau Holding /Pref 50,250 BRL 366,029 248,916 0.45
Jhsf Participacoes Sa 95,100 BRL 107,961 116,319 0.21
Lojas Renner Sa 15,200 BRL 109,196 103,646 0.19
Minerva Sa 104,200 BRL 241,529 166,125 0.30
Movida Participacoes Sa 70,700 BRL 154,424 228,643 0.41
Petroleo Brasileiro /Prf. Shs 35,600 BRL 222,326 158,004 0.29
Sabesp. Cia Saneam. Basestado 28,700 BRL 200,486 199,744 0.36
Sao Martinho Sa 69,600 BRL 293,868 298,225 0.54
Simpar Rg 44,900 BRL 171,502 249,417 0.45
Sul Amer /Units (1sh+2pref) 38,613 BRL 401,274 268,190 0.48
Via Varejo Sa 67,800 BRL 184,810 171,589 0.31
3,834,659 3,784,996 6.84
British Virgin IslandsArcos Dorados Holdings Cls -A- 95,658 USD 524,904 394,506 0.71
Mail. Ru Gr /Gdr 15,285 USD 360,412 331,972 0.60
885,316 726,478 1.31
Cayman IslandsLi Ning Company Ltd 204,000 HKD 581,493 1,140,981 2.06
Shenzhou Intl Group Ltd 64,800 HKD 467,828 1,033,569 1.87
Sitc International Holdings 571,000 HKD 501,382 1,003,026 1.81
DANSKE INVEST SICAV
The accompanying notes form an integral part of these financial statements.
123
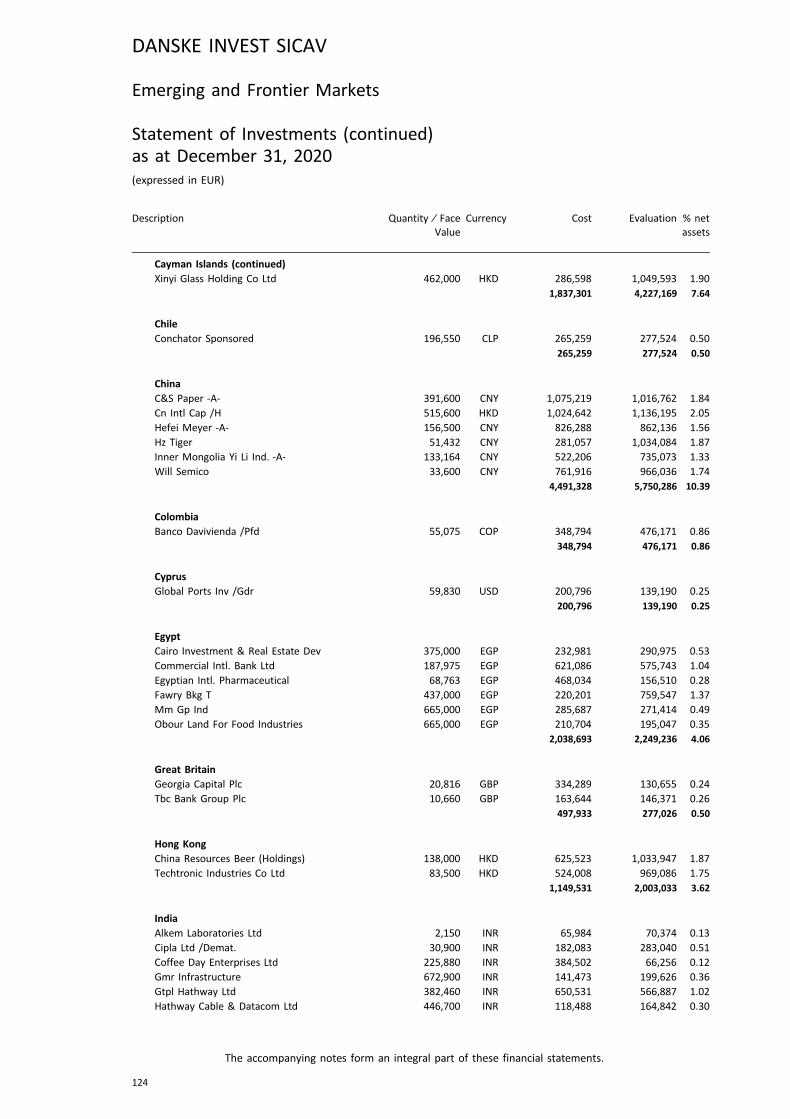
Description Quantity ⁄ FaceValue
Currency Cost Evaluation % netassets
Cayman Islands (continued)Xinyi Glass Holding Co Ltd 462,000 HKD 286,598 1,049,593 1.90
1,837,301 4,227,169 7.64
ChileConchator Sponsored 196,550 CLP 265,259 277,524 0.50
265,259 277,524 0.50
ChinaC&S Paper -A- 391,600 CNY 1,075,219 1,016,762 1.84
Cn Intl Cap /H 515,600 HKD 1,024,642 1,136,195 2.05
Hefei Meyer -A- 156,500 CNY 826,288 862,136 1.56
Hz Tiger 51,432 CNY 281,057 1,034,084 1.87
Inner Mongolia Yi Li Ind. -A- 133,164 CNY 522,206 735,073 1.33
Will Semico 33,600 CNY 761,916 966,036 1.74
4,491,328 5,750,286 10.39
ColombiaBanco Davivienda /Pfd 55,075 COP 348,794 476,171 0.86
348,794 476,171 0.86
CyprusGlobal Ports Inv /Gdr 59,830 USD 200,796 139,190 0.25
200,796 139,190 0.25
EgyptCairo Investment & Real Estate Dev 375,000 EGP 232,981 290,975 0.53
Commercial Intl. Bank Ltd 187,975 EGP 621,086 575,743 1.04
Egyptian Intl. Pharmaceutical 68,763 EGP 468,034 156,510 0.28
Fawry Bkg T 437,000 EGP 220,201 759,547 1.37
Mm Gp Ind 665,000 EGP 285,687 271,414 0.49
Obour Land For Food Industries 665,000 EGP 210,704 195,047 0.35
2,038,693 2,249,236 4.06
Great BritainGeorgia Capital Plc 20,816 GBP 334,289 130,655 0.24
Tbc Bank Group Plc 10,660 GBP 163,644 146,371 0.26
497,933 277,026 0.50
Hong KongChina Resources Beer (Holdings) 138,000 HKD 625,523 1,033,947 1.87
Techtronic Industries Co Ltd 83,500 HKD 524,008 969,086 1.75
1,149,531 2,003,033 3.62
IndiaAlkem Laboratories Ltd 2,150 INR 65,984 70,374 0.13
Cipla Ltd /Demat. 30,900 INR 182,083 283,040 0.51
Coffee Day Enterprises Ltd 225,880 INR 384,502 66,256 0.12
Gmr Infrastructure 672,900 INR 141,473 199,626 0.36
Gtpl Hathway Ltd 382,460 INR 650,531 566,887 1.02
Hathway Cable & Datacom Ltd 446,700 INR 118,488 164,842 0.30
DANSKE INVEST SICAV
The accompanying notes form an integral part of these financial statements.
124
Emerging and Frontier Markets
Statement of Investments (continued)as at December 31, 2020(expressed in EUR)
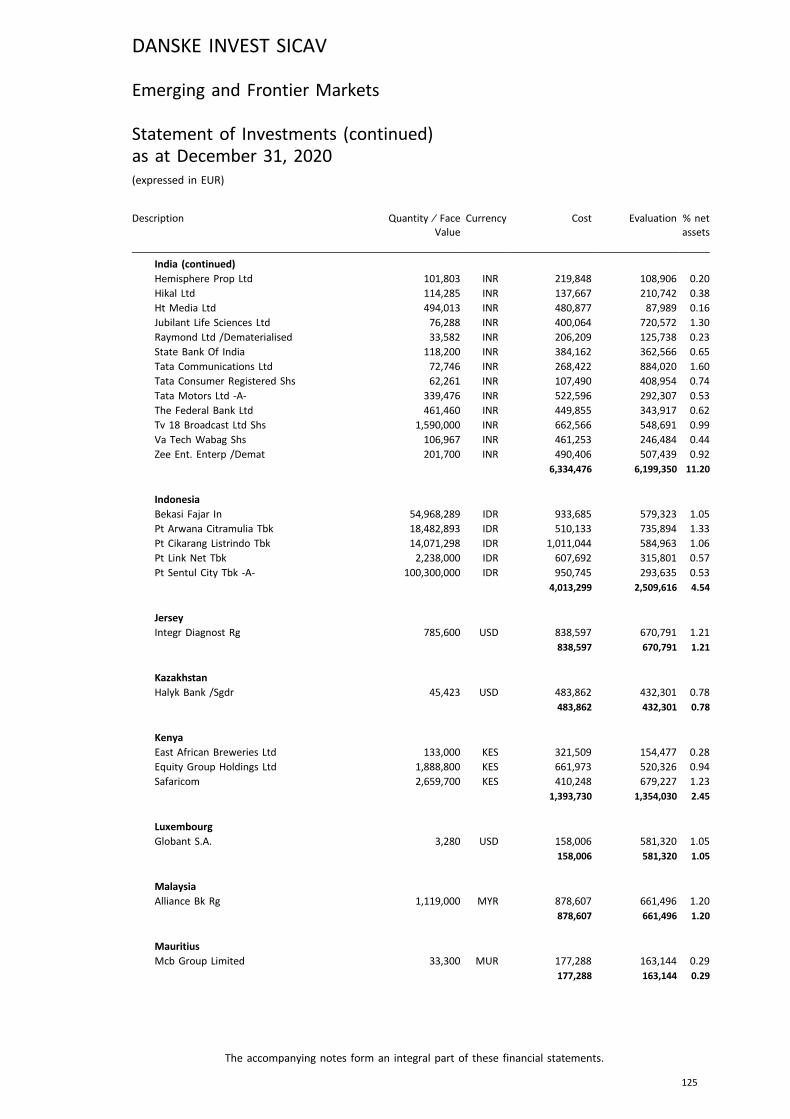
Description Quantity ⁄ FaceValue
Currency Cost Evaluation % netassets
India (continued)Hemisphere Prop Ltd 101,803 INR 219,848 108,906 0.20
Hikal Ltd 114,285 INR 137,667 210,742 0.38
Ht Media Ltd 494,013 INR 480,877 87,989 0.16
Jubilant Life Sciences Ltd 76,288 INR 400,064 720,572 1.30
Raymond Ltd /Dematerialised 33,582 INR 206,209 125,738 0.23
State Bank Of India 118,200 INR 384,162 362,566 0.65
Tata Communications Ltd 72,746 INR 268,422 884,020 1.60
Tata Consumer Registered Shs 62,261 INR 107,490 408,954 0.74
Tata Motors Ltd -A- 339,476 INR 522,596 292,307 0.53
The Federal Bank Ltd 461,460 INR 449,855 343,917 0.62
Tv 18 Broadcast Ltd Shs 1,590,000 INR 662,566 548,691 0.99
Va Tech Wabag Shs 106,967 INR 461,253 246,484 0.44
Zee Ent. Enterp /Demat 201,700 INR 490,406 507,439 0.92
6,334,476 6,199,350 11.20
IndonesiaBekasi Fajar In 54,968,289 IDR 933,685 579,323 1.05
Pt Arwana Citramulia Tbk 18,482,893 IDR 510,133 735,894 1.33
Pt Cikarang Listrindo Tbk 14,071,298 IDR 1,011,044 584,963 1.06
Pt Link Net Tbk 2,238,000 IDR 607,692 315,801 0.57
Pt Sentul City Tbk -A- 100,300,000 IDR 950,745 293,635 0.53
4,013,299 2,509,616 4.54
JerseyIntegr Diagnost Rg 785,600 USD 838,597 670,791 1.21
838,597 670,791 1.21
KazakhstanHalyk Bank /Sgdr 45,423 USD 483,862 432,301 0.78
483,862 432,301 0.78
KenyaEast African Breweries Ltd 133,000 KES 321,509 154,477 0.28
Equity Group Holdings Ltd 1,888,800 KES 661,973 520,326 0.94
Safaricom 2,659,700 KES 410,248 679,227 1.23
1,393,730 1,354,030 2.45
LuxembourgGlobant S.A. 3,280 USD 158,006 581,320 1.05
158,006 581,320 1.05
MalaysiaAlliance Bk Rg 1,119,000 MYR 878,607 661,496 1.20
878,607 661,496 1.20
MauritiusMcb Group Limited 33,300 MUR 177,288 163,144 0.29
177,288 163,144 0.29
DANSKE INVEST SICAV
The accompanying notes form an integral part of these financial statements.
125
Emerging and Frontier Markets
Statement of Investments (continued)as at December 31, 2020(expressed in EUR)
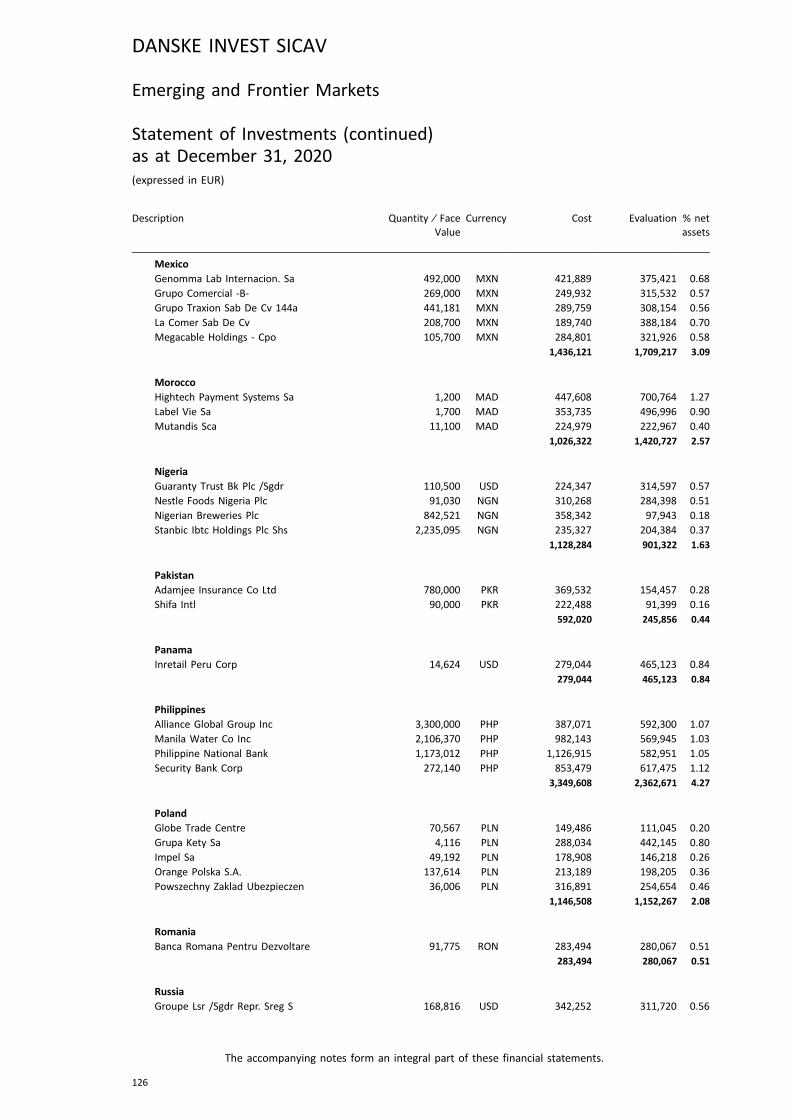
Description Quantity ⁄ FaceValue
Currency Cost Evaluation % netassets
MexicoGenomma Lab Internacion. Sa 492,000 MXN 421,889 375,421 0.68
Grupo Comercial -B- 269,000 MXN 249,932 315,532 0.57
Grupo Traxion Sab De Cv 144a 441,181 MXN 289,759 308,154 0.56
La Comer Sab De Cv 208,700 MXN 189,740 388,184 0.70
Megacable Holdings - Cpo 105,700 MXN 284,801 321,926 0.58
1,436,121 1,709,217 3.09
MoroccoHightech Payment Systems Sa 1,200 MAD 447,608 700,764 1.27
Label Vie Sa 1,700 MAD 353,735 496,996 0.90
Mutandis Sca 11,100 MAD 224,979 222,967 0.40
1,026,322 1,420,727 2.57
NigeriaGuaranty Trust Bk Plc /Sgdr 110,500 USD 224,347 314,597 0.57
Nestle Foods Nigeria Plc 91,030 NGN 310,268 284,398 0.51
Nigerian Breweries Plc 842,521 NGN 358,342 97,943 0.18
Stanbic Ibtc Holdings Plc Shs 2,235,095 NGN 235,327 204,384 0.37
1,128,284 901,322 1.63
PakistanAdamjee Insurance Co Ltd 780,000 PKR 369,532 154,457 0.28
Shifa Intl 90,000 PKR 222,488 91,399 0.16
592,020 245,856 0.44
PanamaInretail Peru Corp 14,624 USD 279,044 465,123 0.84
279,044 465,123 0.84
PhilippinesAlliance Global Group Inc 3,300,000 PHP 387,071 592,300 1.07
Manila Water Co Inc 2,106,370 PHP 982,143 569,945 1.03
Philippine National Bank 1,173,012 PHP 1,126,915 582,951 1.05
Security Bank Corp 272,140 PHP 853,479 617,475 1.12
3,349,608 2,362,671 4.27
PolandGlobe Trade Centre 70,567 PLN 149,486 111,045 0.20
Grupa Kety Sa 4,116 PLN 288,034 442,145 0.80
Impel Sa 49,192 PLN 178,908 146,218 0.26
Orange Polska S.A. 137,614 PLN 213,189 198,205 0.36
Powszechny Zaklad Ubezpieczen 36,006 PLN 316,891 254,654 0.46
1,146,508 1,152,267 2.08
RomaniaBanca Romana Pentru Dezvoltare 91,775 RON 283,494 280,067 0.51
283,494 280,067 0.51
RussiaGroupe Lsr /Sgdr Repr. Sreg S 168,816 USD 342,252 311,720 0.56
DANSKE INVEST SICAV
The accompanying notes form an integral part of these financial statements.
126
Emerging and Frontier Markets
Statement of Investments (continued)as at December 31, 2020(expressed in EUR)
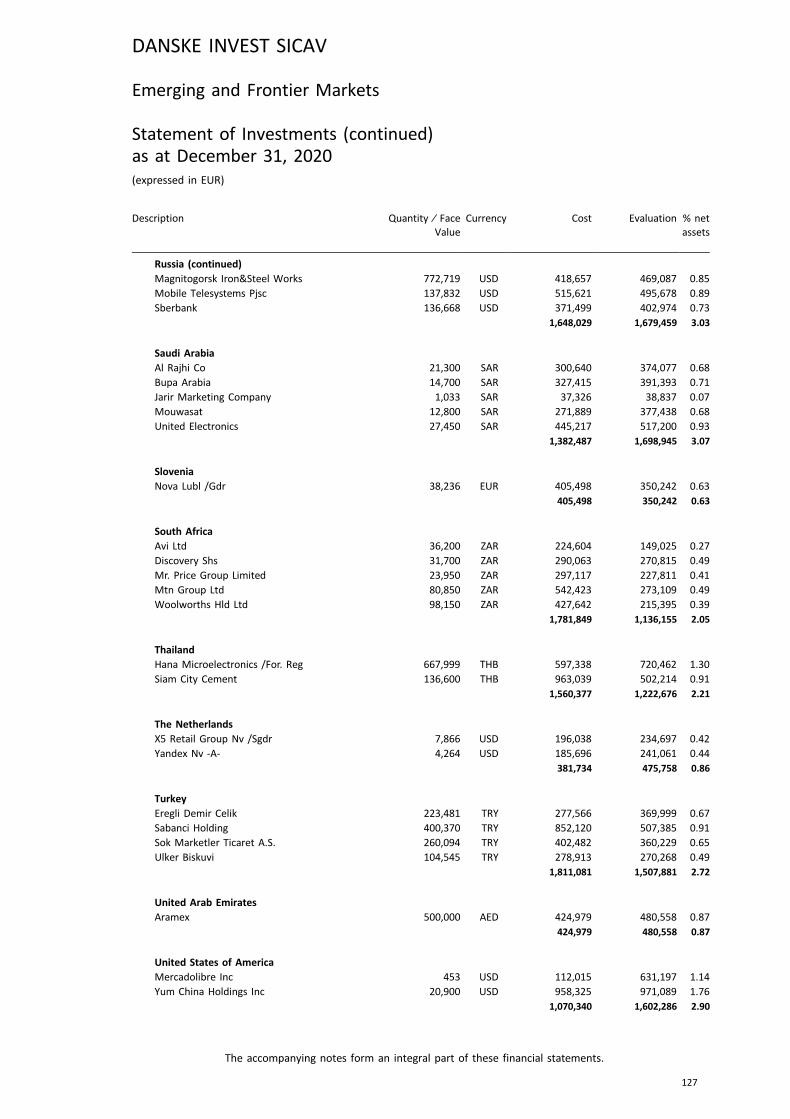
Description Quantity ⁄ FaceValue
Currency Cost Evaluation % netassets
Russia (continued)Magnitogorsk Iron&Steel Works 772,719 USD 418,657 469,087 0.85
Mobile Telesystems Pjsc 137,832 USD 515,621 495,678 0.89
Sberbank 136,668 USD 371,499 402,974 0.73
1,648,029 1,679,459 3.03
Saudi ArabiaAl Rajhi Co 21,300 SAR 300,640 374,077 0.68
Bupa Arabia 14,700 SAR 327,415 391,393 0.71
Jarir Marketing Company 1,033 SAR 37,326 38,837 0.07
Mouwasat 12,800 SAR 271,889 377,438 0.68
United Electronics 27,450 SAR 445,217 517,200 0.93
1,382,487 1,698,945 3.07
SloveniaNova Lubl /Gdr 38,236 EUR 405,498 350,242 0.63
405,498 350,242 0.63
South AfricaAvi Ltd 36,200 ZAR 224,604 149,025 0.27
Discovery Shs 31,700 ZAR 290,063 270,815 0.49
Mr. Price Group Limited 23,950 ZAR 297,117 227,811 0.41
Mtn Group Ltd 80,850 ZAR 542,423 273,109 0.49
Woolworths Hld Ltd 98,150 ZAR 427,642 215,395 0.39
1,781,849 1,136,155 2.05
ThailandHana Microelectronics /For. Reg 667,999 THB 597,338 720,462 1.30
Siam City Cement 136,600 THB 963,039 502,214 0.91
1,560,377 1,222,676 2.21
The NetherlandsX5 Retail Group Nv /Sgdr 7,866 USD 196,038 234,697 0.42
Yandex Nv -A- 4,264 USD 185,696 241,061 0.44
381,734 475,758 0.86
TurkeyEregli Demir Celik 223,481 TRY 277,566 369,999 0.67
Sabanci Holding 400,370 TRY 852,120 507,385 0.91
Sok Marketler Ticaret A.S. 260,094 TRY 402,482 360,229 0.65
Ulker Biskuvi 104,545 TRY 278,913 270,268 0.49
1,811,081 1,507,881 2.72
United Arab EmiratesAramex 500,000 AED 424,979 480,558 0.87
424,979 480,558 0.87
United States of AmericaMercadolibre Inc 453 USD 112,015 631,197 1.14
Yum China Holdings Inc 20,900 USD 958,325 971,089 1.76
1,070,340 1,602,286 2.90
DANSKE INVEST SICAV
The accompanying notes form an integral part of these financial statements.
127
Emerging and Frontier Markets
Statement of Investments (continued)as at December 31, 2020(expressed in EUR)
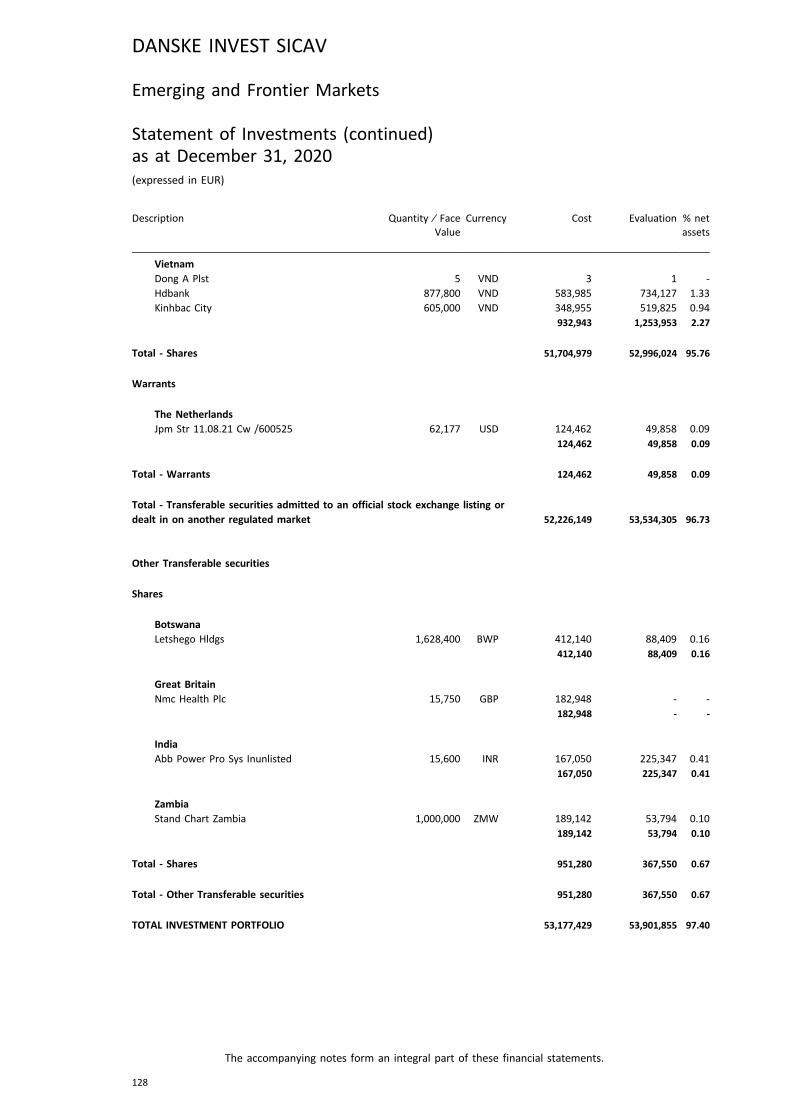
Description Quantity ⁄ FaceValue
Currency Cost Evaluation % netassets
VietnamDong A Plst 5 VND 3 1 -
Hdbank 877,800 VND 583,985 734,127 1.33
Kinhbac City 605,000 VND 348,955 519,825 0.94
932,943 1,253,953 2.27
Total - Shares 51,704,979 52,996,024 95.76
Warrants
The NetherlandsJpm Str 11.08.21 Cw /600525 62,177 USD 124,462 49,858 0.09
124,462 49,858 0.09
Total - Warrants 124,462 49,858 0.09
Total - Transferable securities admitted to an official stock exchange listing ordealt in on another regulated market 52,226,149 53,534,305 96.73
Other Transferable securities
Shares
BotswanaLetshego Hldgs 1,628,400 BWP 412,140 88,409 0.16
412,140 88,409 0.16
Great BritainNmc Health Plc 15,750 GBP 182,948 - -
182,948 - -
IndiaAbb Power Pro Sys Inunlisted 15,600 INR 167,050 225,347 0.41
167,050 225,347 0.41
ZambiaStand Chart Zambia 1,000,000 ZMW 189,142 53,794 0.10
189,142 53,794 0.10
Total - Shares 951,280 367,550 0.67
Total - Other Transferable securities 951,280 367,550 0.67
TOTAL INVESTMENT PORTFOLIO 53,177,429 53,901,855 97.40
DANSKE INVEST SICAV
The accompanying notes form an integral part of these financial statements.
128
Emerging and Frontier Markets
Statement of Investments (continued)as at December 31, 2020(expressed in EUR)

Emerging and Frontier Markets
Geographical and Economic Portfolio Breakdownsas at December 31, 2020(expressed as a percentage of net assets)
Geographical breakdown %
India 11.61China 10.39Cayman Islands 7.64Brazil 6.84Indonesia 4.54Philippines 4.27Egypt 4.06Hong Kong 3.62Mexico 3.09Saudi Arabia 3.07Russia 3.03United States of America 2.90Turkey 2.72Morocco 2.57Kenya 2.45Vietnam 2.27Thailand 2.21Poland 2.08South Africa 2.05Nigeria 1.63British Virgin Islands 1.31Jersey 1.21Malaysia 1.20Luxembourg 1.05Bermuda Islands 1.03The Netherlands 0.95United Arab Emirates 0.87Colombia 0.86Panama 0.84Kazakhstan 0.78Switzerland 0.76Slovenia 0.63Romania 0.51Chile 0.50Great Britain 0.50Pakistan 0.44Mauritius 0.29Cyprus 0.25Botswana 0.16The Bahamas 0.12Zambia 0.10
97.40
Economic breakdown %
Banks and Financial Institutions 13.26Holding and Finance Companies 10.09Retail 7.74Electronic Semiconductor 7.52Internet Software 5.35News Transmission 4.57Food and Distilleries 4.50Public Services 3.82Electronics and Electrical Equipment 3.75Pharmaceuticals and Cosmetics 3.63Construction, Building Material 3.46Insurance 3.02Business Houses 2.66Transportation 2.37Textile 2.10Real Estate Companies 2.03Healthcare Education & Social Services 1.89Leisure 1.88Forest Products and Paper Industry 1.84Mines, Heavy Industries 1.82Chemicals 1.68Agriculture and Fishing 1.50Miscellaneous 1.36Petrol 1.34Other Services 1.25Tobacco and Spirits 0.96Photography And Optics 0.92Automobile Industry 0.53Consumer Goods 0.40Graphic Art, Publishing 0.16
97.40
DANSKE INVEST SICAV
The accompanying notes form an integral part of these financial statements.
129
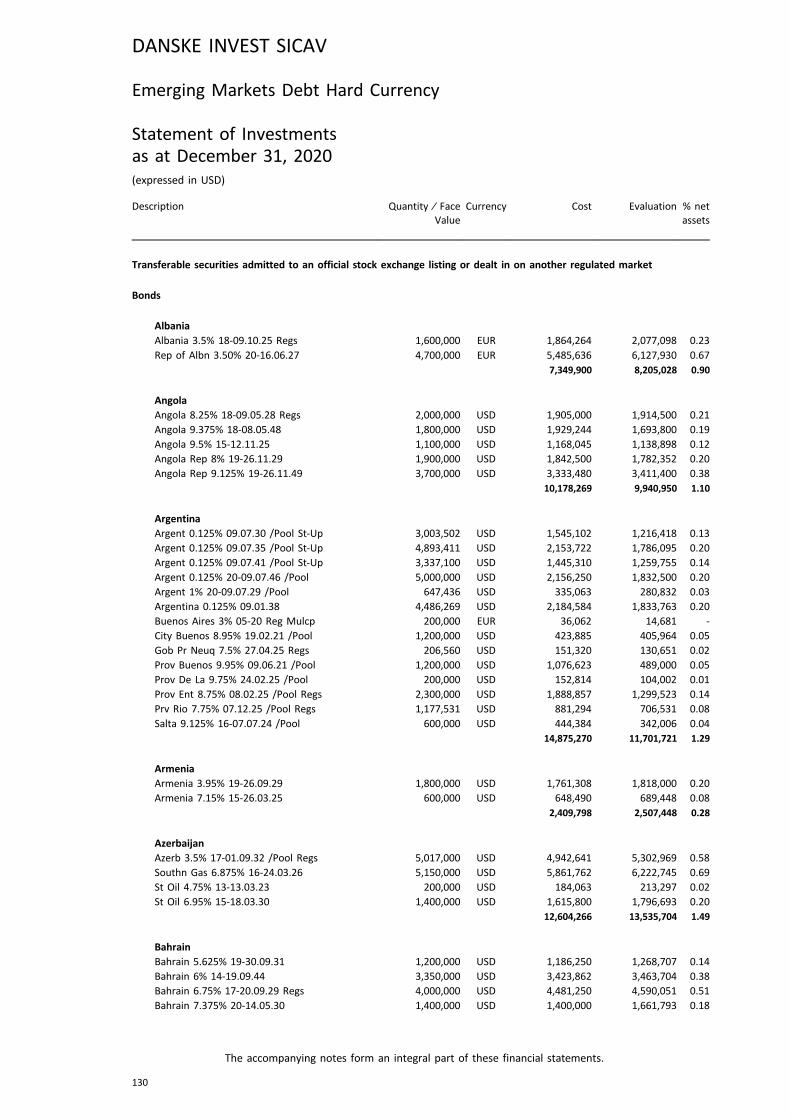
Emerging Markets Debt Hard Currency
Statement of Investmentsas at December 31, 2020(expressed in USD)
Description Quantity ⁄ FaceValue
Currency Cost Evaluation % netassets
Transferable securities admitted to an official stock exchange listing or dealt in on another regulated market
Bonds
AlbaniaAlbania 3.5% 18-09.10.25 Regs 1,600,000 EUR 1,864,264 2,077,098 0.23
Rep of Albn 3.50% 20-16.06.27 4,700,000 EUR 5,485,636 6,127,930 0.67
7,349,900 8,205,028 0.90
AngolaAngola 8.25% 18-09.05.28 Regs 2,000,000 USD 1,905,000 1,914,500 0.21
Angola 9.375% 18-08.05.48 1,800,000 USD 1,929,244 1,693,800 0.19
Angola 9.5% 15-12.11.25 1,100,000 USD 1,168,045 1,138,898 0.12
Angola Rep 8% 19-26.11.29 1,900,000 USD 1,842,500 1,782,352 0.20
Angola Rep 9.125% 19-26.11.49 3,700,000 USD 3,333,480 3,411,400 0.38
10,178,269 9,940,950 1.10
ArgentinaArgent 0.125% 09.07.30 /Pool St-Up 3,003,502 USD 1,545,102 1,216,418 0.13
Argent 0.125% 09.07.35 /Pool St-Up 4,893,411 USD 2,153,722 1,786,095 0.20
Argent 0.125% 09.07.41 /Pool St-Up 3,337,100 USD 1,445,310 1,259,755 0.14
Argent 0.125% 20-09.07.46 /Pool 5,000,000 USD 2,156,250 1,832,500 0.20
Argent 1% 20-09.07.29 /Pool 647,436 USD 335,063 280,832 0.03
Argentina 0.125% 09.01.38 4,486,269 USD 2,184,584 1,833,763 0.20
Buenos Aires 3% 05-20 Reg Mulcp 200,000 EUR 36,062 14,681 -
City Buenos 8.95% 19.02.21 /Pool 1,200,000 USD 423,885 405,964 0.05
Gob Pr Neuq 7.5% 27.04.25 Regs 206,560 USD 151,320 130,651 0.02
Prov Buenos 9.95% 09.06.21 /Pool 1,200,000 USD 1,076,623 489,000 0.05
Prov De La 9.75% 24.02.25 /Pool 200,000 USD 152,814 104,002 0.01
Prov Ent 8.75% 08.02.25 /Pool Regs 2,300,000 USD 1,888,857 1,299,523 0.14
Prv Rio 7.75% 07.12.25 /Pool Regs 1,177,531 USD 881,294 706,531 0.08
Salta 9.125% 16-07.07.24 /Pool 600,000 USD 444,384 342,006 0.04
14,875,270 11,701,721 1.29
ArmeniaArmenia 3.95% 19-26.09.29 1,800,000 USD 1,761,308 1,818,000 0.20
Armenia 7.15% 15-26.03.25 600,000 USD 648,490 689,448 0.08
2,409,798 2,507,448 0.28
AzerbaijanAzerb 3.5% 17-01.09.32 /Pool Regs 5,017,000 USD 4,942,641 5,302,969 0.58
Southn Gas 6.875% 16-24.03.26 5,150,000 USD 5,861,762 6,222,745 0.69
St Oil 4.75% 13-13.03.23 200,000 USD 184,063 213,297 0.02
St Oil 6.95% 15-18.03.30 1,400,000 USD 1,615,800 1,796,693 0.20
12,604,266 13,535,704 1.49
BahrainBahrain 5.625% 19-30.09.31 1,200,000 USD 1,186,250 1,268,707 0.14
Bahrain 6% 14-19.09.44 3,350,000 USD 3,423,862 3,463,704 0.38
Bahrain 6.75% 17-20.09.29 Regs 4,000,000 USD 4,481,250 4,590,051 0.51
Bahrain 7.375% 20-14.05.30 1,400,000 USD 1,400,000 1,661,793 0.18
DANSKE INVEST SICAV
The accompanying notes form an integral part of these financial statements.
130

Description Quantity ⁄ FaceValue
Currency Cost Evaluation % netassets
Bahrain (continued)Bahrain 7.5% 17-20.09.47 1,500,000 USD 1,768,770 1,759,852 0.19
Cbb Intern 6.25% 14.11.24 1,700,000 USD 1,738,250 1,874,097 0.21
Cbb Suz 5.25% 17-20.03.25 2,000,000 USD 2,107,000 2,145,448 0.24
Oil & Gas H 7.625% 18-07.11.24 2,000,000 USD 2,179,600 2,240,000 0.25
Oil & Gas H 8.375% 18-07.11.28 1,100,000 USD 1,179,320 1,296,196 0.14
19,464,302 20,299,848 2.24
BelizeBelize St-Up 20.02.38 /Pool Regs 400,000 USD 252,760 186,494 0.02
252,760 186,494 0.02
BeninBenin Intl 5.75% 26.03.26 /Pool 5,900,000 EUR 6,722,733 7,602,271 0.84
6,722,733 7,602,271 0.84
Bermuda IslandsBermuda 3.375% 20-20.08.50 1,000,000 USD 997,190 1,077,500 0.12
997,190 1,077,500 0.12
BrazilBrazil 3.875% 20-12.06.30 1,000,000 USD 999,000 1,055,000 0.12
Brazil 4.75% 19-14.01.50 1,782,000 USD 1,736,399 1,904,067 0.21
Brazil 5% 14-27.01.45 700,000 USD 581,249 777,000 0.08
Brazil 5.625% 16-21.02.47 1,300,000 USD 1,409,762 1,550,900 0.17
4,726,410 5,286,967 0.58
British Virgin IslandsSinopec Grp 3.25% 15-28.04.25 200,000 USD 195,942 214,472 0.03
Sinopec Ove 3.25% 17-13.09.27 700,000 USD 697,831 750,723 0.08
Sinopec Ove 3.625% 17-12.04.27 1,000,000 USD 1,026,008 1,096,740 0.12
1,919,781 2,061,935 0.23
BurundiEsafrb 4.875% 19-23.05.24 Regs 3,200,000 USD 3,276,314 3,374,976 0.37
3,276,314 3,374,976 0.37
CameroonCameroon 9.5% 19.11.25 /Pool 3,200,000 USD 3,467,975 3,552,000 0.39
3,467,975 3,552,000 0.39
Cayman IslandsAhb Sukuk 4.375% 18-19.09.23 1,900,000 USD 1,907,054 2,062,905 0.23
Amb Circle 3.25% 12-04.12.22 500,000 USD 507,975 519,650 0.06
Avi Funding 3.8% 15-16.09.25 700,000 USD 711,137 785,747 0.09
Bos Fund 4% 19-18.09.24 Regs 1,300,000 USD 1,299,129 1,363,102 0.15
Dubai Dof 2.763% 20-09.09.30 1,500,000 USD 1,500,000 1,514,820 0.17
Icd Funding 3.223% 20-28.04.26 4,000,000 USD 4,002,320 4,017,000 0.44
Mumtalakat 5.625% 19-27.02.24 900,000 USD 903,876 965,034 0.11
Neon Cap Frn 06.01.28 140,000,000 JPY 346,443 320,158 0.03
Sharjah 2.942% 20-10.06.27 3,000,000 USD 3,000,000 3,111,750 0.34
DANSKE INVEST SICAV
The accompanying notes form an integral part of these financial statements.
131
Emerging Markets Debt Hard Currency
Statement of Investments (continued)as at December 31, 2020(expressed in USD)
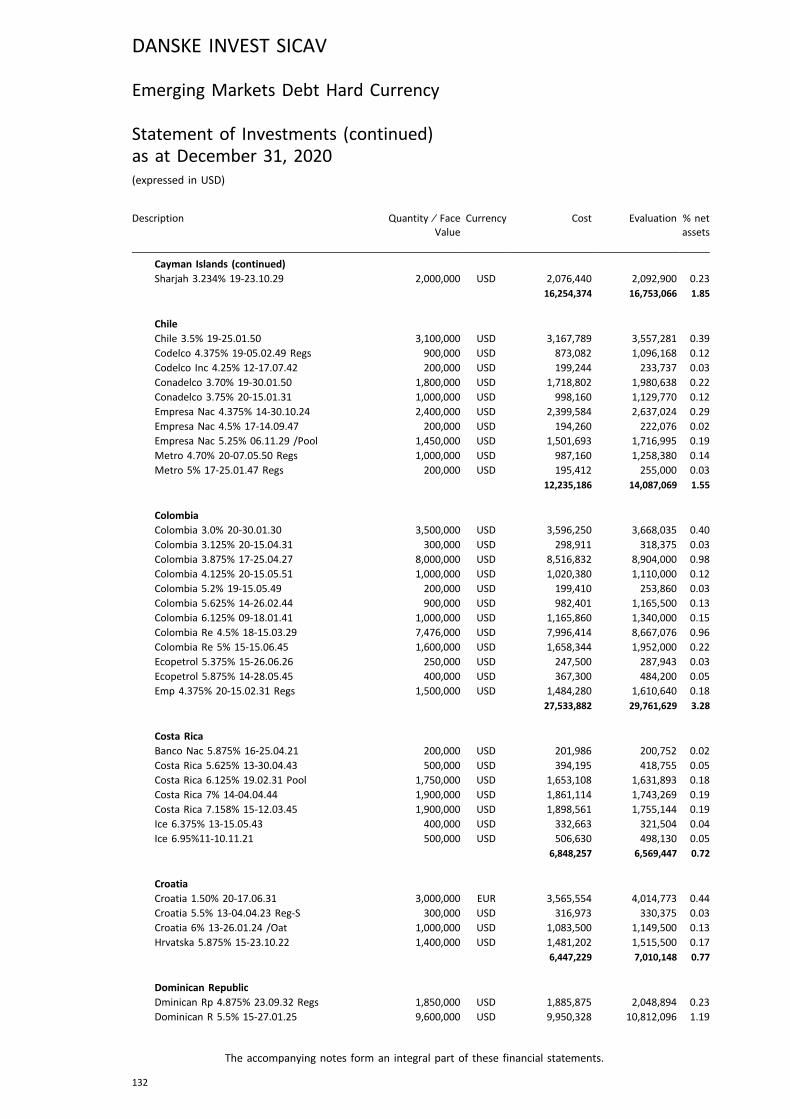
Description Quantity ⁄ FaceValue
Currency Cost Evaluation % netassets
Cayman Islands (continued)Sharjah 3.234% 19-23.10.29 2,000,000 USD 2,076,440 2,092,900 0.23
16,254,374 16,753,066 1.85
ChileChile 3.5% 19-25.01.50 3,100,000 USD 3,167,789 3,557,281 0.39
Codelco 4.375% 19-05.02.49 Regs 900,000 USD 873,082 1,096,168 0.12
Codelco Inc 4.25% 12-17.07.42 200,000 USD 199,244 233,737 0.03
Conadelco 3.70% 19-30.01.50 1,800,000 USD 1,718,802 1,980,638 0.22
Conadelco 3.75% 20-15.01.31 1,000,000 USD 998,160 1,129,770 0.12
Empresa Nac 4.375% 14-30.10.24 2,400,000 USD 2,399,584 2,637,024 0.29
Empresa Nac 4.5% 17-14.09.47 200,000 USD 194,260 222,076 0.02
Empresa Nac 5.25% 06.11.29 /Pool 1,450,000 USD 1,501,693 1,716,995 0.19
Metro 4.70% 20-07.05.50 Regs 1,000,000 USD 987,160 1,258,380 0.14
Metro 5% 17-25.01.47 Regs 200,000 USD 195,412 255,000 0.03
12,235,186 14,087,069 1.55
ColombiaColombia 3.0% 20-30.01.30 3,500,000 USD 3,596,250 3,668,035 0.40
Colombia 3.125% 20-15.04.31 300,000 USD 298,911 318,375 0.03
Colombia 3.875% 17-25.04.27 8,000,000 USD 8,516,832 8,904,000 0.98
Colombia 4.125% 20-15.05.51 1,000,000 USD 1,020,380 1,110,000 0.12
Colombia 5.2% 19-15.05.49 200,000 USD 199,410 253,860 0.03
Colombia 5.625% 14-26.02.44 900,000 USD 982,401 1,165,500 0.13
Colombia 6.125% 09-18.01.41 1,000,000 USD 1,165,860 1,340,000 0.15
Colombia Re 4.5% 18-15.03.29 7,476,000 USD 7,996,414 8,667,076 0.96
Colombia Re 5% 15-15.06.45 1,600,000 USD 1,658,344 1,952,000 0.22
Ecopetrol 5.375% 15-26.06.26 250,000 USD 247,500 287,943 0.03
Ecopetrol 5.875% 14-28.05.45 400,000 USD 367,300 484,200 0.05
Emp 4.375% 20-15.02.31 Regs 1,500,000 USD 1,484,280 1,610,640 0.18
27,533,882 29,761,629 3.28
Costa RicaBanco Nac 5.875% 16-25.04.21 200,000 USD 201,986 200,752 0.02
Costa Rica 5.625% 13-30.04.43 500,000 USD 394,195 418,755 0.05
Costa Rica 6.125% 19.02.31 Pool 1,750,000 USD 1,653,108 1,631,893 0.18
Costa Rica 7% 14-04.04.44 1,900,000 USD 1,861,114 1,743,269 0.19
Costa Rica 7.158% 15-12.03.45 1,900,000 USD 1,898,561 1,755,144 0.19
Ice 6.375% 13-15.05.43 400,000 USD 332,663 321,504 0.04
Ice 6.95%11-10.11.21 500,000 USD 506,630 498,130 0.05
6,848,257 6,569,447 0.72
CroatiaCroatia 1.50% 20-17.06.31 3,000,000 EUR 3,565,554 4,014,773 0.44
Croatia 5.5% 13-04.04.23 Reg-S 300,000 USD 316,973 330,375 0.03
Croatia 6% 13-26.01.24 /Oat 1,000,000 USD 1,083,500 1,149,500 0.13
Hrvatska 5.875% 15-23.10.22 1,400,000 USD 1,481,202 1,515,500 0.17
6,447,229 7,010,148 0.77
Dominican RepublicDminican Rp 4.875% 23.09.32 Regs 1,850,000 USD 1,885,875 2,048,894 0.23
Dominican R 5.5% 15-27.01.25 9,600,000 USD 9,950,328 10,812,096 1.19
DANSKE INVEST SICAV
The accompanying notes form an integral part of these financial statements.
132
Emerging Markets Debt Hard Currency
Statement of Investments (continued)as at December 31, 2020(expressed in USD)
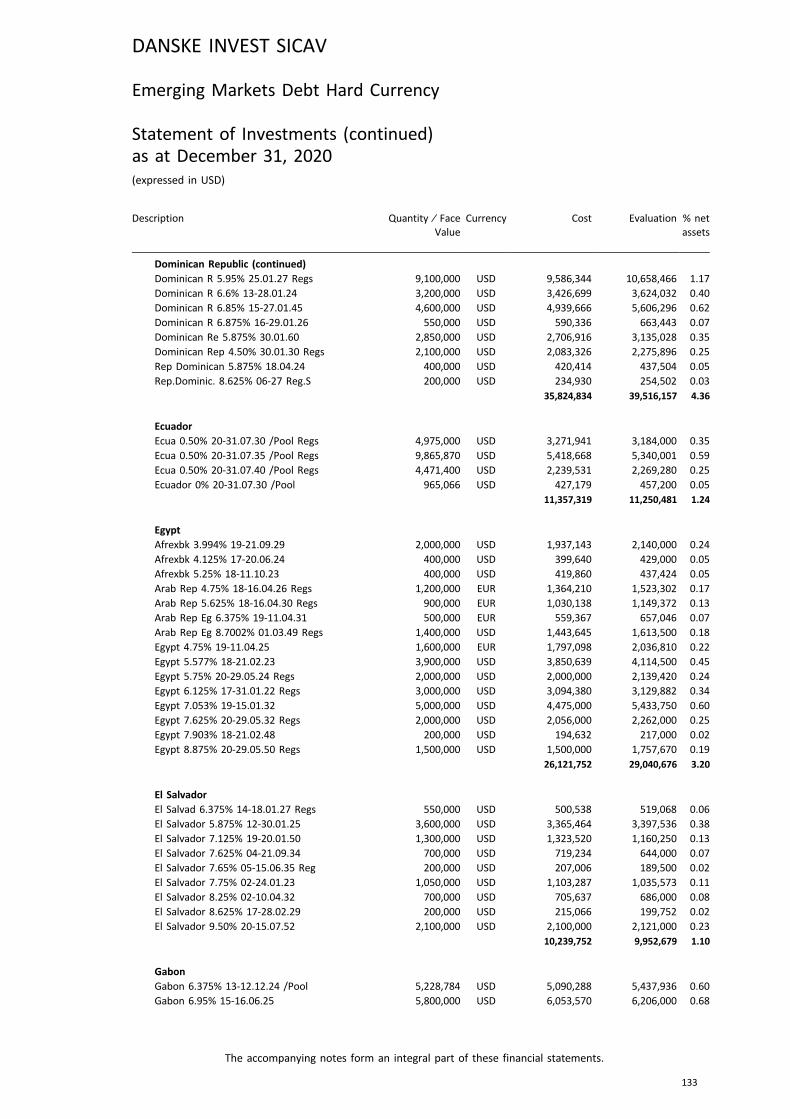
Description Quantity ⁄ FaceValue
Currency Cost Evaluation % netassets
Dominican Republic (continued)Dominican R 5.95% 25.01.27 Regs 9,100,000 USD 9,586,344 10,658,466 1.17
Dominican R 6.6% 13-28.01.24 3,200,000 USD 3,426,699 3,624,032 0.40
Dominican R 6.85% 15-27.01.45 4,600,000 USD 4,939,666 5,606,296 0.62
Dominican R 6.875% 16-29.01.26 550,000 USD 590,336 663,443 0.07
Dominican Re 5.875% 30.01.60 2,850,000 USD 2,706,916 3,135,028 0.35
Dominican Rep 4.50% 30.01.30 Regs 2,100,000 USD 2,083,326 2,275,896 0.25
Rep Dominican 5.875% 18.04.24 400,000 USD 420,414 437,504 0.05
Rep.Dominic. 8.625% 06-27 Reg.S 200,000 USD 234,930 254,502 0.03
35,824,834 39,516,157 4.36
EcuadorEcua 0.50% 20-31.07.30 /Pool Regs 4,975,000 USD 3,271,941 3,184,000 0.35
Ecua 0.50% 20-31.07.35 /Pool Regs 9,865,870 USD 5,418,668 5,340,001 0.59
Ecua 0.50% 20-31.07.40 /Pool Regs 4,471,400 USD 2,239,531 2,269,280 0.25
Ecuador 0% 20-31.07.30 /Pool 965,066 USD 427,179 457,200 0.05
11,357,319 11,250,481 1.24
EgyptAfrexbk 3.994% 19-21.09.29 2,000,000 USD 1,937,143 2,140,000 0.24
Afrexbk 4.125% 17-20.06.24 400,000 USD 399,640 429,000 0.05
Afrexbk 5.25% 18-11.10.23 400,000 USD 419,860 437,424 0.05
Arab Rep 4.75% 18-16.04.26 Regs 1,200,000 EUR 1,364,210 1,523,302 0.17
Arab Rep 5.625% 18-16.04.30 Regs 900,000 EUR 1,030,138 1,149,372 0.13
Arab Rep Eg 6.375% 19-11.04.31 500,000 EUR 559,367 657,046 0.07
Arab Rep Eg 8.7002% 01.03.49 Regs 1,400,000 USD 1,443,645 1,613,500 0.18
Egypt 4.75% 19-11.04.25 1,600,000 EUR 1,797,098 2,036,810 0.22
Egypt 5.577% 18-21.02.23 3,900,000 USD 3,850,639 4,114,500 0.45
Egypt 5.75% 20-29.05.24 Regs 2,000,000 USD 2,000,000 2,139,420 0.24
Egypt 6.125% 17-31.01.22 Regs 3,000,000 USD 3,094,380 3,129,882 0.34
Egypt 7.053% 19-15.01.32 5,000,000 USD 4,475,000 5,433,750 0.60
Egypt 7.625% 20-29.05.32 Regs 2,000,000 USD 2,056,000 2,262,000 0.25
Egypt 7.903% 18-21.02.48 200,000 USD 194,632 217,000 0.02
Egypt 8.875% 20-29.05.50 Regs 1,500,000 USD 1,500,000 1,757,670 0.19
26,121,752 29,040,676 3.20
El SalvadorEl Salvad 6.375% 14-18.01.27 Regs 550,000 USD 500,538 519,068 0.06
El Salvador 5.875% 12-30.01.25 3,600,000 USD 3,365,464 3,397,536 0.38
El Salvador 7.125% 19-20.01.50 1,300,000 USD 1,323,520 1,160,250 0.13
El Salvador 7.625% 04-21.09.34 700,000 USD 719,234 644,000 0.07
El Salvador 7.65% 05-15.06.35 Reg 200,000 USD 207,006 189,500 0.02
El Salvador 7.75% 02-24.01.23 1,050,000 USD 1,103,287 1,035,573 0.11
El Salvador 8.25% 02-10.04.32 700,000 USD 705,637 686,000 0.08
El Salvador 8.625% 17-28.02.29 200,000 USD 215,066 199,752 0.02
El Salvador 9.50% 20-15.07.52 2,100,000 USD 2,100,000 2,121,000 0.23
10,239,752 9,952,679 1.10
GabonGabon 6.375% 13-12.12.24 /Pool 5,228,784 USD 5,090,288 5,437,936 0.60
Gabon 6.95% 15-16.06.25 5,800,000 USD 6,053,570 6,206,000 0.68
DANSKE INVEST SICAV
The accompanying notes form an integral part of these financial statements.
133
Emerging Markets Debt Hard Currency
Statement of Investments (continued)as at December 31, 2020(expressed in USD)
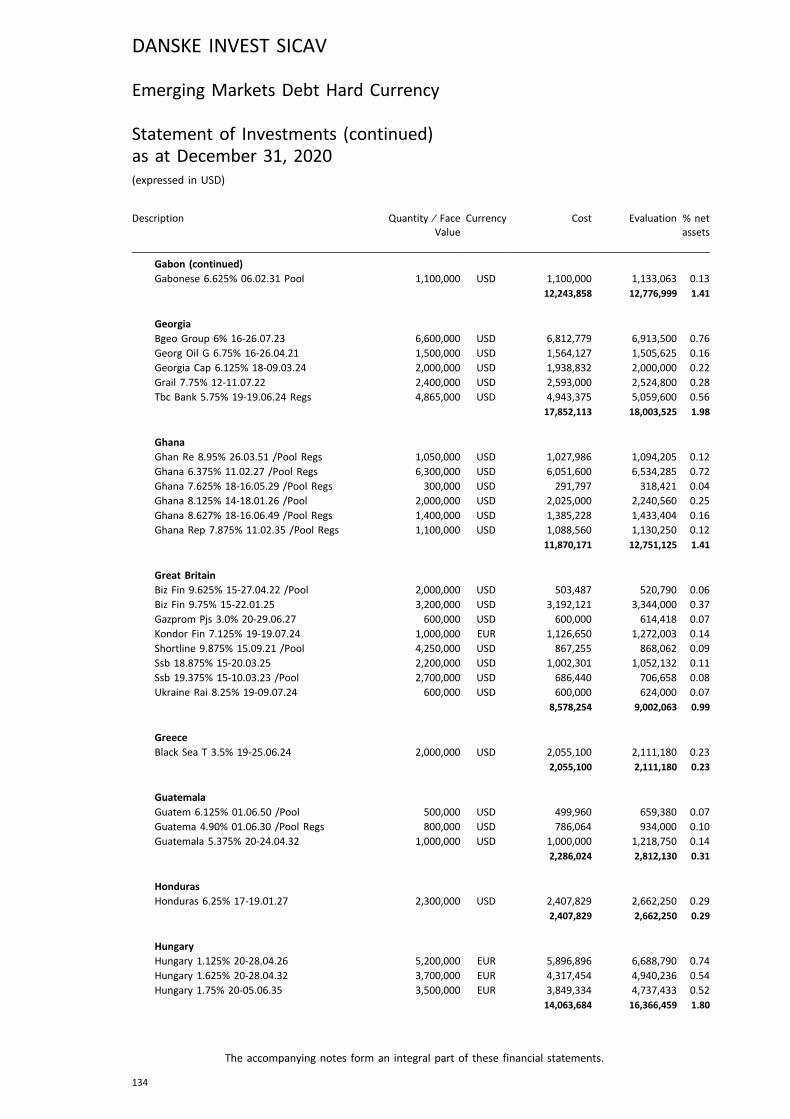
Description Quantity ⁄ FaceValue
Currency Cost Evaluation % netassets
Gabon (continued)Gabonese 6.625% 06.02.31 Pool 1,100,000 USD 1,100,000 1,133,063 0.13
12,243,858 12,776,999 1.41
GeorgiaBgeo Group 6% 16-26.07.23 6,600,000 USD 6,812,779 6,913,500 0.76
Georg Oil G 6.75% 16-26.04.21 1,500,000 USD 1,564,127 1,505,625 0.16
Georgia Cap 6.125% 18-09.03.24 2,000,000 USD 1,938,832 2,000,000 0.22
Grail 7.75% 12-11.07.22 2,400,000 USD 2,593,000 2,524,800 0.28
Tbc Bank 5.75% 19-19.06.24 Regs 4,865,000 USD 4,943,375 5,059,600 0.56
17,852,113 18,003,525 1.98
GhanaGhan Re 8.95% 26.03.51 /Pool Regs 1,050,000 USD 1,027,986 1,094,205 0.12
Ghana 6.375% 11.02.27 /Pool Regs 6,300,000 USD 6,051,600 6,534,285 0.72
Ghana 7.625% 18-16.05.29 /Pool Regs 300,000 USD 291,797 318,421 0.04
Ghana 8.125% 14-18.01.26 /Pool 2,000,000 USD 2,025,000 2,240,560 0.25
Ghana 8.627% 18-16.06.49 /Pool Regs 1,400,000 USD 1,385,228 1,433,404 0.16
Ghana Rep 7.875% 11.02.35 /Pool Regs 1,100,000 USD 1,088,560 1,130,250 0.12
11,870,171 12,751,125 1.41
Great BritainBiz Fin 9.625% 15-27.04.22 /Pool 2,000,000 USD 503,487 520,790 0.06
Biz Fin 9.75% 15-22.01.25 3,200,000 USD 3,192,121 3,344,000 0.37
Gazprom Pjs 3.0% 20-29.06.27 600,000 USD 600,000 614,418 0.07
Kondor Fin 7.125% 19-19.07.24 1,000,000 EUR 1,126,650 1,272,003 0.14
Shortline 9.875% 15.09.21 /Pool 4,250,000 USD 867,255 868,062 0.09
Ssb 18.875% 15-20.03.25 2,200,000 USD 1,002,301 1,052,132 0.11
Ssb 19.375% 15-10.03.23 /Pool 2,700,000 USD 686,440 706,658 0.08
Ukraine Rai 8.25% 19-09.07.24 600,000 USD 600,000 624,000 0.07
8,578,254 9,002,063 0.99
GreeceBlack Sea T 3.5% 19-25.06.24 2,000,000 USD 2,055,100 2,111,180 0.23
2,055,100 2,111,180 0.23
GuatemalaGuatem 6.125% 01.06.50 /Pool 500,000 USD 499,960 659,380 0.07
Guatema 4.90% 01.06.30 /Pool Regs 800,000 USD 786,064 934,000 0.10
Guatemala 5.375% 20-24.04.32 1,000,000 USD 1,000,000 1,218,750 0.14
2,286,024 2,812,130 0.31
HondurasHonduras 6.25% 17-19.01.27 2,300,000 USD 2,407,829 2,662,250 0.29
2,407,829 2,662,250 0.29
HungaryHungary 1.125% 20-28.04.26 5,200,000 EUR 5,896,896 6,688,790 0.74
Hungary 1.625% 20-28.04.32 3,700,000 EUR 4,317,454 4,940,236 0.54
Hungary 1.75% 20-05.06.35 3,500,000 EUR 3,849,334 4,737,433 0.52
14,063,684 16,366,459 1.80
DANSKE INVEST SICAV
The accompanying notes form an integral part of these financial statements.
134
Emerging Markets Debt Hard Currency
Statement of Investments (continued)as at December 31, 2020(expressed in USD)
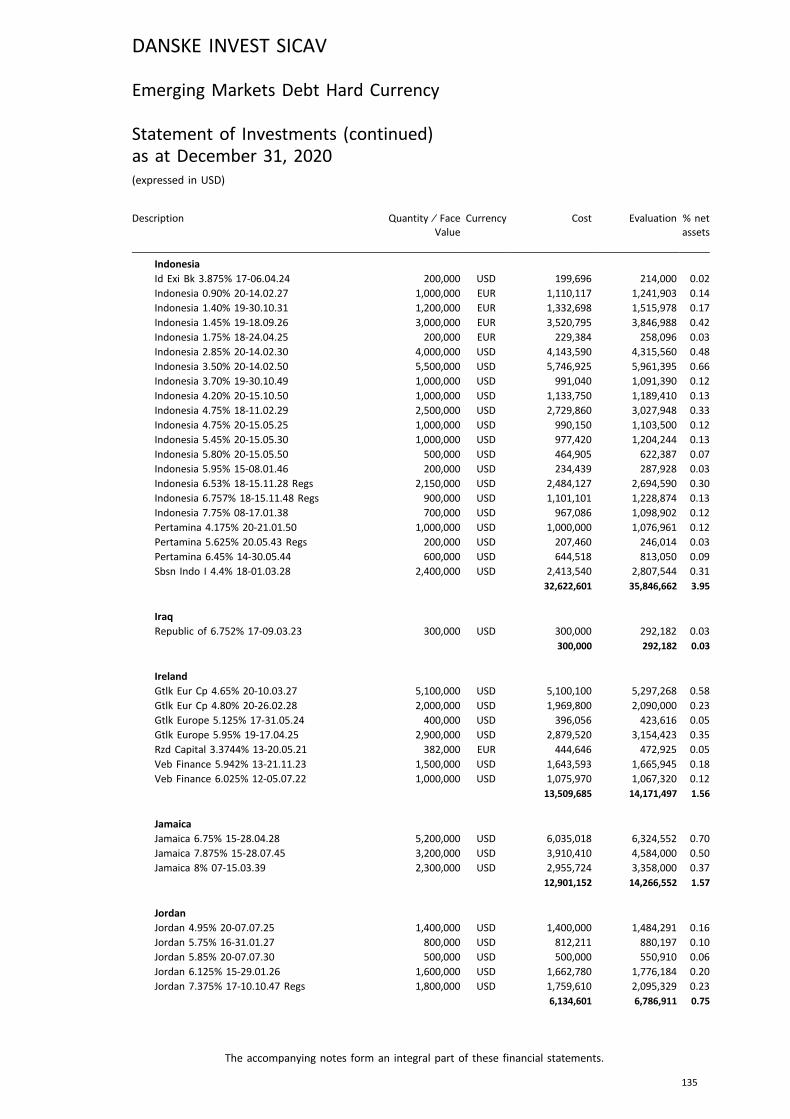
Description Quantity ⁄ FaceValue
Currency Cost Evaluation % netassets
IndonesiaId Exi Bk 3.875% 17-06.04.24 200,000 USD 199,696 214,000 0.02
Indonesia 0.90% 20-14.02.27 1,000,000 EUR 1,110,117 1,241,903 0.14
Indonesia 1.40% 19-30.10.31 1,200,000 EUR 1,332,698 1,515,978 0.17
Indonesia 1.45% 19-18.09.26 3,000,000 EUR 3,520,795 3,846,988 0.42
Indonesia 1.75% 18-24.04.25 200,000 EUR 229,384 258,096 0.03
Indonesia 2.85% 20-14.02.30 4,000,000 USD 4,143,590 4,315,560 0.48
Indonesia 3.50% 20-14.02.50 5,500,000 USD 5,746,925 5,961,395 0.66
Indonesia 3.70% 19-30.10.49 1,000,000 USD 991,040 1,091,390 0.12
Indonesia 4.20% 20-15.10.50 1,000,000 USD 1,133,750 1,189,410 0.13
Indonesia 4.75% 18-11.02.29 2,500,000 USD 2,729,860 3,027,948 0.33
Indonesia 4.75% 20-15.05.25 1,000,000 USD 990,150 1,103,500 0.12
Indonesia 5.45% 20-15.05.30 1,000,000 USD 977,420 1,204,244 0.13
Indonesia 5.80% 20-15.05.50 500,000 USD 464,905 622,387 0.07
Indonesia 5.95% 15-08.01.46 200,000 USD 234,439 287,928 0.03
Indonesia 6.53% 18-15.11.28 Regs 2,150,000 USD 2,484,127 2,694,590 0.30
Indonesia 6.757% 18-15.11.48 Regs 900,000 USD 1,101,101 1,228,874 0.13
Indonesia 7.75% 08-17.01.38 700,000 USD 967,086 1,098,902 0.12
Pertamina 4.175% 20-21.01.50 1,000,000 USD 1,000,000 1,076,961 0.12
Pertamina 5.625% 20.05.43 Regs 200,000 USD 207,460 246,014 0.03
Pertamina 6.45% 14-30.05.44 600,000 USD 644,518 813,050 0.09
Sbsn Indo I 4.4% 18-01.03.28 2,400,000 USD 2,413,540 2,807,544 0.31
32,622,601 35,846,662 3.95
IraqRepublic of 6.752% 17-09.03.23 300,000 USD 300,000 292,182 0.03
300,000 292,182 0.03
IrelandGtlk Eur Cp 4.65% 20-10.03.27 5,100,000 USD 5,100,100 5,297,268 0.58
Gtlk Eur Cp 4.80% 20-26.02.28 2,000,000 USD 1,969,800 2,090,000 0.23
Gtlk Europe 5.125% 17-31.05.24 400,000 USD 396,056 423,616 0.05
Gtlk Europe 5.95% 19-17.04.25 2,900,000 USD 2,879,520 3,154,423 0.35
Rzd Capital 3.3744% 13-20.05.21 382,000 EUR 444,646 472,925 0.05
Veb Finance 5.942% 13-21.11.23 1,500,000 USD 1,643,593 1,665,945 0.18
Veb Finance 6.025% 12-05.07.22 1,000,000 USD 1,075,970 1,067,320 0.12
13,509,685 14,171,497 1.56
JamaicaJamaica 6.75% 15-28.04.28 5,200,000 USD 6,035,018 6,324,552 0.70
Jamaica 7.875% 15-28.07.45 3,200,000 USD 3,910,410 4,584,000 0.50
Jamaica 8% 07-15.03.39 2,300,000 USD 2,955,724 3,358,000 0.37
12,901,152 14,266,552 1.57
JordanJordan 4.95% 20-07.07.25 1,400,000 USD 1,400,000 1,484,291 0.16
Jordan 5.75% 16-31.01.27 800,000 USD 812,211 880,197 0.10
Jordan 5.85% 20-07.07.30 500,000 USD 500,000 550,910 0.06
Jordan 6.125% 15-29.01.26 1,600,000 USD 1,662,780 1,776,184 0.20
Jordan 7.375% 17-10.10.47 Regs 1,800,000 USD 1,759,610 2,095,329 0.23
6,134,601 6,786,911 0.75
DANSKE INVEST SICAV
The accompanying notes form an integral part of these financial statements.
135
Emerging Markets Debt Hard Currency
Statement of Investments (continued)as at December 31, 2020(expressed in USD)
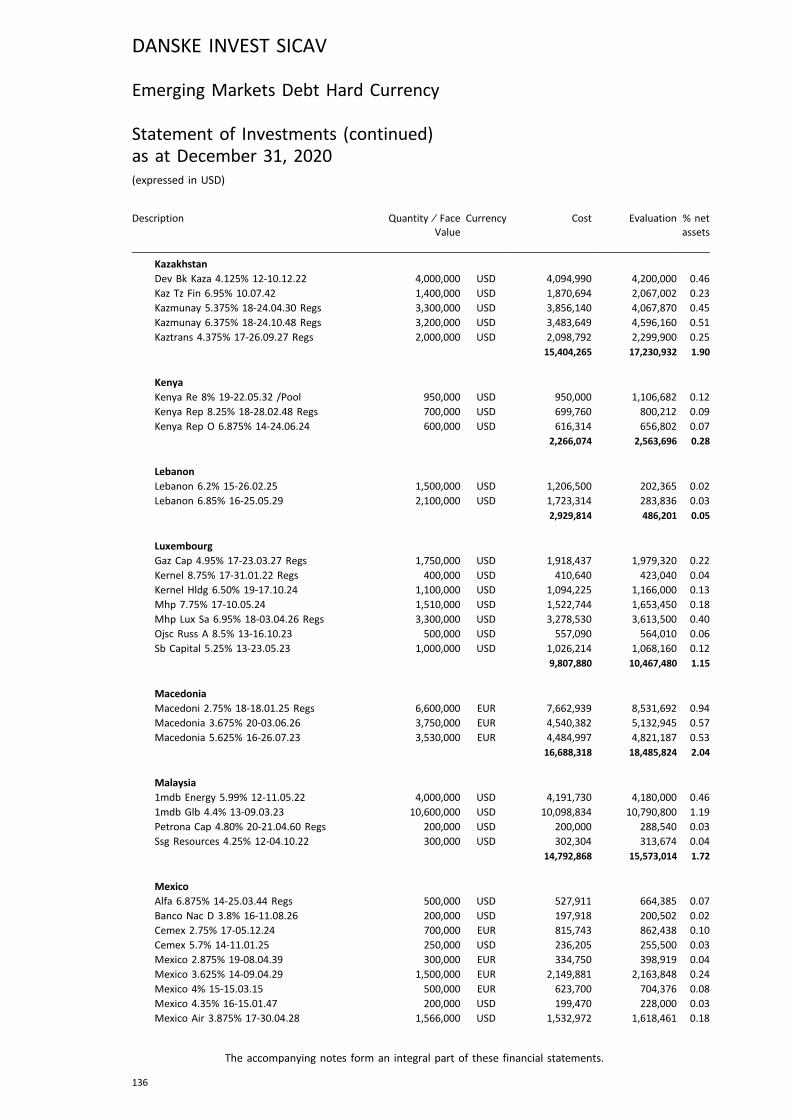
Description Quantity ⁄ FaceValue
Currency Cost Evaluation % netassets
KazakhstanDev Bk Kaza 4.125% 12-10.12.22 4,000,000 USD 4,094,990 4,200,000 0.46
Kaz Tz Fin 6.95% 10.07.42 1,400,000 USD 1,870,694 2,067,002 0.23
Kazmunay 5.375% 18-24.04.30 Regs 3,300,000 USD 3,856,140 4,067,870 0.45
Kazmunay 6.375% 18-24.10.48 Regs 3,200,000 USD 3,483,649 4,596,160 0.51
Kaztrans 4.375% 17-26.09.27 Regs 2,000,000 USD 2,098,792 2,299,900 0.25
15,404,265 17,230,932 1.90
KenyaKenya Re 8% 19-22.05.32 /Pool 950,000 USD 950,000 1,106,682 0.12
Kenya Rep 8.25% 18-28.02.48 Regs 700,000 USD 699,760 800,212 0.09
Kenya Rep O 6.875% 14-24.06.24 600,000 USD 616,314 656,802 0.07
2,266,074 2,563,696 0.28
LebanonLebanon 6.2% 15-26.02.25 1,500,000 USD 1,206,500 202,365 0.02
Lebanon 6.85% 16-25.05.29 2,100,000 USD 1,723,314 283,836 0.03
2,929,814 486,201 0.05
LuxembourgGaz Cap 4.95% 17-23.03.27 Regs 1,750,000 USD 1,918,437 1,979,320 0.22
Kernel 8.75% 17-31.01.22 Regs 400,000 USD 410,640 423,040 0.04
Kernel Hldg 6.50% 19-17.10.24 1,100,000 USD 1,094,225 1,166,000 0.13
Mhp 7.75% 17-10.05.24 1,510,000 USD 1,522,744 1,653,450 0.18
Mhp Lux Sa 6.95% 18-03.04.26 Regs 3,300,000 USD 3,278,530 3,613,500 0.40
Ojsc Russ A 8.5% 13-16.10.23 500,000 USD 557,090 564,010 0.06
Sb Capital 5.25% 13-23.05.23 1,000,000 USD 1,026,214 1,068,160 0.12
9,807,880 10,467,480 1.15
MacedoniaMacedoni 2.75% 18-18.01.25 Regs 6,600,000 EUR 7,662,939 8,531,692 0.94
Macedonia 3.675% 20-03.06.26 3,750,000 EUR 4,540,382 5,132,945 0.57
Macedonia 5.625% 16-26.07.23 3,530,000 EUR 4,484,997 4,821,187 0.53
16,688,318 18,485,824 2.04
Malaysia1mdb Energy 5.99% 12-11.05.22 4,000,000 USD 4,191,730 4,180,000 0.46
1mdb Glb 4.4% 13-09.03.23 10,600,000 USD 10,098,834 10,790,800 1.19
Petrona Cap 4.80% 20-21.04.60 Regs 200,000 USD 200,000 288,540 0.03
Ssg Resources 4.25% 12-04.10.22 300,000 USD 302,304 313,674 0.04
14,792,868 15,573,014 1.72
MexicoAlfa 6.875% 14-25.03.44 Regs 500,000 USD 527,911 664,385 0.07
Banco Nac D 3.8% 16-11.08.26 200,000 USD 197,918 200,502 0.02
Cemex 2.75% 17-05.12.24 700,000 EUR 815,743 862,438 0.10
Cemex 5.7% 14-11.01.25 250,000 USD 236,205 255,500 0.03
Mexico 2.875% 19-08.04.39 300,000 EUR 334,750 398,919 0.04
Mexico 3.625% 14-09.04.29 1,500,000 EUR 2,149,881 2,163,848 0.24
Mexico 4% 15-15.03.15 500,000 EUR 623,700 704,376 0.08
Mexico 4.35% 16-15.01.47 200,000 USD 199,470 228,000 0.03
Mexico Air 3.875% 17-30.04.28 1,566,000 USD 1,532,972 1,618,461 0.18
DANSKE INVEST SICAV
The accompanying notes form an integral part of these financial statements.
136
Emerging Markets Debt Hard Currency
Statement of Investments (continued)as at December 31, 2020(expressed in USD)
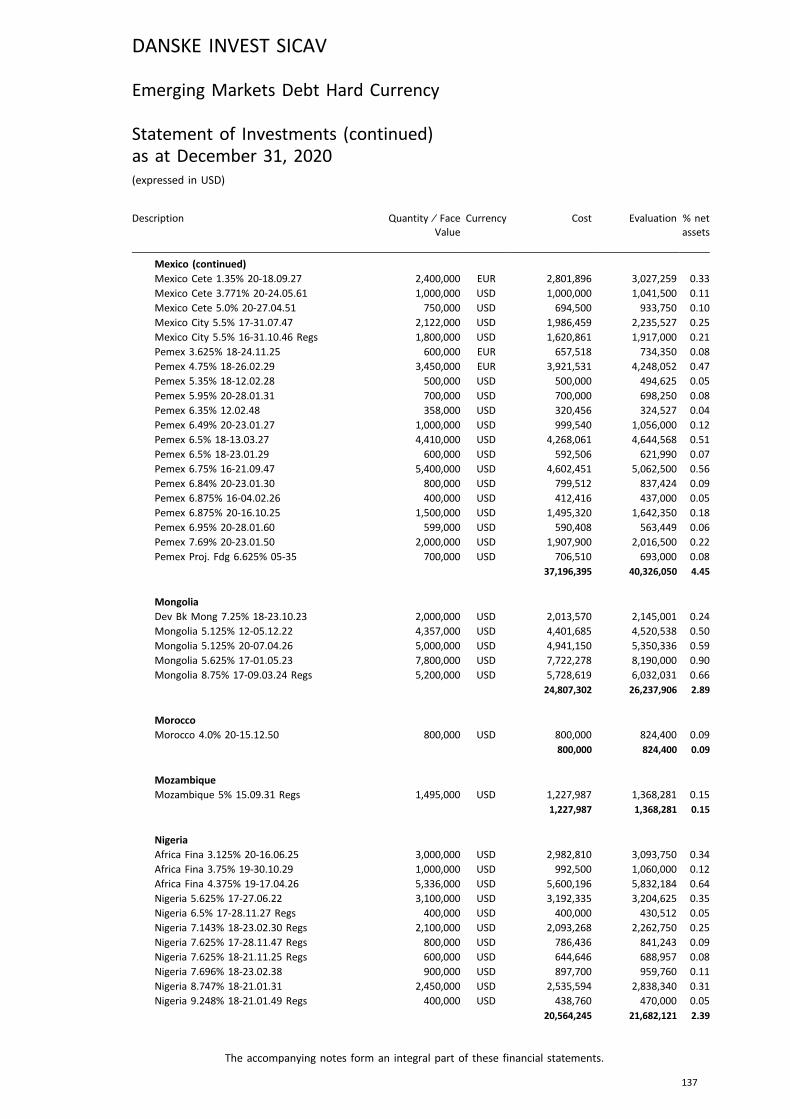
Description Quantity ⁄ FaceValue
Currency Cost Evaluation % netassets
Mexico (continued)Mexico Cete 1.35% 20-18.09.27 2,400,000 EUR 2,801,896 3,027,259 0.33
Mexico Cete 3.771% 20-24.05.61 1,000,000 USD 1,000,000 1,041,500 0.11
Mexico Cete 5.0% 20-27.04.51 750,000 USD 694,500 933,750 0.10
Mexico City 5.5% 17-31.07.47 2,122,000 USD 1,986,459 2,235,527 0.25
Mexico City 5.5% 16-31.10.46 Regs 1,800,000 USD 1,620,861 1,917,000 0.21
Pemex 3.625% 18-24.11.25 600,000 EUR 657,518 734,350 0.08
Pemex 4.75% 18-26.02.29 3,450,000 EUR 3,921,531 4,248,052 0.47
Pemex 5.35% 18-12.02.28 500,000 USD 500,000 494,625 0.05
Pemex 5.95% 20-28.01.31 700,000 USD 700,000 698,250 0.08
Pemex 6.35% 12.02.48 358,000 USD 320,456 324,527 0.04
Pemex 6.49% 20-23.01.27 1,000,000 USD 999,540 1,056,000 0.12
Pemex 6.5% 18-13.03.27 4,410,000 USD 4,268,061 4,644,568 0.51
Pemex 6.5% 18-23.01.29 600,000 USD 592,506 621,990 0.07
Pemex 6.75% 16-21.09.47 5,400,000 USD 4,602,451 5,062,500 0.56
Pemex 6.84% 20-23.01.30 800,000 USD 799,512 837,424 0.09
Pemex 6.875% 16-04.02.26 400,000 USD 412,416 437,000 0.05
Pemex 6.875% 20-16.10.25 1,500,000 USD 1,495,320 1,642,350 0.18
Pemex 6.95% 20-28.01.60 599,000 USD 590,408 563,449 0.06
Pemex 7.69% 20-23.01.50 2,000,000 USD 1,907,900 2,016,500 0.22
Pemex Proj. Fdg 6.625% 05-35 700,000 USD 706,510 693,000 0.08
37,196,395 40,326,050 4.45
MongoliaDev Bk Mong 7.25% 18-23.10.23 2,000,000 USD 2,013,570 2,145,001 0.24
Mongolia 5.125% 12-05.12.22 4,357,000 USD 4,401,685 4,520,538 0.50
Mongolia 5.125% 20-07.04.26 5,000,000 USD 4,941,150 5,350,336 0.59
Mongolia 5.625% 17-01.05.23 7,800,000 USD 7,722,278 8,190,000 0.90
Mongolia 8.75% 17-09.03.24 Regs 5,200,000 USD 5,728,619 6,032,031 0.66
24,807,302 26,237,906 2.89
MoroccoMorocco 4.0% 20-15.12.50 800,000 USD 800,000 824,400 0.09
800,000 824,400 0.09
MozambiqueMozambique 5% 15.09.31 Regs 1,495,000 USD 1,227,987 1,368,281 0.15
1,227,987 1,368,281 0.15
NigeriaAfrica Fina 3.125% 20-16.06.25 3,000,000 USD 2,982,810 3,093,750 0.34
Africa Fina 3.75% 19-30.10.29 1,000,000 USD 992,500 1,060,000 0.12
Africa Fina 4.375% 19-17.04.26 5,336,000 USD 5,600,196 5,832,184 0.64
Nigeria 5.625% 17-27.06.22 3,100,000 USD 3,192,335 3,204,625 0.35
Nigeria 6.5% 17-28.11.27 Regs 400,000 USD 400,000 430,512 0.05
Nigeria 7.143% 18-23.02.30 Regs 2,100,000 USD 2,093,268 2,262,750 0.25
Nigeria 7.625% 17-28.11.47 Regs 800,000 USD 786,436 841,243 0.09
Nigeria 7.625% 18-21.11.25 Regs 600,000 USD 644,646 688,957 0.08
Nigeria 7.696% 18-23.02.38 900,000 USD 897,700 959,760 0.11
Nigeria 8.747% 18-21.01.31 2,450,000 USD 2,535,594 2,838,340 0.31
Nigeria 9.248% 18-21.01.49 Regs 400,000 USD 438,760 470,000 0.05
20,564,245 21,682,121 2.39
DANSKE INVEST SICAV
The accompanying notes form an integral part of these financial statements.
137
Emerging Markets Debt Hard Currency
Statement of Investments (continued)as at December 31, 2020(expressed in USD)
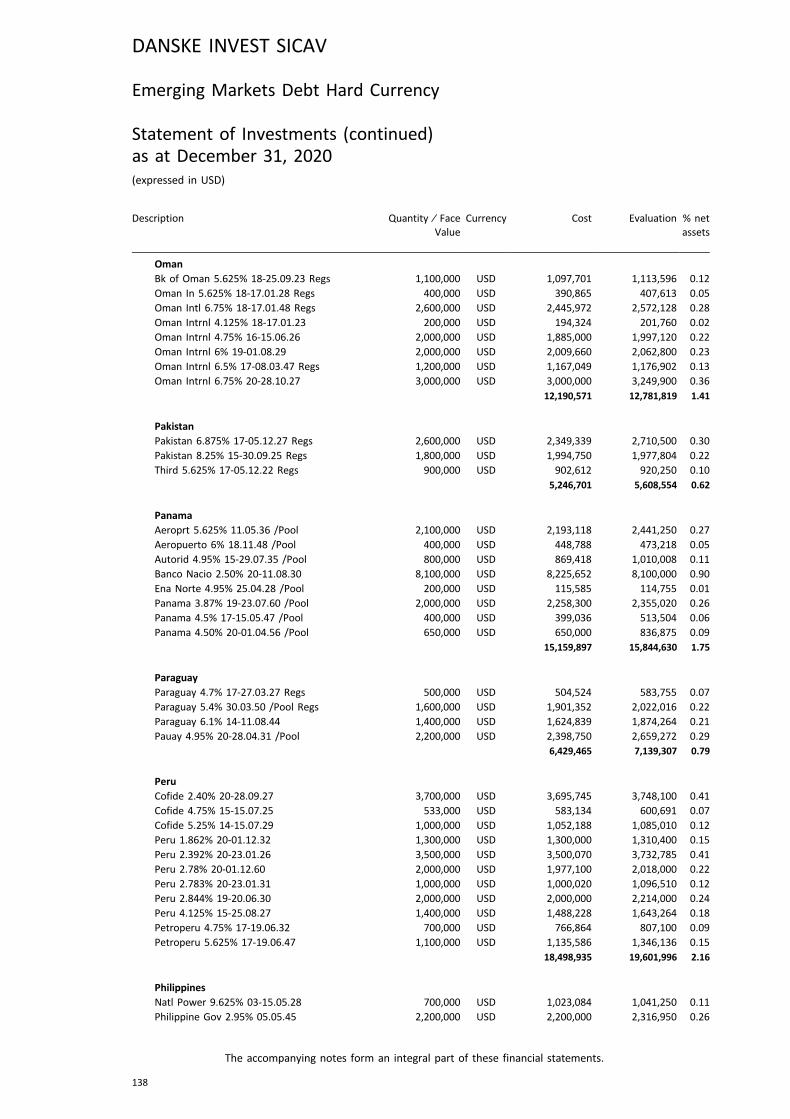
Description Quantity ⁄ FaceValue
Currency Cost Evaluation % netassets
OmanBk of Oman 5.625% 18-25.09.23 Regs 1,100,000 USD 1,097,701 1,113,596 0.12
Oman In 5.625% 18-17.01.28 Regs 400,000 USD 390,865 407,613 0.05
Oman Intl 6.75% 18-17.01.48 Regs 2,600,000 USD 2,445,972 2,572,128 0.28
Oman Intrnl 4.125% 18-17.01.23 200,000 USD 194,324 201,760 0.02
Oman Intrnl 4.75% 16-15.06.26 2,000,000 USD 1,885,000 1,997,120 0.22
Oman Intrnl 6% 19-01.08.29 2,000,000 USD 2,009,660 2,062,800 0.23
Oman Intrnl 6.5% 17-08.03.47 Regs 1,200,000 USD 1,167,049 1,176,902 0.13
Oman Intrnl 6.75% 20-28.10.27 3,000,000 USD 3,000,000 3,249,900 0.36
12,190,571 12,781,819 1.41
PakistanPakistan 6.875% 17-05.12.27 Regs 2,600,000 USD 2,349,339 2,710,500 0.30
Pakistan 8.25% 15-30.09.25 Regs 1,800,000 USD 1,994,750 1,977,804 0.22
Third 5.625% 17-05.12.22 Regs 900,000 USD 902,612 920,250 0.10
5,246,701 5,608,554 0.62
PanamaAeroprt 5.625% 11.05.36 /Pool 2,100,000 USD 2,193,118 2,441,250 0.27
Aeropuerto 6% 18.11.48 /Pool 400,000 USD 448,788 473,218 0.05
Autorid 4.95% 15-29.07.35 /Pool 800,000 USD 869,418 1,010,008 0.11
Banco Nacio 2.50% 20-11.08.30 8,100,000 USD 8,225,652 8,100,000 0.90
Ena Norte 4.95% 25.04.28 /Pool 200,000 USD 115,585 114,755 0.01
Panama 3.87% 19-23.07.60 /Pool 2,000,000 USD 2,258,300 2,355,020 0.26
Panama 4.5% 17-15.05.47 /Pool 400,000 USD 399,036 513,504 0.06
Panama 4.50% 20-01.04.56 /Pool 650,000 USD 650,000 836,875 0.09
15,159,897 15,844,630 1.75
ParaguayParaguay 4.7% 17-27.03.27 Regs 500,000 USD 504,524 583,755 0.07
Paraguay 5.4% 30.03.50 /Pool Regs 1,600,000 USD 1,901,352 2,022,016 0.22
Paraguay 6.1% 14-11.08.44 1,400,000 USD 1,624,839 1,874,264 0.21
Pauay 4.95% 20-28.04.31 /Pool 2,200,000 USD 2,398,750 2,659,272 0.29
6,429,465 7,139,307 0.79
PeruCofide 2.40% 20-28.09.27 3,700,000 USD 3,695,745 3,748,100 0.41
Cofide 4.75% 15-15.07.25 533,000 USD 583,134 600,691 0.07
Cofide 5.25% 14-15.07.29 1,000,000 USD 1,052,188 1,085,010 0.12
Peru 1.862% 20-01.12.32 1,300,000 USD 1,300,000 1,310,400 0.15
Peru 2.392% 20-23.01.26 3,500,000 USD 3,500,070 3,732,785 0.41
Peru 2.78% 20-01.12.60 2,000,000 USD 1,977,100 2,018,000 0.22
Peru 2.783% 20-23.01.31 1,000,000 USD 1,000,020 1,096,510 0.12
Peru 2.844% 19-20.06.30 2,000,000 USD 2,000,000 2,214,000 0.24
Peru 4.125% 15-25.08.27 1,400,000 USD 1,488,228 1,643,264 0.18
Petroperu 4.75% 17-19.06.32 700,000 USD 766,864 807,100 0.09
Petroperu 5.625% 17-19.06.47 1,100,000 USD 1,135,586 1,346,136 0.15
18,498,935 19,601,996 2.16
PhilippinesNatl Power 9.625% 03-15.05.28 700,000 USD 1,023,084 1,041,250 0.11
Philippine Gov 2.95% 05.05.45 2,200,000 USD 2,200,000 2,316,950 0.26
DANSKE INVEST SICAV
The accompanying notes form an integral part of these financial statements.
138
Emerging Markets Debt Hard Currency
Statement of Investments (continued)as at December 31, 2020(expressed in USD)
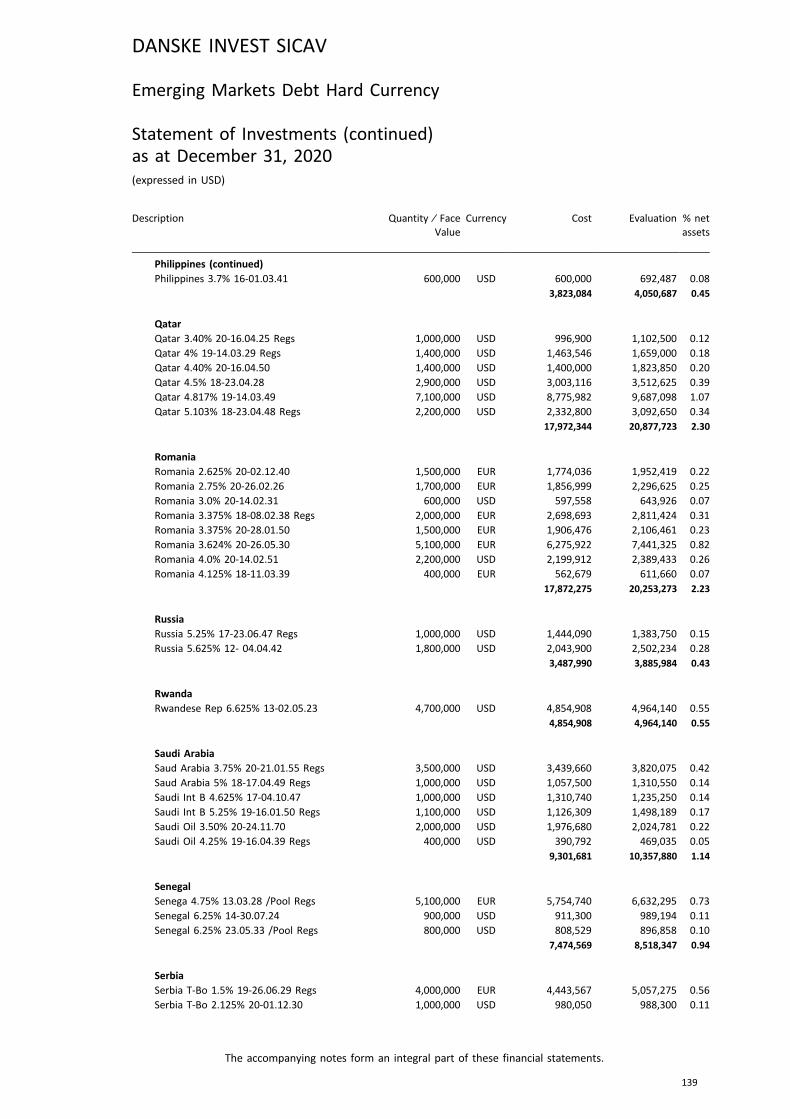
Description Quantity ⁄ FaceValue
Currency Cost Evaluation % netassets
Philippines (continued)Philippines 3.7% 16-01.03.41 600,000 USD 600,000 692,487 0.08
3,823,084 4,050,687 0.45
QatarQatar 3.40% 20-16.04.25 Regs 1,000,000 USD 996,900 1,102,500 0.12
Qatar 4% 19-14.03.29 Regs 1,400,000 USD 1,463,546 1,659,000 0.18
Qatar 4.40% 20-16.04.50 1,400,000 USD 1,400,000 1,823,850 0.20
Qatar 4.5% 18-23.04.28 2,900,000 USD 3,003,116 3,512,625 0.39
Qatar 4.817% 19-14.03.49 7,100,000 USD 8,775,982 9,687,098 1.07
Qatar 5.103% 18-23.04.48 Regs 2,200,000 USD 2,332,800 3,092,650 0.34
17,972,344 20,877,723 2.30
RomaniaRomania 2.625% 20-02.12.40 1,500,000 EUR 1,774,036 1,952,419 0.22
Romania 2.75% 20-26.02.26 1,700,000 EUR 1,856,999 2,296,625 0.25
Romania 3.0% 20-14.02.31 600,000 USD 597,558 643,926 0.07
Romania 3.375% 18-08.02.38 Regs 2,000,000 EUR 2,698,693 2,811,424 0.31
Romania 3.375% 20-28.01.50 1,500,000 EUR 1,906,476 2,106,461 0.23
Romania 3.624% 20-26.05.30 5,100,000 EUR 6,275,922 7,441,325 0.82
Romania 4.0% 20-14.02.51 2,200,000 USD 2,199,912 2,389,433 0.26
Romania 4.125% 18-11.03.39 400,000 EUR 562,679 611,660 0.07
17,872,275 20,253,273 2.23
RussiaRussia 5.25% 17-23.06.47 Regs 1,000,000 USD 1,444,090 1,383,750 0.15
Russia 5.625% 12- 04.04.42 1,800,000 USD 2,043,900 2,502,234 0.28
3,487,990 3,885,984 0.43
RwandaRwandese Rep 6.625% 13-02.05.23 4,700,000 USD 4,854,908 4,964,140 0.55
4,854,908 4,964,140 0.55
Saudi ArabiaSaud Arabia 3.75% 20-21.01.55 Regs 3,500,000 USD 3,439,660 3,820,075 0.42
Saud Arabia 5% 18-17.04.49 Regs 1,000,000 USD 1,057,500 1,310,550 0.14
Saudi Int B 4.625% 17-04.10.47 1,000,000 USD 1,310,740 1,235,250 0.14
Saudi Int B 5.25% 19-16.01.50 Regs 1,100,000 USD 1,126,309 1,498,189 0.17
Saudi Oil 3.50% 20-24.11.70 2,000,000 USD 1,976,680 2,024,781 0.22
Saudi Oil 4.25% 19-16.04.39 Regs 400,000 USD 390,792 469,035 0.05
9,301,681 10,357,880 1.14
SenegalSenega 4.75% 13.03.28 /Pool Regs 5,100,000 EUR 5,754,740 6,632,295 0.73
Senegal 6.25% 14-30.07.24 900,000 USD 911,300 989,194 0.11
Senegal 6.25% 23.05.33 /Pool Regs 800,000 USD 808,529 896,858 0.10
7,474,569 8,518,347 0.94
SerbiaSerbia T-Bo 1.5% 19-26.06.29 Regs 4,000,000 EUR 4,443,567 5,057,275 0.56
Serbia T-Bo 2.125% 20-01.12.30 1,000,000 USD 980,050 988,300 0.11
DANSKE INVEST SICAV
The accompanying notes form an integral part of these financial statements.
139
Emerging Markets Debt Hard Currency
Statement of Investments (continued)as at December 31, 2020(expressed in USD)
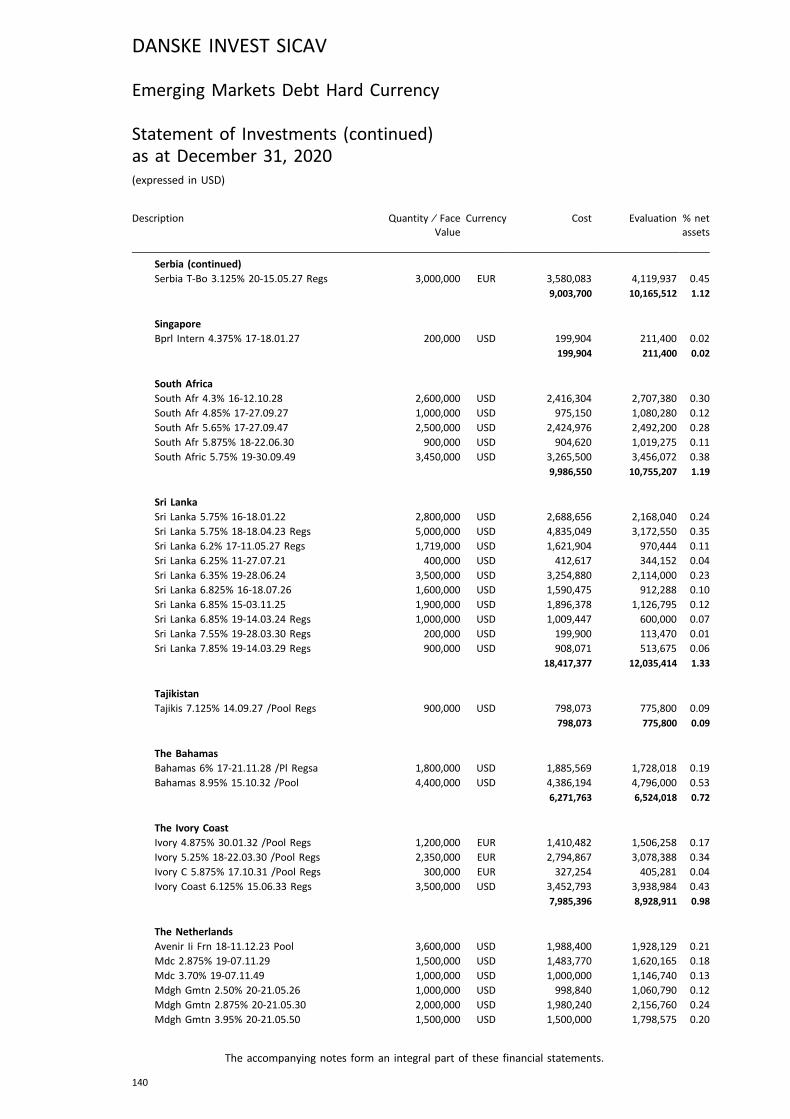
Description Quantity ⁄ FaceValue
Currency Cost Evaluation % netassets
Serbia (continued)Serbia T-Bo 3.125% 20-15.05.27 Regs 3,000,000 EUR 3,580,083 4,119,937 0.45
9,003,700 10,165,512 1.12
SingaporeBprl Intern 4.375% 17-18.01.27 200,000 USD 199,904 211,400 0.02
199,904 211,400 0.02
South AfricaSouth Afr 4.3% 16-12.10.28 2,600,000 USD 2,416,304 2,707,380 0.30
South Afr 4.85% 17-27.09.27 1,000,000 USD 975,150 1,080,280 0.12
South Afr 5.65% 17-27.09.47 2,500,000 USD 2,424,976 2,492,200 0.28
South Afr 5.875% 18-22.06.30 900,000 USD 904,620 1,019,275 0.11
South Afric 5.75% 19-30.09.49 3,450,000 USD 3,265,500 3,456,072 0.38
9,986,550 10,755,207 1.19
Sri LankaSri Lanka 5.75% 16-18.01.22 2,800,000 USD 2,688,656 2,168,040 0.24
Sri Lanka 5.75% 18-18.04.23 Regs 5,000,000 USD 4,835,049 3,172,550 0.35
Sri Lanka 6.2% 17-11.05.27 Regs 1,719,000 USD 1,621,904 970,444 0.11
Sri Lanka 6.25% 11-27.07.21 400,000 USD 412,617 344,152 0.04
Sri Lanka 6.35% 19-28.06.24 3,500,000 USD 3,254,880 2,114,000 0.23
Sri Lanka 6.825% 16-18.07.26 1,600,000 USD 1,590,475 912,288 0.10
Sri Lanka 6.85% 15-03.11.25 1,900,000 USD 1,896,378 1,126,795 0.12
Sri Lanka 6.85% 19-14.03.24 Regs 1,000,000 USD 1,009,447 600,000 0.07
Sri Lanka 7.55% 19-28.03.30 Regs 200,000 USD 199,900 113,470 0.01
Sri Lanka 7.85% 19-14.03.29 Regs 900,000 USD 908,071 513,675 0.06
18,417,377 12,035,414 1.33
TajikistanTajikis 7.125% 14.09.27 /Pool Regs 900,000 USD 798,073 775,800 0.09
798,073 775,800 0.09
The BahamasBahamas 6% 17-21.11.28 /Pl Regsa 1,800,000 USD 1,885,569 1,728,018 0.19
Bahamas 8.95% 15.10.32 /Pool 4,400,000 USD 4,386,194 4,796,000 0.53
6,271,763 6,524,018 0.72
The Ivory CoastIvory 4.875% 30.01.32 /Pool Regs 1,200,000 EUR 1,410,482 1,506,258 0.17
Ivory 5.25% 18-22.03.30 /Pool Regs 2,350,000 EUR 2,794,867 3,078,388 0.34
Ivory C 5.875% 17.10.31 /Pool Regs 300,000 EUR 327,254 405,281 0.04
Ivory Coast 6.125% 15.06.33 Regs 3,500,000 USD 3,452,793 3,938,984 0.43
7,985,396 8,928,911 0.98
The NetherlandsAvenir Ii Frn 18-11.12.23 Pool 3,600,000 USD 1,988,400 1,928,129 0.21
Mdc 2.875% 19-07.11.29 1,500,000 USD 1,483,770 1,620,165 0.18
Mdc 3.70% 19-07.11.49 1,000,000 USD 1,000,000 1,146,740 0.13
Mdgh Gmtn 2.50% 20-21.05.26 1,000,000 USD 998,840 1,060,790 0.12
Mdgh Gmtn 2.875% 20-21.05.30 2,000,000 USD 1,980,240 2,156,760 0.24
Mdgh Gmtn 3.95% 20-21.05.50 1,500,000 USD 1,500,000 1,798,575 0.20
DANSKE INVEST SICAV
The accompanying notes form an integral part of these financial statements.
140
Emerging Markets Debt Hard Currency
Statement of Investments (continued)as at December 31, 2020(expressed in USD)
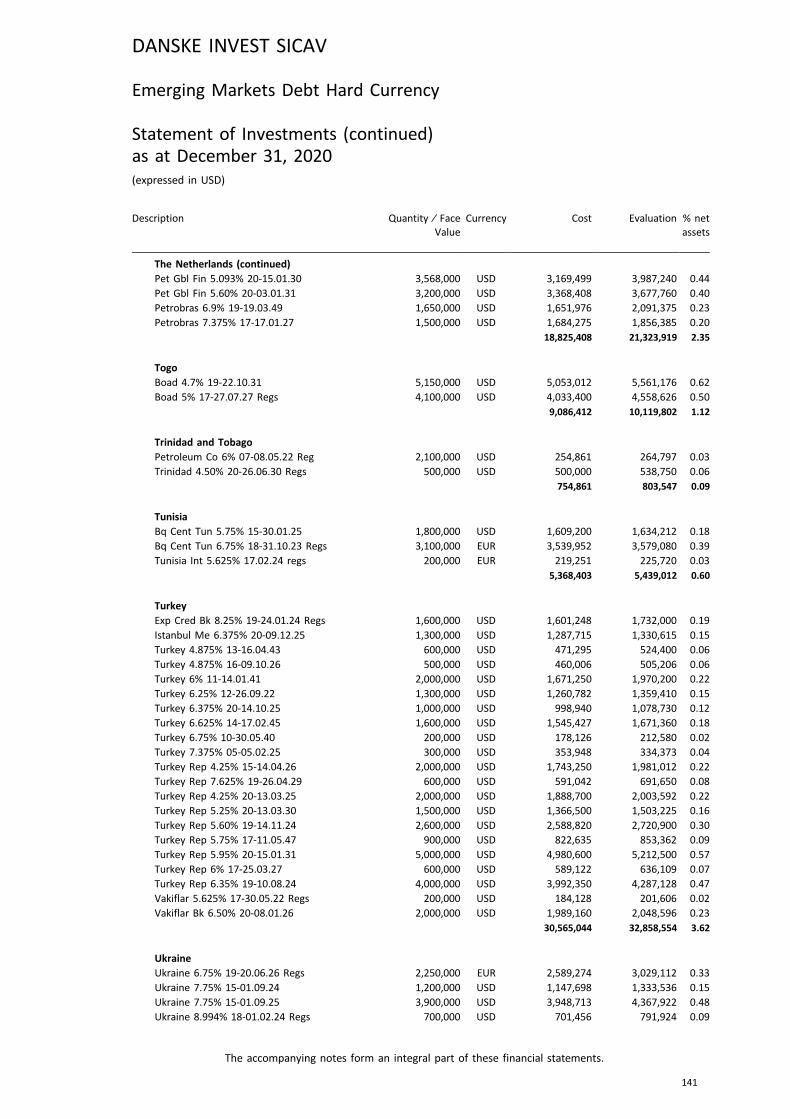
Description Quantity ⁄ FaceValue
Currency Cost Evaluation % netassets
The Netherlands (continued)Pet Gbl Fin 5.093% 20-15.01.30 3,568,000 USD 3,169,499 3,987,240 0.44
Pet Gbl Fin 5.60% 20-03.01.31 3,200,000 USD 3,368,408 3,677,760 0.40
Petrobras 6.9% 19-19.03.49 1,650,000 USD 1,651,976 2,091,375 0.23
Petrobras 7.375% 17-17.01.27 1,500,000 USD 1,684,275 1,856,385 0.20
18,825,408 21,323,919 2.35
TogoBoad 4.7% 19-22.10.31 5,150,000 USD 5,053,012 5,561,176 0.62
Boad 5% 17-27.07.27 Regs 4,100,000 USD 4,033,400 4,558,626 0.50
9,086,412 10,119,802 1.12
Trinidad and TobagoPetroleum Co 6% 07-08.05.22 Reg 2,100,000 USD 254,861 264,797 0.03
Trinidad 4.50% 20-26.06.30 Regs 500,000 USD 500,000 538,750 0.06
754,861 803,547 0.09
TunisiaBq Cent Tun 5.75% 15-30.01.25 1,800,000 USD 1,609,200 1,634,212 0.18
Bq Cent Tun 6.75% 18-31.10.23 Regs 3,100,000 EUR 3,539,952 3,579,080 0.39
Tunisia Int 5.625% 17.02.24 regs 200,000 EUR 219,251 225,720 0.03
5,368,403 5,439,012 0.60
TurkeyExp Cred Bk 8.25% 19-24.01.24 Regs 1,600,000 USD 1,601,248 1,732,000 0.19
Istanbul Me 6.375% 20-09.12.25 1,300,000 USD 1,287,715 1,330,615 0.15
Turkey 4.875% 13-16.04.43 600,000 USD 471,295 524,400 0.06
Turkey 4.875% 16-09.10.26 500,000 USD 460,006 505,206 0.06
Turkey 6% 11-14.01.41 2,000,000 USD 1,671,250 1,970,200 0.22
Turkey 6.25% 12-26.09.22 1,300,000 USD 1,260,782 1,359,410 0.15
Turkey 6.375% 20-14.10.25 1,000,000 USD 998,940 1,078,730 0.12
Turkey 6.625% 14-17.02.45 1,600,000 USD 1,545,427 1,671,360 0.18
Turkey 6.75% 10-30.05.40 200,000 USD 178,126 212,580 0.02
Turkey 7.375% 05-05.02.25 300,000 USD 353,948 334,373 0.04
Turkey Rep 4.25% 15-14.04.26 2,000,000 USD 1,743,250 1,981,012 0.22
Turkey Rep 7.625% 19-26.04.29 600,000 USD 591,042 691,650 0.08
Turkey Rep 4.25% 20-13.03.25 2,000,000 USD 1,888,700 2,003,592 0.22
Turkey Rep 5.25% 20-13.03.30 1,500,000 USD 1,366,500 1,503,225 0.16
Turkey Rep 5.60% 19-14.11.24 2,600,000 USD 2,588,820 2,720,900 0.30
Turkey Rep 5.75% 17-11.05.47 900,000 USD 822,635 853,362 0.09
Turkey Rep 5.95% 20-15.01.31 5,000,000 USD 4,980,600 5,212,500 0.57
Turkey Rep 6% 17-25.03.27 600,000 USD 589,122 636,109 0.07
Turkey Rep 6.35% 19-10.08.24 4,000,000 USD 3,992,350 4,287,128 0.47
Vakiflar 5.625% 17-30.05.22 Regs 200,000 USD 184,128 201,606 0.02
Vakiflar Bk 6.50% 20-08.01.26 2,000,000 USD 1,989,160 2,048,596 0.23
30,565,044 32,858,554 3.62
UkraineUkraine 6.75% 19-20.06.26 Regs 2,250,000 EUR 2,589,274 3,029,112 0.33
Ukraine 7.75% 15-01.09.24 1,200,000 USD 1,147,698 1,333,536 0.15
Ukraine 7.75% 15-01.09.25 3,900,000 USD 3,948,713 4,367,922 0.48
Ukraine 8.994% 18-01.02.24 Regs 700,000 USD 701,456 791,924 0.09
DANSKE INVEST SICAV
The accompanying notes form an integral part of these financial statements.
141
Emerging Markets Debt Hard Currency
Statement of Investments (continued)as at December 31, 2020(expressed in USD)
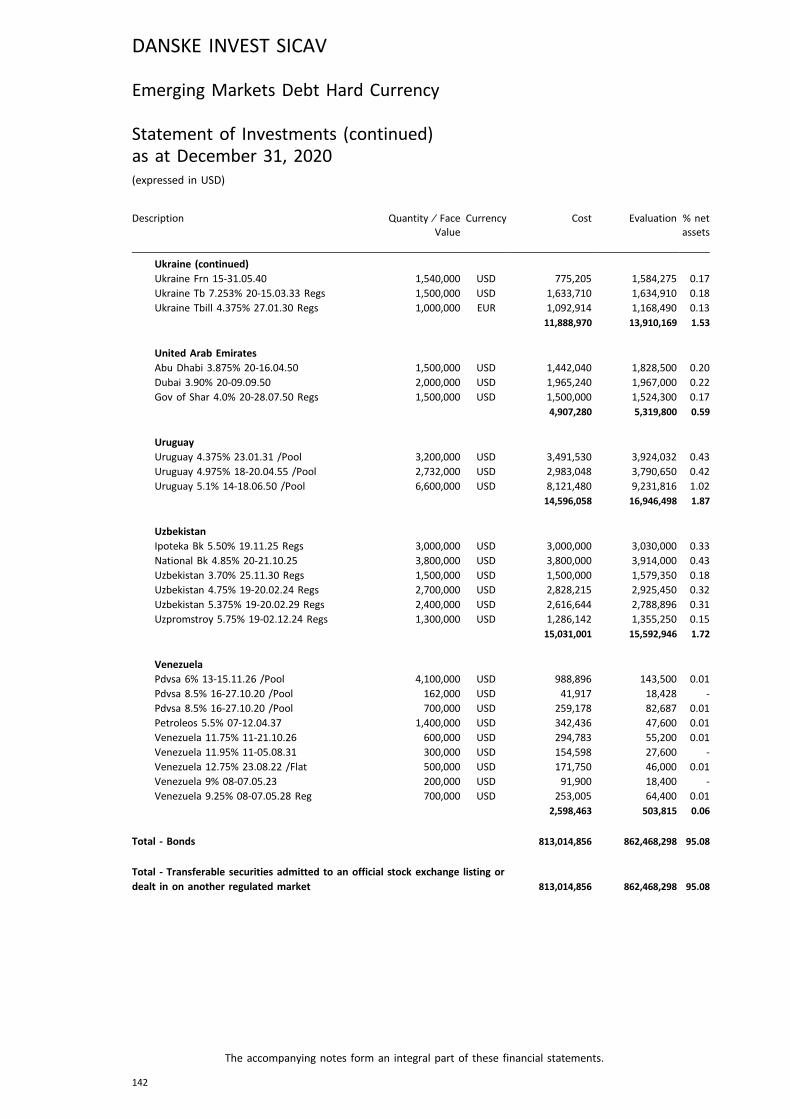
Description Quantity ⁄ FaceValue
Currency Cost Evaluation % netassets
Ukraine (continued)Ukraine Frn 15-31.05.40 1,540,000 USD 775,205 1,584,275 0.17
Ukraine Tb 7.253% 20-15.03.33 Regs 1,500,000 USD 1,633,710 1,634,910 0.18
Ukraine Tbill 4.375% 27.01.30 Regs 1,000,000 EUR 1,092,914 1,168,490 0.13
11,888,970 13,910,169 1.53
United Arab EmiratesAbu Dhabi 3.875% 20-16.04.50 1,500,000 USD 1,442,040 1,828,500 0.20
Dubai 3.90% 20-09.09.50 2,000,000 USD 1,965,240 1,967,000 0.22
Gov of Shar 4.0% 20-28.07.50 Regs 1,500,000 USD 1,500,000 1,524,300 0.17
4,907,280 5,319,800 0.59
UruguayUruguay 4.375% 23.01.31 /Pool 3,200,000 USD 3,491,530 3,924,032 0.43
Uruguay 4.975% 18-20.04.55 /Pool 2,732,000 USD 2,983,048 3,790,650 0.42
Uruguay 5.1% 14-18.06.50 /Pool 6,600,000 USD 8,121,480 9,231,816 1.02
14,596,058 16,946,498 1.87
UzbekistanIpoteka Bk 5.50% 19.11.25 Regs 3,000,000 USD 3,000,000 3,030,000 0.33
National Bk 4.85% 20-21.10.25 3,800,000 USD 3,800,000 3,914,000 0.43
Uzbekistan 3.70% 25.11.30 Regs 1,500,000 USD 1,500,000 1,579,350 0.18
Uzbekistan 4.75% 19-20.02.24 Regs 2,700,000 USD 2,828,215 2,925,450 0.32
Uzbekistan 5.375% 19-20.02.29 Regs 2,400,000 USD 2,616,644 2,788,896 0.31
Uzpromstroy 5.75% 19-02.12.24 Regs 1,300,000 USD 1,286,142 1,355,250 0.15
15,031,001 15,592,946 1.72
VenezuelaPdvsa 6% 13-15.11.26 /Pool 4,100,000 USD 988,896 143,500 0.01
Pdvsa 8.5% 16-27.10.20 /Pool 162,000 USD 41,917 18,428 -
Pdvsa 8.5% 16-27.10.20 /Pool 700,000 USD 259,178 82,687 0.01
Petroleos 5.5% 07-12.04.37 1,400,000 USD 342,436 47,600 0.01
Venezuela 11.75% 11-21.10.26 600,000 USD 294,783 55,200 0.01
Venezuela 11.95% 11-05.08.31 300,000 USD 154,598 27,600 -
Venezuela 12.75% 23.08.22 /Flat 500,000 USD 171,750 46,000 0.01
Venezuela 9% 08-07.05.23 200,000 USD 91,900 18,400 -
Venezuela 9.25% 08-07.05.28 Reg 700,000 USD 253,005 64,400 0.01
2,598,463 503,815 0.06
Total - Bonds 813,014,856 862,468,298 95.08
Total - Transferable securities admitted to an official stock exchange listing ordealt in on another regulated market 813,014,856 862,468,298 95.08
DANSKE INVEST SICAV
The accompanying notes form an integral part of these financial statements.
142
Emerging Markets Debt Hard Currency
Statement of Investments (continued)as at December 31, 2020(expressed in USD)

Description Quantity ⁄ FaceValue
Currency Cost Evaluation % netassets
Other Transferable securities
Bonds
ChileEmpresa De 3.068% 20-18.08.50 3,000,000 USD 3,000,000 2,920,170 0.32
3,000,000 2,920,170 0.32
Total - Bonds 3,000,000 2,920,170 0.32
Total - Other Transferable securities 3,000,000 2,920,170 0.32
TOTAL INVESTMENT PORTFOLIO 816,014,856 865,388,468 95.40
DANSKE INVEST SICAV
The accompanying notes form an integral part of these financial statements.
143
Emerging Markets Debt Hard Currency
Statement of Investments (continued)as at December 31, 2020(expressed in USD)
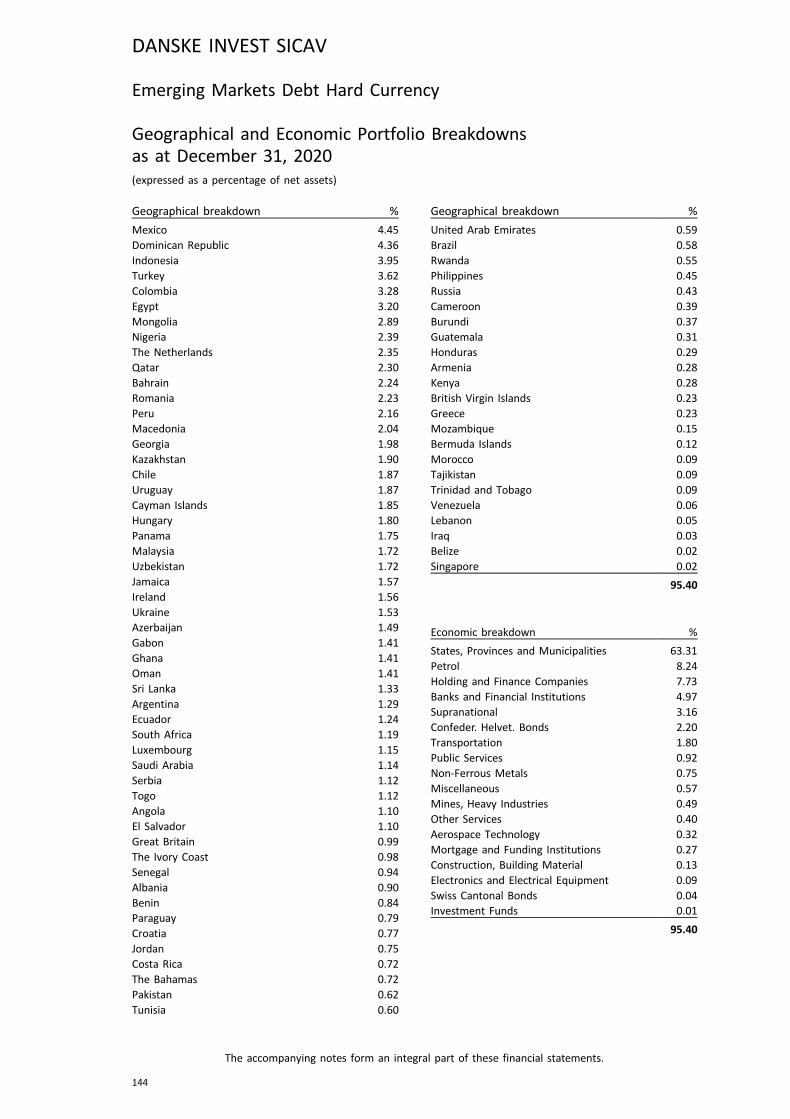
Emerging Markets Debt Hard Currency
Geographical and Economic Portfolio Breakdownsas at December 31, 2020(expressed as a percentage of net assets)
Geographical breakdown %
Mexico 4.45Dominican Republic 4.36Indonesia 3.95Turkey 3.62Colombia 3.28Egypt 3.20Mongolia 2.89Nigeria 2.39The Netherlands 2.35Qatar 2.30Bahrain 2.24Romania 2.23Peru 2.16Macedonia 2.04Georgia 1.98Kazakhstan 1.90Chile 1.87Uruguay 1.87Cayman Islands 1.85Hungary 1.80Panama 1.75Malaysia 1.72Uzbekistan 1.72Jamaica 1.57Ireland 1.56Ukraine 1.53Azerbaijan 1.49Gabon 1.41Ghana 1.41Oman 1.41Sri Lanka 1.33Argentina 1.29Ecuador 1.24South Africa 1.19Luxembourg 1.15Saudi Arabia 1.14Serbia 1.12Togo 1.12Angola 1.10El Salvador 1.10Great Britain 0.99The Ivory Coast 0.98Senegal 0.94Albania 0.90Benin 0.84Paraguay 0.79Croatia 0.77Jordan 0.75Costa Rica 0.72The Bahamas 0.72Pakistan 0.62Tunisia 0.60
Geographical breakdown %
United Arab Emirates 0.59Brazil 0.58Rwanda 0.55Philippines 0.45Russia 0.43Cameroon 0.39Burundi 0.37Guatemala 0.31Honduras 0.29Armenia 0.28Kenya 0.28British Virgin Islands 0.23Greece 0.23Mozambique 0.15Bermuda Islands 0.12Morocco 0.09Tajikistan 0.09Trinidad and Tobago 0.09Venezuela 0.06Lebanon 0.05Iraq 0.03Belize 0.02Singapore 0.02
95.40
Economic breakdown %
States, Provinces and Municipalities 63.31Petrol 8.24Holding and Finance Companies 7.73Banks and Financial Institutions 4.97Supranational 3.16Confeder. Helvet. Bonds 2.20Transportation 1.80Public Services 0.92Non-Ferrous Metals 0.75Miscellaneous 0.57Mines, Heavy Industries 0.49Other Services 0.40Aerospace Technology 0.32Mortgage and Funding Institutions 0.27Construction, Building Material 0.13Electronics and Electrical Equipment 0.09Swiss Cantonal Bonds 0.04Investment Funds 0.01
95.40
DANSKE INVEST SICAV
The accompanying notes form an integral part of these financial statements.
144
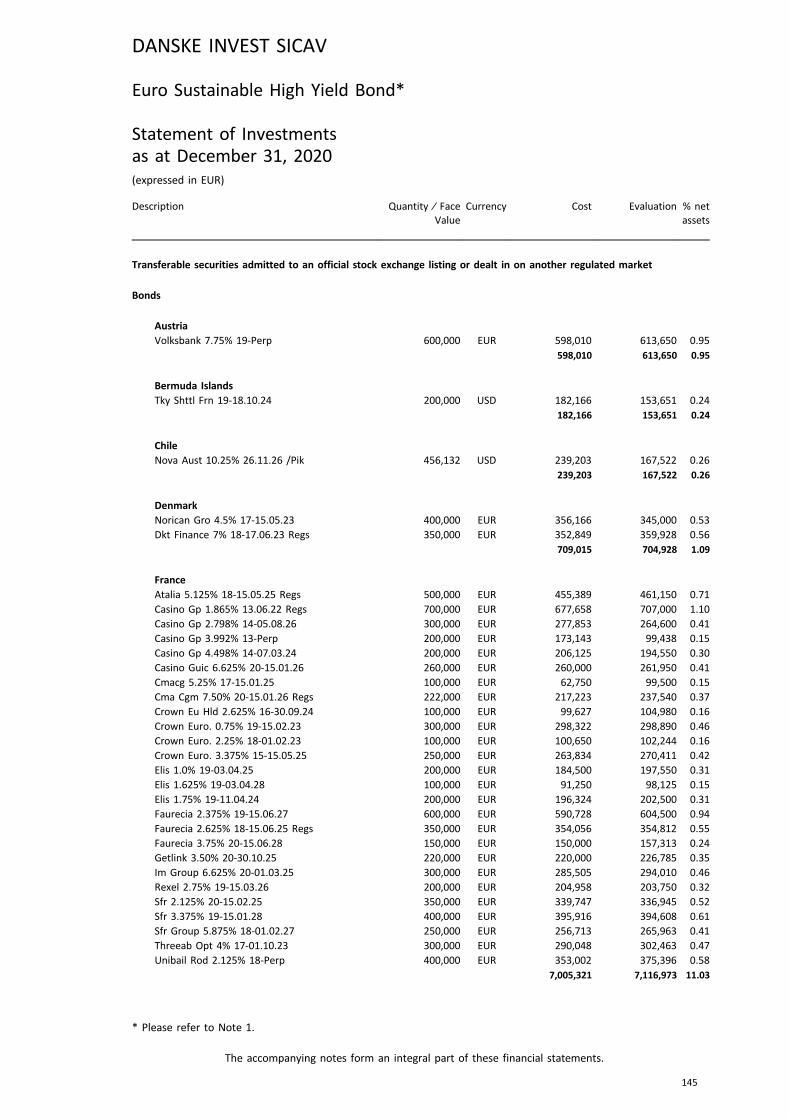
Euro Sustainable High Yield Bond*
Statement of Investmentsas at December 31, 2020(expressed in EUR)
Description Quantity ⁄ FaceValue
Currency Cost Evaluation % netassets
Transferable securities admitted to an official stock exchange listing or dealt in on another regulated market
Bonds
AustriaVolksbank 7.75% 19-Perp 600,000 EUR 598,010 613,650 0.95
598,010 613,650 0.95
Bermuda IslandsTky Shttl Frn 19-18.10.24 200,000 USD 182,166 153,651 0.24
182,166 153,651 0.24
ChileNova Aust 10.25% 26.11.26 /Pik 456,132 USD 239,203 167,522 0.26
239,203 167,522 0.26
DenmarkNorican Gro 4.5% 17-15.05.23 400,000 EUR 356,166 345,000 0.53
Dkt Finance 7% 18-17.06.23 Regs 350,000 EUR 352,849 359,928 0.56
709,015 704,928 1.09
FranceAtalia 5.125% 18-15.05.25 Regs 500,000 EUR 455,389 461,150 0.71
Casino Gp 1.865% 13.06.22 Regs 700,000 EUR 677,658 707,000 1.10
Casino Gp 2.798% 14-05.08.26 300,000 EUR 277,853 264,600 0.41
Casino Gp 3.992% 13-Perp 200,000 EUR 173,143 99,438 0.15
Casino Gp 4.498% 14-07.03.24 200,000 EUR 206,125 194,550 0.30
Casino Guic 6.625% 20-15.01.26 260,000 EUR 260,000 261,950 0.41
Cmacg 5.25% 17-15.01.25 100,000 EUR 62,750 99,500 0.15
Cma Cgm 7.50% 20-15.01.26 Regs 222,000 EUR 217,223 237,540 0.37
Crown Eu Hld 2.625% 16-30.09.24 100,000 EUR 99,627 104,980 0.16
Crown Euro. 0.75% 19-15.02.23 300,000 EUR 298,322 298,890 0.46
Crown Euro. 2.25% 18-01.02.23 100,000 EUR 100,650 102,244 0.16
Crown Euro. 3.375% 15-15.05.25 250,000 EUR 263,834 270,411 0.42
Elis 1.0% 19-03.04.25 200,000 EUR 184,500 197,550 0.31
Elis 1.625% 19-03.04.28 100,000 EUR 91,250 98,125 0.15
Elis 1.75% 19-11.04.24 200,000 EUR 196,324 202,500 0.31
Faurecia 2.375% 19-15.06.27 600,000 EUR 590,728 604,500 0.94
Faurecia 2.625% 18-15.06.25 Regs 350,000 EUR 354,056 354,812 0.55
Faurecia 3.75% 20-15.06.28 150,000 EUR 150,000 157,313 0.24
Getlink 3.50% 20-30.10.25 220,000 EUR 220,000 226,785 0.35
Im Group 6.625% 20-01.03.25 300,000 EUR 285,505 294,010 0.46
Rexel 2.75% 19-15.03.26 200,000 EUR 204,958 203,750 0.32
Sfr 2.125% 20-15.02.25 350,000 EUR 339,747 336,945 0.52
Sfr 3.375% 19-15.01.28 400,000 EUR 395,916 394,608 0.61
Sfr Group 5.875% 18-01.02.27 250,000 EUR 256,713 265,963 0.41
Threeab Opt 4% 17-01.10.23 300,000 EUR 290,048 302,463 0.47
Unibail Rod 2.125% 18-Perp 400,000 EUR 353,002 375,396 0.58
7,005,321 7,116,973 11.03
DANSKE INVEST SICAV
The accompanying notes form an integral part of these financial statements.
145
* Please refer to Note 1.

Description Quantity ⁄ FaceValue
Currency Cost Evaluation % netassets
GermanyAdler Re 1.5% 19-17.04.22 200,000 EUR 198,569 199,324 0.31
Comzbk 4% 16-23.03.26 350,000 EUR 374,850 391,882 0.61
Comzbk 6.125% 20-Perp 600,000 EUR 604,399 639,750 0.99
Consus 9.625% 19-15.05.24 300,000 EUR 328,215 321,672 0.50
Demire Re 1.875% 19-15.10.24 Regs 200,000 EUR 199,742 194,678 0.30
Depfa 4.6% 17-22.02.27 500,000 EUR 522,219 508,724 0.79
Deut Bk 5.625% 20-19.05.31 1,300,000 EUR 1,408,286 1,501,500 2.33
Dt Pfand 2.875% (Frn) 17-28.06.27 200,000 EUR 192,500 199,366 0.31
Kirk Beauty 6.25% 15-15.07.22 400,000 EUR 356,536 358,392 0.56
Kirk Beauty 8.75% 15-15.07.23 250,000 EUR 241,438 158,000 0.24
Lanxess 4.5% 16-06.12.76 Regs 450,000 EUR 468,022 480,946 0.75
Thyssenkp 1.375% 17-03.03.22 175,000 EUR 174,313 174,182 0.27
Thyssenkp 1.875% 19-06.03.23 350,000 EUR 331,022 349,327 0.54
Thyssenkp 2.875% 19-22.02.24 Regs 155,000 EUR 154,609 155,814 0.24
Vertical Ho 6.625% 20-15.07.28 110,000 EUR 110,000 117,893 0.18
Wepa Hygien 2.875% 19-15.12.27 495,000 EUR 484,466 500,551 0.78
Zf Finance 2.75% 20-25.05.27 300,000 EUR 297,834 304,875 0.47
6,447,020 6,556,876 10.17
Great BritainCentrica 3% 15-10.04.76 500,000 EUR 507,783 501,900 0.78
Fce Bk 1.134% 15-10.02.22 250,000 EUR 240,595 249,375 0.39
Natl Westm. Frn 99-Emtn 400,000 EUR 374,281 385,732 0.60
Victoria 5.25% 19-15.07.24 375,000 EUR 383,388 387,563 0.60
Virgin Med 3.75% 20-15.07.30 Regs 415,000 EUR 416,603 422,262 0.65
Vodafone 3.0% 20-27.08.80 440,000 EUR 449,271 458,700 0.71
Vodafone 3.1% 18-03.01.79 950,000 EUR 990,107 984,650 1.53
3,362,028 3,390,182 5.26
IrelandAib Grp 6.25% 20-Perp 200,000 EUR 206,500 221,000 0.34
Ardagh Pck 2.125% 19-15.08.26 355,000 EUR 354,061 355,355 0.55
Eircom Fina 1.75% 19-01.11.24 275,000 EUR 272,370 270,009 0.42
Smurfit Kap 2.875% 18-15.01.26 405,000 EUR 425,037 447,209 0.69
1,257,968 1,293,573 2.00
ItalyAlmaviva 7.25% 17-15.10.22 250,000 EUR 251,690 254,375 0.39
Atlim 1.625% 17-03.02.25 Regs 250,000 EUR 227,500 248,260 0.38
Atlim 1.875% 17-13.07.27 150,000 EUR 135,000 147,552 0.23
Atlim 4.375% 10-16.09.25 955,000 EUR 1,014,206 1,067,212 1.65
Autostrade 5.875% 04-09.06.24 Emtn 100,000 EUR 112,000 114,000 0.18
BMPS 1.875% 20-09.01.26 148,000 EUR 147,372 146,596 0.23
Bmps 3.625% 19-24.09.24 Regs 600,000 EUR 609,893 631,734 0.98
Bmps 5.375% 18-18.01.28 308,000 EUR 258,765 265,573 0.41
Cmc Di Rav 6% 17-15.02.23 275,000 EUR 175,988 4,813 0.01
Cmc Di Rav 6.875% 17-01.08.22 200,000 EUR 200,642 4,300 0.01
Enel 2.5% 18-24.11.78 Regs 100,000 EUR 102,534 103,978 0.16
Enel 3.5% 19-24.05.80 450,000 EUR 472,662 490,581 0.76
Fondiaria 3.875% 18-01.03.28 550,000 EUR 570,437 585,613 0.91
DANSKE INVEST SICAV
The accompanying notes form an integral part of these financial statements.
146
* Please refer to Note 1.
Euro Sustainable High Yield Bond*
Statement of Investments (continued)as at December 31, 2020(expressed in EUR)
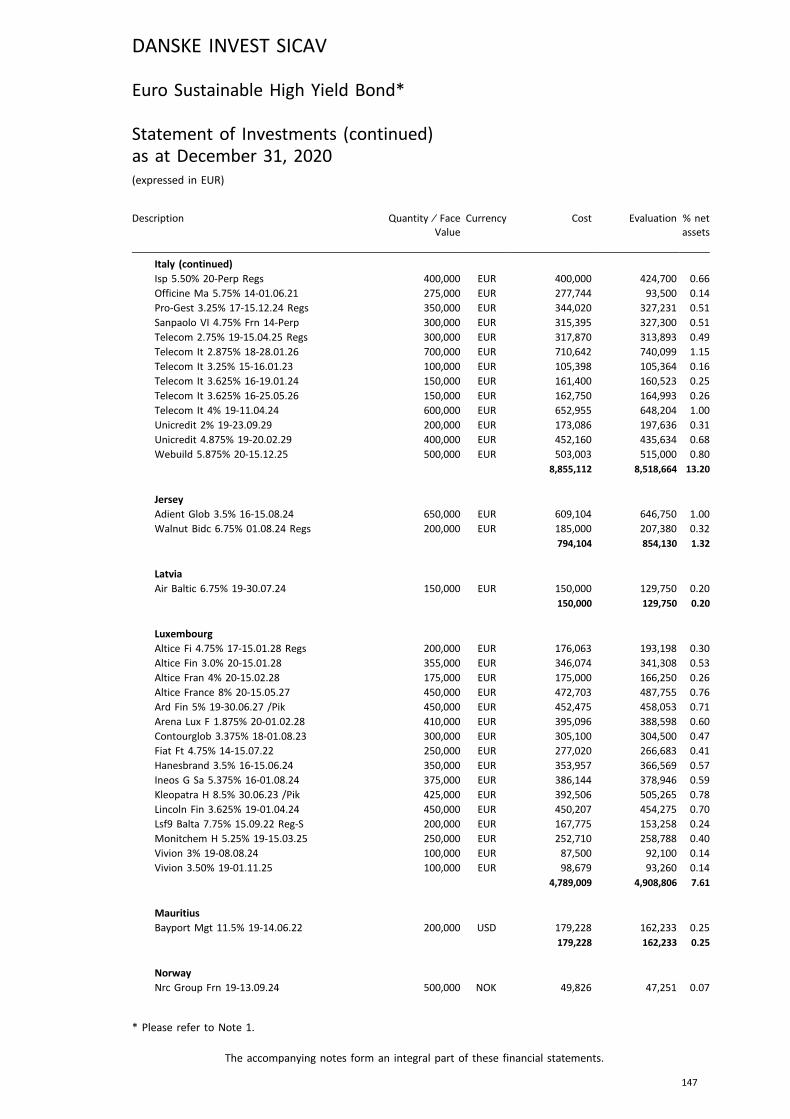
Description Quantity ⁄ FaceValue
Currency Cost Evaluation % netassets
Italy (continued)Isp 5.50% 20-Perp Regs 400,000 EUR 400,000 424,700 0.66
Officine Ma 5.75% 14-01.06.21 275,000 EUR 277,744 93,500 0.14
Pro-Gest 3.25% 17-15.12.24 Regs 350,000 EUR 344,020 327,231 0.51
Sanpaolo VI 4.75% Frn 14-Perp 300,000 EUR 315,395 327,300 0.51
Telecom 2.75% 19-15.04.25 Regs 300,000 EUR 317,870 313,893 0.49
Telecom It 2.875% 18-28.01.26 700,000 EUR 710,642 740,099 1.15
Telecom It 3.25% 15-16.01.23 100,000 EUR 105,398 105,364 0.16
Telecom It 3.625% 16-19.01.24 150,000 EUR 161,400 160,523 0.25
Telecom It 3.625% 16-25.05.26 150,000 EUR 162,750 164,993 0.26
Telecom It 4% 19-11.04.24 600,000 EUR 652,955 648,204 1.00
Unicredit 2% 19-23.09.29 200,000 EUR 173,086 197,636 0.31
Unicredit 4.875% 19-20.02.29 400,000 EUR 452,160 435,634 0.68
Webuild 5.875% 20-15.12.25 500,000 EUR 503,003 515,000 0.80
8,855,112 8,518,664 13.20
JerseyAdient Glob 3.5% 16-15.08.24 650,000 EUR 609,104 646,750 1.00
Walnut Bidc 6.75% 01.08.24 Regs 200,000 EUR 185,000 207,380 0.32
794,104 854,130 1.32
LatviaAir Baltic 6.75% 19-30.07.24 150,000 EUR 150,000 129,750 0.20
150,000 129,750 0.20
LuxembourgAltice Fi 4.75% 17-15.01.28 Regs 200,000 EUR 176,063 193,198 0.30
Altice Fin 3.0% 20-15.01.28 355,000 EUR 346,074 341,308 0.53
Altice Fran 4% 20-15.02.28 175,000 EUR 175,000 166,250 0.26
Altice France 8% 20-15.05.27 450,000 EUR 472,703 487,755 0.76
Ard Fin 5% 19-30.06.27 /Pik 450,000 EUR 452,475 458,053 0.71
Arena Lux F 1.875% 20-01.02.28 410,000 EUR 395,096 388,598 0.60
Contourglob 3.375% 18-01.08.23 300,000 EUR 305,100 304,500 0.47
Fiat Ft 4.75% 14-15.07.22 250,000 EUR 277,020 266,683 0.41
Hanesbrand 3.5% 16-15.06.24 350,000 EUR 353,957 366,569 0.57
Ineos G Sa 5.375% 16-01.08.24 375,000 EUR 386,144 378,946 0.59
Kleopatra H 8.5% 30.06.23 /Pik 425,000 EUR 392,506 505,265 0.78
Lincoln Fin 3.625% 19-01.04.24 450,000 EUR 450,207 454,275 0.70
Lsf9 Balta 7.75% 15.09.22 Reg-S 200,000 EUR 167,775 153,258 0.24
Monitchem H 5.25% 19-15.03.25 250,000 EUR 252,710 258,788 0.40
Vivion 3% 19-08.08.24 100,000 EUR 87,500 92,100 0.14
Vivion 3.50% 19-01.11.25 100,000 EUR 98,679 93,260 0.14
4,789,009 4,908,806 7.61
MauritiusBayport Mgt 11.5% 19-14.06.22 200,000 USD 179,228 162,233 0.25
179,228 162,233 0.25
NorwayNrc Group Frn 19-13.09.24 500,000 NOK 49,826 47,251 0.07
DANSKE INVEST SICAV
The accompanying notes form an integral part of these financial statements.
147
* Please refer to Note 1.
Euro Sustainable High Yield Bond*
Statement of Investments (continued)as at December 31, 2020(expressed in EUR)
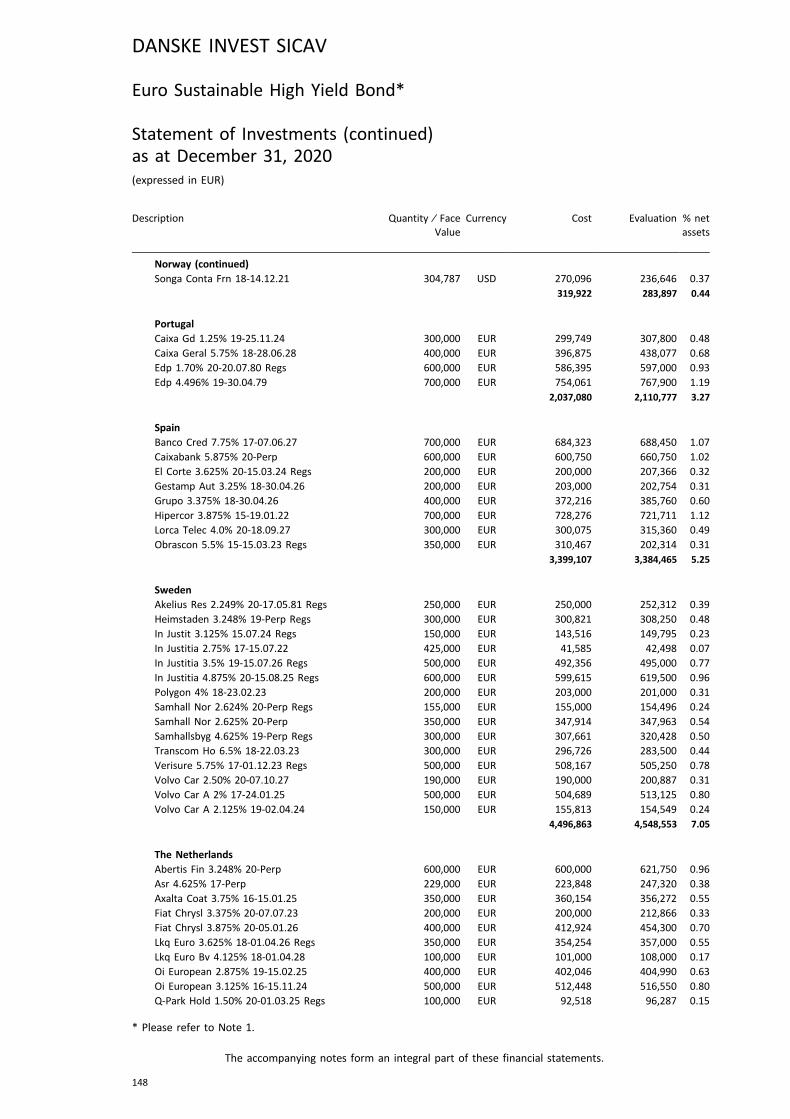
Description Quantity ⁄ FaceValue
Currency Cost Evaluation % netassets
Norway (continued)Songa Conta Frn 18-14.12.21 304,787 USD 270,096 236,646 0.37
319,922 283,897 0.44
PortugalCaixa Gd 1.25% 19-25.11.24 300,000 EUR 299,749 307,800 0.48
Caixa Geral 5.75% 18-28.06.28 400,000 EUR 396,875 438,077 0.68
Edp 1.70% 20-20.07.80 Regs 600,000 EUR 586,395 597,000 0.93
Edp 4.496% 19-30.04.79 700,000 EUR 754,061 767,900 1.19
2,037,080 2,110,777 3.27
SpainBanco Cred 7.75% 17-07.06.27 700,000 EUR 684,323 688,450 1.07
Caixabank 5.875% 20-Perp 600,000 EUR 600,750 660,750 1.02
El Corte 3.625% 20-15.03.24 Regs 200,000 EUR 200,000 207,366 0.32
Gestamp Aut 3.25% 18-30.04.26 200,000 EUR 203,000 202,754 0.31
Grupo 3.375% 18-30.04.26 400,000 EUR 372,216 385,760 0.60
Hipercor 3.875% 15-19.01.22 700,000 EUR 728,276 721,711 1.12
Lorca Telec 4.0% 20-18.09.27 300,000 EUR 300,075 315,360 0.49
Obrascon 5.5% 15-15.03.23 Regs 350,000 EUR 310,467 202,314 0.31
3,399,107 3,384,465 5.25
SwedenAkelius Res 2.249% 20-17.05.81 Regs 250,000 EUR 250,000 252,312 0.39
Heimstaden 3.248% 19-Perp Regs 300,000 EUR 300,821 308,250 0.48
In Justit 3.125% 15.07.24 Regs 150,000 EUR 143,516 149,795 0.23
In Justitia 2.75% 17-15.07.22 425,000 EUR 41,585 42,498 0.07
In Justitia 3.5% 19-15.07.26 Regs 500,000 EUR 492,356 495,000 0.77
In Justitia 4.875% 20-15.08.25 Regs 600,000 EUR 599,615 619,500 0.96
Polygon 4% 18-23.02.23 200,000 EUR 203,000 201,000 0.31
Samhall Nor 2.624% 20-Perp Regs 155,000 EUR 155,000 154,496 0.24
Samhall Nor 2.625% 20-Perp 350,000 EUR 347,914 347,963 0.54
Samhallsbyg 4.625% 19-Perp Regs 300,000 EUR 307,661 320,428 0.50
Transcom Ho 6.5% 18-22.03.23 300,000 EUR 296,726 283,500 0.44
Verisure 5.75% 17-01.12.23 Regs 500,000 EUR 508,167 505,250 0.78
Volvo Car 2.50% 20-07.10.27 190,000 EUR 190,000 200,887 0.31
Volvo Car A 2% 17-24.01.25 500,000 EUR 504,689 513,125 0.80
Volvo Car A 2.125% 19-02.04.24 150,000 EUR 155,813 154,549 0.24
4,496,863 4,548,553 7.05
The NetherlandsAbertis Fin 3.248% 20-Perp 600,000 EUR 600,000 621,750 0.96
Asr 4.625% 17-Perp 229,000 EUR 223,848 247,320 0.38
Axalta Coat 3.75% 16-15.01.25 350,000 EUR 360,154 356,272 0.55
Fiat Chrysl 3.375% 20-07.07.23 200,000 EUR 200,000 212,866 0.33
Fiat Chrysl 3.875% 20-05.01.26 400,000 EUR 412,924 454,300 0.70
Lkq Euro 3.625% 18-01.04.26 Regs 350,000 EUR 354,254 357,000 0.55
Lkq Euro Bv 4.125% 18-01.04.28 100,000 EUR 101,000 108,000 0.17
Oi European 2.875% 19-15.02.25 400,000 EUR 402,046 404,990 0.63
Oi European 3.125% 16-15.11.24 500,000 EUR 512,448 516,550 0.80
Q-Park Hold 1.50% 20-01.03.25 Regs 100,000 EUR 92,518 96,287 0.15
DANSKE INVEST SICAV
The accompanying notes form an integral part of these financial statements.
148
* Please refer to Note 1.
Euro Sustainable High Yield Bond*
Statement of Investments (continued)as at December 31, 2020(expressed in EUR)
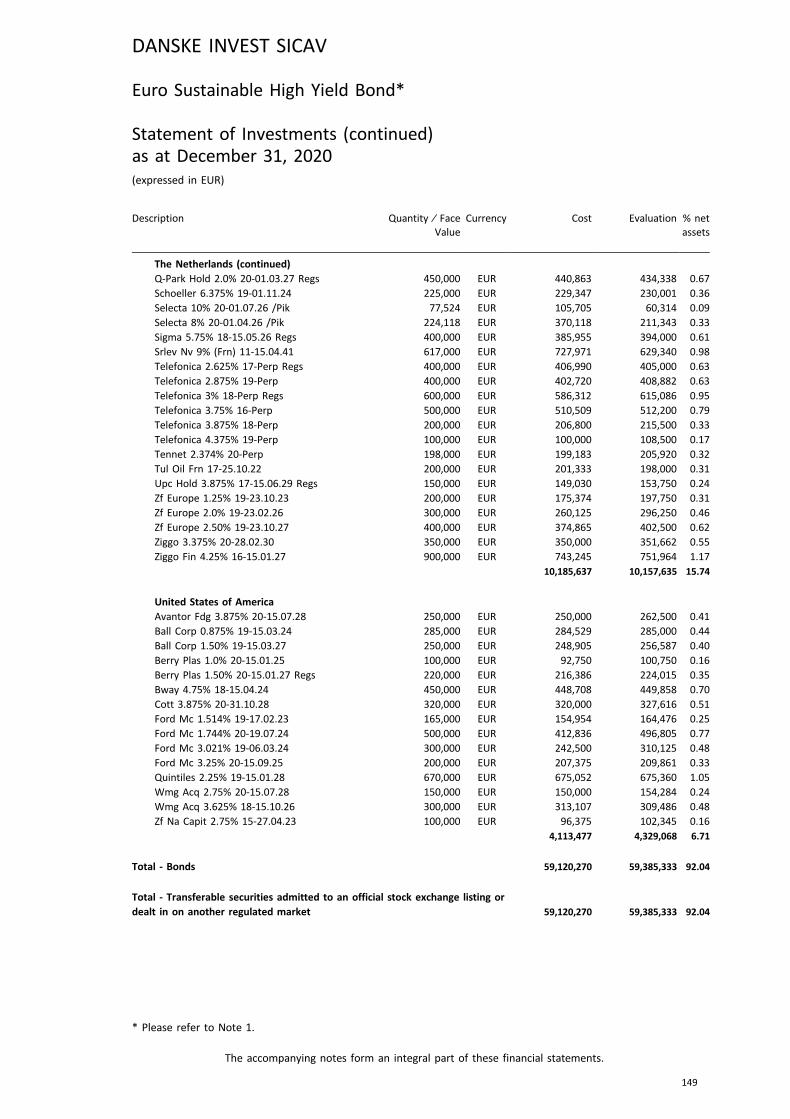
Description Quantity ⁄ FaceValue
Currency Cost Evaluation % netassets
The Netherlands (continued)Q-Park Hold 2.0% 20-01.03.27 Regs 450,000 EUR 440,863 434,338 0.67
Schoeller 6.375% 19-01.11.24 225,000 EUR 229,347 230,001 0.36
Selecta 10% 20-01.07.26 /Pik 77,524 EUR 105,705 60,314 0.09
Selecta 8% 20-01.04.26 /Pik 224,118 EUR 370,118 211,343 0.33
Sigma 5.75% 18-15.05.26 Regs 400,000 EUR 385,955 394,000 0.61
Srlev Nv 9% (Frn) 11-15.04.41 617,000 EUR 727,971 629,340 0.98
Telefonica 2.625% 17-Perp Regs 400,000 EUR 406,990 405,000 0.63
Telefonica 2.875% 19-Perp 400,000 EUR 402,720 408,882 0.63
Telefonica 3% 18-Perp Regs 600,000 EUR 586,312 615,086 0.95
Telefonica 3.75% 16-Perp 500,000 EUR 510,509 512,200 0.79
Telefonica 3.875% 18-Perp 200,000 EUR 206,800 215,500 0.33
Telefonica 4.375% 19-Perp 100,000 EUR 100,000 108,500 0.17
Tennet 2.374% 20-Perp 198,000 EUR 199,183 205,920 0.32
Tul Oil Frn 17-25.10.22 200,000 EUR 201,333 198,000 0.31
Upc Hold 3.875% 17-15.06.29 Regs 150,000 EUR 149,030 153,750 0.24
Zf Europe 1.25% 19-23.10.23 200,000 EUR 175,374 197,750 0.31
Zf Europe 2.0% 19-23.02.26 300,000 EUR 260,125 296,250 0.46
Zf Europe 2.50% 19-23.10.27 400,000 EUR 374,865 402,500 0.62
Ziggo 3.375% 20-28.02.30 350,000 EUR 350,000 351,662 0.55
Ziggo Fin 4.25% 16-15.01.27 900,000 EUR 743,245 751,964 1.17
10,185,637 10,157,635 15.74
United States of AmericaAvantor Fdg 3.875% 20-15.07.28 250,000 EUR 250,000 262,500 0.41
Ball Corp 0.875% 19-15.03.24 285,000 EUR 284,529 285,000 0.44
Ball Corp 1.50% 19-15.03.27 250,000 EUR 248,905 256,587 0.40
Berry Plas 1.0% 20-15.01.25 100,000 EUR 92,750 100,750 0.16
Berry Plas 1.50% 20-15.01.27 Regs 220,000 EUR 216,386 224,015 0.35
Bway 4.75% 18-15.04.24 450,000 EUR 448,708 449,858 0.70
Cott 3.875% 20-31.10.28 320,000 EUR 320,000 327,616 0.51
Ford Mc 1.514% 19-17.02.23 165,000 EUR 154,954 164,476 0.25
Ford Mc 1.744% 20-19.07.24 500,000 EUR 412,836 496,805 0.77
Ford Mc 3.021% 19-06.03.24 300,000 EUR 242,500 310,125 0.48
Ford Mc 3.25% 20-15.09.25 200,000 EUR 207,375 209,861 0.33
Quintiles 2.25% 19-15.01.28 670,000 EUR 675,052 675,360 1.05
Wmg Acq 2.75% 20-15.07.28 150,000 EUR 150,000 154,284 0.24
Wmg Acq 3.625% 18-15.10.26 300,000 EUR 313,107 309,486 0.48
Zf Na Capit 2.75% 15-27.04.23 100,000 EUR 96,375 102,345 0.16
4,113,477 4,329,068 6.71
Total - Bonds 59,120,270 59,385,333 92.04
Total - Transferable securities admitted to an official stock exchange listing ordealt in on another regulated market 59,120,270 59,385,333 92.04
DANSKE INVEST SICAV
The accompanying notes form an integral part of these financial statements.
149
* Please refer to Note 1.
Euro Sustainable High Yield Bond*
Statement of Investments (continued)as at December 31, 2020(expressed in EUR)

Description Quantity ⁄ FaceValue
Currency Cost Evaluation % netassets
Other Transferable securities
Bonds
ChileNova Austra 8.25% 26.11.26 /Pik 224,068 USD 116,114 18,313 0.03
116,114 18,313 0.03
FinlandCaverion 3.25% 19-28.03.23 100,000 EUR 100,000 102,139 0.16
100,000 102,139 0.16
LuxembourgLion /Gem 17.25% 14-31.08.22 /Pik 246,954 EUR 200,590 220,745 0.34
200,590 220,745 0.34
NorwayMercell Hld Frn 20-08.12.25 1,900,000 SEK 185,142 189,084 0.29
185,142 189,084 0.29
SwedenBaseload Ca Frn 19-22.03.23 2,000,000 SEK 189,328 183,112 0.28
Desenio Hld Frn 20-16.12.24 5,000,000 SEK 487,248 497,589 0.77
676,576 680,701 1.06
Total - Bonds 1,278,422 1,210,982 1.88
Total - Other Transferable securities 1,278,422 1,210,982 1.88
TOTAL INVESTMENT PORTFOLIO 60,398,692 60,596,315 93.92
DANSKE INVEST SICAV
The accompanying notes form an integral part of these financial statements.
150
* Please refer to Note 1.
Euro Sustainable High Yield Bond*
Statement of Investments (continued)as at December 31, 2020(expressed in EUR)
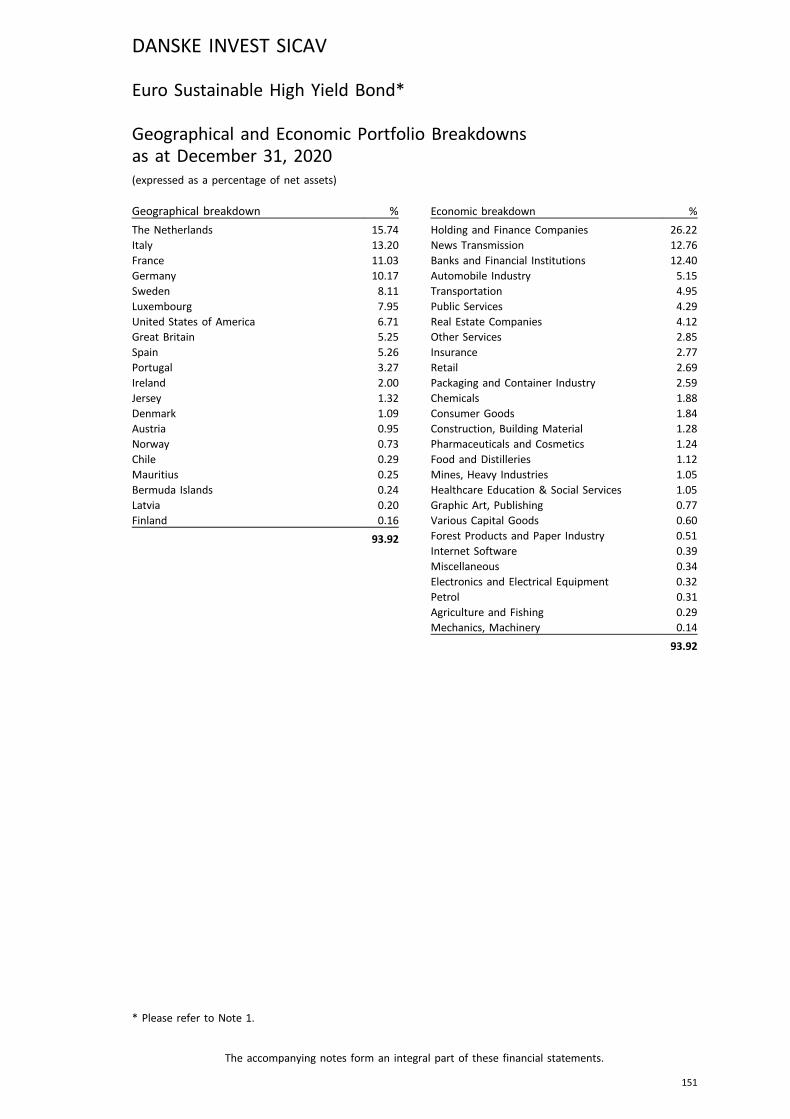
Euro Sustainable High Yield Bond*
Geographical and Economic Portfolio Breakdownsas at December 31, 2020(expressed as a percentage of net assets)
Geographical breakdown %
The Netherlands 15.74Italy 13.20France 11.03Germany 10.17Sweden 8.11Luxembourg 7.95United States of America 6.71Great Britain 5.25Spain 5.26Portugal 3.27Ireland 2.00Jersey 1.32Denmark 1.09Austria 0.95Norway 0.73Chile 0.29Mauritius 0.25Bermuda Islands 0.24Latvia 0.20Finland 0.16
93.92
Economic breakdown %
Holding and Finance Companies 26.22News Transmission 12.76Banks and Financial Institutions 12.40Automobile Industry 5.15Transportation 4.95Public Services 4.29Real Estate Companies 4.12Other Services 2.85Insurance 2.77Retail 2.69Packaging and Container Industry 2.59Chemicals 1.88Consumer Goods 1.84Construction, Building Material 1.28Pharmaceuticals and Cosmetics 1.24Food and Distilleries 1.12Mines, Heavy Industries 1.05Healthcare Education & Social Services 1.05Graphic Art, Publishing 0.77Various Capital Goods 0.60Forest Products and Paper Industry 0.51Internet Software 0.39Miscellaneous 0.34Electronics and Electrical Equipment 0.32Petrol 0.31Agriculture and Fishing 0.29Mechanics, Machinery 0.14
93.92
* Please refer to Note 1.
DANSKE INVEST SICAV
The accompanying notes form an integral part of these financial statements.
151
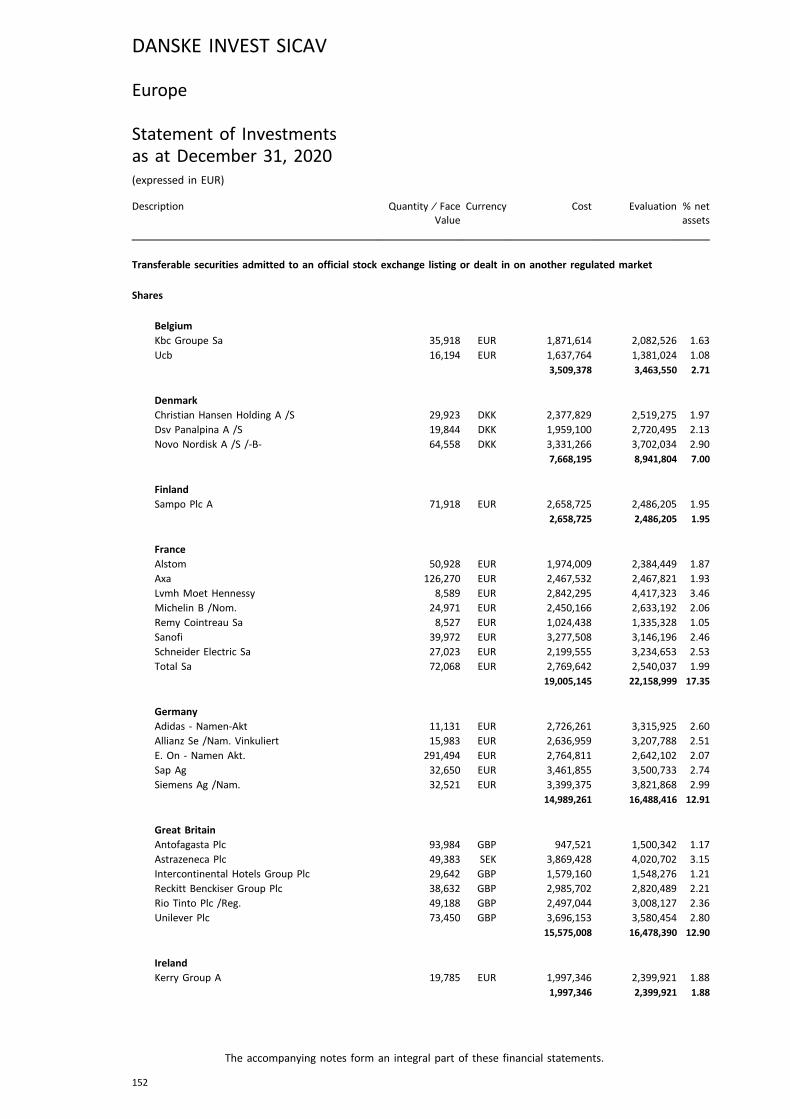
Europe
Statement of Investmentsas at December 31, 2020(expressed in EUR)
Description Quantity ⁄ FaceValue
Currency Cost Evaluation % netassets
Transferable securities admitted to an official stock exchange listing or dealt in on another regulated market
Shares
BelgiumKbc Groupe Sa 35,918 EUR 1,871,614 2,082,526 1.63
Ucb 16,194 EUR 1,637,764 1,381,024 1.08
3,509,378 3,463,550 2.71
DenmarkChristian Hansen Holding A /S 29,923 DKK 2,377,829 2,519,275 1.97
Dsv Panalpina A /S 19,844 DKK 1,959,100 2,720,495 2.13
Novo Nordisk A /S /-B- 64,558 DKK 3,331,266 3,702,034 2.90
7,668,195 8,941,804 7.00
FinlandSampo Plc A 71,918 EUR 2,658,725 2,486,205 1.95
2,658,725 2,486,205 1.95
FranceAlstom 50,928 EUR 1,974,009 2,384,449 1.87
Axa 126,270 EUR 2,467,532 2,467,821 1.93
Lvmh Moet Hennessy 8,589 EUR 2,842,295 4,417,323 3.46
Michelin B /Nom. 24,971 EUR 2,450,166 2,633,192 2.06
Remy Cointreau Sa 8,527 EUR 1,024,438 1,335,328 1.05
Sanofi 39,972 EUR 3,277,508 3,146,196 2.46
Schneider Electric Sa 27,023 EUR 2,199,555 3,234,653 2.53
Total Sa 72,068 EUR 2,769,642 2,540,037 1.99
19,005,145 22,158,999 17.35
GermanyAdidas - Namen-Akt 11,131 EUR 2,726,261 3,315,925 2.60
Allianz Se /Nam. Vinkuliert 15,983 EUR 2,636,959 3,207,788 2.51
E. On - Namen Akt. 291,494 EUR 2,764,811 2,642,102 2.07
Sap Ag 32,650 EUR 3,461,855 3,500,733 2.74
Siemens Ag /Nam. 32,521 EUR 3,399,375 3,821,868 2.99
14,989,261 16,488,416 12.91
Great BritainAntofagasta Plc 93,984 GBP 947,521 1,500,342 1.17
Astrazeneca Plc 49,383 SEK 3,869,428 4,020,702 3.15
Intercontinental Hotels Group Plc 29,642 GBP 1,579,160 1,548,276 1.21
Reckitt Benckiser Group Plc 38,632 GBP 2,985,702 2,820,489 2.21
Rio Tinto Plc /Reg. 49,188 GBP 2,497,044 3,008,127 2.36
Unilever Plc 73,450 GBP 3,696,153 3,580,454 2.80
15,575,008 16,478,390 12.90
IrelandKerry Group A 19,785 EUR 1,997,346 2,399,921 1.88
1,997,346 2,399,921 1.88
DANSKE INVEST SICAV
The accompanying notes form an integral part of these financial statements.
152
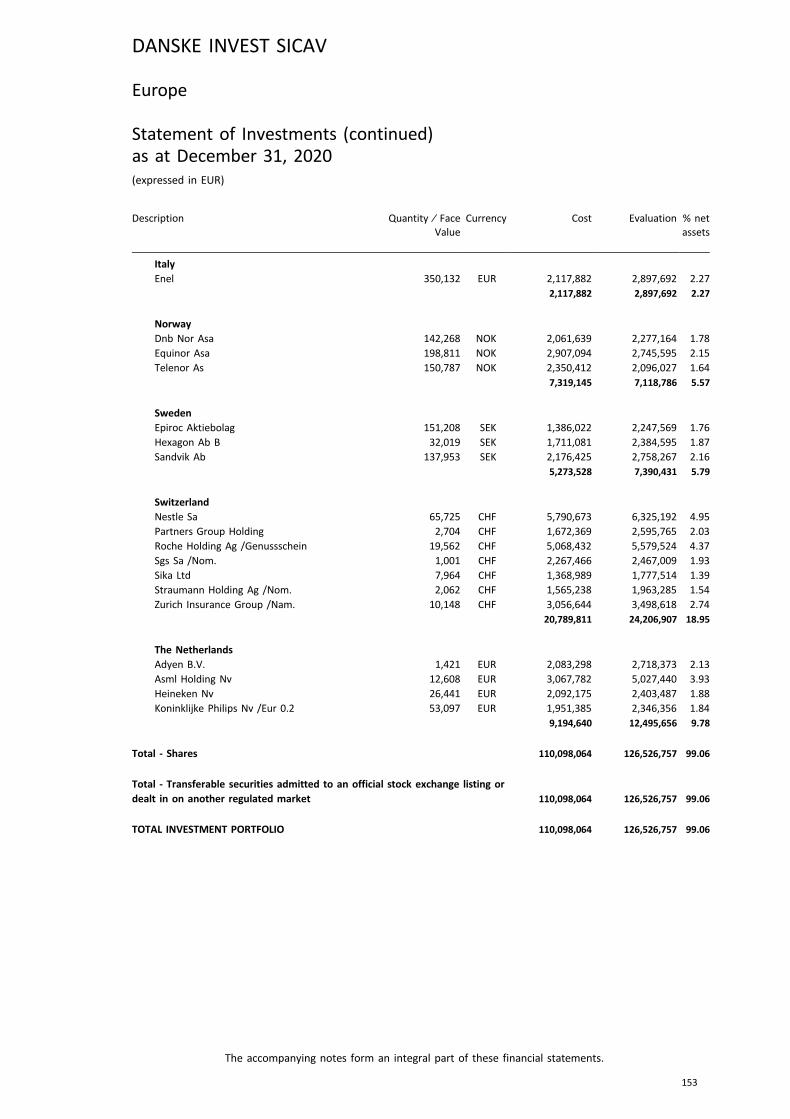
Description Quantity ⁄ FaceValue
Currency Cost Evaluation % netassets
ItalyEnel 350,132 EUR 2,117,882 2,897,692 2.27
2,117,882 2,897,692 2.27
NorwayDnb Nor Asa 142,268 NOK 2,061,639 2,277,164 1.78
Equinor Asa 198,811 NOK 2,907,094 2,745,595 2.15
Telenor As 150,787 NOK 2,350,412 2,096,027 1.64
7,319,145 7,118,786 5.57
SwedenEpiroc Aktiebolag 151,208 SEK 1,386,022 2,247,569 1.76
Hexagon Ab B 32,019 SEK 1,711,081 2,384,595 1.87
Sandvik Ab 137,953 SEK 2,176,425 2,758,267 2.16
5,273,528 7,390,431 5.79
SwitzerlandNestle Sa 65,725 CHF 5,790,673 6,325,192 4.95
Partners Group Holding 2,704 CHF 1,672,369 2,595,765 2.03
Roche Holding Ag /Genussschein 19,562 CHF 5,068,432 5,579,524 4.37
Sgs Sa /Nom. 1,001 CHF 2,267,466 2,467,009 1.93
Sika Ltd 7,964 CHF 1,368,989 1,777,514 1.39
Straumann Holding Ag /Nom. 2,062 CHF 1,565,238 1,963,285 1.54
Zurich Insurance Group /Nam. 10,148 CHF 3,056,644 3,498,618 2.74
20,789,811 24,206,907 18.95
The NetherlandsAdyen B.V. 1,421 EUR 2,083,298 2,718,373 2.13
Asml Holding Nv 12,608 EUR 3,067,782 5,027,440 3.93
Heineken Nv 26,441 EUR 2,092,175 2,403,487 1.88
Koninklijke Philips Nv /Eur 0.2 53,097 EUR 1,951,385 2,346,356 1.84
9,194,640 12,495,656 9.78
Total - Shares 110,098,064 126,526,757 99.06
Total - Transferable securities admitted to an official stock exchange listing ordealt in on another regulated market 110,098,064 126,526,757 99.06
TOTAL INVESTMENT PORTFOLIO 110,098,064 126,526,757 99.06
DANSKE INVEST SICAV
The accompanying notes form an integral part of these financial statements.
153
Europe
Statement of Investments (continued)as at December 31, 2020(expressed in EUR)
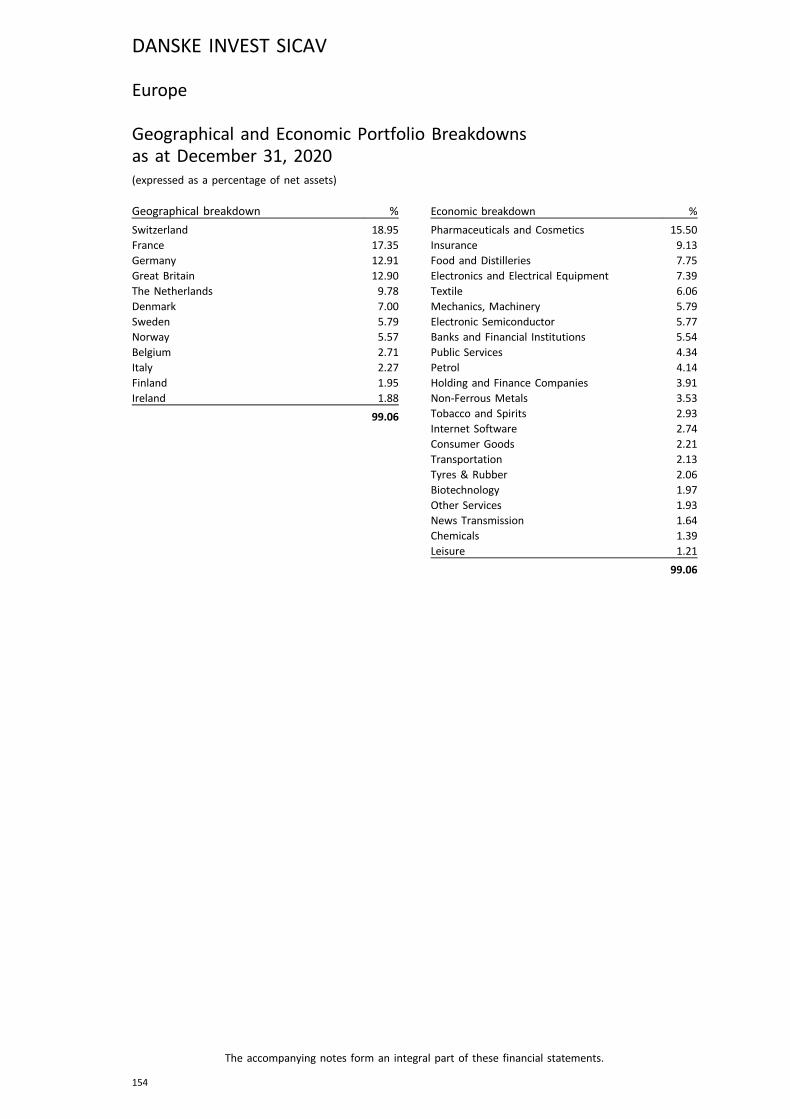
Europe
Geographical and Economic Portfolio Breakdownsas at December 31, 2020(expressed as a percentage of net assets)
Geographical breakdown %
Switzerland 18.95France 17.35Germany 12.91Great Britain 12.90The Netherlands 9.78Denmark 7.00Sweden 5.79Norway 5.57Belgium 2.71Italy 2.27Finland 1.95Ireland 1.88
99.06
Economic breakdown %
Pharmaceuticals and Cosmetics 15.50Insurance 9.13Food and Distilleries 7.75Electronics and Electrical Equipment 7.39Textile 6.06Mechanics, Machinery 5.79Electronic Semiconductor 5.77Banks and Financial Institutions 5.54Public Services 4.34Petrol 4.14Holding and Finance Companies 3.91Non-Ferrous Metals 3.53Tobacco and Spirits 2.93Internet Software 2.74Consumer Goods 2.21Transportation 2.13Tyres & Rubber 2.06Biotechnology 1.97Other Services 1.93News Transmission 1.64Chemicals 1.39Leisure 1.21
99.06
DANSKE INVEST SICAV
The accompanying notes form an integral part of these financial statements.
154
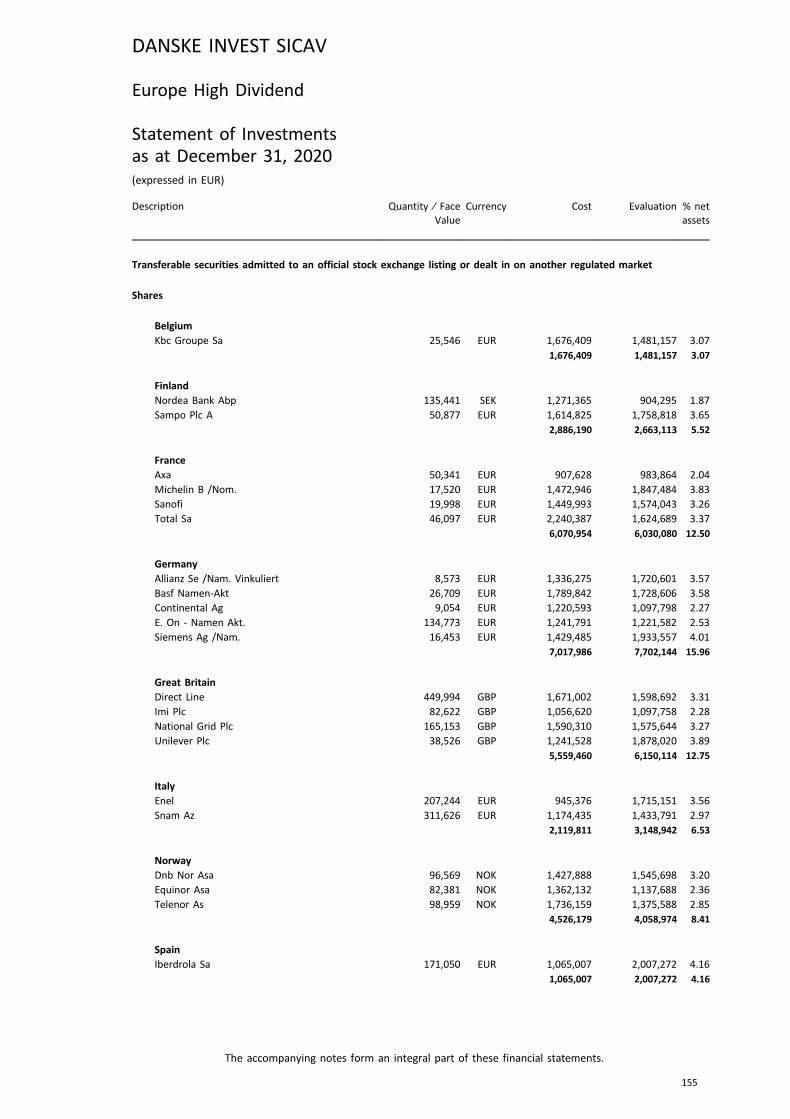
Europe High Dividend
Statement of Investmentsas at December 31, 2020(expressed in EUR)
Description Quantity ⁄ FaceValue
Currency Cost Evaluation % netassets
Transferable securities admitted to an official stock exchange listing or dealt in on another regulated market
Shares
BelgiumKbc Groupe Sa 25,546 EUR 1,676,409 1,481,157 3.07
1,676,409 1,481,157 3.07
FinlandNordea Bank Abp 135,441 SEK 1,271,365 904,295 1.87
Sampo Plc A 50,877 EUR 1,614,825 1,758,818 3.65
2,886,190 2,663,113 5.52
FranceAxa 50,341 EUR 907,628 983,864 2.04
Michelin B /Nom. 17,520 EUR 1,472,946 1,847,484 3.83
Sanofi 19,998 EUR 1,449,993 1,574,043 3.26
Total Sa 46,097 EUR 2,240,387 1,624,689 3.37
6,070,954 6,030,080 12.50
GermanyAllianz Se /Nam. Vinkuliert 8,573 EUR 1,336,275 1,720,601 3.57
Basf Namen-Akt 26,709 EUR 1,789,842 1,728,606 3.58
Continental Ag 9,054 EUR 1,220,593 1,097,798 2.27
E. On - Namen Akt. 134,773 EUR 1,241,791 1,221,582 2.53
Siemens Ag /Nam. 16,453 EUR 1,429,485 1,933,557 4.01
7,017,986 7,702,144 15.96
Great BritainDirect Line 449,994 GBP 1,671,002 1,598,692 3.31
Imi Plc 82,622 GBP 1,056,620 1,097,758 2.28
National Grid Plc 165,153 GBP 1,590,310 1,575,644 3.27
Unilever Plc 38,526 GBP 1,241,528 1,878,020 3.89
5,559,460 6,150,114 12.75
ItalyEnel 207,244 EUR 945,376 1,715,151 3.56
Snam Az 311,626 EUR 1,174,435 1,433,791 2.97
2,119,811 3,148,942 6.53
NorwayDnb Nor Asa 96,569 NOK 1,427,888 1,545,698 3.20
Equinor Asa 82,381 NOK 1,362,132 1,137,688 2.36
Telenor As 98,959 NOK 1,736,159 1,375,588 2.85
4,526,179 4,058,974 8.41
SpainIberdrola Sa 171,050 EUR 1,065,007 2,007,272 4.16
1,065,007 2,007,272 4.16
DANSKE INVEST SICAV
The accompanying notes form an integral part of these financial statements.
155
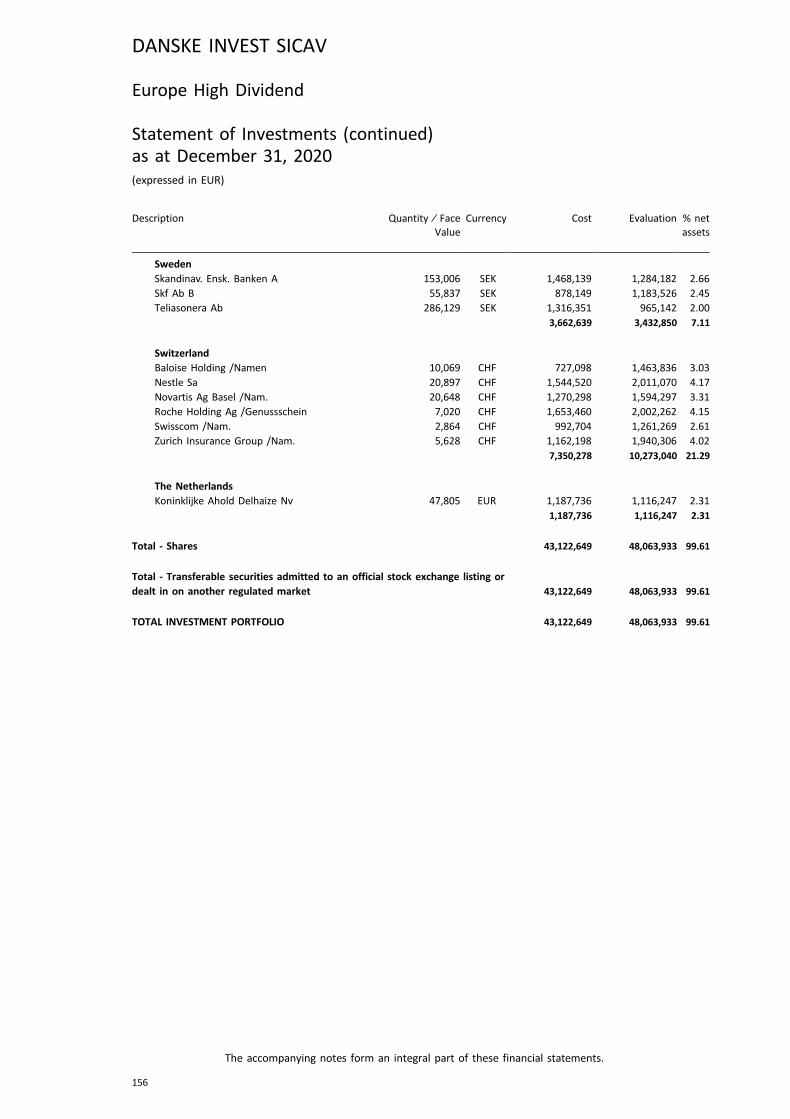
Description Quantity ⁄ FaceValue
Currency Cost Evaluation % netassets
SwedenSkandinav. Ensk. Banken A 153,006 SEK 1,468,139 1,284,182 2.66
Skf Ab B 55,837 SEK 878,149 1,183,526 2.45
Teliasonera Ab 286,129 SEK 1,316,351 965,142 2.00
3,662,639 3,432,850 7.11
SwitzerlandBaloise Holding /Namen 10,069 CHF 727,098 1,463,836 3.03
Nestle Sa 20,897 CHF 1,544,520 2,011,070 4.17
Novartis Ag Basel /Nam. 20,648 CHF 1,270,298 1,594,297 3.31
Roche Holding Ag /Genussschein 7,020 CHF 1,653,460 2,002,262 4.15
Swisscom /Nam. 2,864 CHF 992,704 1,261,269 2.61
Zurich Insurance Group /Nam. 5,628 CHF 1,162,198 1,940,306 4.02
7,350,278 10,273,040 21.29
The NetherlandsKoninklijke Ahold Delhaize Nv 47,805 EUR 1,187,736 1,116,247 2.31
1,187,736 1,116,247 2.31
Total - Shares 43,122,649 48,063,933 99.61
Total - Transferable securities admitted to an official stock exchange listing ordealt in on another regulated market 43,122,649 48,063,933 99.61
TOTAL INVESTMENT PORTFOLIO 43,122,649 48,063,933 99.61
DANSKE INVEST SICAV
The accompanying notes form an integral part of these financial statements.
156
Europe High Dividend
Statement of Investments (continued)as at December 31, 2020(expressed in EUR)
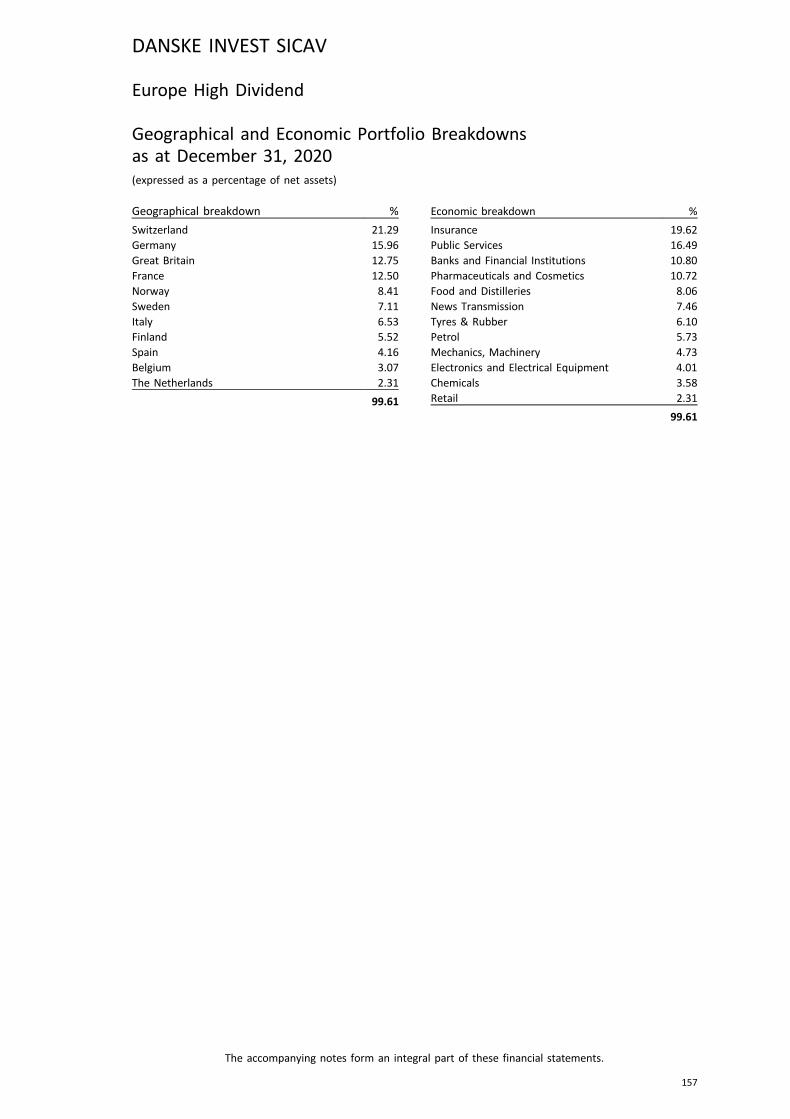
Europe High Dividend
Geographical and Economic Portfolio Breakdownsas at December 31, 2020(expressed as a percentage of net assets)
Geographical breakdown %
Switzerland 21.29Germany 15.96Great Britain 12.75France 12.50Norway 8.41Sweden 7.11Italy 6.53Finland 5.52Spain 4.16Belgium 3.07The Netherlands 2.31
99.61
Economic breakdown %
Insurance 19.62Public Services 16.49Banks and Financial Institutions 10.80Pharmaceuticals and Cosmetics 10.72Food and Distilleries 8.06News Transmission 7.46Tyres & Rubber 6.10Petrol 5.73Mechanics, Machinery 4.73Electronics and Electrical Equipment 4.01Chemicals 3.58Retail 2.31
99.61
DANSKE INVEST SICAV
The accompanying notes form an integral part of these financial statements.
157
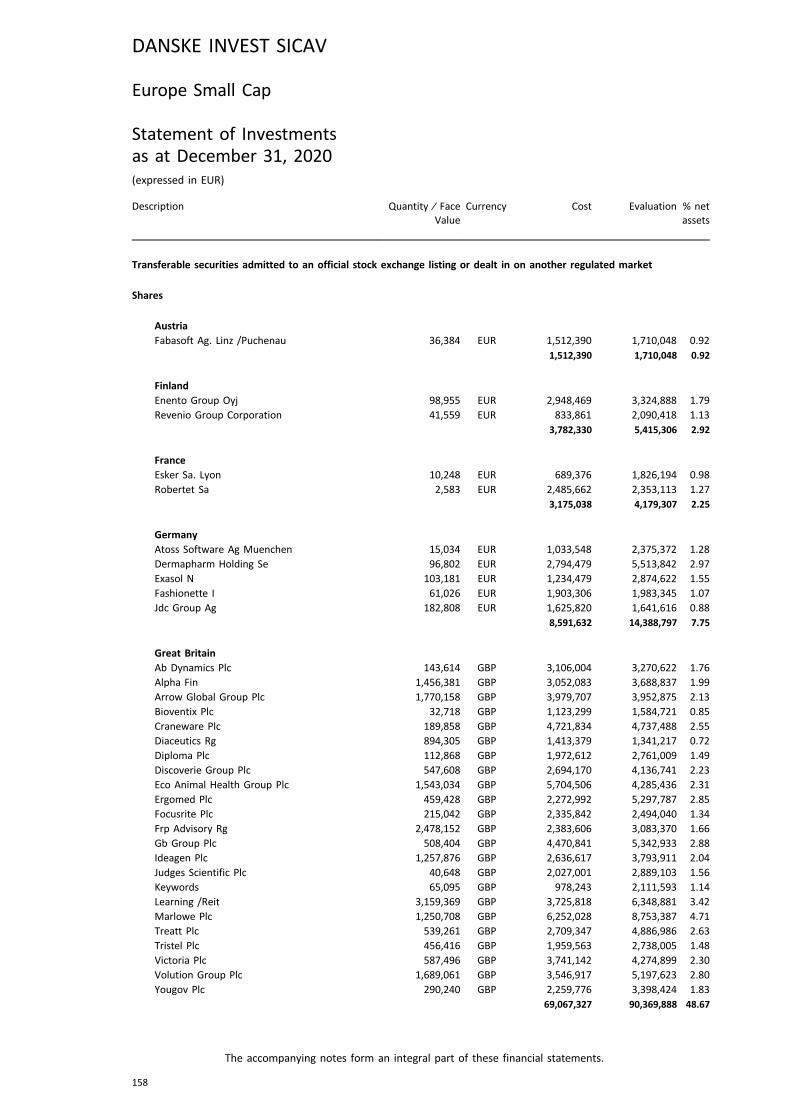
Europe Small Cap
Statement of Investmentsas at December 31, 2020(expressed in EUR)
Description Quantity ⁄ FaceValue
Currency Cost Evaluation % netassets
Transferable securities admitted to an official stock exchange listing or dealt in on another regulated market
Shares
AustriaFabasoft Ag. Linz /Puchenau 36,384 EUR 1,512,390 1,710,048 0.92
1,512,390 1,710,048 0.92
FinlandEnento Group Oyj 98,955 EUR 2,948,469 3,324,888 1.79
Revenio Group Corporation 41,559 EUR 833,861 2,090,418 1.13
3,782,330 5,415,306 2.92
FranceEsker Sa. Lyon 10,248 EUR 689,376 1,826,194 0.98
Robertet Sa 2,583 EUR 2,485,662 2,353,113 1.27
3,175,038 4,179,307 2.25
GermanyAtoss Software Ag Muenchen 15,034 EUR 1,033,548 2,375,372 1.28
Dermapharm Holding Se 96,802 EUR 2,794,479 5,513,842 2.97
Exasol N 103,181 EUR 1,234,479 2,874,622 1.55
Fashionette I 61,026 EUR 1,903,306 1,983,345 1.07
Jdc Group Ag 182,808 EUR 1,625,820 1,641,616 0.88
8,591,632 14,388,797 7.75
Great BritainAb Dynamics Plc 143,614 GBP 3,106,004 3,270,622 1.76
Alpha Fin 1,456,381 GBP 3,052,083 3,688,837 1.99
Arrow Global Group Plc 1,770,158 GBP 3,979,707 3,952,875 2.13
Bioventix Plc 32,718 GBP 1,123,299 1,584,721 0.85
Craneware Plc 189,858 GBP 4,721,834 4,737,488 2.55
Diaceutics Rg 894,305 GBP 1,413,379 1,341,217 0.72
Diploma Plc 112,868 GBP 1,972,612 2,761,009 1.49
Discoverie Group Plc 547,608 GBP 2,694,170 4,136,741 2.23
Eco Animal Health Group Plc 1,543,034 GBP 5,704,506 4,285,436 2.31
Ergomed Plc 459,428 GBP 2,272,992 5,297,787 2.85
Focusrite Plc 215,042 GBP 2,335,842 2,494,040 1.34
Frp Advisory Rg 2,478,152 GBP 2,383,606 3,083,370 1.66
Gb Group Plc 508,404 GBP 4,470,841 5,342,933 2.88
Ideagen Plc 1,257,876 GBP 2,636,617 3,793,911 2.04
Judges Scientific Plc 40,648 GBP 2,027,001 2,889,103 1.56
Keywords 65,095 GBP 978,243 2,111,593 1.14
Learning /Reit 3,159,369 GBP 3,725,818 6,348,881 3.42
Marlowe Plc 1,250,708 GBP 6,252,028 8,753,387 4.71
Treatt Plc 539,261 GBP 2,709,347 4,886,986 2.63
Tristel Plc 456,416 GBP 1,959,563 2,738,005 1.48
Victoria Plc 587,496 GBP 3,741,142 4,274,899 2.30
Volution Group Plc 1,689,061 GBP 3,546,917 5,197,623 2.80
Yougov Plc 290,240 GBP 2,259,776 3,398,424 1.83
69,067,327 90,369,888 48.67
DANSKE INVEST SICAV
The accompanying notes form an integral part of these financial statements.
158
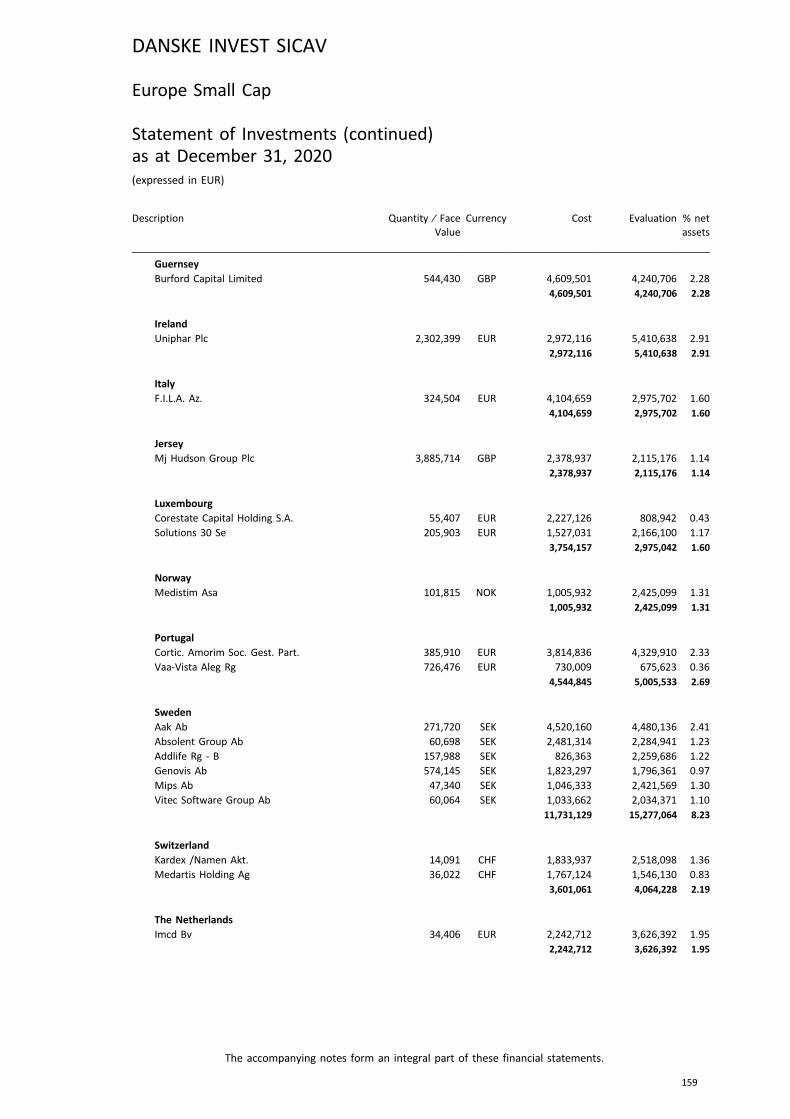
Description Quantity ⁄ FaceValue
Currency Cost Evaluation % netassets
GuernseyBurford Capital Limited 544,430 GBP 4,609,501 4,240,706 2.28
4,609,501 4,240,706 2.28
IrelandUniphar Plc 2,302,399 EUR 2,972,116 5,410,638 2.91
2,972,116 5,410,638 2.91
ItalyF.I.L.A. Az. 324,504 EUR 4,104,659 2,975,702 1.60
4,104,659 2,975,702 1.60
JerseyMj Hudson Group Plc 3,885,714 GBP 2,378,937 2,115,176 1.14
2,378,937 2,115,176 1.14
LuxembourgCorestate Capital Holding S.A. 55,407 EUR 2,227,126 808,942 0.43
Solutions 30 Se 205,903 EUR 1,527,031 2,166,100 1.17
3,754,157 2,975,042 1.60
NorwayMedistim Asa 101,815 NOK 1,005,932 2,425,099 1.31
1,005,932 2,425,099 1.31
PortugalCortic. Amorim Soc. Gest. Part. 385,910 EUR 3,814,836 4,329,910 2.33
Vaa-Vista Aleg Rg 726,476 EUR 730,009 675,623 0.36
4,544,845 5,005,533 2.69
SwedenAak Ab 271,720 SEK 4,520,160 4,480,136 2.41
Absolent Group Ab 60,698 SEK 2,481,314 2,284,941 1.23
Addlife Rg - B 157,988 SEK 826,363 2,259,686 1.22
Genovis Ab 574,145 SEK 1,823,297 1,796,361 0.97
Mips Ab 47,340 SEK 1,046,333 2,421,569 1.30
Vitec Software Group Ab 60,064 SEK 1,033,662 2,034,371 1.10
11,731,129 15,277,064 8.23
SwitzerlandKardex /Namen Akt. 14,091 CHF 1,833,937 2,518,098 1.36
Medartis Holding Ag 36,022 CHF 1,767,124 1,546,130 0.83
3,601,061 4,064,228 2.19
The NetherlandsImcd Bv 34,406 EUR 2,242,712 3,626,392 1.95
2,242,712 3,626,392 1.95
DANSKE INVEST SICAV
The accompanying notes form an integral part of these financial statements.
159
Europe Small Cap
Statement of Investments (continued)as at December 31, 2020(expressed in EUR)
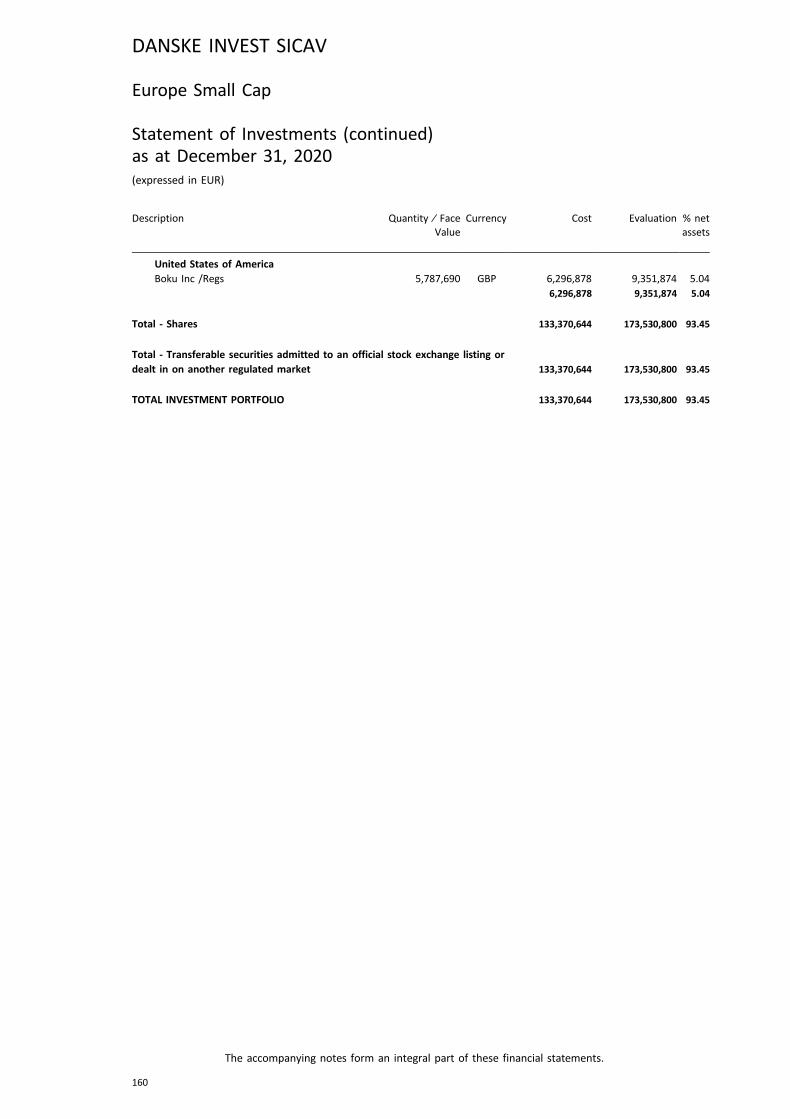
Description Quantity ⁄ FaceValue
Currency Cost Evaluation % netassets
United States of AmericaBoku Inc /Regs 5,787,690 GBP 6,296,878 9,351,874 5.04
6,296,878 9,351,874 5.04
Total - Shares 133,370,644 173,530,800 93.45
Total - Transferable securities admitted to an official stock exchange listing ordealt in on another regulated market 133,370,644 173,530,800 93.45
TOTAL INVESTMENT PORTFOLIO 133,370,644 173,530,800 93.45
DANSKE INVEST SICAV
The accompanying notes form an integral part of these financial statements.
160
Europe Small Cap
Statement of Investments (continued)as at December 31, 2020(expressed in EUR)
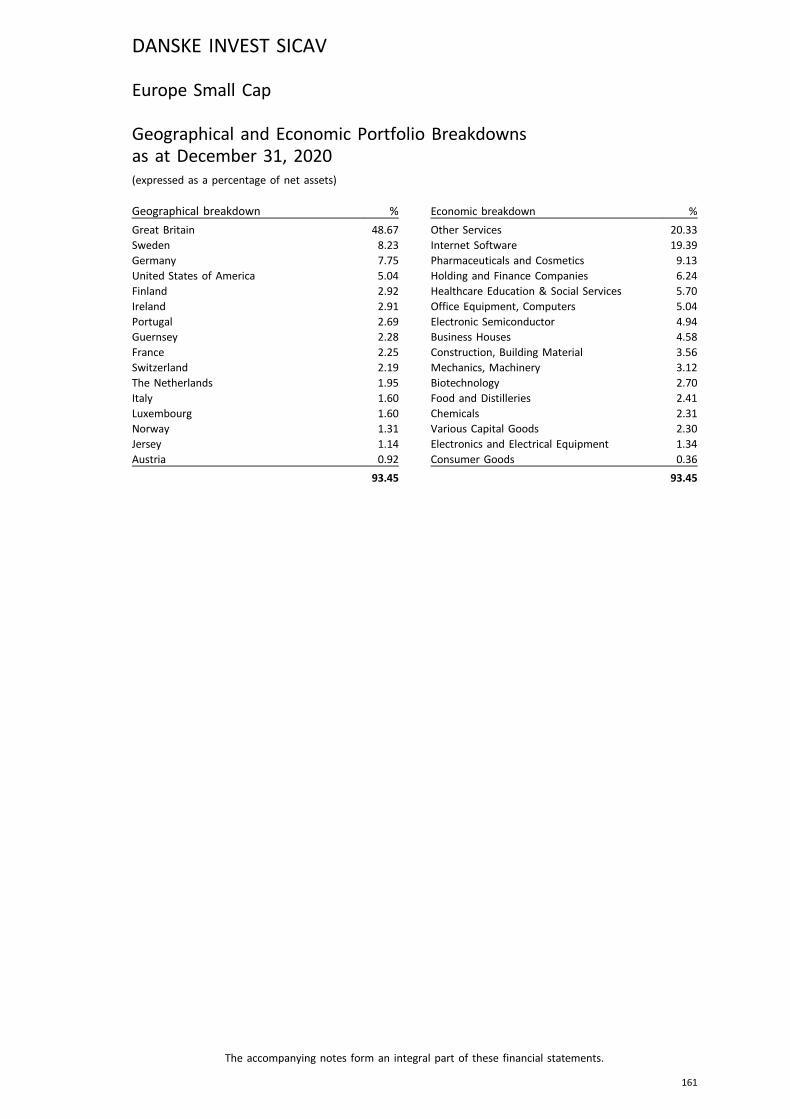
Europe Small Cap
Geographical and Economic Portfolio Breakdownsas at December 31, 2020(expressed as a percentage of net assets)
Geographical breakdown %
Great Britain 48.67Sweden 8.23Germany 7.75United States of America 5.04Finland 2.92Ireland 2.91Portugal 2.69Guernsey 2.28France 2.25Switzerland 2.19The Netherlands 1.95Italy 1.60Luxembourg 1.60Norway 1.31Jersey 1.14Austria 0.92
93.45
Economic breakdown %
Other Services 20.33Internet Software 19.39Pharmaceuticals and Cosmetics 9.13Holding and Finance Companies 6.24Healthcare Education & Social Services 5.70Office Equipment, Computers 5.04Electronic Semiconductor 4.94Business Houses 4.58Construction, Building Material 3.56Mechanics, Machinery 3.12Biotechnology 2.70Food and Distilleries 2.41Chemicals 2.31Various Capital Goods 2.30Electronics and Electrical Equipment 1.34Consumer Goods 0.36
93.45
DANSKE INVEST SICAV
The accompanying notes form an integral part of these financial statements.
161

European Bond
Statement of Investmentsas at December 31, 2020(expressed in EUR)
Description Quantity ⁄ FaceValue
Currency Cost Evaluation % netassets
Transferable securities admitted to an official stock exchange listing or dealt in on another regulated market
Bonds
AustraliaTransurban 1.45% 19-16.05.29 100,000 EUR 99,880 108,815 0.43
99,880 108,815 0.43
BelgiumEthias Sa 5% 15-14.01.26 100,000 EUR 120,605 116,421 0.46
120,605 116,421 0.46
Cayman IslandsXlit 3.25% 17-29.06.47 100,000 EUR 100,150 113,000 0.45
100,150 113,000 0.45
Czech RepublicCez 0.875% 19-02.12.26 100,000 EUR 99,126 102,284 0.41
99,126 102,284 0.41
DenmarkDsk Bk 0.5% 19-27.08.25 150,000 EUR 149,160 150,909 0.60
Dsk Bk 2.75% 14-19.05.26 100,000 EUR 103,370 100,939 0.40
Dsv 0.375% 20-26.02.27 138,000 EUR 137,667 139,104 0.55
Jyske Bk 1.25% 20-28.01.31 100,000 EUR 99,456 99,463 0.40
Sydbank 1.25% 19-04.02.22 294,000 EUR 298,347 298,372 1.18
Sydbank 1.375% 18-18.09.23 100,000 EUR 103,726 103,356 0.41
891,726 892,143 3.54
EstoniaLuminor 1.375% 19-21.10.22 100,000 EUR 99,853 101,737 0.40
99,853 101,737 0.40
FinlandElisa Corp 0.25% 20-15.09.27 100,000 EUR 99,502 100,519 0.40
Kojamo Plc 1.625% 18-07.03.25 200,000 EUR 202,372 210,288 0.83
Sbb Treasur 0.75% 20-14.12.28 100,000 EUR 98,992 98,760 0.39
400,866 409,567 1.62
FranceBfcm 3% 14-21.05.24 100,000 EUR 105,302 109,527 0.43
Bnpp 2.125% (Frn) 19-23.01.27 200,000 EUR 210,424 219,004 0.87
Crdt Agr As 2.0% 20-17.07.30 100,000 EUR 99,588 106,927 0.42
Essilor 0.50% 20-05.06.28 100,000 EUR 99,485 103,111 0.41
France 1.75% 13-25.11.24 /Oat 800,000 EUR 913,550 877,448 3.48
France 5.5% 98-2029 Oat 1,200,000 EUR 1,788,276 1,812,300 7.19
Orange 1.625% 20-07.04.32 100,000 EUR 99,010 114,414 0.45
Orange 1.75% 20-Perp 100,000 EUR 99,631 103,364 0.41
Rci Banque 0.25% 19-08.03.23 47,000 EUR 46,851 46,952 0.19
Rte 1.125% 20-08.07.40 100,000 EUR 99,378 110,417 0.44
Total Sa 1.75% 19-Perp Regs 100,000 EUR 100,000 102,608 0.41
DANSKE INVEST SICAV
The accompanying notes form an integral part of these financial statements.
162
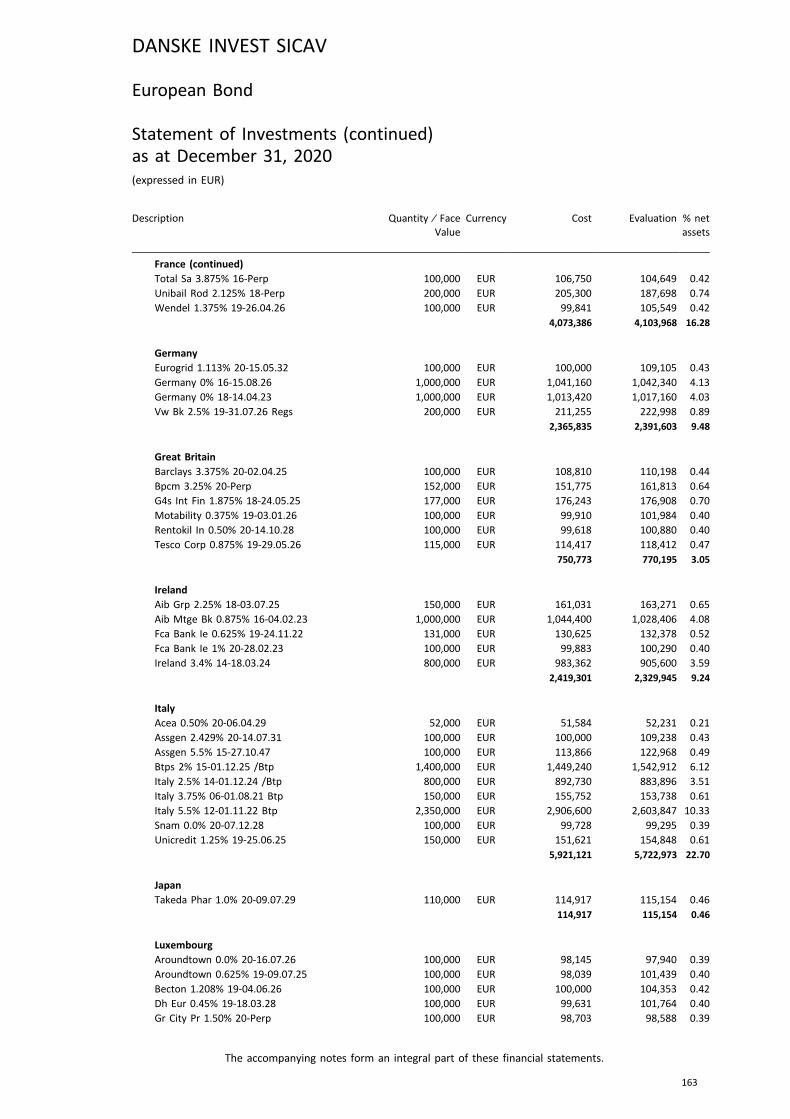
Description Quantity ⁄ FaceValue
Currency Cost Evaluation % netassets
France (continued)Total Sa 3.875% 16-Perp 100,000 EUR 106,750 104,649 0.42
Unibail Rod 2.125% 18-Perp 200,000 EUR 205,300 187,698 0.74
Wendel 1.375% 19-26.04.26 100,000 EUR 99,841 105,549 0.42
4,073,386 4,103,968 16.28
GermanyEurogrid 1.113% 20-15.05.32 100,000 EUR 100,000 109,105 0.43
Germany 0% 16-15.08.26 1,000,000 EUR 1,041,160 1,042,340 4.13
Germany 0% 18-14.04.23 1,000,000 EUR 1,013,420 1,017,160 4.03
Vw Bk 2.5% 19-31.07.26 Regs 200,000 EUR 211,255 222,998 0.89
2,365,835 2,391,603 9.48
Great BritainBarclays 3.375% 20-02.04.25 100,000 EUR 108,810 110,198 0.44
Bpcm 3.25% 20-Perp 152,000 EUR 151,775 161,813 0.64
G4s Int Fin 1.875% 18-24.05.25 177,000 EUR 176,243 176,908 0.70
Motability 0.375% 19-03.01.26 100,000 EUR 99,910 101,984 0.40
Rentokil In 0.50% 20-14.10.28 100,000 EUR 99,618 100,880 0.40
Tesco Corp 0.875% 19-29.05.26 115,000 EUR 114,417 118,412 0.47
750,773 770,195 3.05
IrelandAib Grp 2.25% 18-03.07.25 150,000 EUR 161,031 163,271 0.65
Aib Mtge Bk 0.875% 16-04.02.23 1,000,000 EUR 1,044,400 1,028,406 4.08
Fca Bank Ie 0.625% 19-24.11.22 131,000 EUR 130,625 132,378 0.52
Fca Bank Ie 1% 20-28.02.23 100,000 EUR 99,883 100,290 0.40
Ireland 3.4% 14-18.03.24 800,000 EUR 983,362 905,600 3.59
2,419,301 2,329,945 9.24
ItalyAcea 0.50% 20-06.04.29 52,000 EUR 51,584 52,231 0.21
Assgen 2.429% 20-14.07.31 100,000 EUR 100,000 109,238 0.43
Assgen 5.5% 15-27.10.47 100,000 EUR 113,866 122,968 0.49
Btps 2% 15-01.12.25 /Btp 1,400,000 EUR 1,449,240 1,542,912 6.12
Italy 2.5% 14-01.12.24 /Btp 800,000 EUR 892,730 883,896 3.51
Italy 3.75% 06-01.08.21 Btp 150,000 EUR 155,752 153,738 0.61
Italy 5.5% 12-01.11.22 Btp 2,350,000 EUR 2,906,600 2,603,847 10.33
Snam 0.0% 20-07.12.28 100,000 EUR 99,728 99,295 0.39
Unicredit 1.25% 19-25.06.25 150,000 EUR 151,621 154,848 0.61
5,921,121 5,722,973 22.70
JapanTakeda Phar 1.0% 20-09.07.29 110,000 EUR 114,917 115,154 0.46
114,917 115,154 0.46
LuxembourgAroundtown 0.0% 20-16.07.26 100,000 EUR 98,145 97,940 0.39
Aroundtown 0.625% 19-09.07.25 100,000 EUR 98,039 101,439 0.40
Becton 1.208% 19-04.06.26 100,000 EUR 100,000 104,353 0.42
Dh Eur 0.45% 19-18.03.28 100,000 EUR 99,631 101,764 0.40
Gr City Pr 1.50% 20-Perp 100,000 EUR 98,703 98,588 0.39
DANSKE INVEST SICAV
The accompanying notes form an integral part of these financial statements.
163
European Bond
Statement of Investments (continued)as at December 31, 2020(expressed in EUR)

Description Quantity ⁄ FaceValue
Currency Cost Evaluation % netassets
Luxembourg (continued)Holcim Fin 0.5% 20-23.04.31 Regs 101,000 EUR 100,430 101,269 0.40
Logicor Fin 1.50% 20-13.07.26 100,000 EUR 99,835 105,392 0.42
Medtrnc 0.375% 20-15.10.28 100,000 EUR 99,480 102,510 0.41
794,263 813,255 3.23
NorwaySantander 0.125% 11.09.24 100,000 EUR 96,900 100,531 0.40
Spbk 1 Ostf 0.875% 18-13.03.23 200,000 EUR 199,662 204,296 0.81
296,562 304,827 1.21
SpainCaixabank 1.125% 17-17.05.24 200,000 EUR 208,140 207,602 0.82
Fcc Aqualia 1.413% 17-08.06.22 200,000 EUR 200,521 202,878 0.80
Fer Emision 0.54% 20-12.11.28 100,000 EUR 100,000 100,930 0.40
Inmob Col Frn 16-28.10.24 100,000 EUR 97,555 104,276 0.41
Medio Ambie 0.815% 19-04.12.23 138,000 EUR 138,000 140,572 0.56
San Con 0.875% 18-30.05.23 100,000 EUR 100,386 102,597 0.41
Spain 4.4% 13-31.10.23 1,400,000 EUR 1,592,129 1,597,904 6.34
Spain 5.5% 11-30.04.21 100,000 EUR 123,315 101,941 0.40
Spanish Gov 3.8% 14-30.04.24 800,000 EUR 975,034 916,512 3.64
3,535,080 3,475,212 13.78
SwedenAkelius Res 1.125% 17-14.03.24 150,000 EUR 149,611 154,285 0.61
Essity Ab 0.50% 20-03.02.30 100,000 EUR 99,206 101,918 0.41
Tele2 Ab 1.125% 18-15.05.24 200,000 EUR 198,830 206,662 0.82
447,647 462,865 1.84
SwitzerlandCs Ny 0.45% 20-19.05.25 200,000 EUR 202,338 204,732 0.81
202,338 204,732 0.81
The NetherlandsAkelius Res 1.125% 20-11.01.29 100,000 EUR 99,861 103,181 0.41
De Volksban 1.75% 20-22.10.30 100,000 EUR 99,963 105,434 0.42
Digital Dut 1.0% 20-15.01.32 100,000 EUR 99,017 103,299 0.41
Ing Group 2.125% 20-26.05.31 100,000 EUR 99,838 106,724 0.42
Prosus 1.539% 20-03.08.28 100,000 EUR 100,000 102,930 0.41
Shell If Bv 1.25% 20-11.11.32 134,000 EUR 133,557 147,890 0.58
Signify N.V 2.375% 20-11.05.27 100,000 EUR 99,624 110,716 0.44
Upjohn Fina 1.362% 20-23.06.27 100,000 EUR 100,000 105,887 0.42
Vw Intl Fin 2.5% 15-Perp 120,000 EUR 120,360 121,265 0.48
Vw Intl Fin 4.625% 14-Perp 9,000 EUR 9,912 9,973 0.04
962,132 1,017,299 4.03
United States of AmericaAmerican Tc 1.0% 20-15.01.32 100,000 EUR 99,575 101,765 0.40
At&T Inc 2.35% 18-05.09.29 100,000 EUR 113,350 115,819 0.46
Autoliv Inc 0.75% 18-26.06.23 250,000 EUR 248,818 253,568 1.01
Boston Sci 0.625% 19-01.12.27 100,000 EUR 99,352 100,946 0.40
Comcast 0.75% 20-20.02.32 198,000 EUR 197,683 205,830 0.82
DANSKE INVEST SICAV
The accompanying notes form an integral part of these financial statements.
164
European Bond
Statement of Investments (continued)as at December 31, 2020(expressed in EUR)

Description Quantity ⁄ FaceValue
Currency Cost Evaluation % netassets
United States of America (continued)Public Stor 0.875% 20-24.01.32 114,000 EUR 113,432 117,320 0.46
Verizon Com 1.875% 17-26.10.29 100,000 EUR 114,400 114,020 0.45
986,610 1,009,268 4.00
Total - Bonds 24,682,171 24,565,263 97.42
Total - Transferable securities admitted to an official stock exchange listing ordealt in on another regulated market 24,682,171 24,565,263 97.42
TOTAL INVESTMENT PORTFOLIO 24,682,171 24,565,263 97.42
DANSKE INVEST SICAV
The accompanying notes form an integral part of these financial statements.
165
European Bond
Statement of Investments (continued)as at December 31, 2020(expressed in EUR)
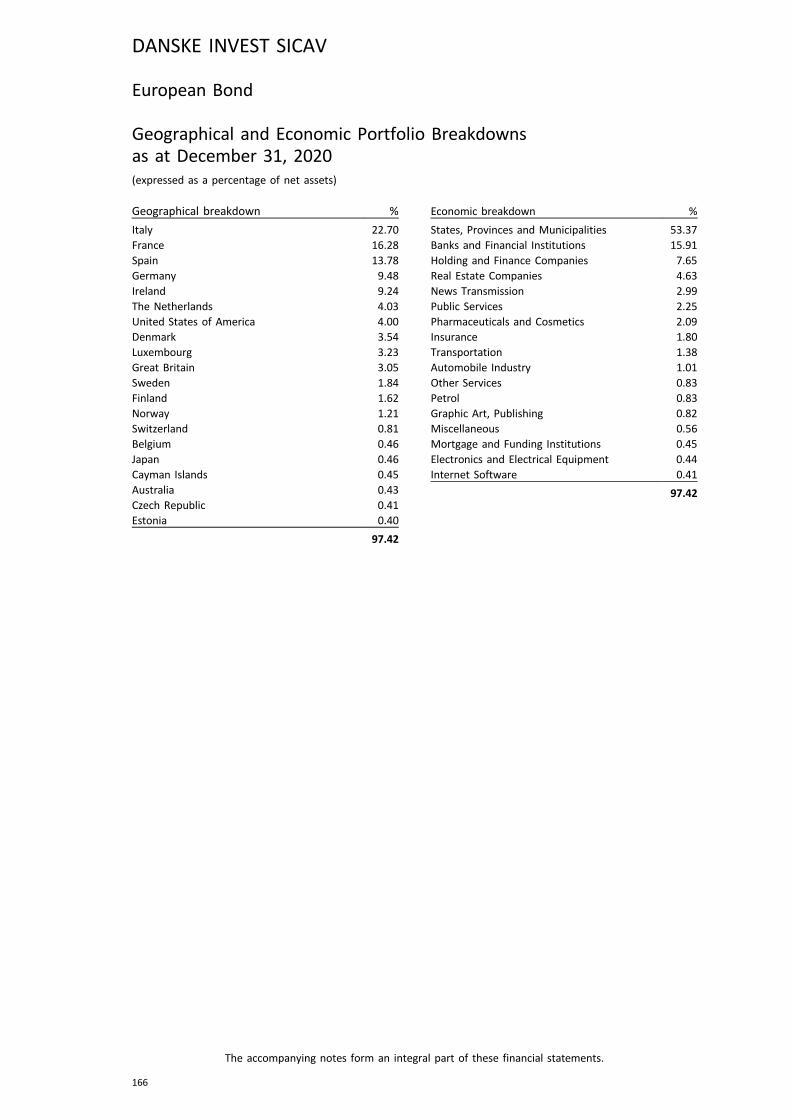
European Bond
Geographical and Economic Portfolio Breakdownsas at December 31, 2020(expressed as a percentage of net assets)
Geographical breakdown %
Italy 22.70France 16.28Spain 13.78Germany 9.48Ireland 9.24The Netherlands 4.03United States of America 4.00Denmark 3.54Luxembourg 3.23Great Britain 3.05Sweden 1.84Finland 1.62Norway 1.21Switzerland 0.81Belgium 0.46Japan 0.46Cayman Islands 0.45Australia 0.43Czech Republic 0.41Estonia 0.40
97.42
Economic breakdown %
States, Provinces and Municipalities 53.37Banks and Financial Institutions 15.91Holding and Finance Companies 7.65Real Estate Companies 4.63News Transmission 2.99Public Services 2.25Pharmaceuticals and Cosmetics 2.09Insurance 1.80Transportation 1.38Automobile Industry 1.01Other Services 0.83Petrol 0.83Graphic Art, Publishing 0.82Miscellaneous 0.56Mortgage and Funding Institutions 0.45Electronics and Electrical Equipment 0.44Internet Software 0.41
97.42
DANSKE INVEST SICAV
The accompanying notes form an integral part of these financial statements.
166
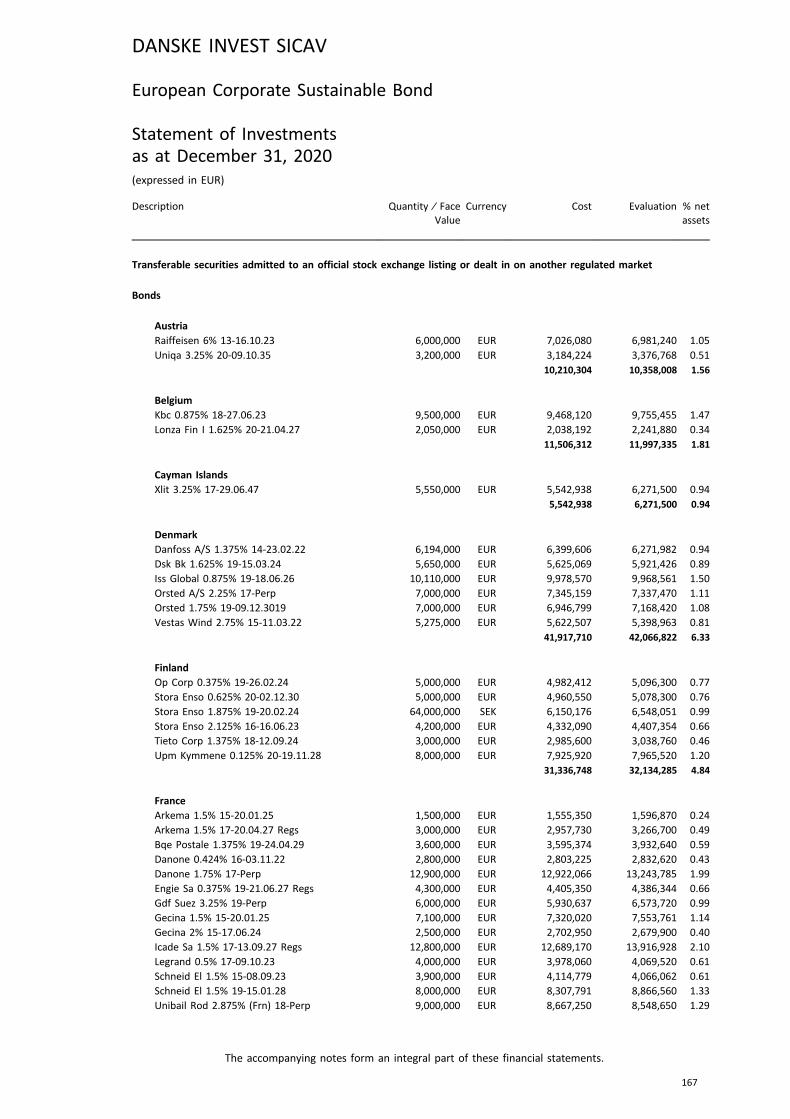
European Corporate Sustainable Bond
Statement of Investmentsas at December 31, 2020(expressed in EUR)
Description Quantity ⁄ FaceValue
Currency Cost Evaluation % netassets
Transferable securities admitted to an official stock exchange listing or dealt in on another regulated market
Bonds
AustriaRaiffeisen 6% 13-16.10.23 6,000,000 EUR 7,026,080 6,981,240 1.05
Uniqa 3.25% 20-09.10.35 3,200,000 EUR 3,184,224 3,376,768 0.51
10,210,304 10,358,008 1.56
BelgiumKbc 0.875% 18-27.06.23 9,500,000 EUR 9,468,120 9,755,455 1.47
Lonza Fin I 1.625% 20-21.04.27 2,050,000 EUR 2,038,192 2,241,880 0.34
11,506,312 11,997,335 1.81
Cayman IslandsXlit 3.25% 17-29.06.47 5,550,000 EUR 5,542,938 6,271,500 0.94
5,542,938 6,271,500 0.94
DenmarkDanfoss A/S 1.375% 14-23.02.22 6,194,000 EUR 6,399,606 6,271,982 0.94
Dsk Bk 1.625% 19-15.03.24 5,650,000 EUR 5,625,069 5,921,426 0.89
Iss Global 0.875% 19-18.06.26 10,110,000 EUR 9,978,570 9,968,561 1.50
Orsted A/S 2.25% 17-Perp 7,000,000 EUR 7,345,159 7,337,470 1.11
Orsted 1.75% 19-09.12.3019 7,000,000 EUR 6,946,799 7,168,420 1.08
Vestas Wind 2.75% 15-11.03.22 5,275,000 EUR 5,622,507 5,398,963 0.81
41,917,710 42,066,822 6.33
FinlandOp Corp 0.375% 19-26.02.24 5,000,000 EUR 4,982,412 5,096,300 0.77
Stora Enso 0.625% 20-02.12.30 5,000,000 EUR 4,960,550 5,078,300 0.76
Stora Enso 1.875% 19-20.02.24 64,000,000 SEK 6,150,176 6,548,051 0.99
Stora Enso 2.125% 16-16.06.23 4,200,000 EUR 4,332,090 4,407,354 0.66
Tieto Corp 1.375% 18-12.09.24 3,000,000 EUR 2,985,600 3,038,760 0.46
Upm Kymmene 0.125% 20-19.11.28 8,000,000 EUR 7,925,920 7,965,520 1.20
31,336,748 32,134,285 4.84
FranceArkema 1.5% 15-20.01.25 1,500,000 EUR 1,555,350 1,596,870 0.24
Arkema 1.5% 17-20.04.27 Regs 3,000,000 EUR 2,957,730 3,266,700 0.49
Bqe Postale 1.375% 19-24.04.29 3,600,000 EUR 3,595,374 3,932,640 0.59
Danone 0.424% 16-03.11.22 2,800,000 EUR 2,803,225 2,832,620 0.43
Danone 1.75% 17-Perp 12,900,000 EUR 12,922,066 13,243,785 1.99
Engie Sa 0.375% 19-21.06.27 Regs 4,300,000 EUR 4,405,350 4,386,344 0.66
Gdf Suez 3.25% 19-Perp 6,000,000 EUR 5,930,637 6,573,720 0.99
Gecina 1.5% 15-20.01.25 7,100,000 EUR 7,320,020 7,553,761 1.14
Gecina 2% 15-17.06.24 2,500,000 EUR 2,702,950 2,679,900 0.40
Icade Sa 1.5% 17-13.09.27 Regs 12,800,000 EUR 12,689,170 13,916,928 2.10
Legrand 0.5% 17-09.10.23 4,000,000 EUR 3,978,060 4,069,520 0.61
Schneid El 1.5% 15-08.09.23 3,900,000 EUR 4,114,779 4,066,062 0.61
Schneid El 1.5% 19-15.01.28 8,000,000 EUR 8,307,791 8,866,560 1.33
Unibail Rod 2.875% (Frn) 18-Perp 9,000,000 EUR 8,667,250 8,548,650 1.29
DANSKE INVEST SICAV
The accompanying notes form an integral part of these financial statements.
167

Description Quantity ⁄ FaceValue
Currency Cost Evaluation % netassets
France (continued)Valeo Sa 1.5% 18-18.06.25 7,000,000 EUR 7,035,380 7,140,000 1.08
88,985,132 92,674,060 13.95
GermanyAllianz Se 4.75% 13-Perp 3,900,000 EUR 4,314,806 4,350,333 0.65
Berl-Han Hy 0.5% 16-26.09.23 6,600,000 EUR 6,615,169 6,690,420 1.01
Comzbk 0.75% 20-24.03.26 3,800,000 EUR 3,781,494 3,852,060 0.58
Comzbk 1.25% 18-23.10.23 8,000,000 EUR 7,929,630 8,273,360 1.25
Deutsch Bah Frn 17-06.12.24 Regs 1,500,000 EUR 1,521,420 1,515,420 0.23
Dt Bahn Fin 0.95% 19-Perp 4,800,000 EUR 4,789,321 4,845,168 0.73
Munich Re 1.25% 20-26.05.41 6,300,000 EUR 6,227,361 6,527,052 0.98
Sap Ag 1.75% 14-22.02.27 4,787,000 EUR 5,203,485 5,318,788 0.80
Symrise Ag 1.25% 19-29.11.25 9,750,000 EUR 9,669,465 10,195,380 1.53
50,052,151 51,567,981 7.76
Great BritainBarclays 0.625% 17-14.11.23 7,500,000 EUR 7,331,083 7,580,625 1.14
Hammerson Reit 2% 14-01.07.22 5,000,000 EUR 5,263,180 4,894,050 0.74
Std Chart 0.9% 19-02.07.27 6,750,000 EUR 6,732,247 7,051,320 1.06
Vodafone 0.9% 19-24.11.26 Regs 7,000,000 EUR 7,342,126 7,357,910 1.11
26,668,636 26,883,905 4.05
ItalyAssgen 2.124% 19-01.10.30 7,500,000 EUR 7,500,000 7,954,950 1.20
Erg 0.50% 20-11.09.27 5,550,000 EUR 5,506,044 5,600,005 0.84
Isp 0.75% 19-04.12.24 Regs 5,400,000 EUR 5,398,164 5,532,732 0.83
18,404,208 19,087,687 2.87
MauritiusBayport Mgt 11.5% 19-14.06.22 7,000,000 USD 6,283,098 5,678,150 0.85
6,283,098 5,678,150 0.85
NorwayEntra 2.79% 19-22.05.26 55,000,000 NOK 5,617,060 5,487,522 0.83
Entra Frn 16-22.09.23 55,000,000 NOK 5,954,676 5,294,629 0.80
Havilafjord Frn 18-19.06.23 50,000,000 NOK 5,236,355 4,761,134 0.72
Hexagon Frn 19-15.03.23 60,000,000 NOK 6,120,817 5,741,947 0.86
Marine Harv Frn 18-12.06.23 6,000,000 EUR 6,000,000 6,095,928 0.92
Marine Harv Frn 20-31.01.25 2,500,000 EUR 2,500,000 2,512,500 0.38
Norsk Hydro 1.125% 19-11.04.25 5,600,000 EUR 5,576,895 5,782,000 0.87
Norsk Hydro Frn 17-07.11.22 34,000,000 NOK 3,511,282 3,206,483 0.48
Nrc Group Frn 19-13.09.24 6,500,000 NOK 646,916 614,264 0.09
Steen & Str 1.093% 17-08.12.22 46,000,000 SEK 4,650,435 4,563,234 0.69
Storebrand Frn 14-Perp 55,000,000 NOK 5,901,005 5,340,576 0.80
Storebrand 6.875% 13-04.04.43 3,365,000 EUR 4,056,782 3,788,317 0.57
Storebrand Frn 19-16.09.49 12,000,000 SEK 1,115,242 1,191,395 0.18
Storebrd Bk Frn 17-22.02.27 27,000,000 NOK 3,046,759 2,598,922 0.39
59,934,224 56,978,851 8.58
DANSKE INVEST SICAV
The accompanying notes form an integral part of these financial statements.
168
European Corporate Sustainable Bond
Statement of Investments (continued)as at December 31, 2020(expressed in EUR)
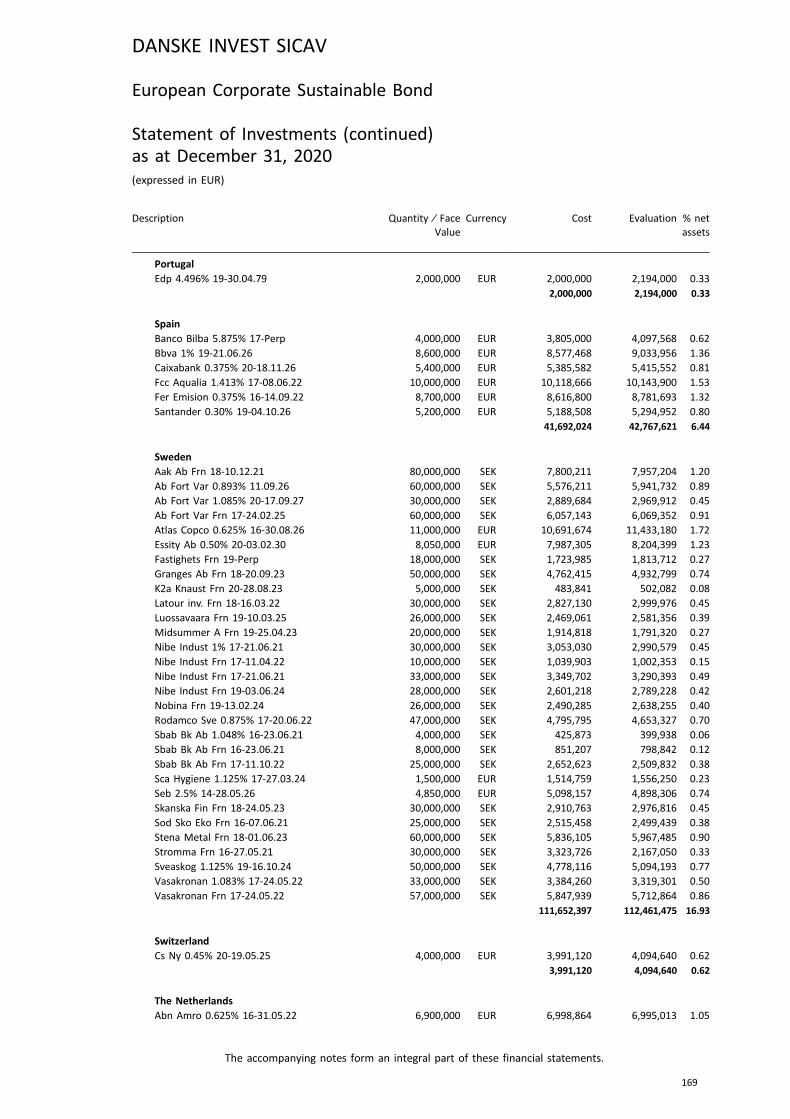
Description Quantity ⁄ FaceValue
Currency Cost Evaluation % netassets
PortugalEdp 4.496% 19-30.04.79 2,000,000 EUR 2,000,000 2,194,000 0.33
2,000,000 2,194,000 0.33
SpainBanco Bilba 5.875% 17-Perp 4,000,000 EUR 3,805,000 4,097,568 0.62
Bbva 1% 19-21.06.26 8,600,000 EUR 8,577,468 9,033,956 1.36
Caixabank 0.375% 20-18.11.26 5,400,000 EUR 5,385,582 5,415,552 0.81
Fcc Aqualia 1.413% 17-08.06.22 10,000,000 EUR 10,118,666 10,143,900 1.53
Fer Emision 0.375% 16-14.09.22 8,700,000 EUR 8,616,800 8,781,693 1.32
Santander 0.30% 19-04.10.26 5,200,000 EUR 5,188,508 5,294,952 0.80
41,692,024 42,767,621 6.44
SwedenAak Ab Frn 18-10.12.21 80,000,000 SEK 7,800,211 7,957,204 1.20
Ab Fort Var 0.893% 11.09.26 60,000,000 SEK 5,576,211 5,941,732 0.89
Ab Fort Var 1.085% 20-17.09.27 30,000,000 SEK 2,889,684 2,969,912 0.45
Ab Fort Var Frn 17-24.02.25 60,000,000 SEK 6,057,143 6,069,352 0.91
Atlas Copco 0.625% 16-30.08.26 11,000,000 EUR 10,691,674 11,433,180 1.72
Essity Ab 0.50% 20-03.02.30 8,050,000 EUR 7,987,305 8,204,399 1.23
Fastighets Frn 19-Perp 18,000,000 SEK 1,723,985 1,813,712 0.27
Granges Ab Frn 18-20.09.23 50,000,000 SEK 4,762,415 4,932,799 0.74
K2a Knaust Frn 20-28.08.23 5,000,000 SEK 483,841 502,082 0.08
Latour inv. Frn 18-16.03.22 30,000,000 SEK 2,827,130 2,999,976 0.45
Luossavaara Frn 19-10.03.25 26,000,000 SEK 2,469,061 2,581,356 0.39
Midsummer A Frn 19-25.04.23 20,000,000 SEK 1,914,818 1,791,320 0.27
Nibe Indust 1% 17-21.06.21 30,000,000 SEK 3,053,030 2,990,579 0.45
Nibe Indust Frn 17-11.04.22 10,000,000 SEK 1,039,903 1,002,353 0.15
Nibe Indust Frn 17-21.06.21 33,000,000 SEK 3,349,702 3,290,393 0.49
Nibe Indust Frn 19-03.06.24 28,000,000 SEK 2,601,218 2,789,228 0.42
Nobina Frn 19-13.02.24 26,000,000 SEK 2,490,285 2,638,255 0.40
Rodamco Sve 0.875% 17-20.06.22 47,000,000 SEK 4,795,795 4,653,327 0.70
Sbab Bk Ab 1.048% 16-23.06.21 4,000,000 SEK 425,873 399,938 0.06
Sbab Bk Ab Frn 16-23.06.21 8,000,000 SEK 851,207 798,842 0.12
Sbab Bk Ab Frn 17-11.10.22 25,000,000 SEK 2,652,623 2,509,832 0.38
Sca Hygiene 1.125% 17-27.03.24 1,500,000 EUR 1,514,759 1,556,250 0.23
Seb 2.5% 14-28.05.26 4,850,000 EUR 5,098,157 4,898,306 0.74
Skanska Fin Frn 18-24.05.23 30,000,000 SEK 2,910,763 2,976,816 0.45
Sod Sko Eko Frn 16-07.06.21 25,000,000 SEK 2,515,458 2,499,439 0.38
Stena Metal Frn 18-01.06.23 60,000,000 SEK 5,836,105 5,967,485 0.90
Stromma Frn 16-27.05.21 30,000,000 SEK 3,323,726 2,167,050 0.33
Sveaskog 1.125% 19-16.10.24 50,000,000 SEK 4,778,116 5,094,193 0.77
Vasakronan 1.083% 17-24.05.22 33,000,000 SEK 3,384,260 3,319,301 0.50
Vasakronan Frn 17-24.05.22 57,000,000 SEK 5,847,939 5,712,864 0.86
111,652,397 112,461,475 16.93
SwitzerlandCs Ny 0.45% 20-19.05.25 4,000,000 EUR 3,991,120 4,094,640 0.62
3,991,120 4,094,640 0.62
The NetherlandsAbn Amro 0.625% 16-31.05.22 6,900,000 EUR 6,998,864 6,995,013 1.05
DANSKE INVEST SICAV
The accompanying notes form an integral part of these financial statements.
169
European Corporate Sustainable Bond
Statement of Investments (continued)as at December 31, 2020(expressed in EUR)
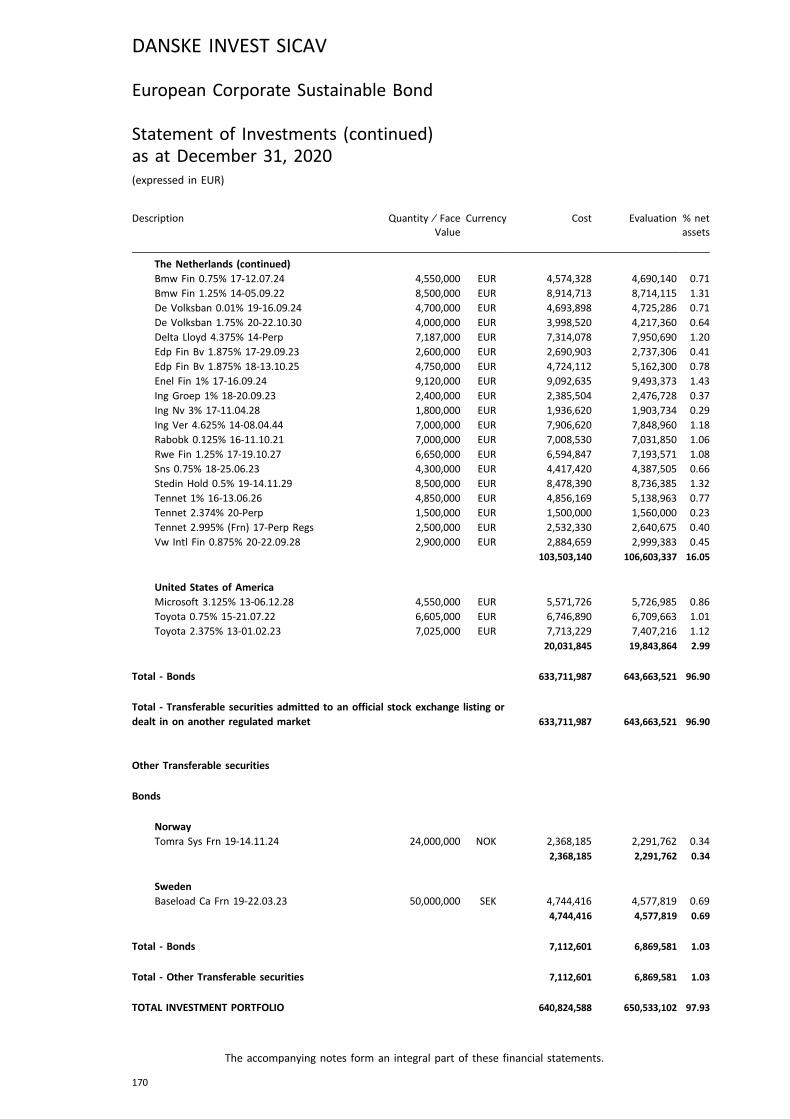
Description Quantity ⁄ FaceValue
Currency Cost Evaluation % netassets
The Netherlands (continued)Bmw Fin 0.75% 17-12.07.24 4,550,000 EUR 4,574,328 4,690,140 0.71
Bmw Fin 1.25% 14-05.09.22 8,500,000 EUR 8,914,713 8,714,115 1.31
De Volksban 0.01% 19-16.09.24 4,700,000 EUR 4,693,898 4,725,286 0.71
De Volksban 1.75% 20-22.10.30 4,000,000 EUR 3,998,520 4,217,360 0.64
Delta Lloyd 4.375% 14-Perp 7,187,000 EUR 7,314,078 7,950,690 1.20
Edp Fin Bv 1.875% 17-29.09.23 2,600,000 EUR 2,690,903 2,737,306 0.41
Edp Fin Bv 1.875% 18-13.10.25 4,750,000 EUR 4,724,112 5,162,300 0.78
Enel Fin 1% 17-16.09.24 9,120,000 EUR 9,092,635 9,493,373 1.43
Ing Groep 1% 18-20.09.23 2,400,000 EUR 2,385,504 2,476,728 0.37
Ing Nv 3% 17-11.04.28 1,800,000 EUR 1,936,620 1,903,734 0.29
Ing Ver 4.625% 14-08.04.44 7,000,000 EUR 7,906,620 7,848,960 1.18
Rabobk 0.125% 16-11.10.21 7,000,000 EUR 7,008,530 7,031,850 1.06
Rwe Fin 1.25% 17-19.10.27 6,650,000 EUR 6,594,847 7,193,571 1.08
Sns 0.75% 18-25.06.23 4,300,000 EUR 4,417,420 4,387,505 0.66
Stedin Hold 0.5% 19-14.11.29 8,500,000 EUR 8,478,390 8,736,385 1.32
Tennet 1% 16-13.06.26 4,850,000 EUR 4,856,169 5,138,963 0.77
Tennet 2.374% 20-Perp 1,500,000 EUR 1,500,000 1,560,000 0.23
Tennet 2.995% (Frn) 17-Perp Regs 2,500,000 EUR 2,532,330 2,640,675 0.40
Vw Intl Fin 0.875% 20-22.09.28 2,900,000 EUR 2,884,659 2,999,383 0.45
103,503,140 106,603,337 16.05
United States of AmericaMicrosoft 3.125% 13-06.12.28 4,550,000 EUR 5,571,726 5,726,985 0.86
Toyota 0.75% 15-21.07.22 6,605,000 EUR 6,746,890 6,709,663 1.01
Toyota 2.375% 13-01.02.23 7,025,000 EUR 7,713,229 7,407,216 1.12
20,031,845 19,843,864 2.99
Total - Bonds 633,711,987 643,663,521 96.90
Total - Transferable securities admitted to an official stock exchange listing ordealt in on another regulated market 633,711,987 643,663,521 96.90
Other Transferable securities
Bonds
NorwayTomra Sys Frn 19-14.11.24 24,000,000 NOK 2,368,185 2,291,762 0.34
2,368,185 2,291,762 0.34
SwedenBaseload Ca Frn 19-22.03.23 50,000,000 SEK 4,744,416 4,577,819 0.69
4,744,416 4,577,819 0.69
Total - Bonds 7,112,601 6,869,581 1.03
Total - Other Transferable securities 7,112,601 6,869,581 1.03
TOTAL INVESTMENT PORTFOLIO 640,824,588 650,533,102 97.93
DANSKE INVEST SICAV
The accompanying notes form an integral part of these financial statements.
170
European Corporate Sustainable Bond
Statement of Investments (continued)as at December 31, 2020(expressed in EUR)
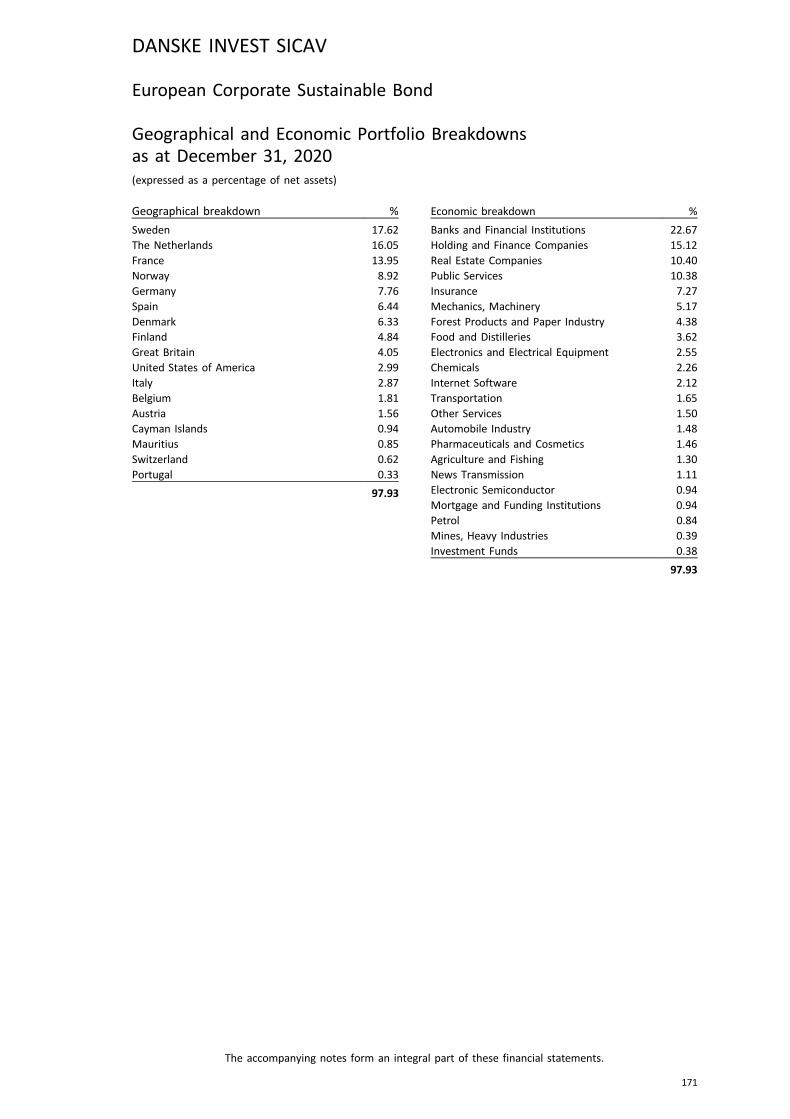
European Corporate Sustainable Bond
Geographical and Economic Portfolio Breakdownsas at December 31, 2020(expressed as a percentage of net assets)
Geographical breakdown %
Sweden 17.62The Netherlands 16.05France 13.95Norway 8.92Germany 7.76Spain 6.44Denmark 6.33Finland 4.84Great Britain 4.05United States of America 2.99Italy 2.87Belgium 1.81Austria 1.56Cayman Islands 0.94Mauritius 0.85Switzerland 0.62Portugal 0.33
97.93
Economic breakdown %
Banks and Financial Institutions 22.67Holding and Finance Companies 15.12Real Estate Companies 10.40Public Services 10.38Insurance 7.27Mechanics, Machinery 5.17Forest Products and Paper Industry 4.38Food and Distilleries 3.62Electronics and Electrical Equipment 2.55Chemicals 2.26Internet Software 2.12Transportation 1.65Other Services 1.50Automobile Industry 1.48Pharmaceuticals and Cosmetics 1.46Agriculture and Fishing 1.30News Transmission 1.11Electronic Semiconductor 0.94Mortgage and Funding Institutions 0.94Petrol 0.84Mines, Heavy Industries 0.39Investment Funds 0.38
97.93
DANSKE INVEST SICAV
The accompanying notes form an integral part of these financial statements.
171
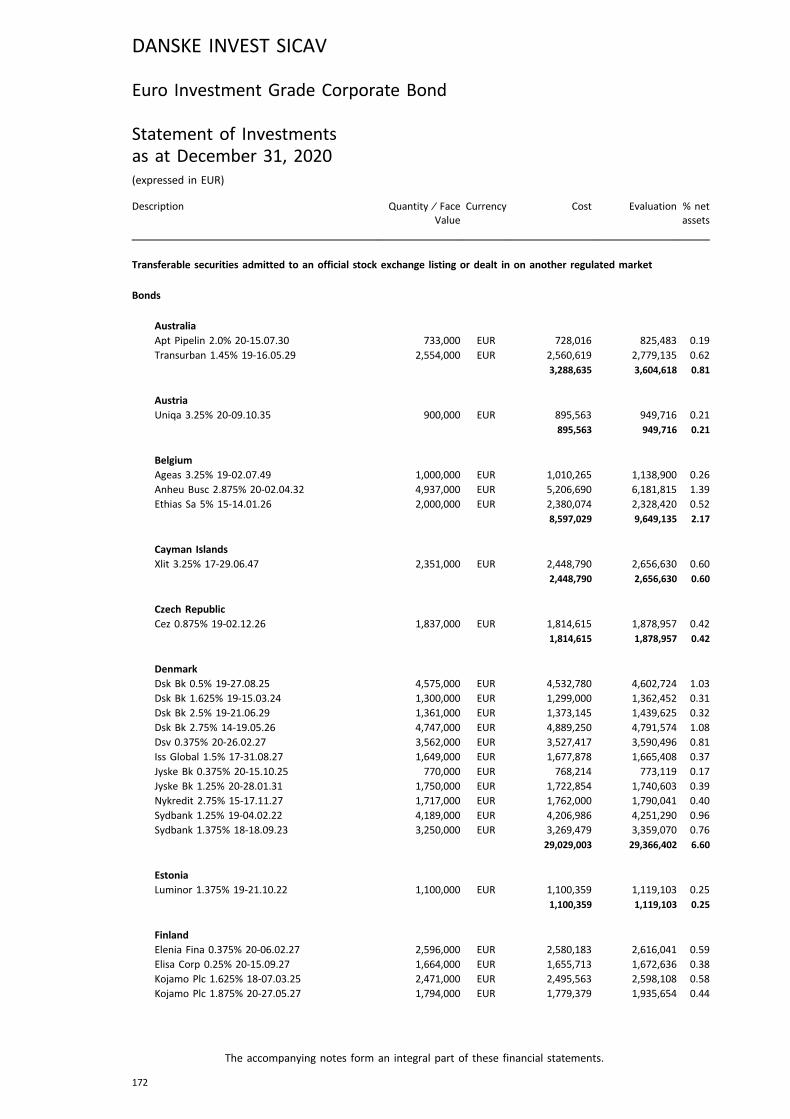
Euro Investment Grade Corporate Bond
Statement of Investmentsas at December 31, 2020(expressed in EUR)
Description Quantity ⁄ FaceValue
Currency Cost Evaluation % netassets
Transferable securities admitted to an official stock exchange listing or dealt in on another regulated market
Bonds
AustraliaApt Pipelin 2.0% 20-15.07.30 733,000 EUR 728,016 825,483 0.19
Transurban 1.45% 19-16.05.29 2,554,000 EUR 2,560,619 2,779,135 0.62
3,288,635 3,604,618 0.81
AustriaUniqa 3.25% 20-09.10.35 900,000 EUR 895,563 949,716 0.21
895,563 949,716 0.21
BelgiumAgeas 3.25% 19-02.07.49 1,000,000 EUR 1,010,265 1,138,900 0.26
Anheu Busc 2.875% 20-02.04.32 4,937,000 EUR 5,206,690 6,181,815 1.39
Ethias Sa 5% 15-14.01.26 2,000,000 EUR 2,380,074 2,328,420 0.52
8,597,029 9,649,135 2.17
Cayman IslandsXlit 3.25% 17-29.06.47 2,351,000 EUR 2,448,790 2,656,630 0.60
2,448,790 2,656,630 0.60
Czech RepublicCez 0.875% 19-02.12.26 1,837,000 EUR 1,814,615 1,878,957 0.42
1,814,615 1,878,957 0.42
DenmarkDsk Bk 0.5% 19-27.08.25 4,575,000 EUR 4,532,780 4,602,724 1.03
Dsk Bk 1.625% 19-15.03.24 1,300,000 EUR 1,299,000 1,362,452 0.31
Dsk Bk 2.5% 19-21.06.29 1,361,000 EUR 1,373,145 1,439,625 0.32
Dsk Bk 2.75% 14-19.05.26 4,747,000 EUR 4,889,250 4,791,574 1.08
Dsv 0.375% 20-26.02.27 3,562,000 EUR 3,527,417 3,590,496 0.81
Iss Global 1.5% 17-31.08.27 1,649,000 EUR 1,677,878 1,665,408 0.37
Jyske Bk 0.375% 20-15.10.25 770,000 EUR 768,214 773,119 0.17
Jyske Bk 1.25% 20-28.01.31 1,750,000 EUR 1,722,854 1,740,603 0.39
Nykredit 2.75% 15-17.11.27 1,717,000 EUR 1,762,000 1,790,041 0.40
Sydbank 1.25% 19-04.02.22 4,189,000 EUR 4,206,986 4,251,290 0.96
Sydbank 1.375% 18-18.09.23 3,250,000 EUR 3,269,479 3,359,070 0.76
29,029,003 29,366,402 6.60
EstoniaLuminor 1.375% 19-21.10.22 1,100,000 EUR 1,100,359 1,119,103 0.25
1,100,359 1,119,103 0.25
FinlandElenia Fina 0.375% 20-06.02.27 2,596,000 EUR 2,580,183 2,616,041 0.59
Elisa Corp 0.25% 20-15.09.27 1,664,000 EUR 1,655,713 1,672,636 0.38
Kojamo Plc 1.625% 18-07.03.25 2,471,000 EUR 2,495,563 2,598,108 0.58
Kojamo Plc 1.875% 20-27.05.27 1,794,000 EUR 1,779,379 1,935,654 0.44
DANSKE INVEST SICAV
The accompanying notes form an integral part of these financial statements.
172

Description Quantity ⁄ FaceValue
Currency Cost Evaluation % netassets
Finland (continued)Sbb Treasur 0.75% 20-14.12.28 2,089,000 EUR 2,067,943 2,063,097 0.46
10,578,781 10,885,536 2.45
FranceBfcm 2.625% 13-24.02.21 1,500,000 EUR 1,536,837 1,506,225 0.34
Bfcm 3% 14-21.05.24 1,422,000 EUR 1,527,272 1,557,474 0.35
Bnp Par 0.50% 20-19.02.28 Regs 3,800,000 EUR 3,772,904 3,838,000 0.86
Bnpp 2.125% (Frn) 19-23.01.27 5,000,000 EUR 5,156,661 5,475,100 1.23
Crdt Agr As 2.0% 20-17.07.30 1,200,000 EUR 1,195,056 1,283,124 0.29
Crdt Agr As 4.25% 15-Perp 1,500,000 EUR 1,583,025 1,678,725 0.38
Credit Agri 1.875% 16-20.12.26 3,000,000 EUR 3,156,563 3,303,420 0.74
Credit Log 1.35% 17-28.11.29 1,000,000 EUR 987,692 1,019,060 0.23
Engie Sa 0.375% 19-21.06.27 Regs 4,200,000 EUR 4,189,523 4,284,336 0.96
Essilor 0.50% 20-05.06.28 3,100,000 EUR 3,087,320 3,196,441 0.72
Groupama 6.375% (Frn) 14-Perp 1,600,000 EUR 1,812,000 1,841,248 0.41
Orange 1% 18-12.09.25 4,300,000 EUR 4,329,768 4,520,074 1.02
Orange 1.625% 20-07.04.32 1,600,000 EUR 1,624,693 1,830,624 0.41
Orange 1.75% 20-Perp 2,000,000 EUR 1,992,620 2,067,280 0.47
Orange 2.375% 19-Perp 1,200,000 EUR 1,221,196 1,263,096 0.28
Rci Banque 0.25% 19-08.03.23 2,006,000 EUR 1,998,669 2,003,954 0.45
Rci Bq 2% 19-11.07.24 1,228,000 EUR 1,228,056 1,284,905 0.29
Rte 1.125% 20-08.07.40 1,400,000 EUR 1,395,026 1,545,838 0.35
Schneid El 1.0% 20-09.04.27 Regs 1,100,000 EUR 1,097,920 1,173,865 0.26
St Gobain 0.875% 18-21.09.23 3,200,000 EUR 3,225,150 3,288,544 0.74
Total Sa 1.75% 19-Perp Regs 2,750,000 EUR 2,754,378 2,821,720 0.63
Total Sa 3.875% 16-Perp 4,030,000 EUR 4,324,723 4,217,355 0.95
Unibail Rod 2.125% 18-Perp 5,900,000 EUR 5,889,896 5,537,091 1.25
Wendel 1.375% 19-26.04.26 1,600,000 EUR 1,593,306 1,688,784 0.38
60,680,254 62,226,283 13.99
GermanyAllianz 2.625% 20-Perp 1,800,000 EUR 1,800,144 1,849,266 0.42
Comzbk 0.625% 19-28.08.24 825,000 EUR 823,990 846,219 0.19
Comzbk 0.75% 20-24.03.26 2,400,000 EUR 2,388,778 2,432,880 0.55
Deut Bk 1.375% 20-10.06.26 2,305,000 EUR 2,370,347 2,432,282 0.55
Deut Bk 1.75% 20-19.11.30 2,000,000 EUR 1,993,080 2,097,840 0.47
Dt Bahn Fin 0.95% 19-Perp 800,000 EUR 794,100 807,528 0.18
Eurogrid 1.113% 20-15.05.32 2,400,000 EUR 2,414,274 2,618,520 0.59
Sap Ag 1.25% 18-10.03.28 Regs 2,600,000 EUR 2,626,725 2,841,124 0.64
Vw Bk 1.25% 18-10.06.24 2,800,000 EUR 2,770,379 2,896,936 0.65
Vw Bk 1.875% 19-31.01.24 Regs 1,200,000 EUR 1,216,200 1,261,956 0.28
Vw Bk 2.5% 19-31.07.26 Regs 7,800,000 EUR 8,144,961 8,696,922 1.95
27,342,978 28,781,473 6.47
Great BritainBarclays 3.375% 20-02.04.25 3,100,000 EUR 3,227,215 3,416,138 0.77
Barclays 6.625% 11-30.03.22 769,000 EUR 926,997 828,951 0.19
Bpcm 3.25% 20-Perp 5,301,000 EUR 5,405,449 5,643,233 1.27
Britel 1.125% 19-12.09.29 Regs 939,000 EUR 924,718 984,570 0.22
G4s 1.5% 16-09.01.23 4,066,000 EUR 4,108,413 4,069,781 0.91
G4s Int Fin 1.875% 18-24.05.25 2,476,000 EUR 2,458,382 2,474,713 0.56
DANSKE INVEST SICAV
The accompanying notes form an integral part of these financial statements.
173
Euro Investment Grade Corporate Bond
Statement of Investments (continued)as at December 31, 2020(expressed in EUR)
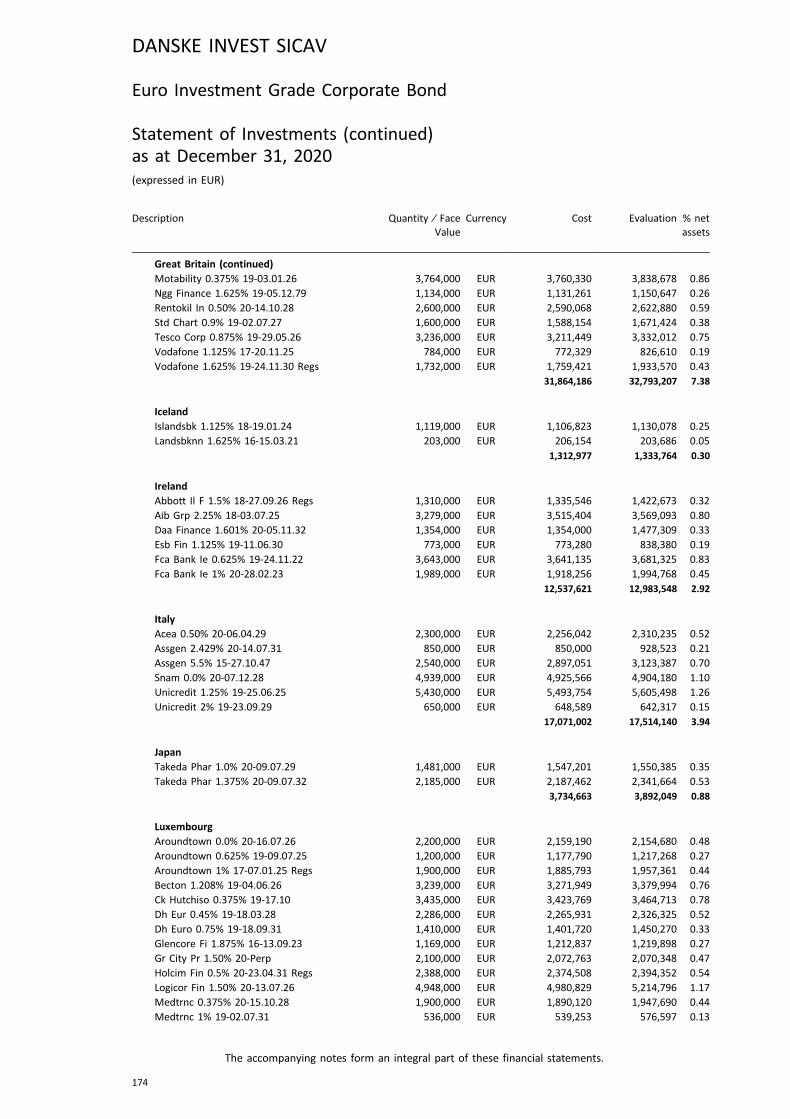
Description Quantity ⁄ FaceValue
Currency Cost Evaluation % netassets
Great Britain (continued)Motability 0.375% 19-03.01.26 3,764,000 EUR 3,760,330 3,838,678 0.86
Ngg Finance 1.625% 19-05.12.79 1,134,000 EUR 1,131,261 1,150,647 0.26
Rentokil In 0.50% 20-14.10.28 2,600,000 EUR 2,590,068 2,622,880 0.59
Std Chart 0.9% 19-02.07.27 1,600,000 EUR 1,588,154 1,671,424 0.38
Tesco Corp 0.875% 19-29.05.26 3,236,000 EUR 3,211,449 3,332,012 0.75
Vodafone 1.125% 17-20.11.25 784,000 EUR 772,329 826,610 0.19
Vodafone 1.625% 19-24.11.30 Regs 1,732,000 EUR 1,759,421 1,933,570 0.43
31,864,186 32,793,207 7.38
IcelandIslandsbk 1.125% 18-19.01.24 1,119,000 EUR 1,106,823 1,130,078 0.25
Landsbknn 1.625% 16-15.03.21 203,000 EUR 206,154 203,686 0.05
1,312,977 1,333,764 0.30
IrelandAbbott Il F 1.5% 18-27.09.26 Regs 1,310,000 EUR 1,335,546 1,422,673 0.32
Aib Grp 2.25% 18-03.07.25 3,279,000 EUR 3,515,404 3,569,093 0.80
Daa Finance 1.601% 20-05.11.32 1,354,000 EUR 1,354,000 1,477,309 0.33
Esb Fin 1.125% 19-11.06.30 773,000 EUR 773,280 838,380 0.19
Fca Bank Ie 0.625% 19-24.11.22 3,643,000 EUR 3,641,135 3,681,325 0.83
Fca Bank Ie 1% 20-28.02.23 1,989,000 EUR 1,918,256 1,994,768 0.45
12,537,621 12,983,548 2.92
ItalyAcea 0.50% 20-06.04.29 2,300,000 EUR 2,256,042 2,310,235 0.52
Assgen 2.429% 20-14.07.31 850,000 EUR 850,000 928,523 0.21
Assgen 5.5% 15-27.10.47 2,540,000 EUR 2,897,051 3,123,387 0.70
Snam 0.0% 20-07.12.28 4,939,000 EUR 4,925,566 4,904,180 1.10
Unicredit 1.25% 19-25.06.25 5,430,000 EUR 5,493,754 5,605,498 1.26
Unicredit 2% 19-23.09.29 650,000 EUR 648,589 642,317 0.15
17,071,002 17,514,140 3.94
JapanTakeda Phar 1.0% 20-09.07.29 1,481,000 EUR 1,547,201 1,550,385 0.35
Takeda Phar 1.375% 20-09.07.32 2,185,000 EUR 2,187,462 2,341,664 0.53
3,734,663 3,892,049 0.88
LuxembourgAroundtown 0.0% 20-16.07.26 2,200,000 EUR 2,159,190 2,154,680 0.48
Aroundtown 0.625% 19-09.07.25 1,200,000 EUR 1,177,790 1,217,268 0.27
Aroundtown 1% 17-07.01.25 Regs 1,900,000 EUR 1,885,793 1,957,361 0.44
Becton 1.208% 19-04.06.26 3,239,000 EUR 3,271,949 3,379,994 0.76
Ck Hutchiso 0.375% 19-17.10 3,435,000 EUR 3,423,769 3,464,713 0.78
Dh Eur 0.45% 19-18.03.28 2,286,000 EUR 2,265,931 2,326,325 0.52
Dh Euro 0.75% 19-18.09.31 1,410,000 EUR 1,401,720 1,450,270 0.33
Glencore Fi 1.875% 16-13.09.23 1,169,000 EUR 1,212,837 1,219,898 0.27
Gr City Pr 1.50% 20-Perp 2,100,000 EUR 2,072,763 2,070,348 0.47
Holcim Fin 0.5% 20-23.04.31 Regs 2,388,000 EUR 2,374,508 2,394,352 0.54
Logicor Fin 1.50% 20-13.07.26 4,948,000 EUR 4,980,829 5,214,796 1.17
Medtrnc 0.375% 20-15.10.28 1,900,000 EUR 1,890,120 1,947,690 0.44
Medtrnc 1% 19-02.07.31 536,000 EUR 539,253 576,597 0.13
DANSKE INVEST SICAV
The accompanying notes form an integral part of these financial statements.
174
Euro Investment Grade Corporate Bond
Statement of Investments (continued)as at December 31, 2020(expressed in EUR)
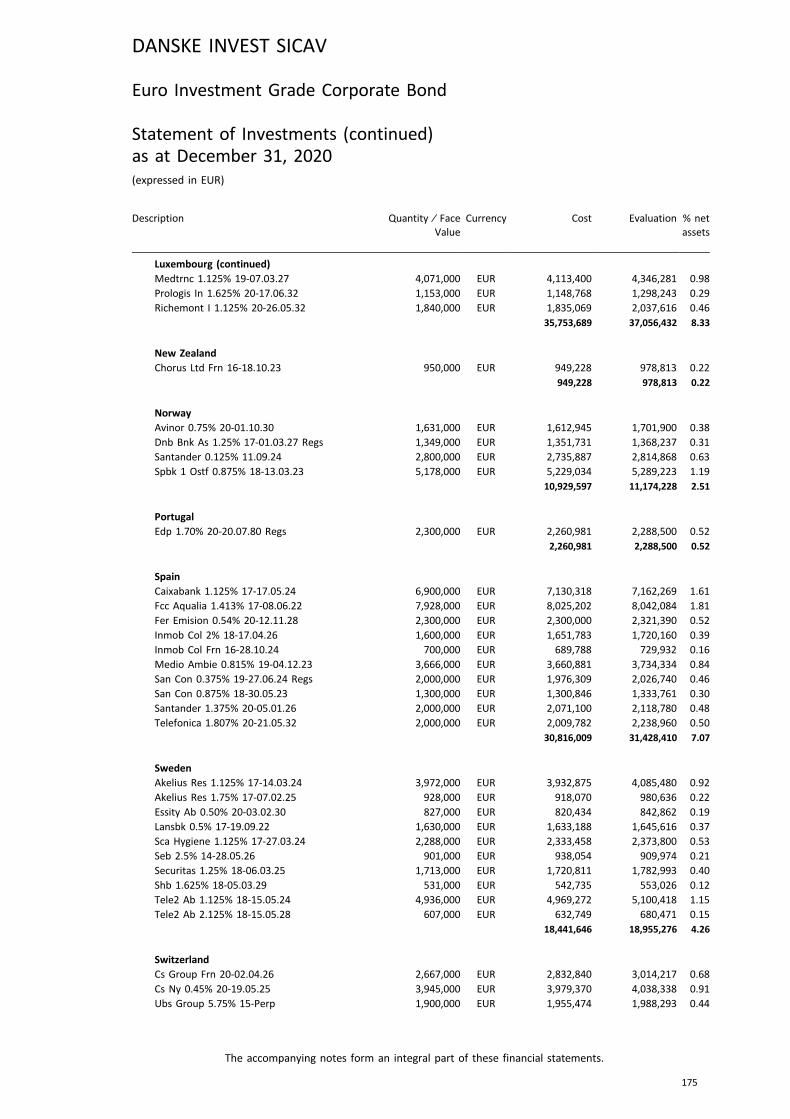
Description Quantity ⁄ FaceValue
Currency Cost Evaluation % netassets
Luxembourg (continued)Medtrnc 1.125% 19-07.03.27 4,071,000 EUR 4,113,400 4,346,281 0.98
Prologis In 1.625% 20-17.06.32 1,153,000 EUR 1,148,768 1,298,243 0.29
Richemont I 1.125% 20-26.05.32 1,840,000 EUR 1,835,069 2,037,616 0.46
35,753,689 37,056,432 8.33
New ZealandChorus Ltd Frn 16-18.10.23 950,000 EUR 949,228 978,813 0.22
949,228 978,813 0.22
NorwayAvinor 0.75% 20-01.10.30 1,631,000 EUR 1,612,945 1,701,900 0.38
Dnb Bnk As 1.25% 17-01.03.27 Regs 1,349,000 EUR 1,351,731 1,368,237 0.31
Santander 0.125% 11.09.24 2,800,000 EUR 2,735,887 2,814,868 0.63
Spbk 1 Ostf 0.875% 18-13.03.23 5,178,000 EUR 5,229,034 5,289,223 1.19
10,929,597 11,174,228 2.51
PortugalEdp 1.70% 20-20.07.80 Regs 2,300,000 EUR 2,260,981 2,288,500 0.52
2,260,981 2,288,500 0.52
SpainCaixabank 1.125% 17-17.05.24 6,900,000 EUR 7,130,318 7,162,269 1.61
Fcc Aqualia 1.413% 17-08.06.22 7,928,000 EUR 8,025,202 8,042,084 1.81
Fer Emision 0.54% 20-12.11.28 2,300,000 EUR 2,300,000 2,321,390 0.52
Inmob Col 2% 18-17.04.26 1,600,000 EUR 1,651,783 1,720,160 0.39
Inmob Col Frn 16-28.10.24 700,000 EUR 689,788 729,932 0.16
Medio Ambie 0.815% 19-04.12.23 3,666,000 EUR 3,660,881 3,734,334 0.84
San Con 0.375% 19-27.06.24 Regs 2,000,000 EUR 1,976,309 2,026,740 0.46
San Con 0.875% 18-30.05.23 1,300,000 EUR 1,300,846 1,333,761 0.30
Santander 1.375% 20-05.01.26 2,000,000 EUR 2,071,100 2,118,780 0.48
Telefonica 1.807% 20-21.05.32 2,000,000 EUR 2,009,782 2,238,960 0.50
30,816,009 31,428,410 7.07
SwedenAkelius Res 1.125% 17-14.03.24 3,972,000 EUR 3,932,875 4,085,480 0.92
Akelius Res 1.75% 17-07.02.25 928,000 EUR 918,070 980,636 0.22
Essity Ab 0.50% 20-03.02.30 827,000 EUR 820,434 842,862 0.19
Lansbk 0.5% 17-19.09.22 1,630,000 EUR 1,633,188 1,645,616 0.37
Sca Hygiene 1.125% 17-27.03.24 2,288,000 EUR 2,333,458 2,373,800 0.53
Seb 2.5% 14-28.05.26 901,000 EUR 938,054 909,974 0.21
Securitas 1.25% 18-06.03.25 1,713,000 EUR 1,720,811 1,782,993 0.40
Shb 1.625% 18-05.03.29 531,000 EUR 542,735 553,026 0.12
Tele2 Ab 1.125% 18-15.05.24 4,936,000 EUR 4,969,272 5,100,418 1.15
Tele2 Ab 2.125% 18-15.05.28 607,000 EUR 632,749 680,471 0.15
18,441,646 18,955,276 4.26
SwitzerlandCs Group Frn 20-02.04.26 2,667,000 EUR 2,832,840 3,014,217 0.68
Cs Ny 0.45% 20-19.05.25 3,945,000 EUR 3,979,370 4,038,338 0.91
Ubs Group 5.75% 15-Perp 1,900,000 EUR 1,955,474 1,988,293 0.44
DANSKE INVEST SICAV
The accompanying notes form an integral part of these financial statements.
175
Euro Investment Grade Corporate Bond
Statement of Investments (continued)as at December 31, 2020(expressed in EUR)
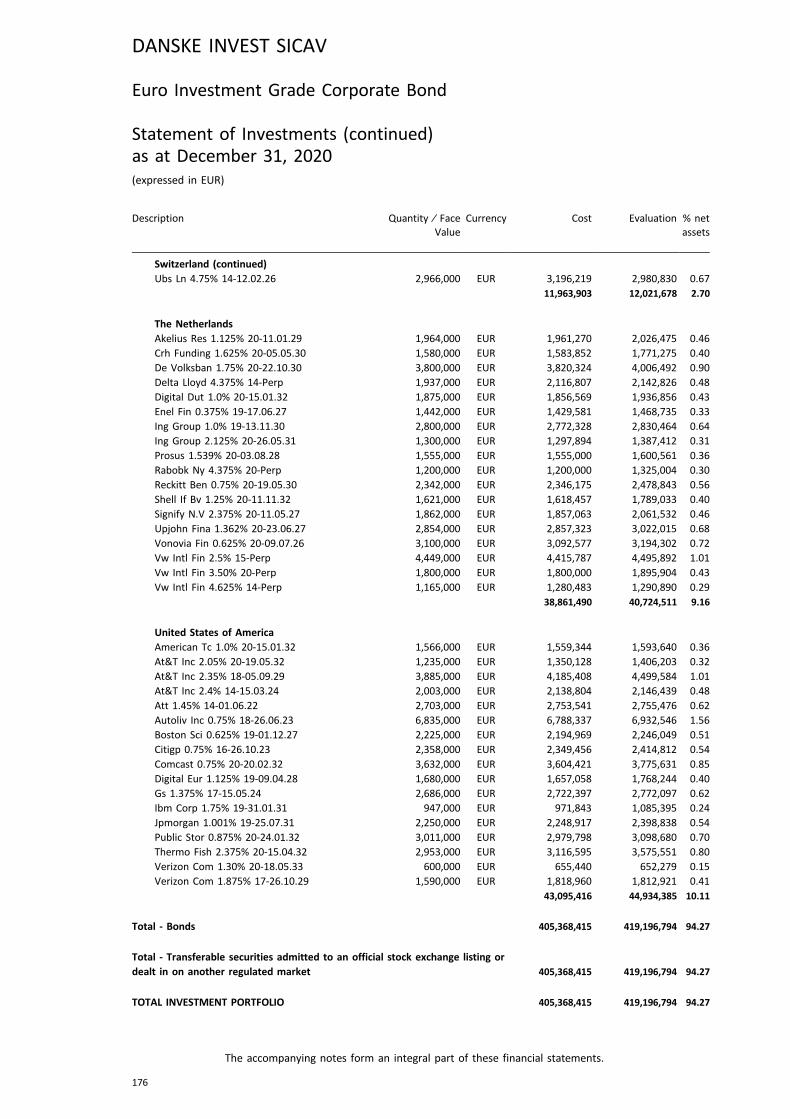
Description Quantity ⁄ FaceValue
Currency Cost Evaluation % netassets
Switzerland (continued)Ubs Ln 4.75% 14-12.02.26 2,966,000 EUR 3,196,219 2,980,830 0.67
11,963,903 12,021,678 2.70
The NetherlandsAkelius Res 1.125% 20-11.01.29 1,964,000 EUR 1,961,270 2,026,475 0.46
Crh Funding 1.625% 20-05.05.30 1,580,000 EUR 1,583,852 1,771,275 0.40
De Volksban 1.75% 20-22.10.30 3,800,000 EUR 3,820,324 4,006,492 0.90
Delta Lloyd 4.375% 14-Perp 1,937,000 EUR 2,116,807 2,142,826 0.48
Digital Dut 1.0% 20-15.01.32 1,875,000 EUR 1,856,569 1,936,856 0.43
Enel Fin 0.375% 19-17.06.27 1,442,000 EUR 1,429,581 1,468,735 0.33
Ing Group 1.0% 19-13.11.30 2,800,000 EUR 2,772,328 2,830,464 0.64
Ing Group 2.125% 20-26.05.31 1,300,000 EUR 1,297,894 1,387,412 0.31
Prosus 1.539% 20-03.08.28 1,555,000 EUR 1,555,000 1,600,561 0.36
Rabobk Ny 4.375% 20-Perp 1,200,000 EUR 1,200,000 1,325,004 0.30
Reckitt Ben 0.75% 20-19.05.30 2,342,000 EUR 2,346,175 2,478,843 0.56
Shell If Bv 1.25% 20-11.11.32 1,621,000 EUR 1,618,457 1,789,033 0.40
Signify N.V 2.375% 20-11.05.27 1,862,000 EUR 1,857,063 2,061,532 0.46
Upjohn Fina 1.362% 20-23.06.27 2,854,000 EUR 2,857,323 3,022,015 0.68
Vonovia Fin 0.625% 20-09.07.26 3,100,000 EUR 3,092,577 3,194,302 0.72
Vw Intl Fin 2.5% 15-Perp 4,449,000 EUR 4,415,787 4,495,892 1.01
Vw Intl Fin 3.50% 20-Perp 1,800,000 EUR 1,800,000 1,895,904 0.43
Vw Intl Fin 4.625% 14-Perp 1,165,000 EUR 1,280,483 1,290,890 0.29
38,861,490 40,724,511 9.16
United States of AmericaAmerican Tc 1.0% 20-15.01.32 1,566,000 EUR 1,559,344 1,593,640 0.36
At&T Inc 2.05% 20-19.05.32 1,235,000 EUR 1,350,128 1,406,203 0.32
At&T Inc 2.35% 18-05.09.29 3,885,000 EUR 4,185,408 4,499,584 1.01
At&T Inc 2.4% 14-15.03.24 2,003,000 EUR 2,138,804 2,146,439 0.48
Att 1.45% 14-01.06.22 2,703,000 EUR 2,753,541 2,755,476 0.62
Autoliv Inc 0.75% 18-26.06.23 6,835,000 EUR 6,788,337 6,932,546 1.56
Boston Sci 0.625% 19-01.12.27 2,225,000 EUR 2,194,969 2,246,049 0.51
Citigp 0.75% 16-26.10.23 2,358,000 EUR 2,349,456 2,414,812 0.54
Comcast 0.75% 20-20.02.32 3,632,000 EUR 3,604,421 3,775,631 0.85
Digital Eur 1.125% 19-09.04.28 1,680,000 EUR 1,657,058 1,768,244 0.40
Gs 1.375% 17-15.05.24 2,686,000 EUR 2,722,397 2,772,097 0.62
Ibm Corp 1.75% 19-31.01.31 947,000 EUR 971,843 1,085,395 0.24
Jpmorgan 1.001% 19-25.07.31 2,250,000 EUR 2,248,917 2,398,838 0.54
Public Stor 0.875% 20-24.01.32 3,011,000 EUR 2,979,798 3,098,680 0.70
Thermo Fish 2.375% 20-15.04.32 2,953,000 EUR 3,116,595 3,575,551 0.80
Verizon Com 1.30% 20-18.05.33 600,000 EUR 655,440 652,279 0.15
Verizon Com 1.875% 17-26.10.29 1,590,000 EUR 1,818,960 1,812,921 0.41
43,095,416 44,934,385 10.11
Total - Bonds 405,368,415 419,196,794 94.27
Total - Transferable securities admitted to an official stock exchange listing ordealt in on another regulated market 405,368,415 419,196,794 94.27
TOTAL INVESTMENT PORTFOLIO 405,368,415 419,196,794 94.27
DANSKE INVEST SICAV
The accompanying notes form an integral part of these financial statements.
176
Euro Investment Grade Corporate Bond
Statement of Investments (continued)as at December 31, 2020(expressed in EUR)
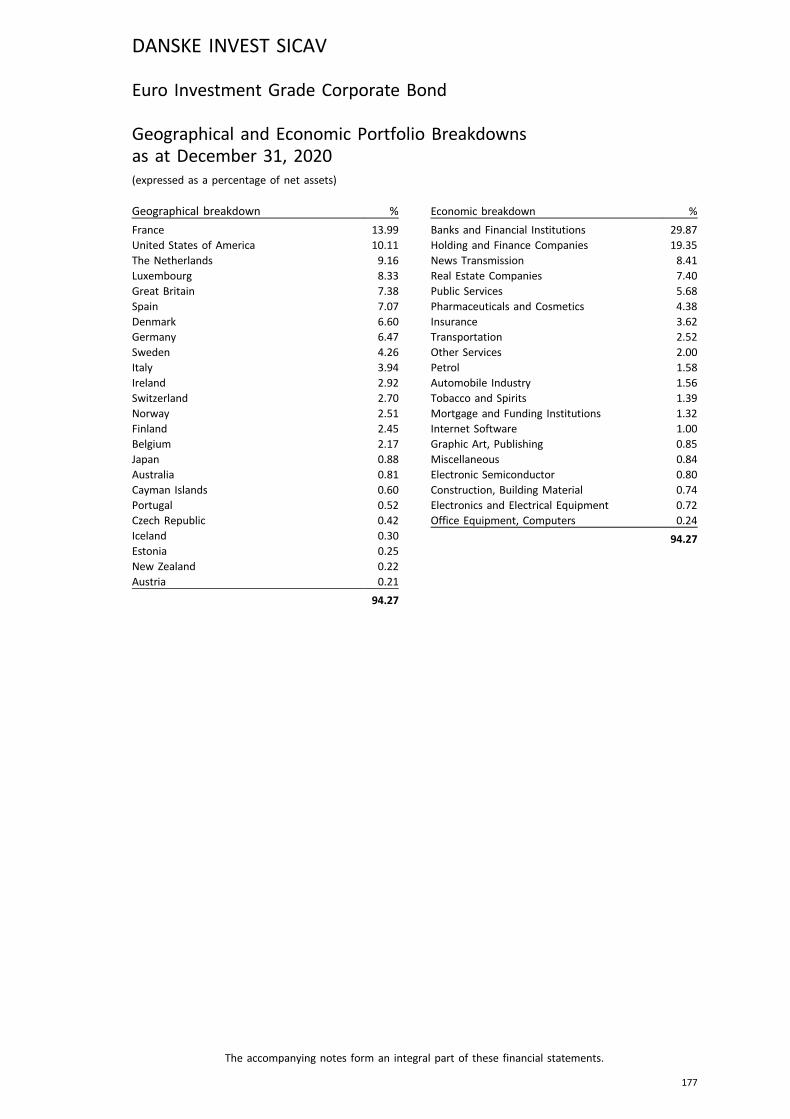
Euro Investment Grade Corporate Bond
Geographical and Economic Portfolio Breakdownsas at December 31, 2020(expressed as a percentage of net assets)
Geographical breakdown %
France 13.99United States of America 10.11The Netherlands 9.16Luxembourg 8.33Great Britain 7.38Spain 7.07Denmark 6.60Germany 6.47Sweden 4.26Italy 3.94Ireland 2.92Switzerland 2.70Norway 2.51Finland 2.45Belgium 2.17Japan 0.88Australia 0.81Cayman Islands 0.60Portugal 0.52Czech Republic 0.42Iceland 0.30Estonia 0.25New Zealand 0.22Austria 0.21
94.27
Economic breakdown %
Banks and Financial Institutions 29.87Holding and Finance Companies 19.35News Transmission 8.41Real Estate Companies 7.40Public Services 5.68Pharmaceuticals and Cosmetics 4.38Insurance 3.62Transportation 2.52Other Services 2.00Petrol 1.58Automobile Industry 1.56Tobacco and Spirits 1.39Mortgage and Funding Institutions 1.32Internet Software 1.00Graphic Art, Publishing 0.85Miscellaneous 0.84Electronic Semiconductor 0.80Construction, Building Material 0.74Electronics and Electrical Equipment 0.72Office Equipment, Computers 0.24
94.27
DANSKE INVEST SICAV
The accompanying notes form an integral part of these financial statements.
177
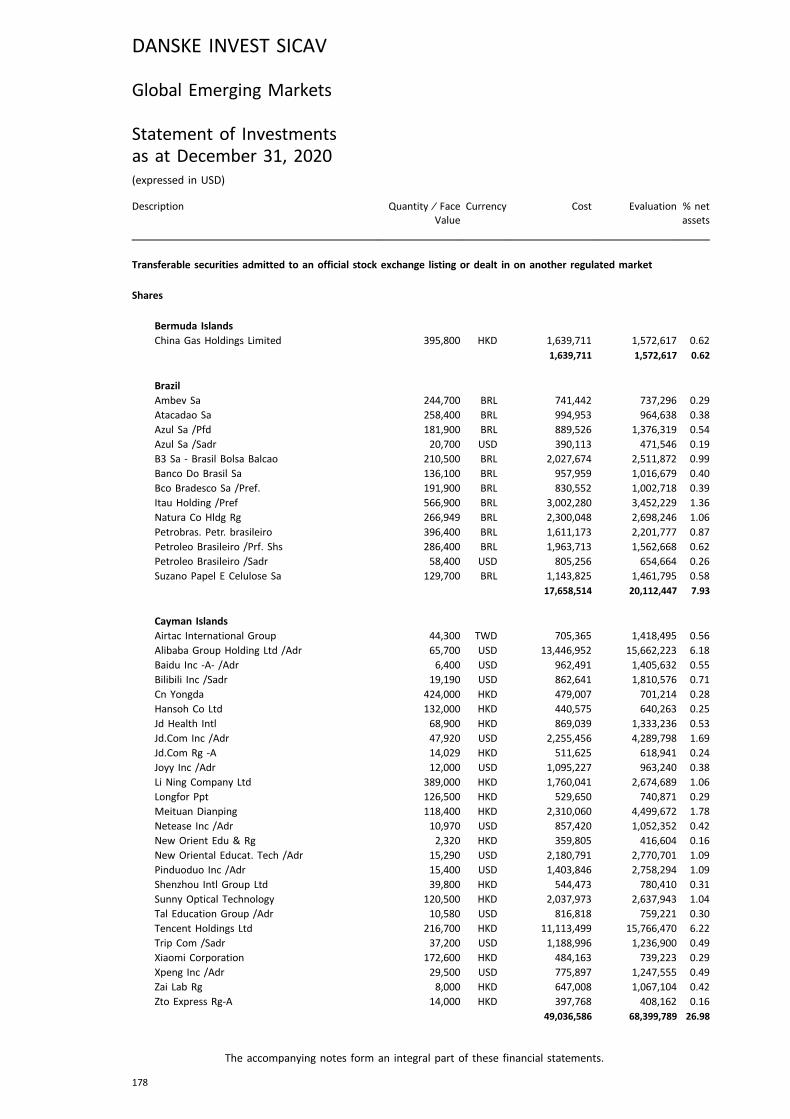
Global Emerging Markets
Statement of Investmentsas at December 31, 2020(expressed in USD)
Description Quantity ⁄ FaceValue
Currency Cost Evaluation % netassets
Transferable securities admitted to an official stock exchange listing or dealt in on another regulated market
Shares
Bermuda IslandsChina Gas Holdings Limited 395,800 HKD 1,639,711 1,572,617 0.62
1,639,711 1,572,617 0.62
BrazilAmbev Sa 244,700 BRL 741,442 737,296 0.29
Atacadao Sa 258,400 BRL 994,953 964,638 0.38
Azul Sa /Pfd 181,900 BRL 889,526 1,376,319 0.54
Azul Sa /Sadr 20,700 USD 390,113 471,546 0.19
B3 Sa - Brasil Bolsa Balcao 210,500 BRL 2,027,674 2,511,872 0.99
Banco Do Brasil Sa 136,100 BRL 957,959 1,016,679 0.40
Bco Bradesco Sa /Pref. 191,900 BRL 830,552 1,002,718 0.39
Itau Holding /Pref 566,900 BRL 3,002,280 3,452,229 1.36
Natura Co Hldg Rg 266,949 BRL 2,300,048 2,698,246 1.06
Petrobras. Petr. brasileiro 396,400 BRL 1,611,173 2,201,777 0.87
Petroleo Brasileiro /Prf. Shs 286,400 BRL 1,963,713 1,562,668 0.62
Petroleo Brasileiro /Sadr 58,400 USD 805,256 654,664 0.26
Suzano Papel E Celulose Sa 129,700 BRL 1,143,825 1,461,795 0.58
17,658,514 20,112,447 7.93
Cayman IslandsAirtac International Group 44,300 TWD 705,365 1,418,495 0.56
Alibaba Group Holding Ltd /Adr 65,700 USD 13,446,952 15,662,223 6.18
Baidu Inc -A- /Adr 6,400 USD 962,491 1,405,632 0.55
Bilibili Inc /Sadr 19,190 USD 862,641 1,810,576 0.71
Cn Yongda 424,000 HKD 479,007 701,214 0.28
Hansoh Co Ltd 132,000 HKD 440,575 640,263 0.25
Jd Health Intl 68,900 HKD 869,039 1,333,236 0.53
Jd.Com Inc /Adr 47,920 USD 2,255,456 4,289,798 1.69
Jd.Com Rg -A 14,029 HKD 511,625 618,941 0.24
Joyy Inc /Adr 12,000 USD 1,095,227 963,240 0.38
Li Ning Company Ltd 389,000 HKD 1,760,041 2,674,689 1.06
Longfor Ppt 126,500 HKD 529,650 740,871 0.29
Meituan Dianping 118,400 HKD 2,310,060 4,499,672 1.78
Netease Inc /Adr 10,970 USD 857,420 1,052,352 0.42
New Orient Edu & Rg 2,320 HKD 359,805 416,604 0.16
New Oriental Educat. Tech /Adr 15,290 USD 2,180,791 2,770,701 1.09
Pinduoduo Inc /Adr 15,400 USD 1,403,846 2,758,294 1.09
Shenzhou Intl Group Ltd 39,800 HKD 544,473 780,410 0.31
Sunny Optical Technology 120,500 HKD 2,037,973 2,637,943 1.04
Tal Education Group /Adr 10,580 USD 816,818 759,221 0.30
Tencent Holdings Ltd 216,700 HKD 11,113,499 15,766,470 6.22
Trip Com /Sadr 37,200 USD 1,188,996 1,236,900 0.49
Xiaomi Corporation 172,600 HKD 484,163 739,223 0.29
Xpeng Inc /Adr 29,500 USD 775,897 1,247,555 0.49
Zai Lab Rg 8,000 HKD 647,008 1,067,104 0.42
Zto Express Rg-A 14,000 HKD 397,768 408,162 0.16
49,036,586 68,399,789 26.98
DANSKE INVEST SICAV
The accompanying notes form an integral part of these financial statements.
178
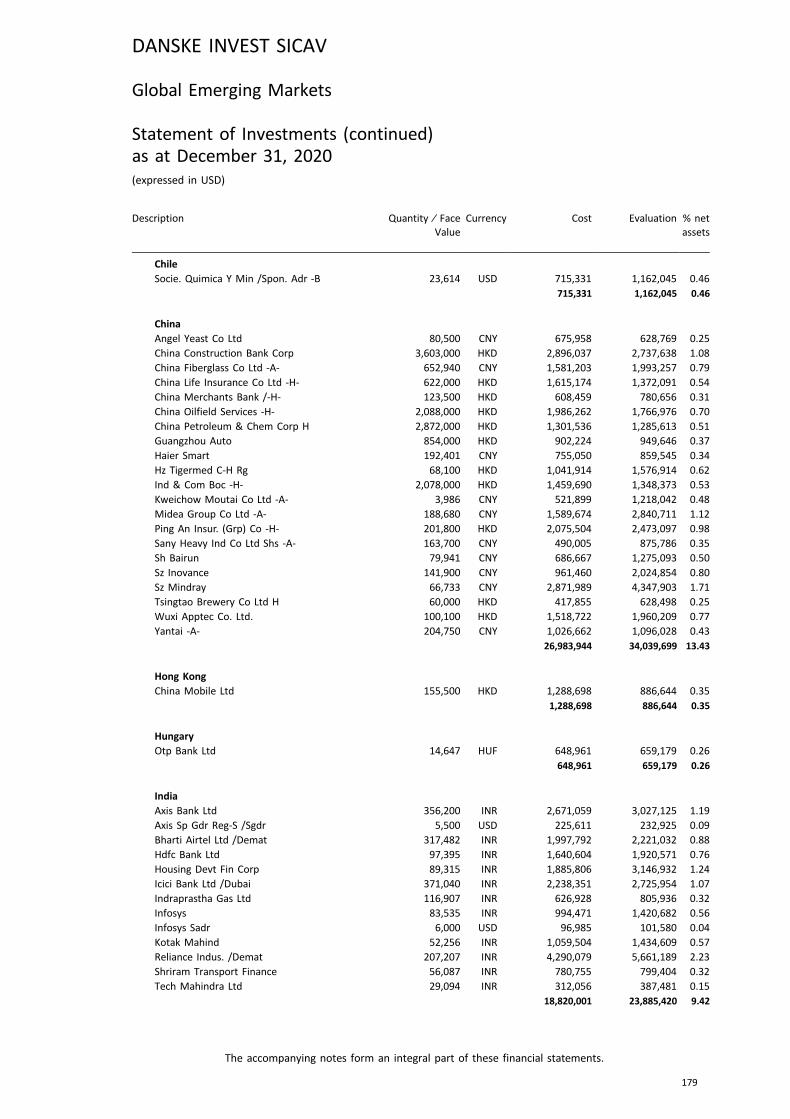
Description Quantity ⁄ FaceValue
Currency Cost Evaluation % netassets
ChileSocie. Quimica Y Min /Spon. Adr -B 23,614 USD 715,331 1,162,045 0.46
715,331 1,162,045 0.46
ChinaAngel Yeast Co Ltd 80,500 CNY 675,958 628,769 0.25
China Construction Bank Corp 3,603,000 HKD 2,896,037 2,737,638 1.08
China Fiberglass Co Ltd -A- 652,940 CNY 1,581,203 1,993,257 0.79
China Life Insurance Co Ltd -H- 622,000 HKD 1,615,174 1,372,091 0.54
China Merchants Bank /-H- 123,500 HKD 608,459 780,656 0.31
China Oilfield Services -H- 2,088,000 HKD 1,986,262 1,766,976 0.70
China Petroleum & Chem Corp H 2,872,000 HKD 1,301,536 1,285,613 0.51
Guangzhou Auto 854,000 HKD 902,224 949,646 0.37
Haier Smart 192,401 CNY 755,050 859,545 0.34
Hz Tigermed C-H Rg 68,100 HKD 1,041,914 1,576,914 0.62
Ind & Com Boc -H- 2,078,000 HKD 1,459,690 1,348,373 0.53
Kweichow Moutai Co Ltd -A- 3,986 CNY 521,899 1,218,042 0.48
Midea Group Co Ltd -A- 188,680 CNY 1,589,674 2,840,711 1.12
Ping An Insur. (Grp) Co -H- 201,800 HKD 2,075,504 2,473,097 0.98
Sany Heavy Ind Co Ltd Shs -A- 163,700 CNY 490,005 875,786 0.35
Sh Bairun 79,941 CNY 686,667 1,275,093 0.50
Sz Inovance 141,900 CNY 961,460 2,024,854 0.80
Sz Mindray 66,733 CNY 2,871,989 4,347,903 1.71
Tsingtao Brewery Co Ltd H 60,000 HKD 417,855 628,498 0.25
Wuxi Apptec Co. Ltd. 100,100 HKD 1,518,722 1,960,209 0.77
Yantai -A- 204,750 CNY 1,026,662 1,096,028 0.43
26,983,944 34,039,699 13.43
Hong KongChina Mobile Ltd 155,500 HKD 1,288,698 886,644 0.35
1,288,698 886,644 0.35
HungaryOtp Bank Ltd 14,647 HUF 648,961 659,179 0.26
648,961 659,179 0.26
IndiaAxis Bank Ltd 356,200 INR 2,671,059 3,027,125 1.19
Axis Sp Gdr Reg-S /Sgdr 5,500 USD 225,611 232,925 0.09
Bharti Airtel Ltd /Demat 317,482 INR 1,997,792 2,221,032 0.88
Hdfc Bank Ltd 97,395 INR 1,640,604 1,920,571 0.76
Housing Devt Fin Corp 89,315 INR 1,885,806 3,146,932 1.24
Icici Bank Ltd /Dubai 371,040 INR 2,238,351 2,725,954 1.07
Indraprastha Gas Ltd 116,907 INR 626,928 805,936 0.32
Infosys 83,535 INR 994,471 1,420,682 0.56
Infosys Sadr 6,000 USD 96,985 101,580 0.04
Kotak Mahind 52,256 INR 1,059,504 1,434,609 0.57
Reliance Indus. /Demat 207,207 INR 4,290,079 5,661,189 2.23
Shriram Transport Finance 56,087 INR 780,755 799,404 0.32
Tech Mahindra Ltd 29,094 INR 312,056 387,481 0.15
18,820,001 23,885,420 9.42
DANSKE INVEST SICAV
The accompanying notes form an integral part of these financial statements.
179
Global Emerging Markets
Statement of Investments (continued)as at December 31, 2020(expressed in USD)
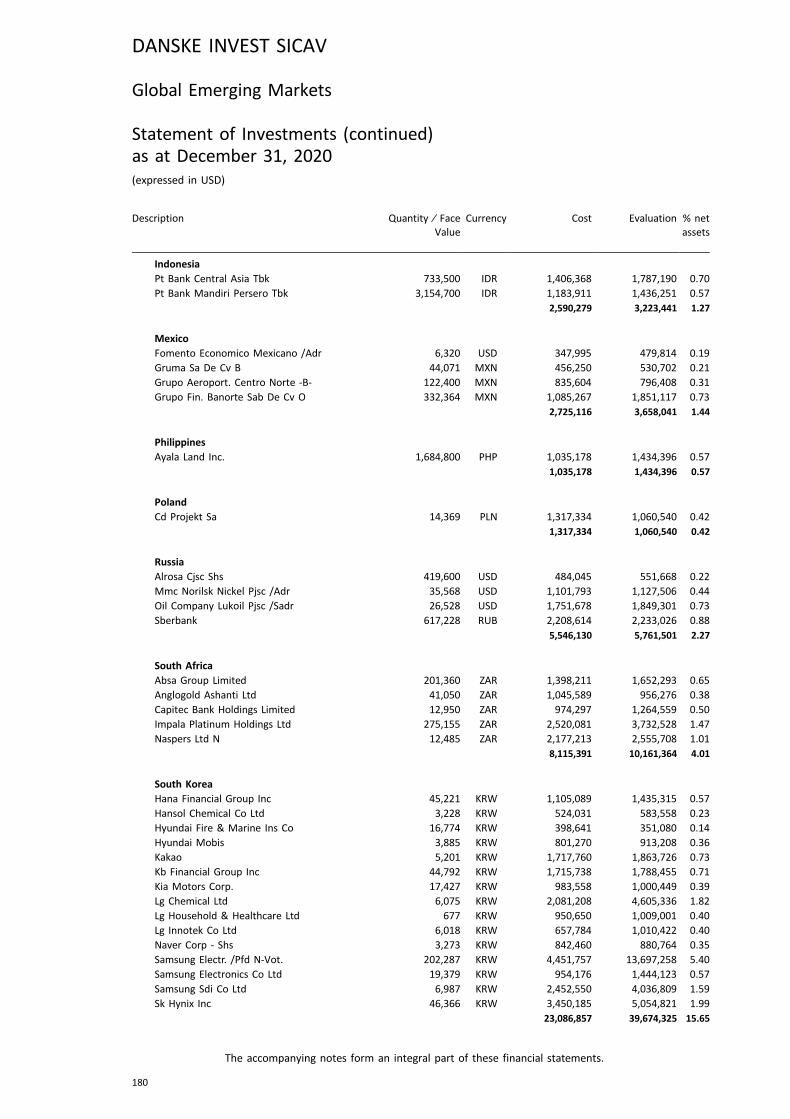
Description Quantity ⁄ FaceValue
Currency Cost Evaluation % netassets
IndonesiaPt Bank Central Asia Tbk 733,500 IDR 1,406,368 1,787,190 0.70
Pt Bank Mandiri Persero Tbk 3,154,700 IDR 1,183,911 1,436,251 0.57
2,590,279 3,223,441 1.27
MexicoFomento Economico Mexicano /Adr 6,320 USD 347,995 479,814 0.19
Gruma Sa De Cv B 44,071 MXN 456,250 530,702 0.21
Grupo Aeroport. Centro Norte -B- 122,400 MXN 835,604 796,408 0.31
Grupo Fin. Banorte Sab De Cv O 332,364 MXN 1,085,267 1,851,117 0.73
2,725,116 3,658,041 1.44
PhilippinesAyala Land Inc. 1,684,800 PHP 1,035,178 1,434,396 0.57
1,035,178 1,434,396 0.57
PolandCd Projekt Sa 14,369 PLN 1,317,334 1,060,540 0.42
1,317,334 1,060,540 0.42
RussiaAlrosa Cjsc Shs 419,600 USD 484,045 551,668 0.22
Mmc Norilsk Nickel Pjsc /Adr 35,568 USD 1,101,793 1,127,506 0.44
Oil Company Lukoil Pjsc /Sadr 26,528 USD 1,751,678 1,849,301 0.73
Sberbank 617,228 RUB 2,208,614 2,233,026 0.88
5,546,130 5,761,501 2.27
South AfricaAbsa Group Limited 201,360 ZAR 1,398,211 1,652,293 0.65
Anglogold Ashanti Ltd 41,050 ZAR 1,045,589 956,276 0.38
Capitec Bank Holdings Limited 12,950 ZAR 974,297 1,264,559 0.50
Impala Platinum Holdings Ltd 275,155 ZAR 2,520,081 3,732,528 1.47
Naspers Ltd N 12,485 ZAR 2,177,213 2,555,708 1.01
8,115,391 10,161,364 4.01
South KoreaHana Financial Group Inc 45,221 KRW 1,105,089 1,435,315 0.57
Hansol Chemical Co Ltd 3,228 KRW 524,031 583,558 0.23
Hyundai Fire & Marine Ins Co 16,774 KRW 398,641 351,080 0.14
Hyundai Mobis 3,885 KRW 801,270 913,208 0.36
Kakao 5,201 KRW 1,717,760 1,863,726 0.73
Kb Financial Group Inc 44,792 KRW 1,715,738 1,788,455 0.71
Kia Motors Corp. 17,427 KRW 983,558 1,000,449 0.39
Lg Chemical Ltd 6,075 KRW 2,081,208 4,605,336 1.82
Lg Household & Healthcare Ltd 677 KRW 950,650 1,009,001 0.40
Lg Innotek Co Ltd 6,018 KRW 657,784 1,010,422 0.40
Naver Corp - Shs 3,273 KRW 842,460 880,764 0.35
Samsung Electr. /Pfd N-Vot. 202,287 KRW 4,451,757 13,697,258 5.40
Samsung Electronics Co Ltd 19,379 KRW 954,176 1,444,123 0.57
Samsung Sdi Co Ltd 6,987 KRW 2,452,550 4,036,809 1.59
Sk Hynix Inc 46,366 KRW 3,450,185 5,054,821 1.99
23,086,857 39,674,325 15.65
DANSKE INVEST SICAV
The accompanying notes form an integral part of these financial statements.
180
Global Emerging Markets
Statement of Investments (continued)as at December 31, 2020(expressed in USD)
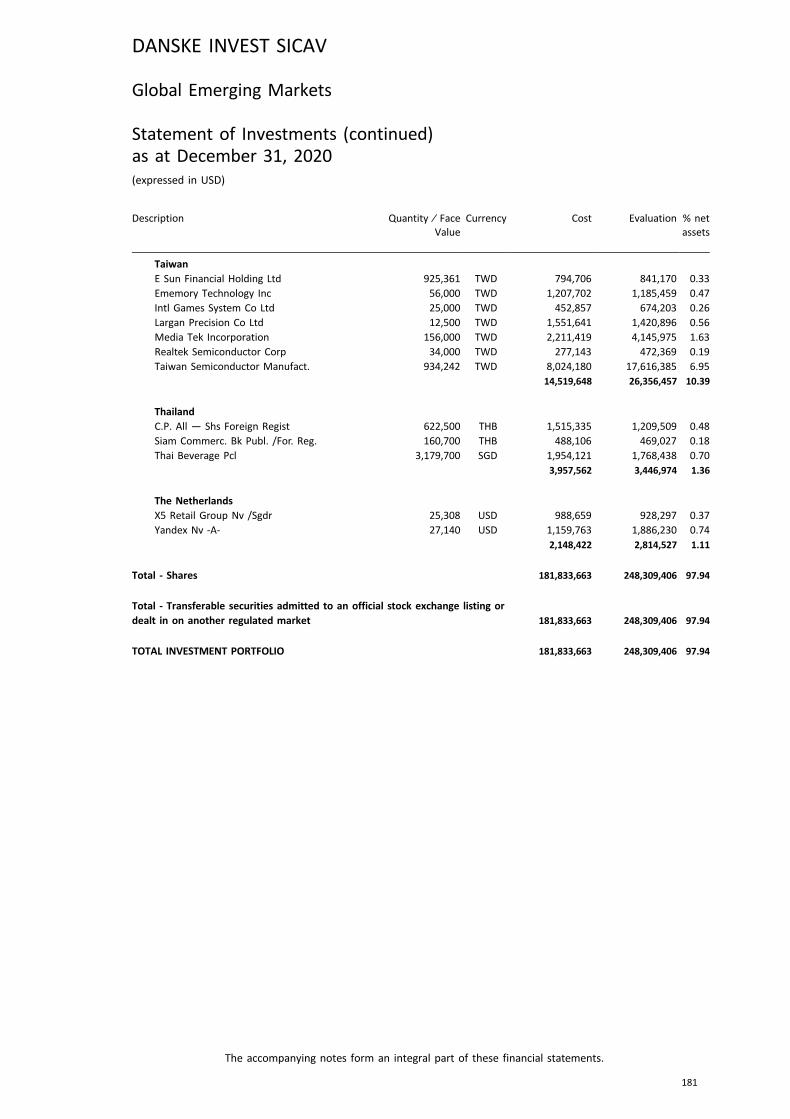
Description Quantity ⁄ FaceValue
Currency Cost Evaluation % netassets
TaiwanE Sun Financial Holding Ltd 925,361 TWD 794,706 841,170 0.33
Ememory Technology Inc 56,000 TWD 1,207,702 1,185,459 0.47
Intl Games System Co Ltd 25,000 TWD 452,857 674,203 0.26
Largan Precision Co Ltd 12,500 TWD 1,551,641 1,420,896 0.56
Media Tek Incorporation 156,000 TWD 2,211,419 4,145,975 1.63
Realtek Semiconductor Corp 34,000 TWD 277,143 472,369 0.19
Taiwan Semiconductor Manufact. 934,242 TWD 8,024,180 17,616,385 6.95
14,519,648 26,356,457 10.39
ThailandC.P. All — Shs Foreign Regist 622,500 THB 1,515,335 1,209,509 0.48
Siam Commerc. Bk Publ. /For. Reg. 160,700 THB 488,106 469,027 0.18
Thai Beverage Pcl 3,179,700 SGD 1,954,121 1,768,438 0.70
3,957,562 3,446,974 1.36
The NetherlandsX5 Retail Group Nv /Sgdr 25,308 USD 988,659 928,297 0.37
Yandex Nv -A- 27,140 USD 1,159,763 1,886,230 0.74
2,148,422 2,814,527 1.11
Total - Shares 181,833,663 248,309,406 97.94
Total - Transferable securities admitted to an official stock exchange listing ordealt in on another regulated market 181,833,663 248,309,406 97.94
TOTAL INVESTMENT PORTFOLIO 181,833,663 248,309,406 97.94
DANSKE INVEST SICAV
The accompanying notes form an integral part of these financial statements.
181
Global Emerging Markets
Statement of Investments (continued)as at December 31, 2020(expressed in USD)
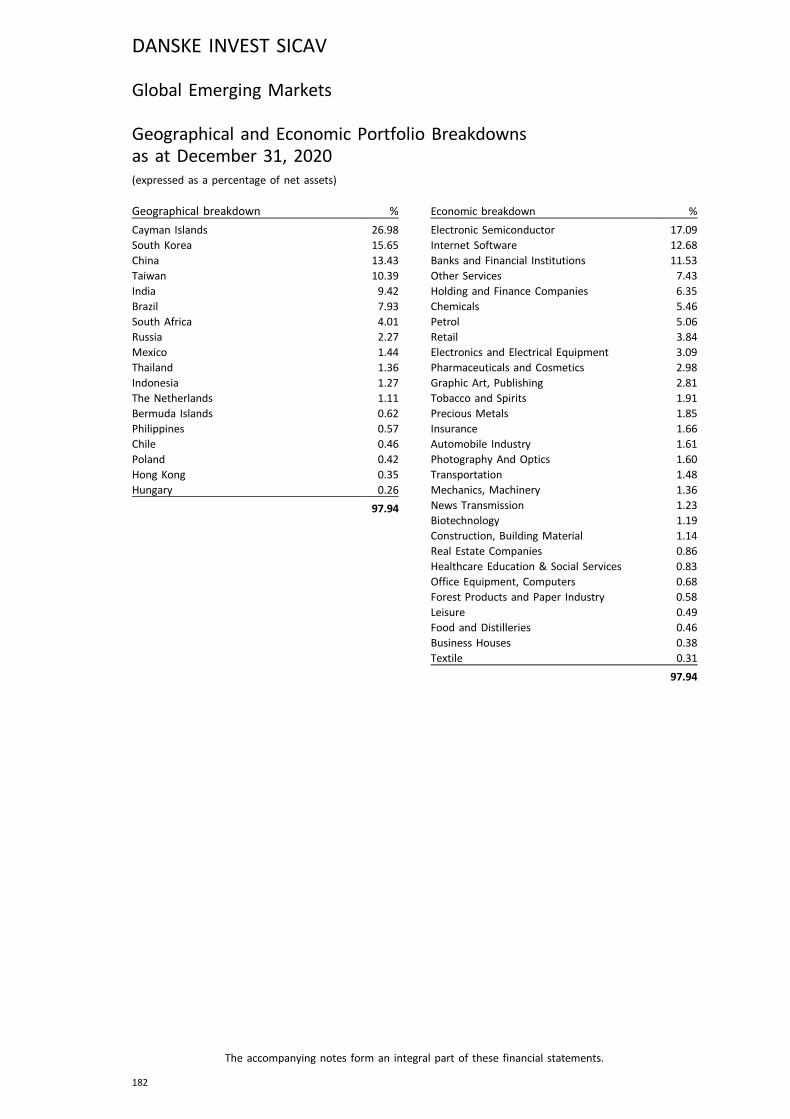
Global Emerging Markets
Geographical and Economic Portfolio Breakdownsas at December 31, 2020(expressed as a percentage of net assets)
Geographical breakdown %
Cayman Islands 26.98South Korea 15.65China 13.43Taiwan 10.39India 9.42Brazil 7.93South Africa 4.01Russia 2.27Mexico 1.44Thailand 1.36Indonesia 1.27The Netherlands 1.11Bermuda Islands 0.62Philippines 0.57Chile 0.46Poland 0.42Hong Kong 0.35Hungary 0.26
97.94
Economic breakdown %
Electronic Semiconductor 17.09Internet Software 12.68Banks and Financial Institutions 11.53Other Services 7.43Holding and Finance Companies 6.35Chemicals 5.46Petrol 5.06Retail 3.84Electronics and Electrical Equipment 3.09Pharmaceuticals and Cosmetics 2.98Graphic Art, Publishing 2.81Tobacco and Spirits 1.91Precious Metals 1.85Insurance 1.66Automobile Industry 1.61Photography And Optics 1.60Transportation 1.48Mechanics, Machinery 1.36News Transmission 1.23Biotechnology 1.19Construction, Building Material 1.14Real Estate Companies 0.86Healthcare Education & Social Services 0.83Office Equipment, Computers 0.68Forest Products and Paper Industry 0.58Leisure 0.49Food and Distilleries 0.46Business Houses 0.38Textile 0.31
97.94
DANSKE INVEST SICAV
The accompanying notes form an integral part of these financial statements.
182
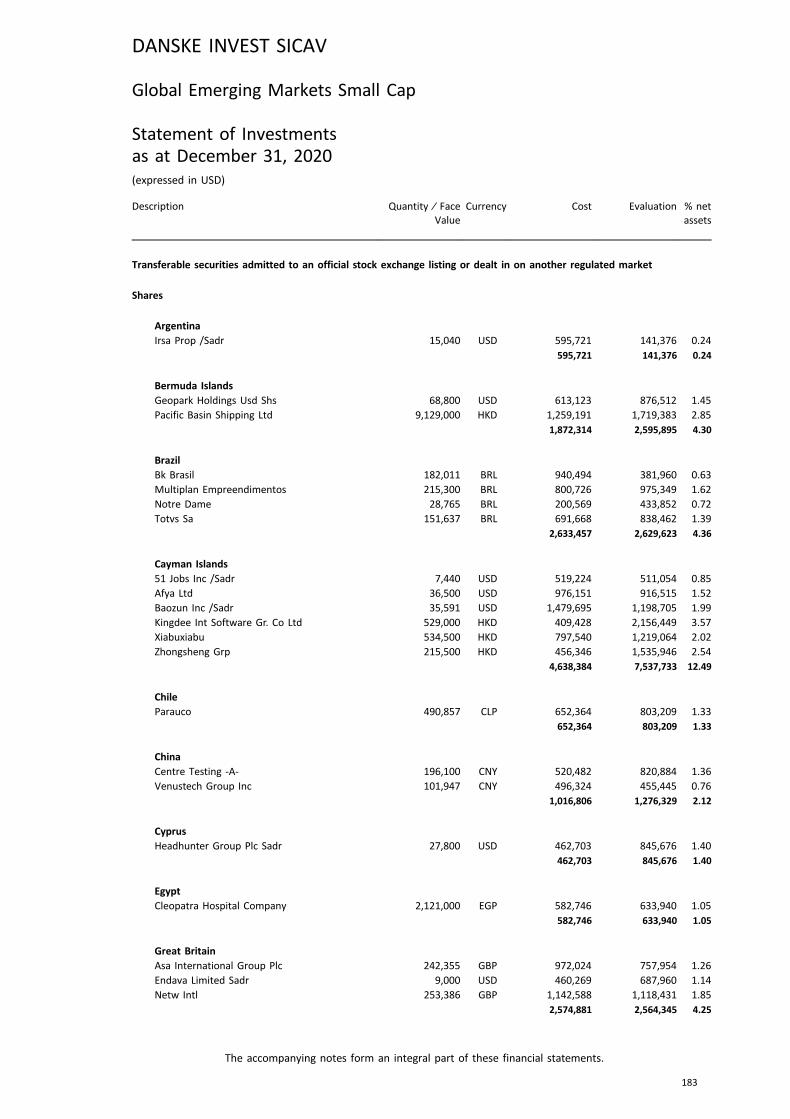
Global Emerging Markets Small Cap
Statement of Investmentsas at December 31, 2020(expressed in USD)
Description Quantity ⁄ FaceValue
Currency Cost Evaluation % netassets
Transferable securities admitted to an official stock exchange listing or dealt in on another regulated market
Shares
ArgentinaIrsa Prop /Sadr 15,040 USD 595,721 141,376 0.24
595,721 141,376 0.24
Bermuda IslandsGeopark Holdings Usd Shs 68,800 USD 613,123 876,512 1.45
Pacific Basin Shipping Ltd 9,129,000 HKD 1,259,191 1,719,383 2.85
1,872,314 2,595,895 4.30
BrazilBk Brasil 182,011 BRL 940,494 381,960 0.63
Multiplan Empreendimentos 215,300 BRL 800,726 975,349 1.62
Notre Dame 28,765 BRL 200,569 433,852 0.72
Totvs Sa 151,637 BRL 691,668 838,462 1.39
2,633,457 2,629,623 4.36
Cayman Islands51 Jobs Inc /Sadr 7,440 USD 519,224 511,054 0.85
Afya Ltd 36,500 USD 976,151 916,515 1.52
Baozun Inc /Sadr 35,591 USD 1,479,695 1,198,705 1.99
Kingdee Int Software Gr. Co Ltd 529,000 HKD 409,428 2,156,449 3.57
Xiabuxiabu 534,500 HKD 797,540 1,219,064 2.02
Zhongsheng Grp 215,500 HKD 456,346 1,535,946 2.54
4,638,384 7,537,733 12.49
ChileParauco 490,857 CLP 652,364 803,209 1.33
652,364 803,209 1.33
ChinaCentre Testing -A- 196,100 CNY 520,482 820,884 1.36
Venustech Group Inc 101,947 CNY 496,324 455,445 0.76
1,016,806 1,276,329 2.12
CyprusHeadhunter Group Plc Sadr 27,800 USD 462,703 845,676 1.40
462,703 845,676 1.40
EgyptCleopatra Hospital Company 2,121,000 EGP 582,746 633,940 1.05
582,746 633,940 1.05
Great BritainAsa International Group Plc 242,355 GBP 972,024 757,954 1.26
Endava Limited Sadr 9,000 USD 460,269 687,960 1.14
Netw Intl 253,386 GBP 1,142,588 1,118,431 1.85
2,574,881 2,564,345 4.25
DANSKE INVEST SICAV
The accompanying notes form an integral part of these financial statements.
183
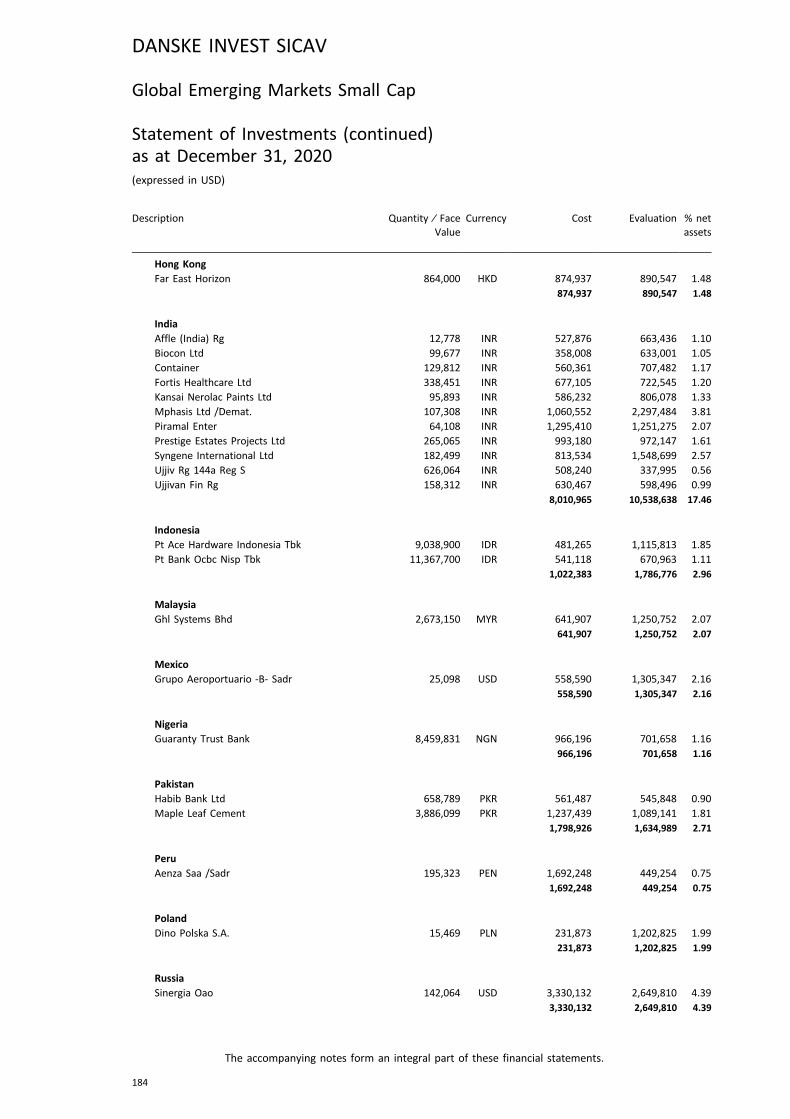
Description Quantity ⁄ FaceValue
Currency Cost Evaluation % netassets
Hong KongFar East Horizon 864,000 HKD 874,937 890,547 1.48
874,937 890,547 1.48
IndiaAffle (India) Rg 12,778 INR 527,876 663,436 1.10
Biocon Ltd 99,677 INR 358,008 633,001 1.05
Container 129,812 INR 560,361 707,482 1.17
Fortis Healthcare Ltd 338,451 INR 677,105 722,545 1.20
Kansai Nerolac Paints Ltd 95,893 INR 586,232 806,078 1.33
Mphasis Ltd /Demat. 107,308 INR 1,060,552 2,297,484 3.81
Piramal Enter 64,108 INR 1,295,410 1,251,275 2.07
Prestige Estates Projects Ltd 265,065 INR 993,180 972,147 1.61
Syngene International Ltd 182,499 INR 813,534 1,548,699 2.57
Ujjiv Rg 144a Reg S 626,064 INR 508,240 337,995 0.56
Ujjivan Fin Rg 158,312 INR 630,467 598,496 0.99
8,010,965 10,538,638 17.46
IndonesiaPt Ace Hardware Indonesia Tbk 9,038,900 IDR 481,265 1,115,813 1.85
Pt Bank Ocbc Nisp Tbk 11,367,700 IDR 541,118 670,963 1.11
1,022,383 1,786,776 2.96
MalaysiaGhl Systems Bhd 2,673,150 MYR 641,907 1,250,752 2.07
641,907 1,250,752 2.07
MexicoGrupo Aeroportuario -B- Sadr 25,098 USD 558,590 1,305,347 2.16
558,590 1,305,347 2.16
NigeriaGuaranty Trust Bank 8,459,831 NGN 966,196 701,658 1.16
966,196 701,658 1.16
PakistanHabib Bank Ltd 658,789 PKR 561,487 545,848 0.90
Maple Leaf Cement 3,886,099 PKR 1,237,439 1,089,141 1.81
1,798,926 1,634,989 2.71
PeruAenza Saa /Sadr 195,323 PEN 1,692,248 449,254 0.75
1,692,248 449,254 0.75
PolandDino Polska S.A. 15,469 PLN 231,873 1,202,825 1.99
231,873 1,202,825 1.99
RussiaSinergia Oao 142,064 USD 3,330,132 2,649,810 4.39
3,330,132 2,649,810 4.39
DANSKE INVEST SICAV
The accompanying notes form an integral part of these financial statements.
184
Global Emerging Markets Small Cap
Statement of Investments (continued)as at December 31, 2020(expressed in USD)
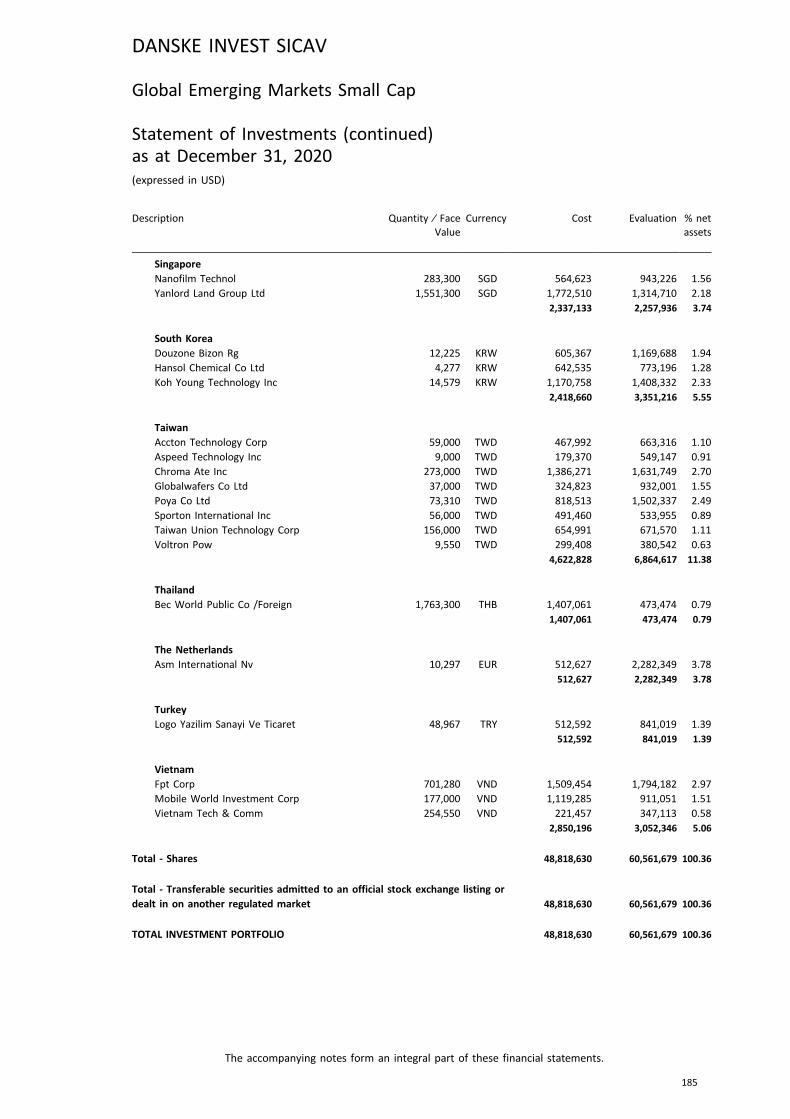
Description Quantity ⁄ FaceValue
Currency Cost Evaluation % netassets
SingaporeNanofilm Technol 283,300 SGD 564,623 943,226 1.56
Yanlord Land Group Ltd 1,551,300 SGD 1,772,510 1,314,710 2.18
2,337,133 2,257,936 3.74
South KoreaDouzone Bizon Rg 12,225 KRW 605,367 1,169,688 1.94
Hansol Chemical Co Ltd 4,277 KRW 642,535 773,196 1.28
Koh Young Technology Inc 14,579 KRW 1,170,758 1,408,332 2.33
2,418,660 3,351,216 5.55
TaiwanAccton Technology Corp 59,000 TWD 467,992 663,316 1.10
Aspeed Technology Inc 9,000 TWD 179,370 549,147 0.91
Chroma Ate Inc 273,000 TWD 1,386,271 1,631,749 2.70
Globalwafers Co Ltd 37,000 TWD 324,823 932,001 1.55
Poya Co Ltd 73,310 TWD 818,513 1,502,337 2.49
Sporton International Inc 56,000 TWD 491,460 533,955 0.89
Taiwan Union Technology Corp 156,000 TWD 654,991 671,570 1.11
Voltron Pow 9,550 TWD 299,408 380,542 0.63
4,622,828 6,864,617 11.38
ThailandBec World Public Co /Foreign 1,763,300 THB 1,407,061 473,474 0.79
1,407,061 473,474 0.79
The NetherlandsAsm International Nv 10,297 EUR 512,627 2,282,349 3.78
512,627 2,282,349 3.78
TurkeyLogo Yazilim Sanayi Ve Ticaret 48,967 TRY 512,592 841,019 1.39
512,592 841,019 1.39
VietnamFpt Corp 701,280 VND 1,509,454 1,794,182 2.97
Mobile World Investment Corp 177,000 VND 1,119,285 911,051 1.51
Vietnam Tech & Comm 254,550 VND 221,457 347,113 0.58
2,850,196 3,052,346 5.06
Total - Shares 48,818,630 60,561,679 100.36
Total - Transferable securities admitted to an official stock exchange listing ordealt in on another regulated market 48,818,630 60,561,679 100.36
TOTAL INVESTMENT PORTFOLIO 48,818,630 60,561,679 100.36
DANSKE INVEST SICAV
The accompanying notes form an integral part of these financial statements.
185
Global Emerging Markets Small Cap
Statement of Investments (continued)as at December 31, 2020(expressed in USD)
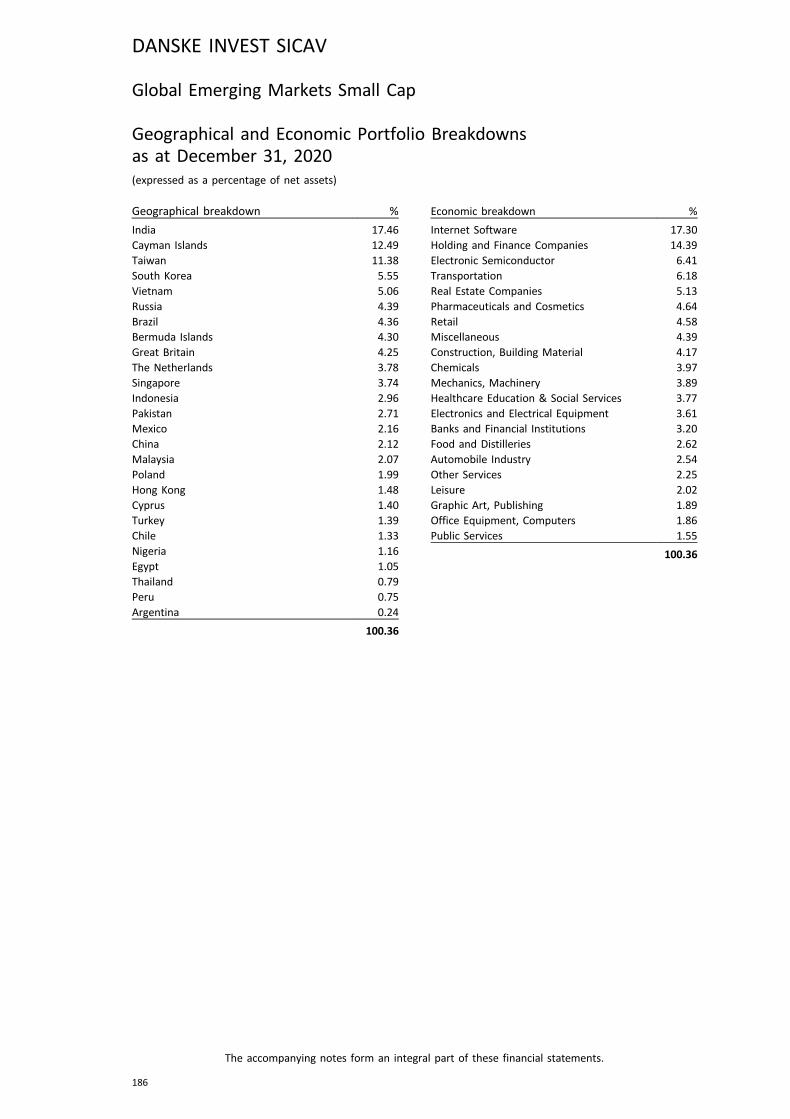
Global Emerging Markets Small Cap
Geographical and Economic Portfolio Breakdownsas at December 31, 2020(expressed as a percentage of net assets)
Geographical breakdown %
India 17.46Cayman Islands 12.49Taiwan 11.38South Korea 5.55Vietnam 5.06Russia 4.39Brazil 4.36Bermuda Islands 4.30Great Britain 4.25The Netherlands 3.78Singapore 3.74Indonesia 2.96Pakistan 2.71Mexico 2.16China 2.12Malaysia 2.07Poland 1.99Hong Kong 1.48Cyprus 1.40Turkey 1.39Chile 1.33Nigeria 1.16Egypt 1.05Thailand 0.79Peru 0.75Argentina 0.24
100.36
Economic breakdown %
Internet Software 17.30Holding and Finance Companies 14.39Electronic Semiconductor 6.41Transportation 6.18Real Estate Companies 5.13Pharmaceuticals and Cosmetics 4.64Retail 4.58Miscellaneous 4.39Construction, Building Material 4.17Chemicals 3.97Mechanics, Machinery 3.89Healthcare Education & Social Services 3.77Electronics and Electrical Equipment 3.61Banks and Financial Institutions 3.20Food and Distilleries 2.62Automobile Industry 2.54Other Services 2.25Leisure 2.02Graphic Art, Publishing 1.89Office Equipment, Computers 1.86Public Services 1.55
100.36
DANSKE INVEST SICAV
The accompanying notes form an integral part of these financial statements.
186
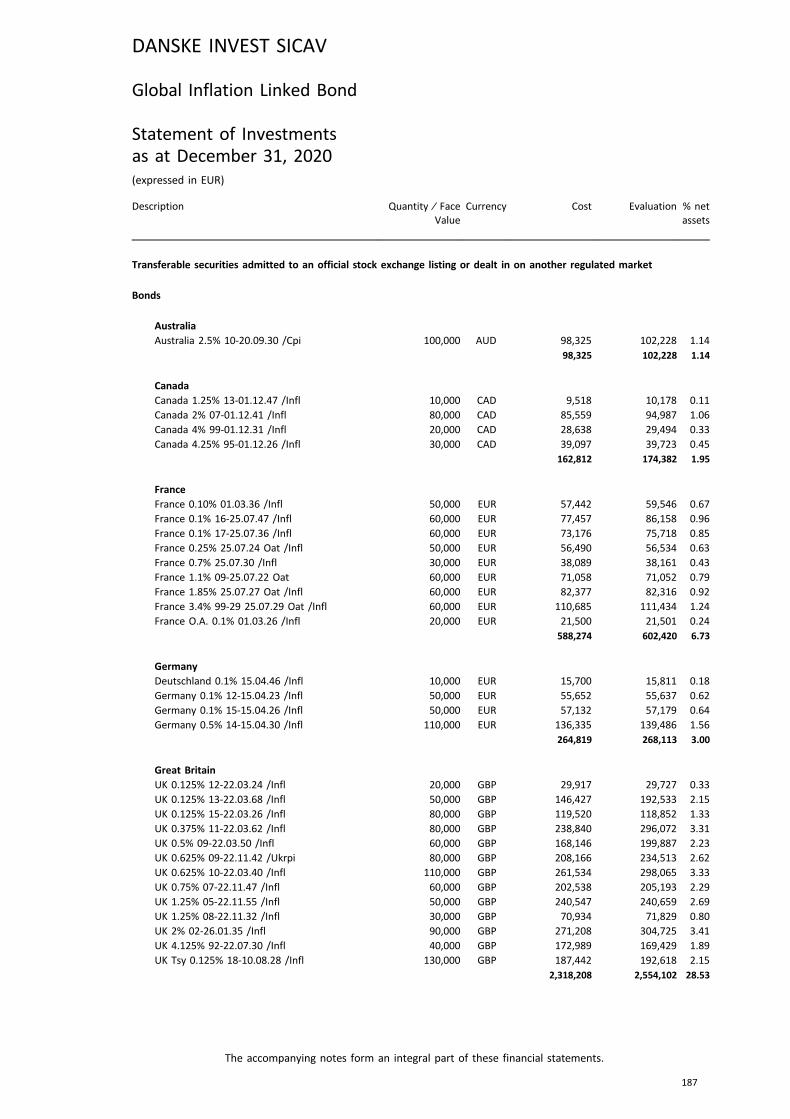
Global Inflation Linked Bond
Statement of Investmentsas at December 31, 2020(expressed in EUR)
Description Quantity ⁄ FaceValue
Currency Cost Evaluation % netassets
Transferable securities admitted to an official stock exchange listing or dealt in on another regulated market
Bonds
AustraliaAustralia 2.5% 10-20.09.30 /Cpi 100,000 AUD 98,325 102,228 1.14
98,325 102,228 1.14
CanadaCanada 1.25% 13-01.12.47 /Infl 10,000 CAD 9,518 10,178 0.11
Canada 2% 07-01.12.41 /Infl 80,000 CAD 85,559 94,987 1.06
Canada 4% 99-01.12.31 /Infl 20,000 CAD 28,638 29,494 0.33
Canada 4.25% 95-01.12.26 /Infl 30,000 CAD 39,097 39,723 0.45
162,812 174,382 1.95
FranceFrance 0.10% 01.03.36 /Infl 50,000 EUR 57,442 59,546 0.67
France 0.1% 16-25.07.47 /Infl 60,000 EUR 77,457 86,158 0.96
France 0.1% 17-25.07.36 /Infl 60,000 EUR 73,176 75,718 0.85
France 0.25% 25.07.24 Oat /Infl 50,000 EUR 56,490 56,534 0.63
France 0.7% 25.07.30 /Infl 30,000 EUR 38,089 38,161 0.43
France 1.1% 09-25.07.22 Oat 60,000 EUR 71,058 71,052 0.79
France 1.85% 25.07.27 Oat /Infl 60,000 EUR 82,377 82,316 0.92
France 3.4% 99-29 25.07.29 Oat /Infl 60,000 EUR 110,685 111,434 1.24
France O.A. 0.1% 01.03.26 /Infl 20,000 EUR 21,500 21,501 0.24
588,274 602,420 6.73
GermanyDeutschland 0.1% 15.04.46 /Infl 10,000 EUR 15,700 15,811 0.18
Germany 0.1% 12-15.04.23 /Infl 50,000 EUR 55,652 55,637 0.62
Germany 0.1% 15-15.04.26 /Infl 50,000 EUR 57,132 57,179 0.64
Germany 0.5% 14-15.04.30 /Infl 110,000 EUR 136,335 139,486 1.56
264,819 268,113 3.00
Great BritainUK 0.125% 12-22.03.24 /Infl 20,000 GBP 29,917 29,727 0.33
UK 0.125% 13-22.03.68 /Infl 50,000 GBP 146,427 192,533 2.15
UK 0.125% 15-22.03.26 /Infl 80,000 GBP 119,520 118,852 1.33
UK 0.375% 11-22.03.62 /Infl 80,000 GBP 238,840 296,072 3.31
UK 0.5% 09-22.03.50 /Infl 60,000 GBP 168,146 199,887 2.23
UK 0.625% 09-22.11.42 /Ukrpi 80,000 GBP 208,166 234,513 2.62
UK 0.625% 10-22.03.40 /Infl 110,000 GBP 261,534 298,065 3.33
UK 0.75% 07-22.11.47 /Infl 60,000 GBP 202,538 205,193 2.29
UK 1.25% 05-22.11.55 /Infl 50,000 GBP 240,547 240,659 2.69
UK 1.25% 08-22.11.32 /Infl 30,000 GBP 70,934 71,829 0.80
UK 2% 02-26.01.35 /Infl 90,000 GBP 271,208 304,725 3.41
UK 4.125% 92-22.07.30 /Infl 40,000 GBP 172,989 169,429 1.89
UK Tsy 0.125% 18-10.08.28 /Infl 130,000 GBP 187,442 192,618 2.15
2,318,208 2,554,102 28.53
DANSKE INVEST SICAV
The accompanying notes form an integral part of these financial statements.
187

Description Quantity ⁄ FaceValue
Currency Cost Evaluation % netassets
ItalyBtps 1.3% 16-15.05.28 /Infl 160,000 EUR 168,827 187,324 2.09
Italy 2.35% 14-15.09.24 Btp 60,000 EUR 68,450 70,455 0.79
Italy 2.55% 09-15.09.41 80,000 EUR 108,217 136,685 1.53
Italy 2.6% 07-15.09.23 /Infl 10,000 EUR 12,294 13,114 0.14
357,788 407,578 4.55
JapanJapan 0.1% 17-10.03.27 /Infl 10,000,000 JPY 80,380 80,715 0.90
Japan 0.1% 18-10.03.28 /Infl 10,000,000 JPY 81,641 79,857 0.89
Japan 0.10% 10.03.29 /Infl 20,000,000 JPY 170,065 158,654 1.78
332,086 319,226 3.57
New ZealandNew Zealand 2% 12-20.09.25 /Cpi 350,000 NZD 237,234 255,640 2.85
New Zealand 2.5% 20.09.35 /Infl 90,000 NZD 72,480 79,308 0.89
New Zealand 2.5% 16-20.09.40 /Infl 60,000 NZD 42,026 54,272 0.61
351,740 389,220 4.35
SpainSpain 0.65% 17-30.11.27 /Infl 150,000 EUR 162,682 176,318 1.97
Spain 0.7% 17-30.11.33 /Infl 10,000 EUR 11,902 12,347 0.14
174,584 188,665 2.11
SwedenSweden I /L 0.125% 01.06.32 /Infl 270,000 SEK 34,000 34,740 0.39
34,000 34,740 0.39
United States of AmericaTsy 0.75% 18-15.07.28 /Infl 320,000 USD 319,118 314,533 3.51
USA 0.125% 14-15.07.24 /Infl 600,000 USD 588,846 573,774 6.41
USA 0.125% 16-15.07.26 /Infl 420,000 USD 383,640 408,552 4.57
USA 0.125% 17-15.04.22 /Infl 440,000 USD 395,885 391,920 4.38
USA 0.125% 20-15.01.30 /Infl 170,000 USD 160,617 156,300 1.75
USA 0.125% 20-15.07.30 /Infl 140,000 USD 130,653 129,926 1.45
USA 0.25% 19-15.07.29 /Infl 170,000 USD 161,216 159,590 1.78
USA 0.25% 20-15.02.50 /Infl 30,000 USD 29,663 29,487 0.33
USA 0.375% 15-15.07.25 /Infl 400,000 USD 400,322 392,760 4.39
USA 0.375% 17-15.01.27 /Infl 150,000 USD 148,392 146,991 1.64
USA 0.5% 15.04.24 /Infl 30,000 USD 27,660 27,033 0.30
USA 0.5% 18-15.01.28 /Infl 260,000 USD 242,831 253,409 2.83
USA 1% 16-15.02.46 /Infl 270,000 USD 267,809 329,627 3.68
USA 1% 18-15.02.48 /Infl 70,000 USD 66,227 83,817 0.94
DANSKE INVEST SICAV
The accompanying notes form an integral part of these financial statements.
188
Global Inflation Linked Bond
Statement of Investments (continued)as at December 31, 2020(expressed in EUR)
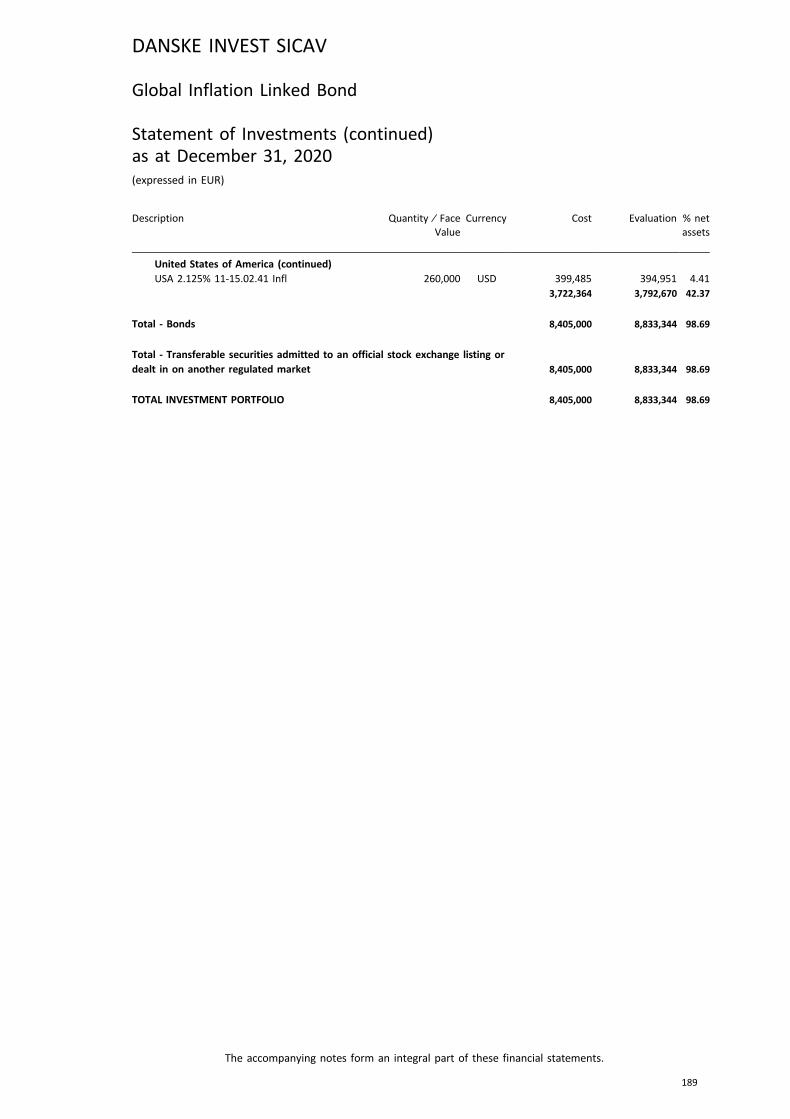
Description Quantity ⁄ FaceValue
Currency Cost Evaluation % netassets
United States of America (continued)USA 2.125% 11-15.02.41 Infl 260,000 USD 399,485 394,951 4.41
3,722,364 3,792,670 42.37
Total - Bonds 8,405,000 8,833,344 98.69
Total - Transferable securities admitted to an official stock exchange listing ordealt in on another regulated market 8,405,000 8,833,344 98.69
TOTAL INVESTMENT PORTFOLIO 8,405,000 8,833,344 98.69
DANSKE INVEST SICAV
The accompanying notes form an integral part of these financial statements.
189
Global Inflation Linked Bond
Statement of Investments (continued)as at December 31, 2020(expressed in EUR)
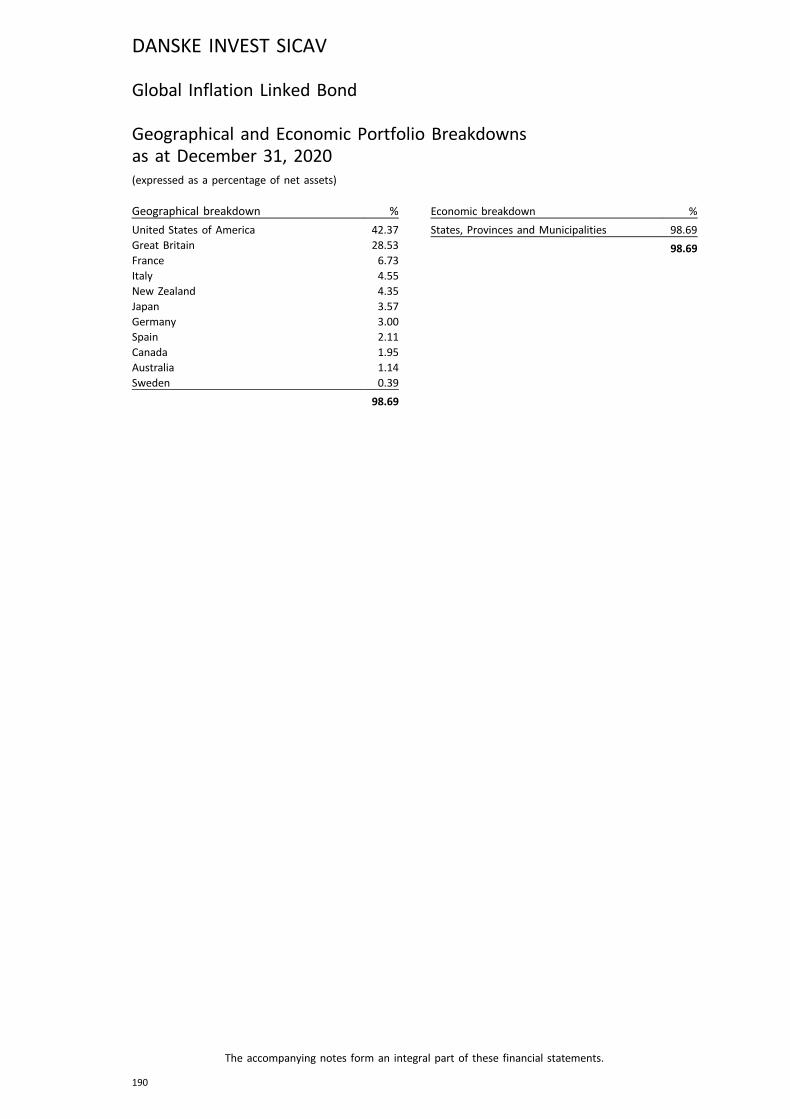
Global Inflation Linked Bond
Geographical and Economic Portfolio Breakdownsas at December 31, 2020(expressed as a percentage of net assets)
Geographical breakdown %
United States of America 42.37Great Britain 28.53France 6.73Italy 4.55New Zealand 4.35Japan 3.57Germany 3.00Spain 2.11Canada 1.95Australia 1.14Sweden 0.39
98.69
Economic breakdown %
States, Provinces and Municipalities 98.69
98.69
DANSKE INVEST SICAV
The accompanying notes form an integral part of these financial statements.
190
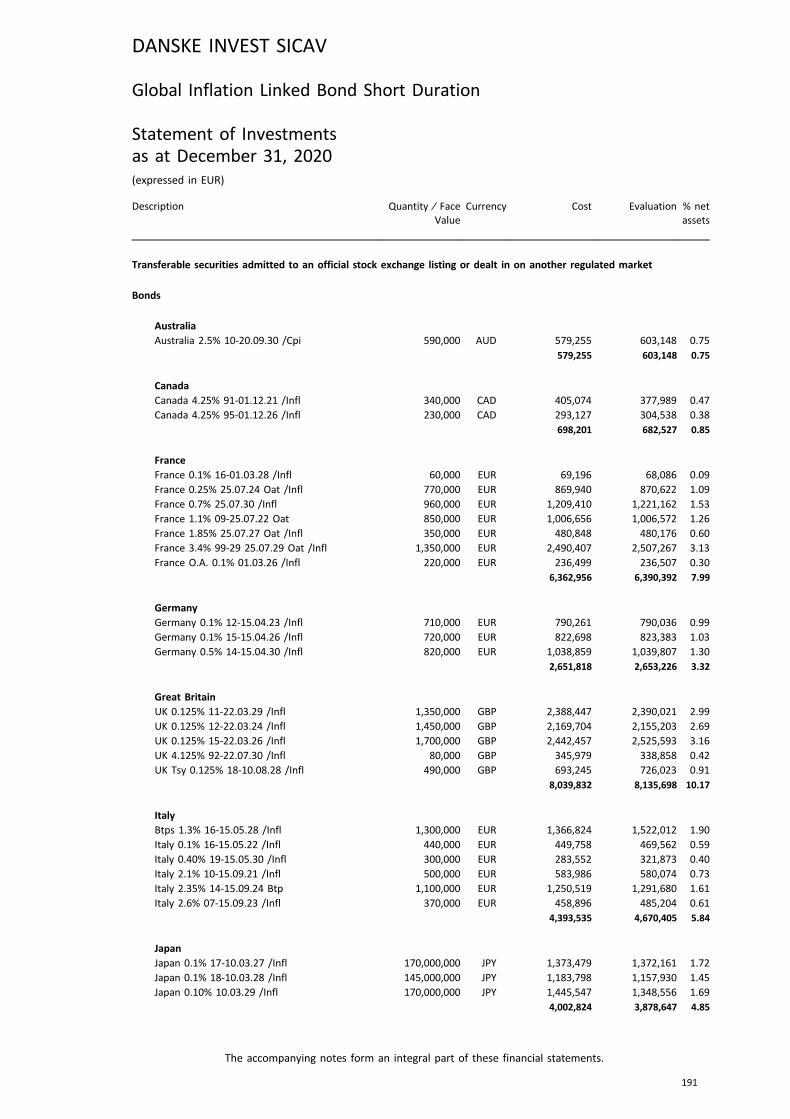
Global Inflation Linked Bond Short Duration
Statement of Investmentsas at December 31, 2020(expressed in EUR)
Description Quantity ⁄ FaceValue
Currency Cost Evaluation % netassets
Transferable securities admitted to an official stock exchange listing or dealt in on another regulated market
Bonds
AustraliaAustralia 2.5% 10-20.09.30 /Cpi 590,000 AUD 579,255 603,148 0.75
579,255 603,148 0.75
CanadaCanada 4.25% 91-01.12.21 /Infl 340,000 CAD 405,074 377,989 0.47
Canada 4.25% 95-01.12.26 /Infl 230,000 CAD 293,127 304,538 0.38
698,201 682,527 0.85
FranceFrance 0.1% 16-01.03.28 /Infl 60,000 EUR 69,196 68,086 0.09
France 0.25% 25.07.24 Oat /Infl 770,000 EUR 869,940 870,622 1.09
France 0.7% 25.07.30 /Infl 960,000 EUR 1,209,410 1,221,162 1.53
France 1.1% 09-25.07.22 Oat 850,000 EUR 1,006,656 1,006,572 1.26
France 1.85% 25.07.27 Oat /Infl 350,000 EUR 480,848 480,176 0.60
France 3.4% 99-29 25.07.29 Oat /Infl 1,350,000 EUR 2,490,407 2,507,267 3.13
France O.A. 0.1% 01.03.26 /Infl 220,000 EUR 236,499 236,507 0.30
6,362,956 6,390,392 7.99
GermanyGermany 0.1% 12-15.04.23 /Infl 710,000 EUR 790,261 790,036 0.99
Germany 0.1% 15-15.04.26 /Infl 720,000 EUR 822,698 823,383 1.03
Germany 0.5% 14-15.04.30 /Infl 820,000 EUR 1,038,859 1,039,807 1.30
2,651,818 2,653,226 3.32
Great BritainUK 0.125% 11-22.03.29 /Infl 1,350,000 GBP 2,388,447 2,390,021 2.99
UK 0.125% 12-22.03.24 /Infl 1,450,000 GBP 2,169,704 2,155,203 2.69
UK 0.125% 15-22.03.26 /Infl 1,700,000 GBP 2,442,457 2,525,593 3.16
UK 4.125% 92-22.07.30 /Infl 80,000 GBP 345,979 338,858 0.42
UK Tsy 0.125% 18-10.08.28 /Infl 490,000 GBP 693,245 726,023 0.91
8,039,832 8,135,698 10.17
ItalyBtps 1.3% 16-15.05.28 /Infl 1,300,000 EUR 1,366,824 1,522,012 1.90
Italy 0.1% 16-15.05.22 /Infl 440,000 EUR 449,758 469,562 0.59
Italy 0.40% 19-15.05.30 /Infl 300,000 EUR 283,552 321,873 0.40
Italy 2.1% 10-15.09.21 /Infl 500,000 EUR 583,986 580,074 0.73
Italy 2.35% 14-15.09.24 Btp 1,100,000 EUR 1,250,519 1,291,680 1.61
Italy 2.6% 07-15.09.23 /Infl 370,000 EUR 458,896 485,204 0.61
4,393,535 4,670,405 5.84
JapanJapan 0.1% 17-10.03.27 /Infl 170,000,000 JPY 1,373,479 1,372,161 1.72
Japan 0.1% 18-10.03.28 /Infl 145,000,000 JPY 1,183,798 1,157,930 1.45
Japan 0.10% 10.03.29 /Infl 170,000,000 JPY 1,445,547 1,348,556 1.69
4,002,824 3,878,647 4.85
DANSKE INVEST SICAV
The accompanying notes form an integral part of these financial statements.
191

Description Quantity ⁄ FaceValue
Currency Cost Evaluation % netassets
New ZealandNew Zealand 2% 12-20.09.25 /Cpi 2,000,000 NZD 1,393,716 1,460,801 1.83
New Zealand 3% 20.09.30 /Infl 900,000 NZD 708,675 775,912 0.97
New Zealand 2.5% 16-20.09.40 /Infl 640,000 NZD 448,281 578,894 0.72
2,550,672 2,815,607 3.52
SpainSpain 0.65% 17-30.11.27 /Infl 850,000 EUR 920,279 999,135 1.25
Spain I /L B 1% 30.11.30 /Infl 550,000 EUR 686,612 688,977 0.86
1,606,891 1,688,112 2.11
SwedenSweden I /L 0.125% 01.06.32 /Infl 2,500,000 SEK 314,815 321,663 0.40
314,815 321,663 0.40
United States of AmericaTsy 0.75% 18-15.07.28 /Infl 3,000,000 USD 2,742,998 2,948,747 3.69
USA 0.125% 14-15.07.24 /Infl 5,210,000 USD 5,023,757 4,982,267 6.23
USA 0.125% 16-15.07.26 /Infl 7,550,000 USD 6,768,784 7,344,205 9.18
USA 0.125% 17-15.04.22 /Infl 2,860,000 USD 2,573,304 2,547,483 3.18
USA 0.125% 20-15.01.30 /Infl 4,700,000 USD 4,429,781 4,321,245 5.40
USA 0.125% 20-15.07.30 /Infl 500,000 USD 466,616 464,022 0.58
USA 0.25% 19-15.07.29 /Infl 980,000 USD 930,593 919,990 1.15
USA 0.375% 13-15.07.23 /Infl 6,400,000 USD 5,930,620 6,180,716 7.73
USA 0.5% 18-15.01.28 /Infl 4,800,000 USD 4,587,211 4,678,314 5.85
USA 0.625% 14-15.01.24 /Infl 5,400,000 USD 5,371,271 5,268,468 6.57
USA 0.875% 19-15.01.29 /Infl 1,250,000 USD 1,223,919 1,234,059 1.54
USA 2.375% 04-15.01.25 /Infl 3,910,000 USD 5,245,180 5,137,853 6.42
45,294,034 46,027,369 57.52
Total - Bonds 76,494,833 77,866,794 97.32
Total - Transferable securities admitted to an official stock exchange listing ordealt in on another regulated market 76,494,833 77,866,794 97.32
TOTAL INVESTMENT PORTFOLIO 76,494,833 77,866,794 97.32
DANSKE INVEST SICAV
The accompanying notes form an integral part of these financial statements.
192
Global Inflation Linked Bond Short Duration
Statement of Investments (continued)as at December 31, 2020(expressed in EUR)

Global Inflation Linked Bond Short Duration
Geographical and Economic Portfolio Breakdownsas at December 31, 2020(expressed as a percentage of net assets)
Geographical breakdown %
United States of America 57.52Great Britain 10.17France 7.99Italy 5.84Japan 4.85New Zealand 3.52Germany 3.32Spain 2.11Canada 0.85Australia 0.75Sweden 0.40
97.32
Economic breakdown %
States, Provinces and Municipalities 97.32
97.32
DANSKE INVEST SICAV
The accompanying notes form an integral part of these financial statements.
193
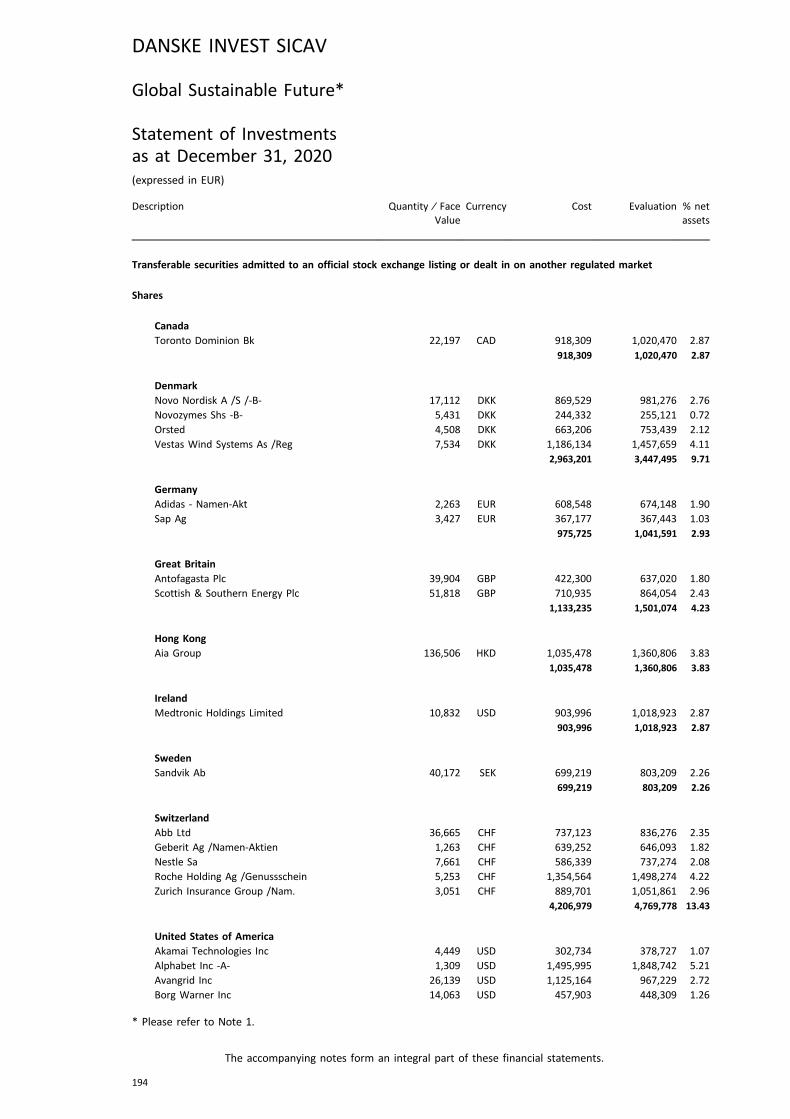
Global Sustainable Future*
Statement of Investmentsas at December 31, 2020(expressed in EUR)
Description Quantity ⁄ FaceValue
Currency Cost Evaluation % netassets
Transferable securities admitted to an official stock exchange listing or dealt in on another regulated market
Shares
CanadaToronto Dominion Bk 22,197 CAD 918,309 1,020,470 2.87
918,309 1,020,470 2.87
DenmarkNovo Nordisk A /S /-B- 17,112 DKK 869,529 981,276 2.76
Novozymes Shs -B- 5,431 DKK 244,332 255,121 0.72
Orsted 4,508 DKK 663,206 753,439 2.12
Vestas Wind Systems As /Reg 7,534 DKK 1,186,134 1,457,659 4.11
2,963,201 3,447,495 9.71
GermanyAdidas - Namen-Akt 2,263 EUR 608,548 674,148 1.90
Sap Ag 3,427 EUR 367,177 367,443 1.03
975,725 1,041,591 2.93
Great BritainAntofagasta Plc 39,904 GBP 422,300 637,020 1.80
Scottish & Southern Energy Plc 51,818 GBP 710,935 864,054 2.43
1,133,235 1,501,074 4.23
Hong KongAia Group 136,506 HKD 1,035,478 1,360,806 3.83
1,035,478 1,360,806 3.83
IrelandMedtronic Holdings Limited 10,832 USD 903,996 1,018,923 2.87
903,996 1,018,923 2.87
SwedenSandvik Ab 40,172 SEK 699,219 803,209 2.26
699,219 803,209 2.26
SwitzerlandAbb Ltd 36,665 CHF 737,123 836,276 2.35
Geberit Ag /Namen-Aktien 1,263 CHF 639,252 646,093 1.82
Nestle Sa 7,661 CHF 586,339 737,274 2.08
Roche Holding Ag /Genussschein 5,253 CHF 1,354,564 1,498,274 4.22
Zurich Insurance Group /Nam. 3,051 CHF 889,701 1,051,861 2.96
4,206,979 4,769,778 13.43
United States of AmericaAkamai Technologies Inc 4,449 USD 302,734 378,727 1.07
Alphabet Inc -A- 1,309 USD 1,495,995 1,848,742 5.21
Avangrid Inc 26,139 USD 1,125,164 967,229 2.72
Borg Warner Inc 14,063 USD 457,903 448,309 1.26
DANSKE INVEST SICAV
The accompanying notes form an integral part of these financial statements.
194
* Please refer to Note 1.
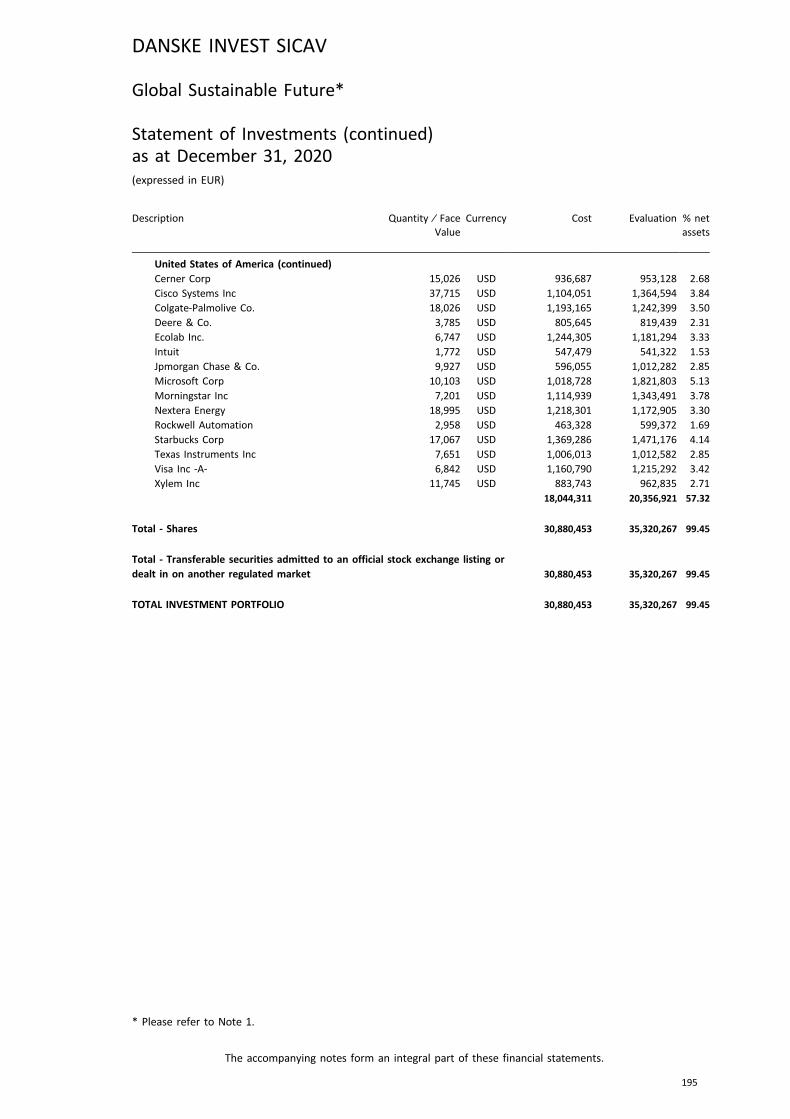
Description Quantity ⁄ FaceValue
Currency Cost Evaluation % netassets
United States of America (continued)Cerner Corp 15,026 USD 936,687 953,128 2.68
Cisco Systems Inc 37,715 USD 1,104,051 1,364,594 3.84
Colgate-Palmolive Co. 18,026 USD 1,193,165 1,242,399 3.50
Deere & Co. 3,785 USD 805,645 819,439 2.31
Ecolab Inc. 6,747 USD 1,244,305 1,181,294 3.33
Intuit 1,772 USD 547,479 541,322 1.53
Jpmorgan Chase & Co. 9,927 USD 596,055 1,012,282 2.85
Microsoft Corp 10,103 USD 1,018,728 1,821,803 5.13
Morningstar Inc 7,201 USD 1,114,939 1,343,491 3.78
Nextera Energy 18,995 USD 1,218,301 1,172,905 3.30
Rockwell Automation 2,958 USD 463,328 599,372 1.69
Starbucks Corp 17,067 USD 1,369,286 1,471,176 4.14
Texas Instruments Inc 7,651 USD 1,006,013 1,012,582 2.85
Visa Inc -A- 6,842 USD 1,160,790 1,215,292 3.42
Xylem Inc 11,745 USD 883,743 962,835 2.71
18,044,311 20,356,921 57.32
Total - Shares 30,880,453 35,320,267 99.45
Total - Transferable securities admitted to an official stock exchange listing ordealt in on another regulated market 30,880,453 35,320,267 99.45
TOTAL INVESTMENT PORTFOLIO 30,880,453 35,320,267 99.45
DANSKE INVEST SICAV
The accompanying notes form an integral part of these financial statements.
195
* Please refer to Note 1.
Global Sustainable Future*
Statement of Investments (continued)as at December 31, 2020(expressed in EUR)

Global Sustainable Future*
Geographical and Economic Portfolio Breakdownsas at December 31, 2020(expressed as a percentage of net assets)
Geographical breakdown %
United States of America 57.32Switzerland 13.43Denmark 9.71Great Britain 4.23Hong Kong 3.83Germany 2.93Canada 2.87Ireland 2.87Sweden 2.26
99.45
Economic breakdown %
Public Services 17.39Internet Software 13.97Pharmaceuticals and Cosmetics 9.85Insurance 6.79Banks and Financial Institutions 5.72Mechanics, Machinery 4.57Leisure 4.14Chemicals 4.05Electronics and Electrical Equipment 4.04Office Equipment, Computers 3.84Holding and Finance Companies 3.78Consumer Goods 3.50Other Services 3.42Electronic Semiconductor 2.85Healthcare Education & Social Services 2.68Food and Distilleries 2.08Textile 1.90Construction, Building Material 1.82Non-Ferrous Metals 1.80Automobile Industry 1.26
99.45
* Please refer to Note 1.
DANSKE INVEST SICAV
The accompanying notes form an integral part of these financial statements.
196

India
Statement of Investmentsas at December 31, 2020(expressed in USD)
Description Quantity ⁄ FaceValue
Currency Cost Evaluation % netassets
Transferable securities admitted to an official stock exchange listing or dealt in on another regulated market
Shares
IndiaAegis Logistics Ltd 294,931 INR 810,989 1,017,307 1.54
Affle (India) Rg 18,250 INR 742,916 947,544 1.44
Asian Paints 72,000 INR 1,468,485 2,707,758 4.11
Axis Bank Ltd 186,250 INR 1,630,573 1,582,824 2.40
Bandhan Bank Ltd 198,281 INR 1,180,252 1,084,440 1.65
Biocon Ltd 157,000 INR 552,380 997,032 1.51
Bosch Ltd 3,517 INR 475,560 615,103 0.93
Container 224,633 INR 1,188,933 1,224,261 1.86
Crompton 146,517 INR 514,086 757,922 1.15
Fortis Healthcare Ltd 422,500 INR 774,943 901,978 1.37
Godrej Agrovet Ltd 122,814 INR 1,066,729 904,222 1.37
Godrej Consumer Pr /Dematerial. 118,846 INR 1,047,528 1,195,654 1.82
Godrej Properties Ltd /Reit 118,300 INR 1,176,701 2,331,105 3.54
Gujarat Gas Ltd 279,000 INR 922,988 1,445,157 2.19
Hdfc Bank Ltd 107,400 INR 1,493,882 2,117,864 3.22
Hindustan Unilever Ltd 138,725 INR 3,581,667 4,565,966 6.93
Housing Devt Fin Corp 195,650 INR 4,793,799 6,893,549 10.47
Icici Prud 95,600 INR 573,052 652,966 0.99
Info Edge India Ltd 12,231 INR 469,469 793,663 1.21
Infosys 307,468 INR 2,652,753 5,229,119 7.94
Jyothy Laboratories Ltd 548,536 INR 1,168,319 1,099,358 1.67
Kotak Mahind 155,367 INR 2,579,540 4,265,365 6.48
Maruti Suzuki India Ltd 15,200 INR 1,583,500 1,593,039 2.42
Mphasis Ltd /Demat. 95,756 INR 928,694 2,050,153 3.11
Nestle India /Dematerialised 9,202 INR 1,679,352 2,302,297 3.50
Piramal Enter 46,225 INR 979,136 902,230 1.37
Power Grid Corp of India Ltd 369,000 INR 784,490 958,193 1.46
Prestige Estates Projects Ltd 324,673 INR 1,207,014 1,190,764 1.81
Sanofi India Shs 9,640 INR 775,170 1,090,347 1.66
Sbi Life Insurance Company Ltd 168,905 INR 1,566,536 2,079,278 3.16
Shree Cements Ltd 2,155 INR 554,298 710,739 1.08
Syngene International Ltd 178,400 INR 828,865 1,513,915 2.30
Tata Consultancy Serv /Demat. 145,100 INR 3,046,024 5,712,443 8.67
Tech Mahindra Ltd 101,500 INR 900,813 1,351,802 2.05
Ultra Tech Cement Ltd 33,500 INR 1,764,330 2,429,543 3.69
Varun Beverages Ltd 30,000 INR 267,665 374,401 0.57
47,731,431 67,589,301 102.64
Total - Shares 47,731,431 67,589,301 102.64
Total - Transferable securities admitted to an official stock exchange listing ordealt in on another regulated market 47,731,431 67,589,301 102.64
TOTAL INVESTMENT PORTFOLIO 47,731,431 67,589,301 102.64
DANSKE INVEST SICAV
The accompanying notes form an integral part of these financial statements.
197
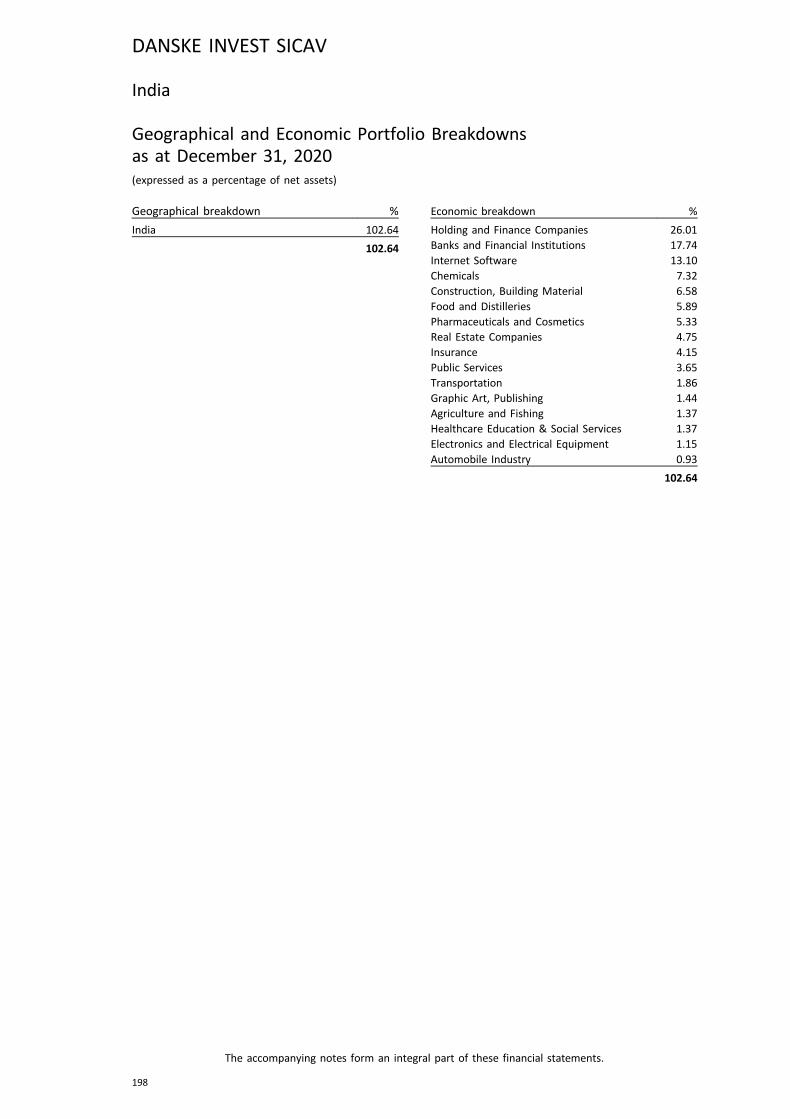
India
Geographical and Economic Portfolio Breakdownsas at December 31, 2020(expressed as a percentage of net assets)
Geographical breakdown %
India 102.64
102.64
Economic breakdown %
Holding and Finance Companies 26.01Banks and Financial Institutions 17.74Internet Software 13.10Chemicals 7.32Construction, Building Material 6.58Food and Distilleries 5.89Pharmaceuticals and Cosmetics 5.33Real Estate Companies 4.75Insurance 4.15Public Services 3.65Transportation 1.86Graphic Art, Publishing 1.44Agriculture and Fishing 1.37Healthcare Education & Social Services 1.37Electronics and Electrical Equipment 1.15Automobile Industry 0.93
102.64
DANSKE INVEST SICAV
The accompanying notes form an integral part of these financial statements.
198
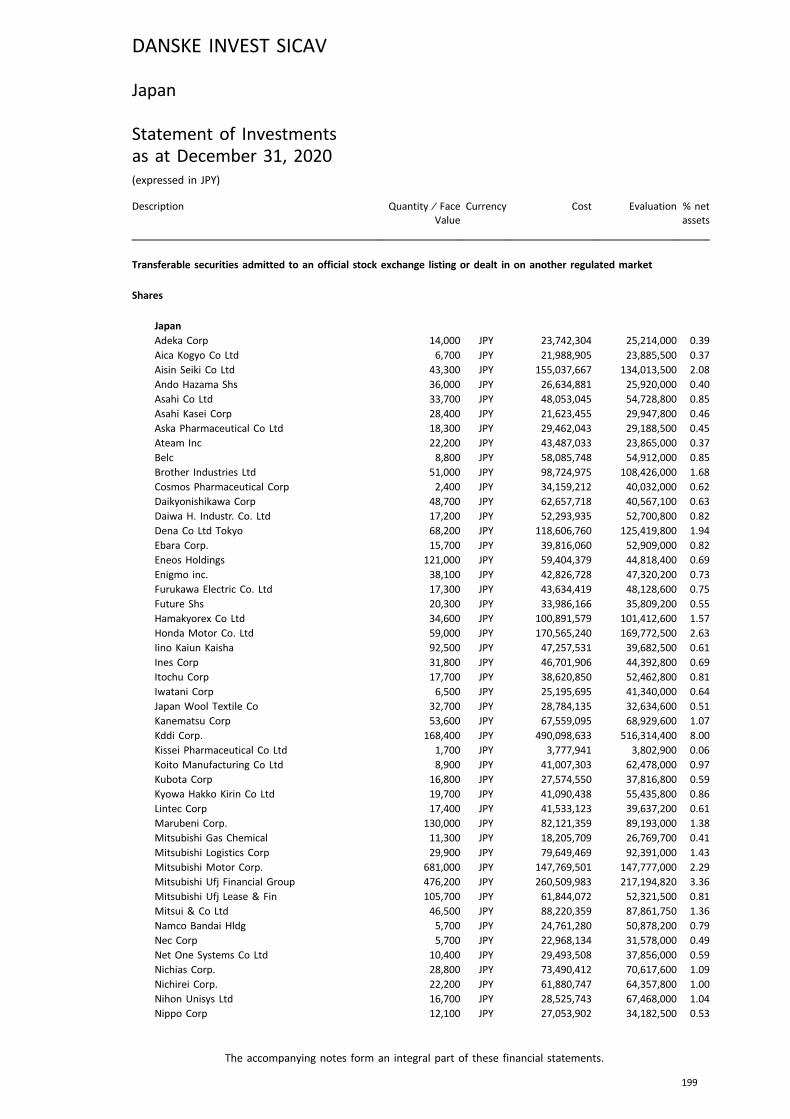
Japan
Statement of Investmentsas at December 31, 2020(expressed in JPY)
Description Quantity ⁄ FaceValue
Currency Cost Evaluation % netassets
Transferable securities admitted to an official stock exchange listing or dealt in on another regulated market
Shares
JapanAdeka Corp 14,000 JPY 23,742,304 25,214,000 0.39
Aica Kogyo Co Ltd 6,700 JPY 21,988,905 23,885,500 0.37
Aisin Seiki Co Ltd 43,300 JPY 155,037,667 134,013,500 2.08
Ando Hazama Shs 36,000 JPY 26,634,881 25,920,000 0.40
Asahi Co Ltd 33,700 JPY 48,053,045 54,728,800 0.85
Asahi Kasei Corp 28,400 JPY 21,623,455 29,947,800 0.46
Aska Pharmaceutical Co Ltd 18,300 JPY 29,462,043 29,188,500 0.45
Ateam Inc 22,200 JPY 43,487,033 23,865,000 0.37
Belc 8,800 JPY 58,085,748 54,912,000 0.85
Brother Industries Ltd 51,000 JPY 98,724,975 108,426,000 1.68
Cosmos Pharmaceutical Corp 2,400 JPY 34,159,212 40,032,000 0.62
Daikyonishikawa Corp 48,700 JPY 62,657,718 40,567,100 0.63
Daiwa H. Industr. Co. Ltd 17,200 JPY 52,293,935 52,700,800 0.82
Dena Co Ltd Tokyo 68,200 JPY 118,606,760 125,419,800 1.94
Ebara Corp. 15,700 JPY 39,816,060 52,909,000 0.82
Eneos Holdings 121,000 JPY 59,404,379 44,818,400 0.69
Enigmo inc. 38,100 JPY 42,826,728 47,320,200 0.73
Furukawa Electric Co. Ltd 17,300 JPY 43,634,419 48,128,600 0.75
Future Shs 20,300 JPY 33,986,166 35,809,200 0.55
Hamakyorex Co Ltd 34,600 JPY 100,891,579 101,412,600 1.57
Honda Motor Co. Ltd 59,000 JPY 170,565,240 169,772,500 2.63
Iino Kaiun Kaisha 92,500 JPY 47,257,531 39,682,500 0.61
Ines Corp 31,800 JPY 46,701,906 44,392,800 0.69
Itochu Corp 17,700 JPY 38,620,850 52,462,800 0.81
Iwatani Corp 6,500 JPY 25,195,695 41,340,000 0.64
Japan Wool Textile Co 32,700 JPY 28,784,135 32,634,600 0.51
Kanematsu Corp 53,600 JPY 67,559,095 68,929,600 1.07
Kddi Corp. 168,400 JPY 490,098,633 516,314,400 8.00
Kissei Pharmaceutical Co Ltd 1,700 JPY 3,777,941 3,802,900 0.06
Koito Manufacturing Co Ltd 8,900 JPY 41,007,303 62,478,000 0.97
Kubota Corp 16,800 JPY 27,574,550 37,816,800 0.59
Kyowa Hakko Kirin Co Ltd 19,700 JPY 41,090,438 55,435,800 0.86
Lintec Corp 17,400 JPY 41,533,123 39,637,200 0.61
Marubeni Corp. 130,000 JPY 82,121,359 89,193,000 1.38
Mitsubishi Gas Chemical 11,300 JPY 18,205,709 26,769,700 0.41
Mitsubishi Logistics Corp 29,900 JPY 79,649,469 92,391,000 1.43
Mitsubishi Motor Corp. 681,000 JPY 147,769,501 147,777,000 2.29
Mitsubishi Ufj Financial Group 476,200 JPY 260,509,983 217,194,820 3.36
Mitsubishi Ufj Lease & Fin 105,700 JPY 61,844,072 52,321,500 0.81
Mitsui & Co Ltd 46,500 JPY 88,220,359 87,861,750 1.36
Namco Bandai Hldg 5,700 JPY 24,761,280 50,878,200 0.79
Nec Corp 5,700 JPY 22,968,134 31,578,000 0.49
Net One Systems Co Ltd 10,400 JPY 29,493,508 37,856,000 0.59
Nichias Corp. 28,800 JPY 73,490,412 70,617,600 1.09
Nichirei Corp. 22,200 JPY 61,880,747 64,357,800 1.00
Nihon Unisys Ltd 16,700 JPY 28,525,743 67,468,000 1.04
Nippo Corp 12,100 JPY 27,053,902 34,182,500 0.53
DANSKE INVEST SICAV
The accompanying notes form an integral part of these financial statements.
199
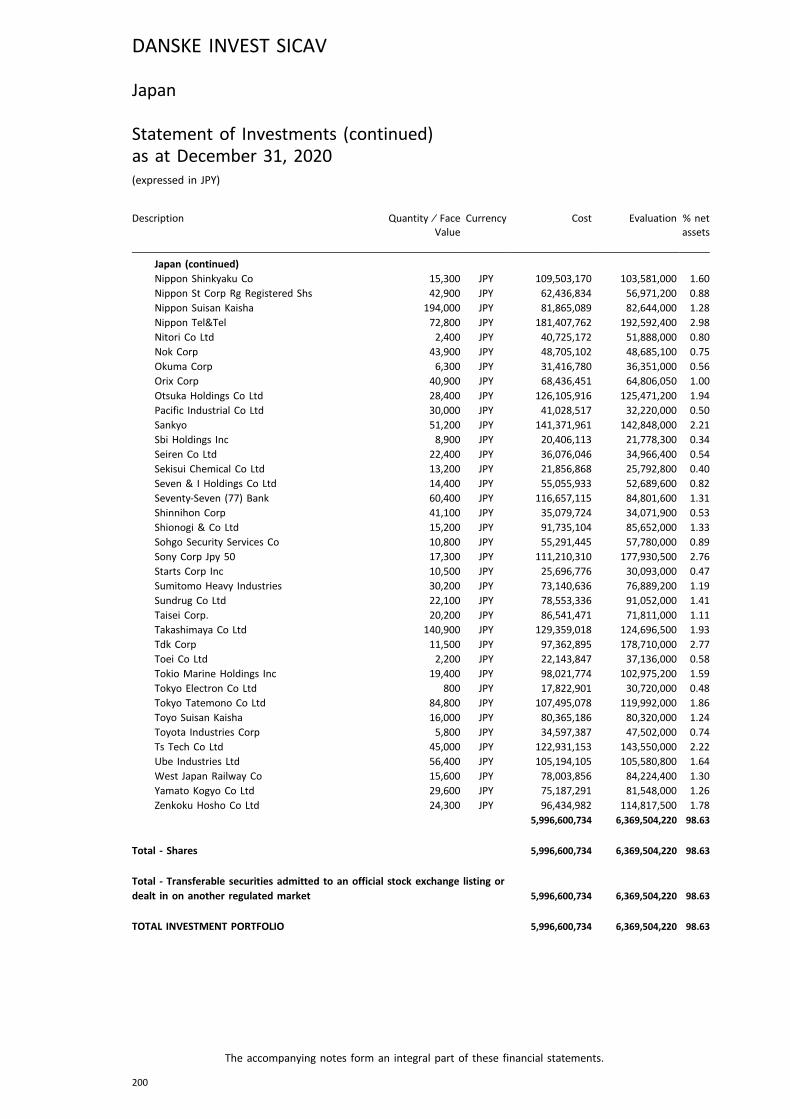
Description Quantity ⁄ FaceValue
Currency Cost Evaluation % netassets
Japan (continued)Nippon Shinkyaku Co 15,300 JPY 109,503,170 103,581,000 1.60
Nippon St Corp Rg Registered Shs 42,900 JPY 62,436,834 56,971,200 0.88
Nippon Suisan Kaisha 194,000 JPY 81,865,089 82,644,000 1.28
Nippon Tel&Tel 72,800 JPY 181,407,762 192,592,400 2.98
Nitori Co Ltd 2,400 JPY 40,725,172 51,888,000 0.80
Nok Corp 43,900 JPY 48,705,102 48,685,100 0.75
Okuma Corp 6,300 JPY 31,416,780 36,351,000 0.56
Orix Corp 40,900 JPY 68,436,451 64,806,050 1.00
Otsuka Holdings Co Ltd 28,400 JPY 126,105,916 125,471,200 1.94
Pacific Industrial Co Ltd 30,000 JPY 41,028,517 32,220,000 0.50
Sankyo 51,200 JPY 141,371,961 142,848,000 2.21
Sbi Holdings Inc 8,900 JPY 20,406,113 21,778,300 0.34
Seiren Co Ltd 22,400 JPY 36,076,046 34,966,400 0.54
Sekisui Chemical Co Ltd 13,200 JPY 21,856,868 25,792,800 0.40
Seven & I Holdings Co Ltd 14,400 JPY 55,055,933 52,689,600 0.82
Seventy-Seven (77) Bank 60,400 JPY 116,657,115 84,801,600 1.31
Shinnihon Corp 41,100 JPY 35,079,724 34,071,900 0.53
Shionogi & Co Ltd 15,200 JPY 91,735,104 85,652,000 1.33
Sohgo Security Services Co 10,800 JPY 55,291,445 57,780,000 0.89
Sony Corp Jpy 50 17,300 JPY 111,210,310 177,930,500 2.76
Starts Corp Inc 10,500 JPY 25,696,776 30,093,000 0.47
Sumitomo Heavy Industries 30,200 JPY 73,140,636 76,889,200 1.19
Sundrug Co Ltd 22,100 JPY 78,553,336 91,052,000 1.41
Taisei Corp. 20,200 JPY 86,541,471 71,811,000 1.11
Takashimaya Co Ltd 140,900 JPY 129,359,018 124,696,500 1.93
Tdk Corp 11,500 JPY 97,362,895 178,710,000 2.77
Toei Co Ltd 2,200 JPY 22,143,847 37,136,000 0.58
Tokio Marine Holdings Inc 19,400 JPY 98,021,774 102,975,200 1.59
Tokyo Electron Co Ltd 800 JPY 17,822,901 30,720,000 0.48
Tokyo Tatemono Co Ltd 84,800 JPY 107,495,078 119,992,000 1.86
Toyo Suisan Kaisha 16,000 JPY 80,365,186 80,320,000 1.24
Toyota Industries Corp 5,800 JPY 34,597,387 47,502,000 0.74
Ts Tech Co Ltd 45,000 JPY 122,931,153 143,550,000 2.22
Ube Industries Ltd 56,400 JPY 105,194,105 105,580,800 1.64
West Japan Railway Co 15,600 JPY 78,003,856 84,224,400 1.30
Yamato Kogyo Co Ltd 29,600 JPY 75,187,291 81,548,000 1.26
Zenkoku Hosho Co Ltd 24,300 JPY 96,434,982 114,817,500 1.78
5,996,600,734 6,369,504,220 98.63
Total - Shares 5,996,600,734 6,369,504,220 98.63
Total - Transferable securities admitted to an official stock exchange listing ordealt in on another regulated market 5,996,600,734 6,369,504,220 98.63
TOTAL INVESTMENT PORTFOLIO 5,996,600,734 6,369,504,220 98.63
DANSKE INVEST SICAV
The accompanying notes form an integral part of these financial statements.
200
Japan
Statement of Investments (continued)as at December 31, 2020(expressed in JPY)
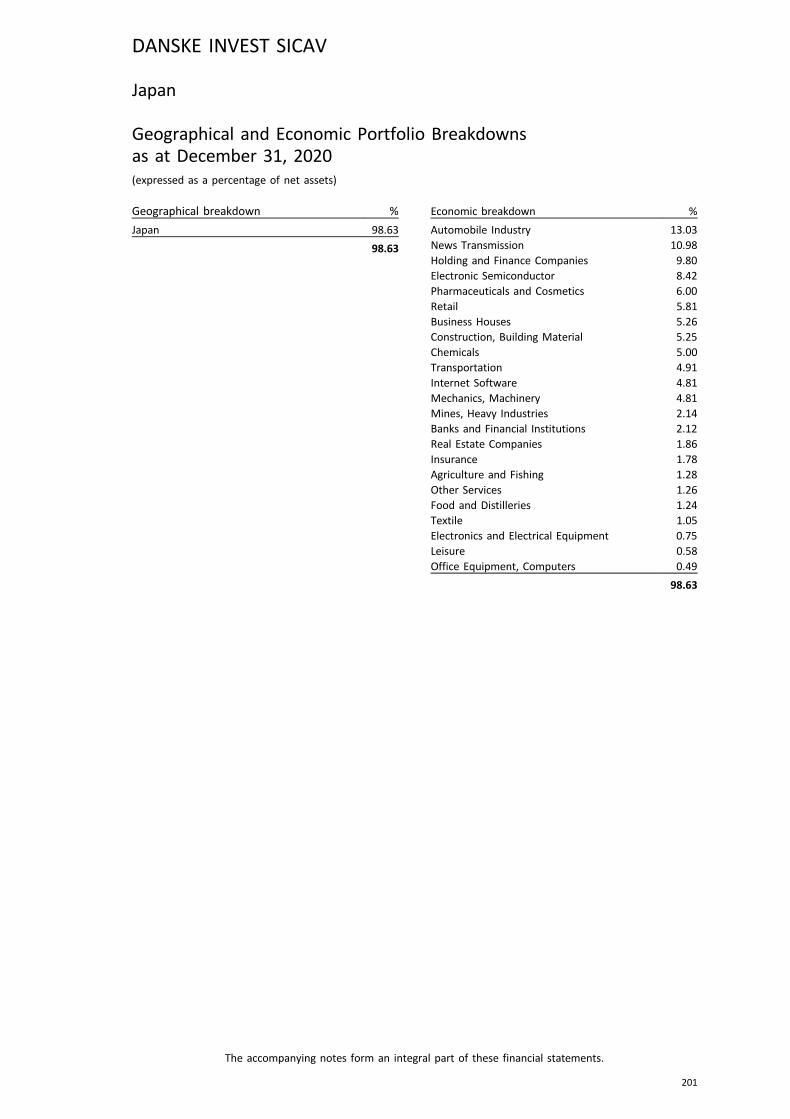
Japan
Geographical and Economic Portfolio Breakdownsas at December 31, 2020(expressed as a percentage of net assets)
Geographical breakdown %
Japan 98.63
98.63
Economic breakdown %
Automobile Industry 13.03News Transmission 10.98Holding and Finance Companies 9.80Electronic Semiconductor 8.42Pharmaceuticals and Cosmetics 6.00Retail 5.81Business Houses 5.26Construction, Building Material 5.25Chemicals 5.00Transportation 4.91Internet Software 4.81Mechanics, Machinery 4.81Mines, Heavy Industries 2.14Banks and Financial Institutions 2.12Real Estate Companies 1.86Insurance 1.78Agriculture and Fishing 1.28Other Services 1.26Food and Distilleries 1.24Textile 1.05Electronics and Electrical Equipment 0.75Leisure 0.58Office Equipment, Computers 0.49
98.63
DANSKE INVEST SICAV
The accompanying notes form an integral part of these financial statements.
201
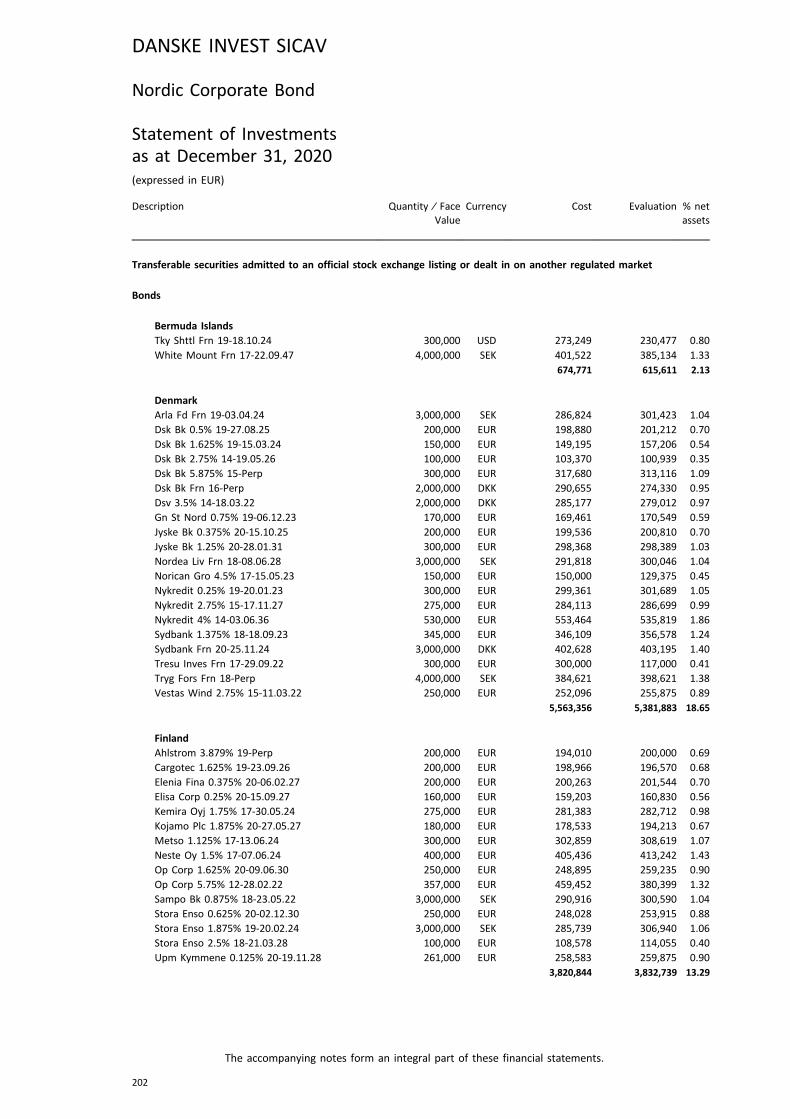
Nordic Corporate Bond
Statement of Investmentsas at December 31, 2020(expressed in EUR)
Description Quantity ⁄ FaceValue
Currency Cost Evaluation % netassets
Transferable securities admitted to an official stock exchange listing or dealt in on another regulated market
Bonds
Bermuda IslandsTky Shttl Frn 19-18.10.24 300,000 USD 273,249 230,477 0.80
White Mount Frn 17-22.09.47 4,000,000 SEK 401,522 385,134 1.33
674,771 615,611 2.13
DenmarkArla Fd Frn 19-03.04.24 3,000,000 SEK 286,824 301,423 1.04
Dsk Bk 0.5% 19-27.08.25 200,000 EUR 198,880 201,212 0.70
Dsk Bk 1.625% 19-15.03.24 150,000 EUR 149,195 157,206 0.54
Dsk Bk 2.75% 14-19.05.26 100,000 EUR 103,370 100,939 0.35
Dsk Bk 5.875% 15-Perp 300,000 EUR 317,680 313,116 1.09
Dsk Bk Frn 16-Perp 2,000,000 DKK 290,655 274,330 0.95
Dsv 3.5% 14-18.03.22 2,000,000 DKK 285,177 279,012 0.97
Gn St Nord 0.75% 19-06.12.23 170,000 EUR 169,461 170,549 0.59
Jyske Bk 0.375% 20-15.10.25 200,000 EUR 199,536 200,810 0.70
Jyske Bk 1.25% 20-28.01.31 300,000 EUR 298,368 298,389 1.03
Nordea Liv Frn 18-08.06.28 3,000,000 SEK 291,818 300,046 1.04
Norican Gro 4.5% 17-15.05.23 150,000 EUR 150,000 129,375 0.45
Nykredit 0.25% 19-20.01.23 300,000 EUR 299,361 301,689 1.05
Nykredit 2.75% 15-17.11.27 275,000 EUR 284,113 286,699 0.99
Nykredit 4% 14-03.06.36 530,000 EUR 553,464 535,819 1.86
Sydbank 1.375% 18-18.09.23 345,000 EUR 346,109 356,578 1.24
Sydbank Frn 20-25.11.24 3,000,000 DKK 402,628 403,195 1.40
Tresu Inves Frn 17-29.09.22 300,000 EUR 300,000 117,000 0.41
Tryg Fors Frn 18-Perp 4,000,000 SEK 384,621 398,621 1.38
Vestas Wind 2.75% 15-11.03.22 250,000 EUR 252,096 255,875 0.89
5,563,356 5,381,883 18.65
FinlandAhlstrom 3.879% 19-Perp 200,000 EUR 194,010 200,000 0.69
Cargotec 1.625% 19-23.09.26 200,000 EUR 198,966 196,570 0.68
Elenia Fina 0.375% 20-06.02.27 200,000 EUR 200,263 201,544 0.70
Elisa Corp 0.25% 20-15.09.27 160,000 EUR 159,203 160,830 0.56
Kemira Oyj 1.75% 17-30.05.24 275,000 EUR 281,383 282,712 0.98
Kojamo Plc 1.875% 20-27.05.27 180,000 EUR 178,533 194,213 0.67
Metso 1.125% 17-13.06.24 300,000 EUR 302,859 308,619 1.07
Neste Oy 1.5% 17-07.06.24 400,000 EUR 405,436 413,242 1.43
Op Corp 1.625% 20-09.06.30 250,000 EUR 248,895 259,235 0.90
Op Corp 5.75% 12-28.02.22 357,000 EUR 459,452 380,399 1.32
Sampo Bk 0.875% 18-23.05.22 3,000,000 SEK 290,916 300,590 1.04
Stora Enso 0.625% 20-02.12.30 250,000 EUR 248,028 253,915 0.88
Stora Enso 1.875% 19-20.02.24 3,000,000 SEK 285,739 306,940 1.06
Stora Enso 2.5% 18-21.03.28 100,000 EUR 108,578 114,055 0.40
Upm Kymmene 0.125% 20-19.11.28 261,000 EUR 258,583 259,875 0.90
3,820,844 3,832,739 13.29
DANSKE INVEST SICAV
The accompanying notes form an integral part of these financial statements.
202
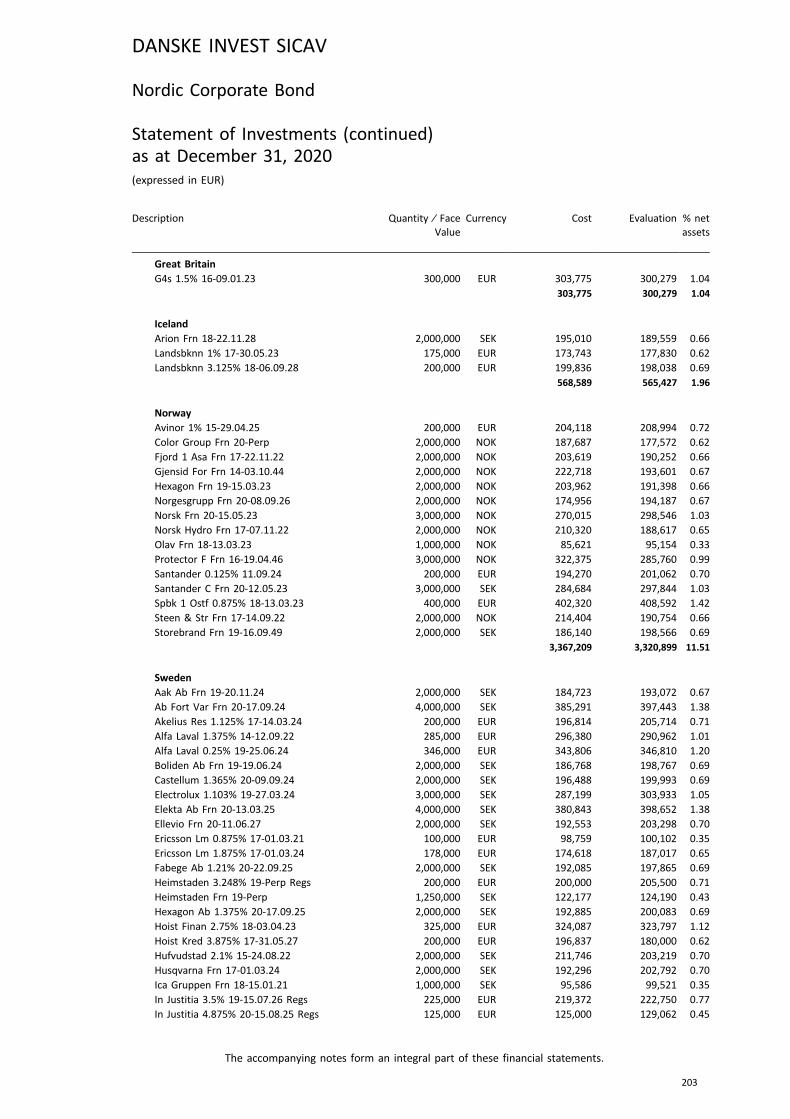
Description Quantity ⁄ FaceValue
Currency Cost Evaluation % netassets
Great BritainG4s 1.5% 16-09.01.23 300,000 EUR 303,775 300,279 1.04
303,775 300,279 1.04
IcelandArion Frn 18-22.11.28 2,000,000 SEK 195,010 189,559 0.66
Landsbknn 1% 17-30.05.23 175,000 EUR 173,743 177,830 0.62
Landsbknn 3.125% 18-06.09.28 200,000 EUR 199,836 198,038 0.69
568,589 565,427 1.96
NorwayAvinor 1% 15-29.04.25 200,000 EUR 204,118 208,994 0.72
Color Group Frn 20-Perp 2,000,000 NOK 187,687 177,572 0.62
Fjord 1 Asa Frn 17-22.11.22 2,000,000 NOK 203,619 190,252 0.66
Gjensid For Frn 14-03.10.44 2,000,000 NOK 222,718 193,601 0.67
Hexagon Frn 19-15.03.23 2,000,000 NOK 203,962 191,398 0.66
Norgesgrupp Frn 20-08.09.26 2,000,000 NOK 174,956 194,187 0.67
Norsk Frn 20-15.05.23 3,000,000 NOK 270,015 298,546 1.03
Norsk Hydro Frn 17-07.11.22 2,000,000 NOK 210,320 188,617 0.65
Olav Frn 18-13.03.23 1,000,000 NOK 85,621 95,154 0.33
Protector F Frn 16-19.04.46 3,000,000 NOK 322,375 285,760 0.99
Santander 0.125% 11.09.24 200,000 EUR 194,270 201,062 0.70
Santander C Frn 20-12.05.23 3,000,000 SEK 284,684 297,844 1.03
Spbk 1 Ostf 0.875% 18-13.03.23 400,000 EUR 402,320 408,592 1.42
Steen & Str Frn 17-14.09.22 2,000,000 NOK 214,404 190,754 0.66
Storebrand Frn 19-16.09.49 2,000,000 SEK 186,140 198,566 0.69
3,367,209 3,320,899 11.51
SwedenAak Ab Frn 19-20.11.24 2,000,000 SEK 184,723 193,072 0.67
Ab Fort Var Frn 20-17.09.24 4,000,000 SEK 385,291 397,443 1.38
Akelius Res 1.125% 17-14.03.24 200,000 EUR 196,814 205,714 0.71
Alfa Laval 1.375% 14-12.09.22 285,000 EUR 296,380 290,962 1.01
Alfa Laval 0.25% 19-25.06.24 346,000 EUR 343,806 346,810 1.20
Boliden Ab Frn 19-19.06.24 2,000,000 SEK 186,768 198,767 0.69
Castellum 1.365% 20-09.09.24 2,000,000 SEK 196,488 199,993 0.69
Electrolux 1.103% 19-27.03.24 3,000,000 SEK 287,199 303,933 1.05
Elekta Ab Frn 20-13.03.25 4,000,000 SEK 380,843 398,652 1.38
Ellevio Frn 20-11.06.27 2,000,000 SEK 192,553 203,298 0.70
Ericsson Lm 0.875% 17-01.03.21 100,000 EUR 98,759 100,102 0.35
Ericsson Lm 1.875% 17-01.03.24 178,000 EUR 174,618 187,017 0.65
Fabege Ab 1.21% 20-22.09.25 2,000,000 SEK 192,085 197,865 0.69
Heimstaden 3.248% 19-Perp Regs 200,000 EUR 200,000 205,500 0.71
Heimstaden Frn 19-Perp 1,250,000 SEK 122,177 124,190 0.43
Hexagon Ab 1.375% 20-17.09.25 2,000,000 SEK 192,885 200,083 0.69
Hoist Finan 2.75% 18-03.04.23 325,000 EUR 324,087 323,797 1.12
Hoist Kred 3.875% 17-31.05.27 200,000 EUR 196,837 180,000 0.62
Hufvudstad 2.1% 15-24.08.22 2,000,000 SEK 211,746 203,219 0.70
Husqvarna Frn 17-01.03.24 2,000,000 SEK 192,296 202,792 0.70
Ica Gruppen Frn 18-15.01.21 1,000,000 SEK 95,586 99,521 0.35
In Justitia 3.5% 19-15.07.26 Regs 225,000 EUR 219,372 222,750 0.77
In Justitia 4.875% 20-15.08.25 Regs 125,000 EUR 125,000 129,062 0.45
DANSKE INVEST SICAV
The accompanying notes form an integral part of these financial statements.
203
Nordic Corporate Bond
Statement of Investments (continued)as at December 31, 2020(expressed in EUR)
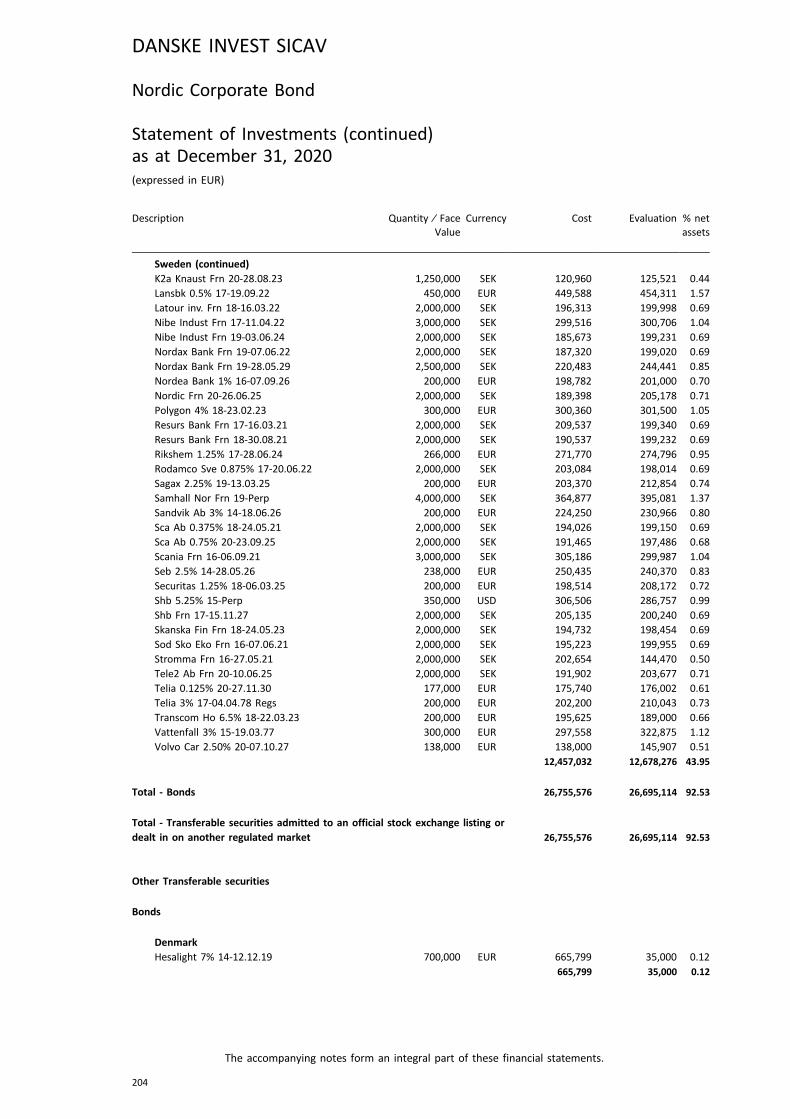
Description Quantity ⁄ FaceValue
Currency Cost Evaluation % netassets
Sweden (continued)K2a Knaust Frn 20-28.08.23 1,250,000 SEK 120,960 125,521 0.44
Lansbk 0.5% 17-19.09.22 450,000 EUR 449,588 454,311 1.57
Latour inv. Frn 18-16.03.22 2,000,000 SEK 196,313 199,998 0.69
Nibe Indust Frn 17-11.04.22 3,000,000 SEK 299,516 300,706 1.04
Nibe Indust Frn 19-03.06.24 2,000,000 SEK 185,673 199,231 0.69
Nordax Bank Frn 19-07.06.22 2,000,000 SEK 187,320 199,020 0.69
Nordax Bank Frn 19-28.05.29 2,500,000 SEK 220,483 244,441 0.85
Nordea Bank 1% 16-07.09.26 200,000 EUR 198,782 201,000 0.70
Nordic Frn 20-26.06.25 2,000,000 SEK 189,398 205,178 0.71
Polygon 4% 18-23.02.23 300,000 EUR 300,360 301,500 1.05
Resurs Bank Frn 17-16.03.21 2,000,000 SEK 209,537 199,340 0.69
Resurs Bank Frn 18-30.08.21 2,000,000 SEK 190,537 199,232 0.69
Rikshem 1.25% 17-28.06.24 266,000 EUR 271,770 274,796 0.95
Rodamco Sve 0.875% 17-20.06.22 2,000,000 SEK 203,084 198,014 0.69
Sagax 2.25% 19-13.03.25 200,000 EUR 203,370 212,854 0.74
Samhall Nor Frn 19-Perp 4,000,000 SEK 364,877 395,081 1.37
Sandvik Ab 3% 14-18.06.26 200,000 EUR 224,250 230,966 0.80
Sca Ab 0.375% 18-24.05.21 2,000,000 SEK 194,026 199,150 0.69
Sca Ab 0.75% 20-23.09.25 2,000,000 SEK 191,465 197,486 0.68
Scania Frn 16-06.09.21 3,000,000 SEK 305,186 299,987 1.04
Seb 2.5% 14-28.05.26 238,000 EUR 250,435 240,370 0.83
Securitas 1.25% 18-06.03.25 200,000 EUR 198,514 208,172 0.72
Shb 5.25% 15-Perp 350,000 USD 306,506 286,757 0.99
Shb Frn 17-15.11.27 2,000,000 SEK 205,135 200,240 0.69
Skanska Fin Frn 18-24.05.23 2,000,000 SEK 194,732 198,454 0.69
Sod Sko Eko Frn 16-07.06.21 2,000,000 SEK 195,223 199,955 0.69
Stromma Frn 16-27.05.21 2,000,000 SEK 202,654 144,470 0.50
Tele2 Ab Frn 20-10.06.25 2,000,000 SEK 191,902 203,677 0.71
Telia 0.125% 20-27.11.30 177,000 EUR 175,740 176,002 0.61
Telia 3% 17-04.04.78 Regs 200,000 EUR 202,200 210,043 0.73
Transcom Ho 6.5% 18-22.03.23 200,000 EUR 195,625 189,000 0.66
Vattenfall 3% 15-19.03.77 300,000 EUR 297,558 322,875 1.12
Volvo Car 2.50% 20-07.10.27 138,000 EUR 138,000 145,907 0.51
12,457,032 12,678,276 43.95
Total - Bonds 26,755,576 26,695,114 92.53
Total - Transferable securities admitted to an official stock exchange listing ordealt in on another regulated market 26,755,576 26,695,114 92.53
Other Transferable securities
Bonds
DenmarkHesalight 7% 14-12.12.19 700,000 EUR 665,799 35,000 0.12
665,799 35,000 0.12
DANSKE INVEST SICAV
The accompanying notes form an integral part of these financial statements.
204
Nordic Corporate Bond
Statement of Investments (continued)as at December 31, 2020(expressed in EUR)

Description Quantity ⁄ FaceValue
Currency Cost Evaluation % netassets
FinlandTieto Corp 2.0% 20-17.06.25 200,000 EUR 198,928 206,460 0.72
198,928 206,460 0.72
NorwayBulk In Frn 20-14.07.23 2,000,000 NOK 183,406 194,731 0.68
Digiplex No Frn 20-12.05.23 2,000,000 NOK 178,676 196,412 0.68
Dolphin 0% 09.03.16 /Strip /Dflt 67,037 NOK - - -
Dolphin 0% 12-Perp /Strip Io 45,045 NOK - - -
Dolphin 0% 13-Perp /Strip Io 65,595 NOK - - -
Hedgehog Frn 18-03.10.25 /Pl 2,953,208 NOK 266,341 280,494 0.97
628,423 671,637 2.33
SwedenGoldcup 100 Frn 20-30.04.23 2,500,000 SEK 240,754 248,795 0.86
240,754 248,795 0.86
Total - Bonds 1,733,904 1,161,892 4.03
Total - Other Transferable securities 1,733,904 1,161,892 4.03
TOTAL INVESTMENT PORTFOLIO 28,489,480 27,857,006 96.56
DANSKE INVEST SICAV
The accompanying notes form an integral part of these financial statements.
205
Nordic Corporate Bond
Statement of Investments (continued)as at December 31, 2020(expressed in EUR)
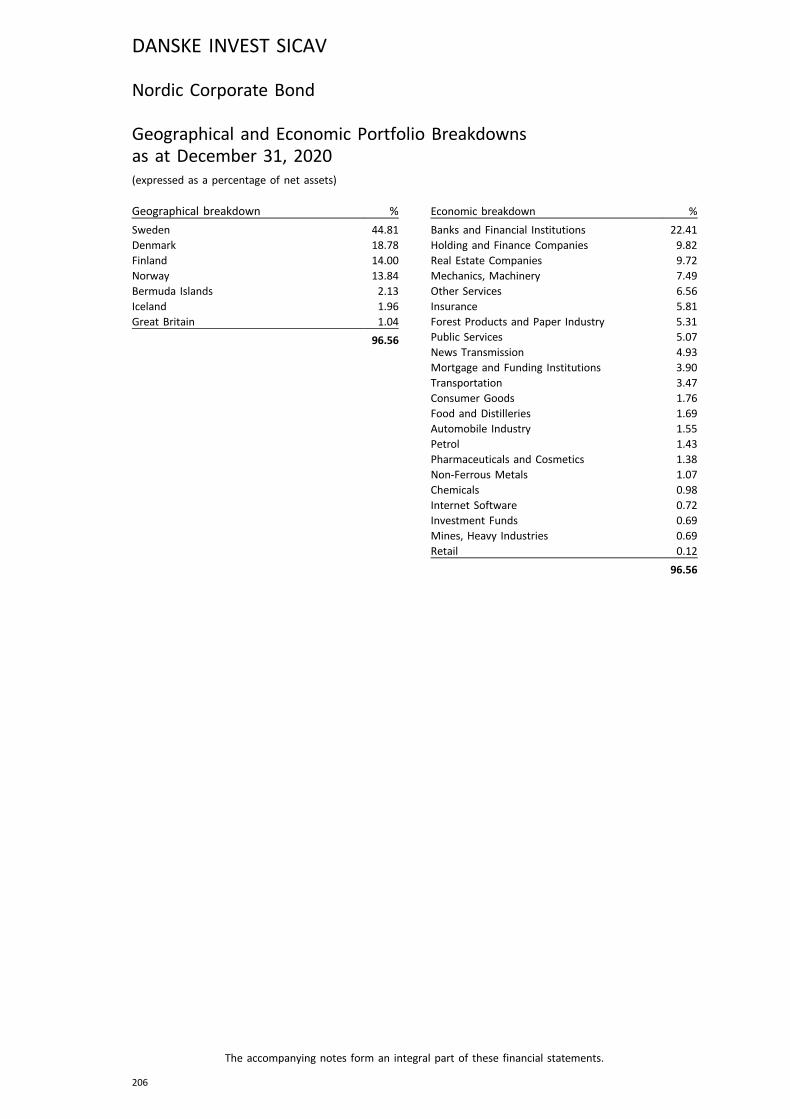
Nordic Corporate Bond
Geographical and Economic Portfolio Breakdownsas at December 31, 2020(expressed as a percentage of net assets)
Geographical breakdown %
Sweden 44.81Denmark 18.78Finland 14.00Norway 13.84Bermuda Islands 2.13Iceland 1.96Great Britain 1.04
96.56
Economic breakdown %
Banks and Financial Institutions 22.41Holding and Finance Companies 9.82Real Estate Companies 9.72Mechanics, Machinery 7.49Other Services 6.56Insurance 5.81Forest Products and Paper Industry 5.31Public Services 5.07News Transmission 4.93Mortgage and Funding Institutions 3.90Transportation 3.47Consumer Goods 1.76Food and Distilleries 1.69Automobile Industry 1.55Petrol 1.43Pharmaceuticals and Cosmetics 1.38Non-Ferrous Metals 1.07Chemicals 0.98Internet Software 0.72Investment Funds 0.69Mines, Heavy Industries 0.69Retail 0.12
96.56
DANSKE INVEST SICAV
The accompanying notes form an integral part of these financial statements.
206

Russia
Statement of Investmentsas at December 31, 2020(expressed in USD)
Description Quantity ⁄ FaceValue
Currency Cost Evaluation % netassets
Transferable securities admitted to an official stock exchange listing or dealt in on another regulated market
Shares
British Virgin IslandsMail. Ru Gr /Gdr 8,257 USD 242,366 220,462 2.14
242,366 220,462 2.14
CyprusGlobal Ports Inv /Gdr 17,508 USD 65,594 50,073 0.49
Ozon Holdings Plc /Sadr 2,250 USD 67,500 99,022 0.96
Tcs Group Holding Plc /Gdr 6,807 USD 161,373 213,740 2.07
294,467 362,835 3.52
Great BritainTbc Bank Group Plc 1,531 GBP 26,775 25,843 0.25
26,775 25,843 0.25
JerseyPolymetal 15,655 GBP 273,710 362,926 3.52
273,710 362,926 3.52
KazakhstanHalyk Bank /Sgdr 7,643 USD 97,002 89,423 0.87
97,002 89,423 0.87
RussiaAcron Ojsc 754 USD 44,112 59,743 0.58
Alrosa Cjsc Shs 265,135 USD 249,853 348,586 3.38
Ao Tatneft 71,671 USD 539,512 490,840 4.76
Enel Wgc-5 Ojsc 4,683,164 USD 93,123 56,357 0.55
Gazprom 357,462 USD 930,572 1,016,561 9.87
Gk Pik Shs 12,604 USD 73,264 100,761 0.98
Groupe Lsr /Sgdr Repr. Sreg S 40,823 USD 108,550 92,668 0.90
Inter Rao Ues Ojsc 1,245,298 USD 76,761 88,456 0.86
Jsc Surgutneftegaz /Pref. 850,628 USD 428,252 475,812 4.62
Lukoil Holding 13,284 USD 915,835 917,926 8.91
Magnit Jsc 6,927 USD 395,437 525,013 5.10
Magnitogorsk Iron&Steel Works 626,110 USD 421,660 467,260 4.54
Mmc Norilsk Nickel Pjsc /Adr 15,966 USD 340,910 506,122 4.91
Mobile Telesystems Pjsc 96,405 USD 417,303 426,211 4.14
Moscow Exchange 119,425 USD 172,871 254,802 2.47
Novolipetsk Steel Regs /Gdr 17,587 USD 457,358 487,864 4.74
Rosneft Oil Company Ojsc 62,140 USD 336,060 361,590 3.51
Sberbank 199,994 USD 630,632 724,942 7.04
Sberbank /Pref. 15,408 USD 42,291 49,592 0.48
Severstal Pjsc /Sgdr 29,544 USD 404,268 521,747 5.07
7,078,624 7,972,853 77.41
The NetherlandsX5 Retail Group Nv /Sgdr 12,592 USD 355,996 461,875 4.49
DANSKE INVEST SICAV
The accompanying notes form an integral part of these financial statements.
207

Description Quantity ⁄ FaceValue
Currency Cost Evaluation % netassets
The Netherlands (continued)Yandex Nv -A- 11,844 USD 693,151 823,158 7.99
1,049,147 1,285,033 12.48
Total - Shares 9,062,091 10,319,375 100.19
Total - Transferable securities admitted to an official stock exchange listing ordealt in on another regulated market 9,062,091 10,319,375 100.19
TOTAL INVESTMENT PORTFOLIO 9,062,091 10,319,375 100.19
DANSKE INVEST SICAV
The accompanying notes form an integral part of these financial statements.
208
Russia
Statement of Investments (continued)as at December 31, 2020(expressed in USD)

Russia
Geographical and Economic Portfolio Breakdownsas at December 31, 2020(expressed as a percentage of net assets)
Geographical breakdown %
Russia 77.41The Netherlands 12.48Cyprus 3.52Jersey 3.52British Virgin Islands 2.14Kazakhstan 0.87Great Britain 0.25
100.19
Economic breakdown %
Petrol 22.29Holding and Finance Companies 20.30Mines, Heavy Industries 14.35Internet Software 11.09Banks and Financial Institutions 8.64Food and Distilleries 5.10Retail 4.49News Transmission 4.14Non-Ferrous Metals 3.52Chemicals 3.38Public Services 1.41Real Estate Companies 0.90Pharmaceuticals and Cosmetics 0.58
100.19
DANSKE INVEST SICAV
The accompanying notes form an integral part of these financial statements.
209
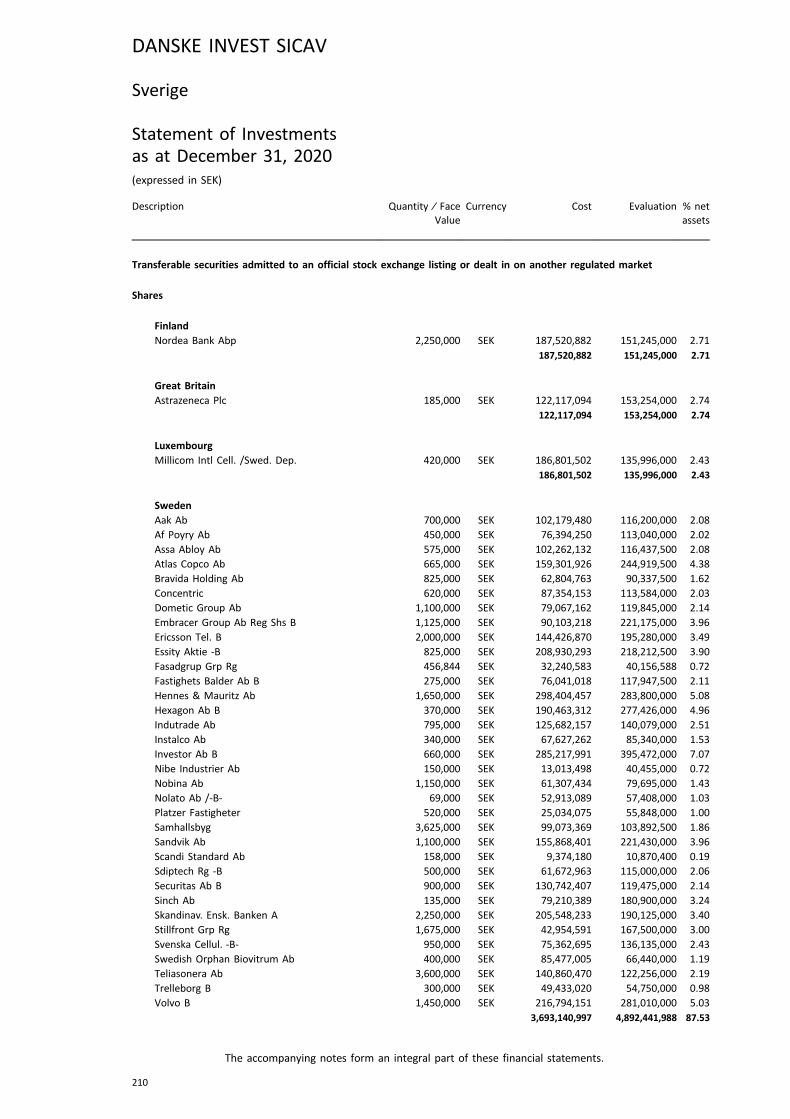
Sverige
Statement of Investmentsas at December 31, 2020(expressed in SEK)
Description Quantity ⁄ FaceValue
Currency Cost Evaluation % netassets
Transferable securities admitted to an official stock exchange listing or dealt in on another regulated market
Shares
FinlandNordea Bank Abp 2,250,000 SEK 187,520,882 151,245,000 2.71
187,520,882 151,245,000 2.71
Great BritainAstrazeneca Plc 185,000 SEK 122,117,094 153,254,000 2.74
122,117,094 153,254,000 2.74
LuxembourgMillicom Intl Cell. /Swed. Dep. 420,000 SEK 186,801,502 135,996,000 2.43
186,801,502 135,996,000 2.43
SwedenAak Ab 700,000 SEK 102,179,480 116,200,000 2.08
Af Poyry Ab 450,000 SEK 76,394,250 113,040,000 2.02
Assa Abloy Ab 575,000 SEK 102,262,132 116,437,500 2.08
Atlas Copco Ab 665,000 SEK 159,301,926 244,919,500 4.38
Bravida Holding Ab 825,000 SEK 62,804,763 90,337,500 1.62
Concentric 620,000 SEK 87,354,153 113,584,000 2.03
Dometic Group Ab 1,100,000 SEK 79,067,162 119,845,000 2.14
Embracer Group Ab Reg Shs B 1,125,000 SEK 90,103,218 221,175,000 3.96
Ericsson Tel. B 2,000,000 SEK 144,426,870 195,280,000 3.49
Essity Aktie -B 825,000 SEK 208,930,293 218,212,500 3.90
Fasadgrup Grp Rg 456,844 SEK 32,240,583 40,156,588 0.72
Fastighets Balder Ab B 275,000 SEK 76,041,018 117,947,500 2.11
Hennes & Mauritz Ab 1,650,000 SEK 298,404,457 283,800,000 5.08
Hexagon Ab B 370,000 SEK 190,463,312 277,426,000 4.96
Indutrade Ab 795,000 SEK 125,682,157 140,079,000 2.51
Instalco Ab 340,000 SEK 67,627,262 85,340,000 1.53
Investor Ab B 660,000 SEK 285,217,991 395,472,000 7.07
Nibe Industrier Ab 150,000 SEK 13,013,498 40,455,000 0.72
Nobina Ab 1,150,000 SEK 61,307,434 79,695,000 1.43
Nolato Ab /-B- 69,000 SEK 52,913,089 57,408,000 1.03
Platzer Fastigheter 520,000 SEK 25,034,075 55,848,000 1.00
Samhallsbyg 3,625,000 SEK 99,073,369 103,892,500 1.86
Sandvik Ab 1,100,000 SEK 155,868,401 221,430,000 3.96
Scandi Standard Ab 158,000 SEK 9,374,180 10,870,400 0.19
Sdiptech Rg -B 500,000 SEK 61,672,963 115,000,000 2.06
Securitas Ab B 900,000 SEK 130,742,407 119,475,000 2.14
Sinch Ab 135,000 SEK 79,210,389 180,900,000 3.24
Skandinav. Ensk. Banken A 2,250,000 SEK 205,548,233 190,125,000 3.40
Stillfront Grp Rg 1,675,000 SEK 42,954,591 167,500,000 3.00
Svenska Cellul. -B- 950,000 SEK 75,362,695 136,135,000 2.43
Swedish Orphan Biovitrum Ab 400,000 SEK 85,477,005 66,440,000 1.19
Teliasonera Ab 3,600,000 SEK 140,860,470 122,256,000 2.19
Trelleborg B 300,000 SEK 49,433,020 54,750,000 0.98
Volvo B 1,450,000 SEK 216,794,151 281,010,000 5.03
3,693,140,997 4,892,441,988 87.53
DANSKE INVEST SICAV
The accompanying notes form an integral part of these financial statements.
210

Description Quantity ⁄ FaceValue
Currency Cost Evaluation % netassets
SwitzerlandAbb Ltd 875,000 SEK 179,248,318 200,375,000 3.59
179,248,318 200,375,000 3.59
Total - Shares 4,368,828,793 5,533,311,988 99.00
Total - Transferable securities admitted to an official stock exchange listing ordealt in on another regulated market 4,368,828,793 5,533,311,988 99.00
TOTAL INVESTMENT PORTFOLIO 4,368,828,793 5,533,311,988 99.00
DANSKE INVEST SICAV
The accompanying notes form an integral part of these financial statements.
211
Sverige
Statement of Investments (continued)as at December 31, 2020(expressed in SEK)
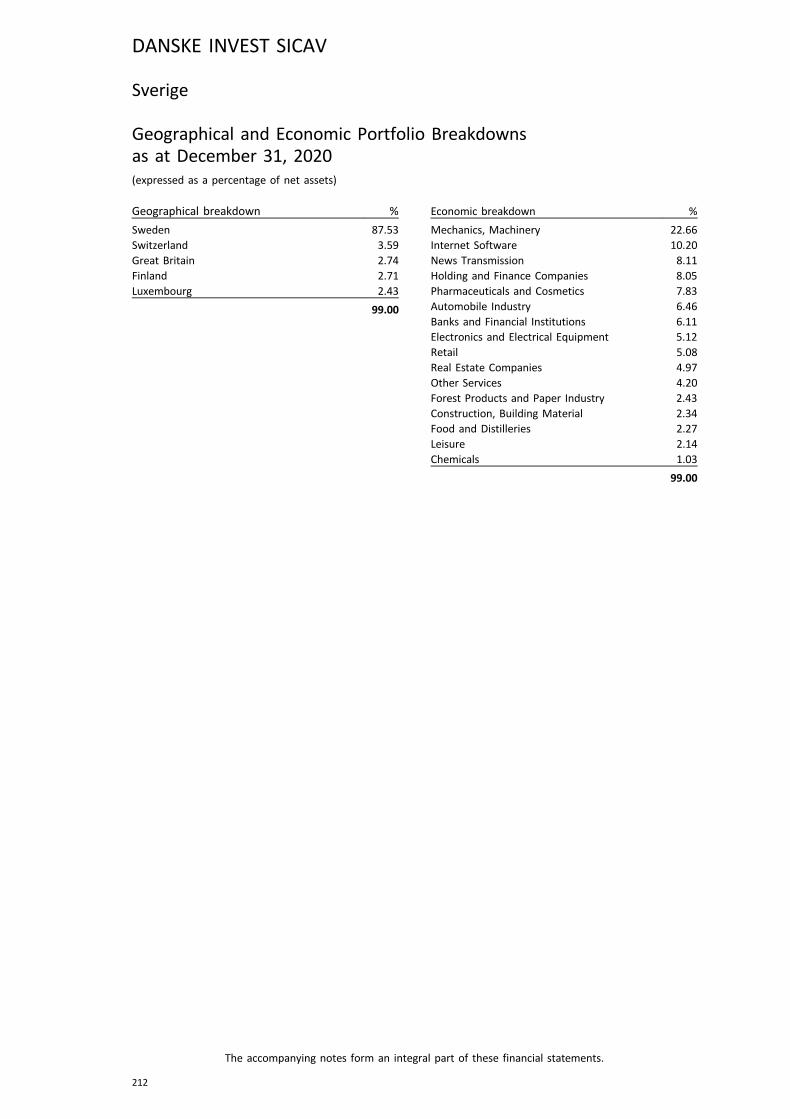
Sverige
Geographical and Economic Portfolio Breakdownsas at December 31, 2020(expressed as a percentage of net assets)
Geographical breakdown %
Sweden 87.53Switzerland 3.59Great Britain 2.74Finland 2.71Luxembourg 2.43
99.00
Economic breakdown %
Mechanics, Machinery 22.66Internet Software 10.20News Transmission 8.11Holding and Finance Companies 8.05Pharmaceuticals and Cosmetics 7.83Automobile Industry 6.46Banks and Financial Institutions 6.11Electronics and Electrical Equipment 5.12Retail 5.08Real Estate Companies 4.97Other Services 4.20Forest Products and Paper Industry 2.43Construction, Building Material 2.34Food and Distilleries 2.27Leisure 2.14Chemicals 1.03
99.00
DANSKE INVEST SICAV
The accompanying notes form an integral part of these financial statements.
212
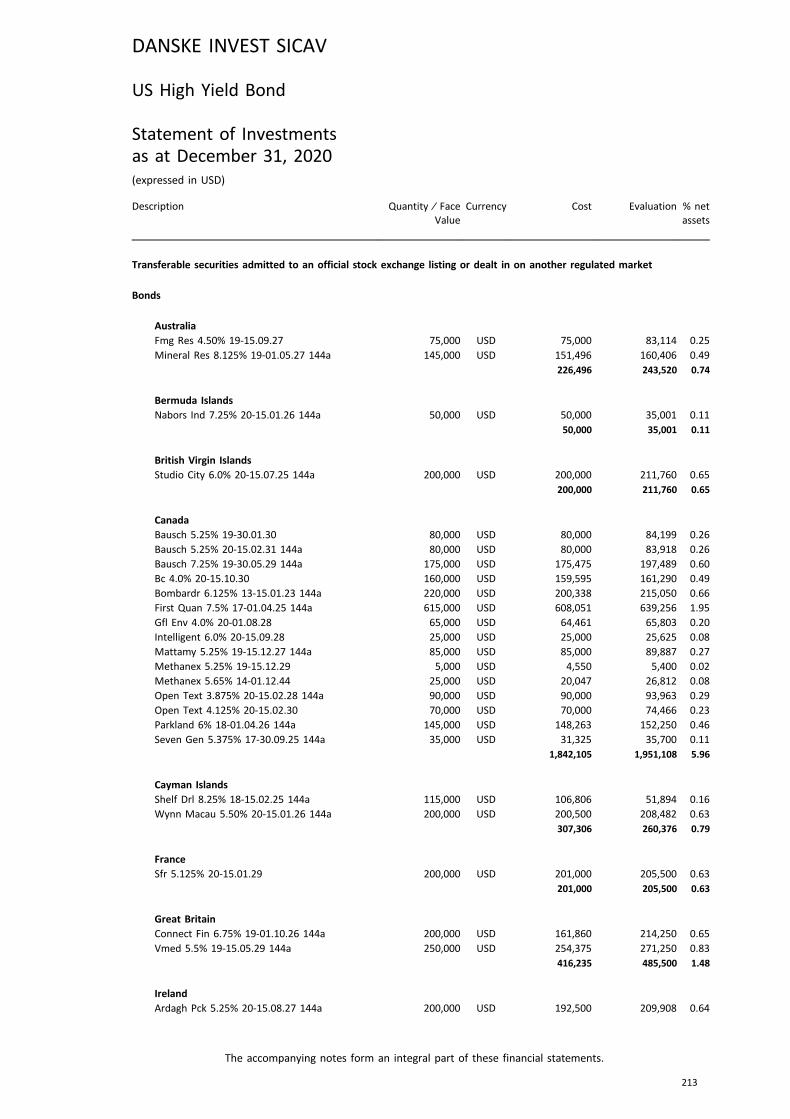
US High Yield Bond
Statement of Investmentsas at December 31, 2020(expressed in USD)
Description Quantity ⁄ FaceValue
Currency Cost Evaluation % netassets
Transferable securities admitted to an official stock exchange listing or dealt in on another regulated market
Bonds
AustraliaFmg Res 4.50% 19-15.09.27 75,000 USD 75,000 83,114 0.25
Mineral Res 8.125% 19-01.05.27 144a 145,000 USD 151,496 160,406 0.49
226,496 243,520 0.74
Bermuda IslandsNabors Ind 7.25% 20-15.01.26 144a 50,000 USD 50,000 35,001 0.11
50,000 35,001 0.11
British Virgin IslandsStudio City 6.0% 20-15.07.25 144a 200,000 USD 200,000 211,760 0.65
200,000 211,760 0.65
CanadaBausch 5.25% 19-30.01.30 80,000 USD 80,000 84,199 0.26
Bausch 5.25% 20-15.02.31 144a 80,000 USD 80,000 83,918 0.26
Bausch 7.25% 19-30.05.29 144a 175,000 USD 175,475 197,489 0.60
Bc 4.0% 20-15.10.30 160,000 USD 159,595 161,290 0.49
Bombardr 6.125% 13-15.01.23 144a 220,000 USD 200,338 215,050 0.66
First Quan 7.5% 17-01.04.25 144a 615,000 USD 608,051 639,256 1.95
Gfl Env 4.0% 20-01.08.28 65,000 USD 64,461 65,803 0.20
Intelligent 6.0% 20-15.09.28 25,000 USD 25,000 25,625 0.08
Mattamy 5.25% 19-15.12.27 144a 85,000 USD 85,000 89,887 0.27
Methanex 5.25% 19-15.12.29 5,000 USD 4,550 5,400 0.02
Methanex 5.65% 14-01.12.44 25,000 USD 20,047 26,812 0.08
Open Text 3.875% 20-15.02.28 144a 90,000 USD 90,000 93,963 0.29
Open Text 4.125% 20-15.02.30 70,000 USD 70,000 74,466 0.23
Parkland 6% 18-01.04.26 144a 145,000 USD 148,263 152,250 0.46
Seven Gen 5.375% 17-30.09.25 144a 35,000 USD 31,325 35,700 0.11
1,842,105 1,951,108 5.96
Cayman IslandsShelf Drl 8.25% 18-15.02.25 144a 115,000 USD 106,806 51,894 0.16
Wynn Macau 5.50% 20-15.01.26 144a 200,000 USD 200,500 208,482 0.63
307,306 260,376 0.79
FranceSfr 5.125% 20-15.01.29 200,000 USD 201,000 205,500 0.63
201,000 205,500 0.63
Great BritainConnect Fin 6.75% 19-01.10.26 144a 200,000 USD 161,860 214,250 0.65
Vmed 5.5% 19-15.05.29 144a 250,000 USD 254,375 271,250 0.83
416,235 485,500 1.48
IrelandArdagh Pck 5.25% 20-15.08.27 144a 200,000 USD 192,500 209,908 0.64
DANSKE INVEST SICAV
The accompanying notes form an integral part of these financial statements.
213
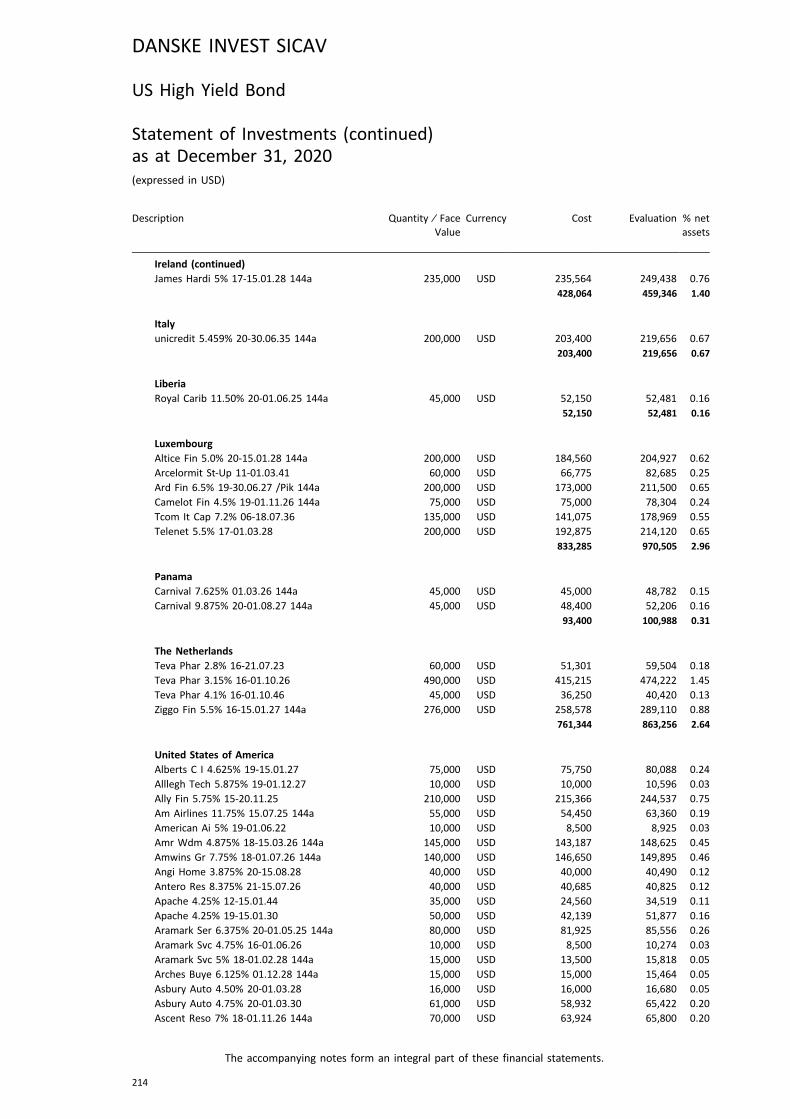
Description Quantity ⁄ FaceValue
Currency Cost Evaluation % netassets
Ireland (continued)James Hardi 5% 17-15.01.28 144a 235,000 USD 235,564 249,438 0.76
428,064 459,346 1.40
Italyunicredit 5.459% 20-30.06.35 144a 200,000 USD 203,400 219,656 0.67
203,400 219,656 0.67
LiberiaRoyal Carib 11.50% 20-01.06.25 144a 45,000 USD 52,150 52,481 0.16
52,150 52,481 0.16
LuxembourgAltice Fin 5.0% 20-15.01.28 144a 200,000 USD 184,560 204,927 0.62
Arcelormit St-Up 11-01.03.41 60,000 USD 66,775 82,685 0.25
Ard Fin 6.5% 19-30.06.27 /Pik 144a 200,000 USD 173,000 211,500 0.65
Camelot Fin 4.5% 19-01.11.26 144a 75,000 USD 75,000 78,304 0.24
Tcom It Cap 7.2% 06-18.07.36 135,000 USD 141,075 178,969 0.55
Telenet 5.5% 17-01.03.28 200,000 USD 192,875 214,120 0.65
833,285 970,505 2.96
PanamaCarnival 7.625% 01.03.26 144a 45,000 USD 45,000 48,782 0.15
Carnival 9.875% 20-01.08.27 144a 45,000 USD 48,400 52,206 0.16
93,400 100,988 0.31
The NetherlandsTeva Phar 2.8% 16-21.07.23 60,000 USD 51,301 59,504 0.18
Teva Phar 3.15% 16-01.10.26 490,000 USD 415,215 474,222 1.45
Teva Phar 4.1% 16-01.10.46 45,000 USD 36,250 40,420 0.13
Ziggo Fin 5.5% 16-15.01.27 144a 276,000 USD 258,578 289,110 0.88
761,344 863,256 2.64
United States of AmericaAlberts C I 4.625% 19-15.01.27 75,000 USD 75,750 80,088 0.24
Alllegh Tech 5.875% 19-01.12.27 10,000 USD 10,000 10,596 0.03
Ally Fin 5.75% 15-20.11.25 210,000 USD 215,366 244,537 0.75
Am Airlines 11.75% 15.07.25 144a 55,000 USD 54,450 63,360 0.19
American Ai 5% 19-01.06.22 10,000 USD 8,500 8,925 0.03
Amr Wdm 4.875% 18-15.03.26 144a 145,000 USD 143,187 148,625 0.45
Amwins Gr 7.75% 18-01.07.26 144a 140,000 USD 146,650 149,895 0.46
Angi Home 3.875% 20-15.08.28 40,000 USD 40,000 40,490 0.12
Antero Res 8.375% 21-15.07.26 40,000 USD 40,685 40,825 0.12
Apache 4.25% 12-15.01.44 35,000 USD 24,560 34,519 0.11
Apache 4.25% 19-15.01.30 50,000 USD 42,139 51,877 0.16
Aramark Ser 6.375% 20-01.05.25 144a 80,000 USD 81,925 85,556 0.26
Aramark Svc 4.75% 16-01.06.26 10,000 USD 8,500 10,274 0.03
Aramark Svc 5% 18-01.02.28 144a 15,000 USD 13,500 15,818 0.05
Arches Buye 6.125% 01.12.28 144a 15,000 USD 15,000 15,464 0.05
Asbury Auto 4.50% 20-01.03.28 16,000 USD 16,000 16,680 0.05
Asbury Auto 4.75% 20-01.03.30 61,000 USD 58,932 65,422 0.20
Ascent Reso 7% 18-01.11.26 144a 70,000 USD 63,924 65,800 0.20
DANSKE INVEST SICAV
The accompanying notes form an integral part of these financial statements.
214
US High Yield Bond
Statement of Investments (continued)as at December 31, 2020(expressed in USD)
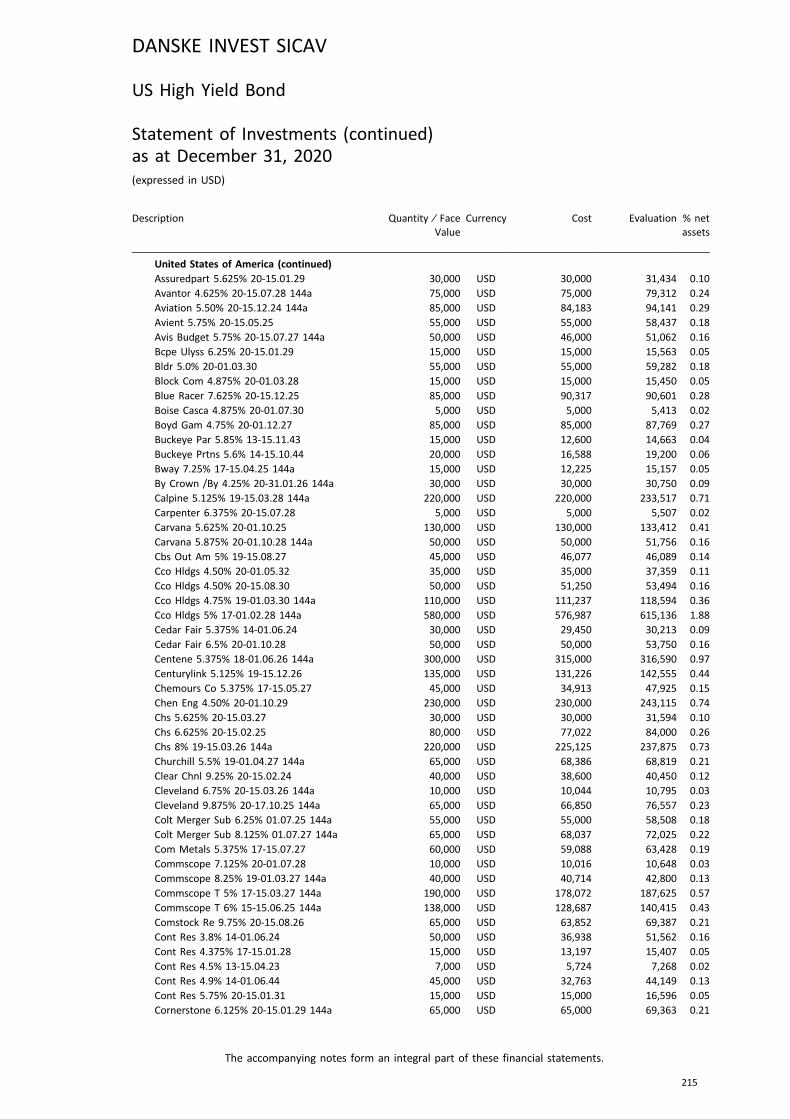
Description Quantity ⁄ FaceValue
Currency Cost Evaluation % netassets
United States of America (continued)Assuredpart 5.625% 20-15.01.29 30,000 USD 30,000 31,434 0.10
Avantor 4.625% 20-15.07.28 144a 75,000 USD 75,000 79,312 0.24
Aviation 5.50% 20-15.12.24 144a 85,000 USD 84,183 94,141 0.29
Avient 5.75% 20-15.05.25 55,000 USD 55,000 58,437 0.18
Avis Budget 5.75% 20-15.07.27 144a 50,000 USD 46,000 51,062 0.16
Bcpe Ulyss 6.25% 20-15.01.29 15,000 USD 15,000 15,563 0.05
Bldr 5.0% 20-01.03.30 55,000 USD 55,000 59,282 0.18
Block Com 4.875% 20-01.03.28 15,000 USD 15,000 15,450 0.05
Blue Racer 7.625% 20-15.12.25 85,000 USD 90,317 90,601 0.28
Boise Casca 4.875% 20-01.07.30 5,000 USD 5,000 5,413 0.02
Boyd Gam 4.75% 20-01.12.27 85,000 USD 85,000 87,769 0.27
Buckeye Par 5.85% 13-15.11.43 15,000 USD 12,600 14,663 0.04
Buckeye Prtns 5.6% 14-15.10.44 20,000 USD 16,588 19,200 0.06
Bway 7.25% 17-15.04.25 144a 15,000 USD 12,225 15,157 0.05
By Crown /By 4.25% 20-31.01.26 144a 30,000 USD 30,000 30,750 0.09
Calpine 5.125% 19-15.03.28 144a 220,000 USD 220,000 233,517 0.71
Carpenter 6.375% 20-15.07.28 5,000 USD 5,000 5,507 0.02
Carvana 5.625% 20-01.10.25 130,000 USD 130,000 133,412 0.41
Carvana 5.875% 20-01.10.28 144a 50,000 USD 50,000 51,756 0.16
Cbs Out Am 5% 19-15.08.27 45,000 USD 46,077 46,089 0.14
Cco Hldgs 4.50% 20-01.05.32 35,000 USD 35,000 37,359 0.11
Cco Hldgs 4.50% 20-15.08.30 50,000 USD 51,250 53,494 0.16
Cco Hldgs 4.75% 19-01.03.30 144a 110,000 USD 111,237 118,594 0.36
Cco Hldgs 5% 17-01.02.28 144a 580,000 USD 576,987 615,136 1.88
Cedar Fair 5.375% 14-01.06.24 30,000 USD 29,450 30,213 0.09
Cedar Fair 6.5% 20-01.10.28 50,000 USD 50,000 53,750 0.16
Centene 5.375% 18-01.06.26 144a 300,000 USD 315,000 316,590 0.97
Centurylink 5.125% 19-15.12.26 135,000 USD 131,226 142,555 0.44
Chemours Co 5.375% 17-15.05.27 45,000 USD 34,913 47,925 0.15
Chen Eng 4.50% 20-01.10.29 230,000 USD 230,000 243,115 0.74
Chs 5.625% 20-15.03.27 30,000 USD 30,000 31,594 0.10
Chs 6.625% 20-15.02.25 80,000 USD 77,022 84,000 0.26
Chs 8% 19-15.03.26 144a 220,000 USD 225,125 237,875 0.73
Churchill 5.5% 19-01.04.27 144a 65,000 USD 68,386 68,819 0.21
Clear Chnl 9.25% 20-15.02.24 40,000 USD 38,600 40,450 0.12
Cleveland 6.75% 20-15.03.26 144a 10,000 USD 10,044 10,795 0.03
Cleveland 9.875% 20-17.10.25 144a 65,000 USD 66,850 76,557 0.23
Colt Merger Sub 6.25% 01.07.25 144a 55,000 USD 55,000 58,508 0.18
Colt Merger Sub 8.125% 01.07.27 144a 65,000 USD 68,037 72,025 0.22
Com Metals 5.375% 17-15.07.27 60,000 USD 59,088 63,428 0.19
Commscope 7.125% 20-01.07.28 10,000 USD 10,016 10,648 0.03
Commscope 8.25% 19-01.03.27 144a 40,000 USD 40,714 42,800 0.13
Commscope T 5% 17-15.03.27 144a 190,000 USD 178,072 187,625 0.57
Commscope T 6% 15-15.06.25 144a 138,000 USD 128,687 140,415 0.43
Comstock Re 9.75% 20-15.08.26 65,000 USD 63,852 69,387 0.21
Cont Res 3.8% 14-01.06.24 50,000 USD 36,938 51,562 0.16
Cont Res 4.375% 17-15.01.28 15,000 USD 13,197 15,407 0.05
Cont Res 4.5% 13-15.04.23 7,000 USD 5,724 7,268 0.02
Cont Res 4.9% 14-01.06.44 45,000 USD 32,763 44,149 0.13
Cont Res 5.75% 20-15.01.31 15,000 USD 15,000 16,596 0.05
Cornerstone 6.125% 20-15.01.29 144a 65,000 USD 65,000 69,363 0.21
DANSKE INVEST SICAV
The accompanying notes form an integral part of these financial statements.
215
US High Yield Bond
Statement of Investments (continued)as at December 31, 2020(expressed in USD)
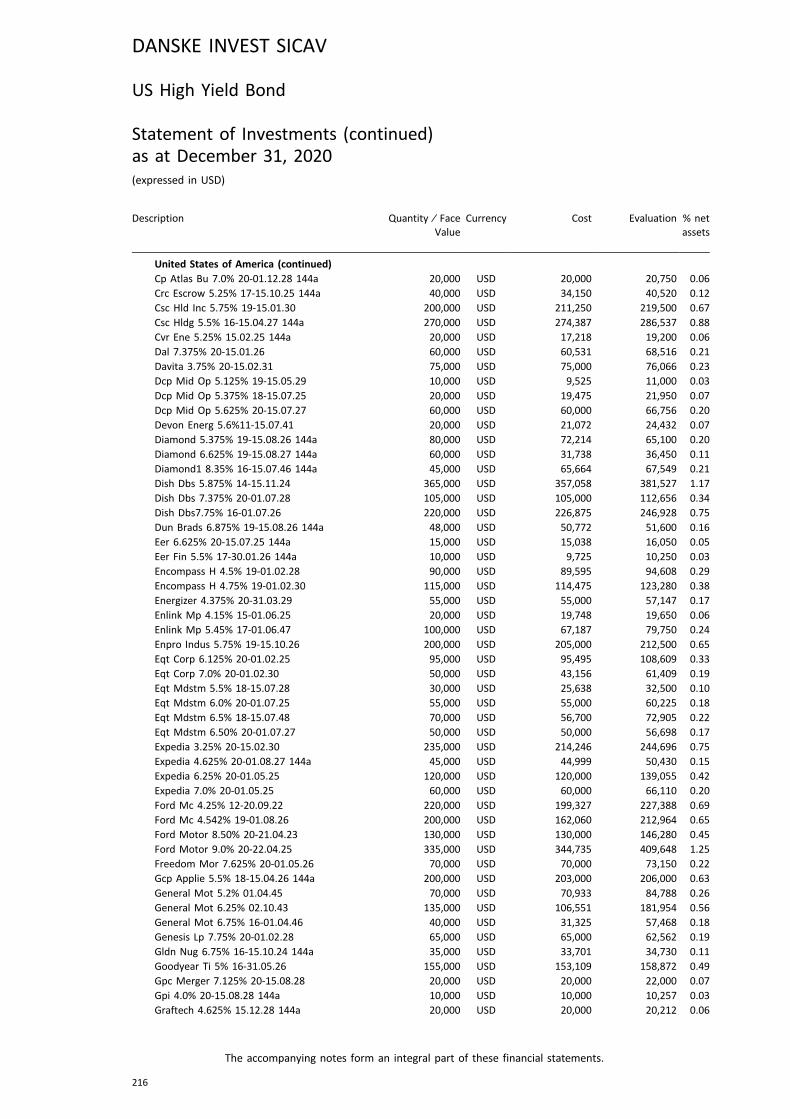
Description Quantity ⁄ FaceValue
Currency Cost Evaluation % netassets
United States of America (continued)Cp Atlas Bu 7.0% 20-01.12.28 144a 20,000 USD 20,000 20,750 0.06
Crc Escrow 5.25% 17-15.10.25 144a 40,000 USD 34,150 40,520 0.12
Csc Hld Inc 5.75% 19-15.01.30 200,000 USD 211,250 219,500 0.67
Csc Hldg 5.5% 16-15.04.27 144a 270,000 USD 274,387 286,537 0.88
Cvr Ene 5.25% 15.02.25 144a 20,000 USD 17,218 19,200 0.06
Dal 7.375% 20-15.01.26 60,000 USD 60,531 68,516 0.21
Davita 3.75% 20-15.02.31 75,000 USD 75,000 76,066 0.23
Dcp Mid Op 5.125% 19-15.05.29 10,000 USD 9,525 11,000 0.03
Dcp Mid Op 5.375% 18-15.07.25 20,000 USD 19,475 21,950 0.07
Dcp Mid Op 5.625% 20-15.07.27 60,000 USD 60,000 66,756 0.20
Devon Energ 5.6%11-15.07.41 20,000 USD 21,072 24,432 0.07
Diamond 5.375% 19-15.08.26 144a 80,000 USD 72,214 65,100 0.20
Diamond 6.625% 19-15.08.27 144a 60,000 USD 31,738 36,450 0.11
Diamond1 8.35% 16-15.07.46 144a 45,000 USD 65,664 67,549 0.21
Dish Dbs 5.875% 14-15.11.24 365,000 USD 357,058 381,527 1.17
Dish Dbs 7.375% 20-01.07.28 105,000 USD 105,000 112,656 0.34
Dish Dbs7.75% 16-01.07.26 220,000 USD 226,875 246,928 0.75
Dun Brads 6.875% 19-15.08.26 144a 48,000 USD 50,772 51,600 0.16
Eer 6.625% 20-15.07.25 144a 15,000 USD 15,038 16,050 0.05
Eer Fin 5.5% 17-30.01.26 144a 10,000 USD 9,725 10,250 0.03
Encompass H 4.5% 19-01.02.28 90,000 USD 89,595 94,608 0.29
Encompass H 4.75% 19-01.02.30 115,000 USD 114,475 123,280 0.38
Energizer 4.375% 20-31.03.29 55,000 USD 55,000 57,147 0.17
Enlink Mp 4.15% 15-01.06.25 20,000 USD 19,748 19,650 0.06
Enlink Mp 5.45% 17-01.06.47 100,000 USD 67,187 79,750 0.24
Enpro Indus 5.75% 19-15.10.26 200,000 USD 205,000 212,500 0.65
Eqt Corp 6.125% 20-01.02.25 95,000 USD 95,495 108,609 0.33
Eqt Corp 7.0% 20-01.02.30 50,000 USD 43,156 61,409 0.19
Eqt Mdstm 5.5% 18-15.07.28 30,000 USD 25,638 32,500 0.10
Eqt Mdstm 6.0% 20-01.07.25 55,000 USD 55,000 60,225 0.18
Eqt Mdstm 6.5% 18-15.07.48 70,000 USD 56,700 72,905 0.22
Eqt Mdstm 6.50% 20-01.07.27 50,000 USD 50,000 56,698 0.17
Expedia 3.25% 20-15.02.30 235,000 USD 214,246 244,696 0.75
Expedia 4.625% 20-01.08.27 144a 45,000 USD 44,999 50,430 0.15
Expedia 6.25% 20-01.05.25 120,000 USD 120,000 139,055 0.42
Expedia 7.0% 20-01.05.25 60,000 USD 60,000 66,110 0.20
Ford Mc 4.25% 12-20.09.22 220,000 USD 199,327 227,388 0.69
Ford Mc 4.542% 19-01.08.26 200,000 USD 162,060 212,964 0.65
Ford Motor 8.50% 20-21.04.23 130,000 USD 130,000 146,280 0.45
Ford Motor 9.0% 20-22.04.25 335,000 USD 344,735 409,648 1.25
Freedom Mor 7.625% 20-01.05.26 70,000 USD 70,000 73,150 0.22
Gcp Applie 5.5% 18-15.04.26 144a 200,000 USD 203,000 206,000 0.63
General Mot 5.2% 01.04.45 70,000 USD 70,933 84,788 0.26
General Mot 6.25% 02.10.43 135,000 USD 106,551 181,954 0.56
General Mot 6.75% 16-01.04.46 40,000 USD 31,325 57,468 0.18
Genesis Lp 7.75% 20-01.02.28 65,000 USD 65,000 62,562 0.19
Gldn Nug 6.75% 16-15.10.24 144a 35,000 USD 33,701 34,730 0.11
Goodyear Ti 5% 16-31.05.26 155,000 USD 153,109 158,872 0.49
Gpc Merger 7.125% 20-15.08.28 20,000 USD 20,000 22,000 0.07
Gpi 4.0% 20-15.08.28 144a 10,000 USD 10,000 10,257 0.03
Graftech 4.625% 15.12.28 144a 20,000 USD 20,000 20,212 0.06
DANSKE INVEST SICAV
The accompanying notes form an integral part of these financial statements.
216
US High Yield Bond
Statement of Investments (continued)as at December 31, 2020(expressed in USD)
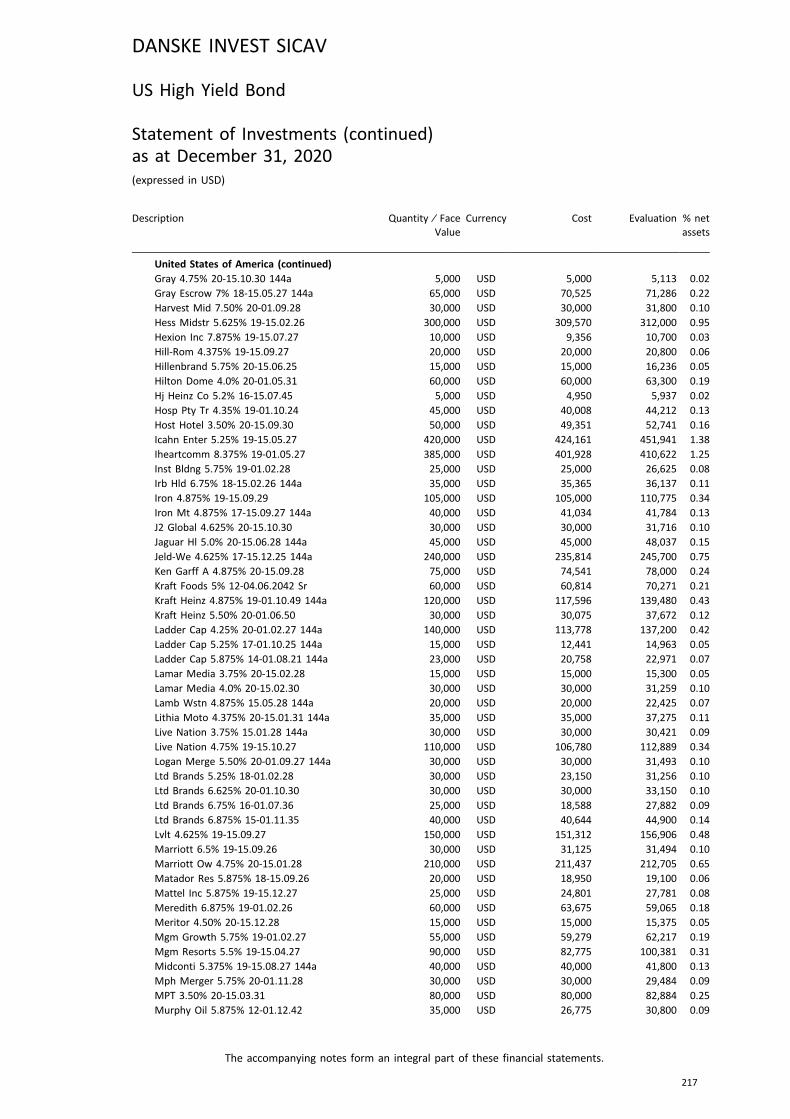
Description Quantity ⁄ FaceValue
Currency Cost Evaluation % netassets
United States of America (continued)Gray 4.75% 20-15.10.30 144a 5,000 USD 5,000 5,113 0.02
Gray Escrow 7% 18-15.05.27 144a 65,000 USD 70,525 71,286 0.22
Harvest Mid 7.50% 20-01.09.28 30,000 USD 30,000 31,800 0.10
Hess Midstr 5.625% 19-15.02.26 300,000 USD 309,570 312,000 0.95
Hexion Inc 7.875% 19-15.07.27 10,000 USD 9,356 10,700 0.03
Hill-Rom 4.375% 19-15.09.27 20,000 USD 20,000 20,800 0.06
Hillenbrand 5.75% 20-15.06.25 15,000 USD 15,000 16,236 0.05
Hilton Dome 4.0% 20-01.05.31 60,000 USD 60,000 63,300 0.19
Hj Heinz Co 5.2% 16-15.07.45 5,000 USD 4,950 5,937 0.02
Hosp Pty Tr 4.35% 19-01.10.24 45,000 USD 40,008 44,212 0.13
Host Hotel 3.50% 20-15.09.30 50,000 USD 49,351 52,741 0.16
Icahn Enter 5.25% 19-15.05.27 420,000 USD 424,161 451,941 1.38
Iheartcomm 8.375% 19-01.05.27 385,000 USD 401,928 410,622 1.25
Inst Bldng 5.75% 19-01.02.28 25,000 USD 25,000 26,625 0.08
Irb Hld 6.75% 18-15.02.26 144a 35,000 USD 35,365 36,137 0.11
Iron 4.875% 19-15.09.29 105,000 USD 105,000 110,775 0.34
Iron Mt 4.875% 17-15.09.27 144a 40,000 USD 41,034 41,784 0.13
J2 Global 4.625% 20-15.10.30 30,000 USD 30,000 31,716 0.10
Jaguar Hl 5.0% 20-15.06.28 144a 45,000 USD 45,000 48,037 0.15
Jeld-We 4.625% 17-15.12.25 144a 240,000 USD 235,814 245,700 0.75
Ken Garff A 4.875% 20-15.09.28 75,000 USD 74,541 78,000 0.24
Kraft Foods 5% 12-04.06.2042 Sr 60,000 USD 60,814 70,271 0.21
Kraft Heinz 4.875% 19-01.10.49 144a 120,000 USD 117,596 139,480 0.43
Kraft Heinz 5.50% 20-01.06.50 30,000 USD 30,075 37,672 0.12
Ladder Cap 4.25% 20-01.02.27 144a 140,000 USD 113,778 137,200 0.42
Ladder Cap 5.25% 17-01.10.25 144a 15,000 USD 12,441 14,963 0.05
Ladder Cap 5.875% 14-01.08.21 144a 23,000 USD 20,758 22,971 0.07
Lamar Media 3.75% 20-15.02.28 15,000 USD 15,000 15,300 0.05
Lamar Media 4.0% 20-15.02.30 30,000 USD 30,000 31,259 0.10
Lamb Wstn 4.875% 15.05.28 144a 20,000 USD 20,000 22,425 0.07
Lithia Moto 4.375% 20-15.01.31 144a 35,000 USD 35,000 37,275 0.11
Live Nation 3.75% 15.01.28 144a 30,000 USD 30,000 30,421 0.09
Live Nation 4.75% 19-15.10.27 110,000 USD 106,780 112,889 0.34
Logan Merge 5.50% 20-01.09.27 144a 30,000 USD 30,000 31,493 0.10
Ltd Brands 5.25% 18-01.02.28 30,000 USD 23,150 31,256 0.10
Ltd Brands 6.625% 20-01.10.30 30,000 USD 30,000 33,150 0.10
Ltd Brands 6.75% 16-01.07.36 25,000 USD 18,588 27,882 0.09
Ltd Brands 6.875% 15-01.11.35 40,000 USD 40,644 44,900 0.14
Lvlt 4.625% 19-15.09.27 150,000 USD 151,312 156,906 0.48
Marriott 6.5% 19-15.09.26 30,000 USD 31,125 31,494 0.10
Marriott Ow 4.75% 20-15.01.28 210,000 USD 211,437 212,705 0.65
Matador Res 5.875% 18-15.09.26 20,000 USD 18,950 19,100 0.06
Mattel Inc 5.875% 19-15.12.27 25,000 USD 24,801 27,781 0.08
Meredith 6.875% 19-01.02.26 60,000 USD 63,675 59,065 0.18
Meritor 4.50% 20-15.12.28 15,000 USD 15,000 15,375 0.05
Mgm Growth 5.75% 19-01.02.27 55,000 USD 59,279 62,217 0.19
Mgm Resorts 5.5% 19-15.04.27 90,000 USD 82,775 100,381 0.31
Midconti 5.375% 19-15.08.27 144a 40,000 USD 40,000 41,800 0.13
Mph Merger 5.75% 20-01.11.28 30,000 USD 30,000 29,484 0.09
MPT 3.50% 20-15.03.31 80,000 USD 80,000 82,884 0.25
Murphy Oil 5.875% 12-01.12.42 35,000 USD 26,775 30,800 0.09
DANSKE INVEST SICAV
The accompanying notes form an integral part of these financial statements.
217
US High Yield Bond
Statement of Investments (continued)as at December 31, 2020(expressed in USD)
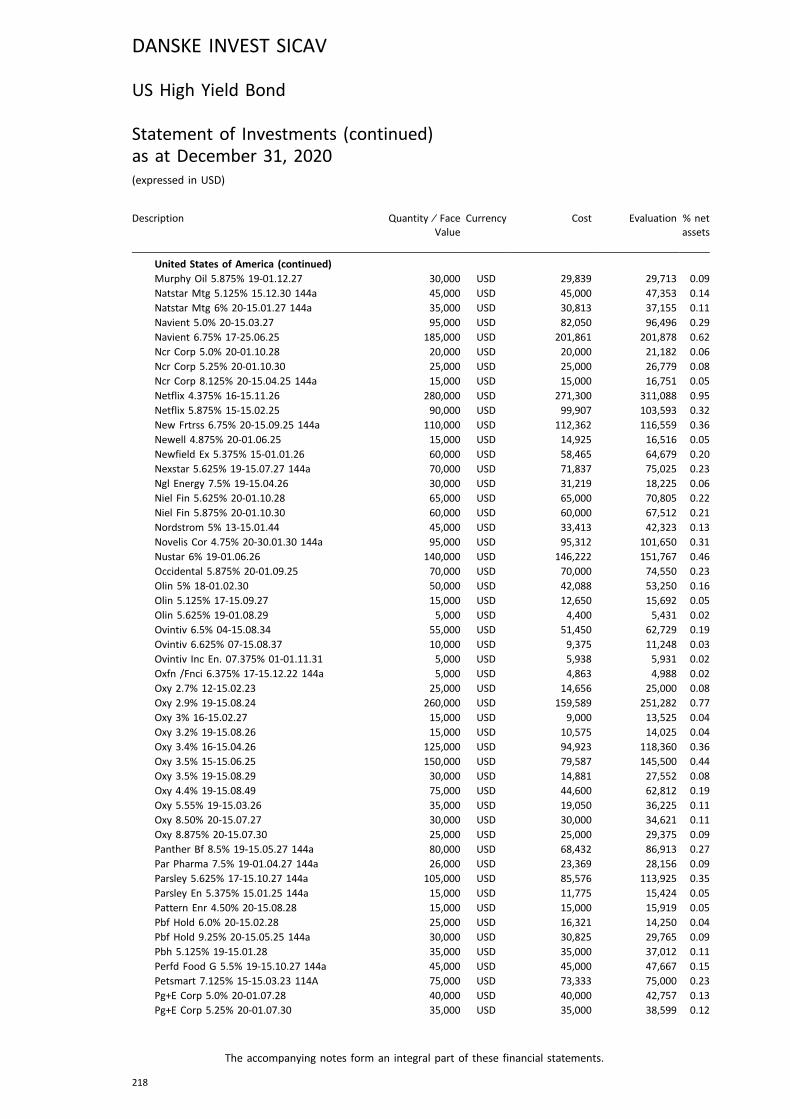
Description Quantity ⁄ FaceValue
Currency Cost Evaluation % netassets
United States of America (continued)Murphy Oil 5.875% 19-01.12.27 30,000 USD 29,839 29,713 0.09
Natstar Mtg 5.125% 15.12.30 144a 45,000 USD 45,000 47,353 0.14
Natstar Mtg 6% 20-15.01.27 144a 35,000 USD 30,813 37,155 0.11
Navient 5.0% 20-15.03.27 95,000 USD 82,050 96,496 0.29
Navient 6.75% 17-25.06.25 185,000 USD 201,861 201,878 0.62
Ncr Corp 5.0% 20-01.10.28 20,000 USD 20,000 21,182 0.06
Ncr Corp 5.25% 20-01.10.30 25,000 USD 25,000 26,779 0.08
Ncr Corp 8.125% 20-15.04.25 144a 15,000 USD 15,000 16,751 0.05
Netflix 4.375% 16-15.11.26 280,000 USD 271,300 311,088 0.95
Netflix 5.875% 15-15.02.25 90,000 USD 99,907 103,593 0.32
New Frtrss 6.75% 20-15.09.25 144a 110,000 USD 112,362 116,559 0.36
Newell 4.875% 20-01.06.25 15,000 USD 14,925 16,516 0.05
Newfield Ex 5.375% 15-01.01.26 60,000 USD 58,465 64,679 0.20
Nexstar 5.625% 19-15.07.27 144a 70,000 USD 71,837 75,025 0.23
Ngl Energy 7.5% 19-15.04.26 30,000 USD 31,219 18,225 0.06
Niel Fin 5.625% 20-01.10.28 65,000 USD 65,000 70,805 0.22
Niel Fin 5.875% 20-01.10.30 60,000 USD 60,000 67,512 0.21
Nordstrom 5% 13-15.01.44 45,000 USD 33,413 42,323 0.13
Novelis Cor 4.75% 20-30.01.30 144a 95,000 USD 95,312 101,650 0.31
Nustar 6% 19-01.06.26 140,000 USD 146,222 151,767 0.46
Occidental 5.875% 20-01.09.25 70,000 USD 70,000 74,550 0.23
Olin 5% 18-01.02.30 50,000 USD 42,088 53,250 0.16
Olin 5.125% 17-15.09.27 15,000 USD 12,650 15,692 0.05
Olin 5.625% 19-01.08.29 5,000 USD 4,400 5,431 0.02
Ovintiv 6.5% 04-15.08.34 55,000 USD 51,450 62,729 0.19
Ovintiv 6.625% 07-15.08.37 10,000 USD 9,375 11,248 0.03
Ovintiv Inc En. 07.375% 01-01.11.31 5,000 USD 5,938 5,931 0.02
Oxfn /Fnci 6.375% 17-15.12.22 144a 5,000 USD 4,863 4,988 0.02
Oxy 2.7% 12-15.02.23 25,000 USD 14,656 25,000 0.08
Oxy 2.9% 19-15.08.24 260,000 USD 159,589 251,282 0.77
Oxy 3% 16-15.02.27 15,000 USD 9,000 13,525 0.04
Oxy 3.2% 19-15.08.26 15,000 USD 10,575 14,025 0.04
Oxy 3.4% 16-15.04.26 125,000 USD 94,923 118,360 0.36
Oxy 3.5% 15-15.06.25 150,000 USD 79,587 145,500 0.44
Oxy 3.5% 19-15.08.29 30,000 USD 14,881 27,552 0.08
Oxy 4.4% 19-15.08.49 75,000 USD 44,600 62,812 0.19
Oxy 5.55% 19-15.03.26 35,000 USD 19,050 36,225 0.11
Oxy 8.50% 20-15.07.27 30,000 USD 30,000 34,621 0.11
Oxy 8.875% 20-15.07.30 25,000 USD 25,000 29,375 0.09
Panther Bf 8.5% 19-15.05.27 144a 80,000 USD 68,432 86,913 0.27
Par Pharma 7.5% 19-01.04.27 144a 26,000 USD 23,369 28,156 0.09
Parsley 5.625% 17-15.10.27 144a 105,000 USD 85,576 113,925 0.35
Parsley En 5.375% 15.01.25 144a 15,000 USD 11,775 15,424 0.05
Pattern Enr 4.50% 20-15.08.28 15,000 USD 15,000 15,919 0.05
Pbf Hold 6.0% 20-15.02.28 25,000 USD 16,321 14,250 0.04
Pbf Hold 9.25% 20-15.05.25 144a 30,000 USD 30,825 29,765 0.09
Pbh 5.125% 19-15.01.28 35,000 USD 35,000 37,012 0.11
Perfd Food G 5.5% 19-15.10.27 144a 45,000 USD 45,000 47,667 0.15
Petsmart 7.125% 15-15.03.23 114A 75,000 USD 73,333 75,000 0.23
Pg+E Corp 5.0% 20-01.07.28 40,000 USD 40,000 42,757 0.13
Pg+E Corp 5.25% 20-01.07.30 35,000 USD 35,000 38,599 0.12
DANSKE INVEST SICAV
The accompanying notes form an integral part of these financial statements.
218
US High Yield Bond
Statement of Investments (continued)as at December 31, 2020(expressed in USD)
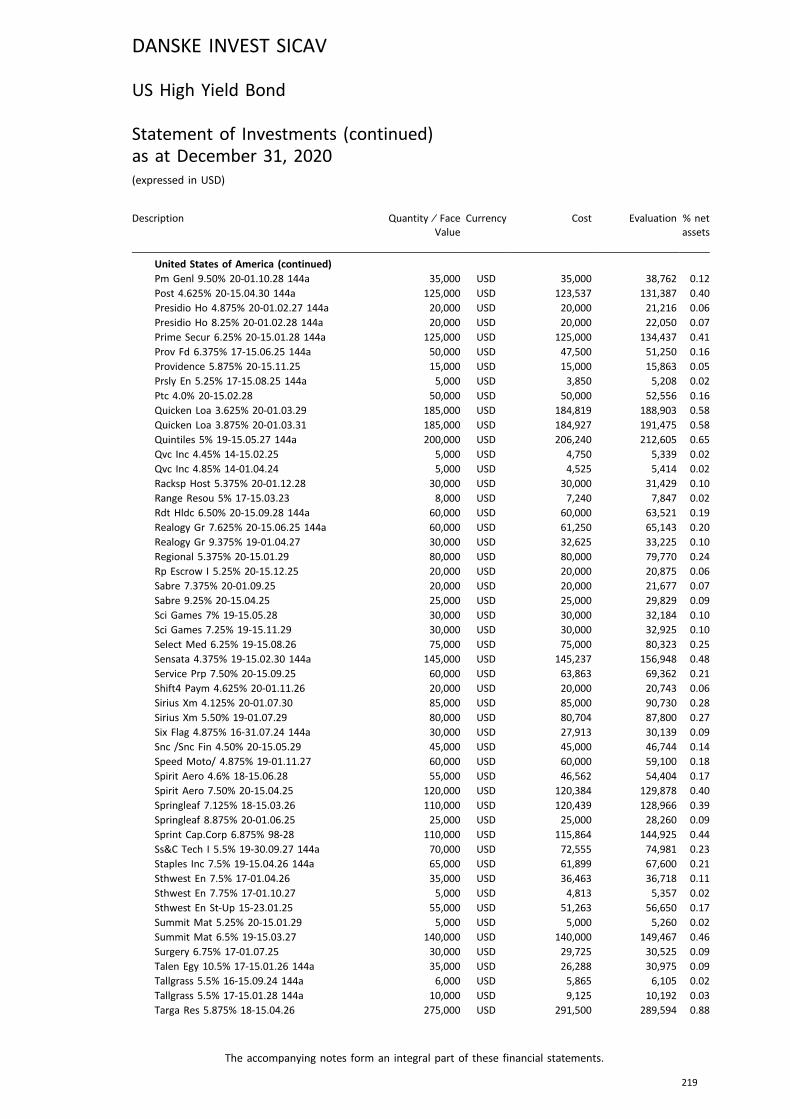
Description Quantity ⁄ FaceValue
Currency Cost Evaluation % netassets
United States of America (continued)Pm Genl 9.50% 20-01.10.28 144a 35,000 USD 35,000 38,762 0.12
Post 4.625% 20-15.04.30 144a 125,000 USD 123,537 131,387 0.40
Presidio Ho 4.875% 20-01.02.27 144a 20,000 USD 20,000 21,216 0.06
Presidio Ho 8.25% 20-01.02.28 144a 20,000 USD 20,000 22,050 0.07
Prime Secur 6.25% 20-15.01.28 144a 125,000 USD 125,000 134,437 0.41
Prov Fd 6.375% 17-15.06.25 144a 50,000 USD 47,500 51,250 0.16
Providence 5.875% 20-15.11.25 15,000 USD 15,000 15,863 0.05
Prsly En 5.25% 17-15.08.25 144a 5,000 USD 3,850 5,208 0.02
Ptc 4.0% 20-15.02.28 50,000 USD 50,000 52,556 0.16
Quicken Loa 3.625% 20-01.03.29 185,000 USD 184,819 188,903 0.58
Quicken Loa 3.875% 20-01.03.31 185,000 USD 184,927 191,475 0.58
Quintiles 5% 19-15.05.27 144a 200,000 USD 206,240 212,605 0.65
Qvc Inc 4.45% 14-15.02.25 5,000 USD 4,750 5,339 0.02
Qvc Inc 4.85% 14-01.04.24 5,000 USD 4,525 5,414 0.02
Racksp Host 5.375% 20-01.12.28 30,000 USD 30,000 31,429 0.10
Range Resou 5% 17-15.03.23 8,000 USD 7,240 7,847 0.02
Rdt Hldc 6.50% 20-15.09.28 144a 60,000 USD 60,000 63,521 0.19
Realogy Gr 7.625% 20-15.06.25 144a 60,000 USD 61,250 65,143 0.20
Realogy Gr 9.375% 19-01.04.27 30,000 USD 32,625 33,225 0.10
Regional 5.375% 20-15.01.29 80,000 USD 80,000 79,770 0.24
Rp Escrow I 5.25% 20-15.12.25 20,000 USD 20,000 20,875 0.06
Sabre 7.375% 20-01.09.25 20,000 USD 20,000 21,677 0.07
Sabre 9.25% 20-15.04.25 25,000 USD 25,000 29,829 0.09
Sci Games 7% 19-15.05.28 30,000 USD 30,000 32,184 0.10
Sci Games 7.25% 19-15.11.29 30,000 USD 30,000 32,925 0.10
Select Med 6.25% 19-15.08.26 75,000 USD 75,000 80,323 0.25
Sensata 4.375% 19-15.02.30 144a 145,000 USD 145,237 156,948 0.48
Service Prp 7.50% 20-15.09.25 60,000 USD 63,863 69,362 0.21
Shift4 Paym 4.625% 20-01.11.26 20,000 USD 20,000 20,743 0.06
Sirius Xm 4.125% 20-01.07.30 85,000 USD 85,000 90,730 0.28
Sirius Xm 5.50% 19-01.07.29 80,000 USD 80,704 87,800 0.27
Six Flag 4.875% 16-31.07.24 144a 30,000 USD 27,913 30,139 0.09
Snc /Snc Fin 4.50% 20-15.05.29 45,000 USD 45,000 46,744 0.14
Speed Moto/ 4.875% 19-01.11.27 60,000 USD 60,000 59,100 0.18
Spirit Aero 4.6% 18-15.06.28 55,000 USD 46,562 54,404 0.17
Spirit Aero 7.50% 20-15.04.25 120,000 USD 120,384 129,878 0.40
Springleaf 7.125% 18-15.03.26 110,000 USD 120,439 128,966 0.39
Springleaf 8.875% 20-01.06.25 25,000 USD 25,000 28,260 0.09
Sprint Cap.Corp 6.875% 98-28 110,000 USD 115,864 144,925 0.44
Ss&C Tech I 5.5% 19-30.09.27 144a 70,000 USD 72,555 74,981 0.23
Staples Inc 7.5% 19-15.04.26 144a 65,000 USD 61,899 67,600 0.21
Sthwest En 7.5% 17-01.04.26 35,000 USD 36,463 36,718 0.11
Sthwest En 7.75% 17-01.10.27 5,000 USD 4,813 5,357 0.02
Sthwest En St-Up 15-23.01.25 55,000 USD 51,263 56,650 0.17
Summit Mat 5.25% 20-15.01.29 5,000 USD 5,000 5,260 0.02
Summit Mat 6.5% 19-15.03.27 140,000 USD 140,000 149,467 0.46
Surgery 6.75% 17-01.07.25 30,000 USD 29,725 30,525 0.09
Talen Egy 10.5% 17-15.01.26 144a 35,000 USD 26,288 30,975 0.09
Tallgrass 5.5% 16-15.09.24 144a 6,000 USD 5,865 6,105 0.02
Tallgrass 5.5% 17-15.01.28 144a 10,000 USD 9,125 10,192 0.03
Targa Res 5.875% 18-15.04.26 275,000 USD 291,500 289,594 0.88
DANSKE INVEST SICAV
The accompanying notes form an integral part of these financial statements.
219
US High Yield Bond
Statement of Investments (continued)as at December 31, 2020(expressed in USD)
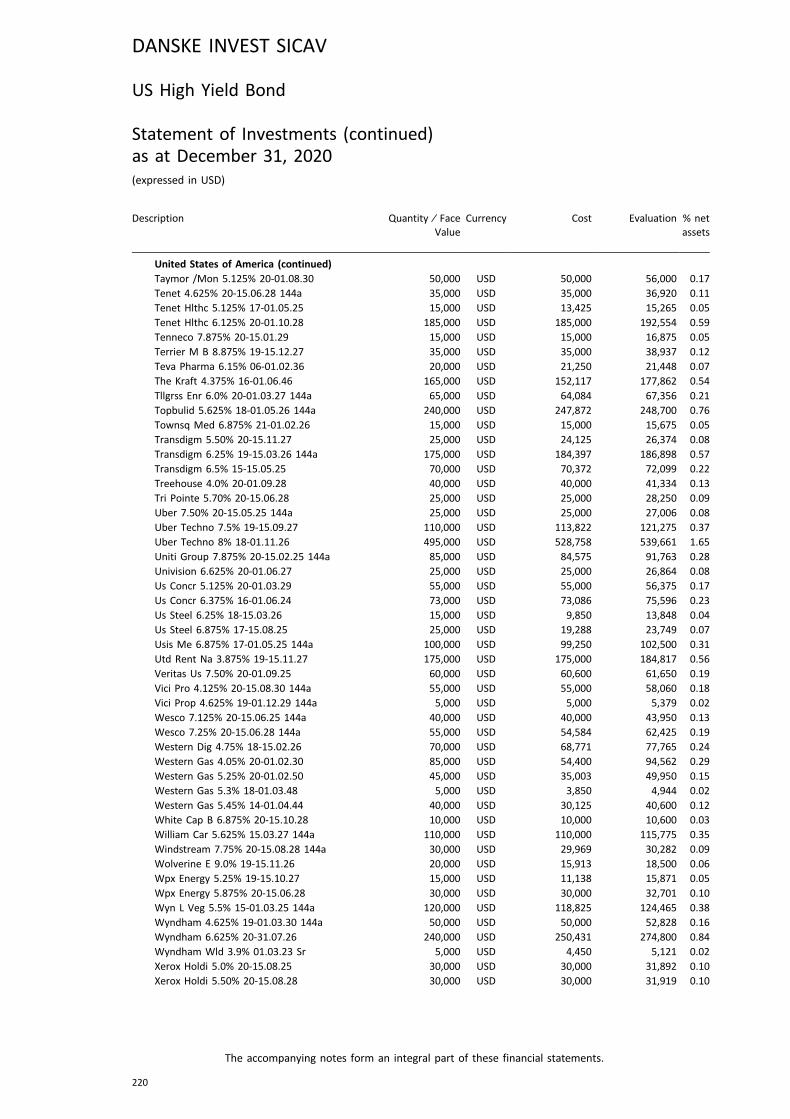
Description Quantity ⁄ FaceValue
Currency Cost Evaluation % netassets
United States of America (continued)Taymor /Mon 5.125% 20-01.08.30 50,000 USD 50,000 56,000 0.17
Tenet 4.625% 20-15.06.28 144a 35,000 USD 35,000 36,920 0.11
Tenet Hlthc 5.125% 17-01.05.25 15,000 USD 13,425 15,265 0.05
Tenet Hlthc 6.125% 20-01.10.28 185,000 USD 185,000 192,554 0.59
Tenneco 7.875% 20-15.01.29 15,000 USD 15,000 16,875 0.05
Terrier M B 8.875% 19-15.12.27 35,000 USD 35,000 38,937 0.12
Teva Pharma 6.15% 06-01.02.36 20,000 USD 21,250 21,448 0.07
The Kraft 4.375% 16-01.06.46 165,000 USD 152,117 177,862 0.54
Tllgrss Enr 6.0% 20-01.03.27 144a 65,000 USD 64,084 67,356 0.21
Topbulid 5.625% 18-01.05.26 144a 240,000 USD 247,872 248,700 0.76
Townsq Med 6.875% 21-01.02.26 15,000 USD 15,000 15,675 0.05
Transdigm 5.50% 20-15.11.27 25,000 USD 24,125 26,374 0.08
Transdigm 6.25% 19-15.03.26 144a 175,000 USD 184,397 186,898 0.57
Transdigm 6.5% 15-15.05.25 70,000 USD 70,372 72,099 0.22
Treehouse 4.0% 20-01.09.28 40,000 USD 40,000 41,334 0.13
Tri Pointe 5.70% 20-15.06.28 25,000 USD 25,000 28,250 0.09
Uber 7.50% 20-15.05.25 144a 25,000 USD 25,000 27,006 0.08
Uber Techno 7.5% 19-15.09.27 110,000 USD 113,822 121,275 0.37
Uber Techno 8% 18-01.11.26 495,000 USD 528,758 539,661 1.65
Uniti Group 7.875% 20-15.02.25 144a 85,000 USD 84,575 91,763 0.28
Univision 6.625% 20-01.06.27 25,000 USD 25,000 26,864 0.08
Us Concr 5.125% 20-01.03.29 55,000 USD 55,000 56,375 0.17
Us Concr 6.375% 16-01.06.24 73,000 USD 73,086 75,596 0.23
Us Steel 6.25% 18-15.03.26 15,000 USD 9,850 13,848 0.04
Us Steel 6.875% 17-15.08.25 25,000 USD 19,288 23,749 0.07
Usis Me 6.875% 17-01.05.25 144a 100,000 USD 99,250 102,500 0.31
Utd Rent Na 3.875% 19-15.11.27 175,000 USD 175,000 184,817 0.56
Veritas Us 7.50% 20-01.09.25 60,000 USD 60,600 61,650 0.19
Vici Pro 4.125% 20-15.08.30 144a 55,000 USD 55,000 58,060 0.18
Vici Prop 4.625% 19-01.12.29 144a 5,000 USD 5,000 5,379 0.02
Wesco 7.125% 20-15.06.25 144a 40,000 USD 40,000 43,950 0.13
Wesco 7.25% 20-15.06.28 144a 55,000 USD 54,584 62,425 0.19
Western Dig 4.75% 18-15.02.26 70,000 USD 68,771 77,765 0.24
Western Gas 4.05% 20-01.02.30 85,000 USD 54,400 94,562 0.29
Western Gas 5.25% 20-01.02.50 45,000 USD 35,003 49,950 0.15
Western Gas 5.3% 18-01.03.48 5,000 USD 3,850 4,944 0.02
Western Gas 5.45% 14-01.04.44 40,000 USD 30,125 40,600 0.12
White Cap B 6.875% 20-15.10.28 10,000 USD 10,000 10,600 0.03
William Car 5.625% 15.03.27 144a 110,000 USD 110,000 115,775 0.35
Windstream 7.75% 20-15.08.28 144a 30,000 USD 29,969 30,282 0.09
Wolverine E 9.0% 19-15.11.26 20,000 USD 15,913 18,500 0.06
Wpx Energy 5.25% 19-15.10.27 15,000 USD 11,138 15,871 0.05
Wpx Energy 5.875% 20-15.06.28 30,000 USD 30,000 32,701 0.10
Wyn L Veg 5.5% 15-01.03.25 144a 120,000 USD 118,825 124,465 0.38
Wyndham 4.625% 19-01.03.30 144a 50,000 USD 50,000 52,828 0.16
Wyndham 6.625% 20-31.07.26 240,000 USD 250,431 274,800 0.84
Wyndham Wld 3.9% 01.03.23 Sr 5,000 USD 4,450 5,121 0.02
Xerox Holdi 5.0% 20-15.08.25 30,000 USD 30,000 31,892 0.10
Xerox Holdi 5.50% 20-15.08.28 30,000 USD 30,000 31,919 0.10
DANSKE INVEST SICAV
The accompanying notes form an integral part of these financial statements.
220
US High Yield Bond
Statement of Investments (continued)as at December 31, 2020(expressed in USD)
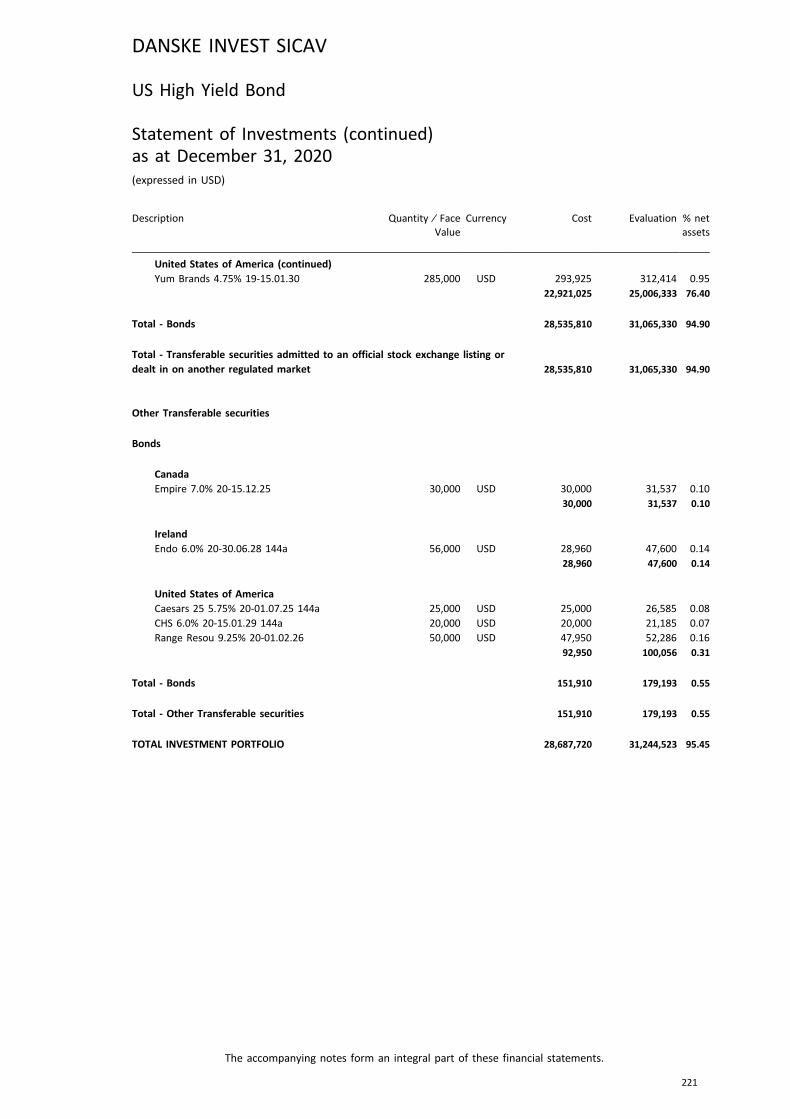
Description Quantity ⁄ FaceValue
Currency Cost Evaluation % netassets
United States of America (continued)Yum Brands 4.75% 19-15.01.30 285,000 USD 293,925 312,414 0.95
22,921,025 25,006,333 76.40
Total - Bonds 28,535,810 31,065,330 94.90
Total - Transferable securities admitted to an official stock exchange listing ordealt in on another regulated market 28,535,810 31,065,330 94.90
Other Transferable securities
Bonds
CanadaEmpire 7.0% 20-15.12.25 30,000 USD 30,000 31,537 0.10
30,000 31,537 0.10
IrelandEndo 6.0% 20-30.06.28 144a 56,000 USD 28,960 47,600 0.14
28,960 47,600 0.14
United States of AmericaCaesars 25 5.75% 20-01.07.25 144a 25,000 USD 25,000 26,585 0.08
CHS 6.0% 20-15.01.29 144a 20,000 USD 20,000 21,185 0.07
Range Resou 9.25% 20-01.02.26 50,000 USD 47,950 52,286 0.16
92,950 100,056 0.31
Total - Bonds 151,910 179,193 0.55
Total - Other Transferable securities 151,910 179,193 0.55
TOTAL INVESTMENT PORTFOLIO 28,687,720 31,244,523 95.45
DANSKE INVEST SICAV
The accompanying notes form an integral part of these financial statements.
221
US High Yield Bond
Statement of Investments (continued)as at December 31, 2020(expressed in USD)
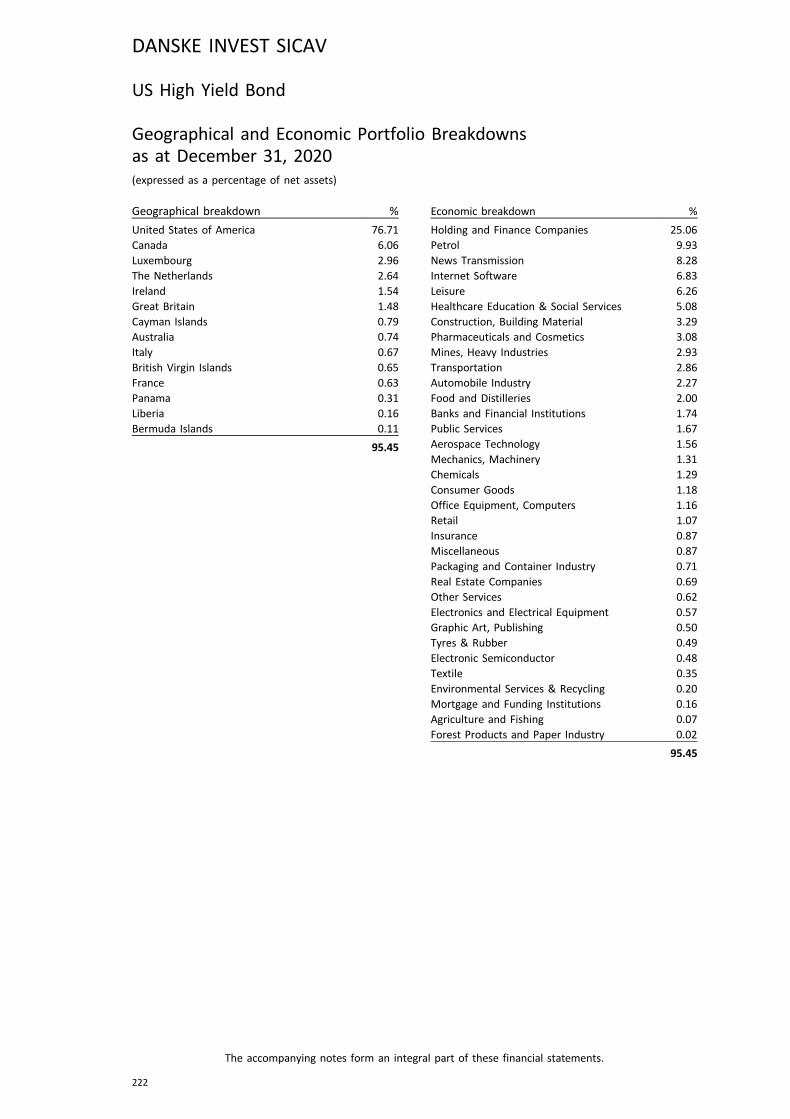
US High Yield Bond
Geographical and Economic Portfolio Breakdownsas at December 31, 2020(expressed as a percentage of net assets)
Geographical breakdown %
United States of America 76.71Canada 6.06Luxembourg 2.96The Netherlands 2.64Ireland 1.54Great Britain 1.48Cayman Islands 0.79Australia 0.74Italy 0.67British Virgin Islands 0.65France 0.63Panama 0.31Liberia 0.16Bermuda Islands 0.11
95.45
Economic breakdown %
Holding and Finance Companies 25.06Petrol 9.93News Transmission 8.28Internet Software 6.83Leisure 6.26Healthcare Education & Social Services 5.08Construction, Building Material 3.29Pharmaceuticals and Cosmetics 3.08Mines, Heavy Industries 2.93Transportation 2.86Automobile Industry 2.27Food and Distilleries 2.00Banks and Financial Institutions 1.74Public Services 1.67Aerospace Technology 1.56Mechanics, Machinery 1.31Chemicals 1.29Consumer Goods 1.18Office Equipment, Computers 1.16Retail 1.07Insurance 0.87Miscellaneous 0.87Packaging and Container Industry 0.71Real Estate Companies 0.69Other Services 0.62Electronics and Electrical Equipment 0.57Graphic Art, Publishing 0.50Tyres & Rubber 0.49Electronic Semiconductor 0.48Textile 0.35Environmental Services & Recycling 0.20Mortgage and Funding Institutions 0.16Agriculture and Fishing 0.07Forest Products and Paper Industry 0.02
95.45
DANSKE INVEST SICAV
The accompanying notes form an integral part of these financial statements.
222
Notes to the Audited Financial Statementsas at December 31, 2020
NOTE 1 – GENERAL
Danske Invest SICAV (the "SICAV") is an investment company incorporated under the laws of the Grand Duchy ofLuxembourg as a Société d'Investissement à Capital Variable subject to Part I of the amended Law ofDecember 17, 2010 relating to the undertakings for collective investment (the "2010 Law"). The SICAV's purposeis to invest in all kinds of transferable securities, units or shares of other open-ended UCI or UCIs, as well asderivatives on transferable securities and other financial instruments authorised by the 2010 Law.
The SICAV was incorporated on June 30, 2011 for an unlimited period of time and is governed by the lawof August 10, 1915 on commercial companies, as amended, and by the 2010 Law.
The registered office of the SICAV is established at 13, rue Edward Steichen, L-2540 Luxembourg. The SICAV isrecorded at the Luxembourg "Registre de Commerce et des Sociétés" under the number B 161867.
An Extraordinary General Meeting took place on July 31, 2020 whereby the Articles of Incorporation were approvedto reflect the new provisions of the Luxembourg Companies Act of August 10, 1915, as amended, in particular furtherto the law of August 10, 2016 modernising the Companies Act and to the regulation dated December 5, 2017coordinating such act. The Articles were first published on August 10, 2011 in the Mémorial C. They were amendedon September 6, 2005, October 24, 2005, November 14, 2008, July 16, 2014 and March 2, 2020 and published in theRESA (Recueil électronique des sociétés et associations) on November 25, 2005, November 16, 2005, December 8,2008, October 8, 2014 and April 23, 2020 respectively.
Until December 31, 2019, Danske Invest Management Company served as the designated Management Company ofthe SICAV under chapter 15 of the 2010 Law and pursuant to the Management Company Agreement datedDecember 9, 2014 entered into force between the SICAV and the Management Company.
As from January 1, 2020, Danske Invest Management Company was absorbed (via a merger) by Danske InvestManagement A/S, which is a public limited company incorporated under the Danish laws, which has been authorizedby Finanstilsynet (the Danish Financial Supervisory Authority) as management company within the meaning ofDirective 2011/61/EU, as amended, and which has its registered office in Parallelvej 17, 2800 Kgs., Lyngby, Denmark.This merger was conducted in compliance with articles 1023-1 and following the Luxembourg lawdated August 10, 1915 on commercial companies, as amended as well as the applicable Danish law andregulations. Consequently, some functions of the Management Company are performed from its registered office inDenmark with the assistance of its branch established in Luxembourg, namely Danske Invest Management A/S,Luxembourg Branch. In Denmark, Danske Invest Management A/S performs the oversight of the delegatedinvestment management function and the Danske Invest Management A/S, Luxembourg Branch performs thedomiciliary services, risk management and oversight of entities to which administration and distribution is delegated.
Danske Invest Management A/S has also been appointed to act as Management Company for the followingInvestment Funds: Danske Invest, Danske Invest Select, Danske Invest Index, Profil Invest, Danske Invest PCC Ltd,Danske Invest Institutional, AP Invest, Danske Invest SICAV-SIF and Danske Invest Allocation.
The SICAV is an umbrella Fund and as such provides investors with the choice of investment in a range of severalseparate funds, each of which relates to a separate portfolio of liquid assets and other securities and assetspermitted by the 2010 Law with specific investment objectives, as described in the relevant fund "Description" in thecurrent Prospectus. Each fund "Description" forms an integral part of the current Prospectus.
On December 31, 2020, twenty five funds are operational:
— China— Danish Bond— Danish Mortgage Bond— Denmark Focus— Eastern Europe— Emerging and Frontier Markets— Emerging Markets Debt Hard Currency— Euro Sustainable High Yield Bond (name change from Euro High Yield Bond, effective January 31, 2020)— Europe— Europe High Dividend— Europe Small Cap— European Bond— European Corporate Sustainable Bond— Euro Investment Grade Corporate Bond— Global Emerging Markets— Global Emerging Markets Small Cap— Global Inflation Linked Bond— Global Inflation Linked Bond Short Duration— Global Sustainable Future (name change from Global StockPicking, effective November 10, 2020)
DANSKE INVEST SICAV
223

NOTE 1 – GENERAL (continued)
— India— Japan— Nordic Corporate Bond— Russia— Sverige— US High Yield Bond
The fund Swedish Bond was liquidated on September 1, 2020. This was due to the fund's assets under managementreaching a level which no longer allowed for the fund to be operated in an economically efficient manner.
In order to optimise the Luxembourg product range of Danske Group, four fund mergers were carried outsuccessfully on October 8, 2020 as outlined below:
— Eastern Europe ex. Russia into Eastern Europe— Global High Dividend into Global StockPicking (renamed as Global Sustainable Future effective November 10,2020)
The fund Eastern Europe Absolute was liquidated on October 19, 2020. This was due to the fund's assets undermanagement reaching a level which no longer allowed for the fund to be operated in an economically efficientmanner. As at December 31, 2020 the following cash was outstanding and this cash will be used to pay performancefees for 2020, management, operating and admin fees for the last quarter of 2020, which could not be paid atliquidation date, due to some outstanding dividend receivables only paid to the fund in the first quarter of 2021.
— Eastern Europe Absolute: DKK -0,06, EUR 452,367 and USD -2,04.
NOTE 2 – SIGNIFICANT ACCOUNTING POLICIES
The financial statements have been prepared in accordance with generally accepted accounting principles and lawsand regulations in force in the Grand Duchy of Luxembourg applicable to undertakings for collective investment intransferable securities.
a) Valuation of investments in portfolio
In general, the value of each fund's assets is determined as follows:
(i) Cash in hand or on deposit, bills and demand notes and accounts receivable, prepaid expenses, cash dividendsand interest declared or accrued but not yet received. Valued at full value, adjusted for any appropriate discount orpremium we may apply based on our assessments of any circumstances that make the full payment unlikely.
(ii) Transferable securities and money market instrument that are listed or traded on an official stock exchange orother regulated market. Generally valued at the most recent price quoted on the market where they are principallytraded.
(iii) Non-listed securities, or listed securities for which the price determined according to the above methods notrepresentative of fair market value. Valued in good faith at a prudent estimate of their sales price.
(iv) Derivatives that are traded on stock exchanges or regulated markets. Valued at the settlement price mostrecently quoted for a derivative’s primary market(s), adjusted if necessary to allow for settlement on a different dayif current-day settlement is not possible.
Derivatives that are not traded on stock exchanges or regulated markets. Valued at liquidation value, according topolicies applied consistently for each given type of derivative.
(v) Shares or units of UCITS or UCIs. Valued at the most recent NAV reported by the UCITS/UCI, or, if the most recentNAV does not reflect current market realities, at fair value.
(vi) Credit default swaps and contracts for difference. Valued according to valuation principles set by the Board ofDirectors of the Management Company, based on mark-to-market practice using standard market practice.
(vii) All other swaps. Valued at market value, with reference to the applicable rate curve.
(viii) Currencies. Valued at the latest mid-market foreign exchange rate (applies to currencies held as assets, tohedging positions, and when translating values of securities denominated in other currencies into the base currencyof the fund).
(ix) All other assets. Valued in good faith at a prudent estimate of their sales price.
All valuation methodologies are established by the Board. For any asset, the Board of Directors of the ManagementCompany can choose a different valuation method if it believes that method may result in a fairer valuation. Formore information on our asset valuation methods, see the articles.
DANSKE INVEST SICAV
224
Notes to the Audited Financial Statementsas at December 31, 2020 (continued)
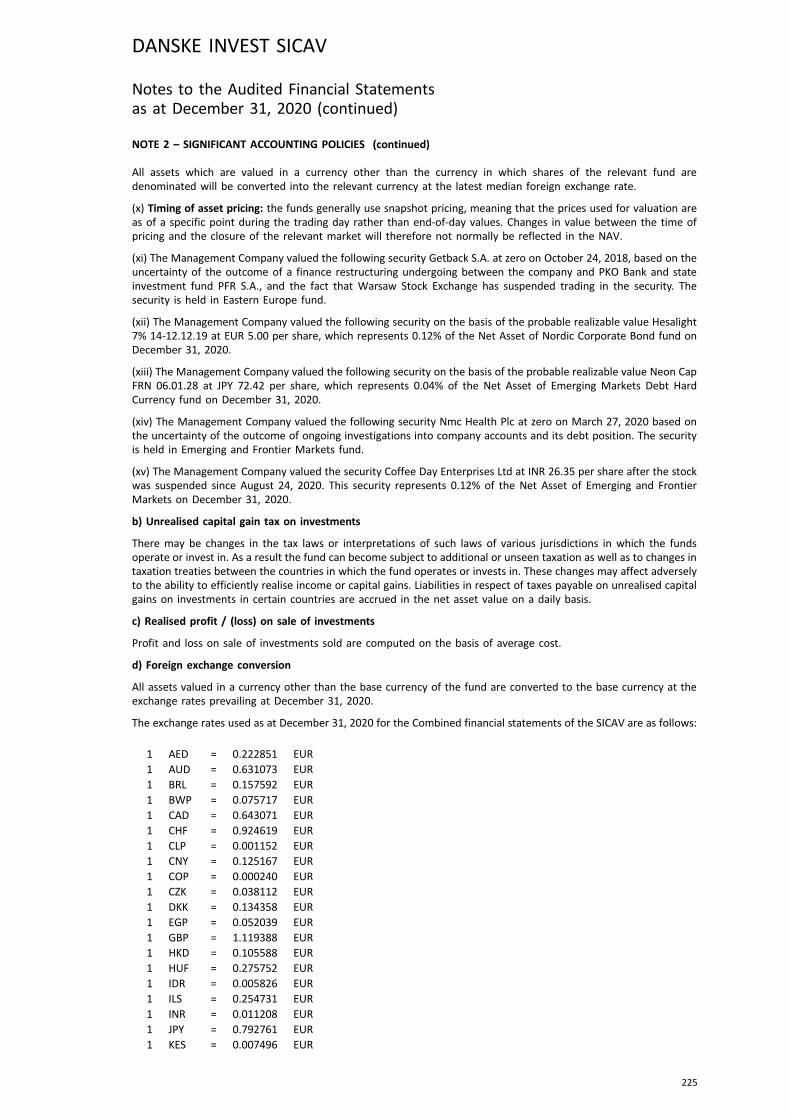
NOTE 2 – SIGNIFICANT ACCOUNTING POLICIES (continued)
All assets which are valued in a currency other than the currency in which shares of the relevant fund aredenominated will be converted into the relevant currency at the latest median foreign exchange rate.
(x) Timing of asset pricing: the funds generally use snapshot pricing, meaning that the prices used for valuation areas of a specific point during the trading day rather than end-of-day values. Changes in value between the time ofpricing and the closure of the relevant market will therefore not normally be reflected in the NAV.
(xi) The Management Company valued the following security Getback S.A. at zero on October 24, 2018, based on theuncertainty of the outcome of a finance restructuring undergoing between the company and PKO Bank and stateinvestment fund PFR S.A., and the fact that Warsaw Stock Exchange has suspended trading in the security. Thesecurity is held in Eastern Europe fund.
(xii) The Management Company valued the following security on the basis of the probable realizable value Hesalight7% 14-12.12.19 at EUR 5.00 per share, which represents 0.12% of the Net Asset of Nordic Corporate Bond fund onDecember 31, 2020.
(xiii) The Management Company valued the following security on the basis of the probable realizable value Neon CapFRN 06.01.28 at JPY 72.42 per share, which represents 0.04% of the Net Asset of Emerging Markets Debt HardCurrency fund on December 31, 2020.
(xiv) The Management Company valued the following security Nmc Health Plc at zero on March 27, 2020 based onthe uncertainty of the outcome of ongoing investigations into company accounts and its debt position. The securityis held in Emerging and Frontier Markets fund.
(xv) The Management Company valued the security Coffee Day Enterprises Ltd at INR 26.35 per share after the stockwas suspended since August 24, 2020. This security represents 0.12% of the Net Asset of Emerging and FrontierMarkets on December 31, 2020.
b) Unrealised capital gain tax on investments
There may be changes in the tax laws or interpretations of such laws of various jurisdictions in which the fundsoperate or invest in. As a result the fund can become subject to additional or unseen taxation as well as to changes intaxation treaties between the countries in which the fund operates or invests in. These changes may affect adverselyto the ability to efficiently realise income or capital gains. Liabilities in respect of taxes payable on unrealised capitalgains on investments in certain countries are accrued in the net asset value on a daily basis.
c) Realised profit / (loss) on sale of investments
Profit and loss on sale of investments sold are computed on the basis of average cost.
d) Foreign exchange conversion
All assets valued in a currency other than the base currency of the fund are converted to the base currency at theexchange rates prevailing at December 31, 2020.
The exchange rates used as at December 31, 2020 for the Combined financial statements of the SICAV are as follows:
1 AED = 0.222851 EUR1 AUD = 0.631073 EUR1 BRL = 0.157592 EUR1 BWP = 0.075717 EUR1 CAD = 0.643071 EUR1 CHF = 0.924619 EUR1 CLP = 0.001152 EUR1 CNY = 0.125167 EUR1 COP = 0.000240 EUR1 CZK = 0.038112 EUR1 DKK = 0.134358 EUR1 EGP = 0.052039 EUR1 GBP = 1.119388 EUR1 HKD = 0.105588 EUR1 HUF = 0.275752 EUR1 IDR = 0.005826 EUR1 ILS = 0.254731 EUR1 INR = 0.011208 EUR1 JPY = 0.792761 EUR1 KES = 0.007496 EUR
DANSKE INVEST SICAV
225
Notes to the Audited Financial Statementsas at December 31, 2020 (continued)
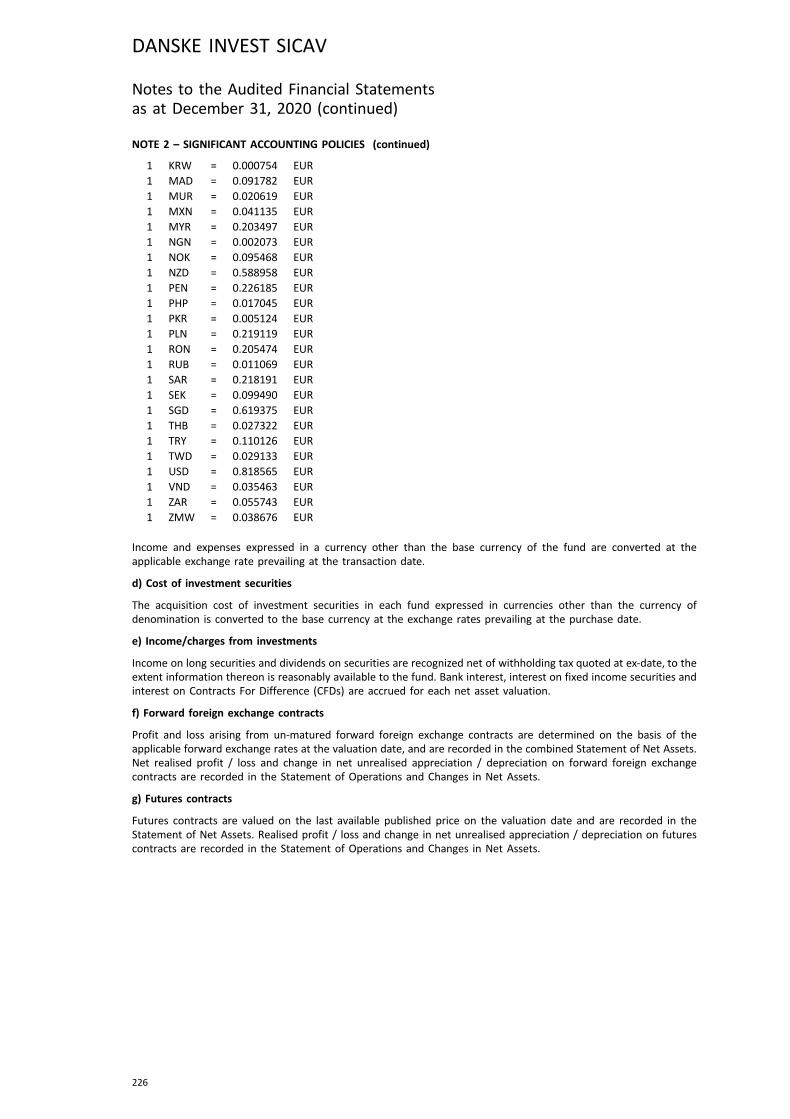
NOTE 2 – SIGNIFICANT ACCOUNTING POLICIES (continued)
1 KRW = 0.000754 EUR1 MAD = 0.091782 EUR1 MUR = 0.020619 EUR1 MXN = 0.041135 EUR1 MYR = 0.203497 EUR1 NGN = 0.002073 EUR1 NOK = 0.095468 EUR1 NZD = 0.588958 EUR1 PEN = 0.226185 EUR1 PHP = 0.017045 EUR1 PKR = 0.005124 EUR1 PLN = 0.219119 EUR1 RON = 0.205474 EUR1 RUB = 0.011069 EUR1 SAR = 0.218191 EUR1 SEK = 0.099490 EUR1 SGD = 0.619375 EUR1 THB = 0.027322 EUR1 TRY = 0.110126 EUR1 TWD = 0.029133 EUR1 USD = 0.818565 EUR1 VND = 0.035463 EUR1 ZAR = 0.055743 EUR1 ZMW = 0.038676 EUR
Income and expenses expressed in a currency other than the base currency of the fund are converted at theapplicable exchange rate prevailing at the transaction date.
d) Cost of investment securities
The acquisition cost of investment securities in each fund expressed in currencies other than the currency ofdenomination is converted to the base currency at the exchange rates prevailing at the purchase date.
e) Income/charges from investments
Income on long securities and dividends on securities are recognized net of withholding tax quoted at ex-date, to theextent information thereon is reasonably available to the fund. Bank interest, interest on fixed income securities andinterest on Contracts For Difference (CFDs) are accrued for each net asset valuation.
f) Forward foreign exchange contracts
Profit and loss arising from un-matured forward foreign exchange contracts are determined on the basis of theapplicable forward exchange rates at the valuation date, and are recorded in the combined Statement of Net Assets.Net realised profit / loss and change in net unrealised appreciation / depreciation on forward foreign exchangecontracts are recorded in the Statement of Operations and Changes in Net Assets.
g) Futures contracts
Futures contracts are valued on the last available published price on the valuation date and are recorded in theStatement of Net Assets. Realised profit / loss and change in net unrealised appreciation / depreciation on futurescontracts are recorded in the Statement of Operations and Changes in Net Assets.
DANSKE INVEST SICAV
226
Notes to the Audited Financial Statementsas at December 31, 2020 (continued)
NOTE 2 – SIGNIFICANT ACCOUNTING POLICIES (continued)
h) Swing Pricing
On business days when trading in a fund’s shares will require net purchases or sales of portfolio investmentsexceeding a certain percentage of the fund’s net assets (as set by the Management Company and approved by theSICAV), a fund’s NAV may be adjusted.
This adjustment reflects an assessment of the overall costs incurred in buying and selling investments to satisfysubscriptions or redemptions of shares (understanding that a fund generally maintains adequate daily liquidity tohandle ordinary cash flows with little or no impact on ordinary investment operations).
Swing pricing is intended to reduce the impact of these costs on shareholders who are not trading their shares atthat time. In general, the NAV will be adjusted upward when there is strong demand to subscribe for fund shares anddownward when there is strong demand to redeem fund shares. Swing pricing adjustments are automatic and areapplied systematically by computation.
Thresholds and adjustment percentages can vary by fund, but the adjustment will not be larger than 2% of NAV forall share classes within a fund. In extraordinary situations the Management Company can raise this limit to protectthe interests of shareholders. No swing pricing adjustment was applied on December 31, 2020.
The NAV for all the funds in the SICAV have swung during the financial period with the exception of the followingfunds:
Global High Dividend* and Sverige.
i) Realised profit / loss on Contracts For Difference ("CFDs")
Net realised profit / loss and change in net unrealised appreciation / depreciation on CFDs are computed on the basisof average cost, and recorded in the Statement of Operations and Changes in Net Assets. The net unrealised profit /loss on CFDs is recorded in the Statement of Net Assets.
j) Swaps and Swaptions
The total return swaps and inflation swaps are valued at fair market value as determined in good faith pursuant tothe procedures established by the Board of Directors of the Management Company. The unrealised profit / loss onswaps is presented in the Statement of Net Assets. The realised profit / loss and change in net unrealisedappreciation / depreciation on swaps and swaptions are recorded in the Statement of Operations and Changes in NetAssets.
A swaption can be defined as the option to enter into a specified swap agreement with the issuer on a specifiedfuture date.
k) Options Contracts
Options are valued at the market price on the valuation date. Unrealised gains or losses resulting at the time ofreporting from the valuation of options are recorded in the Statement of Net Assets. Net realised profit / loss andchange in net unrealised appreciation / depreciation on sale of options are recorded in the Statement of Operationsand Changes in Net Assets.
l) Combined financial statements of the SICAV
The combined financial statements represent the sum of the financial statements of each fund after conversion. Thecombined financial statements are presented in EUR, using the exchange rate in effect as at December 31, 2020. Thedifference between the opening net assets stated at the rate of exchange used for translation into EUR asof December 31, 2020 and December 31, 2019 is shown as Currency translation in the Combined Statement ofOperations and Changes in Net Assets.
* Please refer to Note 1.
DANSKE INVEST SICAV
227
Notes to the Audited Financial Statementsas at December 31, 2020 (continued)
NOTE 3 – MANAGEMENT FEES AND OPERATING AND ADMINISTRATIVE EXPENSES
Management fees
The Management Company receives the management fee from the net assets of each share class, payable quarterlyin arrears, which in turn pays the investment managers.
Operating and Administrative Expenses
The SICAV pays the Management Company operating and administrative expenses (the “Operating andAdministrative Expenses”) as determined in respect of each fund and/or share class in the relevant funddescription in the SICAV Prospectus. The Operating and Administrative Expenses are fixed, and the actual annualrates applied on December 31, 2020 are listed in the table below.
The Management Company shall bear the excess in actual expenses to any Operating and Administrative Expensescharged to the fund and/or share class. On the other hand the Management Company is entitled to retain anyamount of the Operating and Administrative Expenses charged to the fund and/or share class, which exceeds theactual related expenses incurred by the respective fund and/or share class.
The Operating and Administrative Expenses covers the administration and safekeeping of assets and in additionother ongoing operating and administrative expenses as follows:
– Remuneration of the Depositary and its transaction charges and such part of any fees or charges of a localcorrespondent as may exceed the Depositary's remuneration; remuneration of the Central Administration agent;remuneration of the Registrar Agent; remuneration of the Principal Paying Agent and of any paying agent. Thefees and reasonable out-of-pocket expenses incurred by the Board of Directors of the SICAV (no fees are paid tothe Directors who are also employed by the Danske Bank Group) as well as auditors’ fees and expenses;
– A fund servicing fee, remaining part of the Operating and Administrative Expenses after deduction of theexpenses detailed under the section above, paid to the Management Company for administrative and relatedservices including but limited to:
. the cost of ordinary legal advice received by the Management Company, the Depositary, the CentralAdministration Agent or the Registrar Agent when acting in the interest of the Shareholders;
. the costs of printing, preparing, translating and distributing financial reports, KIIDs, and current Prospectus;
. any fees of registration of the funds in different jurisdictions including fees due to the supervisoryauthorities in such countries;
. the cost of publishing the Offer Price and Redemption Price and any notices to Shareholders;
. other customary administration and publication expenses arising from the fund's operations;
. risk and compliance monitoring support;
. operational support relating to securities lending;
. the costs and expenses incurred in connection with the formation of the fund and the initial issue of Sharesby the fund.
. Taxe d'Abonnement as described in note 5 to the Financial Statements for the following fund:Sverige.
In case a portion of the above mentioned fees of the Service Providers is paid directly from the assets of the fundand/or share class, the Operating and Administrative Expenses due to the Management Company is reducedaccordingly. The Operating and Administrative Expenses do not include the following fees and expenses, which arepayable by the fund:
1) brokerage fees and commissions
2) interest and bank charges or other transaction related expenses such as taxes payable in relation to thetransaction
3) extraordinary expenses such as litigation expenses and any tax, levy duty or similar charge and any unforeseencharges imposed on the fund or its assets that would not be considered as ordinary expenses
4) the payment of the Luxembourg subscription tax ("taxe d'abonnement") except for the funds mentioned above,as described in note 5 to the Financial Statements.
The above mentioned fees are calculated on each Valuation Day on the net assets of the relevant fund and/or shareclass and are paid quarterly in arrears.
DANSKE INVEST SICAV
228
Notes to the Audited Financial Statementsas at December 31, 2020 (continued)

NOTE 3 – MANAGEMENT FEES AND OPERATING AND ADMINISTRATIVE EXPENSES (continued)
Fund MaximumManagementFee in % p.a.
CurrentManagementFee in % p.a.
MaximumOperating & Admin.
Expense % p.a.
CurrentOperating & Admin.
Expense % p.a.
China - class A 1.60% 1.60% 0.50% 0.50%
Danish Bond - class A 0.80% 0.80% 0.50% 0.22%
Danish Bond - class A d 0.80% 0.80% 0.50% 0.22%
Danish Bond - class WA 0.80% 0.40% 0.50% 0.22%
Danish Mortgage Bond - class A 0.80% 0.80% 0.50% 0.22%
Danish Mortgage Bond - class A d 0.80% 0.80% 0.50% 0.22%
Danish Mortgage Bond - class A-eur h 0.80% 0.80% 0.50% 0.22%
Danish Mortgage Bond - class A-nok h 0.80% 0.80% 0.50% 0.22%
Danish Mortgage Bond - class A-sek h 0.80% 0.80% 0.50% 0.22%
Danish Mortgage Bond - class I 0.60% 0.20% 0.50% 0.12%
Danish Mortgage Bond - class I-chf h 0.60% 0.20% 0.50% 0.12%
Danish Mortgage Bond - class I-eur h 0.60% 0.20% 0.50% 0.12%
Danish Mortgage Bond - class I-eur hd 0.60% 0.20% 0.50% 0.12%
Danish Mortgage Bond - class WA 0.80% 0.40% 0.50% 0.22%
Danish Mortgage Bond - class WA-eur h 0.80% 0.40% 0.50% 0.22%
Danish Mortgage Bond - class WI-sek h 0.80% 0.40% 0.50% 0.22%
Denmark Focus - class A 1.50% 1.50% 0.50% 0.22%
Denmark Focus - class I 0.90% 0.65% 0.50% 0.12%
Denmark Focus - class RA 1.50% 0.75% 0.50% 0.22%
Denmark Focus - class RI 1.50% 0.70% 0.50% 0.22%
Denmark Focus - class WA 1.50% 0.75% 0.50% 0.22%
Eastern Europe - class A 1.70% 1.60% 0.50% 0.30%
Eastern Europe - class I 0.90% 0.90% 0.50% 0.20%
Eastern Europe - class WA 1.70% 0.90% 0.50% 0.30%
Eastern Europe - class WA d 1.70% 0.90% 0.50% 0.30%
Eastern Europe Absolute* - class A p 1.50% 1.00% 0.50% 0.45%
Eastern Europe Absolute* - class A-sek hp 1.50% 1.00% 0.50% 0.45%
Eastern Europe Absolute* - class I p 0.90% 0.50% 0.50% 0.35%
Eastern Europe Absolute* - class WA p 1.50% 0.50% 0.50% 0.45%
Eastern Europe Absolute* - class WA-sek hp 1.50% 0.50% 0.50% 0.45%
Eastern Europe Absolute* - class WI p 1.50% 0.50% 0.50% 0.45%
Eastern Europe Absolute* - class WI-sek hp 1.50% 0.50% 0.50% 0.45%
Eastern Europe ex. Russia* - class A 1.60% 1.60% 0.50% 0.30%
Eastern Europe ex. Russia* - class I 1.00% 0.90% 0.50% 0.20%
Eastern Europe ex. Russia* - class WA 1.60% 0.90% 0.50% 0.30%
Eastern Europe ex. Russia* - class WA d 1.60% 0.90% 0.50% 0.30%
DANSKE INVEST SICAV
229
Notes to the Audited Financial Statementsas at December 31, 2020 (continued)
* Please refer to Note 1.

NOTE 3 – MANAGEMENT FEES AND OPERATING AND ADMINISTRATIVE EXPENSES (continued)
Fund MaximumManagementFee in % p.a.
CurrentManagementFee in % p.a.
MaximumOperating & Admin.
Expense % p.a.
CurrentOperating & Admin.
Expense % p.a.
Emerging and Frontier Markets - class A 1.80% 1.80% 0.50% 0.45%
Emerging and Frontier Markets - class A-dkk 1.80% 1.80% 0.50% 0.45%
Emerging and Frontier Markets - class A-nok 1.80% 1.80% 0.50% 0.45%
Emerging and Frontier Markets - class A-sek 1.80% 1.80% 0.50% 0.45%
Emerging and Frontier Markets - class I 1.50% 1.50% 0.50% 0.35%
Emerging and Frontier Markets - class WA 1.80% 1.50% 0.50% 0.45%
Emerging Markets Debt Hard Currency - class A 1.20% 1.20% 0.50% 0.25%
Emerging Markets Debt Hard Currency - class I 0.60% 0.60% 0.50% 0.15%
Emerging Markets Debt Hard Currency - class I-eur h 0.60% 0.60% 0.50% 0.15%
Emerging Markets Debt Hard Currency - class I-eur hd 0.60% 0.60% 0.50% 0.15%
Emerging Markets Debt Hard Currency - class I-sek h 0.60% 0.60% 0.50% 0.15%
Emerging Markets Debt Hard Currency - class WA 1.20% 0.60% 0.50% 0.25%
Emerging Markets Debt Hard Currency - classWA-eur h
1.20% 0.60% 0.50% 0.25%
Euro Sustainable High Yield Bond* - class A 1.00% 1.00% 0.50% 0.22%
Euro Sustainable High Yield Bond* - class A d 1.00% 1.00% 0.50% 0.22%
Euro Sustainable High Yield Bond* - class I 0.80% 0.45% 0.50% 0.12%
Euro Sustainable High Yield Bond* - class RI 1.00% 0.60% 0.50% 0.22%
Euro Sustainable High Yield Bond* - class WA 1.00% 0.60% 0.50% 0.22%
Europe - class A 1.50% 1.50% 0.50% 0.22%
Europe - class I 0.90% 0.90% 0.50% 0.12%
Europe - class SA 1.39% 1.36% 0.50% 0.12%
Europe - class SI 1.39% 1.36% 0.50% 0.16%
Europe - class WA 1.50% 0.90% 0.50% 0.22%
Europe - class WA-sek 1.50% 0.90% 0.50% 0.12%
Europe - class WI-sek 1.50% 0.90% 0.50% 0.12%
Europe High Dividend - class A 1.60% 1.60% 0.50% 0.22%
Europe High Dividend - class I 0.90% 0.90% 0.50% 0.12%
Europe High Dividend - class WA 1.60% 0.90% 0.50% 0.22%
Europe High Dividend - class WA-sek 1.60% 0.90% 0.50% 0.22%
Europe Small Cap - class A-nok 1.60% 1.60% 0.50% 0.25%
Europe Small Cap - class A-sek 1.60% 1.60% 0.50% 0.25%
Europe Small Cap - class A 1.60% 1.60% 0.50% 0.25%
Europe Small Cap - class I 0.90% 0.90% 0.50% 0.15%
Europe Small Cap - class WA 1.60% 0.90% 0.50% 0.25%
European Bond - class A 0.80% 0.80% 0.50% 0.25%
European Bond - class A d 0.80% 0.80% 0.50% 0.25%
European Bond - class A-nok h 0.80% 0.80% 0.50% 0.25%
European Bond - class WA 0.80% 0.40% 0.50% 0.25%
DANSKE INVEST SICAV
230
Notes to the Audited Financial Statementsas at December 31, 2020 (continued)
* Please refer to Note 1.
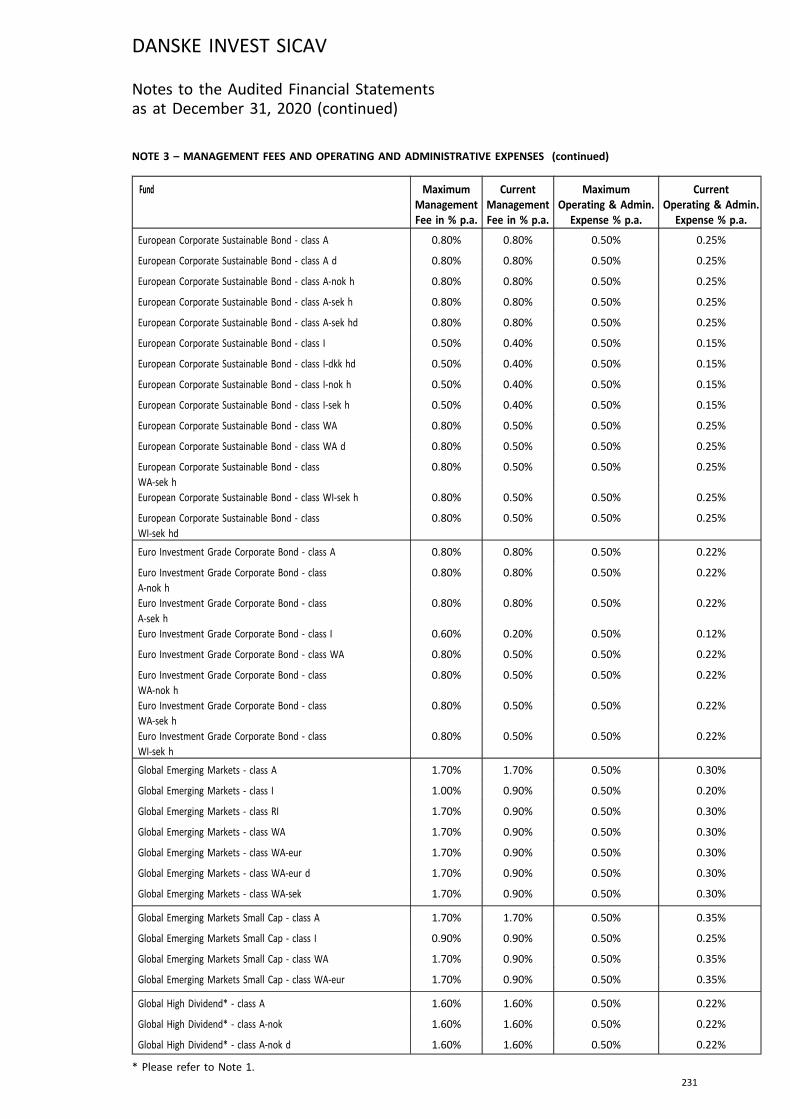
NOTE 3 – MANAGEMENT FEES AND OPERATING AND ADMINISTRATIVE EXPENSES (continued)
Fund MaximumManagementFee in % p.a.
CurrentManagementFee in % p.a.
MaximumOperating & Admin.
Expense % p.a.
CurrentOperating & Admin.
Expense % p.a.
European Corporate Sustainable Bond - class A 0.80% 0.80% 0.50% 0.25%
European Corporate Sustainable Bond - class A d 0.80% 0.80% 0.50% 0.25%
European Corporate Sustainable Bond - class A-nok h 0.80% 0.80% 0.50% 0.25%
European Corporate Sustainable Bond - class A-sek h 0.80% 0.80% 0.50% 0.25%
European Corporate Sustainable Bond - class A-sek hd 0.80% 0.80% 0.50% 0.25%
European Corporate Sustainable Bond - class I 0.50% 0.40% 0.50% 0.15%
European Corporate Sustainable Bond - class I-dkk hd 0.50% 0.40% 0.50% 0.15%
European Corporate Sustainable Bond - class I-nok h 0.50% 0.40% 0.50% 0.15%
European Corporate Sustainable Bond - class I-sek h 0.50% 0.40% 0.50% 0.15%
European Corporate Sustainable Bond - class WA 0.80% 0.50% 0.50% 0.25%
European Corporate Sustainable Bond - class WA d 0.80% 0.50% 0.50% 0.25%
European Corporate Sustainable Bond - classWA-sek h
0.80% 0.50% 0.50% 0.25%
European Corporate Sustainable Bond - class WI-sek h 0.80% 0.50% 0.50% 0.25%
European Corporate Sustainable Bond - classWI-sek hd
0.80% 0.50% 0.50% 0.25%
Euro Investment Grade Corporate Bond - class A 0.80% 0.80% 0.50% 0.22%
Euro Investment Grade Corporate Bond - classA-nok h
0.80% 0.80% 0.50% 0.22%
Euro Investment Grade Corporate Bond - classA-sek h
0.80% 0.80% 0.50% 0.22%
Euro Investment Grade Corporate Bond - class I 0.60% 0.20% 0.50% 0.12%
Euro Investment Grade Corporate Bond - class WA 0.80% 0.50% 0.50% 0.22%
Euro Investment Grade Corporate Bond - classWA-nok h
0.80% 0.50% 0.50% 0.22%
Euro Investment Grade Corporate Bond - classWA-sek h
0.80% 0.50% 0.50% 0.22%
Euro Investment Grade Corporate Bond - classWI-sek h
0.80% 0.50% 0.50% 0.22%
Global Emerging Markets - class A 1.70% 1.70% 0.50% 0.30%
Global Emerging Markets - class I 1.00% 0.90% 0.50% 0.20%
Global Emerging Markets - class RI 1.70% 0.90% 0.50% 0.30%
Global Emerging Markets - class WA 1.70% 0.90% 0.50% 0.30%
Global Emerging Markets - class WA-eur 1.70% 0.90% 0.50% 0.30%
Global Emerging Markets - class WA-eur d 1.70% 0.90% 0.50% 0.30%
Global Emerging Markets - class WA-sek 1.70% 0.90% 0.50% 0.30%
Global Emerging Markets Small Cap - class A 1.70% 1.70% 0.50% 0.35%
Global Emerging Markets Small Cap - class I 0.90% 0.90% 0.50% 0.25%
Global Emerging Markets Small Cap - class WA 1.70% 0.90% 0.50% 0.35%
Global Emerging Markets Small Cap - class WA-eur 1.70% 0.90% 0.50% 0.35%
Global High Dividend* - class A 1.60% 1.60% 0.50% 0.22%
Global High Dividend* - class A-nok 1.60% 1.60% 0.50% 0.22%
Global High Dividend* - class A-nok d 1.60% 1.60% 0.50% 0.22%
DANSKE INVEST SICAV
231
Notes to the Audited Financial Statementsas at December 31, 2020 (continued)
* Please refer to Note 1.
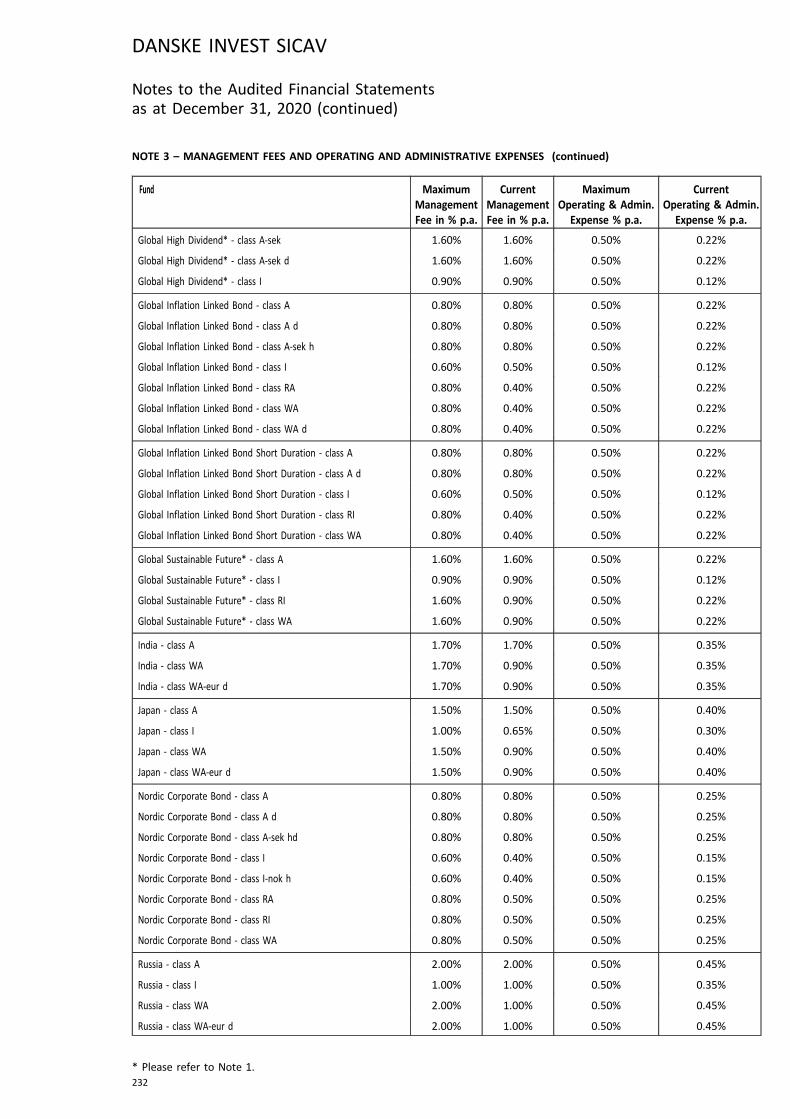
NOTE 3 – MANAGEMENT FEES AND OPERATING AND ADMINISTRATIVE EXPENSES (continued)
Fund MaximumManagementFee in % p.a.
CurrentManagementFee in % p.a.
MaximumOperating & Admin.
Expense % p.a.
CurrentOperating & Admin.
Expense % p.a.
Global High Dividend* - class A-sek 1.60% 1.60% 0.50% 0.22%
Global High Dividend* - class A-sek d 1.60% 1.60% 0.50% 0.22%
Global High Dividend* - class I 0.90% 0.90% 0.50% 0.12%
Global Inflation Linked Bond - class A 0.80% 0.80% 0.50% 0.22%
Global Inflation Linked Bond - class A d 0.80% 0.80% 0.50% 0.22%
Global Inflation Linked Bond - class A-sek h 0.80% 0.80% 0.50% 0.22%
Global Inflation Linked Bond - class I 0.60% 0.50% 0.50% 0.12%
Global Inflation Linked Bond - class RA 0.80% 0.40% 0.50% 0.22%
Global Inflation Linked Bond - class WA 0.80% 0.40% 0.50% 0.22%
Global Inflation Linked Bond - class WA d 0.80% 0.40% 0.50% 0.22%
Global Inflation Linked Bond Short Duration - class A 0.80% 0.80% 0.50% 0.22%
Global Inflation Linked Bond Short Duration - class A d 0.80% 0.80% 0.50% 0.22%
Global Inflation Linked Bond Short Duration - class I 0.60% 0.50% 0.50% 0.12%
Global Inflation Linked Bond Short Duration - class RI 0.80% 0.40% 0.50% 0.22%
Global Inflation Linked Bond Short Duration - class WA 0.80% 0.40% 0.50% 0.22%
Global Sustainable Future* - class A 1.60% 1.60% 0.50% 0.22%
Global Sustainable Future* - class I 0.90% 0.90% 0.50% 0.12%
Global Sustainable Future* - class RI 1.60% 0.90% 0.50% 0.22%
Global Sustainable Future* - class WA 1.60% 0.90% 0.50% 0.22%
India - class A 1.70% 1.70% 0.50% 0.35%
India - class WA 1.70% 0.90% 0.50% 0.35%
India - class WA-eur d 1.70% 0.90% 0.50% 0.35%
Japan - class A 1.50% 1.50% 0.50% 0.40%
Japan - class I 1.00% 0.65% 0.50% 0.30%
Japan - class WA 1.50% 0.90% 0.50% 0.40%
Japan - class WA-eur d 1.50% 0.90% 0.50% 0.40%
Nordic Corporate Bond - class A 0.80% 0.80% 0.50% 0.25%
Nordic Corporate Bond - class A d 0.80% 0.80% 0.50% 0.25%
Nordic Corporate Bond - class A-sek hd 0.80% 0.80% 0.50% 0.25%
Nordic Corporate Bond - class I 0.60% 0.40% 0.50% 0.15%
Nordic Corporate Bond - class I-nok h 0.60% 0.40% 0.50% 0.15%
Nordic Corporate Bond - class RA 0.80% 0.50% 0.50% 0.25%
Nordic Corporate Bond - class RI 0.80% 0.50% 0.50% 0.25%
Nordic Corporate Bond - class WA 0.80% 0.50% 0.50% 0.25%
Russia - class A 2.00% 2.00% 0.50% 0.45%
Russia - class I 1.00% 1.00% 0.50% 0.35%
Russia - class WA 2.00% 1.00% 0.50% 0.45%
Russia - class WA-eur d 2.00% 1.00% 0.50% 0.45%
DANSKE INVEST SICAV
232
Notes to the Audited Financial Statementsas at December 31, 2020 (continued)
* Please refer to Note 1.
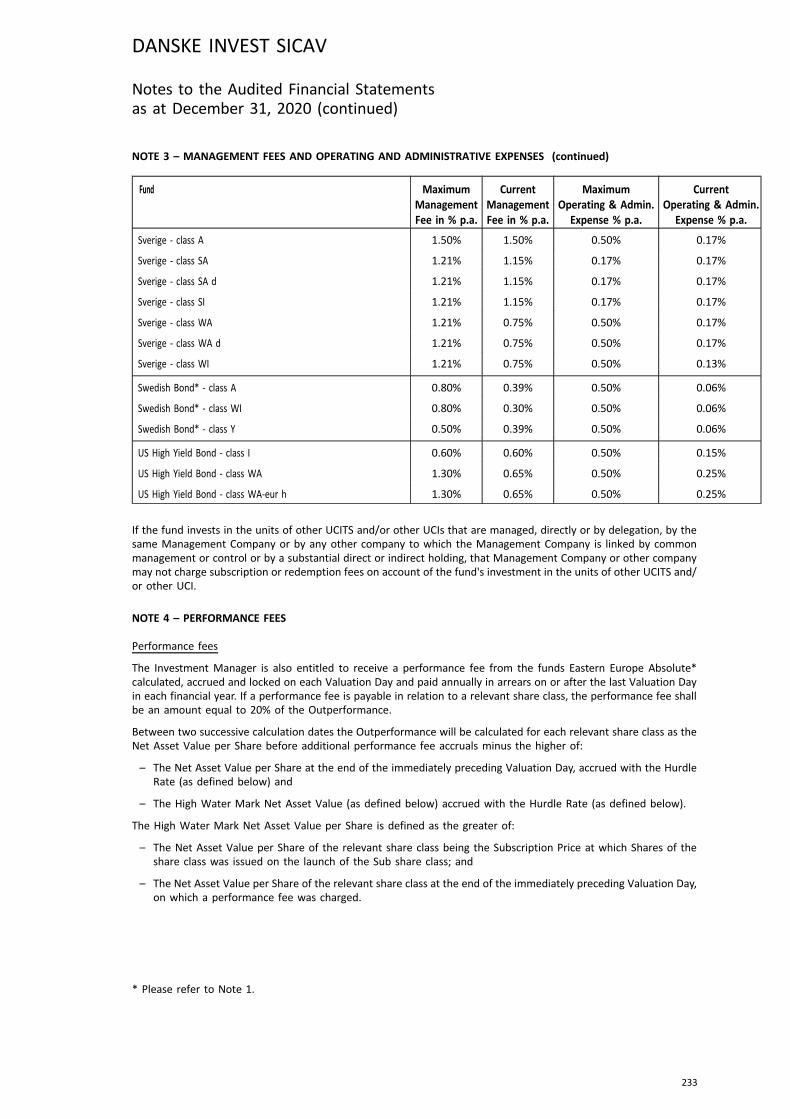
NOTE 3 – MANAGEMENT FEES AND OPERATING AND ADMINISTRATIVE EXPENSES (continued)
Fund MaximumManagementFee in % p.a.
CurrentManagementFee in % p.a.
MaximumOperating & Admin.
Expense % p.a.
CurrentOperating & Admin.
Expense % p.a.
Sverige - class A 1.50% 1.50% 0.50% 0.17%
Sverige - class SA 1.21% 1.15% 0.17% 0.17%
Sverige - class SA d 1.21% 1.15% 0.17% 0.17%
Sverige - class SI 1.21% 1.15% 0.17% 0.17%
Sverige - class WA 1.21% 0.75% 0.50% 0.17%
Sverige - class WA d 1.21% 0.75% 0.50% 0.17%
Sverige - class WI 1.21% 0.75% 0.50% 0.13%
Swedish Bond* - class A 0.80% 0.39% 0.50% 0.06%
Swedish Bond* - class WI 0.80% 0.30% 0.50% 0.06%
Swedish Bond* - class Y 0.50% 0.39% 0.50% 0.06%
US High Yield Bond - class I 0.60% 0.60% 0.50% 0.15%
US High Yield Bond - class WA 1.30% 0.65% 0.50% 0.25%
US High Yield Bond - class WA-eur h 1.30% 0.65% 0.50% 0.25%
If the fund invests in the units of other UCITS and/or other UCIs that are managed, directly or by delegation, by thesame Management Company or by any other company to which the Management Company is linked by commonmanagement or control or by a substantial direct or indirect holding, that Management Company or other companymay not charge subscription or redemption fees on account of the fund's investment in the units of other UCITS and/or other UCI.
NOTE 4 – PERFORMANCE FEES
Performance fees
The Investment Manager is also entitled to receive a performance fee from the funds Eastern Europe Absolute*calculated, accrued and locked on each Valuation Day and paid annually in arrears on or after the last Valuation Dayin each financial year. If a performance fee is payable in relation to a relevant share class, the performance fee shallbe an amount equal to 20% of the Outperformance.
Between two successive calculation dates the Outperformance will be calculated for each relevant share class as theNet Asset Value per Share before additional performance fee accruals minus the higher of:
– The Net Asset Value per Share at the end of the immediately preceding Valuation Day, accrued with the HurdleRate (as defined below) and
– The High Water Mark Net Asset Value (as defined below) accrued with the Hurdle Rate (as defined below).
The High Water Mark Net Asset Value per Share is defined as the greater of:
– The Net Asset Value per Share of the relevant share class being the Subscription Price at which Shares of theshare class was issued on the launch of the Sub share class; and
– The Net Asset Value per Share of the relevant share class at the end of the immediately preceding Valuation Day,on which a performance fee was charged.
* Please refer to Note 1.
DANSKE INVEST SICAV
233
Notes to the Audited Financial Statementsas at December 31, 2020 (continued)
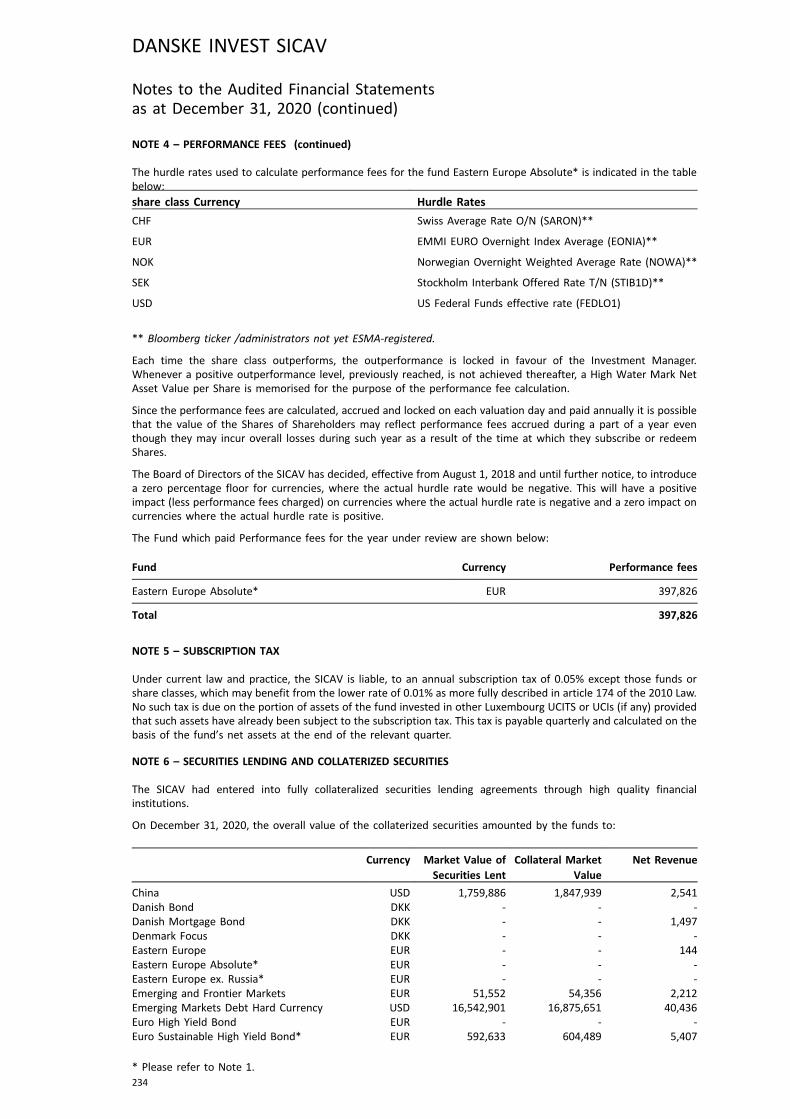
NOTE 4 – PERFORMANCE FEES (continued)
The hurdle rates used to calculate performance fees for the fund Eastern Europe Absolute* is indicated in the tablebelow:
share class Currency Hurdle Rates
CHF Swiss Average Rate O/N (SARON)**
EUR EMMI EURO Overnight Index Average (EONIA)**
NOK Norwegian Overnight Weighted Average Rate (NOWA)**
SEK Stockholm Interbank Offered Rate T/N (STIB1D)**
USD US Federal Funds effective rate (FEDLO1)
** Bloomberg ticker /administrators not yet ESMA-registered.
Each time the share class outperforms, the outperformance is locked in favour of the Investment Manager.Whenever a positive outperformance level, previously reached, is not achieved thereafter, a High Water Mark NetAsset Value per Share is memorised for the purpose of the performance fee calculation.
Since the performance fees are calculated, accrued and locked on each valuation day and paid annually it is possiblethat the value of the Shares of Shareholders may reflect performance fees accrued during a part of a year eventhough they may incur overall losses during such year as a result of the time at which they subscribe or redeemShares.
The Board of Directors of the SICAV has decided, effective from August 1, 2018 and until further notice, to introducea zero percentage floor for currencies, where the actual hurdle rate would be negative. This will have a positiveimpact (less performance fees charged) on currencies where the actual hurdle rate is negative and a zero impact oncurrencies where the actual hurdle rate is positive.
The Fund which paid Performance fees for the year under review are shown below:
Fund Currency Performance fees
Eastern Europe Absolute* EUR 397,826
Total 397,826
NOTE 5 – SUBSCRIPTION TAX
Under current law and practice, the SICAV is liable, to an annual subscription tax of 0.05% except those funds orshare classes, which may benefit from the lower rate of 0.01% as more fully described in article 174 of the 2010 Law.No such tax is due on the portion of assets of the fund invested in other Luxembourg UCITS or UCIs (if any) providedthat such assets have already been subject to the subscription tax. This tax is payable quarterly and calculated on thebasis of the fund’s net assets at the end of the relevant quarter.
NOTE 6 – SECURITIES LENDING AND COLLATERIZED SECURITIES
The SICAV had entered into fully collateralized securities lending agreements through high quality financialinstitutions.
On December 31, 2020, the overall value of the collaterized securities amounted by the funds to:
Currency Market Value ofSecurities Lent
Collateral MarketValue
Net Revenue
China USD 1,759,886 1,847,939 2,541Danish Bond DKK - - -Danish Mortgage Bond DKK - - 1,497Denmark Focus DKK - - -Eastern Europe EUR - - 144Eastern Europe Absolute* EUR - - -Eastern Europe ex. Russia* EUR - - -Emerging and Frontier Markets EUR 51,552 54,356 2,212Emerging Markets Debt Hard Currency USD 16,542,901 16,875,651 40,436Euro High Yield Bond EUR - - -Euro Sustainable High Yield Bond* EUR 592,633 604,489 5,407
DANSKE INVEST SICAV
234
Notes to the Audited Financial Statementsas at December 31, 2020 (continued)
* Please refer to Note 1.
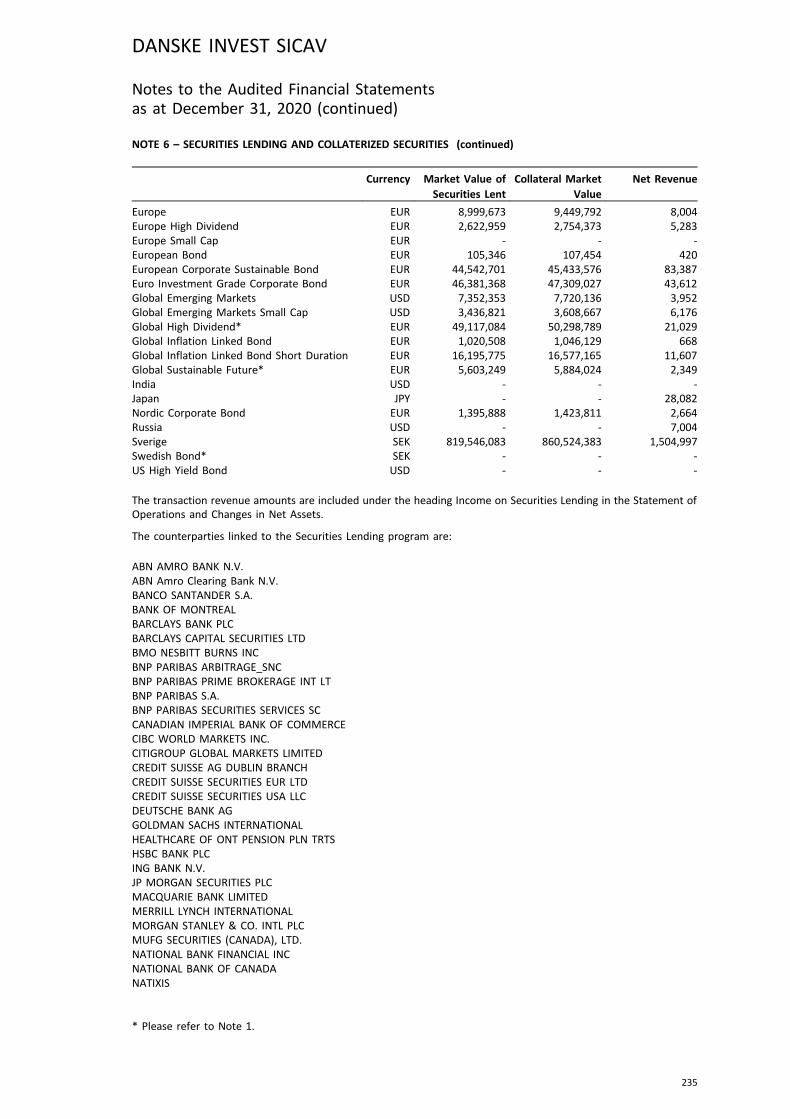
NOTE 6 – SECURITIES LENDING AND COLLATERIZED SECURITIES (continued)
Currency Market Value ofSecurities Lent
Collateral MarketValue
Net Revenue
Europe EUR 8,999,673 9,449,792 8,004Europe High Dividend EUR 2,622,959 2,754,373 5,283Europe Small Cap EUR - - -European Bond EUR 105,346 107,454 420European Corporate Sustainable Bond EUR 44,542,701 45,433,576 83,387Euro Investment Grade Corporate Bond EUR 46,381,368 47,309,027 43,612Global Emerging Markets USD 7,352,353 7,720,136 3,952Global Emerging Markets Small Cap USD 3,436,821 3,608,667 6,176Global High Dividend* EUR 49,117,084 50,298,789 21,029Global Inflation Linked Bond EUR 1,020,508 1,046,129 668Global Inflation Linked Bond Short Duration EUR 16,195,775 16,577,165 11,607Global Sustainable Future* EUR 5,603,249 5,884,024 2,349India USD - - -Japan JPY - - 28,082Nordic Corporate Bond EUR 1,395,888 1,423,811 2,664Russia USD - - 7,004Sverige SEK 819,546,083 860,524,383 1,504,997Swedish Bond* SEK - - -US High Yield Bond USD - - -
The transaction revenue amounts are included under the heading Income on Securities Lending in the Statement ofOperations and Changes in Net Assets.
The counterparties linked to the Securities Lending program are:
ABN AMRO BANK N.V.ABN Amro Clearing Bank N.V.BANCO SANTANDER S.A.BANK OF MONTREALBARCLAYS BANK PLCBARCLAYS CAPITAL SECURITIES LTDBMO NESBITT BURNS INCBNP PARIBAS ARBITRAGE_SNCBNP PARIBAS PRIME BROKERAGE INT LTBNP PARIBAS S.A.BNP PARIBAS SECURITIES SERVICES SCCANADIAN IMPERIAL BANK OF COMMERCECIBC WORLD MARKETS INC.CITIGROUP GLOBAL MARKETS LIMITEDCREDIT SUISSE AG DUBLIN BRANCHCREDIT SUISSE SECURITIES EUR LTDCREDIT SUISSE SECURITIES USA LLCDEUTSCHE BANK AGGOLDMAN SACHS INTERNATIONALHEALTHCARE OF ONT PENSION PLN TRTSHSBC BANK PLCING BANK N.V.JP MORGAN SECURITIES PLCMACQUARIE BANK LIMITEDMERRILL LYNCH INTERNATIONALMORGAN STANLEY & CO. INTL PLCMUFG SECURITIES (CANADA), LTD.NATIONAL BANK FINANCIAL INCNATIONAL BANK OF CANADANATIXIS
* Please refer to Note 1.
DANSKE INVEST SICAV
235
Notes to the Audited Financial Statementsas at December 31, 2020 (continued)
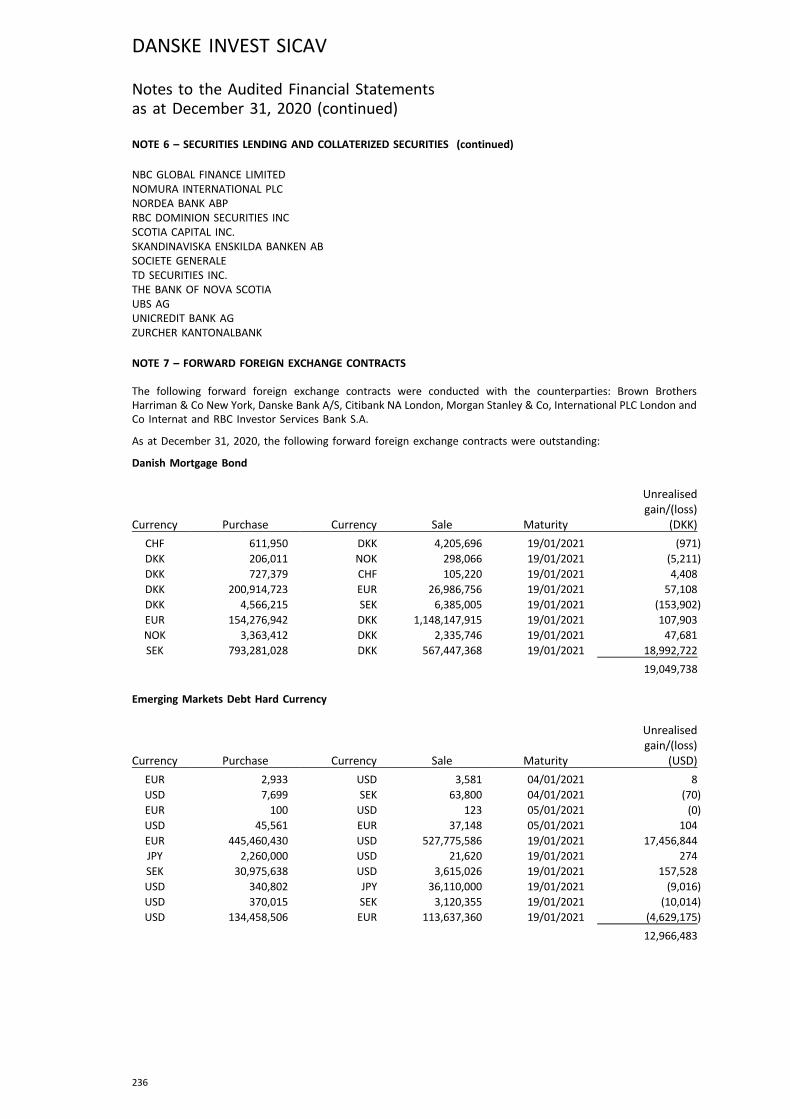
NOTE 6 – SECURITIES LENDING AND COLLATERIZED SECURITIES (continued)
NBC GLOBAL FINANCE LIMITEDNOMURA INTERNATIONAL PLCNORDEA BANK ABPRBC DOMINION SECURITIES INCSCOTIA CAPITAL INC.SKANDINAVISKA ENSKILDA BANKEN ABSOCIETE GENERALETD SECURITIES INC.THE BANK OF NOVA SCOTIAUBS AGUNICREDIT BANK AGZURCHER KANTONALBANK
NOTE 7 – FORWARD FOREIGN EXCHANGE CONTRACTS
The following forward foreign exchange contracts were conducted with the counterparties: Brown BrothersHarriman & Co New York, Danske Bank A/S, Citibank NA London, Morgan Stanley & Co, International PLC London andCo Internat and RBC Investor Services Bank S.A.
As at December 31, 2020, the following forward foreign exchange contracts were outstanding:
Danish Mortgage Bond
Currency Purchase Currency Sale Maturity
Unrealisedgain/(loss)
(DKK)
CHF 611,950 DKK 4,205,696 19/01/2021 (971)DKK 206,011 NOK 298,066 19/01/2021 (5,211)DKK 727,379 CHF 105,220 19/01/2021 4,408DKK 200,914,723 EUR 26,986,756 19/01/2021 57,108DKK 4,566,215 SEK 6,385,005 19/01/2021 (153,902)EUR 154,276,942 DKK 1,148,147,915 19/01/2021 107,903NOK 3,363,412 DKK 2,335,746 19/01/2021 47,681SEK 793,281,028 DKK 567,447,368 19/01/2021 18,992,722
19,049,738
Emerging Markets Debt Hard Currency
Currency Purchase Currency Sale Maturity
Unrealisedgain/(loss)
(USD)
EUR 2,933 USD 3,581 04/01/2021 8USD 7,699 SEK 63,800 04/01/2021 (70)EUR 100 USD 123 05/01/2021 (0)USD 45,561 EUR 37,148 05/01/2021 104EUR 445,460,430 USD 527,775,586 19/01/2021 17,456,844JPY 2,260,000 USD 21,620 19/01/2021 274SEK 30,975,638 USD 3,615,026 19/01/2021 157,528USD 340,802 JPY 36,110,000 19/01/2021 (9,016)USD 370,015 SEK 3,120,355 19/01/2021 (10,014)USD 134,458,506 EUR 113,637,360 19/01/2021 (4,629,175)
12,966,483
DANSKE INVEST SICAV
236
Notes to the Audited Financial Statementsas at December 31, 2020 (continued)

NOTE 7 – FORWARD FOREIGN EXCHANGE CONTRACTS (continued)
Euro Sustainable High Yield Bond*
Currency Purchase Currency Sale Maturity
Unrealisedgain/(loss)
(EUR)
EUR 269 DKK 2,000 19/01/2021 0EUR 47,428 NOK 505,000 19/01/2021 (763)EUR 848,292 SEK 8,721,200 19/01/2021 (19,507)EUR 969,701 USD 1,148,200 19/01/2021 31,621SEK 59,000 EUR 5,745 19/01/2021 126USD 136,000 EUR 114,302 19/01/2021 (3,188)
8,289
European Bond
Currency Purchase Currency Sale Maturity
Unrealisedgain/(loss)
(EUR)
NOK 81,118,667 EUR 7,612,810 19/01/2021 128,105
128,105
European Corporate Sustainable Bond
Currency Purchase Currency Sale Maturity
Unrealisedgain/(loss)
(EUR)
EUR 23,530 SEK 238,075 04/01/2021 (162)SEK 32,826 EUR 3,244 04/01/2021 22EUR 663,075 SEK 6,660,939 05/01/2021 229SEK 711,901 EUR 70,867 05/01/2021 (24)EUR 241 NOK 2,539 06/01/2021 (1)EUR 4,542 SEK 45,665 07/01/2021 (2)DKK 453,134,455 EUR 60,890,687 19/01/2021 (15,391)EUR 134 DKK 1,000 19/01/2021 0EUR 37,182,753 NOK 397,290,297 19/01/2021 (729,714)EUR 115,294,929 SEK 1,196,166,632 19/01/2021 (3,729,105)EUR 6,152,204 USD 7,284,000 19/01/2021 201,172NOK 251,839,092 EUR 23,644,599 19/01/2021 387,662SEK 2,150,405,058 EUR 206,927,605 19/01/2021 7,046,583
3,161,269
* Please refer to Note 1.
DANSKE INVEST SICAV
237
Notes to the Audited Financial Statementsas at December 31, 2020 (continued)
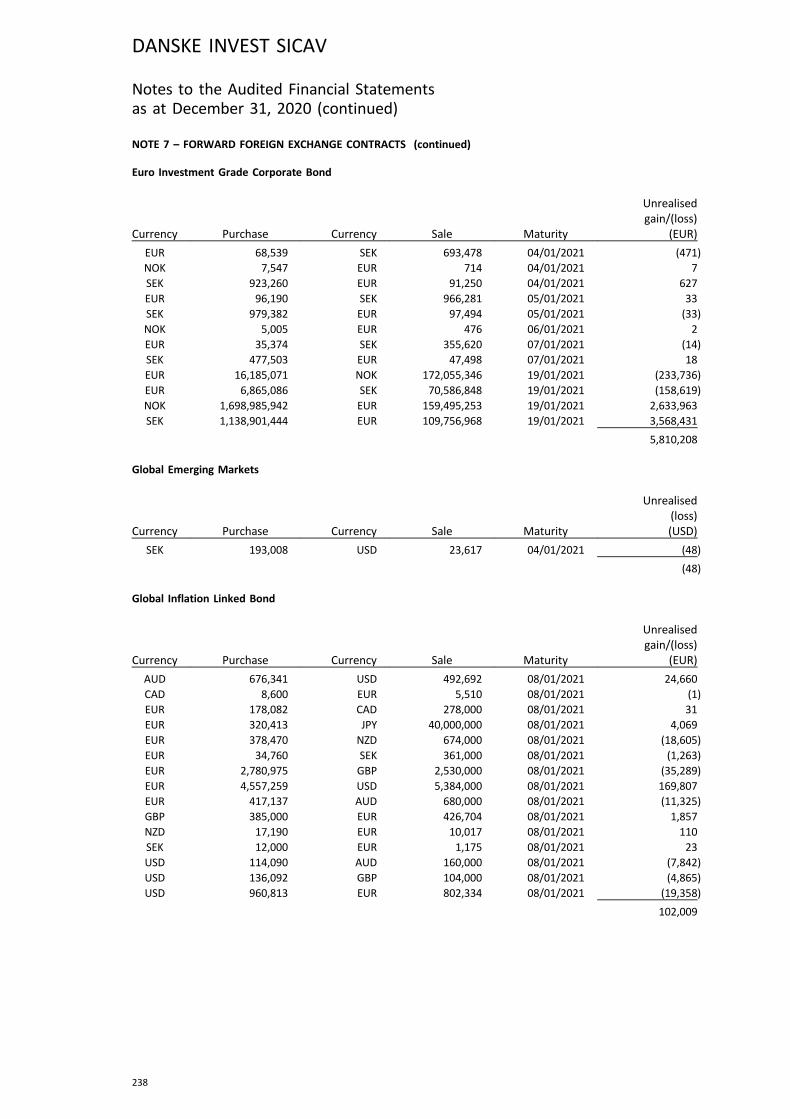
NOTE 7 – FORWARD FOREIGN EXCHANGE CONTRACTS (continued)
Euro Investment Grade Corporate Bond
Currency Purchase Currency Sale Maturity
Unrealisedgain/(loss)
(EUR)
EUR 68,539 SEK 693,478 04/01/2021 (471)NOK 7,547 EUR 714 04/01/2021 7SEK 923,260 EUR 91,250 04/01/2021 627EUR 96,190 SEK 966,281 05/01/2021 33SEK 979,382 EUR 97,494 05/01/2021 (33)NOK 5,005 EUR 476 06/01/2021 2EUR 35,374 SEK 355,620 07/01/2021 (14)SEK 477,503 EUR 47,498 07/01/2021 18EUR 16,185,071 NOK 172,055,346 19/01/2021 (233,736)EUR 6,865,086 SEK 70,586,848 19/01/2021 (158,619)NOK 1,698,985,942 EUR 159,495,253 19/01/2021 2,633,963SEK 1,138,901,444 EUR 109,756,968 19/01/2021 3,568,431
5,810,208
Global Emerging Markets
Currency Purchase Currency Sale Maturity
Unrealised(loss)(USD)
SEK 193,008 USD 23,617 04/01/2021 (48)
(48)
Global Inflation Linked Bond
Currency Purchase Currency Sale Maturity
Unrealisedgain/(loss)
(EUR)
AUD 676,341 USD 492,692 08/01/2021 24,660CAD 8,600 EUR 5,510 08/01/2021 (1)EUR 178,082 CAD 278,000 08/01/2021 31EUR 320,413 JPY 40,000,000 08/01/2021 4,069EUR 378,470 NZD 674,000 08/01/2021 (18,605)EUR 34,760 SEK 361,000 08/01/2021 (1,263)EUR 2,780,975 GBP 2,530,000 08/01/2021 (35,289)EUR 4,557,259 USD 5,384,000 08/01/2021 169,807EUR 417,137 AUD 680,000 08/01/2021 (11,325)GBP 385,000 EUR 426,704 08/01/2021 1,857NZD 17,190 EUR 10,017 08/01/2021 110SEK 12,000 EUR 1,175 08/01/2021 23USD 114,090 AUD 160,000 08/01/2021 (7,842)USD 136,092 GBP 104,000 08/01/2021 (4,865)USD 960,813 EUR 802,334 08/01/2021 (19,358)
102,009
DANSKE INVEST SICAV
238
Notes to the Audited Financial Statementsas at December 31, 2020 (continued)
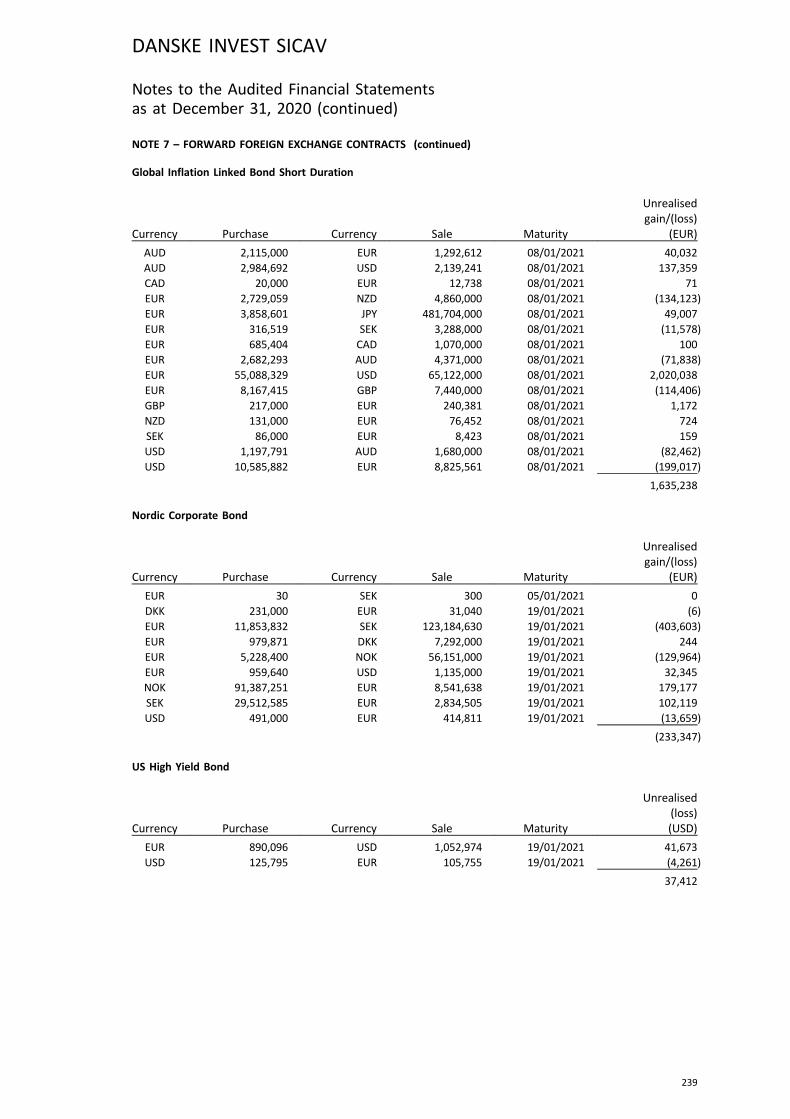
NOTE 7 – FORWARD FOREIGN EXCHANGE CONTRACTS (continued)
Global Inflation Linked Bond Short Duration
Currency Purchase Currency Sale Maturity
Unrealisedgain/(loss)
(EUR)
AUD 2,115,000 EUR 1,292,612 08/01/2021 40,032AUD 2,984,692 USD 2,139,241 08/01/2021 137,359CAD 20,000 EUR 12,738 08/01/2021 71EUR 2,729,059 NZD 4,860,000 08/01/2021 (134,123)EUR 3,858,601 JPY 481,704,000 08/01/2021 49,007EUR 316,519 SEK 3,288,000 08/01/2021 (11,578)EUR 685,404 CAD 1,070,000 08/01/2021 100EUR 2,682,293 AUD 4,371,000 08/01/2021 (71,838)EUR 55,088,329 USD 65,122,000 08/01/2021 2,020,038EUR 8,167,415 GBP 7,440,000 08/01/2021 (114,406)GBP 217,000 EUR 240,381 08/01/2021 1,172NZD 131,000 EUR 76,452 08/01/2021 724SEK 86,000 EUR 8,423 08/01/2021 159USD 1,197,791 AUD 1,680,000 08/01/2021 (82,462)USD 10,585,882 EUR 8,825,561 08/01/2021 (199,017)
1,635,238
Nordic Corporate Bond
Currency Purchase Currency Sale Maturity
Unrealisedgain/(loss)
(EUR)
EUR 30 SEK 300 05/01/2021 0DKK 231,000 EUR 31,040 19/01/2021 (6)EUR 11,853,832 SEK 123,184,630 19/01/2021 (403,603)EUR 979,871 DKK 7,292,000 19/01/2021 244EUR 5,228,400 NOK 56,151,000 19/01/2021 (129,964)EUR 959,640 USD 1,135,000 19/01/2021 32,345NOK 91,387,251 EUR 8,541,638 19/01/2021 179,177SEK 29,512,585 EUR 2,834,505 19/01/2021 102,119USD 491,000 EUR 414,811 19/01/2021 (13,659)
(233,347)
US High Yield Bond
Currency Purchase Currency Sale Maturity
Unrealised(loss)(USD)
EUR 890,096 USD 1,052,974 19/01/2021 41,673USD 125,795 EUR 105,755 19/01/2021 (4,261)
37,412
DANSKE INVEST SICAV
239
Notes to the Audited Financial Statementsas at December 31, 2020 (continued)

NOTE 8 – FUTURES CONTRACTS
The following futures contracts were conducted with the counterparty: Danske Bank A/S.
As at December 31, 2020, the following futures contracts were outstanding:
Emerging Markets Debt Hard Currency
Currency ContractsNumber ofcontracts
Commitment(SEK)
Maturitydate
Unrealisedgain/(loss)
(USD)
PURCHASE USD 10Y TREASURY NOTES USA 200 22,109,000 22/03/2021 34,375PURCHASE USD 2Y TREASURY NOTES USA 110 22,564,520 31/03/2021 22,344PURCHASE USD 30Y TREASURY NOTES USA 170 22,113,770 22/03/2021 (223,997)PURCHASE USD 5Y TREASURY NOTES USA 75 7,482,825 31/03/2021 20,508SALE EUR EURO BOBL (300) (38,089,074) 08/03/2021 7,341SALE EUR EURO BUND (175) (22,659,439) 08/03/2021 (83,507)SALE EUR EURO SCHATZ (135) (16,777,501) 08/03/2021 9,911SALE EUR EURO -BUXL- FUTURES (30) (6,327,345) 08/03/2021 (69,008)PURCHASE USD TREASURY BONDS USA 175 27,219,500 22/03/2021 (186,147)
(468,180)
Euro Sustainable High Yield Bond*
Currency ContractsNumber ofcontracts
Commitment(SEK)
Maturitydate
Unrealisedgain
(EUR)
PURCHASE EUR EURO BOBL 12 1,241,748 08/03/2021 (1,200)PURCHASE EUR EURO BUND 9 949,788 08/03/2021 1,310PURCHASE EUR EURO SCHATZ 25 2,532,250 08/03/2021 (2,627)
(2,517)
European Bond
Currency ContractsNumber ofcontracts
Commitment(EUR)
Maturitydate
Unrealisedgain/(loss)
(EUR)
PURCHASE EUR EURO BOBL 3 310,437 08/03/2021 (640)PURCHASE EUR EURO BUND 12 1,266,384 08/03/2021 2,520SALE EUR EURO SCHATZ (11) (1,114,190) 08/03/2021 1,045PURCHASE EUR EURO -BUXL- FUTURES 15 2,578,485 08/03/2021 22,547
25,472
European Corporate Sustainable Bond
Currency ContractsNumber ofcontracts
Commitment(EUR)
Maturitydate
Unrealised(loss)(EUR)
SALE EUR EURO BUND (295) (31,131,940) 08/03/2021 (76,830)
(76,830)
Euro Investment Grade Corporate Bond
Currency ContractsNumber ofcontracts
Commitment(EUR)
Maturitydate
Unrealisedgain
(EUR)
PURCHASE EUR EURO BOBL 25 2,586,975 08/03/2021 (3,500)SALE EUR EURO BUND (41) (4,326,812) 08/03/2021 27,640PURCHASE EUR EURO SCHATZ 203 20,561,870 08/03/2021 (19,285)PURCHASE EUR EURO -BUXL- FUTURES 39 6,704,061 08/03/2021 58,623
63,478
DANSKE INVEST SICAV
240
Notes to the Audited Financial Statementsas at December 31, 2020 (continued)
* Please refer to Note 1.
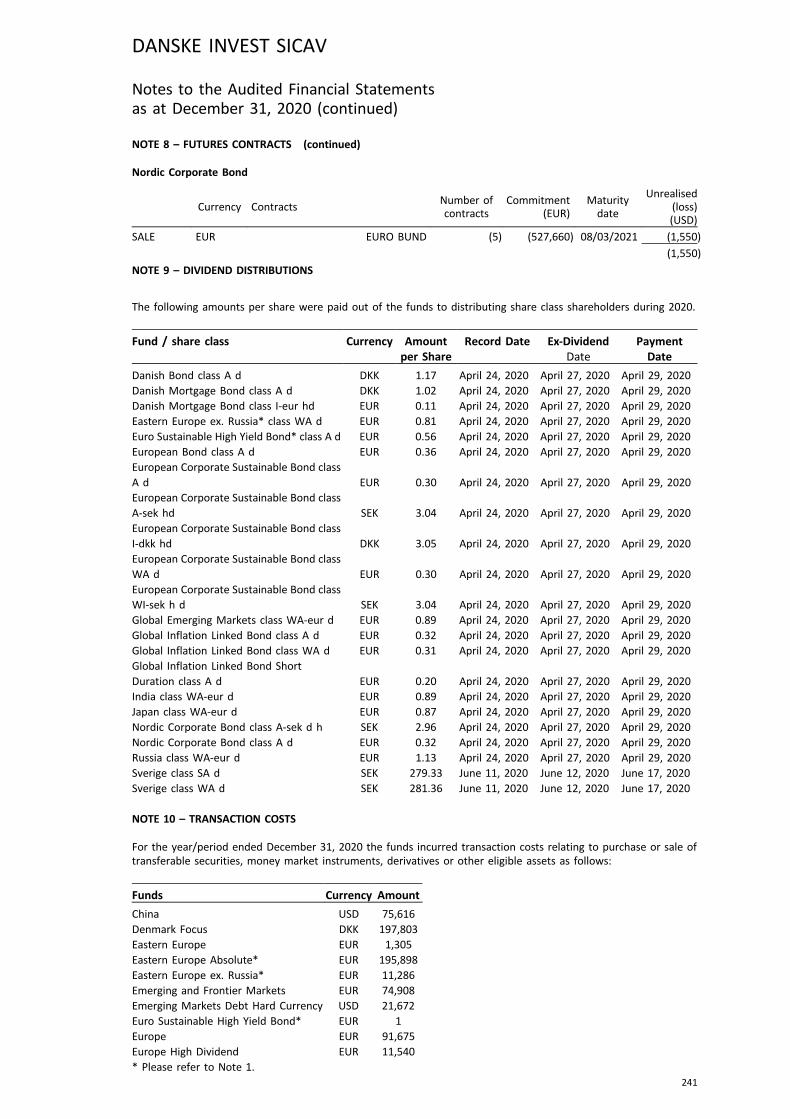
NOTE 8 – FUTURES CONTRACTS (continued)
Nordic Corporate Bond
Currency ContractsNumber ofcontracts
Commitment(EUR)
Maturitydate
Unrealised(loss)(USD)
SALE EUR EURO BUND (5) (527,660) 08/03/2021 (1,550)
(1,550)
NOTE 9 – DIVIDEND DISTRIBUTIONS
The following amounts per share were paid out of the funds to distributing share class shareholders during 2020.
Fund / share class Currency Amountper Share
Record Date Ex-DividendDate
PaymentDate
Danish Bond class A d DKK 1.17 April 24, 2020 April 27, 2020 April 29, 2020Danish Mortgage Bond class A d DKK 1.02 April 24, 2020 April 27, 2020 April 29, 2020Danish Mortgage Bond class I-eur hd EUR 0.11 April 24, 2020 April 27, 2020 April 29, 2020Eastern Europe ex. Russia* class WA d EUR 0.81 April 24, 2020 April 27, 2020 April 29, 2020Euro Sustainable High Yield Bond* class A d EUR 0.56 April 24, 2020 April 27, 2020 April 29, 2020European Bond class A d EUR 0.36 April 24, 2020 April 27, 2020 April 29, 2020European Corporate Sustainable Bond classA d EUR 0.30 April 24, 2020 April 27, 2020 April 29, 2020European Corporate Sustainable Bond classA-sek hd SEK 3.04 April 24, 2020 April 27, 2020 April 29, 2020European Corporate Sustainable Bond classI-dkk hd DKK 3.05 April 24, 2020 April 27, 2020 April 29, 2020European Corporate Sustainable Bond classWA d EUR 0.30 April 24, 2020 April 27, 2020 April 29, 2020European Corporate Sustainable Bond classWI-sek h d SEK 3.04 April 24, 2020 April 27, 2020 April 29, 2020Global Emerging Markets class WA-eur d EUR 0.89 April 24, 2020 April 27, 2020 April 29, 2020Global Inflation Linked Bond class A d EUR 0.32 April 24, 2020 April 27, 2020 April 29, 2020Global Inflation Linked Bond class WA d EUR 0.31 April 24, 2020 April 27, 2020 April 29, 2020Global Inflation Linked Bond ShortDuration class A d EUR 0.20 April 24, 2020 April 27, 2020 April 29, 2020India class WA-eur d EUR 0.89 April 24, 2020 April 27, 2020 April 29, 2020Japan class WA-eur d EUR 0.87 April 24, 2020 April 27, 2020 April 29, 2020Nordic Corporate Bond class A-sek d h SEK 2.96 April 24, 2020 April 27, 2020 April 29, 2020Nordic Corporate Bond class A d EUR 0.32 April 24, 2020 April 27, 2020 April 29, 2020Russia class WA-eur d EUR 1.13 April 24, 2020 April 27, 2020 April 29, 2020Sverige class SA d SEK 279.33 June 11, 2020 June 12, 2020 June 17, 2020Sverige class WA d SEK 281.36 June 11, 2020 June 12, 2020 June 17, 2020
NOTE 10 – TRANSACTION COSTS
For the year/period ended December 31, 2020 the funds incurred transaction costs relating to purchase or sale oftransferable securities, money market instruments, derivatives or other eligible assets as follows:
Funds Currency Amount
China USD 75,616Denmark Focus DKK 197,803Eastern Europe EUR 1,305Eastern Europe Absolute* EUR 195,898Eastern Europe ex. Russia* EUR 11,286Emerging and Frontier Markets EUR 74,908Emerging Markets Debt Hard Currency USD 21,672Euro Sustainable High Yield Bond* EUR 1Europe EUR 91,675Europe High Dividend EUR 11,540
DANSKE INVEST SICAV
241
Notes to the Audited Financial Statementsas at December 31, 2020 (continued)
* Please refer to Note 1.

NOTE 10 – TRANSACTION COSTS (continued)
Funds Currency Amount
Europe Small Cap EUR 143,643Global Emerging Markets USD 637,794Global Emerging Markets Small Cap USD 129,044Global High Dividend* EUR 10,147Global Inflation Linked Bond EUR 4Global Sustainable Future* EUR 22,791India USD 86,779Japan JPY 5,419,870Russia USD 16,800Sverige SEK 1,615,027Swedish Bond* SEK 6
These transaction costs are composed of brokerage costs and are included in cost of securities.
For Bond funds, transaction costs are included in the spread.
NOTE 11 – COVID-19
2020 was a historic year, defined by and large, by the global COVID-19 pandemic. The first quarter in 2020 wasdominated by high volatility and liquidity constraints on the financial markets as a consequence of the COVID-19outbreak, the prices of investments owned by some funds within the SICAV could not be promptly and accuratelyascertained on certain days. Therefore, Danske Invest Management A/S (DIMA) considered it to be in the bestinterest of these funds and their shareholders to suspend the net asset value calculation as well as the subscriptions,switches and redemptions orders for some days.
Furthermore, due to the volatility of the financial markets, Danske Invest Management A/S (DIMA) made temporaryadjustments to swing prices as the difference between the buying and selling prices on the underlying securitieswidened markedly resulting in higher transaction costs in the funds. Cost factors applied to swing pricing wereupdated regularly according to market conditions, and swing pricing was newly introduced to some funds, whichpreviously, were not subject to swing pricing.
The redemption flow during this period did not cause any liquidity issues and all redeeming investors were dulyreimbursed. All internal and external parties involved in the business have taken necessary measures to sustain theday-to-day business during this period and no immediate issues were detected. For the remainder of the year in2020, there were no suspensions of the net asset value calculation due to COVID-19.
Danske Invest Management A/S (DIMA) is ensuring that prices are available for a substantial portion of theunderlying securities, and is also monitoring the market‘s volatility and liquidity. There is also a dialogue withportfolio managers to ensure they can buy or sell in the market at prices indicated on trading platforms in order toabsorb subscriptions and pay redemptions. Swing cost factors have been updated regularly according to marketconditions.
The large volatility, high bond supply and changes in central bank policies due to COVID-19 had also createdopportunities throughout 2020 for some funds which can be seen in the returns for Global Portfolio Solutions fundsin the SICAV.
Despite the euro area economy being in lockdown during the first quarter of 2021 and the slow rollout of thevaccines, both Danske Invest Management A/S’s (DIMA) internal and external service providers have taken necessarymeasures in order to maintain business as usual. It is anticipated that the rollout of the vaccination may limit theneed for restrictions later in 2021.
NOTE 12 – POST BALANCE SHEET EVENTS
The securities lending revenue received by the various parties has been amended based on an agreementdated April 1, 2021. The new breakdown of the gross revenue is as follows; the fund is entitled to 77% and RBC I&TSis entitled to retain 23%. The Management Company will no longer retain revenues from securities lending.
* Please refer to Note 1.
DANSKE INVEST SICAV
242
Notes to the Audited Financial Statementsas at December 31, 2020 (continued)
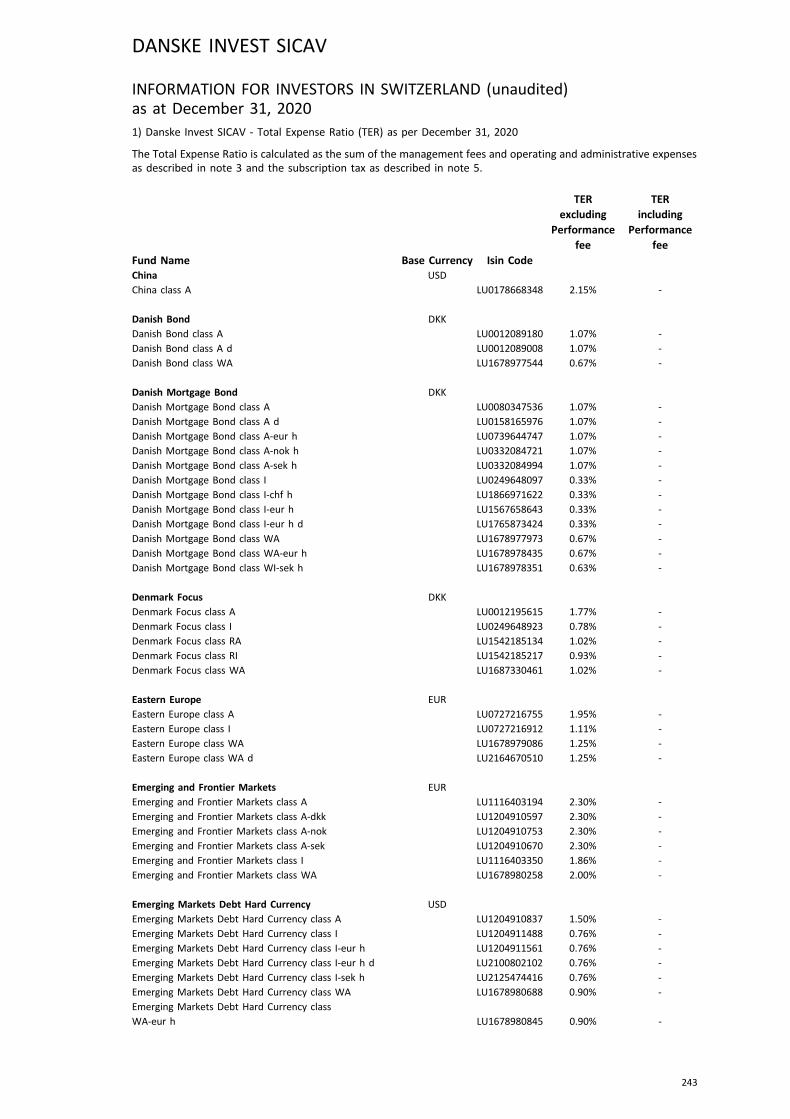
INFORMATION FOR INVESTORS IN SWITZERLAND (unaudited)as at December 31, 20201) Danske Invest SICAV - Total Expense Ratio (TER) as per December 31, 2020
The Total Expense Ratio is calculated as the sum of the management fees and operating and administrative expensesas described in note 3 and the subscription tax as described in note 5.
Fund Name Base Currency Isin Code
TERexcluding
Performancefee
TERincluding
Performancefee
China USD
China class A LU0178668348 2.15% -
Danish Bond DKK
Danish Bond class A LU0012089180 1.07% -
Danish Bond class A d LU0012089008 1.07% -
Danish Bond class WA LU1678977544 0.67% -
Danish Mortgage Bond DKK
Danish Mortgage Bond class A LU0080347536 1.07% -
Danish Mortgage Bond class A d LU0158165976 1.07% -
Danish Mortgage Bond class A-eur h LU0739644747 1.07% -
Danish Mortgage Bond class A-nok h LU0332084721 1.07% -
Danish Mortgage Bond class A-sek h LU0332084994 1.07% -
Danish Mortgage Bond class I LU0249648097 0.33% -
Danish Mortgage Bond class I-chf h LU1866971622 0.33% -
Danish Mortgage Bond class I-eur h LU1567658643 0.33% -
Danish Mortgage Bond class I-eur h d LU1765873424 0.33% -
Danish Mortgage Bond class WA LU1678977973 0.67% -
Danish Mortgage Bond class WA-eur h LU1678978435 0.67% -
Danish Mortgage Bond class WI-sek h LU1678978351 0.63% -
Denmark Focus DKK
Denmark Focus class A LU0012195615 1.77% -
Denmark Focus class I LU0249648923 0.78% -
Denmark Focus class RA LU1542185134 1.02% -
Denmark Focus class RI LU1542185217 0.93% -
Denmark Focus class WA LU1687330461 1.02% -
Eastern Europe EUR
Eastern Europe class A LU0727216755 1.95% -
Eastern Europe class I LU0727216912 1.11% -
Eastern Europe class WA LU1678979086 1.25% -
Eastern Europe class WA d LU2164670510 1.25% -
Emerging and Frontier Markets EUR
Emerging and Frontier Markets class A LU1116403194 2.30% -
Emerging and Frontier Markets class A-dkk LU1204910597 2.30% -
Emerging and Frontier Markets class A-nok LU1204910753 2.30% -
Emerging and Frontier Markets class A-sek LU1204910670 2.30% -
Emerging and Frontier Markets class I LU1116403350 1.86% -
Emerging and Frontier Markets class WA LU1678980258 2.00% -
Emerging Markets Debt Hard Currency USD
Emerging Markets Debt Hard Currency class A LU1204910837 1.50% -
Emerging Markets Debt Hard Currency class I LU1204911488 0.76% -
Emerging Markets Debt Hard Currency class I-eur h LU1204911561 0.76% -
Emerging Markets Debt Hard Currency class I-eur h d LU2100802102 0.76% -
Emerging Markets Debt Hard Currency class I-sek h LU2125474416 0.76% -
Emerging Markets Debt Hard Currency class WA LU1678980688 0.90% -
Emerging Markets Debt Hard Currency class
WA-eur h LU1678980845 0.90% -
DANSKE INVEST SICAV
243
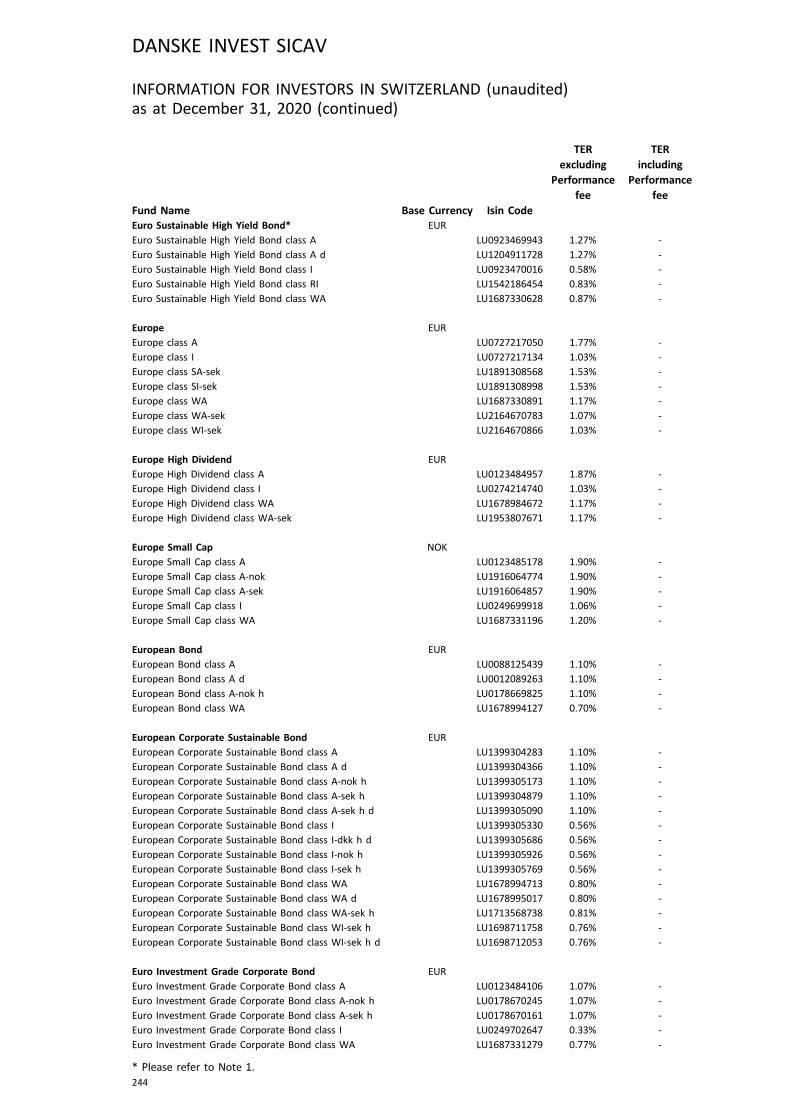
Fund Name Base Currency Isin Code
TERexcluding
Performancefee
TERincluding
Performancefee
Euro Sustainable High Yield Bond* EUR
Euro Sustainable High Yield Bond class A LU0923469943 1.27% -
Euro Sustainable High Yield Bond class A d LU1204911728 1.27% -
Euro Sustainable High Yield Bond class I LU0923470016 0.58% -
Euro Sustainable High Yield Bond class RI LU1542186454 0.83% -
Euro Sustainable High Yield Bond class WA LU1687330628 0.87% -
Europe EUR
Europe class A LU0727217050 1.77% -
Europe class I LU0727217134 1.03% -
Europe class SA-sek LU1891308568 1.53% -
Europe class SI-sek LU1891308998 1.53% -
Europe class WA LU1687330891 1.17% -
Europe class WA-sek LU2164670783 1.07% -
Europe class WI-sek LU2164670866 1.03% -
Europe High Dividend EUR
Europe High Dividend class A LU0123484957 1.87% -
Europe High Dividend class I LU0274214740 1.03% -
Europe High Dividend class WA LU1678984672 1.17% -
Europe High Dividend class WA-sek LU1953807671 1.17% -
Europe Small Cap NOK
Europe Small Cap class A LU0123485178 1.90% -
Europe Small Cap class A-nok LU1916064774 1.90% -
Europe Small Cap class A-sek LU1916064857 1.90% -
Europe Small Cap class I LU0249699918 1.06% -
Europe Small Cap class WA LU1687331196 1.20% -
European Bond EUR
European Bond class A LU0088125439 1.10% -
European Bond class A d LU0012089263 1.10% -
European Bond class A-nok h LU0178669825 1.10% -
European Bond class WA LU1678994127 0.70% -
European Corporate Sustainable Bond EUR
European Corporate Sustainable Bond class A LU1399304283 1.10% -
European Corporate Sustainable Bond class A d LU1399304366 1.10% -
European Corporate Sustainable Bond class A-nok h LU1399305173 1.10% -
European Corporate Sustainable Bond class A-sek h LU1399304879 1.10% -
European Corporate Sustainable Bond class A-sek h d LU1399305090 1.10% -
European Corporate Sustainable Bond class I LU1399305330 0.56% -
European Corporate Sustainable Bond class I-dkk h d LU1399305686 0.56% -
European Corporate Sustainable Bond class I-nok h LU1399305926 0.56% -
European Corporate Sustainable Bond class I-sek h LU1399305769 0.56% -
European Corporate Sustainable Bond class WA LU1678994713 0.80% -
European Corporate Sustainable Bond class WA d LU1678995017 0.80% -
European Corporate Sustainable Bond class WA-sek h LU1713568738 0.81% -
European Corporate Sustainable Bond class WI-sek h LU1698711758 0.76% -
European Corporate Sustainable Bond class WI-sek h d LU1698712053 0.76% -
Euro Investment Grade Corporate Bond EUR
Euro Investment Grade Corporate Bond class A LU0123484106 1.07% -
Euro Investment Grade Corporate Bond class A-nok h LU0178670245 1.07% -
Euro Investment Grade Corporate Bond class A-sek h LU0178670161 1.07% -
Euro Investment Grade Corporate Bond class I LU0249702647 0.33% -
Euro Investment Grade Corporate Bond class WA LU1687331279 0.77% -
DANSKE INVEST SICAV
244
INFORMATION FOR INVESTORS IN SWITZERLAND (unaudited)as at December 31, 2020 (continued)
* Please refer to Note 1.
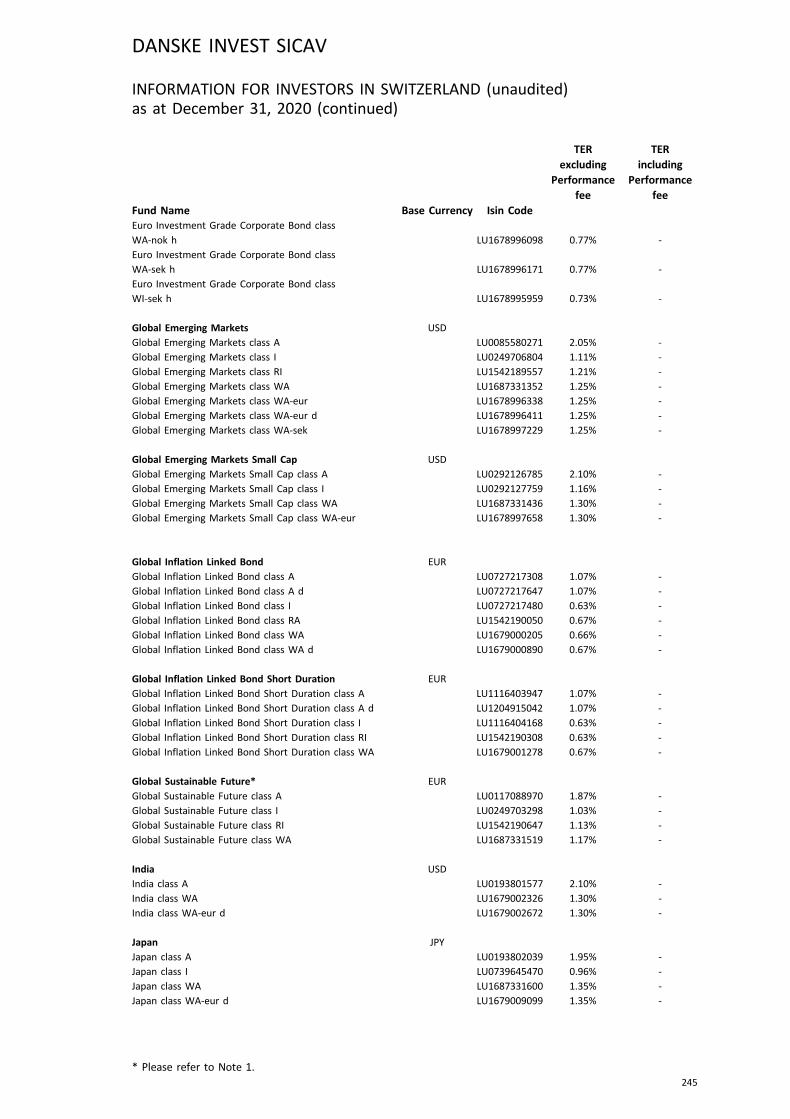
Fund Name Base Currency Isin Code
TERexcluding
Performancefee
TERincluding
Performancefee
Euro Investment Grade Corporate Bond class
WA-nok h LU1678996098 0.77% -
Euro Investment Grade Corporate Bond class
WA-sek h LU1678996171 0.77% -
Euro Investment Grade Corporate Bond class
WI-sek h LU1678995959 0.73% -
Global Emerging Markets USD
Global Emerging Markets class A LU0085580271 2.05% -
Global Emerging Markets class I LU0249706804 1.11% -
Global Emerging Markets class RI LU1542189557 1.21% -
Global Emerging Markets class WA LU1687331352 1.25% -
Global Emerging Markets class WA-eur LU1678996338 1.25% -
Global Emerging Markets class WA-eur d LU1678996411 1.25% -
Global Emerging Markets class WA-sek LU1678997229 1.25% -
Global Emerging Markets Small Cap USD
Global Emerging Markets Small Cap class A LU0292126785 2.10% -
Global Emerging Markets Small Cap class I LU0292127759 1.16% -
Global Emerging Markets Small Cap class WA LU1687331436 1.30% -
Global Emerging Markets Small Cap class WA-eur LU1678997658 1.30% -
Global Inflation Linked Bond EUR
Global Inflation Linked Bond class A LU0727217308 1.07% -
Global Inflation Linked Bond class A d LU0727217647 1.07% -
Global Inflation Linked Bond class I LU0727217480 0.63% -
Global Inflation Linked Bond class RA LU1542190050 0.67% -
Global Inflation Linked Bond class WA LU1679000205 0.66% -
Global Inflation Linked Bond class WA d LU1679000890 0.67% -
Global Inflation Linked Bond Short Duration EUR
Global Inflation Linked Bond Short Duration class A LU1116403947 1.07% -
Global Inflation Linked Bond Short Duration class A d LU1204915042 1.07% -
Global Inflation Linked Bond Short Duration class I LU1116404168 0.63% -
Global Inflation Linked Bond Short Duration class RI LU1542190308 0.63% -
Global Inflation Linked Bond Short Duration class WA LU1679001278 0.67% -
Global Sustainable Future* EUR
Global Sustainable Future class A LU0117088970 1.87% -
Global Sustainable Future class I LU0249703298 1.03% -
Global Sustainable Future class RI LU1542190647 1.13% -
Global Sustainable Future class WA LU1687331519 1.17% -
India USD
India class A LU0193801577 2.10% -
India class WA LU1679002326 1.30% -
India class WA-eur d LU1679002672 1.30% -
Japan JPY
Japan class A LU0193802039 1.95% -
Japan class I LU0739645470 0.96% -
Japan class WA LU1687331600 1.35% -
Japan class WA-eur d LU1679009099 1.35% -
DANSKE INVEST SICAV
245
INFORMATION FOR INVESTORS IN SWITZERLAND (unaudited)as at December 31, 2020 (continued)
* Please refer to Note 1.
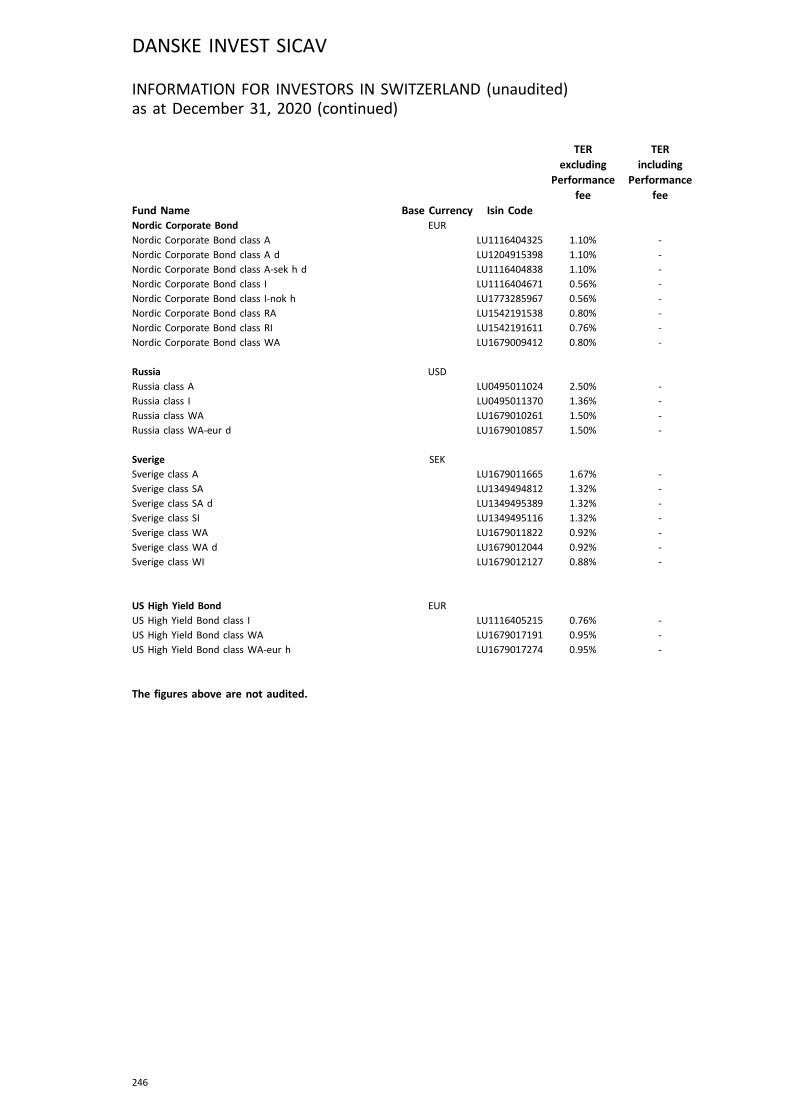
Fund Name Base Currency Isin Code
TERexcluding
Performancefee
TERincluding
Performancefee
Nordic Corporate Bond EUR
Nordic Corporate Bond class A LU1116404325 1.10% -
Nordic Corporate Bond class A d LU1204915398 1.10% -
Nordic Corporate Bond class A-sek h d LU1116404838 1.10% -
Nordic Corporate Bond class I LU1116404671 0.56% -
Nordic Corporate Bond class I-nok h LU1773285967 0.56% -
Nordic Corporate Bond class RA LU1542191538 0.80% -
Nordic Corporate Bond class RI LU1542191611 0.76% -
Nordic Corporate Bond class WA LU1679009412 0.80% -
Russia USD
Russia class A LU0495011024 2.50% -
Russia class I LU0495011370 1.36% -
Russia class WA LU1679010261 1.50% -
Russia class WA-eur d LU1679010857 1.50% -
Sverige SEK
Sverige class A LU1679011665 1.67% -
Sverige class SA LU1349494812 1.32% -
Sverige class SA d LU1349495389 1.32% -
Sverige class SI LU1349495116 1.32% -
Sverige class WA LU1679011822 0.92% -
Sverige class WA d LU1679012044 0.92% -
Sverige class WI LU1679012127 0.88% -
US High Yield Bond EUR
US High Yield Bond class I LU1116405215 0.76% -
US High Yield Bond class WA LU1679017191 0.95% -
US High Yield Bond class WA-eur h LU1679017274 0.95% -
The figures above are not audited.
DANSKE INVEST SICAV
246
INFORMATION FOR INVESTORS IN SWITZERLAND (unaudited)as at December 31, 2020 (continued)

2) Danske Invest SICAV - Publication of fund performance for investors in Switzerland
Danske Invest SICAV - Return and Benchmark
Fund name/ Index name Currency Launch date 2020 2019 2018
China
China class A USD 24-Nov-03 41.24% 16.75% -18.54%
MSCI China Index (net dividends reinvested) USD 29.49% 23.46% -18.88%
Danish Bond*
Danish Bond class A DKK 5-Jul-89 0.34% 0.34% -0.12%
Danish Bond class A d DKK 5-Jul-89 0.34% 0.34% -0.13%
Danish Bond class WA DKK 15-Nov-17 0.74% 0.74% 0.28%
Danish Mortgage Bond*
Danish Mortgage Bond class A DKK 2-Oct-97 1.81% 1.88% 0.42%
Danish Mortgage Bond class A d DKK 13-Dec-02 1.80% 1.88% 0.41%
Danish Mortgage Bond class A-nok h NOK 18-Dec-07 3.37% 3.87% 1.95%
Danish Mortgage Bond class A-sek h SEK 18-Dec-07 2.34% 2.39% 0.58%
Danish Mortgage Bond class I DKK 30-Sep-10 2.57% 2.63% 1.17%
Danish Mortgage Bond class A-eur h EUR 10-Jul-12 2.04% 2.10% 0.55%
Danish Mortgage Bond class I-eur h EUR 6-Apr-17 2.73% 2.84% 1.29%
Danish Mortgage Bond class WA-eur h (dormant since December
16, 2020) EUR 14-Nov-17 - 2.49% 0.97%
Danish Mortgage Bond class WA DKK 15-Nov-17 2.22% 2.28% 0.82%
Danish Mortgage Bond class WI-sek h (reactivated June 25, 2020) SEK 6-Nov-17 1.84% - -
Danish Mortgage Bond class I-chf h CHF 6-Sep-18 2.36% 2.67% 0.21%
Danish Mortgage Bond class I-eur hd EUR 8-Feb-18 2.71% 2.85% 3.03%
Denmark Focus
Denmark Focus class A DKK 19-Dec-90 25.75% 23.37% -12.95%
OMX Copenhagen CAP GI Index (net dividends reinvested) DKK 29.12% 26.24% -7.50%
Denmark Focus class I DKK 26-Jun-17 27.00% 24.59% -12.08%
OMX Copenhagen CAP GI Index (net dividends reinvested) DKK 29.12% 26.24% -7.50%
Denmark Focus class RA (dormant since October 23, 2020) DKK 3-Apr-17 - 24.30% -12.29%
OMX Copenhagen CAP GI Index (net dividends reinvested) DKK 13.65% 26.24% -7.50%
Denmark Focus class WA (dormant since December 16, 2020) DKK 14-Nov-17 - 24.30% -12.30%
OMX Copenhagen CAP GI Index (net dividends reinvested) DKK 29.12 % 26.24% -7.50%
Denmark Focus class RI DKK 22-Dec-17 26.81% 24.40% -12.22%
OMX Copenhagen CAP GI Index (net dividends reinvested) DKK 29.12% 26.24% -
Eastern Europe
Eastern Europe class I EUR 28-Feb-12 - - -8.36%
MSCI EM Europe 10/40 Net Total Return Index in EUR (net
dividends reinvested) EUR -3.12% - -
Eastern Europe class A EUR 10-Jul-12 -18.16 % 38.65% -9.22%
MSCI EM Europe 10/40 Net Total Return Index in EUR (net
dividends reinvested) EUR -19.14% 32.52% -6.73%
Eastern Europe class WA d EUR 14-Nov-17 19.50% - -
MSCI EM Europe 10/40 Net Total Return Index in EUR (net
dividends reinvested) EUR -19.14% - -
Eastern Europe class WA EUR 14-Nov-17 -17.54% 39.75% -8.49%
MSCI EM Europe 10/40 Net Total Return Index in EUR (net
dividends reinvested) EUR -19.14% 32.52% -6.73%
DANSKE INVEST SICAV
247
INFORMATION FOR INVESTORS IN SWITZERLAND (unaudited)as at December 31, 2020 (continued)
* Please refer to Note 1.

Fund name/ Index name Currency Launch date 2020 2019 2018Emerging and Frontier Markets
Emerging and Frontier Markets class A EUR 8-Sep-15 1.04% 12.82% -16.72%
MSCI Emerging Markets Net Total Return Index in EUR (net
dividends reinvested) EUR 8.54% - -
Emerging and Frontier Markets class I EUR 8-Sep-15 1.48% 13.32% -16.35%
MSCI Emerging Markets Net Total Return Index in EUR (net
dividends reinvested) EUR 8.54% 20.60% -10.27%
Emerging and Frontier Markets class A-dkk DKK 8-Sep-15 0.61% 12.91% -16.49%
MSCI Emerging Markets Net Total Return Index in EUR (net
dividends reinvested) DKK 8.11% 20.76% -10.06%
Emerging and Frontier Markets class A-sek SEK 8-Sep-15 -2.83% 15.28% -13.33%
MSCI Emerging Markets Net Total Return Index in EUR (net
dividends reinvested) SEK 3.79% 25.04% -7.50%
Emerging and Frontier Markets class A-nok NOK 8-Sep-15 7.55% 11.87% -15.85%
MSCI Emerging Markets Net Total Return Index in EUR (net
dividends reinvested) NOK 15.27% 20.17% -9.57%
Emerging and Frontier Markets class WA EUR 14-Nov-17 1.34% 13.16% -16.47%
MSCI Emerging Markets Net Total Return Index in EUR (net
dividends reinvested) EUR 8.54% 20.60% -10.27%
Emerging Markets Debt Hard Currency
Emerging Markets Debt Hard Currency class A USD 24-Jun-15 5.64% 14.75% -5.38%
JPM EMBI Global Diversified Composite (hedged into the
respective class currency) USD 5.26% - -
Emerging Markets Debt Hard Currency class I USD 24-Jun-15 6.42% 15.59% -4.65%
JPM EMBI Global Diversified Composite (hedged into the
respective class currency) USD 5.26% 15.04% -4.26%
Emerging Markets Debt Hard Currency class I-eur h EUR 16-Nov-16 4.04% 12.20% -7.33%
JPM EMBI Global Diversified Composite (hedged into the
respective class currency) EUR 3.50% 11.66% -7.04%
Emerging Markets Debt Hard Currency Class I-eur h d EUR 5-Feb-20 - - -
JPM EMBI Global Diversified Composite (hedged into the
respective class currency) EUR -6.01 - -
Emerging Markets Debt Hard Currency Class I-sek h SEK 10-Nov-16 - - -
JPM EMBI Global Diversified Composite (hedged into the
respective class currency) SEK 20.21% - -
Emerging Markets Debt Hard Currency class WA (dormant since
December 16, 2020) USD 14-Nov-17 - 15.43% -4.81%
JPM EMBI Global Diversified Composite (hedged into the
respective class currency) USD 5.26% 15.04% -4.26%
Emerging Markets Debt Hard Currency class WA-eur h EUR 20-Jun-18 3.69% 12.09% -1.19%
JPM EMBI Global Diversified Composite (hedged into the
respective class currency) EUR 3.50% 12.15% -
Euro Sustainable High Yield Bond
Euro Sustainable High Yield Bond class A EUR 10-Jul-13 1.65% 9.48% -5.66%
Bloomberg-Barclays Capital Euro High Yield 3% Issuer Capped
Index in EUR EUR 2.25% - -
Euro Sustainable High Yield Bond class A d EUR 16-Jun-15 1.62% 9.47% -5.67%
Bloomberg-Barclays Capital Euro High Yield 3% Issuer Capped
Index in EUR EUR 2.25% - -
Euro Sustainable High Yield Bond class I EUR 13-Apr-16 2.35% 10.23% -5.01%
Bloomberg-Barclays Capital Euro High Yield 3% Issuer Capped
Index in EUR EUR 2.25% 11.27% -3.79%
Euro Sustainable High Yield Bond class WA EUR 15-Nov-17 2.05% 9.92% -5.28%
Bloomberg-Barclays Capital Euro High Yield 3% Issuer Capped
Index in EUR EUR 2.25% - -
Euro Sustainable High Yield Bond class RI EUR 22-Dec-17 2.09% 9.96% -5.27%
Bloomberg-Barclays Capital Euro High Yield 3% Issuer Capped
Index in EUR EUR 2.25% 11.27% -3.79%
DANSKE INVEST SICAV
248
INFORMATION FOR INVESTORS IN SWITZERLAND (unaudited)as at December 31, 2020 (continued)
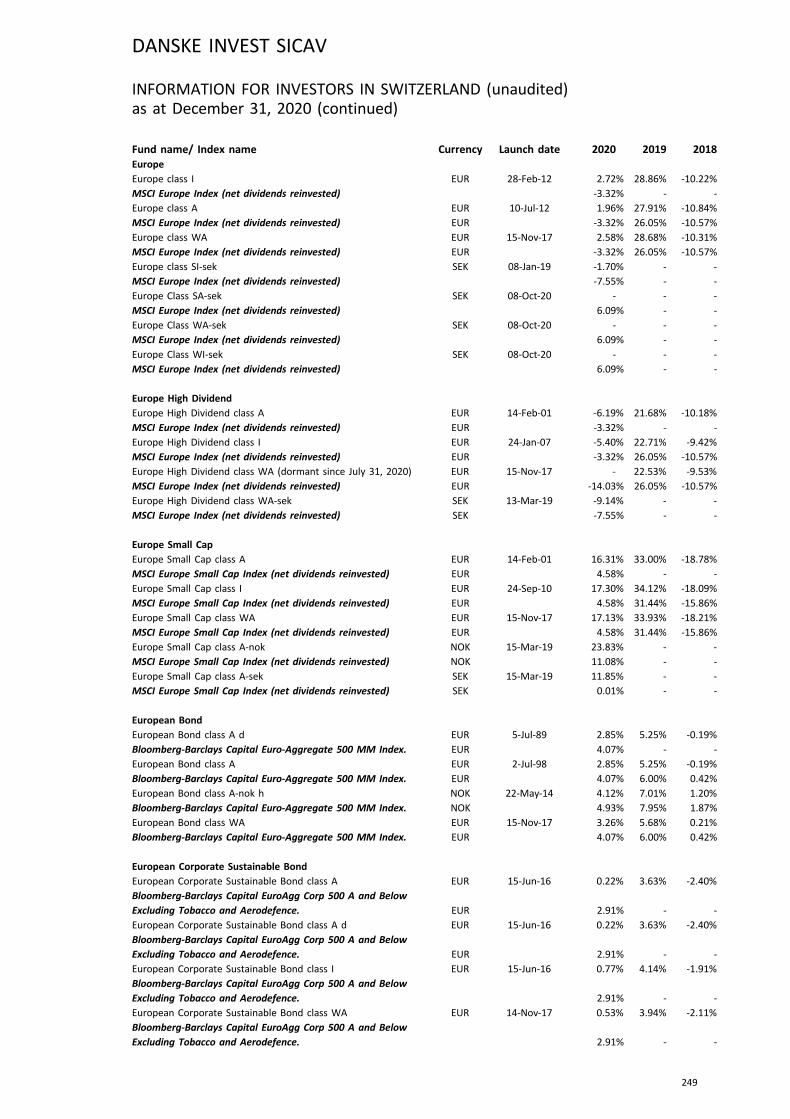
Fund name/ Index name Currency Launch date 2020 2019 2018Europe
Europe class I EUR 28-Feb-12 2.72% 28.86% -10.22%
MSCI Europe Index (net dividends reinvested) -3.32% - -
Europe class A EUR 10-Jul-12 1.96% 27.91% -10.84%
MSCI Europe Index (net dividends reinvested) EUR -3.32% 26.05% -10.57%
Europe class WA EUR 15-Nov-17 2.58% 28.68% -10.31%
MSCI Europe Index (net dividends reinvested) EUR -3.32% 26.05% -10.57%
Europe class SI-sek SEK 08-Jan-19 -1.70% - -
MSCI Europe Index (net dividends reinvested) -7.55% - -
Europe Class SA-sek SEK 08-Oct-20 - - -
MSCI Europe Index (net dividends reinvested) 6.09% - -
Europe Class WA-sek SEK 08-Oct-20 - - -
MSCI Europe Index (net dividends reinvested) 6.09% - -
Europe Class WI-sek SEK 08-Oct-20 - - -
MSCI Europe Index (net dividends reinvested) 6.09% - -
Europe High Dividend
Europe High Dividend class A EUR 14-Feb-01 -6.19% 21.68% -10.18%
MSCI Europe Index (net dividends reinvested) EUR -3.32% - -
Europe High Dividend class I EUR 24-Jan-07 -5.40% 22.71% -9.42%
MSCI Europe Index (net dividends reinvested) EUR -3.32% 26.05% -10.57%
Europe High Dividend class WA (dormant since July 31, 2020) EUR 15-Nov-17 - 22.53% -9.53%
MSCI Europe Index (net dividends reinvested) EUR -14.03% 26.05% -10.57%
Europe High Dividend class WA-sek SEK 13-Mar-19 -9.14% - -
MSCI Europe Index (net dividends reinvested) SEK -7.55% - -
Europe Small Cap
Europe Small Cap class A EUR 14-Feb-01 16.31% 33.00% -18.78%
MSCI Europe Small Cap Index (net dividends reinvested) EUR 4.58% - -
Europe Small Cap class I EUR 24-Sep-10 17.30% 34.12% -18.09%
MSCI Europe Small Cap Index (net dividends reinvested) EUR 4.58% 31.44% -15.86%
Europe Small Cap class WA EUR 15-Nov-17 17.13% 33.93% -18.21%
MSCI Europe Small Cap Index (net dividends reinvested) EUR 4.58% 31.44% -15.86%
Europe Small Cap class A-nok NOK 15-Mar-19 23.83% - -
MSCI Europe Small Cap Index (net dividends reinvested) NOK 11.08% - -
Europe Small Cap class A-sek SEK 15-Mar-19 11.85% - -
MSCI Europe Small Cap Index (net dividends reinvested) SEK 0.01% - -
European Bond
European Bond class A d EUR 5-Jul-89 2.85% 5.25% -0.19%
Bloomberg-Barclays Capital Euro-Aggregate 500 MM Index. EUR 4.07% - -
European Bond class A EUR 2-Jul-98 2.85% 5.25% -0.19%
Bloomberg-Barclays Capital Euro-Aggregate 500 MM Index. EUR 4.07% 6.00% 0.42%
European Bond class A-nok h NOK 22-May-14 4.12% 7.01% 1.20%
Bloomberg-Barclays Capital Euro-Aggregate 500 MM Index. NOK 4.93% 7.95% 1.87%
European Bond class WA EUR 15-Nov-17 3.26% 5.68% 0.21%
Bloomberg-Barclays Capital Euro-Aggregate 500 MM Index. EUR 4.07% 6.00% 0.42%
European Corporate Sustainable Bond
European Corporate Sustainable Bond class A EUR 15-Jun-16 0.22% 3.63% -2.40%
Bloomberg-Barclays Capital EuroAgg Corp 500 A and Below
Excluding Tobacco and Aerodefence. EUR 2.91% - -
European Corporate Sustainable Bond class A d EUR 15-Jun-16 0.22% 3.63% -2.40%
Bloomberg-Barclays Capital EuroAgg Corp 500 A and Below
Excluding Tobacco and Aerodefence. EUR 2.91% - -
European Corporate Sustainable Bond class I EUR 15-Jun-16 0.77% 4.14% -1.91%
Bloomberg-Barclays Capital EuroAgg Corp 500 A and Below
Excluding Tobacco and Aerodefence. 2.91% - -
European Corporate Sustainable Bond class WA EUR 14-Nov-17 0.53% 3.94% -2.11%
Bloomberg-Barclays Capital EuroAgg Corp 500 A and Below
Excluding Tobacco and Aerodefence. 2.91% - -
DANSKE INVEST SICAV
249
INFORMATION FOR INVESTORS IN SWITZERLAND (unaudited)as at December 31, 2020 (continued)
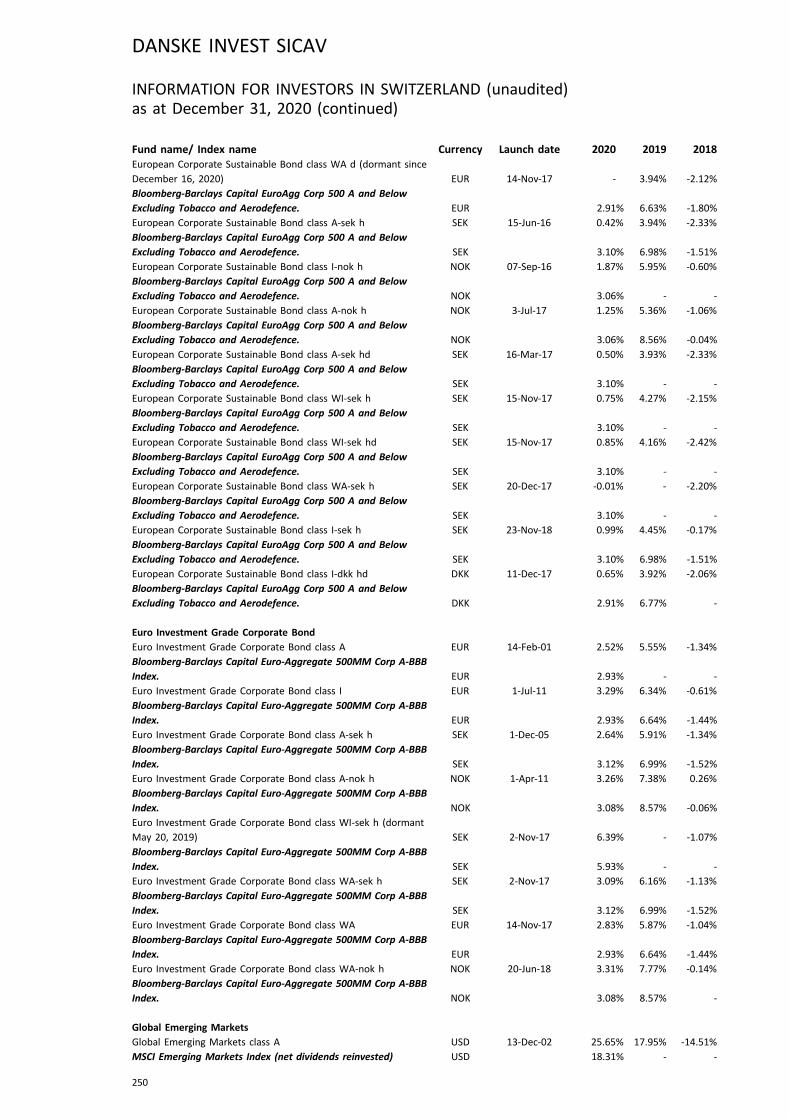
Fund name/ Index name Currency Launch date 2020 2019 2018European Corporate Sustainable Bond class WA d (dormant since
December 16, 2020) EUR 14-Nov-17 - 3.94% -2.12%
Bloomberg-Barclays Capital EuroAgg Corp 500 A and Below
Excluding Tobacco and Aerodefence. EUR 2.91% 6.63% -1.80%
European Corporate Sustainable Bond class A-sek h SEK 15-Jun-16 0.42% 3.94% -2.33%
Bloomberg-Barclays Capital EuroAgg Corp 500 A and Below
Excluding Tobacco and Aerodefence. SEK 3.10% 6.98% -1.51%
European Corporate Sustainable Bond class I-nok h NOK 07-Sep-16 1.87% 5.95% -0.60%
Bloomberg-Barclays Capital EuroAgg Corp 500 A and Below
Excluding Tobacco and Aerodefence. NOK 3.06% - -
European Corporate Sustainable Bond class A-nok h NOK 3-Jul-17 1.25% 5.36% -1.06%
Bloomberg-Barclays Capital EuroAgg Corp 500 A and Below
Excluding Tobacco and Aerodefence. NOK 3.06% 8.56% -0.04%
European Corporate Sustainable Bond class A-sek hd SEK 16-Mar-17 0.50% 3.93% -2.33%
Bloomberg-Barclays Capital EuroAgg Corp 500 A and Below
Excluding Tobacco and Aerodefence. SEK 3.10% - -
European Corporate Sustainable Bond class WI-sek h SEK 15-Nov-17 0.75% 4.27% -2.15%
Bloomberg-Barclays Capital EuroAgg Corp 500 A and Below
Excluding Tobacco and Aerodefence. SEK 3.10% - -
European Corporate Sustainable Bond class WI-sek hd SEK 15-Nov-17 0.85% 4.16% -2.42%
Bloomberg-Barclays Capital EuroAgg Corp 500 A and Below
Excluding Tobacco and Aerodefence. SEK 3.10% - -
European Corporate Sustainable Bond class WA-sek h SEK 20-Dec-17 -0.01% - -2.20%
Bloomberg-Barclays Capital EuroAgg Corp 500 A and Below
Excluding Tobacco and Aerodefence. SEK 3.10% - -
European Corporate Sustainable Bond class I-sek h SEK 23-Nov-18 0.99% 4.45% -0.17%
Bloomberg-Barclays Capital EuroAgg Corp 500 A and Below
Excluding Tobacco and Aerodefence. SEK 3.10% 6.98% -1.51%
European Corporate Sustainable Bond class I-dkk hd DKK 11-Dec-17 0.65% 3.92% -2.06%
Bloomberg-Barclays Capital EuroAgg Corp 500 A and Below
Excluding Tobacco and Aerodefence. DKK 2.91% 6.77% -
Euro Investment Grade Corporate Bond
Euro Investment Grade Corporate Bond class A EUR 14-Feb-01 2.52% 5.55% -1.34%
Bloomberg-Barclays Capital Euro-Aggregate 500MM Corp A-BBB
Index. EUR 2.93% - -
Euro Investment Grade Corporate Bond class I EUR 1-Jul-11 3.29% 6.34% -0.61%
Bloomberg-Barclays Capital Euro-Aggregate 500MM Corp A-BBB
Index. EUR 2.93% 6.64% -1.44%
Euro Investment Grade Corporate Bond class A-sek h SEK 1-Dec-05 2.64% 5.91% -1.34%
Bloomberg-Barclays Capital Euro-Aggregate 500MM Corp A-BBB
Index. SEK 3.12% 6.99% -1.52%
Euro Investment Grade Corporate Bond class A-nok h NOK 1-Apr-11 3.26% 7.38% 0.26%
Bloomberg-Barclays Capital Euro-Aggregate 500MM Corp A-BBB
Index. NOK 3.08% 8.57% -0.06%
Euro Investment Grade Corporate Bond class WI-sek h (dormant
May 20, 2019) SEK 2-Nov-17 6.39% - -1.07%
Bloomberg-Barclays Capital Euro-Aggregate 500MM Corp A-BBB
Index. SEK 5.93% - -
Euro Investment Grade Corporate Bond class WA-sek h SEK 2-Nov-17 3.09% 6.16% -1.13%
Bloomberg-Barclays Capital Euro-Aggregate 500MM Corp A-BBB
Index. SEK 3.12% 6.99% -1.52%
Euro Investment Grade Corporate Bond class WA EUR 14-Nov-17 2.83% 5.87% -1.04%
Bloomberg-Barclays Capital Euro-Aggregate 500MM Corp A-BBB
Index. EUR 2.93% 6.64% -1.44%
Euro Investment Grade Corporate Bond class WA-nok h NOK 20-Jun-18 3.31% 7.77% -0.14%
Bloomberg-Barclays Capital Euro-Aggregate 500MM Corp A-BBB
Index. NOK 3.08% 8.57% -
Global Emerging Markets
Global Emerging Markets class A USD 13-Dec-02 25.65% 17.95% -14.51%
MSCI Emerging Markets Index (net dividends reinvested) USD 18.31% - -
DANSKE INVEST SICAV
250
INFORMATION FOR INVESTORS IN SWITZERLAND (unaudited)as at December 31, 2020 (continued)
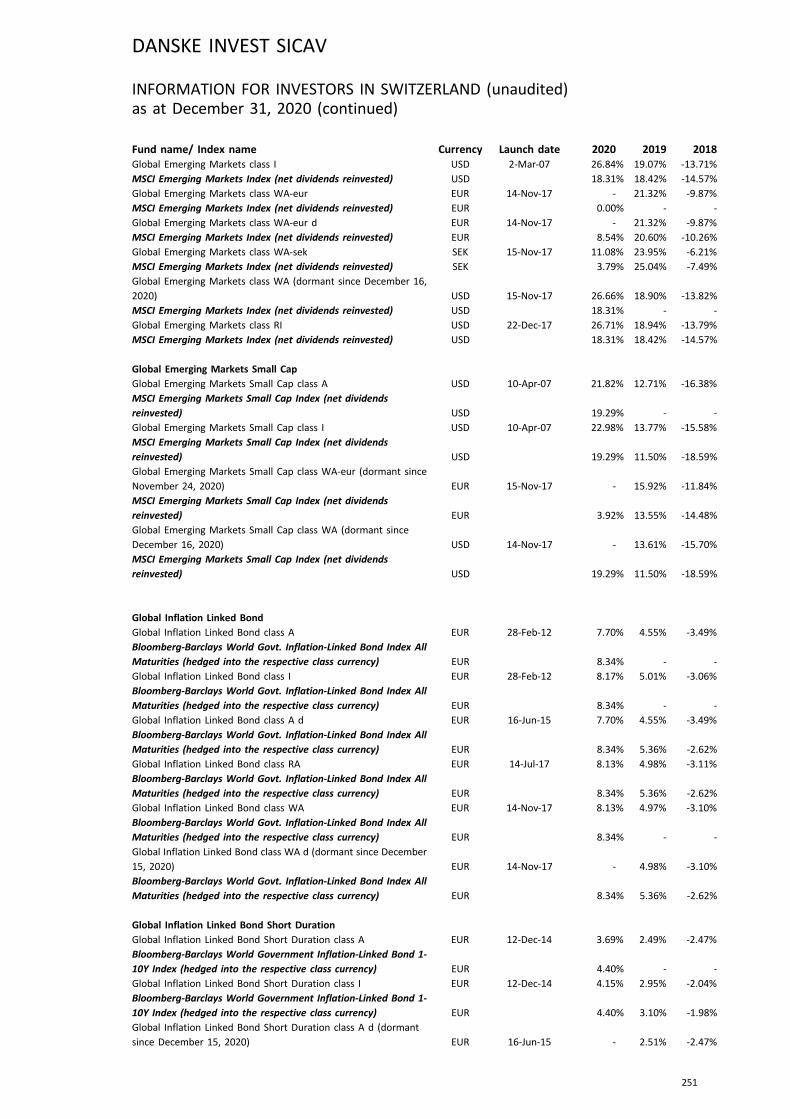
Fund name/ Index name Currency Launch date 2020 2019 2018Global Emerging Markets class I USD 2-Mar-07 26.84% 19.07% -13.71%
MSCI Emerging Markets Index (net dividends reinvested) USD 18.31% 18.42% -14.57%
Global Emerging Markets class WA-eur EUR 14-Nov-17 - 21.32% -9.87%
MSCI Emerging Markets Index (net dividends reinvested) EUR 0.00% - -
Global Emerging Markets class WA-eur d EUR 14-Nov-17 - 21.32% -9.87%
MSCI Emerging Markets Index (net dividends reinvested) EUR 8.54% 20.60% -10.26%
Global Emerging Markets class WA-sek SEK 15-Nov-17 11.08% 23.95% -6.21%
MSCI Emerging Markets Index (net dividends reinvested) SEK 3.79% 25.04% -7.49%
Global Emerging Markets class WA (dormant since December 16,
2020) USD 15-Nov-17 26.66% 18.90% -13.82%
MSCI Emerging Markets Index (net dividends reinvested) USD 18.31% - -
Global Emerging Markets class RI USD 22-Dec-17 26.71% 18.94% -13.79%
MSCI Emerging Markets Index (net dividends reinvested) USD 18.31% 18.42% -14.57%
Global Emerging Markets Small Cap
Global Emerging Markets Small Cap class A USD 10-Apr-07 21.82% 12.71% -16.38%
MSCI Emerging Markets Small Cap Index (net dividends
reinvested) USD 19.29% - -
Global Emerging Markets Small Cap class I USD 10-Apr-07 22.98% 13.77% -15.58%
MSCI Emerging Markets Small Cap Index (net dividends
reinvested) USD 19.29% 11.50% -18.59%
Global Emerging Markets Small Cap class WA-eur (dormant since
November 24, 2020) EUR 15-Nov-17 - 15.92% -11.84%
MSCI Emerging Markets Small Cap Index (net dividends
reinvested) EUR 3.92% 13.55% -14.48%
Global Emerging Markets Small Cap class WA (dormant since
December 16, 2020) USD 14-Nov-17 - 13.61% -15.70%
MSCI Emerging Markets Small Cap Index (net dividends
reinvested) USD 19.29% 11.50% -18.59%
Global Inflation Linked Bond
Global Inflation Linked Bond class A EUR 28-Feb-12 7.70% 4.55% -3.49%
Bloomberg-Barclays World Govt. Inflation-Linked Bond Index All
Maturities (hedged into the respective class currency) EUR 8.34% - -
Global Inflation Linked Bond class I EUR 28-Feb-12 8.17% 5.01% -3.06%
Bloomberg-Barclays World Govt. Inflation-Linked Bond Index All
Maturities (hedged into the respective class currency) EUR 8.34% - -
Global Inflation Linked Bond class A d EUR 16-Jun-15 7.70% 4.55% -3.49%
Bloomberg-Barclays World Govt. Inflation-Linked Bond Index All
Maturities (hedged into the respective class currency) EUR 8.34% 5.36% -2.62%
Global Inflation Linked Bond class RA EUR 14-Jul-17 8.13% 4.98% -3.11%
Bloomberg-Barclays World Govt. Inflation-Linked Bond Index All
Maturities (hedged into the respective class currency) EUR 8.34% 5.36% -2.62%
Global Inflation Linked Bond class WA EUR 14-Nov-17 8.13% 4.97% -3.10%
Bloomberg-Barclays World Govt. Inflation-Linked Bond Index All
Maturities (hedged into the respective class currency) EUR 8.34% - -
Global Inflation Linked Bond class WA d (dormant since December
15, 2020) EUR 14-Nov-17 - 4.98% -3.10%
Bloomberg-Barclays World Govt. Inflation-Linked Bond Index All
Maturities (hedged into the respective class currency) EUR 8.34% 5.36% -2.62%
Global Inflation Linked Bond Short Duration
Global Inflation Linked Bond Short Duration class A EUR 12-Dec-14 3.69% 2.49% -2.47%
Bloomberg-Barclays World Government Inflation-Linked Bond 1-
10Y Index (hedged into the respective class currency) EUR 4.40% - -
Global Inflation Linked Bond Short Duration class I EUR 12-Dec-14 4.15% 2.95% -2.04%
Bloomberg-Barclays World Government Inflation-Linked Bond 1-
10Y Index (hedged into the respective class currency) EUR 4.40% 3.10% -1.98%
Global Inflation Linked Bond Short Duration class A d (dormant
since December 15, 2020) EUR 16-Jun-15 - 2.51% -2.47%
DANSKE INVEST SICAV
251
INFORMATION FOR INVESTORS IN SWITZERLAND (unaudited)as at December 31, 2020 (continued)
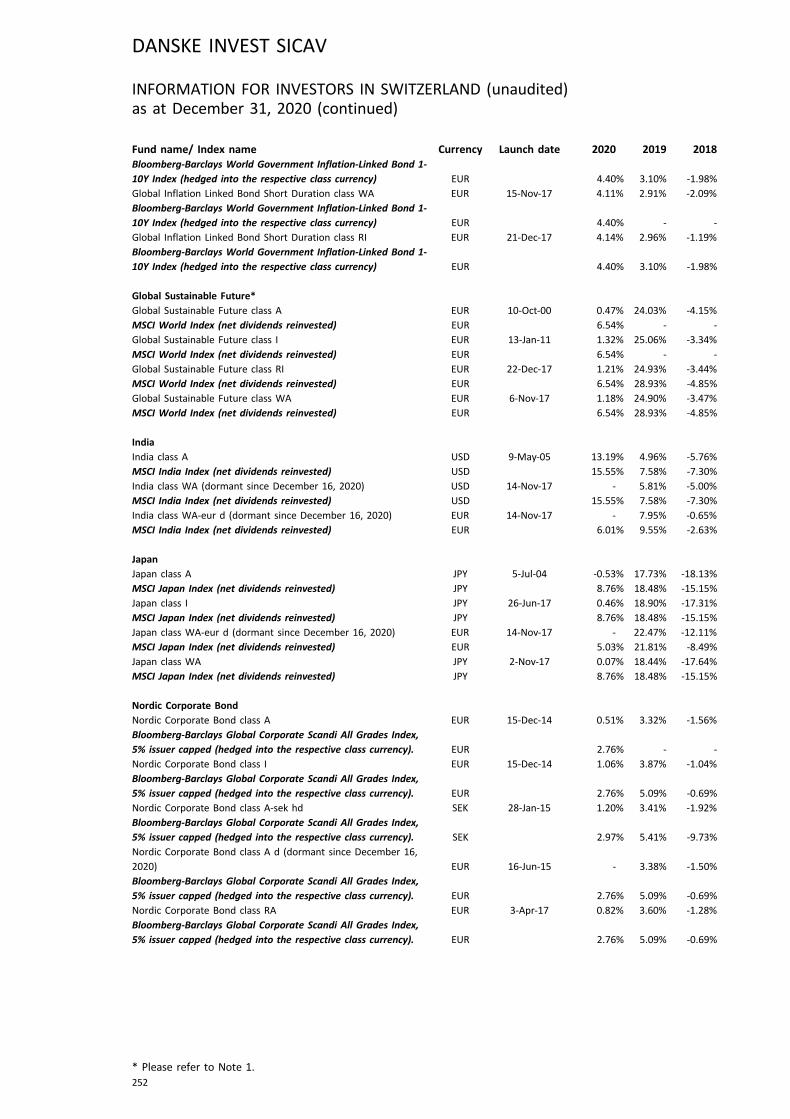
Fund name/ Index name Currency Launch date 2020 2019 2018Bloomberg-Barclays World Government Inflation-Linked Bond 1-
10Y Index (hedged into the respective class currency) EUR 4.40% 3.10% -1.98%
Global Inflation Linked Bond Short Duration class WA EUR 15-Nov-17 4.11% 2.91% -2.09%
Bloomberg-Barclays World Government Inflation-Linked Bond 1-
10Y Index (hedged into the respective class currency) EUR 4.40% - -
Global Inflation Linked Bond Short Duration class RI EUR 21-Dec-17 4.14% 2.96% -1.19%
Bloomberg-Barclays World Government Inflation-Linked Bond 1-
10Y Index (hedged into the respective class currency) EUR 4.40% 3.10% -1.98%
Global Sustainable Future*
Global Sustainable Future class A EUR 10-Oct-00 0.47% 24.03% -4.15%
MSCI World Index (net dividends reinvested) EUR 6.54% - -
Global Sustainable Future class I EUR 13-Jan-11 1.32% 25.06% -3.34%
MSCI World Index (net dividends reinvested) EUR 6.54% - -
Global Sustainable Future class RI EUR 22-Dec-17 1.21% 24.93% -3.44%
MSCI World Index (net dividends reinvested) EUR 6.54% 28.93% -4.85%
Global Sustainable Future class WA EUR 6-Nov-17 1.18% 24.90% -3.47%
MSCI World Index (net dividends reinvested) EUR 6.54% 28.93% -4.85%
India
India class A USD 9-May-05 13.19% 4.96% -5.76%
MSCI India Index (net dividends reinvested) USD 15.55% 7.58% -7.30%
India class WA (dormant since December 16, 2020) USD 14-Nov-17 - 5.81% -5.00%
MSCI India Index (net dividends reinvested) USD 15.55% 7.58% -7.30%
India class WA-eur d (dormant since December 16, 2020) EUR 14-Nov-17 - 7.95% -0.65%
MSCI India Index (net dividends reinvested) EUR 6.01% 9.55% -2.63%
Japan
Japan class A JPY 5-Jul-04 -0.53% 17.73% -18.13%
MSCI Japan Index (net dividends reinvested) JPY 8.76% 18.48% -15.15%
Japan class I JPY 26-Jun-17 0.46% 18.90% -17.31%
MSCI Japan Index (net dividends reinvested) JPY 8.76% 18.48% -15.15%
Japan class WA-eur d (dormant since December 16, 2020) EUR 14-Nov-17 - 22.47% -12.11%
MSCI Japan Index (net dividends reinvested) EUR 5.03% 21.81% -8.49%
Japan class WA JPY 2-Nov-17 0.07% 18.44% -17.64%
MSCI Japan Index (net dividends reinvested) JPY 8.76% 18.48% -15.15%
Nordic Corporate Bond
Nordic Corporate Bond class A EUR 15-Dec-14 0.51% 3.32% -1.56%
Bloomberg-Barclays Global Corporate Scandi All Grades Index,
5% issuer capped (hedged into the respective class currency). EUR 2.76% - -
Nordic Corporate Bond class I EUR 15-Dec-14 1.06% 3.87% -1.04%
Bloomberg-Barclays Global Corporate Scandi All Grades Index,
5% issuer capped (hedged into the respective class currency). EUR 2.76% 5.09% -0.69%
Nordic Corporate Bond class A-sek hd SEK 28-Jan-15 1.20% 3.41% -1.92%
Bloomberg-Barclays Global Corporate Scandi All Grades Index,
5% issuer capped (hedged into the respective class currency). SEK 2.97% 5.41% -9.73%
Nordic Corporate Bond class A d (dormant since December 16,
2020) EUR 16-Jun-15 - 3.38% -1.50%
Bloomberg-Barclays Global Corporate Scandi All Grades Index,
5% issuer capped (hedged into the respective class currency). EUR 2.76% 5.09% -0.69%
Nordic Corporate Bond class RA EUR 3-Apr-17 0.82% 3.60% -1.28%
Bloomberg-Barclays Global Corporate Scandi All Grades Index,
5% issuer capped (hedged into the respective class currency). EUR 2.76% 5.09% -0.69%
DANSKE INVEST SICAV
252
INFORMATION FOR INVESTORS IN SWITZERLAND (unaudited)as at December 31, 2020 (continued)
* Please refer to Note 1.
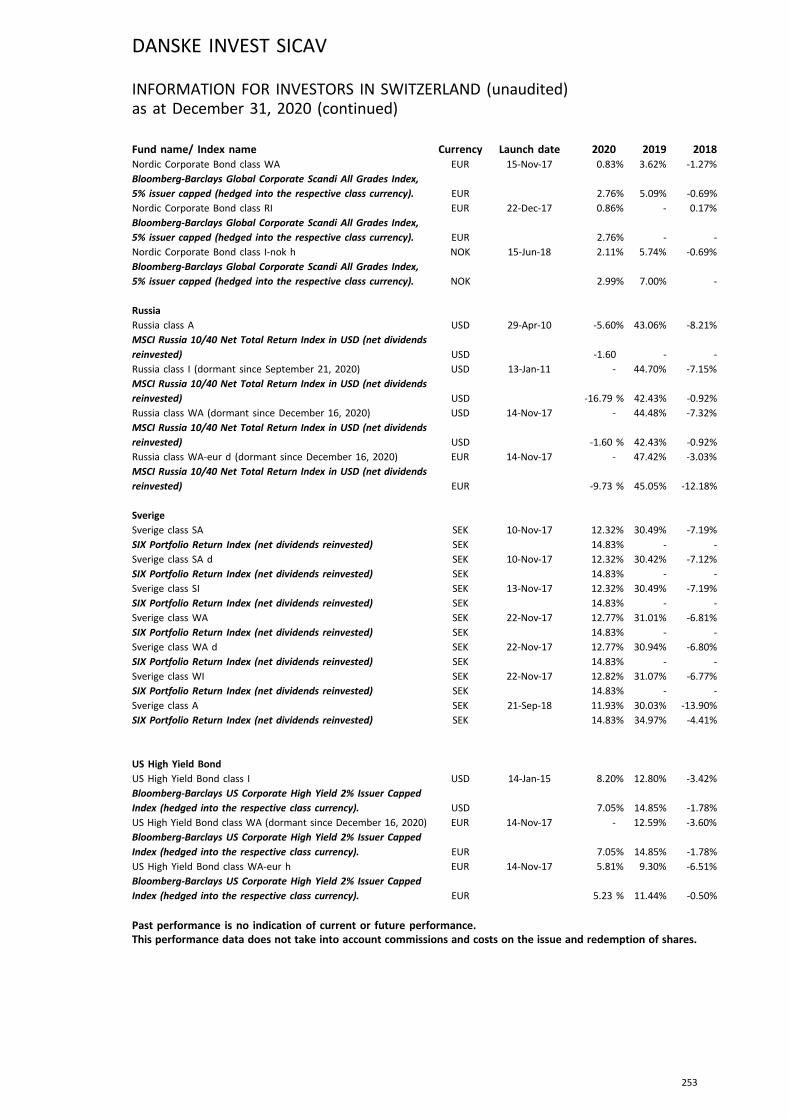
Fund name/ Index name Currency Launch date 2020 2019 2018Nordic Corporate Bond class WA EUR 15-Nov-17 0.83% 3.62% -1.27%
Bloomberg-Barclays Global Corporate Scandi All Grades Index,
5% issuer capped (hedged into the respective class currency). EUR 2.76% 5.09% -0.69%
Nordic Corporate Bond class RI EUR 22-Dec-17 0.86% - 0.17%
Bloomberg-Barclays Global Corporate Scandi All Grades Index,
5% issuer capped (hedged into the respective class currency). EUR 2.76% - -
Nordic Corporate Bond class I-nok h NOK 15-Jun-18 2.11% 5.74% -0.69%
Bloomberg-Barclays Global Corporate Scandi All Grades Index,
5% issuer capped (hedged into the respective class currency). NOK 2.99% 7.00% -
Russia
Russia class A USD 29-Apr-10 -5.60% 43.06% -8.21%
MSCI Russia 10/40 Net Total Return Index in USD (net dividends
reinvested) USD -1.60 - -
Russia class I (dormant since September 21, 2020) USD 13-Jan-11 - 44.70% -7.15%
MSCI Russia 10/40 Net Total Return Index in USD (net dividends
reinvested) USD -16.79 % 42.43% -0.92%
Russia class WA (dormant since December 16, 2020) USD 14-Nov-17 - 44.48% -7.32%
MSCI Russia 10/40 Net Total Return Index in USD (net dividends
reinvested) USD -1.60 % 42.43% -0.92%
Russia class WA-eur d (dormant since December 16, 2020) EUR 14-Nov-17 - 47.42% -3.03%
MSCI Russia 10/40 Net Total Return Index in USD (net dividends
reinvested) EUR -9.73 % 45.05% -12.18%
Sverige
Sverige class SA SEK 10-Nov-17 12.32% 30.49% -7.19%
SIX Portfolio Return Index (net dividends reinvested) SEK 14.83% - -
Sverige class SA d SEK 10-Nov-17 12.32% 30.42% -7.12%
SIX Portfolio Return Index (net dividends reinvested) SEK 14.83% - -
Sverige class SI SEK 13-Nov-17 12.32% 30.49% -7.19%
SIX Portfolio Return Index (net dividends reinvested) SEK 14.83% - -
Sverige class WA SEK 22-Nov-17 12.77% 31.01% -6.81%
SIX Portfolio Return Index (net dividends reinvested) SEK 14.83% - -
Sverige class WA d SEK 22-Nov-17 12.77% 30.94% -6.80%
SIX Portfolio Return Index (net dividends reinvested) SEK 14.83% - -
Sverige class WI SEK 22-Nov-17 12.82% 31.07% -6.77%
SIX Portfolio Return Index (net dividends reinvested) SEK 14.83% - -
Sverige class A SEK 21-Sep-18 11.93% 30.03% -13.90%
SIX Portfolio Return Index (net dividends reinvested) SEK 14.83% 34.97% -4.41%
US High Yield Bond
US High Yield Bond class I USD 14-Jan-15 8.20% 12.80% -3.42%
Bloomberg-Barclays US Corporate High Yield 2% Issuer Capped
Index (hedged into the respective class currency). USD 7.05% 14.85% -1.78%
US High Yield Bond class WA (dormant since December 16, 2020) EUR 14-Nov-17 - 12.59% -3.60%
Bloomberg-Barclays US Corporate High Yield 2% Issuer Capped
Index (hedged into the respective class currency). EUR 7.05% 14.85% -1.78%
US High Yield Bond class WA-eur h EUR 14-Nov-17 5.81% 9.30% -6.51%
Bloomberg-Barclays US Corporate High Yield 2% Issuer Capped
Index (hedged into the respective class currency). EUR 5.23 % 11.44% -0.50%
Past performance is no indication of current or future performance.This performance data does not take into account commissions and costs on the issue and redemption of shares.
DANSKE INVEST SICAV
253
INFORMATION FOR INVESTORS IN SWITZERLAND (unaudited)as at December 31, 2020 (continued)
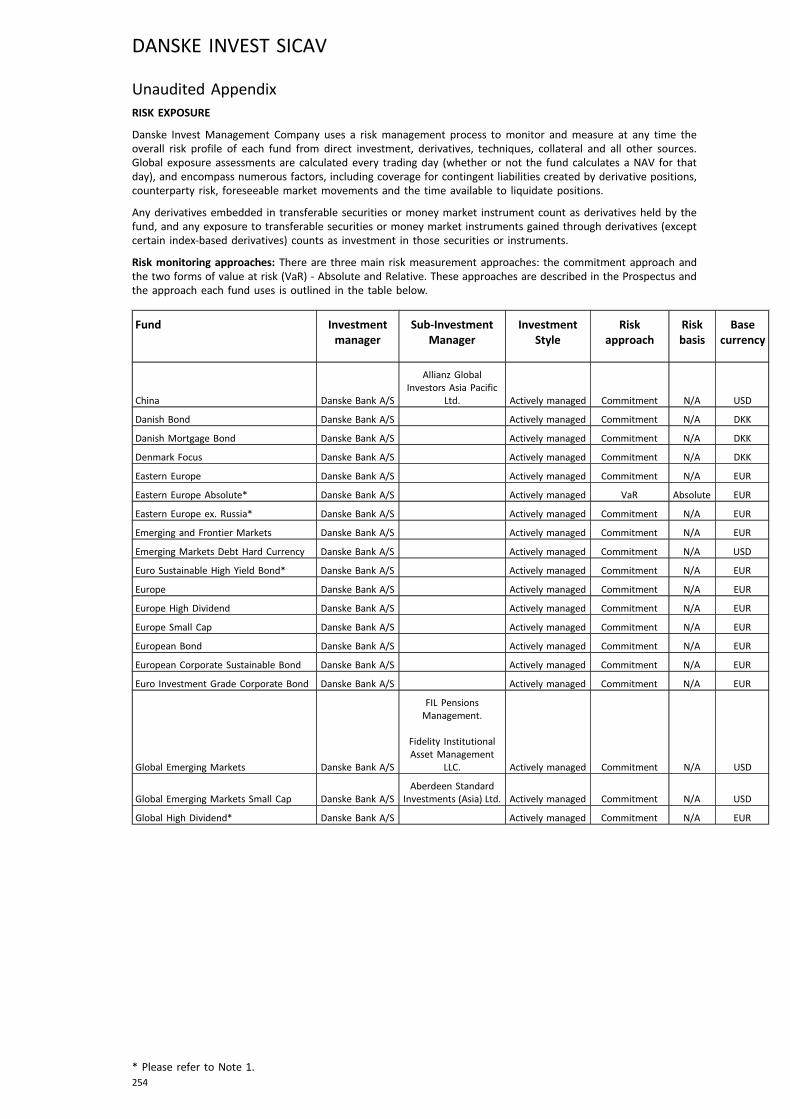
Unaudited AppendixRISK EXPOSURE
Danske Invest Management Company uses a risk management process to monitor and measure at any time theoverall risk profile of each fund from direct investment, derivatives, techniques, collateral and all other sources.Global exposure assessments are calculated every trading day (whether or not the fund calculates a NAV for thatday), and encompass numerous factors, including coverage for contingent liabilities created by derivative positions,counterparty risk, foreseeable market movements and the time available to liquidate positions.
Any derivatives embedded in transferable securities or money market instrument count as derivatives held by thefund, and any exposure to transferable securities or money market instruments gained through derivatives (exceptcertain index-based derivatives) counts as investment in those securities or instruments.
Risk monitoring approaches: There are three main risk measurement approaches: the commitment approach andthe two forms of value at risk (VaR) - Absolute and Relative. These approaches are described in the Prospectus andthe approach each fund uses is outlined in the table below.
Fund Investmentmanager
Sub-InvestmentManager
InvestmentStyle
Riskapproach
Riskbasis
Basecurrency
China Danske Bank A/S
Allianz GlobalInvestors Asia Pacific
Ltd. Actively managed Commitment N/A USD
Danish Bond Danske Bank A/S Actively managed Commitment N/A DKK
Danish Mortgage Bond Danske Bank A/S Actively managed Commitment N/A DKK
Denmark Focus Danske Bank A/S Actively managed Commitment N/A DKK
Eastern Europe Danske Bank A/S Actively managed Commitment N/A EUR
Eastern Europe Absolute* Danske Bank A/S Actively managed VaR Absolute EUR
Eastern Europe ex. Russia* Danske Bank A/S Actively managed Commitment N/A EUR
Emerging and Frontier Markets Danske Bank A/S Actively managed Commitment N/A EUR
Emerging Markets Debt Hard Currency Danske Bank A/S Actively managed Commitment N/A USD
Euro Sustainable High Yield Bond* Danske Bank A/S Actively managed Commitment N/A EUR
Europe Danske Bank A/S Actively managed Commitment N/A EUR
Europe High Dividend Danske Bank A/S Actively managed Commitment N/A EUR
Europe Small Cap Danske Bank A/S Actively managed Commitment N/A EUR
European Bond Danske Bank A/S Actively managed Commitment N/A EUR
European Corporate Sustainable Bond Danske Bank A/S Actively managed Commitment N/A EUR
Euro Investment Grade Corporate Bond Danske Bank A/S Actively managed Commitment N/A EUR
Global Emerging Markets Danske Bank A/S
FIL PensionsManagement.
Fidelity InstitutionalAsset Management
LLC. Actively managed Commitment N/A USD
Global Emerging Markets Small Cap Danske Bank A/SAberdeen Standard
Investments (Asia) Ltd. Actively managed Commitment N/A USD
Global High Dividend* Danske Bank A/S Actively managed Commitment N/A EUR
DANSKE INVEST SICAV
254
* Please refer to Note 1.
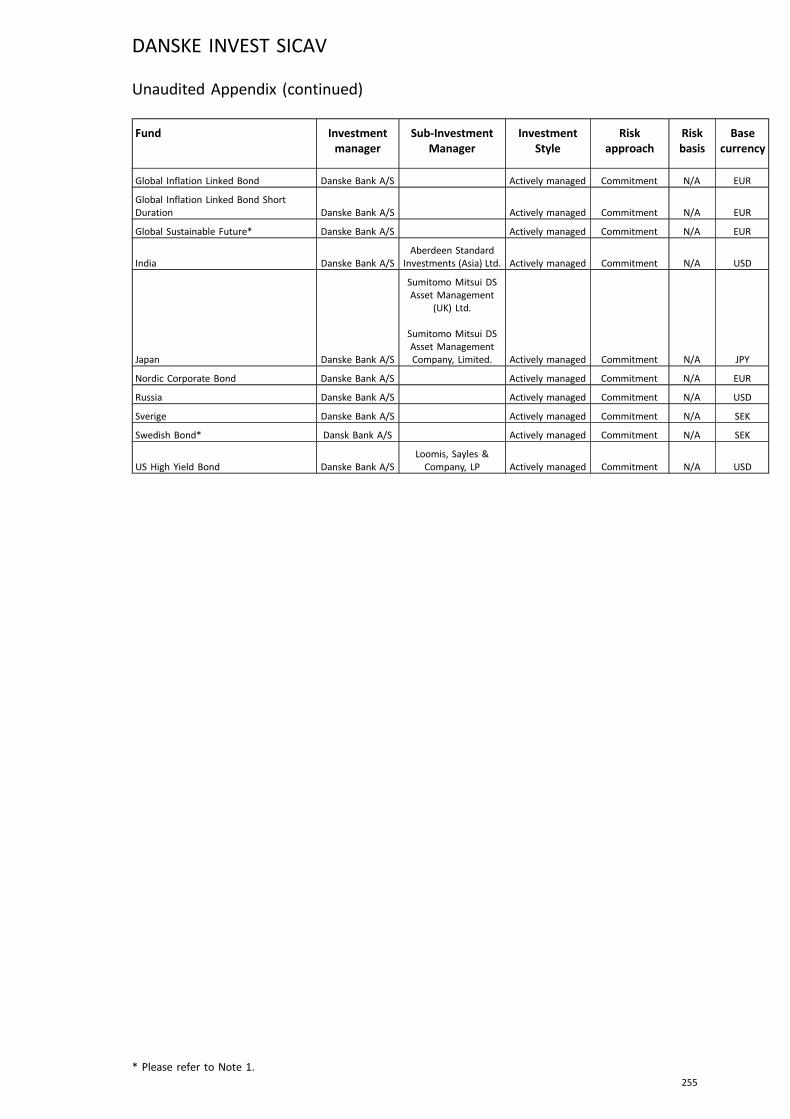
Fund Investmentmanager
Sub-InvestmentManager
InvestmentStyle
Riskapproach
Riskbasis
Basecurrency
Global Inflation Linked Bond Danske Bank A/S Actively managed Commitment N/A EUR
Global Inflation Linked Bond ShortDuration Danske Bank A/S Actively managed Commitment N/A EUR
Global Sustainable Future* Danske Bank A/S Actively managed Commitment N/A EUR
India Danske Bank A/SAberdeen Standard
Investments (Asia) Ltd. Actively managed Commitment N/A USD
Japan Danske Bank A/S
Sumitomo Mitsui DSAsset Management
(UK) Ltd.
Sumitomo Mitsui DSAsset ManagementCompany, Limited. Actively managed Commitment N/A JPY
Nordic Corporate Bond Danske Bank A/S Actively managed Commitment N/A EUR
Russia Danske Bank A/S Actively managed Commitment N/A USD
Sverige Danske Bank A/S Actively managed Commitment N/A SEK
Swedish Bond* Dansk Bank A/S Actively managed Commitment N/A SEK
US High Yield Bond Danske Bank A/SLoomis, Sayles &Company, LP Actively managed Commitment N/A USD
DANSKE INVEST SICAV
255
* Please refer to Note 1.
Unaudited Appendix (continued)
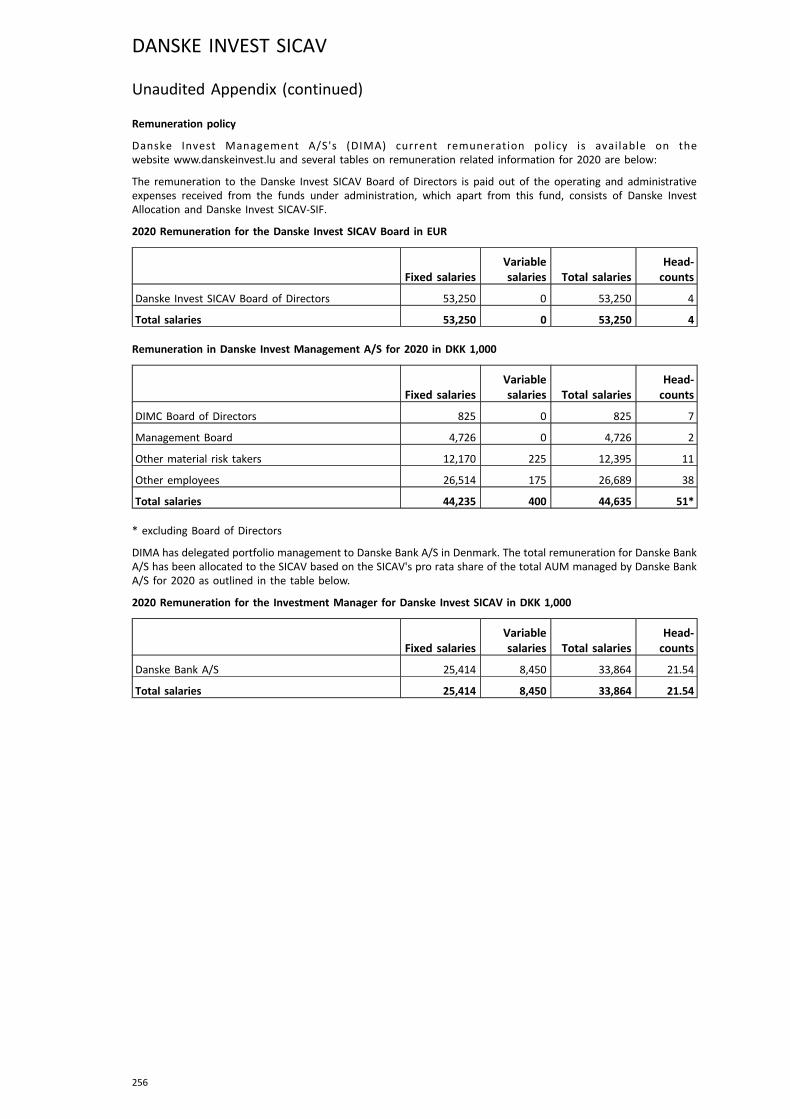
Remuneration policy
Danske Invest Management A/S's (DIMA) current remuneration policy is available on thewebsite www.danskeinvest.lu and several tables on remuneration related information for 2020 are below:
The remuneration to the Danske Invest SICAV Board of Directors is paid out of the operating and administrativeexpenses received from the funds under administration, which apart from this fund, consists of Danske InvestAllocation and Danske Invest SICAV-SIF.
2020 Remuneration for the Danske Invest SICAV Board in EUR
Fixed salariesVariablesalaries Total salaries
Head-counts
Danske Invest SICAV Board of Directors 53,250 0 53,250 4
Total salaries 53,250 0 53,250 4
Remuneration in Danske Invest Management A/S for 2020 in DKK 1,000
Fixed salariesVariablesalaries Total salaries
Head-counts
DIMC Board of Directors 825 0 825 7
Management Board 4,726 0 4,726 2
Other material risk takers 12,170 225 12,395 11
Other employees 26,514 175 26,689 38
Total salaries 44,235 400 44,635 51*
* excluding Board of Directors
DIMA has delegated portfolio management to Danske Bank A/S in Denmark. The total remuneration for Danske BankA/S has been allocated to the SICAV based on the SICAV's pro rata share of the total AUM managed by Danske BankA/S for 2020 as outlined in the table below.
2020 Remuneration for the Investment Manager for Danske Invest SICAV in DKK 1,000
Fixed salariesVariablesalaries Total salaries
Head-counts
Danske Bank A/S 25,414 8,450 33,864 21.54
Total salaries 25,414 8,450 33,864 21.54
DANSKE INVEST SICAV
256
Unaudited Appendix (continued)

Acceptable Collateral
Asset Category Asset Sub-Category AcceptableJurisdictions
Fixed IncomeSecurities
Securities issued by the sovereign governmentSecurities issued by sovereign government agenciesSecurities issued or guaranteed by provincial/state governmentsCorporate bonds with an issuer rating of A- or higher*Bank obligations with a short term issuer rating of A-1 or higher.
Member states ofthe OECD rated A-or higher
Securities issued by supranational organisations rated AAA or higher N/A
Equities &Equivalents
Equities listed or traded on the Main Index** Canada, USA,Australia, HongKong, Japan,Singapore,Austria, Belgium,France, Germany,Italy, Netherlands,Spain, Sweden,Switzerland, orthe UK
American Depository Receipts, Global Depository Receipts, or convertiblesecurities which are unconditionally convertible into equities listed ortraded on the Main Index
Exchange traded funds which are 100% physically backed and which trackthe Main Index
* For any Acceptable Collateral that is required to have an issuer rating: ratings are based on the S&P equivalent butif more than one ratings agency has issued rating and the ratings are not equivalent to each other, then the secondlowest of such ratings will apply.
** Main index means the main index of an Acceptable Jurisdiction.
DANSKE INVEST SICAV
257
Unaudited Appendix (continued)

REGULATION (EU) 2015/2365 OF THE EUROPEAN PARLIAMENT AND OF THE COUNCIL of November 25, 2015
Transparency of Securities Financing Transactions and of Reuse and amending Regulation (EU) Nº648/2012
Securities Lending
Global Data (in EUR)
Fund CollateralOverall
valuationTotal Net
Assets(%) ofassets
China 1,506,308 1,434,534 30,511,088 4.70
Danish Bond - - 30,863,130 -
Danish Mortgage Bond - - 385,300,398 -
Denmark Focus - - 61,122,594 -
Eastern Europe - - 8,950,395 -
Emerging and Frontier Markets 54,356 51,552 55,340,203 0.09
Emerging Markets Debt Hard Currency 13,755,829 13,484,595 741,386,453 1.82
Euro Sustainable High Yield Bond* 604,489 592,633 64,518,969 0.92
Europe 9,449,792 8,999,673 127,729,138 7.05
Europe High Dividend 2,754,373 2,622,959 48,253,776 5.44
Europe Small Cap - - 185,685,772 -
European Bond 107,454 105,346 25,215,385 0.42
European Corporate Sustainable Bond 45,433,576 44,542,701 664,268,848 6.71
Euro Investment Grade Corporate Bond 47,309,027 46,381,368 444,657,577 10.43
Global Emerging Markets 6,292,905 5,993,115 206,234,769 2.91
Global Emerging Markets Small Cap 2,941,528 2,801,452 49,088,234 5.71
Global Inflation Linked Bond 1,046,129 1,020,508 8,950,863 11.40
Global Inflation Linked Bond Short Duration 16,577,165 16,195,775 80,007,653 20.24
Global Sustainable Future* 5,884,024 5,603,249 35,517,023 15.78
India - - 53,563,592 -
Japan - - 50,849,527 -
Nordic Corporate Bond 1,423,811 1,395,888 28,849,980 4.84
Russia - - 8,378,642 -
Sverige 85,905,840 81,814,991 556,816,553 14.69
US High Yield Bond - - 26,625,617 -
Total 241,046,606 233,040,339 3,978,686,179
Fund Overall valuation
Investmentportfolio at
market value
(%)Lendable
Assets
China 1,434,534 29,793,531 4.81
Danish Bond - 30,850,002 -
Danish Mortgage Bond - 382,549,379 -
Denmark Focus - 60,299,749 -
Eastern Europe - 8,945,489 -
Emerging and Frontier Markets 51,552 53,901,855 0.10
Emerging Markets Debt Hard Currency 13,484,595 707,276,751 1.91
Euro Sustainable High Yield Bond* 592,633 60,596,315 0.98
DANSKE INVEST SICAV
258
Unaudited Appendix (continued)
* Please refer to Note 1.
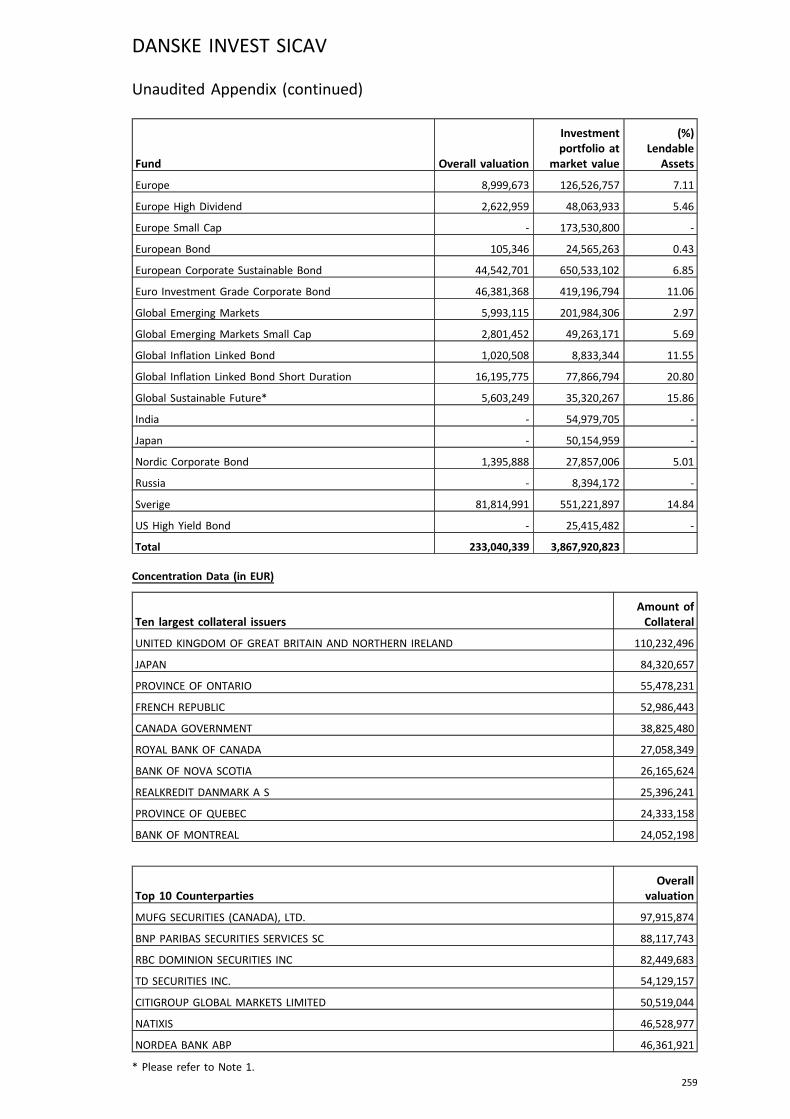
Fund Overall valuation
Investmentportfolio at
market value
(%)Lendable
Assets
Europe 8,999,673 126,526,757 7.11
Europe High Dividend 2,622,959 48,063,933 5.46
Europe Small Cap - 173,530,800 -
European Bond 105,346 24,565,263 0.43
European Corporate Sustainable Bond 44,542,701 650,533,102 6.85
Euro Investment Grade Corporate Bond 46,381,368 419,196,794 11.06
Global Emerging Markets 5,993,115 201,984,306 2.97
Global Emerging Markets Small Cap 2,801,452 49,263,171 5.69
Global Inflation Linked Bond 1,020,508 8,833,344 11.55
Global Inflation Linked Bond Short Duration 16,195,775 77,866,794 20.80
Global Sustainable Future* 5,603,249 35,320,267 15.86
India - 54,979,705 -
Japan - 50,154,959 -
Nordic Corporate Bond 1,395,888 27,857,006 5.01
Russia - 8,394,172 -
Sverige 81,814,991 551,221,897 14.84
US High Yield Bond - 25,415,482 -
Total 233,040,339 3,867,920,823
Concentration Data (in EUR)
Ten largest collateral issuersAmount ofCollateral
UNITED KINGDOM OF GREAT BRITAIN AND NORTHERN IRELAND 110,232,496
JAPAN 84,320,657
PROVINCE OF ONTARIO 55,478,231
FRENCH REPUBLIC 52,986,443
CANADA GOVERNMENT 38,825,480
ROYAL BANK OF CANADA 27,058,349
BANK OF NOVA SCOTIA 26,165,624
REALKREDIT DANMARK A S 25,396,241
PROVINCE OF QUEBEC 24,333,158
BANK OF MONTREAL 24,052,198
Top 10 CounterpartiesOverall
valuation
MUFG SECURITIES (CANADA), LTD. 97,915,874
BNP PARIBAS SECURITIES SERVICES SC 88,117,743
RBC DOMINION SECURITIES INC 82,449,683
TD SECURITIES INC. 54,129,157
CITIGROUP GLOBAL MARKETS LIMITED 50,519,044
NATIXIS 46,528,977
NORDEA BANK ABP 46,361,921
DANSKE INVEST SICAV
259
Unaudited Appendix (continued)
* Please refer to Note 1.
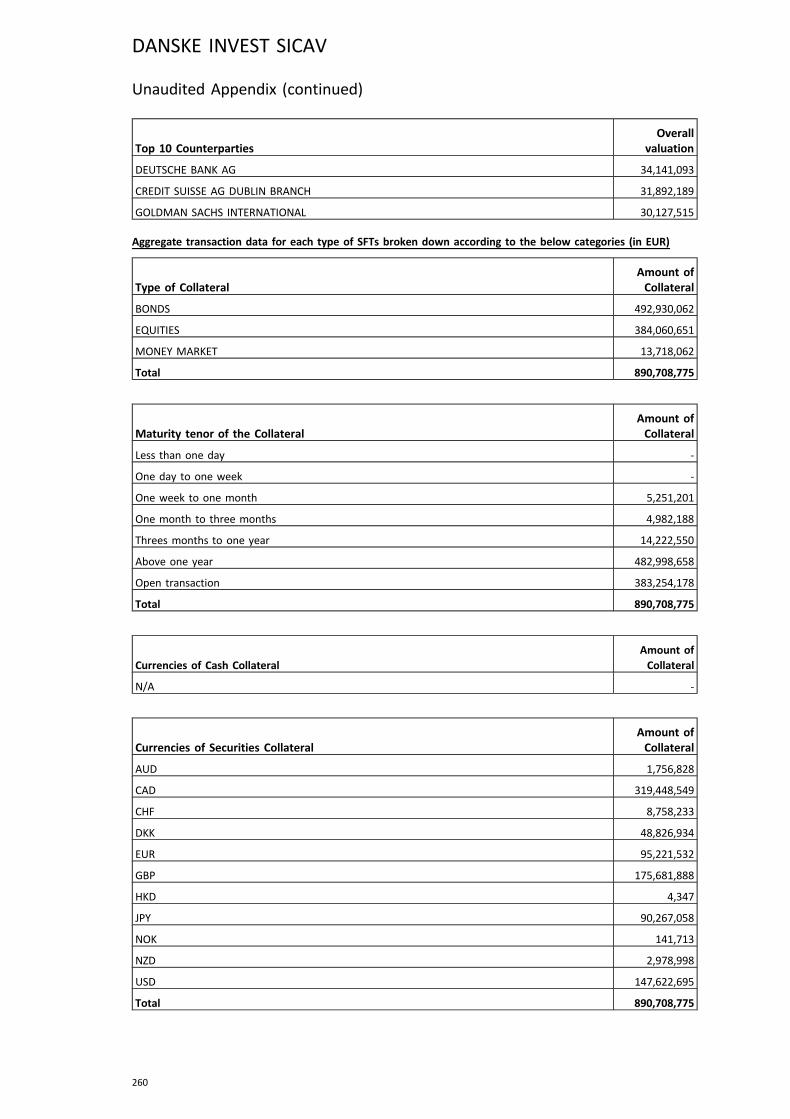
Top 10 CounterpartiesOverall
valuation
DEUTSCHE BANK AG 34,141,093
CREDIT SUISSE AG DUBLIN BRANCH 31,892,189
GOLDMAN SACHS INTERNATIONAL 30,127,515
Aggregate transaction data for each type of SFTs broken down according to the below categories (in EUR)
Type of CollateralAmount ofCollateral
BONDS 492,930,062
EQUITIES 384,060,651
MONEY MARKET 13,718,062
Total 890,708,775
Maturity tenor of the CollateralAmount ofCollateral
Less than one day -
One day to one week -
One week to one month 5,251,201
One month to three months 4,982,188
Threes months to one year 14,222,550
Above one year 482,998,658
Open transaction 383,254,178
Total 890,708,775
Currencies of Cash CollateralAmount ofCollateral
N/A -
Currencies of Securities CollateralAmount ofCollateral
AUD 1,756,828
CAD 319,448,549
CHF 8,758,233
DKK 48,826,934
EUR 95,221,532
GBP 175,681,888
HKD 4,347
JPY 90,267,058
NOK 141,713
NZD 2,978,998
USD 147,622,695
Total 890,708,775
DANSKE INVEST SICAV
260
Unaudited Appendix (continued)
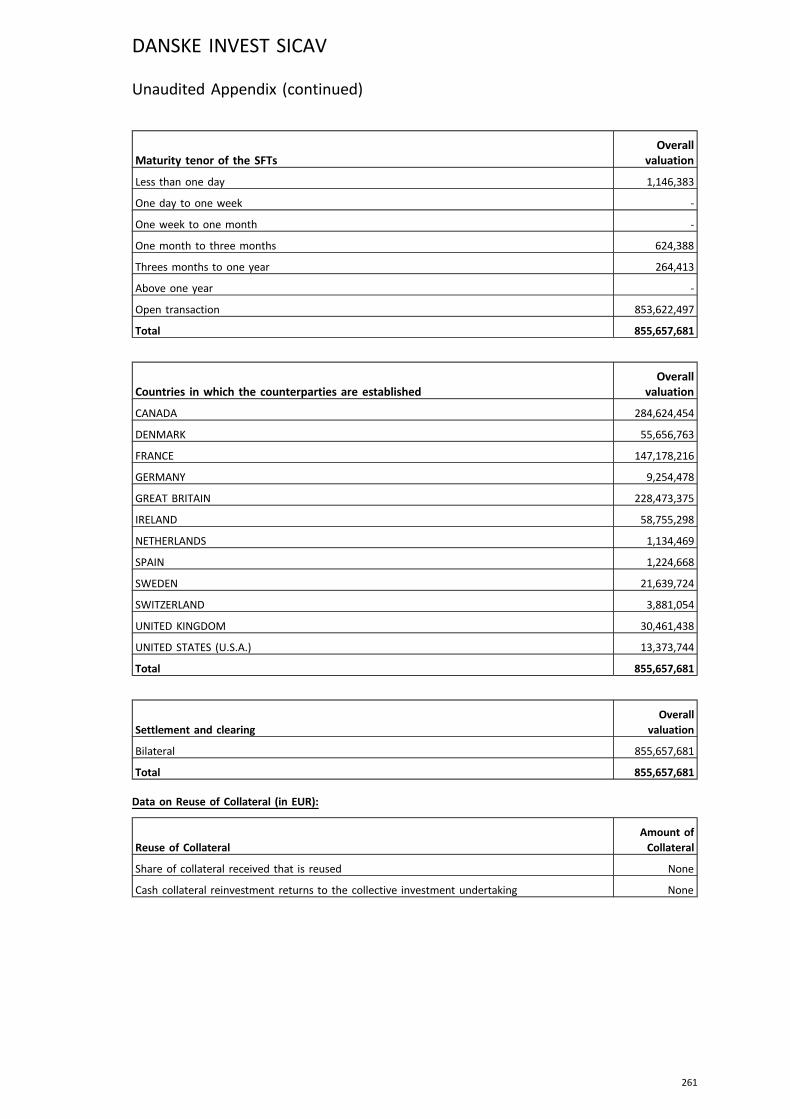
Maturity tenor of the SFTsOverall
valuation
Less than one day 1,146,383
One day to one week -
One week to one month -
One month to three months 624,388
Threes months to one year 264,413
Above one year -
Open transaction 853,622,497
Total 855,657,681
Countries in which the counterparties are establishedOverall
valuation
CANADA 284,624,454
DENMARK 55,656,763
FRANCE 147,178,216
GERMANY 9,254,478
GREAT BRITAIN 228,473,375
IRELAND 58,755,298
NETHERLANDS 1,134,469
SPAIN 1,224,668
SWEDEN 21,639,724
SWITZERLAND 3,881,054
UNITED KINGDOM 30,461,438
UNITED STATES (U.S.A.) 13,373,744
Total 855,657,681
Settlement and clearingOverall
valuation
Bilateral 855,657,681
Total 855,657,681
Data on Reuse of Collateral (in EUR):
Reuse of CollateralAmount ofCollateral
Share of collateral received that is reused None
Cash collateral reinvestment returns to the collective investment undertaking None
DANSKE INVEST SICAV
261
Unaudited Appendix (continued)
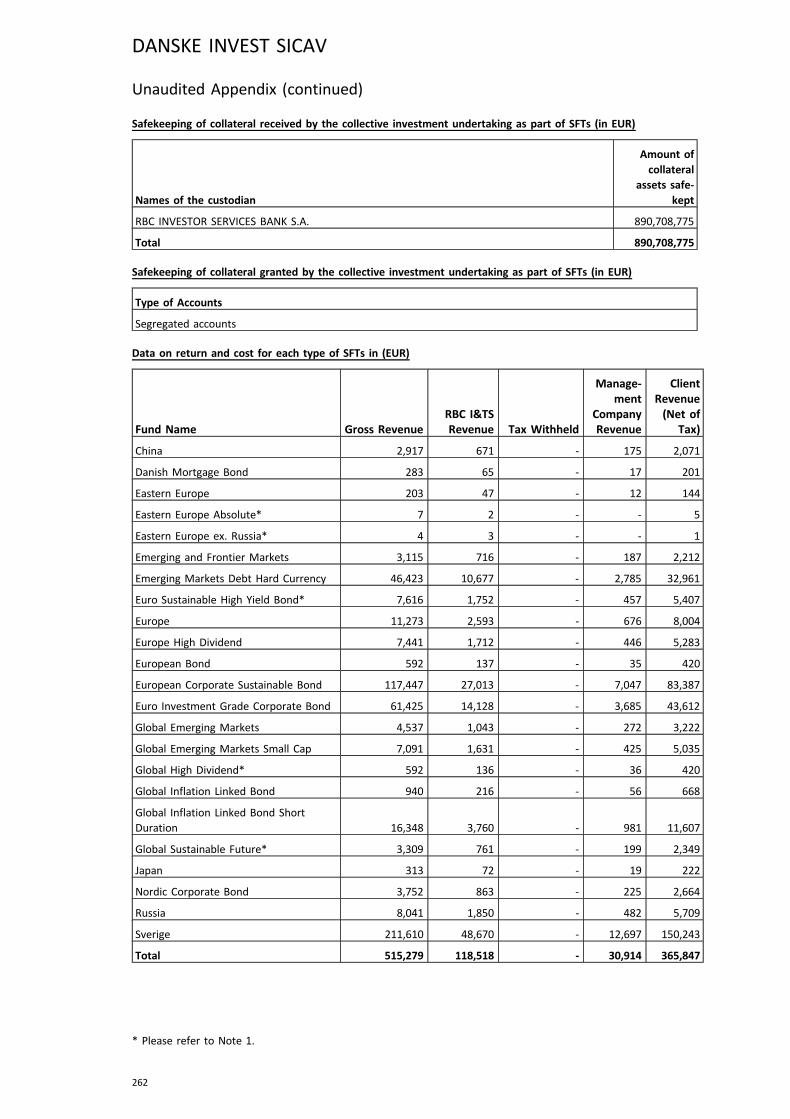
Safekeeping of collateral received by the collective investment undertaking as part of SFTs (in EUR)
Names of the custodian
Amount ofcollateral
assets safe-kept
RBC INVESTOR SERVICES BANK S.A. 890,708,775
Total 890,708,775
Safekeeping of collateral granted by the collective investment undertaking as part of SFTs (in EUR)
Type of Accounts
Segregated accounts
Data on return and cost for each type of SFTs in (EUR)
Fund Name Gross RevenueRBC I&TSRevenue Tax Withheld
Manage-ment
CompanyRevenue
ClientRevenue(Net of
Tax)
China 2,917 671 - 175 2,071
Danish Mortgage Bond 283 65 - 17 201
Eastern Europe 203 47 - 12 144
Eastern Europe Absolute* 7 2 - - 5
Eastern Europe ex. Russia* 4 3 - - 1
Emerging and Frontier Markets 3,115 716 - 187 2,212
Emerging Markets Debt Hard Currency 46,423 10,677 - 2,785 32,961
Euro Sustainable High Yield Bond* 7,616 1,752 - 457 5,407
Europe 11,273 2,593 - 676 8,004
Europe High Dividend 7,441 1,712 - 446 5,283
European Bond 592 137 - 35 420
European Corporate Sustainable Bond 117,447 27,013 - 7,047 83,387
Euro Investment Grade Corporate Bond 61,425 14,128 - 3,685 43,612
Global Emerging Markets 4,537 1,043 - 272 3,222
Global Emerging Markets Small Cap 7,091 1,631 - 425 5,035
Global High Dividend* 592 136 - 36 420
Global Inflation Linked Bond 940 216 - 56 668
Global Inflation Linked Bond ShortDuration 16,348 3,760 - 981 11,607
Global Sustainable Future* 3,309 761 - 199 2,349
Japan 313 72 - 19 222
Nordic Corporate Bond 3,752 863 - 225 2,664
Russia 8,041 1,850 - 482 5,709
Sverige 211,610 48,670 - 12,697 150,243
Total 515,279 118,518 - 30,914 365,847
* Please refer to Note 1.
DANSKE INVEST SICAV
262
Unaudited Appendix (continued)
Additional information
The table above provides details of the securities lending revenue received by the various parties based on anagreement dated January 1, 2019. The breakdown of the gross revenue is as follows; the fund is entitled to 71%, RBCI&TS is entitled to retain 23% and the Management Company is entitled to retain 6%*.
* Please refer to Note 15.
DANSKE INVEST SICAV
263
Unaudited Appendix (continued)

Related Documents