AVANCES EN SISTEMAS ANALÍTICOS DE VANGUARDIA-RETAGUARDIA BASADOS EN EL EMPLEO DE NUEVOS MATERIALES OBTENIDOS DE LA COMBINACIÓN DE LÍQUIDOS IÓNICOS CON NANOTUBO DE CARBONO Tesis Doctoral Mari Lola Polo Luque Córdoba, 2013 Universidad de Córdoba Departamento de Química Analítica

Welcome message from author
This document is posted to help you gain knowledge. Please leave a comment to let me know what you think about it! Share it to your friends and learn new things together.
Transcript

AVANCES EN SISTEMAS ANALÍTICOS DE
VANGUARDIA-RETAGUARDIA BASADOS EN EL
EMPLEO DE NUEVOS MATERIALES OBTENIDOS DE
LA COMBINACIÓN DE LÍQUIDOS IÓNICOS CON
NANOTUBO DE CARBONO
Tesis Doctoral
Mari Lola Polo Luque
Córdoba, 2013
Universidad de Córdoba Departamento de
Química Analítica

TITULO: AVANCES EN SISTEMAS ANALITICOS DEVANGUARDIA-RETAGUARDIA BASADOS EN EL EMPLEO DENUEVOS MATERIALES OBTENIDOS DE LA COMBINACIÓN DELIQUIDOS IÓNICOS CON NAOTUBOS DE CARBONO.
AUTOR: MARIA DOLORES POLO LUQUE
© Edita: Servicio de Publicaciones de la Universidad de Córdoba. Campus de RabanalesCtra. Nacional IV, Km. 396 A14071 Córdoba
www.uco.es/[email protected]

Avances en sistemas analíticos de vanguardia-retaguardia
basados en el empleo de nuevos materiales obtenidos de la
combinación de líquidos iónicos con nanotubo de carbono
EL DIRECTOR,
Trabajo presentado para aspirar al
Grado de Doctor en Ciencias
LA DOCTORANDA,
Fdo. María Dolores Polo Luque
Licenciada en Ciencias Ambientales
Fdo. Miguel Valcárcel Cases
Catedrático del Departamento
de Química Analítica de la
Universidad de Córdoba


Miguel Valcárcel Cases, Catedrático del Departamento de Química
Analítica de la Universidad de Córdoba, en calidad de director de la Tesis
Doctoral presentada por la Licenciada en Ciencias Ambientales, María
Dolores Polo Luque,
CERTIFICA: Que la Tesis Doctoral “AVANCES EN SISTEMAS
ANALÍTICOS DE VANGUARDIA-RETAGUARDIA
BASADOS EN EL EMPLEO DE NUEVOS MATERIALES
OBTENIDOS DE LA COMBINACIÓN DE LÍQUIDOS
IÓNICOS CON NANOTUBO DE CARBONO” ha sido
desarrollada en el laboratorio del Departamento de Química
Analítica de la Universidad de Córdoba, y que, a su juicio,
reúne todos los requisitos exigidos a este tipo de trabajo.
Y para que conste y surta los efectos pertinentes, expide el presente
certificado en la ciudad de Córdoba, a 14 de Marzo de 2013.
Miguel Valcárcel Cases


“El éxito consiste en obtener lo que se desea.
La felicidad, en disfrutar lo que se obtiene” Ralph Waldo Emerson
“Nuestra recompensa se encuentra en el
esfuerzo y no en el resultado.
Un esfuerzo total es una victoria completa” Mahatma Gandhi


Agradezco al Ministerio de Ciencia e Innovación la concesión de una
beca de Formación de Personal Investigados (FPI) que ha hecho posible
mi dedicación a este trabajo y el desarrollo de la presente Tesis Doctoral.


TÍTULO DE LA TESIS: AVANCES EN SISTEMAS ANALÍTICOS DE VANGUARDIA-RETAGUARDIA BASADOS EN EL EMPLEO DE NUEVOS MATERIALES OBTENIDOS DE LA COMBINACIÓN DE LÍQUIDOS IÓNICOS CON NANOTUBO DE CARBONO. DOCTORANDO/A: MARÍA DOLORES POLO LUQUE
INFORME RAZONADO DEL/DE LOS DIRECTOR/ES DE LA TESIS (se hará mención a la evolución y desarrollo de la tesis, así como a trabajos y publicaciones derivados de la misma).
La doctoranda Dª María Dolores Polo Luque cursó brillantemente los estudios del Máster de Química Fina Avanzada obteniendo unas excelentes calificaciones en las materias del mismo. El Trabajo Fin de Máster sobre “Geles de líquidos iónicos y nanotubos de carbono multicapa como nuevos materiales en química para realizar etapas de preconcentración de analitos” obteniendo la calificación de sobresaliente, ha sido publicado el artículo “Ionic liquid combined with carbon nanotubes. A soft material for the preconcentration of PAHs en la revista Talanta. La temática de la tesis se enmarca en la línea genérica “Nanociencia y Nanotecnología Analíticas”, que es considerada como puntera en la actualidad. Específicamente se ha desarrollado la caracterización y empleo de geles formados por nanotubos de carbono y líquidos iónicos, que son dos materiales de gran potencial. Para demostrar su capacidad en la preparación de la muestra, se han preconcentrado una amplia variedad de analitos en diferentes matrices medioambientales. Todo ello ha dado lugar a la producción de 8 artículos científicos ya publicados o en vías de publicación en revistas del primer cuartil del área Chemistry, Analytical del JCR (ISI). También han sido fruto de esta tesis doctoral 16 comunicaciones a congresos nacionales e internacionales. La doctoranda ha adquirido una sólida formación analítica adiestrándose en el manejo de la técnica de separación electroforeris capilar, y otra como fluorimetría y espectroscopía Raman, así como una amplia variedad de técnicas microscópicas (AFM, SEM, TEM, etc). Por todo ello, considero que la investigación desarrollada y recogida en esta memoria reúnes todos los requisitos necesarios en cuanto a originalidad, innovación y calidad que garantizan una adecuada formación de la doctoranda y, por tanto, autorizo la presentación de la tesis doctoral de Dª María Dolores Polo Luque.
Córdoba, 14 de Marzo de 2013
Firma del/de los director/es
Fdo. Miguel Valcárcel Cases


ACRÓNIMOS 1
OBJETO 5
CAPÍTULO 1. INTRODUCCIÓN 11
1.1. Líquidos iónicos 13
1.2. Nanotubos de carbono 21
1.3. Materiales blandos o geles 28
1.4. Functionalization and dispersion of carbon nanotubes in
ionic liquids. Fundamentals and analytical application of soft
materials. 33
CAPÍTULO 2. HERRAMIENTAS ANALÍTICAS 73
CAPÍTULO 3. CARACTERIZACIÓN DE GELES 89
Introducción 91
3.1. Effect of carbon nanotubes on properties of soft materials based
on carbon nanotubes-ionic liquid combinations. 93

3.2. Simple and fast fluorimetric determination of the critical gel
concentration of soft nanomaterials. 113
CAPÍTULO 4. EMPLEO DE GELES COMO SORBENTES 137
Introducción 139
4.1. Ionic liquid combined with carbon nanotubes. A soft
material for the preconcentration of PAHs. 141
4.2. Coiled carbon nanotubes combined with ionic liquid:
a new soft material for SPE. 157
4.3. Solid-phase extraction of nitrophenols in water by using
a combination of carbon nanotubes with an ionic liquid coupled
in-line to CE. 173
CAPÍTULO 5. EMPLEO DE OTRAS COMBINACIONES LI-CNTs 187
Introducción 189
5.1. Solid phase extraction-capillary electrophoresis
determination of sulfonamide residues in milk samples by
using C18-carbon nanotubes as a hybrid sorbent material. 191
5.2. Combination of carbon nanotubes modified filters with
microextraction by packed sorbent for the NACE analysis of
trace levels of ionic liquids in river water samples. 213

CAPÍTULO 6. RESULTADOS Y DISCUSIÓN 231
CONCLUSIONES 267
ANEXO. PRODUCCIÓN CIENTÍFICA 275
Anexo A. Publicaciones científicas derivadas de la Tesis Doctoral 277
Anexo B. Presentación de comunicaciones a Congresos 287
Anexo C. Recopilación de Pósters 293


Acrónimos


ACRÓNIMOS
3
ACNF Nanofibras de carbono acidificadas
AFM Microscopio de fuerza atómica
BGE Buffer electroforético
CCNTS Nanotubos de carbono coil
CE/EC Electroforesis capilar
CGC /CCG Concentración crítica de gelificación
CL Cromatografía líquida
CNTs Nanotubos de carbono
CPE Electrodos de pasta de carbono
DWNTs Nanotubos de carbono de pared doble
EPA Agencia de protección ambiental estadounidense
CG Cromatografía de gases
GCE Electrodos de vidrio de carbono
HPLC Cromatografía líquida de alta resolución
LI/IL Líquido iónico
LOD Límite de detección
LOQ Límite de cuantificación
MEPS Microextracción por sorbentes empaquetados
MIPs Polímeros de impresión molecular
MWNTs Nanotubos de carbono de pared múltiple

ACRÓNIMOS
4
NACE Electroforesis capilar en medio no acuoso
NPs Nitrofenoles
PAHs Hidrocarburos aromáticos policíclicos
pHa pH aparente (en medio no acuoso)
RSD Desviación estándar relativa
RTIL Líquidos ionicos a temperatura ambiente
SAs Sulfonamidas
SEM Microscopio electrónico de barrido
SPE Extracción en fase solida
SPME Microextracción en fase solida
SWNTs Nanotubos de carbono de pared simple
TEM Microscopio de transmisión electrónica
TSILs Líquidos iónicos de tareas específicas
UV-Vis Ultravioleta visible

Objeto


OBJETO
7
En los últimos años, se ha desarrollado una marcada tendencia hacia la
creación, optimización y mejora de nuevos materiales, que han sido
incorporados y utilizados en una amplia variedad de procesos analíticos. En
este sentido, la mayor atención se ha centrado en la creación de nuevos
nanomateriales, que presentan unas propiedades únicas que hacen que su uso
se haya visto incrementado en el campo de las ciencias analíticas, así como en
otros campos. Los nanotubos de carbono (CNTs) junto con sus derivados
híbridos son algunos de estos nuevos nanomateriales.
Los nanotubos de carbono poseen unas excelentes propiedades, deseables
para multitud de aplicaciones. Sin embargo, los CNTs presentan una elevada
tendencia a la agregación, lo cual limita en la mayoría de los casos su
aplicación. Para solventar este inconveniente se han introducido los líquidos
iónicos (LIs) como excelentes dispersantes de CNTs; especialmente los
derivados del ión imidazolio. Además, los líquidos iónicos se consideran,
gracias a sus propiedades, como una “alternativa verde” a los disolventes
orgánicos convencionales, aunque existen controversias al respecto.
La combinación de nanotubos de carbono a elevadas concentraciones con
líquido iónico, conduce a la formación de unos nuevos materiales que se han
denominado “bucky gels” o “soft materials”; en esta Memoria se ha adoptado
la terminología de geles para hacer referencia a los mismos. Estos materiales
están diseñados con el fin de explotar las propiedades sinérgicas derivadas de
dicha combinación. En otras aplicaciones, el objetivo es potenciar y explotar
las propiedades individuales de alguno de los componentes de la mezcla (LI o
CNTs).

OBJETO
8
Teniendo en cuenta lo anteriormente expuesto, el objetivo genérico de la
Tesis Doctoral presentada en esta Memoria será el desarrollo de nuevos
sistemas analíticos de vanguardia-retaguardia basados en el empleo de nuevos
materiales obtenidos de la combinación de líquidos iónicos con nanotubos de
carbono, así como el estudio y caracterización de dichos materiales mediante
el empleo de técnicas espectroscópicas. En este contexto, los objetivos
específicos de esta Memoria son los siguientes:
Obtener geles a partir de la combinación de nanotubos de carbono (de
pared múltiple y de pared simple) y líquidos iónicos.
Estudiar las propiedades físico-químicas de los geles y proponer un
método rápido para determinar la concentración crítica de gelificación
(CCG).
Desarrollar nuevas técnicas de extracción en fase sólida (SPE) para
llevar a cabo la preconcentración de diferentes analitos de interés tales
como hidrocarburos aromáticos policíclicos (PAHs), sulfonamidas
(SAs) y nitrofenoles (NPs), y su posterior separación y detección
mediante fluorescencia y electroforesis capilar.
Mejora de las propiedades intrínsecas de los nanotubos de carbono
mediante el empleo de un líquido iónico como agente dispersante.
Desarrollar un nuevo sorbente híbrido a partir de la modificación de
un sorbente comercial de C18 con nanotubos de carbono.

OBJETO
9
Extraer y determinar líquidos iónicos de agua de río mediante el
empleo combinado de microextracción por sorbentes empaquetados
(MEPS) y filtros modificados con nanotubos de carbono.
Dado que uno de los objetivos fundamentales de la Tesis Doctoral es la
formación de la doctoranda, ésta se ha completado con la realización de
actividades complementarias a la labor investigadora, tales como asistencia a
cursos de carácter formativo y presentación de comunicaciones en congresos.
La relación de artículos científicos y las aportaciones a los diferentes
congresos se recogen en el anexo de esta Memoria.


Introducción


INTRODUCCIÓN
13
1.1. Líquidos iónicos
Un líquido iónico (LI) es aquella sustancia que, como su nombre indica,
está constituida por iones. A diferencia de las sales fundidas convencionales,
los líquidos iónicos permanecen en estado líquido a temperatura ambiente o a
temperaturas próximas a ella. Por lo general, se admite la clasificación de
líquido iónico cuando su temperatura de fusión es menor de 100 ºC [1]. Los
LIs cuyo punto de fusión está por debajo de la temperatura ambiente se
conocen como líquidos iónicos a temperatura ambiente (room temperature
ionic liquids, RTILs).
Los líquidos iónicos, al contrario de lo que pueda parecer, no son
sustancias nuevas. En realidad, el nitrato de etilamonio, con un punto de
fusión de 12 ºC, fue descrito por primera vez por Walden y col. [2] en 1914
durante la Primera Guerra Mundial mientras buscaban el desarrollo de nuevos
explosivos. Estos compuestos fueron olvidados o escasamente utilizados en
química hasta 1951, cuando Hurley y Wier [3] sintetizaron nuevos líquidos
iónicos basados en aniones cloroaluminatos. Durante los años setenta y
ochenta, el empleo de los líquidos iónicos fue fundamentalmente en el campo
de la electroquímica, mientras que en los noventa se amplió su uso en
catálisis, síntesis orgánica y en el campo de la separación. A pesar de esto, no
fue hasta el año 2000 cuando su desarrollo experimentó un marcado
crecimiento exponencial.
Hoy en día, se considera a los LIs como una alternativa ecológica a los
disolventes orgánicos ya que son fácilmente reciclables; aunque existen

CAPÍTULO 1
14
algunas controversias. Presentan propiedades muy interesantes además de ser
relativamente sencillos y baratos de sintetizar. Algunos autores los consideran
como “disolventes de diseño” [4], ya que variando las características de los
iones participantes se pueden fabricar billones de diversas combinaciones,
cada una de ellas con propiedades diferentes. Se obtendrían de esta manera
una gran cantidad de disolventes comparada con los menos de 300
disolventes orgánicos que actualmente se emplean en la industria química.
Como ya se ha mencionado anteriormente, los líquidos iónicos están
compuestos exclusivamente por cationes (muy voluminosos y asimétricos) y
aniones poliatómicos unidos entre sí por fuerzas culómbicas, siendo estas
interacciones más débiles que las que presentan las sales iónicas
convencionales. Las diferencias de simetría y tamaños entre el catión y el
anión hace que presenten una baja energía de red de forma que a temperaturas
moderadas permanecen en estado líquido. Los líquidos iónicos más comunes
están compuestos por cationes orgánicos basados en anillos aromáticos
heterocíclicos, amonios cuaternarios o fosfonios, mientras que los aniones
suelen ser inorgánicos. Debe indicarse que en estos últimos años se ha
producido un desarrollo importante en la síntesis de líquidos iónicos cuyo
anión es de base orgánica. La figura 1 muestra la estructura de los iones
(cationes y aniones) que componen los líquidos iónicos típicos donde Ri hace
referencia a cadenas alquílicas de diferente longitud.

INTRODUCCIÓN
15
Figura 1. Estructura de los principales cationes y aniones constituyentes de líquidos
iónicos.
Los líquidos iónicos más empleados son aquellos cuyo catión es un
derivado del imidazolio. Los aniones PF6- y BF4
- son probablemente los más
usados en investigación. Una clasificación ampliamente utilizada en la
literatura para los líquidos iónicos basados en cationes imidazolio es la
siguiente:
- De primera generación, basados en el anión cloroaluminato. Estos líquidos
iónicos fueron muy útiles en la síntesis orgánica donde se requería el uso de
tricloruro de aluminio [3,5]. Sin embargo, a pesar de ser excelentes
disolventes y catalizadores en multitud de reacciones, estos LIs son inestables
a la atmósfera.
- De segunda generación, en los que se sustituye el anión cloroaluminato por
aniones como el tetrafluoroborato, hexafluoroborato o acetato, entre otros [6].
La principal ventaja de estos líquidos iónicos es la de presentar una alta

CAPÍTULO 1
16
reciclabilidad y biodegradabilidad, por lo que su toxicidad e impacto
ambiental son mínimos.
- De tercera generación, o también denominados LIs “de tareas específicas”
(TSILs, task specific ionic liquids) en los cuales se incorpora un grupo
funcional específico como parte del catión o del anión del líquido iónico.
Visser y col. [7] fueron los primeros en sintetizar este tipo de líquidos iónicos
con la intención de extraer mercurio y cadmio de muestras acuosas y desde
entonces se han sintetizado con diferentes fines [8].
Gracias a la gran variedad de cationes y de aniones existentes es posible
diseñar gran cantidad de líquidos iónicos [9] cuyas propiedades se modulan
en función de la naturaleza del catión y del anión. Debe indicarse que los LIs
no son buenos disolventes genéricamente hablando, pero considerando la
amplia variedad existente de LIs y el amplio rango de posibilidades, es
posible encontrar (en teoría) un líquido iónico cuyas propiedades se adapten a
unas necesidades concretas.
Atendiendo a las características de los LIs, resulta muy difícil predecir
las propiedades para un determinado líquido iónico, sin embargo, se ha
observado que el anión es el principal responsable del comportamiento
químico y la estabilidad del líquido iónico, mientras que el catión es el
principal responsable de las propiedades físicas, tales como punto de fusión,
viscosidad y densidad.
Principalmente los líquidos iónicos se caracterizan por no ser inflamables
y ser estables al aire y al agua, es decir, no reaccionan con ellos ni se

INTRODUCCIÓN
17
degradan es su presencia [10]. Los LIs basados en cationes imidazolio y
amonio son higroscópicos. Es importante conocer la hidrofobicidad/hidrofilia
de los líquidos iónicos, ya que las propiedades de solvatación de los RTILs
pueden verse muy afectadas por la presencia de agua. La solubilidad de los
RTILs no solo con el agua, sino con otros disolventes comunes, es una
propiedad que debe tenerse presente, ya que hará más fácil la recuperación de
los líquidos iónicos tras su uso en ciertas aplicaciones [11,12].
La solubilidad de los RTLIs (basados en el catión imidazolio) en agua es
dependiente de diferentes factores, entre los que podemos destacar: la
naturaleza del anión, la temperatura y la longitud de la cadena alquílica del
catión. Por ejemplo, la combinación del catión 1-butil 3-metilimidazolio
(Bmim+) con el anión BF4
-, CF3CO2
- o NO3
- proporciona LIs totalmente
solubles en agua, mientras que, la combinación con PF6- o NTf2
- forma
líquidos iónicos con una solubilidad muy pequeña o nula en agua. Plechkova
y col. [13] han recopilado las características de los LIs más comunes, así
como su solubilidad y miscibilidad.
La densidad de los RTLIs es altamente dependiente de la composición de
los mismos y la presencia de impurezas, siendo superior a la del agua (varía
entre 1.12 g·cm-3
- 2.24 g·cm-3
). La cadena alquílica provoca una disminución
en la densidad conforme aumenta su longitud. Además, la densidad se ve
afectada por la variación de la temperatura. Esta variación fue estudiada por
Dzyuba y col. [14] que observaron que al aumentar la temperatura hay un
descenso casi lineal de la densidad.

CAPÍTULO 1
18
Los RTLIs son sustancias más viscosas que el agua y los disolventes
moleculares, cuyos valores de viscosidad oscilan entre 10-500 cP. Gran parte
de esta variabilidad se debe probablemente al contenido de impurezas, ya que
se ha comprobado que la presencia de agua y disolventes orgánicos en los LIs
disminuye la viscosidad, mientras que los cloruros la aumentan. La
viscosidad aumenta con la hidrofobicidad, que se relaciona con el aumento en
el número de carbonos de la cadena alquílica del catión imidazolio.
Por otro lado el valor de tensión superficial de los RTILs es mayor al de
los disolventes orgánicos más comunes y menor que el agua. Se ha observado
el hecho de que la tensión superficial aumenta con el volumen del anión que
forma el líquido iónico, mientras que disminuye progresivamente al aumentar
la longitud de la cadena alquílica [14].
En cuanto al punto de fusión, parece que no existe una correlación total,
basada en cambios del tipo de catión y anión, entre la composición de un LI y
su punto de fusión. Se han encontrado ciertas tendencias como la disminución
del punto de fusión con la incorporación de cationes más voluminosos y
asimétricos. Los líquidos iónicos con aniones grandes son generalmente
líquidos a bajas temperaturas.
Por último los líquidos iónicos tienen una presión de vapor muy baja o
prácticamente nula, lo que hace que sean fácilmente manejables al no
evaporarse. Earle y col. [15] demostraron que es posible la destilación de los
líquidos iónicos a baja presión sin que éstos se descompongan, de manera que
pueden ser usados de nuevo (reciclados). La creencia de que los líquidos

INTRODUCCIÓN
19
iónicos no son volátiles procede, muy probablemente, de los líquidos iónicos
de primera generación [16]. Así que con la aparición de los LIs de segunda y
tercera generación, la falta de volatilidad se asumió pero no se comprobó. Los
disolventes orgánicos convencionales más empleados son, en general,
volátiles y perjudiciales para el medioambiente. Por tanto, se ha convertido en
un objetivo prioritario para la denominada química verde el encontrar
sustancias que los sustituyan. En este sentido, los LIs son buenos candidatos,
ya que al no tener presión de vapor en condiciones normales, la
contaminación atmosférica es nula [17]. No obstante, su relativa solubilidad
en fase acuosa puede causar problemas de contaminación de aguas.
Teniendo en cuenta lo descrito anteriormente, las principales propiedades
de los líquidos iónicos se resumen en las siguientes:
Alta conductividad iónica (0.1 Sm-1
)
Amplia ventana electroquímica (hasta 3V)
No volátiles
No inflamables
Alta estabilidad térmica (> 300 ºC)
Fase líquida en amplio rango de temperatura
Buenos disolventes para muchos compuestos
En conclusión, gracias a las excelentes propiedades que presentan los
LIs, su uso se ha visto incrementado en los últimos años, utilizándose en
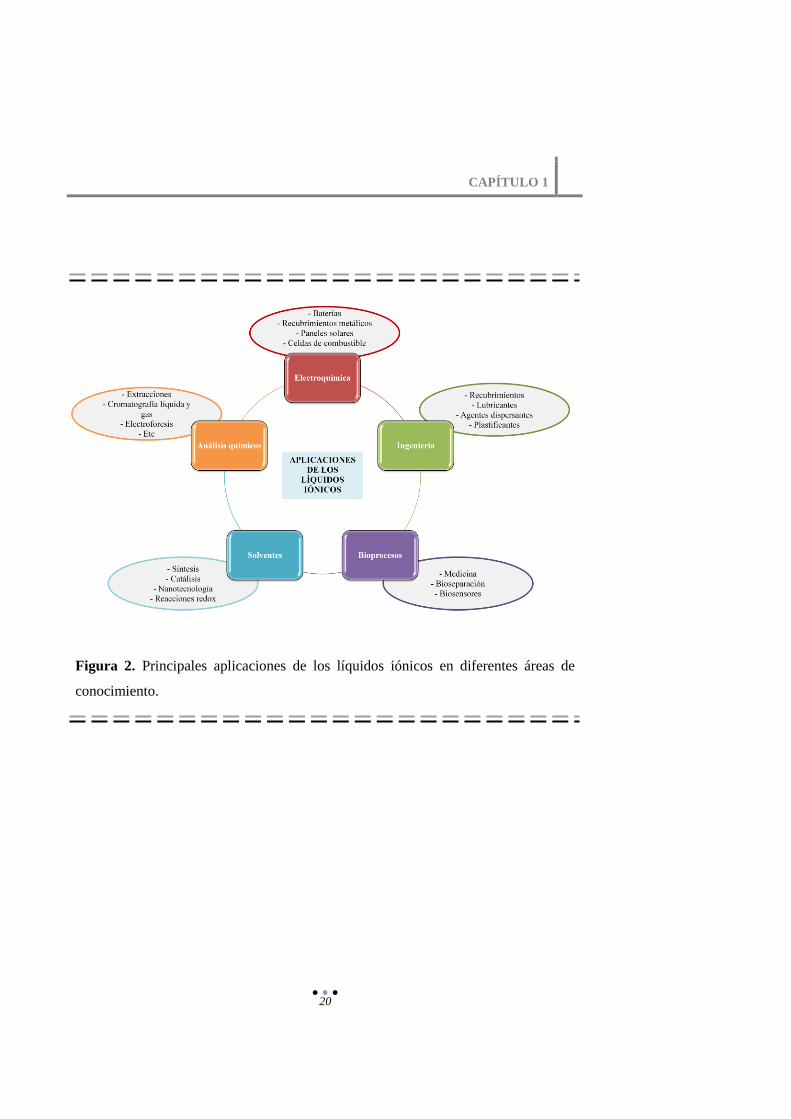
multitud de aplicaciones, algunas de las cuales se resumen en la figura 2.
CAPÍTULO 1
20
Figura 2. Principales aplicaciones de los líquidos iónicos en diferentes áreas de
conocimiento.
INTRODUCCIÓN
21
1.2. Nanotubos de carbono
El físico japonés Sumio Iijima, observó durante el estudio de la
formación del fullereno por microscopía electrónica, la existencia de
moléculas tubulares en el hollín formado a partir de una descarga de arco
usando grafito [18]. Inicialmente denominó a estas estructuras “helical
microtubos”. Investigaciones posteriores determinaron que estos tubos eran
macromoléculas formadas por átomos de carbono con una longitud del orden
de micras y un diámetro de apenas unos nanómetros, denominándolos
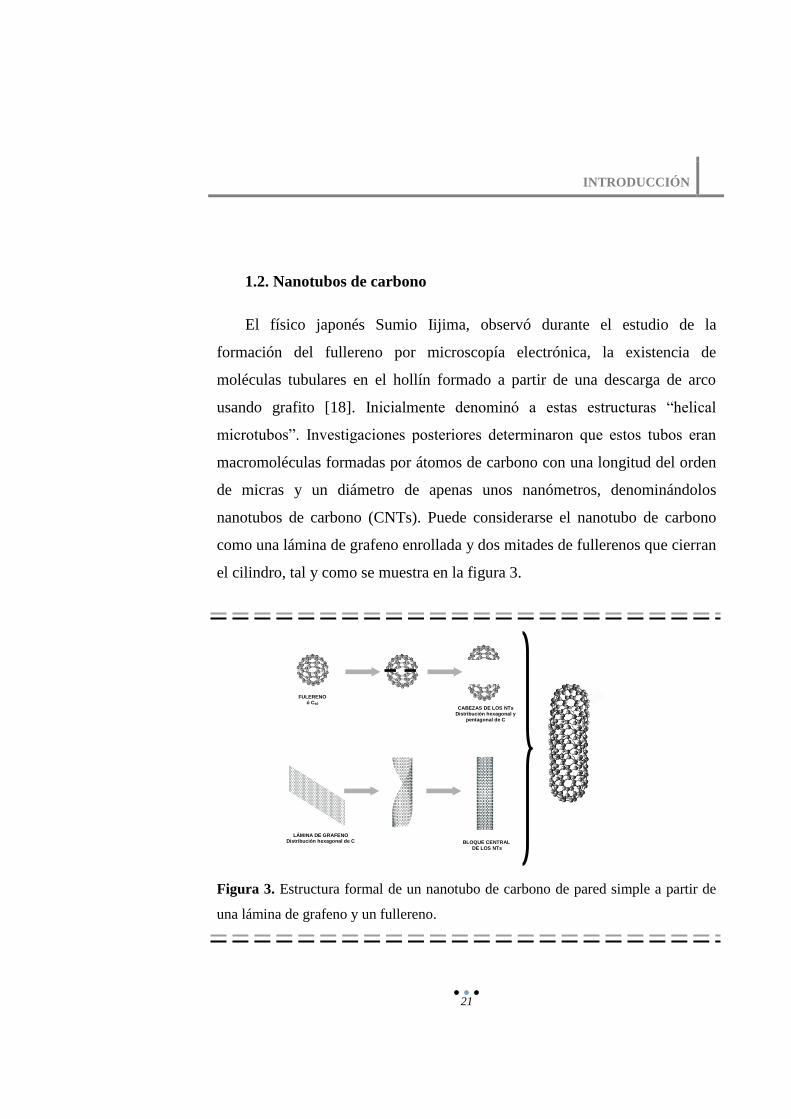
nanotubos de carbono (CNTs). Puede considerarse el nanotubo de carbono
como una lámina de grafeno enrollada y dos mitades de fullerenos que cierran
el cilindro, tal y como se muestra en la figura 3.
Figura 3. Estructura formal de un nanotubo de carbono de pared simple a partir de
una lámina de grafeno y un fullereno.
FULERENO ó C60
CABEZAS DE LOS NTs Distribución hexagonal y
pentagonal de C
BLOQUE CENTRAL
DE LOS NTs
LÁMINA DE GRAFENO Distribución hexagonal de C

CAPÍTULO 1
22
Es muy importante tener presente que la estructura de los nanotubos de
carbono va a determinar la mayoría de sus propiedades, tanto mecánicas
como eléctricas. A continuación se clasificará a los nanotubos de carbono en
base a diversos criterios.
- De acuerdo al número de capas: cabe diferenciar dos tipos principales de
nanotubos de carbono. Los nanotubos de carbono de pared simple (SWNTs),
formados por una capa bidimensional de grafeno enrollada y los nanotubos de
carbono de pared múltiple (MWNTs), que presentan varias capas
concéntricas separadas por una distancia similar a la distancia interplanar del
grafito. Estos últimos años se han realizado grandes esfuerzos por sintetizar
nanotubos de carbono con dos paredes (DWNTs), para estudiar los procesos
de estabilidad e interacciones que se producen entre las láminas concéntricas.
- De acuerdo a su estructura: cabe diferenciar los nanotubos de carbono
lineales (CNTs), nanotubos de carbono bamboo y nanotubos de carbono coil
(CCNT) caracterizados por su estructura en espiral [19]. Los nanotubos de
carbono coil fueron observados experimentalmente por primera vez por
Zhang y col. en 1994 [20].
La figura 4 muestra los diferentes tipos de nanotubos de carbono
existentes según la clasificación propuesta anteriormente.

INTRODUCCIÓN
23
Figura 4. Estructura de los diferentes nanotubos de carbono.
Otra clasificación posible sería la que se propone a continuación:
- De acuerdo a su quiralidad: cabe diferenciar entre nanotubos de carbono
quirales y no quirales. Los nanotubos de carbono no quirales se caracterizan
por tener simetría de reflexión y ser isomórficos.
- Según los índices de Hamada (n, m): también se mide la quiralidad y cabe
diferenciar tres tipos de nanotubos de carbono: armchair, zig-zag y chiral. Los
índices de Hamada se definen como aquellos que describen la celda unidad de
la estructura del nanotubo de carbono. La Figura 5 representa un esquema de
la celda unidad de los nanotubos de carbono.

CAPÍTULO 1
24
Figura 5. Celda unidad de nanotubos de carbono en la que se observa el vector y el
ángulo quiral.
De acuerdo con esta definición, se comprueba experimentalmente que los
nanotubos armchair se caracterizan por tener n=m y un ángulo quiral de 30º.
Por otra parte, los nanotubos zig-zag se caracterizan por tener n ó m igual a
cero y por consiguiente un ángulo quiral de 0º. Por último, se denominan
nanotubos quirales todos los nanotubos que presentan ángulos quirales
comprendidos en el intervalo 0-30º.
El principal reclamo de los nanotubos de carbono son sus sobresalientes
y variadas propiedades (mecánicas, térmicas y químicas), las cuales los hacen
idóneos para múltiples aplicaciones. La tabla 1 recoge los principales valores
de algunas propiedades de los nanotubos de carbono.

INTRODUCCIÓN
25
Tabla 1. Propiedades generales de los nanotubos de carbono.
Propiedad Valor
Diámetro 1-2 nm (SWNTs)
Longitud 100-1000 nm
Resistividad, 300 K (metálicos/semiconductores) 10-4
-10-3
cm/10 cm
Densidad de corriente 107-10
8 A·cm
-2
Conductividad térmica, 300 K 20-3000 W m-1
·K-1
Poder termoeléctrico, 300 K 200 V·K-1
Módulo elástico 1000-3000 GPa
Los CNTs presentan características no polares y son insolubles en agua,
lo que causa la agregación espontánea de los mismos. Esta afinidad a la
agregación combinada con su alta flexibilidad aumenta la posibilidad de
unirse y empaquetarse. Este hecho disminuye y degrada su verdadera relación
superficie/área [21]. Los CNTs son altamente hidrofóbicos y solo algunos
disolventes muy coordinantes son capaces de dispersar completamente los
CNTs como son: dimetil formamida, dimetil acetamida, y dimetil pirrolidona;
reduciendo así su agregación [22]. La alta insolubilidad de los CNTs en agua
dificulta su purificación y caracterización. Sin embargo, al igual que otras
moléculas orgánicas, los CNTs puede ser funcionalizados de forma covalente
o no covalente [23] con grupos polares u otros grupos con el fin de conseguir
dispersar dichos nanomateriales en disolventes orgánicos o agua y poder así
CAPÍTULO 1
26
explotar sus principales características y propiedades en diferentes campos
como la física, química, biología, etc. Una vez solventado el inconveniente de
la agregación, los CNTs presentan una elevada área superficial siendo así
excelentes candidatos para multitud de aplicaciones, entre las que destacan su
participación en procesos de extracción (SPE y SPME).
Debido a su terminación en punta, al estar sometidos a una diferencia de
potencial se incrementa el campo eléctrico en su extremo actuando como
fuertes emisores de campo. Esta propiedad es también el resultado de la
capacidad intrínseca de los CNTs para transportar corrientes eléctricas con
una resistencia mínima y alta eficiencia [24]. Las propiedades eléctricas de
los SWNTs dependen de como sea la distorsión de la hoja de grafeno. Así,
algunos SWNTs son metálicos y otros semiconductores. Esta propiedad ha
sido usada para desarrollar (bio) sensores electroquímicos [25].
Actualmente los procedimientos de síntesis de CNTs más empleados son
la descarga de arco en medio catalítico, ablación por láser y deposición
química de vapor. Desde el punto de vista analítico, esta última técnica es la
más interesante, puesto que permite sintetizar nanotubos de carbono alineados
verticalmente sobre superficies, lo que resulta interesante para su aplicación
en nanosensores. Las principales técnicas de caracterización de CNTs son
aquellas que proporcionan una mayor información de los mismos, tales como
espectroscopía Raman, fluorescencia, masas, electroforesis y microscópicas
(microscopía electrónica de transmisión, microscopía electrónica de barrido,
microscopía de fuerza atómica, etc).

INTRODUCCIÓN
27
Al igual que ocurre con los líquidos iónicos, los nanotubos de carbono,
gracias a sus excelentes propiedades, son ampliamente utilizados en multitud
de aplicaciones en diferentes campos, las cuales se resumen en la figura 6.
Figura 6. Principales aplicaciones de los nanotubos de carbono en diferentes áreas
de conocimiento.

CAPÍTULO 1
28
1.3. Materiales blandos o geles
La combinación de nanotubos de carbono a elevadas concentraciones con
líquido iónico conduce a la formación de unos nuevos materiales que se han
denominado “bucky gels” o “soft materials”. En esta Memoria se ha adoptado
la terminología de geles para hacer referencia a estos materiales.
Es importante tener en cuenta que no todas las relaciones LI/CNTs dan
lugar a la formación de geles. Para formar un gel es necesario tener una
concentración mínima de nanotubos de carbono en el seno del LI, siendo esta
concentración lo que denominamos concentración crítica de gelificación
(CCG). Cuando se sobrepasa esta concentración crítica, experimentalmente se
observa que se pierde la integridad del gel apareciendo agregados. Esta
concentración crítica depende mayoritariamente de las características y
propiedades del nanotubo de carbono empleado, tales como número de capas,
dimensiones y pureza. Según sea la pureza de los CNTs, la formación del gel
será más o menos eficiente. Así, a mayor grado de pureza de los nanotubos de
carbono, más eficiente será el proceso.
Si consideramos la gran diversidad de líquidos iónicos que existen junto
a la gran diversidad de nanotubos de carbono, nos encontramos con la
posibilidad de formar una gran variedad de geles. Los primeros geles
descritos en la literatura estaban constituidos por líquidos iónicos basados en
el ión imidazolio [26]. Desde entonces han sido muchas las combinaciones
LI/CNTs descritas para formar geles (ver tabla 2 review).

INTRODUCCIÓN
29
Los primeros geles descritos en bibliografía estaban formados a partir de
SWNTs [26], sin embargo, a medida que avanzaban los estudios sobre los
geles los MWNTs ganaban importancia para formar parte de los mismos.
Atendiendo al tipo de LI, los más comúnmente utilizados son aquellos
derivados del catión imidazolio, principalmente Bmim+ y Hmim
+, mientras
que aniones tales como PF6- y BF4
-son los más empleados.
Principalmente se han descrito dos procedimientos de formación de los
geles. Uno de ellos se basa en mezclar las proporciones adecuadas de ambos
materiales (LI y CNTs) y someter la mezcla a radiación de ultrasonidos,
obteniéndose al final del proceso se obtiene una pasta negra o gel [26, 27].
Otro procedimiento de obtención del gel es mediante agitación vigorosa de la
mezcla en un mortero hasta lograr una solución homogénea. Esta última
metodología es la que hemos empleado para la formación de los geles
descritos en esta Memoria.
La formación de los geles se atribuye a dos procesos que tienen lugar en
el seno del líquido iónico. Primero la dispersión de los nanotubos de carbono
en el seno del líquido iónico debido a las interacciones “π- stacking” que se
establecen entre la superficie del nanotubo de carbono y el catión del líquido
iónico. A este proceso de dispersión le sigue un proceso de ordenamiento de
las macromoléculas del nanotubo de carbono, de forma que estas se colocan
preferencialmente ordenadas y en paralelo a fin de potenciar las interacciones
- y estabilizar el sistema. Con ello, al final del proceso se obtiene una
estructura que podríamos asemejar a un gel físico. Los geles presentan un
aspecto gelatinoso, son fáciles de manejar, sumamente estables y conservan

CAPÍTULO 1
30
muy bien sus propiedades físicas debido a la combinación de tres factores: i)
la viscosidad de los líquidos iónicos, ii) las excelentes propiedades mecánicas
de los nanotubos de carbono (módulo elástico) y iii) la fortaleza del enlace
establecido entre el líquido iónico y el nanotubo de carbono.
Dado que los geles están constituidos por líquido iónico y nanotubos de
carbono, sus propiedades pueden inferirse de las propiedades/características
de ambos materiales. Así, los geles son materiales con excelentes propiedades
electroquímicas y presentan una alta estabilidad física (térmica y en
disolventes). Los geles de LI y CNTs pueden además actuar de catalizadores
de procesos redox debido a las particularidades y propiedades de ambos
componentes. Otra de las propiedades importantes de los geles es su potencial
para preconcentrar sustancias orgánicas, y es en lo que nos centraremos en
parte de esta Tesis.
Referencias
[1] J.L. Anderson, D.W. Armstrong, G.T. Wei, Anal. Chem. 78 (2006) 2892.
[2] P. Walden, Bull. Acad. Sci. 8 (1914) 405.
[3] F.H. Hurley, T.P. Uier, J. Electrochem. Soc. 98 (1951) 207.
[4] T. Ueki, M. Watanabe, Macromolecules 41 (2008) 3739.
[5] M.J. Earle, K.R. Seddon, Pure Appl. Chem. 72 (2000) 1391.
[6] J.S. Wilkes, M.J. Zawarotko, J. Chem. Soc. Chem. Commun. 13 (1992) 965.
[7] A.E. Visser, R.P. Swatloski, W.M. Reichert, R. Mayton, S. Sheff, A. Wierzbicki,
J.H. Davis, R.D. Rogers, Environ. Sci. Technol. 36 (2002) 2523.

INTRODUCCIÓN
31
[8] D. Kogelnig, A. Stojanovic, M. Galanski, M. Groessl, F. Jirsa, R. Krachler, B.K.
Keppler, Tetrahedron Lett. 49 (2008) 2782.
[9] Z. Ma, J. Yu, S. Dai, Adv. Mater. 22 (2010) 261.
[10] G. Singh, A. Kumar, Indian J. Chem. 47 (2008) 495.
[11] X. Han, D.W. Armstrong, Org. Lett. 7 (2005) 4205.
[12] I. López, G. Silvero, M.J. Arévalo, R. Babiano, J.C. Palacios, J.L. Bravo,
Tetrahedron 63 (2007) 2901.
[13] H. Olivier-Bourbigou, L. Magna, J. Mol. Catal. A- Chem. 182-183 (2002) 419.
[14] S.V. Dzyuba, R.A. Bartsch, Chem. Phys. Chem. 3 (2006) 161.
[15] M.J. Earle, J.M.S.S. Esperanca, M.A. Gilea, J.N.C. Lopes, L.P.N. Rebelo, J.W.
Magee, K.R. Seddon, J.A. Widegren, Nature 439 (2006) 831.
[16] Ionic Liquids in Synthesis, P. Wasserscheid and T. Welton eds. Wiley-VCH,
Weinheim (2003) 1.
[17] T.L. Greaves, C.J. Drummond, Chem. Rev. 108 (2008) 206.
[18] S. Iijima, Nature 354 (1991) 56.
[19] M.L. Polo-Luque, B.M. Simonet, M. Valcárcel, Anal. Bioanal. Chem. 404
(2012) 903.
[20] X.B. Zhang, X.F. Zhang, D. Bernaerts, G. Van Tendeloo, S. Amelinckx, J. Van
Landuyt, V. Ivanov, J.B. Nagy, P. Lambin, A.A. Lucas Europhys. Lett. 27 (1994)
141.
[21] L. Vaisman, H.D. Wagner, G. Marom, Adv. Colloid Interface Sci. 128-130 (2006)
37.
[22] B. Kim, Y.H. Lee, J.H. Ryu, K.D. Suh, Colloid Surf. A 273 (2006) 161.
[23] X. Peng, S.S. Wong, Adv. Mater. 21 (2009) 625.
[24] S.J. Yahachi, Nanosci. Nanotechnol. 3 (2003) 39.
[25] M. Valcárcel, S. Cá rdenas, B.M. Simonet, Anal. Chem. 79 (2007) 4788.
CAPÍTULO 1
32
[26] T. Fukushima, A. Kosaka, Y. Ishimura, T. Yamamoto, T. Takigawa, N. Ishii, T.
Aida, Science 300 (2003) 2072.
[27] T. Fukushima, T. Aida, Chem. Eur. J. 13 (2007) 5048.

A continuación se presenta un trabajo de revisión sobre los diferentes
usos y aplicaciones de diferentes combinaciones de líquidos iónicos y
nanotubos de carbono. Este trabajo completa la introducción de esta Tesis
Doctoral.
1.4. Functionalization and dispersion of carbon nanotubes in
ionic liquids. Fundamentals and analytical application of soft
materials


INTRODUCCIÓN
35
Aceptado (06/03/13) en
Trends in Analytical Chemistry
Functionalization and dispersion of carbon nanotubes in ionic
liquids. Fundamentals and analytical application of soft
materials
M.L. Polo-Luque, B.M. Simonet, M. Valcárcel
Department of Analytical Chemistry, University of Córdoba, Campus de
Rabanales, E-14071 Córdoba, Spain
Ever since their discovery, the combined uses of carbon nanotubes
(CNTs) and ionic liquids (ILs) have attracted much attention for
different applications. Chemical functionalization of CNTs in ILs, the use
of ILs as a new class of CNTs dispersant and the formation of soft
materials based on the adequate combination of two promising materials
as are CNTs and ILs are the subject matter of this Review. The
synergistic effects of the very promising isolated properties of these
“new” materials have been pointed out. Among the described
applications in different fields, it is remarkable their roles in the
improvement of analytical process such as sample treatment and
electrochemical detection.

CAPÍTULO 1
36
1. Introduction
The discovery of carbon nanotubes (CNTs) [1, 2] has boosted intensive
research which has produced remarkable scientific and technological
advances in the development of nanostructured materials. Ionic liquids (ILs),
which are salts with melting points below 100 ºC, are widely used in
electrochemistry. There are also room temperature ionic liquids (RTILs)
which have melting points below room temperature. Figure 1 shows the most
common cationic and anionic liquids currently in use. ILs usually consist of
an organic cation typically containing nitrogen or phosphorus and a weakly
coordinating anion [3].
Figure 1. Selected examples of cations and anions commonly used to obtain ionic
liquids.
INTRODUCCIÓN
37
CNTs are highly prone to aggregating, which limits their excellent
properties, mainly its ability to absorb several compounds on their surface.
Over the last decade, a variety of strategies have been devised to improve
their solubility and dispersibility, mainly in strong acids or volatile organic
solvents. In recent years, ILs have emerged as “green” alternatives to volatile
organic solvents for this purpose [4–6]. In the literature, ILs have been used
as media for functionalization reactions or as functionalizing agents for the
covalent binding of nanotubes.
Likewise, ILs are able to disperse CNTs by themselves, affording readily
processable gelatinous substances. For that reason ILs provide an excellent
choice to increase CNTs dispersibility without the need for solid substances
or organic solvents. In this context Fukushima et al. [7] used imidazolium
ion-based ILs as a new class of CNTs dispersants for the first time. Since
then, CNTs dispersed in ILs have been described in several works [8, 9]. In
some cases, CNTs could be directly dispersed in the ionic liquid; in others, a
stable aqueous or organic solution of an IL is necessary to carry out the total
dispersion of CNTs.
Other way to obtain dispersed CNTs is by means of the combination of
CNTs (working at the critical gel concentration) with an IL, which led to the
obtainment of some new materials designated “bucky gels”, ”soft materials”
or simply “gels”, according to criteria of each author. The broad range of ILs
and CNTs currently available can obviously be used to produce a wide
variety of gels [10, 11].

CAPÍTULO 1
38
The combined uses of these two types of material mentioned above [4-
11] have been widely used in chemical, physical and biological applications.
Worth special note in this respect are chemical functionalization of CNTs in
ILs, the use of ILs as a new class of CNTs dispersant and the development of
new (soft) materials. The previous uses of CNTs–ILs have been used for
various purposes. Some applications have exploited the individual properties
of each material separately; others have exploited their synergistic effects to
develop new soft materials, mainly in sample treatment and electrochemical
detection. Recently, Tunckol et al. [12] reviewed the combinations of carbon
nanomaterials (nanotubes and graphene) and ILs, particularly as regards
electrochemical properties.
In the present Review will be summarized the role of ILs as dispersants
of CNTs that can also lead to the formation of soft materials if the proportion
of both component (IL and CNTs) is adequate. In some cases, ILs allows the
peculiar functionalization of CNTs. This paper places emphasis on the
analytical application of soft materials such as the fabrication of
electrochemical devices owing their unique electrical properties and their use
in sample treatment stage thanks to their synergetic effect derived from the
joint use of CNTs and ILs. Figure 2 depicts the different topics discussed in
this Review.

INTRODUCCIÓN
39
Figure 2. Schematic depiction of the different uses and applications of carbon
nanotube–ionic liquid combinations.
2. Combined uses of IL and CNTs
2.1. Ionic liquids as a new class of CNTs dispersants
The outstanding mechanical, electrical and thermal properties of CNTs
can be expected to be the source of a variety of applications. However, CNTs
are difficult to process owing to their low dispersibility and their tendency to

CAPÍTULO 1
40
form aggregates; this is particularly so with single walled carbon nanotubes
(SWCNTs), which are heavily entangled with one other and require using an
excellent solvent to facilitate its employment in future applications.
Fukushima et al. [7] found imidazolium ion-based ILs dispersed CNTs better
than traditional organic solvents. Previously, dispersants were typically solid
substances that were only effective in combination with an appropriate
solvent. By contrast, ILs are fluid at room temperature and hence capable of
dispersing CNTs by themselves to produce readily processed gelatinous
substances.
Spectroscopic and molecular modeling studies have investigated the
mechanism behind the dispersion of SWCNTs in imidazolium-based ILs [13].
Both experimental and simulated results have shown that ILs interact with
SWCNTs through weak van der Waals forces other than those in the
previously assumed “cation-π” interaction. Figure 3a shows the dispersing
process involved. A π–π interaction shielding model has been proposed to
account for the dispersion of SWCNTs in ILs. The strong interaction between
SWCNTs is shielded by ILs, which eventually prevent detached SWCNTs
from rebundling. This must be the reason why ILs can disperse SWCNTs
more efficiently than ordinary solvents. There are two different
methodologies for dispersing CNTs. In some cases, CNTs are directly
dispersed in the IL; in others, a stable aqueous or organic solution of an IL is
used as dispersant.

INTRODUCCIÓN
41
Figure 3. a) Schematic depiction of the dispersion of SWCNTs in ILs. The cartoon
was not drawn to scale. From reference [13] with permission of ACS. b) Schematic
depiction of the two mechanisms of formation of soft materials by combining ionic
liquids and carbon nanotubes. TEM image of the soft material resulting from the
combination of MWCNTs with Hmim PF6.
By using the first methodology, Fukushima et al. [14] found poly (ILs)
containing methacrylate or vinyl groups to be effective for preparing
dispersed SWCNTs. Typically, a mixture of methacrylate-appended 3-
methylimidazolium salts with CF3(SO2)2N– (508 mg) and SWCNTs (27 mg)
was ground in an agate mortar for 30 min, and the resultant black mixture

CAPÍTULO 1
42
mixed with AIBN (2,2’-azobisisobutyronitrile). Ping et al. [8] reported a
stable water-miscible imidazolium-based ionic liquid/electrolyte interface
constructed in aqueous media based on the interaction between the
imidazolium moiety in ILs and SWCNTs. To this end, they dispersed 1 mg of
SWCNTs into 1 mL of Bmim BF4 with the aid of sonication. Mingwei et al.
[15] studied the phase behavior of the surfactant-like IL 1-tetradecyl-3-
methylimidazolium chloride (C14mim Cl) in the RTIL ethylammonium nitrate
(EAN), using an H1 phase consisting of 65 wt% C14mim Cl and 35 wt% EAN
to disperse a final concentration of multi walled carbon nanotubes
(MWCNTs) of 0.014%. Recently, our group used the ionc liquid Hmim PF6
as a dispersant for MWCNTs [9]. CNTs were manually mouldered with an
excess of IL and C18 for 15 min, after which the ionic liquid was removed and
the resulting CNTs/C18 mixture used to synthesize a new sorbent for SPE.
Mecerreyes and coworkers used the latter methodology with poly (1-
vinyl-3-ethylimidazolium) bromide as a phase-transfer medium between
water and organics for both CNTs and gold nanoparticles [16]. A novel
oligomeric electrolyte [poly (pyridinium 1,4-diyliminocarbonyl 1,4-
phenylene-methylene) chloride] was also used as a new dispersant for
SWCNTs; bath sonication at a low-power for 1 h provided a stable dispersion
of nanotubes [17]. Polyelectrolytes are frequently used as dispersing agents or
stabilizers in chemical processing and poly (ILs) have recently been
recognized as having potential in this area [18]. Zhang et al. [19] used a
mixture of the ionic liquid Omim PF6 and DMF to disperse MWCNTs in
order to form a PtAu–MWNT–[Omim] PF6-GOD coated glassy carbon
electrode. Later, they successfully used surfactants with a polycyclic aromatic

INTRODUCCIÓN
43
moiety and a long hydrocarbon chain such as the carbazole-tailed amphiphilic
imidazolium IL 1-[n-(N-carbazole) alkyl] 3-methylimidazolium bromide
[CzCnMim] Br (n = 10 and 12) to disperse CNTs in aqueous solutions [20].
They obtained well-dispersed CNTs suspensions after ultrasonication and
centrifugation. More recently, Fei et al. [21] found MWCNTs to be
effectively dispersed in aqueous solutions containing IL-based phosphonium
surfactants such as alkyl-triphenyl phosphonium bromide (CnTPB, n = 12,
14). Nanotubes dispersibility increased with increasing length of the
hydrocarbon chain in CnTPB.
Recently, Mohammadi and coworker [22] studied the structural
characteristics and dispersion of the aggregated non-bundled and bundled
carbon nanotubes in an IL (1-n-propyl 4-amino 1,2,4-triazolium bromide).
Their results showed that under the investigated conditions, the IL cannot
disperse the bundled SWCNTs, but it can disperse six and seven aggregated
non-bundled ones.
ILs can be considered better CNTs dispersants than conventional organic
solvents due to their properties as low flammability, low or zero volatility,
high thermal stability and ionic conductivity. So ILs are able to disperse
CNTs by themselves or by a stable aqueous or organic solution of an IL in a
simple way. Both methodologies described above allow the complete CNTs
dispersion, the difference lies in the final application. In some works the
CNTs dispersion in the IL is a prelude to futures applications of the resulting
new material which are summarized in Table 1.

CAPÍTULO 1
44
Table 1. Some applications of different CNTs dispersions.
Type of IL Type of
CNTs
[dispersed CNTs] Application Ref.
poly (ILs) SWCNTs 3-10 % wt Bucky plastic 14
Bmim BF4 SWCNTs 1mg Glass carbon electrode 8
Hmim PF6 MWCNTs 2 mg SPE sorbent 9
poly (IL) SWCNTs - Phase-transfer vehicles, 16
Omim PF6 MWCNTs 0.5 mg Glucose biosensor 19
2.2. Ionic liquids for developing soft materials based on carbon
nanotubes
The combination of CNTs at high concentrations with ILs has provided
some new materials referred to as “bucky gels”, “soft materials” or, simply,
“gels”, which are considered to be other types of dispersed CNTs. It should
be noted that not all IL/CNTs combinations lead to the formation of a
physical gel. In fact, this requires using a minimum concentration of CNTs
known as “critical gel concentration” in the mixture [23]. Above such a
critical concentration, CNTs tend to aggregate.

INTRODUCCIÓN
45
There are two different methodologies for obtaining soft materials (see
Fig. 3b). One involves mixing appropriate proportions of both materials (IL
and CNTs) and sonicating the mixture [7] to obtain a black paste or gel. The
other uses vigorous agitation of the suspension in a mortar until a
homogeneous solution is obtained. Our group [10, 11] found the latter
procedure to provide the best results. The bucky gels thus obtained are easy to
process into any shape (e.g. by through extrusion from a needle one can
obtain a cable-like material that is not easily torn apart even when suspended
[24]).
The formation of gels has been ascribed to two different processes
occurring in the ionic liquid when the critical gel concentration is reached.
First, CNTs are dispersed and dissolved in the ionic liquid via π–π
interactions between nanotubes and the cation in IL; then, macromolecules in
the nanotubes adopt a parallel arrangement that facilitates π–π interactions
and helps stabilize the system. Figure 3 shows a TEM image of the gel. The
process ends with the formation of a structure that may resemble a gel.
These materials have a gelatinous appearance, are easy to handle, and possess
highly stable, well-preserved physical properties.
Fukushima et al. [7] were the first to find SWCNTs to be readily
dispersed in imidazolium ILs by mechanical milling to obtain a gel. The
broad range of ILs and CNTs available has facilitated the obtainment of a
wide variety of gels for an also wide variety of purposes. Table 2 shows
selected combinations of CNTs and ILs. Fukushima et al. [24] published a
concept article describing the formation and fundamental properties of these

CAPÍTULO 1
46
gelatinous soft composite materials and highlighting their applications to
nanoscale materials science.
Table 2. Some examples of gels obtained by combining ionic liquids with carbon
nanotubes [(A) Gels formed by IL and CNTs; and (B) Gels formed by IL, CNTs and
a stabilizer] classified according to type of CNTs used.
A)
Type of
CNTs
[CNT] Type of IL Ref.
Treated
CNTs
1 mg Bmim PF6 25
19 % Bmim BF4 26
19 % Bmim BF4 27
MW
CN
Ts
20 mg Bmim PF6 28
12 mg Bmim PF6 29
– Omim PF6 30
2 mg Bmim BF4 31
0.3 mg Bmim Tf2N, BMPY Tf2N, Bmim NO3 32
5 mg Bmim BF4, Bmim PF6 , Bmim Tf2N 33
25 % Bmim PF6 34
10 mg
Bmim SO3, Bmim BF4, Bmim PF6, Omim PF6,
C10mim BF4, TBA Br, TBA PF6, BmPYR Br,
BmPYR PF6, BmPIP Br, BmPIP PF6
35
25 % Bmim PF6 36
5 mg Bmim BF4 37
17 mg Hmim PF6 10

INTRODUCCIÓN
47
15 mg Hmim PF6 11
2 mg Bmim PF6 38
15 mg Hmim PF6 39
MW/SW
CNTs
1.9-7.5
% Hmim PF6 40
SW
CN
Ts
0.5-3.8
%
Bmim BF4, Emim BF4, Hmim BF4, Emim Tf2N,
Bmim Tf2N, Bmim PF6, ABmim PF6
7
30 mg Hmim PF6 41
2 mg Bmim BF4, Bmim PF6 42
1 mg Bmim PF6 43
70 % Bmim PF6 44
1 mg Bmim PF6 45
0.5 % Omim BF4 46
3.6 mg Omim Cl 47
B)
Type of
CNTs
[CNT]
(%)
Type of IL Stabilizer Ref.
SW
CN
Ts
13 Bmim BF4 PVdF (HFP) 48
22 Emim BF4 PVdF (HFP) 49
20
Emim BF4, Bmim BF4, Hmim
BF4, Omim BF4, Emim TFSI, A-3
, A-4
PVdF (HFP) 50
19.9 Emim BF4 PANI, CB,
PVdF(HFP) 51

CAPÍTULO 1
48
20
Emim (CF3BF3), Emim
(CF3CF2BF3), Emim FTA, Emim
(C1C2)
PVdF (HFP)
52
ACNF +
SWCNT 23
Emim BF4, Bmim BF4, Hmim
BF4, Omim BF4, Emim TFSI, A-3
, A-4
PVdF (HFP) 53
MW
CN
Ts
15 Bmim BF4 PBH, GP 54
15 Bmim BF4 NHMF, GP 55
15 Bmim BF4 NSP, GP 56
20 Bmim BF4 ENTZ, GP 57
5 Bmim BF4 Ionophore L,
GP
58
A-3 [N,N-dimethyl-N-ethyl-N (2-methoxy-2-ethoxyethyl) ammonium tetrafluoroborate]; A-4
[N,N-dimethyl-N-ethyl-N(2-methoxy-2-ethoxyethyl) ammonium bis (trifluoromethylsulfonyl)
imide]; CB [carbon black]; ENTZ [1-(2-ethoxyphenyl)-3-(3-nitrophenyl) triazene]; GP
[graphite powder]; L [N'-(1-oxoacenaphthylen-2(1H)-ylidene) furan-2 carbohydrazide];
NHMF [N-[(2-hydroxyphenyl) methylidene]-2-furohydrazide]; NSP [5-(dimethylamino)
naphthalene-1-sulfonyl 4- phenylsemicarbazide]; PANI [Polyaniline]; PBH [N’-(pyridin-2-
ylmethylene) benzohydrazide]; PVdF (HFP) [vinylidene fluoride-co-hexafluoropropylene].
As can be seen in Table 2, works described in the literature used both
SWCNTs and MWCNTs, in a similar number of references, to form soft
materials. Attending to the type of IL the most commonly used are
imidazolium ion-based ILs, mainly Bmim+
and Hmim+. Anions such as PF6
-
and BF4- are are the most usually used. Some applications require the use of
more complex ILs.

INTRODUCCIÓN
49
2.3. Functionalization of carbon nanotubes in ionic liquids
CNTs have been proposed for many potential applications in biology
[59], sensor development [60], nanoelectronics and photonics [61], and also
for high-performance polymer-based nanocomposites [62] on the grounds of
their unprecedented physico–chemical properties. However, CNTs have a
high tendency to aggregate in various solvents and polymer matrices. Over
the last decade, a variety of strategies have been developed to improve their
solubility/dispersibility through covalent or noncovalent functionalization. So
far, CNTs have been functionalized mainly in strong acids (e.g. nitric, sulfuric
or mixtures thereof) or volatile organic solvents. However, both strong acids
and organic solvents often lead to environmental pollution, equipment
corrosion and health hazards. It is therefore mandatory to develop
environmentally friendly methods for functionalizing CNTs. RTILs may
provide environmentally benign “green” alternatives to volatile organic
solvents for chemical synthesis by virtue of their low volatility,
nonflammability and high thermal stability [63]. ILs can be used as media for
functionalization reactions or as functionalizing agents for the covalent
binding of nanotubes.
By using ILs as reaction media, Zhang et al. [4] accomplished the
electrochemical functionalization of SWCNTs in large amounts with the
RTIL 1-butyl-3-methylimidazolium hexafluorophosphate (Bmim PF6)
supported on a three-dimensional network electrode. Figure 4 shows selected
examples of two methods for electrochemical functionalization of SWCNTs.
One advantage of using bucky gels consisting of ILs for the electrochemical

CAPÍTULO 1
50
functionalization of SWCNTs is that the IL acts both as a dispersant for
SWCNTs and as a supporting electrolyte [24]. Wei et al. [5] reported a novel
electrochemical method for functionalizing very large amounts of SWCNTs
in ILs. The SWCNTs were covalently functionalized by electropolymerizing
aniline in ILs. 1-butyl 3-methyl-imidazolium hexafluorophosphate containing
1M trifluoroacetic acid was used as the IL medium to both separate SWCNTs
and electropolymerize aniline. By using the same procedure, Wang et al. [64]
prepared SWCNTs–IL matrices to synthesize a PANI–SWCNT composite
film. Subsequently, Yingkui et al. [6] developed a green chemical process for
functionalizing MWCNTs in water and Bmim BF4.
Zhang et al. [65] developed a methodology for preparing multifunctional
compounds based on an IL backbone. SWCNTs and counter anions such as
Br, PF6, BF4 and polyoxometalates (POMs) were coupled by using the
imidazolium group, which is a common cation in ILs, as the backbone. The
resulting compounds retained the original properties of each component and
exhibited unusual tunable wet ability and charge-transfer activity. More
recently, these authors functionalized SWCNTs by using the IL 1-
propylamine 3-methylimidazolium bromide as a bridge to fabricate an IL–
SWCNT nanobiocomposite that was employed to immobilize glucose oxidase
(GOD) with a view to constructing a novel glucose biosensor [66]. Some of
these authors developed a multi walled carbon nanotube @ SnO2–Au
composite (MWCNTs@SnO2–Au) by using the same chemical route [67].
Gao et al. [68] developed a method for synthesizing novel composites
consisting of SWCNTs functionalized with a new amine-terminated ionic
liquid: 1-ethylamine 2,3-dimethylimimidazolium bromide (NH2-IL).

INTRODUCCIÓN
51
Figure 4. Illustration of the electrochemical functionalization of SWCNTs. A new
method (II) using bucky gels is compared with a conventional approach using bulk
SWNTs in a supporting electrolyte solution (I). From reference [4] with permission
of ACS.
Several studies of the surface-functionalization of CNTs with poly (ILs)
for use as metal nanoparticle catalyst supports in fuel cells have been reported
[69]. In this work, thermally-initiated free-radical polymerization of 1-vinyl
3-ethylimidazolium tetrafluoroborate on the surface of CNTs introduced a
large number of functional groups to grow metal (PtRu and Pt) nanoparticles.
Liu et al. [70] were the first to prepare poly (urethane–ionic liquid)/multi
walled carbon nanotube (PUIL/MWCNT) composites by fabricating

CAPÍTULO 1
52
MWCNTs into a novel type of PIL [poly (urethane-ionic liquid)]. MWCNTs
were simply fabricated into the PUIL matrix by exploiting the p-cation
interaction between the imidazolium based IL and MWCNTs without the
need for strong oxidation or complex functionalization reactions. Hong et al.
[71] reported a new practical route for synthesizing nanotube-polymeric ionic
liquid gels by noncovalent functionalization of oxidized SWCNTs surfaces
with imidazolium-based poly-ionic liquids (PILs) based on in situ radical
polymerization. Subsequently, Tung et al. [72] accomplished the surface
modification of CNTs by using the PIL poly (1-vinyl 3-ethylimidazolium).
The resulting SWCNT-PIL: PEDOT hybrid material was selectively
suspended in water or organic solvents.
Modifying CNTs with ILs is expected to improve their compatibility and
stability, and hence to expand their scope. More interestingly, CNTs modified
with ILs can be made reversibly water-soluble or nonwater-soluble by
switching electrolyte solutions. Success with the electrolyte-switchable
solubility of modified CNTs was first reported by Yu et al. [73], who
prepared IL-modified CNTs with reversibly switchable solubility between
aqueous and organic solvents induced by anion exchange. Modifying
MWCNTs with ILs can also increase their solubility, especially in structurally
similar ILs. Thus, the solubility of IL-decorated CNTs has been shown to
depend on the particular anions coupled with cationic imidazole rings. The
structural diversity and flexibility in the molecular design of ILs makes CNT
modification by ILs a promising method for functionalizing nanotubes. Yu et
al. [74] also prepared a RTIL/MWCNT composite by chemical modification
as described in their previous paper. Liang et al. [75] used a diazonium salt-

INTRODUCCIÓN
53
based IL for the solvent-free modification of CNTs by using a new class of
stable, conductive, hydrophobic RTIL based on diazonium salts tailored for
chemical and electrochemical functionalization of carbon materials. The
novel ionic liquid consisted of p-butylbenzenediazonium ions and bis
(trifluoromethanesulfonyl) amidates (Tf2N–), and was synthesized as a task-
specific IL for the solvent-free modification of carbon materials. Finally, Lei
et al. [76] obtained an IL of ultralong CNTs (MCNT-IL) via a three-step
procedure.
In brief, ILs can be used as media for functionalization reactions
avoiding the use of strong acids or organic solvents or as functionalizing
agents. The resulting compounds obtained with the second strategy retain the
original properties of each component. Moreover, it is possible the deliberate
combination of other independent components into the functionalization
reaction in order to obtain multifunctional compounds. Some applications of
the different functionalized CNTs described above are shown in Table 3.
Table 3. Some applications of different functionalized CNTs.
IL CNTs Resulting
material
Potencial
Application
Figures of
merit
Ref.
Bmim
PF6
SWCNTs PANI-SWNTs
composite
Organic
photovoltaics
- 5
Bmim SWCNTs PANI-SWNTs Nonenzymatic LOD: 1.2 64

CAPÍTULO 1
54
PF6 composite H2O2 sensor μM, 4 s
reponse time
IL-NH2 SWCNTs Bio-
Nanocomposite
Glucose
sensor
- 66
IL-NH2 MWCNTs MWCNTs@SnO2-
Au composite
Glucose
sensor
linear range:
4-24 mM
67
IL-NH2 SWCNTs IL-GNP-IL-SWNT
nanocomposite
Glucose
sensor
LOD: 0.8
µmol L-1
68
Poly (IL)
SWCNTs SWCNT-PIL:
PEDOT hybrid
materials
Films Resistivity:
6.2×10⁻⁴
Ω/sq, Optical
transparency:
85.5%
72
HEHIm
PF6
MWCNTs RTILs/MWCNTs
composite
Lubricants - 74

INTRODUCCIÓN
55
3. Applications
Soft materials consisting of highly electroactive CNTs and a fluid
electrolyte can be used for a wide variety of electrochemical applications such
as biosensors, capacitors and actuators. In electrochemical biosensors, these
composite materials can also be used as immobilizing matrices to entrap
proteins and enzymes in order to provide a favorable microenvironment for
redox proteins and enzymes to retain their bioactivity, and perform direct
electrochemistry and electrocatalysis [77]. In recent years, research has
focused on their use as sorbent materials for sample pretreatment.
3.1. Development of new materials
The following are some examples of new materials obtained by
combining ILs and CNTs. Free-radical polymerization of an imidazolium ion-
based IL bearing a methacrylate group and gelling with SWCNTs enabled the
fabrication of a mechanically reinforced, electroconductive soft material
(bucky plastic), which was found to exhibit excellent conductivity. Scanning
electron and atomic force micrographs of a bucky plastic film revealed the
presence of cross-linked networks consisting of finely dispersed SWCNTs.
Although a bucky plastic derived from a vinylimidazolium ion-based ionic
liquid monomer possessed comparable conductivity, the film was brittle
irrespective of the presence or absence of SWCNTs [14].
In 2010, Carrión et al. [46] produced different nanocomposites
containing SWCNTs modified by the ionic liquid Omim BF4 (m-CNTs) and
compared their tribological behavior with that of neat polymers and
CAPÍTULO 1
56
nanocomposites containing pristine SWCNTs (p-SWCNTs). The best results
were obtained with nanocomposites containing m-CNTs. This result was
ascribed to dispersion of the nanotubes in the polymer matrix increasing their
resistance to crack propagation and fracture, and also to the surface
modification of the nanotubes by the ionic liquid improving the lubricating
ability of the additive. Recently, Carrión et al. [47] described for the first time
the use of a new nanofluid formed by the combination of the IL (Omim Cl)
and SWCNTs as lubricant. The new lubricant shows outstanding tribological
performance for PC sliding against stainless steel, giving ultralow friction and
preventing wear.
3.2. Enzymatic catalysis
RTILs have been shown to possess a high potential as novel media for a
variety of enzymatic reactions. One common problem, however, is poor
selectivity. As an example, Eker et al. [78] succeeded in enhancing the
activity, stability and reusability of the bacterial protease proteinase K by
asorption onto SWCNTs. They demonstrated the advantages of the resulting
enzyme–SWCNT conjugates as heterogeneous catalysts in RTILs.
3.3. Soft materials in sample treatment
CNTs are known to possess a strong adsorption affinity for a wide
variety of organic compounds; also, their large adsorption surfaces make
them excellent materials for solid phase extraction (SPE) and microextraction
(SPME) [79]. Also, ILs provide excellent media for the thorough dispersion
of CNTs.

INTRODUCCIÓN
57
Our group has found physical gels from ILs and CNTs to exhibit some
unique properties as sorbent materials. We assessed for the first time the
sorptive potential of gels obtained from coiled CNTs and the ionic liquid
Hmim PF6 for extracting Polycyclic Aromatic Hydrocarbons (PAHs) in water
samples [10] by using a miniaturized system. We also used soft materials
obtained by combining Hmim PF6 with two different types of MWCNTs as
sorbents for the preconcentration of organic compounds such as PAHs in
river water samples. The high sorption capacity obtained was suggestive of a
synergistic effect of the orientation of the nanotubes in the soft material [11].
We subsequently compared the fluoranthene preconcentration capabilities of
eight types of gels prepared with eight different types of CNTs (seven
MWCNTs and one SWCNTs) and the IL Hmim PF6 [40]. We invariably
found the sorption mechanism of the analytes in the gels to be a combination
of fast adsorption (first linear range) and subsequent slower, more gradual
absorption (second linear range). These results can open up new avenues for
using soft materials in analytical chemistry for purposes such as sample
cleanup or sample treatment. We also succeeded in the in-line
preconcentration of three nitrophenols in water samples by solid phase
extraction with a gel consisting of MWCNTs and the ionic liquid Hmim PF6
that was in-line coupled to capillary electrophoresis [39].
Pourreza et al. [80] reported a new sorbent for the preconcentration of
trace amounts of bismuth based on MWCNTs dispersed and loaded with 1-
buthyl 3-methylimidazolium hexaflourophosphate (Bmim PF6), and
supported on sawdust. The ensuing method was applied to the determination
of Bi (III) ions in river water, tap water and drug samples.

CAPÍTULO 1
58
3.4. Soft materials in electrochemical detections
The fabrication of electrochemical devices is the most extended use of
soft materials derived from a combination of CNTs and ILs by virtue of their
unique electrical properties. This Review summarizes some contributions to
this research field in the last seven years
3.4.1. Development of novel electrodes
Potential applications include the use of soft materials in carbon paste
electrodes (CPE), glass carbon electrodes (GCE), dry actuators and various
other devices. Table 4 summarizes some examples of the uses of soft
materials in electrochemical applications.
Carbon paste electrodes modified with carboxylic acid group
functionalized SWCNTs and imidazolium-based ILs were used to fabricate
CILE composite electrodes for detecting guanine and adenine bases in a DNA
sequence [44]. Khani et al. [57] investigated a super selective potentiometric
methodology using an ion selective electrode for the determination of
mercury ion (II) in aqueous solutions. The electrode, which had a short
response time (5 s) and was usable for at least 55 days without substantial
divergence in measured potentials, was successfully used as an indicator
electrode for the potentiometric determination of Hg (II) in dental amalgam
and water samples.

INTRODUCCIÓN
59
Table 4. Electrochemical applications of soft materials.
SOFT MATERIALS ANALYTICAL
APPLICATIONS
ILs CNTs CNTs/
IL
Electro-
de
Sam-
ple Analyte LOD
a RSD
b
Ref
.
Bmim
PF6
Purified
SWCNTs 70:30
Gel on
CPEs – DNA
9.9
pM 2.7 44
Bmim
BF4 MWCNTs –
Gel on
CPEs –
Pr (III)
ions
2×
10–6
M – 54
Bmim
BF4 MWCNTs –
Gel on
CPEs –
Ce (III)
ions
3.6×
10–7
M – 55
Bmim
BF4 MWCNTs –
Gel on
CPEs
Er
alloy
s
Er (III)
ions
5.0×
10−8
M – 56
Bmim
BF4 MWCNTs –
Gel on
CPEs
Dent
al
amal
gam
Hg (II)
ions
2.5×
10−9
M – 57
Bmim
BF4 MWCNTs –
Gel on
CPEs –
Yb (III)
ions
1.0×
10–8
M – 58
Bmim
PF6
Purified
Fc@SWCN
Ts
1mg/1
0 µL
Gel on
glass
carbon
– H2O2 5 µM – 25
Bmim
PF6
Purified
MWCNTs
12mg/
0.25
mL
Gel on
glass
carbon
Hum
an
urine
Uric acid 5.0×
10–9
M 3.2 29

CAPÍTULO 1
60
Omim
PF6
Purified
MWCNTs –
Gel on
Chi/GC
E
Saus
age Nitrite
1.0×
10–8
M 1.42 30
Bmim
NTF2
MWCNTs-
COOH
0.3
mg/
6 µL
Gel on
glass
carbon
– – – – 32
Bmim
PF6
Purified
MWCNTs
1:4
mass
ratio
Gel on
glass
carbon
– Hydroqui
none – 3.5 34
Bmim
PF6
Purified
MWCNTs
1:4
mass
ratio
Gel on
glass
carbon
– Hydroqui
none
6.7×
10–8
M 3.4 36
Bmim
PF6
Purified
MWCNTs
1:4
mass
ratio
Gel on
glass
carbon
– Catechol 6×
10–8
M 2.3 36
Bmim
PF6 MWCNTs
2mg/2
0µL
Gel on
glass
carbon
Bloo
d O2
126 μg
L–1
5.6 38
Bmim
BF4
Purified
SWCNTs
2mg/1
mL
Gel on
glass
carbon
– – – – 42
Bmim
PF6
Purified
SWCNTs
1mg/2
0µL
Gel on
glass
carbon
–
p–
Nitroanili
ne
8×
10–9
M 2.1 43
Bmim
PF6
Purified
SWCNTs
1mg/2
0 µL
Gel on
glass
carbon
Appl
e
Methylpa
rathion
1.0×
10−9
M 2.65 45

INTRODUCCIÓN
61
Bmim
PF6
Purified
MWCNTs
20
mg/0.2
mL
Gel on
CFME –
Dopamin
e – – 28
Bmim
PF6 MWCNTs
5
mg/0.1
mL
Gel on
Au
electrod
es
–
OPH
chemical
s
4.37
µM–1
– 33
Hmim
PF6
Purified
SWCNTs
30
mg/0.3
mL
Gel on
Pt wire – –
100
nM – 41
Bmim
BF4 SWCNTs
50
mg/20
5 mg
Dry
actuator – – – – 48
Bmim
SO3
MWCNTs-
COOH
10
mg/10
0 mg
Nonenz
ymatic
sensor
– Glucose – – 35
Bmim
BF4 MWCNTs
5mg/
100
µL
AChE
Biosens
or
– Chlorpyri
fos 4 nM 6 37
a: Limit of detection and b: Relative standar deviation
Ganjali et al. [54] incorporated soft materials onto a carbon paste
electrode by using the RTIL 1-n-butyl 3-methylimidazolium tetrafluoroborate
in combination with MWCNTs to improve the response of a praseodymium
carbon paste ion selective sensor. Subsequently, they applied a MWCNTs/IL
gel to a CPE in order to determine Ce (III) [55] and also to develop the first

CAPÍTULO 1
62
Er (III) modified CPE [56]. More recently, they reported a sensor for the
selective determination of ytterbium (III) ions with an MWCNT–IL–
ionophore–graphite nanocomposite [58]. Based on their results, modified
CPEs provide better potentiometric performance than typical CPEs in terms
of sensitivity, Nernstian slope, linear range and response stability; also, they
possess a long useful life. The modified CPEs described above were used
mainly to determinate metal ions at concentrations as low as 2.5 × 10⁻⁹
M - 2
× 10-6
M.
One other application of soft materials in electrochemical devices is their
incorporation onto a glass carbon electrode [25, 29, 30, 32, 34, 36, 38, 42, 43,
45]. Sun et al. [25] compared the response of two Fc@SWNTs modified
glassy carbon electrodes (Fc@SWNTs/GCE and Fc@SWNTs–gel/GCE). The
better response was obtained with Fc@SWNTs–gel/GCE, which was not only
more stable and convenient to use, but also an excellent mediator for H2O2.
Yan et al. [29] studied the voltammetric behavior of a glassy carbon electrode
coated with MWCNTs and Bmim PF6 paste with a view to developing a new
determination method for uric acid (UA) in human urine. The same authors
examined the electrochemical behavior of a Bmim PF6-SWNT/GCE for the
determination of nitroaromatic compounds (NACs). The modified electrode
exhibited enhanced voltammetric response to NACs and was used for their
determination in lake water [43].
Pauliukaite et al. [32] developed an MWCNT–Bmim NTF2 modified
glassy carbon electrode that was characterized electrochemically in aqueous
and IL media, and used for the electrochemical determination of potassium
INTRODUCCIÓN
63
hexacyanoferrate and ferrocene. The results revealed that the electrode was
mechanically and chemically stable, and also that the composite film
remained stable for at least one month. Liu et al. [34] used a novel Gel/GCE
for the voltammetric determination of hydroquinone (HQ) with the
advantages of simple preparation, fast response and high sensitivity. The
MWCNTs-IL-Gel/GCE may be a new idea for developing novel, powerful
biosensors. Recently, Bu et al. [36] developed a simple, rapid electrochemical
analytical method for the simultaneous determination of hydroquinone and
catechol based on a MWCNTs-IL-Gel/GCE. The modified electrode was
found to combine the properties of MWCNTs and ILs, and hence to provide a
promising strategy for the simultaneous determination of HQ and CC; the
ensuing sensor proved useful for the direct determination of both in aqueous
solutions.
Summarizing, the incorporation of soft materials onto a GCE have been
used to determinate different analytes such as H2O2, uric acid, nitrite,
hydroquinone and methylparathion, etc. The limits of detection achieved are
1.0 × 10⁻⁹
M – 5 µM.
Liu et al. [28] modified the surface of a carbon fiber microelectrode with
a soft material prepared with purified MWCNTs and Bmim PF6. Soft
materials can also be successfully incorporated onto Au electrodes for the
electrochemical detection of organophosphate compounds (OP) [33], and also
onto Pt wires as done by Li et al. [41] to study the oxidation of nitric oxide
(NO) with a linear response range from 100 nM to 100 mM.

CAPÍTULO 1
64
Fukushima et al. [48] prepared a fully plastic dry actuator through layer-
by-layer casting with a bucky gel. This is an important advancement toward
the realization of printing based fabrication of miniaturized mechanical
devices.
3.4.2. Development of sensors and biosensors
In the last years researchers have developed biosensors with high
sensitivity and good biocompatibility by combination of ILs/CNTs
nanocomposites and different enzymes in some applications. In these
biosensor CNTs promote the electron transfer rate between enzyme and
electrode and ILs provide a high ionic conductivity and good thermal
stability.
Recently, Zhu et al. [35] found gold nanoparticles (GNPs) embedded in a
bucky gel consisting of CNTs and an IL to exhibit excellent electrocatalytic
activity to glucose oxidation by effect of synergistic effects among the GNPs,
CNTs and IL. They compared eleven ILs that obviously led to differences in
the sensor response to glucose. This work may have paved the way for the
fabrication of novel sensors by combining a versatile IL with various types of
nanoparticles. Zamfir et al. [37] developed a novel, highly sensitive, reusable
low potential acetylcholinesterase (AChE) biosensor for chlorpyrifos based
on a Bmim BF4/MWCNT electrode. Immobilizing AChE on the sol–gel
matrix provided a highly stable, reproducible biosensor usable for multiple
determinations of the pesticide with no loss of enzyme activity.

INTRODUCCIÓN
65
Rahimi et al. [81] developed a superoxide radical biosensor based on a
nano-composite containing cytochrome c. They used IL (1-allyl 3-
methylimidazolium bromide as a typical RTIL and MWCNTs. The biosensor
showed a relatively high sensitivity (7.455 A M-1
cm-2
) and a long term
stability (180 days) towards O2.- in the concentration range from 0.05 to 8.1
mM with a detection limit of 0.03 mM. Mundaca et al. [82] described an
enzyme biosensor for androsterone based on 3α-hydroxysteroid
dehydrogenase immobilized onto a carbon nanotube/ionic liquid/NAD+
composite electrode. This configuration allowed the fast, sensitive and stable
electro- chemical detection of the NADH with detection limit of 0.15 mM.
4. Concluding remarks
The Lund Declaration [83] specifically includes “Nanotechnology” and
“New Materials” among the emerging technologies required to meet the
Grand Challenges of Mankind stated in it. These two technologies were
combined in the topic critically reviewed in this paper, which discusses the
state of the art and prospects of the combination of carbon nanotubes and
ionic liquids.
The soft materials or bucky gels resulting from the combination of CNTs
and ILs provide interesting advantages such as easy preparation, mechanical
and chemical stability, high versatility and new properties relative to the
combined materials separately. However, it should be noted that not all
IL/CNT combinations lead to the formation of a physical gel. It should be

CAPÍTULO 1
66
noted that the presence of aromatic rings in the IL can lead to a potentially
toxicity.
In the future, soft materials should allow the definition of high
performance nanomaterials for different electrochemical applications, mainly
sensors and biosensors. Moreover, gels could be excellent sorbents in sample
preconcentration steps thanks to the synergistic effect of the CNTs-ILs
properties in the mixture. The properties of the gels as well as the large
variety of CNTs/ILs combinations make these materials adequate to
preconcentrate several analytes from different matrices.
References
[1] S. Iijima, Nature 354 (1991) 56.
[2] S. Iijima, T. Ichihashi, Nature 363 (1993) 603.
[3] M.D. Bermúdez, A.E. Jiménez, J. Sanes, F.J. Carrión, Molecules 14 (2009) 2888.
[4] Y. Zhang, Y. Shen, J. Li, L. Niu, S. Dong, A. Ivaska, Langmuir 21 (2005) 4797.
[5] D. Wei, C. Kvarnstrom, T. Lindfors, A. Ivaska, Electrochem. Commun. 9 (2007)
206.
[6] Y. Yang, S. Qiu, Ch. He, W. He, L. Yu, X. Xie, Appl. Surf. Sci. 257 (2010)
1010.
[7] T. Fukushima, A. Kosaka, Y. Ishimura, T. Yamamoto, T. Takigawa, N. Ishii, T.
Aida, Science 300 (2003) 2072.
[8] P. Yu, H. Zhou, N. Zhu, Y. Lin, L. Mao, Electrochem. Commun. 11 (2009) 1393.
[9] M.L. Polo-Luque, B.M. Simonet, M. Valcárcel, submited to Analyst.

INTRODUCCIÓN
67
[10] M.L. Polo-Luque, B.M. Simonet, M. Valcárcel, Anal. Bioanal. Chem. 404
(2012) 903.
[11] M.L. Polo-Luque, B.M. Simonet, M. Valcárcel, Talanta 104 (2013) 169.
[12] M. Tunckol, J. Durand, P. Serp, Carbon 50 (2012) 4303.
[13] J. Wang, H. Chu, Y. Li, ACS Nano 2 (2008) 2540.
[14] T. Fukushima, A. Kosaka, Y. Yamamoto, T. Aimiya, S. Notazawa, T.
Takigawa, T. Inabe, T. Aida, Small 2 (2006) 554.
[15] M. Zhao, Y. Gao, L. Zheng, Colloids Surf. A Physicochem. Eng. Asp. 369
(2010) 95.
[16] R. Marcilla M.L. Curri, P.D. Cozzoli, M.T. Martínez, I. Loinaz, H. Grande, J.A.
Pomposo, D. Mecerreyes, Small 2 (2006) 507.
[17] M. Yoshida, N. Koumura, Y. Misawa, N. Tamaoki, H. Matsumoto, H.
Kawanami, S. Kazaoui, N. Minami, J. Am. Chem. Soc. 129 (2007) 11039.
[18] O. Green, S. Grubjesic, S. Lee, M.A. Firestone, J. Macrom. Sci. Part C: Polym.
Rev. 49 (2009) 339.
[19] Y. Zhang, G. Guo, F. Zhao, Z. Mo, F. Xiao, B. Zeng, Electroanalysis 22 (2010)
223.
[20] B. Dong, Y. Su, Y. Liu, J. Yuan, J. Xu, L. Zheng, J. Colloid Interface Sci. 356
(2011) 190.
[21] F. Lu, S. Zhang, L. Zheng, J. Mol. Liq. 173 (2012) 42.
[22] M. Mohammadi, M. Foroutan, Phys.Chem. Chem. Phys. 15 (2013) 2482.
[23] M.L. Polo-Luque, B.M. Simonet, M. Valcárcel, submited to Anal. Chim. Acta.
[24] T. Fukushima, T. Aida, Chem. Eur. J. 13 (2007) 5048.
[25] N. Sun, L. Guan, Z. Shi, N. Li, Z. Gu, Z. Zhu, M. Li, Y. Shao Anal. Chem. 78
(2006) 6050.
[26] M. Biso, A. Ansaldo, D. Ricci, Phys. Status Solidi. RRL 4 (2010) 64.

CAPÍTULO 1
68
[27] L. Ceseracciu, M. Biso, A. Ansaldo, D.N. Futaba, K. Hata, A.C. Barone, D.
Ricci, Sens. Actuators B Chem. 156 (2011) 949.
[28] Y. Liu, X. Zou, S. Dong, Electrochem. Commun. 8 (2006) 1429.
[29] Q. Yan, F. Zhao, G. Li, B. Zeng, Electroanal. 18 (2006) 1075.
[30] F. Xiao, L. Liu, J. Li, J. Zeng, B. Zeng, Electroanalysis 20 (2008) 2047.
[31] H.S. Park, B.G. Choi, S.H. Yang, W.H. Shin, J.K Kang, D. Jung, W.H. Hong,
Small 5 (2009) 1754.
[32] R. Pauliukaite, K.D. Murnaghan, A.P. Doherty, Ch.M.A. Brett, J. Electroanal.
Chem. 633 (2009) 106.
[33] B.G. Choi, H.S. Park, T.J. Park, D.H. Kim, S.Y. Lee, W.H. Hong, Electrochem.
Commun. 11 (2009) 672.
[34] X. Liu, Z. Ding, Y. He, Z. Xue, X. Zhao, X. Lu, Colloids Surf. B Biointerfaces
79 (2010) 27.
[35] H. Zhu, X. Liang, J. Chen, M. Li, Z. Zhu, Talanta 85 (2011) 1592.
[36] C. Bu, X. Liu, Y. Zhang, L. Li, X. Zhou, X. Lu, Colloids Surf. B Biointerfaces
88 (2011) 292.
[37] L.G. Zamfir, L. Rotariu, C. Bala, Biosens. Bioelectron. 26 (2011) 3692.
[38] L. Bai, D. Wen, J. Yin, L. Deng, C. Zhu, S. Dong, Talanta 91 (2012) 110.
[39] M.L. Polo-Luque, B.M. Simonet, M. Valcárcel, Electrophoresis 34 (2013) 304.
[40] M.L. Polo-Luque, B.M. Simonet, M. Valcárcel, Talanta D.O.I.
10.1016/j.talanta.2013.02.030.
[41] C.M. Li, J. Zang, D. Zhan, W. Chen, C.Q. Sun, A.L. Teo, Y.T. Chua, V.S. Lee,
S.M. Moochhalac, Electroanalysis 18 (2006) 713.
[42] P. Du, S. Liu, P. Wu, C. Cai, Electrochim. Acta 52 (2007) 6534.
[43] F. Zhao, L. Liu, F. Xiao, J. Li, R. Yan, S. Fan, B. Zeng, Electroanalysis 19
(2007) 1387.
[44] X. Zhang, K. Jiao, X. Wang, Electroanalysis 20 (2008) 1361.

INTRODUCCIÓN
69
[45] S. Fan, F. Xiao, L. Liu, F. Zhao, B. Zeng, Sens. Actuators B Chem. 132 (2008)
34.
[46] F.J. Carrión, C. Espejo, J. Sanes, M.D. Bermúdez, Compos. Sci. Technol. 70
(2010) 2160.
[47] F.J. Carrión, J. Sanes, M.D. Bermúdez, A. Arribas, Tribol. Lett. 41 (2011) 199.
[48] T. Fukushima, K. Asaka, A. Kosaka, T. Aida, Angew. Chem. Int. Ed. 44 (2005)
2410.
[49] K. Mukai, K. Asaka, K. Kiyohara, T. Sugino, I. Takeuchi, T. Fukushima, T.
Aida, Electrochim. Acta 53 (2008) 5555.
[50] I. Takeuchi, K. Asaka, K. Kiyohara, T. Sugino, N. Terasawa, K. Mukai, T.
Fukushima, T. Aida, Electrochim. Acta 54 (2009) 1762.
[51] T. Sugino, K. Kiyohara, I. Takeuchi, K. Mukai, K. Asaka, Carbon 49 (2011)
3560.
[52] N. Terasawa, I. Takeuchi, H. Matsumoto, K. Mukai, K. Asaka, Sens. Actuators
B 156 (2011) 539.
[53] I. Takeuchi, K. Asaka, K. Kiyohara, T. Sugino, N. Terasawa, K. Mukai, S.
Shiraishi, Carbon 47 (2009) 1373.
[54] M.R. Ganjali, H. Khoshsafar, F. Faridbod, A. Shirzadmehr, M. Javanbakht, P.
Norouzia, Electroanalysis 21 (2009) 2175.
[55] M.R. Ganjali, H. Khoshsafar, A. Shirzadmehr, M. Javanbakht, F. Faridbod, Int.
J. Electrochem. Sci. 4 (2009) 435.
[56] F. Faridbod, M.R. Ganjali, B. Larijani, P. Norouzi, Electrochim. Acta 55 (2009)
234.
[57] H. Khani, M.K. Rofouei, P. Arab, V.K. Gupta, Z. Vafaei, J. Hazard. Mater. 183
(2010) 402.
[58] F. Faridbod, M.R. Ganjali, M. Pirali-Hamedani, P. Norouzi, Int. J. Electrochem.
Sci. 5 (2010) 1103.

CAPÍTULO 1
70
[59] H. An, B. Jin, Biotechnol. Adv. 30 (2012) 1721.
[60] C.I.L. Justino, T.A.P. Rocha-Santos, A.C. Duarte, Trends Analyt. Chem. DOI:
http://dx.doi.org/10.1016/j.trac.2012.12.012
[61] V. Sgobba, D.M. Guldi, Chem. Soc. Rev. 38 (2009) 165.
[62] M.C.L McCrary-Dennis, O.I. Okoli, J. Reinf. Plast. Comp. 31 (2012) 1687.
[63] T.L. Greaves, C.J. Drummond, Chem. Rev. 108 (2008) 206.
[64] Q. Wang, Y. Yun, J. Zheng, Microchim. Acta 167 (2009) 153.
[65] Y.J. Zhang, Y.F. Shen, J.H. Yuan, D.X. Han, Z.J. Wang, Q.X. Zhang, L. Niu,
Angew. Chem. Int. Ed. 45 (2006) 5867.
[66] Y.J. Zhang, Y.F. Shen, D.X. Han, Z.J. Wang, J.X. Song, F. Li, L. Niu, Biosen.
Bioelectron. 23 (2007) 438.
[67] F. Li, J. Song, F. Li, X. Wang, Q. Zhang, D. Han, A. Ivaska, L. Niu, Biosens.
Bioelectron. 25 (2009) 883.
[68] R. Gao, J. Zheng Electrochem. Commun. 11 (2009) 608.
[69] B. Wu, D. Hu, Y. Kuang, B. Liu, X. Zhang, J. Chen, Angew. Chem. Int. Ed. 48
(2009) 4751.
[70] L. Liu, Z. Zheng, C. Gu, X. Wang, Compos. Sci. Technol 70 (2010) 1697.
[71] S.H. Hong, T.T. Tung, L.K. Huyen-Trang, T.Y. Kim, K.S. Suh, Colloid. Polym.
Sci. 288 (2010) 1013.
[72] T.T. Tung, T.Y. Kim, K.S. Suh, Org. Electron. 12 (2011) 22.
[73] B. Yu, F. Zhou, G. Liu, Y. Liang, W.T.S. Huck, W. Liu, Chem. Commun. 22
(2006) 2356.
[74] B. Yu , Z. Liu, F. Zhou , W. Liu , Y. Liang, Mater. Lett. 62 (2008) 2967.
[75] C. Liang, J.F. Huang, Z. Li, H. Luo, S. Dai, Eur. J. Org. Chem. 2006 (2006)
586.

INTRODUCCIÓN
71
[76] Y. Lei, C.X. Xiong, L.J. Dong, H. Guo, X.H. Su, J.L. Yao, Y.J. You, D.M.
Tian, X.M. Shang, Small 3 (2007) 1889.
[77] M.J.A. Shiddiky, A.A.J. Torriero, Biosens. Bioelectron. 26 (2011) 1775.
[78] B. Eker, P. Asuri, S. Murugesan, R.J. Linhardt, J.S. Dordick, Appl. Biochem.
Biotechnol. 143 (2007) 153.
[79] M. Valcárcel, S. Cárdenas, B.M. Simonet, Y. Moliner-Martínez, R. Lucena,
Trends Analyt. Chem. 27 (2008) 34.
[80] N. Pourreza, K.Sheikhnajdi, Talanta 99 (2012) 507.
[81] P. Rahimi, H. Ghourchian, H.A. Rafiee-Pour, Analyst 136 (2011) 3803.
[82] R.A. Mundaca, M. Moreno-Guzmán, M. Eguílaz, P. Yáñez-Sedeño, J.M.
Pingarrón, Talanta 99 (2012) 697.
[83]http://www.se2009.eu/polopoly_fs/1.8460!menu/standard/file/lund_declaration_
final_version_9_july.pdf. Lund Declaration. “Europe must focus on the Grand
Challenges of our time” (July 2009).


Herramientas
Analíticas


HERRAMIENTAS ANALÍTICAS
75
El desarrollo experimental de esta Memoria ha requerido el empleo de
diferentes herramientas analíticas tales como analito, reactivos, disolventes,
materiales sorbentes, instrumentos analíticos y aparatos, así como de las
muestras a analizar. En este capítulo de la Memoria se enumeran dichas
herramientas, señalando sus características más relevantes y novedosas.
ANALITOS, ESTÁNDARES Y REACTIVOS
Analitos. Todos los estándares, reactivos y disolventes empleados a lo
largo de la investigación fueron de pureza analítica o superior. Los
compuestos objeto de estudio de la presente Memoria se enumeran a
continuación:
Nitrofenoles (NPs):
2-nitrofenol, 3-nitrofenol y 2,4-dinitrofenol.
Sulfonamidas (SAs):
sulfametacina, sulfadiazine y sulfatiazol.
Hidrocarburos aromáticos policíclicos (PAHs):
acenapteno, antraceno, benzo(a)pireno, benz(a)antraceno,
fenantreno, fluoranteno, fluoreno, naftaleno, perileno y pireno.
Líquidos iónios (LIs):
1-hexil 3-metilimidazolio hexafluorofosfato (Hmim PF6), 1-hexil
3-metilimidazolio bis (trifluorometil sulfonil) imida (Hmim Im),

CAPÍTULO 2
76
1-butil 3-metilimidazolio hexafluorofosfato (Bmim PF6), 1-butil
3-metilimidazolio tetrafluoroborato (Bmim BF4) y 1-etil 3-metil
piridinio bis (trifluorometil sulfonil) imida (Emp Im).
Nanotubos de carbono (CNTs):
nanotubos de carbono multicapa (MWNTs) [5-20 nm x 1-10 µm
(Bayer); 110-170 nm x 2 µm (Mer); 9,5 nm x 1,5 µm (Nanocyl);
10-30 nm x 10-30 µm (Cheap-Tubes); 10-30 nm x 10-30 µm
funcionalizados con 2.5% wt -OH (Cheap-Tubes); 10-30 nm x
10-30 µm funcionalizados con 1.6% wt -COOH (Cheap-Tubes);
10-20 nm x 5-15 µm (NTP) y coil CNTs] y nanotubos de carbono
de monocapa SWNTs [< 2 nm x 5-15 µm (NTP)].
Reactivos. El trabajo experimental llevado a cabo ha requerido el empleo
de reactivos de diferente naturaleza:
Ácidos y bases. Se utilizaron ácido clorhídrico (HCl), hidróxido
sódico (NaOH), hidróxido potásico (KOH) y ácido fórmico
(CH2O2) para la optimización y ajuste del pH así como para el
tratamiento de muestra.
Líquidos iónicos y nanotubos de carbono para la formación de los
diferentes geles descritos.

HERRAMIENTAS ANALÍTICAS
77
Capilares de sílice. Se emplearon capilares de sílice fundida (de
diferentes dimensiones según la aplicación) de 50 ó 75 µm de
diámetro para los estudios de detección/determinación de analitos
por electroforesis capilar.
Tampones electroforéticos: Ácido cítrico (C6H8O7), acetato
amónico (NH4C2H3O2), dihidrógeno fosfato sódico (NaH2PO4) y
hidrógeno fosfato disódico (Na2HPO4).
Otros. Triton X-100 como surfactante.
Disolventes. Los disolventes empleados en la parte experimental de esta
Memoria fueron los siguientes: agua, metanol, acetonitrilo, hexano y acetona.
Éstos se emplearon con diferentes finalidades entre las que destacan:
Para la preparación de disoluciones estándar.
Como componentes del tampón electroforético.
Como eluyentes en los procedimientos de extracción en fase
sólida, así como para la limpieza y acondicionamiento de las
diferentes fases sorbentes.
Otros.

CAPÍTULO 2
78
Sólidos sorbentes y filtros. Empleados para el tratamiento de muestra.
En los métodos de extracción en fase sólida desarrollados y
descritos en esta Memoria se hace uso del C18, sorbente comercial
con un tamaño de partícula de 57 µm. Dicho sorbente se empleó
puro y también modificado con nanotubos de carbono.
Filtros de nylon con 0.45 µm de tamaño de poro cuyas funciones
fueron la retención de interferentes en medio acuoso durante la
etapa de tratamiento de muestra con MEPS y el filtrado del suero
de la leche tras la precipitación de las proteinas.
Geles (combinación de líquido iónico y nanotubos de carbono).
MEPS (microextracción por sorbentes empaquetados) empleados
para extraer trazas de LIs de muestras de agua de río.
SISTEMAS DE TRATAMIENTO DE MUESTRA
A continuación se exponen los diferentes sistemas de tratamiento de
muestra desarrollados durante la investigación recogida en la presente
Memoria.

HERRAMIENTAS ANALÍTICAS
79
1) Geles en etapas de extracción en fase sólida
Procedimiento general de formación de los geles (LI/CNTs)
Para preparar los geles empleados en los diferentes trabajos descritos en
esta Memoria se mezcló la cantidad apropiada de nanotubos de carbono y
líquido iónico (Hmim PF6). Dependiendo del tipo de nanotubo empleado se
necesita una relación LI/CNTs diferente para conseguir la concentración
crítica de gelificación. La mezcla formada se agita manualmente en un
mortero durante unos 15 minutos para conseguir una suspensión homogénea
de los componentes. Durante este tiempo la suspensión se torna negra y
viscosa, hasta obtener el gel. La figura 1 muestra dos fotografías donde
podemos observar a) el color y consistencia del gel y b) la posibilidad de
formar gotas estables mediante extrusión del gel con una jeringa.
a) b)
Figura 1. Fotografías del gel formado a partir de la combinación de MWNTs y LI.

CAPÍTULO 2
80
Desarrollo de unidades de extracción y microextracción
La primera de las unidades desarrolladas consistió en la modificación de
bastones de algodón y se empleó para llevar a cabo etapas de extracción en
fase sólida. Este sistema permite obtener un área de adsorción grande y
homogénea, además de permitir fenómenos de absorción de los analitos a
través del gel. La segunda unidad de extracción, empleada en etapas de
microextracción en fase sólida, consistió en una fibra muy delgada de
algodón natural. Esta unidad miniaturizada permitió la elución directa de los
analitos en microcuvetas de cuarzo. La figura 2 representa un esquema de
ambos dispositivos de extracción desarrollados.
La impregnación de ambas unidades se llevó a cabo mediante un
procedimiento sencillo que constó de dos pasos, (i) sumergir las fibras en el
gel y (ii) eliminar el exceso del mismo “frotando” la superficie de la
fibra cuidadosamente con papel satinado.
Figura 2. Sistemas de extracción desarrollados: a) dispositivo para SPE y b)
dispositivo para SPME.

HERRAMIENTAS ANALÍTICAS
81
Acoplamiento en línea del gel a un equipo de electroforesis
capilar
El acoplamiento en línea del tratamiento de muestra con el equipo de
electroforesis capilar se llevó a cabo realizando una modificación en el mismo
vial de muestra de EC tal y como puede verse en la figura 3. La unidad de
tratamiento de muestra puede definirse como un pistón, que se mueve dentro
del vial. En la parte central se coloca el gel, a través del cual pasará primero
la muestra y después el eluyente. El proceso de extracción implica dos etapas.
En la primera etapa tiene lugar la preconcentración de los analitos (etapa que
tiene lugar fuera del equipo) mientras que la elución y determinación de los
mismos se produce en el inyector automático del equipo de EC.
Figura 3. Modificación del vial de EC para realizar acoplamiento en línea.
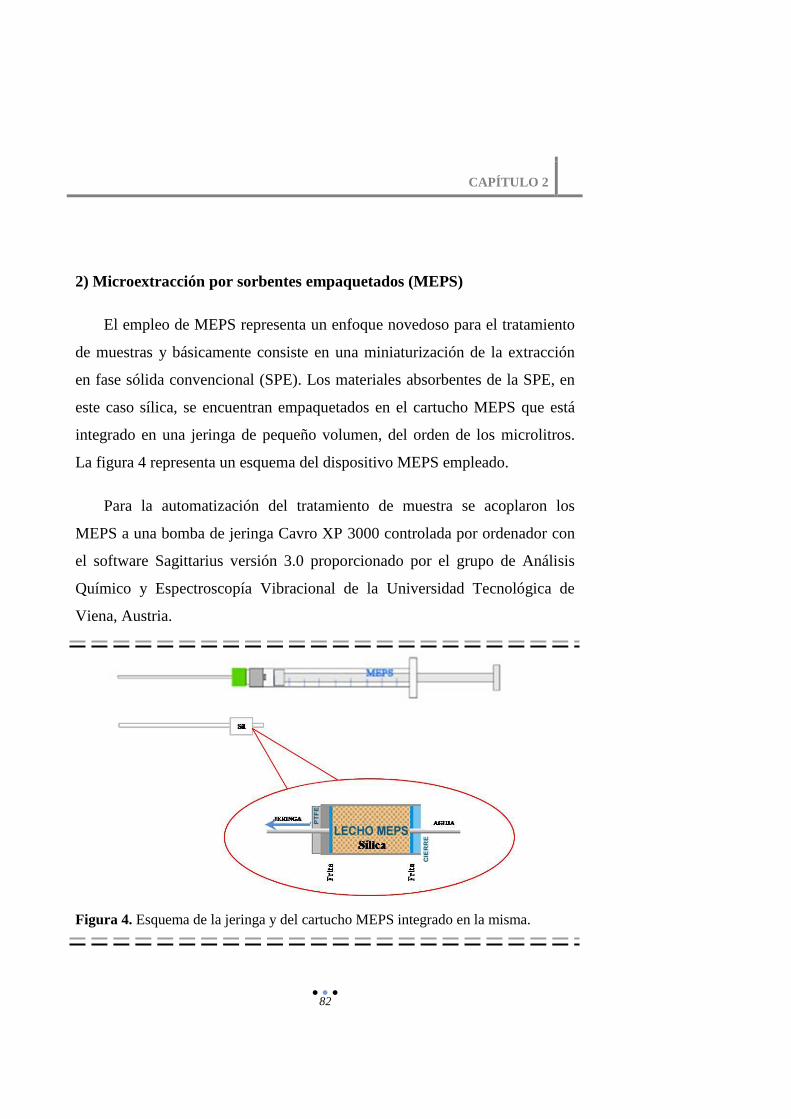
CAPÍTULO 2
82
2) Microextracción por sorbentes empaquetados (MEPS)
El empleo de MEPS representa un enfoque novedoso para el tratamiento
de muestras y básicamente consiste en una miniaturización de la extracción
en fase sólida convencional (SPE). Los materiales absorbentes de la SPE, en
este caso sílica, se encuentran empaquetados en el cartucho MEPS que está
integrado en una jeringa de pequeño volumen, del orden de los microlitros.
La figura 4 representa un esquema del dispositivo MEPS empleado.
Para la automatización del tratamiento de muestra se acoplaron los
MEPS a una bomba de jeringa Cavro XP 3000 controlada por ordenador con
el software Sagittarius versión 3.0 proporcionado por el grupo de Análisis
Químico y Espectroscopía Vibracional de la Universidad Tecnológica de
Viena, Austria.
Figura 4. Esquema de la jeringa y del cartucho MEPS integrado en la misma.

HERRAMIENTAS ANALÍTICAS
83
3) Extracción en fase sólida con sorbente modificado (CNTs/C18)
El sorbente híbrido (CNTs/C18) se obtuvo a través del siguiente
procedimiento: 2 mg de nanotubos de carbono multicapa se mezclaron
manualmente con una mínima cantidad de líquido iónico (Hmim PF6) hasta
obtener una mezcla homogénea. Posteriormente, se añadieron sucesivas
cantidades de LI hasta llegar a un volumen final de 1 mL. Para asegurar la
ausencia de agregados, el sistema se sometió a ultrasonidos durante 15 min a
60Hz. A continuación, 200 mg de material sorbente comercial C18 se
añadieron a la mezcla y se homogeneizaron mediante agitación manual.
Posteriormente, la mezcla resultante se centrifugó a 4.500 rpm durante 15
minutos para eliminar el LI sobrenadante. El sólido se lavó tres veces con
metanol para eliminar el exceso de LI. En cada etapa de lavado, el sólido se
resuspendía en 4 mL de metanol y se centrifugaba. Finalmente, el sorbente
modificado se dejó secar a temperatura ambiente.
Para llevar a cabo la preconcentración de los analitos, 20 mg del material
sorbente sintetizado se empaquetaron en cartuchos de SPE con un diámetro
de 6 mm.
INSTRUMENTACIÓN
En el desarrollo experimental de la presente Tesis Doctoral se ha hecho
uso de diversos equipos instrumentales tales como: espectrofluorímetro,
electroforesis capilar, espectrómetro Raman y microscopio de transmisión
electrónica.

CAPÍTULO 2
84
Espectrofluorímetro.
Todos los espectros de
absorción y de emisión de
fluorescencia se obtuvieron
en un espectrofluorímetro
PTI Quanta Master TM
(Photon Technology International) equipado con una lámpara de arco de
Xenón de 75W y un sistema de detección modelo 814 PTM. La recolección
de datos y el control del instrumento se hace mediante el software Félix 32.
Todas las mediciones ópticas se llevaron a cabo a temperatura ambiente y en
cubetas de cuarzo de diferentes volúmenes según el requerimiento de la
aplicación concreta.
Electroforesis capilar (EC).
La electroforesis capilar se realizó en un
instrumento P/ACE MDQ Beckman Coulter (Palo
Alto, CA, EE.UU.) equipado con un detector UV-
Vis de diodos en fila (DAD). Los capilares de sílice
fundida utilizados fueron de 50 y 75 µm de diámetro
interno. Todas las muestras se inyectaron en el
modo hidrodinámico y polaridad positiva. Parámetros como longitud de onda
de detección, voltaje y temperatura capilar se adecuaron a cada aplicación
concreta. El software Karat 32 controla toda la configuración instrumental y
se usa para procesar los datos obtenidos.

HERRAMIENTAS ANALÍTICAS
85
Espectrómetro Raman.
El equipo Raman está compuesto por un microscopio confocal de Raman
(CRM) alpha500 R equipado con un láser de NdYag de 532 nm y un
espectrómetro WITEC
UHTS 300 y una cámara
DU970N-BV (EMCCD)
(16 x 16 μm tamaño de
pixel, 1600 x 200 pixeles).
Los objetivos utilizados
fueron 100x/1.25, ∞/0,17,
WD 0,18 mm y 20x/0.4, ∞/0,17, WD 3,8 mm. El control del equipo y el
tratamiento de los datos se lleva a cabo mediante el software WITEC Proyect
Plus.
Microscopio de transmisión electrónica.
El microscopio empleado fue un modelo PHILIPS CM-10 con una resolución
de puntos de 0.5 nm y 0.34 líneas. Las muestras se colocaron en rejillas de
“Formvar Carbon Film”.
OTROS INSTRUMENTOS, APARATOS Y MATERIALES
Balanza analítica de precisión. (Ohaus, Barcelona, España), empleada
en la preparación de patrones y muestras.

CAPÍTULO 2
86
pH-Metro. (Crison, Barcelona, España), usado en la preparación de
muestras y tampones electroforéticos.
Baño de ultrasonidos (J.P. Selecta, Barcelona, España).
Agitador magnético (Selecta), utilizado en la homogeneización de
muestras.
Bomba de jeringa Cavro XP3000 controlada por ordenador (software
Sagittarius versión 3.0).
Centrifuga (J.P. Selecta, Barcelona, España).
Equipo de agua Milli-Q (Millipore, Bedford, MA, EEUU).
Material de vidrio clase A. Empleado para la preparación de patrones,
medida de volúmenes y desarrollo de algunas de las técnicas de
extracción presentadas en esta Memoria. En todo caso el material se
lavó antes de uso con una disolución jabonosa neutra y posteriormente
con agua destilada, metanol y el disolvente a utilizar.
Jeringas de vidrio y micropipetas. Se han utilizado para la preparación
de muestras y recuperación del eluyente en los diferentes trabajos
realizados.
Envases de vidrio para el correcto almacenamiento de los estándares y
muestras.

HERRAMIENTAS ANALÍTICAS
87
Microcubetas de cuarzo para llevar a cabo las medidas fluorimétricas.
Crisoles de cerámica para la preparación de los geles.
Gradilla de acero inoxidable para las medidas Raman.
MUESTRAS
En el trabajo experimental presentado en esta Memoria se han analizado
diversos tipos de muestras:
Agua: Los trabajos descritos en los capítulos 4 y 5 se han aplicado a
muestras de aguas de interés ambiental (río). Las muestras recolectadas
se almacenaron en frascos de vidrio ámbar sin dejar espacio de cabeza
para evitar la volatización de los analitos. Se almacenaron en oscuridad
y a 4 ºC hasta su análisis. Las muestras fueron colectadas de varios
efluentes del Rio Guadalquivir a su paso por Córdoba (Andalucía).
Leche: Uno de los trabajos descritos en el capítulo 5 se aplicó a
diferentes muestras de leche comerciales.

CAPÍTULO 2
88
GESTIÓN DE RESIDUOS
Con el fin de evitar cualquier tipo de contaminación, todas las
disoluciones preparadas conteniendo analitos tóxicos así como el material
desechable impregnado con los mismos se desechó correctamente en
recipientes destinados para tal fin. Dichos recipientes son posteriormente
gestionados por un servicio externo.

Caracterización
de Geles


CARACTERIZACIÓN DE GELES
91
Fukushima y colaboradores [1] fueron los primeros en observar que
mediante la adecuada combinación de CNTs y LIs se obtenían unas nuevas
sustancias de aspecto gelatinoso a las que denominaron “soft materials” o
“bucky gels”, las cuales se sospechaba que tendrían unas excelentes
propiedades. Dado que los geles están constituidos por líquido iónico y
nanotubos de carbono, sus propiedades pueden inferirse de las propiedades o
características de ambos materiales. Así, es posible asumir que los geles van a
presentar una alta estabilidad física (térmica y en disolventes) y que podrían
ser empleados como sorbentes en etapas de tratamiento de muestra.
Partiendo de estos antecedentes, en el apartado 3.1. del presente capítulo
se aborda el estudio de las propiedades físico-químicas de diferentes geles.
Para ello se prepararon diferentes geles a partir de la combinación del LI
Hmim PF6 con 8 tipos diferentes de nanotubos de carbono (MWNTs y
SWNTs). La primera parte del trabajo tiene como objetivo estudiar y
comparar la integridad (estabilidad en contacto con disolvente) de los
diferentes geles. En segundo lugar se evalúan y comparan las propiedades
sorbentes de los mismos. También se establece una relación entre ambas
propiedades analíticas estudiadas y los espectros Raman característicos de
cada nanotubo de carbono empleado.
Además del estudio de las principales propiedades que presentan los
geles es importante evaluar el proceso de obtención de los mismos. Tal y
como se ha descrito anteriormente los geles se obtienen mediante la adecuada
combinación de CNTs y LIs, es decir, no todas las relaciones LI/CNTs son
apropiadas para la formación de geles, sino que es necesario tener una

CAPÍTULO 3
92
concentración óptima de nanotubos de carbono en el LI. Esta concentración
es lo que se denomina concentración crítica de gelificación (CCG).
Hasta ahora, la CGC se ha determinado mediante complejas medidas
reológicas, estudiando el cambio en alguna propiedad de las mezclas
LI/CNTs. Así, en el apartado 3.2. de este capítulo se propone un método
rápido y simple de determinación de la CGC de geles de diferentes CNTs y el
LI Hmim PF6 a partir de medidas directas de fluorescencia. El método
descrito se basa en la distinta solubilidad que presenta el LI libre y el LI que
forma parte del gel en disolvente orgánico. Este método es posible gracias a
una propiedad principal de los geles como es su elevada integridad física
gracias a la fuerte unión establecida entre los nanotubos de carbono y el
líquido iónico. Esta interacción afecta directamente a la solubilidad del LI, de
manera que cuando se forma el gel, existe una disminución drástica de la
solubilidad del LI. Además, se registran y describen los espectros Raman
característicos de los diferentes geles.
[1] T. Fukushima, A. Kosaka, Y. Ishimura, T. Yamamoto, T. Takigawa, N. Ishii, T.
Aida, Science 300 (2003) 2072.

3.1. Effect of carbon nanotubes on properties of soft materials
based on carbon nanotubes-ionic liquid combinations


CARACTERIZACIÓN DE GELES
95
Talanta
D.O.I. 10.1016/j.talanta.2013.02.030.
Effect of carbon nanotubes on properties of soft materials
based on carbon nanotubes-ionic liquid combinations
M.L. Polo-Luque, B.M. Simonet, M. Valcárcel
Department of Analytical Chemistry, University of Córdoba, Campus de
Rabanales, E-14071 Córdoba, Spain
Soft materials resulting from the combination of carbon nanotubes with
ionic liquids have aroused analytical interest; thank to their peculiar
characteristics. This paper compares the sorption capacity of eight
different soft materials obtained from the combination of 1-hexyl 3-
methylimidazolium hexafluorophosphate (ionic liquid) with different
types of carbon nanotubes. The main characteristics of carbon nanotubes
were established by Raman spectroscopy. The results obtained pointed
out the critical role of the carbon nanotube types on the stability as well
as the sorption capacity of the soft material. By using the adequate
carbon nanotube it is possible to improve the LOD 4 times when they are
used as sorbent materials for SPE. Working in the recommended
conditions the LOD for the analysis of 5 mL of water sample was 5 µg/L
of fluoranthene and the precision 5.9%.

CAPÍTULO 3
96
Graphical abstract
1. Introduction
In analytical chemistry, the sample preparation step is normally a
bottleneck, in fact, sample preparation gradually becomes a major part of
analysis, capable of taking up to 80% of the total time of a complete
separation-based analytical process [1]. Although, in past years, several
sample treatment systems have been described, in routine laboratories SPE
and SPME are probably the most used because they have high reproducibility
or robustness [2]. Analytical evolutions of these strategies have been mainly
performed in the field of new sorbents as well as in the field of the
miniaturization. In general, recent advances in new sorbents are focused on
nanotechnology, polymers, molecularly imprinted polymers (MIPs), sol-gel
technology and immunoaffinity-based coatings including immunosorbents
with covalent immobilized antibodies or antigens, which have high affinity to
the corresponding antigens, or antibodies, allowing the selective extraction

CARACTERIZACIÓN DE GELES
97
(immunoaffinity extraction) from the sample [3,4]. Although the
immunosorbents have high selectivity [5], they are instable in most cases and
they are only available at high cost [6]. One alternative is the molecularly
imprinted polymers because they have a low cost, are stable, and can be used
without loss of activity [7]. However, they are difficult to synthesize.
Although with a lower selectivity with regard to antibodies or molecularly
imprinted polymers, nanoparticles can be an effective alternative in many
applications. To this end, CNTs have attracted much attention as promising
materials, which are extensively studied in order to make use of their unique
structure and remarkable properties. Their strong adsorption affinity to a wide
variety of organic compounds, together with their large adsorption surface
makes them excellent material for SPE and SPME [8]. CNTs have been also
proposed for the determination of many analytes in different sample matrices
[9]. One of the most important short-comings of carbon nanotubes are their
tendency to aggregate, which affects the adsorption [10]. From one part,
aggregation reduces the effective active surface of carbon nanotube and from
the other part, aggregation allows the adsorption in interstitial places which
can be positive for some applications but extremely difficult to be reproduced
by simple mechanical packing of the nanomaterial.
Recently a new family of compounds, the so called soft material or gel
resulting from the combination of carbon nanotubes with ionic liquids has
been described [11]. Soft materials are interesting from the analytical point of
view because they combine the properties of ionic liquids and the properties
of carbon nanotubes. In addition, they present for some properties a
synergistic effect, probably due to the special configuration of carbon

CAPÍTULO 3
98
nanotubes. This soft material has been widely used in analytical chemistry to
develop electrochemical sensors [12] and to perform sample treatment [13].
Then, the aim of this work is to study how carbon nanotubes affect to the
analytical properties of the soft material concretely their chemical stability
and sorption capacity to perform solid phase extraction of organic
compounds. PAHs have been selected as target analytes for this study.
2. Materials and methods
2.1. Reagents and standards
The ionic liquid 1-hexyl 3-methylimidazolium hexafluorophosphate
(Hmim PF6) > 99% from MERCK (Darmstadt, Germany) and eight different
types of carbon nanotubes were used to prepare the bucky gels. Table 1
summarizes the main characteristics of the carbon nanotubes used in this
work.
Individual standard stock solution containing 1000 mg·L−1
of
fluoranthene (Sigma-Aldrich) was prepared in methanol. Working solution of
fluoranthene was made by using purified water (18 MΩ) from a Milli-Q
water purified system (Millipore, Bedford, MA, USA). Hexane, methanol,
acetonitrile and ethyl acetate from Panreac (HPLC-grade) were used as
solvents. Acetonitrile for fluorescence measurements was from Fluka.
Ammonium acetate, formic acid (Sigma-Aldrich) and HPLC-grade
methanol (Panreac Química, S.A.; Barcelona, Spain) were used to prepare the
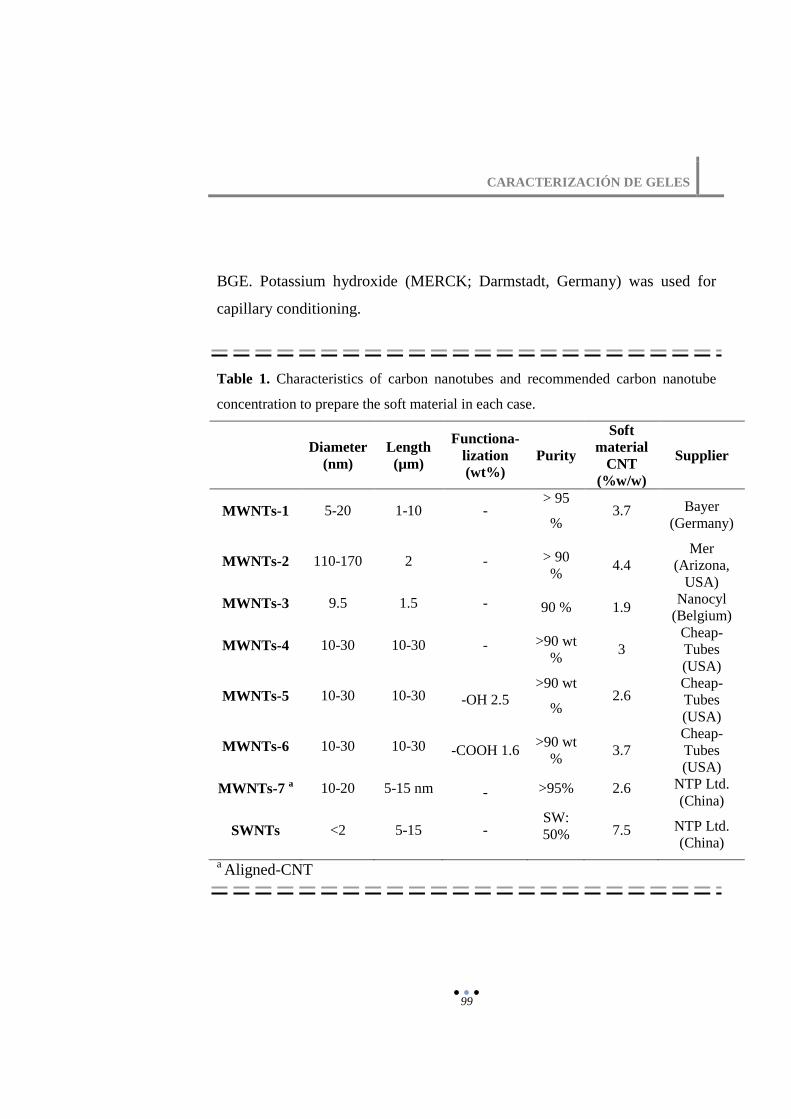
CARACTERIZACIÓN DE GELES
99
BGE. Potassium hydroxide (MERCK; Darmstadt, Germany) was used for
capillary conditioning.
Table 1. Characteristics of carbon nanotubes and recommended carbon nanotube
concentration to prepare the soft material in each case.
Diameter
(nm)
Length
(µm)
Functiona-
lization
(wt%)
Purity
Soft
material
CNT
(%w/w)
Supplier
MWNTs-1 5-20 1-10 - > 95
% 3.7 Bayer
(Germany)
MWNTs-2 110-170 2 - > 90
% 4.4
Mer
(Arizona,
USA)
MWNTs-3 9.5 1.5 - 90 % 1.9 Nanocyl
(Belgium)
MWNTs-4 10-30 10-30 - >90 wt
% 3
Cheap-
Tubes
(USA)
MWNTs-5 10-30 10-30 -OH 2.5
>90 wt
% 2.6
Cheap-
Tubes
(USA)
MWNTs-6 10-30 10-30 -COOH 1.6 >90 wt
% 3.7
Cheap-
Tubes
(USA)
MWNTs-7 a 10-20 5-15 nm - >95% 2.6 NTP Ltd.
(China)
SWNTs <2 5-15 - SW:
50%
7.5 NTP Ltd.
(China)
a Aligned-CNT

CAPÍTULO 3
100
2.2. Instrumentation
Fluorescence emission spectra were measured on a PTIQuantaMasterTM
Spectrofluorometer (Photon Technology International) equipped with a 75W
xenon short arc lamp and the model 814 PTM detection system. Felix 32
software was used for fluorescence data collection and analysis, which also
controlled the whole instrument. All optical measurements were carried out in
10-mm quartz microcuvettes at room temperature under ambient conditions.
Raman spectra were measured on a Confocal Raman Microscope (CRM)
(alpha500 R) equipped with a frequency doubled NdYAG laser with 532nm
excitation. For the analysis using the alpha500 R, a WITec UHTS 300
spectrometer and a DU970N-BV (EMCCD) (16 x 16 µm pixel size, 1600 x
200 pixels) camera are additionally connected to the system. WITec Project
Plus software was used for advanced data evaluation for Confocal Raman
Microscopy.
Capillary electrophoresis was performed on a Beckman Coulter (Palo
Alto, CA, USA) MDQ instrument equipped with an on-column UV detector
and a diode array detector (DAD). The uncoated fused-silica capillary used
was 50 µm I.D., and 375 mm O.D. The instrumental setup was controlled,
and data acquired and processed using a 32 Karat software.
2.3. Preparation of the soft materials
The soft material was prepared by mixing appropriate amount of carbon
nanotubes with 200 L of IL. The suspension formed was then ground in an

CARACTERIZACIÓN DE GELES
101
agate mortar with a pestle. After that the suspension turned viscous, affording
a soft material like a gel. The concentration selected for each nanotube to
prepare the soft material is indicated in table 1. This concentration, close to
the critical gel concentration, was determined experimentally adding
increased amount of carbon nanotubes to the ionic liquid until the absence of
free ionic liquid was observed as a second phase.
2.4. Raman characterization of soft material
The Raman spectra of the soft material and carbon nanotubes were
measured with a 20 x /0.4, ∞/0.17, WD 3.8 mm objective. For measurements,
the soft material was placed into 1 mm hole in a stainless steel plate.
2.5. Determination of solubility of ionic liquid from the soft material.
Stability
The solubility measurement was carried out putting in contact 5 mg of
soft material immobilized on cotton fibers with 1 mL of the organic solvent.
After 5 min, the organic solvent was collected and removed with an air
stream. Finally the ionic liquid was reconstituted in 1 ml methanol. The
methanolic solution of solubilized ionic liquid was diluted and analyzed by
CE. For CE analysis the BGE consisted of 100 mM ammonium acetate pH =
7.7 in methanol. The samples were injected in the hydrodynamic mode at 0.5
psi for 15 s. Tests were carried out in the positive polarity mode, a constant
voltage of 10 kV and an overimposed pressure of 50 psi in both vials in order
to avoid the formation of bubbles which can occur due to the organic
dissolvent analysis. Measurement was performed at 210 nm.

CAPÍTULO 3
102
2.6. Determination of preconcentration capacity of the soft material
To study the preconcentration capacity of the soft material, fluoranthene
was selected as an analyte model. The method used was a modification of
[14]. Briefly, fiber cotton having a surface area of 16.3 mm2 and impregnated
with the soft material was immersed in 5 ml of fluoranthene standard of 0.5
mg/L to perform the preconcentration. Afterwards, the fiber was washed with
water and dried at room temperature. Finally, the fiber was immersed in 1mL
of acetonitrile to perform the elution of the analytes (5-10 min), and then 300
µL of acetonitrile was added into the microcuvette to measure the
fluorescence. The spectra were registered with λexc= 341 nm and λem= 440
nm. The slit widths for excitation and emission were both 3 nm.
3. Results and discussion
This section describes the characterization of carbon nanotubes from
their Raman spectrum. Then, considering the properties of carbon nanotubes,
the formation of soft material or bucky gel by mixing them with ionic liquid
is also presented. Then, the analytical figures of merit resulting from the
study of the sorption process of fluoranthene for the different soft materials
are determined and compared.
Table 1 summarizes the characteristics of the carbon nanotubes studied in
this work and also the information typically provided from suppliers and
manufacturers. As can be seen this information is limited to dimensional
information as well as some indications about purity. In this way, it must be
remarked that synthesis procedures result in a mixture of carbon nanotubes

CARACTERIZACIÓN DE GELES
103
with different chiralities and purities. In order to characterize carbon
nanotubes, the Raman spectrum was recorded. Spectrum is depicted in Fig. 1.
Figure 1. Raman spectrum of carbon nanotubes. The spectra from bottom to top are:
MWNTs-1, MWNTs-2, MWNTs-3, MWNTs-4, MWNTs-5, MWNTs-6, MWNTs-7
and SWNTs.
Interpretation was based on the following facts: (i) The D-band around
1350 cm-1
is sensitive to structural defects in the graphitic sp2
network, for
example it marks the presence of carbonaceous impurities such as amorphous
carbon particles [15-16]; (ii) The intensity ratio of the tangential mode in
carbon nanotube (G-band) with regard to the D-band can be related with
purity [17]. When there are fewer carbon impurities, then the G/D ratio can be
used as an index related with the presence of defects on the sidewall of the
nanotube [18]; (iii) The bandwidth ratio of G and D bands can be related with

CAPÍTULO 3
104
the presence of defect sp3 in the structure. Table 2 shows the information
obtained for the analysis of the eight types of carbon nanotubes.
Table 2. Raman spectroscopy analysis of carbon nanotubes.
Intensity D-
band
Bandwidth
D-band
(cm-1
)
Intensity
G/D ratio
Bandwidth
G/D ratio
MWNTs-1 3697 55 0.70 1.30
MWNTs-2 1094 43 5.00 0.51
MWNTs-3 5048 55 0.69 1.20
MWNTs-4 3215 51 2.60 0.80
MWNTs-5 7656 52 1.88 0.90
MWNTs-6 2826 49 1.90 0.94
MWNTs-7 4241 52 1.03 1.20
SWNTs 2053 52 3.80 0.96
The main conclusions of the spectral analysis can be summarized as
follows: (i) according to D-band symmetry MWNTs-1, MWNTs-3 and
MWNTs-7 are the most pure; (ii) MWNTs-3 present lower defects on the
sidewall; (iii) MWNTs-2 present the higher content in amorphous organic
carbon particles; and (iv) MWNTs-6 compared with MWNTs-4 present a
higher number of defects, probably this defects have been produced during
chemical functionalization.

CARACTERIZACIÓN DE GELES
105
In table 1 the concentration of CNTs required to form the soft material or
gel, it so called critical gel concentration, which has been determined
experimentally as the minimum amount of carbon nanotubes required to
avoid the presence of free ionic liquid as a second phase is presented. If we
relate this information with the characteristics of carbon nanotubes it can be
concluded that the formation of the soft material is improved with the purity
of carbon nanotubes. The presence of sidewall defects as well as the presence
of amorphous carbon material has a negative effect on the formation of the
soft material. The results obtained also pointed out that multiwalled carbon
nanotubes easily interact with the ionic liquid to form the gel, in other words
lower amounts are dispersed and oriented to form the network of the gel.
As it was indicated before, in the gel the amount of free ionic liquid can
be considered negligible. In fact after centrifugation it is not possible to
separate the ionic liquid from the gel. This high interaction between the
carbon nanotube and the ionic liquid it is also observed in the Raman spectra.
As a representative example Fig. 2 shows the Raman spectrum obtained for
the gel. Raman spectrum of the soft material (above spectrum) is the result of
the combination of carbon nanotube and ionic liquid spectra, being possible
to distinguish the typical bands of solid MWNTs-1 (D, G and G´), although
less intense than solid one, and a small band at 750 cm-1
corresponding to the
ionic liquid anion (PF6-). On the other hand, for the mixture of low
concentration of MWNTs-1/IL (bottom spectrum), the Raman spectrum
shows a decrease in the CNTs bands and an increase in the ionic liquid bands.
As can be seen in comparison with the spectrum obtained with a lower
amount of carbon nanotubes dissolved in IL, the formation of the gel results
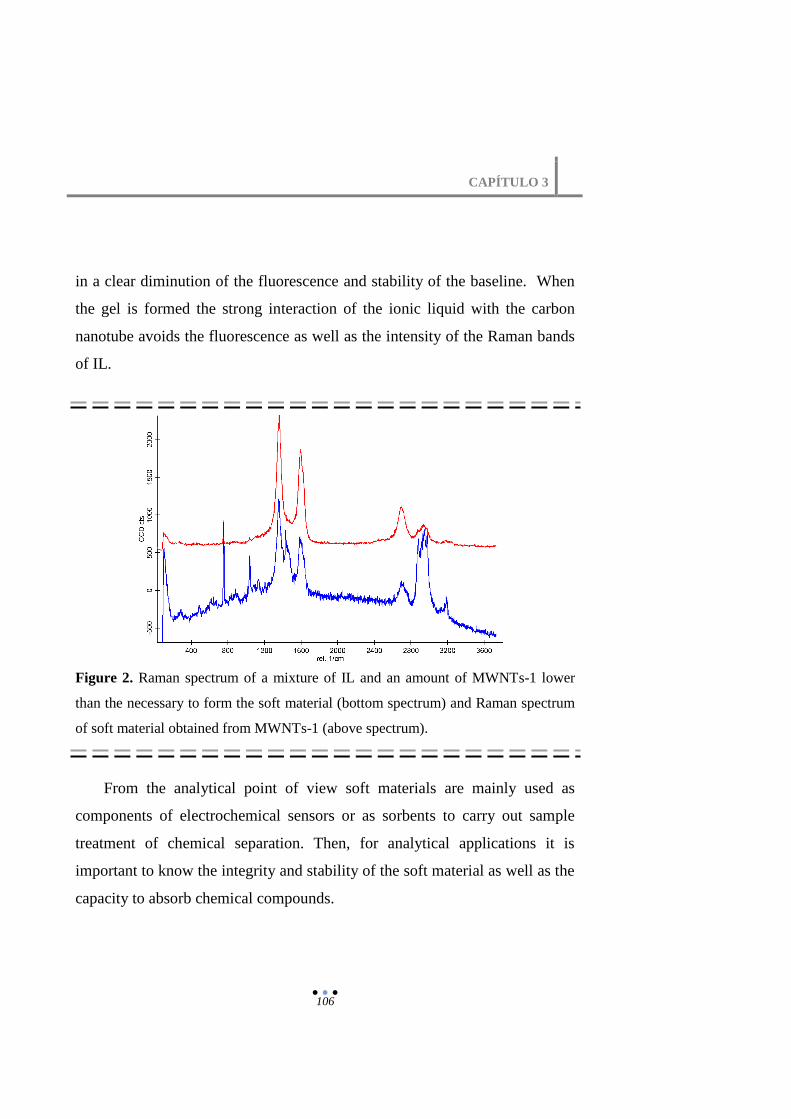
CAPÍTULO 3
106
in a clear diminution of the fluorescence and stability of the baseline. When
the gel is formed the strong interaction of the ionic liquid with the carbon
nanotube avoids the fluorescence as well as the intensity of the Raman bands
of IL.
Figure 2. Raman spectrum of a mixture of IL and an amount of MWNTs-1 lower
than the necessary to form the soft material (bottom spectrum) and Raman spectrum
of soft material obtained from MWNTs-1 (above spectrum).
From the analytical point of view soft materials are mainly used as
components of electrochemical sensors or as sorbents to carry out sample
treatment of chemical separation. Then, for analytical applications it is
important to know the integrity and stability of the soft material as well as the
capacity to absorb chemical compounds.

CARACTERIZACIÓN DE GELES
107
One important characteristic of the soft material (gel) is the integrity and
stability of the system LI/CNTs; thanks to the strong binding among carbon
nanotubes and the IL by means of strong π-π interactions. This strong
interaction also affects to the solubility of the IL, which dramatically decrease
when the soft material is formed. The stability of the soft material has been
tested as their stability in organic solvents. For that methanol, acetonitrile,
ethyl acetate and hexane were tested. Table 3 summarises the results obtained
expressed as reduction of the solubility of the ionic liquid in the solvents with
regard to the solubility obtained with free ionic liquid. Higher reduction
means higher gel stability. As can be seen, the stability was good for all the
nanotubes; this result demonstrated that it is possible to use organic solvents,
for example to elute analyte. The gels obtained from carbon nanotubes of
higher purity seem to be more stable (higher diminution of ionic liquid
solubility).
Table 3. Stability of the soft material. Percentages of reduction of the amount of IL
in different solvents.
Methanol (%) Acetonitrile (%) Ethyl acetate (%) Hexane
MWNTs-1 54 64 51
Qu
anti
tati
ve
red
uct
ion
Sig
nal
< L
OD
MWNTs-2 38 50 41
MWNTs-3 51 60 39
MWNTs-4 49 66 30
MWNTs-5 56 61 46
MWNTs-6 55 65 43
MWNTs-7 56 60 44
SWNTs 57 59 46

CAPÍTULO 3
108
To study the sorption capacity of the soft material, taking into account
the results obtained in table 3, acetonitrile was selected as a solvent because it
allows the direct fluorescence analysis of fluoranthene. In hexane,
fluoranthene was not fluorescent. Table 4 shows the results obtained for the
adsorption study. As can be seen, the higher sorption capacity was obtained
for MWNTs-3. As can be seen, the limit of detection was four times lower for
this carbon nanotubes and the sensitivity expressed as the slope of the
calibration graph was three times higher than that obtained for the single
walled carbon nanotubes. Although soft materials have mainly been described
for single walled carbon nanotubes, the results obtained point out that
multiwalled carbon nanotubes are better for this kind of application than
single walled carbon nanotube. However, between different multiwalled
carbon nanotubes also exists higher differences in the stability and sorption
capacity of the soft material. Differences are not only related with the
sorption capacity but also with the kinetic. With regard to kinetic, MWNTs-4
shows the highest sorption kinetic (see table 4) controversy, the kinetic of
materials having the higher sorption was clearly lower. Probably this fact was
due to the combination of adsorption and absorption process. Absorption
could lead the preconcentration of higher amounts of analyte but required of
higher equilibration time.

CARACTERIZACIÓN DE GELES
109
Table 4. Figures of merit for the preconcentration and fluorescence detection of
fluoranthene.
RECOVERY (%)
LOD Sensibility RSD 0.5 h 1 h 4 h
(µg/L) normalized (%)
MWNTs-1 13,9 45 8.9 29,0 32,8 65,0
MWNTs-2 7,8 80 6.7 51,4 60,1 65,0
MWNTs-3 5,0 100 5.9 64,6 97,5 102,5
MWNTs-4 6,7 93 6.7 60,2 61,9 59,0
MWNTs-5 7,9 79 10.4 51,0 64,2 64,0
MWNTs-6 10,5 59 12.4 38,3 49,7 49,0
MWNTs-7 12,4 50 8.7 32,5 47,8 47,6
SWNTs 19,3 32 9.7 20,9 25,2 29,0
Results can be summarized in the following points: (i) MWNTs have
better preconcentration values for fluoranthene than SWNTs. (ii) High
surface area and purity are related with higher sorption capacity of the gel.
(iii) Sorption kinetic in the gel is due to adsorption (faster process) and
absorption (slower process). The RSD values for consecutives pre-
concentration steps for each gel were between 5.9% and 12.4%. To this end,
it must be remarked that significant differences in the precision was not
found. This was attributed to the similar stability observed for all the soft
materials studied.

CAPÍTULO 3
110
References
[1] Y. Chen, Z. Guo, X. Wang, CH. Qiu, J. Chromatogr. A 1184 (2008) 191-219.
[2] F. Augusto, E. Carasek, R. Gomes Costa Silva, S. Regina Rivellino, A.
Domingues Batista, E. Martendal, J. Chromatogr. A 1217 (2010) 2533-2542.
[3] C. Maisonnette, P. Simon, M.C. Hennion, V. Pichon, J. Chromatogr. A, 1120
(2006) 185-193.
[4] X. Zhang, D. Martens, P.M. Krämer, A.A. Kettrup, X. Liang, J. Chromatogr. A
1102 (2006) 84-90.
[5] N. Delaunay, V. Pichon, M.C. Hennion, J. Chromatogr. B 745 (2000) 15-37.
[6] S. Hu, L. Li, X. He, Progr. Chem. 17 (2005) 531-543.
[7] N. Lavignac, C.J. Allender, K.R. Brain, Anal. Chim. Acta 510 (2004) 139-145.
[8] M. Valcárcel, S. Cárdenas, B.M. Simonet, Y. Moliner-Martínez, R. Lucena,
Trends Anal. Chem. 27 (2008) 34-43.
[9] H. Kataura, Y. Kumazawa, Y. Maniwa, Y. Ohtsuka, R. Sen, S. Suzuki, Y.
Achiba Carbon 38 (2000) 1691-1697.
[10] Q.H. Yang, P.X. Hou, S. Bai, M.Z. Wang, h.M. Cheng, Chem. Phys. Lett. 345
(2001) 18-24.
[11] T. Fukushima, A. Kosaka, Y. Ishimura, T. Yamamoto, T. Takigawa, N. Ishii, T.
Aida, Science 300 (2003) 2072-2074.
[12] R. Pauliukaite, K. D. Murnaghan, A. P. Doherty, C.M.A. Brett, J. Electroanal.
Chem. 633 (2009) 106-112.
[13]M.L. Polo-Luque, B.M. Simonet, M. Valcárcel, Anal. Bioanal. Chem. 404
(2012) 903-907.
[14]M.L. Polo-Luque, B.M. Simonet, M. Valcárcel, Talanta 104 (2013) 169-172.
[15] M.E. Itkis, D.E. Perea, R. Jung, S. Niyogi, R.C. Haddon J. Am. Chem. Soc. 10
(2005) 3439-3448.

CARACTERIZACIÓN DE GELES
111
[16] A.C. Dillon, T. Gennett, K.M. Jones, J.L. Alleman, P.A. Parilla, M.J. Heben,
Adv. Mater. 11 (1999) 1354-1358.
[17] V.N. Popov, P. Lambin, Phys. Rev. B 73 (2006) 165425.
[18] K.K. Kim, J.S. Park, S.J Kim, H.Z. Geng, K.H. An, C.M. Yang, K. Sato, R.
Saito, Y.H. Li, Phys. Rev. B 76 (2007) 205426.


3.2. Simple and fast fluorimetric determination of the critical
gel concentration of soft nanomaterials


CARACTERIZACIÓN DE GELES
115
Submitted to Analytica Chimica Acta
Simple and fast fluorimetric determination of the critical gel
concentration of soft nanomaterials
M.L. Polo-Luque, B.M. Simonet, M. Valcárcel
Department of Analytical Chemistry, University of Córdoba, Campus de
Rabanales, E-14071 Córdoba, Spain
Soft materials or gels are new interesting materials resulting from the
combination of carbon nanotubes with ionic liquids. However, not all
ionic liquid / carbon nanotubes ratios lead to the formation of gels. To
form gels it is necessary to have a minimum concentration ratio carbon
nanotubes/ionic liquid in the mixture, which is defined as the critical gel
concentration (CGC). Since their discovery, this concentration has been
determined by means of rheological measurements or by observing a
change of physical property in the new material such as density. On the
basis of the high stability of gels in solvents, owing to the presence of
carbon nanotubes, this paper reports for the first time a rapid and
simple method to determine the critical gel concentration in the
formation of soft materials by means of fluorescence measurements. We
have determined the critical gel concentration of four gels obtained from
the combination of three different types of multi walled carbon
nanotubes and single walled carbon nanotubes with an ionic liquid (IL)

CAPÍTULO 3
116
1-hexyl 3-methylimidazolium hexafluorophosphate. The main
characteristics of carbon nanotubes and gels resulting of them were
established by Raman spectroscopy. The proposed methodology is
presented as an alternative to traditional complex rheological
measurements.
Graphical abstract

CARACTERIZACIÓN DE GELES
117
1. Introduction
Since their discovery by Iijima [1, 2], carbon nanotubes (CNTs) have
attracted much attention as promising materials, which are extensively
studied in order to make use of their unique structure and remarkable
properties. CNTs provide extraordinary mechanical, electrical, and thermal
properties, so numerous potential applications are expected [3]. However,
CNTs present a marked tendency to aggregation, which negatively affects
reducing their excellent properties. Previously reported dispersants include
solid substances that are usable only by the combination with appropriate
solvents. Fukushima et al. proposed imidazolium-ion-based ionic liquids
(ILs) as a new class of dispersants for CNTs [4].
Ionic liquids are fluid at room temperature and able to disperse CNTs by
themselves, affording readily processable gelatinous substances. This feature
gives a great advantage over the known examples, since one can “design” soft
composite materials directly from the resulting gels [5]. The combination of
carbon nanotubes at high concentrations with ionic liquid, leads to the
formation of some new materials that have been called "bucky gels", "soft
materials" or “gels”, according to criteria of each author. To obtain these
materials, CNTs are mixed with an ionic liquid and the suspension formed is
ground in an agate mortar with a pestle for about 15 minutes, during which
the suspension turned viscous, forming a gel.
Fukushima et al. have fabricated these new materials changing their
components according to their future purpose [4-9]. We have also fabricated

CAPÍTULO 3
118
soft materials by mixing multi-walled, single-walled and coiled carbon
nanotubes with Hmim PF6 ionic liquid, gels which have been used for
different applications [10-12]. In addition, these soft materials have been
widely used to fabricate sensors [13, 14].
As described above, gelation occurs in a wide variety of imidazolium-
ion-based ionic liquids when grinding with carbon nanotubes, both single
walled and multi walled. However, not all IL/CNTs ratios lead to the
formation of gels, being necessary to reach a critical gel concentration (CGC).
The main properties of soft materials have been determined by means of
rheological measurements. Kim and co-workers investigated in detail the
rheological properties of a Bmim BF4 gel with SWNTs [15]. Fukushima et al.
[4] also found that the purity of the nanotubes affects the gelation, for
example raw-produced SWNTs contaminated with 20 wt% of granular metal
catalyst residue produced a much less efficiently gelation. For this reason,
having an experimental method to determinate the critical gel concentration
for each type of carbon nanotubes results crucial.
From the chemical point of view, an interesting characteristic of the soft
material is its chemical stability. When the material is introduced in different
solvents, the ionic liquid is partially solubilized in the solvent. In general, the
solubility of the ionic liquid is clearly lower in the presence of carbon
nanotubes in spite of the fact that there is an ionic liquid excess in the soft
material [10]. Thus, we propose a rapid and simple method to determine the
critical gel concentration of formation of soft materials from the combination
of ionic liquid with carbon nanotubes (multi walled and single walled). In this

CARACTERIZACIÓN DE GELES
119
work the study of the gelation process of these materials by means of
fluorescence measurements has been carried out. Raman spectra were used to
characterize the different gels and mixtures formed. To best of our
knowledge, a fluorimetric approach to experimentally determine the critical
gel concentration has not been previously reported in the literature.
2. Materials and methods
2.1. Chemicals
The ionic liquid used was 1-hexyl 3-methylimidazolium
hexafluorophosphate (Hmim PF6) with a purity > 99% from MERCK
(Darmstadt, Germany). Different types of carbon nanotubes (multi walled and
single walled) were used to prepare the gels. Table 1 shows the main
characteristics of each kind of nanotube.
Table 1. Main characteristics of each kind of carbon nanotube.
Diameter
(nm)
Length
(µm)
Functio-
nalization Purity Supplier
MWNTs 1 5-20 1-10 - > 95 % Bayer (Germany)
MWNTs 2 10-30 10-30 - > 90 %
Cheap-Tubes
(USA)
MWNTs 3 110-170 2 - > 90 %
Mer (Arizona,
USA)
SWNTs < 2 5-15 - SW 50% NTP Ltd. (China)

CAPÍTULO 3
120
Acetonitrile for fluorescence (Fluka) was used as medium for the
fluorescence measurements.
2.2. Instrumentation
Absoption and fluorescence emission spectra were measured on a
PTIQuantaMasterTM Spectrofluorometer (Photon Technology International)
equipped with a 75W Xenon short arc lamp and the model 814 PTM
detection system. Felix 32 software was used for fluorescence data collection
and analysis which also controlled the whole instrument.
Raman spectra were measured on a Confocal Raman Microscope (CRM)
(alpha500 R) equipped with a frequency doubled NdYAG laser with 532nm
excitation. For the analysis using the alpha500 R, a WITec UHTS 300
spectrometer and a DU970N-BV (EMCCD) (16 x 16µm pixel size, 1600 x
200 pixels) camera are additionally connected to the system. WITec Project
Plus software was used for advanced data evaluation for Confocal Raman
Microscopy.
2.3. Preparation of mixtures IL-CNTs
To prepare the different mixtures, increasing amounts of the four types of
CNTs with 200 µL of ionic liquid (Hmim PF6) were mixed. The suspension
formed was manually ground in an agate mortar for about 15 minutes in order
to obtain the complete dispersion of CNTs in the ionic liquid matrix, which
was possible for mixtures with low concentration of CNTs.

CARACTERIZACIÓN DE GELES
121
In order to study the process of formation of the gel and to determine the
critical gel concentration, several mixtures at different ratios IL/CNTs (for
each nanotube) in the range of 1- 40 mg were prepared. The same experiment
was carried out with fullerene in the range of 1-70 mg of fullerene in 200 µL
of ionic liquid. However, as described by Fukushima et al. in 2003 [4] no
gelation of ionic liquids takes place with other carbon allotropes such as
graphite or C60.
2.4. Fluorescence measurements to determine CGC
Ionic liquid native fluorescence in acetonitrile was selected as
characteristic parameter related with their solubility. When critical gel
concentration is achieved the solubility of IL in solvents dramatically
decreases [10], so we can use this fact to establish CGC. To carry out
fluorescence measurements we put in contact cotton fibers impregnated with
the different CNT/IL mixtures with 1 mL of acetonitrile. After 5 min, the
organic solvent was collected and directly measured. Spectra were registered
with λexc= 285 nm and λem= 338nm. The slits width for excitation and
emission were both 5 nm. All optical measurements were carried out in 10-
mm quartz microcuvettes at room temperature under ambient conditions.
Figure 1 shows fluorescence spectrum of the ionic liquid used.

CAPÍTULO 3
122
Figure 1. Fluorescence spectrum of pure Hmim PF6.
2.5. Raman characterization
To carry out Raman spectroscopy measurements, samples were prepared
by placing a small amount of the CNTs/IL mixtures at different
concentrations or solid CNTs into 1 mm hole in a stainless steel plate. The
Raman spectrum of the different mixtures IL/CNTs was measured with a
20x/0.4, ∞/ 0.17, WD 3.8 mm objective.
3. Results and discussion
This section summarizes the most relevant results obtained in this study
focused on experimentally determining the critical gel concentration.
0
500000
1000000
1500000
2000000
2500000
3000000
3500000
4000000
250 350 450 550
Flu
ore
sce
nce
λ (nm)

CARACTERIZACIÓN DE GELES
123
3.1. Determination of the critical gel concentration
As it was indicated before, it is possible to form gels with the
combination of a wide variety of imidazolium-ion-based ionic liquids and
carbon nanotubes (SWNTs and MWNTs). However, not all IL/CNTs
combination are adequate, being necessary to reach a critical gel
concentration (CGC). We have defined this concentration as the minimum
concentration of CNTs necessary to form the gel. When the concentration of
carbon nanotubes is lower than the critical gel concentration, we can observe
the presence of two phases, one of them enriched in IL, which is present in
excess. On the other hand, above CGC and from a certain value the lost of
integrity of the gel is observed, appearing aggregates of CNTs.
The amount of free ionic liquid in the gel can be considered negligible.
In fact, after centrifugation, to separate the ionic liquid from the gel is not
possible. One important characteristic of the soft material (gel) is the integrity
of the system LI/CNTs thanks to the strong binding among carbon nanotubes
and the IL by means of strong π-π interactions. This strong interaction also
affects to the solubility of the IL, which dramatically decrease when
the optimum critical gel concentration is achieved. So, selecting the native
fluorescence of IL as characteristic parameter related with their solubility, a
simple test to study the formation of the gel based on the solubility of IL in
acetonitrile can be performed.
For this study Hmim PF6 ionic liquid was selected due to the aromatic
nature of its cation and because of its extended use in the preparation of gels,

CAPÍTULO 3
124
as well as their purity and cost. For this reason, in this case, critical gel
concentration only depends on the characteristics and properties of the carbon
nanotubes used, such as number of layers, dimensions and purity. As
example, the CGC for three different types (diameter length and purity) of
multi walled carbon nanotubes and one of single walled carbon nanotubes
(see table 1) has been determined. To form the different mixtures 200 µL
were fixed as the adequate amount of IL and several concentrations of each
CNTs within the range of 1-40 mg were studied in order to assure a
representative study. Owing to the high viscosity of the different mixtures,
thanks to the presence of IL, its direct impregnation on natural cotton fibers is
possible. The cotton fibers impregnated with different mixtures were
manually smoothed, to eliminate the excess of material, a process similar to
the one used in electrochemistry to fabricate a paste electrode. Finally, CNT-
IL mixtures impregnated fibers were immersed in 1 mL of acetonitrile, in
which IL is solubilised in an extend related with the amount of CNTs forming
the mixture. Figure 2 shows the evolution of the IL fluorescence when
increasing CNTs concentration. As it was expected, we observe a dramatic
decrease in fluorescence and, therefore, in the solubility of the IL when the
CGC is achieved. From this point, the ionic liquid fluorescence or solubility
is almost constant. As can be seen, when working with MWNTs the CGC is
achieved at low CNT concentration, such as 10, 8 and 12 mg of MWNTs 1,
MWNTs 2 and MWNTs 3, respectively. In the case of SWNTs, a high
concentration of carbon nanoparticles, 20 mg, is needed to form the gel. This
observation is also directly related with carbon nanotube purity. In literature
is more common to find this critical gel concentration expressed in %wt of

CARACTERIZACIÓN DE GELES
125
CNTs in the gel. Thus, the values obtained in this study represented a 3.7; 3;
4.4 and 7.5 % wt for MWNTs 1, MWNTs 2, MWNTs 3 and SWNTs.
Figure 2. IL fluorescence changes in different mixtures for each type of nanotube
studied. Critical gel concentration is indicated. A (MWNTs 1), B (MWNTs 2), C
(MWNTs 3) and D (SWNTs). 200 µL of ionic liquid were fixed for all mixtures.
Figure 3 depicts the decrease in IL solubility when CGC is achieved for
each type of CNT studied. The fluorescence of ionic liquid released into the
acetonitrile solution coming from pure IL impregnated in cotton fibers is
considered as reference (100% of solubility). The bars show the percentage of
IL solubility in gels at CGC with respect to the maximum (when no carbon

CAPÍTULO 3
126
nanotube is present). Higher reduction means higher gel integrity. As it can
be seen, stability was good for all the nanotubes studied. The gel obtained
from carbon nanotubes of higher purity seems to be more stable (higher
diminution of ionic liquid solubility). The results of this study showed a
variation of only 6%, using 4 new impregnated cotton fibres to carry out the
complete process with the optimum gel concentration of each nanotube.
Figure 3. Percentage of decrease of IL solubility in acetonitrile when gels of
different CNTs (at CGC) impregnated in cotton fibers are put in contact with 1 mL
of acetonitrile. The percentage of decrease is calculated by comparing IL solubility
(through fluorescence measurements) of pure IL impregnated cotton fibers in
acetonitrile (maximum solubility) with the gels ones.
If we compare this simple method to determine the critical gel
concentration with the classical based on rheological properties, our
methodology is an approximate method that provides a value in a simple and
0
10
20
30
40
50
60
70
80
Type of CNTs in gel
De
cre
ase
of
IL s
olu
bili
ty (
%)
MWNTs 1
MWNTs 2
MWNTs 3
SWNTs

CARACTERIZACIÓN DE GELES
127
faster way and can be performed with low amounts of sample compared with
those required for a rheometer.
3.2. Optical microscope images of the different mixtures of MWNTs and
SWNTs
Optical microscope images of mixtures of MWNTs 1 (as an example of
MWNTs) and SWNTs were registered with the 20x objective. Figure 4 shows
the obtained images. As can be seen, in both cases, when a high concentration
of carbon nanotubes is added a porous structure is formed which later results
in the formation of aggregates of nanotubes.
Figure 4. Optical microscope images take with a 20x objective for mixtures of a)
SWNTs at 1, 10, 20, 30 and 40 mg and b) MWNTs 1 at 1, 5, 10, 15 and 20 mg.

CAPÍTULO 3
128
At the critical gel concentration we cannot observe the presence of
aggregates of CNTs, implying that CNTs are well dispersed within the ionic
liquid. Thus, a gelatinous and homogeneous substance is observed.
3.3. Raman spectrum of solid carbon nanotubes and pure ionic liquid
In order to characterize carbon nanotubes, the Raman spectrum of solid
MWNTs 1 and SWNTs was recorded. The most significant Raman spectral
features for single-walled carbon nanotubes are the radial breathing mode
(RBM, 100–300 cm-1
), the disorder peak (D peak, 1350 cm-1
), the tangential
mode (G band, 1400–1700 cm-1
), and the second-order overtone of the D
peak (G’, 2500–2800 cm-1
) [16]. The RBM band is originated from the out-
of-plane tangential acoustic modes of monolayer graphene sheet and all
carbon atoms vibrate in phase along the radial direction [17]. It is the
characteristic mode for SWNTs. The G-band comprises several tangential
modes due to stretching vibrations in SWNT sidewall C–C bonds. Two
double resonance features commonly found in the Raman spectra of CNTs
bundles are the D-band feature, stemming from the disorder-induced mode in
graphite with the same name [18], and its second harmonic, the G’ band.
The Raman spectrum of MWNTs 1 exhibits the typical bands for all
MWNTs, namely the G -band ( 1500-1600 cm-1
), which, like for SWNTs,
comprises several tangential modes due to stretching vibrations in MWNT
sidewall C-C bonds. The D-band around 1350 cm-1
is sensitive to structural
defects in the graphitic sp2
network, for example it marks the presence of

CARACTERIZACIÓN DE GELES
129
carbonaceous impurities such as amorphous carbon particles [19,20] (ca.
1287 cm-1
), and its second-order harmonic (G-band, 2500-2800 cm-1
).
At the ionic liquid Raman spectrum appears several bands being the most
significant that around 750 cm-1
produced by the symmetric stretching of
PF6- anion. Figure 5 shows the typical spectra described above.
Figure 5. Raman spectra of A) MWNTs 1, B) SWNTs and C) IL (Hmim PF6).
3.4. Raman spectrum of the different mixtures of MWNTs and SWNTs
Raman spectroscopy has been used to assess the integrity of MWNTs and
SWNTs in Hmim PF6 and to provide information about the interaction
between carbon nanotubes and ionic liquid. Figure 6 depicts the Raman
spectra obtained for different mixtures of each nanotube at the concentration

CAPÍTULO 3
130
range studied. As a rule, for all carbon nanotubes studied we can observe that
working at concentrations of CNTs upper than CGC the predominant bands
are the G-band (1590 cm-1
), the D-band (1350 cm-1
) and its second -order
harmonic (G´ 2500-2800 cm-1
). In the case of SWNTs, we can also observe
the RBM band (100-200 cm-1
) which is a characteristic mode for them. If we
attend to the mixture considered as optimum (a3, b3, c3 and d4 in figure 6),
the Raman spectra obtained is the result of the combination of carbon
nanotube and ionic liquid spectra, being possible to distinguish the typical
bands of solid CNTs (D, G and G´), although less intense than solid one, and
a small band at 750 cm-1
corresponding to the ionic liquid anion (PF6-). When
the gel is formed a small shift of the typical bands of the nanotube can be
observed. The magnitude of this shift ranged from 8 to 12 cm-1
. On the other
hand, at low concentration of CNTs, the Raman spectrum of mixtures shows
a decrease in the CNTs bands and an increase in the ionic liquid bands.
Spectra of the mixtures with less concentration of each CNT are mainly
featured by ionic liquid bands (see fig. 6). Moreover, in this case, an increase
in the baseline is observed due to the ionic liquid fluorescence. Measurements
of the same gel concentration in quintuplicate showed a variation of only 8%
as RSD.

CARACTERIZACIÓN DE GELES
131
Figure 6. Raman spectra obtained for different mixtures CNT/IL of each carbon
nanotube at the concentration range studied. A) MWNTs 1 at 1, 5, 10, 15, 20, 30 mg
in ionic liquid, indicated as a1 to a6 respectively. B) MWNTs 2 at 1, 4, 8, 12, 20, 30
mg in ionic liquid, indicated as b1 to b6 respectively. C) MWNTs 3 at 1, 6, 12, 18,
24, 30 mg in ionic liquid, indicated as c1 to c6 respectively. D) SWNTs at 1, 5, 10,
20, 30, 40 mg in ionic liquid, indicated as d1 to d6 respectively.

CAPÍTULO 3
132
3.5. Evaluation of D/G band intensity ratio
Mixtures of the different types of carbon nanotubes and ionic liquid were
prepared and measured with the optimum conditions. The ratio of intensity of
D/G bands was calculated for each mixture with different concentrations of
each carbon nanotube. The intensity ratio of the D and G peaks (ID/IG) refers
to the ratio of the height of each peak after subtracting the baseline. Table 2
shows the intensity of individual D and G bands and the calculated ratio
(ID/IG) values.
Table 2. ID/IG ratio for each CNTs type/IL mixture in all concentration range
considered.
Raman Intensity
CNT
concentration
(mg)
I1350 I1592 ID/IG
MW
NT
s 1
1 - - -
5 - 505 -
10 1573 1125 1.4
15 1835 1421 1.3
20 2729 2252 1.2
30 1151 869 1.3
MW
NT
s 2
1 - - -
4 - 400 -
8 410 606 0.7
12 396 520 0.8
20 517 803 0.6
30 617 817 0.7

CARACTERIZACIÓN DE GELES
133
MW
NT
s 3
1 - - -
6 - 1202 -
12 400 2925 0.14
18 279 2522 0.11
24 450 3371 0.13
30 340 2532 0.13
SW
NT
s
1 - - -
5 - 996 -
10 1845 7466 0.2
20 5847 23246 0.3
30 3383 14189 0.2
40 3368 18365 0.2
As it can be seen in the case of MWNTs 1 the intensity of D band is in all
the mixtures higher than the intensity of G band, resulting ratio values higher
than 1. However, in the case of other CNTs (MWNTs 2, MWNTs 3 and
SWNTs) the ratio decreases until values ≤ 0.8. In the four gels considered,
working with the critical gel concentration, an increase of the ID/IG ratio is
observed. Differences between different gels may be attributed to the
different dispersion capabilities of ionic liquid for each type of nanotube.
4. Conclusions
In this work, a rapid and simple method to determine the critical gel
concentration for the formation of soft materials by fluorescence
measurements has been described. This CGC has been determined for gels
obtained from the combination of three types of MWNTs and SWNTs with
CAPÍTULO 3
134
Hmim PF6 ionic liquid. A deep study of the Raman spectra of a variety of
CNTs/IL mixtures has been done. These results open up new possibilities to
the formation of soft materials and their application in analytical chemistry.
The main contributions of this work are the following: i) the
determination of CGC of gels of different CNTs; ii) the simplicity of the
proposed methodology; iii) the inexpensive instrumentation and material
involved and iv) the study of the Raman intensity ratio of D and G bands for
different CNT/IL mixtures.
References
[1] S. Iijima, Nature, 354 (1991) 56-58.
[2] S. Iijima, T. Ichihashi, Nature, 363 (1993) 603-605.
[3] R. H. Baughman, A. A. Zakhidov, W. A. de Heer, Science, 297 (2002) 787-792.
[4] T. Fukushima, A. Kosaka, Y. Ishimura, T. Yamamoto, T. Takigawa, N. Ishii, T.
Aida, Science, 300 (2003) 2072-2074.
[5] T. Aida, T. Fukushima, Chem. Eur. J. 13 (2007) 5048-5058.
[6] T. Fukushima, K. Asaka, A. Kosaka, T. Aida, Angew. Chem. Int. Ed. 44 (2005)
2410-2413.
[7] T. Fukushima, A. Kosaka, Y. Yamamoto, T. Aimiya, S. Notazawa, T. Takigawa,
T. Inabe, T. Aida, Small 2 (2006) 554-560.
[8] K. Mukai, K. Asaka, K. Kiyohara, T. Sugino, I. Takeuchi, T. Fukushima, T.
Aida, Electrochim. Acta, 53 (2008) 5555-5562.
[9] I. Takeuchi, K. Asaka, K. Kiyohara, T. Sugino, N. Terasawa, K. Mukai, T.
Fukushima, T. Aida, Electrochim. Acta, 54 (2009) 1762-1768.

CARACTERIZACIÓN DE GELES
135
[10] M.L. Polo-Luque, B.M. Simonet, M. Valcarcel, Talanta 104 (2013)169-172.
[11] M.L. Polo-Luque, B.M. Simonet, M. Valcarcel, submited to Talanta.
[12] M.L. Polo-Luque, B.M. Simonet, M. Valcárcel, Analytical and Bioanalytical
Chemistry 404 (2012) 903-907.
[13] H. Zhu, X. Liang, J. Chen, M. Li, Z. Zhu, Talanta, 85 (2011) 1592-1597.
[14] C. Bu, X. Liu, Y. Zhang, L. Li, X. Zhou, X. Lu, Colloids and Surfaces B:
Biointerfaces, 88 (2011) 292– 296.
[15] H. B. Kim, J. S. Choi, S. T. Lim, H. J. Choi, H. S. Kim, Synth. Met. 154 (2005)
189-192.
[16] M.S. Dresselhaus, G. Dresselhaus, R. Saito, A. Jorio, Phys. Rep. 409 (2005) 47-
99.
[17] Z. Liu, J. Zhang, B. Gao, Chem. Commun. (2009) 6902-6918.
[18] F. Tuinstra, J.L. Koening, J. Phys. Chem. 53 (1970) 1126-1130.
[19] M.E. Itkis, D.E. Perea, R. Jung, S. Niyogi, R.C. Haddon, J. Am. Chem. Soc. 10
(2005) 3439-3448.
[20] A.C. Dillon, T. Gennett, K.M. Jones, J.L. Alleman, P.A. Parilla, M.J. Heben,
Adv. Mater. 11 (1999) 1354-1358.


Empleo de Geles
como Sorbentes


EMPLEO DE GELES COMO SORBENTES
139
Una tendencia clave en la Química Analítica es el desarrollo de nuevos
procedimientos de tratamiento de muestra que sean simples y eficaces, ya que
es una de las etapas más críticas de las diferentes etapas que engloban el
proceso analítico. Todavía esta etapa supone una limitación en el desarrollo
de nuevos métodos analíticos debido fundamentalmente a la complejidad de
las muestras, la baja concentración de los analitos y la incompatibilidad con la
técnica instrumental de análisis.
El objetivo fundamental de este capítulo es el estudio y empleo de geles
basados en mezclas de LI y CNTs en etapas de extracción y microextracción
en fase sólida de diferentes analitos de interés. Para ello se desarrollaron tres
sistemas diferentes de tratamiento de muestra.
En el primer apartado (4.1) de este capítulo se presentan los resultados
más relevantes obtenidos con la primera unidad de extracción desarrollada,
basada en una modificación de bastones de algodón convencionales, los
cuales son impregnados con el gel y empleados directamente como unidad de
preconcentración. La ventaja de este sistema, además de su simplicidad, es
que permite obtener una gran área de adsorción, disminuyendo los tiempos de
extracción y permitiendo efectuar la etapa de elución en un volumen de tan
solo 1 mL. La unidad descrita se empleó para la extracción de hidrocarburos
aromáticos policíclicos de muestras de agua de rio.
En el apartado 4.2. se describe una unidad miniaturizanda que consistió
en una delgada fibra de algodón, con el fin de disminuir la cantidad de
material sorbente (gel) necesario para su preparación y posterior empleo. La

CAPÍTULO 4
140
principal ventaja de este nuevo sistema es que permite la elución directa de
los analitos en microcuvetas de cuarzo alcanzándose pequeños límites de
detección para la determinación de PAHs en muestras de agua de río. Otra
novedad del trabajo descrito en este apartado es el empleo de nanotubos de
carbono coil para la formación del gel.
Tal y como se ha mencionado anteriormente uno de los inconvenientes
que encontramos en la etapa de tratamiento de muestra es la incompatibilidad
de ésta con la técnica instrumental de análisis. Así, en el apartado 4.3. se
propone el acoplamiento en línea del gel (unidad de tratamiento de muestra) a
un equipo comercial de electroforesis capilar. Este sistema de acoplamiento
se considera como una variación o modalidad de la SPME en tubo y es
llevado a cabo en un vial de muestra de EC, gracias a una modificación
“home-made”. El dispositivo consta de un paso tubular cuya pared se recubre
con el gel y a través del cual pasa la muestra preconcentrándose los analitos
de interés, que en esta aplicación concreta son tres nitrofenoles. Este diseño
permite un acoplamiento directo de la etapa de elución de los analitos y su
posterior detección.

4.1. Ionic liquid combined with carbon nanotubes. A soft
material for the preconcentration of PAHs


EMPLEO DE GELES COMO SORBENTES
143
Talanta 104 (2013) 169-172
Ionic liquid combined with carbon nanotubes. A soft material
for the preconcentration of PAHs
M.L. Polo-Luque, B.M. Simonet, M. Valcárcel
Department of Analytical Chemistry, University of Córdoba, Campus de
Rabanales, E-14071 Córdoba, Spain
The combination of ionic liquids with carbon nanotubes has opened a
new possibility of ionic liquids as modifiers for carbon nanotubes. Upon
being ground into ionic liquids, carbon nanotube bundles are untangled,
and the resultant fine bundles form a network structure. This is due to
the possible specific interaction between the imidazolium ion component
and the π-electronic nanotube surface. The resultant soft material has a
high capacity to adsorb/absorb analytes from samples. In this work, the
soft material was prepared by mixing 15 mg of carbon nanotubes with
300 L of IL. The soft material was immobilized on cotton fibers to
perform the preconcentration of aromatic compounds such as PAHs
from river water samples. The most important fact is the synergic effect
between the ionic liquid and the carbon nanotubes which results in a
high capacity to preconcentrate analytes. In fact, the sorption capacity of
15 mg of the soft material containing 0.55 mg of MWNT and 11 L of IL
is two times higher than the capacity of 15 mg of MWNT and 3.7 times
higher than that of 100 L IL.

CAPÍTULO 4
144
1. Introduction
The discovery of carbon nanotubes (CNTs) [1, 2] has stimulated intense
research activities, leading to remarkable scientific and technological
advances in the development of nanostructured materials. This state-of-the-art
carbon form consists of a rolled-up graphene sheet with hexagonally arranged
sp2-hybridized carbon atoms [3, 4], and can be regarded as an ultimate p-
electronic architecture. Since CNTs provide extraordinary mechanical,
electrical, and thermal properties, numerous potential applications are
expected [5]. However, one major drawback is that CNTs are hard to process
due to their poor dispersability. In particular, single-walled CNTs (SWNTs)
exist as ropes and bundles [6], which are heavily entangled with each other to
form agglomerates. For a better processability of CNTs, many chemical and
physical approaches to the modification of the CNT surface have so far been
attempted [7, 8]. For example, adsorption of organic molecules onto the
nanotube surface by means of van der Waals forces and/or π-stacking
interactions has been shown to be promising for dispersing CNTs in fluid
media, occasionally affording individual nanotubes.
Ionic liquids are characterized by negligible vapor pressure, high
chemical and thermal stabilities, high ionic conductivity, and broad
electrochemical potential window [9–12]. Due to such unique properties
coupled with an ability to dissolve a wide range of organic and inorganic
substances, they have drawn increasing attention not only as a new class of
electrolytes, but also for recyclable alternatives to conventional organic

EMPLEO DE GELES COMO SORBENTES
145
solvents for wet processes, including chemical syntheses, catalyses,
liquid/liquid extractions, and so forth [13–15].
Compared with chemical approaches through covalent functionalization,
such noncovalent approaches are easy to perform and have an additional
advantage in that they can avoid disruption of the p-electronic conjugation of
the CNTs. Recently; imidazolium-ion-based ionic liquids (Fig. 1) as a new
class of dispersants for CNTs have been found [16]. Previously reported
dispersants include solid substances that are usable only by the combination
with appropriate solvents. In contrast, ionic liquids are fluid at room
temperature and able to disperse CNTs by themselves, affording readily
processible gelatinous substances. This feature gives a great advantage over
the known examples, since one can “design” soft composite materials directly
from the resulting gels, readily modify their physical properties, incorporate
certain functionalities, and even transfer them into other fluid media or solid
matrices. This method allows for large scale processing of CNTs.
Furthermore, we and other groups have noticed several unique aspects of the
physical gels from ionic liquids and CNTs, referred to as “bucky gels” or
“soft materials”. This article is devoted to study the analytical potential of this
new material to preconcentrate organic molecules. PAHs have been selected
in this paper as a model of aromatic compounds.

CAPÍTULO 4
146
Figure 1. Molecular formulas and schematic structures of typical imidazolium-ion-
based ionic liquids.
2. Experimental section
2.1. Reagents and materials
The ionic liquid (IL) used to obtain the soft material was 1-hexyl 3-
methylimidazolium hexafluorophosphate (Hmim PF6), which was purchased
from Merck (Spain) and used as received. The MWNTs were of two different
types. MWNT-1 with diameters of 5-20 nm and length of 1-10 µm supplied
by Bayer Material Science (Germany) and MWNT-2 with diameters of 10-30
nm and length of 5-15 µm supplied by NanoTech Port Co. (NTP, China). The
purity was 90-98% and 90-95% by volume, correspondingly. HPLC grade
methanol, acetonitrile and hexane were supplied by Panreac (Barcelona,
Spain). Finally, purified water (18 m) was obtained from a Millipore Milli-
Q water purification system. The Polycyclic Aromatic Hydrocarbons (PAHs)
employed as analytes were acenaphthene (99%), naphthalene (≥ 99%, GC),
phenanthrene (≥ 97%, HPLC), benzo (a) pyrene (> 98%, HPLC), pyrene (≥
99%, GC) and perilene (≥ 99%, GC) from Fluka (Spain). Benz (a) anthracene

EMPLEO DE GELES COMO SORBENTES
147
(≥ 98%, GC/HPLC), fluoranthene (99%) and fluorene (99%) were purchased
from Aldrich (Spain).
2.2. Equipment. Instrumentation
Absorption and fluorescence emission spectra were measured on a PTI
QuantaMasterTM Spectrofluorometer (Photon Technology International)
equipped with a 75 W Xenon short arc lamp and the model 814 PTM
detection system. FeliX32 software was used for fluorescence data collection
and analysis, which also controlled the whole instrument. The slits widths for
excitation and emission were both 3 nm. All optical measurements were
carried out in 1 cm quartz cuvettes at room temperature under ambient
conditions.
Transmission electron microscopy (TEM) experiments were carried out
with a Jeol JEM 2010 high-resolution electron microscope to obtain high-
resolution images. Samples were prepared by placing one drop of a dilute
solution of MWNT onto a copper TEM grid with a Carbowax forward.
2.3. Preparation of the soft material and extraction unit
The soft material was prepared by mixing 15 mg of carbon nanotubes
with 300 L of IL. The suspension formed was then ground in an agate
mortar with a pestle. After that the suspension turned viscous, affording a soft
material like a gel. Finally to prepare the extraction unit, a cotton fiber with a
diameter of 4 mm and a length of 13 mm that corresponds to an area of 16.3
mm2 was used as a support. To impregnate the cotton with the soft material,

CAPÍTULO 4
148
the cotton was immersed in the gel, excess of gel was removed and the
surface was carefully smoothed with the weighing paper.
3. Results and discussion
MWNTs were mixed in a mortar with an ionic liquid such as 1-hexyl 3-
methylimidazolium hexafluorophosphate. During this time the suspension
turned viscous, affording a gel or soft material. This observation implied that
the ionic liquid may interact with the π-electronic surface of the MWNTs by
means of cation–π and/or π–π interactions. However, unexpectedly, the
gelation was not reproducible. After many trials with magnets, the mixing of
ionic liquid with MWNTs in an agate mortar with a pestle was the most
reproducible method. The gelation occurs in a variety of imidazolium-ion-
based ionic liquids (Fig. 1) upon grinding with 0.5–1 wt% (critical gel
concentration) of SWNTs [16].
When MWNTs are ground into ionic liquid in excess with respect to the
critical gel concentration, the gel and ionic liquid phases are clearly separated
from each other by centrifugation, indicating that the gel can trap a limited
amount of the ionic liquid. Bucky gels thus obtained are easy to process into
any shape. For example, through extrusion from a needle, one can fabricate a
cable-like material that is not easily torn apart even when suspended. Due to
the negligible volatility of ionic liquids, bucky gels, in sharp contrast with
ordinary organogels and hydrogels, are highly stable and can retain their
physical properties even under a reduced pressure.

EMPLEO DE GELES COMO SORBENTES
149
By means of transmission electron microscopy (TEM), we found that
bucky gels contain highly exfoliated MWNT bundles (Fig. 2). As observed by
electronic absorption and Raman spectroscopy, MWNTs are not chemically
disrupted, indicating that the gelation is induced only physically. Meanwhile,
the rheological properties of the bucky gels suggested that the gel involves an
elastic network.
Figure 2. TEM micrographs of MWNTs (A) received from a commercial source and
dispersed in methanol, (B) dispersed in Hmim PF6, deposited on the grid and washed
with methanol to remove the IL and (C) the sof tmaterial located on the grid and
washed with methanol to remove the IL.
Raman spectroscopy has been used to assess the integrity of MWNTs in
Hmim PF6 and to provide information about the interaction between the
CNTs and the ionic liquid. Fig. 3 depicts the Raman spectra obtained for the

CAPÍTULO 4
150
bundled MWNTs studied. The spectra exhibit the typical bands of MWNTs,
namely the G-band (1597 cm-1
), which comprises several tangential modes
due to stretching vibrations in MWNT sidewall C-C bonds, the D-band (ca.
1287 cm-1
), which is assigned to disordered carbon, and its second-order
harmonic (the G-band, ca. 2582 cm-1
). The D-band is associated with
disordered sp3-hybridized carbon present as impurities and MWNT defects.
The G/D ratio, which increases with increasing graphite crystallite size, is a
measure of purity. We thus ascribed the increased G/D ratio obtained to the
sample treatment removing carbonaceous impurities from the CNT surface.
The Raman bands of the MWNT can be better observed in the difference
spectrum, which was calculated following baseline correction and
normalization to the 2978 cm-1
band for the ionic liquid. A shift of the G-band
was observed in the dispersions. The magnitude of this shift ranged from 8 to
12 cm-1
and depended on the concentration of MWNTs. Such interactions
lead to the formation of a new system, IL-coated MWNTs, which consist of
isolated or weakly interacting MWNTs. The extent of formation of the π-
complex depends on the degree of overlap between pz orbitals in the carbon
atoms or, in others words, on the cylindrical shape of the MWNTs. It is
important to remark that the same behavior and analytical response were
obtained for the two types of nanotubes studied in this work. However,
considering that the soft material was easy to prepare with MWNT-1 and that
the obtained soft material presented a higher mechanical stability, it was
selected to study the analytical response to a preconcentration. This higher
capacity to form the gel was attributed to a minor content in amorphous
carbon material.

EMPLEO DE GELES COMO SORBENTES
151
Figure 3. Raman spectrum (A) MWNTs, (B) ionic liquid and (C) soft material at
three different MWNT/IL ratios.
From the chemical point of view, one interesting characteristic of the soft
material is its chemical stability. When the material is introduced in different
solvents, a part of the ionic liquid is solubilized in the solvent. In general the
solubility of the ionic liquid was clearly lower in the presence of the carbon
nanotubes in spite of the excess of the ionic liquid in the soft material. Fig. 4

CAPÍTULO 4
152
compares the native intrinsic native fluorescence of the IL in different
solvents. The native fluorescence of the IL was measured at 435 nm by
exciting the system at 395 nm. As can be seen, the intensity of fluorescence
was significantly reduced. It will be then possible to desorb the analytes with
organic solvents preserving the integrity of the soft material. In addition,
direct spectroscopic fluorimetric measurements of desorbed analytes will be
possible without the interference of IL.
Figure 4. Comparison of native fluorescence of IL in different solvents obtained
after introducing the IL or soft material in the respective solvent.
Fig. 5 shows the isotherms obtained for the preconcentration of naftalene.
As can be seen, two linear ranges are observed. This means that the sorption
of analytes is the result of the combination of adsorption but also absorption
mechanism. The most important aspect or characteristics of this material is

EMPLEO DE GELES COMO SORBENTES
153
the synergic effect that exists of the IL with the MWNTs. We suppose that
this synergic effect is the result of the special orientation of the MWNT in the
soft material. This special orientation allows the lateral interaction of carbon
nanotubes probably through the π system. Probably, because the π system is
stabilized and present a energy level more similar to the energy level of the π
system of the organic aromatic compound. This, facilitate the interaction.
Figure 5. Characteristic isotherm: evolution of the preconcentration with time.
As can be seen in figure 6, the sorption capacity of 15 mg of the soft
material is two times higher than the capacity of 15 mg of MWNT and 3.7
times higher than 100 µl of IL. However 15 mg of soft material only contain
0.55 mg and 11 µL of IL. Although, as example it is presented the result of
naftalene, the same effect was obtained for all the PAHs analysed.

CAPÍTULO 4
154
Figure 6. Comparison of sorption capacity of 15 mg of soft material versus 15 mg of
MWNTs and 100 µL of IL.
In order to demonstrate the analytical potential of this method, several
river water samples obtained from the Guadalquivir were analysed. Because
no positive samples were obtained, spiked samples were also analysed. For
that, 11 samples were spiked in the range from 5 to 60 µg/L with different
PAHs. Standards and spiked samples were analysed at the same concentration
level. The figure 7 shows the result of the representation of fluorescence of
spiked samples in front of the fluorescence of standard samples. As can be
seen, the graph was statistically comparable with the theoretical graph of
slope 1 and intercept 0. The recovery was in the range from 87 to 105% and
the precision, measured as relative standard deviation of the analysis of 15
consecutive samples at the limit of quantification was of 5.7%.

EMPLEO DE GELES COMO SORBENTES
155
Figure 7. Recovery of the analysis of spiked river samples. Representation of the
concentration found versus concentration added.
4. Conclusions
In this work, the use of soft materials obtained from the combination of
ionic liquid with carbon nanotubes as sorbent material for the
preconcentration of organic compounds such as PAHs has been described.
Compared with IL or free MWNTs, the sorption capacity of the soft material
was clearly higher pointing out the synergic effect produced by the
orientation of the carbon nanoparticles in the soft material. This result opens
up new possibilities to the use of soft materials in analytical chemistry to
perform sample cleanup and sample treatment.
References
[1] S. Iijima, Nature 354 (1991) 56-58.

CAPÍTULO 4
156
[2] S. Iijima, T. Ichihashi, Nature 363 (1993) 603-605.
[3] Carbon Nanotubes: Synthesis, Structure, Properties, and Applications, M.S.
Dresselhaus, G. Dresselhaus, P. Avouris (Eds), Springer, Berlin, 2001.
[4] P.M. Ajayan, Chem. Rev. 99 (1999) 1787-1799.
[5] R.H. Baughman, A.A. Zakhidov, W.A. de Heer, Science 297 (2002) 787-792.
[6] A. Thess, R. Lee, P. Nikolaev, H. Dai, P. Petit, J. Robert, C. Xu, Y.H. Lee, S.G.
Kim, A.G. Rinzler, D.T. Colbert, G.E. Scuseria, D. Tomanek, J.E. Fischer, R.E.
Smalley, Science 273 (1996) 483-487.
[7] C.A. Dyke, J.M. Tour, J. Phys. Chem. A 108 (2004) 11151-11159.
[8] B. Vigolo, A. Penicaud, C. Coulon, C. Sauder, R. Pailler, C. Journet, P. Bernier,
P. Poulin, Science 2000, 290, 1331-1334.
[9] R. Hagiwara, Y. Ito, J. Fluorine Chem. 105 (2000) 221-227.
[10] J.G. Huddleston, A.E. Visser, W.M. Reichert, H.D. Willauer, G.A. Broker, R.D.
Rogers, Green Chem. 3 (2001) 156-164.
[11] J.H. Davis, Jr., P.A. Fox, Chem. Commun. 11 (2003) 1209-1212.
[12] H.B. Kim, J.S. Choi, S.T. Lim, H.J. Choi, H.S. Kim, Synth. Met. 154 (2005)
189-192.
[13] J. Liu, A.G. Rinzler, H. Dai, J.H. Hafner, R.K. Bradley, P.J. Boul, A.Lu, T.
Iverson, K. Shelimov, C.B. Huffman, F. Rodriguez-Macias, Y.S. Shon, T.R. Lee,
D.T. Colbert, R.E. Smalley, Science 280 (1998) 1253-1256.
[14] P.G. Whitten, G.M. Spinks, G.G. Wallace, Carbon 43 (2005) 1891-1896.
[15] J.M. Nugent, K.S.V. Santhanam, A. Rubio, P.M. Ajayan, Nano Lett. 1 (2001)
87-91.
[16] T. Fukushima, A. Kosaka, Y. Ishimura, T. Yamamoto, T. Takigawa, N. Ishii, T.
Aida, Science 300 (2003) 2072-2075.

4.2. Coiled carbon nanotubes combined with ionic liquid: a
new soft material for SPE


EMPLEO DE GELES COMO SORBENTES
159
Anal Bioanal Chem 404 (2012) 903– 907
Coiled carbon nanotubes combined with ionic liquid: a new
soft material for SPE
M.L. Polo-Luque, B.M. Simonet, M. Valcárcel
Department of Analytical Chemistry, University of Córdoba, Campus de
Rabanales, E-14071 Córdoba, Spain
For the first time a soft material formed from coiled carbon nanotubes
and 1-hexyl 3-methylimidazolium hexafluorophosphate has been used as
sorbent material. The soft material has high stability as well as a high
capacity to adsorb analytes. In this work we propose using a natural
cotton fiber impregnated with the soft material to miniaturize the system.
The system was tested for the analysis of polycyclic aromatic
hydrocarbons in spiked river water samples. The absolute recovery
ranged between 97.5 and 105.5 %, demonstrating the usefulness of the
soft material. The limit of detection ranged from 2.5 to 6.1 μg/L and the
precision expressed as the relative standard deviation for the analysis of
five consecutive analyses ranged between 2.5 and 5.8 %.

CAPÍTULO 4
160
1. Introduction
The discovery of carbon nanotubes (CNTs) was the beginning of
nanotechnology based on tubular molecules. Their peculiarities together with
their exceptional optical and electronic properties led to considerable progress
of nanotechnology in both academic research and industrial applications. In
addition, in recent years, thanks to the properties and geometry of carbon, a
large number of allotropic carbon nanoparticles have excited interest, such as
nanodiamonds, fullerenes, carbon nanohorns, and carbon nanofibers [1, 2].
Although all of these nanoparticles have been used from the analytical point
of view, fullerenes and CNTs are the most widely used. Nowadays,
increasing interest exists in graphene nanosheets and their properties.
The term “carbon nanotubes” (CNTs) refers to a large number of related
nanoparticles. There are different types of CNTs and they can be classified
geometrically according to different criteria. Taking into account the numbers
of layers in the wall, we can differentiate three groups: single-walled CNTs
(one layer), double-walled CNTs (two layers), and multiwalled CNTs
(comprising more than two layers of concentric cylindrical shells of graphene
sheets arranged coaxially around a central core). On the other hand, according
to their structure, we can defined linear CNTs, bamboo CNTs, and coiled
CNTs.
The coiled CNTs were first predicted to exist in the early 1990s by Itoh
et al. [3–5] and Dunlap [6] and were experimentally observed in 1994 by
Zhang et al. [7]. Chemical vapor deposition is the most frequent method used

EMPLEO DE GELES COMO SORBENTES
161
for synthesis. In addition to their diameter and length tube, coiled CNTs are
characterized by coil pitch, which describes the distance between adjacent
corresponding points along the axis of the helix. The coil or helix is due to the
incorporation of pentagons and heptagons in the hexagonal carbon sheet of a
CNT. If the incorporation of such defects is periodic, then a regular coiled
structure is obtained [8]. Theoretical computer simulations demonstrated that
coiled nanotubes are energetically and thermodynamically stable [9]. Coiled
nanotubes are of importance not only in the study of basic science; they also
possess great potential for applications in nanocomposites, nanoelectronic
devices, and nanoelectromechanical systems [10]. One interesting property of
coiled nanotubes is that the conduction of electricity through them will
generate an inductive magnetic field, unlike straight nanotubes. From the
point of view of analytical chemistry, coiled nanotubes have not been
exploited yet. It is clear that the particular shape of coiled CNTs as well as the
presence of pentagons and heptagons will produce characteristic properties
different from those of linear CNTs.
Bearing in mind that carbon-based materials have excellent adsorption
and sieving properties for a wide range of organic and inorganic species [11],
coiled CNTs should also have excellent adsorption capabilities. In addition to
adsorption by the nanotube wall, coiled nanotubes can accommodate
molecules in their cavity. CNTs combined with ionic liquid yield a new soft
material with clear advantages to perform sample preconcentration. This soft
material has been used in different applications [12], but one of the main
fields of application is electrochemistry [13]. In previous work, we
synthesized a gel or soft material with an ionic liquid (1-hexyl 3-

CAPÍTULO 4
162
methylimidazolium hexafluorophosphate, Hmim PF6) and multiwalled CNTs
[14]. In this work, we studied the sorptive potential of coiled CNTs combined
with ionic liquids using polycyclic aromatic hydrocarbons (PAHs) as target
analytes. To demonstrate the usefulness of the proposed system, we applied it
to the determination of PAHs in water samples. To the best of our knowledge,
the application of soft material based on coiled CNTs as a sorbent for solid-
phase microextraction has not been reported in the literature.
2. Materials and methods
2.1. Reagents and standards
The PAHs employed as analytes were acenaphthene (purity 99%),
naphthalene (purity 99% or greater for gas chromatography, GC),
phenanthrene (purity 97% or greater for high performance-liquid
chromatography, HPLC), benzo [a] pyrene (purity greater than 98%, HPLC),
pyrene (purity 99% or greater, GC), and perylene (purity 99% or greater, GC)
from Fluka (Spain) and benz[a]anthracene (purity 98% or greater,
GC/HPLC), fluoranthene (purity 99%), and fluorene (purity 99%) from
Aldrich (Spain). The coiled CNTs (multiwalled CNTs) were supplied by
Microphase (purity 90-98 % by volume).
The ionic liquid used to produce the soft material was Hmim PF6, which
was purchased from Merck (Spain) and was used as received. The solvents
used were hexane and methanol from Panreac (Spain) and acetonitrile for
luminescence from Fluka Analytical. Purified water (18 mΩ) was obtained
from a Millipore Milli-Q water purification system.

EMPLEO DE GELES COMO SORBENTES
163
2.2. Instrumentation
Absorption and fluorescence spectra were measured with a PTI
QuantaMasterTM spectrofluorometer (Photon Technology International)
equipped with a 75-W Xenon short arc lamp and a model 814 photomultiplier
detection system. The program FeliX32 was used for fluorescence data
collection and analysis, and also controlled the whole instrument. The
excitation and emission slit widths were both 3 nm. All optical measurements
were conducted in quartz microcuvettes (10-mm light path, from Hellma) at
room temperature under ambient conditions.
Transmission electron microscopy experiments were performed with a
Philips CM-10 transmission electron microscope, with a resolution of 0.5 nm
(point) and 0.34 nm (line). Samples were prepared by placing one drop of a
dilute solution of coiled CNTs suspended in methanol onto a Formvar carbon
film on 400-mesh copper grids.
Raman spectra were measured with a confocal Raman microscope
(alpha500 R) equipped with a frequency doubled Nd:YAG laser with 532 nm
excitation. For the analysis using the confocal Raman microscope, a Witec
UHTS 300 spectrometer and a DU970N-BV (electron-multiplying CCD) (16
μm×16 μm pixel size, 1,600×200 pixels) camera were additionally connected
to the system. Two different objectives were used, 100×/1.25, ∞/ 0.17,
working distance 0.18 mm and 20×/0.4, ∞/ 0.17, working distance 3.8 mm.
The program WITec Project Plus was used for advanced data evaluation for
confocal Raman microscopy.

CAPÍTULO 4
164
2.3. Preparation of the microextraction unit
The preconcentration unit was prepared by impregnating a natural cotton
fiber with the soft material. The fiber had a diameter of 0.8 mm and an
effective length of 10 mm, and it was stiffened with a nylon thread of 0.4
mm. The soft material was prepared by mixing 17 mg of coiled CNTs with
100 μL of Hmim PF6. The suspension formed was then ground in an agate
mortar with a pestle. After that the suspension turned viscous, affording a soft
material like a gel. To impregnate the cotton fiber with the soft material, the
fiber was immersed in the gel and excess gel was removed and the surface
was carefully smoothed with the weighing paper.
2.4. Determination of PAHs from river water
River water samples were collected and preserved in polyethylene bottles
until analysis. For analysis, the cotton fiber containing the soft material was
immersed in 4-5 ml of samples to perform analyte preconcentration for 10-15
min. Afterwards, the fiber was washed with water and dried at room
temperature. Finally 300 µL of acetonitrile was added to the microcuvette and
the fiber was immersed in it to perform the elution of the analytes (5 min).
After this time, the fluorescence was measured.
3. Results and discussion
The main aspects studied related to the formation and stability of the soft
material as well as its use to form a microextraction unit to perform simple
preconcentration and elution are presented in the following paragraphs.
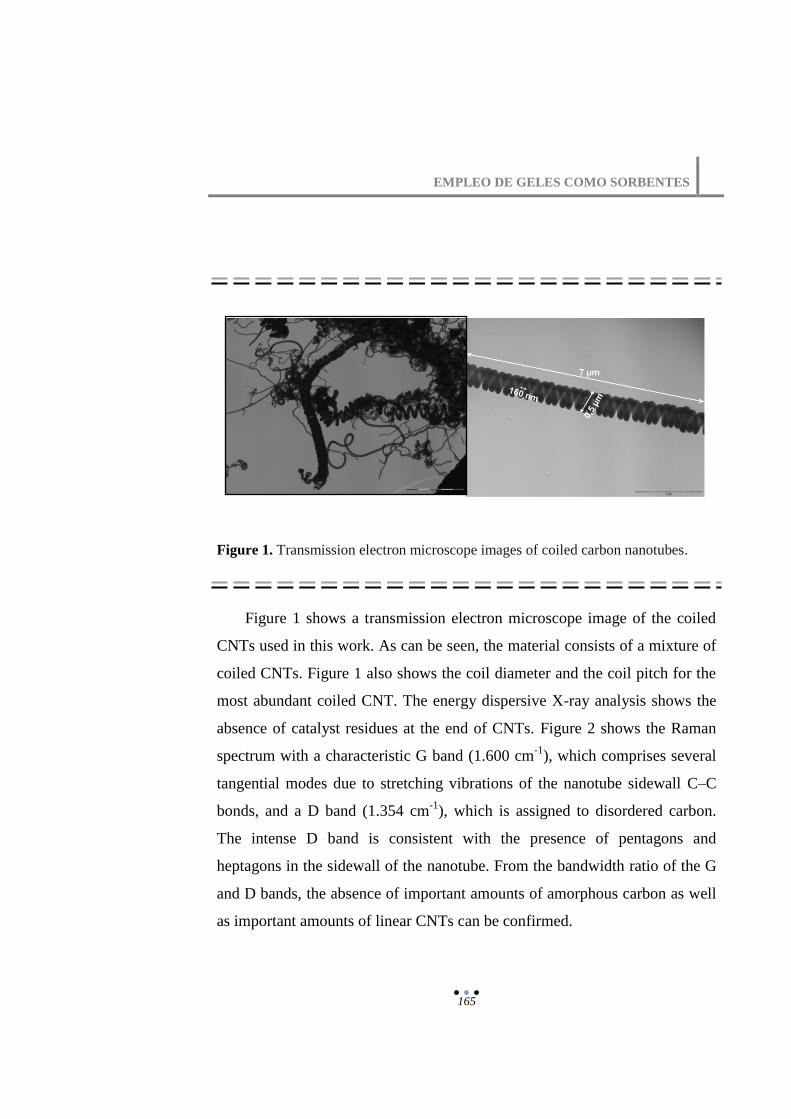
EMPLEO DE GELES COMO SORBENTES
165
Figure 1. Transmission electron microscope images of coiled carbon nanotubes.
Figure 1 shows a transmission electron microscope image of the coiled
CNTs used in this work. As can be seen, the material consists of a mixture of
coiled CNTs. Figure 1 also shows the coil diameter and the coil pitch for the
most abundant coiled CNT. The energy dispersive X-ray analysis shows the
absence of catalyst residues at the end of CNTs. Figure 2 shows the Raman
spectrum with a characteristic G band (1.600 cm-1
), which comprises several
tangential modes due to stretching vibrations of the nanotube sidewall C–C
bonds, and a D band (1.354 cm-1
), which is assigned to disordered carbon.
The intense D band is consistent with the presence of pentagons and
heptagons in the sidewall of the nanotube. From the bandwidth ratio of the G
and D bands, the absence of important amounts of amorphous carbon as well
as important amounts of linear CNTs can be confirmed.

CAPÍTULO 4
166
Figure 2. Raman spectrum of coiled carbon nanotubes.
Imidazolium-ion-based ionic liquids may interact with the π-electronic
surface of single-walled CNTs through cation–π and/or π–π interactions.
Upon grinding with the critical gel concentration, the suspension turned
viscous, affording a gel. In the case of single-walled CNTs, the critical gel
concentrations typically range from 0.5 to 1 %. In addition to single-walled
CNTs, the formation of gel or soft material with multiwalled CNTs has also
been described. To the best of our knowledge, this is the first time that a soft
material has been formed with coiled CNTs. In our case, the soft material was
studied in the range from 3.5 % to 16 % (w/w). The critical gel concentration
or formation of the gel was produced at a concentration of 11.7 %. The soft
material was obtained by grinding the mixture in a mortar; ultrasonic
radiation was not effective for such a purpose. The gel has a viscosity that

EMPLEO DE GELES COMO SORBENTES
167
makes possible its direct impregnation on natural cotton fibers. To provide
stiffness, a nylon thread was inserted inside the cotton fiber. Finally, the
cotton fibers impregnated with the soft material were smoothed manually
similarly to the process used in electrochemistry with a paste electrode.
One important characteristic of the soft material is the integrity of the
system thanks to the strong binding between the CNT and the ionic liquid. In
fact, in the soft material it was not possible to observe the bands of the ionic
liquid in the Raman spectrum. This was attributed to the strong interaction or
binding between the coiled CNT and the ionic liquid. This strong interaction
also affects the solubility of the ionic liquid. A simple test was performed to
study the integrity of the gel based on the solubility of the ionic liquid in
different solvents. The native fluorescence of the ionic liquid was selected as
a characteristic parameter related to the solubility. Hmim PF6 is an ionic
liquid with low solubility in water. As can be seen in Fig. 3, the amount of
ionic liquid solubilized in the presence of coiled CNTs dramatically
decreased for all the solvents studied. In the case of hexane, the amount of
ionic liquid solubilized was negligible. This experiment demonstrated the
high affinity and strong binding between the coiled CNT and the ionic liquid,
but also demonstrated that it is possible to elute the analytes and preserve the
integrity of the gel. We selected this ionic liquid on the basis of its solubility
in water and its chemical nature (Fig. 3), i.e., its strong interaction with
CNTs. Furthermore, Hmim PF6 is suited to forming gels with CNTs and it
has been widely used.

CAPÍTULO 4
168
0
2000
4000
6000
8000
10000
12000
14000
16000
18000
water methanol acetonitrile hexane
Flu
ore
sce
nse
sig
nal
solvents
Figure 3. Study of solubility of ionic liquid from the soft material with different
solvents.
To study the capacity of the soft material to preconcentrate analytes,
PAHs were selected as target analytes. For preconcentration, the cotton fiber
containing the soft material was added to 5 mL of aqueous standard solution.
After preconcentration, the analytes were eluted with acetonitrile because
hexane only provided a partial elution of analytes. The low amount of ionic
liquid solubilized in acetonitrile does not affect the measurement of the
analyte by fluorescence. As an example, Fig. 4 shows the isotherm obtained
for benz[a]anthracene. All the analytes exhibited a similar interaction. As can
be seen, two regions can be distinguished. The first, linear range was mainly
attributed to an adsorption mechanism; the second range was attributed to an
adsorption and absorption mechanism. These results were confirmed by the
elution time. Samples in the first range were eluted in a few minutes, whereas

EMPLEO DE GELES COMO SORBENTES
169
0
20000
40000
60000
80000
100000
120000
140000
0 5 10 15 20
Flu
ore
sce
nci
a
Tiempo (min.)
samples in the second range needed a long time, between 10 and 18 min, to
achieve a quantitative elution of the analytes.
Figure 4. Isotherm of benz[a]anthracene. The experiment was conducted with 5 mL
of samples and 150 μg/L analyte.
In previous work, we studied the characteristic of a soft material based on
multiwalled CNTs. If we compare the soft-material obtained with multiwalled
CNTs or with coiled CNTs, the following conclusions can be drawn: (1) the
critical gelification concentration is higher for coiled CNTs (but both soft
materials exhibit similar stability), (2) both nanotubes form gel able to
perform quantitative preconcentration of the analytes, (3) in both cases
adsorption and absorption can be distinguished in all cases, and (4) the soft
material produced from coiled CNTs has faster sorption and elution kinetics.

CAPÍTULO 4
170
Because the object of this work was to demonstrate the usefulness of the
soft material to perform the preconcentration of analytes, the PAHs were
analyzed by fluorescence. In addition, the use of fluorescence helps to
demonstrate the absence of interference from the native fluorescence of the
ionic liquid. Table 1 shows the recovery and the precision obtained for the
determination of PAHs in fortified river water samples. River water samples
were obtained from Guadalquivir (Spain). For the recovery study, river
samples were fortified at a concentration similar to the limit of quantification
and were analyzed following the recommended procedure. As can be seen,
good absolute recovery and precision were obtained. The loading capacity of
the soft material was calculated from the analysis of spiked samples using a
external calibration graph. The loading capacity ranged from 29 to 32 %.
In addition to the analysis of spiked samples, the reproducibility when
using the same fiber in consecutive analysis as well as the reproducibility
between fibers was studied. The analysis of ten consecutive analyses using
the same fiber resulted in a variation of results of 3.8 %. In general, it is
recommended to change the fiber after 15 analyses. Between analyses the
fiber was washed with water and dried in air. The results of the analysis of ten
aliquots of a sample using ten new fibers showed a variation of only 4.7 %.

EMPLEO DE GELES COMO SORBENTES
171
Table 1. Analysis of spiked samples and analytical features
Analytes Added
(µg/L)
Found
(µg/L)
Recovery
(%)
RSD
(%)
LOD
(µg/L)
Acenaphthene 12.0 12.1 100.8 2.5 3.4
Benz[a] anthracene 12.0 11.8 98.3 3.6 4.1
Benz[a] pyrene 20.0 19.7 98.5 4.1 6.3
Phenanthrene 20.0 20.6 103.0 3.8 5.9
Fluorene 12.0 12.2 101.6 3.9 3.8
Perylene 12.0 11.7 97.5 4.6 3.5
Fluoranthene 20.0 21.1 105.5 5.8 6.1
Naphtalene 10.0 9.9 99.0 4.3 2.7
Pyrene 10.0 10.3 103.0 4.9 2.5
RSD relative standard deviation, LOD limit of detection
4. Conclusions
It has been demonstrated that coiled CNTs are a good alternative to
prepare soft material with excellent stability and properties to perform the
preconcentration and purification of analytes such as PAHs from complex
matrices. The reproducibility of the system is remarkable using both the same
fiber and different fibers.

CAPÍTULO 4
172
References
[1] Jiang G, Zheng Q (2005) J Appl Polym Sci 97:2182–2185.
[2] Dai H (2002) Surf Sci 500:218–241.
[3] Itoh S, Ihara S, Kitakami J (1993) Phys Rev B 47:1703–1704.
[4] Itoh S, Ihara S, Kitakami J (1993) Phys Rev B 48:5643–5647.
[5] Itoh S, Ihara S (1993) Phys Rev B 48:8323–8328.
[6] Dunlap BI (1992) Phys Rev B 46:1933–1936.
[7] Zhang XB, Zhang XF, Bernaerts D, Van Tendeloo G, Amelinckx S, Van
Landuyt J, Ivanov V, Nagy JB, Lambin P, Lucas AA (1994) Europhys Lett 27:141–
146.
[8] Amelinckx S, Zhang XB, Bernaerts D, Zhang XF, Ivanov V, Nagy JB (1994)
Science 265:635–639.
[9] Zhong-can O-Y, Zhao-Bin S, Wang C-L (1997) Phys Rev Lett 78:4055–4058.
[10] Zhang Z, He P, Sun Z, Feng T, Chen Y, Li H, Tay B (2010) Appl Surf Sci
256:4417–4422.
[11] Pyrynska K (2007) Anal Sci 23:631–638.
[12] Fukushima T, Aida T (2007) Chemistry 13:5048–5058.
[13] Shiddiky MJA, Torriero AAJ (2011) Biosens Bioelectron 26:1775–1787.
[14] Polo-Luque ML, Simonet BM, Valcárcel M (2012) (in press).
4.3. Solid-phase extraction of nitrophenols in water by using a
combination of carbon nanotubes with an ionic liquid coupled
in-line to CE


EMPLEO DE GELES COMO SORBENTES
175
Electrophoresis 34 (2013) 304-308
Solid-phase extraction of nitrophenols in water by using a
combination of carbon nanotubes with an ionic liquid coupled
in-line to CE
M.L. Polo-Luque, B.M. Simonet, M. Valcárcel
Department of Analytical Chemistry, University of Córdoba, Campus de
Rabanales, E-14071 Córdoba, Spain
This paper describes the combined use of carbon nanotubes and an ionic
liquid directly coupled in-line to commercial CE equipment for sample
treatment. The extraction unit operates as a spin column to
preconcentrate the analytes. The extraction unit is inserted into the
sample vial. The elution is performed in-line, placing the vial on the
carrousel of the CE equipment. The joint use of carbon nanotubes and
ionic liquids as sorbent is based on the high adsorption capacity of these
materials, which makes them highly suitable for microextraction
purposes. The LOQ of analytes were within the range of 0.65–0.83 µg/L
with a RSD of less than 7%. The values of recovery range between 90
and 112%. The absolute recovery obtained from samples containing 1
µg/L of analytes was 38%.

CAPÍTULO 4
176
1. Introduction
2-Nitrophenol (2-NP) and its isomers (NPs) have been widely used in the
production of pesticides, and also as insecticides and herbicides [1] appearing
in the environment [2]. They can pose serious risks on human health due to
their high toxicity and low degradability by the environment. For that, they
are included on the US Environmental Protection Agency List of Priority
Pollutants [3]. As a result, their separation and determination have become
common in environmental analysis [4–6]. The extremely low concentrations
at which NPs are normally found in water require using a sample
preconcentration step to improve the sensitivity [2, 7–9].
At present, CE is one of the most widely used techniques in separation
science in spite of its low sensitivity. Solid phase extraction (SPE) and solid
phase microextraction (SPME) are effective choices for overcoming the poor
detection limits of CE, with which they can be combined in various ways,
namely: off-line, at-line, on-line, and in-line.
The design of in-line and on-line SPE-CE systems was reviewed in
references [10–13]. In-line SPE-CE systems completely integrate the
preconcentration (SPE) step into the CE system presenting advantages over
on-line and at-line coupled systems.
Based on the foregoing, and bearing in mind that multiwalled carbon
nanotubes (MWNTs) are widely used for removing various organic
compounds [14–16] and that ionic liquids and carbon nanotubes act
synergistically to improve the preconcentration of analytes [17], in this work

EMPLEO DE GELES COMO SORBENTES
177
we used these mixed materials for SPE coupled in-line to CE. The specific
aim of this work was to accomplish the in-line preconcentration of three
nitrophenols in water samples by SPE with a mixed sorbent consisting of
MWNTs and an ionic liquid (Hmim PF6) coupled to CE. The SPE sorbent
was directly incorporated into the CE equipment via a special sample vial in
order to simplify the sample treatment. The proposed interface is simple
enough for routine laboratory work.
2. Materials and methods
2.1. Reagents and standards
The analytes were 3-nitrophenol, 2-nitrophenol, and 2,4-dinitrophenol
(95% purity, Sigma-Aldrich, Spain). Standard stock solutions were prepared
in methanol and working solutions by dilution with purified water (18 MΩ)
from a Milli-Q apparatus (Millipore, Bedford, MA, USA).
Na2HPO4 from Sigma-Aldrich (Madrid, Spain) was used as BGE. HPLC-
grade methanol (Panreac Química, S.A., Spain) was used to prepare both the
BGE and the eluent; potassium hydroxide (Merck, Germany) to adjust the
eluent pH and sodium hydroxide (Panreac Química) to condition the
capillary.
MWNTs 1–10 µm long and 5–20 nm in outer diameter from Bayer and
the ionic liquid 1-hexyl 3-methylimidazolium hexafluorophosphate from
Merck were used to prepare thesorbent for sample preconcentration.

CAPÍTULO 4
178
2.2. Instrumentation
CE was performed on a Beckman Coulter (Palo Alto, CA, USA) P/ACE
MDQ instrument equipped with an on-column UV detector and a DAD. The
instrumental setup was governed, and data acquired and processed, by using
the software 32 Karat.
2.3. Operating conditions
The uncoated fused-silica capillaries used (50 µm ID, 375mm OD) were
supplied by Beckman (Fullerton, CA, USA). Each new capillary was initially
conditioned with 1M HCl (5 min), Milli-Q water (1 min), 0.1 M NaOH (10
min), and Milli-Q water (5 min), in this sequence. Each day, the capillary in
use was conditioned with 0.5 M sodium hydroxide (5 min), water (5 min),
and running buffer (5min). Between runs, the capillary was rinsed with
sodium hydroxide (3 min), water (3 min), and BGE (3 min). All conditioning
steps were performed at 20 psi.
The optimum BGE was found to consist of 25 mM Na2HPO4 in a 90–
10% water–methanol mixture at pH 9. The capillary cartridge was kept at 25
ºC throughout. Samples were kept at ambient temperature in the autosampler
and injected in the hydrodynamic mode at 0.5 psi for 5 s. Tests were carried
out in the positive polarity mode, using a detection wavelength of 200 nm, a
constant voltage of 30 kV, and an overimposed pressure of 50 psi in both
vials in order to avoid current interruptions due to evaporation of the organic
solvent via the Joule effect during analysis. The current was around 35 µA in
all runs.

EMPLEO DE GELES COMO SORBENTES
179
2.4. Preparation of the sorbent material
The soft material was prepared by mixing 15 mg of MWNTs with 300
µL of IL. The suspension formed was then grinding in an agate mortar with a
pestle. After that the suspension turned viscous, affording a soft material such
as a gel.
2.4. Preparation of the integrated system
The sample treatment used can be viewed as a modified version of
treatment made with a spin column. Figure 1 depicts its operational principle.
Briefly, the sample-handling unit works as a piston moving inside the vial.
The unit has a channel of 1 mm in diameter in its central portion. The
adsorptive material (a gel) is placed on the channel wall. Through this
channel, the sample first and the eluent then are circulated to perform
preconcentration and elution, respectively. For preconcentration, a volume of
400–600 µL of sample is placed in the CE vial and the preconcentration unit
as a whole is then positioned in the vial over the sample. Mechanical pressure
applied to the preconcentration unit goes down the vial and causes the sample
to pass through the unit channel. The velocity down the preconcentration unit
governs the preconcentration rate of the analytes. At the end of the
preconcentration process, the sample is over the preconcentration unit and is
then discarded (see Fig. 1). Then, the system is placed on the CE autosampler
for elution and automatic injection. This involves filling the CE capillary with
eluent (methanolic KOH). Then, the vial with the preconcentration unit is
inserted in the inlet and a pressure of 50 psi applied to the outlet for 15 s in

CAPÍTULO 4
180
order to introduce the eluent into the channel of the preconcentration unit.
Finally, the capillary is washed and conditioned with buffer, and a pressure of
0.5 psi is applied to the inlet for 15 s in order to have the preconcentration
unit introduce the eluent into the CE capillary.
Figure 1. Dimensions on the in-vial microtreatment unit system and position in the
autosampler for CE analysis.

EMPLEO DE GELES COMO SORBENTES
181
3. Results and discussion
3.1. Electrophoretic conditions
The composition and concentration of the BGE plays a central role. It
must ensure an appropriate electrophoretic behavior in each individual
analyte. In this work, we examined various types of buffers on the separation
efficiency and found Na2HPO4 to be the most suitable BGE for the intended
purpose. The effect of the Na2HPO4 concentration over the range of 25-75
mM. Increasing the concentration decreased resolution between analyte
peaks; this led us to adopt a concentration of 25 mM as optimal. The effect of
the addition of methanol to BGE was also studied for greater compatibility
with the sample, which was prepared in 100% methanol. Based on the results,
a 10% proportion of methanol in the BGE provided the best CE medium in
terms of current stability, sample compatibility, and sensitivity. The effect of
pH on peak shape and migration times for the analytes was then studied. The
optimum resolution was achieved at pH 9. The applied electrical field
strength was fixed to the highest applied voltage yielding an acceptable
current (35 µA).
Regarding sample volume, under the optimum CE conditions, it was
impossible to feed sample for more than 5 s at 0.5 psi without losing
resolution or peak symmetry.

CAPÍTULO 4
182
3.2. In-line preconcentration unit
The original idea for the new design of the in-vial preconcentration unit
was to use the pressure system of the CE equipment to raise and lower the
unit up and down the vial. However, the upper and lower position of the unit
in the vial was incompatible with the length and position of the capillary and
electrode. For simplicity, and bearing in mind that the primary aim was to
facilitate the use of this procedure in routine laboratories, we chose to
preconcentrate the sample outside the CE equipment. Elution was performed
in-line and then the eluent was introduced into the capillary.
Initially, the channel diameter was adjusted to receive a commercial C18
spin-column. Because particle size and packing density in a spin column are
two critical variables, they were adjusted for optimal movement of the
preconcentration unit through the vial. Using an o-ring afforded uniform
movement of the unit. The next step involved modifying the system to
integrate the gel. Because the sample should not flow through the gel, the gel
was applied to the channel wall similarly as in so-called “solid-phase
microextraction in a tube.” One of the main difficulties was to ensure efficient
interaction of the gel with the channel wall and hence stability in the former.
Various materials including teflon, methacrylate, vinyl ester, and epoxy resins
were assayed for this purpose. The best results were obtained with
thermostable epoxy resin. Also, an inner wall made of sand was used for
improved interaction with the gel. The length of the unit was chosen to be 4
mm as a compromise between the amount of gel used and the dimensions of
the unit to be coupled in the vial.

EMPLEO DE GELES COMO SORBENTES
183
The preconcentration rate has a critical effect on the preconcentration
efficiency. A time of 20 s was selected to preconcentrate samples. The unit
was moved by applying a constant pressure at the top of the unit and
centrifuging it at 1500 rpm for 5 min. The precision was better than 7% in
both cases. The absolute recovery thus obtained from samples containing 1
µg/L concentrations of the analytes was 38%.
3.3. Analytical figures of merit and analytical applications
Table 1 shows the analytical figures of merit of the proposed method. As
can be seen, the precision was better than 4.5% (expressed as RSD).
Calibration graphs were obtained by injecting standard solutions of the
analytes from the acceptor solution or the eluate. Each point in the calibration
graph represents the average of three independent peak area measurements.
The analytical potential was demonstrated by determining the
nitrophenols in real river water samples obtained from Guadalquivir effluents.
Since no positive real samples were found, spiked samples were analysed.
The sample pH and ionic strength were found to have no effect on the analyte
extraction efficiency. Analyses were performed on 600 µL volumes of
sample.
Recoveries for the analysis of six samples at three concentration level
were excellent and the amounts of analytes extracted very similar to those
added in all cases - the paired t-test revealed the absence of significant
differences at p = 0.05 between the concentrations added and those found.
Recoveries ranged from 93.6 to 112% and the precision for the analysis of
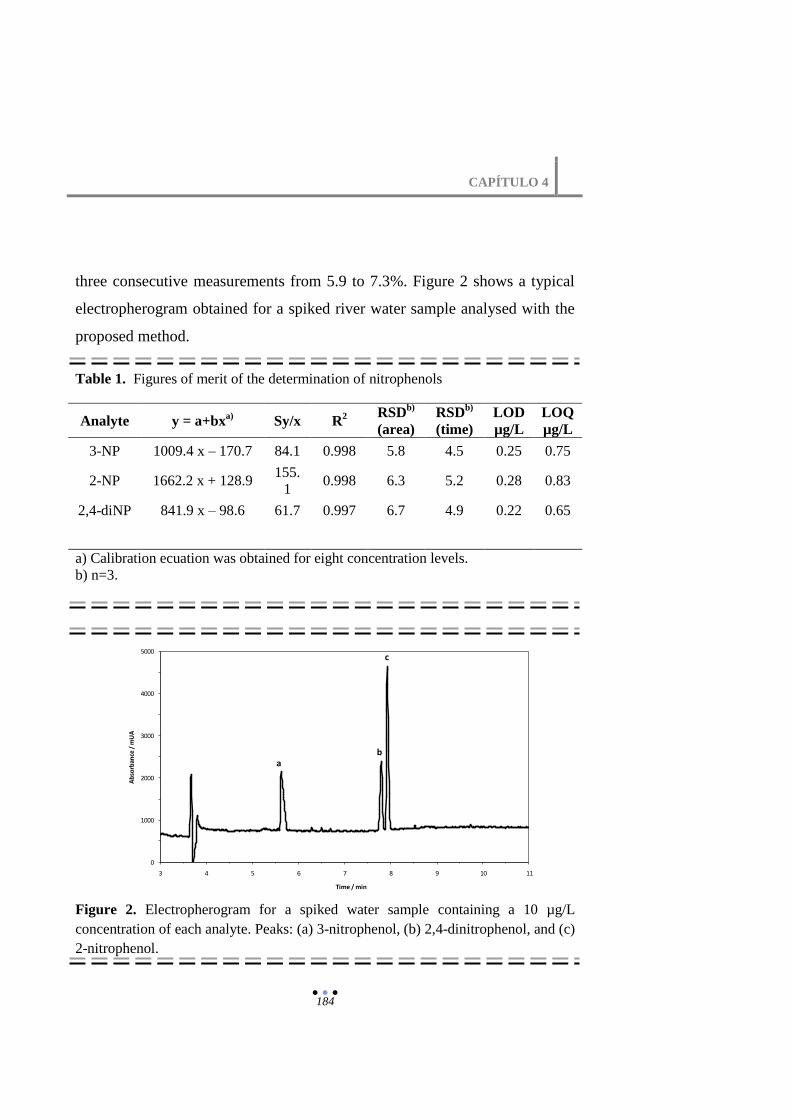
CAPÍTULO 4
184
0
1000
2000
3000
4000
5000
3 4 5 6 7 8 9 10 11
Ab
sorb
ance
/ m
UA
Time / min
ab
c
three consecutive measurements from 5.9 to 7.3%. Figure 2 shows a typical
electropherogram obtained for a spiked river water sample analysed with the
proposed method.
Table 1. Figures of merit of the determination of nitrophenols
Analyte y = a+bxa)
Sy/x R2 RSD
b)
(area)
RSDb)
(time)
LOD
µg/L
LOQ
µg/L
3-NP 1009.4 x – 170.7 84.1 0.998 5.8 4.5 0.25 0.75
2-NP 1662.2 x + 128.9 155.
1 0.998 6.3 5.2 0.28 0.83
2,4-diNP 841.9 x – 98.6 61.7 0.997 6.7 4.9 0.22 0.65
a) Calibration ecuation was obtained for eight concentration levels.
b) n=3.
Figure 2. Electropherogram for a spiked water sample containing a 10 µg/L
concentration of each analyte. Peaks: (a) 3-nitrophenol, (b) 2,4-dinitrophenol, and (c)
2-nitrophenol.

EMPLEO DE GELES COMO SORBENTES
185
4. Conclusions
An in-line micro-SPE-CE unit based on a piston inserted in the sample
vial is for the first time reported. The device affords sample treatment and
introduction into the capillary in the vial itself, thereby, avoiding the need for
filtering and sample handling. The proposed system has three salient features,
namely: (i) it can be directly used with commercial CE equipment; (ii) it
exhibits good analytical performance; and (iii) it is quite economical. In
addition, using a combination of soft materials such as an ionic liquid and
carbon nanotubes provides good analytical performance.
References
[1] Lin, S. H., Juang, R. S., J. Environ. Manage. 2009, 90, 1336–1349.
[2] Guan, W., Han, Ch., Wang, X., Zou, X., Pan, J., Huo, P., Li, Ch., J. Sep. Sci.
2012, 35, 490–497.
[3] US Environmental Protection Agency, Nitrophenols, Ambient Water Quality
Criteria, USEPA,Washington DC, 1980.
[4] Morales, S., Cela, R., J. Chromatogr. A 2000, 896, 95–104.
[5] Guo, X., Wang, Z., Zhou, S., Talanta 2004, 64, 135–139.
[6] Sanagi, M. M., Miskam, M., Wan Ibrahim, W. A., Hermawan, D., Aboul-Enein,
H. Y., J. Sep. Sci. 2010, 33, 2131–2139.
[7] Jaber, F., Schummer, C., Al Chami, J., Mirabel, P., Millet, M., Anal. Bioanal.
Chem. 2007, 387, 2527–2535.
[8] Feng, Q. Z., Zhao, L. X., Lin, J.M., Anal. Chim. Acta 2009, 650, 70–76.
[9] Padilla-Sánchez, J. A., Plaza-Bolaños, P., Romero- González, R., Barco-Bonilla,
N., Martínez-Vidal, J. L., Garrido-Frenich, A., Talanta 2011, 85, 2397–2404.

CAPÍTULO 4
186
[10] Tempels, F. W. A., Underberg, W. J. M., Somsen, G. W., de Jong, G. J.,
Electrophoresis 2008, 29, 108–128.
[11] Puig, P., Borrull, F., Calull, M., Aguilar, C., Trends Anal. Chem. 2007, 26, 664–
678.
[12] Puig, P., Borrull, F., Calull, M., Aguilar, C., Anal. Chim. Acta 2008, 616, 1–18.
[13] Ramautar, R., Somsen, G. W., de Jong, G. J., Electrophoresis 2010, 31, 44–54.
[14] Cai, Y., Jiang, G., Liu, J., Zhou, Q., Anal. Chem. 2003, 75, 2517–2521.
[15] Cai, Y., Jiang, G., Liu, J., Zhou, Q., Anal. Chim. Acta 2003, 494, 149–156.
[16] Cai, Y. Q., Cai, Y. E.,Mou, S. F., Lu, Y. Q., J. Chromatogr. A 2005, 1081, 245–
247.
[17] Polo-Luque, M. L., Simonet, B. M., Valcárcel, M., Anal. Bioanal. Chem. 2012,
404, 903-907.

Empleo de otras
Combinaciones
LI-CNTs


EMPLEO DE OTRAS COMBINACIONES LI-CNTs
189
Una de las propiedades químicas más importantes de los CNTs es su
elevada área superficial altamente hidrofóbica que les confiere una alta
capacidad para adsorber diversos compuestos orgánicos en su superficie. Es
por esta razón por lo que han sido ampliamente utilizados como sorbentes en
extracción en fase sólida. Sin embargo, la alta tendencia a la agregación que
presentan estos materiales afecta negativamente a la adsorción reduciendo
notablemente su superficie activa. Además, cuando esta agregación tiene
lugar en los cartuchos de SPE provoca problemas de sobrepresión que
disminuyen la eficacia del proceso.
Partiendo de estos antecedentes en el apartado 5.1. de esta Memoria se
propone la mejora de las propiedades intrínsecas de los nanotubos de carbono
(SWNTs y MWNTs) mediante el empleo del líquido iónico Hmim PF6 como
agente dispersante de los mismos. Los CNTs totalmente dispersados se
emplearon para sintetizar un sorbente híbrido mediante su combinación con
un sorbente comercial de C18. Dicho sorbente híbrido presenta una mayor
capacidad de adsorción que el sorbente comercial C18 ó los nanotubos,
empaquetados directamente en cartuchos de SPE. Además se observa una
disminución de los problemas de sobrepresión mencionados anteriormente.
Mediante el empaquetado en cartuchos de SPE de tan sólo 20 mg del sorbente
sintetizado fue posible la determinación (mediante EC) de tres sulfonamidas
en diferentes muestras de leche, con límites de detección inferiores a los
establecidos por la regulación europea [1].

CAPÍTULO 5
190
En los últimos años, los líquidos iónicos han cobrado un interés especial
y debido a ello su empleo en diferentes áreas se ha disparado. El interés
despertado por los LIs es en gran parte debido a su consideración como
“disolventes verdes” atendiendo a algunas de sus características tales como
escasa o nula volatilidad, no inflamables y fácilmente reciclables. Sin
embargo, teniendo en cuenta que los LIs son compuestos químicos y por tanto
extraños en el medio ambiente, es probable que en un futuro próximo se
conviertan en contaminantes emergentes, principalmente los derivados del ión
imidazolio (catión muy voluminoso y altamente arómatico), ya que son los
más empleados. Por esta razón es interesante el desarrollo de procedimientos
analíticos para su detección y control.
Así, en el apartado 5.2. del presente Capítulo se proponen un método
miniaturizado y automatizado para llevar a cabo la preconcentración
de niveles traza de líquidos iónicos (imidazolio y piridinio) en muestras de
agua de río y la optimización de un método electroforético para su posterior
determinación y cuantificación. La extracción de los LIs se llevó a cabo con
el empleo de MEPS (microextracción por sorbentes empaquetados) de sílica
conectados a un sistema en flujo. También se emplearon filtros modificados
con nanotubos de carbono para eliminar las potenciales interferencias
orgánicas presentes en el agua.
[1] Establishment of Maximum Residue Levels of Veterinary Medical Products in
Foodstuffs of Animals Origin, Council Regulation No. 237790 of EEC.

5.1. Solid phase extraction-capillary electrophoresis
determination of sulfonamide residues in milk samples by
using C18-carbon nanotubes as hybrid sorbent material


EMPLEO DE OTRAS COMBINACIONES LI-CNTs
193
Submitted to Analyst
Solid phase extraction-capillary electrophoresis determination
of sulphonamide residues in milk samples by use of C18-
Carbon nanotubes as hybrid sorbent material
M.L. Polo-Luque, B.M. Simonet, M. Valcárcel
Department of Analytical Chemistry, University of Córdoba, Campus de
Rabanales, E-14071 Córdoba, Spain
The exceptional sorption capabilities of carbon nanotubes were used to
preconcentrate trace sulphonamides from milk samples. To this end,
single walled carbon nanotubes (SWNTs) and multi walled carbon
nanotubes (MWNTs) dispersed in the ionic liquid 1-hexyl 3-
methylimidazolium hexafluorophosphate were retained on a C18
stationary phase to obtain a hybrid material in a simple manner. In this
approach ionic liquids are an excellent alternative to improve the
dispersion of CNTs, without chemical modification or the use of solid
substances or organic solvent. MWNTs provided better results than
SWNTs. Carbon nanotubes retained in the C18 sorbent matrix were
found to confer aromatic character, increasing its preconcentration
capacity as a result. The conventional C18 stationary phase played a
twofold role: as a support to retain carbon nanotubes in the cartridge
and as a medium to prevent their aggregation. The modified

CAPÍTULO 5
194
MWNTs/C18 and SWNTs/C18 materials were used to preconcentrate
residual sulphonamides (SAs) in milk samples for their determination at
concentrations as low as 0.03–0.069 mg·L-1
by capillary electrophoresis.
Analyte recoveries from spiked samples ranged from 103.2 to 98.8 % and
precision, as RSD, from 8.2 to 5.4 %.
Graphical Abstract

EMPLEO DE OTRAS COMBINACIONES LI-CNTs
195
1. Introduction
Few materials have aroused as much scientific interest as carbon
nanotubes (CNTs), which have gathered an impressive list of superlatives
ever since their discovery in 1991 [1]. CNTs are recognized as the ultimate
carbon fibres and the strongest of all materials known; also, they are
thermally conductive and posses excellent electrical properties and
outstanding field emission properties. CNTs were initially the providence of
scientists interested in their unique physical properties, but in recent years the
focus has increasingly been placed on their chemical properties. Analytical
Chemistry is among the sciences with the highest potential to exploit the
chemical advantages of carbon nanotubes judging by the number of CNT-
based sensors, biosensors, nanoprobes and solid phase extraction devices
currently available [2–4].
One of the most important chemical properties of CNTs is their highly
developed hydrophobic surface, which facilitates strong adsorption of certain
compounds. Their sorption mechanism usually involves weak interactions of
the – stacking, electrostatic, van der Waals or hydrophobic type. They have
been used in Analytical Chemistry to attach small molecules or even
biochemically active molecules onto their surface with a view to developing
various detection devices (microelectrodes), and also to preconcentrating
trace analytes. For example, Long et al. found multi-walled carbon nanotubes
to provide a more efficient sorbent for dioxin removal than activated carbon
[5]. MWNTs have also been used to remove other organic compounds such as
bisphenol A, 4-n-nonylphenol and 4-tert-octylphenol [6], and various

CAPÍTULO 5
196
phthalate esters [7] and chlorophenols [8], from water samples, typically by
using an amount of 0.3–0.5 g of MWNTs packed in a solid phase extraction
minicolumn.
MWNTs have also been used to preconcentrate trace metal ions [9] and
determine trace rare earth metals [10]. Efficient preconcentration was
possible with only 30 mg of MWNTs. Batch adsorption studies have revealed
that SWNTs in suspension or solubilized by chemical modification can
absorb and retain 1,2-dichlorobenzene and trihalomethanes [11, 12]. Also, a
minicolumn packed with MWNTs was succesfully used to preconcentrate
organometallic compounds of lead, mercury and tin [13].
Another analytical use of CNTs based on their surface properties is as
matrices for matrix-assisted laser desorption/ionization time-of-flight mass
spectrometry (MALDI-TOF-MS) [14], where the nanotubes act by trapping
the analytes on their surface and serving as energy receptacles for laser
radiation. Other analytical application of CNTs is microtrap preconcentration
of volatile organic compounds (VOCs). A typical microtrap consists of CNTs
self-assembled on the inside walls of a steel capillary, which thus acts as a
nanoconcentrator and an injector for gas chromatography [15].
Additionally, CNTs could be effectively assembled on the surface of C18
based on the strong hydrophobic interaction between MWNTs and C18. Guo
et al. employed a MWNTs/C18 composite into a carbon paste microelectrode.
For that, they mixed the suitable proportion of C18 and acid treated MWNTs
dispersed in ethanol with ultrasonic agitation [16]. The discovery of

EMPLEO DE OTRAS COMBINACIONES LI-CNTs
197
imidazolium-ion-based ionic liquids as a new class of dispersants for CNTs
by Fukushima et al. [17] has led to a new strategy to disperse CNTs by
themselves, affording readily processable gelatinous substances. The purpose
of this work was to assess the sorption capabilities of a CNTs/C18 hybrid
material for preconcentrating aromatic compounds such as sulphonamides
from milk. MWNTs/C18 and SWNTs/C18 hybrid materials have been prepared
by using the Hmim PF6 ionic liquid as medium for the complete dispersion of
CNTs. The method validated involved clean-up and preconcentration
procedures, based on protein precipitation followed by SPE, prior to CE
analysis. The ensuing analytical method was validated by application to
spiked real milk samples.
2. Materials and methods
2.1. Chemicals
Sulphamethazine, sulphadiazine and sulphathiazole were purchased from
Sigma (Barcelona, Spain). A mixture of the three SAs and individual standard
stock solutions containing a 100 mg·L−1
concentration of each compound
were prepared by dissolution in methanol and stored at 4 °C. Standard
working-strength solutions were prepared on a daily basis by dilution of the
stock standards with Milli-Q water (18 MΩ) from a Millipore (Bedford, MA,
USA) purifying system.
HPLC-grade methanol and hydrochloric acid (35%) were obtained from
Panreac (Barcelona, Spain) and sodium hydroxide was supplied by Sigma–
Aldrich (St. Louis, MO, USA). Multi walled carbon nanotubes (110-170 nm

CAPÍTULO 5
198
Ø) were purchased from Mer Corporation (Arizona, USA) and single walled
carbon nanotubes (˂ 2 nm Ø) from NTP ltd. (China). The ionic liquid (Hmim
PF6) was purchased in purity higher than 99% from Merck (Darmstadt,
Germany). Na2HPO4 and NaH2PO4 used to prepare the background
electrolyte (BGE) were from Sigma–Aldrich (St. Louis, MO, USA). Finally,
the C18 sorbent was extracted from cartridges commercially available from
Waters Corporation (Milford, USA).
2.2. Equipment
Capillary electrophoresis was performed on a Beckman Coulter (Palo
Alto, CA, USA) P/ACE MDQ instrument equipped with an on-column UV
detector and a diode array detector (DAD). The instrumental setup was
governed, and data acquired and processed, by using the software 32 Karat.
2.3. Preparation of the CNTs/C18 hybrid sorbent material
An amount of 2 mg of carbon nanotubes (SWNTs or MWNTs) was
mouldered by hand with the minimum amount of IL (Hmim PF6) until a
homogenous mixture was obtained. Then, proportions of IL were
successively added with continuous mouldering up to 1 mL. The system was
ultrasonicated at 60Hz in a bath for 15 min to ensure the absence of
aggregates. Then, 200 mg of C18 sorbent material was added and mixed with
the moulder to obtain a homogenous mass. This was followed by
centrifugation at 4500 rpm for 15 min to remove the excess of IL. The solid
was then washed with methanol three times to remove IL completely, with
resuspension in 4 mL of methanol and centrifugation between washings.

EMPLEO DE OTRAS COMBINACIONES LI-CNTs
199
Finally, the modified sorbent was allowed to dry at room temperature. To
preconcentrate the analytes, an amount of 20 mg of the hybrid sorbent
material was packed into empty SPE cartridges 6 mm in diameter. This
provided two sorbents designated MWNTs/C18 and SWNTs/C18. Figure 1
shows a representative diagram of the process to obtain the hybrid sorbent.
Figure 1. Diagram of the process to obtain the hybrid sorbents materials: (1)
MWNTs/C18 and (2) SWNTs/C18.

CAPÍTULO 5
200
We also prepared a different sorbent by directly mixing C18 and MWNTs
in the absence of IL so that the MWCNTs would lie atop the C18 sorbent
material (C18+MWNTs). The preconcentration capacity of this sorbent was
compared with that of the hybrid sorbent (MWNTs/C18).
2.4. General procedure
We used a sample treatment similar to that reported by Santos et al. [18]
but optimized for our working conditions. Thus, a volume of 1 mL of milk
spiked with the analytes was mixed with 1 mL of a 6M HCl aqueous solution
and the mixture was left in contact for 1 hour and then was centrifugated at
13500 rpm for 15 min. Next, the supernatant, previously filtered, was loaded
into 20 mg MWNTs/C18 or SWNTs/C18 cartridges previously activated with 2
mL of methanol plus 2 mL of water. Then, the cartridges were cleaned with
0.5 mL of water and dried by gently flowing air through them. Finally, the
analytes were eluted by passing 100 µL of eluent.
2.5. CE operating conditions
The uncoated fused-silica capillary (75 µm I.D., 375 mm O.D.) used was
supplied by Beckman (Fullerton, CA, USA). A detection wavelength of
265 nm and a thermostated experimental temperature of 20 °C were used
throughout. Separation was accomplished by simultaneously using an applied
voltage of 15 kV and an overimposed pressure of 20 psi on both vials in order
to avoid the current interruption due to the evaporation of the organic solvent
present in the sample. Samples were injected in the hydrodynamic mode
under a pressure of 0.5 psi for 10 s. The capillary was sequentially rinsed with

EMPLEO DE OTRAS COMBINACIONES LI-CNTs
201
1 M HCl, 0.1 M NaOH and ultrapure water for 5 min each prior to use, and
conditioned by passing 0.1 M NaOH for 3 min, ultrapure water for 2 min and
running buffer for 5 min between runs. All conditioning steps were performed
at 20 psi. The optimum buffer was found to consist of 45 mM
Na2HPO4/NaH2PO4 at pH 7.3.
3. Results and discussion
The determination of residual sulphonamides in milk samples is of a high
interest because these antibiotics have been deemed emergent contaminants.
However, the capabilities of capillary electrophoresis fall short of the
requirements for their direct determination in milk samples. In this work, we
assessed the ability of MWNTs in dispersed form and retained on a C18 matrix
as alternatives to classical sorbent materials for preconcentrating trace
sulphonamides. To this end, the chemical and instrumental variables involved
were optimized as described below.
3.1. Chemical and instrumental CE variables
The running buffer employed was that also used by Lara F.J. et al. [19]
consisting of an aqueous solution of 45 mM Na2HPO4/NaH2PO4 at pH 7.3. It
was prepared by dissolving 177 mg of NaH2PO4 and 457 mg of Na2HPO4 in
100 mL of Milli-Q water without further pH adjustment. Employing this
buffer lower migration times and higher sensitivity were obtained.

CAPÍTULO 5
202
The effect of the instrumental parameters affecting migration times (viz.
capillary temperature and applied voltage) was also examined. Raising the
temperature from 15 to 35 ºC resulted in poorer resolution, so 20 ºC was
adopted. The influence of the applied voltage was examined over the range 5–
20 kV; based on the results, 15 kV was chosen as optimal. In order to
improve sensitivity, volume sample injection was also studied. The
compounds were introduced into the capillary for 5 to 15 s at 0.5 psi.
Working in the recommended CE conditions, it was found that introducing 10
s of sample provide best results in terms of sensitivity of SAs considered.
3.2. Milk samples pretreatment
Because the milk matrix contains several compounds, mainly proteins
and lactose, the success of the extraction procedure depended on the effective
deproteinization. Direct preconcentration without any deproteinization stage
resulted unsuccessful due to cartridge collapse. In the present work, a simple
protein precipitation was performed using 1 mL of 6 M HCl. The mixture was
left for 1 hour at room temperature in order to favor the total interaction
between the SAs and milk sample. Then, the sample was centrifuged (13500
rpm for 15 min) to remove precipitated proteins and the fatty material in the
sample. Finally, the supernatant was filtered through a 0.45 µm membrane
filter of nylon to obtaining a clear solution. Milk sample clean-up and
extraction of SAs from milk samples using SPE is shown in figure 2.

EMPLEO DE OTRAS COMBINACIONES LI-CNTs
203
Figure 2. Diagram of the sequence of sample clean-up and extraction of SAs from
milk samples.

CAPÍTULO 5
204
3.3. Preconcentration and purification of samples
An amount of 2–20 mg of carbon nanotubes was added to 200 mg of C18
sorbent material to study the effect of the amount of CNTs. Using more than
6 mg of CNTs was discarded because the resulting material was not
homogeneous, it exhibited carbon nanotube aggregates under the microscope.
Modified sorbents containing 2, 4 or 6 mg of CNTs were studied as potential
sorbents. Based on the results, a small amount of CNTs was enough to ensure
quantitative retention of the sulphonamides. In general, increasing the amount
of CNTs decreased retention of the analytes. We examined the distribution of
carbon nanotubes in the C18 sorbent to assess the aromaticity or
hydrophobicity of the hybrid sorbent. The solid was characterized by confocal
Raman spectroscopy. To this end, 10 10 m Raman images were recorded
with a 100×/1.25, ∞/0.17, WD 0.18 mm objective. The images revealed
homogenous distribution of the nanotubes in the solid. Based on the Raman
spectrum, CNTs spanned 95% of its surface. Despite their homogenous
distribution, carbon nanotubes formed small aggregates 0.5–5 m in size that
occupied approximately 0.2% of the total surface. Therefore, although the
nanotubes accounted for only 1 % of the sorbent weight, they spanned more
than 95% of its active surface. A photograph of the optimum hybrid sorbent
(with MWNTs) is shown in figure 3. As can be seen the resulting material is
homogeneous, showing a fine grey texture.

EMPLEO DE OTRAS COMBINACIONES LI-CNTs
205
Figure 3. Photograph of the hybrid sorbent material obtained with 2 mg MWNTs
and 200 mg of C18.
Preliminary tests showed that packing CNTs in cartridges resulted in
high overpressure in the system. It was therefore necessary to determine the
optimum cartridge dimensions and their effect on the flow rate. Very thin
cartridges (2–5 mm) resulted in high pressures and even collapsed after 10–15
determinations. These problems were avoided by using cartridges with an
inner diameter of 6 mm, which afforded constancy in the flow rate even after
several runs.
Once the optimum cartridge dimensions and amount of CNTs were
determined, the influence of the sample pH and eluent composition was
studied in greater detail. The effect of the sample pH was studied by adding
HCl at a variable concentration from 1.5 to 6 M. The best results were
obtained with 6 M HCl, which ensured that the sulphonamides were in neutral
form and hence capable of interacting with the sorbent as well as enables

CAPÍTULO 5
206
sample deproteinization. Methanol and acetonitrile were assessed as eluents,
methanol proved the better. In order to make the sample more compatible
with the electrophoretic method, eluent was used in combination with
ammonia (60% MeOH/39% H2O/1% NH3 by volume) as described Lara F.J.
et al. [19]. The volume of eluent was studied in the interval 50-150 µL and it
was concluded that quantitative elution can be carried out in only 100 μL.
Posterior elutions did not result in quantifiable signals. Recoveries obtained
approaching 100% at the 95% confidence level for analytes concentrations
over the range 0.5–4.5 mg·L-1
.
3.4. Analytical features and applications
Table 1 compares the analytical features of the proposed method
(preconcentration included) using MWNTs/C18 and SWNTs/C18 as sorbent.
As can be seen, the detection limit (LOD) ranged from 0.03 to 0.069 mg·L-1
and the quantitation limit (LOQ) from 0.099 to 0.23 mg·L-1
. The precision, as
RSD, was better than 6.4%. Calibration graphs exhibited good correlation for
the three analytes, with coefficients exceeding 0.994 in all cases. SWNTs/C18
led to poorer precision and sensitivity owing to the low recoveries obtained.
Taking into account that the maximum residue limits (MRL) established by
European regulation is 100 µg of total SAs·kg-1
in edible animal tissues,
including milk [20], this hybrid sorbent is suitable for the determination of
SAs.

EMPLEO DE OTRAS COMBINACIONES LI-CNTs
207
Table 1. Figures of merit of the determination of three sulphonamides by using the
proposed method with MWNTs/C18 and SWNTs/C18 hybrid sorbent.
Analytes LOD
(mg·L-1
)
LOQ
(mg·L-1
)
RSDa
(%)
Recoveryb
(%)
MWNTs/C18
Sulphamethazine 0.069 0.23 5.5 97.8–101.8
Sulphadiazine 0.041 0.136 6.4 98.0–102.3
Sulphathiazole 0.030 0.099 5.4 99.1–101.7
SWNTs/C18
Sulphamethazine 0.103 0.383 7.2 59.8–65.8
Sulphadiazine 0.058 0.235 6.9 55.2–70.2
Sulphathiazole 0.048 0.174 6.2 67.3–71.3
a Mean of 6 measurements
b Corresponding to standards containing 0.5, 1.5, 3 and 4.5 mg·L
-1
Detecting antibiotics in real samples is known to be a difficult task owing
to their typically low concentrations and the presence of many interferents in
the matrix. In addition to sensitivity problems, direct injections of
concentrated samples led to irreproducible migration times that made accurate
quantitation of the analytes impossible. The analysis of commercial milk
samples revealed the absence of sulphonamide residues. Therefore,
demonstrating the analytical potential and accuracy of the proposed method
required using spiked samples for preconcentration with MWNTs/C18 and

CAPÍTULO 5
208
subsequent electrophoretic determination. Figure 4 shows the
electropherogram for a real sample spiked with a 0.25 mg·L-1
concentration of
each sulphonamide and Table 2 the analytical results. As can be seen,
recoveries ranged from 98.8 to 103.2 % and the precision, as RSD, in 5
consecutive analyses from 8.2 to 5.4 %.
Figure 4. Typical electropherogram for a mixture containing a 0.25 mg·L-1
concentration of each sulphonamide. Peaks: (1) Sulphamethazine, (2) Sulphadiazine,
(3) Sulphathiazole.

EMPLEO DE OTRAS COMBINACIONES LI-CNTs
209
Table 2. Analysis of spiked milk samples by using the proposed method with
MWNTs/C18 as sorbent material.
Analytes Added
(mg·L-1
)
Found
(mg·L-1
)
Recovery
(%)
RSDa
(%)
Sample 1
Sulphamethazine 0.25 0.247 98.8 5.9
Sulphadiazine 0.25 0.254 101.6 8.2
Sulphathiazole 0.25 0.248 99.2 6.5
Sample 2
Sulphamethazine 0.3 0.298 99.3 6.8
Sulphadiazine 0.3 0.304 101.4 7.2
Sulphathiazole 0.3 0.299 99.7 6.1
Sample 3
Sulphamethazine 0.5 0.516 103.2 7.6
Sulphadiazine 0.5 0.498 99.6 8.0
Sulphathiazole 0.5 0.496 99.2 6.5
Sample 4
Sulphamethazine 0.8 0.803 100.4 5.4
Sulphadiazine 0.8 0.82 102.5 6.4
Sulphathiazole 0.8 0.799 99.9 5.9
Sample 5
Sulphamethazine 1 0.989 98.9 7.0
Sulphadiazine 1 0.993 99.3 7.4
Sulphathiazole 1 0.1004 100.4 8.2
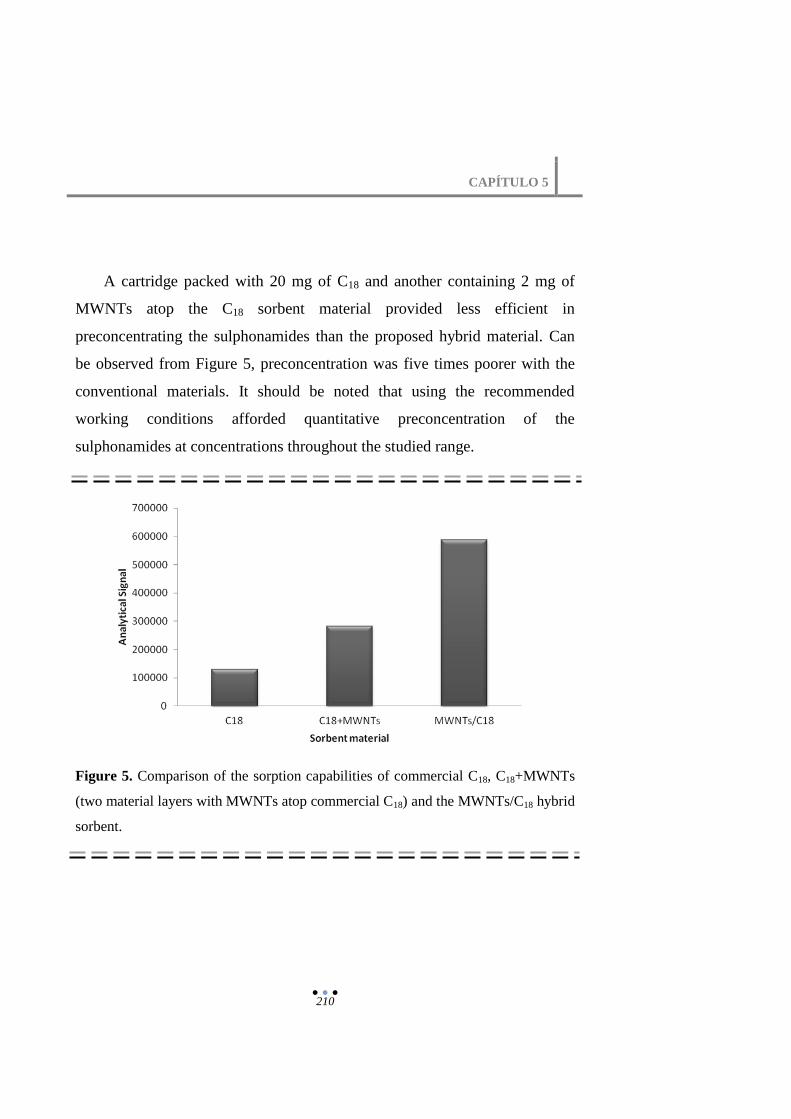
CAPÍTULO 5
210
A cartridge packed with 20 mg of C18 and another containing 2 mg of
MWNTs atop the C18 sorbent material provided less efficient in
preconcentrating the sulphonamides than the proposed hybrid material. Can
be observed from Figure 5, preconcentration was five times poorer with the
conventional materials. It should be noted that using the recommended
working conditions afforded quantitative preconcentration of the
sulphonamides at concentrations throughout the studied range.
Figure 5. Comparison of the sorption capabilities of commercial C18, C18+MWNTs
(two material layers with MWNTs atop commercial C18) and the MWNTs/C18 hybrid
sorbent.

EMPLEO DE OTRAS COMBINACIONES LI-CNTs
211
4. Conclusions
In this paper has been demonstrated the usefulness of MWNTs/C18 as an
alternative hybrid sorbent material for preconcentrating residual
sulphonamides from milk samples. The sorption capabilities of MWNTs/C18
clearly surpass those of SWNTs/C18. This allows one to use small amounts of
MWNTs, which suggests the possibility of purifying analytes by molecular
interaction rather than classical sorbent-surface-analyte interactions.
The main contributions of this work are the following: i) the usefulness
of ionic liquid to disperse CNTs as an alternative to traditional organic
solvent; ii) the synthesis of homogeneous CNTs/C18 corroborated by Raman
were the spectrum of the carbon nanotubes was detected in the 95% of the
surface; iii) the performance of CNTs/C18 as hybrid sorbent material
employed in solid phase extraction; iv) the determination of analytes of
interest such as sulphonamides.
References
[1] S. Iijima, Nature, 1991, 354, 56–58.
[2] A. Merkoci, Microchim. Acta, 2006, 152, 157–174.
[3] M. Trojanowicz, Trends Anal. Chem., 2006, 25, 480–489.
[4] M. Valcárcel, B.M. Simonet, S. Cárdenas, B. Suárez, Anal. Bioanal. Chem.,
2005, 382, 1783–1790.
[5] R.Q. Long, R.T. Yang, J. Am. Chem. Soc., 2001, 123, 2058–2059.
[6] Y. Cai, G. Jiang, J. Liu, Q. Zhou, Anal. Chem., 2003, 75, 2517–2521.
[7] Y. Cai, G. Jiang, J. Liu, Q. Zhou, Anal. Chim. Acta, 2003, 494, 149–156.
[8] Y. Cai, Y. Cai, S. Mou, Y. Lu, J. Chromatogr. A, 2005, 1081, 245–247.

CAPÍTULO 5
212
[9] P. Liang, Y Liu, L. Guo, J Zeng, H.B. Lu, J. Anal. At. Spectrom., 2004, 19,
1489–1492.
[10] P. Liang, Y Liu, L. Guo, Spectrochim. Acta B, 2005, 60, 125–129.
[11] S.B. Fagan, A.G. Souza Filho, J.O.G. Lima, J. Mendes Filho, O.P. Ferreira, I.O.
Mazali, O.L. Alves, M.S. Dresselhaus, Nano Lett., 2004, 4, 1285–1288.
[12] C.S. Lu, Y.L. Chung, K.F. Chang, Water Res., 2005, 39, 1183–1189.
[13] J. Muñoz, M. Gallego, M. Valcárcel, Anal. Chem., 2005, 77, 5389–5395.
[14] C.S Pan, S.Y. Xu, H.F. Zou, Z. Guo, Y. Zhang, B.C. Guo, J. Am. Soc. Mass
Spectrom., 2005, 16, 263–270.
[15] C. Saridara, R. Brukh, Z. Iqbal, S. Mitra, Anal. Chem., 2005, 77, 1183–1187.
[16] Z. Guo, Y. Xue, X. Zheng, J. Electroanal. Chem., 2009, 625, 47–52.
[17] T. Fukushima, A. Kosaka, Y. Ishimura, T. Yamamoto, T. Takigawa, N. Ishii, T.
Aida, Science, 2003, 300, 2072–2074.
[18] B. Santos, A. Lista, B.M. Simonet, A. Ríos, M. Valcárcel, Electrophoresis,
2005, 26, 1567–1575.
[19] F.J. Lara, A.M. García-Campaña, Ch. Neusüss, F. Alés-Barrero, J. Chromatogr.
A, 2009, 1216, 3372–3379.
[20] Establishment of Maximum Residue Levels of Veterinary Medical Products in
Foodstuffs of Animals Origin, Council Regulation No. 237790 of EEC.

5.2. Combination of carbon nanotubes modified filters with
microextraction by packed sorbent for the NACE analysis of
trace levels of ionic liquids in river water samples


EMPLEO DE OTRAS COMBINACIONES LI-CNTs
215
Talanta 89 (2012) 124-128
Combination of carbon nanotubes modified filters with
microextraction by packed sorbent for the NACE analysis of
trace levels of ionic liquids in river water samples
M.L. Polo-Luque, B.M. Simonet, M. Valcárcel
Department of Analytical Chemistry, University of Córdoba, Campus de
Rabanales, E-14071 Córdoba, Spain
This paper reports for the first time the use of microextraction by packed
sorbents in combination with capillary electrophoresis (CE) for carry out
the preconcentration and determination of three characteristics cations
of ionic liquids in river water. Before analysis a carbon nanotubes
modified filter was used to remove potential organic interferences from
the samples. The system was automated by connecting the syringe–
microextraction by packed sorbents (MEPS) assembly to a syringe pump
and interfacing it to a computer. After preconcentration, analytes were
determined by NACE. The limits of quantification of analytes were of
0.02 mg·L−1
from only 5 mL of sample with an RSD of less than 7%. The
values of recovery range between 85 and 97%.

CAPÍTULO 5
216
1. Introduction
Ionic liquids (ILs) are molten salts formed of organic cations and
inorganic or organic anions, some of which can be liquid at room
temperature. As a rule, any salt with melting point below 100 ºC is considered
to be IL [1]. Although ILs exists since 1914, they were not exploited at large
scale until 2000. The main advantage of ionic liquids is that they are a new
class of solvents by their non-molecular nature [2]. Furthermore, ILs have
interesting physical and chemical properties like high electrical conductivity,
tunable solubility and miscibility, high thermal stability and a wide range of
viscosities [3–8].
Ionic liquids have attached more and more attention over the last few
years. This is due to the fact that they have been promoted as “green” solvents
(although more recent data demonstrate that there are issues with this claim).
Due to the increase of the use of ionic liquids, in the future they can be
emergent pollutants, for this reason the study of ILs becomes necessary in the
environment. If we attend to the ionic liquids properties, such no measurable
vapor pressure and easy recycling, we can consider them as green solvents,
therefore their step to the environment is minor that the common organic
solvents. However, if we attend to his definition as chemical compound and
therefore not native, we cannot to consider them like “green”; since their
accidental discharge into the environment is considered like pollution. In
addition, the majority of the most useful ionic liquids in chemistry, they have
in his structure a cation based on the imidazolium ion, which is an aromatic
compound, and therefore very pollutant.

EMPLEO DE OTRAS COMBINACIONES LI-CNTs
217
In recent years, several emerging application areas have been described
in the literature. These show IL as novel media for electrochemistry,
biological studies, as medium for enzyme catalysis and solvents for sample
preparation (extraction process) [9, 10]. CE has been proved to be a reliable,
simple, and with excellent analytical performance parameters in separations
of cations such as alkyl and aryl imidazolium IL cations [11]. Stepnowski and
Mrozik [12] investigated the chromatographic behavior of eight different ILs
with a strong cation exchanger stationary phase.
Stepnowski reports the first published routine SPE method for pre
concentrating room-temperature ionic liquids in environmental water samples
[13]. The method is simple and selective and is thought to be applicable to
imidazolium ionic liquids. The extraction and isolation of room temperature
ionic liquid (RTIL) residues in a number of plants, seeds and soils has been
also described [14].
We propose a miniaturized method for pre-concentrating ionic liquids
which can be applied to imidazolium and pyridinium ionic liquids.
Consequently, the aim of this work is carry out the preconcentration of ionic
liquids in river water by using MEPS (microextraction by packed sorbents
system) and their determination by CE analysis. To best of our knowledge,
the use of MEPS to preconcentrate ionic liquids in river water has not been
previously reported in the literature.

CAPÍTULO 5
218
2. Materials and methods
2.1. Reagents and standards
The analytes studied were Hmim PF6 (1-hexyl 3-methylimidazolium
hexafluorophosphate), Hmim Im (1-hexyl 3-methylimidazolium bis
(trifluoromethylsulfonyl) imide), Bmim PF6 (1-buthyl 3-methylimidazolium
hexafluorophosphate), Bmim BF4 (1-buthyl 3-methylimidazolium
tetrafluoroborate) and Emp Im (1-ethyl 3-methylpyridinium bis
(trifluoromethylsulfonyl) imide) > 99% were purchased from MERCK
(Darmstadt, Germany). The characteristic cation structures of the ionic liquids
(target analytes) are shown in Fig. 1. A mixture of five ILs and individual
standard stock solutions containing a 1000 mg·L−1
concentration of each
compound was prepared by dissolution in methanol. Working solutions of the
ILs were made by using purified water (18 MΩ) from a Milli-Q water
purified system (Millipore, Bedford, MA, USA).
Ammonium acetate, formic acid (Sigma–Aldrich) and HPLC grade
methanol (Panreac Quimica, S.A., Barcelona, Spain) were used to prepare the
BGE and eluent. Potassium hydroxide (Merck, Darmstadt, Germany) was
used for capillary conditioning.
Multi-walled carbon nanotubes (5–20 nm outer diameter and length 1–10
µm) from Bayer and Triton X-100 (Fluka) were used to prepare the carbon
nanotubes modified filters for the sample clean up stage.

EMPLEO DE OTRAS COMBINACIONES LI-CNTs
219
Figure 1. Structures of 5 ionic liquids. (A) Ionic liquids with HMIM cations, (B)
ionic liquids with BMIM cations and (C) ionic liquid with EMP cation.
2.2. Instrumentation
Capillary electrophoresis was performed on a Beckman Coulter (Palo
Alto, CA, USA) P/ACE MDQ instrument equipped with an on column diode
array detector (DAD). The instrumental setup was controlled, and data
acquired and processed using a 32 Karat software.
2.3. Instrumental operation conditions
The uncoated fused-silica capillaries used (50 µm I.D., 375 mm O.D.)
were supplied by Beckman (Fullerton, CA). Each new capillary was initially
conditioned with 1 M HCl (5 min), 0.1 mol·L−1
NaOH (10 min) and Milli-Q

CAPÍTULO 5
220
water (5 min), in this sequence. Each day, the capillary in use was
conditioned with 0.05 mol·L−1
potassium hydroxide (5 min), methanol (5
min) and running buffer (10 min). Between runs, the capillary was rinsed
with potassium hydroxide (5 min), methanol (5 min) and BGE (5 min). All
conditioning steps were performed at 20 psi.
The optimum BGE was found to consist of 100 mmol·L−1
ammonium
acetate in methanol. The capillary cartridge was kept at 20 º C. Samples were
kept at ambient temperature in the autosampler and injected in the
hydrodynamic mode at 0.5 psi for 15 s. Tests were carried out in the positive
polarity mode, using a detection wavelength of 210 nm, a constant voltage of
10 kV and an over imposed pressure of 50 psi in both vials in order to avoid
the current interruption due to the evaporation of the organic solvent during
analysis due to Joule effect. The current was around 20 µA in all analysis.
2.4. Analytical procedure
Automatic setup was performed with a microextraction by packed
sorbents system (MEPS) (SGE Analytical Science); each cartridge contain ≈
4 mg of silica, the cartridge volume is 8 µL, the particle size is 45 µm and a
pore size of 60 A˚. The system was automated by connecting the syringe–
MEPS assembly to a syringe pump (Cavro) that was controlled via a
computer running the software Sagittarius 3.0, which was obtained from the
working group on Chemical Analysis and Vibrational Spectroscopy of the
Vienna University of Technology, Austria. 5 mL of sample was passed
through the MEPS in 8 min. Finally, analyte elution was performed by

EMPLEO DE OTRAS COMBINACIONES LI-CNTs
221
passing through the MEPS a volume of 250 µL methanol containing 5 mg·L−1
ammonium acetate and a 0.2% formic acid. Elution flow rate was 0.25 mL
min−1
.
The MEPS system was conditioned with methanol first and then water
prior to first use. In addition, it was washed with sodium hydroxide 0.1
mol·L−1
and water after each run in order to regenerate the sorbents and to
improve the precision.
The sample treatment was carried out following the above described
procedure. To improve the preconcentration and to prevent possible matrix
effects, a previous clean up stage was carried out by filtering the river water
before carrying out the preconcentration process. River water samples come
from different effluents of river Guadalquivir. For this purpose the use of
carbon nanotubes modified filters was recommended. Modified filters were
obtained from commercially available nylon filters (25 mm, 0.45 µm). For
modification, 5 mL of a solution – containing 1.34 mg·mL−1
MWCNTs
dispersed with 0.5% Triton X-100 and ultrasonication (50 W, 60 Hz, 20 min)
– were passed through the filters by vacuum suction. Finally, the excess of
surfactant was removed from the filters with 10 mL methanol and 5 mL water
with the aim of removing the surfactant.
3. Results and discussion
The study of variables affecting the preconcentration and determination
of analytes as well as the analytical features of the analysis of spiked samples
are discussed in this section.

CAPÍTULO 5
222
3.1. Electrophoretic conditions
Ionic liquids have a high affinity to be adsorbed on the capillary wall
surface. In relation with this fact several publications exist, where ionic
liquids are used as modifiers of the wall of the capillary to improve the
electrophoretic separation of some analytes [15, 16]. For this reason we
selected a silica MEPS to carry out the pre-concentration of ionic liquids.
Moreover NACE analysis was chosen in order to compatibilize the pre-
concentration step with electrophoretic separation. In order to avoid problems
due to analyte adsorption, methanol was selected as a media to carry out the
CE separation. Using methanol as a solvent, several acid and basic buffers
(citric acid and ammonium acetate) were investigated to check the non-
aqueous electrophoretic separation of the analytes. We selected these buffers
in order to obtain an appropriate electroosmotic flow and appropriate
electrophoretic resolution. When citric acid was used as BGE, in general, a
poor sensitivity and resolution was observed. Controversy, when the BGE
was based in ammonium acetate at basic pH the sensitivity was satisfactory. It
became crucial to determine the influence of the BGE’s conditions like type
of dissolvent, ionic strength and pH on ionic liquid migration times. The BGE
composition is known to affect CE analyses, so we studied the effect of the
addition of acetonitrile and water to the BGE. Based on the results, a 100%
volume of methanol provided the best CE system in terms of CE-current
stability and sensitivity.
The effect of the concentration of ammonium acetate was studied in the
range from 50 to 150 mmol·L−1
. As the concentration of the buffer increased

EMPLEO DE OTRAS COMBINACIONES LI-CNTs
223
from 50 to 100 mmol·L−1
, the resolution of separated peaks of the analyzed
compounds increased, so, considering these results, the concentration of 100
mmol·L−1
was finally recommended. In addition, we studied the effect of the
pH on peak shape and migration times of analytes. pHa was studied in the
range 6.5–9.0. The best resolution was obtained at pHa 7.7. Therefore such
value was chosen as the optimal one for separating the mixture of ionic
liquids under study.
The dependence of the migration velocities of the analytes on the applied
electrical field strength was also examined. As expected, the migration time
decreased with increasing separation voltage. Owing to the Joule heat
generation effect in the BGE (100% methanol), which is a function of the
applied field strength, molar conductivity of electrolyte and its concentration,
the highest applied voltage which provide an acceptable current (22 µA) was
10 kV.
In order to improve sensitivity, volume sample injection was also
studied. The compounds were hydrodynamically introduced into the capillary
for 5–15 s at 0.5 psi. Working in the recommended CE conditions, it was
possible to introduce 15 s of sample without lose of resolution or peak
symmetry. Fig. 2 presents an electropherogram of the mixture of 3 ionic
liquid cations under optimized conditions. In the electropherogram we only
observe three picks corresponding to three cations studied, since we selected
2 ILs with the cation Bmim+, two with Hmim
+ and one with Emp
+. From the
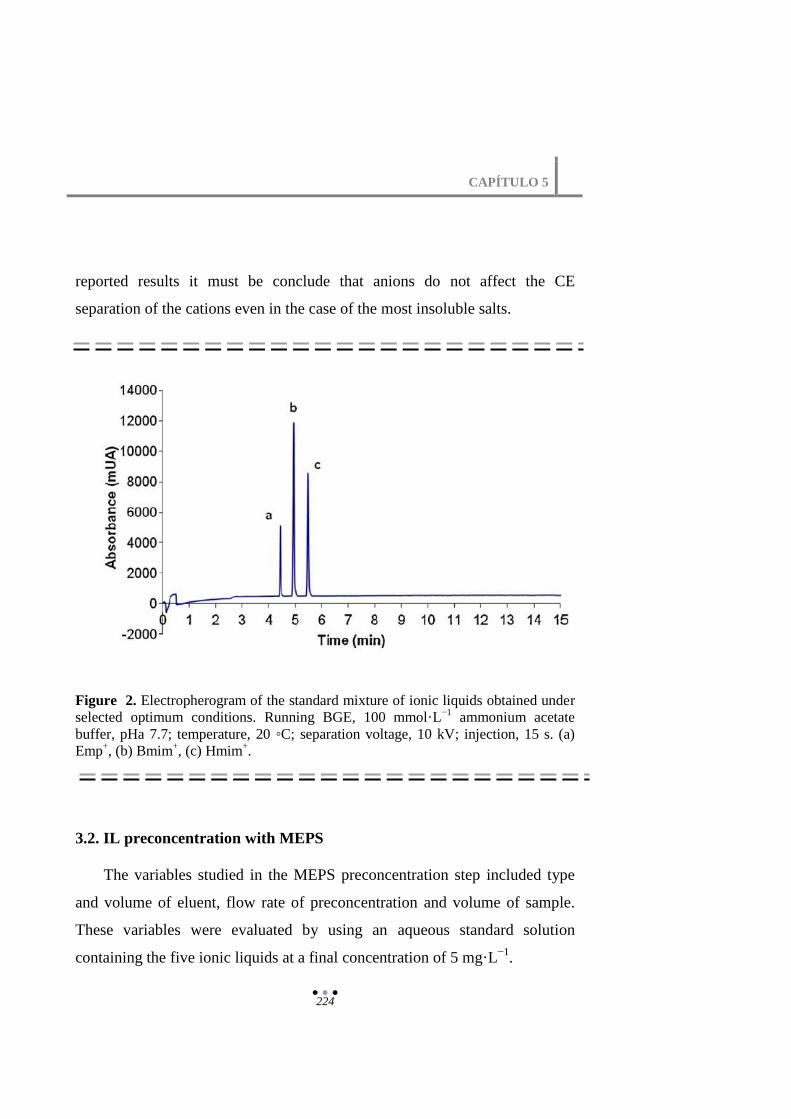
CAPÍTULO 5
224
reported results it must be conclude that anions do not affect the CE
separation of the cations even in the case of the most insoluble salts.
Figure 2. Electropherogram of the standard mixture of ionic liquids obtained under
selected optimum conditions. Running BGE, 100 mmol·L−1
ammonium acetate
buffer, pHa 7.7; temperature, 20 C; separation voltage, 10 kV; injection, 15 s. (a)
Emp+, (b) Bmim
+, (c) Hmim
+.
3.2. IL preconcentration with MEPS
The variables studied in the MEPS preconcentration step included type
and volume of eluent, flow rate of preconcentration and volume of sample.
These variables were evaluated by using an aqueous standard solution
containing the five ionic liquids at a final concentration of 5 mg·L−1
.

EMPLEO DE OTRAS COMBINACIONES LI-CNTs
225
Two different organic solvents were evaluated as eluent, namely:
methanol and acetonitrile. These eluents were selected on the base of the
solubility of ionic liquids and in order to avoid the interaction between the
ionic liquids and the silanol groups of the stationary phase. In this way, it is
important to remark that preconcentration was higher than C18 when using
silica as sorbent. Elution yield was better with methanol than acetonitrile.
However, it was not quantitative. In order to improve the elution the effect to
add a salt such as ammonium acetate in the methanol as eluent was tested.
The salt concentrations were evaluated within the interval 0–15 mmol·L−1
. In
general, elution yield increases when increase the concentration of the salt.
However, higher concentration of salt in the sample results in non-
symmetrical peaks in the CE separation (Fig. 3). Based on the results a
concentration of 5 mmol·L−1
was fixed as the optimum concentration, and the
effect of adding an acid such as formic acid which has a low effect on the
ionic strength of the system was studied. The effect of formic acid was
evaluated in the range from 0 to 1% (v/v). Finally, 0.2% formic acid was
recommended to ensure quantitative elution of the analytes and to assure the
analyses by CE. Considering these studies, we selected 5 mmol·L−1
AcNH4
and 0.2% formic acid in methanol as eluent.
The volume of eluent was studied in the interval 0.1–0.5 mL and it was
concluded that quantitative elution can be carried out in only 250 µL. The
sample volume was optimized within the interval 1–10 mL of aqueous
standards containing in all cases 5 mg·L−1
of each ionic liquid. It was
observed that volumes higher than 5 mL produced a decrease in the peak

CAPÍTULO 5
226
areas, and therefore, it was fixed as the breakthrough volume (Fig. 4). We
also examined the influence of the flow rate of sample which was studied
over the range 5–1000 µL s−1
; based on the results, the best sensitivity was
achieved with 100 µL s−1
.
Figure 3. Effect of the concentration of ammonium acetate in the methanol as
eluent.
Figure 4. Optimization of the sample volume.

EMPLEO DE OTRAS COMBINACIONES LI-CNTs
227
As it has been indicated, ILs were preconcentrated on MEPS of silica.
MEPS containing C18 were not efficient to preconcentrate the ILs. ILs
presents a high tendency to interact with carbon nanotubes, therefore the use
of carbon nanotubes modified filters to preconcentrate the ILs was also tested.
Using the carbon nanotubes provided by Bayer, it was observed that ILs were
not retained in the filter. Contrary, other organic compounds were
preconcentrated as it is well described in the literature [17,18]. Therefore, the
use of modified filters was proposed to remove potential interference from the
matrix before preconcentration. It must be point out that microextraction
techniques, such as MEPS, are limited for the rapid saturation of the sorbents.
The effect of the filters to remove organic compounds in part was observed in
terms of a higher stability of the background line of the electropherogram of
real samples. Syringe and support of the filters was of polyethylene in order
to avoid the non-desired adsorption of the analytes.
3.3. Analytical figures of merit
Table 1 shows the analytical figures of merit of the proposed method.
The studies were made for individual cations and a mixture of the three
cations. No effect of the presence of anions was observed. The RSD values
for migration times were under 2% in method. The RSD values for peak areas
were under 7% in method and samples. The values of recovery range between
85 and 97% (see Table 2).

CAPÍTULO 5
228
Table 1. Figures of merit of the analytes following the recommended procedure.
Analyte Slope ± S Sy/x R2
LOQ (ppb) RSD (%)
Emp+ 38517± 1887 571 0.9905 20 3.5
Bmim+
32051 ± 1909 1727 0.986 30 2.0
Hmim+
35323 ± 1128 828 0.997 25 3.8
Table 2. Precision and recovery values of the analysis of spiked samples. Samples
1–5 means that they come from different effluents of river Guadalquivir.
Samples Analyte
Add
concentration
(µg L-1
)
Found
concentration
(µg L-1
)
Recoveries
(%)
RSD
(%)
#1 Emp+ 40 35 88 5.3
#2 Bmim +
54 42-48 85-88 7
#3 Bmim+ 320 305-310 95-97 4
#4 Hmim+ 320 300-304 94-95 4.5
#5
Emim+ 110 99-102 90-92 -
Bmim +
350 330-340 94-97 -
Hmim+ 280 250-270 89-96 -

EMPLEO DE OTRAS COMBINACIONES LI-CNTs
229
4. Concluding remarks
The usefulness of silica-MEPS to preconcentrate ionic liquids has been
demonstrated. In addition it has been proposed the use of a carbon nanotubes
modified filter to remove potential organic interference from the sample. The
method, which is rapid and simple can be used to monitor the presence of ILs
in environmental water samples as well as to perform environmental and
toxicological studies in order to establish the real effect of IL on environment.
References
[1] J.L. Anderson, D.W. Armstrong, G.T. Wei, Anal. Chem. 78 (2006) 2892-2902.
[2] G. Fitzwater, W. Geissler, R. Moulton, N.V. Plechkowa, A. Robertson, K.R.
Seddon, J. Swindall, K. Wan Joo, Ionic liquids: Sources of Innovation, Report Q002,
QUILL, Belfast, 2005.
[3] R.D. Roger, K.R. Seddon (Eds.), Ionic Liquids: Industrial Applications for Green
Chemistry, American Chemical Society, Washington, USA, 2002.
[4] R.D. Roger, K.R. Seddon (Eds.), Ionic Liquids as Green Solvents: Progress and
Prospects, American Chemical Society, Washington, USA, 2003.
[5] R.D. Roger, K.R. Seddon (Eds.), Ionic Liquids IIIA: Fundamentals, Progress,
Challenges, and Opportunities: Properties and Structure, American Chemical
Society, Washington, USA, 2002.
[6] K.R. Seddon, J. Chem. Technol. Biotechnol. 68 (1997) 351–356.
[7] D.R. MacFarlane, M. Forsyth, P.C. Howlett, J.M. Pringle, J. Sun, G. Annat, W.
Neil, E.I. Izgorodina, Acc. Chem. Res. 40 (2007) 1165–1173.
[8] N.V. Plechkova, K.R. Seddon, Chem. Soc. Rev. 37 (2008) 123–150.
[9] M. Tian, H. Yan, K.H. Row, Anal. Lett. 43 (2010) 110–118.

CAPÍTULO 5
230
[10] N. Fontanals, S. Ronka, F. Borrull, A.W. Trochimczuk, R.M. Marce, Talanta 80
(2009) 250–256.
[11] M.J. Markuszewski, P. Stepnowski, M.P. Marszałł, Electrophoresis 25 (2004)
3450- 3454.
[12] P. Stepnowski, W. Mrozik, J. Sep. Sci. 28 (2005) 149–154.
[13] P. Stepnowski, Anal. Bioanal. Chem. 381 (2005) 189–193.
[14] J. Nichthauser, W. Mrozik, A. Markowska, P. Stepnowski, Chemosphere 74,
(2009) 515–521.
[15] M. Borissova, M. Koel, M. Kaljurand, ACS Symp. Ser. 975 (2007) 35- 46.
[16] Y. Tian, R. Feng, L.P. Liao, H.L. Liu, H. Chen, Z.R. Zeng, Electrophoresis 29
(2008) 3153–3159.
[17] K. Pyrzynska, A. Stafiej, M. Biesaga, Microchim. Acta 159 (2007) 293–298.
[18] H. Katsumata, H. Kojima, S. Kaneco, T. Suzuki, K. Ohta, Microchem. J. 96
(2010) 348–351.

Resultados y
Discusión


RESULTADOS Y DISCUSIÓN
233
Este Capítulo expone y concluye los resultados obtenidos a lo largo del
período experimental de la presente Tesis, los cuales pueden englobarse en
dos grandes apartados:
Geles basados en la combinación de LI y CNTs, describiéndose su
preparación, caracterización y empleo como herramientas analíticas
en sistemas SPE y SPME de tratamiento de muestra.
Otras combinaciones LI-CNTs, describiéndose sus principales
aplicaciones y ventajas.
Para abordar la discusión de los resultados de forma más clara y sencilla, los
apartados anteriores se desglosan en diferentes subapartados.
6.1. Formación y caracterización de geles
Formación de geles mediante combinación de LI y CNTs
Tal y como se indicó al principio de esta Memoria, uno de los objetivos
principales de la presente Tesis doctoral es la obtención de geles a partir de la
combinación de nanotubos de carbono con líquido iónico. La información
sobre este tipo de geles recogida en la bibliografía no describe, en la mayoría
de los casos, la proporción LI/CNTs adecuada para la obtención de los
mismos. En cuanto a la forma de obtenerlos podemos encontrar dos
procedimientos, mediante mezcla en un mortero o mediante la aplicación de
ondas de ultrasonidos a la mezcla.

CAPÍTULO 6
234
Los geles descritos en esta Memoria se obtuvieron mediante la mezcla
manual de nanotubos de carbono y líquido iónico en un mortero, hasta
obtener una mezcla homogénea. Por lo general, 10-15 min fueron suficientes
para lograr la formación del gel. Experimentalmente se ha observado como la
formación del gel presenta una cinética rápida, siendo el tiempo indicado el
necesario para homogenizar correctamente la mezcla y romper los agregados
de nanotubos de carbono. La formación de los geles se atribuye al
establecimiento de interacciones π-π entre los nanotubos de carbono y el
catión del líquido iónico, las cuales provocan una reordenación de los
nanotubos en el seno del líquido iónico, de forma que se refuerzan dichas
interacciones y se estabiliza el nuevo sistema formado. Por ello, se estudiaron
nanotubos de carbono de pared simple y de pared múltiple, y un líquido
iónico derivado de imidazolio. Para explotar las propiedades de los geles,
seleccionamos el LI (Hmim PF6) principalmente por ser un LI muy común en
la preparación de geles, así como por su pureza y coste. Estos materiales
tienen un aspecto gelatinoso, son de fácil manejo y muy estables, por lo que
conservan muy bien sus propiedades físicas. En nuestro caso no llevamos a
cabo la preparación de los geles por ultrasonidos debido a que observamos la
pérdida de la integridad del gel (previamente preparado) al ser sometido a
ultrasonidos. Así mismo, se estudió la reproducibilidad en la preparación de
diferentes geles, obteniendo un valor del 4-5% para 5 geles preparados en
mortero con la adecuada relación LI/CNTs. Ese valor indica la idoneidad de
los geles para llevar a cabo preconcentraciones cuantitativas.

RESULTADOS Y DISCUSIÓN
235
Es importante remarcar que no todas las relaciones LI/CNTs conducen a
la formación de geles. Para formar el gel es necesario tener una concentración
mínima de nanotubos de carbono en el gel, esta concentración es lo que
denominamos concentración crítica de gelificación. Sobrepasada esta
concentración, y a partir de un determinado valor, experimentalmente se
observa que se pierde la integridad del gel apareciendo agregados. Todos los
trabajos descritos en esta memoria se han hecho con geles formados teniendo
en cuenta la CCG. Esta concentración crítica depende mayoritariamente de
las características y propiedades del nanotubo de carbono empleado, tales
como número de capas, dimensiones y pureza. También dependen de la
temperatura, si bien en el marco de esta Tesis Doctoral todos los trabajos de
han realizado a temperatura ambiente. En el siguiente apartado de la presente
sección se describe como obtener la concentración crítica de gelificación.
Con todos los nanotubos de carbono ensayados se obtuvo el gel,
incluyendo nanotubos de carbono de pared múltiple, de pared simple y coil.
En la tabla 1 se resumen los diferentes geles desarrollados a lo largo de la
investigación, mostrándose para cada uno de ellos los valores de CCG. Tal y
como se puede observar, la mayoría de los geles con CNTs multicapa
presentan valores más bajos de CCG. El grado de funcionalización química,
concretamente un 2.5% de hidroxilación o un 1.6% de carboxilación,
únicamente produjo ligeras diferencias en la CCG. Los CNTs 7 (alineados),
que en principio deberían presentar una mayor facilidad a la dispersión,
mostraron un comportamiento similar al resto. Los CNTs 2 son los que
experimentalmente permiten una formación del gel más rápida, los cuales se
caracterizan por ser bastante rígidos y lineales. Los CNTs 3 son los que

CAPÍTULO 6
236
presentan una menor CCG, y además, comparados con otros presentan un
contenido residual de catalizador más elevado, concretamente aluminio.
Tabla 1. Concentración crítica gelificación (CCG) de los diferentes geles descritos.
LI CNTs Características CCG
(%wt)
Hm
im P
F6
MW
NT
s
1 5-20 nm/1-10 µm 3,7
2 110-170 nm/2 µm 4,4
3 9,5 nm/1,5 µm 1,9
4 10-30 nm/10-30 µm 3
5 10-30 nm/10-30 µm 2.5% OH 2,6
6 10-30 nm/10-30 µm 1.6% COOH 3,7
7 10-20 nm/5-15 µm 2,6
8 coil 11,7
SWNTs 9 < 2 nm/5-15 µm 7,5
Los geles formados se guardaban cerrados en crisoles de porcelana y eran
estables en las concentraciones de trabajo ya que con el paso del tiempo no se
apreciaba la separación de fases. Además, es importante remarcar que el gel
una vez formado era estable incluso sometiéndolo a etapas de centrifugación,
es decir, no se observaba separación del LI por aplicación de la fuerza
centrifuga.

RESULTADOS Y DISCUSIÓN
237
Caracterización de geles y determinación de la concentración crítica de
gelificación
Formar los geles, trabajando a la concentración crítica de gelificación, es
imprescindible para asegurar la estabilidad y reproducibilidad del gel así
como sus excelentes propiedades y el efecto sinérgico de los CNTs y el LI, de
ahí el esfuerzo para determinarla.
La concentración crítica de gelificación mencionada anteriormente
tradicionalmente se determina mediante medidas reológicas, estudiando el
cambio de propiedades de las mezclas LI/CNTs. Experimentalmente, cuando
la concentración de nanotubos es inferior a la concentración critica, se
observa la presencia de dos fases, una fase enriquecida de CNTs-LI y una
segunda fase de LI en exceso. Una vez alcanzada la CCG se observa la
desaparición de la segunda fase. La figura 1 muestra imágenes de
microscopía óptica obtenidas a 20 aumentos. Estas ilustran el proceso de
gelificación a partir de CNTs 1. Se observa que a medida que la
concentración de nanotubos de carbono es superior a la CCG, se forma una
estructura porosa que más adelante da lugar a la formación de agregados de
nanotubos.
Figura 1. Proceso de gelificación para CNTs 1.
CAPÍTULO 6
238
Alternativamente, en esta Memoria se propone un método de
determinación de la CCG basado en el estudio de la distinta solubilidad en
disolventes orgánicos que presenta el LI libre y el LI integrado en el gel.
Una de las principales características de los geles es la integridad de la
mezcla gracias a la fuerte unión establecida entre los nanotubos de carbono y
el líquido iónico. Esta interacción afecta directamente a la solubilidad del LI,
lo cual es un aspecto crucial, teniendo en cuenta la posterior aplicación de los
geles en procesos de preconcentración/elución. Puesto que la solubilidad del
LI que forma parte del gel es diferente a la solubilidad del LI puro, se
selecciona dicha propiedad para identificar la CCG. Cabe indicar que el
Hmim PF6, si bien se clasifica como LI insoluble en agua y en un amplio
rango de disolventes orgánicos, en el fondo presenta una cierta solubilidad.
La forma empleada para evaluar la solubilización es la medida directa de la
fluorescencia nativa del LI solubilizado en el disolvente.
A modo de ejemplo en la Figura 2 se muestra la evolución de la
fluorescencia del LI a medida que aumenta la concentración de nanotubos 2.
Lo que se observa es una disminución drástica de la fluorescencia y por tanto
de la solubilidad del LI a pequeñas concentraciones de CNTs, alcanzada la
CCG se observa que la fluorescencia o solubilidad se mantiene prácticamente
constante.

RESULTADOS Y DISCUSIÓN
239
Figura 2. Evolución de la fluorescencia del LI
Si comparamos este método con el clásico de propiedades reológicas
para determinar la CCG, si bien es un método aproximado que proporciona
un valor con un cierto error, es más simple, rápido y puede efectuarse con
cantidades de muestra muy inferiores a las necesarias para un reómetro.
La drástica disminución de la solubilidad en presencia de cantidades
pequeñas de nanotubos demuestra la alta interacción y estabilidad química
que existe entre el LI y los CNTs, muy superior a la solvatación en el
disolvente. Algunos autores establecen que los nanotubos de carbono en el
gel se ordenan estableciendo interacciones con las paredes exteriores tipo
CNT-LI-CNT. Ello en parte explicaría la elevada estabilidad de los CNTs en

CAPÍTULO 6
240
el gel. La figura 3 muestra la ordenación preferencial de los nanotubos en el
seno del LI una vez formado el gel.
Figura 3. Imagen TEM de un gel LI/CNTs
Para determinar las interacciones CNTs-LI así como la evolución de los
espectros a lo largo del proceso de formación del gel se decidió efectuar
medidas Raman de los geles y de mezclas LI-CNTs con concentraciones
variables de nanotubos de carbono. Para ello se prepararon varias mezclas en
diferentes proporciones LI/CNTs con cuatro tipos de nanotubos diferentes
(tres MWNTs y un SWNTs) en el rango de concentración de 1 a 40 mg de
CNTs en 200 µL de LI Hmim PF6.
Las distintas mezclas, así como los geles (trabajando con la CCG) se
formaron mediante agitación manual durante aprox. 15 minutos en un
mortero. Tal y como se ha indicado anteriormente, sólo la mezcla con la

RESULTADOS Y DISCUSIÓN
241
adecuada proporción LI/CNTs tenía textura de gel, mientras que las mezclas
con cantidades bajas de CNTs eran muy líquidas o con agregados en el caso
de las que tenían mayores cantidades de nanotubo.
Como referencia para poder establecer diferencias entre los espectros de
los CNTs y LI puros y los obtenidos con el gel y las diferentes mezclas, en la
figura 4 se muestran los espectros individuales de ambos materiales.
Figura 4. Espectros Raman de: A) CNTs 1, B) SWNTs y C) LI (Hmim PF6).
En los espectros correspondientes a los CNTs se observan las bandas
características de este tipo de material como son: la banda D 1350 cm-1
, la
banda G entre 1400–1700 cm-1
y el sobretono de la banda D (G’ ente 2500–

CAPÍTULO 6
242
2800 cm-1
). En el caso de los SWNTs (espectro B) también podemos observar
los modos de respiración radial (RBM) entre 100–300 cm-1
. Mientras que en
el espectro Raman del LI aparecen varias bandas siendo la más significativa
la correspondiente al anión PF6- en torno a 750 cm
-1.
A continuación, en la figura 5, se muestran a modo de ejemplo los
espectros Raman obtenidos para cada una de las mezclas de SWNTs en LI.
Figura 5. Espectros Raman obtenidos para diferentes mezclas SWNTs/LI en el
rango de concentraciones de CNTs de 1-40 mg en 200 µL de LI: a1) 1 mg, a2) 5 mg,
a3) 10 mg, a4) 20 mg (CCG), a5) 30 mg y a6) 40 mg.

RESULTADOS Y DISCUSIÓN
243
Como puede verse en la figura 5, en los espectros de las mezclas
formadas con concentraciones de SWNTs superiores a la CCG, tales como a5
y a6, las bandas predominantes son las bandas características de los CNTs
puros, siendo estas G, D, G´ y RBM. Por otro lado, en los espectros Raman
de las mezclas con bajas concentraciones de SWNTs se observa una
disminución en las bandas típicas de los nanotubos y un aumento en las
bandas del LI. Además, en este caso, se aprecia un aumento en la línea de
base debido a la fluorescencia del líquido iónico.
El espectro de la mezcla óptima (a4 en la figura 5), correspondiente al
gel, es el resultado de la combinación de las principales bandas de ambos
componentes, siendo posible distinguir las bandas típicas de los SWNTs (D,
G y G '), aunque menos intensas que el espectro del sólido, y una pequeña
banda a 750 cm-1
correspondiente al anión PF6- del líquido iónico. Además, se
aprecia un pequeño desplazamiento del orden de 8 a 12 cm-1
en las bandas de
los nanotubos de carbono. Esta misma tendencia descrita para los espectros
correspondientes a diferentes mezclas SWNTs/LI se observa para el resto de
CNTs estudiados.
Teniendo en cuenta lo anteriormente expuesto podemos comprobar la
integridad del gel gracias a las fuertes interacciones establecidas entre LI y
CNTs, de manera que el espectro obtenido del mismo es una combinación de
las bandas más importantes de ambos materiales de forma individual, lo cual
era de esperar partiendo de la base de que el gel es un sistema donde
intervienen dos componentes.

CAPÍTULO 6
244
Así mismo, se calculó la relación entre las intensidades de las bandas D y
G para cada gel estudiado, para ello se tomó el valor de la altura de pico de
cada banda después de restarle la línea de base, tal y como puede verse en la
tabla 2.
Tabla 2. ID/IG obtenidos para la mezcla CNTs/LI óptima para todos los nanotubos
estudiados.
Concentración
de CNTs (mg) ID/IG
Concentración
de CNTs (mg) ID/IG
CNTs 1 10 1.4 CNTs 2 12 0.14
CNTs 4 8 0.7 SWNTs 20 0.3
Como se puede observar en el caso de los CNTs 1 la intensidad de la
banda D es más alta que la correspondiente a la banda G, dando como
resultado un valor de la relación mayor que 1. Sin embargo, en el caso de los
otros CNTs la proporción disminuye hasta valores ≤ 0.8. Las diferencias entre
los diferentes geles estudiados se pueden atribuir a la diferente capacidad de
dispersión de líquido iónico para cada tipo de nanotubo.
Anteriormente hemos hablado de una propiedad de los geles que es la
solubilidad del LI. Otra de las propiedades interesantes de estos materiales es
su capacidad para adsorber y absorber compuestos orgánicos. Ambas
propiedades son las que nos permitirán, desde un punto de vista analítico, el
empleo de estos geles como sorbentes para efectuar etapas de extracción en
fase sólida.

RESULTADOS Y DISCUSIÓN
245
Por una parte, es ampliamente conocida la capacidad de los nanotubos de
carbono para absorber principalmente compuestos orgánicos apolares. Por
otra parte, también es conocida la capacidad de los líquidos iónicos para
solubilizar y extraer compuestos orgánicos. En los últimos años este hecho ha
propiciado el desarrollo de muchas técnicas de microextracción. Cabe esperar
por tanto que el gel formado por ambos materiales presente también
excelentes propiedades y características para adsorber y absorber compuestos
orgánicos. Experimentalmente, empleando el gel como sorbente, se ha
observado una mayor capacidad de preconcentración a la prevista, resultado
que atribuimos al efecto sinérgico que se establece en el gel entre el LI y los
CNTs.
Como puede verse en la figura 6, la capacidad de ad/absorción de 15 mg
del gel es mayor que la demostrada por 15 mg de MWNTs y 100 µL de LI
por separado. Sin embargo, los 15 mg de gel empleados sólo contienen 0.55
mg de MWNTs y 11 µL de LI. Este estudio se realizó tomando como analito
modelo el Naftaleno, aunque se obtuvo el mismo efecto para los demás PAHs
analizados.
Este efecto sinérgico lo hemos atribuido al efecto positivo que tiene la
orientación preferencial de los nanotubos de carbono en la estructura del gel,
tal y como puede verse en la figura 3, ofreciendo de esta manera una mayor
superficie activa para llevar a cabo procesos de extracción.

CAPÍTULO 6
246
Figura 6. Extracción de Naftaleno con diferentes sorbentes.
Comparativa entre geles formados a partir de diferentes tipos de CNTs
De los resultados presentados hasta el momento se deduce que distintos
geles van a presentar diferente propiedades. Así pues, los obtenidos a partir
del mismo líquido iónico (Hmim PF6) y diferentes nanotubos de carbono
muestran diferentes solubilidades, CCG y obviamente diferente capacidad de
ad/absorber compuestos orgánicos. Con estas observaciones se pretende
comparar las propiedades de los geles formados e intentar relacionarlas con
las características de los CNTs que forman parte de los mismos.

RESULTADOS Y DISCUSIÓN
247
En la tabla 1 se resumen las concentraciones críticas de gelificacion. Es
importante destacar que a pesar de presentar diferentes valores de CCG, fue
posible obtener el gel con todos los CNTs empleados. Se ha observado que
cuanto mayor es el contenido de impurezas presentes en los nanotubos de
carbono, mas difícil es obtener el gel. En general, los nanotubos de carbono
de pared múltiple presentaron CCG claramente inferiores a los nanotubos de
pared simple y la mezcla coil de nanotubos.
Con el fin de estudiar la integridad y estabilidad de los geles
desarrollados se llevó a cabo un estudio para evaluar la integridad de los
mismos en contacto con varios disolventes orgánicos como metanol,
acetonitrilo, acetato de etilo y hexano). Para ello seleccionamos como
parámetro analítico la cantidad de LI disuelta en el disolvente, después de
haber estado el gel 5 minutos en contacto con el mismo. La figura 7
representa los porcentajes de reducción de la cantidad de LI que pasa al
disolvente para cada gel estudiado. Los porcentajes se calcularon en relación
al blanco del líquido iónico (señal del LI en ausencia de CNTs) en cada
disolvente. El contenido de LI solubilizado fue calculado determinando la
concentración del catión imidazolio en cada uno de los medios mediante
electroforesis capilar con detección UV-Vis. Los resultados para el hexano no
se representan en la gráfica ya que son inferiores al LOD del método de
análisis y por tanto se consideran despreciables.

CAPÍTULO 6
248
0
10
20
30
40
50
60
70
1 2 3 4 5 6 7 8 9
% r
ed
ucc
ión
Tipo de CNTs en cada gel
Metanol
Acetonitrilo
Acetato de etilo
Figura 7. Porcentajes de reducción de la cantidad de LI solubilizado en diferentes
disolventes para los geles formados a partir de CNTs de 1-9.
En todos los casos se observó como el gel mantenía su integridad, ya que
en ninguna situación llegó a disolverse o desagregarse, sino que simplemente
se observaron cambios en la solubilidad del LI. En los tres disolventes
ensayados se redujo la solubilidad del LI de todos los geles estudiados. Dicha
reducción fue mayor en los disolventes más polares como el metanol y el
acetonitrilo, donde con la mayoría de los geles la reducción obtenida fue
superior al 50%. Dado que los mayores porcentajes de reducción observados,
en los tres disolventes considerados, correspondían al gel formado con CNTs
1, concluimos que estos nanotubos presentan una mayor interacción con el LI
y por tanto dan lugar a un gel más estable.

RESULTADOS Y DISCUSIÓN
249
Otro aspecto a tener en cuenta es la capacidad de estos geles para
preconcentrar compuestos o analitos orgánicos apolares, para ello se tomaron
como analitos modelo los hidrocarburos aromáticos policíclicos. En este
sentido, los nanotubos de carbono de pared múltiple son los que proporcionan
mejores resultados. Comparativamente hablando, los geles de nanotubos de
carbono de pared múltiple presentan persé una mayor capacidad de
preconcentración. Ello es atribuido a su estabilidad y a que al estar formados
por un mayor número de capas, ofrecen una mayor superficie activa para
llevar a cabo procesos de adsorción y absorción. Todos los geles tienen una
cinética de extracción compuesta por dos regiones, una primera de adsorción
y otra de absorción, siendo este proceso más lento que el primero. Los geles
de nanotubos de carbono 1, 2, 3 y 8 son los que aportan mayores valores de
preconcentración. En todos lo geles estudiados se observa el efecto sinérgico
descrito anteriormente.
En general, los geles presentan propiedades para ad/absorber con
capacidades superiores a las capacidades de muchos sorbentes comerciales.
Una de sus principales limitaciones es la cinética de estos procesos, ya que en
general son relativamente lentos. Es importante indicar que se tratan de
equilibrios en los que los procesos son reversibles y que pueden desplazarse
hacia un sentido del equilibrio introduciendo una fuente de agitación o bien
aumentando las concentraciones. Gracias a las propiedades y estabilidad de
estos geles, es posible emplearlos para preconcentrar analitos de muestras
acuosas y gaseosas.

CAPÍTULO 6
250
6.2. Simplificación de las etapas de tratamiento de muestra mediante el
empleo de geles LI/CNTs
El tratamiento de muestra es una de las etapas más críticas de las
diferentes fases que engloban el proceso analítico. La determinación de un
porcentaje muy alto de analitos, en diferentes matrices, implica una etapa
previa de tratamiento de muestra. Las necesidades actuales de los laboratorios
de rutina están encaminadas a incorporar sistemas de tratamiento de muestra
que sean robustos y de bajo coste, y que impliquen el uso de pequeños
volúmenes de muestra y reactivos, especialmente disolventes orgánicos.
Además es importante que posibiliten su fácil automatización y acoplamiento
a sistemas analíticos de separación, tanto cromatográficos como
electroforéticos, así como a sistemas espectrométricos de detección, tanto
atómicos como moleculares.
En esta Tesis Doctoral se presentan diferentes contribuciones analíticas
centradas en la simplificación y miniaturización de unidades de tratamiento
de muestra, a través del estudio y empleo de geles LI/CNTs como sistemas
para realizar etapas de extracción en fase sólida.
Tal y como se indicó anteriormente, los nanotubos de carbono poseen,
gracias a su estructura química, una elevada capacidad para extraer y absorber
compuestos orgánicos. Por otro lado, los líquidos iónicos son disolventes con
una elevada capacidad para extraer y solubilizar una alta variedad de analitos.
Es por esto por lo que la combinación de ambos, tal como describimos en la

RESULTADOS Y DISCUSIÓN
251
sección anterior, presenta un interesante efecto sinérgico que exalta las
propiedades sortivas del material.
En los siguientes apartados se presenta una visión general de los
diferentes analitos y matrices en los que se han empleado los geles para hacer
mejoras en el tratamiento de muestra, las estrategias para simplificar y
miniaturizar las unidades de tratamiento y por último las estrategias diseñadas
para el acoplamiento de las unidades a equipos comerciales de electroforesis
capilar.
Geles LI/CNT como sorbentes para extracción en fase sólida
Las principales características que propician el empleo de los geles como
material sorbente pueden resumirse en los siguientes puntos:
1) Elevada integridad del gel gracias a la cual mantienen su estructura al
ponerse en contacto con sistemas acuosos y/o orgánicos. Recordemos que
esta integridad incluso conducía a una disminución de la solubilidad del LI.
Esta característica permite que el gel pueda permanecer en contacto con
muestras líquidas, y por tanto posibilitar la extracción y preconcentración de
analitos, así como la posterior elución de los analitos de forma selectiva
mediante el empleo del disolvente adecuado.
2) Presentan una gran capacidad para extraer grandes cantidades de analito.
En el gel, no sólo se observan procesos de adsorcion superficial sino también
procesos de absorción o difusión del analito en el seno del gel.

CAPÍTULO 6
252
3) Las cantidades de gel utilizadas son pequeñas, por tanto el coste es
asequible, así como la fácil formación y manipulación de los mismos.
4) Como se presentará posteriormente, son sistemas muy versátiles que
permiten una fácil miniaturización y automatización.
Todas estas características hacen que los geles sean un excelente material
candidato a actuar como sorbente en etapas de extracción en fase sólida. A
continuación se presentan los diferentes tipos de analitos y muestras tratados
con este nuevo sorbente, con objeto de demostrar su potencial analítico.
En el marco de esta Tesis, las matrices abordadas fueron de interés
medioambiental. Debido a su importancia, los trabajos se focalizaron en agua
de rio, siendo estudiados, por simple localización geográfica, el Río
Guadalquivir (región de Andalucía) y sus afluentes.
Con respecto a los analitos, se estudiaron dos familias de contaminantes:
hidrocarburos aromaticos policíclicos y nitrofenoles. Ambas familias de
compuestos están catalogadas como sustancias de alta toxicidad y baja
degradabilidad en el medio ambiente, por lo que la agencia de protección
ambiental estadounidense (EPA) junto con otras organizaciones
gubernamentales de Europa y de diferentes países los han incluido en la lista
de contaminantes prioritarios.
Los hidrocarburos aromáticos policíclicos (PAHs) estudiados fueron:
acenapteno, antraceno, benzo(a)pireno, benz(a)antraceno, fenantreno,
fluoranteno, fluoreno, naftaleno, perileno y pireno. Los PAHs son una familia

RESULTADOS Y DISCUSIÓN
253
de compuestos muy importantes por su prevalencia y presencia en el medio
ambiente, cuyo origen puede ser natural como las erupciones volcánicas o
incendios naturales o mayoritariamente antropogénico procedente de las
calefacciones domésticas, emisiones de vehículos, etc. Los PAHs pueden
entrar en contacto con las aguas superficiales a través de las descargas de
plantas industriales y de tratamiento de aguas residuales. Estos compuestos
son ampliamente conocidos por su potente carácter mutagénico y cancerígeno
de ahí la gran necesidad de llevar a cabo su determinación y extracción. Éstos
se seleccionaron como analito modelo para estudiar el potencial sorbente de
los geles por ser apolares y presentar una estructura aromática susceptible de
interaccionar con los nanotubos de carbono y con el grupo imidazol del
Hmim PF6. Además, sus características fluorescentes se aprovecharon para
llevar a cabo su determinación mediante detección fluorimétrica.
Los nitrofenoles analizados fueron: 2-nitrofenol, 3-nitrofenol y 2,4-
dinitrofenol. Estos compuestos han sido ampliamente utilizados en la
producción de pesticidas, así como insecticidas y herbicidas. Durante el
proceso de aplicación de los mismos se produce su vertido al medio ambiente,
contaminando ríos y aguas subterráneas. Dada su alta toxicidad y baja
degradabilidad en el medio es importante su extracción y determinación.
Además de por representar un posible daño para la salud humana, se
seleccionaron estos analitos por su carácter aromático, lo que los hace
suceptibles de interaccionar con el gel.

CAPÍTULO 6
254
Diseño y miniaturización de las unidades de preconcentración
A grandes rasgos, los sistemas de tratamiento de muestra implican una
etapa de preconcentración de los analitos de la matriz y una etapa de elución.
Los sistemas de preconcentración mas usados a día de hoy son extracción en
fase sólida (SPE) y extracción en fase líquida (LLE). De estas dos,
posiblemente la técnica de SPE sea la más empleada dada su gran robustez,
sensibilidad y versatilidad, así como el empleo de volúmenes de disolventes
orgánicos claramente inferiores.
Si miramos la evolución de la técnica SPE a lo largo de estos últimos
años, no hay duda que ha tendido hacia la miniaturización. Comercialmente
se han desarrollado los denominados microsistemas de SPE que incluyen
desde las fibras desarrolladas por Pawliszyn a principios de los años 90, la
modalidad en tubo, extracción por barra agitada “stir bar” o la microextración
por sorbentes empaquetados “MEPS”. Todos estos sistemas miniaturizados
presentan la característica común no solo de reducir tiempo de análisis y
volúmenes de muestras y reactivos, alcanzando elevados niveles de
preconcentración, sino que además presentan un fácil acoplamiento a equipos
instrumentales. Por tanto, para facilitar la transferencia a los laboratorios de
rutina desde el punto de vista del desarrollo de herramientas analíticas, tan
importante son el desarrollo y caracterización de nuevos materiales sorbentes
como su miniaturización.
Si examinamos los sistemas miniaturizados descritos hasta el momento
en la bibliografía, éstos se basan en el empaquetamiento de partículas

RESULTADOS Y DISCUSIÓN
255
sorbentes o el recubrimiento (con materiales sobentes) de fibras (por ejemplo
nylon) o paredes de capilares. Para abordar la miniaturización empleando
como sorbentes los geles desarrollados, hemos seleccionado como estrategia
el recubrimiento de fibras con el nuevo material.
Una evaluación previa de diferentes fibras naturales y poliméricas
claramente demostró que las fibras de algodón permitían reproducir de forma
muy simple y rápida la fabricación de las unidades de microextraccion. Fibras
poliméricas de nylon o polipropileno se descartaron debido a la dificultad o a
la baja afinidad de estos materiales a interaccionar con los geles.
A continuación se presentan los microsistemas desarrollados basados en
el empleo de fibras de algodón. Para obtener la inmovilización física de los
geles sobre la fibra de algodón fue suficiente con impregnar las fibras con los
geles, utilizando papel satinado para su distribución y homogenización,
procedimiento similar al utilizado tradicionalmente en electroquímica para
pulir la superficie de los electrodos de aceite y grafito.
El primero de los sistemas miniaturizados desarrollados se basa en la
modificación de bastones de algodón. La ventaja de este sistema, además de
su simplicidad, es que permite obtener una gran área de adsorción,
disminuyendo los tiempos de extracción y efectuar la etapa de elución en un
volumen de tan solo 1 mL.
El segundo de los sistemas se miniaturizó todavía más, disminuyendo la
cantidad de material sorbente necesaria para su preparación. Para ello se
intercambió la fibra de nylon de un sistema tradicional de SPME por una fibra
CAPÍTULO 6
256
de algodón natural. Esta mayor miniaturización permite disminuir aún más
los volúmenes de muestra y fundamentalmente los volúmenes de elución. Si
bien estas técnicas de micropreconcentración no permiten alcanzar elevados
porcentajes de extracción, sí permiten alcanzar pequeños límites de
detección.
Acoplamiento/integración a equipos comerciales de electroforesis capilar
Como se ha comentado anteriormente, es tan importante desarrollar
unidades miniaturizadas de preconcentración como el desarrollar
procedimientos de acoplamiento de las mismas a equipos instrumentales. En
el caso de los sistemas cromatográficos, el acoplamiento a un cromatógrafo
de gases (CG) puede efectuarse con relativa facilidad con el diseño de una
interface que permita la desorción térmica de los analitos, ya que tanto LIs
como CNTs presentan una alta estabilidad térmica. En el caso de un
cromatógrafo de líquidos (CL) la estrategia a seguir sería similar a la
empleada para los sistemas de microextracción en fase líquida en fibra, es
decir, con las respectivas mejoras industriales, el sistema de microextracción
sobre fibras de algodón descrito en el apartado anterior podría acoplarse con
relativa facilidad a una interface de desorción térmica y a una interface de
elución química, tanto estática como dinámica, acoplada a un CL. Por ello
uno de los trabajos experimentales desarrollados se centró en el acoplamiento
a equipos de electroforesis capilar (EC), que entrañan una cierta dificultad
puesto que debe compaginarse el acoplamiento con los pequeños volúmenes
típicamente usados en EC, el modo discontinuo de funcionamiento de los
equipos y la aplicación de voltajes elevados.

RESULTADOS Y DISCUSIÓN
257
Los acoplamientos de unidades de tratamiento de muestra a equipos de
EC pueden efectuarse de forma at-line, on-line e in-line, o bien integradas en
el equipo. En los últimos años, el grupo de investigación en el seno del cual
se ha desarrollado la presente Tesis, ha centrado sus esfuerzos en el empleo
de unidades integradas, por pensar que son la mejor vía de introducción al
mercado real de los laboratorios de rutina. Las unidades integradas coinciden
o pueden interpretarse como acoplamiento in-line cuando se efectúan en el
vial de muestra.
Pensando en la versatilidad del sistema y en la posibilidad de analizar un
número elevado de muestras, se optó por la opción de integrar la unidad de
tratamiento en el vial de muestra, puesto que permite tratar diversas muestras
en paralelo. A este respecto debe considerarse que la etapa de tratamiento de
muestra suele involucrar la participación constante del analista, mientras que
la etapa de elución, separación y detección electroforética se efectúan de
forma automática, bajo la supervisión de éste. Interesa por tanto tener la
opción de procesar un número elevado de muestras en paralelo.
El sistema desarrollado y propuesto es el que se muestra en la fotografía
de la figura 8. El sistema puede considerarse como una variación o modalidad
de la SPME en tubo, así pues, consta de un paso tubular cuya pared se recubre
con el gel, por el cual pasa la muestra, preconcentrándose así los analitos.
Para la etapa de elución, el vial de muestra se sitúa en el carro de muestras del
equipo de EC, de forma que el disolvente seleccionado como eluyente se
introduce de forma automática (a través del capilar) en la cavidad donde se

CAPÍTULO 6
258
encuentra el gel con los analitos preconcentrados, los cuales, una vez eluidos,
van a ser determinados mediante un método electroforético optimizado.
Figura 8. Integración del gel en el sistema miniaturizado desarrollado.
Tras diversas pruebas, el sistema se fabricó con resina epoxídica, puesto
que se observó que ésta ofrecía una mayor interacción y estabilidad con el
gel, descartándose así el uso de polipropileno, teflón y viniléster. Otra
característica interesante del sistema, para evitar la manipulación y
transferencia de muestras o eluidos, es que todas las etapas se efectúan en el
mismo vial. Como se aprecia en la figura 8, el sistema presenta un junta tórica
lateral que permite el desplazamiento a lo largo del vial de muestra comercial
a modo de émbolo de jeringa. La etapa de preconcentración se realizó de la
siguiente forma:

RESULTADOS Y DISCUSIÓN
259
Se sitúa el émbolo o unidad de microextracción en la parte superior del
vial (conteniendo la muestra) y se desplaza hasta el fondo. Este movimiento
obliga a la muestra a pasar a través del gel desde la zona inferior a la zona
superior del vial electroforético, permitiendo la preconcentración y extración
de los analitos. En este momento se desecha la solución que queda arriba del
vial y en caso necesario, por temas de complejidad de la matriz, se efectuaría
una etapa de limpieza. La unidad de extracción conteniendo los analitos se
sitúa directamente en el carrusel de portamuestras del equipo comercial, para
así efectuar la elución de los analitos y la introducción del eluido en el capilar
electroforético para su posterior determinación. Para ello, basta con
programar adecuadamente el sistema electroforético: dispensación de
volúmenes controlados de disolvente de elución en la unidad de
microextración, acondicionamiento del capilar adecuándolo al tiempo mínimo
de elución requerido y por último, la introducción de muestra en el sistema
electroforético por cualquiera de los métodos convencionales.
6.3. Otras aplicaciones de la combinación LI-CNTs
Empleo de líquidos iónicos para dispersar CNTs y obtener materiales híbridos
para SPE
Los nanotubos de carbono, debido a la cavidad interna que presentan son
materiales ideales para almacenar diversos compuestos y sustancias químicas.
Una de las propiedades químicas más importantes de los CNTs es su gran
área superficial, altamente hidrofóbica, que les confiere una elevada
capacidad para adsorber diversos compuestos orgánicos, en particular con

CAPÍTULO 6
260
aquellos que contienen anillos de benceno. En estudios recientes los
nanotubos de carbono han sido utilizados como sorbentes en SPE para extraer
determinadas sustancias tales como pesticidas, antibióticos, hidrocarburos
aromáticos policíclicos, etc. También existen estudios donde los CNTs se
emplean para extraer compuestos inorgánicos como lo son las sales metálicas.
El fuerte carácter hidrofóbico de los nanotubos de carbono combinado
con su alta flexibilidad permiten establecer fuertes interacciones π-π entre
ellos aumentando las posibilidades de unión y empaquetamiento de los
mismos, generándose una agregación espontánea entre los CNTs. En ciertos
casos dicha agregación puede significar un efecto positivo, propiciando la
interacción de los analitos en los intersticios de los agregados cuando éstos
son de poco tamaño. Sin embargo, este efecto es difícil de controlar y
reproducir, principalmente debido a su espontaneidad. En la mayoría de los
casos, esta tendencia a la agregación supone una gran desventaja, ya que
afecta negativamente a la adsorción mediante la reducción de la superficie
activa de los CNTs, lo cual limita en muchos casos su aplicación. Además,
cuando esta agregación tiene lugar en los cartuchos o columnas de SPE, esta
tendencia puede aumentar la presión en los sistemas de flujo. Por todo lo
descrito anteriormente, es importante encontrar un método para lograr la
dispersión total de los CNTs.
Nuestros esfuerzos para aumentar la reproducibilidad del sistema se han
encaminado en el desarrollo de un sorbente solido que permita efectuar SPE
en columna, donde los nanotubos de carbono presenten la máxima dispersión
posible. Por este motivo, se seleccionó el sorbente C18 comercial combinado

RESULTADOS Y DISCUSIÓN
261
con CNTs dispersos como nuevo sorbente para SPE, donde se mejoran las
características hidrofóbicas provenientes de las cadenas alquílicas del C18 con
las aromáticas de los CNTs, consiguiendo la adsorción de analitos tanto
alquílicos como aromáticos con nuestro nuevo material.
Este material híbrido CNTs/C18 se propone como alternativa a los
sorbentes clásicos, así como evaluar el empleo del LI (Hmim PF6) como
agente dispersante de CNTs. El proceso mediante el que se obtiene el nuevo
material es simple y rápido y tal y como puede verse en la figura 9 consta de
los siguientes pasos: (i) dispersión de los CNTs en el LI; (ii) mezcla de la
dispersión CNTs-LI con el C18; (iii) eliminación del LI mediante sucesivas
etapas de lavado con metanol y centrifugación; (iv) secado del sorbente a Tª
ambiente. Se prepararon dos sorbentes diferentes empleando SWNTs y
MWNTs y el procedimiento descrito anteriormente.
Figura 9. Procedimiento de preparación del sorbente híbrido C18/CNTs.
El material híbrido obtenido es totalmente homogéneo donde los CNTs,
que representan sólo un 1% del peso, están presentes en más del 95% de la
superficie activa del sorbente, presentando por tanto una distribución

CAPÍTULO 6
262
homogénea en el sólido, con la presencia de pequeños agregados, que
representan tan sólo un 0.2% de la superficie total.
El sorbente híbrido sintetizado se empleó para la determinación de
sulfonamidas en muestras de leche. Las sulfonamidas (SAs) son fármacos
ampliamente utilizados para prevenir y controlar enfermedades respiratorias y
gastrointestinales en la práctica veterinaria. Debido a su amplio espectro de
actividad y su bajo coste, en muchas ocasiones se aplican sin respetar las
recomendaciones de seguridad. Cuando se hace un uso inadecuado y abusivo
de estos antibióticos, los residuos no deseados pueden permanecer en los
tejidos animales y algunos fluidos, tales como la leche. Estos residuos
representan un riesgo importante para la salud pública, por lo que es necesario
desarrollar métodos para su determinación.
En esta Tesis se propone el empleo de un sorbente alternativo para llevar
a cabo la preconcentración de tres sulfonamidas en diferentes muestras de
leche comerciales. Se observó que 20 mg del material híbrido empaquetados
en cartuchos de SPE fueron suficientes para preconcentrar las SAs de la leche
previamente sometida a un proceso de desnaturalización con ácido para
eliminar las proteínas y la grasa. Los mejores resultados se obtuvieron con el
sorbente formado con MWNTs, obteniéndose valores de recuperación de
muestras fortificadas entre 98.6% y 103.2%.
La capacidad sorbente de este material se comparó con la proporcionada
por separado por el C18, CNTs agregados y una mezcla de LI-CNTs (sin

RESULTADOS Y DISCUSIÓN
263
dispersar en LI), obteniéndose valores significativamente superiores con el
empleo del nuevo material.
Una ventaja del nuevo material con respecto a los sorbentes sólidos
convencionales como directamente empaquetados en cartuchos de SPE, es
que disminuye los problemas de sobrepresión que aparecen a lo largo del
proceso SPE tras sucesivas extracciones.
Determinación de líquidos iónicos
En los últimos años, los líquidos iónicos han cobrado un interés especial
y debido a ello su empleo en diferentes áreas se ha visto disparado, tal y como
puede verse en la gráfica de la figura 10. La gráfica se ha confeccionado
según los valores proporcionados por SciFinder, estableciendo “ionic liquid”
como palabras clave y refinando por años de publicación.
Figura 10. Evolución del número de publicaciones sobre líquidos iónicos.

CAPÍTULO 6
264
A raíz de su catalogación como “disolventes verdes” debido a sus
propiedades, se ha despreciado el posible efecto tóxico que presentan dado su
uso creciente de forma exponencial (ver figura 10). En este sentido, los
líquidos iónicos se han convertido en contaminantes emergentes,
principalmente los derivados del ión imidazolio que son los más empleados
hasta la fecha. A lo largo de esta Memoria se han descrito diferentes
aplicaciones donde los líquidos iónicos están implicados de una u otra forma.
Pese a que los LI, gracias a su nula volatilidad, evitan la contaminación
atmosférica que originan los disolventes orgánicos tradicionales, su relativa
solubilidad en fase acuosa puede causar problemas de contaminación de
aguas y, por ende, problemas en los seres vivos. De este modo, las únicas vías
posibles de exposición se reducen prácticamente al contacto directo con la
piel y la ingestión de aguas contaminadas.
Teniendo en cuenta lo expuesto anteriormente es importante desarrollar
métodos para llevar a cabo la preconcentración y posterior determinación de
estos compuestos en muestras de agua. Para ello proponemos el empleo de
MEPS (microextracción por sorbentes empaquetados) de sílica para llevar a
cabo la preconcentración de los líquidos iónicos (imidazolio y piridinio)
conociendo su demostrada afinidad a la sílica. En este sentido, los LIs se han
empleado (tal y como podemos ver en la bibliografía) como modificadores de
la pared de sílice del capilar electroforético para mejorar la separación de
algunos analitos. Con el fin de automatizar el procediemiento de extracción,
la etapa de preconcentración se llevó a cabo conectando la aguja del MEPS
(donde se encuentra el sorbente) a un sistema de flujo controlado por una

RESULTADOS Y DISCUSIÓN
265
bomba y un ordenador. La etapa de elución se llevó a cabo con la jeringa
MEPS, pasando un volumen de 250 µL de metanol.
Para la posterior determinación mediante electroforesis capilar de los LIs
se optimizó un método electroforético, desarrollado completamente en medio
no acuoso con el fin de compatibilizar la etapa de pre-concentración con la
separación electroforética, así como para evitar posibles uniones no deseadas
del LI a las paredes de sílice del capilar. Además, la aplicación propuesta
demuestra la utilidad de filtros modificados con nanotubos de carbono para
eliminar las potenciales interferencias orgánicas presentes en la muestra.
El método propuesto permite preconcentrar niveles traza de líquidos
iónicos de tan solo 5 mL de muestra de agua de río, y llevar a cabo una
elución cuantitativa de los mismos con 250 µL de eluyente. Estos resultados
demuestran que el método, además de rápido y simple, es adecuado para ser
utilizado para controlar la presencia de LIs en el medio ambiente.
6.4. Ventajas e inconvenientes del empleo de geles LI/CNTs como
sorbentes
A continuación se enumeran las principales ventajas:
Son materiales con una elevada estabilidad física, dada su demostrada
integridad en diferentes disolventes.
Posibilidad de combinar un amplio rango de nanotubos de carbono y
líquidos iónicos. Es posible formar geles incluso con nanotubos de
carbono funcionalizados con hidroxilo o carboxilo.

CAPÍTULO 6
266
La síntesis de los geles es simple, rápida y muy reproducible.
Bajo coste debido a las pequeñas cantidades de CNTs y LI necesarias
para la formación de los geles así como para su empleo en las diferentes
aplicaciones descritas.
Efecto sinérgico de las propiedades de los CNTs y LI en el gel.
Gran capacidad de adsorción y absorción, con una marcada selectividad
hacia la preconcentracion de compuestos aromáticos.
Fácil de miniaturizar.
Posibilidad de acoplamiento a diferentes técnicas instrumentales.
A pesar de las múltiples ventajas encontradas es importante señalar las
posibles deficiencias o inconvenientes de estos materiales, que son:
Necesidad de mezclar manualmente en mortero, ya que no se han
conseguido los geles mediante centrifugación o ultrasonidos.
No todas las nanopartículas de carbono dan lugar a la formación de geles.
En ningún caso se obtuvieron geles al mezclar nanodiamantes y
fullerenos con líquido iónico.
Para cada tipo de nanotubo de carbono considerado es necesario
determinar y garantizar que se trabaja con la concentración crítica de
gelificacion.
Imposibilidad de los geles de empaquetarse directamente en cartuchos
convencionales de SPE.
Deben retenerse en un soporte adecuado, ya que los geles no
interaccionan con todos los soportes disponibles.
Presentan cinéticas de extracción relativamente lentas.

Conclusiones


CONCLUSIONES
269
Las conclusiones de esta Memoria resumen las principales aportaciones
derivadas del trabajo realizado a lo largo de los cuatro años en los que se ha
desarrollado esta Tesis. A continuación se exponen y relacionan los
resultados obtenidos, así como sus limitaciones y futuras líneas de
investigación que puedan derivarse de los mismos. Un aspecto importante de
este capítulo es hacer un autoanálisis crítico del trabajo desarrollado.
Los resultados obtenidos pueden dividirse en cuatro bloques: formación y
caracterización de geles físicos CNT/LI, empleo de geles en unidades de
preconcentración, formación de un sorbente híbrido basado en CNTs/C18 y
finalmente control analítico de líquidos iónicos.
Se ha demostrado que es posible obtener geles físicos mediante la
mezcla en mortero del líquido iónico (1-hexil 3-metilimidazolio
hexafluorofosfato) y nanotubos de carbono. Concretamente ha sido
posible obtener geles con nanotubos de carbono de pared simple, pared
múltiple y de tipo coil.
Se ha demostrado como los geles obtenidos presentan una elevada
estabilidad química y física. Ello se ha atribuido al establecimiento de
fuertes enlaces π-π entre los nanotubos de carbono y el líquido iónico.
Se ha estudiado el proceso de gelificación mediante fluorescencia y
espectroscopia Raman. Se ha propuesto un método alternativo simple y
rápido para determinar la concentración crítica de gelificación basada
en la medida de la solubilidad del LI en acetonitrilo. La solubilidad del

CONCLUSIONES
270
líquido iónico se estableció midiendo la fluorescencia intrínseca del LI
solubilizado.
Se ha confirmado la importancia de trabajar a la concentración crítica
de gelificación para obtener un gel estable para ser utilizado como
sorbente en etapas de SPE.
Se ha demostrado que los geles constituidos por CNTs y LI presentan
una mayor capacidad de sorción que la correspondiente a la capacidad
individual de los nanotubos más la capacidad individual del LI. Esta
mayor capacidad se ha atribuido a la especial ordenación que los
nanotubos adquieren en el seno del LI generándose un efecto sinérgico
de las propiedades de ambos materiales.
Mediante el empleo de fibras naturales de algodón se ha demostrado la
posibilidad de miniaturizar el proceso de extracción en fase sólida. Las
fibras de algodón han mostrado una gran capacidad por retener en su
superficie el gel CNTs/LI. La miniaturización del sistema ha llevado al
diseño de dos unidades que permiten tratar pequeños volúmenes de
muestra y también emplear pequeños volúmenes de eluyente.
Se ha desarrollado una nueva modalidad de extracción en fase sólida
mediante el acoplamiento en línea del gel a un equipo comercial de
electroforesis capilar. También se ha miniaturizado la etapa de
preconcentracion con un dispositivo que puede localizarse directamente

CONCLUSIONES
271
en el vial de muestras de un equipo de EC comercial. El dispositivo
permite tratar hasta 1 mL de muestra y efectuar la elución directamente
en el equipo de EC. Se ha demostrado la utilidad de la aplicación para
la determinación cuantitativa de tres nitrofenoles de interés ambiental
en agua.
Se ha sintetizado un material sorbente híbrido para SPE mediante la
combinación de nanotubos de carbono de pared múltiple y simple y C18,
empleando el LI (Hmim PF6) como agente dispersante de los CNTs. El
nuevo sorbente proporciona mejores valores de preconcentración que
sorbentes concencionales. El nuevo sorbente se propone como una
alternativa útil para preconcentrar residuos de sulfonamidas de muestras
de leche.
Se ha propuesto un método de determinación de LIs por electroforesis
capilar con detección UV/Vis. Dicho método se ha aplicado a la
determinación de LI en muestras acuosas ambientales (concretamente
agua de río) y para la caracterización de geles (determinación del LI
solubilizado).
Se ha demostrado la utilidad de los MEPS de sílica para extraer líquidos
iónicos basados en los cationes imidazolio y piridinio mediante un
procedimiento semiautomatizado, donde sólo la elución tiene lugar de
forma manual.

CONCLUSIONES
272
Tal y como se ha mencionado al principio de este capítulo, resultaría
enriquecedor llevar a cabo un análisis de las posibles deficiencias y
limitaciones del trabajo experimental presentado con vistas a planificar
futuras líneas de investigación. Entre ellas, destacamos:
En cuanto a la formación de los geles, si bien se ha llevado a cabo
mediante un procedimiento bastante simple y reproducible (una vez que se
adquiere cierta experiencia), sería conveniente hacer esfuerzos encaminados a
conseguir la formación del gel mediante sonicación de la mezcla, de forma
que implique la mínima o nula manipulación, y den lugar al mismo gel
independientemente del analista.
No se ha estudiado la influencia que podría tener en la formación de los
geles el empleo de otros LIs diferentes del Hmim PF6, evaluándose sus
posibles ventajas e inconvenientes así como su idoneidad para participar en
los diferentes procesos de extracción descritos.
A la luz de estas limitaciones, el trabajo futuro debería incluir la
formación de nuevos geles a partir de la combinación de diferentes CNTs y
líquidos iónicos de distinta naturaleza, tales como los LI-NH2, los cuales, tal y
como se recoge en la introducción de esta Memoria parecen ser una buena
opción para tal fin. De esta forma se ampliaría la versatilidad de los geles,
permitiendo analizar una mayor diversidad de muestras (al modificar las
inherentes propiedades del LI) y analitos.

CONCLUSIONES
273
En cuanto al empleo de los geles como sorbentes, la principal
limitación es la disponibilidad de un soporte adecuado para depositar el gel,
ya que teniendo en cuenta su textura viscosa (debida al LI), no es posible por
ejemplo introducirlos en cartuchos vacios convencionales de SPE. Sería
enriquecedor encontrar soportes diferentes al algodón o la resina epoxídica y
que cumplan todos los requisitos necesarios para llevar a cabo los procesos de
extracción: deben ser compatibles con la muestra, no interaccionar con los
analitos diana y soportar el gel sin que éste pierda su integridad en ninguna
etapa del proceso analítico.
La mejora del acoplamiento en línea desarrollado sería interesante desde
el punto de vista de automatizar el proceso de extracción completo, de forma
que no requiera manipulación alguna, lo cuál sería una ventaja para su posible
aplicación en laboratorios de rutina. Además, se podría desarrollar el
acoplamiento del gel a cromatografía de gases, llevándose a cabo una elución
térmica de los analitos, siendo esta posible gracias a la elevada estabilidad
térmica de ambos componentes que componen el gel. De esta forma sería
posible llegar a límites de detección mejores que los obtenidos por EC o
fluorescencia.
Finalmente sería muy interesante llevar a cabo cálculos teóricos de los
procesos de extracción.

CONCLUSIONES
274
Por último, y considerando la posible toxicidad de los dos
componentes del gel en el caso de que éstos entren en contacto con el medio
ambiente, es de suma importancia llevar a cabo un estudio detallado de su
toxicidad y biodegradabilidad, así como el desarrollo de diferentes métodos
para su determinación. Si bien se ha propuesto un método para la
determinación de LIs, sería apropiado desarrollar otras alternativas. En el
caso de los CNTs, queda como asignatura pendiente avanzar en este sentido,
quedando como posible línea de investigación en un futuro.

Anexo:
Producción
Científica


Anexo A. Publicaciones Científicas

PUBLICACIONES CIENTÍFICAS
279
1. Combination of carbon nanotubes modified filters with
microextraction by packed sorbent for the NACE analysis of trace
levels of ionic liquids in river water samples.
M.L. Polo-Luque, B.M. Simonet, M. Valcarcel, Talanta 2012, 89, 124-128.
2. Coiled carbon nanotubes combined with ionic liquid: a new soft
material for SPE.
M.L. Polo-Luque, B.M. Simonet, M. Valcárcel, Analytical and Bioanalytical
Chemistry 2012, 404, 903-907.
3. Solid-phase extraction of nitrophenols in water by using a
combination of carbon nanotubes with an ionic liquid coupled in-
line to CE.
M.L. Polo-Luque, B.M. Simonet, M. Valcárcel, Electrophoresis 2013, 34,
304-308.
4. Ionic liquid combined with carbon nanotubes. A soft material for
the preconcentration of PAHs.
M.L. Polo-Luque, B.M. Simonet, M. Valcarcel, Talanta 2013, 104, 169-172.
5. Effect of carbon nanotubes on properties of soft materials based
on carbon nanotubes-ionic liquid combinations.
M.L. Polo-Luque, B.M. Simonet, M. Valcarcel, Talanta
DOI: 10.1016/j.talanta.2013.02.030.

ANEXO A
280
6. Functionalization and dispersion of carbon nanotubes in ionic
liquids. Fundamentals and analytical application of soft materials.
M.L. Polo-Luque, B.M. Simonet, M. Valcarcel, aceptado el 06/03/13 en
Trends in Analytical Chemistry.
7. Solid phase extraction-capillary electrophoresis determination of
sulfonamide residues in milk samples by using C18-Carbon
nanotubes as a hybrid sorbent material.
M.L. Polo-Luque, B.M. Simonet, M. Valcárcel, enviado a Analyst.
8. Simple and fast fluorimetric determination of the critical gel
concentration of soft nanomaterials.
M.L. Polo-Luque, B.M. Simonet, M. Valcarcel, enviado a Analytica Chimica
Acta.

PUBLICACIONES CIENTÍFICAS
281

ANEXO A
282

PUBLICACIONES CIENTÍFICAS
283

ANEXO A
284

PUBLICACIONES CIENTÍFICAS
285

ANEXO A
286
Functionalization and dispersion of carbon nanotubes in ionic
liquids. Fundamentals and analytical application of soft
materials
M.L. Polo-Luque, B.M. Simonet, M. Valcarcel, aceptado el 06/03/13.

Anexo B. Comunicaciones a Congresos


COMUNICACIONES CONGRESOS
289
1. XXI Reunión Nacional de Espectroscopía. V Congreso Ibérico de
Espectroscopía (Murcia, 2008)
Poster titulado: “Empleo de geles de líquido iónico-nanotubo de carbono
para la preconcentración y determinación de PAHs en matrices acuosas”
M.L. Polo-Luque, B. M. Simonet, M. Valcárcel
2. II Workshop de Nanociencia y Nanotecnología (Tarragona, 2008)
Póster titulado: “Potencial de los geles constituidos por líquidos iónicos y
nanotubos de carbono como nuevos materiales sorbentes”
M.L. Polo-Luque, B. M. Simonet, M. Valcárcel
3. I Encuentro sobre Nanociencia y Nanotecnología de
investigadores y tecnólogos de la Universidad de Córdoba
[NANOUCO] (Córdoba, 2008)
Póster titulado: “Potencial analítico de geles constituidos por líquidos iónicos
y nanotubos de carbono para la preconcentración de contaminantes
orgánicos de muestras acuosas y gaseosas”
M.L. Polo-Luque, B. M. Simonet, M. Valcárcel
4. NanoSpain ( Zaragoza, 2009)
Póster titulado: “Carbon nanoparticles-ionic liquid combination: analytical
applications”
M.L. Polo-Luque, B. M. Simonet, M. Valcárcel
5. VII Jornadas Doctorales Andaluzas (Sevilla, 2009)
Póster titulado: “Potencial analítico de la mezcla LI/CNTs para el
pretratamiento de muestras acuosas”
M.L. Polo-Luque

ANEXO B
290
6. III Workshop de Nanociencia y Nanotecnología (Oviedo, 2009)
Póster titulado: “Determinación de sulfonamidas en leche mediante el
empleo combinado de nanotubos de carbono y C18”
M.L. Polo-Luque, B. M. Simonet, M. Valcárcel
7. II Encuentro sobre Nanociencia y Nanotecnología de
investigadores y tecnólogos de la Universidad de Córdoba
[NANOUCO] (Córdoba, 2010)
Póster titulado: “Mejora de la etapa de extracción en fase sólida mediante la
modificación de sorbentes comerciales con nanotubos de carbono”
M.L. Polo-Luque, B. M. Simonet, M. Valcárcel
8. XII GRASEQA (Córdoba, 2010)
Póster titulado: “Determinación de líquidos Iónicos mediante electroforesis
capilar”
M.L. Polo-Luque, B. M. Simonet, M. Valcárcel
9. IV Workshop de Nanociencia y Nanotecnología (Zaragoza, 2010)
Póster titulado: “Combinación de filtros modificados con nanotubos de
carbono con microextracción por MEPS para el análisis de niveles traza de
líquidos iónicos en muestras de agua de río”
M.L. Polo-Luque, B. M. Simonet, M. Valcárcel
10. III Encuentro sobre Nanociencia y Nanotecnología de
investigadores y tecnólogos de la Universidad de Córdoba
[NANOUCO] (Córdoba, 2011)

COMUNICACIONES CONGRESOS
291
Póster titulado: “Determinación de líquidos iónicos en muestras de agua de
río mediante el empleo combinado de filtros modificados con nanotubos de
carbono y microextracción mediante MEPS”
M.L. Polo-Luque, B. M. Simonet, M. Valcárcel
11. III Encuentro sobre Nanociencia y Nanotecnología de
investigadores y tecnólogos de la Universidad de Córdoba
[NANOUCO] (Córdoba, 2011)
Póster titulado: “Relación entre propiedades químicas, físicas y espectros
raman de nanotubos de carbono y geles formados de la combinación de
éstos con líquidos iónicos”
M.L. Polo-Luque, B. M. Simonet, M. Valcárcel
12. V Workshop de Nanociencia y Nanotecnología (Toledo, 2011)
Comunicación Oral Flash y Póster titulados: “Evaluación de nuevos
materiales blandos con nanotubos de carbono espirales como nuevos
sorbentes para SPME”
M.L. Polo-Luque, B. M. Simonet, M. Valcárcel
13. V Workshop de Nanociencia y Nanotecnología (Toledo, 2011)
Póster titulado: “Estudio de las propiedades químicas, físicas y espectros
raman de nanotubos de carbono y geles formados de la combinación de
éstos con líquidos iónicos”
M.L. Polo-Luque, B. M. Simonet, M. Valcárcel
14. XXIII Reunión Nacional de Espectroscopía. VII Congreso Ibérico
de Espectroscopía (Córdoba, 2012)
Póster titulado: “Determinación de la concentración crítica de gelificación”
M.L. Polo-Luque, B. M. Simonet, M. Valcárcel

ANEXO B
292
15. XXIII Reunión Nacional de Espectroscopía. VII Congreso Ibérico
de Espectroscopía (Córdoba, 2012)
Póster titulado: “Estudio de las propiedades químicas, físicas y espectros
raman de geles formados de la combinación de nanotubos de carbono con
líquidos iónicos”
M.L. Polo-Luque, B. M. Simonet, M. Valcárcel
16. IV Encuentro sobre Nanociencia y Nanotecnología de
investigadores y tecnólogos de la Universidad de Córdoba
[NANOUCO] (Córdoba, 2013)
Póster titulado: “Empleo de un gel de nanotubos de carbono y líquido iónico
para la extracción en fase sólida de nitrofenoles en agua acoplada en línea
a un equipo de electroforesis capilar”
M.L. Polo-Luque, B. M. Simonet, M. Valcárcel

Anexo C. Pósters


PÓSTERS
295
EMPLEO DE GELES DE LÍQUIDO IÓNICO-NANOTUBO DE CARBONO PARA LA PRECONCENTRACIÓN
Y DETERMINACIÓN DE PAHs EN MATRICES ACUOSAS
M.L. Polo-Luque, B.M. Simonet, M. Valcárcel
Departamento de Química Analítica. Edificio Anexo C3.Campus de Rabanales – 14071 Córdoba. E-mail: [email protected]
Estudio del potencial analítico de geles (líquido iónico - nanotubo de carbono) como nuevos sorbentes
en técnicas de extracción en fase sólida, para la preconcentración de hidrocarburos aromáticos
policíclicos (PAHs), de muestras acuosas.
OBJETIVO
CONCLUSIÓNSe ha demostrado la
capacidad de los geles para la
preconcentración de analitos orgánicos
(PAHs) de muestras acuosas.
Los analitos adsorbidos y absorbidos en
el gel pueden ser desorbidos en un
disolvente orgánico adecuado, y
posteriormente determinados
mediante detección
fluorimétrica.
Estudio de las propiedades sortivas del gel
Miniaturización: integración del gel en un dispositivo miniaturizado y estudio de la elución
de los analitos preconcentrados en el gel
Aplicación analítica
Efecto sinérgico del gel
y = 0.9883x + 7816.9
R2 = 0.9904
0
200000
400000
600000
800000
1000000
1200000
1400000
1600000
0 200000 400000 600000 800000 1000000 1200000 1400000 1600000
Fluorescencia de estándares
Fluo
resc
enci
a de
mue
stra
de
río fo
rtific
adas
Recuperación
87 – 105 %
RSD 5.7%
Estudio de recuperación del
análisis de muestras de agua
de río fortificadas.
Obtención del gel y caracterización mediante TEM
+
TEM
LI: [HMIM] PF6
MWNTs
Adsorbentes
Buenos conductores
Elevada estabilidad
térmica y mecánica
Obtención mediante homogeinización
de 300 µL LI/15 mg MWNts en un
mortero de agar
- Ordenación preferencial
de los MWNTs
- Los MWNTs tienden a
situarse de forma paralela
- Bajo grado de
agregación
Analito
Gel
0
20000
40000
60000
80000
0 2.5 5 7.5 10 12.5 15 17.5 20
Tiempo / h
Flu
ore
scen
cia
(t0)
- F
luo
resc
enci
a (t
)
0
2000
4000
6000
8000
10000
12000
14000
16000
Acenap
teno
B-antra
ceno
B-pire
no
Fenan
tren
o
Fluor
eno
Perile
no
Fluro
nantre
no
Naftale
no
Pireno
Inte
nsid
ad
Flu
ore
scen
cia
MWNT
MWNT
5-20 nm x 1-10 mm
10-30 nm x 5-15 mm
Cinética de ad- y absorción del pireno.
Efecto del nanotubo de carbono sobre la
extracción de PAHs.
Elevada capacidad de absorción, pero
presenta una cinética lenta debido al
bajo coeficiente de difusión (por tratarse
de un medio viscoso) del analito en el
gel.
15 mg Gel
0.55 mg MWNTs
+
11 ml HMIM PF6
0
200000
400000
600000
800000
1000000
1200000
300 350 400
l / nm
Inte
nsid
ad
flu
ore
scen
cia
15 mg gel
15 mg MWNTs
100 ml HMIM PF6100 ml HMIM PF6
Gel (MWNTs/HMIM
PF6)
MWNTs
HMIM PF6
Con sólo 15 mg de gel, que
contienen mímimas cantidades
de LI y MWNTs, se logra
preconcentrar mayor cantidad de
analito que mayores cantidades
de LI y MWNTs por separado.
Comparación de los valores de intensidad de fluorescencia
de cuatro disolventes puestos en contacto con líquido iónico
puro o con el gel (LI+MWNTs).
0
4000
8000
12000
16000
20000
Agua Metanol Acetonitrilo Hexano
Inte
nsid
ad F
luor
esce
ncia
En contacto con Líquido Iónico
En contacto con el gel
0
10000
20000
30000
40000
50000
60000
70000
80000
Metanol Acetonitrilo Hexano
Inte
nsi
dad
Flu
ore
scen
cia
Primera elución
Segunda elución
Elución de pireno de los geles.
Cada una de las elusiones se obtuvo con
5 min de contacto del gel con el disolvente.
Analitos λ excitación
(nm)
λmax. Excitación
(nm)
λ emisión
(nm)
λmax. Emisión
(nm)
Acenapteno (150-330/359) 292 (292/310-550) 322
B (a) antraceno (200-390/405) 287 (287/310-550) 387
B (a) pireno (200-400/460) 345 (345/365-550) 406
Fenantreno (150-340/350) 292 (292/310-550) 364
Fluoranteno (150-400/440) 341 (341/360-550) 436
Fluoreno (150-370/400) 272 (272/290-550) 423
Naftaleno (150-350/357) 286 (286/310-550) 335
Perileno (250-420/442) 400 (400/420-550) 439
Pireno (200-390/400) 334 (334/350-550) 372
Naftaleno: Metanol > Acetonitrilo Hexano 0
Fluorantreno: Acetonitrilo > Metanol > Hexano
Fenantreno: Metanol > Acetonitrilo >>> Hexano
Pireno: Acetonitrilo > Metanol > Hexano
-Antraceno: Acetonitrilo >>> Metanol Hexano
Resumen del orden de elución para alguno de los analitos más característicos
Longitudes de onda (λ) de excitación y emisión de cada analito. Los
espectros se han realizado en acetonitrilo, estableciendo 5 nm como tamaño
de las ventanas de excitación y emisión, tanto de entrada como de salida.
Resultados extrapolables a los
otros 8 analitos estudiados.
Sistema miniaturizado
que permite tratar
1-10 mLde muestra
en 15-60 min.
La presencia de los MWNTs en el gel disminuye la
solubilidad del LI en el disolvente, permitiendo
realizar medidas de fluorescencia sin interferencias
debidas a la fluorescencia nativa del LI.

ANEXO C
296
POTENCIAL DE LOS GELES CONSTITUIDOS POR LÍQUIDOS IÓNICOS Y NANOTUBOS
DE CARBONO COMO NUEVOS MATERIALES SORBENTES
M.L. Polo-Luque, B.M. Simonet, M. Valcárcel
Departamento de Química Analítica. Edificio Anexo C3.Campus de Rabanales – 14071 Córdoba. E-mail: [email protected]
OBJETIVOS
Sintetizar y caracterizar geles de líquido iónico y nanotubos de carbono. Evaluar el potencial analítico de los geles como nuevos sorbentes en
técnicas de extracción en fase sólida, para la preconcentración y elución de hidrocarburos aromáticos policíclicos (PAHs), de muestras acuosas
y gaseosas.
Síntesis y caracterización de geles
Estudio de las propiedades sortivas del gel y desarrollo de una unidad de microextracción
CONCLUSIONES
Aplicación analítica
Se ha obtenido un gel estable mediante la combinación de nanotubos
de pared múltiple (MWCNTs) y líquido iónico ([HMIM] PF6).
Se ha comprobado mediante microscopía de transmisión electrónica
y espectroscopia Raman que los nanotubos de carbono dispersados en
el líquido iónico se ordenan en una dirección predominante, debido a
interacciones de las paredes laterales de los mismos.
Se ha demostrado la capacidad de los geles para la
preconcentración de analitos orgánicos (PAHs) de muestras acuosas y
gaseosas (espacio de cabeza).
Los analitos adsorbidos y absorbidos en el gel pueden ser
desorbidos en un disolvente orgánico adecuado, y posteriormente
determinados mediante detección fluorimétrica.
Las unidades de microextracción permiten preconcentrar analitos tanto de muestras acuosas como de
muestras gaseosas mediante el análisis por espacio de cabeza.
y = 0.9883x + 7816.9
R2 = 0.9904
0
200000
400000
600000
800000
1000000
1200000
1400000
1600000
0 200000 400000 600000 800000 1000000 1200000 1400000 1600000
Fluorescencia de estándares
Fluo
resc
enci
a de
mue
stra
de
río fo
rtific
adas
Recuperación
87 – 105 %
RSD 5.7%
Estudio de recuperación del
análisis de muestras de agua
de río fortificadas.
Acuosas
Gaseosas
Considerando:
1) La elevada capacidad de
ad/absorción del gel
2) El bajo coste (0,25 euros/
unidad)
** Se propone su empleo para el
desarrollo de muestreadores
pasivos.
Presentan un mejor
comportamiento mecánico
por poseer una menor
cantidad de C amorfo.
Analito
Gel
0
20000
40000
60000
80000
0 2.5 5 7.5 10 12.5 15 17.5 20
Tiempo / h
Flu
ore
scen
cia
(t0)
- F
luo
resc
enci
a (t
)
0
2000
4000
6000
8000
10000
12000
14000
16000
Acenap
teno
B-antra
ceno
B-pire
no
Fenan
tren
o
Fluor
eno
Perile
no
Fluro
nantre
no
Naftale
no
Pireno
Inte
nsid
ad
Flu
ore
scen
cia
MWNT
MWNT
5-20 nm x 1-10 mm
10-30 nm x 5-15 mm
Cinética de ad- y absorción del pireno.
Efecto del nanotubo de carbono sobre la
extracción de PAHs.
Elevada capacidad de absorción, pero
presenta una cinética lenta debido al
bajo coeficiente de difusión del analito
en el gel, posiblemente debido a la
viscosidad del medio
Sistema miniaturizado
que permite tratar
1-10 mLde muestra
en 15-60 min.
0
4000
8000
12000
16000
20000
Agua Metanol Acetonitrilo Hexano
Inte
nsid
ad F
luor
esce
ncia
En contacto con Líquido Iónico
En contacto con el gel
0
10000
20000
30000
40000
50000
60000
70000
80000
Metanol Acetonitrilo Hexano
Inte
nsi
dad
Flu
ore
scen
cia
Primera elución
Segunda elución
Resultados extrapolables a los
otros 8 analitos estudiados.
La presencia de los MWNTs en el gel
disminuye la solubilidad del LI en el
disolvente, permitiendo realizar
medidas de fluorescencia sin
interferencias debidas a la
fluorescencia nativa del LI.
Elución de pireno de los geles.
Cada una de las eluciones se obtuvo con
5 min de contacto del gel con el disolvente.Comparación de los valores de intensidad de
fluorescencia de cuatro disolventes puestos en contacto
con líquido iónico puro o con el gel (LI+MWNTs).
Efecto sinérgico del gel:
Con sólo 15 mg de gel, que contienen
mímimas cantidades de LI y MWNTs, se
logra preconcentrar mayor cantidad de
analito que mayores cantidades de LI y
MWNTs por separado.
0
200000
400000
600000
800000
1000000
1200000
300 350 400
l / nm
Inte
nsi
dad
flu
ore
scen
cia
15 mg gel
15 mg MWNTs
100 ml HMIM PF6100 ml HMIM PF6
Gel (MWNTs/HMIM
PF6)
MWNTs
HMIM PF6
Obtención mediante
homogeinización de 300 µL LI / 15
mg MWNts en un mortero de agar
Espectroscopia Raman
+
LI: [HMIM] PF6 MWNTs
Adsorbentes
Conductores
Elevada
estabilidad
térmica y
mecánica
F:\multiNT_10.txt
F:\multiNT_8.txt
F:\multiNT_7.txt
1612.9
6
1318.4
1
741.7
5
500100015002000
05
00
01
00
00
15
00
02
00
00
25
00
0
Ab
so
rba
nce
Un
its
Al someter el gel a radiación de ultrasonidos se
produce la ruptura de la estructura, perdiéndose la
entidad de gel. Los MWNTs tienden a agregarse. F:\bmimPF6_1.txt
1423.9
9
1342.7
3
1123.1
1
1028.3
7
870.9
4
743.6
9
626.1
7602.2
9
472.1
8
50010001500
02
00
06
00
01
00
00
14
00
0
Ab
so
rba
nce
Un
its
LI ([HMIM] PF6) F:\multiNT_1.txt
2612.7
6
1581.9
4
1313.3
9
50010001500200025003000
0500
1000
1500
2000
Absorb
ance U
nits
MWNTs sólido
D
GD
Sobretono
F:\multiNT_4.txt
F:\multiNT_7.txt
F:\multiNT_5.txt
1586.6
6
1317.6
2
740.7
7
500100015002000
2000
4000
6000
8000
10000
12000
Absorb
ance U
nits
Gel
15mg MWNTs/200μL LI
15mg MWNTs/300μL LI
15mg MWNTs/400μL LI
Gel
No Gel
Espectros Raman
característicos de los
MWNTs sólidos, el LI
puro y el gel (a tres
concentraciones
diferentes)
MWNTs
en
metanol
MWNTs
en LI
Gel
• Ordenación preferencial de
los MWNTs
• Los MWNTs tienden a
situarse de forma paralela
• Bajo grado de agregación
Menor grado
de agregación
Drástica
disminución de
la intensidad
de la banda del
LI
Gel íntegro
Gel sometido a radiación de ultrasonidos
Gel
Gel sometido a ultrasonidos
CNT sólido

PÓSTERS
297
M.L. Polo-Luque, B.M. Simonet, M. Valcárcel
Departamento de Química Analítica. Edificio Anexo C3.Campus de Rabanales – 14071 Córdoba. E-mail: [email protected]
OBJETIVOS Sintetizar y caracterizar geles de líquido iónico y nanotubos de carbono. Evaluar el potencial analítico de los geles como nuevos sorbentes en
técnicas de extracción en fase sólida, para la preconcentración y elución de hidrocarburos aromáticos policíclicos (PAHs), de muestras
acuosas y gaseosas.
CONCLUSIONES
Se ha obtenido un gel estable mediante la combinación de nanotubos depared múltiple (MWCNTs) y líquido iónico ([HMIM] PF6).
Se ha comprobado mediante microscopía de transmisión electrónica yespectroscopia Raman que los nanotubos de carbono dispersados en ellíquido iónico se ordenan en una dirección predominante, debido ainteracciones de las paredes laterales de los mismos.
Se ha demostrado la capacidad de los geles para la preconcentración deanalitos orgánicos (PAHs) de muestras acuosas y gaseosas (espacio decabeza).
Los analitos adsorbidos y absorbidos en el gel pueden ser desorbidos enun disolvente orgánico adecuado, y posteriormente determinadosmediante detección fluorimétrica.
MWNTs en
metanolMWNTs en
LI
Gel
• Ordenación preferencial de
los MWNTs
• Los MWNTs tienden a
situarse de forma paralela
• Bajo grado de agregación
Menor grado
de agregación
Drástica disminución de la intensidad de
la banda del LI
F:\multiNT_4.txt
F:\multiNT_7.txt
F:\multiNT_5.txt
1586.6
6
1317.6
2
740.7
7
500100015002000
2000
4000
6000
8000
10000
12000
Absorb
ance U
nits
Gel
15mg MWNTs/200μL LI
15mg MWNTs/300μL LI
15mg MWNTs/400μL LI
Gel
No Gel
F:\multiNT_1.txt
2612.7
6
1581.9
4
1313.3
9
50010001500200025003000
0500
1000
1500
2000
Absorb
ance U
nits
MWNTs sólido
D
GD
Sobretono
F:\bmimPF6_1.txt
1423.9
9
1342.7
3
1123.1
1
1028.3
7
870.9
4
743.6
9
626.1
7602.2
9
472.1
8
50010001500
02
00
06
00
01
00
00
14
00
0
Ab
so
rba
nce
Un
its
LI ([HMIM] PF6)
CARACTERIZACIÓN DEL
GEL
ESPECTROSCOPIA
RAMAN
LI: [HMIM] PF6 MWNTs
Adsorbentes
Conductores
Elevada
estabilidad
térmica y
mecánica
SÍNTESIS DEL GEL
Obtención mediante homogeinización
de 300 µL LI / 15 mg MWNts en un
mortero de agar
APLICACIÓN ANALÍTICA
Las unidades de microextracción permiten preconcentrar analitos tanto de muestras
acuosas como de muestras gaseosas mediante el análisis por espacio de cabeza.
y = 0.9883x + 7816.9
R2 = 0.9904
0
200000
400000
600000
800000
1000000
1200000
1400000
1600000
0 200000 400000 600000 800000 1000000 1200000 1400000 1600000
Fluorescencia de estándares
Fluo
resc
enci
a de
mue
stra
de
río
fort
ifica
das
Recuperación
87 – 105 %
RSD 5.7%
Estudio de recuperación del
análisis de muestras de agua
de río fortificadas.
Acuosas
Gaseosas
Considerando:
1) La elevada capacidad de
ad/absorción del gel
2) El bajo coste (0,25 euros/ unidad)
** Se propone su empleo para el
desarrollo de muestreadores
pasivos.
ESTUDIO DE LAS PROPIEDADES SORTIVAS DEL GEL Y
DESARROLLO DE UNA UNIDAD DE MICROEXTRACCIÓN
Presentan un mejor
comportamiento mecánico
por poseer una menor
cantidad de C amorfo.
Analito
Gel
0
20000
40000
60000
80000
0 2.5 5 7.5 10 12.5 15 17.5 20
Tiempo / h
Fluo
resc
enci
a (t
0) -
Fluo
resc
enci
a (t)
0
2000
4000
6000
8000
10000
12000
14000
16000
Acenap
teno
B-antra
ceno
B-pire
no
Fenan
tren
o
Fluor
eno
Perile
no
Fluro
nantre
no
Naftale
no
Pireno
Inte
nsi
dad
Flu
ore
scen
cia
MWNT
MWNT
5-20 nm x 1-10 mm
10-30 nm x 5-15 mm
Cinética de ad- y absorción del pireno.
Efecto del nanotubo de carbono sobre la extracción
de PAHs.
Elevada capacidad de absorción, pero
presenta una cinética lenta debido al
bajo coeficiente de difusión del analito
en el gel, posiblemente debido a la
viscosidad del medio
Sistema miniaturizado
que permite tratar
1-10 mLde muestra
en 15-60 min.
0
4000
8000
12000
16000
20000
Agua Metanol Acetonitrilo Hexano
Inte
nsid
ad F
luor
esce
ncia
En contacto con Líquido Iónico
En contacto con el gel
0
10000
20000
30000
40000
50000
60000
70000
80000
Metanol Acetonitrilo Hexano
Inte
nsi
dad
Flu
ore
scen
cia
Primera elución
Segunda elución
Resultados extrapolables a los
otros 8 analitos estudiados.
La presencia de los MWNTs en el gel disminuye
la solubilidad del LI en el disolvente,
permitiendo realizar medidas de fluorescencia
sin interferencias debidas a la fluorescencia
nativa del LI.
Elución de pireno de los geles.
Cada una de las eluciones se obtuvo con
5 min de contacto del gel con el disolvente.
Comparación de los valores de intensidad de
fluorescencia de cuatro disolventes puestos en contacto
con líquido iónico puro o con el gel (LI+MWNTs).
Efecto sinérgico del gel:
Con sólo 15 mg de gel, que contienen
mímimas cantidades de LI y MWNTs, se
logra preconcentrar mayor cantidad de
analito que mayores cantidades de LI y
MWNTs por separado.
0
200000
400000
600000
800000
1000000
1200000
300 350 400
l / nm
Inte
nsid
ad fl
uore
scen
cia
15 mg gel
15 mg MWNTs
100 ml HMIM PF6100 ml HMIM PF6

ANEXO C
298
María Dolores Polo Luque Departamento de Química Analítica. Edificio Anexo C3.Campus de Rabanales – 14071 Córdoba.
Evaluar el potencial analítico de la combinación líquido
iónico /nanotubos de carbono en técnicas de extracción en
fase sólida y en gel para llevar a cabo el pretratamiento de
muestras acuosas y gaseosas.
OBJETIVO
SOFT MATERIAL
NUEVAS PROPIEDADES
GRACIAS AL EFECTO
SINÉRGICO DE LA
COMBINACIÓN
LI/MWCNT S
PROPIEDADES
AD- y ABSORCION ELEVADA
ELECTROCONDUCTIVIDAD
Tratamiento de muestra: SPE, SPME
Fase estacionaria: GC, LC, CEC
Aplicaciones electroquímicas:
sensores, condensadores,etc.
CONCLUSIONES
LI: [HMIM] PF6
ELÉCTRICAS
TÉRMICAS
MECÁNICAS
QUÍMICAS
PPROPIEDADES
Térmicas
Estabilidad química
Propiedades conductoras
Solubilidad
Capacidad de solvatación
PPROPIEDADES
IL/MWCNT´S
OBTENCIÓN DEL GEL
[HMIM] PF6 + MWCNT S
GEL
• Ordenación preferencial de
los MWNTs
• Los MWNTs tienden a
situarse de forma paralela
• Bajo grado de agregación
Preconcentración de analitos orgánicos (PAHs) de muestras acuosas y gaseosas
(espacio de cabeza). Los analitos ad- y absorbidos en el gel pueden ser desorbidos en
un disolvente orgánico adecuado, y posteriormente determinados mediante detección
fluorimétrica.
Acuosas
Gaseosas
0
200000
400000
600000
800000
1000000
1200000
300 350 400
l / nm
Inte
nsid
ad
flu
ore
scen
cia
15 mg gel
15 mg MWNTs
100 ml HMIM PF6100 ml HMIM PF6
* Efecto sinérgico del gel:
Con sólo 15 mg de gel, que contienen
mímimas cantidades de LI y MWNTs, se
logra preconcentrar mayor cantidad de
analito que mayores cantidades de LI y
MWNTs por separado.
MICROEXTRACCIÓN EN GEL
TEM
EXTRACCIÓN EN FASE SÓLIDA
Preconcentración de sulfonamidas de muestras acuosas. Los
analitos son eluidos en metanol y posteriormente determinados
mediante electroforesis capilar.
LI
CO
MO
DIS
OL
VE
NT
E
PA
RA
SO
LU
BIL
IZA
R
CN
T S
C18
+ MWNT sC18 +
MWNT s
MWNT s
LI
MWNT s
dispersos
+ C18
C18/MWNT s
0
100000
200000
300000
400000
500000
600000
700000
C18 C18 + MWNT´s C18 / MWNT´s
SEÑ
AL
AN
ALÍ
TIC
A
ANALITO
Sistema homogéneo en asusencia
de agregados de CNT s; interacción
en la superficie de la nanopartícula.
Dos fases, CNT s agregados;
interacción en intersticios.
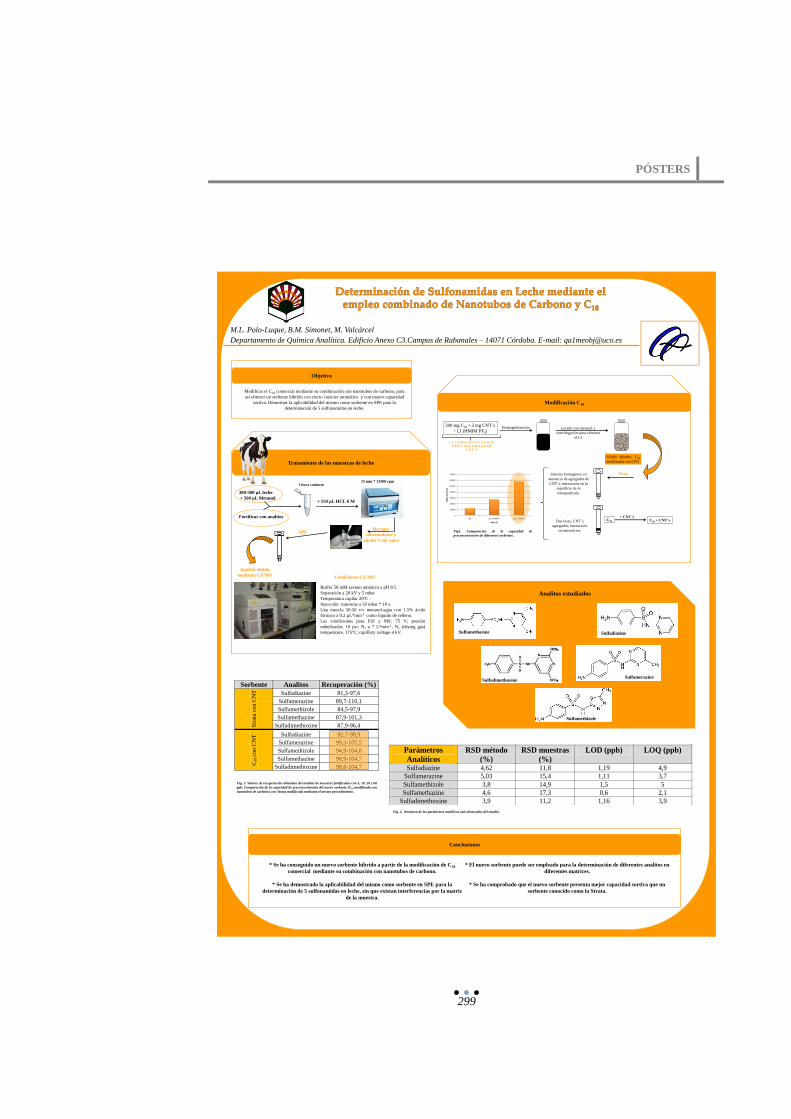
PÓSTERS
299
200 mg C18 + 2 mg CNT s
+ LI (HMIM PF6)Homogeinización Lavado con metanol y
centrifugación para eliminar
el LI
Sólido híbrido: C18
modificada con CNT
C18
+ CNT sC18 + CNT s
M.L. Polo-Luque, B.M. Simonet, M. Valcárcel
Departamento de Química Analítica. Edificio Anexo C3.Campus de Rabanales – 14071 Córdoba. E-mail: [email protected]
Objetivo
Modificar el C18 comercial mediante su combinación con nanotubos de carbono, para
así obtener un sorbente híbrido con cierto carácter aromático y con mayor capacidad
sortiva. Demostrar la aplicabilidad del mismo como sorbente en SPE para la
determinación de 5 sulfonamidas en leche. Modificación C18
0
100000
200000
300000
400000
500000
600000
700000
C18 C18 + MWNT´s C18 / MWNT´s
SEÑ
AL
AN
ALÍ
TIC
A
ANALITO
Sistema homogéneo en
asusencia de agregados de
CNT s; interacción en la
superficie de la
nanopartícula.
20 mg
Dos fases, CNT s
agregados; interacción
en intersticios.
L I C O M O D I S O LV E N T E
PA R A S O L U B I L I Z A R
C N T S
Fig1. Comparación de la capacidad de
preconcentración de diferentes sorbentes.
Tratamiento de las muestras de leche
300-500 μL leche
+ 500 μL Metanol
Fortificar con analitos
1 hora contacto
+ 150 μL HCL 6 M
15 min * 13500 rpm
Recoger
sobrenadante y
añadir 1 mL agua
SPE
Análisis eluido
mediante CE/MS
Buffer 50 mM acetato amónico a pH 8.5
Separación a 20 kV y 5 mbar
Temperatura capilar 20ºC .
Inyección muestras a 50 mbar * 10 s.
Una mezcla 50:50 v/v metanol-agua con 1.5% ácido
fórmico a 0.2 µL*min-1 como líquido de relleno.
Las condiciones para ESI y MS: 75 V; presión
nebulizador, 10 psi; N2 a 7 L*min-1; N2 (drying gas)
temperature, 175ºC; capillary voltage 4 kV.
Analitos estudiados
Sorbente Analitos Recuperación (%)
Str
ata
con C
NT
Sulfadiazine 81,3-97,6
Sulfamerazine 89,7-110,1
Sulfamethizole 84,5-97,9
Sulfamethazine 87,9-101,3
Sulfadimethoxine 87,9-96,4
C18
con C
NT
Sulfadiazine 92,7-98,9
Sulfamerazine 99,3-105,5
Sulfamethizole 94,9-104,8
Sulfamethazine 98,9-104,7
Sulfadimethoxine 98,8-104,7
Sulfamethazine
Sulfamerazine
Sulfamethizole
Sulfadiazine
Sulfadimethoxine
Parámetros
Analíticos
RSD método
(%)
RSD muestras
(%)
LOD (ppb) LOQ (ppb)
Sulfadiazine 4,62 11,8 1,19 4,9
Sulfamerazine 5,03 15,4 1,11 3,7
Sulfamethizole 3,8 14,9 1,5 5
Sulfamethazine 4,6 17,3 0,6 2,1
Sulfadimethoxine 3,9 11,2 1,16 3,9
Condiciones CE/MS
Conclusiones
* Se ha conseguido un nuevo sorbente híbrido a partir de la modificación de C18
comercial mediante su combinación con nanotubos de carbono.
* Se ha demostrado la aplicabilidad del mismo como sorbente en SPE para la
determinación de 5 sulfonamidas en leche, sin que existan interferencias por la matriz
de la muestra.
* El nuevo sorbente puede ser empleado para la determinación de diferentes analitos en
diferentes matrices.
* Se ha comprobado que el nuevo sorbente presenta mejor capacidad sortiva que un
sorbente conocido como la Strata.
Fig. 3. Valores de recuperación obtenidos del análisis de muestras fortificadas con 5, 10, 20 y 60
ppb. Comparación de la capacidad de preconcentración del nuevo sorbente (C18 modificada con
nanotubos de carbono) con Strata modificada mediante el mismo procedimiento.
Fig. 2. Resumen de los parámetros analíticos más destacados del estudio.

ANEXO C
300
M.L. Polo-Luque, B.M. Simonet, M. Valcárcel
Departamento de Química Analítica. Edificio Anexo C3.Campus de Rabanales – 14071 Córdoba. E-mail: [email protected]
OBJETIVO Desarrollar un sistema miniaturizado de preconcentración y un método electroforético adecuados para llevar a cabo la
determinación de niveles traza de líquidos iónicos en muestras medioambientales como agua de río.
RESULTADOS
Y DISCUSIÓN
Se ha desarrollado un sistema
miniaturizado de preconcentración
mediante la combinación de filtros
modificados con nanotubos de carbono y
MEPS de sílice.
Se ha optimizado un método electroforético para llevar a cabo
la determinación de líquidos iónicos.
Se ha logrado determinar trazas de líquidos iónicos, derivados de imidazolio y
piridinio, como nuevos contaminantes emergentes en muestras de agua de río.
Muestras AnalitoConcentración
añadida (ppb)
Concentración
encontrada (ppb)
Recuperación
(%)
RSD muestras
(%)
1 EMP+ 40 35 88 5,3
2 BMIM + 54 42-48 85-88 7
3 BMIM+ 320 305-310 95-97 4
4 HMIM+ 320 300-304 94-95 4,5
5
EMP+ 110 99-102 90-92 -
BMIM + 350 330-340 94-97 -
HMIM+ 280 250-270 89-96 -
Estudio de recuperación y precisión del análisis de muestras.
SECCIÓN
EXPERIMENTAL
-2000
0
2000
4000
6000
8000
10000
12000
14000
0 1 2 3 4 5 6 7 8 9 10 11 12 13 14 15
Tiempo (minutos)
mU
A
BMIM+
HMIM+
EMP+
Electroferograma de una mezcla
estándar obtenido bajo las condiciones
óptimas seleccionadas.
Calibrado de los tres cationes estudiados.
Electrolito: 100 mM acetato amónico en metanol a pH 7.7
Separación:10 kV y 50 psi de sobrepresión en ambos
extremos.
Temperatura capilar : 20ºC .
Inyección muestras : hidrodinámica 0,5psi x10 s.
Detección : 210 nm.
Capilar : 45 cm y 50 µm.
Acondicionamiento capilar: KOH (5 min), metanol (5 min)
y electrolito (5 min).
Condiciones Electroforéticas
Variables CE
estudiadas
Composición del Buffer
(electrolito y disolvente)
pH del buffer
Voltaje y tiempo de inyección
Acondicionamiento del capilar
1234
6
109
5
87
mu
estr
a
0
10000
20000
30000
40000
50000
60000
70000
80000
90000
100000
0 1 2 3 4 5 6 7 8 9 10 11 12 13 14 15 16
mU
A
mM AcNH4
EMP
BMIM
HMIM
0
5000
10000
15000
20000
25000
30000
35000
40000
45000
50000
55000
0 1 2 3 4 5 6 7 8 9 10
mU
A
Sample Volume (mL)
EMP
BMIM
HMIM
Procedimiento de preconcentración
Analitos
Líquidos iónicos:
- derivados de imidazolio
-derivados de piridinio
Etapa de clean-up de
muestra, filtrando a través
de filtros modificados con
nanotubos de carbono
Preconcentación LI mediante
MEPS de silice
5) Elución analitos y
determinación por CE
Efecto de la concentración de
acetato amónico en el eluyente.
Eluyente: Metanol, 0,2 % fórmico y
acetato amónico.
Efecto del volumen de
preconcentración de
muestra.
1
Eliminación de materia
orgánica en suspensión
Analito Pendiente±E Sy/x R2 LOQ (ppb) RSD (%)
EMP+ 38517± 1887 571 0,9905 20 3,5
BMIM+ 32051 ± 1909 1727 0,986 30 2
HMIM+ 35323 ± 1128 828 0,997 25 3.8
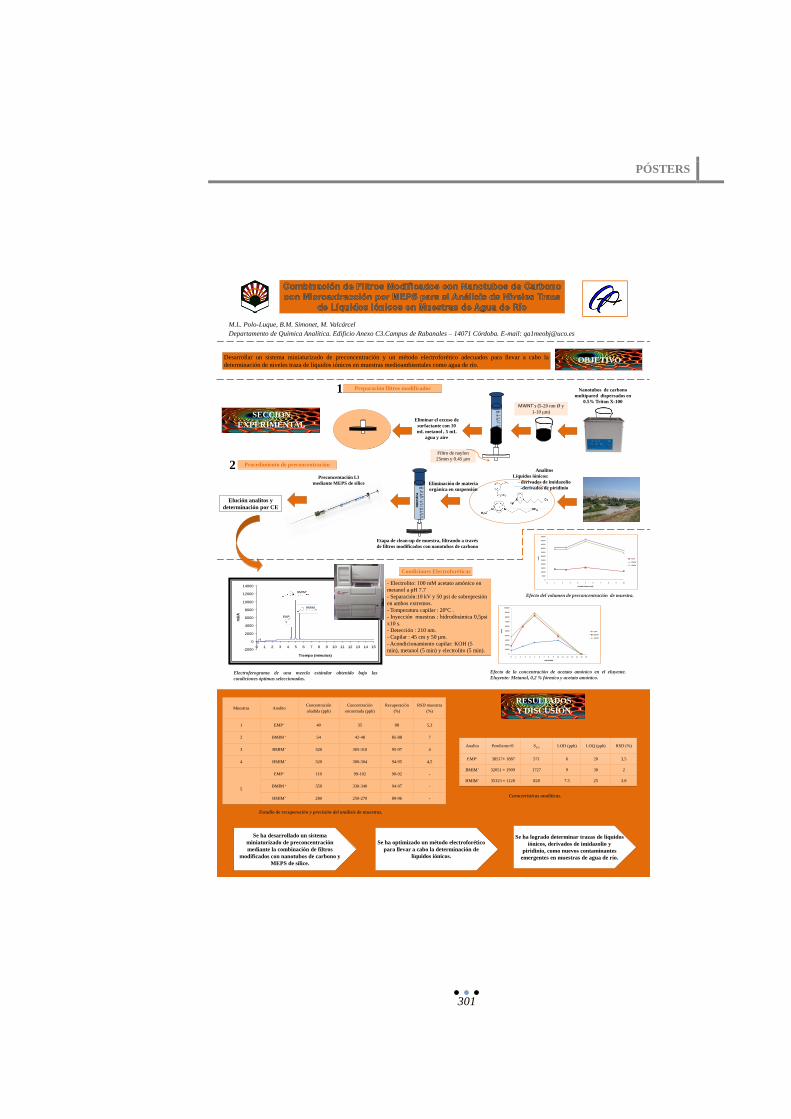
PÓSTERS
301
M.L. Polo-Luque, B.M. Simonet, M. Valcárcel
Departamento de Química Analítica. Edificio Anexo C3.Campus de Rabanales – 14071 Córdoba. E-mail: [email protected]
Desarrollar un sistema miniaturizado de preconcentración y un método electroforético adecuados para llevar a cabo la
determinación de niveles traza de líquidos iónicos en muestras medioambientales como agua de río.
Muestras AnalitoConcentración
añadida (ppb)
Concentración
encontrada (ppb)
Recuperación
(%)
RSD muestras
(%)
1 EMP+ 40 35 88 5,3
2 BMIM + 54 42-48 85-88 7
3 BMIM+ 320 305-310 95-97 4
4 HMIM+ 320 300-304 94-95 4,5
5
EMP+ 110 99-102 90-92 -
BMIM + 350 330-340 94-97 -
HMIM+ 280 250-270 89-96 -
-2000
0
2000
4000
6000
8000
10000
12000
14000
0 1 2 3 4 5 6 7 8 9 10 11 12 13 14 15
Tiempo (minutos)
mU
A
BMIM+
HMIM+
EMP+
Electroferograma de una mezcla estándar obtenido bajo las
condiciones óptimas seleccionadas.
- Electrolito: 100 mM acetato amónico en
metanol a pH 7.7
- Separación:10 kV y 50 psi de sobrepresión
en ambos extremos.
- Temperatura capilar : 20ºC .
- Inyección muestras : hidrodinámica 0,5psi
x10 s.
- Detección : 210 nm.
- Capilar : 45 cm y 50 µm.
- Acondicionamiento capilar: KOH (5
min), metanol (5 min) y electrolito (5 min).
Condiciones Electroforéticas
0
10000
20000
30000
40000
50000
60000
70000
80000
90000
100000
0 1 2 3 4 5 6 7 8 9 10 11 12 13 14 15 16
mU
A
mM AcNH4
EMP
BMIM
HMIM
0
5000
10000
15000
20000
25000
30000
35000
40000
45000
50000
55000
0 1 2 3 4 5 6 7 8 9 10
mU
A
Sample Volume (mL)
EMP
BMIM
HMIM
Efecto de la concentración de acetato amónico en el eluyente.
Eluyente: Metanol, 0,2 % fórmico y acetato amónico.
Efecto del volumen de preconcentración de muestra.
Procedimiento de preconcentración
Analito Pendiente E Sy/x LOD (ppb) LOQ (ppb) RSD (%)
EMP+ 38517 1887 571 6 20 3,5
BMIM+ 32051 1909 1727 9 30 2
HMIM+ 35323 1128 828 7.5 25 3.8
OBJETIVO
SECCION
EXPERIMENTAL
Estudio de recuperación y precisión del análisis de muestras.
Características analíticas.
RESULTADOS
Y DISCUSIÓN
Se ha desarrollado un sistema
miniaturizado de preconcentración
mediante la combinación de filtros
modificados con nanotubos de carbono y
MEPS de sílice.
Se ha optimizado un método electroforético
para llevar a cabo la determinación de
líquidos iónicos.
Se ha logrado determinar trazas de líquidos
iónicos, derivados de imidazolio y
piridinio, como nuevos contaminantes
emergentes en muestras de agua de río.
1234
6
109
5
87
mu
estr
a
Etapa de clean-up de muestra, filtrando a través
de filtros modificados con nanotubos de carbono
Preconcentación LI
mediante MEPS de silice
Elución analitos y
determinación por CE
1
Eliminación de materia
orgánica en suspensión
Analitos
Líquidos iónicos:
- derivados de imidazolio
-derivados de piridinio
2
1234
6
109
5
87
Preparación filtros modificados Nanotubos de carbono
multipared dispersados en
0.5% Triton X-100
Eliminar el exceso de
surfactante con 10
mL metanol , 5 mL
agua y aire
Filtro de naylon
25mm y 0.45 μm
MWNT´s (5-20 nm Ø y
1-10 μm)

ANEXO C
302
RELACIÓN ENTRE PROPIEDADES QUÍMICAS, FÍSICAS Y
ESPECTROS RAMAN DE NANOTUBOS DE CARBONO Y GELES
FORMADOS DE LA COMBINACIÓN DE ÉSTOS CON LÍQUIDOS
IÓNICOS
M.L. Polo-Luque, B.M. Simonet, M. Valcárcel
Departamento de Química Analítica. Edificio Anexo C3.Campus de Rabanales – 14071 Córdoba. E-mail: [email protected]
OBJETIVOSintetizar ocho geles diferentes mediante la combinación del líquido iónico HMIM PF6 con siete tipos de nanotubos de carbono multi pared y uno de pared simple, y llevar a cabo un
estudio comparativo de las propiedades fisicoquímicas y espectros Raman de los mismos.
CONCLUSIONES
1) Obtención del gel mediante homogeinización del LI con la
cantidad adecuada de cada nanotubo en un mortero de agarLI: [HMIM] PF6
MWNTs
+
MWNTs-1 5-20 1-10 - Bayer
MWNTs-2 110-170 2 - Mer
MWNTs-3 9.5 1.5 - Nanocyl
MWNTs-4 10-30 10-30 - Cheap-Tubes
MWNTs-5 10-30 10-30 2.5 (wt)% OH Cheap-Tubes
MWNTs-6 10-30 10-30 1.6 (wt)% COOH Cheap-Tubes
MWNTs-7 10-20 5-15 nm - NTP
SWNTs <2 5-15 - NTP
Tabla 1. Principales características de cada tipo de nanotubo.
2) Integración de los geles en un dispositivo miniaturizado y estudio
de la estabilidad de los mismos en diferentes disolventes
Metanol Acetonitrilo Acetato de Etilo Hexano
Bayer 54 % 64 % 51 %
[LI]
< 8
,3 p
pb
= L
OD
MER 38 % 50 % 41 %
Nanocyl 51 % 60 % 39 %
Cheap-Tubes 49 % 66 % 30 %
Cheap-Tubes-OH 56 % 61 % 46 %
Cheap-Tubes-COOH 55 % 65 % 43 %
NTP-Alineados 56 % 60 % 44 %
NTP-SWNT´s 57 % 59 % 46 %
Tabla 2. Porcentajes de reducción de la cantidad de LI en diferentes solventes.
Electrolito: 100 mM acetato amónico en metanol a pH 7.7
Separación:10 kV y 50 psi de sobrepresión en ambos extremos.
Temperatura capilar : 20ºC .
Inyección muestras : hidrodinámica 0,5psi x15 s.
Detección : 210 nm.
Capilar : 45 cm y 50 µm.
Condiciones Electroforéticas
3) Integración de los geles en un dispositivo miniaturizado y
estudio de su capacidad de preconcentración de fluoranteno
0
500000
1000000
1500000
2000000
2500000
Bay
er
Mer
Nan
ocyl
0,5 horas 1 hora 4 horas
Ch
eap
-Tu
bes
Na
no
cyl
Mer
Ch
eap
-T-C
OO
H
Ch
eap
-Tu
bes
-OH
Los espectros de fluorescencia fueron medidos en un
Espectrofluorímetro PTIQuantaMasterTM. Los espectros de
fluoranteno fueron registrados a λexc = 341 nm and λem = 440 nm.
Fluoranteno
Condiciones Fluorimétricas
Figura 1. Valores de preconcentración de fluoranteno por cada uno de los geles, a 0.5, 1 y 4 horas.
Ba
yer
SW
NT
s
Ali
nea
do
s
4) Estudio RAMAN
Tipo de CNT ID/IG sólidos ID/IG pasta
Bayer 1.39 1.12
MER 0.24 0.47
Nanocyl 1.38 1.01
Cheap-Tubes 0.65 0.81
Cheap-Tubes-OH 0.82 1.02
Cheap-Tubes-COOH 0.55 0.85
NTP-Alineados 0.9 0.94
NTP-SWNT´s 0.5 0.60
Tabla 3. Cocientes altura pico de los espectros Raman de CNT s sólidos y sus correspondientes
geles.
Gel
Sólido
Espectros Raman correspondientes a nanotubos MER en
estado sólido y al gel formado a partir de los mismos.
* Se han sintetizado ocho geles
diferentes a partir de 8 tipos de
CNT s y un LI.
** Se ha comprobado que el gel
formado es estable en contacto
con diferentes solventes.
*** Se ha demostrado la capacidad
de los geles para llevar a cado la
preconcentración de fluoranteno.
** Se ha establecido una relación
entre las propiedades físico-
químicas observadas en los geles y
sus correspondientes espectros
Raman.

PÓSTERS
303
CARACTERIZACIÓN
NANOTUBOS DE CARBONO ESPIRALES
FORMACIÓN DEL “SOFT MATERIAL”
Evaluar el potencial sorbente de un nuevomaterial obtenido a partir de la combinación denanotubos de carbono espirales y líquidoiónico, para la extracción de PAH s demuestras de agua.
CONCLUSIONES
OBJETIVO
17 mg100 µL
LI: [HMIM] PF6 CCNTs
+
0
2000
4000
6000
8000
10000
12000
14000
16000
18000
agua metanol acetonitrilo hexano
Señ
al d
e F
luo
resc
en
cia
solventes
Figura 4: Fluorescencia nativa del líquido iónico en diferentes
solventes, directamente y en un gel con nanotubos de carbono espirales.
Figura 1: Espectro Raman característico de nanotubos de carbono
espirales.
Figura 3: Imagen TEM de una mezcla de nanotubos de carbono
lineales y nanotubos de carbono espirales.
Figura 2: Imagen TEM de nanotubos de carbono
espirales.
EVALUACIÓN DE LAS PROPIEDADES
SORPTIVAS DEL GELCARACTERÍSTICAS ANALÍTICAS
0
20000
40000
60000
80000
100000
120000
140000
0 2 4 6 8 10 12 14 16 18 20
Flu
ore
sce
nci
a
Tiempo (horas)
Figura 5: Isotermas obtenidas para la pre-concentración de Benz (a) antraceno.
0
2000
4000
6000
8000
10000
12000
14000
16000
18000
Acenapteno Benz (a) antraceno
Benzo (a) pireno Fenantreno Fluoreno Perileno Fluoranteno Naftaleno Pireno
Flu
ore
sce
nci
a
analitos
Figura 6: Pre-concentración de diferentes PAH s con el gel formado.
Estudio de la integridad del gel en diferentes solventes , con el fin de
seleccionar el disolvente más adecuado para la elución de los analitos.
CCNT s
Evaluación del mecanismo de ad/ab-sorción del gel; para ello estudiamos
la pre-concentración del Benzo (a) antraceno adiferentes tiempos.
** Primer rango lineal: Mecanismo
de adsorción
** Segundo rango lineal: Mecanismo
de absorción
Figura 8. Estudio de recuperación en muestras de agua de rio fortificadas.
Representación de la concentración añadida frente a la concentración encontrada.
y = 0,995x + 185,9R² = 0,994
0
5000
10000
15000
20000
25000
30000
35000
40000
45000
0 5000 10000 15000 20000 25000 30000 35000 40000 45000
[An
tra
cen
o] f
ou
nd
/ p
pb
[Antraceno] added / ppb
Figura 7. Recta de calibrado.
y = 97,12x + 5450R² = 0,999
y = 45,59x + 16574R² = 0,992
0
5000
10000
15000
20000
25000
30000
35000
40000
45000
50000
33 99 165 231 297 363 429 495 561 627 693
Flu
ore
sce
nci
a
Concentración (ppb)
RSD: 1.02 %
LOD: 2 ppb
M.L. Polo-Luque, B.M. Simonet, M. Valcárcel
Departamento de Química Analítica. Edificio Anexo C3.Campus de Rabanales – 14014 Córdoba. E-mail: [email protected]
V muestra: 4 mL
Gel
100 µL HMIM PF6 +
17 mg CCNT s
15 mg Gel
10 µL Hmim PF6
+
1.74 mg CCNT´s0
200000
400000
600000
800000
1000000
1200000
300 350 400
l / nm
Inte
nsid
ad
flu
ore
scen
cia
15 mg gel
15 mg MWNTs
100 ml HMIM PF6100 ml HMIM PF6
Gel (MWNT´s/HMIM
PF6)
MWNTs
HMIM PF6
La formación del gel conduce a un efecto sinérgico de las
propiedades individuales de ambos materiales. En la gráfica
se observa que la capacidad de preconcentración del gel es
mayor que la de ambos materiales por separado.

ANEXO C
304
ESTUDIO DE LAS PROPIEDADES QUÍMICAS, FÍSICAS Y ESPECTROS
RAMAN DE NANOTUBOS DE CARBONO Y GELES FORMADOS DE LA
COMBINACIÓN DE ÉSTOS CON LÍQUIDO IÓNICO
M.L. Polo-Luque, B.M. Simonet, M. Valcárcel
Departamento de Química Analítica. Edificio Anexo C3.Campus de Rabanales – 14014 Córdoba. E-mail: [email protected]
OBJETIVO Comparar y estudiar la formación de geles a partir de siete tipos diferentes de nanotubos de carbono multi pared y uno de pared simple y líquido
iónico Hmim PF6. El estudio comprende la comparación de las propiedades fisicoquímicas y los espectros Raman.
CONCLUSIONES
1) Formación del gel mediante homogeinización del LI con la
cantidad adecuada de cada nanotubo en un mortero de agarLI: [HMIM] PF6
MWNTs
+
MWNTs-1 5-20 1-10 -
MWNTs-2 110-170 2 -
MWNTs-3 9.5 1.5 -
MWNTs-4 10-30 10-30 -
MWNTs-5 10-30 10-30 2.5 (wt)% OH
MWNTs-6 10-30 10-30 1.6 (wt)% COOH
MWNTs-7 10-20 5-15 nm -
SWNTs <2 5-15 -
Tabla 1. Principales características de cada tipo de nanotubo.
2) Estudio de la estabilidad de los geles en diferentes disolventes.
Solubilidad del LI.
Metanol Acetonitrilo Acetato de Etilo
Bayer 54 % 64 % 51 %
MER 38 % 50 % 41 %
Nanocyl 51 % 60 % 39 %
Cheap-Tubes 49 % 66 % 30 %
Cheap-Tubes-OH 56 % 61 % 46 %
Cheap-Tubes-COOH 55 % 65 % 43 %
NTP-Alineados 56 % 60 % 44 %
NTP-SWNT´s 57 % 59 % 46 %
Tabla 2. Porcentajes de reducción de la cantidad de LI solubilizado en diferentes solventes.
Electrolito: 100 mM acetato amónico en metanol a pH 7.7
Separación:10 kV y 50 psi de sobrepresión en ambos extremos.
Temperatura capilar : 20ºC .
Inyección muestras : hidrodinámica 0,5psi x15 s.
Detección : 210 nm.
Capilar : 45 cm y 50 µm.
Condiciones electroforéticas utilizadas para medir el LI solubilizado
3) Integración de los geles en un dispositivo miniaturizado y
estudio de su capacidad de preconcentración de fluoranteno
0
500000
1000000
1500000
2000000
2500000
0,5 horas 1 hora 4 horas
MW
NT
s4
MW
NT
s3
MW
NT
s2
MW
NT
s6
MW
NT
s5
Los espectros de fluorescencia fueron medidos en un
Espectrofluorímetro PTIQuantaMasterTM. Los espectros de
fluoranteno fueron registrados a λexc = 341 nm and λem = 440
nm.
Fluoranteno
Condiciones Fluorimétricas
Figura 1. Valores de preconcentración de fluoranteno por cada uno de los geles, a 0.5, 1 y 4
horas.
MW
NT
s1
SW
NT
s
MW
NT
s7
4) Estudio RAMAN
Tipo de CNT ID/IG sólidos ID/IG pasta
Bayer 1.39 1.12
MER 0.24 0.47
Nanocyl 1.38 1.01
Cheap-Tubes 0.65 0.81
Cheap-Tubes-OH 0.82 1.02
Cheap-Tubes-COOH 0.55 0.85
NTP-Alineados 0.9 0.94
NTP-SWNT´s 0.5 0.60
Tabla 3. Cocientes altura pico de los espectros Raman de CNT s sólidos y sus correspondientes
geles.
Gel
Sólido
Espectros Raman correspondientes a nanotubos MER
en estado sólido y al gel formado a partir de los mismos.
* Se han sintetizado ocho geles
diferentes a partir de 8 tipos de
CNT s y un LI.
** Se ha comprobado que el gel
formado es estable en contacto
con diferentes solventes.
Posibilita la elución de los
analitos preconcentrados.
*** Se ha demostrado la capacidad
de los geles para llevar a cado la
preconcentración de fluoranteno.
** Se ha establecido una relación
entre las propiedades físico-
químicas observadas en los geles
y sus correspondientes espectros
Raman.
La presencia de los
nanotubos de carbono en el
gel reduce de un 50 a 60% la
cantidad de LI que se
solubiliza. Los geles formados con
nanotubos de carbono
multipared poseen
mayor capacidad de
preconcentración.

PÓSTERS
305
M.L. Polo-Luque, B.M. Simonet, M. Valcárcel
Departamento de Química Analítica. Edificio Anexo C3.Campus de Rabanales – 14014 Córdoba. E-mail: [email protected]
La mezcla de nanotubos de carbono (CNTs) con líquidos iónicos (LIs), en proporciones adecuadas, conduce a la formación de
geles físicos con propiedades y características de gran interés para el desarrollo de herramientas analíticas.
CNT + LI
% CNT
Concentración Crítica de Gelificación (C:C.G)
DOS FASES
Combinación de propiedades
NUEVO MATERIAL – 1 FASE
PROPIEDADES: Estable frente a centrifugación, capacidad de ad- y absorción,
estabilidad en disolventes, etc.
OBJETIVO: Establecer un procedimiento rápido y simple para identificar la formación del gel.
RESULTADOS
Diámetro (nm) Longitud (µm)Concentración crítica de
gelificación (%CNT)
MWNTs-1 5-20 1-10 3.7
MWNTs-2 10-30 10-30 3.0
MWNTs-3 110-170 2 4,4
SWNTs <2 5-15 7,5
Tabla 1. Características y concentración crítica de cada nanotubo 0
300000
600000
900000
1200000
1500000
1800000
2100000
2400000
2700000
3000000
3300000
3600000
0 4 8 12 16 20 24 28 32 36 40
Flu
ore
scen
cia
l
[CNT] mg
MWNT s 1
MWNT s 2
MWNT s 3
SWNT s
Figura 1. Fluorescencia del LI en función de la cantidad de nanotubos. LI= 200 µL
C.C.G
SWCNTs
MWCNTsC.C.G
Imágenes de miscroscopía óptica del proceso de gelificación
Ejemplo
MWCNTs y SWCNTs presentan el mismo comportamiento
El % CNTs debe ser mayor en los SWCNTs
Diferentes MWCNTs presentan una C.C.G similar
Figura 2.
Espectros
Raman de
MWCNTs -1
a1, 5, 10, 15,
20 y 30 mg
en LI.
-La interacción entre el LI y los CNTs disminuye la fluorescencia nativa del LI.
- En el intervalo de concentración estudiado no se observa la formación de
nuevos componentes. Los espectros obtenidos pueden explicarse mediante
combinación lineal de los espectros puros del LI y lo CNTs.
Fluorescencia α Solubilidad LI
Gel
(LI/CNT)
Acetonitrilo
λexc = 285
nm
Flu
ore
scen
cia
[CNT] %Concentración Crítica
de Gelificación
Solubilidad del LI ≈ cte cuando la [CNTs] es
suficiente para interaccionar con todo el LI
Disminución drástica de la solubilidad
debido a la interacción del LI con los CNTs
PROCEDIMIENTO: El procedimiento propuesto se basa en los cambios de solubilidad del líquido iónico en disolvente orgánico. Al interaccionar el líquido
iónico con los nanotubos de carbono, éste se estabiliza disminuyendo drásticamente su solubilidad. Como medida de la solubilidad del líquido iónico en el
disolvente orgánico se ha establecido la medida de su fluorescencia.

ANEXO C
306
ESTUDIO DE LAS PROPIEDADES QUÍMICAS, FÍSICAS Y ESPECTROS
RAMAN DE NANOTUBOS DE CARBONO Y GELES FORMADOS DE LA
COMBINACIÓN DE ÉSTOS CON LÍQUIDO IÓNICO
OBJETIVO
Estudiar el efecto de los nanotubos de carbono en las propiedades fisico-químicas de geles formados a partir de la combinación CNTs/LI. Para ello se comparan
geles obtenidos a partir de siete tipos diferentes de nanotubos de carbono multi pared y uno de pared simple y el líquido iónico Hmim PF6 (1-Hexil 3-
Metilimidazolio Hexafluorofosfato).
M.L. Polo-Luque, B.M. Simonet, M. Valcárcel
Departamento de Química Analítica. Edificio Anexo C3.Campus de Rabanales – 14014 Córdoba. E-mail: [email protected]
CONCLUSIONES
Se han sintetizado ocho geles diferentes a partir de lacombinación de 8 tipos de CNTs y el LI Hmim PF6. Se hademostrado que el gel formado es estable en contacto condiferentes solventes, lo cual hace posible preconcentrar yeluir analitos. Dichos geles son útiles para llevar a cabo lapreconcentración de fluoranteno, principalmente aquellosformados a partir de nanotubos de carbono multipared. Se haestablecido una relación entre las propiedades físico-químicas observadas en los geles y sus correspondientesespectros Raman.
LI: [HMIM] PF6
CNTs+
Diametro
(nm)
Longitud
(µm)
Funcio-
nalizaciónPureza
Gel
CNT % (W/W)Proveedor
MWNTs-15-20 1-10 - > 95 % 3.7 Bayer (Germany)
MWNTs-2110-170 2 - > 90 % 4.4 Mer (Arizona, USA)
MWNTs-39.5 1.5 - 90 % 1.9 Nanocyl (Belgium)
MWNTs-410-30 10-30 - >90 wt % 3 Cheap-Tubes (USA)
MWNTs-510-30 10-30
-OH
2.5 (wt)%>90 wt % 2.6
Cheap-Tubes
(Vermont, USA)
MWNTs-610-30 10-30
-COOH
1.6 (wt)%>90 wt % 3.7
Cheap-Tubes
(Vermont, USA)
MWNTs-7 10-20 5-15 nm - >95% 2.6 NTP L td. (China)
SWNTs<2 5-15 -
SW: 50%
CNT >90%7.5 NTP L td. (China)
Tabla 1. Características de los CNTs empleados. Proporción de nanotubos de carbono
recomendada para preparar los geles.
1) Formación del gel mediante homogenización del LI con la
cantidad adecuada de cada nanotubo en un mortero de agar
Metanol Acetonitrilo Acetato de Etilo Hexano
MWNTs-1 54 % 64 % 51 %
Red
ucc
ión
cu
anti
tati
va
de
la s
eñal
< L
OD
MWNTs-2 38 % 50 % 41 %
MWNTs-3 51 % 60 % 39 %
MWNTs-4 49 % 66 % 30 %
MWNTs-5 56 % 61 % 46 %
MWNTs-6 55 % 65 % 43 %
MWNTs-7 56 % 60 % 44 %
SWNTs 57 % 59 % 46 %
2) Estudio de la estabilidad de los geles en diferentes disolventes.
Solubilidad del LI
Condiciones
electroforéticas
utilizadas para medir el
LI solubilizado
Electrolito: 100 mM acetato amónico en metanol a pH 7.7
Separación:10 kV y 50 psi de sobrepresión en ambos extremos.
Temperatura capilar : 20ºC .
Inyección muestras : hidrodinámica 0.5psi x15 s.
Detección : 210 nm.
Capilar : 45 cm y 50 µm.
Tabla 2. Proporción de reducción de la cantidad de LI solubilizado en diferentes solventes.
La presencia de los
nanotubos de carbono en el
gel estabiliza el LI reduciendo
de un 50 a un 60% la
cantidad de LI solubilizado
3) Integración de los geles en un
dispositivo miniaturizado y estudio de su
capacidad para preconcentrar fluoranteno
4) Estudios Rama
Los espectros de fluoranteno se registraron a
λexc = 341 nm and λem = 440 nm.
Fluoranteno
0
500000
1000000
1500000
2000000
2500000
MWNT-1MWNT-2
MWNT-3MWNT-4
MWNT-5MWNT-6
MWNT-7SWNT-1
Flu
ore
scen
cia
Tiempo
0.5 h
1 h
4 h
Figura 1. Preconcentración de fluoranteno de cada gel medida a tres tiempos de extracción:
0.5, 1 y 4 horas.
Los geles formados con nanotubos de carbono multipared poseen
mayor capacidad de preconcentración
Intensidad
banda-D
Ancho
banda-D
(cm-1)
Intensidad
relación G/D
Relación ancho
banda G/D
MWNTs-1 3697 55 0.70 1.30
MWNTs-2 1094 43 5.00 0.51
MWNTs-3 5048 55 0.69 1.20
MWNTs-4 3215 51 2.60 0.80
MWNTs-5 7656 52 1.88 0.90
MWNTs-6 2826 49 1.90 0.94
MWNTs-7 4241 52 1.03 1.20
SWNTs 2053 52 3.80 0.96
Figura 2. Espectros Raman de CNTs, de abajo a arriba son:
MWNTs-1, MWNTs-2, MWNTs-3, MWNTs-4, MWNTs-
5, MWNTs-6, MWNTs-7 and SWNTs.
Figura 3. Espectro Raman de LI+CNTs (linea azul) y
espectro Raman del gel obtenido con MWNT-1 (linea
roja).
Tabla 3. Análisis Raman de los nanotubos de carbono empleados.

PÓSTERS
307
M.L. Polo-Luque, B.M. Simonet, M. Valcárcel
Departamento de Química Analítica. Edificio Anexo C3.Campus de Rabanales – 14014 Córdoba. E-mail: [email protected]
OBJETIVO
Demostrar la utilidad de un gel de nanotubos de carbono de pared múltiple (MWCNTs) y líquido iónico (HMIM PF6) para llevar a cabo la extracción en fase sólida de 3 nitrofenoles
en agua , mediante el diseño de un dispositivo que permita el acoplamiento en línea del gel a un equipo de electroforesis capilar comercial.
CONCLUSIONES
- Se ha diseñado un dispositivo miniaturizado dentro de un vial de muestra comercial de electroforesis capilar.
- Se ha empleado el nuevo sistema para llevar a cabo la microextracción en fase sólida (de 3 nitrofenoles en agua) acoplada en-línea a EC. Además, el empleo del gel (líquido iónico/ nanotubos
de carbono) proporcionó un buen rendimiento analítico.
- El sistema propuesto tiene tres características principales: (1) se puede usar directamente acoplado a un equipo comercial de EC, lo que disminuye el grado de manipulación de la muestra, (2)
exhibe buen rendimiento analítico, y (3) es bastante económico.
PROBLEMA ANALÍTICO
El 2-nitrofenol y sus isómeros (NPs) han sido ampliamente utilizados en la producción de plaguicidas, insecticidas y herbicidas, por lo que es muy común su presencia en el
medio ambiente. Estos compuestos plantean graves riesgos para la salud humana debido a su alta toxicidad y baja degradabilidad en el medio, por lo que son considerados como
contaminantes prioritarios. Así, es importante su separación y determinación en matrices ambientales; sin embargo, los NPs en agua se encuentran en concentraciones
extremadamente bajas, lo que hace necesaria una etapa de preconcentración de la muestra.
La electroforesis capilar (EC) es una de las técnicas de separación más ampliamente utilizadas en la actualidad, sin embargo, el inconveniente de la misma es su baja
sensibilidad. Para solventar este hecho, la extracción y microextracción en fase sólida son opciones eficaces para mejorar los límites de detección (LOD) de la técnica.
DESARROLLO EXPERIMENTALSOLUCIÓN PROPUESTA
Tabla 1. Características analíticas de la determinación de nitrofenoles en muestras de agua.
0
1000
2000
3000
4000
5000
3 4 5 6 7 8 9 10 11
Abs
orba
nce
/ m
UA
Time / min
ab
c
Figura 1. Esquema del procedimiento de tratamiento de muestra
propuesto y dimensiones del dispositivo “in-vial” diseñado.
Analito y = a+bxa) Sy/x R2RSDb)
(área)
RSDb)
(tiempo)
LOD
(µg/L)
LOD
(µg/L)
3-NP 1009.4 x – 170.7 84.1 0.998 5.8 4.5 0.25 0.75
2-NP 1662.2 x + 128.9 155.1 0.998 6.3 5.2 0.28 0.83
2,4-diNP 841.9 x – 98.6 61.7 0.997 6.7 4.9 0.22 0.65
a) La ecuación de la recta se calculó para ocho niveles de concentración.
b) n=3.
Electrolito: 25 mM Na2HPO4 en 90%–10% agua–metanol a pH = 9.
Separación:30 kV y 50 psi de sobrepresión en ambos extremos.
Temperatura capilar : 25ºC .
Inyección muestra hidrodinámica: 0,5psi x5s.
Detección : 200 nm.
Capilar : 50 µm.
Acondicionamiento capilar: NaOH (3 min), agua (3 min) y electrolito
(3 min).
Condiciones Electroforéticas
Figura 2. Electroferograma de una muestra de agua fortificada con 10
µg/L de cada analito. Picos: (a) 3-nitrofenol, (b) 2,4-dinitrofenol y (c)
2-nitrofenol.
Empleo en un problema real
SPMEGel (CNTs/LI) como
sorbente
Electroforesis capilar (Determinación de NPs)
+
Diseño del dispositivo “in-vial”
Síntesis del Sorbente (gel)
Liquido
iónico (Hmim
PF6)
Nanotubos de
carbono
multipared
+
GEL
GEL
Modificación del vial de muestra
comercial para llevar a cabo el
acoplamiento en-línea de la
etapa de tratamiento de muestra
y la separación de los NPs

Related Documents