JATO Dynamics Daniel Doni Sundjojo INDONESIA CAR AND LIGHT COMMERCIAL VEHICLES SALES REPORT SEPTEMBER 2016

Automotive Market Report I Indonesia I September 2016 I JATO Dynamics I Automotive Business Intelligence in Indonesia I Automotive Market Research in Indonesia I Daniel Doni Sundjojo
Apr 16, 2017
Welcome message from author
This document is posted to help you gain knowledge. Please leave a comment to let me know what you think about it! Share it to your friends and learn new things together.
Transcript

JATO Dynamics Daniel Doni Sundjojo
INDONESIA CAR AND LIGHT COMMERCIAL VEHICLES SALES REPORTSEPTEMBER 2016

Slide | 2 © JATO Dynamics Ltd., All Rights Reserved.
The leading global supplier of automotive intelligence.
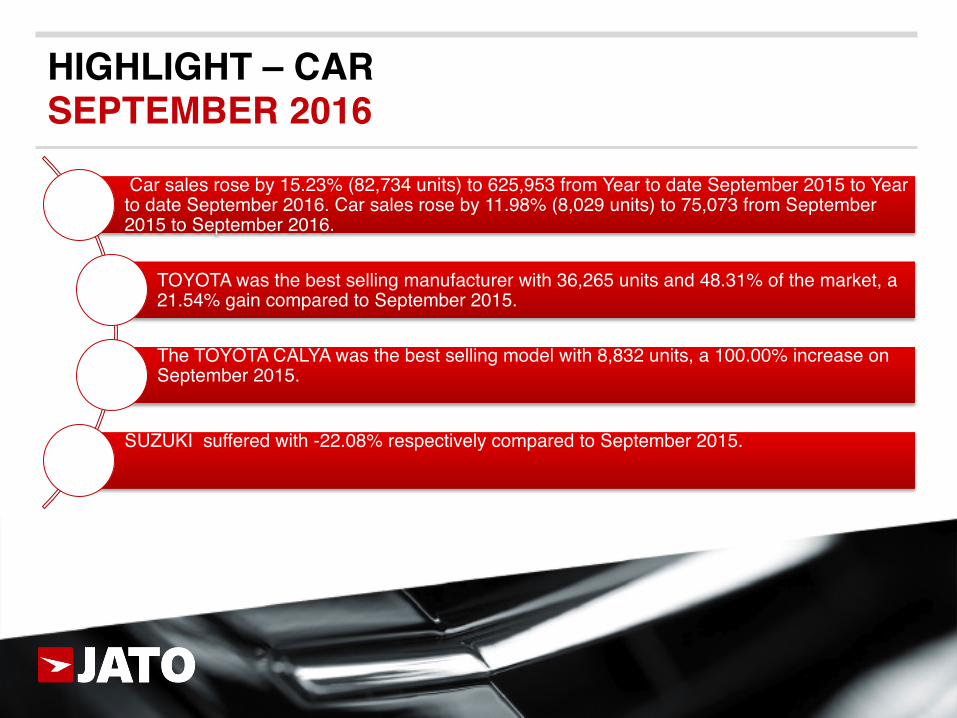
HIGHLIGHT – CAR SEPTEMBER 2016
Car sales rose by 15.23% (82,734 units) to 625,953 from Year to date September 2015 to Year to date September 2016. Car sales rose by 11.98% (8,029 units) to 75,073 from September 2015 to September 2016.
TOYOTA was the best selling manufacturer with 36,265 units and 48.31% of the market, a 21.54% gain compared to September 2015.
The TOYOTA CALYA was the best selling model with 8,832 units, a 100.00% increase on September 2015.
SUZUKI suffered with -22.08% respectively compared to September 2015.

Car Sales in INDONESIA SEPTEMBER 2016 (by Make)
Make Sep 16 Sep 15 +/- % Market share % Sep 16
YTD 16 YTD 15 +/- % Market share % YTD 16
TOYOTA 36,265 29,839 6,426 21.54 48.31 268,471 228,166 40,305 17.66 42.89
HONDA 15,791 14,355 1,436 10.00 21.03 151,849 117,849 34,000 28.85 24.26
DAIHATSU 13,048 8,024 5,024 62.61 17.38 95,349 70,770 24,579 34.73 15.23
SUZUKI 3,664 4,702 -1,038 -22.08 4.88 38,433 42,890 -4,457 -10.39 6.14
MITSUBISHI 1,915 1,883 32 1.70 2.55 20,122 15,821 4,301 27.19 3.21
DATSUN 1,494 2,846 -1,352 -47.51 1.99 24,522 20,968 3,554 16.95 3.92
NISSAN 1,035 1,648 -613 -37.20 1.38 11,006 20,049 -9,043 -45.10 1.76
MERCEDES 453 394 59 14.97 0.60 2,570 2,676 -106 -3.96 0.41
CHEVROLET 277 435 -158 -36.32 0.37 1,795 3,660 -1,865 -50.96 0.29
MAZDA 261 942 -681 -72.29 0.35 4,449 6,757 -2,308 -34.16 0.71

Car Sales in INDONESIA SEPTEMBER 2016 (by Model)
Model Sep 16 Sep 15 +/- % Market share % Sep 16
YTD 16 YTD 15 +/- % Market share % YTD 16
TOYOTA CALYA 8,832 8,832 - 11.76 21,076 21,076 - 3.37
TOYOTA AVANZA 7,001 9,973 -2,972 -29.80 9.33 66,203 69,711 -3,508 -5.03 10.58
DAIHATSU SIGRA 5,721 5,721 - 7.62 13,469 13,469 - 2.15
HONDA BRIO 5,539 3,776 1,763 46.69 7.38 31,810 29,844 1,966 6.59 5.08
TOYOTA KIJANG INNOVA
4,920 3,529 1,391 39.42 6.55 44,600 32,851 11,749 35.76 7.13
TOYOTA SIENTA 4,093 4,093 - 5.45 12,060 12,060 - 1.93
HONDA HR-V 3,044 3,706 -662 -17.86 4.05 34,836 28,292 6,544 23.13 5.57
HONDA MOBILIO 3,033 3,970 -937 -23.60 4.04 30,131 32,499 -2,368 -7.29 4.81
DAIHATSU XENIA 2,962 3,619 -657 -18.15 3.95 32,345 29,146 3,199 10.98 5.17
TOYOTA FORTUNER 2,921 1,023 1,898 185.53 3.89 22,280 9,887 12,393 125.35 3.56

HIGHLIGHT – LIGHT COMMERCIAL VEHICLES SEPTEMBER 2016
Light Commercial Vehicle sales fell by 33.65% (-54,373 units) to 107,203 from Year to date September 2015 to Year to date September 2016. Light Commercial Vehicle sales fell by 42.44% (-7,989 units) to 10,837 from September 2015 to September 2016.
DAIHATSU was the best selling manufacturer with 3,509 units and 32.38% of the market, a 33.40% fall compared to September 2015.
The DAIHATSU GRAN MAX was the best selling model with 3,509 units, a -33.40% decrease on September 2015.
TOYOTA, SUZUKI, MITSUBISHI suffered with -69.81%, -44.85%, -37.56% respectively compared to September 2015.

Light Commercial Vehicles Sales in INDONESIA SEPTEMBER 2016 (by Make)
Make Sep 16 Sep 15 +/- % Market share % Sep 16
YTD 16 YTD 15 +/- % Market share % YTD 16
DAIHATSU 3,509 5,269 -1,760 -33.40 32.38 38,207 55,954 -17,747 -31.72 35.64
MITSUBISHI 3,361 5,383 -2,022 -37.56 31.01 30,641 43,153 -12,512 -28.99 28.58
SUZUKI 2,931 5,315 -2,384 -44.85 27.05 29,338 49,638 -20,300 -40.90 27.37
TOYOTA 681 2,256 -1,575 -69.81 6.28 5,300 8,129 -2,829 -34.80 4.94
ISUZU 226 268 -42 -15.67 2.09 2,347 2,080 267 12.84 2.19
KIA 57 25 32 128.00 0.53 316 181 135 74.59 0.29
TATA 43 82 -39 -47.56 0.40 784 884 -100 -11.31 0.73
FORD 26 136 -110 -80.88 0.24 114 965 -851 -88.19 0.11
VOLKSWAGEN 3 4 -1 -25.00 0.03 29 33 -4 -12.12 0.03
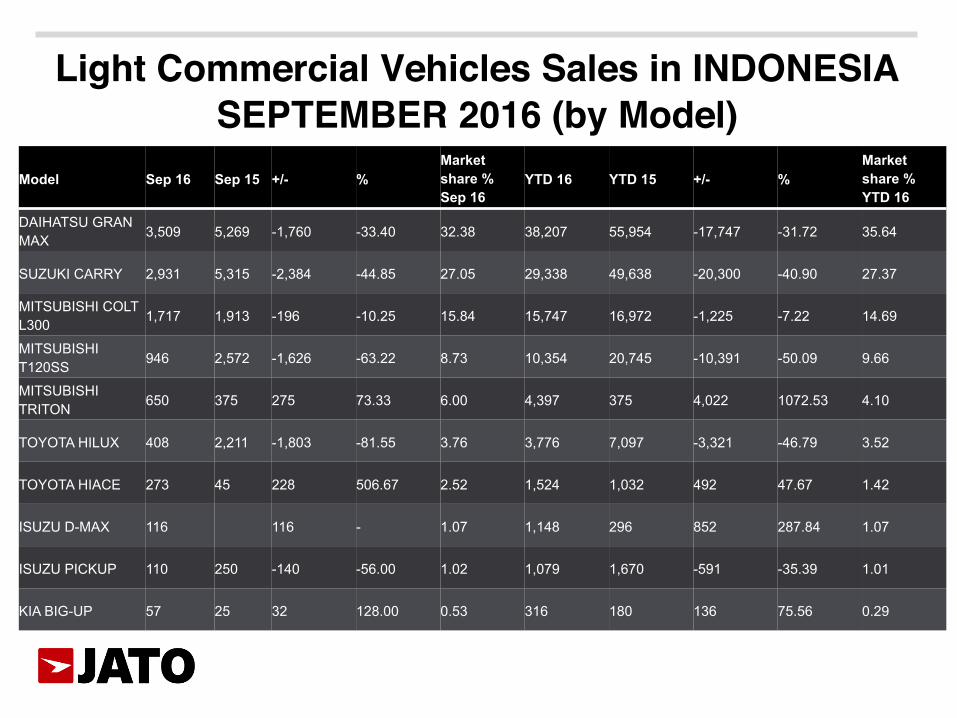
Light Commercial Vehicles Sales in INDONESIA SEPTEMBER 2016 (by Model)
Model Sep 16 Sep 15 +/- % Market share % Sep 16
YTD 16 YTD 15 +/- % Market share % YTD 16
DAIHATSU GRAN MAX 3,509 5,269 -1,760 -33.40 32.38 38,207 55,954 -17,747 -31.72 35.64
SUZUKI CARRY 2,931 5,315 -2,384 -44.85 27.05 29,338 49,638 -20,300 -40.90 27.37
MITSUBISHI COLT L300 1,717 1,913 -196 -10.25 15.84 15,747 16,972 -1,225 -7.22 14.69
MITSUBISHI T120SS 946 2,572 -1,626 -63.22 8.73 10,354 20,745 -10,391 -50.09 9.66
MITSUBISHI TRITON 650 375 275 73.33 6.00 4,397 375 4,022 1072.53 4.10
TOYOTA HILUX 408 2,211 -1,803 -81.55 3.76 3,776 7,097 -3,321 -46.79 3.52
TOYOTA HIACE 273 45 228 506.67 2.52 1,524 1,032 492 47.67 1.42
ISUZU D-MAX 116 116 - 1.07 1,148 296 852 287.84 1.07
ISUZU PICKUP 110 250 -140 -56.00 1.02 1,079 1,670 -591 -35.39 1.01
KIA BIG-UP 57 25 32 128.00 0.53 316 180 136 75.56 0.29

Thank You Merci
Gracias Grazie
Obrigado Tack
Vielen Dank Dank U
Kiitos Спасибо
Ευχαριστούµε תודה
ありがとう 谢谢
감사합니다 Terima Kasih
คุณขอบคุณ cảm ơn bạn
धन्यवादششككرراا للكك
Slide | 9 © JATO Dynamics Ltd., All Rights Reserved.
Related Documents