automatique by meiling Ch en 1 Lesson 11 Bode Diagram

Welcome message from author
This document is posted to help you gain knowledge. Please leave a comment to let me know what you think about it! Share it to your friends and learn new things together.
Transcript

automatique by meiling Chen 1
Lesson 11
Bode Diagram
automatique by meiling Chen 2
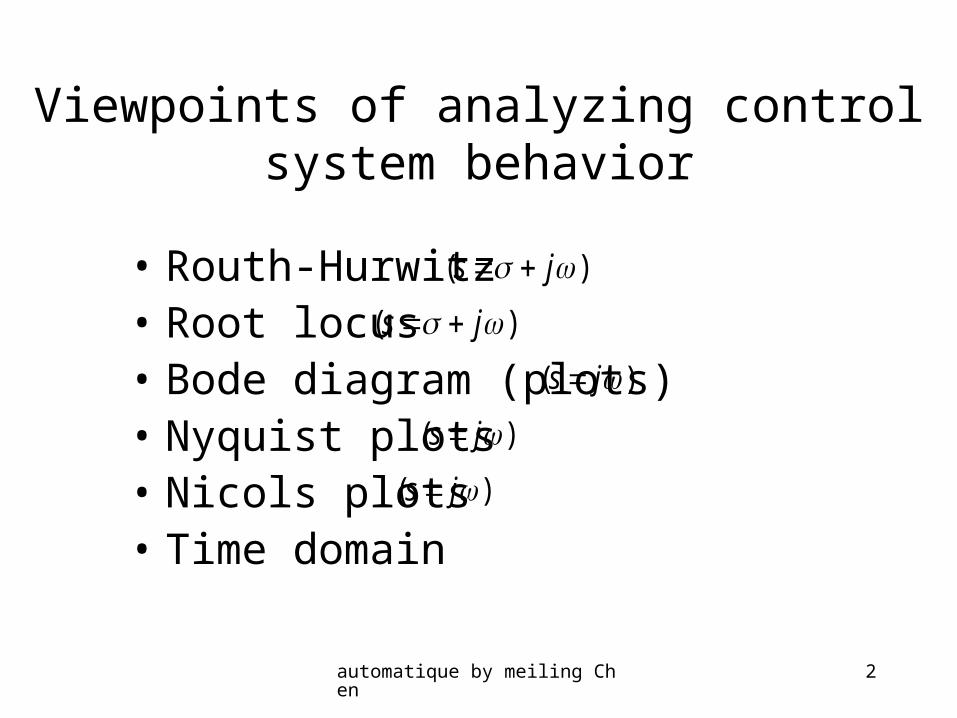
Viewpoints of analyzing control system behavior
• Routh-Hurwitz • Root locus• Bode diagram (plots)• Nyquist plots• Nicols plots• Time domain
)( js
)( js
)( js
)( js
)( js
automatique by meiling Chen 3
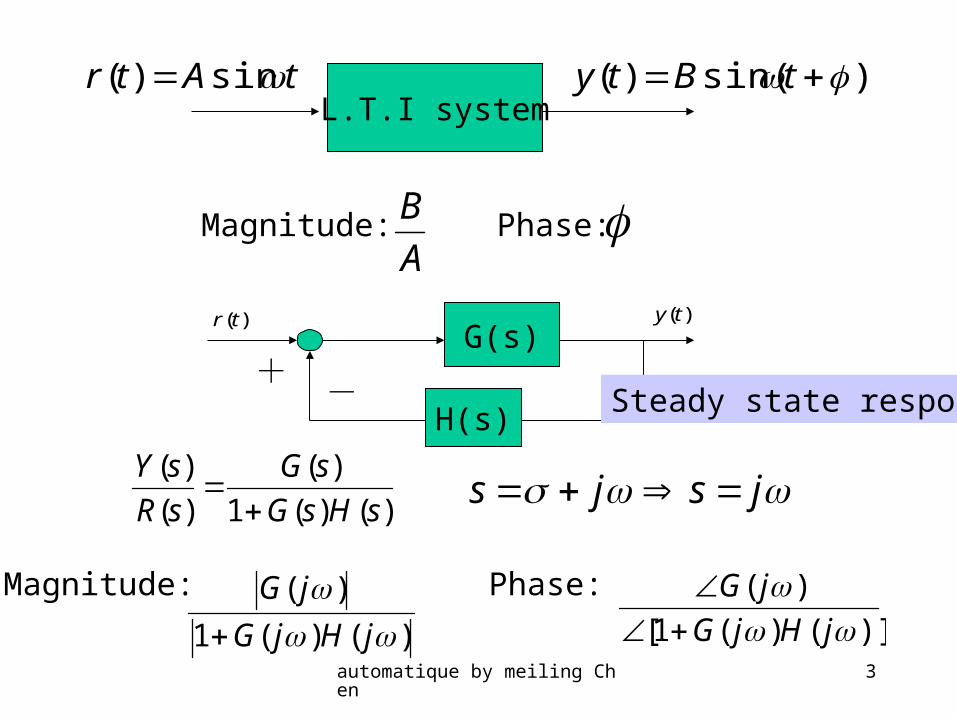
L.T.I systemtAtr sin)( )sin()( tBty
Magnitude: Phase:A
B
G(s)
H(s)
+ -
)(ty)(tr
)()(1
)(
)(
)(
sHsG
sG
sR
sY
jsjs
Magnitude: Phase:
)()(1
)(
jHjG
jG
)]()(1[
)(
jHjG
jG
Steady state response
automatique by meiling Chen 4
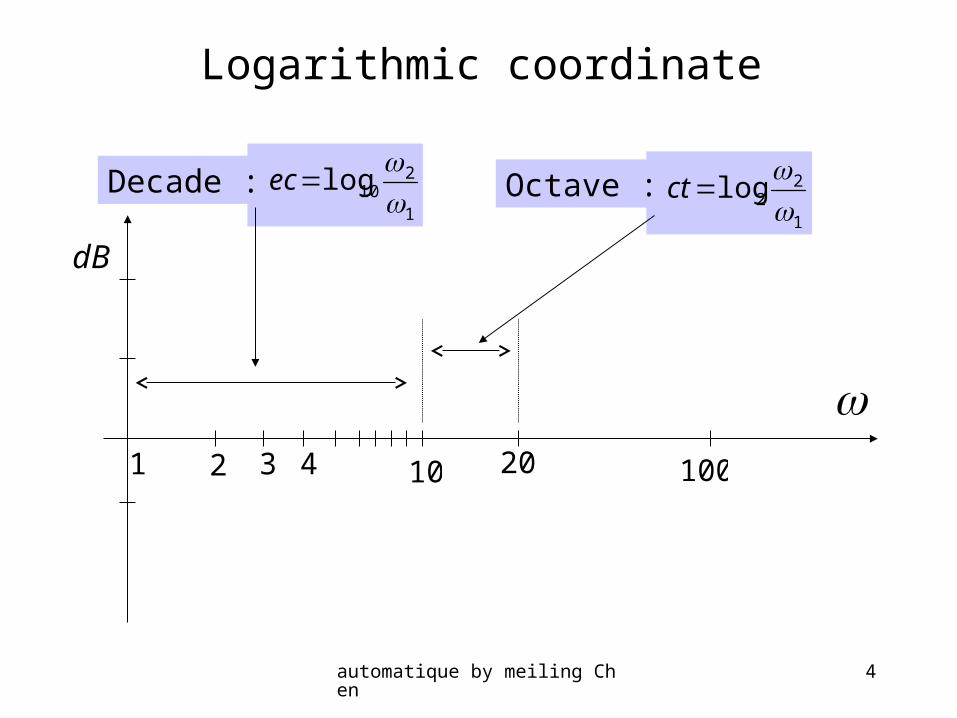
1
210log
decDecade :1
22log
octOctave :
1 10 100
Logarithmic coordinate
2 3 4 20
dB
automatique by meiling Chen 5
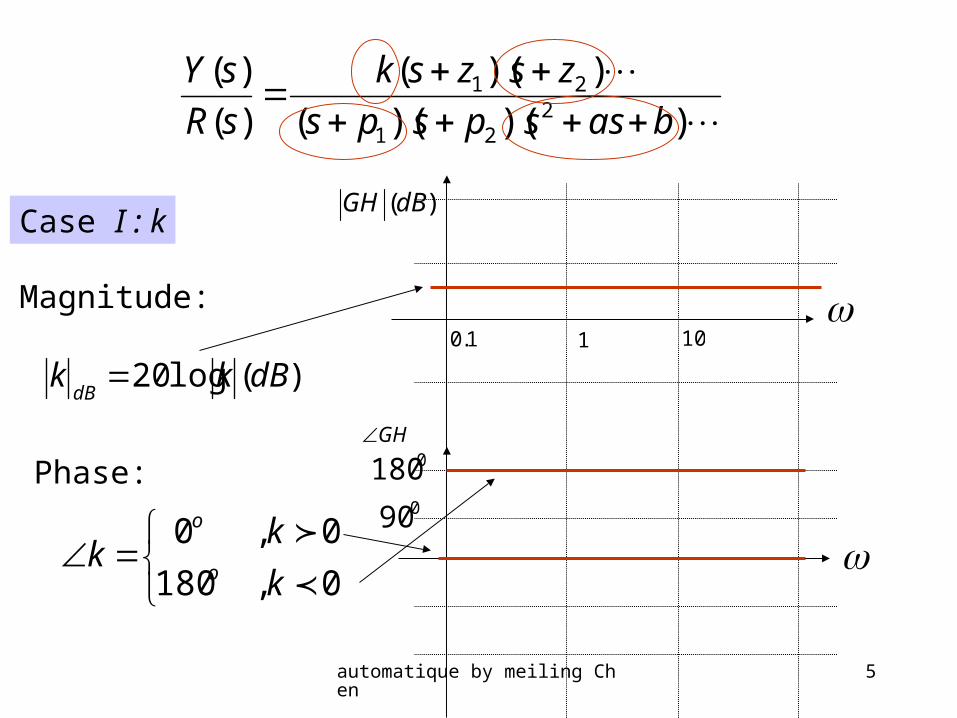
))()((
))((
)(
)(2
21
21
basspsps
zszsk
sR
sY
Case I : k
Magnitude:
Phase:
)(log20 dBkkdB
0,180
0,0
k
kk
o
o
)(dBGH
GH
1.0 1 10
090
0180

automatique by meiling Chen 6
Case II :
Magnitude:
Phase:
)(log20)(
1dBp
jdB
p
pj
op
)90()(
1
)(dBGH
GH
1.0 1 10
0900180
ps
1
090
1p
1p
2p
2p
automatique by meiling Chen 7
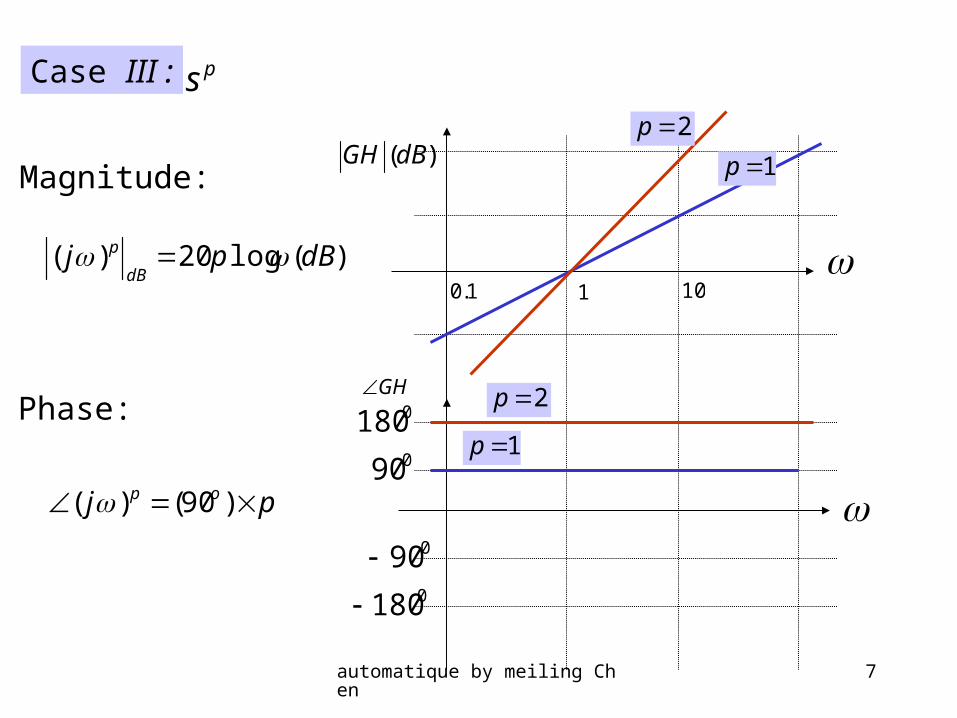
Case III :
Magnitude:
Phase:
)(log20)( dBpjdB
p
pj op )90()(
)(dBGH
GH
1.0 1 10
0900180
ps
0901p
1p
2p
2p0180

automatique by meiling Chen 8
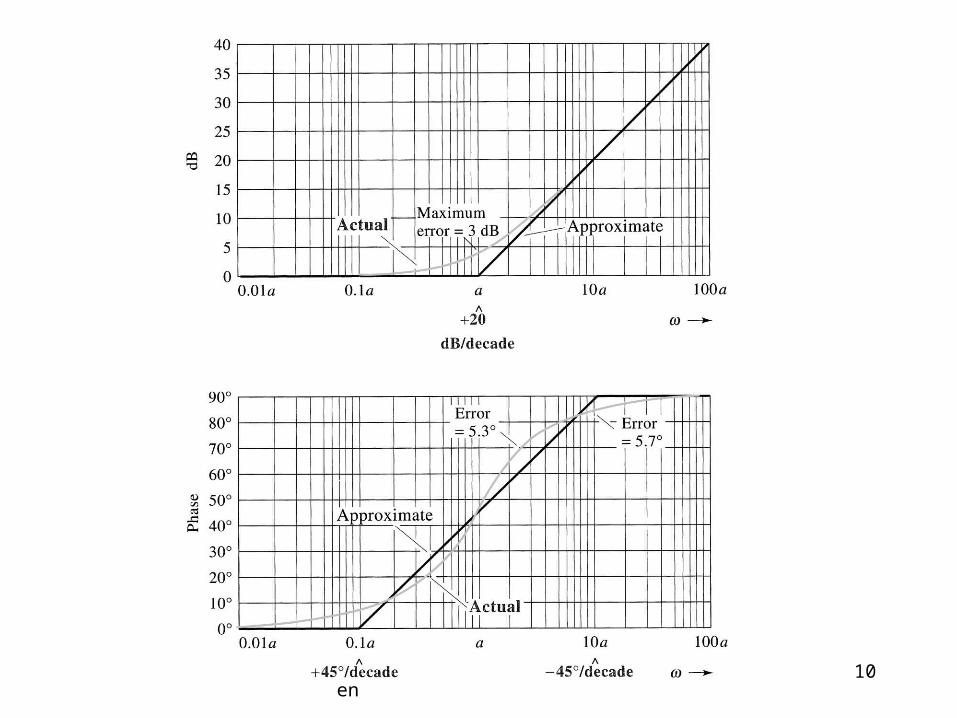
Case IV :1)1
1(
)(
s
aor
as
a
Magnitude:
Phase:
])(1log[10
)(1log20)1(
2
21
a
aaj
dB
aaj
10 tan0)1(
)(dBGH
GH
1.0 1 10
0900180
090
0180
01log100 dBa
a
]log20log20[
log201
adBa
dBaa
ja
oGHa
a 00tan0 1
oGHa
a 90tan 1
01.32log1011 dBja
045a
1a
automatique by meiling Chen 9
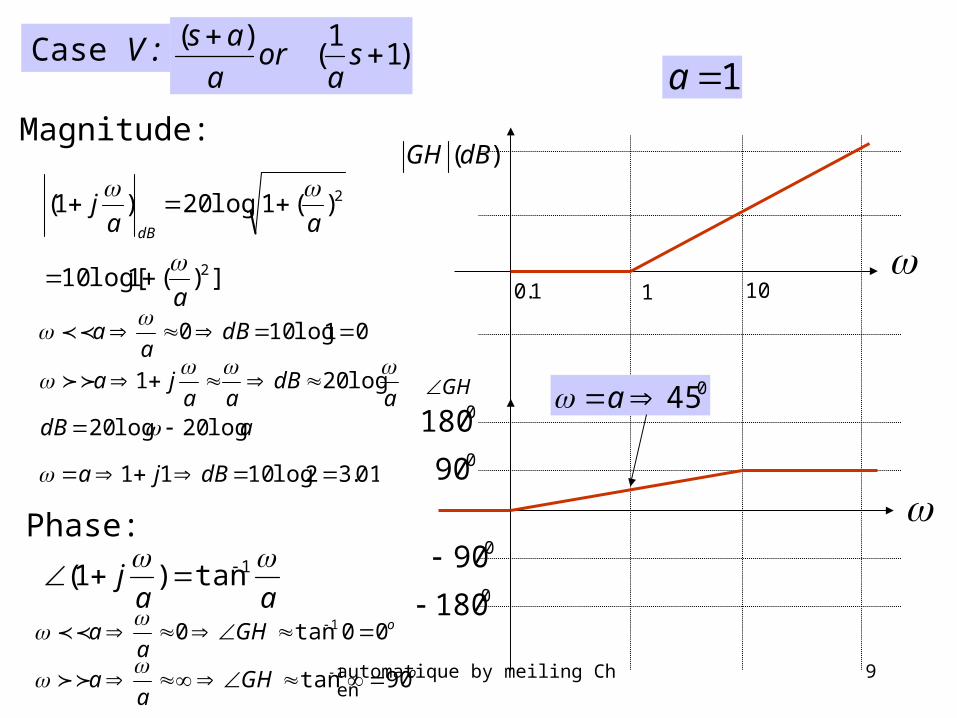
Case V :
Magnitude:
Phase:
])(1log[10
)(1log20)1(
2
2
a
aaj
dB
aaj
1tan)1(
)(dBGH
GH
1.0 1 10
0900180
090
0180
)11
()(
sa
ora
as
01log100 dBa
a
adBa
dBaa
ja
log20log20
log201
oGHa
a 00tan0 1
oGHa
a 90tan 1
01.32log1011 dBja
1a
045a
automatique by meiling Chen 10
automatique by meiling Chen 11
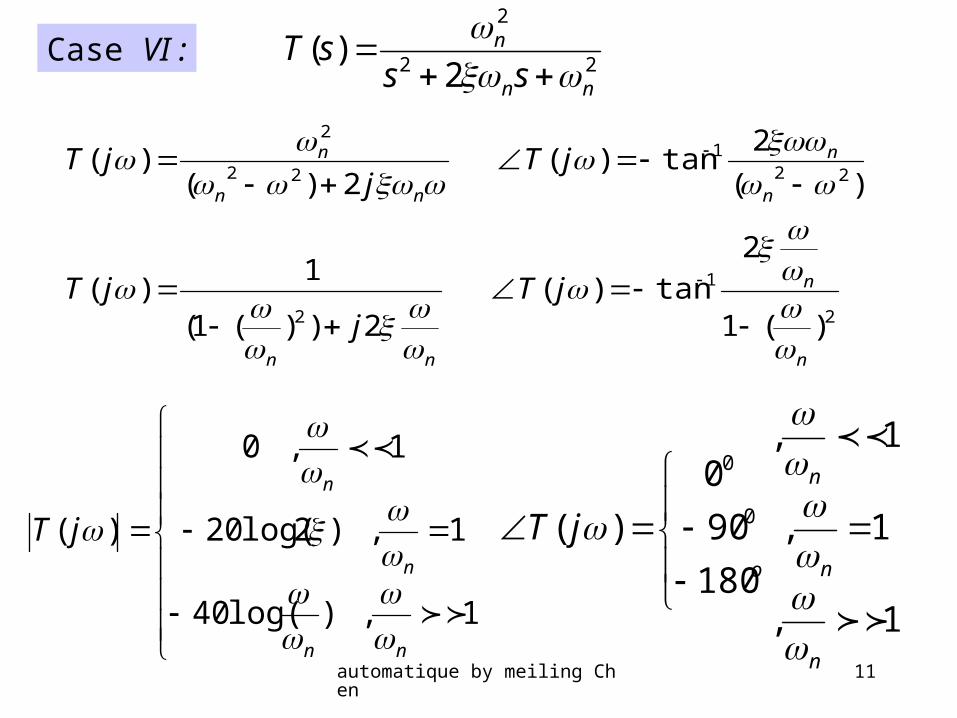
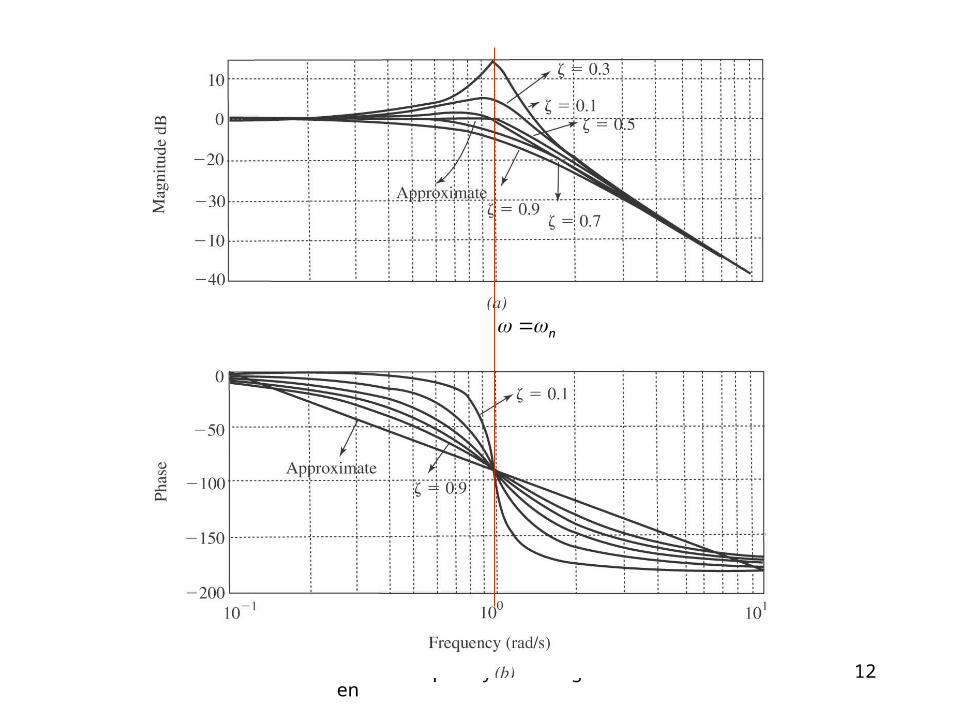
Case VI : 22
2
2)(
nn
n
sssT
2
1
2
221
22
2
)(1
2
tan)(2))(1(
1)(
)(
2tan)(
2)()(
n
n
nn
n
n
nn
n
jTj
jT
jTj
jT
1,)log(40
1,)2log(20
1,0
)(
nn
n
n
jT
1,
1,
1,
180
90
0
)( 0
0
n
n
n
o
jT
automatique by meiling Chen 12
n
automatique by meiling Chen 13
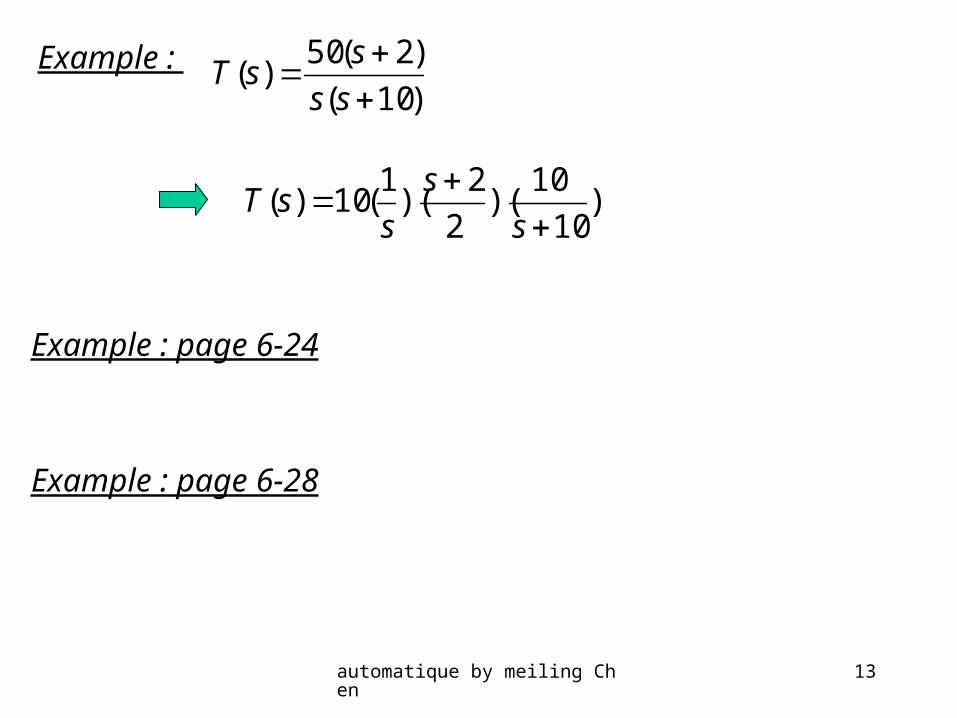
Example : )10(
)2(50)(
ss
ssT
)10
10)(
2
2)(
1(10)(
s
s
ssT
Example : page 6-24
Example : page 6-28

automatique by meiling Chen 14
automatique by meiling Chen 15
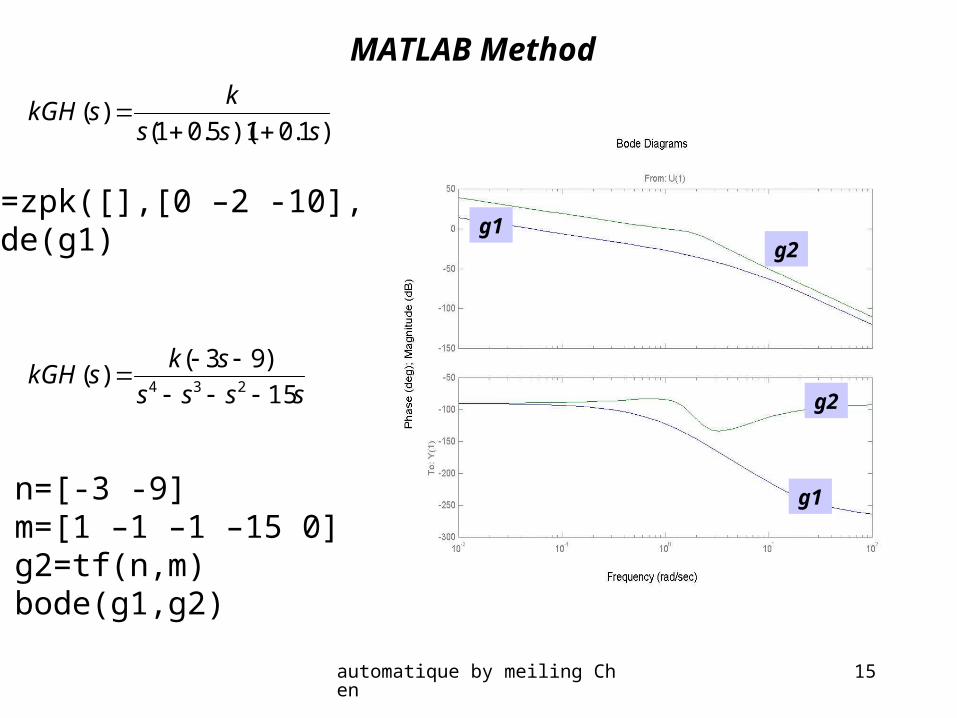
)1.01)(5.01()(
sss
kskGH
n=[-3 -9]m=[1 –1 –1 –15 0]g2=tf(n,m)bode(g1,g2)
ssss
skskGH
15
)93()(
234
g1=zpk([],[0 –2 -10],[1])bode(g1)
MATLAB Method
g1g2
g1
g2
automatique by meiling Chen 16
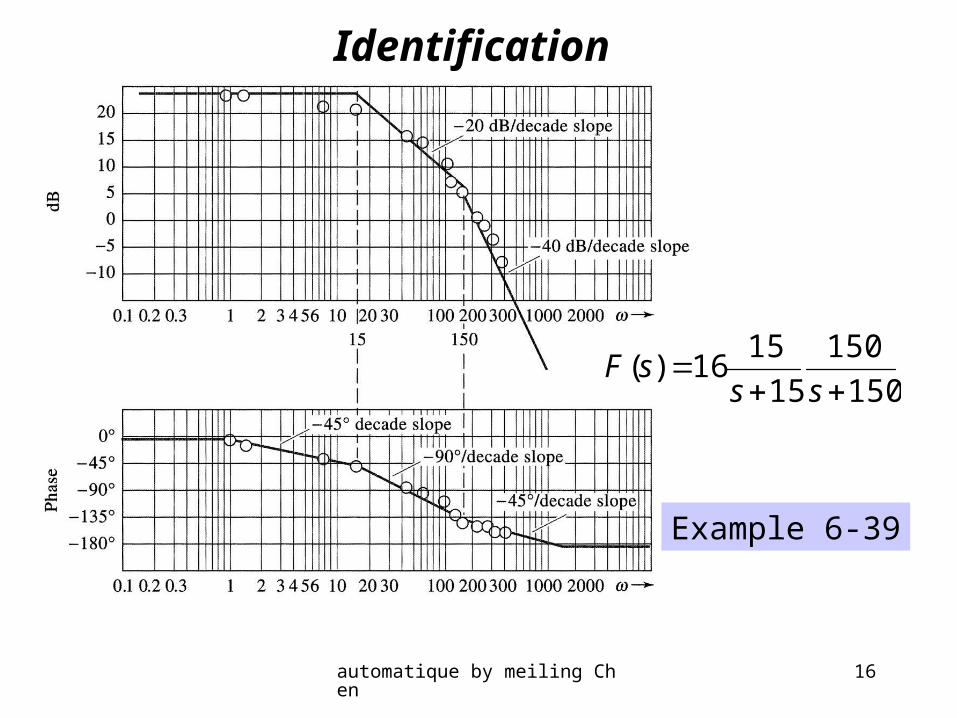
Identification
150
150
15
1516)(
sssF
Example 6-39
automatique by meiling Chen 17
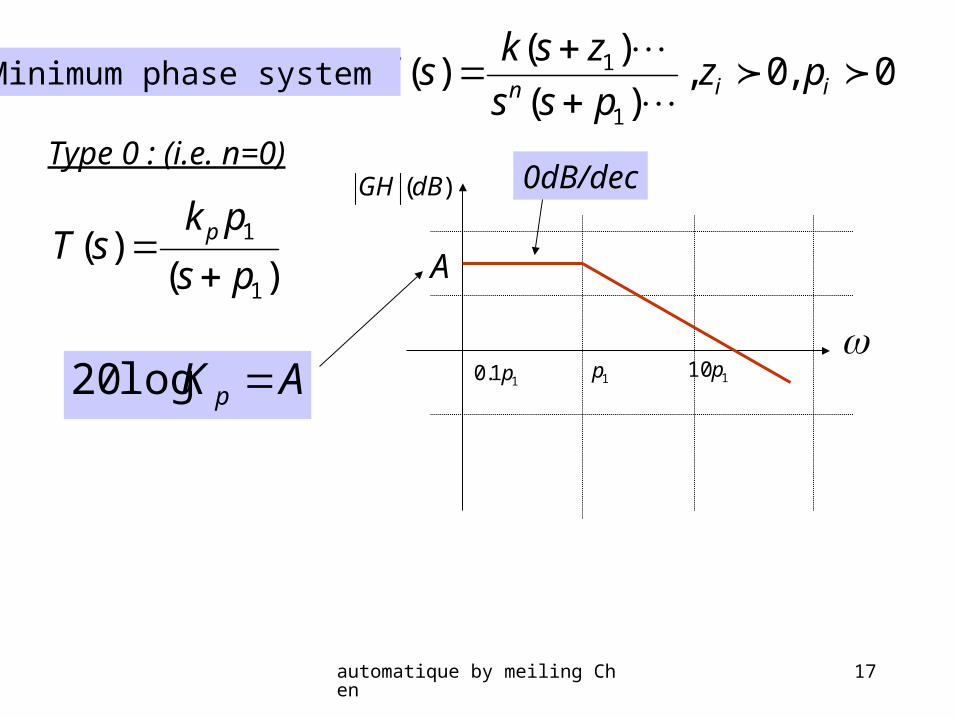
0,0,)(
)()(
1
1
iinpz
pss
zsksT
Minimum phase system
Type 0 : (i.e. n=0)
)()(
1
1
ps
pksT p
)(dBGH
11.0 p 1p 110 p
A
AK p log20
0dB/dec
automatique by meiling Chen 18
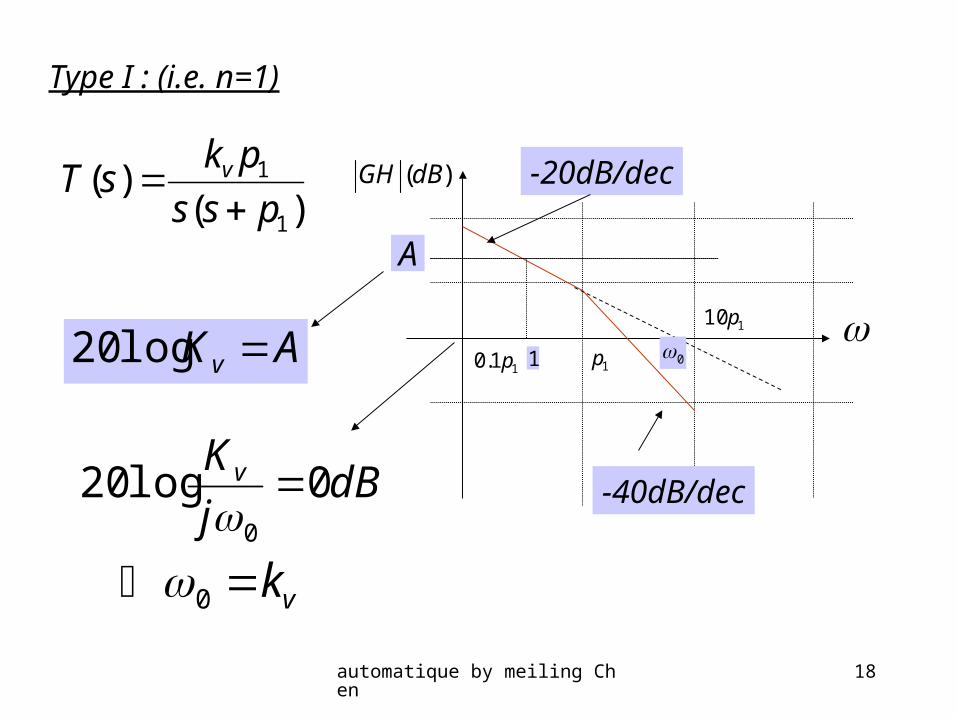
Type I : (i.e. n=1)
)()(
1
1
pss
pksT v
)(dBGH
11.0 p 1p
110 p
A
-20dB/dec
-40dB/dec
1AKv log20 0
dBj
Kv 0log200
vk0
automatique by meiling Chen 19
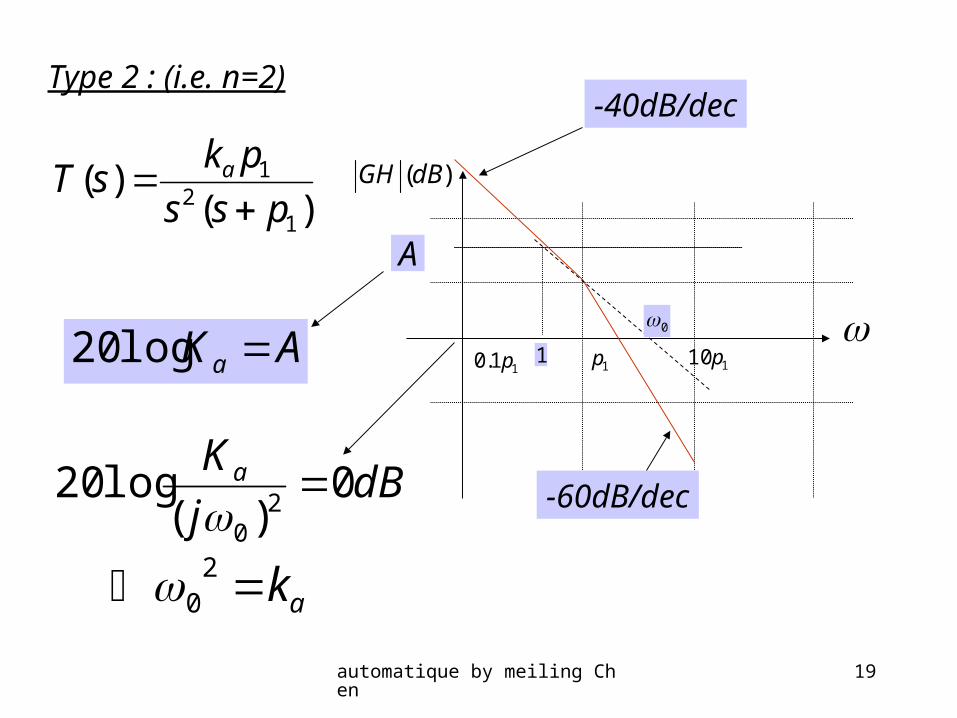
Type 2 : (i.e. n=2)
)()(
12
1
pss
pksT a
)(dBGH
11.0 p 1p 110 p
A
-40dB/dec
-60dB/dec
1AKa log200
dBj
Ka 0)(
log202
0
ak20
automatique by meiling Chen 20
A transfer function is called minimum phase when all the poles and zeros are LHP and non-minimum-phase when there are RHP poles or zeros.
Minimum phase system Stable
The gain margin (GM) is the distance on the bode magnitude plot from the amplitude at the phase crossover frequency up to the 0 dB point. GM=-(dB of GH measured at the phase crossover frequency)
The phase margin (PM) is the distance from -180 up to the phase at the gain crossover frequency. PM=180+phase of GH measured at the gain crossover frequency
Relative stability

automatique by meiling Chen 21
Open loop transfer function :
Closed-loop transfer function :
)()( sHsG
)()(1 sHsG
Open loop Stability poles of in LHP)()( sHsG
)0,0()0,1(Re
Im
RHPClosed-loop Stability poles of in left side of (-1,0))()( sHsG
automatique by meiling Chen 22
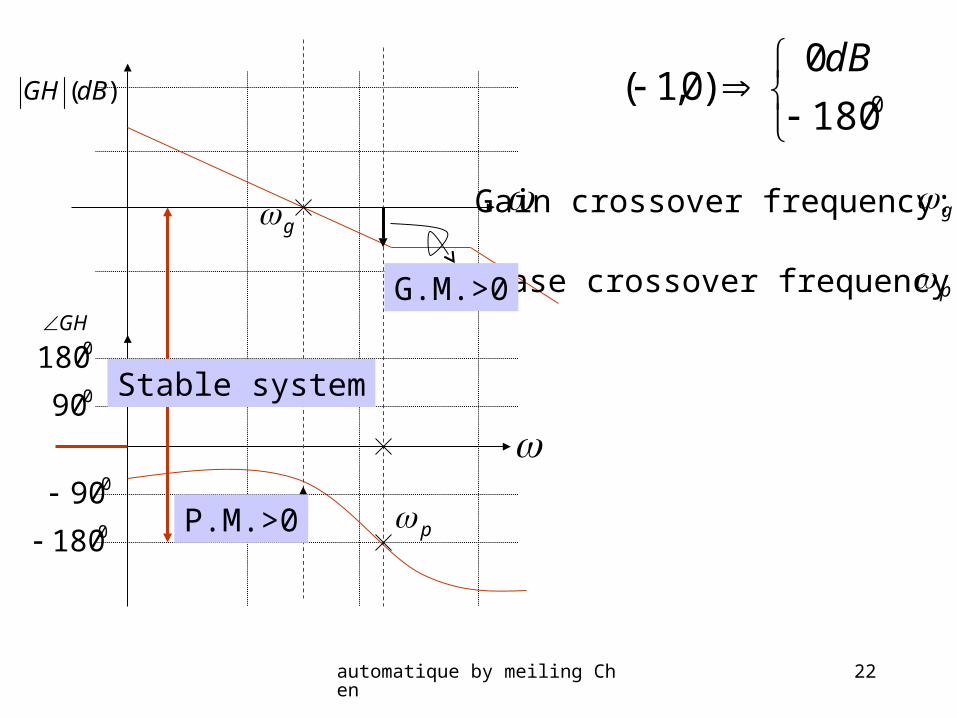
)(dBGH
GH
0900180
090
0180
0180
0)0,1(
dB
g
p
Gain crossover frequency: g
phase crossover frequency: p
P.M.>0
G.M.>0
Stable system
automatique by meiling Chen 23
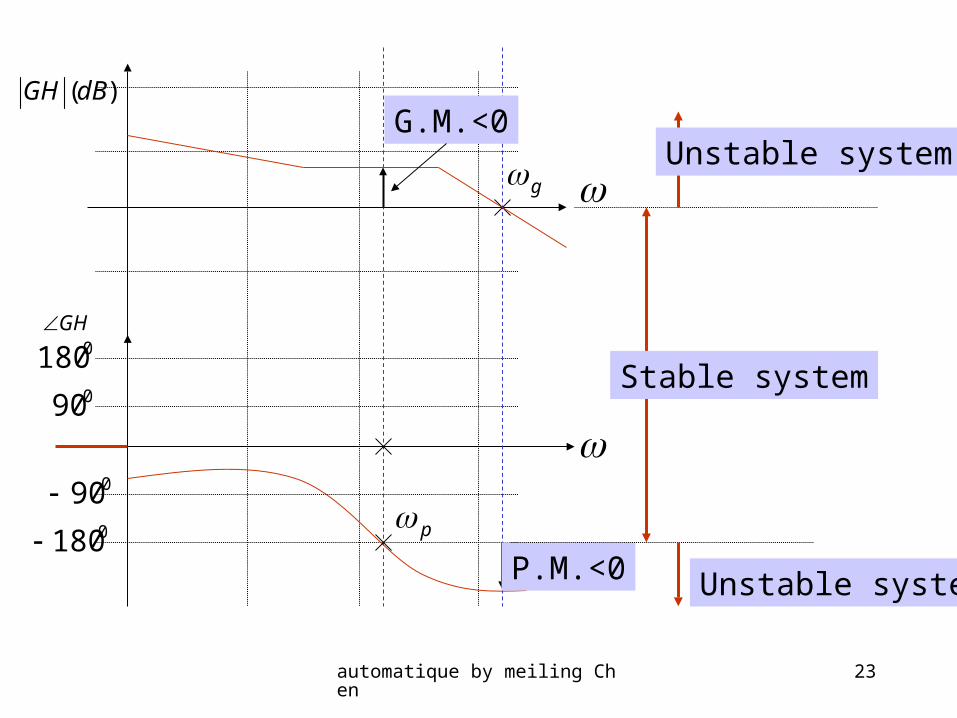
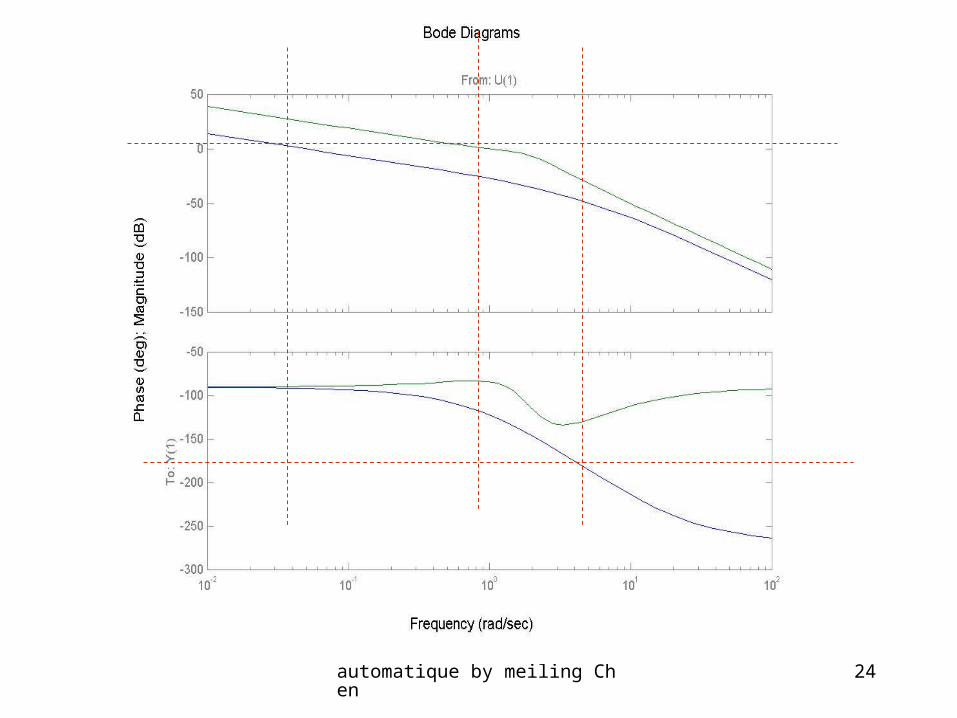
)(dBGH
GH
0900180
090
0180
g
pP.M.<0
G.M.<0
Stable system
Unstable system
Unstable system
automatique by meiling Chen 24
Related Documents